| | | | |
OMB APPROVAL |
| OMB Number: | | 3235-0570 |
| Expires: | | January 31, 2014 |
| Estimated average burden |
| hours per response: | | 20.6 |
UNITED STATES
SECURITIES AND EXCHANGE COMMISSION
Washington, D.C. 20549
FORM N-CSR/A
CERTIFIED SHAREHOLDER REPORT OF REGISTERED
MANAGEMENT INVESTMENT COMPANIES
Investment Company Act file number 811-07890
AIM Tax-Exempt Funds (Invesco Tax-Exempt Funds )
(Exact name of registrant as specified in charter)
11 Greenway Plaza, Suite 1000 Houston, Texas 77046
(Address of principal executive offices) (Zip code)
Philip A. Taylor
11 Greenway Plaza, Suite 1000 Houston, Texas 77046
(Name and address of agent for service)
Registrant’s telephone number, including area code: (713) 626-1919
Date of fiscal year end: 2/28
Date of reporting period: 2/28/13
The Registrant is filing this amendment to its Certified Shareholder Report on Form N-CSR for the period ended February 28, 2013, originally filed with the Securities and Exchange Commission on May 9, 2013 (Accession Number 0001193125-13-209312). The purpose of this amendment is to modify certain information in Item 1 “Reports to Stockholders” with respect to Invesco High Yield Municipal Fund (the “Fund”).
Other than the aforementioned revision this Form N-CSR/A does not reflect events occurring after the filing of the original Form N-CSR, or modify or update the disclosures therein in any way.
Item 1. Report to Stockholders.
Letters to Shareholders
| | |

Philip Taylor | | Dear Shareholders: This annual report contains information about your Fund and the factors that affected its performance during the reporting period. Inside, you’ll find a discussion from your portfolio managers about how they managed your Fund, performance data for your Fund, a complete list of your Fund’s investments as of the close of the reporting period and other important information. I hope you find this report of interest. The reporting period covered by this report was challenging. As it began, investors cheered generally positive economic indicators, and markets generally rose. Soon, however, US economic data turned mixed and investors’ attention shifted to the efforts of eurozone governments to implement new policies intended to reduce debt levels, strengthen the banking system and stimulate economic growth. Later in the year, in the US, mixed economic data and |
| competing proposals on how to reduce the federal budget deficit increased investor uncertainty and hindered market performance. Throughout the reporting period, your Fund’s portfolio managers adhered to their long-term investment strategies, and later in this report they explain why your Fund performed as it did during the reporting period. |
Adhering to your long-term investment plan can be difficult, particularly during periods of market volatility and economic uncertainty. That’s one reason Invesco suggests investors work with a skilled and trusted financial adviser who is familiar with their financial situation, investment goals and risk tolerance. A good financial adviser can provide insight and perspective when markets are volatile; encouragement and reassurance when times are uncertain; and advice and guidance when your financial situation or investment goals change.
Timely insight and information from many of Invesco’s investment professionals is available at our website, invesco.com/us. We offer in-depth articles, video clips and audio commentaries from many of our portfolio managers and other investment professionals on a wide range of topics of interest to investors. At invesco.com/us, you also can access information about your Invesco account at any time.
What we mean by Intentional Investing
At Invesco, all of our people and all of our resources are dedicated to helping investors achieve their financial objectives. It’s a philosophy we call Intentional Investing®, and it guides the way we:
| | ¾ | Manage investments - Our dedicated investment professionals search the world for the best opportunities, and each investment team follows a clear, disciplined process to build portfolios and mitigate risk. |
| | ¾ | Provide choices - We offer equity, fixed income, asset allocation and alternative strategies so you and your financial adviser can build an investment portfolio designed for your individual needs and goals. |
| | ¾ | Connect with you - We’re committed to giving you the expert insights you need to make informed investing decisions, and we are well-equipped to provide high-quality support for investors and advisers. |
Invesco believes in putting investors first, and that’s why investment management is all we do. Our sole focus on managing your money allows your financial adviser to build a portfolio of Invesco funds appropriate for your investment needs and goals now and when your circumstances change.
Have a question?
If you have a question about your account, please contact an Invesco client services representative at 800 959 4246. If you have an Invesco-related question or comment, feel free to email me directly at phil@invesco.com.
All of us at Invesco look forward to serving your investment management needs for many years to come. Thank you for investing with us.
Sincerely,

Philip Taylor
Senior Managing Director, Invesco Ltd.
| | |
| 2 | | Invesco High Yield Municipal Fund |
| | |

Bruce Crockett | | Dear Fellow Shareholders: While short-term challenges for the financial markets regularly come and go, it’s clear that significant and longer term economic obstacles remain both here at home and abroad. There appear to be no easy solutions to many of these issues. As a result, the financial markets have had little conviction to respond to what has been slow, yet noticeable improvement in some economic benchmarks in recent months. No one likes uncertainty, especially financial markets. But even in these uncertain times, it appears that investors are still approaching the market with cautious optimism, with some taking on more risk in order to refocus on their long-term savings goals. Maybe this describes you, or perhaps you have been sitting on the sidelines thinking about getting back into the market, but are still a bit hesitant to act because of market uncertainty. |
| Clearly, risk remains a primary focus for investors of all types. As Trustees of the Invesco Funds, one of our primary responsibilities is to ensure your Fund’s adviser is cognizant of the risks in each of the funds it manages. A thoughtful risk management plan may help investors navigate through market turbulence or an economic downturn. This is why we make risk management a critical element of our annual contract renewal process, like the one we complete with Invesco every year. |
To be sure, there will always be risks involved with investing, but you shouldn’t let short-term news or your emotions dictate your investments. Because no one can predict with 100% accuracy the movements of financial markets, I strongly encourage you to speak with a professional financial adviser who can assist you in building an investment portfolio that reflects your individual risk tolerance and is designed to help achieve your individual financial objectives.
You can be sure your Board remains committed to doing its part in helping you along the way. In addition to ensuring that your Fund’s adviser is focused on the risks in the funds it manages, we also remain committed to managing fund costs and working with your Fund’s adviser to provide a compelling and diversified product offering to potentially meet your investing goals.
In that regard, your Board approved a number of fund mergers and the launch of several new funds, including the first Invesco mutual fund available to US retail investors managed by investment professionals at Invesco Perpetual*, one of the largest independent investment managers in the UK.
Let me close by thanking Carl Frischling upon his retirement from the Invesco Funds Board for his 35 years of distinguished service and unwavering commitment to our funds’ shareholders. As always, please contact me at bruce@brucecrockett.com with any questions or concerns you may have.
On behalf of the Board, we look forward to continuing to represent your interests and serving your investment needs.
Sincerely,

Bruce L. Crockett
Independent Chair
Invesco Funds Board of Trustees
| * | Invesco Perpetual is a business name of Invesco Asset Management Limited (IAML), a registered investment adviser. IAML is a wholly owned, indirect subsidiary of Invesco Ltd. |
| | |
| 3 | | Invesco High Yield Municipal Fund |
Management’s Discussion of Fund Performance
| | | | |
Performance summary For the fiscal year ended February 28, 2013, all share classes of Invesco High Yield Municipal Fund, at net asset value (NAV), posted positive returns. The Fund at NAV underperformed its broad market benchmark, the Barclays High Yield Municipal Bond Index but performed in line with its style-specific benchmark, the Custom High Yield Municipal Index. The Fund’s underweight allocation to the tobacco sector was the main driver of underperformance versus the Barclays High Yield Municipal Bond Index. Conversely, our overweight exposure to hospital bonds contributed to Fund returns for the reporting period. Your Fund’s long-term performance appears later in this report. | |
Fund vs. Indexes Total returns, 2/29/12 to 2/28/13, at net asset value (NAV). Performance shown does not include applicable contingent deferred sales charges (CDSC) or front-end sales charges, which would have reduced performance. | |
Class A Shares | | | 10.78 | % |
Class B Shares | | | 10.87 | |
Class C Shares | | | 9.97 | |
Class Y Shares | | | 11.04 | |
Class R5 Shares* | | | 11.04 | |
| Barclays High Yield Municipal Bond Index‚(Broad Market Index) | | | 14.39 | |
Custom High Yield Municipal Indexn (Style-Specific Index) | | | 10.55 | |
Source(s): ‚Invesco, Barclays; nInvesco, Lipper Inc., Barclays | | | | |
*Effective September 24, 2012, Institutional Class shares were renamed Class R5 shares. | |
See page 7 for a detailed explanation of Fund performance. | | | | |
How we invest
The Fund’s investment objective is to seek federal tax-exempt current income and taxable capital appreciation.
Under normal market conditions, we generally seek to achieve the Fund’s investment objective by investing primarily in a portfolio of medium- and lower-grade municipal securities. Although not governed by specific rating categories, the Fund generally invests at least 75% of its net assets in municipal securities rated medium- to lower-quality by at least one nationally recognized statistical rating organization – or if not rated, securities we determine to be of comparable quality – at the time of purchase.
Under normal market conditions, we may invest all or a substantial portion of the Fund’s assets in municipal securities that are subject to the federal alternative minimum tax (AMT). Accordingly, the Fund may not be a suitable investment for investors who are already subject to
the AMT or could become subject to it as a result of an investment in the Fund.
At times, conditions in the municipal securities markets may be such that we will invest in higher-grade issues, particularly when the difference in returns between quality classifications is very narrow or when we expect interest rates to increase. These investments may lessen the decline in NAV but may affect the amount of current income, since yields of higher-grade securities are usually lower than yields of medium- or lower-grade securities.
Sell decisions generally are based on:
| ¾ | A deterioration or likely deterioration of an individual issuer’s capacity to meet its debt obligations on a timely basis. |
| ¾ | A deterioration or likely deterioration of the broader fundamentals of a particular industry or sector. |
| ¾ | Opportunities in the secondary or primary market to exchange into a security with better relative value. |
Market conditions and your Fund
For the fiscal year ended February 28, 2013, the municipal market produced yet another year of positive performance. The Barclays Municipal Bond Index returned 5.01%, outperforming other fixed income indexes such as the Barclays U.S. Aggregate Index, which returned 3.12%; the Barclays Asset-Backed Securities Index, which returned 2.64%; the Barclays U.S. Mortgage-Backed Securities Index, which returned 1.92%; and the Barclays U.S. Agency Index, which returned 1.88%.1
During the reporting period, municipal issuance, or lack thereof, coupled with strong net inflows into municipal bond funds, resulted in a favorable environment for municipal performance. Municipal bond issuance ended 2012 with $379 billion in gross new issues.2 While the gross figure reflects a 29% increase from the 2011 level, it also marks the second consecutive year of net negative supply.2 Concerns regarding tax reform and general economic uncertainty led investors to flock into municipal bond funds, and net inflows for calendar year 2012 were over $50 billion3, a stark contrast from the $12 billion in net outflows that the category experienced in calendar year 2011.3
The financial situation at the state level generally continues to improve, as evidenced by the growth in tax revenues, which have increased for 11 consecutive quarters, according to data collected by the Rockefeller Institute.4 The 11 quarters of growth in state tax collections came after five straight quarters of declines in collections were posted immediately following the recession.4 Year-over-year state tax revenues increased by 2.7% in the third quarter of 2012, the most recent data available.4 Despite these positive trends, overall tax collections remain weak compared to recent history. Nevertheless, state tax revenues were 1.4% higher in the third quarter of 2012 than they were in the same quarter of 2008.4
| | | | |
| Portfolio Composition | |
| By credit sector, based on total investments | |
Revenue Bonds | | | 93.1 | % |
General Obligation Bonds | | | 5.0 | |
Pre-Refunded Bonds | | | 1.9 | |
| | | | |
Total Net Assets | | | $7.3 billion | |
| |
Total Number of Holdings | | | 1,630 | |
| | | | | | | | |
| Top Five Fixed Income Holdings | | | | | | | | |
| | | Coupon | | Maturity | | | % of Total Net Assets |
1. Sanger Industrial Development Corp. | | 8.00% | | | 07/01/38 | | | 0.7% |
2. Tobacco Settlement Financing Corp. | | 5.00 | | | 06/01/29 | | | 0.6 |
3. Salt Verde Financial Corp. | | 5.00 | | | 12/01/37 | | | 0.6 |
4. Tobacco Settlement Financing Corp. | | 4.75 | | | 06/01/34 | | | 0.6 |
5. King (County of) | | 5.00 | | | 01/01/34 | | | 0.6 |
The Fund’s holdings are subject to change, and there is no assurance that the Fund will continue to hold any particular security.
| | |
| 4 | | Invesco High Yield Municipal Fund |
As we approached the end of the reporting period, we expected political, headline and event risk to remain elevated in 2013 as lawmakers consider various options to close the federal spending gap. We recognize that difficult budget and policy decisions are needed, and as a result we are avoiding investments that are highly dependent on federal aid.
At the sector level, performance was driven by the Fund’s underweight allocation to the Tobacco Master Settlement Agreement (MSA) sector, which was the Fund’s best performing sector during the reporting period. While we increased the Fund’s tobacco exposure by selectively adding to stronger stocks during the reporting period, the Fund remains relatively underweight in this sector. We tend to avoid heavy allocations to the Tobacco MSA sector due to its historical volatility. Our underweight exposure to industrial development revenue/pollution control revenue bonds was also a detractor from relative Fund performance. Conversely, our overweight exposure to hospital bonds contributed to Fund returns for the reporting period.
Performance was also driven by BBB-AAA5 credit quality spread tightening for most of the reporting period, largely a result of continued declining yields, strong demand and low tax-exempt issuance. As a result, BBB-rated and lower credit quality sectors outperformed higher-rated credits and contributed to Fund performance as we held overweight exposure to these market segments. The Fund’s non-rated allocation also contributed to relative Fund performance.
In terms of yield curve positioning, the Fund’s security selection within the long end (20+ years) of the curve detracted from Fund performance, largely due to our relative underweight position in the Tobacco MSA sector. Some of our yield curve and duration positioning was implemented through the use of inverse floating rate securities. Inverse floating rate securities are instruments that have an inverse relationship to a referenced interest rate. Inverse floating rate securities can be a more efficient means of managing duration, yield curve exposure and credit exposure. Also, they potentially can enhance yield.
During the reporting period, leverage made a positive contribution to the performance of the Fund. The Fund achieved a leveraged position through the use of inverse floating rate securities. The Fund uses leverage because we believe that, over time, leveraging can provide opportunities for additional income and total
return for shareholders. However, the use of leverage also can expose shareholders to additional volatility. For more information about the Fund’s use of leverage, see the Notes to Financial Statements later in this report.
Thank you for investing in Invesco High Yield Municipal Fund and for sharing our long-term investment horizon.
| 2 | Source: Securities Industry and Financial Markets Association |
| 4 | Source: The Nelson A. Rockefeller Institute of Government |
| 5 | Standard & Poor’s. A credit rating is an assessment provided by a nationally recognized statistical rating organization (NRSRO) of the creditworthiness of an issuer with respect to debt obligations, including specific securities, money market instruments or other debts. Ratings are measured on a scale that generally ranges from AAA (highest) to D (lowest); ratings are subject to change without notice. “Non-Rated” indicates the debtor was not rated, and should not be interpreted as indicating low quality. For more information on Standard & Poor’s rating methodology, please visit standardandpoors.com and select “Understanding Ratings” under Rating Resources on the homepage. |
The views and opinions expressed in management’s discussion of Fund performance are those of Invesco Advisers, Inc. These views and opinions are subject to change at any time based on factors such as market and economic conditions. These views and opinions may not be relied upon as investment advice or recommendations, or as an offer for a particular security. The information is not a complete analysis of every aspect of any market, country, industry, security or the Fund. Statements of fact are from sources considered reliable, but Invesco Advisers, Inc. makes no representation or warranty as to their completeness or accuracy. Although historical performance is no guarantee of future results, these insights may help you understand our investment management philosophy.
See important Fund and, if applicable, index disclosures later in this report.
| | |
 | | Bill Black Chartered Financial Analyst, portfolio manager, is manager of Invesco High Yield Municipal Fund. |
| He joined Invesco in 2010. Mr. Black earned a BS in engineering and public policy from Washington University in St. Louis and an MBA from Kellogg School of Management, Northwestern University. |
| |
 | | Mark Paris Portfolio manager, is manager of Invesco High Yield Municipal Fund. He joined Invesco in 2010. |
| Mr. Paris earned a BBA in finance from Baruch College, The City University of New York. |
| |
 | | James Phillips Portfolio manager, is manager of Invesco High Yield Municipal Fund. He joined Invesco in 2010. |
| Mr. Phillips earned a BA in American literature from Empire State College and an MBA in finance from University at Albany, The State University of New York. |
| | |
| 5 | | Invesco High Yield Municipal Fund |
Your Fund’s Long-Term Performance
Results of a $10,000 Investment – Oldest Share Class(es)
Fund and index data from 02/28/03
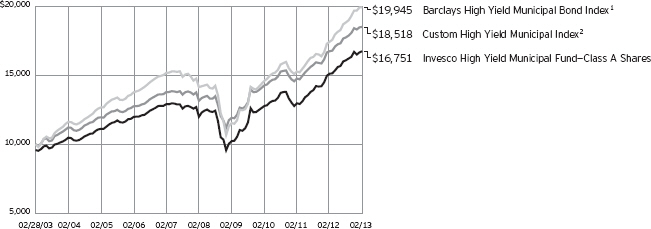
1 Source(s): Invesco, Barclays
2 Source(s): Invesco, Lipper Inc., Barclays
Past performance cannot guarantee comparable future results.
The data shown in the chart include reinvested distributions, applicable sales charges and Fund expenses including
management fees. Index results include reinvested dividends, but they do not reflect sales charges. Performance of the peer group, if applicable, reflects fund expenses and management fees;
performance of a market index does not. Performance shown in the chart above and before tax table(s) does not reflect deduction of taxes a shareholder would pay on Fund distributions or sale of Fund shares.
| | |
| 6 | | Invesco High Yield Municipal Fund |
| | | | | | | | | | | | | | | |
| Average Annual Total Returns | |
| As of 2/28/13, including maximum applicable sales charges | |
| | | |
| | | Before
Taxes | | After Taxes on
Distributions | | After Taxes
on Distributions
and Sale of
Fund Shares |
Class A Shares | | | | | | | | | | | | | | | |
Inception (1/2/86) | | | | 6.11 | % | | | | 6.11 | % | | | | 6.16 | % |
10 Years | | | | 5.29 | | | | | 5.29 | | | | | 5.35 | |
5 Years | | | | 5.97 | | | | | 5.96 | | | | | 5.90 | |
1 Year | | | | 6.08 | | | | | 6.08 | | | | | 5.91 | |
Class B Shares | | | | | | | | | | | | | | | |
Inception (7/20/92) | | | | 5.62 | % | | | | 5.62 | % | | | | 5.66 | % |
10 Years | | | | 5.10 | | | | | 5.10 | | | | | 5.11 | |
5 Years | | | | 6.18 | | | | | 6.17 | | | | | 6.00 | |
1 Year | | | | 5.87 | | | | | 5.87 | | | | | 5.90 | |
Class C Shares | | | | | | | | | | | | | | | |
Inception (12/10/93) | | | | 4.92 | % | | | | 4.92 | % | | | | 4.98 | % |
10 Years | | | | 4.96 | | | | | 4.95 | | | | | 4.96 | |
5 Years | | | | 6.09 | | | | | 6.08 | | | | | 5.86 | |
1 Year | | | | 8.97 | | | | | 8.97 | | | | | 7.31 | |
Class Y Shares | | | | | | | | | | | | | | | |
Inception (3/1/06) | | | | 5.18 | % | | | | 5.18 | % | | | | 5.29 | % |
5 Years | | | | 7.11 | | | | | 7.11 | | | | | 6.88 | |
1 Year | | | | 11.04 | | | | | 11.04 | | | | | 8.95 | |
Class R5 Shares | | | | | | | | | | | | | | | |
10 Years | | | | 6.61 | % | | | | 6.60 | % | | | | 6.45 | % |
5 Years | | | | 7.72 | | | | | 7.71 | | | | | 7.32 | |
1 Year | | | | 11.04 | | | | | 11.04 | | | | | 8.92 | |
| | | | | | | | | | | | | | | |
| Average Annual Total Returns | |
| As of 12/31/12, the most recent calendar quarter end, including maximum applicable sales charges | |
| | | Before
Taxes | | After Taxes on
Distributions | | After Taxes
on Distributions
and Sale of
Fund Shares |
Class A Shares | | | | | | | | | | | | | | | |
Inception (1/2/86) | | | | 6.10 | % | | | | 6.09 | % | | | | 6.13 | % |
10 Years | | | | 5.24 | | | | | 5.24 | | | | | 5.29 | |
5 Years | | | | 4.68 | | | | | 4.67 | | | | | 4.78 | |
1 Year | | | | 9.05 | | | | | 9.05 | | | | | 7.94 | |
Class B Shares | | | | | | | | | | | | | | | |
Inception (7/20/92) | | | | 5.60 | % | | | | 5.59 | % | | | | 5.62 | % |
10 Years | | | | 5.06 | | | | | 5.05 | | | | | 5.07 | |
5 Years | | | | 4.81 | | | | | 4.81 | | | | | 4.86 | |
1 Year | | | | 9.12 | | | | | 9.12 | | | | | 8.09 | |
Class C Shares | | | | | | | | | | | | | | | |
Inception (12/10/93) | | | | 4.89 | % | | | | 4.89 | % | | | | 4.93 | % |
10 Years | | | | 4.92 | | | | | 4.91 | | | | | 4.92 | |
5 Years | | | | 4.80 | | | | | 4.79 | | | | | 4.81 | |
1 Year | | | | 12.10 | | | | | 12.10 | | | | | 9.73 | |
Class Y Shares | | | | | | | | | | | | | | | |
Inception (3/1/06) | | | | 5.07 | % | | | | 5.06 | % | | | | 5.15 | % |
5 Years | | | | 5.80 | | | | | 5.79 | | | | | 5.80 | |
1 Year | | | | 14.07 | | | | | 14.07 | | | | | 11.39 | |
Class R5 Shares | | | | | | | | | | | | | | | |
10 Years | | | | 6.57 | % | | | | 6.56 | % | | | | 6.47 | % |
5 Years | | | | 6.42 | | | | | 6.41 | | | | | 6.30 | |
1 Year | | | | 14.30 | | | | | 14.30 | | | | | 11.51 | |
Effective June 1, 2010, Class A, Class B, Class C and Class I shares of the predecessor fund, Van Kampen High Yield Municipal Fund, advised by Van Kampen Asset Management were reorganized into Class A, Class B, Class C and Class Y shares, respectively, of Invesco Van Kampen High Yield Municipal Fund. Returns shown above for Class A, Class B, Class C and Class Y shares are blended returns of the predecessor fund and Invesco Van Kampen High Yield Municipal Fund (renamed Invesco High Yield Municipal Fund). Share class returns will
differ from the predecessor fund because of different expenses.
Class R5 shares incepted on April 30, 2012. Performance shown prior to that date is that of Class A shares and includes the 12b-1 fees applicable to Class A shares. Class A share performance reflects any applicable fee waivers or expense reimbursements.
The performance data quoted represent past performance and cannot guarantee comparable future results; current performance may be lower or higher. Please visit invesco.com/ performance for the most recent month-end performance.
Performance figures reflect reinvested distributions, changes in net asset value and the effect of the maximum sales charge unless otherwise stated. Investment return and principal value will fluctuate so that you may have a gain or loss when you sell shares.
The total annual Fund operating expense ratio set forth in the most recent Fund prospectus as of the date of this report for Class A, Class B, Class C, Class Y and Class R5 shares was 0.93%, 0.93%, 1.68%, 0.68% and 0.73%, respectively. The expense ratios presented above may vary from the expense ratios presented in other sections of this report that are based on expenses incurred during the period covered by this report.
Class A share performance reflects the maximum 4.25% sales charge, and Class B and Class C share performance reflects the applicable contingent deferred sales charge (CDSC) for the period involved. For shares purchased prior to June 1, 2010, the CDSC on Class B shares declines from 4% at the time of purchase to 0% at the beginning of the sixth year. For shares purchased on or after June 1, 2010,
the CDSC on Class B shares declines from 5% at the time of purchase to 0% at the beginning of the seventh year. The CDSC on Class C shares is 1% for the first year after purchase. Class Y and Class R5 shares do not have a front-end sales charge or a CDSC; therefore, performance is at net asset value.
The performance of the Fund’s share classes will differ primarily due to different sales charge structures and class expenses.
After-tax returns are calculated using the historical highest individual federal marginal income tax rate. They do not reflect the effect of state and local taxes. Actual after-tax returns depend on the investor’s tax situation and may differ from those shown. After-tax returns shown are not relevant to investors who hold their shares in tax-deferred accounts such as 401(k)s or IRAs. The Fund’s past performance, before and after taxes, is not necessarily an indication of how the Fund will perform in the future.
| | |
| 7 | | Invesco High Yield Municipal Fund |
Invesco High Yield Municipal Fund’s investment objective is to seek federal tax-exempt current income and taxable capital appreciation.
| ¾ | Unless otherwise stated, information presented in this report is as of February 28, 2013, and is based on total net assets. |
| ¾ | Unless otherwise noted, all data provided by Invesco. |
| ¾ | To access your Fund’s reports/prospectus, visit invesco.com/fundreports. |
About share classes
| ¾ | Class B shares may not be purchased for new or additional investments. Please see the prospectus for more information. |
| ¾ | Class Y shares are available only to certain investors. Please see the prospectus for more information. |
| ¾ | Class R5 shares are primarily intended for employer sponsored retirement and benefit plans that meet certain standards and for institutional investors. On September 24, 2012, Institutional Class shares were renamed Class R5 shares. Please see the prospectus for more information. |
Principal risks of investing in the Fund
| ¾ | Alternative minimum tax risk. All or a portion of the Fund’s otherwise tax-exempt income may be taxable to those shareholders subject to the federal alternative minimum tax. |
| ¾ | Call risk. If interest rates fall, it is possible that issuers of debt securities with high interest rates will prepay or call their securities before their maturity dates. In this event, the proceeds from these securities would likely be reinvested in securities bearing the new, lower interest rates, resulting in a possible decline in the Fund’s income and distributions to shareholders. |
| ¾ | Credit risk. The issuer of instruments in which the Fund invests may be unable to meet interest and/or principal payments, thereby causing its instruments to decrease in value and lowering the issuer’s credit rating. |
| ¾ | Derivatives risk. The performance of derivative instruments is tied to the performance of an underlying currency, security, index or other instrument. In addition to risks relating to their underlying instruments, the use of derivatives may include other, possibly greater, risks. Derivatives involve costs, may be volatile, and may involve a small initial investment relative to the risk assumed. Risks associated with the use of derivatives include counterparty, leverage, correlation, liquidity, tax, market, interest rate and management risks. Derivatives may also be more difficult to purchase, sell or value than other investments. The Fund may lose more |
| | than the cash amount invested on investments in derivatives. |
| | Investors should bear in mind that, while the Fund intends to use derivative strategies, it is not obligated to actively engage in these transactions, generally or in any particular kind of derivative, if the investment manager elects not to do so due to availability, cost, market conditions or other factors. |
| ¾ | High yield bond (junk bond) risk. Junk bonds involve a greater risk of default or price changes due to changes in the credit quality of the issuer. The values of junk bonds fluctuate more than those of high-quality bonds in response to company, political, regulatory or economic developments. Values of junk bonds can decline significantly over short periods of time. |
| ¾ | Income risk. The income you receive from the Fund is based primarily on prevailing interest rates, which can vary widely over the short- and long-term. If interest rates drop, your income from the Fund may drop as well. |
| ¾ | Interest rate risk. Interest rate risk refers to the risk that bond prices generally fall as interest rates rise; conversely, bond prices generally rise as interest rates fall. Specific bonds differ in their sensitivity to changes in interest rates depending on their individual characteristics, including duration. |
| ¾ | Inverse floating rate obligations risk. Inverse floating rate obligations, including tender option bonds, may be subject to greater price volatility than a fixed income security with similar qualities. When short-term interest rates rise, they may decrease in value and produce less or no income. Additionally, these securities may lose principal. Similar to derivatives, inverse floating rate obligations have the following risks: counterparty, leverage, correlation, liquidity, market, interest rate, and management risks. |
| ¾ | Leverage risk. Leverage exists when the Fund purchases or sells an instrument or enters into a transaction without investing cash in an amount equal to the full economic exposure of the instrument or transaction and the Fund could lose more than it invested. Leverage created from borrowing or certain types of transactions or instruments may impair the Fund’s liquidity, cause it to |
| | liquidate positions at an unfavorable time, increase volatility or otherwise not achieve its intended objective. |
| ¾ | Liquidity risk. The Fund may hold illiquid securities that it is unable to sell at the preferred time or price and could lose its entire investment in such securities. |
| ¾ | Management risk. The investment techniques and risk analysis used by the Fund’s portfolio managers may not produce the desired results. |
| ¾ | Market risk. The prices of and the income generated by the Fund’s securities may decline in response to, among other things, investor sentiment; general economic and market conditions; regional or global instability; and currency and interest rate fluctuations. |
| ¾ | Medium- and lower-grade municipal securities risk. Securities which are in the medium- and lower-grade categories generally offer higher yields than are offered by higher-grade securities of similar maturity, but they also generally involve more volatility and greater risks, such as greater credit risk, market risk, liquidity risk, management risk, and regulatory risk. Furthermore, many medium- and lower-grade securities are not listed for trading on any national securities exchange and many issuers of medium- and lower-grade securities choose not to have a rating assigned to their obligations by any nationally recognized statistical rating organization. As a result, the Fund’s portfolio may consist of a higher portion of unlisted or unrated securities as compared with an investment company that invests solely in higher-grade securities. Unrated securities are usually not as attractive to as many buyers as are rated securities, a factor which may make unrated securities less marketable. These factors may have the effect of limiting the availability of the securities for purchase by the Fund and may also limit the ability of the Fund to sell such securities at their fair value either to meet redemption requests or in response to changes in the economy or the financial markets. |
| ¾ | Municipal issuer focus risk. The Fund generally considers investments in municipal securities not to be subject to industry concentration policies (issuers of municipal securities as a group is not an industry) and the Fund |
| | |
| 8 | | Invesco High Yield Municipal Fund |
| | may invest in municipal securities issued by entities having similar characteristics. The issuers may be located in the same geographic area or may pay their interest obligations from revenue of similar projects, such as hospitals, airports, utility systems and housing finance agencies. This may make the Fund’s investments more susceptible to similar social, economic, political or regulatory occurrences. As the similarity in issuers increases, the potential for fluctuation in the Fund’s net asset value also increases. |
| ¾ | Municipal securities risk. The Fund may invest in municipal securities. Constitutional amendments, legislative enactments, executive orders, administrative regulations, voter initiatives, and the issuer’s regional economic conditions may affect the municipal security’s value, interest payments, repayment of principal and the Fund’s ability to sell it. Failure of a municipal security issuer to comply with applicable tax requirements may make income paid thereon taxable, resulting in a decline in the security’s value. In addition, there could be changes in applicable tax laws or tax treatments that reduce or eliminate the current federal income tax exemption on municipal securities or otherwise adversely affect the current federal or state tax status of municipal securities. |
| ¾ | Reinvestment risk. Reinvestment risk is the risk that a bond’s cash flows (coupon income and principal repayment) will be reinvested at an interest rate below that on the original bond. |
| ¾ | Synthetic securities risk. Fluctuations in the values of synthetic securities may not correlate perfectly with the instruments they are designed to replicate. Synthetic securities may be subject to interest rate changes, market price fluctuations, counterparty risk and liquidity risk. |
| ¾ | Variable rate demand notes risk. The absence of an active secondary market for certain variable and floating rate notes could make it difficult to dispose of the instruments, and a portfolio could suffer a loss if the issuer defaults during periods in which a portfolio is not entitled to exercise its demand rights. |
About indexes used in this report
| ¾ | The Barclays High Yield Municipal Bond Index is an unmanaged index considered representative of non-investment grade bonds. |
| ¾ | The Custom High Yield Municipal Index, created by Invesco to serve as a benchmark for Invesco High Yield Municipal Fund, comprises 60% Barclays High Yield Municipal Bond Index and 40% Barclays Municipal Bond Index. |
| ¾ | The Barclays Municipal Bond Index is an unmanaged index considered representative of the tax-exempt bond market. |
| ¾ | The Barclays U.S. Aggregate Index is an unmanaged index considered representative of the US investment-grade, fixed-rate bond market. |
| ¾ | The Barclays U.S. Mortgage-Backed Securities Index represents mortgage-backed pass-through securities of Ginnie Mae, Fannie Mae and Freddie Mac. |
| ¾ | The Barclays Asset-Backed Securities Index tracks the performance of debt securities backed by assets including credit card, home equity and auto loans that are rated investment grade or higher. |
| ¾ | The Barclays U.S. Agency Index measures the performance of the agency sector of the US government bond market and is composed of investment-grade US dollar-denominated debentures issued by government and government-related agencies, including FNMA and FHLMC. |
| ¾ | The Fund is not managed to track the performance of any particular index, including the index(es) defined here, and consequently, the performance of the Fund may deviate significantly from the performance of the index(es). |
| ¾ | A direct investment cannot be made in an index. Unless otherwise indicated, index results include reinvested dividends, and they do not reflect sales charges. Performance of the peer group, if applicable, reflects fund expenses; performance of a market index does not. |
Other information
| ¾ | The returns shown in management’s discussion of Fund performance are based on net asset values calculated for shareholder transactions. Generally accepted accounting principles require adjustments to be made to the net assets of the Fund at period end for financial reporting purposes, and as such, the net asset values for shareholder transactions and the returns based on those net asset values may differ from the net asset values and returns reported in the Financial Highlights. |
This report must be accompanied or preceded by a currently effective Fund prospectus, which contains more complete information, including sales charges and expenses. Investors should read it carefully before investing.
NOT FDIC INSURED | MAY LOSE VALUE | NO BANK GUARANTEE
| | | | |
Fund Nasdaq Symbols | | | | |
Class A Shares | | | ACTHX | |
Class B Shares | | | ACTGX | |
Class C Shares | | | ACTFX | |
Class Y Shares | | | ACTDX | |
Class R5 Shares | | | ACTNX | |
| | |
| 9 | | Invesco High Yield Municipal Fund |
Schedule of Investments
February 28, 2013
| | | | | | | | | | | | | | | | |
| | | Interest
Rate | | | Maturity
Date | | | Principal
Amount
(000) | | |
Value | |
Municipal Obligations–106.74% | |
| Alabama–0.49% | |
Huntsville (City of) Special Care Facilities Financing Authority (Redstone Village); | | | | | | | | | | | | | | | | |
Series 2007, Retirement Facility RB | | | 5.50 | % | | | 01/01/28 | | | $ | 1,000 | | | $ | 1,006,789 | |
Series 2007, Retirement Facility RB | | | 5.50 | % | | | 01/01/43 | | | | 13,170 | | | | 12,941,499 | |
Series 2008 A, Retirement Facility RB | | | 6.88 | % | | | 01/01/43 | | | | 4,470 | | | | 4,743,340 | |
Series 2011 A, Retirement Facility RB | | | 7.50 | % | | | 01/01/47 | | | | 2,600 | | | | 2,936,647 | |
Series 2012 A, Retirement Facility RB | | | 5.63 | % | | | 01/01/42 | | | | 7,050 | | | | 7,081,160 | |
Mobile (City of) Industrial Development Board (Mobile Energy Services Co.); Series 1995, Ref. Solid Waste Disposal RB | | | 6.95 | % | | | 01/01/20 | | | | 3 | | | | 0 | |
Phenix City (City of) Industrial Development Board (MeadWestvaco Coated Board); Series 2012, Ref. Environmental Improvement RB(b) | | | 4.13 | % | | | 05/15/35 | | | | 7,000 | | | | 6,899,410 | |
| | | | | | | | | | | | | | | | 35,608,845 | |
| | | | |
| Alaska–0.23% | | | | | | | | | | | | | | | | |
Alaska (State of) Industrial Development & Export Authority (Lake Dorothy Hydroelectric); Series 2006, RB (INS–AMBAC)(b)(c) | | | 5.25 | % | | | 12/01/26 | | | | 3,690 | | | | 3,723,985 | |
Alaska (State of) Industrial Development & Export Authority (Providence Health & Services); Series 2011 A, RB(d) | | | 5.00 | % | | | 10/01/40 | | | | 10,000 | | | | 11,179,199 | |
Northern Tobacco Securitization Corp.; | | | | | | | | | | | | | | | | |
Series 2006 B, First Sub. Asset-Backed CAB RB(e) | | | 0.00 | % | | | 06/01/46 | | | | 25,375 | | | | 975,923 | |
Series 2006 C, Second Sub. Asset-Backed CAB RB(e) | | | 0.00 | % | | | 06/01/46 | | | | 20,860 | | | | 741,364 | |
| | | | | | | | | | | | | | | | 16,620,471 | |
| | | | |
| Arizona–4.83% | | | | | | | | | | | | | | | | |
Apache (County of) Industrial Development Authority (Tucson Electric Power Co.); Series 2012 A, PCR | | | 4.50 | % | | | 03/01/30 | | | | 22,235 | | | | 23,103,054 | |
Casa Grande (City of) Industrial Development Authority (Casa Grande Regional Medical Center); | | | | | | | | | | | | | | | | |
Series 2001 A, Ref. Hospital RB | | | 7.25 | % | | | 12/01/19 | | | | 6,850 | | | | 7,088,380 | |
Series 2001 A, Ref. Hospital RB | | | 7.63 | % | | | 12/01/29 | | | | 13,750 | | | | 14,212,275 | |
Series 2002 A, Hospital RB | | | 7.13 | % | | | 12/01/24 | | | | 3,000 | | | | 3,099,210 | |
Cochise (County of) Industrial Development Authority (Sierra Vista Community Hospital); Series 1996 A, Ref. Hospital RB | | | 6.75 | % | | | 12/01/26 | | | | 4,745 | | | | 4,755,961 | |
Cochise (County of) Industrial Development Authority (Sierra Vista Regional Health Center); Series 2001, Hospital RB | | | 7.75 | % | | | 12/01/30 | | | | 2,390 | | | | 2,432,781 | |
Flagstaff (City of) Industrial Development Authority (Senior Living Community Northern Arizona); Series 2007, Ref. RB | | | 5.70 | % | | | 07/01/42 | | | | 16,830 | | | | 16,870,560 | |
Maricopa County Pollution Control Corp. (Arizona Public Service Co.–Palo Verde); Series 2009 A, Ref. PCR(f)(g) | | | 6.00 | % | | | 05/01/14 | | | | 9,775 | | | | 10,305,000 | |
Maricopa County Pollution Control Corp. (El Paso Electric Co.); Series 2009 A, PCR | | | 7.25 | % | | | 02/01/40 | | | | 2,000 | | | | 2,381,020 | |
Peoria (City of) Industrial Development Authority (Sierra Winds Life Care Community); | | | | | | | | | | | | | | | | |
Series 1999 A, Ref. RB | | | 6.25 | % | | | 08/15/20 | | | | 500 | | | | 500,070 | |
Series 1999 A, Ref. RB | | | 6.38 | % | | | 08/15/29 | | | | 9,700 | | | | 9,617,841 | |
Series 1999 A, Ref. RB | | | 6.50 | % | | | 08/15/31 | | | | 3,500 | | | | 3,481,275 | |
Phoenix (City of) Industrial Development Authority (Choice Academies); Series 2012, Education RB | | | 5.63 | % | | | 09/01/42 | | | | 1,850 | | | | 1,888,905 | |
Phoenix (City of) Industrial Development Authority (Phoenix Collegiate Academy); Series 2012, Education RB | | | 5.63 | % | | | 07/01/42 | | | | 2,770 | | | | 2,796,814 | |
Phoenix Civic Improvement Corp.; | | | | | | | | | | | | | | | | |
Series 2008 A, Sr. Lien Airport RB(d) | | | 5.00 | % | | | 07/01/22 | | | | 3,500 | | | | 4,108,405 | |
Series 2008 A, Sr. Lien Airport RB(d) | | | 5.00 | % | | | 07/01/24 | | | | 5,000 | | | | 5,852,400 | |
Series 2008 A, Sr. Lien Airport RB(d) | | | 5.00 | % | | | 07/01/26 | | | | 5,000 | | | | 5,812,400 | |
Series 2009 A, Jr. Lien Water System RB(d) | | | 5.00 | % | | | 07/01/27 | | | | 8,935 | | | | 10,638,100 | |
Series 2009 A, Jr. Lien Water System RB(d) | | | 5.00 | % | | | 07/01/28 | | | | 6,785 | | | | 8,060,444 | |
Series 2009 A, Jr. Lien Water System RB(d) | | | 5.00 | % | | | 07/01/29 | | | | 5,500 | | | | 6,533,890 | |
See accompanying Notes to Financial Statements which are an integral part of the financial statements.
10 Invesco High Yield Municipal Fund
| | | | | | | | | | | | | | | | |
| | | Interest
Rate | | | Maturity
Date | | | Principal
Amount
(000) | | |
Value | |
| Arizona–(continued) | | | | | | | | | | | | | | | | |
Pima (County of) Industrial Development Authority (Acclaim Charter School); | | | | | | | | | | | | | | | | |
Series 2006, Education Facility RB | | | 5.70 | % | | | 12/01/26 | | | $ | 2,200 | | | $ | 2,116,642 | |
Series 2006, Education Facility RB | | | 5.80 | % | | | 12/01/36 | | | | 4,385 | | | | 4,131,635 | |
Pima (County of) Industrial Development Authority (Choice Education & Development Corp.); | | | | | | | | | | | | | | | | |
Series 2006, Education Facility RB | | | 6.25 | % | | | 06/01/26 | | | | 3,525 | | | | 3,590,953 | |
Series 2006, Education Facility RB | | | 6.38 | % | | | 06/01/36 | | | | 4,890 | | | | 4,963,888 | |
Pima (County of) Industrial Development Authority (Constellation Schools); Series 2008, Lease RB | | | 7.00 | % | | | 01/01/38 | | | | 16,000 | | | | 16,648,320 | |
Pima (County of) Industrial Development Authority (Coral Academy Science); | | | | | | | | | | | | | | | | |
Series 2008 A, Education Facilities RB | | | 7.13 | % | | | 12/01/28 | | | | 2,120 | | | | 2,234,734 | |
Series 2008 A, Education Facilities RB | | | 7.25 | % | | | 12/01/38 | | | | 1,100 | | | | 1,152,096 | |
Pima (County of) Industrial Development Authority (Desert Heights Charter School); | | | | | | | | | | | | | | | | |
Series 2003, Education Facility RB | | | 7.25 | % | | | 08/01/19 | | | | 830 | | | | 853,132 | |
Series 2003, Education Facility RB | | | 7.50 | % | | | 08/01/33 | | | | 4,345 | | | | 4,457,275 | |
Pima (County of) Industrial Development Authority (Edkey Charter Schools); | | | | | | | | | | | | | | | | |
Series 2013, Ref. Education Facility RB | | | 6.00 | % | | | 07/01/43 | | | | 250 | | | | 250,895 | |
Series 2013, Ref. Education Facility RB | | | 6.00 | % | | | 07/01/48 | | | | 2,975 | | | | 2,975,000 | |
Pima (County of) Industrial Development Authority (Excalibur Charter School); Series 2003, Education RB | | | 7.75 | % | | | 08/01/33 | | | | 2,905 | | | | 2,622,837 | |
Pima (County of) Industrial Development Authority (Global Water Resources, LLC); | | | | | | | | | | | | | | | | |
Series 2006, Water & Wastewater RB(b)(h) | | | 5.60 | % | | | 12/01/22 | | | | 2,000 | | | | 2,092,360 | |
Series 2006, Water & Wastewater RB(b)(h) | | | 5.75 | % | | | 12/01/32 | | | | 7,120 | | | | 7,417,331 | |
Series 2007, Water & Wastewater RB(b) | | | 6.55 | % | | | 12/01/37 | | | | 1,000 | | | | 1,045,670 | |
Series 2008, Water & Wastewater RB(b) | | | 7.50 | % | | | 12/01/38 | | | | 12,235 | | | | 13,371,142 | |
Pima (County of) Industrial Development Authority (Legacy Traditional School); Series 2009, Education RB | | | 8.50 | % | | | 07/01/39 | | | | 1,735 | | | | 1,999,275 | |
Pima (County of) Industrial Development Authority (Milestones Charter School District); | | | | | | | | | | | | | | | | |
Series 2003, Education Facility RB | | | 7.50 | % | | | 11/01/33 | | | | 3,030 | | | | 2,662,461 | |
Series 2005, Education Facility RB | | | 6.75 | % | | | 11/01/33 | | | | 2,865 | | | | 2,314,204 | |
Pima (County of) Industrial Development Authority (P.L.C. Charter Schools); | | | | | | | | | | | | | | | | |
Series 2006, Education Facility RB | | | 6.50 | % | | | 04/01/26 | | | | 2,590 | | | | 2,598,392 | |
Series 2006, Education Facility RB | | | 6.75 | % | | | 04/01/36 | | | | 3,805 | | | | 3,827,259 | |
Pima (County of) Industrial Development Authority (Paradise Education Center); | | | | | | | | | | | | | | | | |
Series 2006, Ref. Education RB | | | 5.88 | % | | | 06/01/22 | | | | 535 | | | | 555,705 | |
Series 2006, Ref. Education RB | | | 6.00 | % | | | 06/01/36 | | | | 830 | | | | 848,094 | |
Series 2010, Education RB | | | 6.10 | % | | | 06/01/45 | | | | 1,400 | | | | 1,459,612 | |
Pima (County of) Industrial Development Authority (Premier & Air Co.); Series 2005, Education Facility RB(i) | | | 7.00 | % | | | 09/01/35 | | | | 5,092 | | | | 2,036,240 | |
Pima (County of) Industrial Development Authority (Riverbend Prep); Series 2010, Education RB | | | 7.00 | % | | | 09/01/37 | | | | 3,358 | | | | 3,258,637 | |
Pima (County of) Industrial Development Authority (Skyline Technical High School); Series 2004, Education Facility RB | | | 7.50 | % | | | 02/01/34 | | | | 4,300 | | | | 3,612,129 | |
Pima (County of) Industrial Development Authority (Tucson Electric Power Co.); Series 2010 A, IDR | | | 5.25 | % | | | 10/01/40 | | | | 3,900 | | | | 4,261,686 | |
Pinal (County of) Electric District No. 4; Series 2008, Electrical System RB | | | 6.00 | % | | | 12/01/38 | | | | 1,650 | | | | 1,806,569 | |
Quechan Indian Tribe of Fort Yuma (California & Arizona Governmental); Series 2008, RB | | | 7.00 | % | | | 12/01/27 | | | | 5,310 | | | | 4,717,510 | |
Red Hawk Canyon Community Facilities District No. 2; Series 1998 A, Assessment RB | | | 6.50 | % | | | 12/01/17 | | | | 1,575 | | | | 1,575,000 | |
Salt Verde Financial Corp.; Series 2007, Sr. Gas RB | | | 5.00 | % | | | 12/01/37 | | | | 39,610 | | | | 45,855,705 | |
Sundance Community Facilities District (Assessment District No. 2); Series 2003, Special Assessment RB(h) | | | 7.13 | % | | | 07/01/27 | | | | 2,341 | | | | 2,349,451 | |
Sundance Community Facilities District (Assessment District No. 3); Series 2004, Special Assessment RB | | | 6.50 | % | | | 07/01/29 | | | | 426 | | | | 428,283 | |
Sundance Community Facilities District; Series 2004, Unlimited Tax GO Bonds(f)(h)(j) | | | 6.25 | % | | | 07/15/14 | | | | 1,000 | | | | 1,079,470 | |
Tempe (City of) Industrial Development Authority (Friendship Village); | | | | | | | | | | | | | | | | |
Series 2012 A, Ref. RB | | | 6.00 | % | | | 12/01/32 | | | | 1,430 | | | | 1,547,160 | |
Series 2012 A, Ref. RB | | | 6.25 | % | | | 12/01/42 | | | | 2,200 | | | | 2,392,104 | |
Series 2012 A, Ref. RB | | | 6.25 | % | | | 12/01/46 | | | | 2,600 | | | | 2,817,438 | |
Tucson (City of) Industrial Development Authority (Catalina Assisted Living Apartments);
Series 2000 A, MFH RB(b) | | | 6.50 | % | | | 07/01/31 | | | | 4,495 | | | | 2,494,545 | |
See accompanying Notes to Financial Statements which are an integral part of the financial statements.
11 Invesco High Yield Municipal Fund
| | | | | | | | | | | | | | | | |
| | | Interest
Rate | | | Maturity
Date | | | Principal
Amount
(000) | | |
Value | |
| Arizona–(continued) | | | | | | | | | | | | | | | | |
University Medical Center Corp.; | | | | | | | | | | | | | | | | |
Series 2005, Hospital RB | | | 5.00 | % | | | 07/01/35 | | | $ | 12,280 | | | $ | 12,820,934 | |
Series 2009, Hospital RB | | | 6.25 | % | | | 07/01/29 | | | | 1,650 | | | | 1,928,949 | |
Series 2009, Hospital RB | | | 6.50 | % | | | 07/01/39 | | | | 2,100 | | | | 2,444,358 | |
Series 2011, Hospital RB | | | 6.00 | % | | | 07/01/39 | | | | 2,600 | | | | 3,012,542 | |
Verrado Community Facilities District No. 1; | | | | | | | | | | | | | | | | |
Series 2003, Unlimited Tax GO Bonds | | | 6.50 | % | | | 07/15/27 | | | | 7,600 | | | | 7,620,824 | |
Series 2006, Unlimited Tax GO Bonds | | | 5.35 | % | | | 07/15/31 | | | | 5,915 | | | | 5,533,660 | |
Vistancia Community Facilities District; Series 2002, Unlimited Tax GO Bonds | | | 6.75 | % | | | 07/15/22 | | | | 4,000 | | | | 4,012,600 | |
Yavapai (County of) Industrial Development Authority (Yavapai Regional Medical Center);
Series 2003 A, Hospital Facilities RB | | | 6.00 | % | | | 08/01/33 | | | | 4,000 | | | | 4,082,920 | |
| | | | | 351,416,411 | |
| | | | |
| California–12.40% | | | | | | | | | | | | | | | | |
ABAG Finance Authority for Non-profit Corps. (Episcopal Senior Communities); Series 2012 A, Ref. RB | | | 5.00 | % | | | 07/01/47 | | | | 10,500 | | | | 11,286,660 | |
Agua Mansa Industrial Growth Association (Community Facilities District No. 2002-1); Series 2003, Special Tax RB (LOC–American Express Co.)(k) | | | 6.50 | % | | | 09/01/33 | | | | 6,975 | | | | 7,102,921 | |
Alhambra (City of) (Atherton Baptist Homes); | | | | | | | | | | | | | | | | |
Series 2010 A, RB | | | 7.63 | % | | | 01/01/40 | | | | 4,340 | | | | 4,803,512 | |
Series 2010 B, RB | | | 6.63 | % | | | 01/01/17 | | | | 820 | | | | 821,533 | |
Anaheim (City of) Public Financing Authority (Anaheim Public Improvements); Series 1997 C, Sub. Lease CAB RB (INS–AGM)(c)(e) | | | 0.00 | % | | | 09/01/34 | | | | 12,925 | | | | 4,454,084 | |
Bakersfield (City of); Series 2007 A, Wastewater RB (INS–AGM)(c)(d) | | | 5.00 | % | | | 09/15/32 | | | | 14,990 | | | | 16,852,508 | |
Bay Area Toll Authority (San Francisco Bay Area); Series 2009 F-1, Toll Bridge RB(d) | | | 5.13 | % | | | 04/01/39 | | | | 22,295 | | | | 25,379,736 | |
Beaumont (City of) Financing Authority; | | | | | | | | | | | | | | | | |
Series 2003 A, Local Agency RB(f)(j) | | | 7.00 | % | | | 09/01/13 | | | | 4,935 | | | | 5,202,921 | |
Series 2004 D, Local Agency RB | | | 5.80 | % | | | 09/01/35 | | | | 3,375 | | | | 3,477,296 | |
California (State of) Health Facilities Financing Authority (Children’s Hospital of Orange County); Series 2009, RB | | | 6.50 | % | | | 11/01/38 | | | | 3,000 | | | | 3,692,940 | |
California (State of) Municipal Finance Authority (American Heritage Education Foundation);
Series 2006 A, Education RB | | | 5.25 | % | | | 06/01/26 | | | | 2,000 | | | | 1,949,520 | |
California (State of) Municipal Finance Authority (Caritas); Series 2012 A, Mobile Home Park RB | | | 5.50 | % | | | 08/15/47 | | | | 1,000 | | | | 1,067,620 | |
California (State of) Municipal Finance Authority (Goodwill Industries of Sacramento & Nevada); | | | | | | | | | | | | | | | | |
Series 2012, RB(h) | | | 6.63 | % | | | 01/01/32 | | | | 1,000 | | | | 1,061,310 | |
Series 2012, RB(h) | | | 6.88 | % | | | 01/01/42 | | | | 1,500 | | | | 1,596,285 | |
California (State of) Municipal Finance Authority (High Tech High-Chula Vista); | | | | | | | | | | | | | | | | |
Series 2008 B, Educational Facility RB(h) | | | 6.13 | % | | | 07/01/38 | | | | 2,860 | | | | 2,954,866 | |
Series 2008 B, Educational Facility RB(h) | | | 6.13 | % | | | 07/01/43 | | | | 2,000 | | | | 2,062,600 | |
Series 2008 B, Educational Facility RB(h) | | | 6.13 | % | | | 07/01/48 | | | | 3,840 | | | | 3,951,245 | |
California (State of) Municipal Finance Authority (High Tech High-Media Arts); | | | | | | | | | | | | | | | | |
Series 2008 A, Educational Facility RB(h) | | | 6.00 | % | | | 07/01/38 | | | | 1,170 | | | | 1,202,105 | |
Series 2008 A, Educational Facility RB(h) | | | 6.13 | % | | | 07/01/48 | | | | 2,415 | | | | 2,484,963 | |
California (State of) Municipal Finance Authority (King/Chavez); Series 2009 A, Educational Facilities RB | | | 8.50 | % | | | 10/01/29 | | | | 1,000 | | | | 1,181,490 | |
California (State of) Municipal Finance Authority (Literacy First); Series 2010 A, Charter School Lease RB | | | 6.00 | % | | | 09/01/30 | | | | 1,085 | | | | 1,158,520 | |
California (State of) Municipal Finance Authority (Santa Rosa Academy); | | | | | | | | | | | | | | | | |
Series 2012 A, Charter School Lease RB | | | 5.75 | % | | | 07/01/30 | | | | 7,290 | | | | 7,550,399 | |
Series 2012 A, Charter School Lease RB | | | 6.00 | % | | | 07/01/42 | | | | 5,355 | | | | 5,571,877 | |
California (State of) Pollution Control Finance Authority; | | | | | | | | | | | | | | | | |
Series 2012, Water Furnishing RB(b) | | | 5.00 | % | | | 07/01/37 | | | | 10,000 | | | | 10,447,200 | |
Series 2012, Water Furnishing RB(b) | | | 5.00 | % | | | 11/21/45 | | | | 40,000 | | | | 41,478,400 | |
California (State of) School Finance Authority (New Designs Charter School); Series 2012, Educational Facilities RB | | | 5.50 | % | | | 06/01/42 | | | | 5,000 | | | | 5,130,850 | |
California (State of) Statewide Communities Development Authority (American Baptist Homes of the West); Series 2010, RB | | | 6.25 | % | | | 10/01/39 | | | | 2,000 | | | | 2,278,900 | |
See accompanying Notes to Financial Statements which are an integral part of the financial statements.
12 Invesco High Yield Municipal Fund
| | | | | | | | | | | | | | | | |
| | | Interest
Rate | | | Maturity
Date | | | Principal
Amount
(000) | | |
Value | |
| California–(continued) | | | | | | | | | | | | | | | | |
California (State of) Statewide Communities Development Authority (California Baptist University); | | | | | | | | | | | | | | | | |
Series 2007 A, RB | | | 5.50 | % | | | 11/01/38 | | | $ | 6,500 | | | $ | 6,976,320 | |
Series 2011, RB | | | 7.25 | % | | | 11/01/31 | | | | 1,500 | | | | 1,857,990 | |
Series 2011, RB | | | 7.50 | % | | | 11/01/41 | | | | 5,500 | | | | 6,903,490 | |
California (State of) Statewide Communities Development Authority (Collegiate Housing Foundation–Irvine, L.L.C.–University of California-Irvine East Campus Apartments, Phase II); Series 2008, Student Housing RB | | | 6.00 | % | | | 05/15/40 | | | | 5,000 | | | | 5,439,100 | |
California (State of) Statewide Communities Development Authority (Eskaton Properties, Inc.); Series 2012, RB | | | 5.25 | % | | | 11/15/34 | | | | 4,350 | | | | 4,680,382 | |
California (State of) Statewide Communities Development Authority (Front Porch Communities & Services); Series 2007 A, RB(h) | | | 5.13 | % | | | 04/01/37 | | | | 5,000 | | | | 5,241,950 | |
California (State of) Statewide Communities Development Authority (Hospice of Napa Valley); Series 2004 A, RB | | | 7.00 | % | | | 01/01/34 | | | | 3,090 | | | | 2,946,686 | |
California (State of) Statewide Communities Development Authority (Huntington Park Charter School); Series 2007 A, Educational Facilities RB | | | 5.25 | % | | | 07/01/42 | | | | 2,750 | | | | 2,574,412 | |
California (State of) Statewide Communities Development Authority (Lancer Educational Student Housing); | | | | | | | | | | | | | | | | |
Series 2007, RB | | | 5.40 | % | | | 06/01/17 | | | | 2,735 | | | | 2,907,606 | |
Series 2007, RB | | | 5.63 | % | | | 06/01/33 | | | | 4,940 | | | | 5,252,406 | |
Series 2010, RB | | | 7.50 | % | | | 06/01/42 | | | | 1,700 | | | | 1,996,582 | |
California (State of) Statewide Communities Development Authority (Notre Dame de Namur University); | | | | | | | | | | | | | | | | |
Series 2003, RB | | | 6.50 | % | | | 10/01/23 | | | | 2,530 | | | | 2,551,859 | |
Series 2003, RB | | | 6.63 | % | | | 10/01/33 | | | | 2,500 | | | | 2,517,900 | |
California (State of) Statewide Communities Development Authority (San Francisco Art Institute); Series 2002, RB (Acquired 07/05/02; Cost $5,000,000)(h) | | | 7.38 | % | | | 04/01/32 | | | | 5,000 | | | | 5,054,700 | |
California (State of) Statewide Communities Development Authority (Southern California Presbyterian Homes); | | | | | | | | | | | | | | | | |
Series 2009, Senior Living RB | | | 7.00 | % | | | 11/15/29 | | | | 1,745 | | | | 2,026,469 | |
Series 2009, Senior Living RB | | | 7.25 | % | | | 11/15/41 | | | | 3,500 | | | | 4,026,925 | |
California (State of) Statewide Communities Development Authority (Terraces at San Joaquin Garden); | | | | | | | | | | | | | | | | |
Series 2012, RB | | | 4.00 | % | | | 10/01/18 | | | | 3,875 | | | | 3,882,091 | |
Series 2012, RB | | | 4.75 | % | | | 10/01/19 | | | | 5,000 | | | | 5,049,900 | |
Series 2012, RB | | | 6.00 | % | | | 10/01/42 | | | | 2,895 | | | | 3,150,107 | |
Series 2012, RB | | | 6.00 | % | | | 10/01/47 | | | | 1,785 | | | | 1,933,744 | |
California (State of) Statewide Communities Development Authority Community Facilities District 2007-1 (Orinda); | | | | | | | | | | | | | | | | |
Series 2007, Special Tax RB | | | 6.00 | % | | | 09/01/29 | | | | 2,735 | | | | 2,818,445 | |
Series 2007, Special Tax RB | | | 6.00 | % | | | 09/01/37 | | | | 6,185 | | | | 6,305,917 | |
California (State of) Statewide Communities Development Authority; Series 2008 A, Special Assessment RB | | | 6.63 | % | | | 09/02/38 | | | | 7,610 | | | | 7,860,445 | |
California (State of); | | | | | | | | | | | | | | | | |
Series 2004 A1, VRD Unlimited Tax GO Bonds (LOC-Citibank, N.A.)(k)(l) | | | 0.07 | % | | | 05/01/34 | | | | 10,000 | | | | 10,000,000 | |
Series 2004 B-1, VRD Unlimited Tax GO Bonds (LOC-Citibank, N.A.)(k)(l) | | | 0.07 | % | | | 05/01/34 | | | | 5,075 | | | | 5,075,000 | |
California County Tobacco Securitization Agency (The) (Sonoma County Securitization Corp.); Series 2005, Ref. Tobacco Settlement Asset-Backed RB | | | 5.25 | % | | | 06/01/45 | | | | 3,675 | | | | 3,240,946 | |
Carlsbad (City of) Community Facilities District 3 (Improvement Area 2); | | | | | | | | | | | | | | | | |
Series 2008, Special Tax RB | | | 6.10 | % | | | 09/01/28 | | | | 2,615 | | | | 2,749,437 | |
Series 2008, Special Tax RB | | | 6.20 | % | | | 09/01/38 | | | | 5,960 | | | | 6,175,931 | |
Desert Community College District (Election of 2004); Series 2007 C, Unlimited Tax CAB GO
Bonds (INS–AGM)(c)(e) | | | 0.00 | % | | | 08/01/46 | | | | 107,175 | | | | 18,419,095 | |
Eden (Township of) Healthcare District; Series 2010, COP | | | 6.13 | % | | | 06/01/34 | | | | 2,510 | | | | 2,796,943 | |
Fairfield (City of) (Fairfield Water); | | | | | | | | | | | | | | | | |
Series 2007 A, CAB COP (INS–SGI)(c)(e) | | | 0.00 | % | | | 04/01/32 | | | | 4,000 | | | | 1,525,080 | |
Series 2007 A, CAB COP (INS–SGI)(c)(e) | | | 0.00 | % | | | 04/01/33 | | | | 6,480 | | | | 2,321,460 | |
Series 2007 A, CAB COP (INS–SGI)(c)(e) | | | 0.00 | % | | | 04/01/34 | | | | 6,480 | | | | 2,186,870 | |
See accompanying Notes to Financial Statements which are an integral part of the financial statements.
13 Invesco High Yield Municipal Fund
| | | | | | | | | | | | | | | | |
| | | Interest
Rate | | | Maturity
Date | | | Principal
Amount
(000) | | |
Value | |
| California–(continued) | | | | | | | | | | | | | | | | |
Series 2007 A, CAB COP (INS–SGI)(c)(e) | | | 0.00 | % | | | 04/01/35 | | | $ | 6,480 | | | $ | 2,058,826 | |
Series 2007 A, CAB COP (INS–SGI)(c)(e) | | | 0.00 | % | | | 04/01/36 | | | | 6,480 | | | | 1,928,966 | |
Series 2007 A, CAB COP (INS–SGI)(c)(e) | | | 0.00 | % | | | 04/01/37 | | | | 6,480 | | | | 1,822,630 | |
Series 2007 A, CAB COP (INS–SGI)(c)(e) | | | 0.00 | % | | | 04/01/38 | | | | 6,480 | | | | 1,712,340 | |
Fairfield (City of) Community Facilities District No. 2007-1 (Fairfield Commons); | | | | | | | | | | | | | | | | |
Series 2008, Special Tax RB | | | 6.50 | % | | | 09/01/23 | | | | 1,435 | | | | 1,526,180 | |
Series 2008, Special Tax RB | | | 6.75 | % | | | 09/01/28 | | | | 2,950 | | | | 3,130,363 | |
Series 2008, Special Tax RB | | | 6.88 | % | | | 09/01/38 | | | | 5,140 | | | | 5,427,018 | |
Fontana (City of) Community Facilities District No. 22 (Sierra Hills South); Series 2004, Special Tax RB | | | 6.00 | % | | | 09/01/34 | | | | 5,000 | | | | 5,084,800 | |
Golden State Tobacco Securitization Corp.; | | | | | | | | | | | | | | | | |
Series 2005 A, Enhanced Tobacco Settlement Asset-Backed RB (INS–BHAC)(c)(d) | | | 5.00 | % | | | 06/01/45 | | | | 40,380 | | | | 42,458,762 | |
Series 2007 A-1, Sr. Tobacco Settlement Asset-Backed RB | | | 4.50 | % | | | 06/01/27 | | | | 36,985 | | | | 34,753,325 | |
Series 2007 A-1, Sr. Tobacco Settlement Asset-Backed RB | | | 5.00 | % | | | 06/01/33 | | | | 27,860 | | | | 25,563,222 | |
Series 2007 A-1, Sr. Tobacco Settlement Asset-Backed RB | | | 5.13 | % | | | 06/01/47 | | | | 27,315 | | | | 23,194,805 | |
Series 2007 A-2, Sr. Tobacco Settlement Asset-Backed RB | | | 5.30 | % | | | 06/01/37 | | | | 23,500 | | | | 21,437,405 | |
Hawthorne (City of) Community Facilities District No. 2006-1; | | | | | | | | | | | | | | | | |
Series 2006, Special Tax RB | | | 5.00 | % | | | 09/01/30 | | | | 3,000 | | | | 3,015,750 | |
Series 2006, Special Tax RB | | | 5.00 | % | | | 09/01/36 | | | | 2,000 | | | | 1,959,360 | |
Hesperia (City of) Public Financing Authority (Redevelopment & Housing); | | | | | | | | | | | | | | | | |
Series 2007 A, Tax Allocation RB (INS–SGI)(c) | | | 5.00 | % | | | 09/01/31 | | | | 1,495 | | | | 1,495,583 | |
Series 2007 A, Tax Allocation RB (INS–SGI)(c) | | | 5.00 | % | | | 09/01/37 | | | | 3,395 | | | | 3,292,369 | |
Imperial Beach (City of) Public Finance Authority (Palm Avenue/Commercial Redevelopment); Series 2003 A, Tax Allocation RB | | | 6.00 | % | | | 06/01/33 | | | | 3,000 | | | | 3,017,790 | |
Independent Cities Finance Authority (Rancho Del Sol & Grandview); Series 2012, Ref. Mobile Home Park RB | | | 5.50 | % | | | 05/15/47 | | | | 2,000 | | | | 2,114,700 | |
Independent Cities Finance Authority (Rancho Feliz & Las Casitas); Series 2012, Ref. Mobile Home Park RB | | | 5.00 | % | | | 10/15/47 | | | | 3,500 | | | | 3,569,510 | |
Independent Cities Finance Authority (Sahar Mobile Home Park); Series 2012 A, Ref. Mobile Home Park RB | | | 5.00 | % | | | 06/15/47 | | | | 2,250 | | | | 2,304,472 | |
Indio (City of) Redevelopment Agency (Merged Project Area); | | | | | | | | | | | | | | | | |
Series 2004 B, Sub. Tax Allocation RB(f)(j) | | | 6.38 | % | | | 08/15/14 | | | | 3,500 | | | | 3,801,595 | |
Series 2004 B, Sub. Tax Allocation RB(f)(j) | | | 6.50 | % | | | 08/15/14 | | | | 1,350 | | | | 1,451,885 | |
Inland Empire Tobacco Securitization Authority; | | | | | | | | | | | | | | | | |
Series 2007 A, Tobacco Settlement RB | | | 4.63 | % | | | 06/01/21 | | | | 7,040 | | | | 6,811,763 | |
Series 2007 A, Tobacco Settlement RB | | | 5.00 | % | | | 06/01/21 | | | | 5,000 | | | | 5,011,000 | |
Series 2007 C-1, Asset-Backed Tobacco Settlement CAB RB(e) | | | 0.00 | % | | | 06/01/36 | | | | 70,000 | | | | 8,843,100 | |
La Verne (City of) (Brethren Hillcrest Home); Series 2003 B, Revenue COP | | | 6.63 | % | | | 02/15/25 | | | | 4,270 | | | | 4,318,294 | |
Lee Lake Water District Community Facilities District No. 1 (Sycamore Creek); Series 2003, Special Tax RB | | | 6.00 | % | | | 09/01/33 | | | | 1,000 | | | | 1,026,950 | |
Los Alamitos Unified School District (Capital); Series 2012, Conv. CAB COP(n) | | | 6.05 | % | | | 08/01/42 | | | | 9,000 | | | | 5,455,170 | |
Los Angeles (City of) Community Facilities District No. 3 (Cascades Business Park); Series 1997, Special Tax RB | | | 6.40 | % | | | 09/01/22 | | | | 655 | | | | 663,391 | |
Los Angeles (City of) Department of Water & Power; Series 2012 A, Water System RB(d) | | | 5.00 | % | | | 07/01/43 | | | | 15,000 | | | | 17,315,400 | |
M-S-R Energy Authority; | | | | | | | | | | | | | | | | |
Series 2009 A, Gas RB | | | 6.50 | % | | | 11/01/39 | | | | 10,000 | | | | 14,095,500 | |
Series 2009 B, Gas RB | | | 6.50 | % | | | 11/01/39 | | | | 15,000 | | | | 21,143,250 | |
Morongo Band of Mission Indians (The) (Enterprise Casino); Series 2008 B, RB(h) | | | 6.50 | % | | | 03/01/28 | | | | 5,515 | | | | 6,053,871 | |
Murrieta (City of) Community Facilities District No. 2 (The Oaks Improvement Area); | | | | | | | | | | | | | | | | |
Series 2004 B, Special Tax RB | | | 6.00 | % | | | 09/01/27 | | | | 1,000 | | | | 1,019,880 | |
Series 2004 B, Special Tax RB | | | 6.00 | % | | | 09/01/34 | | | | 2,000 | | | | 2,029,280 | |
National City (City of) Community Development Commission (National City Redevelopment); Series 2011, Tax Allocation RB | | | 7.00 | % | | | 08/01/32 | | | | 4,750 | | | | 6,043,377 | |
Orange (City of) Community Facilities District No. 06-1 (Del Rio Public Improvements); | | | | | | | | | | | | | | | | |
Series 2010, Special Tax RB | | | 5.50 | % | | | 10/01/28 | | | | 540 | | | | 556,735 | |
Series 2010, Special Tax RB | | | 6.00 | % | | | 10/01/40 | | | | 3,500 | | | | 3,608,675 | |
See accompanying Notes to Financial Statements which are an integral part of the financial statements.
14 Invesco High Yield Municipal Fund
| | | | | | | | | | | | | | | | |
| | | Interest
Rate | | | Maturity
Date | | | Principal
Amount
(000) | | |
Value | |
| California–(continued) | | | | | | | | | | | | | | | | |
Palomar Community College District; Series 2010, Unlimited Tax Conv. CAB GO Bonds(n) | | | 6.38 | % | | | 08/01/45 | | | $ | 10,000 | | | $ | 5,100,000 | |
Perris (City of) Community Facilities District No. 01-2; Series 2002 A, Special Tax RB | | | 6.38 | % | | | 09/01/32 | | | | 5,000 | | | | 5,106,850 | |
Perris (City of) Public Financing Authority; | | | | | | | | | | | | | | | | |
Series 1995 D, Local Agency Special Tax RB | | | 7.88 | % | | | 09/01/25 | | | | 1,530 | | | | 1,534,697 | |
Series 2006, Tax Allocation RB | | | 5.35 | % | | | 10/01/36 | | | | 1,350 | | | | 1,355,198 | |
Placentia (City of) Public Financing Authority (Working Capital Financing); Series 2009, Lease RB | | | 7.50 | % | | | 06/01/19 | | | | 4,265 | | | | 4,276,899 | |
Rancho Cordova (City of) Community Facilities District No. 2003-1 (Sunridge Antolia); Series 2005, Special Tax RB | | | 5.50 | % | | | 09/01/37 | | | | 2,000 | | | | 2,018,600 | |
Riverside (County of) Redevelopment Agency (Mid-County Redevelopment Project Area); Series 2010 C, Tax Allocation RB | | | 6.25 | % | | | 10/01/40 | | | | 1,780 | | | | 1,859,050 | |
Roseville (City of) (Fountains Community Facilities District No. 1); Series 2008, Special Tax RB | | | 6.13 | % | | | 09/01/38 | | | | 1,000 | | | | 1,062,970 | |
Sacramento (County of) Community Facilities District No. 2005-2 (North Vineyard Station No. 1); Series 2007 A, Special Tax RB | | | 6.00 | % | | | 09/01/37 | | | | 11,110 | | | | 11,395,860 | |
San Bernardino City Unified School District; | | | | | | | | | | | | | | | | |
Series 2011 D, Unlimited Tax CAB GO Bonds (INS–AGM)(c)(e) | | | 0.00 | % | | | 08/01/36 | | | | 7,650 | | | | 2,410,132 | |
Series 2011 D, Unlimited Tax CAB GO Bonds (INS–AGM)(c)(e) | | | 0.00 | % | | | 08/01/37 | | | | 13,130 | | | | 3,924,426 | |
Series 2011 D, Unlimited Tax CAB GO Bonds (INS–AGM)(c)(e) | | | 0.00 | % | | | 08/01/38 | | | | 13,515 | | | | 3,836,098 | |
Series 2011 D, Unlimited Tax CAB GO Bonds (INS–AGM)(c)(e) | | | 0.00 | % | | | 08/01/39 | | | | 13,895 | | | | 3,748,593 | |
Series 2011 D, Unlimited Tax CAB GO Bonds (INS–AGM)(c)(e) | | | 0.00 | % | | | 08/01/40 | | | | 14,280 | | | | 3,675,958 | |
Series 2011 D, Unlimited Tax CAB GO Bonds (INS–AGM)(c)(e) | | | 0.00 | % | | | 08/01/41 | | | | 14,080 | | | | 3,459,034 | |
San Buenaventura (City of) (Community Memorial Health System); | | | | | | | | | | | | | | | | |
Series 2011, RB | | | 7.50 | % | | | 12/01/41 | | | | 14,230 | | | | 17,400,444 | |
Series 2011, RB | | | 8.00 | % | | | 12/01/31 | | | | 9,875 | | | | 12,537,892 | |
San Diego Unified School District (Election of 2008); Series 2012 E, Unlimited Tax Conv. CAB GO Bonds(n) | | | 5.38 | % | | | 07/01/47 | | | | 35,305 | | | | 15,805,695 | |
San Diego Unified School District; | | | | | | | | | | | | | | | | |
Series 2010 C, Unlimited Tax Conv. CAB GO Bonds(n) | | | 6.63 | % | | | 07/01/48 | | | | 34,000 | | | | 17,872,100 | |
Series 2012 R-2, Ref. Unlimited Tax Conv. CAB GO Bonds(n) | | | 6.63 | % | | | 07/01/40 | | | | 20,390 | | | | 10,989,598 | |
San Francisco (City & County of) Redevelopment Financing Authority (Mission Bay South Redevelopment); | | | | | | | | | | | | | | | | |
Series 2009 D, Tax Allocation RB | | | 6.25 | % | | | 08/01/28 | | | | 1,000 | | | | 1,115,540 | |
Series 2009 D, Tax Allocation RB | | | 6.50 | % | | | 08/01/30 | | | | 1,000 | | | | 1,122,320 | |
Series 2009 D, Tax Allocation RB | | | 6.63 | % | | | 08/01/39 | | | | 1,000 | | | | 1,116,440 | |
San Francisco (City & County of) Successor Agency to the Redevelopment Agency Community Facilities District No. 6 (Mission Bay South Public Improvements); | | | | | | | | | | | | | | | | |
Series 2013 C, Special Tax CAB RB(e) | | | 0.00 | % | | | 08/01/36 | | | | 5,710 | | | | 1,574,875 | |
Series 2013 C, Special Tax CAB RB(e) | | | 0.00 | % | | | 08/01/38 | | | | 2,000 | | | | 478,440 | |
Series 2013 C, Special Tax CAB RB(e) | | | 0.00 | % | | | 08/01/43 | | | | 10,000 | | | | 1,748,000 | |
San Francisco (City of) Utilities Commission; Series 2012, Water RB(d) | | | 5.00 | % | | | 11/01/36 | | | | 23,490 | | | | 27,263,434 | |
San Gorgonio Memorial Health Care District (Election 2006); Series 2006 C, Unlimited Tax GO Bonds | | | 7.20 | % | | | 08/01/39 | | | | 13,000 | | | | 15,137,980 | |
San Jose (City of) (Helzer Courts Apartments); Series 1999 A, MFH RB(b) | | | 6.40 | % | | | 12/01/41 | | | | 14,123 | | | | 14,124,412 | |
San Jose (City of) Community Facilities District No. 9 (Bailey/Highway 101); | | | | | | | | | | | | | | | | |
Series 2003, Special Tax RB | | | 6.60 | % | | | 09/01/27 | | | | 2,000 | | | | 2,016,160 | |
Series 2003, Special Tax RB | | | 6.65 | % | | | 09/01/32 | | | | 2,630 | | | | 2,646,122 | |
Santa Cruz (County of) Redevelopment Agency (Live Oak/Soquel Community Improvement);
Series 2009 A, Tax Allocation RB | | | 7.00 | % | | | 09/01/36 | | | | 3,500 | | | | 4,150,405 | |
Savanna Elementary School District (Election of 2008); Series 2012 B, Unlimited Tax Conv. CAB GO Bonds (INS–AGM)(c)(n) | | | 6.75 | % | | | 02/01/52 | | | | 7,500 | | | | 2,829,750 | |
Southern California Logistics Airport Authority; | | | | | | | | | | | | | | | | |
Series 2007, Tax Allocation RB(a) | | | 6.15 | % | | | 12/01/43 | | | | 4,400 | | | | 1,980,396 | |
Series 2008 A, Tax Allocation CAB RB(e) | | | 0.00 | % | | | 12/01/45 | | | | 18,085 | | | | 806,229 | |
Series 2008 A, Tax Allocation CAB RB(e) | | | 0.00 | % | | | 12/01/46 | | | | 18,085 | | | | 735,155 | |
Series 2008 A, Tax Allocation CAB RB(e) | | | 0.00 | % | | | 12/01/47 | | | | 18,085 | | | | 670,592 | |
Series 2008 A, Tax Allocation CAB RB(e) | | | 0.00 | % | | | 12/01/48 | | | | 18,085 | | | | 611,816 | |
See accompanying Notes to Financial Statements which are an integral part of the financial statements.
15 Invesco High Yield Municipal Fund
| | | | | | | | | | | | | | | | |
| | | Interest
Rate | | | Maturity
Date | | | Principal
Amount
(000) | | |
Value | |
| California–(continued) | | | | | | | | | | | | | | | | |
Series 2008 A, Tax Allocation CAB RB(e) | | | 0.00 | % | | | 12/01/49 | | | $ | 18,085 | | | $ | 558,284 | |
Series 2008 A, Tax Allocation CAB RB(e) | | | 0.00 | % | | | 12/01/50 | | | | 18,085 | | | | 509,274 | |
Series 2008 A, Tax Allocation RB | | | 6.00 | % | | | 12/01/33 | | | | 1,475 | | | | 663,883 | |
Southern California Tobacco Securitization Authority (San Diego County Tobacco Asset Securitization Corp.); | | | | | | | | | | | | | | | | |
Series 2006, Tobacco Settlement Asset-Backed First Sub. CAB RB(e) | | | 0.00 | % | | | 06/01/46 | | | | 35,000 | | | | 1,019,550 | |
Series 2006, Tobacco Settlement Asset-Backed Second Sub. CAB RB(e) | | | 0.00 | % | | | 06/01/46 | | | | 27,200 | | | | 755,616 | |
Series 2006, Tobacco Settlement Asset-Backed Third Sub. CAB RB(e) | | | 0.00 | % | | | 06/01/46 | | | | 47,000 | | | | 1,206,960 | |
Series 2006 A-1, Sr. Tobacco Settlement Asset-Backed RB | | | 5.00 | % | | | 06/01/37 | | | | 24,980 | | | | 22,214,714 | |
Series 2006 A-1, Sr. Tobacco Settlement Asset-Backed RB | | | 5.13 | % | | | 06/01/46 | | | | 2,290 | | | | 1,959,026 | |
Southern California Tobacco Securitization Authority; Series 2006 A-1, Sr. RB | | | 4.75 | % | | | 06/01/25 | | | | 15 | | | | 15,054 | |
Tejon Ranch Public Facilities Financing Authority Community Facilities District No. 2008-1 (Tejon Industrial Complex Public Improvements—East); | | | | | | | | | | | | | | | | |
Series 2012 A, Ref. Special Tax RB | | | 5.00 | % | | | 09/01/32 | | | | 750 | | | | 740,798 | |
Series 2012 A, Ref. Special Tax RB | | | 5.25 | % | | | 09/01/40 | | | | 2,000 | | | | 1,974,200 | |
Series 2012 B, Special Tax RB | | | 5.00 | % | | | 09/01/32 | | | | 750 | | | | 740,798 | |
Series 2012 B, Special Tax RB | | | 5.25 | % | | | 09/01/42 | | | | 3,000 | | | | 2,960,100 | |
Upland Unified School District (Election of 2008); Series 2009 B, Unlimited Tax CAB GO Bonds(e) | | | 0.00 | % | | | 08/01/39 | | | | 15,000 | | | | 3,029,550 | |
Val Verde Unified School District Financing Authority; | | | | | | | | | | | | | | | | |
Series 2003, Ref. Jr. Lien Special Tax RB | | | 6.00 | % | | | 10/01/21 | | | | 535 | | | | 550,793 | |
Series 2003, Ref. Jr. Lien Special Tax RB | | | 6.25 | % | | | 10/01/28 | | | | 7,115 | | | | 7,309,524 | |
Vallejo (City of) Public Financing Authority (Hiddenbrooke Improvement District); Series 2004 A, Local Agency RB | | | 5.80 | % | | | 09/01/31 | | | | 4,105 | | | | 4,139,728 | |
Victor Valley Union High School District (Election of 2008); | | | | | | | | | | | | | | | | |
Series 2013 B, Unlimited Tax CAB GO Bonds(e) | | | 0.00 | % | | | 08/01/43 | | | | 11,855 | | | | 2,134,730 | |
Series 2013 B, Unlimited Tax CAB GO Bonds(e) | | | 0.00 | % | | | 08/01/44 | | | | 12,475 | | | | 2,113,140 | |
Series 2013 B, Unlimited Tax CAB GO Bonds(e) | | | 0.00 | % | | | 08/01/47 | | | | 14,550 | | | | 2,042,965 | |
Series 2013 B, Unlimited Tax CAB GO Bonds(e) | | | 0.00 | % | | | 08/01/49 | | | | 11,115 | | | | 1,374,814 | |
Unlimited Tax CAB GO Bonds, Series 2013 B(e) | | | 0.00 | % | | | 08/01/48 | | | | 7,000 | | | | 922,320 | |
Woodland (City of) Community Facilities District 1; Series 2004, Special Tax RB | | | 6.25 | % | | | 09/01/34 | | | | 4,810 | | | | 4,883,882 | |
Yuba City (City of) Redevelopment Agency (Housing Set-Aside); | | | | | | | | | | | | | | | | |
Series 2004 B, Tax Allocation RB | | | 6.00 | % | | | 09/01/31 | | | | 1,060 | | | | 1,076,441 | |
Series 2004 B, Tax Allocation RB | | | 6.00 | % | | | 09/01/39 | | | | 1,880 | | | | 1,901,263 | |
Yuba City (City of) Redevelopment Agency (Redevelopment); Series 2004, Tax Allocation RB | | | 6.00 | % | | | 09/01/31 | | | | 1,800 | | | | 1,827,918 | |
| | | | | | | | | | | | | | | | 902,889,226 | |
| | | | |
| Colorado–3.43% | | | | | | | | | | | | | | | | |
Antelope Heights Metropolitan District; Series 2003, Limited Tax GO Bonds(f)(j) | | | 8.00 | % | | | 12/01/13 | | | | 2,605 | | | | 2,781,072 | |
Arista Metropolitan District; Series 2005, Special Limited Tax GO Bonds | | | 6.75 | % | | | 12/01/35 | | | | 1,987 | | | | 1,507,179 | |
Arvada (City of) (Arvada Nightingale); Series 1998, Ref. MFH RB (Acquired 04/16/99; Cost $765,000)(b)(h) | | | 6.25 | % | | | 12/01/18 | | | | 765 | | | | 765,842 | |
Beacon Point Metropolitan District; | | | | | | | | | | | | | | | | |
Series 2005 A, Limited Tax GO Bonds | | | 6.13 | % | | | 12/01/25 | | | | 1,775 | | | | 1,805,583 | |
Series 2005 A, Limited Tax GO Bonds | | | 6.25 | % | | | 12/01/35 | | | | 3,510 | | | | 3,556,472 | |
Bradburn Metropolitan District No. 3; Series 2010, Ref. Limited Tax GO Bonds | | | 7.50 | % | | | 12/01/39 | | | | 2,575 | | | | 2,650,550 | |
Broomfield Village Metropolitan District No. 2; Series 2003, Ref. & Improvement Limited Tax GO Bonds | | | 6.25 | % | | | 12/01/32 | | | | 4,115 | | | | 3,891,761 | |
Buckhorn Valley Metropolitan District No. 2; Series 2003, Limited Tax GO Bonds | | | 7.00 | % | | | 12/01/23 | | | | 60 | | | | 48,497 | |
Castle Oaks Metropolitan District; | | | | | | | | | | | | | | | | |
Series 2005, Limited Tax GO Bonds(f)(j) | | | 6.00 | % | | | 12/01/15 | | | | 919 | | | | 1,047,825 | |
Series 2005, Limited Tax GO Bonds(f)(j) | | | 6.13 | % | | | 12/01/15 | | | | 1,286 | | | | 1,470,644 | |
Colorado (State of) Educational & Cultural Facilities Authority (Banning Lewis Ranch Academy); Series 2006, Charter School RB(h) | | | 6.13 | % | | | 12/15/35 | | | | 2,760 | | | | 2,799,275 | |
Colorado (State of) Educational & Cultural Facilities Authority (Brighton Charter School); Series 2006, Charter School RB | | | 6.00 | % | | | 11/01/36 | | | | 3,310 | | | | 2,463,401 | |
See accompanying Notes to Financial Statements which are an integral part of the financial statements.
16 Invesco High Yield Municipal Fund
| | | | | | | | | | | | | | | | |
| | | Interest
Rate | | | Maturity
Date | | | Principal
Amount
(000) | | |
Value | |
| Colorado–(continued) | | | | | | | | | | | | | | | | |
Colorado (State of) Educational & Cultural Facilities Authority (Carbon Valley Academy); Series 2006, Charter School RB | | | 5.63 | % | | | 12/01/36 | | | $ | 1,015 | | | $ | 808,072 | |
Colorado (State of) Educational & Cultural Facilities Authority (Community Leadership Academy); | | | | | | | | | | | | | | | | |
Series 2008, Charter School RB | | | 6.25 | % | | | 07/01/28 | | | | 1,650 | | | | 1,630,613 | |
Series 2008, Charter School RB | | | 6.50 | % | | | 07/01/38 | | | | 1,000 | | | | 990,090 | |
Colorado (State of) Educational & Cultural Facilities Authority (Denver Academy); | | | | | | | | | | | | | | | | |
Series 2003 A, Ref. RB | | | 7.00 | % | | | 11/01/23 | | | | 1,505 | | | | 1,526,687 | |
Series 2003 A, Ref. RB | | | 7.13 | % | | | 11/01/28 | | | | 810 | | | | 820,734 | |
Colorado (State of) Educational & Cultural Facilities Authority (Denver School of Science & Technology); Series 2004, RB | | | 5.00 | % | | | 12/01/13 | | | | 152 | | | | 152,181 | |
Colorado (State of) Educational & Cultural Facilities Authority (Flagstaff Academy); Series 2008 A, Charter School RB | | | 7.00 | % | | | 08/01/38 | | | | 1,500 | | | | 1,574,145 | |
Colorado (State of) Educational & Cultural Facilities Authority (Knowledge Quest Academy); Series 2005, Charter School RB | | | 6.50 | % | | | 05/01/36 | | | | 880 | | | | 882,754 | |
Colorado (State of) Educational & Cultural Facilities Authority (Monument Academy); | | | | | | | | | | | | | | | | |
Series 2007, Charter School RB | | | 5.88 | % | | | 10/01/27 | | | | 2,500 | | | | 2,612,575 | |
Series 2007, Charter School RB | | | 6.00 | % | | | 10/01/37 | | | | 1,635 | | | | 1,695,152 | |
Series 2008 A, Charter School RB | | | 7.25 | % | | | 10/01/39 | | | | 500 | | | | 559,295 | |
Colorado (State of) Educational & Cultural Facilities Authority (New Vision Charter School); Series 2008, RB(h) | | | 6.75 | % | | | 04/01/40 | | | | 1,845 | | | | 1,880,941 | |
Colorado (State of) Educational & Cultural Facilities Authority (North Star Academy); Series 2008 A, Ref. & Improvement RB(h) | | | 8.25 | % | | | 11/01/39 | | | | 2,920 | | | | 3,252,442 | |
Colorado (State of) Educational & Cultural Facilities Authority (Northeast Academy); Series 2007, Charter School RB(h) | | | 5.75 | % | | | 05/15/37 | | | | 2,425 | | | | 1,846,808 | |
Colorado (State of) Educational & Cultural Facilities Authority (The Classical Academy); Series 2008 A, Charter School RB | | | 7.40 | % | | | 12/01/38 | | | | 2,000 | | | | 2,359,440 | |
Colorado (State of) Educational & Cultural Facilities Authority (Windsor Academy); Series 2007, Charter School RB | | | 5.70 | % | | | 05/01/37 | | | | 985 | | | | 994,367 | |
Colorado (State of) Health Facilities Authority (American Baptist Homes); Series 2009 A, RB | | | 7.75 | % | | | 08/01/39 | | | | 4,000 | | | | 4,469,920 | |
Colorado (State of) Health Facilities Authority (Christian Living Communities); | | | | | | | | | | | | | | | | |
Series 2006 A, RB | | | 5.75 | % | | | 01/01/37 | | | | 11,855 | | | | 12,669,083 | |
Series 2011, RB | | | 6.38 | % | | | 01/01/41 | | | | 1,615 | | | | 1,851,533 | |
Colorado (State of) Health Facilities Authority (Total Longterm Care National Obligated Group); | | | | | | | | | | | | | | | | |
Series 2010 A, RB | | | 6.00 | % | | | 11/15/30 | | | | 1,600 | | | | 1,833,920 | |
Series 2010 A, RB | | | 6.25 | % | | | 11/15/40 | | | | 4,750 | | | | 5,340,662 | |
Series 2011, RB | | | 5.75 | % | | | 11/15/31 | | | | 1,000 | | | | 1,128,800 | |
Series 2011, RB | | | 6.00 | % | | | 11/15/40 | | | | 1,195 | | | | 1,340,790 | |
Colorado (State of) Health Facilities Authority (Volunteers of America Care); | | | | | | | | | | | | | | | | |
Series 2007 A, Health & Residential Care Facilities RB | | | 5.20 | % | | | 07/01/22 | | | | 800 | | | | 810,224 | |
Series 2007 A, Health & Residential Care Facilities RB | | | 5.25 | % | | | 07/01/27 | | | | 3,260 | | | | 3,280,082 | |
Series 2007 A, Health & Residential Care Facilities RB | | | 5.30 | % | | | 07/01/37 | | | | 5,815 | | | | 5,732,427 | |
Colorado (State of) Regional Transportation District (Denver Transit Partners Eagle P3); | | | | | | | | | | | | | | | | |
Series 2010, Private Activity RB | | | 6.00 | % | | | 01/15/34 | | | | 500 | | | | 578,375 | |
Series 2010, Private Activity RB | | | 6.00 | % | | | 01/15/41 | | | | 9,935 | | | | 11,576,461 | |
Colorado Springs (City of) Urban Renewal Authority (University Village Colorado); Series 2008 A, Tax Increment Allocation RB | | | 7.00 | % | | | 12/01/29 | | | | 2,500 | | | | 1,681,425 | |
Conservatory Metropolitan District (Arapahoe County); Series 2005, Limited Tax GO Bonds(f)(j) | | | 6.75 | % | | | 12/01/13 | | | | 796 | | | | 848,743 | |
Copperleaf Metropolitan District No. 2; | | | | | | | | | | | | | | | | |
Series 2006, Limited Tax GO Bonds | | | 5.85 | % | | | 12/01/26 | | | | 1,000 | | | | 798,860 | |
Series 2006, Limited Tax GO Bonds | | | 5.95 | % | | | 12/01/36 | | | | 9,000 | | | | 6,565,050 | |
Country Club Village Metropolitan District; Series 2006, Limited Tax GO Bonds | | | 6.00 | % | | | 12/01/34 | | | | 595 | | | | 487,323 | |
Cross Creek Metropolitan District No. 2; Series 2006, Ref. Limited Tax GO Bonds(g) | | | 3.50 | % | | | 12/01/37 | | | | 2,630 | | | | 2,091,876 | |
Denver (City & County of) (United Airlines); Series 2007 A, Ref. Special Facilities Airport RB(b) | | | 5.25 | % | | | 10/01/32 | | | | 31,125 | | | | 31,656,304 | |
See accompanying Notes to Financial Statements which are an integral part of the financial statements.
17 Invesco High Yield Municipal Fund
| | | | | | | | | | | | | | | | |
| | | Interest
Rate | | | Maturity
Date | | | Principal
Amount
(000) | | |
Value | |
| Colorado–(continued) | | | | | | | | | | | | | | | | |
Denver (City of) Convention Center Hotel Authority; | | | | | | | | | | | | | | | | |
Series 2006, Ref. Sr. RB (INS–SGI)(c) | | | 5.13 | % | | | 12/01/26 | | | $ | 2,000 | | | $ | 2,128,600 | |
Series 2006, Ref. Sr. RB (INS–SGI)(c) | | | 5.00 | % | | | 12/01/35 | | | | 6,365 | | | | 6,647,670 | |
Elbert (County of) & Highway 86 Commercial Metropolitan District; Series 2008 A, Public
Improvement Fee RB(m) | | | 4.12 | % | | | 12/01/32 | | | | 4,500 | | | | 2,704,545 | |
Fitzsimons Village Metropolitan District No. 1; Series 2010 A, Tax Increment Allocation & Public Improvement Fee Supported RB | | | 7.50 | % | | | 03/01/40 | | | | 5,500 | | | | 5,956,555 | |
Fossil Ridge Metropolitan District No. 1; Series 2010, Ref. Tax Supported Limited Tax GO Bonds | | | 7.25 | % | | | 12/01/40 | | | | 1,000 | | | | 1,066,300 | |
Grandby Ranch Metropolitan District; Series 2006, Limited Tax GO Bonds | | | 6.75 | % | | | 12/01/36 | | | | 2,930 | | | | 2,987,721 | |
High Plains Metropolitan District; | | | | | | | | | | | | | | | | |
Series 2005 A, Limited Tax GO Bonds | | | 6.13 | % | | | 12/01/25 | | | | 2,220 | | | | 1,457,719 | |
Series 2005 A, Limited Tax GO Bonds | | | 6.25 | % | | | 12/01/35 | | | | 4,000 | | | | 2,422,240 | |
Jordan Crossing Metropolitan District; Series 2006, Limited Tax GO Bonds | | | 5.75 | % | | | 12/01/36 | | | | 1,370 | | | | 1,015,471 | |
Lafayette (City of) (Rocky Mountain Instrument); | | | | | | | | | | | | | | | | |
Series 1998 A, IDR(b) | | | 7.00 | % | | | 10/01/18 | | | | 3,800 | | | | 3,172,886 | |
Series 1999 A, IDR | | | 6.75 | % | | | 10/01/14 | | | | 170 | | | | 152,697 | |
Lake Creek Affordable Housing Corp.; Series 1998 A, Ref. MFH RB(f)(j) | | | 6.25 | % | | | 12/01/13 | | | | 8,565 | | | | 9,060,314 | |
Liberty Ranch Metropolitan District; Series 2006, Limited Tax GO Bonds | | | 6.25 | % | | | 12/01/36 | | | | 1,603 | | | | 1,419,104 | |
Lincoln Park Metropolitan District; | | | | | | | | | | | | | | | | |
Series 2008, Ref. & Improvement Unlimited Tax GO Bonds | | | 6.13 | % | | | 12/01/30 | | | | 6,250 | | | | 6,735,625 | |
Series 2008, Ref. & Improvement Unlimited Tax GO Bonds | | | 6.20 | % | | | 12/01/37 | | | | 5,550 | | | | 5,922,738 | |
Montezuma (County of) Hospital District; Series 2007, Ref. RB | | | 5.90 | % | | | 10/01/37 | | | | 6,480 | | | | 6,661,505 | |
Montrose (County of) (The Homestead at Montrose, Inc.); | | | | | | | | | | | | | | | | |
Series 2003 A, Health Care Facilities RB | | | 5.75 | % | | | 02/01/15 | | | | 110 | | | | 110,196 | |
Series 2003 A, Health Care Facilities RB | | | 6.75 | % | | | 02/01/22 | | | | 300 | | | | 300,534 | |
Series 2003 A, Health Care Facilities RB | | | 7.00 | % | | | 02/01/25 | | | | 800 | | | | 801,416 | |
Series 2003 A, Health Care Facilities RB | | | 7.00 | % | | | 02/01/38 | | | | 6,200 | | | | 6,207,130 | |
Montrose (County of) Memorial Hospital Board of Trustees; Series 2003, Enterprise RB | | | 6.00 | % | | | 12/01/33 | | | | 5,500 | | | | 5,779,510 | |
Neu Towne Metropolitan District; Series 2004, Limited Tax GO Bonds(m) | | | 5.45 | % | | | 12/01/34 | | | | 1,500 | | | | 451,785 | |
Northwest Metropolitan District No. 3; | | | | | | | | | | | | | | | | |
Series 2005, Limited Tax GO Bonds | | | 6.13 | % | | | 12/01/25 | | | | 4,500 | | | | 4,510,215 | |
Series 2005, Limited Tax GO Bonds | | | 6.25 | % | | | 12/01/35 | | | | 7,450 | | | | 7,431,151 | |
Plaza Metropolitan District No. 1; Series 2013, Ref. Tax Allocation RB | | | 5.00 | % | | | 12/01/40 | | | | 2,500 | | | | 2,597,275 | |
Reata South Metropolitan District; Series 2007 A, Limited Tax GO Bonds | | | 7.25 | % | | | 06/01/37 | | | | 1,000 | | | | 971,540 | |
Rendezvous Residential Metropolitan District; Series 2002, Limited Tax GO Bonds(f)(j) | | | 8.00 | % | | | 12/01/13 | | | | 1,430 | | | | 1,508,879 | |
Riverdale Peaks II Metropolitan District; Series 2005, Limited Tax GO Bonds | | | 6.50 | % | | | 12/01/35 | | | | 1,000 | | | | 661,120 | |
Serenity Ridge Metropolitan District No. 2; Series 2004, Limited Tax GO Bonds(m) | | | 3.75 | % | | | 12/01/34 | | | | 2,000 | | | | 967,140 | |
Silver Peaks Metropolitan District No. 2; Series 2006, Limited Tax GO Bonds | | | 5.75 | % | | | 12/01/36 | | | | 985 | | | | 689,057 | |
Snowmass Village (Town of); Series 1992 A, Ref. MFH RB | | | 8.00 | % | | | 09/01/14 | | | | 235 | | | | 235,162 | |
Southlands Metropolitan District No. 1; | | | | | | | | | | | | | | | | |
Series 2004, Unlimited Tax GO Bonds(f)(j) | | | 7.00 | % | | | 12/01/14 | | | | 1,000 | | | | 1,117,250 | |
Series 2004, Unlimited Tax GO Bonds(f)(j) | | | 7.13 | % | | | 12/01/14 | | | | 2,500 | | | | 2,798,125 | |
Table Rock Metropolitan District; Series 2003, Limited Tax GO Bonds(f)(j) | | | 7.00 | % | | | 12/01/13 | | | | 700 | | | | 734,433 | |
Tallgrass Metropolitan District; Series 2007, Ref. & Improvement Limited Tax GO Bonds | | | 5.25 | % | | | 12/01/37 | | | | 4,795 | | | | 4,766,997 | |
Tallyns Reach Metropolitan District No. 2; Series 2004, Limited Tax GO Bonds(f)(j) | | | 6.38 | % | | | 12/01/13 | | | | 637 | | | | 667,079 | |
Tallyns Reach Metropolitan District No. 3; | | | | | | | | | | | | | | | | |
Series 2004, Limited Tax GO Bonds(f)(j) | | | 6.63 | % | | | 12/01/13 | | | | 925 | | | | 970,436 | |
Series 2004, Limited Tax GO Bonds(f)(j) | | | 6.75 | % | | | 12/01/13 | | | | 1,000 | | | | 1,050,060 | |
Valagua Metropolitan District; Series 2008, Limited Tax GO Bonds | | | 7.75 | % | | | 12/01/37 | | | | 1,000 | | | | 664,050 | |
Vista Ridge Metropolitan District; Series 2006 B, Ref. Sub. Limited Tax GO Bonds(e)(m) | | | 0.00 | % | | | 12/01/40 | | | | 1,000 | | | | 621,110 | |
Wyndham Hill Metropolitan District No. 2; | | | | | | | | | | | | | | | | |
Series 2005, Limited Tax GO Bonds | | | 6.25 | % | | | 12/01/25 | | | | 85 | | | | 80,351 | |
Series 2005, Limited Tax GO Bonds | | | 6.38 | % | | | 12/01/35 | | | | 500 | | | | 450,495 | |
| | | | | 249,770,441 | |
See accompanying Notes to Financial Statements which are an integral part of the financial statements.
18 Invesco High Yield Municipal Fund
| | | | | | | | | | | | | | | | |
| | | Interest
Rate | | | Maturity
Date | | | Principal
Amount
(000) | | |
Value | |
| Connecticut–0.40% | | | | | | | | | | | | | | | | |
Connecticut (State of) Development Authority (Cargo BDL LLC); Series 2000, IDR(b)(m) | | | 4.00 | % | | | 04/01/30 | | | $ | 2,955 | | | $ | 1,845,191 | |
Connecticut (State of) Health & Educational Facilities Authority (St. Mary’s Hospital); Series 1997 E, RB | | | 5.88 | % | | | 07/01/22 | | | | 3,660 | | | | 3,664,209 | |
Georgetown (City of) Special Taxing District; Series 2006 A, Unlimited Tax GO Bonds(h)(i) | | | 5.13 | % | | | 10/01/36 | | | | 4,405 | | | | 2,042,599 | |
Hamden (Town of) (Whitney Center); | | | | | | | | | | | | | | | | |
Series 2009 A, RB | | | 7.63 | % | | | 01/01/30 | | | | 2,880 | | | | 3,177,302 | |
Series 2009 A, RB | | | 7.75 | % | | | 01/01/43 | | | | 10,995 | | | | 11,970,476 | |
Series 2009 C, RB(f)(g) | | | 7.25 | % | | | 01/01/16 | | | | 2,000 | | | | 2,104,940 | |
Harbor Point Infrastructure Improvement District (Harbor Point); Series 2010 A, Special Obligation Tax Allocation RB | | | 7.88 | % | | | 04/01/39 | | | | 3,000 | | | | 3,428,640 | |
Manchester (Town of) Redevelopment Agency (Bennet Housing Development); Series 1993, MFH Mortgage RB (Acquired 09/20/99; Cost $602,622)(h) | | | 7.20 | % | | | 12/01/18 | | | | 650 | | | | 654,134 | |
| | | | | 28,887,491 | |
| | | | |
| Delaware–0.13% | | | | | | | | | | | | | | | | |
Delaware (State of) Economic Development Authority (Newark Charter School); Series 2012, RB | | | 5.00 | % | | | 09/01/42 | | | | 1,350 | | | | 1,436,036 | |
New Castle (County of) (Newark Charter School, Inc.); Series 2006, RB | | | 5.00 | % | | | 09/01/30 | | | | 1,610 | | | | 1,637,933 | |
Sussex (County of) (Cadbury at Lewes); | | | | | | | | | | | | | | | | |
Series 2006 A, First Mortgage RB | | | 5.45 | % | | | 01/01/16 | | | | 665 | | | | 665,745 | |
Series 2006 A, First Mortgage RB | | | 5.90 | % | | | 01/01/26 | | | | 750 | | | | 762,300 | |
Series 2006 A, First Mortgage RB | | | 6.00 | % | | | 01/01/35 | | | | 600 | | | | 605,076 | |
Wilmington (City of) (Electra Arms Senior Association); Series 1998, MFH Rental RB(b) | | | 6.25 | % | | | 06/01/28 | | | | 4,325 | | | | 4,324,524 | |
| | | | | 9,431,614 | |
| | | | |
| District of Columbia–1.42% | | | | | | | | | | | | | | | | |
District of Columbia (Center for Strategic & International Studies, Inc.); | | | | | | | | | | | | | | | | |
Series 2011, RB | | | 6.38 | % | | | 03/01/31 | | | | 2,000 | | | | 2,167,300 | |
Series 2011, RB | | | 6.63 | % | | | 03/01/41 | | | | 5,150 | | | | 5,629,208 | |
District of Columbia (Cesar Chavez Charter School); Series 2011, RB | | | 7.88 | % | | | 11/15/40 | | | | 7,000 | | | | 8,256,080 | |
District of Columbia (Gallaudet University); | | | | | | | | | | | | | | | | |
Series 2011, University RB | | | 5.50 | % | | | 04/01/34 | | | | 500 | | | | 579,275 | |
Series 2011, University RB | | | 5.50 | % | | | 04/01/41 | | | | 3,000 | | | | 3,427,470 | |
District of Columbia (Methodist Home); | | | | | | | | | | | | | | | | |
Series 1999, RB | | | 6.00 | % | | | 01/01/29 | | | | 2,545 | | | | 2,504,178 | |
Series 2009 A, RB | | | 7.50 | % | | | 01/01/39 | | | | 1,520 | | | | 1,576,255 | |
District of Columbia (National Public Radio, Inc.); Series 2010 A, RB | | | 5.00 | % | | | 04/01/43 | | | | 1,000 | | | | 1,071,640 | |
District of Columbia (Sibley Memorial Hospital); | | | | | | | | | | | | | | | | |
Series 2009, Hospital RB | | | 6.38 | % | | | 10/01/39 | | | | 2,000 | | | | 2,335,140 | |
Series 2009, Hospital RB | | | 6.50 | % | | | 10/01/29 | | | | 5,000 | | | | 5,958,650 | |
District of Columbia Tobacco Settlement Financing Corp.; Series 2006 C, Asset-Backed CAB RB(e) | | | 0.00 | % | | | 06/15/55 | | | | 60,320 | | | | 567,611 | |
District of Columbia; Series 2009 B, Ref. Sec. Income Tax RB(d) | | | 5.00 | % | | | 12/01/25 | | | | 16,165 | | | | 19,562,560 | |
Metropolitan Washington Airports Authority; | | | | | | | | | | | | | | | | |
Series 2006 B, Airport System RB (INS–AGM)(b)(c)(d) | | | 5.00 | % | | | 10/01/36 | | | | 40,695 | | | | 43,111,062 | |
Series 2009 B, Second Sr. Lien Dulles Toll Road CAB RB (INS–AGC)(c)(e) | | | 0.00 | % | | | 10/01/39 | | | | 22,920 | | | | 6,017,417 | |
Series 2009 B, Second Sr. Lien Dulles Toll Road CAB RB (INS–AGC)(c)(e) | | | 0.00 | % | | | 10/01/40 | | | | 3,475 | | | | 865,240 | |
| | | | | 103,629,086 | |
| | | | |
| Florida–9.46% | | | | | | | | | | | | | | | | |
Alachua (County of) (North Florida Retirement Village, Inc.); | | | | | | | | | | | | | | | | |
Series 2007, IDR | | | 5.88 | % | | | 11/15/36 | | | | 10,500 | | | | 10,432,485 | |
Series 2007, IDR | | | 5.88 | % | | | 11/15/42 | | | | 19,000 | | | | 18,787,390 | |
Alachua (County of) Health Facilities Authority (Oak Hammock at the University of Florida); | | | | | | | | | | | | | | | | |
Series 2012 A, Ref. Continuing Care Retirement Community RB | | | 8.00 | % | | | 10/01/32 | | | | 1,000 | | | | 1,226,660 | |
Series 2012 A, Ref. Continuing Care Retirement Community RB | | | 8.00 | % | | | 10/01/42 | | | | 2,500 | | | | 3,043,150 | |
Series 2012 A, Ref. Continuing Care Retirement Community RB | | | 8.00 | % | | | 10/01/46 | | | | 2,000 | | | | 2,426,020 | |
See accompanying Notes to Financial Statements which are an integral part of the financial statements.
19 Invesco High Yield Municipal Fund
| | | | | | | | | | | | | | | | |
| | | Interest
Rate | | | Maturity
Date | | | Principal
Amount
(000) | | |
Value | |
| Florida–(continued) | | | | | | | | | | | | | | | | |
Alachua (County of) Health Facilities Authority (Terraces at Bonita Springs); | | | | | | | | | | | | | | | | |
Series 2011, TEMPS-70SM RB | | | 7.13 | % | | | 11/15/16 | | | $ | 17,100 | | | $ | 17,300,925 | |
Series 2011 A, RB | | | 8.00 | % | | | 11/15/31 | | | | 3,000 | | | | 3,538,410 | |
Series 2011 A, RB | | | 8.13 | % | | | 11/15/41 | | | | 11,000 | | | | 12,943,040 | |
Series 2011 A, RB | | | 8.13 | % | | | 11/15/46 | | | | 6,000 | | | | 7,059,840 | |
Anthem Park Community Development District; Series 2004, Capital Improvement Special
Assessment RB(a) | | | 5.80 | % | | | 05/01/36 | | | | 8,210 | | | | 5,903,565 | |
Bay Laurel Center Community Development District (Candler); Series 2006, Special Assessment RB | | | 5.45 | % | | | 05/01/37 | | | | 1,175 | | | | 1,156,294 | |
Beacon Lakes Community Development District; Series 2003 A, Special Assessment RB | | | 6.90 | % | | | 05/01/35 | | | | 3,055 | | | | 3,097,342 | |
Bloomingdale (Villages of) Community Development District; Series 2004, Special Assessment RB(a) | | | 5.88 | % | | | 05/01/36 | | | | 3,935 | | | | 3,357,224 | |
Bluewaters Community Development District; Series 2004, Special Assessment RB | | | 6.00 | % | | | 05/01/35 | | | | 2,675 | | | | 2,781,599 | |
Boca Raton (City of) Housing Authority (Banyan Place Senior Apartments); | | | | | | | | | | | | | | | | |
Series 2006, Ref. First Lien Mortgage Housing RB
(Acquired 03/23/06-11/12/09; Cost $3,021,676)(a)(h) | | | 5.80 | % | | | 10/01/26 | | | | 3,090 | | | | 1,854,185 | |
Series 2006, Ref. First Lien Mortgage Housing RB
(Acquired 03/23/06-11/12/09; Cost $4,641,040)(h) | | | 5.90 | % | | | 10/01/36 | | | | 4,705 | | | | 2,823,282 | |
Bonnet Creek Resort Community Development District; | | | | | | | | | | | | | | | | |
Series 2002, Special Assessment RB | | | 7.38 | % | | | 05/01/34 | | | | 3,000 | | | | 3,002,670 | |
Series 2002, Special Assessment RB | | | 7.50 | % | | | 05/01/34 | | | | 7,500 | | | | 7,508,250 | |
Brevard (County of) Health Facilities Authority (Health First, Inc.); | | | | | | | | | | | | | | | | |
Series 2009, Health Care Facilities RB | | | 7.00 | % | | | 04/01/33 | | | | 1,960 | | | | 2,446,021 | |
Series 2009, Health Care Facilities RB | | | 7.00 | % | | | 04/01/39 | | | | 6,465 | | | | 7,973,737 | |
Broward (County of) (Civic Arena); | | | | | | | | | | | | | | | | |
Series 2006 A, Ref. Professional Sports Facilities Tax RB (INS–AGM)(c)(d) | | | 5.00 | % | | | 09/01/24 | | | | 7,555 | | | | 8,368,447 | |
Series 2006 A, Ref. Professional Sports Facilities Tax RB (INS–AGM)(c)(d) | | | 5.00 | % | | | 09/01/25 | | | | 7,910 | | | | 8,761,670 | |
Buckeye Park Community Development District; Series 2008 A, Capital Improvement Special
Assessment RB(i) | | | 7.88 | % | | | 05/01/38 | | | | 4,900 | | | | 2,227,932 | |
Capital Trust Agency (Fort Lauderdale); Series 2003, Sr. RB(b)(f)(j) | | | 5.75 | % | | | 01/01/14 | | | | 2,000 | | | | 2,100,180 | |
Capital Trust Agency (Miami Community Charter School) Series 2010 A, RB | | | 7.00 | % | | | 10/15/40 | | | | 1,500 | | | | 1,605,765 | |
Capital Trust Agency (Million Air One LLC); Series 2011, RB(b) | | | 7.75 | % | | | 01/01/41 | | | | 14,400 | | | | 16,215,120 | |
Capital Trust Agency (Orlando); Series 2003, Sub. RB(b)(f)(j) | | | 6.75 | % | | | 01/01/14 | | | | 2,500 | | | | 2,645,700 | |
Caribe Palm Community Development District; Series 2005 A, Special Assessment RB | | | 5.85 | % | | | 05/01/35 | | | | 705 | | | | 739,235 | |
Championsgate Community Development District; Series 1998 A, Capital Improvement Special Assessment RB | | | 6.25 | % | | | 05/01/20 | | | | 2,465 | | | | 2,425,683 | |
Collier (County of) Industrial Development Authority (Arlington Naples); Series 2011, Continuing Care Community BAN | | | 14.00 | % | | | 05/15/15 | | | | 4,500 | | | | 4,545,810 | |
Cory Lakes Community Development District; | | | | | | | | | | | | | | | | |
Series 2001 A, Special Assessment RB | | | 8.38 | % | | | 05/01/17 | | | | 220 | | | | 234,428 | |
Series 2001 B, Special Assessment RB | | | 8.38 | % | | | 05/01/17 | | | | 95 | | | | 101,230 | |
Cutler Cay Community Development District; Series 2004, Special Assessment RB | | | 6.13 | % | | | 05/01/24 | | | | 3,600 | | | | 3,737,952 | |
Cypress Lakes Community Development District; Series 2004 A, Special Assessment RB | | | 6.00 | % | | | 05/01/34 | | | | 500 | | | | 508,390 | |
Double Branch Development District; Series 2002 A, Special Assessment RB | | | 6.70 | % | | | 05/01/34 | | | | 7,345 | | | | 7,447,830 | |
Escambia (County of) (International Paper Co.); Series 2006 A, Ref. Environmental Improvement RB(b) | | | 5.00 | % | | | 08/01/26 | | | | 5,690 | | | | 5,705,306 | |
Escambia (County of); Series 2003 A, Environmental Improvement RB(b) | | | 5.75 | % | | | 11/01/27 | | | | 5,250 | | | | 5,397,000 | |
Florida (State of) Mid-Bay Bridge Authority; Series 2011 A, Springing Lien RB | | | 7.25 | % | | | 10/01/40 | | | | 14,000 | | | | 17,871,980 | |
Florida Development Finance Corp. (Palm Bay Academy, Inc.); | | | | | | | | | | | | | | | | |
Series 2006 A, RB(a) | | | 6.00 | % | | | 05/15/36 | | | | 2,130 | | | | 1,740,849 | |
Series 2007 A, RB(a) | | | 6.13 | % | | | 05/15/37 | | | | 1,855 | | | | 1,536,200 | |
Florida Development Finance Corp. (Renaissance Charter School); | | | | | | | | | | | | | | | | |
Series 2012 A, Educational Facilities RB | | | 6.00 | % | | | 06/15/32 | | | | 2,000 | | | | 2,008,260 | |
Series 2012 A, Educational Facilities RB | | | 6.13 | % | | | 06/15/43 | | | | 4,250 | | | | 4,234,997 | |
Florida Development Finance Corp. (Renaissance Charter School, Inc.); Series 2010 A, Educational Facilities RB | | | 6.00 | % | | | 09/15/40 | | | | 8,840 | | | | 9,627,290 | |
See accompanying Notes to Financial Statements which are an integral part of the financial statements.
20 Invesco High Yield Municipal Fund
| | | | | | | | | | | | | | | | |
| | | Interest
Rate | | | Maturity
Date | | | Principal
Amount
(000) | | |
Value | |
| Florida–(continued) | | | | | | | | | | | | | | | | |
Florida Development Finance Corp. (Sculptor Charter School); | | | | | | | | | | | | | | | | |
Series 2008 A, RB | | | 7.25 | % | | | 10/01/38 | | | $ | 2,710 | | | $ | 2,907,857 | |
Series 2012, RB | | | 7.00 | % | | | 10/01/26 | | | | 125 | | | | 136,620 | |
Series 2012, RB | | | 7.25 | % | | | 10/01/41 | | | | 595 | | | | 655,434 | |
Florida Housing Finance Corp. (Beacon Hill Apartments); Series 1998 C, RB(b)(f) | | | 6.61 | % | | | 07/01/28 | | | | 7,760 | | | | 7,169,852 | |
Florida Housing Finance Corp. (Westbrook Apartments); Series 1998 U-1, RB(b)(f) | | | 6.45 | % | | | 01/01/29 | | | | 10,705 | | | | 10,711,958 | |
Florida Housing Finance Corp. (Westchase Apartments); Series 1998 B, RB(b)(f) | | | 6.61 | % | | | 07/01/28 | | | | 9,720 | | | | 7,136,424 | |
Gramercy Farms Community Development District; | | | | | | | | | | | | | | | | |
Series 2007 A-1, Special Assessment RB(i) | | | 5.25 | % | | | 05/01/39 | | | | 1,335 | | | | 13 | |
Series 2007 A-2, Special Assessment RB(i) | | | 5.25 | % | | | 05/01/39 | | | | 1,700 | | | | 17 | |
Series 2007 B, Special Assessment RB(i) | | | 5.10 | % | | | 05/01/14 | | | | 4,385 | | | | 44 | |
Series 2011, Ref. Special Assessment Conv. CAB RB(n) | | | 6.75 | % | | | 05/01/39 | | | | 29,070 | | | | 4,207,882 | |
Hammock Bay Community Development District; Series 2004 A, Special Assessment RB | | | 6.13 | % | | | 05/01/35 | | | | 2,420 | | | | 2,489,527 | |
Harbour Isles Community Development District; Series 2004, Special Assessment RB | | | 6.13 | % | | | 05/01/35 | | | | 1,330 | | | | 1,356,520 | |
Heritage Harbor Community Development District; Series 1997, Recreational RB | | | 7.75 | % | | | 05/01/23 | | | | 410 | | | | 368,758 | |
Hillsborough (County of) Industrial Development Authority (Health Facilities); Series 2008 B, IDR(f)(j) | | | 8.00 | % | | | 08/15/19 | | | | 1,000 | | | | 1,413,220 | |
Islands at Doral III Community Development District; Series 2004 A, Special Assessment RB | | | 5.90 | % | | | 05/01/35 | | | | 3,380 | | | | 3,395,109 | |
Islands at Doral Southwest Community Development District; Series 2003, Special Assessment RB(f)(j) | | | 6.38 | % | | | 05/01/13 | | | | 1,635 | | | | 1,667,765 | |
Jacksonville (City of) Economic Development Commission (Proton Therapy Institute); Series 2007 A, Ref. Health Care Facilities RB(h) | | | 6.25 | % | | | 09/01/27 | | | | 12,000 | | | | 13,223,280 | |
Kendall Breeze Community Development District; Series 2004, Special Assessment RB | | | 5.88 | % | | | 05/01/34 | | | | 1,355 | | | | 1,380,149 | |
Lakeland (City of) (Carpenter’s Home Estate Accident Investor); Series 2008, Ref. First Mortgage Retirement Community RB(h) | | | 6.38 | % | | | 01/01/43 | | | | 2,250 | | | | 2,353,883 | |
Lakeside Landings Community Development District; | | | | | | | | | | | | | | | | |
Series 2007 A, Special Assessment RB(i) | | | 5.50 | % | | | 05/01/38 | | | | 1,000 | | | | 411,190 | |
Series 2007 B, Special Assessment RB(i) | | | 5.25 | % | | | 05/01/13 | | | | 1,940 | | | | 797,127 | |
Lee (County of) Industrial Development Authority (Cypress Cove Healthpark); | | | | | | | | | | | | | | | | |
Series 2012, Ref. RB | | | 5.25 | % | | | 10/01/32 | | | | 4,500 | | | | 4,459,005 | |
Series 2012, Ref. RB | | | 5.75 | % | | | 10/01/42 | | | | 10,100 | | | | 10,165,953 | |
Series 2012, Ref. RB | | | 6.50 | % | | | 10/01/47 | | | | 10,000 | | | | 10,652,600 | |
Lee (County of) Industrial Development Authority (Lee County Community Charter Schools, LLC); | | | | | | | | | | | | | | | | |
Series 2007 A, IDR | | | 5.25 | % | | | 06/15/27 | | | | 7,000 | | | | 7,115,080 | |
Series 2007 A, IDR | | | 5.38 | % | | | 06/15/37 | | | | 6,230 | | | | 6,273,361 | |
Series 2012, IDR | | | 5.50 | % | | | 06/15/32 | | | | 1,880 | | | | 1,944,822 | |
Series 2012, IDR | | | 5.75 | % | | | 06/15/42 | | | | 3,210 | | | | 3,328,995 | |
Leon (County of) Educational Facilities Authority (Southgate Residence Hall); Series 1998 A, Ref. RB | | | 6.75 | % | | | 09/01/28 | | | | 7,940 | | | | 7,689,811 | |
Marshall Creek Community Development District; Series 2000 A, Special Assessment RB | | | 7.65 | % | | | 05/01/32 | | | | 2,590 | | | | 2,592,253 | |
Martin (County of) Health Facilities Authority (Martin Memorial Medical Center); Series 2012, RB | | | 5.50 | % | | | 11/15/42 | | | | 15,340 | | | | 17,035,837 | |
Miami Beach (City of) Health Facilities Authority (Mount Sinai Medical Center); | | | | | | | | | | | | | | | | |
Series 2004, Ref. RB(f)(h)(j) | | | 6.75 | % | | | 11/15/14 | | | | 840 | | | | 930,166 | |
Series 2004, Ref. RB(h) | | | 6.75 | % | | | 11/15/29 | | | | 5,160 | | | | 5,498,032 | |
Series 2012, Ref. RB | | | 5.00 | % | | | 11/15/29 | | | | 3,500 | | | | 3,875,795 | |
Miami-Dade (County of) (Building Better Communities Program); Series 2008 A, Unlimited Tax GO Bonds (INS–AGC)(c)(d) | | | 5.00 | % | | | 07/01/30 | | | | 15,210 | | | | 17,200,685 | |
Miami-Dade (County of) (Miami International Airport); Series 2008 A, Aviation RB (INS–AGC)(b)(c)(d) | | | 5.25 | % | | | 10/01/33 | | | | 16,500 | | | | 18,528,510 | |
Miami-Dade (County of) Health Facilities Authority (Miami Children’s Hospital); | | | | | | | | | | | | | | | | |
Series 2010 A, Ref. Hospital RB | | | 6.00 | % | | | 08/01/30 | | | | 500 | | | | 600,825 | |
Series 2010 A, Ref. Hospital RB | | | 6.13 | % | | | 08/01/42 | | | | 250 | | | | 296,075 | |
Series 2011, Ref. Hospital RB | | | 6.00 | % | | | 08/01/46 | | | | 1,000 | | | | 1,186,230 | |
Miami-Dade (County of) School Board; | | | | | | | | | | | | | | | | |
Series 2008 B, COP (INS–AGC)(c)(d) | | | 5.25 | % | | | 05/01/26 | | | | 5,000 | | | | 5,858,600 | |
Series 2008 B, COP (INS–AGC)(c)(d) | | | 5.25 | % | | | 05/01/27 | | | | 10,000 | | | | 11,562,800 | |
See accompanying Notes to Financial Statements which are an integral part of the financial statements.
21 Invesco High Yield Municipal Fund
| | | | | | | | | | | | | | | | |
| | | Interest
Rate | | | Maturity
Date | | | Principal
Amount
(000) | | |
Value | |
| Florida–(continued) | | | | | | | | | | | | | | | | |
Miami-Dade (County of); | | | | | | | | | | | | | | | | |
Series 2005 A, Sub. Special Obligation CAB RB (INS–NATL)(c)(e) | | | 0.00 | % | | | 10/01/40 | | | $ | 10,070 | | | $ | 2,428,985 | |
Series 2009, Sub. Special Obligation CAB RB(e) | | | 0.00 | % | | | 10/01/35 | | | | 12,000 | | | | 4,051,080 | |
Series 2009, Sub. Special Obligation CAB RB(e) | | | 0.00 | % | | | 10/01/40 | | | | 10,000 | | | | 2,531,100 | |
Series 2009, Sub. Special Obligation CAB RB(e) | | | 0.00 | % | | | 10/01/42 | | | | 72,215 | | | | 16,602,951 | |
Series 2009, Sub. Special Obligation CAB RB(e) | | | 0.00 | % | | | 10/01/44 | | | | 15,495 | | | | 3,212,733 | |
Series 2009, Sub. Special Obligation CAB RB(e) | | | 0.00 | % | | | 10/01/45 | | | | 7,710 | | | | 1,516,094 | |
Series 2009, Sub. Special Obligation CAB RB(e) | | | 0.00 | % | | | 10/01/47 | | | | 22,300 | | | | 3,903,392 | |
Midtown Miami Community Development District; | | | | | | | | | | | | | | | | |
Series 2004 A, Special Assessment RB | | | 6.00 | % | | | 05/01/24 | | | | 1,665 | | | | 1,689,326 | |
Series 2004 A, Special Assessment RB | | | 6.25 | % | | | 05/01/37 | | | | 8,445 | | | | 8,592,281 | |
Mount Dora (City of) Health Facilities Authority (Waterman Village); | | | | | | | | | | | | | | | | |
Series 2002 A, RB | | | 6.75 | % | | | 08/15/25 | | | | 3,000 | | | | 2,604,180 | |
Series 2004 A, Ref. RB | | | 5.25 | % | | | 08/15/13 | | | | 550 | | | | 543,846 | |
Series 2004 A, Ref. RB | | | 5.75 | % | | | 08/15/18 | | | | 3,750 | | | | 3,379,913 | |
Northern Palm Beach (County of) Improvement District Unit of Development No. 2A; Series 2002, Water Control & Improvement RB | | | 6.40 | % | | | 08/01/33 | | | | 3,910 | | | | 3,913,441 | |
Oak Creek Community Development District; Series 2004, Special Assessment RB | | | 5.80 | % | | | 05/01/35 | | | | 1,590 | | | | 1,528,547 | |
Orange (County of) Health Facilities Authority (Orlando Lutheran Towers, Inc.); | | | | | | | | | | | | | | | | |
Series 2005, Ref. RB | | | 5.38 | % | | | 07/01/20 | | | | 3,300 | | | | 3,382,533 | |
Series 2005, Ref. RB | | | 5.70 | % | | | 07/01/26 | | | | 4,000 | | | | 4,096,000 | |
Series 2007, First Mortgage RB | | | 5.50 | % | | | 07/01/32 | | | | 3,750 | | | | 3,827,962 | |
Series 2007, First Mortgage RB | | | 5.50 | % | | | 07/01/38 | | | | 7,450 | | | | 7,578,661 | |
Orange (County of) Housing Finance Authority (Alhambra Trace Apartments); Series 1998 C, RB | | | 7.00 | % | | | 04/01/28 | | | | 1,815 | | | | 1,815,200 | |
Orange (County of) Housing Finance Authority (Governors Manor Apartments); Series 2001 F-4, RB | | | 7.25 | % | | | 10/01/31 | | | | 3,665 | | | | 3,670,497 | |
Orange (County of) Housing Finance Authority (H.A.N.D.S., Inc.); | | | | | | | | | | | | | | | | |
Series 1995 A, Mortgage RB(h) | | | 7.00 | % | | | 10/01/15 | | | | 705 | | | | 708,187 | |
Series 1995 A, Mortgage RB(h) | | | 7.00 | % | | | 10/01/25 | | | | 2,535 | | | | 2,542,782 | |
Orange (County of) Housing Finance Authority (Lake Davis Apartments); Series 2001 F-1, RB | | | 7.25 | % | | | 10/01/31 | | | | 760 | | | | 761,140 | |
Orange (County of) Housing Finance Authority (Lake Jennie Phase I); Series 2001 F-2, RB | | | 7.25 | % | | | 10/01/31 | | | | 215 | | | | 215,323 | |
Orange (County of) Housing Finance Authority (Lake Jennie Phase II); Series 2001 F-3, RB | | | 7.25 | % | | | 10/01/31 | | | | 760 | | | | 761,140 | |
Orange (County of) Housing Finance Authority (Mellonville Trace Apartments); Series 2001 F-5, RB | | | 7.25 | % | | | 10/01/31 | | | | 300 | | | | 300,450 | |
Orlando (City of) Urban Community Development District; Series 2004, Capital Improvement
Special Assessment RB | | | 6.25 | % | | | 05/01/34 | | | | 1,000 | | | | 1,000,890 | |
Overoaks Community Development District; | | | | | | | | | | | | | | | | |
Series 2004 A, Capital Improvement Special Assessment RB | | | 6.13 | % | | | 05/01/35 | | | | 410 | | | | 4 | |
Series 2010 A-2, Capital Improvement RB | | | 6.13 | % | | | 05/01/35 | | | | 435 | | | | 402,036 | |
Series 2010 B, Capital Improvement RB | | | 5.13 | % | | | 05/01/17 | | | | 975 | | | | 927,596 | |
Palm Beach (County of) Housing Finance Authority (Lake Delray Apartments); Series 1999 A, MFH RB(b) | | | 6.40 | % | | | 01/01/31 | | | | 8,415 | | | | 8,417,272 | |
Palm Coast Park Community Development District; Series 2006, Special Assessment RB | | | 5.70 | % | | | 05/01/37 | | | | 4,635 | | | | 3,219,054 | |
Pier Park Community Development District; Series 2002 1, Capital Improvement RB | | | 7.15 | % | | | 05/01/34 | | | | 14,310 | | | | 14,333,755 | |
Pine Ridge Plantation Community Development District; Series 2006 A, Capital Improvement Special Assessment RB | | | 5.40 | % | | | 05/01/37 | | | | 1,585 | | | | 1,066,974 | |
Pinellas (County of) Educational Facilities Authority (Pinellas Preparatory Academy); | | | | | | | | | | | | | | | | |
Series 2011 A, RB | | | 6.13 | % | | | 09/15/21 | | | | 400 | | | | 442,104 | |
Series 2011 A, RB | | | 7.13 | % | | | 09/15/41 | | | | 3,250 | | | | 3,760,510 | |
Pinellas (County of) Health Facilities Authority (The Oaks of Clearwater); Series 2004, RB | | | 6.25 | % | | | 06/01/34 | | | | 5,580 | | | | 5,679,380 | |
Poinciana West Community Development District; Series 2007, Special Assessment RB | | | 6.00 | % | | | 05/01/37 | | | | 1,495 | | | | 1,506,347 | |
Port St. Lucie (City of) (Glassman Special Assessment District); Series 2003 C, Special
Assessment RB | | | 6.75 | % | | | 07/01/23 | | | | 4,750 | | | | 4,769,475 | |
Reunion East Community Development District; | | | | | | | | | | | | | | | | |
Series 2002 A-1, Special Assessment RB | | | 7.38 | % | | | 05/01/33 | | | | 690 | | | | 704,117 | |
Series 2002 A-2, Special Assessment RB(a) | | | 7.38 | % | | | 05/01/33 | | | | 310 | | | | 170,509 | |
Series 2005, Special Assessment RB(i) | | | 5.80 | % | | | 05/01/36 | | | | 4,300 | | | | 2,365,129 | |
See accompanying Notes to Financial Statements which are an integral part of the financial statements.
22 Invesco High Yield Municipal Fund
| | | | | | | | | | | | | | | | |
| | | Interest
Rate | | | Maturity
Date | | | Principal
Amount
(000) | | |
Value | |
| Florida–(continued) | | | | | | | | | | | | | | | | |
Sarasota (County of) Health Facilities Authority (Village on the Isle); | | | | | | | | | | | | | | | | |
Series 2007, Ref. Retirement Facilities RB | | | 5.00 | % | | | 01/01/17 | | | $ | 1,500 | | | $ | 1,542,030 | |
Series 2007, Ref. Retirement Facilities RB | | | 5.50 | % | | | 01/01/27 | | | | 1,000 | | | | 1,074,480 | |
Series 2007, Ref. Retirement Facilities RB | | | 5.50 | % | | | 01/01/32 | | | | 1,000 | | | | 1,060,410 | |
Sausalito Bay Community Development District; Series 2003, Special Assessment RB | | | 6.20 | % | | | 05/01/35 | | | | 2,610 | | | | 2,637,953 | |
Seminole Indian Tribe of Florida; Series 2007 A, Special Obligation RB(h) | | | 5.50 | % | | | 10/01/24 | | | | 5,350 | | | | 5,880,987 | |
Seven Oaks Community Development District II; | | | | | | | | | | | | | | | | |
Series 2003 A, Special Assessment RB | | | 6.40 | % | | | 05/01/34 | | | | 4,605 | | | | 4,510,459 | |
Series 2004 A, Special Assessment RB | | | 5.88 | % | | | 05/01/35 | | | | 2,590 | | | | 1,971,819 | |
Silver Palms Community Development District; Series 2004, Special Assessment RB | | | 5.90 | % | | | 05/01/34 | | | | 1,750 | | | | 1,774,378 | |
South Lake (County of) Hospital District (South Lake Hospital, Inc.); | | | | | | | | | | | | | | | | |
Series 2003, RB | | | 6.38 | % | | | 10/01/28 | | | | 2,115 | | | | 2,178,725 | |
Series 2003, RB | | | 6.38 | % | | | 10/01/34 | | | | 3,995 | | | | 4,116,448 | |
South-Dade Venture Community Development District; Series 2004, Special Assessment RB | | | 6.13 | % | | | 05/01/34 | | | | 1,295 | | | | 1,343,588 | |
St. Johns (County of) Industrial Development Authority (Glenmoor); | | | | | | | | | | | | | | | | |
Series 2006 A, Health Care RB | | | 5.25 | % | | | 01/01/26 | | | | 6,300 | | | | 5,780,061 | |
Series 2006 A, Health Care RB | | | 5.38 | % | | | 01/01/40 | | | | 8,850 | | | | 7,466,745 | |
St. Johns (County of) Industrial Development Authority (Presbyterian Retirement Communities); | | | | | | | | | | | | | | | | |
Series 2004 A, RB | | | 5.63 | % | | | 08/01/34 | | | | 4,390 | | | | 4,542,377 | |
Series 2010 A, RB | | | 6.00 | % | | | 08/01/45 | | | | 4,000 | | | | 4,508,040 | |
St. Petersburg (City of) Health Facilities Authority (All Children’s Hospital, Inc. Obligated Group); | | | | | | | | | | | | | | | | |
Series 2009 A, Ref. RB | | | 6.25 | % | | | 11/15/29 | | | | 150 | | | | 180,093 | |
Series 2009 A, Ref. RB | | | 6.50 | % | | | 11/15/39 | | | | 1,000 | | | | 1,193,560 | |
Sterling Hill Community Development District; Series 2003 A, Capital Improvement Special Assessment RB | | | 6.20 | % | | | 05/01/35 | | | | 1,495 | | | | 1,199,214 | |
Stonebrier Community Development District; Series 2006, Special Assessment RB | | | 5.50 | % | | | 05/01/37 | | | | 2,770 | | | | 2,769,778 | |
Stonegate Community Development District; Series 2008, Special Assessment RB | | | 8.13 | % | | | 05/01/39 | | | | 4,685 | | | | 5,186,061 | |
Tallahassee (City of) (Tallahassee Memorial Health Care, Inc.); Series 2000, Health Facilities RB | | | 6.38 | % | | | 12/01/30 | | | | 5,875 | | | | 5,972,349 | |
Tampa Bay Water; Series 2001 A, Ref. & Improvement Utility System RB (INS–NATL)(c)(d) | | | 6.00 | % | | | 10/01/29 | | | | 13,440 | | | | 18,668,429 | |
Town Center at Palm Coast Community Development District; Series 2005, Capital Improvement Special Assessment RB | | | 6.00 | % | | | 05/01/36 | | | | 11,430 | | | | 9,524,848 | |
Trails at Monterey Community Development District; | | | | | | | | | | | | | | | | |
Series 2003, Special Assessment RB(f)(j) | | | 6.50 | % | | | 05/01/13 | | | | 945 | | | | 964,278 | |
Series 2003, Special Assessment RB(f)(j) | | | 6.75 | % | | | 05/01/13 | | | | 1,715 | | | | 1,750,741 | |
Treeline Preserve Community Development District; Series 2007 A, Special Assessment RB(a) | | | 6.80 | % | | | 05/01/39 | | | | 4,895 | | | | 2,404,962 | |
Turnbull Creek Community Development District; | | | | | | | | | | | | | | | | |
Series 2005, Special Assessment RB | | | 5.80 | % | | | 05/01/35 | | | | 2,640 | | | | 2,417,026 | |
Series 2006, Special Assessment RB | | | 5.25 | % | | | 05/01/37 | | | | 3,505 | | | | 2,614,835 | |
University Square Community Development District; Series 2007 A-1, Capital Improvement Special Assessment RB | | | 5.88 | % | | | 05/01/38 | | | | 2,890 | | | | 2,962,134 | |
Venetian Isles Community Development District; Series 2002 A, Special Assessment RB | | | 6.75 | % | | | 05/01/33 | | | | 3,850 | | | | 3,895,237 | |
Verandah West Community Development District; Series 2003 A, Capital Improvement Special Assessment RB | | | 6.63 | % | | | 05/01/33 | | | | 4,235 | | | | 4,277,985 | |
Waterlefe Community Development District; Series 2001, Golf Course RB(i) | | | 8.13 | % | | | 10/01/25 | | | | 2,645 | | | | 196,576 | |
West Villages Improvement District (Unit of Development No. 3); Series 2006, Special
Assessment RB(a) | | | 5.50 | % | | | 05/01/37 | | | | 3,755 | | | | 1,680,513 | |
West Villages Improvement District; Series 2007, Special Assessment RB(a) | | | 5.50 | % | | | 05/01/38 | | | | 9,500 | | | | 4,445,715 | |
Winter Garden Village at Fowler Groves Community Development District; Series 2006, Special Assessment RB | | | 5.65 | % | | | 05/01/37 | | | | 2,540 | | | | 2,639,822 | |
World Commerce Community Development District; Series 2004 A-2, Special Assessment RB(i) | | | 6.13 | % | | | 05/01/35 | | | | 1,490 | | | | 1,490,000 | |
| | | | | | | | | | | | | | | | 688,772,959 | |
| | | | |
| Georgia–1.17% | | | | | | | | | | | | | | | | |
Americus (City of) & Sumter (County of) Hospital Authority (South Georgia Methodist); Series 1999 A, Ref. RB | | | 6.38 | % | | | 05/15/29 | | | | 5,250 | | | | 5,254,358 | |
Atlanta (City of) (Beltline); Series 2009 B, Tax Allocation RB | | | 7.38 | % | | | 01/01/31 | | | | 12,000 | | | | 15,030,840 | |
See accompanying Notes to Financial Statements which are an integral part of the financial statements.
23 Invesco High Yield Municipal Fund
| | | | | | | | | | | | | | | | |
| | | Interest
Rate | | | Maturity
Date | | | Principal
Amount
(000) | | |
Value | |
| Georgia–(continued) | | | | | | | | | | | | | | | | |
Atlanta (City of) (Eastside); | | | | | | | | | | | | | | | | |
Series 2005 B, Tax Allocation RB | | | 5.40 | % | | | 01/01/20 | | | $ | 1,000 | | | $ | 1,083,360 | |
Series 2005 B, Tax Allocation RB | | | 5.60 | % | | | 01/01/30 | | | | 4,700 | | | | 5,117,783 | |
Atlanta (City of) (Princeton Lakes); Series 2006, Tax Allocation RB(h) | | | 5.50 | % | | | 01/01/31 | | | | 3,770 | | | | 3,836,050 | |
Atlanta (City of) Urban Residential Finance Authority (John Eagan); Series 1998 A, MFH RB(a)(b) | | | 6.75 | % | | | 07/01/30 | | | | 5,285 | | | | 3,699,024 | |
Clayton (County of) Development Authority (Delta Air Lines, Inc.); Series 2009 B, Special
Facilities RB(b) | | | 9.00 | % | | | 06/01/35 | | | | 9,750 | | | | 10,872,713 | |
DeKalb (County of) Hospital Authority (DeKalb Medical Center, Inc.); | | | | | | | | | | | | | | | | |
Series 2010, RAC | | | 6.00 | % | | | 09/01/30 | | | | 2,200 | | | | 2,615,536 | |
Series 2010, RAC | | | 6.13 | % | | | 09/01/40 | | | | 2,000 | | | | 2,349,060 | |
Fulton (County of) Residential Care Facilities for the Elderly Authority (RHA Assisted Living); | | | | | | | | | | | | | | | | |
Series 1999 A, Sr. Lien RB | | | 6.90 | % | | | 07/01/19 | | | | 3,960 | | | | 3,804,728 | |
Series 1999 A, Sr. Lien RB | | | 7.00 | % | | | 07/01/29 | | | | 8,310 | | | | 7,460,884 | |
Fulton (County of) Residential Care Facilities for the Elderly Authority (St. Anne’s Terrace); Series 2003, Ref. RB | | | 7.63 | % | | | 12/01/33 | | | | 3,240 | | | | 3,358,746 | |
Medical Center Hospital Authority (Spring Harbor Green Island); Series 2007, Ref. RB | | | 5.25 | % | | | 07/01/27 | | | | 2,500 | | | | 2,558,200 | |
Richmond (County of) Development Authority (International Paper Co.); Series 2002 A, Ref. Environmental Improvement RB(b) | | | 6.00 | % | | | 02/01/25 | | | | 1,000 | | | | 1,003,760 | |
Rockdale (County of) Development Authority (Visy Paper); Series 2007 A, RB(b) | | | 6.13 | % | | | 01/01/34 | | | | 9,615 | | | | 10,063,251 | |
Savannah (City of) Economic Development Authority (Marshes of Skidaway); | | | | | | | | | | | | | | | | |
Series 2003 A, First Mortgage RB | | | 6.85 | % | | | 01/01/19 | | | | 1,980 | | | | 2,039,242 | |
Series 2003 A, First Mortgage RB | | | 7.40 | % | | | 01/01/24 | | | | 920 | | | | 946,864 | |
Series 2003 A, First Mortgage RB | | | 7.40 | % | | | 01/01/34 | | | | 3,650 | | | | 3,740,630 | |
| | | | | | | | | | | | | | | | 84,835,029 | |
| | | | |
| Guam–0.10% | | | | | | | | | | | | | | | | |
Guam (Territory of) Waterworks Authority; | | | | | | | | | | | | | | | | |
Series 2005, Water & Wastewater System RB | | | 5.88 | % | | | 07/01/35 | | | | 6,250 | | | | 6,458,187 | |
Series 2005, Water & Wastewater System RB | | | 6.00 | % | | | 07/01/25 | | | | 1,000 | | | | 1,040,590 | |
| | | | | | | | | | | | | | | | 7,498,777 | |
| | | | |
| Hawaii–0.61% | | | | | | | | | | | | | | | | |
Hawaii (State of) Department of Budget & Finance (15 Craigside); | | | | | | | | | | | | | | | | |
Series 2009 A, Special Purpose Senior Living RB | | | 8.75 | % | | | 11/15/29 | | | | 850 | | | | 1,024,624 | |
Series 2009 A, Special Purpose Senior Living RB | | | 9.00 | % | | | 11/15/44 | | | | 6,530 | | | | 7,875,049 | |
Hawaii (State of) Department of Budget & Finance (Kahala Nui); | | | | | | | | | | | | | | | | |
Series 2003 A, Special Purpose RB(f)(j) | | | 7.40 | % | | | 11/15/13 | | | | 5,300 | | | | 5,675,505 | |
Series 2003 A, Special Purpose RB(f)(j) | | | 7.88 | % | | | 11/15/13 | | | | 4,450 | | | | 4,779,834 | |
Series 2003 A, Special Purpose RB(f)(j) | | | 8.00 | % | | | 11/15/13 | | | | 10,000 | | | | 10,749,700 | |
Honolulu (City & County of); Series 2009 A, Unlimited Tax GO Bonds(d) | | | 5.25 | % | | | 04/01/29 | | | | 12,000 | | | | 14,109,360 | |
| | | | | | | | | | | | | | | | 44,214,072 | |
| | | | |
| Idaho–0.23% | | | | | | | | | | | | | | | | |
Gooding Industrial Development Corp. (Intrepid Technology & Resources); Series 2006, Solid Waste Disposal RB (Acquired 11/03/06; Cost $7,640,000)(b)(h)(i) | | | 7.50 | % | | | 11/01/24 | | | | 7,640 | | | | 266,025 | |
Idaho (State of) Health Facilities Authority (Valley Vista Care Corp.); Series 2007, Ref. RB | | | 6.13 | % | | | 11/15/37 | | | | 8,355 | | | | 8,535,384 | |
Idaho (State of) Housing & Finance Association (Compass Public Charter School, Inc.) Series 2010 A, Non-profit Facilities RB | | | 6.25 | % | | | 07/01/40 | | | | 1,000 | | | | 1,081,050 | |
Idaho (State of) Housing & Finance Association (Liberty Charter School); Series 2008 A, Non-profit Facilities RB | | | 6.00 | % | | | 06/01/38 | | | | 750 | | | | 812,678 | |
Idaho (State of) Housing & Finance Association (North Star Charter School); | | | | | | | | | | | | | | | | |
Series 2009 A, Non-profit Facilities RB | | | 9.00 | % | | | 07/01/21 | | | | 150 | | | | 162,974 | |
Series 2009 A, Non-profit Facilities RB | | | 9.25 | % | | | 07/01/29 | | | | 1,000 | | | | 1,095,830 | |
Series 2009 A, Non-profit Facilities RB | | | 9.50 | % | | | 07/01/39 | | | | 2,005 | | | | 2,216,848 | |
See accompanying Notes to Financial Statements which are an integral part of the financial statements.
24 Invesco High Yield Municipal Fund
| | | | | | | | | | | | | | | | |
| | | Interest
Rate | | | Maturity
Date | | | Principal
Amount
(000) | | |
Value | |
| Idaho–(continued) | | | | | | | | | | | | | | | | |
Idaho (State of) Housing & Finance Association (Victory Charter School, Inc.); Series 2009 A, Non–profit Facilities RB | | | 8.25 | % | | | 07/01/39 | | | $ | 745 | | | $ | 873,572 | |
Idaho (State of) Housing & Finance Association; Series 2008 A, Non-profit Facilities RB | | | 6.13 | % | | | 07/01/38 | | | | 1,580 | | | | 1,669,870 | |
| | | | | | | | | | | | | | | | 16,714,231 | |
| | | | |
| Illinois–10.71% | | | | | | | | | | | | | | | | |
Annawan (Village of) (Patriot Renewable Fuels, LLC); Series 2007, Tax Increment Allocation RB | | | 5.63 | % | | | 01/01/18 | | | | 3,140 | | | | 2,893,259 | |
Antioch (Village of) Special Service Area No. 1 (Deercrest); Series 2003, Special Tax RB | | | 6.63 | % | | | 03/01/33 | | | | 3,617 | | | | 3,250,453 | |
Aurora (City of) (East River Area TIF No. 6); Series 2008 A, Tax Increment Allocation RB | | | 6.75 | % | | | 12/30/27 | | | | 2,265 | | | | 2,405,702 | |
Aurora (City of) (River City TIF No. 3); Series 2008 B, Tax Increment Allocation RB | | | 6.50 | % | | | 12/30/23 | | | | 3,635 | | | | 3,868,149 | |
Bartlett (Village of) (Quarry Redevelopment); Series 2007, Ref. Sr. Lien Tax Increment
Allocation RB | | | 5.60 | % | | | 01/01/23 | | | | 5,000 | | | | 4,848,900 | |
Bolingbrook (Village of) Special Services Area No. 1 (Forest City); Series 2005, Special Tax RB | | | 5.90 | % | | | 03/01/27 | | | | 2,000 | | | | 1,862,920 | |
Bolingbrook (Village of); | | | | | | | | | | | | | | | | |
Series 1999 B, Unlimited Tax CAB GO Bonds (INS–NATL)(c)(e) | | | 0.00 | % | | | 01/01/29 | | | | 910 | | | | 380,262 | |
Series 2005, Sales Tax RB(m) | | | 2.30 | % | | | 01/01/15 | | | | 385 | | | | 347,405 | |
Series 2005, Sales Tax RB(m) | | | 2.40 | % | | | 01/01/26 | | | | 4,500 | | | | 3,604,815 | |
Series 2005, Sales Tax RB(m) | | | 2.50 | % | | | 01/01/24 | | | | 6,000 | | | | 4,806,360 | |
Bradley (Village of) (Bradley Commons); Series 2007, Tax Increment Allocation RB | | | 6.10 | % | | | 01/01/27 | | | | 2,795 | | | | 2,837,177 | |
Chicago (City of) (Asphalt Operating Services); Series 2010, Recovery Zone Facility RB | | | 6.13 | % | | | 12/01/18 | | | | 6,955 | | | | 7,463,480 | |
Chicago (City of) (Chatham Ridge Redevelopment); Series 2002, Tax Increment Allocation RB(j) | | | 6.05 | % | | | 12/15/13 | | | | 475 | | | | 495,658 | |
Chicago (City of) (Diversey/Narragansett); Series 2006, COP | | | 7.46 | % | | | 02/15/26 | | | | 2,755 | | | | 2,211,631 | |
Chicago (City of) (Lakeshore East); Series 2003, Special Assessment Improvement RB | | | 6.63 | % | | | 12/01/22 | | | | 3,876 | | | | 3,973,016 | |
Chicago (City of) (O’Hare International Airport); Series 2008 A, Third Lien General Airport RB (INS–AGM)(c)(d) | | | 5.00 | % | | | 01/01/33 | | | | 14,000 | | | | 15,814,680 | |
Chicago (City of) (Read-Dunning); Series 1996 B, Tax Increment Allocation RB (INS–ACA)(c) | | | 7.25 | % | | | 01/01/14 | | | | 400 | | | | 401,224 | |
Chicago (City of) Board of Education; | | | | | | | | | | | | | | | | |
Series 2006 B, Unlimited Tax GO Bonds (INS–AGM)(c)(d) | | | 5.00 | % | | | 12/01/25 | | | | 10,000 | | | | 11,221,500 | |
Series 2008 C, Ref. Unlimited Tax GO Bonds (INS–AGM)(c)(d) | | | 5.00 | % | | | 12/01/32 | | | | 13,050 | | | | 14,222,021 | |
Chicago (City of); | | | | | | | | | | | | | | | | |
Series 2011, COP | | | 7.13 | % | | | 05/01/21 | | | | 1,000 | | | | 1,101,870 | |
Series 2011, COP | | | 7.13 | % | | | 05/01/25 | | | | 9,700 | | | | 10,874,767 | |
Series 2011, COP | | | 7.13 | % | | | 05/01/25 | | | | 9,185 | | | | 10,297,395 | |
Cook (County of) (Navistar International Corp.); Series 2010, Recovery Zone Facility RB | | | 6.50 | % | | | 10/15/40 | | | | 13,575 | | | | 14,712,042 | |
Cortland (Town of) (Sheaffer System); Series 2006, Special Tax RB(a)(h) | | | 5.50 | % | | | 03/01/17 | | | | 3,439 | | | | 2,083,174 | |
Deerfield (Village of); | | | | | | | | | | | | | | | | |
Series 2011, Ref. CAB RB(e) | | | 0.00 | % | | | 10/01/31 | | | | 1,803 | | | | 403,241 | |
Series 2011, Ref. RB | | | 6.00 | % | | | 10/01/42 | | | | 3,403 | | | | 2,809,483 | |
Du Page (County of) Special Service Area No. 31 (Monarch Landing); Series 2006,
Special Tax RB | | | 5.40 | % | | | 03/01/16 | | | | 123 | | | | 124,734 | |
East Dundee (Village of) (Route 25 South Redevelopment); Series 2012, Limited Obligation Tax Increment Allocation RB | | | 5.63 | % | | | 12/01/31 | | | | 1,530 | | | | 1,524,584 | |
Gilberts (Village of) Special Service Area No. 19 (The Conservancy); Series 2006-1,
Special Tax RB(i) | | | 5.38 | % | | | 03/01/16 | | | | 2,500 | | | | 876,125 | |
Hillside (Village of) (Mannheim Redevelopment); | | | | | | | | | | | | | | | | |
Series 2008, Sr. Lien Tax Increment Allocation RB | | | 6.55 | % | | | 01/01/20 | | | | 825 | | | | 858,701 | |
Series 2008, Sr. Lien Tax Increment Allocation RB | | | 7.00 | % | | | 01/01/28 | | | | 5,000 | | | | 5,116,350 | |
Illinois (State of) Finance Authority (Advocate Health Care Network); Series 2012, RB(d) | | | 5.00 | % | | | 06/01/42 | | | | 15,890 | | | | 17,833,665 | |
Illinois (State of) Finance Authority (Beacon Hill); | | | | | | | | | | | | | | | | |
Series 2005 A, Ref. RB | | | 5.25 | % | | | 02/15/14 | | | | 300 | | | | 300,768 | |
Series 2005 A, Ref. RB | | | 5.35 | % | | | 02/15/15 | | | | 225 | | | | 225,547 | |
Illinois (State of) Finance Authority (Christian Homes, Inc.); | | | | | | | | | | | | | | | | |
Series 2007 A, Ref. RB | | | 5.75 | % | | | 05/15/26 | | | | 5,575 | | | | 5,950,644 | |
Series 2007 A, Ref. RB | | | 5.75 | % | | | 05/15/31 | | | | 2,825 | | | | 2,996,223 | |
See accompanying Notes to Financial Statements which are an integral part of the financial statements.
25 Invesco High Yield Municipal Fund
| | | | | | | | | | | | | | | | |
| | | Interest
Rate | | | Maturity
Date | | | Principal
Amount
(000) | | |
Value | |
| Illinois–(continued) | | | | | | | | | | | | | | | | |
Illinois (State of) Finance Authority (Clare Oaks); | | | | | | | | | | | | | | | | |
Series 2012 A-1, RB | | | 7.00 | % | | | 11/15/27 | | | $ | 1,140 | | | $ | 1,132,601 | |
Series 2012 A-2, RB | | | 7.00 | % | | | 11/15/27 | | | | 1,425 | | | | 1,424,843 | |
Series 2012 A-3, RB | | | 7.00 | % | | | 11/15/17 | | | | 710 | | | | 707,934 | |
Series 2012 B, Ref. Sub. RB | | | 4.00 | % | | | 11/15/52 | | | | 6,240 | | | | 4,586,184 | |
Series 2012 C-1, Ref. Sub. RB(e) | | | 0.00 | % | | | 11/15/52 | | | | 3,902 | | | | 181,441 | |
Series 2012 C-2, Ref. Sub. RB(e) | | | 0.00 | % | | | 11/15/52 | | | | 780 | | | | 297,719 | |
Series 2012 C-3, Ref. Sub. Conv. RB(e) | | | 0.00 | % | | | 11/15/52 | | | | 780 | | | | 184,562 | |
Illinois (State of) Finance Authority (Clare Water Tower); | | | | | | | | | | | | | | | | |
Series 2010 A-6, Ref. RB(i) | | | 6.00 | % | | | 05/15/28 | | | | 1,249 | | | | 12 | |
Series 2010 A-7, Ref. RB(i) | | | 6.13 | % | | | 05/15/41 | | | | 11,264 | | | | 113 | |
Series 2010 B, Ref. CAB RB(e)(i) | | | 0.00 | % | | | 05/15/50 | | | | 5,966 | | | | 60 | |
Illinois (State of) Finance Authority (Clinic Altgeld); Series 1996, Community Facilities RB | | | 8.00 | % | | | 11/15/16 | | | | 1,560 | | | | 1,562,839 | |
Illinois (State of) Finance Authority (Collegiate Housing Foundation–DeKalb II, LLC–Northern Illinois University); Series 2011, Student Housing RB | | | 6.88 | % | | | 10/01/43 | | | | 7,000 | | | | 8,450,750 | |
Illinois (State of) Finance Authority (Fairview Obligated Group); | | | | | | | | | | | | | | | | |
Series 2008 A, Ref. RB(i) | | | 6.13 | % | | | 08/15/28 | | | | 1,000 | | | | 9,740 | |
Series 2008 A, Ref. RB(i) | | | 6.25 | % | | | 08/15/35 | | | | 3,500 | | | | 34,090 | |
Series 2008 A, Ref. RB(i) | | | 6.25 | % | | | 08/15/40 | | | | 5,500 | | | | 53,570 | |
Illinois (State of) Finance Authority (Franciscan Communities-St. Joseph); Series 2004 A, RB | | | 6.00 | % | | | 05/15/34 | | | | 2,500 | | | | 2,510,250 | |
Illinois (State of) Finance Authority (Friendship Village of Schaumburg); | | | | | | | | | | | | | | | | |
Series 2005 A, RB | | | 5.38 | % | | | 02/15/25 | | | | 1,000 | | | | 1,008,680 | |
Series 2010, RB | | | 7.25 | % | | | 02/15/45 | | | | 7,400 | | | | 8,187,952 | |
Illinois (State of) Finance Authority (Greenfields of Geneva); | | | | | | | | | | | | | | | | |
Series 2010 A, RB | | | 7.90 | % | | | 02/15/25 | | | | 3,285 | | | | 3,491,856 | |
Series 2010 A, RB | | | 8.00 | % | | | 02/15/28 | | | | 3,000 | | | | 3,181,170 | |
Series 2010 A, RB | | | 8.13 | % | | | 02/15/40 | | | | 6,640 | | | | 7,234,479 | |
Series 2010 A, RB | | | 8.25 | % | | | 02/15/46 | | | | 21,185 | | | | 23,166,221 | |
Series 2010 C-2, TEMPS-65SM RB | | | 6.75 | % | | | 02/15/16 | | | | 5,000 | | | | 5,006,300 | |
Illinois (State of) Finance Authority (Luther Oaks); | | | | | | | | | | | | | | | | |
Series 2006 A, RB | | | 5.70 | % | | | 08/15/28 | | | | 500 | | | | 500,215 | |
Series 2006 A, RB | | | 6.00 | % | | | 08/15/26 | | | | 3,850 | | | | 3,974,663 | |
Series 2006 A, RB | | | 6.00 | % | | | 08/15/39 | | | | 10,460 | | | | 10,593,051 | |
Illinois (State of) Finance Authority (Lutheran Home & Services); | | | | | | | | | | | | | | | | |
Series 2012, Ref. RB | | | 5.50 | % | | | 05/15/30 | | | | 1,500 | | | | 1,575,045 | |
Series 2012, Ref. RB | | | 5.63 | % | | | 05/15/42 | | | | 6,000 | | | | 6,266,880 | |
Illinois (State of) Finance Authority (Montgomery Place); | | | | | | | | | | | | | | | | |
Series 2006 A, RB | | | 5.50 | % | | | 05/15/26 | | | | 2,400 | | | | 2,477,064 | |
Series 2006 A, RB | | | 5.75 | % | | | 05/15/38 | | | | 3,000 | | | | 3,073,980 | |
Illinois (State of) Finance Authority (Navistar International); Series 2010, Recovery Zone Facility RB | | | 6.50 | % | | | 10/15/40 | | | | 27,655 | | | | 29,971,383 | |
Illinois (State of) Finance Authority (Norwegian American Hospital Inc.); | | | | | | | | | | | | | | | | |
Series 2008, RB | | | 7.63 | % | | | 09/15/28 | | | | 2,000 | | | | 1,903,180 | |
Series 2008, RB | | | 7.75 | % | | | 09/15/38 | | | | 3,000 | | | | 2,772,480 | |
Illinois (State of) Finance Authority (Park Place of Elmhurst); | | | | | | | | | | | | | | | | |
Series 2010 A, RB | | | 8.00 | % | | | 05/15/30 | | | | 1,300 | | | | 1,377,337 | |
Series 2010 A, RB | | | 8.13 | % | | | 05/15/40 | | | | 6,370 | | | | 6,719,713 | |
Series 2010 A, RB | | | 8.25 | % | | | 05/15/45 | | | | 14,000 | | | | 14,865,900 | |
Series 2010 D-1, TEMPS-75SM RB | | | 7.25 | % | | | 08/15/16 | | | | 8,230 | | | | 8,234,938 | |
Series 2010 D-2, TEMPS-65SM RB | | | 7.00 | % | | | 11/15/15 | | | | 550 | | | | 550,286 | |
Series 2010 D-3, TEMPS-50SM RB | | | 6.25 | % | | | 08/15/15 | | | | 6,460 | | | | 6,464,651 | |
Illinois (State of) Finance Authority (Provena Health); Series 2009 A, RB | | | 7.75 | % | | | 08/15/34 | | | | 12,800 | | | | 16,455,936 | |
Illinois (State of) Finance Authority (Rush University Medical Center Obligated Group); | | | | | | | | | | | | | | | | |
Series 2009 A, RB | | | 7.25 | % | | | 11/01/30 | | | | 1,865 | | | | 2,379,460 | |
Series 2009 A, RB | | | 7.25 | % | | | 11/01/38 | | | | 24,235 | | | | 30,491,023 | |
See accompanying Notes to Financial Statements which are an integral part of the financial statements.
26 Invesco High Yield Municipal Fund
| | | | | | | | | | | | | | | | |
| | | Interest
Rate | | | Maturity
Date | | | Principal
Amount
(000) | | |
Value | |
| Illinois–(continued) | | | | | | | | | | | | | | | | |
Illinois (State of) Finance Authority (Sherman Health System); Series 2007 A, RB | | | 5.50 | % | | | 08/01/37 | | | $ | 8,250 | | | $ | 9,035,813 | |
Illinois (State of) Finance Authority (Silver Cross Hospital & Medical Centers); | | | | | | | | | | | | | | | | |
Series 2008, Ref. RB | | | 5.50 | % | | | 08/15/30 | | | | 5,000 | | | | 5,382,550 | |
Series 2009, RB | | | 6.88 | % | | | 08/15/38 | | | | 19,875 | | | | 23,573,539 | |
Illinois (State of) Finance Authority (Smith Village); | | | | | | | | | | | | | | | | |
Series 2005 A, RB | | | 5.70 | % | | | 11/15/20 | | | | 500 | | | | 519,510 | |
Series 2005 A, RB | | | 6.13 | % | | | 11/15/25 | | | | 1,100 | | | | 1,141,558 | |
Series 2005 A, RB | | | 6.25 | % | | | 11/15/35 | | | | 1,500 | | | | 1,538,445 | |
Illinois (State of) Finance Authority (The Admiral at the Lake); | | | | | | | | | | | | | | | | |
Series 2010 A, RB | | | 7.25 | % | | | 05/15/20 | | | | 1,905 | | | | 2,037,074 | |
Series 2010 D-1, TEMPS-75SM RB | | | 7.00 | % | | | 05/15/18 | | | | 1,550 | | | | 1,552,837 | |
Series 2010 D-2, TEMPS-65SM RB | | | 6.38 | % | | | 05/15/17 | | | | 10,500 | | | | 10,514,910 | |
Illinois (State of) Finance Authority (The Landing at Plymouth Place); | | | | | | | | | | | | | | | | |
Series 2005 A, RB | | | 6.00 | % | | | 05/15/25 | | | | 4,500 | | | | 4,123,620 | |
Series 2005 A, RB | | | 6.00 | % | | | 05/15/37 | | | | 19,325 | | | | 16,088,642 | |
Illinois (State of) Finance Authority (Three Crowns Park Plaza); | | | | | | | | | | | | | | | | |
Series 2006 A, RB | | | 5.88 | % | | | 02/15/26 | | | | 1,000 | | | | 1,038,920 | |
Series 2006 A, RB | | | 5.88 | % | | | 02/15/38 | | | | 1,500 | | | | 1,542,975 | |
Illinois (State of) Finance Authority (United Neighborhood Organization Charter School Network, Inc.); | | | | | | | | | | | | | | | | |
Series 2011, Ref. Charter School RB | | | 6.88 | % | | | 10/01/31 | | | | 3,500 | | | | 4,037,390 | |
Series 2011, Ref. Charter School RB | | | 7.13 | % | | | 10/01/41 | | | | 1,000 | | | | 1,169,970 | |
Illinois (State of) Finance Authority (Villa St. Benedict); Series 2003 A-1, RB(i) | | | 6.90 | % | | | 11/15/33 | | | | 8,750 | | | | 5,249,913 | |
Illinois (State of) Finance Authority (Waste Management Inc.); Series 2005 A, Solid Waste Disposal RB(b) | | | 5.05 | % | | | 08/01/29 | | | | 1,320 | | | | 1,395,728 | |
Illinois (State of) Finance Authority; | | | | | | | | | | | | | | | | |
Series 2003 A, RB | | | 7.00 | % | | | 11/15/32 | | | | 3,450 | | | | 3,489,951 | |
Series 2003 A, Ref. RB | | | 6.20 | % | | | 08/15/23 | | | | 1,000 | | | | 1,000,870 | |
Series 2003 A, Ref. RB | | | 6.40 | % | | | 08/15/33 | | | | 4,500 | | | | 4,503,060 | |
Illinois (State of) Metropolitan Pier & Exposition Authority (McCormick Place Expansion); | | | | | | | | | | | | | | | | |
Series 2010 A, RB(d) | | | 5.50 | % | | | 06/15/50 | | | | 18,000 | | | | 20,417,400 | |
Series 2012, CAB RB(e) | | | 0.00 | % | | | 12/15/41 | | | | 25,000 | | | | 6,263,000 | |
Series 2012, CAB RB(e) | | | 0.00 | % | | | 12/15/50 | | | | 40,000 | | | | 6,106,400 | |
Series 2012, CAB RB(e) | | | 0.00 | % | | | 12/15/51 | | | | 76,730 | | | | 11,052,957 | |
Illinois (State of) Real Estate Lease; Series 1998, Ctfs. RB (INS–ACA)(c)(h) | | | 6.20 | % | | | 06/15/18 | | | | 4,163 | | | | 4,205,905 | |
Illinois (State of) Regional Transportation Authority; Series 2003 A, RB (INS–NATL)(c)(d) | | | 6.00 | % | | | 07/01/33 | | | | 22,000 | | | | 29,857,300 | |
Illinois (State of) Toll Highway Authority; Series 2008 B, RB(d) | | | 5.50 | % | | | 01/01/33 | | | | 29,000 | | | | 33,149,320 | |
Lombard Public Facilities Corp.; | | | | | | | | | | | | | | | | |
Series 2005 A-1, First Tier Conference Center & Hotel RB | | | 6.38 | % | | | 01/01/15 | | | | 520 | | | | 427,664 | |
Series 2005 A-1, First Tier Conference Center & Hotel RB | | | 7.13 | % | | | 01/01/36 | | | | 2,500 | | | | 1,694,800 | |
Long Grove (Village of) (Sunset Grove); Series 2010, Limited Obligation Tax Increment Allocation RB | | | 7.50 | % | | | 01/01/30 | | | | 3,450 | | | | 3,707,991 | |
Malta (Village of) (Prairie Springs); Series 2006, Tax Increment Allocation RB(h) | | | 5.75 | % | | | 12/30/25 | | | | 1,800 | | | | 1,171,620 | |
Manhattan (Village of) Special Service Area No. 04-1 (Brookstone Springs); Series 2005, Special Tax RB | | | 6.10 | % | | | 03/01/35 | | | | 4,266 | | | | 4,388,903 | |
Metropolitan Pier & Exposition Authority(d) | | | 5.00 | % | | | 06/15/52 | | | | 9,720 | | | | 10,668,964 | |
Minooka (Village of) (Lakewood Trails Unit No. 2); Series 2004, Special Assessment Improvement RB | | | 6.38 | % | | | 03/01/34 | | �� | | 5,394 | | | | 5,524,697 | |
Minooka (Village of) (Lakewood Trails); Series 2003, Special Assessment Improvement RB | | | 6.63 | % | | | 03/01/33 | | | | 3,640 | | | | 3,715,639 | |
Minooka (Village of) (Prairie Ridge); Series 2003, Special Assessment Improvement RB | | | 6.88 | % | | | 03/01/33 | | | | 2,645 | | | | 2,326,859 | |
Pingree Grove (Village of) (Cambridge Lakes Learning Center); | | | | | | | | | | | | | | | | |
Series 2007, RB | | | 6.00 | % | | | 06/01/36 | | | | 5,080 | | | | 4,668,825 | |
Series 2011, RB | | | 8.50 | % | | | 06/01/41 | | | | 3,290 | | | | 3,647,195 | |
Pingree Grove (Village of) (Cambridge Lakes); Series 2006-1, Special Service Area No. 7 Special Tax RB | | | 6.00 | % | | | 03/01/36 | | | | 8,467 | | | | 8,627,873 | |
Pingree Grove (Village of) Special Service Area No. 2 (Cambridge Lakes); Series 2005-2, Special Tax RB | | | 6.00 | % | | | 03/01/35 | | | | 6,906 | | | | 7,063,526 | |
See accompanying Notes to Financial Statements which are an integral part of the financial statements.
27 Invesco High Yield Municipal Fund
| | | | | | | | | | | | | | | | |
| | | Interest
Rate | | | Maturity
Date | | | Principal
Amount
(000) | | |
Value | |
| Illinois–(continued) | | | | | | | | | | | | | | | | |
Plano (City of) Special Service Area No. 1 (Lakewood Springs); Series 2004 A, Special Tax RB | | | 6.20 | % | | | 03/01/34 | | | $ | 4,023 | | | $ | 4,133,673 | |
Plano (City of) Special Service Area No. 10 (Lakewood Springs Club); Series 2007,
Special Tax RB(i) | | | 5.80 | % | | | 03/01/37 | | | | 5,615 | | | | 2,917,329 | |
Quad Cities Regional Economic Development Authority (Heritage Woods Moline Supportive Living Facility); Series 2006, MFH RB(b) | | | 6.00 | % | | | 12/01/41 | | | | 1,305 | | | | 1,268,316 | |
Railsplitter Tobacco Settlement Authority; Series 2010, RB | | | 6.00 | % | | | 06/01/28 | | | | 20,050 | | | | 24,038,546 | |
Regional Transportation Authority; Series 1994 B, RB (INS-AMBAC)(c) | | | 8.00 | % | | | 06/01/17 | | | | 2,095 | | | | 2,582,213 | |
Southwestern Illinois Development Authority (City of Collinsville Limited Incremental Sales Tax); Series 2007, Local Government Program RB | | | 5.35 | % | | | 03/01/31 | | | | 1,000 | | | | 850,710 | |
Southwestern Illinois Development Authority (Eden Retirement Center, Inc.); | | | | | | | | | | | | | | | | |
Series 2006, Senior Care Facilities RB | | | 5.50 | % | | | 12/01/26 | | | | 800 | | | | 686,768 | |
Series 2006, Senior Care Facilities RB | | | 5.85 | % | | | 12/01/36 | | | | 3,000 | | | | 2,488,830 | |
Southwestern Illinois Development Authority (U.S. Steel Corp.) Series 2012, RB(b) | | | 5.75 | % | | | 08/01/42 | | | | 19,000 | | | | 19,219,450 | |
St. Charles (City of) (Zylstra); | | | | | | | | | | | | | | | | |
Series 2008, Sr. Lien Limited Incremental Sales Tax RB | | | 6.95 | % | | | 01/01/21 | | | | 1,675 | | | | 1,734,429 | |
Series 2008, Sr. Lien Limited Incremental Sales Tax RB | | | 6.95 | % | | | 01/01/25 | | | | 2,000 | | | | 2,004,080 | |
St. Charles (City of) Special Service Area No. 21; Series 1998, RB | | | 6.63 | % | | | 03/01/28 | | | | 1,870 | | | | 1,870,954 | |
United City of Yorkville (City of) (Storm Water/Water Improvement); | | | | | | | | | | | | | | | | |
Series 2007, Business District RB | | | 6.00 | % | | | 01/01/26 | | | | 3,185 | | | | 2,261,764 | |
Series 2007, Business District RB | | | 6.00 | % | | | 01/01/27 | | | | 285 | | | | 198,431 | |
United City of Yorkville (City of) Special Service Area No. 2003-100 (Raintree Village); Series 2003, Special Tax RB | | | 6.88 | % | | | 03/01/33 | | | | 5,379 | | | | 5,490,668 | |
United City of Yorkville (City of) Special Service Area No. 2003-101 (Windett Ridge); Series 2003, Special Tax RB (Acquired 09/03/03; Cost $2,571,000)(h) | | | 6.88 | % | | | 03/01/33 | | | | 2,571 | | | | 1,418,344 | |
United City of Yorkville (City of) Special Service Area No. 2004-107 (Raintree Village II); Series 2005, Special Tax RB | | | 6.25 | % | | | 03/01/35 | | | | 5,408 | | | | 3,370,049 | |
United City of Yorkville (City of) Special Service Area No. 2005-108 (Autumn Creek); Series 2006, Special Tax RB | | | 6.00 | % | | | 03/01/36 | | | | 2,740 | | | | 2,634,400 | |
United City of Yorkville (City of) Special Service Area No. 2006-113 (Cannonball/Beecher Road); Series 2007, Special Tax RB | | | 5.75 | % | | | 03/01/28 | | | | 4,275 | | | | 4,346,521 | |
Upper Illinois River Valley Development Authority (Living Springs McHenry Supportive Living Facility); Series 2007, MFH RB(b) | | | 6.10 | % | | | 12/01/41 | | | | 3,900 | | | | 3,868,215 | |
Upper Illinois River Valley Development Authority (Pleasant View Luther Home); | | | | | | | | | | | | | | | | |
Series 2010, RB | | | 7.00 | % | | | 11/15/30 | | | | 2,000 | | | | 2,169,320 | |
Series 2010, RB | | | 7.25 | % | | | 11/15/40 | | | | 3,200 | | | | 3,475,584 | |
Series 2010, RB | | | 7.38 | % | | | 11/15/45 | | | | 1,700 | | | | 1,855,363 | |
Series 2012, RB | | | 6.00 | % | | | 05/15/42 | | | | 6,800 | | | | 6,799,252 | |
Volo (Village of) Special Service Area No. 3 (Symphony Meadows); Series 2006-1, Special Tax RB | | | 6.00 | % | | | 03/01/36 | | | | 3,746 | | | | 3,348,100 | |
Western Illinois Economic Development Authority (Carthage Memorial Hospital); | | | | | | | | | | | | | | | | |
Series 2008 B, Hospital RB | | | 7.00 | % | | | 06/01/33 | | | | 2,295 | | | | 2,446,241 | |
Series 2008 B, Hospital RB | | | 7.05 | % | | | 06/01/37 | | | | 4,700 | | | | 5,010,294 | |
Wheeling (Village of) (N. Milwaukee/Lake-Cook TIF); Series 2005, Tax Increment Allocation RB | | | 6.00 | % | | | 01/01/25 | | | | 8,415 | | | | 8,465,069 | |
Will (County of) & Kankakee (City of) Regional Development Authority (Senior Estates Supportive Living); Series 2007, MFH RB(b) | | | 7.00 | % | | | 12/01/42 | | | | 3,020 | | | | 3,154,722 | |
| | | | | | | | | | | | | | | | 779,790,224 | |
| | | | |
| Indiana–1.58% | | | | | | | | | | | | | | | | |
Carmel (City of) (Barrington Carmel); | | | | | | | | | | | | | | | | |
Series 2012 A, RB | | | 7.00 | % | | | 11/15/27 | | | | 1,550 | | | | 1,741,626 | |
Series 2012 A, RB | | | 7.00 | % | | | 11/15/32 | | | | 2,980 | | | | 3,296,029 | |
Series 2012 A, RB | | | 7.13 | % | | | 11/15/42 | | | | 8,200 | | | | 9,003,682 | |
Series 2012 A, RB | | | 7.13 | % | | | 11/15/47 | | | | 6,250 | | | | 6,838,250 | |
Series 2012 C-1, TEMPS-75SM RB | | | 5.75 | % | | | 11/15/19 | | | | 2,000 | | | | 2,018,920 | |
Series 2012 C-2, TEMPS-65SM RB | | | 5.25 | % | | | 11/15/18 | | | | 2,750 | | | | 2,765,482 | |
See accompanying Notes to Financial Statements which are an integral part of the financial statements.
28 Invesco High Yield Municipal Fund
| | | | | | | | | | | | | | | | |
| | | Interest
Rate | | | Maturity
Date | | | Principal
Amount
(000) | | |
Value | |
| Indiana–(continued) | | | | | | | | | | | | | | | | |
Crown Point (City of) (Wittenberg Village); | | | | | | | | | | | | | | | | |
Series 2009 A, Economic Development RB | | | 8.00 | % | | | 11/15/29 | | | $ | 3,100 | | | $ | 3,658,217 | |
Series 2009 A, Economic Development RB | | | 8.00 | % | | | 11/15/39 | | | | 9,250 | | | | 10,792,160 | |
Delaware (County of) Redevelopment District; Series 1997, Tax Increment Allocation RB | | | 6.88 | % | | | 02/01/18 | | | | 555 | | | | 556,615 | |
Indiana (State of) Finance Authority (Irvington Community School); | | | | | | | | | | | | | | | | |
Series 2009 A, Educational Facilities RB | | | 7.75 | % | | | 07/01/23 | | | | 290 | | | | 340,860 | |
Series 2009 A, Educational Facilities RB | | | 8.00 | % | | | 07/01/29 | | | | 1,385 | | | | 1,638,012 | |
Series 2009 A, Educational Facilities RB | | | 9.00 | % | | | 07/01/39 | | | | 1,000 | | | | 1,227,800 | |
Indiana (State of) Finance Authority (King’s Daughters Hospital & Health Services); Series 2010, Hospital RB | | | 5.50 | % | | | 08/15/45 | | | | 5,755 | | | | 6,272,317 | |
Indiana (State of) Finance Authority (Ohio Valley Electric Corp.); | | | | | | | | | | | | | | | | |
Series 2012 A, Midwestern Disaster Relief RB | | | 5.00 | % | | | 06/01/32 | | | | 5,500 | | | | 5,890,940 | |
Series 2012 A, Midwestern Disaster Relief RB | | | 5.00 | % | | | 06/01/39 | | | | 7,500 | | | | 8,003,325 | |
Indiana (State of) Finance Authority (U.S. Steel Corp); Series 2011, Ref. Environmental RB | | | 6.00 | % | | | 12/01/19 | | | | 8,000 | | | | 8,814,320 | |
Indiana (State of) Health Facility Financing Authority (Community Foundation of Northwest Indiana); | | | | | | | | | | | | | | | | |
Series 2004 A, Hospital RB(f)(j) | | | 6.00 | % | | | 03/01/14 | | | | 13,035 | | | | 13,894,267 | |
Series 2004 A, Hospital RB(f)(j) | | | 6.25 | % | | | 03/01/14 | | | | 1,500 | | | | 1,602,645 | |
Indiana (State of) Health Facility Financing Authority (Franciscan Communities, Inc.); Series 2003 A, Ref. RB | | | 6.40 | % | | | 05/15/24 | | | | 3,435 | | | | 3,450,114 | |
North Manchester (Town of) (Peabody Retirement Communities); Series 2002 A, RB(i) | | | 7.25 | % | | | 07/01/33 | | | | 3,000 | | | | 1,012,440 | |
Portage (City of) Special Improvement District (Marina Shoes); Series 2005, Special
Assessment RB(i) | | | 6.38 | % | | | 03/01/35 | | | | 3,643 | | | | 1,276,289 | |
St. Joseph (County of) Redevelopment District; | | | | | | | | | | | | | | | | |
Series 1997 B, Tax Increment Allocation CAB RB(e) | | | 0.00 | % | | | 12/30/13 | | | | 130 | | | | 122,420 | |
Series 1997 B, Tax Increment Allocation CAB RB(e) | | | 0.00 | % | | | 12/30/14 | | | | 125 | | | | 109,009 | |
Series 1997 B, Tax Increment Allocation CAB RB(e) | | | 0.00 | % | | | 12/30/15 | | | | 125 | | | | 100,949 | |
Series 1997 B, Tax Increment Allocation CAB RB(e) | | | 0.00 | % | | | 12/30/16 | | | | 125 | | | | 93,490 | |
Vigo (County of) Hospital Authority (Union Hospital, Inc.); | | | | | | | | | | | | | | | | |
Series 2007, RB(h) | | | 5.70 | % | | | 09/01/37 | | | | 8,000 | | | | 8,317,680 | |
Series 2007, RB(h) | | | 5.75 | % | | | 09/01/42 | | | | 5,780 | | | | 6,002,588 | |
Series 2007, RB(h) | | | 5.80 | % | | | 09/01/47 | | | | 5,645 | | | | 5,874,187 | |
| | | | | | | | | | | | | | | | 114,714,633 | |
| | | | |
| Iowa–2.31% | | | | | | | | | | | | | | | | |
Altoona (City of); | | | | | | | | | | | | | | | | |
Series 2008, Annual Appropriation Urban Renewal Tax Increment RB | | | 6.00 | % | | | 06/01/28 | | | | 1,250 | | | | 1,395,013 | |
Series 2008, Annual Appropriation Urban Renewal Tax Increment RB | | | 6.00 | % | | | 06/01/39 | | | | 5,000 | | | | 5,439,000 | |
Series 2008, Annual Appropriation Urban Renewal Tax Increment RB | | | 6.00 | % | | | 06/01/43 | | | | 5,500 | | | | 5,967,720 | |
Ames (City of) (Mary Greeley Medical Center); | | | | | | | | | | | | | | | | |
Series 2011, Hospital RB | | | 5.25 | % | | | 06/15/36 | | | | 1,250 | | | | 1,369,913 | |
Series 2011, Hospital RB | | | 5.50 | % | | | 06/15/30 | | | | 1,000 | | | | 1,134,990 | |
Cass (County of) (Cass County Memorial Hospital); Series 2010 A, Hospital RB | | | 7.25 | % | | | 06/01/35 | | | | 5,755 | | | | 6,534,457 | |
Des Moines (City of) (Luther Park Apartments, Inc.); | | | | | | | | | | | | | | | | |
Series 2004, Senior Housing RB | | | 6.00 | % | | | 12/01/23 | | | | 500 | | | | 509,960 | |
Series 2004, Senior Housing RB | | | 6.25 | % | | | 12/01/34 | | | | 2,245 | | | | 2,275,801 | |
Series 2007 A, Ref. MFH RB(h) | | | 5.30 | % | | | 12/01/36 | | | | 3,545 | | | | 3,396,925 | |
Iowa (State of) Finance Authority (Alcoa Inc.); Series 2012, Midwestern Disaster Area RB | | | 4.75 | % | | | 08/01/42 | | | | 3,000 | | | | 3,052,380 | |
Iowa (State of) Finance Authority (Bethany Life Communities); | | | | | | | | | | | | | | | | |
Series 2006 A, Ref. Senior Housing RB | | | 5.45 | % | | | 11/01/26 | | | | 1,395 | | | | 1,400,747 | |
Series 2006 A, Ref. Senior Housing RB | | | 5.55 | % | | | 11/01/41 | | | | 3,795 | | | | 3,810,597 | |
Iowa (State of) Finance Authority (Madrid Home); | | | | | | | | | | | | | | | | |
Series 2007, Ref. Health Care Facility RB | | | 5.75 | % | | | 11/15/24 | | | | 1,000 | | | | 1,011,200 | |
Series 2007, Ref. Health Care Facility RB | | | 5.80 | % | | | 11/15/29 | | | | 1,930 | | | | 1,926,121 | |
Series 2007, Ref. Health Care Facility RB | | | 5.90 | % | | | 11/15/37 | | | | 2,750 | | | | 2,702,700 | |
See accompanying Notes to Financial Statements which are an integral part of the financial statements.
29 Invesco High Yield Municipal Fund
| | | | | | | | | | | | | | | | |
| | | Interest
Rate | | | Maturity
Date | | | Principal
Amount
(000) | | |
Value | |
| Iowa–(continued) | | | | | | | | | | | | | | | | |
Iowa (State of) Finance Authority (Western Home); | | | | | | | | | | | | | | | | |
Series 2012, Ref. Health Care Facilities RB | | | 5.00 | % | | | 12/01/27 | | | $ | 3,220 | | | $ | 3,237,066 | |
Series 2012, Ref. Health Care Facilities RB | | | 5.25 | % | | | 12/01/37 | | | | 9,870 | | | | 9,932,872 | |
Iowa (State of) Tobacco Settlement Authority; | | | | | | | | | | | | | | | | |
Series 2005 C, Asset-Backed RB | | | 5.38 | % | | | 06/01/38 | | | | 31,020 | | | | 29,398,274 | |
Series 2005 C, Asset-Backed RB | | | 5.50 | % | | | 06/01/42 | | | | 19,435 | | | | 18,304,272 | |
Series 2005 C, Asset-Backed RB | | | 5.63 | % | | | 06/01/46 | | | | 33,395 | | | | 31,966,696 | |
Series 2005 D, Asset-Backed CAB RB(e) | | | 0.00 | % | | | 06/01/46 | | | | 70,000 | | | | 7,078,400 | |
Jefferson (County of) Hospital; Series 2007 C, RB | | | 5.95 | % | | | 08/01/37 | | | | 3,935 | | | | 4,010,041 | |
Marion (City of) (Village Place at Marion); | | | | | | | | | | | | | | | | |
Series 2005 A, MFH RB | | | 5.65 | % | | | 09/01/25 | | | | 155 | | | | 140,872 | |
Series 2005 A, MFH RB | | | 6.00 | % | | | 09/01/35 | | | | 400 | | | | 356,652 | |
Orange City (City of); Series 2008, Ref. Hospital Capital Loan RN | | | 5.60 | % | | | 09/01/32 | | | | 7,415 | | | | 7,605,788 | |
Polk (County of) (Luther Park Health Center, Inc.); | | | | | | | | | | | | | | | | |
Series 2004, Health Care Facilities RB | | | 6.00 | % | | | 10/01/24 | | | | 290 | | | | 290,255 | |
Series 2004, Health Care Facilities RB | | | 6.15 | % | | | 10/01/36 | | | | 3,100 | | | | 3,101,612 | |
Series 2007 A, Ref. Health Care Facilities RB | | | 5.30 | % | | | 04/01/37 | | | | 4,835 | | | | 4,730,467 | |
Series 2007 C, Health Care Facilities RB | | | 6.00 | % | | | 04/01/37 | | | | 3,405 | | | | 3,482,736 | |
Washington (City of) (United Presbyterian Home); Series 2006 A, Ref. Senior Housing RB | | | 5.60 | % | | | 12/01/36 | | | | 2,725 | | | | 2,839,750 | |
| | | | | | | | | | | | | | | | 168,403,277 | |
| | | | |
| Kansas–0.23% | | | | | | | | | | | | | | | | |
Kansas (State of) Development Finance Authority (Adventist Health System/Sunbelt Obligated Group); Series 2009 C, Hospital RB | | | 5.75 | % | | | 11/15/38 | | | | 1,900 | | | | 2,243,349 | |
Labette (County of); | | | | | | | | | | | | | | | | |
Series 2007 A, Ref. & Improvement Hospital RB | | | 5.75 | % | | | 09/01/29 | | | | 750 | | | | 782,895 | |
Series 2007 A, Ref. & Improvement Hospital RB | | | 5.75 | % | | | 09/01/37 | | | | 900 | | | | 930,978 | |
Lenexa (City of) (Lakeview Village, Inc.); | | | | | | | | | | | | | | | | |
Series 2009, Health Care Facilities RB | | | 7.13 | % | | | 05/15/29 | | | | 500 | | | | 568,240 | |
Series 2009, Health Care Facilities RB | | | 7.25 | % | | | 05/15/39 | | | | 1,500 | | | | 1,686,300 | |
Olathe (City of) (Aberdeen Village, Inc.); | | | | | | | | | | | | | | | | |
Series 2005, Ref. Senior Living Facility RB | | | 6.13 | % | | | 05/15/30 | | | | 1,000 | | | | 1,021,240 | |
Series 2005 A, Ref. Senior Living Facility RB | | | 5.60 | % | | | 05/15/28 | | | | 1,500 | | | | 1,500,450 | |
Olathe (City of) (Catholic Care Campus, Inc.); Series 2006 A, Senior Living Facility RB | | | 6.00 | % | | | 11/15/38 | | | | 2,500 | | | | 2,572,475 | |
Olathe (City of) (West Village Center); | | | | | | | | | | | | | | | | |
Series 2007, Special Obligation Tax Increment Allocation RB | | | 5.30 | % | | | 09/01/17 | | | | 500 | | | | 379,340 | |
Series 2007, Special Obligation Tax Increment Allocation RB | | | 5.45 | % | | | 09/01/22 | | | | 1,160 | | | | 817,928 | |
Series 2007, Special Obligation Tax Increment Allocation RB | | | 5.50 | % | | | 09/01/26 | | | | 775 | | | | 506,912 | |
Overland Park (City of) Transportation Development District (Grass Creek); Series 2006, Special Assessment RB | | | 5.13 | % | | | 09/01/28 | | | | 1,485 | | | | 1,372,645 | |
Roeland Park (City of) (Roeland Park Redevelopment, LLC); Series 2005, Special Obligation Tax Increment Allocation RB | | | 5.75 | % | | | 08/01/24 | | | | 920 | | | | 922,833 | |
Roeland Park (City of) (TDD No. 1); | | | | | | | | | | | | | | | | |
Series 2005, Transportation Development District Sales Tax RB | | | 5.75 | % | | | 12/01/25 | | | | 445 | | | | 346,962 | |
Series 2006 A, Transportation Development District Sales Tax RB | | | 5.88 | % | | | 12/01/25 | | | | 895 | | | | 706,370 | |
Roeland Park (City of) (TDD No. 2); Series 2006 B, Transportation Development District
Sales Tax RB | | | 5.88 | % | | | 12/01/25 | | | | 1,000 | | | | 680,310 | |
| | | | | | | | | | | | | | | | 17,039,227 | |
| | | | |
| Kentucky–0.33% | | | | | | | | | | | | | | | | |
Kentucky (State of) Economic Development Finance Authority (Masonic Home Independent Living II); | | | | | | | | | | | | | | | | |
Series 2011, RB | | | 6.25 | % | | | 05/15/18 | | | | 1,000 | | | | 1,011,780 | |
Series 2011, RB | | | 7.00 | % | | | 05/15/30 | | | | 2,500 | | | | 2,884,150 | |
Series 2011, RB | | | 7.25 | % | | | 05/15/41 | | | | 3,050 | | | | 3,530,711 | |
Series 2011, RB | | | 7.38 | % | | | 05/15/46 | | | | 1,000 | | | | 1,166,930 | |
See accompanying Notes to Financial Statements which are an integral part of the financial statements.
30 Invesco High Yield Municipal Fund
| | | | | | | | | | | | | | | | |
| | | Interest
Rate | | | Maturity
Date | | | Principal
Amount
(000) | | |
Value | |
| Kentucky–(continued) | | | | | | | | | | | | | | | | |
Kentucky (State of) Economic Development Finance Authority (Masonic Homes of Kent); | | | | | | | | | | | | | | | | |
Series 2012, Ref. Health Care Facilities RB | | | 5.38 | % | | | 11/15/42 | | | $ | 2,000 | | | $ | 2,060,400 | |
Series 2012, Ref. Health Care Facilities RB | | | 5.50 | % | | | 11/15/45 | | | | 1,645 | | | | 1,711,392 | |
Series 2012, Ref. Heath Care Facilities RB | | | 5.38 | % | | | 11/15/32 | | | | 2,000 | | | | 2,085,460 | |
Kentucky (State of) Economic Development Finance Authority (Owensboro Medical Health System, Inc.); Series 2010 A, Hospital RB | | | 6.50 | % | | | 03/01/45 | | | | 6,000 | | | | 7,227,780 | |
Louisville (City of) & Jefferson (County of) Metropolitan Government (Bellarmie University Inc.); Series 2009, College Improvement RB | | | 6.13 | % | | | 05/01/39 | | | | 1,820 | | | | 2,039,401 | |
| | | | | | | | | | | | | | | | 23,718,004 | |
| | | | |
| Louisiana–1.16% | | | | | | | | | | | | | | | | |
Calcasieu (Parish of) Memorial Hospital Service District (Lake Charles Memorial Hospital); Series 1992 A, Hospital RB (INS-Connie Lee)(c) | | | 6.50 | % | | | 12/01/18 | | | | 4,530 | | | | 4,748,029 | |
Lakeshore Villages Master Community Development District; Series 2007, Special Assessment RB(i) | | | 5.25 | % | | | 07/01/17 | | | | 14,685 | | | | 5,879,433 | |
Louisiana (State of) Local Government Environmental Facilities & Community Development Authority (Eunice Student Housing Foundation); Series 2002, RB | | | 7.38 | % | | | 09/01/33 | | | | 2,925 | | | | 2,632,471 | |
Louisiana (State of) Local Government Environmental Facilities & Community Development Authority (Westlake Chemical Corp.); | | | | | | | | | | | | | | | | |
Series 2007, RB | | | 6.75 | % | | | 11/01/32 | | | | 8,690 | | | | 9,869,581 | |
Series 2009 A, RB | | | 6.50 | % | | | 08/01/29 | | | | 9,500 | | | | 11,334,640 | |
Series 2010 A-1, RB | | | 6.50 | % | | | 11/01/35 | | | | 9,245 | | | | 10,946,727 | |
Louisiana (State of) Public Facilities Authority (Belle Chasse Educational Foundation);
Series 2011, RB | | | 6.75 | % | | | 05/01/41 | | | | 3,000 | | | | 3,547,260 | |
Louisiana (State of) Public Facilities Authority (Lake Charles Memorial Hospital); Series 2007, Ref. Hospital RB(h) | | | 6.38 | % | | | 12/01/34 | | | | 15,000 | | | | 16,042,950 | |
Louisiana (State of) Public Facilities Authority (Progressive Health Care); | | | | | | | | | | | | | | | | |
Series 1998, RB | | | 6.38 | % | | | 10/01/20 | | | | 2,500 | | | | 2,500,975 | |
Series 1998, RB | | | 6.38 | % | | | 10/01/28 | | | | 2,000 | | | | 1,990,100 | |
Louisiana State University & Agricultural & Mechanical College (Master Lease M98362); Series 1998, RB (Acquired 11/30/98; Cost $1,688,676)(h) | | | 5.75 | % | | | 10/30/18 | | | | 1,689 | | | | 1,691,648 | |
New Orleans (City of) Aviation Board; Series 2009 A-2, Ref. & Restructuring General Airport RB
(INS–AGC)(c) | | | 6.00 | % | | | 01/01/23 | | | | 3,000 | | | | 3,580,770 | |
St. Charles (Parish of) (Valero Energy Corp.); Series 2010, Gulf Opportunity Zone RB(f)(g) | | | 4.00 | % | | | 06/01/22 | | | | 6,500 | | | | 7,176,715 | |
St. Tammany (Parish of) Public Trust Financing Authority (Christwood); Series 1998, Ref. RB | | | 5.70 | % | | | 11/15/28 | | | | 2,210 | | | | 2,211,260 | |
| | | | | | | | | | | | | | | | 84,152,559 | |
| | | | |
| Maine–0.21% | | | | | | | | | | | | | | | | |
Maine (State of) Health & Higher Educational Facilities Authority (Maine General Medical Center); | | | | | | | | | | | | | | | | |
Series 2011, RB | | | 6.75 | % | | | 07/01/36 | | | | 500 | | | | 612,390 | |
Series 2011, RB | | | 6.75 | % | | | 07/01/41 | | | | 9,505 | | | | 11,534,508 | |
Series 2011, RB | | | 7.50 | % | | | 07/01/32 | | | | 2,500 | | | | 3,227,300 | |
| | | | | | | | | | | | | | | | 15,374,198 | |
| | | | |
| Maryland–1.72% | | | | | | | | | | | | | | | | |
Annapolis (City of) (Park Place); Series 2005 A, Special Obligation Tax Allocation RB | | | 5.35 | % | | | 07/01/34 | | | | 1,874 | | | | 1,893,508 | |
Anne Arundel (County of) (Farmington Village); Series 1998 A, Special Tax RB | | | 6.25 | % | | | 06/01/25 | | | | 1,635 | | | | 1,637,142 | |
Anne Arundel (County of) (National Business Park-North); | | | | | | | | | | | | | | | | |
Series 2010, Special Obligation Tax Allocation RB | | | 5.63 | % | | | 07/01/25 | | | | 1,000 | | | | 1,092,580 | |
Series 2010, Special Obligation Tax Allocation RB | | | 6.10 | % | | | 07/01/40 | | | | 3,250 | | | | 3,551,990 | |
Baltimore (City of) (East Baltimore Research Park); Series 2008 A, Special Obligation Tax
Allocation RB | | | 7.00 | % | | | 09/01/38 | | | | 15,605 | | | | 17,060,166 | |
Baltimore (City of) (Strathdale Manor); Series 2003, Special Obligation Tax Allocation RB | | | 7.00 | % | | | 07/01/33 | | | | 961 | | | | 984,891 | |
Brunswick (City of) (Brunswick Crossing); Series 2006, Special Obligation Tax RB | | | 5.50 | % | | | 07/01/36 | | | | 18,100 | | | | 17,143,234 | |
Frederick (County of) (Urbana Community Development Authority); Series 2010 B, Sub. Special Obligation Tax RB | | | 5.50 | % | | | 07/01/40 | | | | 9,020 | | | | 9,245,229 | |
Harford (County of); Series 2011, Special Obligation Tax Allocation RB | | | 7.50 | % | | | 07/01/40 | | | | 6,000 | | | | 6,743,220 | |
Howard (County of) (Vantage House Facility); Series 2007 B, Ref. Retirement Community RB | | | 5.25 | % | | | 04/01/37 | | | | 620 | | | | 618,704 | |
See accompanying Notes to Financial Statements which are an integral part of the financial statements.
31 Invesco High Yield Municipal Fund
| | | | | | | | | | | | | | | | |
| | | Interest
Rate | | | Maturity
Date | | | Principal
Amount
(000) | | |
Value | |
| Maryland–(continued) | | | | | | | | | | | | | | | | |
Maryland (State of) Health & Higher Educational Facilities Authority (Adventist Healthcare); | | | | | | | | | | | | | | | | |
Series 2011 A, RB | | | 5.13 | % | | | 01/01/23 | | | $ | 1,000 | | | $ | 1,147,600 | |
Series 2011 A, RB | | | 6.13 | % | | | 01/01/36 | | | | 1,500 | | | | 1,797,765 | |
Maryland (State of) Health & Higher Educational Facilities Authority (King Farm Presbyterian Retirement Community); | | | | | | | | | | | | | | | | |
Series 2007 A, RB | | | 5.25 | % | | | 01/01/27 | | | | 4,475 | | | | 4,470,301 | |
Series 2007 A, RB | | | 5.30 | % | | | 01/01/37 | | | | 3,050 | | | | 2,925,499 | |
Maryland (State of) Health & Higher Educational Facilities Authority (Washington Christian Academy); Series 2006, RB | | | 5.50 | % | | | 07/01/38 | | | | 1,500 | | | | 599,850 | |
Maryland (State of) Health & Higher Educational Facilities Authority (Washington County Hospital); Series 2008, RB | | | 6.00 | % | | | 01/01/43 | | | | 16,105 | | | | 17,668,635 | |
Maryland (State of) Industrial Development Financing Authority (Our Lady of Good Counsel High School Facility); Series 2005 A, Economic Development RB | | | 6.00 | % | | | 05/01/35 | | | | 1,500 | | | | 1,566,255 | |
Maryland Economic Development Corp. (AFCO Cargo BWI II, LLC); | | | | | | | | | | | | | | | | |
Series 1999, Air Cargo RB(b) | | | 6.50 | % | | | 07/01/24 | | | | 5,780 | | | | 5,438,575 | |
Series 2003, Ref. Air Cargo RB(b) | | | 7.34 | % | | | 07/01/24 | | | | 1,160 | | | | 1,161,659 | |
Maryland Economic Development Corp. (Chesapeake Bay); Series 2006 B, Sr. Lien RB | | | 5.25 | % | | | 12/01/31 | | | | 1,500 | | | | 1,083,300 | |
Maryland Economic Development Corp. (CNX Marine Terminals Inc. Port of Baltimore Facility); Series 2010, Ref. Port Facilities RB | | | 5.75 | % | | | 09/01/25 | | | | 8,000 | | | | 8,938,720 | |
Montgomery (County of) (Trinity Health); Series 2011, Ref. RB(d) | | | 5.00 | % | | | 12/01/40 | | | | 10,000 | | | | 11,255,100 | |
Montgomery (County of) (West Germantown Development District); Series 2004 B, Special Obligation Limited Tax GO Bonds | | | 6.70 | % | | | 07/01/27 | | | | 1,230 | | | | 1,244,379 | |
Salisbury (City of) (Villages at Aydelotte Farm); Series 2007, Special Obligation Tax Allocation RB | | | 5.25 | % | | | 01/01/37 | | | | 4,000 | | | | 1,514,600 | |
Westminster (City of) (Carroll Lutheran Village); | | | | | | | | | | | | | | | | |
Series 2004 A, Economic Development RB | | | 6.00 | % | | | 05/01/24 | | | | 2,000 | | | | 2,020,560 | |
Series 2004 A, Economic Development RB | | | 6.25 | % | | | 05/01/34 | | | | 2,500 | | | | 2,517,575 | |
| | | | | | | | | | | | | | | | 125,321,037 | |
| | | | |
| Massachusetts–2.84% | | | | | | | | | | | | | | | | |
Massachusetts (State of) Development Finance Agency (Alliance); Series 1999 A, Health Care Facility RB | | | 7.10 | % | | | 07/01/32 | | | | 6,895 | | | | 6,898,792 | |
Massachusetts (State of) Development Finance Agency (Covanta Energy); Series 2012, Ref. Resource Recovery RB(b) | | | 5.25 | % | | | 11/01/42 | | | | 4,370 | | | | 4,585,354 | |
Massachusetts (State of) Development Finance Agency (Criterion Child Enrichment);
Series 2003, RB | | | 6.75 | % | | | 01/01/34 | | | | 5,485 | | | | 5,567,604 | |
Massachusetts (State of) Development Finance Agency (Developmental Disabilities Inc.);
Series 2003, RB(f)(j) | | | 6.75 | % | | | 06/01/13 | | | | 1,265 | | | | 1,307,023 | |
Massachusetts (State of) Development Finance Agency (Dimock Community Health Center); | | | | | | | | | | | | | | | | |
Series 2003, RB | | | 6.25 | % | | | 12/01/13 | | | | 175 | | | | 177,814 | |
Series 2003, RB | | | 6.75 | % | | | 12/01/33 | | | | 7,565 | | | | 7,741,945 | |
Massachusetts (State of) Development Finance Agency (Evergreen Center Inc.); | | | | | | | | | | | | | | | | |
Series 2005, RB | | | 5.00 | % | | | 01/01/24 | | | | 250 | | | | 252,875 | |
Series 2005, RB | | | 5.50 | % | | | 01/01/35 | | | | 500 | | | | 505,625 | |
Massachusetts (State of) Development Finance Agency (GF/Pilgrim, Inc.); | | | | | | | | | | | | | | | | |
Series 1998, First Mortgage RB | | | 6.50 | % | | | 10/01/15 | | | | 395 | | | | 395,296 | |
Series 1998, First Mortgage RB | | | 6.75 | % | | | 10/01/28 | | | | 4,000 | | | | 3,999,840 | |
Massachusetts (State of) Development Finance Agency (Hampshire College); Series 2004, RB | | | 5.70 | % | | | 10/01/34 | | | | 1,500 | | | | 1,543,740 | |
Massachusetts (State of) Development Finance Agency (Harvard University); Series 2009 A, RB(d) | | | 5.50 | % | | | 11/15/36 | | | | 23,660 | | | | 28,571,106 | |
Massachusetts (State of) Development Finance Agency (Hillcrest Educational Centers Inc.); Series 1999, RB | | | 6.38 | % | | | 07/01/29 | | | | 5,870 | | | | 5,874,285 | |
Massachusetts (State of) Development Finance Agency (Jordan Hospital); | | | | | | | | | | | | | | | | |
Series 1998 D, RB | | | 5.25 | % | | | 10/01/23 | | | | 3,610 | | | | 3,614,621 | |
Series 1998 D, RB | | | 5.38 | % | | | 10/01/28 | | | | 1,465 | | | | 1,466,568 | |
Massachusetts (State of) Development Finance Agency (Linden Ponds, Inc. Facility); | | | | | | | | | | | | | | | | |
Series 2011 A-1, RB | | | 6.25 | % | | | 11/15/17 | | | | 732 | | | | 698,276 | |
Series 2011 A-1, RB | | | 6.25 | % | | | 11/15/46 | | | | 975 | | | | 715,932 | |
See accompanying Notes to Financial Statements which are an integral part of the financial statements.
32 Invesco High Yield Municipal Fund
| | | | | | | | | | | | | | | | |
| | | Interest
Rate | | | Maturity
Date | | | Principal
Amount
(000) | | |
Value | |
| Massachusetts–(continued) | | | | | | | | | | | | | | | | |
Series 2011 A-2, RB | | | 5.50 | % | | | 11/15/46 | | | $ | 89 | | | $ | 56,278 | |
Series 2011 B, CAB RB(e) | | | 0.00 | % | | | 11/15/56 | | | | 445 | | | | 2,365 | |
Massachusetts (State of) Development Finance Agency (Loomis Communities); Series 2002 A, First Mortgage RB | | | 6.90 | % | | | 03/01/32 | | | | 2,000 | | | | 2,023,540 | |
Massachusetts (State of) Development Finance Agency (Massachusetts Institute of Technology); Series 2002 K, RB(d) | | | 5.50 | % | | | 07/01/32 | | | | 14,495 | | | | 20,728,430 | |
Massachusetts (State of) Development Finance Agency (Quincy Medical Center); Series 2008 A, RB(a) | | | 5.85 | % | | | 01/15/18 | | | | 5,565 | | | | 28,604 | |
Massachusetts (State of) Development Finance Agency (Regis College); Series 1998, RB | | | 5.50 | % | | | 10/01/28 | | | | 5,865 | | | | 5,865,469 | |
Massachusetts (State of) Development Finance Agency (Sabis International Charter School); | | | | | | | | | | | | | | | | |
Series 2009 A, RB | | | 6.85 | % | | | 04/15/23 | | | | 745 | | | | 875,129 | |
Series 2009 A, RB | | | 6.90 | % | | | 04/15/25 | | | | 895 | | | | 1,051,061 | |
Series 2009 A, RB | | | 8.00 | % | | | 04/15/31 | | | | 1,000 | | | | 1,238,770 | |
Series 2009 A, RB | | | 8.00 | % | | | 04/15/39 | | | | 4,850 | | | | 5,998,431 | |
Massachusetts (State of) Development Finance Agency (The Groves in Lincoln); | | | | | | | | | | | | | | | | |
Series 2009 A, Senior Living Facility RB | | | 7.50 | % | | | 06/01/29 | | | | 1,430 | | | | 672,129 | |
Series 2009 A, Senior Living Facility RB | | | 7.75 | % | | | 06/01/39 | | | | 2,000 | | | | 940,040 | |
Series 2009 A, Senior Living Facility RB | | | 7.88 | % | | | 06/01/44 | | | | 2,000 | | | | 940,040 | |
Series 2009 B-1, TEMPS-85SM Senior Living Facility RB | | | 7.25 | % | | | 06/01/16 | | | | 16,100 | | | | 7,567,322 | |
Massachusetts (State of) Development Finance Agency (Tufts Medical Center); | | | | | | | | | | | | | | | | |
Series 2011 I, RB | | | 6.75 | % | | | 01/01/36 | | | | 1,000 | | | | 1,219,210 | |
Series 2011 I, RB | | | 6.88 | % | | | 01/01/41 | | | | 4,500 | | | | 5,422,005 | |
Massachusetts (State of) Development Finance Agency (Whitney Academy); Series 2000, RB | | | 7.50 | % | | | 09/01/30 | | | | 2,620 | | | | 2,624,585 | |
Massachusetts (State of) Port Authority (Delta Air Lines Inc.); Series 2001 C, Special Facilities RB (INS–AMBAC)(b)(c)(g) | | | 0.29 | % | | | 01/01/31 | | | | 30,000 | | | | 24,000,000 | |
Massachusetts (State of) Port Authority (Delta Airlines Inc.); Series 2001 A, RB
(INS–AMBAC)(b)(c) | | | 5.00 | % | | | 01/01/27 | | | | 7,800 | | | | 7,799,454 | |
Massachusetts (State of); Series 2004 A, Ref. Limited Tax GO Bonds (INS–AMBAC)(c)(d) | | | 5.50 | % | | | 08/01/30 | | | | 32,040 | | | | 43,609,644 | |
| | | | | | | | | | | | | | | | 206,579,202 | |
| | | | |
| Michigan–1.20% | | | | | | | | | | | | | | | | |
Dearborn Economic Development Corp. (Henry Ford Village, Inc.); | | | | | | | | | | | | | | | | |
Series 2008, Ref. Limited Obligation RB | | | 7.00 | % | | | 11/15/28 | | | | 5,500 | | | | 5,816,470 | |
Series 2008, Ref. Limited Obligation RB | | | 7.13 | % | | | 11/15/43 | | | | 7,700 | | | | 8,091,237 | |
Detroit Community High School; | | | | | | | | | | | | | | | | |
Series 2005, Public School Academy RB | | | 5.65 | % | | | 11/01/25 | | | | 1,330 | | | | 1,160,345 | |
Series 2005, Public School Academy RB | | | 5.75 | % | | | 11/01/30 | | | | 1,000 | | | | 842,100 | |
Gogebic (County of) Hospital Finance Authority (Grand View Health System, Inc.); Series 1999, Ref. RB | | | 5.88 | % | | | 10/01/16 | | | | 650 | | | | 652,600 | |
Grand Blanc Academy; Series 2000, COP | | | 7.75 | % | | | 02/01/30 | | | | 1,590 | | | | 1,327,634 | |
Iron River (City of) Hospital Finance Authority (Iron County Community Hospitals); | | | | | | | | | | | | | | | | |
Series 2008, Ref. Hospital RB | | | 6.50 | % | | | 05/15/33 | | | | 3,275 | | | | 3,370,597 | |
Series 2008, Ref. Hospital RB | | | 6.50 | % | | | 05/15/40 | | | | 3,380 | | | | 3,467,982 | |
John Tolfree Health System Corp.; Series 1999, Ref. Mortgage RB | | | 6.00 | % | | | 09/15/23 | | | | 2,845 | | | | 2,844,886 | |
Kentwood Economic Development Corp. (Holland Home); | | | | | | | | | | | | | | | | |
Series 2012, Ref. Limited Obligation RB | | | 5.38 | % | | | 11/15/27 | | | | 2,025 | | | | 2,170,719 | |
Series 2012, Ref. Limited Obligation RB | | | 5.38 | % | | | 11/15/41 | | | | 1,000 | | | | 1,013,230 | |
Series 2012, Ref. Limited Obligation RB | | | 5.63 | % | | | 11/15/32 | | | | 5,000 | | | | 5,348,050 | |
Series 2012, Ref. Limited Obligation RB | | | 5.63 | % | | | 11/15/41 | | | | 4,160 | | | | 4,360,720 | |
Mecosta (County of) General Hospital; Series 1999, Ref. RB | | | 6.00 | % | | | 05/15/18 | | | | 365 | | | | 365,825 | |
Michigan (State of) Finance Authority (Public School Academy–Cesar Chavez Academy); Series 2012, Ref. Limited Obligation RB | | | 5.75 | % | | | 02/01/33 | | | | 4,750 | | | | 4,892,833 | |
Michigan (State of) Finance Authority (Trinity Health); Series 2011, Ref. RB(d) | | | 5.00 | % | | | 12/01/39 | | | | 16,120 | | | | 17,910,287 | |
Michigan (State of) Strategic Fund (Genesee Power Station); Series 1994, Ref. Solid Waste Disposal RB(b) | | | 7.50 | % | | | 01/01/21 | | | | 2,670 | | | | 2,669,920 | |
Michigan (State of) Strategic Fund (The Dow Chemical Co.); Series 2003 B-2, Ref. Limited Obligation RB | | | 6.25 | % | | | 06/01/14 | | | | 10,000 | | | | 10,664,500 | |
See accompanying Notes to Financial Statements which are an integral part of the financial statements.
33 Invesco High Yield Municipal Fund
| | | | | | | | | | | | | | | | |
| | | Interest
Rate | | | Maturity
Date | | | Principal
Amount
(000) | | |
Value | |
| Michigan–(continued) | | | | | | | | | | | | | | | | |
Saline Economic Development Corp. (Evangelical Homes of Michigan); Series 2013, Ref. RB | | | 5.50 | % | | | 06/01/47 | | | $ | 4,000 | | | $ | 4,031,360 | |
Star International Academy; Series 2012, Ref. Public School Academy RB | | | 5.00 | % | | | 03/01/33 | | | | 3,100 | | | | 3,192,752 | |
Wenonah Park Properties, Inc. (Bay City Hotel); | | | | | | | | | | | | | | | | |
Series 2002, RB(m) | | | 3.75 | % | | | 04/01/33 | | | | 11,620 | | | | 2,553,146 | |
Series 2002, RB(m) | | | 3.94 | % | | | 04/01/22 | | | | 3,485 | | | | 807,196 | |
| | | | | | | | | | | | | | | | 87,554,389 | |
| | | | |
| Minnesota–3.65% | | | | | | | | | | | | | | | | |
Albertville (City of) (Group for Affordable Housing); Series 2007, Ref. MFH RB | | | 5.55 | % | | | 09/01/42 | | | | 3,365 | | | | 3,392,963 | |
Anoka (City of) (The Homestead at Anoka, Inc.); Series 2011 A, Health Care Facilities RB | | | 7.00 | % | | | 11/01/46 | | | | 4,070 | | | | 4,403,170 | |
Anoka (County of) Housing & Redevelopment Authority (Fridley Medical Center); | | | | | | | | | | | | | | | | |
Series 2010 A, RB | | | 6.63 | % | | | 05/01/30 | | | | 500 | | | | 552,400 | |
Series 2010 A, RB | | | 6.88 | % | | | 05/01/40 | | | | 1,000 | | | | 1,103,870 | |
Apple Valley (City of) (Ecumen-Seasons at Apple Valley); Series 2010, Housing & Health Care RB | | | 6.75 | % | | | 03/01/40 | | | | 2,500 | | | | 2,711,425 | |
Baytown (Township of) (St. Croix Preparatory Academy); | | | | | | | | | | | | | | | | |
Series 2008 A, Lease RB | | | 6.75 | % | | | 08/01/28 | | | | 1,000 | | | | 1,065,590 | |
Series 2008 A, Lease RB | | | 7.00 | % | | | 08/01/38 | | | | 700 | | | | 748,265 | |
Becker (City of) (Shepherd of Grace); | | | | | | | | | | | | | | | | |
Series 2006, Senior Housing RB | | | 5.88 | % | | | 05/01/29 | | | | 1,000 | | | | 1,010,750 | |
Series 2006, Senior Housing RB | | | 6.00 | % | | | 05/01/41 | | | | 1,000 | | | | 1,009,490 | |
Bloomington (City of) Port Authority (Radisson Blu Mall of America, LLC); | | | | | | | | | | | | | | | | |
Series 2010, Recovery Zone Facility RB | | | 6.25 | % | | | 12/01/16 | | | | 1,900 | | | | 2,009,250 | |
Series 2010, Recovery Zone Facility RB | | | 6.75 | % | | | 12/01/18 | | | | 1,755 | | | | 1,919,233 | |
Series 2010, Recovery Zone Facility RB | | | 8.00 | % | | | 12/01/25 | | | | 1,625 | | | | 1,882,449 | |
Series 2010, Recovery Zone Facility RB | | | 9.00 | % | | | 12/01/35 | | | | 8,000 | | | | 9,544,160 | |
Brooklyn Park (City of) (Prairie Seeds Academy); | | | | | | | | | | | | | | | | |
Series 2009 A, Lease RB | | | 8.38 | % | | | 03/01/23 | | | | 100 | | | | 112,075 | |
Series 2009 A, Lease RB | | | 9.00 | % | | | 03/01/29 | | | | 2,620 | | | | 2,996,153 | |
Series 2009 A, Lease RB | | | 9.25 | % | | | 03/01/39 | | | | 8,000 | | | | 9,276,320 | |
Cambridge (City of) (Grandview West); | | | | | | | | | | | | | | | | |
Series 1998 A, Housing & Health Care Facilities RB | | | 6.00 | % | | | 10/01/28 | | | | 1,410 | | | | 1,411,297 | |
Series 1998 B, Housing & Health Care Facilities RB | | | 6.00 | % | | | 10/01/33 | | | | 3,000 | | | | 3,002,100 | |
Carlton (City of) (Inter-Faith Care Center); Series 2006, Ref. Health Care & Housing Facilities RB | | | 5.70 | % | | | 04/01/36 | | | | 6,900 | | | | 6,951,612 | |
Cold Spring (City of) (Assumption Home, Inc.); | | | | | | | | | | | | | | | | |
Series 2005, Nursing Home & Senior Housing RB | | | 5.50 | % | | | 03/01/25 | | | | 425 | | | | 429,518 | |
Series 2005, Nursing Home & Senior Housing RB | | | 5.75 | % | | | 03/01/35 | | | | 600 | | | | 606,240 | |
Series 2008, Health Care Facilities RB | | | 7.50 | % | | | 03/01/38 | | | | 1,000 | | | | 1,080,380 | |
Columbia Heights (City of) (Crest View Corp.); Series 2007 A, Ref. MFH & Health Care Facilities RB | | | 5.70 | % | | | 07/01/42 | | | | 5,000 | | | | 3,957,350 | |
Cuyuna (City of) (Crosby Senior Services); Series 2007 B, Senior Housing RB | | | 6.10 | % | | | 10/01/47 | | | | 4,100 | | | | 4,145,100 | |
Dakota (County of) Community Development Agency (Highview Hills Senior Housing); Series 2008 A, MFH RB | | | 7.00 | % | | | 08/01/45 | | | | 18,000 | | | | 19,189,980 | |
Detroit Lakes (City of) (CDL Homes); | | | | | | | | | | | | | | | | |
Series 2004 B, Housing & Health Facilities RB | | | 6.00 | % | | | 08/01/24 | | | | 840 | | | | 849,769 | |
Series 2004 B, Housing & Health Facilities RB | | | 6.13 | % | | | 08/01/34 | | | | 1,435 | | | | 1,451,129 | |
Fergus Falls (City of) (Lake Region Healthcare Corp.); | | | | | | | | | | | | | | | | |
Series 2010, Health Care Facilities RB | | | 5.15 | % | | | 08/01/35 | | | | 1,000 | | | | 1,052,610 | |
Series 2010, Health Care Facilities RB | | | 5.40 | % | | | 08/01/40 | | | | 1,000 | | | | 1,052,290 | |
Lake Crystal (City of) (Ecumen-Second Century); Series 2006 A, Ref. Housing RB | | | 5.70 | % | | | 09/01/36 | | | | 2,000 | | | | 2,049,720 | |
Maplewood (City of) (Ecumen Headquarters & The Seasons at Maplewood); Series 2010, Housing & Health Care RB | | | 6.38 | % | | | 03/01/40 | | | | 1,045 | | | | 1,148,424 | |
Maplewood (City of) (Volunteers of America Care Center); Series 2005 A, Ref. Health Care Facilities RB | | | 5.00 | % | | | 10/01/13 | | | | 270 | | | | 272,589 | |
Minneapolis & St. Paul (Cities of) Housing & Redevelopment Authority (Health Partners Obligated Group); Series 2003, Health Care Facility RB | | | 5.88 | % | | | 12/01/29 | | | | 800 | | | | 829,360 | |
Minneapolis (City of) (Grant Park); Series 2006, Tax Increment Allocation RB | | | 5.35 | % | | | 02/01/30 | | | | 1,450 | | | | 1,399,859 | |
See accompanying Notes to Financial Statements which are an integral part of the financial statements.
34 Invesco High Yield Municipal Fund
| | | | | | | | | | | | | | | | |
| | | Interest
Rate | | | Maturity
Date | | | Principal
Amount
(000) | | |
Value | |
| Minnesota–(continued) | | | | | | | | | | | | | | | | |
Minneapolis (City of) (Ivy Tower); Series 2005, Tax Increment Allocation RB | | | 5.70 | % | | | 02/01/29 | | | $ | 1,000 | | | $ | 924,100 | |
Minneapolis (City of) (Providence); | | | | | | | | | | | | | | | | |
Series 2007 A, Ref. Housing & Health Care Facilities RB | | | 5.63 | % | | | 10/01/27 | | | | 5,475 | | | | 5,599,392 | |
Series 2007 A, Ref. Housing & Health Care Facilities RB | | | 5.75 | % | | | 10/01/37 | | | | 7,345 | | | | 7,469,865 | |
Minneapolis (City of) (Riverton Community Housing); Series 2006 A, Ref. Student Housing RB | | | 5.60 | % | | | 08/01/26 | | | | 1,400 | | | | 1,404,844 | |
Moorhead (City of) (Sheyenne Crossing); Series 2006, Sr. Housing RB | | | 5.65 | % | | | 04/01/41 | | | | 5,000 | | | | 5,061,250 | |
New Ulm (City of) Economic Development Authority (HADC Ridgeway); Series 2006 A, Ref. Housing Facilities RB | | | 6.00 | % | | | 06/01/41 | | | | 2,300 | | | | 2,321,505 | |
Northwest Multi-County Housing & Redevelopment Authority (Pooled Housing Program); | | | | | | | | | | | | | | | | |
Series 2005 A, Ref. Governmental Housing RB | | | 5.35 | % | | | 07/01/15 | | | | 70 | | | | 70,561 | |
Series 2005 A, Ref. Governmental Housing RB | | | 6.20 | % | | | 07/01/30 | | | | 2,000 | | | | 2,009,720 | |
Series 2005 A, Ref. Governmental Housing RB | | | 6.25 | % | | | 07/01/40 | | | | 5,000 | | | | 5,012,400 | |
Series 2006, Ref. Governmental Housing RB | | | 5.25 | % | | | 07/01/26 | | | | 850 | | | | 829,252 | |
Series 2006, Ref. Governmental Housing RB | | | 5.45 | % | | | 07/01/41 | | | | 2,340 | | | | 2,229,646 | |
Oak Park Heights (City of) (Oakgreen Commons); | | | | | | | | | | | | | | | | |
Series 2010, Housing RB | | | 6.75 | % | | | 08/01/31 | | | | 1,500 | | | | 1,629,120 | |
Series 2010, Housing RB | | | 7.00 | % | | | 08/01/45 | | | | 3,000 | | | | 3,276,840 | |
Orono (City of) (Orono Woods Apartments); Series 2006 A, Ref. Senior Housing RB | | | 5.40 | % | | | 11/01/41 | | | | 4,700 | | | | 3,904,760 | |
Oronoco (City of) (Wedum Shorewood Campus); | | | | | | | | | | | | | | | | |
Series 2006, Ref. MFH RB | | | 5.25 | % | | | 06/01/26 | | | | 1,600 | | | | 1,626,656 | |
Series 2006, Ref. MFH RB | | | 5.40 | % | | | 06/01/41 | | | | 7,500 | | | | 7,560,300 | |
Owatonna (City of) (Senior Living); Series 2006 A, Senior Housing RB | | | 5.80 | % | | | 10/01/29 | | | | 800 | | | | 829,248 | |
Perham (City of) Hospital District (Perham Memorial Hospital & Home); Series 2010, Health Care Facilities RB | | | 6.35 | % | | | 03/01/35 | | | | 2,000 | | | | 2,251,620 | |
Pine City (City of) (Lakes International Language Academy); Series 2006 A, Lease RB | | | 6.25 | % | | | 05/01/35 | | | | 2,650 | | | | 2,719,324 | |
Ramsey (City of) (Pact Charter School); | | | | | | | | | | | | | | | | |
Series 2004 A, Lease RB | | | 6.50 | % | | | 12/01/22 | | | | 925 | | | | 961,325 | |
Series 2004 A, Lease RB | | | 6.75 | % | | | 12/01/33 | | | | 3,000 | | | | 3,105,720 | |
Rochester (City of) (Samaritan Bethany, Inc.); | | | | | | | | | | | | | | | | |
Series 2009 A, Ref. Health Care & Housing RB | | | 7.38 | % | | | 12/01/41 | | | | 2,000 | | | | 2,253,240 | |
Series 2009 B, Ref. Health Care & Housing RB | | | 7.38 | % | | | 12/01/36 | | | | 1,555 | | | | 1,754,740 | |
Sartell (City of) (Country Manor Campus LLC); Series 2010 A, Health Care Facilities RB | | | 6.25 | % | | | 09/01/36 | | | | 925 | | | | 986,938 | |
Sauk Rapids (City of) (Good Shepherd Lutheran Home); Series 2009, Health Care & Housing Facilities RB | | | 7.50 | % | | | 01/01/39 | | | | 7,000 | | | | 7,401,520 | |
St. Paul (City of) Housing & Redevelopment Authority (Achieve Language Academy); Series 2003 A, Ref. Lease RB | | | 7.00 | % | | | 12/01/32 | | | | 1,600 | | | | 1,618,064 | |
St. Paul (City of) Housing & Redevelopment Authority (Community Peace Academy); Series 2006 A, Lease RB | | | 5.00 | % | | | 12/01/36 | | | | 4,825 | | | | 4,848,063 | |
St. Paul (City of) Housing & Redevelopment Authority (Emerald Gardens); | | | | | | | | | | | | | | | | |
Series 2010, Ref. Tax Increment Allocation RB | | | 5.63 | % | | | 03/01/20 | | | | 705 | | | | 754,054 | |
Series 2010, Ref. Tax Increment Allocation RB | | | 6.50 | % | | | 03/01/29 | | | | 930 | | | | 1,002,224 | |
St. Paul (City of) Housing & Redevelopment Authority (HealthEast); Series 2005, Hospital RB | | | 6.00 | % | | | 11/15/30 | | | | 3,360 | | | | 3,636,662 | |
St. Paul (City of) Housing & Redevelopment Authority (Higher Ground Academy); | | | | | | | | | | | | | | | | |
Series 2004 A, Ref. Lease RB | | | 6.88 | % | | | 12/01/33 | | | | 2,720 | | | | 2,809,542 | |
Series 2009, Lease RB | | | 8.50 | % | | | 12/01/38 | | | | 1,900 | | | | 2,003,607 | |
St. Paul (City of) Housing & Redevelopment Authority (Hmong Academy); | | | | | | | | | | | | | | | | |
Series 2006 A, Lease RB | | | 5.75 | % | | | 09/01/26 | | | | 700 | | | | 718,963 | |
Series 2006 A, Lease RB | | | 6.00 | % | | | 09/01/36 | | | | 3,390 | | | | 3,485,768 | |
St. Paul (City of) Housing & Redevelopment Authority (Hmong College Prep Academy); Series 2012 A, Charter School Lease RB | | | 5.50 | % | | | 09/01/43 | | | | 5,000 | | | | 5,115,150 | |
St. Paul (City of) Housing & Redevelopment Authority (Hope Community Academy); | | | | | | | | | | | | | | | | |
Series 2004 A, Lease RB | | | 6.75 | % | | | 12/01/33 | | | | 2,415 | | | | 2,490,831 | |
Series 2005 A, Lease RB | | | 6.25 | % | | | 12/01/33 | | | | 2,185 | | | | 2,216,158 | |
See accompanying Notes to Financial Statements which are an integral part of the financial statements.
35 Invesco High Yield Municipal Fund
| | | | | | | | | | | | | | | | |
| | | Interest
Rate | | | Maturity
Date | | | Principal
Amount
(000) | | |
Value | |
| Minnesota–(continued) | | | | | | | | | | | | | | | | |
St. Paul (City of) Housing & Redevelopment Authority (Marian Center); | | | | | | | | | | | | | | | | |
Series 2007 A, Ref. MFH RB | | | 5.30 | % | | | 11/01/30 | | | $ | 1,000 | | | $ | 1,002,120 | |
Series 2007 A, Ref. MFH RB | | | 5.38 | % | | | 05/01/43 | | | | 7,590 | | | | 7,585,977 | |
St. Paul (City of) Housing & Redevelopment Authority (Model Cities Health Center); Series 2001 A, Health Care RB | | | 7.25 | % | | | 11/01/26 | | | | 4,035 | | | | 3,733,505 | |
St. Paul (City of) Housing & Redevelopment Authority (New Spirit Charter School); Series 2002 A, Lease RB | | | 7.50 | % | | | 12/01/31 | | | | 4,390 | | | | 4,484,122 | |
St. Paul (City of) Housing & Redevelopment Authority (Nova Classical Academy); | | | | | | | | | | | | | | | | |
Series 2011 A, Charter School Lease RB | | | 6.38 | % | | | 09/01/31 | | | | 1,000 | | | | 1,117,470 | |
Series 2011 A, Charter School Lease RB | | | 6.63 | % | | | 09/01/42 | | | | 1,500 | | | | 1,688,490 | |
St. Paul (City of) Housing & Redevelopment Authority (Rossy & Richard Shaller Family Sholom East Campus); | | | | | | | | | | | | | | | | |
Series 2007 A, RB | | | 5.05 | % | | | 10/01/27 | | | | 1,750 | | | | 1,768,830 | |
Series 2007 A, RB | | | 5.15 | % | | | 10/01/42 | | | | 1,340 | | | | 1,339,933 | |
Series 2007 A, RB | | | 5.25 | % | | | 10/01/42 | | | | 2,000 | | | | 2,012,460 | |
St. Paul (City of) Port Authority (Gerdau St. Paul Steel Mill); Series 2012, Solid Waste Disposal RB(b) | | | 4.50 | % | | | 10/01/37 | | | | 8,500 | | | | 8,618,830 | |
St. Paul (Port of) (HealthEast Midway Campus-03); | | | | | | | | | | | | | | | | |
Series 2005 A, Lease RB | | | 5.75 | % | | | 05/01/25 | | | | 1,700 | | | | 1,810,891 | |
Series 2005 A, Lease RB | | | 5.88 | % | | | 05/01/30 | | | | 1,250 | | | | 1,329,550 | |
Series 2005 B, Lease RB | | | 6.00 | % | | | 05/01/30 | | | | 1,700 | | | | 1,813,016 | |
Vadnais Heights (City of) (Agriculture & Food Sciences Academy); | | | | | | | | | | | | | | | | |
Series 2004 A, Lease RB | | | 6.38 | % | | | 12/01/24 | | | | 1,900 | | | | 1,561,458 | |
Series 2004 A, Lease RB | | | 6.60 | % | | | 12/01/34 | | | | 5,275 | | | | 4,048,457 | |
Victoria (City of) (Holy Family Catholic High School); Series 2012, Ref. Private School Facility RB | | | 5.00 | % | | | 09/01/29 | | | | 2,300 | | | | 2,441,151 | |
Washington (County of) Housing & Redevelopment Authority (Birchwood & Woodbury); Series 2007 A, Health Care & Housing RB | | | 5.00 | % | | | 12/01/14 | | | | 685 | | | | 706,358 | |
Wayzata (City of) (Folkestone Senior Living Community); | | | | | | | | | | | | | | | | |
Series 2012 A, Senior Housing RB | | | 5.50 | % | | | 11/01/32 | | | | 2,000 | | | | 2,085,360 | |
Series 2012 A, Senior Housing RB | | | 5.75 | % | | | 11/01/39 | | | | 4,000 | | | | 4,212,680 | |
Series 2012 A, Senior Housing RB | | | 6.00 | % | | | 05/01/47 | | | | 8,500 | | | | 9,034,650 | |
West St. Paul (City of) (Walker Thompson Hill, LLC); Series 2011A, Health Care Facilities RB | | | 7.00 | % | | | 09/01/46 | | | | 1,530 | | | | 1,661,090 | |
Winsted (City of) (St. Mary’s Care Center); | | | | | | | | | | | | | | | | |
Series 2010 A, Health Care RB | | | 6.25 | % | | | 09/01/30 | | | | 500 | | | | 526,285 | |
Series 2010 A, Health Care RB | | | 6.88 | % | | | 09/01/42 | | | | 2,000 | | | | 2,132,680 | |
Worthington (City of) (Ecumen Corp. Guaranty-Meadows); Series 2009 A, Housing & Health Care RB(f)(g) | | | 6.38 | % | | | 05/01/19 | | | | 650 | | | | 671,801 | |
| | | | | | | | | | | | | | | | 265,897,026 | |
| | | | |
| Mississippi–0.22% | | | | | | | | | | | | | | | | |
Mississippi (State of) Hospital Equipment & Facilities Authority (South Central); Series 2006, Ref. & Improvement RB | | | 5.25 | % | | | 12/01/31 | | | | 1,965 | | | | 2,036,958 | |
Mississippi (State of) Hospital Equipment & Facilities Authority (South West Mississippi Medical Center); | | | | | | | | | | | | | | | | |
Series 2003, Ref. & Improvement RB | | | 5.75 | % | | | 04/01/23 | | | | 1,000 | | | | 1,011,200 | |
Series 2003, Ref. & Improvement RB | | | 5.75 | % | | | 04/01/29 | | | | 2,000 | | | | 2,020,500 | |
Mississippi Business Finance Corp.; Series 2004, Air Cargo RB(b) | | | 7.25 | % | | | 07/01/34 | | | | 1,575 | | | | 824,513 | |
Mississippi Home Corp. (Grove Apartments); Series 2007-1, RB(b) | | | 3.13 | % | | | 04/01/37 | | | | 5,700 | | | | 3,748,890 | |
Mississippi Home Corp. (Kirkwood Apartments); Series 2007, RB(b)(m) | | | 3.40 | % | | | 11/01/37 | | | | 7,000 | | | | 5,072,970 | |
Warren (County of) (International Paper Co.); Series 2011, Gulf Opportunity Zone RB | | | 5.38 | % | | | 12/01/35 | | | | 1,250 | | | | 1,382,675 | |
| | | | | | | | | | | | | | | | 16,097,706 | |
| | | | |
| Missouri–2.56% | | | | | | | | | | | | | | | | |
370/Missouri Bottom Road/Taussig Road Transportation Development District (Hazelwood); | | | | | | | | | | | | | | | | |
Series 2002, RB | | | 7.00 | % | | | 05/01/22 | | | | 1,750 | | | | 1,755,005 | |
Series 2002, RB | | | 7.20 | % | | | 05/01/33 | | | | 5,250 | | | | 5,260,342 | |
Arnold (City of) (Arnold Triangle Redevelopment Project); | | | | | | | | | | | | | | | | |
Series 2009 A, Real Property Tax Increment Allocation RB | | | 7.75 | % | | | 05/01/28 | | | | 835 | | | | 930,800 | |
Series 2009 B, Sales Tax Increment Allocation RB | | | 6.50 | % | | | 05/01/20 | | | | 3,440 | | | | 3,769,930 | |
See accompanying Notes to Financial Statements which are an integral part of the financial statements.
36 Invesco High Yield Municipal Fund
| | | | | | | | | | | | | | | | |
| | | Interest
Rate | | | Maturity
Date | | | Principal
Amount
(000) | | |
Value | |
| Missouri–(continued) | | | | | | | | | | | | | | | | |
Arnold Retail Corridor Transportation Development District; Series 2010, Transportation Sales Tax RB | | | 6.65 | % | | | 05/01/38 | | | $ | 2,000 | | | $ | 2,122,280 | |
Ballwin (City of) (Ballwin Town Center); Series 2002 A, Ref. & Improvement Tax Increment Allocation RB | | | 6.50 | % | | | 10/01/22 | | | | 3,600 | | | | 3,599,496 | |
Branson (City of) Industrial Development Authority (Branson Landing-Retail); Series 2005, Tax Increment Allocation RB | | | 5.25 | % | | | 06/01/21 | | | | 1,055 | | | | 1,020,607 | |
Branson (City of) Regional Airport Transportation Development District; Series 2007 B, Airport RB(a)(b)(m) | | | 6.00 | % | | | 07/01/37 | | | | 28,600 | | | | 5,430,568 | |
Branson Hills Infrastructure Facilities Community Improvement District; | | | | | | | | | | | | | | | | |
Series 2007 A, Special Assessment RB | | | 5.00 | % | | | 04/01/13 | | | | 300 | | | | 299,685 | |
Series 2007 A, Special Assessment RB | | | 5.00 | % | | | 04/01/15 | | | | 500 | | | | 470,590 | |
Series 2007 A, Special Assessment RB | | | 5.50 | % | | | 04/01/22 | | | | 1,455 | | | | 1,160,188 | |
Series 2007 A, Special Assessment RB | | | 5.50 | % | | | 04/01/27 | | | | 1,500 | | | | 1,077,675 | |
Bridgeton (City of) Industrial Development Authority (Sarah Community); | | | | | | | | | | | | | | | | |
Series 1998, Senior Housing RB | | | 5.90 | % | | | 05/01/28 | | | | 2,000 | | | | 2,001,860 | |
Series 2011 A, Ref. & Improvement Senior Housing RB | | | 6.38 | % | | | 05/01/35 | | | | 3,400 | | | | 3,606,108 | |
Cass (County of); | | | | | | | | | | | | | | | | |
Series 2007, Hospital RB | | | 5.00 | % | | | 05/01/16 | | | | 1,000 | | | | 1,077,500 | |
Series 2007, Hospital RB | | | 5.63 | % | | | 05/01/38 | | | | 2,890 | | | | 2,968,261 | |
Chillicothe (City of) (South U.S. 65); Series 2006, Tax Increment Allocation RB | | | 5.50 | % | | | 04/01/21 | | | | 1,000 | | | | 928,860 | |
Cole (County of) Industrial Development Authority (Lutheran Senior Services-Heisinger); Series 2004, Senior Living Facilities RB | | | 5.50 | % | | | 02/01/35 | | | | 130 | | | | 131,672 | |
Dardenne Town Square Transportation Development District; Series 2006 A, Transportation Sales Tax RB | | | 5.00 | % | | | 05/01/36 | | | | 3,190 | | | | 1,594,681 | |
Ellisville (City of) Industrial Development Authority (Gambrill Gardens Phase I); Series 2003 A, IDR | | | 6.75 | % | | | 04/01/33 | | | | 2,390 | | | | 2,392,008 | |
Ellisville (City of) Industrial Development Authority (Gambrill Gardens); Series 1999, Ref. & Improvement RB | | | 6.20 | % | | | 06/01/29 | | | | 2,755 | | | | 2,756,350 | |
Ferguson (City of) (Crossing at Halls Ferry); Series 2005, Ref. Tax Increment Allocation RB | | | 5.00 | % | | | 04/01/17 | | | | 1,435 | | | | 1,444,930 | |
Good Shepherd Nursing Home District; Series 1998, Ref. Nursing Home Facilities RB | | | 5.90 | % | | | 08/15/23 | | | | 2,900 | | | | 2,901,392 | |
Grandview (City of) Industrial Development Authority (Grandview Crossing); Series 2006, Tax Increment Allocation RB(m) | | | 3.75 | % | | | 12/01/28 | | | | 1,250 | | | | 314,013 | |
Grundy (County of) Industrial Development Authority (Wright Memorial Hospital); | | | | | | | | | | | | | | | | |
Series 2009, Health Facilities RB | | | 6.45 | % | | | 09/01/29 | | | | 1,000 | | | | 1,121,830 | |
Series 2009, Health Facilities RB | | | 6.75 | % | | | 09/01/34 | | | | 1,250 | | | | 1,414,300 | |
Joplin (City of) Industrial Development Authority (Christian Homes, Inc. Obligated Group); Series 2007 F, Ref. RB | | | 5.75 | % | | | 05/15/26 | | | | 1,260 | | | | 1,346,411 | |
Kansas City (City of) (Shoal Creek Parkway); Series 2011, Tax Increment Allocation RB | | | 6.50 | % | | | 06/01/25 | | | | 3,000 | | | | 3,118,860 | |
Kansas City (City of) Industrial Development Authority (Brentwood Manor Apartments); | | | | | | | | | | | | | | | | |
Series 2002 A, MFH RB(b) | | | 6.95 | % | | | 04/15/15 | | | | 170 | | | | 172,559 | |
Series 2002 B, MFH RB(b) | | | 5.25 | % | | | 10/15/38 | | | | 2,300 | | | | 1,807,478 | |
Kansas City (City of) Industrial Development Authority (Northwoods Apartments); Series 2004 A, MFH RB(b) | | | 6.45 | % | | | 05/01/40 | | | | 2,302 | | | | 2,308,008 | |
Kansas City (City of) Industrial Development Authority (Plaza Library); Series 2004, RB | | | 5.90 | % | | | 03/01/24 | | | | 5,000 | | | | 5,067,250 | |
Kansas City (City of) Industrial Development Authority (Walnut Grove Apartments); | | | | | | | | | | | | | | | | |
Series 2000 B, MFH RB(b) | | | 7.55 | % | | | 06/15/22 | | | | 990 | | | | 991,168 | |
Series 2000 B, MFH RB(b) | | | 7.55 | % | | | 06/15/35 | | | | 3,430 | | | | 3,433,567 | |
Kirkwood (City of) Industrial Development Authority (Aberdeen Heights); | | | | | | | | | | | | | | | | |
Series 2010 A, Retirement Community RB | | | 8.00 | % | | | 05/15/29 | | | | 7,000 | | | | 8,424,850 | |
Series 2010 A, Retirement Community RB | | | 8.25 | % | | | 05/15/39 | | | | 3,500 | | | | 4,194,295 | |
Series 2010 A, Retirement Community RB | | | 8.25 | % | | | 05/15/45 | | | | 22,000 | | | | 26,319,920 | |
Manchester (City of) (Highway 141/Manchester Road); | | | | | | | | | | | | | | | | |
Series 2010, Ref. Transportation Tax Increment Allocation RB | | | 6.00 | % | | | 11/01/25 | | | | 945 | | | | 1,022,093 | |
Series 2010, Ref. Transportation Tax Increment Allocation RB | | | 6.88 | % | | | 11/01/39 | | | | 1,500 | | | | 1,624,215 | |
Maplewood (City of) (Maplewood South Redevelopment Area); Series 2005, Ref. Tax Increment RB | | | 5.75 | % | | | 11/01/26 | | | | 1,350 | | | | 1,352,646 | |
Missouri (State of) Health & Educational Facilities Authority (BJC Health System); Series 2008 A, VRD Health Facilities RB(l) | | | 0.10 | % | | | 05/15/38 | | | | 12,700 | | | | 12,700,000 | |
See accompanying Notes to Financial Statements which are an integral part of the financial statements.
37 Invesco High Yield Municipal Fund
| | | | | | | | | | | | | | | | |
| | | Interest
Rate | | | Maturity
Date | | | Principal
Amount
(000) | | |
Value | |
| Missouri–(continued) | | | | | | | | | | | | | | | | |
Missouri (State of) Health & Educational Facilities Authority (Lutheran Church Extension Fund-Missouri Synod Loan Program); Series 2004 A, VRD RB (LOC–Bank of America, N.A.)(k)(l) | | | 0.16 | % | | | 07/01/29 | | | $ | 600 | | | $ | 600,000 | |
Missouri (State of) Health & Educational Facilities Authority (Washington University); | | | | | | | | | | | | | | | | |
Series 2011 A, RB(d) | | | 5.00 | % | | | 11/15/41 | | | | 6,210 | | | | 7,225,708 | |
Series 2011 B, RB(d) | | | 5.00 | % | | | 11/15/37 | | | | 10,500 | | | | 12,359,130 | |
Platte (County of) Industrial Development Authority (Zona Rosa Phase II Retail); Series 2007, Transportation RB | | | 6.85 | % | | | 04/01/29 | | | | 3,315 | | | | 3,523,248 | |
Polk (County of) Industrial Development Authority (Citizens Memorial Health Care Foundation); Series 2008, Health Facilities RB | | | 6.50 | % | | | 01/01/33 | | | | 2,000 | | | | 2,057,580 | |
Richmond Heights (City of) (Francis Place Redevelopment); Series 2005, Ref. & Improvement Tax Increment Allocation & Transportation Sales Tax RB | | | 5.63 | % | | | 11/01/25 | | | | 750 | | | | 750,428 | |
St. Joseph (City of) Industrial Development Authority (Living Community of St. Joseph); Series 2002, Health Care RB | | | 7.00 | % | | | 08/15/32 | | | | 6,750 | | | | 6,770,115 | |
St. Joseph (City of) Industrial Development Authority (The Shoppes at North Village); | | | | | | | | | | | | | | | | |
Series 2005 A, Tax Increment Allocation RB | | | 5.25 | % | | | 11/01/13 | | | | 240 | | | | 244,267 | |
Series 2005 A, Tax Increment Allocation RB | | | 5.50 | % | | | 11/01/27 | | | | 750 | | | | 753,263 | |
Series 2005 B, Tax Increment Allocation RB | | | 5.50 | % | | | 11/01/27 | | | | 1,000 | | | | 1,004,350 | |
St. Louis (County of) Industrial Development Authority (Friendship Village Chesterfield); Series 2012, Senior Living Facilities RB | | | 5.00 | % | | | 09/01/42 | | | | 5,000 | | | | 4,927,850 | |
St. Louis (County of) Industrial Development Authority (Grand Center Redevelopment); Series 2011, Tax Increment Allocation Improvement RB | | | 6.38 | % | | | 12/01/25 | | | | 3,490 | | | | 3,749,586 | |
St. Louis (County of) Industrial Development Authority (Ranken-Jordan); Series 2003 A, Health Facilities RB(f)(j) | | | 6.63 | % | | | 11/15/13 | | | | 4,600 | | | | 4,809,346 | |
St. Louis (County of) Industrial Development Authority (St. Andrew’s Resources for Seniors); | | | | | | | | | | | | | | | | |
Series 2007 A, Senior Living Facilities RB | | | 6.38 | % | | | 12/01/30 | | | | 3,770 | | | | 3,985,455 | |
Series 2007 A, Senior Living Facilities RB | | | 6.38 | % | | | 12/01/41 | | | | 8,030 | | | | 8,419,696 | |
| | | | | | | | | | | | | | | | 186,614,273 | |
| | | | |
| Nebraska–0.41% | | | | | | | | | | | | | | | | |
Central Plains Energy (No. 3) Series 2012, Gas RB | | | 5.00 | % | | | 09/01/42 | | | | 15,940 | | | | 17,421,464 | |
Gage (County of) Hospital Authority No. 1 (Beatrice Community Hospital & Health Center); | | | | | | | | | | | | | | | | |
Series 2010 B, Health Care Facilities RB | | | 6.50 | % | | | 06/01/30 | | | | 5,000 | | | | 5,621,200 | |
Series 2010 B, Health Care Facilities RB | | | 6.75 | % | | | 06/01/35 | | | | 6,000 | | | | 6,770,100 | |
| | | | | | | | | | | | | | | | 29,812,764 | |
| | | | |
| Nevada–0.46% | | | | | | | | | | | | | | | | |
Boulder City (City of) (Boulder City Hospital Inc.); Series 1998, Ref. Hospital RB | | | 5.85 | % | | | 01/01/22 | | | | 3,000 | | | | 2,917,140 | |
Clark (County of) (Homestead Boulder City); Series 1997, Assisted Living Facility RB | | | 6.50 | % | | | 12/01/27 | | | | 4,620 | | | | 4,625,544 | |
Henderson (City of) (Local Improvement District No. T-18); Series 2006, Special
Assessment RB | | | 5.30 | % | | | 09/01/35 | | | | 3,095 | | | | 2,417,845 | |
Las Vegas (City of) (Elkhorn Springs Special Improvement District No. 505); Series 1993, Special Assessment RB | | | 8.00 | % | | | 09/15/13 | | | | 40 | | | | 40,231 | |
Las Vegas (City of) (Special Improvement District No. 607); | | | | | | | | | | | | | | | | |
Series 2004, Local Improvement Special Assessment RB | | | 6.00 | % | | | 06/01/19 | | | | 930 | | | | 951,195 | |
Series 2004, Local Improvement Special Assessment RB | | | 6.25 | % | | | 06/01/24 | | | | 1,300 | | | | 1,338,337 | |
Las Vegas (City of) Redevelopment Agency; Series 2009 A, Tax Increment Allocation RB | | | 8.00 | % | | | 06/15/30 | | | | 10,800 | | | | 12,367,620 | |
Mesquite (City of) (Special Improvement District No. 07-01–Anthem at Mesquite); Series 2007, Special Assessment Local Improvement RB | | | 6.15 | % | | | 08/01/37 | | | | 2,495 | | | | 2,448,493 | |
Reno (City of) Special Assessment District No. 4 (Somersett Parkway); Series 2003, Special Assessment RB | | | 6.63 | % | | | 12/01/22 | | | | 3,700 | | | | 3,759,422 | |
Sparks (City of) (Local Improvement District No. 3-Legends at Sparks Marina); Series 2008, Special Assessment Limited Obligation Improvement RB | | | 6.50 | % | | | 09/01/20 | | | | 790 | | | | 840,971 | |
Sparks (City of) (Local Improvement Districts No. 3-Legends at Sparks Marina); Series 2008, Special Assessment Limited Obligation Improvement RB | | | 6.75 | % | | | 09/01/27 | | | | 2,000 | | | | 2,081,800 | |
| | | | | | | | | | | | | | | | 33,788,598 | |
See accompanying Notes to Financial Statements which are an integral part of the financial statements.
38 Invesco High Yield Municipal Fund
| | | | | | | | | | | | | | | | |
| | | Interest
Rate | | | Maturity
Date | | | Principal
Amount
(000) | | |
Value | |
| New Hampshire–0.62% | | | | | | | | | | | | | | | | |
New Hampshire (State of) Business Finance Authority (Huggins Hospital); Series 2009, First Mortgage RB | | | 6.88 | % | | | 10/01/39 | | | $ | 9,360 | | | $ | 10,365,077 | |
New Hampshire (State of) Business Finance Authority (Plymouth Cogeneration L.P.); Series 1993, Electric Facilities RB (Acquired 09/20/99; Cost $890,534) (b)(h) | | | 7.75 | % | | | 06/01/14 | | | | 910 | | | | 911,174 | |
New Hampshire (State of) Business Finance Authority (Public Service Co.); Series 2001 A, Ref. PCR (INS–NATL)(b)(c)(g) | | | 0.16 | % | | | 05/01/21 | | | | 17,250 | | | | 15,076,500 | |
New Hampshire (State of) Health & Education Facilities Authority (Covenant Health Systems Obligated Group); Series 2004, Health Care System RB | | | 5.50 | % | | | 07/01/34 | | | | 1,735 | | | | 1,776,449 | |
New Hampshire (State of) Health & Education Facilities Authority (Rivermead); | | | | | | | | | | | | | | | | |
Series 2011 A, RB | | | 6.63 | % | | | 07/01/31 | | | | 620 | | | | 699,701 | |
Series 2011 A, RB | | | 6.88 | % | | | 07/01/41 | | | | 2,125 | | | | 2,412,491 | |
Series 2011 B-1, RB | | | 5.55 | % | | | 07/01/17 | | | | 400 | | | | 400,724 | |
New Hampshire (State of) Health & Education Facilities Authority (Speare Memorial Hospital); | | | | | | | | | | | | | | | | |
Series 2004, Hospital RB(f)(j) | | | 5.50 | % | | | 07/01/15 | | | | 1,055 | | | | 1,178,034 | |
Series 2004, Hospital RB(f)(j) | | | 5.88 | % | | | 07/01/15 | | | | 2,650 | | | | 2,982,151 | |
New Hampshire (State of) Health & Education Facilities Authority (The Huntington at Nashua); | | | | | | | | | | | | | | | | |
Series 2003 A, RB | | | 6.88 | % | | | 05/01/23 | | | | 2,320 | | | | 2,328,978 | |
Series 2003 A, RB | | | 6.88 | % | | | 05/01/33 | | | | 7,040 | | | | 7,060,135 | |
New Hampshire (State of) Housing Finance Authority; Series 1997 D, Single Family Mortgage Acquisition RB(b) | | | 5.90 | % | | | 07/01/28 | | | | 120 | | | | 120,217 | |
| | | | | | | | | | | | | | | | 45,311,631 | |
| | | | |
| New Jersey–4.11% | | | | | | | | | | | | | | | | |
Burlington (County of) Bridge Commission (The Evergreens); Series 2007, Economic
Development RB | | | 5.63 | % | | | 01/01/38 | | | | 1,500 | | | | 1,561,665 | |
New Jersey (State of) Economic Development Authority (Arbor); Series 1998 A, Sr. Mortgage RB | | | 6.00 | % | | | 05/15/28 | | | | 6,695 | | | | 6,505,866 | |
New Jersey (State of) Economic Development Authority (Continental Airlines, Inc.); | | | | | | | | | | | | | | | | |
Series 1999, Special Facility RB(b) | | | 5.13 | % | | | 09/15/23 | | | | 7,500 | | | | 7,705,950 | |
Series 1999, Special Facility RB(b) | | | 5.25 | % | | | 09/15/29 | | | | 25,000 | | | | 25,496,750 | |
Series 2012, RB(b) | | | 5.75 | % | | | 09/15/27 | | | | 33,500 | | | | 34,515,720 | |
New Jersey (State of) Economic Development Authority (Cranes Mill); | | | | | | | | | | | | | | | | |
Series 2008, First Mortgage RB | | | 5.88 | % | | | 07/01/28 | | | | 500 | | | | 538,555 | |
Series 2008, First Mortgage RB | | | 6.00 | % | | | 07/01/38 | | | | 1,500 | | | | 1,601,640 | |
New Jersey (State of) Economic Development Authority (Kapkowski Road Landfill);
Series 1998 B, RB(b) | | | 6.50 | % | | | 04/01/31 | | | | 2,500 | | | | 2,973,150 | |
New Jersey (State of) Economic Development Authority (Kullman Association, LLC); | | | | | | | | | | | | | | | | |
Series 1998 A, RB(a)(b) | | | 6.13 | % | | | 06/01/18 | | | | 2,005 | | | | 1,449,555 | |
Series 1999 A, RB(a)(b) | | | 6.75 | % | | | 07/01/19 | | | | 670 | | | | 483,733 | |
New Jersey (State of) Economic Development Authority (Lions Gate); | | | | | | | | | | | | | | | | |
Series 2005 A, First Mortgage RB | | | 5.75 | % | | | 01/01/25 | | | | 1,630 | | | | 1,652,706 | |
Series 2005 A, First Mortgage RB | | | 5.88 | % | | | 01/01/37 | | | | 2,590 | | | | 2,609,503 | |
New Jersey (State of) Economic Development Authority (Seashore Gardens Living Center); | | | | | | | | | | | | | | | | |
Series 2006, First Mortgage RB | | | 5.30 | % | | | 11/01/26 | | | | 2,350 | | | | 2,362,737 | |
Series 2006, First Mortgage RB | | | 5.38 | % | | | 11/01/36 | | | | 1,725 | | | | 1,663,780 | |
New Jersey (State of) Economic Development Authority (UMM Energy Partners, LLC); | | | | | | | | | | | | | | | | |
Series 2012 A, Energy Facility RB(b) | | | 5.00 | % | | | 06/15/37 | | | | 1,250 | | | | 1,344,175 | |
Series 2012 A, Energy Facility RB(b) | | | 5.13 | % | | | 06/15/43 | | | | 2,000 | | | | 2,153,820 | |
New Jersey (State of) Economic Development Authority (United Methodist Homes); | | | | | | | | | | | | | | | | |
Series 1999, RB | | | 5.75 | % | | | 07/01/29 | | | | 7,000 | | | | 7,004,480 | |
Series 2003 A-1, RB | | | 6.13 | % | | | 07/01/23 | | | | 3,450 | | | | 3,587,655 | |
Series 2003 A-1, RB | | | 6.25 | % | | | 07/01/33 | | | | 5,800 | | | | 5,994,532 | |
New Jersey (State of) Economic Development Authority (Winchester Gardens at Ward Homestead); Series 2004 A, Ref. First Mortgage RB | | | 5.80 | % | | | 11/01/31 | | | | 2,000 | | | | 2,048,800 | |
New Jersey (State of) Health Care Facilities Financing Authority (Pascack Valley Hospital Association); | | | | | | | | | | | | | | | | |
Series 2003, RB(i) | | | 6.00 | % | | | 07/01/13 | | | | 323 | | | | 3 | |
Series 2003, RB(i) | | | 6.50 | % | | | 07/01/23 | | | | 428 | | | | 4 | |
Series 2003, RB(i) | | | 6.63 | % | | | 07/01/36 | | | | 2,496 | | | | 25 | |
See accompanying Notes to Financial Statements which are an integral part of the financial statements.
39 Invesco High Yield Municipal Fund
| | | | | | | | | | | | | | | | |
| | | Interest
Rate | | | Maturity
Date | | | Principal
Amount
(000) | | |
Value | |
| New Jersey–(continued) | | | | | | | | | | | | | | | | |
New Jersey (State of) Health Care Facilities Financing Authority (St. Joseph’s Health Care System); Series 2008, RB | | | 6.63 | % | | | 07/01/38 | | | $ | 10,000 | | | $ | 11,575,800 | |
Tobacco Settlement Financing Corp.; | | | | | | | | | | | | | | | | |
Series 2007 1-A, RB | | | 4.63 | % | | | 06/01/26 | | | | 34,740 | | | | 33,355,611 | |
Series 2007 1-A, RB | | | 4.75 | % | | | 06/01/34 | | | | 52,510 | | | | 45,645,368 | |
Series 2007 1A, Asset-Backed RB | | | 4.50 | % | | | 06/01/23 | | | | 7,000 | | | | 6,988,170 | |
Series 2007 1A, Asset-Backed RB | | | 5.00 | % | | | 06/01/29 | | | | 47,705 | | | | 46,255,722 | |
Series 2007 1A, Asset-Backed RB | | | 5.00 | % | | | 06/01/41 | | | | 47,605 | | | | 42,159,464 | |
| | | | | | | | | | | | | | | | 299,234,939 | |
| | | | |
| New Mexico–0.81% | | | | | | | | | | | | | | | | |
Bernalillo (County of) (Solar Villas Apartments); Series 1997 F, Sr. MFH RB | | | 7.25 | % | | | 10/15/22 | | | | 1,120 | | | | 1,127,515 | |
Cabezon Public Improvement District; | | | | | | | | | | | | | | | | |
Series 2005, Special Levy Tax RB | | | 6.00 | % | | | 09/01/24 | | | | 1,505 | | | | 1,575,013 | |
Series 2005, Special Levy Tax RB | | | 6.30 | % | | | 09/01/34 | | | | 1,495 | | | | 1,554,860 | |
Farmington (City of) (Public Service Co. of New Mexico San Juan); Series 2010 C, Ref. PCR | | | 5.90 | % | | | 06/01/40 | | | | 10,000 | | | | 11,146,000 | |
New Mexico (State of) Eastern Regional Housing Authority (Wildewood Apartments); Series 2000 A, MFH RB | | | 7.50 | % | | | 12/01/30 | | | | 2,040 | | | | 2,043,692 | |
New Mexico (State of) Hospital Equipment Loan Council (Gerald Champion); Series 2012, Ref. & Improvement RB | | | 5.50 | % | | | 07/01/42 | | | | 14,500 | | | | 14,909,480 | |
New Mexico (State of) Hospital Equipment Loan Council (Haverland Charter Lifestyle Group); | | | | | | | | | | | | | | | | |
Series 2013, First Mortgage RB | | | 5.00 | % | | | 07/01/32 | | | | 2,500 | | | | 2,556,025 | |
Series 2013, First Mortgage RB | | | 5.00 | % | | | 07/01/42 | | | | 4,000 | | | | 4,011,600 | |
New Mexico (State of) Hospital Equipment Loan Council (La Vida Llena); Series 2010 A, First Mortgage RB | | | 6.13 | % | | | 07/01/40 | | | | 8,000 | | | | 8,833,520 | |
New Mexico (State of) Income Housing Authority (Brentwood Gardens Apartments); Series 2001 A, MFH RB(b) | | | 6.85 | % | | | 12/01/31 | | | | 4,270 | | | | 4,379,056 | |
RHA Housing Development Corp. (Woodleaf Apartments); Series 1997 A, Ref. MFH Mortgage RB (CEP–GNMA) | | | 7.13 | % | | | 12/15/27 | | | | 2,295 | | | | 2,297,846 | |
San Juan (County of) (Apple Ridge Apartments); Series 2002 A, MFH RB(b) | | | 7.25 | % | | | 12/01/31 | | | | 2,980 | | | | 2,982,801 | |
Ventana West Public Improvement District; Series 2004, Special Levy Tax RB | | | 6.88 | % | | | 08/01/33 | | | | 1,500 | | | | 1,519,410 | |
| | | | | | | | | | | | | | | | 58,936,818 | |
| | | | |
| New York–5.29% | | | | | | | | | | | | | | | | |
Amherst (Town of) Industrial Development Agency (Shaary Zedek); Series 2006 A, Ref. Civic Facility RB | | | 7.00 | % | | | 06/15/36 | | | | 2,170 | | | | 2,137,841 | |
Brooklyn Arena Local Development Corp. (Barclays Center); | | | | | | | | | | | | | | | | |
Series 2009, PILOT CAB RB(e) | | | 0.00 | % | | | 07/15/31 | | | | 3,890 | | | | 1,770,067 | |
Series 2009, PILOT CAB RB(e) | | | 0.00 | % | | | 07/15/32 | | | | 8,500 | | | | 3,601,705 | |
Series 2009, PILOT CAB RB(e) | | | 0.00 | % | | | 07/15/33 | | | | 3,915 | | | | 1,540,278 | |
Series 2009, PILOT CAB RB(e) | | | 0.00 | % | | | 07/15/34 | | | | 14,345 | | | | 5,312,958 | |
Series 2009, PILOT CAB RB(e) | | | 0.00 | % | | | 07/15/44 | | | | 25,805 | | | | 5,950,891 | |
Series 2009, PILOT CAB RB(e) | | | 0.00 | % | | | 07/15/45 | | | | 10,000 | | | | 2,200,800 | |
Series 2009, PILOT CAB RB(e) | | | 0.00 | % | | | 07/15/46 | | | | 8,950 | | | | 1,879,768 | |
Series 2009, PILOT CAB RB(e) | | | 0.00 | % | | | 07/15/47 | | | | 28,815 | | | | 5,704,217 | |
Broome (County of) Industrial Development Agency (Good Shepherd Village); | | | | | | | | | | | | | | | | |
Series 2008 A, Continuing Care Retirement Community RB | | | 6.15 | % | | | 07/01/18 | | | | 500 | | | | 532,065 | |
Series 2008 A, Continuing Care Retirement Community RB | | | 6.75 | % | | | 07/01/28 | | | | 600 | | | | 629,022 | |
Series 2008 A, Continuing Care Retirement Community RB | | | 6.88 | % | | | 07/01/40 | | | | 1,000 | | | | 1,040,300 | |
Dutchess (County of) Industrial Development Agency (St. Francis Hospital); Series 2004 A, Ref. Civic Facility RB | | | 7.50 | % | | | 03/01/29 | | | | 5,615 | | | | 5,757,116 | |
East Rochester (Village of) Housing Authority (Woodland Village, Inc.); Series 2006, Ref. Senior Living RB | | | 5.50 | % | | | 08/01/33 | | | | 1,700 | | | | 1,719,771 | |
Erie (County of) Industrial Development Agency (Orchard Park CCRC, Inc.); | | | | | | | | | | | | | | | | |
Series 2006 A, RB | | | 6.00 | % | | | 11/15/26 | | | | 10,900 | | | | 11,335,455 | |
Series 2006 A, RB | | | 6.00 | % | | | 11/15/36 | | | | 3,530 | | | | 3,621,533 | |
See accompanying Notes to Financial Statements which are an integral part of the financial statements.
40 Invesco High Yield Municipal Fund
| | | | | | | | | | | | | | | | |
| | | Interest
Rate | | | Maturity
Date | | | Principal
Amount
(000) | | |
Value | |
| New York–(continued) | | | | | | | | | | | | | | | | |
Monroe (County of) Industrial Development Agency (Cloverwood Senior Living); | | | | | | | | | | | | | | | | |
Series 2003 A, Civic Facility RB | | | 6.75 | % | | | 05/01/23 | | | $ | 2,000 | | | $ | 2,004,460 | |
Series 2003 A, Civic Facility RB(f)(j) | | | 6.88 | % | | | 05/01/13 | | | | 805 | | | | 813,815 | |
Series 2003 A, Civic Facility RB | | | 6.88 | % | | | 05/01/33 | | | | 4,195 | | | | 4,201,041 | |
Mount Vernon (City of) Industrial Development Agency (Wartburg Senior Housing, Inc./Meadowview); Series 1999, Civic Facility RB | | | 6.20 | % | | | 06/01/29 | | | | 1,000 | | | | 1,000,910 | |
Nassau (County of) Industrial Development Agency (Amsterdam at Harborside); | | | | | | | | | | | | | | | | |
Series 2007 A, Continuing Care Retirement Community RB | | | 6.50 | % | | | 01/01/27 | | | | 3,750 | | | | 2,598,037 | |
Series 2007 A, Continuing Care Retirement Community RB | | | 6.70 | % | | | 01/01/43 | | | | 29,700 | | | | 20,147,292 | |
New York & New Jersey (States of) Port Authority (JFK International Air Terminal LLC); Series 2010, Special Obligation RB | | | 6.00 | % | | | 12/01/42 | | | | 8,500 | | | | 10,097,490 | |
New York & New Jersey (States of) Port Authority; | | | | | | | | | | | | | | | | |
One Hundred Sixty-Ninth Series 2011, Consolidated RB(b)(d) | | | 5.00 | % | | | 10/15/27 | | | | 15,400 | | | | 18,013,226 | |
One Hundred Sixty-Ninth Series 2011, Consolidated RB(b)(d) | | | 5.00 | % | | | 10/15/28 | | | | 10,760 | | | | 12,532,064 | |
New York (City of) Industrial Development Agency (A Very Special Place Inc.); Series 2003 A, Civic Facility RB | | | 7.00 | % | | | 01/01/33 | | | | 2,650 | | | | 2,661,713 | |
New York (City of) Industrial Development Agency (Polytechnic University); Series 2007, Ref. Civic Facility RB (INS–ACA)(c) | | | 5.25 | % | | | 11/01/37 | | | | 5,850 | | | | 6,297,876 | |
New York (City of) Industrial Development Agency (Visy Paper Inc.); Series 1995, RB(b) | | | 7.95 | % | | | 01/01/28 | | | | 7,500 | | | | 7,507,650 | |
New York (City of) Industrial Development Agency; Series 2002 C, Civic Facility RB | | | 6.80 | % | | | 06/01/28 | | | | 5,000 | | | | 5,066,300 | |
New York (City of) Municipal Water Finance Authority; | | | | | | | | | | | | | | | | |
Series 2012 CC, Ref. Water & Sewer System RB(d) | | | 5.00 | % | | | 06/15/45 | | | | 14,750 | | | | 16,668,385 | |
Series 2012 FF, Water & Sewer System RB(d) | | | 5.00 | % | | | 06/15/45 | | | | 30,000 | | | | 33,989,100 | |
New York (City of); Subseries 1993 A-8, VRD Unlimited Tax GO Bonds (LOC-JPMorgan Chase Bank, N.A.)(k)(l) | | | 0.09 | % | | | 08/01/17 | | | | 415 | | | | 415,000 | |
New York (State of) Dormitory Authority (General Purpose); Series 2011 C, State Personal Income Tax RB(d) | | | 5.00 | % | | | 03/15/31 | | | | 15,000 | | | | 17,521,500 | |
New York (State of) Dormitory Authority (Orange Regional Medical Center); | | | | | | | | | | | | | | | | |
Series 2008, RB | | | 6.25 | % | | | 12/01/37 | | | | 4,275 | | | | 4,731,484 | |
Series 2008, RB | | | 6.50 | % | | | 12/01/21 | | | | 10,100 | | | | 11,721,353 | |
New York (State of) Energy Research & Development Authority (Consolidated Edison Co.); | | | | | | | | | | | | | | | | |
Series 2004 A-1, RB (INS–SGI)(b)(c)(g) | | | 0.18 | % | | | 01/01/39 | | | | 21,500 | | | | 17,737,500 | |
Subseries 2001 B-1, RB (INS–AMBAC)(b)(c)(g) | | | 0.19 | % | | | 10/01/36 | | | | 10,000 | | | | 8,350,000 | |
New York (State of) Energy Research & Development Authority; Series 1993, Regular Residual Interest RB(g) | | | 12.31 | % | | | 04/01/20 | | | | 2,500 | | | | 2,511,200 | |
New York Liberty Development Corp. (1 World Trade Center); Series 2011, Liberty RB(d) | | | 5.00 | % | | | 12/15/41 | | | | 32,775 | | | | 37,064,592 | |
New York Liberty Development Corp. (Goldman Sachs Headquarters); Series 2005, RB | | | 5.25 | % | | | 10/01/35 | | | | 16,515 | | | | 19,745,004 | |
New York Liberty Development Corp. (National Sports Museum); Series 2006 A, RB (Acquired 08/07/06; Cost $2,121,407)(h)(i) | | | 6.13 | % | | | 02/15/19 | | | | 2,500 | | | | 25 | |
New York State Environmental Facilities Corp; Series 2009 A, State Clean Water & Drinking Water RB(d) | | | 5.00 | % | | | 06/15/34 | | | | 20,000 | | | | 23,548,400 | |
Niagara Area Development Corp. (Covanta Energy); Series 2012, Ref. Solid Waste Disposal Facilities RB(b) | | | 5.25 | % | | | 11/01/42 | | | | 1,500 | | | | 1,573,920 | |
Orange (County of) Industrial Development Agency (Arden Hill Life Care Center); Series 2001 A, Civic Facility RB | | | 7.00 | % | | | 08/01/31 | | | | 4,000 | | | | 4,011,440 | |
Seneca (County of) Industrial Development Agency (Seneca Meadows, Inc.); Series 2005, RB(b)(f)(g)(h) | | | 6.63 | % | | | 10/01/13 | | | | 9,270 | | | | 9,347,590 | |
Suffolk (County of) Industrial Development Agency (Eastern Long Island Hospital Association); Series 2007, Civic Facility RB(h) | | | 5.50 | % | | | 01/01/37 | | | | 2,500 | | | | 2,508,375 | |
Suffolk (County of) Industrial Development Agency (Gurwin Jewish-Phase II); Series 2004, Civic Facility RB | | | 6.70 | % | | | 05/01/39 | | | | 1,895 | | | | 1,966,157 | |
Suffolk (County of) Industrial Development Agency (Medford Hamlet Assisted Living); Series 2005, Assisted Living Facility RB(b) | | | 6.38 | % | | | 01/01/39 | | | | 7,520 | | | | 7,553,314 | |
Sullivan (County of) Industrial Development Agency (Hebrew Academy for Special Children); Series 2002, Civic Facility RB | | | 7.50 | % | | | 06/01/32 | | | | 4,100 | | | | 4,155,350 | |
See accompanying Notes to Financial Statements which are an integral part of the financial statements.
41 Invesco High Yield Municipal Fund
| | | | | | | | | | | | | | | | |
| | | Interest
Rate | | | Maturity
Date | | | Principal
Amount
(000) | | |
Value | |
| New York–(continued) | | | | | | | | | | | | | | | | |
Syracuse (City of) Industrial Development Agency (Jewish Home of Central New York, Inc.); | | | | | | | | | | | | | | | | |
Series 2001 A, First Mortgage RB | | | 7.38 | % | | | 03/01/21 | | | $ | 1,455 | | | $ | 1,454,825 | |
Series 2001 A, First Mortgage RB | | | 7.38 | % | | | 03/01/31 | | | | 3,825 | | | | 3,772,559 | |
Utica (City of) Industrial Development Agency (Utica College); Series 2001, Civic Facility RB | | | 6.75 | % | | | 12/01/21 | | | | 2,140 | | | | 2,166,151 | |
Westchester (County of) Industrial Development Agency (Kendal on Hudson); Series 2003 A, Continuing Care Retirement Community Mortgage RB | | | 6.38 | % | | | 01/01/24 | | | | 5,000 | | | | 5,005,000 | |
| | | | | | | | | | | | | | | | 385,193,885 | |
| | | | |
| North Carolina–0.59% | | | | | | | | | | | | | | | | |
Halifax (County of) Industrial Facilities & Pollution Control Financing Authority (International Paper Co.); Series 2001 A, RB(b) | | | 5.90 | % | | | 09/01/25 | | | | 1,000 | | | | 1,003,560 | |
Johnston (County of) Memorial Hospital Authority (Johnston Memorial Hospital); | | | | | | | | | | | | | | | | |
Series 2008, RB (INS–AGM)(c)(d) | | | 5.25 | % | | | 10/01/28 | | | | 5,125 | | | | 5,715,554 | |
Series 2008, RB (INS–AGM)(c)(d) | | | 5.25 | % | | | 10/01/36 | | | | 8,000 | | | | 8,802,160 | |
North Carolina (State of) Medical Care Commission (Baptist Retirement); Series 2001 A, First Mortgage Health Care Facilities RB | | | 6.40 | % | | | 10/01/31 | | | | 7,050 | | | | 7,091,736 | |
North Carolina (State of) Medical Care Commission (Galloway Ridge); | | | | | | | | | | | | | | | | |
Series 2010 A, First Mortgage Retirement Facilities RB | | | 5.88 | % | | | 01/01/31 | | | | 865 | | | | 921,995 | |
Series 2010 A, First Mortgage Retirement Facilities RB | | | 6.00 | % | | | 01/01/39 | | | | 1,520 | | | | 1,617,903 | |
North Carolina (State of) Medical Care Commission (Lutheran Services); | | | | | | | | | | | | | | | | |
Series 2012, Ref. First Mortgage Health Care Facilities RB | | | 5.00 | % | | | 03/01/37 | | | | 1,000 | | | | 1,016,310 | |
Series 2012, Ref. First Mortgage Health Care Facilities RB | | | 5.00 | % | | | 03/01/42 | | | | 1,000 | | | | 1,013,390 | |
North Carolina (State of) Medical Care Commission (Southminster); Series 2007 A, First Mortgage Retirement Facilities RB | | | 5.75 | % | | | 10/01/37 | | | | 3,000 | | | | 3,018,420 | |
North Carolina (State of) Medical Care Commission (The Presbyterian Homes Obligated Group); | | | | | | | | | | | | | | | | |
Series 2006, First Mortgage Health Care Facilities RB | | | 5.60 | % | | | 10/01/36 | | | | 1,000 | | | | 1,026,220 | |
Series 2006 B, Ref. First Mortgage Health Care Facilities RB | | | 5.20 | % | | | 10/01/21 | | | | 1,500 | | | | 1,564,455 | |
North Carolina (State of) Medical Care Commission (Village at Brookwood); Series 2007, Ref. First Mortgage Retirement Facilities RB | | | 5.25 | % | | | 01/01/32 | | | | 7,650 | | | | 7,824,114 | |
North Carolina (State of) Medical Care Commission (WhiteStone); Series 2011 A, First Mortgage Retirement Facilities RB | | | 7.75 | % | | | 03/01/31 | | | | 2,000 | | | | 2,310,040 | |
| | | | | | | | | | | | | | | | 42,925,857 | |
| | | | |
| North Dakota–0.19% | | | | | | | | | | | | | | | | |
Grand Forks (City of) (4000 Valley Square); | | | | | | | | | | | | | | | | |
Series 2006, Ref. Senior Housing RB | | | 5.13 | % | | | 12/01/21 | | | | 1,315 | | | | 1,342,155 | |
Series 2006, Ref. Senior Housing RB | | | 5.20 | % | | | 12/01/26 | | | | 1,545 | | | | 1,563,215 | |
Series 2006, Ref. Senior Housing RB | | | 5.30 | % | | | 12/01/34 | | | | 3,255 | | | | 3,267,792 | |
Traill (County of) (Hillsboro Medical Center); | | | | | | | | | | | | | | | | |
Series 2007, Health Care RB | | | 5.25 | % | | | 05/01/20 | | | | 500 | | | | 518,005 | |
Series 2007, Health Care RB | | | 5.50 | % | | | 05/01/26 | | | | 1,520 | | | | 1,559,718 | |
Series 2007, Health Care RB | | | 5.50 | % | | | 05/01/42 | | | | 5,570 | | | | 5,617,011 | |
| | | | | | | | | | | | | | | | 13,867,896 | |
| | | | |
| Ohio–3.20% | | | | | | | | | | | | | | | | |
Adams (County of) (Adams County Hospital); Series 2005, Hospital Facility Improvement RB | | | 6.50 | % | | | 09/01/36 | | | | 15,955 | | | | 13,998,279 | |
Athens (County of) (O’Bleness Memorial Hospital); | | | | | | | | | | | | | | | | |
Series 2003 A, Ref. & Improvement Hospital Facilities RB | | | 6.90 | % | | | 11/15/23 | | | | 4,000 | | | | 4,069,320 | |
Series 2003 A, Ref. & Improvement Hospital Facilities RB | | | 7.13 | % | | | 11/15/33 | | | | 12,650 | | | | 12,840,256 | |
Buckeye Tobacco Settlement Financing Authority; | | | | | | | | | | | | | | | | |
Series 2007 A-2, Sr. Asset-Backed RB | | | 5.13 | % | | | 06/01/24 | | | | 32,045 | | | | 29,134,353 | |
Series 2007 B, First Sub. Asset-Backed CAB RB(e) | | | 0.00 | % | | | 06/01/47 | | | | 260,000 | | | | 16,569,800 | |
Centerville (City of) (Bethany Lutheran Village Continuing Care Facility Expansion); | | | | | | | | | | | | | | | | |
Series 2007 A, Health Care RB | | | 5.75 | % | | | 11/01/22 | | | | 2,000 | | | | 2,126,280 | |
Series 2007 A, Health Care RB | | | 6.00 | % | | | 11/01/27 | | | | 2,000 | | | | 2,113,840 | |
Series 2007 A, Health Care RB | | | 6.00 | % | | | 11/01/38 | | | | 2,550 | | | | 2,657,074 | |
See accompanying Notes to Financial Statements which are an integral part of the financial statements.
42 Invesco High Yield Municipal Fund
| | | | | | | | | | | | | | | | |
| | | Interest
Rate | | | Maturity
Date | | | Principal
Amount
(000) | | |
Value | |
| Ohio–(continued) | | | | | | | | | | | | | | | | |
Cleveland (City of) & Cuyahoga (County of) Port Authority (St. Clarence-Governmental & Educational Assistance Corp., LLC); Series 2006 A, Senior Housing RB | | | 6.25 | % | | | 05/01/38 | | | $ | 2,210 | | | $ | 2,211,481 | |
Cuyahoga (County of) (Canton, Inc.); Series 2000, Hospital Facilities RB | | | 7.50 | % | | | 01/01/30 | | | | 700 | | | | 701,365 | |
Cuyahoga (County of) (Eliza Jennings Senior Care Network); | | | | | | | | | | | | | | | | |
Series 2007 A, Health Care & Independent Living Facilities RB | | | 5.75 | % | | | 05/15/27 | | | | 2,355 | | | | 2,436,977 | |
Series 2007 A, Health Care & Independent Living Facilities RB | | | 6.00 | % | | | 05/15/37 | | | | 6,000 | | | | 6,195,000 | |
Series 2007 A, Health Care & Independent Living Facilities RB | | | 6.00 | % | | | 05/15/42 | | | | 3,645 | | | | 3,760,692 | |
Cuyahoga (County of) (Franciscan Community Inc.); Series 2004 C, Health Care Facilities RB | | | 6.25 | % | | | 05/15/32 | | | | 3,500 | | | | 3,506,125 | |
Franklin (County of) (First Community Village Obligated Group); Series 2013, Ref. Health Care Facilities RB | | | 5.63 | % | | | 07/01/47 | | | | 15,000 | | | | 14,796,600 | |
Gallia (County of) (Holzer Health System Obligated Group); Series 2012, Ref. & Improvement Hospital Facilities RB | | | 8.00 | % | | | 07/01/42 | | | | 20,000 | | | | 22,559,200 | |
Hamilton (County of) (Christ Hospital); Series 2012, Health Care Facilities RB | | | 5.50 | % | | | 06/01/42 | | | | 13,500 | | | | 15,327,090 | |
Hamilton (County of) (Life Enriching Communities); | | | | | | | | | | | | | | | | |
Series 2012, Health Care RB | | | 5.00 | % | | | 01/01/32 | | | | 2,250 | | | | 2,421,022 | |
Series 2012, Health Care RB | | | 5.00 | % | | | 01/01/46 | | | | 3,610 | | | | 3,788,659 | |
Hancock (County of) (Blanchard Valley Regional Health Center); Series 2011 A, Hospital
Facilities RB | | | 6.25 | % | | | 12/01/34 | | | | 5,850 | | | | 6,950,911 | |
Hickory Chase Community Authority (Hickory Chase); | | | | | | | | | | | | | | | | |
Series 2008, Infrastructure Improvement RB(a) | | | 6.75 | % | | | 12/01/27 | | | | 1,900 | | | | 1,045,076 | |
Series 2008, Infrastructure Improvement RB(a) | | | 7.00 | % | | | 12/01/38 | | | | 1,389 | | | | 764,006 | |
Lorain (County of) Port Authority (U.S. Steel Corp.); Series 2010, Recovery Zone Facility RB | | | 6.75 | % | | | 12/01/40 | | | | 18,500 | | | | 20,621,950 | |
Montgomery (County of) (Miami Valley Hospital); Series 2011 B, VRD RB(l) | | | 0.10 | % | | | 11/15/45 | | | | 10,200 | | | | 10,200,000 | |
Montgomery (County of) (St. Leonard); | | | | | | | | | | | | | | | | |
Series 2010, Ref. & Improvement Health Care & MFH RB | | | 6.38 | % | | | 04/01/30 | | | | 2,000 | | | | 2,245,420 | |
Series 2010, Ref. & Improvement Health Care & MFH RB | | | 6.63 | % | | | 04/01/40 | | | | 6,500 | | | | 7,311,460 | |
Norwood (City of) (Cornerstone at Norwood); | | | | | | | | | | | | | | | | |
Series 2006, Tax Increment Allocation Financing RB | | | 5.25 | % | | | 12/01/15 | | | | 730 | | | | 750,294 | |
Series 2006, Tax Increment Allocation Financing RB | | | 5.75 | % | | | 12/01/20 | | | | 1,300 | | | | 1,320,852 | |
Series 2006, Tax Increment Allocation Financing RB | | | 6.20 | % | | | 12/01/31 | | | | 7,340 | | | | 7,211,477 | |
Ohio (State of) Higher Educational Facility Commission (University Hospitals Health System, Inc.); Series 2009 A, Hospital RB(f)(j) | | | 6.75 | % | | | 01/15/15 | | | | 6,000 | | | | 6,715,860 | |
Toledo-Lucas (County of) Port Authority (Crocker Park Public Improvement); Series 2003, Special Assessment RB | | | 5.38 | % | | | 12/01/35 | | | | 6,580 | | | | 6,754,765 | |
| | | | | | | | | | | | | | | | 233,105,484 | |
| | | | |
| Oklahoma–0.61% | | | | | | | | | | | | | | | | |
Atoka (County of) Health Care Authority (Atoka Memorial Hospital); Series 2007, Hospital RB(a) | | | 6.63 | % | | | 10/01/37 | | | | 3,405 | | | | 3,500,749 | |
Citizen Potawatomi Nation; Series 2004 A, Sr. Obligation Tax RB | | | 6.50 | % | | | 09/01/16 | | | | 2,050 | | | | 2,033,067 | |
Cleveland (County of) Justice Authority (Detention Facility); Series 2009 B, Sales Tax RB | | | 5.75 | % | | | 03/01/29 | | | | 555 | | | | 608,047 | |
Oklahoma (County of) Finance Authority (Epworth Villa); | | | | | | | | | | | | | | | | |
Series 2005 A, Ref. RB | | | 5.00 | % | | | 04/01/15 | | | | 445 | | | | 466,222 | |
Series 2005 A, Ref. RB | | | 5.70 | % | | | 04/01/25 | | | | 2,500 | | | | 2,602,850 | |
Series 2012 A, RB | | | 5.00 | % | | | 04/01/33 | | | | 1,100 | | | | 1,124,145 | |
Series 2012 A, RB | | | 5.13 | % | | | 04/01/42 | | | | 4,260 | | | | 4,372,847 | |
Oklahoma (State of) Development Finance Authority (Great Plains Regional Medical Center); | | | | | | | | | | | | | | | | |
Series 2007, Hospital RB | | | 5.00 | % | | | 12/01/27 | | | | 3,500 | | | | 3,581,480 | |
Series 2007, Hospital RB | | | 5.13 | % | | | 12/01/36 | | | | 9,430 | | | | 9,486,580 | |
Oklahoma (State of) Development Finance Authority (Inverness Village Community); | | | | | | | | | | | | | | | | |
Series 2012, Ref. Continuing Care Retirement Community RB | | | 5.75 | % | | | 01/01/27 | | | | 2,930 | | | | 3,188,983 | |
Series 2012, Ref. Continuing Care Retirement Community RB | | | 6.00 | % | | | 01/01/32 | | | | 3,060 | | | | 3,337,940 | |
Tulsa (County of) Industrial Authority (Montereau, Inc.); | | | | | | | | | | | | | | | | |
Series 2010 A, Senior Living Community RB | | | 7.13 | % | | | 11/01/30 | | | | 1,250 | | | | 1,427,800 | |
Series 2010 A, Senior Living Community RB | | | 7.25 | % | | | 11/01/40 | | | | 5,250 | | | | 5,972,977 | |
Series 2010 A, Senior Living Community RB | | | 7.25 | % | | | 11/01/45 | | | | 2,100 | | | | 2,389,191 | |
| | | | | | | | | | | | | | | | 44,092,878 | |
See accompanying Notes to Financial Statements which are an integral part of the financial statements.
43 Invesco High Yield Municipal Fund
| | | | | | | | | | | | | | | | |
| | | Interest
Rate | | | Maturity
Date | | | Principal
Amount
(000) | | |
Value | |
| Oregon–0.67% | | | | | | | | | | | | | | | | |
Clackamas (County of) Hospital Facilities Authority (Willamette Falls Hospital); Series 2005, Ref. Gross RB(f)(j) | | | 5.13 | % | | | 04/01/15 | | | $ | 1,000 | | | $ | 1,096,770 | |
Clastop (County of) Care Center Health District; | | | | | | | | | | | | | | | | |
Series 1998, Senior Housing RB | | | 6.00 | % | | | 08/01/14 | | | | 345 | | | | 345,348 | |
Series 1998, Senior Housing RB | | | 6.88 | % | | | 08/01/28 | | | | 6,145 | | | | 6,149,179 | |
Douglas (County of) Hospital Facility Authority (Forest Glen); Series 1997 A, Elderly Housing RB(i) | | | 7.50 | % | | | 09/01/27 | | | | 1,600 | | | | 720,096 | |
Gilliam (County of) (Waste Management); Series 2002, Solid Waste Disposal RB(b) | | | 5.25 | % | | | 07/01/29 | | | | 9,220 | | | | 9,817,364 | |
Oregon (State of) Health, Housing, Educational & Cultural Facilities Authority (St. Anthony Village Housing); Series 1998 A, RB(b) | | | 7.25 | % | | | 06/01/28 | | | | 7,400 | | | | 7,406,290 | |
Salem (City of) Hospital Facility Authority (Capital Manor, Inc.); | | | | | | | | | | | | | | | | |
Series 2012, Ref. RB | | | 5.63 | % | | | 05/15/32 | | | | 250 | | | | 265,097 | |
Series 2012, Ref. RB | | | 6.00 | % | | | 05/15/42 | | | | 4,900 | | | | 5,295,381 | |
Series 2012, Ref. RB | | | 6.00 | % | | | 05/15/47 | | | | 5,745 | | | | 6,208,564 | |
Warm Springs Reservation Confederated Tribes of Oregon (Pelton Round Butte); Series 2009 B, Tribal Economic Development Hydroelectric RB(h) | | | 6.38 | % | | | 11/01/33 | | | | 1,000 | | | | 1,156,230 | |
Yamhill (County of) Hospital Authority (Friendsview Retirement Community); Series 2003, RB(f)(j) | | | 7.00 | % | | | 12/01/13 | | | | 9,925 | | | | 10,527,150 | |
| | | | | | | | | | | | | | | | 48,987,469 | |
| | | | |
| Pennsylvania–2.95% | | | | | | | | | | | | | | | | |
Allegheny (County of) Industrial Development Authority (AFCO Cargo PIT, LLC); | | | | | | | | | | | | | | | | |
Series 1999, Cargo Facilities Lease RB(b) | | | 6.63 | % | | | 09/01/24 | | | | 1,510 | | | | 1,497,543 | |
Series 2003, Cargo Facilities Lease RB(b) | | | 7.75 | % | | | 09/01/31 | | | | 6,350 | | | | 6,415,786 | |
Allegheny (County of) Industrial Development Authority (Propel Charter School-McKeesport); Series 2010 B, Charter School RB | | | 6.38 | % | | | 08/15/35 | | | | 1,220 | | | | 1,333,326 | |
Allegheny (County of) Industrial Development Authority (Propel Charter School-Montour); Series 2010 A, Charter School RB | | | 6.75 | % | | | 08/15/35 | | | | 1,225 | | | | 1,368,693 | |
Allegheny (County of) Industrial Development Authority (Propel Schools-Homestead); Series 2004 A, Charter School RB | | | 7.00 | % | | | 12/15/15 | | | | 335 | | | | 347,630 | |
Allegheny (County of) Redevelopment Authority (Pittsburgh Mills); Series 2004, Tax Allocation RB | | | 5.60 | % | | | 07/01/23 | | | | 1,500 | | | | 1,548,345 | |
Beaver (County of) Industrial Development Authority (FirstEnergy Generation Corp.); Series 2006 B, Ref. VRD PCR (LOC–Citibank, N.A.)(k)(l) | | | 0.12 | % | | | 12/01/35 | | | | 5,000 | | | | 5,000,000 | |
Berks (County of) Industrial Development Authority (One Douglassville); Series 2007 A, Ref. RB(b) | | | 6.13 | % | | | 11/01/34 | | | | 4,640 | | | | 4,713,822 | |
Bucks (County of) Industrial Development Authority (Ann’s Choice, Inc. Facility); | | | | | | | | | | | | | | | | |
Series 2005 A, Retirement Community RB | | | 6.13 | % | | | 01/01/25 | | | | 1,500 | | | | 1,519,050 | |
Series 2005 A, Retirement Community RB | | | 6.25 | % | | | 01/01/35 | | | | 5,850 | | | | 5,924,236 | |
Bucks (County of) Industrial Development Authority (Chandler); | | | | | | | | | | | | | | | | |
Series 1999, First Mortgage Health Care Facilities RB | | | 6.10 | % | | | 05/01/14 | | | | 440 | | | | 440,664 | |
Series 1999, First Mortgage Health Care Facilities RB | | | 6.20 | % | | | 05/01/19 | | | | 1,900 | | | | 1,901,349 | |
Series 1999, First Mortgage Health Care Facilities RB | | | 6.30 | % | | | 05/01/29 | | | | 3,450 | | | | 3,450,103 | |
Butler (County of) Hospital Authority (Butler Health System); | | | | | | | | | | | | | | | | |
Series 2009 B, RB | | | 7.13 | % | | | 07/01/29 | | | | 2,145 | | | | 2,703,987 | |
Series 2009 B, RB | | | 7.25 | % | | | 07/01/39 | | | | 1,590 | | | | 1,961,488 | |
Chartiers Valley Industrial & Commercial Development Authority (Asbury Health Center); | | | | | | | | | | | | | | | | |
Series 2006, Ref. First Mortgage RB | | | 5.25 | % | | | 12/01/13 | | | | 500 | | | | 509,810 | |
Series 2006, Ref. First Mortgage RB | | | 5.25 | % | | | 12/01/15 | | | | 260 | | | | 274,479 | |
Series 2006, Ref. First Mortgage RB | | | 5.38 | % | | | 12/01/16 | | | | 500 | | | | 535,835 | |
Series 2006, Ref. First Mortgage RB | | | 5.75 | % | | | 12/01/22 | | | | 935 | | | | 985,004 | |
Chester (County of) Industrial Development Authority (Avon Grove Charter School); | | | | | | | | | | | | | | | | |
Series 2007 A, RB | | | 6.25 | % | | | 12/15/27 | | | | 1,000 | | | | 1,053,950 | |
Series 2007 A, RB | | | 6.38 | % | | | 12/15/37 | | | | 1,500 | | | | 1,578,705 | |
Chester (County of) Industrial Development Authority (Collegium Charter School); | | | | | | | | | | | | | | | | |
Series 2012 A, Ref. RB | | | 5.25 | % | | | 10/15/32 | | | | 2,320 | | | | 2,340,810 | |
Series 2012 A, Ref. RB | | | 5.38 | % | | | 10/15/42 | | | | 4,230 | | | | 4,256,564 | |
See accompanying Notes to Financial Statements which are an integral part of the financial statements.
44 Invesco High Yield Municipal Fund
| | | | | | | | | | | | | | | | |
| | | Interest
Rate | | | Maturity
Date | | | Principal
Amount
(000) | | |
Value | |
| Pennsylvania–(continued) | | | | | | | | | | | | | | | | |
Cumberland (County of) Municipal Authority (Asbury Obligated Group); | | | | | | | | | | | | | | | | |
Series 2012, Ref. RB | | | 5.25 | % | | | 01/01/32 | | | $ | 1,265 | | | $ | 1,314,322 | |
Series 2012, Ref. RB | | | 5.25 | % | | | 01/01/41 | | | | 3,400 | | | | 3,490,474 | |
Cumberland (County of) Municipal Authority (Asbury Pennsylvania Obligated Group); Series 2010, RB | | | 6.13 | % | | | 01/01/45 | | | | 8,000 | | | | 8,780,880 | |
Cumberland (County of) Municipal Authority (Diakon Lutheran Ministries); Series 2007, RB | | | 5.00 | % | | | 01/01/36 | | | | 9,080 | | | | 9,393,351 | |
Cumberland (County of) Municipal Authority (Messiah Village); Series 2008 A, RB | | | 6.00 | % | | | 07/01/35 | | | | 1,000 | | | | 1,097,790 | |
Cumberland (County of) Municipal Authority (Presbyterian Homes Obligated Group); | | | | | | | | | | | | | | | | |
Series 2008 A, RB | | | 5.00 | % | | | 01/01/17 | | | | 1,640 | | | | 1,745,239 | |
Series 2008 A, RB | | | 5.35 | % | | | 01/01/20 | | | | 515 | | | | 516,061 | |
Series 2008 A, RB | | | 5.45 | % | | | 01/01/21 | | | | 885 | | | | 886,682 | |
Dauphin (County of) General Authority (Riverfront Office); Series 1998, Office & Parking RB | | | 6.00 | % | | | 01/01/25 | | | | 7,460 | | | | 7,471,861 | |
Delaware Valley Regional Financial Authority; | | | | | | | | | | | | | | | | |
Series 1998 A, RB (INS–AMBAC)(c) | | | 5.50 | % | | | 08/01/28 | | | | 17,525 | | | | 20,830,390 | |
Series 2007 A, RB | | | 5.50 | % | | | 06/01/37 | | | | 5,000 | | | | 6,197,550 | |
Fulton (County of) Industrial Development Authority (The Fulton County Medical Center); | | | | | | | | | | | | | | | | |
Series 2006, Hospital RB | | | 5.88 | % | | | 07/01/31 | | | | 4,000 | | | | 4,106,800 | |
Series 2006, Hospital RB | | | 5.90 | % | | | 07/01/40 | | | | 4,300 | | | | 4,396,965 | |
Harrisburg (City of) Authority (Harrisburg University of Science); Series 2007 B, University RB(a) | | | 6.00 | % | | | 09/01/36 | | | | 8,500 | | | | 6,401,435 | |
Lehigh (County of) General Purpose Authority (Bible Fellowship Church Homes, Inc.);
Series 2013, RB | | | 5.25 | % | | | 07/01/42 | | | | 4,430 | | | | 4,374,138 | |
Lehigh (County of) General Purpose Authority (KidsPeace Obligated Group); | | | | | | | | | | | | | | | | |
Series 1998, RB(a) | | | 6.00 | % | | | 11/01/18 | | | | 2,750 | | | | 1,354,238 | |
Series 1998, RB(a) | | | 6.00 | % | | | 11/01/23 | | | | 9,085 | | | | 4,473,908 | |
Series 1999, RB(a) | | | 6.20 | % | | | 11/01/14 | | | | 2,280 | | | | 1,122,786 | |
Lehigh (County of) Industrial Development Authority (Lifepath, Inc.); | | | | | | | | | | | | | | | | |
Series 1998, Health Facility RB | | | 6.10 | % | | | 06/01/18 | | | | 1,870 | | | | 1,870,056 | |
Series 1998, Health Facility RB | | | 6.30 | % | | | 06/01/28 | | | | 4,000 | | | | 3,917,120 | |
Montgomery (County of) Higher Education & Health Authority (AHF/Montgomery Inc.); Series 2006, Ref. & Improvement RB | | | 6.88 | % | | | 04/01/36 | | | | 8,000 | | | | 8,555,680 | |
Montgomery (County of) Industrial Development Authority (Geriatric); Series 1993 A, Health Care RB | | | 8.38 | % | | | 07/01/23 | | | | 2,515 | | | | 2,517,565 | |
Montgomery (County of) Industrial Development Authority (Philadelphia Presbytery Homes, Inc.); Series 2010, RB | | | 7.00 | % | | | 12/01/35 | | | | 6,000 | | | | 7,104,000 | |
Montgomery (County of) Industrial Development Authority (Whitemarsh Continuing Care); | | | | | | | | | | | | | | | | |
Series 2005, Mortgage RB | | | 6.13 | % | | | 02/01/28 | | | | 1,875 | | | | 1,910,925 | |
Series 2005, Mortgage RB | | | 6.25 | % | | | 02/01/35 | | | | 8,755 | | | | 8,902,434 | |
Montgomery (County of) Industrial Development Authority (Wordsworth Academy); Series 1994, RB | | | 7.75 | % | | | 09/01/14 | | | | 825 | | | | 827,739 | |
Northeastern Pennsylvania Hospital & Education Authority (Oakwood Terrace); | | | | | | | | | | | | | | | | |
Series 1999, Health Care RB | | | 7.13 | % | | | 10/01/29 | | | | 3,165 | | | | 3,169,273 | |
Series 2005, Health Care RB (Acquired 12/27/05; Cost $1,505,000)(h) | | | 6.50 | % | | | 10/01/32 | | | | 1,505 | | | | 1,550,195 | |
Pennsylvania (State of) Higher Educational Facilities Authority (Student Association, Inc. at California University of Pennsylvania); | | | | | | | | | | | | | | | | |
Series 2000 A, Student Housing RB | | | 6.75 | % | | | 09/01/20 | | | | 425 | | | | 426,054 | |
Series 2000 A, Student Housing RB | | | 6.75 | % | | | 09/01/32 | | | | 2,285 | | | | 2,291,741 | |
Philadelphia (City of) Hospitals & Higher Education Facilities Authority (Centralized Comprehensive Human Services, Inc.); Series 2002 A, RB | | | 7.25 | % | | | 01/01/21 | | | | 4,000 | | | | 4,085,160 | |
Philadelphia (City of) Industrial Development Authority (Baptist Home of Philadelphia); | | | | | | | | | | | | | | | | |
Series 1998 A, Health Care Facility RB(a) | | | 5.50 | % | | | 11/15/18 | | | | 1,350 | | | | 269,933 | |
Series 1998 A, Health Care Facility RB | | | 5.60 | % | | | 11/15/28 | | | | 5,485 | | | | 1,096,726 | |
Philadelphia (City of) Industrial Development Authority (Cathedral Village); Series 2003 A, RB | | | 6.88 | % | | | 04/01/34 | | | | 500 | | | | 505,940 | |
Philadelphia (City of) Industrial Development Authority (Global Leadership Academy Charter School); Series 2010, RB | | | 6.38 | % | | | 11/15/40 | | | | 1,000 | | | | 1,090,030 | |
Philadelphia (City of) Industrial Development Authority (Independence Charter School); Series 2007 A, RB | | | 5.50 | % | | | 09/15/37 | | | | 4,070 | | | | 4,104,025 | |
Philadelphia (City of) Industrial Development Authority (MaST Charter School); Series 2010, RB | | | 6.00 | % | | | 08/01/35 | | | | 500 | | | | 568,315 | |
Philadelphia (City of) Industrial Development Authority (New Foundations Charter School); Series 2012, RB | | | 6.63 | % | | | 12/15/41 | | | | 1,500 | | | | 1,656,495 | |
See accompanying Notes to Financial Statements which are an integral part of the financial statements.
45 Invesco High Yield Municipal Fund
| | | | | | | | | | | | | | | | |
| | | Interest
Rate | | | Maturity
Date | | | Principal
Amount
(000) | | |
Value | |
| Pennsylvania–(continued) | | | | | | | | | | | | | | | | |
Philadelphia (City of) Industrial Development Authority (Russell Byers Charter School); | | | | | | | | | | | | | | | | |
Series 2007 A, RB | | | 5.15 | % | | | 05/01/27 | | | $ | 1,000 | | | $ | 1,004,770 | |
Series 2007 A, RB | | | 5.25 | % | | | 05/01/37 | | | | 1,000 | | | | 987,780 | |
Philadelphia (City of) Industrial Development Authority; Series 1990, Commercial Development RB(b) | | | 7.75 | % | | | 12/01/17 | | | | 11,550 | | | | 11,569,173 | |
Susquehanna Area Regional Airport Authority; Series 2008 A, Airport System RB(b) | | | 6.50 | % | | | 01/01/38 | | | | 4,300 | | | | 4,871,728 | |
| | | | | | | | | | | | | | | | 214,468,906 | |
| | | | |
| Puerto Rico–1.53% | | | | | | | | | | | | | | | | |
Puerto Rico (Commonwealth of) Aqueduct & Sewer Authority; | | | | | | | | | | | | | | | | |
Series 2008 A, Sr. Lien RB | | | 6.00 | % | | | 07/01/38 | | | | 7,065 | | | | 7,316,796 | |
Series 2012 A, Sr. Lien RB | | | 5.25 | % | | | 07/01/42 | | | | 11,800 | | | | 11,630,552 | |
Series 2012 A, Sr. Lien RB | | | 6.00 | % | | | 07/01/47 | | | | 9,000 | | | | 9,414,810 | |
Puerto Rico (Commonwealth of) Electric Power Authority; | | | | | | | | | | | | | | | | |
Series 2008 WW, RB | | | 5.50 | % | | | 07/01/38 | | | | 4,125 | | | | 4,213,564 | |
Series 2010 CCC, RB | | | 5.25 | % | | | 07/01/27 | | | | 5,000 | | | | 5,179,750 | |
Series 2010 CCC, RB | | | 5.25 | % | | | 07/01/28 | | | | 8,825 | | | | 9,109,077 | |
Series 2010 XX, RB | | | 5.25 | % | | | 07/01/40 | | | | 16,110 | | | | 16,299,615 | |
Puerto Rico (Commonwealth of) Public Buildings Authority; Series 2004 I, Government
Facilities RB(f)(j) | | | 5.25 | % | | | 07/01/14 | | | | 75 | | | | 79,972 | |
Puerto Rico Sales Tax Financing Corp.; | | | | | | | | | | | | | | | | |
First Subseries 2010 A, CAB RB(e) | | | 0.00 | % | | | 08/01/36 | | | | 24,230 | | | | 6,356,014 | |
First Subseries 2010 C, CAB RB(e) | | | 0.00 | % | | | 08/01/38 | | | | 61,750 | | | | 14,096,907 | |
Series 2007 A, CAB RB (INS–AMBAC)(c)(e) | | | 0.00 | % | | | 08/01/54 | | | | 80,000 | | | | 7,082,400 | |
Series 2007 A, CAB RB (INS–NATL)(c)(e) | | | 0.00 | % | | | 08/01/45 | | | | 90,725 | | | | 14,809,042 | |
Series 2007 A, CAB RB (INS–NATL)(c)(e) | | | 0.00 | % | | | 08/01/46 | | | | 38,595 | | | | 5,884,194 | |
| | | | | | | | | | | | | | | | 111,472,693 | |
| | | | |
| Rhode Island–0.37% | | | | | | | | | | | | | | | | |
Rhode Island Economic Development Corp. (Providence Place); Series 2000, Sub. Obligation RB | | | 7.25 | % | | | 07/01/20 | | | | 3,255 | | | | 3,256,497 | |
Rhode Island Health & Educational Building Corp. (Lifespan Obligated Group); | | | | | | | | | | | | | | | | |
Series 2009 A, Hospital Financing RB | | | 7.00 | % | | | 05/15/39 | | | | 2,500 | | | | 2,935,125 | |
Series 2009 A, Hospital Financing RB (INS–AGC)(c) | | | 6.25 | % | | | 05/15/30 | | | | 2,000 | | | | 2,355,340 | |
Tobacco Settlement Financing Corp.; Series 2002 A, Asset-Backed RB | | | 6.25 | % | | | 06/01/42 | | | | 18,000 | | | | 18,540,000 | |
| | | | | | | | | | | | | | | | 27,086,962 | |
| | | | |
| South Carolina–0.72% | | | | | | | | | | | | | | | | |
Lancaster (County of) (Sun City Carolina Lakes); Series 2006, Special Assessment RB | | | 5.45 | % | | | 12/01/37 | | | | 1,430 | | | | 1,432,045 | |
Laurens County School District No. 055; Series 2005, Installment Purchase RB | | | 5.25 | % | | | 12/01/30 | | | | 4,080 | | | | 4,255,562 | |
Myrtle Beach (City of) (Myrtle Beach Air Force Base); | | | | | | | | | | | | | | | | |
Series 2006 A, Tax Increment Allocation RB | | | 5.25 | % | | | 10/01/26 | | | | 885 | | | | 814,589 | |
Series 2006 A, Tax Increment Allocation RB | | | 5.30 | % | | | 10/01/35 | | | | 1,250 | | | | 1,097,650 | |
South Carolina (State of) Jobs-Economic Development Authority (Episcopal Home at Still Hopes); Series 2004 B, Residential Care Facilities First Mortgage RB(g) | | | 5.90 | % | | | 05/15/34 | | | | 1,000 | | | | 1,002,260 | |
South Carolina (State of) Jobs-Economic Development Authority (Lutheran Homes); | | | | | | | | | | | | | | | | |
Series 2007, Ref. First Mortgage Health Care Facilities RB | | | 5.00 | % | | | 05/01/14 | | | | 1,035 | | | | 1,061,217 | |
Series 2007, Ref. First Mortgage Health Care Facilities RB | | | 5.38 | % | | | 05/01/21 | | | | 1,500 | | | | 1,579,080 | |
Series 2007, Ref. First Mortgage Health Care Facilities RB | | | 5.50 | % | | | 05/01/28 | | | | 1,100 | | | | 1,140,095 | |
South Carolina (State of) Jobs-Economic Development Authority (Palmetto Health Alliance); | | | | | | | | | | | | | | | | |
Series 2003 A, Ref. Hospital Facilities RB | | | 6.13 | % | | | 08/01/23 | | | | 6,500 | | | | 6,659,705 | |
Series 2003 A, Ref. Hospital Facilities RB | | | 6.25 | % | | | 08/01/31 | | | | 16,270 | | | | 16,669,754 | |
Series 2003 C, Hospital Facilities RB(f)(j) | | | 6.38 | % | | | 08/01/13 | | | | 4,005 | | | | 4,110,372 | |
Series 2003 C, Hospital Facilities RB(f)(j) | | | 6.38 | % | | | 08/01/13 | | | | 495 | | | | 508,023 | |
South Carolina (State of) Jobs-Economic Development Authority (South Carolina Episcopal Home at Still Hopes); | | | | | | | | | | | | | | | | |
Series 2004 A, First Mortgage Residential Care Facilities RB | | | 6.25 | % | | | 05/15/25 | | | | 750 | | | | 751,905 | |
Series 2004 A, First Mortgage Residential Care Facilities RB | | | 6.38 | % | | | 05/15/32 | | | | 1,250 | | | | 1,289,125 | |
See accompanying Notes to Financial Statements which are an integral part of the financial statements.
46 Invesco High Yield Municipal Fund
| | | | | | | | | | | | | | | | |
| | | Interest
Rate | | | Maturity
Date | | | Principal
Amount
(000) | | |
Value | |
| South Carolina–(continued) | | | | | | | | | | | | | | | | |
South Carolina (State of) Jobs-Economic Development Authority (The Woodlands at Furman); | | | | | | | | | | | | | | | | |
Series 2012, Ref. RB | | | 6.00 | % | | | 11/15/32 | | | $ | 1,426 | | | $ | 957,877 | |
Series 2012, Ref. RB | | | 6.00 | % | | | 11/15/42 | | | | 4,777 | | | | 3,136,281 | |
Series 2012, Ref. RB | | | 6.00 | % | | | 11/15/47 | | | | 5,561 | | | | 3,650,747 | |
Series 2012, Ref. Sub. CAB RB(e) | | | 0.00 | % | | | 11/15/47 | | | | 2,383 | | | | 2,383 | |
Series 2012, Ref. Sub. CAB RB(e) | | | 0.00 | % | | | 11/15/47 | | | | 1,742 | | | | 1,742 | |
Series 2012, Ref. Sub. CAB RB(e) | | | 0.00 | % | | | 11/15/47 | | | | 611 | | | | 611 | |
South Carolina (State of) Jobs-Economic Development Authority (Wesley Commons); Series 2006, Ref. First Mortgage Health Facilities RB | | | 5.13 | % | | | 10/01/26 | | | | 2,500 | | | | 2,522,700 | |
| | | | | 52,643,723 | |
| | | | |
| South Dakota–0.04% | | | | | | | | | | | | | | | | |
Sioux Falls (City of) (Dow Rummel Village); Series 2006, Ref. Health Facilities RB | | | 5.00 | % | | | 11/15/33 | | | | 2,000 | | | | 1,966,920 | |
Sioux Falls (City of); Series 2008 A, Tax Increment Allocation RB | | | 5.75 | % | | | 01/15/28 | | | | 1,300 | | | | 1,297,335 | |
| | | | | 3,264,255 | |
| | | | |
| Tennessee–0.90% | | | | | | | | | | | | | | | | |
Johnson City (City of) Health & Educational Facilities Board (Appalachian Christian Village); | | | | | | | | | | | | | | | | |
Series 2004 A, Retirement Facilities RB | | | 6.00 | % | | | 02/15/19 | | | | 805 | | | | 807,318 | |
Series 2004 A, Retirement Facilities RB | | | 6.00 | % | | | 02/15/24 | | | | 1,500 | | | | 1,504,320 | |
Series 2004 A, Retirement Facilities RB(f)(j) | | | 6.25 | % | | | 02/15/14 | | | | 3,550 | | | | 3,740,351 | |
Shelby (County of) Health, Educational & Housing Facilities Board (Kirby Pines); Series 1997 A, Health Care Facility RB | | | 6.38 | % | | | 11/15/25 | | | | 3,000 | | | | 3,004,740 | |
Shelby (County of) Health, Educational & Housing Facilities Board (The Village at Germantown); | | | | | | | | | | | | | | | | |
Series 2003 A, Residential Care Facility Mortgage RB | | | 6.38 | % | | | 12/01/13 | | | | 400 | | | | 408,188 | |
Series 2003 A, Residential Care Facility Mortgage RB(f)(j) | | | 7.00 | % | | | 12/01/13 | | | | 3,650 | | | | 3,833,558 | |
Series 2003 A, Residential Care Facility Mortgage RB(f)(j) | | | 7.25 | % | | | 12/01/13 | | | | 14,800 | | | | 15,571,228 | |
Series 2006, Residential Care Facility Mortgage RB (f)(j) | | | 6.25 | % | | | 12/01/16 | | | | 700 | | | | 801,122 | |
Series 2012, Ref. Residential Care Facility Mortgage RB | | | 5.00 | % | | | 12/01/32 | | | | 2,100 | | | | 2,109,513 | |
Series 2012, Ref. Residential Care Facility Mortgage RB | | | 5.25 | % | | | 12/01/42 | | | | 1,500 | | | | 1,512,990 | |
Series 2012, Ref. Residential Care Facility Mortgage RB | | | 5.38 | % | | | 12/01/47 | | | | 2,000 | | | | 2,022,080 | |
Shelby (County of) Health, Educational & Housing Facilities Board (Trezevant Manor); | | | | | | | | | | | | | | | | |
Series 2006 A, RB | | | 5.63 | % | | | 09/01/26 | | | | 1,000 | | | | 1,016,280 | |
Series 2006 A, RB | | | 5.75 | % | | | 09/01/37 | | | | 1,900 | | | | 1,912,559 | |
Tennessee Energy Acquisition Corp.; Series 2006 C, Gas RB | | | 5.00 | % | | | 02/01/27 | | | | 9,400 | | | | 10,715,248 | |
Trenton (City of) Health & Educational Facilities Board (RHA/Trenton MR, Inc.); Series 2009, RB | | | 9.25 | % | | | 04/01/39 | | | | 13,585 | | | | 16,362,182 | |
| | | | | 65,321,677 | |
| | | | |
| Texas–11.22% | | | | | | | | | | | | | | | | |
ABIA Development Corp. (Austin Belly Port Development, LLC); Series 1998 A, Airport Facilities RB(b) | | | 6.50 | % | | | 10/01/23 | | | | 5,540 | | | | 5,086,440 | |
Abilene Health Facilities Development Corp. (Sears Methodist Retirement System Obligated Group); | | | | | | | | | | | | | | | | |
Series 2003 A, Retirement Facility RB | | | 6.75 | % | | | 11/15/28 | | | | 1,730 | | | | 1,401,404 | |
Series 2003 A, Retirement Facility RB | | | 7.00 | % | | | 11/15/33 | | | | 8,690 | | | | 7,044,896 | |
Angelina & Neches River Authority Industrial Development Corp. (Aspen Power LLC); Series 2007 A, Environmental Facilities RB(a)(b) | | | 6.50 | % | | | 11/01/29 | | | | 9,265 | | | | 6,875,371 | |
Arlington Higher Education Finance Corp. (Arlington Classics Academy); Series 2010 B, Ref. RB | | | 7.65 | % | | | 08/15/40 | | | | 2,500 | | | | 2,824,525 | |
Austin Convention Enterprises, Inc.; Series 2006 B, Ref. Second Tier Convention Center RB(h) | | | 5.75 | % | | | 01/01/34 | | | | 5,060 | | | | 5,284,158 | |
Bexar County Health Facilities Development Corp. (Army Retirement Residence); Series 2010, RB | | | 6.20 | % | | | 07/01/45 | | | | 2,000 | | | | 2,274,000 | |
Bexar County Housing Finance Corp. (Woodland Ridge Apartments); Series 2002 A, MFH RB(b) | | | 7.00 | % | | | 01/01/39 | | | | 4,040 | | | | 4,061,695 | |
Brazoria County Health Facilities Development Corp. (Brazosport Regional Health System); | | | | | | | | | | | | | | | | |
Series 2012, Ref. RB | | | 5.25 | % | | | 07/01/32 | | | | 4,600 | | | | 4,871,262 | |
Series 2012, Ref. RB | | | 5.50 | % | | | 07/01/42 | | | | 10,000 | | | | 10,653,100 | |
See accompanying Notes to Financial Statements which are an integral part of the financial statements.
47 Invesco High Yield Municipal Fund
| | | | | | | | | | | | | | | | |
| | | Interest
Rate | | | Maturity
Date | | | Principal
Amount
(000) | | |
Value | |
| Texas–(continued) | | | | | | | | | | | | | | | | |
Capital Area Cultural Education Facilities Finance Corp. (The Roman Catholic Diocese of Austin); Series 2005 B, RB | | | 6.13 | % | | | 04/01/45 | | | $ | 7,465 | | | $ | 8,472,700 | |
Central Texas Regional Mobility Authority; | | | | | | | | | | | | | | | | |
Series 2011, Sr. Lien RB | | | 6.00 | % | | | 01/01/41 | | | | 7,000 | | | | 8,164,520 | |
Series 2011, Sub. Lien RB | | | 6.75 | % | | | 01/01/41 | | | | 14,500 | | | | 16,968,770 | |
Clifton Higher Education Finance Corp. (Idea Public Schools); | | | | | | | | | | | | | | | | |
Series 2011, Education RB | | | 5.75 | % | | | 08/15/41 | | | | 1,130 | | | | 1,283,816 | |
Series 2012, RB | | | 5.00 | % | | | 08/15/42 | | | | 3,750 | | | | 4,089,300 | |
Clifton Higher Education Finance Corp. (Uplift Education); | | | | | | | | | | | | | | | | |
Series 2010 A, Education RB | | | 6.13 | % | | | 12/01/40 | | | | 4,970 | | | | 5,801,580 | |
Series 2010 A, Education RB | | | 6.25 | % | | | 12/01/45 | | | | 7,000 | | | | 8,229,970 | |
Dallas (County of) Flood Control District No. 1; Series 2002, Ref. Unlimited Tax GO Bonds | | | 7.25 | % | | | 04/01/32 | | | | 9,445 | | | | 9,477,869 | |
Decatur (City of) Hospital Authority (Wise Regional Health System); | | | | | | | | | | | | | | | | |
Series 2004 A, RB | | | 5.63 | % | | | 09/01/13 | | | | 470 | | | | 479,283 | |
Series 2004 A, RB | | | 7.00 | % | | | 09/01/25 | | | | 13,775 | | | | 14,572,159 | |
Series 2004 A, RB | | | 7.13 | % | | | 09/01/34 | | | | 8,155 | | | | 8,610,864 | |
Fort Bend County Industrial Development Corp. (NRG Energy Inc.); Series 2012 A, RB | | | 4.75 | % | | | 05/01/38 | | | | 2,500 | | | | 2,584,125 | |
Grand Prairie Housing Finance Corp.; | | | | | | | | | | | | | | | | |
Series 2003, Priority Lien Independent Senior Living Center RB | | | 7.50 | % | | | 07/01/17 | | | | 810 | | | | 831,538 | |
Series 2003, Priority Lien Independent Senior Living Center RB | | | 7.63 | % | | | 01/01/20 | | | | 655 | | | | 695,689 | |
Series 2003, Priority Lien Independent Senior Living Center RB | | | 7.75 | % | | | 01/01/34 | | | | 6,795 | | | | 7,315,429 | |
Series 2003, Sub. Lien Independent Senior Living Center RB(a) | | | 7.50 | % | | | 07/01/17 | | | | 610 | | | | 29,481 | |
Series 2003, Sub. Lien Independent Senior Living Center RB(a) | | | 7.63 | % | | | 01/01/20 | | | | 345 | | | | 16,674 | |
Series 2003, Sub. Lien Independent Senior Living Center RB(a) | | | 7.75 | % | | | 01/01/34 | | | | 3,595 | | | | 173,746 | |
Harris County Health Facilities Development Corp. (Memorial Hermann Healthcare System); Series 2008 B, Ref. RB | | | 7.20 | % | | | 12/01/28 | | | | 1,000 | | | | 1,099,050 | |
Harrison County Health Facilities Development Corp. (Good Shepherd Health System) Series 2010, Hospital RB | | | 5.25 | % | | | 07/01/28 | | | | 1,500 | | | | 1,675,275 | |
HFDC of Central Texas, Inc. (Legacy at Willow Bend); | | | | | | | | | | | | | | | | |
Series 2006 A, Retirement Facilities RB | | | 5.50 | % | | | 11/01/31 | | | | 500 | | | | 500,145 | |
Series 2006 A, Retirement Facilities RB | | | 5.63 | % | | | 11/01/26 | | | | 10,350 | | | | 10,650,667 | |
HFDC of Central Texas, Inc. (Sears Tyler Methodist); | | | | | | | | | | | | | | | | |
Series 2009 A, RB | | | 7.75 | % | | | 11/15/29 | | | | 4,910 | | | | 3,675,528 | |
Series 2009 A, RB | | | 7.75 | % | | | 11/15/44 | | | | 15,345 | | | | 11,496,321 | |
Series 2009 B, RB | | | 6.38 | % | | | 11/15/19 | | | | 1,210 | | | | 1,210,000 | |
HFDC of Central Texas, Inc. (Village at Gleannloch Farms); | | | | | | | | | | | | | | | | |
Series 2006 A, Retirement Facilities RB | | | 5.50 | % | | | 02/15/27 | | | | 4,300 | | | | 4,340,979 | |
Series 2006 A, Retirement Facilities RB | | | 5.50 | % | | | 02/15/37 | | | | 14,000 | | | | 13,816,180 | |
HFDC of Central Texas, Inc.; Series 2006 A, Retirement Facilities RB | | | 5.75 | % | | | 11/01/36 | | | | 6,355 | | | | 6,474,283 | |
Hidalgo County Health Services Corp. (Mission Hospital, Inc.); | | | | | | | | | | | | | | | | |
Series 2005, Hospital RB | | | 5.00 | % | | | 08/15/15 | | | | 500 | | | | 517,135 | |
Series 2005, Hospital RB | | | 5.00 | % | | | 08/15/19 | | | | 700 | | | | 716,583 | |
Hopkins (County of) Hospital District; | | | | | | | | | | | | | | | | |
Series 2008, RB | | | 6.00 | % | | | 02/15/33 | | | | 2,500 | | | | 2,596,300 | |
Series 2008, RB | | | 6.00 | % | | | 02/15/38 | | | | 5,155 | | | | 5,326,455 | |
Houston (City of) (Continental Airlines, Inc.); | | | | | | | | | | | | | | | | |
Series 1997 C, Special Facilities Airport System RB(b) | | | 6.13 | % | | | 07/15/27 | | | | 3,120 | | | | 3,132,948 | |
Series 1998 C, Airport System Special Facilities RB(b) | | | 5.70 | % | | | 07/15/29 | | | | 4,730 | | | | 4,742,345 | |
Series 2001 E, Airport System Special Facilities RB(b) | | | 6.75 | % | | | 07/01/29 | | | | 6,000 | | | | 6,026,040 | |
Series 2011 A, Ref. Airport System Special Facilities RB(b) | | | 6.63 | % | | | 07/15/38 | | | | 10,000 | | | | 11,187,900 | |
Houston (City of); | | | | | | | | | | | | | | | | |
Series 2009 A, Ref. Sr. Lien Airport System RB(d) | | | 5.00 | % | | | 07/01/23 | | | | 6,580 | | | | 7,635,958 | |
Series 2009 A, Ref. Sr. Lien Airport System RB(d) | | | 5.00 | % | | | 07/01/24 | | | | 3,670 | | | | 4,227,473 | |
See accompanying Notes to Financial Statements which are an integral part of the financial statements.
48 Invesco High Yield Municipal Fund
| | | | | | | | | | | | | | | | |
| | | Interest
Rate | | | Maturity
Date | | | Principal
Amount
(000) | | |
Value | |
| Texas–(continued) | | | | | | | | | | | | | | | | |
Series 2009 A, Ref. Sr. Lien Airport System RB(d) | | | 5.00 | % | | | 07/01/25 | | | $ | 6,800 | | | $ | 7,853,796 | |
Series 2009 A, Ref. Sr. Lien Airport System RB(d) | | | 5.00 | % | | | 07/01/26 | | | | 3,000 | | | | 3,466,890 | |
Series 2011 A, Ref. First Lien Utility System RB(d) | | | 5.25 | % | | | 11/15/31 | | | | 18,360 | | | | 21,959,845 | |
Houston Health Facilities Development Corp. (Buckingham Senior Living Community); | | | | | | | | | | | | | | | | |
Series 2004 A, Retirement Facilities RB(f)(j) | | | 7.00 | % | | | 02/15/14 | | | | 800 | | | | 859,040 | |
Series 2004 A, Retirement Facilities RB(f)(j) | | | 7.00 | % | | | 02/15/14 | | | | 750 | | | | 805,350 | |
Series 2004 A, Retirement Facilities RB(f)(j) | | | 7.13 | % | | | 02/15/14 | | | | 450 | | | | 483,705 | |
Houston Higher Education Finance Corp. (Cosmos Foundation); | | | | | | | | | | | | | | | | |
Series 2012 A, RB | | | 5.00 | % | | | 02/15/32 | | | | 1,200 | | | | 1,301,772 | |
Series 2012 A, RB | | | 5.00 | % | | | 02/15/42 | | | | 2,500 | | | | 2,659,600 | |
Houston Higher Education Finance Corp. (Cosmos Foundation, Inc.); | | | | | | | | | | | | | | | | |
Series 2011 A, RB | | | 6.50 | % | | | 05/15/31 | | | | 500 | | | | 625,295 | |
Series 2011 A, RB | | | 6.88 | % | | | 05/15/41 | | | | 790 | | | | 1,003,434 | |
La Vernia Higher Education Finance Corp. (Amigos Por Vida/Friends for Life); Series 2008, RB | | | 6.38 | % | | | 02/15/37 | | | | 1,635 | | | | 1,679,652 | |
La Vernia Higher Education Finance Corp. (Cosmos Foundation); | | | | | | | | | | | | | | | | |
Series 2008 A, RB | | | 6.25 | % | | | 02/15/17 | | | | 1,025 | | | | 1,148,205 | |
Series 2008 A, RB | | | 7.13 | % | | | 02/15/38 | | | | 2,000 | | | | 2,314,240 | |
La Vernia Higher Education Finance Corp. (Knowledge is Power Program, Inc.); | | | | | | | | | | | | | | | | |
Series 2009 A, RB | | | 6.25 | % | | | 08/15/39 | | | | 1,210 | | | | 1,411,647 | |
Series 2009 A, RB | | | 6.38 | % | | | 08/15/44 | | | | 7,225 | | | | 8,462,787 | |
Lone Star College System; Series 2009, Limited Tax GO Bonds(d) | | | 5.00 | % | | | 08/15/34 | | | | 23,200 | | | | 27,485,272 | |
Lubbock Health Facilities Development Corp. (Carillon Senior LifeCare Community); | | | | | | | | | | | | | | | | |
Series 2005 A, Ref. First Mortgage RB | | | 6.50 | % | | | 07/01/26 | | | | 2,500 | | | | 2,642,975 | |
Series 2005 A, Ref. First Mortgage RB | | | 6.63 | % | | | 07/01/36 | | | | 9,000 | | | | 9,429,930 | |
Matagorda (County of) Navigation District No. 1 (Central Power & Light Co.); Series 2001 A, Ref. PCR | | | 6.30 | % | | | 11/01/29 | | | | 1,000 | | | | 1,179,020 | |
Meadow Parc Development, Inc. (Meadow Parc Apartments); Series 1998, MFH RB | | | 6.50 | % | | | 12/01/30 | | | | 11,205 | | | | 11,206,569 | |
Mesquite Health Facility Development Corp. (Christian Care Centers, Inc.); Series 2005, Retirement Facility RB | | | 5.63 | % | | | 02/15/35 | | | | 1,500 | | | | 1,538,775 | |
Midlothian (City of) Development Authority; Series 2004, Tax Increment Allocation Contract RB(h) | | | 6.20 | % | | | 11/15/29 | | | | 4,500 | | | | 4,543,920 | |
North Central Texas Health Facility Development Corp. (Children’s Medical Center of Dallas); Series 2009, Hospital RB | | | 5.75 | % | | | 08/15/39 | | | | 1,500 | | | | 1,716,555 | |
North Texas Education Finance Corp. (Uplift Education); | | | | | | | | | | | | | | | | |
Series 2012 A, RB | | | 5.13 | % | | | 12/01/42 | | | | 3,000 | | | | 3,240,720 | |
Series 2012 A, RB | | | 5.25 | % | | | 12/01/47 | | | | 2,100 | | | | 2,280,978 | |
North Texas Tollway Authority; | | | | | | | | | | | | | | | | |
Series 2008 A, Ref. First Tier System RB (INS–BHAC)(c)(d) | | | 5.75 | % | | | 01/01/48 | | | | 30,545 | | | | 35,797,213 | |
Series 2011 B, Special Project System CAB RB(e) | | | 0.00 | % | | | 09/01/37 | | | | 15,500 | | | | 4,567,230 | |
Orange Housing Development Corp. (Villages at Pine Hollow); Series 1998, MFH RB | | | 8.00 | % | | | 03/01/28 | | | | 3,130 | | | | 2,886,987 | |
Pearland (City of) Development Authority; Series 2009, Tax Increment Allocation Contract RB(f)(j) | | | 5.88 | % | | | 09/01/18 | | | | 805 | | | | 1,015,548 | |
Pharr (City of) Higher Education Finance Authority (Idea Public Schools); | | | | | | | | | | | | | | | | |
Series 2009 A, Education RB | | | 6.25 | % | | | 08/15/29 | | | | 570 | | | | 654,639 | |
Series 2009 A, Education RB | | | 6.50 | % | | | 08/15/39 | | | | 6,320 | | | | 7,289,741 | |
Red River Health Facilities Development Corp. (MRC the Crossings); Series 2012, Continuing Care Retirement Community BAN(h) | | | 12.00 | % | | | 12/14/17 | | | | 3,000 | | | | 2,984,310 | |
San Antonio Convention Hotel Finance Corp. (Empowerment Zone); Series 2005 A, Contract RB (INS–AMBAC)(b)(c) | | | 5.00 | % | | | 07/15/39 | | | | 16,900 | | | | 17,013,906 | |
San Juan (City of) Higher Education Finance Authority (Idea Public Schools); Series 2010 A, Education RB | | | 6.70 | % | | | 08/15/40 | | | | 1,000 | | | | 1,186,910 | |
Sanger Industrial Development Corp. (Texas Pellets); Series 2012 B, RB(b) | | | 8.00 | % | | | 07/01/38 | | | | 50,000 | | | | 53,627,500 | |
Tarrant County Cultural Education Facilities Finance Corp. (Air Force Village Obligated Group); | | | | | | | | | | | | | | | | |
Series 2009, Retirement Facility RB | | | 6.13 | % | | | 11/15/29 | | | | 1,000 | | | | 1,119,910 | |
Series 2009, Retirement Facility RB | | | 6.38 | % | | | 11/15/44 | | | | 12,150 | | | | 13,452,723 | |
Tarrant County Cultural Education Facilities Finance Corp. (Buckingham Senior Living
Community, Inc.); | | | | | | | | | | | | | | | | |
Series 2007, Retirement Facility RB | | | 5.63 | % | | | 11/15/27 | | | | 1,500 | | | | 1,573,320 | |
Series 2007, Retirement Facility RB | | | 5.75 | % | | | 11/15/37 | | | | 3,500 | | | | 3,634,015 | |
See accompanying Notes to Financial Statements which are an integral part of the financial statements.
49 Invesco High Yield Municipal Fund
| | | | | | | | | | | | | | | | |
| | | Interest
Rate | | | Maturity
Date | | | Principal
Amount
(000) | | |
Value | |
| Texas–(continued) | | | | | | | | | | | | | | | | |
Tarrant County Cultural Education Facilities Finance Corp. (C.C. Young Memorial Home); | | | | | | | | | | | | | | | | |
Series 2007, Retirement Facility RB | | | 5.25 | % | | | 02/15/17 | | | $ | 1,150 | | | $ | 1,199,404 | |
Series 2007, Retirement Facility RB | | | 5.75 | % | | | 02/15/25 | | | | 1,500 | | | | 1,552,545 | |
Series 2007, Retirement Facility RB | | | 5.75 | % | | | 02/15/29 | | | | 1,600 | | | | 1,636,624 | |
Series 2009 A, Retirement Facility RB | | | 8.00 | % | | | 02/15/38 | | | | 12,350 | | | | 14,169,772 | |
Series 2009 B-1, Retirement Facility RB | | | 7.25 | % | | | 02/15/16 | | | | 4,562 | | | | 4,575,321 | |
Tarrant County Cultural Education Facilities Finance Corp. (Mirador); | | | | | | | | | | | | | | | | |
Series 2010 A, Retirement Facility RB | | | 8.00 | % | | | 11/15/29 | | | | 1,500 | | | | 1,695,750 | |
Series 2010 A, Retirement Facility RB | | | 8.13 | % | | | 11/15/39 | | | | 7,000 | | | | 7,901,810 | |
Series 2010 A, Retirement Facility RB | | | 8.25 | % | | | 11/15/44 | | | | 8,000 | | | | 9,061,840 | |
Tarrant County Cultural Education Facilities Finance Corp. (Stayton at Museum Way); | | | | | | | | | | | | | | | | |
Series 2009 A, Retirement Facility RB | | | 8.25 | % | | | 11/15/29 | | | | 2,135 | | | | 2,423,460 | |
Series 2009 A, Retirement Facility RB | | | 8.25 | % | | | 11/15/39 | | | | 2,140 | | | | 2,410,753 | |
Series 2009 A, Retirement Facility RB | | | 8.25 | % | | | 11/15/44 | | | | 5,250 | | | | 5,906,512 | |
Series 2009 C-1, TEMPS 80sm Retirement Facility RB | | | 7.50 | % | | | 11/15/16 | | | | 13,595 | | | | 13,621,238 | |
Texas (State of) Department of Housing & Community Affairs (Linked Select Auction Variable Rate Securities & Residual Interest Bonds); Series 1992 C, Home Mortgage RB (CEP–GNMA)(b) | | | 6.90 | % | | | 07/02/24 | | | | 350 | | | | 361,386 | |
Texas (State of) Transportation Commission; Series 2012 A, Ref. First Tier Turnpike System RB | | | 5.00 | % | | | 08/15/41 | | | | 10,000 | | | | 10,992,200 | |
Texas (State of) Turnpike Authority (Central Texas Turnpike System); | | | | | | | | | | | | | | | | |
Series 2002, CAB RB (INS–AMBAC)(c)(e) | | | 0.00 | % | | | 08/15/32 | | | | 22,115 | | | | 7,017,532 | |
Series 2002, CAB RB (INS–AMBAC)(c)(e) | | | 0.00 | % | | | 08/15/33 | | | | 37,225 | | | | 11,104,217 | |
Series 2002, CAB RB (INS–AMBAC)(c)(e) | | | 0.00 | % | | | 08/15/36 | | | | 19,000 | | | | 4,724,350 | |
Series 2002, CAB RB (INS–AMBAC)(c)(e) | | | 0.00 | % | | | 08/15/37 | | | | 30,000 | | | | 7,008,600 | |
Texas (State of) Water Development Board; | | | | | | | | | | | | | | | | |
Series 2008 A, Sub. Lien State Revolving Fund RB(d) | | | 5.00 | % | | | 07/15/25 | | | | 15,000 | | | | 17,482,350 | |
Series 2008 B, Sub. Lien State Revolving Fund RB(d) | | | 5.00 | % | | | 07/15/28 | | | | 11,425 | | | | 13,121,955 | |
Series 2008 B, Sub. Lien State Revolving Fund RB(d) | | | 5.00 | % | | | 07/15/29 | | | | 5,000 | | | | 5,742,650 | |
Texas Municipal Gas Acquisition & Supply Corp. III; | | | | | | | | | | | | | | | | |
Series 2012, Gas Supply RB | | | 5.00 | % | | | 12/15/28 | | | | 10,000 | | | | 10,986,400 | |
Series 2012, Gas Supply RB | | | 5.00 | % | | | 12/15/29 | | | | 14,500 | | | | 15,868,220 | |
Series 2012, Gas Supply RB | | | 5.00 | % | | | 12/15/30 | | | | 18,950 | | | | 20,657,205 | |
Series 2012, Gas Supply RB | | | 5.00 | % | | | 12/15/31 | | | | 12,390 | | | | 13,453,681 | |
Series 2012, Gas Supply RB | | | 5.00 | % | | | 12/15/32 | | | | 12,915 | | | | 13,969,251 | |
Texas Private Activity Bond Surface Transportation Corp. (LBJ Infrastructure); Series 2010, Sr. Lien RB | | | 7.00 | % | | | 06/30/40 | | | | 22,345 | | | | 27,173,084 | |
Texas Private Activity Bond Surface Transportation Corp. (NTE Mobility Partners LLC North Tarrant Express Management Lanes); Series 2009, Sr. Lien RB | | | 6.88 | % | | | 12/31/39 | | | | 19,915 | | | | 23,809,777 | |
Texas State Public Finance Authority Charter School Finance Corp. (New Frontiers Charter School) Series 2010 A, Education RB | | | 5.80 | % | | | 08/15/40 | | | | 1,000 | | | | 1,082,940 | |
Texas State Public Finance Authority Charter School Finance Corp. (Odyssey Academy, Inc.); | | | | | | | | | | | | | | | | |
Series 2010 A, Education RB | | | 6.88 | % | | | 02/15/30 | | | | 1,455 | | | | 1,630,706 | |
Series 2010 A, Education RB | | | 7.13 | % | | | 02/15/40 | | | | 1,810 | | | | 2,058,061 | |
Texas State Public Finance Authority Charter School Finance Corp. (School Excellence Education); Series 2004 A, RB(h) | | | 7.00 | % | | | 12/01/34 | | | | 3,450 | | | | 3,532,869 | |
Travis County Cultural Education Facilities Finance Corp. (Wayside Schools); Series 2012 A, Education RB | | | 5.25 | % | | | 08/15/42 | | | | 2,375 | | | | 2,394,309 | |
Travis County Health Facilities Development Corp. (Querencia Barton Creek); | | | | | | | | | | | | | | | | |
Series 2005, Retirement Facility RB | | | 5.50 | % | | | 11/15/25 | | | | 1,650 | | | | 1,696,679 | |
Series 2005, Retirement Facility RB | | | 5.65 | % | | | 11/15/35 | | | | 1,250 | | | | 1,273,963 | |
Travis County Health Facilities Development Corp. (Westminster Manor); Series 2010, RB | | | 7.00 | % | | | 11/01/30 | | | | 2,500 | | | | 3,003,175 | |
Tyler Health Facilities Development Corp. (Mother Frances Hospital Regional Health Care Center); Series 2007, Ref. Hospital RB | | | 5.00 | % | | | 07/01/33 | | | | 10,000 | | | | 10,485,800 | |
Uptown Development Authority (Infrastructure Improvement Facilities); | | | | | | | | | | | | | | | | |
Series 2009, Tax Increment Allocation Contract RB | | | 5.38 | % | | | 09/01/25 | | | | 465 | | | | 519,363 | |
Series 2009, Tax Increment Allocation Contract RB | | | 5.50 | % | | | 09/01/29 | | | | 2,250 | | | | 2,520,990 | |
| | | | | | | | | | | | | | | | 817,152,595 | |
See accompanying Notes to Financial Statements which are an integral part of the financial statements.
50 Invesco High Yield Municipal Fund
| | | | | | | | | | | | | | | | |
| | | Interest
Rate | | | Maturity
Date | | | Principal
Amount
(000) | | |
Value | |
| Utah–0.44% | |
Eagle Mountain (City of) (Special Improvement District No. 2000-1); Series 2006, Special Assessment RB | | | 8.25 | % | | | 02/01/21 | | | $ | 1,080 | | | $ | 1,081,577 | |
Provo (City of) (Freedom Academy Foundation); Series 2007, Charter School RB | | | 5.50 | % | | | 06/15/37 | | | | 2,380 | | | | 2,351,511 | |
Utah (County of) (Renaissance Academy); | | | | | | | | | | | | | | | | |
Series 2007 A, Charter School RB | | | 5.35 | % | | | 07/15/17 | | | | 675 | | | | 698,362 | |
Series 2007 A, Charter School RB | | | 5.63 | % | | | 07/15/37 | | | | 2,700 | | | | 2,708,640 | |
Utah (State of) Charter School Finance Authority (George Washington Academy); | | | | | | | | | | | | | | | | |
Series 2008 A, Charter School RB | | | 6.75 | % | | | 07/15/28 | | | | 1,340 | | | | 1,409,626 | |
Series 2008 A, Charter School RB | | | 7.00 | % | | | 07/15/40 | | | | 6,690 | | | | 7,066,179 | |
Utah (State of) Charter School Finance Authority (Navigator Pointe Academy); | | | | | | | | | | | | | | | | |
Series 2010 A, Charter School RB | | | 5.38 | % | | | 07/15/30 | | | | 1,650 | | | | 1,752,498 | |
Series 2010 A, Charter School RB | | | 5.63 | % | | | 07/15/40 | | | | 710 | | | | 760,112 | |
Utah (State of) Charter School Finance Authority (North Davis Preparatory Academy); | | | | | | | | | | | | | | | | |
Series 2010, Charter School RB | | | 6.25 | % | | | 07/15/30 | | | | 1,250 | | | | 1,364,688 | |
Series 2010, Charter School RB | | | 6.38 | % | | | 07/15/40 | | | | 2,500 | | | | 2,725,100 | |
Utah (State of) Charter School Finance Authority (Vista Entrada School of Performing Arts); | | | | | | | | | | | | | | | | |
Series 2012, RB | | | 5.60 | % | | | 07/15/22 | | | | 945 | | | | 995,671 | |
Series 2012, RB | | | 6.30 | % | | | 07/15/32 | | | | 850 | | | | 900,915 | |
Series 2012, RB | | | 6.55 | % | | | 07/15/42 | | | | 2,000 | | | | 2,119,200 | |
Utah (State of) Housing Finance Agency (RHA Community Services); Series 1997 A, RB | | | 6.88 | % | | | 07/01/27 | | | | 4,075 | | | | 4,079,971 | |
West Valley City (City of) (Monticello Academy); Series 2007, Ref. Charter School RB(h) | | | 6.38 | % | | | 06/01/37 | | | | 1,900 | | | | 1,915,485 | |
| | | | | | | | | | | | | | | | 31,929,535 | |
|
| Vermont–0.08% | |
Vermont (State of) Economic Development Authority (Wake Robin Corp.); Series 2006 A,
Mortgage RB | | | 5.38 | % | | | 05/01/36 | | | | 4,750 | | | | 4,849,132 | |
Vermont (State of) Educational & Health Buildings Financing Agency (Developmental & Mental Health); | | | | | | | | | | | | | | | | |
Series 2002 A, RB | | | 6.38 | % | | | 06/15/22 | | | | 545 | | | | 553,306 | |
Series 2002 A, RB | | | 6.50 | % | | | 06/15/32 | | | | 175 | | | | 177,380 | |
| | | | | | | | | | | | | | | | 5,579,818 | |
|
| Virgin Islands–0.13% | |
Virgin Islands (Government of) (Matching Fund Loan Note–Diago); Series 2009 A, RB | | | 6.75 | % | | | 10/01/37 | | | | 4,500 | | | | 5,293,260 | |
Virgin Islands (Government of) Public Finance Authority (Matching Fund Loan Note); Series 2012 A, RB(h) | | | 5.00 | % | | | 10/01/32 | | | | 4,000 | | | | 4,384,360 | |
| | | | | | | | | | | | | | | | 9,677,620 | |
|
| Virginia–2.92% | |
Albemarle (County of) Industrial Development Authority (Covenant School, Inc.); Series 2001 A, Educational Facilities RB | | | 7.75 | % | | | 07/15/32 | | | | 4,000 | | | | 3,952,120 | |
Bell Creek Community Development Authority; | | | | | | | | | | | | | | | | |
Series 2003 A, Special Assessment RB | | | 6.75 | % | | | 03/01/22 | | | | 173 | | | | 174,903 | |
Series 2003 B, Special Assessment RB | | | 7.00 | % | | | 03/01/32 | | | | 1,533 | | | | 1,547,027 | |
Celebrate North Community Development Authority (Celebrate Virginia North); | | | | | | | | | | | | | | | | |
Series 2003 B, Special Assessment RB(a) | | | 6.60 | % | | | 03/01/25 | | | | 1,394 | | | | 984,513 | |
Series 2003 B, Special Assessment RB(a) | | | 6.75 | % | | | 03/01/34 | | | | 7,595 | | | | 5,319,082 | |
Celebrate South Community Development Authority (Celebrate Virginia South); Series 2006, Special Assessment RB(a) | | | 6.25 | % | | | 03/01/37 | | | | 9,500 | | | | 5,689,360 | |
Chesterfield (County of) Economic Development Authority (Brandermill Woods); Series 2012, First Mortgage Retirement Facilities RB | | | 5.13 | % | | | 01/01/43 | | | | 3,000 | | | | 3,038,730 | |
Chesterfield (County of) Health Center Commission (Lucy Corr Village); | | | | | | | | | | | | | | | | |
Series 2008 A, Residential Care Facilities RB | | | 6.13 | % | | | 12/01/30 | | | | 5,000 | | | | 5,019,650 | |
Series 2008 A, Residential Care Facilities RB | | | 6.25 | % | | | 12/01/38 | | | | 5,500 | | | | 5,504,565 | |
Fairfax (County of) Economic Development Authority (Lewinsville Retirement Village); Series 2007 A, Senior Living RB | | | 5.25 | % | | | 03/01/32 | | | | 2,250 | | | | 2,276,303 | |
See accompanying Notes to Financial Statements which are an integral part of the financial statements.
51 Invesco High Yield Municipal Fund
| | | | | | | | | | | | | | | | |
| | | Interest
Rate | | | Maturity
Date | | | Principal
Amount
(000) | | |
Value | |
| Virginia–(continued) | | | | | | | | | | | | | | | | |
Fairfax (County of) Economic Development Authority (Vinson Hall, LLC); | | | | | | | | | | | | | | | | |
Series 2013 A, Residential Care Facility RB | | | 5.00 | % | | | 12/01/42 | | | $ | 2,800 | | | $ | 2,822,988 | |
Series 2013 A, Residential Care Facility RB | | | 5.00 | % | | | 12/01/47 | | | | 3,000 | | | | 3,012,180 | |
Hanover (County of) Economic Development Authority (Covenant Woods); | | | | | | | | | | | | | | | | |
Series 2012 A, Residential Care Facility RB | | | 5.00 | % | | | 07/01/42 | | | | 2,000 | | | | 2,007,280 | |
Series 2012 A, Residential Care Facility RB | | | 5.00 | % | | | 07/01/47 | | | | 1,985 | | �� | | 1,984,861 | |
Isle Wight (County of) Industrial Development Authority; Series 2003 A, Environmental Improvement RB(b) | | | 5.70 | % | | | 11/01/27 | | | | 5,200 | | | | 5,338,528 | |
Lexington (City of) Industrial Development Authority (Kendal at Lexington); | | | | | | | | | | | | | | | | |
Series 2007 A, Residential Care Facilities Mortgage RB | | | 5.25 | % | | | 01/01/21 | | | | 395 | | | | 410,117 | |
Series 2007 A, Residential Care Facilities Mortgage RB | | | 5.38 | % | | | 01/01/22 | | | | 780 | | | | 810,755 | |
Series 2007 A, Residential Care Facilities Mortgage RB | | | 5.38 | % | | | 01/01/23 | | | | 425 | | | | 440,691 | |
Series 2007 A, Residential Care Facilities Mortgage RB | | | 5.38 | % | | | 01/01/28 | | | | 500 | | | | 512,235 | |
Series 2007 A, Residential Care Facilities Mortgage RB | | | 5.50 | % | | | 01/01/37 | | | | 4,350 | | | | 4,432,476 | |
New Port Community Development Authority; | | | | | | | | | | | | | | | | |
Series 2006, Special Assessment RB | | | 5.50 | % | | | 09/01/26 | | | | 923 | | | | 619,730 | |
Series 2006, Special Assessment RB | | | 5.60 | % | | | 09/01/36 | | | | 2,500 | | | | 1,628,675 | |
Norfolk (City of) Redevelopment & Housing Authority (Fort Norfolk Retirement Community,
Inc.–Harbor’s Edge); Series 2004 A, First Mortgage RB | | | 6.00 | % | | | 01/01/25 | | | | 500 | | | | 503,130 | |
Peninsula Ports Authority (Virginia Baptist Homes); Series 2003 A, Residential Care Facilities RB(f)(j) | | | 7.38 | % | | | 12/01/13 | | | | 500 | | | | 527,040 | |
Peninsula Town Center Community Development Authority; | | | | | | | | | | | | | | | | |
Series 2007, Special Obligation RB | | | 6.25 | % | | | 09/01/24 | | | | 6,715 | | | | 7,315,254 | |
Series 2007, Special Obligation RB | | | 6.35 | % | | | 09/01/28 | | | | 7,818 | | | | 8,498,479 | |
Series 2007, Special Obligation RB | | | 6.45 | % | | | 09/01/37 | | | | 5,219 | | | | 5,638,921 | |
Route 460 Funding Corp.; | | | | | | | | | | | | | | | | |
Series 2012, Sr. Lien Toll Road CAB RB(e) | | | 0.00 | % | | | 07/01/44 | | | | 13,050 | | | | 2,611,305 | |
Series 2012 A, Sr. Lien Toll Road RB | | | 5.13 | % | | | 07/01/49 | | | | 8,870 | | | | 9,692,160 | |
Series 2012 B, Sr. Lien Toll Road CAB RB(e) | | | 0.00 | % | | | 07/01/34 | | | | 3,000 | | | | 1,050,030 | |
Series 2012 B, Sr. Lien Toll Road CAB RB(e) | | | 0.00 | % | | | 07/01/35 | | | | 2,855 | | | | 946,147 | |
Series 2012 B, Sr. Lien Toll Road CAB RB(e) | | | 0.00 | % | | | 07/01/36 | | | | 2,310 | | | | 718,225 | |
Series 2012 B, Sr. Lien Toll Road CAB RB(e) | | | 0.00 | % | | | 07/01/37 | | | | 4,185 | | | | 1,232,692 | |
Series 2012 B, Sr. Lien Toll Road CAB RB(e) | | | 0.00 | % | | | 07/01/38 | | | | 3,000 | | | | 836,250 | |
Series 2012 B, Sr. Lien Toll Road CAB RB(e) | | | 0.00 | % | | | 07/01/42 | | | | 11,350 | | | | 2,543,421 | |
Series 2012 B, Sr. Lien Toll Road CAB RB(e) | | | 0.00 | % | | | 07/01/43 | | | | 12,200 | | | | 2,581,276 | |
Series 2012 B, Sr. Lien Toll Road CAB RB(e) | | | 0.00 | % | | | 07/01/45 | | | | 10,285 | | | | 1,944,585 | |
The Farms of New Kent Community Development Authority; | | | | | | | | | | | | | | | | |
Series 2006 B, Special Assessment RB | | | 5.45 | % | | | 03/01/36 | | | | 7,000 | | | | 4,148,130 | |
Series 2006 C, Special Assessment RB | | | 5.80 | % | | | 03/01/36 | | | | 7,250 | | | | 4,247,557 | |
Virginia (State of) Small Business Financing Authority (Elizabeth River Crossings Opco, LLC); | | | | | | | | | | | | | | | | |
Series 2012, Sr. Lien RB(b) | | | 6.00 | % | | | 01/01/37 | | | | 22,710 | | | | 26,412,411 | |
Series 2012, Sr. Lien RB(b) | | | 5.50 | % | | | 01/01/42 | | | | 36,500 | | | | 40,430,685 | |
Virginia (State of) Small Business Financing Authority (Express Lanes, LLC); | | | | | | | | | | | | | | | | |
Series 2012, Sr. Lien RB(b) | | | 5.00 | % | | | 07/01/34 | | | | 4,500 | | | | 4,705,830 | |
Series 2012, Sr. Lien RB(b) | | | 5.00 | % | | | 01/01/40 | | | | 13,000 | | | | 13,546,130 | |
Virginia (State of) Small Business Financing Authority (Hampton Roads Proton Beam Therapy Institute at Hampton University, LLC); Series 2009, RB(h) | | | 9.00 | % | | | 07/01/39 | | | | 8,300 | | | | 8,989,481 | |
Washington (County of) Industrial Development Authority (Mountain States Health Alliance); Series 2009 C, Hospital Facility RB | | | 7.75 | % | | | 07/01/38 | | | | 5,000 | | | | 6,201,600 | |
| | | | | | | | | | | | | | | | 212,847,508 | |
|
| Washington–3.02% | |
Grant (County of) Public Hospital District No. 3 (Columbia Basin Hospital); | | | | | | | | | | | | | | | | |
Series 2012, Unlimited Tax GO Bonds | | | 5.25 | % | | | 12/01/29 | | | | 1,155 | | | | 1,232,604 | |
Series 2012, Unlimited Tax GO Bonds | | | 5.50 | % | | | 12/01/36 | | | | 2,000 | | | | 2,131,180 | |
See accompanying Notes to Financial Statements which are an integral part of the financial statements.
52 Invesco High Yield Municipal Fund
| | | | | | | | | | | | | | | | |
| | | Interest
Rate | | | Maturity
Date | | | Principal
Amount
(000) | | |
Value | |
| Washington–(continued) | | | | | | | | | | | | | | | | |
Greater Wenatchee (City of) Regional Events Center Public Facilities District; Series 2012 A, RB | | | 5.50 | % | | | 09/01/42 | | | $ | 3,420 | | | $ | 3,652,184 | |
Kalispel Tribe of Indians; Series 2008, RB | | | 6.75 | % | | | 01/01/38 | | | | 8,000 | | | | 7,728,560 | |
Kennewick (City of) Public Hospital District; Series 2001, Ref. & Improvement RB | | | 6.30 | % | | | 01/01/25 | | | | 2,000 | | | | 2,002,840 | |
King (County of) Public Hospital District No. 4 (Snoqualmie Valley Hospital); | | | | | | | | | | | | | | | | |
Series 2009, Ref. & Improvement Limited Tax GO Bonds | | | 7.25 | % | | | 12/01/38 | | | | 9,625 | | | | 9,930,979 | |
Series 2011, Ref. & Improvement Limited Tax GO Bonds | | | 6.75 | % | | | 12/01/31 | | | | 500 | | | | 556,520 | |
Series 2011, Ref. & Improvement Limited Tax GO Bonds | | | 7.00 | % | | | 12/01/40 | | | | 4,000 | | | | 4,450,360 | |
King (County of); | | | | | | | | | | | | | | | | |
Series 2010, Ref. Sewer RB(d) | | | 5.00 | % | | | 01/01/45 | | | | 25,555 | | | | 28,622,367 | |
Series 2011 B, Ref. Sewer RB(d) | | | 5.00 | % | | | 01/01/34 | | | | 38,540 | | | | 44,368,404 | |
Klickitat (County of) Public Hospital District No. 2 (Skyline Hospital); | | | | | | | | | | | | | | | | |
Series 2007, Hospital RB | | | 6.50 | % | | | 12/01/38 | | | | 2,000 | | | | 2,041,460 | |
Series 2007, RB | | | 6.25 | % | | | 12/01/28 | | | | 3,645 | | | | 3,730,184 | |
Port of Seattle Industrial Development Corp. (Delta Airlines); Series 2012, Ref. Special
Facilities RB(b) | | | 5.00 | % | | | 04/01/30 | | | | 11,500 | | | | 11,602,005 | |
Skagit (County of) Public Hospital District No. 1 (Skagit Valley Hospital); | | | | | | | | | | | | | | | | |
Series 2007, RB | | | 5.75 | % | | | 12/01/28 | | | | 1,250 | | | | 1,346,363 | |
Series 2010, RB | | | 5.75 | % | | | 12/01/35 | | | | 6,000 | | | | 6,591,180 | |
Series 2003, Ref. RB | | | 6.00 | % | | | 12/01/23 | | | | 1,000 | | | | 1,020,680 | |
Series 2010, RB | | | 6.00 | % | | | 12/01/30 | | | | 3,160 | | | | 3,574,371 | |
Washington (State of) Health Care Facilities Authority (Central Washington Health Services Association); Series 2009, RB | | | 7.00 | % | | | 07/01/39 | | | | 9,145 | | | | 10,631,520 | |
Washington (State of) Health Care Facilities Authority (Kadlec Regional Medical Center);
Series 2010, RB | | | 5.50 | % | | | 12/01/39 | | | | 8,085 | | | | 8,693,881 | |
Washington (State of) Health Care Facilities Authority (MultiCare Health System); Series 2007 B, RB (INS–AGM)(c) | | | 5.00 | % | | | 08/15/41 | | | | 1,000 | | | | 1,071,690 | |
Washington (State of) Health Care Facilities Authority (Seattle Cancer Care Alliance); Series 2009, RB | | | 7.38 | % | | | 03/01/38 | | | | 11,300 | | | | 13,947,138 | |
Washington (State of) Health Care Facilities Authority (Swedish Health Services);
Series 2009 A, RB(f)(j) | | | 6.50 | % | | | 11/15/14 | | | | 1,500 | | | | 1,658,175 | |
Washington (State of) Health Care Facilities Authority; Series 2007 C, RB (INS–Radian)(c) | | | 5.50 | % | | | 08/15/42 | | | | 3,000 | | | | 3,176,580 | |
Washington (State of) Higher Education Facilities Authority (Whitworth University);
Series 2009, Ref. RB | | | 5.63 | % | | | 10/01/40 | | | | 3,415 | | | | 3,711,968 | |
Washington (State of) Housing Finance Commission (Custodial Receipts Wesley Homes); Series 2008 A, Non-Profit RB(h) | | | 6.20 | % | | | 01/01/36 | | | | 19,025 | | | | 20,455,109 | |
Washington (State of); Series 2009 E, Various Purpose Unlimited Tax GO Bonds(d) | | | 5.00 | % | | | 02/01/29 | | | | 18,450 | | | | 21,844,800 | |
| | | | | | | | | | | | | | | | 219,773,102 | |
|
| West Virginia–0.48% | |
Harrison (County of) Commission (Allegheny Energy); Series 2007 D, Ref. Solid Waste
Disposal RB(b) | | | 5.50 | % | | | 10/15/37 | | | | 5,250 | | | | 5,568,203 | |
Harrison (County of) Commission (Charles Pointe No. 2); | | | | | | | | | | | | | | | | |
Series 2008 A, Ref. Tax Increment Allocation RB | | | 6.50 | % | | | 06/01/23 | | | | 1,320 | | | | 1,401,668 | |
Series 2008 A, Ref. Tax Increment Allocation RB | | | 7.00 | % | | | 06/01/35 | | | | 1,500 | | | | 1,576,935 | |
Series 2008 B, Ref. Tax Increment Allocation RB | | | 7.00 | % | | | 06/01/28 | | | | 1,000 | | | | 896,420 | |
West Virginia (State of) Hospital Finance Authority (Thomas Health System); | | | | | | | | | | | | | | | | |
Series 2008, RB | | | 6.00 | % | | | 10/01/20 | | | | 1,500 | | | | 1,587,285 | |
Series 2008, RB | | | 6.50 | % | | | 10/01/38 | | | | 13,000 | | | | 13,528,970 | |
Series 2008, RB | | | 6.75 | % | | | 10/01/43 | | | | 9,650 | | | | 10,156,914 | |
| | | | | | | | | | | | | | | | 34,716,395 | |
|
| Wisconsin–1.20% | |
Hudson (City of) (Christian Community Home, Inc.); Series 2003, Health Care Facility RB | | | 6.50 | % | | | 04/01/33 | | | | 3,465 | | | | 3,467,807 | |
Milwaukee (City of) Redevelopment Authority (Academy of Learning & Leadership, Inc.); Series 2007 A, Education RB(a) | | | 5.50 | % | | | 08/01/22 | | | | 300 | | | | 89,955 | |
Superior (City of) (Superior Water, Light & Power Co.); Series 2007 B, Collateralized Utility RB(b) | | | 5.75 | % | | | 11/01/37 | | | | 4,000 | | | | 4,270,920 | |
Wisconsin (State of) Health & Educational Facilities Authority (AE Nursing Centers); | | | | | | | | | | | | | | | | |
Series 2008, RB | | | 7.15 | % | | | 06/01/28 | | | | 1,025 | | | | 1,118,203 | |
Series 2008, RB | | | 7.25 | % | | | 06/01/38 | | | | 1,000 | | | | 1,081,930 | |
See accompanying Notes to Financial Statements which are an integral part of the financial statements.
53 Invesco High Yield Municipal Fund
| | | | | | | | | | | | | | | | |
| | | Interest
Rate | | | Maturity
Date | | | Principal
Amount
(000) | | |
Value | |
| Wisconsin–(continued) | | | | | | | | | | | | | | | | |
Wisconsin (State of) Health & Educational Facilities Authority (Beaver Dam Community
Hospitals, Inc.); | | | | | | | | | | | | | | | | |
Series 2004 A, RB | | | 6.50 | % | | | 08/15/26 | | | $ | 250 | | | $ | 257,038 | |
Series 2004 A, RB | | | 6.75 | % | | | 08/15/34 | | | | 1,600 | | | | 1,641,280 | |
Wisconsin (State of) Health & Educational Facilities Authority (Community Memorial Hospital, Inc.); | | | | | | | | | | | | | | | | |
Series 2003, RB | | | 7.13 | % | | | 01/15/22 | | | | 1,570 | | | | 1,584,318 | |
Series 2003, RB | | | 7.25 | % | | | 01/15/33 | | | | 2,355 | | | | 2,368,942 | |
Wisconsin (State of) Health & Educational Facilities Authority (Eastcastle Place, Inc.); | | | | | | | | | | | | | | | | |
Series 2004, RB | | | 6.00 | % | | | 12/01/24 | | | | 2,250 | | | | 1,405,418 | |
Series 2004, RB | | | 6.13 | % | | | 12/01/34 | | | | 5,400 | | | | 3,236,814 | |
Wisconsin (State of) Health & Educational Facilities Authority (Marshfield Clinic);
Series 2006 A, RB | | | 5.13 | % | | | 02/15/26 | | | | 500 | | | | 525,845 | |
Wisconsin (State of) Health & Educational Facilities Authority (Middleton Glen, Inc.); | | | | | | | | | | | | | | | | |
Series 1998, RB | | | 5.75 | % | | | 10/01/18 | | | | 980 | | | | 981,058 | |
Series 1998, RB | | | 5.75 | % | | | 10/01/28 | | | | 2,485 | | | | 2,485,621 | |
Series 1998, Special Term RB | | | 5.90 | % | | | 10/01/28 | | | | 335 | | | | 335,127 | |
Wisconsin (State of) Health & Educational Facilities Authority (Reedsburg Area Medical
Center, Inc.), | | | | | | | | | | | | | | | | |
Series 2010 A, Ref. RB | | | 6.00 | % | | | 06/01/27 | | | | 1,000 | | | | 1,069,250 | |
Series 2010 A, Ref. RB | | | 6.10 | % | | | 06/01/28 | | | | 800 | | | | 858,224 | |
Wisconsin (State of) Health & Educational Facilities Authority (Southwest Health Center); | | | | | | | | | | | | | | | | |
Series 2004 A, RB(f)(j) | | | 6.13 | % | | | 04/01/14 | | | | 1,760 | | | | 1,867,131 | |
Series 2004 A, RB(f)(j) | | | 6.25 | % | | | 04/01/14 | | | | 2,775 | | | | 2,947,688 | |
Wisconsin (State of) Health & Educational Facilities Authority (St. John’s Community, Inc.); | | | | | | | | | | | | | | | | |
Series 2009 A, RB | | | 7.25 | % | | | 09/15/29 | | | | 4,000 | | | | 4,588,520 | |
Series 2009 A, RB | | | 7.63 | % | | | 09/15/39 | | | | 1,000 | | | | 1,156,770 | |
Wisconsin (State of) Health & Educational Facilities Authority (Tomah Memorial Hospital, Inc.); | | | | | | | | | | | | | | | | |
Series 2003, RB(f)(j) | | | 6.00 | % | | | 07/01/13 | | | | 100 | | | | 101,855 | |
Series 2003, RB(f)(j) | | | 6.13 | % | | | 07/01/13 | | | | 150 | | | | 152,847 | |
Series 2003, RB(f)(j) | | | 6.50 | % | | | 07/01/13 | | | | 1,200 | | | | 1,224,300 | |
Series 2003, RB(f)(j) | | | 6.63 | % | | | 07/01/13 | | | | 1,750 | | | | 1,786,190 | |
Wisconsin (State of) Health & Educational Facilities Authority (Wisconsin Illinois Senior
Housing, Inc.); | | | | | | | | | | | | | | | | |
Series 2006, Ref. RB | | | 5.50 | % | | | 08/01/16 | | | | 1,660 | | | | 1,719,926 | |
Series 2006, Ref. RB | | | 5.80 | % | | | 08/01/29 | | | | 2,400 | | | | 2,407,416 | |
Series 2010, RB | | | 7.00 | % | | | 08/01/33 | | | | 2,000 | | | | 2,100,300 | |
Series 2012, RB | | | 5.75 | % | | | 08/01/35 | | | | 3,215 | | | | 3,202,783 | |
Series 2012, RB | | | 5.88 | % | | | 08/01/42 | | | | 2,660 | | | | 2,648,775 | |
Wisconsin (State of) Public Finance Authority (Glenridge Palmer Ranch); | | | | | | | | | | | | | | | | |
Series 2011 A, Continuing Care Retirement Community RB | | | 7.00 | % | | | 06/01/20 | | | | 650 | | | | 749,177 | |
Series 2011 A, Continuing Care Retirement Community RB | | | 7.75 | % | | | 06/01/28 | | | | 7,980 | | | | 9,480,240 | |
Series 2011 A, Continuing Care Retirement Community RB | | | 8.00 | % | | | 06/01/35 | | | | 10,150 | | | | 12,079,210 | |
Series 2011 A, Continuing Care Retirement Community RB | | | 8.25 | % | | | 06/01/46 | | | | 4,000 | | | | 4,823,400 | |
Wisconsin (State of) Public Finance Authority (Roseman University of Health Sciences);
Series 2012, RB | | | 5.75 | % | | | 04/01/42 | | | | 3,590 | | | | 3,734,067 | |
Wisconsin (State of) Public Finance Authority (Voyager Foundation Inc.); | | | | | | | | | | | | | | | | |
Series 2012 A, Charter School RB | | | 5.50 | % | | | 10/01/22 | | | | 780 | | | | 801,013 | |
Series 2012 A, Charter School RB | | | 6.00 | % | | | 10/01/32 | | | | 1,475 | | | | 1,519,339 | |
Series 2012 A, Charter School RB | | | 6.20 | % | | | 10/01/42 | | | | 1,300 | | | | 1,342,588 | |
| | | | | | | | | | | | | | | | 87,211,285 | |
|
| Wyoming–0.16% | |
Teton (County of) Hospital District (St. John’s Medical Center); | | | | | | | | | | | | | | | | |
Series 2011 B, RB | | | 5.50 | % | | | 12/01/27 | | | | 1,000 | | | | 1,164,860 | |
Series 2011 B, RB | | | 6.00 | % | | | 12/01/36 | | | | 2,840 | | | | 3,365,542 | |
West Park Hospital District (West Park Hospital); | | | | | | | | | | | | | | | | |
Series 2011, Ref. RB | | | 7.00 | % | | | 06/01/35 | | | | 1,085 | | | | 1,325,165 | |
Series 2011 A, RB | | | 7.00 | % | | | 06/01/40 | | | | 4,890 | | | | 5,899,296 | |
| | | | | | | | | | | | | | | | 11,754,863 | |
Total Municipal Obligations (Cost $7,457,114,527) | | | | | | | | | | | | | | | 7,771,703,564 | |
See accompanying Notes to Financial Statements which are an integral part of the financial statements.
54 Invesco High Yield Municipal Fund
| | | | | | | | | | | | | | | | |
| | | Interest
Rate | | | Maturity
Date | | | Principal
Amount
(000) | | |
Value | |
Bonds and Notes–0.00% | |
| Specialized Consumer Services–0.00% | |
Sears Tyler Methodist Retirement Corp., Sub. Notes (Cost $0) | | | 2.00 | % | | | 02/25/48 | | | $ | 135 | | | $ | 108,243 | |
TOTAL INVESTMENTS(o)—106.74% (Cost $7,457,114,527) | | | | | | | | | | | | | | | 7,771,811,807 | |
FLOATING RATE NOTE OBLIGATIONS–(7.97)% | |
Notes with interest rates ranging from 0.10% to 0.27% at 02/28/13 and contractual maturities of collateral ranging from 07/01/22 to 06/15/52 (See Note 1J)(p) | | | | | | | | | | | | | | | (580,525,000 | ) |
OTHER ASSETS LESS LIABILITIES–1.23% | | | | | | | | | | | | | | | 89,893,086 | |
NET ASSETS–100.00% | | | | | | | | | | | | | | $ | 7,281,179,893 | |
Investment Abbreviations:
| | |
| ACA | | – ACA Financial Guaranty Corp. |
| AGC | | – Assured Guaranty Corp. |
| AGM | | – Assured Guaranty Municipal Corp. |
| AMBAC | | – American Municipal Bond Assurance Corp. |
| BAN | | – Bond Anticipation Notes |
| BHAC | | – Berkshire Hathaway Assurance Corp. |
| CAB | | – Capital Appreciation Bonds |
| CEP | | - Credit Enhancement Provider |
| Connie Lee | | - Connie Lee Insurance Co. |
| Conv. | | - Convertible |
| COP | | – Certificates of Participation |
| Ctfs. | | – Certificates |
| GNMA | | – Government National Mortgage Association |
| GO | | – General Obligation |
| IDR | | – Industrial Development Revenue Bonds |
| INS | | – Insurer |
| | |
| Jr. | | – Junior |
| LOC | | – Letter of Credit |
| MFH | | – Multi-Family Housing |
| NATL | | – National Public Finance Guarantee Corp. |
| PCR | | – Pollution Control Revenue Bonds |
| PILOT | | – Payment-in-Lieu-of-Tax |
| RAC | | – Revenue Anticipation Certificates |
| Radian | | – Radian Asset Assurance, Inc. |
| RB | | – Revenue Bonds |
| Ref. | | – Refunding |
| RN | | – Revenue Notes |
| SGI | | – Syncora Guarantee, Inc. |
| Sr. | | – Senior |
| Sub. | | – Subordinated |
| TEMPS | | – Tax-Exempt Mandatory Paydown Securities |
| VRD | | – Variable Rate Demand |
Notes to Schedule of Investments:
| (a) | Defaulted security. Currently, the issuer is partially or fully in default with respect to interest payments. The aggregate value of these securities at February 28, 2013 was $76,359,089, which represented 1% of the Fund’s Net Assets. |
| (b) | Security subject to the alternative minimum tax. |
| (c) | Principal and/or interest payments are secured by the bond insurance company listed. |
| (d) | Underlying security related to Dealer Trusts entered into by the Fund. See Note 1J. |
| (e) | Zero coupon bond issued at a discount. |
| (f) | Security has an irrevocable call by the issuer or mandatory put by the holder. Maturity date reflects such call or put. |
| (g) | Interest or dividend rate is redetermined periodically. Rate shown is the rate in effect on February 28, 2013. |
| (h) | Security purchased or received in a transaction exempt from registration under the Securities Act of 1933, as amended (the “1933 Act”). The security may be resold pursuant to an exemption from registration under the 1933 Act, typically to qualified institutional buyers. The aggregate value of these securities at February 28, 2013 was $215,529,709, which represented 2.96% of the Fund’s Net Assets. |
| (i) | Defaulted security. Currently, the issuer is in default with respect to principal and interest payments. The aggregate value of these securities at February 28, 2013 was $29,862,159, which represented less than 1% of the Fund’s Net Assets. |
| (j) | Advance refunded; secured by an escrow fund of U.S. Government obligations or other highly rated collateral. |
| (k) | Principal and interest payments are fully enhanced by a letter of credit from the bank listed or a predecessor bank, branch or subsidiary. |
| (l) | Demand security payable upon demand by the Fund at specified time intervals no greater than thirteen months. Interest rate is redetermined periodically. Rate shown is the rate in effect on February 28, 2013. |
| (m) | The issuer is paying less than stated interest, but is not in default on principal because scheduled principal payments have not yet begun. |
| (n) | Convertible CAB. The interest rate shown represents the coupon rate at which the bond will accrue at a specified future date. |
| (o) | Entities may either issue, guarantee, back or otherwise enhance the credit quality of a security. The entities are not primarily responsible for the issuer’s obligation but may be called upon to satisfy issuer’s obligations. No concentration of any single entity was greater than 5%. |
| (p) | Floating rate note obligations related to securities held. The interest rates shown reflect the rates in effect at February 28, 2013. At February 28, 2013, the Fund’s investments with a value of $1,055,495,010 are held by Dealer Trusts and serve as collateral for the $580,525,000 in the floating rate note obligations outstanding at that date. |
See accompanying Notes to Financial Statements which are an integral part of the financial statements.
55 Invesco High Yield Municipal Fund
Statement of Assets and Liabilities
February 28, 2013
| | | | |
Assets: | |
Investments, at value (Cost $7,457,114,527) | | $ | 7,771,811,807 | |
Receivable for: | | | | |
Investments sold | | | 20,515,812 | |
Fund shares sold | | | 10,208,233 | |
Interest | | | 114,458,344 | |
Fund expenses absorbed | | | 26,121 | |
Investment for trustee deferred compensation and retirement plans | | | 109,573 | |
Other assets | | | 90,854 | |
Total assets | | | 7,917,220,744 | |
|
Liabilities: | |
Floating rate note obligations | | | 580,525,000 | |
Payable for: | | | | |
Investments purchased | | | 13,020,459 | |
Fund shares reacquired | | | 14,458,759 | |
Amount due custodian | | | 10,109,664 | |
Dividends | | | 14,459,518 | |
Accrued fees to affiliates | | | 2,615,031 | |
Accrued trustees’ and officers’ fees and benefits | | | 15,831 | |
Accrued other operating expenses | | | 384,210 | |
Trustee deferred compensation and retirement plans | | | 452,379 | |
Total liabilities | | | 636,040,851 | |
Net assets applicable to shares outstanding | | $ | 7,281,179,893 | |
|
Net assets consist of: | |
Shares of beneficial interest | | $ | 7,664,130,198 | |
Undistributed net investment income | | | 15,862,455 | |
Undistributed net realized gain (loss) | | | (713,510,040 | ) |
Unrealized appreciation | | | 314,697,280 | |
| | | $ | 7,281,179,893 | |
| | | | |
Net Assets: | |
Class A | | $ | 4,981,494,047 | |
Class B | | $ | 132,951,998 | |
Class C | | $ | 1,237,888,890 | |
Class Y | | $ | 920,379,433 | |
Class R5 | | $ | 8,465,525 | |
|
Shares outstanding, $0.001 par value per share,
with an unlimited number of shares authorized: | |
Class A | | | 489,915,504 | |
Class B | | | 13,015,348 | |
Class C | | | 121,980,355 | |
Class Y | | | 90,354,944 | |
Class R5 | | | 831,733 | |
Class A: | | | | |
Net asset value per share | | $ | 10.17 | |
Maximum offering price per share | | | | |
(Net asset value of $10.17 ¸ 95.75%) | | $ | 10.62 | |
Class B: | | | | |
Net asset value and offering price per share | | $ | 10.22 | |
Class C: | | | | |
Net asset value and offering price per share | | $ | 10.15 | |
Class Y: | | | | |
Net asset value and offering price per share | | $ | 10.19 | |
Class R5: | | | | |
Net asset value and offering price per share | | $ | 10.18 | |
See accompanying Notes to Financial Statements which are an integral part of the financial statements.
56 Invesco High Yield Municipal Fund
Statement of Operations
For the year ended February 28, 2013
| | | | |
Investment income: | |
Interest | | $ | 415,093,912 | |
| |
Expenses: | | | | |
Advisory fees | | | 33,795,570 | |
Administrative services fees | | | 675,114 | |
Custodian fees | | | 185,668 | |
Distribution fees: | | | | |
Class A | | | 11,530,798 | |
Class B | | | 386,900 | |
Class C | | | 11,496,168 | |
Interest, facilities and maintenance fees | | | 3,722,367 | |
Transfer Agent Fees — A, B, C and Y | | | 3,230,138 | |
Transfer agent fees — R5 | | | 12,899 | |
Trustees’ and officers’ fees and benefits | | | 259,483 | |
Other | | | 1,660,660 | |
Total expenses | | | 66,955,765 | |
Less: Expenses reimbursed and expense offset arrangement(s) | | | (4,508 | ) |
Net expenses | | | 66,951,257 | |
Net investment income | | | 348,142,655 | |
| |
Realized and unrealized gain (loss) from: | | | | |
Net realized gain (loss) from investment securities | | | (29,019,109 | ) |
Change in net unrealized appreciation of investment securities | | | 350,208,027 | |
Net realized and unrealized gain | | | 321,188,918 | |
Net increase in net assets resulting from operations | | $ | 669,331,573 | |
See accompanying Notes to Financial Statements which are an integral part of the financial statements.
57 Invesco High Yield Municipal Fund
Statement of Changes in Net Assets
For the years ended February 28, 2013 and February 29, 2012
| | | | | | | | |
| | | 2013 | | | 2012 | |
Operations: | | | | | | | | |
Net investment income | | $ | 348,142,655 | | | $ | 301,074,401 | |
Net realized gain (loss) | | | (29,019,109 | ) | | | (107,535,322 | ) |
Change in net unrealized appreciation | | | 350,208,027 | | | | 554,275,491 | |
Net increase in net assets resulting from operations | | | 669,331,573 | | | | 747,814,570 | |
| | |
Distributions to shareholders from net investment income: | | | | | | | | |
Class A | | | (258,944,546 | ) | | | (210,221,166 | ) |
Class B | | | (8,723,241 | ) | | | (11,919,037 | ) |
Class C | | | (55,954,425 | ) | | | (43,435,326 | ) |
Class Y | | | (43,158,720 | ) | | | (27,076,377 | ) |
Class R5 | | | (893,935 | ) | | | — | |
Total distributions from net investment income | | | (367,674,867 | ) | | | (292,651,906 | ) |
| | |
Share transactions–net: | | | | | | | | |
Class A | | | 1,006,461,833 | | | | 44,079,116 | |
Class B | | | (37,640,385 | ) | | | (105,961,920 | ) |
Class C | | | 304,209,275 | | | | (6,657,898 | ) |
Class Y | | | 456,744,618 | | | | (125,735,590 | ) |
Class R5 | | | 7,430,359 | | | | — | |
Net increase (decrease) in net assets resulting from share transactions | | | 1,737,205,700 | | | | (194,276,292 | ) |
Net increase in net assets | | | 2,038,862,406 | | | | 260,886,372 | |
| | |
Net assets: | | | | | | | | |
Beginning of year | | | 5,242,317,487 | | | | 4,981,431,115 | |
End of year (includes undistributed net investment income of $15,862,455 and $31,149,785, respectively) | | $ | 7,281,179,893 | | | $ | 5,242,317,487 | |
Notes to Financial Statements
February 28, 2013
NOTE 1—Significant Accounting Policies
Invesco High Yield Municipal Fund, formerly Invesco Van Kampen High Yield Municipal Fund (the “Fund”) is a series portfolio of AIM Tax-Exempt Funds (Invesco Tax-Exempt Funds) (the “Trust”). The Trust is a Delaware statutory trust registered under the Investment Company Act of 1940, as amended (the “1940 Act”), as an open-end series management investment company consisting of six separate portfolios, each authorized to issue an unlimited number of shares of beneficial interest. The assets, liabilities and operations of each portfolio are accounted for separately. Information presented in these financial statements pertains only to the Fund. Matters affecting each portfolio or class will be voted on exclusively by the shareholders of such portfolio or class.
The Fund’s investment objective is to seek federal tax-exempt current income and taxable capital appreciation.
The Fund currently consists of five different classes of shares: Class A, Class B, Class C, Class Y and Class R5. On September 24, 2012, Institutional Class shares were renamed Class R5 shares. Class A shares are sold with a front-end sales charge unless certain waiver criteria are met and under certain circumstances load waived shares may be subject to contingent deferred sales charges (“CDSC”). Class C shares are sold with a CDSC. Class Y and Class R5 shares are sold at net asset value. Effective November 30, 2010, new or additional investments in Class B shares are no longer permitted. Existing shareholders of Class B shares may continue to reinvest dividends and capital gains distributions in Class B shares until they convert to Class A shares. Also, shareholders in Class B shares will be able to exchange those shares for Class B shares of other Invesco Funds offering such shares until they convert to Class A shares. Generally, Class B shares will automatically convert to Class A shares on or about the month-end, which is at least eight years after the date of purchase. Redemption of Class B shares prior to the conversion date will be subject to a CDSC.
As of the close of business on September 4, 2012, the Fund has limited public sales of its shares to certain investors.
The following is a summary of the significant accounting policies followed by the Fund in the preparation of its financial statements.
| A. | Security Valuations — Securities, including restricted securities, are valued according to the following policy. |
Securities are fair valued using an evaluated quote provided by an independent pricing service approved by the Board of Trustees. Evaluated quotes provided by the pricing service may be determined without exclusive reliance on quoted prices, and may reflect appropriate factors such as institution-size trading in similar groups of securities, developments related to specific securities, dividend rate (for unlisted equities), yield (for debt obligations), quality, type of issue, coupon rate (for debt obligations), maturity (for debt obligations), individual trading characteristics and other market data. Debt obligations are subject to interest rate and credit risks. In addition, all debt obligations involve some risk of default with respect to interest and/or principal payments.
Securities for which market quotations either are not readily available or became unreliable are valued at fair value as determined in good faith by or under the supervision of the Trust’s officers following procedures approved by the Board of Trustees. Some of the factors which may be
58 Invesco High Yield Municipal Fund
considered in determining fair value are fundamental analytical data relating to the investment; the nature and duration of any restrictions on transferability or disposition; trading in similar securities by the same issuer or comparable companies; relevant political, economic or issuer specific news; and other relevant factors under the circumstances.
Valuations change in response to many factors including the historical and prospective earnings of the issuer, the value of the issuer’s assets, general economic conditions, interest rates, investor perceptions and market liquidity. Because of the inherent uncertainties of valuation, the values reflected in the financial statements may materially differ from the value received upon actual sale of those investments.
| B. | Securities Transactions and Investment Income — Securities transactions are accounted for on a trade date basis. Realized gains or losses on sales are computed on the basis of specific identification of the securities sold. Interest income is recorded on the accrual basis from settlement date. Paydown gains and losses on mortgage and asset-backed securities are recorded as adjustments to interest income. Dividend income (net of withholding tax, if any) is recorded on the ex-dividend date. Bond premiums and discounts are amortized and/or accreted for financial reporting purposes. |
The Fund may periodically participate in litigation related to Fund investments. As such, the Fund may receive proceeds from litigation settlements. Any proceeds received are included in the Statement of Operations as realized gain (loss) for investments no longer held and as unrealized gain (loss) for investments still held.
Brokerage commissions and mark ups are considered transaction costs and are recorded as an increase to the cost basis of securities purchased and/or a reduction of proceeds on a sale of securities. Such transaction costs are included in the determination of net realized and unrealized gain (loss) from investment securities reported in the Statement of Operations and the Statement of Changes in Net Assets and the net realized and unrealized gains (losses) on securities per share in the Financial Highlights. Transaction costs are included in the calculation of the Fund’s net asset value and, accordingly, they reduce the Fund’s total returns. These transaction costs are not considered operating expenses and are not reflected in net investment income reported in the Statement of Operations and Statement of Changes in Net Assets, or the net investment income per share and ratios of expenses and net investment income reported in the Financial Highlights, nor are they limited by any expense limitation arrangements between the Fund and the investment adviser.
The Fund allocates realized and unrealized capital gains and losses to a class based on the relative net assets of each class. The Fund allocates income to a class based on the relative value of the settled shares of each class.
| C. | Country Determination — For the purposes of making investment selection decisions and presentation in the Schedule of Investments, the investment adviser may determine the country in which an issuer is located and/or credit risk exposure based on various factors. These factors include the laws of the country under which the issuer is organized, where the issuer maintains a principal office, the country in which the issuer derives 50% or more of its total revenues and the country that has the primary market for the issuer’s securities, as well as other criteria. Among the other criteria that may be evaluated for making this determination are the country in which the issuer maintains 50% or more of its assets, the type of security, financial guarantees and enhancements, the nature of the collateral and the sponsor organization. Country of issuer and/or credit risk exposure has been determined to be the United States of America, unless otherwise noted. |
| D. | Distributions — Distributions from income are declared daily and paid monthly. Distributions from net realized capital gain, if any, are generally declared and paid annually and recorded on the ex-dividend date. The Fund may elect to treat a portion of the proceeds from redemptions as distributions for federal income tax purposes. |
| E. | Federal Income Taxes — The Fund intends to comply with the requirements of Subchapter M of the Internal Revenue Code necessary to qualify as a regulated investment company and to distribute substantially all of the Fund’s taxable and tax-exempt earnings to shareholders. As such, the Fund will not be subject to federal income taxes on otherwise taxable income (including net realized capital gain) that is distributed to shareholders. Therefore, no provision for federal income taxes is recorded in the financial statements. |
In addition, the Fund intends to invest in such municipal securities to allow it to qualify to pay shareholders “exempt-interest dividends”, as defined in the Internal Revenue Code.
The Fund files tax returns in the U.S. Federal jurisdiction and certain other jurisdictions. Generally, the Fund is subject to examinations by such taxing authorities for up to three years after the filing of the return for the tax period.
| F. | Expenses — Fees provided for under the Rule 12b-1 plan of a particular class of the Fund are charged to the operations of such class. Transfer agency fees and expenses and other shareholder recordkeeping fees and expenses attributable to Class R5 are charged to such class. Transfer agency fees and expenses and other shareholder recordkeeping fees and expenses relating to all other classes are allocated among those classes based on relative net assets. All other expenses are allocated among the classes based on relative net assets. Prior to June 1, 2010, incremental transfer agency fees which were unique to each class of shares were charged to the operations of such class. |
| G. | Interest, Facilities and Maintenance Fees — Interest, Facilities and Maintenance Fees include interest and related borrowing costs such as commitment fees and other expenses associated with lines of credit and interest and administrative expenses related to establishing and maintaining floating rate note obligations, if any. |
| H. | Accounting Estimates — The preparation of financial statements in conformity with accounting principles generally accepted in the United States of America (“GAAP”) requires management to make estimates and assumptions that affect the reported amounts of assets and liabilities at the date of the financial statements and the reported amounts of revenues and expenses during the reporting period including estimates and assumptions related to taxation. Actual results could differ from those estimates by a significant amount. In addition, the Fund monitors for material events or transactions that may occur or become known after the period-end date and before the date the financial statements are released to print. |
| I. | Indemnifications — Under the Trust’s organizational documents, each Trustee, officer, employee or other agent of the Trust is indemnified against certain liabilities that may arise out of the performance of their duties to the Fund. Additionally, in the normal course of business, the Fund enters into contracts, including the Fund’s servicing agreements, that contain a variety of indemnification clauses. The Fund’s maximum exposure under these arrangements is unknown as this would involve future claims that may be made against the Fund that have not yet occurred. The risk of material loss as a result of such indemnification claims is considered remote. |
| J. | Floating Rate Note Obligations — The Fund invests in inverse floating rate securities, such as Residual Interest Bonds (“RIBs”) or Tender Option Bonds (“TOBs”) for investment purposes and to enhance the yield of the Fund. Inverse floating rate investments tend to underperform the market for fixed rate bonds in a rising interest rate environment, but tend to outperform the market for fixed rate bonds when interest rates decline or remain relatively stable. Such transactions may be purchased in the secondary market without first owning the underlying bond or by |
59 Invesco High Yield Municipal Fund
| | the sale of fixed rate bonds by the Fund to special purpose trusts established by a broker dealer (“Dealer Trusts”) in exchange for cash and residual interests in the Dealer Trusts’ assets and cash flows, which are in the form of inverse floating rate securities. The Dealer Trusts finance the purchases of the fixed rate bonds by issuing floating rate notes to third parties and allowing the Fund to retain residual interests in the bonds. The floating rate notes issued by the Dealer Trusts have interest rates that reset weekly and the floating rate note holders have the option to tender their notes to the Dealer Trusts for redemption at par at each reset date. The residual interests held by the Fund (inverse floating rate investments) include the right of the Fund (1) to cause the holders of the floating rate notes to tender their notes at par at the next interest rate reset date, and (2) to transfer the municipal bond from the Dealer Trusts to the Fund, thereby collapsing the Dealer Trusts. |
TOBs are presently classified as private placement securities. Private placement securities are subject to restrictions on resale because they have not been registered under the Securities Act of 1933, as amended, or are otherwise not readily marketable. As a result of the absence of a public trading market for these securities, they may be less liquid than publicly traded securities. Although these securities may be resold in privately negotiated transactions, the prices realized from these sales could be less than those originally paid by the Fund or less than what may be considered the fair value of such securities.
The Fund accounts for the transfer of bonds to the Dealer Trusts as secured borrowings, with the securities transferred remaining in the Fund’s investment assets, and the related floating rate notes reflected as Fund liabilities under the caption Floating rate note obligations on the Statement of Assets and Liabilities. The Fund records the interest income from the fixed rate bonds under the caption Interest and records the expenses related to floating rate obligations and any administrative expenses of the Dealer Trusts as a component of Interest, facilities and maintenance fees on the Statement of Operations.
The Fund generally invests in inverse floating rate securities that include embedded leverage, thus exposing the Fund to greater risks and increased costs. The primary risks associated with inverse floating rate securities are varying degrees of liquidity and the changes in the value of such securities in response to changes in market rates of interest to a greater extent than the value of an equal principal amount of a fixed rate security having similar credit quality, redemption provisions and maturity which may cause the Fund’s net asset value to be more volatile than if it had not invested in inverse floating rate securities. In certain instances, the short-term floating rate interests created by the special purpose trust may not be able to be sold to third parties or, in the case of holders tendering (or putting) such interests for repayment of principal, may not be able to be remarketed to third parties. In such cases, the special purpose trust holding the long-term fixed rate bonds may be collapsed. In the case of RIBs or TOBs created by the contribution of long-term fixed income bonds by the Fund, the Fund will then be required to repay the principal amount of the tendered securities. During times of market volatility, illiquidity or uncertainty, the Fund could be required to sell other portfolio holdings at a disadvantageous time to raise cash to meet that obligation.
| K. | Other Risks — The value of, payment of interest on, repayment of principal for and the ability to sell a municipal security may be affected by constitutional amendments, legislative enactments, executive orders, administrative regulations, voter initiatives and the economics of the regions in which the issuers are located. |
Since many municipal securities are issued to finance similar projects, especially those relating to education, health care, transportation and utilities, conditions in those sectors can affect the overall municipal securities market and a Fund’s investments in municipal securities.
There is some risk that a portion or all of the interest received from certain tax-free municipal securities could become taxable as a result of determinations by the Internal Revenue Service.
NOTE 2—Advisory Fees and Other Fees Paid to Affiliates
The Trust has entered into a master investment advisory agreement with Invesco Advisers, Inc. (the “Adviser” or “Invesco”). Under the terms of the investment advisory agreement, the Fund pays an advisory fee to the Adviser based on the annual rate of the Fund’s average daily net assets as follows:
| | | | |
| Average Daily Net Assets | | Rate | |
First $300 million | | | 0.60% | |
Next $300 million | | | 0.55% | |
Over $600 million | | | 0.50% | |
Under the terms of a master sub-advisory agreement between the Adviser and each of Invesco Asset Management Deutschland GmbH, Invesco Asset Management Limited, Invesco Asset Management (Japan) Limited, Invesco Australia Limited, Invesco Hong Kong Limited, Invesco Senior Secured Management, Inc. and Invesco Canada Ltd. (collectively, the “Affiliated Sub-Advisers”) the Adviser, not the Fund, may pay 40% of the fees paid to the Adviser to any such Affiliated Sub-Adviser(s) that provide(s) discretionary investment management services to the Fund based on the percentage of assets allocated to such Sub-Adviser(s).
Effective July 1, 2012, the Adviser has contractually agreed, through June 30, 2013, to waive advisory fees and/or reimburse expenses of all shares to the extent necessary to limit total annual fund operating expenses after fee waiver and/or expense reimbursement (excluding certain items discussed below) of Class A, Class B, Class C, Class Y and Class R5 shares to 1.50%, 2.25%, 2.25%, 1.25% and 1.25%, respectively, of average daily net assets. Prior to July 1, 2012, the Adviser had contractually agreed to waive advisory fees and/or reimburse expenses of all shares to the extent necessary to limit total annual fund operating expenses after fee waiver and/or expense reimbursement (excluding certain items discussed below) of Class A, Class B, Class C and Class Y shares to 0.87%, 1.62%, 1.62% and 0.62%, respectively, of average daily net assets. In determining the Adviser’s obligation to waive advisory fees and/or reimburse expenses, the following expenses are not taken into account, and could cause the total annual fund operating expenses after fee waiver and/or expense reimbursement to exceed the numbers reflected above: (1) interest, facilities and maintenance fees; (2) taxes; (3) dividend expense on short sales; (4) extraordinary or non-routine items, including litigation expenses; and (5) expenses that the Fund has incurred but did not actually pay because of an expense offset arrangement. Unless the Board of Trustees and Invesco mutually agree to amend or continue the fee waiver agreement, it will terminate on June 30, 2013.
For the year ended February 28, 2013, the Adviser reimbursed expenses of $2,411 for Class R5 shares.
The Trust has entered into a master administrative services agreement with Invesco pursuant to which the Fund has agreed to pay Invesco for certain administrative costs incurred in providing accounting services to the Fund. For the year ended February 28, 2013, expenses incurred under the agreement are shown in the Statement of Operations as Administrative services fees.
60 Invesco High Yield Municipal Fund
The Trust has entered into a transfer agency and service agreement with Invesco Investment Services, Inc. (“IIS”) pursuant to which the Fund has agreed to pay IIS a fee for providing transfer agency and shareholder services to the Fund and reimburse IIS for certain expenses incurred by IIS in the course of providing such services. IIS may make payments to intermediaries that provide omnibus account services, sub-accounting services and/or networking services. All fees payable by IIS to intermediaries that provide omnibus account services or sub-accounting are charged back to the Fund, subject to certain limitations approved by the Trust’s Board of Trustees. For the year ended February 28, 2013, expenses incurred under the agreement are shown in the Statement of Operations as Transfer agent fees.
Shares of the Fund are distributed by Invesco Distributors, Inc. (“IDI”). The Fund has adopted a distribution plan pursuant to Rule 12b-1 under the 1940 Act, and a service plan (collectively, the “Plans”) for Class A shares, Class B shares and Class C shares to compensate IDI for the sale, distribution, shareholder servicing and maintenance of shareholder accounts for these shares. Under the Plans, the Fund will incur annual fees of up to 0.25% of Class A average daily net assets and up to 1.00% each of Class B and Class C average daily net assets.
With respect to Class B and Class C shares, the Fund is authorized to reimburse in future years any distribution related expenses that exceed the maximum annual reimbursement rate for such class, so long as such reimbursement does not cause the Fund to exceed the Class B and Class C maximum annual reimbursement rate, respectively. With respect to Class A shares, distribution related expenses that exceed the maximum annual reimbursement rate for such class are not carried forward to future years and the Fund will not reimburse IDI for any such expenses.
For the year ended February 28, 2013, expenses incurred under these agreements are shown in the Statement of Operations as Distribution fees.
Front-end sales commissions and CDSC (collectively, the “sales charges”) are not recorded as expenses of the Fund. Front-end sales commissions are deducted from proceeds from the sales of Fund shares prior to investment in Class A shares of the Fund. CDSC are deducted from redemption proceeds prior to remittance to the shareholder. During the year ended February 28, 2013, IDI advised the Fund that IDI retained $2,044,877 in front-end sales commissions from the sale of Class A shares and $127,490, $98,714 and $68,424 from Class A, Class B and Class C shares, respectively, for CDSC imposed on redemptions by shareholders.
Certain officers and trustees of the Trust are officers and directors of the Adviser, IIS and/or IDI.
NOTE 3—Additional Valuation Information
GAAP defines fair value as the price that would be received to sell an asset or paid to transfer a liability in an orderly transaction between market participants at the measurement date, under current market conditions. GAAP establishes a hierarchy that prioritizes the inputs to valuation methods giving the highest priority to readily available unadjusted quoted prices in an active market for identical assets (Level 1) and the lowest priority to significant unobservable inputs (Level 3) generally when market prices are not readily available or are unreliable. Based on the valuation inputs, the securities or other investments are tiered into one of three levels. Changes in valuation methods may result in transfers in or out of an investment’s assigned level:
| | Level 1 — | Prices are determined using quoted prices in an active market for identical assets. |
| | Level 2 — | Prices are determined using other significant observable inputs. Observable inputs are inputs that other market participants may use in pricing a security. These may include quoted prices for similar securities, interest rates, prepayment speeds, credit risk, yield curves, loss severities, default rates, discount rates, volatilities and others. |
| | Level 3 — | Prices are determined using significant unobservable inputs. In situations where quoted prices or observable inputs are unavailable (for example, when there is little or no market activity for an investment at the end of the period), unobservable inputs may be used. Unobservable inputs reflect the Fund’s own assumptions about the factors market participants would use in determining fair value of the securities or instruments and would be based on the best available information. |
The following is a summary of the tiered valuation input levels, as of February 28, 2013. The level assigned to the securities valuations may not be an indication of the risk or liquidity associated with investing in those securities. Because of the inherent uncertainties of valuation, the values reflected in the financial statements may materially differ from the value received upon actual sale of those investments.
| | | | | | | | | | | | | | | | |
| | | Level 1 | | | Level 2 | | | Level 3 | | | Total | |
Municipal Obligations | | $ | — | | | $ | 7,771,703,564 | | | $ | — | | | $ | 7,771,703,564 | |
Bonds and Notes | | | — | | | | — | | | | 108,243 | | | | 108,243 | |
Total Investments | | $ | — | | | $ | 7,771,703,564 | | | $ | 108,243 | | | $ | 7,771,811,807 | |
NOTE 4—Expense Offset Arrangement(s)
The expense offset arrangement is comprised of transfer agency credits which result from balances in Demand Deposit Accounts (DDA) used by the transfer agent for clearing shareholder transactions. For the year ended February 28, 2013, the Fund received credits from this arrangement, which resulted in the reduction of the Fund’s total expenses of $2,097.
NOTE 5—Trustees’ and Officers’ Fees and Benefits
“Trustees’ and Officers’ Fees and Benefits” include amounts accrued by the Fund to pay remuneration to certain Trustees and Officers of the Fund. Trustees have the option to defer compensation payable by the Fund, and “Trustees’ and Officers’ Fees and Benefits” also include amounts accrued by the Fund to fund such deferred compensation amounts. Those Trustees who defer compensation have the option to select various Invesco Funds in which their deferral accounts shall be deemed to be invested. Finally, certain current Trustees are eligible to participate in a retirement plan that provides for benefits to be paid upon retirement to Trustees over a period of time based on the number of years of service. The Fund may have certain former Trustees who also participate in a retirement plan and receive benefits under such plan. “Trustees’ and Officers’ Fees and Benefits” include amounts accrued by the Fund to fund such retirement benefits. Obligations under the deferred compensation and retirement plans represent unsecured claims against the general assets of the Fund.
NOTE 6—Cash Balances and Borrowings
The Fund is permitted to temporarily carry a negative or overdrawn balance in its account with State Street Bank and Trust Company (“SSB”), the custodian bank. Such balances, if any at period end, are shown in the Statement of Assets and Liabilities under the payable caption Amount due custodian. To compensate the custodian bank for such overdrafts, the overdrawn Fund may either (1) leave funds as a compensating balance in the account so the custodian bank can be compensated by earning the additional interest; or (2) compensate by paying the custodian bank at a rate agreed upon by the custodian bank and Invesco, not to exceed the contractually agreed upon rate.
61 Invesco High Yield Municipal Fund
Inverse floating rate obligations resulting from the transfer of bonds to Dealer Trusts are accounted for as secured borrowings. The average floating rate notes outstanding and average annual interest and fees related to inverse floating rate note obligations during the year ended February 28, 2013 were $561,743,077 and 0.66%, respectively.
NOTE 7—Distributions to Shareholders and Tax Components of Net Assets
Tax Character of Distributions to Shareholders Paid During the Years Ended February 28, 2013 and February 29, 2012:
| | | | | | | | |
| | | 2013 | | | 2012 | |
Ordinary income — tax exempt | | $ | 367,674,867 | | | $ | 292,651,906 | |
Tax Components of Net Assets at Period-End:
| | | | |
| | | 2013 | |
Undistributed ordinary income | | $ | 17,491,440 | |
Net unrealized appreciation — investments | | | 289,598,368 | |
Temporary book/tax differences | | | (439,541 | ) |
Capital loss carryforward | | | (689,600,572 | ) |
Shares of beneficial interest | | | 7,664,130,198 | |
Total net assets | | $ | 7,281,179,893 | |
The difference between book-basis and tax-basis unrealized appreciation (depreciation) is due to differences in the timing of recognition of gains and losses on investments for tax and book purposes. The Fund’s net unrealized appreciation (depreciation) difference is attributable primarily to wash sales, TOBs, book to tax accretion and amortization differences and defaulted securities.
The temporary book/tax differences are a result of timing differences between book and tax recognition of income and/or expenses. The Fund’s temporary book/tax differences are the result of the trustee deferral of compensation and retirement plan benefits.
Capital loss carryforward is calculated and reported as of a specific date. Results of transactions and other activity after that date may affect the amount of capital loss carryforward actually available for the Fund to utilize. The Regulated Investment Company Modernization Act of 2010 (the “Act”) eliminated the eight-year carryover period for capital losses that arise in taxable years beginning after its enactment date of December 22, 2010. Consequently, these capital losses can be carried forward for an unlimited period. However, capital losses with an expiration period may not be used to offset capital gains until all net capital losses without an expiration date have been utilized. Additionally, post-enactment capital loss carryovers will retain their character as either short-term or long-term capital losses instead of as short-term capital losses as under prior law. The ability to utilize capital loss carryforward in the future may be limited under the Internal Revenue Code and related regulations based on the results of future transactions.
The Fund has a capital loss carryforward as of February 28, 2013, which expires as follows:
| | | | | | | | | | | | |
| Capital Loss Carryforward* | |
| Expiration | | Short-Term | | | Long-Term | | | Total | |
February 28, 2014 | | $ | 7,041,918 | | | $ | — | | | $ | 7,041,918 | |
February 28, 2015 | | | 14,397,352 | | | | — | | | | 14,397,352 | |
February 28, 2016 | | | 162,672,266 | | | | — | | | | 162,672,266 | |
February 28, 2017 | | | 261,369,579 | | | | — | | | | 261,369,579 | |
February 28, 2018 | | | 77,334,684 | | | | — | | | | 77,334,684 | |
February 28, 2019 | | | 42,986,977 | | | | — | | | | 42,986,977 | |
Not subject to expiration | | | 6,279,201 | | | | 117,518,595 | | | | 123,797,796 | |
| | | $ | 572,081,977 | | | $ | 117,518,595 | | | $ | 689,600,572 | |
| * | Capital loss carryforward as of the date listed above is reduced for limitations, if any, to the extent required by the Internal Revenue Code. To the extent that unrealized gains as of April 30, 2012, the date of reorganization of Invesco High Income Municipal Fund into the Fund, are realized on securities held in each fund at such date of reorganization, the capital loss carryforward may be further limited for up to five years from the date of the reorganization. |
NOTE 8—Investment Securities
The aggregate amount of investment securities (other than short-term securities, U.S. Treasury obligations and money market funds, if any) purchased and sold by the Fund during the year ended February 28, 2013 was $2,432,942,028 and $1,248,332,466, respectively. Cost of investments on a tax basis includes the adjustments for financial reporting purposes as of the most recently completed federal income tax reporting period-end.
| | | | |
| Unrealized Appreciation (Depreciation) of Investment Securities on a Tax Basis | |
Aggregate unrealized appreciation of investment securities | | $ | 572,554,437 | |
Aggregate unrealized (depreciation) of investment securities | | | (282,956,069 | ) |
Net unrealized appreciation of investment securities | | $ | 289,598,368 | |
Cost of investments for tax purposes is $7,482,213,439.
NOTE 9—Reclassification of Permanent Differences
Primarily as a result of differing book/tax treatment of expired capital loss carryforward, taxable income and defaulted bonds and on February 28, 2013, undistributed net investment income was increased by $4,363,174, undistributed net realized gain (loss) was increased by
62 Invesco High Yield Municipal Fund
$58,512,562 and shares of beneficial interest was decreased by $62,875,736. Further, as a result of tax deferrals acquired in the reorganization of Invesco High Income Municipal Fund into the Fund, undistributed net investment income was decreased by $118,292, undistributed net realized gain (loss) was decreased by $74,730,810 and shares of beneficial interest was increased by $74,849,102. These reclassifications had no effect on the net assets of the Fund.
NOTE 10—Share Information
| | | | | | | | | | | | | | | | |
| | | Summary of Share Activity | |
| | | Year ended
February 28, 2013(a) | | | Year ended
February 29, 2012 | |
| | | Shares | | | Amount | | | Shares | | | Amount | |
Sold: | | | | | | | | | | | | | | | | |
Class A | | | 119,772,225 | | | $ | 1,196,470,258 | | | | 53,757,689 | | | $ | 500,938,156 | |
Class B | | | 155,273 | | | | 1,581,648 | | | | 219,751 | | | | 2,038,922 | |
Class C | | | 29,063,907 | | | | 289,170,697 | | | | 13,218,543 | | | | 123,190,108 | |
Class Y | | | 50,676,109 | | | | 507,890,291 | | | | 21,543,148 | | | | 199,141,707 | |
Class R5(b) | | | 195,041 | | | | 1,904,680 | | | | — | | | | — | |
| | | | |
Issued as reinvestment of dividends: | | | | | | | | | | | | | | | | |
Class A | | | 13,748,665 | | | | 137,651,817 | | | | 11,098,282 | | | | 102,711,097 | |
Class B | | | 478,796 | | | | 4,835,010 | | | | 658,442 | | | | 6,079,617 | |
Class C | | | 3,315,117 | | | | 33,155,737 | | | | 2,690,121 | | | | 24,791,725 | |
Class Y | | | 3,277,984 | | | | 32,996,797 | | | | 2,496,177 | | | | 22,949,072 | |
Class R5 | | | 55,839 | | | | 557,267 | | | | — | | | | — | |
| | | | |
Issued in connection with acquisitions:(c) | | | | | | | | | | | | | | | | |
Class A | | | 38,941,092 | | | | 380,289,898 | | | | — | | | | — | |
Class B | | | 1,360,176 | | | | 13,344,973 | | | | — | | | | — | |
Class C | | | 14,758,854 | | | | 143,978,139 | | | | — | | | | — | |
Class Y | | | 13,877,140 | | | | 135,657,431 | | | | — | | | | — | |
Class R5 | | | 7,799,579 | | | | 76,242,015 | | | | — | | | | — | |
| | | | |
Automatic conversion of Class B shares to Class A shares: | | | | | | | | | | | | | | | | |
Class A | | | 4,096,565 | | | | 41,032,498 | | | | 8,856,002 | | | | 81,149,693 | |
Class B | | | (4,076,611 | ) | | | (41,032,498 | ) | | | (8,840,899 | ) | | | (81,149,693 | ) |
| | | | |
Reacquired: | | | | | | | | | | | | | | | | |
Class A | | | (74,600,894 | ) | | | (748,982,638 | ) | | | (69,903,626 | ) | | | (640,719,830 | ) |
Class B | | | (1,628,805 | ) | | | (16,369,518 | ) | | | (3,610,978 | ) | | | (32,930,766 | ) |
Class C | | | (16,185,427 | ) | | | (162,095,298 | ) | | | (16,925,016 | ) | | | (154,639,731 | ) |
Class Y | | | (21,814,848 | ) | | | (219,799,901 | ) | | | (38,128,216 | ) | | | (347,826,369 | ) |
Class R5 | | | (7,218,726 | ) | | | (71,273,603 | ) | | | — | | | | — | |
Net increase (decrease) in share activity | | | 176,047,051 | | | $ | 1,737,205,700 | | | | (22,870,580 | ) | | $ | (194,276,292 | ) |
| (a) | There are entities that are record owners of more than 5% of the outstanding shares of the Fund and in the aggregate own 57% of the outstanding shares of the Fund. IDI has an agreement with these entities to sell Fund shares. The Fund, Invesco and/or Invesco affiliates may make payments to these entities, which are considered to be related to the Fund, for providing services to the Fund, Invesco and/or Invesco affiliates including but not limited to services such as securities brokerage, distribution, third party record keeping and account servicing. The Fund has no knowledge as to whether all or any portion of the shares owned of record by these entities are also owned beneficially. |
| (b) | Commencement date of April 30, 2012. |
| (c) | As of the opening of business on April 30, 2012, the Fund acquired all the net assets of Invesco High Income Municipal Fund (the “Target Fund”) pursuant to a plan of reorganization approved by the Trustees of the Fund on November 30, 2011 and by the shareholders of the Target Fund on April 2, 2012. The acquisition was accomplished by a tax-free exchange of 76,736,841 shares of the Fund for 93,571,671 shares outstanding of the Target Fund as of the close of business on April 27, 2012. Each class of the Target Fund was exchanged for the like class of shares of the Fund based on the relative net asset value of the Target Fund to the net asset value of the Fund at the close of business on April 27, 2012. The Target Fund’s net assets at that date of $749,512,456, including $7,209,042 of unrealized appreciation, were combined with those of the Fund. The net assets of the Fund immediately before the acquisition were $5,430,090,787 and $6,179,603,243 immediately after the acquisition. |
| | The pro forma results of operations for the year ended February 28, 2013 assuming the reorganization had been completed on March 1, 2012, the beginning of the annual reporting period, are as follows: |
| | | | |
Net investment income | | $ | 354,609,427 | |
Net realized/unrealized gains | | | 327,447,326 | |
Change in net assets resulting from operations | | $ | 682,056,753 | |
| | The combined investment portfolios have been managed as a single integrated portfolio since the acquisition was completed; it is not practicable to separate the amounts of revenue and earnings of the Target Fund that has been included in the Fund’s Statement of Operations since April 30, 2012. |
63 Invesco High Yield Municipal Fund
NOTE 11—Financial Highlights
The following schedule presents financial highlights for a share of the Fund outstanding throughout the periods indicated.
| | | | | | | | | | | | | | | | | | | | | | | | | | | | | | | | | | | | | | | | | | | | | | | | |
| | | Net asset
value,
beginning
of period | | | Net
investment
income(a) | | | Net gains
(losses)
on securities
(both
realized and
unrealized) | | | Total from
investment
operations | | | Dividends
from net
investment
income | | | Net asset
value, end
of period | | | Total
return | | | Net assets,
end of period
(000’s omitted) | | | Ratio of
expenses
to average
net assets | | | Supplemental ratio of expenses
to average
net assets
(excluding interest,
facilities and
maintenance fees)(b) | | | Ratio of net
investment
income
to average
net assets | | | Portfolio
turnover(c) | |
Class A | |
Year ended 02/28/13 | | $ | 9.71 | | | $ | 0.53 | | | $ | 0.49 | | | $ | 1.02 | | | $ | (0.56 | ) | | $ | 10.17 | | | | 10.78 | %(d) | | $ | 4,981,494 | | | | 0.90 | %(e) | | | 0.84 | %(e) | | | 5.32 | %(e) | | | 19 | % |
Year ended 02/29/12 | | | 8.85 | | | | 0.57 | | | | 0.85 | | | | 1.42 | | | | (0.56 | ) | | | 9.71 | | | | 16.56 | (d) | | | 3,766,082 | | | | 0.93 | | | | 0.85 | | | | 6.24 | | | | 16 | |
Period ended 02/28/11 | | | 9.24 | | | | 0.15 | | | | (0.40 | ) | | | (0.25 | ) | | | (0.14 | ) | | | 8.85 | | | | (2.72 | )(d) | | | 3,399,724 | | | | 0.84 | (f) | | | 0.76 | (f) | | | 6.80 | (f) | | | 3 | |
Year ended 11/30/10 | | | 9.07 | | | | 0.57 | | | | 0.15 | | | | 0.72 | | | | (0.55 | ) | | | 9.24 | | | | 8.07 | (d) | | | 3,875,386 | | | | 0.91 | | | | 0.84 | | | | 6.10 | | | | 20 | |
Year ended 11/30/09 | | | 8.15 | | | | 0.58 | | | | 0.92 | | | | 1.50 | | | | (0.58 | ) | | | 9.07 | | | | 19.33 | (g) | | | 3,294,547 | | | | 0.97 | | | | 0.87 | | | | 6.90 | | | | 16 | |
Year ended 11/30/08 | | | 10.61 | | | | 0.59 | | | | (2.48 | ) | | | (1.89 | ) | | | (0.57 | ) | | | 8.15 | | | | (18.57 | )(g) | | | 2,662,943 | | | | 1.21 | | | | 0.86 | | | | 5.96 | | | | 49 | |
Class B | |
Year ended 02/28/13 | | | 9.75 | | | | 0.53 | | | | 0.51 | | | | 1.04 | | | | (0.57 | ) | | | 10.22 | | | | 10.87 | (d)(h) | | | 132,952 | | | | 0.90 | (e)(h) | | | 0.84 | (e)(h) | | | 5.32 | (e)(h) | | | 19 | |
Year ended 02/29/12 | | | 8.85 | | | | 0.60 | | | | 0.85 | | | | 1.45 | | | | (0.55 | ) | | | 9.75 | | | | 16.89 | (d)(h) | | | 163,123 | | | | 0.68 | (h) | | | 0.60 | (h) | | | 6.49 | (h) | | | 16 | |
Period ended 02/28/11 | | | 9.24 | | | | 0.14 | | | | (0.41 | ) | | | (0.27 | ) | | | (0.12 | ) | | | 8.85 | | | | (2.90 | )(d)(h) | | | 250,532 | | | | 1.39 | (f)(h) | | | 1.31 | (f)(h) | | | 6.25 | (f)(h) | | | 3 | |
Year ended 11/30/10 | | | 9.07 | | | | 0.50 | | | | 0.15 | | | | 0.65 | | | | (0.48 | ) | | | 9.24 | | | | 7.27 | (d) | | | 299,439 | | | | 1.66 | | | | 1.59 | | | | 5.35 | | | | 20 | |
Year ended 11/30/09 | | | 8.15 | | | | 0.51 | | | | 0.93 | | | | 1.44 | | | | (0.52 | ) | | | 9.07 | | | | 18.46 | (i) | | | 316,094 | | | | 1.72 | | | | 1.62 | | | | 6.15 | | | | 16 | |
Year ended 11/30/08 | | | 10.61 | | | | 0.52 | | | | (2.49 | ) | | | (1.97 | ) | | | (0.49 | ) | | | 8.15 | | | | (19.21 | )(i) | | | 329,752 | | | | 1.96 | | | | 1.61 | | | | 5.19 | | | | 49 | |
Class C | |
Year ended 02/28/13 | | | 9.69 | | | | 0.46 | | | | 0.49 | | | | 0.95 | | | | (0.49 | ) | | | 10.15 | | | | 9.97 | (d) | | | 1,237,889 | | | | 1.65 | (e) | | | 1.59 | (e) | | | 4.57 | (e) | | | 19 | |
Year ended 02/29/12 | | | 8.83 | | | | 0.50 | | | | 0.85 | | | | 1.35 | | | | (0.49 | ) | | | 9.69 | | | | 15.73 | (d) | | | 881,847 | | | | 1.68 | | | | 1.60 | | | | 5.49 | | | | 16 | |
Period ended 02/28/11 | | | 9.23 | | | | 0.13 | | | | (0.41 | ) | | | (0.28 | ) | | | (0.12 | ) | | | 8.83 | | | | (3.02 | )(d) | | | 813,001 | | | | 1.59 | (f) | | | 1.51 | (f) | | | 6.05 | (f) | | | 3 | |
Year ended 11/30/10 | | | 9.05 | | | | 0.50 | | | | 0.16 | | | | 0.66 | | | | (0.48 | ) | | | 9.23 | | | | 7.40 | (d) | | | 953,475 | | | | 1.66 | | | | 1.59 | | | | 5.35 | | | | 20 | |
Year ended 11/30/09 | | | 8.14 | | | | 0.51 | | | | 0.92 | | | | 1.43 | | | | (0.52 | ) | | | 9.05 | | | | 18.36 | (j) | | | 799,982 | | | | 1.72 | | | | 1.62 | | | | 6.09 | | | | 16 | |
Year ended 11/30/08 | | | 10.60 | | | | 0.51 | | | | (2.48 | ) | | | (1.97 | ) | | | (0.49 | ) | | | 8.14 | | | | (19.22 | )(j) | | | 584,835 | | | | 1.96 | | | | 1.61 | | | | 5.22 | | | | 49 | |
Class Y(l) | |
Year ended 02/28/13 | | | 9.73 | | | | 0.56 | | | | 0.49 | | | | 1.05 | | | | (0.59 | ) | | | 10.19 | | | | 11.04 | (d) | | | 920,379 | | | | 0.65 | (e) | | | 0.59 | (e) | | | 5.57 | (e) | | | 19 | |
Year ended 02/29/12 | | | 8.87 | | | | 0.59 | | | | 0.84 | | | | 1.43 | | | | (0.57 | ) | | | 9.73 | | | | 16.83 | (d) | | | 431,266 | | | | 0.68 | | | | 0.60 | | | | 6.49 | | | | 16 | |
Period ended 02/28/11 | | | 9.26 | | | | 0.15 | | | | (0.40 | ) | | | (0.25 | ) | | | (0.14 | ) | | | 8.87 | | | | (2.65 | )(d) | | | 518,173 | | | | 0.59 | (f) | | | 0.51 | (f) | | | 7.05 | (f) | | | 3 | |
Year ended 11/30/10 | | | 9.09 | | | | 0.60 | | | | 0.15 | | | | 0.75 | | | | (0.58 | ) | | | 9.26 | | | | 8.33 | (d) | | | 522,709 | | | | 0.66 | | | | 0.59 | | | | 6.35 | | | | 20 | |
Year ended 11/30/09 | | | 8.17 | | | | 0.59 | | | | 0.93 | | | | 1.52 | | | | (0.60 | ) | | | 9.09 | | | | 19.57 | (j) | | | 281,752 | | | | 0.72 | | | | 0.62 | | | | 6.94 | | | | 16 | |
Year ended 11/30/08 | | | 10.64 | | | | 0.62 | | | | (2.50 | ) | | | (1.88 | ) | | | (0.59 | ) | | | 8.17 | | | | (18.39 | )(j) | | | 55,427 | | | | 0.99 | | | | 0.64 | | | | 6.70 | | | | 49 | |
Class R5 | |
Year ended 02/28/13(k) | | | 9.79 | | | | 0.46 | | | | 0.42 | | | | 0.88 | | | | (0.49 | ) | | | 10.18 | | | | 9.16 | (d) | | | 8,466 | | | | 0.67 | (e)(f)(m) | | | 0.63 | (e)(f) | | | 5.55 | (e)(f) | | | 19 | |
| (a) | Calculated using average shares outstanding. |
| (b) | For the years ended November 30, 2010 and prior, ratio does not exclude facilities and maintenance fees. |
| (c) | Portfolio turnover is calculated at the fund level and is not annualized for periods less than one year, if applicable. For the year ended February 28, 2013, the portfolio turnover calculation excludes the value of securities purchased of $729,359,150 and sold of $70,250,290 in the effort to realign the Fund’s portfolio holdings after the reorganization of Invesco High Income Municipal Fund into the Fund. |
| (d) | Includes adjustments in accordance with accounting principles generally accepted in the United States of America and as such, the net asset value for financial reporting purposes and the returns based upon those net asset values may differ from the net asset value and returns for shareholder transactions. Does not include sales charges and is not annualized for periods less than one year, if applicable. |
| (e) | Ratios are based on average daily net assets (000’s) of $4,612,319, $154,760, $1,149,617, $737,153 and $18,090 for Class A, Class B, Class C, Class Y and Class R5 shares, respectively. |
| (g) | Assumes reinvestment of all distributions for the period and does not include payment of the maximum sales charge of 4.75% or contingent deferred sales charge (CDSC). On purchases of $1 million or more, a CDSC of 1% may be imposed on certain redemptions made within eighteen months of purchase. If the sales charges were included, total returns would be lower. These returns include combined Rule 12b-1 fees and service fees of up to 0.25% and do not reflect the deduction of taxes that a shareholder would pay on Fund distributions or the redemption of Fund shares. |
| (h) | The total return, ratio of expenses to average net assets and ratio of net investment income (loss) to average net assets reflect actual 12b-1 fees of 0.25%, 0.00% and 0.80% for the years ended February 28, 2013, February 29, 2012 and February 28, 2011, respectively. |
| (i) | Assumes reinvestment of all distributions for the period and does not include payment of the maximum CDSC of 4%, charged on certain redemptions made within one year of purchase and declining to 0% after the fifth year. If the sales charge was included, total returns would be lower. These returns include combined Rule 12b-1 fees and service fees of up to 1% and do not reflect the deduction of taxes that a shareholder would pay on Fund distributions or the redemption of Fund shares. |
| (j) | Assumes reinvestment of all distributions for the period and does not include payment of the maximum CDSC of 1%, charged on certain redemptions made within one year of purchase. If the sales charge was included, total returns would be lower. These returns include combined Rule 12b-1 fees and service fees of up to 1% and do not reflect the deduction of taxes that a shareholder would pay on Fund distributions or the redemption of Fund shares. |
| (k) | Commencement date of April 30, 2012. |
| (l) | On June 1, 2010, Class I shares of Van Kampen High Yield Municipal Fund were reorganized into Class Y shares of the Fund. |
| (m) | For the year ended February 28, 2013, the Ratio of expenses to average net assets without fee waivers and/or expenses absorbed was 0.69%. |
64 Invesco High Yield Municipal Fund
Report of Independent Registered Public Accounting Firm
To the Board of Trustees of AIM Tax-Exempt Funds (Invesco Tax-Exempt Funds)
and Shareholders of Invesco High Yield Municipal Fund:
In our opinion, the accompanying statement of assets and liabilities, including the schedule of investments, and the related statements of operations and of changes in net assets and the financial highlights present fairly, in all material respects, the financial position of Invesco High Yield Municipal Fund (formerly known as Invesco Van Kampen High Yield Municipal Fund; one of the funds constituting AIM Tax-Exempt Funds (Invesco Tax-Exempt Funds), hereafter referred to as the “Fund”) at February 28, 2013, the results of its operations for the year then ended, the changes in its net assets for each of the two years in the period then ended and the financial highlights for each of the two years in the period then ended, the period ended February 28, 2011 and the year ended November 30, 2010, in conformity with accounting principles generally accepted in the United States of America. These financial statements and financial highlights (hereafter referred to as “financial statements”) are the responsibility of the Fund’s management; our responsibility is to express an opinion on these financial statements based on our audits. We conducted our audits of these financial statements in accordance with the standards of the Public Company Accounting Oversight Board (United States). Those standards require that we plan and perform the audit to obtain reasonable assurance about whether the financial statements are free of material misstatement. An audit includes examining, on a test basis, evidence supporting the amounts and disclosures in the financial statements, assessing the accounting principles used and significant estimates made by management, and evaluating the overall financial statement presentation. We believe that our audits, which included confirmation of securities at February 28, 2013 by correspondence with the custodian and brokers, provide a reasonable basis for our opinion. The financial highlights of the Fund for the periods ended November 30, 2009 and prior were audited by another independent registered public accounting firm whose report dated January 22, 2010 expressed an unqualified opinion on those financial statements.
PRICEWATERHOUSECOOPERS LLP
April 26, 2013
Houston, Texas
65 Invesco High Yield Municipal Fund
Calculating your ongoing Fund expenses
Example
As a shareholder of the Fund, you incur two types of costs: (1) transaction costs, which may include sales charges (loads) on purchase payments or contingent deferred sales charges on redemptions, and redemption fees, if any; and (2) ongoing costs, including management fees, distribution and/or service (12b-1) fees, and other Fund expenses. This example is intended to help you understand your ongoing costs (in dollars) of investing in the Fund and to compare these costs with ongoing costs of investing in other mutual funds. The example is based on an investment of $1,000 invested at the beginning of the period and held for the entire period September 1, 2012 through February 28, 2013.
Actual expenses
The table below provides information about actual account values and actual expenses. You may use the information in this table, together with the amount you invested, to estimate the expenses that you paid over the period. Simply divide your account value by $1,000 (for example, an $8,600 account value divided by $1,000 = 8.6), then multiply the result by the number in the table under the heading entitled “Actual Expenses Paid During Period” to estimate the expenses you paid on your account during this period.
Hypothetical example for comparison purposes
The table below also provides information about hypothetical account values and hypothetical expenses based on the Fund’s actual expense ratio and an assumed rate of return of 5% per year before expenses, which is not the Fund’s actual return.
The hypothetical account values and expenses may not be used to estimate the actual ending account balance or expenses you paid for the period. You may use this information to compare the ongoing costs of investing in the Fund and other funds. To do so, compare this 5% hypothetical example with the 5% hypothetical examples that appear in the shareholder reports of the other funds.
Please note that the expenses shown in the table are meant to highlight your ongoing costs only and do not reflect any transaction costs, such as sales charges (loads) on purchase payments, contingent deferred sales charges on redemptions, and redemption fees, if any. Therefore, the hypothetical information is useful in comparing ongoing costs only, and will not help you determine the relative total costs of owning different funds. In addition, if these transaction costs were included, your costs would have been higher.
| | | | | | | | | | | | | | | | | | | | | | | | |
| Class | | Beginning
Account Value
(09/01/12) | | | ACTUAL | | | HYPOTHETICAL
(5% annual return before
expenses) | | | Annualized
Expense
Ratio | |
| | | Ending
Account Value
(02/28/13)1 | | | Expenses
Paid During
Period2 | | | Ending
Account Value
(02/28/13) | | | Expenses
Paid During
Period2 | | |
A | | $ | 1,000.00 | | | $ | 1,040.30 | | | $ | 4.45 | | | $ | 1,020.43 | | | $ | 4.41 | | | | 0.88 | % |
B | | | 1,000.00 | | | | 1,040.30 | | | | 4.45 | | | | 1,020.43 | | | | 4.41 | | | | 0.88 | |
C | | | 1,000.00 | | | | 1,036.50 | | | | 8.23 | | | | 1,016.71 | | | | 8.15 | | | | 1.63 | |
Y | | | 1,000.00 | | | | 1,041.60 | | | | 3.19 | | | | 1,021.67 | | | | 3.16 | | | | 0.63 | |
R5 | | | 1,000.00 | | | | 1,041.50 | | | | 3.49 | | | | 1,021.37 | | | | 3.46 | | | | 0.69 | |
| 1 | The actual ending account value is based on the actual total return of the Fund for the period September 1, 2012 through February 28, 2013, after actual expenses and will differ from the hypothetical ending account value which is based on the Fund’s expense ratio and a hypothetical annual return of 5% before expenses. |
| 2 | Expenses are equal to the Fund’s annualized expense ratio as indicated above multiplied by the average account value over the period, multiplied by 181/365 to reflect the most recent fiscal half year. |
66 Invesco High Yield Municipal Fund
Tax Information
Form 1099-DIV, Form 1042-S and other year—end tax information provide shareholders with actual calendar year amounts that should be included in their tax returns. Shareholders should consult their tax advisors.
The following distribution information is being provided as required by the Internal Revenue Code or to meet a specific state’s requirement.
The Fund designates the following amounts or, if subsequently determined to be different, the maximum amount allowable for its fiscal year ended February 28, 2013:
| | | | |
Federal and State Income Tax | |
Qualified Dividend Income* | | | 0 | % |
Corporate Dividends Received Deduction* | | | 0 | % |
Tax-Exempt Interest Dividends* | | | 100 | % |
| | * | The above percentages are based on ordinary income dividends paid to shareholders during the Fund’s fiscal year. |
67 Invesco High Yield Municipal Fund
Trustees and Officers
The address of each trustee and officer is AIM Tax-Exempt Funds (Invesco Tax-Exempt Funds) (the “Trust”), 11 Greenway Plaza, Suite 1000, Houston, Texas 77046-1173. The trustees serve for the life of the Trust, subject to their earlier death, incapacitation, resignation, retirement or removal as more specifically provided in the Trust’s organizational documents. Each officer serves for a one year term or until their successors are elected and qualified. Column two below includes length of time served with predecessor entities, if any.
| | | | | | | | |
Name, Year of Birth and
Position(s) Held with the Trust | | Trustee and/
or Officer Since | | Principal Occupation(s)
During Past 5 Years | | Number of Funds in Fund Complex Overseen by Trustee | | Other Directorship(s) Held by Trustee During
Past 5 Years |
| Interested Persons | | | | | | | | |
| Martin L. Flanagan1 — 1960 Trustee | | 2007 | | Executive Director, Chief Executive Officer and President, Invesco Ltd. (ultimate parent of Invesco and a global investment management firm); Advisor to the Board, Invesco Advisers, Inc. (formerly known as Invesco Institutional (N.A.), Inc.); Trustee, The Invesco Funds; Vice Chair, Investment Company Institute; and Member of Executive Board, SMU Cox School of Business Formerly: Chairman and Chief Executive Officer, Invesco Advisers, Inc. (registered investment adviser); Director, Chairman, Chief Executive Officer and President, IVZ Inc. (holding company), INVESCO Group Services, Inc. (service provider) and Invesco North American Holdings, Inc. (holding company); Director, Chief Executive Officer and President, Invesco Holding Company Limited (parent of Invesco and a global investment management firm); Director, Invesco Ltd.; Chairman, Investment Company Institute and President, Co-Chief Executive Officer, Co-President, Chief Operating Officer and Chief Financial Officer, Franklin Resources, Inc. (global investment management organization) | | 124 | | None |
| Philip A. Taylor2 — 1954 Trustee, President and Principal Executive Officer | | 2006 | | Head of North American Retail and Senior Managing Director, Invesco Ltd.; Director, Co-Chairman, Co-President and Co-Chief Executive Officer, Invesco Advisers, Inc. (formerly known as Invesco Institutional (N.A.), Inc.) (registered investment adviser); Director, Chairman, Chief Executive Officer and President, Invesco Management Group, Inc. (formerly known as Invesco Aim Management Group, Inc.) (financial services holding company); Director and President, INVESCO Funds Group, Inc. (registered investment adviser and registered transfer agent); Director and Chairman, Invesco Investment Services, Inc. (formerly known as Invesco Aim Investment Services, Inc.) (registered transfer agent) and IVZ Distributors, Inc. (formerly known as INVESCO Distributors, Inc.) (registered broker dealer); Director, President and Chairman, Invesco Inc. (holding company) and Invesco Canada Holdings Inc. (holding company); Chief Executive Officer, Invesco Corporate Class Inc. (corporate mutual fund company) and Invesco Canada Fund Inc. (corporate mutual fund company); Director, Chairman and Chief Executive Officer, Invesco Canada Ltd. (formerly known as Invesco Trimark Ltd./Invesco Trimark Ltèe) (registered investment adviser and registered transfer agent); Trustee, President and Principal Executive Officer, The Invesco Funds (other than AIM Treasurer’s Series Trust (Invesco Treasurer’s Series Trust) and Short-Term Investments Trust); Trustee and Executive Vice President, The Invesco Funds (AIM Treasurer’s Series Trust (Invesco Treasurer’s Series Trust) and Short-Term Investments Trust only); Director, Invesco Investment Advisers LLC (formerly known as Van Kampen Asset Management); Director, Chief Executive Officer and President, Van Kampen Exchange Corp. Formerly: Director and Chairman, Van Kampen Investor Services Inc.: Director, Chief Executive Officer and President, 1371 Preferred Inc. (holding company); and Van Kampen Investments Inc.; Director and President, AIM GP Canada Inc. (general partner for limited partnerships); and Van Kampen Advisors, Inc.; Director and Chief Executive Officer, Invesco Trimark Dealer Inc. (registered broker dealer); Director, Invesco Distributors, Inc. (formerly known as Invesco Aim Distributors, Inc.) (registered broker dealer); Manager, Invesco PowerShares Capital Management LLC; Director, Chief Executive Officer and President, Invesco Advisers, Inc.; Director, Chairman, Chief Executive Officer and President, Invesco Aim Capital Management, Inc.; President, Invesco Trimark Dealer Inc. and Invesco Trimark Ltd./Invesco Trimark Ltèe; Director and President, AIM Trimark Corporate Class Inc. and AIM Trimark Canada Fund Inc.; Senior Managing Director, Invesco Holding Company Limited; Trustee and Executive Vice President, Tax-Free Investments Trust; Director and Chairman, Fund Management Company (former registered broker dealer); President and Principal Executive Officer, The Invesco Funds (AIM Treasurer’s Series Trust (Invesco Treasurer’s Series Trust), Short-Term Investments Trust and Tax-Free Investments Trust only); President, AIM Trimark Global Fund Inc. and AIM Trimark Canada Fund Inc. | | 124 | | None |
Wayne W. Whalen3 — 1939 Trustee | | 2010 | | Of Counsel, and prior to 2010, partner in the law firm of Skadden, Arps, Slate, Meagher & Flom LLP, legal counsel to certain funds in the Fund Complex | | 137 | | Director of the Mutual Fund Directors Forum, a nonprofit membership organization for investment directors; Chairman and Director of the Abraham Lincoln Presidential Library Foundation; and Director of the Stevenson Center for Democracy |
| 1 | Mr. Flanagan is considered an interested person of the Trust because he is an officer of the adviser to the Trust, and an officer and a director of Invesco Ltd., ultimate parent of the adviser to the Trust. |
| 2 | Mr. Taylor is considered an interested person of the Trust because he is an officer and a director of the adviser to, and a director of the principal underwriter of, the Trust. |
| 3 | Mr. Whalen is considered an “interested person” (within the meaning of Section 2(a)(19) of the 1940 Act) of certain Funds in the Invesco Fund Complex because he and his firm currently provide legal services as legal counsel to such Funds. |
T-1 Invesco High Yield Municipal Fund
Trustees and Officers—(continued)
| | | | | | | | |
Name, Year of Birth and
Position(s) Held with the Trust | | Trustee and/ or Officer Since | | Principal Occupation(s) During Past 5 Years | | Number of Funds in Fund Complex Overseen by Trustee | | Other Directorship(s) Held by Trustee During Past 5 Years |
| Independent Trustees | | | | | | | | |
Bruce L. Crockett — 1944 Trustee and Chair | | 1993 | | Chairman, Crockett Technologies Associates (technology consulting company) Formerly: Director, Captaris (unified messaging provider); Director, President and Chief Executive Officer COMSAT Corporation; and Chairman, Board of Governors of INTELSAT (international communications company) | | 124 | | ACE Limited (insurance company); and Investment Company Institute |
David C. Arch — 1945 Trustee | | 2010 | | Chairman and Chief Executive Officer of Blistex Inc., (consumer health care products manufacturer) Formerly: Member of the Heartland Alliance Advisory Board, a nonprofit organization serving human needs based in Chicago | | 137 | | Board member of the Illinois Manufacturers’ Association; Member of the Board of Visitors, Institute for the Humanities, University of Michigan |
Frank S. Bayley — 1939 Trustee | | 2001 | | Retired Formerly: Director, Badgley Funds, Inc. (registered investment company) (2 portfolios) and General Partner and Of Counsel, law firm of Baker & McKenzie, LLP | | 124 | | Director and Chairman, C.D. Stimson Company (a real estate investment company); Trustee and Overseer, The Curtis institute of Music |
James T. Bunch — 1942 Trustee | | 2003 | | Managing Member, Grumman Hill Group LLC (family office private equity management) Formerly: Founder, Green, Manning & Bunch Ltd. (investment banking firm)(1988-2010); Executive Committee, United States Golf Association; and Director, Policy Studies, Inc. and Van Gilder Insurance Corporation | | 124 | | Chairman, Board of Governors, Western Golf Association; Chairman-elect, Evans Scholars Foundation; and Director, Denver Film Society |
Rodney F. Dammeyer — 1940 Trustee | | 2010 | | Chairman of CAC, LLC, (private company offering capital investment and management advisory services) Formerly: Prior to 2001, Managing Partner at Equity Group Corporate Investments; Prior to 1995, Vice Chairman of Anixter International; Prior to 1985, experience includes Senior Vice President and Chief Financial Officer of Household International, Inc., Executive Vice President and Chief Financial Officer of Northwest Industries, Inc. and Partner of Arthur Andersen & Co.; From 1987 to 2010, Director/Trustee of investment companies in the Van Kampen Funds complex | | 124 | | Director of Quidel Corporation and Stericycle, Inc.; Prior to May 2008, Trustee of The Scripps Research Institute; Prior to February 2008, Director of Ventana Medical Systems, Inc. |
Albert R. Dowden — 1941 Trustee | | 2000 | | Director of a number of public and private business corporations, including the Boss Group, Ltd. (private investment and management); Reich & Tang Funds (5 portfolios) (registered investment company); and Homeowners of America Holding Corporation/ Homeowners of America Insurance Company (property casualty company) Formerly: Director, Continental Energy Services, LLC (oil and gas pipeline service); Director, CompuDyne Corporation (provider of product and services to the public security market) and Director, Annuity and Life Re (Holdings), Ltd. (reinsurance company); Director, President and Chief Executive Officer, Volvo Group North America, Inc.; Senior Vice President, AB Volvo; Director of various public and private corporations; Chairman, DHJ Media, Inc.; Director Magellan Insurance Company; and Director, The Hertz Corporation, Genmar Corporation (boat manufacturer), National Media Corporation; Advisory Board of Rotary Power International (designer, manufacturer, and seller of rotary power engines); and Chairman, Cortland Trust, Inc. (registered investment company) | | 124 | | Director of Nature’s Sunshine Products, Inc. |
Jack M. Fields — 1952 Trustee | | 1997 | | Chief Executive Officer, Twenty First Century Group, Inc. (government affairs company); Owner and Chief Executive Officer, Dos Angeles Ranch, L.P. (cattle, hunting, corporate entertainment); and Discovery Global Education Fund (non-profit) Formerly: Chief Executive Officer, Texana Timber LP (sustainable forestry company); Director of Cross Timbers Quail Research Ranch (non-profit); and member of the U.S. House of Representatives | | 124 | | Insperity, Inc. (formerly known as Administaff) |
Prema Mathai-Davis — 1950 Trustee | | 1998 | | Retired Formerly: Chief Executive Officer, YWCA of the U.S.A. | | 124 | | None |
Larry Soll – 1942 Trustee | | 2003 | | Retired Formerly: Chairman, Chief Executive Officer and President, Synergen Corp. (a biotechnology company) | | 124 | | None |
Hugo F. Sonnenschein — 1940 Trustee | | 2010 | | Distinguished Service Professor and President Emeritus of the University of Chicago and the Adam Smith Distinguished Service Professor in the Department of Economics at the University of Chicago Formerly: President of the University of Chicago | | 137 | | Trustee of the University of Rochester and a member of its investment committee. Member of the National Academy of Sciences, the American Philosophical Society and a fellow of the American Academy of Arts and Sciences |
Raymond Stickel, Jr. — 1944 Trustee | | 2005 | | Retired Formerly: Director, Mainstay VP Series Funds, Inc. (25 portfolios) and Partner, Deloitte & Touche | | 124 | | None |
T-2 Invesco High Yield Municipal Fund
Trustees and Officers—(continued)
| | | | | | | | |
Name, Year of Birth and
Position(s) Held with the Trust | | Trustee and/ or Officer Since | | Principal Occupation(s) During Past 5 Years | | Number of Funds inFund Complex Overseen by Trustee | | Other Directorship(s) Held by Trustee During Past 5 Years |
| Other Officers | | | | | | | | |
Russell C. Burk — 1958
Senior Vice President and Senior Officer | | 2005 | | Senior Vice President and Senior Officer, The Invesco Funds | | N/A | | N/A |
John M. Zerr — 1962
Senior Vice President, Chief Legal Officer and Secretary | | 2006 | | Director, Senior Vice President, Secretary and General Counsel, Invesco Management Group, Inc. (formerly known as Invesco Aim Management Group, Inc.) and Van Kampen Exchange Corp.; Senior Vice President, Invesco Advisers, Inc. (formerly known as Invesco Institutional (N.A.), Inc.) (registered investment adviser); Senior Vice President and Secretary, Invesco Distributors, Inc. (formerly known as Invesco Aim Distributors, Inc.); Director, Vice President and Secretary, Invesco Investment Services, Inc. (formerly known as Invesco Aim Investment Services, Inc.) and IVZ Distributors, Inc. (formerly known as INVESCO Distributors, Inc.); Director and Vice President, INVESCO Funds Group, Inc.; Senior Vice President, Chief Legal Officer and Secretary, The Invesco Funds; Manager, Invesco PowerShares Capital Management LLC; Director, Secretary and General Counsel, Invesco Investment Advisers LLC (formerly known as Van Kampen Asset Management); Secretary and General Counsel, Invesco Capital Markets, Inc. (formerly known as Van Kampen Funds Inc.) and Chief Legal Officer, PowerShares Exchange-Traded Fund Trust, PowerShares Exchange-Traded Fund Trust II, PowerShares India Exchange-Traded Fund Trust and PowerShares Actively Managed Exchange-Traded Fund Trust Formerly: Director and Vice President, Van Kampen Advisors Inc.; Director, Vice President, Secretary and General Counsel Van Kampen Investor Services Inc.; Director, Invesco Distributors, Inc. (formerly known as Invesco Aim Distributors, Inc.); Director, Senior Vice President, General Counsel and Secretary, Invesco Aim Advisers, Inc. and Van Kampen Investments Inc.; Director, Vice President and Secretary, Fund Management Company; Director, Senior Vice President, Secretary, General Counsel and Vice President, Invesco Aim Capital Management, Inc.; Chief Operating Officer and General Counsel, Liberty Ridge Capital, Inc. (an investment adviser); Vice President and Secretary, PBHG Funds (an investment company) and PBHG Insurance Series Fund (an investment company); Chief Operating Officer, General Counsel and Secretary, Old Mutual Investment Partners (a broker-dealer); General Counsel and Secretary, Old Mutual Fund Services (an administrator) and Old Mutual Shareholder Services (a shareholder servicing center); Executive Vice President, General Counsel and Secretary, Old Mutual Capital, Inc. (an investment adviser); and Vice President and Secretary, Old Mutual Advisors Funds (an investment company) | | N/A | | N/A |
Karen Dunn Kelley — 1960
Vice President | | 1993 | | Head of Invesco’s World Wide Fixed Income and Cash Management Group; Co-President, Co-Chief Executive Officer, and Co-Chairman, Invesco Advisers, Inc. (formerly known as Invesco Institutional (N.A.), Inc.) (registered investment adviser); Senior Vice President, Invesco Management Group, Inc. (formerly known as Invesco Aim Management Group, Inc.); Executive Vice President, Invesco Distributors, Inc. (formerly known as Invesco Aim Distributors, Inc.); Director, Invesco Mortgage Capital Inc., INVESCO Global Asset Management Limited, Invesco Management Company Limited and INVESCO Management S.A.; Vice President, The Invesco Funds (other than AIM Treasurer’s Series Trust (Invesco Treasurer’s Series Trust) and Short-Term Investments Trust); and President and Principal Executive Officer, The Invesco Funds (AIM Treasurer’s Series Trust (Invesco Treasurer’s Series Trust) and Short-Term Investments Trust only) Formerly: Senior Vice President, Van Kampen Investments Inc. and Invesco Advisers, Inc. (formerly known as Invesco Institutional (N.A.), Inc.) (registered investment adviser); Vice President, Invesco Advisers, Inc. (formerly known as Invesco Institutional (N.A.), Inc.); Director of Cash Management and Senior Vice President, Invesco Advisers, Inc. and Invesco Aim Capital Management, Inc.; President and Principal Executive Officer, Tax-Free Investments Trust; Director and President, Fund Management Company; Chief Cash Management Officer, Director of Cash Management, Senior Vice President, and Managing Director, Invesco Aim Capital Management, Inc.; Director of Cash Management, Senior Vice President, and Vice President, Invesco Advisers, Inc. and The Invesco Funds (AIM Treasurer’s Series Trust (Invesco Treasurer’s Series Trust), Short-Term Investments Trust and Tax-Free Investments Trust only) | | N/A | | N/A |
T-3 Invesco High Yield Municipal Fund
Trustees and Officers—(continued)
| | | | | | | | |
Name, Year of Birth and
Position(s) Held with the Trust | | Trustee and/ or Officer Since | | Principal Occupation(s) During Past 5 Years | | Number of Funds inFund Complex Overseen by Trustee | | Other Directorship(s) Held by Trustee During Past 5 Years |
| Other Officers—(continued) | | | | | | | | |
Sheri Morris — 1964
Vice President, Treasurer and Principal Financial Officer | | 1999 | | Vice President, Treasurer and Principal Financial Officer, The Invesco Funds; Vice President, Invesco Advisers, Inc. (formerly known as Invesco Institutional (N.A.), Inc.) (registered investment adviser); and Vice President, PowerShares Exchange-Traded Fund Trust, PowerShares Exchange-Traded Fund Trust II, PowerShares India Exchange-Traded Fund Trust and PowerShares Actively Managed Exchange-Traded Fund Trust Formerly: Vice President, Invesco Aim Advisers, Inc., Invesco Aim Capital Management, Inc. and Invesco Aim Private Asset Management, Inc.; Assistant Vice President and Assistant Treasurer, The Invesco Funds and Assistant Vice President, Invesco Advisers, Inc., Invesco Aim Capital Management, Inc. and Invesco Aim Private Asset Management, Inc.; and Treasurer, PowerShares Exchange-Traded Fund Trust, PowerShares Exchange-Traded Fund Trust II, PowerShares India Exchange-Traded Fund Trust and PowerShares Actively Managed Exchange-Traded Fund Trust | | N/A | | N/A |
Yinka Akinsola — 1977 Anti-Money Laundering Compliance Officer | | 2011 | | Anti-Money Laundering Compliance Officer, Invesco Advisers, Inc. (formerly known as Invesco Institutional (N.A.), Inc.) (registered investment adviser); Invesco Distributors, Inc. (formerly known as Invesco Aim Distributors, Inc.), Invesco Investment Services, Inc. (formerly known as Invesco Aim Investment Services, Inc.), Invesco Management Group, Inc., The Invesco Funds, Invesco Van Kampen Closed-End Funds, Van Kampen Exchange Corp., Invesco Capital Markets, Inc. (formerly known as Van Kampen Funds Inc.), PowerShares Exchange-Traded Fund Trust, PowerShares Exchange-Traded Fund Trust II, PowerShares India Exchange-Traded Fund Trust, and PowerShares Actively Managed Exchange-Traded Fund Trust Formerly: Regulatory Analyst III, Financial Industry Regulatory Authority (FINRA) | | N/A | | N/A |
Todd L. Spillane — 1958
Chief Compliance Officer | | 2006 | | Senior Vice President, Invesco Management Group, Inc. (formerly known as Invesco Aim Management Group, Inc.) and Van Kampen Exchange Corp.; Senior Vice President and Chief Compliance Officer, Invesco Advisers, Inc. (registered investment adviser) (formerly known as Invesco Institutional (N.A.), Inc.); Chief Compliance Officer, The Invesco Funds; Vice President, Invesco Distributors, Inc. (formerly known as Invesco Aim Distributors, Inc.) and Invesco Investment Services, Inc. (formerly known as Invesco Aim Investment Services, Inc.) Formerly: Chief Compliance Officer, Invesco Van Kampen Closed-End Funds; Senior Vice President, Van Kampen Investments Inc.; Senior Vice President and Chief Compliance Officer, Invesco Aim Advisers, Inc. and Invesco Aim Capital Management, Inc.; Chief Compliance Officer, INVESCO Private Capital Investments, Inc. (holding company), Invesco Private Capital, Inc. (registered investment adviser), Invesco Global Asset Management (N.A.), Inc., Invesco Senior Secured Management, Inc. (registered investment adviser), Van Kampen Investor Services Inc., PowerShares Exchange-Traded Fund Trust, PowerShares Exchange-Traded Fund Trust II, PowerShares India Exchange-Traded Fund Trust and PowerShares Actively Managed Exchange-Traded Fund Trust; and Vice President, Invesco Aim Capital Management, Inc. and Fund Management Company | | N/A | | N/A |
The Statement of Additional Information of the Trust includes additional information about the Fund’s Trustees and is available upon request, without charge, by calling 1.800.959.4246. Please refer to the Fund’s prospectus for information on the Fund’s sub-advisers.
| | | | | | |
Office of the Fund 11 Greenway Plaza, Suite 1000 Houston, TX 77046-1173 | | Investment Adviser Invesco Advisers, Inc. 1555 Peachtree Street, N.E. Atlanta, GA 30309 | | Distributor Invesco Distributors, Inc. 11 Greenway Plaza, Suite 1000 Houston, TX 77046-1173 | | Auditors PricewaterhouseCoopers LLP 1201 Louisiana Street, Suite 2900 Houston, TX 77002-5678 |
| | | |
| | | | | | |
Counsel to the Fund Stradley Ronon Stevens & Young, LLP 2005 Market Street, Suite 2600 Philadelphia, PA 19103-7018 | | Counsel to the Independent Trustees Goodwin Procter LLP 901 New York Avenue, N.W. Washington, D.C. 20001 | | Transfer Agent Invesco Investment Services, Inc. 11 Greenway Plaza, Suite 1000 Houston, TX 77046-1173 | | Custodian State Street Bank and Trust Company 225 Franklin Street Boston, MA 02110-2801 |
T-4 Invesco High Yield Municipal Fund

| | |
| Go Paperless with eDelivery |
Visit invesco.com/edelivery to receive quarterly statements, tax forms, fund reports and prospectuses with a service that’s all about eeees: |
- environmentally friendly. Go green by reducing the number of trees used to produce paper. | | - efficient. Stop waiting for regular mail. Your documents will be sent via email as soon as they’re available. |
| |
- economical. Help reduce your fund’s printing and delivery expenses and put more capital back in your fund’s returns. | | - easy. Download, save and print files using your home computer with a few clicks of your mouse. |
| This service is provided by Invesco Investment Services, Inc. |
Invesco mailing information
Send general correspondence to Invesco Investment Services, Inc., P.O. Box 219078, Kansas City, MO 64121-9078.
Invesco privacy policy
You share personal and financial information with us that is necessary for your transactions and your account records. We take very seriously the obligation to keep that information confidential and private.
Invesco collects nonpublic personal information about you from account applications or other forms you complete and from your transactions with us or our affiliates. We do not disclose information about you or our former customers to service providers or other third parties except to the extent necessary to service your account and in other limited circumstances as permitted by law. For example, we use this information to facilitate the delivery of transaction confirmations, financial reports, prospectuses and tax forms.
Even within Invesco, only people involved in the servicing of your accounts and compliance monitoring have access to your information. To ensure the highest level of confidentiality and security, Invesco maintains physical, electronic and procedural safeguards that meet or exceed federal standards. Special measures, such as data encryption and authentication, apply to your communications with us on our website. More detail is available to you at invesco.com/privacy.
Important notice regarding delivery of security holder documents
To reduce Fund expenses, only one copy of most shareholder documents may be mailed to shareholders with multiple accounts at the same address (Householding). Mailing of your shareholder documents may be householded indefinitely unless you instruct us otherwise. If you do not want the mailing of these documents to be combined with those for other members of your household, please contact Invesco Investment Services, Inc. at 800 959 4246 or contact your financial institution. We will begin sending you individual copies for each account within 30 days after receiving your request.
Fund holdings and proxy voting information
The Fund provides a complete list of its holdings four times in each fiscal year, at the quarter ends. For the second and fourth quarters, the lists appear in the Fund’s semiannual and annual reports to shareholders. For the first and third quarters, the Fund files the lists with the Securities and Exchange Commission (SEC) on Form N-Q. The most recent list of portfolio holdings is available at invesco.com/completeqtrholdings. Shareholders can also look up the Fund’s
Forms N-Q on the SEC website at sec.gov. Copies of the Fund’s Forms N-Q may be reviewed and copied at the SEC Public Reference Room in Washington, D.C. You can obtain information on the operation of the Public Reference Room, including information about duplicating fee charges, by calling 202 551 8090 or 800 732 0330, or by electronic request at the following email address: publicinfo@sec.gov. The SEC file numbers for the Fund are shown below.
A description of the policies and procedures that the Fund uses to determine how to vote proxies relating to portfolio securities is available without charge, upon request, from our Client Services department at 800 959 4246 or at invesco.com/proxyguidelines. The information is also available on the SEC website, sec.gov.
| | |
Information regarding how the Fund voted proxies related to its portfolio securities during the 12 months ended June 30, 2012, is available at invesco.com/proxysearch. The information is also available on the SEC website, sec.gov. Invesco Advisers, Inc. is an investment adviser; it provides investment advisory services to individual and institutional clients and does not sell securities. Invesco Distributors, Inc. is the US distributor for Invesco Ltd.’s retail mutual funds, exchange-traded funds and institutional money market funds. Both are wholly owned, indirect subsidiaries of Invesco Ltd. | |  |
| | | | |
| SEC file numbers: 811-07890 and 033-66242 | | VK-HYM-AR-1 | | Invesco Distributors, Inc. |
There were no amendments to the Code of Ethics (the “Code”) that applies to the Registrant’s Principal Executive Officer (“PEO”) and Principal Financial Officer (“PFO”) during the period covered by the report. The Registrant did not grant any waivers, including implicit waivers, from any provisions of the Code to the PEO or PFO during the period covered by this report.
| ITEM 3. | AUDIT COMMITTEE FINANCIAL EXPERT. |
The Board of Trustees has determined that the Registrant has at least one audit committee financial expert serving on its Audit Committee. The Audit Committee financial expert is Raymond Stickel, Jr. Mr. Stickel is “independent” within the meaning of that term as used in Form N-CSR.
| ITEM 4. | PRINCIPAL ACCOUNTANT FEES AND SERVICES. |
Fees Billed by PWC Related to the Registrant
PWC billed the Registrant aggregate fees for services rendered to the Registrant for the last two fiscal years as follows:
| | | | | | | | | | | | | | | | |
| | | Fees Billed for
Services Rendered to
the Registrant for
fiscal year end 2013 | | | Percentage of Fees
Billed Applicable to
Non-Audit Services
Provided for fiscal
year end 2013
Pursuant to Waiver of
Pre-Approval
Requirement(1) | | | Fees Billed for
Services Rendered to
the Registrant for
fiscal year end 2012 | | | Percentage of Fees
Billed Applicable to
Non-Audit Services
Provided for fiscal
year end 2012
Pursuant to Waiver of
Pre-Approval
Requirement(1) | |
Audit Fees | | $ | 226,850 | | | | N/A | | | $ | 222,800 | | | | N/A | |
Audit-Related Fees(2) | | $ | 6,000 | | | | 0 | % | | $ | 12,750 | | | | 0 | % |
Tax Fees(3) | | $ | 31,550 | | | | 0 | % | | $ | 72,000 | | | | 0 | % |
All Other Fees | | $ | 0 | | | | 0 | % | | $ | 0 | | | | 0 | % |
| | | | | | | | | | | | | | | | |
Total Fees | | $ | 264,400 | | | | 0 | % | | $ | 307,550 | | | | 0 | % |
| | | | | | | | | | | | | | | | |
PWC billed the Registrant aggregate non-audit fees of $37,550 for the fiscal year ended 2013, and $84,750 for the fiscal year ended 2012, for non-audit services rendered to the Registrant.
| (1) | With respect to the provision of non-audit services, the pre-approval requirement is waived pursuant to a de minimis exception if (i) such services were not recognized as non-audit services by the Registrant at the time of engagement, (ii) the aggregate amount of all such services provided is no more than 5% of the aggregate audit and non-audit fees paid by the Registrant to PWC during a fiscal year; and (iii) such services are promptly brought to the attention of the Registrant’s Audit Committee and approved by the Registrant’s Audit Committee prior to the completion of the audit. |
| (2) | Tax fees for the fiscal year end 2013 include fees billed for agreed upon procedures related to fund mergers. Tax fees for the fiscal year end 2012 include fees billed for agreed upon procedures related to fund mergers. |
| (3) | Tax fees for the fiscal year end 2013 includes fees billed for reviewing tax returns. Tax fees for the fiscal year end 2012 includes fees billed for reviewing tax returns. |
Fees Billed by PWC Related to Invesco and Invesco Affiliates
PWC billed Invesco Advisers, Inc. (“Invesco”), the Registrant’s adviser, and any entity controlling, controlled by or under common control with Invesco that provides ongoing services to the Registrant (“Invesco Affiliates”) aggregate fees for pre-approved non-audit services rendered to Invesco and Invesco Affiliates for the last two fiscal years as follows:
| | | | | | | | | | | | | | | | |
| | | Fees Billed for Non-
Audit Services
Rendered to Invesco
and Invesco Affiliates
for fiscal year end
2013 That Were
Required
to be Pre-Approved
by the Registrant’s
Audit Committee | | | Percentage of Fees
Billed Applicable to
Non-Audit Services
Provided for fiscal year
end 2013 Pursuant to
Waiver of Pre-
Approval
Requirement(1) | | | Fees Billed for Non-
Audit Services
Rendered to Invesco
and
Invesco Affiliates
for fiscal year end
2012 That Were
Required
to be Pre-Approved
by the Registrant’s
Audit Committee | | | Percentage of Fees
Billed Applicable to
Non-Audit Services
Provided for fiscal year
end 2012 Pursuant to
Waiver of Pre-
Approval
Requirement(1) | |
Audit-Related Fees | | $ | 0 | | | | 0 | % | | $ | 0 | | | | 0 | % |
Tax Fees | | $ | 0 | | | | 0 | % | | $ | 0 | | | | 0 | % |
All Other Fees | | $ | 0 | | | | 0 | % | | $ | 0 | | | | 0 | % |
| | | | | | | | | | | | | | | | |
Total Fees(2) | | $ | 0 | | | | 0 | % | | $ | 0 | | | | 0 | % |
| (1) | With respect to the provision of non-audit services, the pre-approval requirement is waived pursuant to a de minimis exception if (i) such services were not recognized as non-audit services by the Registrant at the time of engagement, (ii) the aggregate amount of all such services provided is no more than 5% of the aggregate audit and non-audit fees paid by the Registrant, Invesco and Invesco Affiliates to PWC during a fiscal year; and (iii) such services are promptly brought to the attention of the Registrant’s Audit Committee and approved by the Registrant’s Audit Committee prior to the completion of the audit. |
| (2) | Including the fees for services not required to be pre-approved by the registrant’s audit committee, PWC billed Invesco and Invesco Affiliates aggregate non-audit fees of $0 for the fiscal year ended 2013, and $0 for the fiscal year ended 2012, for non-audit services rendered to Invesco and Invesco Affiliates. |
The Audit Committee also has considered whether the provision of non-audit services that were rendered to Invesco and Invesco Affiliates that were not required to be pre-approved pursuant to SEC regulations, if any, is compatible with maintaining PWC’s independence. To the extent that such services were provided, the Audit Committee determined that the provision of such services is compatible with PWC maintaining independence with respect to the Registrant.
PRE-APPROVAL OF AUDIT AND NON-AUDIT SERVICES
POLICIES AND PROCEDURES
As adopted by the Audit Committees of
the Invesco Funds (the “Funds”)
Last Amended May 4, 2010
Statement of Principles
Under the Sarbanes-Oxley Act of 2002 and rules adopted by the Securities and Exchange Commission (“SEC”) (“Rules”), the Audit Committees of the Funds’ (the “Audit Committees”) Board of Trustees (the “Board”) are responsible for the appointment, compensation and oversight of the work of independent accountants (an “Auditor”). As part of this responsibility and to assure that the Auditor’s independence is not impaired, the Audit Committees pre-approve the audit and non-audit services provided to the Funds by each Auditor, as well as all non-audit services provided by the Auditor to the Funds’ investment adviser and to affiliates of the adviser that provide ongoing services to the Funds (“Service Affiliates”) if the services directly impact the Funds’ operations or financial reporting. The SEC Rules also specify the types of services that an Auditor may not provide to its audit client. The following policies and procedures comply with the requirements for pre-approval and provide a mechanism by which management of the Funds may request and secure pre-approval of audit and non-audit services in an orderly manner with minimal disruption to normal business operations.
Proposed services either may be pre-approved without consideration of specific case-by-case services by the Audit Committees (“general pre-approval”) or require the specific pre-approval of the Audit Committees (“specific pre-approval”). As set forth in these policies and procedures, unless a type of service has received general pre-approval, it will require specific pre-approval by the Audit Committees. Additionally, any fees exceeding 110% of estimated pre-approved fee levels provided at the time the service was pre-approved will also require specific approval by the Audit Committees before payment is made. The Audit Committees will also consider the impact of additional fees on the Auditor’s independence when determining whether to approve any additional fees for previously pre-approved services.
The Audit Committees will annually review and generally pre-approve the services that may be provided by each Auditor without obtaining specific pre-approval from the Audit Committee generally on an annual basis. The term of any general pre-approval runs from the date of such pre-approval through September 30th of the following year, unless the Audit Committees consider a different period and state otherwise. The Audit Committees will add to or subtract from the list of general pre-approved services from time to time, based on subsequent determinations.
The purpose of these policies and procedures is to set forth the guidelines to assist the Audit Committees in fulfilling their responsibilities.
Delegation
The Audit Committees may from time to time delegate pre-approval authority to one or more of its members who are Independent Trustees. All decisions to pre-approve a service by a delegated member shall be reported to the Audit Committees at the next quarterly meeting.
Audit Services
The annual audit services engagement terms will be subject to specific pre-approval of the Audit Committees. Audit services include the annual financial statement audit and other procedures such as tax provision work that is required to be performed by the independent auditor to be able to form an opinion on the Funds’ financial statements. The Audit Committees will obtain, review and consider sufficient information concerning the proposed Auditor to make a reasonable evaluation of the Auditor’s qualifications and independence.
In addition to the annual Audit services engagement, the Audit Committees may grant either general or specific pre-approval of other audit services, which are those services that only the independent auditor reasonably can provide. Other Audit services may include services such as issuing consents for the inclusion of audited financial statements with SEC registration statements, periodic reports and other documents filed with the SEC or other documents issued in connection with securities offerings.
Non-Audit Services
The Audit Committees may provide either general or specific pre-approval of any non-audit services to the Funds and its Service Affiliates if the Audit Committees believe that the provision of the service will not impair the independence of the Auditor, is consistent with the SEC’s Rules on auditor independence, and otherwise conforms to the Audit Committees’ general principles and policies as set forth herein.
Audit-Related Services
“Audit-related services” are assurance and related services that are reasonably related to the performance of the audit or review of the Fund’s financial statements or that are traditionally performed by the independent auditor. Audit-related services include, among others, accounting consultations related to accounting, financial reporting or disclosure matters not classified as “Audit services”; assistance with understanding and implementing new accounting and financial reporting guidance from rulemaking authorities; and agreed-upon procedures related to mergers, compliance with ratings agency requirements and interfund lending activities.
Tax Services
“Tax services” include, but are not limited to, the review and signing of the Funds’ federal tax returns, the review of required distributions by the Funds and consultations regarding tax matters such as the tax treatment of new investments or the impact of new regulations. The Audit Committees will scrutinize carefully the retention of the Auditor in connection with a transaction initially recommended by the Auditor, the major business purpose of which may be tax avoidance or the tax treatment of which may not be supported in the Internal Revenue Code and related regulations. The Audit Committees will consult with the Funds’ Treasurer (or his or her designee) and may consult with outside counsel or advisors as necessary to ensure the consistency of Tax services rendered by the Auditor with the foregoing policy.
No Auditor shall represent any Fund or any Service Affiliate before a tax court, district court or federal court of claims.
Under rules adopted by the Public Company Accounting Oversight Board and approved by the SEC, in connection with seeking Audit Committees’ pre-approval of permissible Tax services, the Auditor shall:
| | 1. | Describe in writing to the Audit Committees, which writing may be in the form of the proposed engagement letter: |
| | a. | The scope of the service, the fee structure for the engagement, and any side letter or amendment to the engagement letter, or any other agreement between the Auditor and the Fund, relating to the service; and |
| | b. | Any compensation arrangement or other agreement, such as a referral agreement, a referral fee or fee-sharing arrangement, between the Auditor and any person (other than the Fund) with respect to the promoting, marketing, or recommending of a transaction covered by the service; |
| | 2. | Discuss with the Audit Committees the potential effects of the services on the independence of the Auditor; and |
| | 3. | Document the substance of its discussion with the Audit Committees. |
All Other Auditor Services
The Audit Committees may pre-approve non-audit services classified as “All other services” that are not categorically prohibited by the SEC, as listed in Exhibit 1 to this policy.
Pre-Approval Fee Levels or Established Amounts
Pre-approval of estimated fees or established amounts for services to be provided by the Auditor under general or specific pre-approval policies will be set periodically by the Audit Committees. Any proposed fees exceeding 110% of the maximum estimated pre-approved fees or established amounts for pre-approved audit and non-audit services will be reported to the Audit Committees at the quarterly Audit Committees meeting and will require specific approval by the Audit Committees before payment is made. The Audit Committees will always factor in the overall relationship of fees for audit and non-audit services in determining whether to pre-approve any such services and in determining whether to approve any additional fees exceeding 110% of the maximum pre-approved fees or established amounts for previously pre-approved services.
Procedures
Generally on an annual basis, Invesco Advisers, Inc. (“Invesco”) will submit to the Audit Committees for general pre-approval, a list of non-audit services that the Funds or Service Affiliates of the Funds may request from the Auditor. The list will describe the non-audit services in reasonable detail and will include an estimated range of fees and such other information as the Audit Committee may request.
Each request for services to be provided by the Auditor under the general pre-approval of the Audit Committees will be submitted to the Funds’ Treasurer (or his or her designee) and must include a detailed description of the services to be rendered. The Treasurer or his or her designee will ensure that such services are included within the list of services that have received the general pre-approval of the Audit Committees. The Audit Committees will be informed at the next quarterly scheduled Audit Committees meeting of any such services for which the Auditor rendered an invoice and whether such services and fees had been pre-approved and if so, by what means.
Each request to provide services that require specific approval by the Audit Committees shall be submitted to the Audit Committees jointly by the Fund’s Treasurer or his or her designee and the Auditor, and must include a joint statement that, in their view, such request is consistent with the policies and procedures and the SEC Rules.
Each request to provide tax services under either the general or specific pre-approval of the Audit Committees will describe in writing: (i) the scope of the service, the fee structure for the engagement, and any side letter or amendment to the engagement letter, or any other agreement between the Auditor and the audit client, relating to the service; and (ii) any compensation arrangement or other agreement between the Auditor and any person (other than the audit client) with respect to the promoting, marketing, or recommending of a transaction covered by the service. The Auditor will discuss with the Audit Committees the potential effects of the services on the Auditor’s independence and will document the substance of the discussion.
Non-audit services pursuant to the de minimis exception provided by the SEC Rules will be promptly brought to the attention of the Audit Committees for approval, including documentation that each of the conditions for this exception, as set forth in the SEC Rules, has been satisfied.
On at least an annual basis, the Auditor will prepare a summary of all the services provided to any entity in the investment company complex as defined in section 2-01(f)(14) of Regulation S-X in sufficient detail as to the nature of the engagement and the fees associated with those services.
The Audit Committees have designated the Funds’ Treasurer to monitor the performance of all services provided by the Auditor and to ensure such services are in compliance with these policies and procedures. The Funds’ Treasurer will report to the Audit Committees on a periodic basis as to the results of such monitoring. Both the Funds’ Treasurer and management of Invesco will immediately report to the chairman of the Audit Committees any breach of these policies and procedures that comes to the attention of the Funds’ Treasurer or senior management of Invesco.
Exhibit 1 to Pre-Approval of Audit and Non-Audit Services Policies and Procedures
Conditionally Prohibited Non-Audit Services (not prohibited if the Fund can reasonably conclude that the results of the service would not be subject to audit procedures in connection with the audit of the Fund’s financial statements)
| | • | | Bookkeeping or other services related to the accounting records or financial statements of the audit client |
| | • | | Financial information systems design and implementation |
| | • | | Appraisal or valuation services, fairness opinions, or contribution-in-kind reports |
| | • | | Internal audit outsourcing services |
Categorically Prohibited Non-Audit Services
| | • | | Broker-dealer, investment adviser, or investment banking services |
| | • | | Expert services unrelated to the audit |
| | • | | Any service or product provided for a contingent fee or a commission |
| | • | | Services related to marketing, planning, or opining in favor of the tax treatment of confidential transactions or aggressive tax position transactions, a significant purpose of which is tax avoidance |
| | • | | Tax services for persons in financial reporting oversight roles at the Fund |
| | • | | Any other service that the Public Company Oversight Board determines by regulation is impermissible. |
| ITEM 5. | AUDIT COMMITTEE OF LISTED REGISTRANTS. |
Not applicable.
| ITEM 6. | SCHEDULE OF INVESTMENTS. |
Investments in securities of unaffiliated issuers is included as part of the reports to stockholders filed under Item 1 of this Form.
| ITEM 7. | DISCLOSURE OF PROXY VOTING POLICIES AND PROCEDURES FOR CLOSED-END MANAGEMENT INVESTMENT COMPANIES. |
Not applicable.
| ITEM 8. | PORTFOLIO MANAGERS OF CLOSED-END MANAGEMENT COMPANIES. |
Not applicable.
| ITEM 9. | PURCHASES OF EQUITY SECURITIES BY CLOSED-END MANAGEMENT INVESTMENT COMPANY AND AFFILIATED PURCHASERS. |
Not applicable.
| ITEM 10. | SUBMISSION OF MATTERS TO A VOTE OF SECURITY HOLDERS. |
None
| ITEM 11. | CONTROLS AND PROCEDURES. |
| (a) | As of May 23, 2013, an evaluation was performed under the supervision and with the participation of the officers of the Registrant, including the PEO and PFO, to assess the effectiveness of the Registrant’s disclosure controls and procedures, as that term is defined in Rule 30a-3(c) under the Investment Company Act of 1940 (the “Act”), as amended. Based on that evaluation, the Registrant’s officers, including the PEO and PFO, concluded that, as of May 23, 2013, the Registrant’s disclosure controls and procedures were reasonably designed to ensure: (1) that information required to be disclosed by the Registrant on Form N-CSR is recorded, processed, summarized and reported within the time periods specified by the rules and forms of the Securities and Exchange Commission; and (2) that material information relating to the Registrant is made known to the PEO and PFO as appropriate to allow timely decisions regarding required disclosure. |
| (b) | There have been no changes in the Registrant’s internal control over financial reporting (as defined in Rule 30a-3(d) under the Act) that occurred during the second fiscal quarter of the period covered by this report that have materially affected, or are reasonably likely to materially affect, the Registrant’s internal control over financial reporting. |
| | |
12(a) (1) | | Code of Ethics. |
| |
12(a) (2) | | Certifications of principal executive officer and principal financial officer as required by Rule 30a-2(a) under the Investment Company Act of 1940. |
| |
12(a) (3) | | Not applicable. |
| |
12(b) | | Certifications of principal executive officer and principal financial officer as required by Rule 30a-2(b) under the Investment Company Act of 1940. |
SIGNATURES
Pursuant to the requirements of the Securities Exchange Act of 1934 and the Investment Company Act of 1940, the Registrant has duly caused this report to be signed on its behalf by the undersigned, thereunto duly authorized.
Registrant: AIM Tax-Exempt Funds (Invesco Tax-Exempt Funds)
| | |
| By: | | /s/ Philip A. Taylor |
| | Philip A. Taylor |
| | Principal Executive Officer |
| |
| Date: | | July 5, 2013 |
Pursuant to the requirements of the Securities and Exchange Act of 1934 and the Investment Company Act of 1940, this report has been signed below by the following persons on behalf of the Registrant and in the capacities and on the dates indicated.
| | |
| By: | | /s/ Philip A. Taylor |
| | Philip A. Taylor |
| | Principal Executive Officer |
| |
| Date: | | July 5, 2013 |
| |
| By: | | /s/ Sheri Morris |
| | Sheri Morris |
| | Principal Financial Officer |
| |
| Date: | | July 5, 2013 |
EXHIBIT INDEX
| | |
| 12(a) (1) | | Code of Ethics. |
| |
| 12(a) (2) | | Certifications of principal executive officer and principal financial officer as required by Rule 30a-2(a) under the Investment Company Act of 1940. |
| |
| 12(a) (3) | | Not applicable. |
| |
| 12(b) | | Certifications of principal executive officer and principal financial officer as required by Rule 30a-2(b) under the Investment Company Act of 1940. |