| | |
| | OMB APPROVAL |
| | OMB Number: 3235-0570 Expires: January 31, 2017 Estimated average burden hours per response: 20.6 |
UNITED STATES
SECURITIES AND EXCHANGE COMMISSION
Washington, D.C. 20549
FORM N-CSR
CERTIFIED SHAREHOLDER REPORT OF REGISTERED
MANAGEMENT INVESTMENT COMPANIES
Investment Company Act file number 811-07890
AIM Tax-Exempt Funds
(Invesco Tax-Exempt Funds)
(Exact name of registrant as specified in charter)
11 Greenway Plaza, Suite 1000 Houston, Texas 77046
(Address of principal executive offices) (Zip code)
Philip A. Taylor 11 Greenway Plaza, Suite 1000 Houston, Texas 77046
(Name and address of agent for service)
Registrant’s telephone number, including area code: (713) 626-1919
Date of fiscal year end: 2/28
Date of reporting period: 2/28/14
Item 1. Report to Stockholders.
Letters to Shareholders
| | | | |

Philip Taylor | | | | Dear Shareholders: This annual report includes information about your Fund, including performance data and a complete list of its investments as of the close of the reporting period. Inside, your Fund’s portfolio managers discuss how they managed your Fund and the factors that affected its performance during the reporting period. I hope you find this report of interest. During the reporting period covered by this report, major US and global equity market indexes hit multiyear or all-time highs1, the result of a strengthening US economy and relatively healthy corporate profits. Also helping equities was a return of individual investors to stocks – due in part to monetary policies that kept interest rates (and yields on fixed income securities) low. Despite some volatility in the summer of 2013, overseas equity market indexes in developed and emerging nations generally rose during the reporting period – although |
developed markets generally outpaced emerging markets. In January 2014, amid widespread signs of an improving economy, the US Federal Reserve began a long-anticipated reduction in its bond-buying program.
Extended periods of strong market performance can lull some investors into a false sense of security – just as extended periods of volatility or market weakness can discourage some investors from undertaking disciplined, long-term investment plans. That’s why Invesco believes it can often be helpful to work with a skilled and trusted financial adviser; he or she can emphasize the importance of adhering to an investment plan designed to achieve long-term goals like a first home, a college education for a child or a comfortable retirement. A financial adviser who is familiar with your individual financial situation, investment goals and risk tolerance can be an invaluable partner as you work toward your financial goals. He or she can provide insight and perspective when markets are volatile; encouragement and reassurance when times are uncertain; and advice and guidance when your financial situation or investment goals change.
Timely information when and where you want it
Invesco’s efforts to help investors achieve their financial objectives include providing individual investors and financial professionals with timely information about the markets, the economy and investing – whenever and wherever they want it.
Our website, invesco.com/us, offers a wide range of market insights and investment perspectives. On the website, you’ll find detailed information about our funds, including prices, performance, holdings and portfolio manager commentaries. You can access information about your individual Invesco account whenever it’s convenient for you; just complete a simple, secure online registration. Use the “Login” box on our home page to get started.
Invesco’s mobile app for iPad® (available free from the App StoreSM) allows you to obtain the same detailed information about your Fund and the same investment insights from our investment leaders, market strategists, economists and retirement experts on the go. You also can watch portfolio manager videos and have instant access to Invesco news and updates wherever you may be.
In addition to the resources accessible on our website and through our mobile app, you can obtain timely updates to help you stay informed about the markets, the economy and investing by connecting with Invesco on Twitter, LinkedIn or Facebook. You can access our blog at blog.invesco.us.com or by visiting the “Intentional Investing Forum” on our home page. Our goal is to provide you the information you want, when and where you want it.
Have questions?
For questions about your account, feel free to contact an Invesco client services representative at 800 959 4246. For Invesco-related questions or comments, please email me directly at phil@invesco.com.
All of us at Invesco look forward to serving your investment management needs for many years to come. Thank you for investing with us.
Sincerely,

Philip Taylor
Senior Managing Director, Invesco Ltd.
1 Source: Reuters
iPad is a trademark of Apple Inc., registered in the US and other countries. App Store is a service mark of Apple Inc. Invesco Distributors, Inc. is not affiliated with Apple Inc.
2 Invesco High Yield Municipal Fund
| | | | |

Bruce Crockett | | | | Dear Fellow Shareholders: Members of the Invesco Funds Board work continually to oversee how the Invesco Funds are performing in light of ever-changing and often unpredictable economic and market conditions. One of the ways we do this is by verifying that the teams that manage funds understand the risks associated with the investments they make in the funds they manage. In light of market conditions over the last few years, the financial news media of late have given increased attention to “alternative investment strategies.” Despite this increased attention, many investors don’t know very much about these types of investment strategies. Let me put alternative investment strategies and the new focus on them in some perspective. First, these types of investment strategies have been used predominately by institutional investors and investment professionals for decades to increase diversification – in an effort to |
dampen portfolio volatility (risk) with the goal of increasing returns. The focal point of the increased news coverage is that these types of strategies are now being made more widely available to individual investors.
Alternative investment strategies generally seek to provide measured exposure to various asset classes whose performance, historically, has not been highly correlated with one another. These strategies may help mitigate the impact to a portfolio from severe or prolonged market downturns while potentially providing reasonable returns over time. After a careful and thorough examination of the potential risks and potential benefits of alternative investment strategies, the Invesco Funds Board has approved the launch of several new alternative funds for the Invesco product lineup, to be managed by teams we determined have the depth and experience to pursue the funds’ investment objectives.
While no single investment product can provide complete downside protection in falling markets and full upside participation in rising markets, your Board believes alternative funds can be a prudent tool to work in concert with more traditional mutual funds and other investments to build well diversified portfolios. Your financial adviser can determine whether or not such investments are appropriate for your individual needs, goals and risk tolerance. Also, he or she can explain the risks associated with alternative investment strategies. This type of professional guidance is why Invesco believes it’s so important that individual investors work with trusted, experienced financial advisers.
Whether you’re invested in equity, fixed income, cash management or alternative investment funds, be assured that the Invesco Funds Board will continue working on your behalf and on behalf of all our fund shareholders, keeping your needs and interests uppermost in our minds.
As always, please contact me at bruce@brucecrockett.com with any questions or concerns you may have. On behalf of the Board, we look forward to continuing to represent your interests and serving your needs.
Sincerely,

Bruce L. Crockett
Independent Chair
Invesco Funds Board of Trustees
Asset allocation/diversification does not guarantee a profit or eliminate the risk of loss.
Alternative products typically hold more non-traditional investments and employ more complex trading strategies, including hedging and leveraging through derivatives, short selling and opportunistic strategies that change with market conditions. Investors considering alternatives should be aware of their unique characteristics and additional risks from the strategies they use. Like all investments, performance will fluctuate. You can lose money.
3 Invesco High Yield Municipal Fund
Management’s Discussion of Fund Performance
Performance summary
For the fiscal year ended February 28, 2014, Invesco High Yield Municipal Fund, at net asset value (NAV), posted negative returns. The Fund at NAV underperformed its broad market and style-specific benchmarks, the Barclays High Yield Municipal Bond Index and the Custom High Yield Municipal Index, respectively. The Fund’s leverage during a down year for municipal bonds detracted from relative performance. The Fund’s underweight allocation to Puerto Rico bonds was the largest positive contributor to performance.
Your Fund’s long-term performance appears later in this report.
Fund vs. Indexes
Total returns, 2/28/13 to 2/28/14, at net asset value (NAV). Performance shown does not include applicable contingent deferred sales charges (CDSC) or front-end sales charges, which would have reduced performance.
| | | | | |
| Class A Shares | | | | -2.37 | % |
| Class B Shares | | | | -2.44 | |
| Class C Shares | | | | -3.15 | |
| Class Y Shares | | | | -2.11 | |
| Class R5 Shares | | | | -2.10 | |
| Barclays High Yield Municipal Bond Index‚ (Broad Market Index) | | | | -1.60 | |
| Custom High Yield Municipal Index¢ (Style-Specific Index) | | | | -1.04 | |
Source(s): ‚Invesco, Barclays; ¢Invesco, Lipper Inc., Barclays
How we invest
The Fund’s investment objective is to seek federal tax-exempt current income and taxable capital appreciation.
Under normal market conditions, we generally seek to achieve the Fund’s investment objective by investing primarily in a portfolio of medium- and lower-grade municipal securities. Although not governed by specific rating categories, the Fund generally invests at least 75% of its net assets in municipal securities rated medium- to lower-quality - or if not rated, securities we determine to be of comparable quality - at the time of investment.
Under normal market conditions, we may invest all or a substantial portion of the Fund’s assets in municipal securities that are subject to the federal alternative minimum tax (AMT). Accordingly, the Fund may not be a suitable investment for investors who are already subject to the AMT or could become subject to it as a result of an investment in the Fund.
At times, conditions in the municipal securities markets may be such that we
will invest in higher-grade issues, particularly when the difference in returns between quality classifications is very narrow or when we expect interest rates to increase. These investments may lessen the decline in NAV but may affect the amount of current income, since yields of higher-grade securities are usually lower than yields of medium- or lower-grade securities.
Sell decisions generally are based on:
| n | | A deterioration or likely deterioration of an individual issuer’s capacity to meet its debt obligations on a timely basis. |
| n | | A deterioration or likely deterioration of the broader fundamentals of a particular industry or sector. |
| n | | Opportunities in the secondary or primary market to purchase a security with better relative value. |
Market conditions and your Fund
For the fiscal year ended February 28, 2014, the municipal bond market returned -0.21%1, as measured by the
Barclays Municipal Bond Index. Record outflows from municipal bond funds, driven by concerns over rising interest rates and high-profile credit events, resulted in a challenging year for municipal bond investors. The $67 billion2 in municipal bond fund redemptions between March and December 2013 was in stark contrast to inflows of $65 billion2 and strong performance for the asset class over the prior two years.
Shortly after the fiscal year began, investors became apprehensive that the US Federal Reserve (the Fed) would reduce its asset purchase program, known as quantitative easing (QE), as the US economy improved. Concerned that Fed action would cause interest rates to rise and bond prices to fall, investors began trimming their allocations to fixed income investments, including municipal bonds. The rate of outflows increased dramatically in June following comments made by then-Fed Chairman Ben Bernanke on the timing for tapering QE.
Over the summer of 2013, several high-profile credit events had an adverse impact on the municipal bond market. These included downgrades to the credit ratings of Chicago debt on pension concerns, Detroit filing the largest municipal bankruptcy in US history3 and increased uncertainty about the financial condition of Puerto Rico.
The market received a two-month reprieve in September when the Fed decided not to reduce QE, although it reversed that decision in December when it announced that it would decrease its asset purchases by $10 billion per month, beginning in January 2014.4 A final head-wind for the municipal bond market was significant tax-loss selling of municipal bonds in December to offset gains from strong equity returns during 2013.
In the first two months of 2014, the municipal bond market turned positive. Softer economic data reduced expectations for hawkish Fed action. Relatively
| | | | |
Portfolio Composition | |
By credit sector, based on total investments | |
| Revenue Bonds | | | 94.4 | % |
| General Obligation Bonds | | | 5.0 | |
| Pre-Refunded Bonds | | | 0.6 | |
| | | | | | |
Top Five Fixed Income Issuers | |
| 1. | | Collier (County of) Industrial Development Authority (The Arlington of Naples); Series 2014 A | | | 0.7 | % |
| 2. | | King (County of); Series 2011 B | | | 0.7 | |
| 3. | | Massachusetts (State of); Series 2004 A | | | 0.7 | |
| 4. | | Golden State Tobacco Securitization Corp.; Series 2005 A | | | 0.7 | |
| 5. | | Sanger Industrial Development Corp. (Texas Pellets); Series
2012 B | | | 0.7 | |
| | | | | |
Total Net Assets | | | | $6.1 billion | |
| Total Number of Holdings | | | | 1,340 | |
The Fund’s holdings are subject to change, and there is no assurance that the Fund will continue to hold any particular security.
4 Invesco High Yield Municipal Fund
high yields on municipal bonds, coupled with higher personal income tax rates and improving municipal fundamentals, drew investors back to the asset class. Net positive fund flows in January and February, combined with limited supply of new issuance, produced strong returns in the final two months of the fiscal year.
During the fiscal year, a primary driver of the Fund’s underperformance relative to its broad market benchmark was its use of leverage. This had a negative impact on Fund performance as the municipal bond market experienced negative price returns for the period.
At the sector level, the Fund’s underweight allocation and security selection in Tobacco settlement bonds made a positive contribution to performance. The Fund’s significant underweight position in Puerto Rico was also a large contributor to performance. Returns from bonds rated below investment grade were also additive to Fund performance.
Prior to the beginning of the fiscal year, the Fund had been closed to new investors for six months due primarily to a lack of supply in the primary and secondary markets that met the managers’ criteria for reaching the Fund’s objectives. During the first three months of the fiscal year, the Fund remained closed. It was reopened to new investors in June 2013 after the market changed due to net outflows from municipal bond funds and investment opportunities became available.
During the reporting period, leverage detracted from Fund performance. The Fund achieved a leveraged position through the use of inverse floating rate securities or Tender Option Bonds (TOBs). The Fund uses leverage because we believe that, over time, leveraging provides opportunities for additional income and total return for shareholders. However, the use of leverage also can expose shareholders to additional volatility. For more information about the Fund’s use of leverage, see the Notes to Financial Statements later in this report.
We wish to remind you that the Fund is subject to interest rate risk, meaning when interest rates rise, the value of fixed income securities generally will fall. This risk may be greater in the current market environment because interest rates are at or near historic lows. We are monitoring interest rates and market and economic factors that may impact interest rates, including the potential impact of the Fed’s tapering of QE. If interest
rates rise, markets may experience increased volatility, which may affect the value and/or liquidity of certain of the Fund’s investments.
Recently published rules implementing section 619 of the Dodd-Frank Wall Street Reform and Consumer Protection Act may preclude banking entities from sponsoring and/or providing services for TOB trust programs. As a result, the Trust’s ability to utilize TOBs for leverage purposes may be adversely affected.
Thank you for investing in Invesco High Yield Municipal Fund and for sharing our long-term investment horizon.
| 4 | Source: US Federal Reserve |
| 5 | Source: Standard & Poor’s. A credit rating is an assessment provided by a nationally recognized statistical rating organization (NRSRO) of the creditworthiness of an issuer with respect to debt obligations, including specific securities, money market instruments or other debts. Ratings are measured on a scale that generally ranges from AAA (highest) to D (lowest); ratings are subject to change without notice. “Non-Rated” indicates the debtor was not rated, and should not be interpreted as indicating low quality. For more information on Standard & Poor’s rating methodology, please visit standard and poors. com and select “Understanding Ratings” under Rating Resources on the homepage. |
The views and opinions expressed in management’s discussion of Fund performance are those of Invesco Advisers, Inc. These views and opinions are subject to change at any time based on factors such as market and economic conditions. These views and opinions may not be relied upon as investment advice or recommendations, or as an offer for a particular security. The information is not a complete analysis of every aspect of any market, country, industry, security or the Fund. Statements of fact are from sources considered reliable, but Invesco Advisers, Inc. makes no representation or warranty as to their completeness or accuracy. Although historical performance is no guarantee of future results, these insights may help you understand our investment management philosophy.
See important Fund and, if applicable, index disclosures later in this report.
| | |
 | | Bill Black Chartered Financial Analyst, portfolio manager, is manager of Invesco High Yield Municipal Fund. He |
| joined Invesco in 2010. Mr. Black earned a BS in engineering and public policy from Washington University in St. Louis and an MBA from Kellogg School of Management, Northwestern University. |
| | |
 | | Mark Paris Portfolio manager, is manager of Invesco High Yield Municipal Fund. He joined Invesco in 2010. |
| Mr. Paris earned a BBA in finance from Baruch College, The City University of New York. |
| | |
 | | James Phillips Portfolio manager, is manager of Invesco High Yield Municipal Fund. He joined Invesco in 2010. |
| Mr. Phillips earned a BA in American literature from Empire State College and an MBA in finance from University at Albany, The State University of New York. |
5 Invesco High Yield Municipal Fund
Your Fund’s Long-Term Performance
Results of a $10,000 Investment – Oldest Share Class(es)
Fund and index data from 2/29/04
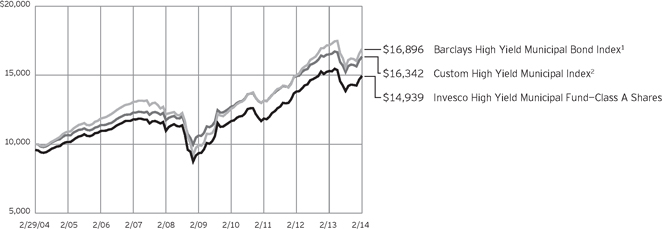
| 1 | Source(s): Invesco, Barclays |
| 2 | Source(s): Invesco, Lipper Inc., Barclays |
Past performance cannot guarantee comparable future results.
The data shown in the chart include reinvested distributions, applicable sales charges and Fund expenses including management fees. Index results include reinvested dividends, but they do not reflect sales charges. Performance of the
peer group, if applicable, reflects fund expenses and management fees; performance of a market index does not. Performance shown in the chart and table(s) does not reflect deduction of taxes a shareholder would pay on Fund distributions or sale of Fund shares.
6 Invesco High Yield Municipal Fund
| | | | | |
| Average Annual Total Returns |
As of 2/28/14, including maximum applicable sales charges | |
| |
Class A Shares | | | | | |
| Inception (1/2/86) | | | | 5.80 | % |
| 10 Years | | | | 4.10 | |
| 5 Years | | | | 8.90 | |
| 1 Year | | | | -6.51 | |
| |
Class B Shares | | | | | |
| Inception (7/20/92) | | | | 5.24 | % |
| 10 Years | | | | 4.03 | |
| 5 Years | | | | 9.33 | |
| 1 Year | | | | -7.05 | |
| |
Class C Shares | | | | | |
| Inception (12/10/93) | | | | 4.51 | % |
| 10 Years | | | | 3.76 | |
| 5 Years | | | | 9.03 | |
| 1 Year | | | | -4.07 | |
| |
Class Y Shares | | | | | |
| Inception (3/1/06) | | | | 4.24 | % |
| 5 Years | | | | 10.13 | |
| 1 Year | | | | -2.11 | |
| |
Class R5 Shares | | | | | |
| 10 Years | | | | 5.34 | |
| 5 Years | | | | 10.56 | |
| 1 Year | | | | -2.10 | |
| | | | | |
| Average Annual Total Returns |
| As of 12/31/13, the most recent calendar quarter end, including maximum applicable sales charges | |
| |
| Class A Shares | | | | | |
| Inception (1/2/86) | | | | 5.66 | % |
| 10 Years | | | | 3.88 | |
| 5 Years | | | | 9.33 | |
| 1 Year | | | | -9.58 | |
| |
Class B Shares | | | | | |
| Inception (7/20/92) | | | | 5.05 | % |
| 10 Years | | | | 3.78 | |
| 5 Years | | | | 9.71 | |
| 1 Year | | | | -9.99 | |
| |
Class C Shares | | | | | |
| Inception (12/10/93) | | | | 4.31 | % |
| 10 Years | | | | 3.56 | |
| 5 Years | | | | 9.45 | |
| 1 Year | | | | -7.14 | |
| |
Class Y Shares | | | | | |
| Inception (3/1/06) | | | | 3.69 | % |
| 5 Years | | | | 10.51 | |
| 1 Year | | | | -5.31 | |
| |
Class R5 Shares | | | | | |
| 10 Years | | | | 5.13 | |
| 5 Years | | | | 11.02 | |
| 1 Year | | | | -5.30 | |
Effective June 1, 2010, Class A, Class B, Class C and Class I shares of the predecessor fund, Van Kampen High Yield Municipal Fund, advised by Van Kampen Asset Management were reorganized into Class A, Class B, Class C and Class Y shares, respectively, of Invesco Van Kampen High Yield Municipal Fund (renamed Invesco High Yield Municipal Fund). Returns shown above for Class A, Class B, Class C and Class Y shares are blended returns of the predecessor fund and Invesco High Yield Municipal Fund. Share class returns will differ from the predecessor fund because of different expenses.
Class R5 shares incepted on April 30, 2012. Performance shown prior to that date is that of the Fund’s and the predecessor fund’s Class A shares and includes the 12b-1 fees applicable to Class A shares. Class A share performance reflects any applicable fee waivers or expense reimbursements.
The performance data quoted represent past performance and cannot guarantee comparable future results; current performance may
be lower or higher. Please visit invesco.com/performance for the most recent month-end performance. Performance figures reflect reinvested distributions, changes in net asset value and the effect of the maximum sales charge unless otherwise stated. Investment return and principal value will fluctuate so that you may have a gain or loss when you sell shares.
The total annual Fund operating expense ratio set forth in the most recent Fund prospectus as of the date of this report for Class A, Class B, Class C, Class Y and Class R5 shares was 0.90%, 0.90%, 1.65%, 0.65% and 0.69%, respectively. The expense ratios presented above may vary from the expense ratios presented in other sections of this report that are based on expenses incurred during the period covered by this report.
Class A share performance reflects the maximum 4.25% sales charge, and Class B and Class C share performance reflects the applicable contingent deferred sales charge (CDSC) for the period involved. For shares purchased
prior to June 1, 2010, the CDSC on Class B shares declines from 4% at the time of purchase to 0% at the beginning of the sixth year. For shares purchased on or after June 1, 2010, the CDSC on Class B shares declines from 5% at the time of purchase to 0% at the beginning of the seventh year. The CDSC on Class C shares is 1% for the first year after purchase. Class Y and Class R5 shares do not have a front-end sales charge or a CDSC; therefore, performance is at net asset value.
The performance of the Fund’s share classes will differ primarily due to different sales charge structures and class expenses.
7 Invesco High Yield Municipal Fund
Invesco High Yield Municipal Fund’s investment objective is to seek federal tax-exempt current income and taxable capital appreciation.
| n | | Unless otherwise stated, information presented in this report is as of February 28, 2014, and is based on total net assets. |
| n | | Unless otherwise noted, all data provided by Invesco. |
| n | | To access your Fund’s reports/prospectus, visit invesco.com/fundreports. |
About share classes
| n | | Class B shares may not be purchased for new or additional investments. Please see the prospectus for more information. |
| n | | Class Y shares are available only to certain investors. Please see the prospectus for more information. |
| n | | Class R5 shares are primarily intended for employer sponsored retirement and benefit plans that meet certain standards and for institutional investors. Please see the prospectus for more information. |
Principal risks of investing in the Fund
| n | | Alternative minimum tax risk. All or a portion of the Fund’s otherwise tax-exempt income may be taxable to those shareholders subject to the federal alternative minimum tax. |
| n | | Call risk. If interest rates fall, it is possible that issuers of debt securities with high interest rates will prepay or call their securities before their maturity dates. In this event, the proceeds from the called securities would likely be reinvested by the Fund in securities bearing the new, lower interest rates, resulting in a possible decline in the Fund’s income and distributions to shareholders. |
| n | | Credit risk. The issuer of instruments in which the Fund invests may be unable to meet interest and/or principal payments, thereby causing its instruments to decrease in value and lowering the issuer’s credit rating. |
| n | | Derivatives risk. The value of a derivative instrument depends largely on (and is derived from) the value of an underlying security, currency, commodity, interest rate, index or other asset (each referred to as an underlying asset). In addition to risks |
| | | relating to the underlying assets, the use of derivatives may include other, possibly greater, risks, including counterparty, leverage and liquidity risks. Counterparty risk is the risk that the counterparty to the derivative contract will default on its obligation to pay the Fund the amount owed or otherwise perform under the derivative contract. Derivatives create leverage risk because they do not require payment up front equal to the economic exposure created by owning the derivative. As a result, an adverse change in the value of the underlying asset could result in the Fund sustaining a loss that is substantially greater than the amount invested in the derivative, which may make the Fund’s returns more volatile and increase the risk of loss. Derivative instruments may also be less liquid than more traditional investments and the Fund may be unable to sell or close out its derivative positions at a desirable time or price. This risk may be more acute under adverse market conditions, during which the Fund may be most in need of liquidating its derivative positions. Derivatives may also be harder to value, less tax efficient and subject to changing government regulation that could impact the Fund’s ability to use certain derivatives or their cost. Also, derivatives used for hedging or to gain or limit exposure to a particular market segment may not provide the expected benefits, particularly during adverse market conditions. |
| n | | High yield bond (junk bond) risk. Junk bonds involve a greater risk of default or price changes due to changes in the credit quality of the issuer. The values of junk bonds fluctuate more than those of high-quality bonds in response to company, political, regulatory or economic developments. Values of junk bonds can decline significantly over short periods of time. |
| n | | Income risk. The income you receive from the Fund is based primarily on prevailing interest rates, which can vary widely over the short- and long-term. If interest rates drop, your income from the Fund may drop as well. |
| n | | Interest rate risk. Interest rate risk refers to the risk that bond prices generally fall as interest rates rise; conversely, bond prices generally |
| | | rise as interest rates fall. Specific bonds differ in their sensitivity to changes in interest rates depending on their individual characteristics, including duration. |
| n | | Inverse floating rate obligations risk. Inverse floating rate obligations, including tender option bonds, may be subject to greater price volatility than a fixed income security with similar qualities. When short-term interest rates rise, they may decrease in value and produce less or no income. Additionally, these securities may lose principal. Similar to derivatives, inverse floating rate obligations have the following risks: counterparty, leverage, correlation, liquidity, market, interest rate, and management risks. |
| n | | Leverage risk. Leverage exists when the Fund purchases or sells an instrument or enters into a transaction without investing cash in an amount equal to the full economic exposure of the asset or transaction and the Fund could lose more than it invested. Leverage created from certain types of transactions or instruments may impair the Fund’s liquidity, cause it to liquidate positions at an unfavorable time, increase volatility or otherwise not achieve its intended objective. |
| n | | Liquidity risk. The Fund may hold illiquid securities that it is unable to sell at the preferred time or price and could lose its entire investment in such securities. |
| n | | Management risk. The investment techniques and risk analysis used by the Fund’s portfolio managers may not produce the desired results. |
| n | | Market risk. The prices of and the income generated by the Fund’s securities may decline in response to, among other things, investor sentiment, general economic and market conditions, regional or global instability, and currency and interest rate fluctuations. |
This report must be accompanied or preceded by a currently effective Fund prospectus, which contains more complete information, including sales charges and expenses. Investors should read it carefully before investing.
NOT FDIC INSURED | MAY LOSE VALUE | NO BANK GUARANTEE
7 Invesco Emerging Market Local Currency Debt Fund
| n | | Medium- and lower-grade municipal securities risk. Securities which are in the medium- and lower-grade categories generally offer higher yields than are offered by higher-grade securities of similar maturity, but they also generally involve more volatility and greater risks, such as greater credit risk, market risk, liquidity risk, management risk, and regulatory risk. Furthermore, many medium- and lower-grade securities are not listed for trading on any national securities exchange and many issuers of medium- and lower-grade securities choose not to have a rating assigned to their obligations by any nationally recognized statistical rating organization. As a result, the Fund’s portfolio may consist of a higher portion of unlisted or unrated securities as compared with an investment company that invests solely in higher-grade securities. Unrated securities are usually not as attractive to as many buyers as are rated securities, a factor which may make unrated securities less marketable. These factors may have the effect of limiting the availability of the securities for purchase by the Fund and may also limit the ability of the Fund to sell such securities at their fair value either to meet redemption requests or in response to changes in the economy or the financial markets. |
| n | | Municipal issuer focus risk. The Fund generally considers investments in municipal securities not to be subject to industry concentration policies (issuers of municipal securities as a group is not an industry) and the Fund may invest in municipal securities issued by entities having similar characteristics. The issuers may be located in the same geographic area or may pay their interest obligations from revenue of similar projects, such as hospitals, airports, utility systems and housing finance agencies. This may make the Fund’s investments more susceptible to similar social, economic, political or regulatory occurrences. As the similarity in issuers increases, the potential for fluctuation in the Fund’s net asset value also increases. |
| n | | Municipal securities risk. The Fund may invest in municipal securities. Constitutional amendments, legislative enactments, executive orders, administrative regulations, voter initiatives, and the issuer’s regional economic conditions may affect the municipal security’s value, interest payments, repayment of principal and the Fund’s ability to sell it. Failure of a municipal security issuer to comply with applicable tax requirements may make income paid thereon taxable, resulting in a decline in the security’s value. In addition, there could be changes in applicable tax laws or tax treatments that reduce or eliminate the current federal income tax exemption on municipal securities or otherwise adversely affect the current federal or state tax status of municipal securities. |
| n | | Reinvestment risk. Reinvestment risk is the risk that a bond’s cash flows (coupon income and principal repayment) will be reinvested at an interest rate below that on the original bond. |
| n | | Variable-rate demand notes risk. The absence of an active secondary market for certain variable and floating rate notes could make it difficult to dispose of the instruments, and a portfolio could suffer a loss if the issuer defaults during periods in which a portfolio is not entitled to exercise its demand rights. |
| n | | When-issued and delayed delivery risks. When-issued and delayed delivery transactions are subject to market risk as the value or yield of a security at delivery may be more or less than the purchase price or the yield generally available on securities when delivery occurs. In addition, the Fund is subject to counterparty risk because it relies on the buyer or seller, as the case may be, to consummate the transaction, and failure by the other party to complete the transaction may result in the Fund missing the opportunity of obtaining a price or yield considered to be advantageous. |
| n | | Zero coupon or pay-in-kind securities risk. The value, interest rates, and liquidity of non-cash paying instruments, such as zero coupon and pay-in-kind securities, are subject to greater fluctuation than other types of securities. |
About indexes used in this report
| n | | The Barclays High Yield Municipal Bond Index is an unmanaged index considered representative of non-investment-grade bonds. |
| n | | The Custom High Yield Municipal Index, created by Invesco to serve as a benchmark for Invesco High Yield Municipal Fund, comprises 60% Barclays High Yield Municipal Bond Index and 40% Barclays Municipal Bond Index. |
| n | | The Barclays Municipal Bond Index is an unmanaged index considered representative of the tax-exempt bond market. |
| n | | The Fund is not managed to track the performance of any particular index, including the index(es) described here, and consequently, the performance of the Fund may deviate significantly from the performance of the |
| n | | A direct investment cannot be made in an index. Unless otherwise indicated, index results include reinvested dividends, and they do not reflect sales charges. Performance of the peer group, if applicable, reflects fund expenses; performance of a market index does not. |
Other information
| n | | The returns shown in management’s discussion of Fund performance are based on net asset values (NAVs) calculated for shareholder transactions. Generally accepted accounting principles require adjustments to be made to the net assets of the Fund at period end for financial reporting purposes, and as such, the NAVs for shareholder transactions and the returns based on those NAVs may differ from the NAVs and returns reported in the Financial Highlights. |
9 Invesco High Yield Municipal Fund
Schedule of Investments
February 28, 2014
| | | | | | | | | | | | | | | | |
| | | Interest Rate | | | Maturity Date | | | Principal Amount (000) | | | Value | |
Municipal Obligations–107.77% | |
| Alabama–1.24% | |
Huntsville (City of) Special Care Facilities Financing Authority (Redstone Village); | | | | | | | | | | | | | | | | |
Series 2007, Retirement Facility RB | | | 5.50 | % | | | 01/01/28 | | | $ | 1,000 | | | $ | 952,440 | |
Series 2007, Retirement Facility RB | | | 5.50 | % | | | 01/01/43 | | | | 13,170 | | | | 11,281,159 | |
Series 2008 A, Retirement Facility RB | | | 6.88 | % | | | 01/01/43 | | | | 4,470 | | | | 4,523,372 | |
Series 2011 A, Retirement Facility RB | | | 7.50 | % | | | 01/01/47 | | | | 2,600 | | | | 2,750,488 | |
Series 2012 A, Retirement Facility RB | | | 5.63 | % | | | 01/01/42 | | | | 7,050 | | | | 6,215,139 | |
Jefferson (County of); | | | | | | | | | | | | | | | | |
Series 2013 C, Sr. Lien Sewer Revenue Conv. CAB Wts. (INS–AGM)(a)(b) | | | 6.50 | % | | | 10/01/38 | | | | 10,250 | | | | 5,818,822 | |
Series 2013 C, Sr. Lien Sewer Revenue Conv. CAB Wts. (INS–AGM)(a)(b) | | | 6.60 | % | | | 10/01/42 | | | | 9,200 | | | | 5,146,296 | |
Series 2013 F, Sr. Lien Sewer Revenue Conv. CAB Wts.(b) | | | 7.75 | % | | | 10/01/46 | | | | 54,300 | | | | 28,321,251 | |
Series 2013 F, Sub. Lien Sewer Revenue Conv. CAB Wts.(b) | | | 7.50 | % | | | 10/01/39 | | | | 20,000 | | | | 10,638,800 | |
Mobile (City of) Industrial Development Board (Mobile Energy Services Co.); Series 1995, Ref. Solid Waste Disposal RB | | | 6.95 | % | | | 01/01/20 | | �� | | 3 | | | | 0 | |
| | | | | | | | | | | | | | | | 75,647,767 | |
|
| Alaska–0.08% | |
Alaska (State of) Industrial Development & Export Authority (Lake Dorothy Hydroelectric); Series 2006, RB (INS–AMBAC)(a)(c) | | | 5.25 | % | | | 12/01/26 | | | | 3,690 | | | | 3,703,063 | |
Northern Tobacco Securitization Corp.; | | | | | | | | | | | | | | | | |
Series 2006 B, First Sub. Asset-Backed CAB RB(d) | | | 0.00 | % | | | 06/01/46 | | | | 25,375 | | | | 729,531 | |
Series 2006 C, Second Sub. Asset-Backed CAB RB(d) | | | 0.00 | % | | | 06/01/46 | | | | 20,860 | | | | 609,112 | |
| | | | | | | | | | | | | | | | 5,041,706 | |
|
| Arizona–4.32% | |
Casa Grande (City of) Industrial Development Authority (Casa Grande Regional Medical Center); | | | | | | | | | | | | | | | | |
Series 2001 A, Ref. Hospital RB | | | 7.25 | % | | | 12/01/19 | | | | 6,850 | | | | 6,330,838 | |
Series 2001 A, Ref. Hospital RB | | | 7.63 | % | | | 12/01/29 | | | | 13,750 | | | | 12,741,025 | |
Series 2002 A, Hospital RB | | | 7.13 | % | | | 12/01/24 | | | | 3,000 | | | | 2,950,800 | |
Flagstaff (City of) Industrial Development Authority (Senior Living Community Northern Arizona); Series 2007, Ref. RB | | | 5.70 | % | | | 07/01/42 | | | | 17,830 | | | | 16,196,594 | |
Peoria (City of) Industrial Development Authority (Sierra Winds Life Care Community); | | | | | | | | | | | | | | | | |
Series 1999 A, Ref. RB | | | 6.25 | % | | | 08/15/20 | | | | 500 | | | | 500,125 | |
Series 1999 A, Ref. RB | | | 6.38 | % | | | 08/15/29 | | | | 9,700 | | | | 9,283,094 | |
Series 1999 A, Ref. RB | | | 6.50 | % | | | 08/15/31 | | | | 3,500 | | | | 3,341,975 | |
Phoenix (City of) Industrial Development Authority (Choice Academies); Series 2012, Education RB | | | 5.63 | % | | | 09/01/42 | | | | 2,850 | | | | 2,478,731 | |
Phoenix (City of) Industrial Development Authority (Phoenix Collegiate Academy); Series 2012, Education RB | | | 5.63 | % | | | 07/01/42 | | | | 2,770 | | | | 2,527,514 | |
Phoenix Civic Improvement Corp.; | | | | | | | | | | | | | | | | |
Series 2008 A, Sr. Lien Airport RB(e) | | | 5.00 | % | | | 07/01/22 | | | | 3,500 | | | | 3,982,055 | |
Series 2008 A, Sr. Lien Airport RB(e) | | | 5.00 | % | | | 07/01/24 | | | | 5,000 | | | | 5,668,500 | |
Series 2008 A, Sr. Lien Airport RB(e) | | | 5.00 | % | | | 07/01/26 | | | | 5,000 | | | | 5,610,500 | |
Series 2009 A, Jr. Lien Water System RB(e) | | | 5.00 | % | | | 07/01/27 | | | | 8,935 | | | | 10,171,247 | |
Series 2009 A, Jr. Lien Water System RB(e) | | | 5.00 | % | | | 07/01/28 | | | | 6,785 | | | | 7,663,522 | |
Series 2009 A, Jr. Lien Water System RB(e) | | | 5.00 | % | | | 07/01/29 | | | | 5,500 | | | | 6,132,940 | |
Pima (County of) Industrial Development Authority (Acclaim Charter School); | | | | | | | | | | | | | | | | |
Series 2006, Education Facility RB | | | 5.70 | % | | | 12/01/26 | | | | 2,200 | | | | 2,046,902 | |
Series 2006, Education Facility RB | | | 5.80 | % | | | 12/01/36 | | | | 4,385 | | | | 3,830,166 | |
Pima (County of) Industrial Development Authority (Choice Education & Development Corp.); | | | | | | | | | | | | | | | | |
Series 2006, Education Facility RB | | | 6.25 | % | | | 06/01/26 | | | | 4,225 | | | | 4,080,885 | |
Series 2006, Education Facility RB | | | 6.38 | % | | | 06/01/36 | | | | 4,890 | | | | 4,575,817 | |
See accompanying Notes to Financial Statements which are an integral part of the financial statements.
10 Invesco High Yield Municipal Fund
| | | | | | | | | | | | | | | | |
| | | Interest Rate | | | Maturity Date | | | Principal Amount (000) | | | Value | |
| Arizona–(continued) | |
Pima (County of) Industrial Development Authority (Constellation Schools); Series 2008, Lease RB | | | 7.00 | % | | | 01/01/38 | | | $ | 16,000 | | | $ | 16,099,200 | |
Pima (County of) Industrial Development Authority (Coral Academy Science); | | | | | | | | | | | | | | | | |
Series 2008 A, Education Facilities RB | | | 7.13 | % | | | 12/01/28 | | | | 2,120 | | | | 2,150,083 | |
Series 2008 A, Education Facilities RB | | | 7.25 | % | | | 12/01/38 | | | | 3,285 | | | | 3,311,313 | |
Pima (County of) Industrial Development Authority (Desert Heights Charter School); | | | | | | | | | | | | | | | | |
Series 2003, Education Facility RB | | | 7.25 | % | | | 08/01/19 | | | | 735 | | | | 750,832 | |
Series 2003, Education Facility RB | | | 7.50 | % | | | 08/01/33 | | | | 4,345 | | | | 4,389,971 | |
Pima (County of) Industrial Development Authority (Edkey Charter Schools); | | | | | | | | | | | | | | | | |
Series 2013, Ref. Education Facility RB | | | 6.00 | % | | | 07/01/43 | | | | 250 | | | | 227,558 | |
Series 2013, Ref. Education Facility RB | | | 6.00 | % | | | 07/01/48 | | | | 2,975 | | | | 2,677,203 | |
Pima (County of) Industrial Development Authority (Excalibur Charter School); Series 2003, Education RB | | | 7.75 | % | | | 08/01/33 | | | | 2,905 | | | | 2,411,237 | |
Pima (County of) Industrial Development Authority (Global Water Resources, LLC); | | | | | | | | | | | | | | | | |
Series 2006, Water & Wastewater RB(c)(f) | | | 5.60 | % | | | 12/01/22 | | | | 2,000 | | | | 2,014,340 | |
Series 2006, Water & Wastewater RB(c)(f) | | | 5.75 | % | | | 12/01/32 | | | | 7,120 | | | | 7,147,412 | |
Series 2007, Water & Wastewater RB(c) | | | 6.55 | % | | | 12/01/37 | | | | 1,000 | | | | 1,007,460 | |
Series 2008, Water & Wastewater RB(c) | | | 7.50 | % | | | 12/01/38 | | | | 12,235 | | | | 12,747,891 | |
Pima (County of) Industrial Development Authority (Legacy Traditional School); Series 2009, Education RB | | | 8.50 | % | | | 07/01/39 | | | | 1,720 | | | | 1,880,201 | |
Pima (County of) Industrial Development Authority (Milestones Charter School District); | | | | | | | | | | | | | | | | |
Series 2003, Education Facility RB | | | 7.50 | % | | | 11/01/33 | | | | 3,030 | | | | 2,560,108 | |
Series 2005, Education Facility RB | | | 6.75 | % | | | 11/01/33 | | | | 2,865 | | | | 2,227,251 | |
Pima (County of) Industrial Development Authority (P.L.C. Charter Schools); | | | | | | | | | | | | | | | | |
Series 2006, Education Facility RB | | | 6.50 | % | | | 04/01/26 | | | | 2,590 | | | | 2,541,023 | |
Series 2006, Education Facility RB | | | 6.75 | % | | | 04/01/36 | | | | 3,805 | | | | 3,667,487 | |
Pima (County of) Industrial Development Authority (Paradise Education Center); | | | | | | | | | | | | | | | | |
Series 2006, Ref. Education RB | | | 5.88 | % | | | 06/01/22 | | | | 535 | | | | 540,682 | |
Series 2006, Ref. Education RB | | | 6.00 | % | | | 06/01/36 | | | | 830 | | | | 795,530 | |
Series 2010, Education RB | | | 6.10 | % | | | 06/01/45 | | | | 1,400 | | | | 1,325,338 | |
Pima (County of) Industrial Development Authority (Premier & Air Co.); Series 2005, Education Facility RB(g) | | | 7.00 | % | | | 09/01/35 | | | | 5,092 | | | | 1,782,251 | |
Pima (County of) Industrial Development Authority (Riverbend Prep); Series 2010, Education RB | | | 7.00 | % | | | 09/01/37 | | | | 3,358 | | | | 2,770,350 | |
Pima (County of) Industrial Development Authority (Skyline Technical High School); Series 2004, Education Facility RB | | | 7.50 | % | | | 02/01/34 | | | | 4,300 | | | | 3,309,151 | |
Quechan Indian Tribe of Fort Yuma (California & Arizona Governmental); Series 2008, RB | | | 7.00 | % | | | 12/01/27 | | | | 5,310 | | | | 4,920,883 | |
Red Hawk Canyon Community Facilities District No. 2; Series 1998 A, Assessment RB | | | 6.50 | % | | | 12/01/17 | | | | 1,575 | | | | 1,539,169 | |
Salt Verde Financial Corp.; | | | | | | | | | | | | | | | | |
Series 2007, Sr. Gas RB | | | 5.00 | % | | | 12/01/32 | | | | 10,000 | | | | 10,602,100 | |
Series 2007, Sr. Gas RB | | | 5.00 | % | | | 12/01/37 | | | | 12,625 | | | | 13,274,177 | |
Sundance Community Facilities District (Assessment District No. 2); Series 2003, Special Assessment RB(f) | | | 7.13 | % | | | 07/01/27 | | | | 2,221 | | | | 2,222,399 | |
Sundance Community Facilities District (Assessment District No. 3); Series 2004, Special Assessment RB | | | 6.50 | % | | | 07/01/29 | | | | 391 | | | | 391,004 | |
Sundance Community Facilities District; Series 2004, Unlimited Tax GO Bonds(f)(h)(i) | | | 6.25 | % | | | 07/15/14 | | | | 1,000 | | | | 1,023,170 | |
Tempe (City of) Industrial Development Authority (Friendship Village); | | | | | | | | | | | | | | | | |
Series 2012 A, Ref. RB | | | 6.25 | % | | | 12/01/42 | | | | 2,700 | | | | 2,750,274 | |
Series 2012 A, Ref. RB | | | 6.25 | % | | | 12/01/46 | | | | 4,100 | | | | 4,168,142 | |
Town of Florence, Inc. (The) Industrial Development Authority (Legacy Traditional School–Queen Creek and Casa Grande Campuses); | | | | | | | | | | | | | | | | |
Series 2013, Education RB | | | 5.75 | % | | | 07/01/33 | | | | 3,000 | | | | 2,826,300 | |
Series 2013, Education RB | | | 6.00 | % | | | 07/01/43 | | | | 3,625 | | | | 3,366,175 | |
Tucson (City of) Industrial Development Authority (Catalina Assisted Living Apartments); Series 2013, Ref. MFH RB | | | 6.00 | % | | | 10/01/45 | | | | 4,435 | | | | 3,235,332 | |
See accompanying Notes to Financial Statements which are an integral part of the financial statements.
11 Invesco High Yield Municipal Fund
| | | | | | | | | | | | | | | | |
| | | Interest Rate | | | Maturity Date | | | Principal Amount (000) | | | Value | |
| Arizona–(continued) | |
University Medical Center Corp.; | | | | | | | | | | | | | | | | |
Series 2005, Hospital RB | | | 5.00 | % | | | 07/01/35 | | | $ | 7,280 | | | $ | 7,321,714 | |
Series 2009, Hospital RB | | | 6.25 | % | | | 07/01/29 | | | | 1,650 | | | | 1,803,632 | |
Series 2009, Hospital RB | | | 6.50 | % | | | 07/01/39 | | | | 2,100 | | | | 2,294,187 | |
Series 2011, Hospital RB | | | 6.00 | % | | | 07/01/39 | | | | 2,600 | | | | 2,756,286 | |
Verrado Community Facilities District No. 1; Series 2006, Unlimited Tax GO Bonds | | | 5.35 | % | | | 07/15/31 | | | | 5,915 | | | | 5,311,078 | |
Vistancia Community Facilities District; Series 2002, Unlimited Tax GO Bonds | | | 6.75 | % | | | 07/15/22 | | | | 4,000 | | | | 4,011,600 | |
| | | | | | | | | | | | | | | | 262,264,724 | |
|
| California–12.73% | |
ABAG Finance Authority for Non-profit Corps. (Episcopal Senior Communities); Series 2012 A, Ref. RB | | | 5.00 | % | | | 07/01/47 | | | | 6,000 | | | | 5,641,380 | |
Alhambra (City of) (Atherton Baptist Homes); | | | | | | | | | | | | | | | | |
Series 2010 A, RB | | | 7.63 | % | | | 01/01/40 | | | | 4,340 | | | | 4,502,273 | |
Series 2010 B, RB | | | 6.63 | % | | | 01/01/17 | | | | 225 | | | | 225,344 | |
Bakersfield (City of); Series 2007 A, Wastewater RB (INS–AGM)(a)(e) | | | 5.00 | % | | | 09/15/32 | | | | 14,990 | | | | 16,214,533 | |
Bay Area Toll Authority (San Francisco Bay Area); Series 2009 F-1, Toll Bridge RB(e) | | | 5.13 | % | | | 04/01/39 | | | | 22,295 | | | | 24,368,435 | |
California (State of) Educational Facilities Authority (Stanford University); | | | | | | | | | | | | | | | | |
Series 2010, RB(e) | | | 5.25 | % | | | 04/01/40 | | | | 6,255 | | | | 7,862,285 | |
Series 2012 U-2, Ref. RB(e) | | | 5.00 | % | | | 10/01/32 | | | | 8,745 | | | | 10,819,052 | |
California (State of) Health Facilities Financing Authority (Children’s Hospital of Orange County); Series 2009, RB | | | 6.50 | % | | | 11/01/38 | | | | 3,000 | | | | 3,473,610 | |
California (State of) Health Facilities Financing Authority (Sutter Health); Series 2013 A, RB | | | 5.00 | % | | | 08/15/52 | | | | 7,000 | | | | 7,156,100 | |
California (State of) Municipal Finance Authority (American Heritage Education Foundation); Series 2006 A, Education RB | | | 5.25 | % | | | 06/01/26 | | | | 2,000 | | | | 1,772,180 | |
California (State of) Municipal Finance Authority (Caritas); Series 2012 A, Mobile Home Park RB | | | 5.50 | % | | | 08/15/47 | | | | 1,000 | | | | 1,023,380 | |
California (State of) Municipal Finance Authority (Goodwill Industries of Sacramento & Nevada); | | | | | | | | | | | | | | | | |
Series 2012, RB(f) | | | 6.63 | % | | | 01/01/32 | | | | 1,000 | | | | 1,037,590 | |
Series 2012, RB(f) | | | 6.88 | % | | | 01/01/42 | | | | 1,500 | | | | 1,558,665 | |
California (State of) Municipal Finance Authority (High Tech High-Chula Vista); | | | | | | | | | | | | | | | | |
Series 2008 B, Educational Facility RB(f) | | | 6.13 | % | | | 07/01/38 | | | | 2,860 | | | | 2,836,491 | |
Series 2008 B, Educational Facility RB(f) | | | 6.13 | % | | | 07/01/43 | | | | 2,000 | | | | 1,969,020 | |
Series 2008 B, Educational Facility RB(f) | | | 6.13 | % | | | 07/01/48 | | | | 3,840 | | | | 3,750,874 | |
California (State of) Municipal Finance Authority (High Tech High-Media Arts); | | | | | | | | | | | | | | | | |
Series 2008 A, Educational Facility RB(f) | | | 6.00 | % | | | 07/01/38 | | | | 1,170 | | | | 1,149,326 | |
Series 2008 A, Educational Facility RB(f) | | | 6.13 | % | | | 07/01/48 | | | | 2,415 | | | | 2,375,636 | |
California (State of) Municipal Finance Authority (King/Chavez); Series 2009 A, Educational Facilities RB | | | 8.50 | % | | | 10/01/29 | | | | 1,000 | | | | 1,123,740 | |
California (State of) Municipal Finance Authority (Santa Rosa Academy); | | | | | | | | | | | | | | | | |
Series 2012 A, Charter School Lease RB | | | 5.75 | % | | | 07/01/30 | | | | 7,290 | | | | 7,281,689 | |
Series 2012 A, Charter School Lease RB | | | 6.00 | % | | | 07/01/42 | | | | 5,355 | | | | 5,289,776 | |
California (State of) Pollution Control Finance Authority; | | | | | | | | | | | | | | | | |
Series 2012, Water Furnishing RB(c)(f) | | | 5.00 | % | | | 07/01/37 | | | | 13,500 | | | | 13,407,120 | |
Series 2012, Water Furnishing RB(c)(f) | | | 5.00 | % | | | 11/21/45 | | | | 8,000 | | | | 7,632,640 | |
Series 2012, Water Furnishing RB MBTC(c)(e)(f) | | | 5.00 | % | | | 11/21/45 | | | | 16,000 | | | | 15,265,280 | |
California (State of) School Finance Authority (Alliance for College-Ready Public Schools); Series 2013 A, School Facility RB | | | 6.40 | % | | | 07/01/48 | | | | 3,000 | | | | 3,079,830 | |
California (State of) School Finance Authority (New Designs Charter School); Series 2012, Educational Facilities RB | | | 5.50 | % | | | 06/01/42 | | | | 5,000 | | | | 4,635,650 | |
California (State of) Statewide Communities Development Authority (American Baptist Homes of the West); Series 2010, RB | | | 6.25 | % | | | 10/01/39 | | | | 2,000 | | | | 2,110,560 | |
See accompanying Notes to Financial Statements which are an integral part of the financial statements.
12 Invesco High Yield Municipal Fund
| | | | | | | | | | | | | | | | |
| | | Interest Rate | | | Maturity Date | | | Principal Amount (000) | | | Value | |
| California–(continued) | |
California (State of) Statewide Communities Development Authority (California Baptist University); | | | | | | | | | | | | | | | | |
Series 2007 A, RB | | | 5.50 | % | | | 11/01/38 | | | $ | 8,000 | | | $ | 7,400,560 | |
Series 2011, RB | | | 7.25 | % | | | 11/01/31 | | | | 1,500 | | | | 1,632,540 | |
Series 2011, RB | | | 7.50 | % | | | 11/01/41 | | | | 5,500 | | | | 6,014,965 | |
Series 2014 A, RB | | | 6.13 | % | | | 11/01/33 | | | | 1,560 | | | | 1,577,425 | |
California (State of) Statewide Communities Development Authority (Collegiate Housing Foundation–Irvine, L.L.C.–University of California-Irvine East Campus Apartments, Phase II); Series 2008, Student Housing RB | | | 6.00 | % | | | 05/15/40 | | | | 5,000 | | | | 5,220,200 | |
California (State of) Statewide Communities Development Authority (Eskaton Properties, Inc.); Series 2012, RB | | | 5.25 | % | | | 11/15/34 | | | | 4,350 | | | | 4,373,795 | |
California (State of) Statewide Communities Development Authority (Hospice of Napa Valley); Series 2004 A, RB | | | 7.00 | % | | | 01/01/34 | | | | 3,020 | | | | 2,735,516 | |
California (State of) Statewide Communities Development Authority (Huntington Park Charter School); Series 2007 A, Educational Facilities RB | | | 5.25 | % | | | 07/01/42 | | | | 3,500 | | | | 2,897,440 | |
California (State of) Statewide Communities Development Authority (Lancer Educational Student Housing); | | | | | | | | | | | | | | | | |
Series 2007, RB | | | 5.40 | % | | | 06/01/17 | | | | 2,420 | | | | 2,506,660 | |
Series 2007, RB | | | 5.63 | % | | | 06/01/33 | | | | 4,940 | | | | 4,606,945 | |
Series 2010, RB | | | 7.50 | % | | | 06/01/42 | | | | 1,700 | | | | 1,796,084 | |
California (State of) Statewide Communities Development Authority (Southern California Presbyterian Homes); | | | | | | | | | | | | | | | | |
Series 2009, Senior Living RB | | | 7.00 | % | | | 11/15/29 | | | | 1,745 | | | | 1,941,138 | |
Series 2009, Senior Living RB | | | 7.25 | % | | | 11/15/41 | | | | 3,500 | | | | 3,863,090 | |
California (State of) Statewide Communities Development Authority (Terraces at San Joaquin Garden); | | | | | | | | | | | | | | | | |
Series 2012, RB | | | 4.75 | % | | | 10/01/19 | | | | 5,000 | | | | 5,002,050 | |
Series 2012, RB | | | 6.00 | % | | | 10/01/42 | | | | 2,895 | | | | 2,879,135 | |
Series 2012, RB | | | 6.00 | % | | | 10/01/47 | | | | 1,785 | | | | 1,765,954 | |
California (State of) Statewide Communities Development Authority Community Facilities District 2007-1 (Orinda); | | | | | | | | | | | | | | | | |
Series 2007, Special Tax RB | | | 6.00 | % | | | 09/01/29 | | | | 2,735 | | | | 2,830,889 | |
Series 2007, Special Tax RB | | | 6.00 | % | | | 09/01/37 | | | | 6,185 | | | | 6,333,193 | |
California (State of) Statewide Communities Development Authority; Series 2008 A, Special Assessment RB | | | 6.63 | % | | | 09/02/38 | | | | 7,610 | | | | 7,658,628 | |
California (State of) Statewide Finance Authority (Pooled Tobacco Securitization); Series 2002, Tobacco Settlement Asset-Backed RB | | | 6.00 | % | | | 05/01/43 | | | | 15,000 | | | | 14,576,400 | |
California (State of); Series 2012, Various Purpose Unlimited Tax GO Bonds | | | 5.00 | % | | | 04/01/42 | | | | 11,180 | | | | 11,807,422 | |
California County Tobacco Securitization Agency (The) (Sonoma County Securitization Corp.); | | | | | | | | | | | | | | | | |
Series 2005, Ref. Tobacco Settlement Asset-Backed RB | | | 5.13 | % | | | 06/01/38 | | | | 9,280 | | | | 7,297,699 | |
Series 2005, Ref. Tobacco Settlement Asset-Backed RB | | | 5.25 | % | | | 06/01/45 | | | | 3,675 | | | | 2,878,076 | |
Carlsbad (City of) Community Facilities District 3 (Improvement Area 2); | | | | | | | | | | | | | | | | |
Series 2008, Special Tax RB | | | 6.10 | % | | | 09/01/28 | | | | 2,615 | | | | 2,664,685 | |
Series 2008, Special Tax RB | | | 6.20 | % | | | 09/01/38 | | | | 5,960 | | | | 5,996,296 | |
Desert Community College District (Election of 2004); Series 2007 C, Unlimited Tax CAB GO Bonds (INS–AGM)(a)(d) | | | 0.00 | % | | | 08/01/46 | | | | 107,175 | | | | 17,710,669 | |
Eden (Township of) Healthcare District; Series 2010, COP | | | 6.13 | % | | | 06/01/34 | | | | 2,510 | | | | 2,626,991 | |
Fairfield (City of) Community Facilities District No. 2007-1 (Fairfield Commons); | | | | | | | | | | | | | | | | |
Series 2008, Special Tax RB | | | 6.50 | % | | | 09/01/23 | | | | 1,435 | | | | 1,533,828 | |
Series 2008, Special Tax RB | | | 6.75 | % | | | 09/01/28 | | | | 2,950 | | | | 3,093,429 | |
Series 2008, Special Tax RB | | | 6.88 | % | | | 09/01/38 | | | | 5,140 | | | | 5,424,396 | |
Fontana (City of) Community Facilities District No. 22 (Sierra Hills South); Series 2004, Special Tax RB | | | 6.00 | % | | | 09/01/34 | | | | 5,000 | | | | 5,025,650 | |
See accompanying Notes to Financial Statements which are an integral part of the financial statements.
13 Invesco High Yield Municipal Fund
| | | | | | | | | | | | | | | | |
| | | Interest Rate | | | Maturity Date | | | Principal Amount (000) | | | Value | |
| California–(continued) | |
Foothill-Eastern Transportation Corridor Agency; | | | | | | | | | | | | | | | | |
Series 2013 C, Ref. Jr. Lien Toll Road RB | | | 6.50 | % | | | 01/15/43 | | | $ | 10,750 | | | $ | 11,391,990 | |
Series 2014 A, Ref. Conv. Toll Road CAB RB(b) | | | 6.85 | % | | | 01/15/42 | | | | 5,000 | | | | 2,753,750 | |
Series 2014 A, Ref. Toll Road CAB RB(d) | | | 0.00 | % | | | 01/15/36 | | | | 35,000 | | | | 10,103,100 | |
Series 2014 A, Ref. Toll Road CAB RB(d) | | | 0.00 | % | | | 01/15/37 | | | | 20,000 | | | | 5,406,200 | |
Series 2014 A, Ref. Toll Road RB | | | 6.00 | % | | | 01/15/49 | | | | 20,000 | | | | 21,112,000 | |
Golden State Tobacco Securitization Corp.; | | | | | | | | | | | | | | | | |
Series 2005 A, Enhanced Tobacco Settlement Asset-Backed RB (INS–BHAC)(a)(e) | | | 5.00 | % | | | 06/01/45 | | | | 40,380 | | | | 40,467,221 | |
Series 2007 A-1, Sr. Tobacco Settlement Asset-Backed RB | | | 4.50 | % | | | 06/01/27 | | | | 35,880 | | | | 31,331,492 | |
Series 2007 A-1, Sr. Tobacco Settlement Asset-Backed RB | | | 5.00 | % | | | 06/01/33 | | | | 20,000 | | | | 15,963,800 | |
Series 2007 A-1, Sr. Tobacco Settlement Asset-Backed RB | | | 5.13 | % | | | 06/01/47 | | | | 31,245 | | | | 23,561,854 | |
Series 2007 A-1, Sr. Tobacco Settlement Asset-Backed RB | | | 5.75 | % | | | 06/01/47 | | | | 18,060 | | | | 14,882,885 | |
Series 2007 A-2, Sr. Tobacco Settlement Asset-Backed RB | | | 5.30 | % | | | 06/01/37 | | | | 33,500 | | | | 26,267,685 | |
Hawthorne (City of) Community Facilities District No. 2006-1; Series 2006, Special Tax RB | | | 5.00 | % | | | 09/01/30 | | | | 3,000 | | | | 3,049,140 | |
Hesperia (City of) Public Financing Authority (Redevelopment & Housing); | | | | | | | | | | | | | | | | |
Series 2007 A, Tax Allocation RB (INS–SGI)(a) | | | 5.00 | % | | | 09/01/31 | | | | 1,495 | | | | 1,417,006 | |
Series 2007 A, Tax Allocation RB (INS–SGI)(a) | | | 5.00 | % | | | 09/01/37 | | | | 3,395 | | | | 3,104,320 | |
Independent Cities Finance Authority (Rancho Del Sol & Grandview); Series 2012, Ref. Mobile Home Park RB | | | 5.50 | % | | | 05/15/47 | | | | 2,000 | | | | 2,045,960 | |
Indio (City of) Redevelopment Agency (Merged Project Area); | | | | | | | | | | | | | | | | |
Series 2004 B, Sub. Tax Allocation RB(h)(i) | | | 6.38 | % | | | 08/15/14 | | | | 3,500 | | | | 3,599,925 | |
Series 2004 B, Sub. Tax Allocation RB(h)(i) | | | 6.50 | % | | | 08/15/14 | | | | 1,320 | | | | 1,353,449 | |
Inland Empire Tobacco Securitization Authority; | | | | | | | | | | | | | | | | |
Series 2007 A, Tobacco Settlement RB | | | 4.63 | % | | | 06/01/21 | | | | 6,150 | | | | 5,686,782 | |
Series 2007 A, Tobacco Settlement RB | | | 5.00 | % | | | 06/01/21 | | | | 4,365 | | | | 4,131,647 | |
Series 2007 C-1, Asset-Backed Tobacco Settlement CAB RB(d) | | | 0.00 | % | | | 06/01/36 | | | | 39,000 | | | | 6,898,320 | |
Series 2007 D, Asset-Backed Tobacco Settlement CAB RB(d) | | | 0.00 | % | | | 06/01/57 | | | | 32,090 | | | | 297,474 | |
La Verne (City of) (Brethren Hillcrest Home); Series 2003 B, Revenue COP | | | 6.63 | % | | | 02/15/25 | | | | 4,025 | | | | 4,048,224 | |
Los Alamitos Unified School District (Capital); Series 2012, Conv. CAB COP(b) | | | 6.05 | % | | | 08/01/42 | | | | 9,000 | | | | 5,300,100 | |
Los Angeles (City of) Community Facilities District No. 3 (Cascades Business Park); Series 1997, Special Tax RB | | | 6.40 | % | | | 09/01/22 | | | | 605 | | | | 612,538 | |
Morongo Band of Mission Indians (The) (Enterprise Casino); Series 2008 B, RB(f) | | | 6.50 | % | | | 03/01/28 | | | | 5,515 | | | | 6,015,597 | |
Murrieta (City of) Community Facilities District No. 2 (The Oaks Improvement Area); | | | | | | | | | | | | | | | | |
Series 2004 B, Special Tax RB | | | 6.00 | % | | | 09/01/27 | | | | 1,000 | | | | 1,010,280 | |
Series 2004 B, Special Tax RB | | | 6.00 | % | | | 09/01/34 | | | | 2,000 | | | | 2,009,280 | |
National City (City of) Community Development Commission (National City Redevelopment); Series 2011, Tax Allocation RB | | | 7.00 | % | | | 08/01/32 | | | | 4,750 | | | | 5,682,710 | |
Orange (City of) Community Facilities District No. 06-1 (Del Rio Public Improvements); Series 2010, Special Tax RB | | | 6.00 | % | | | 10/01/40 | | | | 3,500 | | | | 3,606,575 | |
Perris (City of) Community Facilities District No. 01-2; Series 2002 A, Special Tax RB | | | 6.38 | % | | | 09/01/32 | | | | 5,000 | | | | 5,028,000 | |
Perris (City of) Public Financing Authority; Series 2006, Tax Allocation RB | | | 5.35 | % | | | 10/01/36 | | | | 1,350 | | | | 1,350,878 | |
Placentia (City of) Public Financing Authority (Working Capital Financing); Series 2009, Lease RB | | | 7.50 | % | | | 06/01/19 | | | | 4,115 | | | | 4,128,744 | |
Rancho Cordova (City of) Community Facilities District No. 2003-1 (Sunridge Anatolia); Series 2005, Special Tax RB | | | 5.50 | % | | | 09/01/37 | | | | 2,000 | | | | 2,012,800 | |
Riverside (County of) Redevelopment Agency (Mid-County Redevelopment Project Area); Series 2010 C, Tax Allocation RB | | | 6.25 | % | | | 10/01/40 | | | | 1,780 | | | | 1,782,332 | |
Riverside (County of) Transportation Commission; Series 2013 A, Sr. Lien Toll RB | | | 5.75 | % | | | 06/01/48 | | | | 7,000 | | | | 7,249,760 | |
Roseville (City of) (Fountains Community Facilities District No. 1); Series 2008, Special Tax RB | | | 6.13 | % | | | 09/01/38 | | | | 1,000 | | | | 1,027,730 | |
Sacramento (County of) Community Facilities District No. 2005-2 (North Vineyard Station No. 1); Series 2007 A, Special Tax RB | | | 6.00 | % | | | 09/01/37 | | | | 11,110 | | | | 11,122,665 | |
See accompanying Notes to Financial Statements which are an integral part of the financial statements.
14 Invesco High Yield Municipal Fund
| | | | | | | | | | | | | | | | |
| | | Interest Rate | | | Maturity Date | | | Principal Amount (000) | | | Value | |
| California–(continued) | |
San Bernardino City Unified School District; | | | | | | | | | | | | | | | | |
Series 2011 D, Unlimited Tax CAB GO Bonds (INS–AGM)(a)(d) | | | 0.00 | % | | | 08/01/36 | | | $ | 7,650 | | | $ | 2,273,121 | |
Series 2011 D, Unlimited Tax CAB GO Bonds (INS–AGM)(a)(d) | | | 0.00 | % | | | 08/01/37 | | | | 13,130 | | | | 3,670,885 | |
Series 2011 D, Unlimited Tax CAB GO Bonds (INS–AGM)(a)(d) | | | 0.00 | % | | | 08/01/38 | | | | 13,515 | | | | 3,582,556 | |
Series 2011 D, Unlimited Tax CAB GO Bonds (INS–AGM)(a)(d) | | | 0.00 | % | | | 08/01/39 | | | | 13,895 | | | | 3,471,388 | |
Series 2011 D, Unlimited Tax CAB GO Bonds (INS–AGM)(a)(d) | | | 0.00 | % | | | 08/01/40 | | | | 14,280 | | | | 3,361,084 | |
Series 2011 D, Unlimited Tax CAB GO Bonds (INS–AGM)(a)(d) | | | 0.00 | % | | | 08/01/41 | | | | 14,080 | | | | 3,120,691 | |
San Buenaventura (City of) (Community Memorial Health System); | | | | | | | | | | | | | | | | |
Series 2011, RB | | | 7.50 | % | | | 12/01/41 | | | | 20,980 | | | | 23,690,406 | |
Series 2011, RB | | | 8.00 | % | | | 12/01/31 | | | | 9,875 | | | | 11,651,710 | |
San Diego Unified School District (Election of 2008); Series 2012 E, Unlimited Tax Conv. CAB GO Bonds(b) | | | 5.25 | % | | | 07/01/42 | | | | 20,000 | | | | 7,816,000 | |
San Francisco (City & County of) Redevelopment Financing Authority (Mission Bay South Redevelopment); | | | | | | | | | | | | | | | | |
Series 2009 D, Tax Allocation RB | | | 6.25 | % | | | 08/01/28 | | | | 1,000 | | | | 1,107,180 | |
Series 2009 D, Tax Allocation RB | | | 6.50 | % | | | 08/01/30 | | | | 1,000 | | | | 1,116,930 | |
San Francisco (City & County of) Successor Agency to the Redevelopment Agency Community Facilities District No. 6 (Mission Bay South Public Improvements); | | | | | | | | | | | | | | | | |
Series 2013 C, Special Tax CAB RB(d) | | | 0.00 | % | | | 08/01/36 | | | | 5,710 | | | | 1,495,049 | |
Series 2013 C, Special Tax CAB RB(d) | | | 0.00 | % | | | 08/01/38 | | | | 2,000 | | | | 453,180 | |
Series 2013 C, Special Tax CAB RB(d) | | | 0.00 | % | | | 08/01/43 | | | | 17,000 | | | | 2,803,470 | |
San Gorgonio Memorial Health Care District (Election 2006); Series 2006 C, Unlimited Tax GO Bonds | | | 7.20 | % | | | 08/01/39 | | | | 13,000 | | | | 15,166,060 | |
San Jose (City of) (Helzer Courts Apartments); Series 1999 A, MFH RB(c) | | | 6.40 | % | | | 12/01/41 | | | | 14,123 | | | | 13,217,151 | |
San Jose (City of) Community Facilities District No. 9 (Bailey/Highway 101); | | | | | | | | | | | | | | | | |
Series 2003, Special Tax RB | | | 6.60 | % | | | 09/01/27 | | | | 2,000 | | | | 2,001,660 | |
Series 2003, Special Tax RB | | | 6.65 | % | | | 09/01/32 | | | | 2,630 | | | | 2,631,026 | |
Santa Cruz (County of) Redevelopment Agency (Live Oak/Soquel Community Improvement); Series 2009 A, Tax Allocation RB | | | 7.00 | % | | | 09/01/36 | | | | 3,500 | | | | 3,927,210 | |
Savanna Elementary School District (Election of 2008); Series 2012 B, Unlimited Tax Conv. CAB GO Bonds (INS–AGM)(a)(b) | | | 6.75 | % | | | 02/01/52 | | | | 7,500 | | | | 2,806,575 | |
Southern California Logistics Airport Authority; | | | | | | | | | | | | | | | | |
Series 2007, Tax Allocation RB(j) | | | 6.15 | % | | | 12/01/43 | | | | 4,400 | | | | 1,409,320 | |
Series 2008 A, Tax Allocation CAB RB(d) | | | 0.00 | % | | | 12/01/45 | | | | 18,085 | | | | 528,082 | |
Series 2008 A, Tax Allocation CAB RB(d) | | | 0.00 | % | | | 12/01/46 | | | | 18,085 | | | | 500,955 | |
Series 2008 A, Tax Allocation CAB RB(d) | | | 0.00 | % | | | 12/01/47 | | | | 18,085 | | | | 432,232 | |
Series 2008 A, Tax Allocation CAB RB(d) | | | 0.00 | % | | | 12/01/48 | | | | 18,085 | | | | 401,487 | |
Series 2008 A, Tax Allocation CAB RB(d) | | | 0.00 | % | | | 12/01/49 | | | | 18,085 | | | | 365,317 | |
Series 2008 A, Tax Allocation CAB RB(d) | | | 0.00 | % | | | 12/01/50 | | | | 18,085 | | | | 338,190 | |
Series 2008 A, Tax Allocation RB | | | 6.00 | % | | | 12/01/33 | | | | 1,475 | | | | 472,443 | |
Southern California Tobacco Securitization Authority (San Diego County Tobacco Asset Securitization Corp.); | | | | | | | | | | | | | | | | |
Series 2006, Tobacco Settlement Asset-Backed First Sub. CAB RB(d) | | | 0.00 | % | | | 06/01/46 | | | | 35,000 | | | | 828,100 | |
Series 2006, Tobacco Settlement Asset-Backed Second Sub. CAB RB(d) | | | 0.00 | % | | | 06/01/46 | | | | 27,200 | | | | 553,520 | |
Series 2006, Tobacco Settlement Asset-Backed Third Sub. CAB RB(d) | | | 0.00 | % | | | 06/01/46 | | | | 47,000 | | | | 886,420 | |
Series 2006 A-1, Sr. Tobacco Settlement Asset-Backed RB | | | 5.00 | % | | | 06/01/37 | | | | 21,715 | | | | 16,822,393 | |
Southern California Tobacco Securitization Authority; Series 2006 A-1, Sr. RB | | | 4.75 | % | | | 06/01/25 | | | | 10 | | | | 9,786 | |
Val Verde Unified School District Financing Authority; Series 2003, Ref. Jr. Lien Special Tax RB | | | 6.25 | % | | | 10/01/28 | | | | 6,000 | | | | 6,068,700 | |
Vallejo (City of) Public Financing Authority (Hiddenbrooke Improvement District); Series 2004 A, Local Agency RB | | | 5.80 | % | | | 09/01/31 | | | | 4,015 | | | | 4,033,790 | |
See accompanying Notes to Financial Statements which are an integral part of the financial statements.
15 Invesco High Yield Municipal Fund
| | | | | | | | | | | | | | | | |
| | | Interest Rate | | | Maturity Date | | | Principal Amount (000) | | | Value | |
| California–(continued) | |
Victor Valley Union High School District (Election of 2008); | | | | | | | | | | | | | | | | |
Series 2013 B, Unlimited Tax CAB GO Bonds(d) | | | 0.00 | % | | | 08/01/43 | | | $ | 11,855 | | | $ | 2,191,634 | |
Series 2013 B, Unlimited Tax CAB GO Bonds(d) | | | 0.00 | % | | | 08/01/44 | | | | 12,475 | | | | 2,171,274 | |
Series 2013 B, Unlimited Tax CAB GO Bonds(d) | | | 0.00 | % | | | 08/01/47 | | | | 14,550 | | | | 2,010,374 | |
Series 2013 B, Unlimited Tax CAB GO Bonds(d) | | | 0.00 | % | | | 08/01/48 | | | | 7,000 | | | | 909,720 | |
Series 2013 B, Unlimited Tax CAB GO Bonds(d) | | | 0.00 | % | | | 08/01/49 | | | | 15,715 | | | | 1,922,259 | |
Series 2013 B, Unlimited Tax CAB GO Bonds(d) | | | 0.00 | % | | | 08/01/52 | | | | 37,560 | | | | 3,778,536 | |
Woodland (City of) Community Facilities District 1; Series 2004, Special Tax RB | | | 6.25 | % | | | 09/01/34 | | | | 4,735 | | | | 4,679,316 | |
Yuba City (City of) Redevelopment Agency (Housing Set-Aside); | | | | | | | | | | | | | | | | |
Series 2004 B, Tax Allocation RB | | | 6.00 | % | | | 09/01/31 | | | | 1,060 | | | | 1,062,215 | |
Series 2004 B, Tax Allocation RB | | | 6.00 | % | | | 09/01/39 | | | | 1,880 | | | | 1,881,598 | |
Yuba City (City of) Redevelopment Agency (Redevelopment); Series 2004, Tax Allocation RB | | | 6.00 | % | | | 09/01/31 | | | | 1,800 | | | | 1,803,762 | |
| | | | | | | | | | | | | | | | 773,473,175 | |
|
| Colorado–3.37% | |
Arista Metropolitan District; Series 2005, Special Limited Tax GO Bonds | | | 6.75 | % | | | 12/01/35 | | | | 1,964 | | | | 1,749,315 | |
Beacon Point Metropolitan District; | | | | | | | | | | | | | | | | |
Series 2005 A, Limited Tax GO Bonds | | | 6.13 | % | | | 12/01/25 | | | | 1,545 | | | | 1,536,518 | |
Series 2005 A, Limited Tax GO Bonds | | | 6.25 | % | | | 12/01/35 | | | | 3,510 | | | | 3,420,074 | |
Bradburn Metropolitan District No. 3; Series 2010, Ref. Limited Tax GO Bonds | | | 7.50 | % | | | 12/01/39 | | | | 2,575 | | | | 2,616,329 | |
Broomfield Village Metropolitan District No. 2; Series 2003, Ref. & Improvement Limited Tax GO Bonds | | | 6.25 | % | | | 12/01/32 | | | | 4,005 | | | | 3,504,655 | |
Buckhorn Valley Metropolitan District No. 2; Series 2003, Limited Tax GO Bonds | | | 7.00 | % | | | 12/01/23 | | | | 60 | | | | 33,394 | |
Castle Oaks Metropolitan District; | | | | | | | | | | | | | | | | |
Series 2005, Limited Tax GO Bonds(h)(i) | | | 6.00 | % | | | 12/01/15 | | | | 865 | | | | 947,045 | |
Series 2005, Limited Tax GO Bonds(h)(i) | | | 6.13 | % | | | 12/01/15 | | | | 1,286 | | | | 1,410,781 | |
Colorado (State of) Educational & Cultural Facilities Authority (Banning Lewis Ranch Academy); Series 2006, Charter School RB(f) | | | 6.13 | % | | | 12/15/35 | | | | 2,690 | | | | 2,572,985 | |
Colorado (State of) Educational & Cultural Facilities Authority (Brighton Charter School); Series 2006, Charter School RB | | | 6.00 | % | | | 11/01/36 | | | | 3,255 | | | | 2,575,389 | |
Colorado (State of) Educational & Cultural Facilities Authority (Community Leadership Academy); | | | | | | | | | | | | | | | | |
Series 2008, Charter School RB | | | 6.25 | % | | | 07/01/28 | | | | 1,650 | | | | 1,590,880 | |
Series 2008, Charter School RB | | | 6.50 | % | | | 07/01/38 | | | | 1,000 | | | | 945,170 | |
Series 2013, Charter School RB | | | 7.45 | % | | | 08/01/48 | | | | 2,245 | | | | 2,325,730 | |
Colorado (State of) Educational & Cultural Facilities Authority (Flagstaff Academy); Series 2008 A, Charter School RB | | | 7.00 | % | | | 08/01/38 | | | | 1,500 | | | | 1,530,645 | |
Colorado (State of) Educational & Cultural Facilities Authority (Monument Academy); | | | | | | | | | | | | | | | | |
Series 2007, Charter School RB | | | 5.88 | % | | | 10/01/27 | | | | 2,500 | | | | 2,534,900 | |
Series 2007, Charter School RB | | | 6.00 | % | | | 10/01/37 | | | | 1,635 | | | | 1,640,641 | |
Series 2008 A, Charter School RB | | | 7.25 | % | | | 10/01/39 | | | | 500 | | | | 532,860 | |
Colorado (State of) Educational & Cultural Facilities Authority (New Vision Charter School); Series 2008, RB(f) | | | 6.75 | % | | | 04/01/40 | | | | 1,845 | | | | 1,790,960 | |
Colorado (State of) Educational & Cultural Facilities Authority (North Star Academy); Series 2008 A, Ref. & Improvement RB(f) | | | 8.25 | % | | | 11/01/39 | | | | 2,890 | | | | 3,102,675 | |
Colorado (State of) Educational & Cultural Facilities Authority (Northeast Academy); Series 2007, Charter School RB (Acquired 07/27/07-03/31/08; Cost $2,302,785)(f) | | | 5.75 | % | | | 05/15/37 | | | | 2,395 | | | | 1,659,256 | |
Colorado (State of) Educational & Cultural Facilities Authority (The Classical Academy); Series 2008 A, Charter School RB | | | 7.40 | % | | | 12/01/38 | | | | 2,000 | | | | 2,218,220 | |
Colorado (State of) Health Facilities Authority (American Baptist Homes); Series 2009 A, RB | | | 7.75 | % | | | 08/01/39 | | | | 4,000 | | | | 4,018,880 | |
Colorado (State of) Health Facilities Authority (Christian Living Communities); | | | | | | | | | | | | | | | | |
Series 2006 A, RB | | | 5.75 | % | | | 01/01/37 | | | | 9,355 | | | | 9,438,166 | |
Series 2011, RB | | | 6.38 | % | | | 01/01/41 | | | | 1,615 | | | | 1,683,524 | |
Colorado (State of) Health Facilities Authority (SCL Health System); Series 2013 A, RB | | | 5.00 | % | | | 01/01/44 | | | | 4,600 | | | | 4,775,444 | |
See accompanying Notes to Financial Statements which are an integral part of the financial statements.
16 Invesco High Yield Municipal Fund
| | | | | | | | | | | | | | | | |
| | | Interest Rate | | | Maturity Date | | | Principal Amount (000) | | | Value | |
| Colorado–(continued) | |
Colorado (State of) Health Facilities Authority (Total Longterm Care National Obligated Group); | | | | | | | | | | | | | | | | |
Series 2010 A, RB | | | 6.00 | % | | | 11/15/30 | | | $ | 1,600 | | | $ | 1,707,056 | |
Series 2010 A, RB | | | 6.25 | % | | | 11/15/40 | | | | 4,750 | | | | 5,023,980 | |
Series 2011, RB | | | 5.75 | % | | | 11/15/31 | | | | 1,000 | | | | 1,048,740 | |
Series 2011, RB | | | 6.00 | % | | | 11/15/40 | | | | 1,195 | | | | 1,255,097 | |
Colorado (State of) Health Facilities Authority (Volunteers of America Care); | | | | | | | | | | | | | | | | |
Series 2007 A, Health & Residential Care Facilities RB | | | 5.20 | % | | | 07/01/22 | | | | 800 | | | | 752,408 | |
Series 2007 A, Health & Residential Care Facilities RB | | | 5.25 | % | | | 07/01/27 | | | | 3,260 | | | | 2,894,489 | |
Series 2007 A, Health & Residential Care Facilities RB | | | 5.30 | % | | | 07/01/37 | | | | 5,815 | | | | 4,818,716 | |
Colorado (State of) Regional Transportation District (Denver Transit Partners Eagle P3); Series 2010, Private Activity RB | | | 6.00 | % | | | 01/15/41 | | | | 13,935 | | | | 14,656,276 | |
Colorado Springs (City of) Urban Renewal Authority (University Village Colorado); Series 2008 A, Tax Increment Allocation RB | | | 7.00 | % | | | 12/01/29 | | | | 2,500 | | | | 1,622,950 | |
Copperleaf Metropolitan District No. 2; | | | | | | | | | | | | | | | | |
Series 2006, Limited Tax GO Bonds | | | 5.85 | % | | | 12/01/26 | | | | 1,000 | | | | 873,140 | |
Series 2006, Limited Tax GO Bonds | | | 5.95 | % | | | 12/01/36 | | | | 9,000 | | | | 7,445,430 | |
Country Club Village Metropolitan District; Series 2006, Limited Tax GO Bonds | | | 6.00 | % | | | 12/01/34 | | | | 592 | | | | 485,819 | |
Cross Creek Metropolitan District No. 2; Series 2006, Ref. Limited Tax GO Bonds | | | 5.00 | % | | | 12/01/37 | | | | 2,630 | | | | 2,014,869 | |
Denver (City & County of) (United Airlines); | | | | | | | | | | | | | | | | |
Series 2007 A, Ref. Special Facilities Airport RB(c) | | | 5.25 | % | | | 10/01/32 | | | | 17,110 | | | | 16,195,813 | |
Series 2007 A, Ref. Special Facilities Airport RB(c) | | | 5.75 | % | | | 10/01/32 | | | | 11,400 | | | | 11,410,260 | |
Elbert (County of) & Highway 86 Commercial Metropolitan District; Series 2008 A, Public Improvement Fee RB(k) | | | 4.13 | % | | | 12/01/32 | | | | 4,500 | | | | 2,000,250 | |
Fitzsimons Village Metropolitan District No. 1; Series 2010 A, Tax Increment Allocation & Public Improvement Fee Supported RB | | | 7.50 | % | | | 03/01/40 | | | | 5,393 | | | | 5,668,636 | |
Fossil Ridge Metropolitan District No. 1; Series 2010, Ref. Tax Supported Limited Tax GO Bonds | | | 7.25 | % | | | 12/01/40 | | | | 995 | | | | 1,013,398 | |
Grandby Ranch Metropolitan District; Series 2006, Limited Tax GO Bonds | | | 6.75 | % | | | 12/01/36 | | | | 2,880 | | | | 2,881,958 | |
High Plains Metropolitan District; | | | | | | | | | | | | | | | | |
Series 2005 A, Limited Tax GO Bonds(k) | | | 2.76 | % | | | 12/01/25 | | | | 2,220 | | | | 1,228,459 | |
Series 2005 A, Limited Tax GO Bonds(k) | | | 2.81 | % | | | 12/01/35 | | | | 4,000 | | | | 2,212,080 | |
Jordan Crossing Metropolitan District; Series 2006, Limited Tax GO Bonds | | | 5.75 | % | | | 12/01/36 | | | | 1,350 | | | | 928,030 | |
Lafayette (City of) (Rocky Mountain Instrument); | | | | | | | | | | | | | | | | |
Series 1998 A, IDR(c) | | | 7.00 | % | | | 10/01/18 | | | | 3,360 | | | | 2,789,774 | |
Series 1999 A, IDR | | | 6.75 | % | | | 10/01/14 | | | | 90 | | | | 85,969 | |
Liberty Ranch Metropolitan District; Series 2006, Limited Tax GO Bonds | | | 6.25 | % | | | 12/01/36 | | | | 1,583 | | | | 1,291,744 | |
Lincoln Park Metropolitan District; | | | | | | | | | | | | | | | | |
Series 2008, Ref. & Improvement Unlimited Tax GO Bonds | | | 6.13 | % | | | 12/01/30 | | | | 6,250 | | | | 6,480,187 | |
Series 2008, Ref. & Improvement Unlimited Tax GO Bonds | | | 6.20 | % | | | 12/01/37 | | | | 5,550 | | | | 5,717,943 | |
Montezuma (County of) Hospital District; Series 2007, Ref. RB | | | 5.90 | % | | | 10/01/37 | | | | 6,360 | | | | 5,997,162 | |
Montrose (County of) (The Homestead at Montrose, Inc.); | | | | | | | | | | | | | | | | |
Series 2003 A, Health Care Facilities RB | | | 5.75 | % | | | 02/01/15 | | | | 55 | | | | 55,015 | |
Series 2003 A, Health Care Facilities RB | | | 6.75 | % | | | 02/01/22 | | | | 300 | | | | 300,078 | |
Series 2003 A, Health Care Facilities RB | | | 7.00 | % | | | 02/01/25 | | | | 800 | | | | 800,208 | |
Series 2003 A, Health Care Facilities RB | | | 7.00 | % | | | 02/01/38 | | | | 6,200 | | | | 6,059,012 | |
Montrose (County of) Memorial Hospital Board of Trustees; Series 2003, Enterprise RB | | | 6.00 | % | | | 12/01/33 | | | | 5,500 | | | | 5,608,625 | |
Neu Towne Metropolitan District; Series 2004, Limited Tax GO Bonds(k) | | | 5.45 | % | | | 12/01/34 | | | | 1,500 | | | | 398,820 | |
Northwest Metropolitan District No. 3; | | | | | | | | | | | | | | | | |
Series 2005, Limited Tax GO Bonds | | | 6.13 | % | | | 12/01/25 | | | | 4,500 | | | | 4,263,165 | |
Series 2005, Limited Tax GO Bonds | | | 6.25 | % | | | 12/01/35 | | | | 7,450 | | | | 6,752,531 | |
Plaza Metropolitan District No. 1; Series 2013, Ref. Tax Allocation RB | | | 5.00 | % | | | 12/01/40 | | | | 1,000 | | | | 971,340 | |
Reata South Metropolitan District; Series 2007 A, Limited Tax GO Bonds | | | 7.25 | % | | | 06/01/37 | | | | 1,000 | | | | 920,870 | |
Riverdale Peaks II Metropolitan District; Series 2005, Limited Tax GO Bonds | | | 6.50 | % | | | 12/01/35 | | | | 1,000 | | | | 594,310 | |
Serenity Ridge Metropolitan District No. 2; Series 2004, Limited Tax GO Bonds(k) | | | 3.75 | % | | | 12/01/34 | | | | 2,000 | | | | 962,100 | |
See accompanying Notes to Financial Statements which are an integral part of the financial statements.
17 Invesco High Yield Municipal Fund
| | | | | | | | | | | | | | | | |
| | | Interest Rate | | | Maturity Date | | | Principal Amount (000) | | | Value | |
| Colorado–(continued) | |
Tallgrass Metropolitan District; Series 2007, Ref. & Improvement Limited Tax GO Bonds | | | 5.25 | % | | | 12/01/37 | | | $ | 4,712 | | | $ | 4,244,051 | |
Tallyns Reach Metropolitan District No. 3; | | | | | | | | | | | | | | | | |
Series 2013, Ref. & Improvement Conv. Limited Tax GO Bonds | | | 5.00 | % | | | 12/01/33 | | | | 505 | | | | 483,113 | |
Series 2013, Ref. & Improvement Conv. Limited Tax GO Bonds | | | 5.13 | % | | | 11/01/38 | | | | 1,035 | | | | 980,393 | |
Valagua Metropolitan District; Series 2008, Limited Tax GO Bonds | | | 7.75 | % | | | 12/01/37 | | | | 1,000 | | | | 401,190 | |
Vista Ridge Metropolitan District; Series 2006 B, Ref. Sub. Limited Tax GO Bonds(d)(j) | | | 0.00 | % | | | 12/01/40 | | | | 1,000 | | | | 605,160 | |
| | | | | | | | | | | | | | | | 205,055,050 | |
|
| Connecticut–0.42% | |
Connecticut (State of) Health & Educational Facilities Authority (St. Mary’s Hospital); Series 1997 E, RB | | | 5.88 | % | | | 07/01/22 | | | | 3,660 | | | | 3,662,928 | |
Georgetown (City of) Special Taxing District; Series 2006 A, Unlimited Tax GO Bonds(f)(g) | | | 5.13 | % | | | 10/01/36 | | | | 4,405 | | | | 1,704,339 | |
Hamden (Town of) (Whitney Center); | | | | | | | | | | | | | | | | |
Series 2009 A, RB | | | 7.63 | % | | | 01/01/30 | | | | 2,880 | | | | 2,991,888 | |
Series 2009 A, RB | | | 7.75 | % | | | 01/01/43 | | | | 10,995 | | | | 11,288,127 | |
Series 2009 C, RB(h) | | | 7.25 | % | | | 01/01/16 | | | | 2,000 | | | | 2,035,260 | |
Harbor Point Infrastructure Improvement District (Harbor Point); Series 2010 A, Special Obligation Tax Allocation RB | | | 7.88 | % | | | 04/01/39 | | | | 3,000 | | | | 3,318,930 | |
Manchester (Town of) Redevelopment Agency (Bennet Housing Development); Series 1993, MFH Mortgage RB (Acquired 09/20/99; Cost $519,182)(f) | | | 7.20 | % | | | 12/01/18 | | | | 560 | | | | 563,662 | |
| | | | | | | | | | | | | | | | 25,565,134 | |
|
| Delaware–0.11% | |
Delaware (State of) Economic Development Authority (Newark Charter School); Series 2012, RB | | | 5.00 | % | | | 09/01/42 | | | | 1,350 | | | | 1,354,860 | |
New Castle (County of) (Newark Charter School, Inc.); Series 2006, RB | | | 5.00 | % | | | 09/01/30 | | | | 1,610 | | | | 1,615,071 | |
Wilmington (City of) (Electra Arms Senior Association); Series 1998, MFH Rental RB(c) | | | 6.25 | % | | | 06/01/28 | | | | 4,165 | | | | 4,034,844 | |
| | | | | | | | | | | | | | | | 7,004,775 | |
|
| District of Columbia–0.81% | |
District of Columbia (Center for Strategic & International Studies, Inc.); | | | | | | | | | | | | | | | | |
Series 2011, RB | | | 6.38 | % | | | 03/01/31 | | | | 2,000 | | | | 2,044,680 | |
Series 2011, RB | | | 6.63 | % | | | 03/01/41 | | | | 5,150 | | | | 5,308,208 | |
District of Columbia (Cesar Chavez Charter School); Series 2011, RB | | | 7.88 | % | | | 11/15/40 | | | | 7,000 | | | | 7,781,970 | |
District of Columbia (Gallaudet University); Series 2011, University RB | | | 5.50 | % | | | 04/01/41 | | | | 3,000 | | | | 3,215,070 | |
District of Columbia (Methodist Home); | | | | | | | | | | | | | | | | |
Series 1999, RB | | | 6.00 | % | | | 01/01/29 | | | | 2,545 | | | | 2,269,224 | |
Series 2009 A, RB | | | 7.50 | % | | | 01/01/39 | | | | 1,520 | | | | 1,521,307 | |
District of Columbia (Sibley Memorial Hospital); | | | | | | | | | | | | | | | | |
Series 2009, Hospital RB | | | 6.38 | % | | | 10/01/39 | | | | 2,000 | | | | 2,186,560 | |
Series 2009, Hospital RB | | | 6.50 | % | | | 10/01/29 | | | | 5,000 | | | | 5,554,450 | |
District of Columbia Tobacco Settlement Financing Corp.; Series 2006 C, Asset-Backed CAB RB(d) | | | 0.00 | % | | | 06/15/55 | | | | 60,320 | | | | 434,304 | |
District of Columbia; Series 2009 B, Ref. Sec. Income Tax RB(e) | | | 5.00 | % | | | 12/01/25 | | | | 16,165 | | | | 18,727,799 | |
| | | | | | | | | | | | | | | | 49,043,572 | |
|
| Florida–9.52% | |
Alachua (County of) (North Florida Retirement Village, Inc.); | | | | | | | | | | | | | | | | |
Series 2007, IDR | | | 5.88 | % | | | 11/15/36 | | | | 10,500 | | | | 9,731,190 | |
Series 2007, IDR | | | 5.88 | % | | | 11/15/42 | | | | 19,000 | | | | 17,245,350 | |
Alachua (County of) Health Facilities Authority (East Ridge Retirement Village, Inc.); | | | | | | | | | | | | | | | | |
Series 2014, RB | | | 6.25 | % | | | 11/15/44 | | | | 2,500 | | | | 2,494,625 | |
Series 2014, RB | | | 6.38 | % | | | 11/15/49 | | | | 5,250 | | | | 5,203,905 | |
Alachua (County of) Health Facilities Authority (Oak Hammock at the University of Florida); | | | | | | | | | | | | | | | | |
Series 2012 A, Ref. Continuing Care Retirement Community RB | | | 8.00 | % | | | 10/01/32 | | | | 1,000 | | | | 1,135,280 | |
Series 2012 A, Ref. Continuing Care Retirement Community RB | | | 8.00 | % | | | 10/01/42 | | | | 2,500 | | | | 2,800,700 | |
Series 2012 A, Ref. Continuing Care Retirement Community RB | | | 8.00 | % | | | 10/01/46 | | | | 2,000 | | | | 2,236,060 | |
See accompanying Notes to Financial Statements which are an integral part of the financial statements.
18 Invesco High Yield Municipal Fund
| | | | | | | | | | | | | | | | |
| | | Interest Rate | | | Maturity Date | | | Principal Amount (000) | | | Value | |
| Florida–(continued) | |
Alachua (County of) Health Facilities Authority (Terraces at Bonita Springs); | | | | | | | | | | | | | | | | |
Series 2011, TEMPS–70SM RB | | | 7.13 | % | | | 11/15/16 | | | $ | 17,100 | | | $ | 17,147,367 | |
Series 2011 A, RB | | | 8.00 | % | | | 11/15/31 | | | | 3,000 | | | | 3,328,650 | |
Series 2011 A, RB | | | 8.13 | % | | | 11/15/41 | | | | 11,000 | | | | 12,125,300 | |
Series 2011 A, RB | | | 8.13 | % | | | 11/15/46 | | | | 6,000 | | | | 6,597,660 | |
Anthem Park Community Development District; Series 2004, Capital Improvement Special Assessment RB(j) | | | 5.80 | % | | | 05/01/36 | | | | 8,045 | | | | 5,793,044 | |
Beacon Lakes Community Development District; Series 2003 A, Special Assessment RB | | | 6.90 | % | | | 05/01/35 | | | | 130 | | | | 130,343 | |
Bloomingdale (Villages of) Community Development District; Series 2004, Special Assessment RB | | | 5.88 | % | | | 05/01/36 | | | | 2,960 | | | | 2,774,941 | |
Bluewaters Community Development District; Series 2004, Special Assessment RB | | | 6.00 | % | | | 05/01/35 | | | | 2,615 | | | | 2,649,335 | |
Bonnet Creek Resort Community Development District; | | | | | | | | | | | | | | | | |
Series 2002, Special Assessment RB | | | 7.38 | % | | | 05/01/34 | | | | 3,000 | | | | 2,979,330 | |
Series 2002, Special Assessment RB | | | 7.50 | % | | | 05/01/34 | | | | 6,240 | | | | 6,239,126 | |
Brevard (County of) Health Facilities Authority (Health First, Inc.); Series 2009, Health Care Facilities RB | | | 7.00 | % | | | 04/01/33 | | | | 1,960 | | | | 2,178,775 | |
Broward (County of) (Civic Arena); | | | | | | | | | | | | | | | | |
Series 2006 A, Ref. Professional Sports Facilities Tax RB (INS–AGM)(a)(e) | | | 5.00 | % | | | 09/01/24 | | | | 7,555 | | | | 8,168,995 | |
Series 2006 A, Ref. Professional Sports Facilities Tax RB (INS–AGM)(a)(e) | | | 5.00 | % | | | 09/01/25 | | | | 7,910 | | | | 8,552,846 | |
Buckeye Park Community Development District; Series 2008 A, Capital Improvement Special Assessment RB(g) | | | 7.88 | % | | | 05/01/38 | | | | 4,900 | | | | 2,161,880 | |
Capital Trust Agency (Miami Community Charter School) Series 2010 A, RB | | | 7.00 | % | | | 10/15/40 | | | | 1,500 | | | | 1,528,425 | |
Capital Trust Agency (Million Air One LLC); Series 2011, RB(c) | | | 7.75 | % | | | 01/01/41 | | | | 14,400 | | | | 15,502,896 | |
Caribe Palm Community Development District; Series 2005 A, Special Assessment RB | | | 5.85 | % | | | 05/01/35 | | | | 690 | | | | 697,066 | |
Championsgate Community Development District; Series 1998 A, Capital Improvement Special Assessment RB | | | 6.25 | % | | | 05/01/20 | | | | 2,220 | | | | 2,109,866 | |
Collier (County of) Industrial Development Authority (The Arlington of Naples); | | | | | | | | | | | | | | | | |
Series 2014 A, Continuing Care Community RB(f) | | | 8.13 | % | | | 05/15/44 | | | | 5,560 | | | | 5,614,488 | |
Series 2014 A, Continuing Care Community RB(f) | | | 8.25 | % | | | 05/15/49 | | | | 44,570 | | | | 45,019,711 | |
Series 2014 B-1, TEMPS-85SM Continuing Care Community RB(f) | | | 6.88 | % | | | 05/15/21 | | | | 8,350 | | | | 8,360,771 | |
Series 2014 B-2, TEMPS-70SM Continuing Care Community RB(f) | | | 6.50 | % | | | 05/15/20 | | | | 5,000 | | | | 5,006,300 | |
Cory Lakes Community Development District; | | | | | | | | | | | | | | | | |
Series 2001 A, Special Assessment RB | | | 8.38 | % | | | 05/01/17 | | | | 170 | | | | 175,173 | |
Series 2001 B, Special Assessment RB | | | 8.38 | % | | | 05/01/17 | | | | 85 | | | | 87,587 | |
Cutler Cay Community Development District; Series 2004, Special Assessment RB | | | 6.13 | % | | | 05/01/24 | | | | 3,390 | | | | 3,433,697 | |
East Homestead Community Development District; | | | | | | | | | | | | | | | | |
Series 2013, Special Assessment RB | | | 5.00 | % | | | 11/01/33 | | | | 1,000 | | | | 900,270 | |
Series 2013, Special Assessment RB | | | 5.63 | % | | | 11/01/43 | | | | 2,000 | | | | 1,899,080 | |
Florida (State of) Mid-Bay Bridge Authority; Series 2011 A, Springing Lien RB | | | 7.25 | % | | | 10/01/40 | | | | 14,000 | | | | 15,780,380 | |
Florida Development Finance Corp. (Palm Bay Academy, Inc.); | | | | | | | | | | | | | | | | |
Series 2006 A, RB(j) | | | 6.00 | % | | | 05/15/36 | | | | 2,130 | | | | 1,363,221 | |
Series 2007 A, RB(j) | | | 6.13 | % | | | 05/15/37 | | | | 1,855 | | | | 1,187,219 | |
Florida Development Finance Corp. (Renaissance Charter School, Inc.); | | | | | | | | | | | | | | | | |
Series 2012 A, Educational Facilities RB | | | 6.00 | % | | | 06/15/32 | | | | 4,250 | | | | 3,934,225 | |
Series 2012 A, Educational Facilities RB | | | 6.13 | % | | | 06/15/43 | | | | 4,250 | | | | 3,813,142 | |
Florida Development Finance Corp. (Sculptor Charter School); | | | | | | | | | | | | | | | | |
Series 2008 A, RB | | | 7.25 | % | | | 10/01/38 | | | | 2,710 | | | | 2,789,891 | |
Series 2012, RB | | | 7.00 | % | | | 10/01/26 | | | | 125 | | | | 130,435 | |
Series 2012, RB | | | 7.25 | % | | | 10/01/41 | | | | 595 | | | | 620,091 | |
Florida Housing Finance Corp. (Beacon Hill Apartments); Series 1998 C, RB(c)(h) | | | 6.61 | % | | | 07/01/28 | | | | 7,640 | | | | 6,988,232 | |
Florida Housing Finance Corp. (Westchase Apartments); Series 1998 B, RB(c)(h) | | | 6.61 | % | | | 07/01/28 | | | | 9,550 | | | | 6,700,280 | |
See accompanying Notes to Financial Statements which are an integral part of the financial statements.
19 Invesco High Yield Municipal Fund
| | | | | | | | | | | | | | | | |
| | | Interest Rate | | | Maturity Date | | | Principal Amount (000) | | | Value | |
| Florida–(continued) | |
Gramercy Farms Community Development District; | | | | | | | | | | | | | | | | |
Series 2007 A-1, Special Assessment RB(g) | | | 5.25 | % | | | 05/01/39 | | | $ | 1,335 | | | $ | 13 | |
Series 2007 A-2, Special Assessment RB(g) | | | 5.25 | % | | | 05/01/39 | | | | 1,700 | | | | 17 | |
Series 2007 B, Special Assessment RB(g) | | | 5.10 | % | | | 05/01/14 | | | | 4,385 | | | | 44 | |
Series 2011, Ref. Special Assessment Conv. CAB RB(b) | | | 6.75 | % | | | 05/01/39 | | | | 29,070 | | | | 3,830,554 | |
Hammock Bay Community Development District; Series 2004 A, Special Assessment RB | | | 6.13 | % | | | 05/01/35 | | | | 2,420 | | | | 2,432,681 | |
Harbour Isles Community Development District; Series 2004, Special Assessment RB | | | 6.13 | % | | | 05/01/35 | | | | 1,295 | | | | 1,314,192 | |
Heritage Harbor Community Development District; Series 1997, Recreational RB | | | 7.75 | % | | | 05/01/23 | | | | 385 | | | | 379,298 | |
Hillsborough (County of) Industrial Development Authority (Health Facilities); Series 2008 B, IDR(h)(i) | | | 8.00 | % | | | 08/15/19 | | | | 1,000 | | | | 1,353,880 | |
Jacksonville (City of) Economic Development Commission (Proton Therapy Institute); Series 2007 A, Ref. Health Care Facilities RB(f) | | | 6.25 | % | | | 09/01/27 | | | | 10,500 | | | | 11,317,845 | |
Kendall Breeze Community Development District; Series 2004, Special Assessment RB | | | 5.88 | % | | | 05/01/34 | | | | 1,325 | | | | 1,310,226 | |
Lakeland (City of) (Carpenter’s Home Estate Accident Investor); Series 2008, Ref. First Mortgage Retirement Community RB(f) | | | 6.38 | % | | | 01/01/43 | | | | 2,250 | | | | 2,312,302 | |
Lakeside Landings Community Development District; | | | | | | | | | | | | | | | | |
Series 2007 A, Special Assessment RB(g) | | | 5.50 | % | | | 05/01/38 | | | | 1,000 | | | | 435,600 | |
Series 2007 B, Special Assessment RB(g) | | | 5.25 | % | | | 05/01/13 | | | | 1,940 | | | | 845,064 | |
Lee (County of) Industrial Development Authority (Cypress Cove Healthpark); | | | | | | | | | | | | | | | | |
Series 2012, Ref. RB | | | 5.25 | % | | | 10/01/32 | | | | 4,500 | | | | 4,237,515 | |
Series 2012, Ref. RB | | | 5.75 | % | | | 10/01/42 | | | | 10,100 | | | | 9,756,196 | |
Series 2012, Ref. RB | | | 6.50 | % | | | 10/01/47 | | | | 10,000 | | | | 10,274,200 | |
Lee (County of) Industrial Development Authority (Lee County Community Charter Schools, LLC); | | | | | | | | | | | | | | | | |
Series 2012, IDR | | | 5.50 | % | | | 06/15/32 | | | | 1,880 | | | | 1,869,115 | |
Series 2012, IDR | | | 5.75 | % | | | 06/15/42 | | | | 3,210 | | | | 3,191,928 | |
Leon (County of) Educational Facilities Authority (Southgate Residence Hall); Series 1998 A, Ref. RB | | | 6.75 | % | | | 09/01/28 | | | | 7,640 | | | | 7,373,440 | |
Martin (County of) Health Facilities Authority (Martin Memorial Medical Center); Series 2012, RB MBTC(e) | | | 5.50 | % | | | 11/15/42 | | | | 15,000 | | | | 15,329,400 | |
Miami Beach (City of) Health Facilities Authority (Mount Sinai Medical Center); Series 2004, Ref. RB(f)(h)(i) | | | 6.75 | % | | | 11/15/14 | | | | 840 | | | | 879,178 | |
Miami-Dade (County of) (Building Better Communities Program); Series 2008 A, Unlimited Tax GO Bonds (INS–AGC)(a)(e) | | | 5.00 | % | | | 07/01/30 | | | | 15,210 | | | | 16,503,002 | |
Miami-Dade (County of) (Miami International Airport); Series 2008 A, Aviation RB
(INS–AGC)(a)(c)(e) | | | 5.25 | % | | | 10/01/33 | | | | 16,500 | | | | 17,759,445 | |
Miami-Dade (County of) Health Facilities Authority (Miami Children’s Hospital); | | | | | | | | | | | | | | | | |
Series 2010 A, Ref. Hospital RB | | | 6.00 | % | | | 08/01/30 | | | | 500 | | | | 552,570 | |
Series 2010 A, Ref. Hospital RB | | | 6.13 | % | | | 08/01/42 | | | | 250 | | | | 271,712 | |
Series 2011, Ref. Hospital RB | | | 6.00 | % | | | 08/01/46 | | | | 1,000 | | | | 1,089,800 | |
Miami-Dade (County of) School Board; | | | | | | | | | | | | | | | | |
Series 2008 B, COP (INS–AGC)(a)(e) | | | 5.25 | % | | | 05/01/26 | | | | 5,000 | | | | 5,550,100 | |
Series 2008 B, COP (INS–AGC)(a)(e) | | | 5.25 | % | | | 05/01/27 | | | | 10,000 | | | | 11,152,900 | |
Miami-Dade (County of); | | | | | | | | | | | | | | | | |
Series 2005 A, Sub. Special Obligation CAB RB (INS–NATL)(a)(d) | | | 0.00 | % | | | 10/01/40 | | | | 10,070 | | | | 2,373,096 | |
Series 2009, Sub. Special Obligation CAB RB(d) | | | 0.00 | % | | | 10/01/35 | | | | 12,000 | | | | 3,806,160 | |
Series 2009, Sub. Special Obligation CAB RB(d) | | | 0.00 | % | | | 10/01/40 | | | | 10,000 | | | | 2,413,900 | |
Series 2009, Sub. Special Obligation CAB RB(d) | | | 0.00 | % | | | 10/01/42 | | | | 72,215 | | | | 15,581,108 | |
Series 2009, Sub. Special Obligation CAB RB(d) | | | 0.00 | % | | | 10/01/44 | | | | 15,495 | | | | 2,987,901 | |
Series 2009, Sub. Special Obligation CAB RB(d) | | | 0.00 | % | | | 10/01/45 | | | | 7,710 | | | | 1,379,088 | |
Midtown Miami Community Development District; | | | | | | | | | | | | | | | | |
Series 2004 A, Special Assessment RB | | | 6.00 | % | | | 05/01/24 | | | | 1,570 | | | | 1,572,261 | |
Series 2004 A, Special Assessment RB | | | 6.25 | % | | | 05/01/37 | | | | 8,445 | | | | 8,448,631 | |
Mount Dora (City of) Health Facilities Authority (Waterman Village); | | | | | | | | | | | | | | | | |
Series 2002 A, RB | | | 6.75 | % | | | 08/15/25 | | | | 3,000 | | | | 2,329,740 | |
Series 2004 A, Ref. RB | | | 5.75 | % | | | 08/15/18 | | | | 3,750 | | | | 3,235,462 | |
Oak Creek Community Development District; Series 2004, Special Assessment RB | | | 5.80 | % | | | 05/01/35 | | | | 1,555 | | | | 1,556,151 | |
See accompanying Notes to Financial Statements which are an integral part of the financial statements.
20 Invesco High Yield Municipal Fund
| | | | | | | | | | | | | | | | |
| | | Interest Rate | | | Maturity Date | | | Principal Amount (000) | | | Value | |
| Florida–(continued) | |
Orange (County of) Health Facilities Authority (Orlando Lutheran Towers, Inc.); | | | | | | | | | | | | | | | | |
Series 2005, Ref. RB | | | 5.70 | % | | | 07/01/26 | | | $ | 4,000 | | | $ | 4,001,480 | |
Series 2007, First Mortgage RB | | | 5.50 | % | | | 07/01/32 | | | | 3,750 | | | | 3,503,325 | |
Series 2007, First Mortgage RB | | | 5.50 | % | | | 07/01/38 | | | | 7,450 | | | | 6,746,571 | |
Orange (County of) Housing Finance Authority (Alhambra Trace Apartments); Series 1998 C, RB | | | 7.00 | % | | | 04/01/28 | | | | 1,750 | | | | 1,689,222 | |
Orange (County of) Housing Finance Authority (Governors Manor Apartments); Series 2001 F-4, RB | | | 7.25 | % | | | 10/01/31 | | | | 3,580 | | | | 3,582,864 | |
Orange (County of) Housing Finance Authority (Lake Davis Apartments); Series 2001 F-1, RB | | | 7.25 | % | | | 10/01/31 | | | | 740 | | | | 740,592 | |
Orange (County of) Housing Finance Authority (Lake Jennie Phase I); Series 2001 F-2, RB | | | 7.25 | % | | | 10/01/31 | | | | 205 | | | | 205,164 | |
Orange (County of) Housing Finance Authority (Lake Jennie Phase II); Series 2001 F-3, RB | | | 7.25 | % | | | 10/01/31 | | | | 740 | | | | 740,592 | |
Orange (County of) Housing Finance Authority (Mellonville Trace Apartments); Series 2001 F-5, RB | | | 7.25 | % | | | 10/01/31 | | | | 290 | | | | 290,232 | |
Orlando (City of) Urban Community Development District; Series 2004, Capital Improvement Special Assessment RB | | | 6.25 | % | | | 05/01/34 | | | | 1,000 | | | | 1,000,560 | |
Overoaks Community Development District; | | | | | | | | | | | | | | | | |
Series 2004 A, Capital Improvement Special Assessment RB(r) | | | 6.13 | % | | | 05/01/35 | | | | 410 | | | | 4 | |
Series 2010 A-2, Capital Improvement RB | | | 6.13 | % | | | 05/01/35 | | | | 425 | | | | 424,979 | |
Series 2010 B, Capital Improvement RB | | | 5.13 | % | | | 05/01/17 | | | | 750 | | | | 720,600 | |
Palm Beach (County of) Housing Finance Authority (Lake Delray Apartments); Series 1999 A, MFH RB(c) | | | 6.40 | % | | | 01/01/31 | | | | 8,155 | | | | 7,907,659 | |
Palm Coast Park Community Development District; Series 2006, Special Assessment RB | | | 5.70 | % | | | 05/01/37 | | | | 4,550 | | | | 2,941,120 | |
Pier Park Community Development District; Series 2002 1, Capital Improvement RB | | | 7.15 | % | | | 05/01/34 | | | | 14,030 | | | | 14,032,104 | |
Pine Ridge Plantation Community Development District; Series 2006 A, Capital Improvement Special Assessment RB | | | 5.40 | % | | | 05/01/37 | | | | 1,555 | | | | 1,246,721 | |
Pinellas (County of) Educational Facilities Authority (Pinellas Preparatory Academy); | | | | | | | | | | | | | | | | |
Series 2011 A, RB | | | 6.13 | % | | | 09/15/21 | | | | 400 | | | | 421,312 | |
Series 2011 A, RB | | | 7.13 | % | | | 09/15/41 | | | | 3,250 | | | | 3,356,307 | |
Poinciana West Community Development District; Series 2007, Special Assessment RB | | | 6.00 | % | | | 05/01/37 | | | | 1,495 | | | | 1,400,860 | |
Port St. Lucie (City of) (Glassman Special Assessment District); Series 2003 C, Special Assessment RB | | | 6.75 | % | | | 07/01/23 | | | | 3,460 | | | | 3,461,142 | |
Reunion East Community Development District; | | | | | | | | | | | | | | | | |
Series 2002 A-1, Special Assessment RB | | | 7.38 | % | | | 05/01/33 | | | | 690 | | | | 700,302 | |
Series 2002 A-2, Special Assessment RB(j) | | | 7.38 | % | | | 05/01/33 | | | | 310 | | | | 215,605 | |
Series 2005, Special Assessment RB(g) | | | 5.80 | % | | | 05/01/36 | | | | 4,300 | | | | 2,990,650 | |
Seminole Indian Tribe of Florida; Series 2007 A, Special Obligation RB(f) | | | 5.50 | % | | | 10/01/24 | | | | 5,350 | | | | 5,633,175 | |
Seven Oaks Community Development District II; | | | | | | | | | | | | | | | | |
Series 2003 A, Special Assessment RB | | | 6.40 | % | | | 05/01/34 | | | | 4,505 | | | | 4,070,943 | |
Series 2004 A, Special Assessment RB | | | 5.88 | % | | | 05/01/35 | | | | 2,535 | | | | 2,188,972 | |
Silver Palms Community Development District; Series 2004, Special Assessment RB | | | 5.90 | % | | | 05/01/34 | | | | 1,710 | | | | 1,699,860 | |
South-Dade Venture Community Development District; Series 2004, Special Assessment RB(h)(i) | | | 6.13 | % | | | 05/01/14 | | | | 1,295 | | | | 1,321,017 | |
St. Johns (County of) Industrial Development Authority (Glenmoor); | | | | | | | | | | | | | | | | |
Series 2006 A, Health Care RB(g) | | | 5.25 | % | | | 01/01/26 | | | | 6,300 | | | | 2,741,130 | |
Series 2006 A, Health Care RB(g) | | | 5.38 | % | | | 01/01/40 | | | | 8,850 | | | | 3,850,635 | |
St. Johns (County of) Industrial Development Authority (Presbyterian Retirement Communities); | | | | | | | | | | | | | | | | |
Series 2004 A, RB | | | 5.63 | % | | | 08/01/34 | | | | 4,390 | | | | 4,449,397 | |
Series 2010 A, RB | | | 6.00 | % | | | 08/01/45 | | | | 4,000 | | | | 4,203,880 | |
St. Petersburg (City of) Health Facilities Authority (All Children’s Hospital, Inc. Obligated Group); | | | | | | | | | | | | | | | | |
Series 2009 A, Ref. RB | | | 6.25 | % | | | 11/15/29 | | | | 150 | | | | 167,564 | |
Series 2009 A, Ref. RB | | | 6.50 | % | | | 11/15/39 | | | | 1,000 | | | | 1,108,720 | |
Sterling Hill Community Development District; Series 2003 A, Capital Improvement Special Assessment RB | | | 6.20 | % | | | 05/01/35 | | | | 1,495 | | | | 1,127,948 | |
Stonegate Community Development District; Series 2008, Special Assessment RB | | | 8.13 | % | | | 05/01/39 | | | | 4,635 | | | | 4,897,202 | |
Tampa Bay Water; Series 2001 A, Ref. & Improvement Utility System RB (INS–NATL)(a)(e) | | | 6.00 | % | | | 10/01/29 | | | | 13,440 | | | | 17,178,739 | |
Town Center at Palm Coast Community Development District; Series 2005, Capital Improvement Special Assessment RB | | | 6.00 | % | | | 05/01/36 | | | | 10,980 | | | | 9,529,981 | |
Treeline Preserve Community Development District; Series 2007 A, Special Assessment RB(j) | | | 6.80 | % | | | 05/01/39 | | | | 4,895 | | | | 1,969,846 | |
See accompanying Notes to Financial Statements which are an integral part of the financial statements.
21 Invesco High Yield Municipal Fund
| | | | | | | | | | | | | | | | |
| | | Interest Rate | | | Maturity Date | | | Principal Amount (000) | | | Value | |
| Florida–(continued) | |
Turnbull Creek Community Development District; | | | | | | | | | | | | | | | | |
Series 2005, Special Assessment RB | | | 5.80 | % | | | 05/01/35 | | | $ | 2,580 | | | $ | 2,362,532 | |
Series 2006, Special Assessment RB | | | 5.25 | % | | | 05/01/37 | | | | 3,390 | | | | 2,836,176 | |
University Square Community Development District; Series 2007 A-1, Capital Improvement Special Assessment RB | | | 5.88 | % | | | 05/01/38 | | | | 2,830 | | | | 2,806,285 | |
Waterlefe Community Development District; Series 2001, Golf Course RB(g) | | | 8.13 | % | | | 10/01/25 | | | | 2,645 | | | | 184,489 | |
West Villages Improvement District; Series 2007, Special Assessment RB(g) | | | 5.50 | % | | | 05/01/38 | | | | 9,500 | | | | 5,646,800 | |
Winter Garden Village at Fowler Groves Community Development District; Series 2006, Special Assessment RB | | | 5.65 | % | | | 05/01/37 | | | | 2,490 | | | | 2,520,727 | |
World Commerce Community Development District; Series 2004 A-2, Special Assessment RB | | | 6.13 | % | | | 05/01/35 | | | | 1,460 | | | | 1,340,893 | |
| | | | | | | | | | | | | | | | 578,479,741 | |
|
| Georgia–1.24% | |
Americus (City of) & Sumter (County of) Hospital Authority (Magnolia Manor Obligated Group); | | | | | | | | | | | | | | | | |
Series 2013 A, Ref. RB | | | 6.25 | % | | | 05/15/33 | | | | 4,000 | | | | 4,037,160 | |
Series 2013 A, Ref. RB | | | 6.38 | % | | | 05/15/43 | | | | 8,000 | | | | 8,030,800 | |
Atlanta (City of) (Beltline); Series 2009 B, Tax Allocation RB | | | 7.38 | % | | | 01/01/31 | | | | 12,000 | | | | 14,015,880 | |
Atlanta (City of) (Eastside); Series 2005 B, Tax Allocation RB | | | 5.60 | % | | | 01/01/30 | | | | 4,700 | | | | 4,914,179 | |
Clayton (County of) Development Authority (Delta Air Lines, Inc.); | | | | | | | | | | | | | | | | |
Series 2009 A, Special Facilities RB | | | 8.75 | % | | | 06/01/29 | | | | 4,500 | | | | 5,410,125 | |
Series 2009 B, Special Facilities RB(c) | | | 9.00 | % | | | 06/01/35 | | | | 9,750 | | | | 10,352,550 | |
DeKalb (County of) Hospital Authority (DeKalb Medical Center, Inc.); | | | | | | | | | | | | | | | | |
Series 2010, RAC | | | 6.00 | % | | | 09/01/30 | | | | 2,200 | | | | 2,249,830 | |
Series 2010, RAC | | | 6.13 | % | | | 09/01/40 | | | | 6,510 | | | | 6,594,305 | |
Fulton (County of) Residential Care Facilities for the Elderly Authority (RHA Assisted Living); | | | | | | | | | | | | | | | | |
Series 1999 A, Sr. Lien RB | | | 6.90 | % | | | 07/01/19 | | | | 3,500 | | | | 3,223,605 | |
Series 1999 A, Sr. Lien RB | | | 7.00 | % | | | 07/01/29 | | | | 8,310 | | | | 6,774,561 | |
Rockdale (County of) Development Authority (Visy Paper); Series 2007 A, RB(c) | | | 6.13 | % | | | 01/01/34 | | | | 9,615 | | | | 9,736,245 | |
| | | | | | | | | | | | | | | | 75,339,240 | |
|
| Guam–0.12% | |
Guam (Territory of) Waterworks Authority; Series 2005, Water & Wastewater System RB | | | 5.88 | % | | | 07/01/35 | | | | 7,250 | | | | 7,310,175 | |
|
| Hawaii–0.43% | |
Hawaii (State of) Department of Budget & Finance (15 Craigside); | | | | | | | | | | | | | | | | |
Series 2009 A, Special Purpose Senior Living RB | | | 8.75 | % | | | 11/15/29 | | | | 850 | | | | 960,823 | |
Series 2009 A, Special Purpose Senior Living RB | | | 9.00 | % | | | 11/15/44 | | | | 6,530 | | | | 7,357,351 | |
Hawaii (State of) Department of Budget & Finance (Hawaiian Electric Co., Inc. & Subsidiary); Series 2007 A, Special Purpose RB (INS–FGIC)(a)(c) | | | 4.65 | % | | | 03/01/37 | | | | 4,210 | | | | 3,993,353 | |
Honolulu (City & County of); Series 2009 A, Unlimited Tax GO Bonds(e) | | | 5.25 | % | | | 04/01/29 | | | | 12,000 | | | | 13,691,640 | |
| | | | | | | | | | | | | | | | 26,003,167 | |
|
| Idaho–0.46% | |
Gooding Industrial Development Corp. (Intrepid Technology & Resources); Series 2006, Solid Waste Disposal RB (Acquired 11/03/06; Cost $7,640,000)(c)(f)(g) | | | 7.50 | % | | | 11/01/24 | | | | 7,640 | | | | 264,038 | |
Idaho (State of) Health Facilities Authority (Terraces of Boise); | | | | | | | | | | | | | | | | |
Series 2014 A, RB | | | 8.00 | % | | | 10/01/44 | | | | 4,000 | | | | 4,047,880 | |
Series 2014 A, RB | | | 8.13 | % | | | 10/01/49 | | | | 9,000 | | | | 9,110,250 | |
Idaho (State of) Health Facilities Authority (Valley Vista Care Corp.); Series 2007, Ref. RB | | | 6.13 | % | | | 11/15/37 | | | | 8,355 | | | | 8,225,748 | |
Idaho (State of) Housing & Finance Association (Compass Public Charter School, Inc.); Series 2010 A, Non-profit Facilities RB | | | 6.25 | % | | | 07/01/40 | | | | 1,000 | | | | 1,027,770 | |
Idaho (State of) Housing & Finance Association (Liberty Charter School); Series 2008 A, Non-profit Facilities RB | | | 6.00 | % | | | 06/01/38 | | | | 750 | | | | 755,790 | |
See accompanying Notes to Financial Statements which are an integral part of the financial statements.
22 Invesco High Yield Municipal Fund
| | | | | | | | | | | | | | | | |
| | | Interest Rate | | | Maturity Date | | | Principal Amount (000) | | | Value | |
| Idaho–(continued) | |
Idaho (State of) Housing & Finance Association (North Star Charter School); | | | | | | | | | | | | | | | | |
Series 2009 A, Non-profit Facilities RB(k) | | | 2.70 | % | | | 07/01/21 | | | $ | 150 | | | $ | 97,502 | |
Series 2009 A, Non-profit Facilities RB(k) | | | 2.78 | % | | | 07/01/29 | | | | 1,000 | | | | 650,010 | |
Series 2009 A, Non-profit Facilities RB(k) | | | 2.85 | % | | | 07/01/39 | | | | 2,005 | | | | 1,303,270 | |
Idaho (State of) Housing & Finance Association (Victory Charter School, Inc.); Series 2009 A, Non-profit Facilities RB | | | 8.25 | % | | | 07/01/39 | | | | 745 | | | | 827,032 | |
Idaho (State of) Housing & Finance Association; Series 2008 A, Non-profit Facilities RB | | | 6.13 | % | | | 07/01/38 | | | | 1,580 | | | | 1,593,888 | |
| | | | | | | | | | | | | | | | 27,903,178 | |
|
| Illinois–10.61% | |
Annawan (Village of) (Patriot Renewable Fuels, LLC); Series 2007, Tax Increment Allocation RB | | | 5.63 | % | | | 01/01/18 | | | | 2,620 | | | | 2,390,698 | |
Antioch (Village of) Special Service Area No. 1 (Deercrest); Series 2003, Special Tax RB | | | 6.63 | % | | | 03/01/33 | | | | 3,569 | | | | 2,981,471 | |
Aurora (City of) (East River Area TIF No. 6); Series 2008 A, Tax Increment Allocation RB | | | 6.75 | % | | | 12/30/27 | | | | 2,170 | | | | 2,256,626 | |
Aurora (City of) (River City TIF No. 3); Series 2008 B, Tax Increment Allocation RB | | | 6.50 | % | | | 12/30/23 | | | | 3,395 | | | | 3,582,947 | |
Bartlett (Village of) (Quarry Redevelopment); Series 2007, Ref. Sr. Lien Tax Increment Allocation RB | | | 5.60 | % | | | 01/01/23 | | | | 5,000 | | | | 4,927,750 | |
Bolingbrook (Village of) Special Services Area No. 1 (Forest City); Series 2005, Special Tax RB | | | 5.90 | % | | | 03/01/27 | | | | 2,000 | | | | 1,857,260 | |
Bolingbrook (Village of); | | | | | | | | | | | | | | | | |
Series 2005, Sales Tax RB(k) | | | 2.30 | % | | | 01/01/15 | | | | 210 | | | | 198,200 | |
Series 2005, Sales Tax RB(k) | | | 2.40 | % | | | 01/01/26 | | | | 4,500 | | | | 4,032,720 | |
Series 2005, Sales Tax RB(k) | | | 2.50 | % | | | 01/01/24 | | | | 6,000 | | | | 5,421,660 | |
Bourbonnais (Village of) (Olivet Nazarene University); Series 2013, Industrial Project RB | | | 5.00 | % | | | 11/01/44 | | | | 2,775 | | | | 2,671,659 | |
Bradley (Village of) (Bradley Commons); Series 2007, Tax Increment Allocation RB | | | 6.10 | % | | | 01/01/27 | | | | 2,670 | | | | 2,684,151 | |
Chicago (City of) (Asphalt Operating Services); Series 2010, Recovery Zone Facility RB | | | 6.13 | % | | | 12/01/18 | | | | 5,965 | | | | 6,403,547 | |
Chicago (City of) (Diversey/Narragansett); Series 2006, COP | | | 7.46 | % | | | 02/15/26 | | | | 2,655 | | | | 2,041,217 | |
Chicago (City of) (Lakeshore East); Series 2003, Special Assessment Improvement RB | | | 6.63 | % | | | 12/01/22 | | | | 3,432 | | | | 3,481,249 | |
Chicago (City of) (O’Hare International Airport); Series 2008 A, Third Lien General Airport RB (INS–AGM)(a)(e) | | | 5.00 | % | | | 01/01/33 | | | | 14,000 | | | | 14,355,320 | |
Chicago (City of) Board of Education; Series 2008 C, Ref. Unlimited Tax GO Bonds
(INS–AGM)(a)(e) | | | 5.00 | % | | | 12/01/32 | | | | 13,050 | | | | 13,250,448 | |
Chicago (City of); | | | | | | | | | | | | | | | | |
Series 2011, COP | | | 7.13 | % | | | 05/01/21 | | | | 1,000 | | | | 1,105,870 | |
Series 2011, COP | | | 7.13 | % | | | 05/01/25 | | | | 9,700 | | | | 10,688,624 | |
Series 2011, COP | | | 7.13 | % | | | 05/01/25 | | | | 9,185 | | | | 10,121,135 | |
Cook (County of) (Navistar International Corp.); Series 2010, Recovery Zone Facility RB | | | 6.50 | % | | | 10/15/40 | | | | 13,665 | | | | 13,644,776 | |
Cortland (Town of) (Sheaffer System); Series 2006, Special Tax RB(f)(g) | | | 5.50 | % | | | 03/01/17 | | | | 3,439 | | | | 1,032,732 | |
Deerfield (Village of); | | | | | | | | | | | | | | | | |
Series 2011, Ref. CAB RB(d) | | | 0.00 | % | | | 10/01/31 | | | | 1,803 | | | | 389,700 | |
Series 2011, Ref. RB | | | 6.00 | % | | | 10/01/42 | | | | 3,362 | | | | 2,705,032 | |
Du Page (County of) Special Service Area No. 31 (Monarch Landing); Series 2006, Special Tax RB | | | 5.40 | % | | | 03/01/16 | | | | 78 | | | | 79,498 | |
East Dundee (Village of) (Route 25 South Redevelopment); Series 2012, Limited Obligation Tax Increment Allocation RB | | | 5.63 | % | | | 12/01/31 | | | | 1,530 | | | | 1,402,811 | |
Gilberts (Village of) Special Service Area No. 19 (The Conservancy); Series 2006-1, Special Tax RB(g) | | | 5.38 | % | | | 03/01/16 | | | | 2,500 | | | | 862,350 | |
Hillside (Village of) (Mannheim Redevelopment); | | | | | | | | | | | | | | | | |
Series 2008, Sr. Lien Tax Increment Allocation RB | | | 6.55 | % | | | 01/01/20 | | | | 745 | | | | 762,746 | |
Series 2008, Sr. Lien Tax Increment Allocation RB | | | 7.00 | % | | | 01/01/28 | | | | 8,000 | | | | 8,125,600 | |
Illinois (State of) Finance Authority (Beacon Hill); Series 2005 A, Ref. RB | | | 5.35 | % | | | 02/15/15 | | | | 225 | | | | 225,497 | |
Illinois (State of) Finance Authority (Christian Homes, Inc.); | | | | | | | | | | | | | | | | |
Series 2007 A, Ref. RB | | | 5.75 | % | | | 05/15/26 | | | | 5,575 | | | | 5,690,625 | |
Series 2007 A, Ref. RB | | | 5.75 | % | | | 05/15/31 | | | | 2,825 | | | | 2,868,533 | |
See accompanying Notes to Financial Statements which are an integral part of the financial statements.
23 Invesco High Yield Municipal Fund
| | | | | | | | | | | | | | | | |
| | | Interest Rate | | | Maturity Date | | | Principal Amount (000) | | | Value | |
| Illinois–(continued) | | | | | | | | | | | | | | | | |
Illinois (State of) Finance Authority (Clare Oaks); | | | | | | | | | | | | | | | | |
Series 2012 A-1, RB | | | 7.00 | % | | | 11/15/27 | | | $ | 1,080 | | | $ | 977,886 | |
Series 2012 A-2, RB | | | 7.00 | % | | | 11/15/27 | | | | 1,355 | | | | 1,247,386 | |
Series 2012 A-3, RB | | | 7.00 | % | | | 11/15/17 | | | | 710 | | | | 688,310 | |
Series 2012 B, Ref. Sub. RB | | | 4.00 | % | | | 11/15/52 | | | | 6,240 | | | | 3,157,256 | |
Series 2012 C-1, Ref. Sub. RB(d) | | | 0.00 | % | | | 11/15/52 | | | | 3,902 | | | | 146,557 | |
Series 2012 C-2, Ref. Sub. RB(d) | | | 0.00 | % | | | 11/15/52 | | | | 780 | | | | 250,334 | |
Series 2012 C-3, Ref. Sub. Conv. RB(d) | | | 0.00 | % | | | 11/15/52 | | | | 780 | | | | 163,180 | |
Illinois (State of) Finance Authority (Clare Water Tower); | | | | | | | | | | | | | | | | |
Series 2010 A-6, Ref. RB(g) | | | 6.00 | % | | | 05/15/28 | | | | 1,249 | | | | 12 | |
Series 2010 A-7, Ref. RB(g) | | | 6.13 | % | | | 05/15/41 | | | | 11,264 | | | | 113 | |
Series 2010 B, Ref. CAB RB(d)(g) | | | 0.00 | % | | | 05/15/50 | | | | 5,966 | | | | 60 | |
Illinois (State of) Finance Authority (Clinic Altgeld); Series 1996, Community Facilities RB | | | 8.00 | % | | | 11/15/16 | | | | 1,215 | | | | 1,215,753 | |
Illinois (State of) Finance Authority (Collegiate Housing Foundation–DeKalb II, LLC–Northern Illinois University); Series 2011, Student Housing RB | | | 6.88 | % | | | 10/01/43 | | | | 7,000 | | | | 7,553,070 | |
Illinois (State of) Finance Authority (Fairview Obligated Group); | | | | | | | | | | | | | | | | |
Series 2008 A, Ref. RB(g) | | | 6.13 | % | | | 08/15/28 | | | | 1,000 | | | | 7,410 | |
Series 2008 A, Ref. RB(g) | | | 6.25 | % | | | 08/15/35 | | | | 3,500 | | | | 25,935 | |
Series 2008 A, Ref. RB(g) | | | 6.25 | % | | | 08/15/40 | | | | 5,500 | | | | 40,755 | |
Illinois (State of) Finance Authority (Friendship Village of Schaumburg); | | | | | | | | | | | | | | | | |
Series 2005 A, RB | | | 5.38 | % | | | 02/15/25 | | | | 1,000 | | | | 959,980 | |
Series 2010, RB | | | 7.13 | % | | | 02/15/39 | | | | 1,710 | | | | 1,747,911 | |
Series 2010, RB | | | 7.25 | % | | | 02/15/45 | | | | 8,900 | | | | 9,108,616 | |
Illinois (State of) Finance Authority (Greenfields of Geneva); | | | | | | | | | | | | | | | | |
Series 2010 A, RB | | | 7.90 | % | | | 02/15/25 | | | | 3,285 | | | | 3,342,028 | |
Series 2010 A, RB | | | 8.00 | % | | | 02/15/28 | | | | 3,000 | | | | 3,036,300 | |
Series 2010 A, RB | | | 8.13 | % | | | 02/15/40 | | | | 14,140 | | | | 14,355,069 | |
Series 2010 A, RB | | | 8.25 | % | | | 02/15/46 | | | | 27,685 | | | | 28,180,561 | |
Series 2010 C-2, TEMPS-65SM RB | | | 6.75 | % | | | 02/15/16 | | | | 2,510 | | | | 2,510,803 | |
Illinois (State of) Finance Authority (Luther Oaks); | | | | | | | | | | | | | | | | |
Series 2006 A, RB | | | 5.70 | % | | | 08/15/28 | | | | 500 | | | | 487,690 | |
Series 2006 A, RB | | | 6.00 | % | | | 08/15/26 | | | | 3,850 | | | | 3,869,520 | |
Series 2006 A, RB | | | 6.00 | % | | | 08/15/39 | | | | 10,460 | | | | 9,739,306 | |
Illinois (State of) Finance Authority (Lutheran Home & Services); | | | | | | | | | | | | | | | | |
Series 2012, Ref. RB | | | 5.50 | % | | | 05/15/30 | | | | 1,500 | | | | 1,437,780 | |
Series 2012, Ref. RB | | | 5.63 | % | | | 05/15/42 | | | | 6,000 | | | | 5,501,340 | |
Series 2012, Ref. RB | | | 5.75 | % | | | 05/15/46 | | | | 1,500 | | | | 1,390,335 | |
Illinois (State of) Finance Authority (Montgomery Place); Series 2006 A, RB | | | 5.75 | % | | | 05/15/38 | | | | 3,000 | | | | 3,004,920 | |
Illinois (State of) Finance Authority (Navistar International); Series 2010, Recovery Zone Facility RB | | | 6.50 | % | | | 10/15/40 | | | | 20,000 | | | | 19,970,400 | |
Illinois (State of) Finance Authority (Norwegian American Hospital Inc.); | | | | | | | | | | | | | | | | |
Series 2008, RB | | | 7.63 | % | | | 09/15/28 | | | | 2,000 | | | | 1,992,060 | |
Series 2008, RB | | | 7.75 | % | | | 09/15/38 | | | | 3,000 | | | | 2,897,910 | |
Illinois (State of) Finance Authority (Park Place of Elmhurst); | | | | | | | | | | | | | | | | |
Series 2010 A, RB | | | 8.00 | % | | | 05/15/30 | | | | 1,300 | | | | 715,130 | |
Series 2010 A, RB | | | 8.13 | % | | | 05/15/40 | | | | 9,370 | | | | 5,154,437 | |
Series 2010 A, RB | | | 8.25 | % | | | 05/15/45 | | | | 14,000 | | | | 7,701,400 | |
Series 2010 D-1, TEMPS-75SM RB | | | 7.25 | % | | | 08/15/16 | | | | 8,230 | | | | 4,938,823 | |
Series 2010 D-2, TEMPS-65SM RB | | | 7.00 | % | | | 11/15/15 | | | | 550 | | | | 330,055 | |
Series 2010 D-3, TEMPS-50SM RB | | | 6.25 | % | | | 08/15/15 | | | | 3,450 | | | | 2,070,345 | |
Illinois (State of) Finance Authority (Peace Village); Series 2013, RB | | | 7.00 | % | | | 08/15/43 | | | | 8,230 | | | | 8,360,363 | |
Illinois (State of) Finance Authority (Plymouth Place); Series 2013, Ref. RB | | | 6.00 | % | | | 05/15/43 | | | | 10,600 | | | | 9,467,178 | |
Illinois (State of) Finance Authority (Provena Health); Series 2009 A, RB | | | 7.75 | % | | | 08/15/34 | | | | 12,800 | | | | 15,674,112 | |
See accompanying Notes to Financial Statements which are an integral part of the financial statements.
24 Invesco High Yield Municipal Fund
| | | | | | | | | | | | | | | | |
| | | Interest Rate | | | Maturity Date | | | Principal Amount (000) | | | Value | |
| Illinois–(continued) | | | | | | | | | | | | | | | | |
Illinois (State of) Finance Authority (Rush University Medical Center Obligated Group); Series 2009 A, RB | | | 7.25 | % | | | 11/01/38 | | | $ | 24,235 | | | $ | 28,708,539 | |
Illinois (State of) Finance Authority (Silver Cross Hospital & Medical Centers); | | | | | | | | | | | | | | | | |
Series 2008, Ref. RB | | | 5.50 | % | | | 08/15/30 | | | | 5,000 | | | | 5,122,900 | |
Series 2009, RB | | | 6.88 | % | | | 08/15/38 | | | | 21,875 | | | | 24,055,500 | |
Illinois (State of) Finance Authority (Smith Village); | | | | | | | | | | | | | | | | |
Series 2005 A, RB | | | 5.70 | % | | | 11/15/20 | | | | 500 | | | | 508,495 | |
Series 2005 A, RB | | | 6.13 | % | | | 11/15/25 | | | | 1,100 | | | | 1,105,456 | |
Series 2005 A, RB | | | 6.25 | % | | | 11/15/35 | | | | 1,500 | | | | 1,455,660 | |
Illinois (State of) Finance Authority (The Admiral at the Lake); | | | | | | | | | | | | | | | | |
Series 2010 A, RB | | | 7.25 | % | | | 05/15/20 | | | | 1,905 | | | | 1,945,996 | |
Series 2010 D-1, TEMPS-75SM RB | | | 7.00 | % | | | 05/15/18 | | | | 1,550 | | | | 1,552,666 | |
Series 2010 D-2, TEMPS-65SM RB | | | 6.38 | % | | | 05/15/17 | | | | 8,105 | | | | 8,116,752 | |
Illinois (State of) Finance Authority (The Landing at Plymouth Place); | | | | | | | | | | | | | | | | |
Series 2005 A, RB | | | 6.00 | % | | | 05/15/25 | | | | 5,500 | | | | 5,446,375 | |
Series 2005 A, RB | | | 6.00 | % | | | 05/15/37 | | | | 19,685 | | | | 17,942,287 | |
Illinois (State of) Finance Authority (Three Crowns Park Plaza); | | | | | | | | | | | | | | | | |
Series 2006 A, RB | | | 5.88 | % | | | 02/15/26 | | | | 1,000 | | | | 1,006,630 | |
Series 2006 A, RB | | | 5.88 | % | | | 02/15/38 | | | | 1,500 | | | | 1,449,495 | |
Illinois (State of) Finance Authority (United Neighborhood Organization Charter School Network, Inc.); | | | | | | | | | |
Series 2011, Ref. Charter School RB | | | 6.88 | % | | | 10/01/31 | | | | 3,485 | | | | 3,878,840 | |
Series 2011, Ref. Charter School RB | | | 7.13 | % | | | 10/01/41 | | | | 1,000 | | | | 1,119,580 | |
Illinois (State of) Finance Authority (University of Chicago); Series 2013 A, RB | | | 5.25 | % | | | 10/01/52 | | | | 27,000 | | | | 28,443,960 | |
Illinois (State of) Finance Authority (Villa St. Benedict); Series 2003 A-1, RB(g) | | | 6.90 | % | | | 11/15/33 | | | | 8,750 | | | | 5,929,875 | |
Illinois (State of) Finance Authority (Waste Management Inc.); Series 2005 A, Solid Waste Disposal RB(c) | | | 5.05 | % | | | 08/01/29 | | | | 1,320 | | | | 1,360,537 | |
Illinois (State of) Metropolitan Pier & Exposition Authority (McCormick Place Expansion); Series 2010 A, RB(e) | | | 5.50 | % | | | 06/15/50 | | | | 18,000 | | | | 18,582,660 | |
Illinois (State of) Real Estate Lease; Series 1998, Ctfs. RB (INS–ACA)(a)(f) | | | 6.20 | % | | | 06/15/18 | | | | 3,523 | | | | 3,560,177 | |
Illinois (State of) Toll Highway Authority; Series 2008 B, RB(e) | | | 5.50 | % | | | 01/01/33 | | | | 29,000 | | | | 31,748,910 | |
Lombard Public Facilities Corp.; Series 2005 A-1, First Tier Conference Center & Hotel RB | | | 6.38 | % | | | 01/01/15 | | | | 270 | | | | 176,839 | |
Long Grove (Village of) (Sunset Grove); Series 2010, Limited Obligation Tax Increment Allocation RB | | | 7.50 | % | | | 01/01/30 | | | | 3,390 | | | | 3,548,686 | |
Malta (Village of) (Prairie Springs); Series 2006, Tax Increment Allocation RB (Acquired 09/14/06; Cost $1,800,000)(f)(j) | | | 5.75 | % | | | 12/30/25 | | | | 1,800 | | | | 888,264 | |
Manhattan (Village of) Special Service Area No. 04-1 (Brookstone Springs); Series 2005, Special Tax RB | | | 6.10 | % | | | 03/01/35 | | | | 4,266 | | | | 4,181,917 | |
Minooka (Village of) (Lakewood Trails Unit No. 2); Series 2004, Special Assessment Improvement RB | | | 6.38 | % | | | 03/01/34 | | | | 5,288 | | | | 5,302,225 | |
Minooka (Village of) (Lakewood Trails); Series 2003, Special Assessment Improvement RB | | | 6.63 | % | | | 03/01/33 | | | | 3,553 | | | | 3,566,821 | |
Minooka (Village of) (Prairie Ridge); Series 2003, Special Assessment Improvement RB | | | 6.88 | % | | | 03/01/33 | | | | 2,629 | | | | 2,644,406 | |
Pingree Grove (Village of) (Cambridge Lakes Learning Center); | | | | | | | | | |
Series 2007, RB | | | 6.00 | % | | | 06/01/36 | | | | 4,980 | | | | 4,233,647 | |
Series 2011, RB | | | 8.50 | % | | | 06/01/41 | | | | 3,290 | | | | 3,506,910 | |
Pingree Grove (Village of) (Cambridge Lakes); Series 2006-1, Special Service Area No. 7 Special Tax RB | | | 6.00 | % | | | 03/01/36 | | | | 8,354 | | | | 8,226,685 | |
Pingree Grove (Village of) Special Service Area No. 2 (Cambridge Lakes); Series 2005-2, Special Tax RB | | | 6.00 | % | | | 03/01/35 | | | | 6,773 | | | | 6,792,980 | |
Plano (City of) Special Service Area No. 1 (Lakewood Springs); Series 2004 A, Special Tax RB | | | 6.20 | % | | | 03/01/34 | | | | 3,962 | | | | 3,981,216 | |
Plano (City of) Special Service Area No. 10 (Lakewood Springs Club); Series 2007, Special Tax RB(j) | | | 5.80 | % | | | 03/01/37 | | | | 5,615 | | | | 1,869,963 | |
Quad Cities Regional Economic Development Authority (Heritage Woods Moline Supportive Living Facility); Series 2006, MFH RB(c) | | | 6.00 | % | | | 12/01/41 | | | | 1,270 | | | | 1,093,267 | |
Railsplitter Tobacco Settlement Authority; Series 2010, RB | | | 6.00 | % | | | 06/01/28 | | | | 17,050 | | | | 19,519,351 | |
Regional Transportation Authority; Series 1994 B, RB (INS–AMBAC)(a) | | | 8.00 | % | | | 06/01/17 | | | | 2,095 | | | | 2,455,151 | |
See accompanying Notes to Financial Statements which are an integral part of the financial statements.
25 Invesco High Yield Municipal Fund
| | | | | | | | | | | | | | | | |
| | | Interest Rate | | | Maturity Date | | | Principal Amount (000) | | | Value | |
| Illinois–(continued) | | | | | | | | | | | | | | | | |
Southwestern Illinois Development Authority (Eden Retirement Center, Inc.); | | | | | | | | | |
Series 2006, Senior Care Facilities RB | | | 5.50 | % | | | 12/01/26 | | | $ | 800 | | | $ | 649,520 | |
Series 2006, Senior Care Facilities RB | | | 5.85 | % | | | 12/01/36 | | | | 3,000 | | | | 2,295,420 | |
Southwestern Illinois Development Authority (U.S. Steel Corp.) Series 2012, RB(c) | | | 5.75 | % | | | 08/01/42 | | | | 8,000 | | | | 6,877,680 | |
St. Charles (City of) (Zylstra); | | | | | | | | | |
Series 2008, Sr. Lien Limited Incremental Sales Tax RB | | | 6.95 | % | | | 01/01/21 | | | | 1,535 | | | | 1,541,094 | |
Series 2008, Sr. Lien Limited Incremental Sales Tax RB | | | 6.95 | % | | | 01/01/25 | | | | 1,980 | | | | 1,969,348 | |
St. Charles (City of) Special Service Area No. 21; Series 1998, RB | | | 6.63 | % | | | 03/01/28 | | | | 1,760 | | | | 1,757,606 | |
United City of Yorkville (City of) (Storm Water/Water Improvement); | | | | | | | | | |
Series 2007, Business District RB | | | 6.00 | % | | | 01/01/26 | | | | 3,045 | | | | 2,104,734 | |
Series 2007, Business District RB | | | 6.00 | % | | | 01/01/27 | | | | 285 | | | | 197,126 | |
United City of Yorkville (City of) Special Service Area No. 2004-107 (Raintree Village II); Series 2005, Special Tax RB(g) | | | 6.25 | % | | | 03/01/35 | | | | 5,408 | | | | 2,737,043 | |
United City of Yorkville (City of) Special Service Area No. 2005-108 (Autumn Creek); Series 2006, Special Tax RB(j) | | | 6.00 | % | | | 03/01/36 | | | | 2,695 | | | | 2,375,508 | |
United City of Yorkville (City of) Special Service Area No. 2006-113 (Cannonball/Beecher Road); Series 2007, Special Tax RB | | | 5.75 | % | | | 03/01/28 | | | | 4,175 | | | | 4,012,092 | |
Upper Illinois River Valley Development Authority (Living Springs McHenry Supportive Living Facility); Series 2007, MFH RB(c) | | | 6.10 | % | | | 12/01/41 | | | | 3,900 | | | | 3,404,037 | |
Upper Illinois River Valley Development Authority (Pleasant View Luther Home); | | | | | | | | | | | | | | | | |
Series 2010, RB | | | 7.00 | % | | | 11/15/30 | | | | 2,000 | | | | 2,046,900 | |
Series 2010, RB | | | 7.25 | % | | | 11/15/40 | | | | 3,200 | | | | 3,273,536 | |
Series 2010, RB | | | 7.38 | % | | | 11/15/45 | | | | 1,700 | | | | 1,737,757 | |
Series 2012, RB | | | 6.00 | % | | | 05/15/42 | | | | 6,550 | | | | 5,755,027 | |
Volo (Village of) Special Service Area No. 3 (Symphony Meadows); Series 2006-1, Special Tax RB | | | 6.00 | % | | | 03/01/36 | | | | 3,708 | | | | 3,619,564 | |
Western Illinois Economic Development Authority (Carthage Memorial Hospital); | | | | | | | | | | | | | | | | |
Series 2008 B, Hospital RB | | | 7.00 | % | | | 06/01/33 | | | | 2,295 | | | | 2,366,512 | |
Series 2008 B, Hospital RB | | | 7.05 | % | | | 06/01/37 | | | | 4,700 | | | | 4,840,013 | |
Wheeling (Village of) (N. Milwaukee/Lake-Cook TIF); Series 2005, Tax Increment Allocation RB | | | 6.00 | % | | | 01/01/25 | | | | 8,030 | | | | 7,922,478 | |
Will (County of) & Kankakee (City of) Regional Development Authority (Senior Estates Supportive Living); Series 2007, MFH RB(c) | | | 7.00 | % | | | 12/01/42 | | | | 2,970 | | | | 2,940,538 | |
| | | | | | | | | | | | | | | | 645,113,992 | |
|
| Indiana–2.33% | |
Carmel (City of) (Barrington Carmel); | | | | | | | | | | | | | | | | |
Series 2012 A, RB | | | 7.00 | % | | | 11/15/27 | | | | 1,550 | | | | 1,619,068 | |
Series 2012 A, RB | | | 7.00 | % | | | 11/15/32 | | | | 2,980 | | | | 3,062,606 | |
Series 2012 A, RB | | | 7.13 | % | | | 11/15/42 | | | | 12,200 | | | | 12,485,480 | |
Series 2012 A, RB | | | 7.13 | % | | | 11/15/47 | | | | 9,940 | | | | 10,144,466 | |
Series 2012 C-1, TEMPS-75SM RB | | | 5.75 | % | | | 11/15/19 | | | | 2,000 | | | | 2,001,160 | |
Series 2012 C-2, TEMPS-65SM RB | | | 5.25 | % | | | 11/15/18 | | | | 2,750 | | | | 2,749,890 | |
Crown Point (City of) (Wittenberg Village); | | | | | | | | | | | | | | | | |
Series 2009 A, Economic Development RB | | | 8.00 | % | | | 11/15/29 | | | | 3,100 | | | | 3,443,759 | |
Series 2009 A, Economic Development RB | | | 8.00 | % | | | 11/15/39 | | | | 9,250 | | | | 10,127,825 | |
Indiana (State of) Finance Authority (Irvington Community School); | | | | | | | | | | | | | | | | |
Series 2009 A, Educational Facilities RB | | | 7.75 | % | | | 07/01/23 | | | | 1,040 | | | | 1,027,780 | |
Series 2009 A, Educational Facilities RB | | | 8.00 | % | | | 07/01/29 | | | | 1,385 | | | | 1,334,004 | |
Series 2009 A, Educational Facilities RB | | | 9.00 | % | | | 07/01/39 | | | | 3,575 | | | | 3,647,322 | |
Indiana (State of) Finance Authority (Ohio River Bridges East End Crossing); | | | | | | | | | | | | | | | | |
Series 2013, Private Activity RB(c) | | | 5.25 | % | | | 01/01/51 | | | | 8,000 | | | | 8,084,160 | |
Series 2013, Private Activity RB MBTC(e) | | | 5.25 | % | | | 01/01/51 | | | | 16,000 | | | | 16,168,320 | |
Indiana (State of) Finance Authority (Ohio Valley Electric Corp.); Series 2012 A, Midwestern Disaster Relief RB | | | 5.00 | % | | | 06/01/39 | | | | 13,545 | | | | 13,128,356 | |
Indiana (State of) Finance Authority (U.S. Steel Corp); Series 2011, Ref. Environmental RB | | | 6.00 | % | | | 12/01/19 | | | | 8,000 | | | | 8,318,240 | |
See accompanying Notes to Financial Statements which are an integral part of the financial statements.
26 Invesco High Yield Municipal Fund
| | | | | | | | | | | | | | | | |
| | | Interest Rate | | | Maturity Date | | | Principal Amount (000) | | | Value | |
| Indiana–(continued) | | | | | | | | | | | | | | | | |
North Manchester (Town of) Economic Development Authority (Peabody Retirement Community); | | | | | | | | | | | | | | | | |
Series 2013, Ref. RB | | | 5.13 | % | | | 12/01/45 | | | $ | 1,558 | | | $ | 1,217,324 | |
Series 2013, Ref. Sub. RB | | | 1.00 | % | | | 12/01/45 | | | | 1,341 | | | | 13 | |
St. Joseph (County of) (Holy Cross Village at Notre Dame); Series 2006 A, Economic Development RB | | | 6.00 | % | | | 05/15/38 | | | | 1,150 | | | | 1,152,346 | |
St. Joseph (County of) Redevelopment District; | | | | | | | | | | | | | | | | |
Series 1997 B, Tax Increment Allocation CAB RB(d) | | | 0.00 | % | | | 12/30/14 | | | | 125 | | | | 117,810 | |
Series 1997 B, Tax Increment Allocation CAB RB(d) | | | 0.00 | % | | | 12/30/15 | | | | 125 | | | | 109,096 | |
Series 1997 B, Tax Increment Allocation CAB RB(d) | | | 0.00 | % | | | 12/30/16 | | | | 125 | | | | 101,036 | |
Valparaiso (City of) (Pratt Paper, LLC); | | | | | | | | | | | | | | | | |
Series 2013, Exempt Facilities RB(c) | | | 6.75 | % | | | 01/01/34 | | | | 10,785 | | | | 11,378,499 | |
Series 2013, Exempt Facilities RB(c) | | | 7.00 | % | | | 01/01/44 | | | | 11,000 | | | | 11,681,450 | |
Vigo (County of) Hospital Authority (Union Hospital, Inc.); | | | | | | | | | | | | | | | | |
Series 2007, RB(f) | | | 5.70 | % | | | 09/01/37 | | | | 8,000 | | | | 7,629,920 | |
Series 2007, RB(f) | | | 5.75 | % | | | 09/01/42 | | | | 5,780 | | | | 5,470,886 | |
Series 2007, RB(f) | | | 5.80 | % | | | 09/01/47 | | | | 5,645 | | | | 5,341,355 | |
| | | | | | | | | | | | | | | | 141,542,171 | |
|
| Iowa–3.50% | |
Altoona (City of); | | | | | | | | | | | | | | | | |
Series 2008, Annual Appropriation Urban Renewal Tax Increment RB | | | 6.00 | % | | | 06/01/28 | | | | 1,250 | | | | 1,325,300 | |
Series 2008, Annual Appropriation Urban Renewal Tax Increment RB | | | 6.00 | % | | | 06/01/39 | | | | 5,000 | | | | 5,183,400 | |
Series 2008, Annual Appropriation Urban Renewal Tax Increment RB | | | 6.00 | % | | | 06/01/43 | | | | 5,500 | | | | 5,686,835 | |
Ames (City of) (Mary Greeley Medical Center); | | | | | | | | | | | | | | | | |
Series 2011, Hospital RB | | | 5.25 | % | | | 06/15/36 | | | | 1,250 | | | | 1,295,275 | |
Series 2011, Hospital RB | | | 5.50 | % | | | 06/15/30 | | | | 1,000 | | | | 1,059,860 | |
Cass (County of) (Cass County Memorial Hospital); Series 2010 A, Hospital RB | | | 7.25 | % | | | 06/01/35 | | | | 5,755 | | | | 6,164,814 | |
Des Moines (City of) (Luther Park Apartments, Inc.); | | | | | | | | | | | | | | | | |
Series 2004, Senior Housing RB | | | 6.00 | % | | | 12/01/23 | | | | 500 | | | | 502,260 | |
Series 2004, Senior Housing RB | | | 6.25 | % | | | 12/01/34 | | | | 2,245 | | | | 2,245,471 | |
Series 2007 A, Ref. MFH RB(f) | | | 5.30 | % | | | 12/01/36 | | | | 3,500 | | | | 3,037,720 | |
Iowa (State of) Finance Authority (Alcoa Inc.); Series 2012, Midwestern Disaster Area RB | | | 4.75 | % | | | 08/01/42 | | | | 22,530 | | | | 20,233,066 | |
Iowa (State of) Finance Authority (Bethany Life Communities); | | | | | | | | | | | | | | | | |
Series 2006 A, Ref. Senior Housing RB | | | 5.45 | % | | | 11/01/26 | | | | 1,395 | | | | 1,387,816 | |
Series 2006 A, Ref. Senior Housing RB | | | 5.55 | % | | | 11/01/41 | | | | 3,795 | | | | 3,542,215 | |
Iowa (State of) Finance Authority (Iowa Fertilizer Co.); | | | | | | | | | | | | | | | | |
Series 2013, Midwestern Disaster Area RB | | | 5.00 | % | | | 12/01/19 | | | | 10,000 | | | | 10,043,900 | |
Series 2013, Midwestern Disaster Area RB | | | 5.25 | % | | | 12/01/25 | | | | 8,000 | | | | 7,767,120 | |
Series 2013, Midwestern Disaster Area RB | | | 5.50 | % | | | 12/01/22 | | | | 27,195 | | | | 27,203,702 | |
Series 2013, Midwestern Disaster Area RB MBTC(e) | | | 5.25 | % | | | 12/01/25 | | | | 17,800 | | | | 17,281,842 | |
Iowa (State of) Finance Authority (Madrid Home); | | | | | | | | | | | | | | | | |
Series 2007, Ref. Health Care Facility RB | | | 5.75 | % | | | 11/15/24 | | | | 1,000 | | | | 978,420 | |
Series 2007, Ref. Health Care Facility RB | | | 5.80 | % | | | 11/15/29 | | | | 1,930 | | | | 1,791,194 | |
Series 2007, Ref. Health Care Facility RB | | | 5.90 | % | | | 11/15/37 | | | | 2,750 | | | | 2,456,107 | |
Iowa (State of) Tobacco Settlement Authority; | | | | | | | | | | | | | | | | |
Series 2005 B, Asset-Backed RB | | | 5.60 | % | | | 06/01/34 | | | | 27,450 | | | | 23,704,173 | |
Series 2005 C, Asset-Backed RB | | | 5.50 | % | | | 06/01/42 | | | | 19,685 | | | | 15,664,536 | |
Series 2005 C, Asset-Backed RB | | | 5.63 | % | | | 06/01/46 | | | | 25,380 | | | | 20,352,222 | |
Series 2005 D, Asset-Backed CAB RB(d) | | | 0.00 | % | | | 06/01/46 | | | | 180,800 | | | | 13,343,040 | |
Jefferson (County of) Hospital; Series 2007 C, RB | | | 5.95 | % | | | 08/01/37 | | | | 1,435 | | | | 1,444,328 | |
Marion (City of) (Village Place at Marion); | | | | | | | | | | | | | | | | |
Series 2005 A, MFH RB | | | 5.65 | % | | | 09/01/25 | | | | 155 | | | | 140,469 | |
Series 2005 A, MFH RB | | | 6.00 | % | | | 09/01/35 | | | | 400 | | | | 341,700 | |
Orange City (City of); Series 2008, Ref. Hospital Capital Loan RN | | | 5.60 | % | | | 09/01/32 | | | | 7,415 | | | | 7,415,890 | |
See accompanying Notes to Financial Statements which are an integral part of the financial statements.
27 Invesco High Yield Municipal Fund
| | | | | | | | | | | | | | | | |
| | | Interest Rate | | | Maturity Date | | | Principal Amount (000) | | | Value | |
| Iowa–(continued) | | | | | | | | | | | | | | | | |
Polk (County of) (Luther Park Health Center, Inc.); | | | | | | | | | | | | | | | | |
Series 2004, Health Care Facilities RB | | | 6.00 | % | | | 10/01/24 | | | $ | 290 | | | $ | 290,139 | |
Series 2004, Health Care Facilities RB | | | 6.15 | % | | | 10/01/36 | | | | 3,100 | | | | 3,099,721 | |
Series 2007 A, Ref. Health Care Facilities RB | | | 5.30 | % | | | 04/01/37 | | | | 4,770 | | | | 4,277,545 | |
Series 2007 C, Health Care Facilities RB | | | 6.00 | % | | | 04/01/37 | | | | 3,365 | | | | 3,319,270 | |
| | | | | | | | | | | | | | | | 212,579,350 | |
|
| Kansas–0.70% | |
Kansas (State of) Development Finance Authority (Adventist Health System/Sunbelt Obligated Group); Series 2009 C, Hospital RB | | | 5.75 | % | | | 11/15/38 | | | | 1,900 | | | | 2,097,296 | |
Lenexa (City of) (Lakeview Village, Inc.); | | | | | | | | | | | | | | | | |
Series 2009, Health Care Facilities RB | | | 7.13 | % | | | 05/15/29 | | | | 500 | | | | 530,260 | |
Series 2009, Health Care Facilities RB | | | 7.25 | % | | | 05/15/39 | | | | 1,500 | | | | 1,578,930 | |
Olathe (City of) (Aberdeen Village, Inc.); | | | | | | | | | | | | | | | | |
Series 2005, Ref. Senior Living Facility RB | | | 6.13 | % | | | 05/15/30 | | | | 1,000 | | | | 988,010 | |
Series 2005 A, Ref. Senior Living Facility RB | | | 5.60 | % | | | 05/15/28 | | | | 1,500 | | | | 1,441,905 | |
Olathe (City of) (Catholic Care Campus, Inc.); Series 2006 A, Senior Living Facility RB | | | 6.00 | % | | | 11/15/38 | | | | 2,500 | | | | 2,500,350 | |
Olathe (City of) (West Village Center); | | | | | | | | | | | | | | | | |
Series 2007, Special Obligation Tax Increment Allocation RB | | | 5.30 | % | | | 09/01/17 | | | | 500 | | | | 408,935 | |
Series 2007, Special Obligation Tax Increment Allocation RB | | | 5.45 | % | | | 09/01/22 | | | | 3,315 | | | | 2,371,385 | |
Series 2007, Special Obligation Tax Increment Allocation RB | | | 5.50 | % | | | 09/01/26 | | | | 2,835 | | | | 1,880,399 | |
Overland Park (City of) Transportation Development District (Grass Creek); Series 2006, Special Assessment RB | | | 5.13 | % | | | 09/01/28 | | | | 1,485 | | | | 1,410,349 | |
Roeland Park (City of) (Roeland Park Redevelopment, LLC); Series 2005, Special Obligation Tax Increment Allocation RB | | | 5.75 | % | | | 08/01/24 | | | | 920 | | | | 913,551 | |
Roeland Park (City of) (TDD No. 1); | | | | | | | | | | | | | | | | |
Series 2005, Transportation Development District Sales Tax RB | | | 5.75 | % | | | 12/01/25 | | | | 445 | | | | 329,527 | |
Series 2006 A, Transportation Development District Sales Tax RB | | | 5.88 | % | | | 12/01/25 | | | | 865 | | | | 648,110 | |
Roeland Park (City of) (TDD No. 2); Series 2006 B, Transportation Development District Sales Tax RB | | | 5.88 | % | | | 12/01/25 | | | | 1,000 | | | | 600,780 | |
Wichita (City of) (Larksfield Place); Series 2013 III, Ref. Health Care Facilities & Improvement RB | | | 7.38 | % | | | 12/15/43 | | | | 5,000 | | | | 5,136,800 | |
Wichita (City of) (Presbyterian Manors, Inc.); | | | | | | | | | | | | | | | | |
Series 2013 IV-A, Health Care Facilities RB | | | 6.38 | % | | | 05/15/43 | | | | 5,000 | | | | 5,092,600 | |
Series 2013 IV-A, Health Care Facilities RB | | | 6.50 | % | | | 05/15/48 | | | | 14,000 | | | | 14,353,080 | |
| | | | | | | | | | | | | | | | 42,282,267 | |
|
| Kentucky–0.55% | |
Kentucky (State of) Economic Development Finance Authority (Masonic Home Independent Living II); | | | | | | | | | | | | | | | | |
Series 2011, RB | | | 7.00 | % | | | 05/15/30 | | | | 2,500 | | | | 2,682,125 | |
Series 2011, RB | | | 7.25 | % | | | 05/15/41 | | | | 3,050 | | | | 3,265,605 | |
Series 2011, RB | | | 7.38 | % | | | 05/15/46 | | | | 1,000 | | | | 1,076,200 | |
Kentucky (State of) Economic Development Finance Authority (Masonic Homes of Kent); | | | | | | | | | | | | | | | | |
Series 2012, Ref. Health Care Facilities RB | | | 5.38 | % | | | 11/15/32 | | | | 2,000 | | | | 1,880,180 | |
Series 2012, Ref. Health Care Facilities RB | | | 5.38 | % | | | 11/15/42 | | | | 1,750 | | | | 1,575,070 | |
Series 2012, Ref. Health Care Facilities RB | | | 5.50 | % | | | 11/15/45 | | | | 1,645 | | | | 1,498,562 | |
Kentucky (State of) Economic Development Finance Authority (Owensboro Medical Health System, Inc.); Series 2010 A, Hospital RB | | | 6.50 | % | | | 03/01/45 | | | | 6,000 | | | | 6,381,900 | |
Kentucky (State of) Public Transportation Infrastructure Authority (Downtown Crossing); | | | | | | | | | | | | | | | | |
Series 2013 C, First Tier Toll Conv. CAB RB(b) | | | 6.88 | % | | | 07/01/46 | | | | 8,000 | | | | 4,573,360 | |
Series 2013 C, First Tier Toll Cov. CAB RB(b) | | | 6.60 | % | | | 07/01/39 | | | | 10,000 | | | | 5,898,000 | |
Series 2013 C, First Tier Toll Cov. CAB RB(b) | | | 6.75 | % | | | 07/01/43 | | | | 5,000 | | | | 2,886,800 | |
Louisville (City of) & Jefferson (County of) Metropolitan Government (Bellarmie University Inc.); Series 2009, College Improvement RB | | | 6.13 | % | | | 05/01/39 | | | | 1,820 | | | | 1,929,600 | |
| | | | | | | | | | | | | | | | 33,647,402 | |
See accompanying Notes to Financial Statements which are an integral part of the financial statements.
28 Invesco High Yield Municipal Fund
| | | | | | | | | | | | | | | | |
| | | Interest Rate | | | Maturity Date | | | Principal Amount (000) | | | Value | |
| Louisiana–1.03% | |
Calcasieu (Parish of) Memorial Hospital Service District (Lake Charles Memorial Hospital); Series 1992 A, Hospital RB (INS–Connie Lee)(a) | | | 6.50 | % | | | 12/01/18 | | | $ | 3,890 | | | $ | 4,025,683 | |
Lakeshore Villages Master Community Development District; Series 2007, Special Assessment RB(g) | | | 5.25 | % | | | 07/01/17 | | | | 14,685 | | | | 5,799,106 | |
Louisiana (State of) Local Government Environmental Facilities & Community Development Authority (Eunice Student Housing Foundation); Series 2002, RB | | | 7.38 | % | | | 09/01/33 | | | | 2,865 | | | | 2,446,567 | |
Louisiana (State of) Local Government Environmental Facilities & Community Development Authority (Westlake Chemical Corp.); | | | | | | | | | | | | | | | | |
Series 2009 A, RB | | | 6.50 | % | | | 08/01/29 | | | | 4,250 | | | | 4,754,688 | |
Series 2010 A-1, RB | | | 6.50 | % | | | 11/01/35 | | | | 9,245 | | | | 10,160,440 | |
Louisiana (State of) Public Facilities Authority (Belle Chasse Educational Foundation); Series 2011, RB | | | 6.75 | % | | | 05/01/41 | | | | 3,000 | | | | 3,199,140 | |
Louisiana (State of) Public Facilities Authority (Lake Charles Memorial Hospital); Series 2007, Ref. Hospital RB(f) | | | 6.38 | % | | | 12/01/34 | | | | 24,750 | | | | 25,166,542 | |
Louisiana State University & Agricultural & Mechanical College (Master Lease M98362); Series 1998, RB (Acquired 11/30/98; Cost $1,445,558)(f) | | | 5.75 | % | | | 10/30/18 | | | | 1,446 | | | | 1,449,129 | |
New Orleans (City of) Aviation Board; Series 2009 A-2, Ref. & Restructuring General Airport RB
(INS–AGC)(a) | | | 6.00 | % | | | 01/01/23 | | | | 3,000 | | | | 3,419,310 | |
St. Tammany (Parish of) Public Trust Financing Authority (Christwood); Series 1998, Ref. RB | | | 5.70 | % | | | 11/15/28 | | | | 2,210 | | | | 2,188,961 | |
| | | | | | | | | | | | | | | | 62,609,566 | |
|
| Maine–0.31% | |
Maine (State of) Health & Higher Educational Facilities Authority (Maine General Medical Center); | | | | | | | | | | | | | | | | |
Series 2011, RB | | | 6.75 | % | | | 07/01/36 | | | | 3,175 | | | | 3,457,734 | |
Series 2011, RB | | | 6.75 | % | | | 07/01/41 | | | | 11,505 | | | | 12,464,057 | |
Series 2011, RB | | | 7.50 | % | | | 07/01/32 | | | | 2,500 | | | | 2,863,375 | |
| | | | | 18,785,166 | |
|
| Maryland–1.71% | |
Anne Arundel (County of) (National Business Park-North); | | | | | | | | | | | | | | | | |
Series 2010, Special Obligation Tax Allocation RB | | | 5.63 | % | | | 07/01/25 | | | | 1,000 | | | | 1,045,190 | |
Series 2010, Special Obligation Tax Allocation RB | | | 6.10 | % | | | 07/01/40 | | | | 3,250 | | | | 3,400,865 | |
Baltimore (City of) (East Baltimore Research Park); Series 2008 A, Special Obligation Tax Allocation RB | | | 7.00 | % | | | 09/01/38 | | | | 15,605 | | | | 16,454,224 | |
Baltimore (City of) (Strathdale Manor); Series 2003, Special Obligation Tax Allocation RB | | | 7.00 | % | | | 07/01/33 | | | | 961 | | | | 972,791 | |
Brunswick (City of) (Brunswick Crossing); Series 2006, Special Obligation Tax RB | | | 5.50 | % | | | 07/01/36 | | | | 17,900 | | | | 16,566,808 | |
Frederick (County of) (Jefferson Technology Park); | | | | | | | | | | | | | | | | |
Series 2013 A, Special Tax RB | | | 7.25 | % | | | 07/01/43 | | | | 3,640 | | | | 3,724,921 | |
Series 2013 B, Tax Increment & Special Tax RB | | | 7.13 | % | | | 07/01/43 | | | | 5,290 | | | | 5,537,942 | |
Frederick (County of) (Urbana Community Development Authority); Series 2010 B, Sub. Special Obligation Tax RB | | | 5.50 | % | | | 07/01/40 | | | | 9,020 | | | | 8,578,020 | |
Harford (County of); Series 2011, Special Obligation Tax Allocation RB | | | 7.50 | % | | | 07/01/40 | | | | 6,000 | | | | 6,512,280 | |
Howard (County of) (Vantage House Facility); Series 2007 B, Ref. Retirement Community RB | | | 5.25 | % | | | 04/01/37 | | | | 620 | | | | 521,780 | |
Maryland (State of) Health & Higher Educational Facilities Authority (Adventist Healthcare); Series 2011 A, RB | | | 6.13 | % | | | 01/01/36 | | | | 1,500 | | | | 1,629,510 | |
Maryland (State of) Health & Higher Educational Facilities Authority (King Farm Presbyterian Retirement Community); | | | | | | | | | | | | | | | | |
Series 2007 A, RB | | | 5.25 | % | | | 01/01/27 | | | | 4,475 | | | | 4,475,850 | |
Series 2007 A, RB | | | 5.30 | % | | | 01/01/37 | | | | 3,050 | | | | 2,886,825 | |
Maryland (State of) Health & Higher Educational Facilities Authority (Washington County Hospital); Series 2008, RB | | | 6.00 | % | | | 01/01/43 | | | | 16,105 | | | | 16,451,580 | |
Maryland (State of) Industrial Development Financing Authority (Our Lady of Good Counsel High School Facility); Series 2005 A, Economic Development RB(h)(i) | | | 6.00 | % | | | 05/01/15 | | | | 1,500 | | | | 1,538,865 | |
Maryland Economic Development Corp. (AFCO Cargo BWI II, LLC); | | | | | | | | | | | | | | | | |
Series 1999, Air Cargo RB(c) | | | 6.50 | % | | | 07/01/24 | | | | 5,525 | | | | 4,987,418 | |
Series 2003, Ref. Air Cargo RB(c) | | | 7.34 | % | | | 07/01/24 | | | | 1,090 | | | | 1,046,792 | |
See accompanying Notes to Financial Statements which are an integral part of the financial statements.
29 Invesco High Yield Municipal Fund
| | | | | | | | | | | | | | | | |
| | | Interest Rate | | | Maturity Date | | | Principal Amount (000) | | | Value | |
| Maryland–(continued) | | | | | | | | | | | | | | | | |
Maryland Economic Development Corp. (Chesapeake Bay); Series 2006 B, Sr. Lien RB | | | 5.25 | % | | | 12/01/31 | | | $ | 1,500 | | | $ | 749,625 | |
Montgomery (County of) (West Germantown Development District); Series 2004 B, Special Obligation Limited Tax GO Bonds | | | 6.70 | % | | | 07/01/27 | | | | 1,200 | | | | 1,201,800 | |
Salisbury (City of) (Villages at Aydelotte Farm); Series 2007, Special Obligation Tax Allocation RB(g) | | | 5.25 | % | | | 01/01/37 | | | | 4,000 | | | | 1,452,920 | |
Westminster (City of) (Carroll Lutheran Village); | | | | | | | | | | | | | | | | |
Series 2004 A, Economic Development RB | | | 6.00 | % | | | 05/01/24 | | | | 2,000 | | | | 2,001,780 | |
Series 2004 A, Economic Development RB | | | 6.25 | % | | | 05/01/34 | | | | 2,500 | | | | 2,500,100 | |
| | | | | | | | | | | | | | | | 104,237,886 | |
|
| Massachusetts–2.48% | |
Massachusetts (State of) Development Finance Agency (Alliance); Series 1999 A, Health Care Facility RB | | | 7.10 | % | | | 07/01/32 | | | | 6,740 | | | | 6,739,798 | |
Massachusetts (State of) Development Finance Agency (Covanta Energy); Series 2012, Ref. Resource Recovery RB(c) | | | 5.25 | % | | | 11/01/42 | | | | 12,870 | | | | 12,443,359 | |
Massachusetts (State of) Development Finance Agency (Criterion Child Enrichment); Series 2003, RB | | | 6.75 | % | | | 01/01/34 | | | | 5,360 | | | | 5,256,123 | |
Massachusetts (State of) Development Finance Agency (Evergreen Center Inc.); | | | | | | | | | | | | | | | | |
Series 2005, RB | | | 5.00 | % | | | 01/01/24 | | | | 250 | | | | 250,320 | |
Series 2005, RB | | | 5.50 | % | | | 01/01/35 | | | | 500 | | | | 488,150 | |
Massachusetts (State of) Development Finance Agency (GF/Pilgrim, Inc.); | | | | | | | | | | | | | | | | |
Series 1998, First Mortgage RB | | | 6.50 | % | | | 10/01/15 | | | | 235 | | | | 235,155 | |
Series 1998, First Mortgage RB | | | 6.75 | % | | | 10/01/28 | | | | 4,000 | | | | 3,877,240 | |
Massachusetts (State of) Development Finance Agency (Hampshire College); Series 2004, RB | | | 5.70 | % | | | 10/01/34 | | | | 1,500 | | | | 1,509,195 | |
Massachusetts (State of) Development Finance Agency (Harvard University); Series 2009 A, RB(e) | | | 5.50 | % | | | 11/15/36 | | | | 23,660 | | | | 26,782,883 | |
Massachusetts (State of) Development Finance Agency (Hillcrest Educational Centers Inc.); Series 1999, RB | | | 6.38 | % | | | 07/01/29 | | | | 5,655 | | | | 5,655,905 | |
Massachusetts (State of) Development Finance Agency (Linden Ponds, Inc. Facility); | | | | | | | | | | | | | | | | |
Series 2011 A-1, RB | | | 6.25 | % | | | 11/15/17 | | | | 732 | | | | 722,290 | |
Series 2011 A-1, RB | | | 6.25 | % | | | 11/15/39 | | | | 705 | | | | 582,516 | |
Series 2011 A-1, RB | | | 6.25 | % | | | 11/15/46 | | | | 975 | | | | 784,469 | |
Series 2011 A-2, RB | | | 5.50 | % | | | 11/15/46 | | | | 89 | | | | 64,142 | |
Series 2011 B, CAB RB(d) | | | 0.00 | % | | | 11/15/56 | | | | 911 | | | | 4,272 | |
Massachusetts (State of) Development Finance Agency (Massachusetts Institute of Technology); Series 2002 K, RB(e) | | | 5.50 | % | | | 07/01/32 | | | | 5,015 | | | | 6,503,552 | |
Massachusetts (State of) Development Finance Agency (Quincy Medical Center); Series 2008 A,
RB(g) | | | 5.85 | % | | | 01/15/18 | | | | 5,565 | | | | 15,638 | |
Massachusetts (State of) Development Finance Agency (Sabis International Charter School); | | | | | | | | | | | | | | | | |
Series 2009 A, RB | | | 6.85 | % | | | 04/15/23 | | | | 745 | | | | 830,511 | |
Series 2009 A, RB | | | 6.90 | % | | | 04/15/25 | | | | 895 | | | | 991,033 | |
Series 2009 A, RB | | | 8.00 | % | | | 04/15/31 | | | | 1,000 | | | | 1,158,470 | |
Series 2009 A, RB | | | 8.00 | % | | | 04/15/39 | | | | 4,850 | | | | 5,574,687 | |
Massachusetts (State of) Development Finance Agency (Tufts Medical Center); | | | | | | | | | | | | | | | | |
Series 2011 I, RB | | | 6.75 | % | | | 01/01/36 | | | | 1,000 | | | | 1,148,280 | |
Series 2011 I, RB | | | 6.88 | % | | | 01/01/41 | | | | 4,610 | | | | 5,289,145 | |
Massachusetts (State of) Development Finance Agency (Whitney Academy); Series 2000, RB | | | 7.50 | % | | | 09/01/30 | | | | 2,545 | | | | 2,542,582 | |
Massachusetts (State of) Port Authority (Delta Air Lines Inc.); Series 2001 C, Special Facilities RB (INS–AMBAC)(a)(c)(l) | | | 0.12 | % | | | 01/01/31 | | | | 15,000 | | | | 11,100,000 | |
Massachusetts (State of) Port Authority (Delta Airlines Inc.); Series 2001 A, RB (INS–AMBAC)(a)(c) | | | 5.00 | % | | | 01/01/27 | | | | 10,105 | | | | 9,652,296 | |
Massachusetts (State of); Series 2004 A, Ref. Limited Tax GO Bonds (INS–AMBAC)(a)(e) | | | 5.00 | % | | | 08/01/30 | | | | 32,040 | | | | 40,523,551 | |
| | | | | | | | | | | | | | | | 150,725,562 | |
|
| Michigan–1.14% | |
Dearborn Economic Development Corp. (Henry Ford Village, Inc.); | | | | | | | | | | | | | | | | |
Series 2008, Ref. Limited Obligation RB | | | 7.00 | % | | | 11/15/28 | | | | 5,500 | | | | 5,584,920 | |
Series 2008, Ref. Limited Obligation RB | | | 7.13 | % | | | 11/15/43 | | | | 7,700 | | | | 7,734,650 | |
See accompanying Notes to Financial Statements which are an integral part of the financial statements.
30 Invesco High Yield Municipal Fund
| | | | | | | | | | | | | | | | |
| | | Interest Rate | | | Maturity Date | | | Principal Amount (000) | | | Value | |
| Michigan–(continued) | | | | | | | | | | | | | | | | |
Detroit (City of) Water and Sewerage Department; | | | | | | | | | | | | | | | | |
Series 2012 A, Ref. Sr. Lien Sewage Disposal System RB | | | 5.00 | % | | | 07/01/32 | | | $ | 12,725 | | | $ | 12,287,005 | |
Series 2012 A, Ref. Sr. Lien Sewage Disposal System RB | | | 5.25 | % | | | 07/01/39 | | | | 6,620 | | | | 6,434,309 | |
Detroit Community High School; | | | | | | | | | | | | | | | | |
Series 2005, Public School Academy RB | | | 5.65 | % | | | 11/01/25 | | | | 1,260 | | | | 1,017,261 | |
Series 2005, Public School Academy RB | | | 5.75 | % | | | 11/01/30 | | | | 1,000 | | | | 753,450 | |
Grand Blanc Academy; Series 2000, COP | | | 7.75 | % | | | 02/01/30 | | | | 1,590 | | | | 1,028,507 | |
Iron River (City of) Hospital Finance Authority (Iron County Community Hospitals); | | | | | | | | | | | | | | | | |
Series 2008, Ref. Hospital RB | | | 6.50 | % | | | 05/15/33 | | | | 3,275 | | | | 3,232,196 | |
Series 2008, Ref. Hospital RB | | | 6.50 | % | | | 05/15/40 | | | | 3,380 | | | | 3,264,269 | |
Kentwood Economic Development Corp. (Holland Home); | | | | | | | | | | | | | | | | |
Series 2012, Ref. Limited Obligation RB | | | 5.63 | % | | | 11/15/32 | | | | 3,500 | | | | 3,451,875 | |
Series 2012, Ref. Limited Obligation RB | | | 5.63 | % | | | 11/15/41 | | | | 4,160 | | | | 3,979,830 | |
Michigan (State of) Finance Authority (Public School Academy–Cesar Chavez Academy); Series 2012, Ref. Limited Obligation RB | | | 5.75 | % | | | 02/01/33 | | | | 4,750 | | | | 4,513,545 | |
Michigan (State of) Strategic Fund (Genesee Power Station); Series 1994, Ref. Solid Waste Disposal RB(c) | | | 7.50 | % | | | 01/01/21 | | | | 2,470 | | | | 2,321,553 | |
Saline Economic Development Corp. (Evangelical Homes of Michigan); Series 2013, Ref. RB | | | 5.50 | % | | | 06/01/47 | | | | 4,000 | | | | 3,742,840 | |
Star International Academy; Series 2012, Ref. Public School Academy RB | | | 5.00 | % | | | 03/01/33 | | | | 3,100 | | | | 2,867,004 | |
Wayne Charter County Economic Development Corp. (Rivers of Grosse Point); Series 2013, First Mortgage RB | | | 7.88 | % | | | 12/01/43 | | | | 4,000 | | | | 4,044,240 | |
Wenonah Park Properties, Inc. (Bay City Hotel); | | | | | | | | | | | | | | | | |
Series 2002, RB(k) | | | 3.75 | % | | | 04/01/33 | | | | 11,620 | | | | 2,201,758 | |
Series 2002, RB(k) | | | 3.94 | % | | | 04/01/22 | | | | 3,485 | | | | 660,338 | |
| | | | | | | | | | | | | | | | 69,119,550 | |
|
| Minnesota–3.40% | |
Albertville (City of) (Group for Affordable Housing); Series 2007, Ref. MFH RB | | | 5.55 | % | | | 09/01/42 | | | | 3,320 | | | | 3,100,017 | |
Anoka (City of) (The Homestead at Anoka, Inc.); Series 2011 A, Health Care Facilities RB | | | 7.00 | % | | | 11/01/46 | | | | 4,070 | | | | 3,992,629 | |
Anoka (County of) Housing & Redevelopment Authority (Fridley Medical Center); | | | | | | | | | | | | | | | | |
Series 2010 A, RB | | | 6.63 | % | | | 05/01/30 | | | | 500 | | | | 521,100 | |
Series 2010 A, RB | | | 6.88 | % | | | 05/01/40 | | | | 1,000 | | | | 1,041,350 | |
Apple Valley (City of) (Ecumen-Seasons at Apple Valley); Series 2010, Housing & Health Care RB | | | 6.75 | % | | | 03/01/40 | | | | 2,500 | | | | 2,548,050 | |
Baytown (Township of) (St. Croix Preparatory Academy); | | | | | | | | | | | | | | | | |
Series 2008 A, Lease RB | | | 6.75 | % | | | 08/01/28 | | | | 1,000 | | | | 1,036,750 | |
Series 2008 A, Lease RB | | | 7.00 | % | | | 08/01/38 | | | | 700 | | | | 725,438 | |
Becker (City of) (Shepherd of Grace); | | | | | | | | | | | | | | | | |
Series 2006, Senior Housing RB | | | 5.88 | % | | | 05/01/29 | | | | 1,000 | | | | 998,910 | |
Series 2006, Senior Housing RB | | | 6.00 | % | | | 05/01/41 | | | | 1,000 | | | | 969,950 | |
Bloomington (City of) Port Authority (Radisson Blu Mall of America, LLC); | | | | | | | | | | | | | | | | |
Series 2010, Recovery Zone Facility RB | | | 6.25 | % | | | 12/01/16 | | | | 1,500 | | | | 1,520,430 | |
Series 2010, Recovery Zone Facility RB | | | 6.75 | % | | | 12/01/18 | | | | 1,755 | | | | 1,801,648 | |
Series 2010, Recovery Zone Facility RB | | | 8.00 | % | | | 12/01/25 | | | | 1,625 | | | | 1,747,639 | |
Series 2010, Recovery Zone Facility RB | | | 9.00 | % | | | 12/01/35 | | | | 8,000 | | | | 8,817,280 | |
Brooklyn Park (City of) (Prairie Seeds Academy); | | | | | | | | | | | | | | | | |
Series 2009 A, Lease RB | | | 8.38 | % | | | 03/01/23 | | | | 100 | | | | 108,194 | |
Series 2009 A, Lease RB | | | 9.00 | % | | | 03/01/29 | | | | 2,620 | | | | 2,867,407 | |
Series 2009 A, Lease RB | | | 9.25 | % | | | 03/01/39 | | | | 8,000 | | | | 8,830,560 | |
Carlton (City of) (Inter-Faith Care Center); Series 2006, Ref. Health Care & Housing Facilities RB | | | 5.70 | % | | | 04/01/36 | | | | 2,000 | | | | 1,891,460 | |
Cold Spring (City of) (Assumption Home, Inc.); | | | | | | | | | | | | | | | | |
Series 2005, Nursing Home & Senior Housing RB | | | 5.50 | % | | | 03/01/25 | | | | 10 | | | | 10,059 | |
Series 2005, Nursing Home & Senior Housing RB | | | 5.75 | % | | | 03/01/35 | | | | 10 | | | | 10,042 | |
Series 2008, Health Care Facilities RB | | | 7.50 | % | | | 03/01/38 | | | | 1,000 | | | | 1,047,710 | |
Columbia Heights (City of) (Crest View Corp.); Series 2007 A, Ref. MFH & Health Care Facilities RB | | | 5.70 | % | | | 07/01/42 | | | | 5,000 | | | | 3,770,000 | |
See accompanying Notes to Financial Statements which are an integral part of the financial statements.
31 Invesco High Yield Municipal Fund
| | | | | | | | | | | | | | | | |
| | | Interest Rate | | | Maturity Date | | | Principal Amount (000) | | | Value | |
| Minnesota–(continued) | | | | | | | | | | | | | | | | |
Dakota (County of) Community Development Agency (Highview Hills Senior Housing); Series 2008 A, MFH RB | | | 7.00 | % | | | 08/01/45 | | | $ | 18,000 | | | $ | 18,243,720 | |
Lake Crystal (City of) (Ecumen-Second Century); Series 2006 A, Ref. Housing RB | | | 5.70 | % | | | 09/01/36 | | | | 2,000 | | | | 2,007,580 | |
Maplewood (City of) (Ecumen Headquarters & The Seasons at Maplewood); Series 2010, Housing & Health Care RB | | | 6.38 | % | | | 03/01/40 | | | | 1,045 | | | | 1,091,785 | |
Minneapolis (City of) (Ivy Tower); Series 2005, Tax Increment Allocation RB | | | 5.70 | % | | | 02/01/29 | | | | 1,000 | | | | 898,940 | |
Minneapolis (City of) (Providence); | | | | | | | | | | | | | | | | |
Series 2007 A, Ref. Housing & Health Care Facilities RB | | | 5.63 | % | | | 10/01/27 | | | | 4,000 | | | | 4,019,240 | |
Series 2007 A, Ref. Housing & Health Care Facilities RB | | | 5.75 | % | | | 10/01/37 | | | | 4,345 | | | | 4,333,616 | |
Minneapolis (City of) (Riverton Community Housing); Series 2006 A, Ref. Student Housing RB | | | 5.60 | % | | | 08/01/26 | | | | 1,400 | | | | 1,399,888 | |
Moorhead (City of) (Sheyenne Crossing); Series 2006, Sr. Housing RB | | | 5.65 | % | | | 04/01/41 | | | | 5,000 | | | | 4,969,500 | |
Northwest Multi-County Housing & Redevelopment Authority (Pooled Housing Program); | | | | | | | | | | | | | | | | |
Series 2005 A, Ref. Governmental Housing RB | | | 5.35 | % | | | 07/01/15 | | | | 70 | | | | 71,338 | |
Series 2005 A, Ref. Governmental Housing RB | | | 6.20 | % | | | 07/01/30 | | | | 2,000 | | | | 2,000,820 | |
Series 2005 A, Ref. Governmental Housing RB | | | 6.25 | % | | | 07/01/40 | | | | 5,000 | | | | 4,892,150 | |
Series 2006, Ref. Governmental Housing RB | | | 5.25 | % | | | 07/01/26 | | | | 850 | | | | 809,132 | |
Series 2006, Ref. Governmental Housing RB | | | 5.45 | % | | | 07/01/41 | | | | 2,340 | | | | 2,087,537 | |
Oak Park Heights (City of) (Oakgreen Commons); | | | | | | | | | | | | | | | | |
Series 2010, Housing RB | | | 6.75 | % | | | 08/01/31 | | | | 1,500 | | | | 1,585,305 | |
Series 2010, Housing RB | | | 7.00 | % | | | 08/01/45 | | | | 3,000 | | | | 3,151,290 | |
Orono (City of) (Orono Woods Apartments); Series 2006 A, Ref. Senior Housing RB | | | 5.40 | % | | | 11/01/41 | | | | 4,700 | | | | 3,318,529 | |
Oronoco (City of) (Wedum Shorewood Campus); Series 2006, Ref. MFH RB | | | 5.40 | % | | | 06/01/41 | | | | 7,500 | | | | 7,183,875 | |
Perham (City of) Hospital District (Perham Memorial Hospital & Home); Series 2010, Health Care Facilities RB | | | 6.35 | % | | | 03/01/35 | | | | 2,000 | | | | 2,117,900 | |
Pine City (City of) (Lakes International Language Academy); Series 2006 A, Lease RB | | | 6.25 | % | | | 05/01/35 | | | | 2,650 | | | | 2,730,798 | |
Ramsey (City of) (Pact Charter School); Series 2004 A, Lease RB(h)(i) | | | 6.75 | % | | | 06/01/14 | | | | 3,000 | | | | 3,109,860 | |
Rochester (City of) (Homestead at Rochester, Inc.); Series 2013 A, Health Care & Housing RB | | | 6.88 | % | | | 12/01/48 | | | | 6,000 | | | | 6,244,620 | |
Rochester (City of) (Samaritan Bethany, Inc.); | | | | | | | | | | | | | | | | |
Series 2009 A, Ref. Health Care & Housing RB | | | 7.38 | % | | | 12/01/41 | | | | 2,000 | | | | 2,105,900 | |
Series 2009 B, Ref. Health Care & Housing RB | | | 7.38 | % | | | 12/01/36 | | | | 1,555 | | | | 1,644,257 | |
Sartell (City of) (Country Manor Campus LLC); | | | | | | | | | | | | | | | | |
Series 2010 A, Health Care Facilities RB | | | 6.25 | % | | | 09/01/36 | | | | 925 | | | | 957,061 | |
Series 2013, Health Care & Housing Facilities RB | | | 5.38 | % | | | 09/01/43 | | | | 5,000 | | | | 4,617,050 | |
Sauk Rapids (City of) (Good Shepherd Lutheran Home); Series 2009, Health Care & Housing Facilities RB(h)(i) | | | 7.50 | % | | | 01/01/16 | | | | 7,000 | | | | 7,868,700 | |
St. Paul (City of) Housing & Redevelopment Authority (Emerald Gardens); | | | | | | | | | | | | | | | | |
Series 2010, Ref. Tax Increment Allocation RB | | | 5.63 | % | | | 03/01/20 | | | | 705 | | | | 744,092 | |
Series 2010, Ref. Tax Increment Allocation RB | | | 6.50 | % | | | 03/01/29 | | | | 915 | | | | 945,927 | |
St. Paul (City of) Housing & Redevelopment Authority (HealthEast); Series 2005, Hospital RB | | | 6.00 | % | | | 11/15/30 | | | | 3,360 | | | | 3,440,842 | |
St. Paul (City of) Housing & Redevelopment Authority (Higher Ground Academy); Series 2009, Lease RB(h)(i) | | | 8.50 | % | | | 06/01/14 | | | | 1,900 | | | | 1,978,774 | |
St. Paul (City of) Housing & Redevelopment Authority (Hmong Academy); | | | | | | | | | | | | | | | | |
Series 2006 A, Lease RB | | | 5.75 | % | | | 09/01/26 | | | | 700 | | | | 704,774 | |
Series 2006 A, Lease RB | | | 6.00 | % | | | 09/01/36 | | | | 3,390 | | | | 3,397,390 | |
Series 2012 A, Charter School Lease RB | | | 5.50 | % | | | 09/01/43 | | | | 5,000 | | | | 4,662,650 | |
St. Paul (City of) Housing & Redevelopment Authority (Hope Community Academy); | | | | | | | | | | | | | | | | |
Series 2004 A, Lease RB | | | 6.75 | % | | | 12/01/33 | | | | 2,415 | | | | 2,417,149 | |
Series 2005 A, Lease RB | | | 6.25 | % | | | 12/01/33 | | | | 2,185 | | | | 2,082,458 | |
St. Paul (City of) Housing & Redevelopment Authority (Marian Center); Series 2007 A, Ref. MFH RB | | | 5.38 | % | | | 05/01/43 | | | | 5,000 | | | | 4,819,650 | |
St. Paul (City of) Housing & Redevelopment Authority (Model Cities Health Center); Series 2001 A, Health Care RB | | | 7.25 | % | | | 11/01/26 | | | | 4,035 | | | | 3,537,081 | |
St. Paul (City of) Housing & Redevelopment Authority (New Spirit Charter School); Series 2002 A, Lease RB | | | 7.50 | % | | | 12/01/31 | | | | 4,390 | | | | 4,425,822 | |
See accompanying Notes to Financial Statements which are an integral part of the financial statements.
32 Invesco High Yield Municipal Fund
| | | | | | | | | | | | | | | | |
| | | Interest Rate | | | Maturity Date | | | Principal Amount (000) | | | Value | |
| Minnesota–(continued) | | | | | | | | | | | | | | | | |
St. Paul (City of) Housing & Redevelopment Authority (Nova Classical Academy); | | | | | | | | | | | | | | | | |
Series 2011 A, Charter School Lease RB | | | 6.38 | % | | | 09/01/31 | | | $ | 1,000 | | | $ | 1,047,280 | |
Series 2011 A, Charter School Lease RB | | | 6.63 | % | | | 09/01/42 | | | | 1,500 | | | | 1,578,420 | |
St. Paul (City of) Housing & Redevelopment Authority (Rossy & Richard Shaller Family Sholom East Campus); | | | | | | | | | | | | | | | | |
Series 2007 A, RB | | | 5.05 | % | | | 10/01/27 | | | | 1,750 | | | | 1,684,287 | |
Series 2007 A, RB | | | 5.25 | % | | | 10/01/42 | | | | 2,000 | | | | 1,802,280 | |
St. Paul (Port of) (HealthEast Midway Campus-03); | | | | | | | | | | | | | | | | |
Series 2005 A, Lease RB | | | 5.75 | % | | | 05/01/25 | | | | 1,700 | | | | 1,741,463 | |
Series 2005 A, Lease RB | | | 5.88 | % | | | 05/01/30 | | | | 1,250 | | | | 1,276,125 | |
Series 2005 B, Lease RB | | | 6.00 | % | | | 05/01/30 | | | | 1,700 | | | | 1,738,148 | |
Vadnais Heights (City of) (Agriculture & Food Sciences Academy); | | | | | | | | | | | | | | | | |
Series 2004 A, Lease RB(g) | | | 6.38 | % | | | 12/01/24 | | | | 1,900 | | | | 1,457,129 | |
Series 2004 A, Lease RB(g) | | | 6.60 | % | | | 12/01/34 | | | | 5,275 | | | | 3,654,995 | |
Washington (County of) Housing & Redevelopment Authority (Birchwood & Woodbury); Series 2007 A, Health Care & Housing RB | | | 5.00 | % | | | 12/01/14 | | | | 355 | | | | 359,306 | |
Wayzata (City of) (Folkestone Senior Living Community); | | | | | | | | | | | | | | | | |
Series 2012 A, Senior Housing RB | | | 5.75 | % | | | 11/01/39 | | | | 4,000 | | | | 4,089,160 | |
Series 2012 A, Senior Housing RB | | | 6.00 | % | | | 05/01/47 | | | | 7,500 | | | | 7,753,575 | |
West St. Paul (City of) (Walker Thompson Hill, LLC); Series 2011A, Health Care Facilities RB | | | 7.00 | % | | | 09/01/46 | | | | 1,530 | | | | 1,565,527 | |
Winsted (City of) (St. Mary’s Care Center); | | | | | | | | | | | | | | | | |
Series 2010 A, Health Care RB | | | 6.25 | % | | | 09/01/30 | | | | 500 | | | | 499,485 | |
Series 2010 A, Health Care RB | | | 6.88 | % | | | 09/01/42 | | | | 2,000 | | | | 2,008,600 | |
Worthington (City of) (Ecumen Corp. Guaranty-Meadows); Series 2009 A, Housing & Health Care RB(h) | | | 6.38 | % | | | 05/01/19 | | | | 650 | | | | 658,853 | |
| | | | | | | | | | | | | | | | 206,888,256 | |
|
| Mississippi–0.16% | |
Mississippi Business Finance Corp.; Series 2004, Air Cargo RB(c) | | | 7.25 | % | | | 07/01/34 | | | | 1,560 | | | | 748,722 | |
Mississippi Home Corp. (Grove Apartments); Series 2007-1, RB(c)(g) | | | 3.13 | % | | | 04/01/37 | | | | 5,650 | | | | 4,241,737 | |
Mississippi Home Corp. (Kirkwood Apartments); Series 2007, RB(c)(k) | | | 3.40 | % | | | 11/01/37 | | | | 7,000 | | | | 4,768,400 | |
| | | | | | | | | | | | | | | | 9,758,859 | |
| | | | |
| Missouri–2.63% | | | | | | | | | | | | | | | | |
370/Missouri Bottom Road/Taussig Road Transportation Development District (Hazelwood); | | | | | | | | | | | | | | | | |
Series 2002, RB | | | 7.00 | % | | | 05/01/22 | | | | 1,750 | | | | 1,752,888 | |
Series 2002, RB | | | 7.20 | % | | | 05/01/33 | | | | 5,250 | | | | 5,253,255 | |
Arnold (City of) (Arnold Triangle Redevelopment Project); | | | | | | | | | | | | | | | | |
Series 2009 A, Real Property Tax Increment Allocation RB | | | 7.75 | % | | | 05/01/28 | | | | 765 | | | | 829,512 | |
Series 2009 B, Sales Tax Increment Allocation RB | | | 6.50 | % | | | 05/01/20 | | | | 3,170 | | | | 3,408,859 | |
Arnold Retail Corridor Transportation Development District; Series 2010, Transportation Sales Tax RB | | | 6.65 | % | | | 05/01/38 | | | | 2,000 | | | | 2,065,080 | |
Ballwin (City of) (Ballwin Town Center); Series 2002 A, Ref. & Improvement Tax Increment Allocation RB | | | 6.50 | % | | | 10/01/22 | | | | 3,600 | | | | 2,960,784 | |
Branson (City of) Industrial Development Authority (Branson Landing-Retail); Series 2005, Tax Increment Allocation RB(k) | | | 5.25 | % | | | 06/01/21 | | | | 965 | | | | 957,772 | |
Branson (City of) Regional Airport Transportation Development District; Series 2007 B, Airport
RB(c)(g) | | | 6.00 | % | | | 07/01/37 | | | | 28,600 | | | | 4,077,788 | |
Branson Hills Infrastructure Facilities Community Improvement District; | | | | | | | | | | | | | | | | |
Series 2007 A, Special Assessment RB | | | 5.00 | % | | | 04/01/15 | | | | 500 | | | | 358,550 | |
Series 2007 A, Special Assessment RB | | | 5.50 | % | | | 04/01/22 | | | | 2,440 | | | | 1,396,510 | |
Series 2007 A, Special Assessment RB | | | 5.50 | % | | | 04/01/27 | | | | 5,055 | | | | 2,730,458 | |
Bridgeton (City of) Industrial Development Authority (Sarah Community); Series 2011 A, Ref. & Improvement Senior Housing RB | | | 6.38 | % | | | 05/01/35 | | | | 3,400 | | | | 3,489,250 | |
See accompanying Notes to Financial Statements which are an integral part of the financial statements.
33 Invesco High Yield Municipal Fund
| | | | | | | | | | | | | | | | |
| | | Interest Rate | | | Maturity Date | | | Principal Amount (000) | | | Value | |
| Missouri–(continued) | | | | | | | | | | | | | | | | |
Cass (County of); | | | | | | | | | | | | | | | | |
Series 2007, Hospital RB | | | 5.00 | % | | | 05/01/16 | | | $ | 1,000 | | | $ | 1,057,370 | |
Series 2007, Hospital RB | | | 5.63 | % | | | 05/01/38 | | | | 2,890 | | | | 2,899,335 | |
Chillicothe (City of) (South U.S. 65); Series 2006, Tax Increment Allocation RB | | | 5.50 | % | | | 04/01/21 | | | | 1,000 | | | | 947,950 | |
Cole (County of) Industrial Development Authority (Lutheran Senior Services-Heisinger); Series 2004, Senior Living Facilities RB | | | 5.50 | % | | | 02/01/35 | | | | 130 | | | | 130,040 | |
Dardenne Town Square Transportation Development District; Series 2006 A, Transportation Sales Tax RB(k) | | | 3.75 | % | | | 05/01/36 | | | | 3,190 | | | | 1,218,580 | |
Ellisville (City of) Industrial Development Authority (Gambrill Gardens Phase I); Series 2003 A, IDR | | | 6.75 | % | | | 04/01/33 | | | | 2,390 | | | | 2,390,024 | |
Ellisville (City of) Industrial Development Authority (Gambrill Gardens); Series 1999, Ref. & Improvement RB | | | 6.20 | % | | | 06/01/29 | | | | 2,755 | | | | 2,707,559 | |
Ferguson (City of) (Crossing at Halls Ferry); Series 2005, Ref. Tax Increment Allocation RB | | | 5.00 | % | | | 04/01/17 | | | | 1,015 | | | | 1,016,786 | |
Good Shepherd Nursing Home District; Series 1998, Ref. Nursing Home Facilities RB | | | 5.90 | % | | | 08/15/23 | | | | 2,695 | | | | 2,694,811 | |
Grandview (City of) Industrial Development Authority (Grandview Crossing); Series 2006, Tax Increment Allocation RB(k) | | | 3.75 | % | | | 12/01/28 | | | | 1,250 | | | | 307,188 | |
Grundy (County of) Industrial Development Authority (Wright Memorial Hospital); | | | | | | | | | | | | | | | | |
Series 2009, Health Facilities RB | | | 6.45 | % | | | 09/01/29 | | | | 1,000 | | | | 1,066,090 | |
Series 2009, Health Facilities RB | | | 6.75 | % | | | 09/01/34 | | | | 1,250 | | | | 1,333,150 | |
Joplin (City of) Industrial Development Authority (Christian Homes, Inc. Obligated Group); Series 2007 F, Ref. RB | | | 5.75 | % | | | 05/15/26 | | | | 1,260 | | | | 1,287,254 | |
Kansas City (City of) (Shoal Creek Parkway); Series 2011, Tax Increment Allocation RB | | | 6.50 | % | | | 06/01/25 | | | | 3,000 | | | | 3,023,430 | |
Kansas City (City of) Industrial Development Authority (Brentwood Manor Apartments); | | | | | | | | | | | | | | | | |
Series 2002 A, MFH RB(c) | | | 6.95 | % | | | 04/15/15 | | | | 103 | | | | 104,077 | |
Series 2002 B, MFH RB(c) | | | 5.25 | % | | | 10/15/38 | | | | 2,270 | | | | 1,714,191 | |
Kansas City (City of) Industrial Development Authority (Northwoods Apartments); Series 2004 A, MFH RB(c) | | | 6.45 | % | | | 05/01/40 | | | | 2,213 | | | | 2,053,598 | |
Kansas City (City of) Industrial Development Authority (Plaza Library); Series 2004, RB | | | 5.90 | % | | | 03/01/24 | | | | 5,000 | | | | 5,005,800 | |
Kansas City (City of) Industrial Development Authority (Walnut Grove Apartments); | | | | | | | | | | | | | | | | |
Series 2000 B, MFH RB(c) | | | 7.55 | % | | | 06/15/22 | | | | 920 | | | | 920,681 | |
Series 2000 B, MFH RB(c) | | | 7.55 | % | | | 06/15/35 | | | | 3,430 | | | | 3,431,029 | |
Kirkwood (City of) Industrial Development Authority (Aberdeen Heights); | | | | | | | | | | | | | | | | |
Series 2010 A, Retirement Community RB | | | 8.00 | % | | | 05/15/29 | | | | 7,000 | | | | 7,880,320 | |
Series 2010 A, Retirement Community RB | | | 8.25 | % | | | 05/15/39 | | | | 3,500 | | | | 3,925,110 | |
Series 2010 A, Retirement Community RB | | | 8.25 | % | | | 05/15/45 | | | | 8,500 | | | | 9,518,385 | |
Series 2010 A, Retirement Community RB MBTC(e) | | | 8.25 | % | | | 05/15/45 | | | | 13,500 | | | | 15,117,435 | |
Manchester (City of) (Highway 141/Manchester Road); | | | | | | | | | | | | | | | | |
Series 2010, Ref. Transportation Tax Increment Allocation RB | | | 6.00 | % | | | 11/01/25 | | | | 865 | | | | 892,810 | |
Series 2010, Ref. Transportation Tax Increment Allocation RB | | | 6.88 | % | | | 11/01/39 | | | | 1,500 | | | | 1,555,905 | |
Maplewood (City of) (Maplewood South Redevelopment Area); Series 2005, Ref. Tax Increment RB | | | 5.75 | % | | | 11/01/26 | | | | 1,350 | | | | 1,345,842 | |
Missouri (State of) Health & Educational Facilities Authority (Washington University); | | | | | | | | | | | | | | | | |
Series 2004 B, VRD RB(m) | | | 0.03 | % | | | 02/15/34 | | | | 4,675 | | | | 4,675,000 | |
Series 2011 A, RB(e) | | | 5.00 | % | | | 11/15/41 | | | | 6,210 | | | | 6,757,970 | |
Series 2011 B, RB(e) | | | 5.00 | % | | | 11/15/37 | | | | 10,500 | | | | 11,552,415 | |
Platte (County of) Industrial Development Authority (Zona Rosa Phase II Retail); Series 2007, Transportation RB | | | 6.85 | % | | | 04/01/29 | | | | 3,200 | | | | 3,326,528 | |
Polk (County of) Industrial Development Authority (Citizens Memorial Health Care Foundation); Series 2008, Health Facilities RB | | | 6.50 | % | | | 01/01/33 | | | | 2,000 | | | | 2,002,340 | |
St. Joseph (City of) Industrial Development Authority (Living Community of St. Joseph); Series 2002, Health Care RB | | | 7.00 | % | | | 08/15/32 | | | | 6,750 | | | | 6,756,142 | |
St. Joseph (City of) Industrial Development Authority (The Shoppes at North Village); | | | | | | | | | | | | | | | | |
Series 2005 A, Tax Increment Allocation RB | | | 5.50 | % | | | 11/01/27 | | | | 750 | | | | 750,623 | |
Series 2005 B, Tax Increment Allocation RB | | | 5.50 | % | | | 11/01/27 | | | | 1,000 | | | | 1,000,240 | |
St. Louis (County of) Industrial Development Authority (Friendship Village Chesterfield); Series 2012, Senior Living Facilities RB | | | 5.00 | % | | | 09/01/42 | | | | 3,000 | | | | 2,809,860 | |
See accompanying Notes to Financial Statements which are an integral part of the financial statements.
34 Invesco High Yield Municipal Fund
| | | | | | | | | | | | | | | | |
| | | Interest Rate | | | Maturity Date | | | Principal Amount (000) | | | Value | |
| Missouri–(continued) | | | | | | | | | | | | | | | | |
St. Louis (County of) Industrial Development Authority (Grand Center Redevelopment); Series 2011, Tax Increment Allocation Improvement RB | | | 6.38 | % | | | 12/01/25 | | | $ | 3,490 | | | $ | 3,581,996 | |
St. Louis (County of) Industrial Development Authority (St. Andrew’s Resources for Seniors); | | | | | | | | | | | | | | | | |
Series 2007 A, Senior Living Facilities RB | | | 6.38 | % | | | 12/01/30 | | | | 3,770 | | | | 3,785,419 | |
Series 2007 A, Senior Living Facilities RB | | | 6.38 | % | | | 12/01/41 | | | | 8,030 | | | | 7,862,815 | |
| | | | | | | | | | | | | | | | 159,686,804 | |
|
| Nebraska–0.59% | |
Central Plains Energy Project (No. 3); | | | | | | | | | | | | | | | | |
Series 2012, Gas RB | | | 5.00 | % | | | 09/01/42 | | | | 18,815 | | | | 19,049,059 | |
Series 2012, Gas RB | | | 5.25 | % | | | 09/01/37 | | | | 5,000 | | | | 5,183,900 | |
Gage (County of) Hospital Authority No. 1 (Beatrice Community Hospital & Health Center); | | | | | | | | | | | | | | | | |
Series 2010 B, Health Care Facilities RB | | | 6.50 | % | | | 06/01/30 | | | | 5,000 | | | | 5,341,550 | |
Series 2010 B, Health Care Facilities RB | | | 6.75 | % | | | 06/01/35 | | | | 6,000 | | | | 6,364,260 | |
| | | | | | | | | | | | | | | | 35,938,769 | |
|
| Nevada–0.44% | |
Clark (County of) (Homestead Boulder City); Series 1997, Assisted Living Facility RB | | | 6.50 | % | | | 12/01/27 | | | | 4,435 | | | | 4,406,572 | |
Henderson (City of) (Local Improvement District No. T-18); Series 2006, Special Assessment RB | | | 5.30 | % | | | 09/01/35 | | | | 2,235 | | | | 1,719,810 | |
Las Vegas (City of) Redevelopment Agency; Series 2009 A, Tax Increment Allocation RB | | | 8.00 | % | | | 06/15/30 | | | | 10,800 | | | | 11,899,008 | |
Mesquite (City of) (Special Improvement District No. 07-01-Anthem at Mesquite); Series 2007, Special Assessment Local Improvement RB | | | 6.15 | % | | | 08/01/37 | | | | 2,420 | | | | 2,263,160 | |
Reno (City of) Special Assessment District No. 4 (Somersett Parkway); Series 2003, Special Assessment RB | | | 6.63 | % | | | 12/01/22 | | | | 3,500 | | | | 3,543,540 | |
Sparks (City of) (Local Improvement District No. 3–Legends at Sparks Marina); | | | | | | | | | | | | | | | | |
Series 2008, Special Assessment Limited Obligation Improvement RB | | | 6.50 | % | | | 09/01/20 | | | | 710 | | | | 765,841 | |
Series 2008, Special Assessment Limited Obligation Improvement RB | | | 6.75 | % | | | 09/01/27 | | | | 2,000 | | | | 2,048,180 | |
| | | | | | | | | | | | | | | | 26,646,111 | |
|
| New Hampshire–0.21% | |
New Hampshire (State of) Business Finance Authority (Huggins Hospital); Series 2009, First Mortgage RB | | | 6.88 | % | | | 10/01/39 | | | | 9,235 | | | | 9,655,654 | |
New Hampshire (State of) Health & Education Facilities Authority (Rivermead); | | | | | | | | | | | | | | | | |
Series 2011 A, RB | | | 6.63 | % | | | 07/01/31 | | | | 620 | | | | 662,377 | |
Series 2011 A, RB | | | 6.88 | % | | | 07/01/41 | | | | 2,125 | | | | 2,272,879 | |
| | | | | | | | | | | | | | | | 12,590,910 | |
| | | | |
| New Jersey–3.78% | | | | | | | | | | | | | | | | |
Burlington (County of) Bridge Commission (The Evergreens); Series 2007, Economic Development RB | | | 5.63 | % | | | 01/01/38 | | | | 1,500 | | | | 1,351,905 | |
New Jersey (State of) Economic Development Authority (Arbor); Series 1998 A, Sr. Mortgage RB | | | 6.00 | % | | | 05/15/28 | | | | 6,695 | | | | 5,356,201 | |
New Jersey (State of) Economic Development Authority (Continental Airlines, Inc.); | | | | | | | | | | | | | | | | |
Series 1999, Special Facility RB(c) | | | 5.25 | % | | | 09/15/29 | | | | 20,300 | | | | 19,891,970 | |
Series 2000 B, Special Facility RB(c) | | | 5.63 | % | | | 11/15/30 | | | | 10,000 | | | | 10,024,400 | |
Series 2003, Special Facility RB(c) | | | 5.50 | % | | | 06/01/33 | | | | 16,480 | | | | 16,002,410 | |
Series 2012, RB(c) | | | 5.75 | % | | | 09/15/27 | | | | 33,500 | | | | 33,343,220 | |
New Jersey (State of) Economic Development Authority (Cranes Mill); | | | | | | | | | | | | | | | | |
Series 2008, First Mortgage RB | | | 5.88 | % | | | 07/01/28 | | | | 500 | | | | 515,865 | |
Series 2008, First Mortgage RB | | | 6.00 | % | | | 07/01/38 | | | | 1,500 | | | | 1,531,965 | |
New Jersey (State of) Economic Development Authority (Lions Gate); | | | | | | | | | | | | | | | | |
Series 2005 A, First Mortgage RB | | | 5.75 | % | | | 01/01/25 | | | | 1,630 | | | | 1,632,168 | |
Series 2005 A, First Mortgage RB | | | 5.88 | % | | | 01/01/37 | | | | 2,590 | | | | 2,483,059 | |
New Jersey (State of) Economic Development Authority (Seashore Gardens Living Center); | | | | | | | | | | | | | | | | |
Series 2006, First Mortgage RB | | | 5.30 | % | | | 11/01/26 | | | | 2,850 | | | | 2,549,753 | |
Series 2006, First Mortgage RB | | | 5.38 | % | | | 11/01/36 | | | | 1,725 | | | | 1,397,250 | |
See accompanying Notes to Financial Statements which are an integral part of the financial statements.
35 Invesco High Yield Municipal Fund
| | | | | | | | | | | | | | | | |
| | | Interest Rate | | | Maturity Date | | | Principal Amount (000) | | | Value | |
| New Jersey–(continued) | | | | | | | | | | | | | | | | |
New Jersey (State of) Economic Development Authority (The Goethals Bridge Replacement); | | | | | | | | | | | | | | | | |
Series 2013, Private Activity RB(c) | | | 5.38 | % | | | 01/01/43 | | | $ | 11,000 | | | $ | 11,271,260 | |
Series 2013, Private Activity RB(c) | | | 5.63 | % | | | 01/01/52 | | | | 10,750 | | | | 11,013,590 | |
New Jersey (State of) Economic Development Authority (United Methodist Homes); | | | | | | | | | | | | | | | | |
Series 1999, RB | | | 5.75 | % | | | 07/01/29 | | | | 7,000 | | | | 6,978,230 | |
Series 2003 A-1, RB(h)(i) | | | 6.13 | % | | | 07/01/14 | | | | 3,450 | | | | 3,588,655 | |
New Jersey (State of) Economic Development Authority (Winchester Gardens at Ward Homestead); Series 2004 A, Ref. First Mortgage RB | | | 5.80 | % | | | 11/01/31 | | | | 2,000 | | | | 2,007,880 | |
New Jersey (State of) Health Care Facilities Financing Authority (St. Joseph’s Health Care System); Series 2008, RB | | | 6.63 | % | | | 07/01/38 | | | | 10,000 | | | | 10,238,600 | |
Tobacco Settlement Financing Corp.; | | | | | | | | | | | | | | | | |
Series 2007 1-A, RB | | | 4.63 | % | | | 06/01/26 | | | | 34,790 | | | | 30,732,442 | |
Series 2007 1-A, RB | | | 4.75 | % | | | 06/01/34 | | | | 26,075 | | | | 19,886,620 | |
Series 2007 1A, Asset-Backed RB | | | 4.50 | % | | | 06/01/23 | | | | 2,000 | | | | 1,938,100 | |
Series 2007 1A, Asset-Backed RB | | | 5.00 | % | | | 06/01/29 | | | | 18,500 | | | | 15,837,665 | |
Series 2007 1A, Asset-Backed RB | | | 5.00 | % | | | 06/01/41 | | | | 26,400 | | | | 20,298,168 | |
| | | | | | | | | | | | | | | | 229,871,376 | |
|
| New Mexico–0.80% | |
Bernalillo (County of) (Solar Villas Apartments); Series 1997 F, Sr. MFH RB | | | 7.25 | % | | | 10/15/22 | | | | 1,050 | | | | 1,051,355 | |
Cabezon Public Improvement District; | | | | | | | | | | | | | | | | |
Series 2005, Special Levy Tax RB | | | 6.00 | % | | | 09/01/24 | | | | 1,505 | | | | 1,554,454 | |
Series 2005, Special Levy Tax RB | | | 6.30 | % | | | 09/01/34 | | | | 1,495 | | | | 1,515,691 | |
Farmington (City of) (Public Service Co. of New Mexico San Juan); Series 2010 C, Ref. PCR | | | 5.90 | % | | | 06/01/40 | | | | 5,000 | | | | 5,307,750 | |
New Mexico (State of) Eastern Regional Housing Authority (Wildewood Apartments); Series 2000 A, MFH RB | | | 7.50 | % | | | 12/01/30 | | | | 1,990 | | | | 1,992,229 | |
New Mexico (State of) Hospital Equipment Loan Council (Gerald Champion); Series 2012, Ref. & Improvement RB | | | 5.50 | % | | | 07/01/42 | | | | 14,500 | | | | 12,033,260 | |
New Mexico (State of) Hospital Equipment Loan Council (Haverland Charter Lifestyle Group); | | | | | | | | | | | | | | | | |
Series 2013, First Mortgage RB | | | 5.00 | % | | | 07/01/32 | | | | 2,500 | | | | 2,311,675 | |
Series 2013, First Mortgage RB | | | 5.00 | % | | | 07/01/42 | | | | 4,000 | | | | 3,484,720 | |
New Mexico (State of) Hospital Equipment Loan Council (La Vida Llena); Series 2010 A, First Mortgage RB | | | 6.13 | % | | | 07/01/40 | | | | 8,000 | | | | 8,339,920 | |
New Mexico (State of) Income Housing Authority (Brentwood Gardens Apartments); Series 2001 A, MFH RB(c) | | | 6.85 | % | | | 12/01/31 | | | | 4,165 | | | | 4,187,199 | |
RHA Housing Development Corp. (Woodleaf Apartments); Series 1997 A, Ref. MFH Mortgage RB (CEP–GNMA) | | | 7.13 | % | | | 12/15/27 | | | | 2,265 | | | | 2,266,404 | |
San Juan (County of) (Apple Ridge Apartments); Series 2002 A, MFH RB(c) | | | 7.25 | % | | | 12/01/31 | | | | 2,910 | | | | 2,910,698 | |
Ventana West Public Improvement District; Series 2004, Special Levy Tax RB | | | 6.88 | % | | | 08/01/33 | | | | 1,500 | | | | 1,503,315 | |
| | | | | | | | | | | | | | | | 48,458,670 | |
|
| New York–3.33% | |
Amherst (Town of) Industrial Development Agency (Shaary Zedek); Series 2006 A, Ref. Civic Facility RB | | | 7.00 | % | | | 06/15/36 | | | | 2,135 | | | | 2,083,013 | |
Brooklyn Arena Local Development Corp. (Barclays Center); | | | | | | | | | | | | | | | | |
Series 2009, PILOT CAB RB(d) | | | 0.00 | % | | | 07/15/34 | | | | 14,345 | | | | 4,438,056 | |
Series 2009, PILOT CAB RB(d) | | | 0.00 | % | | | 07/15/44 | | | | 25,805 | | | | 4,295,242 | |
Dutchess (County of) Industrial Development Agency (St. Francis Hospital); Series 2004 A, Ref. Civic Facility RB | | | 7.50 | % | | | 03/01/29 | | | | 5,615 | | | | 4,324,112 | |
East Rochester (Village of) Housing Authority (Woodland Village, Inc.); Series 2006, Ref. Senior Living RB | | | 5.50 | % | | | 08/01/33 | | | | 1,700 | | | | 1,570,205 | |
Erie (County of) Industrial Development Agency (Orchard Park CCRC, Inc.); | | | | | | | | | | | | | | | | |
Series 2006 A, RB | | | 6.00 | % | | | 11/15/26 | | | | 10,900 | | | | 10,946,107 | |
Series 2006 A, RB | | | 6.00 | % | | | 11/15/36 | | | | 3,530 | | | | 3,365,784 | |
See accompanying Notes to Financial Statements which are an integral part of the financial statements.
36 Invesco High Yield Municipal Fund
| | | | | | | | | | | | | | | | |
| | | Interest Rate | | | Maturity Date | | | Principal Amount (000) | | | Value | |
| New York–(continued) | |
Mount Vernon (City of) Industrial Development Agency (Wartburg Senior Housing, Inc./Meadowview); Series 1999, Civic Facility RB | | | 6.20 | % | | | 06/01/29 | | | $ | 1,000 | | | $ | 1,000,010 | |
Nassau (County of) Industrial Development Agency (Amsterdam at Harborside); | | | | | | | | | | | | | | | | |
Series 2007 A, Continuing Care Retirement Community RB | | | 6.50 | % | | | 01/01/27 | | | | 3,750 | | | | 2,044,500 | |
Series 2007 A, Continuing Care Retirement Community RB | | | 6.70 | % | | | 01/01/43 | | | | 29,700 | | | | 16,192,440 | |
New York & New Jersey (States of) Port Authority (JFK International Air Terminal LLC); Series 2010, Special Obligation RB | | | 6.00 | % | | | 12/01/42 | | | | 8,500 | | | | 9,276,560 | |
New York & New Jersey (States of) Port Authority; | | | | | | | | | |
One Hundred Sixty-Ninth Series 2011, Consolidated RB(c)(e) | | | 5.00 | % | | | 10/15/27 | | | | 15,400 | | | | 16,841,132 | |
One Hundred Sixty-Ninth Series 2011, Consolidated RB(c)(e) | | | 5.00 | % | | | 10/15/28 | | | | 10,760 | | | | 11,679,980 | |
New York (City of) Industrial Development Agency (American Civil Liberties Union Foundation, Inc.) Series 2005, VRD Ref. & Improvement Civic Facility RB (LOC-JPMorgan Chase Bank, N.A.)(m)(n) | | | 0.03 | % | | | 06/01/35 | | | | 1,100 | | | | 1,100,000 | |
New York (City of) Industrial Development Agency (Polytechnic University); Series 2007, Ref. Civic Facility RB (INS–ACA)(a) | | | 5.25 | % | | | 11/01/37 | | | | 5,850 | | | | 6,106,405 | |
New York (City of) Industrial Development Agency (Queens Baseball Stadium); | | | | | | | | | |
Series 2006, PILOT RB (INS–AMBAC)(a) | | | 5.00 | % | | | 01/01/36 | | | | 3,590 | | | | 3,356,650 | |
Series 2006, PILOT RB (INS–AMBAC)(a) | | | 5.00 | % | | | 01/01/39 | | | | 5,180 | | | | 4,762,129 | |
New York (City of) Industrial Development Agency (Visy Paper Inc.); Series 1995, RB(c) | | | 7.95 | % | | | 01/01/28 | | | | 7,500 | | | | 7,512,225 | |
New York (City of) Transitional Finance Authority; Subseries 2012 F-1, Future Tax Sec. RB(e) | | | 5.00 | % | | | 05/01/39 | | | | 14,000 | | | | 15,043,000 | |
New York (City of) Trust for Cultural Resources (Lincoln Center); Series 2008 A-1, Ref. VRD RB (LOC–JPMorgan Chase Bank, N.A.)(m)(n) | | | 0.04 | % | | | 12/01/35 | | | | 1,235 | | | | 1,235,000 | |
New York (City of); Subseries 2012 A-3, VRD Unlimited Tax GO Bonds (LOC-Mizuho Corporate Bank, Ltd.)(m)(n) | | | 0.03 | % | | | 10/01/40 | | | | 2,650 | | | | 2,650,000 | |
New York (State of) Dormitory Authority (General Purpose); Series 2011 C, State Personal Income Tax RB(e) | | | 5.00 | % | | | 03/15/31 | | | | 15,000 | | | | 16,566,600 | |
New York (State of) Energy Research & Development Authority; Series 1993, Regular Residual Interest RB(o) | | | 12.38 | % | | | 04/01/20 | | | | 2,500 | | | | 2,508,050 | |
New York Liberty Development Corp. (National Sports Museum); Series 2006 A, RB (Acquired 08/07/06; Cost $2,121,407)(f)(g) | | | 6.13 | % | | | 02/15/19 | | | | 2,500 | | | | 25 | |
New York State Environmental Facilities Corp; Series 2009 A, State Clean Water & Drinking Water RB(e) | | | 5.00 | % | | | 06/15/34 | | | | 20,000 | | | | 22,137,800 | |
Niagara Area Development Corp. (Covanta Energy); Series 2012, Ref. Solid Waste Disposal Facilities RB(c) | | | 5.25 | % | | | 11/01/42 | | | | 15,475 | | | | 14,962,004 | |
Suffolk (County of) Industrial Development Agency (Eastern Long Island Hospital Association); Series 2007, Civic Facility RB(f) | | | 5.50 | % | | | 01/01/37 | | | | 2,500 | | | | 2,264,900 | |
Suffolk (County of) Industrial Development Agency (Gurwin Jewish-Phase II); Series 2004, Civic Facility RB(i) | | | 6.70 | % | | | 05/01/39 | | | | 1,875 | | | | 1,933,988 | |
Suffolk (County of) Industrial Development Agency (Medford Hamlet Assisted Living); Series 2005, Assisted Living Facility RB(c) | | | 6.38 | % | | | 01/01/39 | | | | 7,440 | | | | 7,244,923 | |
Syracuse (City of) Industrial Development Agency (Jewish Home of Central New York, Inc.); | |
Series 2001 A, First Mortgage RB | | | 7.38 | % | | | 03/01/21 | | | | 1,315 | | | | 1,247,988 | |
Series 2001 A, First Mortgage RB | | | 7.38 | % | | | 03/01/31 | | | | 3,825 | | | | 3,407,119 | |
| | | | | | | | | | | | | | | | 202,095,947 | |
| | | | |
| North Carolina–0.46% | | | | | | | | | | | | | | | | |
Johnston (County of) Memorial Hospital Authority (Johnston Memorial Hospital); | | | | | | | | | |
Series 2008, RB (INS–AGM)(a)(e) | | | 5.25 | % | | | 10/01/28 | | | | 5,016 | | | | 5,493,323 | |
Series 2008, RB (INS–AGM)(a)(e) | | | 5.25 | % | | | 10/01/36 | | | | 7,835 | | | | 8,404,213 | |
North Carolina (State of) Medical Care Commission (Aldersgate); Series 2013, Ref. First Mortgage Retirement Facilities RB | | | 6.25 | % | | | 07/01/35 | | | | 3,750 | | | | 3,790,575 | |
North Carolina (State of) Medical Care Commission (Galloway Ridge); | | | | | | | | | |
Series 2010 A, First Mortgage Retirement Facilities RB | | | 5.88 | % | | | 01/01/31 | | | | 865 | | | | 875,138 | |
Series 2010 A, First Mortgage Retirement Facilities RB | | | 6.00 | % | | | 01/01/39 | | | | 1,520 | | | | 1,531,005 | |
North Carolina (State of) Medical Care Commission (Lutheran Services); | | | | | | | | | |
Series 2012, Ref. First Mortgage Health Care Facilities RB | | | 5.00 | % | | | 03/01/37 | | | | 1,000 | | | | 931,470 | |
Series 2012, Ref. First Mortgage Health Care Facilities RB | | | 5.00 | % | | | 03/01/42 | | | | 1,000 | | | | 918,300 | |
See accompanying Notes to Financial Statements which are an integral part of the financial statements.
37 Invesco High Yield Municipal Fund
| | | | | | | | | | | | | | | | |
| | | Interest Rate | | | Maturity Date | | | Principal Amount (000) | | | Value | |
| North Carolina–(continued) | | | | | | | | | | | | | | | | |
North Carolina (State of) Medical Care Commission (Southminster); Series 2007 A, First Mortgage Retirement Facilities RB | | | 5.75 | % | | | 10/01/37 | | | $ | 3,000 | | | $ | 2,935,410 | |
North Carolina (State of) Medical Care Commission (The Presbyterian Homes Obligated Group); Series 2006, First Mortgage Health Care Facilities RB | | | 5.60 | % | | | 10/01/36 | | | | 1,000 | | | | 961,560 | |
North Carolina (State of) Medical Care Commission (WhiteStone); Series 2011 A, First Mortgage Retirement Facilities RB | | | 7.75 | % | | | 03/01/31 | | | | 2,000 | | | | 2,168,740 | |
| | | | | 28,009,734 | |
|
| North Dakota–0.17% | |
Grand Forks (City of) (4000 Valley Square); | | | | | | | | | | | | | | | | |
Series 2006, Ref. Senior Housing RB | | | 5.13 | % | | | 12/01/21 | | | | 1,315 | | | | 1,326,440 | |
Series 2006, Ref. Senior Housing RB | | | 5.30 | % | | | 12/01/34 | | | | 3,255 | | | | 3,089,060 | |
Traill (County of) (Hillsboro Medical Center); | | | | | | | | | | | | | | | | |
Series 2007, Health Care RB | | | 5.25 | % | | | 05/01/20 | | | | 500 | | | | 514,425 | |
Series 2007, Health Care RB | | | 5.50 | % | | | 05/01/26 | | | | 1,520 | | | | 1,530,853 | |
Series 2007, Health Care RB | | | 5.50 | % | | | 05/01/42 | | | | 3,820 | | | | 3,606,004 | |
| | | | | | | | | | | | | | | | 10,066,782 | |
|
| Ohio–3.81% | |
Adams (County of) (Adams County Hospital); Series 2005, Hospital Facility Improvement RB | | | 6.50 | % | | | 09/01/36 | | | | 15,955 | | | | 12,245,941 | |
Buckeye Tobacco Settlement Financing Authority; | | | | | | | | | | | | | | | | |
Series 2007 A-2, Sr. Asset-Backed RB | | | 5.88 | % | | | 06/01/30 | | | | 4,000 | | | | 3,351,720 | |
Series 2007 A-3, Sr. Asset-Backed Turbo RB | | | 6.25 | % | | | 06/01/37 | | | | 14,025 | | | | 12,176,084 | |
Series 2007 B, First Sub. Asset-Backed CAB RB(d) | | | 0.00 | % | | | 06/01/47 | | | | 431,000 | | | | 25,661,740 | |
Centerville (City of) (Bethany Lutheran Village Continuing Care Facility Expansion); | | | | | | | | | | | | | | | | |
Series 2007 A, Health Care RB | | | 5.75 | % | | | 11/01/22 | | | | 2,000 | | | | 2,054,020 | |
Series 2007 A, Health Care RB | | | 6.00 | % | | | 11/01/27 | | | | 2,000 | | | | 2,036,680 | |
Series 2007 A, Health Care RB | | | 6.00 | % | | | 11/01/38 | | | | 2,550 | | | | 2,554,743 | |
Cleveland (City of) & Cuyahoga (County of) Port Authority (St. Clarence-Governmental & Educational Assistance Corp., LLC); Series 2006 A, Senior Housing RB | | | 6.25 | % | | | 05/01/38 | | | | 2,210 | | | | 2,011,851 | |
Cleveland (City of) (Continental Airlines, Inc.); Series 1998, Airport Special RB(c) | | | 5.38 | % | | | 09/15/27 | | | | 4,190 | | | | 4,043,392 | |
Cuyahoga (County of) (Eliza Jennings Senior Care Network); | | | | | | | | | | | | | | | | |
Series 2007 A, Health Care & Independent Living Facilities RB | | | 5.75 | % | | | 05/15/27 | | | | 2,355 | | | | 2,362,630 | |
Series 2007 A, Health Care & Independent Living Facilities RB | | | 6.00 | % | | | 05/15/37 | | | | 6,000 | | | | 5,954,820 | |
Series 2007 A, Health Care & Independent Living Facilities RB | | | 6.00 | % | | | 05/15/42 | | | | 3,645 | | | | 3,576,583 | |
Cuyahoga (County of) (Franciscan Community Inc.); Series 2004 C, Health Care Facilities RB | | | 6.25 | % | | | 05/15/32 | | | | 3,500 | | | | 3,500,980 | |
Franklin (County of) (First Community Village Obligated Group); Series 2013, Ref. Health Care Facilities RB | | | 5.63 | % | | | 07/01/47 | | | | 7,750 | | | | 6,519,842 | |
Gallia (County of) (Holzer Health System Obligated Group); Series 2012, Ref. & Improvement Hospital Facilities RB | | | 8.00 | % | | | 07/01/42 | | | | 29,255 | | | | 31,208,941 | |
Hamilton (County of) (Christ Hospital); Series 2012, Health Care Facilities RB | | | 5.50 | % | | | 06/01/42 | | | | 7,200 | | | | 7,504,848 | |
Hamilton (County of) (Life Enriching Communities); | | | | | | | | | | | | | | | | |
Series 2006 A, Ref. Health Care RB | | | 5.00 | % | | | 01/01/37 | | | | 6,870 | | | | 6,750,187 | |
Series 2012, Health Care RB | | | 5.00 | % | | | 01/01/32 | | | | 2,250 | | | | 2,283,593 | |
Hancock (County of) (Blanchard Valley Regional Health Center); Series 2011 A, Hospital Facilities RB | | | 6.25 | % | | | 12/01/34 | | | | 5,850 | | | | 6,473,668 | |
Lorain (County of) Port Authority (U.S. Steel Corp.); Series 2010, Recovery Zone Facility RB | | | 6.75 | % | | | 12/01/40 | | | | 9,500 | | | | 9,810,175 | |
Montgomery (County of) (St. Leonard); | | | | | | | | | | | | | | | | |
Series 2010, Ref. & Improvement Health Care & MFH RB | | | 6.38 | % | | | 04/01/30 | | | | 2,000 | | | | 2,120,160 | |
Series 2010, Ref. & Improvement Health Care & MFH RB | | | 6.63 | % | | | 04/01/40 | | | | 6,500 | | | | 6,914,310 | |
Muskingum (County of) (Genesis Healthcare System); | | | | | | | | | | | | | | | | |
Series 2013, Hospital Facilities RB | | | 5.00 | % | | | 02/15/44 | | | | 14,795 | | | | 12,031,590 | |
Series 2013, Hospital Facilities RB | | | 5.00 | % | | | 02/15/48 | | | | 10,535 | | | | 8,117,850 | |
See accompanying Notes to Financial Statements which are an integral part of the financial statements.
38 Invesco High Yield Municipal Fund
| | | | | | | | | | | | | | | | |
| | | Interest Rate | | | Maturity Date | | | Principal Amount (000) | | | Value | |
| Ohio–(continued) | |
Norwood (City of) (Cornerstone at Norwood); | | | | | | | | | | | | | | | | |
Series 2006, Tax Increment Allocation Financing RB | | | 5.25 | % | | | 12/01/15 | | | $ | 480 | | | $ | 499,186 | |
Series 2006, Tax Increment Allocation Financing RB | | | 5.75 | % | | | 12/01/20 | | | | 1,300 | | | | 1,346,410 | |
Series 2006, Tax Increment Allocation Financing RB | | | 6.20 | % | | | 12/01/31 | | | | 7,340 | | | | 7,378,829 | |
Ohio (State of) (USG Corp.); | | | | | | | | | | | | | | | | |
Series 1997, Solid Waste Disposal RB(c) | | | 5.60 | % | | | 08/01/32 | | | | 14,765 | | | | 14,514,586 | |
Series 1998, Solid Waste Disposal RB(c) | | | 5.65 | % | | | 03/01/33 | | | | 13,000 | | | | 12,850,760 | |
Ohio (State of) Higher Educational Facility Commission (University Hospitals Health System, Inc.); Series 2009 A, Hospital RB(h)(i) | | | 6.75 | % | | | 01/15/15 | | | | 6,000 | | | | 6,350,100 | |
Toledo-Lucas (County of) Port Authority (Crocker Park Public Improvement); Series 2003, Special Assessment RB | | | 5.38 | % | | | 12/01/35 | | | | 7,630 | | | | 7,635,036 | |
| | | | | | | | | | | | | | | | 231,841,255 | |
|
| Oklahoma–2.06% | |
Atoka (County of) Health Care Authority (Atoka Memorial Hospital); Series 2007, Hospital RB | | | 6.63 | % | | | 10/01/37 | | | | 3,405 | | | | 3,101,751 | |
Citizen Potawatomi Nation; Series 2004 A, Sr. Obligation Tax RB | | | 6.50 | % | | | 09/01/16 | | | | 1,595 | | | | 1,551,090 | |
Cleveland (County of) Justice Authority (Detention Facility); Series 2009 B, Sales Tax RB | | | 5.75 | % | | | 03/01/29 | | | | 295 | | | | 304,222 | |
Oklahoma (State of) Development Finance Authority (Great Plains Regional Medical Center); | | | | | | | | | | | | | | | | |
Series 2007, Hospital RB | | | 5.00 | % | | | 12/01/27 | | | | 3,500 | | | | 3,335,605 | |
Series 2007, Hospital RB | | | 5.13 | % | | | 12/01/36 | | | | 9,430 | | | | 8,539,336 | |
Oklahoma (State of) Development Finance Authority (Inverness Village Community); | | | | | | | | | | | | | | | | |
Series 2012, Ref. Continuing Care Retirement Community RB | | | 5.75 | % | | | 01/01/27 | | | | 2,430 | | | | 2,454,980 | |
Series 2012, Ref. Continuing Care Retirement Community RB | | | 6.00 | % | | | 01/01/32 | | | | 9,935 | | | | 9,977,124 | |
Series 2013, Ref. Continuing Care Retirement Community RB | | | 5.75 | % | | | 01/01/37 | | | | 8,500 | | | | 8,165,440 | |
Oklahoma (State of) Turnpike Authority; Series 2006 F, Ref. VRD Second Sr. RB(m) | | | 0.03 | % | | | 01/01/28 | | | | 27,770 | | | | 27,770,000 | |
Tulsa (City of) Municipal Airport Trust; | | | | | | | | | | | | | | | | |
Series 2001 B, Ref. RB(c) | | | 5.50 | % | | | 12/01/35 | | | | 15,000 | | | | 14,627,100 | |
Series 2001 C, Ref. RB(c) | | | 5.50 | % | | | 12/01/35 | | | | 38,250 | | | | 37,299,105 | |
Tulsa (County of) Industrial Authority (Montereau, Inc.); | | | | | | | | | | | | | | | | |
Series 2010 A, Senior Living Community RB | | | 7.25 | % | | | 11/01/40 | | | | 5,350 | | | | 5,714,389 | |
Series 2010 A, Senior Living Community RB | | | 7.25 | % | | | 11/01/45 | | | | 2,100 | | | | 2,237,445 | |
| | | | | | | | | | | | | | | | 125,077,587 | |
|
| Oregon–0.38% | |
Douglas (County of) Hospital Facility Authority (Forest Glen); Series 1997 A, Elderly Housing RB(g) | | | 7.50 | % | | | 09/01/27 | | | | 1,600 | | | | 878,400 | |
Gilliam (County of) (Waste Management); Series 2002, Solid Waste Disposal RB(c) | | | 5.25 | % | | | 07/01/29 | | | | 7,845 | | | | 8,175,589 | |
Oregon (State of) Health, Housing, Educational & Cultural Facilities Authority (St. Anthony Village Housing); Series 1998 A, RB(c) | | | 7.25 | % | | | 06/01/28 | | | | 7,130 | | | | 7,130,784 | |
Salem (City of) Hospital Facility Authority (Capital Manor, Inc.); | | | | | | | | | | | | | | | | |
Series 2012, Ref. RB | | | 5.63 | % | | | 05/15/32 | | | | 250 | | | | 251,445 | |
Series 2012, Ref. RB | | | 6.00 | % | | | 05/15/42 | | | | 1,990 | | | | 2,024,606 | |
Series 2012, Ref. RB | | | 6.00 | % | | | 05/15/47 | | | | 3,250 | | | | 3,299,400 | |
Warm Springs Reservation Confederated Tribes of Oregon (Pelton Round Butte); Series 2009 B, Tribal Economic Development Hydroelectric RB(f) | | | 6.38 | % | | | 11/01/33 | | | | 1,000 | | | | 1,084,580 | |
| | | | | | | | | | | | | | | | 22,844,804 | |
| | | | |
| Pennsylvania–2.60% | | | | | | | | | | | | | | | | |
Allegheny (County of) Industrial Development Authority (Propel Charter School-McKeesport); Series 2010 B, Charter School RB | | | 6.38 | % | | | 08/15/35 | | | | 1,220 | | | | 1,252,379 | |
Allegheny (County of) Industrial Development Authority (Propel Charter School-Montour); Series 2010 A, Charter School RB | | | 6.75 | % | | | 08/15/35 | | | | 1,225 | | | | 1,284,523 | |
Allegheny (County of) Industrial Development Authority (Propel Schools-Homestead); Series 2004 A, Charter School RB | | | 7.00 | % | | | 12/15/15 | | | | 230 | | | | 234,306 | |
Berks (County of) Industrial Development Authority (One Douglassville); Series 2007 A, Ref.
RB(c) | | | 6.13 | % | | | 11/01/34 | | | | 4,535 | | | | 4,192,562 | |
See accompanying Notes to Financial Statements which are an integral part of the financial statements.
39 Invesco High Yield Municipal Fund
| | | | | | | | | | | | | | | | |
| | | Interest Rate | | | Maturity Date | | | Principal Amount (000) | | | Value | |
| Pennsylvania–(continued) | |
Butler (County of) Hospital Authority (Butler Health System); | | | | | | | | | | | | | | | | |
Series 2009 B, RB | | | 7.13 | % | | | 07/01/29 | | | $ | 2,145 | | | $ | 2,504,781 | |
Series 2009 B, RB | | | 7.25 | % | | | 07/01/39 | | | | 1,590 | | | | 1,817,322 | |
Chartiers Valley Industrial & Commercial Development Authority (Asbury Health Center); | | | | | | | | | | | | | | | | |
Series 2006, Ref. First Mortgage RB | | | 5.25 | % | | | 12/01/15 | | | | 260 | | | | 268,962 | |
Series 2006, Ref. First Mortgage RB | | | 5.38 | % | | | 12/01/16 | | | | 500 | | | | 524,520 | |
Series 2006, Ref. First Mortgage RB | | | 5.75 | % | | | 12/01/22 | | | | 935 | | | | 956,645 | |
Chester (County of) Industrial Development Authority (Avon Grove Charter School); | | | | | | | | | | | | | | | | |
Series 2007 A, RB | | | 6.25 | % | | | 12/15/27 | | | | 1,000 | | | | 1,025,630 | |
Series 2007 A, RB | | | 6.38 | % | | | 12/15/37 | | | | 1,500 | | | | 1,525,035 | |
Chester (County of) Industrial Development Authority (Collegium Charter School); | | | | | | | | | | | | | | | | |
Series 2012 A, Ref. RB | | | 5.25 | % | | | 10/15/32 | | | | 2,320 | | | | 2,150,756 | |
Series 2012 A, Ref. RB | | | 5.38 | % | | | 10/15/42 | | | | 4,230 | | | | 3,795,917 | |
Cumberland (County of) Municipal Authority (Asbury Pennsylvania Obligated Group); | | | | | | | | | | | | | | | | |
Series 2010, RB | | | 6.13 | % | | | 01/01/45 | | | | 8,000 | | | | 8,117,600 | |
Series 2012, Ref. RB | | | 5.25 | % | | | 01/01/32 | | | | 1,265 | | | | 1,213,287 | |
Series 2012, Ref. RB | | | 5.25 | % | | | 01/01/41 | | | | 3,000 | | | | 2,733,030 | |
Cumberland (County of) Municipal Authority (Diakon Lutheran Ministries); Series 2007, RB | | | 5.00 | % | | | 01/01/36 | | | | 9,080 | | | | 9,112,779 | |
Cumberland (County of) Municipal Authority (Messiah Village); Series 2008 A, RB | | | 6.00 | % | | | 07/01/35 | | | | 1,000 | | | | 1,028,500 | |
Dauphin (County of) General Authority (Riverfront Office); Series 1998, Office & Parking RB | | | 6.00 | % | | | 01/01/25 | | | | 4,225 | | | | 4,225,296 | |
Fulton (County of) Industrial Development Authority (The Fulton County Medical Center); | | | | | | | | | | | | | | | | |
Series 2006, Hospital RB | | | 5.88 | % | | | 07/01/31 | | | | 4,000 | | | | 4,006,120 | |
Series 2006, Hospital RB | | | 5.90 | % | | | 07/01/40 | | | | 4,300 | | | | 4,229,609 | |
Geisinger Authority (Geisinger Health System Foundation); Series 2005 A, VRD Health System RB(m) | | | 0.03 | % | | | 05/15/35 | | | | 1,400 | | | | 1,400,000 | |
Harrisburg (City of) Authority (Harrisburg University of Science); Series 2007 B, University RB(j) | | | 6.00 | % | | | 09/01/36 | | | | 8,500 | | | | 4,248,640 | |
Lehigh (County of) General Purpose Authority (Bible Fellowship Church Homes, Inc.); Series 2013, RB | | | 5.25 | % | | | 07/01/42 | | | | 4,430 | | | | 3,831,596 | |
Lehigh (County of) General Purpose Authority (KidsPeace Obligated Group); | | | | | �� | | | | | | | | | | | |
Series 1998, RB(g) | | | 6.00 | % | | | 11/01/18 | | | | 2,750 | | | | 1,100,275 | |
Series 1998, RB(g) | | | 6.00 | % | | | 11/01/23 | | | | 9,085 | | | | 3,634,909 | |
Series 1999, RB(g) | | | 6.20 | % | | | 11/01/14 | | | | 2,280 | | | | 912,228 | |
Montgomery (County of) Higher Education & Health Authority (AHF/Montgomery Inc.); Series 2006, Ref. & Improvement RB | | | 6.88 | % | | | 04/01/36 | | | | 7,885 | | | | 8,201,740 | |
Montgomery (County of) Industrial Development Authority (Philadelphia Presbytery Homes, Inc.); Series 2010, RB | | | 7.00 | % | | | 12/01/35 | | | | 6,000 | | | | 6,639,300 | |
Montgomery (County of) Industrial Development Authority (Whitemarsh Continuing Care); | | | | | | | | | | | | | | | | |
Series 2005, Mortgage RB | | | 6.13 | % | | | 02/01/28 | | | | 1,875 | | | | 1,892,400 | |
Series 2005, Mortgage RB | | | 6.25 | % | | | 02/01/35 | | | | 8,755 | | | | 8,825,565 | |
Northeastern Pennsylvania Hospital & Education Authority (Oakwood Terrace); | | | | | | | | | | | | | | | | |
Series 1999, Health Care RB | | | 7.13 | % | | | 10/01/29 | | | | 3,065 | | | | 3,066,410 | |
Series 2005, Health Care RB (Acquired 12/27/05; Cost $1,465,000)(f) | | | 6.50 | % | | | 10/01/32 | | | | 1,465 | | | | 1,450,863 | |
Pennsylvania (State of) Economic Development Financing Authority (USG Corp.); Series 1999, Solid Waste Disposal RB(c) | | | 6.00 | % | | | 06/01/31 | | | | 15,000 | | | | 15,000,750 | |
Pennsylvania (State of) Higher Educational Facilities Authority (Student Association, Inc. at California University of Pennsylvania); Series 2000 A, Student Housing RB | | | 6.75 | % | | | 09/01/32 | | | | 2,285 | | | | 2,291,238 | |
Philadelphia (City of) Hospitals & Higher Education Facilities Authority (Centralized Comprehensive Human Services, Inc.); Series 2002 A, RB | | | 7.25 | % | | | 01/01/21 | | | | 3,670 | | | | 3,712,755 | |
Philadelphia (City of) Industrial Development Authority (Cathedral Village); Series 2003 A, RB | | | 6.88 | % | | | 04/01/34 | | | | 35 | | | | 35,383 | |
Philadelphia (City of) Industrial Development Authority (First Philadelphia Preparatory Charter School); Series 2014 A, RB | | | 7.25 | % | | | 06/15/43 | | | | 5,500 | | | | 5,540,755 | |
Philadelphia (City of) Industrial Development Authority (Global Leadership Academy Charter School); Series 2010, RB | | | 6.38 | % | | | 11/15/40 | | | | 1,000 | | | | 1,014,570 | |
Philadelphia (City of) Industrial Development Authority (Independence Charter School); Series 2007 A, RB | | | 5.50 | % | | | 09/15/37 | | | | 4,070 | | | | 3,747,737 | |
Philadelphia (City of) Industrial Development Authority (MaST Charter School); Series 2010, RB | | | 6.00 | % | | | 08/01/35 | | | | 500 | | | | 532,390 | |
See accompanying Notes to Financial Statements which are an integral part of the financial statements.
40 Invesco High Yield Municipal Fund
| | | | | | | | | | | | | | | | |
| | | Interest Rate | | | Maturity Date | | | Principal Amount (000) | | | Value | |
| Pennsylvania–(continued) | |
Philadelphia (City of) Industrial Development Authority (New Foundations Charter School); Series 2012, RB | | | 6.63 | % | | | 12/15/41 | | | $ | 1,500 | | | $ | 1,537,695 | |
Philadelphia (City of) Industrial Development Authority (Performing Arts Charter School); | | | | | | | | | | | | | | | | |
Series 2013, RB(f) | | | 6.50 | % | | | 06/15/33 | | | | 2,000 | | | | 2,015,120 | |
Series 2013, RB(f) | | | 6.75 | % | | | 06/15/43 | | | | 8,000 | | | | 8,053,840 | |
Philadelphia (City of) Industrial Development Authority; Series 1990, Commercial Development
RB(c) | | | 7.75 | % | | | 12/01/17 | | | | 8,550 | | | | 8,573,683 | |
Susquehanna Area Regional Airport Authority; Series 2008 A, Airport System RB(c) | | | 6.50 | % | | | 01/01/38 | | | | 4,300 | | | | 4,652,772 | |
| | | | | | | | | | | | | | | | 158,112,173 | |
|
| Puerto Rico–1.47% | |
Puerto Rico (Commonwealth of) Aqueduct & Sewer Authority; | | | | | | | | | | | | | | | | |
Series 2008 A, Sr. Lien RB | | | 5.00 | % | | | 07/01/14 | | | | 12,050 | | | | 11,867,684 | |
Series 2008 A, Sr. Lien RB | | | 6.00 | % | | | 07/01/44 | | | | 16,800 | | | | 12,788,496 | |
Series 2012 A, Sr. Lien RB | | | 5.00 | % | | | 07/01/33 | | | | 25,295 | | | | 18,022,940 | |
Puerto Rico (Commonwealth of) Electric Power Authority; | | | | | | | | | | | | | | | | |
Series 2007 UU, Ref. Floating Rate Power RB(l) | | | 1.27 | % | | | 07/01/17 | | | | 9,150 | | | | 6,024,098 | |
Series 2010 AAA, RB | | | 5.25 | % | | | 07/01/30 | | | | 5,440 | | | | 3,829,597 | |
Series 2013 A, RB | | | 6.75 | % | | | 07/01/36 | | | | 19,800 | | | | 14,528,646 | |
Puerto Rico (Commonwealth of) Public Buildings Authority; Series 2004 I, Government Facilities RB(h)(i) | | | 5.25 | % | | | 07/01/14 | | | | 75 | | | | 76,265 | |
Puerto Rico Sales Tax Financing Corp.; | | | | | | | | | | | | | | | | |
First Sr. Series 2009 C, RB | | | 5.75 | % | | | 08/01/57 | | | | 13,000 | | | | 11,358,880 | |
Series 2007 A, CAB RB(d) | | | 0.00 | % | | | 08/01/56 | | | | 100,000 | | | | 6,156,000 | |
Series 2011 C, CAB RB(d) | | | 0.00 | % | | | 08/01/38 | | | | 24,245 | | | | 4,463,262 | |
| | | | | | | | | | | | | | | | 89,115,868 | |
|
| Rhode Island–0.31% | |
Rhode Island Economic Development Corp. (Providence Place); Series 2000, Sub. Obligation RB | | | 7.25 | % | | | 07/01/20 | | | | 2,940 | | | | 2,907,513 | |
Rhode Island Health & Educational Building Corp. (Lifespan Obligated Group); | | | | | | | | | | | | | | | | |
Series 2009 A, Hospital Financing RB | | | 7.00 | % | | | 05/15/39 | | | | 2,500 | | | | 2,741,150 | |
Series 2009 A, Hospital Financing RB (INS–AGC)(a) | | | 6.25 | % | | | 05/15/30 | | | | 2,000 | | | | 2,222,660 | |
Tobacco Settlement Financing Corp.; Series 2002 A, Asset-Backed RB | | | 6.25 | % | | | 06/01/42 | | | | 10,965 | | | | 10,963,575 | |
| | | | | | | | | | | | | | | | 18,834,898 | |
|
| South Carolina–0.39% | |
Laurens County School District No. 055; Series 2005, Installment Purchase RB | | | 5.25 | % | | | 12/01/30 | | | | 3,080 | | | | 3,178,160 | |
Myrtle Beach (City of) (Myrtle Beach Air Force Base); | | | | | | | | | | | | | | | | |
Series 2006 A, Tax Increment Allocation RB | | | 5.25 | % | | | 10/01/26 | | | | 835 | | | | 768,025 | |
Series 2006 A, Tax Increment Allocation RB | | | 5.30 | % | | | 10/01/35 | | | | 1,250 | | | | 1,074,238 | |
South Carolina (State of) Jobs-Economic Development Authority (Episcopal Home at Still Hopes); Series 2004 B, Residential Care Facilities First Mortgage RB | | | 5.90 | % | | | 05/15/34 | | | | 1,000 | | | | 1,001,400 | |
South Carolina (State of) Jobs-Economic Development Authority (Lutheran Homes); | | | | | | | | | | | | | | | | |
Series 2007, Ref. First Mortgage Health Care Facilities RB | | | 5.00 | % | | | 05/01/14 | | | | 1,035 | | | | 1,038,695 | |
Series 2007, Ref. First Mortgage Health Care Facilities RB | | | 5.38 | % | | | 05/01/21 | | | | 1,500 | | | | 1,532,985 | |
Series 2007, Ref. First Mortgage Health Care Facilities RB | | | 5.50 | % | | | 05/01/28 | | | | 1,100 | | | | 1,101,496 | |
Series 2013, Health Facilities RB | | | 5.00 | % | | | 05/01/43 | | | | 1,000 | | | | 852,030 | |
Series 2013, Health Facilities RB | | | 5.13 | % | | | 05/01/48 | | | | 2,000 | | | | 1,706,540 | |
South Carolina (State of) Jobs-Economic Development Authority (South Carolina Episcopal Home at Still Hopes); | | | | | | | | | | | | | | | | |
Series 2004 A, First Mortgage Residential Care Facilities RB | | | 6.25 | % | | | 05/15/25 | | | | 750 | | | | 751,500 | |
Series 2004 A, First Mortgage Residential Care Facilities RB | | | 6.38 | % | | | 05/15/32 | | | | 1,250 | | | | 1,251,262 | |
See accompanying Notes to Financial Statements which are an integral part of the financial statements.
41 Invesco High Yield Municipal Fund
| | | | | | | | | | | | | | | | |
| | | Interest Rate | | | Maturity Date | | | Principal Amount (000) | | | Value | |
| South Carolina–(continued) | |
South Carolina (State of) Jobs-Economic Development Authority (The Woodlands at Furman); | | | | | | | | | | | | | | | | |
Series 2012, Ref. RB | | | 6.00 | % | | | 11/15/32 | | | $ | 1,426 | | | $ | 904,805 | |
Series 2012, Ref. RB | | | 6.00 | % | | | 11/15/42 | | | | 4,777 | | | | 2,937,185 | |
Series 2012, Ref. RB | | | 6.00 | % | | | 11/15/47 | | | | 5,437 | | | | 3,323,015 | |
Series 2012, Ref. Sub. CAB RB(d) | | | 0.00 | % | | | 11/15/47 | | | | 2,383 | | | | 23,833 | |
Series 2012, Ref. Sub. CAB RB(d) | | | 0.00 | % | | | 11/15/47 | | | | 611 | | | | 6,111 | |
Series 2012, Ref. Sub. CAB RB(d) | | | 0.00 | % | | | 11/15/47 | | | | 1,742 | | | | 17,416 | |
South Carolina (State of) Jobs-Economic Development Authority (Wesley Commons); Series 2006, Ref. First Mortgage Health Facilities RB | | | 5.13 | % | | | 10/01/26 | | | | 2,500 | | | | 2,405,600 | |
| | | | | | | | | | | | | | | | 23,874,296 | |
|
| Tennessee–0.63% | |
Shelby (County of) Health, Educational & Housing Facilities Board (Kirby Pines); Series 1997 A, Health Care Facility RB | | | 6.38 | % | | | 11/15/25 | | | | 3,000 | | | | 3,002,610 | |
Shelby (County of) Health, Educational & Housing Facilities Board (The Village at Germantown); | | | | | | | | | | | | | | | | |
Series 2012, Ref. Residential Care Facility Mortgage RB | | | 5.00 | % | | | 12/01/32 | | | | 2,100 | | | | 1,902,579 | |
Series 2012, Ref. Residential Care Facility Mortgage RB | | | 5.25 | % | | | 12/01/42 | | | | 1,500 | | | | 1,323,360 | |
Series 2012, Ref. Residential Care Facility Mortgage RB | | | 5.38 | % | | | 12/01/47 | | | | 2,000 | | | | 1,754,280 | |
Shelby (County of) Health, Educational & Housing Facilities Board (Trezevant Manor); | | | | | | | | | | | | | | | | |
Series 2006 A, RB | | | 5.63 | % | | | 09/01/26 | | | | 1,000 | | | | 1,008,530 | |
Series 2006 A, RB | | | 5.75 | % | | | 09/01/37 | | | | 1,900 | | | | 1,801,656 | |
Series 2013 A, Ref. RB | | | 5.50 | % | | | 09/01/47 | | | | 15,000 | | | | 13,344,600 | |
Trenton (City of) Health & Educational Facilities Board (RHA/Trenton MR, Inc.); Series 2009, RB | | | 9.25 | % | | | 04/01/39 | | | | 12,655 | | | | 14,314,197 | |
| | | | | | | | | | | | | | | | 38,451,812 | |
|
| Texas–13.08% | |
Angelina & Neches River Authority Industrial Development Corp. (Aspen Power LLC); Series 2007 A, Environmental Facilities RB(c)(j) | | | 6.50 | % | | | 11/01/29 | | | | 9,265 | | | | 5,188,029 | |
Arlington Higher Education Finance Corp. (Arlington Classics Academy); Series 2010 B, Ref. RB | | | 7.65 | % | | | 08/15/40 | | | | 2,500 | | | | 2,676,175 | |
Austin Convention Enterprises, Inc.; Series 2006 B, Ref. Second Tier Convention Center RB(f) | | | 5.75 | % | | | 01/01/34 | | | | 5,060 | | | | 5,056,559 | |
Bexar County Health Facilities Development Corp. (Army Retirement Residence); Series 2010, RB | | | 6.20 | % | | | 07/01/45 | | | | 2,000 | | | | 2,135,620 | |
Bexar County Housing Finance Corp. (Woodland Ridge Apartments); Series 2002 A, MFH RB(c) | | | 7.00 | % | | | 01/01/39 | | | | 3,980 | | | | 3,924,200 | |
Brazoria County Health Facilities Development Corp. (Brazosport Regional Health System); | | | | | | | | | | | | | | | | |
Series 2012, Ref. RB | | | 5.25 | % | | | 07/01/32 | | | | 4,600 | | | | 4,260,014 | |
Series 2012, Ref. RB | | | 5.50 | % | | | 07/01/42 | | | | 10,000 | | | | 9,182,100 | |
Capital Area Cultural Education Facilities Finance Corp. (The Roman Catholic Diocese of Austin); Series 2005 B, RB | | | 6.13 | % | | | 04/01/45 | | | | 7,465 | | | | 8,061,379 | |
Central Texas Regional Mobility Authority; Series 2011, Sub. Lien RB | | | 6.75 | % | | | 01/01/41 | | | | 17,500 | | | | 19,350,625 | |
Clifton Higher Education Finance Corp. (Idea Public Schools); Series 2011, Education RB | | | 5.75 | % | | | 08/15/41 | | | | 1,130 | | | | 1,177,776 | |
Clifton Higher Education Finance Corp. (Uplift Education); Series 2010 A, Education RB | | | 6.25 | % | | | 12/01/45 | | | | 5,000 | | | | 5,366,000 | |
Dallas (County of) Flood Control District No. 1; Series 2002, Ref. Unlimited Tax GO Bonds | | | 7.25 | % | | | 04/01/32 | | | | 9,445 | | | | 9,470,218 | |
Decatur (City of) Hospital Authority (Wise Regional Health System); | | | | | | | | | | | | | | | | |
Series 2004 A, RB | | | 7.00 | % | | | 09/01/25 | | | | 13,775 | | | | 13,983,691 | |
Series 2004 A, RB | | | 7.13 | % | | | 09/01/34 | | | | 8,155 | | | | 8,261,749 | |
Grand Parkway Transportation Corp.; | | | | | | | | | | | | | | | | |
Series 2013 A, First Tier Toll RB MBTC(e) | | | 5.50 | % | | | 04/01/53 | | | | 12,000 | | | | 12,200,520 | |
Series 2013 B, Sub. Tier Conv. Toll System CAB RB(b) | | | 5.85 | % | | | 10/01/48 | | | | 17,000 | | | | 10,654,750 | |
Series 2013 B, Sub. Tier Toll RB | | | 5.00 | % | | | 04/01/53 | | | | 25,000 | | | | 25,699,000 | |
Grand Prairie Housing Finance Corp.; | | | | | | | | | | | | | | | | |
Series 2003, Priority Lien Independent Senior Living Center RB | | | 7.50 | % | | | 07/01/17 | | | | 645 | | | | 658,326 | |
Series 2003, Priority Lien Independent Senior Living Center RB | | | 7.63 | % | | | 01/01/20 | | | | 655 | | | | 678,567 | |
Series 2003, Priority Lien Independent Senior Living Center RB | | | 7.75 | % | | | 01/01/34 | | | | 6,795 | | | | 6,936,268 | |
Series 2003, Sub. Lien Independent Senior Living Center RB(r) | | | 7.50 | % | | | 07/01/17 | | | | 610 | | | | 29,347 | |
Series 2003, Sub. Lien Independent Senior Living Center RB(r) | | | 7.63 | % | | | 01/01/20 | | | | 345 | | | | 16,598 | |
Series 2003, Sub. Lien Independent Senior Living Center RB(r) | | | 7.75 | % | | | 01/01/34 | | | | 3,595 | | | | 172,955 | |
See accompanying Notes to Financial Statements which are an integral part of the financial statements.
42 Invesco High Yield Municipal Fund
| | | | | | | | | | | | | | | | |
| | | Interest Rate | | | Maturity Date | | | Principal Amount (000) | | | Value | |
| Texas–(continued) | |
HFDC of Central Texas, Inc. (Legacy at Willow Bend); | | | | | | | | | | | | | | | | |
Series 2006 A, Retirement Facilities RB | | | 5.50 | % | | | 11/01/31 | | | $ | 500 | | | $ | 499,945 | |
Series 2006 A, Retirement Facilities RB | | | 5.63 | % | | | 11/01/26 | | | | 5,100 | | | | 5,164,821 | |
HFDC of Central Texas, Inc. (Sears Tyler Methodist); | | | | | | | | | | | | | | | | |
Series 2009 A, RB | | | 7.75 | % | | | 11/15/29 | | | | 4,910 | | | | 3,337,818 | |
Series 2009 A, RB | | | 7.75 | % | | | 11/15/44 | | | | 15,345 | | | | 10,264,424 | |
Series 2009 B, RB | | | 6.38 | % | | | 11/15/19 | | | | 1,210 | | | | 822,558 | |
HFDC of Central Texas, Inc. (Village at Gleannloch Farms); | | | | | | | | | | | | | | | | |
Series 2006 A, Retirement Facilities RB | | | 5.50 | % | | | 02/15/27 | | | | 4,800 | | | | 4,610,784 | |
Series 2006 A, Retirement Facilities RB | | | 5.50 | % | | | 02/15/37 | | | | 15,265 | | | | 13,572,875 | |
HFDC of Central Texas, Inc.; Series 2006 A, Retirement Facilities RB | | | 5.75 | % | | | 11/01/36 | | | | 6,355 | | | | 6,370,760 | |
Hopkins (County of) Hospital District; | | | | | | | | | | | | | | | | |
Series 2008, RB | | | 6.00 | % | | | 02/15/33 | | | | 2,500 | | | | 2,414,900 | |
Series 2008, RB | | | 6.00 | % | | | 02/15/38 | | | | 5,155 | | | | 4,879,723 | |
Houston (City of) (Continental Airlines, Inc.); | | | | | | | | | | | | | | | | |
Series 1997 C, Airport System Special Facilities RB(c) | | | 6.13 | % | | | 07/15/27 | | | | 17,745 | | | | 17,748,194 | |
Series 1998 C, Airport System Special Facilities RB(c) | | | 5.70 | % | | | 07/15/29 | | | | 4,730 | | | | 4,691,451 | |
Series 2001 E, Airport System Special Facilities RB(c) | | | 6.75 | % | | | 07/01/29 | | | | 14,880 | | | | 14,882,678 | |
Series 2001 E, Airport System Special Facilities RB(c) | | | 7.00 | % | | | 07/01/29 | | | | 4,000 | | | | 4,000,600 | |
Series 2011 A, Ref. Airport System Special Facilities RB(c) | | | 6.63 | % | | | 07/15/38 | | | | 14,000 | | | | 14,616,140 | |
Houston (City of); | | | | | | | | | | | | | | | | |
Series 2009 A, Ref. Sr. Lien Airport System RB(e) | | | 5.00 | % | | | 07/01/23 | | | | 6,580 | | | | 7,409,804 | |
Series 2009 A, Ref. Sr. Lien Airport System RB(e) | | | 5.00 | % | | | 07/01/24 | | | | 3,670 | | | | 4,121,447 | |
Series 2009 A, Ref. Sr. Lien Airport System RB(e) | | | 5.00 | % | | | 07/01/25 | | | | 6,800 | | | | 7,606,820 | |
Series 2009 A, Ref. Sr. Lien Airport System RB(e) | | | 5.00 | % | | | 07/01/26 | | | | 3,000 | | | | 3,369,030 | |
Series 2011 A, Ref. First Lien Utility System RB(e) | | | 5.25 | % | | | 11/15/31 | | | | 18,360 | | | | 20,953,717 | |
Houston Higher Education Finance Corp. (Cosmos Foundation, Inc.); | | | | | | | | | | | | | | | | |
Series 2011 A, RB | | | 6.50 | % | | | 05/15/31 | | | | 500 | | | | 557,340 | |
Series 2011 A, RB | | | 6.88 | % | | | 05/15/41 | | | | 790 | | | | 893,427 | |
La Vernia Higher Education Finance Corp. (Amigos Por Vida/Friends for Life); Series 2008, RB | | | 6.38 | % | | | 02/15/37 | | | | 1,635 | | | | 1,615,544 | |
La Vernia Higher Education Finance Corp. (Cosmos Foundation, Inc.); | | | | | | | | | | | | | | | | |
Series 2008 A, RB | | | 6.25 | % | | | 02/15/17 | | | | 790 | | | | 852,766 | |
Series 2008 A, RB | | | 7.13 | % | | | 02/15/38 | | | | 2,000 | | | | 2,249,320 | |
La Vernia Higher Education Finance Corp. (Knowledge is Power Program, Inc.); | | | | | | | | | | | | | | | | |
Series 2009 A, RB | | | 6.25 | % | | | 08/15/39 | | | | 1,210 | | | | 1,327,709 | |
Series 2009 A, RB | | | 6.38 | % | | | 08/15/44 | | | | 7,225 | | | | 7,952,991 | |
Leander Independent School District; Series 2014 C, Unlimited Tax CAB GO Bonds(d) | | | 0.00 | % | | | 08/15/48 | | | | 26,330 | | | | 4,057,980 | |
Lone Star College System; Series 2009, Limited Tax GO Bonds(e) | | | 5.00 | % | | | 08/15/34 | | | | 23,200 | | | | 25,738,080 | |
Lubbock Health Facilities Development Corp. (Carillon Senior LifeCare Community); | | | | | | | | | | | | | | | | |
Series 2005 A, Ref. First Mortgage RB | | | 6.50 | % | | | 07/01/26 | | | | 2,500 | | | | 2,579,350 | |
Series 2005 A, Ref. First Mortgage RB | | | 6.63 | % | | | 07/01/36 | | | | 9,000 | | | | 9,169,830 | |
Matagorda (County of) Navigation District No. 1 (Central Power & Light Co.); Series 2001 A, Ref. PCR | | | 6.30 | % | | | 11/01/29 | | | | 1,000 | | | | 1,126,530 | |
Mesquite Health Facility Development Corp. (Christian Care Centers, Inc.); Series 2005, Retirement Facility RB | | | 5.63 | % | | | 02/15/35 | | | | 1,500 | | | | 1,503,690 | |
Midlothian (City of) Development Authority; Series 2004, Tax Increment Allocation Contract RB(f) | | | 6.20 | % | | | 11/15/29 | | | | 4,500 | | | | 4,515,885 | |
New Hope Cultural Education Facilities Corp. (Morningside Ministries); | | | | | | | | | | | | | | | | |
Series 2013, First Mortgage RB | | | 6.50 | % | | | 01/01/43 | | | | 4,325 | | | | 4,468,287 | |
Series 2013, First Mortgage RB | | | 6.50 | % | | | 01/01/48 | | | | 5,675 | | | | 5,814,151 | |
North Texas Education Finance Corp. (Uplift Education); | | | | | | | | | | | | | | | | |
Series 2012 A, RB | | | 5.13 | % | | | 12/01/42 | | | | 3,000 | | | | 2,993,040 | |
Series 2012 A, RB | | | 5.25 | % | | | 12/01/47 | | | | 2,100 | | | | 2,101,218 | |
See accompanying Notes to Financial Statements which are an integral part of the financial statements.
43 Invesco High Yield Municipal Fund
| | | | | | | | | | | | | | | | |
| | | Interest Rate | | | Maturity Date | | | Principal Amount (000) | | | Value | |
| Texas–(continued) | |
North Texas Tollway Authority; | | | | | | | | | | | | | | | | |
Series 2008 A, Ref. First Tier System RB (INS–BHAC)(a)(e) | | | 5.75 | % | | | 01/01/48 | | | $ | 30,545 | | | $ | 34,105,020 | |
Series 2011 B, Special Project System CAB RB(d) | | | 0.00 | % | | | 09/01/37 | | | | 15,500 | | | | 4,153,380 | |
Orange Housing Development Corp. (Villages at Pine Hollow); Series 1998, MFH RB | | | 8.00 | % | | | 03/01/28 | | | | 3,020 | | | | 2,899,230 | |
Pearland (City of) Development Authority; Series 2009, Tax Increment Allocation Contract RB(h)(i) | | | 5.88 | % | | | 09/01/18 | | | | 805 | | | | 981,319 | |
Pharr (City of) Higher Education Finance Authority (Idea Public Schools); | | | | | | | | | | | | | | | | |
Series 2009 A, Education RB | | | 6.25 | % | | | 08/15/29 | | | | 570 | | | | 611,382 | |
Series 2009 A, Education RB | | | 6.50 | % | | | 08/15/39 | | | | 6,320 | | | | 6,806,893 | |
Red River Health Facilities Development Corp. (MRC the Crossings); Series 2012, Continuing Care Retirement Community BAN(f) | | | 12.00 | % | | | 12/14/17 | | | | 3,000 | | | | 3,005,160 | |
Red River Health Facilities Development Corp. (Parkview on Hollybrook); | | | | | | | | | | | | | | | | |
Series 2013 A, First Mortgage RB | | | 7.25 | % | | | 07/01/43 | | | | 6,425 | | | | 6,047,017 | |
Series 2013 A, First Mortgage RB | | | 7.38 | % | | | 07/01/48 | | | | 11,995 | | | | 11,305,407 | |
Red River Health Facilities Development Corp. (Sears Methodist Retirement System); | | | | | | | | | | | | | | | | |
Series 2013, Retirement Facility RB | | | 5.45 | % | | | 11/15/38 | | | | 2,100 | | | | 1,680,231 | |
Series 2013, Retirement Facility RB | | | 5.75 | % | | | 11/15/39 | | | | 1,730 | | | | 1,430,935 | |
Series 2013, Retirement Facility RB | | | 6.05 | % | | | 11/15/46 | | | | 1,323 | | | | 1,119,417 | |
Series 2013, Retirement Facility RB | | | 6.05 | % | | | 11/15/46 | | | | 6,130 | | | | 5,186,716 | |
Series 2013, Retirement Facility RB | | | 6.15 | % | | | 11/15/49 | | | | 2,968 | | | | 2,523,067 | |
Series 2013, Retirement Facility RB | | | 6.25 | % | | | 05/09/53 | | | | 673 | | | | 575,126 | |
San Antonio Convention Hotel Finance Corp. (Empowerment Zone); Series 2005 A, Contract RB MBTC (INS–AMBAC)(a)(c)(e) | | | 5.00 | % | | | 07/15/39 | | | | 13,500 | | | | 13,038,030 | |
San Juan (City of) Higher Education Finance Authority (Idea Public Schools); Series 2010 A, Education RB | | | 6.70 | % | | | 08/15/40 | | | | 1,000 | | | | 1,099,870 | |
Sanger Industrial Development Corp. (Texas Pellets); Series 2012 B, RB(c) | | | 8.00 | % | | | 07/01/38 | | | | 39,000 | | | | 40,063,140 | |
Tarrant County Cultural Education Facilities Finance Corp. (Air Force Village Obligated Group); | | | | | | | | | | | | | | | | |
Series 2009, Retirement Facility RB | | | 6.13 | % | | | 11/15/29 | | | | 1,000 | | | | 1,059,810 | |
Series 2009, Retirement Facility RB | | | 6.38 | % | | | 11/15/44 | | | | 12,150 | | | | 12,585,699 | |
Tarrant County Cultural Education Facilities Finance Corp. (Buckingham Senior Living Community, Inc.); | | | | | | | | | | | | | | | | |
Series 2007, Retirement Facility RB | | | 5.63 | % | | | 11/15/27 | | | | 1,500 | | | | 1,516,980 | |
Series 2007, Retirement Facility RB | | | 5.75 | % | | | 11/15/37 | | | | 2,500 | | | | 2,493,325 | |
Tarrant County Cultural Education Facilities Finance Corp. (C.C. Young Memorial Home); | | | | | | | | | | | | | | | | |
Series 2007, Retirement Facility RB | | | 5.25 | % | | | 02/15/17 | | | | 880 | | | | 906,101 | |
Series 2007, Retirement Facility RB | | | 5.75 | % | | | 02/15/25 | | | | 1,500 | | | | 1,504,425 | |
Series 2007, Retirement Facility RB | | | 5.75 | % | | | 02/15/29 | | | | 1,600 | | | | 1,554,672 | |
Series 2009 A, Retirement Facility RB | | | 8.00 | % | | | 02/15/38 | | | | 12,350 | | | | 13,418,275 | |
Series 2009 B-1, Retirement Facility RB | | | 7.25 | % | | | 02/15/16 | | | | 750 | | | | 752,085 | |
Tarrant County Cultural Education Facilities Finance Corp. (Mirador); | | | | | | | | | | | | | | | | |
Series 2010 A, Retirement Facility RB | | | 8.00 | % | | | 11/15/29 | | | | 1,500 | | | | 1,469,580 | |
Series 2010 A, Retirement Facility RB | | | 8.13 | % | | | 11/15/39 | | | | 7,000 | | | | 6,740,160 | |
Series 2010 A, Retirement Facility RB | | | 8.25 | % | | | 11/15/44 | | | | 8,000 | | | | 7,755,920 | |
Tarrant County Cultural Education Facilities Finance Corp. (Stayton at Museum Way); | | | | | | | | | | | | | | | | |
Series 2009 A, Retirement Facility RB | | | 8.25 | % | | | 11/15/29 | | | | 2,135 | | | | 1,976,007 | |
Series 2009 A, Retirement Facility RB | | | 8.25 | % | | | 11/15/39 | | | | 2,140 | | | | 1,907,981 | |
Series 2009 A, Retirement Facility RB | | | 8.25 | % | | | 11/15/44 | | | | 13,770 | | | | 12,182,457 | |
Series 2009 C-1, TEMPS-80SM Retirement Facility RB | | | 7.50 | % | | | 11/15/16 | | | | 9,870 | | | | 9,527,511 | |
Texas (State of) Department of Housing & Community Affairs (Linked Select Auction Variable Rate Securities & Residual Interest Bonds); Series 1992 C, Home Mortgage RB (CEP–GNMA)(c) | | | 6.90 | % | | | 07/02/24 | | | | 300 | | | | 309,540 | |
Texas (State of) Turnpike Authority (Central Texas Turnpike System); | | | | | | | | | | | | | | | | |
Series 2002, CAB RB (INS–AMBAC)(a)(d) | | | 0.00 | % | | | 08/15/32 | | | | 22,115 | | | | 7,346,161 | |
Series 2002, CAB RB (INS–AMBAC)(a)(d) | | | 0.00 | % | | | 08/15/33 | | | | 37,225 | | | | 11,624,623 | |
Series 2002, CAB RB (INS–AMBAC)(a)(d) | | | 0.00 | % | | | 08/15/36 | | | | 19,000 | | | | 4,945,130 | |
Series 2002, CAB RB (INS–AMBAC)(a)(d) | | | 0.00 | % | | | 08/15/37 | | | | 30,000 | | | | 7,337,400 | |
See accompanying Notes to Financial Statements which are an integral part of the financial statements.
44 Invesco High Yield Municipal Fund
| | | | | | | | | | | | | | | | |
| | | Interest Rate | | | Maturity Date | | | Principal Amount (000) | | | Value | |
| Texas–(continued) | |
Texas (State of) Water Development Board; | | | | | | | | | | | | | | | | |
Series 2008 A, Sub. Lien State Revolving Fund RB(e) | | | 5.00 | % | | | 07/15/25 | | | $ | 15,000 | | | $ | 16,894,050 | |
Series 2008 B, Sub. Lien State Revolving Fund RB(e) | | | 5.00 | % | | | 07/15/28 | | | | 11,425 | | | | 12,543,964 | |
Series 2008 B, Sub. Lien State Revolving Fund RB(e) | | | 5.00 | % | | | 07/15/29 | | | | 5,000 | | | | 5,489,700 | |
Texas Municipal Gas Acquisition & Supply Corp. I; Series 2008 D, Sr. Lien Gas Supply RB | | | 6.25 | % | | | 12/15/26 | | | | 7,660 | | | | 9,193,303 | |
Texas Municipal Gas Acquisition & Supply Corp. III; Series 2012, Gas Supply RB | | | 5.00 | % | | | 12/15/31 | | | | 19,000 | | | | 19,433,010 | |
Texas Private Activity Bond Surface Transportation Corp. (LBJ Infrastructure); | | | | | | | | | | | | | | | | |
Series 2010, Sr. Lien RB | | | 7.00 | % | | | 06/30/40 | | | | 25,575 | | | | 28,956,782 | |
Series 2010, Sr. Lien RB MBTC(e) | | | 7.00 | % | | | 06/30/40 | | | | 9,000 | | | | 10,190,070 | |
Texas Private Activity Bond Surface Transportation Corp. (NTE Mobility Partners LLC North Tarrant Express Management Lanes); Series 2009, Sr. Lien RB | | | 6.88 | % | | | 12/31/39 | | | | 13,415 | | | | 14,942,968 | |
Texas Private Activity Bond Surface Transportation Corp. (NTE Mobility Partners LLC); | | | | | | | | | | | | | | | | |
Series 2013, Sr. Lien RB(c) | | | 6.75 | % | | | 06/30/43 | | | | 18,450 | | | | 20,211,421 | |
Series 2013, Sr. Lien RB(c) | | | 7.00 | % | | | 12/31/38 | | | | 4,000 | | | | 4,471,080 | |
Texas State Public Finance Authority Charter School Finance Corp. (New Frontiers Charter School); Series 2010 A, Education RB | | | 5.80 | % | | | 08/15/40 | | | | 1,000 | | | | 1,032,590 | |
Texas State Public Finance Authority Charter School Finance Corp. (Odyssey Academy, Inc.); | | | | | | | | | | | | | | | | |
Series 2010 A, Education RB | | | 6.88 | % | | | 02/15/30 | | | | 1,455 | | | | 1,550,768 | |
Series 2010 A, Education RB | | | 7.13 | % | | | 02/15/40 | | | | 1,810 | | | | 1,949,461 | |
Texas State Public Finance Authority Charter School Finance Corp. (School Excellence Education); Series 2004 A, RB(f) | | | 7.00 | % | | | 12/01/34 | | | | 3,385 | | | | 3,386,726 | |
Travis County Cultural Education Facilities Finance Corp. (Wayside Schools); Series 2012 A, Education RB | | | 5.25 | % | | | 08/15/42 | | | | 2,375 | | | | 2,154,196 | |
Travis County Health Facilities Development Corp. (Westminster Manor); Series 2010, RB | | | 7.00 | % | | | 11/01/30 | | | | 2,500 | | | | 2,738,275 | |
Tyler Health Facilities Development Corp. (Mother Frances Hospital Regional Health Care Center); Series 2007, Ref. Hospital RB | | | 5.00 | % | | | 07/01/33 | | | | 5,300 | | | | 5,315,794 | |
Uptown Development Authority (Infrastructure Improvement Facilities); | | | | | | | | | | | | | | | | |
Series 2009, Tax Increment Allocation Contract RB | | | 5.38 | % | | | 09/01/25 | | | | 465 | | | | 497,276 | |
Series 2009, Tax Increment Allocation Contract RB | | | 5.50 | % | | | 09/01/29 | | | | 2,250 | | | | 2,377,778 | |
| | | | | | | | | | | | | | | | 794,870,487 | |
|
| Utah–0.44% | |
Provo (City of) (Freedom Academy Foundation); Series 2007, Charter School RB | | | 5.50 | % | | | 06/15/37 | | | | 2,345 | | | | 2,040,009 | |
Utah (County of) (Renaissance Academy); | | | | | | | | | | | | | | | | |
Series 2007 A, Charter School RB | | | 5.35 | % | | | 07/15/17 | | | | 540 | | | | 555,752 | |
Series 2007 A, Charter School RB | | | 5.63 | % | | | 07/15/37 | | | | 2,700 | | | | 2,402,973 | |
Utah (State of) Charter School Finance Authority (George Washington Academy); | | | | | | | | | | | | | | | | |
Series 2008 A, Charter School RB | | | 6.75 | % | | | 07/15/28 | | | | 1,340 | | | | 1,352,207 | |
Series 2008 A, Charter School RB | | | 7.00 | % | | | 07/15/40 | | | | 6,690 | | | | 6,754,358 | |
Utah (State of) Charter School Finance Authority (Navigator Pointe Academy); | | | | | | | | | | | | | | | | |
Series 2010 A, Charter School RB | | | 5.38 | % | | | 07/15/30 | | | | 1,650 | | | | 1,617,346 | |
Series 2010 A, Charter School RB | | | 5.63 | % | | | 07/15/40 | | | | 710 | | | | 691,398 | |
Utah (State of) Charter School Finance Authority (North Davis Preparatory Academy); | | | | | | | | | | | | | | | | |
Series 2010, Charter School RB | | | 6.25 | % | | | 07/15/30 | | | | 1,250 | | | | 1,295,700 | |
Series 2010, Charter School RB | | | 6.38 | % | | | 07/15/40 | | | | 2,500 | | | | 2,561,500 | |
Utah (State of) Charter School Finance Authority (Vista Entrada School of Performing Arts); | | | | | | | | | | | | | | | | |
Series 2012, RB | | | 5.60 | % | | | 07/15/22 | | | | 900 | | | | 914,373 | |
Series 2012, RB | | | 6.30 | % | | | 07/15/32 | | | | 850 | | | | 852,992 | |
Series 2012, RB | | | 6.55 | % | | | 07/15/42 | | | | 2,000 | | | | 2,003,760 | |
Utah (State of) Housing Finance Agency (RHA Community Services); Series 1997 A, RB | | | 6.88 | % | | | 07/01/27 | | | | 3,910 | | | | 3,911,838 | |
| | | | | | | | | | | | | | | | 26,954,206 | |
See accompanying Notes to Financial Statements which are an integral part of the financial statements.
45 Invesco High Yield Municipal Fund
| | | | | | | | | | | | | | | | |
| | | Interest Rate | | | Maturity Date | | | Principal Amount (000) | | | Value | |
| Vermont–0.05% | |
Vermont (State of) Economic Development Authority (Wake Robin Corp.); Series 2006 A, Mortgage RB | | | 5.38 | % | | | 05/01/36 | | | $ | 2,750 | | | $ | 2,566,823 | |
Vermont (State of) Educational & Health Buildings Financing Agency (Developmental & Mental Health); | | | | | | | | | | | | | | | | |
Series 2002 A, RB | | | 6.38 | % | | | 06/15/22 | | | | 40 | | | | 40,530 | |
Series 2002 A, RB | | | 6.50 | % | | | 06/15/32 | | | | 175 | | | | 176,934 | |
| | | | | | | | | | | | | | | | 2,784,287 | |
|
| Virgin Islands–0.08% | |
Virgin Islands (Government of) (Matching Fund Loan Note–Diago); Series 2009 A, RB | | | 6.75 | % | | | 10/01/37 | | | | 4,500 | | | | 4,956,165 | |
|
| Virginia–2.16% | |
Celebrate North Community Development Authority (Celebrate Virginia North); | | | | | | | | | | | | | | | | |
Series 2003 B, Special Assessment RB(g) | | | 4.95 | % | | | 03/01/25 | | | | 1,324 | | | | 853,781 | |
Series 2003 B, Special Assessment RB(g) | | | 5.06 | % | | | 03/01/34 | | | | 7,248 | | | | 4,674,888 | |
Celebrate South Community Development Authority (Celebrate Virginia South); Series 2006, Special Assessment RB(g) | | | 6.25 | % | | | 03/01/37 | | | | 9,500 | | | | 5,435,140 | |
Chesterfield (County of) Economic Development Authority (Brandermill Woods); Series 2012, First Mortgage Retirement Facilities RB | | | 5.13 | % | | | 01/01/43 | | | | 3,000 | | | | 2,720,670 | |
Chesterfield (County of) Health Center Commission (Lucy Corr Village); | | | | | | | | | | | | | | | | |
Series 2008 A, Residential Care Facilities RB | | | 6.13 | % | | | 12/01/30 | | | | 5,000 | | | | 3,762,000 | |
Series 2008 A, Residential Care Facilities RB | | | 6.25 | % | | | 12/01/38 | | | | 5,500 | | | | 3,875,245 | |
Fairfax (County of) Economic Development Authority (Vinson Hall, LLC); Series 2013 A, Residential Care Facility RB | | | 5.00 | % | | | 12/01/47 | | | | 3,000 | | | | 2,726,100 | |
Hanover (County of) Economic Development Authority (Covenant Woods); | | | | | | | | | | | | | | | | |
Series 2012 A, Residential Care Facility RB | | | 5.00 | % | | | 07/01/42 | | | | 2,000 | | | | 1,707,260 | |
Series 2012 A, Residential Care Facility RB | | | 5.00 | % | | | 07/01/47 | | | | 1,985 | | | | 1,669,325 | |
Lexington (City of) Industrial Development Authority (Kendal at Lexington); | | | | | | | | | | | | | | | | |
Series 2007 A, Residential Care Facilities Mortgage RB | | | 5.25 | % | | | 01/01/21 | | | | 395 | | | | 401,952 | |
Series 2007 A, Residential Care Facilities Mortgage RB | | | 5.38 | % | | | 01/01/22 | | | | 780 | | | | 791,934 | |
Series 2007 A, Residential Care Facilities Mortgage RB | | | 5.38 | % | | | 01/01/23 | | | | 425 | | | | 431,052 | |
Series 2007 A, Residential Care Facilities Mortgage RB | | | 5.38 | % | | | 01/01/28 | | | | 500 | | | | 499,720 | |
New Port Community Development Authority; | | | | | | | | | | | | | | | | |
Series 2006, Special Assessment RB | | | 5.50 | % | | | 09/01/26 | | | | 918 | | | | 599,445 | |
Series 2006, Special Assessment RB | | | 5.60 | % | | | 09/01/36 | | | | 2,500 | | | | 1,545,950 | |
Norfolk (City of) Redevelopment & Housing Authority (Fort Norfolk Retirement Community, Inc.–Harbor’s Edge); Series 2004 A, First Mortgage RB | | | 6.00 | % | | | 01/01/25 | | | | 500 | | | | 500,140 | |
Peninsula Town Center Community Development Authority; | | | | | | | | | | | | | | | | |
Series 2007, Special Obligation RB | | | 6.25 | % | | | 09/01/24 | | | | 6,715 | | | | 7,077,409 | |
Series 2007, Special Obligation RB | | | 6.35 | % | | | 09/01/28 | | | | 7,818 | | | | 8,159,490 | |
Series 2007, Special Obligation RB | | | 6.45 | % | | | 09/01/37 | | | | 5,219 | | | | 5,421,080 | |
Route 460 Funding Corp.; | | | | | | | | | | | | | | | | |
Series 2012 A, Sr. Lien Toll Road RB | | | 5.00 | % | | | 07/01/52 | | | | 25,370 | | | | 25,424,545 | |
Series 2012 B, Sr. Lien Toll Road CAB RB(d) | | | 0.00 | % | | | 07/01/36 | | | | 5,310 | | | | 1,447,984 | |
Series 2012 B, Sr. Lien Toll Road CAB RB(d) | | | 0.00 | % | | | 07/01/38 | | | | 6,250 | | | | 1,496,313 | |
The Farms of New Kent Community Development Authority; | | | | | | | | | | | | | | | | |
Series 2006 B, Special Assessment RB(k) | | | 2.73 | % | | | 03/01/36 | | | | 7,000 | | | | 3,636,570 | |
Series 2006 C, Special Assessment RB(k) | | | 2.90 | % | | | 03/01/36 | | | | 7,250 | | | | 3,766,085 | |
Virginia (State of) Small Business Financing Authority (Carilion Clinic Obligated Group); Series 2008 A, VRD Hospital RB(m) | | | 0.05 | % | | | 07/01/42 | | | | 3,400 | | | | 3,400,000 | |
Virginia (State of) Small Business Financing Authority (Elizabeth River Crossings Opco, LLC); Series 2012, Sr. Lien RB MBTC(c)(e) | | | 5.50 | % | | | 01/01/42 | | | | 24,000 | | | | 24,709,680 | |
Virginia (State of) Small Business Financing Authority (Hampton Roads Proton Beam Therapy Institute at Hampton University, LLC); Series 2009, RB(f)(h)(i) | | | 9.00 | % | | | 07/01/14 | | | | 8,300 | | | | 8,710,518 | |
Washington (County of) Industrial Development Authority (Mountain States Health Alliance); Series 2009 C, Hospital Facility RB | | | 7.75 | % | | | 07/01/38 | | | | 5,000 | | | | 5,748,700 | |
| | | | | | | | | | | | | | | | 131,192,976 | |
See accompanying Notes to Financial Statements which are an integral part of the financial statements.
46 Invesco High Yield Municipal Fund
| | | | | | | | | | | | | | | | |
| | | Interest Rate | | | Maturity Date | | | Principal Amount (000) | | | Value | |
| Washington–3.01% | |
Greater Wenatchee (City of) Regional Events Center Public Facilities District; Series 2012 A, RB | | | 5.50 | % | | | 09/01/42 | | | $ | 3,420 | | | $ | 3,328,857 | |
Kalispel Tribe of Indians; Series 2008, RB | | | 6.75 | % | | | 01/01/38 | | | | 8,000 | | | | 6,949,040 | |
Kennewick (City of) Public Hospital District; Series 2001, Ref. & Improvement RB | | | 6.30 | % | | | 01/01/25 | | | | 2,000 | | | | 2,001,040 | |
King (County of) Public Hospital District No. 4 (Snoqualmie Valley Hospital); | | | | | | | | | | | | | | | | |
Series 2009, Ref. & Improvement Limited Tax GO Bonds | | | 7.25 | % | | | 12/01/38 | | | | 9,625 | | | | 9,680,055 | |
Series 2011, Ref. & Improvement Limited Tax GO Bonds | | | 6.75 | % | | | 12/01/31 | | | | 500 | | | | 514,195 | |
Series 2011, Ref. & Improvement Limited Tax GO Bonds | | | 7.00 | % | | | 12/01/40 | | | | 4,000 | | | | 4,122,280 | |
King (County of); Series 2011 B, Ref. Sewer RB(e) | | | 5.00 | % | | | 01/01/34 | | | | 38,540 | | | | 41,820,910 | |
Klickitat (County of) Public Hospital District No. 2 (Skyline Hospital); | | | | | | | | | | | | | | | | |
Series 2007, Hospital RB | | | 6.50 | % | | | 12/01/38 | | | | 2,000 | | | | 1,939,980 | |
Series 2007, RB | | | 6.25 | % | | | 12/01/28 | | | | 3,645 | | | | 3,613,398 | |
Port of Seattle Industrial Development Corp. (Delta Airlines); Series 2012, Ref. Special Facilities
RB(c) | | | 5.00 | % | | | 04/01/30 | | | | 19,500 | | | | 17,823,975 | |
Skagit (County of) Public Hospital District No. 1 (Skagit Valley Hospital); | | | | | | | | | | | | | | | | |
Series 2007, RB | | | 5.75 | % | | | 12/01/28 | | | | 1,250 | | | | 1,300,313 | |
Series 2010, RB | | | 5.75 | % | | | 12/01/35 | | | | 6,000 | | | | 6,279,360 | |
Series 2010, RB | | | 6.00 | % | | | 12/01/30 | | | | 3,160 | | | | 3,400,918 | |
Washington (State of) Health Care Facilities Authority (Central Washington Health Services Association); Series 2009, RB | | | 7.00 | % | | | 07/01/39 | | | | 9,145 | | | | 9,978,933 | |
Washington (State of) Health Care Facilities Authority (Kadlec Regional Medical Center); Series 2010, RB MBTC(e) | | | 5.50 | % | | | 12/01/39 | | | | 7,800 | | | | 7,873,710 | |
Washington (State of) Health Care Facilities Authority (Seattle Cancer Care Alliance); Series 2009, RB | | | 7.38 | % | | | 03/01/38 | | | | 11,300 | | | | 13,604,748 | |
Washington (State of) Health Care Facilities Authority (Swedish Health Services); Series 2009 A,
RB(h)(i) | | | 6.50 | % | | | 11/15/14 | | | | 1,500 | | | | 1,567,845 | |
Washington (State of) Health Care Facilities Authority; Series 2007 C, RB (INS–Radian)(a) | | | 5.50 | % | | | 08/15/42 | | | | 3,000 | | | | 3,043,290 | |
Washington (State of) Higher Education Facilities Authority (Whitworth University); Series 2009, Ref. RB | | | 5.63 | % | | | 10/01/40 | | | | 3,415 | | | | 3,550,303 | |
Washington (State of) Housing Finance Commission (Custodial Receipts Wesley Homes); Series 2008 A, Non-Profit RB(f) | | | 6.20 | % | | | 01/01/36 | | | | 19,025 | | | | 19,344,049 | |
Washington (State of); Series 2009 E, Various Purpose Unlimited Tax GO Bonds(e) | | | 5.00 | % | | | 02/01/29 | | | | 18,450 | | | | 20,965,288 | |
| | | | | | | | | | | | | | | | 182,702,487 | |
|
| West Virginia–0.71% | |
Harrison (County of) Commission (Allegheny Energy); Series 2007 D, Ref. Solid Waste Disposal
RB(c) | | | 5.50 | % | | | 10/15/37 | | | | 5,250 | | | | 5,281,342 | |
Harrison (County of) Commission (Charles Pointe No. 2); | | | | | | | | | | | | | | | | |
Series 2008 A, Ref. Tax Increment Allocation RB | | | 6.50 | % | | | 06/01/23 | | | | 1,230 | | | | 1,299,151 | |
Series 2008 A, Ref. Tax Increment Allocation RB | | | 7.00 | % | | | 06/01/35 | | | | 1,500 | | | | 1,541,715 | |
Series 2013, Ref. Tax Increment Allocation RB(f) | | | 7.00 | % | | | 06/01/35 | | | | 1,000 | | | | 802,730 | |
Kanawha (County of) (The West Virginia State University Foundation); Series 2013, Student Housing RB | | | 6.75 | % | | | 07/01/45 | | | | 5,650 | | | | 5,812,776 | |
West Virginia (State of) Hospital Finance Authority (Thomas Health System); | | | | | | | | | | | | | | | | |
Series 2008, RB | | | 6.00 | % | | | 10/01/20 | | | | 1,500 | | | | 1,572,060 | |
Series 2008, RB | | | 6.50 | % | | | 10/01/38 | | | | 14,000 | | | | 13,829,760 | |
Series 2008, RB | | | 6.75 | % | | | 10/01/43 | | | | 13,150 | | | | 13,205,361 | |
| | | | | | | | | | | | | | | | 43,344,895 | |
|
| Wisconsin–1.30% | |
Hudson (City of) (Christian Community Home, Inc.); Series 2003, Health Care Facility RB | | | 6.50 | % | | | 04/01/33 | | | | 3,380 | | | | 3,380,000 | |
Milwaukee (City of) Redevelopment Authority (Academy of Learning & Leadership, Inc.); Series 2007 A, Education RB(g) | | | 5.50 | % | | | 08/01/22 | | | | 300 | | | | 89,889 | |
Superior (City of) (Superior Water, Light & Power Co.); Series 2007 B, Collateralized Utility RB(c) | | | 5.75 | % | | | 11/01/37 | | | | 4,000 | | | | 4,097,240 | |
Wisconsin (State of) Health & Educational Facilities Authority (AE Nursing Centers); | | | | | | | | | | | | | | | | |
Series 2008, RB | | | 7.15 | % | | | 06/01/28 | | | | 1,000 | | | | 1,038,290 | |
Series 2008, RB | | | 7.25 | % | | | 06/01/38 | | | | 1,000 | | | | 1,030,750 | |
Wisconsin (State of) Health & Educational Facilities Authority (Eastcastle Place, Inc.); Series 2004, RB | | | 6.13 | % | | | 12/01/34 | | | | 5,400 | | | | 3,785,940 | |
See accompanying Notes to Financial Statements which are an integral part of the financial statements.
47 Invesco High Yield Municipal Fund
| | | | | | | | | | | | | | | | |
| | | Interest Rate | | | Maturity Date | | | Principal Amount (000) | | | Value | |
| Wisconsin–(continued) | |
Wisconsin (State of) Health & Educational Facilities Authority (Middleton Glen, Inc.); | | | | | | | | | | | | | | | | |
Series 1998, RB | | | 5.75 | % | | | 10/01/18 | | | $ | 840 | | | $ | 841,075 | |
Series 1998, RB | | | 5.75 | % | | | 10/01/28 | | | | 2,485 | | | | 2,484,801 | |
Series 1998, Special Term RB | | | 5.90 | % | | | 10/01/28 | | | | 335 | | | | 335,017 | |
Wisconsin (State of) Health & Educational Facilities Authority (Southwest Health Center); | | | | | | | | | | | | | | | | |
Series 2004 A, RB(h)(i) | | | 6.13 | % | | | 04/01/14 | | | | 1,760 | | | | 1,769,680 | |
Series 2004 A, RB(h)(i) | | | 6.25 | % | | | 04/01/14 | | | | 2,775 | | | | 2,790,595 | |
Wisconsin (State of) Health & Educational Facilities Authority (St. John’s Community, Inc.); | | | | | | | | | | | | | | | | |
Series 2009 A, RB | | | 7.25 | % | | | 09/15/29 | | | | 4,000 | | | | 4,352,440 | |
Series 2009 A, RB | | | 7.63 | % | | | 09/15/39 | | | | 1,000 | | | | 1,100,620 | |
Wisconsin (State of) Health & Educational Facilities Authority (Wisconsin Illinois Senior Housing, Inc.); | | | | | | | | | | | | | | | | |
Series 2006, Ref. RB | | | 5.50 | % | | | 08/01/16 | | | | 1,280 | | | | 1,293,197 | |
Series 2006, Ref. RB | | | 5.80 | % | | | 08/01/29 | | | | 4,785 | | | | 4,601,878 | |
Series 2010, RB | | | 7.00 | % | | | 08/01/33 | | | | 2,000 | | | | 2,031,340 | |
Series 2012, RB | | | 5.75 | % | | | 08/01/35 | | | | 3,215 | | | | 2,900,348 | |
Series 2012, RB | | | 5.88 | % | | | 08/01/42 | | | | 2,660 | | | | 2,323,616 | |
Series 2013, RB | | | 7.00 | % | | | 08/01/43 | | | | 6,500 | | | | 6,526,130 | |
Wisconsin (State of) Public Finance Authority (Glenridge Palmer Ranch); | | | | | | | | | | | | | | | | |
Series 2011 A, Continuing Care Retirement Community RB | | | 7.00 | % | | | 06/01/20 | | | | 650 | | | | 723,483 | |
Series 2011 A, Continuing Care Retirement Community RB | | | 7.75 | % | | | 06/01/28 | | | | 7,980 | | | | 8,877,351 | |
Series 2011 A, Continuing Care Retirement Community RB | | | 8.00 | % | | | 06/01/35 | | | | 10,150 | | | | 11,302,228 | |
Series 2011 A, Continuing Care Retirement Community RB | | | 8.25 | % | | | 06/01/46 | | | | 4,000 | | | | 4,474,040 | |
Wisconsin (State of) Public Finance Authority (Roseman University of Health Sciences); Series 2012, RB | | | 5.75 | % | | | 04/01/42 | | | | 3,590 | | | | 3,473,325 | |
Wisconsin (State of) Public Finance Authority (Voyager Foundation Inc.); | | | | | | | | | | | | | | | | |
Series 2012 A, Charter School RB | | | 5.50 | % | | | 10/01/22 | | | | 775 | | | | 776,535 | |
Series 2012 A, Charter School RB | | | 6.00 | % | | | 10/01/32 | | | | 1,475 | | | | 1,409,746 | |
Series 2012 A, Charter School RB | | | 6.20 | % | | | 10/01/42 | | | | 1,300 | | | | 1,225,484 | |
| | | | | | | | | | | | | | | | 79,035,038 | |
|
| Wyoming–0.11% | |
West Park Hospital District (West Park Hospital); | | | | | | | | | | | | | | | | |
Series 2011, Ref. RB | | | 7.00 | % | | | 06/01/35 | | | | 1,085 | | | | 1,226,896 | |
Series 2011 A, RB | | | 7.00 | % | | | 06/01/40 | | | | 4,890 | | | | 5,504,038 | |
| | | | | | | | | | | | | | | | 6,730,934 | |
Total Municipal Obligations (Cost $6,622,988,928) | | | | | | | | | | | | | | | 6,549,510,702 | |
|
U.S. Dollar Denominated Bonds and Notes–0.00% | |
| Specialized Consumer Services–0.00% | |
Sear Tyler Methodist Retirement Corp., Sub. Notes (Acquired 02/25/13; Cost $0)(f) | | | 2.00 | % | | | 02/25/48 | | | | 135 | | | | 0 | |
TOTAL INVESTMENTS(p)–107.77% (Cost $6,622,988,928) | | | | | | | | | | | | | | | 6,549,510,702 | |
FLOATING RATE NOTE OBLIGATIONS–(8.38)% | | | | | | | | | | | | | | | | |
Notes with interest and fee rates ranging from 0.55% to 1.30% at 02/28/14 and contractual maturities of collateral ranging from 07/01/22 to 04/01/53 (See Note 1J)(q) | | | | | | | | | | | | | | | (509,605,000 | ) |
OTHER ASSETS LESS LIABILITIES–0.61% | | | | | | | | | | | | | | | 37,279,186 | |
NET ASSETS–100.00% | | | | | | | | | | | | | | $ | 6,077,184,888 | |
See accompanying Notes to Financial Statements which are an integral part of the financial statements.
48 Invesco High Yield Municipal Fund
Investment Abbreviations:
| | |
| ACA | | – ACA Financial Guaranty Corp. |
| AGC | | – Assured Guaranty Corp. |
| AGM | | – Assured Guaranty Municipal Corp. |
| AMBAC | | – American Municipal Bond Assurance Corp. |
| BAN | | – Bond Anticipation Notes |
| BHAC | | – Berkshire Hathaway Assurance Corp. |
| CAB | | – Capital Appreciation Bonds |
| CEP | | – Credit Enhancement Provider |
| Connie Lee | | – Connie Lee Insurance Co. |
| Conv. | | – Convertible |
| COP | | – Certificates of Participation |
| Ctfs. | | – Certificates |
| FGIC | | – Financial Guaranty Insurance Co. |
| GNMA | | – Government National Mortgage Association |
| GO | | – General Obligation |
| IDR | | – Industrial Development Revenue Bonds |
| INS | | – Insurer |
| Jr. | | – Junior |
| LOC | | – Letter of Credit |
| MBTC | | – Municipal Bond Trust Certificates |
| MFH | | – Multi-Family Housing |
| NATL | | – National Public Finance Guarantee Corp. |
| PCR | | – Pollution Control Revenue Bonds |
| PILOT | | – Payment-in-Lieu-of-Tax |
| RAC | | – Revenue Anticipation Certificates |
| Radian | | – Radian Asset Assurance, Inc. |
| RB | | – Revenue Bonds |
| Ref. | | – Refunding |
| RN | | – Revenue Notes |
| Sec. | | – Secured |
| SGI | | – Syncora Guarantee, Inc. |
| Sr. | | – Senior |
| Sub. | | – Subordinated |
| TEMPS | | – Tax-Exempt Mandatory Paydown Securities |
| VRD | | – Variable Rate Demand |
| Wts. | | – Warrants |
Notes to Schedule of Investments:
| (a) | Principal and/or interest payments are secured by the bond insurance company listed. |
| (b) | Convertible CAB. The interest rate shown represents the coupon rate at which the bond will accrue at a specified future date. |
| (c) | Security subject to the alternative minimum tax. |
| (d) | Zero coupon bond issued at a discount. |
| (e) | Underlying security related to Dealer Trusts entered into by the Fund. See Note 1J. |
| (f) | Security purchased or received in a transaction exempt from registration under the Securities Act of 1933, as amended (the “1933 Act”). The security may be resold pursuant to an exemption from registration under the 1933 Act, typically to qualified institutional buyers. The aggregate value of these securities at February 28, 2014 was $278,474,925, which represented 4.58% of the Fund’s Net Assets. |
| (g) | Defaulted security. Currently, the issuer is in default with respect to principal and interest payments. The aggregate value of these securities at February 28, 2014 was $71,522,083, which represented 1.18% of the Fund’s Net Assets. |
| (h) | Security has an irrevocable call by the issuer or mandatory put by the holder. Maturity date reflects such call or put. |
| (i) | Advance refunded; secured by an escrow fund of U.S. Government obligations or other highly rated collateral. |
| (j) | Defaulted security. Currently, the issuer is partially or fully in default with respect to interest payments. The aggregate value of these securities at February 28, 2014 was $27,113,819, which represented less than 1% of the Fund’s Net Assets. |
| (k) | The issuer is paying less than stated interest, but is not in default on principal because scheduled principal payments have not yet begun. |
| (l) | Interest or dividend rate is redetermined periodically. Rate shown is the rate in effect on February 28, 2014. |
| (m) | Demand security payable upon demand by the Fund at specified time intervals no greater than thirteen months. Interest rate is redetermined periodically. Rate shown is the rate in effect on February 28, 2014. |
| (n) | Principal and interest payments are fully enhanced by a letter of credit from the bank listed or a predecessor bank, branch or subsidiary. |
| (o) | Current coupon rate for an inverse floating rate municipal obligation. This rate resets periodically as the rate on the related security changes. Positions in an inverse floating rate municipal obligation have a total value of $2,508,050 which represents less than 1% of the Fund’s Net Assets. |
| (p) | Entities may either issue, guarantee, back or otherwise enhance the credit quality of a security. The entities are not primarily responsible for the issuer’s obligation but may be called upon to satisfy issuer’s obligations. No concentration of any single entity was greater than 5%. |
| (q) | Floating rate note obligations related to securities held. The interest and fee rates shown reflect the rates in effect at February 28, 2014. At February 28, 2014, the Fund’s investments with a value of $870,661,630 are held by Dealer Trusts and serve as collateral for the $509,605,000 in the floating rate note obligations outstanding at that date. |
| (r) | Restructured security not accruing interest income. |
See accompanying Notes to Financial Statements which are an integral part of the financial statements.
49 Invesco High Yield Municipal Fund
Statement of Assets and Liabilities
February 28, 2014
| | | | |
Assets: | |
Investments, at value (Cost $6,622,988,928) | | $ | 6,549,510,702 | |
Receivable for: | | | | |
Investments sold | | | 56,129,322 | |
Fund shares sold | | | 32,720,760 | |
Interest | | | 103,463,384 | |
Investment for trustee deferred compensation and retirement plans | | | 573,421 | |
Other assets | | | 76,750 | |
Total assets | | | 6,742,474,339 | |
|
Liabilities: | |
Floating rate note obligations | | | 509,605,000 | |
Payable for: | | | | |
Investments purchased | | | 110,719,015 | |
Fund shares reacquired | | | 8,162,820 | |
Amount due custodian | | | 20,808,416 | |
Dividends | | | 12,379,482 | |
Accrued fees to affiliates | | | 2,395,981 | |
Accrued trustees’ and officers’ fees and benefits | | | 12,006 | |
Accrued other operating expenses | | | 524,224 | |
Trustee deferred compensation and retirement plans | | | 682,507 | |
Total liabilities | | | 665,289,451 | |
Net assets applicable to shares outstanding | | $ | 6,077,184,888 | |
|
Net assets consist of: | |
Shares of beneficial interest | | $ | 6,980,940,494 | |
Undistributed net investment income | | | 14,235,017 | |
Undistributed net realized gain (loss) | | | (844,512,397 | ) |
Net unrealized appreciation (depreciation) | | | (73,478,226 | ) |
| | | $ | 6,077,184,888 | |
| | | | |
Net Assets: | |
Class A | | $ | 4,317,516,202 | |
Class B | | $ | 85,968,755 | |
Class C | | $ | 991,078,565 | |
Class Y | | $ | 679,827,035 | |
Class R5 | | $ | 2,794,331 | |
|
Shares outstanding, $0.001 par value per share,
with an unlimited number of shares authorized: | |
Class A | | | 459,856,042 | |
Class B | | | 9,114,311 | |
Class C | | | 105,844,690 | |
Class Y | | | 72,276,941 | |
Class R5 | | | 297,054 | |
Class A: | | | | |
Net asset value per share | | $ | 9.39 | |
Maximum offering price per share | | | | |
(Net asset value of $9.39 ¸ 95.75%) | | $ | 9.81 | |
Class B: | | | | |
Net asset value and offering price per share | | $ | 9.43 | |
Class C: | | | | |
Net asset value and offering price per share | | $ | 9.36 | |
Class Y: | | | | |
Net asset value and offering price per share | | $ | 9.41 | |
Class R5: | | | | |
Net asset value and offering price per share | | $ | 9.41 | |
See accompanying Notes to Financial Statements which are an integral part of the financial statements.
50 Invesco High Yield Municipal Fund
Statement of Operations
For the year ended February 28, 2014
| | | | |
Investment income: | |
Interest | | $ | 404,165,968 | |
| |
Expenses: | | | | |
Advisory fees | | | 31,555,670 | |
Administrative services fees | | | 656,634 | |
Custodian fees | | | 131,745 | |
Distribution fees: | | | | |
Class A | | | 11,064,743 | |
Class B | | | 258,168 | |
Class C | | | 10,486,468 | |
Interest, facilities and maintenance fees | | | 3,209,039 | |
Transfer agent fees — A, B, C and Y | | | 3,176,250 | |
Transfer agent fees — R5 | | | 2,417 | |
Trustees’ and officers’ fees and benefits | | | 329,251 | |
Other | | | 2,832,344 | |
Total expenses | | | 63,702,729 | |
Less: Expense offset arrangement(s) | | | (1,480 | ) |
Net expenses | | | 63,701,249 | |
Net investment income | | | 340,464,719 | |
| |
Realized and unrealized gain (loss) from: | | | | |
Net realized gain (loss) from investment securities | | | (138,476,585 | ) |
Change in net unrealized appreciation (depreciation) of investment securities | | | (388,175,506 | ) |
Net realized and unrealized gain (loss) | | | (526,652,091 | ) |
Net increase (decrease) in net assets resulting from operations | | $ | (186,187,372 | ) |
See accompanying Notes to Financial Statements which are an integral part of the financial statements.
51 Invesco High Yield Municipal Fund
Statement of Changes in Net Assets
For the years ended February 28, 2014 and 2013
| | | | | | | | |
| | | 2014 | | | 2013 | |
Operations: | | | | | |
Net investment income | | $ | 340,464,719 | | | $ | 348,142,655 | |
Net realized gain (loss) | | | (138,476,585 | ) | | | (29,019,109 | ) |
Change in net unrealized appreciation (depreciation) | | | (388,175,506 | ) | | | 350,208,027 | |
Net increase (decrease) in net assets resulting from operations | | | (186,187,372 | ) | | | 669,331,573 | |
| | |
Distributions to shareholders from net investment income: | | | | | | | | |
Class A | | | (246,029,075 | ) | | | (258,944,546 | ) |
Class B | | | (5,721,666 | ) | | | (8,723,241 | ) |
Class C | | | (51,045,412 | ) | | | (55,954,425 | ) |
Class Y | | | (36,784,054 | ) | | | (43,158,720 | ) |
Class R5 | | | (348,251 | ) | | | (893,935 | ) |
Total distributions from net investment income | | | (339,928,458 | ) | | | (367,674,867 | ) |
| | |
Share transactions–net: | | | | | | | | |
Class A | | | (285,028,270 | ) | | | 1,006,461,833 | |
Class B | | | (37,113,640 | ) | | | (37,640,385 | ) |
Class C | | | (152,696,047 | ) | | | 304,209,275 | |
Class Y | | | (198,103,303 | ) | | | 456,744,618 | |
Class R5 | | | (4,937,915 | ) | | | 7,430,359 | |
Net increase (decrease) in net assets resulting from share transactions | | | (677,879,175 | ) | | | 1,737,205,700 | |
Net increase (decrease) in net assets | | | (1,203,995,005 | ) | | | 2,038,862,406 | |
| | |
Net assets: | | | | | | | | |
Beginning of year | | | 7,281,179,893 | | | | 5,242,317,487 | |
End of year (includes undistributed net investment income of $14,235,017 and $15,862,455, respectively) | | $ | 6,077,184,888 | | | $ | 7,281,179,893 | |
Notes to Financial Statements
February 28, 2014
NOTE 1—Significant Accounting Policies
Invesco High Yield Municipal Fund (the “Fund”) is a series portfolio of AIM Tax-Exempt Funds (Invesco Tax-Exempt Funds) (the “Trust”). The Trust is a Delaware statutory trust registered under the Investment Company Act of 1940, as amended (the “1940 Act”), as an open-end series management investment company consisting of six separate portfolios, each authorized to issue an unlimited number of shares of beneficial interest. The assets, liabilities and operations of each portfolio are accounted for separately. Information presented in these financial statements pertains only to the Fund. Matters affecting each portfolio or class will be voted on exclusively by the shareholders of such portfolio or class.
The Fund’s investment objective is to seek federal tax-exempt current income and taxable capital appreciation.
The Fund currently consists of five different classes of shares: Class A, Class B, Class C, Class Y and Class R5. Class A shares are sold with a front-end sales charge unless certain waiver criteria are met and under certain circumstances load waived shares may be subject to contingent deferred sales charges (“CDSC”). Class C shares are sold with a CDSC. Class Y and Class R5 shares are sold at net asset value. Effective November 30, 2010, new or additional investments in Class B shares are no longer permitted. Existing shareholders of Class B shares may continue to reinvest dividends and capital gains distributions in Class B shares until they convert to Class A shares. Also, shareholders in Class B shares will be able to exchange those shares for Class B shares of other Invesco Funds offering such shares until they convert to Class A shares. Generally, Class B shares will automatically convert to Class A shares on or about the month-end, which is at least eight years after the date of purchase. Redemption of Class B shares prior to the conversion date will be subject to a CDSC.
As of the opening of business on June 28, 2013, the Fund has reopened public sales of Class A, Class C, Class Y and Class R5 shares to new investors.
The following is a summary of the significant accounting policies followed by the Fund in the preparation of its financial statements.
| A. | Security Valuations — Securities, including restricted securities, are valued according to the following policy. |
Securities are fair valued using an evaluated quote provided by an independent pricing service approved by the Board of Trustees. Evaluated quotes provided by the pricing service may be determined without exclusive reliance on quoted prices, and may reflect appropriate factors such as institution-size trading in similar groups of securities, developments related to specific securities, dividend rate (for unlisted equities), yield (for debt obligations), quality, type of issue, coupon rate (for debt obligations), maturity (for debt obligations), individual trading characteristics and other market data. Debt obligations are subject to interest rate and credit risks. In addition, all debt obligations involve some risk of default with respect to interest and/or principal payments.
52 Invesco High Yield Municipal Fund
Securities for which market quotations either are not readily available or became unreliable are valued at fair value as determined in good faith by or under the supervision of the Trust’s officers following procedures approved by the Board of Trustees. Some of the factors which may be considered in determining fair value are fundamental analytical data relating to the investment; the nature and duration of any restrictions on transferability or disposition; trading in similar securities by the same issuer or comparable companies; relevant political, economic or issuer specific news; and other relevant factors under the circumstances.
The Fund invests in securities that are subject to interest rate risk, meaning the risk that the prices will generally fall as interest rates rise and, conversely, the prices will generally rise as interest rates fall. Specific securities differ in their sensitivity to changes in interest rates depending on their individual characteristics. Changes in interest rates may result in increased market volatility, which may affect the value and/or liquidity of certain of the Fund’s investments.
Valuations change in response to many factors including the historical and prospective earnings of the issuer, the value of the issuer’s assets, general economic conditions, interest rates, investor perceptions and market liquidity. Because of the inherent uncertainties of valuation, the values reflected in the financial statements may materially differ from the value received upon actual sale of those investments.
| B. | Securities Transactions and Investment Income — Securities transactions are accounted for on a trade date basis. Realized gains or losses on sales are computed on the basis of specific identification of the securities sold. Interest income is recorded on the accrual basis from settlement date. Paydown gains and losses on mortgage and asset-backed securities are recorded as adjustments to interest income. Dividend income (net of withholding tax, if any) is recorded on the ex-dividend date. Bond premiums and discounts are amortized and/or accreted for financial reporting purposes. |
The Fund may periodically participate in litigation related to Fund investments. As such, the Fund may receive proceeds from litigation settlements. Any proceeds received are included in the Statement of Operations as realized gain (loss) for investments no longer held and as unrealized gain (loss) for investments still held.
Brokerage commissions and mark ups are considered transaction costs and are recorded as an increase to the cost basis of securities purchased and/or a reduction of proceeds on a sale of securities. Such transaction costs are included in the determination of net realized and unrealized gain (loss) from investment securities reported in the Statement of Operations and the Statement of Changes in Net Assets and the net realized and unrealized gains (losses) on securities per share in the Financial Highlights. Transaction costs are included in the calculation of the Fund’s net asset value and, accordingly, they reduce the Fund’s total returns. These transaction costs are not considered operating expenses and are not reflected in net investment income reported in the Statement of Operations and Statement of Changes in Net Assets, or the net investment income per share and ratios of expenses and net investment income reported in the Financial Highlights, nor are they limited by any expense limitation arrangements between the Fund and the investment adviser.
The Fund allocates realized and unrealized capital gains and losses to a class based on the relative net assets of each class. The Fund allocates income to a class based on the relative value of the settled shares of each class.
| C. | Country Determination — For the purposes of making investment selection decisions and presentation in the Schedule of Investments, the investment adviser may determine the country in which an issuer is located and/or credit risk exposure based on various factors. These factors include the laws of the country under which the issuer is organized, where the issuer maintains a principal office, the country in which the issuer derives 50% or more of its total revenues and the country that has the primary market for the issuer’s securities, as well as other criteria. Among the other criteria that may be evaluated for making this determination are the country in which the issuer maintains 50% or more of its assets, the type of security, financial guarantees and enhancements, the nature of the collateral and the sponsor organization. Country of issuer and/or credit risk exposure has been determined to be the United States of America, unless otherwise noted. |
| D. | Distributions — Distributions from income are declared daily and paid monthly. Distributions from net realized capital gain, if any, are generally declared and paid annually and recorded on the ex-dividend date. The Fund may elect to treat a portion of the proceeds from redemptions as distributions for federal income tax purposes. |
| E. | Federal Income Taxes — The Fund intends to comply with the requirements of Subchapter M of the Internal Revenue Code of 1986, as amended (the “Internal Revenue Code”), necessary to qualify as a regulated investment company and to distribute substantially all of the Fund’s taxable and tax-exempt earnings to shareholders. As such, the Fund will not be subject to federal income taxes on otherwise taxable income (including net realized capital gain) that is distributed to shareholders. Therefore, no provision for federal income taxes is recorded in the financial statements. |
The Fund recognizes the tax benefits of uncertain tax positions only when the position is more likely than not to be sustained. Management has analyzed the Fund’s uncertain tax positions and concluded that no liability for unrecognized tax benefits should be recorded related to uncertain tax positions. Management is not aware of any tax positions for which it is reasonably possible that the total amounts of unrecognized tax benefits will change materially in the next 12 months.
In addition, the Fund intends to invest in such municipal securities to allow it to qualify to pay shareholders “exempt-interest dividends”, as defined in the Internal Revenue Code.
The Fund files tax returns in the U.S. Federal jurisdiction and certain other jurisdictions. Generally, the Fund is subject to examinations by such taxing authorities for up to three years after the filing of the return for the tax period.
| F. | Expenses — Fees provided for under the Rule 12b-1 plan of a particular class of the Fund are charged to the operations of such class. Transfer agency fees and expenses and other shareholder recordkeeping fees and expenses attributable to Class R5 are charged to such class. Transfer agency fees and expenses and other shareholder recordkeeping fees and expenses relating to all other classes are allocated among those classes based on relative net assets. All other expenses are allocated among the classes based on relative net assets. Prior to June 1, 2010, incremental transfer agency fees which were unique to each class of shares were charged to the operations of such class. |
| G. | Interest, Facilities and Maintenance Fees — Interest, Facilities and Maintenance Fees include interest and related borrowing costs such as commitment fees and other expenses associated with lines of credit and interest and administrative expenses related to establishing and maintaining floating rate note obligations, if any. |
| H. | Accounting Estimates — The preparation of financial statements in conformity with accounting principles generally accepted in the United States of America (“GAAP”) requires management to make estimates and assumptions that affect the reported amounts of assets and liabilities at the date of the financial statements and the reported amounts of revenues and expenses during the reporting period including estimates and assumptions related to taxation. Actual results could differ from those estimates by a significant amount. In addition, the Fund |
53 Invesco High Yield Municipal Fund
| | monitors for material events or transactions that may occur or become known after the period-end date and before the date the financial statements are released to print. |
| I. | Indemnifications — Under the Trust’s organizational documents, each Trustee, officer, employee or other agent of the Trust is indemnified against certain liabilities that may arise out of the performance of their duties to the Fund. Additionally, in the normal course of business, the Fund enters into contracts, including the Fund’s servicing agreements, that contain a variety of indemnification clauses. The Fund’s maximum exposure under these arrangements is unknown as this would involve future claims that may be made against the Fund that have not yet occurred. The risk of material loss as a result of such indemnification claims is considered remote. |
| J. | Floating Rate Note Obligations — The Fund invests in inverse floating rate securities, such as Residual Interest Bonds (“RIBs”), Tender Option Bonds (“TOBs”) or Municipal Bond Trust Certificates (“MBTCs”) for investment purposes and to enhance the yield of the Fund. Inverse floating rate investments tend to underperform the market for fixed rate bonds in a rising interest rate environment, but tend to outperform the market for fixed rate bonds when interest rates decline or remain relatively stable. Such transactions may be purchased in the secondary market without first owning the underlying bond or by the sale of fixed rate bonds by the Fund to special purpose trusts established by a broker dealer (“Dealer Trusts”) in exchange for cash and residual interests in the Dealer Trusts’ assets and cash flows, which are in the form of inverse floating rate securities. The Dealer Trusts finance the purchases of the fixed rate bonds by issuing floating rate notes to third parties and allowing the Fund to retain residual interests in the bonds. The floating rate notes issued by the Dealer Trusts have interest rates that reset weekly and the floating rate note holders have the option to tender their notes to the Dealer Trusts for redemption at par at each reset date. The residual interests held by the Fund (inverse floating rate investments) include the right of the Fund (1) to cause the holders of the floating rate notes to tender their notes at par at the next interest rate reset date, and (2) to transfer the municipal bond from the Dealer Trusts to the Fund, thereby collapsing the Dealer Trusts. MBTCs, unlike RIBs and TOBs, enforce a mandatory collapse of the Dealer Trust after a three year term. |
Recently published final rules implementing section 619 of the Dodd-Frank Wall Street Reform and Consumer Protection Act (the “Volcker Rule”) prohibit banking entities from engaging in proprietary trading of certain instruments and limit such entities’ investments in, and relationships with, “covered funds.” These rules may preclude banking entities from sponsoring and/or providing services for existing TOB trust programs. There can be no assurances that TOB trusts can be restructured substantially similar to their present form, that new sponsors of TOB trusts would begin providing these services, or that alternative forms of leverage will be available to the Fund in order to maintain current levels of leverage. Any alternative forms of leverage may be less advantageous to the Fund, and may adversely affect the Fund’s net asset value, distribution rate and ability to achieve its investment objective. The ultimate impact of these rules on the TOBs market and the municipal market generally is not yet certain.
TOBs are presently classified as private placement securities. Private placement securities are subject to restrictions on resale because they have not been registered under the Securities Act of 1933 (the “1933 Act”), as amended, or are otherwise not readily marketable. As a result of the absence of a public trading market for these securities, they may be less liquid than publicly traded securities. Although these securities may be resold in privately negotiated transactions, the prices realized from these sales could be less than those originally paid by the Fund or less than what may be considered the fair value of such securities.
The Fund accounts for the transfer of bonds to the Dealer Trusts as secured borrowings, with the securities transferred remaining in the Fund’s investment assets, and the related floating rate notes reflected as Fund liabilities under the caption Floating rate note obligations on the Statement of Assets and Liabilities. The Fund records the interest income from the fixed rate bonds under the caption Interest and records the expenses related to floating rate obligations and any administrative expenses of the Dealer Trusts as a component of Interest, facilities and maintenance fees on the Statement of Operations.
The Fund generally invests in inverse floating rate securities that include embedded leverage, thus exposing the Fund to greater risks and increased costs. The primary risks associated with inverse floating rate securities are varying degrees of liquidity and the changes in the value of such securities in response to changes in market rates of interest to a greater extent than the value of an equal principal amount of a fixed rate security having similar credit quality, redemption provisions and maturity which may cause the Fund’s net asset value to be more volatile than if it had not invested in inverse floating rate securities. In certain instances, the short-term floating rate interests created by the special purpose trust may not be able to be sold to third parties or, in the case of holders tendering (or putting) such interests for repayment of principal, may not be able to be remarketed to third parties. In such cases, the special purpose trust holding the long-term fixed rate bonds may be collapsed. In the case of RIBs, TOBs or MBTCs created by the contribution of long-term fixed income bonds by the Fund, the Fund will then be required to repay the principal amount of the tendered securities. During times of market volatility, illiquidity or uncertainty, the Fund could be required to sell other portfolio holdings at a disadvantageous time to raise cash to meet that obligation.
| K. | Other Risks — The value of, payment of interest on, repayment of principal for and the ability to sell a municipal security may be affected by constitutional amendments, legislative enactments, executive orders, administrative regulations, voter initiatives and the economics of the regions in which the issuers are located. |
Since many municipal securities are issued to finance similar projects, especially those relating to education, health care, transportation and utilities, conditions in those sectors can affect the overall municipal securities market and a Fund’s investments in municipal securities.
There is some risk that a portion or all of the interest received from certain tax-free municipal securities could become taxable as a result of determinations by the Internal Revenue Service.
NOTE 2—Advisory Fees and Other Fees Paid to Affiliates
The Trust has entered into a master investment advisory agreement with Invesco Advisers, Inc. (the “Adviser” or “Invesco”). Under the terms of the investment advisory agreement, the Fund pays an advisory fee to the Adviser based on the annual rate of the Fund’s average daily net assets as follows:
| | | | |
| Average Daily Net Assets | | Rate | |
First $300 million | | | 0.60% | |
Next $300 million | | | 0.55% | |
Over $600 million | | | 0.50% | |
54 Invesco High Yield Municipal Fund
Under the terms of a master sub-advisory agreement between the Adviser and each of Invesco Asset Management Deutschland GmbH, Invesco Asset Management Limited, Invesco Asset Management (Japan) Limited, Invesco Australia Limited, Invesco Hong Kong Limited, Invesco Senior Secured Management, Inc. and Invesco Canada Ltd. (collectively, the “Affiliated Sub-Advisers”) the Adviser, not the Fund, may pay 40% of the fees paid to the Adviser to any such Affiliated Sub-Adviser(s) that provide(s) discretionary investment management services to the Fund based on the percentage of assets allocated to such Sub-Adviser(s).
The Adviser has contractually agreed, through at least June 30, 2014, to waive advisory fees and/or reimburse expenses of all shares to the extent necessary to limit total annual fund operating expenses after fee waiver and/or expense reimbursement (excluding certain items discussed below) of Class A, Class B, Class C, Class Y and Class R5 shares to 1.50%, 2.25%, 2.25%, 1.25% and 1.25%, respectively, of average daily net assets. In determining the Adviser’s obligation to waive advisory fees and/or reimburse expenses, the following expenses are not taken into account, and could cause the total annual fund operating expenses after fee waiver and/or expense reimbursement to exceed the numbers reflected above: (1) interest, facilities and maintenance fees; (2) taxes; (3) dividend expense on short sales; (4) extraordinary or non-routine items, including litigation expenses; and (5) expenses that the Fund has incurred but did not actually pay because of an expense offset arrangement. Unless Invesco continues the fee waiver agreement, it will terminate on June 30, 2014. The fee waiver agreement cannot be terminated during its term. The Adviser did not waive fees and/or reimburse expenses during the period under the expense limitation.
The Trust has entered into a master administrative services agreement with Invesco pursuant to which the Fund has agreed to pay Invesco for certain administrative costs incurred in providing accounting services to the Fund. For the year ended February 28, 2014, expenses incurred under the agreement are shown in the Statement of Operations as Administrative services fees.
The Trust has entered into a transfer agency and service agreement with Invesco Investment Services, Inc. (“IIS”) pursuant to which the Fund has agreed to pay IIS a fee for providing transfer agency and shareholder services to the Fund and reimburse IIS for certain expenses incurred by IIS in the course of providing such services. IIS may make payments to intermediaries that provide omnibus account services, sub-accounting services and/or networking services. All fees payable by IIS to intermediaries that provide omnibus account services or sub-accounting are charged back to the Fund, subject to certain limitations approved by the Trust’s Board of Trustees. For the year ended February 28, 2014, expenses incurred under the agreement are shown in the Statement of Operations as Transfer agent fees.
Shares of the Fund are distributed by Invesco Distributors, Inc. (“IDI”). The Fund has adopted a distribution plan pursuant to Rule 12b-1 under the 1940 Act, and a service plan (collectively, the “Plans”) for Class A shares, Class B shares and Class C shares to compensate IDI for the sale, distribution, shareholder servicing and maintenance of shareholder accounts for these shares. Under the Plans, the Fund will incur annual fees of up to 0.25% of Class A average daily net assets and up to 1.00% each of Class B and Class C average daily net assets.
With respect to Class B and Class C shares, the Fund is authorized to reimburse in future years any distribution related expenses that exceed the maximum annual reimbursement rate for such class, so long as such reimbursement does not cause the Fund to exceed the Class B and Class C maximum annual reimbursement rate, respectively. With respect to Class A shares, distribution related expenses that exceed the maximum annual reimbursement rate for such class are not carried forward to future years and the Fund will not reimburse IDI for any such expenses.
For the year ended February 28, 2014, expenses incurred under these agreements are shown in the Statement of Operations as Distribution fees.
Front-end sales commissions and CDSC (collectively, the “sales charges”) are not recorded as expenses of the Fund. Front-end sales commissions are deducted from proceeds from the sales of Fund shares prior to investment in Class A shares of the Fund. CDSC are deducted from redemption proceeds prior to remittance to the shareholder. During the year ended February 28, 2014, IDI advised the Fund that IDI retained $749,176 in front-end sales commissions from the sale of Class A shares and $393,389, $120,305 and $139,953 from Class A, Class B and Class C shares, respectively, for CDSC imposed on redemptions by shareholders.
Certain officers and trustees of the Trust are officers and directors of the Adviser, IIS and/or IDI.
NOTE 3—Additional Valuation Information
GAAP defines fair value as the price that would be received to sell an asset or paid to transfer a liability in an orderly transaction between market participants at the measurement date, under current market conditions. GAAP establishes a hierarchy that prioritizes the inputs to valuation methods, giving the highest priority to readily available unadjusted quoted prices in an active market for identical assets (Level 1) and the lowest priority to significant unobservable inputs (Level 3), generally when market prices are not readily available or are unreliable. Based on the valuation inputs, the securities or other investments are tiered into one of three levels. Changes in valuation methods may result in transfers in or out of an investment’s assigned level:
| | Level 1 — | Prices are determined using quoted prices in an active market for identical assets. |
| | Level 2 — | Prices are determined using other significant observable inputs. Observable inputs are inputs that other market participants may use in pricing a security. These may include quoted prices for similar securities, interest rates, prepayment speeds, credit risk, yield curves, loss severities, default rates, discount rates, volatilities and others. |
| | Level 3 — | Prices are determined using significant unobservable inputs. In situations where quoted prices or observable inputs are unavailable (for example, when there is little or no market activity for an investment at the end of the period), unobservable inputs may be used. Unobservable inputs reflect the Fund’s own assumptions about the factors market participants would use in determining fair value of the securities or instruments and would be based on the best available information. |
The following is a summary of the tiered valuation input levels, as of February 28, 2014. The level assigned to the securities valuations may not be an indication of the risk or liquidity associated with investing in those securities. Because of the inherent uncertainties of valuation, the values reflected in the financial statements may materially differ from the value received upon actual sale of those investments.
| | | | | | | | | | | | | | | | |
| | | Level 1 | | | Level 2 | | | Level 3 | | | Total | |
Municipal Obligations | | $ | — | | | $ | 6,549,510,702 | | | $ | — | | | $ | 6,549,510,702 | |
Bonds and Notes | | | — | | | | — | | | | 0 | | | | 0 | |
Total Investments | | $ | — | | | $ | 6,549,510,702 | | | $ | 0 | | | $ | 6,549,510,702 | |
55 Invesco High Yield Municipal Fund
NOTE 4—Security Transactions with Affiliated Funds
The Fund is permitted to purchase or sell securities from or to certain other Invesco Funds under specified conditions outlined in procedures adopted by the Board of Trustees of the Trust. The procedures have been designed to ensure that any purchase or sale of securities by the Fund from or to another fund or portfolio that is or could be considered an affiliate by virtue of having a common investment adviser (or affiliated investment advisers), common Trustees and/or common officers complies with Rule 17a-7 of the 1940 Act. Further, as defined under the procedures, each transaction is effected at the current market price. Pursuant to these procedures, for the year ended February 28, 2014, the Fund engaged in securities purchases of $1,429,023.
NOTE 5—Expense Offset Arrangement(s)
The expense offset arrangement is comprised of transfer agency credits which result from balances in demand deposit accounts used by the transfer agent for clearing shareholder transactions. For the year ended February 28, 2014, the Fund received credits from this arrangement, which resulted in the reduction of the Fund’s total expenses of $1,480.
NOTE 6—Trustees’ and Officers’ Fees and Benefits
Trustees’ and Officers’ Fees and Benefits include amounts accrued by the Fund to pay remuneration to certain Trustees and Officers of the Fund. Trustees have the option to defer compensation payable by the Fund, and Trustees’ and Officers’ Fees and Benefits also include amounts accrued by the Fund to fund such deferred compensation amounts. Those Trustees who defer compensation have the option to select various Invesco Funds in which their deferral accounts shall be deemed to be invested. Finally, certain current Trustees were eligible to participate in a retirement plan that provided for benefits to be paid upon retirement to Trustees over a period of time based on the number of years of service. The Fund may have certain former Trustees who also participate in a retirement plan and receive benefits under such plan. Trustees’ and Officers’ Fees and Benefits include amounts accrued by the Fund to fund such retirement benefits. Obligations under the deferred compensation and retirement plans represent unsecured claims against the general assets of the Fund.
NOTE 7—Cash Balances and Borrowings
The Fund is permitted to temporarily carry a negative or overdrawn balance in its account with State Street Bank and Trust Company (“SSB”), the custodian bank. Such balances, if any at period end, are shown in the Statement of Assets and Liabilities under the payable caption Amount due custodian. To compensate the custodian bank for such overdrafts, the overdrawn Fund may either (1) leave funds as a compensating balance in the account so the custodian bank can be compensated by earning the additional interest; or (2) compensate by paying the custodian bank at a rate agreed upon by the custodian bank and Invesco, not to exceed the contractually agreed upon rate.
Inverse floating rate obligations resulting from the transfer of bonds to Dealer Trusts are accounted for as secured borrowings. The average floating rate notes outstanding and average annual interest and fee rate related to inverse floating rate note obligations during the year ended February 28, 2014 were $557,855,615 and 0.58%, respectively.
NOTE 8—Distributions to Shareholders and Tax Components of Net Assets
Tax Character of Distributions to Shareholders Paid During the Years Ended February 28, 2014 and 2013:
| | | | | | | | |
| | | 2014 | | | 2013 | |
Ordinary income — tax-exempt | | $ | 339,928,458 | | | $ | 367,674,867 | |
Tax Components of Net Assets at Period-End:
| | | | |
| | | 2014 | |
Undistributed ordinary income | | $ | 17,875,366 | |
Net unrealized appreciation (depreciation) — investments | | | (104,799,964 | ) |
Temporary book/tax differences | | | (653,858 | ) |
Capital loss carryforward | | | (816,177,150 | ) |
Shares of beneficial interest | | | 6,980,940,494 | |
Total net assets | | $ | 6,077,184,888 | |
The difference between book-basis and tax-basis unrealized appreciation (depreciation) is due to differences in the timing of recognition of gains and losses on investments for tax and book purposes. The Fund’s net unrealized appreciation (depreciation) difference is attributable primarily to wash sales, TOBs, book to tax accretion and amortization differences and defaulted securities.
The temporary book/tax differences are a result of timing differences between book and tax recognition of income and/or expenses. The Fund’s temporary book/tax differences are the result of the trustee deferral of compensation and retirement plan benefits.
Capital loss carryforward is calculated and reported as of a specific date. Results of transactions and other activity after that date may affect the amount of capital loss carryforward actually available for the Fund to utilize. Capital losses generated in years beginning after December 22, 2010 can be carried forward for an unlimited period, whereas previous losses expire in 8 tax years. Capital losses with an expiration period may not be used to offset capital gains until all net capital losses without an expiration date have been utilized. Capital loss carryforwards with no expiration date will retain their character as either short-term or long-term capital losses instead of as short-term capital losses as under prior law. The ability to utilize capital loss carryforward in the future may be limited under the Internal Revenue Code and related regulations based on the results of future transactions.
56 Invesco High Yield Municipal Fund
The Fund has a capital loss carryforward as of February 28, 2014, which expires as follows:
| | | | | | | | | | | | |
| Capital Loss Carryforward* | |
| Expiration | | Short-Term | | | Long-Term | | | Total | |
February 28, 2015 | | $ | 14,397,352 | | | $ | — | | | $ | 14,397,352 | |
February 29, 2016 | | | 162,672,266 | | | | — | | | | 162,672,266 | |
February 28, 2017 | | | 261,369,579 | | | | — | | | | 261,369,579 | |
February 28, 2018 | | | 77,334,684 | | | | — | | | | 77,334,684 | |
February 28, 2019 | | | 42,986,977 | | | | — | | | | 42,986,977 | |
Not subject to expiration | | | 111,984,594 | | | | 145,431,698 | | | | 257,416,292 | |
| | | $ | 670,745,452 | | | $ | 145,431,698 | | | $ | 816,177,150 | |
| * | Capital loss carryforward as of the date listed above is reduced for limitations, if any, to the extent required by the Internal Revenue Code and may be further limited depending upon a variety of factors, including the realization of net unrealized gains or losses as of the date of any reorganization. |
NOTE 9—Investment Securities
The aggregate amount of investment securities (other than short-term securities, U.S. Treasury obligations and money market funds, if any) purchased and sold by the Fund during the year ended February 28, 2014 was $2,350,681,500 and $3,064,890,202, respectively. Cost of investments on a tax basis includes the adjustments for financial reporting purposes as of the most recently completed federal income tax reporting period-end.
| | | | |
| Unrealized Appreciation (Depreciation) of Investment Securities on a Tax Basis | |
Aggregate unrealized appreciation of investment securities | | $ | 313,255,290 | |
Aggregate unrealized (depreciation) of investment securities | | | (418,055,254 | ) |
Net unrealized appreciation (depreciation) of investment securities | | $ | (104,799,964 | ) |
Cost of investments for tax purposes is $6,654,310,666.
NOTE 10—Reclassification of Permanent Differences
Primarily as a result of differing book/tax treatment of federal income taxes paid, TOB’s, bonds with amortization and expired capital loss carryforward, on February 28, 2014, undistributed net investment income was decreased by $2,163,699, undistributed net realized gain (loss) was increased by $7,474,228 and shares of beneficial interest was decreased by $5,310,529. This reclassification had no effect on the net assets of the Fund.
57 Invesco High Yield Municipal Fund
NOTE 11—Share Information
| | | | | | | | | | | | | | | | |
| | | Summary of Share Activity | |
| | | Years ended February 28, | |
| | | 2014(a) | | | 2013 | |
| | | Shares | | | Amount | | | Shares | | | Amount | |
Sold: | | | | | | | | | | | | | | | | |
Class A | | | 94,786,933 | | | $ | 882,998,870 | | | | 119,772,225 | | | $ | 1,196,470,258 | |
Class B | | | 84,758 | | | | 793,537 | | | | 155,273 | | | | 1,581,648 | |
Class C | | | 19,611,735 | | | | 181,758,845 | | | | 29,063,907 | | | | 289,170,697 | |
Class Y | | | 46,160,963 | | | | 430,952,150 | | | | 50,676,109 | | | | 507,890,291 | |
Class R5(b) | | | 43,040 | | | | 394,844 | | | | 195,041 | | | | 1,904,680 | |
| | | | |
Issued as reinvestment of dividends: | | | | | | | | | | | | | | | | |
Class A | | | 13,905,521 | | | | 130,392,923 | | | | 13,748,665 | | | | 137,651,817 | |
Class B | | | 339,025 | | | | 3,203,110 | | | | 478,796 | | | | 4,835,010 | |
Class C | | | 3,057,873 | | | | 28,672,559 | | | | 3,315,117 | | | | 33,155,737 | |
Class Y | | | 2,548,273 | | | | 24,232,575 | | | | 3,277,984 | | | | 32,996,797 | |
Class R5 | | | 20,754 | | | | 196,741 | | | | 55,839 | | | | 557,267 | |
| | | | |
Issued in connection with acquisitions:(c) | | | | | | | | | | | | | | | | |
Class A | | | — | | | | — | | | | 38,941,092 | | | | 380,289,898 | |
Class B | | | — | | | | — | | | | 1,360,176 | | | | 13,344,973 | |
Class C | | | — | | | | — | | | | 14,758,854 | | | | 143,978,139 | |
Class Y | | | — | | | | — | | | | 13,877,140 | | | | 135,657,431 | |
Class R5 | | | — | | | | — | | | | 7,799,579 | | | | 76,242,015 | |
| | | | |
Automatic conversion of Class B shares to Class A shares: | | | | | | | | | | | | | | | | |
Class A | | | 1,910,274 | | | | 18,241,938 | | | | 4,096,565 | | | | 41,032,498 | |
Class B | | | (1,901,630 | ) | | | (18,241,938 | ) | | | (4,076,611 | ) | | | (41,032,498 | ) |
| | | | |
Reacquired: | | | | | | | | | | | | | | | | |
Class A | | | (140,662,190 | ) | | | (1,316,662,001 | ) | | | (74,600,894 | ) | | | (748,982,638 | ) |
Class B | | | (2,423,190 | ) | | | (22,868,349 | ) | | | (1,628,805 | ) | | | (16,369,518 | ) |
Class C | | | (38,805,273 | ) | | | (363,127,451 | ) | | | (16,185,427 | ) | | | (162,095,298 | ) |
Class Y | | | (66,787,239 | ) | | | (653,288,028 | ) | | | (21,814,848 | ) | | | (219,799,901 | ) |
Class R5 | | | (598,473 | ) | | | (5,529,500 | ) | | | (7,218,726 | ) | | | (71,273,603 | ) |
Net increase (decrease) in share activity | | | (68,708,846 | ) | | $ | (677,879,175 | ) | | | 176,047,051 | | | $ | 1,737,205,700 | |
| (a) | There are entities that are record owners of more than 5% of the outstanding shares of the Fund and in the aggregate own 65% of the outstanding shares of the Fund. IDI has an agreement with these entities to sell Fund shares. The Fund, Invesco and/or Invesco affiliates may make payments to these entities, which are considered to be related to the Fund, for providing services to the Fund, Invesco and/or Invesco affiliates including but not limited to services such as securities brokerage, distribution, third party record keeping and account servicing. The Fund has no knowledge as to whether all or any portion of the shares owned of record by these entities are also owned beneficially. |
| (b) | Commencement date of April 30, 2012. |
| (c) | As of the opening of business on April 30, 2012, the Fund acquired all the net assets of Invesco High Income Municipal Fund (the “Target Fund”) pursuant to a plan of reorganization approved by the Trustees of the Fund on November 30, 2011 and by the shareholders of the Target Fund on April 2, 2012. The acquisition was accomplished by a tax-free exchange of 76,736,841 shares of the Fund for 93,571,671 shares outstanding of the Target Fund as of the close of business on April 27, 2012. Each class of the Target Fund was exchanged for the like class of shares of the Fund based on the relative net asset value of the Target Fund to the net asset value of the Fund at the close of business on April 27, 2012. The Target Fund’s net assets at that date of $749,512,456, including $7,209,042 of unrealized appreciation, were combined with those of the Fund. The net assets of the Fund immediately before the acquisition were $5,430,090,787 and $6,179,603,243 immediately after the acquisition. |
| | The pro forma results of operations for the year ended February 28, 2013 assuming the reorganization had been completed on March 1, 2012, the beginning of the annual reporting period, are as follows: |
| | | | |
Net investment income | | $ | 354,609,427 | |
Net realized/unrealized gains | | | 327,447,326 | |
Change in net assets resulting from operations | | $ | 682,056,753 | |
| | The combined investment portfolios have been managed as a single integrated portfolio since the acquisition was completed; it is not practicable to separate the amounts of revenue and earnings of the Target Fund that has been included in the Fund’s Statement of Operations since April 30, 2012. |
58 Invesco High Yield Municipal Fund
NOTE 12—Financial Highlights
The following schedule presents financial highlights for a share of the Fund outstanding throughout the periods indicated.
| | | | | | | | | | | | | | | | | | | | | | | | | | | | | | | | | | | | | | | | | | | | | | | | |
| | | Net asset
value,
beginning
of period | | | Net
investment
income(a) | | | Net gains
(losses) on securities
(both
realized and
unrealized) | | | Total from
investment
operations | | | Dividends
from net
investment
income | | | Net asset
value, end
of period | | | Total
return | | | Net assets,
end of period
(000’s omitted) | | | Ratio of
expenses to average
net assets | | | Supplemental
ratio of
expenses to average net assets (excluding interest, facilities and maintenance fees(b) | | | Ratio of net
investment
income to average
net assets | | | Portfolio
turnover(c) | |
Class A | |
Year ended 02/28/14 | | $ | 10.17 | | | $ | 0.53 | | | $ | (0.78 | ) | | $ | (0.25 | ) | | $ | (0.53 | ) | | $ | 9.39 | | | | (2.37 | )%(d) | | $ | 4,317,516 | | | | 0.92 | %(e) | | | 0.87 | %(e) | | | 5.58 | %(e) | | | 35 | % |
Year ended 02/28/13 | | | 9.71 | | | | 0.53 | | | | 0.49 | | | | 1.02 | | | | (0.56 | ) | | | 10.17 | | | | 10.78 | (d) | | | 4,981,494 | | | | 0.90 | | | | 0.84 | | | | 5.32 | | | | 19 | |
Year ended 02/29/12 | | | 8.85 | | | | 0.57 | | | | 0.85 | | | | 1.42 | | | | (0.56 | ) | | | 9.71 | | | | 16.56 | (d) | | | 3,766,082 | | | | 0.93 | | | | 0.85 | | | | 6.24 | | | | 16 | |
Period ended 02/28/11 | | | 9.24 | | | | 0.15 | | | | (0.40 | ) | | | (0.25 | ) | | | (0.14 | ) | | | 8.85 | | | | (2.72 | )(d) | | | 3,399,724 | | | | 0.84 | (f) | | | 0.76 | (f) | | | 6.80 | (f) | | | 3 | |
Year ended 11/30/10 | | | 9.07 | | | | 0.57 | | | | 0.15 | | | | 0.72 | | | | (0.55 | ) | | | 9.24 | | | | 8.07 | (d) | | | 3,875,386 | | | | 0.91 | | | | 0.84 | | | | 6.10 | | | | 20 | |
Year ended 11/30/09 | | | 8.15 | | | | 0.58 | | | | 0.92 | | | | 1.50 | | | | (0.58 | ) | | | 9.07 | | | | 19.33 | (g) | | | 3,294,547 | | | | 0.97 | | | | 0.87 | | | | 6.90 | | | | 16 | |
Class B | | | | | | | | | | | | | | | | | | | | | | | | | | | | | | | | | | | | | | | | | | | | | | | | |
Year ended 02/28/14 | | | 10.22 | | | | 0.53 | | | | (0.79 | ) | | | (0.26 | ) | | | (0.53 | ) | | | 9.43 | | | | (2.44 | )(d)(h) | | | 85,969 | | | | 0.92 | (e)(h) | | | 0.87 | (e)(h) | | | 5.58 | (e)(h) | | | 35 | |
Year ended 02/28/13 | | | 9.75 | | | | 0.53 | | | | 0.51 | | | | 1.04 | | | | (0.57 | ) | | | 10.22 | | | | 10.87 | (d)(h) | | | 132,952 | | | | 0.90 | (h) | | | 0.84 | (h) | | | 5.32 | (h) | | | 19 | |
Year ended 02/29/12 | | | 8.85 | | | | 0.60 | | | | 0.85 | | | | 1.45 | | | | (0.55 | ) | | | 9.75 | | | | 16.89 | (d)(h) | | | 163,123 | | | | 0.68 | (h) | | | 0.60 | (h) | | | 6.49 | (h) | | | 16 | |
Period ended 02/28/11 | | | 9.24 | | | | 0.14 | | | | (0.41 | ) | | | (0.27 | ) | | | (0.12 | ) | | | 8.85 | | | | (2.90 | )(d)(h) | | | 250,532 | | | | 1.39 | (f)(h) | | | 1.31 | (f)(h) | | | 6.25 | (f)(h) | | | 3 | |
Year ended 11/30/10 | | | 9.07 | | | | 0.50 | | | | 0.15 | | | | 0.65 | | | | (0.48 | ) | | | 9.24 | | | | 7.27 | (d) | | | 299,439 | | | | 1.66 | | | | 1.59 | | | | 5.35 | | | | 20 | |
Year ended 11/30/09 | | | 8.15 | | | | 0.51 | | | | 0.93 | | | | 1.44 | | | | (0.52 | ) | | | 9.07 | | | | 18.46 | (i) | | | 316,094 | | | | 1.72 | | | | 1.62 | | | | 6.15 | | | | 16 | |
Class C | | | | | | | | | | | | | | | | | | | | | | | | | | | | | | | | | | | | | | | | | | | | | | | | |
Year ended 02/28/14 | | | 10.15 | | | | 0.46 | | | | (0.79 | ) | | | (0.33 | ) | | | (0.46 | ) | | | 9.36 | | | | (3.15 | )(d) | | | 991,079 | | | | 1.67 | (e) | | | 1.62 | (e) | | | 4.83 | (e) | | | 35 | |
Year ended 02/28/13 | | | 9.69 | | | | 0.46 | | | | 0.49 | | | | 0.95 | | | | (0.49 | ) | | | 10.15 | | | | 9.97 | (d) | | | 1,237,889 | | | | 1.65 | | | | 1.59 | | | | 4.57 | | | | 19 | |
Year ended 02/29/12 | | | 8.83 | | | | 0.50 | | | | 0.85 | | | | 1.35 | | | | (0.49 | ) | | | 9.69 | | | | 15.73 | (d) | | | 881,847 | | | | 1.68 | | | | 1.60 | | | | 5.49 | | | | 16 | |
Period ended 02/28/11 | | | 9.23 | | | | 0.13 | | | | (0.41 | ) | | | (0.28 | ) | | | (0.12 | ) | | | 8.83 | | | | (3.02 | )(d) | | | 813,001 | | | | 1.59 | (f) | | | 1.51 | (f) | | | 6.05 | (f) | | | 3 | |
Year ended 11/30/10 | | | 9.05 | | | | 0.50 | | | | 0.16 | | | | 0.66 | | | | (0.48 | ) | | | 9.23 | | | | 7.40 | (d) | | | 953,475 | | | | 1.66 | | | | 1.59 | | | | 5.35 | | | | 20 | |
Year ended 11/30/09 | | | 8.14 | | | | 0.51 | | | | 0.92 | | | | 1.43 | | | | (0.52 | ) | | | 9.05 | | | | 18.36 | (j) | | | 799,982 | | | | 1.72 | | | | 1.62 | | | | 6.09 | | | | 16 | |
Class Y(k) | | | | | | | | | | | | | | | | | | | | | | | | | | | | | | | | | | | | | | | | | | | | | | | | |
Year ended 02/28/14 | | | 10.19 | | | | 0.56 | | | | (0.79 | ) | | | (0.23 | ) | | | (0.55 | ) | | | 9.41 | | | | (2.11 | )(d) | | | 679,827 | | | | 0.67 | (e) | | | 0.62 | (e) | | | 5.83 | (e) | | | 35 | |
Year ended 02/28/13 | | | 9.73 | | | | 0.56 | | | | 0.49 | | | | 1.05 | | | | (0.59 | ) | | | 10.19 | | | | 11.04 | (d) | | | 920,379 | | | | 0.65 | | | | 0.59 | | | | 5.57 | | | | 19 | |
Year ended 02/29/12 | | | 8.87 | | | | 0.59 | | | | 0.84 | | | | 1.43 | | | | (0.57 | ) | | | 9.73 | | | | 16.83 | (d) | | | 431,266 | | | | 0.68 | | | | 0.60 | | | | 6.49 | | | | 16 | |
Period ended 02/28/11 | | | 9.26 | | | | 0.15 | | | | (0.40 | ) | | | (0.25 | ) | | | (0.14 | ) | | | 8.87 | | | | (2.65 | )(d) | | | 518,173 | | | | 0.59 | (f) | | | 0.51 | (f) | | | 7.05 | (f) | | | 3 | |
Year ended 11/30/10 | | | 9.09 | | | | 0.60 | | | | 0.15 | | | | 0.75 | | | | (0.58 | ) | | | 9.26 | | | | 8.33 | (d) | | | 522,709 | | | | 0.66 | | | | 0.59 | | | | 6.35 | | | | 20 | |
Year ended 11/30/09 | | | 8.17 | | | | 0.59 | | | | 0.93 | | | | 1.52 | | | | (0.60 | ) | | | 9.09 | | | | 19.57 | (j) | | | 281,752 | | | | 0.72 | | | | 0.62 | | | | 6.94 | | | | 16 | |
Class R5 | | | | | | | | | | | | | | | | | | | | | | | | | | | | | | | | | | | | | | | | | | | | | | | | |
Year ended 02/28/14 | | | 10.18 | | | | 0.56 | | | | (0.78 | ) | | | (0.22 | ) | | | (0.55 | ) | | | 9.41 | | | | (2.00 | )(d) | | | 2,794 | | | | 0.66 | (e) | | | 0.61 | (e) | | | 5.84 | (e) | | | 35 | |
Year ended 02/28/13(l) | | | 9.79 | | | | 0.46 | | | | 0.42 | | | | 0.88 | | | | (0.49 | ) | | | 10.18 | | | | 9.16 | (d) | | | 8,466 | | | | 0.67 | (f)(m) | | | 0.63 | (f) | | | 5.55 | (f) | | | 19 | |
| (a) | Calculated using average shares outstanding. |
| (b) | For the years ended November 30, 2010 and prior, ratio does not exclude facilities and maintenance fees. |
| (c) | Portfolio turnover is calculated at the fund level and is not annualized for periods less than one year, if applicable. For the period ended February 28, 2013, the portfolio turnover calculation excludes the value of securities purchased of $729,359,150 and sold of $70,250,290 in the effort to realign the Fund’s portfolio holdings after the reorganization of Invesco High Income Municipal Fund into the Fund. |
| (d) | Includes adjustments in accordance with accounting principles generally accepted in the United States of America and as such, the net asset value for financial reporting purposes and the returns based upon those net asset values may differ from the net asset value and returns for shareholder transactions. Does not include sales charges and is not annualized for periods less than one year, if applicable. |
| (e) | Ratios are based on average daily net assets (000’s omitted) of $4,425,897, $103,267, $1,048,647, $637,292 and $6,031 for Class A, Class B, Class C, Class Y and Class R5 shares, respectively. |
| (g) | Assumes reinvestment of all distributions for the period and does not include payment of the maximum sales charge of 4.75% or contingent deferred sales charge (CDSC). On purchases of $1 million or more, a CDSC of 1% may be imposed on certain redemptions made within eighteen months of purchase. If the sales charges were included, total returns would be lower. These returns include combined Rule 12b-1 fees and service fees of up to 0.25% and do not reflect the deduction of taxes that a shareholder would pay on Fund distributions or the redemption of Fund shares. |
| (h) | The total return, ratio of expenses to average net assets and ratio of net investment income (loss) to average net assets reflect actual 12b-1 fees of 0.25%, 0.25%, 0.00% and 0.80% for the years ended February 28, 2014, February 28, 2013, February 29, 2012 and February 28, 2011, respectively. |
| (i) | Assumes reinvestment of all distributions for the period and does not include payment of the maximum CDSC of 4%, charged on certain redemptions made within one year of purchase and declining to 0% after the fifth year. If the sales charge was included, total returns would be lower. These returns include combined Rule 12b-1 fees and service fees of up to 1% and do not reflect the deduction of taxes that a shareholder would pay on Fund distributions or the redemption of Fund shares. |
| (j) | Assumes reinvestment of all distributions for the period and does not include payment of the maximum CDSC of 1%, charged on certain redemptions made within one year of purchase. If the sales charge was included, total returns would be lower. These returns include combined Rule 12b-1 fees and service fees of up to 1% and do not reflect the deduction of taxes that a shareholder would pay on Fund distributions or the redemption of Fund shares. |
| (k) | On June 1, 2010, Class I shares of Van Kampen High Yield Municipal Fund were reorganized into Class Y shares of the Fund. |
| (l) | Commencement date of April 30, 2012. |
| (m) | For the year ended February 28, 2013, the ratio of expenses to average net assets without fee waivers and/or expenses absorbed was 0.69%. |
59 Invesco High Yield Municipal Fund
Report of Independent Registered Public Accounting Firm
To the Board of Trustees of AIM Tax-Exempt Funds (Invesco Tax-Exempt Funds)
and Shareholders of Invesco High Yield Municipal Fund:
In our opinion, the accompanying statement of assets and liabilities, including the schedule of investments, and the related statements of operations and of changes in net assets and the financial highlights present fairly, in all material respects, the financial position of Invesco High Yield Municipal Fund (one of the funds constituting AIM Tax-Exempt Funds (Invesco Tax-Exempt Funds), hereafter referred to as the “Fund”) at February 28, 2014, the results of its operations for the year then ended, the changes in its net assets for each of the two years in the period then ended and the financial highlights for each of the three years in the period then ended, the three month period ended February 28, 2011 and the year ended November 30, 2010, in conformity with accounting principles generally accepted in the United States of America. These financial statements and financial highlights (hereafter referred to as “financial statements”) are the responsibility of the Fund’s management; our responsibility is to express an opinion on these financial statements based on our audits. We conducted our audits of these financial statements in accordance with the standards of the Public Company Accounting Oversight Board (United States). Those standards require that we plan and perform the audit to obtain reasonable assurance about whether the financial statements are free of material misstatement. An audit includes examining, on a test basis, evidence supporting the amounts and disclosures in the financial statements, assessing the accounting principles used and significant estimates made by management, and evaluating the overall financial statement presentation. We believe that our audits, which included confirmation of securities at February 28, 2014 by correspondence with the custodian and brokers, provide a reasonable basis for our opinion. The financial highlights of the Fund for the period ended November 30, 2009 were audited by another independent registered public accounting firm whose report dated January 22, 2010 expressed an unqualified opinion on such financial statement.
PRICEWATERHOUSECOOPERS LLP
April 28, 2014
Houston, Texas
60 Invesco High Yield Municipal Fund
Calculating your ongoing Fund expenses
Example
As a shareholder of the Fund, you incur two types of costs: (1) transaction costs, which may include sales charges (loads) on purchase payments or contingent deferred sales charges on redemptions, if any; and (2) ongoing costs, including management fees, distribution and/or service (12b-1) fees, and other Fund expenses. This example is intended to help you understand your ongoing costs (in dollars) of investing in the Fund and to compare these costs with ongoing costs of investing in other mutual funds. The example is based on an investment of $1,000 invested at the beginning of the period and held for the entire period September 1, 2013 through February 28, 2014.
Actual expenses
The table below provides information about actual account values and actual expenses. You may use the information in this table, together with the amount you invested, to estimate the expenses that you paid over the period. Simply divide your account value by $1,000 (for example, an $8,600 account value divided by $1,000 = 8.6), then multiply the result by the number in the table under the heading entitled “Actual Expenses Paid During Period” to estimate the expenses you paid on your account during this period.
Hypothetical example for comparison purposes
The table below also provides information about hypothetical account values and hypothetical expenses based on the Fund’s actual expense ratio and an assumed rate of return of 5% per year before expenses, which is not the Fund’s actual return.
The hypothetical account values and expenses may not be used to estimate the actual ending account balance or expenses you paid for the period. You may use this information to compare the ongoing costs of investing in the Fund and other funds. To do so, compare this 5% hypothetical example with the 5% hypothetical examples that appear in the shareholder reports of the other funds.
Please note that the expenses shown in the table are meant to highlight your ongoing costs only and do not reflect any transaction costs, such as sales charges (loads) on purchase payments or contingent deferred sales charges on redemptions, if any. Therefore, the hypothetical information is useful in comparing ongoing costs only, and will not help you determine the relative total costs of owning different funds. In addition, if these transaction costs were included, your costs would have been higher.
| | | | | | | | | | | | | | | | | | | | | | | | |
| Class | | Beginning
Account Value
(09/01/13) | | | ACTUAL | | | HYPOTHETICAL
(5% annual return before expenses) | | | Annualized
Expense
Ratio | |
| | | Ending
Account Value
(02/28/14)1 | | | Expenses
Paid During
Period2 | | | Ending
Account Value
(02/28/14) | | | Expenses
Paid During
Period2 | | |
| A | | $ | 1,000.00 | | | $ | 1,078.40 | | | $ | 4.90 | | | $ | 1,020.08 | | | $ | 4.76 | | | | 0.95 | % |
| B | | | 1,000.00 | | | | 1,078.20 | | | | 4.90 | | | | 1,020.08 | | | | 4.76 | | | | 0.95 | |
| C | | | 1,000.00 | | | | 1,073.10 | | | | 9.05 | | | | 1,016.07 | | | | 8.80 | | | | 1.76 | |
| Y | | | 1,000.00 | | | | 1,080.80 | | | | 3.61 | | | | 1,021.32 | | | | 3.51 | | | | 0.70 | |
| R5 | | | 1,000.00 | | | | 1,079.80 | | | | 3.51 | | | | 1,021.42 | | | | 3.41 | | | | 0.68 | |
| 1 | The actual ending account value is based on the actual total return of the Fund for the period September 1, 2013 through February 28, 2014, after actual expenses and will differ from the hypothetical ending account value which is based on the Fund’s expense ratio and a hypothetical annual return of 5% before expenses. |
| 2 | Expenses are equal to the Fund’s annualized expense ratio as indicated above multiplied by the average account value over the period, multiplied by 181/365 to reflect the most recent fiscal half year. |
61 Invesco High Yield Municipal Fund
Tax Information
Form 1099-DIV, Form 1042-S and other year–end tax information provide shareholders with actual calendar year amounts that should be included in their tax returns. Shareholders should consult their tax advisors.
The following distribution information is being provided as required by the Internal Revenue Code or to meet a specific state’s requirement.
The Fund designates the following amounts or, if subsequently determined to be different, the maximum amount allowable for its fiscal year ended February 28, 2014:
| | | | |
Federal and State Income Tax | |
Qualified Dividend Income* | | | 0% | |
Corporate Dividends Received Deduction* | | | 0% | |
U.S. Treasury Obligations* | | | 0% | |
Tax-Exempt Interest Dividends* | | | 100% | |
| | * | The above percentages are based on ordinary income dividends paid to shareholders during the Fund’s fiscal year. |
62 Invesco High Yield Municipal Fund
Trustees and Officers
The address of each trustee and officer is AIM Tax-Exempt Funds (Invesco Tax-Exempt Funds) (the “Trust”), 11 Greenway Plaza, Suite 1000, Houston, Texas 77046-1173. The trustees serve for the life of the Trust, subject to their earlier death, incapacitation, resignation, retirement or removal as more specifically provided in the Trust’s organizational documents. Each officer serves for a one year term or until their successors are elected and qualified. Column two below includes length of time served with predecessor entities, if any.
| | | | | | | | |
Name, Year of Birth and
Position(s) Held with the Trust | | Trustee and/
or Officer Since | | Principal Occupation(s) During Past 5 Years | | Number of
Funds in Fund
Complex
Overseen by
Trustee | | Other Directorship(s)
Held by Trustee During
Past 5 Years |
| Interested Persons | | | | | | | | |
| Martin L. Flanagan1 — 1960 Trustee | | 2007 | | Executive Director, Chief Executive Officer and President, Invesco Ltd. (ultimate parent of Invesco and a global investment management firm); Advisor to the Board, Invesco Advisers, Inc. (formerly known as Invesco Institutional (N.A.), Inc.); Trustee, The Invesco Funds; Vice Chair, Investment Company Institute; and Member of Executive Board, SMU Cox School of Business Formerly: Chairman and Chief Executive Officer, Invesco Advisers, Inc. (registered investment adviser); Director, Chairman, Chief Executive Officer and President, IVZ Inc. (holding company), INVESCO Group Services, Inc. (service provider) and Invesco North American Holdings, Inc. (holding company); Director, Chief Executive Officer and President, Invesco Holding Company Limited (parent of Invesco and a global investment management firm); Director, Invesco Ltd.; Chairman, Investment Company Institute and President, Co-Chief Executive Officer, Co-President, Chief Operating Officer and Chief Financial Officer, Franklin Resources, Inc. (global investment management organization). | | 123 | | None |
Philip A. Taylor2 — 1954 Trustee, President and Principal Executive Officer | | 2006 | | Head of North American Retail and Senior Managing Director, Invesco Ltd.; Director, Co-Chairman, Co-President and Co-Chief Executive Officer, Invesco Advisers, Inc. (formerly known as Invesco Institutional (N.A.), Inc.) (registered investment adviser); Director, Chairman, Chief Executive Officer and President, Invesco Management Group, Inc. (formerly known as Invesco Aim Management Group, Inc.) (financial services holding company); Director and President, INVESCO Funds Group, Inc. (registered investment adviser and registered transfer agent); Director and Chairman, Invesco Investment Services, Inc. (formerly known as Invesco Aim Investment Services, Inc.) (registered transfer agent) and IVZ Distributors, Inc. (formerly known as INVESCO Distributors, Inc.) (registered broker dealer); Director, President and Chairman, Invesco Inc. (holding company) and Invesco Canada Holdings Inc. (holding company); Chief Executive Officer, Invesco Corporate Class Inc. (corporate mutual fund company) and Invesco Canada Fund Inc. (corporate mutual fund company); Director, Chairman and Chief Executive Officer, Invesco Canada Ltd. (formerly known as Invesco Trimark Ltd./Invesco Trimark Ltèe) (registered investment adviser and registered transfer agent); Trustee, President and Principal Executive Officer, The Invesco Funds (other than AIM Treasurer’s Series Trust (Invesco Treasurer’s Series Trust) and Short-Term Investments Trust); Trustee and Executive Vice President, The Invesco Funds (AIM Treasurer’s Series Trust (Invesco Treasurer’s Series Trust) and Short-Term Investments Trust only); Director, Invesco Investment Advisers LLC (formerly known as Van Kampen Asset Management); Director, Chief Executive Officer and President, Van Kampen Exchange Corp. Formerly: Director and Chairman, Van Kampen Investor Services Inc.; Director, Chief Executive Officer and President, 1371 Preferred Inc. (holding company); and Van Kampen Investments Inc.; Director and President, AIM GP Canada Inc. (general partner for limited partnerships); and Van Kampen Advisors, Inc.; Director and Chief Executive Officer, Invesco Trimark Dealer Inc. (registered broker dealer); Director, Invesco Distributors, Inc. (formerly known as Invesco Aim Distributors, Inc.) (registered broker dealer); Manager, Invesco PowerShares Capital Management LLC; Director, Chief Executive Officer and President, Invesco Advisers, Inc.; Director, Chairman, Chief Executive Officer and President, Invesco Aim Capital Management, Inc.; President, Invesco Trimark Dealer Inc. and Invesco Trimark Ltd./Invesco Trimark Ltèe; Director and President, AIM Trimark Corporate Class Inc. and AIM Trimark Canada Fund Inc.; Senior Managing Director, Invesco Holding Company Limited; Trustee and Executive Vice President, Tax-Free Investments Trust; Director and Chairman, Fund Management Company (former registered broker dealer); President and Principal Executive Officer, The Invesco Funds (AIM Treasurer’s Series Trust (Invesco Treasurer’s Series Trust), Short-Term Investments Trust and Tax-Free Investments Trust only); President, AIM Trimark Global Fund Inc. and AIM Trimark Canada Fund Inc. | | 123 | | None |
Wayne W. Whalen3 — 1939 Trustee | | 2010 | | Of Counsel, and prior to 2010, partner in the law firm of Skadden, Arps, Slate, Meagher & Flom LLP, legal counsel to certain funds in the Fund Complex. | | 136 | | Director of the Mutual fund Directors Forum, a nonprofit membership organization for investment directors; Chairman and Director of the Abraham Lincoln Presidential Library Foundation; and Director of the Stevenson Center for Democracy |
| 1 | Mr. Flanagan is considered an interested person of the Trust because he is an officer of the adviser to the Trust, and an officer and a director of Invesco Ltd., ultimate parent of the adviser to the Trust. |
| 2 | Mr. Taylor is considered an interested person of the Trust because he is an officer and a director of the adviser to, and a director of the principal underwriter of, the Trust. |
| 3 | Mr. Whalen is considered an “interested person” (within the meaning of Section 2(a)(19) of the 1940 Act) of certain funds in the Fund Complex because his firm currently provides legal services as legal counsel to such Funds. |
T-1 Invesco High Yield Municipal Fund
Trustees and Officers—(continued)
| | | | | | | | |
Name, Year of Birth and
Position(s) Held with the Trust | | Trustee and/
or Officer Since | | Principal Occupation(s) During Past 5 Years | | Number of
Funds in Fund
Complex
Overseen by
Trustee | | Other Directorship(s)
Held by Trustee During
Past 5 Years |
| Independent Trustees | | | | | | | | |
Bruce L. Crockett — 1944 Trustee and Chair | | 1993 | | Chairman, Crockett Technologies Associates (technology consulting company) Formerly: Director, Captaris (unified messaging provider); Director, President and Chief Executive Officer COMSAT Corporation; Chairman, Board of Governors of INTELSAT (international communications company); ACE Limited (insurance company); and Investment Company Institute | | 123 | | ALPS (Attorneys Liability Protection Society) (insurance company) |
David C. Arch — 1945 Trustee | | 2010 | | Chairman of Blistex Inc., a consumer health care products manufacturer | | 136 | | Board member of the Illinois Manufacturers’ Association; Member of the Board of Visitors, Institute for the Humanities University of Michigan; Member of the Audit Committee of the Edward-Elmhurst Hospital |
Frank S. Bayley — 1939 Trustee | | 2001 | | Retired. Formerly: Director, Badgley Funds Inc. (registered investment company) (2 portfolios) and General Partner and Of Counsel, law firm of Baker & McKenzie, LLP | | 123 | | Director and Chairman, C.D. Stimson Company (a real estate investment company); Trustee, The Curtis Institute of Music |
James T. Bunch — 1942 Trustee | | 2003 | | Managing Member, Grumman Hill Group LLC (family office private equity investments) Formerly: Founder, Green Manning & Bunch Ltd. (investment banking firm) (1988-2010); Executive Committee, United States Golf Association; and Director, Policy Studies, Inc. and Van Gilder Insurance Corporation. | | 123 | | Chairman, Board of Governors, Western Golf Association, Chairman, Evans Scholars Foundation and Director, Denver Film Society |
Rodney F. Dammeyer — 1940 Trustee | | 2010 | | Chairman of CAC,LLC, (private company offering capital investment and management advisory services) Formerly: Prior to 2001, Managing Partner at Equity Group Corporate Investments. Prior to 1995, Chief Executive Officer of Itel Corporation (formerly Anixter International). Prior to 1985, experience includes Senior Vice President and Chief Financial Officer of Household International, Inc., Executive Vice President and Chief Financial Officer of Northwest Industries, Inc. and Partner of Arthur Andersen & Co.; From 1987 to 2010, Director/Trustee of investment companies in the Van Kampen Funds complex | | 123 | | Director of Quidel Corporation and Stericycle, Inc. |
Albert R. Dowden — 1941 Trustee | | 2000 | | Director of a number of public and private business corporations, including the Boss Group, Ltd. (private investment and management); Nature’s Sunshine Products, Inc. and Reich & Tang Funds (5 portfolios) (registered investment company) Formerly: Director, Homeowners of America Holding Corporation/Homeowners of America Insurance Company (property casualty company); Director, Continental Energy Services, LLC (oil and gas pipeline service); Director, CompuDyne Corporation (provider of product and services to the public security market) and Director, Annuity and Life Re (Holdings), Ltd. (reinsurance company); Director, President and Chief Executive Officer, Volvo Group North America, Inc.; Senior Vice President, AB Volvo; Director of various public and private corporations; Chairman, DHJ Media, Inc.; Director, Magellan Insurance Company; and Director, The Hertz Corporation, Genmar Corporation (boat manufacturer), National Media Corporation; Advisory Board of Rotary Power International (designer, manufacturer, and seller of rotary power engines); and Chairman, Cortland Trust, Inc. (registered investment company) | | 123 | | Director of: Nature’s Sunshine Products, Inc., Reich & Tang Funds, Homeowners of America Holding Corporation/ Homeowners of America Insurance Company, the Boss Group |
Jack M. Fields — 1952 Trustee | | 1997 | | Chief Executive Officer, Twenty First Century Group, Inc. (government affairs company); Owner and Chief Executive Officer, Dos Angeles Ranch, L.P. (cattle, hunting, corporate entertainment); and Discovery Global Education Fund (non-profit) Formerly: Chief Executive Officer, Texana Timber LP (sustainable forestry company); Director of Cross Timbers Quail Research Ranch (non-profit); and member of the U.S. House of Representatives | | 123 | | Insperity, Inc. (formerly known as Administaff) |
Prema Mathai-Davis — 1950 Trustee | | 1998 | | Retired. Formerly: Chief Executive Officer, YWCA of the U.S.A. | | 123 | | None |
Larry Soll — 1942 Trustee | | 2003 | | Retired. Formerly: Chairman, Chief Executive Officer and President, Synergen Corp. (a biotechnology company) | | 123 | | None |
T-2 Invesco High Yield Municipal Fund
Trustees and Officers—(continued)
| | | | | | | | |
Name, Year of Birth and
Position(s) Held with the Trust | | Trustee and/
or Officer Since | | Principal Occupation(s) During Past 5 Years | | Number of
Funds in Fund
Complex
Overseen by
Trustee | | Other Directorship(s)
Held by Trustee During
Past 5 Years |
| Independent Trustees—(continued) |
Hugo F. Sonnenschein — 1940 Trustee | | 2010 | | President Emeritus and Honorary Trustee of the University of Chicago and the Adam Smith Distinguished Service Professor in the Department of Economics at the University of Chicago. Prior to 2000, President of the University of Chicago | | 136 | | Trustee of the University of Rochester and a member of its investment committee; Member of the National Academy of Sciences and the American Philosophical Society; Fellow of the American Academy of Arts and Sciences |
| Raymond Stickel, Jr. — 1944 Trustee | | 2005 | | Retired. Formerly: Director, Mainstay VP Series Funds, Inc. (25 portfolios) and Partner, Deloitte & Touche | | 123 | | None |
| Other Officers | | | | | | | | |
Russell C. Burk — 1958 Senior Vice President and Senior Officer | | 2005 | | Senior Vice President and Senior Officer, The Invesco Funds | | N/A | | N/A |
John M. Zerr — 1962 Senior Vice President, Chief Legal Officer and Secretary | | 2006 | | Director, Senior Vice President, Secretary and General Counsel, Invesco Management Group, Inc. (formerly known as Invesco Aim Management Group, Inc.) and Van Kampen Exchange Corp.; Senior Vice President, Invesco Advisers, Inc. (formerly known as Invesco Institutional (N.A.), Inc.) (registered investment adviser); Senior Vice President and Secretary, Invesco Distributors, Inc. (formerly known as Invesco Aim Distributors, Inc.); Director, Vice President and Secretary, Invesco Investment Services, Inc. (formerly known as Invesco Aim Investment Services, Inc.) and IVZ Distributors, Inc. (formerly known as INVESCO Distributors, Inc.); Director and Vice President, INVESCO Funds Group, Inc.; Senior Vice President, Chief Legal Officer and Secretary, The Invesco Funds; Manager, Invesco PowerShares Capital Management LLC; Director, Secretary and General Counsel, Invesco Investment Advisers LLC (formerly known as Van Kampen Asset Management); Secretary and General Counsel, Invesco Capital Markets, Inc. (formerly known as Van Kampen Funds Inc.) and Chief Legal Officer, PowerShares Exchange-Traded Fund Trust, PowerShares Exchange-Traded Fund Trust II, PowerShares India Exchange-Traded Fund Trust and PowerShares Actively Managed Exchange-Traded Fund Trust Formerly: Director and Vice President, Van Kampen Advisors Inc.; Director, Vice President, Secretary and General Counsel, Van Kampen Investor Services Inc.; Director, Invesco Distributors, Inc. (formerly known as Invesco Aim Distributors, Inc.); Director, Senior Vice President, General Counsel and Secretary, Invesco Aim Advisers, Inc. and Van Kampen Investments Inc.; Director, Vice President and Secretary, Fund Management Company; Director, Senior Vice President, Secretary, General Counsel and Vice President, Invesco Aim Capital Management, Inc.; Chief Operating Officer and General Counsel, Liberty Ridge Capital, Inc. (an investment adviser); Vice President and Secretary, PBHG Funds (an investment company) and PBHG Insurance Series Fund (an investment company); Chief Operating Officer, General Counsel and Secretary, Old Mutual Investment Partners (a broker-dealer); General Counsel and Secretary, Old Mutual Fund Services (an administrator) and Old Mutual Shareholder Services (a shareholder servicing center); Executive Vice President, General Counsel and Secretary, Old Mutual Capital, Inc. (an investment adviser); and Vice President and Secretary, Old Mutual Advisors Funds (an investment company) | | N/A | | N/A |
Sheri Morris — 1964 Vice President, Treasurer and Principal Financial Officer | | 1999 | | Vice President, Treasurer and Principal Financial Officer, The Invesco Funds; Vice President, Invesco Advisers, Inc. (formerly known as Invesco Institutional (N.A.), Inc.) (registered investment adviser); and Vice President, PowerShares Exchange-Traded Fund Trust, PowerShares Exchange-Traded Fund Trust II, PowerShares India Exchange-Traded Fund Trust and PowerShares Actively Managed Exchange-Traded Fund Trust Formerly: Vice President, Invesco Aim Advisers, Inc., Invesco Aim Capital Management, Inc. and Invesco Aim Private Asset Management, Inc.; Assistant Vice President and Assistant Treasurer, The Invesco Funds and Assistant Vice President, Invesco Advisers, Inc., Invesco Aim Capital Management, Inc. and Invesco Aim Private Asset Management, Inc.; and Treasurer, PowerShares Exchange-Traded Fund Trust, PowerShares Exchange-Traded Fund Trust II, PowerShares India Exchange-Traded Fund Trust and PowerShares Actively Managed Exchange-Traded Fund Trust | | N/A | | N/A |
T-3 Invesco High Yield Municipal Fund
Trustees and Officers—(continued)
| | | | | | | | |
Name, Year of Birth and
Position(s) Held with the Trust | | Trustee and/
or Officer Since | | Principal Occupation(s) During Past 5 Years | | Number of
Funds in Fund
Complex
Overseen by
Trustee | | Other Directorship(s)
Held by Trustee During
Past 5 Years |
| Other Officers—(continued) | | | | | | | | |
Karen Dunn Kelley — 1960 Vice President | | 1993 | | Senior Managing Director, Investments; Director, Co-President, Co-Chief Executive Officer, and Co-Chairman, Invesco Advisers, Inc. (formerly known as Invesco Institutional (N.A.), Inc.) (registered investment adviser); Chairman, Invesco Senior Secured Management, Inc.; Senior Vice President, Invesco Management Group, Inc. (formerly known as Invesco Aim Management Group, Inc.); Executive Vice President, Invesco Distributors, Inc. (formerly known as Invesco Aim Distributors, Inc.); Director, Invesco Mortgage Capital Inc. and Invesco Management Company Limited; Director and President, INVESCO Asset Management (Bermuda) Ltd., Vice President, The Invesco Funds (other than AIM Treasurer’s Series Trust (Invesco Treasurer’s Series Trust) and Short-Term Investments Trust); and President and Principal Executive Officer, The Invesco Funds (AIM Treasurer’s Series Trust (Invesco Treasurer’s Series Trust) and Short-Term Investments Trust only) Formerly: Director, INVESCO Global Asset Management Limited and INVESCO Management S.A.; Senior Vice President, Van Kampen Investments Inc. and Invesco Advisers, Inc. (formerly known as Invesco Institutional (N.A.), Inc.) (registered investment adviser); Vice President, Invesco Advisers, Inc. (formerly known as Invesco Institutional (N.A.), Inc.); Director of Cash Management and Senior Vice President, Invesco Advisers, Inc. and Invesco Aim Capital Management, Inc.; President and Principal Executive Officer, Tax-Free Investments Trust; Director and President, Fund Management Company; Chief Cash Management Officer, Director of Cash Management, Senior Vice President, and Managing Director, Invesco Aim Capital Management, Inc.; Director of Cash Management, Senior Vice President, and Vice President, Invesco Advisers, Inc. and The Invesco Funds (AIM Treasurer’s Series Trust (Invesco Treasurer’s Series Trust), Short-Term Investments Trust and Tax-Free Investments Trust only) | | N/A | | N/A |
Crissie M. Wisdom — 1969 Anti-Money Laundering Compliance Officer | | 2013 | | Anti-Money Laundering Compliance Officer, Invesco Advisers, Inc. (formerly known as Invesco Institutional (N.A.), Inc.) (registered investment adviser), Invesco Capital Markets, Inc. (formerly known as Van Kampen Funds Inc.), Invesco Distributors, Inc., Invesco Investment Services, Inc., Invesco Management Group, Inc., Van Kampen Exchange Corp., The Invesco Funds, Invesco Funds (Chicago), and PowerShares Exchange-Traded Fund Trust, PowerShares Exchange-Traded Fund Trust II, PowerShares India Exchange-Traded Fund Trust, and PowerShares Actively Managed Exchange-Traded Fund Trust; and Fraud Prevention Manager and Controls and Risk Analysis Manager for Invesco Investment Services, Inc. | | N/A | | N/A |
Todd L. Spillane — 1958 Chief Compliance Officer | | 2006 | | Senior Vice President, Invesco Management Group, Inc. (formerly known as Invesco Aim Management Group, Inc.) and Van Kampen Exchange Corp.; Senior Vice President and Chief Compliance Officer, Invesco Advisers, Inc. (registered investment adviser) (formerly known as Invesco Institutional (N.A.), Inc.); Chief Compliance Officer, The Invesco Funds; Vice President, Invesco Distributors, Inc. (formerly known as Invesco Aim Distributors, Inc.) and Invesco Investment Services, Inc. (formerly known as Invesco Aim Investment Services, Inc.) Formerly: Chief Compliance Officer, Invesco Funds (Chicago); Senior Vice President, Van Kampen Investments Inc.; Senior Vice President and Chief Compliance Officer, Invesco Aim Advisers, Inc. and Invesco Aim Capital Management, Inc.; Chief Compliance Officer, INVESCO Private Capital Investments, Inc. (holding company), Invesco Private Capital, Inc. (registered investment adviser), Invesco Global Asset Management (N.A.), Inc., Invesco Senior Secured Management, Inc. (registered investment adviser), Van Kampen Investor Services Inc., PowerShares Exchange-Traded Fund Trust, PowerShares Exchange-Traded Fund Trust II, PowerShares India Exchange-Traded Fund Trust and PowerShares Actively Managed Exchange-Traded Fund Trust; and Vice President, Invesco Aim Capital Management, Inc. and Fund Management Company | | N/A | | N/A |
The Statement of Additional Information of the Trust includes additional information about the Fund’s Trustees and is available upon request, without charge, by calling 1.800.959.4246. Please refer to the Fund’s prospectus for information on the Fund’s sub-advisers.
| | | | | | |
Office of the Fund 11 Greenway Plaza, Suite 1000 Houston, TX 77046-1173 | | Investment Adviser Invesco Advisers, Inc. 1555 Peachtree Street, N.E. Atlanta, GA 30309 | | Distributor Invesco Distributors, Inc. 11 Greenway Plaza, Suite 1000 Houston, TX 77046-1173 | | Auditors PricewaterhouseCoopers LLP 1201 Louisiana Street, Suite 2900 Houston, TX 77002-5678 |
| | | |
| | | | | | |
Counsel to the Fund Stradley Ronon Stevens & Young, LLP 2005 Market Street, Suite 2600 Philadelphia, PA 19103-7018 | | Counsel to the Independent Trustees Goodwin Procter LLP 901 New York Avenue, N.W. Washington, D.C. 20001 | | Transfer Agent Invesco Investment Services, Inc. 11 Greenway Plaza, Suite 1000 Houston, TX 77046-1173 | | Custodian State Street Bank and Trust Company 225 Franklin Street Boston, MA 02110-2801 |
T-4 Invesco High Yield Municipal Fund

Invesco mailing information
Send general correspondence to Invesco Investment Services, Inc., P.O. Box 219078, Kansas City, MO 64121-9078.
Important notice regarding delivery of security holder documents
To reduce Fund expenses, only one copy of most shareholder documents may be mailed to shareholders with multiple accounts at the same address (Householding). Mailing of your shareholder documents may be householded indefinitely unless you instruct us otherwise. If you do not want the mailing of these documents to be combined with those for other members of your household, please contact Invesco Investment Services, Inc. at 800 959 4246 or contact your financial institution. We will begin sending you individual copies for each account within 30 days after receiving your request.
Fund holdings and proxy voting information
The Fund provides a complete list of its holdings four times in each fiscal year, at the quarter ends. For the second and fourth quarters, the lists appear in the Fund’s semiannual and annual reports to shareholders. For the first and third quarters, the Fund files the lists with the Securities and Exchange Commission (SEC) on Form N-Q. The most recent list of portfolio holdings is available at invesco.com/completeqtrholdings. Shareholders can also look up the Fund’s Forms N-Q on the SEC website at sec.gov. Copies of the Fund’s Forms N-Q may be reviewed and copied at the SEC Public Reference Room in Washington, D.C. You can obtain information on the operation of the Public Reference Room, including information about duplicating fee charges, by calling 202 551 8090 or 800 732 0330, or by electronic request at the following email address: publicinfo@sec.gov. The SEC file numbers for the Fund are shown below.
A description of the policies and procedures that the Fund uses to determine how to vote proxies relating to portfolio securities is available without charge, upon request, from our Client Services department at 800 959 4246 or at invesco.com/proxyguidelines. The information is also available on the SEC website, sec.gov.
| | |
Information regarding how the Fund voted proxies related to its portfolio securities during the most recent 12-month period ended June 30 is available at invesco.com/proxysearch. The information is also available on the SEC website, sec.gov. Invesco Advisers, Inc. is an investment adviser; it provides investment advisory services to individual and institutional clients and does not sell securities. Invesco Distributors, Inc. is the US distributor for Invesco Ltd.’s retail mutual funds, exchange-traded funds and institutional money market funds. Both are wholly owned, indirect subsidiaries of Invesco Ltd. | |  |
| | | | |
| SEC file numbers: 811-07890 and 033-66242 | | VK-HYM-AR-1 | | Invesco Distributors, Inc. |
Letters to Shareholders
| | |

Philip Taylor | | Dear Shareholders: This annual report includes information about your Fund, including performance data and a complete list of its investments as of the close of the reporting period. Inside, your Fund’s portfolio managers discuss how they managed your Fund and the factors that affected its performance during the reporting period. I hope you find this report of interest. During the reporting period covered by this report, major US and global equity market indexes hit multiyear or all-time highs1, the result of a strengthening US economy and relatively healthy corporate profits. Also helping equities was a return of individual investors to stocks – due in part to monetary policies that kept interest rates (and yields on fixed income securities) low. Despite some volatility in the summer of 2013, overseas equity market indexes in developed and emerging nations generally rose during the reporting period – although developed markets |
generally outpaced emerging markets. In January 2014, amid widespread signs of an improving economy, the US Federal Reserve began a long-anticipated reduction in its bond-buying program.
Extended periods of strong market performance can lull some investors into a false sense of security – just as extended periods of volatility or market weakness can discourage some investors from undertaking disciplined, long-term investment plans. That’s why Invesco believes it can often be helpful to work with a skilled and trusted financial adviser; he or she can emphasize the importance of adhering to an investment plan designed to achieve long-term goals like a first home, a college education for a child or a comfortable retirement. A financial adviser who is familiar with your individual financial situation, investment goals and risk tolerance can be an invaluable partner as you work toward your financial goals. He or she can provide insight and perspective when markets are volatile; encouragement and reassurance when times are uncertain; and advice and guidance when your financial situation or investment goals change.
Timely information when and where you want it
Invesco’s efforts to help investors achieve their financial objectives include providing individual investors and financial professionals with timely information about the markets, the economy and investing – whenever and wherever they want it.
Our website, invesco.com/us, offers a wide range of market insights and investment perspectives. On the website, you’ll find detailed information about our funds, including prices, performance, holdings and portfolio manager commentaries. You can access information about your individual Invesco account whenever it’s convenient for you; just complete a simple, secure online registration. Use the “Login” box on our home page to get started.
Invesco’s mobile app for iPad® (available free from the App StoreSM) allows you to obtain the same detailed information about your Fund and the same investment insights from our investment leaders, market strategists, economists and retirement experts on the go. You also can watch portfolio manager videos and have instant access to Invesco news and updates wherever you may be.
In addition to the resources accessible on our website and through our mobile app, you can obtain timely updates to help you stay informed about the markets, the economy and investing by connecting with Invesco on Twitter, LinkedIn or Facebook. You can access our blog at blog.invesco.us.com or by visiting the “Intentional Investing Forum” on our home page. Our goal is to provide you the information you want, when and where you want it.
Have questions?
For questions about your account, feel free to contact an Invesco client services representative at 800 959 4246. For Invesco-related questions or comments, please email me directly at phil@invesco.com.
All of us at Invesco look forward to serving your investment management needs for many years to come. Thank you for investing with us.
Sincerely,

Philip Taylor
Senior Managing Director, Invesco Ltd.
1 Source: Reuters
iPad is a trademark of Apple Inc., registered in the US and other countries. App Store is a service mark of Apple Inc. Invesco Distributors, Inc. is not affiliated with Apple Inc.
2 Invesco Intermediate Term Municipal Income Fund
| | |

Bruce Crockett | | Dear Fellow Shareholders: Members of the Invesco Funds Board work continually to oversee how the Invesco Funds are performing in light of ever-changing and often unpredictable economic and market conditions. One of the ways we do this is by verifying that the teams that manage funds understand the risks associated with the investments they make in the funds they manage. In light of market conditions over the last few years, the financial news media of late have given increased attention to “alternative investment strategies.” Despite this increased attention, many investors don’t know very much about these types of investment strategies. Let me put alternative investment strategies and the new focus on them in some perspective. First, these types of investment strategies have been used predominately by institutional investors and investment professionals for decades to increase diversification – in an effort to dampen portfolio volatility (risk) with the goal of increasing returns. The focal point |
of the increased news coverage is that these types of strategies are now being made more widely available to individual investors.
Alternative investment strategies generally seek to provide measured exposure to various asset classes whose performance, historically, has not been highly correlated with one another. These strategies may help mitigate the impact to a portfolio from severe or prolonged market downturns while potentially providing reasonable returns over time. After a careful and thorough examination of the potential risks and potential benefits of alternative investment strategies, the Invesco Funds Board has approved the launch of several new alternative funds for the Invesco product lineup, to be managed by teams we determined have the depth and experience to pursue the funds’ investment objectives.
While no single investment product can provide complete downside protection in falling markets and full upside participation in rising markets, your Board believes alternative funds can be a prudent tool to work in concert with more traditional mutual funds and other investments to build well diversified portfolios. Your financial adviser can determine whether or not such investments are appropriate for your individual needs, goals and risk tolerance. Also, he or she can explain the risks associated with alternative investment strategies. This type of professional guidance is why Invesco believes it’s so important that individual investors work with trusted, experienced financial advisers.
Whether you’re invested in equity, fixed income, cash management or alternative investment funds, be assured that the Invesco Funds Board will continue working on your behalf and on behalf of all our fund shareholders, keeping your needs and interests uppermost in our minds.
As always, please contact me at bruce@brucecrockett.com with any questions or concerns you may have. On behalf of the Board, we look forward to continuing to represent your interests and serving your needs.
Sincerely,

Bruce L. Crockett
Independent Chair
Invesco Funds Board of Trustees
Asset allocation/diversification does not guarantee a profit or eliminate the risk of loss.
Alternative products typically hold more non-traditional investments and employ more complex trading strategies, including hedging and leveraging through derivatives, short selling and opportunistic strategies that change with market conditions. Investors considering alternatives should be aware of their unique characteristics and additional risks from the strategies they use. Like all investments, performance will fluctuate. You can lose money.
3 Invesco Intermediate Term Municipal Income Fund
Management’s Discussion of Fund Performance
Performance summary
For the fiscal year ended February 28, 2014, Invesco Intermediate Term Municipal Income Fund posted negative returns. The Fund’s Class A shares at NAV slightly underperformed the Fund’s broad market/style-specific benchmark, the Barclays Municipal Bond Index. Positive performance from the Fund’s underweight allocation at the long end of the yield curve was more than offset by an overweight position and security selection in the 12-17 year maturity segment of the yield curve.
Your Fund’s long-term performance appears later in this report.
Fund vs. Indexes
Total returns, 2/28/13 to 2/28/14, at net asset value (NAV). Performance shown does not include applicable contingent deferred sales charges (CDSC) or front-end sales charges, which would have reduced performance.
| | | | | |
| Class A Shares | | | | -0.30 | % |
| Class B Shares | | | | -0.32 | |
| Class C Shares | | | | -1.08 | |
| Class Y Shares | | | | -0.06 | |
| Barclays Municipal Bond Index‚ (Broad Market/Style-Specific Index) | | | | -0.21 | |
Source(s): ‚Lipper Inc.
How we invest
The Fund’s investment objective is to provide investors with a high level of current income exempt from federal income tax, consistent with preservation of capital.
Under normal market conditions, we seek to achieve the Fund’s investment objective by investing at least 65% of the Fund’s total assets in municipal securities rated investment grade by at least one nationally recognized statistical rating organization – or if not rated, securities we determine to be of comparable quality – at the time of purchase.
Under normal market conditions, the Fund may invest up to 35% of its total assets in municipal securities rated below investment grade and unrated municipal securities which we determine to be of comparable quality at the time of purchase. Lower-grade securities are commonly referred to as junk bonds and involve greater risks than investments in higher-grade securities. With respect to
such investments, the Fund has not established any limit on the percentage of its portfolio that may be invested in securities in any one rating category.
The Fund may invest all or a substantial portion of its assets in municipal securities that are subject to the federal alternative minimum tax (AMT). Accordingly, the Fund may not be a suitable investment for investors who are already subject to the AMT or could become subject to it as a result of an investment in the Fund.
We may sell securities based on factors such as degradation in credit quality, a decision to shorten or lengthen the Fund’s duration or reducing exposure to a particular sector or issuer.
Market conditions and your Fund
For the fiscal year ended February 28, 2014, the municipal bond market returned -0.21%1, as measured by the Barclays Municipal Bond Index, the Fund’s
benchmark. Record outflows from municipal bond funds, driven by concerns over rising interest rates and high-profile credit events, resulted in a challenging year for municipal bond investors. The $67 billion2 in municipal bond fund redemptions between March and December 2013 was in stark contrast to inflows of $65 billion2 and strong performance for the asset class over the prior two years.
Shortly after the fiscal year began, investors became apprehensive that the US Federal Reserve (the Fed) would reduce its asset purchase program, known as quantitative easing (QE), as the US economy improved. Concerned that Fed action would cause interest rates to rise and bond prices to fall, investors began trimming their allocations to fixed income investments, including municipal bonds. The rate of outflows increased dramatically in June following comments made by then-Fed Chairman Ben Bernanke on the timing for tapering QE.
Over the summer of 2013, several high-profile credit events had an adverse impact on the municipal bond market. These included downgrades to the credit ratings of Chicago debt on pension concerns, Detroit filing the largest municipal bankruptcy in US history3 and increased uncertainty about the financial condition of Puerto Rico.
The market received a two-month reprieve in September when the Fed decided not to reduce QE, although it reversed that decision in December when it announced that it would decrease its asset purchases by $10 billion per month, beginning in January 2014.4 A final head-wind for the municipal bond market was significant tax-loss selling of municipal bonds in December to offset gains from strong equity returns during 2013.
| | | | |
Portfolio Composition | | | | |
By credit sector, based on total investments | |
| Revenue Bonds | | | 87.5 | % |
| General Obligation Bonds | | | 10.7 | |
Pre-Refunded Bonds | | | 1.8 | |
| | | | | |
| Top Five Fixed Income Holdings |
| | | | | |
1. Houston (City of); Series 2012 | | | | 1.3 | % |
2. California (State of) Pollution Control Finance Authority; Series 2012 | | | | 1.1 | |
3. Illinois (State of) Metropolitan Pier & Exposition Authority (McCormick Place Expansion); Series 2012 B | | | | 0.9 | |
4. Foothill-Eastern Transportation Corridor Agency; Subseries 2014 B-2 | | | | 0.8 | |
5. Texas (State of) Turnpike Authority (Central Texas Turnpike System); Series 2002 A | | | | 0.8 | |
| | | | | |
| Total Net Assets | | | | $684.8 million | |
| |
| Total Number of Holdings | | | | 471 | |
The Fund’s holdings are subject to change, and there is no assurance that the Fund will continue to hold any particular security.
4 Invesco Intermediate Term Municipal Income Fund
In the first two months of 2014, the municipal bond market turned positive. Softer economic data reduced expectations for hawkish Fed action. Relatively high yields on municipal bonds, coupled with higher personal income tax rates and improving municipal fundamentals, drew investors back to the asset class. Net positive fund flows in January and February, combined with limited supply of new issuance, produced strong returns in the final two months of the fiscal year.
During the fiscal year, the largest contributor to Fund performance relative to its benchmark was an underweight allocation at the long end of the yield curve. Allocation and security selection in short-to-intermediate maturity bonds was also additive to relative performance, but was offset by an overweight position and security selection in the 12-17 year maturity segment of the yield curve.
At the sector level, special tax, industrial revenue and electric bonds contributed to performance relative to the Fund’s benchmark for the fiscal year. Security selection in the transportation and education sectors hindered relative performance. The Fund’s underweight position in Puerto Rico bonds significantly contributed to relative performance but security selection in bonds issued by the commonwealth partially offset the positive effect of the allocation.
During the reporting period, leverage detracted from Fund performance. The Fund achieved a leveraged position through the use of inverse floating rate securities or Tender Option Bonds (TOBs). The Fund uses leverage because we believe that, over time, leveraging provides opportunities for additional income and total return for shareholders. However, use of leverage also can expose shareholders to additional volatility. For more information about the Fund’s use of leverage, see the Notes to Financial Statements later in this report.
We wish to remind you that the Fund is subject to interest rate risk, meaning when interest rates rise, the value of fixed income securities generally will fall. This risk may be greater in the current market environment because interest rates are at or near historic lows. We are monitoring interest rates and market and economic factors that may impact interest rates, including the potential impact of the Fed’s tapering of QE. If interest rates rise, markets may experience increased volatility, which may affect the value and/or liquidity of certain of the Fund’s investments.
Recently published rules implementing section 619 of the Dodd-Frank Wall Street Reform and Consumer Protection Act may preclude banking entities from sponsoring and/or providing services for TOB trust programs. As a result, the Trust’s ability to utilize TOBs for leverage purposes may be adversely affected.
Thank you for investing in Invesco Intermediate Term Municipal Income Fund and for sharing our long-term investment horizon.
1 Source: Barclays
2 Source: Morningstar
3 Source: Moody’s
4 Source: US Federal Reserve
The views and opinions expressed in management’s discussion of Fund performance are those of Invesco Advisers, Inc. These views and opinions are subject to change at any time based on factors such as market and economic conditions. These views and opinions may not be relied upon as investment advice or recommendations, or as an offer for a particular security. The information is not a complete analysis of every aspect of any market, country, industry, security or the Fund. Statements of fact are from sources considered reliable, but Invesco Advisers, Inc. makes no representation or warranty as to their completeness or accuracy. Although historical performance is no guarantee of future results, these insights may help you understand our investment management philosophy.
See important Fund and, if applicable, index disclosures later in this report.
| | |
 | | Robert Wimmel Portfolio manager, is manager of Invesco Intermediate Term Municipal Income Fund and is head of |
| Investment Grade Municipals. He joined Invesco in 2010. Mr. Wimmel earned a BA in anthropology from the University of Cincinnati and an MA in economics from the University of Illinois at Chicago. |
| | |
 | | Thomas Byron Portfolio manager, is manager of Invesco Intermediate Term Municipal Income Fund. He joined |
| Invesco in 2010. Mr. Byron earned a BS in finance from Marquette University and an MBA in finance from DePaul University. |
| | |
 | | Robert Stryker Chartered Financial Analyst, portfolio manager, is manager of Invesco Intermediate Term Municipal Income |
| Fund. He joined Invesco in 2010. Mr. Stryker earned a BS in finance from the University of Illinois at Chicago. |
5 Invesco Intermediate Term Municipal Income Fund
Your Fund’s Long-Term Performance
Results of a $10,000 Investment – Oldest Share Class(es)
Fund and index data from 2/29/04
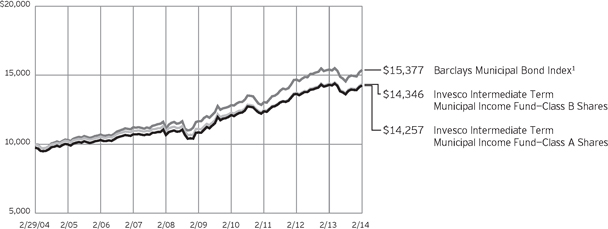
Past performance cannot guarantee comparable future results.
The data shown in the chart include reinvested distributions, applicable sales charges and Fund expenses including management fees. Results for Class B shares are calculated as if a hypothetical shareholder had liquidated his entire investment in the Fund at the close of the reporting period and paid the contingent deferred sales charges, if applicable.
Index results include reinvested dividends, but they do not reflect sales charges. Performance of the peer group, if applicable, reflects fund expenses and management fees; performance of a market index does not. Performance shown in the chart and table(s) does not reflect deduction of taxes a shareholder would pay on Fund distributions or sale of Fund shares.
6 Invesco Intermediate Term Municipal Income Fund
| | | | | |
| Average Annual Total Returns |
| As of 2/28/14, including maximum applicable sales charges | |
| |
| Class A Shares | | | | | |
| Inception (5/28/93) | | | | 4.75 | % |
| 10 Years | | | | 3.61 | |
| 5 Years | | | | 5.09 | |
| 1 Year | | | | -2.79 | |
| |
Class B Shares | | | | | |
| Inception (5/28/93) | | | | 4.58 | % |
| 10 Years | | | | 3.67 | |
| 5 Years | | | | 4.94 | |
| 1 Year | | | | -5.16 | |
| |
| Class C Shares | | | | | |
| Inception (10/19/93) | | | | 3.84 | % |
| 10 Years | | | | 3.11 | |
| 5 Years | | | | 4.83 | |
| 1 Year | | | | -2.05 | |
| |
| Class Y Shares | | | | | |
| Inception (8/12/05) | | | | 4.35 | % |
| 5 Years | | | | 5.88 | |
| 1 Year | | | | -0.06 | |
| | | | |
| Average Annual Total Returns | |
| As of 12/31/13, the most recent calendar quarter end, including maximum applicable sales charges | |
| |
| Class A Shares | | | | |
| Inception (5/28/93) | | | 4.67 | % |
| 10 Years | | | 3.53 | |
| 5 Years | | | 5.46 | |
| 1 Year | | | -4.26 | |
| |
| Class B Shares | | | | |
| Inception (5/28/93) | | | 4.50 | % |
| 10 Years | | | 3.58 | |
| 5 Years | | | 5.27 | |
| 1 Year | | | -6.55 | |
| |
| Class C Shares | | | | |
| Inception (10/19/93) | | | 3.75 | % |
| 10 Years | | | 3.03 | |
| 5 Years | | | 5.20 | |
| 1 Year | | | -3.47 | |
| |
| Class Y Shares | | | | |
| Inception (8/12/05) | | | 4.13 | % |
| 5 Years | | | 6.26 | |
| 1 Year | | | -1.47 | |
Effective June 1, 2010, Class A, Class B, Class C and Class I shares of the predecessor fund, Van Kampen Intermediate Term Municipal Income Fund, advised by Van Kampen Asset Management were reorganized into Class A, Class B, Class C and Class Y shares, respectively, of Invesco Van Kampen Intermediate Term Municipal Income Fund (renamed Invesco Intermediate Term Municipal Income Fund). Returns shown above for Class A, Class B, Class C and Class Y shares are blended returns of the predecessor fund and Invesco Intermediate Term Municipal Income Fund. Share class returns will differ from the predecessor fund because of different expenses.
The performance data quoted represent past performance and cannot guarantee comparable future results; current performance may be lower or higher. Please visit invesco.com/performance for the most recent month-end performance. Performance figures reflect reinvested distributions, changes in net asset value and the effect of the maximum sales charge unless otherwise stated. Investment return and principal value will fluctuate so that you may have a gain or loss when you sell shares.
The net annual Fund operating expense ratio set forth in the most recent Fund prospectus as of the date of this report for Class A, Class B, Class C and Class Y shares was 0.81%, 0.81%, 1.56% and 0.56%, respectively.1 The total annual Fund operating expense ratio set forth in the most recent Fund prospectus as of the date of this report for Class A, Class B, Class C and Class Y shares was 0.89%, 0.89%, 1.64% and 0.64%, respectively. The expense ratios presented above may vary from the expense ratios presented in other sections of this report that are based on expenses incurred during the period covered by this report.
Class A share performance reflects the maximum 2.50% sales charge, and Class B and Class C share performance reflects the applicable contingent deferred sales charge (CDSC) for the period involved. For shares purchased prior to June 1, 2005, the CDSC on Class B shares declines from 3% at the time of purchase to 0% at the beginning of the fifth year. For shares purchased after June 1, 2005, and before June 1, 2010, the CDSC on Class B shares declines from 4% at the time of purchase to 0% at the beginning of the
sixth year. For shares purchased on or after June 1, 2010, the CDSC on Class B shares declines from 5% at the time of purchase to 0% at the beginning of the seventh year. The CDSC on Class C shares is 1% for the first year after purchase. Class Y shares do not have a front-end sales charge or a CDSC; therefore, performance is at net asset value.
The performance of the Fund’s share classes will differ primarily due to different sales charge structures and class expenses.
| 1 | Total annual Fund operating expenses after any contractual fee waivers and/or expense reimbursements by the adviser in effect through at least June 30, 2014. See current prospectus for more information. |
7 Invesco Intermediate Term Municipal Income Fund
Invesco Intermediate Term Municipal Income Fund’s investment objective is to provide investors with a high level of current income exempt from federal income tax, consistent with preservation of capital.
| n | | Unless otherwise stated, information presented in this report is as of February 28, 2014, and is based on total net assets. |
| n | | Unless otherwise noted, all data provided by Invesco. |
| n | | To access your Fund’s reports/prospectus, visit invesco.com/fundreports. |
About share classes
| n | | Class B shares may not be purchased for new or additional investments. Please see the prospectus for more information. |
| n | | Class Y shares are available to only certain investors. Please see the prospectus for more information. |
Principal risks of investing in the Fund
| n | | Alternative minimum tax risk. All or a portion of the Fund’s otherwise tax-exempt income may be taxable to those shareholders subject to the federal alternative minimum tax. |
| n | | Call risk. If interest rates fall, it is possible that issuers of debt securities with high interest rates will prepay or call their securities before their maturity dates. In this event, the proceeds from the called securities would likely be reinvested by the Fund in securities bearing the new, lower interest rates, resulting in a possible decline in the Fund’s income and distributions to shareholders. |
| n | | Credit risk. The issuer of instruments in which the Fund invests may be unable to meet interest and/or principal payments, thereby causing its instruments to decrease in value and lowering the issuer’s credit rating. |
| n | | Derivatives risk. The value of a derivative instrument depends largely on (and is derived from) the value of an underlying security, currency, commodity, interest rate, index or other asset (each referred to as an underlying asset). In addition to risks relating to the underlying assets, the use of derivatives may include other, possibly greater, risks, including counterparty, leverage and liquidity risks. Counterparty risk is the risk that the counterparty to the derivative contract will default on its obligation to pay the Fund the amount owed or otherwise perform under the derivative contract. Derivatives create leverage risk because they do not require payment up |
| | front equal to the economic exposure created by owning the derivative. As a result, an adverse change in the value of the underlying asset could result in the Fund sustaining a loss that is substantially greater than the amount invested in the derivative, which may make the Fund’s returns more volatile and increase the risk of loss. Derivative instruments may also be less liquid than more traditional investments and the Fund may be unable to sell or close out its derivative positions at a desirable time or price. This risk may be more acute under adverse market conditions, during which the Fund may be most in need of liquidating its derivative positions. Derivatives may also be harder to value, less tax efficient and subject to changing government regulation that could impact the Fund’s ability to use certain derivatives or their cost. Also, derivatives used for hedging or to gain or limit exposure to a particular market segment may not provide the expected benefits, particularly during adverse market conditions. |
| n | | High yield bond (junk bond) risk. Junk bonds involve a greater risk of default or price changes due to changes in the credit quality of the issuer. The values of junk bonds fluctuate more than those of high-quality bonds in response to company, political, regulatory or economic developments. Values of junk bonds can decline significantly over short periods of time. |
| n | | Income risk. The income you receive from the Fund is based primarily on prevailing interest rates, which can vary widely over the short- and long-term. If interest rates drop, your income from the Fund may drop as well. |
| n | | Interest rate risk. Interest rate risk refers to the risk that bond prices generally fall as interest rates rise; conversely, bond prices generally rise as interest rates fall. Specific bonds differ in their sensitivity to changes in interest rates depending on their individual characteristics, including duration. |
This report must be accompanied or preceded by a currently effective Fund prospectus, which contains more complete information, including sales charges and expenses. Investors should read it carefully before investing.
NOT FDIC INSURED | MAY LOSE VALUE | NO BANK GUARANTEE
| n | | Intermediate dollar-weighted average life risk. Market prices of municipal securities with intermediate lives generally fluctuate more in response to changes in interest rates than do market prices of municipal securities with shorter lives but generally fluctuate less than market prices of municipal securities with longer lives. |
| n | | Inverse floating rate obligations risk. Inverse floating rate obligations, including tender option bonds, may be subject to greater price volatility than a fixed income security with similar qualities. When short-term interest rates rise, they may decrease in value and produce less or no income. Additionally, these securities may lose principal. Similar to derivatives, inverse floating rate obligations have the following risks: counterparty, leverage, correlation, liquidity, market, interest rate, and management risks. |
| n | | Leverage risk. Leverage exists when the Fund purchases or sells an instrument or enters into a transaction without investing cash in an amount equal to the full economic exposure of the asset or transaction and the Fund could lose more than it invested. Leverage created from certain types of transactions or instruments may impair the Fund’s liquidity, cause it to liquidate positions at an unfavorable time, increase volatility or otherwise not achieve its intended objective. |
| n | | Liquidity risk. The Fund may hold illiquid securities that it is unable to sell at the preferred time or price and could lose its entire investment in such securities. |
| n | | Management risk. The investment techniques and risk analysis used by the Fund’s portfolio managers may not produce the desired results. |
| n | | Market risk. The prices of and the income generated by the Fund’s securities may decline in response to, among other things, investor sentiment, general economic and market conditions, regional or global instability, and currency and interest rate fluctuations. |
8 Invesco Intermediate Term Municipal Income Fund
| n | | Medium- and lower-grade municipal securities risk. Securities which are in the medium- and lower-grade categories generally offer higher yields than are offered by higher-grade securities of similar maturity, but they also generally involve more volatility and greater risks, such as greater credit risk, market risk, liquidity risk, management risk, and regulatory risk. Furthermore, many medium- and lower-grade securities are not listed for trading on any national securities exchange and many issuers of medium- and lower-grade securities choose not to have a rating assigned to their obligations by any nationally recognized statistical rating organization. As a result, the Fund’s portfolio may consist of a higher portion of unlisted or unrated securities as compared with an investment company that invests solely in higher-grade securities. Unrated securities are usually not as attractive to as many buyers as are rated securities, a factor which may make unrated securities less marketable. These factors may have the effect of limiting the availability of the securities for purchase by the Fund and may also limit the ability of the Fund to sell such securities at their fair value either to meet redemption requests or in response to changes in the economy or the financial markets. |
| n | | Municipal issuer focus risk. The Fund generally considers investments in municipal securities not to be subject to industry concentration policies (issuers of municipal securities as a group is not an industry) and the Fund may invest in municipal securities issued by entities having similar characteristics. The issuers may be located in the same geographic area or may pay their interest obligations from revenue of similar projects, such as hospitals, airports, utility systems and housing finance agencies. This may make the Fund’s investments more susceptible to similar social, economic, political or regulatory occurrences. As the similarity in issuers increases, the potential for fluctuation in the Fund’s net asset value also increases. |
| n | | Municipal securities risk. The Fund may invest in municipal securities. Constitutional amendments, legislative enactments, executive orders, administrative regulations, voter initiatives, and the issuer’s regional economic conditions may affect the municipal security’s value, interest payments, repayment of principal and the Fund’s ability to sell it. Failure of a municipal security issuer to comply with applicable tax requirements may make income paid thereon taxable, resulting in a decline in the security’s value. In addition, there could be changes in applicable tax laws or tax treatments that reduce or eliminate the current federal income tax exemption on municipal securities or otherwise adversely affect the current federal or state tax status of municipal securities. |
| n | | Reinvestment risk. Reinvestment risk is the risk that a bond’s cash flows (coupon income and principal repayment) will be reinvested at an interest rate below that on the original bond. |
| n | | Variable-rate demand notes risk. The absence of an active secondary market for certain variable and floating rate notes could make it difficult to dispose of the instruments, and a portfolio could suffer a loss if the issuer defaults during periods in which a portfolio is not entitled to exercise its demand rights. |
| n | | When-issued and delayed delivery risk. When-issued and delayed delivery transactions are subject to market risk as the value or yield of a security at delivery may be more or less than the purchase price or the yield generally available on securities when delivery occurs. In addition, the Fund is subject to counterparty risk because it relies on the buyer or seller, as the case may be, to consummate the transaction, and failure by the other party to complete the transaction may result in the Fund missing the opportunity of obtaining a price or yield considered to be advantageous. |
| n | | Zero coupon or pay-in-kind securities risk. The value, interest rates, and liquidity of non-cash paying instruments, such as zero coupon and pay-in-kind securities, are subject to greater fluctuation than other types of securities. |
About indexes used in this report
| n | | The Barclays Municipal Bond Index is an unmanaged index considered representative of the tax-exempt bond market. |
| n | | The Fund is not managed to track the performance of any particular index, including the index(es) described here, and consequently, the performance of the Fund may deviate significantly from the performance of the index(es). |
| n | | A direct investment cannot be made in an index. Unless otherwise indicated, index results include reinvested dividends, and they do not reflect sales charges. Performance of the peer group, if applicable, reflects fund expenses; performance of a market index does not. |
Other information
| n | | The returns shown in management’s discussion of Fund performance are based on net asset values (NAVs) calculated for shareholder transactions. Generally accepted accounting principles require adjustments to be made to the net assets of the Fund at period end for financial reporting purposes, and as such, the NAVs for shareholder transactions and the returns based on those NAVs may differ from the NAVs and returns reported in the Financial Highlights. |
9 Invesco Intermediate Term Municipal Income Fund
Schedule of Investments
February 28, 2014
| | | | | | | | | | | | | | | | |
| | | Interest
Rate | | | Maturity
Date | | | Principal
Amount
(000) | | | Value | |
Municipal Obligations–100.00% | |
| Alabama–0.38% | |
Pell City (City of) Special Care Facilities Financing Authority; Series 2012, RB | | | 5.00 | % | | | 12/01/21 | | | $ | 2,250 | | | $ | 2,572,538 | |
| | | | |
| Alaska–0.87% | | | | | | | | | | | | | | | | |
Alaska (State of) Municipal Bond Bank Authority; | | | | | | | | | | | | | | | | |
Series 2009 1, RB | | | 5.00 | % | | | 09/01/22 | | | | 250 | | | | 286,012 | |
Series 2009 1, RB | | | 5.25 | % | | | 09/01/24 | | | | 400 | | | | 459,696 | |
Alaska Railroad Corp. (FTA Section 5307 Urbanized Area Formula Funds & Section 5309 Fixed Guideway Modernization Formula Funds); Series 2007, Capital Grant Receipts RB (INS–NATL)(a) | | | 5.00 | % | | | 08/01/15 | | | | 2,680 | | | | 2,844,820 | |
Matanuska-Susitna (Borough of) (Goose Creek Correctional Center); | | | | | | | | | | | | | | | | |
Series 2009, Lease RB (INS–AGC)(a) | | | 5.00 | % | | | 09/01/19 | | | | 1,000 | | | | 1,189,280 | |
Series 2009, Lease RB (INS–AGC)(a) | | | 5.50 | % | | | 09/01/23 | | | | 1,000 | | | | 1,183,280 | |
| | | | | 5,963,088 | |
| | | | |
| Arizona–3.35% | | | | | | | | | | | | | | | | |
Glendale (City of) Industrial Development Authority (Midwestern University); Series 2010, RB | | | 5.00 | % | | | 05/15/26 | | | | 2,000 | | | | 2,120,160 | |
Maricopa (County of) Industrial Development Authority (Catholic Healthcare West); | | | | | | | | | | | | | | | | |
Series 2009 A, Health Facilities RB | | | 5.00 | % | | | 07/01/14 | | | | 500 | | | | 507,770 | |
Series 2009 C, Health Facilities RB(b) | | | 5.00 | % | | | 07/01/14 | | | | 1,500 | | | | 1,524,135 | |
Maricopa County Pollution Control Corp. (Arizona Public Service Co.–Palo Verde); Series 2009 A, Ref. PCR(b) | | | 6.00 | % | | | 05/01/14 | | | | 2,400 | | | | 2,421,768 | |
Navajo County Pollution Control Corp.; | | | | | | | | | | | | | | | | |
Series 2009 C, PCR(b) | | | 5.50 | % | | | 06/01/14 | | | | 1,000 | | | | 1,012,100 | |
Series 2009 E, PCR(b) | | | 5.75 | % | | | 06/01/16 | | | | 1,000 | | | | 1,099,520 | |
Phoenix (City of) Industrial Development Authority (Career Success Schools); Series 2009, Education RB | | | 6.13 | % | | | 01/01/20 | | | | 500 | | | | 490,300 | |
Phoenix (City of) Industrial Development Authority (Rowan University); Series 2012, Lease RB | | | 5.00 | % | | | 06/01/27 | | | | 3,000 | | | | 3,210,870 | |
Pima (County of) Industrial Development Authority (Edkey Charter Schools); Series 2013, Ref. Education Facility RB | | | 5.00 | % | | | 07/01/25 | | | | 750 | | | | 691,335 | |
Pima (County of) Industrial Development Authority (Global Water Resources, LLC); Series 2008, Water & Wastewater RB(c) | | | 6.38 | % | | | 12/01/18 | | | | 378 | | | | 386,724 | |
Pinal (County of) Electric District No. 4; Series 2008, Electrical System RB | | | 5.25 | % | | | 12/01/18 | | | | 500 | | | | 576,740 | |
Salt River Project Agricultural Improvement & Power District; Series 2009 A, Electric System RB | | | 5.00 | % | | | 01/01/22 | | | | 1,000 | | | | 1,143,970 | |
University Medical Center Corp.; Series 2009, Hospital RB | | | 5.25 | % | | | 07/01/17 | | | | 1,000 | | | | 1,117,250 | |
Verrado Community Facilities District No. 1; | | | | | | | | | | | | | | | | |
Series 2013 A, Ref. Unlimited Tax GO Bonds(d) | | | 5.00 | % | | | 07/15/20 | | | | 700 | | | | 761,012 | |
Series 2013 A, Ref. Unlimited Tax GO Bonds(d) | | | 5.00 | % | | | 07/15/21 | | | | 485 | | | | 515,371 | |
Series 2013 A, Ref. Unlimited Tax GO Bonds(d) | | | 5.00 | % | | | 07/15/22 | | | | 570 | | | | 600,980 | |
Series 2013 A, Ref. Unlimited Tax GO Bonds(d) | | | 5.00 | % | | | 07/15/23 | | | | 825 | | | | 857,109 | |
Series 2013 B, Unlimited Tax GO Bonds(d) | | | 5.00 | % | | | 07/15/23 | | | | 560 | | | | 581,795 | |
Yavapai (County of) Industrial Development Authority (Northern Arizona Healthcare System); Series 2011, Ref. Hospital Facility RB | | | 5.25 | % | | | 10/01/26 | | | | 2,000 | | | | 2,239,640 | |
Yuma (City of) Industrial Development Authority (Regional Medical Center); Series 2014 A,
Hospital RB | | | 5.00 | % | | | 08/01/25 | | | | 1,000 | | | | 1,074,670 | |
| | | | | 22,933,219 | |
| | | | |
| California–12.71% | | | | | | | | | | | | | | | | |
Adelanto (City of) Public Utility Authority (Utility System); Series 2009 A, Ref. RB | | | 5.38 | % | | | 07/01/19 | | | | 1,000 | | | | 1,129,590 | |
Alhambra (City of) (Atherton Baptist Homes); Series 2010 B, RB | | | 6.63 | % | | | 01/01/17 | | | | 160 | | | | 160,245 | |
California (State of) Health Facilities Financing Authority (Catholic Healthcare West); Series 2009 F, RB(b) | | | 5.00 | % | | | 07/01/14 | | | | 500 | | | | 508,255 | |
California (State of) Municipal Finance Authority (Community Hospitals of Central California Obligated Group); Series 2007, COP | | | 5.00 | % | | | 02/01/21 | | | | 2,000 | | | | 2,092,340 | |
California (State of) Municipal Finance Authority (Emerson College); Series 2011, RB | | | 5.00 | % | | | 01/01/28 | | | | 1,500 | | | | 1,595,355 | |
See accompanying Notes to Financial Statements which are an integral part of the financial statements.
10 Invesco Intermediate Term Municipal Income Fund
| | | | | | | | | | | | | | | | |
| | | Interest
Rate | | | Maturity
Date | | | Principal
Amount
(000) | | | Value | |
| California–(continued) | | | | | | | | | | | | | | | | |
California (State of) Municipal Finance Authority (High Tech High-Chula Vista); Series 2008 B, Educational Facility RB(d) | | | 5.50 | % | | | 07/01/18 | | | $ | 875 | | | $ | 916,125 | |
California (State of) Pollution Control Finance Authority; Series 2012, Water Furnishing RB(c)(d) | | | 5.00 | % | | | 07/01/27 | | | | 7,000 | | | | 7,265,440 | |
California (State of) School Finance Authority (Alliance for College-Ready Public Schools); Series 2013 A, School Facility RB | | | 5.25 | % | | | 07/01/23 | | | | 2,065 | | | | 2,110,740 | |
California (State of) Statewide Communities Development Authority (American Baptist Homes of the West); Series 2013 B-2, TEMPS–55SM RB | | | 2.40 | % | | | 10/01/20 | | | | 1,250 | | | | 1,244,312 | |
California (State of) Statewide Communities Development Authority (Kaiser Permanente); Series 2012, Floating Rate RB(b)(e) | | | 0.98 | % | | | 05/01/17 | | | | 4,000 | | | | 4,008,052 | |
California (State of) Statewide Communities Development Authority (Methodist Hospital); Series 2009, RB (CEP–FHA) | | | 6.25 | % | | | 08/01/24 | | | | 1,720 | | | | 2,058,066 | |
California (State of) Statewide Communities Development Authority (Southern California Presbyterian Homes); | | | | | | | | | | | | | | | | |
Series 2009, Senior Living RB | | | 5.25 | % | | | 11/15/14 | | | | 295 | | | | 299,525 | |
Series 2009, Senior Living RB | | | 6.25 | % | | | 11/15/19 | | | | 600 | | | | 668,826 | |
California (State of); | | | | | | | | | | | | | | | | |
Series 2012 A, Ref. Floating Rate Unlimited Tax GO Bonds(b)(e) | | | 0.71 | % | | | 05/01/15 | | | | 1,750 | | | | 1,750,000 | |
Series 2012 B, Ref. Floating Rate Unlimited Tax GO Bonds(e) | | | 1.18 | % | | | 05/01/20 | | | | 2,000 | | | | 2,011,857 | |
Corona-Norco Unified School District (Community Facilities District No. 98-1); | | | | | | | | | | | | | | | | |
Series 2013, Ref. Special Tax RB | | | 5.00 | % | | | 09/01/21 | | | | 810 | | | | 928,033 | |
Series 2013, Ref. Special Tax RB | | | 5.00 | % | | | 09/01/23 | | | | 1,000 | | | | 1,138,200 | |
Foothill-Eastern Transportation Corridor Agency; Subseries 2014 B-2, Ref. Toll Road RB(b) | | | 5.00 | % | | | 01/15/20 | | | | 5,000 | | | | 5,495,200 | |
Fresno (City of); Series 2010 A-1, Water System RB | | | 5.50 | % | | | 06/01/22 | | | | 1,000 | | | | 1,176,100 | |
Golden State Tobacco Securitization Corp.; | | | | | | | | | | | | | | | | |
Series 2007 A-1, Sr. Tobacco Settlement Asset-Backed RB | | | 5.00 | % | | | 06/01/33 | | | | 1,000 | | | | 798,190 | |
Series 2013 A, Enhanced Tobacco Settlement Asset-Backed RB | | | 5.00 | % | | | 06/01/21 | | | | 2,000 | | | | 2,318,720 | |
Irvine (City of) (Reassessment District No. 13-1); | | | | | | | | | | | | | | | | |
Series 2013, Limited Obligation Special Assessment RB | | | 4.00 | % | | | 09/02/19 | | | | 475 | | | | 524,310 | |
Series 2013, Limited Obligation Special Assessment RB | | | 5.00 | % | | | 09/02/20 | | | | 450 | | | | 521,276 | |
Series 2013, Limited Obligation Special Assessment RB | | | 5.00 | % | | | 09/02/21 | | | | 375 | | | | 425,351 | |
Series 2013, Limited Obligation Special Assessment RB | | | 5.00 | % | | | 09/02/22 | | | | 375 | | | | 422,246 | |
Series 2013, Limited Obligation Special Assessment RB | | | 5.00 | % | | | 09/02/23 | | | | 500 | | | | 559,630 | |
Irvine (City of) Public Facilities & Infrastructure Authority; | | | | | | | | | | | | | | | | |
Series 2012 A, Special Assessment RB | | | 4.00 | % | | | 09/02/23 | | | | 995 | | | | 1,021,069 | |
Series 2012 A, Special Assessment RB | | | 4.50 | % | | | 09/02/25 | | | | 375 | | | | 384,724 | |
Series 2012 A, Special Assessment RB | | | 4.50 | % | | | 09/02/26 | | | | 550 | | | | 558,690 | |
Los Angeles Unified School District (Election of 2004); Series 2009 I, Unlimited Tax GO Bonds | | | 5.25 | % | | | 07/01/22 | | | | 3,200 | | | | 3,771,968 | |
Morongo Band of Mission Indians (The) (Enterprise Casino); Series 2008 B, RB(d) | | | 5.50 | % | | | 03/01/18 | | | | 100 | | | | 106,170 | |
Murrieta (City of) Public Financing Authority; Series 2012, Ref. Special Tax RB | | | 5.00 | % | | | 09/01/23 | | | | 1,000 | | | | 1,101,170 | |
Palomar Pomerado Health (Election of 2004); Series 2007 A, Unlimited Tax CAB GO Bonds
(INS–NATL)(a)(f) | | | 0.00 | % | | | 08/01/16 | | | | 1,880 | | | | 1,830,932 | |
Rancho Cordova (City of) Community Facilities District No. 2003-1 (Sunridge Anatolia); | | | | | | | | | | | | | | | | |
Series 2012, Ref. Special Tax RB | | | 5.00 | % | | | 09/01/22 | | | | 575 | | | | 638,434 | |
Series 2012, Ref. Special Tax RB | | | 5.00 | % | | | 09/01/23 | | | | 450 | | | | 491,904 | |
Regents of the University of California; | | | | | | | | | | | | | | | | |
Series 2009 O, General RB(g) | | | 5.75 | % | | | 05/15/23 | | | | 795 | | | | 946,527 | |
Series 2009 O, General RB(g) | | | 5.75 | % | | | 05/15/25 | | | | 1,185 | | | | 1,410,861 | |
Richmond (City of) Joint Powers Financing Authority (Point Potrero); Series 2009 A, Lease RB | | | 6.25 | % | | | 07/01/24 | | | | 1,500 | | | | 1,693,470 | |
Riverside (County of) (Public Safety Communication & Refunding); Series 2007 A, COP
(INS–AMBAC)(a) | | | 5.00 | % | | | 11/01/14 | | | | 3,500 | | | | 3,604,720 | |
Sacramento (County of); Series 2009 D, Sub. Passenger Facility Charge Grant Airport System RB | | | 5.38 | % | | | 07/01/26 | | | | 2,000 | | | | 2,283,300 | |
San Buenaventura (City of) (Community Memorial Health System); Series 2011, RB | | | 6.25 | % | | | 12/01/20 | | | | 1,000 | | | | 1,154,740 | |
San Diego (County of) Regional Airport Authority; Series 2013 B, Sr. RB(c) | | | 5.00 | % | | | 07/01/23 | | | | 700 | | | | 806,232 | |
San Francisco (City & County of) Airport Commission (San Francisco International Airport); Series 2011 C, Ref. Second Series RB(c) | | | 5.00 | % | | | 05/01/23 | | | | 2,000 | | | | 2,262,680 | |
See accompanying Notes to Financial Statements which are an integral part of the financial statements.
11 Invesco Intermediate Term Municipal Income Fund
| | | | | | | | | | | | | | | | |
| | | Interest
Rate | | | Maturity
Date | | | Principal
Amount
(000) | | | Value | |
| California–(continued) | | | | | | | | | | | | | | | | |
San Francisco (City & County of) Redevelopment Financing Authority (Mission Bay South Redevelopment); | | | | | | | | | | | | | | | | |
Series 2009 D, Tax Allocation RB | | | 6.00 | % | | | 08/01/20 | | | $ | 1,085 | | | $ | 1,250,387 | |
Series 2009 D, Tax Allocation RB | | | 6.25 | % | | | 08/01/22 | | | | 1,000 | | | | 1,135,490 | |
Series 2011 D, Tax Allocation RB | | | 6.63 | % | | | 08/01/27 | | | | 500 | | | | 549,650 | |
San Francisco (City & County of) Successor Agency to the Redevelopment Agency Community Facilities District No. 6 (Mission Bay South Public Improvements); | | | | | | | | | | | | | | | | |
Series 2013 A, Ref. Special Tax RB | | | 5.00 | % | | | 08/01/27 | | | | 750 | | | | 796,650 | |
Series 2013 B, Special Tax RB | | | 5.00 | % | | | 08/01/27 | | | | 405 | | | | 430,191 | |
San Jose (City of); Series 2011 A-1, Airport RB(c) | | | 5.25 | % | | | 03/01/26 | | | | 2,000 | | | | 2,203,280 | |
San Luis Obispo (County of) Financing Authority (Lopez Dam Improvement); Series 2011 A, Ref. RB (INS–AGM)(a) | | | 5.50 | % | | | 08/01/26 | | | | 3,195 | | | | 3,608,273 | |
Santa Margarita Water District (Community Facilities District No. 2013-1); | | | | | | | | | | | | | | | | |
Series 2013, Special Tax RB | | | 5.00 | % | | | 09/01/26 | | | | 1,030 | | | | 1,072,168 | |
Series 2013, Special Tax RB | | | 5.13 | % | | | 09/01/27 | | | | 1,200 | | | | 1,245,564 | |
Southern California Public Power Authority (Milford Wind Corridor); Series 2010 1, RB | | | 5.00 | % | | | 07/01/24 | | | | 2,000 | | | | 2,300,020 | |
Twin Rivers Unified School District (School Facility Bridge Funding Program); Series 2007, COP (INS–AGM)(a)(b) | | | 3.20 | % | | | 06/01/20 | | | | 5,000 | | | | 5,002,650 | |
West Contra Costa Unified School District (Election of 2005); Series 2008 B, Unlimited Tax GO Bonds | | | 6.00 | % | | | 08/01/23 | | | | 1,000 | | | | 1,248,730 | |
| | | | | 87,036,628 | |
| | | | |
| Colorado–1.27% | | | | | | | | | | | | | | | | |
Colorado (State of) Health Facilities Authority (Christian Living Communities); Series 2006 A, RB | | | 5.25 | % | | | 01/01/15 | | | | 500 | | | | 503,545 | |
Colorado (State of) Regional Transportation District (Denver Transit Partners Eagle P3); | | | | | | | | | | | | | | | | |
Series 2010, Private Activity RB | | | 5.00 | % | | | 01/15/22 | | | | 750 | | | | 796,170 | |
Series 2010, Private Activity RB | | | 5.25 | % | | | 07/15/19 | | | | 1,000 | | | | 1,112,050 | |
Denver (City & County of) (Justice System); | | | | | | | | | | | | | | | | |
Series 2008, Unlimited Tax GO Bonds(g) | | | 5.00 | % | | | 08/01/24 | | | | 2,000 | | | | 2,298,480 | |
Series 2008, Unlimited Tax GO Bonds(g) | | | 5.00 | % | | | 08/01/25 | | | | 500 | | | | 574,240 | |
Denver (City & County of); Series 2012 A, Airport System RB(c) | | | 5.00 | % | | | 11/15/22 | | | | 500 | | | | 584,260 | |
Plaza Metropolitan District No. 1; | | | | | | | | | | | | | | | | |
Series 2013, Ref. Tax Allocation RB | | | 5.00 | % | | | 12/01/21 | | | | 1,045 | | | | 1,103,823 | |
Series 2013, Ref. Tax Allocation RB | | | 5.00 | % | | | 12/01/22 | | | | 500 | | | | 523,565 | |
University of Colorado; Series 2009 A, Enterprise System RB | | | 5.50 | % | | | 06/01/25 | | | | 1,000 | | | | 1,184,600 | |
| | | | | 8,680,733 | |
| | | | |
| Connecticut–0.53% | | | | | | | | | | | | | | | | |
Connecticut (State of) Development Authority (Aquarion Water Co.); Series 2011, Water
Facilities RB(c) | | | 5.50 | % | | | 04/01/21 | | | | 1,000 | | | | 1,134,380 | |
Connecticut (State of); Series 2013 A, Floating Rate Unlimited Tax GO Bonds(e) | | | 0.45 | % | | | 03/01/18 | | | | 2,500 | | | | 2,500,000 | |
| | | | | 3,634,380 | |
| | | | |
| Delaware–0.08% | | | | | | | | | | | | | | | | |
New Castle (County of) (Newark Charter School, Inc.); Series 2006, RB | | | 5.00 | % | | | 09/01/22 | | | | 500 | | | | 515,495 | |
| | | | |
| District of Columbia–1.15% | | | | | | | | | | | | | | | | |
District of Columbia (Provident Group–Howard Properties LLC); Series 2013, Student Dormitory RB | | | 5.00 | % | | | 10/01/30 | | | | 2,000 | | | | 1,873,380 | |
District of Columbia; | | | | | | | | | | | | | | | | |
Series 2007 C, Unlimited Tax GO Bonds (INS–AGM)(a) | | | 5.00 | % | | | 06/01/16 | | | | 2,325 | | | | 2,565,916 | |
Series 2007 C, Unlimited Tax GO Bonds (INS–AGM)(a) | | | 5.00 | % | | | 06/01/19 | | | | 3,000 | | | | 3,438,510 | |
| | | | | 7,877,806 | |
| | | | |
| Florida–5.97% | | | | | | | | | | | | | | | | |
Alachua (County of) (North Florida Retirement Village, Inc.); Series 2007, IDR | | | 5.63 | % | | | 11/15/22 | | | | 1,750 | | | | 1,757,525 | |
Alachua (County of) Health Facilities Authority (Terraces at Bonita Springs); Series 2011,
TEMPS–70SM RB | | | 7.13 | % | | | 11/15/16 | | | | 3,000 | | | | 3,008,310 | |
See accompanying Notes to Financial Statements which are an integral part of the financial statements.
12 Invesco Intermediate Term Municipal Income Fund
| | | | | | | | | | | | | | | | |
| | | Interest
Rate | | | Maturity
Date | | | Principal
Amount
(000) | | | Value | |
| Florida–(continued) | | | | | | | | | | | | | | | | |
Atlantic Beach (City of) (Fleet Landing); | | | | | | | | | | | | | | | | |
Series 2013 A, Ref. Health Care Facilities RB | | | 5.00 | % | | | 11/15/21 | | | $ | 440 | | | $ | 487,832 | |
Series 2013 A, Ref. Health Care Facilities RB | | | 5.00 | % | | | 11/15/22 | | | | 375 | | | | 411,893 | |
Series 2013 A, Ref. Health Care Facilities RB | | | 5.00 | % | | | 11/15/23 | | | | 565 | | | | 613,155 | |
Brevard County School District; Series 2004 B, Ref. COP(b)(h) | | | 5.00 | % | | | 01/01/15 | | | | 1,000 | | | | 1,040,130 | |
Citizens Property Insurance Corp. (Coastal Account); Series 2011 A-1, Sr. Sec. RB | | | 5.00 | % | | | 06/01/20 | | | | 1,000 | | | | 1,159,620 | |
Citizens Property Insurance Corp. (High Risk Account); Series 2010 A-1, Sr. Sec. RB | | | 5.25 | % | | | 06/01/17 | | | | 2,000 | | | | 2,275,240 | |
Citizens Property Insurance Corp.; Series 2012 A-1, Sr. Sec. RB | | | 5.00 | % | | | 06/01/22 | | | | 2,000 | | | | 2,304,700 | |
Collier (County of) Industrial Development Authority (The Arlington of Naples); | | | | | | | | | | | | | | | | |
Series 2014 A, Continuing Care Community RB(d) | | | 7.25 | % | | | 05/15/26 | | | | 1,215 | | | | 1,238,498 | |
Series 2014 B-2, TEMPS–70SM Continuing Care Community RB(d) | | | 6.50 | % | | | 05/15/20 | | | | 1,000 | | | | 1,001,260 | |
Florida (State of) Municipal Power Agency (St. Lucie); Series 2011 B, RB | | | 5.00 | % | | | 10/01/26 | | | | 2,000 | | | | 2,244,600 | |
Florida (State of) Ports Financing Commission (State Transportation Trust Fund); Series 2011 A, Ref. RB | | | 5.00 | % | | | 10/01/27 | | | | 1,000 | | | | 1,113,670 | |
Florida State Board of Education; Series 2005 A, Lottery RB(h) | | | 5.00 | % | | | 07/01/19 | | | | 2,500 | | | | 2,680,700 | |
Highlands (County of) Health Facilities Authority (Adventist Health System/Sunbelt Obligated Group); Series 2008 A, Hospital RB(b) | | | 6.50 | % | | | 11/17/15 | | | | 3,000 | | | | 3,311,820 | |
Martin (County of) Health Facilities Authority (Martin Memorial Medical Center); | | | | | | | | | | | | | | | | |
Series 2012, RB | | | 5.00 | % | | | 11/15/24 | | | | 1,990 | | | | 2,120,524 | |
Series 2012, RB | | | 5.50 | % | | | 11/15/32 | | | | 1,670 | | | | 1,736,850 | |
Miami-Dade (County of) Educational Facilities Authority (University of Miami); Series 2012 A, RB | | | 5.00 | % | | | 04/01/24 | | | | 415 | | | | 466,460 | |
Miami-Dade (County of) Expressway Authority; Series 2013 A, Ref. Toll System RB | | | 5.00 | % | | | 07/01/22 | | | | 2,000 | | | | 2,328,520 | |
Orange (County of) Health Facilities Authority (Orlando Lutheran Towers, Inc.); Series 2005,
Ref. RB | | | 5.38 | % | | | 07/01/20 | | | | 500 | | | | 503,475 | |
Orlando (City of) & Orange (County of) Expressway Authority; Series 2012, Ref. RB | | | 5.00 | % | | | 07/01/23 | | | | 1,000 | | | | 1,137,520 | |
Palm Beach (County of) Health Facilities Authority (Jupiter Medical Center, Inc.); Series 2013 A, Hospital RB | | | 5.00 | % | | | 11/01/23 | | | | 1,215 | | | | 1,330,911 | |
Putnam (County of) Development Authority (Seminole Electric Cooperative); Series 2007 A, Ref. PCR (INS–AMBAC)(a)(b) | | | 5.35 | % | | | 05/01/18 | | | | 1,000 | | | | 1,152,540 | |
Reedy Creek Improvement District; | | | | | | | | | | | | | | | | |
Series 2013 1, Ref. Utilities RB | | | 5.00 | % | | | 10/01/21 | | | | 885 | | | | 1,028,963 | |
Series 2013 1, Ref. Utilities RB | | | 5.00 | % | | | 10/01/22 | | | | 800 | | | | 925,784 | |
Seminole Indian Tribe of Florida; Series 2007 A, Special Obligation RB(d) | | | 5.75 | % | | | 10/01/22 | | | | 750 | | | | 799,808 | |
Tallahassee (City of) & Leon (County of) Blueprint 2000 Intergovernmental Agency; Series 2007, Sales Tax RB (INS–NATL)(a) | | | 5.00 | % | | | 10/01/14 | | | | 1,500 | | | | 1,540,005 | |
Tampa (City of); Series 2010, Ref. Solid Waste System RB (INS–AGM)(a)(c) | | | 5.00 | % | | | 10/01/18 | | | | 1,000 | | | | 1,139,200 | |
| | | | | 40,859,513 | |
| | | | |
| Georgia–1.46% | | | | | | | | | | | | | | | | |
Atlanta (City of) (Beltline); Series 2009 B, Tax Allocation RB | | | 6.75 | % | | | 01/01/20 | | | | 775 | | | | 945,949 | |
Atlanta (City of) (Eastside); Series 2005 B, Tax Allocation RB | | | 5.40 | % | | | 01/01/20 | | | | 1,200 | | | | 1,257,720 | |
Atlanta (City of); Series 2009 A, Water & Wastewater RB | | | 5.25 | % | | | 11/01/17 | | | | 1,500 | | | | 1,739,340 | |
Burke (County of) Development Authority (Oglethorpe Power Vogtle); Series 2013 A, PCR(b) | | | 2.40 | % | | | 04/01/20 | | | | 5,000 | | | | 4,964,750 | |
Fulton (County of) Development Authority (Robert Woodruff); Series 2009 B, Ref. RB | | | 5.25 | % | | | 03/15/24 | | | | 1,000 | | | | 1,091,640 | |
| | | | | 9,999,399 | |
| | | | |
| Guam–1.33% | | | | | | | | | | | | | | | | |
Guam (Territory of) (Section 30); | | | | | | | | | | | | | | | | |
Series 2009 A, Limited Obligation RB | | | 5.25 | % | | | 12/01/17 | | | | 1,000 | | | | 1,097,880 | |
Series 2009 A, Limited Obligation RB | | | 5.50 | % | | | 12/01/18 | | | | 1,000 | | | | 1,118,490 | |
Guam (Territory of) International Airport Authority; Series 2013 C, General RB(c) | | | 6.00 | % | | | 10/01/23 | | | | 3,000 | | | | 3,187,890 | |
Guam (Territory of) Power Authority; | | | | | | | | | | | | | | | | |
Series 2012 A, Ref. RB (INS–AGM)(a) | | | 5.00 | % | | | 10/01/21 | | | | 1,500 | | | | 1,725,900 | |
Series 2012 A, Ref. RB (INS–AGM)(a) | | | 5.00 | % | | | 10/01/22 | | | | 1,700 | | | | 1,958,910 | |
| | | | | 9,089,070 | |
See accompanying Notes to Financial Statements which are an integral part of the financial statements.
13 Invesco Intermediate Term Municipal Income Fund
| | | | | | | | | | | | | | | | |
| | | Interest
Rate | | | Maturity
Date | | | Principal
Amount
(000) | | | Value | |
| Hawaii–0.76% | | | | | | | | | | | | | | | | |
Hawaii (State of) Department of Budget & Finance; Series 2012, Ref. Special Purpose Senior Living RB | | | 5.00 | % | | | 11/15/27 | | | $ | 1,000 | | | $ | 1,043,160 | |
Hawaii (State of) Department of Transportation (Airports Division); | | | | | | | | | | | | | | | | |
Series 2013, Lease Revenue COP(c) | | | 5.00 | % | | | 08/01/21 | | | | 550 | | | | 608,388 | |
Series 2013, Lease Revenue COP(c) | | | 5.00 | % | | | 08/01/22 | | | | 2,000 | | | | 2,188,080 | |
Series 2013, Lease Revenue COP(c) | | | 5.00 | % | | | 08/01/23 | | | | 1,250 | | | | 1,356,013 | |
| | | | | | | | | | | | | | | | 5,195,641 | |
| | | | |
| Idaho–0.10% | | | | | | | | | | | | | | | | |
Idaho (State of) Health Facilities Authority (St. Luke’s Health System); Series 2008 A, RB | | | 6.50 | % | | | 11/01/23 | | | | 500 | | | | 566,365 | |
Idaho (State of) Housing & Finance Association; Series 2008 A, Class I, Single Family Mortgage RB(c) | | | 5.00 | % | | | 07/01/17 | | | | 140 | | | | 143,601 | |
| | | | | 709,966 | |
| | | | |
| Illinois–10.47% | | | | | | | | | | | | | | | | |
Bartlett (Village of) (Quarry Redevelopment); Series 2007, Ref. Sr. Lien Tax Increment Allocation RB | | | 5.60 | % | | | 01/01/23 | | | | 1,000 | | | | 985,550 | |
Bourbonnais (Village of) (Olivet Nazarene University); Series 2010, Industrial Project RB | | | 5.13 | % | | | 11/01/25 | | | | 1,500 | | | | 1,579,935 | |
Chicago (City of) (188 West Randolph/Wells Redevelopment); Series 2014, COP(d) | | | 6.84 | % | | | 03/15/33 | | | | 2,400 | | | | 2,399,472 | |
Chicago (City of) (83rd/Stewart Redevelopment); Series 2013, COP(d) | | | 7.00 | % | | | 01/15/29 | | | | 1,500 | | | | 1,521,270 | |
Chicago (City of) (Metramarket Chicago); Series 2010 A, COP | | | 6.87 | % | | | 02/15/24 | | | | 1,059 | | | | 1,096,300 | |
Chicago (City of) (Midway Airport); | | | | | | | | | | | | | | | | |
Series 2013 A, Ref. Second Lien RB(c) | | | 5.50 | % | | | 01/01/27 | | | | 1,000 | | | | 1,092,430 | |
Series 2013 B, Ref. Second Lien RB | | | 5.00 | % | | | 01/01/25 | | | | 1,000 | | | | 1,102,380 | |
Chicago (City of) (Roosevelt Square/ABLA Redevelopment); Series 2009 A, Ref. COP | | | 7.13 | % | | | 03/15/22 | | | | 796 | | | | 796,167 | |
Chicago (City of) Board of Education; | | | | | | | | | | | | | | | | |
Series 2007 D, Unlimited Tax GO Bonds (INS–AGM)(a) | | | 5.00 | % | | | 12/01/17 | | | | 1,010 | | | | 1,137,098 | |
Series 2013 A3, Ref. Floating Rate Unlimited Tax GO Bonds(b)(e) | | | 0.86 | % | | | 06/02/18 | | | | 5,000 | | | | 5,000,000 | |
Chicago (City of) Metropolitan Water Reclamation District; Series 2011 B, Capital Improvement Limited Tax GO Bonds(g) | | | 5.00 | % | | | 12/01/24 | | | | 3,000 | | | | 3,371,340 | |
Chicago (City of) Transit Authority (FTA Section 5309 Fixed Guideway Modernization Formula Funds); | | | | | | | | | | | | | | | | |
Series 2008, Capital Grant Receipts RB (INS–AGC)(a) | | | 5.25 | % | | | 06/01/23 | | | | 2,200 | | | | 2,350,546 | |
Series 2008, Capital Grant Receipts RB (INS–AGC)(a) | | | 5.25 | % | | | 06/01/24 | | | | 3,965 | | | | 4,197,230 | |
Chicago (City of) Transit Authority; Series 2011, Sales Tax Receipts RB | | | 5.25 | % | | | 12/01/27 | | | | 1,000 | | | | 1,097,870 | |
Chicago (City of); Series 2011, COP | | | 7.13 | % | | | 05/01/21 | | | | 750 | | | | 829,402 | |
Huntley (Village of) Special Service Area No. 7; Series 2007, Ref. Special Tax RB (INS–AGC)(a) | | | 4.60 | % | | | 03/01/17 | | | | 517 | | | | 542,421 | |
Illinois (State of) Finance Authority (Advocate Health Care Network); Series 2008 D, RB | | | 6.13 | % | | | 11/01/23 | | | | 1,000 | | | | 1,199,850 | |
Illinois (State of) Finance Authority (Art Institute of Chicago); Series 2009 A, RB | | | 5.25 | % | | | 03/01/19 | | | | 1,000 | | | | 1,173,020 | |
Illinois (State of) Finance Authority (DePaul University); Series 2013, Ref. RB | | | 5.00 | % | | | 10/01/23 | | | | 750 | | | | 859,725 | |
Illinois (State of) Finance Authority (Edward Hospital Obligated Group); | | | | | | | | | | | | | | | | |
Series 2008 A, RB (INS–AMBAC)(a) | | | 6.00 | % | | | 02/01/23 | | | | 900 | | | | 978,606 | |
Series 2008 A, RB (INS–AMBAC)(a) | | | 6.00 | % | | | 02/01/24 | | | | 1,175 | | | | 1,270,398 | |
Series 2008 A, RB (INS–AMBAC)(a) | | | 6.00 | % | | | 02/01/26 | | | | 380 | | | | 407,588 | |
Illinois (State of) Finance Authority (Fairview Obligated Group); Series 2008 A, Ref. RB(i) | | | 6.00 | % | | | 08/15/22 | | | | 750 | | | | 5,558 | |
Illinois (State of) Finance Authority (Lutheran Home & Services); Series 2012, Ref. RB | | | 5.00 | % | | | 05/15/22 | | | | 2,000 | | | | 1,989,200 | |
Illinois (State of) Finance Authority (Northwestern Memorial Hospital); Series 2009 B, RB | | | 5.00 | % | | | 08/15/16 | | | | 1,890 | | | | 2,092,967 | |
Illinois (State of) Finance Authority (Park Place of Elmhurst); Series 2010 D-2, TEMPS–65SM RB | | | 7.00 | % | | | 11/15/15 | | | | 2,000 | | | | 1,200,200 | |
Illinois (State of) Finance Authority (Peace Village); Series 2013, RB | | | 6.25 | % | | | 08/15/28 | | | | 1,505 | | | | 1,532,918 | |
Illinois (State of) Finance Authority (Silver Cross Hospital & Medical Centers); Series 2008, Ref. RB | | | 6.00 | % | | | 08/15/23 | | | | 2,000 | | | | 2,189,820 | |
Illinois (State of) Finance Authority (The Landing at Plymouth Place); Series 2005 A, RB | | | 5.25 | % | | | 05/15/14 | | | | 255 | | | | 255,701 | |
Illinois (State of) Metropolitan Pier & Exposition Authority (McCormick Place Expansion); | | | | | | | | | | | | | | | | |
Series 2012 B, RB(g) | | | 5.00 | % | | | 12/15/20 | | | | 5,000 | | | | 5,870,500 | |
Series 2012 B, RB(g) | | | 5.00 | % | | | 06/15/23 | | | | 3,500 | | | | 4,030,250 | |
Illinois (State of) Municipal Electric Agency; Series 2007 A, Power Supply System RB (INS–NATL)(a) | | | 5.00 | % | | | 02/01/15 | | | | 1,000 | | | | 1,043,360 | |
See accompanying Notes to Financial Statements which are an integral part of the financial statements.
14 Invesco Intermediate Term Municipal Income Fund
| | | | | | | | | | | | | | | | |
| | | Interest
Rate | | | Maturity
Date | | | Principal
Amount
(000) | | | Value | |
| Illinois–(continued) | | | | | | | | | | | | | | | | |
Illinois (State of); | | | | | | | | | | | | | | | | |
Series 2012, Ref. Unlimited Tax GO Bonds (INS–AGM)(a) | | | 5.00 | % | | | 08/01/22 | | | $ | 1,250 | | | $ | 1,421,337 | |
Series 2013, Unlimited Tax GO Bonds | | | 5.00 | % | | | 07/01/22 | | | | 2,000 | | | | 2,262,520 | |
Series 2014, Unlimited Tax GO Bonds | | | 5.00 | % | | | 02/01/22 | | | | 2,000 | | | | 2,263,340 | |
Lake County Community Consolidated School District No. 73 (Hawthorn); Series 2002, Unlimited Tax CAB GO Bonds(f)(h) | | | 0.00 | % | | | 12/01/21 | | | | 330 | | | | 277,108 | |
Madison & Jersey Counties Community Unit School District No. 11 (Alton); Series 2002, Unlimited Tax CAB GO Bonds (INS–AGM)(a)(f) | | | 0.00 | % | | | 12/01/20 | | | | 2,900 | | | | 2,397,546 | |
Railsplitter Tobacco Settlement Authority; | | | | | | | | | | | | | | | | |
Series 2010, RB | | | 5.25 | % | | | 06/01/21 | | | | 3,000 | | | | 3,514,440 | |
Series 2010, RB | | | 5.38 | % | | | 06/01/21 | | | | 525 | | | | 619,332 | |
University of Illinois; Series 2011 A, Auxiliary Facilities System RB | | | 5.00 | % | | | 04/01/26 | | | | 3,425 | | | | 3,780,755 | |
| | | | | 71,735,450 | |
| | | | |
| Indiana–3.60% | | | | | | | | | | | | | | | | |
Carmel (City of) (Barrington Carmel); Series 2012 C-2, TEMPS–65SM RB | | | 5.25 | % | | | 11/15/18 | | | | 1,000 | | | | 999,960 | |
Carmel (City of) Redevelopment Authority; Series 2006, RB (INS–NATL)(a) | | | 5.00 | % | | | 07/01/22 | | | | 1,000 | | | | 1,095,800 | |
Indiana (State of) Finance Authority (Community Foundation of Northwest Indiana); Series 2007, Hospital RB | | | 5.50 | % | | | 03/01/22 | | | | 500 | | | | 548,925 | |
Indiana (State of) Finance Authority (Indianapolis Power & Light Co.); Series 2009 A, Ref. Environmental Facilities RB | | | 4.90 | % | | | 01/01/16 | | | | 2,000 | | | | 2,139,860 | |
Indiana (State of) Finance Authority (Sisters of St. Francis Health Services); | | | | | | | | | | | | | | | | |
Series 2006 E, Ref. Health System RB (INS–AGM)(a) | | | 5.25 | % | | | 11/01/24 | | | | 365 | | | | 406,975 | |
Series 2006 E, Ref. Health System RB (INS–AGM)(a) | | | 5.25 | % | | | 11/01/25 | | | | 200 | | | | 217,676 | |
Series 2006 E, Ref. Health System RB (INS–AGM)(a) | | | 5.25 | % | | | 11/01/26 | | | | 175 | | | | 189,180 | |
Indiana (State of) Finance Authority; Series 1993 A, Highway CAB RB (INS–AMBAC)(a)(f) | | | 0.00 | % | | | 12/01/16 | | | | 1,695 | | | | 1,660,490 | |
Indiana (State of) Municipal Power Agency; Series 2009 B, Power Supply System RB | | | 5.25 | % | | | 01/01/24 | | | | 500 | | | | 572,260 | |
Indianapolis (City of) Airport Authority (Fed Ex Corp.); Series 2004, Ref. Special Facilities RB(c) | | | 5.10 | % | | | 01/15/17 | | | | 760 | | | | 839,253 | |
Merrillville Multi-School Building Corp.; | | | | | | | | | | | | | | | | |
Series 2008, First Mortgage RB | | | 5.00 | % | | | 01/15/17 | | | | 1,260 | | | | 1,414,602 | |
Series 2008, First Mortgage RB | | | 5.00 | % | | | 07/15/17 | | | | 1,285 | | | | 1,466,365 | |
Michigan City Area-Wide School Building Corp.; | | | | | | | | | | | | | | | | |
Series 2002, First Mortgage CAB RB (INS–NATL)(a)(f) | | | 0.00 | % | | | 01/15/17 | | | | 2,000 | | | | 1,919,740 | |
Series 2002, First Mortgage CAB RB (INS–NATL)(a)(f) | | | 0.00 | % | | | 01/15/18 | | | | 3,000 | | | | 2,812,830 | |
Noblesville High School Building Corp.; Series 1993, First Mortgage CAB RB (INS–AMBAC)(a)(f) | | | 0.00 | % | | | 02/15/19 | | | | 1,850 | | | | 1,673,935 | |
Northwest Allen School Building Corp.; | | | | | | | | | | | | | | | | |
Series 2008, First Mortgage RB (INS–AGM)(a) | | | 5.00 | % | | | 07/15/16 | | | | 1,395 | | | | 1,537,039 | |
Series 2008, First Mortgage RB (INS–AGM)(a) | | | 5.00 | % | | | 07/15/19 | | | | 3,200 | | | | 3,590,496 | |
Valparaiso (City of) (Pratt Paper, LLC); Series 2013, Exempt Facilities RB(c) | | | 5.88 | % | | | 01/01/24 | | | | 1,500 | | | | 1,563,015 | |
| | | | | 24,648,401 | |
| | | | |
| Iowa–2.07% | | | | | | | | | | | | | | | | |
Altoona (City of); Series 2008, Annual Appropriation Urban Renewal Tax Increment RB | | | 5.63 | % | | | 06/01/23 | | | | 1,000 | | | | 1,075,540 | |
Ames (City of) (Mary Greeley Medical Center); Series 2011, Hospital RB | | | 5.50 | % | | | 06/15/30 | | | | 2,255 | | | | 2,389,984 | |
Iowa (State of) Finance Authority (Iowa Health System); Series 2005 A, Health Facilities RB
(INS–AGC)(a) | | | 5.00 | % | | | 02/15/19 | | | | 1,000 | | | | 1,162,930 | |
Iowa (State of) Finance Authority (Mercy Medical Center); | | | | | | | | | | | | | | | | |
Series 2012, Health Facilities RB | | | 4.00 | % | | | 08/15/22 | | | | 1,905 | | | | 2,036,197 | |
Series 2012, Health Facilities RB | | | 4.00 | % | | | 08/15/23 | | | | 1,200 | | | | 1,262,952 | |
Iowa (State of) Finance Authority (Western Home); Series 2012, Ref. Health Care Facilities RB | | | 5.00 | % | | | 12/01/27 | | | | 1,915 | | | | 1,883,077 | |
Iowa Student Loan Liquidity Corp.; Sr. Series 2011 A-2, RB(c) | | | 5.50 | % | | | 12/01/25 | | | | 4,130 | | | | 4,376,809 | |
| | | | | 14,187,489 | |
See accompanying Notes to Financial Statements which are an integral part of the financial statements.
15 Invesco Intermediate Term Municipal Income Fund
| | | | | | | | | | | | | | | | |
| | | Interest
Rate | | | Maturity
Date | | | Principal
Amount
(000) | | | Value | |
| Kansas–1.02% | | | | | | | | | | | | | | | | |
Harvey County Unified School District No. 373 (Newton); Series 2007, Ref. & Improvement Unlimited Tax GO Bonds (INS–NATL)(a) | | | 5.00 | % | | | 09/01/19 | | | $ | 2,630 | | | $ | 3,017,951 | |
Kansas (State of) Development Finance Authority (Adventist Health System/Sunbelt Obligated Group); Series 2009 C, Hospital RB | | | 5.50 | % | | | 11/15/23 | | | | 1,000 | | | | 1,164,580 | |
Kansas (State of) Development Finance Authority (Hays Medical Center Inc.); Series 2005 L, Health Facilities RB | | | 5.25 | % | | | 11/15/16 | | | | 500 | | | | 537,405 | |
Kansas (State of) Development Finance Authority (University of Kansas Health System); Series 2011 H, Health Facilities RB | | | 5.00 | % | | | 03/01/31 | | | | 1,000 | | | | 1,045,870 | |
Kansas (State of) Municipal Energy Agency (Jameson Energy Center); Series 2013, Power
Project RB | | | 5.00 | % | | | 07/01/28 | | | | 1,140 | | | | 1,236,866 | |
| | | | | 7,002,672 | |
| | | | |
| Kentucky–0.95% | | | | | | | | | | | | | | | | |
Kentucky (State of) Asset/Liability Commission (Federal Highway Trust Fund First Series); Series 2007, RN (INS–NATL)(a) | | | 5.00 | % | | | 09/01/14 | | | | 1,800 | | | | 1,844,550 | |
Kentucky (State of) Economic Development Finance Authority (Baptist Healthcare System); | | | | | | | | | | | | | | | | |
Series 2009 A, Hospital RB | | | 5.00 | % | | | 08/15/18 | | | | 1,000 | | | | 1,149,430 | |
Series 2009 A, Hospital RB | | | 5.38 | % | | | 08/15/24 | | | | 1,000 | | | | 1,120,130 | |
Kentucky Housing Corp.; Series 2008 A, RB(c) | | | 5.00 | % | | | 01/01/23 | | | | 285 | | | | 296,078 | |
Louisville & Jefferson (County of) Regional Airport Authority; Series 2003 C, Airport Systems RB (INS–AGM)(a)(c) | | | 5.50 | % | | | 07/01/17 | | | | 1,000 | | | | 1,004,430 | |
Paducah (City of) Electric Plant Board; Series 2009 A, RB (INS–AGC)(a) | | | 5.00 | % | | | 10/01/25 | | | | 1,000 | | | | 1,108,910 | |
| | | | | 6,523,528 | |
| | | | |
| Louisiana–2.05% | | | | | | | | | | | | | | | | |
Lakeshore Villages Master Community Development District; Series 2007, Special Assessment RB(i) | | | 5.25 | % | | | 07/01/17 | | | | 593 | | | | 234,176 | |
Louisiana (State of) Energy & Power Authority (Rodemacher Unit No. 2); Series 2013, Power RB | | | 5.00 | % | | | 01/01/22 | | | | 1,000 | | | | 1,156,560 | |
Louisiana (State of) Local Government Environmental Facilities & Community Development Authority (Bossier City Public Improvement); Series 2007, RB (INS–AMBAC)(a) | | | 5.00 | % | | | 11/01/15 | | | | 1,200 | | | | 1,290,192 | |
Louisiana Citizens Property Insurance Corp.; | | | | | | | | | | | | | | | | |
Series 2006 B, Assessment RB (INS–AMBAC)(a) | | | 5.00 | % | | | 06/01/20 | | | | 1,000 | | | | 1,080,400 | |
Series 2009 C-1, Assessment RB (INS–AGC)(a) | | | 5.88 | % | | | 06/01/23 | | | | 1,000 | | | | 1,146,650 | |
New Orleans (City of) Aviation Board; | | | | | | | | | | | | | | | | |
Series 2009 A-1, Ref. & Restructuring General Airport RB (INS–AGC)(a) | | | 5.00 | % | | | 01/01/18 | | | | 1,235 | | | | 1,403,935 | |
Series 2009 A-1, Ref. & Restructuring General Airport RB (INS–AGC)(a) | | | 5.00 | % | | | 01/01/19 | | | | 500 | | | | 576,995 | |
New Orleans (City of) Port Board of Commissioners; Series 2013 B, Ref. Port Facility RB(c) | | | 5.00 | % | | | 04/01/29 | | | | 1,950 | | | | 2,025,699 | |
Tobacco Settlement Financing Corp.; Series 2013 A, Ref. Asset-Backed RB | | | 5.50 | % | | | 05/15/30 | | | | 5,000 | | | | 5,157,300 | |
| | | | | 14,071,907 | |
| | | | |
| Maine–0.32% | | | | | | | | | | | | | | | | |
Maine (State of) Health & Higher Educational Facilities Authority (Eastern Maine Medical Center Obligated Group); | | | | | | | | | | | | | | | | |
Series 2013, RB | | | 5.00 | % | | | 07/01/26 | | | | 1,000 | | | | 1,092,760 | |
Series 2013, RB | | | 5.00 | % | | | 07/01/27 | | | | 1,000 | | | | 1,081,310 | |
| | | | | 2,174,070 | |
| | | | |
| Maryland–2.14% | | | | | | | | | | | | | | | | |
Maryland (State of) Health & Higher Educational Facilities Authority (Adventist Healthcare); Series 2011 A, RB | | | 6.00 | % | | | 01/01/26 | | | | 4,500 | | | | 5,080,995 | |
Maryland (State of) Health & Higher Educational Facilities Authority (Charlestown Community); Series 2010, RB | | | 5.50 | % | | | 01/01/22 | | | | 1,000 | | | | 1,092,700 | |
Maryland (State of) Health & Higher Educational Facilities Authority (Frederick Memorial Hospital); Series 2012 A, RB | | | 5.00 | % | | | 07/01/22 | | | | 1,000 | | | | 1,119,960 | |
Maryland (State of) Health & Higher Educational Facilities Authority (LifeBridge Health); | | | | | | | | | | | | | | | | |
Series 2011, RB | | | 6.00 | % | | | 07/01/23 | | | | 335 | | | | 389,501 | |
Series 2011, RB | | | 6.00 | % | | | 07/01/25 | | | | 200 | | | | 229,466 | |
See accompanying Notes to Financial Statements which are an integral part of the financial statements.
16 Invesco Intermediate Term Municipal Income Fund
| | | | | | | | | | | | | | | | |
| | | Interest
Rate | | | Maturity
Date | | | Principal
Amount
(000) | | | Value | |
| Maryland–(continued) | | | | | | | | | | | | | | | | |
Maryland (State of) Health & Higher Educational Facilities Authority (The Johns Hopkins Health System Obligated Group); Series 2008 B, RB(b) | | | 5.00 | % | | | 05/15/15 | | | $ | 500 | | | $ | 529,055 | |
Maryland (State of) Health & Higher Educational Facilities Authority (Washington County Hospital); Series 2008, RB | | | 5.25 | % | | | 01/01/23 | | | | 250 | | | | 261,738 | |
Maryland (State of) Transportation Authority; Series 2008, Grant & RAB | | | 5.25 | % | | | 03/01/20 | | | | 3,000 | | | | 3,553,680 | |
Maryland Economic Development Corp. (Transportation Facilities); Series 2010 A, RB | | | 5.13 | % | | | 06/01/20 | | | | 2,250 | | | | 2,401,605 | |
| | | | | 14,658,700 | |
| | | | |
| Massachusetts–0.45% | | | | | | | | | | | | | | | | |
Massachusetts (State of) Development Finance Agency (Carleton Willard Village);
Series 2010, RB | | | 5.25 | % | | | 12/01/25 | | | | 650 | | | | 685,282 | |
Massachusetts (State of) Development Finance Agency (Dominion Energy Brayton);
Series 2009 1, Ref. Solid Waste Disposal RB(b)(h) | | | 5.75 | % | | | 05/01/19 | | | | 1,500 | | | | 1,846,980 | |
Massachusetts (State of) Development Finance Agency (Quincy Medical Center);
Series 2008 A, RB(i) | | | 5.85 | % | | | 01/15/18 | | | | 300 | | | | 843 | |
Massachusetts (State of) Development Finance Agency (Sabis International Charter School); Series 2009 A, RB | | | 6.70 | % | | | 04/15/21 | | | | 500 | | | | 561,355 | |
| | | | | 3,094,460 | |
| | | | |
| Michigan–3.43% | | | | | | | | | | | | | | | | |
Brandon School District; | | | | | | | | | | | | | | | | |
Series 2008, Ref. Unlimited Tax GO Bonds (INS–AGM)(a) | | | 5.00 | % | | | 05/01/16 | | | | 1,425 | | | | 1,568,284 | |
Series 2008, Ref. Unlimited Tax GO Bonds (INS–AGM)(a) | | | 5.00 | % | | | 05/01/18 | | | | 1,410 | | | | 1,647,303 | |
Dearborn School District; Series 2007, Ref. Unlimited Tax GO Bonds (INS–NATL)(a) | | | 5.00 | % | | | 05/01/16 | | | | 2,480 | | | | 2,725,371 | |
Greenville Public Schools; | | | | | | | | | | | | | | | | |
Series 2008, Ref. Unlimited Tax GO Bonds (INS–AGM)(a) | | | 5.00 | % | | | 05/01/16 | | | | 1,410 | | | | 1,551,776 | |
Series 2008, Ref. Unlimited Tax GO Bonds (INS–AGM)(a) | | | 5.00 | % | | | 05/01/18 | | | | 1,235 | | | | 1,442,851 | |
Kent (County of) Hospital Finance Authority (Spectrum Health System); Series 2008 A, RB(b) | | | 5.50 | % | | | 01/15/15 | | | | 1,000 | | | | 1,044,520 | |
Lansing (City of) Board of Water & Light; Series 2008 A, Water Supply, Steam, Chilled Water & Electric Utility System RB | | | 5.00 | % | | | 07/01/24 | | | | 1,000 | | | | 1,075,330 | |
Michigan (State of) Strategic Fund (The Dow Chemical Co.); Series 2003 A-1, Ref. Limited Obligation RB(b)(c) | | | 6.75 | % | | | 06/02/14 | | | | 2,000 | | | | 2,026,580 | |
Traverse City Area Public Schools; | | | | | | | | | | | | | | | | |
Series 2008, Ref. Unlimited Tax GO Bonds (INS–AGM)(a) | | | 5.00 | % | | | 05/01/17 | | | | 2,300 | | | | 2,599,276 | |
Series 2008, Ref. Unlimited Tax GO Bonds (INS–AGM)(a) | | | 5.00 | % | | | 05/01/18 | | | | 2,280 | | | | 2,635,315 | |
Series 2008, Ref. Unlimited Tax GO Bonds (INS–AGM)(a) | | | 5.00 | % | | | 05/01/19 | | | | 2,260 | | | | 2,573,213 | |
Wayne (County of) Airport Authority (Detroit Metropolitan Airport); Series 2012 D, Ref. RB(c) | | | 5.00 | % | | | 12/01/28 | | | | 2,500 | | | | 2,586,750 | |
| | | | | 23,476,569 | |
| | | | |
| Minnesota–0.09% | | | | | | | | | | | | | | | | |
Minneapolis (City of) (Fairview Health Services); Series 2008 A, Health Care System RB | | | 6.38 | % | | | 11/15/23 | | | | 500 | | | | 588,335 | |
| | | | |
| Mississippi–0.15% | | | | | | | | | | | | | | | | |
Mississippi Business Finance Corp. (System Energy Resources, Inc.); Series 1998, PCR | | | 5.88 | % | | | 04/01/22 | | | | 1,000 | | | | 1,000,160 | |
| | | | |
| Missouri–2.50% | | | | | | | | | | | | | | | | |
Bridgeton (City of) Industrial Development Authority (Sarah Community); | | | | | | | | | | | | | | | | |
Series 2013, Ref. RB | | | 4.00 | % | | | 05/01/24 | | | | 500 | | | | 462,360 | |
Series 2013, Ref. RB | | | 4.50 | % | | | 05/01/28 | | | | 1,500 | | | | 1,363,200 | |
Cape Girardeau (County of) Industrial Development Authority (St. Francis Medical Center); Series 2009 A, Health Facilities RB | | | 5.00 | % | | | 06/01/21 | | | | 525 | | | | 579,317 | |
Ferguson (City of) (Crossing at Halls Ferry); Series 2005, Ref. Tax Increment Allocation RB | | | 5.50 | % | | | 04/01/14 | | | | 610 | | | | 611,720 | |
Kansas City (City of) Industrial Development Authority (Downtown Redevelopment District); | | | | | | | | | | | | | | | | |
Series 2011 A, Ref. RB | | | 5.50 | % | | | 09/01/23 | | | | 1,000 | | | | 1,162,200 | |
Series 2011 A, Ref. RB | | | 5.50 | % | | | 09/01/24 | | | | 2,000 | | | | 2,295,000 | |
Series 2011 A, Ref. RB | | | 5.50 | % | | | 09/01/28 | | | | 2,000 | | | | 2,205,860 | |
Kansas City (City of) Industrial Development Authority (Plaza Library); Series 2004, RB | | | 6.00 | % | | | 03/01/16 | | | | 365 | | | | 366,201 | |
See accompanying Notes to Financial Statements which are an integral part of the financial statements.
17 Invesco Intermediate Term Municipal Income Fund
| | | | | | | | | | | | | | | | |
| | | Interest
Rate | | | Maturity
Date | | | Principal
Amount
(000) | | | Value | |
| Missouri–(continued) | | | | | | | | | | | | | | | | |
Manchester (City of) (Highway 141/Manchester Road); Series 2010, Ref. Transportation Tax Increment Allocation RB | | | 6.00 | % | | | 11/01/25 | | | $ | 4,560 | | | $ | 4,706,604 | |
Maryland Heights (City of) (South Heights Redevelopment); Series 2007 A, Ref. Tax Increment Allocation RB | | | 5.50 | % | | | 09/01/18 | | | | 140 | | | | 151,340 | |
Raytown (City of) (Raytown Live Redevelopment Plan); Series 2007 1, Annual Appropriation-Supported Tax RB | | | 5.00 | % | | | 12/01/16 | | | | 500 | | | | 548,785 | |
St. Louis (County of) Industrial Development Authority (Friendship Village of Sunset Hills); | | | | | | | | | | | | | | | | |
Series 2012, Senior Living Facilities RB | | | 4.50 | % | | | 09/01/23 | | | | 340 | | | | 358,765 | |
Series 2012, Senior Living Facilities RB | | | 5.00 | % | | | 09/01/32 | | | | 1,490 | | | | 1,527,354 | |
St. Louis (County of) Industrial Development Authority (Friendship Village West County);
Series 2007 A, Senior Living Facilities RB | | | 5.25 | % | | | 09/01/17 | | | | 250 | | | | 270,850 | |
St. Louis (County of) Industrial Development Authority (Ranken-Jordan); Series 2007, Ref. Health Facilities RB | | | 5.00 | % | | | 11/15/22 | | | | 540 | | | | 540,367 | |
| | | | | 17,149,923 | |
| | | | |
| Nebraska–0.53% | | | | | | | | | | | | | | | | |
Lincoln (County of) Hospital Authority No. 1 (Great Plains Regional Medical Center); | | | | | | | | | | | | | | | | |
Series 2012, Ref. RB | | | 4.00 | % | | | 11/01/22 | | | | 720 | | | | 757,051 | |
Series 2012, Ref. RB | | | 5.00 | % | | | 11/01/23 | | | | 500 | | | | 549,245 | |
Nebraska (State of) Municipal Energy Agency; Series 2009 A, Ref. Power Supply System RB
(INS–BHAC)(a) | | | 5.13 | % | | | 04/01/23 | | | | 560 | | | | 640,035 | |
University of Nebraska Facilities Corp.; Series 2006, Deferred Maintenance RB (INS–AMBAC)(a) | | | 5.00 | % | | | 07/15/17 | | | | 1,500 | | | | 1,657,890 | |
| | | | | 3,604,221 | |
| | | | |
| Nevada–1.57% | | | | | | | | | | | | | | | | |
Carson City (City of) (Carson-Tahoe Regional Medical Center); Series 2012, Ref. Hospital RB | | | 5.00 | % | | | 09/01/27 | | | | 1,000 | | | | 1,039,080 | |
Clark (County of); | | | | | | | | | | | | | | | | |
Series 2013 A, Ref. Jet Aviation Fuel Tax Airport System RB(c) | | | 5.00 | % | | | 07/01/19 | | | | 1,020 | | | | 1,177,345 | |
Series 2013 A, Ref. Jet Aviation Fuel Tax Airport System RB(c) | | | 5.00 | % | | | 07/01/20 | | | | 1,000 | | | | 1,148,920 | |
Director of the State of Nevada Department of Business & Industry (Republic Services, Inc.);
Series 2003, Solid Waste Disposal RB(b)(c)(d) | | | 5.63 | % | | | 06/01/18 | | | | 1,100 | | | | 1,202,366 | |
Humboldt (County of) (Idaho Power Co.); Series 2003, Ref. PCR | | | 5.15 | % | | | 12/01/24 | | | | 1,800 | | | | 1,968,192 | |
Las Vegas (City of) Redevelopment Agency; | | | | | | | | | | | | | | | | |
Series 2009 A, Tax Increment Allocation RB | | | 6.25 | % | | | 06/15/16 | | | | 1,475 | | | | 1,584,445 | |
Series 2009 A, Tax Increment Allocation RB | | | 7.00 | % | | | 06/15/20 | | | | 1,000 | | | | 1,147,360 | |
Washoe County School District; Series 2008 A, School Improvement Limited Tax GO Bonds | | | 4.75 | % | | | 06/01/26 | | | | 1,405 | | | | 1,488,457 | |
| | | | | 10,756,165 | |
| | | | |
| New Hampshire–0.39% | | | | | | | | | | | | | | | | |
Manchester (City of); Series 2009 A, Ref. General Airport RB | | | 5.00 | % | | | 01/01/17 | | | | 1,000 | | | | 1,092,750 | |
New Hampshire (State of) Health & Education Facilities Authority (Southern New Hampshire University); Series 2012, RB | | | 5.00 | % | | | 01/01/27 | | | | 1,500 | | | | 1,558,545 | |
| | | | | 2,651,295 | |
| | | | |
| New Jersey–2.97% | | | | | | | | | | | | | | | | |
Gloucester (County of) Improvement Authority (Waste Management Inc.); Series 1999 B, Ref. Solid Waste RB(b)(c) | | | 2.50 | % | | | 12/01/17 | | | | 500 | | | | 506,185 | |
Monmouth (County of) Improvement Authority; | | | | | | | | | | | | | | | | |
Series 2007, Governmental Loan RB(h) | | | 5.00 | % | | | 12/01/16 | | | | 5 | | | | 5,631 | |
Series 2007, Governmental Loan RB(h) | | | 5.00 | % | | | 12/01/17 | | | | 10 | | | | 11,625 | |
Series 2007, Governmental Loan RB (INS–AMBAC)(a) | | | 5.00 | % | | | 12/01/16 | | | | 1,005 | | | | 1,111,661 | |
Series 2007, Governmental Loan RB (INS–AMBAC)(a) | | | 5.00 | % | | | 12/01/17 | | | | 1,990 | | | | 2,239,785 | |
New Jersey (State of) Economic Development Authority (Paterson Charter School);
Series 2012 C, RB | | | 5.00 | % | | | 07/01/22 | | | | 500 | | | | 508,495 | |
New Jersey (State of) Economic Development Authority (The Goethals Bridge Replacement); | | | | | | | | | | | | | | | | |
Series 2013, Private Activity RB(c) | | | 5.00 | % | | | 07/01/21 | | | | 425 | | | | 474,980 | |
Series 2013, Private Activity RB(c) | | | 5.00 | % | | | 01/01/28 | | | | 1,000 | | | | 1,050,720 | |
Series 2013, Private Activity RB(c) | | | 5.50 | % | | | 01/01/26 | | | | 1,390 | | | | 1,550,990 | |
Series 2013, Private Activity RB(c) | | | 5.50 | % | | | 01/01/27 | | | | 1,130 | | | | 1,241,621 | |
See accompanying Notes to Financial Statements which are an integral part of the financial statements.
18 Invesco Intermediate Term Municipal Income Fund
| | | | | | | | | | | | | | | | |
| | | Interest
Rate | | | Maturity
Date | | | Principal
Amount
(000) | | | Value | |
| New Jersey–(continued) | | | | | | | | | | | | | | | | |
New Jersey (State of) Economic Development Authority; Series 2012, Ref. RB | | | 5.00 | % | | | 06/15/23 | | | $ | 2,000 | | | $ | 2,229,660 | |
New Jersey (State of) Health Care Facilities Financing Authority (Meridian Health System
Obligated Group); | | | | | | | | | | | | | | | | |
Series 2011, Ref. RB | | | 5.00 | % | | | 07/01/25 | | | | 1,500 | | | | 1,656,930 | |
Series 2011, Ref. RB | | | 5.00 | % | | | 07/01/27 | | | | 2,000 | | | | 2,155,280 | |
New Jersey (State of) Health Care Facilities Financing Authority (St. Clare’s Hospital, Inc.)
Series 2004 A, Ref. RB(h) | | | 5.25 | % | | | 07/01/20 | | | | 1,000 | | | | 1,208,550 | |
New Jersey (State of) Health Care Facilities Financing Authority (St. Joseph’s Health Care System); Series 2008, RB | | | 5.75 | % | | | 07/01/15 | | | | 160 | | | | 166,229 | |
New Jersey (State of) Turnpike Authority; Series 2013 E, Floating Rate RB(b)(e) | | | 0.71 | % | | | 01/01/18 | | | | 2,000 | | | | 2,000,000 | |
North Hudson Sewerage Authority; Series 2012 A, Gross Revenue Lease Ctfs. | | | 5.00 | % | | | 06/01/24 | | | | 1,000 | | | | 1,147,070 | |
South Jersey Transportation Authority; Series 2012 A, Ref. RB | | | 5.00 | % | | | 11/01/24 | | | | 1,000 | | | | 1,108,160 | |
| | | | | 20,373,572 | |
| | | | |
| New Mexico–1.52% | | | | | | | | | | | | | | | | |
Farmington (City of) (Public Service Co. of New Mexico San Juan); Series 2010 A, Ref. PCR(b) | | | 5.20 | % | | | 06/01/20 | | | | 1,700 | | | | 1,877,667 | |
Jicarilla Apache Nation; Series 2003 A, RB(d) | | | 5.50 | % | | | 09/01/23 | | | | 1,000 | | | | 974,460 | |
New Mexico (State of) Finance Authority; | | | | | | | | | | | | | | | | |
Series 2006 B, Sr. Lien Public Revolving Fund RB (INS–NATL)(a) | | | 5.00 | % | | | 06/01/17 | | | | 1,310 | | | | 1,440,122 | |
Series 2007 C, Sub. Lien Public Revolving Fund RB (INS–NATL)(a) | | | 5.00 | % | | | 06/15/14 | | | | 1,200 | | | | 1,217,244 | |
New Mexico (State of) Hospital Equipment Loan Council (Haverland Charter Lifestyle Group);
Series 2013, First Mortgage RB | | | 4.00 | % | | | 07/01/22 | | | | 3,000 | | | | 2,959,050 | |
New Mexico (State of) Hospital Equipment Loan Council (La Vida Llena); Series 2010 A, First Mortgage RB | | | 5.00 | % | | | 07/01/19 | | | | 715 | | | | 768,504 | |
New Mexico (State of) Hospital Equipment Loan Council (Presbyterian Health Care Services); Series 2008 A, Hospital RB | | | 6.00 | % | | | 08/01/23 | | | | 1,000 | | | | 1,166,380 | |
| | | | | 10,403,427 | |
| | | | |
| New York–1.57% | | | | | | | | | | | | | | | | |
Albany (City of) Industrial Development Agency (St. Peter’s Hospital); Series 2008 A, Civic Facility RB | | | 5.75 | % | | | 11/15/22 | | | | 500 | | | | 557,740 | |
Brooklyn Arena Local Development Corp. (Barclays Center); | | | | | | | | | | | | | | | | |
Series 2009, PILOT RB | | | 5.75 | % | | | 07/15/17 | | | | 1,000 | | | | 1,134,160 | |
Series 2009, PILOT RB | | | 5.75 | % | | | 07/15/19 | | | | 1,000 | | | | 1,167,430 | |
Metropolitan Transportation Authority; Series 2002 A, Ref. Service Contract RB | | | 5.75 | % | | | 07/01/18 | | | | 1,000 | | | | 1,201,540 | |
New York (City of) Industrial Development Agency (Queens Baseball Stadium); | | | | | | | | | | | | | | | | |
Series 2009, PILOT RB (INS–AGC)(a) | | | 5.00 | % | | | 01/01/18 | | | | 200 | | | | 222,506 | |
Series 2009, PILOT RB (INS–AGC)(a) | | | 5.00 | % | | | 01/01/19 | | | | 200 | | | | 224,944 | |
New York (City of) Transitional Finance Authority; Series 2009 S-3, Building Aid RB(g) | | | 5.00 | % | | | 01/15/21 | | | | 1,000 | | | | 1,142,820 | |
New York (City of); Subseries 2008 J-4, Floating Rate Unlimited Tax GO Bonds(e) | | | 0.58 | % | | | 08/01/25 | | | | 3,000 | | | | 3,000,000 | |
New York State Environmental Facilities Corp. (Municipal Water Finance Authority); Series 2005 C, State Clean Water & Drinking Water Revolving Funds RB | | | 5.00 | % | | | 06/15/21 | | | | 2,000 | | | | 2,121,280 | |
Niagara Falls (City of); Series 1994, Public Improvement Unlimited Tax GO Bonds(j) | | | 6.90 | % | | | 03/01/20 | | | | 5 | | | | 5,017 | |
| | | | | 10,777,437 | |
| | | | |
| North Carolina–0.71% | | | | | | | | | | | | | | | | |
North Carolina (State of) Eastern Municipal Power Agency; | | | | | | | | | | | | | | | | |
Series 2008 C, Power System RB | | | 6.75 | % | | | 01/01/24 | | | | 1,000 | | | | 1,177,020 | |
Series 2008 C, Power System RB (INS–AGC)(a) | | | 6.00 | % | | | 01/01/19 | | | | 1,070 | | | | 1,188,931 | |
North Carolina (State of) Medical Care Commission (Lutheran Services); Series 2012, Ref. First Mortgage Health Care Facilities RB | | | 4.25 | % | | | 03/01/24 | | | | 1,800 | | | | 1,709,676 | |
North Carolina (State of) Medical Care Commission (Salemtowne); Series 2006, Ref. First Mortgage Health Care Facilities RB | | | 5.00 | % | | | 10/01/15 | | | | 500 | | | | 514,000 | |
North Carolina (State of) Medical Care Commission (Southminster); Series 2007 A, First Mortgage Retirement Facilities RB | | | 5.30 | % | | | 10/01/19 | | | | 250 | | | | 257,180 | |
| | | | | 4,846,807 | |
See accompanying Notes to Financial Statements which are an integral part of the financial statements.
19 Invesco Intermediate Term Municipal Income Fund
| | | | | | | | | | | | | | | | |
| | | Interest
Rate | | | Maturity
Date | | | Principal
Amount
(000) | | | Value | |
| North Dakota–0.25% | | | | | | | | | | | | | | | | |
Grand Forks (City of) (4000 Valley Square); Series 2006, Ref. Senior Housing RB | | | 5.00 | % | | | 12/01/16 | | | $ | 310 | | | $ | 318,007 | |
North Dakota (State of) Public Finance Authority (State Revolving Fund Program);
Series 2008 A, RB | | | 5.50 | % | | | 10/01/19 | | | | 1,195 | | | | 1,428,587 | |
| | | | | 1,746,594 | |
| | | | |
| Ohio–2.76% | | | | | | | | | | | | | | | | |
Adams (County of) (Adams County Hospital); Series 2005, Hospital Facility Improvement RB | | | 6.25 | % | | | 09/01/20 | | | | 415 | | | | 343,396 | |
American Municipal Power, Inc. (Amp Fremont Energy Center); Series 2012, RB | | | 5.00 | % | | | 02/15/21 | | | | 1,250 | | | | 1,461,875 | |
American Municipal Power, Inc. (Hydroelectric); Series 2009 C, RB | | | 5.25 | % | | | 02/15/19 | | | | 1,175 | | | | 1,362,577 | |
Cleveland (City of) (Bridges & Roadways Improvements); Series 2008 B, Sub. Lien Income Tax RB (INS–AGC)(a) | | | 5.00 | % | | | 10/01/25 | | | | 1,555 | | | | 1,747,618 | |
Cleveland (City of) (Cleveland Stadium); Series 2004, Ref. RB (INS–AMBAC)(a) | | | 5.13 | % | | | 12/01/20 | | | | 1,370 | | | | 1,419,443 | |
Cleveland (City of); Series 2012 A, Ref. Airport System RB | | | 5.00 | % | | | 01/01/27 | | | | 2,750 | | | | 2,907,795 | |
Franklin (County of) (First Community Village Obligated Group); Series 2013, Ref. Health Care Facilities RB | | | 5.25 | % | | | 07/01/33 | | | | 1,000 | | | | 849,260 | |
Hamilton (County of) (Christ Hospital); Series 2012, Health Care Facilities RB | | | 5.25 | % | | | 06/01/23 | | | | 1,500 | | | | 1,679,175 | |
Montgomery (County of) (Miami Valley Hospital); Series 2009 B, RB(b) | | | 5.25 | % | | | 11/15/14 | | | | 1,000 | | | | 1,034,990 | |
Montgomery (County of) (St. Leonard); Series 2010, Ref. & Improvement Health Care & MFH RB | | | 6.00 | % | | | 04/01/20 | | | | 820 | | | | 901,943 | |
Muskingum (County of) (Genesis Healthcare System); Series 2013, Hospital Facilities RB | | | 5.00 | % | | | 02/15/27 | | | | 2,250 | | | | 2,021,062 | |
Ohio (State of) Air Quality Development Authority (FirstEnergy Generation Corp.); Series 2009 C, Ref. PCR | | | 5.63 | % | | | 06/01/18 | | | | 2,000 | | | | 2,223,520 | |
Ohio (State of) Water Development Authority (FirstEnergy Nuclear Generation Corp.); Series 2009 A, Ref. PCR(b) | | | 5.88 | % | | | 06/01/16 | | | | 865 | | | | 938,689 | |
| | | | | 18,891,343 | |
| | | | |
| Oklahoma–0.30% | | | | | | | | | | | | | | | | |
Chickasawa Nation; Series 2007, Health System RB(d) | | | 5.38 | % | | | 12/01/17 | | | | 225 | | | | 241,850 | |
Tulsa (City of) Airports Improvement Trust; Series 2009 A, General RB | | | 5.38 | % | | | 06/01/24 | | | | 1,750 | | | | 1,803,865 | |
| | | | | 2,045,715 | |
| | | | |
| Oregon–0.47% | | | | | | | | | | | | | | | | |
Salem (City of) Hospital Facility Authority (Capital Manor, Inc.); Series 2012, Ref. RB | | | 5.00 | % | | | 05/15/22 | | | | 1,000 | | | | 1,018,810 | |
Tri-County Metropolitan Transportation District; Series 2011 A, Capital Grant Receipt RB | | | 5.00 | % | | | 10/01/27 | | | | 2,000 | | | | 2,217,420 | |
| | | | | 3,236,230 | |
| | | | |
| Pennsylvania–3.72% | | | | | | | | | | | | | | | | |
Allegheny (County of) Airport Authority (Pittsburgh International Airport); Series 2010 A, Airport RB (INS–AGM)(a)(c) | | | 5.00 | % | | | 01/01/16 | | | | 1,000 | | | | 1,084,610 | |
Allegheny (County of) Hospital Development Authority (University of Pittsburgh Medical Center); Series 2008 A, RB | | | 5.00 | % | | | 09/01/18 | | | | 3,000 | | | | 3,488,460 | |
Allegheny (County of) Industrial Development Authority (Residential Resources, Inc.);
Series 2006, Lease RB | | | 5.00 | % | | | 09/01/21 | | | | 500 | | | | 507,740 | |
Allegheny (County of) Redevelopment Authority (Pittsburgh Mills); Series 2004, Tax
Allocation RB | | | 5.10 | % | | | 07/01/14 | | | | 45 | | | | 45,612 | |
Cumberland (County of) Municipal Authority (Asbury Obligated Group); | | | | | | | | | | | | | | | | |
Series 2012, Ref. RB | | | 5.00 | % | | | 01/01/22 | | | | 750 | | | | 761,130 | |
Series 2012, Ref. RB | | | 5.25 | % | | | 01/01/27 | | | | 1,275 | | | | 1,273,725 | |
Delaware (County of) Authority (Elwyn); Series 2010, RB | | | 5.00 | % | | | 06/01/20 | | | | 1,980 | | | | 2,098,919 | |
Girard School District; | | | | | | | | | | | | | | | | |
Series 1992 B, Unlimited Tax CAB GO Bonds (INS–NATL)(a)(f) | | | 0.00 | % | | | 10/01/18 | | | | 700 | | | | 643,671 | |
Series 1992 B, Unlimited Tax CAB GO Bonds (INS–NATL)(a)(f) | | | 0.00 | % | | | 10/01/19 | | | | 250 | | | | 221,450 | |
Lehigh (County of) General Purpose Authority (Bible Fellowship Church Homes, Inc.); | | | | | | | | | | | | | | | | |
Series 2013, RB | | | 4.25 | % | | | 07/01/20 | | | | 2,265 | | | | 2,205,612 | |
Series 2013, RB | | | 4.50 | % | | | 07/01/17 | | | | 1,435 | | | | 1,440,568 | |
Monroe (County of) Hospital Authority (Pocono Medical Center); Series 2007, RB | | | 5.00 | % | | | 01/01/17 | | | | 500 | | | | 553,065 | |
Montgomery (County of) Industrial Development Authority (ACTS Retirement-Life Community); Series 2012, Ref. RB | | | 5.00 | % | | | 11/15/25 | | | | 2,000 | | | | 2,100,480 | |
Northampton (County of) Industrial Development Authority (Morningstar Senior Living, Inc.); Series 2012, RB | | | 5.00 | % | | | 07/01/27 | | | | 1,500 | | | | 1,458,630 | |
See accompanying Notes to Financial Statements which are an integral part of the financial statements.
20 Invesco Intermediate Term Municipal Income Fund
| | | | | | | | | | | | | | | | |
| | | Interest
Rate | | | Maturity
Date | | | Principal
Amount
(000) | | | Value | |
| Pennsylvania–(continued) | | | | | | | | | | | | | | | | |
Pennsylvania (State of) Economic Development Financing Authority (Shippingport); Series 2006 A, Exempt Facilities RB(b) | | | 2.55 | % | | | 12/03/18 | | | $ | 1,500 | | | $ | 1,502,610 | |
Pennsylvania (State of) Turnpike Commission; Series 2013 B, Floating Rate RB(e) | | | 1.18 | % | | | 12/01/19 | | | | 2,000 | | | | 2,000,000 | |
Philadelphia (City of) Industrial Development Authority (One Benjamin Franklin Parkway);
Series 2007 C, Ref. Lease RB (INS–AGM)(a) | | | 5.00 | % | | | 02/15/15 | | | | 2,150 | | | | 2,234,086 | |
Philadelphia (City of); Eighteenth Series 2004, Gas Works RB (INS–AGC)(a) | | | 5.25 | % | | | 08/01/18 | | | | 750 | | | | 763,702 | |
Washington (County of) Industrial Development Authority (Washington Jefferson College);
Series 2010, College RB | | | 5.00 | % | | | 11/01/25 | | | | 1,000 | | | | 1,083,170 | |
| | | | | 25,467,240 | |
| | | | |
| Rhode Island–0.17% | | | | | | | | | | | | | | | | |
Rhode Island Health & Educational Building Corp. (University of Rhode Island–Auxiliary Enterprise); Series 2013 C, Ref. Higher Education Facility RB | | | 5.00 | % | | | 09/15/22 | | | | 1,000 | | | | 1,159,520 | |
| | | | |
| South Carolina–2.48% | | | | | | | | | | | | | | | | |
Georgetown (County of) (International Paper Co.); Series 2000 A, Ref. Environmental
Improvement RB | | | 5.95 | % | | | 03/15/14 | | | | 1,000 | | | | 1,002,350 | |
Greenwood (County of) (Self Regional Healthcare); Series 2012 B, Ref. Hospital RB | | | 5.00 | % | | | 10/01/26 | | | | 4,650 | | | | 5,045,529 | |
Piedmont Municipal Power Agency; | | | | | | | | | | | | | | | | |
Series 2008 A-2, Electric RB | | | 5.00 | % | | | 01/01/24 | | | | 1,000 | | | | 1,109,790 | |
Series 2009 A-4, Ref. Electric RB | | | 5.00 | % | | | 01/01/21 | | | | 2,000 | | | | 2,290,600 | |
Richland (County of) (International Paper Co.); Series 2003 A, Ref. Environmental Improvement RB(c) | | | 6.10 | % | | | 04/01/23 | | | | 725 | | | | 733,744 | |
South Carolina (State of) Jobs-Economic Development Authority (AnMed Health); Series 2009 B, Ref. & Improvement Hospital RB (INS–AGC)(a) | | | 5.00 | % | | | 02/01/19 | | | | 1,000 | | | | 1,154,910 | |
South Carolina (State of) Jobs-Economic Development Authority (Lutheran Homes); | | | | | | | | | | | | | | | | |
Series 2013, Health Facilities RB | | | 5.00 | % | | | 05/01/23 | | | | 1,000 | | | | 1,002,120 | |
Series 2013, Health Facilities RB | | | 5.00 | % | | | 05/01/28 | | | | 1,250 | | | | 1,185,387 | |
South Carolina (State of) Jobs-Economic Development Authority (Palmetto Health Alliance); Series 2013 A, Ref. Hospital RB | | | 5.25 | % | | | 08/01/26 | | | | 3,215 | | | | 3,460,497 | |
| | | | | 16,984,927 | |
| | | | |
| South Dakota–0.66% | | | | | | | | | | | | | | | | |
Educational Enhancement Funding Corp.; | | | | | | | | | | | | | | | | |
Series 2013 B, Tobacco Settlement RB | | | 5.00 | % | | | 06/01/23 | | | | 1,000 | | | | 1,110,960 | |
Series 2013 B, Tobacco Settlement RB | | | 5.00 | % | | | 06/01/24 | | | | 2,000 | | | | 2,187,780 | |
South Dakota (State of) Health & Educational Facilities Authority (Regional Health); | | | | | | | | | | | | | | | | |
Series 2010, RB | | | 5.00 | % | | | 09/01/21 | | | | 605 | | | | 687,794 | |
Series 2010, RB | | | 5.00 | % | | | 09/01/22 | | | | 500 | | | | 557,990 | |
| | | | | 4,544,524 | |
| | | | |
| Tennessee–1.27% | | | | | | | | | | | | | | | | |
Chattanooga (City of) Health, Educational & Housing Facility Board (Community Development Financial Institution Phase I LLC); Series 2005 A, Ref. RB | | | 5.00 | % | | | 10/01/15 | | | | 115 | | | | 118,202 | |
Franklin Special School District; Series 1999, Limited Tax CAB GO Bonds (INS–AGM)(a)(f) | | | 0.00 | % | | | 06/01/15 | | | | 700 | | | | 696,885 | |
Nashville (City of) & Davidson (County of) Metropolitan Government Health & Educational Facilities Board (Blakeford at Green Hills); | | | | | | | | | | | | | | | | |
Series 2012, Ref. & Improvement RB | | | 5.00 | % | | | 07/01/19 | | | | 770 | | | | 858,735 | |
Series 2012, Ref. & Improvement RB | | | 5.00 | % | | | 07/01/22 | | | | 500 | | | | 541,420 | |
Shelby (County of) Health, Educational & Housing Facilities Board (Methodist Le Bonheur Health); Series 2008 C, RB | | | 5.25 | % | | | 06/01/18 | | | | 1,000 | | | | 1,152,390 | |
Shelby (County of) Health, Educational & Housing Facilities Board (Trezevant Manor);
Series 2006 A, RB | | | 5.25 | % | | | 09/01/16 | | | | 325 | | | | 342,218 | |
Tennessee Energy Acquisition Corp.; | | | | | | | | | | | | | | | | |
Series 2006 C, Gas RB | | | 5.00 | % | | | 02/01/23 | | | | 1,360 | | | | 1,506,717 | |
Series 2006 C, Gas RB | | | 5.00 | % | | | 02/01/24 | | | | 3,225 | | | | 3,506,252 | |
| | | | | 8,722,819 | |
See accompanying Notes to Financial Statements which are an integral part of the financial statements.
21 Invesco Intermediate Term Municipal Income Fund
| | | | | | | | | | | | | | | | |
| | | Interest
Rate | | | Maturity
Date | | | Principal
Amount
(000) | | | Value | |
| Texas–11.39% | | | | | | | | | | | | | | | | |
Alliance Airport Authority, Inc. (Federal Express Corp.); Series 2006, Ref. Special Facilities RB(c) | | | 4.85 | % | | | 04/01/21 | | | $ | 1,000 | | | $ | 1,045,990 | |
Austin (City of); Series 2009, Water & Wastewater System RB | | | 5.00 | % | | | 11/15/24 | | | | 1,500 | | | | 1,712,850 | |
Bexar (County of); Series 2007, Combination Flood Control Limited Tax GO Ctfs. (INS–AGM)(a) | | | 5.00 | % | | | 06/15/14 | | | | 1,330 | | | | 1,349,112 | |
Brownsville (City of); Series 2008 A, Ref. Utilities System RB (INS–AGM)(a) | | | 5.00 | % | | | 09/01/23 | | | | 1,240 | | | | 1,386,494 | |
Capital Area Cultural Education Facilities Finance Corp. (The Roman Catholic Diocese of Austin); | | | | | | | | | | | | | | | | |
Series 2005 A, RB | | | 5.50 | % | | | 04/01/23 | | | | 1,670 | | | | 1,859,044 | |
Series 2005 A, RB | | | 5.50 | % | | | 04/01/25 | | | | 1,610 | | | | 1,754,127 | |
Clifton Higher Education Finance Corp. (Idea Public Schools); Series 2013, Education RB | | | 6.00 | % | | | 08/15/33 | | | | 1,250 | | | | 1,371,125 | |
Dallas (City of) (Civic Center Convention Complex); Series 2009, Ref. & Improvement RB (INS–AGC)(a) | | | 5.00 | % | | | 08/15/18 | | | | 1,500 | | | | 1,722,750 | |
Dallas (County of) Flood Control District No. 1; Series 2002, Ref. Unlimited Tax GO Bonds | | | 6.75 | % | | | 04/01/16 | | | | 85 | | | | 85,307 | |
Dallas-Fort Worth (Cities of) International Airport; Series 2014 A, Ref. RB(c) | | | 5.25 | % | | | 11/01/26 | | | | 2,000 | | | | 2,221,700 | |
Greenville (City of); | | | | | | | | | | | | | | | | |
Series 2010, Ref. & Improvement Electric Utility System RB | | | 5.00 | % | | | 02/15/25 | | | | 2,355 | | | | 2,536,217 | |
Series 2010, Ref. & Improvement Electric Utility System RB | | | 5.00 | % | | | 02/15/26 | | | | 2,475 | | | | 2,649,339 | |
Gulf Coast Waste Disposal Authority; | | | | | | | | | | | | | | | | |
Series 2013, Bayport Area System RB (INS–AGM)(a) | | | 5.00 | % | | | 10/01/21 | | | | 1,250 | | | | 1,444,962 | |
Series 2013, Bayport Area System RB (INS–AGM)(a) | | | 5.00 | % | | | 10/01/23 | | | | 2,610 | | | | 2,978,297 | |
Harris County Cultural Education Facilities Finance Corp. (Brazos Presbyterian Homes, Inc.); | | | | | | | | | | | | | | | | |
Series 2013 A, First Mortgage RB | | | 4.00 | % | | | 01/01/23 | | | | 1,325 | | | | 1,263,083 | |
Series 2013 A, First Mortgage RB | | | 5.00 | % | | | 01/01/33 | | | | 1,090 | | | | 970,144 | |
Harris County Cultural Education Facilities Finance Corp. (Memorial Hermann Health System); Series 2013 B, Ref. Floating Rate Hospital RB(e) | | | 0.78 | % | | | 06/01/20 | | | | 2,000 | | | | 2,000,000 | |
Harris County Cultural Education Facilities Finance Corp. (YMCA of the Greater Houston Area); Series 2013 A, Ref. RB | | | 5.00 | % | | | 06/01/28 | | | | 1,500 | | | | 1,541,865 | |
Harris County Health Facilities Development Corp. (Memorial Hermann Healthcare System);
Series 2008 B, Ref. RB(b)(h) | | | 7.00 | % | | | 12/01/18 | | | | 500 | | | | 638,780 | |
Harris County Health Facilities Development Corp. (TECO); Series 2008, Thermal Utility RB
(INS–AGC)(a) | | | 5.25 | % | | | 11/15/24 | | | | 1,950 | | | | 2,211,241 | |
Harris County Industrial Development Corp. (Deer Park Refining Limited Partnership); Series 2006, Solid Waste Disposal RB | | | 5.00 | % | | | 02/01/23 | | | | 2,500 | | | | 2,702,675 | |
Hidalgo County Health Services Corp. (Mission Hospital, Inc.); Series 2005, Hospital RB | | | 5.00 | % | | | 08/15/19 | | | | 350 | | | | 350,395 | |
Hopkins (County of) Hospital District; Series 2008, RB | | | 5.50 | % | | | 02/15/23 | | | | 500 | | | | 500,870 | |
Houston (City of); | | | | | | | | | | | | | | | | |
Series 2007 A, Ref. Public Improvement Limited Tax GO Bonds (INS–NATL)(a) | | | 5.00 | % | | | 03/01/16 | | | | 1,000 | | | | 1,095,210 | |
Series 2011 A, Ref. Sub Lien Airport System RB(c) | | | 5.00 | % | | | 07/01/25 | | | | 1,000 | | | | 1,089,590 | |
Series 2012, Ref. Floating Rate First Lien Combined Utility System RB(b)(e) | | | 0.78 | % | | | 06/01/17 | | | | 9,000 | | | | 9,038,249 | |
Houston Higher Education Finance Corp. (Cosmos Foundation, Inc.); | | | | | | | | | | | | | | | | |
Series 2011 A, RB | | | 5.88 | % | | | 05/15/21 | | | | 910 | | | | 1,021,175 | |
Series 2012 A, RB | | | 4.00 | % | | | 02/15/22 | | | | 635 | | | | 644,792 | |
Mesquite Health Facility Development Corp. (Christian Care Centers, Inc.); Series 2005, Retirement Facility RB | | | 5.00 | % | | | 02/15/15 | | | | 230 | | | | 234,943 | |
New Hope Cultural Education Facilities Corp. (Morningside Ministries); Series 2013, First Mortgage RB | | | 6.25 | % | | | 01/01/33 | | | | 1,600 | | | | 1,658,624 | |
North Texas Tollway Authority; | | | | | | | | | | | | | | | | |
Series 2008 A, Ref. First Tier System RB | | | 6.00 | % | | | 01/01/23 | | | | 1,000 | | | | 1,143,780 | |
Series 2012 C, Ref. First Tier RB(b) | | | 1.95 | % | | | 01/01/19 | | | | 2,000 | | | | 1,961,860 | |
Red River Health Facilities Development Corp. (Parkview on Hollybrook); Series 2013 A, First Mortgage RB | | | 6.38 | % | | | 07/01/33 | | | | 500 | | | | 474,180 | |
SA Energy Acquisition Public Facility Corp.; Series 2007, Gas Supply RB | | | 5.50 | % | | | 08/01/21 | | | | 1,000 | | | | 1,148,060 | |
Tarrant County Cultural Education Facilities Finance Corp. (Baylor Health Care System); Series 2009, Ref. Hospital RB | | | 5.75 | % | | | 11/15/24 | | | | 1,000 | | | | 1,163,510 | |
Tarrant County Cultural Education Facilities Finance Corp. (Buckner Retirement Services, Inc.); Series 2007, Retirement Facility RB | | | 5.00 | % | | | 11/15/17 | | | | 500 | | | | 548,995 | |
Tarrant County Cultural Education Facilities Finance Corp. (CHRISTUS Health); Series 2008 A, Ref. RB (INS–AGC)(a) | | | 5.75 | % | | | 07/01/18 | | | | 1,540 | | | | 1,683,559 | |
Tarrant County Cultural Education Facilities Finance Corp. (Mirador); Series 2010 B-1, TEMPS–75SM Retirement Facility RB | | | 7.25 | % | | | 11/15/16 | | | | 2,680 | | | | 2,659,525 | |
See accompanying Notes to Financial Statements which are an integral part of the financial statements.
22 Invesco Intermediate Term Municipal Income Fund
| | | | | | | | | | | | | | | | |
| | | Interest
Rate | | | Maturity
Date | | | Principal
Amount
(000) | | | Value | |
| Texas–(continued) | | | | | | | | | | | | | | | | |
Texas (State of) Transportation Commission; Series 2006 A, First Tier RB(b)(h) | | | 5.00 | % | | | 04/01/16 | | | $ | 2,000 | | | $ | 2,194,980 | |
Texas (State of) Turnpike Authority (Central Texas Turnpike System); Series 2002 A, First Tier CAB RB (INS–AMBAC)(a)(f) | | | 0.00 | % | | | 08/15/18 | | | | 5,700 | | | | 5,204,670 | |
Texas Municipal Gas Acquisition & Supply Corp. III; | | | | | | | | | | | | | | | | |
Series 2012, Gas Supply RB | | | 5.00 | % | | | 12/15/21 | | | | 2,600 | | | | 2,890,238 | |
Series 2012, Gas Supply RB | | | 5.00 | % | | | 12/15/22 | | | | 500 | | | | 547,615 | |
Series 2012, Gas Supply RB | | | 5.00 | % | | | 12/15/23 | | | | 3,950 | | | | 4,273,781 | |
Travis County Cultural Education Facilities Finance Corp. (Wayside Schools); | | | | | | | | | | | | | | | | |
Series 2012 A, Education RB | | | 4.63 | % | | | 08/15/22 | | | | 500 | | | | 488,360 | |
Series 2012 A, Education RB | | | 5.00 | % | | | 08/15/27 | | | | 585 | | | | 555,820 | |
| | | | | 78,017,883 | |
| | | | |
| Utah–0.52% | | | | | | | | | | | | | | | | |
Intermountain Power Agency; Series 1993 A, Ref. Power Supply CAB RB(f)(h) | | | 0.00 | % | | | 07/01/17 | | | | 1,750 | | | | 1,614,200 | |
Utah (State of) Transit Authority; | | | | | | | | | | | | | | | | |
Series 2012, Ref. Sales Tax RB | | | 5.00 | % | | | 06/15/21 | | | | 535 | | | | 624,602 | |
Series 2012, Ref. Sales Tax RB | | | 5.00 | % | | | 06/15/22 | | | | 505 | | | | 588,234 | |
Series 2012, Ref. Sales Tax RB | | | 5.00 | % | | | 06/15/23 | | | | 655 | | | | 748,010 | |
| | | | | 3,575,046 | |
| | | | |
| Virgin Islands–0.87% | | | | | | | | | | | | | | | | |
Virgin Islands (Government of) Public Finance Authority (Matching Fund Loan Note–Diago);
Series 2009 A, Sub. RB | | | 6.00 | % | | | 10/01/14 | | | | 260 | | | | 265,514 | |
Virgin Islands (Government of) Public Finance Authority (Matching Fund Loan Note); | | | | | | | | | | | | | | | | |
Series 2010 A, Sr. Lien RB | | | 5.00 | % | | | 10/01/17 | | | | 1,000 | | | | 1,110,970 | |
Series 2012 A, RB(d) | | | 4.00 | % | | | 10/01/22 | | | | 2,205 | | | | 2,287,313 | |
Virgin Islands (Government of) Public Finance Authority; Series 2009 B, Ref. Sr. Lien RB | | | 5.00 | % | | | 10/01/19 | | | | 2,000 | | | | 2,269,940 | |
| | | | | 5,933,737 | |
| | | | |
| Virginia–1.33% | | | | | | | | | | | | | | | | |
Dulles Town Center Community Development Authority (Dulles Town Center); Series 2012, Ref. Special Assessment RB | | | 4.25 | % | | | 03/01/26 | | | | 700 | | | | 647,052 | |
Fairfax (County of) Economic Development Authority (Vinson Hall, LLC); Series 2013 A, Residential Care Facility RB | | | 4.00 | % | | | 12/01/22 | | | | 1,000 | | | | 951,540 | |
Fairfax (County of) Industrial Development Authority (Inova Health System); Series 2009 A, Health Care RB | | | 5.13 | % | | | 05/15/24 | | | | 1,000 | | | | 1,106,400 | |
Hanover (County of) Economic Development Authority (Covenant Woods); Series 2012 A, Residential Care Facility RB | | | 4.00 | % | | | 07/01/22 | | | | 1,320 | | | | 1,214,664 | |
Route 460 Funding Corp.; Series 2012 B, Sr. Lien Toll Road CAB RB(f) | | | 0.00 | % | | | 07/01/25 | | | | 600 | | | | 340,806 | |
Virginia (State of) Small Business Financing Authority (Elizabeth River Crossings Opco, LLC);
Series 2012, Sr. Lien RB(c) | | | 5.00 | % | | | 01/01/27 | | | | 2,500 | | | | 2,540,750 | |
Virginia (State of) Small Business Financing Authority (Hampton Roads Proton Beam Therapy Institute at Hampton University, LLC); Series 2009, RB(b)(d)(h) | | | 8.00 | % | | | 07/01/14 | | | | 800 | | | | 836,840 | |
Washington (County of) Industrial Development Authority (Mountain States Health Alliance); Series 2009 C, Hospital Facility RB | | | 7.25 | % | | | 07/01/19 | | | | 780 | | | | 867,836 | |
White Oak Village Shops Community Development Authority; Series 2007, Special Assessment RB | | | 5.30 | % | | | 03/01/17 | | | | 559 | | | | 597,235 | |
| | | | | 9,103,123 | |
| | | | |
| Washington–2.91% | | | | | | | | | | | | | | | | |
Chelan (County of) Public Utility District No. 1; Series 2011 A, Ref. Consolidated RB(c) | | | 5.50 | % | | | 07/01/25 | | | | 1,000 | | | | 1,141,670 | |
Clark (County of) Public Utility District No. 1; Series 2009, Ref. Electric System RB | | | 5.00 | % | | | 01/01/23 | | | | 1,000 | | | | 1,106,810 | |
FYI Properties (Washington State District); Series 2009, Lease RB | | | 5.25 | % | | | 06/01/26 | | | | 2,000 | | | | 2,212,780 | |
Kalispel Tribe of Indians; Series 2008, RB | | | 6.20 | % | | | 01/01/16 | | | | 100 | | | | 97,763 | |
Seattle (City of); | | | | | | | | | | | | | | | | |
Series 2007, Ref. Solid Waste RB | | | 5.00 | % | | | 02/01/18 | | | | 1,795 | | | | 2,012,769 | |
Series 2008, Ref. & Improvement Municipal Light & Power RB | | | 5.75 | % | | | 04/01/23 | | | | 1,725 | | | | 2,026,840 | |
See accompanying Notes to Financial Statements which are an integral part of the financial statements.
23 Invesco Intermediate Term Municipal Income Fund
| | | | | | | | | | | | | | | | |
| | | Interest
Rate | | | Maturity
Date | | | Principal
Amount
(000) | | | Value | |
| Washington–(continued) | | | | | | | | | | | | | | | | |
Seattle (Port of) (SEATAC Fuel Facilities LLC); | | | | | | | | | | | | | | | | |
Series 2013, Ref. Special Facility RB(c) | | | 5.00 | % | | | 06/01/21 | | | $ | 650 | | | $ | 744,322 | |
Series 2013, Ref. Special Facility RB(c) | | | 5.00 | % | | | 06/01/24 | | | | 1,560 | | | | 1,734,049 | |
Tes Properties; Series 2009, RB | | | 5.00 | % | | | 12/01/24 | | | | 1,000 | | | | 1,088,150 | |
Washington (State of) Health Care Facilities Authority (PeaceHealth); Series 2014 A, Ref. RB | | | 5.00 | % | | | 11/15/27 | | | | 500 | | | | 541,230 | |
Washington (State of) Higher Education Facilities Authority (Whitworth University); Series 2009,
Ref. RB | | | 5.13 | % | | | 10/01/24 | | | | 1,500 | | | | 1,604,865 | |
Washington (State of) Tobacco Settlement Authority; Series 2013, Ref. RB | | | 5.00 | % | | | 06/01/22 | | | | 3,260 | | | | 3,736,058 | |
Washington (State of); Series 2005 C, Motor Vehicle Fuel Unlimited Tax CAB GO Bonds
(INS–AMBAC)(a)(f) | | | 0.00 | % | | | 06/01/16 | | | | 1,885 | | | | 1,862,870 | |
| | | | | 19,910,176 | |
| | | | |
| West Virginia–0.56% | | | | | | | | | | | | | | | | |
Ohio (County of) (Fort Henry Centre Financing District); Series 2007 A, Tax Increment Allocation RB | | | 5.63 | % | | | 06/01/22 | | | | 250 | | | | 258,885 | |
West Virginia (State of) Economic Development Authority (Appalachian Power Co.–Amos);
Series 2011 A, Ref. Solid Waste Disposal Facilities RB(b)(c) | | | 2.25 | % | | | 09/01/16 | | | | 3,000 | | | | 3,055,110 | |
West Virginia (State of) Hospital Finance Authority (Thomas Health System); Series 2008, RB | | | 6.00 | % | | | 10/01/20 | | | | 500 | | | | 524,020 | |
| | | | | 3,838,015 | |
| | | | |
| Wisconsin–1.72% | | | | | | | | | | | | | | | | |
Milwaukee (County of); | | | | | | | | | | | | | | | | |
Series 2010 B, Ref. Airport RB(c) | | | 5.00 | % | | | 12/01/22 | | | | 1,250 | | | | 1,381,763 | |
Series 2010 B, Ref. Airport RB(c) | | | 5.00 | % | | | 12/01/23 | | | | 1,000 | | | | 1,092,000 | |
Superior (City of) (Superior Water, Light & Power Co.); Series 2007 A, Ref. Collateralized
Utility RB(c) | | | 5.38 | % | | | 11/01/21 | | | | 1,370 | | | | 1,465,188 | |
Wisconsin (State of) Health & Educational Facilities Authority (Aurora Health Care, Inc.); | | | | | | | | | | | | | | | | |
Series 2009 B, RB(b) | | | 4.75 | % | | | 08/15/14 | | | | 1,000 | | | | 1,019,340 | |
Series 2009 B, RB(b) | | | 5.13 | % | | | 08/15/16 | | | | 1,000 | | | | 1,101,310 | |
Wisconsin (State of) Health & Educational Facilities Authority (Mercy Alliance); | | | | | | | | | | | | | | | | |
Series 2012, RB | | | 5.00 | % | | | 06/01/25 | | | | 1,650 | | | | 1,790,547 | |
Series 2012, RB | | | 5.00 | % | | | 06/01/26 | | | | 1,000 | | | | 1,068,050 | |
Wisconsin (State of) Housing & Economic Development Authority; Series 2008 A, Home
Ownership RB(c) | | | 5.30 | % | | | 09/01/23 | | | | 1,585 | | | | 1,663,457 | |
Wisconsin (State of) Public Finance Authority (Roseman University of Health Sciences);
Series 2012, RB | | | 5.00 | % | | | 04/01/22 | | | | 1,165 | | | | 1,175,753 | |
| | | | | | | | | | | | | | | | 11,757,408 | |
| | | | |
| Wyoming–0.16% | | | | | | | | | | | | | | | | |
Wyoming (State of) Municipal Power Agency; Series 2008 A, Power Supply RB | | | 5.38 | % | | | 01/01/25 | | | | 1,000 | | | | 1,128,330 | |
TOTAL INVESTMENTS(k)–100.00% (Cost $655,158,478) | | | | | | | | | | | | | | | 684,854,694 | |
FLOATING RATE NOTE OBLIGATIONS–(1.68)% | | | | | | | | | | | | | | | | |
Notes with interest and fee rates ranging from 0.57% to 0.67% at 02/28/14 and contractual maturities of collateral ranging from 12/15/20 to 08/01/25 (See Note 1J)(l) | | | | | | | | | | | | | | | (11,525,000 | ) |
OTHER ASSETS LESS LIABILITIES–1.68% | | | | | | | | | | | | | | | 11,510,193 | |
NET ASSETS–100.00% | | | | | | | | | | | | | | $ | 684,839,887 | |
Investment Abbreviations:
| | |
| AGC | | – Assured Guaranty Corp. |
| AGM | | – Assured Guaranty Municipal Corp. |
| AMBAC | | – American Municipal Bond Assurance Corp. |
| BHAC | | – Berkshire Hathaway Assurance Corp. |
| CAB | | – Capital Appreciation Bonds |
| CEP | | – Credit Enhancement Provider |
| COP | | – Certificates of Participation |
| Ctfs. | | – Certificates |
| FHA | | – Federal Housing Administration |
| FTA | | – Federal Transit Administration |
| GO | | – General Obligation |
| IDR | | – Industrial Development Revenue Bonds |
| INS | | – Insurer |
| | |
| MFH | | – Multi-Family Housing |
| NATL | | – National Public Finance Guarantee Corp. |
| PCR | | – Pollution Control Revenue Bonds |
| PILOT | | – Payment-in-Lieu-of-Tax |
| RAB | | – Revenue Anticipation Bonds |
| RB | | – Revenue Bonds |
| RN | | – Revenue Notes |
| Ref. | | – Refunding |
| Sec. | | – Secured |
| Sr. | | – Senior |
| Sub. | | – Subordinated |
| TEMPS | | – Tax-Exempt Mandatory Paydown Securities |
See accompanying Notes to Financial Statements which are an integral part of the financial statements.
24 Invesco Intermediate Term Municipal Income Fund
Notes to Schedule of Investments:
| (a) | Principal and/or interest payments are secured by the bond insurance company listed. |
| (b) | Security has an irrevocable call by the issuer or mandatory put by the holder. Maturity date reflects such call or put. |
| (c) | Security subject to the alternative minimum tax. |
| (d) | Security purchased or received in a transaction exempt from registration under the Securities Act of 1933, as amended (the “1933 Act”). The security may be resold pursuant to an exemption from registration under the 1933 Act, typically to qualified institutional buyers. The aggregate value of these securities at February 28, 2014 was $24,107,139, which represented 3.52% of the Fund’s Net Assets. |
| (e) | Interest or dividend rate is redetermined periodically. Rate shown is the rate in effect on February 28, 2014. |
| (f) | Zero coupon bonds issued at a discount. |
| (g) | Underlying security related to Dealer Trusts entered into by the Fund. See Note 1J. |
| (h) | Advance refunded; secured by an escrow fund of U.S. Government obligations or other highly rated collateral. |
| (i) | Defaulted security. Currently, the issuer is partially or fully in default with respect to interest payments. The aggregate value of these securities at February 28, 2014 was $240,577, which represented less than 1% of the Fund’s Net Assets. |
| (k) | This table provides a listing of those entities that have either issued, guaranteed, backed or otherwise enhanced the credit quality of more than 5% of the securities held in the portfolio. In instances where the entity has guaranteed, backed or otherwise enhanced the credit quality of a security, it is not primarily responsible for the issuer’s obligations but may be called upon to satisfy the issuer’s obligations. |
| | | | |
| Entities | | Percentage | |
Assured Guaranty Municipal Corp. | | | 8.3 | % |
| (l) | Floating rate note obligations related to securities held. The interest and fee rates shown reflect the rates in effect at February 28, 2014. At February 28, 2014, the Fund’s investments with a value of $19,645,018 are held by Dealer Trusts and serve as collateral for the $11,525,000 in the floating rate note obligations outstanding at that date. |
See accompanying Notes to Financial Statements which are an integral part of the financial statements.
25 Invesco Intermediate Term Municipal Income Fund
Statement of Assets and Liabilities
February 28, 2014
| | | | |
Assets: | |
Investments, at value (Cost $655,158,478) | | $ | 684,854,694 | |
Cash | | | 4,726,957 | |
Receivable for: | | | | |
Investments sold | | | 2,406,788 | |
Fund shares sold | | | 2,166,031 | |
Interest | | | 7,713,970 | |
Investment for trustee deferred compensation and retirement plans | | | 73,812 | |
Other assets | | | 20,810 | |
Total assets | | | 701,963,062 | |
|
Liabilities: | |
Floating rate note obligations | | | 11,525,000 | |
Payable for: | | | | |
Investments purchased | | | 3,519,862 | |
Fund shares reacquired | | | 1,074,841 | |
Dividends | | | 501,758 | |
Accrued fees to affiliates | | | 344,899 | |
Accrued trustees’ and officers’ fees and benefits | | | 4,419 | |
Accrued other operating expenses | | | 66,482 | |
Trustee deferred compensation and retirement plans | | | 85,914 | |
Total liabilities | | | 17,123,175 | |
Net assets applicable to shares outstanding | | $ | 684,839,887 | |
|
Net assets consist of: | |
Shares of beneficial interest | | $ | 741,473,898 | |
Undistributed net investment income | | | 1,325,347 | |
Undistributed net realized gain (loss) | | | (87,655,574 | ) |
Net unrealized appreciation | | | 29,696,216 | |
| | | $ | 684,839,887 | |
| | | | |
Net Assets: | |
Class A | | $ | 399,473,935 | |
Class B | | $ | 7,470,232 | |
Class C | | $ | 127,450,835 | |
Class Y | | $ | 150,444,885 | |
|
Shares outstanding, $0.001 par value per share,
with an unlimited number of shares authorized: | |
Class A | | | 36,526,260 | |
Class B | | | 669,609 | |
Class C | | | 11,671,554 | |
Class Y | | | 13,767,938 | |
Class A: | | | | |
Net asset value per share | | $ | 10.94 | |
Maximum offering price per share | | | | |
(Net asset value of $10.94 ¸ 97.50%) | | $ | 11.22 | |
Class B: | | | | |
Net asset value and offering price per share | | $ | 11.16 | |
Class C: | | | | |
Net asset value and offering price per share | | $ | 10.92 | |
Class Y: | | | | |
Net asset value and offering price per share | | $ | 10.93 | |
See accompanying Notes to Financial Statements which are an integral part of the financial statements.
26 Invesco Intermediate Term Municipal Income Fund
Statement of Operations
For the year ended February 28, 2014
| | | | |
Investment income: | |
Interest | | $ | 29,061,291 | |
| |
Expenses: | | | | |
Advisory fees | | | 3,497,855 | |
Administrative services fees | | | 181,001 | |
Custodian fees | | | 18,420 | |
Distribution fees: | | | | |
Class A | | | 1,034,782 | |
Class B | | | 21,167 | |
Class C | | | 1,385,779 | |
Interest, facilities and maintenance fees | | | 72,185 | |
Transfer agent fees | | | 452,457 | |
Trustees’ and officers’ fees and benefits | | | 57,605 | |
Other | | | 291,092 | |
Total expenses | | | 7,012,343 | |
Less: Fees waived and expense offset arrangement(s) | | | (656,471 | ) |
Net expenses | | | 6,355,872 | |
Net investment income | | | 22,705,419 | |
| |
Realized and unrealized gain (loss) from: | | | | |
Net realized gain (loss) from investment securities | | | (7,718,183 | ) |
Change in net unrealized appreciation (depreciation) of investment securities | | | (22,265,006 | ) |
Net realized and unrealized gain (loss) | | | (29,983,189 | ) |
Net increase (decrease) in net assets resulting from operations | | $ | (7,277,770 | ) |
See accompanying Notes to Financial Statements which are an integral part of the financial statements.
27 Invesco Intermediate Term Municipal Income Fund
Statement of Changes in Net Assets
For the years ended February 28, 2014 and 2013
| | | | | | | | |
| | | 2014 | | | 2013 | |
Operations: | | | | | |
Net investment income | | $ | 22,705,419 | | | $ | 20,396,088 | |
Net realized gain (loss) | | | (7,718,183 | ) | | | 364,023 | |
Change in net unrealized appreciation (depreciation) | | | (22,265,006 | ) | | | 6,962,179 | |
Net increase (decrease) in net assets resulting from operations | | | (7,277,770 | ) | | | 27,722,290 | |
| | |
Distributions to shareholders from net investment income: | | | | | | | | |
Class A | | | (12,877,071 | ) | | | (12,967,975 | ) |
Class B | | | (264,149 | ) | | | (393,131 | ) |
Class C | | | (3,495,177 | ) | | | (2,519,896 | ) |
Class Y | | | (5,179,078 | ) | | | (5,526,901 | ) |
Total distributions from net investment income | | | (21,815,475 | ) | | | (21,407,903 | ) |
| | |
Share transactions–net: | | | | | | | | |
Class A | | | (5,486,705 | ) | | | 99,099,650 | |
Class B | | | (2,065,060 | ) | | | (1,588,331 | ) |
Class C | | | 7,994,716 | | | | 53,941,429 | |
Class Y | | | (4,211,167 | ) | | | 23,037,239 | |
Net increase (decrease) in net assets resulting from share transactions | | | (3,768,216 | ) | | | 174,489,987 | |
Net increase (decrease) in net assets | | | (32,861,461 | ) | | | 180,804,374 | |
| | |
Net assets: | | | | | | | | |
Beginning of year | | | 717,701,348 | | | | 536,896,974 | |
End of year (includes undistributed net investment income of $1,325,347 and $434,325, respectively) | | $ | 684,839,887 | | | $ | 717,701,348 | |
Notes to Financial Statements
February 28, 2014
NOTE 1—Significant Accounting Policies
Invesco Intermediate Term Municipal Income Fund (the “Fund”) is a series portfolio of AIM Tax-Exempt Funds (Invesco Tax-Exempt Funds) (the “Trust”). The Trust is a Delaware statutory trust registered under the Investment Company Act of 1940, as amended (the “1940 Act”), as an open-end series management investment company consisting of six separate portfolios, each authorized to issue an unlimited number of shares of beneficial interest. The assets, liabilities and operations of each portfolio are accounted for separately. Information presented in these financial statements pertains only to the Fund. Matters affecting each portfolio or class will be voted on exclusively by the shareholders of such portfolio or class.
The Fund’s investment objective is to provide investors with a high level of current income exempt from federal income tax, consistent with preservation of capital.
The Fund currently consists of four different classes of shares: Class A, Class B, Class C and Class Y. Class A shares are sold with a front-end sales charge unless certain waiver criteria are met and under certain circumstances load waived shares may be subject to contingent deferred sales charges (“CDSC”). Class C shares are sold with a CDSC. Class Y shares are sold at net asset value. Effective November 30, 2010, new or additional investments in Class B shares are no longer permitted. Existing shareholders of Class B shares may continue to reinvest dividends and capital gains distributions in Class B shares until they convert to Class A shares. Also, shareholders in Class B shares will be able to exchange those shares for Class B shares of other Invesco Funds offering such shares until they convert to Class A shares. Generally, Class B shares will automatically convert to Class A shares on or about the month-end, which is at least eight years after the date of purchase. Redemption of Class B shares prior to conversion date will be subject to a CDSC.
The following is a summary of the significant accounting policies followed by the Fund in the preparation of its financial statements.
| A. | Security Valuations — Securities, including restricted securities, are valued according to the following policy. |
Securities are fair valued using an evaluated quote provided by an independent pricing service approved by the Board of Trustees. Evaluated quotes provided by the pricing service may be determined without exclusive reliance on quoted prices, and may reflect appropriate factors such as institution-size trading in similar groups of securities, developments related to specific securities, dividend rate (for unlisted equities), yield (for debt obligations), quality, type of issue, coupon rate (for debt obligations), maturity (for debt obligations), individual trading characteristics and other market data. Debt obligations are subject to interest rate and credit risks. In addition, all debt obligations involve some risk of default with respect to interest and/or principal payments.
Securities for which market quotations either are not readily available or became unreliable are valued at fair value as determined in good faith by or under the supervision of the Trust’s officers following procedures approved by the Board of Trustees. Some of the factors which may be considered in determining fair value are fundamental analytical data relating to the investment; the nature and duration of any restrictions on
28 Invesco Intermediate Term Municipal Income Fund
transferability or disposition; trading in similar securities by the same issuer or comparable companies; relevant political, economic or issuer specific news; and other relevant factors under the circumstances.
The Fund invests in securities that are subject to interest rate risk, meaning the risk that the prices will generally fall as interest rates rise and, conversely, the prices will generally rise as interest rates fall. Specific securities differ in their sensitivity to changes in interest rates depending on their individual characteristics. Changes in interest rates may result in increased market volatility, which may affect the value and/or liquidity of certain of the Fund’s investments.
Valuations change in response to many factors including the historical and prospective earnings of the issuer, the value of the issuer’s assets, general economic conditions, interest rates, investor perceptions and market liquidity. Because of the inherent uncertainties of valuation, the values reflected in the financial statements may materially differ from the value received upon actual sale of those investments.
| B. | Securities Transactions and Investment Income — Securities transactions are accounted for on a trade date basis. Realized gains or losses on sales are computed on the basis of specific identification of the securities sold. Interest income is recorded on the accrual basis from settlement date. Dividend income (net of withholding tax, if any) is recorded on the ex-dividend date. Bond premiums and discounts are amortized and/or accreted for financial reporting purposes. |
The Fund may periodically participate in litigation related to Fund investments. As such, the Fund may receive proceeds from litigation settlements. Any proceeds received are included in the Statement of Operations as realized gain (loss) for investments no longer held and as unrealized gain (loss) for investments still held.
Brokerage commissions and mark ups are considered transaction costs and are recorded as an increase to the cost basis of securities purchased and/or a reduction of proceeds on a sale of securities. Such transaction costs are included in the determination of net realized and unrealized gain (loss) from investment securities reported in the Statement of Operations and the Statement of Changes in Net Assets and the net realized and unrealized gains (losses) on securities per share in the Financial Highlights. Transaction costs are included in the calculation of the Fund’s net asset value and, accordingly, they reduce the Fund’s total returns. These transaction costs are not considered operating expenses and are not reflected in net investment income reported in the Statement of Operations and Statement of Changes in Net Assets, or the net investment income per share and ratios of expenses and net investment income reported in the Financial Highlights, nor are they limited by any expense limitation arrangements between the Fund and the investment adviser.
The Fund allocates realized and unrealized capital gains and losses to a class based on the relative net assets of each class. The Fund allocates income to a class based on the relative value of the settled shares of each class.
| C. | Country Determination — For the purposes of making investment selection decisions and presentation in the Schedule of Investments, the investment adviser may determine the country in which an issuer is located and/or credit risk exposure based on various factors. These factors include the laws of the country under which the issuer is organized, where the issuer maintains a principal office, the country in which the issuer derives 50% or more of its total revenues and the country that has the primary market for the issuer’s securities, as well as other criteria. Among the other criteria that may be evaluated for making this determination are the country in which the issuer maintains 50% or more of its assets, the type of security, financial guarantees and enhancements, the nature of the collateral and the sponsor organization. Country of issuer and/or credit risk exposure has been determined to be the United States of America, unless otherwise noted. |
| D. | Distributions — Distributions from income are declared daily and paid monthly. Distributions from net realized capital gain, if any, are generally declared and paid annually and recorded on the ex-dividend date. The Fund may elect to treat a portion of the proceeds from redemptions as distributions for federal income tax purposes. |
| E. | Federal Income Taxes — The Fund intends to comply with the requirements of Subchapter M of the Internal Revenue Code of 1986, as amended (the “Internal Revenue Code”), necessary to qualify as a regulated investment company and to distribute substantially all of the Fund’s taxable and tax-exempt earnings to shareholders. As such, the Fund will not be subject to federal income taxes on otherwise taxable income (including net realized capital gain) that is distributed to shareholders. Therefore, no provision for federal income taxes is recorded in the financial statements. |
The Fund recognizes the tax benefits of uncertain tax positions only when the position is more likely than not to be sustained. Management has analyzed the Fund’s uncertain tax positions and concluded that no liability for unrecognized tax benefits should be recorded related to uncertain tax positions. Management is not aware of any tax positions for which it is reasonably possible that the total amounts of unrecognized tax benefits will change materially in the next 12 months.
In addition, the Fund intends to invest in such municipal securities to allow it to qualify to pay shareholders “exempt-interest dividends”, as defined in the Internal Revenue Code.
The Fund files tax returns in the U.S. Federal jurisdiction and certain other jurisdictions. Generally, the Fund is subject to examinations by such taxing authorities for up to three years after the filing of the return for the tax period.
| F. | Expenses — Fees provided for under the Rule 12b-1 plan of a particular class of the Fund and which are directly attributable to that class are charged to the operations of such class. All other expenses are allocated among the classes based on relative net assets. |
| G. | Interest, Facilities and Maintenance Fees — Interest, Facilities and Maintenance Fees include interest and related borrowing costs such as commitment fees and other expenses associated with lines of credit and interest and administrative expenses related to establishing and maintaining floating rate note obligations, if any. |
| H. | Accounting Estimates — The preparation of financial statements in conformity with accounting principles generally accepted in the United States of America (“GAAP”) requires management to make estimates and assumptions that affect the reported amounts of assets and liabilities at the date of the financial statements and the reported amounts of revenues and expenses during the reporting period including estimates and assumptions related to taxation. Actual results could differ from those estimates by a significant amount. In addition, the Fund monitors for material events or transactions that may occur or become known after the period-end date and before the date the financial statements are released to print. |
| I. | Indemnifications — Under the Trust’s organizational documents, each Trustee, officer, employee or other agent of the Trust is indemnified against certain liabilities that may arise out of the performance of their duties to the Fund. Additionally, in the normal course of business, the Fund enters into contracts, including the Fund’s servicing agreements, that contain a variety of indemnification clauses. The Fund’s maximum exposure under these arrangements is unknown as this would involve future claims that may be made against the Fund that have not yet occurred. The risk of material loss as a result of such indemnification claims is considered remote. |
29 Invesco Intermediate Term Municipal Income Fund
| J. | Floating Rate Note Obligations — The Fund invests in inverse floating rate securities, such as Residual Interest Bonds (“RIBs”) or Tender Option Bonds (“TOBs”) for investment purposes and to enhance the yield of the Fund. Inverse floating rate investments tend to underperform the market for fixed rate bonds in a rising interest rate environment, but tend to outperform the market for fixed rate bonds when interest rates decline or remain relatively stable. Such transactions may be purchased in the secondary market without first owning the underlying bond or by the sale of fixed rate bonds by the Fund to special purpose trusts established by a broker dealer (“Dealer Trusts”) in exchange for cash and residual interests in the Dealer Trusts’ assets and cash flows, which are in the form of inverse floating rate securities. The Dealer Trusts finance the purchases of the fixed rate bonds by issuing floating rate notes to third parties and allowing the Fund to retain residual interests in the bonds. The floating rate notes issued by the Dealer Trusts have interest rates that reset weekly and the floating rate note holders have the option to tender their notes to the Dealer Trusts for redemption at par at each reset date. The residual interests held by the Fund (inverse floating rate investments) include the right of the Fund (1) to cause the holders of the floating rate notes to tender their notes at par at the next interest rate reset date, and (2) to transfer the municipal bond from the Dealer Trusts to the Fund, thereby collapsing the Dealer Trusts. |
Recently published final rules implementing section 619 of the Dodd-Frank Wall Street Reform and Consumer Protection Act (the “Volcker Rule”) prohibit banking entities from engaging in proprietary trading of certain instruments and limit such entities’ investments in, and relationships with, “covered funds.” These rules may preclude banking entities from sponsoring and/or providing services for existing TOB trust programs. There can be no assurances that TOB trusts can be restructured substantially similar to their present form, that new sponsors of TOB trusts would begin providing these services, or that alternative forms of leverage will be available to the Trust in order to maintain current levels of leverage. Any alternative forms of leverage may be less advantageous to the Trust, and may adversely affect the Trust’s net asset value, distribution rate and ability to achieve its investment objective. The ultimate impact of these rules on the TOBs market and the municipal market generally is not yet certain.
TOBs are presently classified as private placement securities. Private placement securities are subject to restrictions on resale because they have not been registered under the Securities Act of 1933, as amended (the “1933 Act”), or are otherwise not readily marketable. As a result of the absence of a public trading market for these securities, they may be less liquid than publicly traded securities. Although these securities may be resold in privately negotiated transactions, the prices realized from these sales could be less than those originally paid by the Fund or less than what may be considered the fair value of such securities.
The Fund accounts for the transfer of bonds to the Dealer Trusts as secured borrowings, with the securities transferred remaining in the Fund’s investment assets, and the related floating rate notes reflected as Fund liabilities under the caption Floating rate note obligations on the Statement of Assets and Liabilities. The Fund records the interest income from the fixed rate bonds under the caption Interest and records the expenses related to floating rate obligations and any administrative expenses of the Dealer Trusts as a component of Interest, facilities and maintenance fees on the Statement of Operations.
The Fund generally invests in inverse floating rate securities that include embedded leverage, thus exposing the Fund to greater risks and increased costs. The primary risks associated with inverse floating rate securities are varying degrees of liquidity and the changes in the value of such securities in response to changes in market rates of interest to a greater extent than the value of an equal principal amount of a fixed rate security having similar credit quality, redemption provisions and maturity which may cause the Fund’s net asset value to be more volatile than if it had not invested in inverse floating rate securities. In certain instances, the short-term floating rate interests created by the special purpose trust may not be able to be sold to third parties or, in the case of holders tendering (or putting) such interests for repayment of principal, may not be able to be remarketed to third parties. In such cases, the special purpose trust holding the long-term fixed rate bonds may be collapsed. In the case of RIBs or TOBs created by the contribution of long-term fixed income bonds by the Fund, the Fund will then be required to repay the principal amount of the tendered securities. During times of market volatility, illiquidity or uncertainty, the Fund could be required to sell other portfolio holdings at a disadvantageous time to raise cash to meet that obligation.
| K. | Other Risks — The value of, payment of interest on, repayment of principal for and the ability to sell a municipal security may be affected by constitutional amendments, legislative enactments, executive orders, administrative regulations, voter initiatives and the economics of the regions in which the issuers are located. |
Since many municipal securities are issued to finance similar projects, especially those relating to education, health care, transportation and utilities, conditions in those sectors can affect the overall municipal securities market and a Fund’s investments in municipal securities.
There is some risk that a portion or all of the interest received from certain tax-free municipal securities could become taxable as a result of determinations by the Internal Revenue Service.
NOTE 2—Advisory Fees and Other Fees Paid to Affiliates
The Trust has entered into a master investment advisory agreement with Invesco Advisers, Inc. (the “Adviser” or “Invesco”). Under the terms of the investment advisory agreement, the Fund pays an advisory fee to the Adviser based on the annual rate of the Fund’s average daily net assets as follows:
| | | | |
| Average Daily Net Assets | | Rate | |
First $500 million | | | 0.50% | |
Over $500 million | | | 0.45% | |
Under the terms of a master sub-advisory agreement between the Adviser and each of Invesco Asset Management Deutschland GmbH, Invesco Asset Management Limited, Invesco Asset Management (Japan) Limited, Invesco Australia Limited, Invesco Hong Kong Limited, Invesco Senior Secured Management, Inc. and Invesco Canada Ltd. (collectively, the “Affiliated Sub-Advisers”) the Adviser, not the Fund, may pay 40% of the fees paid to the Adviser to any such Affiliated Sub-Adviser(s) that provide(s) discretionary investment management services to the Fund based on the percentage of assets allocated to such Sub-Adviser(s).
Effective July 1, 2013, the Adviser has contractually agreed, through at least June 30, 2014, to waive advisory fees and/or reimburse expenses of all shares to the extent necessary to limit total annual fund operating expenses after fee waiver and/or expense reimbursement (excluding certain items discussed below) of Class A, Class B, Class C and Class Y shares to 0.80%, 1.55%, 1.55% and 0.55% of average daily net assets,
30 Invesco Intermediate Term Municipal Income Fund
respectively. Prior to July 1, 2013, the Adviser had contractually agreed to waive advisory fees and/or reimburse expenses of all shares to the extent necessary to limit total annual fund operating expenses after fee waiver and/or expense reimbursement (excluding certain items discussed below) of Class A, Class B, Class C and Class Y shares to 0.75%, 1.50%, 1.50% and 0.50%, respectively, of average daily net assets. In determining the Adviser’s obligation to waive advisory fees and/or reimburse expenses, the following expenses are not taken into account, and could cause the net annual fund operating expenses after fee waiver and/or expense reimbursement to exceed the numbers reflected above: (1) interest, facilities and maintenance fees; (2) taxes; (3) dividend expense on short sales; (4) extraordinary or non-routine items, including litigation expenses; and (5) expenses that the Fund has incurred but did not actually pay because of an expense offset arrangement. Unless Invesco continues the fee waiver agreement, it will terminate on June 30, 2014. The fee waiver agreement cannot be terminated during its term.
For the year ended February 28, 2014, the Adviser waived advisory fees of $656,334.
The Trust has entered into a master administrative services agreement with Invesco pursuant to which the Fund has agreed to pay Invesco for certain administrative costs incurred in providing accounting services to the Fund. For the year ended February 28, 2014, expenses incurred under the agreement are shown in the Statement of Operations as Administrative services fees.
The Trust has entered into a transfer agency and service agreement with Invesco Investment Services, Inc. (“IIS”) pursuant to which the Fund has agreed to pay IIS a fee for providing transfer agency and shareholder services to the Fund and reimburse IIS for certain expenses incurred by IIS in the course of providing such services. IIS may make payments to intermediaries that provide omnibus account services, sub-accounting services and/or networking services. All fees payable by IIS to intermediaries that provide omnibus account services or sub-accounting are charged back to the Fund, subject to certain limitations approved by the Trust’s Board of Trustees. For the year ended February 28, 2014, expenses incurred under the agreement are shown in the Statement of Operations as Transfer agent fees.
Shares of the Fund are distributed by Invesco Distributors, Inc. (“IDI”). The Fund has adopted a distribution plan pursuant to Rule 12b-1 under the 1940 Act, and a service plan (collectively, the “Plans”) for Class A shares, Class B shares and Class C shares to compensate IDI for the sale, distribution, shareholder servicing and maintenance of shareholder accounts for these shares. Under the Plans, the Fund will incur annual fees of up to 0.25% of Class A average daily net assets and up to 1.00% each of Class B and Class C average daily net assets.
With respect to Class B and Class C shares, the Fund is authorized to reimburse in future years any distribution related expenses that exceed the maximum annual reimbursement rate for such class, so long as such reimbursement does not cause the Fund to exceed the Class B and Class C maximum annual reimbursement rate, respectively. With respect to Class A shares, distribution related expenses that exceed the maximum annual reimbursement rate for such class are not carried forward to future years and the Fund will not reimburse IDI for any such expenses.
For the year ended February 28, 2014, expenses incurred under these agreements are shown in the Statement of Operations as Distribution fees.
Front-end sales commissions and CDSC (collectively, the “sales charges”) are not recorded as expenses of the Fund. Front-end sales commissions are deducted from proceeds from the sales of Fund shares prior to investment in Class A shares of the Fund. CDSC are deducted from redemption proceeds prior to remittance to the shareholder. During the year ended February 28, 2014, IDI advised the Fund that IDI retained $159,749 in front-end sales commissions from the sale of Class A shares and $72,409, $11,400 and $24,267 from Class A, Class B and Class C shares, respectively, for CDSC imposed on redemptions by shareholders.
Certain officers and trustees of the Trust are officers and directors of the Adviser, IIS and/or IDI.
NOTE 3—Additional Valuation Information
GAAP defines fair value as the price that would be received to sell an asset or paid to transfer a liability in an orderly transaction between market participants at the measurement date, under current market conditions. GAAP establishes a hierarchy that prioritizes the inputs to valuation methods, giving the highest priority to readily available unadjusted quoted prices in an active market for identical assets (Level 1) and the lowest priority to significant unobservable inputs (Level 3), generally when market prices are not readily available or are unreliable. Based on the valuation inputs, the securities or other investments are tiered into one of three levels. Changes in valuation methods may result in transfers in or out of an investment’s assigned level:
| | Level 1 — | Prices are determined using quoted prices in an active market for identical assets. |
| | Level 2 — | Prices are determined using other significant observable inputs. Observable inputs are inputs that other market participants may use in pricing a security. These may include quoted prices for similar securities, interest rates, prepayment speeds, credit risk, yield curves, loss severities, default rates, discount rates, volatilities and others. |
| | Level 3 — | Prices are determined using significant unobservable inputs. In situations where quoted prices or observable inputs are unavailable (for example, when there is little or no market activity for an investment at the end of the period), unobservable inputs may be used. Unobservable inputs reflect the Fund’s own assumptions about the factors market participants would use in determining fair value of the securities or instruments and would be based on the best available information. |
As of February 28, 2014, all of the securities in this Fund were valued based on Level 2 inputs (see the Schedule of Investments for security categories). The level assigned to the securities valuations may not be an indication of the risk or liquidity associated with investing in those securities. Because of the inherent uncertainties of valuation, the values reflected in the financial statements may materially differ from the value received upon actual sale of those investments.
NOTE 4—Security Transactions with Affiliated Funds
The Fund is permitted to purchase or sell securities from or to certain other Invesco Funds under specified conditions outlined in procedures adopted by the Board of Trustees of the Trust. The procedures have been designed to ensure that any purchase or sale of securities by the Fund from or to another fund or portfolio that is or could be considered an affiliate by virtue of having a common investment adviser (or affiliated investment advisers), common Trustees and/or common officers complies with Rule 17a-7 of the 1940 Act. Further, as defined under the procedures, each transaction is effected at the current market price. Pursuant to these procedures, for the year ended February 28, 2014, the Fund engaged in securities purchases of $11,067,476.
NOTE 5—Expense Offset Arrangement(s)
The expense offset arrangement is comprised of transfer agency credits which result from balances in demand deposit accounts used by the transfer agent for clearing shareholder transactions. For the year ended February 28, 2014, the Fund received credits from this arrangement, which resulted in the reduction of the Fund’s total expenses of $137.
31 Invesco Intermediate Term Municipal Income Fund
NOTE 6—Trustees’ and Officers’ Fees and Benefits
Trustees’ and Officers’ Fees and Benefits include amounts accrued by the Fund to pay remuneration to certain Trustees and Officers of the Fund. Trustees have the option to defer compensation payable by the Fund, and Trustees’ and Officers’ Fees and Benefits also include amounts accrued by the Fund to fund such deferred compensation amounts. Those Trustees who defer compensation have the option to select various Invesco Funds in which their deferral accounts shall be deemed to be invested. Finally, certain current Trustees were eligible to participate in a retirement plan that provided for benefits to be paid upon retirement to Trustees over a period of time based on the number of years of service. The Fund may have certain former Trustees who also participate in a retirement plan and receive benefits under such plan. Trustees’ and Officers’ Fees and Benefits include amounts accrued by the Fund to fund such retirement benefits. Obligations under the deferred compensation and retirement plans represent unsecured claims against the general assets of the Fund.
NOTE 7—Cash Balances
The Fund is permitted to temporarily carry a negative or overdrawn balance in its account with State Street Bank and Trust Company (“SSB”), the custodian bank. Such balances, if any at period end, are shown in the Statement of Assets and Liabilities under the payable caption Amount due custodian. To compensate the custodian bank for such overdrafts, the overdrawn Fund may either (1) leave funds as a compensating balance in the account so the custodian bank can be compensated by earning the additional interest; or (2) compensate by paying the custodian bank at a rate agreed upon by the custodian bank and Invesco, not to exceed the contractually agreed upon rate.
Inverse floating rate obligations resulting from the transfer of bonds to Dealer Trusts are accounted for as secured borrowings. The average floating rate notes outstanding and average annual interest and fee rate related to inverse floating rate note obligations during the year ended February 28, 2014 were $11,525,000 and 0.63%, respectively.
NOTE 8—Distributions to Shareholders and Tax Components of Net Assets
Tax Character of Distributions to Shareholders Paid During the Years Ended February 28, 2014 and 2013:
| | | | | | | | |
| | | 2014 | | | 2013 | |
Ordinary income — tax exempt | | $ | 21,815,475 | | | $ | 21,407,903 | |
Tax Components of Net Assets at Period-End:
| | | | |
| | | 2014 | |
Undistributed ordinary income | | $ | 839,422 | |
Net unrealized appreciation — investments | | | 29,631,280 | |
Temporary book/tax differences | | | (87,099 | ) |
Capital loss carryforward | | | (84,894,717 | ) |
Post-October deferrals | | | (2,122,897 | ) |
Shares of beneficial interest | | | 741,473,898 | |
Total net assets | | $ | 684,839,887 | |
The difference between book-basis and tax-basis unrealized appreciation (depreciation) is due to differences in the timing of recognition of gains and losses on investments for tax and book purposes. The Fund’s net unrealized appreciation difference is attributable primarily to wash sales, TOBs, book to tax accretion and amortization differences and defaulted bonds.
The temporary book/tax differences are a result of timing differences between book and tax recognition of income and/or expenses. The Fund’s temporary book/tax differences are the result of the trustee deferral of compensation and retirement plan benefits.
Capital loss carryforward is calculated and reported as of a specific date. Results of transactions and other activity after that date may affect the amount of capital loss carryforward actually available for the Fund to utilize. Capital losses generated in years beginning after December 22, 2010 can be carried forward for an unlimited period, whereas previous losses expire in 8 tax years. Capital losses with an expiration period may not be used to offset capital gains until all net capital losses without an expiration date have been utilized. Capital loss carryforwards with no expiration date will retain their character as either short-term or long-term capital losses instead of as short-term capital losses as under prior law. The ability to utilize capital loss carryforward in the future may be limited under the Internal Revenue Code and related regulations based on the results of future transactions.
The Fund has a capital loss carryforward as of February 28, 2014, which expires as follows:
| | | | | | | | | | | | |
| Capital Loss Carryforward* | |
| Expiration | | Short-Term | | | Long-Term | | | Total | |
February 28, 2018 | | $ | 56,141,670 | | | $ | — | | | $ | 56,141,670 | |
February 28, 2019 | | | 23,141,936 | | | | — | | | | 23,141,936 | |
No expiration date | | | 4,881,401 | | | | 729,710 | | | | 5,611,111 | |
Total capital loss carryforward | | $ | 84,165,007 | | | $ | 729,710 | | | $ | 84,894,717 | |
| * | Capital loss carryforward as of the date listed above is reduced for limitations, if any, to the extent required by the Internal Revenue Code and may be further limited depending upon a variety of factors, including the realization of net unrealized gains or losses as of the date of any reorganization. |
32 Invesco Intermediate Term Municipal Income Fund
NOTE 9—Investment Securities
The aggregate amount of investment securities (other than short-term securities, U.S. Treasury obligations and money market funds, if any) purchased and sold by the Fund during the year ended February 28, 2014 was $165,675,761 and $178,301,712, respectively. Cost of investments on a tax basis includes the adjustments for financial reporting purposes as of the most recently completed federal income tax reporting period-end.
| | | | |
| Unrealized Appreciation (Depreciation) of Investment Securities on a Tax Basis | |
Aggregate unrealized appreciation of investment securities | | $ | 36,030,164 | |
Aggregate unrealized (depreciation) of investment securities | | | (6,398,884 | ) |
Net unrealized appreciation of investment securities | | $ | 29,631,280 | |
Cost of investments for tax purposes is $655,223,414.
NOTE 10—Reclassification of Permanent Differences
Primarily as a result of differing book/tax treatment of expired capital loss carryforward, on February 28, 2014, undistributed net investment income was increased by $1,078, undistributed net realized gain (loss) was increased by $1,846,171 and shares of beneficial interest was decreased by $1,847,249. This reclassification had no effect on the net assets of the Fund.
NOTE 11—Share Information
| | | | | | | | | | | | | | | | |
| | | Summary of Share Activity | |
| | | Years ended February 28, | |
| | | 2014(a) | | | 2013 | |
| | | Shares | | | Amount | | | Shares | | | Amount | |
Sold: | | | | | | | | | | | | | | | | |
Class A | | | 15,034,529 | | | $ | 164,923,115 | | | | 14,285,975 | | | $ | 160,968,717 | |
Class B | | | 56,218 | | | | 622,145 | | | | 76,318 | | | | 876,029 | |
Class C | | | 9,596,056 | | | | 106,535,837 | | | | 6,541,970 | | | | 73,691,626 | |
Class Y | | | 4,694,245 | | | | 51,088,974 | | | | 4,998,960 | | | | 56,309,850 | |
| | | | |
Issued as reinvestment of dividends: | | | | | | | | | | | | | | | | |
Class A | | | 779,321 | | | | 8,499,518 | | | | 764,168 | | | | 8,604,015 | |
Class B | | | 16,364 | | | | 182,236 | | | | 23,230 | | | | 266,630 | |
Class C | | | 251,049 | | | | 2,733,352 | | | | 162,644 | | | | 1,829,124 | |
Class Y | | | 352,529 | | | | 3,842,222 | | | | 396,451 | | | | 4,457,187 | |
| | | | |
Automatic conversion of Class B shares to Class A shares: | | | | | | | | | | | | | | | | |
Class A | | | 57,714 | | | | 631,641 | | | | 112,696 | | | | 1,268,464 | |
Class B | | | (56,571 | ) | | | (631,641 | ) | | | (110,457 | ) | | | (1,268,464 | ) |
| | | | |
Reacquired: | | | | | | | | | | | | | | | | |
Class A | | | (16,538,772 | ) | | | (179,540,979 | ) | | | (6,374,598 | ) | | | (71,741,546 | ) |
Class B | | | (201,983 | ) | | | (2,237,800 | ) | | | (127,425 | ) | | | (1,462,526 | ) |
Class C | | | (9,347,879 | ) | | | (101,274,473 | ) | | | (1,918,238 | ) | | | (21,579,321 | ) |
Class Y | | | (5,458,968 | ) | | | (59,142,363 | ) | | | (3,355,474 | ) | | | (37,729,798 | ) |
Net increase (decrease) in share activity | | | (766,148 | ) | | $ | (3,768,216 | ) | | | 15,476,220 | | | $ | 174,489,987 | |
| (a) | There are entities that are record owners of more than 5% of the outstanding shares of the Fund and in the aggregate own 67% of the outstanding shares of the Fund. IDI has an agreement with these entities to sell Fund shares. The Fund, Invesco and/or Invesco affiliates may make payments to these entities, which are considered to be related to the Fund, for providing services to the Fund, Invesco and/or Invesco affiliates including but not limited to services such as securities brokerage, distribution, third party record keeping and account servicing. The Fund has no knowledge as to whether all or any portion of the shares owned of record by these entities are also owned beneficially. |
33 Invesco Intermediate Term Municipal Income Fund
NOTE 12—Financial Highlights
The following schedule presents financial highlights for a share of the Fund outstanding throughout the periods indicated.
| | | | | | | | | | | | | | | | | | | | | | | | | | | | | | | | | | | | | | | | | | | | | | | | | | | | |
| | | Net asset
value,
beginning
of period | | | Net
investment
income(a) | | | Net gains
(losses)
on securities
(both
realized and
unrealized) | | | Total from
investment
operations | | | Dividends
from net
investment
income | | | Net asset
value, end
of period | | | Total
return | | | Net assets,
end of period
(000’s omitted) | | | Ratio of
expenses
to average
net assets
with fee waivers
and/or expenses
absorbed | | | Ratio of
expenses
to average net
assets without
fee waivers
and/or expenses
absorbed | | | Ratio of net
investment
income
to average
net assets | | | Ratio of expenses to average
net assets
with fee waivers (excluding interest, facilities and maintenance
fees) | | | Portfolio
turnover(b) | |
Class A | |
Year ended 02/28/14 | | $ | 11.32 | | | $ | 0.35 | | | $ | (0.39 | ) | | $ | (0.04 | ) | | $ | (0.34 | ) | | $ | 10.94 | | | | (0.30 | )%(c) | | $ | 399,474 | | | | 0.79 | %(d) | | | 0.88 | %(d) | | | 3.24 | %(d) | | | 0.78 | %(d) | | | 24 | % |
Year ended 02/28/13 | | | 11.20 | | | | 0.39 | | | | 0.14 | | | | 0.53 | | | | (0.41 | ) | | | 11.32 | | | | 4.85 | (c) | | | 421,107 | | | | 0.76 | | | | 0.89 | | | | 3.49 | | | | 0.75 | | | | 10 | |
Year ended 02/29/12 | | | 10.57 | | | | 0.43 | | | | 0.62 | | | | 1.05 | | | | (0.42 | ) | | | 11.20 | | | | 10.18 | (c) | | | 318,219 | | | | 0.76 | | | | 0.89 | | | | 3.96 | | | | 0.75 | | | | 16 | |
Period ended 02/28/11 | | | 11.03 | | | | 0.19 | | | | (0.47 | ) | | | (0.28 | ) | | | (0.18 | ) | | | 10.57 | | | | (2.57 | )(c) | | | 222,214 | | | | 0.81 | (e) | | | 0.91 | (e) | | | 4.19 | (e) | | | 0.80 | (e) | | | 4 | |
Year ended 09/30/10 | | | 10.80 | | | | 0.44 | | | | 0.21 | | | | 0.65 | | | | (0.42 | ) | | | 11.03 | | | | 6.24 | (c) | | | 270,764 | | | | 0.83 | | | | 0.93 | | | | 4.05 | | | | 0.82 | | | | 12 | |
Year ended 09/30/09 | | | 10.05 | | | | 0.42 | | | | 0.76 | | | | 1.18 | | | | (0.43 | ) | | | 10.80 | | | | 12.16 | (f) | | | 225,086 | | | | 0.93 | | | | 1.03 | | | | 4.16 | | | | 0.90 | | | | 23 | |
Class B | |
Year ended 02/28/14 | | | 11.55 | | | | 0.36 | | | | (0.40 | ) | | | (0.04 | ) | | | (0.35 | ) | | | 11.16 | | | | (0.32 | )(c)(g) | | | 7,470 | | | | 0.79 | (d)(g) | | | 0.88 | (d)(g) | | | 3.24 | (d)(g) | | | 0.78 | (d)(g) | | | 24 | |
Year ended 02/28/13 | | | 11.43 | | | | 0.40 | | | | 0.14 | | | | 0.54 | | | | (0.42 | ) | | | 11.55 | | | | 4.82 | (c)(g) | | | 9,881 | | | | 0.76 | (g) | | | 0.89 | (g) | | | 3.49 | (g) | | | 0.75 | (g) | | | 10 | |
Year ended 02/29/12 | | | 10.74 | | | | 0.42 | | | | 0.64 | | | | 1.06 | | | | (0.37 | ) | | | 11.43 | | | | 10.02 | (c)(g) | | | 11,358 | | | | 0.93 | (g) | | | 1.06 | (g) | | | 3.79 | (g) | | | 0.92 | (g) | | | 16 | |
Period ended 02/28/11 | | | 11.20 | | | | 0.16 | | | | (0.47 | ) | | | (0.31 | ) | | | (0.15 | ) | | | 10.74 | | | | (2.81 | )(c) | | | 13,089 | | | | 1.56 | (e) | | | 1.66 | (e) | | | 3.44 | (e) | | | 1.55 | (e) | | | 4 | |
Year ended 09/30/10 | | | 10.96 | | | | 0.36 | | | | 0.22 | | | | 0.58 | | | | (0.34 | ) | | | 11.20 | | | | 5.46 | (c) | | | 16,362 | | | | 1.58 | | | | 1.68 | | | | 3.30 | | | | 1.57 | | | | 12 | |
Year ended 09/30/09 | | | 10.19 | | | | 0.36 | | | | 0.77 | | | | 1.13 | | | | (0.36 | ) | | | 10.96 | | | | 11.42 | (g)(h) | | | 13,648 | | | | 1.57 | (g) | | | 1.67 | (g) | | | 3.53 | (g) | | | 1.55 | (g) | | | 23 | |
Class C | |
Year ended 02/28/14 | | | 11.31 | | | | 0.27 | | | | (0.40 | ) | | | (0.13 | ) | | | (0.26 | ) | | | 10.92 | | | | (1.08 | )(c)(g) | | | 127,451 | | | | 1.50 | (d)(g) | | | 1.59 | (d)(g) | | | 2.53 | (d)(g) | | | 1.49 | (d)(g) | | | 24 | |
Year ended 02/28/13 | | | 11.19 | | | | 0.31 | | | | 0.14 | | | | 0.45 | | | | (0.33 | ) | | | 11.31 | | | | 4.07 | (c) | | | 126,310 | | | | 1.51 | | | | 1.64 | | | | 2.74 | | | | 1.50 | | | | 10 | |
Year ended 02/29/12 | | | 10.56 | | | | 0.35 | | | | 0.62 | | | | 0.97 | | | | (0.34 | ) | | | 11.19 | | | | 9.37 | (c) | | | 71,439 | | | | 1.51 | | | | 1.64 | | | | 3.21 | | | | 1.50 | | | | 16 | |
Period ended 02/28/11 | | | 11.02 | | | | 0.15 | | | | (0.47 | ) | | | (0.32 | ) | | | (0.14 | ) | | | 10.56 | | | | (2.88 | )(c) | | | 55,088 | | | | 1.56 | (e) | | | 1.66 | (e) | | | 3.44 | (e) | | | 1.55 | (e) | | | 4 | |
Year ended 09/30/10 | | | 10.78 | | | | 0.35 | | | | 0.23 | | | | 0.58 | | | | (0.34 | ) | | | 11.02 | | | | 5.53 | (c) | | | 61,646 | | | | 1.58 | | | | 1.68 | | | | 3.30 | | | | 1.57 | | | | 12 | |
Year ended 09/30/09 | | | 10.03 | | | | 0.34 | | | | 0.77 | | | | 1.11 | | | | (0.36 | ) | | | 10.78 | | | | 11.35 | (i) | | | 38,649 | | | | 1.68 | | | | 1.78 | | | | 3.41 | | | | 1.66 | | | | 23 | |
Class Y(j) | |
Year ended 02/28/14 | | | 11.31 | | | | 0.38 | | | | (0.39 | ) | | | (0.01 | ) | | | (0.37 | ) | | | 10.93 | | | | (0.06 | )(c) | | | 150,445 | | | | 0.54 | (d) | | | 0.63 | (d) | | | 3.49 | (d) | | | 0.53 | (d) | | | 24 | |
Year ended 02/28/13 | | | 11.19 | | | | 0.42 | | | | 0.14 | | | | 0.56 | | | | (0.44 | ) | | | 11.31 | | | | 5.11 | (c) | | | 160,404 | | | | 0.51 | | | | 0.64 | | | | 3.74 | | | | 0.50 | | | | 10 | |
Year ended 02/29/12 | | | 10.56 | | | | 0.46 | | | | 0.62 | | | | 1.08 | | | | (0.45 | ) | | | 11.19 | | | | 10.45 | (c) | | | 135,882 | | | | 0.51 | | | | 0.64 | | | | 4.21 | | | | 0.50 | | | | 16 | |
Period ended 02/28/11 | | | 11.03 | | | | 0.20 | | | | (0.48 | ) | | | (0.28 | ) | | | (0.19 | ) | | | 10.56 | | | | (2.56 | )(c) | | | 14,096 | | | | 0.56 | (e) | | | 0.66 | (e) | | | 4.44 | (e) | | | 0.55 | (e) | | | 4 | |
Year ended 09/30/10 | | | 10.79 | | | | 0.46 | | | | 0.23 | | | | 0.69 | | | | (0.45 | ) | | | 11.03 | | | | 6.56 | (c) | | | 9,361 | | | | 0.58 | | | | 0.68 | | | | 4.30 | | | | 0.57 | | | | 12 | |
Year ended 09/30/09 | | | 10.04 | | | | 0.45 | | | | 0.76 | | | | 1.21 | | | | (0.46 | ) | | | 10.79 | | | | 12.45 | (k) | | | 6,598 | | | | 0.67 | | | | 0.77 | | | | 4.49 | | | | 0.65 | | | | 23 | |
| (a) | Calculated using average shares outstanding. |
| (b) | Portfolio turnover is calculated at the fund level and is not annualized for periods less than one year, if applicable. For the year ended February 29, 2012, the portfolio turnover calculation excludes the value of securities purchased of $202,122,885 and sold of $25,268,549 in the effort to realign the Fund’s portfolio holdings after the reorganization of Invesco Municipal Fund into the Fund. |
| (c) | Includes adjustments in accordance with accounting principles generally accepted in the United States of America and as such, the net asset value for financial reporting purposes and the returns based upon those net asset values may differ from the net asset value and returns for shareholder transactions. Does not include sales charges and is not annualized for periods less than one year, if applicable. |
| (d) | Ratios are based on average daily net assets (000’s omitted) of $413,913, $8,467, $145,461 and $153,905 for Class A, Class B, Class C and Class Y shares, respectively. |
| (f) | Assumes reinvestment of all distributions for the period and does not include payment of the maximum sales charge of 4.75% or contingent deferred sales charge (CDSC). On purchases of $1 million or more, a CDSC of 1% may be imposed on certain redemptions made within eighteen months of purchase. If the sales charges were included, total returns would be lower. These returns include combined Rule 12b-1 fees and service fees of up to 0.25% and do not reflect the deduction of taxes that a shareholder would pay on Fund distributions or the redemption of Fund shares. |
| (g) | The total return, ratio of expense to average net assets and ratio of net investment income to average net assets reflect actual 12b-1 fees of less than 1%. |
| (h) | Assumes reinvestment of all distributions for the period and does not include payment of the maximum CDSC of 4%, charged on certain redemptions made within one year of purchase and declining to 0% after the fifth year. If the sales charge was included, total returns would be lower. These returns include combined Rule 12b-1 fees and service fees of up to 1% and do not reflect the deduction of taxes that a shareholder would pay on Fund distributions or the redemption of Fund shares. |
| (i) | Assumes reinvestment of all distributions for the period and does not include payment of the maximum CDSC of 1%, charged on certain redemptions made within one year of purchase. If the sales charge was included, total returns would be lower. These returns include combined Rule 12b-1 fees and service fees of up to 1% and do not reflect the deduction of taxes that a shareholder would pay on Fund distributions or the redemption of Fund shares. |
| (j) | On June 1, 2010, Class I shares of Van Kampen Intermediate Term Municipal Income Fund were reorganized into Class Y shares of the Fund. |
| (k) | Assumes reinvestment of all distributions for the period. These returns do not reflect the deduction of taxes that a shareholder would pay on Fund distributions or the redemption on Fund shares. |
34 Invesco Intermediate Term Municipal Income Fund
Report of Independent Registered Public Accounting Firm
To the Board of Trustees of AIM Tax-Exempt Funds (Invesco Tax-Exempt Funds)
and Shareholders of Invesco Intermediate Term Municipal Income Fund:
In our opinion, the accompanying statement of assets and liabilities, including the schedule of investments, and the related statements of operations and of changes in net assets and the financial highlights present fairly, in all material respects, the financial position of Invesco Intermediate Term Municipal Income Fund (one of the funds constituting AIM Tax-Exempt Funds (Invesco Tax-Exempt Funds), hereafter referred to as the “Fund”) at February 28, 2014, the results of its operations for the year then ended, the changes in its net assets for each of the two years in the period then ended and the financial highlights for each of the three years in the period then ended, the five month period ended February 28, 2011 and the year ended September 30, 2010, in conformity with accounting principles generally accepted in the United States of America. These financial statements and financial highlights (hereafter referred to as “financial statements”) are the responsibility of the Fund’s management; our responsibility is to express an opinion on these financial statements based on our audits. We conducted our audits of these financial statements in accordance with the standards of the Public Company Accounting Oversight Board (United States). Those standards require that we plan and perform the audit to obtain reasonable assurance about whether the financial statements are free of material misstatement. An audit includes examining, on a test basis, evidence supporting the amounts and disclosures in the financial statements, assessing the accounting principles used and significant estimates made by management, and evaluating the overall financial statement presentation. We believe that our audits, which included confirmation of securities at February 28, 2014 by correspondence with the custodian and brokers, provide a reasonable basis for our opinion. The financial highlights of the Fund for the period ended September 30, 2009 were audited by another independent registered public accounting firm whose report dated November 20, 2009 expressed an unqualified opinion on such financial statement.
PRICEWATERHOUSECOOPERS LLP
April 28, 2014
Houston, Texas
35 Invesco Intermediate Term Municipal Income Fund
Calculating your ongoing Fund expenses
Example
As a shareholder of the Fund, you incur two types of costs: (1) transaction costs, which may include sales charges (loads) on purchase payments or contingent deferred sales charges on redemptions, if any; and (2) ongoing costs, including management fees, distribution and/or service (12b-1) fees, and other Fund expenses. This example is intended to help you understand your ongoing costs (in dollars) of investing in the Fund and to compare these costs with ongoing costs of investing in other mutual funds. The example is based on an investment of $1,000 invested at the beginning of the period and held for the entire period September 1, 2013 through February 28, 2014.
Actual expenses
The table below provides information about actual account values and actual expenses. You may use the information in this table, together with the amount you invested, to estimate the expenses that you paid over the period. Simply divide your account value by $1,000 (for example, an $8,600 account value divided by $1,000 = 8.6), then multiply the result by the number in the table under the heading entitled “Actual Expenses Paid During Period” to estimate the expenses you paid on your account during this period.
Hypothetical example for comparison purposes
The table below also provides information about hypothetical account values and hypothetical expenses based on the Fund’s actual expense ratio and an assumed rate of return of 5% per year before expenses, which is not the Fund’s actual return.
The hypothetical account values and expenses may not be used to estimate the actual ending account balance or expenses you paid for the period. You may use this information to compare the ongoing costs of investing in the Fund and other funds. To do so, compare this 5% hypothetical example with the 5% hypothetical examples that appear in the shareholder reports of the other funds.
Please note that the expenses shown in the table are meant to highlight your ongoing costs only and do not reflect any transaction costs, such as sales charges (loads) on purchase payments or contingent deferred sales charges on redemptions, if any. Therefore, the hypothetical information is useful in comparing ongoing costs only, and will not help you determine the relative total costs of owning different funds. In addition, if these transaction costs were included, your costs would have been higher.
| | | | | | | | | | | | | | | | | | | | | | | | |
| Class | | Beginning Account Value (09/01/13) | | | ACTUAL | | | HYPOTHETICAL (5% annual return before
expenses) | | | Annualized
Expense
Ratio | |
| | | Ending
Account Value
(02/28/14)1 | | | Expenses
Paid During
Period2 | | | Ending
Account Value
(02/28/14) | | | Expenses
Paid During
Period2 | | |
| A | | $ | 1,000.00 | | | $ | 1,047.10 | | | $ | 4.06 | | | $ | 1,020.83 | | | $ | 4.01 | | | | 0.80 | % |
| B | | | 1,000.00 | | | | 1,047.40 | | | | 4.06 | | | | 1,020.83 | | | | 4.01 | | | | 0.80 | |
| C | | | 1,000.00 | | | | 1,043.90 | | | | 7.55 | | | | 1,017.41 | | | | 7.45 | | | | 1.49 | |
| Y | | | 1,000.00 | | | | 1,048.40 | | | | 2.79 | | | | 1,022.07 | | | | 2.76 | | | | 0.55 | |
| 1 | The actual ending account value is based on the actual total return of the Fund for the period September 1, 2013 through February 28, 2014, after actual expenses and will differ from the hypothetical ending account value which is based on the Fund’s expense ratio and a hypothetical annual return of 5% before expenses. |
| 2 | Expenses are equal to the Fund’s annualized expense ratio as indicated above multiplied by the average account value over the period, multiplied by 181/365 to reflect the most recent fiscal half year. |
36 Invesco Intermediate Term Municipal Income Fund
Tax Information
Form 1099-DIV, Form 1042-S and other year–end tax information provide shareholders with actual calendar year amounts that should be included in their tax returns. Shareholders should consult their tax advisors.
The following distribution information is being provided as required by the Internal Revenue Code or to meet a specific state’s requirement.
The Fund designates the following amounts or, if subsequently determined to be different, the maximum amount allowable for its fiscal year ended February 28, 2014:
| | | | |
Federal and State Income Tax | |
Qualified Dividend Income* | | | 0 | % |
Corporate Dividends Received Deduction* | | | 0 | % |
U.S. Treasury Obligations* | | | 0 | % |
Tax-Exempt Interest Dividends* | | | 100 | % |
| | * | The above percentages are based on ordinary income dividends paid to shareholders during the Fund’s fiscal year. |
37 Invesco Intermediate Term Municipal Income Fund
Trustees and Officers
The address of each trustee and officer is AIM Tax-Exempt Funds (Invesco Tax-Exempt Funds) (the “Trust”), 11 Greenway Plaza, Suite 1000, Houston, Texas 77046-1173. The trustees serve for the life of the Trust, subject to their earlier death, incapacitation, resignation, retirement or removal as more specifically provided in the Trust’s organizational documents. Each officer serves for a one year term or until their successors are elected and qualified. Column two below includes length of time served with predecessor entities, if any.
| | | | | | | | |
Name, Year of Birth and
Position(s) Held with the Trust | | Trustee and/
or Officer Since | | Principal Occupation(s) During Past 5 Years | | Number of
Funds in Fund
Complex
Overseen by
Trustee | | Other Directorship(s)
Held by Trustee During
Past 5 Years |
| Interested Persons | | | | | | | | |
| Martin L. Flanagan1 — 1960 Trustee | | 2007 | | Executive Director, Chief Executive Officer and President, Invesco Ltd. (ultimate parent of Invesco and a global investment management firm); Advisor to the Board, Invesco Advisers, Inc. (formerly known as Invesco Institutional (N.A.), Inc.); Trustee, The Invesco Funds; Vice Chair, Investment Company Institute; and Member of Executive Board, SMU Cox School of Business Formerly: Chairman and Chief Executive Officer, Invesco Advisers, Inc. (registered investment adviser); Director, Chairman, Chief Executive Officer and President, IVZ Inc. (holding company), INVESCO Group Services, Inc. (service provider) and Invesco North American Holdings, Inc. (holding company); Director, Chief Executive Officer and President, Invesco Holding Company Limited (parent of Invesco and a global investment management firm); Director, Invesco Ltd.; Chairman, Investment Company Institute and President, Co-Chief Executive Officer, Co-President, Chief Operating Officer and Chief Financial Officer, Franklin Resources, Inc. (global investment management organization). | | 123 | | None |
Philip A. Taylor2 — 1954 Trustee, President and Principal Executive Officer | | 2006 | | Head of North American Retail and Senior Managing Director, Invesco Ltd.; Director, Co-Chairman, Co-President and Co-Chief Executive Officer, Invesco Advisers, Inc. (formerly known as Invesco Institutional (N.A.), Inc.) (registered investment adviser); Director, Chairman, Chief Executive Officer and President, Invesco Management Group, Inc. (formerly known as Invesco Aim Management Group, Inc.) (financial services holding company); Director and President, INVESCO Funds Group, Inc. (registered investment adviser and registered transfer agent); Director and Chairman, Invesco Investment Services, Inc. (formerly known as Invesco Aim Investment Services, Inc.) (registered transfer agent) and IVZ Distributors, Inc. (formerly known as INVESCO Distributors, Inc.) (registered broker dealer); Director, President and Chairman, Invesco Inc. (holding company) and Invesco Canada Holdings Inc. (holding company); Chief Executive Officer, Invesco Corporate Class Inc. (corporate mutual fund company) and Invesco Canada Fund Inc. (corporate mutual fund company); Director, Chairman and Chief Executive Officer, Invesco Canada Ltd. (formerly known as Invesco Trimark Ltd./Invesco Trimark Ltèe) (registered investment adviser and registered transfer agent); Trustee, President and Principal Executive Officer, The Invesco Funds (other than AIM Treasurer’s Series Trust (Invesco Treasurer’s Series Trust) and Short-Term Investments Trust); Trustee and Executive Vice President, The Invesco Funds (AIM Treasurer’s Series Trust (Invesco Treasurer’s Series Trust) and Short-Term Investments Trust only); Director, Invesco Investment Advisers LLC (formerly known as Van Kampen Asset Management); Director, Chief Executive Officer and President, Van Kampen Exchange Corp. Formerly: Director and Chairman, Van Kampen Investor Services Inc.; Director, Chief Executive Officer and President, 1371 Preferred Inc. (holding company); and Van Kampen Investments Inc.; Director and President, AIM GP Canada Inc. (general partner for limited partnerships); and Van Kampen Advisors, Inc.; Director and Chief Executive Officer, Invesco Trimark Dealer Inc. (registered broker dealer); Director, Invesco Distributors, Inc. (formerly known as Invesco Aim Distributors, Inc.) (registered broker dealer); Manager, Invesco PowerShares Capital Management LLC; Director, Chief Executive Officer and President, Invesco Advisers, Inc.; Director, Chairman, Chief Executive Officer and President, Invesco Aim Capital Management, Inc.; President, Invesco Trimark Dealer Inc. and Invesco Trimark Ltd./Invesco Trimark Ltèe; Director and President, AIM Trimark Corporate Class Inc. and AIM Trimark Canada Fund Inc.; Senior Managing Director, Invesco Holding Company Limited; Trustee and Executive Vice President, Tax-Free Investments Trust; Director and Chairman, Fund Management Company (former registered broker dealer); President and Principal Executive Officer, The Invesco Funds (AIM Treasurer’s Series Trust (Invesco Treasurer’s Series Trust), Short-Term Investments Trust and Tax-Free Investments Trust only); President, AIM Trimark Global Fund Inc. and AIM Trimark Canada Fund Inc. | | 123 | | None |
Wayne W. Whalen3 — 1939 Trustee | | 2010 | | Of Counsel, and prior to 2010, partner in the law firm of Skadden, Arps, Slate, Meagher & Flom LLP, legal counsel to certain funds in the Fund Complex. | | 136 | | Director of the Mutual fund Directors Forum, a nonprofit membership organization for investment directors; Chairman and Director of the Abraham Lincoln Presidential Library Foundation; and Director of the Stevenson Center for Democracy |
| 1 | Mr. Flanagan is considered an interested person of the Trust because he is an officer of the adviser to the Trust, and an officer and a director of Invesco Ltd., ultimate parent of the adviser to the Trust. |
| 2 | Mr. Taylor is considered an interested person of the Trust because he is an officer and a director of the adviser to, and a director of the principal underwriter of, the Trust. |
| 3 | Mr. Whalen is considered an “interested person” (within the meaning of Section 2(a)(19) of the 1940 Act) of certain funds in the Fund Complex because his firm currently provides legal services as legal counsel to such Funds. |
T-1 Invesco Intermediate Term Municipal Income Fund
Trustees and Officers—(continued)
| | | | | | | | |
Name, Year of Birth and
Position(s) Held with the Trust | | Trustee and/
or Officer Since | | Principal Occupation(s) During Past 5 Years | | Number of
Funds in Fund
Complex
Overseen by
Trustee | | Other Directorship(s)
Held by Trustee During
Past 5 Years |
| Independent Trustees | | | | | | | | |
Bruce L. Crockett — 1944 Trustee and Chair | | 1993 | | Chairman, Crockett Technologies Associates (technology consulting company) Formerly: Director, Captaris (unified messaging provider); Director, President and Chief Executive Officer COMSAT Corporation; Chairman, Board of Governors of INTELSAT (international communications company); ACE Limited (insurance company); and Investment Company Institute | | 123 | | ALPS (Attorneys Liability Protection Society) (insurance company) |
David C. Arch — 1945 Trustee | | 2010 | | Chairman of Blistex Inc., a consumer health care products manufacturer | | 136 | | Board member of the Illinois Manufacturers’ Association; Member of the Board of Visitors, Institute for the Humanities University of Michigan; Member of the Audit Committee of the Edward-Elmhurst Hospital |
Frank S. Bayley — 1939 Trustee | | 2001 | | Retired. Formerly: Director, Badgley Funds Inc. (registered investment company) (2 portfolios) and General Partner and Of Counsel, law firm of Baker & McKenzie, LLP | | 123 | | Director and Chairman, C.D. Stimson Company (a real estate investment company); Trustee, The Curtis Institute of Music |
James T. Bunch — 1942 Trustee | | 2003 | | Managing Member, Grumman Hill Group LLC (family office private equity investments) Formerly: Founder, Green Manning & Bunch Ltd. (investment banking firm) (1988-2010); Executive Committee, United States Golf Association; and Director, Policy Studies, Inc. and Van Gilder Insurance Corporation. | | 123 | | Chairman, Board of Governors, Western Golf Association, Chairman, Evans Scholars Foundation and Director, Denver Film Society |
Rodney F. Dammeyer — 1940 Trustee | | 2010 | | Chairman of CAC,LLC, (private company offering capital investment and management advisory services) Formerly: Prior to 2001, Managing Partner at Equity Group Corporate Investments. Prior to 1995, Chief Executive Officer of Itel Corporation (formerly Anixter International). Prior to 1985, experience includes Senior Vice President and Chief Financial Officer of Household International, Inc., Executive Vice President and Chief Financial Officer of Northwest Industries, Inc. and Partner of Arthur Andersen & Co.; From 1987 to 2010, Director/Trustee of investment companies in the Van Kampen Funds complex | | 123 | | Director of Quidel Corporation and Stericycle, Inc. |
Albert R. Dowden —��1941 Trustee | | 2000 | | Director of a number of public and private business corporations, including the Boss Group, Ltd. (private investment and management); Nature’s Sunshine Products, Inc. and Reich & Tang Funds (5 portfolios) (registered investment company) Formerly: Director, Homeowners of America Holding Corporation/Homeowners of America Insurance Company (property casualty company); Director, Continental Energy Services, LLC (oil and gas pipeline service); Director, CompuDyne Corporation (provider of product and services to the public security market) and Director, Annuity and Life Re (Holdings), Ltd. (reinsurance company); Director, President and Chief Executive Officer, Volvo Group North America, Inc.; Senior Vice President, AB Volvo; Director of various public and private corporations; Chairman, DHJ Media, Inc.; Director, Magellan Insurance Company; and Director, The Hertz Corporation, Genmar Corporation (boat manufacturer), National Media Corporation; Advisory Board of Rotary Power International (designer, manufacturer, and seller of rotary power engines); and Chairman, Cortland Trust, Inc. (registered investment company) | | 123 | | Director of: Nature’s Sunshine Products, Inc., Reich & Tang Funds, Homeowners of America Holding Corporation/ Homeowners of America Insurance Company, the Boss Group |
Jack M. Fields — 1952 Trustee | | 1997 | | Chief Executive Officer, Twenty First Century Group, Inc. (government affairs company); Owner and Chief Executive Officer, Dos Angeles Ranch, L.P. (cattle, hunting, corporate entertainment); and Discovery Global Education Fund (non-profit) Formerly: Chief Executive Officer, Texana Timber LP (sustainable forestry company); Director of Cross Timbers Quail Research Ranch (non-profit); and member of the U.S. House of Representatives | | 123 | | Insperity, Inc. (formerly known as Administaff) |
Prema Mathai-Davis — 1950 Trustee | | 1998 | | Retired. Formerly: Chief Executive Officer, YWCA of the U.S.A. | | 123 | | None |
Larry Soll — 1942 Trustee | | 2003 | | Retired. Formerly: Chairman, Chief Executive Officer and President, Synergen Corp. (a biotechnology company) | | 123 | | None |
T-2 Invesco Intermediate Term Municipal Income Fund
Trustees and Officers—(continued)
| | | | | | | | |
Name, Year of Birth and
Position(s) Held with the Trust | | Trustee and/
or Officer Since | | Principal Occupation(s) During Past 5 Years | | Number of
Funds in Fund
Complex
Overseen by
Trustee | | Other Directorship(s)
Held by Trustee During Past 5 Years |
| Independent Trustees—(continued) |
Hugo F. Sonnenschein — 1940 Trustee | | 2010 | | President Emeritus and Honorary Trustee of the University of Chicago and the Adam Smith Distinguished Service Professor in the Department of Economics at the University of Chicago. Prior to 2000, President of the University of Chicago | | 136 | | Trustee of the University of Rochester and a member of its investment committee; Member of the National Academy of Sciences and the American Philosophical Society; Fellow of the American Academy of Arts and Sciences |
| Raymond Stickel, Jr. — 1944 Trustee | | 2005 | | Retired. Formerly: Director, Mainstay VP Series Funds, Inc. (25 portfolios) and Partner, Deloitte & Touche | | 123 | | None |
| Other Officers | | | | | | | | |
Russell C. Burk — 1958 Senior Vice President and Senior Officer | | 2005 | | Senior Vice President and Senior Officer, The Invesco Funds | | N/A | | N/A |
John M. Zerr — 1962 Senior Vice President, Chief Legal Officer and Secretary | | 2006 | | Director, Senior Vice President, Secretary and General Counsel, Invesco Management Group, Inc. (formerly known as Invesco Aim Management Group, Inc.) and Van Kampen Exchange Corp.; Senior Vice President, Invesco Advisers, Inc. (formerly known as Invesco Institutional (N.A.), Inc.) (registered investment adviser); Senior Vice President and Secretary, Invesco Distributors, Inc. (formerly known as Invesco Aim Distributors, Inc.); Director, Vice President and Secretary, Invesco Investment Services, Inc. (formerly known as Invesco Aim Investment Services, Inc.) and IVZ Distributors, Inc. (formerly known as INVESCO Distributors, Inc.); Director and Vice President, INVESCO Funds Group, Inc.; Senior Vice President, Chief Legal Officer and Secretary, The Invesco Funds; Manager, Invesco PowerShares Capital Management LLC; Director, Secretary and General Counsel, Invesco Investment Advisers LLC (formerly known as Van Kampen Asset Management); Secretary and General Counsel, Invesco Capital Markets, Inc. (formerly known as Van Kampen Funds Inc.) and Chief Legal Officer, PowerShares Exchange-Traded Fund Trust, PowerShares Exchange-Traded Fund Trust II, PowerShares India Exchange-Traded Fund Trust and PowerShares Actively Managed Exchange-Traded Fund Trust Formerly: Director and Vice President, Van Kampen Advisors Inc.; Director, Vice President, Secretary and General Counsel, Van Kampen Investor Services Inc.; Director, Invesco Distributors, Inc. (formerly known as Invesco Aim Distributors, Inc.); Director, Senior Vice President, General Counsel and Secretary, Invesco Aim Advisers, Inc. and Van Kampen Investments Inc.; Director, Vice President and Secretary, Fund Management Company; Director, Senior Vice President, Secretary, General Counsel and Vice President, Invesco Aim Capital Management, Inc.; Chief Operating Officer and General Counsel, Liberty Ridge Capital, Inc. (an investment adviser); Vice President and Secretary, PBHG Funds (an investment company) and PBHG Insurance Series Fund (an investment company); Chief Operating Officer, General Counsel and Secretary, Old Mutual Investment Partners (a broker-dealer); General Counsel and Secretary, Old Mutual Fund Services (an administrator) and Old Mutual Shareholder Services (a shareholder servicing center); Executive Vice President, General Counsel and Secretary, Old Mutual Capital, Inc. (an investment adviser); and Vice President and Secretary, Old Mutual Advisors Funds (an investment company) | | N/A | | N/A |
Sheri Morris — 1964 Vice President, Treasurer and Principal Financial Officer | | 1999 | | Vice President, Treasurer and Principal Financial Officer, The Invesco Funds; Vice President, Invesco Advisers, Inc. (formerly known as Invesco Institutional (N.A.), Inc.) (registered investment adviser); and Vice President, PowerShares Exchange-Traded Fund Trust, PowerShares Exchange-Traded Fund Trust II, PowerShares India Exchange-Traded Fund Trust and PowerShares Actively Managed Exchange-Traded Fund Trust Formerly: Vice President, Invesco Aim Advisers, Inc., Invesco Aim Capital Management, Inc. and Invesco Aim Private Asset Management, Inc.; Assistant Vice President and Assistant Treasurer, The Invesco Funds and Assistant Vice President, Invesco Advisers, Inc., Invesco Aim Capital Management, Inc. and Invesco Aim Private Asset Management, Inc.; and Treasurer, PowerShares Exchange-Traded Fund Trust, PowerShares Exchange-Traded Fund Trust II, PowerShares India Exchange-Traded Fund Trust and PowerShares Actively Managed Exchange-Traded Fund Trust | | N/A | | N/A |
T-3 Invesco Intermediate Term Municipal Income Fund
Trustees and Officers—(continued)
| | | | | | | | |
Name, Year of Birth and
Position(s) Held with the Trust | | Trustee and/
or Officer Since | | Principal Occupation(s) During Past 5 Years | | Number of
Funds in Fund
Complex
Overseen by
Trustee | | Other Directorship(s)
Held by Trustee During
Past 5 Years |
| Other Officers—(continued) | | | | | | | | |
Karen Dunn Kelley — 1960 Vice President | | 1993 | | Senior Managing Director, Investments; Director, Co-President, Co-Chief Executive Officer, and Co-Chairman, Invesco Advisers, Inc. (formerly known as Invesco Institutional (N.A.), Inc.) (registered investment adviser); Chairman, Invesco Senior Secured Management, Inc.; Senior Vice President, Invesco Management Group, Inc. (formerly known as Invesco Aim Management Group, Inc.); Executive Vice President, Invesco Distributors, Inc. (formerly known as Invesco Aim Distributors, Inc.); Director, Invesco Mortgage Capital Inc. and Invesco Management Company Limited; Director and President, INVESCO Asset Management (Bermuda) Ltd., Vice President, The Invesco Funds (other than AIM Treasurer’s Series Trust (Invesco Treasurer’s Series Trust) and Short-Term Investments Trust); and President and Principal Executive Officer, The Invesco Funds (AIM Treasurer’s Series Trust (Invesco Treasurer’s Series Trust) and Short-Term Investments Trust only) Formerly: Director, INVESCO Global Asset Management Limited and INVESCO Management S.A.; Senior Vice President, Van Kampen Investments Inc. and Invesco Advisers, Inc. (formerly known as Invesco Institutional (N.A.), Inc.) (registered investment adviser); Vice President, Invesco Advisers, Inc. (formerly known as Invesco Institutional (N.A.), Inc.); Director of Cash Management and Senior Vice President, Invesco Advisers, Inc. and Invesco Aim Capital Management, Inc.; President and Principal Executive Officer, Tax-Free Investments Trust; Director and President, Fund Management Company; Chief Cash Management Officer, Director of Cash Management, Senior Vice President, and Managing Director, Invesco Aim Capital Management, Inc.; Director of Cash Management, Senior Vice President, and Vice President, Invesco Advisers, Inc. and The Invesco Funds (AIM Treasurer’s Series Trust (Invesco Treasurer’s Series Trust), Short-Term Investments Trust and Tax-Free Investments Trust only) | | N/A | | N/A |
Crissie M. Wisdom — 1969 Anti-Money Laundering Compliance Officer | | 2013 | | Anti-Money Laundering Compliance Officer, Invesco Advisers, Inc. (formerly known as Invesco Institutional (N.A.), Inc.) (registered investment adviser), Invesco Capital Markets, Inc. (formerly known as Van Kampen Funds Inc.), Invesco Distributors, Inc., Invesco Investment Services, Inc., Invesco Management Group, Inc., Van Kampen Exchange Corp., The Invesco Funds, Invesco Funds (Chicago), and PowerShares Exchange-Traded Fund Trust, PowerShares Exchange-Traded Fund Trust II, PowerShares India Exchange-Traded Fund Trust, and PowerShares Actively Managed Exchange-Traded Fund Trust; and Fraud Prevention Manager and Controls and Risk Analysis Manager for Invesco Investment Services, Inc. | | N/A | | N/A |
Todd L. Spillane — 1958 Chief Compliance Officer | | 2006 | | Senior Vice President, Invesco Management Group, Inc. (formerly known as Invesco Aim Management Group, Inc.) and Van Kampen Exchange Corp.; Senior Vice President and Chief Compliance Officer, Invesco Advisers, Inc. (registered investment adviser) (formerly known as Invesco Institutional (N.A.), Inc.); Chief Compliance Officer, The Invesco Funds; Vice President, Invesco Distributors, Inc. (formerly known as Invesco Aim Distributors, Inc.) and Invesco Investment Services, Inc. (formerly known as Invesco Aim Investment Services, Inc.) Formerly: Chief Compliance Officer, Invesco Funds (Chicago); Senior Vice President, Van Kampen Investments Inc.; Senior Vice President and Chief Compliance Officer, Invesco Aim Advisers, Inc. and Invesco Aim Capital Management, Inc.; Chief Compliance Officer, INVESCO Private Capital Investments, Inc. (holding company), Invesco Private Capital, Inc. (registered investment adviser), Invesco Global Asset Management (N.A.), Inc., Invesco Senior Secured Management, Inc. (registered investment adviser), Van Kampen Investor Services Inc., PowerShares Exchange-Traded Fund Trust, PowerShares Exchange-Traded Fund Trust II, PowerShares India Exchange-Traded Fund Trust and PowerShares Actively Managed Exchange-Traded Fund Trust; and Vice President, Invesco Aim Capital Management, Inc. and Fund Management Company | | N/A | | N/A |
The Statement of Additional Information of the Trust includes additional information about the Fund’s Trustees and is available upon request, without charge, by calling 1.800.959.4246. Please refer to the Fund’s prospectus for information on the Fund’s sub-advisers.
| | | | | | |
Office of the Fund 11 Greenway Plaza, Suite 1000 Houston, TX 77046-1173 | | Investment Adviser Invesco Advisers, Inc. 1555 Peachtree Street, N.E. Atlanta, GA 30309 | | Distributor Invesco Distributors, Inc. 11 Greenway Plaza, Suite 1000 Houston, TX 77046-1173 | | Auditors PricewaterhouseCoopers LLP 1201 Louisiana Street, Suite 2900 Houston, TX 77002-5678 |
| | | |
| | | | | | |
Counsel to the Fund Stradley Ronon Stevens & Young, LLP 2005 Market Street, Suite 2600 Philadelphia, PA 19103-7018 | | Counsel to the Independent Trustees Goodwin Procter LLP 901 New York Avenue, N.W. Washington, D.C. 20001 | | Transfer Agent Invesco Investment Services, Inc. 11 Greenway Plaza, Suite 1000 Houston, TX 77046-1173 | | Custodian State Street Bank and Trust Company 225 Franklin Street Boston, MA 02110-2801 |
T-4 Invesco Intermediate Term Municipal Income Fund

Invesco mailing information
Send general correspondence to Invesco Investment Services, Inc., P.O. Box 219078, Kansas City, MO 64121-9078.
Important notice regarding delivery of security holder documents
To reduce Fund expenses, only one copy of most shareholder documents may be mailed to shareholders with multiple accounts at the same address (Householding). Mailing of your shareholder documents may be householded indefinitely unless you instruct us otherwise. If you do not want the mailing of these documents to be combined with those for other members of your household, please contact Invesco Investment Services, Inc. at 800 959 4246 or contact your financial institution. We will begin sending you individual copies for each account within 30 days after receiving your request.
Fund holdings and proxy voting information
The Fund provides a complete list of its holdings four times in each fiscal year, at the quarter ends. For the second and fourth quarters, the lists appear in the Fund’s semiannual and annual reports to shareholders. For the first and third quarters, the Fund files the lists with the Securities and Exchange Commission (SEC) on Form N-Q. The most recent list of portfolio holdings is available at invesco.com/completeqtrholdings. Shareholders can also look up the Fund’s Forms N-Q on the SEC website at sec.gov. Copies of the Fund’s Forms N-Q may be reviewed and copied at the SEC Public Reference Room in Washington, D.C. You can obtain information on the operation of the Public Reference Room, including information about duplicating fee charges, by calling 202 551 8090 or 800 732 0330, or by electronic request at the following email address: publicinfo@sec.gov. The SEC file numbers for the Fund are shown below.
A description of the policies and procedures that the Fund uses to determine how to vote proxies relating to portfolio securities is available without charge, upon request, from our Client Services department at 800 959 4246 or at invesco.com/proxyguidelines. The information is also available on the SEC website, sec.gov.
| | |
Information regarding how the Fund voted proxies related to its portfolio securities during the most recent 12-month period ended June 30 is available at invesco.com/proxysearch. The information is also available on the SEC website, sec.gov. Invesco Advisers, Inc. is an investment adviser; it provides investment advisory services to individual and institutional clients and does not sell securities. Invesco Distributors, Inc. is the US distributor for Invesco Ltd.’s retail mutual funds, exchange-traded funds and institutional money market funds. Both are wholly owned, indirect subsidiaries of Invesco Ltd. | |  |
| | | | |
| SEC file numbers: 811-07890 and 033-66242 | | VK-ITMI-AR-1 | | Invesco Distributors, Inc. |
Letters to Shareholders
| | |

Philip Taylor | | Dear Shareholders: This annual report includes information about your Fund, including performance data and a complete list of its investments as of the close of the reporting period. Inside, your Fund’s portfolio managers discuss how they managed your Fund and the factors that affected its performance during the reporting period. I hope you find this report of interest. During the reporting period covered by this report, major US and global equity market indexes hit multiyear or all-time highs1, the result of a strengthening US economy and relatively healthy corporate profits. Also helping equities was a return of individual investors to stocks – due in part to monetary policies that kept interest rates (and yields on fixed income securities) low. Despite some volatility in the summer of 2013, overseas equity market indexes in developed and emerging nations generally rose during the reporting period – although |
developed markets generally outpaced emerging markets. In January 2014, amid widespread signs of an improving economy, the US Federal Reserve began a long-anticipated reduction in its bond-buying program.
Extended periods of strong market performance can lull some investors into a false sense of security – just as extended periods of volatility or market weakness can discourage some investors from undertaking disciplined, long-term investment plans. That’s why Invesco believes it can often be helpful to work with a skilled and trusted financial adviser; he or she can emphasize the importance of adhering to an investment plan designed to achieve long-term goals like a first home, a college education for a child or a comfortable retirement. A financial adviser who is familiar with your individual financial situation, investment goals and risk tolerance can be an invaluable partner as you work toward your financial goals. He or she can provide insight and perspective when markets are volatile; encouragement and reassurance when times are uncertain; and advice and guidance when your financial situation or investment goals change.
Timely information when and where you want it
Invesco’s efforts to help investors achieve their financial objectives include providing individual investors and financial professionals with timely information about the markets, the economy and investing – whenever and wherever they want it.
Our website, invesco.com/us, offers a wide range of market insights and investment perspectives. On the website, you’ll find detailed information about our funds, including prices, performance, holdings and portfolio manager commentaries. You can access information about your individual Invesco account whenever it’s convenient for you; just complete a simple, secure online registration. Use the “Login” box on our home page to get started.
Invesco’s mobile app for iPad® (available free from the App StoreSM) allows you to obtain the same detailed information about your Fund and the same investment insights from our investment leaders, market strategists, economists and retirement experts on the go. You also can watch portfolio manager videos and have instant access to Invesco news and updates wherever you may be.
In addition to the resources accessible on our website and through our mobile app, you can obtain timely updates to help you stay informed about the markets, the economy and investing by connecting with Invesco on Twitter, LinkedIn or Facebook. You can access our blog at blog.invesco.us.com or by visiting the “Intentional Investing Forum” on our home page. Our goal is to provide you the information you want, when and where you want it.
Have questions?
For questions about your account, feel free to contact an Invesco client services representative at 800 959 4246. For Invesco-related questions or comments, please email me directly at phil@invesco.com.
All of us at Invesco look forward to serving your investment management needs for many years to come. Thank you for investing with us.
Sincerely,

Philip Taylor
Senior Managing Director, Invesco Ltd.
1 Source: Reuters
iPad is a trademark of Apple Inc., registered in the US and other countries. App Store is a service mark of Apple Inc. Invesco Distributors, Inc. is not affiliated with Apple Inc.
2 Invesco Municipal Income Fund
| | | | |

Bruce Crockett | | | | Dear Fellow Shareholders: Members of the Invesco Funds Board work continually to oversee how the Invesco Funds are performing in light of ever-changing and often unpredictable economic and market conditions. One of the ways we do this is by verifying that the teams that manage funds understand the risks associated with the investments they make in the funds they manage. In light of market conditions over the last few years, the financial news media of late have given increased attention to “alternative investment strategies.” Despite this increased attention, many investors don’t know very much about these types of investment strategies. Let me put alternative investment strategies and the new focus on them in some perspective. First, these types of investment strategies have been used predominately by institutional investors and investment professionals for decades to increase diversification – in |
an effort to dampen portfolio volatility (risk) with the goal of increasing returns. The focal point of the increased news coverage is that these types of strategies are now being made more widely available to individual investors.
Alternative investment strategies generally seek to provide measured exposure to various asset classes whose performance, historically, has not been highly correlated with one another. These strategies may help mitigate the impact to a portfolio from severe or prolonged market downturns while potentially providing reasonable returns over time. After a careful and thorough examination of the potential risks and potential benefits of alternative investment strategies, the Invesco Funds Board has approved the launch of several new alternative funds for the Invesco product lineup, to be managed by teams we determined have the depth and experience to pursue the funds’ investment objectives.
While no single investment product can provide complete downside protection in falling markets and full upside participation in rising markets, your Board believes alternative funds can be a prudent tool to work in concert with more traditional mutual funds and other investments to build well diversified portfolios. Your financial adviser can determine whether or not such investments are appropriate for your individual needs, goals and risk tolerance. Also, he or she can explain the risks associated with alternative investment strategies. This type of professional guidance is why Invesco believes it’s so important that individual investors work with trusted, experienced financial advisers.
Whether you’re invested in equity, fixed income, cash management or alternative investment funds, be assured that the Invesco Funds Board will continue working on your behalf and on behalf of all our fund shareholders, keeping your needs and interests uppermost in our minds.
As always, please contact me at bruce@brucecrockett.com with any questions or concerns you may have. On behalf of the Board, we look forward to continuing to represent your interests and serving your needs.
Sincerely,

Bruce L. Crockett
Independent Chair
Invesco Funds Board of Trustees
Asset allocation/diversification does not guarantee a profit or eliminate the risk of loss.
Alternative products typically hold more non-traditional investments and employ more complex trading strategies, including hedging and leveraging through derivatives, short selling and opportunistic strategies that change with market conditions. Investors considering alternatives should be aware of their unique characteristics and additional risks from the strategies they use. Like all investments, performance will fluctuate. You can lose money.
3 Invesco Municipal Income Fund
Management’s Discussion of Fund Performance
Performance summary
For the fiscal year ended February 28, 2014, Invesco Municipal Income Fund posted negative returns. The Fund underperformed its broad market/style-specific benchmark, the Barclays Municipal Bond Index. The main driver of relative performance was the Fund’s exposure to the long end of the yield curve.
Your Fund’s long-term performance appears later in this report.
Fund vs. Indexes
Total returns, 2/28/13 to 2/28/14, at net asset value (NAV). Performance shown does not include applicable contingent deferred sales charges (CDSC) or front-end sales charges, which would have reduced performance.
| | | | | |
| Class A Shares | | | | -1.16 | % |
| Class B Shares | | | | -1.99 | |
| Class C Shares | | | | -2.00 | |
| Class Y Shares | | | | -0.84 | |
| Investor Class Shares* | | | | -1.07 | |
| Barclays Municipal Bond Index‚ (Broad Market/Style-Specific Index) | | | | -0.21 | |
Source(s): ‚Lipper Inc.
| * | Investor Class Shares incepted during the reporting period. See page 7 for a detailed explanation of Fund performance. |
How we invest
The Fund’s investment objective is to provide investors with a high level of current income exempt from federal income tax, consistent with preservation of capital.
Under normal market conditions, we seek to achieve the Fund’s investment objective by investing at least 80% of the Fund’s net assets in municipal securities rated investment grade by at least one nationally recognized statistical rating organization – or if not rated, securities we determine to be of comparable quality – at the time of purchase.
Under normal market conditions, the Fund may invest up to 20% of its total assets in municipal securities rated below investment grade. Lower-grade securities are commonly referred to as junk bonds and involve greater risks than investments in higher-grade securities. The Fund does not purchase securities that are in default or considered extremely speculative.
The Fund may invest all or a substantial portion of its total assets in municipal securities that are subject to the federal alternative minimum tax (AMT). Accordingly,
| | | | | |
Portfolio Composition | | | | | |
By credit sector, based on total investments | |
| Revenue Bonds | | | | 85.6 | % |
| General Obligation Bonds | | | | 9.8 | |
Pre-Refunded Bonds | | | | 4.6 | |
| | | | | | |
| Total Net Assets | | | | $2.2 billion | |
Total Number of Holdings | | | | 854 | |
The Fund’s holdings are subject to change, and there is no assurance that the Fund will continue to hold any particular security.
the Fund may not be a suitable investment for investors who are already subject to the AMT or could become subject to it as a result of an investment in the Fund.
From time to time, the Fund temporarily may invest up to 10% of its total assets in tax-exempt money market funds, and such instruments will be treated as investments in municipal securities. Investments in other mutual funds may involve duplication of management fees and certain other expenses. We may sell securities based on factors such as degradation in credit quality, a decision to shorten or lengthen the Fund’s duration, reducing exposure to a particular sector or issuer, or general liquidity needs of the Fund.
Market conditions and your Fund
For the fiscal year ended February 28, 2014, the municipal bond market returned -0.21%1, as measured by the Barclays Municipal Bond Index. Record outflows from municipal bond funds, driven by concerns over rising interest rates and high-profile credit events,
| | | | | |
| Top Five Fixed Income Holdings |
| | | | | |
1. New York (State of) Dormitory Authority (General Purpose); Series 2011 A | | | | 1.1 | % |
2. Washington (State of); Series 2010 B | | | | 1.1 | |
3. Massachusetts (State of) Development Finance Agency (Harvard University); Series 2009 A | | | | 1.1 | |
4. Houston (City of); Series 2004 A | | | | 1.0 | |
5. Illinois (State of) Metropolitan Pier & Exposition Authority (McCormick Place Expansion); Series 2002 B | | | | 0.9 | |
resulted in a challenging year for municipal bond investors. The $67 billion2 in municipal bond fund redemptions between March and December 2013 was in stark contrast to inflows of $65 billion2 and strong performance for the asset class over the prior two years.
Shortly after the fiscal year began, investors became apprehensive that the US Federal Reserve (the Fed) would reduce its asset purchase program, known as quantitative easing (QE), as the US economy improved. Concerned that Fed action would cause interest rates to rise and bond prices to fall, investors began trimming their allocations to fixed income investments, including municipal bonds. The rate of outflows increased dramatically in June following comments made by then-Fed Chairman Ben Bernanke on the timing for tapering QE.
Over the summer of 2013, several high-profile credit events had an adverse impact on the municipal bond market. These included downgrades to the credit ratings of Chicago debt on pension concerns, Detroit filing the largest municipal bankruptcy in US history3 and increased uncertainty about the financial condition of Puerto Rico.
The market received a two-month reprieve in September when the Fed decided not to reduce QE, although it reversed that decision in December when it announced that it would decrease its asset purchases by $10 billion per month, beginning in January 2014.4 A final headwind for the municipal bond market was significant tax-loss selling of municipal bonds in December to offset gains from strong equity returns during 2013.
In the first two months of 2014, the municipal bond market turned positive. Softer economic data reduced expectations for hawkish Fed action. Relatively high yields on municipal bonds, coupled with higher personal income tax rates and improving municipal fundamentals, drew investors back to the asset class. Net positive fund flows in January and February, combined with limited supply of new issuance, produced strong returns in the final two months of the fiscal year.
During the fiscal year, the largest driver of Fund performance relative to its benchmark was its overweight position in longer-maturity bonds. This position had a negative impact on relative performance as investors sold longer-dated bonds on concerns over rising interest rates. Security selection across most of
4 Invesco Municipal Income Fund
the yield curve was positive and helped to offset the impact of rising rates.
At the sector level, hospitals, the Fund’s largest sector and its largest overweight position relative to its benchmark, contributed to performance. Special tax, education and transportation bonds detracted from relative performance. The Fund’s relative underweight allocation in those sectors and security selection in Puerto Rico bonds also contributed to performance.
During the reporting period, leverage detracted from Fund performance. The Fund achieved a leveraged position through the use of inverse floating rate securities or Tender Option Bonds (TOBs). The Fund uses leverage because we believe that, over time, leveraging provides opportunities for additional income and total return for shareholders. However, the use of leverage also can expose shareholders to additional volatility. For more information about the Fund’s use of leverage, see the Notes to Financial Statements later in this report.
We wish to remind you that the Fund is subject to interest rate risk, meaning when interest rates rise, the value of fixed income securities generally will fall. This risk may be greater in the current market environment because interest rates are at or near historic lows. We are monitoring interest rates and market and economic factors that may impact interest rates, including the potential impact of the Fed’s tapering of QE. If interest rates rise, markets may experience increased volatility, which may affect the value and/or liquidity of certain of the Fund’s investments.
Recently published rules implementing section 619 of the Dodd-Frank Wall Street Reform and Consumer Protection Act may preclude banking entities from sponsoring and/or providing services for TOB trust programs. As a result, the Trust’s ability to utilize TOBs for leverage purposes may be adversely affected.
Thank you for investing in Invesco Municipal Income Fund and for sharing our long-term investment horizon.
1 Source: Barclays
2 Source: Morningstar
3 Source: Moody’s
4 Source: US Federal Reserve
The views and opinions expressed in management’s discussion of Fund performance are those of Invesco Advisers, Inc. These views and opinions are subject to change at any time based on factors such as market and economic conditions. These views and opinions may not be relied upon as investment advice or recommendations, or as an offer for a particular security. The information is not a complete analysis of every aspect of any market, country, industry, security or the Fund. Statements of fact are from sources considered reliable, but Invesco Advisers, Inc. makes no representation or warranty as to their completeness or accuracy. Although historical performance is no guarantee of future results, these insights may help you understand our investment management philosophy.
See important Fund and, if applicable, index disclosures later in this report.
| | |

| | Robert Wimmel Portfolio manager, is manager of Invesco Municipal Income Fund and head of Investment Grade Municipals for |
| Invesco. Mr. Wimmel earned a BA in anthropology from the University of Cincinnati and an MA in economics from the University of Illinois at Chicago. |
| | |
 | | Thomas Byron Portfolio manager, is manager of Invesco Municipal Income Fund. He joined Invesco in 2010. Mr. |
| Byron earned a BS in finance from Marquette University and an MBA in finance from DePaul University. |
| | |
 | | Robert Stryker Chartered Financial Analyst, portfolio manager, is manager of Invesco Municipal Income Fund. He |
| joined Invesco in 2010. Mr. Stryker earned a BS in finance from the University of Illinois at Chicago. |
5 Invesco Municipal Income Fund
Your Fund’s Long-Term Performance
Results of a $10,000 Investment – Oldest Share Class(es)
Fund and index data from 2/29/04
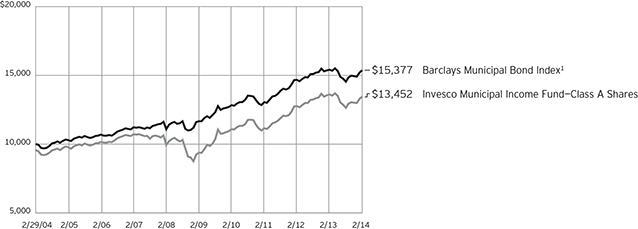
Past performance cannot guarantee comparable future results.
The data shown in the chart include reinvested distributions, applicable sales charges and Fund expenses including
management fees. Index results include reinvested dividends, but they do not reflect sales charges. Performance of the peer group, if applicable, reflects fund expenses and management fees; performance
of a market index does not. Performance shown in the chart and table(s) does not reflect deduction of taxes a shareholder would pay on Fund distributions or sale of Fund shares.
continued from page 8
unlisted or unrated securities as compared with an investment company that invests solely in higher-grade securities. Unrated securities are usually not as attractive to as many buyers as are rated securities, a factor which may make unrated securities less marketable. These factors may have the effect of limiting the availability of the securities for purchase by the Fund and may also limit the ability of the Fund to sell such securities at their fair value either to meet redemption requests or in response to changes in the economy or the financial markets.
| n | | Municipal issuer focus risk. The Fund generally considers investments in municipal securities not to be subject to industry concentration policies (issuers of municipal securities as a group is not an industry) and the Fund may invest in municipal securities issued by entities having similar characteristics. The issuers may be located in the same geographic area or may pay their interest obligations from revenue of similar projects, such as hospitals, airports, utility systems and housing finance agencies. This may make the Fund’s investments more susceptible to similar social, economic, political or regulatory occurrences. As the similarity in issuers increases, the potential for fluctuation in the |
| | | Fund’s net asset value also increases. |
| n | | Municipal securities risk. The Fund may invest in municipal securities. Constitutional amendments, legislative enactments, executive orders, administrative regulations, voter initiatives, and the issuer’s regional economic conditions may affect the municipal security’s value, interest payments, repayment of principal and the Fund’s ability to sell it. Failure of a municipal security issuer to comply with applicable tax requirements may make income paid thereon taxable, resulting in a decline in the security’s value. In addition, there could be changes in applicable tax laws or tax treatments that reduce or eliminate the current federal income tax exemption on municipal securities or otherwise adversely affect the current federal or state tax status of municipal securities. |
| n | | Reinvestment risk. Reinvestment risk is the risk that a bond’s cash flows (coupon income and principal repayment) will be reinvested at an interest rate below that on the original bond. |
| n | | Variable-rate demand notes risk. The absence of an active secondary market for certain variable and floating rate notes could make it difficult to dispose of the instruments, and a portfolio could suffer a loss if the issuer defaults |
| | during periods in which a portfolio is not entitled to exercise its demand rights. |
| n | | When-issued and delayed delivery risk. When-issued and delayed delivery transactions are subject to market risk as the value or yield of a security at delivery may be more or less than the purchase price or the yield generally available on securities when delivery occurs. In addition, the Fund is subject to counterparty risk because it relies on the buyer or seller, as the case may be, to consummate the transaction, and failure by the other party to complete the transaction may result in the Fund missing the opportunity of obtaining a price or yield considered to be advantageous. |
| n | | Zero coupon or pay-in-kind securities risk. The value, interest rates, and liquidity of non-cash paying instruments, such as zero coupon and pay-in-kind securities, are subject to greater fluctuation than other types of securities. |
About indexes used in this report
| n | | The Barclays Municipal Bond Index is an unmanaged index considered representative of the tax-exempt bond market. |
| n | | The Fund is not managed to track the performance of any particular index, |
continued on page 7
6 Invesco Municipal Income Fund
| | | | | |
| Average Annual Total Returns |
As of 2/28/14, including maximum applicable sales charges | |
| |
| Class A Shares | | | | | |
| Inception (8/1/90) | | | | 4.96 | % |
| 10 Years | | | | 3.01 | |
| 5 Years | | | | 6.56 | |
| 1 Year | | | | -5.36 | |
| |
Class B Shares | | | | | |
| Inception (8/24/92) | | | | 4.26 | % |
| 10 Years | | | | 2.83 | |
| 5 Years | | | | 6.37 | |
| 1 Year | | | | -6.72 | |
| |
Class C Shares | | | | | |
| Inception (8/13/93) | | | | 3.45 | % |
| 10 Years | | | | 2.67 | |
| 5 Years | | | | 6.67 | |
| 1 Year | | | | -2.94 | |
| |
Class Y Shares | | | | | |
| Inception (8/12/05) | | | | 3.89 | % |
| 5 Years | | | | 7.77 | |
| 1 Year | | | | -0.84 | |
| |
Investor Class Shares | | | | | |
| 10 Years | | | | 3.47 | % |
| 5 Years | | | | 7.51 | |
1 Year | | | | -1.07 | |
Effective June 1, 2010, Class A, Class B, Class C and Class I shares of the predecessor fund, Van Kampen Municipal Income Fund, advised by Van Kampen Asset Management were reorganized into Class A, Class B, Class C and Class Y shares, respectively, of Invesco Van Kampen Municipal Income Fund (renamed Invesco Municipal Income Fund). Returns shown above for Class A, Class B, Class C and Class Y shares are blended returns of the predecessor fund and Invesco Municipal Income Fund. Share class returns will differ from the predecessor fund
| | | | | |
| Average Annual Total Returns |
| As of 12/31/13, the most recent calendar quarter end, including maximum applicable sales charges | |
| |
| Class A Shares | | | | | |
| Inception (8/1/90) | | | | 4.84 | % |
| 10 Years | | | | 2.89 | |
| 5 Years | | | | 7.25 | |
| 1 Year | | | | -7.59 | |
| |
Class B Shares | | | | | |
| Inception (8/24/92) | | | | 4.12 | % |
| 10 Years | | | | 2.71 | |
| 5 Years | | | | 7.06 | |
| 1 Year | | | | -8.91 | |
| |
Class C Shares | | | | | |
| Inception (8/13/93) | | | | 3.31 | % |
| 10 Years | | | | 2.55 | |
| 5 Years | | | | 7.35 | |
| 1 Year | | | | -5.23 | |
| |
Class Y Shares | | | | | |
| Inception (8/12/05) | | | | 3.53 | % |
| 5 Years | | | | 8.44 | |
| 1 Year | | | | -3.30 | |
| |
Investor Class Shares | | | | | |
| 10 Years | | | | 3.34 | % |
| 5 Years | | | | 8.19 | |
1 Year | | | | -3.47 | |
because of different expenses. Investor Class shares incepted on July 15, 2013. Performance shown prior to that date is that of Class A shares and includes the 12b-1 fees applicable to Class A shares. Class A share performance reflects any applicable fee waivers or expense reimbursements.
The performance data quoted represent past performance and cannot guarantee comparable future results; current performance may be lower or higher. Please visit invesco.com/performance for the
most recent month-end performance. Performance figures reflect reinvested distributions, changes in net asset value and the effect of the maximum sales charge unless otherwise stated. Investment return and principal value will fluctuate so that you may have a gain or loss when you sell shares.
The total annual Fund operating expense ratio set forth in the most recent Fund prospectus as of the date of this report for Class A, Class B, Class C, Class Y and Investor Class shares was 0.87%, 1.62%, 1.62%, 0.62% and 0.78%, respectively. The expense ratios presented above may vary from the expense ratios presented in other sections of this report that are based on expenses incurred during the period covered by this report.
Class A share performance reflects the maximum 4.25% sales charge, and Class B and Class C share performance reflects the applicable contingent deferred sales charge (CDSC) for the period involved. For shares purchased prior to June 1, 2010, the CDSC on Class B shares declines from 4% at the time of purchase to 0% at the beginning of the seventh year. For shares purchased on or after June 1, 2010, the CDSC on Class B shares declines from 5% at the time of purchase to 0% at the beginning of the seventh year. The CDSC on Class C shares is 1% for the first year after purchase. Class Y and Investor Class shares do not have a front-end sales charge or a CDSC; therefore, performance is at net asset value.
The performance of the Fund’s share classes will differ primarily due to different sales charge structures and class expenses.
continued from page 6
including the index(es) described here, and consequently, the performance of the Fund may deviate significantly from the performance of the index(es).
| n | | A direct investment cannot be made in an index. Unless otherwise indicated, index results include reinvested dividends, and they do not reflect sales charges. Performance of the peer group, if applicable, reflects fund expenses; performance of a market index does not. |
Other information
| n | | The returns shown in management’s discussion of Fund performance are based on net asset values (NAVs) calculated for shareholder transactions. Generally accepted accounting principles require adjustments to be made to the net assets of the Fund at period end for financial reporting purposes, and as such, the NAVs for shareholder transactions and the returns based on those NAVs may differ from the NAVs and returns reported in the Financial Highlights. |
7 Invesco Municipal Income Fund
Invesco Municipal Income Fund’s investment objective is to provide investors with a high level of current income exempt from federal income tax, consistent with preservation of capital.
| n | | Unless otherwise stated, information presented in this report is as of February 28, 2014, and is based on total net assets. |
| n | | Unless otherwise noted, all data provided by Invesco. |
| n | | To access your Fund’s reports/prospectus, visit invesco.com/fundreports. |
About share classes
| n | | Class B shares may not be purchased for new or additional investments. Please see the prospectus for more information. |
| n | | Class Y shares are available to only certain investors. Please see the prospectus for more information. |
| n | | Investor Class shares are closed to new investors. Contact your financial adviser about purchasing our other share classes. Please see the prospectus for more information. |
Principal risks of investing in the Fund
| n | | Alternative minimum tax risk. All or a portion of the Fund’s otherwise tax-exempt income may be taxable to those shareholders subject to the federal alternative minimum tax. |
| n | | Call risk. If interest rates fall, it is possible that issuers of debt securities with high interest rates will prepay or call their securities before their maturity dates. In this event, the proceeds from the called securities would likely be reinvested by the Fund in securities bearing the new, lower interest rates, resulting in a possible decline in the Fund’s income and distributions to shareholders. |
| n | | Credit risk. The issuer of instruments in which the Fund invests may be unable to meet interest and/or principal payments, thereby causing its instruments to decrease in value and lowering the issuer’s credit rating. |
| n | | Derivatives risk. The value of a derivative instrument depends largely on (and is derived from) the value of an underlying security, currency, commodity, interest rate, index or other asset (each referred to as an underlying asset). In addition to risks relating to the underlying assets, the use of derivatives may include other, possibly greater, risks, including counterparty, leverage and liquidity risks. Counterparty risk is the risk that the counterparty to the derivative contract will default on its obligation to pay the Fund the amount owed or otherwise perform under the derivative contract. |
| | | Derivatives create leverage risk because they do not require payment up front equal to the economic exposure created by owning the derivative. As a result, an adverse change in the value of the underlying asset could result in the Fund sustaining a loss that is substantially greater than the amount invested in the derivative, which may make the Fund’s returns more volatile and increase the risk of loss. Derivative instruments may also be less liquid than more traditional investments and the Fund may be unable to sell or close out its derivative positions at a desirable time or price. This risk may be more acute under adverse market conditions, during which the Fund may be most in need of liquidating its derivative positions. Derivatives may also be harder to value, less tax efficient and subject to changing government regulation that could impact the Fund’s ability to use certain derivatives or their cost. Also, derivatives used for hedging or to gain or limit exposure to a particular market segment may not provide the expected benefits, particularly during adverse market conditions. |
| n | | High yield bond (junk bond) risk. Junk bonds involve a greater risk of default or price changes due to changes in the credit quality of the issuer. The values of junk bonds fluctuate more than those of high-quality bonds in response to company, political, regulatory or economic developments. Values of junk bonds can decline significantly over short periods of time. |
| n | | Income risk. The income you receive from the Fund is based primarily on prevailing interest rates, which can vary widely over the short- and long-term. If interest rates drop, your income from the Fund may drop as well. |
| n | | Interest rate risk. Interest rate risk refers to the risk that bond prices generally fall as interest rates rise; conversely, bond prices generally rise as interest rates fall. Specific bonds differ in their sensitivity to changes in interest rates depending on their individual characteristics, including duration. |
| n | | Inverse floating rate obligations risk. Inverse floating rate obligations, including |
This report must be accompanied or preceded by a currently effective Fund prospectus, which contains more complete information, including sales charges and expenses. Investors should read it carefully before investing.
NOT FDIC INSURED | MAY LOSE VALUE | NO BANK GUARANTEE
| | tender option bonds, may be subject to greater price volatility than a fixed income security with similar qualities. When short-term interest rates rise, they may decrease in value and produce less or no income. Additionally, these securities may lose principal. Similar to derivatives, inverse floating rate obligations have the following risks: counterparty, leverage, correlation, liquidity, market, interest rate, and management risks. |
| n | | Leverage risk. Leverage exists when the Fund purchases or sells an instrument or enters into a transaction without investing cash in an amount equal to the full economic exposure of the asset or transaction and the Fund could lose more than it invested. Leverage created from certain types of transactions or instruments may impair the Fund’s liquidity, cause it to liquidate positions at an unfavorable time, increase volatility or otherwise not achieve its intended objective. |
| n | | Liquidity risk. The Fund may hold illiquid securities that it is unable to sell at the preferred time or price and could lose its entire investment in such securities. |
| n | | Management risk. The investment techniques and risk analysis used by the Fund’s portfolio managers may not produce the desired results. |
| n | | Market risk. The prices of and the income generated by the Fund’s securities may decline in response to, among other things, investor sentiment, general economic and market conditions, regional or global instability, and currency and interest rate fluctuations. |
| n | | Medium- and lower-grade municipal securities risk. Securities which are in the medium- and lower-grade categories generally offer higher yields than are offered by higher-grade securities of similar maturity, but they also generally involve more volatility and greater risks, such as greater credit risk, market risk, liquidity risk, management risk, and regulatory risk. Furthermore, many medium- and lower-grade securities are not listed for trading on any national securities exchange and many issuers of medium- and lower-grade securities choose not to have a rating assigned to their obligations by any nationally recognized statistical rating organization. As a result, the Fund’s portfolio may consist of a higher portion of |
continued on page 6
8 Invesco Municipal Income Fund
Schedule of Investments
February 28, 2014
| | | | | | | | | | | | | | | | |
| | | Interest
Rate | | | Maturity
Date | | | Principal
Amount
(000) | | | Value | |
Municipal Obligations–106.57% | | | | | | | | | | | | | | | | |
| Alabama–0.82% | | | | | | | | | | | | | | | | |
Auburn University; Series 2011 A, General Fee RB | | | 5.00 | % | | | 06/01/36 | | | $ | 1,000 | | | $ | 1,073,799 | |
Birmingham (City of) Special Care Facilities Financing Authority (Children’s Hospital); Series 2009, Health Care Facility RB (INS–AGC)(a) | | | 6.00 | % | | | 06/01/39 | | | | 1,000 | | | | 1,137,030 | |
Courtland (City of) Industrial Development Board (International Paper Co.); Series 2005 A, Ref. Solid Waste Disposal RB(b) | | | 5.20 | % | | | 06/01/25 | | | | 2,500 | | | | 2,526,175 | |
Houston (County of) Health Care Authority; Series 2006 A, RB (INS–AMBAC)(a) | | | 5.25 | % | | | 10/01/30 | | | | 3,670 | | | | 3,679,322 | |
Huntsville (City of) Special Care Facilities Financing Authority (Redstone Village); Series 2007, Retirement Facility RB | | | 5.50 | % | | | 01/01/43 | | | | 900 | | | | 770,922 | |
Mobile (City of) Industrial Development Board (Mobile Energy Services Co.); Series 1995, Ref. Solid Waste Disposal RB | | | 6.95 | % | | | 01/01/20 | | | | 3 | | | | 0 | |
Selma (City of) Industrial Development Board; Series 2009 A, Gulf Opportunity Zone RB | | | 6.25 | % | | | 11/01/33 | | | | 4,100 | | | | 4,546,367 | |
University of Alabama Board of Trustees; Series 2008 A, Hospital RB | | | 5.75 | % | | | 09/01/22 | | | | 3,000 | | | | 3,365,160 | |
University of Alabama; Series 2004 A, General RB(c) | | | 5.00 | % | | | 07/01/29 | | | | 1,000 | | | | 1,013,030 | |
| | | | | 18,111,805 | |
| | | | |
| Alaska–1.33% | | | | | | | | | | | | | | | | |
Alaska (State of) Industrial Development & Export Authority (Providence Health Services); | | | | | | | | | | | | | | | | |
Series 2011 A, RB | | | 5.00 | % | | | 10/01/40 | | | | 1,250 | | | | 1,286,125 | |
Series 2011 A, RB | | | 5.50 | % | | | 10/01/41 | | | | 3,000 | | | | 3,235,980 | |
Alaska (State of) International Airports System; | | | | | | | | | | | | | | | | |
Series 2006 B, Ref. RB (INS–NATL)(a) | | | 5.00 | % | | | 10/01/24 | | | | 6,525 | | | | 7,120,667 | |
Series 2006 D, Ref. RB (INS–NATL)(a) | | | 5.00 | % | | | 10/01/24 | | | | 9,570 | | | | 10,415,509 | |
Alaska (State of) Municipal Bond Bank Authority; Series 2009 1, RB | | | 5.75 | % | | | 09/01/33 | | | | 200 | | | | 224,540 | |
Matanuska-Susitna (Borough of) (Goose Creek Correctional Center); Series 2009, Lease RB (INS–AGC)(a) | | | 6.00 | % | | | 09/01/28 | | | | 5,000 | | | | 6,005,950 | |
Southeast Alaska Power Agency; Series 2009, Ref. Electric RB (INS–AGC)(a) | | | 5.38 | % | | | 06/01/28 | | | | 1,025 | | | | 1,029,008 | |
| | | | | 29,317,779 | |
| | | | |
| Arizona–3.00% | | | | | | | | | | | | | | | | |
Arizona (State of) Health Facilities Authority (Banner Health); Series 2008 D, RB (INS–BHAC)(a) | | | 5.50 | % | | | 01/01/38 | | | | 5,000 | | | | 5,445,800 | |
Arizona (State of) Health Facilities Authority (Catholic Healthcare West); Series 2011 B-1, RB | | | 5.25 | % | | | 03/01/39 | | | | 5,000 | | | | 5,189,750 | |
Arizona (State of); | | | | | | | | | | | | | | | | |
Series 2008 A, COP (INS–AGM)(a) | | | 5.00 | % | | | 09/01/24 | | | | 2,375 | | | | 2,518,212 | |
Series 2008 A, COP (INS–AGM)(a) | | | 5.00 | % | | | 09/01/26 | | | | 2,420 | | | | 2,541,557 | |
Glendale (City of) Industrial Development Authority (John C. Lincoln Health Network); | | | | | | | | | | | | | | | | |
Series 2005, Ref. Hospital RB | | | 5.00 | % | | | 12/01/35 | | | | 1,655 | | | | 1,666,221 | |
Series 2005 B, Ref. Hospital RB | | | 5.25 | % | | | 12/01/23 | | | | 3,250 | | | | 3,341,130 | |
Series 2005 B, Ref. Hospital RB | | | 5.25 | % | | | 12/01/25 | | | | 2,250 | | | | 2,301,435 | |
Glendale (City of) Industrial Development Authority (Midwestern University); | | | | | | | | | | | | | | | | |
Series 2010, RB | | | 5.00 | % | | | 05/15/35 | | | | 1,000 | | | | 1,026,500 | |
Series 2010, RB | | | 5.13 | % | | | 05/15/40 | | | | 2,150 | | | | 2,210,845 | |
Goodyear (City of) McDowell Road Commercial Corridor Improvement District; Series 2007, Special Assessment Improvement RB (INS–AMBAC)(a) | | | 5.25 | % | | | 01/01/32 | | | | 1,665 | | | | 1,702,546 | |
Goodyear (City of); Series 2010, Sub. Lien Water & Sewer RB | | | 5.63 | % | | | 07/01/39 | | | | 1,000 | | | | 1,067,940 | |
Navajo County Pollution Control Corp.; | | | | | | | | | | | | | | | | |
Series 2009 C, PCR(d) | | | 5.50 | % | | | 06/01/14 | | | | 1,000 | | | | 1,012,100 | |
Series 2009 E, PCR(d) | | | 5.75 | % | | | 06/01/16 | | | | 1,000 | | | | 1,099,520 | |
Phoenix (City of) Industrial Development Authority (Career Success Schools); | | | | | | | | | | | | | | | | |
Series 2009, Education RB | | | 7.00 | % | | | 01/01/39 | | | | 600 | | | | 532,086 | |
Series 2009, Education RB | | | 7.13 | % | | | 01/01/45 | | | | 570 | | | | 506,645 | |
See accompanying Notes to Financial Statements which are an integral part of the financial statements.
9 Invesco Municipal Income Fund
| | | | | | | | | | | | | | | | |
| | | Interest
Rate | | | Maturity
Date | | | Principal
Amount
(000) | | | Value | |
| Arizona–(continued) | | | | | | | | | | | | | | | | |
Phoenix (City of) Industrial Development Authority (Great Hearts Academies); | | | | | | | | | | | | | | | | |
Series 2012, Education RB | | | 6.30 | % | | | 07/01/42 | | | $ | 1,000 | | | $ | 995,440 | |
Series 2012, Education RB | | | 6.40 | % | | | 07/01/47 | | | | 400 | | | | 398,752 | |
Phoenix (City of) Industrial Development Authority (Rowan University); | | | | | | | | | | | | | | | | |
Series 2012, Lease RB | | | 5.00 | % | | | 06/01/42 | | | | 5,000 | | | | 5,092,750 | |
Series 2012, Lease RB | | | 5.25 | % | | | 06/01/34 | | | | 3,000 | | | | 3,108,510 | |
Phoenix Civic Improvement Corp.; | | | | | | | | | | | | | | | | |
Series 2004, Jr. Lien Wastewater System RB (INS–NATL)(a) | | | 5.00 | % | | | 07/01/27 | | | | 2,000 | | | | 2,028,500 | |
Series 2008 B, Sr. Lien Airport RB(b) | | | 5.25 | % | | | 07/01/19 | | | | 1,000 | | | | 1,151,800 | |
Pima (County of) Industrial Development Authority (Global Water Resources, LLC); | | | | | | | | | | | | | | | | |
Series 2007, Water & Wastewater RB(b) | | | 6.55 | % | | | 12/01/37 | | | | 1,600 | | | | 1,611,936 | |
Series 2008, Water & Wastewater RB(b) | | | 6.38 | % | | | 12/01/18 | | | | 617 | | | | 631,240 | |
Pima (County of) Industrial Development Authority (Tucson Electric Power Co.); Series 2010 A, IDR | | | 5.25 | % | | | 10/01/40 | | | | 1,925 | | | | 1,981,037 | |
Pinal (County of) Electric District No. 3; Series 2011, Ref. Electrical System RB | | | 5.25 | % | | | 07/01/41 | | | | 2,000 | | | | 2,124,880 | |
Pinal (County of) Electric District No. 4; | | | | | | | | | | | | | | | | |
Series 2008, Electrical System RB | | | 6.00 | % | | | 12/01/23 | | | | 550 | | | | 604,945 | |
Series 2008, Electrical System RB | | | 6.00 | % | | | 12/01/28 | | | | 740 | | | | 787,663 | |
Salt River Project Agricultural Improvement & Power District; | | | | | | | | | | | | | | | | |
Series 2009 A, Electric System RB(e) | | | 5.00 | % | | | 01/01/25 | | | | 3,000 | | | | 3,397,710 | |
Series 2009 A, Electric System RB(e) | | | 5.00 | % | | | 01/01/28 | | | | 2,000 | | | | 2,233,680 | |
University Medical Center Corp.; Series 2009, Hospital RB | | | 6.00 | % | | | 07/01/24 | | | | 1,250 | | | | 1,383,662 | |
Verrado Community Facilities District No. 1; | | | | | | | | | | | | | | | | |
Series 2013 A, Ref. Unlimited Tax GO Bonds(f) | | | 6.00 | % | | | 07/15/27 | | | | 2,000 | | | | 2,138,240 | |
Series 2013 B, Unlimited Tax GO Bonds(f) | | | 5.70 | % | | | 07/15/29 | | | | 775 | | | | 802,102 | |
Series 2013 B, Unlimited Tax GO Bonds(f) | | | 6.00 | % | | | 07/15/33 | | | | 710 | | | | 735,901 | |
Yavapai (County of) Industrial Development Authority (Northern Arizona Healthcare System); | | | | | | | | | | | | | | | | |
Series 2011, Ref. Hospital Facility RB | | | 5.25 | % | | | 10/01/25 | | | | 1,000 | | | | 1,126,760 | |
Series 2011, Ref. Hospital Facility RB | | | 5.25 | % | | | 10/01/26 | | | | 500 | | | | 559,910 | |
Yuma Municipal Property Corp.; Series 2007 D, Municipal Facilities RB (INS–SGI)(a) | | | 5.00 | % | | | 07/01/24 | | | | 1,000 | | | | 1,087,010 | |
| | | | | 66,144,715 | |
| | | | |
| Arkansas–0.16% | | | | | | | | | | | | | | | | |
Arkansas State University (Jonesboro Campus); Series 2009, Housing System RB (INS–AGM)(a) | | | 5.00 | % | | | 03/01/34 | | | | 1,825 | | | | 1,932,127 | |
Little Rock (City of); Series 2009, Library Construction & Improvement Limited Tax GO Bonds | | | 4.60 | % | | | 03/01/24 | | | | 1,495 | | | | 1,673,832 | |
| | | | | 3,605,959 | |
| | | | |
| California–11.93% | | | | | | | | | | | | | | | | |
Adelanto (City of) Public Utility Authority (Utility System); Series 2009 A, Ref. RB | | | 6.75 | % | | | 07/01/39 | | | | 2,000 | | | | 2,119,380 | |
Alameda (County of) Joint Powers Authority (Juvenile Justice Refunding); Series 2008 A, Lease RB (INS–AGM)(a) | | | 5.00 | % | | | 12/01/25 | | | | 4,535 | | | | 5,108,405 | |
Anaheim (City of) Public Financing Authority (Electric System Distribution Facilities); Series 2011 A, RB | | | 5.38 | % | | | 10/01/36 | | | | 735 | | | | 833,593 | |
Bay Area Governments Association (California Redevelopment Agency Pool); Series 2004 A, Tax Allocation RB (INS–SGI)(a) | | | 5.25 | % | | | 09/01/35 | | | | 3,780 | | | | 3,634,016 | |
Beverly Hills Unified School District (Election of 2008); Series 2009, Unlimited Tax CAB GO Bonds(g) | | | 0.00 | % | | | 08/01/31 | | | | 40 | | | | 18,769 | |
Big Bear Lake (City of); Series 1996, Ref. Water RB (INS–NATL)(a) | | | 6.00 | % | | | 04/01/22 | | | | 2,000 | | | | 2,313,160 | |
California (State of) Department of Veterans Affairs; Series 2007 A, Home Purchase RB(b)(e) | | | 4.95 | % | | | 12/01/37 | | | | 9,585 | | | | 9,706,250 | |
California (State of) Health Facilities Financing Authority (Catholic Healthcare West); Series 2009 A, RB | | | 6.00 | % | | | 07/01/39 | | | | 5,000 | | | | 5,497,800 | |
California (State of) Health Facilities Financing Authority (Children’s Hospital Los Angeles); Series 2010, RB (INS–AGM)(a) | | | 5.25 | % | | | 07/01/38 | | | | 500 | | | | 515,450 | |
California (State of) Health Facilities Financing Authority (The Episcopal Home); Series 2010 B, RB(c)(d) | | | 5.50 | % | | | 02/01/20 | | | | 1,000 | | | | 1,223,540 | |
California (State of) Housing Finance Agency; | | | | | | | | | | | | | | | | |
Series 1983 B, Home Mortgage CAB RB (CEP–FHA)(g) | | | 0.00 | % | | | 08/01/15 | | | | 10 | | | | 9,322 | |
Series 2008 K, Home Mortgage RB(b) | | | 5.30 | % | | | 08/01/23 | | | | 1,835 | | | | 1,874,049 | |
Series 2008 K, Home Mortgage RB(b) | | | 5.45 | % | | | 08/01/28 | | | | 4,000 | | | | 4,051,600 | |
See accompanying Notes to Financial Statements which are an integral part of the financial statements.
10 Invesco Municipal Income Fund
| | | | | | | | | | | | | | | | |
| | | Interest
Rate | | | Maturity
Date | | | Principal
Amount
(000) | | | Value | |
| California–(continued) | | | | | | | | | | | | | | | | |
California (State of) Municipal Finance Authority (Emerson College); | | | | | | | | | | | | | | | | |
Series 2011, RB | | | 5.00 | % | | | 01/01/28 | | | $ | 1,525 | | | $ | 1,621,944 | |
Series 2011, RB | | | 5.75 | % | | | 01/01/33 | | | | 450 | | | | 502,695 | |
California (State of) Pollution Control Finance Authority; | | | | | | | | | | | | | | | | |
Series 2012, Water Furnishing RB(b)(f) | | | 5.00 | % | | | 07/01/30 | | | | 3,160 | | | | 3,213,688 | |
Series 2012, Water Furnishing RB(b)(f) | | | 5.00 | % | | | 07/01/37 | | | | 6,955 | | | | 6,907,150 | |
California (State of) School Finance Authority (New Designs Charter School); Series 2012, Educational Facilities RB | | | 5.50 | % | | | 06/01/42 | | | | 2,000 | | | | 1,854,260 | |
California (State of) Statewide Communities Development Authority (Adventist Health System/West); Series 2005 A, Health Facility RB | | | 5.00 | % | | | 03/01/30 | | | | 5,000 | | | | 5,043,000 | |
California (State of) Statewide Communities Development Authority (California Baptist University); Series 2007 A, RB | | | 5.50 | % | | | 11/01/38 | | | | 1,250 | | | | 1,156,338 | |
California (State of) Statewide Communities Development Authority (Enloe Medical Center); Series 2008, RB (INS–Cal-Mortgage)(a) | | | 5.75 | % | | | 08/15/38 | | | | 500 | | | | 526,665 | |
California (State of) Statewide Communities Development Authority (John Muir Health); Series 2006 A, RB | | | 5.00 | % | | | 08/15/32 | | | | 7,000 | | | | 7,141,190 | |
California (State of) Statewide Communities Development Authority (Methodist Hospital); Series 2009, RB (CEP–FHA) | | | 6.25 | % | | | 08/01/24 | | | | 1,720 | | | | 2,058,066 | |
California (State of) Statewide Communities Development Authority (Pooled Financing Program); Series 2004 A, Water & Wastewater RB(c) | | | 5.25 | % | | | 10/01/24 | | | | 270 | | | | 273,704 | |
California (State of) Statewide Communities Development Authority (Southern California Presbyterian Homes); | | | | | | | | | | | | | | | | |
Series 2009, Senior Living RB | | | 6.25 | % | | | 11/15/19 | | | | 500 | | | | 557,355 | |
Series 2009, Senior Living RB | | | 6.63 | % | | | 11/15/24 | | | | 2,000 | | | | 2,221,180 | |
California (State of); | | | | | | | | | |
Series 2002, Unlimited Tax GO Bonds | | | 6.00 | % | | | 04/01/19 | | | | 3,500 | | | | 4,349,940 | |
Series 2010, Various Purpose Unlimited Tax GO Bonds | | | 5.50 | % | | | 03/01/40 | | | | 250 | | | | 279,393 | |
Series 2011, Various Purpose Unlimited Tax GO Bonds | | | 5.00 | % | | | 10/01/41 | | | | 5,000 | | | | 5,275,800 | |
Series 2012, Various Purpose Unlimited Tax GO Bonds | | | 5.00 | % | | | 09/01/36 | | | | 5,000 | | | | 5,366,900 | |
Capistrano Unified School District; Series 2005, Community Facilities Special Tax RB (INS–NATL)(a) | | | 5.00 | % | | | 09/01/25 | | | | 5,000 | | | | 5,099,250 | |
Clovis Unified School District (Election of 2004); Series 2004 A, Unlimited Tax CAB GO Bonds (INS–NATL)(a)(g) | | | 0.00 | % | | | 08/01/29 | | | | 1,585 | | | | 779,994 | |
Corona-Norco Unified School District (Election of 2006); Series 2009 C, Unlimited Tax CAB GO Bonds (INS–AGM)(a)(g) | | | 0.00 | % | | | 08/01/39 | | | | 1,000 | | | | 272,570 | |
Earlimart School District; Series 1994 1, Unlimited Tax GO Bonds (INS–AMBAC)(a) | | | 6.70 | % | | | 08/01/21 | | | | 425 | | | | 502,533 | |
El Centro (City of) Financing Authority; Series 2006 A, Wastewater RB (INS–AGM)(a) | | | 5.00 | % | | | 10/01/26 | | | | 2,000 | | | | 2,191,160 | |
El Segundo Unified School District (Election of 2008); | | | | | | | | | |
Series 2009 A, Unlimited Tax CAB GO Bonds(g) | | | 0.00 | % | | | 08/01/32 | | | | 5,030 | | | | 1,995,954 | |
Series 2009 A, Unlimited Tax CAB GO Bonds(g) | | | 0.00 | % | | | 08/01/33 | | | | 4,185 | | | | 1,561,549 | |
Folsom (City of) Public Financing Authority; Series 2007 A, Special Tax RB (INS–AMBAC)(a) | | | 5.00 | % | | | 09/01/28 | | | | 1,000 | | | | 1,011,310 | |
Golden State Tobacco Securitization Corp.; | | | | | | | | | |
Series 2005 A, Enhanced Tobacco Settlement Asset-Backed RB | | | 5.00 | % | | | 06/01/45 | | | | 1,500 | | | | 1,486,995 | |
Series 2007 A-1, Sr. Tobacco Settlement Asset-Backed RB | | | 5.00 | % | | | 06/01/33 | | | | 4,000 | | | | 3,192,760 | |
Golden West Schools Financing Authority; Series 1999 A, Ref. RB (INS–NATL)(a) | | | 5.75 | % | | | 08/01/19 | | | | 265 | | | | 312,008 | |
Hacienda La Puente Unified School District Facilities Financing Authority (Unified School District GO Bond Program); Series 2007, RB (INS–AGM)(a) | | | 5.00 | % | | | 08/01/26 | | | | 2,000 | | | | 2,272,920 | |
Hayward Unified School District (Election of 2008); Series 2010 A, Unlimited Tax CAB GO Bonds (INS–AGM)(a)(g) | | | 0.00 | % | | | 08/01/34 | | | | 1,500 | | | | 509,205 | |
Lancaster (City of) Redevelopment Agency (Combined Redevelopment Areas); Series 2009, Tax Allocation RB | | | 6.50 | % | | | 08/01/29 | | | | 2,000 | | | | 2,153,200 | |
Long Beach Unified School District (Election of 2008); Series 2009 A, Unlimited Tax GO Bonds | | | 5.75 | % | | | 08/01/33 | | | | 5,000 | | | | 5,751,300 | |
Los Angeles (City of) Department of Water & Power; Subseries 2008 A-1, Power System RB(e) | | | 5.25 | % | | | 07/01/38 | | | | 2,000 | | | | 2,234,080 | |
Los Angeles (City of) Harbor Department; Series 2009 C, Ref. RB | | | 5.00 | % | | | 08/01/31 | | | | 1,500 | | | | 1,655,055 | |
Los Angeles Unified School District (Election of 2002); Series 2007 B, Unlimited Tax GO Bonds (INS–AMBAC)(a) | | | 4.50 | % | | | 07/01/26 | | | | 2,000 | | | | 2,207,000 | |
See accompanying Notes to Financial Statements which are an integral part of the financial statements.
11 Invesco Municipal Income Fund
| | | | | | | | | | | | | | | | |
| | | Interest
Rate | | | Maturity
Date | | | Principal
Amount
(000) | | | Value | |
| California–(continued) | | | | | | | | | | | | | | | | |
Los Angeles Unified School District (Election of 2004); Series 2009 I, Unlimited Tax GO Bonds | | | 5.00 | % | | | 07/01/29 | | | $ | 3,000 | | | $ | 3,378,510 | |
Menifee Union School District (Election of 2008); Series 2009 C, Unlimited Tax CAB GO Bonds (INS–AGC)(a)(g) | | | 0.00 | % | | | 08/01/35 | | | | 3,260 | | | | 1,044,211 | |
Norco (City of) Financing Authority; Series 2009, Ref. Enterprise RB (INS–AGM)(a) | | | 5.63 | % | | | 10/01/34 | | | | 1,500 | | | | 1,622,160 | |
Oakland (Port of); | | | | | | | | | |
Series 2007 A, Ref. Intermediate Lien RB (INS–NATL)(a)(b) | | | 5.00 | % | | | 11/01/29 | | | | 4,000 | | | | 4,245,040 | |
Series 2012 P, Ref. Sr. Lien RB(b) | | | 5.00 | % | | | 05/01/28 | | | | 2,000 | | | | 2,157,720 | |
Oceanside Unified School District; Series 2009 A, Unlimited Tax GO Bonds (INS–AGC)(a) | | | 5.25 | % | | | 08/01/33 | | | | 775 | | | | 824,081 | |
Palomar Pomerado Health (Election of 2004); Series 2005 A, Unlimited Tax GO Bonds
(INS–AMBAC)(a) | | | 5.00 | % | | | 08/01/26 | | | | 1,080 | | | | 1,135,393 | |
Patterson Joint Unified School District (Election of 2008); | | | | | | | | | |
Series 2009 B, Unlimited Tax CAB GO Bonds (INS–AGM)(a)(g) | | | 0.00 | % | | | 08/01/37 | | | | 1,170 | | | | 347,911 | |
Series 2009 B, Unlimited Tax CAB GO Bonds (INS–AGM)(a)(g) | | | 0.00 | % | | | 08/01/38 | | | | 4,770 | | | | 1,334,074 | |
Series 2009 B, Unlimited Tax CAB GO Bonds (INS–AGM)(a)(g) | | | 0.00 | % | | | 08/01/39 | | | | 5,010 | | | | 1,310,366 | |
Series 2009 B, Unlimited Tax CAB GO Bonds (INS–AGM)(a)(g) | | | 0.00 | % | | | 08/01/40 | | | | 5,260 | | | | 1,295,012 | |
Series 2009 B, Unlimited Tax CAB GO Bonds (INS–AGM)(a)(g) | | | 0.00 | % | | | 08/01/41 | | | | 5,520 | | | | 1,281,965 | |
Pittsburg Unified School District (Election of 2006); Series 2009 B, Unlimited Tax GO Bonds
(INS–AGM)(a) | | | 5.50 | % | | | 08/01/31 | | | | 2,420 | | | | 2,712,239 | |
Placentia-Yorba Linda Unified School District (Election of 2008); Series 2011 D, Unlimited Tax CAB GO Bonds(g) | | | 0.00 | % | | | 08/01/35 | | | | 1,500 | | | | 502,920 | |
Poway Unified School District (Community Facilities District No. 6); Series 2007, Special Tax RB
(INS-AMBAC)(a) | | | 5.00 | % | | | 09/01/35 | | | | 5,000 | | | | 5,071,350 | |
Redlands Unified School District (Election of 2008); Series 2008, Unlimited Tax GO Bonds (INS–AGM)(a) | | | 5.00 | % | | | 07/01/25 | | | | 1,415 | | | | 1,594,082 | |
Redondo Beach Unified School District (Election of 2008); Series 2008 A, Unlimited Tax GO Bonds (INS–AGM)(a) | | | 5.13 | % | | | 08/01/37 | | | | 2,000 | | | | 2,162,780 | |
Regents of the University of California; | | | | | | | | | |
Series 2009 O, General RB | | | 5.25 | % | | | 05/15/39 | | | | 500 | | | | 560,685 | |
Series 2009 O, General RB(e) | | | 5.75 | % | | | 05/15/23 | | | | 5,570 | | | | 6,631,642 | |
Series 2009 O, General RB(e) | | | 5.75 | % | | | 05/15/25 | | | | 8,205 | | | | 9,768,873 | |
Richmond (City of) Joint Powers Financing Authority (Point Potrero); Series 2009 A, Lease RB | | | 6.25 | % | | | 07/01/24 | | | | 2,500 | | | | 2,822,450 | |
Riverside (City of); Series 2008 D, Electric RB (INS–AGM)(a) | | | 5.00 | % | | | 10/01/38 | | | | 6,335 | | | | 6,656,438 | |
Riverside (County of) Transportation Commission; Series 2013 A, Sr. Lien Toll RB | | | 5.75 | % | | | 06/01/44 | | | | 2,500 | | | | 2,597,000 | |
Sacramento (County of); | | | | | | | | | |
Series 2009 B, Sr. Airport System RB (INS–AGC)(a) | | | 5.50 | % | | | 07/01/34 | | | | 1,500 | | | | 1,678,440 | |
Series 2010, Sr. Airport System RB | | | 5.00 | % | | | 07/01/40 | | | | 4,300 | | | | 4,420,787 | |
San Bernardino Community College District (Election of 2008); Series 2008 A, Unlimited Tax GO Bonds(c)(d) | | | 6.50 | % | | | 08/01/18 | | | | 525 | | | | 654,659 | |
San Buenaventura (City of) (Community Memorial Health System); | | | | | | | | | |
Series 2011, RB | | | 6.25 | % | | | 12/01/20 | | | | 1,000 | | | | 1,154,740 | |
Series 2011, RB | | | 6.50 | % | | | 12/01/21 | | | | 2,000 | | | | 2,345,820 | |
Series 2011, RB | | | 6.50 | % | | | 12/01/22 | | | | 2,000 | | | | 2,296,740 | |
San Diego Community College District (Election of 2002); Series 2009, Unlimited Tax GO Bonds(e) | | | 5.25 | % | | | 08/01/33 | | | | 7,500 | | | | 8,483,625 | |
San Francisco (City & County of) Airport Commission (San Francisco International Airport); Series 2011 C, Ref. Second Series RB(b) | | | 5.00 | % | | | 05/01/23 | | | | 10,000 | | | | 11,313,400 | |
San Francisco (City & County of) Redevelopment Financing Authority (Mission Bay South Redevelopment); Series 2009 D, Tax Allocation RB | | | 6.00 | % | | | 08/01/24 | | | | 1,000 | | | | 1,101,110 | |
San Joaquin (County of) Transportation Authority (Measure K); Series 2011 A, Limited Sales Tax RB | | | 5.25 | % | | | 03/01/31 | | | | 1,500 | | | | 1,654,545 | |
San Jose (City of); | | | | | | | | | |
Series 2011 A-1, Airport RB(b) | | | 5.25 | % | | | 03/01/26 | | | | 2,730 | | | | 3,007,477 | |
Series 2011 A-1, Airport RB(b) | | | 6.25 | % | | | 03/01/34 | | | | 2,500 | | | | 2,840,275 | |
San Marcos (City of) Public Facilities Authority; Series 2006 A, Ref. Tax Increment Pass-Through RB (INS–AMBAC)(a) | | | 5.00 | % | | | 10/01/31 | | | | 5,140 | | | | 5,185,078 | |
Santa Margarita Water District (Community Facilities District No. 2013-1); Series 2013, Special Tax RB | | | 5.38 | % | | | 09/01/29 | | | | 2,530 | | | | 2,620,447 | |
South Orange (County of) Public Financing Authority (Ladera Ranch); Series 2005 A, Special Tax RB (INS–AMBAC)(a) | | | 5.00 | % | | | 08/15/27 | | | | 5,380 | | | | 5,481,790 | |
See accompanying Notes to Financial Statements which are an integral part of the financial statements.
12 Invesco Municipal Income Fund
| | | | | | | | | | | | | | | | |
| | | Interest
Rate | | | Maturity
Date | | | Principal
Amount
(000) | | | Value | |
| California–(continued) | | | | | | | | | | | | | | | | |
South Tahoe Joint Powers Financing Authority (South Tahoe Redevelopment Project Area No. 1); Series 2005 A, Ref. RB (INS–AMBAC)(a) | | | 5.00 | % | | | 10/01/35 | | | $ | 2,000 | | | $ | 1,929,520 | |
Southern California Metropolitan Water District; Series 2005 A, RB (INS–AGM)(a) | | | 5.00 | % | | | 07/01/35 | | | | 2,000 | | | | 2,101,680 | |
Southern California Public Power Authority (Mead-Adelanto); Series 1994 A, RB (INS–AMBAC)(a)(h) | | | 9.62 | % | | | 07/01/15 | | | | 9,000 | | | | 9,607,320 | |
Torrance Unified School District (Election of 2008-Measure Z); Series 2009 B-1, Unlimited Tax CAB GO Bonds(g) | | | 0.00 | % | | | 08/01/26 | | | | 1,250 | | | | 750,275 | |
Vernon (City of); Series 2009 A, Electric System RB | | | 5.13 | % | | | 08/01/21 | | | | 3,000 | | | | 3,312,450 | |
West Contra Costa Unified School District; Series 2005, Unlimited Tax CAB GO Bonds
(INS–NATL)(a)(g) | | | 0.00 | % | | | 08/01/27 | | | | 7,865 | | | | 4,070,216 | |
Western Riverside (County of) Water & Wastewater Financing Authority (Eastern Municipal Water District Improvement); Series 2009, RB (INS–AGC)(a) | | | 5.50 | % | | | 09/01/34 | | | | 1,000 | | | | 1,072,220 | |
Yosemite Community College District (Election of 2004); Series 2008 C, Unlimited Tax CAB GO Bonds (INS–AGM)(a)(g) | | | 0.00 | % | | | 08/01/24 | | | | 3,570 | | | | 2,431,456 | |
Yuba (County of) Levee Financing Authority; Series 2008 A, RB (INS–AGC)(a) | | | 5.00 | % | | | 09/01/33 | | | | 1,500 | | | | 1,585,965 | |
| | | | | 262,600,382 | |
| | | | |
| Colorado–1.70% | | | | | | | | | | | | | | | | |
Colorado (State of) Educational & Cultural Facilities Authority (Challenge to Excellence Charter School); Series 2007, Ref. Charter School RB (INS–AGC)(a) | | | 5.00 | % | | | 06/01/37 | | | | 1,070 | | | | 1,092,641 | |
Colorado (State of) Health Facilities Authority (Evangelical Lutheran); Series 2004 A, RB | | | 5.25 | % | | | 06/01/34 | | | | 1,000 | | | | 1,001,150 | |
Colorado (State of) Health Facilities Authority (The Evangelical Lutheran Good Samaritan Society); Series 2013, RB | | | 5.63 | % | | | 06/01/43 | | | | 2,500 | | | | 2,629,600 | |
Colorado (State of) Regional Transportation District (Denver Transit Partners Eagle P3); | | | | | | | | | | | | | | | | |
Series 2010, Private Activity RB | | | 6.00 | % | | | 01/15/41 | | | | 2,650 | | | | 2,787,164 | |
Series 2010, Private Activity RB | | | 6.50 | % | | | 01/15/30 | | | | 2,400 | | | | 2,639,784 | |
Colorado (State of) Water Resources & Power Development Authority (City of Fountain Electric, Water & Wastewater Utility Enterprise); | | | | | | | | | | | | | | | | |
Series 2009 A, Water Resource RB (INS–AGC)(a) | | | 5.13 | % | | | 12/01/30 | | | | 400 | | | | 437,560 | |
Series 2009 A, Water Resource RB (INS–AGC)(a) | | | 5.25 | % | | | 12/01/38 | | | | 525 | | | | 564,323 | |
Colorado Springs (City of); | | | | | | | | | | | | | | | | |
Series 2002, Hospital RB(c)(d) | | | 5.25 | % | | | 12/15/18 | | | | 3,375 | | | | 4,048,346 | |
Series 2002, Hospital RB(c)(d) | | | 5.25 | % | | | 12/15/18 | | | | 3,530 | | | | 4,234,270 | |
Series 2010 D-1, Utilities System RB | | | 5.25 | % | | | 11/15/33 | | | | 1,000 | | | | 1,127,750 | |
Denver (City & County of) (Justice System); | | | | | | | | | | | | | | | | |
Series 2008, Unlimited Tax GO Bonds(e) | | | 5.00 | % | | | 08/01/24 | | | | 6,000 | | | | 6,895,440 | |
Series 2008, Unlimited Tax GO Bonds(e) | | | 5.00 | % | | | 08/01/25 | | | | 1,500 | | | | 1,722,720 | |
Denver (City of) Convention Center Hotel Authority; Series 2006, Ref. Sr. RB (INS–SGI)(a) | | | 5.00 | % | | | 12/01/35 | | | | 5,680 | | | | 5,715,614 | |
Denver (City of) Health & Hospital Authority; Series 2004 A, Ref. Health Care RB(c)(d) | | | 6.25 | % | | | 12/01/14 | | | | 750 | | | | 784,875 | |
Montezuma (County of) Hospital District; Series 2007, Ref. RB | | | 5.90 | % | | | 10/01/37 | | | | 500 | | | | 471,475 | |
University of Colorado; Series 2009 A, Enterprise System RB | | | 5.25 | % | | | 06/01/30 | | | | 1,075 | | | | 1,207,902 | |
| | | | | 37,360,614 | |
| | | | |
| Connecticut–1.05% | | | | | | | | | | | | | | | | |
Connecticut (State of) (Bradley International Airport); Series 2000 A, Special Obligation Parking RB (INS–ACA)(a)(b) | | | 6.60 | % | | | 07/01/24 | | | | 1,000 | | | | 1,003,290 | |
Connecticut (State of) Development Authority (Aquarion Water Co.); Series 2011, Water Facilities RB(b) | | | 5.50 | % | | | 04/01/21 | | | | 3,000 | | | | 3,403,140 | |
Connecticut (State of) Health & Educational Facilities Authority (Hartford Healthcare); | | | | | | | | | | | | | | | | |
Series 2011 A, RB | | | 5.00 | % | | | 07/01/26 | | | | 1,000 | | | | 1,072,240 | |
Series 2011 A, RB | | | 5.00 | % | | | 07/01/41 | | | | 5,700 | | | | 5,783,562 | |
Connecticut (State of) Health & Educational Facilities Authority (Quinnipiac University); | | | | | | | | | | | | | | | | |
Series 2007 J, RB (INS–NATL)(a) | | | 5.75 | % | | | 07/01/33 | | | | 1,000 | | | | 1,119,130 | |
Series 2007 K-2, RB (INS–NATL)(a) | | | 5.00 | % | | | 07/01/23 | | | | 1,100 | | | | 1,221,759 | |
Connecticut (State of) Health & Educational Facilities Authority (Western Connecticut Health Network); Series 2011 M, RB | | | 5.38 | % | | | 07/01/41 | | | | 5,000 | | | | 5,264,250 | |
Hamden (Town of) (Whitney Center); Series 2009 C, RB(d) | | | 7.25 | % | | | 01/01/16 | | | | 1,000 | | | | 1,017,630 | |
See accompanying Notes to Financial Statements which are an integral part of the financial statements.
13 Invesco Municipal Income Fund
| | | | | | | | | | | | | | | | |
| | | Interest
Rate | | | Maturity
Date | | | Principal
Amount
(000) | | | Value | |
| Connecticut–(continued) | | | | | | | | | | | | | | | | |
Harbor Point Infrastructure Improvement District (Harbor Point); Series 2010 A, Special Obligation Tax Allocation RB | | | 7.88 | % | | | 04/01/39 | | | $ | 3,000 | | | $ | 3,318,930 | |
| | | | | 23,203,931 | |
| | | | |
| Delaware–0.08% | | | | | | | | | | | | | | | | |
Delaware (State of) Economic Development Authority (Delmarva Power & Light Co.); Series 2010, Ref. Gas Facilities RB | | | 5.40 | % | | | 02/01/31 | | | | 1,050 | | | | 1,131,480 | |
New Castle (County of) (Newark Charter School, Inc.); Series 2006, RB | | | 5.00 | % | | | 09/01/22 | | | | 630 | | | | 649,524 | |
| | | | | 1,781,004 | |
| | | | |
| District of Columbia–2.26% | | | | | | | | | | | | | | | | |
District of Columbia (Center for Strategic & International Studies, Inc.); | | | | | | | | | | | | | | | | |
Series 2011, RB | | | 6.38 | % | | | 03/01/31 | | | | 2,980 | | | | 3,046,573 | |
Series 2011, RB | | | 6.63 | % | | | 03/01/41 | | | | 1,100 | | | | 1,133,792 | |
District of Columbia (National Public Radio, Inc.); Series 2010 A, RB(c)(d) | | | 5.00 | % | | | 04/01/15 | | | | 1,205 | | | | 1,268,383 | |
District of Columbia (Sibley Memorial Hospital); Series 2009, Hospital RB | | | 6.38 | % | | | 10/01/34 | | | | 2,200 | | | | 2,409,770 | |
District of Columbia Water & Sewer Authority; Series 2007 A, Public Utility Sub. Lien RB (INS–AGM)(a) | | | 5.50 | % | | | 10/01/41 | | | | 4,000 | | | | 4,407,120 | |
District of Columbia; | | | | | | | | | | | | | | | | |
Series 2006 B-1, Ballpark RB (INS–NATL)(a) | | | 5.00 | % | | | 02/01/31 | | | | 12,000 | | | | 12,143,280 | |
Series 2009 A, Sec. Income Tax RB(e) | | | 5.00 | % | | | 12/01/23 | | | | 10,715 | | | | 12,439,044 | |
Series 2009 A, Sec. Income Tax RB(e) | | | 5.25 | % | | | 12/01/27 | | | | 6,860 | | | | 7,926,661 | |
Series 2009 B, Ref. Sec. Income Tax RB(e) | | | 5.00 | % | | | 12/01/24 | | | | 4,285 | | | | 4,964,344 | |
| | | | | 49,738,967 | |
| | | | |
| Florida–6.69% | | | | | | | | | | | | | | | | |
Alachua (County of) (North Florida Retirement Village, Inc.); | | | | | | | | | | | | | | | | |
Series 2007, IDR | | | 5.25 | % | | | 11/15/17 | | | | 1,000 | | | | 1,043,560 | |
Series 2007, IDR | | | 5.88 | % | | | 11/15/36 | | | | 1,000 | | | | 926,780 | |
Broward (County of); Series 2009 A, Water & Sewer Utility RB | | | 5.13 | % | | | 10/01/28 | | | | 1,500 | | | | 1,688,670 | |
Citizens Property Insurance Corp. (Coastal Account); Series 2011 A-1, Sr. Sec. RB | | | 5.00 | % | | | 06/01/20 | | | | 3,000 | | | | 3,478,860 | |
Collier (County of) Industrial Development Authority (The Arlington of Naples); | | | | | | | | | | | | | | | | |
Series 2014 A, Continuing Care Community RB(f) | | | 7.25 | % | | | 05/15/26 | | | | 1,000 | | | | 1,019,340 | |
Series 2014 A, Continuing Care Community RB(f) | | | 7.75 | % | | | 05/15/35 | | | | 2,500 | | | | 2,503,025 | |
Series 2014 B-2, TEMPS-70SMsm Continuing Care Community RB(f) | | | 6.50 | % | | | 05/15/20 | | | | 2,400 | | | | 2,403,024 | |
Crossings at Fleming Island Community Development District; Series 2000 B, Ref. Special Assessment RB (INS–NATL)(a) | | | 5.80 | % | | | 05/01/16 | | | | 575 | | | | 571,458 | |
Davie (Town of) (Nova Southeastern University); Series 2013 A, Educational Facilities RB | | | 6.00 | % | | | 04/01/42 | | | | 3,250 | | | | 3,471,487 | |
Escambia (County of) Health Facilities Authority (Florida Health Care Facility Loan Veterans Health Administration Program); Series 2000, RB (INS–AMBAC)(a) | | | 5.95 | % | | | 07/01/20 | | | | 420 | | | | 451,307 | |
Florida (State of) Board of Education; Series 2007 A, Ref. Public Education Capital Outlay Unlimited Tax GO Bonds | | | 5.00 | % | | | 06/01/19 | | | | 3,715 | | | | 4,115,440 | |
Florida (State of) Department of Transportation; | | | | | | | | | | | | | | | | |
Series 2008 A, Ref. Turnpike RB(e) | | | 5.00 | % | | | 07/01/26 | | | | 1,305 | | | | 1,484,020 | |
Series 2008 A, Ref. Turnpike RB(e) | | | 5.00 | % | | | 07/01/27 | | | | 1,325 | | | | 1,472,314 | |
Series 2008 A, Ref. Turnpike RB(e) | | | 5.00 | % | | | 07/01/28 | | | | 1,440 | | | | 1,598,112 | |
Series 2008 A, Ref. Turnpike RB(e) | | | 5.00 | % | | | 07/01/32 | | | | 2,500 | | | | 2,749,225 | |
Florida (State of) Higher Educational Facilities Financial Authority (Rollins College); Series 2010, RB | | | 5.00 | % | | | 12/01/37 | | | | 2,250 | | | | 2,347,402 | |
Florida (State of) Mid-Bay Bridge Authority; | | | | | | | | | | | | | | | | |
Series 1991 A, RB(c) | | | 6.88 | % | | | 10/01/22 | | | | 2,500 | | | | 3,264,175 | |
Series 2008 A, Ref. RB (INS–AGC)(a) | | | 5.00 | % | | | 10/01/27 | | | | 1,840 | | | | 1,909,773 | |
Florida Housing Finance Corp. (Homeowner Mortgage); | | | | | | | | | | | | | | | | |
Series 2008 1, RB (CEP–GNMA)(b) | | | 5.80 | % | | | 07/01/28 | | | | 770 | | | | 793,293 | |
Series 2008 1, RB (CEP–GNMA)(b) | | | 6.00 | % | | | 07/01/39 | | | | 470 | | | | 492,833 | |
See accompanying Notes to Financial Statements which are an integral part of the financial statements.
14 Invesco Municipal Income Fund
| | | | | | | | | | | | | | | | |
| | | Interest
Rate | | | Maturity
Date | | | Principal
Amount
(000) | | | Value | |
| Florida–(continued) | | | | | | | | | | | | | | | | |
Highlands (County of) Health Facilities Authority (Adventist Health System/Sunbelt Obligated Group); | | | | | | | | | | | | | | | | |
Series 2006 C, RB(c)(d) | | | 5.25 | % | | | 11/15/16 | | | $ | 100 | | | $ | 112,940 | |
Series 2006 C, RB | | | 5.25 | % | | | 11/15/36 | | | | 3,900 | | | | 4,121,130 | |
Hillsborough (County of) Aviation Authority; Series 2008 A, RB (INS–AGC)(a)(b) | | | 5.38 | % | | | 10/01/33 | | | | 2,500 | | | | 2,734,100 | |
Martin (County of) Health Facilities Authority (Martin Memorial Medical Center); Series 2012, RB | | | 5.50 | % | | | 11/15/42 | | | | 6,500 | | | | 6,642,740 | |
Miami (City of); Series 2009, Ref. Parking System RB (INS–AGC)(a) | | | 5.00 | % | | | 10/01/34 | | | | 500 | | | | 517,590 | |
Miami-Dade (County of) (Building Better Communities Program); Series 2009 B-1, Unlimited Tax GO Bonds | | | 5.38 | % | | | 07/01/29 | | | | 1,000 | | | | 1,118,430 | |
Miami-Dade (County of) (Jackson Health System); | | | | | | | | | | | | | | | | |
Series 2009, Public Facilities RB (INS–AGC)(a) | | | 5.63 | % | | | 06/01/34 | | | | 1,000 | | | | 1,055,430 | |
Series 2009, Public Facilities RB (INS–AGC)(a) | | | 5.75 | % | | | 06/01/39 | | | | 775 | | | | 817,261 | |
Miami-Dade (County of) (Miami International Airport); | | | | | | | | | | | | | | | | |
Series 2005, Aviation RB (INS–AGC)(a)(b) | | | 5.00 | % | | | 10/01/38 | | | | 16,100 | | | | 16,183,559 | |
Series 2010 A, Aviation RB | | | 5.38 | % | | | 10/01/35 | | | | 3,105 | | | | 3,312,135 | |
Miami-Dade (County of) Educational Facilities Authority (University of Miami); Series 2008 A, RB (INS–BHAC)(a) | | | 5.50 | % | | | 04/01/38 | | | | 4,000 | | | | 4,261,120 | |
Miami-Dade (County of) Expressway Authority; Series 2010 A, Ref. Toll System RB
(INS–AGM)(a) | | | 5.00 | % | | | 07/01/35 | | | | 3,350 | | | | 3,511,905 | |
Miami-Dade (County of) School Board; Series 2008 B, COP (INS–AGC)(a) | | | 5.25 | % | | | 05/01/26 | | | | 5,000 | | | | 5,550,100 | |
Miami-Dade (County of); | | | | | | | | | | | | | | | | |
Series 2005 B, Sub. Special Obligation RB (INS–NATL)(a) | | | 5.00 | % | | | 10/01/35 | | | | 2,500 | | | | 2,591,600 | |
Series 2009 C, Professional Sports Franchise Facility Tax RB (INS–AGC)(a) | | | 5.75 | % | | | 10/01/39 | | | | 550 | | | | 592,779 | |
Series 2010, Water & Sewer System RB (INS–AGM)(a) | | | 5.00 | % | | | 10/01/39 | | | | 4,500 | | | | 4,730,355 | |
Series 2010 B, Aviation RB (INS–AGM)(a) | | | 5.00 | % | | | 10/01/35 | | | | 1,205 | | | | 1,253,971 | |
Series 2012 A, Ref. Aviation RB(b) | | | 5.00 | % | | | 10/01/30 | | | | 2,000 | | | | 2,093,020 | |
Series 2012 B, Ref. Sub. Special Obligation RB (INS–AGM)(a) | | | 5.00 | % | | | 10/01/35 | | | | 3,800 | | | | 4,010,216 | |
Palm Beach (County of) Health Facilities Authority (Bethesda Health Care System, Inc.); Series 2010 A, RB (INS–AGM)(a) | | | 5.00 | % | | | 07/01/30 | | | | 625 | | | | 660,388 | |
Palm Beach (County of) Health Facilities Authority (The Waterford); | | | | | | | | | | | | | | | | |
Series 2007, RB | | | 5.25 | % | | | 11/15/17 | | | | 1,540 | | | | 1,660,289 | |
Series 2007, RB | | | 5.88 | % | | | 11/15/37 | | | | 800 | | | | 810,816 | |
Port St. Lucie (City of); Series 2009, Ref. Utility System RB (INS–AGC)(a) | | | 5.00 | % | | | 09/01/35 | | | | 1,500 | | | | 1,610,760 | |
Putnam (County of) Development Authority (Seminole Electric Cooperative); Series 2007 A, Ref. PCR (INS–AMBAC)(a)(d) | | | 5.35 | % | | | 05/01/18 | | | | 5,200 | | | | 5,993,208 | |
Reunion East Community Development District; Series 2005, Special Assessment RB(i) | | | 5.80 | % | | | 05/01/36 | | | | 490 | | | | 340,795 | |
Seminole Indian Tribe of Florida; | | | | | | | | | | | | | | | | |
Series 2007 A, Special Obligation RB(f) | | | 5.25 | % | | | 10/01/27 | | | | 3,500 | | | | 3,637,515 | |
Series 2007 A, Special Obligation RB(f) | | | 5.75 | % | | | 10/01/22 | | | | 500 | | | | 533,205 | |
Seven Oaks Community Development District II; Series 2003 A, Special Assessment RB | | | 6.40 | % | | | 05/01/34 | | | | 1,310 | | | | 1,183,781 | |
South Miami (City of) Health Facilities Authority (Baptist Health South Florida Obligated Group); Series 2007, Hospital RB(e) | | | 5.00 | % | | | 08/15/42 | | | | 18,000 | | | | 18,299,880 | |
Sunrise (City of); | | | | | | | | | | | | | | | | |
Series 1998, Ref. Utility System RB(c)(d) | | | 5.20 | % | | | 10/01/20 | | | | 1,725 | | | | 2,048,110 | |
Series 1998, Ref. Utility System RB (INS–AMBAC)(a) | | | 5.00 | % | | | 10/01/28 | | | | 1,150 | | | | 1,216,297 | |
Series 1998, Ref. Utility System RB (INS–AMBAC)(a) | | | 5.20 | % | | | 10/01/22 | | | | 2,275 | | | | 2,510,986 | |
Tampa Bay Water; Series 2001 A, Ref. & Improvement Utility System RB (INS–NATL)(a) | | | 6.00 | % | | | 10/01/29 | | | | 3,000 | | | | 3,834,540 | |
| | | | | 147,335,049 | |
| | | | |
| Georgia–2.24% | | | | | | | | | | | | | | | | |
Atkinson & Coffee (Counties of) Joint Development Authority (SGC Real Estate Foundation II LLC); Series 2009, RB (INS–AGC)(a) | | | 5.25 | % | | | 06/01/34 | | | | 1,000 | | | | 1,060,390 | |
Atlanta (City of) (Atlantic Station); | | | | | | | | | | | | | | | | |
Series 2007, Ref. Tax Allocation RB (INS–AGC)(a) | | | 5.25 | % | | | 12/01/21 | | | | 1,370 | | | | 1,478,381 | |
Series 2007, Ref. Tax Allocation RB (INS–AGC)(a) | | | 5.25 | % | | | 12/01/22 | | | | 1,000 | | | | 1,071,780 | |
Atlanta (City of) (Beltline); Series 2009 B, Tax Allocation RB | | | 7.38 | % | | | 01/01/31 | | | | 4,810 | | | | 5,618,032 | |
See accompanying Notes to Financial Statements which are an integral part of the financial statements.
15 Invesco Municipal Income Fund
| | | | | | | | | | | | | | | | |
| | | Interest
Rate | | | Maturity
Date | | | Principal
Amount
(000) | | | Value | |
| Georgia–(continued) | |
Atlanta (City of) (Eastside); Series 2005 B, Tax Allocation RB | | | 5.60 | % | | | 01/01/30 | | | $ | 2,500 | | | $ | 2,613,925 | |
Atlanta (City of); | | | | | | | | | | | | | | | | |
Series 2004 C, Airport Passenger Facility Charge & Sub. Lien General RB (INS–AGM)(a) | | | 5.00 | % | | | 01/01/33 | | | | 4,000 | | | | 4,054,960 | |
Series 2004 J, Airport Passenger Facility Charge & Sub. Lien General RB (INS–AGM)(a) | | | 5.00 | % | | | 01/01/34 | | | | 3,000 | | | | 3,089,100 | |
Series 2009 A, Water & Wastewater RB | | | 6.00 | % | | | 11/01/27 | | | | 1,000 | | | | 1,201,350 | |
Series 2009 A, Water & Wastewater RB | | | 6.00 | % | | | 11/01/28 | | | | 1,000 | | | | 1,197,610 | |
Series 2009 B, Water & Wastewater RB (INS–AGM)(a) | | | 5.25 | % | | | 11/01/34 | | | | 1,500 | | | | 1,595,445 | |
Series 2009 B, Water & Wastewater RB (INS–AGM)(a) | | | 5.38 | % | | | 11/01/39 | | | | 1,500 | | | | 1,584,600 | |
Series 2010 C, Ref. General Airport RB | | | 5.25 | % | | | 01/01/30 | | | | 1,500 | | | | 1,627,530 | |
Series 2010 C, Ref. General Airport RB | | | 6.00 | % | | | 01/01/30 | | | | 1,000 | | | | 1,161,770 | |
Series 2010 C, Ref. General Airport RB (INS–AGM)(a) | | | 5.25 | % | | | 01/01/30 | | | | 1,500 | | | | 1,635,060 | |
Augusta (City of); Series 2004, Water & Sewerage RB (INS–AGM)(a) | | | 5.25 | % | | | 10/01/39 | | | | 3,000 | | | | 3,072,810 | |
DeKalb (County of) Private Hospital Authority (Children’s Healthcare of Atlanta, Inc.); Series 2009, RAC | | | 5.00 | % | | | 11/15/19 | | | | 600 | | | | 702,822 | |
Gainesville (City of) & Hall (County of) Development Authority (Acts Retirement-Life Community); Series 2009 A-2, Retirement Community RB | | | 6.38 | % | | | 11/15/29 | | | | 700 | | | | 773,584 | |
Georgia (State of) Municipal Electric Authority; | | | | | | | | | | | | | | | | |
Series 1998 Y, Power RB(c) | | | 6.50 | % | | | 01/01/17 | | | | 190 | | | | 204,256 | |
Series 1998 Y, Power RB (INS–NATL)(a) | | | 6.50 | % | | | 01/01/17 | | | | 6,055 | | | | 6,620,234 | |
Gwinnett (County of) Hospital Authority (Gwinnett Hospital System, Inc.); Series 2007 D, RAC
(INS–AGM)(a) | | | 5.50 | % | | | 07/01/34 | | | | 1,000 | | | | 1,055,200 | |
Macon-Bibb (County of) Hospital Authority (Medical Center of Central Georgia, Inc.); Series 2009, RAC | | | 5.00 | % | | | 08/01/32 | | | | 2,000 | | | | 2,107,500 | |
Medical Center Hospital Authority (Columbus Regional Healthcare System, Inc.); Series 2008, RAC (INS–AGC)(a) | | | 6.38 | % | | | 08/01/29 | | | | 2,135 | | | | 2,372,967 | |
Richmond (County of) Hospital Authority (University Health Services, Inc.); Series 2009, RAC | | | 5.25 | % | | | 01/01/29 | | | | 1,500 | | | | 1,586,445 | |
Savannah (City of) Economic Development Authority (SSU Community Development I, LLC); Series 2010, RB (INS–AGC)(a) | | | 5.50 | % | | | 06/15/35 | | | | 1,020 | | | | 1,101,712 | |
Thomasville (City of) Hospital Authority (John D. Archbold Memorial Hospital, Inc.); Series 2010, RAC | | | 5.13 | % | | | 11/01/30 | | | | 750 | | | | 785,085 | |
| | | | | | | | | | | | | | | | 49,372,548 | |
|
| Guam–0.05% | |
Guam (Territory of) Power Authority; Series 2010 A, RB (INS–AGM)(a) | | | 5.00 | % | | | 10/01/37 | | | | 1,100 | | | | 1,128,193 | |
|
| Hawaii–0.44% | |
Hawaii (State of) Department of Budget & Finance (Hawaiian Electric Co., Inc. & Subsidiary); Series 2009, Special Purpose RB | | | 6.50 | % | | | 07/01/39 | | | | 2,000 | | | | 2,184,940 | |
Hawaii (State of) Department of Budget & Finance; | | | | | | | | | | | | | | | | |
Series 2012, Ref. Special Purpose Senior Living RB | | | 5.13 | % | | | 11/15/32 | | | | 1,500 | | | | 1,548,300 | |
Series 2012, Ref. Special Purpose Senior Living RB | | | 5.25 | % | | | 11/15/37 | | | | 1,250 | | | | 1,290,475 | |
Honolulu (City & County of); Series 2009 A, Unlimited Tax GO Bonds(e) | | | 5.25 | % | | | 04/01/29 | | | | 4,120 | | | | 4,700,796 | |
| | | | | | | | | | | | | | | | 9,724,511 | |
|
| Idaho–0.60% | |
Idaho (State of) Health Facilities Authority (St. Luke’s Health System); Series 2008 A, RB | | | 6.50 | % | | | 11/01/23 | | | | 1,000 | | | | 1,132,730 | |
Idaho (State of) Health Facilities Authority (Trinity Health Credit Group); Series 2008 B, Ref. RB | | | 6.13 | % | | | 12/01/28 | | | | 655 | | | | 759,826 | |
Idaho (State of) Health Facilities Authority (Valley Vista Care Corp.); Series 2007, Ref. RB | | | 6.13 | % | | | 11/15/27 | | | | 550 | | | | 555,198 | |
Idaho (State of) Housing & Finance Association (Federal Highway Trust Fund); | | | | | | | | | | | | | | | | |
Series 2008 A, Grant & RAB (INS–AGC)(a) | | | 5.25 | % | | | 07/15/23 | | | | 4,230 | | | | 4,801,685 | |
Series 2008 A, Grant & RAB (INS–AGC)(a) | | | 5.25 | % | | | 07/15/24 | | | | 3,485 | | | | 3,946,588 | |
Idaho (State of) Housing & Finance Association; | | | | | | | | | | | | | | | | |
Series 2008 A, Class II, Single Family Mortgage RB(b) | | | 5.85 | % | | | 07/01/36 | | | | 870 | | | | 883,998 | |
Series 2008 A, Class III, Single Family Mortgage RB(b) | | | 5.70 | % | | | 07/01/28 | | | | 1,110 | | | | 1,140,880 | |
| | | | | | | | | | | | | | | | 13,220,905 | |
See accompanying Notes to Financial Statements which are an integral part of the financial statements.
16 Invesco Municipal Income Fund
| | | | | | | | | | | | | | | | |
| | | Interest
Rate | | | Maturity
Date | | | Principal
Amount
(000) | | | Value | |
| Illinois–13.83% | |
Bartlett (Village of) (Quarry Redevelopment); Series 2007, Ref. Sr. Lien Tax Increment Allocation RB | | | 5.60 | % | | | 01/01/23 | | | $ | 2,250 | | | $ | 2,217,488 | |
Bolingbrook (Village of); Series 2005, Sales Tax RB | | | 6.25 | % | | | 01/01/24 | | | | 1,500 | | | | 1,355,415 | |
Bourbonnais (Village of) (Olivet Nazarene University); Series 2007, Industrial Project RB (INS–Radian)(a) | | | 5.13 | % | | | 11/01/37 | | | | 3,755 | | | | 3,709,076 | |
Chicago (City of) (83rd/Stewart Redevelopment); Series 2013, COP(f) | | | 7.00 | % | | | 01/15/29 | | | | 4,027 | | | | 4,084,103 | |
Chicago (City of) (Cottage View Terrace Apartments); Series 2000 A, FHA/GNMA Collateralized MFH RB (CEP–GNMA)(b) | | | 6.13 | % | | | 02/20/42 | | | | 1,440 | | | | 1,441,742 | |
Chicago (City of) (Diversey/Narragansett); Series 2006, COP | | | 7.46 | % | | | 02/15/26 | | | | 445 | | | | 342,125 | |
Chicago (City of) (Midway Airport); | | | | | | | | | | | | | | | | |
Series 2004 B, Ref. Second Lien RB (INS–AMBAC)(a) | | | 5.00 | % | | | 01/01/21 | | | | 5,925 | | | | 6,141,677 | |
Series 2004 B, Ref. Second Lien RB (INS–AMBAC)(a) | | | 5.00 | % | | | 01/01/22 | | | | 6,220 | | | | 6,445,351 | |
Series 2013 A, Ref. Second Lien RB(b) | | | 5.50 | % | | | 01/01/32 | | | | 5,000 | | | | 5,262,300 | |
Chicago (City of) (O’Hare International Airport); | | | | | | | | | | | | | | | | |
Series 2003 E, Ref. Third Lien General Airport RB (INS–AGC)(a) | | | 5.00 | % | | | 01/01/34 | | | | 5,000 | | | | 5,007,750 | |
Series 2004 A, Ref. Third Lien General Airport RB (INS–AGC)(a) | | | 5.00 | % | | | 01/01/29 | | | | 1,000 | | | | 1,008,350 | |
Series 2005 A, Third Lien General Airport RB (INS–AGC)(a) | | | 5.25 | % | | | 01/01/24 | | | | 6,000 | | | | 6,324,420 | |
Series 2005 A, Third Lien General Airport RB (INS–AGC)(a) | | | 5.25 | % | | | 01/01/26 | | | | 3,855 | | | | 4,075,660 | |
Series 2005 A, Third Lien General Airport RB (INS–NATL)(a) | | | 5.25 | % | | | 01/01/24 | | | | 5,000 | | | | 5,304,900 | |
Series 2008 A, Third Lien General Airport RB (INS–AGM)(a)(e) | | | 5.00 | % | | | 01/01/33 | | | | 3,000 | | | | 3,076,140 | |
Series 2012 B, Ref. Sr. Lien General Airport RB(b) | | | 5.00 | % | | | 01/01/30 | | | | 5,000 | | | | 5,205,250 | |
Chicago (City of) (Roosevelt Square/ABLA Redevelopment); Series 2009 A, Ref. COP | | | 7.13 | % | | | 03/15/22 | | | | 3,184 | | | | 3,184,669 | |
Chicago (City of) Board of Education (School Reform); | | | | | | | | | | | | | | | | |
Series 1998 B-1, Unlimited Tax CAB GO Bonds (INS–NATL)(a)(g) | | | 0.00 | % | | | 12/01/19 | | | | 2,845 | | | | 2,404,622 | |
Series 1999 A, Unlimited Tax CAB GO Bonds (INS–NATL)(a)(g) | | | 0.00 | % | | | 12/01/19 | | | | 1,500 | | | | 1,267,815 | |
Series 1999 A, Unlimited Tax CAB GO Bonds (INS–NATL)(a)(g) | | | 0.00 | % | | | 12/01/25 | | | | 1,020 | | | | 576,402 | |
Chicago (City of) Metropolitan Water Reclamation District; Series 2011 B, Capital Improvement Limited Tax GO Bonds(e) | | | 5.00 | % | | | 12/01/24 | | | | 15,000 | | | | 16,856,700 | |
Chicago (City of) Park District; Series 2008 F, Limited Tax GO Bonds | | | 5.50 | % | | | 01/01/33 | | | | 1,270 | | | | 1,404,252 | |
Chicago (City of) Transit Authority (FTA Section 5309 Fixed Guideway Modernization Formula Funds); Series 2008, Capital Grant Receipts RB (INS–AGC)(a) | | | 5.25 | % | | | 06/01/25 | | | | 4,840 | | | | 5,081,710 | |
Chicago (City of) Transit Authority; Series 2011, Sales Tax Receipts RB(e) | | | 5.25 | % | | | 12/01/36 | | | | 12,000 | | | | 12,691,800 | |
Chicago (City of); | | | | | | | | | | | | | | | | |
Series 2001 A, Ref. Project Unlimited Tax GO Bonds (INS–NATL)(a) | | | 5.38 | % | | | 01/01/17 | | | | 2,000 | | | | 2,190,120 | |
Series 2002 A, Ref. Project Unlimited Tax GO Bonds (INS–AMBAC)(a) | | | 5.63 | % | | | 01/01/39 | | | | 145 | | | | 145,064 | |
Series 2008 A, Unlimited Tax GO Bonds (INS–AGC)(a)(e) | | | 5.25 | % | | | 01/01/24 | | | | 4,200 | | | | 4,560,192 | |
Series 2008 A, Unlimited Tax GO Bonds (INS–AGC)(a)(e) | | | 5.25 | % | | | 01/01/25 | | | | 4,400 | | | | 4,752,352 | |
Series 2011, COP | | | 7.13 | % | | | 05/01/21 | | | | 2,800 | | | | 3,096,436 | |
Series 2011 A, Sales Tax RB | | | 5.00 | % | | | 01/01/41 | | | | 1,000 | | | | 1,033,670 | |
Cook County School District No. 100 (Berwyn South); | | | | | | | | | | | | | | | | |
Series 1997, Unlimited Tax GO Bonds (INS–AGM)(a) | | | 8.10 | % | | | 12/01/16 | | | | 345 | | | | 405,309 | |
Series 1997, Unlimited Tax GO Bonds (INS–AGM)(a) | | | 8.20 | % | | | 12/01/14 | | | | 290 | | | | 305,254 | |
Cook County School District No. 122 (Ridgeland); | | | | | | | | | | | | | | | | |
Series 2000, Unlimited Tax CAB GO Bonds(c)(g) | | | 0.00 | % | | | 12/01/17 | | | | 2,605 | | | | 2,515,544 | |
Series 2000, Unlimited Tax CAB GO Bonds(c)(g) | | | 0.00 | % | | | 12/01/18 | | | | 2,995 | | | | 2,718,591 | |
Series 2000, Unlimited Tax CAB GO Bonds(c)(g) | | | 0.00 | % | | | 12/01/20 | | | | 4,050 | | | | 3,363,930 | |
DeKalb County Community Unit School District No. 428; | | | | | | | | | | | | | | | | |
Series 2008, Unlimited Tax GO Bonds (INS–AGM)(a) | | | 5.00 | % | | | 01/01/26 | | | | 2,600 | | | | 2,861,144 | |
Series 2008, Unlimited Tax GO Bonds (INS–AGM)(a) | | | 5.00 | % | | | 01/01/27 | | | | 990 | | | | 1,082,565 | |
Gilberts (Village of) Special Service Area No. 19 (The Conservancy); Series 2006-1, Special Tax RB(i) | | | 5.38 | % | | | 03/01/16 | | | | 1,000 | | | | 344,940 | |
Huntley (Village of) Special Service Area No. 10; Series 2007, Ref. Special Tax RB (INS–AGC)(a) | | | 5.10 | % | | | 03/01/29 | | | | 3,000 | | | | 3,086,940 | |
Illinois (State of) Department of Central Management Services; Series 1999, COP (INS–NATL)(a) | | | 5.85 | % | | | 07/01/19 | | | | 1,750 | | | | 1,756,965 | |
Illinois (State of) Finance Authority (Advocate Health Care Network); Series 2008 D, RB | | | 6.50 | % | | | 11/01/38 | | | | 1,000 | | | | 1,141,780 | |
Illinois (State of) Finance Authority (Art Institute of Chicago); Series 2009 A, RB | | | 6.00 | % | | | 03/01/38 | | | | 2,500 | | | | 2,729,025 | |
Illinois (State of) Finance Authority (DePaul University); Series 2011 A, RB | | | 6.00 | % | | | 10/01/32 | | | | 1,000 | | | | 1,120,750 | |
See accompanying Notes to Financial Statements which are an integral part of the financial statements.
17 Invesco Municipal Income Fund
| | | | | | | | | | | | | | | | |
| | | Interest
Rate | | | Maturity
Date | | | Principal
Amount
(000) | | | Value | |
| Illinois–(continued) | |
Illinois (State of) Finance Authority (Evangelical Hospitals); | | | | | | | | | | | | | | | | |
Series 1992 A, Ref. RB(c) | | | 6.25 | % | | | 04/15/22 | | | $ | 1,000 | | | $ | 1,233,960 | |
Series 1992 C, RB(c) | | | 6.25 | % | | | 04/15/22 | | | | 1,150 | | | | 1,438,846 | |
Illinois (State of) Finance Authority (Fairview Obligated Group); | | | | | | | | | | | | | | | | |
Series 2008 A, Ref. RB(i) | | | 5.50 | % | | | 08/15/18 | | | | 1,000 | | | | 7,410 | |
Series 2008 A, Ref. RB(i) | | | 6.13 | % | | | 08/15/28 | | | | 1,500 | | | | 11,115 | |
Series 2008 A, Ref. RB(i) | | | 6.00 | % | | | 08/15/22 | | | | 250 | | | | 1,853 | |
Illinois (State of) Finance Authority (Lutheran Home & Services); | | | | | | | | | | | | | | | | |
Series 2012, Ref. RB | | | 5.00 | % | | | 05/15/22 | | | | 2,335 | | | | 2,322,391 | |
Series 2012, Ref. RB | | | 5.50 | % | | | 05/15/27 | | | | 2,250 | | | | 2,222,775 | |
Illinois (State of) Finance Authority (Northwestern Memorial Hospital); | | | | | | | | | | | | | | | | |
Series 2009 A, RB(e) | | | 5.38 | % | | | 08/15/24 | | | | 1,000 | | | | 1,140,320 | |
Series 2009 A, RB(e) | | | 5.75 | % | | | 08/15/30 | | | | 2,000 | | | | 2,243,840 | |
Illinois (State of) Finance Authority (Park Place of Elmhurst); Series 2010 D-2, TEMPS–65SM RB | | | 7.00 | % | | | 11/15/15 | | | | 1,500 | | | | 900,150 | |
Illinois (State of) Finance Authority (Peace Village); Series 2013, RB | | | 6.75 | % | | | 08/15/33 | | | | 2,000 | | | | 2,034,860 | |
Illinois (State of) Finance Authority (Resurrection Health Care Corp.); | | | | | | | | | | | | | | | | |
Series 1999 A, RB (INS–AGM)(a) | | | 5.50 | % | | | 05/15/24 | | | | 12,000 | | | | 13,019,160 | |
Series 1999 B, RB (INS–AGM)(a) | | | 5.00 | % | | | 05/15/17 | | | | 5,100 | | | | 5,579,757 | |
Series 1999 B, RB (INS–AGM)(a) | | | 5.00 | % | | | 05/15/18 | | | | 5,050 | | | | 5,588,279 | |
Series 1999 B, RB (INS–AGM)(a) | | | 5.25 | % | | | 05/15/29 | | | | 3,000 | | | | 3,133,260 | |
Series 2009, Ref. RB | | | 6.13 | % | | | 05/15/25 | | | | 2,870 | | | | 3,165,983 | |
Illinois (State of) Finance Authority (Riverside Health System); Series 2009, RB | | | 6.25 | % | | | 11/15/35 | | | | 2,000 | | | | 2,173,400 | |
Illinois (State of) Finance Authority (Robert Morris College); | | | | | | | | | | | | | | | | |
Series 2000, RB (INS–NATL)(a) | | | 5.75 | % | | | 06/01/20 | | | | 1,305 | | | | 1,308,197 | |
Series 2000, RB (INS–NATL)(a) | | | 5.80 | % | | | 06/01/30 | | | | 1,000 | | | | 1,000,950 | |
Illinois (State of) Finance Authority (Roosevelt University); Series 2007, RB | | | 5.40 | % | | | 04/01/27 | | | | 1,000 | | | | 1,016,000 | |
Illinois (State of) Finance Authority (Rush University Medical Center Obligated Group); Series 2009 A, RB | | | 7.25 | % | | | 11/01/38 | | | | 4,500 | | | | 5,330,655 | |
Illinois (State of) Finance Authority (Sherman Health System); Series 2007 A, RB | | | 5.50 | % | | | 08/01/37 | | | | 3,500 | | | | 3,718,890 | |
Illinois (State of) Finance Authority (Silver Cross Hospital & Medical Centers); Series 2008, Ref. RB | | | 6.00 | % | | | 08/15/23 | | | | 2,745 | | | | 3,005,528 | |
Illinois (State of) Finance Authority (Southern Illinois Healthcare Enterprises, Inc.); Series 2005, RB (INS–AGM)(a) | | | 5.38 | % | | | 03/01/35 | | | | 1,000 | | | | 1,050,450 | |
Illinois (State of) Finance Authority (The Carle Foundation); | | | | | | | | | | | | | | | | |
Series 2011 A, RB | | | 5.75 | % | | | 08/15/34 | | | | 1,000 | | | | 1,091,720 | |
Series 2011 A, RB | | | 6.00 | % | | | 08/15/41 | | | | 4,000 | | | | 4,430,160 | |
Series 2011 A, RB (INS–AGM)(a) | | | 6.00 | % | | | 08/15/41 | | | | 650 | | | | 722,527 | |
Illinois (State of) Metropolitan Pier & Exposition Authority (McCormick Place Expansion); | | | | | | | | | | | | | | | | |
Series 2002 B, Ref. Conv. CAB RB (INS–NATL)(a)(j) | | | 5.65 | % | | | 06/15/22 | | | | 20,000 | | | | 19,551,200 | |
Series 2002 B, Ref. RB (INS–NATL)(a) | | | 5.40 | % | | | 06/15/19 | | | | 9,250 | | | | 10,430,762 | |
Series 2012 A, RB | | | 5.00 | % | | | 06/15/42 | | | | 3,175 | | | | 3,253,867 | |
Illinois (State of) Municipal Electric Agency; Series 2006, Power Supply System RB (INS–NATL)(a) | | | 5.00 | % | | | 02/01/26 | | | | 4,000 | | | | 4,229,000 | |
Illinois (State of) Toll Highway Authority; Series 2013 A, RB(e) | | | 5.00 | % | | | 01/01/38 | | | | 8,000 | | | | 8,333,120 | |
Illinois (State of); | | | | | | | | | | | | | | | | |
Series 1991, Civic Center RB (INS–AMBAC)(a) | | | 6.25 | % | | | 12/15/20 | | | | 2,880 | | | | 3,236,803 | |
Series 2013, Unlimited Tax GO Bonds | | | 5.25 | % | | | 07/01/31 | | | | 4,000 | | | | 4,231,200 | |
Series 2014, Unlimited Tax GO Bonds | | | 5.25 | % | | | 02/01/33 | | | | 2,650 | | | | 2,797,817 | |
Lake County Community Consolidated School District No. 50 (Woodland); Series 2000 B, Unlimited Tax CAB GO Bonds(c)(g) | | | 0.00 | % | | | 12/01/14 | | | | 1,200 | | | | 1,198,176 | |
Lake County Community Unit School District No. 60 (Waukegan); | | | | | | | | | | | | | | | | |
Series 1999 A, Unlimited Tax CAB GO Bonds(c)(g) | | | 0.00 | % | | | 12/01/17 | | | | 2,875 | | | | 2,776,273 | |
Series 1999 A, Unlimited Tax CAB GO Bonds (INS–AGM)(a)(g) | | | 0.00 | % | | | 12/01/17 | | | | 3,915 | | | | 3,647,057 | |
McHenry & Kane Counties Community Consolidated School District No. 158 (Huntley); Series 2000, Unlimited Tax CAB GO Bonds(c)(g) | | | 0.00 | % | | | 01/01/17 | | | | 3,000 | | | | 2,926,890 | |
McHenry (County of) Special Service Area (Wonder Lake Dredging); Series 2010, Special Tax RB | | | 6.50 | % | | | 03/01/30 | | | | 3,820 | | | | 4,074,450 | |
See accompanying Notes to Financial Statements which are an integral part of the financial statements.
18 Invesco Municipal Income Fund
| | | | | | | | | | | | | | | | |
| | | Interest
Rate | | | Maturity
Date | | | Principal
Amount
(000) | | | Value | |
| Illinois–(continued) | |
McHenry County Community High School District No. 154 (Marengo); Series 2001, Unlimited Tax CAB GO Bonds (INS–NATL)(a)(g) | | | 0.00 | % | | | 01/01/16 | | | $ | 1,330 | | | $ | 1,309,984 | |
Northern Illinois University; | | | | | | | | | | | | | | | | |
Series 2011, Ref. Auxiliary Facilities System RB (INS–AGM)(a) | | | 5.25 | % | | | 04/01/28 | | | | 2,000 | | | | 2,137,800 | |
Series 2011, Ref. Auxiliary Facilities System RB (INS–AGM)(a) | | | 5.50 | % | | | 04/01/26 | | | | 2,000 | | | | 2,189,560 | |
Plano (City of) Special Service Area No. 10 (Lakewood Springs Club); Series 2007, Special
Tax RB(i) | | | 5.00 | % | | | 03/01/37 | | | | 1,500 | | | | 499,545 | |
Railsplitter Tobacco Settlement Authority; | | | | | | | | | | | | | | | | |
Series 2010, RB | | | 5.25 | % | | | 06/01/21 | | | | 1,000 | | | | 1,171,480 | |
Series 2010, RB | | | 6.00 | % | | | 06/01/28 | | | | 10,000 | | | | 11,448,300 | |
United City of Yorkville (City of) Special Service Area No. 2004-107 (Raintree Village II); Series 2005, Special Tax RB(i) | | | 6.25 | % | | | 03/01/35 | | | | 958 | | | | 484,853 | |
University of Illinois; Series 2011 A, Auxiliary Facilities System RB | | | 5.13 | % | | | 04/01/36 | | | | 1,000 | | | | 1,060,280 | |
Volo (Village of) Special Service Area No. 3 (Symphony Meadows); Series 2006-1, Special Tax RB | | | 6.00 | % | | | 03/01/36 | | | | 531 | | | | 518,336 | |
Will (County of) & Kankakee (City of) Regional Development Authority (Senior Estates Supportive Living); Series 2007, MFH RB(b) | | | 7.00 | % | | | 12/01/42 | | | | 410 | | | | 405,933 | |
| | | | | | | | | | | | | | | | 304,485,410 | |
|
| Indiana–2.17% | |
Carmel (City of) (Barrington Carmel); Series 2012 C-2, TEMPS–65SM RB | | | 5.25 | % | | | 11/15/18 | | | | 2,500 | | | | 2,499,900 | |
Indiana (State of) Finance Authority (Community Foundation of Northwest Indiana); Series 2007, Hospital RB | | | 5.50 | % | | | 03/01/22 | | | | 500 | | | | 548,925 | |
Indiana (State of) Finance Authority (CWA Authority, Inc.); Series 2011 B, Second Lien Wastewater Utility RB | | | 5.00 | % | | | 10/01/41 | | | | 11,000 | | | | 11,403,590 | |
Indiana (State of) Finance Authority (Ohio Valley Electric Corp.); | | | | | | | | | | | | | | | | |
Series 2012 A, Midwestern Disaster Relief RB | | | 5.00 | % | | | 06/01/32 | | | | 1,220 | | | | 1,209,813 | |
Series 2012 A, Midwestern Disaster Relief RB | | | 5.00 | % | | | 06/01/39 | | | | 2,500 | | | | 2,423,100 | |
Indiana (State of) Finance Authority (Sisters of St. Francis Health Services); Series 2006 E, Ref. Health System RB (INS–AGM)(a) | | | 5.25 | % | | | 05/15/41 | | | | 2,000 | | | | 2,056,760 | |
Indiana (State of) Municipal Power Agency; | | | | | | | | | | | | | | | | |
Series 2009 B, Power Supply System RB | | | 5.75 | % | | | 01/01/29 | | | | 200 | | | | 230,694 | |
Series 2009 B, Power Supply System RB | | | 6.00 | % | | | 01/01/39 | | | | 3,000 | | | | 3,323,460 | |
Indianapolis (City of) Airport Authority (Fed Ex Corp.); Series 2004, Ref. Special Facilities RB(b) | | | 5.10 | % | | | 01/15/17 | | | | 1,500 | | | | 1,656,420 | |
Indianapolis Local Public Improvement Bond Bank (Indianapolis Airport Authority); Series 2006 F, RB (INS–AMBAC)(a)(b) | | | 5.00 | % | | | 01/01/18 | | | | 500 | | | | 544,415 | |
Indianapolis Local Public Improvement Bond Bank (Waterworks); Series 2009 A, RB (INS–AGC)(a) | | | 5.25 | % | | | 01/01/29 | | | | 1,000 | | | | 1,086,320 | |
Monroe County Community 1996 School Building Corp.; Series 2009, First Mortgage RB (INS–AGM)(a) | | | 5.25 | % | | | 01/15/27 | | | | 2,815 | | | | 3,169,943 | |
Noblesville (City of) Redevelopment Authority (146th Street Extension); Series 2006 A, Economic Development Lease Rental RB | | | 5.25 | % | | | 08/01/25 | | | | 1,570 | | | | 1,723,405 | |
Petersburg (City of) (Indianapolis Power & Light Co.); Series 1993 B, Ref. PCR (INS–NATL)(a) | | | 5.40 | % | | | 08/01/17 | | | | 9,850 | | �� | | 11,235,107 | |
Rockville School Building Corp.; Series 2006, First Mortgage RB(c)(d) | | | 5.00 | % | | | 01/15/16 | | | | 1,000 | | | | 1,087,280 | |
St. Joseph (County of) Redevelopment District; | | | | | | | | | | | | | | | | |
Series 1997 B, Tax Increment Allocation CAB RB(g) | | | 0.00 | % | | | 06/30/14 | | | | 130 | | | | 127,299 | |
Series 1997 B, Tax Increment Allocation CAB RB(g) | | | 0.00 | % | | | 06/30/15 | | | | 130 | | | | 117,898 | |
Series 1997 B, Tax Increment Allocation CAB RB(g) | | | 0.00 | % | | | 06/30/16 | | | | 135 | | | | 113,385 | |
Series 1997 B, Tax Increment Allocation CAB RB(g) | | | 0.00 | % | | | 06/30/17 | | | | 225 | | | | 175,001 | |
Valparaiso (City of) (Pratt Paper, LLC); Series 2013, Exempt Facilities RB(b) | | | 6.75 | % | | | 01/01/34 | | | | 1,500 | | | | 1,582,545 | |
Vigo (County of) Hospital Authority (Union Hospital, Inc.); Series 2007, RB(f) | | | 5.50 | % | | | 09/01/27 | | | | 1,500 | | | | 1,488,705 | |
| | | | | | | | | | | | | | | | 47,803,965 | |
|
| Iowa–2.27% | |
Altoona (City of); Series 2008, Annual Appropriation Urban Renewal Tax Increment RB | | | 6.00 | % | | | 06/01/34 | | | | 1,860 | | | | 1,940,519 | |
Ames (City of) (Mary Greeley Medical Center); | | | | | | | | | | | | | | | | |
Series 2011, Hospital RB | | | 5.25 | % | | | 06/15/36 | | | | 7,000 | | | | 7,253,540 | |
Series 2011, Hospital RB | | | 5.50 | % | | | 06/15/30 | | | | 1,000 | | | | 1,059,860 | |
Series 2011, Hospital RB | | | 5.63 | % | | | 06/15/31 | | | | 1,500 | | | | 1,595,760 | |
See accompanying Notes to Financial Statements which are an integral part of the financial statements.
19 Invesco Municipal Income Fund
| | | | | | | | | | | | | | | | |
| | | Interest
Rate | | | Maturity
Date | | | Principal
Amount
(000) | | | Value | |
| Iowa–(continued) | |
Iowa (State of) (IJOBS Program); | | | | | | | | | | | | | | | | |
Series 2009 A, Special Obligation RB(e)(k) | | | 5.00 | % | | | 06/01/25 | | | $ | 5,815 | | | $ | 6,714,813 | |
Series 2009 A, Special Obligation RB(e)(k) | | | 5.00 | % | | | 06/01/26 | | | | 4,360 | | | | 5,034,666 | |
Series 2009 A, Special Obligation RB(e)(k) | | | 5.00 | % | | | 06/01/27 | | | | 9,300 | | | | 10,632,504 | |
Iowa (State of) Finance Authority (Iowa Health System); | | | | | | | | | | | | | | | | |
Series 2005, Health Facilities RB (INS–AGC)(a) | | | 5.25 | % | | | 02/15/29 | | | | 2,000 | | | | 2,194,180 | |
Series 2008 A, Health Facilities RB (INS–AGC)(a) | | | 5.25 | % | | | 08/15/29 | | | | 1,500 | | | | 1,649,220 | |
Iowa (State of) Finance Authority (Western Home); Series 2012, Ref. Health Care Facilities RB | | | 5.00 | % | | | 12/01/27 | | | | 1,915 | | | | 1,883,077 | |
Iowa Student Loan Liquidity Corp.; Sr. Series 2011 A-2, RB(b) | | | 5.70 | % | | | 12/01/27 | | | | 8,260 | | | | 8,673,413 | |
Washington (County of) Hospital; Series 2006, Hospital RB | | | 5.50 | % | | | 07/01/32 | | | | 1,275 | | | | 1,271,252 | |
| | | | | | | | | | | | | | | | 49,902,804 | |
|
| Kansas–0.53% | |
Kansas (State of) Development Finance Authority (Adventist Health System/Sunbelt Obligated Group); Series 2009 C, Hospital RB | | | 5.50 | % | | | 11/15/29 | | | | 1,500 | | | | 1,671,735 | |
Kansas (State of) Development Finance Authority (University of Kansas Health System); | | | | | | | | | | | | | | | | |
Series 2011 H, Health Facilities RB | | | 5.00 | % | | | 03/01/34 | | | | 1,000 | | | | 1,035,110 | |
Series 2011 H, Health Facilities RB | | | 5.13 | % | | | 03/01/39 | | | | 2,000 | | | | 2,064,100 | |
Series 2011 H, Health Facilities RB | | | 5.38 | % | | | 03/01/29 | | | | 1,000 | | | | 1,079,440 | |
Kansas (State of) Municipal Energy Agency (Jameson Energy Center); Series 2013, Power Project RB | | | 5.25 | % | | | 07/01/44 | | | | 2,000 | | | | 2,083,040 | |
Wichita (City of) (Presbyterian Manors, Inc.); Series 2013 IV-A, Health Care Facilities RB | | | 6.38 | % | | | 05/15/43 | | | | 1,500 | | | | 1,527,780 | |
Wyandotte (County of) & Kansas City (City of) Unified Government; Series 2009 A, Utility System RB (INS–BHAC)(a) | | | 5.00 | % | | | 09/01/29 | | | | 2,000 | | | | 2,208,700 | |
| | | | | | | | | | | | | | | | 11,669,905 | |
|
| Kentucky–1.23% | |
Kentucky (State of) Economic Development Finance Authority (Baptist Healthcare System); | | | | | | | | | | | | | | | | |
Series 2009 A, Hospital RB | | | 5.38 | % | | | 08/15/24 | | | | 3,000 | | | | 3,360,390 | |
Series 2009 A, Hospital RB | | | 5.63 | % | | | 08/15/27 | | | | 1,000 | | | | 1,087,430 | |
Kentucky (State of) Economic Development Finance Authority (Louisville Arena Authority, Inc.); | | | | | | | | | | | | | | | | |
Subseries 2008 A-1, RB (INS–AGC)(a) | | | 6.00 | % | | | 12/01/33 | | | | 5,070 | | | | 5,206,129 | |
Subseries 2008 A-1, RB (INS–AGC)(a) | | | 6.00 | % | | | 12/01/38 | | | | 4,000 | | | | 4,090,600 | |
Kentucky (State of) Economic Development Finance Authority (Owensboro Medical Health System, Inc.); Series 2010 A, Hospital RB | | | 6.50 | % | | | 03/01/45 | | | | 3,200 | | | | 3,403,680 | |
Kentucky (State of) Property & Buildings Commission (No. 93); Series 2009, Ref. RB (INS–AGC)(a) | | | 5.25 | % | | | 02/01/28 | | | | 3,000 | | | | 3,377,040 | |
Paducah (City of) Electric Plant Board; Series 2009 A, RB (INS–AGC)(a) | | | 5.25 | % | | | 10/01/35 | | | | 6,000 | | | | 6,494,340 | |
| | | | | | | | | | | | | | | | 27,019,609 | |
|
| Louisiana–2.29% | |
Caddo & Bossier (Parishes of) Port Commission; Series 2011, Ref. Utility RB | | | 5.00 | % | | | 04/01/34 | | | | 550 | | | | 578,276 | |
Calcasieu (Parish of) Memorial Hospital Service District (Lake Charles Memorial Hospital); Series 1992 A, Hospital RB (INS–Connie Lee)(a) | | | 6.50 | % | | | 12/01/18 | | | | 4,745 | | | | 4,910,506 | |
East Baton Rouge (Parish of) Sewerage Commission; Series 2009 A, RB | | | 5.25 | % | | | 02/01/34 | | | | 1,550 | | | | 1,691,096 | |
Jefferson (Parish of) Hospital Service District No. 1 (West Jefferson Medical Center); | | | | | | | | | | | | | | | | |
Series 2011 A, Ref. Hospital RB | | | 6.00 | % | | | 01/01/39 | | | | 2,000 | | | | 2,146,840 | |
Series 2011 A, Ref. Hospital RB (INS–AGM)(a) | | | 5.38 | % | | | 01/01/31 | | | | 400 | | | | 417,756 | |
Series 2011 A, Ref. Hospital RB (INS–AGM)(a) | | | 6.00 | % | | | 01/01/39 | | | | 1,000 | | | | 1,081,920 | |
Lafayette (City of) Public Trust Financing Authority (Ragin’ Cajun Facilities–Housing & Parking); Series 2010, RB (INS–AGM)(a) | | | 5.00 | % | | | 10/01/25 | | | | 1,000 | | | | 1,089,280 | |
Lakeshore Villages Master Community Development District; Series 2007, Special Assessment RB(i) | | | 5.25 | % | | | 07/01/17 | | | | 1,364 | | | | 538,644 | |
Louisiana (State of) Local Government Environmental Facilities & Community Development Authority (Capital Projects & Equipment Acquisitions Program); | | | | | | | | | | | | | | | | |
Series 2000, RB (INS–ACA)(a) | | | 6.55 | % | | | 09/01/25 | | | | 4,860 | | | | 5,156,654 | |
Series 2000 A, RB (INS–AMBAC)(a) | | | 6.30 | % | | | 07/01/30 | | | | 1,780 | | | | 1,822,809 | |
See accompanying Notes to Financial Statements which are an integral part of the financial statements.
20 Invesco Municipal Income Fund
| | | | | | | | | | | | | | | | |
| | | Interest
Rate | | | Maturity
Date | | | Principal
Amount
(000) | | | Value | |
| Louisiana–(continued) | |
Louisiana (State of) Local Government Environmental Facilities & Community Development Authority (Jefferson Parish); Series 2009 A, RB | | | 5.38 | % | | | 04/01/31 | | | $ | 1,000 | | | $ | 1,086,230 | |
Louisiana (State of) Local Government Environmental Facilities & Community Development Authority (Monroe Regional Airport Terminal); Series 2009, Airport RB (INS–AGC)(a) | | | 5.50 | % | | | 02/01/39 | | | | 1,500 | | | | 1,604,130 | |
Louisiana (State of) Public Facilities Authority (Christus Health); Series 2009 A, Ref. RB | | | 6.00 | % | | | 07/01/29 | | | | 1,600 | | | | 1,745,216 | |
Louisiana (State of) Public Facilities Authority (Entergy Louisiana LLC); Series 2010, RB | | | 5.00 | % | | | 06/01/30 | | | | 1,050 | | | | 1,111,813 | |
Louisiana (State of) Public Facilities Authority (Ochsner Clinic Foundation); Series 2002 B, RB(c)(d) | | | 5.50 | % | | | 05/15/26 | | | | 1,010 | | | | 1,280,276 | |
Louisiana (State of); Series 2006 A, Gas & Fuels Tax RB (INS–AGC)(a) | | | 5.00 | % | | | 05/01/28 | | | | 2,500 | | | | 2,598,600 | |
New Orleans (City of) Aviation Board; Series 2009 A-1, Ref. & Restructuring General Airport RB
(INS–AGC)(a) | | | 6.00 | % | | | 01/01/23 | | | | 2,000 | | | | 2,279,540 | |
Regional Transit Authority; Series 2010, Sales Tax RB (INS–AGM)(a) | | | 5.00 | % | | | 12/01/30 | | | | 2,580 | | | | 2,779,589 | |
St. John the Baptist (Parish of) (Marathon Oil Corp.); Series 2007 A, RB | | | 5.13 | % | | | 06/01/37 | | | | 5,000 | | | | 5,023,400 | |
Terrebonne (Parish of); Series 2011 ST, Sales & Use Tax RB (INS–AGM)(a) | | | 5.00 | % | | | 04/01/31 | | | | 2,645 | | | | 2,827,875 | |
Tobacco Settlement Financing Corp.; Series 2013 A, Ref. Asset-Backed RB | | | 5.25 | % | | | 05/15/35 | | | | 8,500 | | | | 8,588,995 | |
| | | | | | | | | | | | | | | | 50,359,445 | |
|
| Maryland–1.44% | |
Baltimore (City of) (East Baltimore Research Park); Series 2008 A, Special Obligation Tax Allocation RB | | | 7.00 | % | | | 09/01/38 | | | | 1,000 | | | | 1,054,420 | |
Baltimore (County of) (Oak Crest Village Inc. Facility); Series 2007 A, RB | | | 5.00 | % | | | 01/01/37 | | | | 2,000 | | | | 2,020,440 | |
Maryland (State of) Community Development Administration; Series 2007, RB(b) | | | 5.05 | % | | | 09/01/32 | | | | 2,005 | | | | 2,041,331 | |
Maryland (State of) Health & Higher Educational Facilities Authority (Adventist Healthcare); | | | | | | | | | | | | | | | | |
Series 2011 A, RB | | | 6.13 | % | | | 01/01/36 | | | | 4,000 | | | | 4,345,360 | |
Series 2011 A, RB | | | 6.25 | % | | | 01/01/31 | | | | 3,175 | | | | 3,507,581 | |
Maryland (State of) Health & Higher Educational Facilities Authority (Charlestown Community); Series 2010, RB | | | 6.13 | % | | | 01/01/30 | | | | 4,250 | | | | 4,603,090 | |
Maryland (State of) Health & Higher Educational Facilities Authority (LifeBridge Health); Series 2011, RB | | | 6.00 | % | | | 07/01/41 | | | | 1,000 | | | | 1,105,330 | |
Maryland (State of) Health & Higher Educational Facilities Authority (MedStar Health); | | | | | | | | | | | | | | | | |
Series 2004, Ref. RB | | | 5.50 | % | | | 08/15/33 | | | | 3,000 | | | | 3,055,320 | |
Series 2011, RB | | | 5.00 | % | | | 08/15/41 | | | | 5,000 | | | | 5,074,550 | |
Maryland (State of) Transportation Authority; Series 2008, Grant & RAB | | | 5.25 | % | | | 03/01/20 | | | | 2,000 | | | | 2,369,120 | |
Maryland Economic Development Corp. (Terminal); Series 2010 B, RB | | | 5.75 | % | | | 06/01/35 | | | | 1,460 | | | | 1,503,318 | |
Maryland Economic Development Corp. (Transportation Facilities); Series 2010 A, RB | | | 5.38 | % | | | 06/01/25 | | | | 1,030 | | | | 1,084,343 | |
| | | | | | | | | | | | | | | | 31,764,203 | |
|
| Massachusetts–2.49% | |
Boston (City of) Water & Sewer Commission; Series 1993 A, Sr. RB (INS–NATL)(a) | | | 5.25 | % | | | 11/01/19 | | | | 4,390 | | | | 4,945,906 | |
Massachusetts (State of) College Building Authority; Series 2009 A, RB | | | 5.50 | % | | | 05/01/39 | | | | 1,000 | | | | 1,116,360 | |
Massachusetts (State of) Development Finance Agency (Boston University); Series 2013 U-1, Floating Rate RB(d)(l) | | | 0.61 | % | | | 03/30/17 | | | | 4,000 | | | | 3,994,143 | |
Massachusetts (State of) Development Finance Agency (Caregroup); Series 1998 B-2, RB
(INS–NATL)(a) | | | 5.38 | % | | | 02/01/27 | | | | 2,000 | | | | 2,219,920 | |
Massachusetts (State of) Development Finance Agency (Dominion Energy Brayton); Series 2009 1, Ref. Solid Waste Disposal RB(c)(d) | | | 5.75 | % | | | 05/01/19 | | | | 2,000 | | | | 2,462,640 | |
Massachusetts (State of) Development Finance Agency (Harvard University); Series 2009 A, RB(e) | | | 5.50 | % | | | 11/15/36 | | | | 20,955 | | | | 23,720,850 | |
Massachusetts (State of) Development Finance Agency (Lesley University); Series 2011 B-1, RB (INS–AGM)(a) | | | 5.25 | % | | | 07/01/33 | | | | 750 | | | | 809,835 | |
Massachusetts (State of) Development Finance Agency (Linden Ponds, Inc. Facility); | | | | | | | | | | | | | | | | |
Series 2011 A-1, RB | | | 6.25 | % | | | 11/15/17 | | | | 732 | | | | 722,290 | |
Series 2011 A-1, RB | | | 6.25 | % | | | 11/15/39 | | | | 1,692 | | | | 1,398,039 | |
Series 2011 A-2, RB | | | 5.50 | % | | | 11/15/46 | | | | 128 | | | | 91,824 | |
Series 2011 B, CAB RB(g) | | | 0.00 | % | | | 11/15/56 | | | | 637 | | | | 2,985 | |
Massachusetts (State of) Development Finance Agency (Massachusetts Institute of Technology); Series 2009 O, RB(e) | | | 5.50 | % | | | 07/01/36 | | | | 6,680 | | | | 7,495,094 | |
See accompanying Notes to Financial Statements which are an integral part of the financial statements.
21 Invesco Municipal Income Fund
| | | | | | | | | | | | | | | | |
| | | Interest
Rate | | | Maturity
Date | | | Principal
Amount
(000) | | | Value | |
| Massachusetts–(continued) | |
Massachusetts (State of) Development Finance Agency (Merrimack College); Series 2012 A, RB | | | 5.25 | % | | | 07/01/42 | | | $ | 1,900 | | | $ | 1,905,586 | |
Massachusetts (State of) Development Finance Agency (Tufts Medical Center); Series 2011 I, RB | | | 6.75 | % | | | 01/01/36 | | | | 1,000 | | | | 1,148,280 | |
Massachusetts (State of) Development Finance Agency (UMass Memorial); Series 2011 H, RB | | | 5.50 | % | | | 07/01/31 | | | | 1,000 | | | | 1,039,680 | |
Massachusetts (State of) Housing Finance Agency; Series 2007 C, RB(b) | | | 5.10 | % | | | 12/01/27 | | | | 1,685 | | | | 1,735,449 | |
| | | | | | | | | | | | | | | | 54,808,881 | |
|
| Michigan–0.74% | |
Detroit (City of); | | | | | | | | | | | | | | | | |
Series 2003 B, Sr. Lien Sewage Disposal System RB (INS–AGM)(a) | | | 7.50 | % | | | 07/01/33 | | | | 5,750 | | | | 6,152,097 | |
Series 2006 B, Second Lien Water Supply System RB (INS–AGM)(a) | | | 6.25 | % | | | 07/01/36 | | | | 1,000 | | | | 1,017,160 | |
Kent (County of) Hospital Finance Authority (Spectrum Health System); Series 2008 A, RB(d) | | | 5.50 | % | | | 01/15/15 | | | | 375 | | | | 391,695 | |
Michigan (State of) Building Authority (Facilities Program); Series 2011 I-A, Ref. RB | | | 5.00 | % | | | 10/15/29 | | | | 500 | | | | 536,830 | |
Michigan (State of) Strategic Fund (Genesee Power Station); Series 1994, Ref. Solid Waste Disposal RB(b) | | | 7.50 | % | | | 01/01/21 | | | | 1,245 | | | | 1,170,176 | |
Wayne (County of) Airport Authority (Detroit Metropolitan Airport); | | | | | | | | | | | | | | | | |
Series 2012 B, RB(b) | | | 5.00 | % | | | 12/01/32 | | | | 1,500 | | | | 1,523,820 | |
Series 2012 B, RB(b) | | | 5.00 | % | | | 12/01/37 | | | | 1,500 | | | | 1,502,520 | |
Series 2012 D, Ref. RB(b) | | | 5.00 | % | | | 12/01/28 | | | | 2,500 | | | | 2,586,750 | |
Wyoming (City of); Series 2008, Water Supply System RB | | | 5.13 | % | | | 06/01/28 | | | | 1,305 | | | | 1,436,296 | |
| | | | | | | | | | | | | | | | 16,317,344 | |
|
| Minnesota–0.89% | |
Columbia Heights (City of) (Crest View Corp.); Series 2007 A, Ref. MFH & Health Care Facilities RB | | | 5.70 | % | | | 07/01/42 | | | | 1,000 | | | | 754,000 | |
Minneapolis (City of) (Fairview Health Services); | | | | | | | | | | | | | | | | |
Series 2008 A, Health Care System RB | | | 6.75 | % | | | 11/15/32 | | | | 3,000 | | | | 3,502,080 | |
Series 2008 B, Health Care System RB (INS–AGC)(a) | | | 6.50 | % | | | 11/15/38 | | | | 5,275 | | | | 6,115,255 | |
Minneapolis (City of) (Providence); Series 2007 A, Ref. Housing & Health Care Facilities RB | | | 5.63 | % | | | 10/01/27 | | | | 2,000 | | | | 2,009,620 | |
Minnesota (State of) Agricultural & Economic Development Board (Essentia Health Obligated Group); Series 2008 C-1, Health Care Facilities RB (INS–AGC)(a) | | | 5.00 | % | | | 02/15/30 | | | | 1,060 | | | | 1,116,879 | |
St. Louis Park (City of) (Park Nicollet Health Services); Series 2009, Ref. Health Care Facilities RB | | | 5.75 | % | | | 07/01/39 | | | | 2,000 | | | | 2,125,200 | |
St. Paul (City of) Housing & Redevelopment Authority (Health Partners Obligated Group); Series 2006, Health Care Facilities RB | | | 5.25 | % | | | 05/15/36 | | | | 3,800 | | | | 3,887,362 | |
| | | | | | | | | | | | | | | | 19,510,396 | |
|
| Mississippi–0.09% | |
Mississippi Business Finance Corp. (System Energy Resources, Inc.); Series 1998, PCR | | | 5.88 | % | | | 04/01/22 | | | | 2,000 | | | | 2,000,320 | |
|
| Missouri–1.54% | |
Bi-State Development Agency of the Missouri-Illinois Metropolitan District (Metrolink Cross County Extension); Series 2009, Mass Transit Sales Tax RB (INS–AGC)(a) | | | 5.00 | % | | | 10/01/39 | | | | 2,000 | | | | 2,097,720 | |
Cape Girardeau (County of) Industrial Development Authority (St. Francis Medical Center); Series 2009 A, Health Facilities RB | | | 5.75 | % | | | 06/01/39 | | | | 2,150 | | | | 2,282,698 | |
Cass (County of); Series 2007, Hospital RB | | | 5.38 | % | | | 05/01/22 | | | | 1,000 | | | | 1,025,900 | |
Gladstone (City of); Series 2006 A, COP (INS–SGI)(a) | | | 5.00 | % | | | 06/01/22 | | | | 1,295 | | | | 1,414,904 | |
Kansas City (City of) Industrial Development Authority (Downtown Redevelopment District); Series 2011 A, Ref. RB | | | 5.50 | % | | | 09/01/24 | | | | 5,990 | | | | 6,873,525 | |
Kansas City (City of) Industrial Development Authority (Plaza Library); Series 2004, RB | | | 6.00 | % | | | 03/01/16 | | | | 805 | | | | 807,648 | |
Ladue School District; Series 2007, Ref. & Improvement Unlimited Tax GO Bonds | | | 4.75 | % | | | 03/01/27 | | | | 1,000 | | | | 1,076,730 | |
Maryland Heights (City of) (South Heights Redevelopment); Series 2007 A, Ref. Tax Increment Allocation RB | | | 5.50 | % | | | 09/01/18 | | | | 390 | | | | 421,590 | |
Missouri (State of) Health & Educational Facilities Authority (Children’s Mercy Hospital); Series 2009, RB | | | 5.63 | % | | | 05/15/39 | | | | 2,500 | | | | 2,623,300 | |
Missouri (State of) Health & Educational Facilities Authority (Lutheran Senior Services); | | | | | | | | | | | | | | | | |
Series 2005 B, Ref. Senior Living Facilities RB | | | 5.13 | % | | | 02/01/27 | | | | 1,200 | | | | 1,214,700 | |
Series 2010, Senior Living Facilities RB | | | 5.50 | % | | | 02/01/42 | | | | 950 | | | | 972,107 | |
See accompanying Notes to Financial Statements which are an integral part of the financial statements.
22 Invesco Municipal Income Fund
| | | | | | | | | | | | | | | | |
| | | Interest
Rate | | | Maturity
Date | | | Principal
Amount
(000) | | | Value | |
| Missouri–(continued) | |
Raytown (City of) (Raytown Live Redevelopment Plan); Series 2007 1, Annual Appropriation-Supported Tax RB | | | 5.13 | % | | | 12/01/31 | | | $ | 3,325 | | | $ | 3,458,100 | |
St. Louis (City of) Industrial Development Authority (Loughborough Commons Redevelopment); Series 2007, Ref. Community Improvement District Tax Increment Allocation RB | | | 5.75 | % | | | 11/01/27 | | | | 450 | | | | 448,736 | |
St. Louis (County of) Industrial Development Authority (Friendship Village of Sunset Hills); Series 2013 A, Senior Living Facilities RB | | | 5.88 | % | | | 09/01/43 | | | | 1,750 | | | | 1,819,090 | |
St. Louis (County of) Industrial Development Authority (Friendship Village of West County); Series 2007 A, Senior Living Facilities RB | | | 5.38 | % | | | 09/01/21 | | | | 1,000 | | | | 1,043,810 | |
St. Louis (County of) Industrial Development Authority (Ranken Jordan); | | | | | | | | | | | | | | | | |
Series 2007, Ref. Health Facilities RB | | | 5.00 | % | | | 11/15/27 | | | | 1,350 | | | | 1,280,488 | |
Series 2007, Ref. Health Facilities RB | | | 5.00 | % | | | 11/15/35 | | | | 2,600 | | | | 2,315,378 | |
St. Louis (County of) Industrial Development Authority (St. Andrew’s Resources for Seniors); | | | | | | | | | | | | | | | | |
Series 2007 A, Senior Living Facilities RB | | | 6.38 | % | | | 12/01/30 | | | | 500 | | | | 502,045 | |
Series 2007 A, Senior Living Facilities RB | | | 6.38 | % | | | 12/01/41 | | | | 1,250 | | | | 1,223,975 | |
St. Louis Municipal Finance Corp.; Series 2007, Recreation Sales Tax Leasehold RB (INS–AMBAC)(a) | | | 4.50 | % | | | 02/15/28 | | | | 1,000 | | | | 1,003,420 | |
| | | | | | | | | | | | | | | | 33,905,864 | |
|
| Montana–0.05% | |
Montana (State of) Facility Finance Authority (Benefit Health System Obligated Group); Series 2011 A, Hospital RB (INS–AGC)(a) | | | 5.75 | % | | | 01/01/31 | | | | 1,000 | | | | 1,100,010 | |
|
| Nebraska–1.13% | |
Central Plains Energy Project (No. 3); Series 2012, Gas RB | | | 5.00 | % | | | 09/01/32 | | | | 2,000 | | | | 2,048,720 | |
Nebraska (State of) Municipal Energy Agency; Series 2009 A, Ref. Power Supply System RB
(INS–BHAC)(a) | | | 5.38 | % | | | 04/01/39 | | | | 4,000 | | | | 4,359,520 | |
Nebraska (State of) Public Power District; Series 2007 B, General RB (INS–BHAC)(a) | | | 5.00 | % | | | 01/01/37 | | | | 15,570 | | | | 16,298,365 | |
University of Nebraska (Lincoln); Series 2009 A, Student Fees & Facilities RB | | | 5.25 | % | | | 07/01/39 | | | | 1,000 | | | | 1,085,200 | |
University of Nebraska (Omaha Health & Recreation); Series 2008, RB | | | 5.00 | % | | | 05/15/33 | | | | 1,000 | | | | 1,070,140 | |
| | | | | | | | | | | | | | | | 24,861,945 | |
|
| Nevada–1.75% | |
Clark (County of) (Las VegaS–McCarran International Airport); | | | | | | | | | | | | | | | | |
Series 2010 A, Passenger Facility Charge RB | | | 5.13 | % | | | 07/01/34 | | | | 2,000 | | | | 2,115,540 | |
Series 2010 A, Passenger Facility Charge RB | | | 5.25 | % | | | 07/01/42 | | | | 2,000 | | | | 2,101,860 | |
Series 2010 A, Passenger Facility Charge RB (INS–AGM)(a) | | | 5.25 | % | | | 07/01/39 | | | | 5,500 | | | | 5,820,925 | |
Clark (County of) Water Reclamation District; Series 2008, Limited Tax GO Bonds | | | 5.63 | % | | | 07/01/32 | | | | 1,500 | | | | 1,697,295 | |
Clark (County of); | | | | | | | | | | | | | | | | |
Series 1992 A, Transportation Improvement Limited Tax GO Bonds (INS–AMBAC)(a) | | | 6.50 | % | | | 06/01/17 | | | | 3,000 | | | | 3,536,790 | |
Series 2004 A-1, Sub. Lien Airport System RB (INS–NATL)(a)(b) | | | 5.50 | % | | | 07/01/20 | | | | 3,045 | | | | 3,092,167 | |
Series 2004 A-1, Sub. Lien Airport System RB (INS–NATL)(a)(b) | | | 5.50 | % | | | 07/01/21 | | | | 3,000 | | | | 3,044,910 | |
Series 2004 A-1, Sub. Lien Airport System RB (INS–NATL)(a)(b) | | | 5.50 | % | | | 07/01/23 | | | | 5,000 | | | | 5,069,600 | |
Series 2004 A-2, Sub. Lien Airport System RB (INS–NATL)(a) | | | 5.13 | % | | | 07/01/25 | | | | 1,000 | | | | 1,014,220 | |
Series 2004 A-2, Sub. Lien Airport System RB (INS–NATL)(a) | | | 5.13 | % | | | 07/01/27 | | | | 1,000 | | | | 1,013,280 | |
Clark County School District; Series 2007 C, Building Limited Tax GO Bonds | | | 5.00 | % | | | 06/15/26 | | | | 4,000 | | | | 4,449,760 | |
Las Vegas (City of) Valley Water District; Series 2009 B, Limited Tax GO Bonds | | | 5.00 | % | | | 06/01/29 | | | | 800 | | | | 890,728 | |
Mesquite (City of) (Special Improvement District No. 07-01-Anthem at Mesquite); | | | | | | | | | | | | | | | | |
Series 2007, Special Assessment Local Improvement RB | | | 5.85 | % | | | 08/01/18 | | | | 565 | | | | 598,747 | |
Series 2007, Special Assessment Local Improvement RB | | | 6.00 | % | | | 08/01/27 | | | | 485 | | | | 479,699 | |
Nevada (State of) (Municipal Bond Bank–R9A Thru R13F); Series 2005, Limited Tax GO Bonds (INS–AGM)(a) | | | 5.00 | % | | | 12/01/23 | | | | 3,500 | | | | 3,691,065 | |
| | | | | | | | | | | | | | | | 38,616,586 | |
|
| New Hampshire–0.62% | |
Manchester (City of); Series 2009 A, Ref. General Airport RB (INS–AGM)(a) | | | 5.13 | % | | | 01/01/30 | | | | 5,250 | | | | 5,553,555 | |
See accompanying Notes to Financial Statements which are an integral part of the financial statements.
23 Invesco Municipal Income Fund
| | | | | | | | | | | | | | | | |
| | | Interest
Rate | | | Maturity
Date | | | Principal
Amount
(000) | | | Value | |
| New Hampshire–(continued) | |
New Hampshire (State of) Business Finance Authority (Huggins Hospital); Series 2009, First Mortgage RB | | | 6.88 | % | | | 10/01/39 | | | $ | 975 | | | $ | 1,019,411 | |
New Hampshire (State of) Health & Education Facilities Authority (Southern New Hampshire University); Series 2012, RB | | | 5.00 | % | | | 01/01/42 | | | | 6,000 | | | | 5,959,440 | |
New Hampshire (State of) Health & Education Facilities Authority (Wentworth Douglas Hospital); Series 2011 A, RB | | | 6.00 | % | | | 01/01/34 | | | | 1,100 | | | | 1,182,093 | |
| | | | | | | | | | | | | | | | 13,714,499 | |
|
| New Jersey–2.65% | |
Landis Sewage Authority (Registered CARS); Series 1993, Sewer RB (INS–NATL)(a)(h) | | | 9.85 | % | | | 09/19/19 | | | | 1,600 | | | | 1,882,496 | |
New Jersey (State of) Economic Development Authority (Paterson Charter School); | | | | | | | | | | | | | | | | |
Series 2012 C, RB | | | 5.00 | % | | | 07/01/32 | | | | 675 | | | | 619,468 | |
Series 2012 C, RB | | | 5.30 | % | | | 07/01/44 | | | | 1,090 | | | | 988,107 | |
New Jersey (State of) Economic Development Authority (Provident Group-Montclair Properties LLC–Montclair State University Student Housing); Series 2010 A, RB | | | 5.75 | % | | | 06/01/31 | | | | 3,020 | | | | 3,253,537 | |
New Jersey (State of) Economic Development Authority (Seabrook Village, Inc. Facility); Series 2006, Ref. Retirement Community RB | | | 5.25 | % | | | 11/15/26 | | | | 750 | | | | 752,100 | |
New Jersey (State of) Economic Development Authority (The Goethals Bridge Replacement); Series 2013, Private Activity RB(b) | | | 5.38 | % | | | 01/01/43 | | | | 1,500 | | | | 1,536,990 | |
New Jersey (State of) Economic Development Authority; | | | | | | | | | | | | | | | | |
Series 2009 BB, School Facilities Construction RB | | | 5.00 | % | | | 09/01/34 | | | | 1,750 | | | | 1,859,287 | |
Series 2009 Z, School Facilities Construction RB (INS–AGC)(a) | | | 5.50 | % | | | 12/15/34 | | | | 1,000 | | | | 1,117,480 | |
Series 2012, Ref. RB | | | 5.00 | % | | | 06/15/25 | | | | 3,000 | | | | 3,230,550 | |
Series 2012, Ref. RB | | | 5.00 | % | | | 06/15/26 | | | | 1,000 | | | | 1,066,560 | |
Series 2012, Ref. RB | | | 5.00 | % | | | 06/15/28 | | | | 3,000 | | | | 3,171,870 | |
Subseries 2005 N-1, Ref. School Facilities Construction RB (INS–AMBAC)(a) | | | 5.50 | % | | | 09/01/24 | | | | 3,885 | | | | 4,666,118 | |
New Jersey (State of) Health Care Facilities Financing Authority (Barnabas Health); | | | | | | | | | | | | | | | | |
Series 2011 A, Ref. RB | | | 5.63 | % | | | 07/01/32 | | | | 4,000 | | | | 4,278,440 | |
Series 2011 A, Ref. RB | | | 5.63 | % | | | 07/01/37 | | | | 4,000 | | | | 4,214,520 | |
New Jersey (State of) Health Care Facilities Financing Authority (St. Joseph’s Health Care System); Series 2008, RB | | | 5.75 | % | | | 07/01/15 | | | | 895 | | | | 929,842 | |
New Jersey (State of) Higher Education Student Assistance Authority; Series 2009 A, Student Loan RB | | | 5.63 | % | | | 06/01/30 | | | | 1,000 | | | | 1,079,010 | |
New Jersey (State of) Housing & Mortgage Finance Agency; | | | | | | | | | | | | | | | | |
Series 2008 AA, RB | | | 6.38 | % | | | 10/01/28 | | | | 2,030 | | | | 2,133,713 | |
Series 2008 X, Single Family Housing RB(b) | | | 5.10 | % | | | 10/01/23 | | | | 1,960 | | | | 2,028,737 | |
New Jersey (State of) Transportation Trust Fund Authority; Series 2006 C, Transportation System CAB RB (INS–AGC)(a)(g) | | | 0.00 | % | | | 12/15/26 | | | | 10,000 | | | | 5,724,400 | |
New Jersey (State of) Turnpike Authority; | | | | | | | | | | | | | | | | |
Series 1991 C, RB(c) | | | 6.50 | % | | | 01/01/16 | | | | 195 | | | | 217,361 | |
Series 1991 C, RB(c) | | | 6.50 | % | | | 01/01/16 | | | | 950 | | | | 1,008,159 | |
Series 1991 C, RB (INS–NATL)(a) | | | 6.50 | % | | | 01/01/16 | | | | 370 | | | | 410,500 | |
Series 2009 H, RB | | | 5.00 | % | | | 01/01/36 | | | | 1,000 | | | | 1,050,530 | |
Series 2009 I, RB | | | 5.00 | % | | | 01/01/35 | | | | 2,000 | | | | 2,116,520 | |
Passaic Valley Sewage Commissioners; Series 2003 F, Sewer System RB (INS–NATL)(a) | | | 5.00 | % | | | 12/01/19 | | | | 9,000 | | | | 9,029,880 | |
| | | | | | | | | | | | | | | | 58,366,175 | |
|
| New Mexico–0.45% | |
Farmington (City of) (Public Service Co. of New Mexico San Juan); | | | | | | | | | | | | | | | | |
Series 2010 A, Ref. PCR(d) | | | 5.20 | % | | | 06/01/20 | | | | 2,000 | | | | 2,209,020 | |
Series 2010 C, Ref. PCR | | | 5.90 | % | | | 06/01/40 | | | | 4,100 | | | | 4,352,355 | |
New Mexico (State of) Hospital Equipment Loan Council (Presbyterian Health Care Services); Series 2008 A, Hospital RB(e) | | | 6.38 | % | | | 08/01/32 | | | | 3,000 | | | | 3,436,200 | |
| | | | | | | | | | | | | | | | 9,997,575 | |
See accompanying Notes to Financial Statements which are an integral part of the financial statements.
24 Invesco Municipal Income Fund
| | | | | | | | | | | | | | | | |
| | | Interest
Rate | | | Maturity
Date | | | Principal
Amount
(000) | | | Value | |
| New York–6.10% | |
Brooklyn Arena Local Development Corp. (Barclays Center); | | | | | | | | | | | | | | | | |
Series 2009, PILOT CAB RB(g) | | | 0.00 | % | | | 07/15/35 | | | $ | 5,000 | | | $ | 1,430,350 | |
Series 2009, PILOT RB | | | 6.25 | % | | | 07/15/40 | | | | 2,710 | | | | 2,908,941 | |
Series 2009, PILOT RB | | | 6.38 | % | | | 07/15/43 | | | | 1,130 | | | | 1,217,180 | |
Long Island Power Authority; | | | | | | | | | | | | | | | | |
Series 2000 A, Electric System General CAB RB (INS–AGM)(a)(g) | | | 0.00 | % | | | 06/01/17 | | | | 5,000 | | | | 4,787,850 | |
Series 2008 A, Electric System General RB | | | 6.00 | % | | | 05/01/33 | | | | 5,000 | | | | 5,716,050 | |
Series 2008 A, Electric System General RB (INS–BHAC)(a) | | | 5.50 | % | | | 05/01/33 | | | | 5,000 | | | | 5,599,600 | |
Metropolitan Transportation Authority; | | | | | | | | | | | | | | | | |
Series 2011 A, RB | | | 5.00 | % | | | 11/15/41 | | | | 2,000 | | | | 2,092,960 | |
Series 2013 A, RB | | | 5.00 | % | | | 11/15/38 | | | | 3,025 | | | | 3,204,564 | |
New York & New Jersey (States of) Port Authority (JFK International Air Terminal LLC); Series 2010, Special Obligation RB | | | 6.00 | % | | | 12/01/42 | | | | 3,000 | | | | 3,274,080 | |
New York & New Jersey (States of) Port Authority; Ninety-Third Series 1994, Consolidated RB | | | 6.13 | % | | | 06/01/94 | | | | 5,250 | | | | 5,997,757 | |
New York (City of) Industrial Development Agency (Polytechnic University); | | | | | | | | | | | | | | | | |
Series 2007, Ref. Civic Facility RB (INS–ACA)(a) | | | 5.25 | % | | | 11/01/27 | | | | 5,000 | | | | 5,331,300 | |
Series 2007, Ref. Civic Facility RB (INS–ACA)(a) | | | 5.25 | % | | | 11/01/37 | | | | 2,500 | | | | 2,609,575 | |
New York (City of) Industrial Development Agency (Queens Baseball Stadium); Series 2009, PILOT RB (INS–AGC)(a) | | | 6.38 | % | | | 01/01/39 | | | | 1,000 | | | | 1,105,040 | |
New York (City of) Transitional Finance Authority; | | | | | | | | | | | | | | | | |
Series 2009 S–3, Building Aid RB(e) | | | 5.25 | % | | | 01/15/39 | | | | 2,000 | | | | 2,178,080 | |
Subseries 2009 A-1, Future Tax Sec. RB(e) | | | 5.00 | % | | | 05/01/28 | | | | 5,570 | | | | 6,361,553 | |
Subseries 2009 A-1, Future Tax Sec. RB(e) | | | 5.00 | % | | | 05/01/29 | | | | 4,455 | | | | 5,088,100 | |
Subseries 2009 A-1, Future Tax Sec. RB(e) | | | 5.00 | % | | | 05/01/30 | | | | 4,455 | | | | 4,930,438 | |
New York (City of); | | | | | | | | | | | | | | | | |
Series 2007 D-1, Unlimited Tax GO Bonds | | | 5.13 | % | | | 12/01/22 | | | | 2,500 | | | | 2,872,925 | |
Subseries 2008 L-1, Unlimited Tax GO Bonds | | | 5.00 | % | | | 04/01/27 | | | | 2,225 | | | | 2,493,402 | |
New York (State of) Dormitory Authority (Brooklyn Law School); Series 2012 A, RB | | | 5.00 | % | | | 07/01/25 | | | | 1,000 | | | | 1,095,930 | |
New York (State of) Dormitory Authority (General Purpose); Series 2011 A, State Personal Income Tax RB(e) | | | 5.00 | % | | | 03/15/31 | | | | 21,885 | | | | 24,170,669 | |
New York (State of) Dormitory Authority (North Shore–Long Island Jewish Obligated Group); | | | | | | | | | | | | | | | | |
Series 2011 A, RB | | | 5.00 | % | | | 05/01/32 | | | | 1,000 | | | | 1,051,590 | |
Series 2011 A, RB | | | 5.00 | % | | | 05/01/41 | | | | 1,000 | | | | 1,035,890 | |
New York (State of) Dormitory Authority (State University Dormitory Facilities); Series 2011A, Lease RB | | | 5.00 | % | | | 07/01/35 | | | | 1,000 | | | | 1,079,190 | |
New York (State of) Dormitory Authority (State University Educational Facilities); Series 1993 A, RB | | | 5.25 | % | | | 05/15/15 | | | | 5,000 | | | | 5,136,750 | |
New York (State of) Dormitory Authority (Suffolk County); Series 1986, Judicial Facilities Lease RB(c) | | | 7.38 | % | | | 07/01/16 | | | | 4,405 | | | | 4,800,613 | |
New York (State of) Energy Research & Development Authority (Brooklyn Union Gas Co.); Series 1991 B, Gas Facilities Residual Interest RB(b)(h) | | | 13.57 | % | | | 07/01/26 | | | | 3,000 | | | | 3,029,700 | |
New York (State of) Energy Research & Development Authority; Series 1993, Regular Residual Interest RB(h) | | | 12.38 | % | | | 04/01/20 | | | | 2,500 | | | | 2,508,050 | |
New York (State of) Thruway Authority (Transportation); Series 2009 A, Personal Income
Tax RB(e) | | | 5.00 | % | | | 03/15/28 | | | | 2,000 | | | | 2,264,180 | |
New York (State of); Series 2009 A, Unlimited Tax GO Bonds | | | 5.00 | % | | | 02/15/39 | | | | 500 | | | | 552,230 | |
New York Liberty Development Corp. (National Sports Museum); Series 2006 A, RB (Acquired 08/07/06; Cost $636,422)(f)(i) | | | 6.13 | % | | | 02/15/19 | | | | 750 | | | | 8 | |
New York State Environmental Facilities Corp. (Municipal Water Finance Authority); Series 2005 C, State Clean Water & Drinking Water Revolving Funds RB | | | 5.00 | % | | | 06/15/21 | | | | 1,545 | | | | 1,638,689 | |
Sales Tax Asset Receivable Corp.; Series 2004 A, RB (INS–AMBAC)(a) | | | 5.00 | % | | | 10/15/29 | | | | 10,000 | | | | 10,265,700 | |
Suffolk (County of) Water Authority; Series 2011, Ref. RB | | | 5.00 | % | | | 06/01/40 | | | | 2,135 | | | | 2,274,458 | |
Triborough Bridge & Tunnel Authority; | | | | | | | | | |
Series 1992 Y, General Purpose RB(c) | | | 5.50 | % | | | 01/01/17 | | | | 1,710 | | | | 1,858,838 | |
Series 1993 B, General Purpose RB(c) | | | 5.00 | % | | | 01/01/20 | | | | 1,960 | | | | 2,302,569 | |
| | | | | | | | | | | | | | | | 134,264,799 | |
See accompanying Notes to Financial Statements which are an integral part of the financial statements.
25 Invesco Municipal Income Fund
| | | | | | | | | | | | | | | | |
| | | Interest
Rate | | | Maturity
Date | | | Principal
Amount
(000) | | | Value | |
| North Carolina–0.83% | |
Johnston (County of) Memorial Hospital Authority (Johnston Memorial Hospital); Series 2008, RB (INS–AGM)(a) | | | 5.25 | % | | | 10/01/24 | | | $ | 5,875 | | | $ | 6,560,142 | |
North Carolina (State of) Medical Care Commission (Duke University Health System); Series 2009 A, Health Care Facilities RB | | | 5.00 | % | | | 06/01/39 | | | | 1,000 | | | | 1,068,300 | |
North Carolina (State of) Medical Care Commission (Lutheran Services); Series 2012, Ref. First Mortgage Health Care Facilities RB | | | 4.25 | % | | | 03/01/24 | | | | 2,000 | | | | 1,899,640 | |
North Carolina (State of) Medical Care Commission (Southminster); Series 2007 A, First Mortgage Retirement Facilities RB | | | 5.63 | % | | | 10/01/27 | | | | 1,000 | | | | 1,004,770 | |
North Carolina (State of) Municipal Power Agency No. 1; Series 1998 A, Catawba Electric RB (INS–NATL)(a) | | | 5.50 | % | | | 01/01/15 | | | | 4,750 | | | | 4,963,038 | |
North Carolina (State of) Turnpike Authority; Series 2009 A, Triangle Expressway System RB (INS–AGC)(a) | | | 5.13 | % | | | 01/01/24 | | | | 2,000 | | | | 2,198,160 | |
Oak Island (Town of); Series 2009, Enterprise System RB (INS–AGC)(a) | | | 6.00 | % | | | 06/01/34 | | | | 500 | | | | 547,585 | |
| | | | | | | | | | | | | | | | 18,241,635 | |
|
| North Dakota–0.35% | |
Cass (County of) (Essentia Health Obligated Group); Series 2008 A, Health Care Facilities RB (INS–AGC)(a) | | | 5.13 | % | | | 02/15/37 | | | | 1,000 | | | | 1,042,980 | |
Fargo (City of) (Sanford); Series 2011, Health System RB | | | 6.25 | % | | | 11/01/31 | | | | 1,250 | | | | 1,439,562 | |
Grand Forks (City of) (4000 Valley Square); Series 2006, Ref. Senior Housing RB | | | 5.20 | % | | | 12/01/26 | | | | 1,000 | | | | 996,600 | |
McLean (County of) (Great River Energy); Series 2010 B, Solid Waste Facilities RB | | | 5.15 | % | | | 07/01/40 | | | | 2,000 | | | | 2,054,800 | |
North Dakota (State of) Board of Higher Education (North Dakota State University); Series 2007, Housing & Auxiliary Facilities RB (INS–AMBAC)(a) | | | 5.00 | % | | | 04/01/27 | | | | 1,085 | | | | 1,131,460 | |
Ward (County of) (Trinity Obligated Group); Series 2006, Health Care Facilities RB | | | 5.13 | % | | | 07/01/29 | | | | 1,000 | | | | 1,010,580 | |
| | | | | | | | | | | | | | | | 7,675,982 | |
|
| Ohio–3.21% | |
Adams (County of) (Adams County Hospital); Series 2005, Hospital Facility Improvement RB | | | 6.25 | % | | | 09/01/20 | | | | 2,760 | | | | 2,283,790 | |
Akron, Bath & Copley Joint Township Hospital District (Medical Center of Akron); Series 2012, RB | | | 5.00 | % | | | 11/15/32 | | | | 1,000 | | | | 1,043,720 | |
Allen (County of) (Catholic Healthcare Partners); Series 2010 A, Hospital Facilities RB | | | 5.00 | % | | | 06/01/38 | | | | 1,025 | | | | 1,061,377 | |
Beavercreek City School District; Series 2009, School Improvement Unlimited Tax GO Bonds | | | 5.00 | % | | | 12/01/30 | | | | 1,000 | | | | 1,102,460 | |
Cleveland (City of); | | | | | | | | | |
Series 1993 G, Ref. First Mortgage Waterworks Improvement RB (INS–NATL)(a) | | | 5.50 | % | | | 01/01/21 | | | | 3,395 | | | | 4,032,649 | |
Series 2008 B-1, Public Power System CAB RB (INS–NATL)(a)(g) | | | 0.00 | % | | | 11/15/25 | | | | 2,895 | | | | 1,797,563 | |
Series 2012 A, Ref. Airport System RB | | | 5.00 | % | | | 01/01/29 | | | | 5,000 | | | | 5,178,400 | |
Cuyahoga (County of) (Eliza Jennings Senior Care Network); Series 2007 A, Health Care & Independent Living Facilities RB | | | 5.75 | % | | | 05/15/27 | | | | 500 | | | | 501,620 | |
Hamilton (County of) (Christ Hospital); | | | | | | | | | |
Series 2012, Health Care Facilities RB | | | 5.25 | % | | | 06/01/27 | | | | 3,295 | | | | 3,536,886 | |
Series 2012, Health Care Facilities RB | | | 5.50 | % | | | 06/01/42 | | | | 6,000 | | | | 6,254,040 | |
Hamilton (County of) (Life Enriching Communities); Series 2006 A, Ref. Health Care RB | | | 5.00 | % | | | 01/01/37 | | | | 4,750 | | | | 4,667,160 | |
Lorain (County of) (Catholic Healthcare Partners); | | | | | | | | | |
Series 2003 C-1, Ref. Hospital Facilities RB (INS–AGM)(a) | | | 5.00 | % | | | 04/01/24 | | | | 1,750 | | | | 1,935,325 | |
Series 2006 H, Hospital Facilities RB (INS–AGC)(a) | | | 5.00 | % | | | 02/01/24 | | | | 4,810 | | | | 5,315,916 | |
Middleburg Heights (City of) (Southwest General Health Center); | | | | | | | | | |
Series 2011, Hospital Facilities RB | | | 5.13 | % | | | 08/01/31 | | | | 1,750 | | | | 1,806,070 | |
Series 2011, Hospital Facilities RB | | | 5.25 | % | | | 08/01/36 | | | | 1,500 | | | | 1,553,055 | |
Muskingum (County of) (Genesis Healthcare System); Series 2013, Hospital Facilities RB | | | 5.00 | % | | | 02/15/44 | | | | 5,000 | | | | 4,066,100 | |
Ohio (State of) (Cleveland Clinic Health System Obligated Group); Series 2009 A, Ref. Hospital RB | | | 5.50 | % | | | 01/01/39 | | | | 3,750 | | | | 4,164,937 | |
Ohio (State of) Air Quality Development Authority (Columbus Southern Power Co.); Series 2009 B, Ref. RB(d) | | | 5.80 | % | | | 12/01/19 | | | | 3,000 | | | | 3,207,450 | |
Ohio (State of) Air Quality Development Authority (FirstEnergy Generation Corp.); Series 2009 C, Ref. PCR | | | 5.63 | % | | | 06/01/18 | | | | 5,850 | | | | 6,503,796 | |
Ohio (State of) Higher Educational Facility Commission (University Hospitals Health System, Inc.); Series 2009 A, Hospital RB(c)(d) | | | 6.75 | % | | | 01/15/15 | | | | 4,000 | | | | 4,233,400 | |
See accompanying Notes to Financial Statements which are an integral part of the financial statements.
26 Invesco Municipal Income Fund
| | | | | | | | | | | | | | | | |
| | | Interest
Rate | | | Maturity
Date | | | Principal
Amount
(000) | | | Value | |
| Ohio–(continued) | |
Ohio (State of) Housing Finance Agency (Covenant House Apartments); Series 2008 C, MFH Mortgage RB (CEP–GNMA)(b) | | | 6.10 | % | | | 09/20/49 | | | $ | 2,845 | | | $ | 3,033,339 | |
Ohio (State of) Water Development Authority (FirstEnergy Nuclear Generation Corp.); Series 2009 A, Ref. PCR(d) | | | 5.88 | % | | | 06/01/16 | | | | 2,140 | | | | 2,322,307 | |
Reynoldsburg City School District; Series 2008, School Facilities Construction & Improvement Unlimited Tax GO Bonds (CEP-Ohio School District) | | | 5.00 | % | | | 12/01/32 | | | | 1,000 | | | | 1,074,380 | |
| | | | | | | | | | | | | | | | 70,675,740 | |
|
| Oklahoma–0.81% | |
Grand River Dam Authority; | | | | | | | | | | | | | | | | |
Series 2008 A, RB (INS–BHAC)(a) | | | 5.00 | % | | | 06/01/21 | | | | 3,735 | | | | 4,286,585 | |
Series 2008 A, RB (INS–BHAC)(a) | | | 5.00 | % | | | 06/01/22 | | | | 3,735 | | | | 4,275,679 | |
Series 2008 A, RB (INS–BHAC)(a) | | | 5.00 | % | | | 06/01/23 | | | | 6,350 | | | | 7,265,098 | |
Oklahoma (State of) Colleges Board Of Regents (University of Central Oklahoma); Series 2004 B, Student Facilities RB (INS–AMBAC)(a) | | | 5.50 | % | | | 06/01/24 | | | | 2,000 | | | | 2,024,120 | |
Oklahoma (State of) Housing Finance Agency; Series 1991 B, SFH Mortgage RB (CEP–GNMA)(b) | | | 8.00 | % | | | 08/01/18 | | | | 15 | | | | 15,308 | |
| | | | | | | | | | | | | | | | 17,866,790 | |
|
| Oregon–0.54% | |
Beaverton School District; | | | | | | | | | | | | | | | | |
Series 2009, Limited Tax GO Bonds (INS–AGC)(a) | | | 5.00 | % | | | 06/01/31 | | | | 750 | | | | 833,205 | |
Series 2009, Limited Tax GO Bonds (INS–AGC)(a) | | | 5.13 | % | | | 06/01/36 | | | | 500 | | | | 557,730 | |
Forest Grove (City of) (Pacific University); Series 2014 A, Ref. Campus Improvement RB | | | 5.25 | % | | | 05/01/34 | | | | 2,000 | | | | 2,075,200 | |
Oregon (State of) Facilities Authority (Samaritan Health Services); Series 2010 A, Ref. RB | | | 5.00 | % | | | 10/01/30 | | | | 1,500 | | | | 1,547,490 | |
Portland (City of); Series 2011 B, Central Eastside Urban Renewal & Redevelopment Tax Allocation RB | | | 5.25 | % | | | 06/15/29 | | | | 900 | | | | 966,708 | |
Salem (City of) Hospital Facility Authority (Capital Manor, Inc.); | | | | | | | | | | | | | | | | |
Series 2012, Ref. RB | | | 5.63 | % | | | 05/15/32 | | | | 1,000 | | | | 1,005,780 | |
Series 2012, Ref. RB | | | 5.75 | % | | | 05/15/27 | | | | 1,000 | | | | 1,037,990 | |
Warm Springs Reservation Confederated Tribes of Oregon (Pelton Round Butte); Series 2009 B, Tribal Economic Development Hydroelectric RB(f) | | | 6.38 | % | | | 11/01/33 | | | | 3,500 | | | | 3,796,030 | |
| | | | | | | | | | | | | | | | 11,820,133 | |
|
| Pennsylvania–1.39% | |
Allegheny (County of) Higher Education Building Authority (Duquesne University); Series 2011 A, University RB | | | 5.25 | % | | | 03/01/27 | | | | 700 | | | | 775,943 | |
Allegheny (County of) Port Authority; Series 2011, Ref. Special Transportation RB | | | 5.75 | % | | | 03/01/29 | | | | 1,385 | | | | 1,562,973 | |
Delaware River Port Authority; Series 2010 D, RB | | | 5.00 | % | | | 01/01/35 | | | | 1,000 | | | | 1,059,870 | |
Erie (City of) Parking Authority; Series 2010, Gtd. RB (INS–AGM)(a) | | | 5.20 | % | | | 09/01/35 | | | | 1,000 | | | | 1,073,790 | |
Lehigh (County of) General Purpose Authority (Bible Fellowship Church Homes, Inc.); Series 2013, RB | | | 4.75 | % | | | 07/01/22 | | | | 2,125 | | | | 2,052,431 | |
Lycoming (County of) Authority (Pennsylvania College of Technology); Series 2008, RB (INS–AGC)(a) | | | 5.50 | % | | | 10/01/32 | | | | 2,250 | | | | 2,394,045 | |
Pennsylvania (State of) Higher Educational Facilities Authority (Drexel University); Series 2011 A, RB | | | 5.13 | % | | | 05/01/36 | | | | 500 | | | | 526,625 | |
Pennsylvania (State of) Turnpike Commission; | | | | | | | | | | | | | | | | |
Series 2009 A, Sub. RB (INS–AGC)(a) | | | 5.00 | % | | | 06/01/39 | | | | 1,850 | | | | 1,921,281 | |
Subseries 2009 A, Sub. RB (INS–AGC)(a) | | | 5.00 | % | | | 06/01/24 | | | | 4,000 | | | | 4,461,720 | |
Subseries 2010 B-2, Sub. Conv. CAB RB(j) | | | 5.75 | % | | | 12/01/28 | | | | 4,550 | | | | 4,598,457 | |
Subseries 2010 B-2, Sub. Conv. CAB RB(j) | | | 6.00 | % | | | 12/01/34 | | | | 2,750 | | | | 2,729,375 | |
Philadelphia (City of); | | | | | | | | | | | | | | | | |
Ninth Series 2010, Gas Works RB | | | 5.00 | % | | | 08/01/30 | | | | 500 | | | | 513,940 | |
Series 2009 B, Limited Tax GO Bonds(c)(d) | | | 7.00 | % | | | 07/15/16 | | | | 2,425 | | | | 2,808,198 | |
Pittsburgh (City of) & Allegheny (County of) Sports & Exhibition Authority (Regional Asset District); Series 2010, Ref. Sales Tax RB (INS–AGM)(a) | | | 5.00 | % | | | 02/01/31 | | | | 2,000 | | | | 2,128,000 | |
State Public School Building Authority (Harrisburg School District); Series 2009 A, RB (INS–AGC)(a) | | | 5.00 | % | | | 11/15/33 | | | | 2,000 | | | | 2,070,780 | |
| | | | | | | | | | | | | | | | 30,677,428 | |
See accompanying Notes to Financial Statements which are an integral part of the financial statements.
27 Invesco Municipal Income Fund
| | | | | | | | | | | | | | | | |
| | | Interest
Rate | | | Maturity
Date | | | Principal
Amount
(000) | | | Value | |
| Puerto Rico–1.75% | |
Puerto Rico (Commonwealth of) Electric Power Authority; Series 1989 O, CAB RB(c)(g) | | | 0.00 | % | | | 07/01/17 | | | $ | 15,000 | | | $ | 13,659,600 | |
Puerto Rico (Commonwealth of) Highway & Transportation Authority; Series 1993 X, Ref. RB(c) | | | 5.50 | % | | | 07/01/15 | | | | 7,680 | | | | 7,968,307 | |
Puerto Rico Sales Tax Financing Corp.; | | | | | | | | | | | | | | | | |
First Subseries 2009 A, RB(c)(d) | | | 5.50 | % | | | 08/01/19 | | | | 20 | | | | 24,492 | |
First Subseries 2009 A, RB | | | 5.50 | % | | | 08/01/28 | | | | 1,980 | | | | 1,676,169 | |
First Subseries 2010 A, CAB RB(g) | | | 0.00 | % | | | 08/01/33 | | | | 2,000 | | | | 421,400 | |
First Subseries 2010 A, RB | | | 5.50 | % | | | 08/01/37 | | | | 2,000 | | | | 1,574,420 | |
First Subseries 2010 A, RB | | | 5.50 | % | | | 08/01/42 | | | | 2,100 | | | | 1,633,086 | |
First Subseries 2010 C, RB | | | 5.25 | % | | | 08/01/41 | | | | 15,300 | | | | 11,531,457 | |
| | | | | | | | | | | | | | | | 38,488,931 | |
|
| Rhode Island–0.18% | |
Rhode Island (State of) Turnpike & Bridge Authority; Series 2010 A, RB | | | 5.00 | % | | | 12/01/35 | | | | 500 | | | | 527,355 | |
Rhode Island Economic Development Corp.; Series 2008 A, Airport RB (INS–AGC)(a)(b) | | | 5.25 | % | | | 07/01/28 | | | | 1,810 | | | | 1,972,176 | |
Rhode Island Health & Educational Building Corp. (Lifespan Obligated Group); Series 2009 A, Hospital Financing RB (INS–AGC)(a) | | | 6.25 | % | | | 05/15/30 | | | | 500 | | | | 555,665 | |
Rhode Island Health & Educational Building Corp. (Public Schools Financing Program-City of Woonsocket); Series 2009 E, RB (INS–AGC)(a) | | | 5.00 | % | | | 05/15/34 | | | | 825 | | | | 838,745 | |
| | | | | | | | | | | | | | | | 3,893,941 | |
|
| South Carolina–1.98% | |
Charleston Educational Excellence Finance Corp. (Charleston County School District); Series 2005, Installment Purchase RB(c)(d) | | | 5.25 | % | | | 12/01/15 | | | | 5,000 | | | | 5,440,650 | |
College of Charleston; Series 2007 D, Academic & Administrative Facilities RB (INS–SGI)(a) | | | 4.63 | % | | | 04/01/30 | | | | 1,500 | | | | 1,530,990 | |
Easley (City of); Series 2005, Ref. & Improvement Utility System RB(c)(d) | | | 5.00 | % | | | 12/01/15 | | | | 5,170 | | | | 5,584,944 | |
Greenwood (County of) (Self Regional Healthcare); Series 2012 B, Ref. Hospital RB | | | 5.00 | % | | | 10/01/31 | | | | 2,120 | | | | 2,260,704 | |
Horry (County of); Series 2010 A, Airport RB | | | 5.00 | % | | | 07/01/40 | | | | 2,000 | | | | 2,097,800 | |
Myrtle Beach (City of); Series 2004 A, Hospitality Fee RB(c) | | | 5.38 | % | | | 06/01/24 | | | | 1,150 | | | | 1,165,571 | |
Piedmont Municipal Power Agency; | | | | | | | | | | | | | | | | |
Series 2008 A-2, Electric RB | | | 5.00 | % | | | 01/01/24 | | | | 2,000 | | | | 2,219,580 | |
Series 2011 C, Ref. Electric RB (INS–AGC)(a) | | | 5.00 | % | | | 01/01/30 | | | | 500 | | | | 539,265 | |
Series 2011 D, Ref. Electric RB (INS–AGC)(a) | | | 5.75 | % | | | 01/01/34 | | | | 1,000 | | | | 1,115,370 | |
South Carolina (State of) Jobs-Economic Development Authority (AnMed Health); | | | | | | | | | | | | | | | | |
Series 2009 B, Ref. & Improvement Hospital RB (INS–AGC)(a) | | | 5.00 | % | | | 02/01/19 | | | | 1,000 | | | | 1,154,910 | |
Series 2009 B, Ref. & Improvement Hospital RB (INS–AGC)(a) | | | 5.38 | % | | | 02/01/29 | | | | 2,000 | | | | 2,166,820 | |
Series 2009 B, Ref. & Improvement Hospital RB (INS–AGC)(a) | | | 5.50 | % | | | 02/01/38 | | | | 3,000 | | | | 3,286,680 | |
South Carolina (State of) Jobs-Economic Development Authority (Lutheran Homes); Series 2013, Health Facilities RB | | | 5.00 | % | | | 05/01/28 | | | | 2,000 | | | | 1,896,620 | |
South Carolina (State of) Jobs-Economic Development Authority (Palmetto Health Alliance); Series 2013 A, Ref. Hospital RB | | | 5.25 | % | | | 08/01/30 | | | | 3,850 | | | | 4,042,500 | |
South Carolina (State of) Jobs-Economic Development Authority (Palmetto Health); Series 2009, Ref. & Improvement Hospital RB | | | 5.75 | % | | | 08/01/39 | | | | 1,000 | | | | 1,056,090 | |
South Carolina (State of) Jobs-Economic Development Authority (The Woodlands at Furman); | | | | | | | | | | | | | | | | |
Series 2012, Ref. RB | | | 6.00 | % | | | 11/15/32 | | | | 713 | | | | 452,402 | |
Series 2012, Ref. Sub. CAB RB(g) | | | 0.00 | % | | | 11/15/47 | | | | 306 | | | | 3,056 | |
South Carolina (State of) Jobs-Economic Development Authority (Wesley Commons); Series 2006, Ref. First Mortgage Health Facilities RB | | | 5.13 | % | | | 10/01/26 | | | | 500 | | | | 481,120 | |
South Carolina (State of) Public Service Authority (Santee Cooper); Series 2008 A, RB | | | 5.50 | % | | | 01/01/38 | | | | 2,000 | | | | 2,216,540 | |
Spartanburg (County of) Regional Health Services District; Series 2008 D, Ref. RB (INS–AGC)(a) | | | 5.25 | % | | | 04/15/22 | | | | 4,465 | | | | 4,902,883 | |
| | | | | | | | | | | | | | | | 43,614,495 | |
| | | | |
| South Dakota–0.63% | | | | | | | | | | | | | | | | |
Rapid City (City of); Series 2011 A, Ref. Airport RB | | | 6.75 | % | | | 12/01/31 | | | | 1,500 | | | | 1,639,590 | |
South Dakota (State of) Health & Educational Facilities Authority (Avera Health); Series 2012 A, RB | | | 5.00 | % | | | 07/01/42 | | | | 4,000 | | | | 4,103,520 | |
See accompanying Notes to Financial Statements which are an integral part of the financial statements.
28 Invesco Municipal Income Fund
| | | | | | | | | | | | | | | | |
| | | Interest
Rate | | | Maturity
Date | | | Principal
Amount
(000) | | | Value | |
| South Dakota–(continued) | | | | | | | | | | | | | | | | |
South Dakota (State of) Health & Educational Facilities Authority (Vocational Education Program); Series 2008, RB (INS–AGC)(a) | | | 5.50 | % | | | 08/01/38 | | | $ | 4,000 | | | $ | 4,435,320 | |
South Dakota (State of) Housing Development Authority (Homeownership Mortgage); Series 2008 G, RB | | | 6.00 | % | | | 05/01/28 | | | | 140 | | | | 141,145 | |
South Dakota (State of); Series 1993 A, Lease Revenue Trust Ctfs. (INS–AGM)(a) | | | 6.70 | % | | | 09/01/17 | | | | 3,290 | | | | 3,636,667 | |
| | | | | | | | | | | | | | | | 13,956,242 | |
|
| Tennessee–0.40% | |
Chattanooga (City of) Health, Educational & Housing Facility Board (Community Development Financial Institution Phase I LLC); Series 2005 A, Ref. Sr. RB | | | 5.00 | % | | | 10/01/25 | | | | 1,000 | | | | 1,007,250 | |
Johnson City (City of) Health & Educational Facilities Board (Mountain States Health Alliance); | | | | | | | | | |
Series 2006 A, First Mortgage Hospital RB | | | 5.50 | % | | | 07/01/36 | | | | 1,000 | | | | 1,029,090 | |
Series 2010, Hospital RB | | | 5.63 | % | | | 07/01/30 | | | | 2,000 | | | | 2,138,740 | |
Nashville (City of) & Davidson (County of) Metropolitan Government Health & Educational Facilities Board (Blakeford at Green Hills); | | | | | | | | | | | | | | | | |
Series 2012, Ref. & Improvement RB | | | 5.00 | % | | | 07/01/27 | | | | 2,000 | | | | 2,063,180 | |
Series 2012, Ref. & Improvement RB | | | 5.00 | % | | | 07/01/32 | | | | 1,500 | | | | 1,509,045 | |
Series 2012, Ref. & Improvement RB | | | 5.00 | % | | | 07/01/37 | | | | 1,100 | | | | 1,098,427 | |
| | | | | | | | | | | | | | | | 8,845,732 | |
|
| Texas–12.07% | |
Alliance Airport Authority, Inc. (Federal Express Corp.); Series 2006, Ref. Special Facilities RB(b) | | | 4.85 | % | | | 04/01/21 | | | | 3,615 | | | | 3,781,254 | |
Angelina & Neches River Authority Industrial Development Corp. (Aspen Power LLC); Series 2007 A, Environmental Facilities RB(b)(i) | | | 6.50 | % | | | 11/01/29 | | | | 430 | | | | 240,783 | |
Beaumont (City of); Series 2008, Limited Tax GO Ctfs. (INS–AGC)(a) | | | 5.00 | % | | | 03/01/30 | | | | 1,000 | | | | 1,076,150 | |
Bexar (County of) (Motor Vehicle Rental Tax); Series 2009, Venue RB (INS–BHAC)(a) | | | 5.00 | % | | | 08/15/39 | | | | 1,020 | | | | 1,070,878 | |
Bexar (County of) Metropolitan Water District; Series 2009, Ref. Waterworks System RB | | | 5.00 | % | | | 05/01/39 | | | | 1,500 | | | | 1,550,625 | |
Bexar County Health Facilities Development Corp. (St. Luke’s Lutheran Hospital); Series 1991, Hospital RB(c) | | | 7.00 | % | | | 05/01/21 | | | | 500 | | | | 645,330 | |
Brazoria (County of) Brazos River Harbor Navigation District (The Dow Chemical Co.); Series 2002 A, Environmental Facilities RB(b)(d) | | | 5.95 | % | | | 05/15/18 | | | | 1,100 | | | | 1,182,852 | |
Brazos Harbor Industrial Development Corp. (Dow Chemical); Series 2008, Environmental Facilities RB(b)(d) | | | 5.90 | % | | | 05/01/28 | | | | 1,050 | | | | 1,102,259 | |
Capital Area Cultural Education Facilities Finance Corp. (The Roman Catholic Diocese of Austin); Series 2005 B, RB | | | 6.13 | % | | | 04/01/45 | | | | 4,500 | | | | 4,859,505 | |
Central Texas Regional Mobility Authority; | | | | | | | | | |
Series 2011, Sr. Lien RB | | | 5.75 | % | | | 01/01/31 | | | | 1,000 | | | | 1,074,490 | |
Series 2011, Sr. Lien RB | | | 6.00 | % | | | 01/01/41 | | | | 5,000 | | | | 5,301,150 | |
Clifton Higher Education Finance Corp. (Idea Public Schools); Series 2013, Education RB | | | 6.00 | % | | | 08/15/43 | | | | 2,000 | | | | 2,154,240 | |
Dallas (City of) (Civic Center Convention Complex); Series 2009, Ref. & Improvement RB (INS–AGC)(a) | | | 5.25 | % | | | 08/15/34 | | | | 4,000 | | | | 4,260,320 | |
Dallas-Fort Worth International Airport Facilities Improvement Corp.; | | | | | | | | | |
Series 2004 B, Joint Improvement RB (INS–AGM)(a)(b) | | | 5.38 | % | | | 11/01/21 | | | | 4,000 | | | | 4,126,120 | |
Series 2004 B, Joint Improvement RB (INS–AGM)(a)(b) | | | 5.50 | % | | | 11/01/19 | | | | 6,110 | | | | 6,319,267 | |
Friendswood Independent School District; Series 2008, Schoolhouse Unlimited Tax GO Bonds (CEP–Texas Permanent School Fund) | | | 5.00 | % | | | 02/15/26 | | | | 2,840 | | | | 3,204,457 | |
Galena Park Independent School District; Series 1996, Ref. Unlimited Tax CAB GO Bonds (CEP–Texas Permanent School Fund)(g) | | | 0.00 | % | | | 08/15/23 | | | | 2,000 | | | | 1,520,380 | |
Harris (County of); | | | | | | | | | |
Series 2007 C, Ref. Sub. Lien Toll Road Unlimited Tax GO Bonds (INS–AGM)(a) | | | 5.25 | % | | | 08/15/31 | | | | 6,665 | | | | 7,970,807 | |
Series 2009 A, Sr. Lien Toll Road RB | | | 5.00 | % | | | 08/15/31 | | | | 2,920 | | | | 3,242,835 | |
Series 2009 A, Sr. Lien Toll Road RB | | | 5.00 | % | | | 08/15/38 | | | | 1,000 | | | | 1,103,380 | |
Harris County Cultural Education Facilities Finance Corp. (Baylor College of Medicine); Series 2008 D, Ref. Medical Facilities RB | | | 5.38 | % | | | 11/15/28 | | | | 825 | | | | 871,250 | |
Harris County Cultural Education Facilities Finance Corp. (TECO); Series 2009 A, Thermal Utility RB | | | 5.25 | % | | | 11/15/35 | | | | 1,100 | | | | 1,170,411 | |
Harris County Health Facilities Development Corp. (Memorial Hermann Healthcare System); Series 2008 B, Ref. RB(c)(d) | | | 7.25 | % | | | 12/01/18 | | | | 1,000 | | | | 1,289,140 | |
See accompanying Notes to Financial Statements which are an integral part of the financial statements.
29 Invesco Municipal Income Fund
| | | | | | | | | | | | | | | | |
| | | Interest
Rate | | | Maturity
Date | | | Principal
Amount
(000) | | | Value | |
| Texas–(continued) | |
Harris County Health Facilities Development Corp. (TECO); Series 2008, Thermal Utility RB (INS–AGC)(a) | | | 5.00 | % | | | 11/15/26 | | | $ | 3,860 | | | $ | 4,273,059 | |
Harris County Health Facilities Development Corp. (Texas Children’s Hospital); Series 1999 A, RB(c) | | | 5.25 | % | | | 10/01/29 | | | | 2,000 | | | | 2,008,840 | |
Harris County Health Facilities Development Corp. (Texas Medical Center Central Heating and Cooling Services Corp.); Series 2008, Thermal Utility RB (INS–AGC)(a) | | | 5.00 | % | | | 11/15/27 | | | | 3,180 | | | | 3,499,049 | |
Hopkins (County of) Hospital District; Series 2008, RB | | | 5.50 | % | | | 02/15/23 | | | | 1,805 | | | | 1,808,141 | |
Houston (City of) Convention & Entertainment Facilities Department; | | | | | | | | | | | | | | | | |
Series 2001 B, Hotel Occupancy Tax & Special CAB RB (INS–AGM)(a)(g) | | | 0.00 | % | | | 09/01/26 | | | | 8,750 | | | | 5,103,612 | |
Series 2001 B, Hotel Occupancy Tax & Special CAB RB (INS–AGM)(a)(g) | | | 0.00 | % | | | 09/01/27 | | | | 3,600 | | | | 1,968,264 | |
Houston (City of); | | | | | | | | | | | | | | | | |
Series 2004 A, Ref. First Lien Combined Utility System RB (INS–AGM)(a) | | | 5.25 | % | | | 05/15/22 | | | | 15,000 | | | | 15,161,700 | |
Series 2004 A, Ref. First Lien Combined Utility System RB (INS–BHAC)(a) | | | 5.25 | % | | | 05/15/23 | | | | 22,500 | | | | 22,736,925 | |
Series 2004 A, Ref. First Lien Combined Utility System RB (INS–NATL)(a) | | | 5.25 | % | | | 05/15/25 | | | | 5,000 | | | | 5,053,800 | |
Series 2009 A, Ref. Sr. Lien Airport System RB | | | 5.50 | % | | | 07/01/34 | | | | 875 | | | | 973,385 | |
Houston Higher Education Finance Corp. (Cosmos Foundation, Inc.); | | | | | | | | | | | | | | | | |
Series 2011 A, RB | | | 6.50 | % | | | 05/15/31 | | | | 1,740 | | | | 1,939,543 | |
Series 2011 A, RB | | | 6.88 | % | | | 05/15/41 | | | | 1,700 | | | | 1,922,564 | |
Houston Independent School District; Series 2008, Schoolhouse Limited Tax GO Bonds (CEP–Texas Permanent School Fund) | | | 5.00 | % | | | 02/15/26 | | | | 6,875 | | | | 7,670,437 | |
Laredo Community College District; Series 2010, Combined Fee RB (INS–AGM)(a) | | | 5.25 | % | | | 08/01/35 | | | | 1,000 | | | | 1,066,970 | |
Love Field Airport Modernization Corp. (Southwest Airlines Co.); | | | | | | | | | | | | | | | | |
Series 2010, Special Facilities RB | | | 5.25 | % | | | 11/01/40 | | | | 1,000 | | | | 1,020,220 | |
Series 2012, Special Facilities RB(b) | | | 5.00 | % | | | 11/01/28 | | | | 2,000 | | | | 2,075,700 | |
Lower Colorado River Authority; Series 2012 A, Ref. RB | | | 5.00 | % | | | 05/15/30 | | | | 4,595 | | | | 4,975,604 | |
Lubbock Health Facilities Development Corp. (Carillon Senior LifeCare Community); Series 2005 A, Ref. First Mortgage RB | | | 6.63 | % | | | 07/01/36 | | | | 4,000 | | | | 4,075,480 | |
Lufkin Health Facilities Development Corp. (Memorial Health System of East Texas); Series 2009, Ref. & Improvement RB | | | 6.00 | % | | | 02/15/24 | | | | 2,500 | | | | 2,704,650 | |
New Hope Cultural Education Facilities Corp. (Morningside Ministries); Series 2013, First Mortgage RB | | | 6.50 | % | | | 01/01/43 | | | | 2,350 | | | | 2,427,856 | |
Newark Cultural Education Facilities Finance Corp. (A.W. Brown-Fellowship Leadership); Series 2012, Lease RB | | | 6.00 | % | | | 08/15/42 | | | | 2,330 | | | | 2,399,574 | |
North Texas Tollway Authority; | | | | | | | | | | | | | | | | |
Series 2005 C, Dallas North Tollway System RB | | | 5.38 | % | | | 01/01/21 | | | | 1,000 | | | | 1,146,770 | |
Series 2008 A, Ref. First Tier System RB | | | 5.63 | % | | | 01/01/33 | | | | 3,500 | | | | 3,822,245 | |
Series 2008 A, Ref. First Tier System RB | | | 6.00 | % | | | 01/01/23 | | | | 2,000 | | | | 2,287,560 | |
Series 2008 A, Ref. First Tier System RB (INS–AGC)(a) | | | 5.63 | % | | | 01/01/33 | | | | 1,750 | | | | 1,927,135 | |
Series 2008 D, Ref. First Tier System CAB RB (INS–AGC)(a)(g) | | | 0.00 | % | | | 01/01/28 | | | | 12,800 | | | | 6,857,600 | |
Series 2008 D, Ref. First Tier System CAB RB (INS–AGC)(a)(g) | | | 0.00 | % | | | 01/01/29 | | | | 2,165 | | | | 1,084,903 | |
Series 2008 D, Ref. First Tier System CAB RB (INS–AGC)(a)(g) | | | 0.00 | % | | | 01/01/31 | | | | 4,710 | | | | 2,091,099 | |
Series 2008 F, Ref. Second Tier System RB | | | 6.13 | % | | | 01/01/31 | | | | 5,000 | | | | 5,339,450 | |
Series 2008 K-1, Ref. First Tier System RB (INS–AGC)(a) | | | 5.75 | % | | | 01/01/38 | | | | 1,630 | | | | 1,821,574 | |
Series 2011, Ref. First Tier System RB | | | 5.00 | % | | | 01/01/38 | | | | 1,000 | | | | 1,037,150 | |
Nueces River Authority (Corpus Christi); | | | | | | | | | | | | | | | | |
Series 2005, Ref. Facilities RB (INS–AGM)(a) | | | 5.00 | % | | | 07/15/25 | | | | 2,750 | | | | 2,897,950 | |
Series 2005, Ref. Facilities RB (INS–AGM)(a) | | | 5.00 | % | | | 03/01/27 | | | | 2,000 | | | | 2,095,780 | |
Parker (County of); Series 2009, Road Unlimited Tax GO Bonds (INS–AGC)(a) | | | 5.13 | % | | | 02/15/31 | | | | 1,000 | | | | 1,099,810 | |
Pflugerville (City of); | | | | | | | | | | | | | | | | |
Series 2009, Limited Tax GO Bonds (INS–AGC)(a) | | | 5.30 | % | | | 08/01/31 | | | | 860 | | | | 966,158 | |
Series 2009, Limited Tax GO Ctfs. (INS–AGC)(a) | | | 5.38 | % | | | 08/01/32 | | | | 755 | | | | 844,739 | |
Pharr-San Juan-Alamo Independent School District; Series 2006, Ref. Unlimited Tax GO Bonds (CEP–Texas Permanent School Fund) | | | 5.13 | % | | | 02/01/24 | | | | 1,010 | | | | 1,084,558 | |
Red River Health Facilities Development Corp. (Parkview on Hollybrook); Series 2013 A, First Mortgage RB | | | 6.38 | % | | | 07/01/33 | | | | 1,470 | | | | 1,394,089 | |
Richardson Independent School District; Series 2008, School Building Unlimited Tax GO Bonds | | | 5.25 | % | | | 02/15/33 | | | | 1,000 | | | | 1,107,650 | |
Sachse (City of); Series 2009, Ref. & Improvement Limited Tax GO Bonds (INS–AGC)(a) | | | 5.25 | % | | | 02/15/31 | | | | 500 | | | | 554,475 | |
See accompanying Notes to Financial Statements which are an integral part of the financial statements.
30 Invesco Municipal Income Fund
| | | | | | | | | | | | | | | | |
| | | Interest
Rate | | | Maturity
Date | | | Principal
Amount
(000) | | | Value | |
| Texas–(continued) | | | | | | | | | | | | | | | | |
San Jacinto River Authority (Groundwater Reduction Plan Division); Series 2011, Special Project RB (INS–AGM)(a) | | | 5.00 | % | | | 10/01/32 | | | $ | 1,250 | | | $ | 1,318,113 | |
Series 2011, Special Project RB (INS–AGM)(a) | | | 5.00 | % | | | 10/01/37 | | | | 1,000 | | | | 1,038,200 | |
Tarrant County Cultural Education Facilities Finance Corp. (Air Force Village Obligated Group); Series 2009, Retirement Facility RB | | | 6.13 | % | | | 11/15/29 | | | | 2,000 | | | | 2,119,620 | |
Tarrant County Cultural Education Facilities Finance Corp. (Buckingham Senior Living Community, Inc.); Series 2007, Retirement Facility RB | | | 5.75 | % | | | 11/15/37 | | | | 345 | | | | 344,079 | |
Tarrant County Cultural Education Facilities Finance Corp. (Buckner Retirement Services, Inc.); | | | | | | | | | | | | | | | | |
Series 2007, Retirement Facility RB | | | 5.00 | % | | | 11/15/17 | | | | 500 | | | | 548,995 | |
Series 2007, Retirement Facility RB | | | 5.25 | % | | | 11/15/37 | | | | 4,000 | | | | 4,019,760 | |
Tarrant County Cultural Education Facilities Finance Corp. (C.C. Young Memorial Home); | | | | | | | | | | | | | | | | |
Series 2007, Retirement Facility RB | | | 5.75 | % | | | 02/15/25 | | | | 2,200 | | | | 2,206,490 | |
Series 2007, Retirement Facility RB | | | 5.75 | % | | | 02/15/29 | | | | 1,500 | | | | 1,457,505 | |
Tarrant County Cultural Education Facilities Finance Corp. (CHRISTUS Health); | | | | | | | | | | | | | | | | |
Series 2008 A, Ref. RB (INS–AGC)(a) | | | 5.75 | % | | | 07/01/18 | | | | 2,495 | | | | 2,727,584 | |
Series 2008 A, Ref. RB (INS–AGC)(a) | | | 6.50 | % | | | 07/01/37 | | | | 4,250 | | | | 4,720,092 | |
Tarrant County Cultural Education Facilities Finance Corp. (Texas Health Resources System); Series 2007 A, Ref. RB | | | 5.00 | % | | | 02/15/17 | | | | 2,700 | | | | 3,032,127 | |
Tarrant County Health Facilities Development Corp.; Series 1987 B, RB(c) | | | 5.00 | % | | | 09/01/15 | | | | 995 | | | | 1,039,148 | |
Texas (State of) Department of Housing & Community Affairs; Series 1992 C-2, Regular Residual Interest Home Mortgage RB (CEP–GNMA)(b)(h) | | | 13.45 | % | | | 07/02/24 | | | | 275 | | | | 292,490 | |
Texas (State of) Transportation Commission; | | | | | | | | | | | | | | | | |
Series 2006 A, First Tier RB(c)(d) | | | 5.00 | % | | | 04/01/16 | | | | 2,000 | | | | 2,194,980 | |
Series 2008, Mobility Fund Unlimited Tax GO Bonds(e) | | | 5.00 | % | | | 04/01/28 | | | | 4,000 | | | | 4,462,040 | |
Texas (State of) Turnpike Authority (Central Texas Turnpike System); Series 2002, First Tier CAB RB (INS–BHAC)(a)(g) | | | 0.00 | % | | | 08/15/27 | | | | 1,000 | | | | 573,790 | |
Texas (State of); Series 2001 A, Ref. Water Development Unlimited Tax GO Bonds | | | 5.25 | % | | | 08/01/35 | | | | 1,840 | | | | 1,847,268 | |
Texas A&M University System Board of Regents; Series 2009 A, Financing System RB | | | 5.00 | % | | | 05/15/25 | | | | 1,610 | | | | 1,855,976 | |
Texas Municipal Gas Acquisition & Supply Corp. III; | | | | | | | | | | | | | | | | |
Series 2012, Gas Supply RB | | | 5.00 | % | | | 12/15/22 | | | | 2,000 | | | | 2,190,460 | |
Series 2012, Gas Supply RB | | | 5.00 | % | | | 12/15/23 | | | | 2,000 | | | | 2,163,940 | |
Series 2012, Gas Supply RB | | | 5.00 | % | | | 12/15/28 | | | | 6,310 | | | | 6,522,773 | |
Series 2012, Gas Supply RB | | | 5.00 | % | | | 12/15/31 | | | | 1,875 | | | | 1,917,731 | |
Series 2012, Gas Supply RB | | | 5.00 | % | | | 12/15/32 | | | | 3,865 | | | | 3,939,131 | |
Texas Private Activity Bond Surface Transportation Corp. (NTE Mobility Partners LLC North Tarrant Express Management Lanes); Series 2009, Sr. Lien RB | | | 6.88 | % | | | 12/31/39 | | | | 5,460 | | | | 6,081,894 | |
Texas Private Activity Bond Surface Transportation Corp. (NTE Mobility Partners LLC); Series 2013, Sr. Lien RB(b) | | | 7.00 | % | | | 12/31/38 | | | | 3,475 | | | | 3,884,251 | |
Texas Woman’s University; Series 2008, Financing System RB | | | 5.13 | % | | | 07/01/27 | | | | 1,325 | | | | 1,403,029 | |
Tyler Health Facilities Development Corp. (Mother Frances Hospital Regional Health Care Center); | | | | | | | | | | | | | | | | |
Series 2011, Hospital RB | | | 5.13 | % | | | 07/01/22 | | | | 1,655 | | | | 1,778,910 | |
Series 2011, Hospital RB | | | 5.25 | % | | | 07/01/23 | | | | 2,000 | | | | 2,141,820 | |
University of Houston; Series 2009, Ref. Consolidated RB | | | 5.00 | % | | | 02/15/29 | | | | 1,000 | | | | 1,102,990 | |
Victoria Independent School District; Series 2008, School Building Unlimited Tax GO Bonds
(CEP–Texas Permanent School Fund) | | | 5.00 | % | | | 02/15/23 | | | | 1,790 | | | | 2,027,819 | |
Ysleta Independent School District Public Facility Corp.; Series 2001, Ref. Lease RB
(INS–AMBAC)(a) | | | 5.38 | % | | | 11/15/24 | | | | 1,300 | | | | 1,313,013 | |
| | | | | | | | | | | | | | | | 265,709,969 | |
|
| Utah–0.37% | |
Pleasant Grove (City of); Series 2008, Water RB (INS–AGM)(a) | | | 5.25 | % | | | 12/01/33 | | | | 710 | | | | 780,979 | |
Provo (City of); Series 1984 A, Electric RB(c) | | | 10.38 | % | | | 09/15/15 | | | | 170 | | | | 184,278 | |
Salt Lake City (City of) (IHC Hospitals, Inc.); Series 1983, Hospital RB(c) | | | 5.00 | % | | | 06/01/15 | | | | 3,380 | | | | 3,496,610 | |
Utah (State of) Charter School Finance Authority (Summit Academy); Series 2007 A, Charter School RB | | | 5.80 | % | | | 06/15/38 | | | | 600 | | | | 600,144 | |
Utah (State of) Transit Authority; Series 2008 A, Sales Tax RB (INS–AGM)(a) | | | 5.00 | % | | | 06/15/36 | | | | 1,050 | | | | 1,143,093 | |
See accompanying Notes to Financial Statements which are an integral part of the financial statements.
31 Invesco Municipal Income Fund
| | | | | | | | | | | | | | | | |
| | | Interest
Rate | | | Maturity
Date | | | Principal
Amount
(000) | | | Value | |
| Utah–(continued) | |
Utah Housing Corp.; Series 2008 C-1, Class III, Single Family Mortgage RB(b) | | | 5.70 | % | | | 07/01/28 | | | $ | 1,860 | | | $ | 1,916,246 | |
| | | | | | | | | | | | | | | | 8,121,350 | |
| | | | |
| Vermont–0.34% | | | | | | | | | | | | | | | | |
University of Vermont & State Agricultural College; Series 2009, RB | | | 5.13 | % | | | 10/01/39 | | | | 1,275 | | | | 1,344,551 | |
Vermont (State of) Economic Development Authority (Central Vermont Public Service Corp.); Series 2010, Recovery Zone Facility Bonds | | | 5.00 | % | | | 12/15/20 | | | | 1,250 | | | | 1,437,338 | |
Vermont (State of) Economic Development Authority (Wake Robin Corp.); Series 2006 A, Mortgage RB | | | 5.38 | % | | | 05/01/36 | | | | 3,300 | | | | 3,080,187 | |
Vermont (State of) Educational & Health Buildings Financing Agency (Fletcher Allen Health Care); Series 2004 B, Hospital RB (INS–AGM)(a) | | | 5.00 | % | | | 12/01/34 | | | | 1,565 | | | | 1,608,335 | |
| | | | | | | | | | | | | | | | 7,470,411 | |
|
| Virgin Islands–0.21% | |
Virgin Islands (Government of) Public Finance Authority (Matching Fund Loan Note); | | | | | | | | | | | | | | | | |
Series 2010 A, Sr. Lien RB | | | 5.00 | % | | | 10/01/25 | | | | 3,600 | | | | 3,853,476 | |
Series 2010 A, Sr. Lien RB | | | 5.00 | % | | | 10/01/29 | | | | 750 | | | | 769,650 | |
| | | | | | | | | | | | | | | | 4,623,126 | |
|
| Virginia–1.33% | |
Hampton Roads Sanitation District; Series 2008, Wastewater RB | | | 5.00 | % | | | 04/01/38 | | | | 2,000 | | | | 2,145,000 | |
Hanover (County of) Economic Development Authority (Covenant Woods); | | | | | | | | | | | | | | | | |
Series 2012 A, Residential Care Facility RB | | | 4.50 | % | | | 07/01/30 | | | | 2,795 | | | | 2,409,122 | |
Series 2012 A, Residential Care Facility RB | | | 4.50 | % | | | 07/01/32 | | | | 1,100 | | | | 926,563 | |
Tobacco Settlement Financing Corp.; Series 2005, Asset-Backed RB(c) | | | 5.50 | % | | | 06/01/26 | | | | 695 | | | | 726,310 | |
Virginia (State of) Public School Authority; Series 2008, Special Obligation School Financing RB(c)(d) | | | 6.00 | % | | | 12/01/18 | | | | 1,000 | | | | 1,234,360 | |
Virginia (State of) Small Business Financing Authority (Elizabeth River Crossings Opco, LLC); | | | | | | | | | | | | | | | | |
Series 2012, Sr. Lien RB(b) | | | 5.00 | % | | | 07/01/27 | | | | 4,465 | | | | 4,537,780 | |
Series 2012, Sr. Lien RB(b) | | | 5.50 | % | | | 01/01/42 | | | | 4,920 | | | | 5,065,484 | |
Virginia (State of) Small Business Financing Authority (Express Lanes, LLC); | | | | | | | | | | | | | | | | |
Series 2012, Sr. Lien RB(b) | | | 5.00 | % | | | 07/01/34 | | | | 5,925 | | | | 5,842,761 | |
Series 2012, Sr. Lien RB(b) | | | 5.00 | % | | | 01/01/40 | | | | 2,535 | | | | 2,475,529 | |
Virginia (State of) Small Business Financing Authority (Hampton Roads Proton Beam Therapy Institute at Hampton University, LLC); Series 2009, RB(c)(d)(f) | | | 8.00 | % | | | 07/01/14 | | | | 800 | | | | 836,840 | |
Washington (County of) Industrial Development Authority (Mountain States Health Alliance); Series 2009 C, Hospital Facility RB | | | 7.50 | % | | | 07/01/29 | | | | 2,000 | | | | 2,289,100 | |
White Oak Village Shops Community Development Authority; Series 2007, Special Assessment RB | | | 5.30 | % | | | 03/01/17 | | | | 783 | | | | 836,557 | |
| | | | | | | | | | | | | | | | 29,325,406 | |
|
| Washington–3.14% | |
Everett (City of) Public Facilities District; Series 2007 A, Sales Tax & Interlocal RB | | | 5.00 | % | | | 12/01/23 | | | | 1,135 | | | | 1,246,934 | |
FYI Properties (Washington State District); Series 2009, Lease RB | | | 5.50 | % | | | 06/01/39 | | | | 1,000 | | | | 1,072,640 | |
Grant (County of) Public Utility District No. 2; Series 2005 A, Ref. Wanapum Hydroelectric Development RB (INS–NATL)(a) | | | 5.00 | % | | | 01/01/38 | | | | 2,500 | | | | 2,573,400 | |
Kalispel Tribe of Indians; Series 2008, RB | | | 6.63 | % | | | 01/01/28 | | | | 950 | | | | 860,852 | |
King (County of) Housing Authority (Egis Housing Program); Series 2007, Capital Fund
Program RB(b)(c)(d) | | | 5.30 | % | | | 06/01/17 | | | | 1,025 | | | | 1,156,764 | |
King (County of) Public Hospital District No. 1; Series 2008 A, Limited Tax GO Bonds (INS–AGC)(a) | | | 5.25 | % | | | 12/01/28 | | | | 3,575 | | | | 3,843,018 | |
Klickitat (County of) Public Utility District No. 1; | | | | | | | | | | | | | | | | |
Series 2006 B, Ref. Electric RB (INS–NATL)(a) | | | 5.00 | % | | | 12/01/23 | | | | 2,100 | | | | 2,316,741 | |
Series 2006 B, Ref. Electric RB (INS–NATL)(a) | | | 5.00 | % | | | 12/01/24 | | | | 2,000 | | | | 2,199,540 | |
Lynnwood (City of) Public Facilities District (Convention Center); Series 2005, RB (INS–AMBAC)(a) | | | 5.00 | % | | | 12/01/34 | | | | 4,140 | | | | 4,161,901 | |
Seattle (City of); | | | | | | | | | | | | | | | | |
Series 2003, Ref. Water System RB (INS–NATL)(a) | | | 5.00 | % | | | 09/01/20 | | | | 2,150 | | | | 2,158,965 | |
Series 2008, Drainage & Wastewater RB | | | 5.00 | % | | | 06/01/25 | | | | 2,450 | | | | 2,803,069 | |
Series 2008, Ref. & Improvement Municipal Light & Power RB | | | 5.75 | % | | | 04/01/23 | | | | 2,000 | | | | 2,349,960 | |
See accompanying Notes to Financial Statements which are an integral part of the financial statements.
32 Invesco Municipal Income Fund
| | | | | | | | | | | | | | | | |
| | | Interest
Rate | | | Maturity
Date | | | Principal
Amount
(000) | | | Value | |
| Washington–(continued) | | | | | | | | | | | | | | | | |
Seattle (Port of); Series 2005 A, Ref. Intermediate Lien RB (INS–NATL)(a) | | | 5.00 | % | | | 03/01/35 | | | $ | 1,000 | | | $ | 1,029,210 | |
Washington (State of) Health Care Facilities Authority (Fred Hutchinson Cancer Research Center); | | | | | | | | | | | | | | | | |
Series 2011, RB | | | 5.63 | % | | | 01/01/35 | | | | 1,250 | | | | 1,312,425 | |
Series 2011, RB | | | 6.00 | % | | | 01/01/31 | | | | 1,500 | | | | 1,623,795 | |
Washington (State of) Health Care Facilities Authority (MultiCare Health System); | | | | | | | | | | | | | | | | |
Series 2004 A, RB (INS–AGM)(a) | | | 5.25 | % | | | 08/15/28 | | | | 1,000 | | | | 1,067,680 | |
Series 2008 B, RB (INS–AGC)(a) | | | 6.00 | % | | | 08/15/39 | | | | 2,000 | | | | 2,182,760 | |
Washington (State of) Health Care Facilities Authority (Providence Health); Series 2006 D, RB
(INS–AGM)(a) | | | 5.25 | % | | | 10/01/33 | | | | 5,000 | | | | 5,469,150 | |
Washington (State of) Higher Education Facilities Authority (Whitworth University); | | | | | | | | | �� | | | | | | | |
Series 2009, Ref. RB | | | 5.38 | % | | | 10/01/29 | | | | 500 | | | | 526,315 | |
Series 2009, Ref. RB | | | 5.63 | % | | | 10/01/40 | | | | 1,500 | | | | 1,559,430 | |
Washington (State of) Housing Finance Commission (Wesley Homes); Series 2008, Non-Profit
CR RB(f) | | | 6.00 | % | | | 01/01/27 | | | | 1,100 | | | | 1,124,629 | |
Washington (State of); | | | | | | | | | | | | | | | | |
Series 2007 B, Motor Vehicle Fuel Unlimited Tax GO Bonds | | | 5.00 | % | | | 07/01/27 | | | | 2,250 | | | | 2,516,130 | |
Series 2010 B, Motor Vehicle Fuel Unlimited Tax GO Bonds(e) | | | 5.00 | % | | | 08/01/30 | | | | 21,500 | | | | 24,095,910 | |
| | | | | | | | | | | | | | | | 69,251,218 | |
|
| West Virginia–0.11% | |
Harrison (County of) Commission (Allegheny Energy); Series 2007 D, Ref. Solid Waste Disposal RB(b) | | | 5.50 | % | | | 10/15/37 | | | | 1,000 | | | | 1,005,970 | |
Ohio (County of) (Fort Henry Centre Financing District); Series 2007 A, Tax Increment Allocation RB | | | 5.85 | % | | | 06/01/34 | | | | 250 | | | | 255,483 | |
Pleasants (County of) Commission (Allegheny Energy Supply Co., LLC Pleasants Station); Series 2007 F, Ref. PCR | | | 5.25 | % | | | 10/15/37 | | | | 1,125 | | | | 1,131,750 | |
| | | | | | | | | | | | | | | | 2,393,203 | |
|
| Wisconsin–1.86% | |
Adams-Friendship Area School District; Series 1996, Ref. Unlimited Tax GO Bonds (INS–AMBAC)(a) | | | 6.50 | % | | | 04/01/15 | | | | 1,340 | | | | 1,427,422 | |
Superior (City of) (Superior Water, Light & Power Co.); Series 2007 A, Ref. Collateralized Utility RB(b) | | | 5.38 | % | | | 11/01/21 | | | | 2,000 | | | | 2,138,960 | |
Wisconsin (State of) Health & Educational Facilities Authority (Catholic Residential Services); Series 2007, Ref. RB | | | 5.25 | % | | | 05/01/28 | | | | 1,250 | | | | 908,887 | |
Wisconsin (State of) Health & Educational Facilities Authority (Essentia Health Obligated Group); Series 2008 B, Health Care Facilities RB (INS–AGC)(a) | | | 5.13 | % | | | 02/15/30 | | | | 1,500 | | | | 1,587,915 | |
Wisconsin (State of) Health & Educational Facilities Authority (Froedtert & Community Health Inc. Obligated Group); Series 2009, RB | | | 5.00 | % | | | 04/01/34 | | | | 750 | | | | 780,180 | |
Wisconsin (State of) Health & Educational Facilities Authority (Mercy Alliance); | | | | | | | | | | | | | | | | |
Series 2012, RB | | | 5.00 | % | | | 06/01/27 | | | | 7,585 | | | | 8,026,902 | |
Series 2012, RB | | | 5.00 | % | | | 06/01/39 | | | | 4,050 | | | | 4,115,448 | |
Wisconsin (State of) Health & Educational Facilities Authority (Meriter Hospital, Inc.); | | | | | | | | | | | | | | | | |
Series 2011 A, RB | | | 5.50 | % | | | 05/01/31 | | | | 2,000 | | | | 2,155,660 | |
Series 2011 A, RB | | | 5.75 | % | | | 05/01/35 | | | | 1,000 | | | | 1,086,070 | |
Wisconsin (State of) Health & Educational Facilities Authority (Prohealth Care, Inc. Obligated Group); | | | | | | | | | | | | | | | | |
Series 2009, RB | | | 6.38 | % | | | 02/15/29 | | | | 500 | | | | 552,265 | |
Series 2009, RB | | | 6.63 | % | | | 02/15/39 | | | | 1,000 | | | | 1,099,160 | |
Wisconsin (State of) Housing & Economic Development Authority; | | | | | | | | | | | | | | | | |
Series 2007 C, Home Ownership RB(b)(e) | | | 5.13 | % | | | 09/01/28 | | | | 1,255 | | | | 1,287,241 | |
Series 2008 A, Home Ownership RB(b) | | | 5.30 | % | | | 09/01/23 | | | | 6,860 | | | | 7,199,570 | |
Wisconsin (State of); | | | | | | | | | | | | | | | | |
Series 2009 A, General Fund Annual Appropriation RB | | | 5.38 | % | | | 05/01/25 | | | | 2,355 | | | | 2,733,213 | |
Series 2009 A, General Fund Annual Appropriation RB | | | 5.63 | % | | | 05/01/28 | | | | 5,000 | | | | 5,778,050 | |
| | | | | | | | | | | | | | | | 40,876,943 | |
| | | | |
| Wyoming–0.46% | | | | | | | | | | | | | | | | |
Campbell (County of) (Basin Electric Power Cooperative); Series 2009 A, Solid Waste Facilities RB | | | 5.75 | % | | | 07/15/39 | | | | 4,000 | | | | 4,393,480 | |
Sweetwater (County of) (FMC Corp.); Series 2005, Ref. Solid Waste Disposal RB(b) | | | 5.60 | % | | | 12/01/35 | | | | 2,005 | | | | 2,044,799 | |
West Park Hospital District (West Park Hospital); Series 2011 A, RB | | | 6.50 | % | | | 06/01/31 | | | | 1,000 | | | | 1,097,930 | |
See accompanying Notes to Financial Statements which are an integral part of the financial statements.
33 Invesco Municipal Income Fund
| | | | | | | | | | | | | | | | |
| | | Interest
Rate | | | Maturity
Date | | | Principal
Amount
(000) | | | Value | |
| Wyoming–(continued) | | | | | | | | | | | | | | | | |
Wyoming (State of) Municipal Power Agency; Series 2008 A, Power Supply RB | | | 5.50 | % | | | 01/01/33 | | | $ | 2,360 | | | $ | 2,590,006 | |
| | | | | | | | | | | | | | | | 10,126,215 | |
TOTAL INVESTMENTS(m)–106.57% (Cost $2,191,628,788) | | | | | | | | | | | | | | | 2,346,770,987 | |
FLOATING RATE NOTE OBLIGATIONS–(7.66)% | | | | | | | | | | | | | | | | |
Notes with interest and fee rates ranging from 0.55% to 0.93% at 02/28/14 and contractual maturities of collateral ranging from 05/15/23 to 08/15/42 (See Note 1J)(n) | | | | | | | | | | | | | | | (168,595,000 | ) |
OTHER ASSETS LESS LIABILITIES–1.09% | | | | | | | | | | | | | | | 23,904,640 | |
NET ASSETS–100.00% | | | | | | | | | | | | | | $ | 2,202,080,627 | |
Investment Abbreviations:
| | |
| ACA | | – ACA Financial Guaranty Corp. |
| AGC | | – Assured Guaranty Corp. |
| AGM | | – Assured Guaranty Municipal Corp. |
| AMBAC | | – American Municipal Bond Assurance Corp. |
| BHAC | | – Berkshire Hathaway Assurance Corp. |
| CAB | | – Capital Appreciation Bonds |
| CARS | | – Convertible Auction Rate Security |
| CEP | | – Credit Enhancement Provider |
| Connie Lee | | – Connie Lee Insurance Co. |
| Conv. | | – Convertible |
| COP | | – Certificates of Participation |
| CR | | – Custodial Receipts |
| Ctfs. | | – Certificates |
| FHA | | – Federal Housing Administration |
| FTA | | – Federal Transit Administration |
| GNMA | | – Government National Mortgage Association |
| GO | | – General Obligation |
| Gtd. | | – Guaranteed |
| | |
| IDR | | – Industrial Development Revenue Bonds |
| INS | | – Insurer |
| Jr. | | – Junior |
| MFH | | – Multi-Family Housing |
| NATL | | – National Public Finance Guarantee Corp. |
| PCR | | – Pollution Control Revenue Bonds |
| PILOT | | – Payment-in-Lieu-of-Tax |
| RAB | | – Revenue Anticipation Bonds |
| RAC | | – Revenue Anticipation Certificates |
| Radian | | – Radian Asset Assurance, Inc. |
| RB | | – Revenue Bonds |
| Ref. | | – Refunding |
| Sec. | | – Secured |
| SFH | | – Single-Family Housing |
| SGI | | – Syncora Guarantee, Inc. |
| Sr. | | – Senior |
| Sub. | | – Subordinated |
| TEMPS | | – Tax-Exempt Mandatory Paydown Securities |
Notes to Schedule of Investments:
| (a) | Principal and/or interest payments are secured by the bond insurance company listed. |
| (b) | Security subject to the alternative minimum tax. |
| (c) | Advance refunded; secured by an escrow fund of U.S. Government obligations or other highly rated collateral. |
| (d) | Security has an irrevocable call by the issuer or mandatory put by the holder. Maturity date reflects such call or put. |
| (e) | Underlying security related to Dealer Trusts entered into by the Fund. See Note 1J. |
| (f) | Security purchased or received in a transaction exempt from registration under the Securities Act of 1933, as amended (the “1933 Act”). The security may be resold pursuant to an exemption from registration under the 1933 Act, typically to qualified institutional buyers. The aggregate value of these securities at February 28, 2014 was $35,223,505, which represented 1.60% of the Fund’s Net Assets. |
| (g) | Zero coupon bond issued at a discount. |
| (h) | Current coupon rate for inverse floating rate municipal obligations. This rate resets periodically as the rate on the related security changes. Positions in inverse floating rate municipal obligations have a total value of $17,320,056, which represented less than 1% of the Fund’s Net Assets. |
| (i) | Defaulted security. Currently, the issuer is partially or fully in default with respect to interest payments. The aggregate value of these securities at February 28, 2014 was $2,469,946, which represented less than 1% of the Fund’s Net Assets. |
| (j) | Convertible CAB. The interest rate shown represents the coupon rate at which the bond will accrue at a specified future date. |
| (k) | Security is subject to a shortfall agreement which may require the Fund to pay amounts to a counterparty in the event of a significant decline in the market value of the security underlying the Dealer Trusts. In case of a shortfall, the maximum potential amount of payments the Fund could ultimately be required to make under the agreement is $13,050,000. However, such shortfall payment would be reduced by the proceeds from the sale of the security underlying the Dealer Trusts. |
| (l) | Interest or dividend rate is redetermined periodically. Rate shown is the rate in effect on February 28, 2014. |
| (m) | This table provides a listing of those entities that have either issued, guaranteed, backed or otherwise enhanced the credit quality of more than 5% of the securities held in the portfolio. In instances where the entity has guaranteed, backed or otherwise enhanced the credit quality of a security, it is not primarily responsible for the issuer’s obligations but may be called upon to satisfy the issuer’s obligations. |
| | | | |
| Entities | | Percentage | |
Assured Guaranty Municipal Corp. | | | 10.2 | % |
Assured Guaranty Corp. | | | 10.0 | |
National Public Finance Guarantee Corp. | | | 7.9 | |
| (n) | Floating rate note obligations related to securities held. The interest and fee rates shown reflect the rates in effect at February 28, 2014. At February 28, 2014, the Fund’s investments with a value of $292,235,218 are held by Dealer Trusts and serve as collateral for the $168,595,000 in the floating rate note obligations outstanding at that date. |
See accompanying Notes to Financial Statements which are an integral part of the financial statements.
34 Invesco Municipal Income Fund
Statement of Assets and Liabilities
February 28, 2014
| | | | |
Assets: | |
Investments, at value (Cost $2,191,628,788) | | $ | 2,346,770,987 | |
Receivable for: | | | | |
Investments sold | | | 6,930,270 | |
Fund shares sold | | | 2,287,959 | |
Interest | | | 28,184,498 | |
Investment for trustee deferred compensation and retirement plans | | | 354,318 | |
Other assets | | | 30,288 | |
Total assets | | | 2,384,558,320 | |
|
Liabilities: | |
Floating rate note obligations | | | 168,595,000 | |
Payable for: | | | | |
Investments purchased | | | 5,272,247 | |
Fund shares reacquired | | | 1,919,480 | |
Amount due custodian | | | 2,508,849 | |
Dividends | | | 2,927,100 | |
Accrued fees to affiliates | | | 680,074 | |
Accrued trustees’ and officers’ fees and benefits | | | 6,591 | |
Accrued other operating expenses | | | 65,201 | |
Trustee deferred compensation and retirement plans | | | 503,151 | |
Total liabilities | | | 182,477,693 | |
Net assets applicable to shares outstanding | | $ | 2,202,080,627 | |
|
Net assets consist of: | |
Shares of beneficial interest | | $ | 2,276,715,551 | |
Undistributed net investment income | | | 7,912,647 | |
Undistributed net realized gain (loss) | | | (237,689,770 | ) |
Net unrealized appreciation | | | 155,142,199 | |
| | | $ | 2,202,080,627 | |
| | | | |
Net Assets: | |
Class A | | $ | 1,567,765,943 | |
Class B | | $ | 15,616,900 | |
Class C | | $ | 94,657,963 | |
Class Y | | $ | 411,717,586 | |
Investor Class | | $ | 112,322,235 | |
|
Shares outstanding, $0.001 par value per share,
with an unlimited number of shares authorized: | |
Class A | | | 118,318,962 | |
Class B | | | 1,181,247 | |
Class C | | | 7,176,661 | |
Class Y | | | 31,077,784 | |
Investor Class | | | 8,470,719 | |
Class A: | | | | |
Net asset value per share | | $ | 13.25 | |
Maximum offering price per share | | | | |
(Net asset value of $13.25 ¸ 95.75%) | | $ | 13.84 | |
Class B: | | | | |
Net asset value and offering price per share | | $ | 13.22 | |
Class C: | | | | |
Net asset value and offering price per share | | $ | 13.19 | |
Class Y: | | | | |
Net asset value and offering price per share | | $ | 13.25 | |
Investor Class: | | | | |
Net asset value and offering price per share | | $ | 13.26 | |
See accompanying Notes to Financial Statements which are an integral part of the financial statements.
35 Invesco Municipal Income Fund
Statement of Operations
For the year ended February 28, 2014
| | | | |
Investment income: | |
Interest | | $ | 115,377,907 | |
| |
Expenses: | | | | |
Advisory fees | | | 10,015,620 | |
Administrative services fees | | | 450,255 | |
Custodian fees | | | 46,765 | |
Distribution fees: | | | | |
Class A | | | 3,900,918 | |
Class B | | | 178,853 | |
Class C | | | 926,694 | |
Investor Class | | | 112,865 | |
Interest, facilities and maintenance fees | | | 1,885,239 | |
Transfer agent fees | | | 1,140,431 | |
Trustees’ and officers’ fees and benefits | | | 138,879 | |
Other | | | 521,632 | |
Total expenses | | | 19,318,151 | |
Less: Expense offset arrangement(s) | | | (1,739 | ) |
Net expenses | | | 19,316,412 | |
Net investment income | | | 96,061,495 | |
| |
Realized and unrealized gain (loss) from: | | | | |
Net realized gain (loss) from investment securities (includes net gains (losses) from securities sold to affiliates of $(469,495)) | | | (23,834,690 | ) |
Change in net unrealized appreciation (depreciation) of investment securities | | | (91,985,971 | ) |
Net realized and unrealized gain (loss) | | | (115,820,661 | ) |
Net increase (decrease) in net assets resulting from operations | | $ | (19,759,166 | ) |
See accompanying Notes to Financial Statements which are an integral part of the financial statements.
36 Invesco Municipal Income Fund
Statement of Changes in Net Assets
For the years ended February 28, 2014 and 2013
| | | | | | | | |
| | | 2014 | | | 2013 | |
Operations: | | | | | |
Net investment income | | $ | 96,061,495 | | | $ | 87,672,900 | |
Net realized gain (loss) | | | (23,834,690 | ) | | | 727,343 | |
Change in net unrealized appreciation (depreciation) | | | (91,985,971 | ) | | | 44,430,626 | |
Net increase (decrease) in net assets resulting from operations | | | (19,759,166 | ) | | | 132,830,869 | |
| | |
Distributions to shareholders from net investment income: | | | | | | | | |
Class A | | | (66,647,846 | ) | | | (63,488,524 | ) |
Class B | | | (628,152 | ) | | | (758,673 | ) |
Class C | | | (3,270,812 | ) | | | (2,488,598 | ) |
Class Y | | | (19,326,568 | ) | | | (20,879,460 | ) |
Investor Class | | | (3,165,468 | ) | | | — | |
Total distributions from net investment income | | | (93,038,846 | ) | | | (87,615,255 | ) |
| | |
Share transactions–net: | | | | | | | | |
Class A | | | 107,271,330 | | | | 24,750,981 | |
Class B | | | (3,291,744 | ) | | | (4,168,273 | ) |
Class C | | | 19,681,315 | | | | 9,553,980 | |
Class Y | | | (26,346,525 | ) | | | (25,131,446 | ) |
Investor Class | | | 111,492,355 | | | | — | |
Net increase in net assets resulting from share transactions | | | 208,806,731 | | | | 5,005,242 | |
Net increase in net assets | | | 96,008,719 | | | | 50,220,856 | |
| | |
Net assets: | | | | | | | | |
Beginning of year | | | 2,106,071,908 | | | | 2,055,851,052 | |
End of year (includes undistributed net investment income of $7,912,647 and $5,288,350, respectively) | | $ | 2,202,080,627 | | | $ | 2,106,071,908 | |
Notes to Financial Statements
February 28, 2014
NOTE 1—Significant Accounting Policies
Invesco Municipal Income Fund (the “Fund”) is a series portfolio of AIM Tax-Exempt Funds (Invesco Tax-Exempt Funds) (the “Trust”). The Trust is a Delaware statutory trust registered under the Investment Company Act of 1940, as amended (the “1940 Act”), as an open-end series management investment company consisting of six separate portfolios, each authorized to issue an unlimited number of shares of beneficial interest. The assets, liabilities and operations of each portfolio are accounted for separately. Information presented in these financial statements pertains only to the Fund. Matters affecting each portfolio or class will be voted on exclusively by the shareholders of such portfolio or class.
The Fund’s investment objective is to provide investors with a high level of current income exempt from federal income tax, consistent with preservation of capital.
The Fund currently consists of five different classes of shares: Class A, Class B, Class C, Class Y and Investor Class. On July 15, 2013, the Fund began offering Investor Class shares. Class A shares are sold with a front-end sales charge unless certain waiver criteria are met and under certain circumstances load waived shares may be subject to contingent deferred sales charges (“CDSC”). Class C shares are sold with a CDSC. Class Y and Investor Class shares are sold at net asset value. Effective November 30, 2010, new or additional investments in Class B shares are no longer permitted. Existing shareholders of Class B shares may continue to reinvest dividends and capital gains distributions in Class B shares until they convert to Class A shares. Also, shareholders in Class B shares will be able to exchange those shares for Class B shares of other Invesco Funds offering such shares until they convert to Class A shares. Generally, Class B shares will automatically convert to Class A shares on or about the month-end, which is at least eight years after the date of purchase. Redemption of Class B shares prior to conversion date will be subject to a CDSC.
The following is a summary of the significant accounting policies followed by the Fund in the preparation of its financial statements.
| A. | Security Valuations — Securities, including restricted securities, are valued according to the following policy. |
Securities are fair valued using an evaluated quote provided by an independent pricing service approved by the Board of Trustees. Evaluated quotes provided by the pricing service may be determined without exclusive reliance on quoted prices, and may reflect appropriate factors such as institution-size trading in similar groups of securities, developments related to specific securities, dividend rate (for unlisted equities), yield (for debt obligations), quality, type of issue, coupon rate (for debt obligations), maturity (for debt obligations), individual trading characteristics and other market data. Debt obligations are subject to interest rate and credit risks. In addition, all debt obligations involve some risk of default with respect to interest and/or principal payments.
37 Invesco Municipal Income Fund
Securities for which market quotations either are not readily available or became unreliable are valued at fair value as determined in good faith by or under the supervision of the Trust’s officers following procedures approved by the Board of Trustees. Some of the factors which may be considered in determining fair value are fundamental analytical data relating to the investment; the nature and duration of any restrictions on transferability or disposition; trading in similar securities by the same issuer or comparable companies; relevant political, economic or issuer specific news; and other relevant factors under the circumstances.
The Fund invests in securities that are subject to interest rate risk, meaning the risk that the prices will generally fall as interest rates rise and, conversely, the prices will generally rise as interest rates fall. Specific securities differ in their sensitivity to changes in interest rates depending on their individual characteristics. Changes in interest rates may result in increased market volatility, which may affect the value and/or liquidity of certain of the Fund’s investments.
Valuations change in response to many factors including the historical and prospective earnings of the issuer, the value of the issuer’s assets, general economic conditions, interest rates, investor perceptions and market liquidity. Because of the inherent uncertainties of valuation, the values reflected in the financial statements may materially differ from the value received upon actual sale of those investments.
| B. | Securities Transactions and Investment Income — Securities transactions are accounted for on a trade date basis. Realized gains or losses on sales are computed on the basis of specific identification of the securities sold. Interest income is recorded on the accrual basis from settlement date. Dividend income (net of withholding tax, if any) is recorded on the ex-dividend date. Bond premiums and discounts are amortized and/or accreted for financial reporting purposes. |
The Fund may periodically participate in litigation related to Fund investments. As such, the Fund may receive proceeds from litigation settlements. Any proceeds received are included in the Statement of Operations as realized gain (loss) for investments no longer held and as unrealized gain (loss) for investments still held.
Brokerage commissions and mark ups are considered transaction costs and are recorded as an increase to the cost basis of securities purchased and/or a reduction of proceeds on a sale of securities. Such transaction costs are included in the determination of net realized and unrealized gain (loss) from investment securities reported in the Statement of Operations and the Statement of Changes in Net Assets and the net realized and unrealized gains (losses) on securities per share in the Financial Highlights. Transaction costs are included in the calculation of the Fund’s net asset value and, accordingly, they reduce the Fund’s total returns. These transaction costs are not considered operating expenses and are not reflected in net investment income reported in the Statement of Operations and Statement of Changes in Net Assets, or the net investment income per share and ratios of expenses and net investment income reported in the Financial Highlights, nor are they limited by any expense limitation arrangements between the Fund and the investment adviser.
The Fund allocates realized and unrealized capital gains and losses to a class based on the relative net assets of each class. The Fund allocates income to a class based on the relative value of the settled shares of each class.
| C. | Country Determination — For the purposes of making investment selection decisions and presentation in the Schedule of Investments, the investment adviser may determine the country in which an issuer is located and/or credit risk exposure based on various factors. These factors include the laws of the country under which the issuer is organized, where the issuer maintains a principal office, the country in which the issuer derives 50% or more of its total revenues and the country that has the primary market for the issuer’s securities, as well as other criteria. Among the other criteria that may be evaluated for making this determination are the country in which the issuer maintains 50% or more of its assets, the type of security, financial guarantees and enhancements, the nature of the collateral and the sponsor organization. Country of issuer and/or credit risk exposure has been determined to be the United States of America, unless otherwise noted. |
| D. | Distributions — Distributions from income are declared daily and paid monthly. Distributions from net realized capital gain, if any, are generally declared and paid annually and recorded on the ex-dividend date. The Fund may elect to treat a portion of the proceeds from redemptions as distributions for federal income tax purposes. |
| E. | Federal Income Taxes — The Fund intends to comply with the requirements of Subchapter M of the Internal Revenue Code of 1986, as amended (the “Internal Revenue Code”), necessary to qualify as a regulated investment company and to distribute substantially all of the Fund’s taxable and tax-exempt earnings to shareholders. As such, the Fund will not be subject to federal income taxes on otherwise taxable income (including net realized capital gain) that is distributed to shareholders. Therefore, no provision for federal income taxes is recorded in the financial statements. |
In addition, the Fund intends to invest in such municipal securities to allow it to qualify to pay shareholders “exempt-interest dividends”, as defined in the Internal Revenue Code.
The Fund recognizes the tax benefits of uncertain tax positions only when the position is more likely than not to be sustained. Management has analyzed the Fund’s uncertain tax positions and concluded that no liability for unrecognized tax benefits should be recorded related to uncertain tax positions. Management is not aware of any tax positions for which it is reasonably possible that the total amounts of unrecognized tax benefits will change materially in the next 12 months.
The Fund files tax returns in the U.S. Federal jurisdiction and certain other jurisdictions. Generally, the Fund is subject to examinations by such taxing authorities for up to three years after the filing of the return for the tax period.
| F. | Expenses — Fees provided for under the Rule 12b-1 plan of a particular class of the Fund and which are directly attributable to that class are charged to the operations of such class. All other expenses are allocated among the classes based on relative net assets. |
| G. | Interest, Facilities and Maintenance Fees — Interest, Facilities and Maintenance Fees include interest and related borrowing costs such as commitment fees and other expenses associated with lines of credit and interest and administrative expenses related to establishing and maintaining floating rate note obligations, if any. |
| H. | Accounting Estimates — The preparation of financial statements in conformity with accounting principles generally accepted in the United States of America (“GAAP”) requires management to make estimates and assumptions that affect the reported amounts of assets and liabilities at the date of the financial statements and the reported amounts of revenues and expenses during the reporting period including estimates and assumptions related to taxation. Actual results could differ from those estimates by a significant amount. In addition, the Fund monitors for material events or transactions that may occur or become known after the period-end date and before the date the financial statements are released to print. |
| I. | Indemnifications — Under the Trust’s organizational documents, each Trustee, officer, employee or other agent of the Trust is indemnified against certain liabilities that may arise out of the performance of their duties to the Fund. Additionally, in the normal course of business, the |
38 Invesco Municipal Income Fund
| | Fund enters into contracts, including the Fund’s servicing agreements, that contain a variety of indemnification clauses. The Fund’s maximum exposure under these arrangements is unknown as this would involve future claims that may be made against the Fund that have not yet occurred. The risk of material loss as a result of such indemnification claims is considered remote. |
| J. | Floating Rate Note Obligations — The Fund invests in inverse floating rate securities, such as Residual Interest Bonds (“RIBs”) or Tender Option Bonds (“TOBs”) for investment purposes and to enhance the yield of the Fund. Inverse floating rate investments tend to underperform the market for fixed rate bonds in a rising interest rate environment, but tend to outperform the market for fixed rate bonds when interest rates decline or remain relatively stable. Such transactions may be purchased in the secondary market without first owning the underlying bond or by the sale of fixed rate bonds by the Fund to special purpose trusts established by a broker dealer (“Dealer Trusts”) in exchange for cash and residual interests in the Dealer Trusts’ assets and cash flows, which are in the form of inverse floating rate securities. The Dealer Trusts finance the purchases of the fixed rate bonds by issuing floating rate notes to third parties and allowing the Fund to retain residual interests in the bonds. The floating rate notes issued by the Dealer Trusts have interest rates that reset weekly and the floating rate note holders have the option to tender their notes to the Dealer Trusts for redemption at par at each reset date. The residual interests held by the Fund (inverse floating rate investments) include the right of the Fund (1) to cause the holders of the floating rate notes to tender their notes at par at the next interest rate reset date, and (2) to transfer the municipal bond from the Dealer Trusts to the Fund, thereby collapsing the Dealer Trusts. |
Recently published final rules implementing section 619 of the Dodd-Frank Wall Street Reform and Consumer Protection Act (the “Volcker Rule”) prohibit banking entities from engaging in proprietary trading of certain instruments and limit such entities’ investments in, and relationships with, “covered funds.” These rules may preclude banking entities from sponsoring and/or providing services for existing TOB trust programs. There can be no assurances that TOB trusts can be restructured substantially similar to their present form, that new sponsors of TOB trusts would begin providing these services, or that alternative forms of leverage will be available to the Trust in order to maintain current levels of leverage. Any alternative forms of leverage may be less advantageous to the Trust, and may adversely affect the Trust’s net asset value, distribution rate and ability to achieve its investment objective. The ultimate impact of these rules on the TOBs market and the municipal market generally is not yet certain.
TOBs are presently classified as private placement securities. Private placement securities are subject to restrictions on resale because they have not been registered under the Securities Act of 1933, as amended (the “1933 Act”), or are otherwise not readily marketable. As a result of the absence of a public trading market for these securities, they may be less liquid than publicly traded securities. Although these securities may be resold in privately negotiated transactions, the prices realized from these sales could be less than those originally paid by the Fund or less than what may be considered the fair value of such securities.
The Fund accounts for the transfer of bonds to the Dealer Trusts as secured borrowings, with the securities transferred remaining in the Fund’s investment assets, and the related floating rate notes reflected as Fund liabilities under the caption Floating rate note obligations on the Statement of Assets and Liabilities. The Fund records the interest income from the fixed rate bonds under the caption Interest and records the expenses related to floating rate obligations and any administrative expenses of the Dealer Trusts as a component of Interest, facilities and maintenance fees on the Statement of Operations.
The Fund generally invests in inverse floating rate securities that include embedded leverage, thus exposing the Fund to greater risks and increased costs. The primary risks associated with inverse floating rate securities are varying degrees of liquidity and the changes in the value of such securities in response to changes in market rates of interest to a greater extent than the value of an equal principal amount of a fixed rate security having similar credit quality, redemption provisions and maturity which may cause the Fund’s net asset value to be more volatile than if it had not invested in inverse floating rate securities. In certain instances, the short-term floating rate interests created by the special purpose trust may not be able to be sold to third parties or, in the case of holders tendering (or putting) such interests for repayment of principal, may not be able to be remarketed to third parties. In such cases, the special purpose trust holding the long-term fixed rate bonds may be collapsed. In the case of RIBs or TOBs created by the contribution of long-term fixed income bonds by the Fund, the Fund will then be required to repay the principal amount of the tendered securities. During times of market volatility, illiquidity or uncertainty, the Fund could be required to sell other portfolio holdings at a disadvantageous time to raise cash to meet that obligation.
| K. | Other Risks — The value of, payment of interest on, repayment of principal for and the ability to sell a municipal security may be affected by constitutional amendments, legislative enactments, executive orders, administrative regulations, voter initiatives and the economics of the regions in which the issuers are located. |
Since many municipal securities are issued to finance similar projects, especially those relating to education, health care, transportation and utilities, conditions in those sectors can affect the overall municipal securities market and a Fund’s investments in municipal securities.
There is some risk that a portion or all of the interest received from certain tax-free municipal securities could become taxable as a result of determinations by the Internal Revenue Service.
NOTE 2—Advisory Fees and Other Fees Paid to Affiliates
The Trust has entered into a master investment advisory agreement with Invesco Advisers, Inc. (the “Adviser” or “Invesco”). Under the terms of the investment advisory agreement, the Fund pays an advisory fee to the Adviser based on the annual rate of the Fund’s average daily net assets as follows:
| | | | |
| Average Daily Net Assets | | Rate | |
First $500 million | | | 0.50% | |
Over $500 million | | | 0.45% | |
Under the terms of a master sub-advisory agreement between the Adviser and each of Invesco Asset Management Deutschland GmbH, Invesco Asset Management Limited, Invesco Asset Management (Japan) Limited, Invesco Australia Limited, Invesco Hong Kong Limited, Invesco Senior Secured Management, Inc. and Invesco Canada Ltd. (collectively, the “Affiliated Sub-Advisers”) the Adviser, not the Fund, may pay 40% of the fees paid to the Adviser to any such Affiliated Sub-Adviser(s) that provide(s) discretionary investment management services to the Fund based on the percentage of assets allocated to such Sub-Adviser(s).
39 Invesco Municipal Income Fund
Effective July 1, 2013, the Adviser has contractually agreed, through at least June 30, 2014, to waive advisory fees and/or reimburse expenses of all shares to the extent necessary to limit annual fund expenses after fee waiver and/or expense reimbursement (excluding certain items discussed below) of Class A, Class B, Class C, Class Y and Investor Class shares to 1.50%, 2.25%, 2.25%, 1.25% and 1.50% of average daily net assets, respectively. Prior to July 1, 2013, the Adviser had contractually agreed to waive advisory fees and/or reimburse expenses of all shares to the extent necessary to limit total annual fund operating expenses after fee waiver and/or expense reimbursement (excluding certain items discussed below) of Class A, Class B, Class C and Class Y shares to 0.83%, 1.58%, 1.58% and 0.58%, respectively, of average daily net assets. In determining the Adviser’s obligation to waive advisory fees and/or reimburse expenses, the following expenses are not taken into account, and could cause the net annual fund operating expenses after fee waiver and/or expense reimbursement to exceed the numbers reflected above: (1) interest, facilities and maintenance fees; (2) taxes; (3) dividend expense on short sales; (4) extraordinary or non-routine items, including litigation expenses; and (5) expenses that the Fund has incurred but did not actually pay because of an expense offset arrangement. Unless Invesco continues the fee waiver agreement, it will terminate on June 30, 2014. The fee waiver agreement cannot be terminated during its term. The Adviser did not waive fees and/or reimburse expenses during the period under this expense limitation.
The Trust has entered into a master administrative services agreement with Invesco pursuant to which the Fund has agreed to pay Invesco for certain administrative costs incurred in providing accounting services to the Fund. For the year ended February 28, 2014, expenses incurred under the agreement are shown in the Statement of Operations as Administrative services fees.
The Trust has entered into a transfer agency and service agreement with Invesco Investment Services, Inc. (“IIS”) pursuant to which the Fund has agreed to pay IIS a fee for providing transfer agency and shareholder services to the Fund and reimburse IIS for certain expenses incurred by IIS in the course of providing such services. IIS may make payments to intermediaries that provide omnibus account services, sub-accounting services and/or networking services. All fees payable by IIS to intermediaries that provide omnibus account services or sub-accounting are charged back to the Fund, subject to certain limitations approved by the Trust’s Board of Trustees. For the year ended February 28, 2014, expenses incurred under the agreement are shown in the Statement of Operations as Transfer agent fees.
Shares of the Fund are distributed by Invesco Distributors, Inc. (“IDI”). The Fund has adopted a distribution plan pursuant to Rule 12b-1 under the 1940 Act, and a service plan (collectively, the “Plans”) for Class A shares, Class B shares and Class C shares and Investor Class shares to compensate IDI for the sale, distribution, shareholder servicing and maintenance of shareholder accounts for these shares. Under the Plans, the Fund will incur annual fees of up to 0.25% of Class A and Investor Class average daily net assets and up to 1.00% each of Class B and Class C average daily net assets.
With respect to Class B and Class C shares, the Fund is authorized to reimburse in future years any distribution related expenses that exceed the maximum annual reimbursement rate for such class, so long as such reimbursement does not cause the Fund to exceed the Class B and Class C maximum annual reimbursement rate, respectively. With respect to Class A shares, distribution related expenses that exceed the maximum annual reimbursement rate for such class are not carried forward to future years and the Fund will not reimburse IDI for any such expenses.
For the year ended February 28, 2014, expenses incurred under these agreements are shown in the Statement of Operations as Distribution fees.
Front-end sales commissions and CDSC (collectively, the “sales charges”) are not recorded as expenses of the Fund. Front-end sales commissions are deducted from proceeds from the sales of Fund shares prior to investment in Class A shares of the Fund. CDSC are deducted from redemption proceeds prior to remittance to the shareholder. During the year ended February 28, 2014, IDI advised the Fund that IDI retained $150,464 in front-end sales commissions from the sale of Class A shares and $17,638, $58,103 and $13,783 from Class A, Class B and Class C shares, respectively, for CDSC imposed on redemptions by shareholders.
Certain officers and trustees of the Trust are officers and directors of the Adviser, IIS and/or IDI.
NOTE 3—Additional Valuation Information
GAAP defines fair value as the price that would be received to sell an asset or paid to transfer a liability in an orderly transaction between market participants at the measurement date, under current market conditions. GAAP establishes a hierarchy that prioritizes the inputs to valuation methods, giving the highest priority to readily available unadjusted quoted prices in an active market for identical assets (Level 1) and the lowest priority to significant unobservable inputs (Level 3), generally when market prices are not readily available or are unreliable. Based on the valuation inputs, the securities or other investments are tiered into one of three levels. Changes in valuation methods may result in transfers in or out of an investment’s assigned level:
| | Level 1 — | Prices are determined using quoted prices in an active market for identical assets. |
| | Level 2 — | Prices are determined using other significant observable inputs. Observable inputs are inputs that other market participants may use in pricing a security. These may include quoted prices for similar securities, interest rates, prepayment speeds, credit risk, yield curves, loss severities, default rates, discount rates, volatilities and others. |
| | Level 3 — | Prices are determined using significant unobservable inputs. In situations where quoted prices or observable inputs are unavailable (for example, when there is little or no market activity for an investment at the end of the period), unobservable inputs may be used. Unobservable inputs reflect the Fund’s own assumptions about the factors market participants would use in determining fair value of the securities or instruments and would be based on the best available information. |
As of February 28, 2014, all of the securities in this Fund were valued based on Level 2 inputs (see the Schedule of Investments for security categories). The level assigned to the securities valuations may not be an indication of the risk or liquidity associated with investing in those securities. Because of the inherent uncertainties of valuation, the values reflected in the financial statements may materially differ from the value received upon actual sale of those investments.
NOTE 4—Security Transactions with Affiliated Funds
The Fund is permitted to purchase or sell securities from or to certain other Invesco Funds under specified conditions outlined in procedures adopted by the Board of Trustees of the Trust. The procedures have been designed to ensure that any purchase or sale of securities by the Fund from or to another fund or portfolio that is or could be considered an affiliate by virtue of having a common investment adviser (or affiliated investment advisers), common Trustees and/or common officers complies with Rule 17a-7 of the 1940 Act. Further, as defined under the procedures, each transaction is effected at the current market price. Pursuant to these procedures, for the year ended February 28, 2014, the Fund engaged in securities sales of $6,321,308, which resulted in net gains (losses) of $(469,495).
40 Invesco Municipal Income Fund
NOTE 5—Expense Offset Arrangement(s)
The expense offset arrangement is comprised of transfer agency credits which result from balances in demand deposit accounts used by the transfer agent for clearing shareholder transactions. For the year ended February 28, 2014, the Fund received credits from this arrangement, which resulted in the reduction of the Fund’s total expenses of $1,739.
NOTE 6—Trustees’ and Officers’ Fees and Benefits
Trustees’ and Officers’ Fees and Benefits include amounts accrued by the Fund to pay remuneration to certain Trustees and Officers of the Fund. Trustees have the option to defer compensation payable by the Fund, and Trustees’ and Officers’ Fees and Benefits also include amounts accrued by the Fund to fund such deferred compensation amounts. Those Trustees who defer compensation have the option to select various Invesco Funds in which their deferral accounts shall be deemed to be invested. Finally, certain current Trustees were eligible to participate in a retirement plan that provided for benefits to be paid upon retirement to Trustees over a period of time based on the number of years of service. The Fund may have certain former Trustees who also participate in a retirement plan and receive benefits under such plan. Trustees’ and Officers’ Fees and Benefits include amounts accrued by the Fund to fund such retirement benefits. Obligations under the deferred compensation and retirement plans represent unsecured claims against the general assets of the Fund.
NOTE 7—Cash Balances and Borrowings
The Fund is permitted to temporarily carry a negative or overdrawn balance in its account with State Street Bank and Trust Company (“SSB”), the custodian bank. Such balances, if any at period end, are shown in the Statement of Assets and Liabilities under the payable caption Amount due custodian. To compensate the custodian bank for such overdrafts, the overdrawn Fund may either (1) leave funds as a compensating balance in the account so the custodian bank can be compensated by earning the additional interest; or (2) compensate by paying the custodian bank at a rate agreed upon by the custodian bank and Invesco, not to exceed the contractually agreed upon rate.
Inverse floating rate obligations resulting from the transfer of bonds to Dealer Trusts are accounted for as secured borrowings. The average floating rate notes outstanding and average annual interest and fee rate related to inverse floating rate note obligations during the year ended February 28, 2014 were $168,286,077 and 1.12%, respectively.
NOTE 8—Distributions to Shareholders and Tax Components of Net Assets
Tax Character of Distributions to Shareholders Paid During the Years Ended February 28, 2014 and 2013:
| | | | | | | | |
| | | 2014 | | | 2013 | |
Ordinary income | | $ | 93,038,846 | | | $ | 87,615,255 | |
Tax Components of Net Assets at Period-End:
| | | | |
| | | 2014 | |
Undistributed ordinary income | | $ | 2,637,871 | |
Net unrealized appreciation — investments | | | 160,214,629 | |
Temporary book/tax differences | | | (475,006 | ) |
Post-October deferrals | | | (2,960,378 | ) |
Capital loss carryforward | | | (234,052,040 | ) |
Shares of beneficial interest | | | 2,276,715,551 | |
Total net assets | | $ | 2,202,080,627 | |
The difference between book-basis and tax-basis unrealized appreciation (depreciation) is due to differences in the timing of recognition of gains and losses on investments for tax and book purposes. The Fund’s net unrealized appreciation (depreciation) difference is attributable primarily to wash sales, TOBs, book to tax accretion and amortization differences and defaulted bonds.
The temporary book/tax differences are a result of timing differences between book and tax recognition of income and/or expenses. The Fund’s temporary book/tax differences are the result of the trustee deferral of compensation and retirement plan benefits.
Capital loss carryforward is calculated and reported as of a specific date. Results of transactions and other activity after that date may affect the amount of capital loss carryforward actually available for the Fund to utilize. Capital losses generated in years beginning after December 22, 2010 can be carried forward for an unlimited period, whereas previous losses expire in 8 tax years. Capital losses with an expiration period may not be used to offset capital gains until all net capital losses without an expiration date have been utilized. Capital loss carryforwards with no expiration date will retain their character as either short-term or long-term capital losses instead of as short-term capital losses as under prior law. The ability to utilize capital loss carryforward in the future may be limited under the Internal Revenue Code and related regulations based on the results of future transactions.
41 Invesco Municipal Income Fund
The Fund has a capital loss carryforward as of February 28, 2014, which expires as follows:
| | | | | | | | | | | | |
| Capital Loss Carryforward* | |
| Expiration | | Short-Term | | | Long-Term | | | Total | |
February 28, 2015 | | $ | 11,115,783 | | | $ | — | | | $ | 11,115,783 | |
February 29, 2016 | | | 12,308,190 | | | | — | | | | 12,308,190 | |
February 28, 2017 | | | 98,220,453 | | | | — | | | | 98,220,453 | |
February 28, 2018 | | | 22,264,986 | | | | — | | | | 22,264,986 | |
February 28, 2019 | | | 21,329,984 | | | | — | | | | 21,329,984 | |
Not subject to expiration | | | 16,875,405 | | | | 51,937,239 | | | | 68,812,644 | |
| | | $ | 182,114,801 | | | $ | 51,937,239 | | | $ | 234,052,040 | |
| * | Capital loss carryforward as of the date listed above is reduced for limitations, if any, to the extent required by the Internal Revenue Code and may be further limited depending upon a variety of factors, including the realization of net unrealized gains or losses as of the date of any reorganization. |
NOTE 9—Investment Securities
The aggregate amount of investment securities (other than short-term securities, U.S. Treasury obligations and money market funds, if any) purchased and sold by the Fund during the year ended February 28, 2014 was $164,889,021 and $336,900,499, respectively. Cost of investments on a tax basis includes the adjustments for financial reporting purposes as of the most recently completed federal income tax reporting period-end.
| | | | |
| Unrealized Appreciation (Depreciation) of Investment Securities on a Tax Basis | |
Aggregate unrealized appreciation of investment securities | | $ | 174,423,137 | |
Aggregate unrealized (depreciation) of investment securities | | | (14,208,508 | ) |
Net unrealized appreciation of investment securities | | $ | 160,214,629 | |
Cost of investments for tax purposes is $2,186,556,358.
NOTE 10—Reclassification of Permanent Differences
Primarily as a result of differing book/tax treatment of taxable income and fair fund adjustments, on February 28, 2014, undistributed net investment income was decreased by $179,020, undistributed net realized gain (loss) was decreased by $7,493 and shares of beneficial interest was increased by $186,513. Further, as a result of tax deferrals acquired in the reorganization of Invesco Municipal Bond Fund into the Fund, undistributed net investment income was decreased by $219,332, undistributed net realized gain (loss) was decreased by $2,371,034 and shares of beneficial interest was increased by $2,590,366. These reclassifications had no effect on the net assets of the Fund.
42 Invesco Municipal Income Fund
NOTE 11—Share Information
| | | | | | | | | | | | | | | | |
| | | Summary of Share Activity | |
| | | Years ended February 28, | |
| | | 2014(a) | | | 2013 | |
| | | Shares | | | Amount | | | Shares | | | Amount | |
Sold: | | | | | | | | | | | | | | | | |
Class A | | | 8,862,474 | | | $ | 118,237,056 | | | | 11,361,114 | | | $ | 157,897,319 | |
Class B | | | 17,578 | | | | 239,297 | | | | 28,822 | | | | 397,163 | |
Class C | | | 1,076,658 | | | | 14,334,605 | | | | 1,316,574 | | | | 18,269,118 | |
Class Y | | | 1,654,478 | | | | 21,740,784 | | | | 910,857 | | | | 12,646,277 | |
Investor Class | | | 158,913 | | | | 2,117,302 | | | | — | | | | — | |
| | | | |
Issued as reinvestment of dividends: | | | | | | | | | | | | | | | | |
Class A | | | 3,205,094 | | | | 42,328,052 | | | | 2,924,603 | | | | 40,607,489 | |
Class B | | | 27,957 | | | | 368,973 | | | | 33,092 | | | | 458,394 | |
Class C | | | 160,059 | | | | 2,098,490 | | | | 116,735 | | | | 1,615,224 | |
Class Y | | | 808,059 | | | | 10,678,815 | | | | 799,960 | | | | 11,110,548 | |
Investor Class | | | 183,449 | | | | 2,385,679 | | | | — | | | | — | |
| | | | |
Issued in connection with acquisitions:(b) | | | | | | | | | | | | | | | | |
Class A | | | 23,387,073 | | | | 307,145,945 | | | | — | | | | — | |
Class B | | | 372,032 | | | | 4,878,245 | | | | — | | | | — | |
Class C | | | 3,517,557 | | | | 46,071,522 | | | | — | | | | — | |
Class Y | | | 2,180,388 | | | | 28,620,905 | | | | — | | | | — | |
Investor Class(c) | | | 9,217,562 | | | | 121,103,748 | | | | — | | | | — | |
| | | | |
Automatic conversion of Class B shares to Class A shares: | | | | | | | | | | | | | | | | |
Class A | | | 170,301 | | | | 2,246,970 | | | | 155,987 | | | | 2,167,558 | |
Class B | | | (170,649 | ) | | | (2,246,970 | ) | | | (156,289 | ) | | | (2,167,558 | ) |
| | | | |
Reacquired: | | | | | | | | | | | | | | | | |
Class A | | | (27,665,808 | ) | | | (362,686,693 | ) | | | (12,677,918 | ) | | | (175,921,385 | ) |
Class B | | | (496,631 | ) | | | (6,531,289 | ) | | | (206,046 | ) | | | (2,856,272 | ) |
Class C | | | (3,286,956 | ) | | | (42,823,302 | ) | | | (747,139 | ) | | | (10,330,362 | ) |
Class Y | | | (6,648,722 | ) | | | (87,387,029 | ) | | | (3,526,250 | ) | | | (48,888,271 | ) |
Investor Class | | | (1,089,205 | ) | | | (14,114,374 | ) | | | — | | | | — | |
Net increase in share activity | | | 15,641,661 | | | $ | 208,806,731 | | | | 334,102 | | | $ | 5,005,242 | |
| (a) | There are entities that are record owners of more than 5% of the outstanding shares of the Fund and in the aggregate own 50% of the outstanding shares of the Fund. IDI has an agreement with these entities to sell Fund shares. The Fund, Invesco and/or Invesco affiliates may make payments to these entities, which are considered to be related to the Fund, for providing services to the Fund, Invesco and/or Invesco affiliates including but not limited to services such as securities brokerage, distribution, third party record keeping and account servicing. The Fund has no knowledge as to whether all or any portion of the shares owned of record by these entities are also owned beneficially. |
| (b) | As of the opening of business on July 15, 2013, the Fund acquired all the net assets of Invesco Municipal Bond Fund (the “Target Fund”) pursuant to a plan of reorganization approved by the Trustees of the Fund on December 6, 2012 and by the shareholders of the Target Fund on April 24, 2013. The acquisition was accomplished by a tax-free exchange of 38,674,612 shares of the Fund for 64,144,596 shares outstanding of the Target Fund as of the close of business on July 12, 2013. Each class of the Target Fund was exchanged for the like class of shares of the Fund based on the relative net asset value of the Target Fund to the net asset value of the Fund at the close of business on July 12, 2013. The Target Fund’s net assets at that date of $507,820,365, including $22,487,572 of unrealized appreciation, were combined with those of the Fund. The net assets of the Fund immediately before the acquisition were $1,921,767,301 and $2,429,587,666 immediately after the acquisition. |
| | The pro forma results of operations for the year ended February 28, 2014 assuming the reorganization had been completed on March 1, 2013, the beginning of the annual reporting period: |
| | | | |
Net investment income | | $ | 103,581,239 | |
Net realized/unrealized gains (losses) | | | (153,066,100 | ) |
Change in net assets resulting from operations | | $ | (49,484,861 | ) |
| | The combined investment portfolios have been managed as a single integrated portfolio since the acquisition was completed, it is not practicable to separate the amounts of revenue and earnings of the Target Fund that have been included in the Fund’s Statement of Operations since July 15, 2013. |
| (c) | Commencement date of July 15, 2013. |
43 Invesco Municipal Income Fund
NOTE 12—Financial Highlights
The following schedule presents financial highlights for a share of the Fund outstanding throughout the periods indicated.
| | | | | | | | | | | | | | | | | | | | | | | | | | | | | | | | | | | | | | | | | | | | | | | | | | | | |
| | | Net asset
value,
beginning
of period | | | Net
investment
income(a) | | | Net gains
(losses)
on securities
(both
realized and
unrealized) | | | Total from
investment
operations | | | Dividends
from net
investment
income | | | Net asset
value, end
of period | | | Total
return | | | Net assets,
end of period
(000’s omitted) | | | Ratio of
expenses
to average
net assets
with fee waivers
and/or expenses
absorbed | | | Ratio of
expenses
to average net
assets without
fee waivers
and/or expenses
absorbed | | | Supplemental
ration of
expenses
to average
net assets with
fee waivers
(excluding
interest,
facilities and
maintenance
fees)(b) | | | Ratio of net
investment
income
to average
net assets | | | Portfolio
turnover(c) | |
Class A | |
Year ended 02/28/14 | | $ | 13.99 | | | $ | 0.58 | | | $ | (0.76 | ) | | $ | (0.18 | ) | | $ | (0.56 | ) | | $ | 13.25 | | | | (1.16 | )%(d) | | $ | 1,567,766 | | | | 0.90 | %(e) | | | 0.90 | %(e) | | | 0.81 | %(e) | | | 4.42 | %(e) | | | 8 | % |
Year ended 02/28/13 | | | 13.69 | | | | 0.58 | | | | 0.30 | | | | 0.88 | | | | (0.58 | ) | | | 13.99 | | | | 6.56 | (d) | | | 1,543,852 | | | | 0.87 | | | | 0.87 | | | | 0.81 | | | | 4.20 | | | | 11 | |
Year ended 02/29/12 | | | 12.54 | | | | 0.60 | | | | 1.17 | | | | 1.77 | | | | (0.62 | ) | | | 13.69 | | | | 14.47 | (d) | | | 1,486,245 | | | | 0.90 | | | | 0.90 | | | | 0.83 | | | | 4.58 | | | | 15 | |
Five months ended 02/28/11 | | | 13.52 | | | | 0.27 | | | | (0.98 | ) | | | (0.71 | ) | | | (0.27 | ) | | | 12.54 | | | | (5.25 | )(d) | | | 518,732 | | | | 0.93 | (f) | | | 0.93 | (f) | | | 0.86 | (f) | | | 5.08 | (f) | | | 3 | |
Year ended 09/30/10 | | | 13.34 | | | | 0.68 | | | | 0.16 | | | | 0.84 | | | | (0.66 | ) | | | 13.52 | | | | 6.54 | (d) | | | 619,236 | | | | 0.95 | | | | 0.95 | | | | 0.87 | | | | 5.14 | | | | 10 | |
Year ended 09/30/09 | | | 12.45 | | | | 0.66 | | | | 0.96 | | | | 1.62 | | | | (0.73 | ) | | | 13.34 | | | | 13.88 | (g) | | | 640,103 | | | | 1.01 | | | | 1.01 | | | | 0.90 | | | | 5.57 | | | | 29 | |
Class B | |
Year ended 02/28/14 | | | 13.97 | | | | 0.48 | | | | (0.77 | ) | | | (0.29 | ) | | | (0.46 | ) | | | 13.22 | | | | (1.99 | )(d) | | | 15,617 | | | | 1.65 | (e) | | | 1.65 | (e) | | | 1.56 | (e) | | | 3.67 | (e) | | | 8 | |
Year ended 02/28/13 | | | 13.66 | | | | 0.48 | | | | 0.31 | | | | 0.79 | | | | (0.48 | ) | | | 13.97 | | | | 5.85 | (d) | | | 19,985 | | | | 1.62 | | | | 1.62 | | | | 1.56 | | | | 3.45 | | | | 11 | |
Year ended 02/29/12 | | | 12.52 | | | | 0.50 | | | | 1.16 | | | | 1.66 | | | | (0.52 | ) | | | 13.66 | | | | 13.56 | (d) | | | 23,656 | | | | 1.65 | | | | 1.65 | | | | 1.58 | | | | 3.83 | | | | 15 | |
Five months ended 02/28/11 | | | 13.50 | | | | 0.23 | | | | (0.98 | ) | | | (0.75 | ) | | | (0.23 | ) | | | 12.52 | | | | (5.57 | )(d) | | | 17,918 | | | | 1.68 | (f) | | | 1.68 | (f) | | | 1.61 | (f) | | | 4.33 | (f) | | | 3 | |
Year ended 09/30/10 | | | 13.32 | | | | 0.57 | | | | 0.17 | | | | 0.74 | | | | (0.56 | ) | | | 13.50 | | | | 5.76 | (d) | | | 23,116 | | | | 1.70 | | | | 1.70 | | | | 1.62 | | | | 4.38 | | | | 10 | |
Year ended 09/30/09 | | | 12.43 | | | | 0.57 | | | | 0.96 | | | | 1.53 | | | | (0.64 | ) | | | 13.32 | | | | 13.05 | (h) | | | 22,144 | | | | 1.76 | | | | 1.76 | | | | 1.65 | | | | 4.81 | | | | 29 | |
Class C | |
Year ended 02/28/14 | | | 13.94 | | | | 0.48 | | | | (0.77 | ) | | | (0.29 | ) | | | (0.46 | ) | | | 13.19 | | | | (2.00 | )(d) | | | 94,658 | | | | 1.65 | (e) | | | 1.65 | (e) | | | 1.56 | (e) | | | 3.67 | (e) | | | 8 | |
Year ended 02/28/13 | | | 13.64 | | | | 0.48 | | | | 0.30 | | | | 0.78 | | | | (0.48 | ) | | | 13.94 | | | | 5.77 | (d) | | | 79,577 | | | | 1.62 | | | | 1.62 | | | | 1.56 | | | | 3.45 | | | | 11 | |
Year ended 02/29/12 | | | 12.50 | | | | 0.50 | | | | 1.16 | | | | 1.66 | | | | (0.52 | ) | | | 13.64 | | | | 13.58 | (d) | | | 68,495 | | | | 1.65 | | | | 1.65 | | | | 1.58 | | | | 3.83 | | | | 15 | |
Five months ended 02/28/11 | | | 13.47 | | | | 0.23 | | | | (0.97 | ) | | | (0.74 | ) | | | (0.23 | ) | | | 12.50 | | | | (5.51 | )(d) | | | 39,563 | | | | 1.68 | (f) | | | 1.68 | (f) | | | 1.61 | (f) | | | 4.33 | (f) | | | 3 | |
Year ended 09/30/10 | | | 13.30 | | | | 0.57 | | | | 0.16 | | | | 0.73 | | | | (0.56 | ) | | | 13.47 | | | | 5.69 | (d) | | | 51,613 | | | | 1.70 | | | | 1.70 | | | | 1.62 | | | | 4.38 | | | | 10 | |
Year ended 09/30/09 | | | 12.41 | | | | 0.57 | | | | 0.96 | | | | 1.53 | | | | (0.64 | ) | | | 13.30 | | | | 13.08 | (i) | | | 44,133 | | | | 1.76 | | | | 1.76 | | | | 1.65 | | | | 4.79 | | | | 29 | |
Class Y(j) | |
Year ended 02/28/14 | | | 13.98 | | | | 0.62 | | | | (0.75 | ) | | | (0.13 | ) | | | (0.60 | ) | | | 13.25 | | | | (0.84 | )(d) | | | 411,718 | | | | 0.65 | (e) | | | 0.65 | (e) | | | 0.56 | (e) | | | 4.67 | (e) | | | 8 | |
Year ended 02/28/13 | | | 13.68 | | | | 0.62 | | | | 0.30 | | | | 0.92 | | | | (0.62 | ) | | | 13.98 | | | | 6.82 | (d) | | | 462,658 | | | | 0.62 | | | | 0.62 | | | | 0.56 | | | | 4.45 | | | | 11 | |
Year ended 02/29/12 | | | 12.53 | | | | 0.64 | | | | 1.16 | | | | 1.80 | | | | (0.65 | ) | | | 13.68 | | | | 14.76 | (d) | | | 477,455 | | | | 0.65 | | | | 0.65 | | | | 0.58 | | | | 4.83 | | | | 15 | |
Five months ended 02/28/11 | | | 13.51 | | | | 0.28 | | | | (0.97 | ) | | | (0.69 | ) | | | (0.29 | ) | | | 12.53 | | | | (5.16 | )(d) | | | 6,370 | | | | 0.68 | (f) | | | 0.68 | (f) | | | 0.61 | (f) | | | 5.33 | (f) | | | 3 | |
Year ended 09/30/10 | | | 13.33 | | | | 0.71 | | | | 0.16 | | | | 0.87 | | | | (0.69 | ) | | | 13.51 | | | | 6.81 | (d) | | | 3,625 | | | | 0.70 | | | | 0.70 | | | | 0.62 | | | | 5.37 | | | | 10 | |
Year ended 09/30/09 | | | 12.45 | | | | 0.70 | | | | 0.94 | | | | 1.64 | | | | (0.76 | ) | | | 13.33 | | | | 14.08 | (k) | | | 5,064 | | | | 0.77 | | | | 0.77 | | | | 0.66 | | | | 5.89 | | | | 29 | |
Investor Class | |
Year ended 02/28/14(l) | | | 13.14 | | | | 0.37 | | | | 0.11 | | | | 0.48 | | | | (0.36 | ) | | | 13.26 | | | | 3.75 | (d) | | | 112,322 | | | | 0.82 | (e)(f) | | | 0.82 | (e)(f) | | | 0.73 | (e)(f) | | | 4.50 | (e)(f) | | | 8 | |
| (a) | Calculated using average shares outstanding. |
| (b) | For years ended September 30, 2010 and prior, ratio does not exclude facilities and maintenance fees. |
| (c) | Portfolio turnover is calculated at the fund level and is not annualized for periods less than one year, if applicable. For the year ended February 28, 2014 the portfolio turnover calculation excludes securities purchased of $477,613,840 and sold of $105,913,153 if effort to realign the Fund’s portfolio after the reorganization of Invesco Municipal Bond Fund into the Fund. For the year ended February 29, 2012, the portfolio turnover calculation excludes securities purchased of $1,346,611,089 and sold of $222,312,073 in effort to realign the Fund’s portfolio after the reorganization of Invesco Van Kampen Insured Tax Free Fund and Invesco Tax-Exempt Securities Fund into the Fund. |
| (d) | Includes adjustments in accordance with accounting principles generally accepted in the United States of America and as such, the net asset value for financial reporting purposes and the returns based upon those net asset values may differ from the net asset value and returns for shareholder transactions. Does not include sales charges and is not annualized for periods less than one year, if applicable. |
| (e) | Ratios are based on average daily net assets (000’s omitted) of $1,560,367, $17,885, $92,669, $427,886 and $113,692 for Class A, Class B, Class C, Class Y and Investor Class shares, respectively. |
| (g) | Assumes reinvestment of all distributions for the period and does not include payment of the maximum sales charge of 4.75% or contingent deferred sales charge (CDSC). On purchases of $1 million or more, a CDSC of 1% may be imposed on certain redemptions made within eighteen months of purchase. If the sales charges were included, total returns would be lower. These returns include combined Rule 12b-1 fees and service fees of up to 0.25% and do not reflect the deduction of taxes that a shareholder would pay on Fund distributions or the redemption of Fund shares. |
| (h) | Assumes reinvestment of all distributions for the period and does not include payment of the maximum CDSC of 4%, charged on certain redemptions made within one year of purchase and declining to 0% after the fifth year. If the sales charge was included, total returns would be lower. These returns include combined Rule 12b-1 fees and service fees of up to 1% and do not reflect the deduction of taxes that a shareholder would pay on Fund distributions or the redemption of Fund shares. |
| (i) | Assumes reinvestment of all distributions for the period and does not include payment of the maximum CDSC of 1%, charged on certain redemptions made within one year of purchase. If the sales charge was included, total returns would be lower. These returns include combined Rule 12b-1 fees and service fees of up to 1% and do not reflect the deduction of taxes that a shareholder would pay on Fund distributions or the redemption of Fund shares. |
| (j) | On June 1, 2010, Class I shares of Invesco Van Kampen Municipal Income Fund were reorganized into Class Y shares of the Fund. |
| (k) | Assumes reinvestment of all distributions for the period. These returns do not reflect the deduction of taxes that a shareholder would pay on Fund distributions or the redemption on Fund shares. |
| (l) | Commencement date of July 15, 2013. |
44 Invesco Municipal Income Fund
Report of Independent Registered Public Accounting Firm
To the Board of Trustees of AIM Tax-Exempt Funds (Invesco Tax-Exempt Funds)
and Shareholders of Invesco Municipal Income Fund:
In our opinion, the accompanying statement of assets and liabilities, including the schedule of investments, and the related statements of operations and of changes in net assets and the financial highlights present fairly, in all material respects, the financial position of Invesco Municipal Income Fund (one of the funds constituting AIM Tax-Exempt Funds (Invesco Tax-Exempt Funds), hereafter referred to as the “Fund”) at February 28, 2014, the results of its operations for the year then ended, the changes in its net assets for each of the two years in the period then ended and the financial highlights for each of the three years in the period then ended, the five month period ended February 28, 2011 and the year ended September 30, 2010, in conformity with accounting principles generally accepted in the United States of America. These financial statements and financial highlights (hereafter referred to as “financial statements”) are the responsibility of the Fund’s management; our responsibility is to express an opinion on these financial statements based on our audits. We conducted our audits of these financial statements in accordance with the standards of the Public Company Accounting Oversight Board (United States). Those standards require that we plan and perform the audit to obtain reasonable assurance about whether the financial statements are free of material misstatement. An audit includes examining, on a test basis, evidence supporting the amounts and disclosures in the financial statements, assessing the accounting principles used and significant estimates made by management, and evaluating the overall financial statement presentation. We believe that our audits, which included confirmation of securities at February 28, 2014 by correspondence with the custodian and brokers, provide a reasonable basis for our opinion. The financial highlights of the Fund for the period ended September 30, 2009 were audited by another independent registered public accounting firm whose report dated November 20, 2009 expressed an unqualified opinion on such financial statement.
PRICEWATERHOUSECOOPERS LLP
April 28, 2014
Houston, Texas
45 Invesco Municipal Income Fund
Calculating your ongoing Fund expenses
Example
As a shareholder of the Fund, you incur two types of costs: (1) transaction costs, which may include sales charges (loads) on purchase payments or contingent deferred sales charges on redemptions, if any; and (2) ongoing costs, including management fees, distribution and/or service (12b-1) fees, and other Fund expenses. This example is intended to help you understand your ongoing costs (in dollars) of investing in the Fund and to compare these costs with ongoing costs of investing in other mutual funds. The example is based on an investment of $1,000 invested at the beginning of the period and held for the entire period September 1, 2013 through February 28, 2014.
Actual expenses
The table below provides information about actual account values and actual expenses. You may use the information in this table, together with the amount you invested, to estimate the expenses that you paid over the period. Simply divide your account value by $1,000 (for example, an $8,600 account value divided by $1,000 = 8.6), then multiply the result by the number in the table under the heading entitled “Actual Expenses Paid During Period” to estimate the expenses you paid on your account during this period.
Hypothetical example for comparison purposes
The table below also provides information about hypothetical account values and hypothetical expenses based on the Fund’s actual expense ratio and an assumed rate of return of 5% per year before expenses, which is not the Fund’s actual return.
The hypothetical account values and expenses may not be used to estimate the actual ending account balance or expenses you paid for the period. You may use this information to compare the ongoing costs of investing in the Fund and other funds. To do so, compare this 5% hypothetical example with the 5% hypothetical examples that appear in the shareholder reports of the other funds.
Please note that the expenses shown in the table are meant to highlight your ongoing costs only and do not reflect any transaction costs, such as sales charges (loads) on purchase payments or contingent deferred sales charges on redemptions, if any. Therefore, the hypothetical information is useful in comparing ongoing costs only, and will not help you determine the relative total costs of owning different funds. In addition, if these transaction costs were included, your costs would have been higher.
| | | | | | | | | | | | | | | | | | | | | | | | |
| Class | | Beginning
Account Value
(09/01/13) | | | ACTUAL | | | HYPOTHETICAL
(5% annual return before
expenses) | | | Annualized
Expense
Ratio | |
| | | Ending
Account Value
(02/28/14)1 | | | Expenses
Paid During
Period2 | | | Ending
Account Value
(02/28/14) | | | Expenses
Paid During
Period2 | | |
| A | | $ | 1,000.00 | | | $ | 1,063.60 | | | $ | 4.81 | | | $ | 1,020.13 | | | $ | 4.71 | | | | 0.94 | % |
| B | | | 1,000.00 | | | | 1,059.80 | | | | 8.63 | | | | 1,016.41 | | | | 8.45 | | | | 1.69 | |
| C | | | 1,000.00 | | | | 1,059.80 | | | | 8.63 | | | | 1,016.41 | | | | 8.45 | | | | 1.69 | |
| Y | | | 1,000.00 | | | | 1,064.90 | | | | 3.53 | | | | 1,021.37 | | | | 3.46 | | | | 0.69 | |
| Investor | | | 1,000.00 | | | | 1,063.90 | | | | 4.30 | | | | 1,020.63 | | | | 4.21 | | | | 0.84 | |
| 1 | The actual ending account value is based on the actual total return of the Fund for the period September 1, 2013 through February 28, 2014, after actual expenses and will differ from the hypothetical ending account value which is based on the Fund’s expense ratio and a hypothetical annual return of 5% before expenses. |
| 2 | Expenses are equal to the Fund’s annualized expense ratio as indicated above multiplied by the average account value over the period, multiplied by 181/365 to reflect the most recent fiscal half year. |
46 Invesco Municipal Income Fund
Tax Information
Form 1099-DIV, Form 1042-S and other year–end tax information provide shareholders with actual calendar year amounts that should be included in their tax returns. Shareholders should consult their tax advisors.
The following distribution information is being provided as required by the Internal Revenue Code or to meet a specific state’s requirement.
The Fund designates the following amounts or, if subsequently determined to be different, the maximum amount allowable for its fiscal year ended February 28, 2014:
| | | | |
Federal and State Income Tax | |
Qualified Dividend Income* | | | 0 | % |
Corporate Dividends Received Deduction* | | | 0 | % |
U.S. Treasury Obligations* | | | 0 | % |
Tax-Exempt Interest Dividends* | | | 100 | % |
| | * | The above percentages are based on ordinary income dividends paid to shareholders during the Fund’s fiscal year. |
47 Invesco Municipal Income Fund
Trustees and Officers
The address of each trustee and officer is AIM Tax-Exempt Funds (Invesco Tax-Exempt Funds) (the “Trust”), 11 Greenway Plaza, Suite 1000, Houston, Texas 77046-1173. The trustees serve for the life of the Trust, subject to their earlier death, incapacitation, resignation, retirement or removal as more specifically provided in the Trust’s organizational documents. Each officer serves for a one year term or until their successors are elected and qualified. Column two below includes length of time served with predecessor entities, if any.
| | | | | | | | |
Name, Year of Birth and
Position(s) Held with the Trust | | Trustee and/
or Officer Since | | Principal Occupation(s) During Past 5 Years | | Number of
Funds in Fund
Complex
Overseen by
Trustee | | Other Directorship(s)
Held by Trustee During
Past 5 Years |
| Interested Persons | | | | | | | | |
| Martin L. Flanagan1 — 1960 Trustee | | 2007 | | Executive Director, Chief Executive Officer and President, Invesco Ltd. (ultimate parent of Invesco and a global investment management firm); Advisor to the Board, Invesco Advisers, Inc. (formerly known as Invesco Institutional (N.A.), Inc.); Trustee, The Invesco Funds; Vice Chair, Investment Company Institute; and Member of Executive Board, SMU Cox School of Business Formerly: Chairman and Chief Executive Officer, Invesco Advisers, Inc. (registered investment adviser); Director, Chairman, Chief Executive Officer and President, IVZ Inc. (holding company), INVESCO Group Services, Inc. (service provider) and Invesco North American Holdings, Inc. (holding company); Director, Chief Executive Officer and President, Invesco Holding Company Limited (parent of Invesco and a global investment management firm); Director, Invesco Ltd.; Chairman, Investment Company Institute and President, Co-Chief Executive Officer, Co-President, Chief Operating Officer and Chief Financial Officer, Franklin Resources, Inc. (global investment management organization). | | 123 | | None |
Philip A. Taylor2 — 1954 Trustee, President and Principal Executive Officer | | 2006 | | Head of North American Retail and Senior Managing Director, Invesco Ltd.; Director, Co-Chairman, Co-President and Co-Chief Executive Officer, Invesco Advisers, Inc. (formerly known as Invesco Institutional (N.A.), Inc.) (registered investment adviser); Director, Chairman, Chief Executive Officer and President, Invesco Management Group, Inc. (formerly known as Invesco Aim Management Group, Inc.) (financial services holding company); Director and President, INVESCO Funds Group, Inc. (registered investment adviser and registered transfer agent); Director and Chairman, Invesco Investment Services, Inc. (formerly known as Invesco Aim Investment Services, Inc.) (registered transfer agent) and IVZ Distributors, Inc. (formerly known as INVESCO Distributors, Inc.) (registered broker dealer); Director, President and Chairman, Invesco Inc. (holding company) and Invesco Canada Holdings Inc. (holding company); Chief Executive Officer, Invesco Corporate Class Inc. (corporate mutual fund company) and Invesco Canada Fund Inc. (corporate mutual fund company); Director, Chairman and Chief Executive Officer, Invesco Canada Ltd. (formerly known as Invesco Trimark Ltd./Invesco Trimark Ltèe) (registered investment adviser and registered transfer agent); Trustee, President and Principal Executive Officer, The Invesco Funds (other than AIM Treasurer’s Series Trust (Invesco Treasurer’s Series Trust) and Short-Term Investments Trust); Trustee and Executive Vice President, The Invesco Funds (AIM Treasurer’s Series Trust (Invesco Treasurer’s Series Trust) and Short-Term Investments Trust only); Director, Invesco Investment Advisers LLC (formerly known as Van Kampen Asset Management); Director, Chief Executive Officer and President, Van Kampen Exchange Corp. Formerly: Director and Chairman, Van Kampen Investor Services Inc.; Director, Chief Executive Officer and President, 1371 Preferred Inc. (holding company); and Van Kampen Investments Inc.; Director and President, AIM GP Canada Inc. (general partner for limited partnerships); and Van Kampen Advisors, Inc.; Director and Chief Executive Officer, Invesco Trimark Dealer Inc. (registered broker dealer); Director, Invesco Distributors, Inc. (formerly known as Invesco Aim Distributors, Inc.) (registered broker dealer); Manager, Invesco PowerShares Capital Management LLC; Director, Chief Executive Officer and President, Invesco Advisers, Inc.; Director, Chairman, Chief Executive Officer and President, Invesco Aim Capital Management, Inc.; President, Invesco Trimark Dealer Inc. and Invesco Trimark Ltd./Invesco Trimark Ltèe; Director and President, AIM Trimark Corporate Class Inc. and AIM Trimark Canada Fund Inc.; Senior Managing Director, Invesco Holding Company Limited; Trustee and Executive Vice President, Tax-Free Investments Trust; Director and Chairman, Fund Management Company (former registered broker dealer); President and Principal Executive Officer, The Invesco Funds (AIM Treasurer’s Series Trust (Invesco Treasurer’s Series Trust), Short-Term Investments Trust and Tax-Free Investments Trust only); President, AIM Trimark Global Fund Inc. and AIM Trimark Canada Fund Inc. | | 123 | | None |
Wayne W. Whalen3 — 1939 Trustee | | 2010 | | Of Counsel, and prior to 2010, partner in the law firm of Skadden, Arps, Slate, Meagher & Flom LLP, legal counsel to certain funds in the Fund Complex. | | 136 | | Director of the Mutual fund Directors Forum, a nonprofit membership organization for investment directors; Chairman and Director of the Abraham Lincoln Presidential Library Foundation; and Director of the Stevenson Center for Democracy |
| 1 | Mr. Flanagan is considered an interested person of the Trust because he is an officer of the adviser to the Trust, and an officer and a director of Invesco Ltd., ultimate parent of the adviser to the Trust. |
| 2 | Mr. Taylor is considered an interested person of the Trust because he is an officer and a director of the adviser to, and a director of the principal underwriter of, the Trust. |
| 3 | Mr. Whalen is considered an “interested person” (within the meaning of Section 2(a)(19) of the 1940 Act) of certain funds in the Fund Complex because his firm currently provides legal services as legal counsel to such Funds. |
T-1 Invesco Municipal Income Fund
Trustees and Officers—(continued)
| | | | | | | | |
Name, Year of Birth and
Position(s) Held with the Trust | | Trustee and/
or Officer Since | | Principal Occupation(s) During Past 5 Years | | Number of
Funds in Fund
Complex
Overseen by
Trustee | | Other Directorship(s)
Held by Trustee During
Past 5 Years |
| Independent Trustees | | | | | | | | |
Bruce L. Crockett — 1944 Trustee and Chair | | 1993 | | Chairman, Crockett Technologies Associates (technology consulting company) Formerly: Director, Captaris (unified messaging provider); Director, President and Chief Executive Officer COMSAT Corporation; Chairman, Board of Governors of INTELSAT (international communications company); ACE Limited (insurance company); and Investment Company Institute | | 123 | | ALPS (Attorneys Liability Protection Society) (insurance company) |
David C. Arch — 1945 Trustee | | 2010 | | Chairman of Blistex Inc., a consumer health care products manufacturer | | 136 | | Board member of the Illinois Manufacturers’ Association; Member of the Board of Visitors, Institute for the Humanities University of Michigan; Member of the Audit Committee of the Edward-Elmhurst Hospital |
Frank S. Bayley — 1939 Trustee | | 2001 | | Retired. Formerly: Director, Badgley Funds Inc. (registered investment company) (2 portfolios) and General Partner and Of Counsel, law firm of Baker & McKenzie, LLP | | 123 | | Director and Chairman, C.D. Stimson Company (a real estate investment company); Trustee, The Curtis Institute of Music |
James T. Bunch — 1942 Trustee | | 2003 | | Managing Member, Grumman Hill Group LLC (family office private equity investments) Formerly: Founder, Green Manning & Bunch Ltd. (investment banking firm) (1988-2010); Executive Committee, United States Golf Association; and Director, Policy Studies, Inc. and Van Gilder Insurance Corporation. | | 123 | | Chairman, Board of Governors, Western Golf Association, Chairman, Evans Scholars Foundation and Director, Denver Film Society |
Rodney F. Dammeyer — 1940 Trustee | | 2010 | | Chairman of CAC,LLC, (private company offering capital investment and management advisory services) Formerly: Prior to 2001, Managing Partner at Equity Group Corporate Investments. Prior to 1995, Chief Executive Officer of Itel Corporation (formerly Anixter International). Prior to 1985, experience includes Senior Vice President and Chief Financial Officer of Household International, Inc., Executive Vice President and Chief Financial Officer of Northwest Industries, Inc. and Partner of Arthur Andersen & Co.; From 1987 to 2010, Director/Trustee of investment companies in the Van Kampen Funds complex | | 123 | | Director of Quidel Corporation and Stericycle, Inc. |
Albert R. Dowden — 1941 Trustee | | 2000 | | Director of a number of public and private business corporations, including the Boss Group, Ltd. (private investment and management); Nature’s Sunshine Products, Inc. and Reich & Tang Funds (5 portfolios) (registered investment company) Formerly: Director, Homeowners of America Holding Corporation/Homeowners of America Insurance Company (property casualty company); Director, Continental Energy Services, LLC (oil and gas pipeline service); Director, CompuDyne Corporation (provider of product and services to the public security market) and Director, Annuity and Life Re (Holdings), Ltd. (reinsurance company); Director, President and Chief Executive Officer, Volvo Group North America, Inc.; Senior Vice President, AB Volvo; Director of various public and private corporations; Chairman, DHJ Media, Inc.; Director, Magellan Insurance Company; and Director, The Hertz Corporation, Genmar Corporation (boat manufacturer), National Media Corporation; Advisory Board of Rotary Power International (designer, manufacturer, and seller of rotary power engines); and Chairman, Cortland Trust, Inc. (registered investment company) | | 123 | | Director of: Nature’s Sunshine Products, Inc., Reich & Tang Funds, Homeowners of America Holding Corporation/ Homeowners of America Insurance Company, the Boss Group |
Jack M. Fields — 1952 Trustee | | 1997 | | Chief Executive Officer, Twenty First Century Group, Inc. (government affairs company); Owner and Chief Executive Officer, Dos Angeles Ranch, L.P. (cattle, hunting, corporate entertainment); and Discovery Global Education Fund (non-profit) Formerly: Chief Executive Officer, Texana Timber LP (sustainable forestry company); Director of Cross Timbers Quail Research Ranch (non-profit); and member of the U.S. House of Representatives | | 123 | | Insperity, Inc. (formerly known as Administaff) |
Prema Mathai-Davis — 1950 Trustee | | 1998 | | Retired. Formerly: Chief Executive Officer, YWCA of the U.S.A. | | 123 | | None |
Larry Soll — 1942 Trustee | | 2003 | | Retired. Formerly: Chairman, Chief Executive Officer and President, Synergen Corp. (a biotechnology company) | | 123 | | None |
T-2 Invesco Municipal Income Fund
Trustees and Officers—(continued)
| | | | | | | | |
Name, Year of Birth and
Position(s) Held with the Trust | | Trustee and/
or Officer Since | | Principal Occupation(s) During Past 5 Years | | Number of
Funds in Fund
Complex
Overseen by
Trustee | | Other Directorship(s)
Held by Trustee During
Past 5 Years |
| Independent Trustees—(continued) |
Hugo F. Sonnenschein — 1940 Trustee | | 2010 | | President Emeritus and Honorary Trustee of the University of Chicago and the Adam Smith Distinguished Service Professor in the Department of Economics at the University of Chicago. Prior to 2000, President of the University of Chicago | | 136 | | Trustee of the University of Rochester and a member of its investment committee; Member of the National Academy of Sciences and the American Philosophical Society; Fellow of the American Academy of Arts and Sciences |
| Raymond Stickel, Jr. — 1944 Trustee | | 2005 | | Retired. Formerly: Director, Mainstay VP Series Funds, Inc. (25 portfolios) and Partner, Deloitte & Touche | | 123 | | None |
| Other Officers | | | | | | | | |
Russell C. Burk — 1958 Senior Vice President and Senior Officer | | 2005 | | Senior Vice President and Senior Officer, The Invesco Funds | | N/A | | N/A |
John M. Zerr — 1962 Senior Vice President, Chief Legal Officer and Secretary | | 2006 | | Director, Senior Vice President, Secretary and General Counsel, Invesco Management Group, Inc. (formerly known as Invesco Aim Management Group, Inc.) and Van Kampen Exchange Corp.; Senior Vice President, Invesco Advisers, Inc. (formerly known as Invesco Institutional (N.A.), Inc.) (registered investment adviser); Senior Vice President and Secretary, Invesco Distributors, Inc. (formerly known as Invesco Aim Distributors, Inc.); Director, Vice President and Secretary, Invesco Investment Services, Inc. (formerly known as Invesco Aim Investment Services, Inc.) and IVZ Distributors, Inc. (formerly known as INVESCO Distributors, Inc.); Director and Vice President, INVESCO Funds Group, Inc.; Senior Vice President, Chief Legal Officer and Secretary, The Invesco Funds; Manager, Invesco PowerShares Capital Management LLC; Director, Secretary and General Counsel, Invesco Investment Advisers LLC (formerly known as Van Kampen Asset Management); Secretary and General Counsel, Invesco Capital Markets, Inc. (formerly known as Van Kampen Funds Inc.) and Chief Legal Officer, PowerShares Exchange-Traded Fund Trust, PowerShares Exchange-Traded Fund Trust II, PowerShares India Exchange-Traded Fund Trust and PowerShares Actively Managed Exchange-Traded Fund Trust Formerly: Director and Vice President, Van Kampen Advisors Inc.; Director, Vice President, Secretary and General Counsel, Van Kampen Investor Services Inc.; Director, Invesco Distributors, Inc. (formerly known as Invesco Aim Distributors, Inc.); Director, Senior Vice President, General Counsel and Secretary, Invesco Aim Advisers, Inc. and Van Kampen Investments Inc.; Director, Vice President and Secretary, Fund Management Company; Director, Senior Vice President, Secretary, General Counsel and Vice President, Invesco Aim Capital Management, Inc.; Chief Operating Officer and General Counsel, Liberty Ridge Capital, Inc. (an investment adviser); Vice President and Secretary, PBHG Funds (an investment company) and PBHG Insurance Series Fund (an investment company); Chief Operating Officer, General Counsel and Secretary, Old Mutual Investment Partners (a broker-dealer); General Counsel and Secretary, Old Mutual Fund Services (an administrator) and Old Mutual Shareholder Services (a shareholder servicing center); Executive Vice President, General Counsel and Secretary, Old Mutual Capital, Inc. (an investment adviser); and Vice President and Secretary, Old Mutual Advisors Funds (an investment company) | | N/A | | N/A |
Sheri Morris — 1964 Vice President, Treasurer and Principal Financial Officer | | 1999 | | Vice President, Treasurer and Principal Financial Officer, The Invesco Funds; Vice President, Invesco Advisers, Inc. (formerly known as Invesco Institutional (N.A.), Inc.) (registered investment adviser); and Vice President, PowerShares Exchange-Traded Fund Trust, PowerShares Exchange-Traded Fund Trust II, PowerShares India Exchange-Traded Fund Trust and PowerShares Actively Managed Exchange-Traded Fund Trust Formerly: Vice President, Invesco Aim Advisers, Inc., Invesco Aim Capital Management, Inc. and Invesco Aim Private Asset Management, Inc.; Assistant Vice President and Assistant Treasurer, The Invesco Funds and Assistant Vice President, Invesco Advisers, Inc., Invesco Aim Capital Management, Inc. and Invesco Aim Private Asset Management, Inc.; and Treasurer, PowerShares Exchange-Traded Fund Trust, PowerShares Exchange-Traded Fund Trust II, PowerShares India Exchange-Traded Fund Trust and PowerShares Actively Managed Exchange-Traded Fund Trust | | N/A | | N/A |
T-3 Invesco Municipal Income Fund
Trustees and Officers—(continued)
| | | | | | | | |
Name, Year of Birth and
Position(s) Held with the Trust | | Trustee and/
or Officer Since | | Principal Occupation(s) During Past 5 Years | | Number of
Funds in Fund
Complex
Overseen by
Trustee | | Other Directorship(s)
Held by Trustee During
Past 5 Years |
| Other Officers—(continued) | | | | | | | | |
Karen Dunn Kelley — 1960 Vice President | | 1993 | | Senior Managing Director, Investments; Director, Co-President, Co-Chief Executive Officer, and Co-Chairman, Invesco Advisers, Inc. (formerly known as Invesco Institutional (N.A.), Inc.) (registered investment adviser); Chairman, Invesco Senior Secured Management, Inc.; Senior Vice President, Invesco Management Group, Inc. (formerly known as Invesco Aim Management Group, Inc.); Executive Vice President, Invesco Distributors, Inc. (formerly known as Invesco Aim Distributors, Inc.); Director, Invesco Mortgage Capital Inc. and Invesco Management Company Limited; Director and President, INVESCO Asset Management (Bermuda) Ltd., Vice President, The Invesco Funds (other than AIM Treasurer’s Series Trust (Invesco Treasurer’s Series Trust) and Short-Term Investments Trust); and President and Principal Executive Officer, The Invesco Funds (AIM Treasurer’s Series Trust (Invesco Treasurer’s Series Trust) and Short-Term Investments Trust only) Formerly: Director, INVESCO Global Asset Management Limited and INVESCO Management S.A.; Senior Vice President, Van Kampen Investments Inc. and Invesco Advisers, Inc. (formerly known as Invesco Institutional (N.A.), Inc.) (registered investment adviser); Vice President, Invesco Advisers, Inc. (formerly known as Invesco Institutional (N.A.), Inc.); Director of Cash Management and Senior Vice President, Invesco Advisers, Inc. and Invesco Aim Capital Management, Inc.; President and Principal Executive Officer, Tax-Free Investments Trust; Director and President, Fund Management Company; Chief Cash Management Officer, Director of Cash Management, Senior Vice President, and Managing Director, Invesco Aim Capital Management, Inc.; Director of Cash Management, Senior Vice President, and Vice President, Invesco Advisers, Inc. and The Invesco Funds (AIM Treasurer’s Series Trust (Invesco Treasurer’s Series Trust), Short-Term Investments Trust and Tax-Free Investments Trust only) | | N/A | | N/A |
Crissie M. Wisdom — 1969 Anti-Money Laundering Compliance Officer | | 2013 | | Anti-Money Laundering Compliance Officer, Invesco Advisers, Inc. (formerly known as Invesco Institutional (N.A.), Inc.) (registered investment adviser), Invesco Capital Markets, Inc. (formerly known as Van Kampen Funds Inc.), Invesco Distributors, Inc., Invesco Investment Services, Inc., Invesco Management Group, Inc., Van Kampen Exchange Corp., The Invesco Funds, Invesco Funds (Chicago), and PowerShares Exchange-Traded Fund Trust, PowerShares Exchange-Traded Fund Trust II, PowerShares India Exchange-Traded Fund Trust, and PowerShares Actively Managed Exchange-Traded Fund Trust; and Fraud Prevention Manager and Controls and Risk Analysis Manager for Invesco Investment Services, Inc. | | N/A | | N/A |
Todd L. Spillane — 1958 Chief Compliance Officer | | 2006 | | Senior Vice President, Invesco Management Group, Inc. (formerly known as Invesco Aim Management Group, Inc.) and Van Kampen Exchange Corp.; Senior Vice President and Chief Compliance Officer, Invesco Advisers, Inc. (registered investment adviser) (formerly known as Invesco Institutional (N.A.), Inc.); Chief Compliance Officer, The Invesco Funds; Vice President, Invesco Distributors, Inc. (formerly known as Invesco Aim Distributors, Inc.) and Invesco Investment Services, Inc. (formerly known as Invesco Aim Investment Services, Inc.) Formerly: Chief Compliance Officer, Invesco Funds (Chicago); Senior Vice President, Van Kampen Investments Inc.; Senior Vice President and Chief Compliance Officer, Invesco Aim Advisers, Inc. and Invesco Aim Capital Management, Inc.; Chief Compliance Officer, INVESCO Private Capital Investments, Inc. (holding company), Invesco Private Capital, Inc. (registered investment adviser), Invesco Global Asset Management (N.A.), Inc., Invesco Senior Secured Management, Inc. (registered investment adviser), Van Kampen Investor Services Inc., PowerShares Exchange-Traded Fund Trust, PowerShares Exchange-Traded Fund Trust II, PowerShares India Exchange-Traded Fund Trust and PowerShares Actively Managed Exchange-Traded Fund Trust; and Vice President, Invesco Aim Capital Management, Inc. and Fund Management Company | | N/A | | N/A |
The Statement of Additional Information of the Trust includes additional information about the Fund’s Trustees and is available upon request, without charge, by calling 1.800.959.4246. Please refer to the Fund’s prospectus for information on the Fund’s sub-advisers.
| | | | | | |
Office of the Fund 11 Greenway Plaza, Suite 1000 Houston, TX 77046-1173 | | Investment Adviser Invesco Advisers, Inc. 1555 Peachtree Street, N.E. Atlanta, GA 30309 | | Distributor Invesco Distributors, Inc. 11 Greenway Plaza, Suite 1000 Houston, TX 77046-1173 | | Auditors PricewaterhouseCoopers LLP 1201 Louisiana Street, Suite 2900 Houston, TX 77002-5678 |
| | | |
| | | | | | |
Counsel to the Fund Stradley Ronon Stevens & Young, LLP 2005 Market Street, Suite 2600 Philadelphia, PA 19103-7018 | | Counsel to the Independent Trustees Goodwin Procter LLP 901 New York Avenue, N.W. Washington, D.C. 20001 | | Transfer Agent Invesco Investment Services, Inc. 11 Greenway Plaza, Suite 1000 Houston, TX 77046-1173 | | Custodian State Street Bank and Trust Company 225 Franklin Street Boston, MA 02110-2801 |
T-4 Invesco Municipal Income Fund

Invesco mailing information
Send general correspondence to Invesco Investment Services, Inc., P.O. Box 219078, Kansas City, MO 64121-9078.
Important notice regarding delivery of security holder documents
To reduce Fund expenses, only one copy of most shareholder documents may be mailed to shareholders with multiple accounts at the same address (Householding). Mailing of your shareholder documents may be householded indefinitely unless you instruct us otherwise. If you do not want the mailing of these documents to be combined with those for other members of your household, please contact Invesco Investment Services, Inc. at 800 959 4246 or contact your financial institution. We will begin sending you individual copies for each account within 30 days after receiving your request.
Fund holdings and proxy voting information
The Fund provides a complete list of its holdings four times in each fiscal year, at the quarter ends. For the second and fourth quarters, the lists appear in the Fund’s semiannual and annual reports to shareholders. For the first and third quarters, the Fund files the lists with the Securities and Exchange Commission (SEC) on Form N-Q. The most recent list of portfolio holdings is available at invesco.com/completeqtrholdings. Shareholders can also look up the Fund’s Forms N-Q on the SEC website at sec.gov. Copies of the Fund’s Forms N-Q may be reviewed and copied at the SEC Public Reference Room in Washington, D.C. You can obtain information on the operation of the Public Reference Room, including information about duplicating fee charges, by calling 202 551 8090 or 800 732 0330, or by electronic request at the following email address: publicinfo@sec.gov. The SEC file numbers for the Fund are shown below.
A description of the policies and procedures that the Fund uses to determine how to vote proxies relating to portfolio securities is available without charge, upon request, from our Client Services department at 800 959 4246 or at invesco.com/proxyguidelines. The information is also available on the SEC website, sec.gov.
| | |
Information regarding how the Fund voted proxies related to its portfolio securities during the most recent 12-month period ended June 30 is available at invesco.com/proxysearch. The information is also available on the SEC website, sec.gov. Invesco Advisers, Inc. is an investment adviser; it provides investment advisory services to individual and institutional clients and does not sell securities. Invesco Distributors, Inc. is the US distributor for Invesco Ltd.’s retail mutual funds, exchange-traded funds and institutional money market funds. Both are wholly owned, indirect subsidiaries of Invesco Ltd. | |  |
| | | | |
| SEC file numbers: 811-07890 and 033-66242 | | VK-MINC-AR-1 | | Invesco Distributors, Inc. |
Letters to Shareholders
| | | | |

Philip Taylor | | | | Dear Shareholders: This annual report includes information about your Fund, including performance data and a complete list of its investments as of the close of the reporting period. Inside, your Fund’s portfolio managers discuss how they managed your Fund and the factors that affected its performance during the reporting period. I hope you find this report of interest. During the reporting period covered by this report, major US and global equity market indexes hit multiyear or all-time highs1, the result of a strengthening US economy and relatively healthy corporate profits. Also helping equities was a return of individual investors to stocks – due in part to monetary policies that kept interest rates (and yields on fixed income securities) low. Despite some volatility in the summer of 2013, overseas equity market indexes in developed and emerging nations generally rose during the reporting period – although developed markets generally outpaced emerging markets. In January 2014, amid widespread signs of an improving |
economy, the US Federal Reserve began a long-anticipated reduction in its bond-buying program.
Extended periods of strong market performance can lull some investors into a false sense of security – just as extended periods of volatility or market weakness can discourage some investors from undertaking disciplined, long-term investment plans. That’s why Invesco believes it can often be helpful to work with a skilled and trusted financial adviser; he or she can emphasize the importance of adhering to an investment plan designed to achieve long-term goals like a first home, a college education for a child or a comfortable retirement. A financial adviser who is familiar with your individual financial situation, investment goals and risk tolerance can be an invaluable partner as you work toward your financial goals. He or she can provide insight and perspective when markets are volatile; encouragement and reassurance when times are uncertain; and advice and guidance when your financial situation or investment goals change.
Timely information when and where you want it
Invesco’s efforts to help investors achieve their financial objectives include providing individual investors and financial professionals with timely information about the markets, the economy and investing – whenever and wherever they want it.
Our website, invesco.com/us, offers a wide range of market insights and investment perspectives. On the website, you’ll find detailed information about our funds, including prices, performance, holdings and portfolio manager commentaries. You can access information about your individual Invesco account whenever it’s convenient for you; just complete a simple, secure online registration. Use the “Login” box on our home page to get started.
Invesco’s mobile app for iPad® (available free from the App StoreSM) allows you to obtain the same detailed information about your Fund and the same investment insights from our investment leaders, market strategists, economists and retirement experts on the go. You also can watch portfolio manager videos and have instant access to Invesco news and updates wherever you may be.
In addition to the resources accessible on our website and through our mobile app, you can obtain timely updates to help you stay informed about the markets, the economy and investing by connecting with Invesco on Twitter, LinkedIn or Facebook. You can access our blog at blog.invesco.us.com or by visiting the “Intentional Investing Forum” on our home page. Our goal is to provide you the information you want, when and where you want it.
Have questions?
For questions about your account, feel free to contact an Invesco client services representative at 800 959 4246. For Invesco-related questions or comments, please email me directly at phil@invesco.com.
All of us at Invesco look forward to serving your investment management needs for many years to come. Thank you for investing with us.
Sincerely,

Philip Taylor
Senior Managing Director, Invesco Ltd.
1 Source: Reuters
iPad is a trademark of Apple Inc., registered in the US and other countries. App Store is a service mark of Apple Inc. Invesco Distributors, Inc. is not affiliated with Apple Inc.
2 Invesco New York Tax Free Income Fund
| | | | |

Bruce Crockett | | | | Dear Fellow Shareholders: Members of the Invesco Funds Board work continually to oversee how the Invesco Funds are performing in light of ever-changing and often unpredictable economic and market conditions. One of the ways we do this is by verifying that the teams that manage funds understand the risks associated with the investments they make in the funds they manage. In light of market conditions over the last few years, the financial news media of late have given increased attention to “alternative investment strategies.” Despite this increased attention, many investors don’t know very much about these types of investment strategies. Let me put alternative investment strategies and the new focus on them in some perspective. First, these types of investment strategies have been used predominately by institutional investors and investment professionals for decades to increase diversification – in an effort to dampen portfolio volatility (risk) with the goal of increasing returns. The focal point of the |
increased news coverage is that these types of strategies are now being made more widely available to individual investors.
Alternative investment strategies generally seek to provide measured exposure to various asset classes whose performance, historically, has not been highly correlated with one another. These strategies may help mitigate the impact to a portfolio from severe or prolonged market downturns while potentially providing reasonable returns over time. After a careful and thorough examination of the potential risks and potential benefits of alternative investment strategies, the Invesco Funds Board has approved the launch of several new alternative funds for the Invesco product lineup, to be managed by teams we determined have the depth and experience to pursue the funds’ investment objectives.
While no single investment product can provide complete downside protection in falling markets and full upside participation in rising markets, your Board believes alternative funds can be a prudent tool to work in concert with more traditional mutual funds and other investments to build well diversified portfolios. Your financial adviser can determine whether or not such investments are appropriate for your individual needs, goals and risk tolerance. Also, he or she can explain the risks associated with alternative investment strategies. This type of professional guidance is why Invesco believes it’s so important that individual investors work with trusted, experienced financial advisers.
Whether you’re invested in equity, fixed income, cash management or alternative investment funds, be assured that the Invesco Funds Board will continue working on your behalf and on behalf of all our fund shareholders, keeping your needs and interests uppermost in our minds.
As always, please contact me at bruce@brucecrockett.com with any questions or concerns you may have. On behalf of the Board, we look forward to continuing to represent your interests and serving your needs.
Sincerely,

Bruce L. Crockett
Independent Chair
Invesco Funds Board of Trustees
Asset allocation/diversification does not guarantee a profit or eliminate the risk of loss.
Alternative products typically hold more non-traditional investments and employ more complex trading strategies, including hedging and leveraging through derivatives, short selling and opportunistic strategies that change with market conditions. Investors considering alternatives should be aware of their unique characteristics and additional risks from the strategies they use. Like all investments, performance will fluctuate. You can lose money.
3 Invesco New York Tax Free Income Fund
Management’s Discussion of Fund Performance
Performance summary
For the fiscal year ended February 28, 2014, Invesco New York Tax Free Income Fund posted negative returns. The Fund underperformed its broad market and style-specific benchmarks, the Barclays Municipal Bond Index and the Barclays New York Municipal Index, respectively. The main driver of returns was the Fund’s exposure to the long end of the yield curve.
Your Fund’s long-term performance appears later in this report.
Fund vs. Indexes
Total returns, 2/28/13 to 2/28/14, at net asset value (NAV). Performance shown does not include applicable contingent deferred sales charges (CDSC) or front-end sales charges, which would have reduced performance.
| | | | | |
| Class A Shares | | | | -3.26 | % |
| Class B Shares | | | | -3.30 | |
| Class C Shares | | | | -4.04 | |
| Class Y Shares | | | | -3.08 | |
| Barclays Municipal Bond Index‚ (Broad Market Index) | | | | -0.21 | |
| Barclays New York Municipal Indexn (Style-Specific Index) | | | | 0.12 | |
Source(s): ‚Lipper Inc., nBarclays via Factset Research Systems Inc.
How we invest
The Fund’s investment objective is to provide investors with a high level of current income exempt from federal, New York State and New York City income taxes, consistent with preservation of capital. Under normal market conditions, we seek to achieve the Fund’s investment objective by investing primarily in a portfolio of New York municipal securities that are investment grade at the time of investment. The Fund is designed for investors who are residents of New York, for New York tax purposes.
Under normal market conditions, the Fund invests at least 80% of its net assets (plus any borrowings for investment purposes) in New York municipal securities at the time of investment. However, the Fund may not invest more than 20% of its total assets in unrated investment-grade securities.
Under normal market conditions, the Fund may invest up to 20% of its total assets in securities with below investment-grade credit quality at the time of purchase. Lower-grade securities are
commonly referred to as junk bonds and involve greater risks than higher-grade securities. The Fund does not purchase municipal securities that are in default or considered extremely speculative.
Under normal market conditions, the Fund may invest up to 20% of its total assets in municipal securities subject to the federal alternative minimum tax.
From time to time, the Fund temporarily may invest up to 10% of its net assets in tax-exempt money market funds and such instruments will be treated as investments in municipal securities. Investments in other mutual funds may involve duplication of management fees and certain other expenses.
Sell decisions generally are based on:
| n | | A deterioration or likely deterioration of an individual issuer’s capacity to meet its debt obligations on a timely basis. |
| n | | A deterioration or likely deterioration of the broader fundamentals of a particular industry or sector. |
| n | | Opportunities in the secondary or primary market to purchase a security with better relative value. |
| | | | | |
Portfolio Composition | |
By credit sector, based on total investments | |
| Revenue Bonds | | | | 92.4 | % |
| General Obligation Bonds | | | | 3.3 | |
| Pre-Refunded Bonds | | | | 2.3 | |
| Other | | | | 2.0 | |
| | | | | |
| Total Net Assets | | | | $143.2 million | |
| |
| Total Number of Holdings | | | | 148 | |
The Fund’s holdings are subject to change, and there is no assurance that the Fund will continue to hold any particular security.
| | | | | | | |
Top Five Fixed Income Holdings | |
| 1. | | New York (State of) Dormitory Authority (Cornell University); Series 2006 A | | | | 3.54 | % |
| 2. | | New York (City of) Municipal Water Finance Authority; Series 2005 D | | | | 2.92 | |
| 3. | | Erie (County of) Industrial Development Agency (City of Buffalo School District); Series 2011 A | | | | 2.20 | |
| 4. | | New York (State of) Dormitory Authority (School Districts Financing Program);
Series 2008 C | | | | 1.69 | |
| 5. | | New York (State of) Dormitory Authority; Series 2008 C | | | | 1.52 | |
Market conditions and your Fund
New York continues to benefit from a well-diversified economy with strong demographic trends, including median household income above the national average and a highly educated workforce. The state’s challenges center on the economy’s cyclical nature and the state’s dependence on the New York City-based financial services industry, volatile state finances due to above-average dependence on income taxes and high recurring expenditures resulting from a generous social services regime. However, we believe that when compared to other states, New York’s pension system is extremely well funded.
For the fiscal year ended February 28, 2014, the municipal bond market returned –0.21%1, as measured by the Barclays Municipal Bond Index. Record outflows from municipal bond funds, driven by concerns over rising interest rates and high-profile credit events, resulted in a challenging year for municipal bond investors. The $67 billion2 in municipal bond fund redemptions between March and December 2013 was in stark contrast to inflows of $65 billion2 and strong performance for the asset class over the prior two years.
Shortly after the fiscal year began, investors became apprehensive that the US Federal Reserve (the Fed) would reduce its asset purchase program, known as quantitative easing (QE), as the US economy improved. Concerned that Fed action would cause interest rates to rise and bond prices to fall, investors began trimming their allocations to fixed income investments, including municipal bonds. The rate of outflows increased dramatically in June following comments made by then-Fed Chairman Ben Bernanke on the timing for tapering QE.
Over the summer of 2013, several high-profile credit events had an adverse impact on the municipal bond market. These included downgrades to the credit ratings of Chicago debt on pension concerns, Detroit filing the largest municipal bankruptcy in US history3 and increased uncertainty about the financial condition of Puerto Rico.
The market received a two-month reprieve in September when the Fed decided not to reduce QE, although it reversed that decision in December when it announced that it would decrease its asset purchases by $10 billion per month, beginning in January 2014.4 A final
4 Invesco New York Tax Free Income Fund
headwind for the municipal bond market was significant tax-loss selling of municipal bonds in December to offset gains from strong equity returns during 2013.
In the first two months of 2014, the municipal bond market turned positive. Softer economic data reduced expectations for hawkish Fed action. Relatively high yields on municipal bonds, coupled with higher personal income tax rates and improving municipal fundamentals, drew investors back to the asset class. Net positive fund flows in January and February, combined with limited supply of new issuance, produced strong returns in the final two months of the fiscal year.
During the fiscal year, the largest driver of Fund performance relative to its style-specific index was its overweight position in longer-maturity bonds. This position had a negative impact on relative performance as investors sold longer-dated bonds on concerns over rising interest rates. Security selection in the intermediate-to-long end of the yield curve was positive and helped offset the impact of rising rates.
At the sector level, the primary detractors from Fund performance relative to its style-specific index were electric, transportation and special-tax bonds. A significant portion of the underperformance in those sectors was driven by bonds issued by Puerto Rico. State-specific funds purchase bonds issued by US territories, such as Puerto Rico, because interest income from those bonds is exempt from state taxes.
During the reporting period, leverage detracted from Fund performance. The Fund achieved a leveraged position through the use of inverse floating rate securities or Tender Option Bonds (TOBs). The Fund uses leverage because we believe that, over time, leveraging provides opportunities for additional income and total return for shareholders. However, use of leverage also can expose shareholders to additional volatility. For more information about the Fund’s use of leverage, see the Notes to Financial Statements later in this report.
We wish to remind you that the Fund is subject to interest rate risk, meaning when interest rates rise, the value of fixed income securities generally will fall. This risk may be greater in the current market environment because interest rates are at or near historic lows. We are monitoring interest rates and market and economic factors that may impact interest rates, including the potential impact of the Fed’s tapering of QE. If interest rates rise, markets may experience increased volatility,
which may affect the value and/or liquidity of certain of the Fund’s investments.
Recently published rules implementing section 619 of the Dodd-Frank Wall Street Reform and Consumer Protection Act may preclude banking entities from sponsoring and/or providing services for TOB trust programs. As a result, the Trust’s ability to utilize TOBs for leverage purposes may be adversely affected.
Thank you for investing in Invesco New York Tax Free Income Fund and for sharing our long-term investment horizon.
| 4 | Source: US Federal Reserve |
The views and opinions expressed in management’s discussion of Fund performance are those of Invesco Advisers, Inc. These views and opinions are subject to change at any time based on factors such as market and economic conditions. These views and opinions may not be relied upon as investment advice or recommendations, or as an offer for a particular security. The information is not a complete analysis of every aspect of any market, country, industry, security or the Fund. Statements of fact are from sources considered reliable, but Invesco Advisers, Inc. makes no representation or warranty as to their completeness or accuracy. Although historical performance is no guarantee of future results, these insights may help you understand our investment management philosophy.
See important Fund and, if applicable, index disclosures later in this report.
| | |
 | | Robert Wimmel Portfolio manager, is manager of Invesco New York Tax Free Income Fund and head of Investment Grade |
| Municipals for Invesco. He joined Invesco in 2010. Mr. Wimmel earned a BA in anthropology from the University of Cincinnati and an MA in economics from the University of Illinois at Chicago. |
| | |
 | | Thomas Byron Portfolio manager, is manager of Invesco New York Tax Free Income Fund. He joined Invesco in 2010. |
| Mr. Byron earned a BS in finance from Marquette University and an MBA in finance from DePaul University. |
| | |
 | | Robert Stryker Chartered Financial Analyst, portfolio manager, is manager of Invesco New York Tax Free Income Fund. He |
| joined Invesco in 2010. Mr. Stryker earned a BS in finance from the University of Illinois at Chicago. |
| | |
 | | Julius Williams Portfolio manager, is manager of Invesco New York Tax Free Income Fund. He joined Invesco in 2010. |
| Mr. Williams earned a BA in economics and sociology and a Master of Education degree in educational psychology from the University of Virginia. |
5 Invesco New York Tax Free Income Fund
Your Fund’s Long-Term Performance
Results of a $10,000 Investment – Oldest Share Class(es)
Fund and index data from 2/29/04
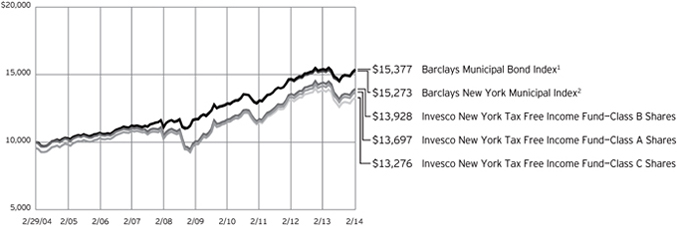
| 2 | Source(s): Barclays via FactSet Research Systems Inc. |
Past performance cannot guarantee comparable future results.
The data shown in the chart include reinvested distributions, applicable sales charges and Fund expenses including management fees. Results for Class B shares are calculated as if a hypothetical
shareholder had liquidated his entire investment in the Fund at the close of the reporting period and paid the contingent deferred sales charges, if applicable. Index results include reinvested dividends, but they do not reflect sales charges. Performance of the peer group,
if applicable, reflects fund expenses and management fees; performance of a market index does not. Performance shown in the chart and table(s) does not reflect deduction of taxes a shareholder would pay on Fund distributions or sale of Fund shares.
6 Invesco New York Tax Free Income Fund
| | | | | |
| Average Annual Total Returns |
| As of 2/28/14, including maximum applicable sales charges | |
| |
Class A Shares | | | | | |
| Inception (7/29/94) | | | | 5.03 | % |
| 10 Years | | | | 3.20 | |
| 5 Years | | | | 5.89 | |
| 1 Year | | | | -7.36 | |
| |
| Class B Shares | | | | | |
| Inception (7/29/94) | | | | 4.95 | % |
| 10 Years | | | | 3.37 | |
| 5 Years | | | | 6.40 | |
| 1 Year | | | | -7.94 | |
| |
| Class C Shares | | | | | |
| Inception (7/29/94) | | | | 4.49 | % |
| 10 Years | | | | 2.87 | |
| 5 Years | | | | 6.03 | |
| 1 Year | | | | -4.97 | |
| |
| Class Y Shares | | | | | |
| 10 Years | | | | 3.73 | % |
| 5 Years | | | | 6.99 | |
| 1 Year | | | | -3.08 | |
Effective June 1, 2010, Class A, Class B and Class C shares of the predecessor fund, Van Kampen New York Tax-Free Income Fund, advised by Van Kampen Asset Management were reorganized into Class A, Class B and Class C shares, respectively, of Invesco Van Kampen New York Tax Free Income Fund (renamed Invesco New York Tax Free Income Fund). Returns shown above for Class A, Class B and Class C shares are blended returns of the predecessor fund and Invesco New York Tax Free Income Fund. Share class returns will differ from the predecessor fund because of different expenses.
Class Y shares incepted on June 1, 2010. Performance shown prior to that date is that of the predecessor fund’s Class A shares and includes the 12b-1 fees applicable to Class A shares. Class A shares performance reflects any applicable fee waivers or expense reimbursements.
The performance data quoted represent past performance and cannot guarantee comparable future results; current performance may be lower or higher. Please visit invesco.com/performance for the most recent month-end performance. Performance figures reflect reinvested distributions, changes in net asset value and the effect of the maximum sales charge unless otherwise stated.
| | | | | |
| Average Annual Total Returns |
| As of 12/31/13, the most recent calendar quarter end, including maximum applicable sales charges | |
| |
| Class A Shares | | | | | |
| Inception (7/29/94) | | | | 4.90 | % |
| 10 Years | | | | 3.09 | |
| 5 Years | | | | 6.51 | |
| 1 Year | | | | -9.34 | |
| |
| Class B Shares | | | | | |
| Inception (7/29/94) | | | | 4.81 | % |
| 10 Years | | | | 3.22 | |
| 5 Years | | | | 7.07 | |
| 1 Year | | | | -9.90 | |
| |
| Class C Shares | | | | | |
| Inception (7/29/94) | | | | 4.36 | % |
| 10 Years | | | | 2.76 | |
| 5 Years | | | | 6.65 | |
| 1 Year | | | | -6.94 | |
| |
| Class Y Shares | | | | | |
| 10 Years | | | | 3.61 | % |
| 5 Years | | | | 7.61 | |
| 1 Year | | | | -5.13 | |
Investment return and principal value will fluctuate so that you may have a gain or loss when you sell shares.
The total annual Fund operating expense ratio set forth in the most recent Fund prospectus as of the date of this report for Class A, Class B, Class C and Class Y shares was 0.91%, 0.91%, 1.66% and 0.66%, respectively. The expense ratios presented above may vary from the expense ratios presented in other sections of this report that are based on expenses incurred during the period covered by this report.
Class A share performance reflects the maximum 4.25% sales charge, and Class B and Class C share performance reflects the applicable contingent deferred sales charge (CDSC) for the period involved. For shares purchased prior to June 1, 2010, the CDSC on Class B shares declines from 4% at the time of purchase to 0% at the beginning of the seventh year. For shares purchased on or after June 1, 2010, the CDSC on Class B shares declines from 5% at the time of purchase to 0% at the beginning of the seventh year. The CDSC on Class C shares is 1% for the first year after purchase. Class Y shares do not have a front-end sales charge or a CDSC; therefore, performance is at net asset value.
The performance of the Fund’s share classes will differ primarily due to different sales charge structures and class expenses.
Had the adviser not waived fees and/ or reimbursed expenses in the past, performance would have been lower.
7 Invesco New York Tax Free Income Fund
Invesco New York Tax Free Income Fund’s investment objective is to provide investors with a high level of current income exempt from federal, New York State and New York City income taxes, consistent with preservation of capital.
| n | | Unless otherwise stated, information presented in this report is as of February 28, 2014, and is based on total net assets. |
| n | | Unless otherwise noted, all data provided by Invesco. |
| n | | To access your Fund’s reports/prospectus, visit invesco.com/fundreports. |
About share classes
| n | | Class B shares may not be purchased for new or additional investments. Please see the prospectus for more information. |
| n | | Class Y shares are available to only certain investors. Please see the prospectus for more information. |
Principal risks of investing in the Fund
| n | | Alternative minimum tax risk. A portion of the Fund’s otherwise tax-exempt income may be taxable to those shareholders subject to the federal alternative minimum tax. |
| n | | Call risk. If interest rates fall, it is possible that issuers of debt securities with high interest rates will prepay or call their securities before their maturity dates. In this event, the proceeds from the called securities would likely be reinvested by the Fund in securities bearing the new, lower interest rates, resulting in a possible decline in the Fund’s income and distributions to shareholders. |
| n | | Credit risk. The issuer of instruments in which the Fund invests may be unable to meet interest and/or principal payments, thereby causing its instruments to decrease in value and lowering the issuer’s credit rating. |
| n | | Derivatives risk. The value of a derivative instrument depends largely on (and is derived from) the value of an underlying security, currency, commodity, interest rate, index or other asset (each referred to as an underlying asset). In addition to risks relating to the underlying assets, the use of derivatives may include other, possibly greater, risks, including counterparty, leverage and liquidity risks. Counterparty risk is the risk that the counterparty to the derivative contract will default on its obligation to pay the Fund the amount owed or otherwise perform under the derivative contract. Derivatives create leverage risk because they do not require |
| | | payment up front equal to the economic exposure created by owning the derivative. As a result, an adverse change in the value of the underlying asset could result in the Fund sustaining a loss that is substantially greater than the amount invested in the derivative, which may make the Fund’s returns more volatile and increase the risk of loss. Derivative instruments may also be less liquid than more traditional investments and the Fund may be unable to sell or close out its derivative positions at a desirable time or price. This risk may be more acute under adverse market conditions, during which the Fund may be most in need of liquidating its derivative positions. Derivatives may also be harder to value, less tax efficient and subject to changing government regulation that could impact the Fund’s ability to use certain derivatives or their cost. Also, derivatives used for hedging or to gain or limit exposure to a particular market segment may not provide the expected benefits, particularly during adverse market conditions. |
| | n | | High yield bond (junk bond) risk. Junk bonds involve a greater risk of default or price changes due to changes in the credit quality of the issuer. The values of junk bonds fluctuate more than those of high-quality bonds in response to company, political, regulatory or economic developments. Values of junk bonds can decline significantly over short periods of time. |
| | n | | Income risk. The income you receive from the Fund is based primarily on prevailing interest rates, which can vary widely over the short- and long-term. If interest rates drop, your income from the Fund may drop as well. |
| | n | | Interest rate risk. Interest rate risk refers to the risk that bond prices generally fall as interest rates rise; conversely, bond prices generally rise as interest rates fall. Specific bonds differ in their sensitivity to changes in interest rates depending on their individual |
This report must be accompanied or preceded by a currently effective Fund prospectus, which contains more complete information, including sales charges and expenses. Investors should read it carefully before investing.
NOT FDIC INSURED | MAY LOSE VALUE | NO BANK GUARANTEE
| | characteristics, including duration. |
| n | | Inverse floating rate obligations risk. Inverse floating rate obligations, including tender option bonds, may be subject to greater price volatility than a fixed income security with similar qualities. When short-term interest rates rise, they may decrease in value and produce less or no income. Additionally, these securities may lose principal. Similar to derivatives, inverse floating rate obligations have the following risks: counterparty, leverage, correlation, liquidity, market, interest rate, and management risks. |
| n | | Leverage risk. Leverage exists when the Fund purchases or sells an instrument or enters into a transaction without investing cash in an amount equal to the full economic exposure of the asset or transaction and the Fund could lose more than it invested. Leverage created from certain types of transactions or instruments may impair the Fund’s liquidity, cause it to liquidate positions at an unfavorable time, increase volatility or otherwise not achieve its intended objective. |
| n | | Liquidity risk. The Fund may hold illiquid securities that it is unable to sell at the preferred time or price and could lose its entire investment in such securities. |
| n | | Management risk. The investment techniques and risk analysis used by the Fund’s portfolio managers may not produce the desired results. |
| n | | Market risk. The prices of and the income generated by the Fund’s securities may decline in response to, among other things, investor sentiment, general economic and market conditions, regional or global instability, and currency and interest rate fluctuations. |
| n | | Medium- and lower-grade municipal securities risk. Securities which are in the medium- and lower-grade categories generally offer higher yields than are offered by higher-grade securities of similar maturity, but they also generally involve more volatility and greater risks, such as greater credit risk, market risk, liquidity risk, management risk, and regulatory risk. Furthermore, many medium- and lower-grade securities are not listed for trading on any national securities exchange and many issuers of |
8 Invesco New York Tax Free Income Fund
| | | medium- and lower-grade securities choose not to have a rating assigned to their obligations by any nationally recognized statistical rating organization. As a result, the Fund’s portfolio may consist of a higher portion of unlisted or unrated securities as compared with an investment company that invests solely in higher-grade securities. Unrated securities are usually not as attractive to as many buyers as are rated securities, a factor which may make unrated securities less marketable. These factors may have the effect of limiting the availability of the securities for purchase by the Fund and may also limit the ability of the Fund to sell such securities at their fair value either to meet redemption requests or in response to changes in the economy or the financial markets. |
| n | | Municipal issuer focus risk. The Fund generally considers investments in municipal securities not to be subject to industry concentration policies (issuers of municipal securities as a group is not an industry) and the Fund may invest in municipal securities issued by entities having similar characteristics. The issuers may be located in the same geographic area or may pay their interest obligations from revenue of similar projects, such as hospitals, airports, utility systems and housing finance agencies. This may make the Fund’s investments more susceptible to similar social, economic, political or regulatory occurrences. As the similarity in issuers increases, the potential for fluctuation in the Fund’s net asset value also increases. |
| n | | Municipal securities risk. The Fund may invest in municipal securities. Constitutional amendments, legislative enactments, executive orders, administrative regulations, voter initiatives, and the issuer’s regional economic conditions may affect the municipal security’s value, interest payments, repayment of principal and the Fund’s ability to sell it. Failure of a municipal security issuer to comply with applicable tax requirements may make income paid thereon taxable, resulting in a decline in the security’s value. In addition, there could be changes in applicable tax laws or tax treatments that reduce or eliminate the current federal income |
| | | tax exemption on municipal securities or otherwise adversely affect the current federal or state tax status of municipal securities. |
| n | | New York municipal securities risk. The Fund invests primarily in a portfolio of New York municipal securities. Because the Fund invests substantially all of its assets in a portfolio of New York municipal securities, the Fund is more susceptible to political, economic, regulatory or other factors affecting issuers of New York municipal securities than a fund which does not limit its investments to such issuers. These risks include possible legislative, state constitutional or regulatory amendments that may affect the ability of state and local governments or regional governmental authorities to raise money to pay principal and interest on their municipal securities. Economic, fiscal and budgetary conditions throughout the state may also influence the Fund’s performance. More detailed information concerning New York municipal securities and the State of New York is set forth in the Statement of Additional Information. |
| n | | Reinvestment risk. Reinvestment risk is the risk that a bond’s cash flows (coupon income and principal repayment) will be reinvested at an interest rate below that on the original bond. |
| n | | Variable-rate demand notes risk. The absence of an active secondary market for certain variable and floating rate notes could make it difficult to dispose of the instruments, and a portfolio could suffer a loss if the issuer defaults during periods in which a portfolio is not entitled to exercise its demand rights. |
| n | | When-issued and delayed delivery risk. When-issued and delayed delivery transactions are subject to market risk as the value or yield of a security at delivery may be more or less than the purchase price or the yield generally available on securities when delivery occurs. In addition, the Fund is subject to counterparty risk because it relies on the buyer or seller, as the case may be, to consummate the transaction, and failure by the other party to complete the transaction may result in the Fund missing the opportunity of obtaining a price or yield considered to be advantageous. |
| n | | Zero coupon or pay-in-kind securities risk. The value, interest rates, and liquidity of non-cash paying instruments, such as zero coupon and pay-in-kind securities, are subject to greater fluctuation than other types of securities. |
About indexes used in this report
| n | | The Barclays Municipal Bond Index is an unmanaged index considered representative of the tax-exempt bond market. |
| n | | The Barclays New York Municipal Index is an unmanaged index considered representative of New York investment-grade municipal bonds. |
| n | | The Fund is not managed to track the performance of any particular index, including the index(es) described here, and consequently, the performance of the Fund may deviate significantly from the performance of the index(es). |
| n | | A direct investment cannot be made in an index. Unless otherwise indicated, index results include reinvested dividends, and they do not reflect sales charges. Performance of the peer group, if applicable, reflects fund expenses; performance of a market index does not. |
Other information
| n | | The returns shown in management’s discussion of Fund performance are based on net asset values (NAVs) calculated for shareholder transactions. Generally accepted accounting principles require adjustments to be made to the net assets of the Fund at period end for financial reporting purposes, and as such, the NAVs for shareholder transactions and the returns based on those NAVs may differ from the NAVs and returns reported in the Financial Highlights. |
9 Invesco New York Tax Free Income Fund
Schedule of Investments
February 28, 2014
| | | | | | | | | | | | | | | | |
| | | Interest
Rate | | | Maturity
Date | | | Principal
Amount
(000) | | |
Value | |
Municipal Obligations–107.31% | | | | | | | | | | | | | | | | |
| New York–101.25% | | | | | | | | | | | | | | | | |
Albany (City of) Industrial Development Agency (Albany College of Pharmacy); Series 2004 A, Civic Facility RB | | | 5.63 | % | | | 12/01/34 | | | $ | 1,290 | | | $ | 1,298,204 | |
Albany (City of) Industrial Development Agency (Albany Law School University); Series 2007 A, Civic Facility RB | | | 5.00 | % | | | 07/01/31 | | | | 1,000 | | | | 1,010,660 | |
Albany (City of) Industrial Development Agency (St. Peter’s Hospital); Series 2008 D, Civic Facility RB | | | 5.75 | % | | | 11/15/27 | | | | 400 | | | | 431,972 | |
Albany (County of) Airport Authority; Series 2010 A, Ref. RB (INS–AGM)(a) | | | 5.00 | % | | | 12/15/25 | | | | 500 | | | | 544,065 | |
Albany Capital Resource Corp. (St. Peter’s Hospital); Series 2011, RB | | | 6.25 | % | | | 11/15/38 | | | | 1,000 | | | | 1,107,680 | |
Battery Park City Authority; Series 2009 B, Sr. RB | | | 5.00 | % | | | 11/01/34 | | | | 500 | | | | 562,160 | |
Brooklyn Arena Local Development Corp. (Barclays Center); | | | | | | | | | | | | | | | | |
Series 2009, PILOT CAB RB(b) | | | 0.00 | % | | | 07/15/34 | | | | 3,685 | | | | 1,140,065 | |
Series 2009, PILOT RB | | | 6.25 | % | | | 07/15/40 | | | | 475 | | | | 509,870 | |
Series 2009, PILOT RB | | | 6.38 | % | | | 07/15/43 | | | | 475 | | | | 511,646 | |
Build NYC Resource Corp. (Bronx Charter School for Excellence); Series 2013 A, RB | | | 5.00 | % | | | 04/01/33 | | | | 500 | | | | 484,435 | |
Build NYC Resource Corp. (YMCA of Greater New York); | | | | | | | | | | | | | | | | |
Series 2012, RB | | | 5.00 | % | | | 08/01/32 | | | | 350 | | | | 368,035 | |
Series 2012, RB | | | 5.00 | % | | | 08/01/42 | | | | 1,750 | | | | 1,808,870 | |
Dutchess (County of) Industrial Development Agency (Elant at Fishkill, Inc.); Series 2007 A, Civic Facility RB | | | 5.25 | % | | | 01/01/37 | | | | 365 | | | | 311,250 | |
East Rochester (Village of) Housing Authority (Woodland Village, Inc.); Series 2006, Ref. Senior Living RB | | | 5.50 | % | | | 08/01/33 | | | | 1,000 | | | | 923,650 | |
Erie (County of) Industrial Development Agency (City of Buffalo School District); Series 2011 A, School Facility RB(c) | | | 5.25 | % | | | 05/01/30 | | | | 2,850 | | | | 3,143,921 | |
Essex (County of) Industrial Development Agency (International Paper); Series 2005 A, Ref. Solid Waste Disposal RB(d) | | | 5.20 | % | | | 12/01/23 | | | | 1,100 | | | | 1,120,064 | |
Hempstead Town Local Development Corp. (Molloy College); Series 2009, RB | | | 5.75 | % | | | 07/01/39 | | | | 1,340 | | | | 1,408,595 | |
Hudson Yards Infrastructure Corp.; Series 2011 A, RB | | | 5.75 | % | | | 02/15/47 | | | | 1,400 | | | | 1,529,766 | |
Islip (Town of) Resource Recovery Agency (1985 Facility); Series 2004 E, RB (INS–AGM)(a)(d) | | | 5.75 | % | | | 07/01/22 | | | | 1,290 | | | | 1,323,540 | |
Livingston (County of) Industrial Development Agency (Nicholas H. Noyes Memorial Hospital); Series 2005, Civic Facility RB | | | 6.00 | % | | | 07/01/30 | | | | 1,000 | | | | 1,000,030 | |
Long Island Power Authority; | | | | | | | | | | | | | | | | |
Series 2000 A, Electric System General CAB RB (INS–AGM)(a)(b) | | | 0.00 | % | | | 06/01/18 | | | | 2,000 | | | | 1,867,320 | |
Series 2008 A, Electric System General RB (INS–BHAC)(a) | | | 5.50 | % | | | 05/01/33 | | | | 355 | | | | 397,572 | |
Madison (County of) Industrial Development Agency (Colgate University); Series 2005 A, RB
(INS–AMBAC)(a) | | | 5.00 | % | | | 07/01/35 | | | | 750 | | | | 765,030 | |
Metropolitan Transportation Authority; | | | | | | | | | | | | | | | | |
Series 2009 B, Dedicated Tax Fund RB | | | 5.25 | % | | | 11/15/27 | | | | 615 | | | | 711,967 | |
Series 2009 B, Dedicated Tax Fund RB | | | 5.00 | % | | | 11/15/34 | | | | 1,500 | | | | 1,597,530 | |
Series 2012 H, RB | | | 5.00 | % | | | 11/15/30 | | | | 750 | | | | 811,853 | |
Series 2013 E, RB | | | 5.00 | % | | | 11/15/30 | | | | 1,000 | | | | 1,090,290 | |
Monroe County Industrial Development Corp. (Nazareth College of Rochester); Series 2011, RB | | | 5.50 | % | | | 10/01/41 | | | | 370 | | | | 388,818 | |
Monroe County Industrial Development Corp. (University of Rochester); Series 2011 A, RB | | | 5.00 | % | | | 07/01/36 | | | | 875 | | | | 929,863 | |
Nassau (County of) Industrial Development Agency (Amsterdam at Harborside); Series 2007 A, Continuing Care Retirement Community RB | | | 6.70 | % | | | 01/01/43 | | | | 240 | | | | 130,848 | |
Nassau County Local Economic Assistance Corp. (South Nassau Communities); Series 2012, Ref. RB | | | 5.00 | % | | | 07/01/27 | | | | 930 | | | | 982,526 | |
Nassau County Local Economic Assistance Corp. (Winthrop University Hospital Association); Series 2012, Ref. RB | | | 5.00 | % | | | 07/01/37 | | | | 1,250 | | | | 1,267,800 | |
Nassau County Tobacco Settlement Corp.; Series 2006 A-2, Sr. Asset-Backed RB | | | 5.25 | % | | | 06/01/26 | | | | 1,000 | | | | 883,400 | |
New York & New Jersey (States of) Port Authority (JFK International Air Terminal LLC); | | | | | | | | | | | | | | | | |
Series 1997, Special Obligation RB (INS–NATL)(a)(d) | | | 5.75 | % | | | 12/01/22 | | | | 2,000 | | | | 2,012,500 | |
Series 2010, Special Obligation RB | | | 6.00 | % | | | 12/01/42 | | | | 860 | | | | 938,570 | |
New York (City of) Industrial Development Agency (IAC/InterActive Corp.); Series 2005, Liberty RB | | | 5.00 | % | | | 09/01/35 | | | | 1,515 | | | | 1,515,500 | |
See accompanying Notes to Financial Statements which are an integral part of the financial statements.
10 Invesco New York Tax Free Income Fund
| | | | | | | | | | | | | | | | |
| | | Interest
Rate | | | Maturity
Date | | | Principal
Amount
(000) | | |
Value | |
| New York–(continued) | | | | | | | | | | | | | | | | |
New York (City of) Industrial Development Agency (Polytechnic University); Series 2007, Ref. Civic Facility RB (INS–ACA)(a) | | | 5.25 | % | | | 11/01/37 | | | $ | 1,300 | | | $ | 1,356,979 | |
New York (City of) Industrial Development Agency (Queens Baseball Stadium); Series 2006, PILOT RB (INS–AMBAC)(a) | | | 5.00 | % | | | 01/01/36 | | | | 1,140 | | | | 1,065,900 | |
New York (City of) Industrial Development Agency (Terminal One Group Association, L.P.); | | | | | | | | | | | | | | | | |
Series 2005, Special Facility RB(d)(e) | | | 5.50 | % | | | 01/01/16 | | | | 2,000 | | | | 2,144,540 | |
Series 2005, Special Facility RB(d)(e) | | | 5.50 | % | | | 01/01/16 | | | | 2,000 | | | | 2,141,520 | |
New York (City of) Municipal Water Finance Authority; | | | | | | | | | | | | | | | | |
Series 2005 D, Water & Sewer System RB(c) | | | 5.00 | % | | | 06/15/37 | | | | 4,000 | | | | 4,175,640 | |
Series 2009 FF-2, Water & Sewer System RB | | | 5.50 | % | | | 06/15/40 | | | | 2,000 | | | | 2,170,120 | |
New York (City of) Transitional Finance Authority; | | | | | | | | | | | | | | | | |
Series 2009 S-1, Building Aid RB | | | 5.50 | % | | | 07/15/38 | | | | 500 | | | | 560,125 | |
Series 2009 S-2, Building Aid RB | | | 6.00 | % | | | 07/15/33 | | | | 850 | | | | 965,558 | |
Series 2009 S-3, Building Aid RB(c) | | | 5.25 | % | | | 01/15/27 | | | | 1,310 | | | | 1,493,937 | |
Series 2009 S-3, Building Aid RB(c) | | | 5.25 | % | | | 01/15/39 | | | | 1,000 | | | | 1,089,040 | |
Series 2009 S-5, Building Aid RB | | | 5.00 | % | | | 01/15/31 | | | | 595 | | | | 643,439 | |
Subseries 2009 A-1, Future Tax Sec. RB(c) | | | 5.00 | % | | | 05/01/28 | | | | 755 | | | | 862,293 | |
Subseries 2009 A-1, Future Tax Sec. RB(c) | | | 5.00 | % | | | 05/01/29 | | | | 605 | | | | 690,977 | |
Subseries 2009 A-1, Future Tax Sec. RB(c) | | | 5.00 | % | | | 05/01/30 | | | | 605 | | | | 669,566 | |
Subseries 2011 E, Future Tax Sec. RB | | | 5.00 | % | | | 11/01/24 | | | | 660 | | | | 757,297 | |
New York (City of) Trust for Cultural Resources (American Museum of Natural History); Series 2004 A, Ref. RB (INS–NATL)(a)(c) | | | 5.00 | % | | | 07/01/44 | | | | 960 | | | | 971,990 | |
New York (City of) Trust for Cultural Resources (Carnegie Hall); Series 2009 A, RB | | | 5.00 | % | | | 12/01/39 | | | | 850 | | | | 884,187 | |
New York (City of) Trust for Cultural Resources (Lincoln Center); Series 2008 A-1, Ref. VRD RB
(LOC–JPMorgan Chase Bank, N.A.)(f)(g) | | | 0.04 | % | | | 12/01/35 | | | | 500 | | | | 500,000 | |
New York (City of) Trust for Cultural Resources (The Museum of Modern Art); Series 2008 1A, Ref. RB | | | 5.00 | % | | | 04/01/31 | | | | 800 | | | | 882,216 | |
New York (City of) Trust for Cultural Resources (Wildlife Conservation Society); Series 2013 A, RB | | | 5.00 | % | | | 08/01/33 | | | | 1,000 | | | | 1,085,620 | |
New York (City of); | | | | | | | | | | | | | | | | |
Subseries 2004 H-1, VRD Unlimited Tax GO Bonds (LOC–Bank of New York Mellon)(f)(g) | | | 0.03 | % | | | 03/01/14 | | | | 1,925 | | | | 1,925,000 | |
Subseries 2008 F-1, Unlimited Tax GO Bonds | | | 5.50 | % | | | 11/15/28 | | | | 1,750 | | | | 2,019,797 | |
Subseries 2008 G-1, Unlimited Tax GO Bonds | | | 6.25 | % | | | 12/15/35 | | | | 400 | | | | 459,768 | |
Subseries 2008 I-1, Unlimited Tax GO Bonds | | | 5.00 | % | | | 02/01/25 | | | | 405 | | | | 455,090 | |
New York (State of) Dormitory Authority (Brooklyn Law School); | | | | | | | | | | | | | | | | |
Series 2009, RB | | | 5.75 | % | | | 07/01/33 | | | | 660 | | | | 697,937 | |
Series 2012 A, RB | | | 5.00 | % | | | 07/01/26 | | | | 1,000 | | | | 1,085,440 | |
New York (State of) Dormitory Authority (Catholic Health Services of Long Island–St. Francis Hospital); Series 2004, RB | | | 5.00 | % | | | 07/01/27 | | | | 1,000 | | | | 1,006,360 | |
New York (State of) Dormitory Authority (City of New York); | | | | | | | | | | | | | | | | |
Series 2005 A, Court Facilities Lease RB (INS–AMBAC)(a) | | | 5.50 | % | | | 05/15/27 | | | | 710 | | | | 870,183 | |
Series 2005 A, Court Facilities Lease RB (INS–AMBAC)(a) | | | 5.50 | % | | | 05/15/30 | | | | 750 | | | | 908,843 | |
Series 2005 A, Court Facilities Lease RB (INS–AMBAC)(a) | | | 5.50 | % | | | 05/15/31 | | | | 555 | | | | 672,194 | |
New York (State of) Dormitory Authority (Columbia University); Series 2011 A, RB | | | 5.00 | % | | | 10/01/41 | | | | 510 | | | | 554,487 | |
New York (State of) Dormitory Authority (Cornell University); Series 2006 A, RB(c) | | | 5.00 | % | | | 07/01/35 | | | | 4,725 | | | | 5,065,011 | |
New York (State of) Dormitory Authority (Education); Series 2008 B, State Personal Income Tax RB | | | 5.75 | % | | | 03/15/36 | | | | 1,000 | | | | 1,141,620 | |
New York (State of) Dormitory Authority (Fashion Institute of Technology Student Housing Corp.); Series 2007, RB (INS–NATL)(a) | | | 5.25 | % | | | 07/01/28 | | | | 935 | | | | 1,042,590 | |
New York (State of) Dormitory Authority (Fordham University); | | | | | | | | | | | | | | | | |
Series 2008 B, RB (INS–AGC)(a) | | | 5.00 | % | | | 07/01/33 | | | | 500 | | | | 548,240 | |
Series 2011 A, RB | | | 5.13 | % | | | 07/01/29 | | | | 500 | | | | 553,375 | |
New York (State of) Dormitory Authority (Manhattan College); Series 2007 A, RB (INS–Radian)(a) | | | 5.00 | % | | | 07/01/41 | | | | 1,150 | | | | 1,150,978 | |
New York (State of) Dormitory Authority (Marymount Manhattan College); Series 2009, RB | | | 5.25 | % | | | 07/01/29 | | | | 1,000 | | | | 1,030,650 | |
New York (State of) Dormitory Authority (Memorial Sloan-Kettering Cancer Center); Series 1998, RB
(INS–NATL)(a) | | | 5.50 | % | | | 07/01/23 | | | | 1,250 | | | | 1,526,300 | |
See accompanying Notes to Financial Statements which are an integral part of the financial statements.
11 Invesco New York Tax Free Income Fund
| | | | | | | | | | | | | | | | |
| | | Interest
Rate | | | Maturity
Date | | | Principal
Amount
(000) | | |
Value | |
| New York–(continued) | | | | | | | | | | | | | | | | |
New York (State of) Dormitory Authority (Montefiore Medical Center); Series 2004, Hospital RB
(INS–NATL)(a) | | | 5.00 | % | | | 08/01/29 | | | $ | 1,000 | | | $ | 1,033,710 | |
New York (State of) Dormitory Authority (Mount Sinai Hospital Obligated Group); Series 2011 A, RB | | | 5.00 | % | | | 07/01/31 | | | | 875 | | | | 919,914 | |
New York (State of) Dormitory Authority (Mount Sinai School of Medicine of New York University); Series 2009, RB | | | 5.13 | % | | | 07/01/39 | | | | 1,250 | | | | 1,298,375 | |
New York (State of) Dormitory Authority (New York University Hospitals Center); Series 2011 A, RB | | | 6.00 | % | | | 07/01/40 | | | | 1,500 | | | | 1,641,000 | |
New York (State of) Dormitory Authority (New York University); Series 2001 1, RB (INS–BHAC)(a) | | | 5.50 | % | | | 07/01/31 | | | | 1,070 | | | | 1,262,632 | |
New York (State of) Dormitory Authority (North Shore-Long Island Jewish Obligated Group); | | | | | |
Series 2009 A, RB | | | 5.50 | % | | | 05/01/37 | | | | 1,250 | | | | 1,327,187 | |
Subseries 2005 A, RB | | | 5.00 | % | | | 11/01/26 | | | | 750 | | | | 781,080 | |
New York (State of) Dormitory Authority (Pace University); Series 2013 A, RB | | | 5.00 | % | | | 05/01/27 | | | | 1,000 | | | | 981,960 | |
New York (State of) Dormitory Authority (Rochester Institute of Technology); Series 2010, RB | | | 5.00 | % | | | 07/01/40 | | | | 1,250 | | | | 1,343,612 | |
New York (State of) Dormitory Authority (Rockefeller University); Series 2010 A, RB | | | 5.00 | % | | | 07/01/41 | | | | 775 | | | | 864,210 | |
New York (State of) Dormitory Authority (School Districts Financing Program); | | | | | |
Series 2008 C, RB | | | 7.50 | % | | | 04/01/39 | | | | 2,000 | | | | 2,415,740 | |
Series 2008 D, RB (INS–AGC)(a) | | | 5.75 | % | | | 10/01/24 | | | | 500 | | | | 587,350 | |
Series 2009 C, RB (INS–AGC)(a) | | | 5.00 | % | | | 10/01/24 | | | | 1,500 | | | | 1,698,705 | |
New York (State of) Dormitory Authority (St. John’s University); Series 2012 B, RB | | | 5.00 | % | | | 07/01/30 | | | | 1,220 | | | | 1,322,395 | |
New York (State of) Dormitory Authority (St. Joseph’s College); Series 2010, RB | | | 5.25 | % | | | 07/01/35 | | | | 500 | | | | 515,865 | |
New York (State of) Dormitory Authority (State University Educational Facilities); Series 1993 A, RB | | | 5.25 | % | | | 05/15/15 | | | | 2,000 | | | | 2,054,700 | |
New York (State of) Dormitory Authority (State University of New York); Series 2013 A, RB | | | 5.00 | % | | | 07/01/29 | | | | 1,185 | | | | 1,320,043 | |
New York (State of) Dormitory Authority (Suffolk County); Series 1986, Judicial Facilities Lease RB(h) | | | 7.38 | % | | | 07/01/16 | | | | 930 | | | | 1,013,523 | |
New York (State of) Dormitory Authority (The New School); | | | | | |
Series 2010, RB | | | 5.50 | % | | | 07/01/40 | | | | 1,245 | | | | 1,335,287 | |
Series 2011, Ref. RB | | | 5.00 | % | | | 07/01/31 | | | | 750 | | | | 804,420 | |
New York (State of) Dormitory Authority; | | | | | |
Series 1996 B, City University System Consolidated RB | | | 6.00 | % | | | 07/01/14 | | | | 155 | | | | 157,426 | |
Series 2001, RB (INS–AMBAC)(a) | | | 5.50 | % | | | 07/01/15 | | | | 60 | | | | 60,284 | |
Series 2007 A, Mental Health Services Facilities Improvement RB (INS–AGM)(a) | | | 5.00 | % | | | 02/15/27 | | | | 1,000 | | | | 1,093,190 | |
Series 2008 C, Mental Health Services Facilities Improvement RB (INS–AGM)(a)(d) | | | 5.25 | % | | | 02/15/28 | | | | 2,000 | | | | 2,175,940 | |
New York (State of) Energy Research & Development Authority (Brooklyn Union Gas Co.);
Series 1991 B, Gas Facilities Residual Interest RB(d)(i) | | | 13.57 | % | | | 07/01/26 | | | | 1,200 | | | | 1,211,880 | |
New York (State of) Long Island Power Authority; Series 2012 D, VRD Electric System General RB (LOC–TD Bank, N.A.)(f)(g) | | | 0.02 | % | | | 12/01/29 | | | | 700 | | | | 700,000 | |
New York (State of) Power Authority; Series 2011 A, RB | | | 5.00 | % | | | 11/15/38 | | | | 730 | | | | 790,846 | |
New York (State of) Thruway Authority; | | | | | |
Series 2008 B, Second General Highway & Bridge Trust Fund RB | | | 5.00 | % | | | 04/01/25 | | | | 500 | | | | 567,850 | |
Series 2009 B, Second General Highway & Bridge Trust Fund RB | | | 5.00 | % | | | 04/01/29 | | | | 500 | | | | 543,065 | |
Series 2014 J, RB | | | 5.00 | % | | | 01/01/34 | | | | 1,620 | | | | 1,739,054 | |
New York City Housing Development Corp.; Series 2005 K, MFH RB(d) | | | 5.00 | % | | | 11/01/37 | | | | 1,000 | | | | 1,006,550 | |
New York Liberty Development Corp. (4 World Trade Center); Series 2011, Ref. Liberty RB | | | 5.00 | % | | | 11/15/31 | | | | 875 | | | | 939,444 | |
New York Liberty Development Corp. (7 World Trade Center); Series 2012, Class 2, Ref. Liberty RB | | | 5.00 | % | | | 09/15/43 | | | | 1,410 | | | | 1,450,890 | |
New York Liberty Development Corp. (Bank of America Tower at One Bryant Park); Series 2010, Ref. Second Priority Liberty RB | | | 6.38 | % | | | 07/15/49 | | | | 1,215 | | | | 1,306,805 | |
New York Liberty Development Corp. (Goldman Sachs Headquarters); Series 2007, RB | | | 5.50 | % | | | 10/01/37 | | | | 855 | | | | 967,031 | |
New York Liberty Development Corp. (National Sports Museum); Series 2006 A, RB
(Acquired 08/07/06; Cost $636,422)(j)(k) | | | 6.13 | % | | | 02/15/19 | | | | 750 | | | | 8 | |
New York State Environmental Facilities Corp. (Municipal Water Finance Authority); Series 2011 B, State Clean Water & Drinking Water Revolving Funds RB | | | 5.00 | % | | | 06/15/31 | | | | 1,430 | | | | 1,583,997 | |
New York State Environmental Facilities Corp. (Pooled Financing Program) ; Series 2005 B, State Clean Water & Drinking Water Revolving Funds RB | | | 5.50 | % | | | 04/15/35 | | | | 310 | | | | 378,150 | |
New York State Urban Development Corp.; Series 2008 B, Ref. Service Contract RB | | | 5.25 | % | | | 01/01/24 | | | | 750 | | | | 856,200 | |
North Syracuse Central School District; Series 2007, Ref. Unlimited Tax GO Bonds (INS–NATL)(a) | | | 5.00 | % | | | 06/15/23 | | | | 935 | | | | 1,097,353 | |
See accompanying Notes to Financial Statements which are an integral part of the financial statements.
12 Invesco New York Tax Free Income Fund
| | | | | | | | | | | | | | | | |
| | | Interest
Rate | | | Maturity
Date | | | Principal
Amount
(000) | | |
Value | |
| New York–(continued) | | | | | | | | | | | | | | | | |
Oneida (County of) Industrial Development Agency (St. Elizabeth Medical Center Facility);
Series 1999 A, Civic Facility RB | | | 5.88 | % | | | 12/01/29 | | | $ | 995 | | | $ | 995,597 | |
Onondaga Civic Development Corp. (Le Moyne College); Series 2010, RB | | | 5.38 | % | | | 07/01/40 | | | | 1,065 | | | | 1,102,477 | |
Rensselaer (County of) Industrial Development Agency (Franciscan Heights, L.P.); Series 2004 A, IDR (LOC–JPMorgan Chase Bank, N.A.)(d)(g) | | | 5.38 | % | | | 12/01/36 | | | | 1,000 | | | | 1,006,640 | |
Rockland (County of) Solid Waste Management Authority; Series 2003 B, RB (INS–AMBAC)(a)(d) | | | 5.00 | % | | | 12/15/23 | | | | 1,000 | | | | 1,003,500 | |
Suffolk (County of) Industrial Development Agency (Eastern Long Island Hospital Association); Series 2007, Civic Facility RB(j) | | | 5.38 | % | | | 01/01/27 | | | | 1,175 | | | | 1,113,818 | |
Suffolk (County of) Industrial Development Agency (Family Service League of Suffolk County, Inc.); Series 2004, Civic Facility RB(e)(h) | | | 5.00 | % | �� | | 11/01/14 | | | | 825 | | | | 851,516 | |
Suffolk (County of) Industrial Development Agency (Jefferson’s Ferry); Series 2006, Ref. First Mortgage Continuing Care Retirement Community RB | | | 5.00 | % | | | 11/01/28 | | | | 1,000 | | | | 1,026,860 | |
Suffolk County Economic Development Corp. (Peconic Landing at Southold, Inc.); Series 2010, Ref. RB | | | 6.00 | % | | | 12/01/40 | | | | 465 | | | | 495,462 | |
Syracuse (City of) Industrial Development Agency (Jewish Home of Central New York, Inc.); Series 2001 A, First Mortgage RB | | | 7.38 | % | | | 03/01/21 | | | | 190 | | | | 180,318 | |
Syracuse (City of); Series 2011 A, Airport Terminal Security & Access Improvement Unlimited Tax GO Bonds(d) | | | 5.00 | % | | | 11/01/36 | | | | 1,000 | | | | 1,029,790 | |
Tomkins County Development Corp. (Tompkins Cortland Community College Foundation, Inc.); Series 2013 A, RB | | | 5.00 | % | | | 07/01/32 | | | | 1,250 | | | | 1,240,287 | |
Tompkins (County of) Industrial Development Agency (Cornell University); Series 2008 A, Civic
Facility RB | | | 5.00 | % | | | 07/01/37 | | | | 250 | | | | 271,520 | |
Triborough Bridge & Tunnel Authority; Series 2008 A, General Purpose RB | | | 4.75 | % | | | 11/15/29 | | | | 200 | | | | 218,556 | |
Troy Capital Resource Corp. (Rensselaer Polytechnic Institute); Series 2010 A, RB | | | 5.00 | % | | | 09/01/30 | | | | 1,250 | | | | 1,322,100 | |
TSASC, Inc.; Series 2006 1, Tobacco Settlement Asset-Backed RB | | | 5.13 | % | | | 06/01/42 | | | | 900 | | | | 709,839 | |
Ulster (County of) Resource Recovery Agency; Series 2002, Ref. RB (INS–AMBAC)(a) | | | 5.25 | % | | | 03/01/18 | | | | 200 | | | | 200,794 | |
United Nations Development Corp.; | | | | | |
Series 2009 A, Ref. RB | | | 5.00 | % | | | 07/01/25 | | | | 1,000 | | | | 1,082,090 | |
Series 2009 A, Ref. RB | | | 5.00 | % | | | 07/01/26 | | | | 810 | | | | 870,944 | |
Westchester (County of) Industrial Development Agency (Guiding Eyes For The Blind, Inc.); Series 2004, Civic Facility RB | | | 5.38 | % | | | 08/01/24 | | | | 940 | | | | 964,308 | |
Westchester Tobacco Asset Securitization Corp.; Series 2005, Tobacco Settlement Asset-Backed RB | | | 5.13 | % | | | 06/01/45 | | | | 570 | | | | 448,721 | |
Yonkers Economic Development Corp. (Charter School of Educational Excellence); Series 2010 A, Educational RB | | | 6.25 | % | | | 10/15/40 | | | | 1,000 | | | | 1,015,060 | |
| | | | | 144,952,540 | |
| | | | |
| Guam–2.69% | | | | | | | | | | | | | | | | |
Guam (Territory of) (Section 30); | | | | | |
Series 2009 A, Limited Obligation RB | | | 5.63 | % | | | 12/01/29 | | | | 135 | | | | 143,286 | |
Series 2009 A, Limited Obligation RB | | | 5.75 | % | | | 12/01/34 | | | | 1,250 | | | | 1,324,813 | |
Guam (Territory of) Power Authority; | | | | | |
Series 2010 A, RB | | | 5.50 | % | | | 10/01/40 | | | | 450 | | | | 462,276 | |
Series 2012 A, Ref. RB | | | 5.00 | % | | | 10/01/34 | | | | 610 | | | | 608,804 | |
Guam (Territory of) Waterworks Authority; Series 2010, Water & Wastewater System RB | | | 5.63 | % | | | 07/01/40 | | | | 740 | | | | 746,408 | |
Guam (Territory of); Series 2011 A, Business Privilege Tax RB | | | 5.25 | % | | | 01/01/36 | | | | 550 | | | | 565,076 | |
| | | | 3,850,663 | |
| | | | |
| Puerto Rico–1.70% | | | | | | | | | | | | | | | | |
Puerto Rico (Commonwealth of) Highway & Transportation Authority; Series 1993 X, Ref. RB(h) | | | 5.50 | % | | | 07/01/15 | | | | 1,535 | | | | 1,592,624 | |
Puerto Rico (Commonwealth of) Infrastructure Financing Authority; Series 2005 C, Ref. Special Tax RB (INS–AMBAC)(a) | | | 5.50 | % | | | 07/01/28 | | | | 675 | | | | 553,426 | |
Puerto Rico Sales Tax Financing Corp.; Series 2011 C, RB | | | 5.25 | % | | | 08/01/40 | | | | 350 | | | | 293,933 | |
| | | | | 2,439,983 | |
| | | | |
| Virgin Islands–1.67% | | | | | | | | | | | | | | | | |
Virgin Islands (Government of) Public Finance Authority (Matching Fund Loan Note–Diageo); Series 2009 A, Sub. RB | | | 6.63 | % | | | 10/01/29 | | | | 845 | | | | 933,294 | |
See accompanying Notes to Financial Statements which are an integral part of the financial statements.
13 Invesco New York Tax Free Income Fund
| | | | | | | | | | | | | | | | |
| | | Interest
Rate | | | Maturity
Date | | | Principal
Amount
(000) | | |
Value | |
| Virgin Islands–(continued) | | | | | | | | | | | | | | | | |
Virgin Islands (Government of) Public Finance Authority (Matching Fund Loan Note); | | | | | |
Series 2010 A, Sr. Lien RB | | | 5.00 | % | | | 10/01/29 | | | $ | 1,000 | | | $ | 1,026,200 | |
Series 2012 A, RB(j) | | | 4.00 | % | | | 10/01/22 | | | | 410 | | | | 425,305 | |
| | | | | 2,384,799 | |
TOTAL INVESTMENTS(l)–107.31% (Cost $146,748,687) | | | | | | | 153,627,985 | |
FLOATING RATE NOTE OBLIGATIONS–(7.80)% | | | | | | | | | | | | | | | | |
Notes with interest rates and rate fees ranging from 0.55% to 0.58% at 02/28/14 and contractual maturities of collateral ranging from 01/15/27 to 07/01/44 (See Note 1J)(m) | | | | | | | | | | | | | | | (11,170,000 | ) |
OTHER ASSETS LESS LIABILITIES–0.49% | | | | 701,088 | |
NET ASSETS–100.00% | | | $ | 143,159,073 | |
Investment Abbreviations:
| | |
| ACA | | – ACA Financial Guaranty Corp. |
| AGC | | – Assured Guaranty Corp. |
| AGM | | – Assured Guaranty Municipal Corp. |
| AMBAC | | – American Municipal Bond Assurance Corp. |
| BHAC | | – Berkshire Hathaway Assurance Corp. |
| CAB | | – Capital Appreciation Bonds |
| GO | | – General Obligation |
| IDR | | – Industrial Development Revenue Bonds |
| INS | | – Insurer |
| LOC | | – Letter of Credit |
| MFH | | – Multi-Family Housing |
| NATL | | – National Public Finance Guarantee Corp. |
| PILOT | | – Payment-in-Lieu-of-Tax |
| Radian | | – Radian Asset Assurance, Inc. |
| RB | | – Revenue Bonds |
| Ref. | | – Refunding |
| Sec. | | – Secured |
| Sr. | | – Senior |
| Sub. | | – Subordinated |
| VRD | | – Variable Rate Demand |
Notes to Schedule of Investments:
| (a) | Principal and/or interest payments are secured by the bond insurance company listed. |
| (b) | Zero coupon bond issued at a discount. |
| (c) | Underlying security related to Dealer Trusts entered into by the Fund. See Note 1J. |
| (d) | Security subject to the alternative minimum tax. |
| (e) | Security has an irrevocable call by the issuer or mandatory put by the holder. Maturity date reflects such call or put. |
| (f) | Demand security payable upon demand by the Fund at specified time intervals no greater than thirteen months. Interest rate is redetermined periodically. Rate shown is the rate in effect on February 28, 2014. |
| (g) | Principal and interest payments are fully enhanced by a letter of credit from the bank listed or a predecessor bank, branch or subsidiary. |
| (h) | Advance refunded; secured by an escrow fund of U.S. Government obligations or other highly rated collateral. |
| (i) | Current coupon rate for an inverse floating rate municipal obligation. This rate resets periodically as the rate on the related security changes. Positions in an inverse floating rate municipal obligation have a total value of $1,211,880 which represents less than 1% of the Fund’s Net Assets. |
| (j) | Security purchased or received in a transaction exempt from registration under the Securities Act of 1933, as amended (the “1933 Act”). The security may be resold pursuant to an exemption from registration under the 1933 Act, typically to qualified institutional buyers. The aggregate value of these securities at February 28, 2014 was $1,539,131, which represented 1.08% of the Fund’s Net Assets. |
| (k) | Defaulted security. Currently, the issuer is partially or fully in default with respect to interest payments. The value of this security at February 28, 2014 represented less than 1% of the Fund’s Net Assets. |
| (l) | This table provides a listing of those entities that have either issued, guaranteed, backed or otherwise enhanced the credit quality of more than 5% of the securities held in the portfolio. In instances where the entity has guaranteed, backed or otherwise enhanced the credit quality of a security, it is not primarily responsible for the issuer’s obligations but may be called upon to satisfy the issuer’s obligations. |
| | | | |
| Entity | | Percentage | |
National Public Finance Guarantee Corp. | | | 5.0 | % |
| (m) | Floating rate note obligations related to securities held. The interest rates shown reflect the rates in effect at February 28, 2014. At February 28, 2014, the Fund’s investments with a value of $18,162,375 are held by Dealer Trusts and serve as collateral for the $11,170,000 in the floating rate note obligations outstanding at that date. |
See accompanying Notes to Financial Statements which are an integral part of the financial statements.
14 Invesco New York Tax Free Income Fund
Statement of Assets and Liabilities
February 28, 2014
| | | | |
Assets: | | | | |
Investments, at value (Cost $146,748,687) | | $ | 153,627,985 | |
Receivable for: | | | | |
Investments sold | | | 20,000 | |
Fund shares sold | | | 380 | |
Interest | | | 1,695,336 | |
Investment for trustee deferred compensation and retirement plans | | | 32,750 | |
Other assets | | | 2,625 | |
Total assets | | | 155,379,076 | |
| |
Liabilities: | | | | |
Floating rate note obligations | | | 11,170,000 | |
Payable for: | | | | |
Fund shares reacquired | | | 368,335 | |
Amount due custodian | | | 310,149 | |
Dividends | | | 160,923 | |
Accrued fees to affiliates | | | 70,212 | |
Accrued trustees’ and officers’ fees and benefits | | | 3,097 | |
Accrued other operating expenses | | | 42,404 | |
Trustee deferred compensation and retirement plans | | | 94,883 | |
Total liabilities | | | 12,220,003 | |
Net assets applicable to shares outstanding | | $ | 143,159,073 | |
| |
Net assets consist of: | | | | |
Shares of beneficial interest | | $ | 147,861,651 | |
Undistributed net investment income | | | 427,072 | |
Undistributed net realized gain (loss) | | | (12,008,948 | ) |
Net unrealized appreciation | | | 6,879,298 | |
| | | $ | 143,159,073 | |
| | | | |
Net Assets: | | | | |
Class A | | $ | 116,781,870 | |
Class B | | $ | 2,827,587 | |
Class C | | $ | 18,496,393 | |
Class Y | | $ | 5,053,223 | |
|
Shares outstanding, $0.001 par value per share,
with an unlimited number of shares authorized: | |
Class A | | | 7,634,431 | |
Class B | | | 184,476 | |
Class C | | | 1,210,394 | |
Class Y | | | 330,668 | |
Class A: | | | | |
Net asset value per share | | $ | 15.30 | |
Maximum offering price per share | | | | |
(Net asset value of $15.30 ¸ 95.75%) | | $ | 15.98 | |
Class B: | | | | |
Net asset value and offering price per share | | $ | 15.33 | |
Class C: | | | | |
Net asset value and offering price per share | | $ | 15.28 | |
Class Y: | | | | |
Net asset value and offering price per share | | $ | 15.28 | |
See accompanying Notes to Financial Statements which are an integral part of the financial statements.
15 Invesco New York Tax Free Income Fund
Statement of Operations
For the year ended February 28, 2014
| | | | |
Investment income: | |
Interest | | $ | 7,962,259 | |
| |
Expenses: | | | | |
Advisory fees | | | 741,647 | |
Administrative services fees | | | 50,000 | |
Custodian fees | | | 5,991 | |
Distribution fees: | | | | |
Class A | | | 320,308 | |
Class B | | | 8,358 | |
Class C | | | 193,538 | |
Interest, facilities and maintenance fees | | | 68,184 | |
Transfer agent fees | | | 88,837 | |
Trustees’ and officers’ fees and benefits | | | 35,921 | |
Other | | | 121,143 | |
Total expenses | | | 1,633,927 | |
Net investment income | | | 6,328,332 | |
| |
Realized and unrealized gain (loss) from: | | | | |
Net realized gain (loss) from investment securities | | | (4,437,564 | ) |
Change in net unrealized appreciation (depreciation) of investment securities | | | (8,566,563 | ) |
Net realized and unrealized gain (loss) | | | (13,004,127 | ) |
Net increase (decrease) in net assets resulting from operations | | $ | (6,675,795 | ) |
See accompanying Notes to Financial Statements which are an integral part of the financial statements.
16 Invesco New York Tax Free Income Fund
Statement of Changes in Net Assets
For the years ended February 28, 2014 and 2013
| | | | | | | | |
| | | 2014 | | | 2013 | |
Operations: | | | | | |
Net investment income | | $ | 6,328,332 | | | $ | 6,667,395 | |
Net realized gain (loss) | | | (4,437,564 | ) | | | 159,431 | |
Change in net unrealized appreciation (depreciation) | | | (8,566,563 | ) | | | 3,632,808 | |
Net increase (decrease) in net assets resulting from operations | | | (6,675,795 | ) | | | 10,459,634 | |
| | |
Distributions to shareholders from net investment income: | | | | | | | | |
Class A | | | (5,036,243 | ) | | | (5,690,517 | ) |
Class B | | | (131,180 | ) | | | (192,639 | ) |
Class C | | | (614,269 | ) | | | (660,118 | ) |
Class Y | | | (291,109 | ) | | | (358,227 | ) |
Total distributions from net investment income | | | (6,072,801 | ) | | | (6,901,501 | ) |
| | |
Share transactions–net: | | | | | | | | |
Class A | | | (18,769,262 | ) | | | 5,833,992 | |
Class B | | | (1,187,349 | ) | | | (1,344,828 | ) |
Class C | | | (1,486,246 | ) | | | 2,604,518 | |
Class Y | | | (2,935,054 | ) | | | 1,696,028 | |
Net increase (decrease) in net assets resulting from share transactions | | | (24,377,911 | ) | | | 8,789,710 | |
Net increase (decrease) in net assets | | | (37,126,507 | ) | | | 12,347,843 | |
| | |
Net assets: | | | | | | | | |
Beginning of year | | | 180,285,580 | | | | 167,937,737 | |
End of year (includes undistributed net investment income of $427,072 and $200,164, respectively) | | $ | 143,159,073 | | | $ | 180,285,580 | |
Notes to Financial Statements
February 28, 2014
NOTE 1—Significant Accounting Policies
Invesco New York Tax Free Income Fund (the “Fund”) is a series portfolio of AIM Tax-Exempt Funds (Invesco Tax-Exempt Funds) (the “Trust”). The Trust is a Delaware statutory trust registered under the Investment Company Act of 1940, as amended (the “1940 Act”), as an open-end series management investment company consisting of six separate portfolios, each authorized to issue an unlimited number of shares of beneficial interest. The assets, liabilities and operations of each portfolio are accounted for separately. Information presented in these financial statements pertains only to the Fund. Matters affecting each portfolio or class will be voted on exclusively by the shareholders of such portfolio or class.
The Fund’s investment objective is to provide investors with a high level of current income exempt from federal, New York State and New York City income taxes, consistent with preservation of capital.
The Fund currently consists of four different classes of shares: Class A, Class B, Class C and Class Y. Class A shares are sold with a front-end sales charge unless certain waiver criteria are met and under certain circumstances load waived shares may be subject to contingent deferred sales charges (“CDSC”). Class C shares are sold with a CDSC. Class Y shares are sold at net asset value. Effective November 30, 2010, new or additional investments in Class B shares are no longer permitted. Existing shareholders of Class B shares may continue to reinvest dividends and capital gains distributions in Class B shares until they convert to Class A shares. Also, shareholders in Class B shares will be able to exchange those shares for Class B shares of other Invesco Funds offering such shares until they convert to Class A shares. Generally, Class B shares will automatically convert to Class A shares on or about the month-end, which is at least eight years after the date of purchase. Redemption of Class B shares prior to conversion date will be subject to a CDSC.
The following is a summary of the significant accounting policies followed by the Fund in the preparation of its financial statements.
| A. | Security Valuations — Securities, including restricted securities, are valued according to the following policy. |
Securities are fair valued using an evaluated quote provided by an independent pricing service approved by the Board of Trustees. Evaluated quotes provided by the pricing service may be determined without exclusive reliance on quoted prices, and may reflect appropriate factors such as institution-size trading in similar groups of securities, developments related to specific securities, dividend rate (for unlisted equities), yield (for debt obligations), quality, type of issue, coupon rate (for debt obligations), maturity (for debt obligations), individual trading characteristics and other market data. Debt obligations are subject to interest rate and credit risks. In addition, all debt obligations involve some risk of default with respect to interest and/or principal payments.
Securities for which market quotations either are not readily available or became unreliable are valued at fair value as determined in good faith by or under the supervision of the Trust’s officers following procedures approved by the Board of Trustees. Some of the factors which may be considered in determining fair value are fundamental analytical data relating to the investment; the nature and duration of any restrictions on
17 Invesco New York Tax Free Income Fund
transferability or disposition; trading in similar securities by the same issuer or comparable companies; relevant political, economic or issuer specific news; and other relevant factors under the circumstances.
The Fund invests in securities that are subject to interest rate risk, meaning the risk that the prices will generally fall as interest rates rise and, conversely, the prices will generally rise as interest rates fall. Specific securities differ in their sensitivity to changes in interest rates depending on their individual characteristics. Changes in interest rates may result in increased market volatility, which may affect the value and/or liquidity of certain of the Fund’s investments.
Valuations change in response to many factors including the historical and prospective earnings of the issuer, the value of the issuer’s assets, general economic conditions, interest rates, investor perceptions and market liquidity. Because of the inherent uncertainties of valuation, the values reflected in the financial statements may materially differ from the value received upon actual sale of those investments.
| B. | Securities Transactions and Investment Income — Securities transactions are accounted for on a trade date basis. Realized gains or losses on sales are computed on the basis of specific identification of the securities sold. Interest income is recorded on the accrual basis from settlement date. Dividend income (net of withholding tax, if any) is recorded on the ex-dividend date. Bond premiums and discounts are amortized and/or accreted for financial reporting purposes. |
The Fund may periodically participate in litigation related to Fund investments. As such, the Fund may receive proceeds from litigation settlements. Any proceeds received are included in the Statement of Operations as realized gain (loss) for investments no longer held and as unrealized gain (loss) for investments still held.
Brokerage commissions and mark ups are considered transaction costs and are recorded as an increase to the cost basis of securities purchased and/or a reduction of proceeds on a sale of securities. Such transaction costs are included in the determination of net realized gain (loss) and unrealized gain (loss) from investment securities reported in the Statement of Operations and the Statement of Changes in Net Assets and the net realized and unrealized gains (losses) on securities per share in the Financial Highlights. Transaction costs are included in the calculation of the Fund’s net asset value and, accordingly, they reduce the Fund’s total returns. These transaction costs are not considered operating expenses and are not reflected in net investment income reported in the Statement of Operations and Statement of Changes in Net Assets, or the net investment income per share and ratios of expenses and net investment income reported in the Financial Highlights, nor are they limited by any expense limitation arrangements between the Fund and the investment adviser.
The Fund allocates realized and unrealized capital gains and losses to a class based on the relative net assets of each class. The Fund allocates income to a class based on the relative value of the settled shares of each class.
| C. | Country Determination — For the purposes of making investment selection decisions and presentation in the Schedule of Investments, the investment adviser may determine the country in which an issuer is located and/or credit risk exposure based on various factors. These factors include the laws of the country under which the issuer is organized, where the issuer maintains a principal office, the country in which the issuer derives 50% or more of its total revenues and the country that has the primary market for the issuer’s securities, as well as other criteria. Among the other criteria that may be evaluated for making this determination are the country in which the issuer maintains 50% or more of its assets, the type of security, financial guarantees and enhancements, the nature of the collateral and the sponsor organization. Country of issuer and/or credit risk exposure has been determined to be the United States of America, unless otherwise noted. |
| D. | Distributions — Distributions from income are declared daily and paid monthly. Distributions from net realized capital gain, if any, are generally declared and paid annually and recorded on the ex-dividend date. The Fund may elect to treat a portion of the proceeds from redemptions as distributions for federal income tax purposes. |
| E. | Federal Income Taxes — The Fund intends to comply with the requirements of Subchapter M of the Internal Revenue Code of 1986, as amended (the “Internal Revenue Code”), necessary to qualify as a regulated investment company and to distribute substantially all of the Fund’s taxable and tax-exempt earnings to shareholders. As such, the Fund will not be subject to federal income taxes on otherwise taxable income (including net realized capital gain) that is distributed to shareholders. Therefore, no provision for federal income taxes is recorded in the financial statements. |
The Fund recognizes the tax benefits of uncertain tax positions only when the position is more likely than not to be sustained. Management has analyzed the Fund’s uncertain tax positions and concluded that no liability for unrecognized tax benefits should be recorded related to uncertain tax positions. Management is not aware of any tax positions for which it is reasonably possible that the total amounts of unrecognized tax benefits will change materially in the next 12 months.
In addition, the Fund intends to invest in such municipal securities to allow it to qualify to pay shareholders “exempt-interest dividends”, as defined in the Internal Revenue Code.
The Fund files tax returns in the U.S. Federal jurisdiction and certain other jurisdictions. Generally, the Fund is subject to examinations by such taxing authorities for up to three years after the filing of the return for the tax period.
| F. | Expenses — Fees provided for under the Rule 12b-1 plan of a particular class of the Fund and which are directly attributable to that class are charged to the operations of such class. All other expenses are allocated among the classes based on relative net assets. |
| G. | Interest, Facilities and Maintenance Fees — Interest, Facilities and Maintenance Fees include interest and related borrowing costs such as commitment fees and other expenses associated with lines of credit and interest and administrative expenses related to establishing and maintaining floating rate note obligations, if any. |
| H. | Accounting Estimates — The preparation of financial statements in conformity with accounting principles generally accepted in the United States of America (“GAAP”) requires management to make estimates and assumptions that affect the reported amounts of assets and liabilities at the date of the financial statements and the reported amounts of revenues and expenses during the reporting period including estimates and assumptions related to taxation. Actual results could differ from those estimates by a significant amount. In addition, the Fund monitors for material events or transactions that may occur or become known after the period-end date and before the date the financial statements are released to print. |
| I. | Indemnifications — Under the Trust’s organizational documents, each Trustee, officer, employee or other agent of the Trust is indemnified against certain liabilities that may arise out of the performance of their duties to the Fund. Additionally, in the normal course of business, the Fund enters into contracts, including the Fund’s servicing agreements, that contain a variety of indemnification clauses. The Fund’s maximum exposure under these arrangements is unknown as this would involve future claims that may be made against the Fund that have not yet occurred. The risk of material loss as a result of such indemnification claims is considered remote. |
18 Invesco New York Tax Free Income Fund
| J. | Floating Rate Note Obligations — The Fund invests in inverse floating rate securities, such as Residual Interest Bonds (“RIBs”) or Tender Option Bonds (“TOBs”) for investment purposes and to enhance the yield of the Fund. Inverse floating rate investments tend to underperform the market for fixed rate bonds in a rising interest rate environment, but tend to outperform the market for fixed rate bonds when interest rates decline or remain relatively stable. Such transactions may be purchased in the secondary market without first owning the underlying bond or by the sale of fixed rate bonds by the Fund to special purpose trusts established by a broker dealer (“Dealer Trusts”) in exchange for cash and residual interests in the Dealer Trusts’ assets and cash flows, which are in the form of inverse floating rate securities. The Dealer Trusts finance the purchases of the fixed rate bonds by issuing floating rate notes to third parties and allowing the Fund to retain residual interests in the bonds. The floating rate notes issued by the Dealer Trusts have interest rates that reset weekly and the floating rate note holders have the option to tender their notes to the Dealer Trusts for redemption at par at each reset date. The residual interests held by the Fund (inverse floating rate investments) include the right of the Fund (1) to cause the holders of the floating rate notes to tender their notes at par at the next interest rate reset date, and (2) to transfer the municipal bond from the Dealer Trusts to the Fund, thereby collapsing the Dealer Trusts. |
Recently published final rules implementing section 619 of the Dodd-Frank Wall Street Reform and Consumer Protection Act (the “Volcker Rule”) prohibit banking entities from engaging in proprietary trading of certain instruments and limit such entities’ investments in, and relationships with, “covered funds.” These rules may preclude banking entities from sponsoring and/or providing services for existing TOB trust programs. There can be no assurances that TOB trusts can be restructured substantially similar to their present form, that new sponsors of TOB trusts would begin providing these services, or that alternative forms of leverage will be available to the Fund in order to maintain current levels of leverage. Any alternative forms of leverage may be less advantageous to the Fund, and may adversely affect the Fund’s net asset value, distribution rate and ability to achieve its investment objective. The ultimate impact of these rules on the TOBs market and the municipal market generally is not yet certain.
TOBs are presently classified as private placement securities. Private placement securities are subject to restrictions on resale because they have not been registered under the Securities Act of 1933, as amended (the “1933 Act”), or are otherwise not readily marketable. As a result of the absence of a public trading market for these securities, they may be less liquid than publicly traded securities. Although these securities may be resold in privately negotiated transactions, the prices realized from these sales could be less than those originally paid by the Fund or less than what may be considered the fair value of such securities.
The Fund accounts for the transfer of bonds to the Dealer Trusts as secured borrowings, with the securities transferred remaining in the Fund’s investment assets, and the related floating rate notes reflected as Fund liabilities under the caption Floating rate note obligations on the Statement of Assets and Liabilities. The Fund records the interest income from the fixed rate bonds under the caption Interest and records the expenses related to floating rate obligations and any administrative expenses of the Dealer Trusts as a component of Interest, facilities and maintenance fees on the Statement of Operations.
The Fund generally invests in inverse floating rate securities that include embedded leverage, thus exposing the Fund to greater risks and increased costs. The primary risks associated with inverse floating rate securities are varying degrees of liquidity and the changes in the value of such securities in response to changes in market rates of interest to a greater extent than the value of an equal principal amount of a fixed rate security having similar credit quality, redemption provisions and maturity which may cause the Fund’s net asset value to be more volatile than if it had not invested in inverse floating rate securities. In certain instances, the short-term floating rate interests created by the special purpose trust may not be able to be sold to third parties or, in the case of holders tendering (or putting) such interests for repayment of principal, may not be able to be remarketed to third parties. In such cases, the special purpose trust holding the long-term fixed rate bonds may be collapsed. In the case of RIBs or TOBs created by the contribution of long-term fixed income bonds by the Fund, the Fund will then be required to repay the principal amount of the tendered securities. During times of market volatility, illiquidity or uncertainty, the Fund could be required to sell other portfolio holdings at a disadvantageous time to raise cash to meet that obligation.
| K. | Other Risks — The value of, payment of interest on, repayment of principal for and the ability to sell a municipal security may be affected by constitutional amendments, legislative enactments, executive orders, administrative regulations, voter initiatives and the economics of the regions in which the issuers are located. |
Since many municipal securities are issued to finance similar projects, especially those relating to education, health care, transportation and utilities, conditions in those sectors can affect the overall municipal securities market and a Fund’s investments in municipal securities.
There is some risk that a portion or all of the interest received from certain tax-free municipal securities could become taxable as a result of determinations by the Internal Revenue Service.
NOTE 2—Advisory Fees and Other Fees Paid to Affiliates
The Trust has entered into a master investment advisory agreement with Invesco Advisers, Inc. (the “Adviser” or “Invesco”). Under the terms of the investment advisory agreement, the Fund pays an advisory fee to the Adviser based on the annual rate of the Fund’s average daily net assets as follows:
| | | | | | |
| Average Daily Net Assets | | Rate |
First $500 million | | | 0 | .47% | | |
Over $500 million | | | 0 | .445% | | |
Under the terms of a master sub-advisory agreement between the Adviser and each of Invesco Asset Management Deutschland GmbH, Invesco Asset Management Limited, Invesco Asset Management (Japan) Limited, Invesco Australia Limited, Invesco Hong Kong Limited, Invesco Senior Secured Management, Inc. and Invesco Canada Ltd. (collectively, the “Affiliated Sub-Advisers”) the Adviser, not the Fund, may pay 40% of the fees paid to the Adviser to any such Affiliated Sub-Adviser(s) that provide(s) discretionary investment management services to the Fund based on the percentage of assets allocated to such Sub-Adviser(s).
The Adviser has contractually agreed, through at least June 30, 2014, to waive advisory fees and/or reimburse expenses to the extent necessary to limit total annual fund operating expenses after fee waiver and/or expense reimbursement (excluding certain items discussed below) of Class A, Class B, Class C and Class Y shares to 1.50%, 2.25%, 2.25% and 1.25% of average daily net assets, respectively. In determining the Adviser’s
19 Invesco New York Tax Free Income Fund
obligation to waive advisory fees and/or reimburse expenses, the following expenses are not taken into account, and could cause total annual fund operating expenses after fee waiver and/or expense reimbursement to exceed the numbers reflected above: (1) interest, facilities and maintenance fees; (2) taxes; (3) dividend expense on short sales; (4) extraordinary or non-routine items, including litigation expenses; and (5) expenses that the Fund has incurred but did not actually pay because of an expense offset arrangement. Unless Invesco continues the fee waiver agreement, it will terminate on June 30, 2014. The fee waiver agreement cannot be terminated during its term. The Adviser did not waive fees and/or reimburse expenses during the period under this expense limitation.
The Trust has entered into a master administrative services agreement with Invesco pursuant to which the Fund has agreed to pay Invesco for certain administrative costs incurred in providing accounting services to the Fund. For the year ended February 28, 2014, expenses incurred under the agreement are shown in the Statement of Operations as Administrative services fees.
The Trust has entered into a transfer agency and service agreement with Invesco Investment Services, Inc. (“IIS”) pursuant to which the Fund has agreed to pay IIS a fee for providing transfer agency and shareholder services to the Fund and reimburse IIS for certain expenses incurred by IIS in the course of providing such services. IIS may make payments to intermediaries that provide omnibus account services, sub-accounting services and/or networking services. All fees payable by IIS to intermediaries that provide omnibus account services or sub-accounting are charged back to the Fund, subject to certain limitations approved by the Trust’s Board of Trustees. For the year ended February 28, 2014, expenses incurred under the agreement are shown in the Statement of Operations as Transfer agent fees.
Shares of the Fund are distributed by Invesco Distributors, Inc. (“IDI”). The Fund has adopted a distribution plan pursuant to Rule 12b-1 under the 1940 Act, and a service plan (collectively, the “Plans”) for Class A shares, Class B shares and Class C shares to compensate IDI for the sale, distribution, shareholder servicing and maintenance of shareholder accounts for these shares. Under the Plans, the Fund will incur annual fees of up to 0.25% of Class A average daily net assets and up to 1.00% each of Class B and Class C average daily net assets.
With respect to Class B and Class C shares, the Fund is authorized to reimburse in future years any distribution related expenses that exceed the maximum annual reimbursement rate for such class, so long as such reimbursement does not cause the Fund to exceed the Class B and Class C maximum annual reimbursement rate, respectively. With respect to Class A shares, distribution related expenses that exceed the maximum annual reimbursement rate for such class are not carried forward to future years and the Fund will not reimburse IDI for any such expenses.
For the year ended February 28, 2014, expenses incurred under these agreements are shown in the Statement of Operations as Distribution fees.
Front-end sales commissions and CDSC (collectively, the “sales charges”) are not recorded as expenses of the Fund. Front-end sales commissions are deducted from proceeds from the sales of Fund shares prior to investment in Class A shares of the Fund. CDSC are deducted from redemption proceeds prior to remittance to the shareholder. During the year ended February 28, 2014, IDI advised the Fund that IDI retained $15,144 in front-end sales commissions from the sale of Class A shares and $35,438, $6,506 and $1,461 from Class A, Class B and Class C shares, respectively, for CDSC imposed on redemptions by shareholders.
Certain officers and trustees of the Trust are officers and directors of the Adviser, IIS and/or IDI.
NOTE 3—Additional Valuation Information
GAAP defines fair value as the price that would be received to sell an asset or paid to transfer a liability in an orderly transaction between market participants at the measurement date, under current market conditions. GAAP establishes a hierarchy that prioritizes the inputs to valuation methods, giving the highest priority to readily available unadjusted quoted prices in an active market for identical assets (Level 1) and the lowest priority to significant unobservable inputs (Level 3), generally when market prices are not readily available or are unreliable. Based on the valuation inputs, the securities or other investments are tiered into one of three levels. Changes in valuation methods may result in transfers in or out of an investment’s assigned level:
| | Level 1 — | Prices are determined using quoted prices in an active market for identical assets. |
| | Level 2 — | Prices are determined using other significant observable inputs. Observable inputs are inputs that other market participants may use in pricing a security. These may include quoted prices for similar securities, interest rates, prepayment speeds, credit risk, yield curves, loss severities, default rates, discount rates, volatilities and others. |
| | Level 3 — | Prices are determined using significant unobservable inputs. In situations where quoted prices or observable inputs are unavailable (for example, when there is little or no market activity for an investment at the end of the period), unobservable inputs may be used. Unobservable inputs reflect the Fund’s own assumptions about the factors market participants would use in determining fair value of the securities or instruments and would be based on the best available information. |
As of February 28, 2014, all of the securities in this Fund were valued based on Level 2 inputs (see the Schedule of Investments for security categories). The level assigned to the securities valuations may not be an indication of the risk or liquidity associated with investing in those securities. Because of the inherent uncertainties of valuation, the values reflected in the financial statements may materially differ from the value received upon actual sale of those investments.
NOTE 4—Trustees’ and Officers’ Fees and Benefits
Trustees’ and Officers’ Fees and Benefits include amounts accrued by the Fund to pay remuneration to certain Trustees and Officers of the Fund. Trustees have the option to defer compensation payable by the Fund, and Trustees’ and Officers’ Fees and Benefits also include amounts accrued by the Fund to fund such deferred compensation amounts. Those Trustees who defer compensation have the option to select various Invesco Funds in which their deferral accounts shall be deemed to be invested. Finally, certain current Trustees were eligible to participate in a retirement plan that provided for benefits to be paid upon retirement to Trustees over a period of time based on the number of years of service. The Fund may have certain former Trustees who also participate in a retirement plan and receive benefits under such plan. Trustees’ and Officers’ Fees and Benefits include amounts accrued by the Fund to fund such retirement benefits. Obligations under the deferred compensation and retirement plans represent unsecured claims against the general assets of the Fund.
20 Invesco New York Tax Free Income Fund
NOTE 5—Cash Balances and Borrowings
The Fund is permitted to temporarily carry a negative or overdrawn balance in its account with SSB, the custodian bank. Such balances, if any at period end, are shown in the Statement of Assets and Liabilities under the payable caption Amount due custodian. To compensate the custodian bank for such overdrafts, the overdrawn Fund may either (1) leave funds as a compensating balance in the account so the custodian bank can be compensated by earning the additional interest; or (2) compensate by paying the custodian bank at a rate agreed upon by the custodian bank and Invesco, not to exceed the contractually agreed upon rate.
Inverse floating rate obligations resulting from the transfer of bonds to Dealer Trusts are accounted for as secured borrowings. The average floating rate notes outstanding and average annual interest and fee rate related to inverse floating rate note obligations during the year ended February 28, 2014 were $11,225,000 and 0.60%, respectively.
NOTE 6—Distributions to Shareholders and Tax Components of Net Assets
Tax Character of Distributions to Shareholders Paid During the Years Ended February 28, 2014 and 2013:
| | | | | | | | |
| | | 2014 | | | 2013 | |
Ordinary income | | $ | — | | | $ | 26,417 | |
Tax-exempt income | | | 6,072,801 | | | | 6,875,084 | |
Total distributions | | $ | 6,072,801 | | | $ | 6,901,501 | |
Tax Components of Net Assets at Period-End:
| | | | |
| | | 2014 | |
Undistributed ordinary income | | $ | 206,358 | |
Net unrealized appreciation — investments | | | 6,951,483 | |
Temporary book/tax differences | | | (91,030 | ) |
Post-October deferrals | | | (2,089,573 | ) |
Capital loss carryforward | | | (9,679,816 | ) |
Shares of beneficial interest | | | 147,861,651 | |
Total net assets | | $ | 143,159,073 | |
The difference between book-basis and tax-basis unrealized appreciation (depreciation) is due to differences in the timing of recognition of gains and losses on investments for tax and book purposes. The Fund’s net unrealized appreciation difference is attributable primarily to TOBs and book to tax accretion and amortization differences.
The temporary book/tax differences are a result of timing differences between book and tax recognition of income and/or expenses. The Fund’s temporary book/tax differences are the result of the trustee deferral of compensation and retirement plan benefits.
Capital loss carryforward is calculated and reported as of a specific date. Results of transactions and other activity after that date may affect the amount of capital loss carryforward actually available for the Fund to utilize. Capital losses generated in years beginning after December 22, 2010 can be carried forward for an unlimited period, whereas previous losses expire in 8 tax years. Capital losses with an expiration period may not be used to offset capital gains until all net capital losses without an expiration date have been utilized. Capital loss carryforwards with no expiration date will retain their character as either short-term or long-term capital losses instead of as short-term capital losses as under prior law. The ability to utilize capital loss carryforward in the future may be limited under the Internal Revenue Code and related regulations based on the results of future transactions.
The Fund has a capital loss carryforward as of February 28, 2014, which expires as follows:
| | | | | | | | | | | | |
| Capital Loss Carryforward* | |
| Expiration | | Short-Term | | | Long-Term | | | Total | |
February 28, 2017 | | $ | 2,489,228 | | | $ | — | | | $ | 2,489,228 | |
February 28, 2018 | | | 3,515,499 | | | | — | | | | 3,515,499 | |
February 28, 2019 | | | 896,118 | | | | — | | | | 896,118 | |
Not subject to expiration | | | 1,893,313 | | | | 885,658 | | | | 2,778,971 | |
Total capital loss carryforward | | $ | 8,794,158 | | | $ | 885,658 | | | $ | 9,679,816 | |
| * | Capital loss carryforward as of the date listed above is reduced for limitations, if any, to the extent required by the Internal Revenue Code and may be further limited depending upon a variety of factors, including the realization of net unrealized gains or losses as of the date of any reorganization. |
NOTE 7—Investment Securities
The aggregate amount of investment securities (other than short-term securities, U.S. Treasury obligations and money market funds, if any) purchased and sold by the Fund during the year ended February 28, 2014 was $13,675,047 and $39,269,013, respectively. Cost of investments on a tax basis includes the adjustments for financial reporting purposes as of the most recently completed federal income tax reporting period-end.
| | | | |
| Unrealized Appreciation (Depreciation) of Investment Securities on a Tax Basis | |
Aggregate unrealized appreciation of investment securities | | $ | 9,363,947 | |
Aggregate unrealized (depreciation) of investment securities | | | (2,412,464 | ) |
Net unrealized appreciation of investment securities | | $ | 6,951,483 | |
Cost of investments for tax purposes is $146,676,502.
21 Invesco New York Tax Free Income Fund
NOTE 8—Reclassification of Permanent Differences
Primarily as a result of differing book/tax treatment of taxable income and book to tax accretion and amortization differences, on February 28, 2014, undistributed net investment income was decreased by $28,623, undistributed net realized gain (loss) was increased by $8,275 and shares of beneficial interest was increased by $20,348. This reclassification had no effect on the net assets of the Fund.
NOTE 9—Share Information
| | | | | | | | | | | | | | | | |
| | | Summary of Share Activity | |
| | | Years ended February 28, | |
| | | 2014(a) | | | 2013 | |
| | | Shares | | | Amount | | | Shares | | | Amount | |
Sold: | | | | | | | | | | | | | | | | |
Class A | | | 761,422 | | | $ | 11,764,217 | | | | 1,796,491 | | | $ | 29,382,383 | |
Class B | | | 3,377 | | | | 50,532 | | | | 319 | | | | 5,189 | |
Class C | | | 187,454 | | | | 2,929,736 | | | | 236,330 | | | | 3,843,650 | |
Class Y | | | 98,225 | | | | 1,503,411 | | | | 218,414 | | | | 3,562,579 | |
| | | | |
Issued as reinvestment of dividends: | | | | | | | | | | | | | | | | |
Class A | | | 211,149 | | | | 3,237,290 | | | | 218,227 | | | | 3,562,959 | |
Class B | | | 4,810 | | | | 74,208 | | | | 7,592 | | | | 124,034 | |
Class C | | | 23,945 | | | | 367,464 | | | | 24,582 | | | | 401,062 | |
Class Y | | | 9,039 | | | | 138,864 | | | | 12,416 | | | | 202,539 | |
| | | | |
Automatic conversion of Class B shares to Class A shares: | | | | | | | | | | | | | | | | |
Class A | | | 30,265 | | | | 462,632 | | | | 55,973 | | | | 909,494 | |
Class B | | | (30,204 | ) | | | (462,632 | ) | | | (55,868 | ) | | | (909,494 | ) |
| | | | |
Reacquired: | | | | | | | | | | | | | | | | |
Class A | | | (2,228,015 | ) | | | (34,233,401 | ) | | | (1,716,186 | ) | | | (28,020,844 | ) |
Class B | | | (54,409 | ) | | | (849,457 | ) | | | (34,776 | ) | | | (564,557 | ) |
Class C | | | (312,444 | ) | | | (4,783,446 | ) | | | (100,626 | ) | | | (1,640,194 | ) |
Class Y | | | (303,234 | ) | | | (4,577,329 | ) | | | (126,077 | ) | | | (2,069,090 | ) |
Net increase (decrease) in share activity | | | (1,598,620 | ) | | $ | (24,377,911 | ) | | | 536,811 | | | $ | 8,789,710 | |
| (a) | There are entities that are record owners of more than 5% of the outstanding shares of the Fund and in the aggregate own 67% of the outstanding shares of the Fund. IDI has an agreement with these entities to sell Fund shares. The Fund, Invesco and/or Invesco affiliates may make payments to these entities, which are considered to be related to the Fund, for providing services to the Fund, Invesco and/or Invesco affiliates including but not limited to services such as securities brokerage, distribution, third party record keeping and account servicing. The Fund has no knowledge as to whether all or any portion of the shares owned of record by these entities are also owned beneficially. |
22 Invesco New York Tax Free Income Fund
NOTE 10—Financial Highlights
The following schedule presents financial highlights for a share of the Fund outstanding throughout the periods indicated.
| | | | | | | | | | | | | | | | | | | | | | | | | | | | | | | | | | | | | | | | | | | | | | | | | | | | |
| | | Net asset
value,
beginning
of period | | | Net
investment
income(a) | | | Net gains
(losses)
on securities
(both
realized and
unrealized) | | | Total from
investment
operations | | | Dividends
from net
investment
income | | | Net asset
value, end
of period | | | Total
return | | | Net assets,
end of period
(000’s omitted) | | | Ratio of
expenses
to average
net assets
with fee waivers
and/or expenses
absorbed | | | Ratio of
expenses
to average net
assets without
fee waivers
and/or expenses
absorbed | | | Ratio of
expenses
to average
net assets
with fee waiver
(excluding
interest,
facilities and
maintenance
fees)(b) | | | Ratio of net
investment
income
to average
net assets | | | Portfolio
turnover(c) | |
Class A | |
Year ended 02/28/14 | | $ | 16.45 | | | $ | 0.63 | | | $ | (1.17 | ) | | $ | (0.54 | ) | | $ | (0.61 | ) | | $ | 15.30 | | | | (3.26 | )%(d) | | $ | 116,782 | | | | 0.95 | %(e) | | | 0.95 | %(e) | | | 0.91 | %(e) | | | 4.10 | %(e) | | | 8 | % |
Year ended 02/28/13 | | | 16.12 | | | | 0.63 | | | | 0.36 | | | | 0.99 | | | | (0.66 | ) | | | 16.45 | | | | 6.22 | (d) | | | 145,772 | | | | 0.83 | | | | 0.91 | | | | 0.78 | | | | 3.88 | | | | 10 | |
Year ended 02/29/12 | | | 14.66 | | | | 0.71 | | | | 1.46 | | | | 2.17 | | | | (0.71 | ) | | | 16.12 | | | | 15.16 | (d) | | | 137,064 | | | | 0.69 | | | | 0.94 | | | | 0.65 | | | | 4.64 | | | | 18 | |
Period ended 02/28/11 | | | 15.78 | | | | 0.30 | | | | (1.12 | ) | | | (0.82 | ) | | | (0.30 | ) | | | 14.66 | | | | (5.25 | )(d) | | | 66,813 | | | | 0.68 | (f) | | | 0.93 | (f) | | | 0.66 | (f) | | | 4.86 | (f) | | | 10 | |
Year ended 09/30/10 | | | 15.40 | | | | 0.70 | | | | 0.39 | | | | 1.09 | | | | (0.71 | ) | | | 15.78 | | | | 7.32 | (d) | | | 74,722 | | | | 0.76 | | | | 1.01 | | | | 0.73 | | | | 4.59 | | | | 18 | |
Year ended 09/30/09 | | | 14.31 | | | | 0.70 | | | | 1.10 | | | | 1.80 | | | | (0.71 | ) | | | 15.40 | | | | 13.24 | (g) | | | 72,726 | | | | 0.84 | | | | 1.09 | | | | 0.78 | | | | 5.06 | | | | 32 | |
Class B | |
Year ended 02/28/14 | | | 16.49 | | | | 0.64 | | | | (1.19 | ) | | | (0.55 | ) | | | (0.61 | ) | | | 15.33 | | | | (3.30 | )(d)(h) | | | 2,828 | | | | 0.95 | (e)(h) | | | 0.95 | (e)(h) | | | 0.91 | (e)(h) | | | 4.10 | (e)(h) | | | 8 | |
Year ended 02/28/13 | | | 16.15 | | | | 0.63 | | | | 0.37 | | | | 1.00 | | | | (0.66 | ) | | | 16.49 | | | | 6.28 | (d)(h) | | | 4,301 | | | | 0.83 | (h) | | | 0.91 | (h) | | | 0.78 | (h) | | | 3.88 | (h) | | | 10 | |
Year ended 02/29/12 | | | 14.62 | | | | 0.74 | | | | 1.47 | | | | 2.21 | | | | (0.68 | ) | | | 16.15 | | | | 15.49 | (d)(h) | | | 5,549 | | | | 0.48 | (h) | | | 0.73 | (h) | | | 0.44 | (h) | | | 4.85 | (h) | | | 18 | |
Period ended 02/28/11 | | | 15.70 | | | | 0.30 | | | | (1.13 | ) | | | (0.83 | ) | | | (0.25 | ) | | | 14.62 | | | | (5.30 | )(d)(h) | | | 7,143 | | | | 0.77 | (f)(h) | | | 1.02 | (f)(h) | | | 0.75 | (f)(h) | | | 4.77 | (f)(h) | | | 10 | |
Year ended 09/30/10 | | | 15.35 | | | | 0.62 | | | | 0.39 | | | | 1.01 | | | | (0.66 | ) | | | 15.70 | | | | 6.76 | (d)(h) | | | 8,895 | | | | 1.26 | (h) | | | 1.51 | (h) | | | 1.23 | (h) | | | 4.09 | (h) | | | 18 | |
Year ended 09/30/09 | | | 14.27 | | | | 0.69 | | | | 1.09 | | | | 1.78 | | | | (0.70 | ) | | | 15.35 | | | | 13.13 | (i)(j) | | | 11,666 | | | | 0.92 | (i) | | | 1.17 | (i) | | | 0.86 | (i) | | | 4.99 | (i) | | | 32 | |
Class C | |
Year ended 02/28/14 | | | 16.44 | | | | 0.52 | | | | (1.19 | ) | | | (0.67 | ) | | | (0.49 | ) | | | 15.28 | | | | (4.04 | )(d) | | | 18,496 | | | | 1.70 | (e) | | | 1.70 | (e) | | | 1.66 | (e) | | | 3.35 | (e) | | | 8 | |
Year ended 02/28/13 | | | 16.10 | | | | 0.51 | | | | 0.36 | | | | 0.87 | | | | (0.53 | ) | | | 16.44 | | | | 5.50 | (d) | | | 21,556 | | | | 1.58 | | | | 1.66 | | | | 1.53 | | | | 3.13 | | | | 10 | |
Year ended 02/29/12 | | | 14.64 | | | | 0.59 | | | | 1.46 | | | | 2.05 | | | | (0.59 | ) | | | 16.10 | | | | 14.33 | (d) | | | 18,533 | | | | 1.44 | | | | 1.69 | | | | 1.40 | | | | 3.89 | | | | 18 | |
Period ended 02/28/11 | | | 15.77 | | | | 0.25 | | | | (1.13 | ) | | | (0.88 | ) | | | (0.25 | ) | | | 14.64 | | | | (5.62 | )(d) | | | 16,684 | | | | 1.43 | (f) | | | 1.68 | (f) | | | 1.41 | (f) | | | 4.11 | (f) | | | 10 | |
Year ended 09/30/10 | | | 15.39 | | | | 0.59 | | | | 0.38 | | | | 0.97 | | | | (0.59 | ) | | | 15.77 | | | | 6.50 | (d) | | | 19,049 | | | | 1.51 | | | | 1.76 | | | | 1.48 | | | | 3.84 | | | | 18 | |
Year ended 09/30/09 | | | 14.29 | | | | 0.61 | | | | 1.10 | | | | 1.71 | | | | (0.61 | ) | | | 15.39 | | | | 12.51 | (i)(k) | | | 19,444 | | | | 1.50 | (i) | | | 1.75 | (i) | | | 1.44 | (i) | | | 4.40 | (i) | | | 32 | |
Class Y | |
Year ended 02/28/14 | | | 16.44 | | | | 0.67 | | | | (1.18 | ) | | | (0.51 | ) | | | (0.65 | ) | | | 15.28 | | | | (3.08 | )(d) | | | 5,053 | | | | 0.70 | (e) | | | 0.70 | (e) | | | 0.66 | (e) | | | 4.35 | (e) | | | 8 | |
Year ended 02/28/13 | | | 16.10 | | | | 0.67 | | | | 0.37 | | | | 1.04 | | | | (0.70 | ) | | | 16.44 | | | | 6.55 | (d) | | | 8,657 | | | | 0.58 | | | | 0.66 | | | | 0.53 | | | | 4.13 | | | | 10 | |
Year ended 02/29/12 | | | 14.64 | | | | 0.76 | | | | 1.45 | | | | 2.21 | | | | (0.75 | ) | | | 16.10 | | | | 15.46 | (d) | | | 6,792 | | | | 0.44 | | | | 0.69 | | | | 0.40 | | | | 4.89 | | | | 18 | |
Period ended 02/28/11 | | | 15.78 | | | | 0.32 | | | | (1.15 | ) | | | (0.83 | ) | | | (0.31 | ) | | | 14.64 | | | | (5.27 | )(d) | | | 10 | | | | 0.43 | (f) | | | 0.68 | (f) | | | 0.41 | (f) | | | 5.11 | (f) | | | 10 | |
Year ended 09/30/10(l) | | | 15.44 | | | | 0.25 | | | | 0.34 | | | | 0.59 | | | | (0.25 | ) | | | 15.78 | | | | 3.83 | (d) | | | 10 | | | | 0.51 | (f) | | | 0.76 | (f) | | | 0.73 | (f) | | | 4.77 | (f) | | | 18 | |
| (a) | Calculated using average shares outstanding. |
| (b) | For the years ended September 30, 2010 and prior, ratio does not exclude facilities and maintenance fees. |
| (c) | Portfolio turnover is calculated at the fund level and is not annualized for periods less than one year, if applicable. For the year ended February 29, 2012, the portfolio turnover calculation excludes the value of securities purchased of $61,546,396 and sold of $9,539,859 in the effort to realign the Fund’s portfolio holdings after the reorganization of Invesco New York Tax-Free Income Fund into the Fund. |
| (d) | Includes adjustments in accordance with accounting principles generally accepted in the United States of America and as such, the net asset value for financial reporting purposes and the returns based upon those net asset values may differ from the net asset value and returns for shareholder transactions. Does not include sales charges and is not annualized for periods less than one year, if applicable. |
| (e) | Ratios are based on average daily net assets (000’s omitted) of $128,123, $3,343, $19,354 and $6,977 for Class A, Class B, Class C and Class Y shares, respectively. |
| (g) | Assumes reinvestment of all distributions for the period and does not include payment of the maximum sales charge of 4.75% or contingent deferred sales charge (CDSC). On purchases of $1 million or more, a CDSC of 1% may be imposed on certain redemptions made within eighteen months of purchase. If the sales charges were included, total returns would be lower. These returns include combined Rule 12b-1 fees and service fees of up to 0.25% and do not reflect the deduction of taxes that a shareholder would pay on Fund distributions or the redemption of Fund shares. |
| (h) | The total return, ratio of expenses to average net assets and ratio of net investment income to average net assets reflect actual 12b-1 fees of 0.25%, 0.25%, 0.04%, 0.33% and 0.75% for the year ended February 28, 2014, the year ended February 28, 2013, the year ended February 29, 2012, period ended February 28, 2011 and the year ended September 30, 2010, respectively. |
| (i) | The total return, ratio of expenses to average net assets and ratio of net investment income to average net assets reflect actual 12b-1 fees of less than 1%. |
| (j) | Assumes reinvestment of all distributions for the period and does not include payment of the maximum CDSC of 4%, charged on certain redemptions made within one year of purchase and declining to 0% after the fifth year. If the sales charge was included, total returns would be lower. These returns include combined Rule 12b-1 fees and service fees of up to 1% and do not reflect the deduction of taxes that a shareholder would pay on Fund distributions or the redemption of Fund shares. |
| (k) | Assumes reinvestment of all distributions for the period and does not include payment of the maximum CDSC of 1%, charged on certain redemptions made within one year of purchase. If the sales charge was included, total returns would be lower. These returns include combined Rule 12b-1 fees and service fees of up to 1% and do not reflect the deduction of taxes that a shareholder would pay on Fund distributions or the redemption of Fund shares. |
| (l) | Commencement date of June 1, 2010. |
23 Invesco New York Tax Free Income Fund
Report of Independent Registered Public Accounting Firm
To the Board of Trustees of AIM Tax-Exempt Funds (Invesco Tax-Exempt Funds)
and Shareholders of Invesco New York Tax Free Income Fund:
In our opinion, the accompanying statement of assets and liabilities, including the schedule of investments, and the related statements of operations and of changes in net assets and the financial highlights present fairly, in all material respects, the financial position of Invesco New York Tax Free Income Fund (one of the funds constituting AIM Tax-Exempt Funds (Invesco Tax-Exempt Funds), hereafter referred to as the “Fund”) at February 28, 2014, the results of its operations for the year then ended, the changes in its net assets for each of the two years in the period then ended and the financial highlights for each of the three years in the period then ended, the five month period ended February 28, 2011 and the year ended September 30, 2010, in conformity with accounting principles generally accepted in the United States of America. These financial statements and financial highlights (hereafter referred to as “financial statements”) are the responsibility of the Fund’s management; our responsibility is to express an opinion on these financial statements based on our audits. We conducted our audits of these financial statements in accordance with the standards of the Public Company Accounting Oversight Board (United States). Those standards require that we plan and perform the audit to obtain reasonable assurance about whether the financial statements are free of material misstatement. An audit includes examining, on a test basis, evidence supporting the amounts and disclosures in the financial statements, assessing the accounting principles used and significant estimates made by management, and evaluating the overall financial statement presentation. We believe that our audits, which included confirmation of securities at February 28, 2014 by correspondence with the custodian and brokers, provide a reasonable basis for our opinion. The financial highlights of the Fund for the year ended September 30, 2009 were audited by another independent registered public accounting firm whose report dated November 20, 2009 expressed an unqualified opinion on such financial statement.
PRICEWATERHOUSECOOPERS LLP
April 28, 2014
Houston, Texas
24 Invesco New York Tax Free Income Fund
Calculating your ongoing Fund expenses
Example
As a shareholder of the Fund, you incur two types of costs: (1) transaction costs, which may include sales charges (loads) on purchase payments or contingent deferred sales charges on redemptions, if any; and (2) ongoing costs, including management fees, distribution and/or service (12b-1) fees, and other Fund expenses. This example is intended to help you understand your ongoing costs (in dollars) of investing in the Fund and to compare these costs with ongoing costs of investing in other mutual funds. The example is based on an investment of $1,000 invested at the beginning of the period and held for the entire period September 1, 2013 through February 28, 2014.
Actual expenses
The table below provides information about actual account values and actual expenses. You may use the information in this table, together with the amount you invested, to estimate the expenses that you paid over the period. Simply divide your account value by $1,000 (for example, an $8,600 account value divided by $1,000 = 8.6), then multiply the result by the number in the table under the heading entitled “Actual Expenses Paid During Period” to estimate the expenses you paid on your account during this period.
Hypothetical example for comparison purposes
The table below also provides information about hypothetical account values and hypothetical expenses based on the Fund’s actual expense ratio and an assumed rate of return of 5% per year before expenses, which is not the Fund’s actual return.
The hypothetical account values and expenses may not be used to estimate the actual ending account balance or expenses you paid for the period. You may use this information to compare the ongoing costs of investing in the Fund and other funds. To do so, compare this 5% hypothetical example with the 5% hypothetical examples that appear in the shareholder reports of the other funds.
Please note that the expenses shown in the table are meant to highlight your ongoing costs only and do not reflect any transaction costs, such as sales charges (loads) on purchase payments or contingent deferred sales charges on redemptions, if any. Therefore, the hypothetical information is useful in comparing ongoing costs only, and will not help you determine the relative total costs of owning different funds. In addition, if these transaction costs were included, your costs would have been higher.
| | | | | | | | | | | | | | | | | | | | | | | | |
| Class | | Beginning
Account Value
(09/01/13) | | | ACTUAL | | | HYPOTHETICAL (5% annual return before expenses) | | | Annualized
Expense
Ratio | |
| | | Ending
Account Value
(02/28/14)1 | | | Expenses
Paid During
Period2 | | | Ending
Account Value
(02/28/14) | | | Expenses
Paid During
Period2 | | |
| A | | $ | 1,000.00 | | | $ | 1,057.60 | | | $ | 4.90 | | | $ | 1,020.03 | | | $ | 4.81 | | | | 0.96 | % |
| B | | | 1,000.00 | | | | 1,057.50 | | | | 4.90 | | | | 1,020.03 | | | | 4.81 | | | | 0.96 | |
| C | | | 1,000.00 | | | | 1,053.10 | | | | 8.70 | | | | 1,016.31 | | | | 8.55 | | | | 1.71 | |
| Y | | | 1,000.00 | | | | 1,058.30 | | | | 3.62 | | | | 1,021.27 | | | | 3.56 | | | | 0.71 | |
| 1 | The actual ending account value is based on the actual total return of the Fund for the period September 1, 2013 through February 28, 2014, after actual expenses and will differ from the hypothetical ending account value which is based on the Fund’s expense ratio and a hypothetical annual return of 5% before expenses. |
| 2 | Expenses are equal to the Fund’s annualized expense ratio as indicated above multiplied by the average account value over the period, multiplied by 181/365 to reflect the most recent fiscal half year. |
25 Invesco New York Tax Free Income Fund
Tax Information
Form 1099-DIV, Form 1042-S and other year–end tax information provide shareholders with actual calendar year amounts that should be included in their tax returns. Shareholders should consult their tax advisors.
The following distribution information is being provided as required by the Internal Revenue Code or to meet a specific state’s requirement.
The Fund designates the following amounts or, if subsequently determined to be different, the maximum amount allowable for its fiscal year ended February 28, 2014:
| | | | |
Federal and State Income Tax | |
Qualified Dividend Income* | | | 0 | % |
Corporate Dividends Received Deduction* | | | 0 | % |
U.S. Treasury Obligations* | | | 0 | % |
Tax-Exempt Interest Dividends* | | | 100 | % |
| | * | The above percentages are based on ordinary income dividends paid to shareholders during the Fund’s fiscal year. |
26 Invesco New York Tax Free Income Fund
Trustees and Officers
The address of each trustee and officer is AIM Tax-Exempt Funds (Invesco Tax-Exempt Funds) (the “Trust”), 11 Greenway Plaza, Suite 1000, Houston, Texas 77046-1173. The trustees serve for the life of the Trust, subject to their earlier death, incapacitation, resignation, retirement or removal as more specifically provided in the Trust’s organizational documents. Each officer serves for a one year term or until their successors are elected and qualified. Column two below includes length of time served with predecessor entities, if any.
| | | | | | | | |
Name, Year of Birth and
Position(s) Held with the Trust | | Trustee and/
or Officer Since | | Principal Occupation(s) During Past 5 Years | | Number of
Funds in Fund
Complex
Overseen by
Trustee | | Other Directorship(s)
Held by Trustee During
Past 5 Years |
| Interested Persons | | | | | | | | |
| Martin L. Flanagan1 — 1960 Trustee | | 2007 | | Executive Director, Chief Executive Officer and President, Invesco Ltd. (ultimate parent of Invesco and a global investment management firm); Advisor to the Board, Invesco Advisers, Inc. (formerly known as Invesco Institutional (N.A.), Inc.); Trustee, The Invesco Funds; Vice Chair, Investment Company Institute; and Member of Executive Board, SMU Cox School of Business Formerly: Chairman and Chief Executive Officer, Invesco Advisers, Inc. (registered investment adviser); Director, Chairman, Chief Executive Officer and President, IVZ Inc. (holding company), INVESCO Group Services, Inc. (service provider) and Invesco North American Holdings, Inc. (holding company); Director, Chief Executive Officer and President, Invesco Holding Company Limited (parent of Invesco and a global investment management firm); Director, Invesco Ltd.; Chairman, Investment Company Institute and President, Co-Chief Executive Officer, Co-President, Chief Operating Officer and Chief Financial Officer, Franklin Resources, Inc. (global investment management organization). | | 123 | | None |
Philip A. Taylor2 — 1954 Trustee, President and Principal Executive Officer | | 2006 | | Head of North American Retail and Senior Managing Director, Invesco Ltd.; Director, Co-Chairman, Co-President and Co-Chief Executive Officer, Invesco Advisers, Inc. (formerly known as Invesco Institutional (N.A.), Inc.) (registered investment adviser); Director, Chairman, Chief Executive Officer and President, Invesco Management Group, Inc. (formerly known as Invesco Aim Management Group, Inc.) (financial services holding company); Director and President, INVESCO Funds Group, Inc. (registered investment adviser and registered transfer agent); Director and Chairman, Invesco Investment Services, Inc. (formerly known as Invesco Aim Investment Services, Inc.) (registered transfer agent) and IVZ Distributors, Inc. (formerly known as INVESCO Distributors, Inc.) (registered broker dealer); Director, President and Chairman, Invesco Inc. (holding company) and Invesco Canada Holdings Inc. (holding company); Chief Executive Officer, Invesco Corporate Class Inc. (corporate mutual fund company) and Invesco Canada Fund Inc. (corporate mutual fund company); Director, Chairman and Chief Executive Officer, Invesco Canada Ltd. (formerly known as Invesco Trimark Ltd./Invesco Trimark Ltèe) (registered investment adviser and registered transfer agent); Trustee, President and Principal Executive Officer, The Invesco Funds (other than AIM Treasurer’s Series Trust (Invesco Treasurer’s Series Trust) and Short-Term Investments Trust); Trustee and Executive Vice President, The Invesco Funds (AIM Treasurer’s Series Trust (Invesco Treasurer’s Series Trust) and Short-Term Investments Trust only); Director, Invesco Investment Advisers LLC (formerly known as Van Kampen Asset Management); Director, Chief Executive Officer and President, Van Kampen Exchange Corp. Formerly: Director and Chairman, Van Kampen Investor Services Inc.; Director, Chief Executive Officer and President, 1371 Preferred Inc. (holding company); and Van Kampen Investments Inc.; Director and President, AIM GP Canada Inc. (general partner for limited partnerships); and Van Kampen Advisors, Inc.; Director and Chief Executive Officer, Invesco Trimark Dealer Inc. (registered broker dealer); Director, Invesco Distributors, Inc. (formerly known as Invesco Aim Distributors, Inc.) (registered broker dealer); Manager, Invesco PowerShares Capital Management LLC; Director, Chief Executive Officer and President, Invesco Advisers, Inc.; Director, Chairman, Chief Executive Officer and President, Invesco Aim Capital Management, Inc.; President, Invesco Trimark Dealer Inc. and Invesco Trimark Ltd./Invesco Trimark Ltèe; Director and President, AIM Trimark Corporate Class Inc. and AIM Trimark Canada Fund Inc.; Senior Managing Director, Invesco Holding Company Limited; Trustee and Executive Vice President, Tax-Free Investments Trust; Director and Chairman, Fund Management Company (former registered broker dealer); President and Principal Executive Officer, The Invesco Funds (AIM Treasurer’s Series Trust (Invesco Treasurer’s Series Trust), Short-Term Investments Trust and Tax-Free Investments Trust only); President, AIM Trimark Global Fund Inc. and AIM Trimark Canada Fund Inc. | | 123 | | None |
Wayne W. Whalen3 — 1939 Trustee | | 2010 | | Of Counsel, and prior to 2010, partner in the law firm of Skadden, Arps, Slate, Meagher & Flom LLP, legal counsel to certain funds in the Fund Complex. | | 136 | | Director of the Mutual fund Directors Forum, a nonprofit membership organization for investment directors; Chairman and Director of the Abraham Lincoln Presidential Library Foundation; and Director of the Stevenson Center for Democracy |
| 1 | Mr. Flanagan is considered an interested person of the Trust because he is an officer of the adviser to the Trust, and an officer and a director of Invesco Ltd., ultimate parent of the adviser to the Trust. |
| 2 | Mr. Taylor is considered an interested person of the Trust because he is an officer and a director of the adviser to, and a director of the principal underwriter of, the Trust. |
| 3 | Mr. Whalen is considered an “interested person” (within the meaning of Section 2(a)(19) of the 1940 Act) of certain funds in the Fund Complex because his firm currently provides legal services as legal counsel to such Funds. |
T-1 Invesco New York Tax Free Income Fund
Trustees and Officers—(continued)
| | | | | | | | |
Name, Year of Birth and
Position(s) Held with the Trust | | Trustee and/
or Officer Since | | Principal Occupation(s) During Past 5 Years | | Number of
Funds in Fund
Complex
Overseen by
Trustee | | Other Directorship(s)
Held by Trustee During
Past 5 Years |
| Independent Trustees | | | | | | | | |
Bruce L. Crockett — 1944 Trustee and Chair | | 1993 | | Chairman, Crockett Technologies Associates (technology consulting company) Formerly: Director, Captaris (unified messaging provider); Director, President and Chief Executive Officer COMSAT Corporation; Chairman, Board of Governors of INTELSAT (international communications company); ACE Limited (insurance company); and Investment Company Institute | | 123 | | ALPS (Attorneys Liability Protection Society) (insurance company) |
David C. Arch — 1945 Trustee | | 2010 | | Chairman of Blistex Inc., a consumer health care products manufacturer | | 136 | | Board member of the Illinois Manufacturers’ Association; Member of the Board of Visitors, Institute for the Humanities University of Michigan; Member of the Audit Committee of the Edward-Elmhurst Hospital |
Frank S. Bayley — 1939 Trustee | | 2001 | | Retired. Formerly: Director, Badgley Funds Inc. (registered investment company) (2 portfolios) and General Partner and Of Counsel, law firm of Baker & McKenzie, LLP | | 123 | | Director and Chairman, C.D. Stimson Company (a real estate investment company); Trustee, The Curtis Institute of Music |
James T. Bunch — 1942 Trustee | | 2003 | | Managing Member, Grumman Hill Group LLC (family office private equity investments) Formerly: Founder, Green Manning & Bunch Ltd. (investment banking firm) (1988-2010); Executive Committee, United States Golf Association; and Director, Policy Studies, Inc. and Van Gilder Insurance Corporation. | | 123 | | Chairman, Board of Governors, Western Golf Association, Chairman, Evans Scholars Foundation and Director, Denver Film Society |
Rodney F. Dammeyer — 1940 Trustee | | 2010 | | Chairman of CAC,LLC, (private company offering capital investment and management advisory services) Formerly: Prior to 2001, Managing Partner at Equity Group Corporate Investments. Prior to 1995, Chief Executive Officer of Itel Corporation (formerly Anixter International). Prior to 1985, experience includes Senior Vice President and Chief Financial Officer of Household International, Inc., Executive Vice President and Chief Financial Officer of Northwest Industries, Inc. and Partner of Arthur Andersen & Co.; From 1987 to 2010, Director/Trustee of investment companies in the Van Kampen Funds complex | | 123 | | Director of Quidel Corporation and Stericycle, Inc. |
Albert R. Dowden — 1941 Trustee | | 2000 | | Director of a number of public and private business corporations, including the Boss Group, Ltd. (private investment and management); Nature’s Sunshine Products, Inc. and Reich & Tang Funds (5 portfolios) (registered investment company) Formerly: Director, Homeowners of America Holding Corporation/Homeowners of America Insurance Company (property casualty company); Director, Continental Energy Services, LLC (oil and gas pipeline service); Director, CompuDyne Corporation (provider of product and services to the public security market) and Director, Annuity and Life Re (Holdings), Ltd. (reinsurance company); Director, President and Chief Executive Officer, Volvo Group North America, Inc.; Senior Vice President, AB Volvo; Director of various public and private corporations; Chairman, DHJ Media, Inc.; Director, Magellan Insurance Company; and Director, The Hertz Corporation, Genmar Corporation (boat manufacturer), National Media Corporation; Advisory Board of Rotary Power International (designer, manufacturer, and seller of rotary power engines); and Chairman, Cortland Trust, Inc. (registered investment company) | | 123 | | Director of: Nature’s Sunshine Products, Inc., Reich & Tang Funds, Homeowners of America Holding Corporation/ Homeowners of America Insurance Company, the Boss Group |
Jack M. Fields — 1952 Trustee | | 1997 | | Chief Executive Officer, Twenty First Century Group, Inc. (government affairs company); Owner and Chief Executive Officer, Dos Angeles Ranch, L.P. (cattle, hunting, corporate entertainment); and Discovery Global Education Fund (non-profit) Formerly: Chief Executive Officer, Texana Timber LP (sustainable forestry company); Director of Cross Timbers Quail Research Ranch (non-profit); and member of the U.S. House of Representatives | | 123 | | Insperity, Inc. (formerly known as Administaff) |
Prema Mathai-Davis — 1950 Trustee | | 1998 | | Retired. Formerly: Chief Executive Officer, YWCA of the U.S.A. | | 123 | | None |
Larry Soll — 1942 Trustee | | 2003 | | Retired. Formerly: Chairman, Chief Executive Officer and President, Synergen Corp. (a biotechnology company) | | 123 | | None |
T-2 Invesco New York Tax Free Income Fund
Trustees and Officers—(continued)
| | | | | | | | |
Name, Year of Birth and
Position(s) Held with the Trust | | Trustee and/
or Officer Since | | Principal Occupation(s) During Past 5 Years | | Number of
Funds in Fund
Complex
Overseen by
Trustee | | Other Directorship(s)
Held by Trustee During Past 5 Years |
| Independent Trustees—(continued) |
Hugo F. Sonnenschein — 1940 Trustee | | 2010 | | President Emeritus and Honorary Trustee of the University of Chicago and the Adam Smith Distinguished Service Professor in the Department of Economics at the University of Chicago. Prior to 2000, President of the University of Chicago | | 136 | | Trustee of the University of Rochester and a member of its investment committee; Member of the National Academy of Sciences and the American Philosophical Society; Fellow of the American Academy of Arts and Sciences |
| Raymond Stickel, Jr. — 1944 Trustee | | 2005 | | Retired. Formerly: Director, Mainstay VP Series Funds, Inc. (25 portfolios) and Partner, Deloitte & Touche | | 123 | | None |
| Other Officers | | | | | | | | |
Russell C. Burk — 1958 Senior Vice President and Senior Officer | | 2005 | | Senior Vice President and Senior Officer, The Invesco Funds | | N/A | | N/A |
John M. Zerr — 1962 Senior Vice President, Chief Legal Officer and Secretary | | 2006 | | Director, Senior Vice President, Secretary and General Counsel, Invesco Management Group, Inc. (formerly known as Invesco Aim Management Group, Inc.) and Van Kampen Exchange Corp.; Senior Vice President, Invesco Advisers, Inc. (formerly known as Invesco Institutional (N.A.), Inc.) (registered investment adviser); Senior Vice President and Secretary, Invesco Distributors, Inc. (formerly known as Invesco Aim Distributors, Inc.); Director, Vice President and Secretary, Invesco Investment Services, Inc. (formerly known as Invesco Aim Investment Services, Inc.) and IVZ Distributors, Inc. (formerly known as INVESCO Distributors, Inc.); Director and Vice President, INVESCO Funds Group, Inc.; Senior Vice President, Chief Legal Officer and Secretary, The Invesco Funds; Manager, Invesco PowerShares Capital Management LLC; Director, Secretary and General Counsel, Invesco Investment Advisers LLC (formerly known as Van Kampen Asset Management); Secretary and General Counsel, Invesco Capital Markets, Inc. (formerly known as Van Kampen Funds Inc.) and Chief Legal Officer, PowerShares Exchange-Traded Fund Trust, PowerShares Exchange-Traded Fund Trust II, PowerShares India Exchange-Traded Fund Trust and PowerShares Actively Managed Exchange-Traded Fund Trust Formerly: Director and Vice President, Van Kampen Advisors Inc.; Director, Vice President, Secretary and General Counsel, Van Kampen Investor Services Inc.; Director, Invesco Distributors, Inc. (formerly known as Invesco Aim Distributors, Inc.); Director, Senior Vice President, General Counsel and Secretary, Invesco Aim Advisers, Inc. and Van Kampen Investments Inc.; Director, Vice President and Secretary, Fund Management Company; Director, Senior Vice President, Secretary, General Counsel and Vice President, Invesco Aim Capital Management, Inc.; Chief Operating Officer and General Counsel, Liberty Ridge Capital, Inc. (an investment adviser); Vice President and Secretary, PBHG Funds (an investment company) and PBHG Insurance Series Fund (an investment company); Chief Operating Officer, General Counsel and Secretary, Old Mutual Investment Partners (a broker-dealer); General Counsel and Secretary, Old Mutual Fund Services (an administrator) and Old Mutual Shareholder Services (a shareholder servicing center); Executive Vice President, General Counsel and Secretary, Old Mutual Capital, Inc. (an investment adviser); and Vice President and Secretary, Old Mutual Advisors Funds (an investment company) | | N/A | | N/A |
Sheri Morris — 1964 Vice President, Treasurer and Principal Financial Officer | | 1999 | | Vice President, Treasurer and Principal Financial Officer, The Invesco Funds; Vice President, Invesco Advisers, Inc. (formerly known as Invesco Institutional (N.A.), Inc.) (registered investment adviser); and Vice President, PowerShares Exchange-Traded Fund Trust, PowerShares Exchange-Traded Fund Trust II, PowerShares India Exchange-Traded Fund Trust and PowerShares Actively Managed Exchange-Traded Fund Trust Formerly: Vice President, Invesco Aim Advisers, Inc., Invesco Aim Capital Management, Inc. and Invesco Aim Private Asset Management, Inc.; Assistant Vice President and Assistant Treasurer, The Invesco Funds and Assistant Vice President, Invesco Advisers, Inc., Invesco Aim Capital Management, Inc. and Invesco Aim Private Asset Management, Inc.; and Treasurer, PowerShares Exchange-Traded Fund Trust, PowerShares Exchange-Traded Fund Trust II, PowerShares India Exchange-Traded Fund Trust and PowerShares Actively Managed Exchange-Traded Fund Trust | | N/A | | N/A |
T-3 Invesco New York Tax Free Income Fund
Trustees and Officers—(continued)
| | | | | | | | |
Name, Year of Birth and
Position(s) Held with the Trust | | Trustee and/
or Officer Since | | Principal Occupation(s) During Past 5 Years | | Number of
Funds in Fund
Complex
Overseen by
Trustee | | Other Directorship(s)
Held by Trustee During
Past 5 Years |
| Other Officers—(continued) | | | | | | | | |
Karen Dunn Kelley — 1960 Vice President | | 1993 | | Senior Managing Director, Investments; Director, Co-President, Co-Chief Executive Officer, and Co-Chairman, Invesco Advisers, Inc. (formerly known as Invesco Institutional (N.A.), Inc.) (registered investment adviser); Chairman, Invesco Senior Secured Management, Inc.; Senior Vice President, Invesco Management Group, Inc. (formerly known as Invesco Aim Management Group, Inc.); Executive Vice President, Invesco Distributors, Inc. (formerly known as Invesco Aim Distributors, Inc.); Director, Invesco Mortgage Capital Inc. and Invesco Management Company Limited; Director and President, INVESCO Asset Management (Bermuda) Ltd., Vice President, The Invesco Funds (other than AIM Treasurer’s Series Trust (Invesco Treasurer’s Series Trust) and Short-Term Investments Trust); and President and Principal Executive Officer, The Invesco Funds (AIM Treasurer’s Series Trust (Invesco Treasurer’s Series Trust) and Short-Term Investments Trust only) Formerly: Director, INVESCO Global Asset Management Limited and INVESCO Management S.A.; Senior Vice President, Van Kampen Investments Inc. and Invesco Advisers, Inc. (formerly known as Invesco Institutional (N.A.), Inc.) (registered investment adviser); Vice President, Invesco Advisers, Inc. (formerly known as Invesco Institutional (N.A.), Inc.); Director of Cash Management and Senior Vice President, Invesco Advisers, Inc. and Invesco Aim Capital Management, Inc.; President and Principal Executive Officer, Tax-Free Investments Trust; Director and President, Fund Management Company; Chief Cash Management Officer, Director of Cash Management, Senior Vice President, and Managing Director, Invesco Aim Capital Management, Inc.; Director of Cash Management, Senior Vice President, and Vice President, Invesco Advisers, Inc. and The Invesco Funds (AIM Treasurer’s Series Trust (Invesco Treasurer’s Series Trust), Short-Term Investments Trust and Tax-Free Investments Trust only) | | N/A | | N/A |
Crissie M. Wisdom — 1969 Anti-Money Laundering Compliance Officer | | 2013 | | Anti-Money Laundering Compliance Officer, Invesco Advisers, Inc. (formerly known as Invesco Institutional (N.A.), Inc.) (registered investment adviser), Invesco Capital Markets, Inc. (formerly known as Van Kampen Funds Inc.), Invesco Distributors, Inc., Invesco Investment Services, Inc., Invesco Management Group, Inc., Van Kampen Exchange Corp., The Invesco Funds, Invesco Funds (Chicago), and PowerShares Exchange-Traded Fund Trust, PowerShares Exchange-Traded Fund Trust II, PowerShares India Exchange-Traded Fund Trust, and PowerShares Actively Managed Exchange-Traded Fund Trust; and Fraud Prevention Manager and Controls and Risk Analysis Manager for Invesco Investment Services, Inc. | | N/A | | N/A |
Todd L. Spillane — 1958 Chief Compliance Officer | | 2006 | | Senior Vice President, Invesco Management Group, Inc. (formerly known as Invesco Aim Management Group, Inc.) and Van Kampen Exchange Corp.; Senior Vice President and Chief Compliance Officer, Invesco Advisers, Inc. (registered investment adviser) (formerly known as Invesco Institutional (N.A.), Inc.); Chief Compliance Officer, The Invesco Funds; Vice President, Invesco Distributors, Inc. (formerly known as Invesco Aim Distributors, Inc.) and Invesco Investment Services, Inc. (formerly known as Invesco Aim Investment Services, Inc.) Formerly: Chief Compliance Officer, Invesco Funds (Chicago); Senior Vice President, Van Kampen Investments Inc.; Senior Vice President and Chief Compliance Officer, Invesco Aim Advisers, Inc. and Invesco Aim Capital Management, Inc.; Chief Compliance Officer, INVESCO Private Capital Investments, Inc. (holding company), Invesco Private Capital, Inc. (registered investment adviser), Invesco Global Asset Management (N.A.), Inc., Invesco Senior Secured Management, Inc. (registered investment adviser), Van Kampen Investor Services Inc., PowerShares Exchange-Traded Fund Trust, PowerShares Exchange-Traded Fund Trust II, PowerShares India Exchange-Traded Fund Trust and PowerShares Actively Managed Exchange-Traded Fund Trust; and Vice President, Invesco Aim Capital Management, Inc. and Fund Management Company | | N/A | | N/A |
The Statement of Additional Information of the Trust includes additional information about the Fund’s Trustees and is available upon request, without charge, by calling 1.800.959.4246. Please refer to the Fund’s prospectus for information on the Fund’s sub-advisers.
| | | | | | |
Office of the Fund 11 Greenway Plaza, Suite 1000 Houston, TX 77046-1173 | | Investment Adviser Invesco Advisers, Inc. 1555 Peachtree Street, N.E. Atlanta, GA 30309 | | Distributor Invesco Distributors, Inc. 11 Greenway Plaza, Suite 1000 Houston, TX 77046-1173 | | Auditors PricewaterhouseCoopers LLP 1201 Louisiana Street, Suite 2900 Houston, TX 77002-5678 |
| | | |
| | | | | | |
Counsel to the Fund Stradley Ronon Stevens & Young, LLP 2005 Market Street, Suite 2600 Philadelphia, PA 19103-7018 | | Counsel to the Independent Trustees Goodwin Procter LLP 901 New York Avenue, N.W. Washington, D.C. 20001 | | Transfer Agent Invesco Investment Services, Inc. 11 Greenway Plaza, Suite 1000 Houston, TX 77046-1173 | | Custodian State Street Bank and Trust Company 225 Franklin Street Boston, MA 02110-2801 |
T-4 Invesco New York Tax Free Income Fund

Invesco mailing information
Send general correspondence to Invesco Investment Services, Inc., P.O. Box 219078, Kansas City, MO 64121-9078.
Important notice regarding delivery of security holder documents
To reduce Fund expenses, only one copy of most shareholder documents may be mailed to shareholders with multiple accounts at the same address (Householding). Mailing of your shareholder documents may be householded indefinitely unless you instruct us otherwise. If you do not want the mailing of these documents to be combined with those for other members of your household, please contact Invesco Investment Services, Inc. at 800 959 4246 or contact your financial institution. We will begin sending you individual copies for each account within 30 days after receiving your request.
Fund holdings and proxy voting information
The Fund provides a complete list of its holdings four times in each fiscal year, at the quarter ends. For the second and fourth quarters, the lists appear in the Fund’s semiannual and annual reports to shareholders. For the first and third quarters, the Fund files the lists with the Securities and Exchange Commission (SEC) on Form N-Q. The most recent list of portfolio holdings is available at invesco.com/completeqtrholdings. Shareholders can also look up the Fund’s Forms N-Q on the SEC website at sec.gov. Copies of the Fund’s Forms N-Q may be reviewed and copied at the SEC Public Reference Room in Washington, D.C. You can obtain information on the operation of the Public Reference Room, including information about duplicating fee charges, by calling 202 551 8090 or 800 732 0330, or by electronic request at the following email address: publicinfo@sec.gov. The SEC file numbers for the Fund are shown below.
A description of the policies and procedures that the Fund uses to determine how to vote proxies relating to portfolio securities is available without charge, upon request, from our Client Services department at 800 959 4246 or at invesco.com/proxyguidelines. The information is also available on the SEC website, sec.gov.
| | |
Information regarding how the Fund voted proxies related to its portfolio securities during the most recent 12-month period ended June 30 is available at invesco.com/proxysearch. The information is also available on the SEC website, sec.gov. Invesco Advisers, Inc. is an investment adviser; it provides investment advisory services to individual and institutional clients and does not sell securities. Invesco Distributors, Inc. is the US distributor for Invesco Ltd.’s retail mutual funds, exchange-traded funds and institutional money market funds. Both are wholly owned, indirect subsidiaries of Invesco Ltd. | |  |
| | | | |
| SEC file numbers: 811-07890 and 033-66242 | | VK-NYTFI-AR-1 | | Invesco Distributors, Inc. |

Letters to Shareholders
| | |

Philip Taylor | | Dear Shareholders: This annual report includes information about your Fund, including performance data and a complete list of its investments as of the close of the reporting period. Inside, your Fund’s portfolio managers discuss how they managed your Fund and the factors that affected its performance during the reporting period. I hope you find this report of interest. During the reporting period covered by this report, major US and global equity market indexes hit multiyear or all-time highs1, the result of a strengthening US economy and relatively healthy corporate profits. Also helping equities was a return of individual investors to stocks – due in part to monetary policies that kept interest rates (and yields on fixed income securities) low. Despite some volatility in the summer of 2013, overseas equity market indexes in developed and emerging nations generally rose during the reporting period – although developed markets generally |
outpaced emerging markets. In January 2014, amid widespread signs of an improving economy, the US Federal Reserve began a long-anticipated reduction in its bond-buying program.
Extended periods of strong market performance can lull some investors into a false sense of security – just as extended periods of volatility or market weakness can discourage some investors from undertaking disciplined, long-term investment plans. That’s why Invesco believes it can often be helpful to work with a skilled and trusted financial adviser; he or she can emphasize the importance of adhering to an investment plan designed to achieve long-term goals like a first home, a college education for a child or a comfortable retirement. A financial adviser who is familiar with your individual financial situation, investment goals and risk tolerance can be an invaluable partner as you work toward your financial goals. He or she can provide insight and perspective when markets are volatile; encouragement and reassurance when times are uncertain; and advice and guidance when your financial situation or investment goals change.
Timely information when and where you want it
Invesco’s efforts to help investors achieve their financial objectives include providing individual investors and financial professionals with timely information about the markets, the economy and investing – whenever and wherever they want it.
Our website, invesco.com/us, offers a wide range of market insights and investment perspectives. On the website, you’ll find detailed information about our funds, including prices, performance, holdings and portfolio manager commentaries. You can access information about your individual Invesco account whenever it’s convenient for you; just complete a simple, secure online registration. Use the “Login” box on our home page to get started.
Invesco’s mobile app for iPad® (available free from the App StoreSM) allows you to obtain the same detailed information about your Fund and the same investment insights from our investment leaders, market strategists, economists and retirement experts on the go. You also can watch portfolio manager videos and have instant access to Invesco news and updates wherever you may be.
In addition to the resources accessible on our website and through our mobile app, you can obtain timely updates to help you stay informed about the markets, the economy and investing by connecting with Invesco on Twitter, LinkedIn or Facebook. You can access our blog at blog.invesco.us.com or by visiting the “Intentional Investing Forum” on our home page. Our goal is to provide you the information you want, when and where you want it.
Have questions?
For questions about your account, feel free to contact an Invesco client services representative at 800 959 4246. For Invesco-related questions or comments, please email me directly at phil@invesco.com.
All of us at Invesco look forward to serving your investment management needs for many years to come. Thank you for investing with us.
Sincerely,

Philip Taylor
Senior Managing Director, Invesco Ltd.
1 Source: Reuters
iPad is a trademark of Apple Inc., registered in the US and other countries. App Store is a service mark of Apple Inc. Invesco Distributors, Inc. is not affiliated with Apple Inc.
2 Invesco Tax-Exempt Cash Fund
| | |

Bruce Crockett | | Dear Fellow Shareholders: Members of the Invesco Funds Board work continually to oversee how the Invesco Funds are performing in light of ever-changing and often unpredictable economic and market conditions. One of the ways we do this is by verifying that the teams that manage funds understand the risks associated with the investments they make in the funds they manage. In light of market conditions over the last few years, the financial news media of late have given increased attention to “alternative investment strategies.” Despite this increased attention, many investors don’t know very much about these types of investment strategies. Let me put alternative investment strategies and the new focus on them in some perspective. First, these types of investment strategies have been used predominately by institutional investors and investment professionals for decades to increase diversification – in an effort to dampen |
portfolio volatility (risk) with the goal of increasing returns. The focal point of the increased news coverage is that these types of strategies are now being made more widely available to individual investors.
Alternative investment strategies generally seek to provide measured exposure to various asset classes whose performance, historically, has not been highly correlated with one another. These strategies may help mitigate the impact to a portfolio from severe or prolonged market downturns while potentially providing reasonable returns over time. After a careful and thorough examination of the potential risks and potential benefits of alternative investment strategies, the Invesco Funds Board has approved the launch of several new alternative funds for the Invesco product lineup, to be managed by teams we determined have the depth and experience to pursue the funds’ investment objectives.
While no single investment product can provide complete downside protection in falling markets and full upside participation in rising markets, your Board believes alternative funds can be a prudent tool to work in concert with more traditional mutual funds and other investments to build well diversified portfolios. Your financial adviser can determine whether or not such investments are appropriate for your individual needs, goals and risk tolerance. Also, he or she can explain the risks associated with alternative investment strategies. This type of professional guidance is why Invesco believes it’s so important that individual investors work with trusted, experienced financial advisers.
Whether you’re invested in equity, fixed income, cash management or alternative investment funds, be assured that the Invesco Funds Board will continue working on your behalf and on behalf of all our fund shareholders, keeping your needs and interests uppermost in our minds.
As always, please contact me at bruce@brucecrockett.com with any questions or concerns you may have. On behalf of the Board, we look forward to continuing to represent your interests and serving your needs.
Sincerely,

Bruce L. Crockett
Independent Chair
Invesco Funds Board of Trustees
Asset allocation/diversification does not guarantee a profit or eliminate the risk of loss.
Alternative products typically hold more non-traditional investments and employ more complex trading strategies, including hedging and leveraging through derivatives, short selling and opportunistic strategies that change with market conditions. Investors considering alternatives should be aware of their unique characteristics and additional risks from the strategies they use. Like all investments, performance will fluctuate. You can lose money.
3 Invesco Tax-Exempt Cash Fund
Management’s Discussion of your Fund
This annual report for Invesco Tax-Exempt Cash Fund covers the fiscal year ended February 28, 2014. As of that date, the Fund had 72 holdings and its net assets totaled $111.5 million. As of the same date, the Fund’s weighted average maturity was 18 days and the Fund’s weighted average life was 18 days.1
How we invest
We seek to provide as high a level of tax-exempt income as is consistent with the preservation of capital and maintenance of liquidity. We invest in high-quality, short-term municipal obligations, focusing on:
| n | | Safety, or preservation of capital, through rigorous credit analysis |
| n | | Liquidity, through a combination of short-term cash management vehicles and selective use of longer maturity investments; and |
| n | | Yield that is exempt from federal income tax. |
The overall portfolio’s structure depends on the supply and availability of municipal securities. Liquidity is managed using daily and weekly variable-rate demand notes. We consider selling a security if the issuer’s credit quality declines; if a geographic region in which the issuers the Fund invests in undergoes a negative change; as a result of interest rate changes; or to enhance yield.
Because we generally do not purchase securities that generate taxable income or that are subject to the alternative minimum tax, we expect the Fund to generate fully tax-exempt income. While the Fund’s distributions are primarily exempt from federal income tax, a portion of the Fund’s distributions may be subject to the federal alternative minimum tax and state and local taxes.
Market conditions affecting money market funds
The fiscal year ended February 28, 2014, was characterized by steady improvement in the US economy and market environment, which continued to be shaped by monetary and fiscal policies. Gross
domestic product (GDP), the broadest measure of overall US economic activity, continued to expand in 2013, growing at an annualized rate of 2.6% in the fourth quarter, down from 4.1% in the third quarter.2 At the same time, the labor market continued to improve and inflation remained subdued. The unemployment rate stood at 6.7% in February 2014.3
Throughout 2013, the US Federal Reserve (the Fed) continued its aggressive monetary stimulus policies, including $40 billion in mortgage-backed securities and $45 billion in longer term Treasury securities it purchased each month as part of the third round of quantitative easing (QE).4 The Fed also maintained its target policy rate in a range of between zero and 0.25%, committing to keep interest rates exceptionally low as long as unemployment remains above 6.5%, while keeping inflation below 2.5%.4
In May 2013, the Fed first announced that it was considering tapering, or slowing down, its asset purchases. The announcement caused a brief, but broad, sell-off in capital markets in the US and emerging markets. While markets stabilized in midsummer, throughout the second half of the year they continued to be dominated by concerns regarding the timing and scope of possible Fed tapering. Finally, in December 2013, the Fed put an end to the speculation, announcing that it would begin reducing the scope of QE in January 2014. Given the Fed’s commitment to accommodative monetary policy, money market funds continued to operate in an ultra-low interest rate environment.
Fiscal policy remained a concern throughout the reporting period. A political standoff over raising the US debt limit culminated in a 16-day federal government shutdown in October. A last-minute compromise helped stave off the risk of default but failed to address fundamental spending and tax issues including entitlements. Another debt ceiling deadline neared in February 2014, but a showdown was avoided when Congress voted to raise the debt ceiling without condition until March 2015.
In an evolving and challenging environment for money market funds, we remain committed to the preservation of principal and providing daily liquidity, while seeking to deliver a competitive yield. Thank you for investing with us.
| 1 | Weighted average maturity (WAM) is an average of all the maturities of all securities held in the portfolio, weighted by each security’s percentage of net assets. The days to maturity for WAM is the lower of the stated maturity date or next interest rate reset date. WAM reflects how a portfolio would react to interest rate changes. Weighted average life (WAL) is an average of all the maturities of all securities held in the portfolio, weighted by each security’s percentage of net assets. The days to maturity for WAL is the lower of the stated maturity date or next demand feature date. WAL reflects how a portfolio would react to deteriorating credit (widening spreads) or tightening liquidity conditions. |
| 2 | Source: Bureau of Economic Analysis |
| 3 | Source: Bureau of Labor Statistics |
| 4 | Source: US Federal Reserve |
Team managed by Invesco Advisers, Inc.
The views and opinions expressed in management’s discussion of Fund performance are those of Invesco Advisers, Inc. These views and opinions are subject to change at any time based on factors such as market and economic conditions. These views and opinions may not be relied upon as investment advice or recommendations, or as an offer for a particular security. The information is not a complete analysis of every aspect of any market, country, industry, security or the Fund. Statements of fact are from sources considered reliable, but Invesco Advisers, Inc. makes no representation or warranty as to their completeness or accuracy. Although historical performance is no guarantee of future results, these insights may help you understand our investment management philosophy.
See important Fund and, if applicable, index disclosures later in this report.
| | | | | |
| Portfolio Composition by Maturity | | |
| In days, as of 2/28/14 | | | | | |
| 1 – 7 | | | | 91.5 | % |
| 8 – 30 | | | | 0.0 | |
| 31 – 60 | | | | 0.9 | |
| 61 – 90 | | | | 0.1 | |
| 91 – 180 | | | | 4.7 | |
| 181+ | | | | 2.8 | |
The number of days to maturity of each holding is determined in accordance with the provisions of Rule 2a-7 of the Investment Company Act of 1940.
continued from page 5
| n | | Variable-rate demand notes risk. The absence of an active secondary market for certain variable and floating rate notes could make it difficult to dispose of the instruments, and a |
| | | portfolio could suffer a loss if the issuer defaults during periods in which a portfolio is not entitled to exercise its demand rights. |
| n | | Yield risk. The Fund’s yield will vary as |
| | | the short-term securities in its portfolio mature or are sold and the proceeds are reinvested in other securities. Additionally, inflation may outpace and diminish investment returns over time. |
An investment in the Fund is not insured or guaranteed by the Federal Deposit Insurance Corporation or any other government agency. Although the Fund seeks to preserve the value of your investment at $1.00 per share, it is possible to lose money by investing in the Fund.
4 Invesco Tax-Exempt Cash Fund
Invesco Tax-Exempt Cash Fund’s investment objective is to provide tax-exempt income consistent with preservation of capital and liquidity.
| n | | Unless otherwise stated, information presented in this report is as of February 28, 2014, and is based on total net assets. |
| n | | Unless otherwise noted, all data provided by Invesco. |
| n | | To access your Fund’s reports/prospectus, visit invesco.com/fundreports. |
Principal risks of investing in the Fund
| n | | Alternative minimum tax risk. A portion of the Fund’s otherwise tax-exempt income may be taxable to those shareholders subject to the federal alternative minimum tax. |
| n | | Banking and financial services industry focus risk. From time to time, the Fund may invest more than 25% of its assets in unsecured bank instruments, including but not limited to certificates of deposit, time deposits and bankers acceptances. To the extent the Fund focuses its investments in these instruments or invests in securities issued or guaranteed by companies in the banking and financial services industries, the Fund’s performance will depend on the overall condition of those industries and the individual banks and financial institutions in which the Fund invests. Financial services companies may be dependent on the supply of short-term financing. The value of bank instruments and securities of issuers in the banking and financial services industry can be affected by and sensitive to changes in government regulation and interest rates and to economic downturns in the US and abroad. The risk of holding bank instruments is also directly tied to the risk of insolvency or bankruptcy of the issuing banks, which risk may be higher for larger or more complex financial institutions that combine traditional, commercial and investment banking. |
| n | | Cash/cash equivalents risk. Holding cash or cash equivalents may negatively affect performance. |
| n | | Counterparty risk. Counterparty risk is the risk that the other party to the contract will not fulfill its contractual obligations, which may cause losses or additional costs to the Fund. |
| n | | Credit risk. The issuer of instruments in which the Fund invests may be unable to meet interest and/or principal payments, thereby causing its instruments to decrease in value and lowering the issuer’s credit rating. |
| n | | Foreign credit exposure risk. U.S. dollar-denominated securities carrying foreign credit exposure may be affected by unfavorable political, economic or governmental developments that could affect payments of principal and interest. |
| n | | Foreign securities risk. The Fund’s foreign investments may be adversely affected by political and social instability, changes in economic or taxation policies, difficulties when enforcing obligations; decreased liquidity, and increased volatility. Foreign companies may be subject to less regulation resulting in less publicly available information about the companies. |
| n | | Interest rate risk. Interest rate risk refers to the risk that bond prices generally fall as interest rates rise; conversely, bond prices generally rise as interest rates fall. Specific bonds differ in their sensitivity to changes in interest rates depending on their individual characteristics, including duration. |
| n | | Liquidity risk. The Fund may hold illiquid securities that it is unable to sell at the preferred time or price and could lose its entire investment in such securities. Liquidity is also the risk that a Fund may not be able to pay redemption proceeds within an allowable amount of time. |
| n | | Management risk. The investment techniques and risk analysis used by the Fund’s portfolio managers may not produce the desired results. |
| n | | Market risk. The prices of and the income generated by the Fund’s securities may decline in response to, among other things, investor sentiment, general economic and market conditions, regional or global instability, and interest rate fluctuations. |
| n | | Money market fund risk. Although the Fund seeks to preserve the value of your investment at $1.00 per share, you may lose money by investing in the Fund. The share price of money market funds can fall below the $1.00 share price. You should not rely on or expect |
This report must be accompanied or preceded by a currently effective Fund prospectus, which contains more complete information, including sales charges and expenses. Investors should read it carefully before investing.
NOT FDIC INSURED | MAY LOSE VALUE | NO BANK GUARANTEE
| | the Fund’s adviser or its affiliates to enter into support agreements or take other actions to maintain the Fund’s $1.00 share price. The credit quality of the Fund’s holdings can change rapidly in certain markets, and the default of a single holding could have an adverse impact on the Fund’s share price. The Fund’s share price can also be negatively affected during periods of high redemption pressures and/or illiquid markets. Furthermore, additional government regulation, including by the SEC, could impact the way the Fund is managed and possibly negatively impacting its return. |
| n | | Municipal securities risk. The Fund may invest in municipal securities. Constitutional amendments, legislative enactments, executive orders, administrative regulations, voter initiatives, and the issuer’s regional economic conditions may affect the municipal security’s value, interest payments, repayment of principal and the Fund’s ability to sell it. Failure of a municipal security issuer to comply with applicable tax requirements may make income paid thereon taxable, resulting in a decline in the security’s value. In addition, there could be changes in applicable tax laws or tax treatments that reduce or eliminate the current federal income tax exemption on municipal securities or otherwise adversely affect the current federal or state tax status of municipal securities. |
| n | | Reinvestment risk. Reinvestment risk is the risk that a bond’s cash flows (coupon income and principal repayment) will be reinvested at an interest rate below that on the original bond. |
| n | | Repurchase agreement risk. If the seller of a repurchase agreement defaults or otherwise does not fulfill its obligations, the Fund may incur delays and losses arising from selling the underlying securities, enforcing its rights, or declining collateral value. These risks are magnified to the extent that a repurchase agreement is secured by securities other than cash or US government securities. |
| n | | US government obligations risk. The Fund may invest in obligations issued by US government agencies and instrumentalities that may receive varying levels of support from the government, which could affect the Fund’s ability to recover should they default. |
continued on page 4
5 Invesco Tax-Exempt Cash Fund
Schedule of Investments
February 28, 2014
| | | | | | | | | | | | | | | | |
| | | Interest Rate | | | Maturity Date | | | Principal Amount (000) | | | Value | |
Municipal Obligations–99.37% | |
| Alabama–5.38% | |
Mobile (County of) Industrial Development Authority (SSAB Alabama Inc.); Series 2010 A, VRD Recovery Zone Facility RB (LOC–Swedbank AB)(a)(b)(c) | | | 0.07 | % | | | 07/01/40 | | | $ | 6,000 | | | $ | 6,000,000 | |
|
| California–0.90% | |
California (State of) Health Facilities Financing Authority (Children’s Hospital of Orange County); Series 2009 C, VRD RB (LOC–U.S. Bank, N.A.)(a)(b) | | | 0.02 | % | | | 11/01/38 | | | | 1,000 | | | | 1,000,000 | |
|
| Colorado–5.02% | |
Bachelor Gulch Metropolitan District; Series 2004, VRD Unlimited Tax GO Bonds (LOC–U.S. Bank, N.A.)(a)(b) | | | 0.04 | % | | | 12/01/23 | | | | 745 | | | | 745,000 | |
Colorado (State of) Health Facilities Authority (Crossroads); Series 2003 A, VRD RB (LOC–U.S. Bank, N.A.)(a)(b) | | | 0.03 | % | | | 11/01/28 | | | | 790 | | | | 790,000 | |
Colorado (State of) Housing & Finance Authority (Winridge Apartments); Series 1998, Ref. VRD MFH RB (CEP–FNMA)(a) | | | 0.04 | % | | | 02/15/28 | | | | 365 | | | | 365,000 | |
Colorado (State of) Housing & Finance Authority (Woodstream Village); Series 1985, VRD MFH RB (CEP–FNMA)(a) | | | 0.05 | % | | | 02/01/31 | | | | 1,585 | | | | 1,585,000 | |
Englewood (City of) (Marks East Apartments); Series 2004, Ref. VRD MFH RB (CEP–FHLMC)(a) | | | 0.05 | % | | | 12/01/34 | | | | 2,110 | | | | 2,110,000 | |
| | | | | | | | | | | | | | | | 5,595,000 | |
|
| Florida–3.97% | |
Broward (County of) Educational Facilities Authority (City College, Inc.); Series 2004, VRD RB (LOC–Citibank, N.A.)(a)(b) | | | 0.04 | % | | | 11/01/31 | | | | 600 | | | | 600,000 | |
Palm Beach (County of) (Henry Morrison Flagler Museum); Series 2003, VRD RB (LOC–Northern Trust Co.)(a)(b) | | | 0.04 | % | | | 11/01/36 | | | | 675 | | | | 675,000 | |
Palm Beach (County of) (The Raymond F. Kravis Center for the Performing Arts, Inc.); Series 2002, VRD RB (LOC–Northern Trust Co.)(a)(b) | | | 0.04 | % | | | 07/01/32 | | | | 3,150 | | | | 3,150,000 | |
| | | | | | | | | | | | | | | | 4,425,000 | |
|
| Georgia–2.42% | |
Glynn-Brunswick Memorial Hospital Authority (Southeast Georgia Health System); Series 2008 B, VRD RAC (LOC–Branch Banking & Trust Co.)(a)(b) | | | 0.03 | % | | | 08/01/38 | | | | 900 | | | | 900,000 | |
Marietta (City of) Housing Authority (Wood Knoll Apartments); Series 1994, Ref. VRD MFH RB
(CEP–FHLMC)(a) | | | 0.03 | % | | | 07/01/24 | | | | 1,200 | | | | 1,200,000 | |
Private Colleges & Universities Authority (Emory University); Series 2005 B-2, VRD RB(a) | | | 0.02 | % | | | 09/01/35 | | | | 600 | | | | 600,000 | |
| | | | | | | | | | | | | | | | 2,700,000 | |
|
| Illinois–12.10% | |
Chicago (City of) (Churchview Supportive Living Facility); Series 2003, VRD MFH RB (LOC–BMO Harris N.A.)(a)(b)(d)(e) | | | 0.09 | % | | | 03/01/33 | | | | 2,700 | | | | 2,700,000 | |
Illinois (State of) Finance Authority (Foundation for Safety & Health); Series 1992, VRD Safety Education RB (LOC–BMO Harris, N.A.)(a)(b)(d) | | | 0.08 | % | | | 10/01/17 | | | | 1,750 | | | | 1,750,000 | |
Illinois (State of) Finance Authority (Garrett-Evangelical Theological Seminary); Series 2010, VRD RB (CEP–FHLB of Chicago)(a)(b) | | | 0.03 | % | | | 06/01/40 | | | | 4,760 | | | | 4,760,000 | |
Illinois (State of) Finance Authority (Institute of Gas Technology); Series 1999, VRD IDR (LOC–BMO Harris N.A.)(a)(b) | | | 0.06 | % | | | 09/01/24 | | | | 900 | | | | 900,000 | |
Illinois (State of) Finance Authority (Radiological Society of North America, Inc.); Series 1997, VRD RB (LOC–JPMorgan Chase Bank, N.A.)(a)(b)(d) | | | 0.14 | % | | | 06/01/17 | | | | 829 | | | | 829,000 | |
Illinois (State of) Housing Development Authority (Brainard Landings II Apartments); Series 2007, VRD MFH RB (LOC–U.S. Bank, N.A.)(a)(b)(e) | | | 0.09 | % | | | 05/01/42 | | | | 2,555 | | | | 2,555,000 | |
| | | | | | | | | | | | | | | | 13,494,000 | |
|
| Iowa–2.28% | |
Iowa (State of) Finance Authority (Windsor on the River, LLC); Series 2007 A, VRD MFH RB (LOC–PNC Bank, N.A.)(a)(b)(e) | | | 0.06 | % | | | 05/01/42 | | | | 2,000 | | | | 2,000,000 | |
West Des Moines (City of); Series 2013 A, Ref. Unlimited Tax GO Bonds | | | 2.00 | % | | | 06/01/14 | | | | 540 | | | | 542,335 | |
| | | | | | | | | | | | | | | | 2,542,335 | |
See accompanying Notes to Financial Statements which are an integral part of the financial statements.
6 Invesco Tax-Exempt Cash Fund
| | | | | | | | | | | | | | | | |
| | | Interest Rate | | | Maturity Date | | | Principal Amount (000) | | | Value | |
| Kansas–0.23% | |
Olathe Unified School District No. 233; Series 2009 C, Ref. Unlimited Tax GO Bonds | | | 4.00 | % | | | 09/01/14 | | | $ | 250 | | | $ | 254,642 | |
|
| Kentucky–9.49% | |
Breckinridge (County of) (Kentucky Association of Counties Leasing Trust); Series 1999, VRD Lease Program RB (LOC–U.S. Bank, N.A.)(a)(b) | | | 0.04 | % | | | 12/01/29 | | | | 3,000 | | | | 3,000,000 | |
Williamstown (City of) (Kentucky League of Cities Funding Trust); | | | | | | | | | | | | | | | | |
Series 2008 A, VRD Lease Program RB (LOC–U.S. Bank, N.A.)(a)(b) | | | 0.04 | % | | | 07/01/38 | | | | 4,590 | | | | 4,590,000 | |
Series 2008 B, VRD Lease Program RB (LOC–U.S. Bank, N.A.)(a)(b) | | | 0.04 | % | | | 12/01/38 | | | | 2,995 | | | | 2,995,000 | |
| | | | | | | | | | | | | | | | 10,585,000 | |
|
| Louisiana–0.81% | |
St. Tammany Parish Wide School District No. 12; Series 2013, Unlimited Tax GO Bonds | | | 3.00 | % | | | 04/01/14 | | | | 900 | | | | 902,143 | |
|
| Massachusetts–3.85% | |
Massachusetts (State of) Development Finance Agency (Clark University); Series 2008, VRD RB (LOC–TD Bank, N.A.)(a)(b) | | | 0.02 | % | | | 10/01/38 | | | | 4,000 | | | | 4,000,000 | |
Massachusetts (State of) Development Finance Agency (Harrington Memorial Hospital, Inc.); Series 2008 A, VRD RB (LOC–TD Bank, N.A.)(a)(b) | | | 0.03 | % | | | 07/01/38 | | | | 300 | | | | 300,000 | |
| | | | | | | | | | | | | | | | 4,300,000 | |
|
| Michigan–0.85% | |
Michigan (State of) Hospital Finance Authority (McLaren Health Care Corp.); Series 2008 B-3, Ref. VRD RB (LOC–JPMorgan Chase Bank, N.A.)(a)(b) | | | 0.04 | % | | | 10/15/38 | | | | 850 | | | | 850,000 | |
Southfield (City of) Economic Development Corp. (Lawrence Technological University); Series 2001, VRD Limited Obligation RB (LOC–JPMorgan Chase Bank, N.A.)(a)(b) | | | 0.04 | % | | | 10/01/31 | | | | 100 | | | | 100,000 | |
| | | | | | | | | | | | | | | | 950,000 | |
|
| Minnesota–2.24% | |
Minneapolis (City of) & St. Paul (City of) Housing & Redevelopment Authority (Allina Health System); Series 2009 C, Ref. VRD Health Care RB (LOC–Wells Fargo Bank, N.A.)(a)(b) | | | 0.03 | % | | | 11/15/35 | | | | 2,500 | | | | 2,500,000 | |
|
| Missouri–3.69% | |
Bridgeton (City of) Industrial Development Authority (Stolze Printing); Series 2010, VRD IDR (LOC–FHLB of Chicago)(a)(b) | | | 0.12 | % | | | 11/01/37 | | | | 2,970 | | | | 2,970,000 | |
St. Louis (City of) Industrial Development Authority (St. Louis Art Museum); Series 2009 B, VRD Cultural Facilities RB (LOC–U.S. Bank, N.A.)(a)(b) | | | 0.04 | % | | | 12/01/40 | | | | 1,150 | | | | 1,150,000 | |
| | | | | | | | | | | | | | | | 4,120,000 | |
|
| New Hampshire–3.23% | |
New Hampshire (State of) Health & Education Facilities Authority (Riverbend Community Mental Health, Inc.); Series 2008, VRD RB (LOC–TD Bank, N.A.)(a)(b) | | | 0.03 | % | | | 07/01/38 | | | | 3,600 | | | | 3,600,000 | |
|
| New Jersey–0.90% | |
New Jersey (State of) Turnpike Authority; Series 2009 A, VRD RB (LOC–JPMorgan Chase Bank, N.A.)(a)(b) | | | 0.04 | % | | | 01/01/24 | | | | 1,000 | | | | 1,000,000 | |
|
| North Carolina–1.33% | |
Mecklenburg (County of); Series 2009 A, Ref. Unlimited Tax GO Bonds | | | 5.00 | % | | | 08/01/14 | | | | 150 | | | | 152,946 | |
North Carolina (State of) Capital Facilities Finance Agency (Duke University); Series 1991 B, VRD RB(a) | | | 0.03 | % | | | 12/01/21 | | | | 900 | | | | 900,000 | |
Winston-Salem (City of); Series 2013, Stormwater Fee RB | | | 2.00 | % | | | 06/01/14 | | | | 430 | | | | 431,888 | |
| | | | | | | | | | | | | | | | 1,484,834 | |
|
| North Dakota–1.79% | |
Fargo (City of) (Cass Oil Co.); Series 1984, VRD Commercial Development RB (LOC–U.S. Bank, N.A.)(a)(b) | | | 0.14 | % | | | 12/01/14 | | | | 2,000 | | | | 2,000,000 | |
|
| Ohio–4.01% | |
Coshocton (County of) (Coshocton County Memorial Hospital); Series 1999, VRD Hospital Facilities RB (LOC–JPMorgan Chase Bank, N.A.)(a)(b) | | | 0.04 | % | | | 03/01/19 | | | | 2,165 | | | | 2,165,000 | |
See accompanying Notes to Financial Statements which are an integral part of the financial statements.
7 Invesco Tax-Exempt Cash Fund
| | | | | | | | | | | | | | | | |
| | | Interest Rate | | | Maturity Date | | | Principal Amount (000) | | | Value | |
| Ohio–(continued) | |
Lorain (County of) Port Authority (St. Ignatius High School); Series 2008, VRD Educational Facilities RB (LOC–U.S. Bank, N.A.)(a)(b) | | | 0.05 | % | | | 08/02/38 | | | $ | 1,600 | | | $ | 1,600,000 | |
Ohio (State of); Series 2010 N, Highway Capital Improvement Unlimited Tax GO Bonds(f)(g) | | | 5.00 | % | | | 06/15/14 | | | | 700 | | | | 709,634 | |
| | | | | | | | | | | | | | | | 4,474,634 | |
|
| Oklahoma–0.22% | |
Oklahoma (City of); Series 2006, Unlimited Tax GO Bonds | | | 5.00 | % | | | 03/01/14 | | | | 250 | | | | 250,000 | |
|
| Oregon–2.33% | |
Clackamas (County of) Hospital Facility Authority (Legacy Health System); Series 2008 C, VRD RB (LOC–U.S. Bank, N.A.)(a)(b) | | | 0.03 | % | | | 06/01/37 | | | | 1,000 | | | | 1,000,000 | |
Oregon (State of) Housing & Community Services Department (Redwood Park Apartments LLC); Series 2005 F, VRD Housing Development RB (CEP–FNMA)(a)(e) | | | 0.07 | % | | | 10/15/38 | | | | 1,600 | | | | 1,600,000 | |
| | | | | | | | | | | | | | | | 2,600,000 | |
|
| Pennsylvania–16.21% | |
Derry (Township of) Industrial & Commercial Development Authority (Hershey Arena); Series 2000 A, VRD Hotel Tax RB (LOC–PNC Bank, N. A.)(a)(b) | | | 0.04 | % | | | 11/01/30 | | | | 580 | | | | 580,000 | |
Emmaus (City of) General Authority (Pennsylvania Variable Rate Loan Program); Series 2000 A, VRD RB (LOC–U.S. Bank, N.A.)(a)(b) | | | 0.03 | % | | | 03/01/30 | | | | 2,500 | | | | 2,500,000 | |
Haverford Township School District; Series 2009, VRD Limited Tax GO Bonds (LOC–TD Bank,
N.A.)(a)(b) | | | 0.03 | % | | | 03/01/30 | | | | 1,100 | | | | 1,100,000 | |
Lebanon (County of) Health Facilities Authority (E.C.C. Retirement Village); Series 2000, VRD RB (LOC–PNC Bank, N.A.)(a)(b) | | | 0.05 | % | | | 10/15/25 | | | | 400 | | | | 400,000 | |
Montgomery (County of) Redevelopment Authority (Forge Gate Apartments); Series 2001 A, VRD MFH RB (CEP–FNMA)(a) | | | 0.03 | % | | | 08/15/31 | | | | 4,575 | | | | 4,575,000 | |
Moon (Township of) Industrial Development Authority (Providence Point); Series 2007, VRD First Mortgage RB (LOC–Lloyds Bank PLC)(a)(b)(c) | | | 0.05 | % | | | 07/01/38 | | | | 5,930 | | | | 5,930,000 | |
Pennsylvania (State of) Higher Educational Facilities Authority (Association of Independent Colleges & Universities of Pennsylvania Financing Program-The Waynesburg College); Series 2004 N-2, VRD RB (LOC–PNC Bank, N.A.)(a)(b) | | | 0.05 | % | | | 05/01/34 | | | | 3,000 | | | | 3,000,000 | |
| | | | | | | | | | | | | | | | 18,085,000 | |
|
| Rhode Island–0.78% | |
Rhode Island (State of) Health & Educational Building Corp. (Brown University); Series 2013, Higher Education Facility RB | | | 5.00 | % | | | 09/01/14 | | | | 850 | | | | 870,557 | |
|
| South Carolina–1.08% | |
South Carolina (State of) Jobs-Economic Development Authority (Heathwood Hall Episcopal School); Series 2001, VRD RB (LOC–Wells Fargo Bank, N.A.)(a)(b) | | | 0.04 | % | | | 08/01/29 | | | | 1,200 | | | | 1,200,000 | |
|
| Tennessee–0.83% | |
Clarksville (City of) Public Building Authority (Tennessee Municipal Bond Fund); Series 1994, VRD Pooled Financing RB (LOC–Bank of America, N.A.)(a)(b)(d) | | | 0.08 | % | | | 06/01/24 | | | | 930 | | | | 930,000 | |
|
| Texas–7.07% | |
El Paso (City of); Series 2012 A, Ref. Water & Sewer Improvement RB | | | 2.00 | % | | | 03/01/14 | | | | 175 | | | | 175,000 | |
Midway Independent School District; Series 2010, Ref. Unlimited Tax GO Bonds (CEP–Texas Permanent School Fund) | | | 5.00 | % | | | 08/15/14 | | | | 550 | | | | 562,083 | |
Plains Independent School District; Series 2013 A, Unlimited Tax GO Bonds (CEP–Texas Permanent School Fund) | | | 2.00 | % | | | 08/15/14 | | | | 880 | | | | 887,086 | |
Tarrant (County of) Housing Finance Corp. (Remington Hill Development); Series 1998, VRD MFH RB (CEP–FNMA)(a) | | | 0.05 | % | | | 02/15/28 | | | | 1,400 | | | | 1,400,000 | |
Southeast Texas Housing Finance Corp. (Mansions at Moses Lake Apartments); Series 2008, VRD MFH RB (CEP–FHLMC)(a)(e) | | | 0.05 | % | | | 06/01/41 | | | | 3,700 | | | | 3,700,000 | |
Texas (State of); Series 2013, TRAN | | | 2.00 | % | | | 08/28/14 | | | | 1,050 | | | | 1,059,344 | |
Texas A&M University System Board of Regents; Series 2010 A, Ref. Financing System RB | | | 4.00 | % | | | 05/15/14 | | | | 100 | | | | 100,760 | |
| | | | | | | | | | | | | | | | 7,884,273 | |
See accompanying Notes to Financial Statements which are an integral part of the financial statements.
8 Invesco Tax-Exempt Cash Fund
| | | | | | | | | | | | | | | | |
| | | Interest Rate | | | Maturity Date | | | Principal Amount (000) | | | Value | |
| Utah–1.24% | |
Davis School District; Series 2009, Unlimited Tax GO Bonds (CEP–Utah School Bond Guarantee Program) | | | 3.00 | % | | | 06/01/14 | | | $ | 875 | | | $ | 880,827 | |
Utah (County of) (IHC Health Services, Inc.); Series 2002 B, VRD Hospital RB(a) | | | 0.02 | % | | | 05/15/35 | | | | 500 | | | | 500,000 | |
| | | | | | | | | | | | | | | | 1,380,827 | |
|
| Virginia–1.25% | |
Hampton (County of) Roads Sanitation District; Series 2009 A, Wastewater RB | | | 4.00 | % | | | 11/01/14 | | | | 100 | | | | 102,472 | |
Roanoke (City of); Series 2004 B, Public Improvement Unlimited Tax GO Bonds(f)(g) | | | 5.00 | % | | | 02/01/15 | | | | 750 | | | | 789,841 | |
Virginia (State of); Series 2011 A-1, Unlimited Tax GO Bonds | | | 3.00 | % | | | 06/01/14 | | | | 500 | | | | 503,450 | |
| | | | | | | | | | | | | | | | 1,395,763 | |
|
| Washington–0.18% | |
Washington (State of) Housing Finance Commission (District Council No. 5 Apprenticeship & Training Trust Fund); Series 2006, VRD Non-profit RB (LOC–Wells Fargo Bank, N.A.)(a)(b) | | | 0.14 | % | | | 11/01/32 | | | | 200 | | | | 200,000 | |
|
| Wisconsin–3.69% | |
Appleton (City of) Public Improvement; Series 2012 C, Unlimited Tax GO Bonds | | | 2.00 | % | | | 04/01/14 | | | | 110 | | | | 110,159 | |
New Berlin (City of); Series 2012 A, Ref. Corporate Purpose Unlimited Tax GO Bonds | | | 2.00 | % | | | 06/01/14 | | | | 500 | | | | 502,263 | |
Oneida Tribe of Indians of Wisconsin; Series 2001, VRD Health Facilities RB (LOC–Bank of America, N.A.)(a)(b) | | | 0.08 | % | | | 07/01/16 | | | | 2,500 | | | | 2,500,000 | |
Wisconsin (State of) Health & Educational Facilities Authority (Indian Community School of Milwaukee, Inc.); Series 2006, VRD RB (LOC–JPMorgan Chase Bank, N.A.)(a)(b) | | | 0.04 | % | | | 12/01/36 | | | | 1,000 | | | | 1,000,000 | |
| | | | | | | | | | | | | | | | 4,112,422 | |
TOTAL INVESTMENTS(h)(i)–99.37% (Cost $110,836,430) | | | | | | | | | | | | | | | 110,836,430 | |
OTHER ASSETS LESS LIABILITIES–0.63% | | | | | | | | | | | | | | | 706,918 | |
NET ASSETS–100.00% | | | | | | | | | | | | | | $ | 111,543,348 | |
Investment Abbreviations:
| | |
| CEP | | – Credit Enhancement Provider |
| FHLB | | – Federal Home Loan Bank |
| FHLMC | | – Federal Home Loan Mortgage Corp. |
| FNMA | | – Federal National Mortgage Association |
| GO | | – General Obligation |
| | |
| IDR | | – Industrial Development Revenue Bonds |
| LOC | | – Letter of Credit |
| MFH | | – Multi-Family Housing |
| RAC | | – Revenue Anticipation Certificates |
| | |
| | |
| RB | | – Revenue Bonds |
| Ref. | | - Refunding |
| TRAN | | – Tax and Revenue Anticipation Notes |
| VRD | | – Variable Rate Demand |
Notes to Schedule of Investments:
| (a) | Demand security payable upon demand by the Fund at specified time intervals no greater than thirteen months. Interest rate is redetermined periodically. Rate shown is the rate in effect on February 28, 2014. |
| (b) | Principal and interest payments are fully enhanced by a letter of credit from the bank listed or a predecessor bank, branch or subsidiary. |
| (c) | The security is credit guaranteed, enhanced or has credit risk by a foreign entity. The foreign credit exposure to countries other than the United States of America (as a percentage of net assets) is summarized as follows: Sweden: 5.4%; United Kingdom: 5.3%. |
| (d) | Security purchased or received in a transaction exempt from registration under the Securities Act of 1933, as amended (the “1933 Act”). The security may be resold pursuant to an exemption from registration under the 1933 Act, typically to qualified institutional buyers. The aggregate value of these securities at February 28, 2014 was $6,209,000, which represented 5.57% of the Fund’s Net Assets. |
| (e) | Security subject to the alternative minimum tax. |
| (f) | Advance refunded; secured by an escrow fund of U.S. Government obligations or other highly rated collateral. |
| (g) | Security has an irrevocable call by the issuer or mandatory put by the holder. Maturity date reflects such call or put. |
| (h) | This table provides a listing of those entities that have either issued, guaranteed, backed or otherwise enhanced the credit quality of more than 5% of the securities held in the portfolio. In instances where the entity has guaranteed, backed or otherwise enhanced the credit quality of a security, it is not primarily responsible for the issuer’s obligations but may be called upon to satisfy the issuer’s obligations. |
| | | | |
| Entities | | Percentage | |
U.S. Bank, N.A. | | | 21.6 | % |
Federal National Mortgage Association | | | 8.6 | |
TD Bank, N.A. | | | 8.1 | |
Federal Home Loan Bank | | | 7.0 | |
Federal Home Loan Mortgage Corp. | | | 6.3 | |
Swedbank AB | | | 5.4 | |
PNC Bank, N.A. | | | 5.4 | |
JPMorgan Chase Bank, N.A. | | | 5.4 | |
Lloyds Bank PLC | | | 5.4 | |
| (i) | Also represents cost for federal income tax purposes. |
See accompanying Notes to Financial Statements which are an integral part of the financial statements.
9 Invesco Tax-Exempt Cash Fund
Statement of Assets and Liabilities
February 28, 2014
| | | | |
Assets: | |
Investments, at value and cost | | $ | 110,836,430 | |
Cash | | | 182,555 | |
Receivable for: | | | | |
Investments sold | | | 350,000 | |
Fund shares sold | | | 255,333 | |
Interest | | | 86,105 | |
Fund expenses absorbed | | | 12,512 | |
Investment for trustee deferred compensation and retirement plans | | | 54,828 | |
Other assets | | | 14,345 | |
Total assets | | | 111,792,108 | |
|
Liabilities: | |
Payable for: | | | | |
Fund shares reacquired | | | 140,125 | |
Dividends | | | 340 | |
Accrued fees to affiliates | | | 21,537 | |
Accrued trustees’ and officers’ fees and benefits | | | 3,150 | |
Accrued other operating expenses | | | 27,941 | |
Trustee deferred compensation and retirement plans | | | 55,667 | |
Total liabilities | | | 248,760 | |
Net assets applicable to shares outstanding | | $ | 111,543,348 | |
|
Net assets consist of: | |
Shares of beneficial interest | | $ | 111,541,411 | |
Undistributed net investment income | | | 18,494 | |
Undistributed net realized gain (loss) | | | (16,557 | ) |
| | | $ | 111,543,348 | |
| | | | |
Net Assets: | |
Class A | | $ | 81,582,959 | |
Class Y | | $ | 10,991,103 | |
Investor Class | | $ | 18,969,286 | |
|
Shares outstanding, $0.001 par value per share,
with an unlimited number of shares authorized: | |
Class A | | | 81,582,814 | |
Class Y | | | 10,991,051 | |
Investor Class | | | 18,969,196 | |
Net asset value, offering and redemption price per share for each class | | $ | 1.00 | |
See accompanying Notes to Financial Statements which are an integral part of the financial statements.
10 Invesco Tax-Exempt Cash Fund
Statement of Operations
For the year ended February 28, 2014
| | | | |
Investment income: | |
Interest | | $ | 111,582 | |
| |
Expenses: | | | | |
Advisory fees | | | 320,974 | |
Administrative services fees | | | 50,000 | |
Custodian fees | | | 3,046 | |
Distribution fees — Class A | | | 62,789 | |
Transfer agent fees | | | 74,693 | |
Trustees’ and officers’ fees and benefits | | | 28,779 | |
Registration and filing fees | | | 39,918 | |
Professional service fees | | | 37,965 | |
Other | | | 31,070 | |
Total expenses | | | 649,234 | |
Less: Fees waived, expenses reimbursed and expense offset arrangement(s) | | | (616,213 | ) |
Net expenses | | | 33,021 | |
Net investment income | | | 78,561 | |
Net realized gain from investment securities | | | 284 | |
Net increase in net assets resulting from operations | | $ | 78,845 | |
See accompanying Notes to Financial Statements which are an integral part of the financial statements.
11 Invesco Tax-Exempt Cash Fund
Statement of Changes in Net Assets
For the years ended February 28, 2014 and 2013
| | | | | | | | |
| | | 2014 | | | 2013 | |
Operations: | | | | | |
Net investment income | | $ | 78,561 | | | $ | 85,116 | |
Net realized gain | | | 284 | | | | 1,738 | |
Net increase in net assets resulting from operations | | | 78,845 | | | | 86,854 | |
| | |
Distributions to shareholders from net investment income: | | | | | | | | |
Class A | | | (52,027 | ) | | | (26,249 | ) |
Class Y | | | (14,554 | ) | | | (10,509 | ) |
Investor Class | | | (11,980 | ) | | | (6,625 | ) |
Total distributions from net investment income | | | (78,561 | ) | | | (43,383 | ) |
| | |
Share transactions–net: | | | | | | | | |
Class A | | | 52,479,826 | | | | (2,758,143 | ) |
Class Y | | | (7,744,013 | ) | | | 6,272,408 | |
Investor Class | | | 10,333,381 | | | | (895,326 | ) |
Net increase in net assets resulting from share transactions | | | 55,069,194 | | | | 2,618,939 | |
Net increase in net assets | | | 55,069,478 | | | | 2,662,410 | |
| | |
Net assets: | | | | | | | | |
Beginning of year | | | 56,473,870 | | | | 53,811,460 | |
End of year (includes undistributed net investment income of $18,494 and $19,518, respectively) | | $ | 111,543,348 | | | $ | 56,473,870 | |
Notes to Financial Statements
February 28, 2014
NOTE 1—Significant Accounting Policies
Invesco Tax-Exempt Cash Fund (the “Fund”) is a series portfolio of AIM Tax-Exempt Funds (Invesco Tax-Exempt Funds) (the “Trust”). The Trust is a Delaware statutory trust registered under the Investment Company Act of 1940, as amended (the “1940 Act”), as an open-end series management investment company consisting of six separate portfolios, each authorized to issue an unlimited number of shares of beneficial interest. The assets, liabilities and operations of each portfolio are accounted for separately. Information presented in these financial statements pertains only to the Fund. Matters affecting each portfolio or class will be voted on exclusively by the shareholders of such portfolio or class.
The Fund’s investment objective is to provide tax-exempt income consistent with preservation of capital and liquidity.
The Fund currently consists of three different classes of shares: Class A, Class Y and Investor Class. Investor Class shares of the Fund are offered only to certain grandfathered investors. Under certain circumstances, Class A shares are subject to contingent deferred sales charges (“CDSC”). Class A, Class Y and Investor Class shares are sold at net asset value.
The following is a summary of the significant accounting policies followed by the Fund in the preparation of its financial statements.
| A. | Security Valuations — The Fund’s securities are recorded on the basis of amortized cost which approximates value as permitted by Rule 2a-7 under the 1940 Act. This method values a security at its cost on the date of purchase and, thereafter, assumes a constant amortization to maturity of any premiums or accretion of any discounts. |
Because of the inherent uncertainties of valuation, the values reflected in the financial statements may materially differ from the value received upon actual sale of those investments.
The Fund invests in securities that are subject to interest rate risk, meaning the risk that the prices will generally fall as interest rates rise and, conversely, the prices will generally rise as interest rates fall. Specific securities differ in their sensitivity to changes in interest rates depending on their individual characteristics. Changes in interest rates may result in increased market volatility, which may affect the value and/or liquidity of certain of the Fund’s investments.
| B. | Securities Transactions and Investment Income — Securities transactions are accounted for on a trade date basis. Realized gains or losses on sales are computed on the basis of specific identification of the securities sold. Interest income, adjusted for amortization of premiums and accretion of discounts on investments, is recorded on the accrual basis from settlement date. |
The Fund may periodically participate in litigation related to Fund investments. As such, the Fund may receive proceeds from litigation settlements. Any proceeds received are included in the Statement of Operations as realized gain (loss) for investments no longer held and as unrealized gain (loss) for investments still held.
Brokerage commissions and mark ups are considered transaction costs and are recorded as an increase to the cost basis of securities purchased and/or a reduction of proceeds on a sale of securities. Such transaction costs are included in the determination of net realized gain (loss) from investment securities reported in the Statement of Operations and the Statement of Changes in Net Assets and the net realized gains (losses) on securities per share in the Financial Highlights. Transaction costs are included in the calculation of the Fund’s net asset value and, accordingly, they reduce the Fund’s total returns. These transaction costs are not considered operating expenses and are not reflected in net
12 Invesco Tax-Exempt Cash Fund
investment income reported in the Statement of Operations and Statement of Changes in Net Assets, or the net investment income per share and ratios of expenses and net investment income reported in the Financial Highlights, nor are they limited by any expense limitation arrangements between the Fund and the investment adviser.
The Fund allocates realized capital gains and losses to a class based on the relative net assets of each class. The Fund allocates income to a class based on the relative value of the settled shares of each class.
| C. | Country Determination — For the purposes of making investment selection decisions and presentation in the Schedule of Investments, the investment adviser may determine the country in which an issuer is located and/or credit risk exposure based on various factors. These factors include the laws of the country under which the issuer is organized, where the issuer maintains a principal office, the country in which the issuer derives 50% or more of its total revenues and the country that has the primary market for the issuer’s securities, as well as other criteria. Among the other criteria that may be evaluated for making this determination are the country in which the issuer maintains 50% or more of its assets, the type of security, financial guarantees and enhancements, the nature of the collateral and the sponsor organization. Country of issuer and/or credit risk exposure has been determined to be the United States of America, unless otherwise noted. |
| D. | Distributions — Distributions from income are declared daily and paid monthly. Distributions from net realized capital gain, if any, are generally declared and paid annually and recorded on the ex-dividend date. The Fund may elect to treat a portion of the proceeds from redemptions as distributions for federal income tax purposes. |
| E. | Federal Income Taxes — The Fund intends to comply with the requirements of Subchapter M of the Internal Revenue Code of 1986, as amended (the “Internal Revenue Code”), necessary to qualify as a regulated investment company and to distribute substantially all of the Fund’s taxable and tax-exempt earnings to shareholders. As such, the Fund will not be subject to federal income taxes on otherwise taxable income (including net realized capital gain) that is distributed to shareholders. Therefore, no provision for federal income taxes is recorded in the financial statements. |
The Fund recognizes the tax benefits of uncertain tax positions only when the position is more likely than not to be sustained. Management has analyzed the Fund’s uncertain tax positions and concluded that no liability for unrecognized tax benefits should be recorded related to uncertain tax positions. Management is not aware of any tax positions for which it is reasonably possible that the total amounts of unrecognized tax benefits will change materially in the next 12 months.
In addition, the Fund intends to invest in such municipal securities to allow it to qualify to pay shareholders “exempt-interest dividends”, as defined in the Internal Revenue Code.
The Fund files tax returns in the U.S. Federal jurisdiction and certain other jurisdictions. Generally, the Fund is subject to examinations by such taxing authorities for up to three years after the filing of the return for the tax period.
| F. | Expenses — Fees provided for under the Rule 12b-1 plan of a particular class of the Fund and which are directly attributable to that class are charged to the operations of such class. All other expenses are allocated among the classes based on relative net assets. |
| G. | Accounting Estimates — The preparation of financial statements in conformity with accounting principles generally accepted in the United States of America (“GAAP”) requires management to make estimates and assumptions that affect the reported amounts of assets and liabilities at the date of the financial statements and the reported amounts of revenues and expenses during the reporting period including estimates and assumptions related to taxation. Actual results could differ from those estimates by a significant amount. In addition, the Fund monitors for material events or transactions that may occur or become known after the period-end date and before the date the financial statements are released to print. |
| H. | Indemnifications — Under the Trust’s organizational documents, each Trustee, officer, employee or other agent of the Trust is indemnified against certain liabilities that may arise out of the performance of their duties to the Fund. Additionally, in the normal course of business, the Fund enters into contracts, including the Fund’s servicing agreements, that contain a variety of indemnification clauses. The Fund’s maximum exposure under these arrangements is unknown as this would involve future claims that may be made against the Fund that have not yet occurred. The risk of material loss as a result of such indemnification claims is considered remote. |
| I. | Other Risks — The value of, payment of interest on, repayment of principal for and the ability to sell a municipal security may be affected by constitutional amendments, legislative enactments, executive orders, administrative regulations, voter initiatives and the economics of the regions in which the issuers are located. |
Since many municipal securities are issued to finance similar projects, especially those relating to education, health care, transportation and utilities, conditions in those sectors can affect the overall municipal securities market and a Fund’s investments in municipal securities.
There is some risk that a portion or all of the interest received from certain tax-free municipal securities could become taxable as a result of determinations by the Internal Revenue Service.
NOTE 2—Advisory Fees and Other Fees Paid to Affiliates
The Trust has entered into a master investment advisory agreement with Invesco Advisers, Inc. (the “Adviser” or “Invesco”). Under the terms of the investment advisory agreement, the Fund pays an advisory fee to the Adviser at the annual rate of 0.35% of the Fund’s average daily net assets.
Under the terms of a master sub-advisory agreement between the Adviser and each of Invesco Asset Management Deutschland GmbH, Invesco Asset Management Limited, Invesco Asset Management (Japan) Limited, Invesco Australia Limited, Invesco Hong Kong Limited, Invesco Senior Secured Management, Inc. and Invesco Canada Ltd. (collectively, the “Affiliated Sub-Advisers”) the Adviser, not the Fund, may pay 40% of the fees paid to the Adviser to any such Affiliated Sub-Adviser(s) that provide(s) discretionary investment management services to the Fund based on the percentage of assets allocated to such Sub-Adviser(s).
Invesco and/or Invesco Distributors, Inc. (“IDI”) voluntarily agreed to waive fees and/or reimburse expenses in order to increase the Fund’s yield. Voluntary fee waivers and/or reimbursements may be modified at any time upon consultation with the Board of Trustees without further notice to investors.
For the year ended February 28, 2014, the Adviser reimbursed Fund expenses of $553,228.
The Trust has entered into a master administrative services agreement with Invesco pursuant to which the Fund has agreed to pay Invesco for certain administrative costs incurred in providing accounting services to the Fund. For the year ended February 28, 2014, expenses incurred under the agreement are shown in the Statement of Operations as Administrative services fees.
13 Invesco Tax-Exempt Cash Fund
The Trust has entered into a transfer agency and service agreement with Invesco Investment Services, Inc. (“IIS”) pursuant to which the Fund has agreed to pay IIS a fee for providing transfer agency and shareholder services to the Fund and reimburse IIS for certain expenses incurred by IIS in the course of providing such services. IIS may make payments to intermediaries that provide omnibus account services, sub-accounting services and/or networking services. All fees payable by IIS to intermediaries that provide omnibus account services or sub-accounting are charged back to the Fund, subject to certain limitations approved by the Trust’s Board of Trustees. For the year ended February 28, 2014, expenses incurred under the agreement are shown in the Statement of Operations as Transfer agent fees.
The Trust has entered into master distribution agreements with IDI to serve as the distributor for the Class A, Class Y and Investor Class shares of the Fund. The Trust has adopted plans pursuant to Rule 12b-1 under the 1940 Act with respect to the Fund’s Class A shares (collectively, the “Plans”). The Fund, pursuant to the Plans, pays IDI compensation up to a maximum annual rate of 0.10% of the Fund’s average daily net assets of Class A shares. Of the Rule 12b-1 payments, up to 0.10% of the average daily net assets of Class A shares may be paid to furnish continuing personal shareholder services to customers who purchase and own the shares of such classes. Any amounts not paid as a service fee under the Plans would constitute an asset-based sales charge. Rules of the Financial Industry Regulatory Authority (“FINRA”) also impose a cap on the total sales charges, including asset-based sales charges, that may be paid by any class of shares of the Fund. Pursuant to the Plans, for the year ended February 28, 2014, the Class A shares paid $0 after IDI waived Plan fees of $62,789.
CDSC are not recorded as expenses of the Fund. CDSC are deducted from redemption proceeds prior to remittance to the shareholder. During the year ended February 28, 2014, IDI advised the Fund that IDI retained $12,776 from Class A shares for CDSC imposed on redemptions by shareholders.
Certain officers and trustees of the Trust are officers and directors of the Adviser, IIS and/or IDI.
NOTE 3—Additional Valuation Information
GAAP defines fair value as the price that would be received to sell an asset or paid to transfer a liability in an orderly transaction between market participants at the measurement date, under current market conditions. GAAP establishes a hierarchy that prioritizes the inputs to valuation methods, giving the highest priority to readily available unadjusted quoted prices in an active market for identical assets (Level 1) and the lowest priority to significant unobservable inputs (Level 3), generally when market prices are not readily available or are unreliable. Based on the valuation inputs, the securities or other investments are tiered into one of three levels. Changes in valuation methods may result in transfers in or out of an investment’s assigned level:
| | Level 1 — | Prices are determined using quoted prices in an active market for identical assets. |
| | Level 2 — | Prices are determined using other significant observable inputs. Observable inputs are inputs that other market participants may use in pricing a security. These may include quoted prices for similar securities, interest rates, prepayment speeds, credit risk, yield curves, loss severities, default rates, discount rates, volatilities and others. |
| | Level 3 — | Prices are determined using significant unobservable inputs. In situations where quoted prices or observable inputs are unavailable (for example, when there is little or no market activity for an investment at the end of the period), unobservable inputs may be used. Unobservable inputs reflect the Fund’s own assumptions about the factors market participants would use in determining fair value of the securities or instruments and would be based on the best available information. |
As of February 28, 2014, all of the securities in this Fund were valued based on Level 2 inputs (see the Schedule of Investments for security categories). The level assigned to the securities valuations may not be an indication of the risk or liquidity associated with investing in those securities. Because of the inherent uncertainties of valuation, the values reflected in the financial statements may materially differ from the value received upon actual sale of those investments.
NOTE 4—Security Transactions with Affiliated Funds
The Fund is permitted to purchase or sell securities from or to certain other Invesco Funds under specified conditions outlined in procedures adopted by the Board of Trustees of the Trust. The procedures have been designed to ensure that any purchase or sale of securities by the Fund from or to another fund or portfolio that is or could be considered an affiliate by virtue of having a common investment adviser (or affiliated investment advisers), common Trustees and/or common officers complies with Rule 17a-7 of the 1940 Act. Further, as defined under the procedures, each transaction is effected at the current market price. Pursuant to these procedures, for the year ended February 28, 2014, the Fund engaged in securities purchases of $190,916,973 and securities sales of $112,709,825, which did not result in any net realized gains (losses).
NOTE 5—Expense Offset Arrangement(s)
The expense offset arrangement is comprised of transfer agency credits which result from balances in demand deposit accounts used by the transfer agent for clearing shareholder transactions. For the year ended February 28, 2014, the Fund received credits from this arrangement, which resulted in the reduction of the Fund’s total expenses of $196.
NOTE 6—Trustees’ and Officers’ Fees and Benefits
Trustees’ and Officers’ Fees and Benefits include amounts accrued by the Fund to pay remuneration to certain Trustees and Officers of the Fund. Trustees have the option to defer compensation payable by the Fund, and Trustees’ and Officers’ Fees and Benefits also include amounts accrued by the Fund to fund such deferred compensation amounts. Those Trustees who defer compensation have the option to select various Invesco Funds in which their deferral accounts shall be deemed to be invested. Finally, certain current Trustees were eligible to participate in a retirement plan that provided for benefits to be paid upon retirement to Trustees over a period of time based on the number of years of service. The Fund may have certain former Trustees who also participate in a retirement plan and receive benefits under such plan. Trustees’ and Officers’ Fees and Benefits include amounts accrued by the Fund to fund such retirement benefits. Obligations under the deferred compensation and retirement plans represent unsecured claims against the general assets of the Fund.
14 Invesco Tax-Exempt Cash Fund
NOTE 7—Cash Balances
The Fund is permitted to temporarily carry a negative or overdrawn balance in its account with The Bank of New York Mellon, the custodian bank. Such balances, if any at period end, are shown in the Statement of Assets and Liabilities under the payable caption Amount due custodian. To compensate the custodian bank for such overdrafts, the overdrawn Fund may either (1) leave funds as a compensating balance in the account so the custodian bank can be compensated by earning the additional interest; or (2) compensate by paying the custodian bank at a rate agreed upon by the custodian bank and Invesco, not to exceed the contractually agreed upon rate.
NOTE 8—Distributions to Shareholders and Tax Components of Net Assets
Tax Character of Distributions to Shareholders Paid During the Years Ended February 28, 2014 and 2013:
| | | | | | | | |
| | | 2014 | | | 2013 | |
Ordinary income-tax exempt | | $ | 78,561 | | | $ | 43,383 | |
Tax Components of Net Assets at Period-End:
| | | | |
| | | 2014 | |
Undistributed ordinary income | | $ | 66,780 | |
Temporary book/tax differences | | | (48,286 | ) |
Capital loss carryforward | | | (16,557 | ) |
Shares of beneficial interest | | | 111,541,411 | |
Total net assets | | $ | 111,543,348 | |
The temporary book/tax differences are a result of timing differences between book and tax recognition of income and/or expenses. The Fund’s temporary book/tax differences are the result of the trustee deferral of compensation and retirement plan benefits.
Capital loss carryforward is calculated and reported as of a specific date. Results of transactions and other activity after that date may affect the amount of capital loss carryforward actually available for the Fund to utilize. Capital losses generated in years beginning after December 22, 2010 can be carried forward for an unlimited period, whereas previous losses expire in 8 tax years. Capital losses with an expiration period may not be used to offset capital gains until all net capital losses without an expiration date have been utilized. Capital loss carryforwards with no expiration date will retain their character as either short-term or long-term capital losses instead of as short-term capital losses as under prior law. The ability to utilize capital loss carryforward in the future may be limited under the Internal Revenue Code and related regulations based on the results of future transactions.
The Fund utilized $284 of capital loss carryforward in the current period to offset net realized capital gain for federal income tax purposes. The Fund has a capital loss carryforward as of February 28, 2014, which expires as follows:
| | | | | | | | | | | | |
| Capital Loss Carryforward* | |
| Expiration | | Short-Term | | | Long-Term | | | Total | |
February 28, 2017 | | $ | 8,282 | | | $ | — | | | $ | 8,282 | |
February 28, 2018 | | | 3,681 | | | | — | | | | 3,681 | |
February 28, 2019 | | | 4,594 | | | | — | | | | 4,594 | |
| | | $ | 16,557 | | | $ | — | | | $ | 16,557 | |
| * | Capital loss carryforward as of the date listed above is reduced for limitations, if any, to the extent required by the Internal Revenue Code and may be further limited depending upon a variety of factors, including the realization of net unrealized gains or losses as of the date of any reorganization. |
NOTE 9—Reclassification of Permanent Differences
Primarily as a result of differing book/tax treatment of taxable income, on February 28, 2014, undistributed net investment income was decreased by $1,024 and shares of beneficial interest was increased by $1,024. This reclassification had no effect on the net assets of the Fund.
15 Invesco Tax-Exempt Cash Fund
NOTE 10—Share Information
| | | | | | | | | | | | | | | | |
| | | Summary of Share Activity | |
| | | Years ended February 28, | |
| | | 2014(a) | | | 2013 | |
| | | Shares | | | Amount | | | Shares | | | Amount | |
Sold: | | | | | | | | | | | | | | | | |
Class A | | | 168,230,831 | | | $ | 168,230,831 | | | | 73,167,119 | | | $ | 73,167,119 | |
Class Y | | | 24,887,917 | | | | 24,887,917 | | | | 34,393,095 | | | | 34,393,095 | |
Investor Class | | | 25,413,813 | | | | 25,413,813 | | | | 2,470,520 | | | | 2,470,520 | |
| | | | |
Issued as reinvestment of dividends: | | | | | | | | | | | | | | | | |
Class A | | | 32,756 | | | | 32,756 | | | | 20,603 | | | | 20,603 | |
Class Y | | | 14,543 | | | | 14,543 | | | | 10,505 | | | | 10,505 | |
Investor Class | | | 11,749 | | | | 11,749 | | | | 6,564 | | | | 6,564 | |
| | | | |
Reacquired: | | | | | | | | | | | | | | | | |
Class A | | | (115,783,761 | ) | | | (115,783,761 | ) | | | (75,945,865 | ) | | | (75,945,865 | ) |
Class Y | | | (32,646,473 | ) | | | (32,646,473 | ) | | | (28,131,192 | ) | | | (28,131,192 | ) |
Investor Class | | | (15,092,181 | ) | | | (15,092,181 | ) | | | (3,372,410 | ) | | | (3,372,410 | ) |
Net increase in share activity | | | 55,069,194 | | | $ | 55,069,194 | | | | 2,618,939 | | | $ | 2,618,939 | |
| (a) | There are entities that are record owners of more than 5% of the outstanding shares of the Fund and in the aggregate own 52% of the outstanding shares of the Fund. IDI has an agreement with these entities to sell Fund shares. The Fund, Invesco and/or Invesco affiliates may make payments to these entities, which are considered to be related to the Fund, for providing services to the Fund, Invesco and/or Invesco affiliates including but not limited to services such as securities brokerage, distribution, third party record keeping and account servicing. The Trust has no knowledge as to whether all or any portion of the shares owned of record by these entities are also owned beneficially. |
NOTE 11—Financial Highlights
The following schedule presents financial highlights for a share of the Fund outstanding throughout the periods indicated.
| | | | | | | | | | | | | | | | | | | | | | | | | | | | | | | | | | | | | | | | | | | | |
| | | Net asset value, beginning of period | | | Net investment income(a) | | | Net gains on securities (both realized and unrealized) | | | Total from investment operations | | | Dividends from net
investment
income | | | Net asset value, end of period | | | Total return(b) | | | Net assets, end of period (000s omitted) | | | Ratio of expenses
to average net assets with fee waivers and/or expenses absorbed | | | Ratio of expenses to average net assets without
fee waivers and/or expenses
absorbed | | | Ratio of net investment income
to average
net assets | |
Class A | |
Year ended 02/28/14 | | $ | 1.00 | | | $ | 0.00 | | | $ | 0.00 | | | $ | 0.00 | | | $ | (0.00 | ) | | $ | 1.00 | | | | 0.10 | % | | $ | 81,583 | | | | 0.04 | %(c) | | | 0.74 | %(c) | | | 0.08 | %(c) |
Year ended 02/28/13 | | | 1.00 | | | | 0.00 | | | | 0.00 | | | | 0.00 | | | | (0.00 | ) | | | 1.00 | | | | 0.07 | | | | 29,103 | | | | 0.08 | | | | 0.79 | | | | 0.14 | |
Year ended 02/29/12 | | | 1.00 | | | | 0.00 | | | | — | | | | 0.00 | | | | (0.00 | ) | | | 1.00 | | | | 0.05 | | | | 31,831 | | | | 0.17 | | | | 0.89 | | | | 0.05 | |
Year ended 02/28/11 | | | 1.00 | | | | 0.00 | | | | — | | | | 0.00 | | | | (0.00 | ) | | | 1.00 | | | | 0.05 | | | | 36,425 | | | | 0.29 | | | | 0.82 | | | | 0.05 | |
Eleven months ended 02/28/10 | | | 1.00 | | | | 0.00 | | | | — | | | | 0.00 | | | | (0.00 | ) | | | 1.00 | | | | 0.07 | | | | 19,008 | | | | 0.36 | (d) | | | 1.07 | (d) | | | 0.08 | (d) |
Year ended 03/31/09 | | | 1.00 | | | | 0.01 | | | | — | | | | 0.01 | | | | (0.01 | ) | | | 1.00 | | | | 1.06 | | | | 18,838 | | | | 0.98 | | | | 1.18 | | | | 1.05 | |
Class Y | |
Year ended 02/28/14 | | | 1.00 | | | | 0.00 | | | | 0.00 | | | | 0.00 | | | | (0.00 | ) | | | 1.00 | | | | 0.10 | | | | 10,991 | | | | 0.04 | (c) | | | 0.64 | (c) | | | 0.08 | (c) |
Year ended 02/28/13 | | | 1.00 | | | | 0.00 | | | | 0.00 | | | | 0.00 | | | | (0.00 | ) | | | 1.00 | | | | 0.07 | | | | 18,735 | | | | 0.08 | | | | 0.69 | | | | 0.14 | |
Year ended 02/29/12 | | | 1.00 | | | | 0.00 | | | | — | | | | 0.00 | | | | (0.00 | ) | | | 1.00 | | | | 0.05 | | | | 12,459 | | | | 0.17 | | | | 0.79 | | | | 0.05 | |
Year ended 02/28/11 | | | 1.00 | | | | 0.00 | | | | — | | | | 0.00 | | | | (0.00 | ) | | | 1.00 | | | | 0.05 | | | | 12,464 | | | | 0.29 | | | | 0.72 | | | | 0.05 | |
Eleven months ended 02/28/10 | | | 1.00 | | | | 0.00 | | | | — | | | | 0.00 | | | | (0.00 | ) | | | 1.00 | | | | 0.07 | | | | 16,782 | | | | 0.36 | (d) | | | 0.93 | (d) | | | 0.08 | (d) |
Year ended 03/31/09(e) | | | 1.00 | | | | 0.00 | | | | — | | | | 0.00 | | | | (0.00 | ) | | | 1.00 | | | | 0.27 | | | | 11,169 | | | | 0.94 | (d) | | | 1.01 | (d) | | | 1.09 | (d) |
Investor Class | |
Year ended 02/28/14 | | | 1.00 | | | | 0.00 | | | | 0.00 | | | | 0.00 | | | | (0.00 | ) | | | 1.00 | | | | 0.10 | | | | 18,969 | | | | 0.04 | (c) | | | 0.64 | (c) | | | 0.08 | (c) |
Year ended 02/28/13 | | | 1.00 | | | | 0.00 | | | | 0.00 | | | | 0.00 | | | | (0.00 | ) | | | 1.00 | | | | 0.07 | | | | 8,636 | | | | 0.08 | | | | 0.69 | | | | 0.14 | |
Year ended 02/29/12 | | | 1.00 | | | | 0.00 | | | | — | | | | 0.00 | | | | (0.00 | ) | | | 1.00 | | | | 0.05 | | | | 9,521 | | | | 0.17 | | | | 0.79 | | | | 0.05 | |
Year ended 02/28/11 | | | 1.00 | | | | 0.00 | | | | — | | | | 0.00 | | | | (0.00 | ) | | | 1.00 | | | | 0.05 | | | | 9,762 | | | | 0.29 | | | | 0.72 | | | | 0.05 | |
Eleven months ended 02/28/10 | | | 1.00 | | | | 0.00 | | | | — | | | | 0.00 | | | | (0.00 | ) | | | 1.00 | | | | 0.07 | | | | 11,960 | | | | 0.36 | (d) | | | 0.93 | (d) | | | 0.08 | (d) |
Year ended 03/31/09 | | | 1.00 | | | | 0.01 | | | | — | | | | 0.01 | | | | (0.01 | ) | | | 1.00 | | | | 1.14 | | | | 12,647 | | | | 0.90 | | | | 0.93 | | | | 1.13 | |
| (a) | Calculated using average shares outstanding. |
| (b) | Includes adjustments in accordance with accounting principles generally accepted in the United States of America and as such, the net asset value for financial reporting purposes and the returns based upon those net asset values may differ from the net asset value and returns for shareholder transactions. Does not include sales charges and is not annualized for periods less than one year, if applicable. |
| (c) | Ratios are based on average daily net assets (000’s) of $62,789, $14,787 and $14,131 for Class A, Class Y and Investor Class shares, respectively. |
| (e) | Commencement date of October 3, 2008. |
16 Invesco Tax-Exempt Cash Fund
Report of Independent Registered Public Accounting Firm
To the Board of Trustees of AIM Tax-Exempt Funds (Invesco Tax-Exempt Funds)
and Shareholders of Invesco Tax-Exempt Cash Fund:
In our opinion, the accompanying statement of assets and liabilities, including the schedule of investments, and the related statements of operations and of changes in net assets and the financial highlights present fairly, in all material respects, the financial position of Invesco Tax-Exempt Cash Fund (one of the funds constituting AIM Tax-Exempt Funds (Invesco Tax-Exempt Funds), hereafter referred to as the “Fund”) at February 28, 2014, the results of its operations for the year then ended, the changes in its net assets for each of the two years in the period then ended and the financial highlights for each of the periods indicated, in conformity with accounting principles generally accepted in the United States of America. These financial statements and financial highlights (hereafter referred to as “financial statements”) are the responsibility of the Fund’s management; our responsibility is to express an opinion on these financial statements based on our audits. We conducted our audits of these financial statements in accordance with the standards of the Public Company Accounting Oversight Board (United States). Those standards require that we plan and perform the audit to obtain reasonable assurance about whether the financial statements are free of material misstatement. An audit includes examining, on a test basis, evidence supporting the amounts and disclosures in the financial statements, assessing the accounting principles used and significant estimates made by management, and evaluating the overall financial statement presentation. We believe that our audits, which included confirmation of securities at February 28, 2014 by correspondence with the custodian, provide a reasonable basis for our opinion.
PRICEWATERHOUSECOOPERS LLP
April 28, 2014
Houston, Texas
17 Invesco Tax-Exempt Cash Fund
Calculating your ongoing Fund expenses
Example
As a shareholder of the Fund, you incur two types of costs: (1) transaction costs, which may include sales charges (loads) on purchase payments or contingent deferred sales charges on redemptions, if any; and (2) ongoing costs, including management fees, distribution and/or service (12b-1) fees, and other Fund expenses. This example is intended to help you understand your ongoing costs (in dollars) of investing in the Fund and to compare these costs with ongoing costs of investing in other mutual funds. The example is based on an investment of $1,000 invested at the beginning of the period and held for the entire period September 1, 2013 through February 28, 2014.
Actual expenses
The table below provides information about actual account values and actual expenses. You may use the information in this table, together with the amount you invested, to estimate the expenses that you paid over the period. Simply divide your account value by $1,000 (for example, an $8,600 account value divided by $1,000 = 8.6), then multiply the result by the number in the table under the heading entitled “Actual Expenses Paid During Period” to estimate the expenses you paid on your account during this period.
Hypothetical example for comparison purposes
The table below also provides information about hypothetical account values and hypothetical expenses based on the Fund’s actual expense ratio and an assumed rate of return of 5% per year before expenses, which is not the Fund’s actual return.
The hypothetical account values and expenses may not be used to estimate the actual ending account balance or expenses you paid for the period. You may use this information to compare the ongoing costs of investing in the Fund and other funds. To do so, compare this 5% hypothetical example with the 5% hypothetical examples that appear in the shareholder reports of the other funds.
Please note that the expenses shown in the table are meant to highlight your ongoing costs only and do not reflect any transaction costs, such as sales charges (loads) on purchase payments or contingent deferred sales charges on redemptions, if any. Therefore, the hypothetical information is useful in comparing ongoing costs only, and will not help you determine the relative total costs of owning different funds. In addition, if these transaction costs were included, your costs would have been higher.
| | | | | | | | | | | | | | | | | | | | | | | | |
| Class | | Beginning Account Value (09/01/13) | | | ACTUAL | | | HYPOTHETICAL (5% annual return before
expenses) | | | Annualized Expense Ratio | |
| | | Ending Account Value (02/28/14)1 | | | Expenses Paid During Period2 | | | Ending Account Value (02/28/14) | | | Expenses Paid During Period2 | | |
| A | | $ | 1,000.00 | | | $ | 1,000.30 | | | $ | 0.15 | | | $ | 1,024.65 | | | $ | 0.15 | | | | 0.03 | % |
| Y | | | 1,000.00 | | | | 1,000.30 | | | | 0.15 | | | | 1,024.65 | | | | 0.15 | | | | 0.03 | |
| Investor | | | 1,000.00 | | | | 1,000.30 | | | | 0.15 | | | | 1,024.65 | | | | 0.15 | | | | 0.03 | |
| 1 | The actual ending account value is based on the actual total return of the Fund for the period September 1, 2013 through February 28, 2014, after actual expenses and will differ from the hypothetical ending account value which is based on the Fund’s expense ratio and a hypothetical annual return of 5% before expenses. |
| 2 | Expenses are equal to the Fund’s annualized expense ratio as indicated above multiplied by the average account value over the period, multiplied by 181/365 to reflect the most recent fiscal half year. |
18 Invesco Tax-Exempt Cash Fund
Tax Information
Form 1099-DIV, Form 1042-S and other year–end tax information provide shareholders with actual calendar year amounts that should be included in their tax returns. Shareholders should consult their tax advisors.
The following distribution information is being provided as required by the Internal Revenue Code or to meet a specific state’s requirement.
The Fund designates the following amounts or, if subsequently determined to be different, the maximum amount allowable for its fiscal year ended February 28, 2014:
| | | | |
Federal and State Income Tax | |
Qualified Dividend Income* | | | 0 | % |
Corporate Dividends Received Deduction* | | | 0 | % |
Tax-Exempt Interest Dividends* | | | 100 | % |
U.S. Treasury Obligations* | | | 0 | % |
| | * | The above percentages are based on ordinary income dividends paid to shareholders during the Fund’s fiscal year. |
19 Invesco Tax-Exempt Cash Fund
Trustees and Officers
The address of each trustee and officer is AIM Tax-Exempt Funds (Invesco Tax-Exempt Funds) (the “Trust”), 11 Greenway Plaza, Suite 1000, Houston, Texas 77046-1173. The trustees serve for the life of the Trust, subject to their earlier death, incapacitation, resignation, retirement or removal as more specifically provided in the Trust’s organizational documents. Each officer serves for a one year term or until their successors are elected and qualified. Column two below includes length of time served with predecessor entities, if any.
| | | | | | | | |
Name, Year of Birth and Position(s) Held with the Trust | | Trustee and/
or Officer Since | | Principal Occupation(s) During Past 5 Years | | Number of
Funds in Fund Complex Overseen by
Trustee | | Other Directorship(s)
Held by Trustee During Past 5 Years |
| Interested Persons | | | | | | | | |
| Martin L. Flanagan1 — 1960 Trustee | | 2007 | | Executive Director, Chief Executive Officer and President, Invesco Ltd. (ultimate parent of Invesco and a global investment management firm); Advisor to the Board, Invesco Advisers, Inc. (formerly known as Invesco Institutional (N.A.), Inc.); Trustee, The Invesco Funds; Vice Chair, Investment Company Institute; and Member of Executive Board, SMU Cox School of Business Formerly: Chairman and Chief Executive Officer, Invesco Advisers, Inc. (registered investment adviser); Director, Chairman, Chief Executive Officer and President, IVZ Inc. (holding company), INVESCO Group Services, Inc. (service provider) and Invesco North American Holdings, Inc. (holding company); Director, Chief Executive Officer and President, Invesco Holding Company Limited (parent of Invesco and a global investment management firm); Director, Invesco Ltd.; Chairman, Investment Company Institute and President, Co-Chief Executive Officer, Co-President, Chief Operating Officer and Chief Financial Officer, Franklin Resources, Inc. (global investment management organization). | | 123 | | None |
Philip A. Taylor2 — 1954 Trustee, President and Principal Executive Officer | | 2006 | | Head of North American Retail and Senior Managing Director, Invesco Ltd.; Director, Co-Chairman, Co-President and Co-Chief Executive Officer, Invesco Advisers, Inc. (formerly known as Invesco Institutional (N.A.), Inc.) (registered investment adviser); Director, Chairman, Chief Executive Officer and President, Invesco Management Group, Inc. (formerly known as Invesco Aim Management Group, Inc.) (financial services holding company); Director and President, INVESCO Funds Group, Inc. (registered investment adviser and registered transfer agent); Director and Chairman, Invesco Investment Services, Inc. (formerly known as Invesco Aim Investment Services, Inc.) (registered transfer agent) and IVZ Distributors, Inc. (formerly known as INVESCO Distributors, Inc.) (registered broker dealer); Director, President and Chairman, Invesco Inc. (holding company) and Invesco Canada Holdings Inc. (holding company); Chief Executive Officer, Invesco Corporate Class Inc. (corporate mutual fund company) and Invesco Canada Fund Inc. (corporate mutual fund company); Director, Chairman and Chief Executive Officer, Invesco Canada Ltd. (formerly known as Invesco Trimark Ltd./Invesco Trimark Ltèe) (registered investment adviser and registered transfer agent); Trustee, President and Principal Executive Officer, The Invesco Funds (other than AIM Treasurer’s Series Trust (Invesco Treasurer’s Series Trust) and Short-Term Investments Trust); Trustee and Executive Vice President, The Invesco Funds (AIM Treasurer’s Series Trust (Invesco Treasurer’s Series Trust) and Short-Term Investments Trust only); Director, Invesco Investment Advisers LLC (formerly known as Van Kampen Asset Management); Director, Chief Executive Officer and President, Van Kampen Exchange Corp. Formerly: Director and Chairman, Van Kampen Investor Services Inc.; Director, Chief Executive Officer and President, 1371 Preferred Inc. (holding company); and Van Kampen Investments Inc.; Director and President, AIM GP Canada Inc. (general partner for limited partnerships); and Van Kampen Advisors, Inc.; Director and Chief Executive Officer, Invesco Trimark Dealer Inc. (registered broker dealer); Director, Invesco Distributors, Inc. (formerly known as Invesco Aim Distributors, Inc.) (registered broker dealer); Manager, Invesco PowerShares Capital Management LLC; Director, Chief Executive Officer and President, Invesco Advisers, Inc.; Director, Chairman, Chief Executive Officer and President, Invesco Aim Capital Management, Inc.; President, Invesco Trimark Dealer Inc. and Invesco Trimark Ltd./Invesco Trimark Ltèe; Director and President, AIM Trimark Corporate Class Inc. and AIM Trimark Canada Fund Inc.; Senior Managing Director, Invesco Holding Company Limited; Trustee and Executive Vice President, Tax-Free Investments Trust; Director and Chairman, Fund Management Company (former registered broker dealer); President and Principal Executive Officer, The Invesco Funds (AIM Treasurer’s Series Trust (Invesco Treasurer’s Series Trust), Short-Term Investments Trust and Tax-Free Investments Trust only); President, AIM Trimark Global Fund Inc. and AIM Trimark Canada Fund Inc. | | 123 | | None |
Wayne W. Whalen3 — 1939 Trustee | | 2010 | | Of Counsel, and prior to 2010, partner in the law firm of Skadden, Arps, Slate, Meagher & Flom LLP, legal counsel to certain funds in the Fund Complex. | | 136 | | Director of the Mutual fund Directors Forum, a nonprofit membership organization for investment directors; Chairman and Director of the Abraham Lincoln Presidential Library Foundation; and Director of the Stevenson Center for Democracy |
| 1 | Mr. Flanagan is considered an interested person of the Trust because he is an officer of the adviser to the Trust, and an officer and a director of Invesco Ltd., ultimate parent of the adviser to the Trust. |
| 2 | Mr. Taylor is considered an interested person of the Trust because he is an officer and a director of the adviser to, and a director of the principal underwriter of, the Trust. |
| 3 | Mr. Whalen is considered an “interested person” (within the meaning of Section 2(a)(19) of the 1940 Act) of certain funds in the Fund Complex because his firm currently provides legal services as legal counsel to such Funds. |
T-1 Invesco Tax-Exempt Cash Fund
Trustees and Officers—(continued)
| | | | | | | | |
Name, Year of Birth and Position(s) Held with the Trust | | Trustee and/
or Officer Since | | Principal Occupation(s) During Past 5 Years | | Number of Funds in Fund Complex Overseen by
Trustee | | Other Directorship(s) Held by Trustee During Past 5 Years |
| Independent Trustees | | | | | | | | |
Bruce L. Crockett — 1944 Trustee and Chair | | 1993 | | Chairman, Crockett Technologies Associates (technology consulting company) Formerly: Director, Captaris (unified messaging provider); Director, President and Chief Executive Officer COMSAT Corporation; Chairman, Board of Governors of INTELSAT (international communications company); ACE Limited (insurance company); and Investment Company Institute | | 123 | | ALPS (Attorneys Liability Protection Society) (insurance company) |
David C. Arch — 1945 Trustee | | 2010 | | Chairman of Blistex Inc., a consumer health care products manufacturer | | 136 | | Board member of the Illinois Manufacturers’ Association; Member of the Board of Visitors, Institute for the Humanities University of Michigan; Member of the Audit Committee of the Edward-Elmhurst Hospital |
Frank S. Bayley — 1939 Trustee | | 2001 | | Retired. Formerly: Director, Badgley Funds Inc. (registered investment company) (2 portfolios) and General Partner and Of Counsel, law firm of Baker & McKenzie, LLP | | 123 | | Director and Chairman, C.D. Stimson Company (a real estate investment company); Trustee, The Curtis Institute of Music |
James T. Bunch — 1942 Trustee | | 2003 | | Managing Member, Grumman Hill Group LLC (family office private equity investments) Formerly: Founder, Green Manning & Bunch Ltd. (investment banking firm) (1988-2010); Executive Committee, United States Golf Association; and Director, Policy Studies, Inc. and Van Gilder Insurance Corporation. | | 123 | | Chairman, Board of Governors, Western Golf Association, Chairman, Evans Scholars Foundation and Director, Denver Film Society |
Rodney F. Dammeyer — 1940 Trustee | | 2010 | | Chairman of CAC, LLC, (private company offering capital investment and management advisory services) Formerly: Prior to 2001, Managing Partner at Equity Group Corporate Investments. Prior to 1995, Chief Executive Officer of Itel Corporation (formerly Anixter International). Prior to 1985, experience includes Senior Vice President and Chief Financial Officer of Household International, Inc., Executive Vice President and Chief Financial Officer of Northwest Industries, Inc. and Partner of Arthur Andersen & Co.; From 1987 to 2010, Director/Trustee of investment companies in the Van Kampen Funds complex | | 123 | | Director of Quidel Corporation and Stericycle, Inc. |
Albert R. Dowden — 1941 Trustee | | 2000 | | Director of a number of public and private business corporations, including the Boss Group, Ltd. (private investment and management); Nature’s Sunshine Products, Inc. and Reich & Tang Funds (5 portfolios) (registered investment company) Formerly: Director, Homeowners of America Holding Corporation/Homeowners of America Insurance Company (property casualty company); Director, Continental Energy Services, LLC (oil and gas pipeline service); Director, CompuDyne Corporation (provider of product and services to the public security market) and Director, Annuity and Life Re (Holdings), Ltd. (reinsurance company); Director, President and Chief Executive Officer, Volvo Group North America, Inc.; Senior Vice President, AB Volvo; Director of various public and private corporations; Chairman, DHJ Media, Inc.; Director, Magellan Insurance Company; and Director, The Hertz Corporation, Genmar Corporation (boat manufacturer), National Media Corporation; Advisory Board of Rotary Power International (designer, manufacturer, and seller of rotary power engines); and Chairman, Cortland Trust, Inc. (registered investment company) | | 123 | | Director of: Nature’s Sunshine Products, Inc., Reich & Tang Funds, Homeowners of America Holding Corporation/ Homeowners of America Insurance Company, the Boss Group |
Jack M. Fields — 1952 Trustee | | 1997 | | Chief Executive Officer, Twenty First Century Group, Inc. (government affairs company); Owner and Chief Executive Officer, Dos Angeles Ranch, L.P. (cattle, hunting, corporate entertainment); and Discovery Global Education Fund (non-profit) Formerly: Chief Executive Officer, Texana Timber LP (sustainable forestry company); Director of Cross Timbers Quail Research Ranch (non-profit); and member of the U.S. House of Representatives | | 123 | | Insperity, Inc. (formerly known as Administaff) |
Prema Mathai-Davis — 1950 Trustee | | 1998 | | Retired. Formerly: Chief Executive Officer, YWCA of the U.S.A. | | 123 | | None |
Larry Soll — 1942 Trustee | | 2003 | | Retired. Formerly: Chairman, Chief Executive Officer and President, Synergen Corp. (a biotechnology company) | | 123 | | None |
Hugo F. Sonnenschein — 1940 Trustee | | 2010 | | President Emeritus and Honorary Trustee of the University of Chicago and the Adam Smith Distinguished Service Professor in the Department of Economics at the University of Chicago. Prior to 2000, President of the University of Chicago | | 136 | | Trustee of the University of Rochester and a member of its investment committee; Member of the National Academy of Sciences and the American Philosophical Society; Fellow of the American Academy of Arts and Sciences |
T-2 Invesco Tax-Exempt Cash Fund
Trustees and Officers—(continued)
| | | | | | | | |
Name, Year of Birth and Position(s) Held with the Trust | | Trustee and/
or Officer Since | | Principal Occupation(s) During Past 5 Years | | Number of Funds in Fund Complex Overseen by
Trustee | | Other Directorship(s) Held by Trustee During Past 5 Years |
| Independent Trustees—(continued) |
Raymond Stickel, Jr. — 1944 Trustee | | 2005 | | Retired. Formerly: Director, Mainstay VP Series Funds, Inc. (25 portfolios) and Partner, Deloitte & Touche | | 123 | | None |
| Other Officers | | | | | | | | |
Russell C. Burk — 1958 Senior Vice President and Senior Officer | | 2005 | | Senior Vice President and Senior Officer, The Invesco Funds | | N/A | | N/A |
John M. Zerr — 1962 Senior Vice President, Chief Legal Officer and Secretary | | 2006 | | Director, Senior Vice President, Secretary and General Counsel, Invesco Management Group, Inc. (formerly known as Invesco Aim Management Group, Inc.) and Van Kampen Exchange Corp.; Senior Vice President, Invesco Advisers, Inc. (formerly known as Invesco Institutional (N.A.), Inc.) (registered investment adviser); Senior Vice President and Secretary, Invesco Distributors, Inc. (formerly known as Invesco Aim Distributors, Inc.); Director, Vice President and Secretary, Invesco Investment Services, Inc. (formerly known as Invesco Aim Investment Services, Inc.) and IVZ Distributors, Inc. (formerly known as INVESCO Distributors, Inc.); Director and Vice President, INVESCO Funds Group, Inc.; Senior Vice President, Chief Legal Officer and Secretary, The Invesco Funds; Manager, Invesco PowerShares Capital Management LLC; Director, Secretary and General Counsel, Invesco Investment Advisers LLC (formerly known as Van Kampen Asset Management); Secretary and General Counsel, Invesco Capital Markets, Inc. (formerly known as Van Kampen Funds Inc.) and Chief Legal Officer, PowerShares Exchange-Traded Fund Trust, PowerShares Exchange-Traded Fund Trust II, PowerShares India Exchange-Traded Fund Trust and PowerShares Actively Managed Exchange-Traded Fund Trust Formerly: Director and Vice President, Van Kampen Advisors Inc.; Director, Vice President, Secretary and General Counsel, Van Kampen Investor Services Inc.; Director, Invesco Distributors, Inc. (formerly known as Invesco Aim Distributors, Inc.); Director, Senior Vice President, General Counsel and Secretary, Invesco Aim Advisers, Inc. and Van Kampen Investments Inc.; Director, Vice President and Secretary, Fund Management Company; Director, Senior Vice President, Secretary, General Counsel and Vice President, Invesco Aim Capital Management, Inc.; Chief Operating Officer and General Counsel, Liberty Ridge Capital, Inc. (an investment adviser); Vice President and Secretary, PBHG Funds (an investment company) and PBHG Insurance Series Fund (an investment company); Chief Operating Officer, General Counsel and Secretary, Old Mutual Investment Partners (a broker-dealer); General Counsel and Secretary, Old Mutual Fund Services (an administrator) and Old Mutual Shareholder Services (a shareholder servicing center); Executive Vice President, General Counsel and Secretary, Old Mutual Capital, Inc. (an investment adviser); and Vice President and Secretary, Old Mutual Advisors Funds (an investment company) | | N/A | | N/A |
Sheri Morris — 1964 Vice President, Treasurer and Principal Financial Officer | | 1999 | | Vice President, Treasurer and Principal Financial Officer, The Invesco Funds; Vice President, Invesco Advisers, Inc. (formerly known as Invesco Institutional (N.A.), Inc.) (registered investment adviser); and Vice President, PowerShares Exchange-Traded Fund Trust, PowerShares Exchange-Traded Fund Trust II, PowerShares India Exchange-Traded Fund Trust and PowerShares Actively Managed Exchange-Traded Fund Trust Formerly: Vice President, Invesco Aim Advisers, Inc., Invesco Aim Capital Management, Inc. and Invesco Aim Private Asset Management, Inc.; Assistant Vice President and Assistant Treasurer, The Invesco Funds and Assistant Vice President, Invesco Advisers, Inc., Invesco Aim Capital Management, Inc. and Invesco Aim Private Asset Management, Inc.; and Treasurer, PowerShares Exchange-Traded Fund Trust, PowerShares Exchange-Traded Fund Trust II, PowerShares India Exchange-Traded Fund Trust and PowerShares Actively Managed Exchange-Traded Fund Trust | | N/A | | N/A |
T-3 Invesco Tax-Exempt Cash Fund
Trustees and Officers—(continued)
| | | | | | | | |
Name, Year of Birth and Position(s) Held with the Trust | | Trustee and/
or Officer Since | | Principal Occupation(s) During Past 5 Years | | Number of Funds in Fund Complex Overseen by
Trustee | | Other Directorship(s) Held by Trustee During Past 5 Years |
| Other Officers—(continued) | | | | | | | | |
Karen Dunn Kelley — 1960 Vice President | | 1993 | | Senior Managing Director, Investments; Director, Co-President, Co-Chief Executive Officer, and Co-Chairman, Invesco Advisers, Inc. (formerly known as Invesco Institutional (N.A.), Inc.) (registered investment adviser); Chairman, Invesco Senior Secured Management, Inc.; Senior Vice President, Invesco Management Group, Inc. (formerly known as Invesco Aim Management Group, Inc.); Executive Vice President, Invesco Distributors, Inc. (formerly known as Invesco Aim Distributors, Inc.); Director, Invesco Mortgage Capital Inc. and Invesco Management Company Limited; Director and President, INVESCO Asset Management (Bermuda) Ltd., Vice President, The Invesco Funds (other than AIM Treasurer’s Series Trust (Invesco Treasurer’s Series Trust) and Short-Term Investments Trust); and President and Principal Executive Officer, The Invesco Funds (AIM Treasurer’s Series Trust (Invesco Treasurer’s Series Trust) and Short-Term Investments Trust only) Formerly: Director, INVESCO Global Asset Management Limited and INVESCO Management S.A.; Senior Vice President, Van Kampen Investments Inc. and Invesco Advisers, Inc. (formerly known as Invesco Institutional (N.A.), Inc.) (registered investment adviser); Vice President, Invesco Advisers, Inc. (formerly known as Invesco Institutional (N.A.), Inc.); Director of Cash Management and Senior Vice President, Invesco Advisers, Inc. and Invesco Aim Capital Management, Inc.; President and Principal Executive Officer, Tax-Free Investments Trust; Director and President, Fund Management Company; Chief Cash Management Officer, Director of Cash Management, Senior Vice President, and Managing Director, Invesco Aim Capital Management, Inc.; Director of Cash Management, Senior Vice President, and Vice President, Invesco Advisers, Inc. and The Invesco Funds (AIM Treasurer’s Series Trust (Invesco Treasurer’s Series Trust), Short-Term Investments Trust and Tax-Free Investments Trust only) | | N/A | | N/A |
Crissie M. Wisdom — 1969 Anti-Money Laundering Compliance Officer | | 2013 | | Anti-Money Laundering Compliance Officer, Invesco Advisers, Inc. (formerly known as Invesco Institutional (N.A.), Inc.) (registered investment adviser), Invesco Capital Markets, Inc. (formerly known as Van Kampen Funds Inc.), Invesco Distributors, Inc., Invesco Investment Services, Inc., Invesco Management Group, Inc., Van Kampen Exchange Corp., The Invesco Funds, Invesco Funds (Chicago), and PowerShares Exchange-Traded Fund Trust, PowerShares Exchange-Traded Fund Trust II, PowerShares India Exchange-Traded Fund Trust, and PowerShares Actively Managed Exchange-Traded Fund Trust; and Fraud Prevention Manager and Controls and Risk Analysis Manager for Invesco Investment Services, Inc. | | N/A | | N/A |
Todd L. Spillane — 1958 Chief Compliance Officer | | 2006 | | Senior Vice President, Invesco Management Group, Inc. (formerly known as Invesco Aim Management Group, Inc.) and Van Kampen Exchange Corp.; Senior Vice President and Chief Compliance Officer, Invesco Advisers, Inc. (registered investment adviser) (formerly known as Invesco Institutional (N.A.), Inc.); Chief Compliance Officer, The Invesco Funds; Vice President, Invesco Distributors, Inc. (formerly known as Invesco Aim Distributors, Inc.) and Invesco Investment Services, Inc. (formerly known as Invesco Aim Investment Services, Inc.) Formerly: Chief Compliance Officer, Invesco Funds (Chicago); Senior Vice President, Van Kampen Investments Inc.; Senior Vice President and Chief Compliance Officer, Invesco Aim Advisers, Inc. and Invesco Aim Capital Management, Inc.; Chief Compliance Officer, INVESCO Private Capital Investments, Inc. (holding company), Invesco Private Capital, Inc. (registered investment adviser), Invesco Global Asset Management (N.A.), Inc., Invesco Senior Secured Management, Inc. (registered investment adviser), Van Kampen Investor Services Inc., PowerShares Exchange-Traded Fund Trust, PowerShares Exchange-Traded Fund Trust II, PowerShares India Exchange-Traded Fund Trust and PowerShares Actively Managed Exchange-Traded Fund Trust; and Vice President, Invesco Aim Capital Management, Inc. and Fund Management Company | | N/A | | N/A |
The Statement of Additional Information of the Trust includes additional information about the Fund’s Trustees and is available upon request, without charge, by calling 1.800.959.4246. Please refer to the Fund’s prospectus for information on the Fund’s sub-advisers.
| | | | | | |
Office of the Fund 11 Greenway Plaza, Suite 1000 Houston, TX 77046-1173 | | Investment Adviser Invesco Advisers, Inc. 1555 Peachtree Street, N.E. Atlanta, GA 30309 | | Distributor Invesco Distributors, Inc. 11 Greenway Plaza, Suite 1000 Houston, TX 77046-1173 | | Auditors PricewaterhouseCoopers LLP 1201 Louisiana Street, Suite 2900 Houston, TX 77002-5678 |
| | | |
| | | | | | |
Counsel to the Fund Stradley Ronon Stevens & Young, LLP 2005 Market Street, Suite 2600 Philadelphia, PA 19103-7018 | | Counsel to the Independent Trustees Goodwin Procter LLP 901 New York Avenue, N.W. Washington, D.C. 20001 | | Transfer Agent Invesco Investment Services, Inc. 11 Greenway Plaza, Suite 1000 Houston, TX 77046-1173 | | Custodian Bank of New York Mellon 2 Hanson Place Brooklyn, NY 11217-1431 |
T-4 Invesco Tax-Exempt Cash Fund

Invesco mailing information
Send general correspondence to Invesco Investment Services, Inc., P.O. Box 219078, Kansas City, MO 64121-9078.
Important notice regarding delivery of security holder documents
To reduce Fund expenses, only one copy of most shareholder documents may be mailed to shareholders with multiple accounts at the same address (Householding). Mailing of your shareholder documents may be householded indefinitely unless you instruct us otherwise. If you do not want the mailing of these documents to be combined with those for other members of your household, please contact Invesco Investment Services, Inc. at 800 959 4246 or contact your financial institution. We will begin sending you individual copies for each account within 30 days after receiving your request.
Fund holdings and proxy voting information
The Fund provides a complete list of its holdings four times in each fiscal year, at the quarter ends. For the second and fourth quarters, the lists appear in the Fund’s semiannual and annual reports to shareholders. For the first and third quarters, the Fund files the lists with the Securities and Exchange Commission (SEC) on Form N-Q. The most recent list of portfolio holdings is available at invesco.com/completeqtrholdings. Shareholders can also look up the Fund’s
Forms N-Q on the SEC website at sec.gov. Copies of the Fund’s Forms N-Q may be reviewed and copied at the SEC Public Reference Room in Washington, D.C. You can obtain information on the operation of the Public Reference Room, including information about duplicating fee charges, by calling 202 551 8090 or 800 732 0330, or by electronic request at the following email address: publicinfo@sec.gov. The SEC file numbers for the Fund are shown below.
A description of the policies and procedures that the Fund uses to determine how to vote proxies relating to portfolio securities is available without charge, upon request, from our Client Services department at 800 959 4246 or at invesco.com/proxyguidelines. The information is also available on the SEC website, sec.gov.
| | |
Information regarding how the Fund voted proxies related to its portfolio securities during the most recent 12-month period ended June 30 is available at invesco.com/proxysearch. The information is also available on the SEC website, sec.gov. Invesco Advisers, Inc. is an investment adviser; it provides investment advisory services to individual and institutional clients and does not sell securities. Invesco Distributors, Inc. is the US distributor for Invesco Ltd.’s retail mutual funds, exchange-traded funds and institutional money market funds. Both are wholly owned, indirect subsidiaries of Invesco Ltd. | |  |
| | | | |
| SEC file numbers: 811-07890 and 033-66242 | | TEC-AR-1 | | Invesco Distributors, Inc. |

Letters to Shareholders
| | |

Philip Taylor | | Dear Shareholders: This annual report includes information about your Fund, including performance data and a complete list of its investments as of the close of the reporting period. Inside, your Fund’s portfolio managers discuss how they managed your Fund and the factors that affected its performance during the reporting period. I hope you find this report of interest. During the reporting period covered by this report, major US and global equity market indexes hit multiyear or all-time highs1, the result of a strengthening US economy and relatively healthy corporate profits. Also helping equities was a return of individual investors to stocks – due in part to monetary policies that kept interest rates (and yields on fixed income securities) low. Despite some volatility in the summer of 2013, overseas equity market indexes in developed and emerging nations generally rose during the reporting period – although developed markets |
generally outpaced emerging markets. In January 2014, amid widespread signs of an improving economy, the US Federal Reserve began a long-anticipated reduction in its bond-buying program.
Extended periods of strong market performance can lull some investors into a false sense of security – just as extended periods of volatility or market weakness can discourage some investors from undertaking disciplined, long-term investment plans. That’s why Invesco believes it can often be helpful to work with a skilled and trusted financial adviser; he or she can emphasize the importance of adhering to an investment plan designed to achieve long-term goals like a first home, a college education for a child or a comfortable retirement. A financial adviser who is familiar with your individual financial situation, investment goals and risk tolerance can be an invaluable partner as you work toward your financial goals. He or she can provide insight and perspective when markets are volatile; encouragement and reassurance when times are uncertain; and advice and guidance when your financial situation or investment goals change.
Timely information when and where you want it
Invesco’s efforts to help investors achieve their financial objectives include providing individual investors and financial professionals with timely information about the markets, the economy and investing – whenever and wherever they want it.
Our website, invesco.com/us, offers a wide range of market insights and investment perspectives. On the website, you’ll find detailed information about our funds, including prices, performance, holdings and portfolio manager commentaries. You can access information about your individual Invesco account whenever it’s convenient for you; just complete a simple, secure online registration. Use the “Login” box on our home page to get started.
Invesco’s mobile app for iPad® (available free from the App StoreSM) allows you to obtain the same detailed information about your Fund and the same investment insights from our investment leaders, market strategists, economists and retirement experts on the go. You also can watch portfolio manager videos and have instant access to Invesco news and updates wherever you may be.
In addition to the resources accessible on our website and through our mobile app, you can obtain timely updates to help you stay informed about the markets, the economy and investing by connecting with Invesco on Twitter, LinkedIn or Facebook. You can access our blog at blog.invesco.us.com or by visiting the “Intentional Investing Forum” on our home page. Our goal is to provide you the information you want, when and where you want it.
Have questions?
For questions about your account, feel free to contact an Invesco client services representative at 800 959 4246. For Invesco-related questions or comments, please email me directly at phil@invesco.com.
All of us at Invesco look forward to serving your investment management needs for many years to come. Thank you for investing with us.
Sincerely,

Philip Taylor
Senior Managing Director, Invesco Ltd.
1 Source: Reuters
iPad is a trademark of Apple Inc., registered in the US and other countries. App Store is a service mark of Apple Inc. Invesco Distributors, Inc. is not affiliated with Apple Inc.
2 Invesco Tax-Free Intermediate Fund
| | |

Bruce Crockett | | Dear Fellow Shareholders: Members of the Invesco Funds Board work continually to oversee how the Invesco Funds are performing in light of ever-changing and often unpredictable economic and market conditions. One of the ways we do this is by verifying that the teams that manage funds understand the risks associated with the investments they make in the funds they manage. In light of market conditions over the last few years, the financial news media of late have given increased attention to “alternative investment strategies.” Despite this increased attention, many investors don’t know very much about these types of investment strategies. Let me put alternative investment strategies and the new focus on them in some perspective. First, these types of investment strategies have been used predominately by institutional investors and investment professionals for decades to increase diversification – in an effort to dampen |
portfolio volatility (risk) with the goal of increasing returns. The focal point of the increased news coverage is that these types of strategies are now being made more widely available to individual investors.
Alternative investment strategies generally seek to provide measured exposure to various asset classes whose performance, historically, has not been highly correlated with one another. These strategies may help mitigate the impact to a portfolio from severe or prolonged market downturns while potentially providing reasonable returns over time. After a careful and thorough examination of the potential risks and potential benefits of alternative investment strategies, the Invesco Funds Board has approved the launch of several new alternative funds for the Invesco product lineup, to be managed by teams we determined have the depth and experience to pursue the funds’ investment objectives.
While no single investment product can provide complete downside protection in falling markets and full upside participation in rising markets, your Board believes alternative funds can be a prudent tool to work in concert with more traditional mutual funds and other investments to build well diversified portfolios. Your financial adviser can determine whether or not such investments are appropriate for your individual needs, goals and risk tolerance. Also, he or she can explain the risks associated with alternative investment strategies. This type of professional guidance is why Invesco believes it’s so important that individual investors work with trusted, experienced financial advisers.
Whether you’re invested in equity, fixed income, cash management or alternative investment funds, be assured that the Invesco Funds Board will continue working on your behalf and on behalf of all our fund shareholders, keeping your needs and interests uppermost in our minds.
As always, please contact me at bruce@brucecrockett.com with any questions or concerns you may have. On behalf of the Board, we look forward to continuing to represent your interests and serving your needs.
Sincerely,

Bruce L. Crockett
Independent Chair
Invesco Funds Board of Trustees
Asset allocation/diversification does not guarantee a profit or eliminate the risk of loss.
Alternative products typically hold more non-traditional investments and employ more complex trading strategies, including hedging and leveraging through derivatives, short selling and opportunistic strategies that change with market conditions. Investors considering alternatives should be aware of their unique characteristics and additional risks from the strategies they use. Like all investments, performance will fluctuate. You can lose money.
3 Invesco Tax-Free Intermediate Fund
Management’s Discussion of Fund Performance
Performance summary
For the fiscal year ended February 28, 2014, Invesco Tax-Free Intermediate Fund at net asset value (NAV) performed in line with its broad market benchmark, the Barclays Municipal Bond Index but underperformed its style-specific benchmark, the Bank of America Merrill Lynch 3–7 Year Municipal Index. The main contributor to the Fund’s return was its allocation of short-to-intermediate maturity bonds.
Your Fund’s long-term performance appears later in this report.
Fund vs. Indexes
Total returns, 2/28/13 to 2/28/14, at net asset value (NAV). Performance shown does not include applicable contingent deferred sales charges (CDSC) or front-end sales charges, which would have reduced performance.
| | | | | |
| Class A Shares | | | | 0.16 | % |
| Class A2 Shares | | | | 0.49 | |
| Class C Shares* | | | | -0.60 | |
| Class Y Shares | | | | 0.40 | |
| Class R5 Shares | | | | 0.48 | |
| Barclays Municipal Bond Index‚ (Broad Market Index) | | | | -0.21 | |
Bank of America Merrill Lynch 3–7 Year Municipal Index‚
(Style-Specific Index) | | | | 1.80 | |
| Lipper Intermediate Municipal Debt Funds Index‚ (Peer Group Index) | | | | 0.02 | |
Source(s): ‚ Lipper Inc.
| * | Class C shares incepted during the reporting period. See page 7 for a detailed explanation of Fund performance. |
How we invest
The Fund’s investment objective is to provide investors with current income exempt from federal income tax, consistent with preservation of capital.
Under normal market conditions, we seek to achieve the Fund’s investment objective by investing at least 80% of the Fund’s total assets in municipal securities rated investment grade by at least one nationally recognized statistical rating organization – or, if not rated, securities we determine to be of comparable quality – at the time of purchase.
Under normal market conditions, the Fund may invest up to 20% of its total assets in municipal securities rated below investment grade and unrated municipal securities which we determine to be of comparable quality at the time of investment. Lower-grade securities are commonly referred to as junk bonds and
involve greater risks than investments in higher-grade securities. With respect to such investments, the Fund has not established any limit on the percentage of its portfolio that may be invested in securities in any one rating category.
At the present time, the Fund will not invest in municipal debt securities if the interest on such securities is subject to the federal alternative minimum tax (AMT).
We may sell securities based on factors such as degradation in credit quality, a decision to shorten or lengthen the Fund’s duration or reducing exposure to a particular sector or issuer.
Market conditions and your Fund
For the fiscal year ended February 28, 2014, the municipal bond market returned –0.21%1, as measured by the Barclays Municipal Bond Index. Record outflows from municipal bond funds, driven by concerns over rising interest
| | | | | |
| Portfolio Composition |
| By credit sector, based on total investments | |
Revenue Bonds | | | | 84.4 | % |
| General Obligation Bonds | | | | 12.4 | |
| Pre-Refunded Bonds | | | | 3.2 | |
| | | | | |
| Total Net Assets | | | | $1.4 billion | |
| |
| Total Number of Holdings | | | | 757 | |
The Fund’s holdings are subject to change, and there is no assurance that the Fund will continue to hold any particular security.
| | | | | |
| Top Five Fixed Income Holdings |
| | | | | | |
1. Louisville (City of) & Jefferson (County of) Metropolitan Sewer District; Series 2009 B | | | | 0.9 | % |
2. Chicago (City of) Board of Education; Series 2013 A3 | | | | 0.7 | |
3. Citizens Property Insurance Corp.; Series 2012 A-1 | | | | 0.7 | |
4. Massachusetts (State of) Development Finance Agency (Partners HealthCare System); Series 2014 M | | | | 0.7 | |
5. Ohio (State of) Air Quality Development Authority (FirstEnergy Generation Corp.); Series 2009 A | | | | 0.6 | |
rates and high-profile credit events, resulted in a challenging year for municipal bond investors. The $67 billion2 in municipal bond fund redemptions between March and December 2013 was in stark contrast to inflows of $65 billion2 and strong performance for the asset class over the prior two years.
Shortly after the fiscal year began, investors became apprehensive that the US Federal Reserve (the Fed) would reduce its asset purchase program, known as quantitative easing (QE), as the US economy improved. Concerned that Fed action would cause interest rates to rise and bond prices to fall, investors began trimming their allocations to fixed income investments, including municipal bonds. The rate of outflows increased dramatically in June following comments made by then-Fed Chairman Ben Bernanke on the timing for tapering QE.
Over the summer of 2013, several high-profile credit events had an adverse impact on the municipal bond market. These included downgrades to the credit ratings of Chicago debt on pension concerns, Detroit filing the largest municipal bankruptcy in US history3 and increased uncertainty about the financial condition of Puerto Rico.
The market received a two-month reprieve in September when the Fed decided not to reduce QE, although it reversed that decision in December when it announced that it would decrease its asset purchases by $10 billion per month, beginning in January 2014.4 A final headwind for the municipal bond market was significant tax-loss selling of municipal bonds in December to offset gains from strong equity returns during 2013.
In the first two months of 2014, the municipal bond market turned positive. Softer economic data reduced expectations for hawkish Fed action. Relatively high yields on municipal bonds, coupled with higher personal income tax rates and improving municipal fundamentals, drew investors back to the asset class. Net positive fund flows in January and February, combined with limited supply of new issuance, produced strong returns in the final two months of the fiscal year.
During the fiscal year, the primary driver of Fund performance versus the broad market benchmark was its maturity and duration positioning. The Fund’s overweight allocation in shorter-maturity bonds and a shorter average duration contributed to relative performance. Conversely, the Fund’s allocation in longer
4 Invesco Tax-Free Intermediate Fund
average duration bonds detracted from relative performance.
At the sector level, hospitals, the Fund’s largest sector and largest overweight position relative to the broad market benchmark, contributed to performance. The Fund’s underweight position in Puerto Rico contributed to relative performance.
We wish to remind you that the Fund is subject to interest rate risk, meaning when interest rates rise, the value of fixed income securities generally will fall. This risk may be greater in the current market environment because interest rates are at or near historic lows. We are monitoring interest rates and market and economic factors that may impact interest rates, including the potential impact of the Fed’s tapering of QE. If interest rates rise, markets may experience increased volatility, which may affect the value and/or liquidity of certain of the Fund’s investments.
Thank you for investing in Invesco Tax-Free Intermediate Fund and for sharing our long-term investment horizon.
| 4 | Source: US Federal Reserve |
The views and opinions expressed in management’s discussion of Fund performance are those of Invesco Advisers, Inc. These views and opinions are subject to change at any time based on factors such as market and economic conditions. These views and opinions may not be relied upon as investment advice or recommendations, or as an offer for a particular security. The information is not a complete analysis of every aspect of any market, country, industry, security or the Fund. Statements of fact are from sources considered reliable, but Invesco Advisers, Inc. makes no representation or warranty as to their completeness or accuracy. Although historical performance is no guarantee of future results, these insights may help you understand our investment management philosophy.
See important Fund and, if applicable, index disclosures later in this report.
| | |
 | | Robert Wimmel Portfolio manager, is manager of Invesco Tax-Free Intermediate Fund and is head of Investment Grade Municipals. He joined |
| Invesco in 2010. Mr. Wimmel earned a BA in anthropology from the University of Cincinnati and an MA in economics from the University of Illinois at Chicago. |
| | |
 | | Thomas Byron Portfolio manager, is manager of Invesco Tax-Free Intermediate Fund. He joined Invesco in 2010. Mr. Byron earned a |
| BS in finance from Marquette University and an MBA in finance from DePaul University. |
| | |
 | | Robert Stryker Chartered Financial Analyst, portfolio manager, is manager of Invesco Tax-Free Intermediate Fund. He joined Invesco in 2010. |
| Mr. Stryker earned a BS in finance from the University of Illinois at Chicago. |
5 Invesco Tax-Free Intermediate Fund
Your Fund’s Long-Term Performance
Results of a $10,000 Investment – Oldest Share Class(es)
Fund and index data from 2/29/04
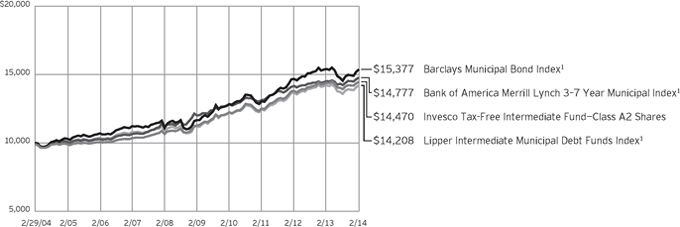
1 Source: Lipper Inc.
Past performance cannot guarantee comparable future results.
The data shown in the chart include reinvested distributions, applicable sales charges and Fund expenses including
management fees. Index results include reinvested dividends, but they do not reflect sales charges. Performance of the peer group, if applicable, reflects fund expenses and management fees; performance
of a market index does not. Performance shown in the chart and table(s) does not reflect deduction of taxes a shareholder would pay on Fund distributions or sale of Fund shares.
continued from page 8
regulations, voter initiatives, and the issuer’s regional economic conditions may affect the municipal security’s value, interest payments, repayment of principal and the Fund’s ability to sell it. Failure of a municipal security issuer to comply with applicable tax requirements may make income paid thereon taxable, resulting in a decline in the security’s value. In addition, there could be changes in applicable tax laws or tax treatments that reduce or eliminate the current federal income tax exemption on municipal securities or otherwise adversely affect the current federal or state tax status of municipal securities.
| n | | Reinvestment risk. Reinvestment risk is the risk that a bond’s cash flows (coupon income and principal repayment) will be reinvested at an interest rate below that on the original bond. |
| n | | Variable-rate demand notes risk. The absence of an active secondary market for certain variable and floating rate notes could make it difficult to dispose of the instruments, and a portfolio could suffer a loss if the issuer defaults during periods in which a portfolio is not entitled to exercise its demand rights. |
| n | | When-issued and delayed delivery risks. When-issued and delayed delivery |
| | transactions are subject to market risk as the value or yield of a security at delivery may be more or less than the purchase price or the yield generally available on securities when delivery occurs. In addition, the Fund is subject to counterparty risk because it relies on the buyer or seller, as the case may be, to consummate the transaction, and failure by the other party to complete the transaction may result in the Fund missing the opportunity of obtaining a price or yield considered to be advantageous. |
| n | | Zero coupon or pay-in-kind securities risk. The value, interest rates, and liquidity of non-cash paying instruments, such as zero coupon and pay-in-kind securities, are subject to greater fluctuation than other types of securities. |
About indexes used in this report
| n | | The Barclays Municipal Bond Index is an unmanaged index considered representative of the tax-exempt bond market. |
| n | | The Bank of America Merrill Lynch 3-7 Year Municipal Index is an unmanaged index comprising bonds with outstanding par of at least $25 million and maturities of three to seven years. |
| n | | The Lipper Intermediate Municipal Debt Funds Index is an unmanaged index considered representative of intermediate municipal debt funds tracked by Lipper. |
| n | | The Fund is not managed to track the performance of any particular index, including the index(es) described here, and consequently, the performance of the Fund may deviate significantly from the performance of the index(es). |
| n | | A direct investment cannot be made in an index. Unless otherwise indicated, index results include reinvested dividends, and they do not reflect sales charges. Performance of the peer group, if applicable, reflects fund expenses; performance of a market index does not. |
continued on page 7
6 Invesco Tax-Free Intermediate Fund
| | | | | |
| Average Annual Total Returns |
As of 2/28/14, including maximum applicable sales charges | |
| |
| Class A Shares | | | | | |
| Inception (10/31/02) | | | | 3.53 | % |
| 10 Years | | | | 3.33 | |
| 5 Years | | | | 4.32 | |
| 1 Year | | | | -2.38 | |
| |
| Class A2 Shares | | | | | |
| Inception (5/11/87) | | | | 5.23 | % |
| 10 Years | | | | 3.76 | |
| 5 Years | | | | 4.90 | |
| 1 Year | | | | -0.51 | |
| |
| Class C Shares | | | | | |
| 10 Years | | | | 2.83 | % |
| 5 Years | | | | 4.06 | |
| 1 Year | | | | -1.58 | |
| |
| Class Y Shares | | | | | |
| 10 Years | | | | 3.85 | % |
| 5 Years | | | | 5.08 | |
| 1 Year | | | | 0.40 | |
| |
| Class R5 Shares | | | | | |
| 10 Years | | | | 3.85 | % |
| 5 Years | | | | 5.12 | |
| 1 Year | | | | 0.48 | |
Class C shares incepted on June 28, 2013. Performance shown prior to that date is that of Class A2 shares, restated to reflect the higher 12b-1 fees applicable to Class C shares. Class A2 share performance reflects any applicable fee waivers or expense reimbursements.
Class Y shares incepted on October 3, 2008. Performance shown prior to that date is that of Class A2 shares and includes the 12b-1 fees applicable to Class A2 shares. Class A2 share performance
| | | | | |
| Average Annual Total Returns |
| As of 12/31/13, the most recent calendar quarter end, including maximum applicable sales charges | |
| |
| Class A Shares | | | | | |
| Inception (10/31/02) | | | | 3.41 | % |
| 10 Years | | | | 3.28 | |
| 5 Years | | | | 4.53 | |
| 1 Year | | | | -3.22 | |
| |
| Class A2 Shares | | | | | |
| Inception (5/11/87) | | | | 5.18 | % |
| 10 Years | | | | 3.72 | |
| 5 Years | | | | 5.12 | |
| 1 Year | | | | -1.51 | |
| |
| Class C Shares | | | | | |
| 10 Years | | | | 2.79 | % |
| 5 Years | | | | 4.27 | |
| 1 Year | | | | -2.56 | |
| |
| Class Y Shares | | | | | |
| 10 Years | | | | 3.82 | % |
| 5 Years | | | | 5.32 | |
| 1 Year | | | | -0.52 | |
| |
| Class R5 Shares | | | | | |
| 10 Years | | | | 3.81 | % |
| 5 Years | | | | 5.32 | |
| 1 Year | | | | -0.54 | |
reflects any applicable fee waivers or expense reimbursements.
Class R5 shares incepted on July 30, 2004. Performance shown prior to that date is that of Class A2 shares and includes the 12b-1 fees applicable to Class A2 shares. Class A2 share performance reflects any applicable fee waivers or expense reimbursements.
The performance data quoted represent past performance and cannot guarantee comparable future results; current performance may
be lower or higher. Please visit invesco.com/performance for the most recent month-end performance. Performance figures reflect reinvested distributions, changes in net asset value and the effect of the maximum applicable sales charge unless otherwise stated. Investment return and principal value will fluctuate so that you may have a gain or loss when you sell shares.
The total annual Fund operating expense ratio set forth in the most recent Fund prospectus as of the date of this report for Class A, Class A2, Class C, Class Y and Class R5 shares was 0.60%, 0.35%, 1.35%, 0.35% and 0.41%, respectively. The expense ratios presented above may vary from the expense ratios presented in other sections of this report that are based on expenses incurred during the period covered by this report.
Class A share performance reflects the maximum 2.50% sales charge. Class A2 share performance reflects the maximum 1.00% sales charge. The CDSC on Class C shares is 1% for the first year after purchase. Class Y and Class R5 shares do not have a front-end sales charge or a CDSC; therefore, performance is at net asset value.
The performance of the Fund’s share classes will differ primarily due to different sales charge structures and class expenses.
Had the adviser not waived fees and/ or reimbursed expenses in the past, performance would have been lower.
continued from page 6
Other information
| n | | The returns shown in management’s discussion of Fund performance are based on net asset values (NAVs) calculated for shareholder transactions. Generally accepted accounting principles require adjustments to be made to the net assets of the Fund at period end for financial reporting purposes, and as such, the NAVs for shareholder transactions and the returns based on those NAVs may differ from the NAVs and returns reported in the Financial Highlights. |
7 Invesco Tax-Free Intermediate Fund
Invesco Tax-Free Intermediate Fund’s investment objective is federal tax-exempt current income.
| n | | Unless otherwise stated, information presented in this report is as of February 28, 2014, and is based on total net assets. |
| n | | Unless otherwise noted, all data provided by Invesco. |
| n | | To access your Fund’s reports/prospectus, visit invesco.com/fundreports. |
About share classes
| n | | As of close of business October 30, 2002, Class A2 shares were closed to new investors. |
| n | | Class Y shares are available only to certain investors. Please see the prospectus for more information. |
| n | | Class R5 shares are primarily intended for employer sponsored retirement and benefit plans that meet certain standards and for institutional investors. Please see the prospectus for more information. |
Principal risks of investing in the Fund
| n | | Alternative minimum tax risk. A portion of the Fund’s otherwise tax-exempt income may be taxable to those shareholders subject to the federal alternative minimum tax. |
| n | | Call risk. If interest rates fall, it is possible that issuers of debt securities with high interest rates will prepay or call their securities before their maturity dates. In this event, the proceeds from the called securities would likely be reinvested by the Fund in securities bearing the new, lower interest rates, resulting in a possible decline in the Fund’s income and distributions to shareholders. |
| n | | Credit risk. The issuer of instruments in which the Fund invests may be unable to meet interest and/or principal payments, thereby causing its instruments to decrease in value and lowering the issuer’s credit rating. |
| n | | Derivatives risk. The value of a derivative instrument depends largely on (and is derived from) the value of an underlying security, currency, commodity, interest rate, index or other asset (each referred to as an underlying asset). In addition to risks relating to the underlying assets, the use of derivatives may include other, possibly greater, risks, including counterparty, leverage and liquidity risks. Counterparty risk is the risk that the counterparty to the derivative contract will default on its obligation to pay the Fund the amount owed or otherwise perform under the derivative contract. |
Derivatives create leverage risk because they do not require payment up front equal to the economic exposure created by owning the derivative. As a result, an adverse change in the value of the underlying asset could result in the Fund sustaining a loss that is substantially greater than the amount invested in the derivative, which may make the Fund’s returns more volatile and increase the risk of loss. Derivative instruments may also be less liquid than more traditional investments and the Fund may be unable to sell or close out its derivative positions at a desirable time or price. This risk may be more acute under adverse market conditions, during which the Fund may be most in need of liquidating its derivative positions. Derivatives may also be harder to value, less tax efficient and subject to changing government regulation that could impact the Fund’s ability to use certain derivatives or their cost. Also, derivatives used for hedging or to gain or limit exposure to a particular market segment may not provide the expected benefits, particularly during adverse market conditions.
| n | | High yield bond (junk bond) risk. Junk bonds involve a greater risk of default or price changes due to changes in the credit quality of the issuer. The values of junk bonds fluctuate more than those of high-quality bonds in response to company, political, regulatory or economic developments. Values of junk bonds can decline significantly over short periods of time. |
| n | | Income risk. The income you receive from the Fund is based primarily on prevailing interest rates, which can vary widely over the short- and long-term. If interest rates drop, your income from the Fund may drop as well. |
| n | | Intermediate dollar-weighted average life risk. Market prices of municipal securities with intermediate lives generally fluctuate more in response to changes in interest rates than do market prices of municipal securities with shorter lives but generally fluctuate less than market prices of municipal securities with longer lives. |
This report must be accompanied or preceded by a currently effective Fund prospectus, which contains more complete information, including sales charges and expenses. Investors should read it carefully before investing.
NOT FDIC INSURED | MAY LOSE VALUE | NO BANK GUARANTEE
| n | | Interest rate risk. Interest rate risk refers to the risk that bond prices generally fall as interest rates rise; conversely, bond prices generally rise as interest rates fall. Specific bonds differ in their sensitivity to changes in interest rates depending on their individual characteristics, including duration. |
| n | | Leverage risk. Leverage exists when the Fund purchases or sells an instrument or enters into a transaction without investing cash in an amount equal to the full economic exposure of the asset or transaction and the Fund could lose more than it invested. Leverage created from certain types of transactions or instruments may impair the Fund’s liquidity, cause it to liquidate positions at an unfavorable time, increase volatility or otherwise not achieve its intended objective. |
| n | | Liquidity risk. The Fund may hold illiquid securities that it is unable to sell at the preferred time or price and could lose its entire investment in such securities. |
| n | | Management risk. The investment techniques and risk analysis used by the Fund’s portfolio managers may not produce the desired results. |
| n | | Market risk. The prices of and the income generated by the Fund’s securities may decline in response to, among other things, investor sentiment, general economic and market conditions, regional or global instability, and currency and interest rate fluctuations. |
| n | | Municipal issuer focus risk. The Fund generally considers investments in municipal securities not to be subject to industry concentration policies (issuers of municipal securities as a group is not an industry) and the Fund may invest in municipal securities issued by entities having similar characteristics. The issuers may be located in the same geographic area or may pay their interest obligations from revenue of similar projects, such as hospitals, airports, utility systems and housing finance agencies. This may make the Fund’s investments more susceptible to similar social, economic, political or regulatory occurrences. As the similarity in issuers increases, the potential for fluctuation in the Fund’s net asset value also increases. |
| n | | Municipal securities risk. The Fund may invest in municipal securities. Constitutional amendments, legislative enactments, executive orders, administrative |
continued on page 6
8 Invesco Tax-Free Intermediate Fund
Schedule of Investments
February 28, 2014
| | | | | | | | | | | | | | | | |
| | | Interest
Rate | | | Maturity
Date | | | Principal
Amount
(000) | | | Value | |
Municipal Obligations–98.35% | |
| Alabama–3.06% | |
Alabama (State of) 21st Century Authority; | | | | | | | | | | | | | | | | |
Series 2012 A, Tobacco Settlement RB | | | 5.00 | % | | | 06/01/19 | | | $ | 1,750 | | | $ | 2,034,480 | |
Series 2012 A, Tobacco Settlement RB | | | 5.00 | % | | | 06/01/21 | | | | 1,500 | | | | 1,721,115 | |
Alabama (State of) Public School & College Authority; | | | | | | | | | | | | | | | | |
Series 2009 A, Ref. Capital Improvement RB | | | 5.00 | % | | | 05/01/15 | | | | 1,000 | | | | 1,056,890 | |
Series 2009 A, Ref. Capital Improvement RB | | | 5.00 | % | | | 05/01/18 | | | | 1,000 | | | | 1,172,350 | |
Birmingham (City of) Airport Authority; | | | | | | | | | | | | | | | | |
Series 2003 A, Ref. RB (INS–AGM)(a) | | | 4.00 | % | | | 07/01/15 | | | | 1,930 | | | | 2,006,293 | |
Series 2003 A, Ref. RB (INS–AGM)(a) | | | 4.00 | % | | | 07/01/16 | | | | 2,335 | | | | 2,486,892 | |
Series 2003 A, Ref. RB (INS–AGM)(a) | | | 4.00 | % | | | 07/01/17 | | | | 2,465 | | | | 2,672,233 | |
Series 2003 A, Ref. RB (INS–AGM)(a) | | | 4.00 | % | | | 07/01/18 | | | | 1,985 | | | | 2,176,572 | |
Series 2003 A, Ref. RB (INS–AGM)(a) | | | 4.00 | % | | | 07/01/19 | | | | 1,410 | | | | 1,558,572 | |
Series 2003 A, Ref. RB (INS–AGM)(a) | | | 4.50 | % | | | 07/01/20 | | | | 1,375 | | �� | | 1,523,307 | |
Birmingham (City of) Special Care Facilities Financing Authority (Ascension Health Senior Credit Group); Series 2006 C-1, RB(b) | | | 4.10 | % | | | 11/03/16 | | | | 2,000 | | | | 2,180,120 | |
Birmingham (City of) Special Care Facilities Financing Authority (Children’s Hospital); | | | | | | | | | | | | | | | | |
Series 2009, Health Care Facility RB(b)(c) | | | 4.50 | % | | | 06/01/14 | | | | 990 | | | | 1,001,167 | |
Series 2009, Health Care Facility RB(b)(c) | | | 4.63 | % | | | 06/01/14 | | | | 750 | | | | 758,722 | |
Series 2009, Health Care Facility RB(b)(c) | | | 5.00 | % | | | 06/01/14 | | | | 525 | | | | 531,631 | |
Series 2009, Health Care Facility RB(b)(c) | | | 5.25 | % | | | 06/01/14 | | | | 1,000 | | | | 1,013,270 | |
Series 2009, Health Care Facility RB(b)(c) | | | 5.75 | % | | | 06/01/14 | | | | 2,000 | | | | 2,029,120 | |
Chatom (Town of) Industrial Development Board (PowerSouth Energy Cooperative); | | | | | | | | | | | | | | | | |
Series 2010 A, Ref. Gulf Opportunity Zone RB (INS–AGC)(a) | | | 4.25 | % | | | 08/01/18 | | | | 3,540 | | | | 4,015,316 | |
Series 2010 A, Ref. Gulf Opportunity Zone RB (INS–AGC)(a) | | | 4.25 | % | | | 08/01/19 | | | | 3,535 | | | | 4,037,571 | |
Huntsville (City of) Health Care Authority; | | | | | | | | | | | | | | | | |
Series 2010 A, RB | | | 4.50 | % | | | 06/01/15 | | | | 1,970 | | | | 2,057,842 | |
Series 2010 A, RB | | | 5.00 | % | | | 06/01/18 | | | | 2,740 | | | | 3,101,379 | |
Mobile (City of) Industrial Development Board (Alabama Power Co.–Barry Plant); Series 2007 C,
PCR(b) | | | 5.00 | % | | | 03/19/15 | | | | 2,150 | | | | 2,246,750 | |
| | | | | | | | | | | | | | | | 41,381,592 | |
|
| Alaska–1.14% | |
Alaska (State of) Industrial Development & Export Authority (Greater Fairbanks Community Hospital Foundation); | | | | | | | | | | | | | | | | |
Series 2004 A, RB (INS–AGM)(a) | | | 5.13 | % | | | 04/01/19 | | | | 1,000 | | | | 1,169,030 | |
Series 2009 C, Ref. RB | | | 4.25 | % | | | 04/01/15 | | | | 1,025 | | | | 1,057,431 | |
Alaska (State of) Industrial Development & Export Authority; Series 2010 A, Ref. Revolving Fund RB | | | 5.25 | % | | | 04/01/21 | | | | 765 | | | | 896,396 | |
Alaska (State of) International Airports System; Series 2006 B, RB (INS–NATL)(a) | | | 5.00 | % | | | 10/01/27 | | | | 1,135 | | | | 1,225,562 | |
Alaska (State of) Municipal Bond Bank Authority; Series 2009 1, RB | | | 5.63 | % | | | 09/01/29 | | | | 250 | | | | 285,348 | |
North Slope (Borough of); Series 2008 A, Unlimited Tax GO Bonds | | | 5.50 | % | | | 06/30/19 | | | | 1,000 | | | | 1,217,410 | |
Southeast Alaska Power Agency; Series 2009, Ref. Electric RB (INS–AGC)(a) | | | 5.13 | % | | | 06/01/24 | | | | 650 | | | | 707,128 | |
Valdez (City of) (BP Pipelines); | | | | | | | | | | | | | | | | |
Series 2003 B, Ref. Marine Terminal RB | | | 5.00 | % | | | 01/01/21 | | | | 1,800 | | | | 2,107,854 | |
Series 2003 C, Ref. Marine Terminal RB | | | 5.00 | % | | | 01/01/21 | | | | 5,730 | | | | 6,710,002 | |
| | | | | | | | | | | | | | | | 15,376,161 | |
|
| Arizona–1.96% | |
Amphitheater Unified School District No. 10; Series 2009 B, School Improvement Unlimited Tax GO Bonds (INS–AGC)(a) | | | 4.00 | % | | | 07/01/18 | | | | 1,250 | | | | 1,393,962 | |
See accompanying Notes to Financial Statements which are an integral part of the financial statements.
9 Invesco Tax-Free Intermediate Fund
| | | | | | | | | | | | | | | | |
| | | Interest
Rate | | | Maturity
Date | | | Principal
Amount
(000) | | | Value | |
| Arizona–(continued) | | | | | | | | | | | | | | | | |
Arizona (State of); | | | | | | | | | | | | | | | | |
Series 2010 A, COP (INS–AGM)(a) | | | 5.00 | % | | | 10/01/14 | | | $ | 3,000 | | | $ | 3,083,910 | |
Series 2010 A, COP (INS–AGM)(a) | | | 5.00 | % | | | 10/01/15 | | | | 2,000 | | | | 2,141,000 | |
Series 2010 A, COP (INS–AGM)(a) | | | 5.00 | % | | | 10/01/16 | | | | 3,000 | | | | 3,318,030 | |
Series 2010 A, COP (INS–AGM)(a) | | | 5.00 | % | | | 10/01/18 | | | | 2,000 | | | | 2,298,380 | |
Series 2010 A, COP (INS–AGM)(a) | | | 5.00 | % | | | 10/01/19 | | | | 1,000 | | | | 1,161,950 | |
Series 2010 B, COP (INS–AGM)(a) | | | 5.00 | % | | | 10/01/21 | | | | 2,000 | | | | 2,253,760 | |
Series 2010 B, COP (INS–AGM)(a) | | | 5.00 | % | | | 10/01/22 | | | | 2,000 | | | | 2,223,780 | |
Series 2010 B, COP (INS–AGM)(a) | | | 5.00 | % | | | 10/01/23 | | | | 2,000 | | | | 2,200,660 | |
Kingman Unified School District No. 20; Series 2009 C, School Improvement Unlimited Tax GO Bonds (INS–AGC)(a) | | | 5.00 | % | | | 07/01/23 | | | | 1,500 | | | | 1,727,685 | |
Pima (County of); | | | | | | | | | | | | | | | | |
Series 2010, COP | | | 3.50 | % | | | 06/01/14 | | | | 2,130 | | | | 2,148,488 | |
Series 2010, COP | | | 3.50 | % | | | 06/01/15 | | | | 1,200 | | | | 1,249,296 | |
Yuma (City of) Industrial Development Authority (Regional Medical Center); Series 2014 A, Hospital RB | | | 5.00 | % | | | 08/01/19 | | | | 500 | | | | 570,710 | |
Yuma Municipal Property Corp.; Series 2007 D, Municipal Facilities RB
(INS–SGI)(a) | | | 5.00 | % | | | 07/01/24 | | | | 750 | | | | 815,258 | |
| | | | | | | | | | | | | | | | 26,586,869 | |
|
| California–9.32% | |
Albany Unified School District (Election of 2008); Series 2009 A, Unlimited Tax GO Bonds
(INS–AGC)(a) | | | 5.00 | % | | | 08/01/25 | | | | 1,520 | | | | 1,682,898 | |
Alhambra Unified School District (Election of 2004); Series 2009 B, Unlimited Tax GO Bonds
(INS–AGC)(a) | | | 5.25 | % | | | 08/01/28 | | | | 1,350 | | | | 1,462,658 | |
Association of Bay Area Governments Finance Authority for Non-profit Corps. (Casa de las Campanas, Inc.); Series 2010, RB (INS–Cal-Mortgage)(a) | | | 4.00 | % | | | 09/01/15 | | | | 675 | | | | 704,781 | |
California (State of) Health Facilities Financing Authority (Cedars-Sinai Medical Center); Series 2011, Ref. RB | | | 5.00 | % | | | 08/15/15 | | | | 1,000 | | | | 1,068,870 | |
California (State of) Health Facilities Financing Authority (St. Joseph Health System); | | | | | | | | | | | | | | | | |
Series 2009 C, Ref. RB(b) | | | 5.00 | % | | | 10/16/14 | | | | 3,125 | | | | 3,220,125 | |
Series 2009 D, Ref. RB(b) | | | 5.00 | % | | | 10/18/16 | | | | 6,000 | | | | 6,687,300 | |
California (State of) Health Facilities Financing Authority (The Episcopal Home); | | | | | | | | | | | | | | | | |
Series 2010 B, RB(c) | | | 5.10 | % | | | 02/01/19 | | | | 620 | | | | 697,308 | |
Series 2010 B, RB(b)(c) | | | 5.50 | % | | | 02/01/20 | | | | 1,250 | | | | 1,529,425 | |
California (State of) Pollution Control Financing Authority (BP West Coast Products LLC); Series 2009, Ref. Environmental Improvement RB(b) | | | 2.60 | % | | | 09/02/14 | | | | 4,650 | | | | 4,701,010 | |
California (State of) Statewide Communities Development Authority (American Baptist Homes of the West); Series 2013 B-3, TEMPS-40SM RB | | | 2.10 | % | | | 10/01/19 | | | | 2,250 | | | | 2,254,140 | |
California (State of) Statewide Communities Development Authority (Enloe Medical Center); | | | | | | | | | | | | | | | | |
Series 2008 A, RB (INS–Cal-Mortgage)(a) | | | 5.00 | % | | | 08/15/17 | | | | 385 | | | | 431,916 | |
Series 2008 A, RB (INS–Cal-Mortgage)(a) | | | 5.25 | % | | | 08/15/19 | | | | 325 | | | | 369,697 | |
California (State of) Statewide Communities Development Authority (Henry Mayo Newhall Memorial Hospital); Series 2007 B, RB(b)(c) | | | 5.05 | % | | | 10/01/18 | | | | 1,500 | | | | 1,779,345 | |
California (State of) Statewide Communities Development Authority (Kaiser Permanente); Series 2012, Floating Rate RB(b)(d) | | | 0.98 | % | | | 05/01/17 | | | | 6,000 | | | | 6,000,000 | |
California (State of); | | | | | | | | | | | | | | | | |
Series 2009, Various Purpose Unlimited Tax GO Bonds | | | 5.00 | % | | | 10/01/20 | | | | 1,900 | | | | 2,231,113 | |
Series 2009 B, Ref. Economic Recovery Unlimited Tax GO Bonds(b) | | | 5.00 | % | | | 07/01/14 | | | | 1,095 | | | | 1,113,035 | |
Series 2011, Ref. Unlimited Tax GO Bonds | | | 5.00 | % | | | 09/01/17 | | | | 2,000 | | | | 2,307,140 | |
Series 2012 A, Ref. Floating Rate Unlimited Tax GO Bonds(b)(d) | | | 0.71 | % | | | 05/01/15 | | | | 3,000 | | | | 3,000,000 | |
Series 2012 B, Ref. Floating Rate Unlimited Tax GO Bonds(d) | | | 1.03 | % | | | 05/01/19 | | | | 4,000 | | | | 4,000,000 | |
California Infrastructure & Economic Development Bank (The Paul Getty Trust); Series 2011 J, Ref. Floating Rate RB(b)(d) | | | 0.53 | % | | | 04/01/14 | | | | 2,000 | | | | 2,000,000 | |
Chula Vista (City of) (San Diego Gas & Electric Co.); Series 2006 A, Ref. IDR | | | 1.65 | % | | | 07/01/18 | | | | 3,000 | | | | 3,028,740 | |
Corona-Norco Unified School District (Election of 2006); Series 2009 C, Unlimited Tax CAB GO Bonds
(INS–AGM)(a)(e) | | | 0.00 | % | | | 08/01/21 | | | | 1,500 | | | | 1,213,005 | |
See accompanying Notes to Financial Statements which are an integral part of the financial statements.
10 Invesco Tax-Free Intermediate Fund
| | | | | | | | | | | | | | | | |
| | | Interest
Rate | | | Maturity
Date | | | Principal
Amount
(000) | | | Value | |
| California–(continued) | | | | | | | | | | | | | | | | |
Fresno (City of); Series 2008 A, Sewer System RB (INS–AGC)(a) | | | 5.00 | % | | | 09/01/25 | | | $ | 2,040 | | | $ | 2,314,176 | |
Hayward Unified School District (Election of 2008); | | | | | | | | | | | | | | | | |
Series 2010 A, Unlimited Tax CAB GO Bonds (INS–AGM)(a)(e) | | | 0.00 | % | | | 08/01/17 | | | | 1,000 | | | | 947,680 | |
Series 2010 A, Unlimited Tax CAB GO Bonds (INS–AGM)(a)(e) | | | 0.00 | % | | | 08/01/20 | | | | 1,000 | | | | 844,120 | |
Inland Valley Development Agency; | | | | | | | | | | | | | | | | |
Series 2011 B, Tax Allocation RB(b) | | | 4.25 | % | | | 03/01/15 | | | | 2,500 | | | | 2,568,750 | |
Series 2011 C, Tax Allocation RB(b) | | | 4.50 | % | | | 03/01/16 | | | | 2,500 | | | | 2,645,150 | |
Irvine (City of) (Reassessment District No. 13-1); | | | | | | | | | | | | | | | | |
Series 2013, Limited Obligation Special Assessment RB | | | 4.00 | % | | | 09/02/17 | | | | 575 | | | | 631,419 | |
Series 2013, Limited Obligation Special Assessment RB | | | 4.00 | % | | | 09/02/18 | | | | 450 | | | | 497,907 | |
Irvine (City of) Public Facilities & Infrastructure Authority; Series 2012 A, Special Assessment RB | | | 3.00 | % | | | 09/02/14 | | | | 445 | | | | 449,833 | |
Kern Community College District; Series 2010, Ref. COP | | | 4.00 | % | | | 04/01/14 | | | | 2,000 | | | | 2,006,940 | |
Lake Tahoe Unified School District (Election of 2008); Series 2009, Unlimited Tax GO Bonds (INS–AGM)(a) | | | 5.00 | % | | | 08/01/24 | | | | 1,000 | | | | 1,113,140 | |
Los Angeles (City of) Department of Airports (Los Angeles International Airport); | | | | | | | | | | | | | | | | |
Series 2008 C, Sub. RB | | | 5.00 | % | | | 05/15/28 | | | | 1,000 | | | | 1,110,910 | |
Series 2009 A, Sr. RB | | | 5.25 | % | | | 05/15/29 | | | | 1,000 | | | | 1,148,800 | |
Los Angeles (City of) Harbor Department; Series 2009 C, Ref. RB | | | 5.00 | % | | | 08/01/21 | | | | 2,000 | | | | 2,409,160 | |
Los Angeles Unified School District (Election of 2004); Series 2009 I, Unlimited Tax GO Bonds | | | 5.00 | % | | | 07/01/26 | | | | 670 | | | | 773,703 | |
Madera (City of) Irrigation District; Series 2008, Ref. Water RB | | | 5.00 | % | | | 01/01/23 | | | | 2,250 | | | | 2,415,848 | |
Monterey (County of) (2009 Refinancing); | | | | | | | | | | | | | | | | |
Series 2009, COP (INS–AGM)(a) | | | 5.00 | % | | | 08/01/16 | | | | 1,000 | | | | 1,100,820 | |
Series 2009, COP (INS–AGM)(a) | | | 5.00 | % | | | 08/01/19 | | | | 2,360 | | | | 2,749,022 | |
Murrieta (City of) Public Financing Authority; Series 2012, Ref. Special Tax RB | | | 5.00 | % | | | 09/01/21 | | | | 1,155 | | | | 1,294,547 | |
New Haven Unified School District; Series 2009, Ref. Unlimited Tax GO Bonds (INS–AGC)(a) | | | 5.00 | % | | | 08/01/20 | | | | 2,530 | | | | 2,939,986 | |
Northern California Power Agency; | | | | | | | | | | | | | | | | |
Series 2010 A, Ref. Capital Facilities RB | | | 4.00 | % | | | 08/01/14 | | | | 1,000 | | | | 1,015,430 | |
Series 2010 A, Ref. Capital Facilities RB | | | 4.00 | % | | | 08/01/16 | | | | 1,000 | | | | 1,081,760 | |
Series 2010 A, Ref. Capital Facilities RB | | | 5.00 | % | | | 08/01/20 | | | | 1,000 | | | | 1,162,620 | |
Series 2010 A, Ref. Capital Facilities RB | | | 5.00 | % | | | 08/01/21 | | | | 1,000 | | | | 1,137,220 | |
Rowland Unified School District (Election of 2006); Series 2009 B, Unlimited Tax CAB GO Bonds(e) | | | 0.00 | % | | | 08/01/23 | | | | 1,300 | | | | 924,105 | |
Sacramento (County of); | | | | | | | | | | | | | | | | |
Series 2009 B, Sr. Airport System RB | | | 5.00 | % | | | 07/01/18 | | | | 1,000 | | | | 1,153,620 | |
Series 2009 D, Sub. & Passenger Facility Charge Grant Airport System RB (INS–AGC)(a) | | | 5.13 | % | | | 07/01/25 | | | | 1,500 | | | | 1,623,090 | |
Series 2010, Ref. COP | | | 5.00 | % | | | 02/01/16 | | | | 4,665 | | | | 5,004,379 | |
Series 2010, Ref. COP | | | 5.00 | % | | | 02/01/17 | | | | 4,000 | | | | 4,373,400 | |
Series 2010, Ref. COP | | | 5.25 | % | | | 02/01/18 | | | | 3,000 | | | | 3,341,760 | |
Series 2010, Ref. COP | | | 5.25 | % | | | 02/01/19 | | | | 1,500 | | | | 1,680,495 | |
Series 2010, Sr. Airport System RB | | | 5.00 | % | | | 07/01/23 | | | | 500 | | | | 561,185 | |
San Diego (City of) Public Facilities Financing Authority; Series 2009 B, Ref. Sr. Sewer RB | | | 5.00 | % | | | 05/15/14 | | | | 500 | | | | 505,245 | |
San Francisco (City & County of) Airport Commission (San Francisco International Airport); Series 2009 E, Second Series RB | | | 5.50 | % | | | 05/01/26 | | | | 2,000 | | | | 2,332,320 | |
San Francisco (City & County of) Successor Agency to the Redevelopment Agency (Mission Bay South Redevelopment); | | | | | | | | | | | | | | | | |
Series 2014 A, Tax Allocation RB | | | 5.00 | % | | | 08/01/20 | | | | 125 | | | | 144,101 | |
Series 2014 A, Tax Allocation RB | | | 5.00 | % | | | 08/01/21 | | | | 150 | | | | 171,408 | |
Series 2014 A, Tax Allocation RB | | | 5.00 | % | | | 08/01/22 | | | | 125 | | | | 141,804 | |
Santa Ana (City of) (Local Street Improvement); Series 2007, Gas Tax Revenue COP (INS–NATL)(a) | | | 4.38 | % | | | 01/01/24 | | | | 1,000 | | | | 1,020,870 | |
Torrance Unified School District (Election of 2008–Measure Z); | | | | | | | | | | | | | | | | |
Series 2009 B-1, Unlimited Tax CAB GO Bonds(e) | | | 0.00 | % | | | 08/01/22 | | | | 1,900 | | | | 1,451,011 | |
Series 2009 B-1, Unlimited Tax CAB GO Bonds(e) | | | 0.00 | % | | | 08/01/23 | | | | 2,000 | | | | 1,421,700 | |
Twin Rivers Unified School District (School Facility Bridge Funding Program); Series 2007, COP (INS–AGM)(a)(b) | | | 3.20 | % | | | 06/01/20 | | | | 4,355 | | | | 4,357,308 | |
See accompanying Notes to Financial Statements which are an integral part of the financial statements.
11 Invesco Tax-Free Intermediate Fund
| | | | | | | | | | | | | | | | |
| | | Interest
Rate | | | Maturity
Date | | | Principal
Amount
(000) | | | Value | |
| California–(continued) | | | | | | | | | | | | | | | | |
Val Verde Unified School District; Series 2009 A, Ref. COP (INS–AGC)(a) | | | 5.00 | % | | | 03/01/29 | | | $ | 2,040 | | | $ | 2,105,117 | |
Vernon (City of); | | | | | | | | | | | | | | | | |
Series 2009 A, Electric System RB | | | 5.13 | % | | | 08/01/21 | | | | 4,600 | | | | 5,079,090 | |
Series 2009 A, Electric System RB | | | 5.50 | % | | | 08/01/15 | | | | 625 | | | | 667,719 | |
West Contra Costa Unified School District (Election of 2005); Series 2008 B, Unlimited Tax GO Bonds | | | 6.00 | % | | | 08/01/27 | | | | 1,000 | | | | 1,240,600 | |
West Sacramento (City of) Area Flood Control Agency; Series 2008, Special Assessment RB | | | 5.13 | % | | | 09/01/23 | | | | 1,075 | | | | 1,126,299 | |
| | | | | | | | | | | | | | | | 126,268,073 | |
|
| Colorado–1.29% | |
Adams State College; | | | | | | | | | | | | | | | | |
Series 2009 A, Auxiliary Facilities Improvement RB (CEP-Colorado Higher Education Intercept Program) | | | 5.00 | % | | | 05/15/29 | | | | 450 | | | | 481,338 | |
Series 2009 A, Auxiliary Facilities Improvement RB (CEP-Colorado Higher Education Intercept Program) | | | 5.20 | % | | | 05/15/27 | | | | 340 | | | | 370,529 | |
Aurora (City of) (The Children’s Hospital Association); Series 2004 D, Hospital RB (INS–AGM)(a) | | | 5.00 | % | | | 12/01/20 | | | | 1,000 | | | | 1,128,470 | |
Colorado (State of) Educational & Cultural Facilities Authority (The Classical Academy); Series 2008 A, Charter School RB | | | 6.75 | % | | | 12/01/23 | | | | 760 | | | | 827,176 | |
Colorado (State of) Health Facilities Authority (North Colorado Medical Center, Inc.); | | | | | | | | | | | | | | | | |
Series 2003 A, Hospital RB (INS–AGM)(a) | | | 5.00 | % | | | 05/15/15 | | | | 1,000 | | | | 1,051,190 | |
Series 2003 A, Hospital RB (INS–AGM)(a) | | | 5.25 | % | | | 05/15/26 | | | | 1,000 | | | | 1,081,960 | |
Colorado (State of) Health Facilities Authority (Sisters of Charity of Leavenworth Health System); Series 2010 B, RB | | | 5.00 | % | | | 01/01/19 | | | | 2,795 | | | | 3,266,517 | |
Colorado School of Mines Board of Trustees; Series 2009 A, Ref. & Improvement Enterprise RB (CEP–Colorado Higher Education Intercept Program) | | | 5.00 | % | | | 12/01/29 | | | | 500 | | | | 540,300 | |
Denver School District No. 1; Series 2009 A, Unlimited Tax GO Bonds | | | 5.00 | % | | | 12/01/28 | | | | 1,000 | | | | 1,139,010 | |
Glenwood Springs (City of); | | | | | | | | | | | | | | | | |
Series 2010, Ref. Sales & Use Tax RB | | | 3.00 | % | | | 10/01/14 | | | | 1,005 | | | | 1,020,728 | |
Series 2010, Ref. Sales & Use Tax RB | | | 3.00 | % | | | 10/01/15 | | | | 1,000 | | | | 1,040,310 | |
Northern Colorado Water Conservancy District; Series 2007 J, Ref. RB (INS–AMBAC)(a) | | | 5.00 | % | | | 12/01/14 | | | | 1,300 | | | | 1,346,644 | |
Public Authority for Colorado Energy; | | | | | | | | | | | | | | | | |
Series 2008, Natural Gas Purchase RB | | | 6.13 | % | | | 11/15/23 | | | | 1,525 | | | | 1,817,495 | |
Series 2008, Natural Gas Purchase RB | | | 6.25 | % | | | 11/15/28 | | | | 2,000 | | | | 2,359,260 | |
| | | | | | | | | | | | | | | | 17,470,927 | |
|
| Connecticut–0.72% | |
Connecticut (State of) (Transportation Infrastructure); Series 2009 A, Special Tax Obligation RB | | | 5.00 | % | | | 12/01/16 | | | | 2,000 | | | | 2,254,360 | |
Connecticut (State of) Health & Educational Facilities Authority (Hartford Healthcare); Series 2011 A, RB | | | 4.00 | % | | | 07/01/23 | | | | 1,500 | | | | 1,564,935 | |
Connecticut (State of) Health & Educational Facility Authority (Sacred Heart University); Series 2012 H, Ref. RB (INS–AGM)(a) | | | 4.00 | % | | | 07/01/22 | | | | 2,590 | | | | 2,823,825 | |
Connecticut (State of); Series 2013 A, Floating Rate Unlimited Tax GO Bonds(d) | | | 0.58 | % | | | 03/01/19 | | | | 2,000 | | | | 2,000,000 | |
New Haven (City of) Solid Waste & Recycling Authority; Series 2008, RB | | | 5.13 | % | | | 06/01/23 | | | | 1,000 | | | | 1,123,710 | |
| | | | | | | | | | | | | | | | 9,766,830 | |
|
| Delaware–0.21% | |
Delaware (State of) Health Facilities Authority (Bayhealth Medical Center); | | | | | | | | | | | | | | | | |
Series 2009 A, RB | | | 4.05 | % | | | 07/01/22 | | | | 1,000 | | | | 1,040,910 | |
Series 2009 A, RB | | | 5.00 | % | | | 07/01/18 | | | | 1,540 | | | | 1,745,575 | |
| | | | | | | | | | | | | | | | 2,786,485 | |
|
| District of Columbia–0.80% | |
District of Columbia (Center for Strategic & International Studies, Inc.); Series 2011, RB | | | 4.75 | % | | | 03/01/17 | | | | 2,035 | | | | 2,075,822 | |
See accompanying Notes to Financial Statements which are an integral part of the financial statements.
12 Invesco Tax-Free Intermediate Fund
| | | | | | | | | | | | | | | | |
| | | Interest
Rate | | | Maturity
Date | | | Principal
Amount
(000) | | | Value | |
| District of Columbia–(continued) | |
District of Columbia (Georgetown University); | | | | | | | | | | | | | | | | |
Series 2001 C, University RB(b) | | | 5.25 | % | | | 04/01/23 | | | $ | 2,000 | | | $ | 2,232,340 | |
Series 2009 A, Ref. University RB | | | 5.00 | % | | | 04/01/15 | | | | 2,000 | | | | 2,100,220 | |
Series 2011, University RB(b) | | | 5.00 | % | | | 04/01/21 | | | | 2,055 | | | | 2,360,722 | |
District of Columbia; Series 2011 E, Ref. Income Tax Sec. Floating Rate RB(d) | | | 0.63 | % | | | 12/01/15 | | | | 2,000 | | | | 2,000,000 | |
| | | | | | | | | | | | | | | | 10,769,104 | |
|
| Florida–5.08% | |
Broward (County of); Series 2009 O, Ref. Airport System RB | | | 5.00 | % | | | 10/01/14 | | | | 1,490 | | | | 1,532,942 | |
Citizens Property Insurance Corp. (Coastal Account); Series 2011 A-1, Sr. Sec. RB | | | 5.00 | % | | | 06/01/20 | | | | 1,000 | | | | 1,159,620 | |
Citizens Property Insurance Corp. (High Risk Account); | | | | | | | | | | | | | | | | |
Series 2009 A-1, Sr. Sec. RB (INS–AGC)(a) | | | 5.00 | % | | | 06/01/16 | | | | 2,000 | | | | 2,202,000 | |
Series 2010 A-1, Sr. Sec. RB (INS–AGM)(a) | | | 5.00 | % | | | 06/01/14 | | | | 2,500 | | | | 2,531,575 | |
Series 2010 A-1, Sr. Sec. RB (INS–AGM)(a) | | | 5.00 | % | | | 06/01/17 | | | | 2,000 | | | | 2,259,240 | |
Citizens Property Insurance Corp.; Series 2012 A-1, Sr. Sec. RB | | | 5.00 | % | | | 06/01/22 | | | | 8,000 | | | | 9,218,800 | |
Florida (State of) Board of Education; | | | | | | | | | | | | | | | | |
Series 2009 A, Lottery RB | | | 5.00 | % | | | 07/01/23 | | | | 2,000 | | | | 2,284,040 | |
Series 2009 A, Lottery RB | | | 5.25 | % | | | 07/01/24 | | | | 1,715 | | | | 1,972,662 | |
Florida (State of) Department of Education; Series 2006 A, Community College Capital Improvement RB (INS–NATL)(a) | | | 5.00 | % | | | 07/01/18 | | | | 1,335 | | | | 1,482,077 | |
Florida (State of) Municipal Power Agency (St. Lucie); | | | | | | | | | | | | | | | | |
Series 2011 A, RB | | | 4.00 | % | | | 10/01/16 | | | | 500 | | | | 543,175 | |
Series 2011 A, RB | | | 4.00 | % | | | 04/01/17 | | | | 500 | | | | 549,085 | |
Florida Hurricane Catastrophe Fund Finance Corp.; Series 2010 A, RB | | | 5.00 | % | | | 07/01/15 | | | | 5,250 | | | | 5,581,957 | |
Gulf Breeze (City of) (2010 A Loan Program–Loans to City of Pensacola); | | | | | | | | | | | | | | | | |
Series 2010 A, Capital Funding RB (INS–AGM)(a) | | | 5.00 | % | | | 10/01/15 | | | | 1,590 | | | | 1,704,210 | |
Series 2010 A, Capital Funding RB (INS–AGM)(a) | | | 5.00 | % | | | 10/01/16 | | | | 1,495 | | | | 1,657,551 | |
Gulf Breeze (City of) (Local Government Loan Program); Series 1985 J, RB(f) | | | 4.50 | % | | | 12/01/20 | | | | 3,050 | | | | 3,469,680 | |
Highlands (County of) Health Facilities Authority (Adventist Health System/Sunbelt Obligated Group); | | | | | | | | | | | | | | | | |
Series 2005 I, Hospital RB | | | 4.50 | % | | | 11/15/15 | | | | 2,000 | | | | 2,141,340 | |
Series 2005 I, Hospital RB | | | 5.00 | % | | | 11/15/16 | | | | 2,000 | | | | 2,240,120 | |
JEA; Series 2009 Three A, Electric System RB(b)(c) | | | 5.00 | % | | | 04/01/14 | | | | 1,125 | | | | 1,130,051 | |
Kissimmee (City of) Utility Authority; | | | | | | | | | | | | | | | | |
Series 2003, Ref. Electric System RB (INS–AGM)(a) | | | 5.00 | % | | | 10/01/17 | | | | 1,900 | | | | 2,168,508 | |
Series 2003, Ref. Electric System RB (INS–AGM)(a) | | | 5.25 | % | | | 10/01/15 | | | | 1,500 | | | | 1,612,935 | |
Series 2003, Ref. Electric System RB (INS–AGM)(a) | | | 5.25 | % | | | 10/01/16 | | | | 1,500 | | | | 1,674,555 | |
Lakeland (City of) (Lakeland Regional Health Systems); Series 2011, Ref. Hospital System RB | | | 4.00 | % | | | 11/15/14 | | | | 585 | | | | 598,262 | |
Miami (City of) (Homeland Defense); Series 2007, Ref. Limited Tax GO Bonds (INS–AGM)(a) | | | 5.00 | % | | | 01/01/16 | | | | 1,000 | | | | 1,072,510 | |
Miami (City of); | | | | | | | | | | | | | | | | |
Series 1998, Ref. Parking System RB (INS–NATL)(a) | | | 5.25 | % | | | 10/01/15 | | | | 900 | | | | 939,645 | |
Series 2009, Ref. Parking System RB (INS–AGC)(a) | | | 5.00 | % | | | 10/01/28 | | | | 750 | | | | 794,737 | |
Miami-Dade (County of) (Double-Barreled Aviation); Series 2010, Unlimited Tax GO Bonds | | | 5.00 | % | | | 07/01/17 | | | | 500 | | | | 571,330 | |
Miami-Dade (County of) (Jackson Health System); | | | | | | | | | | | | | | | | |
Series 2009, Public Facilities RB (INS–AGC)(a) | | | 5.00 | % | | | 06/01/18 | | | | 1,000 | | | | 1,142,130 | |
Series 2009, Public Facilities RB (INS–AGC)(a) | | | 5.50 | % | | | 06/01/29 | | | | 2,455 | | | | 2,630,312 | |
Miami-Dade (County of) (Miami International Airport); | | | | | | | | | | | | | | | | |
Series 2009 A, Aviation RB (INS–AGC)(a) | | | 5.00 | % | | | 10/01/27 | | | | 120 | | | | 129,097 | |
Series 2009 B, Aviation RB (INS–AGC)(a) | | | 5.00 | % | | | 10/01/26 | | | | 1,000 | | | | 1,082,010 | |
Series 2009 B, Aviation RB (INS–AGC)(a) | | | 5.00 | % | | | 10/01/29 | | | | 1,000 | | | | 1,061,200 | |
Miami-Dade (County of); | | | | | | | | | | | | | | | | |
Series 2008 C, Ref. Water & Sewer System RB (INS–BHAC)(a) | | | 5.00 | % | | | 10/01/24 | | | | 1,500 | | | | 1,696,365 | |
Series 2008 C, Ref. Water & Sewer System RB (INS–BHAC)(a) | | | 5.13 | % | | | 10/01/25 | | | | 1,525 | | | | 1,727,947 | |
Series 2008 C, Ref. Water & Sewer System RB (INS–BHAC)(a) | | | 5.50 | % | | | 10/01/20 | | | | 1,500 | | | | 1,732,935 | |
Orange (County of) Health Facilities Authority (Orlando Health, Inc.); Series 2009, Hospital RB | | | 5.00 | % | | | 10/01/14 | | | | 1,085 | | | | 1,113,080 | |
See accompanying Notes to Financial Statements which are an integral part of the financial statements.
13 Invesco Tax-Free Intermediate Fund
| | | | | | | | | | | | | | | | |
| | | Interest
Rate | | | Maturity
Date | | | Principal
Amount
(000) | | | Value | |
| Florida–(continued) | |
Pasco (County of); Series 2009 A, Water & Sewer RB | | | 5.00 | % | | | 10/01/16 | | | $ | 750 | | | $ | 836,685 | |
Port St. Lucie (City of) (Municipal Complex); Series 2008, Ref. Master Lease Project COP (INS–AGC)(a) | | | 6.25 | % | | | 09/01/27 | | | | 500 | | | | 545,845 | |
Volusia (County of) School Board; Series 2011, Ref. Sales Tax RB (INS–AGM)(a) | | | 5.00 | % | | | 10/01/14 | | | | 2,000 | | | | 2,047,000 | |
| | | | | | | | | | | | | | | | 68,837,213 | |
|
| Georgia–3.78% | |
Atlanta (City of); | | | | | | | | | | | | | | | | |
Series 2009 B, Water & Wastewater RB (INS–AGM)(a) | | | 4.13 | % | | | 11/01/19 | | | | 970 | | | | 1,108,244 | |
Series 2009 B, Water & Wastewater RB (INS–AGM)(a) | | | 5.00 | % | | | 11/01/17 | | | | 1,500 | | | | 1,725,795 | |
Series 2009 B, Water & Wastewater RB (INS–AGM)(a) | | | 5.00 | % | | | 11/01/20 | | | | 1,500 | | | | 1,733,520 | |
Series 2009 B, Water & Wastewater RB (INS–AGM)(a) | | | 5.00 | % | | | 11/01/21 | | | | 1,500 | | | | 1,703,550 | |
Series 2009 B, Water & Wastewater RB (INS–AGM)(a) | | | 5.25 | % | | | 11/01/27 | | | | 2,000 | | | | 2,332,960 | |
Burke (County of) Development Authority (Oglethorpe Power Vogtle); Series 2013 A, PCR(b) | | | 2.40 | % | | | 04/01/20 | | | | 2,000 | | | | 1,985,900 | |
DeKalb (County of) Hospital Authority (DeKalb Medical Center, Inc.); Series 2010, RAC | | | 5.25 | % | | | 09/01/20 | | | | 2,440 | | | | 2,626,514 | |
Fayette (County of) Hospital Authority (Fayette Community Hospital); | | | | | | | | | | | | | | | | |
Series 2009 A, RAC | | | 4.38 | % | | | 06/15/20 | | | | 2,500 | | | | 2,772,875 | |
Series 2009 A, RAC | | | 4.50 | % | | | 06/15/21 | | | | 2,500 | | | | 2,735,750 | |
Fulton (County of) Development Authority (Catholic Health East); Series 2010, Health System RB(c) | | | 4.00 | % | | | 11/15/16 | | | | 2,460 | | | | 2,699,678 | |
Fulton (County of) Development Authority (Piedmont Healthcare, Inc.); Series 2009 A, RB | | | 5.00 | % | | | 06/15/29 | | | | 2,830 | | | | 3,042,703 | |
Gainesville (City of) & Hall (County of) Development Authority (Acts Retirement-Life Community); Series 2012, Retirement Community RB | | | 5.00 | % | | | 11/15/22 | | | | 2,000 | | | | 2,251,860 | |
Gainesville (City of) & Hall (County of) Hospital Authority (Northeast Georgia Health System, Inc.); Series 2010 A, RAC | | | 5.00 | % | | | 02/15/16 | | | | 1,245 | | | | 1,334,914 | |
Glynn-Brunswick Memorial Hospital Authority (Southeast Georgia Health System); | | | | | | | | | | | | | | | | |
Series 2008 A, RAC | | | 5.00 | % | | | 08/01/20 | | | | 1,000 | | | | 1,098,880 | |
Series 2008 A, RAC | | | 5.25 | % | | | 08/01/23 | | | | 1,000 | | | | 1,078,220 | |
Gwinnett (County of) Hospital Authority (Gwinnett Hospital System, Inc.); Series 2007 D, RAC (INS–AGM)(a) | | | 5.25 | % | | | 07/01/29 | | | | 2,000 | | | | 2,111,180 | |
Macon-Bibb (County of) Hospital Authority (Medical Center of Central Georgia, Inc.); | | | | | | | | | | | | | | | | |
Series 2009, RAC | | | 4.00 | % | | | 08/01/19 | | | | 635 | | | | 705,599 | |
Series 2009, RAC | | | 5.00 | % | | | 08/01/24 | | | | 1,260 | | | | 1,420,285 | |
Medical Center Hospital Authority (Columbus Regional Healthcare System, Inc.); | | | | | | | | | | | | | | | | |
Series 2010, RAC (INS–AGM)(a) | | | 3.50 | % | | | 08/01/20 | | | | 2,000 | | | | 2,128,000 | |
Series 2010, RAC (INS–AGM)(a) | | | 5.00 | % | | | 08/01/21 | | | | 1,500 | | | | 1,689,585 | |
Private Colleges & Universities Authority (Mercer University); | | | | | | | | | | | | | | | | |
Series 2012 A, RB | | | 4.00 | % | | | 10/01/14 | | | | 585 | | | | 594,500 | |
Series 2012 A, RB | | | 4.00 | % | | | 10/01/16 | | | | 1,660 | | | | 1,765,294 | |
Series 2012 C, RB | | | 5.25 | % | | | 10/01/27 | | | | 1,000 | | | | 1,069,450 | |
Richmond (County of) Hospital Authority (University Health Services, Inc.); Series 2009, RAC | | | 5.25 | % | | | 01/01/29 | | | | 2,500 | | | | 2,644,075 | |
South Regional Joint Development Authority (Valdosta State University Parking & Health Center); | | | | | | | | | | | | | | | | |
Series 2007, RB (INS–SGI)(a) | | | 5.00 | % | | | 08/01/20 | | | | 1,385 | | | | 1,536,145 | |
Series 2007, RB (INS–SGI)(a) | | | 5.00 | % | | | 08/01/21 | | | | 1,490 | | | | 1,680,318 | |
Series 2007, RB (INS–SGI)(a) | | | 5.00 | % | | | 08/01/22 | | | | 605 | | | | 682,277 | |
Thomasville (City of) Hospital Authority (John D. Archbold Memorial Hospital, Inc.); Series 2010, RAC | | | 4.75 | % | | | 11/01/25 | | | | 750 | | | | 759,997 | |
Valdosta (City of) & Lowndes (County of) Hospital Authority (South Medical Center); Series 2011 B, RB | | | 5.00 | % | | | 10/01/24 | | | | 2,000 | | | | 2,232,300 | |
| | | | | | | | | | | | | | | | 51,250,368 | |
|
| Guam–0.78% | |
Guam (Territory of) (Section 30); Series 2009 A, Limited Obligation RB | | | 5.00 | % | | | 12/01/15 | | | | 1,085 | | | | 1,146,509 | |
Guam (Territory of) Power Authority; | | | | | | | | | | | | | | | | |
Series 2012 A, Ref. RB (INS–AGM)(a) | | | 5.00 | % | | | 10/01/19 | | | | 1,000 | | | | 1,153,920 | |
Series 2012 A, Ref. RB (INS–AGM)(a) | | | 5.00 | % | | | 10/01/20 | | | | 1,595 | | | | 1,839,290 | |
Series 2012 A, Ref. RB (INS–AGM)(a) | | | 5.00 | % | | | 10/01/23 | | | | 2,000 | | | | 2,272,520 | |
Series 2012 A, Ref. RB (INS–AGM)(a) | | | 5.00 | % | | | 10/01/24 | | | | 2,250 | | | | 2,517,525 | |
Series 2012 A, Ref. RB (INS–AGM)(a) | | | 5.00 | % | | | 10/01/25 | | | | 1,500 | | | | 1,660,680 | |
| | | | | | | | | | | | | | | | 10,590,444 | |
See accompanying Notes to Financial Statements which are an integral part of the financial statements.
14 Invesco Tax-Free Intermediate Fund
| | | | | | | | | | | | | | | | |
| | | Interest
Rate | | | Maturity
Date | | | Principal
Amount
(000) | | | Value | |
| Idaho–0.64% | |
Idaho (State of) Health Facilities Authority (Trinity Health Credit Group); Series 2008 B, Ref. RB | | | 5.63 | % | | | 12/01/19 | | | $ | 1,000 | | | $ | 1,175,130 | |
Idaho (State of) Housing & Finance Association (Federal Highway Trust Fund); Series 2009 A, Grant & RAB | | | 5.25 | % | | | 07/15/25 | | | | 500 | | | | 552,535 | |
Idaho (State of) Housing & Finance Association; | | | | | | | | | | | | | | | | |
Series 2008 D, Class III, Single Family Mortgage RB | | | 5.35 | % | | | 01/01/29 | | | | 260 | | | | 265,720 | |
Series 2009 B, Class III, Single Family Mortgage RB | | | 5.65 | % | | | 07/01/26 | | | | 290 | | | | 305,912 | |
Regents of the University of Idaho; | | | | | | | | | | | | | | | | |
Series 2007 B, General RB (INS–AGM)(a)(b) | | | 4.50 | % | | | 04/01/18 | | | | 1,760 | | | | 1,959,162 | |
Series 2011, Ref. General RB(b) | | | 5.25 | % | | | 04/01/21 | | | | 3,850 | | | | 4,473,738 | |
| | | | | | | | | | | | | | | | 8,732,197 | |
|
| Illinois–6.06% | |
Bolingbrook (Village of); Series 2010 A, Ref. Unlimited Tax GO Bonds (INS–AGM)(a) | | | 5.00 | % | | | 01/01/23 | | | | 1,260 | | | | 1,385,206 | |
Bourbonnais (Village of) (Olivet Nazarene University); Series 2010, Industrial Project RB | | | 5.13 | % | | | 11/01/25 | | | | 1,145 | | | | 1,206,017 | |
Chicago (City of) (Midway Airport); Series 2013 B, Ref. Second Lien RB | | | 5.00 | % | | | 01/01/20 | | | | 2,000 | | | | 2,327,400 | |
Chicago (City of) (O’Hare International Airport); | | | | | | | | | | | | | | | | |
Series 2008 A, Ref. Passenger Facility Charge RB (INS–AGM)(a) | | | 5.00 | % | | | 01/01/16 | | | | 1,400 | | | | 1,516,550 | |
Series 2010 C, Third Lien General Airport RB (INS–AGC)(a) | | | 5.25 | % | | | 01/01/21 | | | | 1,025 | | | | 1,183,004 | |
Chicago (City of) Board of Education; Series 2013 A3, Ref. Floating Rate Unlimited Tax GO
Bonds(b)(d) | | | 0.86 | % | | | 06/02/18 | | | | 10,000 | | | | 10,000,000 | |
Chicago (City of) Transit Authority (FTA Section 5309 Fixed Guideway Modernization Formula Funds); Series 2008 A, Capital Grant Receipts RB (INS–AGC)(a) | | | 5.25 | % | | | 06/01/23 | | | | 2,500 | | | | 2,719,250 | |
Cook (County of); | | | | | | | | | | | | | | | | |
Series 2004 A, Ref. Unlimited Tax GO Bonds(b)(c) | | | 5.00 | % | | | 05/15/14 | | | | 1,590 | | | | 1,622,547 | |
Series 2004 A, Ref. Unlimited Tax GO Bonds(b)(c) | | | 5.00 | % | | | 05/15/14 | | | | 3,410 | | | | 3,479,803 | |
Series 2009 A, Ref. Unlimited Tax GO Bonds | | | 5.00 | % | | | 11/15/19 | | | | 2,015 | | | | 2,349,006 | |
Series 2009 C, Ref. Unlimited Tax GO Bonds | | | 5.00 | % | | | 11/15/20 | | | | 5,150 | | | | 5,873,781 | |
Cook County School District No. 144 (Prairie Hills); | | | | | | | | | | | | | | | | |
Series 2010 A, School Limited Tax GO Bonds(c) | | | 4.00 | % | | | 12/01/16 | | | | 870 | | | | 953,215 | |
Series 2010 A, School Limited Tax GO Bonds(c) | | | 4.25 | % | | | 12/01/20 | | | | 555 | | | | 642,956 | |
DeKalb County Community Unit School District No. 428; | | | | | | | | | | | | | | | | |
Series 2010, School Building Unlimited Tax CAB GO Bonds(e) | | | 0.00 | % | | | 01/01/19 | | | | 1,000 | | | | 903,370 | |
Series 2010, School Building Unlimited Tax CAB GO Bonds(e) | | | 0.00 | % | | | 01/01/20 | | | | 1,000 | | | | 859,930 | |
Illinois (State of) Finance Authority (Advocate Health Care Network); | | | | | | | | | | | | | | | | |
Series 2003 A, RB(b) | | | 4.38 | % | | | 07/01/14 | | | | 640 | | | | 648,928 | |
Series 2010 D, Ref. RB | | | 5.00 | % | | | 04/01/20 | | | | 1,200 | | | | 1,373,280 | |
Illinois (State of) Finance Authority (OSF Healthcare System); Series 2009 A, RB(b)(c) | | | 7.00 | % | | | 11/17/14 | | | | 1,000 | | | | 1,049,440 | |
Illinois (State of) Finance Authority (Resurrection Health Care Corp.); Series 1999 A, RB
(INS–AGM)(a) | | | 5.00 | % | | | 05/15/17 | | | | 2,000 | | | | 2,188,140 | |
Illinois (State of) Finance Authority (Southern Illinois Healthcare Enterprises, Inc.); | | | | | | | | | | | | | | | | |
Series 2005, RB (INS–AGM)(a) | | | 5.25 | % | | | 03/01/22 | | | | 1,275 | | | | 1,442,650 | |
Series 2005, RB (INS–AGM)(a) | | | 5.25 | % | | | 03/01/23 | | | | 1,500 | | | | 1,677,600 | |
Illinois (State of) Finance Authority (The University of Chicago Medical Center); Series 2009 C, RB | | | 5.25 | % | | | 08/15/29 | | | | 2,015 | | | | 2,049,718 | |
Illinois (State of); | | | | | | | | | | | | | | | | |
Series 2010, Ref. Unlimited Tax GO Bonds (INS–AGM)(a) | | | 5.00 | % | | | 01/01/16 | | | | 1,000 | | | | 1,082,480 | |
Series 2010, Ref. Unlimited Tax GO Bonds (INS–AGM)(a) | | | 5.00 | % | | | 01/01/17 | | | | 800 | | | | 889,784 | |
Series 2012, Ref. Unlimited Tax GO Bonds | | | 5.00 | % | | | 08/01/24 | | | | 2,000 | | | | 2,201,240 | |
Series 2012, Ref. Unlimited Tax GO Bonds | | | 5.00 | % | | | 08/01/25 | | | | 2,000 | | | | 2,181,640 | |
Series 2013, Unlimited Tax GO Bonds | | | 5.00 | % | | | 07/01/21 | | | | 2,500 | | | | 2,862,725 | |
Series 2014, Unlimited Tax GO Bonds | | | 5.00 | % | | | 02/01/20 | | | | 2,500 | | | | 2,866,350 | |
Joliet (City of); Series 2012, Ref. Waterworks & Sewage RB | | | 4.00 | % | | | 01/01/15 | | | | 1,000 | | | | 1,029,570 | |
Kane & DeKalb Counties Community Unit School District No. 302 (Kaneland); Series 2008, School Building Unlimited Tax GO Bonds (INS–AGM)(a) | | | 5.50 | % | | | 02/01/28 | | | | 1,500 | | | | 1,611,330 | |
Kendall (County of) Forest Preserve District; Series 2007, Unlimited Tax GO Bonds (INS–NATL)(a) | | | 5.25 | % | | | 01/01/23 | | | | 4,000 | | | | 4,510,720 | |
See accompanying Notes to Financial Statements which are an integral part of the financial statements.
15 Invesco Tax-Free Intermediate Fund
| | | | | | | | | | | | | | | | |
| | | Interest
Rate | | | Maturity
Date | | | Principal
Amount
(000) | | | Value | |
| Illinois–(continued) | |
Kendall, Kane & Will Counties Community Unit School District No. 308; | | | | | | | | | | | | | | | | |
Series 2007, Unlimited Tax GO Bonds (INS–AGC)(a) | | | 5.00 | % | | | 02/01/23 | | | $ | 5,795 | | | $ | 6,385,047 | |
Series 2007 A, Ref. Unlimited Tax GO Bonds (INS–NATL)(a) | | | 4.38 | % | | | 10/01/21 | | | | 1,020 | | | | 1,106,119 | |
Northern Illinois Municipal Power Agency (Prairie State Power); Series 2007 A, RB (INS–NATL)(a) | | | 5.00 | % | | | 01/01/19 | | | | 1,000 | | | | 1,119,230 | |
Railsplitter Tobacco Settlement Authority; Series 2010, RB | | | 5.50 | % | | | 06/01/23 | | | | 1,000 | | | | 1,156,060 | |
St. Clair (County of) (Alternative Revenue Source); | | | | | | | | | | | | | | | | |
Series 2009, Ref. Unlimited Tax GO Bonds | | | 5.00 | % | | | 10/01/19 | | | | 1,000 | | | | 1,179,960 | |
Series 2009, Ref. Unlimited Tax GO Bonds | | | 5.00 | % | | | 10/01/21 | | | | 1,480 | | | | 1,674,413 | |
Will County Community Unit School District No. 365 (Valley View); Series 2011 B, Ref. Unlimited Tax GO Bonds | | | 5.00 | % | | | 11/01/17 | | | | 1,060 | | | | 1,210,446 | |
Will, Grundy, Etc. Counties Community College District No. 525 (Joliet Junior College); | | | | | | | | | | | | | | | | |
Series 2008, Unlimited Tax GO Bonds(b)(c) | | | 5.75 | % | | | 06/01/18 | | | | 240 | | | | 288,574 | |
Series 2008, Unlimited Tax GO Bonds | | | 5.75 | % | | | 06/01/27 | | | | 1,195 | | | | 1,322,674 | |
| | | | | | | | | | | | | | | | 82,130,153 | |
|
| Indiana–1.00% | |
Clark-Pleasant Middle School Building Corp.; Series 2009, First Mortgage RB | | | 5.00 | % | | | 07/15/22 | | | | 1,000 | | | | 1,120,000 | |
Indiana (State of) Health Facility Financing Authority (Ascension Health Subordinate Credit Group); Series 2005 A-6, RB(b) | | | 5.00 | % | | | 06/01/14 | | | | 3,500 | | | | 3,542,875 | |
Indiana (State of) Municipal Power Agency; | | | | | | | | | | | | | | | | |
Series 2011 A, Power Supply System RB | | | 5.00 | % | | | 01/01/21 | | | | 250 | | | | 293,447 | |
Series 2011 A, Power Supply System RB | | | 5.00 | % | | | 01/01/22 | | | | 250 | | | | 292,498 | |
Indianapolis Local Public Improvement Bond Bank (Waterworks); Series 2009 A, RB (INS–AGC)(a) | | | 5.25 | % | | | 01/01/29 | | | | 1,040 | | | | 1,129,773 | |
Monroe County Community 1996 School Building Corp.; Series 2008, First Mortgage RB
(INS–AGM)(a) | | | 5.13 | % | | | 01/15/24 | | | | 2,285 | | | | 2,609,744 | |
Portage (City of) Redevelopment District; Series 2008, Ref. Tax Increment Allocation RB
(INS–AGC)(a) | | | 5.00 | % | | | 01/15/22 | | | | 2,470 | | | | 2,646,877 | |
Rockport (City of) (Indiana Michigan Power Co.); | | | | | | | | | | | | | | | | |
Series 2009 A, Ref. PCR(b) | | | 6.25 | % | | | 06/02/14 | | | | 1,000 | | | | 1,014,020 | |
Series 2009 B, Ref. PCR(b) | | | 6.25 | % | | | 06/02/14 | | | | 500 | | | | 507,010 | |
University of Southern Indiana; Series 2009 J, Student Fee RB (INS–AGC)(a) | | | 5.00 | % | | | 10/01/23 | | | | 400 | | | | 442,516 | |
| | | | | | | | | | | | | | | | 13,598,760 | |
|
| Iowa–1.64% | |
Ames (City of) (Mary Greeley Medical Center); Series 2011, Hospital RB | | | 5.38 | % | | | 06/15/28 | | | | 1,825 | | | | 1,941,417 | |
Iowa (State of) Finance Authority (Iowa Health System); | | | | | | | | | | | | | | | | |
Series 2005 A, Health Facilities RB (INS–AGC)(a) | | | 5.00 | % | | | 02/15/18 | | | | 1,000 | | | | 1,145,420 | |
Series 2005 A, Health Facilities RB (INS–AGC)(a) | | | 5.00 | % | | | 02/15/19 | | | | 500 | | | | 581,465 | |
Iowa (State of) Finance Authority (Mercy Medical Center); Series 2012, Health Facilities RB | | | 4.00 | % | | | 08/15/21 | | | | 1,830 | | | | 1,984,891 | |
Iowa Student Loan Liquidity Corp.; | | | | | | | | | | | | | | | | |
Series 2009 1, RB | | | 5.00 | % | | | 12/01/15 | | | | 2,500 | | | | 2,660,075 | |
Series 2009 1, RB | | | 5.00 | % | | | 12/01/16 | | | | 2,525 | | | | 2,763,082 | |
Series 2009 1, RB | | | 5.25 | % | | | 12/01/17 | | | | 2,500 | | | | 2,812,150 | |
Series 2009 1, RB | | | 5.25 | % | | | 12/01/18 | | | | 2,500 | | | | 2,845,200 | |
Series 2009 2, RB | | | 5.40 | % | | | 12/01/23 | | | | 2,500 | | | | 2,663,050 | |
Series 2009 3, RB | | | 5.00 | % | | | 12/01/19 | | | | 2,500 | | | | 2,824,775 | |
| | | | | | | | | | | | | | | | 22,221,525 | |
|
| Kansas–0.34% | |
Dodge City (City of); Series 2009, Sales Tax RB (INS–AGC)(a) | | | 5.00 | % | | | 06/01/21 | | | | 1,000 | | | | 1,143,070 | |
Kansas (State of) Development Finance Authority (Adventist Health System/Sunbelt Obligated Group); | | | | | | | | | | | | | | | | |
Series 2009 C, Hospital RB | | | 5.00 | % | | | 11/15/16 | | | | 1,000 | | | | 1,117,760 | |
Series 2009 D, Hospital RB | | | 5.00 | % | | | 11/15/24 | | | | 1,585 | | | | 1,773,821 | |
Kansas (State of) Development Finance Authority (University of Kansas Health System); Series 2011 H, Health Facilities RB | | | 5.00 | % | | | 03/01/24 | | | | 500 | | | | 543,995 | |
| | | | | | | | | | | | | | | | 4,578,646 | |
See accompanying Notes to Financial Statements which are an integral part of the financial statements.
16 Invesco Tax-Free Intermediate Fund
| | | | | | | | | | | | | | | | |
| | | Interest
Rate | | | Maturity
Date | | | Principal
Amount
(000) | | | Value | |
| Kentucky–3.13% | |
Christian (County of) (Jennie Stuart Medical Center, Inc.); Series 2006, Ref. Hospital RB (INS–AGC)(a) | | | 5.25 | % | | | 02/01/28 | | | $ | 1,030 | | | $ | 1,067,214 | |
Kentucky (State of) Economic Development Finance Authority (Louisville Arena Authority, Inc.); Subseries 2008 A-1, RB (INS–AGC)(a) | | | 5.75 | % | | | 12/01/28 | | | | 550 | | | | 579,051 | |
Kentucky (State of) Municipal Power Agency (Prairie State); | | | | | | | | | | | | | | | | |
Series 2010 A, Power System RB (INS–AGM)(a) | | | 4.00 | % | | | 09/01/16 | | | | 800 | | | | 865,904 | |
Series 2010 A, Power System RB (INS–AGM)(a) | | | 5.00 | % | | | 09/01/21 | | | | 5,860 | | | | 6,748,141 | |
Series 2010 A, Power System RB (INS–AGM)(a) | | | 5.00 | % | | | 09/01/22 | | | | 4,560 | | | | 5,178,701 | |
Series 2010 A, Power System RB (INS–AGM)(a) | | | 5.00 | % | | | 09/01/23 | | | | 1,000 | | | | 1,120,680 | |
Kentucky (State of) Public Transportation Infrastructure Authority (Downtown Crossing); Series 2013 A, Sub. Toll Revenue BAN | | | 5.00 | % | | | 07/01/17 | | | | 5,000 | | | | 5,589,900 | |
Louisville (City of) & Jefferson (County of) Metropolitan Government (Louisville Gas & Electric Co.); Series 2005 A, PCR(b) | | | 2.20 | % | | | 08/01/19 | | | | 3,000 | | | | 3,059,340 | |
Louisville (City of) & Jefferson (County of) Metropolitan Sewer District; | | | | | | | | | | | | | | | | |
Series 2009 B, Sewer & Drainage System RB | | | 5.00 | % | | | 05/15/14 | | | | 1,500 | | | | 1,515,585 | |
Series 2009 B, Sewer & Drainage System RB | | | 5.00 | % | | | 05/15/15 | | | | 2,500 | | | | 2,645,650 | |
Series 2009 B, Sewer & Drainage System RB | | | 5.00 | % | | | 05/15/20 | | | | 10,000 | | | | 11,816,400 | |
Paducah (City of) Electric Plant Board; Series 2009 A, RB (INS–AGC)(a) | | | 5.00 | % | | | 10/01/24 | | | | 2,000 | | | | 2,235,100 | |
| | | | | | | | | | | | | | | | 42,421,666 | |
|
| Louisiana–4.01% | |
Greater New Orleans Expressway Commission; Series 2009, Ref. RB (INS–AGC)(a) | | | 2.75 | % | | | 11/01/14 | | | | 600 | | | | 609,366 | |
Jefferson (Parish of) Hospital Service District No. 1 (West Jefferson Medical Center); Series 1998 B, Hospital RB (INS–AGM)(a) | | | 5.25 | % | | | 01/01/28 | | | | 1,000 | | | | 1,054,440 | |
Louisiana (State of) Energy & Power Authority (Rodemacher Unit No. 2); Series 2013, Power RB | | | 5.00 | % | | | 01/01/21 | | | | 1,100 | | | | 1,272,293 | |
Louisiana (State of) Local Government Environmental Facilities & Community Development Authority (BRCC Facilities Corp.); | | | | | | | | | | | | | | | | |
Series 2011, Ref. RB (INS–AGM)(a) | | | 3.00 | % | | | 12/01/15 | | | | 1,750 | | | | 1,829,590 | |
Series 2011, Ref. RB (INS–AGM)(a) | | | 4.00 | % | | | 12/01/17 | | | | 1,690 | | | | 1,878,604 | |
Series 2011, Ref. RB (INS–AGM)(a) | | | 4.00 | % | | | 12/01/18 | | | | 1,775 | | | | 1,970,356 | |
Louisiana (State of) Local Government Environmental Facilities & Community Development Authority (Caddo/Bossier Parishes Port Commission); Series 2010, Ref. RB (INS–AGM)(a) | | | 4.00 | % | | | 04/01/18 | | | | 1,600 | | | | 1,779,376 | |
Louisiana (State of) Local Government Environmental Facilities & Community Development Authority (City of Lake Charles Public Improvement); Series 2010, RB (INS–AGC)(a) | | | 3.00 | % | | | 05/01/14 | | | | 1,000 | | | | 1,004,550 | |
Louisiana (State of) Local Government Environmental Facilities & Community Development Authority (City of Lake Charles); | | | | | | | | | | | | | | | | |
Series 2009, Ref. RB (INS–AGC)(a) | | | 4.00 | % | | | 04/01/16 | | | | 1,435 | | | | 1,530,356 | |
Series 2009, Ref. RB (INS–AGC)(a) | | | 4.00 | % | | | 04/01/18 | | | | 1,555 | | | | 1,722,100 | |
Louisiana (State of) Local Government Environmental Facilities & Community Development Authority (Jefferson Parish); Series 2009 A, Ref. RB | | | 5.00 | % | | | 04/01/18 | | | | 1,000 | | | | 1,144,820 | |
Louisiana (State of) Local Government Environmental Facilities & Community Development Authority (Louisiana Community & Technical College System Facilities Corp.); Series 2009 B, RB (INS–AGC)(a) | | | 5.00 | % | | | 10/01/26 | | | | 1,500 | | | | 1,608,795 | |
Louisiana (State of) Local Government Environmental Facilities & Community Development Authority (Monroe Regional Airport Terminal); Series 2009, Airport RB (INS–AGC)(a) | | | 5.00 | % | | | 02/01/29 | | | | 1,000 | | | | 1,070,490 | |
Louisiana (State of) Offshore Terminal Authority (Loop LCC); Series 2007 B-2A, Deepwater Port RB(b) | | | 2.13 | % | | | 10/01/15 | | | | 1,000 | | | | 1,018,670 | |
Louisiana (State of) Public Facilities Authority (Black & Gold Facilities); Series 2007 A, RB
(INS–AGC)(a) | | | 5.00 | % | | | 07/01/22 | | | | 500 | | | | 526,505 | |
Louisiana (State of) Public Facilities Authority (CHRISTUS Health); | | | | | | | | | | | | | | | | |
Series 2008 B, Ref. RB (INS–AGC)(a) | | | 5.75 | % | | | 07/01/18 | | | | 620 | | | | 671,962 | |
Series 2009 A, Ref. RB | | | 5.00 | % | | | 07/01/15 | | | | 1,000 | | | | 1,054,130 | |
Series 2009 A, Ref. RB | | | 5.00 | % | | | 07/01/16 | | | | 1,000 | | | | 1,089,170 | |
Series 2009 A, Ref. RB | | | 5.25 | % | | | 07/01/20 | | | | 1,000 | | | | 1,166,070 | |
Louisiana (State of) Public Facilities Authority (Hurricane Recovery Program); Series 2007, RB
(INS–AMBAC)(a) | | | 5.00 | % | | | 06/01/18 | | | | 1,000 | | | | 1,098,800 | |
Louisiana (State of) Public Facilities Authority (Nineteenth Judicial District Court Building); Series 2007, RB (INS–NATL)(a) | | | 4.50 | % | | | 06/01/21 | | | | 1,000 | | | | 1,046,940 | |
See accompanying Notes to Financial Statements which are an integral part of the financial statements.
17 Invesco Tax-Free Intermediate Fund
| | | | | | | | | | | | | | | | |
| | | Interest
Rate | | | Maturity
Date | | | Principal
Amount
(000) | | | Value | |
| Louisiana–(continued) | |
Louisiana (State of) Stadium & Exposition District; Series 2013 A, Ref. Sr. RB | | | 5.00 | % | | | 07/01/24 | | | $ | 1,500 | | | $ | 1,699,650 | |
Louisiana Citizens Property Insurance Corp.; | | | | | | | | | | | | | | | | |
Series 2006 B, Assessment RB (INS–AMBAC)(a) | | | 5.00 | % | | | 06/01/16 | | | | 1,000 | | | | 1,090,690 | |
Series 2006 B, Assessment RB (INS–AMBAC)(a) | | | 5.25 | % | | | 06/01/14 | | | | 1,280 | | | | 1,295,693 | |
Series 2006 C-3, Assessment RB (INS–AGC)(a) | | | 6.13 | % | | | 06/01/25 | | | | 1,550 | | | | 1,780,718 | |
Series 2012, Ref. RB | | | 5.00 | % | | | 06/01/24 | | | | 1,020 | | | | 1,129,497 | |
New Orleans (City of) Aviation Board (Consolidated Rental Car); | | | | | | | | | | | | | | | | |
Series 2009 A, Gulf Opportunity Zone Customer Facility Charge RB | | | 5.00 | % | | | 01/01/16 | | | | 1,250 | | | | 1,334,938 | |
Series 2009 A, Gulf Opportunity Zone Customer Facility Charge RB | | | 5.13 | % | | | 01/01/17 | | | | 1,730 | | | | 1,901,512 | |
Series 2009 A, Gulf Opportunity Zone Customer Facility Charge RB | | | 5.25 | % | | | 01/01/18 | | | | 1,575 | | | | 1,770,473 | |
Series 2009 A, Gulf Opportunity Zone Customer Facility Charge RB | | | 5.50 | % | | | 01/01/19 | | | | 1,100 | | | | 1,265,000 | |
Series 2009 A, Gulf Opportunity Zone Customer Facility Charge RB | | | 5.75 | % | | | 01/01/20 | | | | 1,890 | | | | 2,160,516 | |
Series 2009 A, Gulf Opportunity Zone Customer Facility Charge RB | | | 6.00 | % | | | 01/01/25 | | | | 1,000 | | | | 1,124,380 | |
New Orleans (City of) Aviation Board; | | | | | | | | | | | | | | | | |
Series 2009 A-1, Ref. & Restructuring General Airport RB (INS–AGC)(a) | | | 5.00 | % | | | 01/01/19 | | | | 500 | | | | 576,995 | |
Series 2009 A-1, Ref. & Restructuring General Airport RB (INS–AGC)(a) | | | 6.00 | % | | | 01/01/23 | | | | 1,025 | | | | 1,168,264 | |
New Orleans (City of); Series 2009, Ref. Sewerage Service RB (INS–AGC)(a) | | | 6.25 | % | | | 06/01/29 | | | | 1,000 | | | | 1,124,580 | |
Plaquemines (Parish of) Law Enforcement District; | | | | | | | | | | | | | | | | |
Series 2009, Limited Tax GO Bonds | | | 4.00 | % | | | 09/01/14 | | | | 415 | | | | 421,167 | |
Series 2009, Limited Tax GO Bonds | | | 4.50 | % | | | 09/01/17 | | | | 1,350 | | | | 1,479,222 | |
Terrebonne (Parish of) Hospital Service District No. 1 (Terrebonne General Medical Center); Series 2010, Ref. RB | | | 4.00 | % | | | 04/01/20 | | | | 1,000 | | | | 1,079,270 | |
Tobacco Settlement Financing Corp.; Series 2013 A, Ref. Asset-Backed RB | | | 5.00 | % | | | 05/15/22 | | | | 5,000 | | | | 5,715,200 | |
| | | | | | | | | | | | | | | | 54,265,148 | |
|
| Maine–0.54% | |
Lewiston (City of) (UBS Financial Services, Inc.); | | | | | | | | | | | | | | | | |
Series 2008 B, Unlimited Tax GO School Bonds (INS–AGM)(a) | | | 5.00 | % | | | 12/15/19 | | | | 750 | | | | 840,285 | |
Series 2008 B, Unlimited Tax GO School Bonds (INS–AGM)(a) | | | 5.00 | % | | | 12/15/20 | | | | 870 | | | | 973,156 | |
Series 2008 B, Unlimited Tax GO School Bonds (INS–AGM)(a) | | | 5.50 | % | | | 12/15/23 | | | | 950 | | | | 1,073,253 | |
Maine (State of) Health & Higher Educational Facilities Authority (Eastern Maine Medical Center Obligated Group); | | | | | | | | | | | | | | | | |
Series 2013, RB | | | 5.00 | % | | | 07/01/22 | | | | 300 | | | | 340,194 | |
Series 2013, RB | | | 5.00 | % | | | 07/01/25 | | | | 1,290 | | | | 1,422,457 | |
Maine (State of) Housing Authority; Series 2009 B, Mortgage Purchase RB | | | 5.00 | % | | | 11/15/29 | | | | 2,500 | | | | 2,603,550 | |
| | | | | | | | | | | | | | | | 7,252,895 | |
|
| Maryland–0.32% | |
Baltimore (City of) (Water); Series 2009 A, Sub. Project RB | | | 5.13 | % | | | 07/01/29 | | | | 250 | | | | 276,295 | |
Maryland (State of) Health & Higher Educational Facilities Authority (LifeBridge Health); | | | | | | | | | | | | | | | | |
Series 2008, RB | | | 5.00 | % | | | 07/01/18 | | | | 1,000 | | | | 1,115,030 | |
Series 2008, RB (INS–AGC)(a) | | | 5.00 | % | | | 07/01/20 | | | | 1,000 | | | | 1,086,010 | |
Maryland (State of) Health & Higher Educational Facilities Authority (The Johns Hopkins Health System Obligated Group); Series 2008 B, RB(b) | | | 5.00 | % | | | 05/15/15 | | | | 715 | | | | 756,549 | |
Montgomery (County of) Housing Opportunities Commission; Series 2009 A, Single Family Mortgage RB | | | 3.38 | % | | | 07/01/16 | | | | 1,000 | | | | 1,060,940 | |
| | | | | | | | | | | | | | | | 4,294,824 | |
|
| Massachusetts–1.15% | |
Massachusetts (State of) Development Finance Agency (Cape Cod Healthcare Obligated Group); Series 2004 D, RB (INS–AGC)(a) | | | 4.00 | % | | | 11/15/17 | | | | 730 | | | | 805,000 | |
Massachusetts (State of) Development Finance Agency (Dominion Energy Brayton); Series 2010 A, RB(b)(c) | | | 2.25 | % | | | 09/01/16 | | | | 920 | | | | 962,522 | |
Massachusetts (State of) Development Finance Agency (Lesley University); Series 2009 A, RB (INS–AGC)(a) | | | 5.00 | % | | | 07/01/23 | | | | 1,095 | | | | 1,227,276 | |
See accompanying Notes to Financial Statements which are an integral part of the financial statements.
18 Invesco Tax-Free Intermediate Fund
| | | | | | | | | | | | | | | | |
| | | Interest
Rate | | | Maturity
Date | | | Principal
Amount
(000) | | | Value | |
| Massachusetts–(continued) | |
Massachusetts (State of) Development Finance Agency (Partners HealthCare System); Series 2014 M, Floating Rate RB(b)(d) | | | 0.58 | % | | | 01/30/18 | | | $ | 8,930 | | | $ | 8,930,000 | |
Massachusetts (State of) Development Finance Agency (Suffolk University); Series 2009 A, Ref. RB | | | 6.00 | % | | | 07/01/24 | | | | 1,500 | | | | 1,696,020 | |
Worcester (City of); Series 2009, Limited Tax GO Bonds (INS–AGC)(a) | | | 4.00 | % | | | 11/01/16 | | | | 1,860 | | | | 2,012,781 | |
| | | | | | | | | | | | | | | | 15,633,599 | |
|
| Michigan–4.05% | |
Adrian City School District; Series 2007, Ref. Unlimited Tax GO Bonds (INS–AGM)(a) | | | 5.50 | % | | | 05/01/15 | | | | 755 | | | | 801,523 | |
Battle Creek (City of); Series 2008, Ref. Downtown Development Limited Tax GO Bonds (INS–AMBAC)(a) | | | 5.00 | % | | | 05/01/15 | | | | 1,110 | | | | 1,172,748 | |
Central Michigan University Board of Trustees; Series 2009, Ref. General RB | | | 5.00 | % | | | 10/01/14 | | | | 1,510 | | | | 1,550,679 | |
Hastings Area School System; Series 2009, Ref. Unlimited Tax GO Bonds (INS–AGC)(a) | | | 3.25 | % | | | 05/01/15 | | | | 1,475 | | | | 1,516,492 | |
Michigan (State of) Building Authority (Facilities Program); | | | | | | | | | | | | | | | | |
Series 2009 I, Ref. RB (INS–AGC)(a) | | | 5.00 | % | | | 10/15/23 | | | | 7,150 | | | | 8,071,992 | |
Series 2009 I, Ref. RB (INS–AGC)(a) | | | 5.25 | % | | | 10/15/24 | | | | 1,040 | | | | 1,182,896 | |
Series 2009 II, RB | | | 4.00 | % | | | 10/15/15 | | | | 1,000 | | | | 1,058,550 | |
Series 2009 II, RB | | | 4.00 | % | | | 10/15/16 | | | | 1,950 | | | | 2,124,213 | |
Series 2009 II, RB (INS–AGM)(a) | | | 5.00 | % | | | 10/15/21 | | | | 1,180 | | | | 1,323,287 | |
Series 2009 II, RB (INS–AGM)(a) | | | 5.00 | % | | | 10/15/22 | | | | 520 | | | | 577,429 | |
Michigan (State of) Hospital Finance Authority (Ascension Health Senior Credit Group); Series 2010 F-3, Ref. & Project RB(b) | | | 2.63 | % | | | 06/30/14 | | | | 2,700 | | | | 2,721,195 | |
Michigan (State of) Hospital Finance Authority (Henry Ford Health System); | | | | | | | | | | | | | | | | |
Series 2009, Ref. RB | | | 4.00 | % | | | 11/15/14 | | | | 655 | | | | 667,956 | |
Series 2009, Ref. RB | | | 5.00 | % | | | 11/15/19 | | | | 1,500 | | | | 1,701,240 | |
Series 2009, Ref. RB | | | 5.50 | % | | | 11/15/18 | | | | 1,000 | | | | 1,143,230 | |
Michigan (State of) Hospital Finance Authority (McLaren Health Care Corp.); Series 2008 A, Ref. RB | | | 5.25 | % | | | 05/15/18 | | | | 1,100 | | | | 1,274,460 | |
Michigan (State of) Municipal Bond Authority (Local Government Loan Program); | | | | | | | | | | | | | | | | |
Series 2009 A, City of Grand Rapids Downtown Development Limited Tax GO Bonds | | | 5.00 | % | | | 05/01/21 | | | | 1,515 | | | | 1,692,710 | |
Series 2009 A, City of Grand Rapids Downtown Development Limited Tax GO Bonds | | | 5.13 | % | | | 05/01/23 | | | | 300 | | | | 329,160 | |
Series 2009 A, City of Grand Rapids Downtown Development Limited Tax GO Bonds | | | 5.25 | % | | | 05/01/24 | | | | 500 | | | | 548,220 | |
Series 2009 C, State Qualified School Limited Obligation Bonds (CEP–Michigan School Bond Loan Fund) | | | 5.00 | % | | | 05/01/15 | | | | 1,850 | | | | 1,947,144 | |
Series 2009 C, State Qualified School Limited Obligation Bonds (CEP–Michigan School Bond Loan Fund) | | | 5.00 | % | | | 05/01/16 | | | | 1,860 | | | | 2,034,096 | |
Michigan (State of); | | | | | | | | | | | | | | | | |
Series 2009, Ref. & State Trunk Line Fund RB | | | 5.00 | % | | | 11/01/19 | | | | 3,000 | | | | 3,556,680 | |
Series 2009, Ref. & State Trunk Line Fund RB | | | 5.00 | % | | | 11/01/23 | | | | 1,500 | | | | 1,668,225 | |
Royal Oak (City of) Hospital Finance Authority (William Beaumont Hospital Obligated Group); | | | | | | | | | | | | | | | | |
Series 2009 W, Ref. RB | | | 5.00 | % | | | 08/01/15 | | | | 1,000 | | | | 1,053,570 | |
Series 2009 W, Ref. RB | | | 5.25 | % | | | 08/01/16 | | | | 3,000 | | | | 3,268,620 | |
Series 2009 W, Ref. RB | | | 5.25 | % | | | 08/01/17 | | | | 2,000 | | | | 2,228,160 | |
Series 2009 W, Ref. RB | | | 5.50 | % | | | 08/01/19 | | | | 1,775 | | | | 2,048,616 | |
Southgate Community School District; Series 2005, Ref. Unlimited Tax GO Bonds (INS–NATL)(a) | | | 5.00 | % | | | 05/01/18 | | | | 1,710 | | | | 1,791,567 | |
Wayne State University Board of Governors; Series 2009 A, Ref. General RB | | | 5.00 | % | | | 11/15/17 | | | | 2,000 | | | | 2,299,620 | |
Ypsilanti School District; | | | | | | | | | | | | | | | | |
Series 2009, Ref. Unlimited Tax GO Bonds (INS–AGC)(a) | | | 4.00 | % | | | 05/01/14 | | | | 1,985 | | | | 1,998,002 | |
Series 2009, Ref. Unlimited Tax GO Bonds (INS–AGC)(a) | | | 5.00 | % | | | 05/01/18 | | | | 1,270 | | | | 1,471,854 | |
| | | | | | | | | | | | | | | | 54,824,134 | |
|
| Minnesota–2.12% | |
Duluth Independent School District No. 709; | | | | | | | | | | | | | | | | |
Series 2009 B, COP | | | 4.00 | % | | | 03/01/14 | | | | 1,360 | | | | 1,360,313 | |
Series 2009 B, COP | | | 4.00 | % | | | 03/01/15 | | | | 1,400 | | | | 1,435,588 | |
See accompanying Notes to Financial Statements which are an integral part of the financial statements.
19 Invesco Tax-Free Intermediate Fund
| | | | | | | | | | | | | | | | |
| | | Interest
Rate | | | Maturity
Date | | | Principal
Amount
(000) | | | Value | |
| Minnesota–(continued) | |
Minneapolis & St. Paul (Cities of) Housing & Redevelopment Authority (Children’s Health Care); | | | | | | | | | | | | | | | | |
Series 1995 B, Health Care RB (INS–AGM)(a) | | | 5.00 | % | | | 08/15/19 | | | $ | 1,400 | | | $ | 1,641,500 | |
Series 1995 B, Health Care RB (INS–AGM)(a) | | | 5.00 | % | | | 08/15/21 | | | | 1,350 | | | | 1,560,883 | |
Series 2010 A, Health Care Facilities RB | | | 5.00 | % | | | 08/15/20 | | | | 730 | | | | 861,093 | |
Minneapolis & St. Paul (Cities of) Metropolitan Airports Commission; | | | | | | | | | | | | | | | | |
Series 2007 B, Ref. Sub. RB (INS–NATL)(a) | | | 5.00 | % | | | 01/01/19 | | | | 2,930 | | | | 3,223,234 | |
Series 2009 A, Ref. Sr. RB | | | 4.00 | % | | | 01/01/16 | | | | 135 | | | | 143,844 | |
Series 2009 A, Ref. Sr. RB | | | 5.00 | % | | | 01/01/20 | | | | 1,000 | | | | 1,136,520 | |
Series 2011, Ref. RB | | | 5.00 | % | | | 01/01/20 | | | | 1,500 | | | | 1,761,810 | |
Series 2011, Ref. RB | | | 5.00 | % | | | 01/01/21 | | | | 1,240 | | | | 1,457,223 | |
Minnesota (State of) Agricultural & Economic Development Board (Essentia Health Obligated Group); | | | | | | | | | | | | | | | | |
Series 2008 C-1, Health Care Facilities RB (INS–AGC)(a) | | | 4.00 | % | | | 02/15/20 | | | | 1,500 | | | | 1,665,870 | |
Series 2008 C-1, Health Care Facilities RB (INS–AGC)(a) | | | 5.00 | % | | | 02/15/16 | | | | 570 | | | | 615,914 | |
Series 2008 C-1, Health Care Facilities RB (INS–AGC)(a) | | | 5.00 | % | | | 02/15/21 | | | | 1,500 | | | | 1,722,360 | |
Minnesota (State of) Higher Education Facilities Authority (University of St. Thomas); | | | | | | | | | | | | | | | | |
Series 2009 Seven-A, RB | | | 4.00 | % | | | 10/01/15 | | | | 1,000 | | | | 1,058,460 | |
Series 2009 Seven-A, RB | | | 4.00 | % | | | 10/01/16 | | | | 1,000 | | | | 1,088,110 | |
Series 2009 Seven-A, RB | | | 4.50 | % | | | 10/01/22 | | | | 1,000 | | | | 1,102,780 | |
Series 2009 Six-X, RB | | | 5.00 | % | | | 04/01/24 | | | | 500 | | | | 558,200 | |
Minnesota (State of) Housing Finance Agency; | | | | | | | | | | | | | | | | |
Series 2009 A, Residential RB | | | 5.20 | % | | | 01/01/23 | | | | 365 | | | | 386,185 | |
Series 2009 B, Residential RB | | | 5.45 | % | | | 07/01/24 | | | | 340 | | | | 364,283 | |
St. Cloud (City of) (CentraCare Health System); | | | | | | | | | | | | | | | | |
Series 2010 A, Health Care RB | | | 5.00 | % | | | 05/01/15 | | | | 500 | | | | 527,015 | |
Series 2010 B, Health Care RB | | | 5.00 | % | | | 05/01/16 | | | | 1,000 | | | | 1,094,930 | |
St. Paul (City of) Housing & Redevelopment Authority (Gillette Children’s Specialty Healthcare); | | | | | | | | | | | | | | | | |
Series 2009, Health Care RB | | | 5.00 | % | | | 02/01/16 | | | | 1,470 | | | | 1,572,709 | |
Series 2009, Health Care RB | | | 5.25 | % | | | 02/01/21 | | | | 2,175 | | | | 2,388,128 | |
| | | | | | | | | | | | | | | | 28,726,952 | |
|
| Mississippi–0.56% | |
Alcorn State University Educational Building Corp. (Student Housing); Series 2009 A, RB | | | 4.63 | % | | | 09/01/26 | | | | 1,695 | | | | 1,808,005 | |
Mississippi (State of) Development Bank (Jackson County Limited Tax Note); Series 2009, Special Obligation RB (INS–AGC)(a) | | | 5.00 | % | | | 07/01/24 | | | | 1,000 | | | | 1,096,450 | |
Mississippi (State of) Development Bank (Lowndes County Industrial Development); Series 2007, Special Obligation RB (INS–AGM)(a) | | | 5.00 | % | | | 07/01/19 | | | | 1,160 | | | | 1,311,844 | |
Mississippi (State of) Development Bank (Mississippi Power Co.); Series 2007 A, Special Obligation RB (INS–AMBAC)(a) | | | 5.00 | % | | | 07/01/16 | | | | 1,000 | | | | 1,089,050 | |
Mississippi (State of) Hospital Equipment & Facilities Authority (Baptist Memorial Health Care); Series 2004 B-2, RB | | | 5.00 | % | | | 09/01/23 | | | | 1,975 | | | | 2,236,826 | |
| | | | | | | | | | | | | | | | 7,542,175 | |
|
| Missouri–1.41% | |
Cass (County of); Series 2007, Hospital RB | | | 5.00 | % | | | 05/01/17 | | | | 500 | | | | 530,800 | |
Kansas City (City of); | | | | | | | | | | | | | | | | |
Series 2008 A, Ref. General Improvement Airport RB(c) | | | 4.00 | % | | | 09/01/14 | | | | 1,000 | | | | 1,019,430 | |
Series 2010 B, Ref. Special Obligation Tax Allocation RB | | | 4.13 | % | | | 01/01/21 | | | | 2,000 | | | | 2,165,940 | |
Ladue School District; Series 2007, Ref. & Improvement Unlimited Tax GO Bonds | | | 5.00 | % | | | 03/01/25 | | | | 1,250 | | | | 1,396,500 | |
Missouri (State of) Health & Educational Facilities Authority (SSM Health Care); | | | | | | | | | | | | | | | | |
Series 2010 B, Health Facilities RB | | | 5.00 | % | | | 06/01/19 | | | | 1,000 | | | | 1,163,740 | |
Series 2010 B, Health Facilities RB | | | 5.00 | % | | | 06/01/21 | | | | 4,645 | | | | 5,345,188 | |
Missouri (State of) Health & Educational Facilities Authority (St. Luke’s Health System, Inc.); Series 2010 A, RB | | | 5.00 | % | | | 11/15/20 | | | | 1,000 | | | | 1,176,750 | |
St. Charles (City of); Series 2012, COP | | | 2.00 | % | | | 05/01/15 | | | | 1,885 | | | | 1,917,384 | |
See accompanying Notes to Financial Statements which are an integral part of the financial statements.
20 Invesco Tax-Free Intermediate Fund
| | | | | | | | | | | | | | | | |
| | | Interest
Rate | | | Maturity
Date | | | Principal
Amount
(000) | | | Value | |
| Missouri–(continued) | |
St. Louis (City of) (Lambert–St. Louis International Airport); Series 2007 A, Ref. Airport RB
(INS–AGM)(a) | | | 5.00 | % | | | 07/01/20 | | | $ | 1,125 | | | $ | 1,258,065 | |
St. Louis (County of) Industrial Development Authority (Friendship Village of Sunset Hills); Series 2013 A, Senior Living Facilities RB | | | 5.00 | % | | | 09/01/23 | | | | 1,385 | | | | 1,475,025 | |
St. Louis Municipal Finance Corp. (Convention Center Capital Improvement); Series 2008, Leasehold RB (INS–AGC)(a) | | | 5.00 | % | | | 07/15/21 | | | | 1,500 | | | | 1,604,505 | |
| | | | | | | | | | | | | | | | 19,053,327 | |
|
| Montana–0.56% | |
Gallatin (County of) Airport Authority (Passenger Facility Charge Supported); Series 2009, RB | | | 4.38 | % | | | 06/01/29 | | | | 1,500 | | | | 1,545,735 | |
Helena (City of); Series 2009, COP | | | 5.00 | % | | | 01/01/29 | | | | 400 | | | | 429,904 | |
Montana (State of) Facility Finance Authority (Kalispell Regional Medical Center Obligated Group); Series 2010, Health Care Facilities RB | | | 5.00 | % | | | 07/01/30 | | | | 400 | | | | 425,192 | |
Montana (State of) Facility Finance Authority (Master Loan Program–Glendive Medical Center, Inc.); Series 2008 A, Health Care Facilities RB (CEP–State of Montana Board of Investments) | | | 4.63 | % | | | 07/01/18 | | | | 1,010 | | | | 1,160,753 | |
Montana (State of) Facility Finance Authority (Sisters of Charity of Leavenworth Health System); | | | | | | | | | | | | | | | | |
Series 2010 B, Ref. RB | | | 4.00 | % | | | 01/01/20 | | | | 1,000 | | | | 1,107,690 | |
Series 2010 B, Ref. RB | | | 5.00 | % | | | 01/01/19 | | | | 2,500 | | | | 2,912,825 | |
| | | | | | | | | | | | | | | | 7,582,099 | |
|
| Nevada–2.47% | |
Carson City (City of) (Carson-Tahoe Regional Medical Center); Series 2012, Ref. Hospital RB | | | 5.00 | % | | | 09/01/27 | | | | 2,000 | | | | 2,078,160 | |
Clark (County of); | | | | | | | | | | | | | | | | |
Series 2006, Bond Bank Limited Tax GO Bonds (INS–AMBAC)(a) | | | 5.00 | % | | | 11/01/21 | | | | 5,235 | | | | 5,832,418 | |
Series 2009 C, Sub. Lien Airport System RB (INS–AGM)(a) | | | 5.00 | % | | | 07/01/22 | | | | 1,000 | | | | 1,140,650 | |
Series 2009 C, Sub. Lien Airport System RB (INS–AGM)(a) | | | 5.00 | % | | | 07/01/23 | | | | 4,000 | | | | 4,543,160 | |
Series 2009 C, Sub. Lien Airport System RB (INS–AGM)(a) | | | 5.00 | % | | | 07/01/24 | | | | 1,855 | | | | 2,104,887 | |
Series 2009 C, Sub. Lien Airport System RB (INS–AGM)(a) | | | 5.00 | % | | | 07/01/25 | | | | 1,500 | | | | 1,692,405 | |
Sr. Series 2010 D, Airport System RB | | | 4.00 | % | | | 07/01/17 | | | | 2,000 | | | | 2,210,260 | |
Clark County School District; Series 2004 A, Ref. Limited Tax GO Bonds (INS–AGM)(a) | | | 5.00 | % | | | 06/15/16 | | | | 5,000 | | | | 5,069,250 | |
Humboldt (County of) (Idaho Power Co.); Series 2003, Ref. PCR | | | 5.15 | % | | | 12/01/24 | | | | 4,100 | | | | 4,483,104 | |
Las Vegas (City of) Valley Water District; Series 2009 D, Ref. Limited Tax GO Bonds | | | 5.00 | % | | | 06/01/16 | | | | 500 | | | | 550,600 | |
Reno (City of) (Washoe Medical Center); | | | | | | | | | | | | | | | | |
Series 2004 C, Hospital RB (INS–AGM)(a) | | | 5.00 | % | | | 06/01/15 | | | | 750 | | | | 788,603 | |
Series 2004 C, Hospital RB (INS–AGM)(a) | | | 5.00 | % | | | 06/01/17 | | | | 1,365 | | | | 1,525,114 | |
Series 2005 A, Hospital RB (INS–AGM)(a) | | | 5.25 | % | | | 06/01/17 | | | | 1,300 | | | | 1,462,825 | |
| | | | | | | | | | | | | | | | 33,481,436 | |
|
| New Hampshire–0.38% | |
Manchester (City of); | | | | | | | | | | | | | | | | |
Series 2009 A, Ref. General Airport RB | | | 5.00 | % | | | 01/01/15 | | | | 1,750 | | | | 1,806,770 | |
Series 2009 A, Ref. General Airport RB | | | 5.00 | % | | | 01/01/17 | | | | 500 | | | | 546,375 | |
New Hampshire (State of) Health & Education Facilities Authority (Concord Hospital); | | | | | | | | | | | | | | | | |
Series 2011, RB | | | 5.25 | % | | | 10/01/25 | | | | 525 | | | | 576,775 | |
Series 2011, RB | | | 5.50 | % | | | 10/01/26 | | | | 510 | | | | 564,213 | |
New Hampshire (State of) Housing Finance Authority; | | | | | | | | | | | | | | | | |
Series 2008 E, Single Family Mortgage Acquisition RB | | | 5.05 | % | | | 07/01/23 | | | | 325 | | | | 341,338 | |
Series 2008 E, Single Family Mortgage Acquisition RB | | | 5.30 | % | | | 07/01/28 | | | | 215 | | | | 226,133 | |
Series 2009 A, Single Family Mortgage Acquisition RB | | | 5.13 | % | | | 07/01/29 | | | | 980 | | | | 1,031,342 | |
| | | | | | | | | | | | | | | | 5,092,946 | |
|
| New Jersey–3.53% | |
New Jersey (State of) Economic Development Authority (Provident Group-Montclair Properties LLC–Montclair State University Student Housing); | | | | | | | | | | | | | | | | |
Series 2010 A, RB | | | 5.00 | % | | | 06/01/21 | | | | 1,500 | | | | 1,653,930 | |
Series 2010 A, RB | | | 5.25 | % | | | 06/01/20 | | | | 1,295 | | | | 1,461,589 | |
See accompanying Notes to Financial Statements which are an integral part of the financial statements.
21 Invesco Tax-Free Intermediate Fund
| | | | | | | | | | | | | | | | |
| | | Interest
Rate | | | Maturity
Date | | | Principal
Amount
(000) | | | Value | |
| New Jersey–(continued) | |
New Jersey (State of) Economic Development Authority; | | | | | | | | | | | | | | | | |
Series 2004, Cigarette Tax RB(c) | | | 5.50 | % | | | 06/15/16 | | | $ | 1,805 | | | $ | 2,019,272 | |
Series 2010 DD-1, Ref. School Facilities Construction RB | | | 5.00 | % | | | 12/15/16 | | | | 630 | | | | 709,638 | |
Series 2010 DD-1, Ref. School Facilities Construction RB | | | 5.00 | % | | | 12/15/17 | | | | 1,550 | | | | 1,791,955 | |
Series 2012, Ref. RB | | | 5.00 | % | | | 06/15/23 | | | | 1,500 | | | | 1,672,245 | |
Series 2012, Ref. RB | | | 5.00 | % | | | 06/15/24 | | | | 4,500 | | | | 4,913,370 | |
New Jersey (State of) Educational Facilities Authority (Seton Hall University); Series 2011 A, Ref. RB | | | 2.00 | % | | | 07/01/14 | | | | 1,000 | | | | 1,005,610 | |
New Jersey (State of) Health Care Facilities Financing Authority (Barnabas Health); | | | | | | | | | | | | | | | | |
Series 2012 A, Ref. RB | | | 5.00 | % | | | 07/01/22 | | | | 650 | | | | 732,004 | |
Series 2012 A, Ref. RB | | | 5.00 | % | | | 07/01/23 | | | | 1,000 | | | | 1,109,190 | |
New Jersey (State of) Health Care Facilities Financing Authority (Meridian Health System Obligated Group); Series 2011, Ref. RB | | | 5.00 | % | | | 07/01/15 | | | | 1,000 | | | | 1,057,170 | |
New Jersey (State of) Transportation Trust Fund Authority; | | | | | | | | | | | | | | | | |
Series 2011 B, Transportation System RB | | | 5.00 | % | | | 06/15/19 | | | | 1,000 | | | | 1,180,020 | |
Series 2011 B, Transportation System RB | | | 5.00 | % | | | 06/15/20 | | | | 1,000 | | | | 1,181,210 | |
Series 2011 B, Transportation System RB | | | 5.00 | % | | | 06/15/21 | | | | 1,000 | | | | 1,172,580 | |
New Jersey (State of) Turnpike Authority; | | | | | | | | | | | | | | | | |
Series 2009 H, RB | | | 5.00 | % | | | 01/01/20 | | | | 2,000 | | | | 2,313,020 | |
Series 2009 H, RB | | | 5.00 | % | | | 01/01/21 | | | | 2,000 | | | | 2,276,000 | |
Series 2013 D, Floating Rate RB(b)(d) | | | 0.71 | % | | | 01/01/18 | | | | 4,000 | | | | 4,038,000 | |
Series 2013 E, Floating Rate RB(b)(d) | | | 0.71 | % | | | 01/01/18 | | | | 3,000 | | | | 3,000,000 | |
Newark (City of) Housing Authority (South Ward Police Facility); | | | | | | | | | | | | | | | | |
Series 2009 A, City-Secured Police Facility RB (INS–AGC)(a) | | | 5.00 | % | | | 12/01/21 | | | | 1,130 | | | | 1,289,036 | |
Series 2009 A, City-Secured Police Facility RB (INS–AGC)(a) | | | 5.38 | % | | | 12/01/26 | | | | 750 | | | | 832,657 | |
Newark (City of); Series 2010 A, Ref. Qualified General Improvement Unlimited Tax GO Bonds | | | 4.00 | % | | | 10/01/16 | | | | 3,710 | | | | 4,003,424 | |
North Hudson Sewerage Authority; Series 2012 A, Gross Revenue Lease Ctfs. | | | 5.00 | % | | | 06/01/25 | | | | 1,500 | | | | 1,710,390 | |
Perth Amboy (City of) Board of Education; | | | | | | | | | | | | | | | | |
Series 2010, Ref. COP (INS–AGC)(a) | | | 4.00 | % | | | 06/15/15 | | | | 1,345 | | | | 1,396,097 | |
Series 2010, Ref. COP (INS–AGC)(a) | | | 4.00 | % | | | 12/15/15 | | | | 1,395 | | | | 1,467,024 | |
South Jersey Port Corp.; Series 2009 P-2, Marine Terminal RB | | | 4.00 | % | | | 01/01/16 | | | | 1,505 | | | | 1,599,288 | |
South Jersey Transportation Authority; Series 2012 A, Ref. RB | | | 5.00 | % | | | 11/01/24 | | | | 2,000 | | | | 2,216,320 | |
| | | | | 47,801,039 | |
| | | | |
| New Mexico–0.36% | | | | | | | | | | | | | | | | |
New Mexico (State of) Hospital Equipment Loan Council (Haverland Charter Lifestyle Group); Series 2013, First Mortgage RB | | | 4.00 | % | | | 07/01/22 | | | | 4,965 | | | | 4,897,228 | |
| | | | |
| New York–2.72% | | | | | | | | | | | | | | | | |
Amherst Development Corp. (UBF Faculty-Student Housing Corp.–Greiner & Hadley Projects at SUNY Buffalo); Series 2010 A, Student Housing Facility RB (INS–AGM)(a) | | | 4.00 | % | | | 10/01/16 | | | | 1,000 | | | | 1,074,820 | |
Babylon (Town of) Industrial Development Agency (Covanta Babylon, Inc.); | | | | | | | | | | | | | | | | |
Series 2009 A, Resource Recovery RB | | | 5.00 | % | | | 01/01/18 | | | | 445 | | | | 509,467 | |
Series 2009 A, Resource Recovery RB | | | 5.00 | % | | | 01/01/19 | | | | 365 | | | | 423,604 | |
Nassau (County of) Industrial Development Agency (New York Institute of Technology); | | | | | | | | | | | | | | | | |
Series 2000 A, Ref. Civic Facility RB | | | 5.25 | % | | | 03/01/17 | | | | 930 | | | | 1,028,227 | |
Series 2000 A, Ref. Civic Facility RB | | | 5.25 | % | | | 03/01/19 | | | | 1,585 | | | | 1,806,266 | |
New York (City of) Transitional Finance Authority; | | | | | | | | | | | | | | | | |
Series 2009 S-5, Building Aid RB | | | 5.00 | % | | | 01/15/16 | | | | 2,000 | | | | 2,174,600 | |
Series 2009 S-5, Building Aid RB | | | 5.00 | % | | | 01/15/17 | | | | 1,875 | | | | 2,112,300 | |
New York (City of); | | | | | | | | | | | | | | | | |
Subseries 2008 J-1, Unlimited Tax GO Bonds | | | 5.00 | % | | | 08/01/17 | | | | 750 | | | | 861,878 | |
Subseries 2008 J-4, Floating Rate Unlimited Tax GO Bonds(d) | | | 0.58 | % | | | 08/01/25 | | | | 3,250 | | | | 3,250,000 | |
New York (State of) Dormitory Authority (Mount Sinai Hospital Obligated Group); Series 2010 A, RB | | | 5.00 | % | | | 07/01/19 | | | | 500 | | | | 582,790 | |
See accompanying Notes to Financial Statements which are an integral part of the financial statements.
22 Invesco Tax-Free Intermediate Fund
| | | | | | | | | | | | | | | | |
| | | Interest
Rate | | | Maturity
Date | | | Principal
Amount
(000) | | | Value | |
| New York–(continued) | | | | | | | | | | | | | | | | |
New York (State of) Dormitory Authority (Mount Sinai School of Medicine of New York University); Series 2009, RB | | | 5.50 | % | | | 07/01/22 | | | $ | 2,925 | | | $ | 3,312,679 | |
New York (State of) Dormitory Authority (North Shore—Long Island Jewish Obligated Group); Series 2011 A, RB | | | 5.00 | % | | | 05/01/15 | | | | 500 | | | | 526,060 | |
New York (State of) Dormitory Authority (School Districts Financing Program); Series 2008 D, RB (INS–AGC)(a) | | | 5.75 | % | | | 10/01/24 | | | | 1,000 | | | | 1,174,700 | |
New York (State of) Dormitory Authority (St. Lawrence University); Series 2009, RB(c) | | | 5.00 | % | | | 07/01/14 | | | | 2,000 | | | | 2,033,500 | |
New York (State of) Thruway Authority; Series 2013 A, Jr. General RB | | | 5.00 | % | | | 05/01/19 | | | | 5,000 | | | | 5,865,050 | |
Niagara Falls (City of) Bridge Commission; Series 1993 A, Toll Bridge System RB (INS–AGC)(a) | | | 4.00 | % | | | 10/01/19 | | | | 1,100 | | | | 1,193,005 | |
Tobacco Settlement Financing Corp.; | | | | | | | | | | | | | | | | |
Series 2011 A, Asset-Backed RB | | | 3.00 | % | | | 06/01/16 | | | | 3,000 | | | | 3,178,650 | |
Series 2011 A, Asset-Backed RB | | | 4.00 | % | | | 06/01/17 | | | | 4,000 | | | | 4,436,320 | |
Yonkers (City of); | | | | | | | | | | | | | | | | |
Series 2010 A, Unlimited Tax GO Bonds (INS–AGM)(a) | | | 5.00 | % | | | 11/15/20 | | | | 655 | | | | 760,612 | |
Series 2010 A, Unlimited Tax GO Bonds (INS–AGM)(a) | | | 5.00 | % | | | 11/15/22 | | | | 500 | | | | 560,665 | |
| | | | | | | | | | | | | | | | 36,865,193 | |
|
| North Carolina–1.01% | |
Charlotte (City of) & Mecklenburg (County of) Hospital Authority (Carolinas HealthCare System); | | | | | | | | | | | | | | | | |
Series 2007 A, Ref. Health Care RB | | | 5.00 | % | | | 01/15/19 | | | | 1,000 | | | | 1,115,370 | |
Series 2009 A, Ref. Health Care RB | | | 5.00 | % | | | 01/15/20 | | | | 3,500 | | | | 4,027,660 | |
North Carolina (State of) Eastern Municipal Power Agency; Series 2008 C, Power System RB (INS–AGC)(a) | | | 6.00 | % | | | 01/01/19 | | | | 355 | | | | 394,458 | |
North Carolina (State of) Medical Care Commission (Wake Forest Baptist); Series 2012, Ref. Floating Rate Health Care Facilities RB(b)(d) | | | 0.77 | % | | | 07/01/17 | | | | 4,800 | | | | 4,800,000 | |
North Carolina (State of); Series 2011, Vehicle Grant Anticipation RB(b) | | | 4.00 | % | | | 03/01/18 | | | | 2,000 | | | | 2,191,300 | |
Oak Island (Town of); Series 2008 A, Enterprise System RB (INS–NATL)(a) | | | 5.00 | % | | | 06/01/20 | | | | 1,065 | | | | 1,177,028 | |
| | | | | | | | | | | | | | | | 13,705,816 | |
|
| Ohio–5.66% | |
Akron (City of); | | | | | | | | | | | | | | | | |
Series 2009, Ref. & Improvement Waterworks System Mortgage RB (INS–AGC)(a) | | | 5.00 | % | | | 03/01/16 | | | | 2,675 | | | | 2,916,285 | |
Series 2009, Ref. & Improvement Waterworks System Mortgage RB (INS–AGC)(a) | | | 5.00 | % | | | 03/01/18 | | | | 2,010 | | | | 2,321,349 | |
Akron, Bath & Copley Joint Township Hospital District (Medical Center of Akron); Series 2012, RB | | | 5.00 | % | | | 11/15/25 | | | | 1,000 | | | | 1,087,800 | |
Allen (County of) (Catholic Healthcare Partners); | | | | | | | | | | | | | | | | |
Series 2010 B, Hospital Facilities RB | | | 5.00 | % | | | 09/01/16 | | | | 1,000 | | | | 1,106,070 | |
Series 2010 B, Hospital Facilities RB | | | 5.00 | % | | | 09/01/18 | | | | 2,000 | | | | 2,320,880 | |
Series 2010 B, Hospital Facilities RB | | | 5.00 | % | | | 09/01/20 | | | | 2,920 | | | | 3,418,648 | |
American Municipal Power, Inc. (Hydroelectric); Series 2009 C, RB | | | 5.00 | % | | | 02/15/23 | | | | 2,850 | | | | 3,141,156 | |
Buckeye Tobacco Settlement Financing Authority; | | | | | | | | | | | | | | | | |
Series 2007 A-1, Sr. Asset-Backed RB | | | 5.00 | % | | | 06/01/16 | | | | 1,430 | | | | 1,542,326 | |
Series 2007 A-1, Sr. Asset-Backed RB | | | 5.00 | % | | | 06/01/17 | | | | 1,985 | | | | 2,189,078 | |
Cleveland (City of); | | | | | | | | | | | | | | | | |
Series 2006 A, Airport System RB (INS–AMBAC)(a) | | | 5.25 | % | | | 01/01/21 | | | | 3,980 | | | | 4,536,603 | |
Series 2009 C, Airport System RB (INS–AGC)(a) | | | 5.00 | % | | | 01/01/18 | | | | 2,000 | | | | 2,263,940 | |
Series 2009 C, Airport System RB (INS–AGC)(a) | | | 5.00 | % | | | 01/01/19 | | | | 2,000 | | | | 2,282,960 | |
Series 2009 C, Airport System RB (INS–AGC)(a) | | | 5.00 | % | | | 01/01/20 | | | | 4,000 | | | | 4,475,480 | |
Series 2009 C, Airport System RB (INS–AGC)(a) | | | 5.00 | % | | | 01/01/23 | | | | 2,000 | | | | 2,151,360 | |
Series 2009 C, Airport System RB (INS–AGC)(a) | | | 5.00 | % | | | 01/01/27 | | | | 1,000 | | | | 1,055,510 | |
Series 2011 A, Airport System RB | | | 5.00 | % | | | 01/01/17 | | | | 7,605 | | | | 8,390,749 | |
Series 2011 A, Airport System RB | | | 5.00 | % | | | 01/01/22 | | | | 2,315 | | | | 2,568,377 | |
Franklin (County of) (OhioHealth Corp.); Series 2011 D, Ref. Hospital Facilities RB(b) | | | 4.00 | % | | | 08/01/16 | | | | 2,500 | | | | 2,699,175 | |
See accompanying Notes to Financial Statements which are an integral part of the financial statements.
23 Invesco Tax-Free Intermediate Fund
| | | | | | | | | | | | | | | | |
| | | Interest
Rate | | | Maturity
Date | | | Principal
Amount
(000) | | | Value | |
| Ohio–(continued) | |
Hancock (County of) (Blanchard Valley Regional Health Center); | | | | | | | | | | | | | | | | |
Series 2011 A, Hospital Facilities RB | | | 4.00 | % | | | 12/01/16 | | | $ | 250 | | | $ | 267,358 | |
Series 2011 A, Hospital Facilities RB | | | 5.00 | % | | | 12/01/18 | | | | 170 | | | | 192,549 | |
Series 2011 A, Hospital Facilities RB | | | 5.75 | % | | | 12/01/26 | | | | 250 | | | | 275,515 | |
Ohio (State of) (Cleveland Clinic Health System Obligated Group); | | | | | | | | | | | | | | | | |
Series 2009 B-1, Hospital RB | | | 4.75 | % | | | 01/01/20 | | | | 3,000 | | | | 3,415,230 | |
Series 2009 B-1, Hospital RB | | | 4.75 | % | | | 01/01/21 | | | | 1,000 | | | | 1,118,680 | |
Series 2009 B-1, Hospital RB | | | 5.00 | % | | | 01/01/22 | | | | 1,000 | | | | 1,115,480 | |
Series 2011 B-1, Ref. Hospital RB | | | 5.00 | % | | | 01/01/24 | | | | 1,000 | | | | 1,134,410 | |
Ohio (State of) Air Quality Development Authority (FirstEnergy Generation Corp.); | | | | | | | | | | | | | | | | |
Series 2009, Ref. PCR(b) | | | 2.25 | % | | | 09/15/16 | | | | 1,000 | | | | 1,005,270 | |
Series 2009 A, RB | | | 5.70 | % | | | 08/01/20 | | | | 7,620 | | | | 8,539,658 | |
Series 2009 C, Ref. PCR | | | 5.63 | % | | | 06/01/18 | | | | 3,200 | | | | 3,557,632 | |
Ohio (State of) Higher Educational Facility Commission (University Hospitals Health System, Inc.); Series 2009 C, Hospital RB(b) | | | 4.88 | % | | | 07/15/15 | | | | 2,525 | | | | 2,679,277 | |
Ohio (State of) Higher Educational Facility Commission (University of Dayton); Series 2013, RB | | | 5.00 | % | | | 12/01/24 | | | | 585 | | | | 667,479 | |
Ohio (State of); Series 2009 A II, Parks & Recreation Capital Facilities RB | | | 5.00 | % | | | 12/01/19 | | | | 1,825 | | | | 2,168,264 | |
| | | | | | | | | | | | | | | | 76,604,548 | |
|
| Oklahoma–1.49% | |
Cleveland (County of) Justice Authority (Detention Facility); Series 2009 A, Sales Tax RB | | | 5.00 | % | | | 03/01/22 | | | | 1,000 | | | | 1,037,160 | |
Oklahoma (County of) Finance Authority (Western Heights Public Schools); Series 2009, Educational Facilities Lease RB | | | 4.50 | % | | | 09/01/19 | | | | 2,000 | | | | 2,268,220 | |
Oklahoma (State of) Development Finance Authority (Oklahoma State System of Higher Education); Series 2009 A, Master Real Property Lease RB | | | 4.00 | % | | | 06/01/20 | | | | 1,000 | | | | 1,110,860 | |
Oklahoma (State of) Industries Authority (Oklahoma Medical Research Foundation); Series 2008, RB | | | 5.50 | % | | | 07/01/29 | | | | 1,280 | | | | 1,359,424 | |
Oklahoma (State of) Municipal Power Authority; | | | | | | | | | | | | | | | | |
Series 2008 A, Power Supply System RB | | | 5.25 | % | | | 01/01/18 | | | | 300 | | | | 347,745 | |
Series 2008 A, Power Supply System RB | | | 5.38 | % | | | 01/01/19 | | | | 250 | | | | 287,087 | |
Series 2008 A, Power Supply System RB | | | 5.88 | % | | | 01/01/28 | | | | 250 | | | | 282,133 | |
Okmulgee (City of) Municipal Authority; Series 2009 A, Utility System & Sales Tax RB | | | 4.00 | % | | | 12/01/19 | | | | 2,165 | | | | 2,392,650 | |
Tulsa (City of) Airports Improvement Trust; | | | | | | | | | | | | | | | | |
Series 2009 A, General RB | | | 4.00 | % | | | 06/01/15 | | | | 670 | | | | 695,936 | |
Series 2009 A, General RB | | | 5.38 | % | | | 06/01/24 | | | | 1,750 | | | | 1,803,865 | |
Tulsa (County of) Industrial Authority (Jenks Public Schools); Series 2009, Educational Facilities Lease RB | | | 4.00 | % | | | 09/01/14 | | | | 2,000 | | | | 2,037,860 | |
Tulsa (County of) Industrial Authority; | | | | | | | | | | | | | | | | |
Series 2003 A, Capital Improvements RB | | | 4.00 | % | | | 05/15/16 | | | | 5,000 | | | | 5,402,400 | |
Series 2005 A, Capital Improvements RB | | | 4.00 | % | | | 05/15/17 | | | | 1,000 | | | | 1,107,840 | |
| | | | | | | | | | | | | | | | 20,133,180 | |
|
| Oregon–0.75% | |
Lane (County of); Series 2009 A, Limited Tax GO Bonds | | | 4.00 | % | | | 11/01/16 | | | | 1,000 | | | | 1,093,570 | |
Oregon (State of) Department of Administrative Services; Series 2009 A, Lottery RB | | | 5.00 | % | | | 04/01/28 | | | | 500 | | | | 568,895 | |
Oregon (State of) Facilities Authority (Legacy Health System); Series 2010 A, Ref. RB | | | 5.00 | % | | | 03/15/16 | | | | 1,490 | | | | 1,613,819 | |
Oregon (State of) Facilities Authority (PeaceHealth); | | | | | | | | | | | | | | | | |
Series 2009 A, Ref. RB | | | 5.00 | % | | | 11/01/15 | | | | 660 | | | | 710,160 | |
Series 2009 A, Ref. RB | | | 5.00 | % | | | 11/01/16 | | | | 1,880 | | | | 2,095,053 | |
Oregon (State of) Facilities Authority (Samaritan Health Services); Series 2010 A, Ref. RB | | | 4.00 | % | | | 10/01/16 | | | | 1,000 | | | | 1,069,100 | |
Portland (City of); Series 2011 B, Central Eastside Urban Renewal & Redevelopment Tax Allocation RB | | | 5.25 | % | | | 06/15/29 | | | | 1,000 | | | | 1,074,120 | |
Salem-Keizer School District No. 24J; Series 2009 B, Unlimited Tax CAB GO Bonds (CEP–Oregon School Bond Guaranty)(e) | | | 0.00 | % | | | 06/15/23 | | | | 2,500 | | | | 1,919,925 | |
| | | | | | | | | | | | | | | | 10,144,642 | |
See accompanying Notes to Financial Statements which are an integral part of the financial statements.
24 Invesco Tax-Free Intermediate Fund
| | | | | | | | | | | | | | | | |
| | | Interest
Rate | | | Maturity
Date | | | Principal
Amount
(000) | | | Value | |
| Pennsylvania–5.45% | |
Bethel Park School District; Series 2009, Limited Tax GO Bonds | | | 4.00 | % | | | 08/01/17 | | | $ | 800 | | | $ | 892,016 | |
Delaware (County of) Authority (Villanova University); Series 2010, RB | | | 4.00 | % | | | 12/01/16 | | | | 500 | | | | 545,540 | |
Montgomery (County of) Industrial Development Authority (ACTS Retirement-Life Community); Series 2012, Ref. RB | | | 5.00 | % | | | 11/15/25 | | | | 1,000 | | | | 1,050,240 | |
Pennsylvania (State of) Economic Development Financing Agency (Forum Place); | | | | | | | | | | | | | | | | |
Series 2012, Governmental Lease RB | | | 3.00 | % | | | 03/01/14 | | | | 450 | | | | 450,095 | |
Series 2012, Governmental Lease RB | | | 4.00 | % | | | 03/01/16 | | | | 250 | | | | 265,330 | |
Pennsylvania (State of) Economic Development Financing Authority (Shippingport); Series 2006 A, Exempt Facilities RB(b) | | | 2.55 | % | | | 12/03/18 | | | | 2,000 | | | | 2,003,480 | |
Pennsylvania (State of) Economic Development Financing Authority (Waste Management); Series 2009, Solid Waste Disposal RB(b) | | | 1.75 | % | | | 12/01/15 | | | | 2,000 | | | | 2,031,340 | |
Pennsylvania (State of) Higher Educational Facilities Authority (Carnegie Mellon University); | | | | | | | | | | | | | | | | |
Series 2009, RB | | | 4.25 | % | | | 08/01/19 | | | | 3,000 | | | | 3,411,570 | |
Series 2009, RB | | | 5.00 | % | | | 08/01/17 | | | | 1,000 | | | | 1,132,760 | |
Series 2009, RB | | | 5.00 | % | | | 08/01/21 | | | | 775 | | | | 886,019 | |
Pennsylvania (State of) Higher Educational Facilities Authority (University of Pittsburgh Medical Center); Series 2010 E, RB | | | 5.00 | % | | | 05/15/21 | | | | 5,000 | | | | 5,736,900 | |
Pennsylvania (State of) Turnpike Commission; | | | | | | | | | | | | | | | | |
Series 2008 C-1, Sub. RB (INS–AGC)(a) | | | 6.00 | % | | | 06/01/23 | | | | 500 | | | | 583,600 | |
Series 2009 B, Sub. RB | | | 5.00 | % | | | 06/01/21 | | | | 3,550 | | | | 3,994,318 | |
Series 2009 B, Sub. RB | | | 5.25 | % | | | 06/01/24 | | | | 2,500 | | | | 2,799,425 | |
Series 2011 A, RB | | | 5.00 | % | | | 12/01/22 | | | | 1,500 | | | | 1,768,380 | |
Series 2011 A, RB | | | 5.00 | % | | | 12/01/23 | | | | 1,500 | | | | 1,761,090 | |
Series 2012 B, Floating Rate RB(d) | | | 0.58 | % | | | 12/01/16 | | | | 5,000 | | | | 5,000,000 | |
Series 2013 B, Floating Rate RB(d) | | | 1.18 | % | | | 12/01/19 | | | | 3,000 | | | | 3,000,000 | |
Philadelphia (City of) (1975 General Ordinance); Twentieth Series 2011, Ref. Gas Works RB | | | 4.00 | % | | | 07/01/15 | | | | 2,465 | | | | 2,563,452 | |
Philadelphia (City of) (1998 General Ordinance); | | | | | | | | | | | | | | | | |
Tenth Series 2011, Ref. Gas Works RB | | | 4.00 | % | | | 07/01/14 | | | | 1,605 | | | | 1,622,896 | |
Tenth Series 2011, Ref. Gas Works RB (INS–AGM)(a) | | | 4.00 | % | | | 07/01/17 | | | | 1,000 | | | | 1,082,700 | |
Philadelphia (City of) Industrial Development Authority (Discovery Charter School); Series 2012, RB | | | 5.50 | % | | | 04/01/27 | | | | 1,320 | | | | 1,296,992 | |
Philadelphia (City of); | | | | | | | | | | | | | | | | |
Series 2009 A, Ref. Unlimited Tax GO Bonds (INS–AGC)(a) | | | 4.50 | % | | | 08/01/20 | | | | 2,150 | | | | 2,398,131 | |
Series 2009 A, Ref. Unlimited Tax GO Bonds (INS–AGC)(a) | | | 5.25 | % | | | 08/01/21 | | | | 2,500 | | | | 2,860,375 | |
Series 2009 A, Ref. Unlimited Tax GO Bonds (INS–AGC)(a) | | | 5.25 | % | | | 08/01/22 | | | | 5,000 | | | | 5,649,450 | |
Series 2009 B, Limited Tax GO Bonds(b)(c) | | | 6.00 | % | | | 07/15/16 | | | | 1,000 | | | | 1,134,320 | |
Series 2009 B, Limited Tax GO Bonds(b)(c) | | | 6.25 | % | | | 07/15/16 | | | | 2,000 | | | | 2,280,500 | |
Series 2009 B, Limited Tax GO Bonds (INS–AGC)(a) | | | 5.75 | % | | | 07/15/17 | | | | 1,000 | | | | 1,102,900 | |
Series 2010 A, Ref. Water & Wastewater RB (INS–AGM)(a) | | | 5.00 | % | | | 06/15/19 | | | | 1,000 | | | | 1,186,190 | |
Philadelphia School District; Series 2010 C, Ref. Unlimited Tax GO Bonds | | | 5.00 | % | | | 09/01/14 | | | | 1,000 | | | | 1,023,640 | |
Pittsburgh Public School District; | | | | | | | | | | | | | | | | |
Series 2009 A, Limited Tax GO Bonds(c) | | | 4.00 | % | | | 09/01/19 | | | | 860 | | | | 987,693 | |
Series 2009 A, Limited Tax GO Bonds (INS–AGC)(a) | | | 4.00 | % | | | 09/01/19 | | | | 2,245 | | | | 2,514,692 | |
Reading (City of); Series 2008, Unlimited Tax GO Bonds (INS–AGM)(a) | | | 5.63 | % | | | 11/01/23 | | | | 1,500 | | | | 1,663,335 | |
South Fork (Borough of) Municipal Authority (Conemaugh Valley Memorial Hospital); Series 2005 A, Ref. Hospital RB (INS–AGC)(a) | | | 6.00 | % | | | 07/01/26 | | | | 500 | | | | 566,565 | |
Spring-Ford Area School District; | | | | | | | | | | | | | | | | |
Series 2012, Unlimited Tax GO Bonds | | | 3.00 | % | | | 03/01/16 | | | | 685 | | | | 720,147 | |
Series 2012, Unlimited Tax GO Bonds | | | 3.00 | % | | | 03/01/17 | | | | 620 | | | | 663,127 | |
St. Mary Hospital Authority (Catholic Health East); | | | | | | | | | | | | | | | | |
Series 2010 A, Health System RB | | | 4.00 | % | | | 11/15/15 | | | | 1,445 | | | | 1,531,267 | |
Series 2010 A, Health System RB | | | 5.00 | % | | | 11/15/18 | | | | 2,645 | | | | 3,076,558 | |
West Mifflin Area School District; Series 2009, Limited Tax GO Bonds (INS–AGM)(a) | | | 5.50 | % | | | 04/01/24 | | | | 500 | | | | 574,240 | |
| | | | | | | | | | | | | | | | 73,811,273 | |
See accompanying Notes to Financial Statements which are an integral part of the financial statements.
25 Invesco Tax-Free Intermediate Fund
| | | | | | | | | | | | | | | | |
| | | Interest
Rate | | | Maturity
Date | | | Principal
Amount
(000) | | | Value | |
| Rhode Island–0.38% | |
Rhode Island (State of) Student Loan Authority; Sr. Series 2009 A, Student Loan Program RB | | | 4.75 | % | | | 12/01/15 | | | $ | 1,150 | | | $ | 1,221,047 | |
Rhode Island Health & Educational Building Corp. (Lifespan Obligated Group); | | | | | | | | | | | | | | | | |
Series 2006 A, Ref. Hospital Financing RB (INS–AGM)(a) | | | 5.00 | % | | | 05/15/15 | | | | 1,000 | | | | 1,048,440 | |
Series 2009 A, Hospital Financing RB (INS–AGC)(a) | | | 6.13 | % | | | 05/15/27 | | | | 500 | | | | 560,070 | |
Rhode Island Health & Educational Building Corp. (Public Schools Financing Program–City of Woonsocket); Series 2009 E, RB (INS–AGC)(a) | | | 5.00 | % | | | 05/15/20 | | | | 900 | | | | 977,229 | |
Rhode Island Health & Educational Building Corp. (University of Rhode Island–Auxiliary Enterprise); Series 2009 B, Higher Education Facility RB (INS–AGC)(a) | | | 5.25 | % | | | 09/15/29 | | | | 1,265 | | | | 1,372,727 | |
| | | | | | | | | | | | | | | | 5,179,513 | |
|
| South Carolina–1.94% | |
Greenwood (County of) (Self Regional Healthcare); | | | | | | | | | | | | | | | | |
Series 2012 B, Ref. Hospital RB | | | 5.00 | % | | | 10/01/27 | | | | 3,130 | | | | 3,365,720 | |
Series 2012 B, Ref. RB | | | 5.00 | % | | | 10/01/25 | | | | 1,250 | | | | 1,358,600 | |
Oconee (County of) (Duke Energy Carolinas); Series 1993, Ref. Pollution Control Facilities RB | | | 3.60 | % | | | 02/01/17 | | | | 1,000 | | | | 1,081,480 | |
Piedmont Municipal Power Agency; | | | | | | | | | | | | | | | | |
Series 2009 A-3, Ref. Electric RB | | | 5.00 | % | | | 01/01/16 | | | | 2,225 | | | | 2,405,959 | |
Series 2009 A-4, Ref. Electric RB | | | 5.00 | % | | | 01/01/20 | | | | 2,000 | | | | 2,337,000 | |
Rock Hill (City of); Series 2009 C, Ref. Combined Utility System RB (INS–AGC)(a) | | | 4.00 | % | | | 01/01/15 | | | | 2,405 | | | | 2,479,844 | |
South Carolina (State of) Education Assistance Authority; Series 2009 I, Student Loan RB | | | 4.40 | % | | | 10/01/18 | | | | 680 | | | | 743,260 | |
South Carolina (State of) Jobs-Economic Development Authority (AnMed Health); | | | | | | | | | | | | | | | | |
Series 2010, Ref. Hospital RB | | | 5.00 | % | | | 02/01/15 | | | | 1,000 | | | | 1,040,870 | |
Series 2010, Ref. Hospital RB | | | 5.00 | % | | | 02/01/16 | | | | 1,140 | | | | 1,230,585 | |
Series 2010, Ref. Hospital RB | | | 5.00 | % | | | 02/01/18 | | | | 1,000 | | | | 1,134,870 | |
South Carolina (State of) Jobs-Economic Development Authority (Palmetto Health); | | | | | | | | | | | | | | | | |
Series 2005 A, Ref. Hospital RB (INS–AGM)(a) | | | 4.00 | % | | | 08/01/17 | | | | 1,500 | | | | 1,636,275 | |
Series 2009, Ref. & Improvement Hospital RB | | | 5.00 | % | | | 08/01/15 | | | | 500 | | | | 525,690 | |
Series 2013 A, Ref. Hospital RB | | | 5.00 | % | | | 08/01/21 | | | | 1,300 | | | | 1,435,083 | |
South Carolina (State of) Transportation Infrastructure Bank; Series 2004 A, RB(b)(c) | | | 5.25 | % | | | 10/01/14 | | | | 1,390 | | | | 1,432,242 | |
Spartanburg (City of) Sanitary Sewer District; Series 2009 B, Ref. Conv. Sewer System RB (INS–AGC)(a) | | | 4.00 | % | | | 03/01/16 | | | | 1,110 | | | | 1,184,348 | |
Spartanburg Regional Health Services District, Inc.; | | | | | | | | | | | | | | | | |
Series 2008 A, Ref. Hospital RB (INS–AGC)(a) | | | 4.50 | % | | | 04/15/27 | | | | 1,735 | | | | 1,785,922 | |
Series 2008 D, Ref. Hospital RB (INS–AGC)(a) | | | 5.25 | % | | | 04/15/20 | | | | 1,000 | | | | 1,128,680 | |
| | | | | | | | | | | | | | | | 26,306,428 | |
|
| South Dakota–0.87% | |
Educational Enhancement Funding Corp.; Series 2013 B, Tobacco Settlement RB | | | 5.00 | % | | | 06/01/23 | | | | 1,000 | | | | 1,110,960 | |
Rapid City (City of); | | | | | | | | | | | | | | | | |
Series 2009, Water RB | | | 5.00 | % | | | 11/01/21 | | | | 1,170 | | | | 1,370,363 | |
Series 2009, Water RB | | | 5.00 | % | | | 11/01/24 | | | | 1,620 | | | | 1,880,091 | |
Series 2009, Water RB | | | 5.00 | % | | | 11/01/25 | | | | 1,650 | | | | 1,910,980 | |
South Dakota (State of) Health & Educational Facilities Authority (Avera Health); Series 2012 A, RB | | | 5.00 | % | | | 07/01/24 | | | | 1,575 | | | | 1,727,791 | |
South Dakota (State of) Health & Educational Facilities Authority (Regional Health); Series 2010, RB | | | 5.00 | % | | | 09/01/21 | | | | 1,000 | | | | 1,136,850 | |
South Dakota (State of) Health & Educational Facilities Authority (Sanford Health); | | | | | | | | | | | | | | | | |
Series 2009, RB | | | 5.00 | % | | | 11/01/16 | | | | 500 | | �� | | 552,415 | |
Series 2009, RB | | | 5.00 | % | | | 11/01/17 | | | | 430 | | | | 487,895 | |
Series 2009, RB | | | 5.00 | % | | | 11/01/24 | | | | 1,000 | | | | 1,081,360 | |
Series 2009, RB | | | 5.25 | % | | | 11/01/29 | | | | 500 | | | | 528,045 | |
| | | | | | | | | | | | | | | | 11,786,750 | |
|
| Tennessee–0.96% | |
Chattanooga (City of) & Hamilton (County of) Hospital Authority (Erlanger Health System); Series 2004, Ref. RB (INS–AGM)(a) | | | 4.50 | % | | | 10/01/16 | | | | 2,500 | | | | 2,707,850 | |
Jackson (City of) (Jackson-Madison County General Hospital); Series 2008, Ref. & Improvement Hospital RB | | | 5.25 | % | | | 04/01/23 | | | | 1,000 | | | | 1,086,410 | |
See accompanying Notes to Financial Statements which are an integral part of the financial statements.
26 Invesco Tax-Free Intermediate Fund
| | | | | | | | | | | | | | | | |
| | | Interest
Rate | | | Maturity
Date | | | Principal
Amount
(000) | | | Value | |
| Tennessee–(continued) | |
Memphis (City of) & Shelby (County of) Airport Authority; Series 2011 D, Ref. RB | | | 5.00 | % | | | 07/01/22 | | | $ | 2,165 | | | $ | 2,503,974 | |
Nashville (City of) & Davidson (County of) Metropolitan Government Health & Educational Facilities Board (Blakeford at Green Hills); | | | | | | | | | | | | | | | | |
Series 2012, Ref. & Improvement RB | | | 5.00 | % | | | 07/01/20 | | | | 860 | | | | 952,347 | |
Series 2012, Ref. & Improvement RB | | | 5.00 | % | | | 07/01/21 | | | | 885 | | | | 968,774 | |
Sevierville (City of) Public Building Authority; Series 2009, Local Government Public Improvement RB | | | 4.00 | % | | | 06/01/14 | | | | 2,500 | | | | 2,524,925 | |
Shelby (County of) Health, Educational & Housing Facilities Board (Baptist Memorial Health Care); | | | | | | | | | | | | | | | | |
Series 2004 A, RB | | | 5.00 | % | | | 09/01/18 | | | | 500 | | | | 580,220 | |
Series 2004 A, RB | | | 5.00 | % | | | 09/01/19 | | | | 500 | | | | 584,525 | |
Shelby (County of) Health, Educational & Housing Facilities Board (Methodist Healthcare); Series 2004 B, RB (INS–AGM)(a) | | | 5.00 | % | | | 09/01/17 | | | | 1,000 | | | | 1,140,150 | |
| | | | | | | | | | | | | | | | 13,049,175 | |
|
| Texas–8.78% | |
Beaumont Independent School District; Series 2009, School Building Unlimited Tax GO Bonds (INS–AGC)(a) | | | 5.00 | % | | | 02/15/24 | | | | 1,500 | | | | 1,669,815 | |
Bexar (County of) Metropolitan Water District; | | | | | | | | | | | | | | | | |
Series 2009, Ref. Waterworks System RB | | | 5.00 | % | | | 05/01/16 | | | | 1,295 | | | | 1,406,992 | |
Series 2009, Ref. Waterworks System RB | | | 5.00 | % | | | 05/01/19 | | | | 2,500 | | | | 2,869,375 | |
Series 2009, Ref. Waterworks System RB | | | 5.00 | % | | | 05/01/20 | | | | 2,500 | | | | 2,812,575 | |
Series 2009, Ref. Waterworks System RB | | | 5.00 | % | | | 05/01/21 | | | | 2,500 | | | | 2,766,825 | |
Series 2009, Ref. Waterworks System RB | | | 5.00 | % | | | 05/01/22 | | | | 2,500 | | | | 2,736,100 | |
Clifton Higher Education Finance Corp. (Idea Public Schools); Series 2013, Education RB | | | 5.00 | % | | | 08/15/23 | | | | 750 | | | | 816,712 | |
Corpus Christi Independent School District; Series 2009, School Building Unlimited Tax GO Bonds | | | 5.00 | % | | | 08/15/22 | | | | 1,100 | | | | 1,280,334 | |
Dallas (County of) Utility & Reclamation District; | | | | | | | | | | | | | | | | |
Series 2005 A, Ref. Unlimited Tax GO Bonds (INS–AMBAC)(a) | | | 5.00 | % | | | 02/15/19 | | | | 1,200 | | | | 1,324,788 | |
Series 2005 A, Ref. Unlimited Tax GO Bonds (INS–AMBAC)(a) | | | 5.15 | % | | | 02/15/21 | | | | 3,000 | | | | 3,289,260 | |
Dallas-Fort Worth International Airport Facilities Improvement Corp.; Series 2009 A, Ref. Joint RB | | | 4.00 | % | | | 11/01/14 | | | | 1,500 | | | | 1,539,165 | |
Galveston (City of); Series 2011, Ref. Wharves & Terminal RB | | | 5.00 | % | | | 02/01/21 | | | | 1,000 | | | | 1,126,060 | |
Harris County Cultural Education Facilities Finance Corp. (Memorial Hermann Health System); | | | | | | | | | | | | | | | | |
Series 2013 B, Ref. Floating Rate Hospital RB(d) | | | 0.63 | % | | | 06/01/18 | | | | 1,750 | | | | 1,750,000 | |
Series 2013 B, Ref. Floating Rate Hospital RB(d) | | | 0.73 | % | | | 06/01/19 | | | | 2,065 | | | | 2,065,000 | |
Harris County Cultural Education Facilities Finance Corp. (St. Luke’s Episcopal Health System); | | | | | | | | | | | | | | | | |
Series 2009, Ref. RB(c) | | | 5.00 | % | | | 02/15/17 | | | | 1,700 | | | | 1,923,856 | |
Series 2009, Ref. RB(c) | | | 5.00 | % | | | 02/15/18 | | | | 2,000 | | | | 2,324,980 | |
Series 2009, Ref. RB(c) | | | 5.00 | % | | | 02/15/19 | | | | 1,000 | | | | 1,186,040 | |
Series 2009, Ref. RB(b)(c) | | | 5.63 | % | | | 02/15/19 | | | | 2,500 | | | | 3,040,300 | |
Harris County Cultural Education Facilities Finance Corp. (TECO); Series 2009 A, Thermal Utility RB | | | 5.00 | % | | | 11/15/19 | | | | 485 | | | | 577,397 | |
Harris County Cultural Education Facilities Finance Corp. (Texas Children’s Hospital); Series 2009, Hospital RB | | | 5.00 | % | | | 10/01/24 | | | | 1,750 | | | | 1,985,147 | |
Harris County Cultural Education Facilities Finance Corp. (Texas Medical Center); Series 2009 A, Ref. Special Facilities RB (INS–AGC)(a) | | | 5.00 | % | | | 05/15/23 | | | | 1,500 | | | | 1,644,135 | |
Harris County Cultural Education Facilities Finance Corp. (YMCA of the Greater Houston Area); | | | | | | | | | | | | | | | | |
Series 2013 A, Ref. RB | | | 5.00 | % | | | 06/01/21 | | | | 535 | | | | 595,883 | |
Series 2013 A, Ref. RB | | | 5.00 | % | | | 06/01/22 | | | | 855 | | | | 947,502 | |
Series 2013 A, Ref. RB | | | 5.00 | % | | | 06/01/23 | | | | 915 | | | | 1,008,943 | |
Harris County Industrial Development Corp. (Deer Park Refining Limited Partnership); | | | | | | | | | | | | | | | | |
Series 2006, Solid Waste Disposal RB | | | 5.00 | % | | | 02/01/23 | | | | 4,000 | | | | 4,324,280 | |
Series 2008, Solid Waste Disposal RB | | | 4.70 | % | | | 05/01/18 | | | | 7,320 | | | | 8,041,459 | |
Houston (City of) Convention & Entertainment Facilities Department; | | | | | | | | | | | | | | | | |
Series 2011 A, Ref. Hotel Occupancy Tax & Special RB | | | 5.00 | % | | | 09/01/14 | | | | 745 | | | | 763,253 | |
Series 2011 A, Ref. Hotel Occupancy Tax & Special RB | | | 5.00 | % | | | 09/01/15 | | | | 1,000 | | | | 1,064,530 | |
See accompanying Notes to Financial Statements which are an integral part of the financial statements.
27 Invesco Tax-Free Intermediate Fund
| | | | | | | | | | | | | | | | |
| | | Interest
Rate | | | Maturity
Date | | | Principal
Amount
(000) | | | Value | |
| Texas–(continued) | |
Houston (City of); | | | | | | | | | | | | | | | | |
Series 2009 A, Ref. Sr. Lien Airport System RB | | | 5.00 | % | | | 07/01/15 | | | $ | 325 | | | $ | 345,595 | |
Series 2009 A, Ref. Sr. Lien Airport System RB | | | 5.00 | % | | | 07/01/16 | | | | 250 | | | | 275,940 | |
Series 2009 A, Ref. Sr. Lien Airport System RB | | | 5.00 | % | | | 07/01/17 | | | | 340 | | | | 387,172 | |
Series 2009 A, Ref. Sr. Lien Airport System RB | | | 5.00 | % | | | 07/01/18 | | | | 500 | | | | 582,330 | |
Series 2009 A, Ref. Sr. Lien Airport System RB | | | 5.00 | % | | | 07/01/19 | | | | 250 | | | | 286,018 | |
Series 2012, Ref. Floating Rate First Lien Combined Utility System RB(b)(d) | | | 0.78 | % | | | 06/01/17 | | | | 2,000 | | | | 2,000,000 | |
La Vernia Higher Education Finance Corp. (Knowledge is Power Program, Inc.); Series 2009 A, RB | | | 5.75 | % | | | 08/15/24 | | | | 365 | | | | 402,723 | |
Lake Worth (City of); Series 2008, Combination Tax & Revenue Limited Tax GO Ctfs. (INS–AGC)(a) | | | 5.00 | % | | | 10/01/27 | | | | 1,230 | | | | 1,364,833 | |
Live Oak (City of); Series 2004, Unlimited Tax GO Bonds (INS–NATL)(a) | | | 5.00 | % | | | 08/01/16 | | | | 390 | | | | 397,157 | |
Lower Colorado River Authority; | | | | | | | | | | | | | | | | |
Series 1999 A, Ref. RB (INS–AGM)(a) | | | 5.88 | % | | | 05/15/14 | | | | 415 | | | | 417,129 | |
Series 2009, RB | | | 5.25 | % | | | 05/15/29 | | | | 455 | | | | 494,544 | |
Series 2009, Ref. RB(b)(c) | | | 5.25 | % | | | 05/15/19 | | | | 30 | | | | 36,049 | |
Series 2009, Ref. RB(b)(c) | | | 5.25 | % | | | 05/15/19 | | | | 5 | | | | 6,008 | |
Series 2009, Ref. RB(b)(c) | | | 5.25 | % | | | 05/15/19 | | | | 10 | | | | 12,016 | |
Lufkin Health Facilities Development Corp. (Memorial Health System of East Texas); | | | | | | | | | | | | | | | | |
Series 2009, Ref. & Improvement RB | | | 5.50 | % | | | 02/15/15 | | | | 1,875 | | | | 1,943,100 | |
Series 2009, Ref. & Improvement RB | | | 5.50 | % | | | 02/15/16 | | | | 1,505 | | | | 1,605,790 | |
Series 2009, Ref. & Improvement RB | | | 5.50 | % | | | 02/15/17 | | | | 2,100 | | | | 2,294,922 | |
Mansfield (City of); Series 2008, Limited Tax GO Ctfs. | | | 6.13 | % | | | 02/15/26 | | | | 500 | | | | 581,275 | |
North Fort Bend Water Authority; Series 2009, Water System RB (INS–AGC)(a) | | | 5.00 | % | | | 12/15/24 | | | | 2,000 | | | | 2,209,040 | |
North Texas Tollway Authority; | | | | | | | | | | | | | | | | |
Series 2005 C, Dallas North Tollway System RB | | | 5.38 | % | | | 01/01/21 | | | | 2,000 | | | | 2,293,540 | |
Series 2008 E-3, Ref. First Tier System RB(b) | | | 5.75 | % | | | 01/01/16 | | | | 2,610 | | | | 2,836,887 | |
Series 2011 B, Ref. First Tier System RB | | | 5.00 | % | | | 01/01/19 | | | | 500 | | | | 569,995 | |
Parker (County of); Series 2009, Road Unlimited Tax GO Bonds (INS–AGC)(a) | | | 5.25 | % | | | 02/15/26 | | | | 1,000 | | | | 1,134,490 | |
Sachse (City of); Series 2009, Ref. & Improvement Limited Tax GO Bonds (INS–AGC)(a) | | | 5.00 | % | | | 02/15/24 | | | | 500 | | | | 565,245 | |
San Jacinto River Authority (Groundwater Reduction Plan Division); Series 2011, Special Project RB (INS–AGM)(a) | | | 4.50 | % | | | 10/01/27 | | | | 1,000 | | | | 1,043,900 | |
Tarrant County Cultural Education Facilities Finance Corp. (Hendrick Medical Center); | | | | | | | | | | | | | | | | |
Series 2009 A, Hospital RB (INS–AGC)(a) | | | 3.75 | % | | | 09/01/14 | | | | 1,000 | | | | 1,015,680 | |
Series 2009 A, Hospital RB (INS–AGC)(a) | | | 5.00 | % | | | 09/01/22 | | | | 595 | | | | 659,677 | |
Series 2009 A, Hospital RB (INS–AGC)(a) | | | 5.00 | % | | | 09/01/24 | | | | 1,280 | | | | 1,394,150 | |
Tarrant County Cultural Education Facilities Finance Corp. (Texas Health Resources System); Series 2007 A, Ref. RB | | | 5.00 | % | | | 02/15/19 | | | | 4,405 | | | | 4,900,430 | |
Tarrant County Health Facilities Development Corp. (Cook Children’s Medical Center); | | | | | | | | | | | | | | | | |
Series 2010 A, Hospital RB | | | 5.00 | % | | | 12/01/15 | | | | 525 | | | | 567,588 | |
Series 2010 A, Hospital RB | | | 5.00 | % | | | 12/01/17 | | | | 1,250 | | | | 1,435,350 | |
Texas Municipal Gas Acquisition & Supply Corp. III; | | | | | | | | | | | | | | | | |
Series 2012, Gas Supply RB | | | 5.00 | % | | | 12/15/19 | | | | 3,500 | | | | 3,918,215 | |
Series 2012, Gas Supply RB | | | 5.00 | % | | | 12/15/21 | | | | 3,900 | | | | 4,335,357 | |
Series 2012, Gas Supply RB | | | 5.00 | % | | | 12/15/22 | | | | 500 | | | | 547,615 | |
Series 2012, Gas Supply RB | | | 5.00 | % | | | 12/15/23 | | | | 6,050 | | | | 6,545,918 | |
Texas Woman’s University; Series 2008, Financing System RB | | | 5.13 | % | | | 07/01/26 | | | | 1,500 | | | | 1,596,090 | |
Trinity River Authority (Tarrant County Water); Series 2005, Ref. & Improvement RB
(INS–NATL)(a) | | | 5.00 | % | | | 02/01/24 | | | | 4,240 | | | | 4,468,621 | |
Tyler Health Facilities Development Corp. (Mother Frances Hospital Regional Health Care Center); Series 2011, Hospital RB | | | 5.00 | % | | | 07/01/21 | | | | 1,285 | | | | 1,406,638 | |
Uptown Development Authority (Infrastructure Improvement Facilities); | | | | | | | | | | | | | | | | |
Series 2009, Tax Increment Allocation Contract RB | | | 5.00 | % | | | 09/01/22 | | | | 900 | | | | 973,188 | |
Series 2009, Tax Increment Allocation Contract RB | | | 5.10 | % | | | 09/01/23 | | | | 1,455 | | | | 1,560,909 | |
Series 2009, Tax Increment Allocation Contract RB | | | 5.38 | % | | | 09/01/25 | | | | 450 | | | | 481,235 | |
See accompanying Notes to Financial Statements which are an integral part of the financial statements.
28 Invesco Tax-Free Intermediate Fund
| | | | | | | | | | | | | | | | |
| | | Interest
Rate | | | Maturity
Date | | | Principal
Amount
(000) | | | Value | |
| Texas–(continued) | |
West Harris County Regional Water Authority; | | | | | | | | | | | | | | | | |
Series 2005, Water System RB (INS–AGM)(a) | | | 5.00 | % | | | 12/15/17 | | | $ | 1,000 | | | $ | 1,036,860 | |
Series 2009, Water System RB | | | 5.00 | % | | | 12/15/16 | | | | 1,000 | | | | 1,117,740 | |
| | | | | | | | | | | | | | | | 118,927,665 | |
|
| Utah–0.35% | |
Intermountain Power Agency; Series 2009 B, Ref. Sub. Power Supply RB | | | 4.00 | % | | | 07/01/18 | | | | 1,945 | | | | 1,999,168 | |
Riverton (City of) (IHC Health Services, Inc.); | | | | | | | | | | | | | | | | |
Series 2009, Hospital RB | | | 5.00 | % | | | 08/15/15 | | | | 645 | | | | 689,079 | |
Series 2009, Hospital RB | | | 5.00 | % | | | 08/15/18 | | | | 1,310 | | | | 1,522,666 | |
Salt Lake Valley Fire Service Area Local Building Authority; Series 2008, Lease RB | | | 5.00 | % | | | 04/01/22 | | | | 500 | | | | 565,790 | |
| | | | | | | | | | | | | | | | 4,776,703 | |
|
| Vermont–0.08% | |
Vermont (State of) Educational & Health Buildings Financing Agency (Fletcher Allen Health Care); Series 2004 B, Hospital RB (INS–AGM)(a) | | | 5.00 | % | | | 12/01/22 | | | | 1,000 | | | | 1,086,290 | |
| | | | |
| Virgin Islands–0.96% | | | | | | | | | | | | | | | | |
Virgin Islands (Government of) Public Finance Authority (Matching Fund Loan Note–Diageo); Series 2009 A, Sub. RB | | | 6.75 | % | | | 10/01/19 | | | | 1,500 | | | | 1,684,020 | |
Virgin Islands (Government of) Public Finance Authority (Virgin Islands Matching Fund Loan Note); | | | | | | | | | | | | | | | | |
Series 2009 A-1, Ref. Sr. Lien Capital Projects RB | | | 4.13 | % | | | 10/01/18 | | | | 1,875 | | | | 2,041,162 | |
Series 2009 B, Ref. Sr. Lien RB | | | 5.00 | % | | | 10/01/15 | | | | 1,000 | | | | 1,056,460 | |
Series 2009 B, Ref. Sr. Lien RB | | | 5.00 | % | | | 10/01/16 | | | | 1,000 | | | | 1,087,820 | |
Series 2009 B, Ref. Sr. Lien RB | | | 5.00 | % | | | 10/01/17 | | | | 1,000 | | | | 1,110,970 | |
Series 2009 B, Ref. Sr. Lien RB | | | 5.00 | % | | | 10/01/18 | | | | 1,000 | | | | 1,126,970 | |
Series 2009 B, Ref. Sr. Lien RB | | | 5.00 | % | | | 10/01/25 | | | | 500 | | | | 530,405 | |
Series 2010 A, Sr. Lien RB | | | 5.00 | % | | | 10/01/15 | | | | 500 | | | | 528,230 | |
Series 2010 A, Sr. Lien RB | | | 5.00 | % | | | 10/01/16 | | | | 345 | | | | 375,298 | |
Series 2010 B, Sub. Lien RB | | | 5.00 | % | | | 10/01/25 | | | | 750 | | | | 785,415 | |
Series 2010 B, Sub. Lien RB | | | 5.25 | % | | | 10/01/29 | | | | 570 | | | | 589,363 | |
Virgin Islands (Government of) Water & Power Authority; | | | | | | | | | | | | | | | | |
Series 2010 A, Ref. Electric System RB | | | 4.00 | % | | | 07/01/14 | | | | 1,000 | | | | 999,170 | |
Series 2010 B, Electric System RB (INS–AGM)(a) | | | 5.00 | % | | | 07/01/22 | | | | 1,000 | | | | 1,104,040 | |
| | | | | | | | | | | | | | | | 13,019,323 | |
|
| Virginia–0.65% | |
Chesterfield (County of) Economic Development Authority (Virginia Electric & Power Co.); Series 2009 A, Ref. PCR | | | 5.00 | % | | | 05/01/23 | | | | 500 | | | | 553,785 | |
Smyth (County of) Industrial Development Authority (Mountain States Health Alliance); | | | | | | | | | | | | | | | | |
Series 2010 B, Ref. Hospital RB | | | 5.00 | % | | | 07/01/15 | | | | 1,095 | | | | 1,145,699 | |
Series 2010 B, Ref. Hospital RB | | | 5.00 | % | | | 07/01/16 | | | | 2,090 | | | | 2,248,129 | |
Series 2010 B, Ref. Hospital RB | | | 5.00 | % | | | 07/01/18 | | | | 1,255 | | | | 1,396,413 | |
Virginia (State of) Resources Authority (State Revolving Fund); Series 2008, Sub. Clean Water RB | | | 5.00 | % | | | 10/01/29 | | | | 1,315 | | | | 1,461,452 | |
York (County of) Economic Development Authority (Virginia Electric & Power Co.); Series 2009 A, Ref. PCR(b) | | | 4.05 | % | | | 05/01/14 | | | | 2,000 | | | | 2,011,100 | |
| | | | | | | | | | | | | | | | 8,816,578 | |
|
| Washington–1.37% | |
Clark (County of) Public Utility District No. 1; | | | | | | | | | | | | | | | | |
Series 2009, Ref. Electric System RB | | | 5.00 | % | | | 01/01/26 | | | | 500 | | | | 541,335 | |
Series 2009, Ref. Electric System RB | | | 5.00 | % | | | 01/01/28 | | | | 300 | | | | 319,524 | |
Cowlitz (County of) (Cowlitz Sewer Operating Board–Wastewater Treatment); Series 2002, Ref. Special Sewer RB (INS–NATL)(a) | | | 5.50 | % | | | 11/01/19 | | | | 2,500 | | | | 2,867,775 | |
See accompanying Notes to Financial Statements which are an integral part of the financial statements.
29 Invesco Tax-Free Intermediate Fund
| | | | | | | | | | | | | | | | |
| | | Interest
Rate | | | Maturity
Date | | | Principal
Amount
(000) | | | Value | |
| Washington–(continued) | |
Washington (State of) Health Care Facilities Authority (Highline Medical Center); Series 2008, Mortgage RB(b)(c) | | | 5.25 | % | | | 08/01/18 | | | $ | 985 | | | $ | 1,161,522 | |
Washington (State of) Health Care Facilities Authority (MultiCare Health System); Series 2008 A, RB (INS–AGC)(a) | | | 5.75 | % | | | 08/15/29 | | | | 450 | | | | 499,329 | |
Washington (State of) Health Care Facilities Authority (PeaceHealth); Series 2014 A, Ref. RB | | | 5.00 | % | | | 11/15/20 | | | | 500 | | | | 581,925 | |
Washington (State of) Higher Education Facilities Authority (Gonzaga University); | | | | | | | | | | | | | | | | |
Series 2009, Ref. RB | | | 5.38 | % | | | 04/01/20 | | | | 1,050 | | | | 1,191,582 | |
Series 2010 A, Ref. RB | | | 4.50 | % | | | 04/01/16 | | | | 3,095 | | | | 3,304,315 | |
Series 2010 A, Ref. RB | | | 4.50 | % | | | 04/01/17 | | | | 2,725 | | | | 2,973,656 | |
Series 2010 A, Ref. RB | | | 5.00 | % | | | 04/01/15 | | | | 2,955 | | | | 3,082,006 | |
Series 2010 A, Ref. RB | | | 5.00 | % | | | 04/01/19 | | | | 1,810 | | | | 2,065,970 | |
| | | | | | | | | | | | | | | | 18,588,939 | |
|
| West Virginia–0.36% | |
Mason (County of) (Appalachian Power Co.); Series 2003 L, PCR(b) | | | 2.00 | % | | | 10/01/14 | | | | 3,500 | | | | 3,522,750 | |
West Virginia (State of) Hospital Finance Authority (West Virginia University Hospitals, Inc.); Series 2003 D, Hospital Improvement RB (INS–AGM)(a) | | | 5.38 | % | | | 06/01/28 | | | | 1,200 | | | | 1,286,892 | |
| | | | | | | | | | | | | | | | 4,809,642 | |
|
| Wisconsin–1.70% | |
Manitowoc (City of); Series 2009, Ref. Electric Power System RB (INS–AGC)(a) | | | 4.25 | % | | | 10/01/15 | | | | 1,510 | | | | 1,596,553 | |
Wisconsin (State of) Health & Educational Facilities Authority (Aurora Health Care, Inc.); | | | | | | | | | | | | | | | | |
Series 2009 B, RB(b) | | | 4.75 | % | | | 08/15/14 | | | | 1,000 | | | | 1,019,340 | |
Series 2009 B, RB(b) | | | 5.13 | % | | | 08/15/16 | | | | 2,130 | | | | 2,345,790 | |
Wisconsin (State of) Health & Educational Facilities Authority (Froedtert & Community Health, Inc. Obligated Group); | | | | | | | | | | | | | | | | |
Series 2009 C, RB | | | 4.00 | % | | | 04/01/15 | | | | 2,060 | | | | 2,143,471 | |
Series 2009 C, RB | | | 5.00 | % | | | 04/01/19 | | | | 750 | | | | 877,418 | |
Series 2009 C, RB | | | 5.00 | % | | | 04/01/20 | | | | 750 | | | | 860,258 | |
Wisconsin (State of) Health & Educational Facilities Authority (Marquette University); | | | | | | | | | | | | | | | | |
Series 2008 B-1, Ref. RB | | | 3.50 | % | | | 10/01/16 | | | | 1,005 | | | | 1,078,214 | |
Series 2008 B-1, Ref. RB | | | 3.75 | % | | | 10/01/18 | | | | 880 | | | | 977,847 | |
Series 2008 B-3, RB | | | 3.75 | % | | | 10/01/18 | | | | 1,125 | | | | 1,250,089 | |
Series 2008 B-3, RB | | | 4.00 | % | | | 10/01/19 | | | | 1,145 | | | | 1,289,430 | |
Series 2012, Ref. RB | | | 5.00 | % | | | 10/01/24 | | | | 700 | | | | 799,197 | |
Wisconsin (State of) Health & Educational Facilities Authority (Marshfield Clinic); Series 2006 A, RB | | | 5.00 | % | | | 02/15/18 | | | | 400 | | | | 425,160 | |
Wisconsin (State of) Health & Educational Facilities Authority (Mercy Alliance); | | | | | | | | | | | | | | | | |
Series 2012, RB | | | 5.00 | % | | | 06/01/25 | | | | 5,000 | | | | 5,425,900 | |
Series 2012, RB | | | 5.00 | % | | | 06/01/26 | | | | 1,855 | | | | 1,981,233 | |
Wisconsin (State of) Health & Educational Facilities Authority (ThedaCare, Inc.); Series 2005, RB (INS–AMBAC)(a) | | | 5.00 | % | | | 12/15/16 | | | | 855 | | | | 907,830 | |
| | | | | | | | | | | | | | | | 22,977,730 | |
|
| Wyoming–0.46% | |
Campbell (County of) Hospital District (Campbell County Memorial Hospital); | | | | | | | | | | | | | | | | |
Series 2009, RB | | | 4.00 | % | | | 12/01/15 | | | | 1,285 | | | | 1,358,451 | |
Series 2009, RB | | | 5.00 | % | | | 12/01/17 | | | | 1,170 | | | | 1,312,225 | |
Series 2009, RB | | | 5.00 | % | | | 12/01/18 | | | | 545 | | | | 612,553 | |
Laramie (County of) (Cheyenne Regional Medical Center); Series 2012, Hospital RB | | | 3.00 | % | | | 05/01/16 | | | | 485 | | | | 504,642 | |
Sweetwater (County of) (Idaho Power Co.); Series 2006, Ref. PCR | | | 5.25 | % | | | 07/15/26 | | | | 1,200 | | | | 1,303,116 | |
Wyoming (State of) Municipal Power Agency; Series 2008 A, Power Supply RB | | | 5.38 | % | | | 01/01/25 | | | | 1,000 | | | | 1,128,330 | |
| | | | | 6,219,317 | |
TOTAL INVESTMENTS(g)–98.35% (Cost $1,246,095,895) | | | | | | | | | | | | | | | 1,332,023,520 | |
OTHER ASSETS LESS LIABILITIES–1.65% | | | | | | | | | | | | | | | 22,402,966 | |
NET ASSETS–100.00% | | | $ | 1,354,426,486 | |
See accompanying Notes to Financial Statements which are an integral part of the financial statements.
30 Invesco Tax-Free Intermediate Fund
Investment Abbreviations:
| | |
| AGC | | – Assured Guaranty Corp. |
| AGM | | – Assured Guaranty Municipal Corp. |
| AMBAC | | – American Municipal Bond Assurance Corp. |
| BAN | | – Bond Anticipation Notes |
| BHAC | | – Berkshire Hathaway Assurance Corp. |
| CAB | | – Capital Appreciation Bonds |
| CEP | | – Credit Enhancement Provider |
| Conv. | | – Convertible |
| COP | | – Certificates of Participation |
| Ctfs. | | – Certificates |
| FTA | | – Federal Transit Administration |
| GO | | – General Obligation |
| IDR | | – Industrial Development Revenue Bonds |
| INS | | – Insurer |
| Jr. | | – Junior |
| NATL | | – National Public Finance Guarantee Corp. |
| PCR | | – Pollution Control Revenue Bonds |
| RAB | | – Revenue Anticipation Bonds |
| RAC | | – Revenue Anticipation Certificates |
| RB | | – Revenue Bonds |
| Ref. | | – Refunding |
| Sec. | | – Secured |
| SGI | | – Syncora Guarantee, Inc. |
| Sr. | | – Senior |
| Sub. | | – Subordinated |
| TEMPS | | – Tax-Exempt Mandatory Paydown Securities |
Notes to Schedule of Investments:
| (a) | Principal and/or interest payments are secured by the bond insurance company listed. |
| (b) | Security has an irrevocable call by the issuer or mandatory put by the holder. Maturity date reflects such call or put. |
| (c) | Advance refunded; secured by an escrow fund of U.S. Government obligations or other highly rated collateral. |
| (d) | Interest or dividend rate is redetermined periodically. Rate shown is the rate in effect on February 28, 2014. |
| (e) | Zero coupon bonds issued at a discount. |
| (f) | Security subject to crossover refunding. |
| (g) | This table provides a listing of those entities that have either issued, guaranteed, backed or otherwise enhanced the credit quality of more than 5% of the securities held in the portfolio. In instances where the entity has guaranteed, backed or otherwise enhanced the credit quality of a security, it is not primarily responsible for the issuer’s obligations but may be called upon to satisfy the issuer’s obligations. |
| | | | |
| Entities | | Percentage | |
Assured Guaranty Municipal Corp. | | | 13.5 | % |
Assured Guaranty Corp. | | | 11.9 | |
See accompanying Notes to Financial Statements which are an integral part of the financial statements.
31 Invesco Tax-Free Intermediate Fund
Statement of Assets and Liabilities
February 28, 2014
| | | | |
Assets: | |
Investments, at value (Cost $1,246,095,895) | | $ | 1,332,023,520 | |
Cash | | | 4,468,069 | |
Receivable for: | | | | |
Investments sold | | | 5,080,132 | |
Fund shares sold | | | 2,861,230 | |
Interest | | | 14,039,466 | |
Investment for trustee deferred compensation and retirement plans | | | 214,635 | |
Other assets | | | 43,995 | |
Total assets | | | 1,358,731,047 | |
|
Liabilities: | |
Payable for: | | | | |
Investments purchased | | | 1,032,004 | |
Fund shares reacquired | | | 1,387,092 | |
Dividends | | | 1,166,484 | |
Accrued fees to affiliates | | | 377,265 | |
Accrued trustees’ and officers’ fees and benefits | | | 5,333 | |
Accrued other operating expenses | | | 85,714 | |
Trustee deferred compensation and retirement plans | | | 250,669 | |
Total liabilities | | | 4,304,561 | |
Net assets applicable to shares outstanding | | $ | 1,354,426,486 | |
|
Net assets consist of: | |
Shares of beneficial interest | | $ | 1,273,033,251 | |
Undistributed net investment income | | | 1,928,792 | |
Undistributed net realized gain (loss) | | | (6,463,182 | ) |
Net unrealized appreciation | | | 85,927,625 | |
| | | $ | 1,354,426,486 | |
| | | | |
Net Assets: | |
Class A | | $ | 963,413,965 | |
Class A2 | | $ | 88,597,772 | |
Class C | | $ | 10,354,708 | |
Class Y | | $ | 280,143,527 | |
Class R5 | | $ | 11,916,514 | |
|
Shares outstanding, $0.001 par value per share,
with an unlimited number of shares authorized: | |
Class A | | | 83,135,590 | |
Class A2 | | | 7,628,212 | |
Class C | | | 893,573 | |
Class Y | | | 24,186,977 | |
Class R5 | | | 1,028,512 | |
Class A | | | | |
Net asset value per share | | $ | 11.59 | |
Maximum offering price per share | | | | |
(Net asset value of $11.59 ¸ 97.50%) | | $ | 11.89 | |
Class A2: | | | | |
Net asset value and offering price per share | | $ | 11.61 | |
Maximum offering price per share | | | | |
(Net asset value of $11.61 ¸ 99.00%) | | $ | 11.73 | |
Class C: | | | | |
Net asset value and offering price per share | | $ | 11.59 | |
Class Y: | | | | |
Net asset value and offering price per share | | $ | 11.58 | |
Class R5: | | | | |
Net asset value and offering price per share | | $ | 11.59 | |
See accompanying Notes to Financial Statements which are an integral part of the financial statements.
32 Invesco Tax-Free Intermediate Fund
Statement of Operations
For the year ended February 28, 2014
| | | | |
Investment income: | |
Interest | | $ | 50,973,988 | |
| |
Expenses: | | | | |
Advisory fees | | | 3,588,098 | |
Administrative services fees | | | 344,751 | |
Custodian fees | | | 36,878 | |
Distribution fees — Class A | | | 2,666,806 | |
Distribution fees — Class C | | | 34,379 | |
Transfer agent fees — A, A2, C and Y | | | 732,533 | |
Transfer agent fees — R5 | | | 4,705 | |
Trustees’ and officers’ fees and benefits | | | 92,587 | |
Other | | | 457,486 | |
Total expenses | | | 7,958,223 | |
Less: Expense offset arrangement(s) | | | (309 | ) |
Net expenses | | | 7,957,914 | |
Net investment income | | | 43,016,074 | |
| |
Realized and unrealized gain (loss) from: | | | | |
Net realized gain (loss) from investment securities | | | (4,861,641 | ) |
Change in net unrealized appreciation (depreciation) of investment securities | | | (40,168,622 | ) |
Net realized and unrealized gain (loss) | | | (45,030,263 | ) |
Net increase (decrease) in net assets resulting from operations | | $ | (2,014,189 | ) |
See accompanying Notes to Financial Statements which are an integral part of the financial statements.
33 Invesco Tax-Free Intermediate Fund
Statement of Changes in Net Assets
For the years ended February 28, 2014 and 2013
| | | | | | | | |
| | | 2014 | | | 2013 | |
Operations: | | | | | |
Net investment income | | $ | 43,016,074 | | | $ | 44,818,845 | |
Net realized gain (loss) | | | (4,861,641 | ) | | | 775,343 | |
Change in net unrealized appreciation (depreciation) | | | (40,168,622 | ) | | | 14,934,096 | |
Net increase (decrease) in net assets resulting from operations | | | (2,014,189 | ) | | | 60,528,284 | |
| | |
Distributions to shareholders from net investment income: | | | | | | | | |
Class A | | | (30,718,690 | ) | | | (35,851,155 | ) |
Class A2 | | | (3,098,312 | ) | | | (4,029,937 | ) |
Class C | | | (71,417 | ) | | | — | |
Class Y | | | (7,419,825 | ) | | | (8,138,284 | ) |
Class R5 | | | (388,754 | ) | | | (678,937 | ) |
Total distributions from net investment income | | | (41,696,998 | ) | | | (48,698,313 | ) |
| | |
Share transactions–net: | | | | | | | | |
Class A | | | (188,450,011 | ) | | | 112,695,018 | |
Class A2 | | | (27,205,683 | ) | | | 5,855,520 | |
Class C | | | 10,243,532 | | | | — | |
Class Y | | | 59,490,621 | | | | (38,630,204 | ) |
Class R5 | | | (2,551,347 | ) | | | (5,893,949 | ) |
Net increase (loss) in net assets resulting from share transactions | | | (148,472,888 | ) | | | 74,026,385 | |
Net increase (loss) in net assets | | | (192,184,075 | ) | | | 85,856,356 | |
| | |
Net assets: | | | | | | | | |
Beginning of year | | | 1,546,610,561 | | | | 1,460,754,205 | |
End of year (includes undistributed net investment income of $1,928,792 and $615,408, respectively) | | $ | 1,354,426,486 | | | $ | 1,546,610,561 | |
Notes to Financial Statements
February 28, 2014
NOTE 1—Significant Accounting Policies
Invesco Tax-Free Intermediate Fund (the “Fund”) is a series portfolio of AIM Tax-Exempt Funds (Invesco Tax-Exempt Funds) (the “Trust”). The Trust is a Delaware statutory trust registered under the Investment Company Act of 1940, as amended (the “1940 Act”), as an open-end series management investment company consisting of six separate portfolios, each authorized to issue an unlimited number of shares of beneficial interest. The assets, liabilities and operations of each portfolio are accounted for separately. Information presented in these financial statements pertains only to the Fund. Matters affecting each portfolio or class will be voted on exclusively by the shareholders of such portfolio or class.
The Fund’s investment objective is federal tax-exempt current income.
The Fund currently consists of five different classes of shares: Class A, Class A2, Class C, Class Y and Class R5. On June 28, 2013, the Fund began offering Class C shares. Class A and Class A2 shares are sold with a front-end sales charge unless certain waiver criteria are met and under certain circumstances load waived shares may be subject to contingent deferred sales charges (“CDSC”). Class C shares are sold with a CDSC. Class Y and Class R5 shares are sold at net asset value.
As of the close of business on October 30, 2002, Class A2 shares are closed to new investors.
The following is a summary of the significant accounting policies followed by the Fund in the preparation of its financial statements.
| A. | Security Valuations — Securities, including restricted securities, are valued according to the following policy. |
Securities are fair valued using an evaluated quote provided by an independent pricing service approved by the Board of Trustees. Evaluated quotes provided by the pricing service may be determined without exclusive reliance on quoted prices, and may reflect appropriate factors such as institution-size trading in similar groups of securities, developments related to specific securities, dividend rate (for unlisted equities), yield (for debt obligations), quality, type of issue, coupon rate (for debt obligations), maturity (for debt obligations), individual trading characteristics and other market data. Debt obligations are subject to interest rate and credit risks. In addition, all debt obligations involve some risk of default with respect to interest and/or principal payments.
Securities for which market quotations either are not readily available or became unreliable are valued at fair value as determined in good faith by or under the supervision of the Trust’s officers following procedures approved by the Board of Trustees. Some of the factors which may be considered in determining fair value are fundamental analytical data relating to the investment; the nature and duration of any restrictions on transferability or disposition; trading in similar securities by the same issuer or comparable companies; relevant political, economic or issuer specific news; and other relevant factors under the circumstances.
34 Invesco Tax-Free Intermediate Fund
The Fund invests in securities that are subject to interest rate risk, meaning the risk that the prices will generally fall as interest rates rise and, conversely, the prices will generally rise as interest rates fall. Specific securities differ in their sensitivity to changes in interest rates depending on their individual characteristics. Changes in interest rates may result in increased market volatility, which may affect the value and/or liquidity of certain of the Fund’s investments.
Valuations change in response to many factors including the historical and prospective earnings of the issuer, the value of the issuer’s assets, general economic conditions, interest rates, investor perceptions and market liquidity. Because of the inherent uncertainties of valuation, the values reflected in the financial statements may materially differ from the value received upon actual sale of those investments.
| B. | Securities Transactions and Investment Income — Securities transactions are accounted for on a trade date basis. Realized gains or losses on sales are computed on the basis of specific identification of the securities sold. Interest income is recorded on the accrual basis from settlement date. Dividend income (net of withholding tax, if any) is recorded on the ex-dividend date. Bond premiums and discounts are amortized and/or accreted for financial reporting purposes. |
The Fund may periodically participate in litigation related to Fund investments. As such, the Fund may receive proceeds from litigation settlements. Any proceeds received are included in the Statement of Operations as realized gain (loss) for investments no longer held and as unrealized gain (loss) for investments still held.
Brokerage commissions and mark ups are considered transaction costs and are recorded as an increase to the cost basis of securities purchased and/or a reduction of proceeds on a sale of securities. Such transaction costs are included in the determination of net realized and unrealized gain (loss) from investment securities reported in the Statement of Operations and the Statement of Changes in Net Assets and the net realized and unrealized gains (losses) on securities per share in the Financial Highlights. Transaction costs are included in the calculation of the Fund’s net asset value and, accordingly, they reduce the Fund’s total returns. These transaction costs are not considered operating expenses and are not reflected in net investment income reported in the Statement of Operations and Statement of Changes in Net Assets, or the net investment income per share and ratios of expenses and net investment income reported in the Financial Highlights, nor are they limited by any expense limitation arrangements between the Fund and the investment adviser.
The Fund allocates realized and unrealized capital gains and losses to a class based on the relative net assets of each class. The Fund allocates income to a class based on the relative value of the settled shares of each class.
| C. | Country Determination — For the purposes of making investment selection decisions and presentation in the Schedule of Investments, the investment adviser may determine the country in which an issuer is located and/or credit risk exposure based on various factors. These factors include the laws of the country under which the issuer is organized, where the issuer maintains a principal office, the country in which the issuer derives 50% or more of its total revenues and the country that has the primary market for the issuer’s securities, as well as other criteria. Among the other criteria that may be evaluated for making this determination are the country in which the issuer maintains 50% or more of its assets, the type of security, financial guarantees and enhancements, the nature of the collateral and the sponsor organization. Country of issuer and/or credit risk exposure has been determined to be the United States of America, unless otherwise noted. |
| D. | Distributions — Distributions from income are declared daily and paid monthly. Distributions from net realized capital gain, if any, are generally declared and paid annually and recorded on the ex-dividend date. The Fund may elect to treat a portion of the proceeds from redemptions as distributions for federal income tax purposes. |
| E. | Federal Income Taxes — The Fund intends to comply with the requirements of Subchapter M of the Internal Revenue Code of 1986, as amended (the “Internal Revenue Code”), necessary to qualify as a regulated investment company and to distribute substantially all of the Fund’s taxable and tax-exempt earnings to shareholders. As such, the Fund will not be subject to federal income taxes on otherwise taxable income (including net realized capital gain) that is distributed to shareholders. Therefore, no provision for federal income taxes is recorded in the financial statements. |
The Fund recognizes the tax benefits of uncertain tax positions only when the position is more likely than not to be sustained. Management has analyzed the Fund’s uncertain tax positions and concluded that no liability for unrecognized tax benefits should be recorded related to uncertain tax positions. Management is not aware of any tax positions for which it is reasonably possible that the total amounts of unrecognized tax benefits will change materially in the next 12 months.
In addition, the Fund intends to invest in such municipal securities to allow it to qualify to pay shareholders “exempt-interest dividends”, as defined in the Internal Revenue Code.
The Fund files tax returns in the U.S. Federal jurisdiction and certain other jurisdictions. Generally, the Fund is subject to examinations by such taxing authorities for up to three years after the filing of the return for the tax period.
| F. | Expenses — Fees provided for under the Rule 12b-1 plan of a particular class of the Fund are charged to the operations of such class. Transfer agency fees and expenses and other shareholder recordkeeping fees and expenses attributable to Class R5 are charged to such class. Transfer agency fees and expenses and other shareholder recordkeeping fees and expenses relating to all other classes are allocated among those classes based on relative net assets. All other expenses are allocated among the classes based on relative net assets. |
| G. | Accounting Estimates — The preparation of financial statements in conformity with accounting principles generally accepted in the United States of America (“GAAP”) requires management to make estimates and assumptions that affect the reported amounts of assets and liabilities at the date of the financial statements and the reported amounts of revenues and expenses during the reporting period including estimates and assumptions related to taxation. Actual results could differ from those estimates by a significant amount. In addition, the Fund monitors for material events or transactions that may occur or become known after the period-end date and before the date the financial statements are released to print. |
| H. | Indemnifications — Under the Trust’s organizational documents, each Trustee, officer, employee or other agent of the Trust is indemnified against certain liabilities that may arise out of the performance of their duties to the Fund. Additionally, in the normal course of business, the Fund enters into contracts, including the Fund’s servicing agreements, that contain a variety of indemnification clauses. The Fund’s maximum exposure under these arrangements is unknown as this would involve future claims that may be made against the Fund that have not yet occurred. The risk of material loss as a result of such indemnification claims is considered remote. |
| I. | Other Risks — The value of, payment of interest on, repayment of principal for and the ability to sell a municipal security may be affected by constitutional amendments, legislative enactments, executive orders, administrative regulations, voter initiatives and the economics of the regions in which the issuers are located. |
Since many municipal securities are issued to finance similar projects, especially those relating to education, health care, transportation and utilities, conditions in those sectors can affect the overall municipal securities market and a Fund’s investments in municipal securities.
35 Invesco Tax-Free Intermediate Fund
There is some risk that a portion or all of the interest received from certain tax-free municipal securities could become taxable as a result of determinations by the Internal Revenue Service.
NOTE 2—Advisory Fees and Other Fees Paid to Affiliates
The Trust has entered into a master investment advisory agreement with Invesco Advisers, Inc. (the “Adviser” or “Invesco”). Under the terms of the investment advisory agreement, the Fund pays an advisory fee to the Adviser based on the annual rate of the Fund’s average daily net assets as follows:
| | | | | | |
| Average Daily Net Assets | | Rate |
First $500 million | | | 0 | .30% | | |
Over $500 million up to and including $1 billion | | | 0 | .25% | | |
Over $1 billion | | | 0 | .20% | | |
Under the terms of a master sub-advisory agreement between the Adviser and each of Invesco Asset Management Deutschland GmbH, Invesco Asset Management Limited, Invesco Asset Management (Japan) Limited, Invesco Australia Limited, Invesco Hong Kong Limited, Invesco Senior Secured Management, Inc. and Invesco Canada Ltd. (collectively, the “Affiliated Sub-Advisers”) the Adviser, not the Fund, may pay 40% of the fees paid to the Adviser to any such Affiliated Sub-Adviser(s) that provide(s) discretionary investment management services to the Fund based on the percentage of assets allocated to such Sub-Adviser(s).
The Adviser has contractually agreed, through at least June 30, 2014, to waive advisory fees and/or reimburse expenses of all shares to the extent necessary to limit total annual fund operating expenses after fee waiver and/or expense reimbursement (excluding certain items discussed below) of Class A, Class A2, Class C, Class Y and Class R5 shares to 1.50%, 1.25%, 2.25%, 1.25% and 1.25%, respectively, of average daily net assets. In determining the Adviser’s obligation to waive advisory fees and/or reimburse expenses, the following expenses are not taken into account, and could cause the total annual fund operating expenses after fee waiver and/or expense reimbursement to exceed the numbers reflected above: (1) interest, facilities and maintenance fees; (2) taxes; (3) dividend expense on short sales; (4) extraordinary or non-routine items, including litigation expenses; and (5) expenses that the Fund has incurred but did not actually pay because of an expense offset arrangement. Unless Invesco continues the fee waiver agreement, it will terminate on June 30, 2014. The fee waiver agreement cannot be terminated during its term. The Adviser did not waive fees and/or reimburse expenses during the period under this expense limitation.
The Trust has entered into a master administrative services agreement with Invesco pursuant to which the Fund has agreed to pay Invesco for certain administrative costs incurred in providing accounting services to the Fund. For the year ended February 28, 2014, expenses incurred under the agreement are shown in the Statement of Operations as Administrative services fees.
The Trust has entered into a transfer agency and service agreement with Invesco Investment Services, Inc. (“IIS”) pursuant to which the Fund has agreed to pay IIS a fee for providing transfer agency and shareholder services to the Fund and reimburse IIS for certain expenses incurred by IIS in the course of providing such services. IIS may make payments to intermediaries that provide omnibus account services, sub-accounting services and/or networking services. All fees payable by IIS to intermediaries that provide omnibus account services or sub-accounting are charged back to the Fund, subject to certain limitations approved by the Trust’s Board of Trustees. For the year ended February 28, 2014, expenses incurred under the agreement are shown in the Statement of Operations as Transfer agent fees.
The Trust has entered into master distribution agreements with Invesco Distributors, Inc. (“IDI”) to serve as the distributor for the Class A, Class A2, Class C, Class Y and Class R5 shares of the Fund. The Trust has adopted plans pursuant to Rule 12b-1 under the 1940 Act with respect to the Fund’s Class A shares (collectively, the “Plans”). The Fund, pursuant to the Plan, pays IDI compensation at the annual rate of 0.25% of the Fund’s average daily net assets of Class A shares and 1.00% of the average daily net assets of Class C shares. Of the Rule 12b-1 payment, up to 0.25% of the average daily net assets of the Class A shares may be paid to furnish continuing personal shareholder services to customers who purchase and own Class A shares of the Fund. Any amounts not paid as a service fee under the Plan would constitute an asset-based sales charge. Rules of the Financial Industry Regulatory Authority (“FINRA”) also impose a cap on the total sales charges, including asset-based sales charges, that may be paid by any class of shares of the Fund. For the year ended February 28, 2014, expenses incurred under the Plans are shown in the Statement of Operations as Distribution fees.
Front-end sales commissions and CDSC (collectively, the “sales charges”) are not recorded as expenses of the Fund. Front-end sales commissions are deducted from proceeds from the sales of Fund shares prior to investment in Class A and Class A2 shares of the Fund. CDSC are deducted from redemption proceeds prior to remittance to the shareholder. During the year ended February 28, 2014, IDI advised the Fund that IDI retained $151,940 and $405 in front-end sales commissions from the sale of Class A and Class A2 shares, respectively. Also, $94,414 and $1,484 from Class A and Class C shares respectively, for CDSC imposed upon redemptions by shareholders.
Certain officers and trustees of the Trust are officers and directors of the Adviser, IIS and/or IDI.
NOTE 3—Additional Valuation Information
GAAP defines fair value as the price that would be received to sell an asset or paid to transfer a liability in an orderly transaction between market participants at the measurement date, under current market conditions. GAAP establishes a hierarchy that prioritizes the inputs to valuation methods, giving the highest priority to readily available unadjusted quoted prices in an active market for identical assets (Level 1) and the lowest priority to significant unobservable inputs (Level 3), generally when market prices are not readily available or are unreliable. Based on the valuation inputs, the securities or other investments are tiered into one of three levels. Changes in valuation methods may result in transfers in or out of an investment’s assigned level:
| | Level 1 — | Prices are determined using quoted prices in an active market for identical assets. |
| | Level 2 — | Prices are determined using other significant observable inputs. Observable inputs are inputs that other market participants may use in pricing a security. These may include quoted prices for similar securities, interest rates, prepayment speeds, credit risk, yield curves, loss severities, default rates, discount rates, volatilities and others. |
| | Level 3 — | Prices are determined using significant unobservable inputs. In situations where quoted prices or observable inputs are unavailable (for example, when there is little or no market activity for an investment at the end of the period), unobservable inputs may be used. Unobservable inputs reflect the Fund’s own assumptions about the factors market participants would use in determining fair value of the securities or instruments and would be based on the best available information. |
36 Invesco Tax-Free Intermediate Fund
As of February 28, 2014, all of the securities in this Fund were valued based on Level 2 inputs (see the Schedule of Investments for security categories). The level assigned to the securities valuations may not be an indication of the risk or liquidity associated with investing in those securities. Because of the inherent uncertainties of valuation, the values reflected in the financial statements may materially differ from the value received upon actual sale of those investments.
NOTE 4—Security Transactions with Affiliated Funds
The Fund is permitted to purchase or sell securities from or to certain other Invesco Funds under specified conditions outlined in procedures adopted by the Board of Trustees of the Trust. The procedures have been designed to ensure that any purchase or sale of securities by the Fund from or to another fund or portfolio that is or could be considered an affiliate by virtue of having a common investment adviser (or affiliated investment advisers), common Trustees and/or common officers complies with Rule 17a-7 of the 1940 Act. Further, as defined under the procedures, each transaction is effected at the current market price. Pursuant to these procedures, for the year ended February 28, 2014, the Fund engaged in securities purchases of $26,595,873 and securities sales of $26,496,351, which did not result in any net realized gains (losses).
NOTE 5—Expense Offset Arrangement(s)
The expense offset arrangement is comprised of transfer agency credits which result from balances in demand deposit accounts used by the transfer agent for clearing shareholder transactions. For the year ended February 28, 2014, the Fund received credits from this arrangement, which resulted in the reduction of the Fund’s total expenses of $309.
NOTE 6—Trustees’ and Officers’ Fees and Benefits
Trustees’ and Officers’ Fees and Benefits include amounts accrued by the Fund to pay remuneration to certain Trustees and Officers of the Fund. Trustees have the option to defer compensation payable by the Fund, and Trustees’ and Officers’ Fees and Benefits also include amounts accrued by the Fund to fund such deferred compensation amounts. Those Trustees who defer compensation have the option to select various Invesco Funds in which their deferral accounts shall be deemed to be invested. Finally, certain current Trustees were eligible to participate in a retirement plan that provided for benefits to be paid upon retirement to Trustees over a period of time based on the number of years of service. The Fund may have certain former Trustees who also participate in a retirement plan and receive benefits under such plan. Trustees’ and Officers’ Fees and Benefits include amounts accrued by the Fund to fund such retirement benefits. Obligations under the deferred compensation and retirement plans represent unsecured claims against the general assets of the Fund.
NOTE 7—Cash Balances
The Fund may borrow for leveraging in an amount up to 5% of the Fund’s total assets (excluding the amount borrowed) at the time the borrowing is made. In doing so, the Fund is permitted to temporarily carry a negative or overdrawn balance in its account with The Bank of New York Mellon, the custodian bank. Such balances, if any at period end, are shown in the Statement of Assets and Liabilities under the payable caption Amount due custodian. To compensate the custodian bank for such overdrafts, the overdrawn Fund may either (1) leave funds as a compensating balance in the account so the custodian bank can be compensated by earning the additional interest; or (2) compensate by paying the custodian bank at a rate agreed upon by the custodian bank and Invesco, not to exceed the contractually agreed upon rate. A Fund may not purchase additional securities when any borrowings from banks exceeds 5% of the Fund’s total assets.
NOTE 8—Distributions to Shareholders and Tax Components of Net Assets
Tax Character of Distributions to Shareholders Paid During the Years Ended February 28, 2014 and 2013:
| | | | | | | | |
| | | 2014 | | | 2013 | |
Ordinary income — tax-exempt | | $ | 41,696,998 | | | $ | 48,698,313 | |
Tax Components of Net Assets at Period-End:
| | | | |
| | | 2014 | |
Undistributed ordinary income | | $ | 2,162,932 | |
Net unrealized appreciation — investments | | | 85,927,625 | |
Temporary book/tax differences | | | (234,140 | ) |
Capital loss carryforward | | | (6,463,182 | ) |
Shares of beneficial interest | | | 1,273,033,251 | |
Total net assets | | $ | 1,354,426,486 | |
The temporary book/tax differences are a result of timing differences between book and tax recognition of income and/or expenses. The Fund’s temporary book/tax differences are the result of the trustee deferral of compensation and retirement plan benefits.
Capital loss carryforward is calculated and reported as of a specific date. Results of transactions and other activity after that date may affect the amount of capital loss carryforward actually available for the Fund to utilize. Capital losses generated in years beginning after December 22, 2010 can be carried forward for an unlimited period, whereas previous losses expire in 8 tax years. Capital losses with an expiration period may not be used to offset capital gains until all net capital losses without an expiration date have been utilized. Capital loss carryforwards with no expiration date will retain their character as either short-term or long-term capital losses instead of as short-term capital losses as under prior law. The ability to utilize capital loss carryforward in the future may be limited under the Internal Revenue Code and related regulations based on the results of future transactions.
37 Invesco Tax-Free Intermediate Fund
The Fund has a capital loss carryforward as of February 28, 2014, which expires as follows:
| | | | | | | | | | | | |
| Capital Loss Carryforward* | |
| Expiration | | Short-Term | | | Long-Term | | | Total | |
February 28, 2017 | | $ | 176,146 | | | $ | — | | | $ | 176,146 | |
February 28, 2018 | | | 195,867 | | | | — | | | | 195,867 | |
Not subject to expiration | | | 5,521,849 | | | | 569,320 | | | | 6,091,169 | |
| | | $ | 5,893,862 | | | $ | 569,320 | | | $ | 6,463,182 | |
| * | Capital loss carryforward as of the date listed above is reduced for limitations, if any, to the extent required by the Internal Revenue Code. |
NOTE 9—Investment Securities
The aggregate amount of investment securities (other than short-term securities, U.S. Treasury obligations and money market funds, if any) purchased and sold by the Fund during the year ended February 28, 2014 was $67,815,506 and $252,919,406, respectively. Cost of investments on a tax basis includes the adjustments for financial reporting purposes as of the most recently completed federal income tax reporting period-end.
| | | | |
| Unrealized Appreciation (Depreciation) of Investment Securities on a Tax Basis | |
Aggregate unrealized appreciation of investment securities | | $ | 86,848,098 | |
Aggregate unrealized (depreciation) of investment securities | | | (920,473 | ) |
Net unrealized appreciation of investment securities | | $ | 85,927,625 | |
Cost of investments is the same for tax and financial statement purposes.
NOTE 10—Reclassification of Permanent Differences
Primarily as a result of differing book/tax treatment of taxable income, on February 28, 2014, undistributed net investment income was decreased by $5,692 and shares of beneficial interest was increased by $5,692. This reclassification had no effect on the net assets of the Fund.
NOTE 11—Share Information
| | | | | | | | | | | | | | | | |
| | | Summary of Share Activity | |
| | | Years ended February 28, | |
| | | 2014(a) | | | 2013 | |
| | | Shares | | | Amount | | | Shares | | | Amount | |
Sold: | | | | | | | | | | | | | | | | |
Class A | | | 22,012,732 | | | $ | 255,386,713 | | | | 31,616,854 | | | $ | 374,720,546 | |
Class A2 | | | 294,174 | | | | 3,405,945 | | | | 1,445,260 | | | | 17,116,077 | |
Class C(b) | | | 1,083,553 | | | | 12,422,833 | | | | — | | | | — | |
Class Y | | | 14,436,708 | | | | 166,605,811 | | | | 8,832,720 | | | | 104,540,316 | |
Class R5 | | | 625,651 | | | | 7,264,624 | | | | 876,474 | | | | 10,363,830 | |
| | | | |
Issued as reinvestment of dividends: | | | | | | | | | | | | | | | | |
Class A | | | 1,842,690 | | | | 21,323,100 | | | | 2,282,241 | | | | 27,045,122 | |
Class A2 | | | 136,541 | | | | 1,577,898 | | | | 215,923 | | | | 2,558,555 | |
Class C | | | 5,160 | | | | 59,387 | | | | — | | | | — | |
Class Y | | | 342,844 | | | | 3,959,503 | | | | 355,031 | | | | 4,207,006 | |
Class R5 | | | 13,546 | | | | 156,810 | | | | 38,751 | | | | 458,785 | |
| | | | |
Reacquired: | | | | | | | | | | | | | | | | |
Class A | | | (40,304,941 | ) | | | (465,159,824 | ) | | | (24,407,495 | ) | | | (289,070,650 | ) |
Class A2 | | | (2,801,353 | ) | | | (32,189,526 | ) | | | (1,165,443 | ) | | | (13,819,112 | ) |
Class C | | | (195,140 | ) | | | (2,238,688 | ) | | | — | | | | — | |
Class Y | | | (9,632,791 | ) | | | (111,074,693 | ) | | | (12,483,751 | ) | | | (147,377,526 | ) |
Class R5 | | | (859,152 | ) | | | (9,972,781 | ) | | | (1,411,799 | ) | | | (16,716,564 | ) |
Net increase (decrease) in share activity | | | (12,999,778 | ) | | $ | (148,472,888 | ) | | | 6,194,766 | | | $ | 74,026,385 | |
| (a) | There are entities that are record owners of more than 5% of the outstanding shares of the Fund and in the aggregate own 63% of the outstanding shares of the Fund. IDI has an agreement with these entities to sell Fund shares. The Fund, Invesco and/or Invesco affiliates may make payments to these entities, which are considered to be related to the Fund, for providing services to the Fund, Invesco and/or Invesco affiliates including but not limited to services such as, securities brokerage, distribution, third party record keeping and account servicing. The Fund has no knowledge as to whether all or any portion of the shares owned of record by these entities are also owned beneficially. |
| (b) | Commencement date of June 28, 2013. |
38 Invesco Tax-Free Intermediate Fund
NOTE 12—Financial Highlights
The following schedule presents financial highlights for a share of the Fund outstanding throughout the periods indicated.
| | | | | | | | | | | | | | | | | | | | | | | | | | | | | | | | | | | | | | | | | | | | | | | | | | | | | | | | |
| | | Net asset
value,
beginning
of period | | | Net
investment
income(a) | | | Net gains
(losses) on securities (both
realized and
unrealized) | | | Total from
investment
operations | | | Dividends
from net
investment
income | | | Distributions
from net
realized
gains | | | Total
distributions | | | Net asset
value, end
of period | | | Total
return(b) | | | Net assets,
end of period
(000’s omitted) | | | Ratio of expenses to average net assets with fee waivers and/or expenses absorbed | | | Ratio of expenses to average net assets without fee waivers and/or expenses absorbed | | | Ratio of net
investment
income
to average
net assets | | | Portfolio
turnover(c) | |
Class A | | | | | | | | | | | | | | | | | | | | | | | | | | | | | | | | | | | | | | | | | | | | | | | | | | | | | | | | |
Year ended 02/28/14 | | $ | 11.91 | | | $ | 0.34 | | | $ | (0.33 | ) | | $ | 0.01 | | | $ | (0.33 | ) | | $ | — | | | $ | (0.33 | ) | | $ | 11.59 | | | | 0.16 | % | | $ | 963,414 | | | | 0.62 | %(d) | | | 0.62 | %(d) | | | 2.97 | %(d) | | | 5 | % |
Year ended 02/28/13 | | | 11.81 | | | | 0.35 | | | | 0.13 | | | | 0.48 | | | | (0.38 | ) | | | — | | | | (0.38 | ) | | | 11.91 | | | | 4.14 | | | | 1,186,009 | | | | 0.60 | | | | 0.60 | | | | 2.96 | | | | 8 | |
Year ended 02/29/12 | | | 11.12 | | | | 0.36 | | | | 0.72 | | | | 1.08 | | | | (0.39 | ) | | | — | | | | (0.39 | ) | | | 11.81 | | | | 9.88 | | | | 1,064,169 | | | | 0.60 | | | | 0.60 | | | | 3.14 | | | | 11 | |
Year ended 02/28/11 | | | 11.19 | | | | 0.36 | | | | (0.13 | ) | | | 0.23 | | | | (0.30 | ) | | | — | | | | (0.30 | ) | | | 11.12 | | | | 2.10 | | | | 1,033,795 | | | | 0.60 | | | | 0.60 | | | | 3.20 | | | | 18 | |
Eleven months ended 02/28/10 | | | 10.72 | | | | 0.33 | | | | 0.49 | | | | 0.82 | | | | (0.35 | ) | | | — | | | | (0.35 | ) | | | 11.19 | | | | 7.80 | | | | 1,552,931 | | | | 0.63 | (e) | | | 0.63 | (e) | | | 3.23 | (e) | | | 8 | |
Year ended 03/31/09 | | | 10.70 | | | | 0.46 | | | | (0.02 | ) | | | 0.44 | | | | (0.41 | ) | | | (0.01 | ) | | | (0.42 | ) | | | 10.72 | | | | 4.18 | | | | 224,508 | | | | 0.69 | | | | 0.69 | | | | 4.32 | | | | 22 | |
Class A2 | |
Year ended 02/28/14 | | | 11.91 | | | | 0.37 | | | | (0.31 | ) | | | 0.06 | | | | (0.36 | ) | | | — | | | | (0.36 | ) | | | 11.61 | | | | 0.58 | | | | 88,598 | | | | 0.37 | (d) | | | 0.37 | (d) | | | 3.22 | (d) | | | 5 | |
Year ended 02/28/13 | | | 11.82 | | | | 0.38 | | | | 0.12 | | | | 0.50 | | | | (0.41 | ) | | | — | | | | (0.41 | ) | | | 11.91 | | | | 4.31 | | | | 119,129 | | | | 0.35 | | | | 0.35 | | | | 3.21 | | | | 8 | |
Year ended 02/29/12 | | | 11.12 | | | | 0.39 | | | | 0.73 | | | | 1.12 | | | | (0.42 | ) | | | — | | | | (0.42 | ) | | | 11.82 | | | | 10.25 | | | | 112,293 | | | | 0.35 | | | | 0.35 | | | | 3.39 | | | | 11 | |
Year ended 02/28/11 | | | 11.20 | | | | 0.39 | | | | (0.14 | ) | | | 0.25 | | | | (0.33 | ) | | | — | | | | (0.33 | ) | | | 11.12 | | | | 2.26 | | | | 96,998 | | | | 0.35 | | | | 0.35 | | | | 3.45 | | | | 18 | |
Eleven months ended 02/28/10 | | | 10.72 | | | | 0.35 | | | | 0.51 | | | | 0.86 | | | | (0.38 | ) | | | — | | | | (0.38 | ) | | | 11.20 | | | | 8.14 | | | | 109,342 | | | | 0.38 | (e) | | | 0.38 | (e) | | | 3.48 | (e) | | | 8 | |
Year ended 03/31/09 | | | 10.70 | | | | 0.48 | | | | (0.02 | ) | | | 0.46 | | | | (0.43 | ) | | | (0.01 | ) | | | (0.44 | ) | | | 10.72 | | | | 4.44 | | | | 116,422 | | | | 0.44 | | | | 0.44 | | | | 4.57 | | | | 22 | |
Class C | |
Period ended 02/28/14(f) | | | 11.50 | | | | 0.17 | | | | 0.08 | | | | 0.25 | | | | (0.16 | ) | | | — | | | | (0.16 | ) | | | 11.59 | | | | 2.21 | | | | 10,355 | | | | 1.38 | (d)(e) | | | 1.38 | (d)(e) | | | 2.21 | (d)(e) | | | 5 | |
Class Y | |
Year ended 02/28/14 | | | 11.90 | | | | 0.37 | | | | (0.33 | ) | | | 0.04 | | | | (0.36 | ) | | | — | | | | (0.36 | ) | | | 11.58 | | | | 0.40 | | | | 280,144 | | | | 0.37 | (d) | | | 0.37 | (d) | | | 3.22 | (d) | | | 5 | |
Year ended 02/28/13 | | | 11.81 | | | | 0.38 | | | | 0.12 | | | | 0.50 | | | | (0.41 | ) | | | — | | | | (0.41 | ) | | | 11.90 | | | | 4.32 | | | | 226,613 | | | | 0.35 | | | | 0.35 | | | | 3.21 | | | | 8 | |
Year ended 02/29/12 | | | 11.11 | | | | 0.39 | | | | 0.73 | | | | 1.12 | | | | (0.42 | ) | | | — | | | | (0.42 | ) | | | 11.81 | | | | 10.26 | | | | 263,693 | | | | 0.35 | | | | 0.35 | | | | 3.39 | | | | 11 | |
Year ended 02/28/11 | | | 11.19 | | | | 0.39 | | | | (0.14 | ) | | | 0.25 | | | | (0.33 | ) | | | — | | | | (0.33 | ) | | | 11.11 | | | | 2.26 | | | | 131,884 | | | | 0.35 | | | | 0.35 | | | | 3.45 | | | | 18 | |
Eleven months ended 02/28/10 | | | 10.72 | | | | 0.35 | | | | 0.50 | | | | 0.85 | | | | (0.38 | ) | | | — | | | | (0.38 | ) | | | 11.19 | | | | 8.05 | | | | 107,447 | | | | 0.38 | (e) | | | 0.38 | (e) | | | 3.48 | (e) | | | 8 | |
Year ended 03/31/09(f) | | | 10.42 | | | | 0.24 | | | | 0.28 | | | | 0.52 | | | | (0.21 | ) | | | (0.01 | ) | | | (0.22 | ) | | | 10.72 | | | | 5.01 | | | | 29,834 | | | | 0.45 | (e) | | | 0.45 | (e) | | | 4.56 | (e) | | | 22 | |
Class R5 | |
Year ended 02/28/14 | | | 11.90 | | | | 0.37 | | | | (0.32 | ) | | | 0.05 | | | | (0.36 | ) | | | — | | | | (0.36 | ) | | | 11.59 | | | | 0.48 | | | | 11,917 | | | | 0.36 | (d) | | | 0.36 | (d) | | | 3.23 | (d) | | | 5 | |
Year ended 02/28/13 | | | 11.80 | | | | 0.37 | | | | 0.13 | | | | 0.50 | | | | (0.40 | ) | | | — | | | | (0.40 | ) | | | 11.90 | | | | 4.35 | | | | 14,860 | | | | 0.41 | | | | 0.41 | | | | 3.15 | | | | 8 | |
Year ended 02/29/12 | | | 11.11 | | | | 0.38 | | | | 0.72 | | | | 1.10 | | | | (0.41 | ) | | | — | | | | (0.41 | ) | | | 11.80 | | | | 10.11 | | | | 20,598 | | | | 0.40 | | | | 0.40 | | | | 3.34 | | | | 11 | |
Year ended 02/28/11 | | | 11.18 | | | | 0.39 | | | | (0.13 | ) | | | 0.26 | | | | (0.33 | ) | | | — | | | | (0.33 | ) | | | 11.11 | | | | 2.36 | | | | 7,395 | | | | 0.35 | | | | 0.35 | | | | 3.45 | | | | 18 | |
Eleven months ended 02/28/10 | | | 10.70 | | | | 0.35 | | | | 0.51 | | | | 0.86 | | | | (0.38 | ) | | | — | | | | (0.38 | ) | | | 11.18 | | | | 8.14 | | | | 7,990 | | | | 0.37 | (e) | | | 0.37 | (e) | | | 3.49 | (e) | | | 8 | |
Year ended 03/31/09 | | | 10.69 | | | | 0.48 | | | | (0.03 | ) | | | 0.45 | | | | (0.43 | ) | | | (0.01 | ) | | | (0.44 | ) | | | 10.70 | | | | 4.28 | | | | 2,344 | | | | 0.50 | | | | 0.50 | | | | 4.51 | | | | 22 | |
| (a) | Calculated using average shares outstanding. |
| (b) | Includes adjustments in accordance with accounting principles generally accepted in the United States of America and as such, the net asset value for financial reporting purposes and the returns based upon those net asset values may differ from the net asset value and returns for shareholder transactions. Does not include sales charges and is not annualized for periods less than one year, if applicable. |
| (c) | Portfolio turnover is calculated at the fund level and is not annualized for periods less than one year, if applicable. |
| (d) | Ratios are based on average daily net assets (000’s omitted) of $1,066,722, $98,891, $5,101, $237,516 and $12,482 for Class A, Class A2, Class C, Class Y and Class R5 shares, respectively. |
| (f) | Commencement date of June 28, 2013 and October 3, 2008 for Class C and Class Y shares respectively. |
39 Invesco Tax-Free Intermediate Fund
Report of Independent Registered Public Accounting Firm
To the Board of Trustees of AIM Tax-Exempt Funds (Invesco Tax-Exempt Funds)
and Shareholders of Invesco Tax-Free Intermediate Fund:
In our opinion, the accompanying statement of assets and liabilities, including the schedule of investments, and the related statements of operations and of changes in net assets and the financial highlights present fairly, in all material respects, the financial position of Invesco Tax-Free Intermediate Fund (one of the funds constituting AIM Tax-Exempt Funds (Invesco Tax-Exempt Funds), hereafter referred to as the “Fund”) at February 28, 2014, the results of its operations for the year then ended, the changes in its net assets for each of the two years in the period then ended and the financial highlights for each of the periods indicated, in conformity with accounting principles generally accepted in the United States of America. These financial statements and financial highlights (hereafter referred to as “financial statements”) are the responsibility of the Fund’s management; our responsibility is to express an opinion on these financial statements based on our audits. We conducted our audits of these financial statements in accordance with the standards of the Public Company Accounting Oversight Board (United States). Those standards require that we plan and perform the audit to obtain reasonable assurance about whether the financial statements are free of material misstatement. An audit includes examining, on a test basis, evidence supporting the amounts and disclosures in the financial statements, assessing the accounting principles used and significant estimates made by management, and evaluating the overall financial statement presentation. We believe that our audits, which included confirmation of securities at February 28, 2014 by correspondence with the custodian and brokers, provide a reasonable basis for our opinion.
PRICEWATERHOUSECOOPERS LLP
April 28, 2014
Houston, Texas
40 Invesco Tax-Free Intermediate Fund
Calculating your ongoing Fund expenses
Example
As a shareholder of the Fund, you incur two types of costs: (1) transaction costs, which may include sales charges (loads) on purchase payments or contingent deferred sales charges on redemptions, if any; and (2) ongoing costs, including management fees, distribution and/or service (12b-1) fees, and other Fund expenses. This example is intended to help you understand your ongoing costs (in dollars) of investing in the Fund and to compare these costs with ongoing costs of investing in other mutual funds. The example is based on an investment of $1,000 invested at the beginning of the period and held for the entire period September 1, 2013 through February 28, 2014.
Actual expenses
The table below provides information about actual account values and actual expenses. You may use the information in this table, together with the amount you invested, to estimate the expenses that you paid over the period. Simply divide your account value by $1,000 (for example, an $8,600 account value divided by $1,000 = 8.6), then multiply the result by the number in the table under the heading entitled “Actual Expenses Paid During Period” to estimate the expenses you paid on your account during this period.
Hypothetical example for comparison purposes
The table below also provides information about hypothetical account values and hypothetical expenses based on the Fund’s actual expense ratio and an assumed rate of return of 5% per year before expenses, which is not the Fund’s actual return.
The hypothetical account values and expenses may not be used to estimate the actual ending account balance or expenses you paid for the period. You may use this information to compare the ongoing costs of investing in the Fund and other funds. To do so, compare this 5% hypothetical example with the 5% hypothetical examples that appear in the shareholder reports of the other funds.
Please note that the expenses shown in the table are meant to highlight your ongoing costs only and do not reflect any transaction costs, such as sales charges (loads) on purchase payments or contingent deferred sales charges on redemptions, if any. Therefore, the hypothetical information is useful in comparing ongoing costs only, and will not help you determine the relative total costs of owning different funds. In addition, if these transaction costs were included, your costs would have been higher.
| | | | | | | | | | | | | | | | | | | | | | | | |
| Class | | Beginning
Account Value
(09/01/13) | | | ACTUAL | | | HYPOTHETICAL (5% annual return before
expenses) | | | Annualized
Expense
Ratio | |
| | | Ending
Account Value
(02/28/14)1 | | | Expenses
Paid During
Period2 | | | Ending
Account Value
(02/28/14) | | | Expenses
Paid During
Period2 | | |
A | | $ | 1,000.00 | | | $ | 1,036.70 | | | $ | 3.23 | | | $ | 1,021.62 | | | $ | 3.21 | | | | 0.64 | % |
A2 | | | 1,000.00 | | | | 1,038.00 | | | | 1.97 | | | | 1,022.86 | | | | 1.96 | | | | 0.39 | |
C | | | 1,000.00 | | | | 1,032.80 | | | | 7.01 | | | | 1,017.90 | | | | 6.95 | | | | 1.39 | |
Y | | | 1,000.00 | | | | 1,038.00 | | | | 1.97 | | | | 1,022.86 | | | | 1.96 | | | | 0.39 | |
R5 | | | 1,000.00 | | | | 1,038.10 | | | | 1.67 | | | | 1,023.16 | | | | 1.66 | | | | 0.33 | |
| 1 | The actual ending account value is based on the actual total return of the Fund for the period September 1, 2013 through February 28, 2014, after actual expenses and will differ from the hypothetical ending account value which is based on the Fund’s expense ratio and a hypothetical annual return of 5% before expenses. |
| 2 | Expenses are equal to the Fund’s annualized expense ratio as indicated above multiplied by the average account value over the period, multiplied by 181/365 to reflect the most recent fiscal half year. |
41 Invesco Tax-Free Intermediate Fund
Tax Information
Form 1099-DIV, Form 1042-S and other year–end tax information provide shareholders with actual calendar year amounts that should be included in their tax returns. Shareholders should consult their tax advisors.
The following distribution information is being provided as required by the Internal Revenue Code or to meet a specific state’s requirement.
The Fund designates the following amounts or, if subsequently determined to be different, the maximum amount allowable for its fiscal year ended February 28, 2014:
| | | | |
Federal and State Income Tax | |
Qualified Dividend Income* | | | 0 | % |
Corporate Dividends Received Deduction* | | | 0 | % |
U.S. Treasury Obligations* | | | 0 | % |
Tax-Exempt Interest Dividends* | | | 100 | % |
| | * | The above percentages are based on ordinary income dividends paid to shareholders during the Fund’s fiscal year. |
42 Invesco Tax-Free Intermediate Fund
Trustees and Officers
The address of each trustee and officer is AIM Tax-Exempt Funds (Invesco Tax-Exempt Funds) (the “Trust”), 11 Greenway Plaza, Suite 1000, Houston, Texas 77046-1173. The trustees serve for the life of the Trust, subject to their earlier death, incapacitation, resignation, retirement or removal as more specifically provided in the Trust’s organizational documents. Each officer serves for a one year term or until their successors are elected and qualified. Column two below includes length of time served with predecessor entities, if any.
| | | | | | | | |
Name, Year of Birth and Position(s) Held with the Trust | | Trustee and/
or Officer Since | | Principal Occupation(s) During Past 5 Years | | Number of
Funds in Fund Complex Overseen by
Trustee | | Other Directorship(s)
Held by Trustee During Past 5 Years |
| Interested Persons | | | | | | | | |
| Martin L. Flanagan1 — 1960 Trustee | | 2007 | | Executive Director, Chief Executive Officer and President, Invesco Ltd. (ultimate parent of Invesco and a global investment management firm); Advisor to the Board, Invesco Advisers, Inc. (formerly known as Invesco Institutional (N.A.), Inc.); Trustee, The Invesco Funds; Vice Chair, Investment Company Institute; and Member of Executive Board, SMU Cox School of Business Formerly: Chairman and Chief Executive Officer, Invesco Advisers, Inc. (registered investment adviser); Director, Chairman, Chief Executive Officer and President, IVZ Inc. (holding company), INVESCO Group Services, Inc. (service provider) and Invesco North American Holdings, Inc. (holding company); Director, Chief Executive Officer and President, Invesco Holding Company Limited (parent of Invesco and a global investment management firm); Director, Invesco Ltd.; Chairman, Investment Company Institute and President, Co-Chief Executive Officer, Co-President, Chief Operating Officer and Chief Financial Officer, Franklin Resources, Inc. (global investment management organization). | | 123 | | None |
Philip A. Taylor2 — 1954 Trustee, President and Principal Executive Officer | | 2006 | | Head of North American Retail and Senior Managing Director, Invesco Ltd.; Director, Co-Chairman, Co-President and Co-Chief Executive Officer, Invesco Advisers, Inc. (formerly known as Invesco Institutional (N.A.), Inc.) (registered investment adviser); Director, Chairman, Chief Executive Officer and President, Invesco Management Group, Inc. (formerly known as Invesco Aim Management Group, Inc.) (financial services holding company); Director and President, INVESCO Funds Group, Inc. (registered investment adviser and registered transfer agent); Director and Chairman, Invesco Investment Services, Inc. (formerly known as Invesco Aim Investment Services, Inc.) (registered transfer agent) and IVZ Distributors, Inc. (formerly known as INVESCO Distributors, Inc.) (registered broker dealer); Director, President and Chairman, Invesco Inc. (holding company) and Invesco Canada Holdings Inc. (holding company); Chief Executive Officer, Invesco Corporate Class Inc. (corporate mutual fund company) and Invesco Canada Fund Inc. (corporate mutual fund company); Director, Chairman and Chief Executive Officer, Invesco Canada Ltd. (formerly known as Invesco Trimark Ltd./Invesco Trimark Ltèe) (registered investment adviser and registered transfer agent); Trustee, President and Principal Executive Officer, The Invesco Funds (other than AIM Treasurer’s Series Trust (Invesco Treasurer’s Series Trust) and Short-Term Investments Trust); Trustee and Executive Vice President, The Invesco Funds (AIM Treasurer’s Series Trust (Invesco Treasurer’s Series Trust) and Short-Term Investments Trust only); Director, Invesco Investment Advisers LLC (formerly known as Van Kampen Asset Management); Director, Chief Executive Officer and President, Van Kampen Exchange Corp. Formerly: Director and Chairman, Van Kampen Investor Services Inc.; Director, Chief Executive Officer and President, 1371 Preferred Inc. (holding company); and Van Kampen Investments Inc.; Director and President, AIM GP Canada Inc. (general partner for limited partnerships); and Van Kampen Advisors, Inc.; Director and Chief Executive Officer, Invesco Trimark Dealer Inc. (registered broker dealer); Director, Invesco Distributors, Inc. (formerly known as Invesco Aim Distributors, Inc.) (registered broker dealer); Manager, Invesco PowerShares Capital Management LLC; Director, Chief Executive Officer and President, Invesco Advisers, Inc.; Director, Chairman, Chief Executive Officer and President, Invesco Aim Capital Management, Inc.; President, Invesco Trimark Dealer Inc. and Invesco Trimark Ltd./Invesco Trimark Ltèe; Director and President, AIM Trimark Corporate Class Inc. and AIM Trimark Canada Fund Inc.; Senior Managing Director, Invesco Holding Company Limited; Trustee and Executive Vice President, Tax-Free Investments Trust; Director and Chairman, Fund Management Company (former registered broker dealer); President and Principal Executive Officer, The Invesco Funds (AIM Treasurer’s Series Trust (Invesco Treasurer’s Series Trust), Short-Term Investments Trust and Tax-Free Investments Trust only); President, AIM Trimark Global Fund Inc. and AIM Trimark Canada Fund Inc. | | 123 | | None |
Wayne W. Whalen3 — 1939 Trustee | | 2010 | | Of Counsel, and prior to 2010, partner in the law firm of Skadden, Arps, Slate, Meagher & Flom LLP, legal counsel to certain funds in the Fund Complex. | | 136 | | Director of the Mutual fund Directors Forum, a nonprofit membership organization for investment directors; Chairman and Director of the Abraham Lincoln Presidential Library Foundation; and Director of the Stevenson Center for Democracy |
| 1 | Mr. Flanagan is considered an interested person of the Trust because he is an officer of the adviser to the Trust, and an officer and a director of Invesco Ltd., ultimate parent of the adviser to the Trust. |
| 2 | Mr. Taylor is considered an interested person of the Trust because he is an officer and a director of the adviser to, and a director of the principal underwriter of, the Trust. |
| 3 | Mr. Whalen is considered an “interested person” (within the meaning of Section 2(a)(19) of the 1940 Act) of certain funds in the Fund Complex because his firm currently provides legal services as legal counsel to such Funds. |
T-1 Invesco Tax-Free Intermediate Fund
Trustees and Officers—(continued)
| | | | | | | | |
Name, Year of Birth and Position(s) Held with the Trust | | Trustee and/
or Officer Since | | Principal Occupation(s) During Past 5 Years | | Number of Funds in Fund Complex Overseen by
Trustee | | Other Directorship(s) Held by Trustee During Past 5 Years |
| Independent Trustees | | | | | | | | |
Bruce L. Crockett — 1944 Trustee and Chair | | 1993 | | Chairman, Crockett Technologies Associates (technology consulting company) Formerly: Director, Captaris (unified messaging provider); Director, President and Chief Executive Officer COMSAT Corporation; Chairman, Board of Governors of INTELSAT (international communications company); ACE Limited (insurance company); and Investment Company Institute | | 123 | | ALPS (Attorneys Liability Protection Society) (insurance company) |
David C. Arch — 1945 Trustee | | 2010 | | Chairman of Blistex Inc., a consumer health care products manufacturer | | 136 | | Board member of the Illinois Manufacturers’ Association; Member of the Board of Visitors, Institute for the Humanities University of Michigan; Member of the Audit Committee of the Edward-Elmhurst Hospital |
Frank S. Bayley — 1939 Trustee | | 2001 | | Retired. Formerly: Director, Badgley Funds Inc. (registered investment company) (2 portfolios) and General Partner and Of Counsel, law firm of Baker & McKenzie, LLP | | 123 | | Director and Chairman, C.D. Stimson Company (a real estate investment company); Trustee, The Curtis Institute of Music |
James T. Bunch — 1942 Trustee | | 2003 | | Managing Member, Grumman Hill Group LLC (family office private equity investments) Formerly: Founder, Green Manning & Bunch Ltd. (investment banking firm) (1988-2010); Executive Committee, United States Golf Association; and Director, Policy Studies, Inc. and Van Gilder Insurance Corporation. | | 123 | | Chairman, Board of Governors, Western Golf Association, Chairman, Evans Scholars Foundation and Director, Denver Film Society |
Rodney F. Dammeyer — 1940 Trustee | | 2010 | | Chairman of CAC, LLC, (private company offering capital investment and management advisory services) Formerly: Prior to 2001, Managing Partner at Equity Group Corporate Investments. Prior to 1995, Chief Executive Officer of Itel Corporation (formerly Anixter International). Prior to 1985, experience includes Senior Vice President and Chief Financial Officer of Household International, Inc., Executive Vice President and Chief Financial Officer of Northwest Industries, Inc. and Partner of Arthur Andersen & Co.; From 1987 to 2010, Director/Trustee of investment companies in the Van Kampen Funds complex | | 123 | | Director of Quidel Corporation and Stericycle, Inc. |
Albert R. Dowden — 1941 Trustee | | 2000 | | Director of a number of public and private business corporations, including the Boss Group, Ltd. (private investment and management); Nature’s Sunshine Products, Inc. and Reich & Tang Funds (5 portfolios) (registered investment company) Formerly: Director, Homeowners of America Holding Corporation/Homeowners of America Insurance Company (property casualty company); Director, Continental Energy Services, LLC (oil and gas pipeline service); Director, CompuDyne Corporation (provider of product and services to the public security market) and Director, Annuity and Life Re (Holdings), Ltd. (reinsurance company); Director, President and Chief Executive Officer, Volvo Group North America, Inc.; Senior Vice President, AB Volvo; Director of various public and private corporations; Chairman, DHJ Media, Inc.; Director, Magellan Insurance Company; and Director, The Hertz Corporation, Genmar Corporation (boat manufacturer), National Media Corporation; Advisory Board of Rotary Power International (designer, manufacturer, and seller of rotary power engines); and Chairman, Cortland Trust, Inc. (registered investment company) | | 123 | | Director of: Nature’s Sunshine Products, Inc., Reich & Tang Funds, Homeowners of America Holding Corporation/ Homeowners of America Insurance Company, the Boss Group |
Jack M. Fields — 1952 Trustee | | 1997 | | Chief Executive Officer, Twenty First Century Group, Inc. (government affairs company); Owner and Chief Executive Officer, Dos Angeles Ranch, L.P. (cattle, hunting, corporate entertainment); and Discovery Global Education Fund (non-profit) Formerly: Chief Executive Officer, Texana Timber LP (sustainable forestry company); Director of Cross Timbers Quail Research Ranch (non-profit); and member of the U.S. House of Representatives | | 123 | | Insperity, Inc. (formerly known as Administaff) |
Prema Mathai-Davis — 1950 Trustee | | 1998 | | Retired. Formerly: Chief Executive Officer, YWCA of the U.S.A. | | 123 | | None |
Larry Soll — 1942 Trustee | | 2003 | | Retired. Formerly: Chairman, Chief Executive Officer and President, Synergen Corp. (a biotechnology company) | | 123 | | None |
Hugo F. Sonnenschein — 1940 Trustee | | 2010 | | President Emeritus and Honorary Trustee of the University of Chicago and the Adam Smith Distinguished Service Professor in the Department of Economics at the University of Chicago. Prior to 2000, President of the University of Chicago | | 136 | | Trustee of the University of Rochester and a member of its investment committee; Member of the National Academy of Sciences and the American Philosophical Society; Fellow of the American Academy of Arts and Sciences |
T-2 Invesco Tax-Free Intermediate Fund
Trustees and Officers—(continued)
| | | | | | | | |
Name, Year of Birth and Position(s) Held with the Trust | | Trustee and/
or Officer Since | | Principal Occupation(s) During Past 5 Years | | Number of Funds in Fund Complex Overseen by
Trustee | | Other Directorship(s) Held by Trustee During Past 5 Years |
| Independent Trustees—(continued) |
Raymond Stickel, Jr. — 1944 Trustee | | 2005 | | Retired. Formerly: Director, Mainstay VP Series Funds, Inc. (25 portfolios) and Partner, Deloitte & Touche | | 123 | | None |
| Other Officers | | | | | | | | |
Russell C. Burk — 1958 Senior Vice President and Senior Officer | | 2005 | | Senior Vice President and Senior Officer, The Invesco Funds | | N/A | | N/A |
John M. Zerr — 1962 Senior Vice President, Chief Legal Officer and Secretary | | 2006 | | Director, Senior Vice President, Secretary and General Counsel, Invesco Management Group, Inc. (formerly known as Invesco Aim Management Group, Inc.) and Van Kampen Exchange Corp.; Senior Vice President, Invesco Advisers, Inc. (formerly known as Invesco Institutional (N.A.), Inc.) (registered investment adviser); Senior Vice President and Secretary, Invesco Distributors, Inc. (formerly known as Invesco Aim Distributors, Inc.); Director, Vice President and Secretary, Invesco Investment Services, Inc. (formerly known as Invesco Aim Investment Services, Inc.) and IVZ Distributors, Inc. (formerly known as INVESCO Distributors, Inc.); Director and Vice President, INVESCO Funds Group, Inc.; Senior Vice President, Chief Legal Officer and Secretary, The Invesco Funds; Manager, Invesco PowerShares Capital Management LLC; Director, Secretary and General Counsel, Invesco Investment Advisers LLC (formerly known as Van Kampen Asset Management); Secretary and General Counsel, Invesco Capital Markets, Inc. (formerly known as Van Kampen Funds Inc.) and Chief Legal Officer, PowerShares Exchange-Traded Fund Trust, PowerShares Exchange-Traded Fund Trust II, PowerShares India Exchange-Traded Fund Trust and PowerShares Actively Managed Exchange-Traded Fund Trust Formerly: Director and Vice President, Van Kampen Advisors Inc.; Director, Vice President, Secretary and General Counsel, Van Kampen Investor Services Inc.; Director, Invesco Distributors, Inc. (formerly known as Invesco Aim Distributors, Inc.); Director, Senior Vice President, General Counsel and Secretary, Invesco Aim Advisers, Inc. and Van Kampen Investments Inc.; Director, Vice President and Secretary, Fund Management Company; Director, Senior Vice President, Secretary, General Counsel and Vice President, Invesco Aim Capital Management, Inc.; Chief Operating Officer and General Counsel, Liberty Ridge Capital, Inc. (an investment adviser); Vice President and Secretary, PBHG Funds (an investment company) and PBHG Insurance Series Fund (an investment company); Chief Operating Officer, General Counsel and Secretary, Old Mutual Investment Partners (a broker-dealer); General Counsel and Secretary, Old Mutual Fund Services (an administrator) and Old Mutual Shareholder Services (a shareholder servicing center); Executive Vice President, General Counsel and Secretary, Old Mutual Capital, Inc. (an investment adviser); and Vice President and Secretary, Old Mutual Advisors Funds (an investment company) | | N/A | | N/A |
Sheri Morris — 1964 Vice President, Treasurer and Principal Financial Officer | | 1999 | | Vice President, Treasurer and Principal Financial Officer, The Invesco Funds; Vice President, Invesco Advisers, Inc. (formerly known as Invesco Institutional (N.A.), Inc.) (registered investment adviser); and Vice President, PowerShares Exchange-Traded Fund Trust, PowerShares Exchange-Traded Fund Trust II, PowerShares India Exchange-Traded Fund Trust and PowerShares Actively Managed Exchange-Traded Fund Trust Formerly: Vice President, Invesco Aim Advisers, Inc., Invesco Aim Capital Management, Inc. and Invesco Aim Private Asset Management, Inc.; Assistant Vice President and Assistant Treasurer, The Invesco Funds and Assistant Vice President, Invesco Advisers, Inc., Invesco Aim Capital Management, Inc. and Invesco Aim Private Asset Management, Inc.; and Treasurer, PowerShares Exchange-Traded Fund Trust, PowerShares Exchange-Traded Fund Trust II, PowerShares India Exchange-Traded Fund Trust and PowerShares Actively Managed Exchange-Traded Fund Trust | | N/A | | N/A |
T-3 Invesco Tax-Free Intermediate Fund
Trustees and Officers—(continued)
| | | | | | | | |
Name, Year of Birth and Position(s) Held with the Trust | | Trustee and/
or Officer Since | | Principal Occupation(s) During Past 5 Years | | Number of Funds in Fund Complex Overseen by
Trustee | | Other Directorship(s) Held by Trustee During Past 5 Years |
| Other Officers—(continued) | | | | | | | | |
Karen Dunn Kelley — 1960 Vice President | | 1993 | | Senior Managing Director, Investments; Director, Co-President, Co-Chief Executive Officer, and Co-Chairman, Invesco Advisers, Inc. (formerly known as Invesco Institutional (N.A.), Inc.) (registered investment adviser); Chairman, Invesco Senior Secured Management, Inc.; Senior Vice President, Invesco Management Group, Inc. (formerly known as Invesco Aim Management Group, Inc.); Executive Vice President, Invesco Distributors, Inc. (formerly known as Invesco Aim Distributors, Inc.); Director, Invesco Mortgage Capital Inc. and Invesco Management Company Limited; Director and President, INVESCO Asset Management (Bermuda) Ltd., Vice President, The Invesco Funds (other than AIM Treasurer’s Series Trust (Invesco Treasurer’s Series Trust) and Short-Term Investments Trust); and President and Principal Executive Officer, The Invesco Funds (AIM Treasurer’s Series Trust (Invesco Treasurer’s Series Trust) and Short-Term Investments Trust only) Formerly: Director, INVESCO Global Asset Management Limited and INVESCO Management S.A.; Senior Vice President, Van Kampen Investments Inc. and Invesco Advisers, Inc. (formerly known as Invesco Institutional (N.A.), Inc.) (registered investment adviser); Vice President, Invesco Advisers, Inc. (formerly known as Invesco Institutional (N.A.), Inc.); Director of Cash Management and Senior Vice President, Invesco Advisers, Inc. and Invesco Aim Capital Management, Inc.; President and Principal Executive Officer, Tax-Free Investments Trust; Director and President, Fund Management Company; Chief Cash Management Officer, Director of Cash Management, Senior Vice President, and Managing Director, Invesco Aim Capital Management, Inc.; Director of Cash Management, Senior Vice President, and Vice President, Invesco Advisers, Inc. and The Invesco Funds (AIM Treasurer’s Series Trust (Invesco Treasurer’s Series Trust), Short-Term Investments Trust and Tax-Free Investments Trust only) | | N/A | | N/A |
Crissie M. Wisdom — 1969 Anti-Money Laundering Compliance Officer | | 2013 | | Anti-Money Laundering Compliance Officer, Invesco Advisers, Inc. (formerly known as Invesco Institutional (N.A.), Inc.) (registered investment adviser), Invesco Capital Markets, Inc. (formerly known as Van Kampen Funds Inc.), Invesco Distributors, Inc., Invesco Investment Services, Inc., Invesco Management Group, Inc., Van Kampen Exchange Corp., The Invesco Funds, Invesco Funds (Chicago), and PowerShares Exchange-Traded Fund Trust, PowerShares Exchange-Traded Fund Trust II, PowerShares India Exchange-Traded Fund Trust, and PowerShares Actively Managed Exchange-Traded Fund Trust; and Fraud Prevention Manager and Controls and Risk Analysis Manager for Invesco Investment Services, Inc. | | N/A | | N/A |
Todd L. Spillane — 1958 Chief Compliance Officer | | 2006 | | Senior Vice President, Invesco Management Group, Inc. (formerly known as Invesco Aim Management Group, Inc.) and Van Kampen Exchange Corp.; Senior Vice President and Chief Compliance Officer, Invesco Advisers, Inc. (registered investment adviser) (formerly known as Invesco Institutional (N.A.), Inc.); Chief Compliance Officer, The Invesco Funds; Vice President, Invesco Distributors, Inc. (formerly known as Invesco Aim Distributors, Inc.) and Invesco Investment Services, Inc. (formerly known as Invesco Aim Investment Services, Inc.) Formerly: Chief Compliance Officer, Invesco Funds (Chicago); Senior Vice President, Van Kampen Investments Inc.; Senior Vice President and Chief Compliance Officer, Invesco Aim Advisers, Inc. and Invesco Aim Capital Management, Inc.; Chief Compliance Officer, INVESCO Private Capital Investments, Inc. (holding company), Invesco Private Capital, Inc. (registered investment adviser), Invesco Global Asset Management (N.A.), Inc., Invesco Senior Secured Management, Inc. (registered investment adviser), Van Kampen Investor Services Inc., PowerShares Exchange-Traded Fund Trust, PowerShares Exchange-Traded Fund Trust II, PowerShares India Exchange-Traded Fund Trust and PowerShares Actively Managed Exchange-Traded Fund Trust; and Vice President, Invesco Aim Capital Management, Inc. and Fund Management Company | | N/A | | N/A |
The Statement of Additional Information of the Trust includes additional information about the Fund’s Trustees and is available upon request, without charge, by calling 1.800.959.4246. Please refer to the Fund’s prospectus for information on the Fund’s sub-advisers.
| | | | | | |
Office of the Fund 11 Greenway Plaza, Suite 1000 Houston, TX 77046-1173 | | Investment Adviser Invesco Advisers, Inc. 1555 Peachtree Street, N.E. Atlanta, GA 30309 | | Distributor Invesco Distributors, Inc. 11 Greenway Plaza, Suite 1000 Houston, TX 77046-1173 | | Auditors PricewaterhouseCoopers LLP 1201 Louisiana Street, Suite 2900 Houston, TX 77002-5678 |
| | | |
| | | | | | |
Counsel to the Fund Stradley Ronon Stevens & Young, LLP 2005 Market Street, Suite 2600 Philadelphia, PA 19103-7018 | | Counsel to the Independent Trustees Goodwin Procter LLP 901 New York Avenue, N.W. Washington, D.C. 20001 | | Transfer Agent Invesco Investment Services, Inc. 11 Greenway Plaza, Suite 1000 Houston, TX 77046-1173 | | Custodian Bank of New York Mellon 2 Hanson Place Brooklyn, NY 11217-1431 |
T-4 Invesco Tax-Free Intermediate Fund

Invesco mailing information
Send general correspondence to Invesco Investment Services, Inc., P.O. Box 219078, Kansas City, MO 64121-9078.
Important notice regarding delivery of security holder documents
To reduce Fund expenses, only one copy of most shareholder documents may be mailed to shareholders with multiple accounts at the same address (Householding). Mailing of your shareholder documents may be householded indefinitely unless you instruct us otherwise. If you do not want the mailing of these documents to be combined with those for other members of your household, please contact Invesco Investment Services, Inc. at 800 959 4246 or contact your financial institution. We will begin sending you individual copies for each account within 30 days after receiving your request.
Fund holdings and proxy voting information
The Fund provides a complete list of its holdings four times in each fiscal year, at the quarter ends. For the second and fourth quarters, the lists appear in the Fund’s semiannual and annual reports to shareholders. For the first and third quarters, the Fund files the lists with the Securities and Exchange Commission (SEC) on Form N-Q. The most recent list of portfolio holdings is available at invesco.com/completeqtrholdings. Shareholders can also look up the Fund’s
Forms N-Q on the SEC website at sec.gov. Copies of the Fund’s Forms N-Q may be reviewed and copied at the SEC Public Reference Room in Washington, D.C. You can obtain information on the operation of the Public Reference Room, including information about duplicating fee charges, by calling 202 551 8090 or 800 732 0330, or by electronic request at the following email address: publicinfo@sec.gov. The SEC file numbers for the Fund are shown below.
A description of the policies and procedures that the Fund uses to determine how to vote proxies relating to portfolio securities is available without charge, upon request, from our Client Services department at 800 959 4246 or at invesco.com/proxyguidelines. The information is also available on the SEC website, sec.gov.
| | |
Information regarding how the Fund voted proxies related to its portfolio securities during the most recent 12-month period ended June 30 is available at invesco.com/proxysearch. The information is also available on the SEC website, sec.gov. Invesco Advisers, Inc. is an investment adviser; it provides investment advisory services to individual and institutional clients and does not sell securities. Invesco Distributors, Inc. is the US distributor for Invesco Ltd.’s retail mutual funds, exchange-traded funds and institutional money market funds. Both are wholly owned, indirect subsidiaries of Invesco Ltd. | |  |
| | | | |
| SEC file numbers: 811-07890 and 033-66242 | | TFI-AR-1 | | Invesco Distributors, Inc. |
There were no amendments to the Code of Ethics (the “Code”) that applies to the Registrant’s Principal Executive Officer (“PEO”) and Principal Financial Officer (“PFO”) during the period covered by the report. The Registrant did not grant any waivers, including implicit waivers, from any provisions of the Code to the PEO or PFO during the period covered by this report.
| ITEM 3. | AUDIT COMMITTEE FINANCIAL EXPERT. |
The Board of Trustees has determined that the Registrant has at least one audit committee financial expert serving on its Audit Committee. The Audit Committee financial expert is Raymond Stickel, Jr. Mr. Stickel is “independent” within the meaning of that term as used in Form N-CSR.
| ITEM 4. | PRINCIPAL ACCOUNTANT FEES AND SERVICES. |
(a) to (d)
Fees Billed by PWC Related to the Registrant
PWC billed the Registrant aggregate fees for services rendered to the Registrant for the last two fiscal years as follows:
| | | | | | | | | | | | | | | | |
| | | Fees Billed for
Services Rendered to
the Registrant for
fiscal year end 2014 | | | (e)(2)
Percentage of Fees
Billed Applicable to
Non-Audit Services
Provided for fiscal
year end 2014
Pursuant to Waiver of
Pre-Approval
Requirement(1) | | | Fees Billed for
Services Rendered to
the Registrant for
fiscal year end 2013 | | | (e)(2)
Percentage of Fees
Billed Applicable to
Non-Audit Services
Provided for fiscal
year end 2013
Pursuant to Waiver of
Pre-Approval
Requirement(1) | |
Audit Fees | | $ | 203,350 | | | | N/A | | | $ | 226,850 | | | | N/A | |
Audit-Related Fees(2) | | $ | 6,500 | | | | 0 | % | | $ | 6,000 | | | | 0 | % |
Tax Fees(3) | | $ | 63,770 | | | | 0 | % | | $ | 31,550 | | | | 0 | % |
All Other Fees | | $ | 0 | | | | 0 | % | | $ | 0 | | | | 0 | % |
| | | | | | | | | | | | | | | | |
Total Fees | | $ | 273,620 | | | | 0 | % | | $ | 264,400 | | | | 0 | % |
(g) PWC billed the Registrant aggregate non-audit fees of $70,270 for the fiscal year ended 2014, and $37,550 for the fiscal year ended 2013, for non-audit services rendered to the Registrant.
| (1) | With respect to the provision of non-audit services, the pre-approval requirement is waived pursuant to a de minimis exception if (i) such services were not recognized as non-audit services by the Registrant at the time of engagement, (ii) the aggregate amount of all such services provided is no more than 5% of the aggregate audit and non-audit fees paid by the Registrant to PWC during a fiscal year; and (iii) such services are promptly brought to the attention of the Registrant’s Audit Committee and approved by the Registrant’s Audit Committee prior to the completion of the audit. |
| (2) | Audit-Related fees for the fiscal year end February 28, 2014 includes fees billed for agreed upon procedures related to fund mergers. Audit-Related fees for the fiscal year end February 28, 2013 includes fees billed for agreed upon procedures related to fund mergers. |
| (3) | Tax fees for the fiscal year end February 28, 2014 includes fees billed for reviewing tax returns and consultation services. Tax fees for fiscal year end February 28, 2013 includes fees billed for reviewing tax returns. |
Fees Billed by PWC Related to Invesco and Invesco Affiliates
PWC billed Invesco Advisers, Inc. (“Invesco”), the Registrant’s adviser, and any entity controlling, controlled by or under common control with Invesco that provides ongoing services to the Registrant (“Invesco Affiliates”) aggregate fees for pre-approved non-audit services rendered to Invesco and Invesco Affiliates for the last two fiscal years as follows:
| | | | | | | | | | | | | | | | |
| | | Fees Billed for Non-
Audit Services
Rendered to Invesco
and Invesco Affiliates
for fiscal year end
2014 That Were
Required
to be Pre-Approved
by the Registrant’s
Audit Committee | | | (e)(2)
Percentage of Fees
Billed Applicable to
Non-Audit Services
Provided for fiscal year
end 2014 Pursuant to
Waiver of Pre-
Approval
Requirement(1) | | | Fees Billed for Non-
Audit Services
Rendered to Invesco
and Invesco Affiliates
for fiscal year end
2013 That Were
Required
to be Pre-Approved
by the Registrant’s
Audit Committee | | | (e)(2)
Percentage of Fees
Billed Applicable to
Non-Audit Services
Provided for fiscal year
end 2013 Pursuant to
Waiver of Pre-
Approval
Requirement(1) | |
Audit-Related Fees | | $ | 574,000 | | | | 0 | % | | $ | 0 | | | | 0 | % |
Tax Fees | | $ | 0 | | | | 0 | % | | $ | 0 | | | | 0 | % |
All Other Fees | | $ | 0 | | | | 0 | % | | $ | 0 | | | | 0 | % |
| | | | | | | | | | | | | | | | |
Total Fees(2) | | $ | 574,000 | | | | 0 | % | | $ | 0 | | | | 0 | % |
| (1) | With respect to the provision of non-audit services, the pre-approval requirement is waived pursuant to a de minimis exception if (i) such services were not recognized as non-audit services by the Registrant at the time of engagement, (ii) the aggregate amount of all such services provided is no more than 5% of the aggregate audit and non-audit fees paid by the Registrant, Invesco and Invesco Affiliates to PWC during a fiscal year; and (iii) such services are promptly brought to the attention of the Registrant’s Audit Committee and approved by the Registrant’s Audit Committee prior to the completion of the audit. |
| (2) | Audit-Related fees for the year end 2014 include fees billed related to reviewing controls at a service organization. |
(g) Including the fees for services not required to be pre-approved by the registrant’s audit committee, PWC billed Invesco and Invesco Affiliates aggregate non-audit fees of $1,645,309 for the fiscal year ended 2014, and $0 for the fiscal year ended 2013, for non-audit services rendered to Invesco and Invesco Affiliates.
(h) The Audit Committee also has considered whether the provision of non-audit services that were rendered to Invesco and Invesco Affiliates that were not required to be pre-approved pursuant to SEC regulations, if any, is compatible with maintaining PWC’s independence.
(f) Not applicable.
(e)(1)
PRE-APPROVAL OF AUDIT AND NON-AUDIT SERVICES
POLICIES AND PROCEDURES
As adopted by the Audit Committees of
the Invesco Funds (the “Funds”)
Last Amended May 4, 2010
Statement of Principles
Under the Sarbanes-Oxley Act of 2002 and rules adopted by the Securities and Exchange Commission (“SEC”) (“Rules”), the Audit Committees of the Funds’ (the “Audit Committees”) Board of Trustees (the “Board”) are responsible for the appointment, compensation and oversight of the work of independent accountants (an “Auditor”). As part of this responsibility and to assure that the Auditor’s independence is not impaired, the Audit Committees pre-approve the audit and non-audit services provided to the Funds by each Auditor, as well as all non-audit services provided by the Auditor to the Funds’ investment adviser and to affiliates of the adviser that provide ongoing services to the Funds (“Service Affiliates”) if the services directly impact the Funds’ operations or financial reporting. The SEC Rules also specify the types of services that an Auditor may not provide to its audit client. The following policies and procedures comply with the requirements for pre-approval and provide a mechanism by which management of the Funds may request and secure pre-approval of audit and non-audit services in an orderly manner with minimal disruption to normal business operations.
Proposed services either may be pre-approved without consideration of specific case-by-case services by the Audit Committees (“general pre-approval”) or require the specific pre-approval of the Audit Committees (“specific pre-approval”). As set forth in these policies and procedures, unless a type of service has received general pre-approval, it will require specific pre-approval by the Audit Committees. Additionally, any fees exceeding 110% of estimated pre-approved fee levels provided at the time the service was pre-approved will also require specific approval by the Audit Committees before payment is made. The Audit Committees will also consider the impact of additional fees on the Auditor’s independence when determining whether to approve any additional fees for previously pre-approved services.
The Audit Committees will annually review and generally pre-approve the services that may be provided by each Auditor without obtaining specific pre-approval from the Audit Committee generally on an annual basis. The term of any general pre-approval runs from the date of such pre-approval through September 30th of the following year, unless the Audit Committees consider a different period and state otherwise. The Audit Committees will add to or subtract from the list of general pre-approved services from time to time, based on subsequent determinations.
The purpose of these policies and procedures is to set forth the guidelines to assist the Audit Committees in fulfilling their responsibilities.
Delegation
The Audit Committees may from time to time delegate pre-approval authority to one or more of its members who are Independent Trustees. All decisions to pre-approve a service by a delegated member shall be reported to the Audit Committees at the next quarterly meeting.
Audit Services
The annual audit services engagement terms will be subject to specific pre-approval of the Audit Committees. Audit services include the annual financial statement audit and other procedures such as tax provision work that is required to be performed by the independent auditor to be able to form an opinion on the Funds’ financial statements. The Audit Committees will obtain, review and consider sufficient information concerning the proposed Auditor to make a reasonable evaluation of the Auditor’s qualifications and independence.
In addition to the annual Audit services engagement, the Audit Committees may grant either general or specific pre-approval of other audit services, which are those services that only the independent auditor reasonably can provide. Other Audit services may include services such as issuing consents for the inclusion of audited financial statements with SEC registration statements, periodic reports and other documents filed with the SEC or other documents issued in connection with securities offerings.
Non-Audit Services
The Audit Committees may provide either general or specific pre-approval of any non-audit services to the Funds and its Service Affiliates if the Audit Committees believe that the provision of the service will not impair the independence of the Auditor, is consistent with the SEC’s Rules on auditor independence, and otherwise conforms to the Audit Committees’ general principles and policies as set forth herein.
Audit-Related Services
“Audit-related services” are assurance and related services that are reasonably related to the performance of the audit or review of the Fund’s financial statements or that are traditionally performed by the independent auditor. Audit-related services include, among others, accounting consultations related to accounting, financial reporting or disclosure matters not classified as “Audit services”; assistance with understanding and implementing new accounting and financial reporting guidance from rulemaking authorities; and agreed-upon procedures related to mergers, compliance with ratings agency requirements and interfund lending activities.
Tax Services
“Tax services” include, but are not limited to, the review and signing of the Funds’ federal tax returns, the review of required distributions by the Funds and consultations regarding tax matters such as the tax treatment of new investments or the impact of new regulations. The Audit Committees will scrutinize carefully the retention of the Auditor in connection with a transaction initially recommended by the Auditor, the major business purpose of which may be tax avoidance or the tax treatment of which may not be supported in the Internal Revenue Code and related regulations. The Audit Committees will consult with the Funds’ Treasurer (or his or her designee) and may consult with outside counsel or advisors as necessary to ensure the consistency of Tax services rendered by the Auditor with the foregoing policy.
No Auditor shall represent any Fund or any Service Affiliate before a tax court, district court or federal court of claims.
Under rules adopted by the Public Company Accounting Oversight Board and approved by the SEC, in connection with seeking Audit Committees’ pre-approval of permissible Tax services, the Auditor shall:
| | 1. | Describe in writing to the Audit Committees, which writing may be in the form of the proposed engagement letter: |
| | a. | The scope of the service, the fee structure for the engagement, and any side letter or amendment to the engagement letter, or any other agreement between the Auditor and the Fund, relating to the service; and |
| | b. | Any compensation arrangement or other agreement, such as a referral agreement, a referral fee or fee-sharing arrangement, between the Auditor and any person (other than the Fund) with respect to the promoting, marketing, or recommending of a transaction covered by the service; |
| | 2. | Discuss with the Audit Committees the potential effects of the services on the independence of the Auditor; and |
| | 3. | Document the substance of its discussion with the Audit Committees. |
All Other Auditor Services
The Audit Committees may pre-approve non-audit services classified as “All other services” that are not categorically prohibited by the SEC, as listed in Exhibit 1 to this policy.
Pre-Approval Fee Levels or Established Amounts
Pre-approval of estimated fees or established amounts for services to be provided by the Auditor under general or specific pre-approval policies will be set periodically by the Audit Committees. Any proposed fees exceeding 110% of the maximum estimated pre-approved fees or established amounts for pre-approved audit and non-audit services will be reported to the Audit Committees at the quarterly Audit Committees meeting and will require specific approval by the Audit Committees before payment is made. The Audit Committees will always factor in the overall relationship of fees for audit and non-audit services in determining whether to pre-approve any such services and in determining whether to approve any additional fees exceeding 110% of the maximum pre-approved fees or established amounts for previously pre-approved services.
Procedures
Generally on an annual basis, Invesco Advisers, Inc. (“Invesco”) will submit to the Audit Committees for general pre-approval, a list of non-audit services that the Funds or Service Affiliates of the Funds may request from the Auditor. The list will describe the non-audit services in reasonable detail and will include an estimated range of fees and such other information as the Audit Committee may request.
Each request for services to be provided by the Auditor under the general pre-approval of the Audit Committees will be submitted to the Funds’ Treasurer (or his or her designee) and must include a detailed description of the services to be rendered. The Treasurer or his or her designee will ensure that such services are included within the list of services that have received the general pre-approval of the Audit Committees. The Audit Committees will be informed at the next quarterly scheduled Audit Committees meeting of any such services for which the Auditor rendered an invoice and whether such services and fees had been pre-approved and if so, by what means.
Each request to provide services that require specific approval by the Audit Committees shall be submitted to the Audit Committees jointly by the Fund’s Treasurer or his or her designee and the Auditor, and must include a joint statement that, in their view, such request is consistent with the policies and procedures and the SEC Rules.
Each request to provide tax services under either the general or specific pre-approval of the Audit Committees will describe in writing: (i) the scope of the service, the fee structure for the engagement, and any side letter or amendment to the engagement letter, or any other agreement between the Auditor and the audit client, relating to the service; and (ii) any compensation arrangement or other agreement between the Auditor and any person (other than the audit client) with respect to the promoting, marketing, or recommending of a transaction covered by the service. The Auditor will discuss with the Audit Committees the potential effects of the services on the Auditor’s independence and will document the substance of the discussion.
Non-audit services pursuant to the de minimis exception provided by the SEC Rules will be promptly brought to the attention of the Audit Committees for approval, including documentation that each of the conditions for this exception, as set forth in the SEC Rules, has been satisfied.
On at least an annual basis, the Auditor will prepare a summary of all the services provided to any entity in the investment company complex as defined in section 2-01(f)(14) of Regulation S-X in sufficient detail as to the nature of the engagement and the fees associated with those services.
The Audit Committees have designated the Funds’ Treasurer to monitor the performance of all services provided by the Auditor and to ensure such services are in compliance with these policies and procedures. The Funds’ Treasurer will report to the Audit Committees on a periodic basis as to the results of such monitoring. Both the Funds’ Treasurer and management of Invesco will immediately report to the chairman of the Audit Committees any breach of these policies and procedures that comes to the attention of the Funds’ Treasurer or senior management of Invesco.
Exhibit 1 to Pre-Approval of Audit and Non-Audit Services Policies and Procedures
Conditionally Prohibited Non-Audit Services (not prohibited if the Fund can reasonably conclude that the results of the service would not be subject to audit procedures in connection with the audit of the Fund’s financial statements)
| | • | | Bookkeeping or other services related to the accounting records or financial statements of the audit client |
| | • | | Financial information systems design and implementation |
| | • | | Appraisal or valuation services, fairness opinions, or contribution-in-kind reports |
| | • | | Internal audit outsourcing services |
Categorically Prohibited Non-Audit Services
| | • | | Broker-dealer, investment adviser, or investment banking services |
| | • | | Expert services unrelated to the audit |
| | • | | Any service or product provided for a contingent fee or a commission |
| | • | | Services related to marketing, planning, or opining in favor of the tax treatment of confidential transactions or aggressive tax position transactions, a significant purpose of which is tax avoidance |
| | • | | Tax services for persons in financial reporting oversight roles at the Fund |
| | • | | Any other service that the Public Company Oversight Board determines by regulation is impermissible. |
| ITEM 5. | AUDIT COMMITTEE OF LISTED REGISTRANTS. |
Not applicable.
| ITEM 6. | SCHEDULE OF INVESTMENTS. |
Investments in securities of unaffiliated issuers is included as part of the reports to stockholders filed under Item 1 of this Form.
| ITEM 7. | DISCLOSURE OF PROXY VOTING POLICIES AND PROCEDURES FOR CLOSED-END MANAGEMENT INVESTMENT COMPANIES. |
Not applicable.
| ITEM 8. | PORTFOLIO MANAGERS OF CLOSED-END MANAGEMENT COMPANIES. |
Not applicable.
| ITEM 9. | PURCHASES OF EQUITY SECURITIES BY CLOSED-END MANAGEMENT INVESTMENT COMPANY AND AFFILIATED PURCHASERS. |
Not applicable.
| ITEM 10. | SUBMISSION OF MATTERS TO A VOTE OF SECURITY HOLDERS. |
None
| ITEM 11. | CONTROLS AND PROCEDURES. |
| (a) | As of February 12, 2014, an evaluation was performed under the supervision and with the participation of the officers of the Registrant, including the PEO and PFO, to assess the effectiveness of the Registrant’s disclosure controls and procedures, as that term is defined in Rule 30a-3(c) under the Investment Company Act of 1940 (the “Act”), as amended. Based on that evaluation, the Registrant’s officers, including the PEO and PFO, concluded that, as of February 12, 2014, the Registrant’s disclosure controls and procedures were reasonably designed to ensure: (1) that information required to be disclosed by the Registrant on Form N-CSR is recorded, processed, summarized and reported within the time periods specified by the rules and forms of the Securities and Exchange Commission; and (2) that material information relating to the Registrant is made known to the PEO and PFO as appropriate to allow timely decisions regarding required disclosure. |
| (b) | There have been no changes in the Registrant’s internal control over financial reporting (as defined in Rule 30a-3(d) under the Act) that occurred during the second fiscal quarter of the period covered by this report that have materially affected, or are reasonably likely to materially affect, the Registrant’s internal control over financial reporting. |
| 12(a) (2) | Certifications of principal executive officer and principal financial officer as required by Rule 30a-2(a) under the Investment Company Act of 1940. |
| 12(b) | Certifications of principal executive officer and principal financial officer as required by Rule 30a-2(b) under the Investment Company Act of 1940. |
SIGNATURES
Pursuant to the requirements of the Securities Exchange Act of 1934 and the Investment Company Act of 1940, the Registrant has duly caused this report to be signed on its behalf by the undersigned, thereunto duly authorized.
Registrant: AIM Tax-Exempt Funds (Invesco Tax-Exempt Funds)
| | |
| By: | | /s/ PHILIP A. TAYLOR |
| | Philip A. Taylor |
| | Principal Executive Officer |
Date: May 9, 2014
Pursuant to the requirements of the Securities and Exchange Act of 1934 and the Investment Company Act of 1940, this report has been signed below by the following persons on behalf of the Registrant and in the capacities and on the dates indicated.
| | |
| By: | | /s/ PHILIP A. TAYLOR |
| | Philip A. Taylor |
| | Principal Executive Officer |
Date: May 9, 2014
| | |
| By: | | /s/ Sheri Morris |
| | Sheri Morris |
| | Principal Financial Officer |
Date: May 9, 2014
EXHIBIT INDEX
| | |
| 12(a) (1) | | Code of Ethics. |
| |
| 12(a) (2) | | Certifications of principal executive officer and principal financial officer as required by Rule 30a-2(a) under the Investment Company Act of 1940. |
| |
| 12(a) (3) | | Not applicable. |
| |
| 12(b) | | Certifications of principal executive officer and principal financial officer as required by Rule 30a-2(b) under the Investment Company Act of 1940. |