UNITED STATES
SECURITIES AND EXCHANGE COMMISSION
Washington, D.C. 20549
FORMN-CSR
CERTIFIED SHAREHOLDER REPORT OF REGISTERED
MANAGEMENT INVESTMENT COMPANIES
Investment Company Act file number811-07890
AIMTax-Exempt Funds (InvescoTax-Exempt Funds)
(Exact name of registrant as specified in charter)
11 Greenway Plaza, Suite 1000 Houston, Texas 77046
(Address of principal executive offices) (Zip code)
Sheri Morris 11 Greenway Plaza, Suite 1000 Houston, Texas 77046
(Name and address of agent for service)
Registrant’s telephone number, including area code: (713)626-1919
Date of fiscal year end: 2/28
Date of reporting period: 2/28/19
Item 1. Report to Stockholders.
| | | | | | |
| | | |
 | | Annual Report to Shareholders | | | February 28, 2019 | |
| | | |
| | InvescoHighYieldMunicipalFund Nasdaq: A: ACTHX ∎ C: ACTFX ∎ Y: ACTDX ∎ R5: ACTNX ∎ R6: ACTSX | |

Letters to Shareholders

Dear Shareholders:
This annual report includes information about your Fund, including performance data and a complete list of its investments as of the close of the reporting period. Inside is a discussion of how your Fund was managed and the factors that affected its performance during the reporting period.
Philip Taylor, whose messages to shareholders have appeared here for the last 13 years, transitioned to a senior advisory role on March 1, prior to his retirement from the firm at the end of the year, and I assumed his role as Head of the Americas and Senior Managing Director, Invesco Ltd. All of us at Invesco are indebted to Phil for his many years of dedicated service to the company and to its funds’ shareholders. I’m excited about this new opportunity, and I look forward to communicating with fund shareholders going forward.
The reporting period proved to be an increasingly volatile time for markets. Amid corporate tax cuts and improving global growth, several US equity indexes redefined highs during the first half of the reporting period. The ebullience, however, ended in October as global equities, in particular US stocks, sold off sharply and continued this downward spiral for the rest of 2018. The catalyst for thesell-off was a combination of ongoing trade conflicts between the US and China, fears of a global economic slowdown and rising US interest rates. Gains posted earlier in the year for global equities were erased, while US Treasury bonds, along with government and municipal bonds, rallied. The reporting period ended on a positive note, however, as global equities bounced back strongly at the outset of 2019, mitigating some of the losses from thesell-off in late 2018. Given the strong economy during the reporting period, the US Federal Reserve (the Fed) raised the federal funds rate four times. At its December 2018 meeting, however, the Fed delivered a more “dovish hike” by simultaneously raising rates while reducing guidance for 2019 rate increases. At its first meeting in 2019, the Fed left rates unchanged. As 2019 unfolds, we’ll see how the interplay of interest rates, economic data, geopolitics and a host of other factors affect US and over-seas equity and fixed income markets.
Investor uncertainty and market volatility, such as we witnessed during the reporting period, are unfortunate facts of life when it comes to investing. That’s why Invesco encourages investors to work with a professional financial adviser who can stress the importance of starting to save and invest early and the importance of adhering to a disciplined investment plan. A financial adviser who knows your unique financial situation, investment goals and risk tolerance can be an invaluable partner as you seek to achieve your financial goals. He or she can offer a long-term perspective when markets are volatile and time-tested advice and guidance when your financial situation or investment goals change.
Visit our website for more information on your investments
Our website,invesco.com/us, offers a wide range of market insights and investment perspectives. On the website, you’ll find detailed information about our funds, including performance, holdings and portfolio manager commentaries. You can access information about your account by completing a simple, secure online registration. To do so, select “Log In” on the right side of the homepage, and then select “Register for Individual Account Access.”
In addition to the resources accessible on our website and through our mobile app, you can obtain timely updates to help you stay informed about the markets and the economy by connecting with Invesco on Twitter, LinkedIn or Facebook. You can access our blog atblog.invesco.us.com. Our goal is to provide you the information you want, when and where you want it.
Finally, I’m pleased to share with you Invesco’s commitment to both the Principles for Responsible Investment and to considering environmental, social and governance issues in our robust investment process. I invite you to learn more atinvesco.com/esg.
Have questions?
For questions about your account, contact an Invesco client services representative at 800 959 4246.
All of us at Invesco look forward to serving your investment management needs. Thank you for investing with us.
Sincerely,

Andrew Schlossberg
Head of the Americas,
Senior Managing Director, Invesco Ltd.
| | |
| 2 | | Invesco High Yield Municipal Fund |
| | |

| | Dear Fellow Shareholders: Among the many important lessons I’ve learned in more than 40 years in a variety of business endeavors is the value of a trusted advocate. As independent chair of the Invesco Funds Board, I can assure you that the members of the Board are strong advocates for the interests of investors in Invesco’s mutual funds. We work hard to represent your interests through oversight of the quality of the investment management services your funds receive and other matters important to your investment, including but not limited to: ∎ Ensuring that Invesco offers a diverse lineup of mutual funds that your financial adviser can use to strive to meet your financial needs as your investment goals change over time. ∎ Monitoring how the portfolio management teams of the Invesco funds are performing in light of changing economic and market conditions. |
∎ Assessing each portfolio management team’s investment performance within the context of the investment strategy described in the fund’s prospectus.
∎ Monitoring for potential conflicts of interests that may impact the nature of the services that your funds receive.
We believe one of the most important services we provide our fund shareholders is the annual review of the funds’ advisory andsub-advisory contracts with Invesco Advisers and its affiliates. This review is required by the Investment Company Act of 1940 and focuses on the nature and quality of the services Invesco provides as the adviser to the Invesco funds and the reasonableness of the fees that it charges for those services. Each year, we spend months carefully reviewing information received from Invesco and a variety of independent sources, such as performance and fee data prepared by Lipper, Inc. (a subsidiary of Broadridge Financial Solutions, Inc.), an independent, third-party firm widely recognized as a leader in its field. We also meet with our independent legal counsel and other independent advisers to review and help us assess the information that we have received. Our goal is to assure that you receive quality investment management services for a reasonable fee.
I trust the measures outlined above provide assurance that you have a worthy advocate when it comes to choosing the Invesco Funds. On behalf of the Board, we look forward to continuing to represent your interests and serving your needs.
Sincerely,

Bruce L. Crockett
Independent Chair
Invesco Funds Board of Trustees
|
| 3 Invesco High Yield Municipal Fund |
Management’s Discussion of Fund Performance
| | |
Performance summary | | |
For the fiscal year ended February 28, 2019, Class A shares of Invesco High Yield Municipal Fund (the Fund), at net asset value (NAV), underperformed the Custom Invesco High Yield Municipal Index, the Fund’s style-specific benchmark. Your Fund’s long-term performance appears later in this report. |
Fund vs. Indexes |
Total returns, 2/28/18 to 2/28/19, at net asset value (NAV). Performance shown does not include applicable contingent deferred sales charges (CDSC) orfront-end sales charges, which would have reduced performance. |
Class A Shares | | 4.17% |
Class C Shares | | 3.52 |
Class Y Shares | | 4.54 |
Class R5 Shares | | 4.51 |
Class R6 Shares | | 4.59 |
S&P Municipal Bond High Yield Indexq(Broad Market Index) | | 6.76 |
Custom Invesco High Yield Municipal Index⬛(Style-Specific Index) | | 6.17 |
Lipper High Yield Municipal Debt Funds Index◆(Peer Group Index) | | 4.44 |
Source(s):qRIMES Technologies Corp.;⬛Invesco, RIMES Technologies Corp.;◆Lipper Inc. | | |
Market conditions and your Fund
The broad municipal bond market experienced positive returns for the fifth consecutive year in 2018. During the fiscal year, investment grade municipals returned 4.13% and high yield municipals returned 6.96%.1 This strong performance included investment grade municipals returning 1.30% and high yield municipals returning 1.22% for the first two months of 2019.1
The first half of the fiscal year began with supportive technical conditions (supply and demand balances) in place as new issuance of municipal bonds totaled $187 billion – down 8% from the same time period in 2017.2 However, fund flows into the municipal bond market remained positive, totaling $6.5 billion from March through August 2018.3 The high yield municipal bond market outperformed the investment grade bond segment, led by strong performance of tobacco bonds and improved price discovery on Puerto Rico
bonds as a result of developments in the commonwealth’s debt restructuring.
Municipal bonds withstood headwinds from interest rate movements that had the10-year US Treasury yield breaching 3.00% in April 2018.4 During the fiscal year, the US Federal Reserve (the Fed) raised the federal funds rate four times: in March, June, September and December 2018.5 This series of anticipated rate hikes reflected increased confidence in the US economy amid low unemployment, relatively stable inflation and overall robust economic growth. This expansionary monetary policy significantly flattened the US Treasury yield curve with a slight inversion on the short end occurring in December 2018.
In September 2018, market conditions weakened in stark contrast to the first half of the fiscal year, and thus, exposed the municipal bond market to more sensitivity relating to the month’ssell-off in US Treasuries. Both investment grade municipals
and high yield municipals posted negative returns for the months of September and October 2018. The municipal yield curve continued to steepen, showing confidence in strong gross domestic product growth, as well as rising concern that an impending trade war between the US and China could increase inflation pressures.
As anticipated, US midterm election results had a positive impact on municipal securities as perceived threats to municipal tax exemptions, further tax reform and changes to the Affordable Care Act were greatly reduced. News of a possible ban on flavorede-cigarettes and menthol cigarettes made headlines, which caused a short-lived decline in valuations for Tobacco Master Settlement Agreement (Tobacco MSA) bonds, primarily below investment grade, securities, Meanwhile,year-end demand for yield and coupon payments caused the municipal bond asset class to end 2018 on a strong note.
The Fed’s dovish stance to begin calendar year 2019 took the market by surprise, leading economists to change their predictions from two interest rate increases in 2019, to just one. Additionally, the US government shutdown, which lasted a total of 35 days, along with ongoingUS-China trade negotiations and Brexit developments, created a challenging market environment. Despite these challenges, the municipal market performed positively as technical conditions continued to provide tailwinds, driven particularly by the insatiable demand for maturities (10 years and shorter) from US retail separately managed accounts (SMAs).
Flows into the municipal bond asset class were positive for six of the 12 months covered by the fiscal year. With slowing economic growth and the Fed’s interest rate policy detour, investor
| | | | |
Portfolio Composition | | | | |
By credit sector, based on total investments | | | | |
| |
Revenue Bonds | | | 85.2 | % |
| General Obligation Bonds | | | 8.3 | |
| Pre-Refunded Bonds | | | 6.0 | |
| Other | | | 0.5 | |
| | | | |
Top Five Debt Holdings |
| | % of total net assets |
| 1. | | Jefferson (County of);
Series 2013 F | | 0.9% |
| 2. | | Port Beaumont Navigation District (Jefferson Energy Companies); Series 2016 | | 0.8 |
| 3. | | Chicago (City of); Series 2017 A | | 0.8 |
| 4. | | Children’s Trust Fund; Series 2005 A | | 0.7 |
| 5. | | Cuyahoga (County of) (Metrohealth System); Series 2017 | | 0.7 |
| | | | |
| | |
Total Net Assets | | $ | 9.4 billion | |
| |
Total Number of Holdings | | | 1,404 | |
The Fund’s holdings are subject to change, and there is no assurance that the Fund will continue to hold any particular security.
Data presented here are as of February 28, 2019.
|
| 4 Invesco High Yield Municipal Fund |
demand for municipal securities spiked, bringing record net inflows of $18.9 billion for the first two months of 2019.3
At the close of the fiscal year, we believed municipal fundamentals remained strong and ramifications of the Tax Cuts and Jobs Act of 2017 had not yet been fully realized. As a result, we believe demand fortax-exempt investments from retail investors could continue as taxes become front of mind.
During the fiscal year, security selection innon-rated bonds contributed to the Fund’s performance relative to its style-specific benchmark. At the end of the fiscal year, approximately 37% of the Fund’s holdings werenon-rated by national credit rating agencies, but they were assigned internal proprietary ratings that allowed us to take advantage of pricing anomalies in the high yield municipal market. The Fund’s preference for revenue bonds over general obligation bonds also benefited its relative performance. Security selection in the public power sector contributed to relative return over the fiscal year. On a state level, security selection in California domiciled issues contributed to the Fund’s relative performance.
The Fund’s security selection in and underweight allocation to dedicated tax issues detracted from its performance relative to the style-specific benchmark during the fiscal year. Security selection in long duration bonds (seven years and greater) was also a detractor from relative performance. The Fund’s continued underexposure to Puerto Rico bonds detracted from relative return, as speculation that the territory may emerge with better-than-expected debt restructuring terms made headlines during the fiscal year, which led to price appreciation in bonds.
During the fiscal year, leverage contributed to the Fund’s performance relative to its style-specific benchmark. The Fund achieved a leveraged position through the use of inverse floating rate securities or tender option bonds (TOBs). Exposure to TOBs aided performance due to the price appreciation in municipal holdings when interest rates declined. The Fund uses leverage because we believe that,
over time, leveraging provides opportunities for additional income and total return for shareholders. However, the use of leverage also can expose shareholders to additional volatility. For more information about the Fund’s use of leverage, see the Notes to Financial Statements later in this report.
We wish to remind you that the Fund is subject to interest rate risk, meaning when interest rates rise, the value of fixed income securities tends to fall. The degree to which the value of fixed income securities may decline due to rising interest rates may vary depending on the speed and magnitude of the increase in interest rates, as well as individual security characteristics, such as price, maturity, duration and coupon and market forces, such as supply and demand for similar securities. We are monitoring interest rates, and the market, economic and geopolitical factors that may impact the direction, speed and magnitude of changes to interest rates across the maturity spectrum, including the potential impact of monetary policy changes by the Fed and certain foreign central banks. If interest rates rise faster than expected, markets may experience increased volatility, which may affect the value and/or liquidity of certain of the Fund’s investments.
Thank you for investing in Invesco High Yield Municipal Fund and for sharing our long-term investment horizon.
| 1 | Source: FactSet Research Systems Inc. |
| 3 | Source: Strategic Insight |
4 Source: US Department of the Treasury
5 Source: US Federal Reserve
The views and opinions expressed in management’s discussion of Fund performance are those of Invesco Advisers, Inc. These views and opinions are subject to change at any time based on factors such as market and economic conditions. These views and opinions may not be relied upon as investment advice or recommendations, or as an offer for a particular security. The information is not a complete analysis of every aspect of any market, country, industry, security or the Fund. Statements of fact are from sources considered reliable, but Invesco Advisers, Inc. makes no representation or warranty as to their completeness or accuracy. Although historical performance is no guarantee of future results, these insights may help you understand our investment management philosophy.
See important Fund and, if applicable, index disclosures later in this report.
| | |
| |
 | | Mark Paris Portfolio Manager and Chief Investment Officer and Head of Municipal Strategies for Invesco Fixed Income, is manager of Invesco |
| High Yield Municipal Fund. He joined Invesco in 2010. Mr. Paris earned a BBA in finance from Baruch College – The City University of New York. |
| | |
| |
 | | John (Jack) Connelly Portfolio Manager, is manager of Invesco High Yield Municipal Fund. He joined Invesco in 2016. |
| Mr. Connelly earned a BA in philosophy from Wheaton College and masters degrees from the University of Rhode Island and Yale University. |
| |
 | | Tim O’Reilly Portfolio Manager, is manager of Invesco High Yield Municipal Fund. He joined Invesco in 2010. |
| Mr. O’Reilly earned a BS in finance from Eastern Illinois University and an MBA in finance from the University of Illinois at Chicago. |
| |
 | | James Phillips Portfolio Manager, is manager of Invesco High Yield Municipal Fund. He joined Invesco in 2010. Mr. Phillips earned a BA in American literature |
| from Empire State College, the independent study division of the State University of New York, and an MBA in finance from the University at Albany, State University of New York. |
| |
 | | John Schorle Portfolio Manager, is manager of Invesco High Yield Municipal Fund. He joined Invesco in 2010. |
| Mr. Schorle earned a BA degree in economics from DePaul University. He is also a Certified Public Accountant. |
| |
 | | Julius Williams Portfolio Manager, is manager of Invesco High Yield Municipal Fund. He joined Invesco in 2010. |
| Mr. Williams earned a BA in economics and sociology and a Master of Education degree in educational psychology from the University of Virginia. |
|
| 5 Invesco High Yield Municipal Fund |
Your Fund’s Long-Term Performance
Results of a $10,000 Investment – Oldest Share Class(es)
Fund and index data from 2/28/09
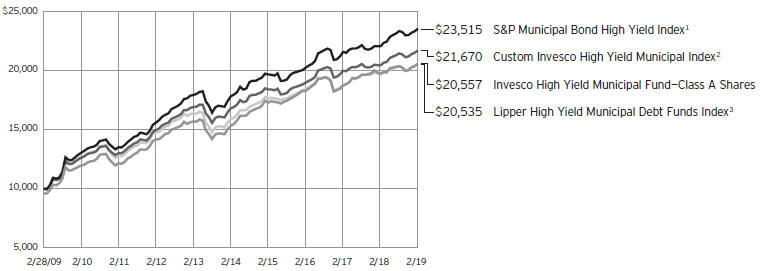
1 Source: RIMES Technologies Corp.
2 Source(s): Invesco, RIMES Technologies Corp.
3 Source: Lipper Inc.
Past performance cannot guarantee comparable future results.
The data shown in the chart include re-invested distributions, applicable sales charges and Fund expenses including
management fees. Index results include reinvested dividends, but they do not reflect sales charges. Performance of the peer group, if applicable, reflects fund expenses and management fees;
performance of a market index does not. Performance shown in the chart and table(s) does not reflect deduction of taxes a shareholder would pay on Fund distributions or sale of Fund shares.
|
| 6 Invesco High Yield Municipal Fund |
| | | | |
| Average Annual Total Returns | |
As of 2/28/19, including maximum applicable sales charges | |
| |
| Class A Shares | | | | |
| Inception (1/2/86) | | | 5.84% | |
| 10 Years | | | 7.47 | |
| 5 Years | | | 5.14 | |
| 1 Year | | | -0.25 | |
| |
| Class C Shares* | | | | |
| Inception (12/10/93) | | | 5.14% | |
| 10 Years | | | 7.15 | |
| 5 Years | | | 5.30 | |
| 1 Year | | | 2.53 | |
| |
| Class Y Shares | | | | |
| Inception (3/1/06) | | | 5.04% | |
| 10 Years | | | 8.21 | |
| 5 Years | | | 6.33 | |
| 1 Year | | | 4.54 | |
| |
| Class R5 Shares | | | | |
| 10 Years | | | 8.41% | |
| 5 Years | | | 6.29 | |
| 1 Year | | | 4.51 | |
| |
| Class R6 Shares | | | | |
| 10 Years | | | 8.00% | |
| 5 Years | | | 6.20 | |
| 1 Year | | | 4.59 | |
*Effective January 26, 2019, Class C share performance includes the conversion to A shares after 10 years. | |
Effective June 1, 2010, Class A, Class C and Class I shares of the predecessor fund, Van Kampen High Yield Municipal Fund, advised by Van Kampen Asset Management were reorganized into Class A, Class C and Class Y shares, respectively, of Invesco Van Kampen High Yield Municipal Fund (renamed Invesco High Yield Municipal Fund). Returns shown above, prior to June 1, 2010, for Class A, Class C and Class Y shares are blended returns of the predecessor fund and Invesco High Yield Municipal Fund. Share class returns will differ from the predecessor fund because of different expenses.
Class R5 shares incepted on April 30, 2012. Performance shown prior to that date is that of the Fund’s and the predecessor fund’s Class A shares and includes the12b-1 fees applicable to Class A shares.
Class R6 shares incepted on April 4, 2017. Performance shown prior to that date is that of Class A shares and includes the12b-1 fees applicable to Class A shares.
| | | | |
| Average Annual Total Returns | |
As of 12/31/18, the most recent calendar quarter end, including maximum applicable sales charges | |
| |
| Class A Shares | | | | |
| Inception (1/2/86) | | | 5.83% | |
| 10 Years | | | 8.05 | |
| 5 Years | | | 5.86 | |
| 1 Year | | | -2.89 | |
| |
| Class C Shares | | | | |
| Inception (12/10/93) | | | 4.64% | |
| 10 Years | | | 7.70 | |
| 5 Years | | | 5.98 | |
| 1 Year | | | -0.39 | |
| |
| Class Y Shares | | | | |
| Inception (3/1/06) | | | 4.98% | |
| 10 Years | | | 8.76 | |
| 5 Years | | | 7.05 | |
| 1 Year | | | 1.58 | |
| |
| Class R5 Shares | | | | |
| 10 Years | | | 8.98% | |
| 5 Years | | | 6.99 | |
| 1 Year | | | 1.64 | |
| |
| Class R6 Shares | | | | |
| 10 Years | | | 8.57% | |
| 5 Years | | | 6.88 | |
| 1 Year | | | 1.63 | |
The performance data quoted represent past performance and cannot guarantee comparable future results; current performance may be lower or higher. Please visit invesco.com/performance for the most recentmonth-end performance. Performance figures reflect reinvested distributions, changes in net asset value and the effect of the maximum sales charge unless otherwise stated. Investment return and principal value will fluctuate so that you may have a gain or loss when you sell shares.
The total annual Fund operating expense ratio set forth in the most recent Fund prospectus as of the date of this report for Class A, Class C, Class Y, Class R5 and Class R6 shares was 1.06%, 1.81%, 0.81%, 0.80% and 0.74%, respectively. The expense ratios presented above may vary from the expense ratios presented in other sections of this report that are based on expenses incurred during the period covered by this report.
Class A share performance reflects the maximum 4.25% sales charge, and Class C share performance reflects the applicable contingent deferred sales
charge (CDSC) for the period involved. The CDSC on Class C shares is 1% for the first year after purchase. Class Y, Class R5 and Class R6 shares do not have afront-end sales charge or a CDSC; therefore, performance is at net asset value.
The performance of the Fund’s share classes will differ primarily due to different sales charge structures and class expenses.
Fund performance reflects any applicable fee waivers and/or expense reimbursements. Had fees not been waived and/or expenses reimbursed currently or in the past, returns would have been lower. See current prospectus for more information.
|
| 7 Invesco High Yield Municipal Fund |
Invesco High Yield Municipal Fund’s investment objective is to seek federaltax-exempt current income and taxable capital appreciation.
| ∎ | | Unless otherwise stated, information presented in this report is as of February 28, 2019, and is based on total net assets. |
| ∎ | | Unless otherwise noted, all data provided by Invesco. |
| ∎ | | To access your Fund’s reports/prospectus, visit invesco.com/fundreports. |
About share classes
| ∎ | | Class Y shares are available only to certain investors. Please see the prospectus for more information. |
| ∎ | | Class R5 shares andClass R6 sharesare available for use by retirement plans that meet certain standards and for institutional investors. Class R6 shares are also available through intermediaries that have established an agreement with Invesco Distributors, Inc. to make such shares available for use in retail omnibus accounts. See the prospectus for more information. |
Principal risks of investing in the Fund
| ∎ | | Alternative minimum tax risk.All or a portion of the Fund’s otherwisetax-exempt income may be taxable to those shareholders subject to the federal alternative minimum tax. |
| ∎ | | Changing fixed income market conditions risk.The current low interest rate environment was created in part by the Federal Reserve Board (FRB) and certain foreign central banks keeping the federal funds and equivalent foreign rates near historical lows. Increases in the federal funds and equivalent foreign rates may expose fixed income markets to heightened volatility and reduced liquidity for certain fixed income investments, particularly those with longer maturities. In addition, decreases in fixed income dealer market-making capacity may also potentially lead to heightened volatility and reduced liquidity in the fixed income markets. As a result, the value of the Fund’s investments and share price may decline. Changes in central bank policies could also result in higher than normal shareholder redemptions, which could potentially increase portfolio turnover and the Fund’s transaction costs. |
| ∎ | | Debt securities risk.The prices of debt securities held by the Fund will be affected by changes in interest rates, the creditworthiness of the issuer and other factors. An increase in prevailing interest |
| | | rates typically causes the value of existing debt securities to fall and often has a greater impact onlonger-duration debt securities and higher quality debt securities. Falling interest rates will cause the Fund to reinvest the proceeds of debt securities that have been repaid by the issuer at lower interest rates. Falling interest rates may also reduce the Fund’s distributable income because interest payments on floating rate debt instruments held by the Fund will decline. The Fund could lose money on investments in debt securities if the issuer or borrower fails to meet its obligations to make interest payments and/or to repay principal in a timely manner. Changes in an issuer’s financial strength, the market’s perception of such strength or in the credit rating of the issuer or the security may affect the value of debt securities. The Adviser’s credit analysis may fail to anticipate such changes, which could result in buying a debt security at an inopportune time or failing to sell a debt security in advance of a price decline or other credit event. |
| ∎ | | Derivatives risk.The value of a derivative instrument depends largely on (and is derived from) the value of an underlying security, currency, commodity, interest rate, index or other asset (each referred to as an underlying asset). In addition to risks relating to the underlying assets, the use of derivatives may include other, possibly greater, risks, including counterparty, leverage and liquidity risks. Counterparty risk is the risk that the counterparty to the derivative contract will default on its obligation to pay the Fund the amount owed or otherwise perform under the derivative contract. Derivatives create leverage risk because they do not require payment up front equal to the economic exposure created by holding a position in the derivative. As a result, an adverse change in the value of the underlying asset could result in the Fund sustaining a loss that is substantially |
This report must be accompanied or preceded by a currently effective Fund prospectus, which contains more complete information, including sales charges and expenses. Investors should read it carefully before investing.
NOT FDIC INSURED | MAY LOSE VALUE | NO BANK GUARANTEE
| | | greater than the amount invested in the derivative or the anticipated value of the underlying asset, which may make the Fund’s returns more volatile and increase the risk of loss. Derivative instruments may also be less liquid than more traditional investments and the Fund may be unable to sell or close out its derivative positions at a desirable time or price. This risk may be more acute under adverse market conditions, during which the Fund may be most in need of liquidating its derivative positions. Derivatives may also be harder to value, less tax efficient and subject to changing government regulation that could impact the Fund’s ability to use certain derivatives or their cost. Derivatives strategies may not always be successful. For example, derivatives used for hedging or to gain or limit exposure to a particular market segment may not provide the expected benefits, particularly during adverse market conditions. |
| ∎ | | High yield debt securities (junk bond) risk.Investments in high yield debt securities (“junk bonds”) and other lower-rated securities will subject the Fund to substantial risk of loss. These securities are considered to be speculative with respect to the issuer’s ability to pay interest and principal when due, are more susceptible to default or decline in market value and are less liquid than investment grade debt securities. Prices of high yield debt securities tend to be very volatile. |
| ∎ | | Inverse floating rate obligations risk. The price of inverse floating rate obligations (inverse floaters) is expected to decline when interest rates rise, and generally will decline further than the price of a bond with a similar maturity. The price of inverse floaters is typically more volatile than the price of bonds with similar maturities. These risks can be particularly high if leverage is used in the formula that determines the interest payable by the inverse floater, which may make the Fund’s returns more volatile and increase the risk of loss. Additionally, these securities may lose some or all of their principal and, in some cases, the Fund could lose money in excess of its investment. |
|
| 8 Invesco High Yield Municipal Fund |
| ∎ | | Liquidity risk.The Fund may be unable to sell illiquid investments at the time or price it desires and, as a result, could lose its entire investment in such investments. Liquid securities can become illiquid during periods of market stress. If a significant amount of the Fund’s securities become illiquid, the Fund may not be able to timely pay redemption proceeds and may need to sell securities at significantly reduced prices. |
| ∎ | | Management risk.The Fund is actively managed and depends heavily on the Adviser’s judgment about markets, interest rates or the attractiveness, relative values, liquidity, or potential appreciation of particular investments made for the Fund’s portfolio. The Fund could experience losses if these judgments prove to be incorrect. Additionally, legislative, regulatory, or tax developments may adversely affect management of the Fund and, therefore, the ability of the Fund to achieve its investment objective. |
| ∎ | | Market risk.The market values of the Fund’s investments, and therefore the value of the Fund’s shares, will go up and down, sometimes rapidly or unpredictably. Market risk may affect a single issuer, industry or section of the economy, or it may affect the market as a whole. Individual stock prices tend to go up and down more dramatically than those of certain other types of investments, such as bonds. During a general downturn in the financial markets, multiple asset classes may decline in value. When markets perform well, there can be no assurance that specific investments held by the Fund will rise in value. |
| ∎ | | Medium- and lower-grade municipal securities risk.Medium- and lower-grade municipal securities generally involve more volatility and greater risks, including credit, market, liquidity and management risks, than higher-grade securities. Furthermore, many issuers of medium- and lower-grade securities choose not to have a rating assigned to their obligations. As such, the Fund’s portfolio may consist of a higher portion of unrated securities than an investment company investing solely in higher-grade securities. Unrated securities may not be as attractive to as many buyers as are rated securities, which may have the effect of limiting the Fund’s ability to sell such securities at their fair value. |
| ∎ | | Municipal issuer focus risk.The municipal issuers in which the Fund invests may be located in the same geographic area or may pay their interest obligations from revenue of similar projects, such as hospitals, airports, utility systems and housing finance agencies. This may make the Fund’s investments more susceptible to similar social, economic, political or regulatory occurrences, making the Fund more susceptible to experience a drop in its share price than if the Fund had been more diversified across issuers that did not have similar characteristics. |
| ∎ | | Municipal securities risk.The risk of a municipal obligation generally depends on the financial and credit status of the issuer. Constitutional amendments, legislative enactments, executive orders, administrative regulations, voter initiatives, and the issuer’s regional economic conditions may affect the municipal security’s value, interest payments, repayment of principal and the Fund’s ability to sell the security. Failure of a municipal security issuer to comply with applicable tax requirements may make income paid thereon taxable, resulting in a decline in the security’s value. In addition, there could be changes in applicable tax laws or tax treatments that reduce or eliminate the current federal income tax exemption on municipal securities or otherwise adversely affect the current federal or state tax status of municipal securities. |
| ∎ | | Variable-rate demand notes risk.The absence of an active secondary market for certain variable and floating rate notes could make it difficult to dispose of these instruments, which could result in a loss. |
| ∎ | | When-issued, delayed delivery and forward commitment risks.When-issued and delayed delivery transactions subject the Fund to market risk because the value or yield of a security at delivery may be more or less than the purchase price or yield generally available when delivery occurs, and counterparty risk because the Fund relies on the buyer or seller, as the case may be, to consummate the transaction. These transactions also have a leveraging effect on the Fund because the Fund commits to purchase securities that it does not have to pay for until a later date, which increases the Fund’s overall investment exposure and, as a result, its volatility. |
| ∎ | | Zero coupon orpay-in-kind securities risk.The value, interest rates, and liquidity ofnon-cash paying instruments, such as zero coupon andpay-in-kind securities, are subject to greater fluctuation than other types of securities. The higher yields and interest rates onpay-in-kind securities reflect the payment deferral and increased credit risk associated with such instruments and that such investments may represent a higher credit risk than loans that periodically pay interest. |
About indexes used in this report
| ∎ | | TheS&P Municipal Bond High Yield Index is an unmanaged index considered representative of municipal bonds that are not rated or are rated below investment grade. |
| ∎ | | TheCustom Invesco High Yield Municipal Index is composed of 80% S&P Municipal Bond High Yield Index and 20% S&P Municipal Bond Investment Grade Index. |
| ∎ | | TheLipper High Yield Municipal Debt Funds Index is an unmanaged index considered representative of high yield municipal debt funds tracked by Lipper. |
| ∎ | | TheS&P Municipal Bond Investment Grade Index is considered representative of investment grade US municipal bonds. |
| ∎ | | The Fund is not managed to track the performance of any particular index, including the index(es) described here, and consequently, the performance of the Fund may deviate significantly from the performance of the index(es). |
| ∎ | | A direct investment cannot be made in an index. Unless otherwise indicated, index results include reinvested dividends, and they do not reflect sales charges. Performance of the peer group, if applicable, reflects fund expenses; performance of a market index does not. |
Other information
| ∎ | | CPA® and Certified Public Accountant® are trademarks owned by the American Institute of Certified Public Accountants. |
| ∎ | | The returns shown in management’s discussion of Fund performance are based on net asset values (NAVs) calculated for shareholder transactions. Generally accepted accounting principles require adjustments to be made to the net assets of the Fund at period end for financial reporting purposes, and as such, the NAVs for shareholder transactions and the returns based on those NAVs may differ from the NAVs and returns reported in the Financial Highlights. |
|
| 9 Invesco High Yield Municipal Fund |
Schedule of Investments
February 28, 2019
| | | | | | | | | | | | | | | | |
| | | Interest
Rate | | | Maturity
Date | | | Principal
Amount
(000) | | | Value | |
Municipal Obligations–111.86%(a) | | | | | | | | | | | | | | | | |
| Alabama–2.83% | | | | | | | | | | | | | | | | |
Birmingham (City of) Special Care Facilities Financing Authority (Methodist Home for the Aging);
Series 2016, RB | | | 5.75 | % | | | 06/01/2045 | | | $ | 3,250 | | | $ | 3,481,855 | |
Series 2016, RB | | | 6.00 | % | | | 06/01/2050 | | | | 5,400 | | | | 5,850,360 | |
Birmingham (City of) Water Works Board; Series 2015 A, Ref. Water RB(b) | | | 5.00 | % | | | 01/01/2042 | | | | 12,750 | | | | 14,049,480 | |
Huntsville (City of) Special Care Facilities Financing Authority (Redstone Village);
Series 2007, Retirement Facility RB(c) | | | 5.50 | % | | | 01/01/2043 | | | | 19,785 | | | | 14,023,410 | |
Series 2008 A, Retirement Facility RB(c) | | | 6.88 | % | | | 01/01/2043 | | | | 4,470 | | | | 3,787,654 | |
Series 2011 A, Retirement Facility RB(c) | | | 7.50 | % | | | 01/01/2047 | | | | 2,600 | | | | 2,203,838 | |
Series 2012 A, Retirement Facility RB(c) | | | 5.63 | % | | | 01/01/2042 | | | | 6,575 | | | | 4,779,565 | |
Jefferson (County of);
Series 2013 C, Sr. Lien Sewer Revenue Conv. CAB Wts. (INS-AGM)(d)(e) | | | 6.50 | % | | | 10/01/2038 | | | | 7,000 | | | | 6,300,980 | |
Series 2013 C, Sr. Lien Sewer Revenue Conv. CAB Wts.(INS-AGM)(d)(e) | | | 6.60 | % | | | 10/01/2042 | | | | 11,700 | | | | 10,455,237 | |
Series 2013 F, Sub. Lien Sewer Revenue Conv. CAB Wts.(d) | | | 7.50 | % | | | 10/01/2039 | | | | 27,640 | | | | 24,453,108 | |
Series 2013 F, Sub. Lien Sewer Revenue Conv. CAB Wts.(d) | | | 7.75 | % | | | 10/01/2046 | | | | 96,055 | | | | 84,539,927 | |
Series2013-F, Sub. Lien Sewer Revenue Conv. CAB Wts.(d) | | | 7.90 | % | | | 10/01/2050 | | | | 65,400 | | | | 57,470,904 | |
Lower Alabama Gas District (The);
Series 2016A, Gas Project RB | | | 5.00 | % | | | 09/01/2046 | | | | 5,000 | | | | 5,853,350 | |
Series 2016A, Gas Project RB(b) | | | 5.00 | % | | | 09/01/2046 | | | | 24,000 | | | | 28,096,080 | |
Mobile (City of) Industrial Development Board (Mobile Energy Services Co.); Series 1995, Ref. Solid Waste Disposal RB | | | 6.95 | % | | | 01/01/2020 | | | | 3 | | | | 0 | |
| | | | | | | | | | | | | | | | 265,345,748 | |
| | | | |
| Alaska–0.33% | | | | | | | | | | | | | | | | |
Alaska (State of) Municipal Bond Bank Authority (Master Resolution);
Series 2017 A, RB | | | 5.50 | % | | | 10/01/2046 | | | | 505 | | | | 586,760 | |
Series 2017 A, RB(b) | | | 5.50 | % | | | 10/01/2046 | | | | 22,000 | | | | 25,561,800 | |
Northern Tobacco Securitization Corp.;
Series 2006B, First Sub. Asset-Backed CAB RB(f) | | | 0.00 | % | | | 06/01/2046 | | | | 27,225 | | | | 2,856,175 | |
Series 2006C, Second Sub. Asset-Backed CAB RB(f) | | | 0.00 | % | | | 06/01/2046 | | | | 20,860 | | | | 1,846,944 | |
| | | | | | | | | | | | | | | | 30,851,679 | |
| | | | |
| American Samoa–0.14% | | | | | | | | | | | | | | | | |
American Samoa (Territory of) Economic Development Authority;
Series 2015 A, Ref. RB | | | 6.63 | % | | | 09/01/2035 | | | | 13,345 | | | | 13,148,962 | |
| | | | |
| Arizona–2.39% | | | | | | | | | | | | | | | | |
Arizona (State of) Health Facilities Authority (Banner Health);
Series 2015 C, Ref. VRD RB(LOC-Bank Of America, N.A.)(g)(h) | | | 1.56 | % | | | 01/01/2046 | | | | 2,930 | | | | 2,930,000 | |
Arizona (State of) Industrial Development Authority (American Charter Schools Foundation); | | | | | | | | | | | | | | | | |
Series 2017, Ref. Education RB(i) | | | 6.00 | % | | | 07/01/2037 | | | | 13,845 | | | | 14,719,173 | |
Series 2017, Ref. Education RB(i) | | | 6.00 | % | | | 07/01/2047 | | | | 15,000 | | | | 15,718,650 | |
Arizona (State of) Industrial Development Authority (Basis Schools); | | | | | | | | | | | | | | | | |
Series 2017 A, Ref. Education RB(i) | | | 5.13 | % | | | 07/01/2037 | | | | 1,180 | | | | 1,220,309 | |
Series 2017 D, Ref. Education RB(i) | | | 5.00 | % | | | 07/01/2047 | | | | 1,035 | | | | 1,051,839 | |
Series 2017 D, Ref. Education RB(i) | | | 5.00 | % | | | 07/01/2051 | | | | 2,300 | | | | 2,321,666 | |
Series 2017 G, Ref. Education RB(i) | | | 5.00 | % | | | 07/01/2037 | | | | 1,105 | | | | 1,137,531 | |
Series 2017 G, Ref. Education RB(i) | | | 5.00 | % | | | 07/01/2047 | | | | 3,260 | | | | 3,313,040 | |
Series 2017 G, Ref. Education RB(i) | | | 5.00 | % | | | 07/01/2051 | | | | 1,000 | | | | 1,009,420 | |
Series2017-A, Ref. Education RB(i) | | | 5.38 | % | | | 07/01/2050 | | | | 6,000 | | | | 6,191,820 | |
Arizona (State of) Industrial Development Authority (Kaizen Education Foundation); | | | | | | | | | | | | | | | | |
Series 2016, Education RB(i) | | | 5.70 | % | | | 07/01/2047 | | | | 10,730 | | | | 11,171,754 | |
Series 2016, Education RB(i) | | | 5.80 | % | | | 07/01/2052 | | | | 4,920 | | | | 5,121,818 | |
See accompanying Notes to Financial Statements which are an integral part of the financial statements.
10 Invesco High Yield Municipal Fund
| | | | | | | | | | | | | | | | |
| | | Interest
Rate | | | Maturity
Date | | | Principal
Amount
(000) | | | Value | |
| Arizona–(continued) | | | | | | | | | | | | | | | | |
Arizona (State of) Industrial Development Authority (Leman Academy of Excellence); | | | | | | | | | | | | | | | | |
Series 2017 A, Ref. Education RB(i) | | | 5.25 | % | | | 07/01/2052 | | | $ | 500 | | | $ | 497,230 | |
Arizona (State of) Industrial Development Authority (Mater Academy of Nevada Mountain Vista Campus Project); | | | | | | | | | | | | | | | | |
Series 2018 A, Education RB(i) | | | 5.25 | % | | | 12/15/2038 | | | | 1,015 | | | | 1,021,354 | |
Series 2018 A, Education RB(i) | | | 5.50 | % | | | 12/15/2048 | | | | 2,265 | | | | 2,290,504 | |
Glendale (City of) Industrial Development Authority (Terraces of Phoenix); Series 2018 A, Ref. RB | | | 5.00 | % | | | 07/01/2048 | | | | 1,500 | | | | 1,523,370 | |
Glendale (City of) Industrial Development Authority (The Beatitudes Campus); | | | | | | | | | | | | | | | | |
Series 2017, Ref. RB | | | 4.00 | % | | | 11/15/2027 | | | | 1,935 | | | | 1,898,661 | |
Series 2017, Ref. RB | | | 5.00 | % | | | 11/15/2040 | | | | 1,485 | | | | 1,485,936 | |
Series 2017, Ref. RB | | | 5.00 | % | | | 11/15/2045 | | | | 11,060 | | | | 10,994,635 | |
Series 2018, RB | | | 5.00 | % | | | 11/15/2053 | | | | 5,870 | | | | 5,802,788 | |
Maricopa (County of) Industrial Development Authority (Paradise Schools); Series 2016, Ref. Education RB(i) | | | 5.00 | % | | | 07/01/2047 | | | | 4,000 | | | | 4,088,320 | |
Peoria (City of) Industrial Development Authority (Sierra Winds Life Care Community); | | | | | | | | | | | | | | | | |
Series 2014, Ref. RB | | | 5.50 | % | | | 11/15/2034 | | | | 3,695 | | | | 3,585,148 | |
Series 2014, Ref. RB | | | 5.75 | % | | | 11/15/2040 | | | | 6,015 | | | | 5,755,994 | |
Phoenix (City of) Industrial Development Authority (Basis Schools); Series 2016A, Ref. Education RB(i) | | | 5.00 | % | | | 07/01/2046 | | | | 4,050 | | | | 4,104,472 | |
Phoenix (City of) Industrial Development Authority (Choice Academies); Series 2012, Education RB | | | 5.63 | % | | | 09/01/2042 | | | | 2,850 | | | | 2,920,139 | |
Phoenix (City of) Industrial Development Authority (Legacy Traditional Schools); Series 2014 A, Education Facility RB(i) | | | 6.75 | % | | | 07/01/2044 | | | | 5,250 | | | | 5,730,743 | |
Phoenix (City of) Industrial Development Authority (Phoenix Collegiate Academy); Series 2012, Education RB | | | 5.63 | % | | | 07/01/2042 | | | | 2,770 | | | | 2,864,180 | |
Phoenix Civic Improvement Corp.; | | | | | | | | | | | | | | | | |
Series 2009 A, Jr. Lien Water System RB(b)(j)(k) | | | 5.00 | % | | | 07/01/2019 | | | | 5,500 | | | | 5,562,040 | |
Series 2009 A, Jr. Lien Water System RB(b)(j)(k) | | | 5.00 | % | | | 07/01/2019 | | | | 15,720 | | | | 15,897,322 | |
Pima (County of) Industrial Development Authority (Acclaim Charter School); | | | | | | | | | | | | | | | | |
Series 2006, Education Facility RB | | | 5.70 | % | | | 12/01/2026 | | | | 1,850 | | | | 1,849,834 | |
Series 2006, Education Facility RB | | | 5.80 | % | | | 12/01/2036 | | | | 4,385 | | | | 4,161,233 | |
Pima (County of) Industrial Development Authority (American Leadership Academy); | | | | | | | | | | | | | | | | |
Series 2015, Ref. Education Facility RB(i) | | | 5.38 | % | | | 06/15/2035 | | | | 2,370 | | | | 2,449,442 | |
Series 2015, Ref. Education Facility RB(i) | | | 5.63 | % | | | 06/15/2045 | | | | 3,500 | | | | 3,608,780 | |
Series 2017, Education Facility RB(i) | | | 4.13 | % | | | 06/15/2029 | | | | 1,500 | | | | 1,473,120 | |
Series 2017, Education Facility RB(i) | | | 5.00 | % | | | 06/15/2047 | | | | 11,600 | | | | 11,358,372 | |
Series 2017, Education Facility RB(i) | | | 5.00 | % | | | 06/15/2052 | | | | 6,945 | | | | 6,683,243 | |
Pima (County of) Industrial Development Authority (Coral Academy Science); | | | | | | | | | | | | | | | | |
Series 2008 A, Education Facilities RB | | | 7.13 | % | | | 12/01/2028 | | | | 2,120 | | | | 2,122,502 | |
Series 2008 A, Education Facilities RB | | | 7.25 | % | | | 12/01/2038 | | | | 3,285 | | | | 3,287,989 | |
Pima (County of) Industrial Development Authority (Desert Heights Charter School); Series 2014, Ref. Education Facility RB | | | 7.25 | % | | | 05/01/2044 | | | | 3,000 | | | | 3,255,090 | |
Pima (County of) Industrial Development Authority (Edkey Charter Schools); | | | | | | | | | | | | | | | | |
Series 2013, Ref. Education Facility RB | | | 6.00 | % | | | 07/01/2043 | | | | 250 | | | | 230,718 | |
Series 2013, Ref. Education Facility RB | | | 6.00 | % | | | 07/01/2048 | | | | 2,975 | | | | 2,711,534 | |
Pima (County of) Industrial Development Authority (Legacy Traditional School); Series 2009, Education RB(j)(k) | | | 8.50 | % | | | 07/01/2019 | | | | 1,620 | | | | 1,655,478 | |
Pima (County of) Industrial Development Authority (Paradise Education Center); Series 2010, Education RB(j)(k) | | | 6.10 | % | | | 06/01/2019 | | | | 1,400 | | | | 1,415,120 | |
Pima (County of) Industrial Development Authority (Premier Charter High School); | | | | | | | | | | | | | | | | |
Series 2016A, Ref. Education Facility RB(i) | | | 7.00 | % | | | 07/01/2045 | | | | 3,315 | | | | 3,136,189 | |
Series 2016B, Ref. Sub. Education Facility RB | | | 2.07 | % | | | 07/01/2045 | | | | 1,735 | | | | 342,056 | |
Series 2016C, Ref. Jr. Sub. Education Facility RB | | | 2.07 | % | | | 07/01/2045 | | | | 1,036 | | | | 10,355 | |
Pima (County of) Industrial Development Authority (Riverbend Prep); Series 2010, Education RB (i) | | | 7.00 | % | | | 09/01/2037 | | | | 3,358 | | | | 3,359,813 | |
See accompanying Notes to Financial Statements which are an integral part of the financial statements.
11 Invesco High Yield Municipal Fund
| | | | | | | | | | | | | | | | |
| | | Interest
Rate | | | Maturity
Date | | | Principal
Amount
(000) | | | Value | |
| Arizona–(continued) | | | | | | | | | | | | | | | | |
Sundance Community Facilities District (Assessment District No. 2); Series 2003, Special Assessment RB(i) | | | 7.13 | % | | | 07/01/2027 | | | $ | 911 | | | $ | 911,128 | |
Sundance Community Facilities District (Assessment District No. 3); Series 2004, Special Assessment RB | | | 6.50 | % | | | 07/01/2029 | | | | 165 | | | | 165,010 | |
Tempe (City of) Industrial Development Authority (Friendship Village); | | | | | | | | | | | | | | | | |
Series 2012 A, Ref. RB | | | 6.25 | % | | | 12/01/2042 | | | | 2,700 | | | | 2,843,856 | |
Series 2012 A, Ref. RB | | | 6.25 | % | | | 12/01/2046 | | | | 4,100 | | | | 4,314,102 | |
Tempe (City of) Industrial Development Authority (Mirabella at ASU); | | | | | | | | | | | | | | | | |
Series 2017 A, RB(i) | | | 6.13 | % | | | 10/01/2047 | | | | 1,400 | | | | 1,517,824 | |
Series 2017 A, RB(i) | | | 6.13 | % | | | 10/01/2052 | | | | 1,400 | | | | 1,513,750 | |
Town of Florence, Inc. (The) Industrial Development Authority (Legacy Traditional School - Queen Creek and Casa Grande Campuses); | | | | | | | | | | | | | | | | |
Series 2013, Education RB | | | 5.75 | % | | | 07/01/2033 | | | | 3,000 | | | | 3,169,800 | |
Series 2013, Education RB | | | 6.00 | % | | | 07/01/2043 | | | | 3,625 | | | | 3,782,724 | |
Tucson (City of) Industrial Development Authority (Catalina Village Assisted Living Apartments); | | | | | | | | | | | | | | | | |
Series 2017 A, Multifamily Housing RB(l) | | | 5.50 | % | | | 05/01/2051 | | | | 4,435 | | | | 3,139,182 | |
Series 2017 B, Multifamily Housing RB(l) | | | 2.50 | % | | | 05/01/2051 | | | | 1,700 | | | | 472,940 | |
University Medical Center Corp.; | | | | | | | | | | | | | | | | |
Series 2009, Hospital RB(j)(k) | | | 6.25 | % | | | 07/01/2019 | | | | 1,650 | | | �� | 1,674,981 | |
Series 2009, Hospital RB(j)(k) | | | 6.50 | % | | | 07/01/2019 | | | | 2,100 | | | | 2,133,432 | |
Series 2011, Hospital RB(j)(k) | | | 6.00 | % | | | 07/01/2021 | | | | 2,600 | | | | 2,850,614 | |
| | | | | | | | | | | | | | | | 223,530,067 | |
| | | | |
| California–11.96% | | | | | | | | | | | | | | | | |
ABAG Finance Authority forNon-profit Corps. (Episcopal Senior Communities); Series 2012 A, Ref. RB | | | 5.00 | % | | | 07/01/2047 | | | | 6,000 | | | | 6,282,900 | |
Alhambra (City of) (Atherton Baptist Homes); Series 2010 A, RB(j)(k) | | | 7.63 | % | | | 01/01/2020 | | | | 4,340 | | | | 4,557,000 | |
Bay Area Toll Authority (San Francisco Bay Area); Series 2017F-1, Toll Bridge RB(b) | | | 5.00 | % | | | 04/01/2056 | | | | 21,000 | | | | 23,436,840 | |
California (County of) Tobacco Securitization Agency (Gold Country Settlement Funding Corp.); | | | | | | | | | | | | | | | | |
Series 2006, Tobacco Settlement Asset-Backed CAB RB(f) | | | 0.00 | % | | | 06/01/2033 | | | | 14,880 | | | | 6,616,094 | |
California (County of) Tobacco Securitization Agency (Stanislaus County Tobacco Funding Corp.); | | | | | | | | | | | | | | | | |
Series 2006A, Tobacco Settlement CAB Sub. RB(f) | | | 0.00 | % | | | 06/01/2046 | | | | 25,000 | | | | 4,108,500 | |
California (State of) Educational Facilities Authority (Stanford University); | | | | | | | | | | | | | | | | |
Series 2012U-2, Ref. RB(b) | | | 5.00 | % | | | 10/01/2032 | | | | 8,745 | | | | 11,127,838 | |
Series 2014U-6, RB(b) | | | 5.00 | % | | | 05/01/2045 | | | | 15,000 | | | | 19,555,050 | |
Series 2010, RB(b) | | | 5.25 | % | | | 04/01/2040 | | | | 6,255 | | | | 8,254,724 | |
California (State of) Health Facilities Financing Authority (Children’s Hospital of Orange County); | | | | | | | | | | | | | | | | |
Series 2009, RB | | | 6.50 | % | | | 11/01/2038 | | | | 3,000 | | | | 3,089,760 | |
California (State of) Health Facilities Financing Authority (Kaiser Permanente); Subseries 2017A-2, RB(b) | | | 5.00 | % | | | 11/01/2047 | | | | 10,000 | | | | 13,027,400 | |
California (State of) Municipal Finance Authority (California Baptist University); | | | | | | | | | | | | | | | | |
Series 2016A, RB(i) | | | 5.00 | % | | | 11/01/2036 | | | | 1,500 | | | | 1,628,940 | |
Series 2016A, RB(i) | | | 5.00 | % | | | 11/01/2046 | | | | 3,000 | | | | 3,212,400 | |
California (State of) Municipal Finance Authority (Goodwill Industries of Sacramento & Nevada); | | | | | | | | | | | | | | | | |
Series 2012, RB(i) | | | 6.63 | % | | | 01/01/2032 | | | | 1,000 | | | | 1,052,180 | |
Series 2012, RB(i) | | | 6.88 | % | | | 01/01/2042 | | | | 1,500 | | | | 1,584,015 | |
California (State of) Municipal Finance Authority (King/Chavez); Series 2009 A, Educational Facilities RB(j)(k) | | | 8.50 | % | | | 10/01/2019 | | | | 1,000 | | | | 1,039,550 | |
California (State of) Municipal Finance Authority (Santa Rosa Academy); | | | | | | | | | | | | | | | | |
Series 2012 A, Charter School Lease RB | | | 5.75 | % | | | 07/01/2030 | | | | 6,360 | | | | 6,759,917 | |
Series 2012 A, Charter School Lease RB | | | 6.00 | % | | | 07/01/2042 | | | | 5,355 | | | | 5,650,864 | |
California (State of) Pollution Control Finance Authority; | | | | | | | | | | | | | | | | |
Series 2012, Water Furnishing RB(i)(m) | | | 5.00 | % | | | 07/01/2037 | | | | 13,500 | | | | 14,160,015 | |
Series 2012, Water Furnishing RB(i)(m) | | | 5.00 | % | | | 11/21/2045 | | | | 22,210 | | | | 23,125,496 | |
See accompanying Notes to Financial Statements which are an integral part of the financial statements.
12 Invesco High Yield Municipal Fund
| | | | | | | | | | | | | | | | |
| | | Interest
Rate | | | Maturity
Date | | | Principal
Amount
(000) | | | Value | |
| California–(continued) | | | | | | | | | | | | | | | | |
California (State of) Pollution Control Financing Authority (Aemerge Redpack Services Southern California, LLC); Series 2016, Solid Waste Disposal RB(i)(m) | | | 7.00 | % | | | 12/01/2027 | | | $ | 9,925 | | | $ | 9,597,078 | |
California (State of) Pollution Control Financing Authority (San Diego County Water Authority); Ref. RB(i) | | | 5.00 | % | | | 07/01/2039 | | | | 2,500 | | | | 2,802,750 | |
Ref. Water Furnishing RB(i) | | | 5.00 | % | | | 11/21/2045 | | | | 11,650 | | | | 12,917,870 | |
California (State of) School Finance Authority (Alliance for College-Ready Public Schools); | | | | | | | | | | | | | | | | |
Series 2013 A, School Facility RB | | | 6.40 | % | | | 07/01/2048 | | | | 3,000 | | | | 3,358,170 | |
California (State of) School Finance Authority (New Designs Charter School); Series 2012, Educational Facilities RB | | | 5.50 | % | | | 06/01/2042 | | | | 5,000 | | | | 5,130,700 | |
California (State of) Statewide Communities Development Authority (American Baptist Homes of the West); Series 2010, RB | | | 6.25 | % | | | 10/01/2039 | | | | 2,000 | | | | 2,046,800 | |
California (State of) Statewide Communities Development Authority (California Baptist University); | | | | | | | | | | | | | | | | |
Series 2011, RB(j)(k) | | | 7.25 | % | | | 11/01/2021 | | | | 1,500 | | | | 1,723,050 | |
Series 2011, RB(j)(k) | | | 7.50 | % | | | 11/01/2021 | | | | 5,500 | | | | 6,353,545 | |
Series 2014 A, RB | | | 6.13 | % | | | 11/01/2033 | | | | 1,560 | | | | 1,766,762 | |
California (State of) Statewide Communities Development Authority (Creative Child Care & Team); Series 2015, School Facilities RB (Acquired 11/03/2015; Cost $755,000)(i) | | | 6.75 | % | | | 06/01/2045 | | | | 6,700 | | | | 6,774,906 | |
California (State of) Statewide Communities Development Authority (Eskaton Properties, Inc.); | | | | | | | | | | | | | | | | |
Series 2012, RB | | | 5.25 | % | | | 11/15/2034 | | | | 4,350 | | | | 4,619,526 | |
California (State of) Statewide Communities Development Authority (Lancer Educational Student Housing); Series 2016, Ref. RB(i) | | | 5.00 | % | | | 06/01/2036 | | | | 4,250 | | | | 4,569,983 | |
California (State of) Statewide Communities Development Authority (Loma Linda University Medical Center); | | | | | | | | | | | | | | | | |
Series 2014, RB | | | 5.50 | % | | | 12/01/2054 | | | | 11,000 | | | | 11,834,680 | |
Series 2016A, RB(i) | | | 5.00 | % | | | 12/01/2036 | | | | 1,500 | | | | 1,605,930 | |
Series 2016A, RB(i) | | | 5.25 | % | | | 12/01/2056 | | | | 47,945 | | | | 51,000,055 | |
California (State of) Statewide Communities Development Authority(NCCD - Hooper Street LLC - California College of the Arts); | | | | | | | | | | | | | | | | |
Series 2019, College Housing RB(i) | | | 5.25 | % | | | 07/01/2049 | | | | 375 | | | | 396,094 | |
Series 2019, College Housing RB(i) | | | 5.25 | % | | | 07/01/2052 | | | | 1,450 | | | | 1,525,458 | |
California (State of) Statewide Communities Development Authority (Southern California Presbyterian Homes); | | | | | | | | | | | | | | | | |
Series 2009, Senior Living RB(i) | | | 7.00 | % | | | 11/15/2029 | | | | 1,745 | | | | 1,799,025 | |
Series 2009, Senior Living RB(i) | | | 7.25 | % | | | 11/15/2041 | | | | 3,500 | | | | 3,613,505 | |
California (State of) Statewide Communities Development Authority (Terraces at San Joaquin Garden); | | | | | | | | | | | | | | | | |
Series 2012, RB | | | 6.00 | % | | | 10/01/2042 | | | | 2,895 | | | | 3,079,035 | |
Series 2012, RB | | | 6.00 | % | | | 10/01/2047 | | | | 1,785 | | | | 1,894,813 | |
California (State of) Statewide Finance Authority (Pooled Tobacco Securitization); | | | | | | | | | | | | | | | | |
Series 2002, Tobacco Settlement Asset-Backed RB | | | 6.00 | % | | | 05/01/2043 | | | | 15,000 | | | | 15,079,500 | |
Series 2006A, Tobacco Settlement CAB Turbo RB(f) | | | 0.00 | % | | | 06/01/2046 | | | | 181,950 | | | | 31,189,869 | |
California County Tobacco Securitization Agency (The) (Sonoma County Securitization Corp.); | | | | | | | | | | | | | | | | |
Series 2005, Ref. Tobacco Settlement Asset-Backed RB | | | 5.13 | % | | | 06/01/2038 | | | | 9,380 | | | | 9,401,855 | |
Series 2005, Ref. Tobacco Settlement Asset-Backed RB | | | 5.25 | % | | | 06/01/2045 | | | | 3,730 | | | | 3,738,728 | |
California Public Finance Authority (Henry Mayo Newhall Hospital); | | | | | | | | | | | | | | | | |
Series 2017, Ref. RB | | | 5.00 | % | | | 10/15/2037 | | | | 3,430 | | | | 3,716,679 | |
Series 2017, Ref. RB | | | 5.00 | % | | | 10/15/2047 | | | | 10,170 | | | | 10,894,918 | |
Eden (Township of) Healthcare District; Series 2010, COP(j)(k) | | | 6.13 | % | | | 06/01/2020 | | | | 2,510 | | | | 2,653,170 | |
Fairfield (City of) Community Facilities DistrictNo. 2007-1 (Fairfield Commons); | | | | | | | | | | | | | | | | |
Series 2008, Special Tax RB | | | 6.50 | % | | | 09/01/2023 | | | | 1,235 | | | | 1,263,776 | |
Series 2008, Special Tax RB | | | 6.75 | % | | | 09/01/2028 | | | | 2,550 | | | | 2,612,526 | |
Series 2008, Special Tax RB | | | 6.88 | % | | | 09/01/2038 | | | | 4,440 | | | | 4,549,357 | |
See accompanying Notes to Financial Statements which are an integral part of the financial statements.
13 Invesco High Yield Municipal Fund
| | | | | | | | | | | | | | | | |
| | | Interest
Rate | | | Maturity
Date | | | Principal
Amount
(000) | | | Value | |
| California–(continued) | | | | | | | | | | | | | | | | |
Foothill-Eastern Transportation Corridor Agency; | | | | | | | | | | | | | | | | |
Series 2014 A, Ref. Toll Road CAB RB (INS-AGM)(e)(f) | | | 0.00 | % | | | 01/15/2036 | | | $ | 61,010 | | | $ | 33,061,929 | |
Series 2014 A, Ref. Toll Road CAB RB (INS-AGM)(e)(f) | | | 0.00 | % | | | 01/15/2037 | | | | 20,000 | | | | 10,300,200 | |
Series 2014 A, Ref. Toll Road RB | | | 6.00 | % | | | 01/15/2049 | | | | 20,000 | | | | 22,917,800 | |
Series 2014 A, Toll Road Conv. CAB RB(d) | | | 6.85 | % | | | 01/15/2042 | | | | 5,000 | | | | 4,654,250 | |
Series 2014 C, Ref. Jr. Lien Toll Road RB | | | 6.50 | % | | | 01/15/2043 | | | | 10,750 | | | | 12,385,505 | |
Golden State Tobacco Securitization Corp.; | | | | | | | | | | | | | | | | |
Series 2007A-2, Sr. Tobacco Settlement Asset-Backed Conv. CAB RB(d) | | | 5.30 | % | | | 06/01/2037 | | | | 47,000 | | | | 47,197,870 | |
Series 2007 B, First Sub. Tobacco Settlement Asset-Backed CAB RB (f) | | | 0.00 | % | | | 06/01/2047 | | | | 185,000 | | | | 29,729,500 | |
Series 2018A-1, Ref. Tobacco Settlement Asset-Backed RB | | | 5.00 | % | | | 06/01/2047 | | | | 55,140 | | | | 53,227,745 | |
Inland Empire Tobacco Securitization Authority; | | | | | | | | | | | | | | | | |
Series 2007 A, Tobacco Settlement RB | | | 5.00 | % | | | 06/01/2021 | | | | 3,110 | | | | 3,110,249 | |
Series 2007C-1, Asset-Backed Tobacco Settlement CAB Turbo RB (f) | | | 0.00 | % | | | 06/01/2036 | | | | 161,415 | | | | 48,879,690 | |
Series 2007 D, Asset-Backed Tobacco Settlement CAB RB (f) | | | 0.00 | % | | | 06/01/2057 | | | | 46,635 | | | | 2,554,665 | |
Lake Tahoe Unified School District (Election of 2008); Series 2010, Conv. CAB Unlimited Tax GO Bonds (INS-AGM)(d)(e) | | | 6.38 | % | | | 08/01/2045 | | | | 5,315 | | | | 3,905,621 | |
Los Angeles (City of) Community Facilities District No. 3 (Cascades Business Park); Series 1997, Special Tax RB | | | 6.40 | % | | | 09/01/2022 | | | | 310 | | | | 311,779 | |
Los Angeles (City of) Department of Airports (Los Angeles International Airport); Series 2018 A, Sub. RB(b)(n) | | | 5.25 | % | | | 05/15/2048 | | | | 26,000 | | | | 29,848,260 | |
Los Angeles (City of) Department of Water & Power; Series 2012 B, Waterworks RB (b) | | | 5.00 | % | | | 07/01/2043 | | | | 66,530 | | | | 72,672,715 | |
M-S-R Energy Authority; | | | | | | | | | | | | | | | | |
Series 2009 A, Gas RB | | | 6.50 | % | | | 11/01/2039 | | | | 4,490 | | | | 6,267,546 | |
Series 2009 B, Gas RB | | | 6.50 | % | | | 11/01/2039 | | | | 5,500 | | | | 7,677,395 | |
National City (City of) Community Development Commission (National City Redevelopment); | | | | | | | | | | | | | | | | |
Series 2011, Tax Allocation RB(j)(k) | | | 7.00 | % | | | 08/01/2021 | | | | 4,750 | | | | 5,369,923 | |
Placentia (City of) Public Financing Authority (Working Capital Financing); Series 2009, Lease RB | | | 7.50 | % | | | 06/01/2019 | | | | 690 | | | | 688,655 | |
Regents of the University of California; Series 2014 AM, General RB (b) | | | 5.00 | % | | | 05/15/2044 | | | | 34,545 | | | | 38,398,840 | |
Riverside (County of) Transportation Commission; Series 2013 A, Sr. Lien Toll RB | | | 5.75 | % | | | 06/01/2048 | | | | 7,000 | | | | 7,621,180 | |
San Bernardino City Unified School District; | | | | | | | | | | | | | | | | |
Series 2011 D, Unlimited Tax CAB GO Bonds (INS-AGM)(e)(f) | | | 0.00 | % | | | 08/01/2036 | | | | 7,650 | | | | 4,061,615 | |
Series 2011 D, Unlimited Tax CAB GO Bonds (INS-AGM)(e)(f) | | | 0.00 | % | | | 08/01/2037 | | | | 13,130 | | | | 6,616,207 | |
Series 2011 D, Unlimited Tax CAB GO Bonds (INS-AGM)(e)(f) | | | 0.00 | % | | | 08/01/2038 | | | | 13,515 | | | | 6,500,985 | |
Series 2011 D, Unlimited Tax CAB GO Bonds (INS-AGM)(e)(f) | | | 0.00 | % | | | 08/01/2039 | | | | 13,895 | | | | 6,365,161 | |
Series 2011 D, Unlimited Tax CAB GO Bonds (INS-AGM)(e)(f) | | | 0.00 | % | | | 08/01/2040 | | | | 14,280 | | | | 6,231,649 | |
Series 2011 D, Unlimited Tax CAB GO Bonds (INS-AGM)(e)(f) | | | 0.00 | % | | | 08/01/2041 | | | | 14,080 | | | | 5,857,843 | |
San Buenaventura (City of) (Community Memorial Health System); | | | | | | | | | | | | | | | | |
Series 2011, RB | | | 8.00 | % | | | 12/01/2031 | | | | 9,875 | | | | 11,033,930 | |
Series 2011, RB | | | 7.50 | % | | | 12/01/2041 | | | | 21,980 | | | | 23,967,651 | |
San Diego Unified School District (Election of 2008); Series 2012 E, Unlimited Tax Conv. CAB GO Bonds(d) | | | 5.25 | % | | | 07/01/2042 | | | | 10,000 | | | | 6,797,900 | |
San Francisco (City & County of) Redevelopment Financing Authority (Mission Bay South Redevelopment); | | | | | | | | | | | | | | | | |
Series 2009 D, Tax Allocation RB(j)(k) | | | 6.25 | % | | | 08/01/2019 | | | | 1,000 | | | | 1,019,660 | |
Series 2009 D, Tax Allocation RB(j)(k) | | | 6.50 | % | | | 08/01/2019 | | | | 1,000 | | | | 1,020,630 | |
San Francisco (City & County of) Successor Agency to the Redevelopment Agency Community Facilities District No. 6 (Mission Bay South Public Improvements); | | | | | | | | | | | | | | | | |
Series 2013 C, Special Tax CAB RB(f) | | | 0.00 | % | | | 08/01/2036 | | | | 5,710 | | | | 2,330,422 | |
Series 2013 C, Special Tax CAB RB(f) | | | 0.00 | % | | | 08/01/2038 | | | | 2,000 | | | | 713,480 | |
Series 2013 C, Special Tax CAB RB(f) | | | 0.00 | % | | | 08/01/2043 | | | | 17,000 | | | | 4,489,870 | |
San Joaquin Hills Transportation Corridor Agency; | | | | | | | | | | | | | | | | |
Series 2014 B, Ref. Jr. Lien Toll Road RB | | | 5.25 | % | | | 01/15/2044 | | | | 7,000 | | | | 7,550,340 | |
Series 2014 B, Ref. Jr. Toll Road RB | | | 5.25 | % | | | 01/15/2049 | | | | 12,000 | | | | 12,904,920 | |
See accompanying Notes to Financial Statements which are an integral part of the financial statements.
14 Invesco High Yield Municipal Fund
| | | | | | | | | | | | | | | | |
| | | Interest
Rate | | | Maturity
Date | | | Principal
Amount
(000) | | | Value | |
| California–(continued) | | | | | | | | | | | | | | | | |
San Jose (City of); | | | | | | | | | | | | | | | | |
Series 2017 A, Ref. Airport RB(b) | | | 5.00 | % | | | 03/01/2041 | | | $ | 10,000 | | | $ | 11,126,500 | |
Series 2017 A, Ref. Airport RB(b) | | | 5.00 | % | | | 03/01/2047 | | | | 20,000 | | | | 22,133,800 | |
San Jose (City of) (Helzer Courts Apartments); Series 1999 A, MFH RB (m) | | | 6.40 | % | | | 12/01/2041 | | | | 14,123 | | | | 14,127,661 | |
San Jose (City of) Community Facilities District No. 9 (Bailey/Highway 101); | | | | | | | | | | | | | | | | |
Series 2003, Special Tax RB | | | 6.60 | % | | | 09/01/2027 | | | | 2,000 | | | | 2,000,700 | |
Series 2003, Special Tax RB | | | 6.65 | % | | | 09/01/2032 | | | | 2,630 | | | | 2,634,287 | |
San Mateo (City of) Foster School District (Election 2008); Series 2010, Unlimited Tax Conv. CAB GO Bonds(d) | | | 6.63 | % | | | 08/01/2042 | | | | 4,080 | | | | 3,687,749 | |
Santa Cruz (County of) Redevelopment Agency (Live Oak/Soquel Community Improvement);
Series 2009 A, Tax Allocation RB(j)(k) | | | 7.00 | % | | | 09/01/2019 | | | | 3,500 | | | | 3,593,940 | |
Savanna Elementary School District (Election of 2008); Series 2012 B, Unlimited Tax Conv. CAB GO Bonds (INS-AGM)(d)(e) | | | 6.75 | % | | | 02/01/2052 | | | | 7,500 | | | | 5,692,575 | |
Silicon Valley Tobacco Securitization Authority (Santa Clara); | | | | | | | | | | | | | | | | |
Series 2007 A, Tobacco Settlement Asset-Backed CAB Turbo RB (f) | | | 0.00 | % | | | 06/01/2047 | | | | 20,000 | | | | 3,517,200 | |
Series 2007 A, Tobacco Settlement CAB Turbo RB(f) | | | 0.00 | % | | | 06/01/2036 | | | | 10,000 | | | | 3,626,700 | |
Southern California Logistics Airport Authority; | | | | | | | | | | | | | | | | |
Series 2007, Tax Allocation RB | | | 6.15 | % | | | 12/01/2043 | | | | 4,400 | | | | 4,439,468 | |
Series 2008 A, Tax Allocation CAB RB(f) | | | 0.00 | % | | | 12/01/2045 | | | | 18,085 | | | | 2,537,868 | |
Series 2008 A, Tax Allocation CAB RB(f) | | | 0.00 | % | | | 12/01/2046 | | | | 18,085 | | | | 2,345,625 | |
Series 2008 A, Tax Allocation CAB RB(f) | | | 0.00 | % | | | 12/01/2047 | | | | 18,085 | | | | 2,166,945 | |
Series 2008 A, Tax Allocation CAB RB(f) | | | 0.00 | % | | | 12/01/2048 | | | | 18,085 | | | | 2,001,286 | |
Series 2008 A, Tax Allocation CAB RB(f) | | | 0.00 | % | | | 12/01/2049 | | | | 18,085 | | | | 1,847,564 | |
Series 2008 A, Tax Allocation CAB RB(f) | | | 0.00 | % | | | 12/01/2050 | | | | 18,085 | | | | 1,704,873 | |
Series 2008 A, Tax Allocation RB | | | 6.00 | % | | | 12/01/2033 | | | | 1,475 | | | | 1,452,226 | |
Southern California Tobacco Securitization Authority (San Diego County Tobacco Asset Securitization Corp.); | | | | | | | | | | | | | | | | |
Series2006A-1, Sr. RB | | | 4.75 | % | | | 06/01/2025 | | | | 5 | | | | 5,000 | |
Series2006A-1, Sr. Tobacco Settlement Asset-Backed RB | | | 5.00 | % | | | 06/01/2037 | | | | 6,850 | | | | 6,850,206 | |
Series2006A-1, Sr. Tobacco Settlement Asset-Backed RB | | | 5.13 | % | | | 06/01/2046 | | | | 8,205 | | | | 8,205,246 | |
Series 2006, Tobacco Settlement Asset-Backed First Sub. CAB RB (f) | | | 0.00 | % | | | 06/01/2046 | | | | 30,000 | | | | 4,392,900 | |
Series 2006, Tobacco Settlement Asset-Backed Third Sub. CAB RB (f) | | | 0.00 | % | | | 06/01/2046 | | | | 47,000 | | | | 4,865,440 | |
University of California; Series 2017 M, Limited RB(b) | | | 5.00 | % | | | 05/15/2047 | | | | 50,890 | | | | 57,474,657 | |
Vallejo (City of) Public Financing Authority (Hiddenbrooke Improvement District); Series 2004 A, Local Agency RB | | | 5.80 | % | | | 09/01/2031 | | | | 3,665 | | | | 3,680,246 | |
Victor Valley Union High School District (Election of 2008); Series 2013 B, Unlimited Tax CAB GO Bonds (f)(j)(k) | | | 0.00 | % | | | 08/01/2023 | | | | 74,825 | | | | 14,642,148 | |
| | | | | | | | | | | | | | | | 1,120,775,986 | |
| | | | |
| Colorado–5.44% | | | | | | | | | | | | | | | | |
Amber Creak Metropolitan District; Series 2017 B, Sub. Limited Tax GO Bonds | | | 7.75 | % | | | 12/15/2047 | | | | 515 | | | | 506,178 | |
Arista Metroplitan District; Series 2018 A, Ref. & Improvement Limited Special Tax GO Bonds | | | 5.13 | % | | | 12/01/2048 | | | | 7,750 | | | | 7,890,585 | |
Banning Lewis Ranch Metropolitan District; | | | | | | | | | | | | | | | | |
Series 2018 A, Limited Tax GO Bonds | | | 5.38 | % | | | 12/01/2048 | | | | 2,500 | | | | 2,538,525 | |
Series 2018 B, Sub. Limited Tax GO Bonds | | | 7.75 | % | | | 12/15/2041 | | | | 630 | | | | 637,201 | |
Banning Lewis Ranch Metropolitan District No. 3; Series 2015 A, Limited Tax GO Bonds | | | 6.13 | % | | | 12/01/2045 | | | | 1,025 | | | | 976,425 | |
Banning Lewis Ranch Metropolitan District No. 4; | | | | | | | | | | | | | | | | |
Series 2018 A, Limited Tax GO Bonds | | | 5.75 | % | | | 12/01/2048 | | | | 5,000 | | | | 5,061,750 | |
Series 2018 B, Sub. Limited Tax GO Bonds | | | 8.00 | % | | | 12/15/2048 | | | | 2,063 | | | | 2,085,363 | |
Banning Lewis Ranch Metropolitan District No. 5; | | | | | | | | | | | | | | | | |
Series 2018 A, Limited Tax GO Bonds | | | 5.75 | % | | | 12/01/2048 | | | | 2,195 | | | | 2,222,108 | |
Series 2018 B, Limited Tax GO Bonds | | | 8.00 | % | | | 12/15/2048 | | | | 511 | | | | 516,539 | |
Brighton Crossing Metropolitan District No. 4; Series 2017 B, Sub. Limited Tax GO Bonds | | | 7.00 | % | | | 12/15/2047 | | | | 670 | | | | 652,051 | |
Bromley Park Metropolitan District No. 2; Series 2018 C, Ref. Limited Tax GO Bonds | | | 7.85 | % | | | 12/15/2047 | | | | 6,408 | | | | 6,386,021 | |
See accompanying Notes to Financial Statements which are an integral part of the financial statements.
15 Invesco High Yield Municipal Fund
| | | | | | | | | | | | | | | | |
| | | Interest
Rate | | | Maturity Date | | | Principal
Amount
(000) | | | Value | |
| Colorado–(continued) | | | | | | | | | | | | | | | | |
Broomfield Village Metropolitan District No. 2; Series 2003, Ref. & Improvement Limited Tax GO Bonds | | | 6.25 | % | | | 12/01/2032 | | | $ | 3,355 | | | $ | 2,717,550 | |
Buffalo Highlands Metropolitan District; | | | | | | | | | | | | | | | | |
Series 2018 A, Ref. & Improvement Limited Tax GO Bonds | | | 5.25 | % | | | 12/01/2038 | | | | 1,000 | | | | 1,001,930 | |
Series 2018 A, Ref. & Improvement Limited Tax GO Bonds | | | 5.38 | % | | | 12/01/2048 | | | | 1,750 | | | | 1,752,590 | |
Series 2018 B, Ref. Sub. Limited Tax GO Bonds | | | 7.63 | % | | | 12/15/2046 | | | | 1,226 | | | | 1,206,752 | |
Buffalo Ridge Metropolitan Distric; Series 2018 B, Sub. Limited Tax GO Bonds | | | 7.38 | % | | | 12/15/2047 | | | | 3,230 | | | | 3,233,230 | |
Canyons Metropolitan District No. 5; | | | | | | | | | | | | | | | | |
Series 2017 A, Ref. Limited Tax GO Bonds | | | 6.00 | % | | | 12/01/2037 | | | | 1,750 | | | | 1,773,012 | |
Series 2017 A, Ref. Limited Tax GO Bonds | | | 6.13 | % | | | 12/01/2047 | | | | 4,735 | | | | 4,769,518 | |
Series 2017 B, Sub. Limited Tax GO Bonds | | | 8.00 | % | | | 12/15/2047 | | | | 3,500 | | | | 3,544,450 | |
Castle Oaks Metropolitan District No. 3; | | | | | | | | | | | | | | | | |
Series 2017, Ref. Limited Tax GO Bonds | | | 5.00 | % | | | 12/01/2037 | | | | 3,275 | | | | 3,277,489 | |
Series 2017, Ref. Limited Tax GO Bonds | | | 5.00 | % | | | 12/01/2047 | | | | 9,265 | | | | 9,125,284 | |
Centerra Metropolitan District No. 1 (In the City of Loveland); | | | | | | | | | | | | | | | | |
Series 2017, Ref. Special Tax Allocation RB(i) | | | 5.00 | % | | | 12/01/2047 | | | | 7,000 | | | | 7,035,280 | |
Series 2018, Ref. Special Tax Allocation RB | | | 5.25 | % | | | 12/01/2048 | | | | 5,550 | | | | 5,616,378 | |
City & County of Denver CO Airport System Revenue; | | | | | | | | | | | | | | | | |
Series 2018 A, Sub. Airport System RB(b) | | | 5.00 | % | | | 12/01/2029 | | | | 24,580 | | | | 29,440,203 | |
Series 2018 A, Sub. Airport System RB(b) | | | 5.00 | % | | | 12/01/2036 | | | | 25,865 | | | | 29,824,414 | |
Clear Creek Station Metropolitan District No. 2; Series 2017 B, Sub. Limited Tax GO Bonds | | | 7.38 | % | | | 12/15/2047 | | | | 500 | | | | 502,775 | |
Colorado (State of) Educational & Cultural Facilities Authority (Community Leadership Academy); | | | | | | | | | | | | | | | | |
Series 2008, Charter School RB | | | 6.25 | % | | | 07/01/2028 | | | | 1,650 | | | | 1,653,019 | |
Series 2008, Charter School RB | | | 6.50 | % | | | 07/01/2038 | | | | 1,000 | | | | 1,001,590 | |
Series 2013, Charter School RB | | | 7.45 | % | | | 08/01/2048 | | | | 2,245 | | | | 2,520,372 | |
Colorado (State of) Health Facilities Authority (American Baptist Homes); Series 2009 A, RB(j)(k) | | | 7.75 | % | | | 08/01/2019 | | | | 4,000 | | | | 4,098,440 | |
Colorado (State of) Health Facilities Authority (Christian Living Communities); Series 2011, RB | | | 6.38 | % | | | 01/01/2041 | | | | 1,615 | | | | 1,726,193 | |
Colorado (State of) Health Facilities Authority (Frasier Meadows Retirement Community); | | | | | | | | | | | | | | | | |
Series 2017 A, Ref. Hospital RB | | | 5.25 | % | | | 05/15/2037 | | | | 750 | | | | 807,323 | |
Series 2017 A, Ref. Hospital RB | | | 5.25 | % | | | 05/15/2047 | | | | 3,500 | | | | 3,727,430 | |
Colorado (State of) Health Facilities Authority (SCL Health System); Series 2013 A, RB(b) | | | 5.00 | % | | | 01/01/2044 | | | | 21,000 | | | | 22,703,310 | |
Colorado (State of) Health Facilities Authority (Sunny Vista Living Center); | | | | | | | | | | | | | | | | |
Series 2015 A, Ref. RB(i) | | | 5.75 | % | | | 12/01/2035 | | | | 1,650 | | | | 1,698,064 | |
Series 2015 A, Ref. RB(i) | | | 6.13 | % | | | 12/01/2045 | | | | 2,300 | | | | 2,389,010 | |
Series 2015 A, Ref. RB(i) | | | 6.25 | % | | | 12/01/2050 | | | | 4,070 | | | | 4,244,237 | |
Colorado (State of) Health Facilities Authority (Total Longterm Care National Obligated Group); | | | | | | | | | | | | | | | | |
Series 2010 A, RB(j)(k) | | | 6.00 | % | | | 11/15/2020 | | | | 1,600 | | | | 1,714,016 | |
Series 2010 A, RB(j)(k) | | | 6.25 | % | | | 11/15/2020 | | | | 4,750 | | | | 5,108,245 | |
Series 2011, RB(j)(k) | | | 5.75 | % | | | 11/15/2021 | | | | 1,000 | | | | 1,103,510 | |
Series 2011, RB(j)(k) | | | 6.00 | % | | | 11/15/2021 | | | | 1,195 | | | | 1,326,522 | |
Colorado (State of) Health Facilities Authority (Volunteers of America Care); | | | | | | | | | | | | | | | | |
Series 2007 A, Health & Residential Care Facilities RB | | | 5.20 | % | | | 07/01/2022 | | | | 600 | | | | 600,246 | |
Series 2007 A, Health & Residential Care Facilities RB | | | 5.25 | % | | | 07/01/2027 | | | | 3,260 | | | | 3,260,293 | |
Series 2007 A, Health & Residential Care Facilities RB | | | 5.30 | % | | | 07/01/2037 | | | | 5,815 | | | | 5,794,299 | |
Colorado (State of) Regional Transportation District (Denver Transit Partners Eagle P3); | | | | | | | | | | | | | | | | |
Series 2010, Private Activity RB | | | 6.50 | % | | | 01/15/2030 | | | | 4,500 | | | | 4,662,765 | |
Series 2010, Private Activity RB | | | 6.00 | % | | | 01/15/2041 | | | | 12,935 | | | | 13,274,285 | |
Colorado International Center Metropolitan District No. 14; Series 2018, Ref. & Improvement Limited Tax GO Bonds | | | 5.88 | % | | | 12/01/2046 | | | | 15,750 | | | | 16,645,072 | |
Copperleaf Metropolitan District No. 6; | | | | | | | | | | | | | | | | |
Series 2018 A, Limited Tax GO Bonds | | | 5.25 | % | | | 12/01/2048 | | | | 2,000 | | | | 2,002,980 | |
Subseries 2018 B, Limited Tax GO Bonds | | | 7.50 | % | | | 12/15/2048 | | | | 820 | | | | 820,090 | |
See accompanying Notes to Financial Statements which are an integral part of the financial statements.
16 Invesco High Yield Municipal Fund
| | | | | | | | | | | | | | | | |
| | | Interest
Rate | | | Maturity Date | | | Principal
Amount
(000) | | | Value | |
| Colorado–(continued) | | | | | | | | | | | | | | | | |
Cornerstar Metropolitan District; | | | | | | | | | | | | | | | | |
Series 2017 A, Ref. Limited Tax GO Bonds | | | 5.13 | % | | | 12/01/2037 | | | $ | 1,000 | | | $ | 1,025,980 | |
Series 2017 A, Ref. Limited Tax GO Bonds | | | 5.25 | % | | | 12/01/2047 | | | | 2,600 | | | | 2,662,010 | |
Crowfoot Valley Ranch Metropolitan District No. 2; | | | | | | | | | | | | | | | | |
Series 2018 A, Limited Tax GO Bonds | | | 5.63 | % | | | 12/01/2038 | | | | 2,555 | | | | 2,518,821 | |
Series 2018 A, Limited Tax GO Bonds | | | 5.75 | % | | | 12/01/2048 | | | | 9,665 | | | | 9,501,758 | |
Series 2018 B, Sub. Limited Tax GO Bonds | | | 8.00 | % | | | 12/15/2048 | | | | 1,630 | | | | 1,607,408 | |
Denver (City & County of); Series 2018 A, Ref. Sub. Airport System RB (b) | | | 5.25 | % | | | 12/01/2043 | | | | 17,500 | | | | 20,178,375 | |
Denver (City & County of) (United Airlines, Inc.); Series 2017, Ref. Special Facilities Airport RB(m) | | | 5.00 | % | | | 10/01/2032 | | | | 13,000 | | | | 13,820,820 | |
Denver (City of) Urban Renewal Authority (9th and Colorado Urban); Series 2018 A, Tax Increment Allocation RB (i) | | | 5.25 | % | | | 12/01/2039 | | | | 9,000 | | | | 9,060,000 | |
Denver Gateway Center Metropolitan District; | | | | | | | | | | | | | | | | |
Series 2018 A, Limited Tax GO Bonds | | | 5.63 | % | | | 12/01/2048 | | | | 2,130 | | | | 2,182,803 | |
Series 2018 B, Sub. Limited Tax GO Bonds | | | 7.88 | % | | | 12/15/2048 | | | | 1,855 | | | | 1,848,804 | |
Douglas (County of) Sierra Ridge Metropolitan District No. 2; | | | | | | | | | | | | | | | | |
Series 2016A, Sr. Limited Tax GO Bonds | | | 5.50 | % | | | 12/01/2046 | | | | 2,000 | | | | 2,033,240 | |
Series 2016B, Sub. Limited Tax GO Bonds | | | 7.63 | % | | | 12/15/2046 | | | | 1,500 | | | | 1,459,905 | |
Elbert (County of) & Highway 86 Commercial Metropolitan District; Series 2008 A, Public Improvement Fee RB (o) | | | 7.50 | % | | | 12/01/2032 | | | | 4,500 | | | | 3,375,000 | |
Fitzsimons Village Metropolitan District No. 1; Series 2010 A, Tax Increment Allocation & Public Improvement Fee Supported RB | | | 7.50 | % | | | 03/01/2040 | | | | 4,526 | | | | 4,615,841 | |
Fossil Ridge Metropolitan District No. 1; Series 2010, Ref. Tax Supported Limited Tax GO Bonds | | | 7.25 | % | | | 12/01/2040 | | | | 930 | | | | 962,076 | |
Gardens on Havana Metropolitan District No. 3 (The); | | | | | | | | | | | | | | | | |
Series 2017 A, Special RB | | | 5.13 | % | | | 12/01/2037 | | | | 1,070 | | | | 1,095,937 | |
Series 2017 A, Special RB | | | 5.25 | % | | | 12/01/2047 | | | | 1,015 | | | | 1,037,442 | |
Series 2017 B, Sub. Special RB | | | 7.75 | % | | | 12/15/2047 | | | | 1,000 | | | | 1,013,980 | |
Grandby Ranch Metropolitan District; Series 2018, Ref. Limited Tax GO Bonds(i) | | | 5.50 | % | | | 12/01/2052 | | | | 5,490 | | | | 5,456,127 | |
Johnston (Town of) Plaza Metropolitan District; | | | | | | | | | | | | | | | | |
Series 2016A, Special RB | | | 5.25 | % | | | 12/01/2036 | | | | 4,000 | | | | 3,887,280 | |
Series 2016A, Special RB | | | 5.38 | % | | | 12/01/2046 | | | | 12,000 | | | | 11,562,240 | |
Lakes at Centerra Metropolitan District No. 2; | | | | | | | | | | | | | | | | |
Series 2018 A, Improvement Limited Tax GO Bonds | | | 5.13 | % | | | 12/01/2037 | | | | 2,200 | | | | 2,221,516 | |
Series 2018 A, Improvement Limited Tax GO Bonds | | | 5.25 | % | | | 12/01/2047 | | | | 3,470 | | | | 3,498,246 | |
Series 2018 B, Sub. Limited Tax GO Bonds | | | 7.63 | % | | | 12/15/2047 | | | | 1,795 | | | | 1,800,834 | |
Leyden Rock Metropolitan District No. 10; Series 2017 C, Ref. Jr. Lien Sub. Limited Tax GO Bonds | | | 10.75 | % | | | 12/15/2049 | | | | 1,025 | | | | 999,918 | |
Montrose (County of) (The Homestead at Montrose, Inc.); | | | | | | | | | | | | | | | | |
Series 2003 A, Health Care Facilities RB | | | 6.75 | % | | | 02/01/2022 | | | | 150 | | | | 150,038 | |
Series 2003 A, Health Care Facilities RB | | | 7.00 | % | | | 02/01/2025 | | | | 800 | | | | 800,072 | |
Series 2003 A, Health Care Facilities RB | | | 7.00 | % | | | 02/01/2038 | | | | 6,200 | | | | 6,072,404 | |
Neu Towne Metropolitan District; Series 2018 B, Ref. Sub. Limited Tax GO Bonds | | | 7.75 | % | | | 12/15/2046 | | | | 2,285 | | | | 2,274,260 | |
North Holly Metropolitan District; | | | | | | | | | | | | | | | | |
Series 2018 A, Limited Tax GO Bonds | | | 5.50 | % | | | 12/01/2048 | | | | 1,260 | | | | 1,232,809 | |
Series 2018 B, Sub. Limited Tax GO Bonds | | | 7.88 | % | | | 12/15/2048 | | | | 1,015 | | | | 999,095 | |
North Park Metropolitan District No. 1; | | | | | | | | | | | | | | | | |
Series 2018A-2, Special RB | | | 5.50 | % | | | 12/01/2034 | | | | 8,340 | | | | 8,618,890 | |
Series 2018A-2, Special RB | | | 5.85 | % | | | 12/01/2048 | | | | 9,000 | | | | 9,241,200 | |
Series 2018A-1, Special RB | | | 5.38 | % | | | 12/01/2034 | | | | 5,650 | | | | 5,795,092 | |
Series 2018A-1, Special RB | | | 5.75 | % | | | 12/01/2048 | | | | 3,850 | | | | 3,916,913 | |
North Range Metropolitan District No. 2; | | | | | | | | | | | | | | | | |
Series 2017 A, Ref. Limited Tax GO Bonds | | | 5.63 | % | | | 12/01/2037 | | | | 3,270 | | | | 3,270,589 | |
Series 2017 A, Ref. Limited Tax GO Bonds | | | 5.75 | % | | | 12/01/2047 | | | | 4,885 | | | | 4,884,511 | |
Series 2017 B, Sub. Limited Tax GO Bonds | | | 7.75 | % | | | 12/15/2047 | | | | 2,830 | | | | 2,828,613 | |
Painted Prairie Metropolitain District No. 2; Series 2018, Limited Tax GO Bonds | | | 5.25 | % | | | 12/01/2048 | | | | 5,250 | | | | 5,264,332 | |
See accompanying Notes to Financial Statements which are an integral part of the financial statements.
17 Invesco High Yield Municipal Fund
| | | | | | | | | | | | | | | | |
| | | Interest
Rate | | | Maturity Date | | | Principal
Amount
(000) | | | Value | |
| Colorado–(continued) | | | | | | | | | | | | | | | | |
Prairie Center Metropolitan District No. 3 (Park & Recreation Improvements); Series 2018, Special RB | | | 5.13 | % | | | 12/15/2042 | | | $ | 4,335 | | | $ | 4,249,991 | |
Public Authority for Colorado Energy; Series 2008, Natural Gas Purchase RB | | | 6.50 | % | | | 11/15/2038 | | | | 22,895 | | | | 32,122,143 | |
Riverdale Peaks II Metropolitan District; Series 2005, Limited Tax GO Bonds | | | 6.50 | % | | | 12/01/2035 | | | | 1,000 | | | | 500,000 | |
South Aurora Regional Improvement Authority; Series 2018, Special RB | | | 6.25 | % | | | 12/01/2057 | | | | 2,815 | | | | 2,842,868 | |
Southlands Metropolitan District No. 1;
Series 2017A-1, Ref. Unlimited Tax GO Bonds | | | 5.00 | % | | | 12/01/2037 | | | | 265 | | | | 281,356 | |
Series 2017A-1, Ref. Unlimited Tax GO Bonds | | | 5.00 | % | | | 12/01/2047 | | | | 500 | | | | 522,650 | |
Series 2017A-2, Unlimited Tax GO Bonds | | | 5.00 | % | | | 12/01/2047 | | | | 325 | | | | 339,723 | |
St. Vrain Lakes Metropolitan District No. 2; | | | | | | | | | | | | | | | | |
Series 2017 A, Sr. Limited Tax GO Bonds | | | 5.00 | % | | | 12/01/2037 | | | | 2,510 | | | | 2,512,661 | |
Series 2017 A, Sr. Limited Tax GO Bonds | | | 5.13 | % | | | 12/01/2047 | | | | 2,550 | | | | 2,547,883 | |
Series 2017 B, Sub. Limited Tax GO Bonds | | | 7.63 | % | | | 12/15/2047 | | | | 1,080 | | | | 1,050,840 | |
Sterling Ranch Community Authority Board; Series 2017 B, Sr. Sub. Supported and Special RB | | | 7.50 | % | | | 12/15/2047 | | | | 5,500 | | | | 5,491,035 | |
Tailholt Metropolitan District No. 3;
Series 2018 A, Limited Tax GO Bonds | | | 6.00 | % | | | 12/01/2048 | | | | 7,545 | | | | 7,646,178 | |
Series 2018 B, Limited Tax GO Bonds | | | 8.13 | % | | | 12/15/2048 | | | | 1,647 | | | | 1,666,962 | |
University of Colorado; Series 2014 A, Enterprise RB(b)(j)(k) | | | 5.00 | % | | | 06/01/2024 | | | | 16,835 | | | | 19,618,499 | |
Villages at Castle Rock Metropolitan District No. 6 (Cobblestone Ranch); Series 2007, CAB Limited Tax GO Bonds(f) | | | 0.00 | % | | | 12/01/2037 | | | | 90,348 | | | | 24,841,315 | |
Vista Ridge Metropolitan District; Series 2006 B, Ref. Sub. Limited Tax GO
Bonds(j)(k) | | | 9.50 | % | | | 12/01/2021 | | | | 1,000 | | | | 1,223,460 | |
| | | | | | | | | | | | | | | | 509,407,655 | |
| | | | |
| Connecticut–0.19% | | | | | | | | | | | | | | | | |
Georgetown (City of) Special Taxing District; Series 2006 A, Unlimited Tax GO Bonds (Acquired 11/16/2006; Cost $2,955,000)(c)(i) | | | 5.13 | % | | | 10/01/2036 | | | | 4,405 | | | | 1,409,600 | |
Hamden (Town of) (Whitney Center);
Series 2009 A, Facility RB | | | 7.75 | % | | | 01/01/2043 | | | | 10,815 | | | | 11,056,607 | |
Series 2009 C, RB(k) | | | 5.50 | % | | | 01/01/2022 | | | | 2,000 | | | | 1,888,400 | |
Harbor Point Infrastructure Improvement District (Harbor Point); Series 2010 A, Special Obligation Tax Allocation RB(j)(k) | | | 7.88 | % | | | 04/01/2020 | | | | 3,000 | | | | 3,197,460 | |
| | | | | | | | | | | | | | | | 17,552,067 | |
| | | | |
| Delaware–0.20% | | | | | | | | | | | | | | | | |
Delaware (State of) Economic Development Authority (Aspira of Delaware Charter Operations, Inc.); Series 2016A, RB | | | 5.00 | % | | | 06/01/2051 | | | | 2,200 | | | | 2,121,394 | |
Delaware (State of) Economic Development Authority (Newark Charter School); Series 2012, RB | | | 5.00 | % | | | 09/01/2042 | | | | 1,350 | | | | 1,391,391 | |
Millsboro (Town of) (Plantation Lakes Special Development District);
Series 2018, Special GO Bonds(i) | | | 5.13 | % | | | 07/01/2038 | | | | 8,000 | | | | 8,217,280 | |
Series 2018, Special Obligation Bonds(i) | | | 5.25 | % | | | 07/01/2048 | | | | 4,100 | | | | 4,193,767 | |
Wilmington (City of) (Electra Arms Senior Association); Series 1998, MFH Rental RB (m) | | | 6.25 | % | | | 06/01/2028 | | | | 3,185 | | | | 3,186,656 | |
| | | | | | | | | | | | | | | | 19,110,488 | |
| | | | |
| District of Columbia–1.65% | | | | | | | | | | | | | | | | |
District of Columbia;
Series 2009 B, Ref. Sec. Income Tax RB(b) | | | 5.00 | % | | | 12/01/2025 | | | | 16,165 | | | | 16,560,881 | |
Series 2014 C, Unlimited Tax GO Bonds(b) | | | 5.00 | % | | | 06/01/2038 | | | | 21,000 | | | | 23,423,610 | |
District of Columbia (Center for Strategic & International Studies, Inc.);
Series 2011, RB(j)(k) | | | 6.38 | % | | | 03/01/2021 | | | | 1,815 | | | | 1,960,817 | |
Series 2011, RB(j)(k) | | | 6.63 | % | | | 03/01/2021 | | | | 5,150 | | | | 5,645,688 | |
District of Columbia (Cesar Chavez Charter School); Series 2011, RB | | | 7.88 | % | | | 11/15/2040 | | | | 7,000 | | | | 7,143,430 | |
District of Columbia (Gallaudet University); Series 2011, University RB | | | 5.50 | % | | | 04/01/2041 | | | | 3,000 | | | | 3,193,080 | |
See accompanying Notes to Financial Statements which are an integral part of the financial statements.
18 Invesco High Yield Municipal Fund
| | | | | | | | | | | | | | | | |
| | | Interest
Rate | | | Maturity Date | | | Principal
Amount
(000) | | | Value | |
| District of Columbia–(continued) | | | | | | | | | | | | | | | | |
District of Columbia (Ingleside at Rock Creek);
Series 2017 A, RB | | | 5.00 | % | | | 07/01/2032 | | | $ | 500 | | | $ | 525,320 | |
Series 2017 A, RB | | | 5.00 | % | | | 07/01/2037 | | | | 1,450 | | | | 1,491,673 | |
Series 2017 A, RB | | | 5.00 | % | | | 07/01/2042 | | | | 1,250 | | | | 1,268,625 | |
Series 2017 A, RB | | | 5.00 | % | | | 07/01/2052 | | | | 8,250 | | | | 8,316,495 | |
District of Columbia (Provident Group—Howard Properties LLC); Series 2013, Student Dormitory RB | | | 5.00 | % | | | 10/01/2045 | | | | 7,750 | | | | 7,789,990 | |
District of Columbia (Sibley Memorial Hospital);
Series 2009, Hospital RB(j)(k) | | | 6.38 | % | | | 10/01/2019 | | | | 2,000 | | | | 2,054,060 | |
Series 2009, Hospital RB(j)(k) | | | 6.50 | % | | | 10/01/2019 | | | | 5,000 | | | | 5,138,400 | |
District of Columbia Tobacco Settlement Financing Corp.;
Series 2006A, Asset-Backed CAB RB(f) | | | 0.00 | % | | | 06/15/2046 | | | | 100,920 | | | | 15,478,100 | |
Series 2006C, Asset-Backed CAB RB(f) | | | 0.00 | % | | | 06/15/2055 | | | | 60,320 | | | | 2,284,318 | |
District of Columbia Water & Sewer Authority; Series 2013 A, Sub. Lien Public Utility RB(b) | | | 5.00 | % | | | 10/01/2044 | | | | 27,000 | | | | 29,635,200 | |
District of Columbia Water & Sewer Authority (Green Bonds); Series 2017 A, Public Utility RB(b) | | | 5.00 | % | | | 10/01/2052 | | | | 20,000 | | | | 22,511,000 | |
| | | | | | | | | | | | | | | | 154,420,687 | |
| | | | |
| Florida–5.07% | | | | | | | | | | | | | | | | |
Alachua (County of) Health Facilities Authority (East Ridge Retirement Village, Inc.); Series 2014, RB | | | 6.25 | % | | | 11/15/2044 | | | | 6,500 | | | | 5,658,445 | |
Series 2014, RB | | | 6.38 | % | | | 11/15/2049 | | | | 6,750 | | | | 5,929,200 | |
Alachua (County of) Health Facilities Authority (Oak Hammock at the University of Florida); Series 2012 A, Ref. Continuing Care Retirement Community RB | | | 8.00 | % | | | 10/01/2032 | | | | 1,000 | | | | 1,131,750 | |
Series 2012 A, Ref. Continuing Care Retirement Community RB | | | 8.00 | % | | | 10/01/2042 | | | | 2,500 | | | | 2,816,100 | |
Series 2012 A, Ref. Continuing Care Retirement Community RB | | | 8.00 | % | | | 10/01/2046 | | | | 2,000 | | | | 2,245,820 | |
Alachua (County of) Health Facilities Authority (Terraces at Bonita Springs); Series 2011 A, RB | | | 8.00 | % | | | 11/15/2031 | | | | 3,000 | | | | 3,277,140 | |
Series 2011 A, RB | | | 8.13 | % | | | 11/15/2041 | | | | 11,200 | | | | 12,201,392 | |
Series 2011 A, RB | | | 8.13 | % | | | 11/15/2046 | | | | 6,000 | | | | 6,520,620 | |
Atlantic Beach (City of) (Fleet Landing);
Series 2018 A, Health Care Facilities RB | | | 5.00 | % | | | 11/15/2043 | | | | 1,100 | | | | 1,173,909 | |
Series 2018 A, Health Care Facilities RB | | | 5.00 | % | | | 11/15/2048 | | | | 3,190 | | | | 3,391,257 | |
Series 2018 A, Health Care Facilities RB | | | 5.00 | % | | | 11/15/2053 | | | | 6,235 | | | | 6,577,987 | |
Broward (County of); Series 2017, Airport System RB(b) | | | 5.00 | % | | | 10/01/2042 | | | | 12,045 | | | | 13,395,365 | |
Buckeye Park Community Development District; Series 2008 A, Capital Improvement Special Assessment RB(c) | | | 7.88 | % | | | 05/01/2038 | | | | 4,900 | | | | 2,107,000 | |
Cape Coral (City of) Health Facilities Authority (Gulf Care Inc.);
Series 2015, Ref. Senior Housing RB(i) | | | 6.00 | % | | | 07/01/2045 | | | | 4,000 | | | | 4,245,440 | |
Series 2015, Ref. Senior Housing RB(i) | | | 6.00 | % | | | 07/01/2050 | | | | 5,265 | | | | 5,573,371 | |
Capital Trust Agency (Miami Community Charter School); Series 2010 A, RB | | | 7.00 | % | | | 10/15/2040 | | | | 1,500 | | | | 1,541,865 | |
Capital Trust Agency Inc.(H-Bay Ministries, Inc.- Superior Residences);
Series 2018A-1, Sr. Living RB | | | 4.00 | % | | | 07/01/2038 | | | | 2,750 | | | | 2,680,150 | |
Series 2018A-1, Sr. Living RB | | | 4.00 | % | | | 07/01/2043 | | | | 1,000 | | | | 950,040 | |
Series 2018A-1, Sr. Living RB | | | 4.13 | % | | | 07/01/2053 | | | | 2,000 | | | | 1,895,020 | |
Series 2018 B, Sr. Living RB | | | 5.00 | % | | | 07/01/2043 | | | | 500 | | | | 505,955 | |
Series 2018 B, Sr. Living RB | | | 5.00 | % | | | 07/01/2053 | | | | 1,100 | | | | 1,102,365 | |
Capital Trust Agency Inc. (Sarasota-Manatee Jewish Housing Council, Inc.);
Series 2017, Ref. Retirement Facility RB(i) | | | 5.00 | % | | | 07/01/2037 | | | | 1,000 | | | | 1,023,170 | |
Series 2017, Ref. Retirement Facility RB(i) | | | 5.00 | % | | | 07/01/2046 | | | | 600 | | | | 603,612 | |
Capital Trust Agency Inc. (Tallahassee Tapestry);
Series 2015, First Mortgage RB(i) | | | 6.75 | % | | | 12/01/2035 | | | | 5,405 | | | | 5,477,103 | |
Series 2015, First Mortgage RB(i) | | | 7.13 | % | | | 12/01/2050 | | | | 2,000 | | | | 2,030,080 | |
Capital Trust Agency Inc. (University Bridge LLC Student Housing);
Series A, Student Housting RB(i) | | | 5.25 | % | | | 12/01/2043 | | | | 11,000 | | | | 10,983,940 | |
See accompanying Notes to Financial Statements which are an integral part of the financial statements.
19 Invesco High Yield Municipal Fund
| | | | | | | | | | | | | | | | |
| | | Interest
Rate | | | Maturity Date | | | Principal
Amount
(000) | | | Value | |
| Florida–(continued) | | | | | | | | | | | | | | | | |
Capital Trust Agency, Inc. (Tallahassee Tapestry); Series 2015, First Mortgage RB(i) | | | 7.00 | % | | | 12/01/2045 | | | $ | 2,000 | | | $ | 2,016,760 | |
Championsgate Community Development District; Series 1998 A, Capital Improvement Special Assessment RB | | | 6.25 | % | | | 05/01/2020 | | | | 700 | | | | 701,505 | |
Collier (County of) Industrial Development Authority (The Arlington of Naples); | | | | | | | | | | | | | | | | |
Series 2014 A, Continuing Care Community RB(i) | | | 8.13 | % | | | 05/15/2044 | | | | 5,560 | | | | 5,444,908 | |
Series 2014 A, Continuing Care Community RB(i) | | | 8.25 | % | | | 05/15/2049 | | | | 44,570 | | | | 43,613,528 | |
Series 2015 A, Continuing Care Community RB(i) | | | 5.50 | % | | | 05/15/2025 | | | | 345 | | | | 333,553 | |
Series 2015 A, Continuing Care Community RB(i) | | | 6.25 | % | | | 05/15/2035 | | | | 875 | | | | 811,108 | |
Series 2015 A, Continuing Care Community RB(i) | | | 6.50 | % | | | 05/15/2049 | | | | 3,000 | | | | 2,693,550 | |
East Homestead Community Development District; Series 2013, Special Assessment RB | | | 5.63 | % | | | 11/01/2043 | | | | 2,000 | | | | 2,047,900 | |
Florida (State of)Mid-Bay Bridge Authority; Series 2011 A, Springing Lien RB (j)(k) | | | 7.25 | % | | | 10/01/2021 | | | | 14,000 | | | | 15,930,180 | |
Florida Development Finance Corp. (Brightline Passenger Rail); Series 2017, Surface Transportation Facility RB (i)(k)(m) | | | 5.63 | % | | | 01/01/2028 | | | | 37,000 | | | | 38,160,320 | |
Florida Development Finance Corp. (Palm Bay Academy Inc.); | | | | | | | | | | | | | | | | |
Series 2017, Ref. Sr. Lien Taxable RB(i) | | | 6.38 | % | | | 05/15/2037 | | | | 2,705 | | | | 2,560,066 | |
Series 2017, Ref. Sub Lien Taxable RB(f)(i) | | | 0.00 | % | | | 05/15/2037 | | | | 2,235 | | | | 843,386 | |
Florida Development Finance Corp. (Renaissance Charter School, Inc.); | | | | | | | | | | | | | | | | |
Series 2012 A, Educational Facilities RB(i) | | | 6.00 | % | | | 06/15/2032 | | | | 4,250 | | | | 4,331,685 | |
Series 2012 A, Educational Facilities RB(i) | | | 6.13 | % | | | 06/15/2043 | | | | 4,250 | | | | 4,285,615 | |
Series 2015, Educational Facilities RB(i) | | | 6.13 | % | | | 06/15/2046 | | | | 14,035 | | | | 14,314,858 | |
Florida Development Finance Corp. (Sculptor Charter School); | | | | | | | | | | | | | | | | |
Series 2008 A, RB | | | 7.25 | % | | | 10/01/2038 | | | | 2,525 | | | | 2,531,691 | |
Series 2012, RB | | | 7.00 | % | | | 10/01/2026 | | | | 90 | | | | 97,089 | |
Series 2012, RB | | | 7.25 | % | | | 10/01/2041 | | | | 595 | | | | 640,184 | |
Gramercy Farms Community Development District; | | | | | | | | | | | | | | | | |
Series 2007A-1, Special Assessment RB(c) | | | 5.25 | % | | | 05/01/2039 | | | | 1,335 | | | | 13 | |
Series 2007A-2, Special Assessment RB(c) | | | 5.25 | % | | | 05/01/2039 | | | | 1,700 | | | | 17 | |
Series 2011, Ref. Special Assessment Conv. CAB RB(d) | | | 6.75 | % | | | 05/01/2039 | | | | 25,185 | | | | 12,088,800 | |
Highlands (County of) Health Facilities Authority (Trousdale Foundation Properties); Series 2018 A, Sr. Living RB | | | 6.25 | % | | | 04/01/2049 | | | | 10,010 | | | | 10,352,342 | |
Hillsborough (County of) Industrial Development Authority (Health Facilities); Series 2008 B, IDR (j)(k) | | | 8.00 | % | | | 08/15/2019 | | | | 1,000 | | | | 1,037,990 | |
Kendall Breeze West Community Development District; Series 2004, Special Assessment RB | | | 5.88 | % | | | 05/01/2034 | | | | 1,120 | | | | 1,120,179 | |
Lake (County of) Florida (Lakeside at Waterman Village); | | | | | | | | | | | | | | | | |
Series 2018 A, Retirement Community RB(i) | | | 10.00 | % | �� | | 10/31/2023 | | | | 2,500 | | | | 2,500,100 | |
Series 2018 A, Taxable Retirement Community RB(i) | | | 12.00 | % | | | 10/31/2023 | | | | 1,000 | | | | 999,850 | |
Lake Helen (City of) (Ivy Hawn Charter School of the Arts); | | | | | | | | | | | | | | | | |
Series 2018 A, Educational Facilities RB(i) | | | 5.50 | % | | | 07/15/2048 | | | | 2,250 | | | | 2,257,178 | |
Series 2018 A, Educational Facilities RB(i) | | | 5.75 | % | | | 07/15/2053 | | | | 2,030 | | | | 2,054,746 | |
Lakeland (City of) (Carpenter’s Home Estate Accident Investor); Series 2008, Ref. First Mortgage Retirement Community RB | | | 6.38 | % | | | 01/01/2043 | | | | 2,250 | | | | 2,253,803 | |
Lee (County of) Industrial Development Authority (Cypress Cove Healthpark); | | | | | | | | | | | | | | | | |
Series 2012, Ref. RB | | | 5.25 | % | | | 10/01/2032 | | | | 4,500 | | | | 4,691,610 | |
Series 2012, Ref. RB | | | 5.75 | % | | | 10/01/2042 | | | | 10,100 | | | | 10,624,594 | |
Series 2012, Ref. RB | | | 6.50 | % | | | 10/01/2047 | | | | 10,000 | | | | 10,849,000 | |
Lee (County of) Industrial Development Authority (Lee County Community Charter Schools, LLC); | | | | | | | | | | | | | | | | |
Series 2012, IDR | | | 5.50 | % | | | 06/15/2032 | | | | 1,880 | | | | 1,869,340 | |
Series 2012, IDR | | | 5.75 | % | | | 06/15/2042 | | | | 3,210 | | | | 3,129,333 | |
Miami-Dade (County of); | | | | | | | | | | | | | | | | |
Series 2009, Sub. Special Obligation CAB RB(f) | | | 0.00 | % | | | 10/01/2035 | | | | 12,000 | | | | 6,504,600 | |
Series 2009, Sub. Special Obligation CAB RB(f) | | | 0.00 | % | | | 10/01/2042 | | | | 42,215 | | | | 15,968,668 | |
Miami-Dade (County of) (Building Better Communities Program); | | | | | | | | | | | | | | | | |
Series 2016A, Ref. Unlimited Tax GO Bonds(b) | | | 5.00 | % | | | 07/01/2037 | | | | 15,605 | | | | 17,704,653 | |
Series 2016A, Ref. Unlimited Tax GO Bonds(b) | | | 5.00 | % | | | 07/01/2038 | | | | 15,985 | | | | 18,103,332 | |
See accompanying Notes to Financial Statements which are an integral part of the financial statements.
20 Invesco High Yield Municipal Fund
| | | | | | | | | | | | | | | | |
| | | Interest
Rate | | | Maturity
Date | | | Principal
Amount
(000) | | | Value | |
| Florida–(continued) | | | | | | | | | | | | | | | | |
Miami-Dade (County of) Educational Facilities Authority (University of Miami); Series 2018 A, RB(b) | | | 5.00 | % | | | 04/01/2053 | | | $ | 13,500 | | | $ | 14,908,320 | |
Miami-Dade (County of) Health Facilities Authority (Miami Children’s Hospital); | | | | | | | | | | | | | | | | |
Series 2010, Ref. Hospital RB(j)(k) | | | 6.00 | % | | | 08/01/2020 | | | | 365 | | | | 386,374 | |
Series 2010, Ref. Hospital RB(j)(k) | | | 6.13 | % | | | 08/01/2020 | | | | 185 | | | | 196,154 | |
Series 2010, Ref. Hospital RB | | | 6.00 | % | | | 08/01/2030 | | | | 135 | | | | 142,255 | |
Series 2010, Ref. Hospital RB | | | 6.13 | % | | | 08/01/2042 | | | | 65 | | | | 68,475 | |
Orange (County of) Housing Finance Authority (Alhambra Trace Apartments); Series 1998 C, RB | | | 7.00 | % | | | 04/01/2028 | | | | 1,290 | | | | 1,290,968 | |
Orange (County of) Housing Finance Authority (Governors Manor Apartments); Series 2001F-4, RB | | | 7.25 | % | | | 10/01/2031 | | | | 3,320 | | | | 3,325,544 | |
Orange (County of) Housing Finance Authority (Lake Davis Apartments); Series 2001F-1, RB | | | 7.25 | % | | | 10/01/2031 | | | | 690 | | | | 691,152 | |
Orange (County of) Housing Finance Authority (Lake Jennie Phase I); Series 2001F-2, RB | | | 7.25 | % | | | 10/01/2031 | | | | 180 | | | | 180,301 | |
Orange (County of) Housing Finance Authority (Lake Jennie Phase II); Series 2001F-3, RB | | | 7.25 | % | | | 10/01/2031 | | | | 690 | | | | 691,152 | |
Orange (County of) Housing Finance Authority (Mellonville Trace Apartments); Series 2001F-5, RB | | | 7.25 | % | | | 10/01/2031 | | | | 265 | | | | 265,443 | |
Orlando (City of); Series 2014 A, Contract Tourist Development Tax Payments RB(b)(j)(k) | | | 5.00 | % | | | 05/01/2024 | | | | 20,305 | | | | 23,556,846 | |
Overoaks Community Development District; Series 2010A-2, Capital Improvement Conv. CAB RB (d) | | | 6.13 | % | | | 05/01/2035 | | | | 365 | | | | 365,438 | |
Palm Beach (County of) Health Facilities Authority (Sinai Residences of Boca Raton); Series 2014 A, RB | | | 7.50 | % | | | 06/01/2049 | | | | 2,750 | | | | 3,089,845 | |
Pine Ridge Plantation Community Development District; Series 2006 A, Capital Improvement Special Assessment RB | | | 5.40 | % | | | 05/01/2037 | | | | 1,369 | | | | 1,218,298 | |
Pinellas (County of) Educational Facilities Authority (Pinellas Preparatory Academy); | | | | | | | | | | | | | | | | |
Series 2011 A, RB | | | 6.13 | % | | | 09/15/2021 | | | | 300 | | | | 312,843 | |
Series 2011 A, RB | | | 7.13 | % | | | 09/15/2041 | | | | 3,250 | | | | 3,352,992 | |
Reunion East Community Development District; | | | | | | | | | | | | | | | | |
Series 2002A-2, Special Assessment RB(c) | | | 7.38 | % | | | 05/01/2033 | | | | 145 | | | | 1 | |
Series 2005, Special Assessment RB(c) | | | 5.80 | % | | | 05/01/2036 | | | | 1,716 | | | | 17 | |
Series2015-1, Special Assessment RB | | | 6.60 | % | | | 05/01/2033 | | | | 150 | | | | 149,574 | |
Series2015-2, Special Assessment RB | | | 6.60 | % | | | 05/01/2036 | | | | 2,080 | | | | 2,073,427 | |
Sarasota (County of) Public Hospital District (Sarasota Memorial Hospital); Series 2008 B, Ref. RB(LOC-Wells Fargo Bank N.A.)(g)(h) | | | 1.75 | % | | | 07/01/2037 | | | | 2,000 | | | | 2,000,000 | |
Seminole (County of) Industrial Development Authority (Legacy Pointe at UCF); | | | | | | | | | | | | | | | | |
Series 2016 A, RB(i) | | | 10.00 | % | | | 12/28/2021 | | | | 5,350 | | | | 6,558,511 | |
Series 2018 A, RB(i) | | | 10.50 | % | | | 12/28/2021 | | | | 1,400 | | | | 1,400,112 | |
St. Johns (County of) Industrial Development Authority (Presbyterian Retirement Communities); | | | | | | | | | | | | | | | | |
Series 2010 A, RB(j)(k) | | | 6.00 | % | | | 08/01/2020 | | | | 4,000 | | | | 4,237,120 | |
St. Petersburg (City of) Health Facilities Authority (All Children’s Hospital, Inc. Obligated Group); | | | | | | | | | | | | | | | | |
Series 2009 A, Ref. RB(j)(k) | | | 6.25 | % | | | 11/15/2019 | | | | 150 | | | | 154,706 | |
Series 2009 A, Ref. RB(j)(k) | | | 6.50 | % | | | 11/15/2019 | | | | 1,000 | | | | 1,033,380 | |
Sterling Hill Community Development District; Series 2003 A, Capital Improvement Special Assessment RB(o) | | | 6.20 | % | | | 05/01/2035 | | | | 1,375 | | | | 879,793 | |
Stonegate Community Development District; Series 2008, Special Assessment RB | | | 8.13 | % | | | 05/01/2039 | | | | 4,310 | | | | 4,423,094 | |
Tallahassee (City of) (Tallahassee Memorial Health Care, Inc.); Series 2016, Health Facility RB | | | 5.00 | % | | | 12/01/2055 | | | | 6,000 | | | | 6,390,420 | |
Tampa Bay Water; Series 2001 A, Ref. & Improvement Utility System RB(INS - NATL)(b)(e) | | | 6.00 | % | | | 10/01/2029 | | | | 13,440 | | | | 17,930,976 | |
Treeline Preserve Community Development District; Series 2007 A, Special Assessment RB(c) | | | 6.80 | % | | | 05/01/2039 | | | | 4,895 | | | | 2,692,250 | |
| | | | | | | | | | | | | | | | 474,471,911 | |
| | | | |
| Georgia–0.82% | | | | | | | | | | | | | | | | |
Americus (City of) & Sumter (County of) Hospital Authority (Magnolia Manor Obligated Group); | | | | | | | | | | | | | | | | |
Series 2013 A, Ref. RB | | | 6.25 | % | | | 05/15/2033 | | | | 3,950 | | | | 4,241,036 | |
Series 2013 A, Ref. RB | | | 6.38 | % | | | 05/15/2043 | | | | 8,000 | | | | 8,583,040 | |
Atlanta (City of); Series 2015, Ref. Water & Wastewater RB(b) | | | 5.00 | % | | | 11/01/2040 | | | | 37,555 | | | | 41,906,873 | |
See accompanying Notes to Financial Statements which are an integral part of the financial statements.
21 Invesco High Yield Municipal Fund
| | | | | | | | | | | | | | | | |
| | | Interest
Rate | | | Maturity
Date | | | Principal
Amount
(000) | | | Value | |
| Georgia–(continued) | | | | | | | | | | | | | | | | |
Clayton (County of) Development Authority (Delta Air Lines, Inc.);
Series 2009 A, Special Facilities RB | | | 8.75 | % | | | 06/01/2029 | | | $ | 4,500 | | | $ | 4,855,590 | |
DeKalb (County of) Hospital Authority (DeKalb Medical Center, Inc.);
Series 2010, RAC(j)(k) | | | 6.00 | % | | | 09/01/2020 | | | | 2,200 | | | | 2,336,400 | |
Series 2010, RAC(j)(k) | | | 6.13 | % | | | 09/01/2020 | | | | 5,510 | | | | 5,861,703 | |
Marietta (City of) Developing Authority (Life University, Inc.); Series 2017 A, Ref. University Facilities RB(i) | | | 5.00 | % | | | 11/01/2047 | | | | 8,480 | | | | 8,867,451 | |
| | | | | | | | | | | | | | | | 76,652,093 | |
| | | | |
| Hawaii–0.21% | | | | | | | | | | | | | | | | |
Hawaii (State of) Department of Budget & Finance (15 Craigside); | | | | | | | | | | | | | | | | |
Series 2009 A, Special Purpose Senior Living RB(j)(k) | | | 8.75 | % | | | 11/15/2019 | | | | 735 | | | | 770,464 | |
Series 2009 A, Special Purpose Senior Living RB(j)(k) | | | 9.00 | % | | | 11/15/2019 | | | | 6,530 | | | | 6,855,390 | |
Honolulu (City & County of); Series 2009 A, Unlimited Tax GO Bonds(b)(j)(k) | | | 5.25 | % | | | 04/01/2019 | | | | 12,000 | | | | 12,033,840 | |
| | | | | | | | | | | | | | | | 19,659,694 | |
| | | | |
| Idaho–0.29% | | | | | | | | | | | | | | | | |
Gooding Industrial Development Corp. (Intrepid Technology & Resources);
Series 2006, Solid Waste Disposal RB(c)(l)(m) | | | 7.50 | % | | | 11/01/2024 | | | | 7,640 | | | | 0 | |
Idaho (State of) Health Facilities Authority (Terraces of Boise);
Series 2014 A, RB | | | 8.00 | % | | | 10/01/2044 | | | | 10,440 | | | | 11,577,647 | |
Series 2014 A, RB | | | 8.13 | % | | | 10/01/2049 | | | | 9,000 | | | | 10,011,150 | |
Idaho (State of) Housing & Finance Association (Compass Public Charter School, Inc.); Series 2010 A,Non-Profit Facilities RB | | | 6.25 | % | | | 07/01/2040 | | | | 1,000 | | | | 1,015,490 | |
Series 2010 A,Non-Profit Facilities RB | | | 6.25 | % | | | 07/01/2045 | | | | 1,000 | | | | 1,014,850 | |
Idaho (State of) Housing & Finance Association (Liberty Charter School);
Series 2008 A,Non-Profit Facilities RB | | | 6.00 | % | | | 06/01/2038 | | | | 750 | | | | 751,027 | |
Idaho (State of) Housing & Finance Association (North Star Charter School);
Series 2014 A, Ref.Non-Profit Facilities RB | | | 6.75 | % | | | 07/01/2028 | | | | 39 | | | | 41,255 | |
Series 2014 A, Ref.Non-Profit Facilities RB | | | 6.75 | % | | | 07/01/2036 | | | | 526 | | | | 546,185 | |
Series 2014 A, Ref.Non-Profit Facilities RB | | | 6.75 | % | | | 07/01/2048 | | | | 1,061 | | | | 1,088,627 | |
Series 2014 B, Ref.Non-Profit Facilities CAB RB(f)(i) | | | 0.00 | % | | | 07/01/2049 | | | | 9,112 | | | | 1,185,397 | |
| | | | | | | | | | | | | | | | 27,231,628 | |
| | | | |
| Illinois–11.01% | | | | | | | | | | | | | | | | |
Bartlett (Village of) (Quarry Redevelopment); Series 2007, Ref. Sr. Lien Tax Increment Allocation RB | | | 5.60 | % | | | 01/01/2023 | | | | 3,580 | | | | 3,582,363 | |
Bolingbrook (Village of);
Series 2005, Sales Tax Conv. CAB RB | | | 6.25 | % | | | 01/01/2024 | | | | 3,745 | | | | 3,652,798 | |
Series 2005, Sales Tax RB | | | 6.00 | % | | | 01/01/2026 | | | | 4,500 | | | | 4,286,655 | |
Bolingbrook (Village of) Special Service AreaNo. 2005-1; Series 2019, Ref. Special Tax RB | | | 5.25 | % | | | 03/01/2041 | | | | 4,000 | | | | 3,999,680 | |
Bolingbrook (Village of) Special Services Area No. 1 (Forest City); Series 2005, Special Tax Conv. CAB RB(d) | | | 5.90 | % | | | 03/01/2027 | | | | 2,000 | | | | 2,000,000 | |
Burbank (City of) (Intercultural Montessori Language School); Series 2015, Educational Facilities RB(i) | | | 6.25 | % | | | 09/01/2045 | | | | 4,000 | | | | 4,170,760 | |
Chicago (City of);
Series 2002 B, Unlimited Tax GO Bonds | | | 5.50 | % | | | 01/01/2034 | | | | 3,145 | | | | 3,379,334 | |
Series 2003 B, Ref. Unlimited Tax GO Bonds | | | 5.50 | % | | | 01/01/2032 | | | | 2,150 | | | | 2,320,603 | |
Series 2003 B, Ref. Unlimited Tax GO Bonds | | | 5.50 | % | | | 01/01/2033 | | | | 3,000 | | | | 3,231,600 | |
Series 2003 B, Ref. Unlimited Tax GO Bonds | | | 5.50 | % | | | 01/01/2034 | | | | 2,160 | | | | 2,320,942 | |
Series 2005 D, Ref. Unlimited Tax GO Bonds | | | 5.50 | % | | | 01/01/2037 | | | | 6,075 | | | | 6,478,927 | |
Series 2007 E, Ref. Unlimited Tax GO Bonds | | | 5.50 | % | | | 01/01/2035 | | | | 2,500 | | | | 2,680,900 | |
Series 2007 F, Ref. Unlimited Tax GO Bonds | | | 5.50 | % | | | 01/01/2035 | | | | 10,640 | | | | 11,409,910 | |
Series 2007 G, Ref. Unlimited Tax GO Bonds | | | 5.50 | % | | | 01/01/2035 | | | | 375 | | | | 402,135 | |
Series 2007 G, Ref. Unlimited Tax GO Bonds | | | 5.50 | % | | | 01/01/2042 | | | | 400 | | | | 422,576 | |
See accompanying Notes to Financial Statements which are an integral part of the financial statements.
22 Invesco High Yield Municipal Fund
| | | | | | | | | | | | | | | | |
| | | Interest
Rate | | | Maturity
Date | | | Principal
Amount
(000) | | | Value | |
| Illinois–(continued) | | | | | | | | | | | | | | | | |
Series 2011, Tax Increment Allocation Revenue COP | | | 7.13 | % | | | 05/01/2021 | | | $ | 952 | | | $ | 952,883 | |
Series 2011, Tax Increment Allocation Revenue COP | | | 7.13 | % | | | 05/01/2025 | | | | 18,885 | | | | 18,889,910 | |
Series 2012 A, Unlimited Tax GO Bonds | | | 5.00 | % | | | 01/01/2033 | | | | 3,500 | | | | 3,574,585 | |
Series 2014 A, Ref. Unlimited Tax GO Bonds | | | 5.25 | % | | | 01/01/2033 | | | | 3,250 | | | | 3,426,475 | |
Series 2014, Second Lien Wastewater Transmission RB(b) | | | 5.00 | % | | | 01/01/2044 | | | | 16,755 | | | | 17,852,620 | |
Series 2015 A, Unlimited Tax GO Bonds | | | 5.50 | % | | | 01/01/2034 | | | | 4,440 | | | | 4,770,824 | |
Series 2015 A, Unlimited Tax GO Bonds | | | 5.50 | % | | | 01/01/2035 | | | | 2,000 | | | | 2,144,720 | |
Series 2017 A, Ref. Unlimited Tax GO Bonds | | | 6.00 | % | | | 01/01/2038 | | | | 64,150 | | | | 72,188,636 | |
Chicago (City of) (Diversey/Narragansett); Series 2006, Tax Increment Allocation Revenue COP | | | 7.46 | % | | | 02/15/2026 | | | | 2,304 | | | | 1,684,015 | |
Chicago (City of) (Lakeshore East); Series 2003, Special Assessment Improvement RB | | | 6.63 | % | | | 12/01/2022 | | | | 1,899 | | | | 1,902,532 | |
Chicago (City of) (O’Hare International Airport); Series 2017 D, Sr. Lien General Airport RB(b) | | | 5.00 | % | | | 01/01/2052 | | | | 9,960 | | | | 10,790,365 | |
Chicago (City of) Board of Education; | | | | | | | | | | | | | | | | |
Series 2011 A, Unlimited Tax GO Bonds | | | 5.00 | % | | | 12/01/2041 | | | | 23,015 | | | | 23,129,845 | |
Series 2012 A, Unlimited Tax GO Bonds | | | 5.00 | % | | | 12/01/2042 | | | | 19,420 | | | | 19,543,511 | |
Series 2017 H, Dedicated Unlimited Tax GO Bonds | | | 5.00 | % | | | 12/01/2046 | | | | 3,000 | | | | 3,037,920 | |
Series 2018 D, Ref. Unlimited Tax GO Bonds | | | 5.00 | % | | | 12/01/2046 | | | | 27,000 | | | | 27,252,720 | |
Series 2018 E, Educational Purpose TAN, Floating Rate (1 mo. USD LIBOR + 0.67%)(g)(i) | | | 2.63 | % | | | 03/29/2019 | | | | 3,500 | | | | 3,500,000 | |
Chicago (City of) Metropolitan Water Reclamation District; | | | | | | | | | | | | | | | | |
Series 2015 A, Unlimited Tax GO Green Bonds(b) | | | 5.00 | % | | | 12/01/2044 | | | | 31,000 | | | | 33,969,490 | |
Series 2016C, Unlimited Tax GO Green Bonds(b) | | | 5.00 | % | | | 12/01/2045 | | | | 19,750 | | | | 21,667,528 | |
Chicago (City of) Transit Authority; Series 2014, Sales Tax Receipts RB(b) | | | 5.25 | % | | | 12/01/2049 | | | | 27,000 | | | | 29,596,590 | |
Chicago O’Hare International Airport; Series 2017 D, Sr. Lien General Airport RB(b) | | | 5.00 | % | | | 01/01/2047 | | | | 27,500 | | | | 29,970,325 | |
Cook (County of) (Navistar International Corp.); Series 2010, Recovery Zone Facility RB | | | 6.75 | % | | | 10/15/2040 | | | | 7,250 | | | | 7,534,780 | |
East Dundee (Village of) (Route 25 South Redevelopment); Series 2012, Limited Obligation Tax Increment Allocation RB | | | 5.63 | % | | | 12/01/2031 | | | | 1,530 | | | | 1,492,530 | |
Gilberts (Village of) Special Service Area No. 24 (The Conservancy); Series 2014 A, Special Tax RB | | | 5.38 | % | | | 03/01/2034 | | | | 1,379 | | | | 1,321,565 | |
Gilberts Special Service Area No. 25 (The Conservancy); Series 2018 A, Special Tax Conv. CAB RB (d) | | | 6.00 | % | | | 03/01/2048 | | | | 13,121 | | | | 11,435,870 | |
Illinois (State of); | | | | | | | | | | | | | | | | |
Series 2013, GO Bonds | | | 5.50 | % | | | 07/01/2033 | | | | 10,520 | | | | 11,114,906 | |
Series 2013, Unlimited Tax GO Bonds | | | 5.50 | % | | | 07/01/2027 | | | | 5,105 | | | | 5,475,419 | |
Series 2013, Unlimited Tax GO Bonds | | | 5.25 | % | | | 07/01/2030 | | | | 4,965 | | | | 5,209,328 | |
Series 2016, Ref. Unlimited Tax GO Bonds | | | 5.00 | % | | | 02/01/2025 | | | | 35,550 | | | | 38,269,219 | |
Series 2016, Ref. Unlimited Tax GO Bonds | | | 5.00 | % | | | 02/01/2027 | | | | 7,145 | | | | 7,754,254 | |
Series 2016, Ref. Unlimited Tax GO Bonds | | | 5.00 | % | | | 02/01/2029 | | | | 11,000 | | | | 11,793,210 | |
Series 2016, Unlimited Tax GO Bonds | | | 5.00 | % | | | 11/01/2028 | | | | 10,700 | | | | 11,470,186 | |
Series 2017 A, Unlimited Tax GO Bonds | | | 5.00 | % | | | 12/01/2034 | | | | 5,125 | | | | 5,364,286 | |
Series 2017 D, Unlimited Tax GO Bonds | | | 5.00 | % | | | 11/01/2026 | | | | 10,500 | | | | 11,413,920 | |
Series 2017 D, Unlimited Tax GO Bonds(b)(n) | | | 5.00 | % | | | 11/01/2023 | | | | 33,000 | | | | 35,297,460 | |
Series 2018 A, Unlimited Tax GO Bonds | | | 6.00 | % | | | 05/01/2028 | | | | 6,000 | | | | 6,987,960 | |
Illinois (State of) Finance Authority (Clare Oaks); | | | | | | | | | | | | | | | | |
Series 2012A-1, RB | | | 7.00 | % | | | 11/15/2027 | | | | 2,200 | | | | 2,199,956 | |
Series 2012A-2, RB | | | 7.00 | % | | | 11/15/2027 | | | | 2,140 | | | | 2,115,219 | |
Series 2012 B, Ref. Sub. RB(p) | | | 6.00 | % | | | 11/15/2052 | | | | 9,584 | | | | 7,330,901 | |
Series 2012C-1, Ref. Sub. RB(f) | | | 0.00 | % | | | 11/15/2052 | | | | 3,902 | | | | 111,635 | |
Series 2012C-2, Ref. Sub. Conv. RB(p) | | | 6.00 | % | | | 11/15/2052 | | | | 780 | | | | 228,865 | |
Series 2012C-3, Ref. Sub. Conv. RB(p) | | | 4.00 | % | | | 11/15/2052 | | | | 780 | | | | 135,655 | |
Illinois (State of) Finance Authority (Collegiate Housing Foundation - DeKalb II, LLC - Northern Illinois University); Series 2011, Student Housing RB | | | 6.88 | % | | | 10/01/2043 | | | | 7,000 | | | | 7,420,560 | |
See accompanying Notes to Financial Statements which are an integral part of the financial statements.
23 Invesco High Yield Municipal Fund
| | | | | | | | | | | | | | | | |
| | | Interest
Rate | | | Maturity
Date | | | Principal
Amount
(000) | | | Value | |
| Illinois–(continued) | | | | | | | | | | | | | | | | |
Illinois (State of) Finance Authority (Friendship Village of Schaumburg); | | | | | | | | | | | | | | | | |
Series 2010, RB(j)(k) | | | 7.13 | % | | | 02/15/2020 | | | $ | 1,710 | | | $ | 1,796,783 | |
Series 2010, RB(j)(k) | | | 7.25 | % | | | 02/15/2020 | | | | 8,900 | | | | 9,362,088 | |
Illinois (State of) Finance Authority (Intrinsic Schools-Belmont School); Series 2015, Charter School RB (i) | | | 6.00 | % | | | 12/01/2045 | | | | 3,715 | | | | 3,751,444 | |
Illinois (State of) Finance Authority (Luther Oaks); | | | | | | | | | | | | | | | | |
Series 2006A, RB | | | 6.00 | % | | | 08/15/2026 | | | | 3,255 | | | | 3,257,181 | |
Series 2006A, RB | | | 5.70 | % | | | 08/15/2028 | | | | 500 | | | | 500,075 | |
Series 2006A, RB | | | 6.00 | % | | | 08/15/2039 | | | | 10,460 | | | | 10,461,255 | |
Illinois (State of) Finance Authority (Lutheran Home & Services); | | | | | | | | | | | | | | | | |
Series 2012, Ref. RB | | | 5.63 | % | | | 05/15/2042 | | | | 10,700 | | | | 10,900,839 | |
Series 2012, Ref. RB | | | 5.75 | % | | | 05/15/2046 | | | | 3,000 | | | | 3,063,690 | |
Illinois (State of) Finance Authority (Montgomery Place); | | | | | | | | | | | | | | | | |
Series 2017, Ref. RB | | | 5.25 | % | | | 05/15/2037 | | | | 6,795 | | | | 7,116,947 | |
Series 2017, Ref. RB | | | 5.25 | % | | | 05/15/2048 | | | | 11,770 | | | | 12,108,505 | |
Illinois (State of) Finance Authority (Navistar International); Series 2010, Recovery Zone Facility RB | | | 6.75 | % | | | 10/15/2040 | | | | 9,000 | | | | 9,388,350 | |
Illinois (State of) Finance Authority (Norwegian American Hospital Inc.); | | | | | | | | | | | | | | | | |
Series 2008, RB | | | 7.63 | % | | | 09/15/2028 | | | | 3,100 | | | | 3,171,269 | |
Series 2008, RB | | | 7.75 | % | | | 09/15/2038 | | | | 8,140 | | | | 8,708,823 | |
Illinois (State of) Finance Authority (Park Place of Elmhurst); | | | | | | | | | | | | | | | | |
Series 2016A, RB | | | 6.20 | % | | | 05/15/2030 | | | | 103 | | | | 95,163 | |
Series 2016A, RB | | | 6.24 | % | | | 05/15/2038 | | | | 10,797 | | | | 9,676,603 | |
Series 2016A, RB | | | 6.33 | % | | | 05/15/2048 | | | | 22,474 | | | | 20,043,885 | |
Series 2016A, RB | | | 6.44 | % | | | 05/15/2055 | | | | 23,482 | | | | 20,811,171 | |
Series 2016B, RB | | | 5.63 | % | | | 05/15/2020 | | | | 5,628 | | | | 5,334,131 | |
Series 2016, RB | | | 2.00 | % | | | 05/15/2055 | | | | 7,144 | | | | 352,556 | |
Illinois (State of) Finance Authority (Peace Village); Series 2013, RB | | | 7.00 | % | | | 08/15/2043 | | | | 12,210 | | | | 12,762,014 | |
Illinois (State of) Finance Authority (Plymouth Place); | | | | | | | | | | | | | | | | |
Series 2013, Ref. RB | | | 6.00 | % | | | 05/15/2043 | | | | 10,600 | | | | 11,561,314 | |
Series 2015, Ref. RB | | | 5.25 | % | | | 05/15/2050 | | | | 6,660 | | | | 6,793,466 | |
Illinois (State of) Finance Authority (Provena Health); Series 2009 A, RB(j)(k) | | | 7.75 | % | | | 08/15/2019 | | | | 12,800 | | | | 13,145,088 | |
Illinois (State of) Finance Authority (Rogers Park Montessori School); | | | | | | | | | | | | | | | | |
Series 2014, Ref. Sr. Educational Facilities RB | | | 6.00 | % | | | 02/01/2034 | | | | 750 | | | | 787,230 | |
Series 2014, Ref. Sr. Educational Facilities RB | | | 6.13 | % | | | 02/01/2045 | | | | 1,500 | | | | 1,559,985 | |
Illinois (State of) Finance Authority (Roosevelt University); Series 2007, RB | | | 5.50 | % | | | 04/01/2037 | | | | 9,170 | | | | 9,169,817 | |
Illinois (State of) Finance Authority (Rush University Medical Center); | | | | | | | | | | | | | | | | |
Series 2015 A, Ref. RB | | | 5.00 | % | | | 11/15/2038 | | | | 5,000 | | | | 5,422,950 | |
Series 2015 B, Ref. RB | | | 5.00 | % | | | 11/15/2039 | | | | 3,700 | | | | 4,005,546 | |
Illinois (State of) Finance Authority (Silver Cross Hospital & Medical Centers); Series 2009, RB (j)(k) | | | 6.88 | % | | | 08/15/2019 | | | | 21,875 | | | | 22,383,812 | |
Illinois (State of) Finance Authority (Swedish Covenant Hospital); Series 2016A, Ref. RB | | | 5.00 | % | | | 08/15/2032 | | | | 500 | | | | 552,355 | |
Illinois (State of) Finance Authority (Three Crowns Park); | | | | | | | | | | | | | | | | |
Series 2017, Ref. RB | | | 5.25 | % | | | 02/15/2037 | | | | 1,185 | | | | 1,244,606 | |
Series 2017, Ref. RB | | | 5.25 | % | | | 02/15/2047 | | | | 2,870 | | | | 2,992,922 | |
Illinois (State of) Finance Authority (United Neighborhood Organization Charter School Network, Inc.); | | | | | | | | | | | | | | | | |
Series 2011, Ref. Charter School RB | | | 6.88 | % | | | 10/01/2031 | | | | 2,895 | | | | 3,040,184 | |
Series 2011, Ref. Charter School RB | | | 7.13 | % | | | 10/01/2041 | | | | 1,000 | | | | 1,047,250 | |
Illinois (State of) Finance Authority (University of Chicago Medical);Series 2009 D-1, VRD RB (LOC - PNC Bank N.A.)(g)(h) | | | 1.56 | % | | | 08/01/2043 | | | | 2,500 | | | | 2,500,000 | |
Illinois (State of) Finance Authority (University of Chicago); Series 2013 A, RB (b) | | | 5.25 | % | | | 10/01/2052 | | | | 27,000 | | | | 29,840,400 | |
See accompanying Notes to Financial Statements which are an integral part of the financial statements.
24 Invesco High Yield Municipal Fund
| | | | | | | | | | | | | | | | |
| | | Interest
Rate | | | Maturity
Date | | | Principal
Amount
(000) | | | Value | |
| Illinois–(continued) | | | | | | | | | | | | | | | | |
Illinois (State of) Finance Authority (Villa St. Benedict); | | | | | | | | | | | | | | | | |
Series 2015, Ref. RB | | | 6.13 | % | | | 11/15/2035 | | | $ | 9,925 | | | $ | 10,788,078 | |
Series 2015, Ref. RB | | | 6.38 | % | | | 11/15/2043 | | | | 10,700 | | | | 11,680,120 | |
Illinois (State of) Housing Development Authority (Stonebridge of Gurnee); | | | | | | | | | | | | | | | | |
Series 2016A, MFH RB(i) | | | 5.45 | % | | | 01/01/2046 | | | | 2,500 | | | | 2,238,175 | |
Series 2016A, MFH RB(i) | | | 5.60 | % | | | 01/01/2056 | | | | 2,700 | | | | 2,419,740 | |
Illinois (State of) Metropolitan Pier & Exposition Authority (McCormick Place Expansion); | | | | | | | | | | | | | | | | |
Series 2002 A, CAP Dedicated State Tax RB (INS -NATL)(e)(f) | | | 0.00 | % | | | 12/15/2038 | | | | 29,950 | | | | 12,031,814 | |
Series 2010B-2, Ref. Dedicated State Tax RB | | | 5.00 | % | | | 06/15/2050 | | | | 1,000 | | | | 1,004,660 | |
Series 2010B-2, Ref. RB | | | 5.25 | % | | | 06/15/2050 | | | | 8,015 | | | | 8,076,956 | |
Series 2010, Dedicated State Tax RB(j)(k) | | | 5.50 | % | | | 06/15/2020 | | | | 4,300 | | | | 4,507,690 | |
Series 2010, Dedicated State Tax RB | | | 5.50 | % | | | 06/15/2050 | | | | 44,020 | | | | 44,495,416 | |
Series 2012 A, RB | | | 5.00 | % | | | 06/15/2042 | | | | 2,000 | | | | 2,044,780 | |
Series 2012 B, CAB RB(f) | | | 0.00 | % | | | 12/15/2051 | | | | 13,165 | | | | 2,663,806 | |
Series 2012, CAB RB(f) | | | 0.00 | % | | | 12/15/2050 | | | | 35,755 | | | | 7,645,849 | |
Series 2015, CAB RB(f) | | | 0.00 | % | | | 12/15/2052 | | | | 26,000 | | | | 4,993,040 | |
Series 2017 B, Ref. CAB RB(f) | | | 0.00 | % | | | 12/15/2054 | | | | 20,000 | | | | 3,444,600 | |
Series 2017 B, Ref. Conv. CAB RB(d) | | | 4.95 | % | | | 12/15/2047 | | | | 3,000 | | | | 1,711,560 | |
Long Grove (Village of) (Sunset Grove); Series 2010, Limited Obligation Tax Increment Allocation RB | | | 7.50 | % | | | 01/01/2030 | | | | 2,880 | | | | 2,906,410 | |
Malta (Village of) (Prairie Springs); Series 2006, Tax Increment Allocation RB (o) | | | 5.75 | % | | | 12/30/2025 | | | | 1,800 | | | | 576,000 | |
Pingree Grove (Village of) (Cambridge Lakes Learning Center); Series 2011, RB (j)(k) | | | 8.50 | % | | | 06/01/2021 | | | | 3,290 | | | | 3,772,018 | |
Plano (City of) Special Service Area No. 10 (Lakewood Springs Club); Series 2007, Special Tax RB (c) | | | 5.80 | % | | | 03/01/2037 | | | | 5,615 | | | | 617,650 | |
Railsplitter Tobacco Settlement Authority; Series 2010, RB(j)(k) | | | 6.00 | % | | | 06/01/2021 | | | | 17,050 | | | | 18,655,257 | |
Sales Tax Securitization Corp.; Series 2018 C, Ref. RB | | | 5.25 | % | | | 01/01/2048 | | | | 15,000 | | | | 16,768,650 | |
Southwestern Illinois Development Authority (Eden Retirement Center, Inc.); | | | | | | | | | | | | | | | | |
Series 2006, Senior Care Facilities RB | | | 5.50 | % | | | 12/01/2026 | | | | 800 | | | | 742,192 | |
Series 2006, Senior Care Facilities RB | | | 5.85 | % | | | 12/01/2036 | | | | 3,000 | | | | 2,619,180 | |
St. Charles (City of) Special Service Area No. 21; Series 1998, RB | | | 6.63 | % | | | 03/01/2028 | | | | 1,075 | | | | 1,046,330 | |
United City of Yorkville (City of) Special Service AreaNo. 2004-107 (Raintree Village II); | | | | | | | | | | | | | | | | |
Series 2005, Special Tax RB(c) | | | 6.25 | % | | | 03/01/2035 | | | | 5,408 | | | | 2,433,600 | |
United City of Yorkville (City of) Special Service AreaNo. 2006-113 (Cannonball/Beecher Road); | | | | | | | | | | | | | | | | |
Series 2007, Special Tax RB | | | 5.75 | % | | | 03/01/2028 | | | | 3,415 | | | | 3,391,368 | |
Upper Illinois River Valley Development Authority (Pleasant View Luther Home); Series 2010, RB | | | 7.00 | % | | | 11/15/2030 | | | | 2,000 | | | | 2,045,480 | |
Series 2010, RB | | | 7.25 | % | | | 11/15/2040 | | | | 3,300 | | | | 3,382,863 | |
Series 2010, RB | | | 7.38 | % | | | 11/15/2045 | | | | 1,700 | | | | 1,744,965 | |
Series 2012, RB | | | 6.00 | % | | | 05/15/2042 | | | | 6,035 | | | | 6,257,873 | |
| | | | | | | | | | | | | | | | 1,031,078,178 | |
| | | | |
| Indiana–1.56% | | | | | | | | | | | | | | | | |
Allen (County of) Economic Development (StoryPoint Fort Wayne); | | | | | | | | | | | | | | | | |
Series 2017, RB(i) | | | 6.63 | % | | | 01/15/2034 | | | | 625 | | | | 657,937 | |
Series 2017, RB(i) | | | 6.75 | % | | | 01/15/2043 | | | | 1,625 | | | | 1,707,631 | |
Series 2017, RB(i) | | | 6.88 | % | | | 01/15/2052 | | | | 1,850 | | | | 1,947,754 | |
Carmel (City of) (Barrington Carmel); | | | | | | | | | | | | | | | | |
Series 2012 A, RB | | | 7.00 | % | | | 11/15/2027 | | | | 1,050 | | | | 840,000 | |
Series 2012 A, RB | | | 7.00 | % | | | 11/15/2032 | | | | 2,980 | | | | 2,384,000 | |
Series 2012 A, RB | | | 7.13 | % | | | 11/15/2042 | | | | 12,200 | | | | 9,760,000 | |
Series 2012 A, RB | | | 7.13 | % | | | 11/15/2047 | | | | 9,940 | | | | 7,952,000 | |
Chestertown (Town of) (Storypoint Chesterton); Series 2016A-1, Economic Development RB(i) | | | 6.38 | % | | | 01/15/2051 | | | | 3,000 | | | | 3,067,560 | |
See accompanying Notes to Financial Statements which are an integral part of the financial statements.
25 Invesco High Yield Municipal Fund
| | | | | | | | | | | | | | | | |
| | | Interest
Rate | | | Maturity
Date | | | Principal
Amount
(000) | | | Value | |
| Indiana–(continued) | | | | | | | | | | | | | | | | |
Crown Point (City of) (Wittenberg Village); | | | | | | | | | | | | | | | | |
Series 2009 A, Economic Development RB | | | 8.00 | % | | | 11/15/2029 | | | $ | 3,100 | | | $ | 3,160,884 | |
Series 2009 A, Economic Development RB | | | 8.00 | % | | | 11/15/2039 | | | | 9,250 | | | | 9,408,730 | |
Huntington (City of) (Huntington University); Series 2007, Ref. VRD Economic Development & Improvement RB(LOC-Wells Fargo Bank, N.A.)(g)(h) | | | 1.85 | % | | | 08/01/2037 | | | | 230 | | | | 230,000 | |
Indiana (State of) Finance Authority (Good Samaritan Hospital); Series 2016 A, Health Facilities RB | | | 5.50 | % | | | 04/01/2046 | | | | 5,785 | | | | 6,150,496 | |
Indiana (State of) Finance Authority (Indiana University Health Obligated Group); Series 2015 A, Ref. Hospital RB(b) | | | 5.00 | % | | | 12/01/2040 | | | | 15,750 | | | | 17,321,378 | |
Indiana (State of) Finance Authority (Irvington Community School); | | | | | | | | | | | | | | | | |
Series 2018 A, Ref. Educational Facilities RB(i) | | | 5.90 | % | | | 07/01/2038 | | | | 1,000 | | | | 1,009,350 | |
Series 2018 A, Ref. Educational Facilities RB(i) | | | 6.00 | % | | | 07/01/2048 | | | | 2,750 | | | | 2,775,190 | |
Indiana (State of) Finance Authority (Ohio River Bridges East End Crossing); Series 2013, Private Activity RB(m) | | | 5.25 | % | | | 01/01/2051 | | | | 37,790 | | | | 40,088,010 | |
Indiana (State of) Finance Authority (Ohio Valley Electric Corp.); Series 2012 A, Midwestern Disaster Relief RB | | | 5.00 | % | | | 06/01/2039 | | | | 7,145 | | | | 7,046,042 | |
Indianapolis (City of) (Ritter Affordable Assisted Living); Series 2014, MFH RB | | | 6.90 | % | | | 12/01/2033 | | | | 5,500 | | | | 5,499,175 | |
Valparaiso (City of) (Pratt Paper, LLC); | | | | | | | | | | | | | | | | |
Series 2013, Exempt Facilities RB(m) | | | 6.75 | % | | | 01/01/2034 | | | | 10,785 | | | | 12,343,325 | |
Series 2013, Exempt Facilities RB(m) | | | 7.00 | % | | | 01/01/2044 | | | | 11,000 | | | | 12,625,030 | |
| | | | | | | | | | | | | | | | 145,974,492 | |
| | | | |
| Iowa–2.93% | | | | | | | | | | | | | | | | |
Ames (City of) (Mary Greeley Medical Center); Series 2011, Hospital RB(j)(k) | | | 5.25 | % | | | 06/15/2020 | | | | 1,250 | | | | 1,305,612 | |
Cass (County of) (Cass County Memorial Hospital); Series 2010 A, Hospital RB (q) | | | 7.25 | % | | | 06/01/2035 | | | | 5,755 | | | | 5,830,851 | |
Iowa (State of) Finance Authority (Iowa Fertilizer Co.); | | | | | | | | | | | | | | | | |
Series 2013, Midwestern Disaster Area RB | | | 5.50 | % | | | 12/01/2022 | | | | 29,210 | | | | 29,239,210 | |
Series 2013, Midwestern Disaster Area RB | | | 5.25 | % | | | 12/01/2025 | | | | 48,890 | | | | 51,892,824 | |
Series 2013, Midwestern Disaster Area RB(i) | | | 5.88 | % | | | 12/01/2026 | | | | 2,420 | | | | 2,543,009 | |
Series 2013, Midwestern Disaster Area RB(i) | | | 5.88 | % | | | 12/01/2027 | | | | 10,330 | | | | 10,885,857 | |
Series 2013, Ref. Midwestern Disaster Area RB(k) | | | 5.25 | % | | | 12/01/2037 | | | | 15,260 | | | | 16,256,325 | |
Iowa (State of) Finance Authority (Lifespace Communities Inc.);
Series 2018 A, RB | | | 5.00 | % | | | 05/15/2048 | | | | 4,500 | | | | 4,682,295 | |
Iowa (State of) Finance Authority (Madrid Home); | | | | | | | | | | | | | | | | |
Series 2007, Ref. Health Care Facility RB | | | 5.75 | % | | | 11/15/2024 | | | | 1,000 | | | | 1,000,280 | |
Series 2007, Ref. Health Care Facility RB | | | 5.80 | % | | | 11/15/2029 | | | | 1,930 | | | | 1,929,865 | |
Series 2007, Ref. Health Care Facility RB | | | 5.90 | % | | | 11/15/2037 | | | | 2,750 | | | | 2,703,910 | |
Iowa (State of) Tobacco Settlement Authority; | | | | | | | | | | | | | | | | |
Series 2005 B, Asset-Backed Conv. CAB RB | | | 5.60 | % | | | 06/01/2034 | | | | 31,350 | | | | 31,487,940 | |
Series 2005 C, Asset-Backed RB | | | 5.50 | % | | | 06/01/2042 | | | | 28,435 | | | | 28,406,565 | |
Series 2005 C, Asset-Backed RB | | | 5.63 | % | | | 06/01/2046 | | | | 33,390 | | | | 33,331,234 | |
Series 2005 D, Asset-Backed CAB RB(f) | | | 0.00 | % | | | 06/01/2046 | | | | 181,600 | | | | 28,687,352 | |
Series 2005 E, Asset-Backed CAB RB(f) | | | 0.00 | % | | | 06/01/2046 | | | | 225,990 | | | | 24,400,140 | |
| | | | | | | | | | | | | | | | 274,583,269 | |
| | | | |
| Kansas–0.44% | | | | | | | | | | | | | | | | |
Kansas (State of) Development Finance Authority (Adventist Health System); Series 2009, Hospital RB (j)(k) | | | 5.75 | % | | | 11/15/2019 | | | | 1,900 | | | | 1,954,341 | |
Lenexa (City of) (Lakeview Village, Inc.); Series 2009, Health Care Facilities RB (j)(k) | | | 7.13 | % | | | 05/15/2019 | | | | 500 | | | | 505,325 | |
Olathe (City of) (West Village Center); | | | | | | | | | | | | | | | | |
Series 2007, Special Obligation Tax Increment Allocation RB | | | 5.45 | % | | | 09/01/2022 | | | | 2,460 | | | | 2,414,146 | |
Series 2007, Special Obligation Tax Increment Allocation RB | | | 5.50 | % | | | 09/01/2026 | | | | 2,835 | | | | 2,697,332 | |
Roeland Park (City of) (TDD No. 1); | | | | | | | | | | | | | | | | |
Series 2005, Transportation Development District Sales Tax RB (o) | | | 5.75 | % | | | 12/01/2025 | | | | 445 | | | | 235,850 | |
Series 2006 A, Transportation Development District Sales Tax RB | | | 5.88 | % | | | 12/01/2025 | | | | 835 | | | | 442,550 | |
See accompanying Notes to Financial Statements which are an integral part of the financial statements.
26 Invesco High Yield Municipal Fund
| | | | | | | | | | | | | | | | |
| | | Interest
Rate | | | Maturity
Date | | | Principal
Amount
(000) | | | Value | |
| Kansas–(continued) | | | | | | | | | | | | | | | | |
Roeland Park (City of) (TDD No. 2); Series 2006B, Transportation Development District Sales Tax RB (o) | | | 5.88 | % | | | 12/01/2025 | | | $ | 1,000 | | | $ | 750,000 | |
Wichita (City of) (Larksfield Place); | | | | | | | | | | | | | | | | |
Series 2013 III, Ref. & Healthcare Facilities Improvement RB | | | 7.13 | % | | | 12/15/2036 | | | | 1,000 | | | | 1,050,680 | |
Series 2013 III, Ref. Health Care Facilities & Improvement RB | | | 7.38 | % | | | 12/15/2043 | | | | 5,000 | | | | 5,287,800 | |
Wichita (City of) (Presbyterian Manors, Inc.); | | | | | | | | | | | | | | | | |
Series 2013IV-A, Health Care Facilities RB | | | 6.38 | % | | | 05/15/2043 | | | | 5,000 | | | | 5,315,250 | |
Series 2013IV-A, Health Care Facilities RB | | | 6.50 | % | | | 05/15/2048 | | | | 12,500 | | | | 13,347,000 | |
Series 2014IV-A, Health Care Facilities RB | | | 5.63 | % | | | 05/15/2044 | | | | 1,850 | | | | 1,912,456 | |
Series 2014IV-A, Health Care Facilities RB | | | 5.63 | % | | | 05/15/2049 | | | | 2,750 | | | | 2,836,460 | |
Wyandotte (County of) Unified Government (Legends Apartments Garage & West Lawn); | | | | | | | | | | | | | | | | |
Series 2018, RB | | | 4.50 | % | | | 06/01/2040 | | | | 2,250 | | | | 2,249,865 | |
| | | | | | | | | | | | | | | | 40,999,055 | |
| | | | |
| Kentucky–1.17% | | | | | | | | | | | | | | | | |
Christian (County of) (Jennie Stuart Medical Center, Inc.); | | | | | | | | | | | | | | | | |
Series 2016, Ref. Hospital RB | | | 5.38 | % | | | 02/01/2036 | | | | 13,245 | | | | 14,318,905 | |
Series 2016, Ref. Hospital RB | | | 5.50 | % | | | 02/01/2044 | | | | 12,020 | | | | 12,863,203 | |
Kentucky (State of) Economic Development Finance Authority (Baptist Healthcare System); | | | | | | | | | | | | | | | | |
Series 2017 B, RB | | | 5.00 | % | | | 08/15/2046 | | | | 7,855 | | | | 8,487,249 | |
Kentucky (State of) Economic Development Finance Authority (Masonic Home Independent Living II); | | | | | | | | | | | | | | | | |
Series 2011, RB(j)(k) | | | 7.00 | % | | | 05/15/2021 | | | | 2,500 | | | | 2,781,625 | |
Series 2011, RB(j)(k) | | | 7.25 | % | | | 05/15/2021 | | | | 3,050 | | | | 3,409,930 | |
Series 2011, RB(j)(k) | | | 7.38 | % | | | 05/15/2021 | | | | 1,000 | | | | 1,120,690 | |
Kentucky (State of) Economic Development Finance Authority (Masonic Homes of Kent); | | | | | | | | | | | | | | | | |
Series 2012, Ref. Health Care Facilities RB | | | 5.38 | % | | | 11/15/2032 | | | | 1,600 | | | | 1,664,208 | |
Kentucky (State of) Economic Development Finance Authority (Norton Healthcare, Inc.); | | | | | | | | | | | | | | | | |
Series 2000 B, Health System RB (INS -NATL)(e)(f) | | | 0.00 | % | | | 10/01/2026 | | | | 13,930 | | | | 11,138,149 | |
Series 2000 B, Health System RB (INS -NATL)(e)(f) | | | 0.00 | % | | | 10/01/2027 | | | | 12,955 | | | | 9,952,679 | |
Kentucky (State of) Economic Development Finance Authority (Owensboro Health Inc.); Series 2017 A, Ref. Hospital RB | | | 5.00 | % | | | 06/01/2041 | | | | 4,000 | | | | 4,235,840 | |
Kentucky (State of) Economic Development Finance Authority (Owensboro Medical Health System, Inc.); Series 2010 A, Hospital RB(j)(k) | | | 6.50 | % | | | 06/01/2020 | | | | 8,000 | | | | 8,471,600 | |
Kentucky (State of) Economic Development Finance Authority (Rosedale Green); | | | | | | | | | | | | | | | | |
Series 2015, Ref. Health Care Facilities RB | | | 5.75 | % | | | 11/15/2045 | | | | 3,350 | | | | 3,426,179 | |
Series 2015, Ref. Health Care Facilities RB | | | 5.75 | % | | | 11/15/2050 | | | | 4,650 | | | | 4,742,628 | |
Kentucky (State of) Public Transportation Infrastructure Authority (Downtown Crossing); | | | | | | | | | | | | | | | | |
Series 2013 C, First Tier Toll Conv. CAB RB(d) | | | 6.60 | % | | | 07/01/2039 | | | | 10,000 | | | | 9,767,000 | |
Series 2013 C, First Tier Toll Conv. CAB RB(d) | | | 6.75 | % | | | 07/01/2043 | | | | 5,000 | | | | 4,884,450 | |
Series 2013 C, First Tier Toll Conv. CAB RB(d) | | | 6.88 | % | | | 07/01/2046 | | | | 7,000 | | | | 6,851,180 | |
Louisville (City of) & Jefferson (County of) Metropolitan Government (Bellarmie University Inc.); | | | | | | | | | | | | | | | | |
Series 2009, College Improvement RB(j)(k) | | | 6.13 | % | | | 11/01/2019 | | | | 1,820 | | | | 1,873,053 | |
| | | | | | | | | | | | | | | | 109,988,568 | |
| | | | |
| Louisiana–1.11% | | | | | | | | | | | | | | | | |
East Baton Rouge (Parish of) Industrial Development Board (ExxonMobil); Series 2010 A, VRD Gulf Opportunity Zone RB(g) | | | 1.56 | % | | | 08/01/2035 | | | | 1,980 | | | | 1,980,000 | |
Louisiana (State of) Local Government Environmental Facilities & Community Development Authority; | | | | | | | | | | | | | | | | |
Series 2015 A, Ref. RB | | | 6.00 | % | | | 11/15/2030 | | | | 2,250 | | | | 2,455,335 | |
Series 2015 A, Ref. RB | | | 6.00 | % | | | 11/15/2035 | | | | 4,135 | | | | 4,457,695 | |
Series 2015 A, Ref. RB | | | 6.25 | % | | | 11/15/2045 | | | | 8,985 | | | | 9,760,406 | |
Louisiana (State of) Local Government Environmental Facilities & Community Development Authority (Cameron Parish, Louisiana Gomesa); Series 2018, Green RB(i) | | | 5.65 | % | | | 11/01/2037 | | | | 3,000 | | | | 3,101,250 | |
See accompanying Notes to Financial Statements which are an integral part of the financial statements.
27 Invesco High Yield Municipal Fund
| | | | | | | | | | | | | | | | |
| | | Interest
Rate | | | Maturity
Date | | | Principal
Amount
(000) | | | Value | |
| Louisiana–(continued) | |
Louisiana (State of) Local Government Environmental Facilities & Community Development Authority (Livingston Parish Gomesha Project); Series 2018, Ref. RB(i) | | | 5.38 | % | | | 11/01/2038 | | | $ | 665 | | | $ | 674,709 | |
Louisiana (State of) Local Government Environmental Facilities & Community Development Authority (Terrebonne Parish Gomesa Project); Series A, RB(i) | | | 5.50 | % | | | 11/01/2039 | | | | 2,000 | | | | 2,039,900 | |
Louisiana (State of) Local Government Environmental Facilities & Community Development Authority (Westlake Chemical Corp.); | | | | | | | | | | | | | | | | |
Series 2009 A, RB | | | 6.50 | % | | | 08/01/2029 | | | | 3,560 | | | | 3,765,234 | |
Series 2010A-1, RB | | | 6.50 | % | | | 11/01/2035 | | | | 9,245 | | | | 9,823,922 | |
Louisiana (State of) Local Government Environmental Facilities & Community Development Authority (Womans Foundation); | | | | | | | | | | | | | | | | |
Series 2017 A, Ref. RB | | | 5.00 | % | | | 10/01/2041 | | | | 10,000 | | | | 11,026,900 | |
Series 2017 A, Ref. RB | | | 5.00 | % | | | 10/01/2044 | | | | 4,765 | | | | 5,229,254 | |
Louisiana (State of) Public Facilities Authority (Belle Chasse Educational Foundation); | | | | | | | | | | | | | | | | |
Series 2011, RB | | | 6.75 | % | | | 05/01/2041 | | | | 3,000 | | | | 3,136,830 | |
Louisiana (State of) Public Facilities Authority (Lake Charles Memorial Hospital); Series 2007, Ref. Hospital RB(i) | | | 6.38 | % | | | 12/01/2034 | | | | 26,250 | | | | 27,250,125 | |
New Orleans (City of) Aviation Board (North Terminal); Series 2017 B, General Airport RB(b)(m) | | | 5.00 | % | | | 01/01/2048 | | | | 17,750 | | | | 19,354,068 | |
| | | | | | | | | | | | | | | | 104,055,628 | |
|
| Maine–0.48% | |
Maine (State of) Health & Higher Educational Facilities Authority (Eastern Maine Healthcare System); | | | | | | | | | | | | | | | | |
Series 2016 A, RB | | | 5.00 | % | | | 07/01/2041 | | | | 5,000 | | | | 5,308,050 | |
Series 2016 A, RB | | | 5.00 | % | | | 07/01/2046 | | | | 3,705 | | | | 3,920,705 | |
Maine (State of) Health & Higher Educational Facilities Authority (Eastern Maine Medical Center Obligated Group); Series 2013, RB | | | 5.00 | % | | | 07/01/2043 | | | | 16,300 | | | | 17,010,354 | |
Maine (State of) Health & Higher Educational Facilities Authority (Maine General Medical Center); | | | | | | | | | | | | | | | | |
Series 2011, RB | | | 7.50 | % | | | 07/01/2032 | | | | 2,500 | | | | 2,765,600 | |
Series 2011, RB | | | 6.75 | % | | | 07/01/2036 | | | | 3,425 | | | | 3,703,555 | |
Series 2011, RB | | | 6.75 | % | | | 07/01/2041 | | | | 11,505 | | | | 12,380,416 | |
| | | | | | | | | | | | | | | | 45,088,680 | |
|
| Maryland–0.66% | |
Anne Arundel (County of) (The Villages at Two Rivers); Series 2014, Special Tax RB | | | 5.25 | % | | | 07/01/2044 | | | | 2,145 | | | | 2,154,803 | |
Brunswick (City of) (Brunswick Crossing); Series 2006, Special Obligation Tax RB | | | 5.50 | % | | | 07/01/2036 | | | | 18,599 | | | | 18,608,113 | |
Frederick (County of) (Jefferson Technology Park); | | | | | | | | | | | | | | | | |
Series 2013 A, Special Tax RB | | | 7.25 | % | | | 07/01/2043 | | | | 3,605 | | | | 3,757,311 | |
Series 2013 B, Tax Increment & Special Tax RB(i) | | | 7.13 | % | | | 07/01/2043 | | | | 5,270 | | | | 5,285,704 | |
Frederick (County of) (Urbana Community Development Authority); Series 2010 B, Sub. Special Obligation Tax RB | | | 5.50 | % | | | 07/01/2040 | | | | 8,151 | | | | 8,389,743 | |
Harford (County of); Series 2011, Special Obligation Tax Allocation RB | | | 7.50 | % | | | 07/01/2040 | | | | 6,000 | | | | 6,139,140 | |
Howard (County of) (Annapolis Junction Town Center); | | | | | | | | | | | | | | | | |
Series 2014, Special Obligation Tax Allocation RB | | | 5.80 | % | | | 02/15/2034 | | | | 720 | | | | 730,152 | |
Series 2014, Special Obligation Tax Allocation RB | | | 6.10 | % | | | 02/15/2044 | | | | 1,420 | | | | 1,445,972 | |
Howard (County of) (Vantage House Facility); Series 2016, Ref. Retirement Community RB | | | 5.00 | % | | | 04/01/2046 | | | | 2,710 | | | | 2,727,778 | |
Maryland (State of) Health & Higher Educational Facilities Authority (Adventist Healthcare);
Series 2011 A, RB | | | 6.13 | % | | | 01/01/2036 | | | | 1,500 | | | | 1,632,630 | |
Maryland (State of) Health & Higher Educational Facilities Authority (University of Maryland Medical System); Series 2008 D, VRD RB(LOC-Td Bank N.A.)(g)(h) | | | 1.55 | % | | | 07/01/2041 | | | | 1,935 | | | | 1,935,000 | |
Prince George’s (County of) (Westphalia Town Center); | | | | | | | | | | | | | | | | |
Series 2018, Special Obligation RB(i) | | | 5.13 | % | | | 07/01/2039 | | | | 1,300 | | | | 1,336,985 | |
Series 2018, Special Obligation RB(i) | | | 5.25 | % | | | 07/01/2048 | | | | 2,100 | | | | 2,141,727 | |
See accompanying Notes to Financial Statements which are an integral part of the financial statements.
28 Invesco High Yield Municipal Fund
| | | | | | | | | | | | | | | | |
| | | Interest
Rate | | | Maturity
Date | | | Principal
Amount
(000) | | | Value | |
| Maryland–(continued) | |
Rockville (City of) (Ingleside at King Farm); | | | | | | | | | | | | | | | | |
Series 2017A-1, Ref. Economic Development RB | | | 5.00 | % | | | 11/01/2037 | | | $ | 1,250 | | | $ | 1,317,250 | |
Series 2017 B, Economic Development RB | | | 5.00 | % | | | 11/01/2042 | | | | 2,000 | | | | 2,078,200 | |
Series 2017 B, Economic Development RB | | | 5.00 | % | | | 11/01/2047 | | | | 2,250 | | | | 2,328,165 | |
| | | | | | | | | | | | | | | | 62,008,673 | |
|
| Massachusetts–1.41% | |
Massachusetts (State of); Series 2004 A, Ref. Limited Tax GO Bonds (INS -AMBAC)(b)(e) | | | 5.50 | % | | | 08/01/2030 | | | | 32,040 | | | | 41,477,702 | |
Massachusetts (State of) Development Finance Agency (Boston University); Series 2008U-6C, VRD RB (LOC - Td Bank N.A.)(g)(h) | | | 1.40 | % | | | 10/01/2042 | | | | 3,905 | | | | 3,905,000 | |
Massachusetts (State of) Development Finance Agency (GF/Pilgrim, Inc.); Series 1998, First Mortgage RB | | | 6.75 | % | | | 10/01/2028 | | | | 3,250 | | | | 3,252,437 | |
Massachusetts (State of) Development Finance Agency (Lawrence General Hospital); | | | | | | | | | | | | | | | | |
Series 2017, Ref. RB | | | 5.00 | % | | | 07/01/2047 | | | | 2,700 | | | | 2,824,308 | |
Massachusetts (State of) Development Finance Agency (Massachusetts Institute of Technology); | | | | | | | | | | | | | | | | |
Series 2002 K, RB(b) | | | 5.50 | % | | | 07/01/2032 | | | | 5,015 | | | | 6,711,524 | |
Massachusetts (State of) Development Finance Agency (Sabis International Charter School); | | | | | | | | | | | | | | | | |
Series 2009 A, RB(j)(k) | | | 6.85 | % | | | 10/15/2019 | | | | 745 | | | | 769,064 | |
Series 2009 A, RB(j)(k) | | | 6.90 | % | | | 10/15/2019 | | | | 895 | | | | 924,177 | |
Series 2009 A, RB(j)(k) | | | 8.00 | % | | | 10/15/2019 | | | | 5,850 | | | | 6,076,512 | |
Massachusetts (State of) Development Finance Agency (Tufts Medical Center); | | | | | | | | | | | | | | | | |
Series 2011 I, RB(j)(k) | | | 6.75 | % | | | 01/01/2021 | | | | 1,000 | | | | 1,089,580 | |
Series 2011 I, RB(j)(k) | | | 6.88 | % | | | 01/01/2021 | | | | 4,610 | | | | 5,033,244 | |
Massachusetts (State of) Development Finance Agency (Whitney Academy); Series 2000, RB | | | 7.50 | % | | | 09/01/2030 | | | | 2,085 | | | | 2,086,147 | |
Massachusetts (State of) Port Authority (Delta Air Lines Inc.); Series 2001 C, Special Facilities Floating Rate RB (INS -AMBAC)(e)(k)(m)(r) | | | 5.12 | % | | | 12/19/2030 | | | | 14,625 | | | | 14,625,000 | |
University of Massachusetts Building Authority; Sr. Series 2017 1, RB(b) | | | 5.25 | % | | | 11/01/2047 | | | | 36,580 | | | | 42,848,349 | |
| | | | | | | | | | | | | | | | 131,623,044 | |
|
| Michigan–1.54% | |
Charyl Stockwell Academy; | | | | | | | | | | | | | | | | |
Series 2015, Ref. Public School Academy RB | | | 5.50 | % | | | 10/01/2035 | | | | 2,740 | | | | 2,675,857 | |
Series 2015, Ref. Public School Academy RB | | | 5.75 | % | | | 10/01/2045 | | | | 3,500 | | | | 3,416,070 | |
Dearborn Economic Development Corp. (Henry Ford Village Inc. Project); Series 2017, RB(i) | | | 7.50 | % | | | 11/15/2044 | | | | 4,965 | | | | 4,715,807 | |
Dearborn Economic Development Corp. (Henry Ford Village, Inc.); | | | | | | | | | | | | | | | | |
Series 2008, Ref. Limited Obligation RB | | | 7.00 | % | | | 11/15/2028 | | | | 5,500 | | | | 5,304,695 | |
Series 2008, Ref. Limited Obligation RB | | | 7.13 | % | | | 11/15/2043 | | | | 7,700 | | | | 7,117,495 | |
Detroit (City of) Water and Sewerage Department; Series 2012 A, Ref. Sr. Lien Sewage Disposal System RB | | | 5.00 | % | | | 07/01/2032 | | | | 12,725 | | | | 13,708,515 | |
Detroit Community High School; | | | | | | | | | | | | | | | | |
Series 2005, Public School Academy RB | | | 5.65 | % | | | 11/01/2025 | | | | 835 | | | | 587,264 | |
Series 2005, Public School Academy RB | | | 5.75 | % | | | 11/01/2030 | | | | 1,000 | | | | 631,590 | |
Grand Blanc Academy; Series 2000, COP | | | 7.75 | % | | | 02/01/2030 | | | | 1,590 | | | | 1,382,616 | |
Kentwood Economic Development Corp. (Holland Home); | | | | | | | | | | | | | | | | |
Series 2012, Ref. Limited Obligation RB | | | 5.63 | % | | | 11/15/2032 | | | | 3,500 | | | | 3,740,415 | |
Series 2012, Ref. Limited Obligation RB | | | 5.63 | % | | | 11/15/2041 | | | | 4,160 | | | | 4,382,435 | |
Michigan (State of) Finance Authority (Detroit Water & Sewerage Department); | | | | | | | | | | | | | | | | |
Series 2014C-2, Ref. Local Government Loan Program RB(m) | | | 5.00 | % | | | 07/01/2044 | | | | 5,125 | | | | 5,426,657 | |
Series 2014D-4, Ref. Local Government Loan Program RB | | | 5.00 | % | | | 07/01/2031 | | | | 7,000 | | | | 7,762,650 | |
Series 2014D-4, Ref. Local Government Loan Program RB | | | 5.00 | % | | | 07/01/2032 | | | | 4,000 | | | | 4,422,120 | |
Series 2014D-4, Ref. Local Government Loan Program RB | | | 5.00 | % | | | 07/01/2034 | | | | 8,700 | | | | 9,559,734 | |
Michigan (State of) Finance Authority (Public School Academy - Cesar Chavez Academy); | | | | | | | | | | | | | | | | |
Series 2012, Ref. Limited Obligation RB | | | 5.75 | % | | | 02/01/2033 | | | | 4,750 | | | | 4,785,483 | |
See accompanying Notes to Financial Statements which are an integral part of the financial statements.
29 Invesco High Yield Municipal Fund
| | | | | | | | | | | | | | | | |
| | | Interest
Rate | | | Maturity
Date | | | Principal
Amount
(000) | | | Value | |
| Michigan–(continued) | |
Michigan (State of) Strategic Fund (Canterbury Health Care, Inc.); | | | | | | | | | | | | | | | | |
Series 2016, Limited Obligation RB(i) | | | 5.00 | % | | | 07/01/2036 | | | $ | 1,970 | | | $ | 2,015,940 | |
Series 2016, Limited Obligation RB(i) | | | 5.00 | % | | | 07/01/2046 | | | | 1,000 | | | | 1,011,550 | |
Series 2016, Limited Obligation RB(i) | | | 5.00 | % | | | 07/01/2051 | | | | 2,000 | | | | 2,016,940 | |
Michigan (State of) Strategic Fund (Genesee Power Station); Series 1994, Ref. Solid Waste Disposal RB (m) | | | 7.50 | % | | | 01/01/2021 | | | | 1,070 | | | | 1,055,416 | |
Michigan (State of) Tobacco Settlement Finance Authority; Series 2007 A, Sr. Asset-Backed RB | | | 6.00 | % | | | 06/01/2048 | | | | 37,670 | | | | 37,114,367 | |
Saline Economic Development Corp. (Evangelical Homes of Michigan); Series 2013, Ref. RB | | | 5.50 | % | | | 06/01/2047 | | | | 5,500 | | | | 5,638,765 | |
Star International Academy; Series 2012, Ref. Public School Academy RB | | | 5.00 | % | | | 03/01/2033 | | | | 3,100 | | | | 3,165,131 | |
Waterford Township Economic Development Corp. (Canterbury Health Care, Inc.); | | | | | | | | | | | | | | | | |
Series 2016 A, Ref. Limited Tax Obligation RB(i) | | | 5.00 | % | | | 07/01/2036 | | | | 4,550 | | | | 4,656,106 | |
Series 2016 A, Ref. Limited Tax Obligation RB(i) | | | 5.00 | % | | | 07/01/2046 | | | | 2,000 | | | | 2,023,100 | |
Series 2016 A, Ref. Limited Tax Obligation RB(i) | | | 5.00 | % | | | 07/01/2051 | | | | 2,795 | | | | 2,818,674 | |
Wayne Charter County Economic Development Corp. (Rivers of Grosse Point); Series 2013, First Mortgage RB | | | 7.88 | % | | | 12/01/2043 | | | | 4,000 | | | | 3,290,760 | |
| | | | | | | | | | | | | | | | 144,426,152 | |
|
| Minnesota–1.79% | |
Anoka (City of) (The Homestead at Anoka, Inc.); | | | | | | | | | | | | | | | | |
Series 2011 A, Health Care Facilities RB(j)(k) | | | 7.00 | % | | | 11/01/2019 | | | | 4,070 | | | | 4,249,365 | |
Series 2017, Ref. Housing RB | | | 5.50 | % | | | 11/01/2046 | | | | 3,700 | | | | 3,932,656 | |
Anoka (City of) Minnesota (Homestead at Anoka, Inc.); Series 2017, Ref. Housing RB | | | 5.00 | % | | | 11/01/2046 | | | | 1,500 | | | | 1,530,540 | |
Anoka (County of) Housing & Redevelopment Authority (Fridley Medical Center); | | | | | | | | | | | | | | | | |
Series 2010 A, RB | | | 6.63 | % | | | 05/01/2030 | | | | 500 | | | | 511,125 | |
Series 2010 A, RB | | | 6.88 | % | | | 05/01/2040 | | | | 1,000 | | | | 1,019,030 | |
Apple Valley (City of) (Ecumen-Seasons at Apple Valley); Series 2010, Housing & Health Care RB (j)(k) | | | 6.75 | % | | | 03/01/2020 | | | | 2,500 | | | | 2,623,125 | |
Bethel (City of) (Spectrum High School); Series 2017 A, Ref. Charter School Lease RB | | | 4.00 | % | | | 07/01/2037 | | | | 375 | | | | 361,740 | |
Bloomington (City of) Port Authority (Radisson Blu Mall of America, LLC); | | | | | | | | | | | | | | | | |
Series 2010, Recovery Zone Facility RB | | | 8.00 | % | | | 12/01/2025 | | | | 1,625 | | | | 1,692,957 | |
Series 2010, Recovery Zone Facility RB | | | 9.00 | % | | | 12/01/2035 | | | | 10,500 | | | | 11,357,010 | |
Brooklyn Park (City of) (Athlos Leadership Academy); | | | | | | | | | | | | | | | | |
Series 2015, Charter School Lease RB | | | 5.50 | % | | | 07/01/2035 | | | | 665 | | | | 682,789 | |
Series 2015, Charter School Lease RB | | | 5.50 | % | | | 07/01/2040 | | | | 2,250 | | | | 2,285,820 | |
Series 2015, Charter School Lease RB | | | 5.75 | % | | | 07/01/2046 | | | | 2,800 | | | | 2,869,720 | |
Carlton (City of) (Inter-Faith Care Center); Series 2006, Ref. Health Care & Housing Facilities RB | | | 5.70 | % | | | 04/01/2036 | | | | 2,000 | | | | 1,967,540 | |
Deephaven (City of) (Seven Hills Preparatory Academy); Series 2017, Charter School Lease RB | | | 5.00 | % | | | 10/01/2049 | | | | 1,200 | | | | 1,163,400 | |
Minneapolis (City of) (Riverton Community Housing); | | | | | | | | | | | | | | | | |
Series 2014, Ref. RB | | | 5.50 | % | | | 08/01/2049 | | | | 6,500 | | | | 6,815,055 | |
Series 2018, Student Housing RB(i) | | | 4.75 | % | | | 08/01/2043 | | | | 600 | | | | 610,092 | |
Minnesota (State of) Higher Education Facilities Authority (Concordia University, St. Paul); | | | | | | | | | | | | | | | | |
Series 2007Six-Q, VRD RB (LOC - U.s. Bank N.A.) (g)(h) | | | 1.58 | % | | | 04/01/2037 | | | | 5,600 | | | | 5,600,000 | |
Oak Park Heights (City of) (Oakgreen Commons); | | | | | | | | | | | | | | | | |
Series 2010, Housing RB(j)(k) | | | 6.75 | % | | | 08/01/2020 | | | | 1,500 | | | | 1,604,295 | |
Series 2010, Housing RB(j)(k) | | | 7.00 | % | | | 08/01/2020 | | | | 3,000 | | | | 3,217,230 | |
Perham (City of) Hospital District (Perham Memorial Hospital & Home); Series 2010, Health Care Facilities RB(j)(k) | | | 6.35 | % | | | 03/01/2020 | | | | 2,000 | | | | 2,090,860 | |
Rochester (City of) (Homestead at Rochester, Inc.); Series 2013 A, Health Care & Housing RB | | | 6.88 | % | | | 12/01/2048 | | | | 6,000 | | | | 6,453,360 | |
Rochester (City of) (Samaritan Bethany, Inc.); | | | | | | | | | | | | | | | | |
Series 2009 A, Ref. Health Care & Housing RB(j)(k) | | | 7.38 | % | | | 12/01/2019 | | | | 2,000 | | | | 2,082,460 | |
Series 2009 B, Ref. Health Care & Housing RB(j)(k) | | | 7.38 | % | | | 12/01/2019 | | | | 1,555 | | | | 1,619,113 | |
Sartell (City of) (Country Manor Campus LLC); Series 2013, Health Care & Housing Facilities RB | | | 5.38 | % | | | 09/01/2043 | | | | 5,000 | | | | 5,339,400 | |
St. Louis Park (City of), Minnesota (Place Via Sol Project); Series 2018,
Ref. RB(i)(k) | | | 6.00 | % | | | 07/01/2027 | | | | 26,750 | | | | 26,921,200 | |
See accompanying Notes to Financial Statements which are an integral part of the financial statements.
30 Invesco High Yield Municipal Fund
| | | | | | | | | | | | | | | | |
| | | Interest
Rate | | | Maturity
Date | | | Principal
Amount
(000) | | | Value | |
| Minnesota–(continued) | |
St. Paul (City of) (Presbyterian Homes Bloomington); Series 2017, Ref. Sr. Housing & Health Care RB | | | 5.00 | % | | | 09/01/2042 | | | $ | 500 | | | $ | 534,600 | |
St. Paul (City of) Housing & Redevelopment Authority (Emerald Gardens); | | | | | | | | | | | | | | | | |
Series 2010, Ref. Tax Increment Allocation RB | | | 5.63 | % | | | 03/01/2020 | | | | 165 | | | | 166,856 | |
Series 2010, Ref. Tax Increment Allocation RB | | | 6.50 | % | | | 03/01/2029 | | | | 885 | | | | 897,514 | |
St. Paul (City of) Housing & Redevelopment Authority (High School for Recording Arts); | | | | | | | | | | | | | | | | |
Series 2015, Charter School Lease RB | | | 6.00 | % | | | 10/01/2035 | | | | 2,695 | | | | 2,751,999 | |
Series 2015, Charter School Lease RB | | | 6.25 | % | | | 10/01/2045 | | | | 4,275 | | | | 4,348,359 | |
St. Paul (City of) Housing & Redevelopment Authority (Higher Ground Academy Project); | | | | | | | | | | | | | | | | |
Series 2018, Charter School Lease RB | | | 5.00 | % | | | 12/01/2043 | | | | 4,170 | | | | 4,198,481 | |
Series 2018, Charter School Lease RB | | | 5.13 | % | | | 12/01/2049 | | | | 7,560 | | | | 7,625,772 | |
St. Paul (City of) Housing & Redevelopment Authority (Hmong Academy); Series 2012 A, Charter School Lease RB | | | 5.50 | % | | | 09/01/2043 | | | | 5,000 | | | | 5,089,850 | |
St. Paul (City of) Housing & Redevelopment Authority (Hmong College Prep Academy); | | | | | | | | | | | | | | | | |
Series 2016, Ref. Charter School Lease RB | | | 5.75 | % | | | 09/01/2046 | | | | 1,000 | | | | 1,051,480 | |
Series 2016, Ref. Charter School Lease RB | | | 6.00 | % | | | 09/01/2051 | | | | 3,550 | | | | 3,764,988 | |
St. Paul (City of) Housing & Redevelopment Authority (Marian Center); Series 2007 A, Ref. MFH RB | | | 5.38 | % | | | 05/01/2043 | | | | 5,000 | | | | 4,800,500 | |
St. Paul (City of) Housing & Redevelopment Authority (Nova Classical Academy); | | | | | | | | | | | | | | | | |
Series 2011 A, Charter School Lease RB(j)(k) | | | 6.63 | % | | | 09/01/2021 | | | | 1,500 | | | | 1,677,135 | |
Series 2011 A, Charter School Lease RB | | | 6.38 | % | | | 09/01/2031 | | | | 1,000 | | | | 1,076,450 | |
St. Paul (City of) Housing & Redevelopment Authority (Rossy & Richard Shaller Family Sholom East Campus); | | | | | | | | | | | | | | | | |
Series 2018, Ref. RB | | | 4.35 | % | | | 10/01/2038 | | | | 1,185 | | | | 1,149,983 | |
Series 2018, Ref. RB | | | 5.00 | % | | | 10/01/2043 | | | | 1,000 | | | | 1,018,360 | |
Series 2018, Ref. RB | | | 4.65 | % | | | 10/01/2048 | | | | 1,500 | | | | 1,441,695 | |
Vadnais Heights (City of) (Agriculture & Food Sciences Academy); | | | | | | | | | | | | | | | | |
Series 2018 A, Lease RB | | | 5.50 | % | | | 12/01/2038 | | | | 3,355 | | | | 3,402,708 | |
Series 2018 A, Lease RB | | | 5.88 | % | | | 12/01/2048 | | | | 4,500 | | | | 4,566,195 | |
Series 2018 A, Lease RB | | | 6.50 | % | | | 12/01/2053 | | | | 4,315 | | | | 4,376,575 | |
Series 2018 B, Lease RB | | | 6.75 | % | | | 12/01/2025 | | | | 595 | | | | 596,327 | |
Wayzata (City of) (Folkestone Senior Living Community); | | | | | | | | | | | | | | | | |
Series 2012 A, Senior Housing RB | | | 5.75 | % | | | 11/01/2039 | | | | 3,000 | | | | 3,068,940 | |
Series 2012 A, Senior Housing RB | | | 6.00 | % | | | 05/01/2047 | | | | 7,500 | | | | 7,674,150 | |
West St. Paul (City of) (Walker Thompson Hill, LLC); Series 2011A, Health Care Facilities RB(j)(k) | | | 7.00 | % | | | 09/01/2019 | | | | 1,530 | | | | 1,569,000 | |
West St. Paul (City of) (Walker Westwood Ridge Campus); | | | | | | | | | | | | | | | | |
Series 2017, Ref. Housing & Health Care Facilities RB | | | 5.00 | % | | | 11/01/2037 | | | | 400 | | | | 416,040 | |
Series 2017, Ref. Housing & Health Care Facilities RB | | | 5.00 | % | | | 11/01/2049 | | | | 1,275 | | | | 1,305,358 | |
Series 2017, Ref. Housing & Health Care Facilities RB | | | 4.75 | % | | | 11/01/2052 | | | | 375 | | | | 377,959 | |
| | | | | | | | | | | | | | | | 167,547,156 | |
|
| Mississippi–0.31% | |
Jackson (County of) Mississippi (Chevron U.S.A., Inc.); Series 1993, Ref. VRD RB(g) | | | 1.60 | % | | | 06/01/2023 | | | | 15,025 | | | | 15,025,000 | |
Mississippi Business Finance Corp. (Chevron U.S.A., Inc.); Series 2010 I, VRD Gulf Opportunity Zone IDR (g) | | | 1.60 | % | | | 11/01/2035 | | | | 13,860 | | | | 13,860,000 | |
| | | | | | | | | | | | | | | | 28,885,000 | |
|
| Missouri–1.60% | |
370/Missouri Bottom Road/Taussig Road Transportation Development District (Hazelwood); | | | | | | | | | | | | | | | | |
Series 2002, RB(c) | | | 7.00 | % | | | 05/01/2022 | | | | 1,750 | | | | 910,000 | |
Series 2002, RB(c) | | | 7.20 | % | | | 05/01/2033 | | | | 5,250 | | | | 2,730,000 | |
Arnold Retail Corridor Transportation Development District; Series 2010, Transportation Sales Tax RB | | | 6.65 | % | | | 05/01/2038 | | | | 2,000 | | | | 2,003,580 | |
Ballwin (City of) (Ballwin Town Center); Series 2002 A, Ref. & Improvement Tax Increment Allocation RB | | | 6.50 | % | | | 10/01/2022 | | | | 3,065 | | | | 1,787,907 | |
See accompanying Notes to Financial Statements which are an integral part of the financial statements.
31 Invesco High Yield Municipal Fund
| | | | | | | | | | | | | | | | |
| | | Interest
Rate | | | Maturity
Date | | | Principal
Amount
(000) | | | Value | |
| Missouri–(continued) | |
Branson Hills Infrastructure Facilities Community Improvement District; | | | | | | | | | | | | | | | | |
Series 2007 A, Special Assessment RB | | | 5.50 | % | | | 04/01/2022 | | | $ | 3,170 | | | $ | 1,268,000 | |
Series 2007 A, Special Assessment RB | | | 5.50 | % | | | 04/01/2027 | | | | 6,055 | | | | 2,422,000 | |
Chillicothe (City of) (South U.S. 65); Series 2006, Tax Increment Allocation RB | | | 5.50 | % | | | 04/01/2021 | | | | 450 | | | | 395,474 | |
Dardenne Town Square Transportation Development District; Series 2006A, Transportation Sales Tax RB(o) | | | 5.00 | % | | | 05/01/2036 | | | | 3,190 | | | | 1,642,850 | |
Grandview (City of) Industrial Development Authority (Grandview Crossing); Series 2006, Tax Increment Allocation RB(o) | | | 5.75 | % | | | 12/01/2028 | | | | 1,250 | | | | 187,500 | |
Grundy (County of) Industrial Development Authority (Wright Memorial Hospital); | | | | | | | | | | | | | | | | |
Series 2009, Health Facilities RB | | | 6.45 | % | | | 09/01/2029 | | | | 1,000 | | | | 1,012,820 | |
Series 2009, Health Facilities RB | | | 6.75 | % | | | 09/01/2034 | | | | 1,250 | | | | 1,266,825 | |
I-470 Western Gateway Transportation Development District; | | | | | | | | | | | | | | | | |
Series 2019 A, RB(i) | | | 5.25 | % | | | 12/01/2048 | | | | 5,415 | | | | 5,431,624 | |
Series 2019 B, RB(i) | | | 7.75 | % | | | 12/15/2048 | | | | 3,853 | | | | 3,862,093 | |
Kansas City (City of) Industrial Development Authority (Brentwood Manor Apartments); | | | | | | | | | | | | | | | | |
Series 2002 B, MFH RB(m) | | | 5.25 | % | | | 10/15/2038 | | | | 2,075 | | | | 1,684,942 | |
Kansas City (City of) Industrial Development Authority (Northwoods Apartments); Series 2004 A, MFH RB(m) | | | 6.45 | % | | | 05/01/2040 | | | | 1,943 | | | | 1,944,962 | |
Kansas City (City of) Industrial Development Authority (Walnut Grove Apartments); | | | | | | | | | | | | | | | | |
Series 2000 B, MFH RB(m) | | | 7.55 | % | | | 06/15/2022 | | | | 485 | | | | 485,611 | |
Series 2000 B, MFH RB(m) | | | 7.55 | % | | | 06/15/2035 | | | | 3,430 | | | | 3,434,288 | |
Kansas City (City of) Land Clearance for Redevelopment Authority (Convention Center Hotel); | | | | | | | | | | | | | | | | |
Series 2018 B, Tax Allocation RB(i) | | | 5.00 | % | | | 02/01/2050 | | | | 2,550 | | | | 2,577,234 | |
Kirkwood (City of) Industrial Development Authority (Aberdeen Heights); | | | | | | | | | | | | | | | | |
Series 2010 A, Retirement Community RB(j)(k) | | | 8.00 | % | | | 05/15/2020 | | | | 7,000 | | | | 7,509,740 | |
Series 2010 A, Retirement Community RB(j)(k) | | | 8.25 | % | | | 05/15/2020 | | | | 25,500 | | | | 27,431,880 | |
Series 2017 A, Ref. Retirement Community RB | | | 5.25 | % | | | 05/15/2050 | | | | 9,000 | | | | 9,388,890 | |
Series 2017, Ref. Retirement Community RB | | | 5.25 | % | | | 05/15/2037 | | | | 2,285 | | | | 2,420,523 | |
Liberty (City of) (Liberty Commons); Series 2015 A, Tax Allocation RB(i) | | | 6.00 | % | | | 06/01/2046 | | | | 6,170 | | | | 6,000,078 | |
Manchester (City of) (Highway 141/Manchester Road); | | | | | | | | | | | | | | | | |
Series 2010, Ref. Transportation Tax Increment Allocation RB | | | 6.00 | % | | | 11/01/2025 | | | | 120 | | | | 119,664 | |
Series 2010, Ref. Transportation Tax Increment Allocation RB | | | 6.88 | % | | | 11/01/2039 | | | | 1,500 | | | | 1,505,400 | |
Maplewood (City of) (Maplewood South Redevelopment Area); Series 2005, Ref. Tax Increment RB | | | 5.75 | % | | | 11/01/2026 | | | | 1,350 | | | | 1,315,683 | |
Missouri (State of) Health & Educational Facilities Authority (Truman Medical Center, Inc.); | | | | | | | | | | | | | | | | |
Series 2017 B, Educational Facilities RB(i) | | | 4.25 | % | | | 12/01/2042 | | | | 2,870 | | | | 2,852,464 | |
Missouri (State of) Health & Educational Facilities Authority (Washington University); | | | | | | | | | | | | | | | | |
Series 2011 A, RB(b) | | | 5.00 | % | | | 11/15/2041 | | | | 6,210 | | | | 6,694,939 | |
Series 2011 B, RB(b) | | | 5.00 | % | | | 11/15/2037 | | | | 10,500 | | | | 11,331,390 | |
St. Joseph (City of) Industrial Development Authority (Living Community of
St. Joseph); | | | | | | | | | | | | | | | | |
Series 2002, Health Care RB | | | 7.00 | % | | | 08/15/2032 | | | | 6,305 | | | | 6,305,000 | |
St. Louis (City of) Industrial Development Authority (Ballpark Village Development); Series 2017 A, Ref. Financing RB | | | 4.75 | % | | | 11/15/2047 | | | | 2,500 | | | | 2,545,000 | |
St. Louis (County of) Industrial Development Authority (Friendship Village Chesterfield); | | | | | | | | | | | | | | | | |
Series 2012, Senior Living Facilities RB(j)(k) | | | 5.00 | % | | | 09/01/2022 | | | | 3,000 | | | | 3,325,620 | |
St. Louis (County of) Industrial Development Authority (Friendship Village West County); | | | | | | | | | | | | | | | | |
Series 2018 A, Senior Living Facilities RB | | | 5.13 | % | | | 09/01/2048 | | | | 7,500 | | | | 7,649,625 | |
Series 2018 A, Senior Living Facilities RB | | | 5.13 | % | | | 09/01/2049 | | | | 3,975 | | | | 4,051,280 | |
Series 2018 A, Senior Living Facilities RB | | | 5.25 | % | | | 09/01/2053 | | | | 11,000 | | | | 11,323,070 | |
St. Louis (County of) Industrial Development Authority (Grand Center Redevelopment); | | | | | | | | | | | | | | | | |
Series 2011, Tax Increment Allocation Improvement RB | | | 6.38 | % | | | 12/01/2025 | | | | 3,165 | | | | 3,185,889 | |
| | | | | | | | | | | | | | | | 150,003,845 | |
See accompanying Notes to Financial Statements which are an integral part of the financial statements.
32 Invesco High Yield Municipal Fund
| | | | | | | | | | | | | | | | |
| | | Interest
Rate | | | Maturity
Date | | | Principal
Amount
(000) | | | Value | |
| Montana–0.04% | |
Kalispell (City of) (Immanuel Lutheran Corp.); | | | | | | | | | | | | | | | | |
Series 2017, Ref. Housing & Healthcare Facilities RB | | | 5.25 | % | | | 05/15/2037 | | | $ | 1,000 | | | $ | 1,034,240 | |
Series 2017, Ref. Housing & Healthcare Facilities RB | | | 5.25 | % | | | 05/15/2052 | | | | 2,320 | | | | 2,375,680 | |
| | | | | | | | | | | | | | | | 3,409,920 | |
|
| Nebraska–0.62% | |
Central Plains Energy Project (No. 3); | | | | | | | | | | | | | | | | |
Series 2012, Gas RB(q) | | | 5.00 | % | | | 09/01/2042 | | | | 21,715 | | | | 23,323,430 | |
Series 2017 A, Ref. Gas RB | | | 5.00 | % | | | 09/01/2042 | | | | 20,000 | | | | 23,114,600 | |
Gage (County of) Hospital Authority No. 1 (Beatrice Community Hospital & Health Center); | | | | | | | | | | | | | | | | |
Series 2010 B, Health Care Facilities RB(j)(k) | | | 6.50 | % | | | 06/01/2020 | | | | 5,000 | | | | 5,288,350 | |
Series 2010 B, Health Care Facilities RB(j)(k) | | | 6.75 | % | | | 06/01/2020 | | | | 6,000 | | | | 6,364,380 | |
| | | | | | | | | | | | | | | | 58,090,760 | |
|
| Nevada–0.60% | |
Clark (County of) (Homestead Boulder City); Series 1997, Assisted Living Facility RB | | | 6.50 | % | | | 12/01/2027 | | | | 3,305 | | | | 3,305,925 | |
Clark (County of) (Stadium Improvement Bonds); Series 2018 A, Limited Tax GO Bonds(b) | | | 5.00 | % | | | 05/01/2048 | | | | 16,650 | | | | 18,881,766 | |
Director of the State of Nevada Department of Business & Industry (Somerset Academy); | | | | | | | | | | | | | | | | |
Series 2018 A, RB(i) | | | 5.00 | % | | | 12/15/2038 | | | | 1,000 | | | | 1,013,700 | |
Series 2018 A, RB(i) | | | 5.00 | % | | | 12/15/2048 | | | | 3,000 | | | | 3,022,080 | |
Las Vegas (City of) Nevada; Series 2016, Sales Tax Increment RB(i) | | | 4.38 | % | | | 06/15/2035 | | | | 4,000 | | | | 3,643,520 | |
Las Vegas (City of) Redevelopment Agency; Series 2009 A, Tax Increment Allocation RB(j)(k) | | | 8.00 | % | | | 06/15/2019 | | | | 10,300 | | | | 10,480,662 | |
Las Vegas (City of) Valley Water District; Series 2016 A, Ref. & Improvement Limited Tax GO Bonds(b) | | | 5.00 | % | | | 06/01/2046 | | | | 9,665 | | | | 10,820,354 | |
Nevada (State of) Department of Business & Industry (Fulcrum Sierra Biofuels, LLC); | | | | | | | | | | | | | | | | |
Series 2017, Environmental Improvement Green Bonds(i)(m) | | | 6.25 | % | | | 12/15/2037 | | | | 1,000 | | | | 1,065,910 | |
Reno (City of), Nevada (ReTRAC - Reno Transportation Rail Access Corridor); | | | | | | | | | | | | | | | | |
Series 2018 C, Ref. Sub. CAB Sales Tax RB(f)(i) | | | 0.00 | % | | | 07/01/2058 | | | | 27,000 | | | | 3,133,890 | |
Series 2018 D, Ref. Sub. CAB Sales Tax RB(f)(i) | | | 0.00 | % | | | 07/01/2058 | | | | 13,000 | | | | 1,049,360 | |
| | | | | | | | | | | | | | | | 56,417,167 | |
|
| New Hampshire–0.20% | |
National Finance Authority (Convanta); Series 2018 C, Ref. Resource Recovery RB(i)(m) | | | 4.88 | % | | | 11/01/2042 | | | | 7,500 | | | | 7,503,825 | |
New Hampshire (State of) Business Finance Authority (Huggins Hospital); Series 2009, First Mortgage RB(j)(k) | | | 6.88 | % | | | 10/01/2019 | | | | 8,470 | | | | 8,722,575 | |
New Hampshire (State of) Health & Education Facilities Authority (Rivermead); | | | | | | | | | | | | | | | | |
Series 2011 A, RB | | | 6.63 | % | | | 07/01/2031 | | | | 620 | | | | 658,583 | |
Series 2011 A, RB | | | 6.88 | % | | | 07/01/2041 | | | | 2,125 | | | | 2,250,949 | |
| | | | | | | | | | | | | | | | 19,135,932 | |
|
| New Jersey–4.72% | |
New Jersey (State of) Economic Development Authority; | | | | | | | | | | | | | | | | |
Series 2015 XX, Ref. RB | | | 5.25 | % | | | 06/15/2027 | | | | 10,000 | | | | 11,244,800 | |
Series 2017 B, Ref. RB | | | 5.00 | % | | | 11/01/2024 | | | | 27,780 | | | | 31,070,819 | |
Series 2017 B, Ref. RB | | | 5.00 | % | | | 11/01/2026 | | | | 23,695 | | | | 26,924,865 | |
New Jersey (State of) Economic Development Authority (Continental Airlines, Inc.); | | | | | | | | | | | | | | | | |
Series 1999, Special Facility RB(m) | | | 5.25 | % | | | 09/15/2029 | | | | 26,770 | | | | 29,081,322 | |
Series 2000 B, Special Facility RB(m) | | | 5.63 | % | | | 11/15/2030 | | | | 20,000 | | | | 22,591,000 | |
Series 2003, Special Facility RB(m) | | | 5.50 | % | | | 06/01/2033 | | | | 16,480 | | | | 18,108,554 | |
Series 2012, Special Facility RB(m) | | | 5.75 | % | | | 09/15/2027 | | | | 34,325 | | | | 37,796,974 | |
New Jersey (State of) Economic Development Authority (Paterson Charter School for Science and Technology Inc.); | | | | | | | | | | | | | | | | |
Series 2012 A, RB | | | 6.00 | % | | | 07/01/2032 | | | | 1,800 | | | | 1,812,186 | |
Series 2012 A, RB | | | 6.10 | % | | | 07/01/2044 | | | | 3,950 | | | | 3,954,306 | |
See accompanying Notes to Financial Statements which are an integral part of the financial statements.
33 Invesco High Yield Municipal Fund
| | | | | | | | | | | | | | | | |
| | | Interest
Rate | | | Maturity
Date | | | Principal
Amount
(000) | | | Value | |
| New Jersey–(continued) | |
New Jersey (State of) Economic Development Authority (Paterson Charter School for Science and Technology, Inc.); | | | | | | | | | | | | | | | | |
Series 2012 C, RB | | | 5.00 | % | | | 07/01/2032 | | | $ | 1,370 | | | $ | 1,260,770 | |
Series 2012 C, RB | | | 5.30 | % | | | 07/01/2044 | | | | 4,500 | | | | 4,006,485 | |
New Jersey (State of) Economic Development Authority (Port Newark Container Terminal LLC); | | | | | | | | | | | | | | | | |
Series 2017, Ref. Special Facility RB(m) | | | 5.00 | % | | | 10/01/2047 | | | | 8,730 | | | | 9,223,420 | |
New Jersey (State of) Economic Development Authority (The Goethals Bridge Replacement); | | | | | | | | | | | | | | | | |
Series 2013, Private Activity RB(m) | | | 5.38 | % | | | 01/01/2043 | | | | 24,860 | | | | 27,061,353 | |
Series 2013, Private Activity RB(m) | | | 5.63 | % | | | 01/01/2052 | | | | 22,695 | | | | 24,902,316 | |
New Jersey (State of) Transportation Trust Fund Authority; | | | | | | | | | | | | | | | | |
Series 2006 C, CAB Transportation System RB(INS-NATL)(e)(f) | | | 0.00 | % | | | 12/15/2031 | | | | 46,780 | | | | 28,323,419 | |
Series 2008 A, Transportation System CAB RB(f) | | | 0.00 | % | | | 12/15/2035 | | | | 20,000 | | | | 9,617,200 | |
Series 2009 A, Transportation System CAB RB(f) | | | 0.00 | % | | | 12/15/2038 | | | | 63,105 | | | | 25,498,206 | |
Series 2010 A, Transportation System CAB RB(f) | | | 0.00 | % | | | 12/15/2029 | | | | 2,110 | | | | 1,396,672 | |
Series 2010 A, Transportation System CAB RB(f) | | | 0.00 | % | | | 12/15/2030 | | | | 8,620 | | | | 5,417,842 | |
Series 2010 A, Transportation System CAB RB(f) | | | 0.00 | % | | | 12/15/2031 | | | | 10,965 | | | | 6,547,969 | |
Series 2010 A, Transportation System CAB RB(f) | | | 0.00 | % | | | 12/15/2036 | | | | 45,555 | | | | 20,742,558 | |
Series 2011 A, Transportation System RB | | | 5.50 | % | | | 06/15/2041 | | | | 12,600 | | | | 13,099,716 | |
Series 2011 B, Transportation System RB | | | 5.00 | % | | | 06/15/2042 | | | | 9,225 | | | | 9,484,868 | |
Series 2012 AA, Transportation Program RB | | | 5.00 | % | | | 06/15/2038 | | | | 10,000 | | | | 10,344,200 | |
Series 2013 AA, Transportation Program RB | | | 5.00 | % | | | 06/15/2044 | | | | 3,645 | | | | 3,767,982 | |
Series 2014, Transportation Program Floating Rate Notes (SIFMA Municipal Swap Index + 1.20%) (k)(s) | | | 2.94 | % | | | 12/15/2021 | | | | 5,000 | | | | 5,042,750 | |
Series 2018 A, Ref. RB | | | 5.00 | % | | | 12/15/2034 | | | | 5,000 | | | | 5,454,650 | |
Series 2018 A, Ref. RB | | | 5.00 | % | | | 12/15/2036 | | | | 7,500 | | | | 8,118,150 | |
Subseries 2016A-1, Federal Highway Reimbursement RN | | | 5.00 | % | | | 06/15/2028 | | | | 2,000 | | | | 2,265,060 | |
New Jersey (State of) Turnpike Authority; Series 2017 B, Ref. RB(b) | | | 5.00 | % | | | 01/01/2040 | | | | 11,000 | | | | 12,519,980 | |
Tobacco Settlement Financing Corp.; Series 2018 B, Ref. Sub. RB | | | 5.00 | % | | | 06/01/2046 | | | | 25,000 | | | | 25,349,250 | |
| | | | | | | | | | | | | | | | 442,029,642 | |
|
| New Mexico–0.41% | |
Farmington (City of) (Public Service Co. of New Mexico San Juan); Series 2010 C, Ref. PCR | | | 5.90 | % | | | 06/01/2040 | | | | 5,000 | | | | 5,210,750 | |
New Mexico (State of) Hospital Equipment Loan Council (Gerald Champion); Series 2012, Ref. & Improvement RB | | | 5.50 | % | | | 07/01/2042 | | | | 10,000 | | | | 10,736,200 | |
New Mexico (State of) Hospital Equipment Loan Council (Haverland Charter Lifestyle Group); | | | | | | | | | | | | | | | | |
Series 2013, First Mortgage RB | | | 5.00 | % | | | 07/01/2042 | | | | 4,625 | | | | 4,755,888 | |
New Mexico (State of) Hospital Equipment Loan Council (La Vida Llena); Series 2010 A, First Mortgage RB | | | 6.13 | % | | | 07/01/2040 | | | | 8,000 | | | | 8,230,480 | |
RHA Housing Development Corp. (Woodleaf Apartments); Series 1997 A, Ref. MFH Mortgage RB (CEP -GNMA) | | | 7.13 | % | | | 12/15/2027 | | | | 1,755 | | | | 1,757,053 | |
Winrock Town Center Tax Increment Development District 1; Series 2015,
Sr. Lien Gross Receipts Tax Increment Tax Allocation RB(i) | | | 6.00 | % | | | 05/01/2040 | | | | 7,838 | | | | 7,897,334 | |
| | | | | | | | | | | | | | | | 38,587,705 | |
|
| New York–11.31% | |
Amherst (Town of) Industrial Development Agency (Shaary Zedek); Series
2006 A, Ref. Civic Facility RB | | | 7.00 | % | | | 06/15/2036 | | | | 1,910 | | | | 1,875,983 | |
Brooklyn Arena Local Development Corp. (Barclays Center); | | | | | | | | | | | | | | | | |
Series 2009, PILOT CAB RB(f) | | | 0.00 | % | | | 07/15/2034 | | | | 14,345 | | | | 7,758,350 | |
Series 2009, PILOT CAB RB(f) | | | 0.00 | % | | | 07/15/2044 | | | | 25,805 | | | | 8,118,511 | |
Buffalo & Erie County Industrial Land Development Corp. (Tapestry Charter School); Series 2017 A, RB | | | 5.00 | % | | | 08/01/2052 | | | | 5,000 | | | | 5,152,000 | |
Erie Tobacco Asset Securitization Corp.; Series 2005 A, Tobacco Settlement Asset-Backed RB | | | 5.00 | % | | | 06/01/2045 | | | | 10,000 | | | | 9,785,400 | |
Hudson Yards Infrastructure Corp; Series 2017 A, Second Indenture RB(b) | | | 5.00 | % | | | 02/15/2039 | | | | 21,060 | | | | 23,919,316 | |
See accompanying Notes to Financial Statements which are an integral part of the financial statements.
34 Invesco High Yield Municipal Fund
| | | | | | | | | | | | | | | | |
| | | Interest
Rate | | | Maturity
Date | | | Principal
Amount
(000) | | | Value | |
| New York–(continued) | |
Nassau (County of) Industrial Development Agency (Amsterdam at Harborside); | | | | | | | | | | | | | | | | |
Series 2014 A, Continuing Care Retirement Community RB | | | 6.50 | % | | | 01/01/2032 | | | $ | 6,866 | | | $ | 7,028,499 | |
Series 2014 A, Continuing Care Retirement Community RB | | | 6.70 | % | | | 01/01/2049 | | | | 26,628 | | | | 26,655,598 | |
Series 2014 B, Continuing Care Retirement Community RB | | | 5.50 | % | | | 07/01/2020 | | | | 1,998 | | | | 2,003,587 | |
Series 2014 C, Continuing Care Retirement Community RB | | | 2.00 | % | | | 01/01/2049 | | | | 13,770 | | | | 2,340,907 | |
Nassau County Tobacco Settlement Corp.; | | | | | | | | | | | | | | | | |
Series 2006A-3, Sr. Asset-Backed RB | | | 5.00 | % | | | 06/01/2035 | | | | 10,290 | | | | 9,988,503 | |
Series 2006A-3, Sr. Asset-Backed RB | | | 5.13 | % | | | 06/01/2046 | | | | 64,130 | | | | 61,026,749 | |
Series 2006 B, CAB Asset-Backed RB(f) | | | 0.00 | % | | | 06/01/2046 | | | | 105,990 | | | | 17,789,362 | |
New York & New Jersey (States of) Port Authority; | | | | | | | | | | | | | | | | |
One Hundred Sixty-Ninth Series 2011, Consolidated RB(b) | | | 5.00 | % | | | 10/15/2028 | | | | 10,760 | | | | 11,563,772 | |
Two Hundred Series 2017, Ref. Consolidated RB(b) | | | 5.25 | % | | | 10/15/2057 | | | | 20,000 | | | | 22,919,800 | |
Two Hundred Seventh Series 2018, Ref. Consolidated RB(b) | | | 5.00 | % | | | 09/15/2029 | | | | 22,235 | | | | 26,609,514 | |
One Hundred Sixty-Ninth Series 2011, Consolidated RB(b) | | | 5.00 | % | | | 10/15/2027 | | | | 15,400 | | | | 16,550,380 | |
New York & New Jersey (States of) Port Authority (JFK International Air Terminal LLC); | | | | | | | | | | | | | | | | |
Series 2010, Special Obligation RB | | | 6.00 | % | | | 12/01/2042 | | | | 7,500 | | | | 7,927,050 | |
New York (City of); | | | | | | | | | | | | | | | | |
Subseries 2015F-5, VRD Unlimited Tax GO Bonds(g) | | | 1.55 | % | | | 06/01/2044 | | | | 3,800 | | | | 3,800,000 | |
Subseries 2016A-1, Unlimited Tax GO Bonds(b) | | | 5.00 | % | | | 08/01/2038 | | | | 31,010 | | | | 35,197,280 | |
New York (City of) Municipal Water Finance Authority; | | | | | | | | | | | | | | | | |
Series 2012 BB, Water & Sewer System Second General Resolution RB(b) | | | 5.00 | % | | | 06/15/2047 | | | | 16,470 | | | | 18,034,650 | |
Series 2014 BB, Water & Sewer System Second General Resolution RB(b) | | | 5.00 | % | | | 06/15/2046 | | | | 15,050 | | | | 16,465,754 | |
Series 2017 DD, Water & Sewer System RB(b) | | | 5.25 | % | | | 06/15/2047 | | | | 14,150 | | | | 16,276,321 | |
Series 2017 EE, Ref. Water & Sewer System RB(b) | | | 5.25 | % | | | 06/15/2036 | | | | 5,000 | | | | 5,918,950 | |
Series 2017 EE, Ref. Water & Sewer System RB(b) | | | 5.25 | % | | | 06/15/2037 | | | | 5,000 | | | | 5,882,650 | |
Subseries 2012A-1, VRD Water & Sewer System RB(g) | | | 1.55 | % | | | 06/15/2044 | | | | 2,200 | | | | 2,200,000 | |
New York (City of) Transitional Finance Authority; | | | | | | | | | | | | | | | | |
Series 2013 I, Sub. Future Tax Sec. RB(b) | | | 5.00 | % | | | 05/01/2042 | | | | 25,775 | | | | 28,398,637 | |
Subseries 2012F-1, Future Tax Sec. RB(b) | | | 5.00 | % | | | 05/01/2039 | | | | 14,000 | | | | 15,164,380 | |
Subseries 2013, Sub. Future Tax Sec. RB(b) | | | 5.00 | % | | | 11/01/2042 | | | | 17,340 | | | | 19,273,757 | |
New York (Counties of) Tobacco Trust V; | | | | | | | | | | | | | | | | |
Series 2005S-1, Sub. Pass Through CAB RB(f) | | | 0.00 | % | | | 06/01/2038 | | | | 65,990 | | | | 20,573,042 | |
Series 2005S-2, Sub. Pass Through CAB RB(f) | | | 0.00 | % | | | 06/01/2050 | | | | 30,000 | | | | 3,874,500 | |
Series 2005S-3, Sub. Pass Through CAB RB(f) | | | 0.00 | % | | | 06/01/2055 | | | | 225,000 | | | | 14,523,750 | |
New York (State of) Dormitory Authority; Series 2014 C, State Personal Income Tax RB(b) | | | 5.00 | % | | | 03/15/2041 | | | | 26,940 | | | | 30,194,621 | |
New York (State of) Dormitory Authority (General Purpose); Series 2011 C, State Personal Income Tax RB(b) | | | 5.00 | % | | | 03/15/2031 | | | | 15,000 | | | | 15,923,700 | |
New York (State of) Dormitory Authority (Sales Tax); Series 2015B-C, RB(b) | | | 5.00 | % | | | 03/15/2045 | | | | 49,100 | | | | 54,978,743 | |
New York Convention Center Development Corp; Series 2016 A, Sr. RB(f) | | | 0.00 | % | | | 11/15/2047 | | | | 12,525 | | | | 3,942,244 | |
New York Liberty Development Corp. (3 World Trade Center); | | | | | | | | | | | | | | | | |
Series 2014, Class 1, Ref. Liberty RB(i) | | | 5.00 | % | | | 11/15/2044 | | | | 49,160 | | | | 51,257,657 | |
Series 2014, Class 2, Ref. RB(i) | | | 5.38 | % | | | 11/15/2040 | | | | 2,500 | | | | 2,651,200 | |
Series 2014, Class 3, Ref. Liberty RB(i) | | | 7.25 | % | | | 11/15/2044 | | | | 45,000 | | | | 52,456,500 | |
New York State Dormitory Authority; Series 2018 E, Sales Tax RB(b) | | | 5.00 | % | | | 03/15/2045 | | | | 35,050 | | | | 40,157,837 | |
New York State Environmental Facilities Corp; Series 2009 A, State Clean Water & Drinking Water RB(b) | | | 5.00 | % | | | 06/15/2034 | | | | 20,000 | | | | 20,192,400 | |
New York State Urban Development Corp.; | | | | | | | | | | | | | | | | |
Series 2013A-1, State Personal Income Tax RB(b) | | | 5.00 | % | | | 03/15/2043 | | | | 26,175 | | | | 28,822,601 | |
Series 2013A-1, State Personal Income Tax RB(b) | | | 5.00 | % | | | 03/15/2045 | | | | 46,015 | | | | 52,558,333 | |
New York Transportation Development Corp. (American Airlines, Inc.); | | | | | | | | | | | | | | | | |
Series 2016, Ref. Special Facilities RB(m) | | | 5.00 | % | | | 08/01/2026 | | | | 6,500 | | | | 6,809,725 | |
Series 2016, Ref. Special Facilities RB(m) | | | 5.00 | % | | | 08/01/2031 | | | | 5,000 | | | | 5,186,950 | |
See accompanying Notes to Financial Statements which are an integral part of the financial statements.
35 Invesco High Yield Municipal Fund
| | | | | | | | | | | | | | | | |
| | | Interest
Rate | | | Maturity
Date | | | Principal
Amount
(000) | | | Value | |
| New York–(continued) | |
New York Transportation Development Corp. (Delta Air Lines, Inc. LaGuardia Airport Terminal C&D Redevelopment); | | | | | | | | | | | | | | | | |
Series 2018, Special Facilities RB(m) | | | 5.00 | % | | | 01/01/2030 | | | $ | 3,275 | | | $ | 3,782,494 | |
Series 2018, Special Facilities RB(m) | | | 5.00 | % | | | 01/01/2033 | | | | 5,000 | | | | 5,679,150 | |
Series 2018, Special Facilities RB(m) | | | 5.00 | % | | | 01/01/2034 | | | | 5,000 | | | | 5,654,000 | |
Series 2018, Special Facilities RB(m) | | | 5.00 | % | | | 01/01/2036 | | | | 7,970 | | | | 8,932,457 | |
New York Transportation Development Corp. (LaGuardia Airport Terminal B Redevelopment); | | | | | | | | | | | | | | | | |
Series 2016 A, Special Facilities RB(m) | | | 5.25 | % | | | 01/01/2050 | | | | 41,870 | | | | 44,754,843 | |
Niagara Area Development Corp. (Covanta); Series 2018 A, Ref. Solid Waste Disposal Facilities RB (i)(m) | | | 4.75 | % | | | 11/01/2042 | | | | 2,390 | | | | 2,373,055 | |
Rockland Tobacco Asset Securitization Corp.; Series 2005 C, Third Sub. Tobacco Settlement Asset-Backed RB(f)(i) | | | 0.00 | % | | | 08/15/2060 | | | | 368,350 | | | | 12,468,648 | |
Suffolk (County of) Industrial Development Agency (Eastern Long Island Hospital Association); | | | | | | | | | | | | | | | | |
Series 2007, Civic Facility RB(i) | | | 5.50 | % | | | 01/01/2037 | | | | 2,500 | | | | 2,468,025 | |
Suffolk Tobacco Asset Securitization Corp.; Series 2008 B, Tobacco Settlement RB | | | 6.00 | % | | | 06/01/2048 | | | | 7,915 | | | | 7,924,023 | |
Tompkins County Development Corp. (Tompkins Cortland Community College Foundation, Inc.); | | | | | | | | | | | | | | | | |
Series 2013 A, RB | | | 5.00 | % | | | 07/01/2027 | | | | 1,985 | | | | 2,007,927 | |
Series 2013 A, RB | | | 5.00 | % | | | 07/01/2038 | | | | 5,700 | | | | 5,382,396 | |
Triborough Bridge & Tunnel Authority; | | | | | | | | | | | | | | | | |
Series 2017 B, Ref. General RB(b) | | | 5.00 | % | | | 11/15/2037 | | | | 10,000 | | | | 11,551,400 | |
Series 2017 B, Ref. General RB(b) | | | 5.00 | % | | | 11/15/2038 | | | | 11,000 | | | | 12,665,290 | |
TSASC, Inc.; | | | | | | | | | | | | | | | | |
Series 2016 B, Ref. Sub. Tobacco Settlement Turbo RB | | | 5.00 | % | | | 06/01/2045 | | | | 5,000 | | | | 4,833,300 | |
Series 2016 B, Ref. Sub. Tobacco Settlement Turbo RB | | | 5.00 | % | | | 06/01/2048 | | | | 15,750 | | | | 15,139,687 | |
Westchester (County of) Industrial Development Agency (Million Air Two LLC General Aviation Facilities); Series 2017 A, Special Facility RB(i)(m) | | | 7.00 | % | | | 06/01/2046 | | | | 55,500 | | | | 60,044,340 | |
Westchester County Healthcare Corp.; Series 2014 A, Sr. Lien RB | | | 5.00 | % | | | 11/01/2044 | | | | 4,512 | | | | 4,809,782 | |
Westchester Tobacco Asset Securitization Corp.; Series 2016 C, Ref. Sub. RB | | | 5.13 | % | | | 06/01/2051 | | | | 9,405 | | | | 9,489,175 | |
| | | | | | | | | | | | | | | | 1,059,689,455 | |
|
| North Carolina–0.60% | |
North Carolina (State of) Capital Facilities Finance Agency (Duke University); Series 2015 B, Ref. RB(b) | | | 5.00 | % | | | 10/01/2055 | | | | 29,400 | | | | 33,067,650 | |
North Carolina (State of) Medical Care Commission (Aldersgate); Series 2013, Ref. First Mortgage Retirement Facilities RB | | | 6.25 | % | | | 07/01/2035 | | | | 3,750 | | | | 4,100,475 | |
North Carolina (State of) Medical Care Commission (Galloway Ridge); | | | | | | | | | | | | | | | | |
Series 2010 A, First Mortgage Retirement Facilities RB | | | 5.88 | % | | | 01/01/2031 | | | | 865 | | | | 883,719 | |
Series 2010 A, First Mortgage Retirement Facilities RB | | | 6.00 | % | | | 01/01/2039 | | | | 1,520 | | | | 1,552,300 | |
North Carolina (State of) Medical Care Commission (WhiteStone); Series 2011 A, First Mortgage Retirement Facilities RB(j)(k) | | | 7.75 | % | | | 03/01/2021 | | | | 2,000 | | | | 2,230,520 | |
North Carolina Medical Care Commission (Salemtowne Project); | | | | | | | | | | | | | | | | |
Series 2018 A, RB | | | 5.00 | % | | | 10/01/2038 | | | | 1,185 | | | | 1,202,064 | |
Series 2018 A, RB | | | 5.00 | % | | | 10/01/2048 | | | | 13,080 | | | | 13,109,037 | |
| | | | | | | | | | | | | | | | 56,145,765 | |
|
| North Dakota–0.04% | |
Burleigh (County of) (University of Mary); | | | | | | | | | | | | | | | | |
Series 2016, Education Facilities RB | | | 5.10 | % | | | 04/15/2036 | | | | 1,500 | | | | 1,515,960 | |
Series 2016, Education Facilities RB | | | 5.20 | % | | | 04/15/2046 | | | | 2,000 | | | | 1,997,000 | |
| | | | | | | | | | | | | | | | 3,512,960 | |
|
| Ohio–5.78% | |
Adams (County of) (Adams County Hospital); Series 2005, Hospital Facility Improvement RB | | | 6.50 | % | | | 09/01/2036 | | | | 17,555 | | | | 16,495,556 | |
Akron, Bath & Copley Joint Township Hospital District; Series 2016, Ref. RB | | | 5.25 | % | | | 11/15/2041 | | | | 3,800 | | | | 4,196,302 | |
See accompanying Notes to Financial Statements which are an integral part of the financial statements.
36 Invesco High Yield Municipal Fund
| | | | | | | | | | | | | | | | |
| | | Interest
Rate | | | Maturity
Date | | | Principal
Amount
(000) | | | Value | |
| Ohio–(continued) | |
Buckeye Tobacco Settlement Financing Authority; | | | | | | | | | | | | | | | | |
Series 2007A-2, Sr. Asset-Backed Turbo RB | | | 5.13 | % | | | 06/01/2024 | | | $ | 15,360 | | | $ | 14,251,008 | |
Series 2007A-2, Sr. Asset-Backed Turbo RB | | | 5.38 | % | | | 06/01/2024 | | | | 955 | | | | 894,520 | |
Series 2007A-2, Sr. Asset-Backed Turbo RB | | | 5.88 | % | | | 06/01/2030 | | | | 60,230 | | | | 56,858,927 | |
Series 2007A-2, Sr. Asset-Backed Turbo RB | | | 5.75 | % | | | 06/01/2034 | | | | 5,000 | | | | 4,670,350 | |
Series 2007A-2, Sr. Asset-Backed Turbo RB | | | 5.88 | % | | | 06/01/2047 | | | | 65,345 | | | | 61,342,619 | |
Series 2007A-3, Sr. Asset-Backed Conv. CAB RB(d) | | | 6.25 | % | | | 06/01/2037 | | | | 21,205 | | | | 20,954,993 | |
Series 2007 B, First Sub. Asset-Backed CAB RB(f) | | | 0.00 | % | | | 06/01/2047 | | | | 336,460 | | | | 18,448,102 | |
Butler (County of) Port Authority (Storypoint Fairfield); | | | | | | | | | | | | | | | | |
Sr. Series 2017A-1, RB(i) | | | 6.25 | % | | | 01/15/2034 | | | | 1,100 | | | | 1,132,208 | |
Sr. Series 2017A-1, RB(i) | | | 6.38 | % | | | 01/15/2043 | | | | 1,175 | | | | 1,207,383 | |
Sr. Series 2017A-1, RB(i) | | | 6.50 | % | | | 01/15/2052 | | | | 7,075 | | | | 7,284,632 | |
Cleveland (City of) & Cuyahoga (County of) Port Authority (Constellation Schools); Series 2014 A, Ref. & Improvement Lease RB | | | 6.75 | % | | | 01/01/2044 | | | | 14,900 | | | | 15,279,056 | |
Cleveland (City of) (Continental Airlines, Inc.); Series 1998, Airport Special RB (m) | | | 5.38 | % | | | 09/15/2027 | | | | 4,190 | | | | 4,199,260 | |
Cuyahoga (County of) (Metrohealth System); | | | | | | | | | | | | | | | | |
Series 2017, Ref. Hospital RB | | | 5.50 | % | | | 02/15/2052 | | | | 14,320 | | | | 15,564,981 | |
Series 2017, Ref. Hospital RB | | | 5.00 | % | | | 02/15/2057 | | | | 19,295 | | | | 20,100,566 | |
Series 2017, Ref. Hospital RB | | | 5.50 | % | | | 02/15/2057 | | | | 56,555 | | | | 61,390,452 | |
Series 2017, Ref. RB | | | 5.25 | % | | | 02/15/2047 | | | | 5,000 | | | | 5,334,150 | |
Franklin (County of) (First Community Village Obligated Group); Series 2013, Ref. Health Care Facilities RB | | | 5.63 | % | | | 07/01/2047 | | | | 7,200 | | | | 7,233,624 | |
Gallia (County of) (Holzer Health System Obligated Group); Series 2012, Ref. & Improvement Hospital Facilities RB | | | 8.00 | % | | | 07/01/2042 | | | | 35,425 | | | | 39,050,749 | |
Hamilton (County of) (Christ Hospital); Series 2012, Health Care Facilities RB | | | 5.50 | % | | | 06/01/2042 | | | | 7,200 | | | | 7,843,032 | |
Hamilton (County of) (Life Enriching Communities); Series 2012, Health Care RB | | | 5.00 | % | | | 01/01/2032 | | | | 2,250 | | | | 2,333,790 | |
Hancock (County of) (Blanchard Valley Regional Health Center); Series
2011 A, Hospital Facilities RB (j)(k) | | | 6.25 | % | | | 06/01/2021 | | | | 5,850 | | | | 6,432,835 | |
Montgomery (County of) (St. Leonard); | | | | | | | | | | | | | | | | |
Series 2010, Ref. & Improvement Health Care & MFH RB | | | 6.38 | % | | | 04/01/2030 | | | | 2,000 | | | | 2,066,300 | |
Series 2010, Ref. & Improvement Health Care & MFH RB | | | 6.63 | % | | | 04/01/2040 | | | | 6,500 | | | | 6,746,545 | |
Montgomery (County of) (Trousdale Foundation Properties); | | | | | | | | | | | | | | | | |
Series 2018 A, Sr. Living RB(i) | | | 6.00 | % | | | 04/01/2038 | | | | 7,220 | | | | 7,391,980 | |
Series 2018 A, Sr. Living RB(i) | | | 6.25 | % | | | 04/01/2049 | | | | 18,500 | | | | 19,145,835 | |
Muskingum (County of) (Genesis Healthcare System); | | | | | | | | | | | | | | | | |
Series 2013, Hospital Facilities RB | | | 5.00 | % | | | 02/15/2044 | | | | 38,560 | | | | 39,424,130 | |
Series 2013, Hospital Facilities RB | | | 5.00 | % | | | 02/15/2048 | | | | 3,120 | | | | 3,178,906 | |
Norwood (City of) (Cornerstone at Norwood); | | | | | | | | | | | | | | | | |
Series 2006, Tax Increment Allocation Financing RB | | | 5.75 | % | | | 12/01/2020 | | | | 700 | | | | 700,707 | |
Series 2006, Tax Increment Allocation Financing RB | | | 6.20 | % | | | 12/01/2031 | | | | 7,340 | | | | 7,341,101 | |
Ohio (State of) (USG Corp.); | | | | | | | | | | | | | | | | |
Series 1997, Solid Waste Disposal RB(m) | | | 5.60 | % | | | 08/01/2032 | | | | 14,765 | | | | 14,784,785 | |
Series 1998, Solid Waste Disposal RB(m) | | | 5.65 | % | | | 03/01/2033 | | | | 13,000 | | | | 13,017,290 | |
Ohio (State of) Air Quality Development Authority (FirstEnergy Generation Corp.); Series 2009 D, Ref. PCR(c)(k) | | | 4.25 | % | | | 09/15/2021 | | | | 2,000 | | | | 2,000,000 | |
Ohio (State of) Air Quality Development Authority (Pratt Paper LLC); Series 2017, Exempt Facility RB (i)(m) | | | 4.50 | % | | | 01/15/2048 | | | | 500 | | | | 513,595 | |
Ohio (State of) Water Development Authority (FirstEnergy Nuclear Generation Corp.); | | | | | | | | | | | | | | | | |
Series 2009 A, Ref. PCR(c)(k) | | | 4.38 | % | | | 06/01/2022 | | | | 3,500 | | | | 3,500,000 | |
Southeastern Ohio (State of) Port Authority (Memorial Health Systems); | | | | | | | | | | | | | | | | |
Series 2015, Ref. Hospital Facilities Improvement RB | | | 5.00 | % | | | 12/01/2035 | | | | 1,750 | | | | 1,839,898 | |
Series 2015, Ref. Hospital Facilities Improvement RB | | | 5.00 | % | | | 12/01/2043 | | | | 6,695 | | | | 6,743,873 | |
Series 2015, Ref. RB | | | 5.50 | % | | | 12/01/2043 | | | | 3,875 | | | | 4,028,876 | |
See accompanying Notes to Financial Statements which are an integral part of the financial statements.
37 Invesco High Yield Municipal Fund
| | | | | | | | | | | | | | | | |
| | | Interest
Rate | | | Maturity
Date | | | Principal
Amount
(000) | | | Value | |
| Ohio–(continued) | |
Toledo-Lucas (County of) Port Authority (StoryPoint Waterville); | | | | | | | | | | | | | | | | |
Series 2016A-1, RB(i) | | | 6.13 | % | | | 01/15/2034 | | | $ | 2,000 | | | $ | 2,042,940 | |
Series 2016A-1, RB(i) | | | 6.25 | % | | | 01/15/2043 | | | | 5,000 | | | | 5,098,950 | |
Series 2016A-1, RB(i) | | | 6.38 | % | | | 01/15/2051 | �� | | | 4,000 | | | | 4,090,080 | |
Tuscarawas (County of) Economic Development and Finance Alliance (Ashland University); | | | | | | | | | | | | | | | | |
Series 2015, Ref. Higher Education Facilities Improvement RB | | | 6.00 | % | | | 03/01/2045 | | | | 5,000 | | | | 5,032,400 | |
| | | | | | | | | | | | | | | | 541,187,286 | |
|
| Oklahoma–1.92% | |
Atoka (County of) Health Care Authority (Atoka Memorial Hospital); Series 2007, Hospital RB | | | 6.63 | % | | | 10/01/2037 | | | | 3,405 | | | | 2,724,000 | |
Comanche (County of) Hospital Authority; Series 2015, Ref. RB | | | 5.00 | % | | | 07/01/2027 | | | | 1,800 | | | | 1,948,320 | |
Oklahoma (State of) Development Finance Authority (Inverness Village Community); | | | | | | | | | | | | | | | | |
Series 2012, Ref. Continuing Care Retirement Community RB(c) | | | 5.75 | % | | | 01/01/2027 | | | | 2,430 | | | | 1,579,500 | |
Series 2012, Ref. Continuing Care Retirement Community RB(c) | | | 6.00 | % | | | 01/01/2032 | | | | 9,935 | | | | 6,457,750 | |
Series 2013, Ref. Continuing Care Retirement Community RB(c) | | | 5.75 | % | | | 01/01/2037 | | | | 12,750 | | | | 8,287,500 | |
Oklahoma (State of) Development Finance Authority (OU Medicine); Series 2018 B, Health System RB (b)(n) | | | 5.50 | % | | | 08/15/2052 | | | | 33,500 | | | | 37,338,430 | |
Oklahoma (State of) Development Finance Authority (Provident Oklahoma Education Resources Inc.-Cross Village Student Housing); Series 2017, RB | | | 5.00 | % | | | 08/01/2047 | | | | 5,000 | | | | 4,677,900 | |
Oklahoma (State of) Development Finance Authority (Provident Oklahoma Education Resources, Inc.-Cross Village Student Housing); | | | | | | | | | | | | | | | | |
Series 2017, RB | | | 5.00 | % | | | 08/01/2052 | | | | 12,000 | | | | 11,230,560 | |
Series 2017, RB | | | 5.25 | % | | | 08/01/2057 | | | | 3,500 | | | | 3,276,000 | |
Oklahoma Development Finance Authority; Series 2018 B, Health System RB(b)(n) | | | 5.50 | % | | | 08/15/2057 | | | | 15,210 | | | | 16,775,717 | |
Payne (County of) Economic Development Authority (Epworth Living at the Ranch); | | | | | | | | | | | | | | | | |
Series 2016 A, RB | | | 6.63 | % | | | 11/01/2036 | | | | 1,750 | | | | 673,750 | |
Series 2016 A, RB | | | 6.88 | % | | | 11/01/2046 | | | | 3,710 | | | | 1,428,350 | |
Series 2016 A, RB | | | 7.00 | % | | | 11/01/2051 | | | | 3,650 | | | | 1,405,250 | |
Series 2016B-1, RB | | | 5.25 | % | | | 11/01/2024 | | | | 2,500 | | | | 962,500 | |
Tulsa (City of) Municipal Airport Trust; | | | | | | | | | | | | | | | | |
Series 2000 B, Ref. RB(m) | | | 5.50 | % | | | 06/01/2035 | | | | 10,500 | | | | 11,239,410 | |
Series 2001 A, Ref. RB(m) | | | 5.50 | % | | | 12/01/2035 | | | | 15,000 | | | | 16,056,750 | |
Series 2001 B, Ref. RB(m) | | | 5.50 | % | | | 12/01/2035 | | | | 43,250 | | | | 46,296,962 | |
Tulsa (County of) Industrial Authority (Montereau, Inc.); Series 2010 A, Senior Living Community RB (j)(k) | | | 7.25 | % | | | 05/01/2020 | | | | 7,450 | | | | 7,911,379 | |
| | | | | | | | | | | | | | | | 180,270,028 | |
|
| Oregon–0.12% | |
Clackamas (County of) Hospital Facility Authority (Willamette View); | | | | | | | | | | | | | | | | |
Series 2017 A, Ref. Sr. Living RB | | | 5.00 | % | | | 11/15/2032 | | | | 500 | | | | 552,990 | |
Series 2017 A, Ref. Sr. Living RB | | | 5.00 | % | | | 11/15/2037 | | | | 500 | | | | 546,240 | |
Series 2017 A, Ref. Sr. Living RB | | | 5.00 | % | | | 11/15/2052 | | | | 2,750 | | | | 2,904,632 | |
Salem (City of) Hospital Facility Authority (Capital Manor, Inc.); | | | | | | | | | | | | | | | | |
Series 2012, Ref. RB | | | 5.63 | % | | | 05/15/2032 | | | | 250 | | | | 270,013 | |
Series 2012, Ref. RB | | | 6.00 | % | | | 05/15/2042 | | | | 1,990 | | | | 2,149,140 | |
Series 2012, Ref. RB | | | 6.00 | % | | | 05/15/2047 | | | | 3,250 | | | | 3,503,760 | |
Warm Springs Reservation Confederated Tribes of Oregon (Pelton Round Butte); Series 2009 B, Tribal Economic Development Hydroelectric RB | | | 6.38 | % | | | 11/01/2033 | | | | 1,000 | | | | 1,019,410 | |
| | | | | | | | | | | | | | | | 10,946,185 | |
|
| Pennsylvania–1.64% | |
Allegheny (County of) Higher Education Building Authority (Carnegie Mellon University); | | | | | | | | | | | | | | | | |
Series 2008 A, VRD University RB(g) | | | 1.56 | % | | | 12/01/2037 | | | | 2,480 | | | | 2,480,000 | |
Allegheny (County of) Industrial Development Authority (Propel Charter School-McKeesport); | | | | | | | | | | | | | | | | |
Series 2010 B, Charter School RB | | | 6.38 | % | | | 08/15/2035 | | | | 1,220 | | | | 1,255,465 | |
See accompanying Notes to Financial Statements which are an integral part of the financial statements.
38 Invesco High Yield Municipal Fund
| | | | | | | | | | | | | | | | |
| | | Interest
Rate | | | Maturity
Date | | | Principal
Amount
(000) | | | Value | |
| Pennsylvania–(continued) | | | | | | | | | | | | | | | | |
Allegheny (County of) Industrial Development Authority (Propel Charter School-Montour);
Series 2010 A, Charter School RB | | | 6.75 | % | | | 08/15/2035 | | | $ | 1,145 | | | $ | 1,184,239 | |
Beaver (County of) Industrial Development Authority (FirstEnergy Nuclear Generation); Series 2006 A, Ref. PCR(c)(k) | | | 4.38 | % | | | 07/01/2022 | | | | 925 | | | | 925,000 | |
Butler (County of) Hospital Authority (Butler Health System);
Series 2009 B, RB(j)(k) | | | 7.13 | % | | | 07/01/2019 | | | | 2,145 | | | | 2,182,473 | |
Chester (County of) Industrial Development Authority (Collegium Charter School); Series 2012 A, Ref. RB | | | 5.25 | % | | | 10/15/2032 | | | | 2,320 | | | | 2,368,070 | |
Series 2012 A, Ref. RB | | | 5.38 | % | | | 10/15/2042 | | | | 4,230 | | | | 4,283,002 | |
Cumberland (County of) Municipal Authority (Asbury Pennsylvania Obligated Group); Series 2010, RB | | | 6.13 | % | | | 01/01/2045 | | | | 8,000 | | | | 8,153,760 | |
Series 2012, Ref. RB | | | 5.25 | % | | | 01/01/2041 | | | | 3,000 | | | | 3,050,910 | |
Franklin (County of) Industrial Development Authority (Menno-Haven, Inc.); Series 2018, Ref. RB | | | 5.00 | % | | | 12/01/2038 | | | | 1,750 | | | | 1,824,988 | |
Series 2018, Ref. RB | | | 5.00 | % | | | 12/01/2043 | | | | 2,500 | | | | 2,577,375 | |
Series 2018, Ref. RB | | | 5.00 | % | | | 12/01/2048 | | | | 2,500 | | | | 2,563,800 | |
Geisinger Authority (Geisinger Health System Foundation); Series 2013 A, VRD Health System RB(g) | | | 1.53 | % | | | 10/01/2043 | | | | 8,710 | | | | 8,710,000 | |
Lancaster (County of) Hospital Authority (Masonic Villages); Series 2008 D, Ref. VRD RB (LOC - JP Morgan Chase Bank N.A.)(g)(h) | | | 1.59 | % | | | 07/01/2034 | | | | 1,700 | | | | 1,700,000 | |
Lehigh (County of) General Purpose Authority (Bible Fellowship Church Homes, Inc.); Series 2013, RB | | | 5.25 | % | | | 07/01/2042 | | | | 3,430 | | | | 3,451,540 | |
Lehigh (County of) General Purpose Authority (Kidspeace Obligation Group);
Series 2014 A, RB | | | 7.50 | % | | | 02/01/2044 | | | | 5,207 | | | | 5,201,821 | |
Series 2014 B, Conv. CAB RB(d) | | | 7.50 | % | | | 02/01/2044 | | | | 1,379 | | | | 447,033 | |
Series 2014 C, RB | | | 0.00 | % | | | 02/01/2044 | | | | 4,122 | | | | 824 | |
Montgomery (County of) Industrial Development Authority (Albert Einstein Healthcare); Series 2015, Ref. Health System RB | | | 5.25 | % | | | 01/15/2046 | | | | 4,000 | | | | 4,300,920 | |
Montgomery (County of) Industrial Development Authority (Philadelphia Presbytery Homes, Inc.); Series 2010, RB(j)(k) | | | 7.00 | % | | | 12/01/2021 | | | | 6,000 | | | | 6,839,400 | |
Pennsylvania (Commonwealth of); First Series 2014, Unlimited Tax GO Bonds(b) | | | 5.00 | % | | | 06/15/2034 | | | | 15,450 | | | | 17,316,051 | |
Pennsylvania (State of) Economic Development Financing Authority (National
Gypson Co.);
Series 2014, Ref. Exempt Facilities RB(m) | | | 5.50 | % | | | 11/01/2044 | | | | 4,000 | | | | 4,157,120 | |
Pennsylvania (State of) Economic Development Financing Authority (PPL Energy Supply);
Series 2009 A, Ref. Exempt Facilities RB | | | 6.40 | % | | | 12/01/2038 | | | | 4,450 | | | | 4,496,948 | |
Pennsylvania (State of) Economic Development Financing Authority (USG Corp.); Series 1999, Solid Waste Disposal RB(m) | | | 6.00 | % | | | 06/01/2031 | | | | 15,500 | | | | 15,501,705 | |
Pennsylvania (State of) Turnpike Commission; Subseries 2013B-2, Sub.
Turnpike Conv. CAB RB(d) | | | 6.00 | % | | | 12/01/2037 | | | | 7,000 | | | | 5,523,070 | |
Philadelphia (City of) Authority for Industrial Development (Wesley Enhanced Living Obligated Group);
Series 2017, Ref. Sr. Living Facilities RB | | | 5.00 | % | | | 07/01/2037 | | | | 3,575 | | | | 3,657,833 | |
Series 2017, Ref. Sr. Living Facilities RB | | | 5.00 | % | | | 07/01/2049 | | | | 8,815 | | | | 8,910,114 | |
Philadelphia (City of) Industrial Development Authority (First Philadelphia Preparatory Charter School); Series 2014 A, RB | | | 7.25 | % | | | 06/15/2043 | | | | 5,500 | | | | 6,126,835 | |
Philadelphia (City of) Industrial Development Authority (Global Leadership Academy Charter School);
Series 2010, RB | | | 6.38 | % | | | 11/15/2040 | | | | 1,000 | | | | 1,019,240 | |
Philadelphia (City of) Industrial Development Authority (Independence Charter School); Series 2007 A, RB | | | 5.50 | % | | | 09/15/2037 | | | | 4,070 | | | | 4,076,634 | |
Philadelphia (City of) Industrial Development Authority (MaST Charter School); Series 2010, RB(j)(k) | | | 6.00 | % | | | 08/01/2020 | | | | 500 | | | | 529,280 | |
Philadelphia (City of) Industrial Development Authority (Mast I Charter School); Series 2016 A, Ref. RB | | | 5.38 | % | | | 08/01/2051 | | | | 3,950 | | | | 4,003,957 | |
Philadelphia (City of) Industrial Development Authority (MaST I Charter School); Series 2016 A, Ref. RB | | | 5.25 | % | | | 08/01/2046 | | | | 2,410 | | | | 2,439,354 | |
Philadelphia (City of) Industrial Development Authority (New Foundations Charter School); Series 2012, RB(j)(k) | | | 6.63 | % | | | 12/15/2022 | | | | 1,500 | | | | 1,759,710 | |
See accompanying Notes to Financial Statements which are an integral part of the financial statements.
39 Invesco High Yield Municipal Fund
| | | | | | | | | | | | | | | | |
| | | Interest
Rate | | | Maturity
Date | | | Principal
Amount
(000) | | | Value | |
Pennsylvania–(continued) | | | | | | | | | | | | | | | | |
Philadelphia (City of) Industrial Development Authority (Performing Arts Charter School);
Series 2013, RB(i) | | | 6.50 | % | | | 06/15/2033 | | | $ | 2,000 | | | $ | 2,061,400 | |
Series 2013, RB(i) | | | 6.75 | % | | | 06/15/2043 | | | | 8,000 | | | | 8,240,000 | |
| | | | | | | | | | | | | | | | 153,319,871 | |
|
| Puerto Rico–5.63% | |
Children’s Trust Fund;
Series 2002, Tobacco Settlement Asset-Backed RB | | | 5.38 | % | | | 05/15/2033 | | | | 19,465 | | | | 19,653,227 | |
Series 2002, Tobacco Settlement Asset-Backed RB | | | 5.50 | % | | | 05/15/2039 | | | | 29,090 | | | | 29,388,172 | |
Series 2002, Tobacco Settlement Asset-Backed RB | | | 5.63 | % | | | 05/15/2043 | | | | 5,415 | | | | 5,471,641 | |
Series 2005 A, Tobacco Settlement Asset-Backed RB(f) | | | 0.00 | % | | | 05/15/2050 | | | | 470,980 | | | | 64,025,021 | |
Puerto Rico (Commonwealth of);
Series 2003C-7, Ref. Public Improvement Sub. Unlimited Tax GO Bonds (INS -NATL)(e) | | | 6.00 | % | | | 07/01/2028 | | | | 4,500 | | | | 4,567,275 | |
Series 2003C-7, Ref. Sub. Unlimited Tax GO Bonds (INS -NATL)(e) | | | 6.00 | % | | | 07/01/2027 | | | | 21,000 | | | | 21,452,550 | |
Puerto Rico (Commonwealth of) Aqueduct & Sewer Authority;
Series 2008 A, Sr. Lien Conv. CAB RB(d) | | | 6.13 | % | | | 07/01/2024 | | | | 15,980 | | | | 16,339,550 | |
Series 2008 A, Sr. Lien RB | | | 6.00 | % | | | 07/01/2038 | | | | 25,620 | | | | 25,684,050 | |
Series 2008 A, Sr. Lien RB | | | 6.00 | % | | | 07/01/2044 | | | | 21,375 | | | | 21,428,437 | |
Series 2012 A, Sr. Lien RB | | | 5.50 | % | | | 07/01/2028 | | | | 2,395 | | | | 2,412,962 | |
Series 2012 A, Sr. Lien RB | | | 5.25 | % | | | 07/01/2029 | | | | 5,520 | | | | 5,506,200 | |
Series 2012 A, Sr. Lien RB | | | 5.13 | % | | | 07/01/2037 | | | | 6,790 | | | | 6,688,150 | |
Series 2012 A, Sr. Lien RB | | | 5.75 | % | | | 07/01/2037 | | | | 4,730 | | | | 4,718,175 | |
Series 2012 A, Sr. Lien RB | | | 5.25 | % | | | 07/01/2042 | | | | 41,740 | | | | 41,113,900 | |
Series 2012 A, Sr. Lien RB | | | 6.00 | % | | | 07/01/2047 | | | | 1,800 | | | | 1,809,000 | |
Puerto Rico (Commonwealth of) Electric Power Authority;
Series 2003 NN, RB(c) | | | 5.50 | % | | | 07/01/2020 | | | | 50 | | | | 34,438 | |
Series 2004 PP, Ref. RB (INS -NATL)(e) | | | 5.00 | % | | | 07/01/2023 | | | | 755 | | | | 759,870 | |
Series 2005 SS, Ref. RB (INS -NATL)(e) | | | 5.00 | % | | | 07/01/2024 | | | | 5,565 | | | | 5,598,724 | |
Series 2007 TT, RB(c) | | | 5.00 | % | | | 07/01/2020 | | | | 80 | | | | 54,900 | |
Series 2007 TT, RB(c) | | | 5.00 | % | | | 07/01/2023 | | | | 250 | | | | 171,563 | |
Series 2007 TT, RB(c) | | | 5.00 | % | | | 07/01/2026 | | | | 6,685 | | | | 4,587,581 | |
Series 2007 TT, RB(c) | | | 5.00 | % | | | 07/01/2027 | | | | 7,350 | | | | 5,043,937 | |
Series 2007 TT, RB(c) | | | 5.00 | % | | | 07/01/2032 | | | | 16,285 | | | | 11,175,581 | |
Series 2007 VV, Ref. RB(c) | | | 5.50 | % | | | 07/01/2020 | | | | 75 | | | | 51,656 | |
Series 2007 VV, Ref. RB (INS -NATL)(e) | | | 5.25 | % | | | 07/01/2024 | | | | 4,560 | | | | 4,844,042 | |
Series 2007 VV, Ref. RB(INS-NATL)(e) | | | 5.25 | % | | | 07/01/2030 | | | | 9,275 | | | | 9,926,198 | |
Series 2007 VV, Ref. RB (INS-AGM)(e) | | | 5.25 | % | | | 07/01/2031 | | | | 20,000 | | | | 22,278,000 | |
Series 2007 VV, Ref. RB (INS -NATL)(e) | | | 5.25 | % | | | 07/01/2032 | | | | 6,275 | | | | 6,692,978 | |
Series 2008 WW, RB(c) | | | 5.50 | % | | | 07/01/2019 | | | | 4,220 | | | | 2,906,525 | |
Series 2008 WW, RB(c) | | | 5.00 | % | | | 07/01/2028 | | | | 13,620 | | | | 9,346,725 | |
Series 2008 WW, RB(c) | | | 5.50 | % | | | 07/01/2038 | | | | 9,200 | | | | 6,336,500 | |
Series 2010 AAA, RB(c) | | | 5.25 | % | | | 07/01/2021 | | | | 350 | | | | 240,188 | |
Series 2010 AAA, RB(c) | | | 5.25 | % | | | 07/01/2031 | | | | 1,350 | | | | 926,438 | |
Series 2010 CCC, RB(c) | | | 5.00 | % | | | 07/01/2025 | | | | 325 | | | | 223,031 | |
Series 2010 CCC, RB(c) | | | 5.25 | % | | | 07/01/2026 | | | | 14,455 | | | | 9,919,744 | |
Series 2010 CCC, RB(c) | | | 5.25 | % | | | 07/01/2028 | | | | 13,295 | | | | 9,123,694 | |
Series 2010 DDD, Ref. RB(c) | | | 5.00 | % | | | 07/01/2020 | | | | 5,000 | | | | 3,431,250 | |
Series 2010 DDD, Ref. RB(c) | | | 5.00 | % | | | 07/01/2021 | | | | 11,020 | | | | 7,562,475 | |
Series 2010 DDD, Ref. RB(c) | | | 5.00 | % | | | 07/01/2022 | | | | 1,575 | | | | 1,080,844 | |
Series 2010 DDD, Ref. RB(c) | | | 5.00 | % | | | 07/01/2023 | | | | 1,150 | | | | 789,188 | |
Series 2010 XX, RB(c) | | | 5.25 | % | | | 07/01/2035 | | | | 6,699 | | | | 4,597,189 | |
Series 2010 XX, RB(c) | | | 5.25 | % | | | 07/01/2040 | | | | 5,200 | | | | 3,568,500 | |
See accompanying Notes to Financial Statements which are an integral part of the financial statements.
40 Invesco High Yield Municipal Fund
| | | | | | | | | | | | | | | | |
| | | Interest
Rate | | | Maturity Date | | | Principal
Amount
(000) | | | Value | |
| Puerto Rico–(continued) | | | | | | | | | | | | | | | | |
Series 2010 ZZ, Ref. RB(c) | | | 5.00 | % | | | 07/01/2019 | | | $ | 1,940 | | | $ | 1,331,325 | |
Series 2010 ZZ, Ref. RB(c) | | | 5.25 | % | | | 07/01/2020 | | | | 1,000 | | | | 686,250 | |
Series 2010 ZZ, Ref. RB(c) | | | 5.25 | % | | | 07/01/2024 | | | | 65 | | | | 44,606 | |
Series 2010 ZZ, Ref. RB(c) | | | 5.25 | % | | | 07/01/2026 | | | | 650 | | | | 446,063 | |
Series 2012 A, RB(c) | | | 4.80 | % | | | 07/01/2029 | | | | 1,850 | | | | 1,261,237 | |
Series 2012 A, RB(c) | | | 5.05 | % | | | 07/01/2042 | | | | 3,095 | | | | 2,123,944 | |
Series 2012 A, RB(c) | | | 5.00 | % | | | 12/31/2049 | | | | 19,350 | | | | 13,278,938 | |
Series 2013 A, RB(c) | | | 7.00 | % | | | 07/01/2033 | | | | 2,785 | | | | 1,952,981 | |
Series 2013 A, RB(c) | | | 6.75 | % | | | 07/01/2036 | | | | 6,050 | | | | 4,227,437 | |
Series 2013 A, RB(c) | | | 7.00 | % | | | 12/31/2049 | | | | 6,970 | | | | 4,887,712 | |
Puerto Rico (Commonwealth of) Public Buildings Authority; Series 2007M-3, Ref. Government Facilities RB (INS - NATL)(e) | | | 6.00 | % | | | 07/01/2024 | | | | 7,970 | | | | 8,205,912 | |
Puerto Rico Sales Tax Financing Corp.;
Series 2007 A, RB(f) | | | 0.00 | % | | | 08/01/2041 | | | | 1,465 | | | | 1,442,818 | |
Series 2007 A, RB(f) | | | 0.00 | % | | | 08/01/2044 | | | | 13,979 | | | | 13,771,368 | |
Series 2007 A, RB(f) | | | 0.00 | % | | | 08/01/2045 | | | | 310 | | | | 304,579 | |
Series 2018A-1, CAB RB(f) | | | 0.00 | % | | | 07/01/2024 | | | | 6,403 | | | | 5,311,743 | |
Series 2018A-1, CAB RB(f) | | | 0.00 | % | | | 07/01/2027 | | | | 4,265 | | | | 3,099,448 | |
Series 2018A-1, CAB RB(f) | | | 0.00 | % | | | 07/01/2029 | | | | 1,491 | | | | 962,304 | |
Series 2018A-1, CAB RB(f) | | | 0.00 | % | | | 07/01/2031 | | | | 1,921 | | | | 1,105,672 | |
Series 2018A-1, CAB RB(f) | | | 0.00 | % | | | 07/01/2033 | | | | 2,162 | | | | 1,096,010 | |
Series 2018A-1, CAB RB(f) | | | 0.00 | % | | | 07/01/2046 | | | | 20,579 | | | | 4,005,199 | |
Series 2018A-1, CAB RB(f) | | | 0.00 | % | | | 07/01/2051 | | | | 56,764 | | | | 8,219,467 | |
Series 2018A-1, RB | | | 4.50 | % | | | 07/01/2034 | | | | 17,351 | | | | 17,372,915 | |
Series 2018A-1, RB | | | 4.55 | % | | | 07/01/2040 | | | | 802 | | | | 777,195 | |
Series 2018A-1, RB | | | 4.75 | % | | | 07/01/2053 | | | | 5,881 | | | | 5,415,466 | |
Series 2018A-1, RB | | | 5.00 | % | | | 07/01/2058 | | | | 14,873 | | | | 14,137,510 | |
Series 2018A-2, RB | | | 4.55 | % | | | 07/01/2040 | | | | 8,144 | | | | 7,065,157 | |
Series 2018A-2, RB | | | 4.75 | % | | | 07/01/2053 | | | | 244 | | | | 206,027 | |
Series 2018A-2, RB | | | 5.00 | % | | | 07/01/2058 | | | | 3,265 | | | | 2,813,088 | |
| | | | | | | | | | | | | | | | 527,082,440 | |
| | | | |
| Rhode Island–0.00% | | | | | | | | | | | | | | | | |
Tobacco Settlement Financing Corp.; Series 2015 B, Ref. RB | | | 5.00 | % | | | 06/01/2050 | | | | 30 | | | | 30,205 | |
| | | | |
| South Carolina–0.06% | | | | | | | | | | | | | | | | |
South Carolina (State of) Jobs-Economic Development Authority (High Point Academy Project); Series 2018 A, Tax Exempt Educational RB(i) | | | 5.75 | % | | | 06/15/2049 | | | | 2,000 | | | | 2,123,320 | |
South Carolina (State of) Jobs-Economic Development Authority (Lutheran Homes);
Series 2013, Health Facilities RB | | | 5.00 | % | | | 05/01/2043 | | | | 1,000 | | | | 999,930 | |
Series 2013, Health Facilities RB | | | 5.13 | % | | | 05/01/2048 | | | | 2,000 | | | | 2,005,420 | |
Series 2017, Ref. Health Facilities RB | | | 5.00 | % | | | 05/01/2042 | | | | 250 | | | | 250,150 | |
| | | | | | | | | | | | | | | | 5,378,820 | |
| | | | |
| Tennessee–0.62% | | | | | | | | | | | | | | | | |
Bristol (City of) Industrial Development Board (Pinnacle); Series 2016, Tax Increment Allocation RB | | | 5.63 | % | | | 06/01/2035 | | | | 13,000 | | | | 13,265,850 | |
Memphis (City of) & Shelby (County of) Economic Development Growth Engine Industrial Development Board (Graceland);
Series 2017 A, Ref. Sr. Tax Allocation Incremental RB | | | 5.50 | % | | | 07/01/2037 | | | | 250 | | | | 264,868 | |
Series 2017 A, Ref. Sr. Tax Allocation Incremental RB | | | 5.63 | % | | | 01/01/2046 | | | | 250 | | | | 262,598 | |
Nashville (City of) & Davidson (County of) Health and Educational Facilities Board of Metropolitan Government (Trousdale Foundation Properties); Series 2018 A, Sr. Living RB(i) | | | 6.00 | % | | | 04/01/2038 | | | | 16,625 | | | | 17,021,007 | |
See accompanying Notes to Financial Statements which are an integral part of the financial statements.
41 Invesco High Yield Municipal Fund
| | | | | | | | | | | | | | | | |
| | | Interest
Rate | | | Maturity Date | | | Principal
Amount
(000) | | | Value | |
| Tennessee–(continued) | | | | | | | | | | | | | | | | |
Nashville (City of) & Davidson (County of) Health and Educational Facilities Board of Metropolitan Government (Trousdale Roundation Properties); Series 2018 A, Sr. Living RB(i) | | | 6.25 | % | | | 04/01/2049 | | | $ | 10,155 | | | $ | 10,502,301 | |
Shelby (County of) Health, Educational & Housing Facilities Board (Kirby Pines); Series 1997 A, Health Care Facility RB | | | 6.38 | % | | | 11/15/2025 | | | | 2,445 | | | | 2,446,907 | |
Shelby (County of) Health, Educational & Housing Facilities Board (Trezevant Manor); Series 2013 A, Ref. RB | | | 5.50 | % | | | 09/01/2047 | | | | 15,300 | | | | 14,663,673 | |
| | | | | | | | | | | | | | | | 58,427,204 | |
| | | | |
| Texas–9.82% | | | | | | | | | | | | | | | | |
Angelina & Neches River Authority Industrial Development Corp. (Aspen Power LLC); Series 2007 A, Environmental Facilities RB(c)(m) | | | 6.50 | % | | | 11/01/2029 | | | | 9,265 | | | | 93 | |
Arlington Higher Education Finance Corp. (Arlington Classics Academy); Series 2010 B, Ref. RB | | | 7.65 | % | | | 08/15/2040 | | | | 2,500 | | | | 2,636,375 | |
Arlington Higher Education Finance Corp. (Leadership Prep School); Series 2016 A, Education RB | | | 5.00 | % | | | 06/15/2046 | | | | 1,325 | | | | 1,328,008 | |
Arlington Higher Education Finance Corp. (Universal Academy); Series 2014 A, Education RB | | | 7.13 | % | | | 03/01/2044 | | | | 2,000 | | | | 2,041,480 | |
Bexar County Health Facilities Development Corp. (Army Retirement Residence); Series 2010, RB(j)(k) | | | 6.20 | % | | | 07/01/2020 | | | | 2,000 | | | | 2,115,460 | |
Bexar County Housing Finance Corp. (Woodland Ridge Apartments); Series 2002 A, MFH RB(m) | | | 7.00 | % | | | 01/01/2039 | | | | 3,630 | | | | 3,634,175 | |
Brazoria County Health Facilities Development Corp. (Brazosport Regional Health System);
Series 2012, Ref. RB(j)(k) | | | 5.25 | % | | | 07/01/2022 | | | | 7,100 | | | | 7,867,510 | |
Series 2012, Ref. RB(j)(k) | | | 5.50 | % | | | 07/01/2022 | | | | 13,410 | | | | 14,967,169 | |
Capital Area Cultural Education Facilities Finance Corp. (The Roman Catholic Diocese of Austin); Series 2005 B, RB | | | 6.13 | % | | | 04/01/2045 | | | | 7,465 | | | | 7,730,455 | |
Celina (City of);
Series 2015, Special Assessment RB | | | 5.38 | % | | | 09/01/2028 | | | | 600 | | | | 609,192 | |
Series 2015, Special Assessment RB | | | 5.50 | % | | | 09/01/2032 | | | | 250 | | | | 252,870 | |
Series 2015, Special Assessment RB | | | 5.88 | % | | | 09/01/2040 | | | | 1,000 | | | | 1,009,990 | |
Central Texas Regional Mobility Authority; Series 2011, Sub. Lien RB(j)(k) | | | 6.75 | % | | | 01/01/2021 | | | | 17,500 | | | | 19,051,025 | |
Clifton Higher Education Finance Corp. (Idea Public Schools); Series 2011, Education RB(j)(k) | | | 5.75 | % | | | 08/15/2021 | | | | 1,130 | | | | 1,236,378 | |
Clifton Higher Education Finance Corp. (International Leadership of Texas);
Series 2015, Education RB | | | 5.75 | % | | | 08/15/2038 | | | | 1,000 | | | | 1,023,720 | |
Series 2015, Education RB | | | 5.75 | % | | | 08/15/2045 | | | | 8,000 | | | | 8,107,040 | |
Series 2018 D, Education RB | | | 5.75 | % | | | 08/15/2033 | | | | 4,940 | | | | 5,136,365 | |
Series 2018 D, Education RB | | | 6.00 | % | | | 08/15/2038 | | | | 14,250 | | | | 14,780,385 | |
Series 2018 D, Education RB | | | 6.13 | % | | | 08/15/2048 | | | | 20,750 | | | | 21,411,095 | |
Clifton Higher Education Finance Corp. (Uplift Education); Series 2010 A, Education RB(j)(k) | | | 6.25 | % | | | 12/01/2020 | | | | 5,000 | | | | 5,386,850 | |
Grand Parkway Transportation Corp.;
Series 2013 A, First Tier Toll RB | | | 5.50 | % | | | 04/01/2053 | | | | 10,000 | | | | 11,038,600 | |
Series 2013 B, Sub. Tier Toll Conv. CAB RB(d) | | | 5.85 | % | | | 10/01/2048 | | | | 17,000 | | | | 16,301,130 | |
Series 2013 B, Sub. Tier Toll RB(b) | | | 5.25 | % | | | 10/01/2051 | | | | 24,405 | | | | 26,717,618 | |
Series 2013 B, Sub. Tier Toll RB | | | 5.00 | % | | | 04/01/2053 | | | | 43,260 | | | | 46,593,616 | |
Grand Prairie Housing Finance Corp.;
Series 2003, Priority Lien Independent Senior Living Center RB | | | 7.63 | % | | | 01/01/2020 | | | | 235 | | | | 235,785 | |
Series 2003, Priority Lien Independent Senior Living Center RB | | | 7.75 | % | | | 01/01/2034 | | | | 6,795 | | | | 6,904,943 | |
Series 2003, Sub. Lien Independent Senior Living Center RB(c)(t) | | | 7.63 | % | | | 01/01/2020 | | | | 345 | | | | 34,500 | |
Series 2003, Sub. Lien Independent Senior Living Center RB(c)(t) | | | 7.75 | % | | | 01/01/2034 | | | | 3,595 | | | | 359,500 | |
Guadalupe (County of) & Seguin (City of) Hospital Board of Managers;
Series 2015, Ref. Hospital Mortgage RB | | | 5.00 | % | | | 12/01/2040 | | | | 5,350 | | | | 5,475,029 | |
Series 2015, Ref. Hospital Mortgage RB | | | 5.00 | % | | | 12/01/2045 | | | | 9,230 | | | | 9,407,124 | |
Gulf Coast Industrial Development Authority (ExxonMobil); Series 2012, VRD RB(g) | | | 1.45 | % | | | 03/05/2019 | | | | 24,300 | | | | 24,300,000 | |
HFDC of Central Texas, Inc. (Sears Tyler Methodist);
Series 2009 A, RB(c) | | | 7.75 | % | | | 11/15/2029 | | | | 4,910 | | | | 49 | |
Series 2009 A, RB(c) | | | 7.75 | % | | | 11/15/2044 | | | | 15,345 | | | | 153 | |
Series 2009 B, RB(c) | | | 6.38 | % | | | 11/15/2019 | | | | 1,210 | | | | 12 | |
See accompanying Notes to Financial Statements which are an integral part of the financial statements.
42 Invesco High Yield Municipal Fund
| | | | | | | | | | | | | | | | |
| | | Interest
Rate | | | Maturity Date | | | Principal
Amount
(000) | | | Value | |
| Texas–(continued) | | | | | | | | | | | | | | | | |
Hopkins (County of) Hospital District;
Series 2008, RB | | | 6.00 | % | | | 02/15/2033 | | | $ | 2,500 | | | $ | 2,504,825 | |
Series 2008, RB | | | 6.00 | % | | | 02/15/2038 | | | | 5,155 | | | | 5,163,763 | |
Houston (City of);
Series 2011 A, Ref. First Lien Utility System RB(b)(j)(k) | | | 5.25 | % | | | 11/15/2020 | | | | 18,360 | | | | 19,470,780 | |
Series 2015B-1, Airport System RB(m) | | | 5.00 | % | | | 07/15/2030 | | | | 24,605 | | | | 26,837,166 | |
Series 2015B-1, Airport System RB(m) | | | 5.00 | % | | | 07/15/2035 | | | | 21,545 | | | | 23,186,514 | |
Houston (City of) (Continental Airlines, Inc.); Series 2011 A, Ref. Airport System Special Facilities RB(m) | | | 6.63 | % | | | 07/15/2038 | | | | 14,000 | | | | 14,998,480 | |
Houston (City of), Texas (United Airlines, Inc. Terminal E); Series 2014, Ref. Airport System Special Facilities RB (m) | | | 5.00 | % | | | 07/01/2029 | | | | 11,750 | | | | 12,864,957 | |
Houston Higher Education Finance Corp. (Cosmos Foundation, Inc.);
Series 2011 A, RB(j)(k) | | | 6.88 | % | | | 05/15/2021 | | | | 790 | | | | 874,878 | |
Series 2011, RB(j)(k) | | | 6.50 | % | | | 05/15/2021 | | | | 500 | | | | 549,705 | |
La Vernia Higher Education Finance Corp. (Knowledge is Power Program, Inc.);
Series 2009 A, RB(j)(k) | | | 6.25 | % | | | 08/15/2019 | | | | 1,210 | | | | 1,234,732 | |
Series 2009 A, RB(j)(k) | | | 6.38 | % | | | 08/15/2019 | | | | 7,225 | | | | 7,376,725 | |
La Vernia Higher Education Finance Corp. (Meridian World School); Series 2015, RB(i) | | | 5.60 | % | | | 08/15/2045 | | | | 4,420 | | | | 4,564,092 | |
Leander Independent School District; | | | | | | | | | | | | | | | | |
Series 2014 C, Unlimited Tax CAB GO Bonds (CEP -Texas Permanent School Fund)(f)(j)(k) | | | 0.00 | % | | | 08/15/2024 | | | | 121,355 | | | | 29,918,252 | |
Series 2014 D, Ref. Unlimited Tax CAB GO Bonds (CEP -Texas Permanent School Fund)(f)(j)(k) | | | 0.00 | % | | | 08/15/2024 | | | | 425 | | | | 204,765 | |
Series 2014 D, Ref. Unlimited Tax CAB GO Bonds (CEP -Texas Permanent School Fund)(f) | | | 0.00 | % | | | 08/15/2037 | | | | 3,645 | | | | 1,697,440 | |
Lone Star College System; Series 2009, Limited Tax GO Bonds(b)(j)(k) | | | 5.00 | % | | | 08/15/2019 | | | | 23,200 | | | | 23,561,456 | |
Lower Neches Valley Authority Industrial Development Corp. (Exxonmobil); Series 2010, VRD RB(g) | | | 1.50 | % | | | 11/01/2038 | | | | 4,000 | | | | 4,000,000 | |
Mclendon-Chisholm (City of) (Sonoma Public Improvement Distribution Phase); | | | | | | | | | | | | | | | | |
Series 2015, Special Assessment RB | | | 5.13 | % | | | 09/15/2028 | | | | 500 | | | | 500,490 | |
Series 2015, Special Assessment RB | | | 5.38 | % | | | 09/15/2035 | | | | 400 | | | | 398,908 | |
Series 2015, Special Assessment RB | | | 5.50 | % | | | 09/15/2040 | | | | 765 | | | | 756,424 | |
Mission Economic Development Corp. (CarbonLite Recycling LLC); Series 2016, Solid Waste Disposal RB(i)(m) | | | 6.50 | % | | | 12/01/2033 | | | | 10,900 | | | | 10,773,124 | |
Mission Economic Development Corp. (Natgasoline); Series 2018, Ref. Sr. Lien RB(i)(m) | | | 4.63 | % | | | 10/01/2031 | | | | 22,150 | | | | 22,696,883 | |
New Hope Cultural Education Facilities Corp. (Morningside Ministries); Series 2013, First Mortgage RB | | | 6.50 | % | | | 01/01/2048 | | | | 5,675 | | | | 6,152,211 | |
New Hope Cultural Education Facilities Corp. (Presbyterian Village North);
Series 2018, Ref. Retirement Facility RB | | | 5.00 | % | | | 10/01/2039 | | | | 1,000 | | | | 989,820 | |
Series 2018, Ref. Retirement Facility RB | | | 5.25 | % | | | 10/01/2049 | | | | 13,240 | | | | 13,308,716 | |
New Hope Cultural Education Facilities Finance Corp.(4-K Housing, Inc.-Stoney Brook); Series 2017 C, Sr. Living RB | | | 5.00 | % | | | 07/01/2037 | | | | 1,780 | | | | 1,780,676 | |
New Hope Cultural Education Facilities Finance Corp. (Carillon Lifecare Community);
Series 2016, Ref. Retirement Facility RB | | | 5.00 | % | | | 07/01/2036 | | | | 750 | | | | 774,555 | |
Series 2016, Ref. Retirement Facility RB | | | 5.00 | % | | | 07/01/2046 | | | | 14,675 | | | | 14,871,645 | |
New Hope Cultural Education Facilities Finance Corp. (Jubilee Academic Center);
Series 2016 A, Ref. Education RB(i) | | | 5.00 | % | | | 08/15/2046 | | | | 2,500 | | | | 2,477,800 | |
Series 2017 A, Education RB(i) | | | 5.00 | % | | | 08/15/2037 | | | | 2,000 | | | | 2,006,780 | |
Series 2017 A, Education RB(i) | | | 5.13 | % | | | 08/15/2047 | | | | 2,085 | | | | 2,087,544 | |
New Hope Cultural Education Facilities Finance Corp. (Legacy Midtown Park); Series 2018 A, Retirement Facilities RB | | | 5.50 | % | | | 07/01/2054 | | | | 4,750 | | | | 4,752,755 | |
New Hope Cultural Education Facilities Finance Corp. (Longhorn Village); Series 2017, Ref. Retirement Facility RB | | | 5.00 | % | | | 01/01/2042 | | | | 3,000 | | | | 3,022,980 | |
New Hope Cultural Education Facilities Finance Corp. (Morningside Ministries); Series 2013, First Mortgage RB | | | 6.50 | % | | | 01/01/2043 | | | | 4,325 | | | | 4,696,691 | |
New Hope Cultural Education Facilities Finance Corp. (Wesleyan Homes Inc.); Series 2014, Retirement Facility RB | | | 5.50 | % | | | 01/01/2049 | | | | 1,000 | | | | 1,045,980 | |
See accompanying Notes to Financial Statements which are an integral part of the financial statements.
43 Invesco High Yield Municipal Fund
| | | | | | | | | | | | | | | | |
| | | Interest
Rate | | | Maturity Date | | | Principal
Amount
(000) | | | Value | |
| Texas–(continued) | | | | | | | | | | | | | | | | |
Newark High Education Finance Corp. (A+ Charter Schools, Inc.); | | | | | | | | | | | | | | | | |
Series 2015 A, Education RB(i) | | | 5.50 | % | | | 08/15/2035 | | | $ | 845 | | | $ | 886,033 | |
Series 2015 A, Education RB(i) | | | 5.75 | % | | | 08/15/2045 | | | | 2,015 | | | | 2,116,596 | |
North Texas Education Finance Corp. (Uplift Education); Series 2012 A, RB | | | 5.25 | % | | | 12/01/2047 | | | | 2,100 | | | | 2,186,709 | |
North Texas Tollway Authority; Series 2011 B, Special Project System CAB RB(f)(j)(k) | | | 0.00 | % | | | 09/01/2031 | | | | 15,500 | | | | 6,934,545 | |
Pharr (City of) Higher Education Finance Authority (Idea Public Schools);
Series 2009 A, Education RB(j)(k) | | | 6.25 | % | | | 08/15/2019 | | | | 570 | | | | 581,651 | |
Series 2009 A, Education RB(j)(k) | | | 6.50 | % | | | 08/15/2019 | | | | 6,320 | | | | 6,457,091 | |
Port Beaumont Navigation District (Jefferson Energy Companies); Series 2016, Dock & Wharf Facility RB(i)(k)(m) | | | 7.25 | % | | | 02/13/2020 | | | | 72,500 | | | | 74,742,425 | |
Red River Health Facilities Development Corp. (MRC Crossing);
Series 2014 A, Retirement Facility RB | | | 7.50 | % | | | 11/15/2034 | | | | 2,250 | | | | 2,517,368 | |
Series 2014 A, Retirement Facility RB | | | 7.75 | % | | | 11/15/2044 | | | | 3,600 | | | | 4,043,484 | |
Series 2014 A, Retirement Facility RB | | | 8.00 | % | | | 11/15/2049 | | | | 5,000 | | | | 5,663,700 | |
Red River Health Facilities Development Corp. (Sears Methodist Retirement System);
Series 2013, Retirement Facility RB(c) | | | 5.45 | % | | | 11/15/2038 | | | | 2,055 | | | | 1,438 | |
Series 2013, Retirement Facility RB(c) | | | 5.75 | % | | | 11/15/2039 | | | | 1,693 | | | | 1,185 | |
Series 2013, Retirement Facility RB(c) | | | 6.05 | % | | | 11/15/2046 | | | | 7,293 | | | | 5,105 | |
Series 2013, Retirement Facility RB(c) | | | 6.15 | % | | | 11/15/2049 | | | | 2,904 | | | | 4,066 | |
Series 2013, Retirement Facility RB(c) | | | 6.25 | % | | | 05/09/2053 | | | | 658 | | | | 922 | |
San Juan (City of) Higher Education Finance Authority (Idea Public Schools); Series 2010 A, Education RB(j)(k) | | | 6.70 | % | | | 08/15/2020 | | | | 1,000 | | | | 1,070,720 | |
Sanger Industrial Development Corp. (Texas Pellets); Series 2012 B, RB (c)(m) | | | 8.00 | % | | | 07/01/2038 | | | | 37,110 | | | | 11,875,200 | |
SQLC Senior Living Center at Corpus Christi Inc.; Series 2019, Floating Rate RB (3 mo. USD LIBOR + 8.50%)(i)(s) | | | 8.50 | % | | | 08/08/2019 | | | | 1,000 | | | | 1,000,000 | |
Tarrant County Cultural Education Facilities Finance Corp. (Air Force Village Obligated Group);
Series 2009, Retirement Facility RB(j)(k) | | | 6.13 | % | | | 11/15/2019 | | | | 1,000 | | | | 1,030,720 | |
Series 2009, Retirement Facility RB(j)(k) | | | 6.38 | % | | | 11/15/2019 | | | | 7,150 | | | | 7,382,017 | |
Series 2016, Ref. Retirement Facilities RB | | | 5.00 | % | | | 05/15/2045 | | | | 8,000 | | | | 8,081,280 | |
Tarrant County Cultural Education Facilities Finance Corp. (Buckingham Senior Living Community, Inc.);
Series 2007, Retirement Facility RB | | | 5.63 | % | | | 11/15/2027 | | | | 1,500 | | | | 1,185,000 | |
Series 2007, Retirement Facility RB | | | 5.75 | % | | | 11/15/2037 | | | | 2,500 | | | | 1,975,000 | |
Series 2014, Retirement Facility RB | | | 5.63 | % | | | 11/15/2041 | | | | 3,250 | | | | 2,567,500 | |
Tarrant County Cultural Education Facilities Finance Corp. (Buckner Senior Living - Ventana);
Series 2017, Retirement Facility RB | | | 6.63 | % | | | 11/15/2037 | | | | 1,745 | | | | 1,931,157 | |
Series 2017, Retirement Facility RB | | | 6.75 | % | | | 11/15/2047 | | | | 9,625 | | | | 10,555,641 | |
Series 2017, Retirement Facility RB | | | 6.75 | % | | | 11/15/2052 | | | | 1,465 | | | | 1,601,553 | |
Series 2017, TEMPS 50SMRetirement Facility RB | | | 3.88 | % | | | 11/15/2022 | | | | 750 | | | | 747,540 | |
Series 2017, TEMPS 65SMRetirement Facility RB | | | 4.50 | % | | | 11/15/2023 | | | | 2,250 | | | | 2,256,930 | |
Tarrant County Cultural Education Facilities Finance Corp. (C.C. Young Memorial Home);
Series 2007, Retirement Facility RB | | | 5.75 | % | | | 02/15/2025 | | | | 1,185 | | | | 1,186,149 | |
Series 2007, Retirement Facility RB | | | 5.75 | % | | | 02/15/2029 | | | | 1,600 | | | | 1,601,008 | |
Series 2009 A, Retirement Facility RB | | | 8.00 | % | | | 02/15/2038 | | | | 12,350 | | | | 12,726,181 | |
Series 2017A, Retirement Facility RB | | | 6.38 | % | | | 02/15/2048 | | | | 16,125 | | | | 17,097,337 | |
Series 2017A, Retirement Facility RB | | | 6.38 | % | | | 02/15/2052 | | | | 31,045 | | | | 32,835,055 | |
Tarrant County Cultural Education Facilities Finance Corp. (MRC Stevenson Oaks); Series 2018 A, Retirement Community RN(i) | | | 10.00 | % | | | 03/15/2023 | | | | 4,250 | | | | 4,226,285 | |
See accompanying Notes to Financial Statements which are an integral part of the financial statements.
44 Invesco High Yield Municipal Fund
| | | | | | | | | | | | | | | | |
| | | Interest
Rate | | | Maturity Date | | | Principal
Amount
(000) | | | Value | |
| Texas–(continued) | | | | | | | | | | | | | | | | |
Tarrant County Cultural Education Facilities Finance Corp. (SQLC Senior Living Center at Corpus Christi, Inc.-Mirador); | | | | | | | | | | | | | | | | |
Series 2017 A, Retirement Facility RB(c) | | | 4.13 | % | | | 11/15/2028 | | | $ | 1,775 | | | $ | 891,600 | |
Series 2017 A, Retirement Facility RB(c) | | | 4.38 | % | | | 11/15/2034 | | | | 595 | | | | 296,768 | |
Series 2017 A, Retirement Facility RB(c) | | | 4.63 | % | | | 11/15/2041 | | | | 3,125 | | | | 1,553,344 | |
Series 2017 A, Retirement Facility RB(c) | | | 4.88 | % | | | 11/15/2048 | | | | 7,000 | | | | 3,474,940 | |
Series 2017 A, Retirement Facility RB(c) | | | 5.00 | % | | | 11/15/2055 | | | | 13,000 | | | | 6,450,210 | |
Tarrant County Cultural Education Facilities Finance Corp. (Stayton at Museum Way); | | | | | | | | | | | | | | | | |
Series 2009 A, Retirement Facility RB | | | 8.25 | % | | | 11/15/2029 | | | | 2,135 | | | | 1,921,500 | |
Series 2009 A, Retirement Facility RB | | | 8.25 | % | | | 11/15/2039 | | | | 3,640 | | | | 3,276,000 | |
Series 2009 A, Retirement Facility RB | | | 8.25 | % | | | 11/15/2044 | | | | 6,815 | | | | 6,133,500 | |
Series 2009 B, Retirement Facility Floating Rate RB(u) | | | 6.86 | % | | | 11/15/2045 | | | | 1,245 | | | | 1,120,500 | |
Tarrant Cultural Educational Facilities Finance Corp. (Methodist Hospitals of Dallas); Series 2008 A, VRD Hospital RB (LOC - Td Bank N.A.)(g)(h) | | | 1.55 | % | | | 10/01/2041 | | | | 12,560 | | | | 12,560,000 | |
Texas (State of) Transportation Commission; | | | | | | | | | | | | | | | | |
Series 2019, First Tier Toll CAB RB(f) | | | 0.00 | % | | | 08/01/2051 | | | | 6,000 | | | | 1,205,700 | |
Series 2019, First Tier Toll CAB RB(f) | | | 0.00 | % | | | 08/01/2052 | | | | 6,000 | | | | 1,135,920 | |
Series 2019, First Tier Toll CAB RB(f) | | | 0.00 | % | | | 08/01/2053 | | | | 1,000 | | | | 178,850 | |
Texas Municipal Gas Acquisition & Supply Corp. I; Series 2008 D, Sr. Lien Gas Supply RB | | | 6.25 | % | | | 12/15/2026 | | | | 3,255 | | | | 3,765,417 | |
Texas Municipal Gas Acquisition & Supply Corp. III; Series 2012, Gas Supply RB | | | 5.00 | % | | | 12/15/2031 | | | | 10,000 | | | | 10,740,900 | |
Texas Private Activity Bond Surface Transportation Corp. (Blueridge Transportation Group, LLC SH 288 Toll Lanes); Series 2016, Sr. Lien RB(m) | | | 5.00 | % | | | 12/31/2055 | | | | 13,135 | | | | 13,928,091 | |
Texas Private Activity Bond Surface Transportation Corp. (LBJ Infrastructure); Series 2010, Sr. Lien RB | | | 7.00 | % | | | 06/30/2040 | | | | 25,575 | | | | 27,168,578 | |
Texas Private Activity Bond Surface Transportation Corp. (NTE Mobility Partners LLC North Tarrant Express Management Lanes); Series 2009, Sr. Lien RB | | | 6.88 | % | | | 12/31/2039 | | | | 13,415 | | | | 13,925,575 | |
Texas Private Activity Bond Surface Transportation Corp. (NTE Mobility Partners LLC); | | | | | | | | | | | | | | | | |
Series 2013, Sr. Lien RB(m) | | | 7.00 | % | | | 12/31/2038 | | | | 4,000 | | | | 4,627,600 | |
Series 2013, Sr. Lien RB(m) | | | 6.75 | % | | | 06/30/2043 | | | | 17,450 | | | | 19,928,423 | |
Texas State Public Finance Authority Charter School Finance Corp. (New Frontiers Charter School); Series 2010 A, Education RB | | | 5.80 | % | | | 08/15/2040 | | | | 1,000 | | | | 1,028,880 | |
Texas State Public Finance Authority Charter School Finance Corp.(Odyssey Academy, Inc.); | | | | | | | | | | | | | | | | |
Series 2010 A, Education RB(j)(k) | | | 6.88 | % | | | 02/15/2020 | | | | 1,455 | | | | 1,525,291 | |
Series 2010 A, Education RB(j)(k) | | | 7.13 | % | | | 02/15/2020 | | | | 1,810 | | | | 1,900,971 | |
Texas State Public Finance Authority Charter School Finance Corp. (School Excellence Education); Series 2004 A, RB | | | 7.00 | % | | | 12/01/2034 | | | | 3,075 | | | | 3,080,043 | |
Travis County Cultural Education Facilities Finance Corp. (Wayside Schools); Series 2012 A, Education RB | | | 5.25 | % | | | 08/15/2042 | | | | 4,185 | | | | 4,258,447 | |
Travis County Health Facilities Development Corp. (Westminster Manor); | | | | | | | | | | | | | | | | |
Series 2010, RB(j)(k) | | | 7.00 | % | | | 11/01/2020 | | | | 2,005 | | | | 2,175,565 | |
Series 2010, RB | | | 7.00 | % | | | 11/01/2030 | | | | 265 | | | | 276,883 | |
Uptown Development Authority (Infrastructure Improvement Facilities); | | | | | | | | | | | | | | | | |
Series 2009, Tax Increment Allocation Contract RB(j)(k) | | | 5.38 | % | | | 09/01/2019 | | | | 465 | | | | 473,468 | |
Series 2009, Tax Increment Allocation Contract RB(j)(k) | | | 5.50 | % | | | 09/01/2019 | | | | 2,250 | | | | 2,292,345 | |
| | | | | | | | | | | | | | | | 920,166,106 | |
| | | | |
| Utah–0.44% | | | | | | | | | | | | | | | | |
Salt Lake City Corp Airport Revenue; | | | | | | | | | | | | | | | | |
Series 2018 A, Airport RB(b) | | | 5.00 | % | | | 07/01/2043 | | | | 14,750 | | | | 16,554,073 | |
Series 2018 A, Airport RB(b) | | | 5.00 | % | | | 07/01/2048 | | | | 11,250 | | | | 12,557,250 | |
Utah (County of) (Renaissance Academy); Series 2007 A, Charter School RB(i) | | | 5.63 | % | | | 07/15/2037 | | | | 2,635 | | | | 2,635,263 | |
Utah (State of) Charter School Finance Authority (Navigator Pointe Academy); | | | | | | | | | | | | | | | | |
Series 2010 A, Charter School RB | | | 5.38 | % | | | 07/15/2030 | | | | 1,650 | | | | 1,673,116 | |
Series 2010 A, Charter School RB | | | 5.63 | % | | | 07/15/2040 | | | | 710 | | | | 716,667 | |
See accompanying Notes to Financial Statements which are an integral part of the financial statements.
45 Invesco High Yield Municipal Fund
| | | | | | | | | | | | | | | | |
| | | Interest
Rate | | | Maturity Date | | | Principal
Amount
(000) | | | Value | |
| Utah–(continued) | | | | | | | | | | | | | | | | |
Utah (State of) Charter School Finance Authority (North Davis Preparatory Academy); | | | | | | | | | | | | | | | | |
Series 2010, Charter School RB | | | 6.25 | % | | | 07/15/2030 | | | $ | 1,250 | | | $ | 1,297,537 | |
Series 2010, Charter School RB | | | 6.38 | % | | | 07/15/2040 | | | | 2,500 | | | | 2,590,050 | |
Utah (State of) Charter School Finance Authority (Vista Entrada School of Performing Arts); | | | | | | | | | | | | | | | | |
Series 2012, RB | | | 5.60 | % | | | 07/15/2022 | | | | 475 | | | | 494,599 | |
Series 2012, RB | | | 6.30 | % | | | 07/15/2032 | | | | 850 | | | | 906,772 | |
Series 2012, RB | | | 6.55 | % | | | 07/15/2042 | | | | 2,000 | | | | 2,131,020 | |
| | | | | | | | | | | | | | | | 41,556,347 | |
| | | | |
| Virgin Islands–0.40% | | | | | | | | | | | | | | | | |
Virgin Islands (Government of) (Matching Fund Loan Note - Diago); Series 2009 A, RB | | | 6.75 | % | | | 10/01/2037 | | | | 4,500 | | | | 4,389,750 | |
Virgin Islands (Government of) Public Finance Authority (Matching Fund Loan Note - Sr. Lien Capital); | | | | | | | | | | | | | | | | |
Series 2009A-1, RB | | | 5.00 | % | | | 10/01/2029 | | | | 3,620 | | | | 3,520,450 | |
Series 2009A-1, RB | | | 5.00 | % | | | 10/01/2039 | | | | 12,910 | | | | 12,458,150 | |
Virgin Islands (Government of) Public Finance Authority (Matching Fund Loan Note); | | | | | | | | | | | | | | | | |
Series 2009 B, Ref. Sr. Lien RB | | | 5.00 | % | | | 10/01/2025 | | | | 3,700 | | | | 3,626,000 | |
Series 2010 A, Sr. Lien RB | | | 5.00 | % | | | 10/01/2025 | | | | 7,575 | | | | 7,423,500 | |
Series 2010 A, Sr. Lien RB | | | 5.00 | % | | | 10/01/2029 | | | | 500 | | | | 486,250 | |
Series 2012 A, RB | | | 5.00 | % | | | 10/01/2032 | | | | 5,730 | | | | 5,558,100 | |
| | | | | | | | | | | | | | | | 37,462,200 | |
| | | | |
| Virginia–1.53% | | | | | | | | | | | | | | | | |
Ballston Quarter Communities Development Authority; | | | | | | | | | | | | | | | | |
Series 2016A, Tax Allocation RB | | | 5.38 | % | | | 03/01/2036 | | | | 1,635 | | | | 1,689,119 | |
Series 2016A, Tax Allocation RB | | | 5.50 | % | | | 03/01/2046 | | | | 10,000 | | | | 10,332,700 | |
New Port Community Development Authority; | | | | | | | | | | | | | | | | |
Series 2006, Special Assessment RB(c) | | | 5.50 | % | | | 09/01/2026 | | | | 492 | | | | 223,860 | |
Series 2006, Special Assessment RB(c) | | | 5.60 | % | | | 09/01/2036 | | | | 1,670 | | | | 759,850 | |
Tobacco Settlement Financing Corp.; | | | | | | | | | | | | | | | | |
Series 2007B-1, Sr. Tobacco Settlement RB | | | 5.00 | % | | | 06/01/2047 | | | | 21,035 | | | | 20,096,629 | |
Series 2007B-2, Sr. Tobacco Settlement Conv. CAB RB(d) | | | 5.20 | % | | | 06/01/2046 | | | | 3,000 | | | | 2,978,130 | |
Virginia (State of) Small Business Financing Authority (Elizabeth River Crossings Opco, LLC); Series 2012, Sr. Lien RB(m) | | | 5.50 | % | | | 01/01/2042 | | | | 21,975 | | | | 23,477,431 | |
Virginia (State of) Small Business Financing Authority (Express Lanes, LLC); Series 2012, Sr. Lien RB (m) | | | 5.00 | % | | | 01/01/2040 | | | | 40,550 | | | | 42,359,746 | |
Virginia (State of) Small Business Financing Authority (Transform 66P3); | | | | | | | | | | | | | | | | |
Series 2017, Sr. Lien Private Activity RB(m) | | | 5.00 | % | | | 12/31/2052 | | | | 17,150 | | | | 18,466,091 | |
Series 2017, Sr. Lien Private Activity RB(m) | | | 5.00 | % | | | 12/31/2056 | | | | 6,750 | | | | 7,258,072 | |
Virginia Beach Development Authority (Westminster-Canterbury); | | | | | | | | | | | | | | | | |
Series 2018, Ref. Residential Care Facility RB | | | 5.00 | % | | | 09/01/2040 | | | | 1,750 | | | | 1,947,103 | |
Series 2018, Ref. Residential Care Facility RB | | | 5.00 | % | | | 09/01/2044 | | | | 2,215 | | | | 2,456,236 | |
Series 2018, Ref. Residential Care Facility RB | | | 4.00 | % | | | 09/01/2048 | | | | 4,390 | | | | 4,446,060 | |
Virginia Small Business Financing Authority (Transform 66P3 Project); Series 2017,Tax-Exempt Sr. Lien RB (m) | | | 5.00 | % | | | 12/31/2047 | | | | 6,350 | | | | 6,870,128 | |
| | | | | | | | | | | | | | | | 143,361,155 | |
| | | | |
| Washington–1.98% | | | | | | | | | | | | | | | | |
Greater Wenatchee (City of) Regional Events Center Public Facilities District; Series 2012 A, RB | | | 5.50 | % | | | 09/01/2042 | | | | 6,720 | | | | 6,819,926 | |
King (County of); Series 2011 B, Ref. Sewer RB(b) | | | 5.00 | % | | | 01/01/2034 | | | | 38,540 | | | | 40,829,276 | |
King (County of) Public Hospital District No. 4; | | | | | | | | | | | | | | | | |
Series 2015 A, RB | | | 5.75 | % | | | 12/01/2030 | | | | 3,000 | | | | 3,063,930 | |
Series 2015 A, RB | | | 6.00 | % | | | 12/01/2035 | | | | 2,685 | | | | 2,723,476 | |
Series 2015 A, RB | | | 6.25 | % | | | 12/01/2045 | | | | 6,465 | | | | 6,522,991 | |
See accompanying Notes to Financial Statements which are an integral part of the financial statements.
46 Invesco High Yield Municipal Fund
| | | | | | | | | | | | | | | | |
| | | Interest
Rate | | | Maturity Date | | | Principal
Amount
(000) | | | Value | |
| Washington–(continued) | | | | | | | | | | | | | | | | |
King (County of) Public Hospital District No. 4 (Snoqualmie Valley Hospital);
Series 2011, Ref. & Improvement Limited Tax GO Bonds | | | 6.75 | % | | | 12/01/2031 | | | $ | 500 | | | $ | 516,265 | |
Series 2011, Ref. & Improvement Limited Tax GO Bonds | | | 7.00 | % | | | 12/01/2040 | | | | 4,000 | | | | 4,108,200 | |
Port of Seattle Industrial Development Corp. (Delta Airlines); Series 2012, Ref. Special Facilities RB(m) | | | 5.00 | % | | | 04/01/2030 | | | | 19,500 | | | | 20,958,210 | |
Skagit (County of) Public Hospital District No. 1 (Skagit Valley Hospital); | | | | | | | | | | | | | | | | |
Series 2010, RB | | | 6.00 | % | | | 12/01/2030 | | | | 3,160 | | | | 3,331,800 | |
Series 2010, RB | | | 5.75 | % | | | 12/01/2035 | | | | 6,000 | | | | 6,260,100 | |
State of Washington; Series 2019 A, Various Purpose Unlimited Tax GO Bonds (b) | | | 5.00 | % | | | 08/01/2042 | | | | 9,000 | | | | 10,376,730 | |
Washington (State of) Convention Center Public Facilities District; Series 2018, RB(b) | | | 5.00 | % | | | 07/01/2048 | | | | 27,000 | | | | 30,183,030 | |
Washington (State of) Health Care Facilities Authority (Central Washington Health Services Association); Series 2009, RB(j)(k) | | | 7.00 | % | | | 07/01/2019 | | | | 9,145 | | | | 9,301,014 | |
Washington (State of) Higher Education Facilities Authority (Whitworth University); Series 2009, Ref. RB(j)(k) | | | 5.63 | % | | | 10/01/2019 | | | | 3,415 | | | | 3,491,735 | |
Washington (State of) Housing Finance Commission (Bayview Manor Senior); | | | | | | | | | | | | | | | | |
Series 2016A, Ref. RB(i) | | | 5.00 | % | | | 07/01/2036 | | | | 1,460 | | | | 1,501,362 | |
Series 2016A, Ref. RB(i) | | | 5.00 | % | | | 07/01/2046 | | | | 1,700 | | | | 1,731,178 | |
Series 2016A, Ref. RB(i) | | | 5.00 | % | | | 07/01/2051 | | | | 8,650 | | | | 8,781,913 | |
Washington (State of) Housing Finance Commission (Heron’s Key Senior Living); | | | | | | | | | | | | | | | | |
Series 2015 A, RB(i) | | | 7.00 | % | | | 07/01/2045 | | | | 2,150 | | | | 2,280,075 | |
Series 2015 A, RB(i) | | | 7.00 | % | | | 07/01/2050 | | | | 1,500 | | | | 1,586,700 | |
Series 2015B-1, TEMPS 85SMRB(i) | | | 5.50 | % | | | 01/01/2024 | | | | 5,515 | | | | 5,516,930 | |
Washington (State of) Housing Finance Commission (Judson Park); Series 2018, Ref.Non-profit RB(i) | | | 5.00 | % | | | 07/01/2048 | | | | 1,650 | | | | 1,691,679 | |
Washington (State of) Housing Finance Commission (Presbyterian Retirement Co.); Series 2016 A, Ref. RB(i) | | | 5.00 | % | | | 01/01/2046 | | | | 2,250 | | | | 2,344,478 | |
Washington (State of) Housing Finance Commission (Presbyterian Retirement Communities Northwest); Series 2016 A, Ref. RB(i) | | | 5.00 | % | | | 01/01/2051 | | | | 8,650 | | | | 8,984,149 | |
Washington (State of) Housing Finance Commission (Wesley Homes at Lea Hill); | | | | | | | | | | | | | | | | |
Series 2016, Ref.Non-Profit RB(i) | | | 5.00 | % | | | 07/01/2041 | | | | 2,000 | | | | 2,031,740 | |
Series 2016, Ref.Non-Profit RB(i) | | | 5.00 | % | | | 07/01/2046 | | | | 1,000 | | | | 1,012,780 | |
| | | | | | | | | | | | | | | | 185,949,667 | |
| | | | |
| West Virginia–0.50% | | | | | | | | | | | | | | | | |
Harrison (County of) Commission (Charles Pointe No. 2); | | | | | | | | | | | | | | | | |
Series 2008 A, Ref. Tax Increment Allocation RB | | | 7.00 | % | | | 06/01/2035 | | | | 3,340 | | | | 3,130,682 | |
Series 2013, Ref. Tax Increment Allocation RB(i) | | | 7.00 | % | | | 06/01/2035 | | | | 1,000 | | | | 500,000 | |
Kanawha (County of) (The West Virginia State University Foundation); Series 2013, Student Housing RB | | | 6.75 | % | | | 07/01/2045 | | | | 5,650 | | | | 5,924,647 | |
Monongalia (County of) Commission Special District (University Town Centre Economic Opportunity Development District); Series 2017 A, Ref. Excise Tax & Improvement RB(i) | | | 5.75 | % | | | 06/01/2043 | | | | 3,000 | | | | 3,090,930 | |
West Virginia (State of) Economic Development Authority (Entsorga West Virginia LLC); | | | | | | | | | | | | | | | | |
Series 2016, Solid Waste Disposal Facilities RB(i)(m) | | | 7.25 | % | | | 02/01/2036 | | | | 10,965 | | | | 10,353,701 | |
Series 2018, Solid Waste Disposal Facilities RB(i)(m) | | | 8.75 | % | | | 02/01/2036 | | | | 3,500 | | | | 3,522,365 | |
West Virginia (State of) Hospital Finance Authority (Thomas Health System); | | | | | | | | | | | | | | | | |
Series 2008, RB | | | 6.00 | % | | | 10/01/2020 | | | | 720 | | | | 539,561 | |
Series 2008, RB | | | 6.50 | % | | | 10/01/2038 | | | | 14,000 | | | | 10,432,660 | |
Series 2008, RB | | | 6.75 | % | | | 10/01/2043 | | | | 13,150 | | | | 9,798,328 | |
| | | | | | | | | | | | | | | | 47,292,874 | |
See accompanying Notes to Financial Statements which are an integral part of the financial statements.
47 Invesco High Yield Municipal Fund
| | | | | | | | | | | | | | | | |
| | | Interest
Rate | | | Maturity Date | | | Principal
Amount
(000) | | | Value | |
| | | | |
| Wisconsin–5.28% | | | | | | | | | | | | | | | | |
Public Finance Authority (American Dream at Meadowlands); | | | | | | | | | | | | | | | | |
Series 2017, Limited Obligation Grant RB(i) | | | 6.25 | % | | | 08/01/2027 | | | $ | 11,000 | | | $ | 11,910,360 | |
Series 2017, Limited Obligation Grant RB(i) | | | 6.75 | % | | | 08/01/2031 | | | | 22,090 | | | | 24,069,927 | |
Series 2017, Limited Obligation PILOT RB(i) | | | 6.50 | % | | | 12/01/2037 | | | | 25,000 | | | | 27,795,500 | |
Series 2017, Limited Obligation PILOT RB(i) | | | 6.75 | % | | | 12/01/2042 | | | | 12,270 | | | | 13,719,087 | |
Public Finance Authority (KU Campus Development Corporation - Central District Development Project); Series 2016, Lease Development RB(b) | | | 5.00 | % | | | 03/01/2041 | | | | 24,000 | | | | 26,513,520 | |
Public Finance Authority (Million Air Two LLC General Aviation Facilities); Series 2017, Ref. Special Facilities RB(i)(m) | | | 7.13 | % | | | 06/01/2041 | | | | 7,000 | | | | 7,302,750 | |
Public Finance Authority (National Gypsum Co.); Series 2014, Ref. Exempt Facilities RB(m) | | | 5.25 | % | | | 04/01/2030 | | | | 4,000 | | | | 4,215,520 | |
Public Finance Authority (Southminster); | | | | | | | | | | | | | | | | |
Series 2018, Retirement Facility RB(i) | | | 5.00 | % | | | 10/01/2043 | | | | 2,500 | | | | 2,536,000 | |
Series 2018, Retirement Facility RB(i) | | | 5.00 | % | | | 10/01/2048 | | | | 3,000 | | | | 3,031,740 | |
Series 2018, Retirement Facility RB(i) | | | 5.00 | % | | | 10/01/2053 | | | | 6,665 | | | | 6,710,122 | |
Public Finance Authority (WhiteStone); Series 2017, Ref. Retirement Facility RB (i) | | | 5.00 | % | | | 03/01/2052 | | | | 500 | | | | 522,080 | |
Superior (City of) (Superior Water, Light & Power Co.); Series 2007 B, Collateralized Utility RB (m) | | | 5.75 | % | | | 11/01/2037 | | | | 4,000 | | | | 4,010,240 | |
Wisconsin (State of) Health & Educational Facilities Authority (AE Nursing Centers); | | | | | | | | | | | | | | | | |
Series 2008, RB | | | 7.15 | % | | | 06/01/2028 | | | | 745 | | | | 372,500 | |
Series 2008, RB | | | 7.25 | % | | | 06/01/2038 | | | | 1,000 | | | | 500,000 | |
Wisconsin (State of) Health & Educational Facilities Authority (American Baptist Homes of the Midwest Obligated Group); | | | | | | | | | | | | | | | | |
Series 2017, Ref. RB | | | 5.00 | % | | | 08/01/2027 | | | | 2,000 | | | | 2,096,400 | |
Series 2017, Ref. RB | | | 5.00 | % | | | 08/01/2037 | | | | 5,770 | | | | 5,836,874 | |
Series 2017, Ref. RB | | | 5.00 | % | | | 08/01/2039 | | | | 4,290 | | | | 4,327,924 | |
Wisconsin (State of) Health & Educational Facilities Authority (Ascension Senior Credit Group); Series 2016 A, Ref. RB(b) | | | 5.00 | % | | | 11/15/2039 | | | | 38,800 | | | | 43,137,452 | |
Wisconsin (State of) Health & Educational Facilities Authority (Benevolent Corp. Cedar Community); | | | | | | | | | | | | | | | | |
Series 2017, Ref. RB | | | 5.00 | % | | | 06/01/2037 | | | | 860 | | | | 888,870 | |
Series 2017, Ref. RB | | | 5.00 | % | | | 06/01/2041 | | | | 955 | | | | 979,085 | |
Wisconsin (State of) Health & Educational Facilities Authority (Middleton Glen, Inc.); | | | | | | | | | | | | | | | | |
Series 1998, RB | | | 5.75 | % | | | 10/01/2028 | | | | 2,485 | | | | 2,485,373 | |
Series 1998, Special Term RB | | | 5.90 | % | | | 10/01/2028 | | | | 305 | | | | 305,079 | |
Wisconsin (State of) Health & Educational Facilities Authority (Mile Bluff Medical Center, Inc.); Series 2014, RB | | | 5.75 | % | | | 05/01/2039 | | | | 4,260 | | | | 4,428,653 | |
Wisconsin (State of) Health & Educational Facilities Authority (St. John’s Community, Inc.); | | | | | | | | | | | | | | | | |
Series 2009 A, RB(j)(k) | | | 7.25 | % | | | 09/15/2019 | | | | 4,000 | | | | 4,117,360 | |
Series 2009 A, RB(j)(k) | | | 7.63 | % | | | 09/15/2019 | | | | 1,000 | | | | 1,031,320 | |
Wisconsin (State of) Health & Educational Facilities Authority (Wisconsin Illinois Senior Housing, Inc.); | | | | | | | | | | | | | | | | |
Series 2012, RB(j)(k) | | | 5.75 | % | | | 08/01/2019 | | | | 3,215 | | | | 3,268,755 | |
Series 2012, RB(j)(k) | | | 5.88 | % | | | 08/01/2019 | | | | 3,170 | | | | 3,224,619 | |
Series 2013, RB(j)(k) | | | 7.00 | % | | | 08/01/2020 | | | | 6,500 | | | | 6,975,345 | |
Wisconsin (State of) Public Finance Authority (Alabama Proton Therapy Center); | | | | | | | | | | | | | | | | |
Series 2017 A, RB(i) | | | 6.25 | % | | | 10/01/2031 | | | | 2,475 | | | | 2,610,185 | |
Series 2017 A, RB(i) | | | 6.85 | % | | | 10/01/2047 | | | | 20,735 | | | | 21,623,287 | |
Series 2017 A, RB(i) | | | 7.00 | % | | | 10/01/2047 | | | | 250 | | | | 263,175 | |
Wisconsin (State of) Public Finance Authority (American Dream at Meadowlands); Series 2017, Limited Obligation PILOT RB(i) | | | 7.00 | % | | | 12/01/2050 | | | | 21,000 | | | | 23,641,800 | |
Wisconsin (State of) Public Finance Authority (Bancroft Neurohealth); | | | | | | | | | | | | | | | | |
Series 2016A, RB(i) | | | 5.00 | % | | | 06/01/2036 | | | | 4,225 | | | | 4,250,181 | |
Series 2016A, RB(i) | | | 5.13 | % | | | 06/01/2048 | | | | 8,000 | | | | 8,030,560 | |
See accompanying Notes to Financial Statements which are an integral part of the financial statements.
48 Invesco High Yield Municipal Fund
| | | | | | | | | | | | | | | | |
| | | Interest
Rate | | | Maturity
Date | | | Principal
Amount
(000) | | | Value | |
| Wisconsin–(continued) | | | | | | | | | | | | | | | | |
Wisconsin (State of) Public Finance Authority (Delray Beach Radiation Therapy Center); | | | | | | | | | | | | | | | | |
Series 2017 A, Sr. RB(i) | | | 5.75 | % | | | 11/01/2024 | | | $ | 1,440 | | | $ | 1,467,504 | |
Series 2017 A, Sr. RB(i) | | | 6.25 | % | | | 11/01/2028 | | | | 2,525 | | | | 2,714,804 | |
Series 2017 A, Sr. RB(i) | | | 6.85 | % | | | 11/01/2046 | | | | 30,015 | | | | 31,642,713 | |
Series 2017 B, Sub. RB(i) | | | 8.50 | % | | | 11/01/2046 | | | | 8,000 | | | | 8,004,640 | |
Wisconsin (State of) Public Finance Authority (Explore Academy); Series 2018 A, Educational Facility RB(i) | | | 6.13 | % | | | 02/01/2048 | | | | 4,285 | | | | 4,273,173 | |
Wisconsin (State of) Public Finance Authority (Glenridge Palmer Ranch); | | | | | | | | | | | | | | | | |
Series 2011 A, Continuing Care Retirement Community RB(i) | | | 7.00 | % | | | 06/01/2020 | | | | 245 | | | | 252,174 | |
Series 2011 A, Continuing Care Retirement Community RB(i) | | | 7.75 | % | | | 06/01/2028 | | | | 7,980 | | | | 8,879,745 | |
Series 2011 A, Continuing Care Retirement Community RB(i) | | | 8.00 | % | | | 06/01/2035 | | | | 10,150 | | | | 11,294,717 | |
Series 2011 A, Continuing Care Retirement Community RB(i) | | | 8.25 | % | | | 06/01/2046 | | | | 4,000 | | | | 4,462,320 | |
Wisconsin (State of) Public Finance Authority (Goodwill Industries of Southern Nevada); | | | | | | | | | | | | | | | | |
Series 2015, RB(c) | | | 5.50 | % | | | 12/01/2035 | | | | 4,000 | | | | 2,800,000 | |
Series 2015, RB(c) | | | 5.75 | % | | | 12/01/2045 | | | | 6,660 | | | | 4,662,000 | |
Wisconsin (State of) Public Finance Authority (Maryland Proton Treatment Center); | | | | | | | | | | | | | | | | |
Series 2018A-1, Sr. RB(i) | | | 6.13 | % | | | 01/01/2033 | | | | 1,250 | | | | 1,314,713 | |
Series 2018A-1, Sr. RB(i) | | | 6.25 | % | | | 01/01/2038 | | | | 5,500 | | | | 5,695,855 | |
Series 2018A-1, Sr. RB(i) | | | 6.38 | % | | | 01/01/2048 | | | | 27,725 | | | | 28,501,854 | |
Wisconsin (State of) Public Finance Authority (Mary’s Woods at Marylhurst); | | | | | | | | | | | | | | | | |
Series 2017 A, Ref. Senior Living RB(i) | | | 5.25 | % | | | 05/15/2037 | | | | 1,000 | | | | 1,050,170 | |
Series 2017 A, Ref. Senior Living RB(i) | | | 5.25 | % | | | 05/15/2042 | | | | 1,230 | | | | 1,282,287 | |
Series 2017 A, Ref. Senior Living RB(i) | | | 5.25 | % | | | 05/15/2047 | | | | 1,225 | | | | 1,272,849 | |
Series 2017 A, Ref. Senior Living RB(i) | | | 5.25 | % | | | 05/15/2052 | | | | 3,300 | | | | 3,410,715 | |
Wisconsin (State of) Public Finance Authority (Million Air Two LLC General Aviation Facilities); Series 2017 A, Special Facilities RB(m) | | | 7.25 | % | | | 06/01/2035 | | | | 6,965 | | | | 7,404,074 | |
Wisconsin (State of) Public Finance Authority (Prime Healthcare Foundation, Inc.); | | | | | | | | | | | | | | | | |
Series 2018 A, RB | | | 5.20 | % | | | 12/01/2037 | | | | 17,025 | | | | 18,252,843 | |
Series 2018 A, RB | | | 5.35 | % | | | 12/01/2045 | | | | 30,500 | | | | 32,527,640 | |
Wisconsin (State of) Public Finance Authority (Rose Villa); Series 2014 A, Senior Living RB(i) | | | 6.00 | % | | | 11/15/2049 | | | | 2,500 | | | | 2,664,450 | |
Wisconsin (State of) Public Finance Authority (Roseman University of Health Sciences); | | | | | | | | | | | | | | | | |
Series 2012, RB | | | 5.75 | % | | | 04/01/2042 | | | | 6,340 | | | | 6,665,559 | |
Series 2015, Ref. RB | | | 5.88 | % | | | 04/01/2045 | | | | 7,500 | | | | 7,960,725 | |
Wisconsin (State of) Public Finance Authority (Voyager Foundation Inc.); | | | | | | | | | | | | | | | | |
Series 2012 A, Charter School RB | | | 5.50 | % | | | 10/01/2022 | | | | 395 | | | | 413,522 | |
Series 2012 A, Charter School RB | | | 6.00 | % | | | 10/01/2032 | | | | 1,475 | | | | 1,574,843 | |
Wisconsin (State of) Public Finance Authority (Voyager Foundation, Inc.); Series 2012 A, Charter School RB | | | 6.20 | % | | | 10/01/2042 | | | | 1,300 | | | | 1,377,454 | |
Wisconsin (State of) Public Finance Authority (Wittenberg University); | | | | | | | | | | | | | | | | |
Series 2016, Higher Education Facility RB(i) | | | 5.00 | % | | | 12/01/2031 | | | | 6,830 | | | | 7,144,795 | |
Series 2016, Higher Education Facility RB(i) | | | 5.25 | % | | | 12/01/2039 | | | | 8,685 | | | | 9,041,953 | |
| | | | | | | | | | | | | | | | 494,741,734 | |
| | | | |
| Wyoming–0.07% | | | | | | | | | | | | | | | | |
West Park Hospital District (West Park Hospital); | | | | | | | | | | | | | | | | |
Series 2011 A, RB | | | 7.00 | % | | | 06/01/2040 | | | | 4,890 | | | | 5,217,875 | |
Series 2011, Ref. RB | | | 7.00 | % | | | 06/01/2035 | | | | 1,085 | | | | 1,163,456 | |
| | | | | | | | | | | | | | | | 6,381,331 | |
Total Municipal Obligations (Cost $10,116,231,182) | | | | | | | | | | | | | | | 10,478,993,164 | |
| | | | |
U.S. Dollar Denominated Bonds & Notes–0.06% | | | | | | | | | | | | | | | | |
| Texas–0.06% | | | | | | | | | | | | | | | | |
Sears Tyler Methodist Retirement Corp.; Sub. Notes (Acquired 02/25/2013; Cost $0)(l) | | | 2.00 | % | | | 02/25/2048 | | | | 135 | | | | 0 | |
See accompanying Notes to Financial Statements which are an integral part of the financial statements.
49 Invesco High Yield Municipal Fund
| | | | | | | | | | | | | | | | | | | | |
| | | Interest
Rate | | Maturity Date | | Principal
Amount
(000) | | Value |
| Texas–(continued) | | | | | | | | | | | | | | | | | | | | |
Texas Pellets Inc./German Pellets Texas LLC; Sr. Sec. Notes(i)(l) | | | | 8.00 | % | | | | 03/29/2019 | | | | $ | 5,330 | | | | $ | 5,330,000 | |
Total U.S. Dollar Denominated Bonds & Notes (Cost $5,330,000) | | | | | | | | | | | | | | | | | | | 5,330,000 | |
TOTAL INVESTMENTS IN SECURITIES(v)-111.92% (Cost $10,121,561,182) | | | | | | | | | | | | | | | | | | | 10,484,323,164 | |
FLOATING RATE NOTE OBLIGATIONS-(13.27)% | | | | | | | | | | | | | | | | | | | | |
Notes with interest and fee rates ranging from 2.21% to 2.66% at 02/28/2019 and contractual maturities of collateral ranging from 11/01/2023 to 10/15/2057 (See Note 1K)(w) | | | | | | | | | | | | | | | | | | | (1,243,090,000 | ) |
OTHER ASSETS LESS LIABILITIES-1.35% | | | | | | | | | | | | | | | | | | | 126,344,153 | |
NET ASSETS-100.00% | | | | | | | | | | | | | | | | | | $ | 9,367,577,317 | |
Abbreviations:
| | |
| AGM | | - Assured Guaranty Municipal Corp. |
| AMBAC | | - American Municipal Bond Assurance Corp. |
| CAB | | - Capital Appreciation Bonds |
| CEP | | - Credit Enhancement Provider |
| Conv. | | - Convertible |
| COP | | - Certificates of Participation |
| GNMA | | - Government National Mortgage Association |
| GO | | - General Obligation |
| IDR | | - Industrial Development Revenue Bonds |
| INS | | - Insurer |
| Jr. | | - Junior |
| LIBOR | | - London Interbank Offered Rate |
| LOC | | - Letter of Credit |
| MFH | | - Multi-Family Housing |
| NATL | | - National Public Finance Guarantee Corp. |
| PCR | | - Pollution Control Revenue Bonds |
| PILOT | | - Payment-in-Lieu-of-Tax |
| RAC | | - Revenue Anticipation Certificates |
| RB | | - Revenue Bonds |
| Ref. | | - Refunding |
| RN | | - Revenue Notes |
| Sec. | | - Secured |
| SIFMA | | - Securities Industry and Financial Markets Association |
| Sr. | | - Senior |
| Sub. | | - Subordinated |
| TEMPS | | - Tax-Exempt Mandatory Paydown Securities |
| USD | | - U.S. Dollar |
| VRD | | - Variable Rate Demand |
| Wts. | | - Warrants |
See accompanying Notes to Financial Statements which are an integral part of the financial statements.
50 Invesco High Yield Municipal Fund
Notes to Schedule of Investments:
| (a) | Calculated as a percentage of net assets. Amounts in excess of 100% are due to the Fund’s use of leverage. |
| (b) | Underlying security related to TOB Trusts entered into by the Fund. See Note 1K. |
| (c) | Defaulted security. Currently, the issuer is in default with respect to principal and/or interest payments. The aggregate value of these securities at February 28, 2019 was $205,251,600, which represented 2.19% of the Fund’s Net Assets. |
| (d) | Convertible CAB. The interest rate shown represents the coupon rate at which the bond will accrue at a specified future date. |
| (e) | Principal and/or interest payments are secured by the bond insurance company listed. |
| (f) | Zero coupon bond issued at a discount. |
| (g) | Demand security payable upon demand by the Fund at specified time intervals no greater than thirteen months. Interest rate is redetermined periodically by the issuer or agent based on current market conditions. Rate shown is the rate in effect on February 28, 2019. |
| (h) | Principal and interest payments are fully enhanced by a letter of credit from the bank listed or a predecessor bank, branch or subsidiary. |
| (i) | Security purchased or received in a transaction exempt from registration under the Securities Act of 1933, as amended (the “1933 Act”). The security may be resold pursuant to an exemption from registration under the 1933 Act, typically to qualified institutional buyers. The aggregate value of these securities at February 28, 2019 was $1,427,743,141, which represented 15.24% of the Fund’s Net Assets. |
| (j) | Advance refunded; secured by an escrow fund of U.S. Government obligations or other highly rated collateral. |
| (k) | Security has an irrevocable call by the issuer or mandatory put by the holder. Maturity date reflects such call or put. |
| (l) | Security valued using significant unobservable inputs (Level 3). See Note 3. |
| (m) | Security subject to the alternative minimum tax. |
| (n) | Security is subject to a reimbursement agreement which may require the Fund to pay amounts to a counterparty in the event of a significant decline in the market value of the security underlying the TOB Trusts. In case of a shortfall, the maximum potential amount of payments the Fund could ultimately be required to make under the agreement is $71,800,000. However, such shortfall payment would be reduced by the proceeds from the sale of the security underlying the TOB Trusts. |
| (o) | The issuer is paying less than stated interest, but is not in default on principal because scheduled principal payments have not yet begun. |
| (p) | Step coupon bond. The interest rate represents the coupon rate at which the bond will accrue at a specified future date. |
| (q) | Security subject to crossover refunding. |
| (r) | Interest rate is redetermined periodically based on an auction conducted by the auction agent. |
| (s) | Interest or dividend rate is redetermined periodically. Rate shown is the rate in effect on February 28, 2019. |
| (t) | Restructured security not accruing interest income. The aggregate value of these securities at February 28, 2019 was $394,000, which represented less than 1% of the Fund’s Net Assets. |
| (u) | Interest rate is redetermined periodically based on current market interest rates. The rate shown is the rate in effect on February 28, 2019. |
| (v) | Entities may either issue, guarantee, back or otherwise enhance the credit quality of a security. The entities are not primarily responsible for the issuer’s obligation but may be called upon to satisfy issuer’s obligations. No concentration of any single entity was greater than 5% each. |
| (w) | Floating rate note obligations related to securities held. The interest and fee rates shown reflect the rates in effect at February 28, 2019. At February 28, 2019, the Fund’s investments with a value of $2,050,224,390 are held by TOB Trusts and serve as collateral for the $1,243,090,000 in the floating rate note obligations outstanding at that date. |
Open Futures Contracts(a)
| | | | | | | | | | | | | | | | | | | | |
| Short Futures Contracts | | Number of
Contracts | | | Expiration Month | | | Notional Value | | | Value | | | Unrealized
Appreciation | |
Interest Rate Risk | | | | | | | | | | | | | | | | | | | | |
U.S. Treasury 10 Year Notes | | | 4,327 | | | | June-2019 | | | $ | (527,894,000 | ) | | $ | 1,544,717 | | | $ | 1,544,717 | |
| (a) | Futures contracts collateralized by $5,575,000 held with Goldman Sachs & Co. LLC, the futures commission merchant. |
See accompanying Notes to Financial Statements which are an integral part of the financial statements.
51 Invesco High Yield Municipal Fund
Statement of Assets and Liabilities
February 28, 2019
| | | | |
Assets: | | | | |
Investments in securities, at value (Cost $10,121,561,182) | | $ | 10,484,323,164 | |
Other investments: | | | | |
Variation margin receivable – futures contracts | | | 946,512 | |
Deposits with brokers: | | | | |
Cash collateral – exchange-traded futures contracts | | | 5,575,000 | |
Receivable for: | | | | |
Investments sold | | | 1,359,000 | |
Fund shares sold | | | 15,052,987 | |
Interest | | | 135,444,951 | |
Investments matured, at value
(Cost $28,193,538) | | | 19,906,094 | |
Investment for trustee deferred compensation and retirement plans | | | 662,835 | |
Other assets | | | 156,087 | |
Total assets | | | 10,663,426,630 | |
|
Liabilities: | |
Floating rate note obligations | | | 1,243,090,000 | |
Payable for: | | | | |
Investments purchased | | | 20,539,703 | |
Dividends | | | 15,927,154 | |
Fund shares reacquired | | | 8,476,789 | |
Amount due custodian | | | 4,058,590 | |
Accrued fees to affiliates | | | 2,722,752 | |
Accrued trustees’ and officers’ fees and benefits | | | 20,906 | |
Accrued other operating expenses | | | 265,881 | |
Trustee deferred compensation and retirement plans | | | 747,538 | |
Total liabilities | | | 1,295,849,313 | |
Net assets applicable to shares outstanding | | $ | 9,367,577,317 | |
|
Net assets consist of: | |
Shares of beneficial interest | | $ | 9,436,865,815 | |
Distributable earnings | | | (69,288,498 | ) |
| | | $ | 9,367,577,317 | |
| | | | |
Net Assets: | |
Class A | | $ | 5,561,342,355 | |
Class C | | $ | 860,987,868 | |
Class Y | | $ | 2,557,002,790 | |
Class R5 | | $ | 214,923 | |
Class R6 | | $ | 388,029,381 | |
|
Shares outstanding, no par value, with an unlimited number of shares authorized: | |
Class A | | | 563,353,428 | |
Class C | | | 87,531,583 | |
Class Y | | | 258,541,220 | |
Class R5 | | | 21,785 | |
Class R6 | | | 39,370,594 | |
Class A: | | | | |
Net asset value per share | | $ | 9.87 | |
Maximum offering price per share | | | | |
(Net asset value of $9.87 ÷ 95.75%) | | $ | 10.31 | |
Class C: | | | | |
Net asset value and offering price per share | | $ | 9.84 | |
Class Y: | | | | |
Net asset value and offering price per share | | $ | 9.89 | |
Class R5: | | | | |
Net asset value and offering price per share | | $ | 9.87 | |
Class R6: | | | | |
Net asset value and offering price per share | | $ | 9.86 | |
See accompanying Notes to Financial Statements which are an integral part of the financial statements.
52 Invesco High Yield Municipal Fund
Statement of Operations
For the year ended February 28, 2019
| | | | |
Investment income: | |
Interest | | $ | 522,305,667 | |
| |
Expenses: | | | | |
Advisory fees | | | 47,160,549 | |
Administrative services fees | | | 843,399 | |
Custodian fees | | | 118,763 | |
Distribution fees: | | | | |
Class A | | | 13,195,255 | |
Class C | | | 11,855,942 | |
Interest, facilities and maintenance fees | | | 33,304,079 | |
Transfer agent fees – A, C and Y | | | 6,386,601 | |
Transfer agent fees – R5 | | | 233 | |
Transfer agent fees – R6 | | | 44,676 | |
Trustees’ and officers’ fees and benefits | | | 151,947 | |
Registration and filing fees | | | 414,899 | |
Reports to shareholders | | | 375,099 | |
Professional services fees | | | 159,126 | |
Taxes | | | 1,565,031 | |
Other | | | 246,061 | |
Total expenses | | | 115,821,660 | |
Less: Expense offset arrangement(s) | | | (4,697 | ) |
Net expenses | | | 115,816,963 | |
Net investment income | | | 406,488,704 | |
| |
Realized and unrealized gain (loss) from: | | | | |
Net realized gain (loss) from: | | | | |
Investment securities (includes net gains (losses) from securities sold to affiliates of $236,389) | | | 22,204,002 | |
Futures contracts | | | (11,045,551 | ) |
| | | | 11,158,451 | |
Change in net unrealized appreciation (depreciation) of: | | | | |
Investment securities | | | (38,891,866 | ) |
Futures contracts | | | 1,544,717 | |
| | | | (37,347,149 | ) |
Net realized and unrealized gain (loss) | | | (26,188,698 | ) |
Net increase in net assets resulting from operations | | $ | 380,300,006 | |
See accompanying Notes to Financial Statements which are an integral part of the financial statements.
53 Invesco High Yield Municipal Fund
Statement of Changes in Net Assets
For the years ended February 28, 2019 and 2018
| | | | | | | | |
| | | 2019 | | | 2018 | |
Operations: | | | | | |
Net investment income | | $ | 406,488,704 | | | $ | 462,203,229 | |
Net realized gain (loss) | | | 11,158,451 | | | | (105,820,750 | ) |
Change in net unrealized appreciation (depreciation) | | | (37,347,149 | ) | | | 94,509,589 | |
Net increase in net assets resulting from operations | | | 380,300,006 | | | | 450,892,068 | |
| | |
Distributions to shareholders from distributable earnings(1): | | | | | | | | |
Class A | | | (248,183,225 | ) | | | (247,314,749 | ) |
Class B | | | – | | | | (1,131,604 | ) |
Class C | | | (47,103,255 | ) | | | (50,396,561 | ) |
Class Y | | | (127,066,006 | ) | | | (119,805,025 | ) |
Class R5 | | | (13,790 | ) | | | (22,076 | ) |
Class R6 | | | (15,694,832 | ) | | | (1,066,832 | ) |
Total distributions to shareholders from distributable earnings | | | (438,061,108 | ) | | | (419,736,847 | ) |
| | |
Share transactions-net: | | | | | | | | |
Class A | | | 229,372,990 | | | | 417,173,255 | |
Class B | | | – | | | | (37,907,638 | ) |
Class C | | | (412,175,652 | ) | | | 101,751,627 | |
Class Y | | | 11,691,502 | | | | 687,769,079 | |
Class R5 | | | (97,865 | ) | | | (324,639 | ) |
Class R6 | | | 182,379,024 | | | | 211,460,091 | |
Net increase in net assets resulting from share transactions | | | 11,169,999 | | | | 1,379,921,775 | |
Net increase (decrease) in net assets | | | (46,591,103 | ) | | | 1,411,076,996 | |
| | |
Net assets: | | | | | | | | |
Beginning of year | | | 9,414,168,420 | | | | 8,003,091,424 | |
End of year | | $ | 9,367,577,317 | | | $ | 9,414,168,420 | |
| (1) | The Securities and Exchange Commission eliminated the requirement to disclose distribution components separately, except for tax return of capital. For the year ended February 28, 2018, distributions to shareholders from distributable earnings consisted of distributions from net investment income. |
See accompanying Notes to Financial Statements which are an integral part of the financial statements.
54 Invesco High Yield Municipal Fund
Statement of Cash Flows
For the year ended February 28, 2019
| | | | |
Cash provided by operating activities: | | | | |
Net increase in net assets resulting from operations | | $ | 380,300,006 | |
|
Adjustments to reconcile the change in net assets from operations to net cash provided by operating activities: | |
Purchases of investments | | | (2,561,618,050 | ) |
Proceeds from sales of investments | | | 2,571,624,614 | |
Purchases of short-term investments, net | | | (76,283,226 | ) |
Amortization of premium on investment securities | | | 41,524,194 | |
Accretion of discount on investment securities | | | (53,567,040 | ) |
Decrease in receivables and other assets | | | 5,303,020 | |
Decrease in accrued expenses and other payables | | | (580,049 | ) |
Increase in variation margin receivable - futures contracts | | | (946,512 | ) |
Net realized gain from investment securities | | | (22,204,002 | ) |
Net change in unrealized depreciation on investment securities | | | 38,891,866 | |
Increase in cash collateral – exchange-traded futures contracts | | | (5,575,000 | ) |
Net cash provided by operating activities | | | 316,869,821 | |
| |
Cash provided by (used in) financing activities: | | | | |
Dividends paid to shareholders from distributable earnings | | | (182,371,200 | ) |
Increase in payable for amount due custodian | | | 4,058,590 | |
Proceeds from shares of beneficial interest sold | | | 2,357,059,459 | |
Proceeds of TOB Trusts | | | 345,455,000 | |
Repayments of TOB Trusts | | | (242,835,000 | ) |
Disbursements from shares of beneficial interest reacquired | | | (2,600,592,656 | ) |
Net cash provided by (used in) financing activities | | | (319,225,807 | ) |
Net decrease in cash and cash equivalents | | | (2,355,986 | ) |
Cash and cash equivalents at beginning of period | | | 2,355,986 | |
Cash and cash equivalents at end of period | | $ | – | |
|
Non-cash financing activities: | |
Value of shares of beneficial interest issued in reinvestment of dividends paid to shareholders | | $ | 256,063,094 | |
| |
Supplemental disclosure of cash flow information: | | | | |
Cash paid during the period for interest, facilities and maintenance fees | | $ | 33,304,079 | |
See accompanying Notes to Financial Statements which are an integral part of the financial statements.
55 Invesco High Yield Municipal Fund
Notes to Financial Statements
February 28, 2019
NOTE 1–Significant Accounting Policies
Invesco High Yield Municipal Fund (the “Fund”) is a series portfolio of AIMTax-Exempt Funds (InvescoTax-Exempt Funds) (the “Trust”). The Trust is a Delaware statutory trust registered under the Investment Company Act of 1940, as amended (the “1940 Act”), as anopen-end series management investment company authorized to issue an unlimited number of shares of beneficial interest. Information presented in these financial statements pertains only to the Fund. Matters affecting the Fund or each class will be voted on exclusively by the shareholders of the Fund or each class.
The Fund’s investment objective is to seek federaltax-exempt current income and taxable capital appreciation.
The Fund currently consists of five different classes of shares: Class A, Class C, Class Y, Class R5 and Class R6. Class Y shares are available only to certain investors. Class A shares are sold with afront-end sales charge unless certain waiver criteria are met. Under certain circumstances, load waived shares may be subject to contingent deferred sales charges (“CDSC”). Class C shares are sold with a CDSC. Class Y, Class R5 and Class R6 shares are sold at net asset value.
As of the opening of business on October 2, 2017, the Fund has limited public sales of its shares to certain investors.
The Fund is an investment company and accordingly follows the investment company accounting and reporting guidance in accordance with Financial Accounting Standards Board Accounting Standards Codification Topic 946,Financial Services - Investment Companies.
The following is a summary of the significant accounting policies followed by the Fund in the preparation of its financial statements.
| A. | Security Valuations – Securities, including restricted securities, are valued according to the following policy. |
Securities are fair valued using an evaluated quote provided by an independent pricing service approved by the Board of Trustees. Evaluated quotes provided by the pricing service may be determined without exclusive reliance on quoted prices, and may reflect appropriate factors such asinstitution-size trading in similar groups of securities, developments related to specific securities, dividend rate (for unlisted equities), yield (for debt obligations), quality, type of issue, coupon rate (for debt obligations), maturity (for debt obligations), individual trading characteristics and other market data. Pricing services generally value debt obligations assuming orderly transactions of institutional round lot size, but a fund may hold or transact in the same securities in smaller, odd lot sizes. Odd lots often trade at lower prices than institutional round lots. Debt obligations are subject to interest rate and credit risks. In addition, all debt obligations involve some risk of default with respect to interest and/or principal payments.
A security listed or traded on an exchange (except convertible securities) is valued at its last sales price or official closing price as of the close of the customary trading session on the exchange where the security is principally traded, or lacking any sales or official closing price on a particular day, the security may be valued at the closing bid price on that day. Securities traded in theover-the-counter market are valued based on prices furnished by independent pricing services or market makers. When such securities are valued by an independent pricing service they may be considered fair valued. Futures contracts are valued at the final settlement price set by an exchange on which they are principally traded. Listed options are valued at the mean between the last bid and asked prices from the exchange on which they are principally traded. Options not listed on an exchange are valued by an independent source at the mean between the last bid and asked prices. For purposes of determining net asset value (“NAV”) per share, futures and option contracts generally are valued 15 minutes after the close of the customary trading session of the New York Stock Exchange (“NYSE”).
Securities for which market quotations either are not readily available or became unreliable are valued at fair value as determined in good faith by or under the supervision of the Trust’s officers following procedures approved by the Board of Trustees. Some of the factors which may be considered in determining fair value are fundamental analytical data relating to the investment; the nature and duration of any restrictions on transferability or disposition; trading in similar securities by the same issuer or comparable companies; relevant political, economic or issuer specific news; and other relevant factors under the circumstances.
The Fund may invest in securities that are subject to interest rate risk, meaning the risk that the prices will generally fall as interest rates rise and, conversely, the prices will generally rise as interest rates fall. Specific securities differ in their sensitivity to changes in interest rates depending on their individual characteristics. Changes in interest rates may result in increased market volatility, which may affect the value and/or liquidity of certain Fund investments.
Valuations change in response to many factors including the historical and prospective earnings of the issuer, the value of the issuer’s assets, general economic conditions, interest rates, investor perceptions and market liquidity. Because of the inherent uncertainties of valuation, the values reflected in the financial statements may materially differ from the value received upon actual sale of those investments.
| B. | Securities Transactions and Investment Income – Securities transactions are accounted for on a trade date basis. Realized gains or losses on sales are computed on the basis of specific identification of the securities sold. Interest income (net of withholding tax, if any) is recorded on the accrual basis from settlement date. Bond premiums and discounts are amortized and/or accreted over the lives of the respective securities.Pay-in-kind interest income andnon-cash dividend income received in the form of securitiesin-lieu of cash are recorded at the fair value of the securities received. Paydown gains and losses on mortgage and asset-backed securities are recorded as adjustments to interest income. Dividend income (net of withholding tax, if any) is recorded on theex-dividend date. |
The Fund may periodically participate in litigation related to Fund investments. As such, the Fund may receive proceeds from litigation settlements. Any proceeds received are included in the Statement of Operations as realized gain (loss) for investments no longer held and as unrealized gain (loss) for investments still held.
Brokerage commissions and mark ups are considered transaction costs and are recorded as an increase to the cost basis of securities purchased and/or a reduction of proceeds on a sale of securities. Such transaction costs are included in the determination of net realized and unrealized gain (loss) from investment securities reported in the Statement of Operations and the Statement of Changes in Net Assets and the net realized and unrealized gains (losses) on securities per share in the Financial Highlights. Transaction costs are included in the calculation of the Fund’s net asset value and, accordingly, they reduce the Fund’s total returns. These transaction costs are not considered operating expenses and are not reflected in net investment income reported in the Statement of Operations and the Statement of Changes in Net Assets, or the net investment income per share and the ratios of expenses and net investment income reported in the Financial Highlights, nor are they limited by any expense limitation arrangements between the Fund and the investment adviser.
| | |
| 56 | | Invesco High Yield Municipal Fund |
The Fund allocates realized and unrealized capital gains and losses to a class based on the relative net assets of each class. The Fund allocates income to a class based on the relative value of the settled shares of each class.
| C. | Country Determination – For the purposes of making investment selection decisions and presentation in the Schedule of Investments, the investment adviser may determine the country in which an issuer is located and/or credit risk exposure based on various factors. These factors include the laws of the country under which the issuer is organized, where the issuer maintains a principal office, the country in which the issuer derives 50% or more of its total revenues and the country that has the primary market for the issuer’s securities, as well as other criteria. Among the other criteria that may be evaluated for making this determination are the country in which the issuer maintains 50% or more of its assets, the type of security, financial guarantees and enhancements, the nature of the collateral and the sponsor organization. Country of issuer and/or credit risk exposure has been determined to be the United States of America, unless otherwise noted. |
| D. | Distributions – Distributions from net investment income, if any, are declared daily and paid monthly. Distributions from net realized capital gain, if any, are generally declared and paid annually and recorded on theex-dividend date. The Fund may elect to treat a portion of the proceeds from redemptions as distributions for federal income tax purposes. |
| E. | Federal Income Taxes – The Fund intends to comply with the requirements of Subchapter M of the Internal Revenue Code of 1986, as amended (the “Internal Revenue Code”), necessary to qualify as a regulated investment company and to distribute substantially all of the Fund’s taxable andtax-exempt earnings to shareholders. As such, the Fund will not be subject to federal income taxes on otherwise taxable income (including net realized capital gain) that is distributed to shareholders. Therefore, no provision for federal income taxes is recorded in the financial statements. |
The Fund recognizes the tax benefits of uncertain tax positions only when the position is more likely than not to be sustained. Management has analyzed the Fund’s uncertain tax positions and concluded that no liability for unrecognized tax benefits should be recorded related to uncertain tax positions. Management is not aware of any tax positions for which it is reasonably possible that the total amounts of unrecognized tax benefits will change materially in the next 12 months.
In addition, the Fund intends to invest in such municipal securities to allow it to qualify to pay shareholders “exempt-interest dividends”, as defined in the Internal Revenue Code.
The Fund files tax returns in the U.S. Federal jurisdiction and certain other jurisdictions. Generally, the Fund is subject to examinations by such taxing authorities for up to three years after the filing of the return for the tax period.
| F. | Expenses – Fees provided for under the Rule12b-1 plan of a particular class of the Fund are charged to the operations of such class. Transfer agency fees and expenses and other shareholder recordkeeping fees and expenses attributable to Class R5 and Class R6 are allocated to each share class based on relative net assets.Sub-accounting fees attributable to Class R5 are charged to the operations of the class. Transfer agency fees and expenses and other shareholder recordkeeping fees and expenses relating to all other classes are allocated among those classes based on relative net assets. All other expenses are allocated among the classes based on relative net assets. |
| G. | Interest, Facilities and Maintenance Fees – Interest, Facilities and Maintenance Fees include interest and related borrowing costs such as commitment fees and other expenses associated with lines of credit and interest and administrative expenses related to establishing and maintaining floating rate note obligations, if any. |
| H. | Accounting Estimates – The preparation of financial statements in conformity with accounting principles generally accepted in the United States of America (“GAAP”) requires management to make estimates and assumptions that affect the reported amounts of assets and liabilities at the date of the financial statements and the reported amounts of revenues and expenses during the reporting period including estimates and assumptions related to taxation. Actual results could differ from those estimates by a significant amount. In addition, the Fund monitors for material events or transactions that may occur or become known after theperiod-end date and before the date the financial statements are released to print. |
| I. | Indemnifications – Under the Trust’s organizational documents, each Trustee, officer, employee or other agent of the Fund is indemnified against certain liabilities that may arise out of the performance of their duties to the Fund. Additionally, in the normal course of business, the Fund enters into contracts, including the Fund’s servicing agreements, that contain a variety of indemnification clauses. The Fund’s maximum exposure under these arrangements is unknown as this would involve future claims that may be made against the Fund that have not yet occurred. The risk of material loss as a result of such indemnification claims is considered remote. |
| J. | Cash and Cash Equivalents – For the purposes of the Statement of Cash Flows, the Fund defines Cash and Cash Equivalents as cash (including foreign currency), money market funds and other investments held in lieu of cash and excludes investments made with cash collateral received. |
| K. | Floating Rate Note Obligations – The Fund invests in inverse floating rate securities, such as Tender Option Bonds (“TOBs”), for investment purposes and to enhance the yield of the Fund. Such securities may be purchased in the secondary market without first owning an underlying bond but generally are created through the sale of fixed rate bonds by the Fund to special purpose trusts established by a broker dealer or by the Fund (“TOB Trusts”) in exchange for cash and residual interests in the TOB Trusts’ assets and cash flows, which are in the form of inverse floating rate securities. The TOB Trusts finance the purchases of the fixed rate bonds by issuing floating rate notes to third parties and allowing the Fund to retain residual interests in the bonds. The floating rate notes issued by the TOB Trusts have interest rates that reset weekly and the floating rate note holders have the option to tender their notes to the TOB Trusts for redemption at par at each reset date. The residual interests held by the Fund (inverse floating rate securities) include the right of the Fund (1) to cause the holders of the floating rate notes to tender their notes at par at the next interest rate reset date, and (2) to transfer the municipal bond from the TOB Trust to the Fund, thereby collapsing the TOB Trust. Inverse floating rate securities tend to underperform the market for fixed rate bonds in a rising interest rate environment, but tend to outperform the market for fixed rate bonds when interest rates decline or remain relatively stable. |
The Fund generally invests in inverse floating rate securities that include embedded leverage, thus exposing the Fund to greater risks and increased costs. The primary risks associated with inverse floating rate securities are varying degrees of liquidity and decreases in the value of such securities in response to changes in interest rates to a greater extent than fixed rate securities having similar credit quality, redemption provisions and maturity, which may cause the Fund’s net asset value to be more volatile than if it had not invested in inverse floating rate securities. In certain instances, the short-term floating rate notes created by the TOB Trust may not be able to be sold to third parties or, in the case of holders tendering (or putting) such notes for repayment of principal, may not be able to be remarketed to third parties. In such cases, the TOB Trust holding the fixed rate bonds may be collapsed with the entity that contributed the fixed rate bonds to the TOB Trust. In the case where a
| | |
| 57 | | Invesco High Yield Municipal Fund |
TOB Trust is collapsed with the Fund, the Fund will be required to repay the principal amount of the tendered securities, which may require the Fund to sell other portfolio holdings to raise cash to meet that obligation. The Fund could therefore be required to sell other portfolio holdings at a disadvantageous time or price to raise cash to meet this obligation, which risk will be heightened during times of market volatility, illiquidity or uncertainty. The embedded leverage in the TOB Trust could cause the Fund to lose more money than the value of the asset it has contributed to the TOB Trust and greater levels of leverage create the potential for greater losses. In addition, a Fund may enter into reimbursement agreements with the liquidity provider of certain TOB transactions in connection with certain residuals held by the Fund. These agreements commit a Fund to reimburse the liquidity provider to the extent that the liquidity provider must provide cash to a TOB Trust, including following the termination of a TOB Trust resulting from a mandatory tender event (“liquidity shortfall”). The reimbursement agreement will effectively make the Fund liable for the amount of the negative difference, if any, between the liquidation value of the underlying security and the purchase price of the floating rate notes issued by the TOB Trust.
The Fund accounts for the transfer of fixed rate bonds to the TOB Trusts as secured borrowings, with the securities transferred remaining in the Fund’s investment assets, and the related floating rate notes reflected as Fund liabilities under the captionFloating rate note obligations on the Statement of Assets and Liabilities. The carrying amount of the Fund’s floating rate note obligations as reported on the Statement of Assets and Liabilities approximates its fair value. The Fund records the interest income from the fixed rate bonds under the caption Interest and records the expenses related to floating rate obligations and any administrative expenses of the TOB Trusts as a component ofInterest, facilities and maintenance fees on the Statement of Operations.
Final rules implementing section 619 of the Dodd-Frank Wall Street Reform and Consumer Protection Act (the “Volcker Rule”) prohibit banking entities from engaging in proprietary trading of certain instruments and limit such entities’ investments in, and relationships with, “covered funds”, as defined in the rules. These rules preclude banking entities and their affiliates from sponsoring and/or providing services for existing TOB Trusts. A new TOB structure is being utilized by the Fund wherein the Fund, as holder of the residuals, will perform certain duties previously performed by banking entities as “sponsors” of TOB Trusts. These duties may be performed by a third-party service provider. The Fund’s expanded role under the new TOB structure may increase its operational and regulatory risk. The new structure is substantially similar to the previous structure; however, pursuant to the Volcker Rule, the remarketing agent would not be able to repurchase tendered floaters for its own account upon a failed remarketing. In the event of a failed remarketing, a banking entity serving as liquidity provider may loan the necessary funds to the TOB Trust to purchase the tendered floaters. The TOB Trust, not the Fund, would be the borrower and the loan from the liquidity provider will be secured by the purchased floaters now held by the TOB Trust. However, as previously described, the Fund would bear the risk of loss with respect to any liquidity shortfall to the extent it entered into a reimbursement agreement with the liquidity provider.
Further, the SEC and various banking agencies have adopted rules implementing credit risk retention requirements for asset-backed securities (the “Risk Retention Rules”). The Risk Retention Rules require the sponsor of a TOB Trust to retain at least 5% of the credit risk of the underlying assets supporting the TOB Trust’s municipal bonds. The Fund has adopted policies intended to comply with the Risk Retention Rules. The Risk Retention Rules may adversely affect the Fund’s ability to engage in TOB Trust transactions or increase the costs of such transactions in certain circumstances.
There can be no assurances that the new TOB structure will continue to be a viable form of leverage. Further, there can be no assurances that alternative forms of leverage will be available to the Fund in order to maintain current levels of leverage. Any alternative forms of leverage may be less advantageous to the Fund, and may adversely affect the Fund’s net asset value, distribution rate and ability to achieve its investment objective.
TOBs are presently classified as private placement securities. Private placement securities are subject to restrictions on resale because they have not been registered under the Securities Act of 1933, as amended (the “1933 Act”), or are otherwise not readily marketable. As a result of the absence of a public trading market for these securities, they may be less liquid than publicly traded securities. Although atypical, these securities may be resold in privately negotiated transactions, the prices realized from these sales could be less than those originally paid by the Fund or less than what may be considered the fair value of such securities.
| L. | Futures Contracts – The Fund may enter into futures contracts to manage exposure to interest rate, equity and market price movements and/or currency risks. A futures contract is an agreement between two parties (“Counterparties”) to purchase or sell a specified underlying security, currency or commodity (or delivery of a cash settlement price, in the case of an index future) for a fixed price at a future date. The Fund currently invests only in exchange-traded futures and they are standardized as to maturity date and underlying financial instrument. Initial margin deposits required upon entering into futures contracts are satisfied by the segregation of specific securities or cash as collateral at the futures commission merchant (broker). During the period the futures contracts are open, changes in the value of the contracts are recognized as unrealized gains or losses by recalculating the value of the contracts on a daily basis. Subsequent or variation margin payments are received or made depending upon whether unrealized gains or losses are incurred. These amounts are reflected as receivables or payables on the Statement of Assets and Liabilities. When the contracts are closed or expire, the Fund recognizes a realized gain or loss equal to the difference between the proceeds from, or cost of, the closing transaction and the Fund’s basis in the contract. The net realized gain (loss) and the change in unrealized gain (loss) on futures contracts held during the period is included on the Statement of Operations. The primary risks associated with futures contracts are market risk and the absence of a liquid secondary market. If the Fund were unable to liquidate a futures contract and/or enter into an offsetting closing transaction, the Fund would continue to be subject to market risk with respect to the value of the contracts and continue to be required to maintain the margin deposits on the futures contracts. Futures contracts have minimal Counterparty risk since the exchange’s clearinghouse, as Counterparty to all exchange-traded futures, guarantees the futures against default. Risks may exceed amounts recognized in the Statement of Assets and Liabilities. |
| M. | Other Risks – The Fund may invest in lower-quality debt securities, i.e., “junk bonds.” Investments in lower-rated securities or unrated securities of comparable quality tend to be more sensitive to economic conditions than higher-rated securities. Junk bonds involve a greater risk of default by the issuer because such securities are generally unsecured and are often subordinated to other creditors’ claims. |
The value of, payment of interest on, repayment of principal for and the ability to sell a municipal security may be affected by constitutional amendments, legislative enactments, executive orders, administrative regulations, voter initiatives and the economics of the regions in which the issuers are located.
Since many municipal securities are issued to finance similar projects, especially those relating to education, health care, transportation and utilities, conditions in those sectors can affect the overall municipal securities market and the Fund’s investments in municipal securities.
| | |
| 58 | | Invesco High Yield Municipal Fund |
There is some risk that a portion or all of the interest received from certaintax-free municipal securities could become taxable as a result of determinations by the Internal Revenue Service.
| N. | Collateral– To the extent the Fund has designated or segregated a security as collateral and that security is subsequently sold, it is the Fund’s practice to replace such collateral no later than the next business day. |
NOTE 2–Advisory Fees and Other Fees Paid to Affiliates
The Trust has entered into a master investment advisory agreement with Invesco Advisers, Inc. (the“Adviser” or “Invesco”). Under the terms of the investment advisory agreement, the Fund accrues daily and pays monthly an advisory fee to the Adviser based on the annual rate of the Fund’s average daily net assets as follows:
| | |
| Average Daily Net Assets | | Rate |
First $ 300 million | | 0.60% |
Next $300 million | | 0.55% |
Over $600 million | | 0.50% |
For the year ended February 28, 2019, the effective advisory fees incurred by the Fund was 0.50%.
Under the terms of a mastersub-advisory agreement between the Adviser and each of Invesco Asset Management Deutschland GmbH, Invesco Asset Management Limited, Invesco Asset Management (Japan) Limited, Invesco Hong Kong Limited, Invesco Senior Secured Management, Inc. and Invesco Canada Ltd. and separatesub-advisory agreements with Invesco Capital Management LLC and Invesco Asset Management (India) Private Limited (collectively, the “AffiliatedSub-Advisers”) the Adviser, not the Fund, will pay 40% of the fees paid to the Adviser to any such AffiliatedSub-Adviser(s) that provide(s) discretionary investment management services to the Fund based on the percentage of assets allocated to such AffiliatedSub-Adviser(s).
The Adviser has contractually agreed, through at least June 30, 2019, to waive advisory fees and/or reimburse expenses of all shares to the extent necessary to limit total annual fund operating expenses after fee waiver and/or expense reimbursement (excluding certain items discussed below) of Class A, Class C, Class Y, Class R5 and Class R6 shares to 1.50%, 2.25%, 1.25%, 1.25% and 1.25%, respectively, of average daily net assets (the “expense limits”). In determining the Adviser’s obligation to waive advisory fees and/or reimburse expenses, the following expenses are not taken into account, and could cause the total annual fund operating expenses after fee waiver and/or expense reimbursement to exceed the numbers reflected above: (1) interest, facilities and maintenance fees; (2) taxes; (3) dividend expense on short sales; (4) extraordinary ornon-routine items, including litigation expenses; and (5) expenses that the Fund has incurred but did not actually pay because of an expense offset arrangement. Unless Invesco continues the fee waiver agreement, it will terminate on June 30, 2019. During its term, the fee waiver agreement cannot be terminated or amended to increase the expense limits or reduce the advisory fee waiver without approval of the Board of Trustees. The Adviser did not waive fees and/or reimburse expenses during the period under these expense limits.
The Trust has entered into a master administrative services agreement with Invesco pursuant to which the Fund has agreed to pay Invesco for certain administrative costs incurred in providing accounting services to the Fund. For the year ended February 28, 2019, expenses incurred under the agreement are shown in the Statement of Operations asAdministrative services fees. Also, Invesco has entered into asub-administration agreement whereby State Street Bank and Trust Company (“SSB”) serves as custodian and fund accountant and provides certain administrative services to the Fund.
The Trust has entered into a transfer agency and service agreement with Invesco Investment Services, Inc. (“IIS”) pursuant to which the Fund has agreed to pay IIS a fee for providing transfer agency and shareholder services to the Fund and reimburse IIS for certain expenses incurred by IIS in the course of providing such services. IIS may make payments to intermediaries that provide omnibus account services,sub-accounting services and/or networking services. All fees payable by IIS to intermediaries that provide omnibus account services orsub-accounting services are charged back to the Fund, subject to certain limitations approved by the Trust’s Board of Trustees. For the year ended February 28, 2019, expenses incurred under the agreement are shown in the Statement of Operations asTransfer agent fees.
Shares of the Fund are distributed by Invesco Distributors, Inc. (“IDI”). The Fund has adopted a distribution plan pursuant to Rule12b-1 under the 1940 Act, and a service plan (collectively, the “Plans”) for Class A shares and Class C shares to compensate IDI for the sale, distribution, shareholder servicing and maintenance of shareholder accounts for these shares. Under the Plans, the Fund will incur annual fees of up to 0.25% of Class A average daily net assets and up to 1.00% of Class C average daily net assets. The fees are accrued daily and paid monthly.
With respect to Class C shares, the Fund is authorized to reimburse in future years any distribution related expenses that exceed the maximum annual reimbursement rate for such class, so long as such reimbursement does not cause the Fund to exceed the Class C maximum annual reimbursement rate, respectively. With respect to Class A shares, distribution related expenses that exceed the maximum annual reimbursement rate for such class are not carried forward to future years and the Fund will not reimburse IDI for any such expenses.
For the year ended February 28, 2019, expenses incurred under these agreements are shown in the Statement of Operations asDistribution fees.
Front-end sales commissions and CDSC (collectively, the “sales charges”) are not recorded as expenses of the Fund.Front-end sales commissions are deducted from proceeds from the sales of Fund shares prior to investment in Class A shares of the Fund. CDSC are deducted from redemption proceeds prior to remittance to the shareholder. During the year ended February 28, 2019, IDI advised the Fund that IDI retained $561,662 infront-end sales commissions from the sale of Class A shares and $152,665 and $36,891 from Class A and Class C shares, respectively, for CDSC imposed upon redemptions by shareholders.
Certain officers and trustees of the Trust are officers and directors of the Adviser, IIS and/or IDI.
NOTE 3–Additional Valuation Information
GAAP defines fair value as the price that would be received to sell an asset or paid to transfer a liability in an orderly transaction between market participants at the measurement date, under current market conditions. GAAP establishes a hierarchy that prioritizes the inputs to valuation methods, giving the highest priority to readily available unadjusted quoted prices in an active market for identical assets (Level 1) and the lowest priority to
| | |
| 59 | | Invesco High Yield Municipal Fund |
significant unobservable inputs (Level 3), generally when market prices are not readily available or are unreliable. Based on the valuation inputs, the securities or other investments are tiered into one of three levels. Changes in valuation methods may result in transfers in or out of an investment’s assigned level:
| | Level 1 - | Prices are determined using quoted prices in an active market for identical assets. |
| | Level 2 - | Prices are determined using other significant observable inputs. Observable inputs are inputs that other market participants may use in pricing a security. These may include quoted prices for similar securities, interest rates, prepayment speeds, credit risk, yield curves, loss severities, default rates, discount rates, volatilities and others. |
| | Level 3 - | Prices are determined using significant unobservable inputs. In situations where quoted prices or observable inputs are unavailable (for example, when there is little or no market activity for an investment at the end of the period), unobservable inputs may be used. Unobservable inputs reflect the Fund’s own assumptions about the factors market participants would use in determining fair value of the securities or instruments and would be based on the best available information. |
The following is a summary of the tiered valuation input levels, as of February 28, 2019. The level assigned to the securities valuations may not be an indication of the risk or liquidity associated with investing in those securities. Because of the inherent uncertainties of valuation, the values reflected in the financial statements may materially differ from the value received upon actual sale of those investments.
| | | | | | | | | | | | | | | | |
| | | Level 1 | | | Level 2 | | | Level 3 | | | Total | |
Investments in Securities | | | | | | | | | | | | | | | | |
Municipal Obligations | | $ | – | | | $ | 10,475,381,042 | | | $ | 3,612,122 | | | $ | 10,478,993,164 | |
U.S. Dollar Denominated Bonds & Notes | | | – | | | | – | | | | 5,330,000 | | | | 5,330,000 | |
Investments Matured | | | – | | | | 1,906,094 | | | | 18,000,000 | | | | 19,906,094 | |
Total Investments in Securities | | | – | | | | 10,477,287,136 | | | | 26,942,122 | | | | 10,504,229,258 | |
| | | | |
Other Investments - Assets* | | | | | | | | | | | | | | | | |
Futures Contracts | | | 1,544,717 | | | | – | | | | – | | | | 1,544,717 | |
Total Investments | | $ | 1,544,717 | | | $ | 10,477,287,136 | | | $ | 26,942,122 | | | $ | 10,505,773,975 | |
| * | Unrealized appreciation. |
NOTE 4–Derivative Investments
The Fund may enter into an International Swaps and Derivatives Association Master Agreement (“ISDA Master Agreement”) under which a fund may trade OTC derivatives. An OTC transaction entered into under an ISDA Master Agreement typically involves a collateral posting arrangement, payment netting provisions andclose-out netting provisions. These netting provisions allow for reduction of credit risk through netting of contractual obligations. The enforceability of the netting provisions of the ISDA Master Agreement depends on the governing law of the ISDA Master Agreement, among other factors.
For financial reporting purposes, the Fund does not offset OTC derivative assets or liabilities that are subject to ISDA Master Agreements in the Statement of Assets and Liabilities.
Value of Derivative Investments atPeriod-End
The table below summarizes the value of the Fund’s derivative investments, detailed by primary risk exposure, held as of February 28, 2019:
| | | | | |
| | | Value |
| Derivative Assets | | Interest Rate Risk |
Unrealized appreciation on futures contracts – Exchange-Traded(a) | | | $ | 1,544,717 | |
Derivatives not subject to master netting agreements | | | | (1,544,717 | ) |
Total Derivative Assets subject to master netting agreements | | | $ | – | |
| (a) | The daily variation margin receivable (payable) atperiod-end is recorded in the Statement of Assets and Liabilities. |
Effect of Derivative Investments for the year ended February 28, 2019
The table below summarizes the gains (losses) on derivative investments, detailed by primary risk exposure, recognized in earnings during the period:
| | | | | |
| | | Location of Gain (Loss) on
Statement of Operations |
| | | Interest Rate Risk |
Realized (Loss): | | | | | |
Futures contracts | | | $ | (11,045,551 | ) |
Change in Net Unrealized Appreciation: | | | | | |
Futures contracts | | | | 1,544,717 | |
Total | | | $ | (9,500,834 | ) |
| | |
| 60 | | Invesco High Yield Municipal Fund |
The table below summarizes the four month average notional value of derivatives held during the period.
| | |
| | | Futures
Contracts |
Average notional value | | $438,689,922 |
NOTE 5–Security Transactions with Affiliated Funds
The Fund is permitted to purchase or sell securities from or to certain other Invesco Funds under specified conditions outlined in procedures adopted by the Board of Trustees of the Trust. The procedures have been designed to ensure that any purchase or sale of securities by the Fund from or to another fund or portfolio that is or could be considered an affiliate by virtue of having a common investment adviser (or affiliated investment advisers), common Trustees and/or common officers complies with Rule17a-7 of the 1940 Act. Further, as defined under the procedures, each transaction is effected at the current market price. Pursuant to these procedures, for the year ended February 28, 2019, the Fund engaged in securities purchases of $421,027,887 and securities sales of $432,633,401, which resulted in net realized gains of $236,389.
NOTE 6–Expense Offset Arrangement(s)
The expense offset arrangement is comprised of transfer agency credits which result from balances in demand deposit accounts used by the transfer agent for clearing shareholder transactions. For the year ended February 28, 2019, the Fund received credits from this arrangement, which resulted in the reduction of the Fund’s total expenses of $4,697.
NOTE 7–Trustees’ and Officers’ Fees and Benefits
Trustees’ and Officers’ Fees and Benefits include amounts accrued by the Fund to pay remuneration to certain Trustees and Officers of the Fund. Trustees have the option to defer compensation payable by the Fund, andTrustees’ and Officers’ Fees and Benefits also include amounts accrued by the Fund to fund such deferred compensation amounts. Those Trustees who defer compensation have the option to select various Invesco Funds in which their deferral accounts shall be deemed to be invested. Finally, certain current Trustees were eligible to participate in a retirement plan that provided for benefits to be paid upon retirement to Trustees over a period of time based on the number of years of service. The Fund may have certain former Trustees who also participate in a retirement plan and receive benefits under such plan.Trustees’ and Officers’ Fees and Benefits include amounts accrued by the Fund to fund such retirement benefits. Obligations under the deferred compensation and retirement plans represent unsecured claims against the general assets of the Fund.
NOTE 8–Cash Balances and Borrowings
The Fund is permitted to temporarily carry a negative or overdrawn balance in its account with SSB, the custodian bank. Such balances, if any atperiod-end, are shown in the Statement of Assets and Liabilities under the payable captionAmount due custodian. To compensate the custodian bank for such overdrafts, the overdrawn Fund may either (1) leave funds as a compensating balance in the account so the custodian bank can be compensated by earning the additional interest; or (2) compensate by paying the custodian bank at a rate agreed upon by the custodian bank and Invesco, not to exceed the contractually agreed upon rate.
Inverse floating rate obligations resulting from the transfer of bonds to TOB Trusts are accounted for as secured borrowings. The average floating rate notes outstanding and average annual interest and fee rate related to inverse floating rate note obligations during the year ended February 28, 2019 were $1,206,101,154 and 2.75%, respectively.
NOTE 9–Distributions to Shareholders and Tax Components of Net Assets
Tax Character of Distributions to Shareholders Paid During the Fiscal Years Ended February 28, 2019 and 2018
| | | | | | | | |
| | | 2019 | | | 2018 | |
Ordinary income -tax-exempt | | $ | 438,061,108 | | | $ | 419,736,847 | |
Tax Components of Net Assets atPeriod-End:
| | | | |
| | | 2019 | |
Undistributed -tax-exempt income | | $ | 21,158,400 | |
Net unrealized appreciation - investments | | | 366,311,798 | |
Temporary book/tax differences | | | (659,367 | ) |
Capital loss carryforward | | | (456,099,329 | ) |
Shares of beneficial interest | | | 9,436,865,815 | |
Total net assets | | $ | 9,367,577,317 | |
The difference between book-basis andtax-basis unrealized appreciation (depreciation) is due to differences in the timing of recognition of gains and losses on investments for tax and book purposes. The Fund’s net unrealized appreciation difference is attributable primarily to wash sales, TOBs book to tax accretion and amortization discounts and defaulted securities.
The temporary book/tax differences are a result of timing differences between book and tax recognition of income and/or expenses. The Fund’s temporary book/tax differences are the result of the trustee deferral of compensation and retirement plan benefits.
Capital loss carryforward is calculated and reported as of a specific date. Results of transactions and other activity after that date may affect the amount of capital loss carryforward actually available for the Fund to utilize. Capital losses generated in years beginning after December 22, 2010
| | |
| 61 | | Invesco High Yield Municipal Fund |
can be carried forward for an unlimited period, whereas previous losses expire in eight tax years. Capital losses with an expiration period may not be used to offset capital gains until all net capital losses without an expiration date have been utilized. Capital loss carryforwards with no expiration date will retain their character as either short-term or long-term capital losses instead of as short-term capital losses as under prior law. The ability to utilize capital loss carryforwards in the future may be limited under the Internal Revenue Code and related regulations based on the results of future transactions.
The Fund has a capital loss carryforward as of February 28, 2019, as follows:
| | | | | | |
| Capital Loss Carryforward* |
| Expiration | | Short-Term | | Long-Term | | Total |
Not subject to expiration | | $181,638,615 | | $274,460,714 | | $456,099,329 |
| * | Capital loss carryforward as of the date listed above is reduced for limitations, if any, to the extent required by the Internal Revenue Code and may be further limited depending upon a variety of factors, including the realization of net unrealized gains or losses as of the date of any reorganization. |
NOTE 10–Investment Transactions
The aggregate amount of investment securities (other than short-term securities, U.S. Treasury obligations and money market funds, if any) purchased and sold by the Fund during the year ended February 28, 2019 was $2,498,261,231 and $2,465,409,211, respectively. Cost of investments, including any derivatives, on a tax basis includes the adjustments for financial reporting purposes as of the most recently completed federal income tax reportingperiod-end.
| | | | | |
| Unrealized Appreciation (Depreciation) of Investments on a Tax Basis |
Aggregate unrealized appreciation of investments | | | | $ 619,719,239 | |
Aggregate unrealized (depreciation) of investments | | | | (253,407,441 | ) |
Net unrealized appreciation of investments | | | | $ 366,311,798 | |
Cost of investments for tax purposes is $10,139,462,177.
NOTE 11–Reclassification of Permanent Differences
Primarily as a result of differing book/tax treatment of expired capital loss carryforward and federal taxes paid by the Fund, on February 28, 2019, undistributed net investment income was decreased by $678,905, undistributed net realized gain (loss) was increased by $40,437,653 and shares of beneficial interest was decreased by $39,758,748. This reclassification had no effect on the net assets of the Fund.
NOTE 12–Share Information
| | | | | | | | | | | | | | | | | | | | |
| | | Summary of Share Activity |
| | | Years ended February 28, |
| | | 2019(a) | | 2018 |
| | | Shares | | Amount | | Shares | | Amount |
Sold: | | | | | | | | | | | | | | | | | | | | |
Class A | | | | 105,661,087 | | | | $ | 1,041,022,411 | | | | | 118,994,500 | | | | $ | 1,193,473,497 | |
Class B(b) | | | | – | | | | | – | | | | | 16,150 | | | | | 161,362 | |
Class C | | | | 11,363,795 | | | | | 111,808,569 | | | | | 29,622,710 | | | | | 296,109,326 | |
Class Y | | | | 94,536,871 | | | | | 936,776,988 | | | | | 151,543,759 | | | | | 1,520,003,427 | |
Class R5 | | | | 7,632 | | | | | 74,810 | | | | | 2,142 | | | | | 21,300 | |
Class R6 | | | | 26,850,229 | | | | | 266,089,763 | | | | | 21,412,893 | | | | | 215,216,528 | |
| | | | |
Issued as reinvestment of dividends: | | | | | | | | | | | | | | | | | | | | |
Class A | | | | 14,447,108 | | | | | 142,926,007 | | | | | 14,387,034 | | | | | 144,342,693 | |
Class B(b) | | | | – | | | | | – | | | | | 63,654 | | | | | 641,338 | |
Class C | | | | 2,855,598 | | | | | 28,160,284 | | | | | 3,182,249 | | | | | 31,821,826 | |
Class Y | | | | 7,217,203 | | | | | 71,545,145 | | | | | 6,880,862 | | | | | 69,183,851 | |
Class R5 | | | | 470 | | | | | 4,660 | | | | | 628 | | | | | 6,291 | |
Class R6 | | | | 1,360,291 | | | | | 13,426,998 | | | | | 89,639 | | | | | 889,866 | |
| | | | |
Conversion of Class B shares to Class A shares:(c) | | | | | | | | | | | | | | | | | | | | |
Class A | | | | – | | | | | – | | | | | 982,147 | | | | | 9,870,575 | |
Class B | | | | – | | | | | – | | | | | (977,393 | ) | | | | (9,870,575 | ) |
| | |
| 62 | | Invesco High Yield Municipal Fund |
| | | | | | | | | | | | | | | | | | | | |
| | | Summary of Share Activity |
| | | Years ended February 28, |
| | | 2019(a) | | 2018 |
| | | Shares | | Amount | | Shares | | Amount |
Reacquired: | | | | | | | | | | | | | | | | | | | | |
Class A | | | | (96,761,632 | ) | | | | (954,575,428 | ) | | | | (93,113,907 | ) | | | | (930,513,510 | ) |
Class B(b) | | | | – | | | | | – | | | | | (2,856,216 | ) | | | | (28,839,763 | ) |
Class C | | | | (56,357,428 | ) | | | | (552,144,505 | ) | | | | (22,616,132 | ) | | | | (226,179,525 | ) |
Class Y | | | | (100,893,617 | ) | | | | (996,630,631 | ) | | | | (89,590,429 | ) | | | | (901,418,199 | ) |
Class R5 | | | | (17,970 | ) | | | | (177,335 | ) | | | | (35,095 | ) | | | | (352,230 | ) |
Class R6 | | | | (9,876,565 | ) | | | | (97,137,737 | ) | | | | (465,893 | ) | | | | (4,646,303 | ) |
Net increase in share activity | | | | 393,072 | | | | $ | 11,169,999 | | | | | 137,523,302 | | | | $ | 1,379,921,775 | |
| (a) | There are entities that are record owners of more than 5% of the outstanding shares of the Fund and in the aggregate own 51% of the outstanding shares of the Fund. IDI has an agreement with these entities to sell Fund shares. The Fund, Invesco and/or Invesco affiliates may make payments to these entities, which are considered to be related to the Fund, for providing services to the Fund, Invesco and/or Invesco affiliates including but not limited to services such as securities brokerage, distribution, third party record keeping and account servicing. The Fund has no knowledge as to whether all or any portion of the shares owned of record by these entities are also owned beneficially. |
| (b) | Class B shares activity for the period March 1, 2017 through January 26, 2018 (date of conversion). |
| (c) | Effective as of the close of business January 26, 2018, all outstanding Class B shares were converted to Class A shares. |
NOTE 13–Financial Highlights
The following schedule presents financial highlights for a share of the Fund outstanding throughout the periods indicated.
| | | | | | | | | | | | | | | | | | | | | | | | | | | | | | | | | | | | | | | | | | | | | | | | | | | | | | | | | | | | | | | | | |
| | | Net asset value, beginning of period | | Net investment income(a) | | Net gains (losses) on securities (both realized and unrealized) | | Total from investment operations | | Dividends from net investment income | | Net asset value, end of period | | Total
return(b) | | Net assets, end of period (000’s omitted) | | Ratio of expenses to average
net assets with fee waivers and/or expenses absorbed | | Ratio of expenses to average net assets without fee waivers and/or expenses
absorbed | | Supplemental ratio of expenses to average net assets with fee waivers
(excluding interest, facilities and maintenance fees) | | Ratio of net investment income to average net assets | | Portfolio turnover(c) |
Class A | | | | | | | | | | | | | | | | | | | | | | | | | | | | | | | | | | | | | | | | | | | | | | | | | | | | | | | | | | | | | | | | | |
Year ended 02/28/19 | | | $ | 9.93 | | | | $ | 0.43 | | | | $ | (0.02 | ) | | | $ | 0.41 | | | | $ | (0.47 | ) | | | $ | 9.87 | | | | | 4.17% | | | | | $5,561,342 | | | | | 1.22 | %(d) | | | | 1.22 | %(d) | | | | 0.86 | %(d) | | | | 4.37 | %(d) | | | | 24 | % |
Year ended 02/28/18 | | | | 9.87 | | | | | 0.52 | | | | | 0.01 | | | | | 0.53 | | | | | (0.47 | ) | | | | 9.93 | | | | | 5.46 | | | | | 5,360,001 | | | | | 1.06 | | | | | 1.06 | | | | | 0.89 | | | | | 5.17 | | | | | 14 | |
Year ended 02/28/17 | | | | 10.11 | | | | | 0.50 | | | | | (0.24 | ) | | | | 0.26 | | | | | (0.50 | ) | | | | 9.87 | | | | | 2.53 | | | | | 4,922,389 | | | | | 1.01 | | | | | 1.01 | | | | | 0.87 | | | | | 4.87 | | | | | 17 | |
Year ended 02/29/16 | | | | 10.06 | | | | | 0.52 | | | | | 0.03 | | | | | 0.55 | | | | | (0.50 | ) | | | | 10.11 | | | | | 5.62 | | | | | 4,838,666 | | | | | 0.93 | | | | | 0.93 | | | | | 0.86 | | | | | 5.22 | | | | | 14 | |
Year ended 02/28/15 | | | | 9.39 | | | | | 0.51 | | | | | 0.67 | | | | | 1.18 | | | | | (0.51 | ) | | | | 10.06 | | | | | 12.86 | | | | | 4,791,381 | | | | | 0.93 | | | | | 0.93 | | | | | 0.86 | | | | | 5.18 | | | | | 17 | |
Class C | | | | | | | | | | | | | | | | | | | | | | | | | | | | | | | | | | | | | | | | | | | | | | | | | | | | | | | | | | | | | | | | | |
Year ended 02/28/19 | | | | 9.89 | | | | | 0.36 | | | | | (0.02 | ) | | | | 0.34 | | | | | (0.39 | ) | | | | 9.84 | | | | | 3.52 | | | | | 860,988 | | | | | 1.97 | (d) | | | | 1.97 | (d) | | | | 1.61 | (d) | | | | 3.62 | (d) | | | | 24 | |
Year ended 02/28/18 | | | | 9.84 | | | | | 0.45 | | | | | 0.00 | | | | | 0.45 | | | | | (0.40 | ) | | | | 9.89 | | | | | 4.57 | | | | | 1,282,971 | | | | | 1.81 | | | | | 1.81 | | | | | 1.64 | | | | | 4.42 | | | | | 14 | |
Year ended 02/28/17 | | | | 10.07 | | | | | 0.42 | | | | | (0.23 | ) | | | | 0.19 | | | | | (0.42 | ) | | | | 9.84 | | | | | 1.86 | | | | | 1,175,513 | | | | | 1.76 | | | | | 1.76 | | | | | 1.62 | | | | | 4.12 | | | | | 17 | |
Year ended 02/29/16 | | | | 10.03 | | | | | 0.45 | | | | | 0.02 | | | | | 0.47 | | | | | (0.43 | ) | | | | 10.07 | | | | | 4.79 | (e) | | | | 1,182,368 | | | | | 1.66 | (e) | | | | 1.66 | (e) | | | | 1.59 | (e) | | | | 4.49 | (e) | | | | 14 | |
Year ended 02/28/15 | | | | 9.36 | | | | | 0.43 | | | | | 0.68 | | | | | 1.11 | | | | | (0.44 | ) | | | | 10.03 | | | | | 12.06 | (e) | | | | 1,220,444 | | | | | 1.67 | (e) | | | | 1.67 | (e) | | | | 1.60 | (e) | | | | 4.44 | (e) | | | | 17 | |
Class Y | | | | | | | | | | | | | | | | | | | | | | | | | | | | | | | | | | | | | | | | | | | | | | | | | | | | | | | | | | | | | | | | | |
Year ended 02/28/19 | | | | 9.94 | | | | | 0.46 | | | | | (0.02 | ) | | | | 0.44 | | | | | (0.49 | ) | | | | 9.89 | | | | | 4.54 | | | | | 2,557,003 | | | | | 0.97 | (d) | | | | 0.97 | (d) | | | | 0.61 | (d) | | | | 4.62 | (d) | | | | 24 | |
Year ended 02/28/18 | | | | 9.89 | | | | | 0.55 | | | | | 0.00 | | | | | 0.55 | | | | | (0.50 | ) | | | | 9.94 | | | | | 5.61 | | | | | 2,562,437 | | | | | 0.81 | | | | | 0.81 | | | | | 0.64 | | | | | 5.42 | | | | | 14 | |
Year ended 02/28/17 | | | | 10.12 | | | | | 0.52 | | | | | (0.22 | ) | | | | 0.30 | | | | | (0.53 | ) | | | | 9.89 | | | | | 2.89 | | | | | 1,867,338 | | | | | 0.76 | | | | | 0.76 | | | | | 0.62 | | | | | 5.12 | | | | | 17 | |
Year ended 02/29/16 | | | | 10.08 | | | | | 0.55 | | | | | 0.01 | | | | | 0.56 | | | | | (0.52 | ) | | | | 10.12 | | | | | 5.78 | | | | | 1,560,105 | | | | | 0.68 | | | | | 0.68 | | | | | 0.61 | | | | | 5.47 | | | | | 14 | |
Year ended 02/28/15 | | | | 9.41 | | | | | 0.54 | | | | | 0.67 | | | | | 1.21 | | | | | (0.54 | ) | | | | 10.08 | | | | | 13.12 | | | | | 1,346,986 | | | | | 0.68 | | | | | 0.68 | | | | | 0.61 | | | | | 5.43 | | | | | 17 | |
Class R5 | | | | | | | | | | | | | | | | | | | | | | | | | | | | | | | | | | | | | | | | | | | | | | | | | | | | | | | | | | | | | | | | | |
Year ended 02/28/19 | | | | 9.92 | | | | | 0.46 | | | | | (0.02 | ) | | | | 0.44 | | | | | (0.49 | ) | | | | 9.87 | | | | | 4.51 | | | | | 215 | | | | | 0.99 | (d) | | | | 0.99 | (d) | | | | 0.63 | (d) | | | | 4.60 | (d) | | | | 24 | |
Year ended 02/28/18 | | | | 9.86 | | | | | 0.55 | | | | | 0.01 | | | | | 0.56 | | | | | (0.50 | ) | | | | 9.92 | | | | | 5.70 | | | | | 314 | | | | | 0.80 | | | | | 0.80 | | | | | 0.63 | | | | | 5.43 | | | | | 14 | |
Year ended 02/28/17 | | | | 10.11 | | | | | 0.52 | | | | | (0.25 | ) | | | | 0.27 | | | | | (0.52 | ) | | | | 9.86 | | | | | 2.64 | | | | | 631 | | | | | 0.80 | | | | | 0.80 | | | | | 0.66 | | | | | 5.08 | | | | | 17 | |
Year ended 02/29/16 | | | | 10.07 | | | | | 0.54 | | | | | 0.02 | | | | | 0.56 | | | | | (0.52 | ) | | | | 10.11 | | | | | 5.77 | | | | | 2,633 | | | | | 0.72 | | | | | 0.72 | | | | | 0.65 | | | | | 5.43 | | | | | 14 | |
Year ended 02/28/15 | | | | 9.41 | | | | | 0.53 | | | | | 0.67 | | | | | 1.20 | | | | | (0.54 | ) | | | | 10.07 | | | | | 13.01 | | | | | 2,851 | | | | | 0.68 | | | | | 0.68 | | | | | 0.61 | | | | | 5.43 | | | | | 17 | |
Class R6 | | | | | | | | | | | | | | | | | | | | | | | | | | | | | | | | | | | | | | | | | | | | | | | | | | | | | | | | | | | | | | | | | |
Year ended 02/28/19 | | | | 9.91 | | | | | 0.46 | | | | | (0.01 | ) | | | | 0.45 | | | | | (0.50 | ) | | | | 9.86 | | | | | 4.59 | | | | | 388,029 | | | | | 0.92 | (d) | | | | 0.92 | (d) | | | | 0.56 | (d) | | | | 4.67 | (d) | | | | 24 | |
Year ended 02/28/18(f) | | | | 9.90 | | | | | 0.50 | | | | | (0.03 | ) | | | | 0.47 | | | | | (0.46 | ) | | | | 9.91 | | | | | 4.76 | | | | | 208,446 | | | | | 0.74 | (g) | | | | 0.74 | (g) | | | | 0.57 | (g) | | | | 5.49 | (g) | | | | 14 | |
| (a) | Calculated using average shares outstanding. |
| (b) | Includes adjustments in accordance with accounting principles generally accepted in the United States of America and as such, the net asset value for financial reporting purposes and the returns based upon those net asset values may differ from the net asset value and returns for shareholder transactions. Does not include sales charges and is not annualized for periods less than one year, if applicable. |
| (c) | Portfolio turnover is calculated at the fund level and is not annualized for periods less than one year, if applicable. |
| (d) | Ratios are based on average daily net assets (000’s omitted) of $5,278,102, $1,184,515, $2,565,921, $280 and $313,291 for Class A, Class C, Class Y, Class R5 and Class R6 shares, respectively. |
| (e) | The total return, ratio of expenses to average net assets and ratio of net investment income to average net assets reflect actual12b-1 fees of 0.98% and 0.99% for the years ended February 29, 2016and February 28, 2015. |
| (f) | Commencement date of April 4, 2017. |
63 Invesco High Yield Municipal Fund
Report of Independent Registered Public Accounting Firm
To the Board of Trustees of AIMTax-Exempt Funds (InvescoTax-Exempt Funds)
and Shareholders of Invesco High Yield Municipal Fund:
Opinion on the Financial Statements
We have audited the accompanying statement of assets and liabilities, including the schedule of investments, of Invesco High Yield Municipal Fund (one of the funds constituting AIMTax-Exempt Funds (InvescoTax-Exempt Funds), hereafter referred to as the “Fund”) as of February 28, 2019, the related statements of operations and cash flows for the year ended February 28, 2019, the statement of changes in net assets for each of the two years in the period ended February 28, 2019, including the related notes, and the financial highlights for each of the periods indicated therein (collectively referred to as the “financial statements”). In our opinion, the financial statements present fairly, in all material respects, the financial position of the Fund as of February 28, 2019, the results of its operations and its cash flows for the year then ended, the changes in its net assets for each of the two years in the period ended February 28, 2019 and the financial highlights for each of the periods indicated therein in conformity with accounting principles generally accepted in the United States of America.
Basis for Opinion
These financial statements are the responsibility of the Fund’s management. Our responsibility is to express an opinion on the Fund’s financial statements based on our audits. We are a public accounting firm registered with the Public Company Accounting Oversight Board (United States) (PCAOB) and are required to be independent with respect to the Fund in accordance with the U.S. federal securities laws and the applicable rules and regulations of the Securities and Exchange Commission and the PCAOB.
We conducted our audits of these financial statements in accordance with the standards of the PCAOB. Those standards require that we plan and perform the audit to obtain reasonable assurance about whether the financial statements are free of material misstatement, whether due to error or fraud.
Our audits included performing procedures to assess the risks of material misstatement of the financial statements, whether due to error or fraud, and performing procedures that respond to those risks. Such procedures included examining, on a test basis, evidence regarding the amounts and disclosures in the financial statements. Our audits also included evaluating the accounting principles used and significant estimates made by management, as well as evaluating the overall presentation of the financial statements. Our procedures included confirmation of securities owned as of February 28, 2019 by correspondence with the custodian and brokers; when replies were not received from brokers, we performed other auditing procedures. We believe that our audits provide a reasonable basis for our opinion.
PricewaterhouseCoopers LLP
Houston, TX
April 29, 2019
We have served as the auditor of one or more of the investment companies in the Invesco group of investment companies since at least 1995. We have not been able to determine the specific year we began serving as auditor.
64 Invesco High Yield Municipal Fund
Calculating your ongoing Fund expenses
Example
As a shareholder of the Fund, you incur two types of costs: (1) transaction costs, which may include sales charges (loads) on purchase payments or contingent deferred sales charges on redemptions, if any; and (2) ongoing costs, including management fees, distribution and/or service(12b-1) fees, and other Fund expenses. This example is intended to help you understand your ongoing costs (in dollars) of investing in the Fund and to compare these costs with ongoing costs of investing in other mutual funds. The example is based on an investment of $1,000 invested at the beginning of the period and held for the entire period September 1, 2018 through February 28, 2019.
Actual expenses
The table below provides information about actual account values and actual expenses. You may use the information in this table, together with the amount you invested, to estimate the expenses that you paid over the period. Simply divide your account value by $1,000 (for example, an $8,600 account value divided by $1,000 = 8.6), then multiply the result by the number in the table under the heading entitled “Actual Expenses Paid During Period” to estimate the expenses you paid on your account during this period.
Hypothetical example for comparison purposes
The table below also provides information about hypothetical account values and hypothetical expenses based on the Fund’s actual expense ratio and an assumed rate of return of 5% per year before expenses, which is not the Fund’s actual return.
The hypothetical account values and expenses may not be used to estimate the actual ending account balance or expenses you paid for the period. You may use this information to compare the ongoing costs of investing in the Fund and other funds. To do so, compare this 5% hypothetical example with the 5% hypothetical examples that appear in the shareholder reports of the other funds.
Please note that the expenses shown in the table are meant to highlight your ongoing costs only and do not reflect any transaction costs, such as sales charges (loads) on purchase payments or contingent deferred sales charges on redemptions, if any. Therefore, the hypothetical information is useful in comparing ongoing costs only, and will not help you determine the relative total costs of owning different funds. In addition, if these transaction costs were included, your costs would have been higher.
| | | | | | | | | | | | | | | | | | | | | | | | |
| | | Beginning
Account Value
(09/01/18) | | | ACTUAL | | | HYPOTHETICAL
(5% annual return before expenses) | | | Annualized
Expense Ratio | |
| | Ending
Account Value
(02/28/19)1 | | | Expenses
Paid During
Period2 | | | Ending
Account Value
(02/28/19) | | | Expenses
Paid During
Period2 | |
Class A | | | $1,000.00 | | | | $1,009.30 | | | | $ 6.63 | | | | $1,018.20 | | | | $ 6.66 | | | | 1.33 | % |
Class C | | | 1,000.00 | | | | 1,005.60 | | | | 10.54 | | | | 1,014.28 | | | | 10.59 | | | | 2.12 | |
Class Y | | | 1,000.00 | | | | 1,010.60 | | | | 5.38 | | | | 1,019.44 | | | | 5.41 | | | | 1.08 | |
Class R5 | | | 1,000.00 | | | | 1,011.50 | | | | 5.34 | | | | 1,019.49 | | | | 5.36 | | | | 1.07 | |
Class R6 | | | 1,000.00 | | | | 1,011.90 | | | | 5.14 | | | | 1,019.69 | | | | 5.16 | | | | 1.03 | |
| 1 | The actual ending account value is based on the actual total return of the Fund for the period September 1, 2018 through February 28, 2019, after actual expenses and will differ from the hypothetical ending account value which is based on the Fund’s expense ratio and a hypothetical annual return of 5% before expenses. |
| 2 | Expenses are equal to the Fund’s annualized expense ratio as indicated above multiplied by the average account value over the period, multiplied by 181/365 to reflect the most recent fiscal half year. |
65 Invesco High Yield Municipal Fund
Tax Information
Form1099-DIV, Form1042-S and other year-end tax information provide shareholders with actual calendar year amounts that should be included in their tax returns. Shareholders should consult their tax advisors.
The following distribution information is being provided as required by the Internal Revenue Code or to meet a specific state’s requirement.
The Fund designates the following amounts or, if subsequently determined to be different, the maximum amount allowable for its fiscal year ended February 28, 2019:
| | | | | | | | |
| Federal and State Income Tax | | | | |
Qualified Dividend Income* | | | 0 | % | | | | |
Corporate Dividends Received Deduction* | | | 0 | % | | | | |
U.S. Treasury Obligations* | | | 0 | % | | | | |
Tax-Exempt Interest Dividends* | | | 100 | % | | | | |
| | * | The above percentages are based on ordinary income dividends paid to shareholders during the Fund’s fiscal year. |
66 Invesco High Yield Municipal Fund
Trustees and Officers
The address of each trustee and officer is AIMTax-Exempt Funds (InvescoTax-Exempt Funds) (the “Trust”), 11 Greenway Plaza, Suite 1000, Houston, Texas 77046-1173. The trustees serve for the life of the Trust, subject to their earlier death, incapacitation, resignation, retirement or removal as more specifically provided in the Trust’s organizational documents. Each officer serves for a one year term or until their successors are elected and qualified. Column two below includes length of time served with predecessor entities, if any.
| | | | | | | | |
Name, Year of Birth and
Position(s) Held with the Trust | | Trustee and/
or Officer Since | | Principal Occupation(s) During Past 5 Years | | Number of
Funds in Fund
Complex
Overseen by
Trustee | | Other Directorship(s)
Held by Trustee During
Past 5 Years |
| Interested Persons | | | | | | | | |
Martin L. Flanagan1 – 1960 Trustee and Vice Chair | | 2007 | | Executive Director, Chief Executive Officer and President, Invesco Ltd. (ultimate parent of Invesco and a global investment management firm); Trustee and Vice Chair, The Invesco Funds; Vice Chair, Investment Company Institute; and Member of Executive Board, SMU Cox School of Business Formerly: Advisor to the Board, Invesco Advisers, Inc. (formerly known as Invesco Institutional (N.A.), Inc.); Chairman and Chief Executive Officer, Invesco Advisers, Inc. (registered investment adviser); Director, Chairman, Chief Executive Officer and President, Invesco Holding Company (US), Inc. (formerly IVZ Inc.) (holding company), Invesco Group Services, Inc. (service provider) and Invesco North American Holdings, Inc. (holding company); Director, Chief Executive Officer and President, Invesco Holding Company Limited (parent of Invesco and a global investment management firm); Director, Invesco Ltd.; Chairman, Investment Company Institute and President,Co-Chief Executive Officer,Co-President, Chief Operating Officer and Chief Financial Officer, Franklin Resources, Inc. (global investment management organization) | | 158 | | None |
Philip A. Taylor2 – 1954 Trustee | | 2006 | | Vice Chair, Invesco Ltd.; Director, Invesco Canada Ltd. (formerly known as Invesco Trimark Ltd./Invesco Trimark Ltèe) (registered investment adviser and registered transfer agent); Trustee, The Invesco Funds Formerly: Head of the Americas and Senior Managing Director, Invesco Ltd.; Director, Invesco Advisers, Inc. (formerly known as Invesco Institutional (N.A.), Inc.) (registered investment adviser); Director and Chairman, Invesco Investment Services, Inc. (formerly known as Invesco AIM Investment Services, Inc.) (registered transfer agent); Chief Executive Officer, Invesco Corporate Class Inc. (corporate mutual fund company); Chairman and Chief Executive Officer, Invesco Canada Ltd. (formerly known as Invesco Trimark Ltd./Invesco Trimark Ltèe) (registered investment adviser and registered transfer agent); Senior Vice President, The Invesco Funds; Director, Invesco Investment Advisers LLC (formerly known as Van Kampen Asset Management); Director, Chairman, Chief Executive Officer and President, Invesco Management Group, Inc. (formerly known as Invesco AIM Management Group, Inc.) (financial services holding company);Co-Chairman,Co-President andCo-Chief Executive Officer, Invesco Advisers, Inc. (formerly known as Invesco Institutional (N.A.), Inc.) (registered investment adviser); Director, Chief Executive Officer and President, Van Kampen Exchange Corp; President and Principal Executive Officer, The Invesco Funds (other than AIM Treasurer’s Series Trust (Invesco Treasurer’s Series Trust), Short-Term Investments Trust and Invesco Management Trust); Executive Vice President, The Invesco Funds (AIM Treasurer’s Series Trust (Invesco Treasurer’s Series Trust), Short-Term Investments Trust and Invesco Management Trust only); Director and President, INVESCO Funds Group, Inc. (registered investment adviser and registered transfer agent); Director and Chairman, IVZ Distributors, Inc. (formerly known as INVESCO Distributors, Inc.) (registered broker dealer); Director, President and Chairman, Invesco Inc. (holding company), Invesco Canada Holdings Inc. (holding company), Trimark Investments Ltd./ Placements Trimark Ltèe and Invesco Financial Services Ltd/Services Financiers Invesco Ltèe; Chief Executive Officer, Invesco Canada Fund Inc. (corporate mutual fund company); Director and Chairman, Van Kampen Investor Services Inc.; Director, Chief Executive Officer and President, 1371 Preferred Inc. (holding company) and Van Kampen Investments Inc.; Director and President, AIM GP Canada Inc. (general partner for limited partnerships) and Van Kampen Advisors, Inc.; Director and Chief Executive Officer, Invesco Trimark Dealer Inc. (registered broker dealer); Director, Invesco Distributors, Inc. (formerly known as Invesco AIM Distributors, Inc.) (registered broker dealer); Manager, Invesco Capital Management LLC; Director, Chief Executive Officer and President, Invesco Advisers, Inc.; Director, Chairman, Chief Executive Officer and President, Invesco AIM Capital Management, Inc.; President, Invesco Trimark Dealer Inc. and Invesco Trimark Ltd./Invesco Trimark Ltèe; Director and President, AIM Trimark Corporate Class Inc. and AIM Trimark Canada Fund Inc.; Senior Managing Director, Invesco Holding Company Limited; Director and Chairman, Fund Management Company (former registered broker dealer); President and Principal Executive Officer, The Invesco Funds (AIM Treasurer’s Series Trust (Invesco Treasurer’s Series Trust), and Short-Term Investments Trust only); President, AIM Trimark Global Fund Inc. and AIM Trimark Canada Fund Inc. | | 158 | | None |
| 1 | Mr. Flanagan is considered an interested person (within the meaning of Section 2(a)(19) of the 1940 Act) of the Trust because he is an officer of the Adviser to the Trust, and an officer and a director of Invesco Ltd., ultimate parent of the Adviser. |
| 2 | Mr. Taylor is considered an interested person (within the meaning of Section 2(a)(19) of the 1940 Act) of the Trust because he is an officer and a director of the Adviser. |
T-1 Invesco High Yield Municipal Fund
Trustees and Officers–(continued)
| | | | | | | | |
Name, Year of Birth and
Position(s) Held with the Trust | | Trustee and/
or Officer Since | | Principal Occupation(s) During Past 5 Years | | Number of
Funds in Fund
Complex
Overseen by
Trustee | | Other Directorship(s)
Held by Trustee During
Past 5 Years |
| Independent Trustees | | | | | | | | |
Bruce L. Crockett – 1944 Trustee and Chair | | 1993 | | Chairman, Crockett Technologies Associates (technology consulting company) Formerly: Director, Captaris (unified messaging provider); Director, President and Chief Executive Officer, COMSAT Corporation; Chairman, Board of Governors of INTELSAT (international communications company); ACE Limited (insurance company); Independent Directors Council and Investment Company Institute: Member of the Audit Committee, Investment Company Institute; Member of the Executive Committee and Chair of the Governance Committee, Independent Directors Council | | 158 | | Director and Chairman of the Audit Committee, ALPS (Attorneys Liability Protection Society) (insurance company); Director and Member of the Audit Committee and Compensation Committee, Ferroglobe PLC (metallurgical company) |
David C. Arch – 1945 Trustee | | 2010 | | Chairman of Blistex Inc. (consumer health care products manufacturer); Member, World Presidents’ Organization | | 158 | | Board member of the Illinois Manufacturers’ Association |
Jack M. Fields – 1952 Trustee | | 1997 | | Chief Executive Officer, Twenty First Century Group, Inc. (government affairs company); and Chairman, Discovery Learning Alliance(non-profit) Formerly: Owner and Chief Executive Officer, Dos Angeles Ranch L.P. (cattle, hunting, corporate entertainment); Director, Insperity, Inc. (formerly known as Administaff) (human resources provider); Chief Executive Officer, Texana Timber LP (sustainable forestry company); Director of Cross Timbers Quail Research Ranch(non-profit); and member of the U.S. House of Representatives | | 158 | | None |
Cynthia Hostetler – 1962 Trustee | | 2017 | | Non-Executive Director and Trustee of a number of public and private business corporations Formerly: Director, Aberdeen Investment Funds (4 portfolios); Head of Investment Funds and Private Equity, Overseas Private Investment Corporation; President, First Manhattan Bancorporation, Inc.; Attorney, Simpson Thacher & Bartlett LLP | | 158 | | Vulcan Materials Company (construction materials company); Trilinc Global Impact Fund; Genesee & Wyoming, Inc. (railroads); Artio Global Investment LLC (mutual fund complex); Edgen Group, Inc. (specialized energy and infrastructure products distributor); Investment Company Institute (professional organization); Independent Directors Council (professional organization) |
Eli Jones – 1961 Trustee | | 2016 | | Professor and Dean, Mays Business School – Texas A&M University Formerly: Professor and Dean, Walton College of Business, University of Arkansas and E.J. Ourso College of Business, Louisiana State University; Director, Arvest Bank | | 158 | | Insperity, Inc. (formerly known as Administaff) (human resources provider) |
Anthony J. LaCava, Jr. – 1956 Trustee | | 2019 | | Formerly: Director and Member of the Audit Committee, Blue Hills Bank and Managing Partner, KPMG LLP | | 158 | | Blue Hills Bank; Chairman, Bentley University; Member, Business School Advisory Council; KPMG LLP |
Prema Mathai-Davis – 1950 Trustee | | 1998 | | Retired Co-Owner & Partner of Quantalytics Research, LLC, (a FinTech Investment Research Platform for the Self-Directed Investor) | | 158 | | None |
Teresa M. Ressel – 1962 Trustee | | 2017 | | Non-executive director and trustee of a number of public and private business corporations Formerly: Chief Financial Officer, Olayan America, The Olayan Group (international investor/commercial/industrial); Chief Executive Officer, UBS Securities LLC; Group Chief Operating Officer, Americas, UBS AG; Assistant Secretary for Management & Budget and CFO, US Department of the Treasury | | 158 | | Atlantic Power Corporation (power generation company); ON Semiconductor Corp. (semiconductor supplier) |
Ann Barnett Stern – 1957 Trustee | | 2017 | | President and Chief Executive Officer, Houston Endowment Inc. (private philanthropic institution) Formerly: Executive Vice President and General Counsel, Texas Children’s Hospital; Attorney, Beck, Redden and Secrest, LLP; Business Law Instructor, University of St. Thomas; Attorney, Andrews & Kurth LLP | | 158 | | Federal Reserve Bank of Dallas |
Raymond Stickel, Jr. – 1944 Trustee | | 2005 | | Retired Formerly: Director, Mainstay VP Series Funds, Inc. (25 portfolios); Partner, Deloitte & Touche | | 158 | | None |
Robert C. Troccoli – 1949 Trustee | | 2016 | | Adjunct Professor, University of Denver – Daniels College of Business Formerly: Senior Partner, KPMG LLP | | 158 | | None |
Christopher L. Wilson – 1957 Trustee | | 2017 | | Non-executive director and trustee of a number of public and private business corporations Formerly: Director, TD Asset Management USA Inc. (mutual fund complex) (22 portfolios); Managing Partner, CT2, LLC (investing and consulting firm); President/Chief Executive Officer, Columbia Funds, Bank of America Corporation; President/Chief Executive Officer, CDC IXIS Asset Management Services, Inc.; Principal & Director of Operations, Scudder Funds, Scudder, Stevens & Clark, Inc.; Assistant Vice President, Fidelity Investments | | 158 | | ISO New England, Inc.(non-profit organization managing regional electricity market) |
T-2 Invesco High Yield Municipal Fund
Trustees and Officers–(continued)
| | | | | | | | |
Name, Year of Birth and
Position(s) Held with the Trust | | Trustee and/
or Officer Since | | Principal Occupation(s) During Past 5 Years | | Number of
Funds in Fund
Complex
Overseen by
Trustee | | Other Directorship(s)
Held by Trustee During
Past 5 Years |
| Other Officers | | | | | | | | |
Sheri Morris – 1964 President, Principal Executive Officer and Treasurer | | 1999 | | President, Principal Executive Officer and Treasurer, The Invesco Funds; Vice President, Invesco Advisers, Inc. (formerly known as Invesco Institutional (N.A.), Inc.) (registered investment adviser); and Vice President, Invesco Exchange-Traded Fund Trust, Invesco Exchange-Traded Fund Trust II, Invesco India Exchange-Traded Fund Trust, Invesco Actively Managed Exchange-Traded Fund Trust, Invesco Actively Managed Exchange-Traded Commodity Fund Trust and Invesco Exchange-Traded Self-Indexed Fund Trust Formerly: Vice President and Principal Financial Officer, The Invesco Funds; Vice President, Invesco AIM Advisers, Inc., Invesco AIM Capital Management, Inc. and Invesco AIM Private Asset Management, Inc.; Assistant Vice President and Assistant Treasurer, The Invesco Funds and Assistant Vice President, Invesco Advisers, Inc., Invesco AIM Capital Management, Inc. and Invesco AIM Private Asset Management, Inc.; and Treasurer, Invesco Exchange-Traded Fund Trust, Invesco Exchange-Traded Fund Trust II, Invesco India Exchange- Traded Fund Trust and Invesco Actively Managed Exchange-Traded Fund Trust | | N/A | | N/A |
Russell C. Burk – 1958 Senior Vice President and Senior Officer | | 2005 | | Senior Vice President and Senior Officer, The Invesco Funds | | N/A | | N/A |
Jeffrey H. Kupor – 1968 Senior Vice President, Chief Legal Officer and Secretary | | 2018 | | Head of Legal of the Americas, Invesco Ltd.; Senior Vice President and Secretary, Invesco Advisers, Inc. (formerly known as Invesco Institutional (N.A.), Inc.) (registered investment adviser); Senior Vice President and Secretary, Invesco Distributors, Inc. (formerly known as Invesco AIM Distributors, Inc.); Vice President and Secretary, Invesco Investment Services, Inc. (formerly known as Invesco AIM Investment Services, Inc.) Senior Vice President, Chief Legal Officer and Secretary, The Invesco Funds; Secretary and General Counsel, Invesco Investment Advisers LLC (formerly known as Van Kampen Asset Management); Secretary and General Counsel, Invesco Capital Markets, Inc. (formerly known as Van Kampen Funds Inc.) and Chief Legal Officer, Invesco Exchange-Traded Fund Trust, Invesco Exchange- Traded Fund Trust II, Invesco India Exchange-Traded Fund Trust, Invesco Actively Managed Exchange-Traded Fund Trust, Invesco Actively Managed Exchange-Traded Commodity Fund Trust and Invesco Exchange-Traded Self-Indexed Fund Trust; Secretary, Invesco Indexing LLC; Secretary, W.L. Ross & Co., LLC; Secretary and Vice President, Jemstep, Inc. Formerly: Head of Legal, Worldwide Institutional, Invesco Ltd.; Secretary and General Counsel, INVESCO Private Capital Investments, Inc.; Senior Vice President, Secretary and General Counsel, Invesco Management Group, Inc. (formerly known as Invesco AIM Management Group, Inc.); Assistant Secretary, INVESCO Asset Management (Bermuda) Ltd.; Secretary and General Counsel, Invesco Private Capital, Inc.; Assistant Secretary and General Counsel, INVESCO Realty, Inc.; Secretary and General Counsel, Invesco Senior Secured Management, Inc.; and Secretary, Sovereign G./P. Holdings Inc. | | N/A | | N/A |
Andrew R. Schlossberg – 1974 Senior Vice President | | 2019 | | Head of the Americas and Senior Managing Director, Invesco Ltd.; Director and Senior Vice President, Invesco Advisers, Inc. (formerly known as Invesco Institutional (N.A.), Inc.) (registered investment adviser); Director and Chairman, Invesco Investment Services, Inc. (formerly known as Invesco AIM Investment Services, Inc.) (registered transfer agent); Senior Vice President, The Invesco Funds; Director, Invesco Investment Advisers LLC (formerly known as Van Kampen Asset Management) and Invesco UK Limited; Director, President and Chairman, Invesco Insurance Agency, Inc.; Director and Chief Executive, Invesco Asset Management Limited and Invesco Fund Managers Limited Formerly: Assistant Vice President, The Invesco Funds; Senior Vice President, Invesco Advisers, Inc. (formerly known as Invesco Institutional (N.A.), Inc.) (registered investment adviser); Director and Chief Executive, Invesco Administration Services Limited and Invesco Global Investment Funds Limited; Director, Invesco Distributors, Inc.; Head of EMEA, Invesco Ltd.; President, Invesco Actively Managed Exchange-Traded Commodity Fund Trust, Invesco Actively Managed Exchange-Traded Fund Trust, Invesco Exchange-Traded Fund Trust, Invesco Exchange-Traded Fund Trust II and Invesco India Exchange- Traded Fund Trust; Managing Director and Principal Executive Officer, Invesco Capital Management LLC | | N/A | | N/A |
John M. Zerr – 1962 Senior Vice President | | 2006 | | Chief Operating Officer of the Americas; Senior Vice President, Invesco Advisers, Inc. (formerly known as Invesco Institutional (N.A.), Inc.) (registered investment adviser); Senior Vice President, Invesco Distributors, Inc. (formerly known as Invesco AIM Distributors, Inc.); Director and Vice President, Invesco Investment Services, Inc. (formerly known as Invesco AIM Investment Services, Inc.) Senior Vice President, The Invesco Funds; Managing Director, Invesco Capital Management LLC; Director, Invesco Investment Advisers LLC (formerly known as Van Kampen Asset Management); Senior Vice President, Invesco Capital Markets, Inc. (formerly known as Van Kampen Funds Inc.); Manager, Invesco Indexing LLC; Invesco Canada Funds Advisory Board Member; Director, President Chief Executive Officer, Invesco Corporate Class Inc. (corporate mutual fund company); and Director, Chairman, President and Chief Executive Officer, Invesco Canada Ltd. (formerly known as Invesco Trimark Ltd./Invesco Trimark Ltèe) (registered investment adviser and registered transfer agent) | | N/A | | N/A |
T-3 Invesco High Yield Municipal Fund
Trustees and Officers–(continued)
| | | | | | | | |
Name, Year of Birth and
Position(s) Held with the Trust | | Trustee and/
or Officer Since | | Principal Occupation(s) During Past 5 Years | | Number of
Funds in Fund
Complex
Overseen by
Trustee | | Other Directorship(s)
Held by Trustee During
Past 5 Years |
| Other Officers–(continued) | | | | | | | | |
| | | | | Formerly: Director and Senior Vice President, Invesco Management Group, Inc. (formerly known as Invesco AIM Management Group, Inc.); Secretary and General Counsel, Invesco Management Group, Inc. (formerly known as Invesco AIM Management Group, Inc.); Secretary, Invesco Investment Services, Inc. (formerly known as Invesco AIM Investment Services, Inc.); Chief Legal Officer and Secretary, The Invesco Funds; Secretary and General Counsel, Invesco Investment Advisers LLC (formerly known as Van Kampen Asset Management); Secretary and General Counsel, Invesco Capital Markets, Inc. (formerly known as Van Kampen Funds Inc.); Chief Legal Officer, Invesco Exchange-Traded Fund Trust, Invesco Exchange-Traded Fund Trust II, Invesco India Exchange-Traded Fund Trust, Invesco Actively Managed Exchange-Traded Fund Trust, Invesco Actively Managed Exchange-Traded Commodity Fund Trust and Invesco Exchange-Traded Self-Indexed Fund Trust; Secretary, Invesco Indexing LLC; Director, Secretary, General Counsel and Senior Vice President, Van Kampen Exchange Corp.; Director, Vice President and Secretary, IVZ Distributors, Inc. (formerly known as INVESCO Distributors, Inc.); Director and Vice President, INVESCO Funds Group, Inc.; Director and Vice President, Van Kampen Advisors Inc.; Director, Vice President, Secretary and General Counsel, Van Kampen Investor Services Inc.; Director and Secretary, Invesco Distributors, Inc. (formerly known as Invesco AIM Distributors, Inc.); Director, Senior Vice President, General Counsel and Secretary, Invesco AIM Advisers, Inc. and Van Kampen Investments Inc.; Director, Vice President and Secretary, Fund Management Company; Director, Senior Vice President, Secretary, General Counsel and Vice President, Invesco AIM Capital Management, Inc.; Chief Operating Officer and General Counsel, Liberty Ridge Capital, Inc. (an investment adviser) | | | | |
Gregory G.McGreevey – 1962 Senior Vice President | | 2012 | | Senior Managing Director, Invesco Ltd.; Director, Chairman, President, and Chief Executive Officer, Invesco Advisers, Inc. (formerly known as Invesco Institutional (N.A.), Inc.) (registered investment adviser); Director, Invesco Mortgage Capital, Inc. and Invesco Senior Secured Management, Inc.; and Senior Vice President, The Invesco Funds Formerly: Senior Vice President, Invesco Management Group, Inc. and Invesco Advisers, Inc.; Assistant Vice President, The Invesco Funds | | N/A | | N/A |
Kelli Gallegos – 1970 Vice President, Principal Financial Officer and Assistant Treasurer | | 2008 | | Vice President and Treasurer, Invesco Exchange-Traded Fund Trust, Invesco Exchange-Traded Fund Trust II, Invesco India Exchange-Traded Fund Trust, Invesco Actively Managed Exchange-Traded Fund Trust, Invesco Actively Managed Exchange-Traded Commodity Fund Trust and Invesco Exchange-Traded Self-Indexed Fund Trust; Vice President, Principal Financial Officer and Assistant Treasurer, The Invesco Funds; Principal Financial and Accounting Officer – Pooled Investments, Invesco Capital Management LLC Formerly: Assistant Treasurer, Invesco Exchange-Traded Fund Trust, Invesco Exchange-Traded Fund Trust II, Invesco India Exchange-Traded Fund Trust, Invesco Actively Managed Exchange-Traded Fund Trust, Invesco Actively Managed Exchange-Traded Commodity Fund Trust and Invesco Exchange-Traded Self-Indexed Fund Trust; Assistant Treasurer, Invesco Capital Management LLC; Assistant Vice President, The Invesco Funds | | N/A | | N/A |
Tracy Sullivan – 1962 Vice President, Chief Tax Officer and Assistant Treasurer | | 2008 | | Vice President, Chief Tax Officer and Assistant Treasurer, The Invesco Funds; Assistant Treasurer, Invesco Capital Management LLC, Invesco Exchange-Traded Fund Trust, Invesco Exchange-Traded Fund Trust II, Invesco India Exchange-Traded Fund Trust, Invesco Actively Managed Exchange-Traded Fund Trust, Invesco Actively Managed Exchange-Traded Commodity Fund Trust and Invesco Exchange-Traded Self-Indexed Fund Trust Formerly: Assistant Vice President, The Invesco Funds | | N/A | | N/A |
| Crissie M. Wisdom – 1969 Anti-Money Laundering Compliance Officer | | 2013 | | Anti-Money Laundering Compliance Officer, Invesco Advisers, Inc. (formerly known as Invesco Institutional (N.A.), Inc.) (registered investment adviser), Invesco Capital Markets, Inc. (formerly known as Van Kampen Funds Inc.), Invesco Distributors, Inc., Invesco Investment Services, Inc., The Invesco Funds, and Invesco Exchange-Traded Fund Trust, Invesco Exchange-Traded Fund Trust II, Invesco India Exchange-Traded Fund Trust, Invesco Actively Managed Exchange-Traded Fund Trust, Invesco Actively Managed Exchange-Traded Commodity Fund Trust and Invesco Exchange-Traded Self-Indexed Fund Trust; Anti-Money Laundering Compliance Officer and Bank Secrecy Act Officer, INVESCO National Trust Company and Invesco Trust Company; and Fraud Prevention Manager and Controls and Risk Analysis Manager for Invesco Investment Services, Inc. Formerly: Anti-Money Laundering Compliance Officer, Van Kampen Exchange Corp. and Invesco Management Group, Inc. | | N/A | | N/A |
| Robert R. Leveille – 1969 Chief Compliance Officer | | 2016 | | Chief Compliance Officer, Invesco Advisers, Inc. (registered investment adviser); and Chief Compliance Officer, The Invesco Funds Formerly: Chief Compliance Officer, Putnam Investments and the Putnam Funds | | N/A | | N/A |
The Statement of Additional Information of the Trust includes additional information about the Fund’s Trustees and is available upon request, without charge, by calling 1.800.959.4246. Please refer to the Fund’s Statement of Additional Information for information on the Fund’ssub-advisers.
| | | | | | |
Office of the Fund 11 Greenway Plaza, Suite 1000 Houston, TX 77046-1173 | | Investment Adviser Invesco Advisers, Inc. 1555 Peachtree Street, N.E. Atlanta, GA 30309 | | Distributor Invesco Distributors, Inc. 11 Greenway Plaza, Suite 1000 Houston, TX 77046-1173 | | Auditors PricewaterhouseCoopers LLP 1000 Louisiana Street, Suite 5800 Houston, TX 77002-5021 |
| | | | | | |
Counsel to the Fund Stradley Ronon Stevens & Young, LLP 2005 Market Street, Suite 2600 Philadelphia, PA 19103-7018 | | Counsel to the Independent Trustees Goodwin Procter LLP 901 New York Avenue, N.W. Washington, D.C. 20001 | | Transfer Agent Invesco Investment Services, Inc. 11 Greenway Plaza, Suite 1000 Houston, TX 77046-1173 | | Custodian State Street Bank and Trust Company 225 Franklin Street Boston, MA 02110-2801 |
T-4 Invesco High Yield Municipal Fund
Explore High-Conviction Investing with Invesco

Go paperless with eDelivery
Visit invesco.com/edelivery to enjoy the convenience and security of anytime electronic access to your investment documents.
With eDelivery, you can elect to have any or all of the following materials delivered straight to your inbox to download, save and print from your own computer:
| ∎ | | Fund reports and prospectuses |
Invesco mailing information
Send general correspondence to Invesco Investment Services, Inc., P.O. Box 219078, Kansas City, MO 64121-9078.
Important notice regarding delivery of security holder documents
To reduce Fund expenses, only one copy of most shareholder documents may be mailed to shareholders with multiple accounts at the same address (Householding). Mailing of your shareholder documents may be householded indefinitely unless you instruct us otherwise. If you do not want the mailing of these documents to be combined with those for other members of your household, please contact Invesco Investment Services, Inc. at 800 959 4246 or contact your financial institution. We will begin sending you individual copies for each account within 30 days after receiving your request.
Fund holdings and proxy voting information
The Fund provides a complete list of its holdings four times in each fiscal year, at the quarter ends. For the second and fourth quarters, the lists appear in the Fund’s semiannual and annual reports to shareholders. For the first and third quarters, the Fund files the lists with the Securities and Exchange Commission (SEC) on FormN-Q (or any successor Form). The most recent list of portfolio holdings is available at invesco.com/completeqtrholdings. Shareholders can also look up the Fund’s FormsN-Q (or any successor Form) on the SEC website at sec.gov. The SEC file numbers for the Fund are shown below.
A description of the policies and procedures that the Fund uses to determine how to vote proxies relating to portfolio securities is available without charge, upon request, from our Client Services department at 800 959 4246 or at invesco.com/proxyguidelines. The information is also available on the SEC website, sec.gov.
| | |
Information regarding how the Fund voted proxies related to its portfolio securities during the most recent12-month period ended June 30 is available at invesco.com/proxysearch. The information is also available on the SEC website, sec.gov. Invesco Advisers, Inc. is an investment adviser; it provides investment advisory services to individual and institutional clients and does not sell securities. Invesco Distributors, Inc. is the US distributor for Invesco Ltd.’s retail mutual funds, exchange-traded funds and institutional money market funds. Both are wholly owned, indirect subsidiaries of Invesco Ltd. | | 
|
SEC file numbers:811-07890 and033-66242 Invesco Distributors, Inc. VK-HYM-AR-1 04242019 1411
| | | | | | |
| | | | |
 | | Annual Report to Shareholders | | February 28, 2019 | | |
| | | | |
| | Invesco Intermediate Term Municipal Income Fund | | |
| | Nasdaq: | | |
| | A: VKLMX∎ C: VKLCX∎ Y: VKLIX∎ R6: VKLSX | | |

Beginning on January 1, 2021, as permitted by regulations adopted by the Securities and Exchange Commission, paper copies of the Fund’s shareholder reports will no longer be sent by mail, unless you specifically request paper copies of the reports from the Fund or from your financial intermediary, such as a broker-dealer or bank. Instead, the reports will be made available on the Fund’s website, and you will be
notified by mail each time a report is posted and provided with a website link to access the report.
If you already elected to receive shareholder reports electronically, you will not be affected by this change and you need not take any action. You may elect to receive shareholder reports and other communications from the Fund electronically by contacting your financial intermediary (such as a broker-dealer or bank) or, if you are a direct investor, by enrolling at invesco.com/edelivery.
You may elect to receive all future reports in paper free of charge. If you invest through a financial intermediary, you can contact your financial intermediary to request that you continue to receive paper copies of your shareholder reports. If you invest directly with the Fund, you can call 800 959 4246 to let the Fund know you wish to continue receiving paper copies of your shareholder reports. Your election to receive reports in paper will apply to all funds held with your financial intermediary or all funds held with the fund complex if you invest directly with the Fund.
2 Letters to Shareholders 4 Performance Summary 4 Management’s Discussion 6 Long-Term Fund Performance 8 Supplemental Information 10 Schedule of Investments 32 Financial Statements 35 Notes to Financial Statements
42 Financial Highlights 43 Report of Independent Registered Public Accounting Firm 44 Fund Expenses 45 Tax Information T-1 Trustees and Officers
Letters to Shareholders
| | |

Andrew Schlossberg | | Dear Shareholders: This annual report includes information about your Fund, including performance data and a complete list of its investments as of the close of the reporting period. Inside is a discussion of how your Fund was managed and the factors that affected its performance during the reporting period. Philip Taylor, whose messages to shareholders have appeared here for the last 13 years, transitioned to a senior advisory role on March 1, prior to his retirement from the firm at the end of the year, and I assumed his role as Head of the Americas and Senior Managing Director, Invesco Ltd. All of us at Invesco are indebted to Phil for his many years of dedicated service to the company and to its funds’ shareholders. I’m excited about this new opportunity, and I look forward to communicating with fund shareholders going forward. The reporting period proved to be an increasingly volatile time for markets. Amid corporate tax |
cuts and improving global growth, several US equity indexes redefined highs during the first half of the reporting period. The ebullience, however, ended in October as global equities, in particular US stocks, sold off sharply and continued this downward spiral for the rest of 2018. The catalyst for thesell-off was a combination of ongoing trade conflicts between the US and China, fears of a global economic slowdown and rising US interest rates. Gains posted earlier in the year for global equities were erased, while US Treasury bonds, along with government and municipal bonds, rallied. The reporting period ended on a positive note, however, as global equities bounced back strongly at the outset of 2019, mitigating some of the losses from thesell-off in late 2018. Given the strong economy during the reporting period, the US Federal Reserve (the Fed) raised the federal funds rate four times. At its December 2018 meeting, however, the Fed delivered a more “dovish hike” by simultaneously raising rates while reducing guidance for 2019 rate increases. At its first meeting in 2019, the Fed left rates unchanged. As 2019 unfolds, we’ll see how the interplay of interest rates, economic data, geopolitics and a host of other factors affect US and over-seas equity and fixed income markets. Investor uncertainty and market volatility, such as we witnessed during the reporting period, are unfortunate facts of life when it comes to investing. That’s why Invesco encourages investors to work with a professional financial adviser who can stress the importance of starting to save and invest early and the importance of adhering to a disciplined investment plan. A financial adviser who knows your unique financial situation, investment goals and risk tolerance can be an invaluable partner as you seek to achieve your financial goals. He or she can offer a long-term perspective when markets are volatile and time-tested advice and guidance when your financial situation or investment goals change. |
Visit our website for more information on your investments
Our website,invesco.com/us, offers a wide range of market insights and investment perspectives. On the website, you’ll find detailed information about our funds, including performance, holdings and portfolio manager commentaries. You can access information about your account by completing a simple, secure online registration. To do so, select “Log In” on the right side of the homepage, and then select “Register for Individual Account Access.”
In addition to the resources accessible on our website and through our mobile app, you can obtain timely updates to help you stay informed about the markets and the economy by connecting with Invesco on Twitter, LinkedIn or Facebook. You can access our blog atblog.invesco.us.com. Our goal is to provide you the information you want, when and where you want it.
Finally, I’m pleased to share with you Invesco’s commitment to both the Principles for Responsible Investment and to considering environmental, social and governance issues in our robust investment process. I invite you to learn more atinvesco.com/esg.
Have questions?
For questions about your account, contact an Invesco client services representative at 800 959 4246.
All of us at Invesco look forward to serving your investment management needs. Thank you for investing with us.
Sincerely,

Andrew Schlossberg
Head of the Americas,
Senior Managing Director, Invesco Ltd.
| | |
| 2 | | Invesco Intermediate Term Municipal Income Fund |
| | | | |

Bruce Crockett | | Dear Fellow Shareholders: Among the many important lessons I’ve learned in more than 40 years in a variety of business endeavors is the value of a trusted advocate. As independent chair of the Invesco Funds Board, I can assure you that the members of the Board are strong advocates for the interests of investors in Invesco’s mutual funds. We work hard to represent your interests through oversight of the quality of the investment management services your funds receive and other matters important to your investment, including but not limited to: |
| | ∎ | | Ensuring that Invesco offers a diverse lineup of mutual funds that your financial adviser can use to strive to meet your financial needs as your investment goals change over time. |
| | ∎ | | Monitoring how the portfolio management teams of the Invesco funds are performing in light of changing economic and market conditions. |
| ∎ | | Assessing each portfolio management team’s investment performance within the context of the investment strategy described in the fund’s prospectus. |
| ∎ | | Monitoring for potential conflicts of interests that may impact the nature of the services that your funds receive. |
We believe one of the most important services we provide our fund shareholders is the annual review of the funds’ advisory andsub-advisory contracts with Invesco Advisers and its affiliates. This review is required by the Investment Company Act of 1940 and focuses on the nature and quality of the services Invesco provides as the adviser to the Invesco funds and the reasonableness of the fees that it charges for those services. Each year, we spend months carefully reviewing information received from Invesco and a variety of independent sources, such as performance and fee data prepared by Lipper, Inc. (a subsidiary of Broadridge Financial Solutions, Inc.), an independent, third-party firm widely recognized as a leader in its field. We also meet with our independent legal counsel and other independent advisers to review and help us assess the information that we have received. Our goal is to assure that you receive quality investment management services for a reasonable fee.
I trust the measures outlined above provide assurance that you have a worthy advocate when it comes to choosing the Invesco Funds. On behalf of the Board, we look forward to continuing to represent your interests and serving your needs.
Sincerely,

Bruce L. Crockett
Independent Chair
Invesco Funds Board of Trustees
| | |
| 3 | | Invesco Intermediate Term Municipal Income Fund |
Management’s Discussion of Fund Performance
| | | | | | | | |
| | |
Performance summary For the fiscal year ended February 28, 2019, Class A shares of Invesco Intermediate Term Municipal Income Fund (the Fund), at net asset value (NAV), underperformed the S&P Municipal Bond2-17 Years Investment Grade Index, the Fund’s style-specific benchmark. Your Fund’s long-term performance appears later in this report. | | | | | |
Fund vs. Indexes Total returns, 2/28/18 to 2/28/19, at net asset value (NAV). Performance shown does not include applicable contingent deferred sales charges (CDSC) orfront-end sales charges, which would have reduced performance. | | | | | |
| | |
Class A Shares | | | 3.19 | % | | | | |
Class C Shares | | | 2.42 | | | | | |
Class Y Shares | | | 3.54 | | | | | |
Class R6 Shares | | | 3.54 | | | | | |
S&P Municipal Bond Indexq(Broad Market Index) | | | 4.03 | | | | | |
S&P Municipal Bond2-17 Years Investment Grade Indexq(Style-Specific Index) | | | 4.25 | | | | | |
Lipper Intermediate Municipal Debt Funds Index∎(Peer Group Index) | | | 3.64 | | | | | |
Source(s):qRIMES Technologies Corp.;∎Lipper Inc. | | | | | | | | |
Market conditions and your Fund
The broad municipal bond market experi enced positive returns for the fifth con secutive year in 2018. During the fiscal year, investment grade municipals returned 4.13% and high yield munici pals returned 6.96%.1 This strong perfor mance included investment grade municipals returning 1.30% and high yield municipals returning 1.22% for the first two months of 2019.1
The first half of the fiscal year began with supportive technical conditions (sup ply and demand balances) in place as new issuance of municipal bonds totaled $187 billion – down 8% from the same time period in 2017.2 However, fund flows into the municipal bond market remained positive, totaling $6.5 billion from March through August 2018.3 The high yield municipal bond market outper formed the investment grade bond seg ment, led by strong performance of tobacco bonds and improved price
discovery on Puerto Rico bonds as a result of developments in the common wealth’s debt restructuring.
Municipal bonds withstood headwinds from interest rate movements that had the10-year US Treasury yield breaching 3.00% in April 2018.4 During the fiscal year, the US Federal Reserve (the Fed) raised the federal funds rate four times: in March, June, September and Decem ber 2018.5 This series of anticipated rate hikes reflected increased confidence in the US economy amid low unemployment, relatively stable inflation and over all robust economic growth. This expansionary monetary policy signifi cantly flattened the US Treasury yield curve with a slight inversion on the short end occurring in December 2018.
In September 2018, market conditions weakened in stark contrast to the first half of the fiscal year, and thus, exposed the municipal bond market to more sensi tivity relating to the month’ssell-off in US
Treasuries. Both investment grade municipals and high yield municipals posted negative returns for the months of September and October 2018. The municipal yield curve continued to steepen, showing confidence in strong gross domestic product growth, as well as rising concern that an impending trade war between the US and China could increase inflation pressures.
As anticipated, US midterm election results had a positive impact on munici pal securities as perceived threats to municipal tax exemptions, further tax reform and changes to the Affordable Care Act were greatly reduced. News of a possible ban on flavorede-cigarettes and menthol cigarettes made headlines, which caused a short-lived decline in val uations for Tobacco Master Settlement Agreement (Tobacco MSA) bonds, pri marily below investment grade securities. Meanwhile,year-end demand for yield and coupon payments caused the munici pal bond asset class to end 2018 on a strong note.
The Fed’s dovish stance to begin calen dar year 2019 took the market by sur prise, leading economists to change their predictions from two interest rate increases in 2019, to just one. Addition ally, the US government shutdown, which lasted a total of 35 days, along with ongo ingUS-China trade negotiations and Brexit developments, created a challenging mar ket environment. Despite these challenges, the municipal market performed positively as technical conditions continued to pro vide tailwinds, driven particularly by the insatiable demand for maturities (10 years and shorter) from US retail separately managed accounts (SMAs).
Flows into the municipal bond asset class were positive for six of the 12 months covered by the fiscal year. With slowing
| | | | |
| | |
Portfolio Composition | | | | |
By credit sector, based on total investments | |
| |
Revenue Bonds | | | 87.4 | % |
General Obligation Bonds | | | 8.0 | |
Pre-Refunded Bonds | | | 3.5 | |
Other | | | 1.1 | |
| | | | | | |
| |
| Top Five Debt Holdings | |
| | % of total net assets | |
| | |
1. | | Illinois (State of) Toll Highway Authority; Series 2014 D | | | 1.0 | % |
2. | | New York Transportation Development Corp. (Delta Air Lines, Inc. LaGuardia Airport Terminal C&D Redevelopment) | | | 0.9 | |
3. | | New York & New Jersey (States of) Port Authority | | | 0.8 | |
4. | | Gulf Coast Industrial Development Authority (ExxonMobil) | | | 0.8 | |
5. | | Michigan (State of) Finance Authority (Detroit Water & Sewerage Department) Series 2014D-2 | | | 0.8 | |
| | | | |
| | |
Total Net Assets | | $ | 1.4 billion | |
| |
Total Number of Holdings | | | 655 | |
The Fund’s holdings are subject to change, and there is no assurance that the Fund will continue to hold any particular security.
Data presented here are as of February 28, 2019.
| | |
| 4 | | Invesco Intermediate Term Municipal Income Fund |
economic growth and the Fed’s interest rate policy detour, investor demand for municipal securities spiked, bringing record net inflows of more than $18.9 billion for the first two months of 2019.3
At the close of the fiscal year, we believed municipal fundamentals remained strong and ramifications of the Tax Cuts and Jobs Act of 2017 had not yet been fully realized. As a result, we believe demand fortax-exempt investments from retail investors could continue as taxes become front of mind.
Security selection in higher coupon bonds (5.00%+) was a substantial contributor to the Fund’s performance relative to its style-specific benchmark during the fiscal year. Security selection innon-rated bonds also aided relative performance. On a state level, security selection in Illinois and Wisconsin holdings contributed to relative return, as well.
During the fiscal year, security selection in lower coupon bonds (4.99% and less) detracted from the Fund’s performance relative to its style-specific benchmark. Security selection in and overweight allocation to the life care sector detracted from the Fund’s relative performance. On a state level, security selection in Texas domiciled issues detracted from relative return.
During the fiscal year, leverage contributed to the Fund’s performance relative to its style-specific benchmark. The Fund achieved a leveraged position through the use of inverse floating rate securities or tender option bonds (TOBs). The Fund uses leverage because we believe that, over time, leveraging provides opportunities for additional income and total return for shareholders. However, the use of leverage also can expose shareholders to additional volatility. For more information about the Fund’s use of leverage, see the Notes to Financial Statements later in this report.
We wish to remind you that the Fund is subject to interest rate risk, meaning when interest rates rise, the value of fixed income securities tends to fall. The degree to which the value of fixed income securities may decline due to rising interest rates may vary depending on the speed and magnitude of the increase in interest rates, as well as individual security characteristics, such as price, maturity, duration and coupon and market forces, such as supply and demand for similar securities. We are monitoring interest rates, and the market, economic and geopolitical factors that may impact the direction, speed and magnitude of changes to interest rates across the maturity spectrum, including the
potential impact of monetary policy changes by the Fed and certain foreign central banks. If interest rates rise faster than expected, markets may experience increased volatility, which may affect the value and/or liquidity of certain of the Fund’s investments.
Thank you for investing in Invesco Intermediate Term Municipal Income Fund and for sharing our long-term investment horizon.
1 Source: FactSet Research Systems Inc.
2 Source: The Bond Buyer
3 Source: Strategic Insight
4 Source: US Department of the Treasury
5 Source: US Federal Reserve
The views and opinions expressed in management’s discussion of Fund performance are those of Invesco Advisers, Inc. These views and opinions are subject to change at any time based on factors such as market and economic conditions. These views and opinions may not be relied upon as investment advice or recommendations, or as an offer for a particular security. The information is not a complete analysis of every aspect of any market, country, industry, security or the Fund. Statements of fact are from sources considered reliable, but Invesco Advisers, Inc. makes no representation or warranty as to their completeness or accuracy. Although historical performance is no guarantee of future results, these insights may help you understand our investment management philosophy.
See important Fund and, if applicable, index disclosures later in this report.
| | |
 | | Mark Paris Portfolio Manager and Chief Investment Officer and Head of Municipal Strategies for Invesco Fixed Income, is |
manager of Invesco Intermediate Term Municipal Income Fund. He joined Invesco in 2010. Mr. Paris earned a BBA in finance from Baruch College – The City University of New York. |
| |
 | | Jack Connelly Portfolio Manager, is manager of Invesco Intermediate Term Municipal Income Fund. He joined Invesco in |
| 2016. Mr. Connelly earned a BA in philosophy from Wheaton College and masters degrees from the University of Rhode Island and Yale University. |
| | |
 | | Tim O’Reilly Portfolio Manager, is manager of Invesco Intermediate Term Municipal Income Fund. He joined Invesco in 2010. |
| Mr. O’Reilly earned a BS in finance from Eastern Illinois University and an MBA in finance from the University of Illinois at Chicago. |
| |
 | | James Phillips Portfolio Manager, is manager of Invesco Intermediate Term Municipal Income Fund. He joined Invesco in 2010. |
| Mr. Phillips earned a BA in American literature from Empire State College, the independent study division of the State University of New York, and an MBA in finance from the University at Albany, State University of New York. |
| |
 | | John Schorle Portfolio Manager, is manager of Invesco Intermediate Term Municipal Income Fund. He joined Invesco in 2010. |
| Mr. Schorle earned a BA degree in economics from DePaul University. He is also a Certified Public Accountant. |
| |
 | | Julius Williams Portfolio Manager, is manager of Invesco Intermediate Term Municipal Income Fund. He joined Invesco in 2010. |
| Mr. Williams earned a BA in economics and sociology and a Master of Education degree in educational psychology from the University of Virginia. |
5 Invesco Intermediate Term Municipal Income Fund
Your Fund’s Long-Term Performance
Results of a $10,000 Investment – Oldest Share Class(es)
Fund and index data from 2/28/09
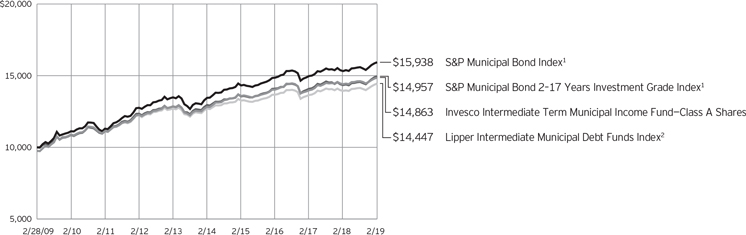
1 Source: RIMES Technologies Corp.
2 Source: Lipper Inc.
Past performance cannot guarantee comparable future results.
The data shown in the chart include reinvested distributions, applicable sales charges and Fund expenses including
management fees. Index results include reinvested dividends, but they do not re-flect sales charges. Performance of the peer group, if applicable, reflects fund expenses and management fees; perfor-
mance of a market index does not. Per formance shown in the chart and table(s) does not reflect deduction of taxes a shareholder would pay on Fund distributions or sale of Fund shares.
| | |
| 6 | | Invesco Intermediate Term Municipal Income Fund |
| | | | |
| |
Average Annual Total Returns | |
As of 2/28/19, including maximum applicable sales charges | |
| |
Class A Shares | | | | |
Inception (5/28/93) | | | 4.41 | % |
10 Years | | | 4.04 | |
5 Years | | | 2.49 | |
1 Year | | | 0.62 | |
| |
Class C Shares* | | | | |
Inception (10/19/93) | | | 3.98 | % |
10 Years | | | 3.53 | |
5 Years | | | 2.25 | |
1 Year | | | 1.42 | |
| |
Class Y Shares | | | | |
Inception (8/12/05) | | | 3.96 | % |
10 Years | | | 4.58 | |
5 Years | | | 3.28 | |
1 Year | | | 3.54 | |
| |
Class R6 Shares | | | | |
10 Years | | | 4.36 | % |
5 Years | | | 3.11 | |
1 Year | | | 3.54 | |
*Effective January 26, 2019, Class C share performance includes the conversion to A shares after 10 years. | |
Effective June 1, 2010, Class A, Class C and Class I shares of the predecessor fund, Van Kampen Intermediate Term Municipal Income Fund, advised by Van Kampen Asset Management were reorganized into Class A, Class C and Class Y shares, respectively, of Invesco Van Kampen Intermediate Term Municipal Income Fund (renamed Invesco Intermediate Term Municipal Income Fund). Returns shown above, prior to June 1, 2010, for Class A, Class C and Class Y shares are blended returns of the predecessor fund and Invesco Intermediate Term Municipal Income Fund. Share class returns will differ from the predecessor fund because of different expenses.
Class R6 shares incepted on April 4, 2017. Performance shown prior to that date is that of Class A shares and includes the12b-1 fees applicable to Class A shares.
The performance data quoted represent past performance and cannot guarantee comparable future results; current performance may be lower or higher. Please visit invesco.com/performance for the most recent month-end performance. Performance figures reflect reinvested distributions, changes in net asset value and the effect of the maximum sales charge unless otherwise stated. Investment return and
| | | | |
| |
Average Annual Total Returns | |
As of 12/31/18, the most recent calendar quarter end, including maximum applicable sales charges | |
| |
Class A Shares | | | | |
Inception (5/28/93) | | | 4.39 | % |
10 Years | | | 4.36 | |
5 Years | | | 2.73 | |
1 Year | | | -1.67 | |
| |
Class C Shares | | | | |
Inception (10/19/93) | | | 3.50 | % |
10 Years | | | 3.85 | |
5 Years | | | 2.51 | |
1 Year | | | -0.86 | |
| |
Class Y Shares | | | | |
Inception (8/12/05) | | | 3.90 | % |
10 Years | | | 4.88 | |
5 Years | | | 3.52 | |
1 Year | | | 1.13 | |
| |
Class R6 Shares | | | | |
10 Years | | | 4.66 | % |
5 Years | | | 3.34 | |
1 Year | | | 1.04 | |
principal value will fluctuate so that you may have a gain or loss when you sell shares.
The net annual Fund operating expense ratio set forth in the most recent Fund prospectus as of the date of this report for Class A, Class C, Class Y and Class R6 shares was 0.87%, 1.62%, 0.62% and 0.62%, respectively.1 The total annual Fund operating expense ratio set forth in the most recent Fund prospectus as of the date of this report for Class A, Class C, Class Y and Class R6 shares was 0.91%, 1.66%, 0.66% and 0.67%, respectively. The expense ratios presented above may vary from the expense ratios presented in other sections of this report that are based on expenses incurred during the period covered by this report.
Class A share performance reflects the maximum 2.50% sales charge, and Class C share performance reflects the applicable contingent deferred sales charge (CDSC) for the period involved. The CDSC on Class C shares is 1% for the first year after purchase. Class Y and Class R6 shares do not have afront-end sales charge or a CDSC; therefore, performance is at net asset value.
The performance of the Fund’s share classes will differ primarily due to different sales charge structures and class expenses.
Fund performance reflects any applicable fee waivers and/or expense reimbursements. Had the adviser not waived fees and/or reimbursed expenses currently or in the past, returns would have been lower. See current prospectus for more information.
| 1 | Total annual Fund operating expenses after any contractual fee waivers and/or expense reimbursements by the adviser in effect through at least June 30, 2019. See current prospectus for more information. |
7 Invesco Intermediate Term Municipal Income Fund
Invesco Intermediate Term Municipal Income Fund’s investment objective is to provide investors with a high level of current income exempt from federal income tax, consistent with preservation of capital.
| ∎ | | Unless otherwise stated, information presented in this report is as of February 28, 2019, and is based on total net assets. |
| ∎ | | Unless otherwise noted, all data provided by Invesco. |
| ∎ | | To access your Fund’s reports/prospectus, visit invesco.com/fundreports. |
About share classes
| ∎ | | Class Y shares are available to only certain investors. Please see the prospectus for more information. |
| ∎ | | Class R6 shares are available for use by retirement plans that meet certain standards and for institutional investors. Class R6 shares are also available through intermediaries that have established an agreement with Invesco Distributors, Inc. to make such shares available for use in retail omnibus accounts. See the prospectus for more information. |
Principal risks of investing in the Fund
| ∎ | | Alternative minimum tax risk.All or a portion of the Fund’s otherwisetax-exempt income may be taxable to those shareholders subject to the federal alternative minimum tax. |
| ∎ | | Changing fixed income market conditions risk.The current low interest rate environment was created in part by the Federal Reserve Board (FRB) and certain foreign central banks keeping the federal funds and equivalent foreign rates near historical lows. Increases in the federal funds and equivalent foreign rates may expose fixed income markets to heightened volatility and reduced liquidity for certain fixed income investments, particularly those with longer maturities. In addition, decreases es in fixed income dealer market-making capacity may also potentially lead to heightened volatility and reduced liquidity in the fixed income markets. As a result, the value of the Fund’s investments and share price may decline. Changes in central bank policies could also result in higher than normal shareholder redemptions, which could potentially increase portfolio turnover and the Fund’s transaction costs. |
| ∎ | | Debt securities risk.The prices of debt securities held by the Fund will be affected by changes in interest rates, the creditworthiness of the issuer and other factors. An increase in prevailing |
| | | interest rates typically causes the value of existing debt securities to fall and often has a greater impact onlonger-duration debt securities and higher quality debt securities. Falling interest rates will cause the Fund to reinvest the proceeds of debt securities that have been repaid by the issuer at lower interest rates. Falling interest rates may also reduce the Fund’s distributable income because interest payments on floating rate debt instruments held by the Fund will decline. The Fund could lose money on investments in debt securities if the issuer or borrower fails to meet its obligations to make interest payments and/or to repay principal in a timely manner. Changes in an issuer’s financial strength, the market’s perception of such strength or in the credit rating of the issuer or the security may affect the value of debt securities. The Adviser’s credit analysis may fail to anticipate such changes, which could result in buying a debt security at an inopportune time or failing to sell a debt security in advance of a price decline or other credit event. |
| ∎ | | Derivatives risk.The value of a derivative instrument depends largely on (and is derived from) the value of an underlying security, currency, commodity, interest rate, index or other asset (each referred to as an underlying asset). In addition to risks relating to the underlying assets, the use of derivatives may include other, possibly greater, risks, including counterparty, leverage and liquidity risks. Counterparty risk is the risk that the counterparty to the derivative contract will default on its obligation to pay the Fund the amount owed or otherwise perform under the derivative contract. Derivatives create leverage risk because they do not require payment up front equal to the economic exposure created by holding a position in the derivative. As a result, an adverse change in the value of the underlying asset could result in the Fund sustaining a loss that is substantially |
This report must be accompanied or preceded by a currently effective Fund prospectus, which contains more complete information, including sales charges and expenses. Investors should read it carefully before investing.
NOT FDIC INSURED | MAY LOSE VALUE | NO BANK GUARANTEE
greater than the amount invested in the derivative or the anticipated value of the underlying asset, which may make the Fund’s returns more volatile and increase the risk of loss. Derivative instruments may also be less liquid than more traditional investments and the Fund may be unable to sell or close out its derivative positions at a desirable time or price. This risk may be more acute under adverse market conditions, during which the Fund may be most in need of liquidating its derivative positions. Derivatives may also be harder to value, less tax efficient and subject to changing government regulation that could impact the Fund’s ability to use certain derivatives or their cost. Derivatives strategies may not always be successful. For example, derivatives used for hedging or to gain or limit exposure to a particular market segment may not provide the expected benefits, particularly during adverse market conditions.
| ∎ | | High yield debt securities (junk bond) risk.Investments in high yield debt securities (“junk bonds”) and other lower- rated securities will subject the Fund to substantial risk of loss. These securities are considered to be speculative with respect to the issuer’s ability to pay interest and principal when due, are more susceptible to default or decline in market value and are less liquid than investment grade debt securities. Prices of high yield debt securities tend to be very volatile. |
| ∎ | | Inverse floating rate obligations risk. The price of inverse floating rate obligations (inverse floaters) is expected to decline when interest rates rise, and generally will decline further than the price of a bond with a similar maturity. The price of inverse floaters is typically more volatile than the price of bonds with similar maturities. These risks can be particularly high if leverage is used in the formula that determines the interest payable by the inverse floater, which may make the Fund’s returns more volatile and increase the risk of loss. Additionally, these securities may lose some or all of their principal and, in some cases, the Fund could lose money in excess of its investment. |
| ∎ | | Liquidity risk.The Fund may be unable to sell illiquid investments at the time or |
| | |
| 8 | | Invesco Intermediate Term Municipal Income Fund |
price it desires and, as a result, could lose its entire investment in such investments. Liquid securities can become illiquid during periods of market stress. If a significant amount of the Fund’s securities become illiquid, the Fund may not be able to timely pay redemption proceeds and may need to sell securities at significantly reduced prices.
| ∎ | | Management risk.The Fund is actively managed and depends heavily on the Adviser’s judgment about markets, interest rates or the attractiveness, relative values, liquidity, or potential appreciation of particular investments made for the Fund’s portfolio. The Fund could experience losses if these judgments prove to be incorrect. Additionally, legislative, regulatory, or tax developments may adversely affect management of the Fund and, therefore, the ability of the Fund to achieve its investment objective. |
| ∎ | | Market risk.The market values of the Fund’s investments, and therefore the value of the Fund’s shares, will go up and down, sometimes rapidly or unpredictably. Market risk may affect a single issuer, industry or section of the economy, or it may affect the market as a whole. Individual stock prices tend to go up and down more dramatically than those of certain other types of investments, such as bonds. During a general downturn in the financial markets, multiple asset classes may decline in value. When markets perform well, there can be no assurance that specific investments held by the Fund will rise in value. |
| ∎ | | Medium- and lower-grade municipal securities risk.Medium- and lower-grade municipal securities generally involve more volatility and greater risks, including credit, market, liquidity and management risks, than higher-grade securities. Furthermore, many issuers of medium-and lower-grade securities choose not to have a rating assigned to their obligations. As such, the Fund’s portfolio may consist of a higher portion of unrated securities than an in vestment company investing solely in higher-grade securities. Unrated securities may not be as attractive to as many buyers as are rated securities, which may have the effect of limiting the Fund’s ability to sell such securities at their fair value. |
| ∎ | | Municipal issuer focus risk.The municipal issuers in which the Fund invests may be located in the same geographic area or may pay their interest obligations from revenue of similar projects, such as hospitals, airports, utility |
| | | systems and housing finance agencies. This may make the Fund’s investments more susceptible to similar social, economic, political or regulatory occurrences, making the Fund more susceptible to experience a drop in its share price than if the Fund had been more diversified across issuers that did not have similar characteristics. |
| ∎ | | Municipal securities risk.The risk of a municipal obligation generally depends on the financial and credit status of the issuer. Constitutional amendments, legislative enactments, executive orders, administrative regulations, voter initiatives, and the issuer’s regional economic conditions may affect the municipal security’s value, interest payments, repayment of principal and the Fund’s ability to sell the security. Failure of a municipal security issuer to comply with applicable tax requirements may make income paid thereon taxable, resulting in a decline in the security’s value. In addition, there could be changes in applicable tax laws or tax treatments that reduce or eliminate the current federal income tax exemption on municipal securities or otherwise adversely affect the current federal or state tax status of municipal securities. |
| ∎ | | Variable-rate demand notes risk.The absence of an active secondary market for certain variable and floating rate notes could make it difficult to dispose of these instruments, which could result in a loss. |
| ∎ | | When-issued, delayed delivery and forward commitment risks.When-issued and delayed delivery transactions subject the Fund to market risk because the value or yield of a security at delivery may be more or less than the purchase price or yield generally available when delivery occurs, and counterparty risk because the Fund relies on the buyer or seller, as the case may be, to consummate the transaction. These transactions also have a leveraging effect on the Fund because the Fund commits to purchase securities that it does not have to pay for until a later date, which increases the Fund’s overall investment exposure and, as a result, its volatility. |
| ∎ | | Zero coupon orpay-in-kind securities risk.The value, interest rates, and liquidity ofnon-cash paying instruments, such as zero coupon andpay-in-kind securities, are subject to greater fluctuation than other types of securities. The higher yields and interest rates onpay-in-kind securities reflect the payment deferral and increased |
| | | credit risk associated with such instruments and that such investments may represent a higher credit risk than loans that periodically pay interest. |
About indexes used in this report
| ∎ | | TheS&P Municipal Bond Index is a broad, market value-weighted index that seeks to measure the performance of the US municipal bond market. |
| ∎ | | TheS&P Municipal Bond2-17 Years Investment Grade Index seeks to measure the performance of investment grade US municipals with maturities between two and 17 years. |
| ∎ | | TheLipper Intermediate Municipal Debt Funds Index is an unmanaged index considered representative of intermediate municipal debt funds tracked by Lipper. |
| ∎ | | The Fund is not managed to track the performance of any particular index, including the index(es) described here, and consequently, the performance of the Fund may deviate significantly from the performance of the index(es). |
| ∎ | | A direct investment cannot be made in an index. Unless otherwise indicated, index results include reinvested dividends, and they do not reflect sales charges. Performance of the peer group, if applicable, reflects fund expenses; performance of a market index does not. |
Other information
| ∎ | | CPA® and Certified Public Accountant® are trademarks owned by the American Institute of Certified Public Accountants. |
| ∎ | | The returns shown in management’s discussion of Fund performance are based on net asset values (NAVs) calculated for shareholder transactions. Generally accepted accounting principles require adjustments to be made to the net assets of the Fund at period end for financial reporting purposes, and as such, the NAVs for shareholder transactions and the returns based on those NAVs may differ from the NAVs and returns reported in the Financial Highlights. |
| | |
| 9 | | Invesco Intermediate Term Municipal Income Fund |
Schedule of Investments
February 28, 2019
| | | | | | | | | | | | | | | | |
| | | Interest
Rate | | | Maturity
Date | | | Principal
Amount
(000) | | | Value | |
Municipal Obligations-102.38% | | | | | | | | | | | | | | | | |
| | | | |
Alabama-2.16% | | | | | | | | | | | | | | | | |
| | | | |
Alabama (State of) Port Authority; Series 2017 A, Ref. Docks Facilities RB
(INS-AGM)(a)(b) | | | 5.00% | | | | 10/01/2033 | | | $ | 3,500 | | | $ | 3,959,305 | |
Alabaster (City of) Board of Education; | | | | | | | | | | | | | | | | |
Series 2014 A, Limited Special Tax GO Wts. (INS-AGM)(b) | | | 5.00% | | | | 09/01/2025 | | | | 1,500 | | | | 1,726,440 | |
Series 2014 A, Limited Special Tax GO Wts. (INS-AGM)(b) | | | 5.00% | | | | 09/01/2028 | | | | 1,500 | | | | 1,711,575 | |
Birmingham (City of) Special Care Facilities Financing Authority (Methodist Home for the Aging); | | | | | | | | | | | | | | | | |
Series 2016, RB | | | 5.25% | | | | 06/01/2025 | | | | 100 | | | | 109,907 | |
Series 2016, RB | | | 5.50% | | | | 06/01/2030 | | | | 2,000 | | | | 2,194,780 | |
Lower Alabama Gas District (The); Series 2016A, Gas Project RB | | | 5.00% | | | | 09/01/2034 | | | | 5,000 | | | | 5,801,250 | |
Pell City (City of) Special Care Facilities Financing Authority (Noland Health Services, Inc.); | | | | | | | | | | | | | | | | |
Series 2012, RB | | | 5.00% | | | | 12/01/2021 | | | | 2,250 | | | | 2,436,638 | |
Series 2016A, RB | | | 5.00% | | | | 12/01/2031 | | | | 4,850 | | | | 5,203,807 | |
Southeast Alabama Gas Supply District (The) (No. 1); | | | | | | | | | | | | | | | | |
Series 2018 B, Gas Supply Floating Rate RB (1 mo. USD LIBOR +
0.90%)(c)(d) | | | 2.57% | | | | 04/01/2024 | | | | 4,875 | | | | 4,826,981 | |
Series 2018 C, Gas Supply Floating Rate RB (SIFMA Municipal Swap Index + 0.65%)(c)(d) | | | 2.39% | | | | 04/01/2024 | | | | 1,625 | | | | 1,625,081 | |
| | | | | | | | | | | | | | | | 29,595,764 | |
| | | | |
Alaska-0.15% | | | | | | | | | | | | | | | | |
| | | | |
Matanuska-Susitna (Borough of) (Goose Creek Correctional Center); | | | | | | | | | | | | | | | | |
Series 2009, Lease RB (INS-AGC)(b) | | | 5.00% | | | | 09/01/2019 | | | | 1,000 | | | | 1,015,940 | |
Series 2009, Lease RB(c)(e) | | | 5.50% | | | | 09/01/2019 | | | | 1,000 | | | | 1,019,170 | |
| | | | | | | | | | | | | | | | 2,035,110 | |
| | | | |
Arizona-3.33% | | | | | | | | | | | | | | | | |
| | | | |
Arizona (State of) Health Facilities Authority (Scottsdale Lincoln Hospital); Series 2014, Ref. RB | | | 5.00% | | | | 12/01/2032 | | | | 3,400 | | | | 3,793,278 | |
Arizona (State of) Industrial Development Authority (Basis Schools); Series 2017 D, Ref. Education RB(f) | | | 5.00% | | | | 07/01/2037 | | | | 630 | | | | 648,547 | |
Arizona (State of) Industrial Development Authority (Pinecrest Academy of Nevada-Horizon, Inspirada and St. Rose Campus Projects); Series 2018 A, Education RB(f) | | | 5.75% | | | | 07/15/2038 | | | | 1,810 | | | | 1,920,102 | |
Glendale (City of) Industrial Development Authority (Midwestern University); Series 2010, RB | | | 5.00% | | | | 05/15/2026 | | | | 2,000 | | | | 2,073,160 | |
Glendale (City of) Industrial Development Authority (The Beatitudes Campus); Series 2017, Ref. RB | | | 5.00% | | | | 11/15/2028 | | | | 2,105 | | | | 2,195,326 | |
La Paz (County of) Industrial Development Authority (Charter School Solutions- Harmony Public Schools); Series 2018 A, Education Facility Lease RB | | | 5.00% | | | | 02/15/2038 | | | | 1,200 | | | | 1,284,336 | |
Maricopa County Pollution Control Corp. (Southern California Education Co.); Series 2000 B, Ref. RB | | | 5.00% | | | | 06/01/2035 | | | | 3,000 | | | | 3,057,720 | |
Peoria (City of) Industrial Development Authority (Sierra Winds Life Care Community); | | | | | | | | | | | | | | | | |
Series 2014, Ref. RB | | | 5.00% | | | | 11/15/2024 | | | | 2,025 | | | | 2,036,806 | |
Series 2014, Ref. RB | | | 5.25% | | | | 11/15/2029 | | | | 2,105 | | | | 2,086,160 | |
Phoenix (City of) Industrial Development Authority (Great Hearts Academies); Series 2016, Ref. Education Facilities RB | | | 5.00% | | | | 07/01/2036 | | | | 1,000 | | | | 1,047,940 | |
Phoenix (City of) Industrial Development Authority (Legacy Traditional Schools); Series 2014 A, Education Facility RB(f) | | | 5.75% | | | | 07/01/2024 | | | | 1,000 | | | | 1,064,220 | |
Phoenix (City of) Industrial Development Authority (Rowan University); Series 2012, Lease RB | | | 5.00% | | | | 06/01/2027 | | | | 3,000 | | | | 3,254,700 | |
Pima (County of) Industrial Development Authority (American Leadership Academy); | | | | | | | | | | | | | | | | |
Series 2015, Ref. Education Facility RB(f) | | | 5.38% | | | | 06/15/2035 | | | | 1,360 | | | | 1,405,587 | |
Series 2017, Education Facility RB(f) | | | 4.75% | | | | 06/15/2037 | | | | 3,500 | | | | 3,436,825 | |
Pima (County of) Industrial Development Authority (Desert Heights Charter School); Series 2014, Ref. Education Facility RB | | | 6.00% | | | | 05/01/2024 | | | | 465 | | | | 486,413 | |
Pima (County of) Industrial Development Authority (Edkey Charter Schools); Series 2013, Ref. Education Facility RB | | | 5.00% | | | | 07/01/2025 | | | | 750 | | | | 716,753 | |
Pima (County of) Industrial Development Authority (Grande Innovations Academy); Series 2018, Education Facility RB(f) | | | 5.00% | | | | 07/01/2033 | | | | 2,245 | | | | 2,191,030 | |
Salt River Project Agricultural Improvement & Power District; Series 2016A, Ref. Electric System RB | | | 5.00% | | | | 01/01/2034 | | | | 5,500 | | | | 6,445,835 | |
See accompanying Notes to Financial Statements which are an integral part of the financial statements.
| | |
| 10 | | Invesco Intermediate Term Municipal Income Fund |
| | | | | | | | | | | | | | | | |
| | | Interest
Rate | | | Maturity
Date | | | Principal
Amount
(000) | | | Value | |
Arizona-(continued) | | | | | | | | | | | | | | | | |
| | | | |
Verrado Community Facilities District No. 1; | | | | | | | | | | | | | | | | |
Series 2013 A, Ref. Unlimited Tax GO Bonds(f) | | | 5.00% | | | | 07/15/2020 | | | $ | 700 | | | $ | 712,152 | |
Series 2013 A, Ref. Unlimited Tax GO Bonds(f) | | | 5.00% | | | | 07/15/2021 | | | | 485 | | | | 497,246 | |
Series 2013 A, Ref. Unlimited Tax GO Bonds(f) | | | 5.00% | | | | 07/15/2022 | | | | 570 | | | | 586,844 | |
Series 2013 A, Ref. Unlimited Tax GO Bonds(f) | | | 5.00% | | | | 07/15/2023 | | | | 825 | | | | 852,687 | |
Series 2013 B, Unlimited Tax GO Bonds(f) | | | 5.00% | | | | 07/15/2023 | | | | 455 | | | | 470,270 | |
Yavapai (County of) Industrial Development Authority (Northern Arizona Healthcare System); Series 2011, Ref. Hospital Facility RB | | | 5.25% | | | | 10/01/2026 | | | | 2,000 | | | | 2,158,180 | |
Yuma (City of) Industrial Development Authority (Regional Medical Center); Series 2014 A, Hospital RB | | | 5.00% | | | | 08/01/2025 | | | | 1,000 | | | | 1,141,350 | |
| | | | | | | | | | | | | | | | 45,563,467 | |
| | | | |
Arkansas-0.11% | | | | | | | | | | | | | | | | |
| | | | |
Pulaski (County of) Public Facilities Board; Series 2014, RB | | | 5.00% | | | | 12/01/2028 | | | | 1,345 | | | | 1,529,023 | |
| | | | |
California-8.04% | | | | | | | | | | | | | | | | |
| | | | |
California (County of) Tobacco Securitization Agency (Gold Country Settlement Funding Corp.); Series 2006, Tobacco Settlement Asset-Backed CAB RB(g) | | | 0.00% | | | | 06/01/2033 | | | | 3,490 | | | | 1,551,759 | |
California (State of); | | | | | | | | | | | | | | | | |
Series 2012 B, Ref. Unlimited Tax GO Floating Rate Bonds (SIFMA Municipal Swap Index + 1.15%)(c)(d) | | | 2.89% | | | | 05/01/2020 | | | | 2,000 | | | | 2,011,940 | |
Series 2013 B, Ref. Various Purpose Unlimited Tax GO Floating Rate Bonds (SIFMA Municipal Swap Index + 0.38%)(c)(d) | | | 2.12% | | | | 12/01/2022 | | | | 4,000 | | | | 4,003,000 | |
Series 2013 C, Unlimited Tax GO Floating Rate Bonds (1 mo. USD LIBOR + 0.70%)(c)(d) | | | 2.44% | | | | 12/01/2020 | | | | 4,000 | | | | 4,017,520 | |
Series 2015, Various Purpose GO Bonds | | | 5.00% | | | | 03/01/2030 | | | | 5,000 | | | | 5,773,250 | |
Series 2016B, Unlimited Tax GO Floating Rate Bonds (1 mo. USD LIBOR + 0.76%)(c)(d) | | | 2.50% | | | | 12/01/2021 | | | | 2,000 | | | | 2,014,800 | |
California (State of) Municipal Finance Authority (Emerson College); | | | | | | | | | | | | | | | | |
Series 2011, RB(c)(e) | | | 5.00% | | | | 01/01/2022 | | | | 1,230 | | | | 1,351,844 | |
Series 2011, RB | | | 5.00% | | | | 01/01/2028 | | | | 270 | | | | 289,761 | |
California (State of) Pollution Control Finance Authority; Series 2012, Water Furnishing RB(a)(f) | | | 5.00% | | | | 07/01/2027 | | | | 7,000 | | | | 7,522,340 | |
California (State of) School Finance Authority (Alliance for College-Ready Public Schools); Series 2013 A, School Facility RB | | | 5.25% | | | | 07/01/2023 | | | | 1,050 | | | | 1,116,118 | |
California (State of) School Finance Authority (KIPP LA); Series 2014 A, RB | | | 4.13% | | | | 07/01/2024 | | | | 440 | | | | 459,360 | |
California (State of) Statewide Communities Development Authority (California Baptist University); Series 2017 A, Ref. RB(f) | | | 5.00% | | | | 11/01/2032 | | | | 1,135 | | | | 1,258,057 | |
California (State of) Statewide Communities Development Authority (Loma Linda University Medical Center); | | | | | | | | | | | | | | | | |
Series 2014, RB | | | 5.25% | | | | 12/01/2029 | | | | 3,000 | | | | 3,316,800 | |
Series 2018 A, RB(f) | | | 5.25% | | | | 12/01/2038 | | | | 1,000 | | | | 1,097,160 | |
California (State of) Statewide Communities Development Authority (Methodist Hospital); Series 2009, RB(c)(e) | | | 6.25% | | | | 08/01/2019 | | | | 1,650 | | | | 1,681,746 | |
California (State of) Statewide Communities Development Authority (Southern California Presbyterian Homes); Series 2009, Senior Living RB (f) | | | 6.25% | | | | 11/15/2019 | | | | 135 | | | | 138,490 | |
California Public Finance Authority (Henry Mayo Newhall Hospital); | | | | | | | | | | | | | | | | |
Series 2017, Ref. RB | | | 5.00% | | | | 10/15/2031 | | | | 1,070 | | | | 1,186,726 | |
Series 2017, Ref. RB | | | 5.00% | | | | 10/15/2033 | | | | 1,000 | | | | 1,100,350 | |
Corona-Norco Unified School District (Community Facilities DistrictNo. 98-1); | | | | | | | | | | | | | | | | |
Series 2013, Ref. Special Tax RB | | | 5.00% | | | | 09/01/2021 | | | | 810 | | | | 877,457 | |
Series 2013, Ref. Special Tax RB | | | 5.00% | | | | 09/01/2023 | | | | 1,000 | | | | 1,143,920 | |
Foothill-Eastern Transportation Corridor Agency; Subseries 2014B-2, Ref. Toll Road RB(c) | | | 5.00% | | | | 01/15/2020 | | | | 5,000 | | | | 5,056,350 | |
Fresno (City of); Series 2010A-1, Water System RB | | | 5.50% | | | | 06/01/2022 | | | | 1,000 | | | | 1,049,210 | |
Golden State Tobacco Securitization Corp.; | | | | | | | | | | | | | | | | |
Series 2013 A, Enhanced Tobacco Settlement Asset-Backed RB | | | 5.00% | | | | 06/01/2021 | | | | 2,000 | | | | 2,145,600 | |
Series 2017A-1, Enhanced Tobacco Settlement Asset-Backed RB | | | 5.00% | | | | 06/01/2027 | | | | 4,000 | | | | 4,621,200 | |
Series2018A-1, Enhanced Tobacco Settlement Asset-Backed RB | | | 5.00% | | | | 06/01/2030 | | | | 4,000 | | | | 4,568,480 | |
See accompanying Notes to Financial Statements which are an integral part of the financial statements.
| | |
| 11 | | Invesco Intermediate Term Municipal Income Fund |
| | | | | | | | | | | | | | | | |
| | | Interest
Rate | | | Maturity
Date | | | Principal
Amount
(000) | | | Value | |
California-(continued) | | | | | | | | | | | | | | | | |
| | | | |
Irvine (City of) (Reassessment DistrictNo. 13-1); | | | | | | | | | | | | | | | | |
Series 2013, Limited Obligation Special Assessment RB | | | 4.00% | | | | 09/02/2019 | | | $ | 475 | | | $ | 480,994 | |
Series 2013, Limited Obligation Special Assessment RB | | | 5.00% | | | | 09/02/2020 | | | | 450 | | | | 473,279 | |
Series 2013, Limited Obligation Special Assessment RB | | | 5.00% | | | | 09/02/2021 | | | | 375 | | | | 406,744 | |
Series 2013, Limited Obligation Special Assessment RB | | | 5.00% | | | | 09/02/2022 | | | | 710 | | | | 792,942 | |
Series 2013, Limited Obligation Special Assessment RB | | | 5.00% | | | | 09/02/2023 | | | | 500 | | | | 571,995 | |
Lake Elsinore (City of) Public Financing Authority; Series 2015, Ref. Local Agency Special Tax RB | | | 5.00% | | | | 09/01/2028 | | | | 2,115 | | | | 2,352,282 | |
Los Angeles (City of) Department of Airports (Los Angeles International Airport); | | | | | | | | | | | | | | | | |
Series 2018 B, Ref. RB(a) | | | 5.00% | | | | 05/15/2029 | | | | 2,000 | | | | 2,410,100 | |
Series 2018 D, Sub. RB(a) | | | 5.00% | | | | 05/15/2031 | | | | 3,000 | | | | 3,592,170 | |
Los Angeles Unified School District (Election of 2004); Series 2009 I, Unlimited Tax GO Bonds | | | 5.25% | | | | 07/01/2022 | | | | 3,200 | | | | 3,239,104 | |
Murrieta (City of) Public Financing Authority; Series 2012, Ref. Special Tax RB | | | 5.00% | | | | 09/01/2023 | | | | 1,000 | | | | 1,101,350 | |
Oakland Unified School District (County of Alameda, California); | | | | | | | | | | | | | | | | |
Series 2015 A, Unlimited Tax GO Bonds | | | 5.00% | | | | 08/01/2028 | | | | 1,000 | | | | 1,178,780 | |
Series 2015 A, Unlimited Tax GO Bonds | | | 5.00% | | | | 08/01/2029 | | | | 1,160 | | | | 1,363,568 | |
Oroville (City of) (Oroville Hospital); Series 2019, RB | | | 5.25% | | | | 04/01/2034 | | | | 2,000 | | | | 2,268,600 | |
Rancho Cordova (City of) Community Facilities DistrictNo. 2003-1 (Sunridge Anatolia); | | | | | | | | | | | | | | | | |
Series 2012, Ref. Special Tax RB | | | 5.00% | | | | 09/01/2022 | | | | 575 | | | | 628,015 | |
Series 2012, Ref. Special Tax RB | | | 5.00% | | | | 09/01/2023 | | | | 450 | | | | 489,591 | |
Regents of the University of California; Series 2009 O, General RB(c)(e)(h) | | | 5.75% | | | | 05/15/2019 | | | | 1,980 | | | | 1,997,048 | |
Richmond (City of) Joint Powers Financing Authority (Point Potrero); Series 2009 A, Lease RB | | | 6.25% | | | | 07/01/2024 | | | | 1,500 | | | | 1,523,640 | |
San Buenaventura (City of) (Community Memorial Health System); Series 2011, RB | | | 6.25% | | | | 12/01/2020 | | | | 1,000 | | | | 1,067,010 | |
San Diego (County of) Regional Airport Authority; Series 2013 B, Sr. RB(a) | | | 5.00% | | | | 07/01/2023 | | | | 700 | | | | 789,313 | |
San Francisco (City & County of) Airport Commission (San Francisco International Airport); | | | | | | | | | | | | | | | | |
Series 2011 C, Ref. Second Series RB(a) | | | 5.00% | | | | 05/01/2023 | | | | 2,000 | | | | 2,129,340 | |
Series 2019 D, Ref. Second Series RB | | | 5.00% | | | | 05/01/2030 | | | | 1,800 | | | | 2,269,152 | |
San Francisco (City & County of) Redevelopment Financing Authority (Mission Bay South Redevelopment); | | | | | | | | | | | | | | | | |
Series 2009 D, Tax Allocation RB(c)(e) | | | 6.00% | | | | 08/01/2019 | | | | 1,085 | | | | 1,105,235 | |
Series 2009 D, Tax Allocation RB(c)(e) | | | 6.25% | | | | 08/01/2019 | | | | 1,000 | | | | 1,019,660 | |
Series 2011 D, Tax Allocation RB(c)(e) | | | 6.63% | | | | 02/01/2021 | | | | 500 | | | | 548,920 | |
San Francisco (City & County of) Successor Agency to the Redevelopment Agency Community Facilities District No. 6 (Mission Bay South Public Improvements); | | | | | | | | | | | | | | | | |
Series 2013 A, Ref. Special Tax RB | | | 5.00% | | | | 08/01/2027 | | | | 750 | | | | 815,745 | |
Series 2013 B, Special Tax RB | | | 5.00% | | | | 08/01/2027 | | | | 405 | | | | 440,502 | |
San Jose (City of); Series 2011A-1, Airport RB(a) | | | 5.25% | | | | 03/01/2026 | | | | 2,000 | | | | 2,126,140 | |
San Luis Obispo (County of) Financing Authority (Lopez Dam Improvement); Series 2011 A, Ref. RB (INS-AGM)(b) | | | 5.50% | | | | 08/01/2026 | | | | 3,195 | | | | 3,474,914 | |
Santa Margarita Water District (Community Facilities DistrictNo. 2013-1); | | | | | | | | | | | | | | | | |
Series 2013, Special Tax RB | | | 5.00% | | | | 09/01/2026 | | | | 1,030 | | | | 1,100,318 | |
Series 2013, Special Tax RB | | | 5.13% | | | | 09/01/2027 | | | | 1,200 | | | | 1,288,140 | |
Southern California Public Power Authority (Milford Wind Corridor); Series 2010 1, RB | | | 5.00% | | | | 07/01/2024 | | | | 2,000 | | | | 2,056,980 | |
Twin Rivers Unified School District (School Facility Bridge Funding Program); Series 2007, COP(INS-AGM)(b)(c) | | | 3.20% | | | | 06/01/2020 | | | | 4,245 | | | | 4,250,052 | |
West Contra Costa Unified School District (Election of 2005); Series 2008 B, Unlimited Tax GO Bonds | | | 6.00% | | | | 08/01/2023 | | | | 1,000 | | | | 1,190,940 | |
| | | | | | | | | | | | | | | | 109,895,801 | |
| | | | |
Colorado-1.64% | | | | | | | | | | | | | | | | |
| | | | |
Arkansas River Power Authority; Series 2006, Power Improvement RB(e) | | | 5.88% | | | | 10/01/2021 | | | | 1,000 | | | | 1,062,040 | |
Centerra Metropolitan District No. 1 (In the City of Loveland); Series 2017, Ref. Special Tax Allocation RB(f) | | | 5.00% | | | | 12/01/2029 | | | | 4,000 | | | | 4,229,240 | |
Colorado (State of) Health Facilities Authority (Christian Living Neighborhoods); Series 2016, Ref. Hospital RB | | | 5.00% | | | | 01/01/2031 | | | | 2,475 | | | | 2,656,195 | |
See accompanying Notes to Financial Statements which are an integral part of the financial statements.
| | |
| 12 | | Invesco Intermediate Term Municipal Income Fund |
| | | | | | | | | | | | | | | | |
| | | Interest Rate | | | Maturity Date | | | Principal Amount (000) | | | Value | |
Colorado-(continued) | | | | | | | | | | | | | | | | |
| | | | |
Colorado (State of) Health Facilities Authority (Sunny Vista Living Center); | | | | | | | | | | | | | | | | |
Series 2015 A, Ref. RB(f) | | | 5.00% | | | | 12/01/2025 | | | $ | 550 | | | $ | 559,746 | |
Series 2015 A, Ref. RB(f) | | | 5.50% | | | | 12/01/2030 | | | | 750 | | | | 769,883 | |
Colorado (State of) Regional Transportation District (Denver Transit Partners Eagle P3); | | | | | | | | | | | | | | | | |
Series 2010, Private Activity RB | | | 5.25% | | | | 07/15/2019 | | | | 1,000 | | | | 1,004,890 | |
Series 2010, Private Activity RB | | | 5.00% | | | | 01/15/2022 | | | | 850 | | | | 858,202 | |
Denver (City & County of); | | | | | | | | | | | | | | | | |
Series 2012 A, Airport System RB(a) | | | 5.00% | | | | 11/15/2022 | | | | 740 | | | | 820,216 | |
Series 2018 A, Ref. Sub. Airport System RB(a) | | | 5.00% | | | | 12/01/2030 | | | | 2,000 | | | | 2,442,700 | |
Series 2018A-2, Dedicated Tax CAB RB(g) | | | 0.00% | | | | 08/01/2030 | | | | 800 | | | | 540,064 | |
Series 2018A-2, Dedicated Tax CAB RB(g) | | | 0.00% | | | | 08/01/2031 | | | | 1,000 | | | | 643,330 | |
Denver (City & County of) (United Airlines, Inc.); Series 2017, Ref. Special Facilities Airport RB(a) | | | 5.00% | | | | 10/01/2032 | | | | 3,000 | | | | 3,189,420 | |
Plaza Metropolitan District No. 1; | | | | | | | | | | | | | | | | |
Series 2013, Ref. Tax Allocation RB(f) | | | 5.00% | | | | 12/01/2021 | | | | 1,045 | | | | 1,101,827 | |
Series 2013, Ref. Tax Allocation RB(f) | | | 5.00% | | | | 12/01/2022 | | | | 500 | | | | 533,115 | |
Prairie Center Metropolitan District No. 3; Series 2017 A, Ref. Limited Property Tax Supported RB(f) | | | 4.13% | | | | 12/15/2027 | | | | 965 | | | | 970,182 | |
University of Colorado; Series 2009 A, Enterprise RB(c)(e) | | | 5.50% | | | | 06/01/2019 | | | | 1,000 | | | | 1,009,480 | |
| | | | | | | | | | | | | | | | 22,390,530 | |
| | | | |
Connecticut-1.29% | | | | | | | | | | | | | | | | |
| | | | |
Connecticut (State of); Series 2018 C, Unlimited Tax GO Bonds | | | 5.00% | | | | 06/15/2027 | | | | 3,000 | | | | 3,492,900 | |
Connecticut (State of) (Transportation Infrastructure); Series 2018, Special Tax Obligation RB | | | 5.00% | | | | 01/01/2030 | | | | 3,500 | | | | 4,068,890 | |
Connecticut (State of) Development Authority (Aquarion Water Co.); Series 2011, Water Facilities RB (a) | | | 5.50% | | | | 04/01/2021 | | | | 1,000 | | | | 1,062,060 | |
University of Connecticut; | | | | | | | | | | | | | | | | |
Series 2016 A, GO Bonds | | | 5.00% | | | | 03/15/2032 | | | | 2,940 | | | | 3,270,485 | |
Series 2017 A, RB | | | 5.00% | | | | 01/15/2030 | | | | 5,000 | | | | 5,713,350 | |
| | | | | | | | | | | | | | | | 17,607,685 | |
| | | | |
District of Columbia-0.51% | | | | | | | | | | | | | | | | |
District of Columbia (Provident Group - Howard Properties LLC); Series 2013, Student Dormitory RB | | | 5.00% | | | | 10/01/2030 | | | | 2,250 | | | | 2,310,615 | |
Metropolitan Washington Airports Authority; Series 2016 A, Ref. Airport System RB(a) | | | 5.00% | | | | 10/01/2034 | | | | 2,215 | | | | 2,509,573 | |
Metropolitan Washington Airports Authority (Dulles Metrorail and Capital Improvement); Series 2010 A, Second Sr. Lien Dulles Toll Road CAB RB(g) | | | 0.00% | | | | 10/01/2037 | | | | 5,000 | | | | 2,185,100 | |
| | | | | | | | | | | | | | | | 7,005,288 | |
| | | | |
Florida-3.65% | | | | | | | | | | | | | | | | |
| | | | |
Atlantic Beach (City of) (Fleet Landing); | | | | | | | | | | | | | | | | |
Series 2013 A, Ref. Health Care Facilities RB | | | 5.00% | | | | 11/15/2021 | | | | 440 | | | | 467,434 | |
Series 2013 A, Ref. Health Care Facilities RB | | | 5.00% | | | | 11/15/2022 | | | | 375 | | | | 405,330 | |
Series 2013 A, Ref. Health Care Facilities RB | | | 5.00% | | | | 11/15/2023 | | | | 565 | | | | 618,449 | |
Capital Trust Agency Inc.(H-Bay Ministries, Inc. - Superior Residences); Series 2018 B, Sr. Living RB | | | 4.50% | | | | 07/01/2038 | | | | 500 | | | | 483,495 | |
Capital Trust Agency Inc. (Sarasota-Manatee Jewish Housing Council, Inc.); Series 2017, Ref. Retirement Facility RB(f) | | | 5.00% | | | | 07/01/2032 | | | | 2,045 | | | | 2,136,882 | |
Citizens Property Insurance Corp.; Series 2012A-1, Sr. Sec. RB | | | 5.00% | | | | 06/01/2022 | | | | 2,000 | | | | 2,205,420 | |
Citizens Property Insurance Corp. (Coastal Account); Series 2011A-1, Sr. Sec. RB | | | 5.00% | | | | 06/01/2020 | | | | 1,000 | | | | 1,039,850 | |
Collier (County of) Industrial Development Authority (The Arlington of Naples); Series 2014 A, Continuing Care Community RB(f) | | | 7.25% | | | | 05/15/2026 | | | | 1,215 | | | | 1,204,332 | |
Florida (State of) Municipal Power Agency (St. Lucie); Series 2011 B, RB | | | 5.00% | | | | 10/01/2026 | | | | 2,000 | | | | 2,150,400 | |
Florida (State of) North Broward Hospital District; Series 2017 B, Ref. RB | | | 5.00% | | | | 01/01/2034 | | | | 5,000 | | | | 5,457,700 | |
Florida (State of) Ports Financing Commission (State Transportation Trust Fund); Series 2011 A, Ref. RB | | | 5.00% | | | | 10/01/2027 | | | | 1,000 | | | | 1,077,030 | |
Florida Development Finance Corp. (Renaissance Charter School, Inc.); Series 2015, Educational Facilities RB(f) | | | 6.00% | | | | 06/15/2035 | | | | 1,265 | | | | 1,304,848 | |
See accompanying Notes to Financial Statements which are an integral part of the financial statements.
| | |
| 13 | | Invesco Intermediate Term Municipal Income Fund |
| | | | | | | | | | | | | | | | |
| | | Interest Rate | | | Maturity Date | | | Principal Amount (000) | | | Value | |
Florida-(continued) | | | | | | | | | | | | | | | | |
| | | | |
Highlands (County of) Health Facilities Authority (Trousdale Foundation Properties); Series 2018 A, Sr. Living RB | | | 5.25% | | | | 04/01/2028 | | | $ | 2,500 | | | $ | 2,531,175 | |
Manatee (County of) School District; | | | | | | | | | | | | | | | | |
Series 2017, Sales Tax RB (INS-AGM)(b) | | | 5.00% | | | | 10/01/2029 | | | | 1,000 | | | | 1,184,020 | |
Series 2017, Sales Tax RB (INS-AGM)(b) | | | 5.00% | | | | 10/01/2031 | | | | 3,000 | | | | 3,490,290 | |
Series 2017, Sales Tax RB (INS-AGM)(b) | | | 5.00% | | | | 10/01/2032 | | | | 1,250 | | | | 1,445,138 | |
Martin (County of) Health Facilities Authority (Martin Memorial Medical Center); | | | | | | | | | | | | | | | | |
Series 2012, RB | | | 5.00% | | | | 11/15/2024 | | | | 1,990 | | | | 2,131,907 | |
Series 2012, RB | | | 5.50% | | | | 11/15/2032 | | | | 1,670 | | | | 1,804,301 | |
Miami (City of) Health Facilities Authority (Miami Jewish Health System, Inc.); | | | | | | | | | | | | | | | | |
Series 2017, Ref. Health Facilities RB | | | 5.00% | | | | 07/01/2025 | | | | 600 | | | | 664,362 | |
Series 2017, Ref. Health Facilities RB | | | 5.00% | | | | 07/01/2026 | | | | 1,135 | | | | 1,270,144 | |
Series 2017, Ref. Health Facilities RB | | | 5.00% | | | | 07/01/2027 | | | | 1,000 | | | | 1,125,230 | |
Miami-Dade (County of) Expressway Authority; | | | | | | | | | | | | | | | | |
Series 2013 A, Ref. Toll System RB | | | 5.00% | | | | 07/01/2022 | | | | 2,000 | | | | 2,206,360 | |
Series 2016 A, Ref. Toll System RB | | | 5.00% | | | | 07/01/2028 | | | | 1,625 | | | | 1,919,547 | |
Miami-Dade (County of) Florida Industrial Development Authority (Waste Management, Inc.); Series 2018 B, Solid Waste Disposal Floating Rate RB (SIFMA Municipal Swap Index + 0.80%)(a)(c)(d) | | | 2.54% | | | | 11/01/2021 | | | | 3,000 | | | | 3,000,720 | |
Orlando (City of) & Orange (County of) Expressway Authority; Series 2012, Ref. RB | | | 5.00% | | | | 07/01/2023 | | | | 1,000 | | | | 1,103,860 | |
Palm Beach (County of) Health Facilities Authority (BRRH Corp. Obligated Group); Series 2014, Ref. RB | | | 5.00% | | | | 12/01/2031 | | | | 4,000 | | | | 4,380,840 | |
Palm Beach (County of) Health Facilities Authority (Jupiter Medical Center, Inc.); Series 2013 A, Hospital RB | | | 5.00% | | | | 11/01/2023 | | | | 1,215 | | | | 1,320,912 | |
Reedy Creek Improvement District; | | | | | | | | | | | | | | | | |
Series 2013 1, Ref. Utilities RB | | | 5.00% | | | | 10/01/2021 | | | | 885 | | | | 956,428 | |
Series 2013 1, Ref. Utilities RB | | | 5.00% | | | | 10/01/2022 | | | | 800 | | | | 887,840 | |
| | | | | | | | | | | | | | | | 49,974,244 | |
| | | | |
Georgia-0.95% | | | | | | | | | | | | | | | | |
| | | | |
Fulton (County of) Development Authority (Robert Woodruff); Series 2009 B, Ref. RB | | | 5.25% | | | | 03/15/2024 | | | | 1,000 | | | | 1,001,130 | |
Fulton (County of) Development Authority (Wellstar Health System, Inc.); Series 2017, Anticipation Ctfs. Hospital RB | | | 5.00% | | | | 04/01/2033 | | | | 1,870 | | | | 2,121,459 | |
Macon-Bibb (County of) Urban Development Authority (Academy for Classical Education, Inc.); Series 2017 A, RB(f) | | | 5.75% | | | | 06/15/2037 | | | | 1,540 | | | | 1,548,917 | |
Metropolitan Atlanta Rapid Transit Authority; Series 2016 B, Ref. Sales Tax RB | | | 5.00% | | | | 07/01/2032 | | | | 7,150 | | | | 8,334,683 | |
| | | | | | | | | | | | | | | | 13,006,189 | |
| | | | |
Guam-0.48% | | | | | | | | | | | | | | | | |
| | | | |
Guam (Territory of) International Airport Authority; Series 2013 C, General RB(a) | | | 6.00% | | | | 10/01/2023 | | | | 3,000 | | | | 3,008,520 | |
Guam (Territory of) Power Authority; | | | | | | | | | | | | | | | | |
Series 2012 A, Ref. RB (INS-AGM)(b) | | | 5.00% | | | | 10/01/2021 | | | | 1,500 | | | | 1,612,410 | |
Series 2012 A, Ref. RB (INS-AGM)(b) | | | 5.00% | | | | 10/01/2022 | | | | 1,700 | | | | 1,869,915 | |
| | | | | | | | | | | | | | | | 6,490,845 | |
| | | | |
Hawaii-0.93% | | | | | | | | | | | | | | | | |
| | | | |
Hawaii (State of) Department of Budget & Finance; Series 2012, Ref. Special Purpose Senior Living RB | | | 5.00% | | | | 11/15/2027 | | | | 1,000 | | | | 1,109,470 | |
Hawaii (State of) Department of Transportation (Airports Division); | | | | | | | | | | | | | | | | |
Series 2013, Lease Revenue COP(a) | | | 5.00% | | | | 08/01/2021 | | | | 1,000 | | | | 1,069,750 | |
Series 2013, Lease Revenue COP(a) | | | 5.00% | | | | 08/01/2022 | | | | 2,000 | | | | 2,193,180 | |
Series 2013, Lease Revenue COP(a) | | | 5.00% | | | | 08/01/2023 | | | | 1,250 | | | | 1,397,563 | |
Honolulu (City & County of); Series 2015 A, Ref. Jr. Wastewater System RB(h) | | | 5.00% | | | | 07/01/2031 | | | | 6,000 | | | | 6,953,160 | |
| | | | | | | | | | | | | | | | 12,723,123 | |
See accompanying Notes to Financial Statements which are an integral part of the financial statements.
| | |
| 14 | | Invesco Intermediate Term Municipal Income Fund |
| | | | | | | | | | | | | | |
| | | Interest Rate | | Maturity Date | | | Principal Amount (000) | | | Value | |
Illinois-13.01% | | | | | | | | | | | | | | |
| | | | |
Bartlett (Village of) (Quarry Redevelopment); | | | | | | | | | | | | | | |
Series 2007, Ref. Sr. Lien Tax Increment Allocation RB | | 5.60% | | | 01/01/2023 | | | $ | 715 | | | $ | 715,472 | |
Series 2016, Ref. Sr. Lien Tax Increment Allocation RB | | 4.00% | | | 01/01/2024 | | | | 3,130 | | | | 3,057,321 | |
Bolingbrook (Village of) Special Service AreaNo. 2005-1; Series 2019, Ref. Special Tax RB | | 5.00% | | | 03/01/2033 | | | | 1,645 | | | | 1,665,201 | |
Chicago (City of); | | | | | | | | | | | | | | |
Series 2003 B, Ref. Unlimited Tax GO Bonds | | 5.00% | | | 01/01/2024 | | | | 1,795 | | | | 1,925,443 | |
Series 2004, Ref. Second Lien Water RB | | 5.00% | | | 11/01/2028 | | | | 3,000 | | | | 3,433,560 | |
Series 2007 A, Ref. Unlimited Tax GO Bonds (INS -NATL)(b) | | 5.00% | | | 01/01/2032 | | | | 215 | | | | 215,548 | |
Series 2008 C, Ref. Second Lien Wastewater Transmission RB | | 5.00% | | | 01/01/2029 | | | | 2,500 | | | | 2,786,925 | |
Series 2008 C, Ref. Second Lien Wastewater Transmission RB | | 5.00% | | | 01/01/2030 | | | | 1,500 | | | | 1,667,040 | |
Series 2010 A, Ref. Unlimited Tax GO Bonds (INS-AGM)(b) | | 5.00% | | | 01/01/2029 | | | | 2,500 | | | | 2,559,725 | |
Series 2011, Tax Increment Allocation Revenue COP | | 7.13% | | | 05/01/2021 | | | | 716 | | | | 716,711 | |
Series 2015 A, Unlimited Tax GO Bonds | | 5.38% | | | 01/01/2029 | | | | 5,000 | | | | 5,424,050 | |
Series 2017 A, Ref. Unlimited Tax GO Bonds | | 5.75% | | | 01/01/2034 | | | | 2,500 | | | | 2,798,425 | |
Series 2017 B, Ref. Second Lien Wastewater Transmission RB | | 5.00% | | | 01/01/2033 | | | | 3,000 | | | | 3,336,150 | |
Chicago (City of) (188 West Randolph/Wells Redevelopment); Series 2014, Tax Increment Allocation Revenue COP(f) | | 6.84% | | | 03/15/2033 | | | | 2,290 | | | | 2,289,577 | |
Chicago (City of) (83rd/Stewart Redevelopment); Series 2013, Tax Increment Allocation Revenue COP(f) | | 7.00% | | | 01/15/2029 | | | | 1,208 | | | | 1,208,661 | |
Chicago (City of) (Metramarket Chicago); Series 2010 A, Tax Increment Allocation Revenue COP | | 6.87% | | | 02/15/2024 | | | | 617 | | | | 617,502 | |
Chicago (City of) (Midway Airport); | | | | | | | | | | | | | | |
Series 2013 A, Ref. Second Lien RB(a) | | 5.50% | | | 01/01/2027 | | | | 1,000 | | | | 1,111,890 | |
Series 2013 B, Ref. Second Lien RB | | 5.00% | | | 01/01/2025 | | | | 1,000 | | | | 1,107,240 | |
Series 2014 A, Ref. Second Lien RB(a) | | 5.00% | | | 01/01/2023 | | | | 3,000 | | | | 3,301,980 | |
Chicago (City of) (O’Hare International Airport); | | | | | | | | | | | | | | |
Series 2015 A, Ref. RB(a) | | 5.00% | | | 01/01/2029 | | | | 6,000 | | | | 6,681,780 | |
Series 2017 D, General Sr. Lien Airport RB(a) | | 5.00% | | | 01/01/2031 | | | | 1,000 | | | | 1,138,880 | |
Series 2017 D, General Sr. Lien Airport RB(a) | | 5.00% | | | 01/01/2032 | | | | 1,000 | | | | 1,133,470 | |
Series 2017 D, General Sr. Lien Airport RB(a) | | 5.00% | | | 01/01/2033 | | | | 2,000 | | | | 2,257,840 | |
Chicago (City of) (Roosevelt Square/ABLA Redevelopment); Series 2009 A, Ref. Tax Increment Allocation Revenue COP | | 7.13% | | | 03/15/2022 | | | | 371 | | | | 371,056 | |
Chicago (City of) Board of Education; | | | | | | | | | | | | | | |
Series 2017 C, Ref. Dedicated Unlimited Tax GO Bonds | | 5.00% | | | 12/01/2030 | | | | 2,000 | | | | 2,119,340 | |
Series 2018 A, Ref. Unlimited Tax GO Bonds (INS-AGM)(b) | | 5.00% | | | 12/01/2027 | | | | 1,500 | | | | 1,725,225 | |
Series 2018 A, Ref. Unlimited Tax GO Bonds (INS-AGM)(b) | | 5.00% | | | 12/01/2030 | | | | 1,000 | | | | 1,138,150 | |
Series 2018 A, Unlimited Tax GO Bonds (INS-AGM)(b) | | 5.00% | | | 12/01/2031 | | | | 1,250 | | | | 1,411,063 | |
Series 2018 C, Ref. Unlimited Tax GO Bonds | | 5.00% | | | 12/01/2025 | | | | 1,000 | | | | 1,070,030 | |
Series 2018 E, Educational Purpose TAN, Floating Rate (1 mo. USD LIBOR + 0.67%)(f) | | 2.63% | | | 03/29/2019 | | | | 1,000 | | | | 1,000,000 | |
Chicago (City of) Metropolitan Water Reclamation District; | | | | | | | | | | | | | | |
Series 2011 B, Capital Improvement Limited Tax GO Bonds(h) | | 5.00% | | | 12/01/2024 | | | | 3,000 | | | | 3,248,850 | |
Series 2015 C, Limited Tax GO Green Bonds(h) | | 5.00% | | | 12/01/2027 | | | | 7,000 | | | | 8,018,360 | |
Chicago (City of) Transit Authority; Series 2011, Sales Tax Receipts RB | | 5.25% | | | 12/01/2027 | | | | 1,000 | | | | 1,067,990 | |
Illinois (State of); | | | | | | | | | | | | | | |
Series 2012 A, Unlimited Tax GO Bonds | | 5.00% | | | 01/01/2027 | | | | 1,795 | | | | 1,857,735 | |
Series 2012, Ref. Unlimited Tax GO Bonds (INS-AGM)(b) | | 5.00% | | | 08/01/2022 | | | | 1,250 | | | | 1,349,313 | |
Series 2013, Unlimited Tax GO Bonds | | 5.00% | | | 07/01/2022 | | | | 2,000 | | | | 2,127,620 | |
Series 2013, Unlimited Tax GO Bonds | | 5.50% | | | 07/01/2027 | | | | 2,295 | | | | 2,461,525 | |
Series 2014, Unlimited Tax GO Bonds | | 5.00% | | | 02/01/2020 | | | | 1,300 | | | | 1,329,211 | |
Series 2017 D, Unlimited Tax GO Bonds | | 5.00% | | | 11/01/2024 | | | | 2,000 | | | | 2,155,260 | |
Series 2018 A, Unlimited Tax GO Bonds | | 5.25% | | | 05/01/2023 | | | | 5,000 | | | | 5,365,300 | |
Illinois (State of) Finance Authority (Art Institute of Chicago); Series 2009 A, RB | | 5.25% | | | 03/01/2019 | | | | 1,000 | | | | 1,000,000 | |
See accompanying Notes to Financial Statements which are an integral part of the financial statements.
| | |
| 15 | | Invesco Intermediate Term Municipal Income Fund |
| | | | | | | | | | | | | | |
| | | Interest Rate | | Maturity Date | | | Principal Amount (000) | | | Value | |
Illinois-(continued) | | | | | | | | | | | | | | |
Illinois (State of) Finance Authority (Centegra Health System); | | | | | | | | | | | | | | |
Series 2014 A, RB | | 5.00% | | | 09/01/2026 | | | $ | 1,000 | | | $ | 1,152,210 | |
Series 2014 A, RB | | 5.00% | | | 09/01/2028 | | | | 1,250 | | | | 1,428,400 | |
Illinois (State of) Finance Authority (Lutheran Home & Services); Series 2012, Ref. RB | | 5.00% | | | 05/15/2022 | | | | 1,320 | | | | 1,352,274 | |
Illinois (State of) Finance Authority (Park Place of Elmhurst); | | | | | | | | | | | | | | |
Series 2016 B, RB | | 5.63% | | | 05/15/2020 | | | | 1,159 | | | | 1,099,100 | |
Series 2016, RB | | 2.00% | | | 05/15/2055 | | | | 271 | | | | 13,362 | |
Illinois (State of) Finance Authority (Peace Village); Series 2013, RB | | 6.25% | | | 08/15/2028 | | | | 1,505 | | | | 1,560,941 | |
Illinois (State of) Finance Authority (Rogers Park Montessori School); Series 2014, Ref. Sr. Educational Facilities RB | | 5.00% | | | 02/01/2024 | | | | 395 | | | | 409,046 | |
Illinois (State of) Finance Authority (Rush University Medical Center); Series 2015 A, Ref. RB | | 5.00% | | | 11/15/2034 | | | | 4,500 | | | | 4,968,090 | |
Illinois (State of) Finance Authority (Swedish Covenant Hospital); Series 2016 A, Ref. RB | | 5.25% | | | 08/15/2030 | | | | 5,000 | | | | 5,702,850 | |
Illinois (State of) Metropolitan Pier & Exposition Authority; Series 2002, Dedicated State Tax CAB RB (INS - AGM)(b)(g) | | 0.00% | | | 12/15/2029 | | | | 2,550 | | | | 1,714,900 | |
Illinois (State of) Metropolitan Pier & Exposition Authority (McCormick Place Expansion); | | | | | | | | | | | | | | |
Series 2002 A, Ref. Conv. CAB Dedicated State Tax RB (INS -NATL)(b)(i) | | 5.70% | | | 06/15/2023 | | | | 1,295 | | | | 1,453,832 | |
Series 2002, Dedicated State Tax CAB RB (INS -NATL)(b)(g) | | 0.00% | | | 12/15/2032 | | | | 10,000 | | | | 5,544,100 | |
Series 2012 B, Ref. RB | | 5.00% | | | 12/15/2022 | | | | 5,010 | | | | 5,330,339 | |
Illinois (State of) Toll Highway Authority; | | | | | | | | | | | | | | |
Series 2014 D, Ref. RB(h) | | 5.00% | | | 01/01/2024 | | | | 12,500 | | | | 14,283,625 | |
Series 2016 A, Ref. Sr. RB | | 5.00% | | | 12/01/2031 | | | | 2,305 | | | | 2,626,847 | |
Lake County Community Consolidated School District No. 73 (Hawthorn); Series 2002, Unlimited Tax CAB GO Bonds(e)(g) | | 0.00% | | | 12/01/2021 | | | | 330 | | | | 314,180 | |
Madison & Jersey Counties Community Unit School District No. 11 (Alton); Series 2002, Unlimited Tax CAB GO Bonds(e)(g) | | 0.00% | | | 12/01/2020 | | | | 2,900 | | | | 2,783,855 | |
Manhattan (Village of) Special Service AreaNo. 2004-1 (Brookstone Springs); Series 2015, Ref. Sr. Lien Special Tax RB | | 4.25% | | | 03/01/2024 | | | | 975 | | | | 977,915 | |
Railsplitter Tobacco Settlement Authority; | | | | | | | | | | | | | | |
Series 2010, RB | | 5.25% | | | 06/01/2021 | | | | 3,000 | | | | 3,209,460 | |
Series 2010, RB | | 5.38% | | | 06/01/2021 | | | | 525 | | | | 563,682 | |
Series 2017, RB | | 5.00% | | | 06/01/2027 | | | | 4,000 | | | | 4,646,280 | |
Series 2017, RB | | 5.00% | | | 06/01/2028 | | | | 2,000 | | | | 2,308,080 | |
Regional Transportation Authority; | | | | | | | | | | | | | | |
Series 2002 A, RB (INS-AGM)(b) | | 6.00% | | | 07/01/2027 | | | | 2,700 | | | | 3,408,723 | |
Series 2018 B, RB(h) | | 5.00% | | | 06/01/2031 | | | | 3,800 | | | | 4,426,658 | |
Series 2018 B, RB(h) | | 5.00% | | | 06/01/2032 | | | | 3,995 | | | | 4,609,711 | |
Sales Tax Securitization Corp.; | | | | | | | | | | | | | | |
Series 2017 A, Ref. RB | | 5.00% | | | 01/01/2029 | | | | 1,000 | | | | 1,155,700 | |
Series 2017 A, Ref. RB | | 5.00% | | | 01/01/2030 | | | | 1,000 | | | | 1,147,340 | |
Springfield (City of); | | | | | | | | | | | | | | |
Series 2015, Ref. Electric Sr. Lien RB | | 5.00% | | | 03/01/2032 | | | | 2,000 | | | | 2,243,700 | |
Series 2015, Ref. Sr. Lien Electric RB | | 5.00% | | | 03/01/2033 | | | | 3,500 | | | | 3,914,155 | |
University of Illinois; Series 2011 A, Auxiliary Facilities System RB | | 5.00% | | | 04/01/2026 | | | | 3,425 | | | | 3,617,382 | |
| | | | | | | | | | | | | | 177,933,156 | |
| | | | |
Indiana-0.85% | | | | | | | | | | | | | | |
| | | | |
Northern Indiana Commuter Transportation District; | | | | | | | | | | | | | | |
Series 2016, Limited Obligation RB | | 5.00% | | | 07/01/2027 | | | | 1,800 | | | | 2,111,400 | |
Series 2016, Limited Obligation RB | | 5.00% | | | 07/01/2028 | | | | 1,250 | | | | 1,458,238 | |
Valparaiso (City of) (Pratt Paper, LLC); Series 2013, Exempt Facilities RB(a) | | 5.88% | | | 01/01/2024 | | | | 1,015 | | | | 1,110,227 | |
Whiting (City of) (BP Products North America); Series 2014, Environmental Facilities Floating Rate RB (SIFMA Municipal Swap Index + 0.75%)(a)(c)(d) | | 2.49% | | | 12/02/2019 | | | | 7,000 | | | | 7,005,460 | |
| | | | | | | | | | | | | | 11,685,325 | |
See accompanying Notes to Financial Statements which are an integral part of the financial statements.
| | |
| 16 | | Invesco Intermediate Term Municipal Income Fund |
| | | | | | | | | | | | | | | | |
| | | Interest
Rate | | | Maturity
Date | | | Principal
Amount
(000) | | | Value | |
Iowa-1.32% | | | | | | | | | | | | | | | | |
Ames (City of) (Mary Greeley Medical Center); Series 2011, Hospital RB(c)(e) | | | 5.50% | | | | 06/15/2020 | | | $ | 2,255 | | | $ | 2,362,428 | |
Iowa (State of) Finance Authority (Iowa Fertilizer Co.); | | | | | | | | | | | | | | | | |
Series 2013, Midwestern Disaster Area RB(f) | | | 5.88% | | | | 12/01/2026 | | | | 2,565 | | | | 2,695,379 | |
Series 2013, Ref. Midwestern Disaster Area RB(c) | | | 5.25% | | | | 12/01/2033 | | | | 2,990 | | | | 3,113,666 | |
Iowa (State of) Finance Authority (Iowa Health System); Series 2018, Ref. Floating Rate RB (SIFMA | | | | | | | | | | | | | | | | |
Municipal Swap Index + 0.58%)(c)(d)(f) | | | 2.32% | | | | 01/04/2024 | | | | 3,715 | | | | 3,715,074 | |
Iowa (State of) Finance Authority (Mercy Medical Center); | | | | | | | | | | | | | | | | |
Series 2012, Health Facilities RB | | | 4.00% | | | | 08/15/2022 | | | | 1,905 | | | | 2,037,112 | |
Series 2012, Health Facilities RB | | | 4.00% | | | | 08/15/2023 | | | | 1,200 | | | | 1,280,424 | |
Iowa (State of) Tobacco Settlement Authority; Series 2005 B, Asset-Backed Conv. CAB RB(i) | | | 5.60% | | | | 06/01/2034 | | | | 1,750 | | | | 1,757,700 | |
Iowa Student Loan Liquidity Corp.; Sr. Series 2011A-2, RB(a) | | | 5.50% | | | | 12/01/2025 | | | | 1,075 | | | | 1,120,161 | |
| | | | | | | | | | | | | | | | 18,081,944 | |
| | | | |
Kansas-0.61% | | | | | | | | | | | | | | | | |
Kansas (State of) Development Finance Authority (Adventist Health System); | | | | | | | | | | | | | | | | |
Series 2009, Hospital RB(c)(e) | | | 5.50% | | | | 11/15/2019 | | | | 20 | | | | 20,510 | |
Series 2009, Hospital RB | | | 5.50% | | | | 11/15/2023 | | | | 980 | | | | 1,004,774 | |
Kansas (State of) Development Finance Authority (University of Kansas Health System); Series 2011 | | | | | | | | | | | | | | | | |
H, Health Facilities RB | | | 5.00% | | | | 03/01/2031 | | | | 1,000 | | | | 1,028,710 | |
Kansas (State of) Municipal Energy Agency (Jameson Energy Center); Series 2013, Power Project RB | | | 5.00% | | | | 07/01/2028 | | | | 1,140 | | | | 1,264,910 | |
Lenexa (City of) (Lakeview Village, Inc.); | | | | | | | | | | | | | | | | |
Series 2018 A, Ref. Health Care Facilities RB | | | 5.00% | | | | 05/15/2029 | | | | 1,210 | | | | 1,300,350 | |
Series 2018 A, Ref. Health Care Facilities RB | | | 5.00% | | | | 05/15/2031 | | | | 1,335 | | | | 1,422,002 | |
Wichita (City of) (Kansas Masonic Home); Series2016II-A, Health Care Facilities RB | | | 5.25% | | | | 12/01/2036 | | | | 1,000 | | | | 1,034,620 | |
Wichita (City of) (Presbyterian Manors, Inc.); Series 2018 I, Ref. Health Care Facilities RB | | | 5.00% | | | | 05/15/2033 | | | | 1,140 | | | | 1,191,209 | |
| | | | | | | | | | | | | | | | 8,267,085 | |
| | | | |
Kentucky-2.06% | | | | | | | | | | | | | | | | |
Kentucky (State of) Economic Development Finance Authority (Catholic Health Initiatives); | | | | | | | | | | | | | | | | |
Series 2011 B, Floating Rate RB (SIFMA Municipal Swap Index +
1.40%)(c)(d)(j) | | | 3.14% | | | | 02/01/2025 | | | | 1,430 | | | | 1,452,894 | |
Kentucky (State of) Economic Development Finance Authority (Masonic Home Independent Living II Inc.); Series 2016 A, Ref. RB | | | 5.00% | | | | 05/15/2021 | | | | 770 | | | | 800,646 | |
Kentucky (State of) Economic Development Finance Authority (Next Generation Kentucky Information Highway); | | | | | | | | | | | | | | | | |
Series 2015 A, Sr. RB | | | 5.00% | | | | 07/01/2028 | | | | 1,500 | | | | 1,677,120 | |
Series 2015 A, Sr. RB | | | 5.00% | | | | 07/01/2030 | | | | 3,000 | | | | 3,319,290 | |
Kentucky (State of) Economic Development Finance Authority (Owensboro Health Inc.); Series 2017 A, Ref. Hospital RB | | | 5.00% | | | | 06/01/2032 | | | | 1,435 | | | | 1,571,296 | |
Kentucky (State of) Economic Development Finance Authority (Rosedale Green); Series 2015, Ref. Health Care Facilities RB | | | 5.50% | | | | 11/15/2035 | | | | 3,100 | | | | 3,162,310 | |
Kentucky (State of) Municipal Power Agency; | | | | | | | | | | | | | | | | |
Series 2015 A, Ref. Power System RB(INS-NATL)(b) | | | 5.00% | | | | 09/01/2026 | | | | 1,000 | | | | 1,160,190 | |
Series 2015 A, Ref. Power System RB(INS-NATL)(b) | | | 5.00% | | | | 09/01/2027 | | | | 1,620 | | | | 1,874,227 | |
Series 2015 A, Ref. Power System RB(INS-NATL)(b) | | | 5.00% | | | | 09/01/2028 | | | | 1,260 | | | | 1,455,262 | |
Kentucky (State of) Municipal Power Agency (Prairie State); Series 2016, Ref. Power System RB (INS -NATL)(b) | | | 5.00% | | | | 09/01/2031 | | | | 5,000 | | | | 5,625,450 | |
Kentucky (State of) Property & Building Commission (No. 108); Series 2015 A, Ref. RB | | | 5.00% | | | | 08/01/2029 | | | | 1,000 | | | | 1,131,210 | |
Kentucky (State of) Public Energy Authority; Series 2018 B, Gas Supply RB(c) | | | 4.00% | | | | 01/01/2025 | | | | 2,000 | | | | 2,147,340 | |
Louisville (City of) & Jefferson (County of) Metropolitan Government (Norton Healthcare, Inc.); | | | | | | | | | | | | | | | | |
Series 2016 A, Health System RB | | | 5.00% | | | | 10/01/2033 | | | | 2,450 | | | | 2,745,397 | |
| | | | | | | | | | | | | | | | 28,122,632 | |
| | | | |
Louisiana-1.81% | | | | | | | | | | | | | | | | |
Louisiana (State of) Energy & Power Authority (Rodemacher Unit No. 2); Series 2013, Power RB | | | 5.00% | | | | 01/01/2022 | | | | 1,000 | | | | 1,079,930 | |
See accompanying Notes to Financial Statements which are an integral part of the financial statements.
| | |
| 17 | | Invesco Intermediate Term Municipal Income Fund |
| | | | | | | | | | | | | | | | |
| | | Interest
Rate | | | Maturity
Date | | | Principal
Amount
(000) | | | Value | |
Louisiana-(continued) | | | | | | | | | | | | | | | | |
| | | | |
New Orleans (City of); | | | | | | | | | | | | | | | | |
Series 2014, Ref. Water RB | | | 5.00% | | | | 12/01/2026 | | | $ | 1,250 | | | $ | 1,417,450 | |
Series 2015, Sewerage Service RB | | | 5.00% | | | | 06/01/2030 | | | | 500 | | | | 561,275 | |
Series 2015, Sewerage Service RB | | | 5.00% | | | | 06/01/2032 | | | | 300 | | | | 333,318 | |
Series 2015, Sewerage Service RB | | | 5.00% | | | | 06/01/2033 | | | | 1,050 | | | | 1,161,584 | |
Series 2015, Sewerage Service RB | | | 5.00% | | | | 06/01/2034 | | | | 1,000 | | | | 1,101,500 | |
Series 2015, Sewerage Service RB | | | 5.00% | | | | 06/01/2035 | | | | 500 | | | | 548,375 | |
Series 2015, Water System RB | | | 5.00% | | | | 12/01/2030 | | | | 500 | | | | 562,510 | |
Series 2015, Water System RB | | | 5.00% | | | | 12/01/2031 | | | | 1,750 | | | | 1,957,427 | |
Series 2015, Water System RB | | | 5.00% | | | | 12/01/2032 | | | | 1,000 | | | | 1,113,370 | |
Series 2015, Water System RB | | | 5.00% | | | | 12/01/2034 | | | | 1,200 | | | | 1,323,768 | |
Series 2015, Water System RB | | | 5.00% | | | | 12/01/2035 | | | | 1,165 | | | | 1,280,719 | |
New Orleans (City of) Aviation Board; | | | | | | | | | | | | | | | | |
Series 2015 B, RB(a) | | | 5.00% | | | | 01/01/2027 | | | | 1,750 | | | | 1,973,877 | |
Series 2015 B, RB(a) | | | 5.00% | | | | 01/01/2029 | | | | 1,805 | | | | 2,017,286 | |
New Orleans (City of) Aviation Board (Parking Facilities Corp. Consolitdated Garage System); | | | | | | | | | | | | | | | | |
Series 2018 B, Ref. RB (INS-AGM)(b) | | | 5.00% | | | | 10/01/2030 | | | | 350 | | | | 413,252 | |
St. Tammany (Parish of) Public Trust Financing Authority (Christwood); | | | | | | | | | | | | | | | | |
Series 2015, Ref. RB | | | 5.00% | | | | 11/15/2024 | | | | 1,250 | | | | 1,329,975 | |
Series 2015, Ref. RB | | | 5.25% | | | | 11/15/2029 | | | | 1,250 | | | | 1,332,763 | |
Tobacco Settlement Financing Corp.; Series 2013 A, Ref. Asset-Backed RB | | | 5.50% | | | | 05/15/2030 | | | | 5,000 | | | | 5,176,250 | |
| | | | | | | | | | | | | | | | 24,684,629 | |
| | | | |
Maine-0.07% | | | | | | | | | | | | | | | | |
Maine (State of) Health & Higher Educational Facilities Authority (Maine General Medical Center); | | | | | | | | | | | | | | | | |
Series 2011, RB | | | 5.00% | | | | 07/01/2019 | | | | 1,000 | | | | 1,006,750 | |
| | | | |
Maryland-1.68% | | | | | | | | | | | | | | | | |
Baltimore (City of); Series 2017, Ref. Convention Center Hotel RB | | | 5.00% | | | | 09/01/2033 | | | | 1,105 | | | | 1,240,948 | |
Howard (County of) (Downtown Columbia); Series 2017 A, Special Obligation Tax Allocation RB(f) | | | 4.13% | | | | 02/15/2034 | | | | 1,000 | | | | 996,110 | |
Maryland (State of) Health & Higher Educational Facilities Authority (Adventist Healthcare); | | | | | | | | | | | | | | | | |
Series 2011 A, RB | | | 6.00% | | | | 01/01/2026 | | | | 4,500 | | | | 4,962,330 | |
Maryland (State of) Health & Higher Educational Facilities Authority (Charlestown Community); | | | | | | | | | | | | | | | | |
Series 2010, RB(c)(e) | | | 5.50% | | | | 01/01/2021 | | | | 1,000 | | | | 1,067,410 | |
Maryland (State of) Health & Higher Educational Facilities Authority (LifeBridge Health); | | | | | | | | | | | | | | | | |
Series 2011, RB(c)(e) | | | 6.00% | | | | 07/01/2021 | | | | 535 | | | | 586,569 | |
Maryland (State of) Transportation Authority; Series 2008, Grant & RAB | | | 5.25% | | | | 03/01/2020 | | | | 3,000 | | | | 3,005,160 | |
Maryland Economic Development Corp. (AFCO Cargo BWI II, LLC); Series 2017, Ref. Air Cargo RB(a)(f) | | | 4.00% | | | | 07/01/2024 | | | | 1,805 | | | | 1,891,947 | |
Maryland Economic Development Corp. (Purple Line Light Rail); | | | | | | | | | | | | | | | | |
Series 2016 D, Private Activity RB(a) | | | 5.00% | | | | 03/31/2036 | | | | 2,600 | | | | 2,833,922 | |
Series 2016, Private Activity RB(a) | | | 5.00% | | | | 09/30/2029 | | | | 2,100 | | | | 2,365,902 | |
Maryland Economic Development Corp. (Transportation Facilities); Series 2010 A, RB(e) | | | 5.13% | | | | 06/01/2020 | | | | 1,310 | | | | 1,354,841 | |
Mayor & Council of Rockville (The) (Ingleside at King Farm); Series 2017C-2,TEMPS-70™ Mandatory Paydown Economic Development RB | | | 3.00% | | | | 11/01/2025 | | | | 2,750 | | | | 2,702,590 | |
| | | | | | | | | | | | | | | | 23,007,729 | |
| | | | |
Massachusetts-0.66% | | | | | | | | | | | | | | | | |
Massachusetts (State of) Department of Transportation (Contract Assistance); Series 2018 A, Ref. | | | | | | | | | | | | | | | | |
Sub. Metropolitan Highway Systems RB | | | 5.00% | | | | 01/01/2029 | | | | 495 | | | | 616,810 | |
Massachusetts (State of) Development Finance Agency; | | | | | | | | | | | | | | | | |
Series 2019 A, Ref. RB | | | 5.00% | | | | 07/01/2031 | | | | 1,530 | | | | 1,768,420 | |
Series 2019 A, Ref. RB | | | 5.00% | | | | 07/01/2032 | | | | 2,115 | | | | 2,430,008 | |
Massachusetts (State of) Development Finance Agency (Carleton Willard Village); Series 2010, RB | | | 5.25% | | | | 12/01/2025 | | | | 650 | | | | 666,425 | |
Massachusetts (State of) Development Finance Agency (Newbridge Charles, Inc.); Series 2017, Ref. RB(f) | | | 5.00% | | | | 10/01/2037 | | | | 1,500 | | | | 1,588,935 | |
See accompanying Notes to Financial Statements which are an integral part of the financial statements.
| | |
| 18 | | Invesco Intermediate Term Municipal Income Fund |
| | | | | | | | | | | | | | | | |
| | | Interest
Rate | | | Maturity
Date | | | Principal
Amount
(000) | | | Value | |
Massachusetts-(continued) | | | | | | | | | | | | | | | | |
Massachusetts (State of) Development Finance Agency (Sabis International Charter School); | | | | | | | | | | | | | | | | |
Series 2009 A, RB(c)(e) | | | 6.70% | | | | 10/15/2019 | | | $ | 500 | | | $ | 515,690 | |
Massachusetts (State of) Development Finance Agency (Suffolk University); Series 2017, Ref. RB | | | 5.00% | | | | 07/01/2034 | | | | 1,000 | | | | 1,120,610 | |
Massachusetts (State of) Water Resources Authority; Series 2007 B, Ref. General RB (INS- AGM)(b) | | | 5.25% | | | | 08/01/2025 | | | | 300 | | | | 363,339 | |
| | | | | | | | | | | | | | | | 9,070,237 | |
| | | | |
Michigan-3.99% | | | | | | | | | | | | | | | | |
Charyl Stockwell Academy; Series 2015, Ref. Public School Academy RB | | | 4.88% | | | | 10/01/2023 | | | | 335 | | | | 335,462 | |
Detroit (City of) Downtown Development Authority; | | | | | | | | | | | | | | | | |
Series 2018 A, Tax Increment Allocation RB (INS- AGM)(b) | | | 5.00% | | | | 07/01/2030 | | | | 700 | | | | 767,914 | |
Series 2018 A, Tax Increment Allocation RB (INS- AGM)(b) | | | 5.00% | | | | 07/01/2032 | | | | 2,000 | | | | 2,180,660 | |
Great Lakes Water Authority; Series 2018 B, Ref. Second Lien Water Supply System RB | | | 5.00% | | | | 07/01/2029 | | | | 3,000 | | | | 3,692,580 | |
Michigan (State of) Buillding Authority (Facilities Program); Series 2015 I, Ref. RB | | | 5.00% | | | | 04/15/2031 | | | | 5,000 | | | | 5,812,400 | |
Michigan (State of) Finance Authority (Detroit Water & Sewerage Department); | | | | | | | | | | | | | | | | |
Series 2014D-2, Ref. Local Government Loan Program RB (INS- AGM)(b) | | | 5.00% | | | | 07/01/2026 | | | | 9,000 | | | | 10,266,660 | |
Series 2014D-4, Ref. Local Government Loan Program RB | | | 5.00% | | | | 07/01/2029 | | | | 5,000 | | | | 5,586,450 | |
Michigan (State of) Finance Authority (Henry Ford Health System); Series 2016, Ref. RB | | | 5.00% | | | | 11/15/2028 | | | | 2,000 | | | | 2,328,680 | |
Michigan (State of) Finance Authority (Local Government Loan Program); Series 2014 F, Ref. RB | | | 4.50% | | | | 10/01/2029 | | | | 5,000 | | | | 5,302,700 | |
Michigan (State of) Finance Authority (Mclaren Health Care); Series 2015D-2, Ref. Hospital Floating Rate RB (1 mo. USD LIBOR + 0.75%)(c)(d) | | | 2.45% | | | | 10/15/2020 | | | | 2,500 | | | | 2,510,375 | |
Michigan (State of) Finance Authority (Trinity Health); Series 2015, Hospital Floating Rate RB (1 mo. USD LIBOR + 0.54%)(c)(d) | | | 2.21% | | | | 12/01/2020 | | | | 3,500 | | | | 3,505,495 | |
Michigan (State of) Finance Authority (Wayne (County of) Criminal Justice Center); Series 2018, Sr. Lien RB | | | 5.00% | | | | 11/01/2029 | | | | 1,500 | | | | 1,814,115 | |
Michigan (State of) Tobacco Settlement Finance Authority; Series 2007 A, Sr. Asset-Backed RB | | | 6.00% | | | | 06/01/2048 | | | | 3,000 | | | | 2,955,750 | |
Star International Academy; Series 2012, Ref. Public School Academy RB | | | 5.00% | | | | 03/01/2033 | | | | 2,075 | | | | 2,118,596 | |
Summit Academy North; | | | | | | | | | | | | | | | | |
Series 2016, Ref. Public School Academy RB | | | 4.00% | | | | 11/01/2021 | | | | 1,000 | | | | 1,001,460 | |
Series 2016, Ref. Public School Academy RB | | | 5.00% | | | | 11/01/2031 | | | | 1,665 | | | | 1,657,175 | |
Wayne (County of) Airport Authority (Detroit Metropolitan Airport); Series 2012 D, Ref. RB(a) | | | 5.00% | | | | 12/01/2028 | | | | 2,500 | | | | 2,745,575 | |
| | | | | | | | | | | | | | | | 54,582,047 | |
| | | | |
Minnesota-0.67% | | | | | | | | | | | | | | | | |
Maple Grove (City of) (Maple Grove Hospital Corp.); | | | | | | | | | | | | | | | | |
Series 2017, Ref. Health Care Facilities RB | | | 5.00% | | | | 05/01/2031 | | | | 500 | | | | 573,350 | |
Series 2017, Ref. Health Care Facilities RB | | | 5.00% | | | | 05/01/2032 | | | | 1,600 | | | | 1,821,408 | |
Minnesota (State of) Higher Education Facilities Authority (Bethel University); Series 2017, Ref. RB | | | 5.00% | | | | 05/01/2032 | | | | 1,750 | | | | 1,905,015 | |
St. Louis Park (City of), Minnesota (Place Via Sol Project); Series 2018, Ref. RB(c)(f) | | | 6.00% | | | | 07/01/2027 | | | | 1,250 | | | | 1,258,000 | |
St. Paul (City of) Housing & Redevelopment Authority (High School for Recording Arts); Series 2015, Charter School Lease RB | | | 5.13% | | | | 10/01/2023 | | | | 280 | | | | 284,953 | |
Woodbury (City of) Housing & Redevelopment Authority (St. Therese of Woodbury); | | | | | | | | | | | | | | | | |
Series 2014, RB | | | 2.90% | | | | 12/01/2019 | | | | 455 | | | | 454,754 | |
Series 2014, RB | | | 3.15% | | | | 12/01/2020 | | | | 620 | | | | 619,045 | |
Series 2014, RB | | | 3.60% | | | | 12/01/2021 | | | | 225 | | | | 226,220 | |
Series 2014, RB | | | 4.00% | | | | 12/01/2022 | | | | 490 | | | | 498,501 | |
Series 2014, RB | | | 4.00% | | | | 12/01/2023 | | | | 300 | | | | 305,043 | |
Series 2014, RB | | | 4.00% | | | | 12/01/2024 | | | | 175 | | | | 176,873 | |
Series 2014, RB | | | 5.00% | | | | 12/01/2029 | | | | 1,000 | | | | 1,036,760 | |
| | | | | | | | | | | | | | | | 9,159,922 | |
| | | | |
Mississippi–0.05% | | | | | | | | | | | | | | | | |
Mississippi Business Finance Corp. (System Energy Resources, Inc.); Series 1998, PCR | | | 5.88% | | | | 04/01/2022 | | | | 625 | | | | 626,213 | |
See accompanying Notes to Financial Statements which are an integral part of the financial statements.
| | |
| 19 | | Invesco Intermediate Term Municipal Income Fund |
| | | | | | | | | | | | | | | | |
| | | Interest
Rate | | | Maturity
Date | | | Principal
Amount
(000) | | | Value | |
Missouri-2.24% | | | | | | | | | | | | | | | | |
Boone (County of) (Boone Hospital Center); Series 2016, Ref. Hospital RB | | | 5.00% | | | | 08/01/2026 | | | $ | 3,050 | | | $ | 3,382,907 | |
Bridgeton (City of) Industrial Development Authority (Sarah Community); | | | | | | | | | | | | | | | | |
Series 2013, Ref. RB | | | 4.00% | | | | 05/01/2024 | | | | 500 | | | | 491,740 | |
Series 2013, Ref. RB | | | 4.50% | | | | 05/01/2028 | | | | 1,500 | | | | 1,475,610 | |
Cape Girardeau (County of) Industrial Development Authority; Series 2017, Ref. Health Facilities RB | | | 5.00% | | | | 03/01/2029 | | | | 100 | | | | 113,141 | |
Cape Girardeau (County of) Industrial Development Authority (South Eastern Health); Series 2017, Ref. Health Facilities RB | | | 5.00% | | | | 03/01/2036 | | | | 3,000 | | | | 3,264,750 | |
Cape Girardeau (County of) Industrial Development Authority (St. Francis Medical Center); | | | | | | | | | | | | | | | | |
Series 2009 A, Health Facilities RB(c)(e) | | | 5.00% | | | | 06/01/2019 | | | | 525 | | | | 529,284 | |
Kansas City (City of); Series 2017 C, Ref. Special Obligation RB | | | 5.00% | | | | 09/01/2032 | | | | 1,850 | | | | 2,139,192 | |
Kansas City (City of) Industrial Development Authority (Downtown Redevelopment District); | | | | | | | | | | | | | | | | |
Series 2011 A, Ref. RB | | | 5.50% | | | | 09/01/2023 | | | | 1,000 | | | | 1,087,250 | |
Series 2011 A, Ref. RB | | | 5.50% | | | | 09/01/2024 | | | | 2,000 | | | | 2,171,940 | |
Series 2011 A, Ref. RB | | | 5.50% | | | | 09/01/2028 | | | | 2,000 | | | | 2,170,920 | |
Kirkwood (City of) Industrial Development Authority (Aberdeen Heights); Series 2017, Ref. Retirement Community RB | | | 5.25% | | | | 05/15/2032 | | | | 2,685 | | | | 2,903,801 | |
Manchester (City of) (Highway 141/Manchester Road); Series 2010, Ref. Transportation Tax Increment Allocation RB | | | 6.00% | | | | 11/01/2025 | | | | 630 | | | | 628,236 | |
Missouri (State of) Health & Educational Facilities Authority (Lutheran Senior Service); Series A, RB | | | 5.00% | | | | 02/01/2029 | | | | 1,100 | | | | 1,218,877 | |
Missouri (State of) Health & Educational Facilities Authority (Lutheran Senior Services); | | | | | | | | | | | | | | | | |
Series 2016 B, Ref. Senior Living Facilities RB | | | 5.00% | | | | 02/01/2032 | | | | 1,000 | | | | 1,075,200 | |
Series 2016, Ref. Senior Living Facilities RB | | | 5.00% | | | | 02/01/2033 | | | | 1,305 | | | | 1,398,986 | |
Missouri (State of) Joint Municipal Electric Utility Commission (Iatan 2); Series 2014 A, Ref. Power Project RB | | | 5.00% | | | | 01/01/2029 | | | | 2,000 | | | | 2,247,040 | |
Missouri (State of) Joint Municipal Electric Utility Commission (Prairie Street); | | | | | | | | | | | | | | | | |
Series 2015 A, Ref. Power Project RB | | | 5.00% | | | | 06/01/2027 | | | | 1,500 | | | | 1,746,255 | |
Series 2015 A, Ref. Power Project RB | | | 5.00% | | | | 12/01/2027 | | | | 640 | | | | 743,846 | |
St. Louis (County of) Industrial Development Authority (Friendship Village of Sunset Hills); | | | | | | | | | | | | | | | | |
Series 2012, Senior Living Facilities RB | | | 4.50% | | | | 09/01/2023 | | | | 340 | | | | 352,101 | |
Series 2012, Senior Living Facilities RB | | | 5.00% | | | | 09/01/2032 | | | | 1,490 | | | | 1,539,081 | |
| | | | | | | | | | | | | | | | 30,680,157 | |
| | | | |
Nebraska-1.59% | | | | | | | | | | | | | | | | |
Central Plains Energy Project; Series 2014, Gas Supply RB(c) | | | 5.00% | | | | 12/01/2019 | | | | 3,445 | | | | 3,517,518 | |
Central Plains Energy Project (No. 3); | | | | | | | | | | | | | | | | |
Series 2012, Gas RB(k) | | | 5.00% | | | | 09/01/2032 | | | | 5,000 | | | | 5,368,650 | |
Series 2012, Gas RB(k) | | | 5.25% | | | | 09/01/2037 | | | | 5,000 | | | | 5,411,700 | |
Lincoln (County of) Hospital Authority No. 1 (Great Plains Regional Medical Center); | | | | | | | | | | | | | | | | |
Series 2012, Ref. RB | | | 4.00% | | | | 11/01/2022 | | | | 720 | | | | 755,071 | |
Series 2012, Ref. RB | | | 5.00% | | | | 11/01/2023 | | | | 500 | | | | 536,615 | |
Nebraska (State of) Municipal Energy Agency; Series 2009 A, Ref. Power Supply System RB(c)(e) | | | 5.13% | | | | 04/01/2019 | | | | 560 | | | | 561,523 | |
Public Power Generation Agency (Whelan Energy Center Unit 2); Series 2016 A, Ref. RB | | | 5.00% | | | | 01/01/2034 | | | | 5,000 | | | | 5,614,450 | |
| | | | | | | | | | | | | | | | 21,765,527 | |
| | | | |
Nevada-0.55% | | | | | | | | | | | | | | | | |
Carson City (City of) (Carson-Tahoe Regional Medical Center); Series 2012, Ref. Hospital RB | | | 5.00% | | | | 09/01/2027 | | | | 1,000 | | | | 1,084,420 | |
Clark (County of) (Special Improvement District No. 159); | | | | | | | | | | | | | | | | |
Series 2015, Local Improvement Special Assessment RB | | | 5.00% | | | | 08/01/2026 | | | | 150 | | | | 158,053 | |
Series 2015, Local Improvement Special Assessment RB | | | 5.00% | | | | 08/01/2029 | | | | 1,370 | | | | 1,423,951 | |
Series 2015, Local Improvement Special Assessment RB | | | 5.00% | | | | 08/01/2031 | | | | 1,510 | | | | 1,561,763 | |
Series 2015, Local Improvement Special Assessment RB | | | 5.00% | | | | 08/01/2032 | | | | 370 | | | | 381,433 | |
Humboldt (County of) (Idaho Power Co.); Series 2003, Ref. PCR | | | 5.15% | | | | 12/01/2024 | | | | 1,800 | | | | 1,827,792 | |
Las Vegas (City of) Redevelopment Agency; Series 2009 A, Tax Increment Allocation RB(c)(e) | | | 7.00% | | | | 06/15/2019 | | | | 1,000 | | | | 1,014,900 | |
| | | | | | | | | | | | | | | | 7,452,312 | |
See accompanying Notes to Financial Statements which are an integral part of the financial statements.
| | |
| 20 | | Invesco Intermediate Term Municipal Income Fund |
| | | | | | | | | | | | | | | | |
| | | Interest
Rate | | | Maturity
Date | | | Principal
Amount
(000) | | | Value | |
New Hampshire-0.12% | | | | | | | | | | | | | | | | |
New Hampshire (State of) Health & Education Facilities Authority (Southern New Hampshire | | | | | | | | | | | | | | | | |
University); Series 2012, RB | | | 5.00% | | | | 01/01/2027 | | | $ | 1,500 | | | $ | 1,620,330 | |
| | | | |
New Jersey-6.72% | | | | | | | | | | | | | | | | |
Gloucester (County of) Pollution Control Financing Authority (Logan); Series 2014 A, Ref. PCR(a) | | | 5.00% | | | | 12/01/2024 | | | | 4,000 | | | | 4,241,040 | |
New Jersey (State of) Economic Development Authority; | | | | | | | | | | | | | | | | |
Series 2005N-1, Ref. School Facilities Construction RB (INS - NATL)(b)(h)(l) | | | 5.50% | | | | 09/01/2022 | | | | 7,500 | | | | 8,284,275 | |
Series 2012, Ref. RB | | | 5.00% | | | | 06/15/2023 | | | | 2,000 | | | | 2,160,460 | |
Series 2012, Ref. RB | | | 5.00% | | | | 06/15/2025 | | | | 3,050 | | | | 3,277,134 | |
Series 2017 A, Ref. Motor Vehicle Surcharge Sub. RB(INS-BAM)(b) | | | 5.00% | | | | 07/01/2028 | | | | 5,035 | | | | 5,809,131 | |
Series 2017 DDD, RB | | | 5.00% | | | | 06/15/2031 | | | | 3,670 | | | | 4,001,768 | |
New Jersey (State of) Economic Development Authority (Paterson Charter School for Science and Technology Inc.); Series 2012 C, RB | | | 5.00% | | | | 07/01/2022 | | | | 1,095 | | | | 1,094,255 | |
New Jersey (State of) Economic Development Authority (Paterson Charter School for Science and Technology, Inc.); Series 2012 C, RB | | | 5.00% | | | | 07/01/2032 | | | | 475 | | | | 437,128 | |
New Jersey (State of) Economic Development Authority (The Goethals Bridge Replacement); | | | | | | | | | | | | | | | | |
Series 2013, Private Activity RB(a) | | | 5.00% | | | | 07/01/2021 | | | | 425 | | | | 450,623 | |
Series 2013, Private Activity RB(a) | | | 5.50% | | | | 01/01/2026 | | | | 1,390 | | | | 1,571,631 | |
Series 2013, Private Activity RB(a) | | | 5.50% | | | | 01/01/2027 | | | | 2,130 | | | | 2,398,018 | |
Series 2013, Private Activity RB(a) | | | 5.00% | | | | 01/01/2028 | | | | 1,000 | | | | 1,097,190 | |
New Jersey (State of) Health Care Facilities Financing Authority (Meridian Health System Obligated Group); | | | | | | | | | | | | | | | | |
Series 2011, Ref. RB | | | 5.00% | | | | 07/01/2025 | | | | 1,500 | | | | 1,652,715 | |
Series 2011, Ref. RB | | | 5.00% | | | | 07/01/2027 | | | | 2,000 | | | | 2,196,840 | |
New Jersey (State of) Health Care Facilities Financing Authority (Princeton Healthcare System); | | | | | | | | | | | | | | | | |
Series 2016, Ref. RB | | | 5.00% | | | | 07/01/2030 | | | | 1,200 | | | | 1,401,540 | |
Series 2016, Ref. RB | | | 5.00% | | | | 07/01/2031 | | | | 1,000 | | | | 1,160,290 | |
New Jersey (State of) Health Care Facilities Financing Authority (St. Clare’s Hospital, Inc.); | | | | | | | | | | | | | | | | |
Series 2004 A, Ref. RB(e) | | | 5.25% | | | | 07/01/2020 | | | | 1,000 | | | | 1,047,370 | |
New Jersey (State of) Higher Education Student Assistance Authority; Series 2018 B, Ref. Sr. Student Loan RB(a) | | | 5.00% | | | | 12/01/2025 | | | | 2,250 | | | | 2,590,673 | |
New Jersey (State of) Transportation Trust Fund Authority; | | | | | | | | | | | | | | | | |
Series 2010 D, Transportation System RB | | | 5.25% | | | | 12/15/2023 | | | | 4,000 | | | | 4,489,040 | |
Series 2013 AA, Transportation Program RB | | | 5.00% | | | | 06/15/2021 | | | | 5,270 | | | | 5,590,680 | |
Series 2014, Transportation Program Floating Rate RN (SIFMA Municipal Swap Index + 1.00%)(c)(d) | | | 2.74% | | | | 12/15/2019 | | | | 2,500 | | | | 2,503,050 | |
Series 2018 A, Ref. Federal Highway Reimbursement RN | | | 5.00% | | | | 06/15/2023 | | | | 2,500 | | | | 2,764,000 | |
Series 2018 A, Ref. Federal Highway Reimbursement RN(h)(l) | | | 5.00% | | | | 06/15/2029 | | | | 4,500 | | | | 5,062,500 | |
Series 2018 A, Ref. Federal Highway Reimbursement RN(h) | | | 5.00% | | | | 06/15/2030 | | | | 2,000 | | | | 2,234,240 | |
Series 2018 A, Ref. RB | | | 5.00% | | | | 12/15/2032 | | | | 5,000 | | | | 5,504,700 | |
North Hudson Sewerage Authority; | | | | | | | | | | | | | | | | |
Series 2012 A, Sr. Lien Gross Revenue Lease Ctfs.(c)(e) | | | 5.00% | | | | 06/01/2022 | | | | 90 | | | | 99,296 | |
Series 2012 A, Sr. Lien Gross Revenue Lease Ctfs. | | | 5.00% | | | | 06/01/2024 | | | | 515 | | | | 561,592 | |
Salem (County of) Pollution Control Financing Authority (Chambers); Series 2014 A, Ref. PCR(a) | | | 5.00% | | | | 12/01/2023 | | | | 5,000 | | | | 5,297,900 | |
Tobacco Settlement Financing Corp.; | | | | | | | | | | | | | | | | |
Series 2018 A, Ref. RB | | | 5.00% | | | | 06/01/2029 | | | | 2,500 | | | | 2,909,600 | |
Series 2018 A, Ref. RB | | | 5.00% | | | | 06/01/2030 | | | | 5,000 | | | | 5,766,800 | |
Series 2018 A, Ref. RB | | | 5.00% | | | | 06/01/2031 | | | | 3,750 | | | | 4,289,625 | |
| | | | | | | | | | | | | | | | 91,945,104 | |
| | | | |
New Mexico-0.97% | | | | | | | | | | | | | | | | |
Farmington (City of) (Public Service Co. of New Mexico San Juan); Series 2010 A, Ref. Floating Rate PCR(c) | | | 5.20% | | | | 06/01/2020 | | | | 1,700 | | | | 1,751,272 | |
New Mexico (State of) Hospital Equipment Loan Council (Haverland Charter Lifestyle Group); | | | | | | | | | | | | | | | | |
Series 2013, First Mortgage RB | | | 4.00% | | | | 07/01/2022 | | | | 1,375 | | | | 1,400,327 | |
See accompanying Notes to Financial Statements which are an integral part of the financial statements.
| | |
| 21 | | Invesco Intermediate Term Municipal Income Fund |
| | | | | | | | | | | | | | | | |
| | | Interest
Rate | | | Maturity
Date | | | Principal
Amount
(000) | | | Value | |
New Mexico-(continued) | | | | | | | | | | | | | | | | |
| | | | |
New Mexico (State of) Hospital Equipment Loan Council (La Vida Llena); Series 2010 A, First Mortgage RB | | | 5.00% | | | | 07/01/2019 | | | $ | 140 | | | $ | 141,169 | |
New Mexico (State of) Municipal Energy Acquisition Authority; Subseries 2014 B, Gas Supply Floating Rate RB (1 mo. USD LIBOR + 0.75%)(c)(d) | | | 2.42% | | | | 08/01/2019 | | | | 10,000 | | | | 10,002,100 | |
| | | | | | | | | | | | | | | | 13,294,868 | |
| | | | |
New York-7.75% | | | | | | | | | | | | | | | | |
| | | | |
Brooklyn Arena Local Development Corp. (Barclays Center); | | | | | | | | | | | | | | | | |
Series 2009, PILOT RB(e) | | | 5.75% | | | | 07/15/2019 | | | | 290 | | | | 294,512 | |
Series 2009, PILOT RB | | | 5.75% | | | | 07/15/2019 | | | | 710 | | | | 719,684 | |
Build NYC Resource Corp. (Pratt Paper Inc.); | | | | | | | | | | | | | | | | |
Series 2014, Ref. Waste Disposal RB(a)(f) | | | 3.75% | | | | 01/01/2020 | | | | 375 | | | | 378,278 | |
Series 2014, Ref. Waste Disposal RB(a)(f) | | | 4.50% | | | | 01/01/2025 | | | | 1,000 | | | | 1,085,870 | |
Long Island (City of) Power Authority; Series 2014 A, Ref. RB | | | 5.00% | | | | 09/01/2034 | | | | 4,000 | | | | 4,500,400 | |
Metropolitan Transportation Authority; | | | | | | | | | | | | | | | | |
Subseries 2012A-2, Transportation Floating Rate RB (SIFMA Municipal Swap Index + 0.58%)(c)(d) | | | 2.32% | | | | 06/01/2019 | | | | 5,000 | | | | 5,002,950 | |
Subseries 2012G-4, Ref. Floating Rate RB (1 mo. USD LIBOR + 0.55%)(c)(d) | | | 2.22% | | | | 11/01/2022 | | | | 2,985 | | | | 2,981,239 | |
Subseries 2014D-2, Floating Rate RB (SIFMA Municipal Swap Index + 0.45%)(c)(d) | | | 2.19% | | | | 11/15/2022 | | | | 3,500 | | | | 3,464,335 | |
Metropolitan Transportation Authority (Green Bonds); Series 2017C-2, Ref. CAB RB(g) | | | 0.00% | | | | 11/15/2029 | | | | 1,000 | | | | 712,410 | |
Nassau County Tobacco Settlement Corp.; Series 2006A-2, Sr. Asset-Backed Conv. CAB RB(i) | | | 5.25% | | | | 06/01/2026 | | | | 2,100 | | | | 2,100,336 | |
New York & New Jersey (States of) Port Authority; | | | | | | | | | | | | | | | | |
Two Hundred Second Series 2017, Ref. Consolidated RB(a) | | | 5.00% | | | | 10/15/2035 | | | | 3,000 | | | | 3,412,620 | |
Two Hundred Seventh Series 2018, Ref. Consolidated RB(a)(h) | | | 5.00% | | | | 09/15/2028 | | | | 9,000 | | | | 10,841,580 | |
New York (City of); | | | | | | | | | | | | | | | | |
Series 2016 E, Ref. Unlimited Tax GO Bonds | | | 5.00% | | | | 08/01/2027 | | | | 5,000 | | | | 5,991,650 | |
Subseries 2015F-5, VRD Unlimited Tax GO Bonds(m) | | | 1.55% | | | | 06/01/2044 | | | | 3,000 | | | | 3,000,000 | |
New York (City of) Transitional Finance Authority; Series 2018S-2A, Ref. Building Aid RB | | | 5.00% | | | | 07/15/2034 | | | | 5,000 | | | | 5,900,050 | |
New York (State of) Dormitory Authority (Montefiore Obligated Group); | | | | | | | | | | | | | | | | |
Series 2018 A, Ref. RB | | | 5.00% | | | | 08/01/2028 | | | | 1,755 | | | | 2,092,241 | |
Series 2018 A, Ref. RB | | | 5.00% | | | | 08/01/2030 | | | | 2,420 | | | | 2,834,473 | |
New York (State of) Dormitory Authority (Orange Regional Medical Center); | | | | | | | | | | | | | | | | |
Series 2017, Ref. RB(f) | | | 5.00% | | | | 12/01/2033 | | | | 2,000 | | | | 2,239,640 | |
Series 2017, Ref. RB(f) | | | 5.00% | | | | 12/01/2034 | | | | 1,000 | | | | 1,115,540 | |
New York (State of) Thruway Authority; | | | | | | | | | | | | | | | | |
Series 2018 L, Ref. RB | | | 5.00% | | | | 01/01/2030 | | | | 500 | | | | 606,415 | |
Series 2018 L, Ref. RB | | | 5.00% | | | | 01/01/2031 | | | | 1,000 | | | | 1,203,420 | |
New York Transportation Development Corp. (American Airlines, Inc.); Series 2016, Ref. Special Facilities RB(a) | | | 5.00% | | | | 08/01/2026 | | | | 5,000 | | | | 5,238,250 | |
New York Transportation Development Corp. (Delta Air Lines, Inc. LaGuardia Airport Terminal C&D Redevelopment); | | | | | | | | | | | | | | | | |
Series 2018, Special Facilities RB(a) | | | 5.00% | | | | 01/01/2029 | | | | 10,545 | | | | 12,266,155 | |
Series 2018, Special Facilities RB(a) | | | 5.00% | | | | 01/01/2032 | | | | 5,000 | | | | 5,704,400 | |
Series 2018, Special Facilities RB(a) | | | 5.00% | | | | 01/01/2036 | | | | 2,500 | | | | 2,801,900 | |
Niagara Falls (City of); Series 1994, Public Improvement Unlimited Tax GO Bonds (INS -NATL)(b) | | | 6.90% | | | | 03/01/2020 | | | | 5 | | | | 5,019 | |
Onondaga Civic Development Corp. (St. Joseph’s Hospital Health Center); Series 2014 A, RB(c)(e) | | | 4.63% | | | | 07/01/2019 | | | | 1,000 | | | | 1,009,940 | |
Rockland Tobacco Asset Securitization Corp.; Series 2001, Tobacco Settlement Asset-Backed RB | | | 5.63% | | | | 08/15/2035 | | | | 3,415 | | | | 3,501,126 | |
Syracuse (City of) Industrial Development Agency (Carousel Center); Series 2016 A, Ref. PILOT RB(a) | | | 5.00% | | | | 01/01/2032 | | | | 1,250 | | | | 1,368,638 | |
Triborough Bridge & Tunnel Authority; Subseries 2016B-4A, Ref. General Floating Rate RB (1 mo. USD LIBOR + 0.70%)(c)(d) | | | 2.37% | | | | 02/01/2021 | | | | 5,500 | | | | 5,548,565 | |
Triborough Bridge & Tunnel Authority (MTA Bridges and Tunnels); Series 2018 D, General Floating Rate RB (1 mo. USD SOFR + 0.50%)(c)(d) | | | 2.10% | | | | 10/01/2020 | | | | 3,000 | | | | 3,003,330 | |
See accompanying Notes to Financial Statements which are an integral part of the financial statements.
| | |
| 22 | | Invesco Intermediate Term Municipal Income Fund |
| | | | | | | | | | | | | | |
| | | Interest
Rate | | Maturity
Date | | | Principal
Amount
(000) | | | Value | |
| | | | |
New York-(continued) | | | | | | | | | | | | | | |
TSASC, Inc.; | | | | | | | | | | | | | | |
Series 2017 A, Ref. Tobacco Settlement RB | | 5.00% | | | 06/01/2033 | | | $ | 1,500 | | | $ | 1,666,605 | |
Series 2017 A, Ref. Tobacco Settlement RB | | 5.00% | | | 06/01/2034 | | | | 1,000 | | | | 1,105,030 | |
Series 2017 A, Tobacco Settlement Asset-Backed RB | | 5.00% | | | 06/01/2032 | | | | 2,000 | | | | 2,231,260 | |
| | | | | | | | | | | | | | 105,927,861 | |
| | | | |
North Carolina-1.64% | | | | | | | | | | | | | | |
Charlotte (City of) & Mecklenburg (County of) Hospital Authority (Carolinas HealthCare System); | | | | | | | | | | | | | | |
Series 2018 E, Ref. Health Care System RB | | 2.19% | | | 12/01/2021 | | | | 3,000 | | | | 2,996,490 | |
Charlotte (City of) (Charlotte Douglas International Airport); | | | | | | | | | | | | | | |
Series 2017 A, Airport RB | | 5.00% | | | 07/01/2034 | | | | 750 | | | | 879,120 | |
Series 2017 A, Airport RB | | 5.00% | | | 07/01/2035 | | | | 1,000 | | | | 1,166,810 | |
New Hanover (County of) (New Hanover Regional Medical Center); Series 2017, Ref. RB | | 5.00% | | | 10/01/2027 | | | | 1,100 | | | | 1,320,605 | |
New Hanover (County of) North Carolina (New Hanover Regional Medical Center); Series 2017, Hospital RB | | 5.00% | | | 10/01/2034 | | | | 1,000 | | | | 1,134,650 | |
North Carolina (State of) Department of Transportation(I-77 HOT Lanes); | | | | | | | | | | | | | | |
Series 2015, RB(a) | | 5.00% | | | 06/30/2026 | | | | 1,700 | | | | 1,875,865 | |
Series 2015, RB(a) | | 5.00% | | | 06/30/2027 | | | | 1,215 | | | | 1,332,672 | |
Series 2015, RB(a) | | 5.00% | | | 06/30/2029 | | | | 1,340 | | | | 1,457,009 | |
Series 2015, RB(a) | | 5.00% | | | 06/30/2030 | | | | 1,405 | | | | 1,522,711 | |
North Carolina (State of) Medical Care Commission (Lutheran Services); Series 2012, Ref. First Mortgage Health Care Facilities RB | | 4.25% | | | 03/01/2024 | | | | 1,340 | | | | 1,392,260 | |
North Carolina (State of) Municipal Power Agency #1 (Catawba); Series 2015 A, Ref. Electric RB | | 5.00% | | | 01/01/2028 | | | | 5,000 | | | | 5,876,450 | |
North Carolina (State of) Turnpike Authority; Series 2017, Ref. Sr. Lien Triangle Expressway System RB (INS-AGM)(b) | | 5.00% | | | 01/01/2031 | | | | 1,250 | | | | 1,444,350 | |
| | | | | | | | | | | | | | 22,398,992 | |
| | | | |
North Dakota-0.26% | | | | | | | | | | | | | | |
Burleigh (County of) (University of Mary); | | | | | | | | | | | | | | |
Series 2016, Education Facilities RB | | 4.38% | | | 04/15/2026 | | | | 755 | | | | 763,630 | |
Series 2016, Education Facilities RB | | 5.10% | | | 04/15/2036 | | | | 2,815 | | | | 2,844,951 | |
| | | | | | | | | | | | | | 3,608,581 | |
| | | | |
Ohio-2.76% | | | | | | | | | | | | | | |
Adams (County of) (Adams County Hospital); Series 2005, Hospital Facility Improvement RB | | 6.25% | | | 09/01/2020 | | | | 415 | | | | 404,559 | |
American Municipal Power, Inc. (Amp Fremont Energy Center); Series 2012, RB | | 5.00% | | | 02/15/2021 | | | | 1,250 | | | | 1,328,663 | |
American Municipal Power, Inc. (Combined Hydroelectric); Series 2018 A, RB(c) | | 2.25% | | | 08/15/2021 | | | | 1,500 | | | | 1,505,595 | |
Buckeye Tobacco Settlement Financing Authority; Series 2007A-2, Sr. Asset-Backed Turbo RB | | 5.88% | | | 06/01/2047 | | | | 4,000 | | | | 3,755,000 | |
Centerville (City of) (Graceworks Lutheran Services); Series 2017, Ref. Health Care RB | | 5.25% | | | 11/01/2037 | | | | 2,195 | | | | 2,300,601 | |
Cleveland (City of); Series 2012 A, Ref. Airport System RB | | 5.00% | | | 01/01/2027 | | | | 2,750 | | | | 2,969,807 | |
Cleveland (City of) & Cuyahoga (County of) Port Authority (Constellation Schools); Series 2014 A, | | | | | | | | | | | | | | |
Ref. & Improvement Lease RB | | 5.75% | | | 01/01/2024 | | | | 805 | | | | 830,188 | |
Cuyahoga (County of) (Metrohealth System); | | | | | | | | | | | | | | |
Series 2017, Ref. Hospital RB | | 5.00% | | | 02/15/2031 | | | | 1,750 | | | | 1,923,425 | |
Series 2017, Ref. Hospital RB | | 5.00% | | | 02/15/2032 | | | | 3,980 | | | | 4,354,438 | |
Franklin (County of) (First Community Village Obligated Group); Series 2013, Ref. Health Care Facilities RB | | 5.25% | | | 07/01/2033 | | | | 1,000 | | | | 1,000,310 | |
Gallia (County of) (Holzer Health System Obligated Group); Series 2012, Ref. & Improvement Hospital Facilities RB | | 8.00% | | | 07/01/2042 | | | | 3,385 | | | | 3,731,455 | |
Hamilton (County of); Series 2016 A, Ref. Sales Tax RB | | 5.00% | | | 12/01/2027 | | | | 3,410 | | | | 4,171,112 | |
Hamilton (County of) (Christ Hospital); Series 2012, Health Care Facilities RB | | 5.25% | | | 06/01/2023 | | | | 1,500 | | | | 1,654,845 | |
Hamilton (County of) (Life Enriching Communities); Series 2012, Health Care RB | | 5.00% | | | 01/01/2032 | | | | 750 | | | | 777,930 | |
Lancaster Port Authority; Series 2014, Ref. Gas Supply Floating Rate RB (1 mo. USD LIBOR + 0.72%)(c)(d) | | 2.39% | | | 08/01/2019 | | | | 2,000 | | | | 2,000,360 | |
Montgomery (County of) (St. Leonard); Series 2010, Ref. & Improvement Health Care & MFH RB | | 6.00% | | | 04/01/2020 | | | | 270 | | | | 275,835 | |
See accompanying Notes to Financial Statements which are an integral part of the financial statements.
| | |
| 23 | | Invesco Intermediate Term Municipal Income Fund |
| | | | | | | | | | | | | | |
| | | Interest
Rate | | Maturity
Date | | | Principal
Amount
(000) | | | Value | |
Ohio-(continued) | | | | | | | | | | | | | | |
| | | | |
Muskingum (County of) (Genesis Healthcare System); Series 2013, Hospital Facilities RB | | 5.00% | | | 02/15/2033 | | | $ | 1,240 | | | $ | 1,288,199 | |
Ohio (State of) (Portsmouth Bypass); Series 2015, Private Activity RB(a) | | 5.00% | | | 12/31/2025 | | | | 1,300 | | | | 1,445,496 | |
Ohio (State of) Air Quality Development Authority (Pratt Paper LLC); Series 2017, Exempt Facility RB(a)(f) | | 3.75% | | | 01/15/2028 | | | | 2,000 | | | | 2,044,940 | |
| | | | | | | | | | | | | | 37,762,758 | |
| | | | |
Oklahoma-0.65% | | | | | | | | | | | | | | |
| | | | |
Comanche (County of) Hospital Authority; Series 2015, Ref. RB | | 5.00% | | | 07/01/2023 | | | | 2,815 | | | | 3,036,709 | |
Payne (County of) Economic Development Authority (Epworth Living at the Ranch); Series 2016B-2, RB(n) | | 4.75% | | | 11/01/2023 | | | | 1,280 | | | | 492,800 | |
Tulsa (City of) Municipal Airport Trust (American Airlines Group, Inc.); Series 2015, Ref. RB(a)(c) | | 5.00% | | | 06/01/2025 | | | | 5,000 | | | | 5,411,300 | |
| | | | | | | | | | | | | | 8,940,809 | |
| | | | |
Oregon-0.49% | | | | | | | | | | | | | | |
| | | | |
Portland (Port of); Series 201724-B, Airport RB(a) | | 5.00% | | | 07/01/2035 | | | | 3,255 | | | | 3,687,850 | |
Salem (City of) Hospital Facility Authority (Capital Manor, Inc.); Series 2012, Ref. RB | | 5.00% | | | 05/15/2022 | | | | 820 | | | | 887,847 | |
Tri-County Metropolitan Transportation District; Series 2011 A, Capital Grant Receipt RB(c)(e) | | 5.00% | | | 10/01/2021 | | | | 2,000 | | | | 2,168,200 | |
| | | | | | | | | | | | | | 6,743,897 | |
| | | | |
Pennsylvania-6.18% | | | | | | | | | | | | | | |
| | | | |
Allegheny (County of) Hospital Development Authority (Allegheny Health Network Obligated Group Issue); Series 2018 A, Ref. RB | | 5.00% | | | 04/01/2032 | | | | 2,000 | | | | 2,292,720 | |
Allegheny (County of) Industrial Development Authority (Residential Resources, Inc.); Series 2006, Lease RB | | 5.00% | | | 09/01/2021 | | | | 315 | | | | 315,605 | |
Allentown Neighborhood Improvement Zone Development Authority (City Center); Series 2018, Tax RB(f) | | 5.00% | | | 05/01/2033 | | | | 2,045 | | | | 2,241,504 | |
Commonwealth Financing Authority; | | | | | | | | | | | | | | |
Series 2018, Tobacco Master Settlement Payment RB | | 5.00% | | | 06/01/2030 | | | | 5,500 | | | | 6,410,690 | |
Series 2018, Tobacco Master Settlement Payment RB | | 5.00% | | | 06/01/2031 | | | | 2,000 | | | | 2,310,560 | |
Cumberland (County of) Municipal Authority (Asbury Obligated Group); | | | | | | | | | | | | | | |
Series 2012, Ref. RB | | 5.00% | | | 01/01/2022 | | | | 945 | | | | 986,391 | |
Series 2012, Ref. RB | | 5.25% | | | 01/01/2027 | | | | 1,275 | | | | 1,326,790 | |
Franklin (County of) Industrial Development Authority (Menno-Haven, Inc.); | | | | | | | | | | | | | | |
Series 2018, Ref. RB | | 5.00% | | | 12/01/2029 | | | | 1,000 | | | | 1,083,340 | |
Series 2018, Ref. RB | | 5.00% | | | 12/01/2031 | | | | 1,005 | | | | 1,074,305 | |
Series 2018, Ref. RB | | 5.00% | | | 12/01/2033 | | | | 750 | | | | 794,123 | |
Geisinger Authority (Geisinger Health System); Series 2011 B, Health System RB | | 1.55% | | | 03/05/2019 | | | | 3,000 | | | | 3,000,000 | |
Girard School District; Series 1992 B, Unlimited Tax CAB GO Bonds (INS -NATL)(b)(g) | | 0.00% | | | 10/01/2019 | | | | 250 | | | | 246,848 | |
Lehigh (County of) General Purpose Authority (Bible Fellowship Church Homes, Inc.); Series 2013, RB | | 4.25% | | | 07/01/2020 | | | | 1,390 | | | | 1,397,200 | |
Montgomery (County of) Higher Education & Health Authority (Thomas Jefferson University); | | | | | | | | | | | | | | |
Series 2018 A, Ref. RB | | 5.00% | | | 09/01/2030 | | | | 3,500 | | | | 4,133,500 | |
Series 2018 C, Floating Rate RB (SIFMA Municipal Swap Index + 0.72%)(c)(d) | | 2.46% | | | 09/01/2023 | | | | 2,800 | | | | 2,801,820 | |
Montgomery (County of) Industrial Development Authority (ACTS Retirement Life Communities); | | | | | | | | | | | | | | |
Series 2012, Ref. RB | | 5.00% | | | 11/15/2029 | | | | 1,045 | | | | 1,108,379 | |
Montgomery (County of) Industrial Development Authority (ACTS Retirement-Life Community); | | | | | | | | | | | | | | |
Series 2012, Ref. RB | | 5.00% | | | 11/15/2025 | | | | 2,000 | | | | 2,148,880 | |
Montgomery (County of) Industrial Development Authority (PECO Energy Company); Series 1999, Ref. RB(a)(c) | | 2.70% | | | 04/01/2020 | | | | 4,380 | | | | 4,377,635 | |
Northampton (County of) Industrial Development Authority (Morningstar Senior Living, Inc.); | | | | | | | | | | | | | | |
Series 2012, RB | | 5.00% | | | 07/01/2027 | | | | 1,500 | | | | 1,541,475 | |
Pennsylvania (Commonwealth of); | | | | | | | | | | | | | | |
First Series 2017, Ref. Unlimited Tax GO Bonds | | 5.00% | | | 01/01/2026 | | | | 5,400 | | | | 6,362,118 | |
Series 2018 A, Ref. COP | | 5.00% | | | 07/01/2029 | | | | 300 | | | | 351,315 | |
Series 2018 A, Ref. COP | | 5.00% | | | 07/01/2030 | | | | 375 | | | | 435,510 | |
Series 2018 A, Ref. COP | | 5.00% | | | 07/01/2031 | | | | 425 | | | | 489,783 | |
See accompanying Notes to Financial Statements which are an integral part of the financial statements.
| | |
| 24 | | Invesco Intermediate Term Municipal Income Fund |
| | | | | | | | | | | | | | |
| | | Interest
Rate | | Maturity
Date | | | Principal
Amount
(000) | | | Value | |
Pennsylvania-(continued) | | | | | | | | | | | | | | |
Pennsylvania (State of) Economic Development Financing Authority (PA Bridges Finco L.P.); | | | | | | | | | | | | | | |
Series 2015, RB(a) | | 5.00% | | | 12/31/2027 | | | $ | 5,965 | | | $ | 6,791,033 | |
Series 2015, RB(a) | | 5.00% | | | 12/31/2034 | | | | 2,630 | | | | 2,887,056 | |
Pennsylvania (State of) Turnpike Commission; | | | | | | | | | | | | | | |
Series 2013 B, Floating Rate RB (SIFMA Municipal Swap Index + 1.15%)(d) | | 2.89% | | | 12/01/2019 | | | | 2,000 | | | | 2,003,560 | |
Series 2014B-1, Ref. Floating Rate RB (SIFMA Municipal Swap Index + 0.98%)(d) | | 2.72% | | | 12/01/2021 | | | | 5,000 | | | | 5,050,250 | |
Pennsylvania Turnpike Commission; Subseries 2017, Sub. Ref. RB | | 5.00% | | | 12/01/2031 | | | | 4,075 | | | | 4,659,640 | |
Philadelphia (City of) Gas Works; | | | | | | | | | | | | | | |
Series 2015, Ref. RB | | 5.00% | | | 08/01/2031 | | | | 1,000 | | | | 1,138,130 | |
Series 2015, Ref. RB | | 5.00% | | | 08/01/2032 | | | | 1,000 | | | | 1,134,350 | |
Philadelphia (City of) Hospitals & Higher Education Facilities Authority (Temple University Health System); | | | | | | | | | | | | | | |
Series 2017, Ref. RB | | 5.00% | | | 07/01/2027 | | | | 3,480 | | | | 3,959,266 | |
Series 2017, Ref. RB | | 5.00% | | | 07/01/2029 | | | | 2,295 | | | | 2,558,351 | |
Philadelphia (City of) Industrial Development Authority (Thomas Jefferson University); Series 2017 A, Ref. RB | | 5.00% | | | 09/01/2035 | | | | 3,000 | | | | 3,370,440 | |
Philadelphia School District; Series 2007 A, Ref. Unlimited Tax GO Bonds (INS-NATL)(b) | | 5.00% | | | 06/01/2025 | | | | 2,400 | | | | 2,754,720 | |
Washington (County of) Industrial Development Authority (Washington Jefferson College); | | | | | | | | | | | | | | |
Series 2010, College RB(c)(e) | | 5.00% | | | 05/01/2020 | | | | 1,000 | | | | 1,039,200 | |
| | | | | | | | | | | | | | 84,576,487 | |
| | | | |
Puerto Rico-0.92% | | | | | | | | | | | | | | |
Children’s Trust Fund; Series 2002, Tobacco Settlement Asset-Backed RB | | 5.38% | | | 05/15/2033 | | | | 2,745 | | | | 2,771,544 | |
Puerto Rico (Commonwealth of); | | | | | | | | | | | | | | |
Series 2001 A, Public Improvement Unlimited Tax GO Bonds
(INS -NATL)(b) | | 5.50% | | | 07/01/2029 | | | | 1,570 | | | | 1,709,950 | |
Series 2006 A, Public Improvement Unlimited Tax GO Bonds (INS-AGC) (CPI RATE + 1.02%)(b)(d) | | 3.48% | | | 07/01/2020 | | | | 1,060 | | | | 1,060,551 | |
Puerto Rico (Commonwealth of) Highway & Transportation Authority; Series 2007 CC, Ref. Transportation RB (INS-AGM)(b) | | 5.50% | | | 07/01/2030 | | | | 2,535 | | | | 2,882,321 | |
Puerto Rico Sales Tax Financing Corp.; Series 2018A-1, CAB RB(g) | | 0.00% | | | 07/01/2027 | | | | 5,700 | | | | 4,142,760 | |
| | | | | | | | | | | | | | 12,567,126 | |
| | | | |
Rhode Island-0.85% | | | | | | | | | | | | | | |
Rhode Island Health & Educational Building Corp. (University of Rhode Island -Auxiliary Enterprise); | | | | | | | | | | | | | | |
Series 2013 C, Ref. Higher Education Facility RB | | 5.00% | | | 09/15/2022 | | | | 1,000 | | | | 1,105,620 | |
Tobacco Settlement Financing Corp.; | | | | | | | | | | | | | | |
Series 2015 A, Asset-Backed RB | | 5.00% | | | 06/01/2035 | | | | 5,000 | | | | 5,273,450 | |
Series 2015 A, Ref. RB | | 5.00% | | | 06/01/2026 | | | | 1,375 | | | | 1,523,803 | |
Series 2015 A, Ref. RB | | 5.00% | | | 06/01/2027 | | | | 900 | | | | 988,821 | |
Series 2015 A, Ref. RB | | 5.00% | | | 06/01/2028 | | | | 1,080 | | | | 1,171,962 | |
Series 2015 B, Ref. RB | | 2.25% | | | 06/01/2041 | | | | 1,530 | | | | 1,531,346 | |
| | | | | | | | | | | | | | 11,595,002 | |
| | | | |
South Carolina-0.96% | | | | | | | | | | | | | | |
Greenwood (County of) (Self Regional Healthcare); Series 2012 B, Ref. Hospital RB | | 5.00% | | | 10/01/2026 | | | | 4,650 | | | | 5,051,713 | |
Piedmont Municipal Power Agency; Series 2009A-4, Ref. Electric RB | | 5.00% | | | 01/01/2021 | | | | 2,000 | | | | 2,050,460 | |
South Carolina (State of) Jobs-Economic Development Authority (Lutheran Homes); | | | | | | | | | | | | | | |
Series 2013, Health Facilities RB | | 5.00% | | | 05/01/2023 | | | | 1,000 | | | | 1,049,240 | |
Series 2013, Health Facilities RB | | 5.00% | | | 05/01/2028 | | | | 1,250 | | | | 1,281,013 | |
South Carolina (State of) Jobs-Economic Development Authority (Palmetto Health Alliance); | | | | | | | | | | | | | | |
Series 2013 A, Ref. Hospital RB(c)(e) | | 5.25% | | | 08/01/2023 | | | | 3,215 | | | | 3,694,774 | |
| | | | | | | | | | | | | | 13,127,200 | |
| | | | |
South Dakota-0.09% | | | | | | | | | | | | | | |
South Dakota (State of) Health & Educational Facilities Authority (Regional Health); Series 2010, RB(c)(e) | | 5.00% | | | 09/01/2020 | | | | 1,105 | | | | 1,158,990 | |
See accompanying Notes to Financial Statements which are an integral part of the financial statements.
| | |
| 25 | | Invesco Intermediate Term Municipal Income Fund |
| | | | | | | | | | | | | | |
| | | Interest
Rate | | Maturity
Date | | | Principal
Amount
(000) | | | Value | |
Tennessee-1.54% | | | | | | | | | | | | | | |
Bristol (City of) Industrial Development Board (Pinnacle); Series 2016, Tax Increment Allocation RB | | 4.25% | | | 06/01/2021 | | | $ | 850 | | | $ | 849,770 | |
Greeneville (Town of) Health & Educational Facilities Board (Ballad Health Obligation Group); | | | | | | | | | | | | | | |
Series 2018 A, Ref. Hospital RB | | 5.00% | | | 07/01/2034 | | | | 3,000 | | | | 3,221,550 | |
Series 2018 A, Ref. Hospital RB | | 5.00% | | | 07/01/2035 | | | | 2,500 | | | | 2,844,150 | |
Nashville (City of) & Davidson (County of) Metropolitan Government Health & Educational Facilities Board (Blakeford at Green Hills); | | | | | | | | | | | | | | |
Series 2012, Ref. & Improvement RB | | 5.00% | | | 07/01/2019 | | | | 770 | | | | 776,530 | |
Series 2012, Ref. & Improvement RB | | 5.00% | | | 07/01/2022 | | | | 500 | | | | 533,050 | |
Nashville (City of) & Davidson (County of) Metropolitan Government Health & Educational Facilities Board (Vanderbilt University Medical Center); | | | | | | | | | | | | | | |
Series 2016 A, RB | | 5.00% | | | 07/01/2031 | | | | 1,000 | | | | 1,132,460 | |
Series 2016 A, RB | | 5.00% | | | 07/01/2035 | | | | 2,000 | | | | 2,232,720 | |
Shelby (County of) Health, Educational & Housing Facilities Board (Methodist Le Bonheur Healthcare); | | | | | | | | | | | | | | |
Series 2017 A, RB | | 5.00% | | | 05/01/2031 | | | | 1,185 | | | | 1,385,964 | |
Shelby (County of) Health, Educational & Housing Facilities Board (The Village at Germantown Inc.); | | | | | | | | | | | | | | |
Series 2014, Residential Care Facility Mortgage RB | | 5.00% | | | 12/01/2029 | | | | 650 | | | | 672,555 | |
Tennessee Energy Acquisition Corp.; | | | | | | | | | | | | | | |
Series 2006 C, Gas RB | | 5.00% | | | 02/01/2023 | | | | 1,360 | | | | 1,484,753 | |
Series 2006 C, Gas RB | | 5.00% | | | 02/01/2024 | | | | 3,225 | | | | 3,569,075 | |
Series 2006 C, Gas RB | | 5.00% | | | 02/01/2027 | | | | 150 | | | | 171,389 | |
Series 2018, Gas RB(c) | | 4.00% | | | 11/01/2025 | | | | 2,000 | | | | 2,119,280 | |
| | | | | | | | | | | | | | 20,993,246 | |
| | | | |
Texas-9.36% | | | | | | | | | | | | | | |
Arlington Higher Education Finance Corp. (Universal Academy); | | | | | | | | | | | | | | |
Series 2014 A, Education RB | | 5.88% | | | 03/01/2024 | | | | 300 | | | | 303,027 | |
Series 2014 A, Education RB | | 6.63% | | | 03/01/2029 | | | | 1,000 | | | | 1,022,730 | |
Austin (City of); Series 2009 A, Ref. Water & Wastewater System RB(c)(e) | | 5.00% | | | 11/15/2019 | | | | 1,500 | | | | 1,535,506 | |
Austin Convention Enterprises, Inc.; | | | | | | | | | | | | | | |
Series 2017, Ref. First Tier Convention Center RB | | 5.00% | | | 01/01/2033 | | | | 1,200 | | | | 1,347,540 | |
Series 2017, Ref. Sub. Second Tier Convention Center RB | | 5.00% | | | 01/01/2032 | | | | 500 | | | | 547,345 | |
Capital Area Cultural Education Facilities Finance Corp. (The Roman Catholic Diocese of Austin); | | | | | | | | | | | | | | |
Series 2005 A, RB | | 5.50% | | | 04/01/2023 | | | | 1,670 | | | | 1,731,706 | |
Series 2005 A, RB | | 5.50% | | | 04/01/2025 | | | | 1,610 | | | | 1,669,377 | |
Clifton Higher Education Finance Corp. (Idea Public Schools); Series 2013, Education RB | | 6.00% | | | 08/15/2033 | | | | 1,250 | | | | 1,409,613 | |
Clifton Higher Education Finance Corp. (International Leadership of Texas); | | | | | | | | | | | | | | |
Series 2015 A, Education RB | | 5.13% | | | 08/15/2030 | | | | 3,000 | | | | 3,055,110 | |
Series 2018 D, Education RB | | 5.75% | | | 08/15/2033 | | | | 5,000 | | | | 5,198,750 | |
Dallas-Fort Worth (Cities of) International Airport; Series 2014 A, Ref. RB(a) | | 5.25% | | | 11/01/2026 | | | | 2,000 | | | | 2,252,440 | |
Decatur (City of) Hospital Authority (Wise Regional Health System); | | | | | | | | | | | | | | |
Series 2014 A, Ref. RB | | 5.00% | | | 09/01/2022 | | | | 150 | | | | 161,982 | |
Series 2014 A, Ref. RB | | 5.00% | | | 09/01/2023 | | | | 150 | | | | 164,958 | |
Series 2014 A, Ref. RB | | 5.00% | | | 09/01/2024 | | | | 265 | | | | 294,987 | |
Series 2014 A, Ref. RB | | 5.25% | | | 09/01/2029 | | | | 1,000 | | | | 1,107,650 | |
Dickinson Independent School District; Series 2000, Ref. Unlimited Tax General Obligation Bonds(CEP-Texas Permanent School Fund) | | 6.00% | | | 02/15/2028 | | | | 2,000 | | | | 2,436,260 | |
Greenville (City of); | | | | | | | | | | | | | | |
Series 2010, Ref. & Improvement Electric Utility System RB | | 5.00% | | | 02/15/2025 | | | | 2,355 | | | | 2,360,652 | |
Series 2010, Ref. & Improvement Electric Utility System RB | | 5.00% | | | 02/15/2026 | | | | 2,475 | | | | 2,480,890 | |
Gulf Coast Industrial Development Authority (ExxonMobil); Series 2012, VRD RB(m) | | 1.45% | | | 03/05/2019 | | | | 10,300 | | | | 10,300,000 | |
Gulf Coast Waste Disposal Authority; | | | | | | | | | | | | | | |
Series 2013, Bayport Area System RB (INS-AGM)(b) | | 5.00% | | | 10/01/2021 | | | | 1,250 | | | | 1,346,613 | |
Series 2013, Bayport Area System RB (INS-AGM)(b) | | 5.00% | | | 10/01/2023 | | | | 2,610 | | | | 2,892,741 | |
See accompanying Notes to Financial Statements which are an integral part of the financial statements.
| | |
| 26 | | Invesco Intermediate Term Municipal Income Fund |
| | | | | | | | | | | | | | |
| | | Interest
Rate | | Maturity
Date | | | Principal
Amount
(000) | | | Value | |
Texas-(continued) | | | | | | | | | | | | | | |
Harris County Cultural Education Facilities Finance Corp. (Brazos Presbyterian Homes, Inc.); | | | | | | | | | | | | | | |
Series 2013 A, First Mortgage RB | | 4.00% | | | 01/01/2023 | | | $ | 1,300 | | | $ | 1,331,460 | |
Series 2013 A, First Mortgage RB | | 5.00% | | | 01/01/2033 | | | | 1,090 | | | | 1,128,248 | |
Harris County Cultural Education Facilities Finance Corp. (Memorial Hermann Health System); | | | | | | | | | | | | | | |
Series 2013 B, Ref. Hospital Floating Rate RB (SIFMA Municipal Swap Index + 0.75%)(d) | | 2.49% | | | 06/01/2020 | | | | 2,000 | | | | 2,010,020 | |
Harris County Cultural Education Facilities Finance Corp. (Texas Children’s Hospital); Series 2015, | | | | | | | | | | | | | | |
Floating Rate RB (1 mo. USD LIBOR + 0.85%)(c)(d) | | 2.54% | | | 06/01/2020 | | | | 5,000 | | | | 5,023,750 | |
Harris County Cultural Education Facilities Finance Corp. (YMCA of the Greater Houston Area); | | | | | | | | | | | | | | |
Series 2013 A, Ref. RB | | 5.00% | | | 06/01/2028 | | | | 1,500 | | | | 1,582,575 | |
Harris County Industrial Development Corp. (Deer Park Refining Limited Partnership); Series 2006, Solid Waste Disposal RB(c)(e) | | 5.00% | | | 12/01/2019 | | | | 2,500 | | | | 2,562,925 | |
Hopkins (County of) Hospital District; Series 2008, RB | | 5.50% | | | 02/15/2023 | | | | 410 | | | | 410,820 | |
Houston (City of); | | | | | | | | | | | | | | |
Series 2011 A, Ref. Sub. Lien Airport System RB(a) | | 5.00% | | | 07/01/2025 | | | | 1,000 | | | | 1,065,280 | |
Series 2018 C, Ref. First Lien Combined Utility System Floating Rate RB (1 mo. USD LIBOR + 0.36%)(c)(d) | | 2.11% | | | 08/01/2021 | | | | 2,000 | | | | 1,993,500 | |
Houston (City of) Airport System (United Airlines, Inc. Airport Improvement); Series 2015 C, Ref. RB (a) | | 5.00% | | | 07/15/2020 | | | | 5,000 | | | | 5,156,550 | |
Houston Higher Education Finance Corp. (Cosmos Foundation, Inc.); | | | | | | | | | | | | | | |
Series 2011 A, RB(e) | | 5.88% | | | 05/15/2021 | | | | 390 | | | | 407,573 | |
Series 2012 A, RB | | 4.00% | | | 02/15/2022 | | | | 260 | | | | 268,421 | |
Katy (City of) Independent School District; Series 2015 C, Ref. Unlimited Tax GO Floating Rate Bonds (CEP -Texas Permanent School Fund) (1 mo. USD LIBOR + 0.55%)(c)(d) | | 2.22% | | | 08/15/2019 | | | | 8,000 | | | | 8,000,960 | |
Lower Neches Valley Authority Industrial Development Corp. (Exxonmobil); Series 2010, VRD RB(m) | | 1.50% | | | 11/01/2038 | | | | 3,200 | | | | 3,200,000 | |
Mesquite Health Facilities Development Corporation (Christian Care Centers, Inc.); Series 2014, Ref. RB | | 5.00% | | | 02/15/2024 | | | | 350 | | | | 365,880 | |
New Hope Cultural Education Facilities Corp. (Morningside Ministries); Series 2013, First Mortgage RB | | 6.25% | | | 01/01/2033 | | | | 1,600 | | | | 1,734,672 | |
New Hope Cultural Education Facilities Corp. (Presbyterian Village North); | | | | | | | | | | | | | | |
Series 2018, Ref. Retirement Facility RB | | 5.00% | | | 10/01/2029 | | | | 2,105 | | | | 2,164,614 | |
Series 2018, Ref. Retirement Facility RB | | 5.00% | | | 10/01/2030 | | | | 2,210 | | | | 2,263,990 | |
New Hope Cultural Education Facilities Corp. (Wesleyan Homes Inc.); | | | | | | | | | | | | | | |
Series 2014, Retirement Facilities RB | | 5.25% | | | 01/01/2029 | | | | 1,500 | | | | 1,574,220 | |
Series 2014, Retirement Facilities RB | | 5.50% | | | 01/01/2035 | | | | 1,400 | | | | 1,476,076 | |
New Hope Cultural Education Facilities Finance Corp. (MRC SeniorLiving-The Langford); Series 2016B-1, TEMPS 80SMRB | | 3.25% | | | 11/15/2022 | | | | 1,000 | | | | 983,190 | |
New Hope Cultural Education Facilities Finance Corp. (Tarleton State University); Series 2014 A, Student Housing RB | | 5.00% | | | 04/01/2029 | | | | 620 | | | | 664,969 | |
Newark High Education Finance Corp. (A+ Charter Schools, Inc.);
Series 2015 A, Education RB(f) | | 4.63% | | | 08/15/2025 | | | | 1,000 | | | | 1,039,800 | |
North Texas Tollway Authority; | | | | | | | | | | | | | | |
Series 2014 C, Ref. First Tier Floating Rate RB (SIFMA Municipal Swap Index + 0.67%)(c)(d) | | 2.41% | | | 01/01/2020 | | | | 5,000 | | | | 4,997,750 | |
Series 2017 B, Ref. Second Tier System RB (INS-AGM)(b) | | 4.00% | | | 01/01/2034 | | | | 750 | | | | 791,730 | |
Port Beaumont Navigation District (Jefferson Energy Companies); Series 2016, Dock & Wharf Facility RB(a)(c)(f) | | 7.25% | | | 02/13/2020 | | | | 2,000 | | | | 2,061,860 | |
Pottsboro Higher Education Finance Corp. (Imagine International Academy of North Texas, LLC); Series 2016 A, Education RB | | 5.00% | | | 08/15/2036 | | | | 1,960 | | | | 1,978,777 | |
SA Energy Acquisition Public Facility Corp.; Series 2007, Gas Supply RB | | 5.50% | | | 08/01/2021 | | | | 1,475 | | | | 1,580,005 | |
Tarrant County Cultural Education Facilities Finance Corp. (SQLC Senior Living Center at Corpus Christi, Inc.-Mirador); Series 2017 A, Retirement Facility RB(n) | | 4.13% | | | 11/15/2028 | | | | 2,680 | | | | 1,346,191 | |
Temple (City of); Series 2018 A, Incremental RB(f) | | 5.00% | | | 08/01/2038 | | | | 4,000 | | | | 4,204,000 | |
Texas (State of) Transportation Commission; | | | | | | | | | | | | | | |
Series 2019, First Tier Toll CAB RB(g) | | 0.00% | | | 08/01/2034 | | | | 1,400 | | | | 739,802 | |
Series 2019, First Tier Toll CAB RB(g) | | 0.00% | | | 08/01/2035 | | | | 1,250 | | | | 618,200 | |
Series 2019, First Tier Toll CAB RB(g) | | 0.00% | | | 08/01/2036 | | | | 1,000 | | | | 467,840 | |
See accompanying Notes to Financial Statements which are an integral part of the financial statements.
| | |
| 27 | | Invesco Intermediate Term Municipal Income Fund |
| | | | | | | | | | | | | | |
| | | Interest
Rate | | Maturity
Date | | | Principal
Amount
(000) | | | Value | |
Texas-(continued) | | | | | | | | | | | | | | |
Texas (State of) Transportation Commission (Central Texas Turnpike System); Series 2015 C, Ref. Sub. RB | | 5.00% | | | 08/15/2033 | | | $ | 5,000 | | | $ | 5,429,050 | |
Texas Municipal Gas Acquisition & Supply Corp. I; Series 2008 D, Sr. Lien Gas Supply RB | | 6.25% | | | 12/15/2026 | | | | 2,790 | | | | 3,227,500 | |
Texas Municipal Gas Acquisition & Supply Corp. III; | | | | | | | | | | | | | | |
Series 2012, Gas Supply RB | | 5.00% | | | 12/15/2021 | | | | 2,600 | | | | 2,787,148 | |
Series 2012, Gas Supply RB | | 5.00% | | | 12/15/2022 | | | | 500 | | | | 546,360 | |
Series 2012, Gas Supply RB | | 5.00% | | | 12/15/2023 | | | | 3,950 | | | | 4,344,644 | |
Series 2012, Gas Supply RB | | 5.00% | | | 12/15/2028 | | | | 1,775 | | | | 1,926,975 | |
Travis County Cultural Education Facilities Finance Corp. (Wayside Schools); | | | | | | | | | | | | | | |
Series 2012 A, Education RB | | 4.63% | | | 08/15/2022 | | | | 330 | | | | 340,507 | |
Series 2012 A, Education RB | | 5.00% | | | 08/15/2027 | | | | 585 | | | | 600,971 | |
| | | | | | | | | | | | | | 128,018,680 | |
| | | | |
Utah-0.37% | | | | | | | | | | | | | | |
Salt Lake City (City of); Series 2017 A, Airport RB(a) | | 5.00% | | | 07/01/2034 | | | | 3,500 | | | | 3,995,915 | |
Utah (State of) Charter School Finance Authority (North Davis Preparatory Academy); Series 2010, Charter School RB | | 6.38% | | | 07/15/2040 | | | | 1,000 | | | | 1,036,020 | |
| | | | | | | | | | | | | | 5,031,935 | |
| | | | |
Virgin Islands-0.21% | | | | | | | | | | | | | | |
Virgin Islands (Government of) Public Finance Authority (Matching Fund Loan Note); Series 2009 B, Ref. Sr. Lien RB | | 5.00% | | | 10/01/2025 | | | | 2,950 | | | | 2,891,000 | |
| | | | |
Virginia-0.88% | | | | | | | | | | | | | | |
Dulles Town Center Community Development Authority (Dulles Town Center); | | | | | | | | | | | | | | |
Series 2012, Ref. Special Assessment RB | | 5.00% | | | 03/01/2022 | | | | 1,100 | | | | 1,144,253 | |
Series 2012, Ref. Special Assessment RB | | 5.00% | | | 03/01/2021 | | | | 1,395 | | | | 1,438,176 | |
Series 2012, Ref. Special Assessment RB | | 4.25% | | | 03/01/2026 | | | | 700 | | | | 697,067 | |
Fairfax (County of) Economic Development Authority (Vinson Hall, LLC); Series 2013 A, Residential Care Facility RB | | 4.00% | | | 12/01/2022 | | | | 695 | | | | 713,056 | |
Virginia (State of) Small Business Financing Authority (95 Express Lanes, LLC); Series 2017, Sr. Lien RB(a) | | 5.00% | | | 07/01/2034 | | | | 5,000 | | | | 5,250,700 | |
Virginia (State of) Small Business Financing Authority (Elizabeth River Crossings Opco, LLC); | | | | | | | | | | | | | | |
Series 2012, Sr. Lien RB(a) | | 5.00% | | | 01/01/2027 | | | | 2,500 | | | | 2,659,450 | |
Washington (County of) Industrial Development Authority (Mountain States Health Alliance); | | | | | | | | | | | | | | |
Series 2009 C, Hospital Facility RB(e) | | 7.25% | | | 07/01/2019 | | | | 145 | | | | 147,620 | |
| | | | | | | | | | | | | | 12,050,322 | |
| | | | |
Washington-2.14% | | | | | | | | | | | | | | |
Chelan (County of) Public Utility District No. 1; Series 2011 A, Ref. Consolidated RB(a) | | 5.50% | | | 07/01/2025 | | | | 1,000 | | | | 1,077,990 | |
FYI Properties (Washington State District); Series 2009, Lease RB | | 5.25% | | | 06/01/2026 | | | | 2,000 | | | | 2,017,760 | |
Seattle (City of); Series 2018C-2, Ref. Municipal Light & Power Floating Rate RB (SIFMA Municipal | | | | | | | | | | | | | | |
Swap Index + 0.49%)(c)(d) | | 2.23% | | | 11/01/2023 | | | | 1,160 | | | | 1,161,148 | |
Seattle (Port of); Series 2016 B, First Lien RB(a) | | 5.00% | | | 10/01/2028 | | | | 3,730 | | | | 4,322,324 | |
Seattle (Port of) (SEATAC Fuel Facilities LLC); | | | | | | | | | | | | | | |
Series 2013, Ref. Special Facility RB(a) | | 5.00% | | | 06/01/2021 | | | | 650 | | | | 694,207 | |
Series 2013, Ref. Special Facility RB(a) | | 5.00% | | | 06/01/2024 | | | | 1,560 | | | | 1,734,127 | |
Tes Properties; Series 2009, RB(c)(e) | | 5.00% | | | 06/01/2019 | | | | 1,000 | | | | 1,008,410 | |
Washington (State of) Convention Center Public Facilities District; Series 2018, Tax RB | | 5.00% | | | 07/01/2031 | | | | 2,425 | | | | 2,854,953 | |
Washington (State of) Health Care Facilities Authority (Catholic Health Initiatives); Series 2013, | | | | | | | | | | | | | | |
Floating Rate RB (SIFMA Municipal Swap Index + 1.40%)(c)(d) | | 3.14% | | | 01/01/2025 | | | | 3,350 | | | | 3,407,084 | |
Washington (State of) Health Care Facilities Authority (PeaceHealth); Series 2014 A, Ref. RB | | 5.00% | | | 11/15/2027 | | | | 500 | | | | 563,980 | |
Washington (State of) Health Care Facilities Authority (Virginia Mason Medical Center); | | | | | | | | | | | | | | |
Series 2017, RB | | 5.00% | | | 08/15/2032 | | | | 1,500 | | | | 1,663,695 | |
Series 2017, RB | | 5.00% | | | 08/15/2037 | | | | 1,360 | | | | 1,467,766 | |
See accompanying Notes to Financial Statements which are an integral part of the financial statements.
| | |
| 28 | | Invesco Intermediate Term Municipal Income Fund |
| | | | | | | | |
| | | Interest
Rate | | Maturity
Date | | Principal
Amount
(000) | | Value |
| | | | | | | | | | | | | | | | |
Washington-(continued) | | | | | | | | | | | | | | | | |
Washington (State of) Higher Education Facilities Authority (Whitworth University); Series 2009, Ref. RB(c)(e) | | | 5.13 | % | | | 10/01/2019 | | | $ | 1,500 | | | $ | 1,529,430 | |
Washington (State of) Housing Finance Commission (Bayview Manor Senior); Series 2016 A, Ref. RB(f) | | | 5.00 | % | | | 07/01/2031 | | | | 1,350 | | | | 1,408,766 | |
Washington (State of) Housing Finance Commission (The Heathstone); Series 2018 A, Ref.Non-Profit RB(f) | | | 5.00 | % | | | 07/01/2038 | | | | 830 | | | | 849,198 | |
Washington (State of) Tobacco Settlement Authority; Series 2013, Ref. RB | | | 5.00 | % | | | 06/01/2022 | | | | 3,260 | | | | 3,524,842 | |
| | | | | | | | | | | | | | | | 29,285,680 | |
| | | | |
West Virginia-0.35% | | | | | | | | | | | | | | | | |
Monongalia (County of) Commission Special District (University Town Centre Economic Opportunity | | | | | | | | | | | | | | | | |
Development District); Series 2017 A, Ref. Excise Tax & Improvement RB(f) | | | 5.50 | % | | | 06/01/2037 | | | | 2,000 | | | | 2,050,400 | |
West Virginia (State of) Economic Development Authority (Entsorga West Virginia LLC); | | | | | | | | | | | | | | | | |
Series 2016, Solid Waste Disposal Facilities RB(a)(f) | | | 6.75 | % | | | 02/01/2026 | | | | 2,000 | | | | 1,929,440 | |
Series 2018, Solid Waste Disposal Facilities RB(a)(f) | | | 8.75 | % | | | 02/01/2036 | | | | 640 | | | | 644,089 | |
West Virginia (State of) Hospital Finance Authority (Thomas Health System); Series 2008, RB | | | 6.00 | % | | | 10/01/2020 | | | | 240 | | | | 179,854 | |
| | | | | | | | | | | | | | | | 4,803,783 | |
| | | | |
Wisconsin-2.64% | | | | | | | | | | | | | | | | |
Milwaukee (County of); | | | | | | | | | | | | | | | | |
Series 2010 B, Ref. Airport RB(a) | | | 5.00 | % | | | 12/01/2022 | | | | 1,250 | | | | 1,276,500 | |
Series 2010 B, Ref. Airport RB(a) | | | 5.00 | % | | | 12/01/2023 | | | | 1,000 | | | | 1,021,050 | |
Public Finance Authority (American Dream at Meadowlands); Series 2017, Limited Obligation Grant RB(f) | | | 6.25 | % | | | 08/01/2027 | | | | 5,000 | | | | 5,413,800 | |
Superior (City of) (Superior Water, Light & Power Co.); Series 2007 A, Ref. Collateralized Utility RB(a) | | | 5.38 | % | | | 11/01/2021 | | | | 1,370 | | | | 1,373,754 | |
Wisconsin (State of) Health & Educational Facilities Authority (Benevolent Corp. Cedar Community); | | | | | | | | | | | | | | | | |
Series 2017, Ref. RB | | | 5.00 | % | | | 06/01/2030 | | | | 1,560 | | | | 1,665,768 | |
Series 2017, Ref. RB | | | 5.00 | % | | | 06/01/2032 | | | | 1,720 | | | | 1,814,944 | |
Wisconsin (State of) Health & Educational Facilities Authority (Mercy Alliance); | | | | | | | | | | | | | | | | |
Series 2012, RB | | | 5.00 | % | | | 06/01/2025 | | | | 2,450 | | | | 2,650,827 | |
Series 2012, RB | | | 5.00 | % | | | 06/01/2026 | | | | 1,000 | | | | 1,080,340 | |
Wisconsin (State of) Public Finance Authority (Bancroft Neurohealth);
Series 2016 A, RB(f) | | | 5.00 | % | | | 06/01/2025 | | | | 1,000 | | | | 1,050,750 | |
Wisconsin (State of) Public Finance Authority (Goodwill Industries of Southern Nevada); Series 2015, RB(n) | | | 5.50 | % | | | 12/01/2035 | | | | 1,875 | | | | 1,312,500 | |
Wisconsin (State of) Public Finance Authority (Maryland Proton Treatment Center); Series 2018A-1, Sr. RB(f) | | | 6.25 | % | | | 01/01/2038 | | | | 3,250 | | | | 3,365,732 | |
Wisconsin (State of) Public Finance Authority (Mary’s Woods at Marylhurst); Series 2017 A, Ref. | | | | | | | | | | | | | | | | |
TEMPS 85SMSenior Living RB(f) | | | 3.95 | % | | | 11/15/2024 | | | | 1,000 | | | | 1,004,610 | |
Wisconsin (State of) Public Finance Authority (Prime Healthcare Foundation, Inc.); Series 2018 A, RB | | | 5.20 | % | | | 12/01/2037 | | | | 4,000 | | | | 4,288,480 | |
Wisconsin (State of) Public Finance Authority (Roseman University of Health Sciences); | | | | | | | | | | | | | | | | |
Series 2012, RB | | | 5.00 | % | | | 04/01/2022 | | | | 595 | | | | 618,979 | |
Series 2015, Ref. RB | | | 5.00 | % | | | 04/01/2025 | | | | 1,340 | | | | 1,411,770 | |
Wisconsin (State of) Public Finance Authority (Wittenberg University); Series 2016, Higher Education Facility RB(f) | | | 4.13 | % | | | 12/01/2024 | | | | 2,900 | | | | 2,964,525 | |
Wisconsin Health & Educational Facilities Authority (American Baptist Homes of the Midwest Obligated Group); Series 2017, Ref. RB | | | 5.00 | % | | | 08/01/2032 | | | | 3,700 | | | | 3,802,083 | |
| | | | | | | | | | | | | | | | 36,116,412 | |
See accompanying Notes to Financial Statements which are an integral part of the financial statements.
| | |
| 29 | | Invesco Intermediate Term Municipal Income Fund |
| | | | | | | | | | | | | | | | |
| | | Interest
Rate | | | Maturity
Date | | | Principal
Amount
(000) | | | Value | |
| Wyoming-0.13% | | | | | | | | | | | | | | | | |
Wyoming (State of) Municipal Power Agency; Series 2017 A, Ref. Power Supply RB (INS-BAM)(b) | | | 5.00 | % | | | 01/01/2031 | | | $ | 1,500 | | | $ | 1,726,395 | |
TOTAL INVESTMENTS IN SECURITIES(o)-102.38% (Cost $1,365,824,002) | | | | | | | | | | | | | | | 1,400,128,192 | |
FLOATING RATE NOTE OBLIGATIONS-(3.00)% | | | | | | | | | | | | | | | | |
Notes with interest and fee rates ranging from 2.26% to 2.36% at 02/28/2019 and contractual maturities of collateral ranging from 09/01/2022 to 06/01/2032 (See Note 1J)(p) | | | | | | | | | | | | | | | (41,050,000 | ) |
OTHER ASSETS LESS LIABILITIES-0.62% | | | | | | | | | | | | | | | 8,487,119 | |
NET ASSETS -100.00% | | | | | | | | | | | | | | $ | 1,367,565,311 | |
Abbreviations:
| | |
| AGC | | - Assured Guaranty Corp. |
| AGM | | - Assured Guaranty Municipal Corp. |
| BAM | | - Build America Mutual Assurance Co. |
| CAB | | - Capital Appreciation Bonds |
| CEP | | - Credit Enhancement Provider |
| Conv. | | - Convertible |
| COP | | - Certificates of Participation |
| CPI | | - Consumer Price Index |
| Ctfs. | | - Certificates |
| GO | | - General Obligation |
| INS | | - Insurer |
| Jr. | | - Junior |
| LIBOR | | - London Interbank Offered Rate |
| MFH | | - Multi-Family Housing |
| NATL | | - National Public Finance Guarantee Corp. |
| PCR | | - Pollution Control Revenue Bonds |
| PILOT | | -Payment-in-Lieu-of-Tax |
| RAB | | - Revenue Anticipation Bonds |
| RB | | - Revenue Bonds |
| Ref. | | - Refunding |
| RN | | - Revenue Notes |
| Sec. | | - Secured |
| SIFMA | | - Securities Industry and Financial Markets Association |
| SOFR | | - Secured Overnight Financing Rate |
| Sr. | | - Senior |
| Sub. | | - Subordinated |
| TEMPS | | -Tax-Exempt Mandatory Paydown Securities |
| USD | | - U.S. Dollar |
| VRD | | - Variable Rate Demand |
| Wts. | | - Warrants |
See accompanying Notes to Financial Statements which are an integral part of the financial statements.
| | |
| 30 | | Invesco Intermediate Term Municipal Income Fund |
Notes to Schedule of Investments:
| (a) | Security subject to the alternative minimum tax. |
| (b) | Principal and/or interest payments are secured by the bond insurance company listed. |
| (c) | Security has an irrevocable call by the issuer or mandatory put by the holder. Maturity date reflects such call or put. |
| (d) | Interest or dividend rate is redetermined periodically. Rate shown is the rate in effect on February 28, 2019. |
| (e) | Advance refunded; secured by an escrow fund of U.S. Government obligations or other highly rated collateral. |
| (f) | Security purchased or received in a transaction exempt from registration under the Securities Act of 1933, as amended (the “1933 Act”). The security may be resold pursuant to an exemption from registration under the 1933 Act, typically to qualified institutional buyers. The aggregate value of these securities at February 28, 2019 was $91,896,954, which represented 6.72% of the Fund’s Net Assets. |
| (g) | Zero coupon bond issued at a discount. |
| (h) | Underlying security related to TOB Trusts entered into by the Fund. See Note1J. |
| (i) | Convertible CAB. The interest rate shown represents the coupon rate at which the bond will accrue at a specified future date. |
| (j) | Acquired as part of the Adelphia Communications bankruptcy reorganization. |
| (k) | Security subject to crossover refunding. |
| (l) | Security is subject to a reimbursement agreement which may require the Fund to pay amounts to a counterparty in the event of a significant decline in the market value of the security underlying the TOB Trusts. In case of a shortfall, the maximum potential amount of payments the Fund could ultimately be required to make under the agreement is $8,000,000. However, such shortfall payment would be reduced by the proceeds from the sale of the security underlying the TOB Trusts. |
| (m) | Demand security payable upon demand by the Fund at specified time intervals no greater than thirteen months. Interest rate is redetermined periodically by the issuer or agent based on current market conditions. Rate shown is the rate in effect on February 28, 2019. |
| (n) | Defaulted security. Currently, the issuer is in default with respect to principal and/or interest payments. The aggregate value of these securities at February 28, 2019 was $3,151,491, which represented less than 1% of the Fund’s Net Assets. |
| (o) | Entities may either issue, guarantee, back or otherwise enhance the credit quality of a security. The entities are not primarily responsible for the issuer’s obligation but may be called upon to satisfy issuer’s obligations. No concentration of any single entity was greater than 5% each. |
| (p) | Floating rate note obligations related to securities held. The interest and fee rates shown reflect the rates in effect at February 28, 2019. At February 28, 2019, the Fund’s investments with a value of $69,960,007 are held by TOB Trusts and serve as collateral for the $41,050,000 in the floating rate note obligations outstanding at that date. |
| | | | | | | | | | | | | | | | | | | | |
Open Futures Contracts(a) | | | | | | | | | | | | | | | | | |
| Short Futures Contracts | | Number of
Contracts | | | Expiration
Month | | | Notional Value | | | Value | | | Unrealized
Appreciation | |
Interest Rate Risk | | | | | | | | | | | | | | | | | | | | |
U.S. Treasury 10 Year Notes | | | 426 | | | | June-2019 | | | $ | (51,972,000 | ) | | $ | 153,094 | | | | $153,094 | |
| (a) | Futures contracts collateralized by $520,000 held with Goldman Sachs & Co., the futures commission merchant. |
See accompanying Notes to Financial Statements which are an integral part of the financial statements.
| | |
| 31 | | Invesco Intermediate Term Municipal Income Fund |
Statement of Assets and Liabilities
February 28, 2019
| | | | |
Assets: | | | | |
Investments in securities, at value
(Cost $1,365,824,002) | | $ | 1,400,128,192 | |
Other investments: | | | | |
Variation margin receivable - futures contracts | | | 93,187 | |
Deposits with brokers: | | | | |
Cash collateral - exchange-traded futures contracts | | | 520,000 | |
Receivable for: | | | | |
Investments sold | | | 615,408 | |
Fund shares sold | | | 2,924,740 | |
Fund expenses absorbed | | | 78,380 | |
Interest | | | 14,764,429 | |
Investment for trustee deferred compensation and retirement plans | | | 90,598 | |
Other assets | | | 7,320 | |
Total assets | | | 1,419,222,254 | |
| |
Liabilities: | | | | |
Floating rate note obligations | | | 41,050,000 | |
Payable for: | | | | |
Investments purchased | | | 7,591,545 | |
Dividends | | | 926,023 | |
Fund shares reacquired | | | 1,197,216 | |
Amount due custodian | | | 231,190 | |
Accrued fees to affiliates | | | 434,844 | |
Accrued trustees’ and officers’ fees and benefits | | | 5,543 | |
Accrued other operating expenses | | | 116,961 | |
Trustee deferred compensation and retirement plans | | | 103,621 | |
Total liabilities | | | 51,656,943 | |
Net assets applicable to shares outstanding | | $ | 1,367,565,311 | |
| | | | |
| |
Net assets consist of: | | | | |
Shares of beneficial interest | | $ | 1,355,130,878 | |
Distributable earnings | | | 12,434,433 | |
| | | $ | 1,367,565,311 | |
| |
Net Assets: | | | | |
Class A | | $ | 848,115,898 | |
Class C | | $ | 106,165,544 | |
Class Y | | $ | 413,273,842 | |
Class R6 | | $ | 10,027 | |
|
Shares outstanding, no par value, with an unlimited number of shares authorized: | |
Class A | | | 76,934,831 | |
Class C | | | 9,659,167 | |
Class Y | | | 37,516,386 | |
Class R6 | | | 911 | |
| |
Class A: | | | | |
Net asset value per share | | $ | 11.02 | |
Maximum offering price per share
(Net asset value of $11.02 ÷ 97.50%) | | $ | 11.30 | |
| |
Class C: | | | | |
Net asset value and offering price per share | | $ | 10.99 | |
| |
Class Y: | | | | |
Net asset value and offering price per share | | $ | 11.02 | |
| |
Class R6: | | | | |
Net asset value and offering price per share | | $ | 11.01 | |
See accompanying Notes to Financial Statements which are an integral part of the financial statements.
| | |
| 32 | | Invesco Intermediate Term Municipal Income Fund |
Statement of Operations
For the year ended February 28, 2019
| | | | |
Investment income: | | | | |
Interest | | $ | 50,189,332 | |
| |
Expenses: | | | | |
Advisory fees | | | 6,301,207 | |
Administrative services fees | | | 303,206 | |
Custodian fees | | | 17,243 | |
Distribution fees: | | | | |
Class A | | | 1,914,337 | |
Class C | | | 2,056,277 | |
Interest, facilities and maintenance fees | | | 543,616 | |
Transfer agent fees - A, C and Y | | | 1,179,520 | |
Transfer agent fees - R6 | | | 10 | |
Trustees’ and officers’ fees and benefits | | | 38,299 | |
Registration and filing fees | | | 221,966 | |
Reports to shareholders | | | 101,170 | |
Professional services fees | | | 79,055 | |
Other | | | 150,775 | |
Total expenses | | | 12,906,681 | |
Less: Fees waived, expenses reimbursed and expense offset arrangement(s) | | | (459,085 | ) |
Net expenses | | | 12,447,596 | |
Net investment income | | | 37,741,736 | |
| |
Realized and unrealized gain (loss) from: | | | | |
Net realized gain (loss) from: | | | | |
Investment securities (includes net gains (losses) from securities sold to affiliates of $(172,062)) | | | (3,585,643 | ) |
Futures contracts | | | (757,276 | ) |
| | | | (4,342,919 | ) |
Change in net unrealized appreciation (depreciation) of: | | | | |
Investment securities | | | 8,686,615 | |
Futures contracts | | | 153,094 | |
| | | | 8,839,709 | |
Net realized and unrealized gain | | | 4,496,790 | |
Net increase in net assets resulting from operations | | $ | 42,238,526 | |
See accompanying Notes to Financial Statements which are an integral part of the financial statements.
| | |
| 33 | | Invesco Intermediate Term Municipal Income Fund |
Statement of Changes in Net Assets
For the years ended February 28, 2019 and 2018
| | | | | | | | |
| | | 2019 | | | 2018 | |
Operations: | | | | | | | | |
Net investment income | | $ | 37,741,736 | | | $ | 34,561,482 | |
| |
Net realized gain (loss) | | | (4,342,919 | ) | | | (3,652,141 | ) |
Change in net unrealized appreciation | | | 8,839,709 | | | | 3,687,642 | |
Net increase in net assets resulting from operations | | | 42,238,526 | | | | 34,596,983 | |
| | |
Distributions to shareholders from distributable earnings(1): | | | | | | | | |
Class A | | | (21,992,216 | ) | | | (20,449,571 | ) |
Class B | | | - | | | | (51,650 | ) |
Class C | | | (4,350,818 | ) | | | (4,802,778 | ) |
Class Y | | | (11,651,405 | ) | | | (9,433,699 | ) |
Class R6 | | | (312 | ) | | | (285 | ) |
Total distributions to shareholders from distributable earnings | | | (37,994,751 | ) | | | (34,737,983 | ) |
| | |
Share transactions-net: | | | | | | | | |
Class A | | | 78,379,131 | | | | 65,810,167 | |
Class B | | | - | | | | (2,779,567 | ) |
Class C | | | (130,236,175 | ) | | | 1,497,230 | |
Class Y | | | 77,124,676 | | | | 63,080,134 | |
Class R6 | | | - | | | | 10,000 | |
Net increase in net assets resulting from share transactions | | | 25,267,632 | | | | 127,617,964 | |
Net increase in net assets | | | 29,511,407 | | | | 127,476,964 | |
| | |
Net assets: | | | | | | | | |
Beginning of year | | | 1,338,053,904 | | | | 1,210,576,940 | |
End of year | | $ | 1,367,565,311 | | | $ | 1,338,053,904 | |
| (1) | The Securities and Exchange Commission eliminated the requirement to disclose distribution components separately, except for tax return of capital. For the year ended February 28, 2018, distributions to shareholders from distributable earnings consisted of distributions from net investment income. |
See accompanying Notes to Financial Statements which are an integral part of the financial statements.
| | |
| 34 | | Invesco Intermediate Term Municipal Income Fund |
Notes to Financial Statements
February 28, 2019
NOTE 1–Significant Accounting Policies
Invesco Intermediate Term Municipal Income Fund (the “Fund”) is a series portfolio of AIMTax-Exempt Funds (InvescoTax-Exempt Funds) (the “Trust”) The Trust is a Delaware statutory trust registered under the Investment Company Act of 1940, as amended (the “1940 Act”), as anopen-end series management investment company authorized to issue an unlimited number of shares of beneficial interest. Information presented in these financial statements pertains only to the Fund. Matters affecting the Fund or each class will be voted on exclusively by the shareholders of the Fund or each class.
The Fund’s investment objective is to provide investors with a high level of current income exempt from federal income tax, consistent with preservation of capital.
The Fund currently consists of four different classes of shares: Class A, Class C, Class Y and Class R6. Class Y shares are available only to certain investors. Class A shares are sold with afront-end sales charge unless certain waiver criteria are met. Under certain circumstances, load waived shares may be subject to contingent deferred sales charges (“CDSC”). Class C shares are sold with a CDSC. Class Y and Class R6 shares are sold at net asset value.
The Fund is an investment company and accordingly follows the investment company accounting and reporting guidance in accordance with Financial Accounting Standards Board Accounting Standards Codification Topic 946,Financial Services - Investment Companies.
The following is a summary of the significant accounting policies followed by the Fund in the preparation of its financial statements.
| A. | Security Valuations- Securities, including restricted securities, are valued according to the following policy. |
Securities are fair valued using an evaluated quote provided by an independent pricing service approved by the Board of Trustees. Evaluated quotes provided by the pricing service may be determined without exclusive reliance on quoted prices, and may reflect appropriate factors such asinstitution-size trading in similar groups of securities, developments related to specific securities, dividend rate (for unlisted equities), yield (for debt obligations), quality, type of issue, coupon rate (for debt obligations), maturity (for debt obligations), individual trading characteristics and other market data. Pricing services generally value debt obligations assuming orderly transactions of institutional round lot size, but a fund may hold or transact in the same securities in smaller, odd lot sizes. Odd lots often trade at lower prices than institutional round lots. Debt obligations are subject to interest rate and credit risks. In addition, all debt obligations involve some risk of default with respect to interest and/or principal payments.
A security listed or traded on an exchange (except convertible securities) is valued at its last sales price or official closing price as of the close of the customary trading session on the exchange where the security is principally traded, or lacking any sales or official closing price on a particular day, the security may be valued at the closing bid price on that day. Securities traded in theover-the-counter market are valued based on prices furnished by independent pricing services or market makers. When such securities are valued by an independent pricing service they may be considered fair valued. Futures contracts are valued at the final settlement price set by an exchange on which they are principally traded. Listed options are valued at the mean between the last bid and asked prices from the exchange on which they are principally traded. Options not listed on an exchange are valued by an independent source at the mean between the last bid and asked prices. For purposes of determining net asset value (“NAV”) per share, futures and option contracts generally are valued 15 minutes after the close of the customary trading session of the New York Stock Exchange (“NYSE”).
Securities for which market quotations either are not readily available or became unreliable are valued at fair value as determined in good faith by or under the supervision of the Trust’s officers following procedures approved by the Board of Trustees. Some of the factors which may be considered in determining fair value are fundamental analytical data relating to the investment; the nature and duration of any restrictions on transferability or disposition; trading in similar securities by the same issuer or comparable companies; relevant political, economic or issuer specific news; and other relevant factors under the circumstances.
The Fund may invest in securities that are subject to interest rate risk, meaning the risk that the prices will generally fall as interest rates rise and, conversely, the prices will generally rise as interest rates fall. Specific securities differ in their sensitivity to changes in interest rates depending on their individual characteristics. Changes in interest rates may result in increased market volatility, which may affect the value and/or liquidity of certain Fund investments.
Valuations change in response to many factors including the historical and prospective earnings of the issuer, the value of the issuer’s assets, general economic conditions, interest rates, investor perceptions and market liquidity. Because of the inherent uncertainties of valuation, the values reflected in the financial statements may materially differ from the value received upon actual sale of those investments.
| B. | Securities Transactions and Investment Income- Securities transactions are accounted for on a trade date basis. Realized gains or losses on sales are computed on the basis of specific identification of the securities sold. Interest income (net of withholding tax, if any) is recorded on the accrual basis from settlement date. Bond premiums and discounts are amortized and/or accreted over the lives of the respective securities.Pay-in-kind interest income andnon-cash dividend income received in the form of securitiesin-lieu of cash are recorded at the fair value of the securities received. Dividend income (net of withholding tax, if any) is recorded on theex-dividend date. |
The Fund may periodically participate in litigation related to Fund investments. As such, the Fund may receive proceeds from litigation settlements. Any proceeds received are included in the Statement of Operations as realized gain (loss) for investments no longer held and as unrealized gain (loss) for investments still held.
Brokerage commissions and mark ups are considered transaction costs and are recorded as an increase to the cost basis of securities purchased and/or a reduction of proceeds on a sale of securities. Such transaction costs are included in the determination of net realized and unrealized gain (loss) from investment securities reported in the Statement of Operations and the Statement of Changes in Net Assets and the net realized and unrealized gains (losses) on securities per share in the Financial Highlights. Transaction costs are included in the calculation of the Fund’s net asset value and, accordingly, they reduce the Fund’s total returns. These transaction costs are not considered operating expenses and are not reflected in net investment income reported in the Statement of Operations and the Statement of Changes in Net Assets, or the net investment income per share and the ratios of expenses and net investment income reported in the Financial Highlights, nor are they limited by any expense limitation arrangements between the Fund and the investment adviser.
| | |
| 35 | | Invesco Intermediate Term Municipal Income Fund |
The Fund allocates realized and unrealized capital gains and losses to a class based on the relative net assets of each class. The Fund allocates income to a class based on the relative value of the settled shares of each class.
| C. | Country Determination– For the purposes of making investment selection decisions and presentation in the Schedule of Investments, the investment adviser may determine the country in which an issuer is located and/or credit risk exposure based on various factors. These factors include the laws of the country under which the issuer is organized, where the issuer maintains a principal office, the country in which the issuer derives 50% or more of its total revenues and the country that has the primary market for the issuer’s securities, as well as other criteria. Among the other criteria that may be evaluated for making this determination are the country in which the issuer maintains 50% or more of its assets, the type of security, financial guarantees and enhancements, the nature of the collateral and the sponsor organization. Country of issuer and/or credit risk exposure has been determined to be the United States of America, unless otherwise noted. |
| D. | Distributions– Distributions from net investment income, if any, are declared daily and paid monthly. Distributions from net realized capital gain, if any, are generally declared and paid annually and recorded on theex-dividend date. The Fund may elect to treat a portion of the proceeds from redemptions as distributions for federal income tax purposes. |
| E. | Federal Income Taxes– The Fund intends to comply with the requirements of Subchapter M of the Internal Revenue Code of 1986, as amended (the “Internal Revenue Code”), necessary to qualify as a regulated investment company and to distribute substantially all of the Fund’s taxable andtax-exempt earnings to shareholders. As such, the Fund will not be subject to federal income taxes on otherwise taxable income (including net realized capital gain) that is distributed to shareholders. Therefore, no provision for federal income taxes is recorded in the financial statements. |
The Fund recognizes the tax benefits of uncertain tax positions only when the position is more likely than not to be sustained. Management has analyzed the Fund’s uncertain tax positions and concluded that no liability for unrecognized tax benefits should be recorded related to uncertain tax positions. Management is not aware of any tax positions for which it is reasonably possible that the total amounts of unrecognized tax benefits will change materially in the next 12 months.
In addition, the Fund intends to invest in such municipal securities to allow it to qualify to pay shareholders “exempt-interest dividends”, as defined in the Internal Revenue Code.
The Fund files tax returns in the U.S. Federal jurisdiction and certain other jurisdictions. Generally, the Fund is subject to examinations by such taxing authorities for up to three years after the filing of the return for the tax period.
| F. | Expenses– Fees provided for under the Rule12b-1 plan of a particular class of the Fund are charged to the operations of such class. Transfer agency fees and expenses and other shareholder recordkeeping fees and expenses attributable to Class R6 are charged to such class. Transfer agency fees and expenses and other shareholder recordkeeping fees and expenses relating to all other classes are allocated among those classes based on relative net assets. All other expenses are allocated among the classes based on relative net assets. |
| G. | Interest, Facilities and Maintenance Fees– Interest, Facilities and Maintenance Fees include interest and related borrowing costs such as commitment fees and other expenses associated with lines of credit and interest and administrative expenses related to establishing and maintaining floating rate note obligations, if any. |
| H. | Accounting Estimates –The preparation of financial statements in conformity with accounting principles generally accepted in the United States of America (“GAAP”) requires management to make estimates and assumptions that affect the reported amounts of assets and liabilities at the date of the financial statements and the reported amounts of revenues and expenses during the reporting period including estimates and assumptions related to taxation. Actual results could differ from those estimates by a significant amount. In addition, the Fund monitors for material events or transactions that may occur or become known after theperiod-end date and before the date the financial statements are released to print. |
| I. | Indemnifications– Under the Trust’s organizational documents, each Trustee, officer, employee or other agent of the Trust is indemnified against certain liabilities that may arise out of the performance of their duties to the Fund. Additionally, in the normal course of business, the Fund enters into contracts, including the Fund’s servicing agreements, that contain a variety of indemnification clauses. The Fund’s maximum exposure under these arrangements is unknown as this would involve future claims that may be made against the Fund that have not yet occurred. The risk of material loss as a result of such indemnification claims is considered remote. |
| J. | Floating Rate Note Obligations– The Fund invests in inverse floating rate securities, such as Tender Option Bonds (“TOBs”), for investment purposes and to enhance the yield of the Fund. Such securities may be purchased in the secondary market without first owning an underlying bond but generally are created through the sale of fixed rate bonds by the Fund to special purpose trusts established by a broker dealer or by the Fund (“TOB Trusts”) in exchange for cash and residual interests in the TOB Trusts’ assets and cash flows, which are in the form of inverse floating rate securities. The TOB Trusts finance the purchases of the fixed rate bonds by issuing floating rate notes to third parties and allowing the Fund to retain residual interests in the bonds. The floating rate notes issued by the TOB Trusts have interest rates that reset weekly and the floating rate note holders have the option to tender their notes to the TOB Trusts for redemption at par at each reset date. The residual interests held by the Fund (inverse floating rate securities) include the right of the Fund (1) to cause the holders of the floating rate notes to tender their notes at par at the next interest rate reset date, and (2) to transfer the municipal bond from the TOB Trust to the Fund, thereby collapsing the TOB Trust. Inverse floating rate securities tend to underperform the market for fixed rate bonds in a rising interest rate environment, but tend to outperform the market for fixed rate bonds when interest rates decline or remain relatively stable. |
The Fund generally invests in inverse floating rate securities that include embedded leverage, thus exposing the Fund to greater risks and increased costs. The primary risks associated with inverse floating rate securities are varying degrees of liquidity and decreases in the value of such securities in response to changes in interest rates to a greater extent than fixed rate securities having similar credit quality, redemption provisions and maturity, which may cause the Fund’s net asset value to be more volatile than if it had not invested in inverse floating rate securities. In certain instances, the short-term floating rate notes created by the TOB Trust may not be able to be sold to third parties or, in the case of holders tendering (or putting) such notes for repayment of principal, may not be able to be remarketed to third parties. In such cases, the TOB Trust holding the fixed rate bonds may be collapsed with the entity that contributed the fixed rate bonds to the TOB Trust. In the case where a TOB Trust is collapsed with the Fund, the Fund will be required to repay the principal amount of the tendered securities, which may require the Fund to sell other portfolio holdings to raise cash to meet that obligation. The Fund could therefore be required to sell other portfolio holdings at a disadvantageous time or price to raise cash to meet this obligation, which risk will be heightened during times of market volatility, illiquidity or uncertainty. The embedded leverage in the TOB Trust could cause the Fund to lose more money than the value of the asset it has contributed to
| | |
| 36 | | Invesco Intermediate Term Municipal Income Fund |
the TOB Trust and greater levels of leverage create the potential for greater losses. In addition, a Fund may enter into reimbursement agreements with the liquidity provider of certain TOB transactions in connection with certain residuals held by the Fund. These agreements commit a Fund to reimburse the liquidity provider to the extent that the liquidity provider must provide cash to a TOB Trust, including following the termination of a TOB Trust resulting from a mandatory tender event (“liquidity shortfall”). The reimbursement agreement will effectively make the Fund liable for the amount of the negative difference, if any, between the liquidation value of the underlying security and the purchase price of the floating rate notes issued by the TOB Trust.
The Fund accounts for the transfer of fixed rate bonds to the TOB Trusts as secured borrowings, with the securities transferred remaining in the Fund’s investment assets, and the related floating rate notes reflected as Fund liabilities under the captionFloating rate note obligations on the Statement of Assets and Liabilities. The carrying amount of the Fund’s floating rate note obligations as reported on the Statement of Assets and Liabilities approximates its fair value. The Fund records the interest income from the fixed rate bonds under the caption Interest and records the expenses related to floating rate obligations and any administrative expenses of the TOB Trusts as a component ofInterest, facilities and maintenance fees on the Statement of Operations.
Final rules implementing section 619 of the Dodd-Frank Wall Street Reform and Consumer Protection Act (the “Volcker Rule”) prohibit banking entities from engaging in proprietary trading of certain instruments and limit such entities’ investments in, and relationships with, “covered funds”, as defined in the rules. These rules preclude banking entities and their affiliates from sponsoring and/or providing services for existing TOB Trusts. A new TOB structure is being utilized by the Fund wherein the Fund, as holder of the residuals, will perform certain duties previously performed by banking entities as “sponsors” of TOB Trusts. These duties may be performed by a third-party service provider. The Fund’s expanded role under the new TOB structure may increase its operational and regulatory risk. The new structure is substantially similar to the previous structure; however, pursuant to the Volcker Rule, the remarketing agent would not be able to repurchase tendered floaters for its own account upon a failed remarketing. In the event of a failed remarketing, a banking entity serving as liquidity provider may loan the necessary funds to the TOB Trust to purchase the tendered floaters. The TOB Trust, not the Fund, would be the borrower and the loan from the liquidity provider will be secured by the purchased floaters now held by the TOB Trust. However, as previously described, the Fund would bear the risk of loss with respect to any liquidity shortfall to the extent it entered into a reimbursement agreement with the liquidity provider.
Further, the SEC and various banking agencies have adopted rules implementing credit risk retention requirements for asset-backed securities (the “Risk Retention Rules”). The Risk Retention Rules require the
sponsor of a TOB Trust to retain at least 5% of the credit risk of the underlying assets supporting the TOB Trust’s municipal bonds. The Fund has adopted policies intended to comply with the Risk Retention Rules. The Risk Retention Rules may adversely affect the Fund’s ability to engage in TOB Trust transactions or increase the costs of such transactions in certain circumstances.
There can be no assurances that the new TOB structure will continue to be a viable form of leverage. Further, there can be no assurances that alternative forms of leverage will be available to the Fund in order to maintain current levels of leverage. Any alternative forms of leverage may be less advantageous to the Fund, and may adversely affect the Fund’s net asset value, distribution rate and ability to achieve its investment objective.
TOBs are presently classified as private placement securities. Private placement securities are subject to restrictions on resale because they have not been registered under the Securities Act of 1933, as amended (the “1933 Act”), or are otherwise not readily marketable. As a result of the absence of a public trading market for these securities, they may be less liquid than publicly traded securities. Although atypical, these securities may be resold in privately negotiated transactions, the prices realized from these sales could be less than those originally paid by the Fund or less than what may be considered the fair value of such securities.
| K. | Futures Contracts– The Fund may enter into futures contracts to manage exposure to interest rate, equity and market price movements and/or currency risks. A futures contract is an agreement between two parties (“Counterparties”) to purchase or sell a specified underlying security, currency or commodity (or delivery of a cash settlement price, in the case of an index future) for a fixed price at a future date. The Fund currently invests only in exchange-traded futures and they are standardized as to maturity date and underlying financial instrument. Initial margin deposits required upon entering into futures contracts are satisfied by the segregation of specific securities or cash as collateral at the futures commission merchant (broker). During the period the futures contracts are open, changes in the value of the contracts are recognized as unrealized gains or losses by recalculating the value of the contracts on a daily basis. Subsequent or variation margin payments are received or made depending upon whether unrealized gains or losses are incurred. These amounts are reflected as receivables or payables on the Statement of Assets and Liabilities. When the contracts are closed or expire, the Fund recognizes a realized gain or loss equal to the difference between the proceeds from, or cost of, the closing transaction and the Fund’s basis in the contract. The net realized gain (loss) and the change in unrealized gain (loss) on futures contracts held during the period is included on the Statement of Operations. The primary risks associated with futures contracts are market risk and the absence of a liquid secondary market. If the Fund were unable to liquidate a futures contract and/or enter into an offsetting closing transaction, the Fund would continue to be subject to market risk with respect to the value of the contracts and continue to be required to maintain the margin deposits on the futures contracts. Futures contracts have minimal Counterparty risk since the exchange’s clearinghouse, as Counterparty to all exchange-traded futures, guarantees thefutures against default. Risks may exceed amounts recognized in the Statement of Assets and Liabilities. |
| L. | Other Risks– The value of, payment of interest on, repayment of principal for and the ability to sell a municipal security may be affected by constitutional amendments, legislative enactments, executive orders, administrative regulations, voter initiatives and the economics of the regions in which the issuers are located. |
Since many municipal securities are issued to finance similar projects, especially those relating to education, health care, transportation and utilities, conditions in those sectors can affect the overall municipal securities market and the Fund’s investments in municipal securities.
There is some risk that a portion or all of the interest received from certaintax-free municipal securities could become taxable as a result of determinations by the Internal Revenue Service.
| | |
| 37 | | Invesco Intermediate Term Municipal Income Fund |
NOTE 2–Advisory Fees and Other Fees Paid to Affiliates
The Trust has entered into a master investment advisory agreement with Invesco Advisers, Inc. (the “Adviser” or “Invesco”). Under the terms of the investment advisory agreement, the Fund accrues daily and pays monthly an advisory fee to the Adviser based on the annual rate of the Fund’s average daily net assets as follows:
| | | | |
| Average Net Assets | | Rate | |
First $ 500 million | | | 0.50 | % |
Over $500 million | | | 0.45 | % |
For the year ended February 28, 2019, the effective advisory fees incurred by the Fund was 0.47%.
Under the terms of a mastersub-advisory agreement between the Adviser and each of Invesco Asset Management Deutschland GmbH, Invesco Asset Management Limited, Invesco Asset Management (Japan) Limited, Invesco Hong Kong Limited, Invesco Senior Secured Management, Inc. and Invesco Canada Ltd. and separatesub-advisory agreements with Invesco Capital Management LLC and Invesco Asset Management (India) Private Limited (collectively, the “AffiliatedSub-Advisers”) the Adviser, not the Fund, will pay 40% of the fees paid to the Adviser to any such AffiliatedSub-Adviser(s) that provide(s) discretionary investment management services to the Fund based on the percentage of assets allocated to such AffiliatedSub-Adviser(s).
The Adviser has contractually agreed, through at least June 30, 2019, to waive advisory fees and/or reimburse expenses of all shares to the extent necessary to limit total annual fund operating expenses after fee waiver and/or expense reimbursement (excluding certain items discussed below) of Class A, Class C, Class Y and Class R6 shares to 0.84%, 1.59%, 0.59% and 0.59%, respectively, of average daily net assets (the “expense limits”). In determining the Adviser’s obligation to waive advisory fees and/or reimburse expenses, the following expenses are not taken into account, and could cause the total annual fund operating expenses after fee waiver and/or expense reimbursement to exceed the numbers reflected above: (1) interest, facilities and maintenance fees; (2) taxes; (3) dividend expense on short sales; (4) extraordinary ornon-routine items, including litigation expenses; and (5) expenses that the Fund has incurred but did not actually pay because of an expense offset arrangement. Unless Invesco continues the fee waiver agreement, it will terminate on June 30, 2019. During its term, the fee waiver agreement cannot be terminated or amended to increase the expense limits or reduce the advisory fee waiver without approval of the Board of Trustees.
For the year ended February 28, 2019, the Adviser waived advisory fees of $8,943 and reimbursed class level expenses of $256,024, $68,752, $124,827 and $4 of Class A, Class C, Class Y and Class R6 Shares,, respectively.
The Trust has entered into a master administrative services agreement with Invesco pursuant to which the Fund has agreed to pay Invesco for certain administrative costs incurred in providing accounting services to the Fund. For the year ended February 28, 2019, expenses incurred under the agreement are shown in the Statement of Operations as Administrative services fees. Also, Invesco has entered into asub-administration agreement whereby State Street Bank and Trust Company (“SSB”) serves as custodian and fund accountant and provides certain administrative services to the Fund.
The Trust has entered into a transfer agency and service agreement with Invesco Investment Services, Inc. (“IIS”) pursuant to which the Fund has agreed to pay IIS a fee for providing transfer agency and shareholder services to the Fund and reimburse IIS for certain expenses incurred by IIS in the course of providing such services. IIS may make payments to intermediaries that provide omnibus account services,sub-accounting services and/or networking services. All fees payable by IIS to intermediaries that provide omnibus account services orsub-accounting services are charged back to the Fund, subject to certain limitations approved by the Trust’s Board of Trustees. For the year ended February 28, 2019, expenses incurred under the agreement are shown in the Statement of Operations as Transfer agent fees Shares of the Fund are distributed by Invesco Distributors, Inc. (“IDI”). The Fund has adopted a distribution plan pursuant to Rule12b-1 under the 1940 Act, and a service plan (collectively, the “Plans”) for Class A shares and Class C shares to compensate IDI for the sale, distribution, shareholder servicing and maintenance of shareholder accounts for these shares. Under the Plans, the Fund will incur annual fees of up to 0.25% of Class A average daily net assets and up to 1.00% of Class C average daily net assets. The fees are accrued daily and paid monthly.
With respect to Class C shares, the Fund is authorized to reimburse in future years any distribution related expenses that exceed the maximum annual reimbursement rate for such class, so long as such reimbursement does not cause the Fund to exceed the Class C maximum annual reimbursement rate, respectively. With respect to Class A shares, distribution related expenses that exceed the maximum annual reimbursement rate for such class are not carried forward to future years and the Fund will not reimburse IDI for any such expenses.
For the year ended February 28, 2019, expenses incurred under these agreements are shown in the Statement of Operations as Distribution fees.Front-end sales commissions and CDSC (collectively, the “sales charges”) are not recorded as expenses of the Fund.Front-end sales commissions are deducted from proceeds from the sales of Fund shares prior to investment in Class A shares of the Fund. CDSC are deducted from redemption proceeds prior to remittance to the shareholder. During the year ended February 28, 2019, IDI advised the Fund that IDI retained $117,463 infront-end sales commissions from the sale of Class A shares and $73,993 and $2,403 from Class A and Class C shares, respectively, for CDSC imposed upon redemptions by shareholders.
Certain officers and trustees of the Trust are officers and directors of the Adviser, IIS and/or IDI.
NOTE 3–Additional Valuation Information
GAAP defines fair value as the price that would be received to sell an asset or paid to transfer a liability in an orderly transaction between market participants at the measurement date, under current market conditions. GAAP establishes a hierarchy that prioritizes the inputs to valuation methods, giving the highest priority to readily available unadjusted quoted prices in an active market for identical assets (Level 1) and the lowest priority to significant unobservable inputs (Level 3), generally when market prices are not readily available or are unreliable. Based on the valuation inputs, the securities or other investments are tiered into one of three levels. Changes in valuation methods may result in transfers in or out of an investment’s assigned level:
Level 1 – Prices are determined using quoted prices in an active market for identical assets.
| | |
| 38 | | Invesco Intermediate Term Municipal Income Fund |
| | |
Level 2 – | | Prices are determined using other significant observable inputs. Observable inputs are inputs that other market participants may use in pricing a security. These may include quoted prices for similar securities, interest rates, prepayment speeds, credit risk, yield curves, loss severities, default rates, discount rates, volatilities and others. |
| |
Level 3 – | | Prices are determined using significant unobservable inputs. In situations where quoted prices or observable inputs are unavailable (for example, when there is little or no market activity for an investment at the end of the period), unobservable inputs may be used. Unobservable inputs reflect the Fund’s own assumptions about the factors market participants would use in determining fair value of the securities or instruments and would be based on the best available information. |
The following is a summary of the tiered valuation input levels, as of February 28, 2019. The level assigned to the securities valuations may not be an indication of the risk or liquidity associated with investing in those securities. Because of the inherent uncertainties of valuation, the values reflected in the financial statements may materially differ from the value received upon actual sale of those investments.
| | | | | | | | | | | | | | | | |
| | | Level 1 | | | Level 2 | | | Level 3 | | | Total | |
Investments in Securities | | | | | | | | | | | | | | | | |
Municipal Obligations | | $ | – | | | $ | 1,400,128,192 | | | $ | – | | | $ | 1,400,128,192 | |
Other Investments - Assets* | | | | | | | | | | | | | | | | |
Futures Contracts | | | 153,094 | | | | – | | | | – | | | | 153,094 | |
Total Investments | | $ | 153,094 | | | $ | 1,400,128,192 | | | $ | – | | | $ | 1,400,281,286 | |
| * | Unrealized appreciation. |
NOTE 4–Derivative Investments
The Fund may enter into an International Swaps and Derivatives Association Master Agreement (“ISDA Master Agreement”) under which a fund may trade OTC derivatives. An OTC transaction entered into under an ISDA Master Agreement typically involves a collateral posting arrangement, payment netting provisions andclose-out netting provisions. These netting provisions allow for reduction of credit risk through netting of contractual
obligations. The enforceability of the netting provisions of the ISDA Master Agreement depends on the governing law of the ISDA Master Agreement, among other factors.
For financial reporting purposes, the Fund does not offset OTC derivative assets or liabilities that are subject to ISDA Master Agreements in the Statement of Assets and Liabilities.
Value of Derivative Investments atPeriod-End
The table below summarizes the value of the Fund’s derivative investments, detailed by primary risk exposure, held as of February 28, 2019:
| | | | |
| | | Value | |
| Derivative Assets | | Interest
Rate Risk | |
Unrealized appreciation on futures contracts – Exchange-Traded | | $ | 153,094 | |
Derivatives not subject to master netting agreements | | | (153,094 | ) |
Total Derivative Assets subject to master netting agreements | | $ | - | |
Effect of Derivative Investments for the year ended February 28, 2019
The table below summarizes the gains (losses) on derivative investments, detailed by primary risk exposure, recognized in earnings during the period:
| | | | |
| | | Location of Gain (Loss) on | |
| | | Statement of Operations | |
| | | Interest Rate Risk | |
Realized (Loss): | | | | |
Futures contracts | | $ | (757,276 | ) |
Change in Net Unrealized Appreciation: | | | | |
Futures contracts | | | 153,094 | |
Total | | $ | (604,182 | ) |
The table below summarizes the eight month average notional value of futures contracts outstanding during the period.
| | | | |
| | | Futures
Contracts | |
Average notional value | | $ | 36,646,404 | |
| | |
| 39 | | Invesco Intermediate Term Municipal Income Fund |
NOTE 5–Expense Offset Arrangement(s)
The expense offset arrangement is comprised of transfer agency credits which result from balances in demand deposit accounts used by the transfer agent for clearing shareholder transactions. For the year ended February 28, 2019, the Fund received credits from this arrangement, which resulted in the reduction of the Fund’s total expenses of $535.
NOTE 6–Security Transactions with Affiliated Funds
The Fund is permitted to purchase or sell securities from or to certain other Invesco Funds under specified conditions outlined in procedures adopted by the Board of Trustees of the Trust. The procedures have been designed to ensure that any purchase or sale of securities by the Fund from or to another fund or portfolio that is or could be considered an affiliate by virtue of having a common investment adviser (or affiliated investment advisers), common Trustees and/or common officers complies with Rule17a-7 of the 1940 Act. Further, as defined under the procedures, each transaction is effected at the current market price. Pursuant to these procedures, for the year ended February 28, 2019, the Fund engaged in securities purchases of $96,111,292 and securities sales of $141,890,077, which resulted in net realized gains (losses) of $(172,062).
NOTE 7–Trustees’ and Officers’ Fees and Benefits
Trustees’ and Officers’ Fees and Benefits include amounts accrued by the Fund to pay remuneration to certain Trustees and Officers of the Fund. Trustees have the option to defer compensation payable by the Fund, andTrustees’ and Officers’ Fees and Benefits also include amounts accrued by the Fund to fund such deferred compensation amounts. Those Trustees who defer compensation have the option to select various Invesco Funds in which their deferral accounts shall be deemed to be invested. Finally, certain current Trustees were eligible to participate in a retirement plan that provided for benefits to be paid upon retirement to Trustees over a period of time based on the number of years of service. The Fund may have certain former Trustees who also participate in a retirement plan and receive benefits under such plan.Trustees’ and Officers’ Fees and Benefits include amounts accrued by the Fund to fund such retirement benefits. Obligations under the deferred compensation and retirement plans represent unsecured claims against the general assets of the Fund.
NOTE 8–Cash Balances and Borrowings
The Trust is permitted to temporarily carry a negative or overdrawn balance in its account with SSB, the custodian bank. Such balances, if any atperiod-end, are shown in the Statement of Assets and Liabilities under the payable captionAmount due custodian. To compensate the custodian bank for such overdrafts, the overdrawn Trust may either (1) leave funds as a compensating balance in the account so the custodian bank can be compensated by earning the additional interest; or (2) compensate by paying the custodian bank at a rate agreed upon by the custodian bank and Invesco, not to exceed the contractually agreed upon rate.
Inverse floating rate obligations resulting from the transfer of bonds to TOB Trusts are accounted for as secured borrowings. The average floating rate notes outstanding and average annual interest and fee rate related to inverse floating rate note obligations during the year ended February 28, 2019 were $37,149,615 and 1.46%, respectively.
NOTE 9–Distributions to Shareholders and Tax Components of Net Assets
| | | | |
Tax Character of Distributions to Shareholders Paid During the Fiscal Years Ended February 28, 2019 and 2018 |
| | | | | | | | |
| | | 2019 | | | 2018 | |
Ordinaryincome -Tax-Exempt | | $ | 37,994,751 | | | $ | 34,737,983 | |
| | |
Tax Components of Net Assets atPeriod-End: | | | | | | | | |
| | | | | | 2019 | |
UndistributedTax-Exempt Income | | | | | | $ | 2,674,898 | |
Net unrealized appreciation - investments | | | | | | | 34,874,502 | |
Unrealized appreciation (depreciation) - other investments | | | | | | | (1,014 | ) |
Temporary book/tax differences | | | | | | | (90,313 | ) |
Capital loss carryforward | | | | | | | (25,023,640 | ) |
Shares of beneficial interest | | | | | | | 1,355,130,878 | |
Total net assets | | | | | | $ | 1,367,565,311 | |
The difference between book-basis andtax-basis unrealized appreciation (depreciation) is due to differences in the timing of recognition of gains and losses on investments for tax and book purposes. The Fund’s net unrealized appreciation (depreciation) difference is attributable primarily to TOBS accretion of bond discount and defaulted bonds and futures contracts.
The temporary book/tax differences are a result of timing differences between book and tax recognition of income and/or expenses. The Fund’s temporary book/tax differences are the result of the trustee deferral of compensation and retirement plan benefits.
Capital loss carryforward is calculated and reported as of a specific date. Results of transactions and other activity after that date may affect the amount of capital loss carryforward actually available for the Fund to utilize. Capital losses generated in years beginning after December 22, 2010 can be carried forward for an unlimited period, whereas previous losses expire in eight tax years. Capital losses with an expiration period may not be used to offset capital gains until all net capital losses without an expiration date have been utilized. Capital loss carryforwards with no expiration date
| | |
| 40 | | Invesco Intermediate Term Municipal Income Fund |
will retain their character as either short-term or long-term capital losses instead of as short-term capital losses as under prior law. The ability to utilize capital loss carryforwards in the future may be limited under the Internal Revenue Code and related regulations based on the results of future transactions.
The Fund has a capital loss carryforward as of February 28, 2019, as follows:
| | | | | | | | | | | | |
| Capital Loss Carryforward* | |
| Expiration | | Short-Term | | | Long-Term | | | Total | |
Not subject to expiration | | $ | 18,481,645 | | | $ | 6,541,995 | | | $ | 25,023,640 | |
| * | Capital loss carryforward as of the date listed above is reduced for limitations, if any, to the extent required by the Internal Revenue Code and may be further limited depending upon a variety of factors, including the realization of net unrealized gains or losses as of the date of any reorganization. |
NOTE 10–Investment Transactions
The aggregate amount of investment securities (other than short-term securities, U.S. Treasury obligations and money market funds, if any) purchased and sold by the Fund during the year ended February 28, 2019 was $395,239,066 and $357,079,852, respectively. Cost of investments, including any derivatives, on a tax basis includes the adjustments for financial reporting purposes as of the most recently completed federal income tax reportingperiod-end.
| | | | |
| Unrealized Appreciation (Depreciation) of Investments on a TaxBasis | |
Aggregate unrealized appreciation of investments | | | $39,262,549 | |
Aggregate unrealized (depreciation) of investments | | | (4,388,047 | ) |
Net unrealized appreciation of investments | | | $34,874,502 | |
Cost of investments for tax purposes is $1,365,406,784.
NOTE 11–Reclassification of Permanent Differences
Primarily as a result of differing book/tax treatment of capital loss carryforward, on February 28, 2019, undistributed net investment income (loss) was decreased by $283,646, undistributed net realized gain (loss) was increased by $23,209,586 and shares of beneficial interest was decreased by $22,925,940. This reclassification had no effect on the net assets of the Fund.
NOTE 12–Share Information
| | | | | | | | | | | | | | | | | | | | |
| | | Summary of Share Activity | |
| | | Years ended February 28, | |
| | | 2019(a) | | | | | | 2018 | |
| | | Shares | | | Amount | | | | | | Shares | | | Amount | |
Sold: | | | | | | | | | | | | | | | | | | | | |
Class A | | | 26,873,300 | | | $ | 294,160,713 | | | | | | | | 22,720,912 | | | $ | 252,739,274 | |
Class B(b) | | | – | | | | – | | | | | | | | 9,099 | | | | 102,901 | |
Class C | | | 3,454,954 | | | | 37,731,473 | | | | | | | | 7,566,863 | | | | 83,967,036 | |
Class Y | | | 19,035,068 | | | | 208,316,573 | | | | | | | | 15,858,495 | | | | 175,805,911 | |
Class R6(c) | | | – | | | | – | | | | | | | | 911 | | | | 10,000 | |
| | | | | |
Issued as reinvestment of dividends: | | | | | | | | | | | | | | | | | | | | |
Class A | | | 1,480,164 | | | | 16,216,458 | | | | | | | | 1,345,587 | | | | 14,943,701 | |
Class B(b) | | | – | | | | – | | | | | | | | 3,414 | | | | 38,700 | |
Class C | | | 322,679 | | | | 3,524,937 | | | | | | | | 358,343 | | | | 3,968,611 | |
Class Y | | | 784,161 | | | | 8,584,058 | | | | | | | | 578,069 | | | | 6,414,284 | |
| | | | | |
Conversion of Class B shares to Class A shares:(d) | | | | | | | | | | | | | | | | | | | | |
Class A | | | – | | | | – | | | | | | | | 81,886 | | | | 908,111 | |
Class B | | | – | | | | – | | | | | | | | (80,240 | ) | | | (908,111 | ) |
| | |
| 41 | | Invesco Intermediate Term Municipal Income Fund |
| | | | | | | | | | | | | | | | | | |
| | | Summary of Share Activity | |
| | | Years ended February 28, | |
| | | 2019(a) | | | | | 2018 | |
| | | Shares | | | Amount | | | | | Shares | | | Amount | |
| | | | | |
Reacquired: | | | | | | | | | | | | | | | | | | |
Class A | | | (21,200,690 | ) | | | (231,998,040 | ) | | | | | (18,296,441 | ) | | | (202,780,919 | ) |
Class B(b) | | | – | | | | – | | | | | | (177,421 | ) | | | (2,013,057 | ) |
Class C | | | (15,698,929 | ) | | | (171,492,585 | ) | | | | | (7,805,308 | ) | | | (86,438,417 | ) |
Class Y | | | (12,796,537 | ) | | | (139,775,955 | ) | | | | | (10,722,119 | ) | | | (119,140,061 | ) |
Net increase in share activity | | | 2,254,170 | | | $ | 25,267,632 | | | | | | 11,442,050 | | | | $ 127,617,964 | |
| (a) | There is an entity that is a record owner of more than 5% of the outstanding shares of the Fund and owns 59% of the outstanding shares of the Fund. IDI has an agreement with this entity to sell Fund shares. The Fund, Invesco and/or Invesco affiliates may make payments to this entity, which is considered to be related to the Fund, for providing services to the Fund, Invesco and/or Invesco affiliates including but not limited to services such as, securities brokerage, distribution, third party record keeping and account servicing. The Fund has no knowledge as to whether all or any portion of the shares owned of record by this entity are also owned beneficially. |
| (b) | Class B shares activity for the period March 1, 2017 through January 26, 2018 (date of conversion). |
| (c) | Commencement date of April 4, 2017. |
| (d) | Effective as of the close of business January 26, 2018, all outstanding Class B shares were converted to Class A shares. |
NOTE 13–Financial Highlights
The following schedule presents financial highlights for a share of the Fund outstanding throughout the periods indicated.
| | | | | | | | | | | | | | | | | | | | | | | | | | | | | | | | | | | | | | | | | | | | | | | | | | | | | | | | | | | | | | | | | |
| | | Net asset
value,
beginning
of period | | Net
investment
income(a) | | Net gains
(losses)
on securities
(both
realized and
unrealized) | | Total from
investment
operations | | Dividends
from net
investment
income | | Net asset
value, end
of period | | Total
return(b) | | Net assets,
end of period
(000’s omitted) | | Ratio of
expenses
to average
net assets
with fee waivers
and/or expenses
absorbed | | Ratio of
expenses
to average net
assets without
fee waivers
and/or expenses
absorbed | | Supplemental ratio of expenses to average net assets with fee waivers (excluding interest, facilities and maintenance fees) | | Ratio of net
investment
income
to average
net assets | | Portfolio
turnover(c) |
Class A | |
Year ended 02/28/19 | | | | $10.99 | | | | | $0.31 | | | | | $ 0.03 | | | | | $ 0.34 | | | | $ | (0.31 | ) | | | | $11.02 | | | | | 3.19 | % | | | | $848,116 | | | | | 0.88 | %(d) | | | | 0.91 | %(d) | | | | 0.84 | %(d) | | | | 2.85 | %(d) | | | | 27 | % |
Year ended 02/28/18 | | | | 10.97 | | | | | 0.31 | | | | | 0.02 | | | | | 0.33 | | | | | (0.31 | ) | | | | 10.99 | | | | | 3.03 | | | | | 766,748 | | | | | 0.87 | | | | | 0.91 | | | | | 0.84 | | | | | 2.79 | | | | | 16 | |
Year ended 02/28/17 | | | | 11.29 | | | | | 0.30 | | | | | (0.33 | ) | | | | (0.03 | ) | | | | (0.29 | ) | | | | 10.97 | | | | | (0.30 | ) | | | | 701,376 | | | | | 0.85 | | | | | 0.90 | | | | | 0.82 | | | | | 2.71 | | | | | 20 | |
Year ended 02/29/16 | | | | 11.23 | | | | | 0.32 | | | | | 0.04 | | | | | 0.36 | | | | | (0.30 | ) | | | | 11.29 | | | | | 3.25 | | | | | 648,535 | | | | | 0.82 | | | | | 0.90 | | | | | 0.80 | | | | | 2.88 | | | | | 7 | |
Year ended 02/28/15 | | | | 10.94 | | | | | 0.34 | | | | | 0.31 | | | | | 0.65 | | | | | (0.36 | ) | | | | 11.23 | | | | | 5.97 | | | | | 505,876 | | | | | 0.81 | | | | | 0.90 | | | | | 0.80 | | | | | 3.09 | | | | | 12 | |
Class C | |
Year ended 02/28/19 | | | | 10.96 | | | | | 0.23 | | | | | 0.03 | | | | | 0.26 | | | | | (0.23 | ) | | | | 10.99 | | | | | 2.42 | (e) | | | | 106,166 | | | | | 1.63 | (d)(e) | | | | 1.66 | (d)(e) | | | | 1.59 | (d)(e) | | | | 2.10 | (d)(e) | | | | 27 | |
Year ended 02/28/18 | | | | 10.94 | | | | | 0.23 | | | | | 0.02 | | | | | 0.25 | | | | | (0.23 | ) | | | | 10.96 | | | | | 2.26 | (e) | | | | 236,475 | | | | | 1.62 | (e) | | | | 1.66 | (e) | | | | 1.59 | (e) | | | | 2.04 | (e) | | | | 16 | |
Year ended 02/28/17 | | | | 11.26 | | | | | 0.22 | | | | | (0.34 | ) | | | | (0.12 | ) | | | | (0.20 | ) | | | | 10.94 | | | | | (1.06 | )(e) | | | | 234,811 | | | | | 1.60 | (e) | | | | 1.65 | (e) | | | | 1.57 | (e) | | | | 1.96 | (e) | | | | 20 | |
Year ended 02/29/16 | | | | 11.20 | | | | | 0.24 | | | | | 0.04 | | | | | 0.28 | | | | | (0.22 | ) | | | | 11.26 | | | | | 2.53 | (e) | | | | 204,971 | | | | | 1.57 | (e) | | | | 1.65 | (e) | | | | 1.55 | (e) | | | | 2.13 | (e) | | | | 7 | |
Year ended 02/28/15 | | | | 10.92 | | | | | 0.26 | | | | | 0.30 | | | | | 0.56 | | | | | (0.28 | ) | | | | 11.20 | | | | | 5.20 | (e) | | | | 167,154 | | | | | 1.53 | (e) | | | | 1.62 | (e) | | | | 1.52 | (e) | | | | 2.37 | (e) | | | | 12 | |
Class Y | |
Year ended 02/28/19 | | | | 10.98 | | | | | 0.34 | | | | | 0.04 | | | | | 0.38 | | | | | (0.34 | ) | | | | 11.02 | | | | | 3.54 | | | | | 413,274 | | | | | 0.63 | (d) | | | | 0.66 | (d) | | | | 0.59 | (d) | | | | 3.10 | (d) | | | | 27 | |
Year ended 02/28/18 | | | | 10.96 | | | | | 0.34 | | | | | 0.02 | | | | | 0.36 | | | | | (0.34 | ) | | | | 10.98 | | | | | 3.29 | | | | | 334,820 | | | | | 0.62 | | | | | 0.66 | | | | | 0.59 | | | | | 3.04 | | | | | 16 | |
Year ended 02/28/17 | | | | 11.28 | | | | | 0.33 | | | | | (0.33 | ) | | | | 0.00 | | | | | (0.32 | ) | | | | 10.96 | | | | | (0.05 | ) | | | | 271,646 | | | | | 0.60 | | | | | 0.65 | | | | | 0.57 | | | | | 2.96 | | | | | 20 | |
Year ended 02/29/16 | | | | 11.22 | | | | | 0.35 | | | | | 0.04 | | | | | 0.39 | | | | | (0.33 | ) | | | | 11.28 | | | | | 3.51 | | | | | 212,783 | | | | | 0.57 | | | | | 0.65 | | | | | 0.55 | | | | | 3.13 | | | | | 7 | |
Year ended 02/28/15 | | | | 10.93 | | | | | 0.37 | | | | | 0.30 | | | | | 0.67 | | | | | (0.38 | ) | | | | 11.22 | | | | | 6.24 | | | | | 171,903 | | | | | 0.56 | | | | | 0.65 | | | | | 0.55 | | | | | 3.34 | | | | | 12 | |
Class R6 | |
Year ended 02/28/19 | | | | 10.97 | | | | | 0.34 | | | | | 0.04 | | | | | 0.38 | | | | | (0.34 | ) | | | | 11.01 | | | | | 3.54 | | | | | 10 | | | | | 0.63 | (d) | | | | 0.67 | (d) | | | | 0.59 | (d) | | | | 3.10 | (d) | | | | 27 | |
Year ended 02/28/18(f) | | | | 10.99 | | | | | 0.31 | | | | | (0.02 | ) | | | | 0.29 | | | | | (0.31 | ) | | | | 10.97 | | | | | 2.65 | | | | | 10 | | | | | 0.62 | (g) | | | | 0.67 | (g) | | | | 0.59 | (g) | | | | 3.04 | (g) | | | | 16 | |
| (a) | Calculated using average shares outstanding. |
| (b) | Includes adjustments in accordance with accounting principles generally accepted in the United States of America and as such, the net asset value for financial reporting purposes and the returns based upon those net asset values may differ from the net asset value and returns for shareholder transactions. Does not include sales charges and is not annualized for periods less than one year, if applicable. |
| (c) | Portfolio turnover is calculated at the fund level and is not annualized for periods less than one year, if applicable. |
| (d) | Ratios are based on average daily net assets (000’s omitted) of $765,735, $205,628, $373,341 and $10 for Class A, Class C, Class Y and Class R6 shares, respectively. |
| (e) | The total return, ratio of expenses to average net assets and ratio of net investment income to average net assets reflect actual12b-1 fees of 1.00%, 1.00%, 1.00%, 1.00% and 0.98% for the years ended February 28, 2019, February 28, 2018, February 28, 2017, February 29, 2016 and February 28, 2015, respectively. |
| (f) | Commencement date of April 4, 2017. |
| | |
| 42 | | Invesco Intermediate Term Municipal Income Fund |
Report of Independent Registered Public Accounting Firm
To the Board of Trustees of AIMTax-Exempt Funds (InvescoTax-Exempt Funds)
and Shareholders of Invesco Intermediate Term Municipal Income Fund:
Opinion on the Financial Statements
We have audited the accompanying statement of assets and liabilities, including the schedule of investments, of Invesco Intermediate Term Municipal Income Fund (one of the funds constituting AIMTax-Exempt Funds (InvescoTax-Exempt Funds), hereafter referred to as the “Fund”) as of February 28, 2019, the related statement of operations for the year ended February 28, 2019, the statement of changes in net assets for each of the two years in the period ended February 28, 2019, including the related notes, and the financial highlights for each of the periods indicated therein (collectively referred to as the “financial statements”). In our opinion, the financial statements present fairly, in all material respects, the financial position of the Fund as of February 28, 2019, the results of its operations for the year then ended, the changes in its net assets for each of the two years in the period ended February 28, 2019 and the financial highlights for each of the periods indicated therein in conformity with accounting principles generally accepted in the United States of America.
Basis for Opinion
These financial statements are the responsibility of the Fund’s management. Our responsibility is to express an opinion on the Fund’s financial statements based on our audits. We are a public accounting firm registered with the Public Company Accounting Oversight Board (United States) (PCAOB) and are required to be independent with respect to the Fund in accordance with the U.S. federal securities laws and the applicable rules and regulations of the Securities and Exchange Commission and the PCAOB.
We conducted our audits of these financial statements in accordance with the standards of the PCAOB. Those standards require that we plan and perform the audit to obtain reasonable assurance about whether the financial statements are free of material misstatement, whether due to error or fraud.
Our audits included performing procedures to assess the risks of material misstatement of the financial statements, whether due to error or fraud, and performing procedures that respond to those risks. Such procedures included examining, on a test basis, evidence regarding the amounts and disclosures in the financial statements. Our audits also included evaluating the accounting principles used and significant estimates made by management, as well as evaluating the overall presentation of the financial statements. Our procedures included confirmation of securities owned as of February 28, 2019 by correspondence with the custodian and brokers; when replies were not received from brokers, we performed other auditing procedures. We believe that our audits provide a reasonable basis for our opinion.
PricewaterhouseCoopers LLP
Houston, TX
April 29, 2019
We have served as the auditor of one or more of the investment companies in the Invesco group of investment companies since at least 1995. We have not been able to determine the specific year we began serving as auditor.
| | |
| 43 | | Invesco Intermediate Term Municipal Income Fund |
Calculating your ongoing Fund expenses
Example
As a shareholder of the Fund, you incur two types of costs: (1) transaction costs, which may include sales charges (loads) on purchase payments or contingent deferred sales charges on redemptions, if any; and (2) ongoing costs, including management fees, distribution and/or service(12b-1) fees, and other Fund expenses. This example is intended to help you understand your ongoing costs (in dollars) of investing in the Fund and to compare these costs with ongoing costs of investing in other mutual funds. The example is based on an investment of $1,000 invested at the beginning of the period and held for the entire period September 1, 2018 through February 28, 2019.
Actual expenses
The table below provides information about actual account values and actual expenses. You may use the information in this table, together with the amount you invested, to estimate the expenses that you paid over the period. Simply divide your account value by $1,000 (for example, an $8,600 account value divided by $1,000 = 8.6), then multiply the result by the number in the table under the heading entitled “Actual Expenses Paid During Period” to estimate the expenses you paid on your account during this period.
Hypothetical example for comparison purposes
The table below also provides information about hypothetical account values and hypothetical expenses based on the Fund’s actual expense ratio and an assumed rate of return of 5% per year before expenses, which is not the Fund’s actual return.
The hypothetical account values and expenses may not be used to estimate the actual ending account balance or expenses you paid for the period. You may use this information to compare the ongoing costs of investing in the Fund and other funds. To do so, compare this 5% hypothetical example with the 5% hypothetical examples that appear in the shareholder reports of the other funds.
Please note that the expenses shown in the table are meant to highlight your ongoing costs only and do not reflect any transaction costs, such as sales charges (loads) on purchase payments or contingent deferred sales charges on redemptions, if any. Therefore, the hypothetical information is useful in comparing ongoing costs only, and will not help you determine the relative total costs of owning different funds. In addition, if these transaction costs were included, your costs would have been higher.
| | | | | | | | | | | | |
| | | Beginning Account Value (09/01/18) | | ACTUAL | | HYPOTHETICAL (5% annual return before expenses) | | Annualized
Expense Ratio |
| | Ending
Account Value
(02/28/19)1 | | Expenses
Paid During Period2 | | Ending
Account Value
(02/28/19) | | Expenses
Paid During Period2 |
| Class A | | $1,000.00 | | $1,017.20 | | $4.35 | | $1,020.48 | | $4.36 | | 0.87% |
| Class C | | 1,000.00 | | 1,013.50 | | 8.09 | | 1,016.76 | | 8.10 | | 1.62 |
| Class Y | | 1,000.00 | | 1,018.50 | | 3.10 | | 1,021.72 | | 3.11 | | 0.62 |
| Class R6 | | 1,000.00 | | 1,018.50 | | 3.10 | | 1,021.72 | | 3.11 | | 0.62 |
| 1 | The actual ending account value is based on the actual total return of the Fund for the period September 1, 2018 through February 28, 2019, after actual expenses and will differ from the hypothetical ending account value which is based on the Fund’s expense ratio and a hypothetical annual return of 5% before expenses. |
| 2 | Expenses are equal to the Fund’s annualized expense ratio as indicated above multiplied by the average account value over the period, multiplied by 181/365 to reflect the most recent fiscal half year. |
| | |
| 44 | | Invesco Intermediate Term Municipal Income Fund |
Tax Information
Form1099-DIV, Form1042-S and other year-end tax information provide shareholders with actual calendar year amounts that should be included in their tax returns. Shareholders should consult their tax advisors.
The following distribution information is being provided as required by the Internal Revenue Code or to meet a specific state’s requirement.
The Fund designates the following amounts or, if subsequently determined to be different, the maximum amount allowable for its fiscal year ended February 28, 2019:
| | | | | | | | |
| | Federal and State Income Tax | | | | | | |
| | Qualified Dividend Income* | | | 0 | % | | |
| | Corporate Dividends Received Deduction* | | | 0 | % | | |
| | U.S. Treasury Obligations* | | | 0 | % | | |
| | Tax-Exempt Interest Dividends* | | | 100 | % | | |
| | * | The above percentages are based on ordinary income dividends paid to shareholders during the Fund’s fiscal year. |
| | |
| 45 | | Invesco Intermediate Term Municipal Income Fund |
Trustees and Officers
The address of each trustee and officer is AIMTax-Exempt Funds (InvescoTax-Exempt Funds) (the “Trust”), 11 Greenway Plaza, Suite 1000, Houston, Texas 77046-1173. The trustees serve for the life of the Trust, subject to their earlier death, incapacitation, resignation, retirement or removal as more specifically provided in the Trust’s organizational documents. Each officer serves for a one year term or until their successors are elected and qualified. Column two below includes length of time served with predecessor entities, if any.
| | | | | | | | |
Name, Year of Birth and Position(s) Held with the Trust | | Trustee and/ or Officer Since | | Principal Occupation(s) During Past 5 Years | | Number of Funds in Fund Complex Overseen by Trustee | | Other Directorship(s) Held by Trustee During
Past 5 Years |
| Interested Persons | | | | | | | | |
| Martin L. Flanagan1 – 1960 Trustee and Vice Chair | | 2007 | | Executive Director, Chief Executive Officer and President, Invesco Ltd. (ultimate parent of Invesco and a global investment management firm); Trustee and Vice Chair, The Invesco Funds; Vice Chair, Investment Company Institute; and Member of Executive Board, SMU Cox School of Business Formerly: Advisor to the Board, Invesco Advisers, Inc. (formerly known as Invesco Institutional (N.A.), Inc.); Chairman and Chief Executive Officer, Invesco Advisers, Inc. (registered investment adviser); Director, Chairman, Chief Executive Officer and President, Invesco Holding Company (US), Inc. (formerly IVZ Inc.) (holding company), Invesco Group Services, Inc. (service provider) and Invesco North American Holdings, Inc. (holding company); Director, Chief Executive Officer and President, Invesco Holding Company Limited (parent of Invesco and a global investment management firm); Director, Invesco Ltd.; Chairman, Investment Company Institute and President,Co-Chief Executive Officer,Co-President, Chief Operating Officer and Chief Financial Officer, Franklin Resources, Inc. (global investment management organization) | | 158 | | None |
| Philip A. Taylor2– 1954 Trustee | | 2006 | | Vice Chair, Invesco Ltd.; Director, Invesco Canada Ltd. (formerly known as Invesco Trimark Ltd./Invesco Trimark Ltèe) (registered investment adviser and registered transfer agent); Trustee, The Invesco Funds Formerly: Head of the Americas and Senior Managing Director, Invesco Ltd.; Director, Invesco Advisers, Inc. (formerly known as Invesco Institutional (N.A.), Inc.) (registered investment adviser); Director and Chairman, Invesco Investment Services, Inc. (formerly known as Invesco AIM Investment Services, Inc.) (registered transfer agent); Chief Executive Officer, Invesco Corporate Class Inc. (corporate mutual fund company); Chairman and Chief Executive Officer, Invesco Canada Ltd. (formerly known as Invesco Trimark Ltd./Invesco Trimark Ltèe) (registered investment adviser and registered transfer agent); Senior Vice President, The Invesco Funds; Director, Invesco Investment Advisers LLC (formerly known as Van Kampen Asset Management); Director, Chairman, Chief Executive Officer and President, Invesco Management Group, Inc. (formerly known as Invesco AIM Management Group, Inc.) (financial services holding company);Co-Chairman,Co-President andCo-Chief Executive Officer, Invesco Advisers, Inc. (formerly known as Invesco Institutional (N.A.), Inc.) (registered investment adviser); Director, Chief Executive Officer and President, Van Kampen Exchange Corp; President and Principal Executive Officer, The Invesco Funds (other than AIM Treasurer’s Series Trust (Invesco Treasurer’s Series Trust), Short-Term Investments Trust and Invesco Management Trust); Executive Vice President, The Invesco Funds (AIM Treasurer’s Series Trust (Invesco Treasurer’s Series Trust), Short-Term Investments Trust and Invesco Management Trust only); Director and President, INVESCO Funds Group, Inc. (registered investment adviser and registered transfer agent); Director and Chairman, IVZ Distributors, Inc. (formerly known as INVESCO Distributors, Inc.) (registered broker dealer); Director, President and Chairman, Invesco Inc. (holding company), Invesco Canada Holdings Inc. (holding company), Trimark Investments Ltd./Placements Trimark Ltèe and Invesco Financial Services Ltd/Services Financiers Invesco Ltèe; Chief Executive Officer, Invesco Canada Fund Inc. (corporate mutual fund company); Director and Chairman, Van Kampen Investor Services Inc.; Director, Chief Executive Officer and President, 1371 Preferred Inc. (holding company) and Van Kampen Investments Inc.; Director and President, AIM GP Canada Inc. (general partner for limited partnerships) and Van Kampen Advisors, Inc.; Director and Chief Executive Officer, Invesco Trimark Dealer Inc. (registered broker dealer); Director, Invesco Distributors, Inc. (formerly known as Invesco AIM Distributors, Inc.) (registered broker dealer); Manager, Invesco Capital Management LLC; Director, Chief Executive Officer and President, Invesco Advisers, Inc.; Director, Chairman, Chief Executive Officer and President, Invesco AIM Capital Management, Inc.; President, Invesco Trimark Dealer Inc. and Invesco Trimark Ltd./Invesco Trimark Ltèe; Director and President, AIM Trimark Corporate Class Inc. and AIM Trimark Canada Fund Inc.; Senior Managing Director, Invesco Holding Company Limited; Director and Chairman, Fund Management Company (former registered broker dealer); President and Principal Executive Officer, The Invesco Funds (AIM Treasurer’s Series Trust (Invesco Treasurer’s Series Trust), and Short-Term Investments Trust only); President, AIM Trimark Global Fund Inc. and AIM Trimark Canada Fund Inc. | | 158 | | None |
| 1 | Mr. Flanagan is considered an interested person (within the meaning of Section 2(a)(19) of the 1940 Act) of the Trust because he is an officer of the Adviser to the Trust, and an officer and a director of Invesco Ltd., ultimate parent of the Adviser. |
| 2 | Mr. Taylor is considered an interested person (within the meaning of Section 2(a)(19) of the 1940 Act) of the Trust because he is an officer and a director of the Adviser. |
| | |
| T-1 | | Invesco Intermediate Term Municipal Income Fund |
Trustees and Officers–(continued)
| | | | | | | | |
Name, Year of Birth and Position(s) Held with the Trust | | Trustee and/ or Officer Since | | Principal Occupation(s) During Past 5 Years | | Number of Funds in Fund Complex Overseen by Trustee | | Other Directorship(s) Held by Trustee During
Past 5 Years |
Independent Trustees | | | | | | | | |
Bruce L. Crockett – 1944 Trustee and Chair | | 1993 | | Chairman, Crockett Technologies Associates (technology consulting company) Formerly: Director, Captaris (unified messaging provider); Director, President and Chief Executive Officer, COMSAT Corporation; Chairman, Board of Governors of INTELSAT (international communications company); ACE Limited (insurance company); Independent Directors Council and Investment Company Institute: Member of the Audit Committee, Investment Company Institute; Member of the Executive Committee and Chair of the Governance Committee, Independent Directors Council | | 158 | | Director and Chairman of the Audit Committee, ALPS (Attorneys Liability Protection Society) (insurance company); Director and Member of the Audit Committee and Compensation Committee, Ferroglobe PLC (metallurgical company) |
David C. Arch – 1945 Trustee | | 2010 | | Chairman of Blistex Inc. (consumer health care products manufacturer); Member, World Presidents’ Organization | | 158 | | Board member of the Illinois Manufacturers’ Association |
Jack M. Fields – 1952 Trustee | | 1997 | | Chief Executive Officer, Twenty First Century Group, Inc. (government affairs company); and Chairman, Discovery Learning Alliance(non-profit) Formerly: Owner and Chief Executive Officer, Dos Angeles Ranch L.P. (cattle, hunting, corporate entertainment); Director, Insperity, Inc. (formerly known as Administaff) (human resources provider); Chief Executive Officer, Texana Timber LP (sustainable forestry company); Director of Cross Timbers Quail Research Ranch(non-profit); and member of the U.S. House of Representatives | | 158 | | None |
Cynthia Hostetler – 1962 Trustee | | 2017 | | Non-Executive Director and Trustee of a number of public and private business corporations Formerly: Director, Aberdeen Investment Funds (4 portfolios); Head of Investment Funds and Private Equity, Overseas Private Investment Corporation; President, First Manhattan Bancorporation, Inc.; Attorney, Simpson Thacher & Bartlett LLP | | 158 | | Vulcan Materials Company (construction materials company); Trilinc Global Impact Fund; Genesee & Wyoming, Inc. (railroads); Artio Global Investment LLC (mutual fund complex); Edgen Group, Inc. (specialized energy and infrastructure products distributor); Investment Company Institute (professional organization); Independent Directors Council (professional organization) |
Eli Jones – 1961 Trustee | | 2016 | | Professor and Dean, Mays Business School – Texas A&M University Formerly: Professor and Dean, Walton College of Business, University of Arkansas and E.J. Ourso College of Business, Louisiana State University; Director, Arvest Bank | | 158 | | Insperity, Inc. (formerly known as Administaff) (human resources provider) |
Anthony J. LaCava, Jr. – 1956 Trustee | | 2019 | | Formerly: Director and Member of the Audit Committee, Blue Hills Bank and Managing Partner, KPMG LLP | | 158 | | Blue Hills Bank; Chairman, Bentley University; Member, Business School Advisory Council; KPMG LLP |
Prema Mathai-Davis – 1950 Trustee | | 1998 | | Retired Co-Owner & Partner of Quantalytics Research, LLC, (a FinTech Investment Research Platform for the Self-Directed Investor) | | 158 | | None |
Teresa M. Ressel – 1962 Trustee | | 2017 | | Non-executive director and trustee of a number of public and private business corporations Formerly: Chief Financial Officer, Olayan America, The Olayan Group (international investor/commercial/industrial); Chief Executive Officer, UBS Securities LLC; Group Chief Operating Officer, Americas, UBS AG; Assistant Secretary for Management &Budget and CFO, US Department of the Treasury | | 158 | | Atlantic Power Corporation (power generation company); ON Semiconductor Corp. (semiconductor supplier) |
Ann Barnett Stern – 1957 Trustee | | 2017 | | President and Chief Executive Officer, Houston Endowment Inc. (private philanthropic institution) Formerly: Executive Vice President and General Counsel, Texas Children’s Hospital; Attorney, Beck, Redden and Secrest, LLP; Business Law Instructor, University of St. Thomas; Attorney, Andrews & Kurth LLP | | 158 | | Federal Reserve Bank of Dallas |
Raymond Stickel, Jr. – 1944 Trustee | | 2005 | | Retired Formerly: Director, Mainstay VP Series Funds, Inc. (25 portfolios); Partner, Deloitte & Touche | | 158 | | None |
Robert C. Troccoli – 1949 Trustee | | 2016 | | Adjunct Professor, University of Denver – Daniels College of Business Formerly: Senior Partner, KPMG LLP | | 158 | | None |
Christopher L. Wilson – 1957 Trustee | | 2017 | | Non-executive director and trustee of a number of public and private business corporations Formerly: Director, TD Asset Management USA Inc. (mutual fund complex) (22 portfolios); Managing Partner, CT2, LLC (investing and consulting firm); President/Chief Executive Officer, Columbia Funds, Bank of America Corporation; President/Chief Executive Officer, CDC IXIS Asset Management Services, Inc.; Principal & Director of Operations, Scudder Funds, Scudder, Stevens & Clark, Inc.; Assistant Vice President, Fidelity Investments | | 158 | | ISO New England, Inc.(non-profit organization managing regional electricity market) |
| | |
| T-2 | | Invesco Intermediate Term Municipal Income Fund |
Trustees and Officers–(continued)
| | | | | | | | |
Name, Year of Birth and Position(s) Held with the Trust | | Trustee and/ or Officer Since | | Principal Occupation(s) During Past 5 Years | | Number of Funds in Fund Complex Overseen by Trustee | | Other Directorship(s) Held by Trustee During
Past 5 Years |
Other Officers | | | | | | | | |
Sheri Morris – 1964 President, Principal Executive Officer and Treasurer | | 1999 | | President, Principal Executive Officer and Treasurer, The Invesco Funds; Vice President, Invesco Advisers, Inc. (formerly known as Invesco Institutional (N.A.), Inc.) (registered investment adviser); and Vice President, Invesco Exchange-Traded Fund Trust, Invesco Exchange-Traded Fund Trust II, Invesco India Exchange-Traded Fund Trust, Invesco Actively Managed Exchange-Traded Fund Trust, Invesco Actively Managed Exchange-Traded Commodity Fund Trust and Invesco Exchange-Traded Self-Indexed Fund Trust Formerly: Vice President and Principal Financial Officer, The Invesco Funds; Vice President, Invesco AIM Advisers, Inc., Invesco AIM Capital Management, Inc. and Invesco AIM Private Asset Management, Inc.; Assistant Vice President and Assistant Treasurer, The Invesco Funds and Assistant Vice President, Invesco Advisers, Inc., Invesco AIM Capital Management, Inc. and Invesco AIM Private Asset Management, Inc.; and Treasurer, Invesco Exchange-Traded Fund Trust, Invesco Exchange-Traded Fund Trust II, Invesco India Exchange-Traded Fund Trust and Invesco Actively Managed Exchange-Traded Fund Trust | | N/A | | N/A |
Russell C. Burk – 1958 Senior Vice President and Senior Officer | | 2005 | | Senior Vice President and Senior Officer, The Invesco Funds | | N/A | | N/A |
Jeffrey H. Kupor – 1968 Senior Vice President, Chief Legal Officer and Secretary | | 2018 | | Head of Legal of the Americas, Invesco Ltd.; Senior Vice President and Secretary, Invesco Advisers, Inc. (formerly known as Invesco Institutional (N.A.), Inc.) (registered investment adviser); Senior Vice President and Secretary, Invesco Distributors, Inc. (formerly known as Invesco AIM Distributors, Inc.); Vice President and Secretary, Invesco Investment Services, Inc. (formerly known as Invesco AIM Investment Services, Inc.) Senior Vice President, Chief Legal Officer and Secretary, The Invesco Funds; Secretary and General Counsel, Invesco Investment Advisers LLC (formerly known as Van Kampen Asset Management); Secretary and General Counsel, Invesco Capital Markets, Inc. (formerly known as Van Kampen Funds Inc.) and Chief Legal Officer, Invesco Exchange-Traded Fund Trust, InvescoExchange-Traded Fund Trust II, Invesco India Exchange-Traded Fund Trust, Invesco Actively Managed Exchange-Traded Fund Trust, Invesco Actively Managed Exchange-Traded Commodity Fund Trust and Invesco Exchange-Traded Self-Indexed Fund Trust; Secretary, Invesco Indexing LLC; Secretary, W.L. Ross & Co., LLC; Secretary and Vice President, Jemstep, Inc. Formerly: Head of Legal, Worldwide Institutional, Invesco Ltd.; Secretary and General Counsel, INVESCO Private Capital Investments, Inc.; Senior Vice President, Secretary and General Counsel, Invesco Management Group, Inc. (formerly known as Invesco AIM Management Group, Inc.); Assistant Secretary, INVESCO Asset Management (Bermuda) Ltd.; Secretary and General Counsel, Invesco Private Capital, Inc.; Assistant Secretary and General Counsel, INVESCO Realty, Inc.; Secretary and General Counsel, Invesco Senior Secured Management, Inc.; and Secretary, Sovereign G./P. Holdings Inc. | | N/A | | N/A |
Andrew R. Schlossberg – 1974 Senior Vice President | | 2019 | | Head of the Americas and Senior Managing Director, Invesco Ltd.; Director and Senior Vice President, Invesco Advisers, Inc. (formerly known as Invesco Institutional (N.A.), Inc.) (registered investment adviser); Director and Chairman, Invesco Investment Services, Inc. (formerly known as Invesco AIM Investment Services, Inc.) (registered transfer agent); Senior Vice President, The Invesco Funds; Director, Invesco Investment Advisers LLC (formerly known as Van Kampen Asset Management) and Invesco UK Limited; Director, President and Chairman, Invesco Insurance Agency, Inc.; Director and Chief Executive, Invesco Asset Management Limited and Invesco Fund Managers Limited Formerly: Assistant Vice President, The Invesco Funds; Senior Vice President, Invesco Advisers, Inc. (formerly known as Invesco Institutional (N.A.), Inc.) (registered investment adviser); Director and Chief Executive, Invesco Administration Services Limited and Invesco Global Investment Funds Limited; Director, Invesco Distributors, Inc.; Head of EMEA, Invesco Ltd.; President, Invesco Actively Managed Exchange-Traded Commodity Fund Trust, Invesco Actively Managed Exchange-Traded Fund Trust, Invesco Exchange-Traded Fund Trust, Invesco Exchange-Traded Fund Trust II and Invesco India Exchange-Traded Fund Trust; Managing Director and Principal Executive Officer, Invesco Capital Management LLC | | N/A | | N/A |
John M. Zerr – 1962 Senior Vice President | | 2006 | | Chief Operating Officer of the Americas; Senior Vice President, Invesco Advisers, Inc. (formerly known as Invesco Institutional (N.A.), Inc.) (registered investment adviser); Senior Vice President, Invesco Distributors, Inc. (formerly known as Invesco AIM Distributors, Inc.); Director and Vice President, Invesco Investment Services, Inc. (formerly known as Invesco AIM Investment Services, Inc.) Senior Vice President, The Invesco Funds; Managing Director, Invesco Capital Management LLC; Director, Invesco Investment Advisers LLC (formerly known as Van Kampen Asset Management); Senior Vice President, Invesco Capital Markets, Inc. (formerly known as Van Kampen Funds Inc.); Manager, Invesco Indexing LLC; Invesco Canada Funds Advisory Board Member; Director, President Chief Executive Officer, Invesco Corporate Class Inc. (corporate mutual fund company); and Director, Chairman, President and Chief Executive Officer, Invesco Canada Ltd. (formerly known as Invesco Trimark Ltd./Invesco Trimark Ltèe) (registered investment adviser and registered transfer agent) | | N/A | | N/A |
| | |
| T-3 | | Invesco Intermediate Term Municipal Income Fund |
Trustees and Officers–(continued)
| | | | | | | | |
Name, Year of Birth and Position(s) Held with the Trust | | Trustee and/ or Officer Since | | Principal Occupation(s) During Past 5 Years | | Number of Funds in Fund Complex Overseen by Trustee | | Other Directorship(s) Held by Trustee During
Past 5 Years |
Other Officers
–(continued) | | | | | | | | |
| | | | | Formerly: Director and Senior Vice President, Invesco Management Group, Inc. (formerly known as Invesco AIM Management Group, Inc.); Secretary and General Counsel, Invesco Management Group, Inc. (formerly known as Invesco AIM Management Group, Inc.); Secretary, Invesco Investment Services, Inc. (formerly known as Invesco AIM Investment Services, Inc.); Chief Legal Officer and Secretary, The Invesco Funds; Secretary and General Counsel, Invesco Investment Advisers LLC (formerly known as Van Kampen Asset Management); Secretary and General Counsel, Invesco Capital Markets, Inc. (formerly known as Van Kampen Funds Inc.); Chief Legal Officer, Invesco Exchange-Traded Fund Trust, Invesco Exchange-Traded Fund Trust II, Invesco India Exchange-Traded Fund Trust, Invesco Actively Managed Exchange-Traded Fund Trust, Invesco Actively Managed Exchange-Traded Commodity Fund Trust and Invesco Exchange-Traded Self-Indexed Fund Trust; Secretary, Invesco Indexing LLC; Director, Secretary, General Counsel and Senior Vice President, Van Kampen Exchange Corp.; Director, Vice President and Secretary, IVZ Distributors, Inc. (formerly known as INVESCO Distributors, Inc.); Director and Vice President, INVESCO Funds Group, Inc.; Director and Vice President, Van Kampen Advisors Inc.; Director, Vice President, Secretary and General Counsel, Van Kampen Investor Services Inc.; Director and Secretary, Invesco Distributors, Inc. (formerly known as Invesco AIM Distributors, Inc.); Director, Senior Vice President, General Counsel and Secretary, Invesco AIM Advisers, Inc. and Van Kampen Investments Inc.; Director, Vice President and Secretary, Fund Management Company; Director, Senior Vice President, Secretary, General Counsel and Vice President, Invesco AIM Capital Management, Inc.; Chief Operating Officer and General Counsel, Liberty Ridge Capital, Inc. (an investment adviser) | | | | |
Gregory G. McGreevey – 1962 Senior Vice President | | 2012 | | Senior Managing Director, Invesco Ltd.; Director, Chairman, President, and Chief Executive Officer, Invesco Advisers, Inc. (formerly known as Invesco Institutional (N.A.), Inc.) (registered investment adviser); Director, Invesco Mortgage Capital, Inc. and Invesco Senior Secured Management, Inc.; and Senior Vice President, The Invesco Funds Formerly: Senior Vice President, Invesco Management Group, Inc. and Invesco Advisers, Inc.; Assistant Vice President, The Invesco Funds | | N/A | | N/A |
Kelli Gallegos – 1970 Vice President, Principal Financial Officer and Assistant Treasurer | | 2008 | | Vice President and Treasurer, Invesco Exchange-Traded Fund Trust, Invesco Exchange-Traded Fund Trust II, Invesco India Exchange-Traded Fund Trust, Invesco Actively Managed Exchange-Traded Fund Trust, Invesco Actively Managed Exchange-Traded Commodity Fund Trust and Invesco Exchange-Traded Self-Indexed Fund Trust; Vice President, Principal Financial Officer and Assistant Treasurer, The Invesco Funds; Principal Financial and Accounting Officer – Pooled Investments, Invesco Capital Management LLC Formerly: Assistant Treasurer, Invesco Exchange-Traded Fund Trust, Invesco Exchange-Traded Fund Trust II, Invesco India Exchange-Traded Fund Trust, Invesco Actively Managed Exchange-Traded Fund Trust, Invesco Actively Managed Exchange-Traded Commodity Fund Trust and Invesco Exchange- Traded Self-Indexed Fund Trust; Assistant Treasurer, Invesco Capital Management LLC; Assistant Vice President, The Invesco Funds | | N/A | | N/A |
Tracy Sullivan – 1962 Vice President, Chief Tax Officer and Assistant Treasurer | | 2008 | | Vice President, Chief Tax Officer and Assistant Treasurer, The Invesco Funds; Assistant Treasurer, Invesco Capital Management LLC, Invesco Exchange-Traded Fund Trust, Invesco Exchange-Traded Fund Trust II, Invesco India Exchange-Traded Fund Trust, Invesco Actively Managed Exchange-Traded Fund Trust, Invesco Actively Managed Exchange-Traded Commodity Fund Trust and Invesco Exchange-Traded Self-Indexed Fund Trust Formerly: Assistant Vice President, The Invesco Funds | | N/A | | N/A |
Crissie M. Wisdom – 1969 Anti-Money Laundering Compliance Officer | | 2013 | | Anti-Money Laundering Compliance Officer, Invesco Advisers, Inc. (formerly known as Invesco Institutional (N.A.), Inc.) (registered investment adviser), Invesco Capital Markets, Inc. (formerly known as Van Kampen Funds Inc.), Invesco Distributors, Inc., Invesco Investment Services, Inc., The Invesco Funds, and Invesco Exchange-Traded Fund Trust, Invesco Exchange-Traded Fund Trust II, Invesco India Exchange-Traded Fund Trust, Invesco Actively Managed Exchange-Traded Fund Trust, Invesco Actively Managed Exchange-Traded Commodity Fund Trust and Invesco Exchange-Traded Self-Indexed Fund Trust; Anti-Money Laundering Compliance Officer and Bank Secrecy Act Officer, INVESCO National Trust Company and Invesco Trust Company; and Fraud Prevention Manager and Controls and Risk Analysis Manager for Invesco Investment Services, Inc. Formerly: Anti-Money Laundering Compliance Officer, Van Kampen Exchange Corp. and Invesco Management Group, Inc. | | N/A | | N/A |
Robert R. Leveille – 1969 Chief Compliance Officer | | 2016 | | Chief Compliance Officer, Invesco Advisers, Inc. (registered investment adviser); and Chief Compliance Officer, The Invesco Funds Formerly: Chief Compliance Officer, Putnam Investments and the Putnam Funds | | N/A | | N/A |
The Statement of Additional Information of the Trust includes additional information about the Fund’s Trustees and is available upon request, without charge, by calling 1.800.959.4246. Please refer to the Fund’s Statement of Additional Information for information on the Fund’ssub-advisers.
| | | | | | | | | | |
Office of the Fund 11 Greenway Plaza, Suite 1000 Houston, TX 77046-1173 | | Investment Adviser Invesco Advisers, Inc. 1555 Peachtree Street, N.E. Atlanta, GA 30309 | | | | Distributor Invesco Distributors, Inc. 11 Greenway Plaza, Suite 1000 Houston, TX 77046-1173 | | | | Auditors PricewaterhouseCoopers LLP 1000 Louisiana Street, Suite 5800 Houston, TX 77002-5021 |
| | | | | |
Counsel to the Fund Stradley Ronon Stevens & Young, LLP 2005 Market Street, Suite 2600 Philadelphia, PA 19103-7018 | | Counsel to the Independent TrusteesGoodwin Procter LLP 901 New York Avenue, N.W. Washington, D.C. 20001 | | | | Transfer Agent Invesco Investment Services, Inc. 11 Greenway Plaza, Suite 1000 Houston, TX 77046-1173 | | | | Custodian State Street Bank and Trust Company 225 Franklin Street Boston, MA 02110-2801 |
| | |
| T-4 | | Invesco Intermediate Term Municipal Income Fund |
Explore High-Conviction Investing with Invesco

Go paperless with eDelivery
Visit invesco.com/edelivery to enjoy the convenience and security of anytime electronic access to your investment documents.
With eDelivery, you can elect to have any or all of the following materials delivered straight to your inbox to download, save and print from your own computer:
∎ Fund reports and prospectuses
∎ Quarterly statements
∎ Daily confirmations
∎ Tax forms
Invesco mailing information
Send general correspondence to Invesco Investment Services, Inc., P.O. Box 219078, Kansas City, MO 64121-9078.
Important notice regarding delivery of security holder documents
To reduce Fund expenses, only one copy of most shareholder documents may be mailed to shareholders with multiple accounts at the same address (Householding). Mailing of your shareholder documents may be householded indefinitely unless you instruct us otherwise. If you do not want the mailing of these documents to be combined with those for other members of your household, please contact Invesco Investment Services, Inc. at 800 959 4246 or contact your financial institution. We will begin sending you individual copies for each account within 30 days after receiving your request.
Fund holdings and proxy voting information
The Fund provides a complete list of its holdings four times in each fiscal year, at the quarter ends. For the second and fourth quarters, the lists appear in the Fund’s semiannual and annual reports to shareholders. For the first and third quarters, the Fund files the lists with the Securities and Exchange Commission (SEC) on FormN-Q (or any successor Form). The most recent list of portfolio holdings is available at invesco.com/completeqtrholdings. Shareholders can also look up the Fund’s FormsN-Q (or any successor Form) on the SEC website at sec.gov. The SEC file numbers for the Fund are shown below.
A description of the policies and procedures that the Fund uses to determine how to vote proxies relating to portfolio securities is available without charge, upon request, from our Client Services department at 800 959 4246 or at invesco.com/proxyguidelines. The information is also available on the SEC website, sec.gov.
| | |
Information regarding how the Fund voted proxies related to its portfolio securities during the most recent12-month period ended June 30 is available at invesco.com/proxysearch. The information is also available on the SEC website, sec.gov. Invesco Advisers, Inc. is an investment adviser; it provides investment advisory services to individual and institutional clients and does not sell securities. Invesco Distributors, Inc. is the US distributor for Invesco Ltd.’s retail mutual funds, exchange-traded funds and institutional money market funds. Both are wholly owned, indirect subsidiaries of Invesco Ltd. | | 
|
| | | | | | | | |
| SEC file numbers:811-07890 and033-66242 | | Invesco Distributors, Inc. | | VK-ITMI-AR-1 | | 04292019 | | 1409 |
| | | | |
| | |
 | | Annual Report to Shareholders | | February 28, 2019 |
| | |
| | Invesco Limited Term Municipal Income Fund |
| | Nasdaq: |
| | A: ATFAX ∎ A2: AITFX ∎ C: ATFCX ∎ Y: ATFYX ∎ R5: ATFIX ∎ R6: ATFSX |

Beginning on January 1, 2021, as permitted by regulations adopted by the Securities and Exchange Commission, paper copies of the Funds shareholder reports will no longer be sent by mail, unless you specifically request paper copies of the reports from the Fund or from your financial intermediary, such as a broker-dealer or bank. Instead, the reports will be made available on the Funds website, and you will be notified by mail each time a report is posted and provided with a website link to access the report.If you already elected to receive shareholder reports electronically, you will not be affected by this change and you need not take any action. You may elect to receive shareholder reports and other communications from the Fund electronically by contacting your financial intermediary (such as a broker-dealer or bank).You may elect to receive all future reports in paper free of charge. If you invest through a financial intermediary, you can contact your financial intermediary to request that you continue to receive paper copies of your shareholder reports. If you invest directly with the Fund, you can call 800 341 2929 to let the Fund know you wish to continue receiving paper copies of your shareholder reports. Your election to receive reports in paper will apply to all funds held with your financial intermediary or all funds held with the fund complex if you invest directly with the Fund.2 Letters to Shareholders4 Performance Summary4 Managements Discussion6 Long-Term Fund Performance8 Supplemental Information10 Schedule of Investments31 Financial Statements34 Notes to Financial Statements39 Financial Highlights41 Report of Independent Registered Public Accounting Firm42 Fund Expenses43 Tax InformationT-1 Trustees and Officers
Letters to Shareholders
| | |

Andrew Schlossberg | | Dear Shareholders: This annual report includes information about your Fund, including performance data and a complete list of its investments as of the close of the reporting period. Inside is a discussion of how your Fund was managed and the factors that affected its performance during the reporting period. Philip Taylor, whose messages to shareholders have appeared here for the last 13 years, transitioned to a senior advisory role on March 1, prior to his retirement from the firm at the end of the year, and I assumed his role as Head of the Americas and Senior Managing Director, Invesco Ltd. All of us at Invesco are indebted to Phil for his many years of dedicated service to the company and to its funds’ shareholders. I’m excited about this new opportunity, and I look forward to communicating with fund shareholders going forward. |
The reporting period proved to be an increasingly volatile time for markets. Amid corporate tax cuts and improving global growth, several US equity indexes redefined highs during the first half of the reporting period. The ebullience, however, ended in October as global equities, in particular US stocks, sold off sharply and continued this downward spiral for the rest of 2018. The catalyst for thesell-off was a combination of ongoing trade conflicts between the US and China, fears of a global economic slowdown and rising US interest rates. Gains posted earlier in the year for global equities were erased, while US Treasury bonds, along with government and municipal bonds, rallied. The reporting period ended on a positive note, however, as global equities bounced back strongly at the outset of 2019, mitigating some of the losses from thesell-off in late 2018. Given the strong economy during the reporting period, the US Federal Reserve (the Fed) raised the federal funds rate four times. At its December 2018 meeting, however, the Fed delivered a more “dovish hike” by simultaneously raising rates while reducing guidance for 2019 rate increases. At its first meeting in 2019, the Fed left rates unchanged. As 2019 unfolds, we’ll see how the interplay of interest rates, economic data, geopolitics and a host of other factors affect US and over-seas equity and fixed income markets.
Investor uncertainty and market volatility, such as we witnessed during the reporting period, are unfortunate facts of life when it comes to investing. That’s why Invesco encourages investors to work with a professional financial adviser who can stress the importance of starting to save and invest early and the importance of adhering to a disciplined investment plan. A financial adviser who knows your unique financial situation, investment goals and risk tolerance can be an invaluable partner as you seek to achieve your financial goals. He or she can offer a long-term perspective when markets are volatile and time-tested advice and guidance when your financial situation or investment goals change.
Visit our website for more information on your investments
Our website,invesco.com/us, offers a wide range of market insights and investment perspectives. On the website, you’ll find detailed information about our funds, including performance, holdings and portfolio manager commentaries. You can access information about your account by completing a simple, secure online registration. To do so, select “Log In” on the right side of the homepage, and then select “Register for Individual Account Access.”
In addition to the resources accessible on our website and through our mobile app, you can obtain timely updates to help you stay informed about the markets and the economy by connecting with Invesco on Twitter, LinkedIn or Facebook. You can access our blog atblog.invesco.us.com. Our goal is to provide you the information you want, when and where you want it.
Finally, I’m pleased to share with you Invesco’s commitment to both the Principles for Responsible Investment and to considering environmental, social and governance issues in our robust investment process. I invite you to learn more atinvesco.com/esg.
Have questions?
For questions about your account, contact an Invesco client services representative at 800 959 4246.
All of us at Invesco look forward to serving your investment management needs. Thank you for investing with us.
Sincerely,

Andrew Schlossberg
Head of the Americas,
Senior Managing Director, Invesco Ltd.
2 Invesco Limited Term Municipal Income Fund
| | |

Bruce Crockett | | Dear Fellow Shareholders: Among the many important lessons I’ve learned in more than 40 years in a variety of business endeavors is the value of a trusted advocate. As independent chair of the Invesco Funds Board, I can assure you that the members of the Board are strong advocates for the interests of investors in Invesco’s mutual funds. We work hard to represent your interests through oversight of the quality of the investment management services your funds receive and other matters important to your investment, including but not limited to: ∎ Ensuring that Invesco offers a diverse lineup of mutual funds that your financial adviser can use to strive to meet your financial needs as your investment goals change over time. ∎ Monitoring how the portfolio management teams of the Invesco funds are performing in light of changing economic and market conditions. |
|
|
∎ Assessing each portfolio management team’s investment performance within the context of the investment strategy described in the fund’s prospectus.
∎ Monitoring for potential conflicts of interests that may impact the nature of the services that your funds receive.
We believe one of the most important services we provide our fund shareholders is the annual review of the funds’ advisory andsub-advisory contracts with Invesco Advisers and its affiliates. This review is required by the Investment Company Act of 1940 and focuses on the nature and quality of the services Invesco provides as the adviser to the Invesco funds and the reasonableness of the fees that it charges for those services. Each year, we spend months carefully reviewing information received from Invesco and a variety of independent sources, such as performance and fee data prepared by Lipper, Inc. (a subsidiary of Broadridge Financial Solutions, Inc.), an independent, third-party firm widely recognized as a leader in its field. We also meet with our independent legal counsel and other independent advisers to review and help us assess the information that we have received. Our goal is to assure that you receive quality investment management services for a reasonable fee.
I trust the measures outlined above provide assurance that you have a worthy advocate when it comes to choosing the Invesco Funds. On behalf of the Board, we look forward to continuing to represent your interests and serving your needs.
Sincerely,

Bruce L. Crockett
Independent Chair
Invesco Funds Board of Trustees
3 Invesco Limited Term Municipal Income Fund
Management’s Discussion of Fund Performance
| | |
Performance summary For the fiscal year ended February 28, 2019, Class A shares of Invesco Limited Term Municipal Income Fund (the Fund), at net asset value (NAV), underperformed the S&P Municipal Bond Investment Grade Short Intermediate Index, the Fund’s style-specific benchmark. Your Fund’s long-term performance appears later in this report. Fund vs. Indexes Total returns, 2/28/18 to 2/28/19, at net asset value (NAV). Performance shown does not include applicable contingent deferred sales charges (CDSC) orfront-end sales charges, which would have reduced performance. |
| |
Class A Shares | | 2.38% |
Class A2 Shares | | 2.63 |
Class C Shares | | 1.61 |
Class Y Shares | | 2.64 |
Class R5 Shares | | 2.54 |
Class R6 Shares | | 2.71 |
S&P Municipal Bond Indexq(Broad Market Index) | | 4.03 |
S&P Municipal Bond Investment Grade Short Intermediate Indexq(Style-Specific Index) | | 3.26 |
Lipper Short-Intermediate Municipal Debt Funds Index∎(Peer Group Index) | | 2.92 |
|
Source(s):qRIMES Technologies Corp.;∎Lipper Inc. |
Market conditions and your Fund
The broad municipal bond market experienced positive returns for the fifth consecutive year in 2018. During the fiscal year, investment grade municipals returned 4.13% and high yield municipals returned 6.96%.1 This strong performance included investment grade municipals returning 1.30% and high yield municipals returning 1.22% for the first two months of 2019.1
The first half of the fiscal year began with supportive technical conditions (supply and demand balances) in place as new issuance of municipal bonds totaled $187 billion — down 8% from the same time period in 2017.2 However, fund flows into the municipal bond market remained positive, totaling $6.5 billion from March through August 2018.3 The high yield municipal bond market outperformed the investment grade bond segment, led by strong performance of tobacco bonds and improved price discovery on Puerto Rico bonds as a result
of developments in the commonwealth’s debt restructuring.
Municipal bonds withstood headwinds from interest rate movements that had the10-year US Treasury yield breaching 3.00% in April 2018.4 During the fiscal year, the US Federal Reserve (the Fed) raised the federal funds rate four times: in March, June, September and December 2018.5 This series of anticipated rate hikes reflected increased confidence in the US economy amid low unemployment, relatively stable inflation and overall robust economic growth. This expansionary monetary policy significantly flattened the US Treasury yield curve with a slight inversion on the short end occurring in December 2018.
In September 2018, market conditions weakened in stark contrast to the first half of the fiscal year, and thus, exposed the municipal bond market to more sensitivity relating to the month’ssell-off in US Treasuries. Both investment grade municipals and high yield municipals posted negative returns for the months
of September and October 2018. The municipal yield curve continued to steepen, showing confidence in strong gross domestic product growth, as well as rising concern that an impending trade war between the US and China could increase inflation pressures.
As anticipated, US midterm election results had a positive impact on municipal securities as perceived threats to municipal tax exemptions, further tax reform and changes to the Affordable Care Act were greatly reduced. News of a possible ban on flavorede-cigarettes and menthol cigarettes made headlines, which caused a short-lived decline in valuations for Tobacco Master Settlement Agreement (Tobacco MSA) bonds, primarily below investment grade securities. Meanwhile,year-end demand for yield and coupon payments caused the municipal bond asset class to end 2018 on a strong note.
The Fed’s dovish stance to begin calendar year 2019 took the market by surprise, leading economists to change their predictions from two interest rate increases in 2019, to just one. Additionally, the US government shutdown, which lasted a total of 35 days, along with ongoingUS-China trade negotiations and Brexit developments, created a challenging market environment. Despite these challenges, the municipal market performed positively as technical conditions continued to provide tailwinds, driven particularly by the insatiable demand for maturities (10 years and shorter) from US retail separately managed accounts (SMAs).
Flows into the municipal bond asset class were positive for six of the 12 months covered by the fiscal year. With slowing economic growth and the Fed’s interest rate policy detour, investor demand for municipal securities spiked, bringing record net inflows of more than $18.9 billion for the first two months of 2019.3
| | | | |
| | |
Portfolio Composition | | |
By credit sector, based on total investments | | |
Revenue Bonds | | 77.8% | | |
General Obligation Bonds | | 15.8 | | |
Pre-Refunded Bonds | | 6.4 | | |
| | | | | | | |
| | |
1. | | New Mexico (State of) Municipal Energy Acquisition Authority | | | | 1.1% | |
2. | | Whiting (City of) (BP Products North America); Series 2008 | | | | 1.0 | |
3. | | Katy (City of) Independent School District; Series 2015 C | | | | 0.9 | |
4. | | Massachusetts (State of) Development Finance Agency (Harvard University) | | | | 0.8 | |
5. | | Metropolitan Transportation Authority; Subseries 2012 A-2 | | | | 0.8 | |
| | | | | |
| | |
Total Net Assets | | | $ | 2.1 billion | |
| |
Total Number of Holdings | | | | 664 | |
The Fund’s holdings are subject to change, and there is no assurance that the Fund will continue to hold any particular security.
Data presented here are as of February 28, 2019.
4 Invesco Limited Term Municipal Income Fund
At the close of the fiscal year, we believed municipal fundamentals remained strong and ramifications of the Tax Cuts and Jobs Act of 2017 had not yet been fully realized. As a result, we believe demand fortax-exempt investments from retail investors could continue as taxes become front of mind.
During the fiscal year, the Fund’s over-weight allocation to revenue bonds compared to general obligation bonds benefited performance relative to its style-specific benchmark. At a sector level, security selection in transportation bonds aided the Fund’s relative performance. On a state level, security selection in South Carolina holdings also benefited the Fund’s relative performance.
Over the fiscal year, security selection in the toll road and hospital sectors detracted from the Fund’s performance relative to its style-specific benchmark. Security selection in lower coupon bonds (0.00–3.99%) also detracted from the Fund’s relative performance. On a state level, security selection in Texas domiciled bonds moderately detracted from the Fund’s relative performance.
We wish to remind you that the Fund is subject to interest rate risk, meaning when interest rates rise, the value of fixed income securities tends to fall. The degree to which the value of fixed income securities may decline due to rising interest rates may vary depending on the speed and magnitude of the increase in interest rates, as well as individual security characteristics, such as price, maturity, duration and coupon and market forces, such as supply and demand for similar securities. We are monitoring interest rates, and the market, economic and geopolitical factors that may impact the direction, speed and magnitude of changes to interest rates across the maturity spectrum, including the potential impact of monetary policy changes by the Fed and certain foreign central banks. If interest rates rise faster than expected, markets may experience increased volatility, which may affect the value and/or liquidity of certain of the Fund’s investments.
Thank you for investing in Invesco Limited Term Municipal Income Fund and for sharing our long-term investment horizon.
1 Source: FactSet Research Systems Inc.
2 Source: The Bond Buyer
3 Source: Strategic Insight
4 Source: US Department of the Treasury
5 Source: US Federal Reserve
The views and opinions expressed in management’s discussion of Fund performance are those of Invesco Advisers, Inc. These views and opinions are subject to change at any time based on factors such as market and economic conditions. These views and opinions may not be relied upon as investment advice or recommendations, or as an offer for a particular security. The information is not a complete analysis of every aspect of any market, country, industry, security or the Fund. Statements of fact are from sources considered reliable, but Invesco Advisers, Inc. makes no representation or warranty as to their completeness or accuracy. Although historical performance is no guarantee of future results, these insights may help you understand our investment management philosophy.
See important Fund and, if applicable, index disclosures later in this report.
| | |
 | | Mark Paris Portfolio Manager and Chief Investment Officer and Head of Municipal Strategies for Invesco Fixed Income, is manager of Invesco |
| Limited Term Municipal Income Fund. He joined Invesco in 2010. Mr. Paris earned a BBA in finance from Baruch College – The City University of New York. |
| |
 | | John (Jack) Connelly Portfolio Manager, is manager of Invesco Limited Term Municipal Income Fund. He joined Invesco in 2016. Mr. Connelly earned |
| a BA in philosophy from Wheaton College and masters degrees from the University of Rhode Island and Yale University. |
| |
 | | Tim O’Reilly Portfolio Manager, is manager of Invesco Limited Term Municipal Income Fund. He joined Invesco in 2010. Mr. O’Reilly earned a |
| BS in finance from Eastern Illinois University and an MBA in finance from the University of Illinois at Chicago. |
| |
 | | James Phillips Portfolio Manager, is manager of Invesco Limited Term Municipal Income Fund. He joined Invesco in 2010. Mr. Phillips earned a |
| BA in American literature from Empire State College, the independent study division of the State University of New York, and an MBA in finance from the University at Albany, State University of New York. |
| | |
| |
 | | John Schorle Portfolio Manager, is manager of Invesco Limited Term Municipal Income Fund. He joined Invesco in 2010. Mr. Schorle earned |
| a BA degree in economics from DePaul University. He is also a Certified Public Accountant. |
| |
 | | Julius Williams Portfolio Manager, is manager of Invesco Limited Term Municipal Income Fund. He joined Invesco in 2010. Mr. Williams earned |
| a BA in economics and sociology and a Master of Education degree in educational psychology from the University of Virginia. |
5 Invesco Limited Term Municipal Income Fund
Your Fund’s Long-Term Performance
Results of a $10,000 Investment – Oldest Share Class(es)
Fund and index data from 2/28/09
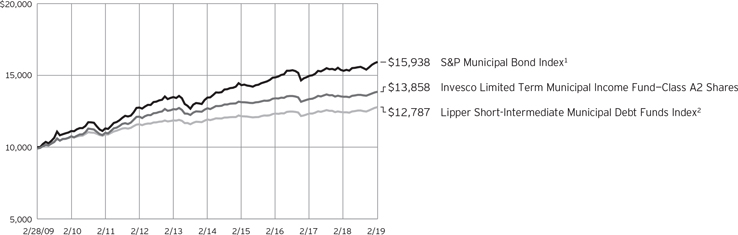
1 Source: RIMES Technologies Corp.
2 Source: Lipper Inc.
Past performance cannot guarantee comparable future results.
The S&P Municipal Bond Investment Grade Short Intermediate Index is not shown on the chart as the index does not have 10 years of performance history.
The data shown in the chart include
reinvested distributions, applicable sales charges and Fund expenses including management fees. Index results include reinvested dividends, but they do not reflect sales charges. Performance
of the peer group, if applicable, reflects fund expenses and management fees; performance of a market index does not. Performance shown in the chart and table(s) does not reflect deduction of taxes a shareholder would pay on Fund distributions or sale of Fund shares.
6 Invesco Limited Term Municipal Income Fund
| | | | |
| Average Annual Total Returns | |
As of 2/28/19, including maximum applicable sales charges | |
| |
Class A Shares | | | | |
Inception (10/31/02) | | | 2.91 | % |
10 Years | | | 2.91 | |
5 Years | | | 1.00 | |
1 Year | | | –0.20 | |
| |
Class A2 Shares | | | | |
Inception (5/11/87) | | | 4.67 | % |
10 Years | | | 3.32 | |
5 Years | | | 1.54 | |
1 Year | | | 1.64 | |
| |
Class C Shares* | | | | |
10 Years | | | 2.38 | % |
5 Years | | | 0.74 | |
1 Year | | | 0.61 | |
| |
Class Y Shares | | | | |
Inception (10/3/08) | | | 3.72 | % |
10 Years | | | 3.41 | |
5 Years | | | 1.77 | |
1 Year | | | 2.64 | |
| |
Class R5 Shares | | | | |
Inception (7/30/04) | | | 3.36 | % |
10 Years | | | 3.42 | |
5 Years | | | 1.75 | |
1 Year | | | 2.54 | |
| |
Class R6 Shares | | | | |
10 Years | | | 3.23 | % |
5 Years | | | 1.65 | |
1 Year | | | 2.71 | |
* Effective January 26, 2019, Class C share performance includes the conversion to A shares after 10 years. | | | | |
Class C shares incepted on June 28, 2013. Performance shown prior to that date is that of Class A2 shares, restated to reflect the higher12b-1 fees applicable to Class C shares.
Class R6 shares incepted on April 4, 2017. Performance shown prior to that date is that of Class A shares and includes the12b-1 fees applicable to Class A shares.
The performance data quoted represent past performance and cannot guarantee comparable future results; current performance may be lower or higher. Please visit invesco.com/performance for the most recentmonth-end performance. Performance figures reflect reinvested distributions, changes in net asset value and the effect of the maximum applicable sales charge unless otherwise stated. Investment return and principal value will fluctuate
| | | | |
| Average Annual Total Returns | |
As of 12/31/18, the most recent calendar quarter end, including maximum applicable sales charges | |
| |
Class A Shares | | | | |
Inception (10/31/02) | | | 2.88 | % |
10 Years | | | 3.10 | |
5 Years | | | 1.19 | |
1 Year | | | –1.64 | |
| |
Class A2 Shares | | | | |
Inception (5/11/87) | | | 4.67 | % |
10 Years | | | 3.52 | |
5 Years | | | 1.73 | |
1 Year | | | 0.15 | |
| |
Class C Shares | | | | |
10 Years | | | 2.58 | % |
5 Years | | | 0.92 | |
1 Year | | | –0.87 | |
| |
Class Y Shares | | | | |
Inception (10/3/08) | | | 3.69 | % |
10 Years | | | 3.62 | |
5 Years | | | 1.95 | |
1 Year | | | 1.22 | |
| |
Class R5 Shares | | | | |
Inception (7/30/04) | | | 3.33 | % |
10 Years | | | 3.62 | |
5 Years | | | 1.95 | |
1 Year | | | 1.13 | |
| |
Class R6 Shares | | | | |
10 Years | | | 3.42 | % |
5 Years | | | 1.81 | |
1 Year | | | 1.20 | |
so that you may have a gain or loss when you sell shares.
The total annual Fund operating expense ratio set forth in the most recent Fund prospectus as of the date of this report for Class A, Class A2, Class C, Class Y, Class R5 and Class R6 shares was 0.62%, 0.37%, 1.37%, 0.37%, 0.37% and 0.29%, respectively. The expense ratios presented above may vary from the expense ratios presented in other sections of this report that are based on expenses incurred during the period covered by this report.
Class A share performance reflects the maximum 2.50% sales charge. Class A2 share performance reflects the maximum 1.00% sales charge. The CDSC on Class C shares is 1% for the first year after purchase. Class Y, Class R5 and Class R6 shares do not have afront-end sales charge or a CDSC; therefore, performance is at net asset value.
The performance of the Fund’s share classes will differ primarily due to different
sales charge structures and class expenses.
Fund performance reflects any applicable fee waivers and/or expense reimbursements. Had the adviser not waived fees and/or reimbursed expenses currently or in the past, returns would have been lower. See current prospectus for more information.
7 Invesco Limited Term Municipal Income Fund
Invesco Limited Term Municipal Income Fund’s investment objective is federaltax-exempt current income.
| ∎ | | Unless otherwise stated, information presented in this report is as of February 28, 2019, and is based on total net assets. |
| ∎ | | Unless otherwise noted, all data provided by Invesco. |
| ∎ | | To access your Fund’s reports/prospectus, visit invesco.com/fundreports. |
About share classes
| ∎ | | As of close of business October 30, 2002,Class A2 shareswere closed to new investors. |
| ∎ | | Class Y sharesare available only to certain investors. Please see the prospectus for more information. |
| ∎ | | Class R5 sharesandClass R6 sharesare available for use by retirement plans that meet certain standards and for institutional investors. Class R6 shares are also available through intermediaries that have established an agreement with Invesco Distributors, Inc. to make such shares available for use in retail omnibus accounts. Please see the prospectus for more information. |
Principal risks of investing in the Fund
| ∎ | | Changing fixed income market conditions risk.The current low interest rate environment was created in part by the Federal Reserve Board (FRB) and certain foreign central banks keeping the federal funds and equivalent foreign rates near historical lows. Increases in the federal funds and equivalent foreign rates may expose fixed income markets to heightened volatility and reduced liquidity for certain fixed income investments, particularly those with longer maturities. In addition, decreases in fixed income dealer market-making capacity may also potentially lead to heightened volatility and reduced liquidity in the fixed income markets. As a result, the value of the Fund’s investments and share price may decline. Changes in central bank policies could also result in higher than normal shareholder redemptions, which could potentially increase portfolio turnover and the Fund’s transaction costs. |
| ∎ | | Debt securities risk.The prices of debt securities held by the Fund will be affected by changes in interest rates, the creditworthiness of the issuer and other factors. An increase in prevailing interest rates typically causes the value of existing debt securities to fall and often has a greater impact onlonger-duration |
| | debt securities and higher quality debt securities. Falling interest rates will cause the Fund to reinvest the proceeds of debt securities that have been repaid by the issuer at lower interest rates. Falling interest rates may also reduce the Fund’s distributable income because interest payments on floating rate debt instruments held by the Fund will decline. The Fund could lose money on investments in debt securities if the issuer or borrower fails to meet its obligations to make interest payments and/or to repay principal in a timely manner. Changes in an issuer’s financial strength, the market’s perception of such strength or in the credit rating of the issuer or the security may affect the value of debt securities. The Adviser’s credit analysis may fail to anticipate such changes, which could result in buying a debt security at an inopportune time or failing to sell a debt security in advance of a price decline or other credit event. |
| ∎ | | Derivatives risk.The value of a derivative instrument depends largely on (and is derived from) the value of an underlying security, currency, commodity, interest rate, index or other asset (each referred to as an underlying asset). In addition to risks relating to the underlying assets, the use of derivatives may include other, possibly greater, risks, including counterparty, leverage and liquidity risks. Counterparty risk is the risk that the counterparty to the derivative contract will default on its obligation to pay the Fund the amount owed or otherwise perform under the derivative contract. Derivatives create leverage risk because they do not require payment up front equal to the economic exposure created by holding a position in the derivative. As a result, an adverse change in the value of the underlying asset could result in the Fund sustaining a loss that is substantially greater than the amount invested in the derivative or the anticipated value of the underlying asset, which may make the Fund’s returns more volatile and increase the risk of loss. Derivative instruments may also be less liquid than more traditional investments and the Fund may be unable to sell or close out its derivative positions at a desirable time or |
This report must be accompanied or preceded by a currently effective Fund prospectus, which contains more complete information, including sales charges and expenses. Investors should read it carefully before investing.
NOT FDIC INSURED | MAY LOSE VALUE | NO BANK GUARANTEE
| | price. This risk may be more acute under adverse market conditions, during which the Fund may be most in need of liquidating its derivative positions. Derivatives may also be harder to value, less tax efficient and subject to changing government regulation that could impact the Fund’s ability to use certain derivatives or their cost. Derivatives strategies may not always be successful. For example, derivatives used for hedging or to gain or limit exposure to a particular market segment may not provide the expected benefits, particularly during adverse market conditions. |
| ∎ | | High yield debt securities (junk bond) risk.Investments in high yield debt securities (“junk bonds”) and other lower- rated securities will subject the Fund to substantial risk of loss. These securities are considered to be speculative with respect to the issuer’s ability to pay interest and principal when due, are more susceptible to default or decline in market value and are less liquid than investment grade debt securities. Prices of high yield debt securities tend to be very volatile. |
| ∎ | | Inverse floating rate obligations risk. The price of inverse floating rate obligations (inverse floaters) is expected to decline when interest rates rise, and generally will decline further than the price of a bond with a similar maturity. The price of inverse floaters is typically more volatile than the price of bonds with similar maturities. These risks can be particularly high if leverage is used in the formula that determines the interest payable by the inverse floater, which may make the Fund’s returns more volatile and increase the risk of loss. Additionally, these securities may lose some or all of their principal and, in some cases, the Fund could lose money in excess of its investment. |
| ∎ | | Liquidity risk.The Fund may be unable to sell illiquid investments at the time or price it desires and, as a result, could lose its entire investment in such investments. Liquid securities can become illiquid during periods of market |
8 Invesco Limited Term Municipal Income Fund
stress. If a significant amount of the Fund’s securities become illiquid, the Fund may not be able to timely pay redemption proceeds and may need to sell securities at significantly reduced prices.
| ∎ | | Management risk.The Fund is actively managed and depends heavily on the Adviser’s judgment about markets, interest rates or the attractiveness, relative values, liquidity, or potential appreciation of particular investments made for the Fund’s portfolio. The Fund could experience losses if these judgments prove to be incorrect. Additionally, legislative, regulatory, or tax developments may adversely affect management of the Fund and, therefore, the ability of the Fund to achieve its investment objective. |
| ∎ | | Market risk.The market values of the Fund’s investments, and therefore the value of the Fund’s shares, will go up and down, sometimes rapidly or unpredictably. Market risk may affect a single issuer, industry or section of the economy, or it may affect the market as a whole. Individual stock prices tend to go up and down more dramatically than those of certain other types of investments, such as bonds. During a general downturn in the financial markets, multiple asset classes may decline in value. When markets perform well, there can be no assurance that specific investments held by the Fund will rise in value. |
| ∎ | | Medium- and lower-grade municipal securities risk.Medium- and lower-grade municipal securities generally involve more volatility and greater risks, including credit, market, liquidity and management risks, than higher-grade securities. Furthermore, many issuers of medium- and lower-grade securities choose not to have a rating assigned to their obligations. As such, the Fund’s portfolio may consist of a higher portion of unrated securities than an investment company investing solely in higher-grade securities. Unrated securities may not be as attractive to as many buyers as are rated securities, which may have the effect of limiting the Fund’s ability to sell such securities at their fair value. |
| ∎ | | Municipal issuer focus risk.The municipal issuers in which the Fund invests may be located in the same geographic area or may pay their interest obligations from revenue of similar projects, such as hospitals, airports, utility systems and housing finance agencies. This may make the Fund’s investments more susceptible to similar social, economic, |
| | | political or regulatory occurrences, making the Fund more susceptible to experience a drop in its share price than if the Fund had been more diversified across issuers that did not have similar characteristics. |
| ∎ | | Municipal securities risk.The risk of a municipal obligation generally depends on the financial and credit status of the issuer. Constitutional amendments, legislative enactments, executive orders, administrative regulations, voter initiatives, and the issuer’s regional economic conditions may affect the municipal security’s value, interest payments, repayment of principal and the Fund’s ability to sell the security. Failure of a municipal security issuer to comply with applicable tax requirements may make income paid thereon taxable, resulting in a decline in the security’s value. In addition, there could be changes in applicable tax laws or tax treatments that reduce or eliminate the current federal income tax exemption on municipal securities or otherwise adversely affect the current federal or state tax status of municipal securities. |
| ∎ | | Variable-rate demand notes risk.The absence of an active secondary market for certain variable and floating rate notes could make it difficult to dispose of these instruments, which could result in a loss. |
| ∎ | | When-issued, delayed delivery and forward commitment risks.When-issued and delayed delivery transactions subject the Fund to market risk because the value or yield of a security at delivery may be more or less than the purchase price or yield generally available when delivery occurs, and counterparty risk because the Fund relies on the buyer or seller, as the case may be, to consummate the transaction. These transactions also have a leveraging effect on the Fund because the Fund commits to purchase securities that it does not have to pay for until a later date, which increases the Fund’s overall investment exposure and, as a result, its volatility. |
| ∎ | | Zero coupon orpay-in-kind securities risk.The value, interest rates, and liquidity ofnon-cash paying instruments, such as zero coupon andpay-in- kind securities, are subject to greater fluctuation than other types of securities. The higher yields and interest rates onpay-in-kind securities reflect the payment deferral and increased credit risk associated with such instruments and that such investments may represent a higher credit risk than loans that periodically pay interest. |
About indexes used in this report
| ∎ | | TheS&P Municipal Bond Index is a broad, market value-weighted index that seeks to measure the performance of the US municipal bond market. |
| ∎ | | TheS&P Municipal Bond Investment Grade Short Intermediate Index is an unmanaged index considered representative of investment grade US municipal bonds with maturities between one and eight years. |
| ∎ | | TheLipper Short-Intermediate Municipal Debt Funds Index is an unmanaged index considered representative of short-intermediate municipal debt funds tracked by Lipper. |
| ∎ | | The Fund is not managed to track the performance of any particular index, including the index(es) described here, and consequently, the performance of the Fund may deviate significantly from the performance of the index(es). |
| ∎ | | A direct investment cannot be made in an index. Unless otherwise indicated, index results include reinvested dividends, and they do not reflect sales charges. Performance of the peer group, if applicable, reflects fund expenses; performance of a market index does not. |
Other information
| ∎ | | CPA® and Certified Public Accountant® are trademarks owned by the American Institute of Certified Public Accountants. |
| ∎ | | The returns shown in management’s discussion of Fund performance are based on net asset values (NAVs) calculated for shareholder transactions. Generally accepted accounting principles require adjustments to be made to the net assets of the Fund at period end for financial reporting purposes, and as such, the NAVs for shareholder transactions and the returns based on those NAVs may differ from the NAVs and returns reported in the Financial Highlights. |
| ∎ | | Industry classifications used in this report are generally according to the Global Industry Classification Standard, which was developed by and is the exclusive property and a service mark of MSCI Inc. and Standard & Poor’s. |
9 Invesco Limited Term Municipal Income Fund
Schedule of Investments
February 28, 2019
| | | | | | | | | | | | | | | | |
| | | Interest
Rate | | | Maturity Date | | | Principal
Amount
(000) | | | Value | |
Municipal Obligations–100.27% | | | | | | | | | | | | | | | | |
| Alabama–1.23% | | | | | | | | | | | | | | | | |
Birmingham (City of) Airport Authority; | | | | | | | | | | | | | | | | |
Series 2003 A, Ref. RB(INS-AGM)(a) | | | 4.00 | % | | | 07/01/2019 | | | $ | 1,410 | | | $ | 1,420,152 | |
Series 2003 A, Ref. RB(INS-AGM)(a) | | | 4.50 | % | | | 07/01/2020 | | | | 1,375 | | | | 1,385,890 | |
Series 2010, Ref. RB(INS-AGM)(a) | | | 6.00 | % | | | 07/01/2022 | | | | 2,365 | | | | 2,493,940 | |
Black Belt Energy Gas District (The); Series 2016 A, Gas Supply RB(b) | | | 4.00 | % | | | 06/01/2021 | | | | 5,000 | | | | 5,182,100 | |
Chatom (Town of) Industrial Development Board (PowerSouth Energy Cooperative); Series 2010 A, Ref. Gulf Opportunity Zone RB(INS-AGC)(a) | | | 4.25 | % | | | 08/01/2019 | | | | 3,535 | | | | 3,569,572 | |
Southeast Alabama Gas Supply District (The) (No. 1); | | | | | | | | | | | | | | | | |
Series 2018 B, Gas Supply Floating Rate RB (1 mo. USD LIBOR + 0.90%)(b)(c) | | | 2.57 | % | | | 04/01/2024 | | | | 8,625 | | | | 8,540,044 | |
Series 2018 C, Gas Supply Floating Rate RB (SIFMA Municipal Swap Index + 0.65%)(b)(c) | | | 2.39 | % | | | 04/01/2024 | | | | 2,875 | | | | 2,875,144 | |
| | | | | | | | | | | | | | | | 25,466,842 | |
| | | | |
| Alaska–0.66% | | | | | | | | | | | | | | | | |
Alaska (State of) Industrial Development & Export Authority; Series 2010 A, Ref. Revolving Fund RB | | | 5.25 | % | | | 04/01/2021 | | | | 765 | | | | 793,290 | |
Alaska (State of) Industrial Development & Export Authority (Greater Fairbanks Community Hospital Foundation); Series 2004 A, RB (INS - AGM)(a) | | | 5.13 | % | | | 04/01/2019 | | | | 1,000 | | | | 1,002,480 | |
Alaska (State of) Municipal Bond Bank Authority; Series2016-3, RB | | | 5.00 | % | | | 12/01/2025 | | | | 4,635 | | | | 5,446,635 | |
North Slope (Borough of); | | | | | | | | | | | | | | | | |
Series 2008 A, Unlimited Tax GO Bonds | | | 5.50 | % | | | 06/30/2019 | | | | 1,000 | | | | 1,012,480 | |
Series 2018 A, General Purpose GO Bonds | | | 5.00 | % | | | 06/30/2021 | | | | 1,000 | | | | 1,073,220 | |
Series 2018 A, General Purpose GO Bonds | | | 5.00 | % | | | 06/30/2022 | | | | 1,710 | | | | 1,838,455 | |
Southeast Alaska Power Agency; Series 2009, Ref. Electric RB(INS-AGC)(a) | | | 5.13 | % | | | 06/01/2024 | | | | 650 | | | | 655,148 | |
Valdez (City of) (BP Pipelines); Series 2003 B, Ref. Marine Terminal RB | | | 5.00 | % | | | 01/01/2021 | | | | 1,800 | | | | 1,899,918 | |
| | | | | | | | | | | | | | | | 13,721,626 | |
| | | | |
| Arizona–1.84% | | | | | | | | | | | | | | | | |
Arizona (State of); | | | | | | | | | | | | | | | | |
Series 2010 A, COP (INS - AGM)(a) | | | 5.00 | % | | | 10/01/2019 | | | | 1,000 | | | | 1,019,200 | |
Series 2010 B, COP(INS-AGM)(a) | | | 5.00 | % | | | 10/01/2021 | | | | 2,000 | | | | 2,070,180 | |
Series 2010 B, COP(INS-AGM)(a) | | | 5.00 | % | | | 10/01/2022 | | | | 2,000 | | | | 2,069,960 | |
Series 2010 B, COP(INS-AGM)(a) | | | 5.00 | % | | | 10/01/2023 | | | | 2,000 | | | | 2,069,080 | |
Arizona (State of) Water Infrastructure Finance Authority; Series 2014 A, Ref. Water Quality RB | | | 5.00 | % | | | 10/01/2024 | | | | 5,000 | | | | 5,862,300 | |
Kingman Unified School District No. 20; Series 2009 C, School Improvement Unlimited Tax GO Bonds(b)(d) | | | 5.00 | % | | | 07/01/2019 | | | | 1,500 | | | | 1,516,665 | |
La Paz (County of) Industrial Development Authority (Charter School Solutions- Harmony Public Schools); Series 2016 A, Education Facility Lease RB(e) | | | 5.00 | % | | | 02/15/2026 | | | | 1,150 | | | | 1,273,671 | |
Maricopa (County of) Special Health Care District; Series 2018 C, Unlimited GO Bonds | | | 5.00 | % | | | 07/01/2024 | | | | 2,000 | | | | 2,323,160 | |
Maricopa (County of), Industrial Development Authority (Banner Health); Series 2017 C, RB(b) | | | 5.00 | % | | | 10/18/2024 | | | | 7,500 | | | | 8,671,875 | |
Maricopa County Pollution Control Corp. (Southern California Education Co.); Series 2000 B, Ref. RB | | | 5.00 | % | | | 06/01/2035 | | | | 2,000 | | | | 2,038,480 | |
Phoenix Civic Improvement Corp.; Series 2017 D, Sr. Lien Airport RB | | | 5.00 | % | | | 07/01/2024 | | | | 5,080 | | | | 5,906,414 | |
Phoenix Civic Improvement Corp.,; Series 2014 B, Jr. Lien Water System RB | | | 5.00 | % | | | 07/01/2027 | | | | 2,450 | | | | 2,827,006 | |
Yuma (City of) Industrial Development Authority (Regional Medical Center); Series 2014 A, Hospital RB | | | 5.00 | % | | | 08/01/2019 | | | | 500 | | | | 506,530 | |
| | | | | | | | | | | | | | | | 38,154,521 | |
| | | | |
| California–7.91% | | | | | | | | | | | | | | | | |
Albany Unified School District (Election of 2008); Series 2009 A, Unlimited Tax GO Bonds(b)(d) | | | 5.00 | % | | | 08/01/2019 | | | | 1,520 | | | | 1,542,177 | |
Bay Area Toll Authority; Series 2014 G, Toll Bridge Floating Rate RB (SIFMA Municipal Swap Index + 0.60%)(b)(c) | | | 2.34 | % | | | 04/01/2020 | | | | 11,890 | | | | 11,904,981 | |
See accompanying Notes to Financial Statements which are an integral part of the financial statements.
10 Invesco Limited Term Municipal Income Fund
| | | | | | | | | | | | | | | | |
| | | Interest
Rate | | | Maturity Date | | | Principal
Amount
(000) | | | Value | |
| California–(continued) | | | | | | | | | | | | | | | | |
| | | | |
Bay Area Toll Authority (San Francisco Bay Area); | | | | | | | | | | | | | | | | |
Series 2007E-3, Toll Bridge Floating Rate RB (SIFMA Municipal Swap Index + 0.70%)(b)(c) | | | 2.44 | % | | | 10/01/2019 | | | $ | 11,790 | | | $ | 11,793,773 | |
Series 2017 D, Ref. Toll Bridge Floating Rate RB (3 mo. USD LIBOR + 0.55%)(b)(c) | | | 2.51 | % | | | 04/01/2021 | | | | 1,000 | | | | 1,001,870 | |
California (State of); | | | | | | | | | | | | | | | | |
Series 2009, Various Purpose Unlimited Tax GO Bonds | | | 5.00 | % | | | 10/01/2020 | | | | 1,900 | | | | 1,939,007 | |
Series 2012 B, Ref. Unlimited Tax GO Floating Rate Bonds (SIFMA Municipal Swap Index + 1.00%)(c) | | | 2.74 | % | | | 05/01/2019 | | | | 4,000 | | | | 4,001,040 | |
Series 2013 B, Ref. Various Purpose Unlimited Tax GO Floating Rate Bonds (SIFMA Municipal Swap Index + 0.38%)(b)(c) | | | 2.12 | % | | | 12/01/2022 | | | | 4,000 | | | | 4,003,000 | |
Series 2013 C, Unlimited Tax GO Floating Rate Bonds (1 mo. USD LIBOR + 0.70%)(b)(c) | | | 2.44 | % | | | 12/01/2020 | | | | 8,000 | | | | 8,035,040 | |
Series 2013 E, Unlimited Tax GO Floating Rate Bonds (SIFMA Municipal Swap Index + 0.43%)(b)(c) | | | 2.17 | % | | | 12/01/2023 | | | | 9,000 | | | | 9,012,600 | |
Series 2016 B, Unlimited Tax GO Floating Rate Bonds (1 mo. USD LIBOR + 0.76%)(b)(c) | | | 2.50 | % | | | 12/01/2021 | | | | 10,000 | | | | 10,074,000 | |
California (State of) Department of Water Resources; Series 2014 AT, Water System Floating Rate RB (SIFMA Municipal Swap Index + 0.37%)(b)(c) | | | 2.11 | % | | | 12/01/2022 | | | | 4,000 | | | | 3,997,560 | |
California (State of) Health Facilities Financing Authority (Providence St. Joseph Health); Series 2016B-2, Ref. RB(b) | | | 4.00 | % | | | 10/01/2024 | | | | 5,000 | | | | 5,558,400 | |
California (State of) Health Facilities Financing Authority (The Episcopal Home); Series 2010 B, RB(b)(d) | | | 5.50 | % | | | 02/01/2020 | | | | 1,250 | | | | 1,295,500 | |
California (State of) Municipal Finance Authority (American Heritage Education Foundation);
Series 2016A, Ref. Education RB | | | 4.00 | % | | | 06/01/2026 | | | | 2,215 | | | | 2,311,951 | |
California (State of) Municipal Finance Authority (Anaheim System Distribution Facilities);
Series 2015 A, Second Lien Qualified Obligations Floating Rate RB (SIFMA Municipal Swap Index +
0.35%)(b)(c) | | | 2.09 | % | | | 12/01/2020 | | | | 3,500 | | | | 3,496,640 | |
California (State of) Statewide Communities Development Authority (Enloe Medical Center);
Series 2008 A, RB(INS - Cal-Mortgage)(a) | | | 5.25 | % | | | 08/15/2019 | | | | 325 | | | | 328,185 | |
California Infrastructure & Economic Development Bank (California Academy of Sciences); Series 2018 C, Ref. Floating Rate RB (1 mo. USD LIBOR + 0.38%)(b)(c) | | | 2.12 | % | | | 08/01/2021 | | | | 5,000 | | | | 5,005,900 | |
California Infrastructure & Economic Development Bank (The J. Paul Getty Trust); Series 2011A-3, Ref. Floating Rate RB (3 mo. USD LIBOR + 0.37%)(b)(c) | | | 2.21 | % | | | 04/01/2020 | | | | 7,875 | | | | 7,893,585 | |
Corona-Norco Unified School District (Election of 2006); Series 2009 C, Unlimited Tax CAB GO Bonds(INS-AGM)(a)(f) | | | 0.00 | % | | | 08/01/2021 | | | | 1,500 | | | | 1,439,475 | |
Golden State Tobacco Securitization Corp.; | | | | | | | | | | | | | | | | |
Series 2017A-1, Ref. Tobacco Settlement Asset-Backed RB | | | 5.00 | % | | | 06/01/2028 | | | | 11,765 | | | | 13,489,867 | |
Series 2017A-1, Ref. Tobacco Settlement RB | | | 5.00 | % | | | 06/01/2024 | | | | 6,500 | | | | 7,259,590 | |
Series 2017A-1, Tobacco Settlement Asset-Backed RB | | | 5.00 | % | | | 06/01/2025 | | | | 10,000 | | | | 11,331,000 | |
Grossmont-Cuyamaca Community College District (Election of 2002); Series 2008 C, Unlimited Tax CAB GO Bonds(INS-AGC)(a)(f) | | | 0.00 | % | | | 08/01/2025 | | | | 3,000 | | | | 2,593,980 | |
Hayward Unified School District (Election of 2008); Series 2010 A, Unlimited Tax CAB GO Bonds
(INS-AGM)(a)(f) | | | 0.00 | % | | | 08/01/2020 | | | | 1,000 | | | | 975,540 | |
Lake Tahoe Unified School District (Election of 2008); Series 2009, Unlimited Tax GO Bonds(INS-AGM)(a) | | | 5.00 | % | | | 08/01/2024 | | | | 1,000 | | | | 1,013,640 | |
Los Angeles (City of) Harbor Department; Series 2009 C, Ref. RB | | | 5.00 | % | | | 08/01/2021 | | | | 2,000 | | | | 2,168,040 | |
Monterey (County of) (2009 Refinancing); Series 2009, COP(INS-AGM)(a) | | | 5.00 | % | | | 08/01/2019 | | | | 2,360 | | | | 2,394,621 | |
New Haven Unified School District; | | | | | | | | | | | | | | | | |
Series 2009, Ref. Unlimited Tax GO Bonds(b)(d) | | | 5.00 | % | | | 08/01/2019 | | | | 925 | | | | 938,690 | |
Series 2009, Ref. Unlimited Tax GO Bonds (INS - AGC)(a) | | | 5.00 | % | | | 08/01/2020 | | | | 1,605 | | | | 1,628,882 | |
Northern California Power Agency; | | | | | | | | | | | | | | | | |
Series 2010 A, Ref. Capital Facilities RB | | | 5.00 | % | | | 08/01/2020 | | | | 1,000 | | | | 1,030,430 | |
Series 2010 A, Ref. Capital Facilities RB | | | 5.00 | % | | | 08/01/2021 | | | | 1,000 | | | | 1,029,790 | |
Rowland Unified School District (Election of 2006); Series 2009 B, Unlimited Tax CAB GO Bonds(f) | | | 0.00 | % | | | 08/01/2023 | | | | 1,300 | | | | 1,191,502 | |
Sacramento (County of); | | | | | | | | | | | | | | | | |
Series 2010, Sr. Airport System RB | | | 5.00 | % | | | 07/01/2023 | | | | 500 | | | | 522,695 | |
Series 2018 B, Ref. Sr. Airport System RB | | | 5.00 | % | | | 07/01/2022 | | | | 750 | | | | 834,322 | |
Series 2018 B, Ref. Sr. Airport System RB | | | 5.00 | % | | | 07/01/2023 | | | | 1,000 | | | | 1,139,630 | |
See accompanying Notes to Financial Statements which are an integral part of the financial statements.
11 Invesco Limited Term Municipal Income Fund
| | | | | | | | | | | | | | | | |
| | | Interest
Rate | | | Maturity Date | | | Principal
Amount
(000) | | | Value | |
California–(continued) | | | | | | | | | | | | | | | | |
| | | | |
San Francisco (City & County of) Airport Commission (San Francisco International Airport); | | | | | | | | | | | | | | | | |
Series 2009 E, Second Series RB | | | 5.50 | % | | | 05/01/2026 | | | $ | 2,000 | | | $ | 2,013,040 | |
Santa Ana (City of) (Local Street Improvement); Series 2007, Gas Tax Revenue COP(INS-NATL)(a) | | | 4.38 | % | | | 01/01/2024 | | | | 1,000 | | | | 1,002,090 | |
Torrance Unified School District (Election of 2008-Measure Z); | | | | | | | | | | | | | | | | |
Series 2009B-1, Unlimited Tax CAB GO Bonds(f) | | | 0.00 | % | | | 08/01/2022 | | | | 1,900 | | | | 1,782,561 | |
Series 2009B-1, Unlimited Tax CAB GO Bonds(f) | | | 0.00 | % | | | 08/01/2023 | | | | 2,000 | | | | 1,834,700 | |
Tustin Unified School District (Community Facilities DistrictNo. 88-1); | | | | | | | | | | | | | | | | |
Series 2015, Ref. Special Tax RB(INS-BAM)(a) | | | 5.00 | % | | | 09/01/2022 | | | | 1,500 | | | | 1,674,570 | |
Series 2015, Ref. Special Tax RB(INS-BAM)(a) | | | 5.00 | % | | | 09/01/2023 | | | | 1,000 | | | | 1,145,790 | |
Tustin Unified School District (Community Facilities DistrictNo. 97-1); | | | | | | | | | | | | | | | | |
Series 2015 A, Ref. Special Tax RB | | | 5.00 | % | | | 09/01/2022 | | | | 1,000 | | | | 1,108,820 | |
Series 2015 A, Ref. Special Tax RB | | | 5.00 | % | | | 09/01/2023 | | | | 650 | | | | 738,719 | |
Series 2015 A, Ref. Special Tax RB | | | 5.00 | % | | | 09/01/2024 | | | | 1,500 | | | | 1,732,530 | |
Twin Rivers Unified School District (School Facility Bridge Funding Program); Series 2007, COP(INS-AGM)(a)(b) | | | 3.20 | % | | | 06/01/2020 | | | | 3,695 | | | | 3,699,397 | |
Vernon (City of); | | | | | | | | | | | | | | | | |
Series 2009 A, Electric System RB(b)(d) | | | 5.13 | % | | | 08/01/2019 | | | | 510 | | | | 517,594 | |
Series 2009 A, Electric System RB | | | 5.13 | % | | | 08/01/2021 | | | | 1,065 | | | | 1,078,110 | |
West Contra Costa Unified School District (Election of 2005); Series 2008 B, Unlimited Tax GO Bonds | | | 6.00 | % | | | 08/01/2027 | | | | 1,000 | | | | 1,323,100 | |
| | | | | | | | | | | | | | | | 163,827,924 | |
| | | | |
Colorado–1.81% | | | | | | | | | | | | | | | | |
Arkansas River Power Authority; Series 2006, Power Improvement RB(a) | | | 5.88 | % | | | 10/01/2021 | | | | 2,960 | | | | 3,143,638 | |
Colorado (State of); Series 2018 A, COP RB | | | 5.00 | % | | | 12/15/2023 | | | | 2,000 | | | | 2,290,020 | |
Colorado (State of) Health Facilities Authority (Adventist Health System/Sunbelt Obligated Group); Series 2018 B, Hospital RB(b) | | | 5.00 | % | | | 11/20/2025 | | | | 4,600 | | | | 5,405,736 | |
Colorado (State of) Health Facilities Authority (North Colorado Medical Center, Inc.); Series 2003 A, Hospital RB(b)(d) | | | 5.25 | % | | | 05/15/2019 | | | | 1,000 | | | | 1,007,290 | |
Colorado Springs (City of); Series 2018A-1, Ref. Utilities System RB | | | 5.00 | % | | | 11/15/2023 | | | | 2,990 | | | | 3,434,464 | |
Denver (City & County of); Series 2016, Ref. Airport System Floating Rate RB (1 mo. USD LIBOR + 0.86%)(b)(c) | | | 2.60 | % | | | 11/15/2019 | | | | 7,580 | | | | 7,589,323 | |
Denver School District No. 1; Series 2009 A, Unlimited Tax GO Bonds(b)(d) | | | 5.00 | % | | | 06/01/2019 | | | | 1,000 | | | | 1,008,280 | |
E-470 Public Highway Authority; | | | | | | | | | | | | | | | | |
Series 2017 A, Ref. Sr. Floating Rate RB (1 mo. USD LIBOR + 0.90%)(b)(c) | | | 2.57 | % | | | 09/01/2019 | | | | 5,830 | | | | 5,830,350 | |
Series 2017 B, Ref. Sr. Floating Rate RB (1 mo. USD LIBOR + 1.05%)(b)(c) | | | 2.72 | % | | | 09/01/2021 | | | | 2,000 | | | | 2,019,840 | |
Series 2019, VRD RB(g) | | | 1.00 | % | | | 09/01/2021 | | | | 1,500 | | | | 1,500,435 | |
Public Authority for Colorado Energy; | | | | | | | | | | | | | | | | |
Series 2008, Natural Gas Purchase RB | | | 6.13 | % | | | 11/15/2023 | | | | 1,550 | | | | 1,732,218 | |
Series 2008, Natural Gas Purchase RB | | | 6.25 | % | | | 11/15/2028 | | | | 2,000 | | | | 2,509,080 | |
| | | | | | | | | | | | | | | | 37,470,674 | |
| | | | |
Connecticut–2.23% | | | | | | | | | | | | | | | | |
| | | | |
Connecticut (State of); | | | | | | | | | | | | | | | | |
Series 2013 A, Unlimited Tax GO Floating Rate Bonds (SIFMA Municipal Swap Index +
0.55%)(c) | | | 2.29 | % | | | 03/01/2019 | | | | 4,425 | | | | 4,425,000 | |
Series 2013 A, Unlimited Tax GO Floating Rate Bonds (SIFMA Municipal Swap Index +
0.65%)(c) | | | 2.39 | % | | | 03/01/2020 | | | | 6,000 | | | | 6,013,200 | |
Series 2013 A, Unlimited Tax GO Floating Rate Bonds (SIFMA Municipal Swap Index +
0.85%)(c) | | | 2.59 | % | | | 03/01/2022 | | | | 5,000 | | | | 5,042,550 | |
Series 2018 C, Unlimited Tax GO Bonds | | | 5.00 | % | | | 06/15/2022 | | | | 1,350 | | | | 1,474,416 | |
Connecticut (State of) (Transportation Infrastructure); | | | | | | | | | | | | | | | | |
Series 2018, Special Tax Obligation RB | | | 5.00 | % | | | 01/01/2023 | | | | 10,000 | | | | 11,072,400 | |
Series 2018, Special Tax Obligation RB | | | 5.00 | % | | | 01/01/2027 | | | | 3,000 | | | | 3,503,490 | |
Connecticut (State of) Health & Educational Facility Authority (Sacred Heart University); Series 2012 H, Ref. RB(b)(d) | | | 4.00 | % | | | 07/01/2022 | | | | 2,590 | | | | 2,783,473 | |
Connecticut (State of) Health & Educational Facility Authority (Yale New Haven Health); Series 2014 B, Floating Rate RB (1 mo. USD LIBOR + 0.55%)(b)(c) | | | 2.22 | % | | | 07/01/2019 | | | | 12,000 | | | | 12,000,480 | |
| | | | | | | | | | | | | | | | 46,315,009 | |
See accompanying Notes to Financial Statements which are an integral part of the financial statements.
12 Invesco Limited Term Municipal Income Fund
| | | | | | | | | | | | | | | | |
| | | Interest
Rate | | | Maturity Date | | | Principal
Amount
(000) | | | Value | |
Delaware–0.05% | | | | | | | | | | | | | | | | |
| | | | |
Delaware (State of) Health Facilities Authority (Bayhealth Medical Center); Series 2009 A, RB(b)(d) | | | 4.05 | % | | | 07/01/2019 | | | $ | 1,000 | | | $ | 1,007,880 | |
| | | | |
District of Columbia–0.24% | | | | | | | | | | | | | | | | |
| | | | |
District of Columbia (Georgetown University); | | | | | | | | | | | | | | | | |
Series 2011, University RB(b)(d) | | | 5.00 | % | | | 04/01/2021 | | | | 2,055 | | | | 2,195,274 | |
Series 2017, Ref. University RB(d) | | | 5.00 | % | | | 04/01/2023 | | | | 1,000 | | | | 1,127,280 | |
Series 2017, Ref. University RB(d) | | | 5.00 | % | | | 04/01/2024 | | | | 1,500 | | | | 1,732,575 | |
| | | | | | | | | | | | | | | | 5,055,129 | |
| | | | |
Florida–3.86% | | | | | | | | | | | | | | | | |
| | | | |
Brevard County School District; Series 2013 A, Ref. COP | | | 5.00 | % | | | 07/01/2024 | | | | 2,000 | | | | 2,256,940 | |
Broward (County of); Series 2012 B, Water & Sewer Utility RB | | | 5.00 | % | | | 10/01/2023 | | | | 3,555 | | | | 3,961,017 | |
Broward (County of) School Board; Series 2017 C, Ref. COP | | | 5.00 | % | | | 07/01/2025 | | | | 5,000 | | | | 5,904,000 | |
Citizens Property Insurance Corp.; | | | | | | | | | | | | | | | | |
Series 2012A-1, Sr. Sec. RB | | | 5.00 | % | | | 06/01/2022 | | | | 8,000 | | | | 8,821,680 | |
Series 2015A-1, Sr. Sec. RB | | | 5.00 | % | | | 06/01/2025 | | | | 6,000 | | | | 6,985,200 | |
Citizens Property Insurance Corp. (Coastal Account); Series 2011A-1, Sr. Sec. RB | | | 5.00 | % | | | 06/01/2020 | | | | 1,000 | | | | 1,039,850 | |
Escambia (County of) (Gulf Power Co.); Series 1997, Ref. PCR(b) | | | 2.10 | % | | | 04/11/2019 | | | | 2,000 | | | | 1,999,900 | |
Florida (State of) (Department of Transportation); Series 2016A, Ref. Unlimited Tax GO Bonds | | | 5.00 | % | | | 07/01/2025 | | | | 2,610 | | | | 3,104,125 | |
Florida (State of) Board of Education; Series 2011 D, Ref. Public Education Public Outlay Unlimited GO Bonds | | | 5.00 | % | | | 06/01/2025 | | | | 10,000 | | | | 10,709,700 | |
Florida (State of)Mid-Bay Bridge Authority; | | | | | | | | | | | | | | | | |
Series 2015 A, Ref. RB | | | 5.00 | % | | | 10/01/2022 | | | | 2,485 | | | | 2,729,773 | |
Series 2015 A, Ref. RB | | | 5.00 | % | | | 10/01/2023 | | | | 1,000 | | | | 1,119,990 | |
Florida (State of) Municipal Power Agency (All Requirement Power Supply); Series2017-A, Ref. RB | | | 5.00 | % | | | 10/01/2026 | | | | 4,000 | | | | 4,819,400 | |
Gulf Breeze (City of) (Local Government Loan Program); Series 1985 J, RB(h) | | | 4.50 | % | | | 12/01/2020 | | | | 3,050 | | | | 3,192,099 | |
Hillsborough (County of) Aviation Authority (Tampa International Airport); | | | | | | | | | | | | | | | | |
Series 2018 F, RB | | | 5.00 | % | | | 10/01/2023 | | | | 1,250 | | | | 1,424,513 | |
Series 2018 F, RB | | | 5.00 | % | | | 10/01/2024 | | | | 1,050 | | | | 1,221,381 | |
Hillsborough (County of) School Board; | | | | | | | | | | | | | | | | |
Series 2015, Ref. Sales Tax RB(INS-AGM) (a) | | | 5.00 | % | | | 10/01/2021 | | | | 1,700 | | | | 1,837,649 | |
Series 2015, Ref. Sales Tax RB(INS-AGM) (a) | | | 5.00 | % | | | 10/01/2022 | | | | 1,500 | | | | 1,666,350 | |
JEA; Series 2017 A, Ref. Water & Sewer System RB | | | 5.00 | % | | | 10/01/2025 | | | | 4,500 | | | | 5,257,800 | |
Manatee (County of) School District; Series 2017, Sales Tax RB (INS-AGM) (a) | | | 5.00 | % | | | 10/01/2024 | | | | 2,600 | | | | 3,031,860 | |
Miami (City of); Series 2009, Ref. Parking System RB(INS-AGC) (a) | | | 5.00 | % | | | 10/01/2028 | | | | 750 | | | | 763,530 | |
Miami-Dade (County of); Series 2010 B, Ref. Aviation RB(INS-AGM) (a) | | | 5.00 | % | | | 10/01/2023 | | | | 3,500 | | | | 3,686,095 | |
Miami-Dade (County of) (Jackson Health System); Series 2009, Public Facilities RB(b)(d) | | | 5.50 | % | | | 06/01/2019 | | | | 2,455 | | | | 2,478,273 | |
Miami-Dade (County of) (Miami International Airport); Series 2009 B, Aviation RB(b)(d) | | | 5.00 | % | | | 10/01/2019 | | | | 2,000 | | | | 2,038,980 | |
| | | | | | | | | | | | | | | | 80,050,105 | |
| | | | |
Georgia–2.46% | | | | | | | | | | | | | | | | |
| | | | |
Atlanta (City of); | | | | | | | | | | | | | | | | |
Series 2009 B, Water & Wastewater RB(INS-AGM) (a) | | | 4.13 | % | | | 11/01/2019 | | | | 970 | | | | 986,150 | |
Series 2009 B, Water & Wastewater RB(b)(d) | | | 5.00 | % | | | 11/01/2019 | | | | 1,735 | | | | 1,774,020 | |
Series 2009 B, Water & Wastewater RB(INS-AGM) (a) | | | 5.00 | % | | | 11/01/2020 | | | | 630 | | | | 644,043 | |
Series 2009 B, Water & Wastewater RB(INS-AGM) (a) | | | 5.00 | % | | | 11/01/2021 | | | | 635 | | | | 648,519 | |
Series 2009 B, Water & Wastewater RB(INS-AGM) (a) | | | 5.25 | % | | | 11/01/2027 | | | | 2,000 | | | | 2,452,000 | |
Water & Wastewater RB | | | 5.00 | % | | | 11/01/2024 | | | | 2,000 | | | | 2,343,260 | |
Burke (County of) Development Authority (Georgia Power Co. Plant Vogtle); Series 1994, PCR(b) | | | 2.20 | % | | | 04/02/2019 | | | | 5,000 | | | | 5,000,200 | |
Burke (County of) Development Authority (Oglethorpe Power Vogtle); Series 2013 A, PCR(b) | | | 2.40 | % | | | 04/01/2020 | | | | 2,000 | | | | 1,996,400 | |
DeKalb (County of) Hospital Authority (DeKalb Medical Center, Inc.); Series 2010, RAC(d) | | | 5.25 | % | | | 09/01/2020 | | | | 1,050 | | | | 1,085,406 | |
See accompanying Notes to Financial Statements which are an integral part of the financial statements.
13 Invesco Limited Term Municipal Income Fund
| | | | | | | | | | | | | | | | |
| | | Interest
Rate | | | Maturity Date | | | Principal
Amount
(000) | | | Value | |
Georgia–(continued) | | | | | | | | | | | | | | | | |
| | | | |
Fayette (County of) Hospital Authority (Fayette Community Hospital); | | | | | | | | | | | | | | | | |
Series 2009 A, RAC | | | 4.38 | % | | | 06/15/2020 | | | $ | 2,500 | | | $ | 2,518,700 | |
Series 2009 A, RAC | | | 4.50 | % | | | 06/15/2021 | | | | 2,500 | | | | 2,517,950 | |
Fulton (County of) Development Authority (Piedmont Healthcare, Inc.); Series 2009 A, RB (b)(d) | | | 5.00 | % | | | 06/15/2019 | | | | 2,830 | | | | 2,857,225 | |
Gainesville (City of) & Hall (County of) Development Authority (Acts Retirement-Life Community); Series 2012, Retirement Community RB | | | 5.00 | % | | | 11/15/2022 | | | | 1,805 | | | | 1,943,317 | |
Gainesville (City of) & Hall (County of) Hospital Authority (Northeast Georgia Health System, Inc.); Series 2014 B, Ref. Floating Rate RB (SIFMA Municipal Swap Index + 0.95%)(b)(c) | | | 2.69 | % | | | 02/18/2020 | | | | 8,100 | | | | 8,105,670 | |
Gwinnett (County of) Hospital Authority (Gwinnett Hospital System, Inc.); Series 2007 D, RAC(INS-AGM)(a) | | | 5.25 | % | | | 07/01/2029 | | | | 2,000 | | | | 2,017,980 | |
Macon-Bibb (County of) Hospital Authority (Medical Center of Central Georgia, Inc.); | | | | | | | | | | | | | | | | |
Series 2009, RAC (d) | | | 4.00 | % | | | 08/01/2019 | | | | 635 | | | | 641,115 | |
Series 2009, RAC (b)(d) | | | 5.00 | % | | | 08/01/2019 | | | | 1,260 | | | | 1,277,237 | |
Main Street Natural Gas, Inc.; Subseries 2018 E, Gas Supply Floating Rate RB (SIFMA Municipal Swap Index + 0.57%)(b)(c) | | | 2.31 | % | | | 12/01/2023 | | | | 5,000 | | | | 4,975,250 | |
Medical Center Hospital Authority (Columbus Regional Healthcare System, Inc.); | | | | | | | | | | | | | | | | |
Series 2010, RAC(d) | | | 3.50 | % | | | 08/01/2020 | | | | 2,000 | | | | 2,047,900 | |
Series 2010, RAC(b)(d) | | | 5.00 | % | | | 08/01/2020 | | | | 1,500 | | | | 1,568,145 | |
Monroe (County of) Development Authority (Georgia Power Co. Plant Sherer); Series 1995, PCR (b) | | | 2.00 | % | | | 06/13/2019 | | | | 3,500 | | | | 3,498,670 | |
| | | | | | | | | | | | | | | | 50,899,157 | |
| | | | |
Guam–0.28% | | | | | | | | | | | | | | | | |
| | | | |
Guam (Territory of); | | | | | | | | | | | | | | | | |
Series 2015 D, Ref. Business Privilege Tax RB | | | 5.00 | % | | | 11/15/2019 | | | | 1,000 | | | | 1,016,160 | |
Series 2015 D, Ref. Business Privilege Tax RB | | | 5.00 | % | | | 11/15/2020 | | | | 1,500 | | | | 1,556,805 | |
Guam (Territory of) Power Authority; | | | | | | | | | | | | | | | | |
Series 2012 A, Ref. RB(INS-AGM)(a) | | | 5.00 | % | | | 10/01/2019 | | | | 1,000 | | | | 1,017,630 | |
Series 2012 A, Ref. RB(INS-AGM)(a) | | | 5.00 | % | | | 10/01/2020 | | | | 2,070 | | | | 2,168,739 | |
| | | | | | | | | | | | | | | | 5,759,334 | |
| | | | |
Hawaii–0.97% | | | | | | | | | | | | | | | | |
| | | | |
Hawaii (State of); | | | | | | | | | | | | | | | | |
Series 2013, Unlimited Tax GO Bonds | | | 5.00 | % | | | 08/01/2028 | | | | 7,000 | | | | 7,898,590 | |
Series 2016FE, Ref. GO Bonds | | | 5.00 | % | | | 10/01/2026 | | | | 4,845 | | | | 5,882,896 | |
Series 2016FE, Ref. GO Bonds | | | 5.00 | % | | | 10/01/2027 | | | | 5,265 | | | | 6,362,542 | |
| | | | | | | | | | | | | | | | 20,144,028 | |
| | | | |
Idaho–0.43% | | | | | | | | | | | | | | | | |
| | | | |
Idaho (State of) Health Facilities Authority (St. Luke’s Health System); | | | | | | | | | | | | | | | | |
Series 2018 A, Ref. RB | | | 5.00 | % | | | 03/01/2023 | | | | 2,000 | | | | 2,225,660 | |
Series 2018 A, Ref. RB | | | 5.00 | % | | | 03/01/2024 | | | | 1,350 | | | | 1,533,168 | |
Idaho (State of) Health Facilities Authority (Trinity Health Credit Group); Series 2008 B, Ref. RB | | | 5.63 | % | | | 12/01/2019 | | | | 1,000 | | | | 1,003,060 | |
Idaho (State of) Housing & Finance Association (Federal Highway Trust Fund); Series 2009 A, Grant & RAB (b)(d) | | | 5.25 | % | | | 07/15/2019 | | | | 500 | | | | 506,675 | |
Regents of the University of Idaho; Series 2011, Ref. General RB(b) | | | 5.25 | % | | | 04/01/2021 | | | | 3,390 | | | | 3,608,180 | |
| | | | | | | | | | | | | | | | 8,876,743 | |
| | | | |
Illinois–8.72% | | | | | | | | | | | | | | | | |
| | | | |
Bolingbrook (Village of); Series 2010 A, Ref. Unlimited Tax GO Bonds(INS-AGM)(a) | | | 5.00 | % | | | 01/01/2023 | | | | 1,260 | | | | 1,291,790 | |
See accompanying Notes to Financial Statements which are an integral part of the financial statements.
14 Invesco Limited Term Municipal Income Fund
| | | | | | | | | | | | | | | | |
| | | Interest
Rate | | | Maturity Date | | | Principal
Amount
(000) | | | Value | |
Illinois–(continued) | | | | | | | | | | | | | | | | |
| | | | |
Chicago (City of); | | | | | | | | | | | | | | | | |
| | | | |
Series 2003 B, Ref. Unlimited Tax GO Bonds | | | 5.00 | % | | | 01/01/2024 | | | $ | 3,205 | | | $ | 3,437,907 | |
Series 2004, Ref. Second Lien Water VRD RB(g) | | | 5.00 | % | | | 11/01/2021 | | | | 6,000 | | | | 6,445,860 | |
Series 2004, Ref. Second Lien Waterworks RB | | | 5.00 | % | | | 11/01/2022 | | | | 5,675 | | | | 6,239,776 | |
Series 2004, Ref. Second Lien Waterworks RB | | | 5.00 | % | | | 11/01/2023 | | | | 2,475 | | | | 2,767,198 | |
Series 2004, Ref. Second Lien Waterworks RB | | | 5.00 | % | | | 11/01/2024 | | | | 14,440 | | | | 16,385,501 | |
Series 2007 A, Ref. Project Unlimited Tax GO Bonds(INS-NATL)(a) | | | 5.00 | % | | | 01/01/2029 | | | | 960 | | | | 962,534 | |
Series 2012, Second Lien Wastewater Transmission RB | | | 5.00 | % | | | 01/01/2027 | | | | 1,000 | | | | 1,069,690 | |
Series 2014, Second Lien Waterworks RB | | | 5.00 | % | | | 11/01/2021 | | | | 1,000 | | | | 1,074,310 | |
Series 2017 B, Ref. Second Lien Wastewater Transmission RB | | | 5.00 | % | | | 01/01/2025 | | | | 3,520 | | | | 4,000,867 | |
Chicago (City of) (Midway Airport); | | | | | | | | | | | | | | | | |
Series 2013 B, Ref. Second Lien RB | | | 5.00 | % | | | 01/01/2020 | | | | 2,000 | | | | 2,054,300 | |
Series 2014 B, Ref. Second Lien RB | | | 5.00 | % | | | 01/01/2020 | | | | 500 | | | | 513,575 | |
Chicago (City of) (O’Hare International Airport); | | | | | | | | | | | | | | | | |
Series 2010 C, Third Lien General Airport RB(INS-AGC)(a) | | | 5.25 | % | | | 01/01/2021 | | | | 1,025 | | | | 1,055,084 | |
Series 2015 B, Ref. RB | | | 5.00 | % | | | 01/01/2022 | | | | 3,650 | | | | 3,971,127 | |
Series 2015 B, Ref. RB | | | 5.00 | % | | | 01/01/2023 | | | | 5,000 | | | | 5,585,050 | |
Chicago (City of) Transit Authority; Series 2011, Sales Tax Receipts RB | | | 5.25 | % | | | 12/01/2029 | | | | 2,500 | | | | 2,661,125 | |
Chicago (City of) Transit Authority (FTA Section 5307 Urbanized Area Formula Funds); | | | | | | | | | | | | | | | | |
Series 2015, Ref. Capital Grant Receipts RB | | | 5.00 | % | | | 06/01/2021 | | | | 8,000 | | | | 8,487,760 | |
Series 2017, Ref. Capital Grant Receipts RB | | | 5.00 | % | | | 06/01/2025 | | | | 4,000 | | | | 4,568,800 | |
Chicago (City of) Transit Authority (FTA Section 5337 State of Good Repair Formula Funds); | | | | | | | | | | | | | | | | |
Series 2017, Ref. Capital Grant Receipts RB | | | 5.00 | % | | | 06/01/2025 | | | | 1,500 | | | | 1,717,035 | |
Cook (County of); | | | | | | | | | | | | | | | | |
Series 2009 A, Ref. Unlimited Tax GO Bonds | | | 5.00 | % | | | 11/15/2019 | | | | 2,015 | | | | 2,058,282 | |
Series 2009 C, Ref. Unlimited Tax GO Bonds | | | 5.00 | % | | | 11/15/2020 | | | | 5,150 | | | | 5,255,935 | |
Cook County School District No. 144 (Prairie Hills); Series 2010 A, School Limited Tax GO Bonds (d) | | | 4.25 | % | | | 12/01/2020 | | | | 555 | | | | 579,953 | |
DeKalb County Community Unit School District No. 428; | | | | | | | | | | | | | | | | |
Series 2010, School Building Unlimited Tax CAB GO Bonds(d)(f) | | | 0.00 | % | | | 01/01/2020 | | | | 380 | | | | 374,517 | |
Series 2010, School Building Unlimited Tax CAB GO Bonds | | | 0.00 | % | | | 01/01/2020 | | | | 620 | | | | 609,305 | |
Illinois (State of); | | | | | | | | | | | | | | | | |
Series 2010, Ref. Unlimited Tax GO Bonds | | | 5.00 | % | | | 01/01/2020 | | | | 1,675 | | | | 1,709,204 | |
Series 2010, Ref. Unlimited Tax GO Bonds | | | 5.00 | % | | | 01/01/2023 | | | | 525 | | | | 533,605 | |
Series 2012, Ref. Unlimited Tax GO Bonds | | | 5.00 | % | | | 08/01/2025 | | | | 4,710 | | | | 4,933,113 | |
Series 2013, Unlimited Tax GO Bonds | | | 5.00 | % | | | 07/01/2021 | | | | 2,500 | | | | 2,627,100 | |
Series 2014, Unlimited Tax GO Bonds | | | 5.00 | % | | | 02/01/2021 | | | | 5,000 | | | | 5,210,500 | |
Series 2014, Unlimited Tax GO Bonds | | | 5.00 | % | | | 02/01/2024 | | | | 1,100 | | | | 1,177,572 | |
Series 2014, Unlimited Tax GO Bonds | | | 5.00 | % | | | 02/01/2025 | | | | 4,695 | | | | 4,998,438 | |
Series 2017 D, Unlimited Tax GO Bonds | | | 5.00 | % | | | 11/01/2024 | | | | 3,480 | | | | 3,750,152 | |
Series 2018 A, Unlimited Tax GO Bonds | | | 5.25 | % | | | 05/01/2023 | | | | 3,000 | | | | 3,219,180 | |
Illinois (State of) Finance Authority (Advocate Health Care Network); Series 2010 D, Ref. RB (b)(d) | | | 5.00 | % | | | 04/01/2019 | | | | 1,200 | | | | 1,203,060 | |
Illinois (State of) Finance Authority (Edward-Elmhurst Heathcare); Series 2018 B, Ref. RB (SIFMA Municipal Swap Index + 0.75%)(b)(c) | | | 2.49 | % | | | 07/01/2023 | | | | 3,500 | | | | 3,501,120 | |
Illinois (State of) Finance Authority (Northwestern Memorial Healthcare); Series 2017 B, RB(b) | | | 5.00 | % | | | 12/15/2022 | | | | 10,750 | | | | 11,960,772 | |
Illinois (State of) Finance Authority (Southern Illinois Healthcare Enterprises, Inc.); Series 2005, RB (b)(d) | | | 5.25 | % | | | 03/01/2020 | | | | 2,775 | | | | 2,872,569 | |
Illinois (State of) Finance Authority (Swedish Covenant Hospital); Series 2016A, Ref. RB | | | 5.00 | % | | | 08/15/2019 | | | | 500 | | | | 505,695 | |
Illinois (State of) Metropolitan Pier & Exposition Authority (McCormick Place Expansion); | | | | | | | | | | | | | | | | |
Series 2002, Dedicated State Tax CAB RB (INS -NATL)(a)(f) | | | 0.00 | % | | | 12/15/2032 | | | | 25,000 | | | | 13,860,250 | |
Series 2002, Dedicated State Tax RB(b)(d) | | | 5.70 | % | | | 06/15/2022 | | | | 875 | | | | 993,563 | |
Series 2002, Dedicated State Tax RB(INS-NATL)(a) | | | 5.70 | % | | | 06/15/2025 | | | | 3,125 | | | | 3,445,375 | |
See accompanying Notes to Financial Statements which are an integral part of the financial statements.
15 Invesco Limited Term Municipal Income Fund
| | | | | | | | | | | | | | | | |
| | | Interest
Rate | | | Maturity Date | | | Principal
Amount
(000) | | | Value | |
Illinois–(continued) | | | | | | | | | | | | | | | | |
| | | | |
Railsplitter Tobacco Settlement Authority; | | | | | | | | | | | | | | | | |
Series 2010, RB(b)(d) | | | 5.50 | % | | | 06/01/2021 | | | $ | 1,500 | | | $ | 1,624,815 | |
Series 2017, RB | | | 5.00 | % | | | 06/01/2025 | | | | 7,000 | | | | 8,078,420 | |
Regional Transportation Authority; | | | | | | | | | | | | | | | | |
Series 2002 A, RB(INS-NATL)(a) | | | 6.00 | % | | | 07/01/2020 | | | | 3,840 | | | | 4,047,514 | |
Series 2002 A, RB(INS-NATL)(a) | | | 6.00 | % | | | 07/01/2021 | | | | 2,055 | | | | 2,246,321 | |
Series 2003 A, RB(INS-NATL)(a) | | | 5.50 | % | | | 07/01/2020 | | | | 2,580 | | | | 2,702,627 | |
Sales Tax Securitization Corp.; Series 2017 A, Ref. RB | | | 5.00 | % | | | 01/01/2025 | | | | 6,700 | | | | 7,555,992 | |
Springfield (City of); Series 2015, Ref. Sr. Lien Electric RB | | | 5.00 | % | | | 03/01/2023 | | | | 2,000 | | | | 2,228,100 | |
St. Clair (County of) (Alternative Revenue Source); | | | | | | | | | | | | | | | | |
Series 2009, Ref. Unlimited Tax GO Bonds(b)(d) | | | 5.00 | % | | | 10/01/2019 | | | | 970 | | | | 988,624 | |
Series 2009, Ref. Unlimited Tax GO Bonds(d) | | | 5.00 | % | | | 10/01/2019 | | | | 625 | | | | 637,000 | |
Series 2009, Ref. Unlimited Tax GO Bonds | | | 5.00 | % | | | 10/01/2019 | | | | 375 | | | | 382,069 | |
Series 2009, Ref. Unlimited Tax GO Bonds | | | 5.00 | % | | | 10/01/2021 | | | | 510 | | | | 519,761 | |
| | | | | | | | | | | | | | | | 180,679,792 | |
| | | | |
Indiana–2.27% | | | | | | | | | | | | | | | | |
| | | | |
Clark-Pleasant Middle School Building Corp.; Series 2009, First Mortgage RB(b)(d) | | | 5.00 | % | | | 07/15/2019 | | | | 1,000 | | | | 1,012,630 | |
Egypt Government International Bond; | | | | | | | | | | | | | | | | |
Series 2016, IDR | | | 5.00 | % | | | 07/01/2024 | | | | 1,000 | | | | 1,141,910 | |
Series 2016, IDR | | | 5.00 | % | | | 07/01/2025 | | | | 880 | | | | 1,023,176 | |
Indiana (State of) Finance Authority; Series 2016C, Ref. Highway RB | | | 5.00 | % | | | 12/01/2025 | | | | 7,000 | | | | 8,390,690 | |
Indiana (State of) Finance Authority (Parkview Health System Obligated Group); Series 2018 C, Ref. Hospital Floating Rate RB (SIFMA Municipal Swap Index + 0.55%)(b)(c) | | | 2.29 | % | | | 11/01/2023 | | | | 5,000 | | | | 5,001,950 | |
Indiana (State of) Finance Authority (Sisters of St. Francis Health Services, Inc. Obligated Group); Series 2008 J, Ref. VRD Health System RB (LOC—Barclays Bank PLC)(g)(i) | | | 1.55 | % | | | 03/05/2019 | | | | 1,000 | | | | 1,000,000 | |
Indiana (State of) Municipal Power Agency; | | | | | | | | | | | | | | | | |
Series 2011 A, Power Supply System RB | | | 5.00 | % | | | 01/01/2021 | | | | 250 | | | | 264,618 | |
Series 2011 A, Power Supply System RB(b)(d) | | | 5.00 | % | | | 07/01/2021 | | | | 250 | | | | 269,318 | |
Indiana Bond Bank; Series 2007B-1, Special Program Gas Floating Rate RB (3 mo. USD LIBOR + 0.97%)(c) | | | 2.84 | % | | | 10/15/2022 | | | | 2,875 | | | | 2,875,345 | |
Indianapolis (City of) Department of Public Utilities; Series 2018 A, Ref. First Lien RB | | | 5.00 | % | | | 10/01/2025 | | | | 1,350 | | | | 1,607,337 | |
Northern Indiana (State of) Commuter Transportation District; Series 2016, IDR | | | 5.00 | % | | | 07/01/2026 | | | | 450 | | | | 531,283 | |
Purdue University; Series 2016CC, Ref. RB | | | 5.00 | % | | | 07/01/2023 | | | | 3,115 | | | | 3,547,175 | |
University of Southern Indiana; Series 2009 J, Student Fee RB(b)(d) | | | 5.00 | % | | | 10/01/2019 | | | | 400 | | | | 407,796 | |
Whiting (City of) (BP Products North America); Series 2008, Environmental Facilities RB(b) | | | 1.85 | % | | | 10/01/2019 | | | | 20,000 | | | | 19,981,800 | |
| | | | | | | | | | | | | | | | 47,055,028 | |
| | | | |
Iowa–0.64% | | | | | | | | | | | | | | | | |
| | | | |
Ames (City of) (Mary Greeley Medical Center); Series 2011, Hospital RB(b)(d) | | | 5.38 | % | | | 06/15/2020 | | | | 1,825 | | | | 1,909,078 | |
Iowa (State of) Finance Authority (Iowa Health System); Series 2018, Ref. Floating Rate RB (SIFMA Municipal Swap Index + 0.58%)(b)(c)(e) | | | 2.32 | % | | | 01/04/2024 | | | | 6,210 | | | | 6,210,124 | |
Iowa Student Loan Liquidity Corp.; | | | | | | | | | | | | | | | | |
Series 2009 2, RB | | | 5.40 | % | | | 12/01/2023 | | | | 2,500 | | | | 2,560,375 | |
Series 2009 3, RB | | | 5.00 | % | | | 12/01/2019 | | | | 2,500 | | | | 2,555,050 | |
| | | | | | | | | | | | | | | | 13,234,627 | |
| | | | |
Kansas–0.66% | | | | | | | | | | | | | | | | |
| | | | |
Dodge City (City of); Series 2009, Sales Tax RB(b)(d) | | | 5.00 | % | | | 06/01/2019 | | | | 1,000 | | | | 1,008,280 | |
Kansas (State of) Development Finance Authority; | | | | | | | | | | | | | | | | |
Series 2015 G, RB | | | 5.00 | % | | | 04/01/2027 | | | | 5,000 | | | | 5,545,400 | |
Series 2015 G, RB | | | 5.00 | % | | | 04/01/2028 | | | | 5,000 | | | | 5,539,250 | |
Kansas (State of) Development Finance Authority (University of Kansas Health System); Series 2011 H, Health Facilities RB | | | 5.00 | % | | | 03/01/2024 | | | | 500 | | | | 515,505 | |
See accompanying Notes to Financial Statements which are an integral part of the financial statements.
16 Invesco Limited Term Municipal Income Fund
| | | | | | | | | | | | | | | | |
| | | Interest
Rate | | | Maturity Date | | | Principal
Amount
(000) | | | Value | |
Kansas–(continued) | | | | | | | | | | | | | | | | |
| | | | |
Wyandotte (County of) & Kansas City (City of) Unified Government; Series 2014 A, Ref. & Improvement Utility System RB | | | 5.00 | % | | | 09/01/2021 | | | $ | 1,000 | | | $ | 1,078,180 | |
| | | | | | | | | | | | | | | | 13,686,615 | |
| | | | |
Kentucky–3.73% | | | | | | | | | | | | | | | | |
| | | | |
Kentucky (State of) Economic Development Finance Authority (Catholic Health Initiatives); | | | | | | | | | | | | | | | | |
Series 2011 B, Floating Rate RB (SIFMA Municipal Swap Index + 1.40%)(b)(c) | | | 3.14 | % | | | 02/01/2025 | | | | 2,340 | | | | 2,377,463 | |
Kentucky (State of) Economic Development Finance Authority (Next Generation Kentucky Information Highway); | | | | | | | | | | | | | | | | |
Series 2015 A, Sr. RB | | | 5.00 | % | | | 07/01/2025 | | | | 1,635 | | | | 1,842,073 | |
Series 2015, Sr. RB | | | 5.00 | % | | | 07/01/2022 | | | | 850 | | | | 915,926 | |
Kentucky (State of) Municipal Power Agency; | | | | | | | | | | | | | | | | |
Series 2015 A, Ref. Power System RB(INS-NATL)(a) | | | 5.00 | % | | | 09/01/2026 | | | | 2,000 | | | | 2,320,380 | |
Series 2015 A, Ref. Power System RB(INS-NATL)(a) | | | 5.00 | % | | | 09/01/2027 | | | | 3,380 | | | | 3,910,423 | |
Series 2015 A, Ref. Power System RB(INS-NATL)(a) | | | 5.00 | % | | | 09/01/2028 | | | | 2,870 | | | | 3,314,764 | |
Kentucky (State of) Municipal Power Agency (Prairie State); | | | | | | | | | | | | | | | | |
Series 2010 A, Power System RB(INS-AGM)(a) | | | 5.00 | % | | | 09/01/2021 | | | | 5,860 | | | | 6,126,161 | |
Series 2010 A, Power System RB(INS-AGM)(a) | | | 5.00 | % | | | 09/01/2022 | | | | 4,560 | | | | 4,766,431 | |
Series 2010 A, Power System RB(INS-AGM)(a) | | | 5.00 | % | | | 09/01/2023 | | | | 1,000 | | | | 1,044,820 | |
Kentucky (State of) Property & Building Commission (No. 108); Series 2015 A, Ref. RB | | | 5.00 | % | | | 08/01/2029 | | | | 4,000 | | | | 4,524,840 | |
Kentucky (State of) Property & Building Commission (No. 112); Series 2016 B, Ref. RB | | | 5.00 | % | | | 11/01/2026 | | | | 14,290 | | | | 16,695,579 | |
Kentucky (State of) Public Energy Authority; Series 2018 B, Gas Supply RB(b) | | | 4.00 | % | | | 01/01/2025 | | | | 5,000 | | | | 5,368,350 | |
Kentucky (State of) Turnpike Authority (Revitalization); Series 2017 B, Economic Development Road RB | | | 4.00 | % | | | 07/01/2026 | | | | 3,750 | | | | 4,167,975 | |
Louisville & Jefferson (Counties of) Kentucky Metropolitan Government (Louisville Gas & Electric Co.); | | | | | | | | | | | | | | | | |
Series 2005 A, PCR(b) | | | 2.20 | % | | | 08/01/2019 | | | | 3,000 | | | | 3,002,760 | |
Louisville & Jefferson (Counties of) Kentucky Metropolitan Sewer District; Series 2009 B, Sewer & Drainage System RB(b)(d) | | | 5.00 | % | | | 11/15/2019 | | | | 5,890 | | | | 6,030,241 | |
Louisville & Jefferson (Counties of), Kentucky Metropolitan Sewer District; | | | | | | | | | | | | | | | | |
Series 2009 B, Sewer & Drainage System RB | | | 5.00 | % | | | 05/15/2020 | | | | 4,110 | | | | 4,207,572 | |
Series 2017 A, Sewer & Drainage System RB | | | 5.00 | % | | | 05/15/2025 | | | | 4,025 | | | | 4,753,646 | |
Paducah (City of) Electric Plant Board; Series 2009 A, RB(b)(d) | | | 5.00 | % | | | 04/01/2019 | | | | 2,000 | | | | 2,005,180 | |
| | | | | | | | | | | | | | | | 77,374,584 | |
| | | | |
Louisiana–3.79% | | | | | | | | | | | | | | | | |
| | | | |
East Baton Rouge (Parish of) Industrial Development Board (ExxonMobil); Series 2010 A, VRD Gulf Opportunity Zone RB(g) | | | 1.56 | % | | | 08/01/2035 | | | | 700 | | | | 700,000 | |
Jefferson (Parish of) Hospital Service District No. 1 (West Jefferson Medical Center); Series 1998 B, Hospital RB(b)(d) | | | 5.25 | % | | | 01/01/2020 | | | | 1,000 | | | | 1,049,510 | |
Louisiana (State of); | | | | | | | | | | | | | | | | |
Series 2016 B, Ref. Unlimited Tax GO Bonds | | | 5.00 | % | | | 08/01/2025 | | | | 10,000 | | | | 11,820,700 | |
Series C, Ref. GO Bonds | | | 5.00 | % | | | 08/01/2025 | | | | 2,400 | | | | 2,771,400 | |
Louisiana (State of) Local Government Environmental Facilities & Community Development Authority (Louisiana Community & Technical College System Facilities Corp.); Series 2009 B, RB(b)(d) | | | 5.00 | % | | | 10/01/2019 | | | | 1,500 | | | | 1,529,235 | |
Louisiana (State of) Local Government Environmental Facilities & Community Development Authority (Monroe Regional Airport Terminal); Series 2009, Airport RB(b)(d) | | | 5.00 | % | | | 02/01/2020 | | | | 1,000 | | | | 1,030,520 | |
Louisiana (State of) Local Government Environmental Facilities & Community Development Authority (Westlake Chemical Corp.); Series 2009 A, RB | | | 6.50 | % | | | 08/01/2029 | | | | 8,980 | | | | 9,497,697 | |
Louisiana (State of) Public Facilities Authority (CHRISTUS Health); Series 2009 A, Ref. RB(d) | | | 5.25 | % | | | 07/01/2020 | | | | 1,000 | | | | 1,044,000 | |
Louisiana (State of) Public Facilities Authority (Louisiana Children’s Medical Center); Series 2015A-2, Hospital RB(b) | | | 5.00 | % | | | 06/01/2025 | | | | 5,000 | | | | 5,792,350 | |
Louisiana Citizens Property Insurance Corp.; Series 2015, Ref. RB(INS-AGM)(a) | | | 5.00 | % | | | 06/01/2022 | | | | 14,575 | | | | 16,013,844 | |
Louisiana State University & Agricultural & Mechanical College Board of Supervisors; Series 2016 A, Ref. Auxiliary RB | | | 5.00 | % | | | 07/01/2023 | | | | 3,250 | | | | 3,658,882 | |
See accompanying Notes to Financial Statements which are an integral part of the financial statements.
17 Invesco Limited Term Municipal Income Fund
| | | | | | | | | | | | | | | | |
| | | Interest
Rate | | | Maturity Date | | | Principal
Amount
(000) | | | Value | |
Louisiana–(continued) | | | | | | | | | | | | | | | | |
| | | | |
New Orleans (City of); | | | | | | | | | | | | | | | | |
Series 2009, Ref. Sewerage Service RB(b)(d) | | | 6.25 | % | | | 06/01/2019 | | | $ | 1,000 | | | $ | 1,011,280 | |
Series 2014, Ref. Sewerage Service RB | | | 5.00 | % | | | 06/01/2019 | | | | 700 | | | | 705,523 | |
Series 2014, Ref. Water RB | | | 5.00 | % | | | 12/01/2019 | | | | 1,000 | | | | 1,023,820 | |
Series 2015, Ref. Unlimited Tax GO Bonds | | | 5.00 | % | | | 12/01/2022 | | | | 500 | | | | 556,535 | |
Series 2015, Ref. Unlimited Tax GO Bonds | | | 5.00 | % | | | 12/01/2023 | | | | 500 | | | | 568,825 | |
Series 2015, Ref. Unlimited Tax GO Bonds | | | 5.00 | % | | | 12/01/2024 | | | | 1,000 | | | | 1,162,430 | |
Series 2015, Sewerage Service RB | | | 5.00 | % | | | 06/01/2023 | | | | 700 | | | | 780,535 | |
Series 2015, Sewerage Service RB | | | 5.00 | % | | | 06/01/2024 | | | | 400 | | | | 454,344 | |
Series 2015, Sewerage Service RB | | | 5.00 | % | | | 06/01/2025 | | | | 500 | | | | 578,290 | |
Series 2015, Sewerage Service RB | | | 5.00 | % | | | 06/01/2026 | | | | 250 | | | | 287,733 | |
Series 2015, Sewerage Service RB | | | 5.00 | % | | | 06/01/2027 | | | | 350 | | | | 400,642 | |
Series 2015, Water System RB | | | 5.00 | % | | | 12/01/2023 | | | | 600 | | | | 673,902 | |
Series 2015, Water System RB | | | 5.00 | % | | | 12/01/2024 | | | | 750 | | | | 856,943 | |
Series 2015, Water System RB | | | 5.00 | % | | | 12/01/2025 | | | | 825 | | | | 958,237 | |
Series 2015, Water System RB | | | 5.00 | % | | | 12/01/2026 | | | | 500 | | | | 577,380 | |
Series 2015, Water System RB | | | 5.00 | % | | | 12/01/2027 | | | | 750 | | | | 861,555 | |
New Orleans (City of) Aviation Board (Parking Facilities Corp. Consolidated Garage System); | | | | | | | | | | | | | | | | |
Series 2018 B, Ref. RB(INS-AGM)(a) | | | 5.00 | % | | | 10/01/2026 | | | | 200 | | | | 235,898 | |
St. Charles (Parish of) (Valero Energy Corp.); Series 2010, Gulf Opportunity Zone RB(b) | | | 4.00 | % | | | 06/01/2022 | | | | 2,865 | | | | 2,979,743 | |
Terrebonne (Parish of) Hospital Service District No. 1 (Terrebonne General Medical Center); | | | | | | | | | | | | | | | | |
Series 2010, Ref. RB | | | 4.00 | % | | | 04/01/2020 | | | | 1,000 | | | | 1,022,120 | |
Tobacco Settlement Financing Corp.; | | | | | | | | | | | | | | | | |
Series 2013 A, Ref. Asset-Backed RB | | | 5.00 | % | | | 05/15/2019 | | | | 2,540 | | | | 2,554,148 | |
Series 2013 A, Ref. Asset-Backed RB | | | 5.00 | % | | | 05/15/2022 | | | | 5,000 | | | | 5,400,850 | |
| | | | | | | | | | | | | | | | 78,558,871 | |
| | | | |
Maine–0.12% | | | | | | | | | | | | | | | | |
| | | | |
Lewiston (City of) (UBS Financial Services, Inc.); | | | | | | | | | | | | | | | | |
Series 2008 B, Unlimited Tax GO School Bonds(INS-AGM)(a) | | | 5.00 | % | | | 12/15/2019 | | | | 750 | | | | 752,220 | |
Series 2008 B, Unlimited Tax GO School Bonds(INS-AGM)(a) | | | 5.00 | % | | | 12/15/2020 | | | | 870 | | | | 872,462 | |
Series 2008 B, Unlimited Tax GO School Bonds(INS-AGM)(a) | | | 5.50 | % | | | 12/15/2023 | | | | 950 | | | | 952,936 | |
| | | | | | | | | | | | | | | | 2,577,618 | |
| | | | |
Maryland–0.82% | | | | | | | | | | | | | | | | |
| | | | |
Maryland (State of); | | | | | | | | | | | | | | | | |
Series 2014 B, State and Local Facilities GO Bonds | | | 5.00 | % | | | 08/01/2021 | | | | 5,000 | | | | 5,397,850 | |
Series 2017 C, Ref. Unlimited Tax GO Bonds | | | 5.00 | % | | | 08/01/2024 | | | | 10,000 | | | | 11,676,100 | |
| | | | | | | | | | | | | | | | 17,073,950 | |
| | | | |
Massachusetts–1.87% | | | | | | | | | | | | | | | | |
| | | | |
Massachusetts (State of) Department of Transportation (Contract Assistance); Series 2019 A, Metropolitan Highway Systems RB(b) | | | 5.00 | % | | | 01/01/2023 | | | | 4,750 | | | | 5,300,240 | |
Massachusetts (State of) Development Finance Agency; | | | | | | | | | | | | | | | | |
Series 2019 A, Ref. RB | | | 5.00 | % | | | 07/01/2025 | | | | 845 | | | | 971,184 | |
Series 2019 A, Ref. RB | | | 5.00 | % | | | 07/01/2027 | | | | 2,300 | | | | 2,692,150 | |
Massachusetts (State of) Development Finance Agency (Caregroup); Series 2017S-5, RB(b)(c) | | | 2.16 | % | | | 01/27/2022 | | | | 300 | | | | 298,845 | |
Massachusetts (State of) Development Finance Agency (Harvard University); | | | | | | | | | | | | | | | | |
Series 2016 A, Ref. RB | | | 5.00 | % | | | 07/15/2024 | | | | 4,735 | | | | 5,554,960 | |
Series 2017S-4, Ref. RB(b) | | | 5.00 | % | | | 01/25/2024 | | | | 15,000 | | | | 17,090,400 | |
Massachusetts (State of) Development Finance Agency (International Charter School); | | | | | | | | | | | | | | | | |
Series 2015, Ref. RB | | | 4.00 | % | | | 04/15/2020 | | | | 115 | | | | 115,938 | |
Series 2015, Ref. RB | | | 5.00 | % | | | 04/15/2025 | | | | 1,750 | | | | 1,891,733 | |
Massachusetts (State of) Development Finance Agency (Lesley University); Series 2009 A, RB(b)(d) | | | 5.00 | % | | | 07/01/2019 | | | | 1,095 | | | | 1,107,352 | |
See accompanying Notes to Financial Statements which are an integral part of the financial statements.
18 Invesco Limited Term Municipal Income Fund
| | | | | | | | | | | | | | | | |
| | | Interest
Rate | | | Maturity
Date | | | Principal
Amount
(000) | | |
Value | |
| Massachusetts-(continued) | | | | | | | | | | | | | | | | |
| | | | |
Massachusetts (State of) Development Finance Agency (Suffolk University); | | | | | | | | | | | | | | | | |
Series 2009, Ref. RB(b)(d) | | | 6.00 | % | | | 07/01/2019 | | | $ | 940 | | | $ | 953,630 | |
Series 2009, Ref. RB | | | 6.00 | % | | | 07/01/2024 | | | | 560 | | | | 567,935 | |
Series 2017, Ref. RB | | | 5.00 | % | | | 07/01/2024 | | | | 1,000 | | | | 1,133,840 | |
University of Massachusetts Building Authority; Series2015-2, Ref. RB | | | 5.00 | % | | | 11/01/2023 | | | | 975 | | | | 1,118,432 | |
| | | | | | | | | | | | | | | | 38,796,639 | |
| | | | |
| Michigan-3.39% | | | | | | | | | | | | | | | | |
| | | | |
Great Lakes Water Authority; Series 2018 A, Ref. Second Lien Water Supply System RB | | | 5.00 | % | | | 07/01/2024 | | | | 2,425 | | | | 2,791,539 | |
Michigan (State of); | | | | | | | | | | | | | | | | |
Series 2009, Ref. & State Trunk Line Fund RB | | | 5.00 | % | | | 11/01/2019 | | | | 3,000 | | | | 3,066,660 | |
Series 2009, Ref. & State Trunk Line Fund RB | | | 5.00 | % | | | 11/01/2023 | | | | 1,500 | | | | 1,532,640 | |
Michigan (State of) Building Authority (Facilities Program); | | | | | | | | | | | | | | | | |
Series 2009 I, Ref. RB(INS-AGC)(a) | | | 5.00 | % | | | 10/15/2023 | | | | 7,150 | | | | 7,291,141 | |
Series 2009 I, Ref. RB(INS-AGC)(a) | | | 5.25 | % | | | 10/15/2024 | | | | 1,040 | | | | 1,061,788 | |
Series 2009 II, RB(INS-AGM)(a) | | | 5.00 | % | | | 10/15/2021 | | | | 1,180 | | | | 1,204,025 | |
Series 2009 II, RB(INS-AGM)(a) | | | 5.00 | % | | | 10/15/2022 | | | | 520 | | | | 530,426 | |
Michigan (State of) Finance Authority (Detroit Water & Sewerage Department); | | | | | | | | | | | | | | | | |
Series 2014D-1, Ref. Local Government Loan Program RB(INS-AGM)(a) | | | 5.00 | % | | | 07/01/2020 | | | | 3,500 | | | | 3,642,135 | |
Series 2014D-1, Ref. Local Government Loan Program RB(INS-AGM)(a) | | | 5.00 | % | | | 07/01/2021 | | | | 4,000 | | | | 4,279,040 | |
Series 2014D-1, Ref. Local Government Loan Program RB(INS-AGM)(a) | | | 5.00 | % | | | 07/01/2022 | | | | 10,000 | | | | 11,028,400 | |
Michigan (State of) Finance Authority (Local Government Loan Program); Series 2014, Ref. RB | | | 3.88 | % | | | 10/01/2023 | | | | 2,000 | | | | 2,091,120 | |
Michigan (State of) Finance Authority (Mclaren Health Care); | | | | | | | | | | | | | | | | |
Series 2015D-1, Ref. Hospital Floating Rate RB (1 mo. USD LIBOR + 0.40%)(b)(c) | | | 2.10 | % | | | 10/15/2021 | | | | 7,255 | | | | 7,250,211 | |
Series 2015D-2, Ref. Hospital Floating Rate RB (1 mo. USD LIBOR + 0.75%)(b)(c) | | | 2.45 | % | | | 10/15/2020 | | | | 10,000 | | | | 10,041,500 | |
Michigan (State of) Finance Authority (Trinity Health); Series 2015, Hospital Floating Rate RB (1 mo. USD LIBOR + 0.54%)(b)(c) | | | 2.21 | % | | | 12/01/2020 | | | | 10,000 | | | | 10,015,700 | |
Michigan (State of) Hospital Finance Authority (Henry Ford Health System); Series 2009, Ref. RB(d) | | | 5.00 | % | | | 11/15/2019 | | | | 1,500 | | | | 1,534,650 | |
Michigan (State of) Municipal Bond Authority (Local Government Loan Program); | | | | | | | | | | | | | | | | |
Series 2009 A, City of Grand Rapids Downtown Development RB(b)(d) | | | 5.00 | % | | | 05/01/2019 | | | | 1,515 | | | | 1,523,272 | |
Series 2009 A, City of Grand Rapids Downtown Development RB(b)(d) | | | 5.13 | % | | | 05/01/2019 | | | | 300 | | | | 301,695 | |
Series 2009 A, City of Grand Rapids Downtown Development RB(b)(d) | | | 5.25 | % | | | 05/01/2019 | | | | 500 | | | | 502,925 | |
Royal Oak (City of) Hospital Finance Authority (William Beaumont Hospital Obligated Group); | | | | | | | | | | | | | | | | |
Series 2009 W, Ref. RB(d) | | | 5.50 | % | | | 08/01/2019 | | | | 490 | | | | 497,595 | |
| | | | | | | | | | | | | | | | 70,186,462 | |
| | | | |
| Minnesota-0.89% | | | | | | | | | | | | | | | | |
| | | | |
Maple Grove (City of) (Maple Grove Hospital Corp.); | | | | | | | | | | | | | | | | |
Series 2017, Ref. Health Care Facilities RB | | | 5.00 | % | | | 05/01/2023 | | | | 500 | | | | 557,395 | |
Series 2017, Ref. Health Care Facilities RB | | | 5.00 | % | | | 05/01/2024 | | | | 1,200 | | | | 1,366,596 | |
Series 2017, Ref. Health Care Facilities RB | | | 5.00 | % | | | 05/01/2025 | | | | 800 | | | | 926,936 | |
Minneapolis & St. Paul (Cities of) Housing & Redevelopment Authority (Allina Health System); | | | | | | | | | | | | | | | | |
Series 2017 A, Ref. Health Care System RB | | | 5.00 | % | | | 11/15/2024 | | | | 1,780 | | | | 2,073,558 | |
Minneapolis & St. Paul (Cities of) Housing & Redevelopment Authority (Children’s Health Care); | | | | | | | | | | | | | | | | |
Series 1995 B, Health Care RB(INS-AGM)(a) | | | 5.00 | % | | | 08/15/2019 | | | | 1,400 | | | | 1,418,774 | |
Series 1995 B, Health Care RB(INS-AGM)(a) | | | 5.00 | % | | | 08/15/2021 | | | | 1,350 | | | | 1,412,680 | |
Series 2010 A, Health Care Facilities RB | | | 5.00 | % | | | 08/15/2020 | | | | 730 | | | | 763,967 | |
See accompanying Notes to Financial Statements which are an integral part of the financial statements.
19 Invesco Limited Term Municipal Income Fund
| | | | | | | | | | | | | | | | |
| | | Interest
Rate | | | Maturity
Date | | | Principal
Amount
(000) | | |
Value | |
| Minnesota–(continued) | | | | | | | | | | | | | | | | |
| | | | |
Minneapolis & St. Paul (Cities of) Metropolitan Airports Commission; | | | | | | | | | | | | | | | | |
Series 2009 A, Ref. Sr. RB | | | 5.00 | % | | | 01/01/2020 | | | $ | 1,000 | | | $ | 1,002,580 | |
Series 2011, Ref. RB | | | 5.00 | % | | | 01/01/2020 | | | | 1,500 | | | | 1,541,595 | |
Series 2011, Ref. RB | | | 5.00 | % | | | 01/01/2021 | | | | 1,240 | | | | 1,314,350 | |
Series 2016 B, Ref. Sub. RB | | | 5.00 | % | | | 01/01/2023 | | | | 1,000 | | | | 1,119,380 | |
Series 2016 C, Sr. Airport RB | | | 4.00 | % | | | 01/01/2021 | | | | 175 | | | | 182,361 | |
Series 2016 C, Sr. Airport RB | | | 5.00 | % | | | 01/01/2022 | | | | 250 | | | | 272,792 | |
Series 2016 C, Sr. Airport RB | | | 5.00 | % | | | 01/01/2023 | | | | 225 | | | | 252,304 | |
Series 2016 C, Sr. Airport RB | | | 5.00 | % | | | 01/01/2024 | | | | 200 | | | | 229,434 | |
Minnesota (State of) Agricultural & Economic Development Board (Essentia Health Obligated Group); | | | | | | | | | | | | | | | | |
Series 2008C-1, Health Care Facilities RB(INS-AGC)(a) | | | 4.00 | % | | | 02/15/2020 | | | | 1,500 | | | | 1,533,840 | |
Series 2008C-1, Health Care Facilities RB(INS-AGC)(a) | | | 5.00 | % | | | 02/15/2021 | | | | 1,500 | | | | 1,546,440 | |
Minnesota (State of) Higher Education Facilities Authority (University of St. Thomas); Series 2009Seven-A, RB(b)(d) | | | 4.50 | % | | | 10/01/2019 | | | | 1,000 | | | | 1,016,350 | |
| | | | | | | | | | | | | | | | 18,531,332 | |
| | | | |
| Mississippi–0.94% | | | | | | | | | | | | | | | | |
| | | | |
Alcorn State University Educational Building Corp. (Student Housing); Series 2009 A, RB(b)(d) | | | 4.63 | % | | | 09/01/2019 | | | | 1,695 | | | | 1,720,679 | |
Mississippi (State of) Development Bank (Jackson County Limited Tax Note); Series 2009, Special Obligation RB(INS-AGC)(a) | | | 5.00 | % | | | 07/01/2024 | | | | 1,000 | | | | 1,010,290 | |
Mississippi Business Finance Corp. (Chevron U.S.A. Inc.); Series 2009 A, VRD Gulf Opportunity Zone IDR (g) | | | 1.60 | % | | | 12/01/2030 | | | | 725 | | | | 725,000 | |
Mississippi Business Finance Corp.(Chevron U.S.A., Inc.); Series 2010 I, VRD Gulf Opportunity Zone IDR (g) | | | 1.60 | % | | | 11/01/2035 | | | | 16,000 | | | | 16,000,000 | |
| | | | | | | | | | | | | | | | 19,455,969 | |
| | | | |
| Missouri–1.12% | | | | | | | | | | | | | | | | |
| | | | |
Kansas City (City of); | | | | | | | | | | | | | | | | |
Series 2010 B, Ref. Special Obligation RB | | | 4.13 | % | | | 01/01/2021 | | | | 2,000 | | | | 2,037,860 | |
Series 2017 C, Ref. Special Obligation RB | | | 5.00 | % | | | 09/01/2023 | | | | 1,500 | | | | 1,695,735 | |
Series 2017 C, Ref. Special Obligation RB | | | 5.00 | % | | | 09/01/2024 | | | | 2,675 | | | | 3,082,162 | |
Missouri (State of) Health & Educational Facilities Authority (Lutheran Senior Service); Series B, RB(b) | | | 2.88 | % | | | 02/01/2022 | | | | 3,600 | | | | 3,606,372 | |
Missouri (State of) Health & Educational Facilities Authority (SSM Health Care); | | | | | | | | | | | | | | | | |
Series 2010 B, Health Facilities RB(d) | | | 5.00 | % | | | 06/01/2019 | | | | 1,000 | | | | 1,008,160 | |
Series 2010 B, Health Facilities RB(b)(d) | | | 5.00 | % | | | 06/01/2020 | | | | 4,645 | | | | 4,834,191 | |
Missouri (State of) Health & Educational Facilities Authority (St. Luke’s Health System, Inc.); | | | | | | | | | | | | | | | | |
Series 2010 A, RB | | | 5.00 | % | | | 11/15/2020 | | | | 1,000 | | | | 1,057,550 | |
Missouri (State of) Joint Municipal Electric Utility Commission (Prairie Street); | | | | | | | | | | | | | | | | |
Series 2015 A, Ref. Power Project RB | | | 5.00 | % | | | 06/01/2027 | | | | 2,600 | | | | 3,026,842 | |
Series 2015 A, Ref. Power Project RB | | | 5.00 | % | | | 12/01/2027 | | | | 1,140 | | | | 1,324,976 | |
St. Louis (County of) Industrial Development Authority (Friendship Village of Sunset Hills); | | | | | | | | | | | | | | | | |
Series 2013 A, Senior Living Facilities RB | | | 5.00 | % | | | 09/01/2023 | | | | 1,385 | | | | 1,439,140 | |
| | | | | | | | | | | | | | | | 23,112,988 | |
| | | | |
| Montana–0.05% | | | | | | | | | | | | | | | | |
| | | | |
Montana (State of) Facility Finance Authority (Sisters of Charity of Leavenworth Health System); | | | | | | | | | | | | | | | | |
Series 2010 B, Ref. RB | | | 4.00 | % | | | 01/01/2020 | | | | 1,000 | | | | 1,018,910 | |
| | | | |
| Nebraska–0.07% | | | | | | | | | | | | | | | | |
| | | | |
Lincoln (City of); Series 2012, Ref. Electric System RB | | | 5.00 | % | | | 09/01/2023 | | | | 1,250 | | | | 1,389,613 | |
See accompanying Notes to Financial Statements which are an integral part of the financial statements.
20 Invesco Limited Term Municipal Income Fund
| | | | | | | | | | | | | | | | |
| | | Interest
Rate | | | Maturity Date | | | Principal
Amount
(000) | | | Value | |
| Nevada-0.72% | | | | | | | | | | | | | | | | |
| | | | |
Clark (County of); | | | | | | | | | | | | | | | | |
Series 2009 C, Sub. Lien Airport System RB(INS-AGM)(a) | | | 5.00 | % | | | 07/01/2022 | | | $ | 1,000 | | | $ | 1,011,510 | |
Series 2009 C, Sub. Lien Airport System RB(INS-AGM)(a) | | | 5.00 | % | | | 07/01/2023 | | | | 4,000 | | | | 4,045,120 | |
Series 2009 C, Sub. Lien Airport System RB(INS-AGM)(a) | | | 5.00 | % | | | 07/01/2024 | | | | 1,855 | | | | 1,875,498 | |
Series 2009 C, Sub. Lien Airport System RB(INS-AGM)(a) | | | 5.00 | % | | | 07/01/2025 | | | | 1,500 | | | | 1,516,230 | |
Clark (County of) (Las Vegas-McCarran International Airport); Series 2015, Ref. Passenger Facility Charge RB | | | 5.00 | % | | | 07/01/2022 | | | | 2,000 | | | | 2,207,040 | |
Humboldt (County of) (Idaho Power Co.); Series 2003, Ref. PCR | | | 5.15 | % | | | 12/01/2024 | | | | 4,100 | | | | 4,163,304 | |
| | | | | | | | | | | | | | | | 14,818,702 | |
| | | | |
| New Hampshire-0.07% | | | | | | | | | | | | | | | | |
| | | | |
New Hampshire (State of) Health & Education Facilities Authority (Concord Hospital); | | | | | | | | | | | | | | | | |
Series 2011, RB | | | 5.25 | % | | | 10/01/2025 | | | | 525 | | | | 565,015 | |
Series 2011, RB | | | 5.50 | % | | | 10/01/2026 | | | | 510 | | | | 551,514 | |
New Hampshire (State of) Housing Finance Authority; Series 2009 A, Single Family Mortgage Acquisition RB | | | 5.13 | % | | | 07/01/2029 | | | | 430 | | | | 433,208 | |
| | | | | | | | | | | | | | | | 1,549,737 | |
| | | | |
| New Jersey-5.51% | | | | | | | | | | | | | | | | |
| | | | |
New Jersey (State of) Economic Development Authority; | | | | | | | | | | | | | | | | |
Series 2005N-1, Ref. School Facilities Construction RB(INS-NATL)(a) | | | 5.50 | % | | | 09/01/2022 | | | | 5,000 | | | | 5,522,850 | |
Series 2012, Ref. RB | | | 5.00 | % | | | 06/15/2019 | | | | 1,000 | | | | 1,007,940 | |
Series 2012, Ref. RB | | | 5.00 | % | | | 06/15/2022 | | | | 1,500 | | | | 1,623,840 | |
Series 2017 A, Ref. Motor Vehicle Surcharge Sub. RB(INS-BAM)(a) | | | 5.00 | % | | | 07/01/2027 | | | | 8,200 | | | | 9,538,322 | |
Series 2017 A, Ref. Motor Vehicle Surcharge Sub. RB(INS-BAM)(a) | | | 5.00 | % | | | 07/01/2028 | | | | 5,005 | | | | 5,774,519 | |
New Jersey (State of) Economic Development Authority (Provident Group-Montclair Properties LLC- Montclair State University Student Housing); | | | | | | | | | | | | | | | | |
Series 2010 A, RB(b)(d) | | | 5.00 | % | | | 06/01/2020 | | | | 1,500 | | | | 1,562,985 | |
Series 2010 A, RB | | | 5.25 | % | | | 06/01/2020 | | | | 1,295 | | | | 1,337,903 | |
New Jersey (State of) Transportation Trust Fund Authority; Series 2005 B, Transportation System RB(INS-AGC)(a) | | | 5.50 | % | | | 12/15/2021 | | | | 6,000 | | | | 6,534,240 | |
Series 2006A, Transportation System RB (INS - AGM)(a) | | | 5.25 | % | | | 12/15/2021 | | | | 1,820 | | | | 1,969,841 | |
Series 2010 D, Transportation System RB | | | 5.25 | % | | | 12/15/2023 | | | | 3,305 | | | | 3,709,069 | |
Series 2011 B, Transportation System RB | | | 5.00 | % | | | 06/15/2020 | | | | 1,000 | | | | 1,036,810 | |
Series 2013 AA, Transportation Program RB | | | 5.00 | % | | | 06/15/2021 | | | | 6,000 | | | | 6,365,100 | |
Series 2014, Transportation Program Floating Rate Notes (SIFMA Municipal Swap Index + 1.20%)(b)(c) | | | 2.94 | % | | | 12/15/2021 | | | | 1,000 | | | | 1,008,550 | |
Series 2014, Transportation Program Floating Rate RN (SIFMA Municipal Swap Index + 1.00%)(b)(c) | | | 2.74 | % | | | 12/15/2019 | | | | 2,000 | | | | 2,002,440 | |
Series 2016, Federal Highway Reimbursement Notes | | | 5.00 | % | | | 06/15/2030 | | | | 2,025 | | | | 2,262,168 | |
Series 2018 A, Ref. Federal Highway Reimbursement RN | | | 5.00 | % | | | 06/15/2023 | | | | 8,500 | | | | 9,397,600 | |
Series 2018 A, Ref. Federal Highway Reimbursement RN | | | 5.00 | % | | | 06/15/2030 | | | | 5,000 | | | | 5,585,600 | |
Series 2018 A, Ref. RB | | | 5.00 | % | | | 12/15/2025 | | | | 5,000 | | | | 5,670,350 | |
Subseries 2016A-1, Federal Highway Reimbursement RN | | | 5.00 | % | | | 06/15/2024 | | | | 4,500 | | | | 5,052,960 | |
Transportation System RB | | | 5.00 | % | | | 06/15/2019 | | | | 1,000 | | | | 1,008,930 | |
Transportation System RB | | | 5.00 | % | | | 06/15/2021 | | | | 1,000 | | | | 1,060,850 | |
Transportation System RB | | | 5.00 | % | | | 06/15/2024 | | | | 8,750 | | | | 9,825,200 | |
New Jersey (State of) Turnpike Authority; | | | | | | | | | | | | | | | | |
Series 2005D-4, RB (INS - AGM)(a) | | | 5.25 | % | | | 01/01/2026 | | | | 5,000 | | | | 5,963,450 | |
Series 2009 H, Turnpike RB | | | 5.00 | % | | | 01/01/2020 | | | | 1,325 | | | | 1,328,273 | |
Series 2017C-6, Ref. Turnpike Floating Rate RB (1 mo. USD LIBOR + 0.75%)(b)(c) | | | 2.49 | % | | | 01/01/2023 | | | | 10,000 | | | | 10,106,700 | |
Newark (City of) Housing Authority; | | | | | | | | | | | | | | | | |
Series 2009, City-Secured Police Facility RB(b)(d) | | | 5.00 | % | | | 12/01/2019 | | | | 770 | | | | 789,496 | |
Series 2009, City-Secured Police Facility RB (INS - AGC)(a) | | | 5.00 | % | | | 12/01/2021 | | | | 360 | | | | 367,765 | |
See accompanying Notes to Financial Statements which are an integral part of the financial statements.
21 Invesco Limited Term Municipal Income Fund
| | | | | | | | | | | | | | | | |
| | | Interest
Rate | | | Maturity Date | | | Principal
Amount
(000) | | | Value | |
| New Jersey–(continued) | | | | | | | | | | | | | | | | |
| | | | |
Tobacco Settlement Financing Corp.; | | | | | | | | | | | | | | | | |
Series 2018 A, Ref. RB | | | 5.00 | % | | | 06/01/2023 | | | $ | 3,000 | | | $ | 3,315,240 | |
Series 2018 A, Ref. RB | | | 5.00 | % | | | 06/01/2024 | | | | 2,000 | | | | 2,248,320 | |
Series 2018 A, Ref. RB | | | 5.00 | % | | | 06/01/2025 | | | | 1,000 | | | | 1,141,560 | |
| | | | | | | | | | | | | | | | 114,118,871 | |
| | | | |
| New Mexico–1.46% | | | | | | | | | | | | | | | | |
| | | | |
Albuquerque (City of) & Bernalillo (County of) Water Utility Authority; Series 2015, Ref. & Improvement Sr. Lien Joint Water & Sewer System RB | | | 5.00 | % | | | 07/01/2023 | | | | 5,170 | | | | 5,880,306 | |
New Mexico (State of) Hospital Equipment Loan Council (Haverland Charter Lifestyle Group); Series 2013, First Mortgage RB | | | 4.00 | % | | | 07/01/2022 | | | | 2,275 | | | | 2,316,906 | |
New Mexico (State of) Municipal Energy Acquisition Authority; Subseries 2014 B, Gas Supply Floating Rate RB (1 mo. USD LIBOR + 0.75%)(b)(c) | | | 2.42 | % | | | 08/01/2019 | | | | 22,000 | | | | 22,004,620 | |
| | | | | | | | | | | | | | | | 30,201,832 | |
| | | | |
| New York–8.17% | | | | | | | | | | | | | | | | |
| | | | |
Jefferson Civic Facility Development Corp. (Samaritan Medical Center); | | | | | | | | | | | | | | | | |
Series 2017 A, Ref. RB | | | 5.00 | % | | | 11/01/2023 | | | | 1,185 | | | | 1,302,896 | |
Series 2017 A, Ref. RB | | | 5.00 | % | | | 11/01/2024 | | | | 1,245 | | | | 1,386,258 | |
Long Island (City of) Power Authority; | | | | | | | | | | | | | | | | |
Series 2014 C, Ref. Electric System General Floating Rate RN (1 mo. USD LIBOR + 0.75%)(b)(c) | | | 2.49 | % | | | 10/01/2023 | | | | 5,000 | | | | 5,017,150 | |
Series 2016B, Ref. Electric System RB | | | 5.00 | % | | | 09/01/2024 | | | | 2,485 | | | | 2,904,021 | |
Series 2017, Electric System General RB | | | 5.00 | % | | | 09/01/2025 | | | | 1,000 | | | | 1,190,030 | |
Metropolitan Transportation Authority; | | | | | | | | | | | | | | | | |
Subseries 2002G-1H, Ref. Floating Rate RB (1 mo. USD LIBOR + 0.82%)(b)(c) | | | 2.49 | % | | | 02/01/2022 | | | | 3,615 | | | | 3,641,028 | |
Subseries 2008A-2A, Ref. Dedicated Tax Fund Floating Rate RB (SIFMA Municipal Swap Index + 0.45%)(b)(c) | | | 2.19 | % | | | 06/01/2022 | | | | 14,555 | | | | 14,433,320 | |
Subseries 2012A-2, Transportation Floating Rate RB (SIFMA Municipal Swap Index + 0.58%)(b)(c) | | | 2.32 | % | | | 06/01/2019 | | | | 17,000 | | | | 17,010,030 | |
Subseries 2012G-4, Ref. Floating Rate RB (1 mo. USD LIBOR + 0.55%)(b)(c) | | | 2.22 | % | | | 11/01/2022 | | | | 11,935 | | | | 11,919,962 | |
Subseries 2018C-2, RB | | | 5.00 | % | | | 09/01/2021 | | | | 5,000 | | | | 5,353,900 | |
Subseries 2018D-1, Floating Rate RB (1 mo. USD LIBOR + 0.65%)(b)(c) | | | 2.32 | % | | | 07/01/2021 | | | | 5,000 | | | | 5,009,700 | |
Metropolitan Transportation Authority (Green Bonds); Series 2018 B, Ref. RB | | | 5.00 | % | | | 11/15/2023 | | | | 5,000 | | | | 5,646,700 | |
Nassau (County of) Industrial Development Agency (New York Institute of Technology); Series 2000 A, Ref. Civic Facility RB(d) | | | 5.25 | % | | | 03/01/2019 | | | | 1,585 | | | | 1,585,000 | |
New York (City of); Subseries 2015F-5, VRD Unlimited Tax GO Bonds(g) | | | 1.55 | % | | | 06/01/2044 | | | | 5,700 | | | | 5,700,000 | |
New York (City of) Industrial Development Agency (Yankee Stadium); | | | | | | | | | | | | | | | | |
Series 2006, PILOT RB (INS - FGIC) (CPI Rate + 0.87%)(a)(c) | | | 3.74 | % | | | 03/01/2025 | | | | 1,025 | | | | 1,032,995 | |
Series 2006, PILOT RB (INS - FGIC) (CPI Rate + 0.88%)(a)(c) | | | 3.75 | % | | | 03/01/2026 | | | | 2,725 | | | | 2,735,982 | |
Series 2006, PILOT RB (INS - FGIC) (CPI Rate + 0.89%)(a)(c) | | | 3.76 | % | | | 03/01/2027 | | | | 5,500 | | | | 5,479,265 | |
New York (City of), New York; | | | | | | | | | | | | | | | | |
Series 2012 F, GO Bonds | | | 5.00 | % | | | 08/01/2023 | | | | 9,165 | | | | 10,038,149 | |
Series 2017 C, GO Bonds | | | 5.00 | % | | | 08/01/2024 | | | | 8,050 | | | | 9,376,640 | |
New York (State of) Dormitory Authority (Montefiore Obligated Group); | | | | | | | | | | | | | | | | |
Series 2018 A, Ref. RB | | | 5.00 | % | | | 08/01/2024 | | | | 1,250 | | | | 1,424,837 | |
Series 2018 A, Ref. RB | | | 5.00 | % | | | 08/01/2025 | | | | 3,000 | | | | 3,477,630 | |
New York (State of) Dormitory Authority (Mount Sinai Hospital Obligated Group); Series 2010 A, RB | | | 5.00 | % | | | 07/01/2019 | | | | 500 | | | | 505,325 | |
New York (State of) Dormitory Authority (Mount Sinai School of Medicine of New York University); Series 2009, RB(b)(d) | | | 5.50 | % | | | 07/01/2019 | | | | 2,925 | | | | 2,962,323 | |
New York (State of) Thruway Authority; | | | | | | | | | | | | | | | | |
Series 2018 L, Ref. RB | | | 5.00 | % | | | 01/01/2025 | | | | 780 | | | | 921,344 | |
Series 2018 L, Ref. RB | | | 5.00 | % | | | 01/01/2026 | | | | 1,000 | | | | 1,205,620 | |
New York State Dormitory Authority; Series 2013 A, RB | | | 5.00 | % | | | 02/15/2024 | | | | 5,375 | | | | 6,049,079 | |
New York State Urban Development Corp.; Series 2017 A, Ref. State Personal Income Tax RB | | | 5.00 | % | | | 03/15/2024 | | | | 10,000 | | | | 11,584,000 | |
Niagara Falls (City of) Bridge Commission; Series 1993 A, Toll Bridge System RB(INS-AGC)(a) | | | 4.00 | % | | | 10/01/2019 | | | | 205 | | | | 207,696 | |
See accompanying Notes to Financial Statements which are an integral part of the financial statements.
22 Invesco Limited Term Municipal Income Fund
| | | | | | | | | | | | | | | | |
| | | Interest
Rate | | | Maturity Date | | | Principal
Amount
(000) | | | Value | |
| New York-(continued) | | | | | | | | | | | | | | | | |
| | | | |
Triborough Bridge & Tunnel Authority; Subseries 2016B-4A, Ref. General Floating Rate RB (1 mo.
USD LIBOR + 0.70%)(b)(c) | | | 2.37 | % | | | 02/01/2021 | | | $ | 13,350 | | | $ | 13,467,880 | |
Triborough Bridge & Tunnel Authority (MTA Bridges and Tunnels); | | | | | | | | | | | | | | | | |
Series 2001 B, General RB (SOFR + 0.43%)(b)(c) | | | 2.03 | % | | | 09/26/2019 | | | | 1,890 | | | | 1,891,493 | |
Series 2018 D, General Floating Rate RB (1 mo. USD SOFR + 0.50%)(c) | | | 2.10 | % | | | 10/01/2020 | | | | 3,000 | | | | 3,003,330 | |
TSASC, Inc.; | | | | | | | | | | | | | | | | |
Series 2017 A, Ref. Tobacco Settlement RB | | | 5.00 | % | | | 06/01/2024 | | | | 4,500 | | | | 5,048,415 | |
Series 2017 A, Ref. Tobacco Settlement RB | | | 5.00 | % | | | 06/01/2025 | | | | 5,000 | | | | 5,684,000 | |
Yonkers (City of); | | | | | | | | | | | | | | | | |
Series 2010 A, Unlimited Tax GO Bonds(b)(d) | | | 5.00 | % | | | 11/15/2020 | | | | 500 | | | | 529,295 | |
Series 2010 A, Unlimited Tax GO Bonds(INS-AGM)(a) | | | 5.00 | % | | | 11/15/2020 | | | | 655 | | | | 691,333 | |
| | | | | | | | | | | | | | | | 169,416,626 | |
| | | | |
| North Carolina-1.13% | | | | | | | | | | | | | | | | |
| | | | |
Charlotte (City of) & Mecklenburg (County of) Hospital Authority (Carolinas HealthCare System); | | | | | | | | | | | | | | | | |
Series 2018 E, Ref. Health Care System RB(g) | | | 2.19 | % | | | 12/01/2021 | | | | 5,000 | | | | 4,994,150 | |
North Carolina (State of) Municipal Power Agency #1 (Catawba); | | | | | | | | | | | | | | | | |
Series 2015 A, Ref. Electric RB | | | 5.00 | % | | | 01/01/2028 | | | | 1,615 | | | | 1,898,094 | |
Series 2015 B, Ref. Electric RB | | | 5.00 | % | | | 01/01/2022 | | | | 1,875 | | | | 2,044,856 | |
North Carolina (State of) Turnpike Authority; | | | | | | | | | | | | | | | | |
Series 2017, Ref. Sr. Lien Triangle Expressway System RB (INS - AGM)(a) | | | 5.00 | % | | | 01/01/2024 | | | | 1,150 | | | | 1,301,041 | |
Series 2017, Ref. Sr. Lien Triangle Expressway System RB | | | 5.00 | % | | | 01/01/2025 | | | | 1,500 | | | | 1,710,780 | |
Series 2017, Ref. Sr. Lien Triangle Expressway System RB(INS-AGM)(a) | | | 5.00 | % | | | 01/01/2026 | | | | 1,350 | | | | 1,583,982 | |
University of North Carolina at Chapel Hill; Series 2012, Floating Rate RB (1 mo. USD LIBOR + 0.40%)(b)(c) | | | 2.07 | % | | | 11/09/2022 | | | | 10,000 | | | | 9,980,000 | |
| | | | | | | | | | | | | | | | 23,512,903 | |
| | | | |
| Ohio-2.24% | | | | | | | | | | | | | | | | |
| | | | |
Allen (County of) (Catholic Healthcare Partners); Series 2010 B, Hospital Facilities RB | | | 5.00 | % | | | 09/01/2020 | | | | 2,920 | | | | 3,057,357 | |
American Municipal Power, Inc. (AMP Fremont Energy Center); Series 2017 A, Ref. RB | | | 5.00 | % | | | 02/15/2027 | | | | 5,000 | | | | 6,008,000 | |
American Municipal Power, Inc. (Combined Hydroelectric); | | | | | | | | | | | | | | | | |
Series 2009 C, RB(b)(d) | | | 5.00 | % | | | 02/15/2020 | | | | 2,850 | | | | 2,939,347 | |
Series 2018 A, RB(b) | | | 2.25 | % | | | 08/15/2021 | | | | 2,500 | | | | 2,509,325 | |
Cleveland (City of); | | | | | | | | | | | | | | | | |
Series 2006 A, Airport System RB(INS-AMBAC)(a) | | | 5.25 | % | | | 01/01/2021 | | | | 3,980 | | | | 4,221,626 | |
Series 2011 A, Airport System RB | | | 5.00 | % | | | 01/01/2022 | | | | 2,315 | | | | 2,451,585 | |
Franklin (County of) (OhioHealth Corp.); Series 2011 B, Ref. Hospital Facilities RB(b) | | | 5.00 | % | | | 05/15/2023 | | | | 5,000 | | | | 5,617,100 | |
Hancock (County of) (Blanchard Valley Regional Health Center); Series 2011 A, Hospital Facilities RB(b)(d) | | | 5.75 | % | | | 06/01/2021 | | | | 250 | | | | 272,170 | |
Lancaster Port Authority; Series 2014, Ref. Gas Supply Floating Rate RB (1 mo. USD LIBOR + 0.72%)(b)(c) | �� | | 2.39 | % | | | 08/01/2019 | | | | 11,000 | | | | 11,001,980 | |
Miami University (A State University of Ohio); | | | | | | | | | | | | | | | | |
Series 2014, Ref. RB | | | 5.00 | % | | | 09/01/2023 | | | | 1,465 | | | | 1,669,704 | |
Series 2017, Ref. RB | | | 5.00 | % | | | 09/01/2023 | | | | 1,995 | | | | 2,273,761 | |
Ohio (State of); Series 2009 A II, Parks & Recreation Capital Facilities RB | | | 5.00 | % | | | 12/01/2019 | | | | 1,825 | | | | 1,870,242 | |
Ohio (State of) (Cleveland Clinic Health System Obligated Group); | | | | | | | | | | | | | | | | |
Series 2011B-1, Ref. Hospital RB | | | 5.00 | % | | | 01/01/2024 | | | | 1,000 | | | | 1,057,520 | |
Series 2017, Ref. Hospital Facilities RB | | | 5.00 | % | | | 01/01/2026 | | | | 1,205 | | | | 1,434,854 | |
| | | | | | | | | | | | | | | | 46,384,571 | |
| | | | |
| Oklahoma-0.45% | | | | | | | | | | | | | | | | |
| | | | |
Grand River Dam Authority; Series 2016 A, Ref. RB | | | 5.00 | % | | | 06/01/2024 | | | | 2,500 | | | | 2,900,025 | |
Oklahoma (County of) Finance Authority (Western Heights Public Schools); Series 2009, Educational Facilities Lease RB(d) | | | 4.50 | % | | | 09/01/2019 | | | | 2,000 | | | | 2,026,800 | |
See accompanying Notes to Financial Statements which are an integral part of the financial statements.
23 Invesco Limited Term Municipal Income Fund
| | | | | | | | | | | | | | | | |
| | | Interest
Rate | | | Maturity
Date | | | Principal
Amount
(000) | | |
Value | |
| Oklahoma-(continued) | | | | | | | | | | | | | | | | |
| | | | |
Oklahoma (State of) Development Finance Authority (Oklahoma State System of Higher Education); | | | | | | | | | | | | | | | | |
Series 2009 A, Master Real Property Lease RB | | | 4.00 | % | | | 06/01/2020 | | | $ | 1,000 | | | $ | 1,005,810 | |
Tulsa (County of) Industrial Authority (Broken Arrow Public Schools); Series 2016, Educational Facilities Lease RB | | | 5.00 | % | | | 09/01/2026 | | | | 3,100 | | | | 3,477,549 | |
| | | | | | | | | | | | | | | | 9,410,184 | |
| | | | |
| Oregon-1.22% | | | | | | | | | | | | | | | | |
| | | | |
Multnomah (County of); Series 2017, Limited Tax GO Bonds | | | 5.00 | % | | | 06/01/2023 | | | | 7,045 | | | | 8,002,627 | |
Oregon (State of) Department of Administrative Services; Series 2009 A, Lottery RB(b)(d) | | | 5.00 | % | | | 04/01/2019 | | | | 500 | | | | 501,315 | |
Oregon (State of) Department of Transportation; | | | | | | | | | | | | | | | | |
Series 2017 C, Sr. Ref. Lien Highway Tax RB | | | 5.00 | % | | | 11/15/2025 | | | | 3,525 | | | | 4,228,660 | |
Series 2017 C, Sr. Ref. Lien Highway Tax RB | | | 5.00 | % | | | 11/15/2026 | | | | 2,000 | | | | 2,438,760 | |
Portland (City of); Series 2011 B, Central Eastside Urban Renewal & Redevelopment Tax Allocation RB | | | 5.25 | % | | | 06/15/2029 | | | | 1,000 | | | | 1,072,620 | |
Portland (City of) Community College District; Series 2013, Unlimited Tax GO Bonds | | | 5.00 | % | | | 06/15/2022 | | | | 6,000 | | | | 6,645,600 | |
Salem-Keizer School District No. 24J; Series 2009 B, Unlimited Tax CAB GO Bonds(CEP-Oregon School Bond Guaranty)(f) | | | 0.00 | % | | | 06/15/2023 | | | | 2,500 | | | | 2,298,850 | |
| | | | | 25,188,432 | |
| | | | |
| Pennsylvania-4.93% | | | | | | | | | | | | | | | | |
| | | | |
Bethlehem (City of); | | | | | | | | | | | | | | | | |
Series 2014, Ref. Gtd. Water RB(INS-BAM)(a) | | | 5.00 | % | | | 11/15/2020 | | | | 1,475 | | | | 1,553,765 | |
Series 2014, Ref. Gtd. Water RB(INS-BAM)(a) | | | 5.00 | % | | | 11/15/2021 | | | | 1,400 | | | | 1,517,012 | |
Commonwealth Financing Authority; | | | | | | | | | | | | | | | | |
Series 2018, Tobacco Master Settlement Payment RB | | | 5.00 | % | | | 06/01/2025 | | | | 5,500 | | | | 6,354,260 | |
Series 2018, Tobacco Master Settlement Payment RB | | | 5.00 | % | | | 06/01/2026 | | | | 2,000 | | | | 2,341,460 | |
Delaware Valley Regional Financial Authority; Series 2018 B, Floating Rate RB (SIFMA Municipal Swap Index + 0.42%)(b)(c) | | | 2.16 | % | | | 09/01/2022 | | | | 4,000 | | | | 4,000,960 | |
DuBois (City of) Hospital Authority (Penn Highlands Healthcare; | | | | | | | | | | | | | | | | |
Series 2018, Ref. Hospital RB | | | 5.00 | % | | | 07/15/2020 | | | | 500 | | | | 521,310 | |
Series 2018, Ref. Hospital RB | | | 5.00 | % | | | 07/15/2021 | | | | 500 | | | | 535,925 | |
DuBois (City of) Hospital Authority (Penn Highlands Healthcare); Series 2018, Ref. Hospital RB | | | 5.00 | % | | | 07/15/2019 | | | | 500 | | | | 505,800 | |
Montgomery (County of) Higher Education & Health Authority (Thomas Jefferson University); | | | | | | | | | | | | | | | | |
Series 2018 A, Ref. RB | | | 5.00 | % | | | 09/01/2022 | | | | 1,350 | | | | 1,488,699 | |
Series 2018 A, Ref. RB | | | 5.00 | % | | | 09/01/2023 | | | | 1,050 | | | | 1,185,566 | |
Series 2018 A, Ref. RB | | | 5.00 | % | | | 09/01/2024 | | | | 1,000 | | | | 1,151,650 | |
Series 2018 C, Floating Rate RB (SIFMA Municipal Swap Index + 0.72%)(b)(c) | | | 2.46 | % | | | 09/01/2023 | | | | 4,700 | | | | 4,703,055 | |
Montgomery (County of) Industrial Development Authority (ACTS Retirement-Life Community); | | | | | | | | | | | | | | | | |
Series 2012, Ref. RB | | | 5.00 | % | | | 11/15/2025 | | | | 1,000 | | | | 1,074,440 | |
Montgomery (County of) Industrial Development Authority (PECO Energy Company); | | | | | | | | | | | | | | | | |
Series 1994 A, Ref. RB(b) | | | 2.55 | % | | | 06/01/2020 | | | | 5,000 | | | | 4,996,850 | |
Series 1999 A, Ref. RB(b) | | | 2.50 | % | | | 04/01/2020 | | | | 6,000 | | | | 5,996,760 | |
Pennsylvania (Commonwealth of); | | | | | | | | | | | | | | | | |
First Series 2016, Ref. Unlimited Tax GO Bonds | | | 5.00 | % | | | 09/15/2026 | | | | 5,000 | | | | 5,947,650 | |
First Series 2016, Ref. Unlimited Tax GO Bonds | | | 5.00 | % | | | 02/01/2028 | | | | 1,690 | | | | 1,974,697 | |
Second Series 2016, Ref. Unlimited Tax GO Bonds | | | 5.00 | % | | | 09/15/2028 | | | | 2,455 | | | | 2,894,322 | |
Series 2018 A, Ref. COP | | | 5.00 | % | | | 07/01/2023 | | | | 500 | | | | 557,405 | |
Series 2018 A, Ref. COP | | | 5.00 | % | | | 07/01/2025 | | | | 500 | | | | 573,720 | |
Pennsylvania (State of) Higher Educational Facilities Authority (University of Pittsburgh Medical Center); Series 2010 E, RB | | | 5.00 | % | | | 05/15/2021 | | | | 7,285 | | | | 7,566,493 | |
See accompanying Notes to Financial Statements which are an integral part of the financial statements.
24 Invesco Limited Term Municipal Income Fund
| | | | | | | | | | | | | | | | |
| | | Interest
Rate | | | Maturity
Date | | | Principal
Amount
(000) | | |
Value | |
| Pennsylvania-(continued) | | | | | | | | | | | | | | | | |
| | | | |
Pennsylvania (State of) Turnpike Commission; | | | | | | | | | | | | | | | | |
Series 2009 B, Sub. RB(b)(d) | | | 5.00 | % | | | 06/01/2019 | | | $ | 3,550 | | | $ | 3,579,394 | |
Series 2009 B, Sub. RB(b)(d) | | | 5.25 | % | | | 06/01/2019 | | | | 2,500 | | | | 2,522,200 | |
Series 2011 A, RB | | | 5.00 | % | | | 12/01/2022 | | | | 1,500 | | | | 1,673,070 | |
Series 2011 A, RB | | | 5.00 | % | | | 12/01/2023 | | | | 1,500 | | | | 1,713,060 | |
Series 2013 B, Floating Rate RB (SIFMA Municipal Swap Index + 1.15%)(c) | | | 2.89 | % | | | 12/01/2019 | | | | 3,300 | | | | 3,305,874 | |
Series 2014B-1, Variable Rate RB (SIFMA Municipal Swap Index + 0.88%)(c) | | | 2.62 | % | | | 12/01/2020 | | | | 5,100 | | | | 5,125,296 | |
Series 2018A-1, Ref. Floating Rate RB (SIFMA Municipal Swap Index + 0.43%)(c) | | | 2.17 | % | | | 12/01/2021 | | | | 4,000 | | | | 3,990,080 | |
Philadelphia (City of); | | | | | | | | | | | | | | | | |
Series 2009 A, Ref. Unlimited Tax GO Bonds(b)(d) | | | 5.25 | % | | | 08/01/2019 | | | | 795 | | | | 807,012 | |
Series 2009 A, Ref. Unlimited Tax GO Bonds (INS- AGC)(a) | | | 4.50 | % | | | 08/01/2020 | | | | 2,150 | | | | 2,174,166 | |
Series 2009 A, Ref. Unlimited Tax GO Bonds (INS - AGC)(a) | | | 5.25 | % | | | 08/01/2021 | | | | 2,235 | | | | 2,267,184 | |
Series 2009 A, Ref. Unlimited Tax GO Bonds (INS - AGC)(a) | | | 5.25 | % | | | 08/01/2022 | | | | 4,470 | | | | 4,534,010 | |
Series 2010 A, Ref. Water & Wastewater RB (INS- AGM)(a) | | | 5.00 | % | | | 06/15/2019 | | | | 1,000 | | | | 1,009,130 | |
Philadelphia (City of) Gas Works; | | | | | | | | | | | | | | | | |
Series 2015, Ref. RB | | | 5.00 | % | | | 08/01/2022 | | | | 2,250 | | | | 2,475,135 | |
Series 2015, Ref. RB | | | 5.00 | % | | | 08/01/2023 | | | | 4,000 | | | | 4,508,080 | |
Philadelphia (City of) Industrial Development Authority (Discovery Charter School); Series 2012, RB | | | 5.50 | % | | | 04/01/2027 | | | | 1,320 | | | | 1,331,431 | |
Pittsburgh Public School District; Series 2009 A, Limited Tax GO Bonds(INS-AGC)(a) | | | 4.00 | % | | | 09/01/2019 | | | | 3,105 | | | | 3,140,937 | |
South Fork (Borough of) Municipal Authority (Conemaugh Valley Memorial Hospital); Series 2005 A, Ref. Hospital RB(b)(d) | | | 6.00 | % | | | 07/01/2020 | | | | 500 | | | | 527,560 | |
| | | | | | | | | | | | | | | | 102,125,418 | |
| | | | |
| Rhode Island-0.53% | | | | | | | | | | | | | | | | |
| | | | |
Rhode Island Health & Educational Building Corp. (Lifespan Obligated Group); Series 2009 A, Hospital Financing RB(b)(d) | | | 6.13 | % | | | 05/15/2019 | | | | 500 | | | | 504,500 | |
Rhode Island Health & Educational Building Corp. (University of Rhode Island - Auxiliary Enterprise); | | | | | | | | | | | | | | | | |
Series 2009 B, Higher Education Facility RB(INS-AGC)(a) | | | 5.25 | % | | | 09/15/2029 | | | | 1,265 | | | | 1,286,846 | |
Tobacco Settlement Financing Corp.; | | | | | | | | | | | | | | | | |
Series 2015 A, Ref. RB | | | 5.00 | % | | | 06/01/2026 | | | | 2,435 | | | | 2,698,516 | |
Series 2015 A, Ref. RB | | | 5.00 | % | | | 06/01/2027 | | | | 1,600 | | | | 1,757,904 | |
Series 2015 A, Ref. RB | | | 5.00 | % | | | 06/01/2028 | | | | 1,920 | | | | 2,083,488 | |
Series 2015 B, Ref. RB | | | 2.25 | % | | | 06/01/2041 | | | | 2,700 | | | | 2,702,376 | |
| | | | | | | | | | | | | | | | 11,033,630 | |
| | | | |
| South Carolina-1.63% | | | | | | | | | | | | | | | | |
| | | | |
Patriots Energy Group Financing Agency; Series 2018 A, Gas Supply RB(b) | | | 4.00 | % | | | 02/01/2024 | | | | 8,000 | | | | 8,560,560 | |
Piedmont Municipal Power Agency; Series 2009A-4, Ref. Electric RB | | | 5.00 | % | | | 01/01/2020 | | | | 2,000 | | | | 2,052,460 | |
SCAGO Educational Facilities Corporation for Pickens School District; Series 2015, Ref. RB | | | 5.00 | % | | | 12/01/2026 | | | | 2,250 | | | | 2,613,443 | |
South Carolina (State of) Jobs-Economic Development Authority (AnMed Health); | | | | | | | | | | | | | | | | |
Series 2012 B, Ref. RB | | | 5.00 | % | | | 10/01/2024 | | | | 5,000 | | | | 5,538,000 | |
Series 2018 A, Hospital RB | | | 5.00 | % | | | 05/01/2025 | | | | 1,500 | | | | 1,728,675 | |
South Carolina (State of) Jobs-Economic Development Authority (Palmetto Health Alliance); | | | | | | | | | | | | | | | | |
Series 2013 A, Ref. Hospital RB(d) | | | 5.00 | % | | | 08/01/2021 | | | | 1,300 | | | | 1,402,388 | |
South Carolina (State of) Jobs-Economic Development Authority (Prisma Health Obligated Group); | | | | | | | | | | | | | | | | |
Series 2018 A, Hospital RB | | | 5.00 | % | | | 05/01/2024 | | | | 1,000 | | | | 1,135,160 | |
South Carolina Transportation Infrastructure Bank; Series 2012 A, Ref. RB | | | 5.00 | % | | | 10/01/2024 | | | | 10,000 | | | | 10,807,100 | |
| | | | | | | | | | | | | | | | 33,837,786 | |
| | | | |
| South Dakota-0.32% | | | | | | | | | | | | | | | | |
| | | | |
Rapid City (City of); | | | | | | | | | | | | | | | | |
Series 2009, Water RB(h) | | | 5.00 | % | | | 11/01/2021 | | | | 1,170 | | | | 1,194,207 | |
Series 2009, Water RB(h) | | | 5.00 | % | | | 11/01/2024 | | | | 1,620 | | | | 1,653,631 | |
Series 2009, Water RB(h) | | | 5.00 | % | | | 11/01/2025 | | | | 1,650 | | | | 1,684,139 | |
See accompanying Notes to Financial Statements which are an integral part of the financial statements.
25 Invesco Limited Term Municipal Income Fund
| | | | | | | | | | | | | | | | |
| | | Interest
Rate | | | Maturity
Date | | | Principal
Amount
(000) | | |
Value | |
| South Dakota-(continued) | | | | | | | | | | | | | | | | |
| | | | |
South Dakota (State of) Health & Educational Facilities Authority (Regional Health); Series 2010, RB(b)(d) | | | 5.00 | % | | | 09/01/2020 | | | $ | 1,000 | | | $ | 1,048,860 | |
South Dakota (State of) Health & Educational Facilities Authority (Sanford Health); Series 2009, RB | | | 5.00 | % | | | 11/01/2024 | | | | 1,000 | | | | 1,020,360 | |
| | | | | | | | | | | | | | | | 6,601,197 | |
| | | | |
| Tennessee-1.22% | | | | | | | | | | | | | | | | |
| | | | |
Greeneville (Town of) Health &Educational Facilities Board (Ballad Health); | | | | | | | | | | | | | | | | |
Series 2018 A, Ref. Hospital RB | | | 5.00 | % | | | 07/01/2023 | | | | 1,800 | | | | 2,011,392 | |
Series 2018 A, Ref. Hospital RB | | | 5.00 | % | | | 07/01/2024 | | | | 2,000 | | | | 2,234,720 | |
Series 2018 A, Ref. Hospital RB | | | 5.00 | % | | | 07/01/2025 | | | | 2,000 | | | | 2,229,120 | |
Memphis (City of) & Shelby (County of) Airport Authority; Series 2011 D, Ref. RB | | | 5.00 | % | | | 07/01/2022 | | | | 2,165 | | | | 2,319,105 | |
Nashville (City of) & Davidson (County of) Metropolitan Government Health & Educational Facilities | | | | | | | | | | | | | | | | |
Board (Blakeford at Green Hills); | | | | | | | | | | | | | | | | |
Series 2012, Ref. & Improvement RB | | | 5.00 | % | | | 07/01/2020 | | | | 860 | | | | 887,313 | |
Series 2012, Ref. & Improvement RB | | | 5.00 | % | | | 07/01/2021 | | | | 885 | | | | 929,790 | |
Shelby (County of) Health, Educational & Housing Facilities Board (Methodist Le Bonheur Healthcare); | | | | | | | | | | | | | | | | |
Series 2017 A, RB | | | 5.00 | % | | | 05/01/2024 | | | | 1,840 | | | | 2,112,890 | |
Tennessee Energy Acquisition Corp.; | | | | | | | | | | | | | | | | |
Series 2006 A, Gas RB | | | 5.25 | % | | | 09/01/2021 | | | | 4,385 | | | | 4,682,391 | |
Series 2017 A, Gas RB(b) | | | 4.00 | % | | | 05/01/2023 | | | | 3,420 | | | | 3,582,074 | |
Series 2018, Gas RB(b) | | | 4.00 | % | | | 11/01/2025 | | | | 4,000 | | | | 4,238,560 | |
| | | | | | | | | | | | | | | | 25,227,355 | |
| | | | |
| Texas-11.33% | | | | | | | | | | | | | | | | |
| | | | |
Austin Convention Enterprises, Inc.; | | | | | | | | | | | | | | | | |
Series 2017, Ref. First Tier Convention Center RB | | | 5.00 | % | | | 01/01/2022 | | | | 350 | | | | 378,690 | |
Series 2017, Ref. First Tier Convention Center RB | | | 5.00 | % | | | 01/01/2025 | | | | 500 | | | | 567,350 | |
Series 2017, Ref. Sub. Second Tier Convention Center RB | | | 5.00 | % | | | 01/01/2025 | | | | 400 | | | | 448,344 | |
Bexar (County of) Metropolitan Water District; | | | | | | | | | | | | | | | | |
Series 2009, Ref. Waterworks System RB(d) | | | 5.00 | % | | | 05/01/2019 | | | | 2,500 | | | | 2,513,750 | |
Series 2009, Ref. Waterworks System RB(b)(d) | | | 5.00 | % | | | 05/01/2019 | | | | 7,500 | | | | 7,541,250 | |
Central Texas Regional Mobility Authority; Series 2018, Sub. Lien RB | | | 4.00 | % | | | 01/01/2022 | | | | 2,500 | | | | 2,606,525 | |
Clifton Higher Education Finance Corp. (Idea Public Schools); Series 2013, Education RB | | | 5.00 | % | | | 08/15/2023 | | | | 750 | | | | 807,698 | |
Corpus Christi Independent School District; Series 2009, School Building Unlimited Tax GO Bonds(b)(d) | | | 5.00 | % | | | 08/15/2019 | | | | 1,100 | | | | 1,116,632 | |
Denton Independent School District; Series 2015, Ref. Unlimited Tax GO Bonds(CEP-Texas Permanent School Fund) | | | 5.00 | % | | | 08/15/2024 | | | | 6,685 | | | | 7,781,942 | |
Dickinson Independent School District; Series 2000, Ref. Unlimited Tax General Obligation Bonds(CEP-Texas Permanent School Fund) | | | 6.00 | % | | | 02/15/2028 | | | | 11,370 | | | | 13,850,138 | |
Frisco Independent School District; Series 2016 A, Ref. School Building Unlimited Tax GO Bonds(CEP-Texas Permanent School Fund) | | | 5.00 | % | | | 08/15/2025 | | | | 2,500 | | | | 2,972,400 | |
Galveston (City of); Series 2011, Ref. Wharves & Terminal RB | | | 5.00 | % | | | 02/01/2021 | | | | 1,000 | | | | 1,057,760 | |
Grand Parkway Transportation Corp. (Tela Supported); Series 2018 B, Sub. Tier Toll RB(b) | | | 5.00 | % | | | 10/01/2023 | | | | 5,000 | | | | 5,646,450 | |
Gulf Coast Industrial Development Authority (ExxonMobil); Series 2012, VRD RB(g) | | | 1.45 | % | | | 03/05/2019 | | | | 6,500 | | | | 6,500,000 | |
Harris (County of) Metropolitan Transit Authority; Series 2017 B, Sales & Use Tax RB | | | 5.00 | % | | | 11/01/2025 | | | | 3,040 | | | | 3,635,840 | |
Harris County Cultural Education Facilities Finance Corp. (Memorial Hermann Health System); | | | | | | | | | | | | | | | | |
Series 2013 B, Ref. Hospital Floating Rate RB (SIFMA Municipal Swap Index + 0.70%)(c) | | | 2.44 | % | | | 06/01/2019 | | | | 2,065 | | | | 2,068,221 | |
Series 2014 B, Hospital Floating Rate RB (SIFMA Municipal Swap Index + 0.58%)(b)(c) | | | 2.32 | % | | | 12/01/2019 | | | | 11,000 | | | | 11,011,330 | |
Harris County Cultural Education Facilities Finance Corp. (Memorial Hermann Healthcare System); | | | | | | | | | | | | | | | | |
Series 2013 A, Ref. Hospital RB | | | 5.00 | % | | | 12/01/2023 | | | | 1,625 | | | | 1,805,001 | |
Harris County Cultural Education Facilities Finance Corp. (TECO); Series 2009 A, Thermal Utility RB | | | 5.00 | % | | | 11/15/2019 | | | | 485 | | | | 496,000 | |
Harris County Cultural Education Facilities Finance Corp. (Texas Children’s Hospital); | | | | | | | | | | | | | | | | |
Series 2009, Hospital RB | | | 5.00 | % | | | 10/01/2024 | | | | 1,750 | | | | 1,782,165 | |
Series 2015, Floating Rate RB (1 mo. USD LIBOR + 0.85%)(b)(c) | | | 2.54 | % | | | 06/01/2020 | | | | 5,000 | | | | 5,023,750 | |
See accompanying Notes to Financial Statements which are an integral part of the financial statements.
26 Invesco Limited Term Municipal Income Fund
| | | | | | | | | | | | | | | | |
| | | Interest
Rate | | | Maturity
Date | | | Principal
Amount
(000) | | | Value | |
| Texas-(continued) | | | | | | | | | | | | | | | | |
Harris County Cultural Education Facilities Finance Corp. (Texas Medical Center); Series 2009 A, Ref.
Special Facilities RB(INS-AGC)(a) | | | 5.00 | % | | | 05/15/2023 | | | $ | 1,500 | | | $ | 1,509,540 | |
Harris County Cultural Education Facilities Finance Corp. (YMCA of the Greater Houston Area); | | | | | | | | | | | | | | | | |
Series 2013 A, Ref. RB | | | 5.00 | % | | | 06/01/2021 | | | | 535 | | | | 564,008 | |
Series 2013 A, Ref. RB | | | 5.00 | % | | | 06/01/2022 | | | | 855 | | | | 913,482 | |
Harris County Industrial Development Corp. (Deer Park Refining Limited Partnership); Series 2006, Solid Waste Disposal RB(b)(d) | | | 5.00 | % | | | 12/01/2019 | | | | 4,000 | | | | 4,100,680 | |
Houston (City of); | | | | | | | | | | | | | | | | |
Series 2014 C, Ref. First Lien Combined Utility System RB | | | 5.00 | % | | | 05/15/2024 | | | | 3,685 | | | | 4,264,503 | |
Series 2016 A, Ref. Public Improvement Limited Tax GO Bonds | | | 5.00 | % | | | 03/01/2024 | | | | 5,060 | | | | 5,813,788 | |
Series 2017 A, Ref. Unlimited Tax GO Bonds | | | 5.00 | % | | | 03/01/2028 | | | | 5,350 | | | | 6,415,934 | |
Series 2018 C, Ref. First Lien Combined Utility System Floating Rate RB (1 mo. USD LIBOR + 0.36%)(b)(c) | | | 2.11 | % | | | 08/01/2021 | | | | 4,000 | | | | 3,987,000 | |
Houston Independent School District; Series 2016 A, Schoolhouse Limited Tax GO Bonds(CEP-Texas Permanent School Fund) | | | 5.00 | % | | | 02/15/2025 | | | | 3,750 | | | | 4,415,625 | |
Katy (City of) Independent School District; Series 2015 C, Ref. Unlimited Tax GO Floating Rate Bonds
(CEP -Texas Permanent School Fund) (1 mo. USD LIBOR + 0.55%)(b)(c) | | | 2.22 | % | | | 08/15/2019 | | | | 17,600 | | | | 17,602,112 | |
La Vernia Higher Education Finance Corp. (Knowledge is Power Program, Inc.); Series 2009 A, RB(b)(d) | | | 5.75 | % | | | 08/15/2019 | | | | 365 | | | | 371,650 | |
Leander Independent School District; Series 2014 D, Ref. Unlimited Tax CAB GO Bonds(CEP-Texas Permanent School Fund)(f) | | | 0.00 | % | | | 08/15/2027 | | | | 5,675 | | | | 4,472,751 | |
Lower Colorado River Authority; | | | | | | | | | | | | | | | | |
Series 2009, Ref. RB(b)(d) | | | 5.25 | % | | | 05/15/2019 | | | | 45 | | | | 45,318 | |
Series 2014, Ref. RB | | | 5.25 | % | | | 05/15/2029 | | | | 455 | | | | 458,039 | |
Lower Colorado River Authority (LCRA Transmission Services Corp.); | | | | | | | | | | | | | | | | |
Series 2018, Ref. Transmission Contract RB | | | 5.00 | % | | | 05/15/2023 | | | | 1,900 | | | | 2,136,949 | |
Series 2018, Ref. Transmission Contract RB | | | 5.00 | % | | | 05/15/2024 | | | | 2,430 | | | | 2,782,277 | |
Lower Neches Valley Authority Industrial Development Corp. (Exxonmobil); Series 2010, VRD RB(g) | | | 1.50 | % | | | 11/01/2038 | | | | 6,300 | | | | 6,300,000 | |
New Hope Cultural Education Facilities Corp.(CHF-Collegiate Housing College Station I,LLC-Texas A&M University); Series 2014 A, Student Housing RB(INS-AGM)(a) | | | 4.00 | % | | | 04/01/2020 | | | | 325 | | | | 331,003 | |
North East Texas Regional Mobility Authority; Series 2016, Sr. Lien RB | | | 5.00 | % | | | 01/01/2026 | | | | 1,870 | | | | 2,165,909 | |
North Fort Bend Water Authority; Series 2009, Water System RB(INS-AGC)(a) | | | 5.00 | % | | | 12/15/2024 | | | | 2,000 | | | | 2,050,900 | |
North Texas Tollway Authority; | | | | | | | | | | | | | | | | |
Series 2005 C, Dallas North Tollway System RB | | | 5.38 | % | | | 01/01/2021 | | | | 375 | | | | 376,009 | |
Series 2014 C, Ref. First Tier Floating Rate RB (SIFMA Municipal Swap Index + 0.67%)(b)(c) | | | 2.41 | % | | | 01/01/2020 | | | | 9,600 | | | | 9,595,680 | |
Northside Independent School District (School Building); Series 2012, Unlimited Tax GO Bonds(CEP-Texas Permanent School Fund)(b) | | | 1.75 | % | | | 06/01/2022 | | | | 3,270 | | | | 3,231,839 | |
Sachse (City of); Series 2009, Ref. & Improvement Limited Tax GO Bonds (INS-AGC)(a) | | | 5.00 | % | | | 02/15/2024 | | | | 5 | | | | 5,012 | |
San Antonio (City of); | | | | | | | | | | | | | | | | |
Series 2012, Ref. Electric & Gas Systems RB | | | 5.25 | % | | | 02/01/2024 | | | | 1,070 | | | | 1,245,608 | |
Series 2016, Ref. Electric & Gas Systems RB | | | 5.00 | % | | | 02/01/2023 | | | | 6,500 | | | | 7,318,155 | |
Series 2018, Electric & Gas Systems RB | | | 5.00 | % | | | 02/01/2021 | | | | 5,000 | | | | 5,318,200 | |
Tarrant County Cultural Education Facilities Finance Corp. (CHRISTUS Health); Series 2018 A, Ref. RB | | | 5.00 | % | | | 07/01/2024 | | | | 1,850 | | | | 2,116,548 | |
Tarrant County Cultural Education Facilities Finance Corp. (Hendrick Medical Center); | | | | | | | | | | | | | | | | |
Series 2009 A, Hospital RB(INS-AGC)(a) | | | 5.00 | % | | | 09/01/2022 | | | | 595 | | | | 604,187 | |
Series 2009 A, Hospital RB(INS-AGC)(a) | | | 5.00 | % | | | 09/01/2024 | | | | 1,280 | | | | 1,299,264 | |
Texas (State of) Water Development Board (State Water Implementation Revenue Fund); | | | | | | | | | | | | | | | | |
Series 2018 A, RB | | | 5.00 | % | | | 10/15/2022 | | | | 2,500 | | | | 2,791,250 | |
Series 2018 A, RB | | | 5.00 | % | | | 10/15/2024 | | | | 2,500 | | | | 2,926,300 | |
Texas Municipal Gas Acquisition & Supply Corp. I; Series 2008 D, Sr. Lien Gas Supply RB | | | 6.25 | % | | | 12/15/2026 | | | | 5,300 | | | | 6,131,093 | |
Texas Municipal Gas Acquisition & Supply Corp. III; | | | | | | | | | | | | | | | | |
Series 2012, Gas Supply RB | | | 5.00 | % | | | 12/15/2019 | | | | 3,500 | | | | 3,579,170 | |
Series 2012, Gas Supply RB | | | 5.00 | % | | | 12/15/2021 | | | | 5,485 | | | | 5,879,810 | |
Series 2012, Gas Supply RB | | | 5.00 | % | | | 12/15/2022 | | | | 500 | | | | 546,360 | |
Series 2012, Gas Supply RB | | | 5.00 | % | | | 12/15/2023 | | | | 8,050 | | | | 8,854,275 | |
See accompanying Notes to Financial Statements which are an integral part of the financial statements.
27 Invesco Limited Term Municipal Income Fund
| | | | | | | | | | | | | | | | |
| | | Interest
Rate | | | Maturity
Date | | | Principal
Amount
(000) | | | Value | |
| Texas-(continued) | | | | | | | | | | | | | | | | |
| | | | |
Texas Public Finance Authority; Series 2018 A, Unlimited GO Bonds | | | 5.00 | % | | | 10/01/2023 | | | $ | 5,000 | | | $ | 5,719,350 | |
Texas State University Board of Regents; | | | | | | | | | | | | | | | | |
Series 2017 A, Ref. Financing System RB | | | 5.00 | % | | | 03/15/2023 | | | | 2,150 | | | | 2,426,640 | |
Series 2017 A, Ref. Financing System RB | | | 5.00 | % | | | 03/15/2024 | | | | 4,000 | | | | 4,624,680 | |
Tyler Health Facilities Development Corp. (Mother Frances Hospital Regional Health Care Center); | | | | | | | | | | | | | | | | |
Series 2011, Hospital RB(d) | | | 5.00 | % | | | 07/01/2021 | | | | 1,285 | | | | 1,378,188 | |
University of Texas System Board of Regents; Series 2010, Ref. Financing System RB | | | 5.00 | % | | | 08/15/2021 | | | | 5,340 | | | | 5,771,579 | |
Uptown Development Authority (Infrastructure Improvement Facilities); | | | | | | | | | | | | | | | | |
Series 2009, Tax Increment Allocation Contract RB(b)(d) | | | 5.00 | % | | | 09/01/2019 | | | | 900 | | | | 914,742 | |
Series 2009, Tax Increment Allocation Contract RB(b)(d) | | | 5.10 | % | | | 09/01/2019 | | | | 1,455 | | | | 1,479,546 | |
Series 2009, Tax Increment Allocation Contract RB(b)(d) | | | 5.38 | % | | | 09/01/2019 | | | | 450 | | | | 458,195 | |
| | | | | 234,904,384 | |
| | | | |
| Utah-0.22% | | | | | | | | | | | | | | | | |
| | | | |
Utah (County of) (IHC Health Services, Inc.); Series 2018 B, Hospital RB(b) | | | 5.00 | % | | | 08/01/2024 | | | | 4,000 | | | | 4,489,400 | |
| | | | |
| Virgin Islands–0.40% | | | | | | | | | | | | | | | | |
| | | | |
Virgin Islands (Government of) Public Finance Authority; | | | | | | | | | | | | | | | | |
Series 2015, RB(e) | | | 5.00 | % | | | 09/01/2022 | | | | 2,220 | | | | 2,372,825 | |
Series 2015, RB(e) | | | 5.00 | % | | | 09/01/2023 | | | | 1,500 | | | | 1,627,050 | |
Series 2015, RB(e) | | | 5.00 | % | | | 09/01/2024 | | | | 1,650 | | | | 1,807,641 | |
Series 2015, RB(e) | | | 5.00 | % | | | 09/01/2025 | | | | 1,500 | | | | 1,660,185 | |
Virgin Islands (Government of) Water & Power Authority; Series 2010 B, Electric System RB(INS-AGM)(a) | | | 5.00 | % | | | 07/01/2022 | | | | 780 | | | | 810,014 | |
| | | | | | | | | | | | | | | | 8,277,715 | |
| | | | |
| Virginia-1.84% | | | | | | | | | | | | | | | | |
| | | | |
Chesterfield (County of) Economic Development Authority (Virginia Electric & Power Co.); | | | | | | | | | | | | | | | | |
Series 2009 A, Ref. PCR | | | 5.00 | % | | | 05/01/2023 | | | | 500 | | | | 502,285 | |
Norfolk (City of); Series 2017, Ref. Water RB | | | 5.00 | % | | | 11/01/2022 | | | | 10,000 | | | | 11,189,800 | |
Virginia (State of) College Building Authority (21st Century College and Equipment Programs); | | | | | | | | | | | | | | | | |
Series 2015 A, Educational Facilities RB | | | 5.00 | % | | | 02/01/2024 | | | | 4,075 | | | | 4,704,384 | |
Virginia Commonwealth Transportation Board; | | | | | | | | | | | | | | | | |
Series 2016, Federal Transportation Grant Anticipation RB | | | 5.00 | % | | | 03/15/2024 | | | | 1,500 | | | | 1,738,965 | |
Series 2016, Federal Transportation Grant Anticipation RB | | | 5.00 | % | | | 09/15/2024 | | | | 1,015 | | | | 1,190,057 | |
Series 2017 A, Transportation Capital Project RB | | | 5.00 | % | | | 05/15/2024 | | | | 5,395 | | | | 6,278,323 | |
Series 2017, Ref. Federal Transportation Grant Anticipation RB | | | 5.00 | % | | | 09/15/2023 | | | | 5,000 | | | | 5,727,350 | |
Series 2017, Transportation Capital Project RB | | | 5.00 | % | | | 05/15/2025 | | | | 5,640 | | | | 6,704,550 | |
| | | | | | | | | | | | | | | | 38,035,714 | |
| | | | |
| Washington-2.10% | | | | | | | | | | | | | | | | |
| | | | |
Cowlitz (County of) (Cowlitz Sewer Operating Board—Wastewater Treatment); Series 2002, Ref. Special Sewer RB(INS-NATL)(a) | | | 5.50 | % | | | 11/01/2019 | | | | 900 | | | | 922,212 | |
Energy Northwest (Columbia Generating Station); Ref. Electric RB | | | 5.00 | % | | | 07/01/2023 | | | | 2,500 | | | | 2,689,200 | |
Energy Northwest (Project #3); Series 2018 C, Ref. Electric RB | | | 5.00 | % | | | 07/01/2023 | | | | 4,000 | | | | 4,549,560 | |
Everett (City of); Series 2014, Ref. Limited Tax GO Floating Rate Bonds (SIFMA Municipal Swap Index + 0.40%)(b)(c) | | | 2.14 | % | | | 06/01/2019 | | | | 5,415 | | | | 5,415,596 | |
Seattle (City of); Series 2015 A, Ref. Limited Tax GO Bonds | | | 5.00 | % | | | 06/01/2023 | | | | 4,000 | | | | 4,545,480 | |
Seattle (Port of); Series 2015 B, Ref. RB | | | 5.00 | % | | | 03/01/2022 | | | | 1,205 | | | | 1,318,559 | |
Washington (State of) Economic Development Finance Authority (Waste Management, Inc.); | | | | | | | | | | | | | | | | |
Series 2008, Solid Waste Disposal RB(e) | | | 2.13 | % | | | 06/01/2020 | | | | 3,000 | | | | 2,989,800 | |
Washington (State of) Health Care Facilities Authority (Catholic Health Initiatives); Series 2013, Floating Rate RB (SIFMA Municipal Swap Index + 1.40%)(b)(c) | | | 3.14 | % | | | 01/01/2025 | | | | 5,650 | | | | 5,746,276 | |
Washington (State of) Health Care Facilities Authority (Fred Hutchinson Cancer Research Center); Series 2017, Ref. Floating Rate RB (1 mo. USD LIBOR + 0.67%)(b)(c) | | | 2.77 | % | | | 07/01/2022 | | | | 5,000 | | | | 5,061,800 | |
See accompanying Notes to Financial Statements which are an integral part of the financial statements.
28 Invesco Limited Term Municipal Income Fund
| | | | | | | | | | | | | | | | |
| | | Interest
Rate | | | Maturity Date | | | Principal
Amount
(000) | | | Value | |
| Washington-(continued) | | | | | | | | | | | | | | | | |
| | | | |
Washington (State of) Health Care Facilities Authority (PeaceHealth); Series 2014 A, Ref. RB | | | 5.00 | % | | | 11/15/2020 | | | $ | 500 | | | $ | 526,615 | |
Washington (State of) Higher Education Facilities Authority (Gonzaga University); | | | | | | | | | | | | | | | | |
Series 2009, Ref. RB(b)(d) | | | 5.38 | % | | | 04/01/2019 | | | | 1,050 | | | | 1,052,972 | |
Series 2010 A, Ref. RB(d) | | | 5.00 | % | | | 04/01/2019 | | | | 1,810 | | | | 1,814,615 | |
Washington (State of) Tobacco Settlement Authority; | | | | | | | | | | | | | | | | |
Series 2018, Ref. RB | | | 5.00 | % | | | 06/01/2023 | | | | 2,500 | | | | 2,757,375 | |
Series 2018, Ref. RB | | | 5.00 | % | | | 06/01/2024 | | | | 3,750 | | | | 4,126,537 | |
| | | | | | | | | | | | | | | | 43,516,597 | |
| | | | |
| West Virginia-0.90% | | | | | | | | | | | | | | | | |
| | | | |
Mason (County of) (Appalachian Power Co.); Series 2003 L, PCR | | | 2.75 | % | | | 10/01/2022 | | | | 2,500 | | | | 2,505,400 | |
West Virginia (State of) Economic Development Authority; Ref. Limited Obligation Lottery RB | | | 5.00 | % | | | 06/15/2027 | | | | 5,610 | | | | 6,804,481 | |
West Virginia (State of) Economic Development Authority (Appalachian Power Co. - Amos); | | | | | | | | | | | | | | | | |
Series 2008 C, Ref. PCR | | | 3.25 | % | | | 05/01/2019 | | | | 5,255 | | | | 5,260,465 | |
West Virginia (State of) University; Series 2014 C, Ref. Floating Rate RB (SIFMA Municipal Swap Index + 0.53%)(b)(c) | | | 2.27 | % | | | 10/01/2019 | | | | 4,000 | | | | 4,000,600 | |
| | | | | | | | | | | | | | | | 18,570,946 | |
| | | | |
| Wisconsin-0.72% | | | | | | | | | | | | | | | | |
| | | | |
Wisconsin (State of); Series2017-1, Transportation RB | | | 5.00 | % | | | 07/01/2025 | | | | 3,790 | | | | 4,507,523 | |
Wisconsin (State of) Health & Educational Facilities Authority (Advocate Aurora Health Credit Group); | | | | | | | | | | | | | | | | |
Series 2018B-3, Ref. RB(b) | | | 5.00 | % | | | 01/31/2024 | | | | 2,495 | | | | 2,834,969 | |
Series 2018C-1, Ref. Floating Rate RB (SIFMA Municipal Swap Index + 0.35%)(b)(c) | | | 2.09 | % | | | 07/28/2021 | | | | 5,000 | | | | 4,978,450 | |
Wisconsin (State of) Health & Educational Facilities Authority (Froedtert & Community Health, Inc. Obligated Group); | | | | | | | | | | | | | | | | |
Series 2009 C, RB | | | 5.00 | % | | | 04/01/2019 | | | | 750 | | | | 751,860 | |
Series 2009 C, RB(b)(d) | | | 5.00 | % | | | 04/01/2019 | | | | 750 | | | | 751,942 | |
Wisconsin (State of) Health & Educational Facilities Authority (Marquette University); Series 2008B-3, RB | | | 4.00 | % | | | 10/01/2019 | | | | 1,145 | | | | 1,159,335 | |
| | | | | | | | | | | | | | | | 14,984,079 | |
| | | | |
| Wyoming-0.11% | | | | | | | | | | | | | | | | |
| | | | |
Sweetwater (County of) (Idaho Power Co.); Series 2006, Ref. PCR | | | 5.25 | % | | | 07/15/2026 | | | | 1,200 | | | | 1,218,636 | |
Wyoming (State of) Municipal Power Agency; Series 2017 A, Ref. Power Supply RB (INS - BAM)(a) | | | 5.00 | % | | | 01/01/2024 | | | | 1,000 | | | | 1,131,830 | |
| | | | | | | | | | | | | | | | 2,350,466 | |
TOTAL INVESTMENTS IN SECURITIES(j)-100.27% (Cost $2,044,773,811) | | | | | | | | | | | | | | | 2,078,038,515 | |
OTHER ASSETS LESS LIABILITIES – (0.27)% | | | | | | | | | | | | | | | (5,580,544 | ) |
NET ASSETS - 100.00% | | | | | | | | | | | | | | $ | 2,072,457,971 | |
See accompanying Notes to Financial Statements which are an integral part of the financial statements.
29 Invesco Limited Term Municipal Income Fund
Abbreviations:
| | |
| AGC | | – Assured Guaranty Corp. |
| AGM | | – Assured Guaranty Municipal Corp. |
| AMBAC | | – American Municipal Bond Assurance Corp. |
| BAM | | – Build America Mutual Assurance Co. |
| CAB | | – Capital Appreciation Bonds |
| CEP | | – Credit Enhancement Provider |
| COP | | – Certificates of Participation |
| CPI | | – Consumer Price Index |
| FGIC | | – Financial Guaranty Insurance Company |
| GO | | – General Obligation |
| Gtd. | | – Guaranteed |
| IDR | | – Industrial Development Revenue Bonds |
| INS | | – Insurer |
| Jr. | | – Junior |
| LIBOR | | – London Interbank Offered Rate |
| LOC | | – Letter of Credit |
| NATL | | – National Public Finance Guarantee Corp. |
| PCR | | – Pollution Control Revenue Bonds |
| PILOT | | – Payment-in-Lieu-of-Tax |
| RAB | | – Revenue Anticipation Bonds |
| RAC | | – Revenue Anticipation Certificates |
| RB | | – Revenue Bonds |
| Ref. | | – Refunding |
| RN | | – Revenue Notes |
| Sec. | | – Secured |
| SIFMA | | – Securities Industry and Financial Markets Association |
| SOFR | | – Secured Overnight Financing Rate |
| Sr. | | – Senior |
| Sub. | | – Subordinated |
| USD | | – U.S. Dollar |
| VRD | | – Variable Rate Demand |
Notes to Schedule of Investments:
| (a) | Principal and/or interest payments are secured by the bond insurance company listed. |
| (b) | Security has an irrevocable call by the issuer or mandatory put by the holder. Maturity date reflects such call or put. |
| (c) | Interest or dividend rate is redetermined periodically. Rate shown is the rate in effect on February 28, 2019. |
| (d) | Advance refunded; secured by an escrow fund of U.S. Government obligations or other highly rated collateral. |
| (e) | Security purchased or received in a transaction exempt from registration under the Securities Act of 1933, as amended (the “1933 Act”). The security may be resold pursuant to an exemption from registration under the 1933 Act, typically to qualified institutional buyers. The aggregate value of these securities at February 28, 2019 was $17,941,296, which represented less than 1% of the Fund’s Net Assets. |
| (f) | Zero coupon bond issued at a discount. |
| (g) | Demand security payable upon demand by the Fund at specified time intervals no greater than thirteen months. Interest rate is redetermined periodically by the issuer or agent based on current market conditions. Rate shown is the rate in effect on February 28, 2019. |
| (h) | Security subject to crossover refunding. |
| (i) | Principal and interest payments are fully enhanced by a letter of credit from the bank listed or a predecessor bank, branch or subsidiary. |
| (j) | This table provides a listing of those entities that have either issued, guaranteed, backed or otherwise enhanced the credit quality of more than 5% of the securities held in the portfolio. In instances where the entity has guaranteed, backed or otherwise enhanced the credit quality of a security, it is not primarily responsible for the issuer’s obligations but may be called upon to satisfy the issuer’s obligations. |
| | | | |
| Entity | | Percent | |
Assured Guaranty Municipal Corp. | | | 5.8 | % |
See accompanying Notes to Financial Statements which are an integral part of the financial statements.
30 Invesco Limited Term Municipal Income Fund
Statement of Assets and Liabilities
February 28, 2019
| | | | |
Assets: | |
Investments in securities, at value
(Cost $2,044,773,811) | | $ | 2,078,038,515 | |
| |
Cash | | | 1,060,816 | |
| |
Receivable for: | | | | |
Investments sold | | | 2,085,000 | |
| |
Fund shares sold | | | 2,191,409 | |
| |
Interest | | | 18,604,095 | |
| |
Investment for trustee deferred compensation and retirement plans | | | 227,872 | |
| |
Other assets | | | 85,617 | |
| |
Total assets | | | 2,102,293,324 | |
| |
|
Liabilities: | |
Payable for: | | | | |
Investments purchased | | | 25,692,984 | |
| |
Dividends | | | 1,198,530 | |
| |
Fund shares reacquired | | | 1,935,652 | |
| |
Accrued fees to affiliates | | | 559,183 | |
| |
Accrued trustees’ and officers’ fees and benefits | | | 7,674 | |
| |
Accrued other operating expenses | | | 186,169 | |
| |
Trustee deferred compensation and retirement plans | | | 255,161 | |
| |
Total liabilities | | | 29,835,353 | |
| |
Net assets applicable to shares outstanding | | $ | 2,072,457,971 | |
| |
|
Net assets consist of: | |
Shares of beneficial interest | | $ | 2,073,159,118 | |
| |
Distributable earnings | | | (701,147 | ) |
| |
| | $ | 2,072,457,971 | |
| |
|
Net Assets: | |
Class A | | $ | 1,033,140,377 | |
| |
Class A2 | | $ | 52,006,635 | |
| |
Class C | | $ | 95,673,847 | |
| |
Class Y | | $ | 677,051,229 | |
| |
Class R5 | | $ | 2,811,632 | |
| |
Class R6 | | $ | 211,774,251 | |
| |
| | | | |
Shares outstanding, no par value, with an unlimited number of shares authorized: | |
Class A | | | 91,870,379 | |
| |
Class A2 | | | 4,622,112 | |
| |
Class C | | | 8,511,344 | |
| |
Class Y | | | 60,241,124 | |
| |
Class R5 | | | 250,286 | |
| |
Class R6 | | | 18,846,002 | |
| |
Class A: | | | | |
Net asset value per share | | $ | 11.25 | |
| |
Maximum offering price per share
| | | | |
(Net asset value of $11.25 ÷ 97.50%) | | $ | 11.54 | |
| |
Class A2: | | | | |
Net asset value per share | | $ | 11.25 | |
| |
Maximum offering price per share
| | | | |
(Net asset value of $11.25 ÷ 99.00%) | | $ | 11.36 | |
| |
Class C: | | | | |
Net asset value and offering price per share | | $ | 11.24 | |
| |
Class Y: | | | | |
Net asset value and offering price per share | | $ | 11.24 | |
| |
Class R5: | | | | |
Net asset value and offering price per share | | $ | 11.23 | |
| |
Class R6: | | | | |
Net asset value and offering price per share | | $ | 11.24 | |
| |
See accompanying Notes to Financial Statements which are an integral part of the financial statements.
31 Invesco Limited Term Municipal Income Fund
Statement of Operations
For the year ended February 28, 2019
| | | | |
Investment income: | |
Interest | | $ | 60,526,671 | |
| |
| |
Expenses: | | | | |
Advisory fees | | | 5,071,605 | |
| |
Administrative services fees | | | 432,388 | |
| |
Custodian fees | | | 30,285 | |
| |
Distribution fees: | | | | |
Class A | | | 2,443,415 | |
| |
Class C | | | 2,404,715 | |
| |
Transfer agent fees — A, A2, C and Y | | | 1,739,736 | |
| |
Transfer agent fees — R5 | | | 7,897 | |
| |
Transfer agent fees — R6 | | | 32,585 | |
| |
Trustees’ and officers’ fees and benefits | | | 50,537 | |
| |
Registration and filing fees | | | 198,500 | |
| |
Reports to shareholders | | | 152,598 | |
| |
Professional services fees | | | 102,649 | |
| |
Other | | | 169,268 | |
| |
Total expenses | | | 12,836,178 | |
| |
Less: Expense offset arrangement(s) | | | (1,112 | ) |
| |
Net expenses | | | 12,835,066 | |
| |
Net investment income | | | 47,691,605 | |
| |
| |
Realized and unrealized gain (loss) from: | | | | |
Net realized gain (loss) from: | | | | |
Investment securities (includes net gains (losses) from securities sold to affiliates of $(12,801)) | | | (16,750,111 | ) |
| |
Futures contracts | | | 798,714 | |
| |
| | | (15,951,397 | ) |
| |
Change in net unrealized appreciation (depreciation) of Investment securities | | | 18,409,994 | |
| |
Net realized and unrealized gain | | | 2,458,597 | |
| |
Net increase in net assets resulting from operations | | $ | 50,150,202 | |
| |
See accompanying Notes to Financial Statements which are an integral part of the financial statements.
32 Invesco Limited Term Municipal Income Fund
Statement of Changes in Net Assets
For the years ended February 28, 2019 and 2018
| | | | | | | | |
| | | 2019 | | | 2018 | |
| |
Operations: | | | | | | | | |
Net investment income | | $ | 47,691,605 | | | $ | 46,131,092 | |
| |
Net realized gain (loss) | | | (15,951,397 | ) | | | (7,696,500 | ) |
| |
Change in net unrealized appreciation (depreciation) | | | 18,409,994 | | | | (15,635,824 | ) |
| |
Net increase in net assets resulting from operations | | | 50,150,202 | | | | 22,798,768 | |
| |
| | |
Distributions to shareholders from distributable earnings(1): | | | | | | | | |
Class A | | | (20,416,390 | ) | | | (19,489,858 | ) |
| |
Class A2 | | | (1,260,107 | ) | | | (1,285,499 | ) |
| |
Class C | | | (3,162,192 | ) | | | (3,413,701 | ) |
| |
Class Y | | | (16,188,721 | ) | | | (17,866,592 | ) |
| |
Class R5 | | | (203,638 | ) | | | (214,732 | ) |
| |
Class R6 | | | (4,500,235 | ) | | | (391,264 | ) |
| |
Total distributions to shareholders from distributable earnings | | | (45,731,283 | ) | | | (42,661,646 | ) |
| |
| | |
Share transactions–net: | | | | | | | | |
Class A | | | (17,752,621 | ) | | | (217,475,031 | ) |
| |
Class A2 | | | (5,646,483 | ) | | | (14,112,643 | ) |
| |
Class C | | | (209,049,185 | ) | | | (83,579,383 | ) |
| |
Class Y | | | (61,464,077 | ) | | | (57,071,914 | ) |
| |
Class R5 | | | (7,353,609 | ) | | | (569,342 | ) |
| |
Class R6 | | | 44,009,167 | | | | 168,297,902 | |
| |
Net increase (decrease) in net assets resulting from share transactions | | | (257,256,808 | ) | | | (204,510,411 | ) |
| |
Net increase (decrease) in net assets | | | (252,837,889 | ) | | | (224,373,289 | ) |
| |
| | |
Net assets: | | | | | | | | |
Beginning of year | | | 2,325,295,860 | | | | 2,549,669,149 | |
| |
End of year | | $ | 2,072,457,971 | | | $ | 2,325,295,860 | |
| |
| (1) | The Securities and Exchange Commission eliminated the requirement to disclose distribution components separately, except for tax return of capital. For the year ended February 28, 2018, distributions to shareholders from distributable earnings consisted of distributions from net investment income. |
See accompanying Notes to Financial Statements which are an integral part of the financial statements.
33 Invesco Limited Term Municipal Income Fund
Notes to Financial Statements
February 28, 2019
NOTE 1–Significant Accounting Policies
Invesco Limited Term Municipal Income Fund (the “Fund”) is a series portfolio of AIMTax-Exempt Funds (InvescoTax-Exempt Funds) (the “Trust”). The Trust is a Delaware statutory trust registered under the Investment Company Act of 1940, as amended (the “1940 Act”), as anopen-end series management investment company authorized to issue an unlimited number of shares of beneficial interest. Information presented in these financial statements pertains only to the Fund. Matters affecting the Fund or each class will be voted on exclusively by the shareholders of the Fund or each class.
The Fund’s investment objective is federaltax-exempt current income.
The Fund currently consists of six different classes of shares: Class A, Class A2, Class C, Class Y, Class R5 and Class R6. Class Y shares are available only to certain investors. Class A and Class A2 shares are sold with afront-end sales charge unless certain waiver criteria are met and under certain circumstances, load waived shares may be subject to contingent deferred sales charges (“CDSC”). Class C shares are sold with a CDSC. Class Y, Class R5 and Class R6 shares are sold at net asset value.
As of the close of business on October 30, 2002, Class A2 shares are closed to new investors.
The Fund is an investment company and accordingly follows the investment company accounting and reporting guidance in accordance with Financial Accounting Standards Board Accounting Standards Codification Topic 946,Financial Services - Investment Companies.
The following is a summary of the significant accounting policies followed by the Fund in the preparation of its financial statements.
| A. | Security Valuations-Securities, including restricted securities, are valued according to the following policy. |
Securities are fair valued using an evaluated quote provided by an independent pricing service approved by the Board of Trustees. Evaluated quotes provided by the pricing service may be determined without exclusive reliance on quoted prices, and may reflect appropriate factors such asinstitution-size trading in similar groups of securities, developments related to specific securities, dividend rate (for unlisted equities), yield (for debt obligations), quality, type of issue, coupon rate (for debt obligations), maturity (for debt obligations), individual trading characteristics and other market data. Pricing services generally value debt obligations assuming orderly transactions of institutional round lot size, but a fund may hold or transact in the same securities in smaller, odd lot sizes. Odd lots often trade at lower prices than institutional round lots. Debt obligations are subject to interest rate and credit risks. In addition, all debt obligations involve some risk of default with respect to interest and/or principal payments.
Securities for which market quotations either are not readily available or became unreliable are valued at fair value as determined in good faith by or under the supervision of the Trust’s officers following procedures approved by the Board of Trustees. Some of the factors which may be considered in determining fair value are fundamental analytical data relating to the investment; the nature and duration of any restrictions on transferability or disposition; trading in similar securities by the same issuer or comparable companies; relevant political, economic or issuer specific news; and other relevant factors under the circumstances.
The Fund may invest in securities that are subject to interest rate risk, meaning the risk that the prices will generally fall as interest rates rise and, conversely, the prices will generally rise as interest rates fall. Specific securities differ in their sensitivity to changes in interest rates depending on their individual characteristics. Changes in interest rates may result in increased market volatility, which may affect the value and/or liquidity of certain Fund investments.
Valuations change in response to many factors including the historical and prospective earnings of the issuer, the value of the issuer’s assets, general economic conditions, interest rates, investor perceptions and market liquidity. Because of the inherent uncertainties of valuation, the values reflected in the financial statements may materially differ from the value received upon actual sale of those investments.
| B. | Securities Transactions and Investment Income- Securities transactions are accounted for on a trade date basis. Realized gains or losses on sales are computed on the basis of specific identification of the securities sold. Interest income (net of withholding tax, if any) is recorded on the accrual basis from settlement date. Bond premiums and discounts are amortized and/or accreted over the lives of the respective securities.Pay-in-kind interest income andnon-cash dividend income received in the form of securitiesin-lieu of cash are recorded at the fair value of the securities received. Dividend income (net of withholding tax, if any) is recorded on theex-dividend date. |
The Fund may periodically participate in litigation related to Fund investments. As such, the Fund may receive proceeds from litigation settlements. Any proceeds received are included in the Statement of Operations as realized gain (loss) for investments no longer held and as unrealized gain (loss) for investments still held.
Brokerage commissions and mark ups are considered transaction costs and are recorded as an increase to the cost basis of securities purchased and/or a reduction of proceeds on a sale of securities. Such transaction costs are included in the determination of net realized and unrealized gain (loss) from investment securities reported in the Statement of Operations and the Statement of Changes in Net Assets and the net realized and unrealized gains (losses) on securities per share in the Financial Highlights. Transaction costs are included in the calculation of the Fund’s net asset value and, accordingly, they reduce the Fund’s total returns. These transaction costs are not considered operating expenses and are not reflected in net investment income reported in the Statement of Operations and the Statement of Changes in Net Assets, or the net investment income per share and the ratios of expenses and net investment income reported in the Financial Highlights, nor are they limited by any expense limitation arrangements between the Fund and the investment adviser.
The Fund allocates realized and unrealized capital gains and losses to a class based on the relative net assets of each class. The Fund allocates income to a class based on the relative value of the settled shares of each class.
| C. | Country Determination- For the purposes of making investment selection decisions and presentation in the Schedule of Investments, the investment adviser may determine the country in which an issuer is located and/or credit risk exposure based on various factors. These factors include the laws of the country under which the issuer is organized, where the issuer maintains a principal office, the country in which the issuer derives 50% or more of its total revenues and the country that has the primary market for the issuer’s securities, as well as other criteria. Among the other criteria that may be evaluated for making this determination are the country in which the issuer maintains 50% or more of its assets, the type of security, financial guarantees and enhancements, the nature of the collateral and the sponsor organization. Country of issuer and/or credit risk exposure has been determined to be the United States of America, unless otherwise noted. |
34 Invesco Limited Term Municipal Income Fund
| D. | Distributions- Distributions from net investment income, if any, are declared daily and paid monthly. Distributions from net realized capital gain, if any, are generally declared and paid annually and recorded on theex-dividend date. The Fund may elect to treat a portion of the proceeds from redemptions as distributions for federal income tax purposes. |
| E. | Federal Income Taxes- The Fund intends to comply with the requirements of Subchapter M of the Internal Revenue Code of 1986, as amended (the “Internal Revenue Code”), necessary to qualify as a regulated investment company and to distribute substantially all of the Fund’s taxable andtax-exempt earnings to shareholders. As such, the Fund will not be subject to federal income taxes on otherwise taxable income (including net realized capital gain) that is distributed to shareholders. Therefore, no provision for federal income taxes is recorded in the financial statements. |
The Fund recognizes the tax benefits of uncertain tax positions only when the position is more likely than not to be sustained. Management has analyzed the Fund’s uncertain tax positions and concluded that no liability for unrecognized tax benefits should be recorded related to uncertain tax positions. Management is not aware of any tax positions for which it is reasonably possible that the total amounts of unrecognized tax benefits will change materially in the next 12 months.
In addition, the Fund intends to invest in such municipal securities to allow it to qualify to pay shareholders “exempt-interest dividends”, as defined in the Internal Revenue Code.
The Fund files tax returns in the U.S. Federal jurisdiction and certain other jurisdictions. Generally, the Fund is subject to examinations by such taxing authorities for up to three years after the filing of the return for the tax period.
| F. | Expenses -Fees provided for under the Rule12b-1 plan of a particular class of the Fund are charged to the operations of such class. Transfer agency fees and expenses and other shareholder recordkeeping fees and expenses attributable to Class R5 and Class R6 are allocated to each share class based on relative net assets.Sub-accounting fees attributable to Class R5 are charged to the operations of the class. Transfer agency fees and expenses and other shareholder recordkeeping fees and expenses relating to all other classes are allocated among those classes based on relative net assets. All other expenses are allocated among the classes based on relative net assets. |
| G. | Accounting Estimates -The preparation of financial statements in conformity with accounting principles generally accepted in the United States of America (“GAAP”) requires management to make estimates and assumptions that affect the reported amounts of assets and liabilities at the date of the financial statements and the reported amounts of revenues and expenses during the reporting period including estimates and assumptions related to taxation. Actual results could differ from those estimates by a significant amount. In addition, the Fund monitors for material events or transactions that may occur or become known after theperiod-end date and before the date the financial statements are released to print. |
| H. | Indemnifications- Under the Trust’s organizational documents, each Trustee, officer, employee or other agent of the Fund is indemnified against certain liabilities that may arise out of the performance of their duties to the Fund. Additionally, in the normal course of business, the Fund enters into contracts, including the Fund’s servicing agreements, that contain a variety of indemnification clauses. The Fund’s maximum exposure under these arrangements is unknown as this would involve future claims that may be made against the Fund that have not yet occurred. The risk of material loss as a result of such indemnification claims is considered remote. |
| I. | Futures Contracts- The Fund may enter into futures contracts to manage exposure to interest rate, equity and market price movements and/or currency risks. A futures contract is an agreement between two parties (“Counterparties”) to purchase or sell a specified underlying security, currency or commodity (or delivery of a cash settlement price, in the case of an index future) for a fixed price at a future date. The Fund currently invests only in exchange-traded futures and they are standardized as to maturity date and underlying financial instrument. Initial margin deposits required upon entering into futures contracts are satisfied by the segregation of specific securities or cash as collateral at the futures commission merchant (broker). During the period the futures contracts are open, changes in the value of the contracts are recognized as unrealized gains or losses by recalculating the value of the contracts on a daily basis. Subsequent or variation margin payments are received or made depending upon whether unrealized gains or losses are incurred. These amounts are reflected as receivables or payables on the Statement of Assets and Liabilities. When the contracts are closed or expire, the Fund recognizes a realized gain or loss equal to the difference between the proceeds from, or cost of, the closing transaction and the Fund’s basis in the contract. The net realized gain (loss) and the change in unrealized gain (loss) on futures contracts held during the period is included on the Statement of Operations. The primary risks associated with futures contracts are market risk and the absence of a liquid secondary market. If the Fund were unable to liquidate a futures contract and/or enter into an offsetting closing transaction, the Fund would continue to be subject to market risk with respect to the value of the contracts and continue to be required to maintain the margin deposits on the futures contracts. Futures contracts have minimal Counterparty risk since the exchange’s clearinghouse, as Counterparty to all exchange-traded futures, guarantees the futures against default. Risks may exceed amounts recognized in the Statement of Assets and Liabilities. |
| J. | Other Risks- The value of, payment of interest on, repayment of principal for and the ability to sell a municipal security may be affected by constitutional amendments, legislative enactments, executive orders, administrative regulations, voter initiatives and the economics of the regions in which the issuers are located. |
Since many municipal securities are issued to finance similar projects, especially those relating to education, health care, transportation and utilities, conditions in those sectors can affect the overall municipal securities market and the Fund’s investments in municipal securities.
There is some risk that a portion or all of the interest received from certaintax-free municipal securities could become taxable as a result of determinations by the Internal Revenue Service.
NOTE 2–Advisory Fees and Other Fees Paid to Affiliates
The Trust has entered into a master investment advisory agreement with Invesco Advisers, Inc. (the “Adviser” or “Invesco”). Under the terms of the investment advisory agreement, the Fund accrues daily and pays monthly an advisory fee to the Adviser based on the annual rate of the Fund’s average daily net assets as follows:
| | | | |
| Average Net Assets | | Rate | |
First $500 million | | | 0.30% | |
Over $500 million up to and including $1 billion | | | 0.25% | |
Over $1 billion | | | 0.20% | |
35 Invesco Limited Term Municipal Income Fund
For the year ended February 28, 2019, the effective advisory fees incurred by the Fund was 0.23%.
Under the terms of a mastersub-advisory agreement between the Adviser and each of Invesco Asset Management Deutschland GmbH, Invesco Asset Management Limited, Invesco Asset Management (Japan) Limited, Invesco Hong Kong Limited, Invesco Senior Secured Management, Inc. and Invesco Canada Ltd. and separate sub-advisory agreements with Invesco Capital Management LLC and Invesco Asset Management (India) Private Limited (collectively, the “AffiliatedSub-Advisers”) the Adviser, not the Fund, will pay 40% of the fees paid to the Adviser to any such AffiliatedSub-Adviser(s) that provide(s) discretionary investment management services to the Fund based on the percentage of assets allocated to such AffiliatedSub-Adviser(s).
The Adviser has contractually agreed, through at least June 30, 2019, to waive advisory fees and/or reimburse expenses of all shares to the extent necessary to limit total annual fund operating expenses after fee waiver and/or expense reimbursement (excluding certain items discussed below) of Class A, Class A2, Class C, Class Y, Class R5 and Class R6 shares to 1.50%, 1.25%, 2.25%, 1.25%, 1.25% and 1.25%, respectively, of average daily net assets (the “expense limits”). In determining the Adviser’s obligation to waive advisory fees and/or reimburse expenses, the following expenses are not taken into account, and could cause the total annual fund operating expenses after fee waiver and/or expense reimbursement to exceed the numbers reflected above: (1) interest, facilities and maintenance fees; (2) taxes; (3) dividend expense on short sales; (4) extraordinary ornon-routine items, including litigation expenses; and (5) expenses that the Fund has incurred but did not actually pay because of an expense offset arrangement. Unless Invesco continues the fee waiver agreement, it will terminate on June 30, 2019. During its term, the fee waiver agreement cannot be terminated or amended to increase the expense limits or reduce the advisory fee waiver without approval of the Board of Trustees. The Adviser did not waive fees and/or reimburse expenses during the period under these expense limits.
The Trust has entered into a master administrative services agreement with Invesco pursuant to which the Fund has agreed to pay Invesco for certain administrative costs incurred in providing accounting services to the Fund. For the year ended February 28, 2019, expenses incurred under the agreement are shown in the Statement of Operations asAdministrative services fees. Also, Invesco has entered into asub-administration agreement whereby State Street Bank and Trust Company (“SSB”) serves as custodian and fund accountant and provides certain administrative services to the Fund.
The Trust has entered into a transfer agency and service agreement with Invesco Investment Services, Inc. (“IIS”) pursuant to which the Fund has agreed to pay IIS a fee for providing transfer agency and shareholder services to the Fund and reimburse IIS for certain expenses incurred by IIS in the course of providing such services. IIS may make payments to intermediaries that provide omnibus account services,sub-accounting services and/or networking services. All fees payable by IIS to intermediaries that provide omnibus account services orsub-accounting services are charged back to the Fund, subject to certain limitations approved by the Trust’s Board of Trustees. For the year ended February 28, 2019, expenses incurred under the agreement are shown in the Statement of Operations asTransfer agent fees.
The Trust has entered into master distribution agreements with Invesco Distributors, Inc. (“IDI”) to serve as the distributor for the Class A, Class A2, Class C, Class Y, Class R5 and Class R6 shares of the Fund. The Trust has adopted plans pursuant to Rule12b-1 under the 1940 Act with respect to the Fund’s Class A and Class C shares (collectively, the “Plans”). The Fund, pursuant to the Plan, pays IDI compensation at the annual rate of 0.25% of the Fund’s average daily net assets of Class A shares and 1.00% of the average daily net assets of Class C shares. The fees are accrued daily and paid monthly. Of the Rule12b-1 payment, up to 0.25% of the average daily net assets of the Class A and Class C shares may be paid to furnish continuing personal shareholder services to customers who purchase and own Class A and Class C shares of the Fund. Any amounts not paid as a service fee under the Plan would constitute an asset-based sales charge. Rules of the Financial Industry Regulatory Authority (“FINRA”) also impose a cap on the total sales charges, including asset-based sales charges, that may be paid by any class of shares of the Fund. For the year ended February 28, 2019, expenses incurred under the Plans are shown in the Statement of Operations asDistribution fees.
Front-end sales commissions and CDSC (collectively, the “sales charges”) are not recorded as expenses of the Fund.Front-end sales commissions are deducted from proceeds from the sales of Fund shares prior to investment in Class A and Class A2 shares of the Fund. CDSC are deducted from redemption proceeds prior to remittance to the shareholder. During the year ended February 28, 2019, IDI advised the Fund that IDI retained $102,025 and $197 infront-end sales commissions from the sale of Class A and Class A2 shares, respectively, and $140,566, $0 and $5,358 from Class A, Class A2 and Class C shares, respectively, for CDSC imposed upon redemptions by shareholders.
Certain officers and trustees of the Trust are officers and directors of the Adviser, IIS and/or IDI.
NOTE 3–Additional Valuation Information
GAAP defines fair value as the price that would be received to sell an asset or paid to transfer a liability in an orderly transaction between market participants at the measurement date, under current market conditions. GAAP establishes a hierarchy that prioritizes the inputs to valuation methods, giving the highest priority to readily available unadjusted quoted prices in an active market for identical assets (Level 1) and the lowest priority to significant unobservable inputs (Level 3), generally when market prices are not readily available or are unreliable. Based on the valuation inputs, the securities or other investments are tiered into one of three levels. Changes in valuation methods may result in transfers in or out of an investment’s assigned level:
| | Level 1 – | Prices are determined using quoted prices in an active market for identical assets. |
| | Level 2 – | Prices are determined using other significant observable inputs. Observable inputs are inputs that other market participants may use in pricing a security. These may include quoted prices for similar securities, interest rates, prepayment speeds, credit risk, yield curves, loss severities, default rates, discount rates, volatilities and others. |
| | Level 3 – | Prices are determined using significant unobservable inputs. In situations where quoted prices or observable inputs are unavailable (for example, when there is little or no market activity for an investment at the end of the period), unobservable inputs may be used. Unobservable inputs reflect the Fund’s own assumptions about the factors market participants would use in determining fair value of the securities or instruments and would be based on the best available information. |
As of February 28, 2019, all of the securities in this Fund were valued based on Level 2 inputs (see the Schedule of Investments for security categories). The level assigned to the securities valuations may not be an indication of the risk or liquidity associated with investing in those securities. Because of the inherent uncertainties of valuation, the values reflected in the financial statements may materially differ from the value received upon actual sale of those investments.
36 Invesco Limited Term Municipal Income Fund
NOTE 4–Derivative Investments
The Fund may enter into an International Swaps and Derivatives Association Master Agreement (“ISDA Master Agreement”) under which a fund may trade OTC derivatives. An OTC transaction entered into under an ISDA Master Agreement typically involves a collateral posting arrangement, payment netting provisions andclose-out netting provisions. These netting provisions allow for reduction of credit risk through netting of contractual obligations. The enforceability of the netting provisions of the ISDA Master Agreement depends on the governing law of the ISDA Master Agreement, among other factors.
For financial reporting purposes, the Fund does not offset OTC derivative assets or liabilities that are subject to ISDA Master Agreements in the Statement of Assets and Liabilities.
Effect of Derivative Investments for the year ended February 28, 2019
The table below summarizes the gains on derivative investments, detailed by primary risk exposure, recognized in earnings during the period:
| | | | |
| | | Location of Gain on
Statement of Operations | |
| | | Interest Rate Risk | |
Realized Gain: | | | | |
Futures contracts | | | $798,714 | |
Total | | | $798,714 | |
The table below summarizes the four month average notional value of derivatives held during the period.
| | |
| | | Futures
Contracts |
Average notional value | | $51,863,645 |
NOTE 5–Security Transactions with Affiliated Funds
The Fund is permitted to purchase or sell securities from or to certain other Invesco Funds under specified conditions outlined in procedures adopted by the Board of Trustees of the Trust. The procedures have been designed to ensure that any purchase or sale of securities by the Fund from or to another fund or portfolio that is or could be considered an affiliate by virtue of having a common investment adviser (or affiliated investment advisers), common Trustees and/or common officers complies with Rule17a-7 of the 1940 Act. Further, as defined under the procedures, each transaction is effected at the current market price. Pursuant to these procedures, for the year ended February 28, 2019, the Fund engaged in securities purchases of $330,851,992 and securities sales of $347,498,932, which resulted in net realized gains (losses) of $(12,801).
NOTE 6–Expense Offset Arrangement(s)
The expense offset arrangement is comprised of transfer agency credits which result from balances in demand deposit accounts used by the transfer agent for clearing shareholder transactions. For the year ended February 28, 2019, the Fund received credits from this arrangement, which resulted in the reduction of the Fund’s total expenses of $1,112.
NOTE 7–Trustees’ and Officers’ Fees and Benefits
Trustees’ and Officers’ Fees and Benefits include amounts accrued by the Fund to pay remuneration to certain Trustees and Officers of the Fund. Trustees have the option to defer compensation payable by the Fund, andTrustees’ and Officers’ Fees and Benefits also include amounts accrued by the Fund to fund such deferred compensation amounts. Those Trustees who defer compensation have the option to select various Invesco Funds in which their deferral accounts shall be deemed to be invested. Finally, certain current Trustees were eligible to participate in a retirement plan that provided for benefits to be paid upon retirement to Trustees over a period of time based on the number of years of service. The Fund may have certain former Trustees who also participate in a retirement plan and receive benefits under such plan.Trustees’ and Officers’ Fees and Benefits include amounts accrued by the Fund to fund such retirement benefits. Obligations under the deferred compensation and retirement plans represent unsecured claims against the general assets of the Fund.
NOTE 8–Cash Balances
The Fund is permitted to temporarily carry a negative or overdrawn balance in its account with SSB, the custodian bank. Such balances, if any atperiod-end, are shown in the Statement of Assets and Liabilities under the payable captionAmount due custodian. To compensate the custodian bank for such overdrafts, the overdrawn Fund may either (1) leave funds as a compensating balance in the account so the custodian bank can be compensated by earning the additional interest; or (2) compensate by paying the custodian bank at a rate agreed upon by the custodian bank and Invesco, not to exceed the contractually agreed upon rate.
NOTE 9–Distributions to Shareholders and Tax Components of Net Assets
Tax Character of Distributions to Shareholders Paid During the Fiscal Years Ended February 28, 2019 and 2018
| | | | |
| | | 2019 | | 2018 |
Ordinary income –tax-exempt | | $45,731,283 | | $42,661,646 |
Total distributions | | $45,731,283 | | $42,661,646 |
37 Invesco Limited Term Municipal Income Fund
Tax Components of Net Assets atPeriod-End:
| | | | |
| | | 2019 | |
| |
Undistributed ordinary income | | $ | 6,103,545 | |
| |
Net unrealized appreciation - investments | | | 33,767,686 | |
| |
Temporary book/tax differences | | | (223,104 | ) |
| |
Capital loss carryforward | | | (40,349,274 | ) |
| |
Shares of beneficial interest | | | 2,073,159,118 | |
| |
Total net assets | | $ | 2,072,457,971 | |
| |
The difference between book-basis and tax-basis unrealized appreciation (depreciation) is due to differences in the timing of recognition of gains and losses on investments for tax and book purposes. The Fund’s net unrealized appreciation difference is attributable primarily to book to tax accretion differences and wash sales.
The temporary book/tax differences are a result of timing differences between book and tax recognition of income and/or expenses. The Fund’s temporary book/tax differences are the result of the trustee deferral of compensation and retirement plan benefits.
Capital loss carryforward is calculated and reported as of a specific date. Results of transactions and other activity after that date may affect the amount of capital loss carryforward actually available for the Fund to utilize. Capital losses generated in years beginning after December 22, 2010 can be carried forward for an unlimited period, whereas previous losses expire in eight tax years. Capital losses with an expiration period may not be used to offset capital gains until all net capital losses without an expiration date have been utilized. Capital loss carryforwards with no expiration date will retain their character as either short-term or long-term capital losses instead of as short-term capital losses as under prior law. The ability to utilize capital loss carryforwards in the future may be limited under the Internal Revenue Code and related regulations based on the results of future transactions.
The Fund has a capital loss carryforward as of February 28, 2019, as follows:
| | | | | | | | | | | | |
| Capital Loss Carryforward* | |
| |
| Expiration | | Short-Term | | | Long-Term | | | Total | |
| |
Not subject to expiration | | | $22,557,214 | | | | $17,792,060 | | | | $40,349,274 | |
| |
| * | Capital loss carryforward as of the date listed above is reduced for limitations, if any, to the extent required by the Internal Revenue Code and may be further limited depending upon a variety of factors, including the realization of net unrealized gains or losses as of the date of any reorganization. |
NOTE 10–Investment Transactions
The aggregate amount of investment securities (other than short-term securities, U.S. Treasury obligations and money market funds, if any) purchased and sold by the Fund during the year ended February 28, 2019 was $840,584,347 and $1,104,125,248, respectively. Cost of investments, including any derivatives, on a tax basis includes the adjustments for financial reporting purposes as of the most recently completed federal income tax reportingperiod-end.
| | | | |
| Unrealized Appreciation (Depreciation) of Investments on a Tax Basis | |
| |
Aggregate unrealized appreciation of investments | | | $35,118,678 | |
| |
Aggregate unrealized (depreciation) of investments | | | (1,350,992 | ) |
| |
Net unrealized appreciation of investments | | | $33,767,686 | |
| |
Cost of investments for tax purposes is $2,044,270,829.
NOTE 11–Reclassification of Permanent Differences
Primarily as a result of differing book/tax treatment of taxable income, on February 28, 2019, undistributed net investment income was decreased by $42,079, undistributed net realized gain (loss) was increased by $24,109 and shares of beneficial interest was increased by $17,970. This reclassification had no effect on the net assets of the Fund.
NOTE 12–Share Information
| | | | | | | | | | | | | | | | |
| | | Summary of Share Activity | |
| | | Years ended February 28, | |
| | | 2019(a) | | | 2018 | |
| | | Shares | | | Amount | | | Shares | | | Amount | |
Sold: | | | | | | | | | | | | | | | | |
Class A | | | 33,312,882 | | | $ | 372,772,646 | | | | 27,900,934 | | | $ | 317,089,285 | |
Class A2 | | | 73,268 | | | | 820,916 | | | | 689,094 | | | | 7,853,213 | |
Class C | | | 3,184,940 | | | | 35,591,148 | | | | 9,704,662 | | | | 110,250,801 | |
Class Y | | | 31,143,144 | | | | 347,963,046 | | | | 49,052,104 | | | | 556,104,940 | |
Class R5 | | | 610,874 | | | | 6,821,354 | | | | 263,724 | | | | 2,997,331 | |
Class R6 | | | 9,077,349 | | | | 101,404,114 | | | | 15,359,959 | | | | 173,353,027 | |
38 Invesco Limited Term Municipal Income Fund
| | | | | | | | | | | | | | | | |
| | | Summary of Share Activity | |
| |
| | | Years ended February 28, | |
| | | 2019(a) | | | 2018 | |
| | | Shares | | | Amount | | | Shares | | | Amount | |
| |
| | | | |
Issued as reinvestment of dividends: | | | | | | | | | | | | | | | | |
Class A | | | 1,415,181 | | | | 15,828,220 | | | | 1,306,796 | | | | 14,825,623 | |
| |
Class A2 | | | 81,419 | | | | 910,624 | | | | 88,188 | | | | 1,001,546 | |
| |
Class C | | | 238,764 | | | | 2,667,374 | | | | 262,498 | | | | 2,976,711 | |
| |
Class Y | | | 932,204 | | | | 10,418,898 | | | | 991,637 | | | | 11,246,297 | |
| |
Class R5 | | | 2,996 | | | | 33,467 | | | | 3,410 | | | | 38,556 | |
| |
Class R6 | | | 358,122 | | | | 4,002,470 | | | | 34,218 | | | | 383,812 | |
| |
| | | | |
Reacquired: | | | | | | | | | | | | | | | | |
Class A | | | (36,335,835 | ) | | | (406,353,487 | ) | | | (48,436,602 | ) | | | (549,389,939 | ) |
| |
Class A2 | | | (659,840 | ) | | | (7,378,023 | ) | | | (2,023,437 | ) | | | (22,967,402 | ) |
| |
Class C | | | (22,111,553 | ) | | | (247,307,707 | ) | | | (17,347,674 | ) | | | (196,806,895 | ) |
| |
Class Y | | | (37,607,728 | ) | | | (419,846,021 | ) | | | (55,160,963 | ) | | | (624,423,151 | ) |
| |
Class R5 | | | (1,276,877 | ) | | | (14,208,430 | ) | | | (317,613 | ) | | | (3,605,229 | ) |
| |
Class R6 | | | (5,499,370 | ) | | | (61,397,417 | ) | | | (484,276 | ) | | | (5,438,937 | ) |
| |
Net increase (decrease) in share activity | | | (23,060,060 | ) | | | $(257,256,808 | ) | | | (18,113,341 | ) | | | $(204,510,411 | ) |
| |
| (a) | There are entities that are record owners of more than 5% of the outstanding shares of the Fund and in the aggregate own 63% of the outstanding shares of the Fund. IDI has an agreement with these entities to sell Fund shares. The Fund, Invesco and/or Invesco affiliates may make payments to these entities, which are considered to be related to the Fund, for providing services to the Fund, Invesco and/or Invesco affiliates including but not limited to services such as securities brokerage, distribution, third party record keeping and account servicing. The Fund has no knowledge as to whether all or any portion of the shares owned of record by these entities are also owned beneficially. |
NOTE 13–Financial Highlights
The following schedule presents financial highlights for a share of the Fund outstanding throughout the periods indicated.
| | | | | | | | | | | | | | | | | | | | | | | | | | | | | | | | | | | | | | | | | | | | | | | | | | | | | | | | | | | | |
| | | Net asset
value,
beginning
of period | | Net
investment
income(a) | | Net gains
(losses)
on securities
(both
realized and
unrealized) | | Total from
investment
operations | | Dividends
from net
investment
income | | Net asset
value, end
of period | | Total
return (b) | | Net assets,
end of period (000’s omitted) | | Ratio of
expenses
to average
net assets
with fee waivers
and/or expenses
absorbed | | Ratio of
expenses
to average net
assets without
fee waivers
and/or expenses
absorbed | | Ratio of net
investment
income
to average
net assets | | Portfolio
turnover (c) |
Class A | | | | | | | | | | | | | | | | | | | | | | | | | | | | | | | | | | | | | | | | | | | | | | | | | | | | | | | | | | | | |
Year ended 02/28/19 | | | | $11.22 | | | | | $0.24 | | | | | $0.02 | | | | | $0.26 | | | | | $(0.23 | ) | | | | $11.25 | | | | | 2.38 | % | | | | $1,033,140 | | | | | 0.63 | %(d) | | | | 0.63 | %(d) | | | | 2.17 | %(d) | | | | 45 | % |
Year ended 02/28/18 | | | | 11.31 | | | | | 0.21 | | | | | (0.10 | ) | | | | 0.11 | | | | | (0.20 | ) | | | | 11.22 | | | | | 0.93 | | | | | 1,048,359 | | | | | 0.62 | | | | | 0.62 | | | | | 1.86 | | | | | 20 | |
Year ended 02/28/17 | | | | 11.57 | | | | | 0.21 | | | | | (0.27 | ) | | | | (0.06 | ) | | | | (0.20 | ) | | | | 11.31 | | | | | (0.51 | ) | | | | 1,274,653 | | | | | 0.60 | | | | | 0.60 | | | | | 1.79 | | | | | 29 | |
Year ended 02/29/16 | | | | 11.62 | | | | | 0.24 | | | | | (0.04 | ) | | | | 0.20 | | | | | (0.25 | ) | | | | 11.57 | | | | | 1.76 | | | | | 1,183,160 | | | | | 0.61 | | | | | 0.61 | | | | | 2.14 | | | | | 13 | |
Year ended 02/28/15 | | | | 11.59 | | | | | 0.31 | | | | | 0.04 | | | | | 0.35 | | | | | (0.32 | ) | | | | 11.62 | | | | | 3.06 | | | | | 942,344 | | | | | 0.63 | | | | | 0.63 | | | | | 2.67 | | | | | 15 | |
Class A2 | | | | | | | | | | | | | | | | | | | | | | | | | | | | | | | | | | | | | | | | | | | | | | | | | | | | | | | | | | | | |
Year ended 02/28/19 | | | | 11.22 | | | | | 0.27 | | | | | 0.02 | | | | | 0.29 | | | | | (0.26 | ) | | | | 11.25 | | | | | 2.64 | | | | | 52,007 | | | | | 0.38 | (d) | | | | 0.38 | (d) | | | | 2.42 | (d) | | | | 45 | |
Year ended 02/28/18 | | | | 11.31 | | | | | 0.24 | | | | | (0.11 | ) | | | | 0.13 | | | | | (0.22 | ) | | | | 11.22 | | | | | 1.18 | | | | | 57,533 | | | | | 0.37 | | | | | 0.37 | | | | | 2.11 | | | | | 20 | |
Year ended 02/28/17 | | | | 11.58 | | | | | 0.23 | | | | | (0.27 | ) | | | | (0.04 | ) | | | | (0.23 | ) | | | | 11.31 | | | | | (0.35 | ) | | | | 72,115 | | | | | 0.35 | | | | | 0.35 | | | | | 2.04 | | | | | 29 | |
Year ended 02/29/16 | | | | 11.63 | | | | | 0.27 | | | | | (0.04 | ) | | | | 0.23 | | | | | (0.28 | ) | | | | 11.58 | | | | | 2.02 | | | | | 93,226 | | | | | 0.36 | | | | | 0.36 | | | | | 2.39 | | | | | 13 | |
Year ended 02/28/15 | | | | 11.61 | | | | | 0.34 | | | | | 0.03 | | | | | 0.37 | | | | | (0.35 | ) | | | | 11.63 | | | | | 3.23 | | | | | 91,972 | | | | | 0.38 | | | | | 0.38 | | | | | 2.92 | | | | | 15 | |
Class C | | | | | | | | | | | | | | | | | | | | | | | | | | | | | | | | | | | | | | | | | | | | | | | | | | | | | | | | | | | | |
Year ended 02/28/19 | | | | 11.21 | | | | | 0.16 | | | | | 0.02 | | | | | 0.18 | | | | | (0.15 | ) | | | | 11.24 | | | | | 1.61 | | | | | 95,674 | | | | | 1.38 | (d) | | | | 1.38 | (d) | | | | 1.42 | (d) | | | | 45 | |
Year ended 02/28/18 | | | | 11.30 | | | | | 0.13 | | | | | (0.11 | ) | | | | 0.02 | | | | | (0.11 | ) | | | | 11.21 | | | | | 0.18 | | | | | 304,861 | | | | | 1.37 | | | | | 1.37 | | | | | 1.11 | | | | | 20 | |
Year ended 02/28/17 | | | | 11.56 | | | | | 0.12 | | | | | (0.26 | ) | | | | (0.14 | ) | | | | (0.12 | ) | | | | 11.30 | | | | | (1.26 | ) | | | | 390,826 | | | | | 1.35 | | | | | 1.35 | | | | | 1.04 | | | | | 29 | |
Year ended 02/29/16 | | | | 11.62 | | | | | 0.16 | | | | | (0.06 | ) | | | | 0.10 | | | | | (0.16 | ) | | | | 11.56 | | | | | 0.91 | | | | | 264,598 | | | | | 1.36 | | | | | 1.36 | | | | | 1.39 | | | | | 13 | |
Year ended 02/28/15 | | | | 11.59 | | | | | 0.22 | | | | | 0.04 | | | | | 0.26 | | | | | (0.23 | ) | | | | 11.62 | | | | | 2.30 | | | | | 91,977 | | | | | 1.38 | | | | | 1.38 | | | | | 1.92 | | | | | 15 | |
Class Y | | | | | | | | | | | | | | | | | | | | | | | | | | | | | | | | | | | | | | | | | | | | | | | | | | | | | | | | | | | | |
Year ended 02/28/19 | | | | 11.21 | | | | | 0.27 | | | | | 0.02 | | | | | 0.29 | | | | | (0.26 | ) | | | | 11.24 | | | | | 2.64 | | | | | 677,051 | | | | | 0.38 | (d) | | | | 0.38 | (d) | | | | 2.42 | (d) | | | | 45 | |
Year ended 02/28/18 | | | | 11.30 | | | | | 0.24 | | | | | (0.11 | ) | | | | 0.13 | | | | | (0.22 | ) | | | | 11.21 | | | | | 1.18 | | | | | 737,222 | | | | | 0.37 | | | | | 0.37 | | | | | 2.11 | | | | | 20 | |
Year ended 02/28/17 | | | | 11.56 | | | | | 0.23 | | | | | (0.26 | ) | | | | (0.03 | ) | | | | (0.23 | ) | | | | 11.30 | | | | | (0.27 | ) | | | | 801,182 | | | | | 0.35 | | | | | 0.35 | | | | | 2.04 | | | | | 29 | |
Year ended 02/29/16 | | | | 11.61 | | | | | 0.27 | | | | | (0.04 | ) | | | | 0.23 | | | | | (0.28 | ) | | | | 11.56 | | | | | 2.02 | | | | | 674,461 | | | | | 0.36 | | | | | 0.36 | | | | | 2.39 | | | | | 13 | |
Year ended 02/28/15 | | | | 11.58 | | | | | 0.34 | | | | | 0.04 | | | | | 0.38 | | | | | (0.35 | ) | | | | 11.61 | | | | | 3.32 | | | | | 375,156 | | | | | 0.38 | | | | | 0.38 | | | | | 2.92 | | | | | 15 | |
Class R5 | | | | | | | | | | | | | | | | | | | | | | | | | | | | | | | | | | | | | | | | | | | | | | | | | | | | | | | | | | | | |
Year ended 02/28/19 | | | | 11.21 | | | | | 0.27 | | | | | 0.01 | | | | | 0.28 | | | | | (0.26 | ) | | | | 11.23 | | | | | 2.54 | | | | | 2,812 | | | | | 0.38 | (d) | | | | 0.38 | (d) | | | | 2.42 | (d) | | | | 45 | |
Year ended 02/28/18 | | | | 11.30 | | | | | 0.24 | | | | | (0.11 | ) | | | | 0.13 | | | | | (0.22 | ) | | | | 11.21 | | | | | 1.18 | | | | | 10,237 | | | | | 0.37 | | | | | 0.37 | | | | | 2.11 | | | | | 20 | |
Year ended 02/28/17 | | | | 11.57 | | | | | 0.23 | | | | | (0.27 | ) | | | | (0.04 | ) | | | | (0.23 | ) | | | | 11.30 | | | | | (0.33 | ) | | | | 10,893 | | | | | 0.35 | | | | | 0.35 | | | | | 2.04 | | | | | 29 | |
Year ended 02/29/16 | | | | 11.62 | | | | | 0.28 | | | | | (0.05 | ) | | | | 0.23 | | | | | (0.28 | ) | | | | 11.57 | | | | | 2.06 | | | | | 16,076 | | | | | 0.31 | | | | | 0.31 | | | | | 2.44 | | | | | 13 | |
Year ended 02/28/15 | | | | 11.59 | | | | | 0.34 | | | | | 0.04 | | | | | 0.38 | | | | | (0.35 | ) | | | | 11.62 | | | | | 3.34 | | | | | 14,216 | | | | | 0.36 | | | | | 0.36 | | | | | 2.94 | | | | | 15 | |
39 Invesco Limited Term Municipal Income Fund
| | | | | | | | | | | | | | | | | | | | | | | | | | | | | | | | | | | | | | | | | | | | | | | | | | | | | | | | | | | | |
| | | Net asset
value,
beginning
of period | | Net
investment
income(a) | | Net gains
(losses)
on securities
(both
realized and
unrealized) | | Total from
investment
operations | | Dividends
from net
investment
income | | Net asset
value, end
of period | | Total
return (b) | | Net assets,
end of period (000’s omitted) | | Ratio of
expenses
to average
net assets
with fee waivers
and/or expenses
absorbed | | Ratio of
expenses
to average net
assets without
fee waivers
and/or expenses
absorbed | | Ratio of net
investment
income
to average
net assets | | Portfolio
turnover (c) |
Class R6 | | | | | | | | | | | | | | | | | | | | | | | | | | | | | | | | | | | | | | | | | | | | | | | | | | | | | | | | | | | | |
Year ended 02/28/19 | | | | $11.21 | | | | | $0.28 | | | | | $0.02 | | | | | $0.30 | | | | | $(0.27 | ) | | | | $11.24 | | | | | 2.71 | % | | | | $211,774 | | | | | 0.30 | %(d) | | | | 0.30 | %(d) | | | | 2.50 | %(d) | | | | 45 | % |
Year ended 02/28/18(e) | | | | 11.30 | | | | | 0.22 | | | | | (0.10 | ) | | | | 0.12 | | | | | (0.21 | ) | | | | 11.21 | | | | | 1.10 | | | | | 167,084 | | | | | 0.29 | (f) | | | | 0.29 | (f) | | | | 2.19 | (f) | | | | 20 | |
| (a) | Calculated using average shares outstanding. |
| (b) | Includes adjustments in accordance with accounting principles generally accepted in the United States of America and as such, the net asset value for financial reporting purposes and the returns based upon those net asset values may differ from the net asset value and returns for shareholder transactions. Does not include sales charges and is not annualized for periods less than one year, if applicable. |
| (c) | Portfolio turnover is calculated at the fund level and is not annualized for periods less than one year, if applicable. |
| (d) | Ratios are based on average daily net assets (000’s omitted) of $977,366, $54,029, $240,472, $693,267 , $8,903 and $186,765 for Class A, Class A2, Class C, Class Y, Class R5 and Class R6 shares, respectively. |
| (e) | Commencement date of April 4, 2017 for Class R6 Shares. |
40 Invesco Limited Term Municipal Income Fund
Report of Independent Registered Public Accounting Firm
To the Board of Trustees of AIMTax-Exempt Funds (InvescoTax-Exempt Funds)
and Shareholders of Invesco Limited Term Municipal Income Fund:
Opinion on the Financial Statements
We have audited the accompanying statement of assets and liabilities, including the schedule of investments, of Invesco Limited Term Municipal Income Fund (one of the funds constituting AIMTax-Exempt Funds (InvescoTax-Exempt Funds), hereafter referred to as the “Fund”) as of February 28, 2019, the related statement of operations for the year ended February 28, 2019, the statement of changes in net assets for each of the two years in the period ended February 28, 2019, including the related notes, and the financial highlights for each of the periods indicated therein (collectively referred to as the “financial statements”). In our opinion, the financial statements present fairly, in all material respects, the financial position of the Fund as of February 28, 2019, the results of its operations for the year then ended, the changes in its net assets for each of the two years in the period ended February 28, 2019 and the financial highlights for each of the periods indicated therein in conformity with accounting principles generally accepted in the United States of America.
Basis for Opinion
These financial statements are the responsibility of the Fund’s management. Our responsibility is to express an opinion on the Fund’s financial statements based on our audits. We are a public accounting firm registered with the Public Company Accounting Oversight Board (United States) (PCAOB) and are required to be independent with respect to the Fund in accordance with the U.S. federal securities laws and the applicable rules and regulations of the Securities and Exchange Commission and the PCAOB.
We conducted our audits of these financial statements in accordance with the standards of the PCAOB. Those standards require that we plan and perform the audit to obtain reasonable assurance about whether the financial statements are free of material misstatement, whether due to error or fraud.
Our audits included performing procedures to assess the risks of material misstatement of the financial statements, whether due to error or fraud, and performing procedures that respond to those risks. Such procedures included examining, on a test basis, evidence regarding the amounts and disclosures in the financial statements. Our audits also included evaluating the accounting principles used and significant estimates made by management, as well as evaluating the overall presentation of the financial statements. Our procedures included confirmation of securities owned as of February 28, 2019 by correspondence with the custodian and brokers; when replies were not received from brokers, we performed other auditing procedures. We believe that our audits provide a reasonable basis for our opinion.
PricewaterhouseCoopers LLP
Houston, TX
April 29, 2019
We have served as the auditor of one or more of the investment companies in the Invesco group of investment companies since at least 1995. We have not been able to determine the specific year we began serving as auditor.
41 Invesco Limited Term Municipal Income Fund
Calculating your ongoing Fund expenses
Example
As a shareholder of the Fund, you incur two types of costs: (1) transaction costs, which may include sales charges (loads) on purchase payments or contingent deferred sales charges on redemptions, if any; and (2) ongoing costs, including management fees, distribution and/or service(12b-1) fees, and other Fund expenses. This example is intended to help you understand your ongoing costs (in dollars) of investing in the Fund and to compare these costs with ongoing costs of investing in other mutual funds. The example is based on an investment of $1,000 invested at the beginning of the period and held for the entire period September 1, 2018 through February 28, 2019.
Actual expenses
The table below provides information about actual account values and actual expenses. You may use the information in this table, together with the amount you invested, to estimate the expenses that you paid over the period. Simply divide your account value by $1,000 (for example, an $8,600 account value divided by $1,000 = 8.6), then multiply the result by the number in the table under the heading entitled “Actual Expenses Paid During Period” to estimate the expenses you paid on your account during this period.
Hypothetical example for comparison purposes
The table below also provides information about hypothetical account values and hypothetical expenses based on the Fund’s actual expense ratio and an assumed rate of return of 5% per year before expenses, which is not the Fund’s actual return.
The hypothetical account values and expenses may not be used to estimate the actual ending account balance or expenses you paid for the period. You may use this information to compare the ongoing costs of investing in the Fund and other funds. To do so, compare this 5% hypothetical example with the 5% hypothetical examples that appear in the shareholder reports of the other funds.
Please note that the expenses shown in the table are meant to highlight your ongoing costs only and do not reflect any transaction costs, such as sales charges (loads) on purchase payments or contingent deferred sales charges on redemptions, if any. Therefore, the hypothetical information is useful in comparing ongoing costs only, and will not help you determine the relative total costs of owning different funds. In addition, if these transaction costs were included, your costs would have been higher.
| | | | | | | | | | | | | | | | | | | | | | | | |
| | | Beginning
Account Value
(09/01/18) | | | ACTUAL | | | HYPOTHETICAL (5% annual return before expenses) | | | Annualized
Expense
Ratio | |
| | Ending
Account Value
(02/28/19)1 | | | Expenses
Paid During
Period2 | | | Ending
Account Value
(02/28/19) | | | Expenses
Paid During
Period2 | |
| Class A | | | $1,000.00 | | | | $1,015.40 | | | | $3.15 | | | | $1,021.67 | | | | $3.16 | | | | 0.63 | % |
| Class A2 | | | 1,000.00 | | | | 1,016.60 | | | | 1.90 | | | | 1,022.91 | | | | 1.91 | | | | 0.38 | |
| Class C | | | 1,000.00 | | | | 1,011.60 | | | | 6.88 | | | | 1,017.95 | | | | 6.90 | | | | 1.38 | |
| Class Y | | | 1,000.00 | | | | 1,016.60 | | | | 1.90 | | | | 1,022.91 | | | | 1.91 | | | | 0.38 | |
| Class R5 | | | 1,000.00 | | | | 1,015.70 | | | | 1.90 | | | | 1,022.91 | | | | 1.91 | | | | 0.38 | |
| Class R6 | | | 1,000.00 | | | | 1,017.00 | | | | 1.55 | | | | 1,023.26 | | | | 1.56 | | | | 0.31 | |
| 1 | The actual ending account value is based on the actual total return of the Fund for the period September 1, 2018 through February 28, 2019, after actual expenses and will differ from the hypothetical ending account value which is based on the Fund’s expense ratio and a hypothetical annual return of 5% before expenses. |
| 2 | Expenses are equal to the Fund’s annualized expense ratio as indicated above multiplied by the average account value over the period, multiplied by 181/365 to reflect the most recent fiscal half year. |
42 Invesco Limited Term Municipal Income Fund
Tax Information
Form1099-DIV, Form1042-S and other year-end tax information provide shareholders with actual calendar year amounts that should be included in their tax returns. Shareholders should consult their tax advisors.
The following distribution information is being provided as required by the Internal Revenue Code or to meet a specific state’s requirement.
The Fund designates the following amounts or, if subsequently determined to be different, the maximum amount allowable for its fiscal year ended February 28, 2019:
| | | | | | |
Federal and State Income Tax | | | |
Qualified Dividend Income* | | 0% | | | | |
Corporate Dividends Received Deduction* | | 0% | | | | |
U.S. Treasury Obligations* | | 0% | | | | |
Tax-Exempt Interest Dividends* | | 100% | | | | |
| | * | The above percentages are based on ordinary income dividends paid to shareholders during the Fund’s fiscal year. |
43 Invesco Limited Term Municipal Income Fund
Trustees and Officers
The address of each trustee and officer is AIMTax-Exempt Funds (InvescoTax-Exempt Funds) (the “Trust”), 11 Greenway Plaza, Suite 1000, Houston, Texas 77046-1173. The trustees serve for the life of the Trust, subject to their earlier death, incapacitation, resignation, retirement or removal as more specifically provided in the Trust’s organizational documents. Each officer serves for a one year term or until their successors are elected and qualified. Column two below includes length of time served with predecessor entities, if any.
| | | | | | | | |
Name, Year of Birth and
Position(s) Held with the Trust | | Trustee and/
or Officer Since | | Principal Occupation(s) During Past 5 Years | | Number of
Funds in Fund
Complex
Overseen by
Trustee | | Other Directorship(s)
Held by Trustee During
Past 5 Years |
| Interested Persons | | | | | | | | |
Martin L. Flanagan1- 1960 Trustee and Vice Chair | | 2007 | | Executive Director, Chief Executive Officer and President, Invesco Ltd. (ultimate parent of Invesco and a global investment management firm); Trustee and Vice Chair, The Invesco Funds; Vice Chair, Investment Company Institute; and Member of Executive Board, SMU Cox School of Business Formerly: Advisor to the Board, Invesco Advisers, Inc. (formerly known as Invesco Institutional (N.A.), Inc.); Chairman and Chief Executive Officer, Invesco Advisers, Inc. (registered investment adviser); Director, Chairman, Chief Executive Officer and President, Invesco Holding Company (US), Inc. (formerly IVZ Inc.) (holding company), Invesco Group Services, Inc. (service provider) and Invesco North American Holdings, Inc. (holding company); Director, Chief Executive Officer and President, Invesco Holding Company Limited (parent of Invesco and a global investment management firm); Director, Invesco Ltd.; Chairman, Investment Company Institute and President,Co-Chief Executive Officer,Co-President, Chief Operating Officer and Chief Financial Officer, Franklin Resources, Inc. (global investment management organization) | | 158 | | None |
Philip A. Taylor2- 1954 Trustee | | 2006 | | Vice Chair, Invesco Ltd.; Director, Invesco Canada Ltd. (formerly known as Invesco Trimark Ltd./Invesco Trimark Ltèe) (registered investment adviser and registered transfer agent); Trustee, The Invesco Funds Formerly: Head of the Americas and Senior Managing Director, Invesco Ltd.; Director, Invesco Advisers, Inc. (formerly known as Invesco Institutional (N.A.), Inc.) (registered investment adviser); Director and Chairman, Invesco Investment Services, Inc. (formerly known as Invesco AIM Investment Services, Inc.) (registered transfer agent); Chief Executive Officer, Invesco Corporate Class Inc. (corporate mutual fund company); Chairman and Chief Executive Officer, Invesco Canada Ltd. (formerly known as Invesco Trimark Ltd./Invesco Trimark Ltèe) (registered investment adviser and registered transfer agent); Senior Vice President, The Invesco Funds; Director, Invesco Investment Advisers LLC (formerly known as Van Kampen Asset Management); Director, Chairman, Chief Executive Officer and President, Invesco Management Group, Inc. (formerly known as Invesco AIM Management Group, Inc.) (financial services holding company);Co-Chairman,Co-President andCo-Chief Executive Officer, Invesco Advisers, Inc. (formerly known as Invesco Institutional (N.A.), Inc.) (registered investment adviser); Director, Chief Executive Officer and President, Van Kampen Exchange Corp; President and Principal Executive Officer, The Invesco Funds (other than AIM Treasurer’s Series Trust (Invesco Treasurer’s Series Trust), Short-Term Investments Trust and Invesco Management Trust); Executive Vice President, The Invesco Funds (AIM Treasurer’s Series Trust (Invesco Treasurer’s Series Trust), Short-Term Investments Trust and Invesco Management Trust only); Director and President, INVESCO Funds Group, Inc. (registered investment adviser and registered transfer agent); Director and Chairman, IVZ Distributors, Inc. (formerly known as INVESCO Distributors, Inc.) (registered broker dealer); Director, President and Chairman, Invesco Inc. (holding company), Invesco Canada Holdings Inc. (holding company), Trimark Investments Ltd./ Placements Trimark Ltèe and Invesco Financial Services Ltd/Services Financiers Invesco Ltèe; Chief Executive Officer, Invesco Canada Fund Inc. (corporate mutual fund company); Director and Chairman, Van Kampen Investor Services Inc.; Director, Chief Executive Officer and President, 1371 Preferred Inc. (holding company) and Van Kampen Investments Inc.; Director and President, AIM GP Canada Inc. (general partner for limited partnerships) and Van Kampen Advisors, Inc.; Director and Chief Executive Officer, Invesco Trimark Dealer Inc. (registered broker dealer); Director, Invesco Distributors, Inc. (formerly known as Invesco AIM Distributors, Inc.) (registered broker dealer); Manager, Invesco Capital Management LLC; Director, Chief Executive Officer and President, Invesco Advisers, Inc.; Director, Chairman, Chief Executive Officer and President, Invesco AIM Capital Management, Inc.; President, Invesco Trimark Dealer Inc. and Invesco Trimark Ltd./Invesco Trimark Ltèe; Director and President, AIM Trimark Corporate Class Inc. and AIM Trimark Canada Fund Inc.; Senior Managing Director, Invesco Holding Company Limited; Director and Chairman, Fund Management Company (former registered broker dealer); President and Principal Executive Officer, The Invesco Funds (AIM Treasurer’s Series Trust (Invesco Treasurer’s Series Trust), and Short-Term Investments Trust only); President, AIM Trimark Global Fund Inc. and AIM Trimark Canada Fund Inc. | | 158 | | None |
| 1 | Mr. Flanagan is considered an interested person (within the meaning of Section 2(a)(19) of the 1940 Act) of the Trust because he is an officer of the Adviser to the Trust, and an officer and a director of Invesco Ltd., ultimate parent of the Adviser. |
| 2 | Mr. Taylor is considered an interested person (within the meaning of Section 2(a)(19) of the 1940 Act) of the Trust because he is an officer and a director of the Adviser. |
T-1 Invesco Limited Term Municipal Income Fund
Trustees and Officers–(continued)
| | | | | | | | |
Name, Year of Birth and
Position(s) Held with the Trust | | Trustee and/
or Officer Since | | Principal Occupation(s) During Past 5 Years | | Number of
Funds in Fund
Complex
Overseen by
Trustee | | Other Directorship(s)
Held by Trustee During
Past 5 Years |
| Independent Trustees | | | | | | | | |
Bruce L. Crockett - 1944 Trustee and Chair | | 1993 | | Chairman, Crockett Technologies Associates (technology consulting company) Formerly: Director, Captaris (unified messaging provider); Director, President and Chief Executive Officer, COMSAT Corporation; Chairman, Board of Governors of INTELSAT (international communications company); ACE Limited (insurance company); Independent Directors Council and Investment Company Institute: Member of the Audit Committee, Investment Company Institute; Member of the Executive Committee and Chair of the Governance Committee, Independent Directors Council | | 158 | | Director and Chairman of the Audit Committee, ALPS (Attorneys Liability Protection Society) (insurance company); Director and Member of the Audit Committee and Compensation Committee, Ferroglobe PLC (metallurgical company) |
David C. Arch - 1945 Trustee | | 2010 | | Chairman of Blistex Inc. (consumer health care products manufacturer); Member, World Presidents’ Organization | | 158 | | Board member of the Illinois Manufacturers’ Association |
Jack M. Fields - 1952 Trustee | | 1997 | | Chief Executive Officer, Twenty First Century Group, Inc. (government affairs company); and Chairman, Discovery Learning Alliance(non-profit) Formerly: Owner and Chief Executive Officer, Dos Angeles Ranch L.P. (cattle, hunting, corporate entertainment); Director, Insperity, Inc. (formerly known as Administaff) (human resources provider); Chief Executive Officer, Texana Timber LP (sustainable forestry company); Director of Cross Timbers Quail Research Ranch(non-profit); and member of the U.S. House of Representatives | | 158 | | None |
Cynthia Hostetler - 1962 Trustee | | 2017 | | Non-Executive Director and Trustee of a number of public and private business corporations Formerly: Director, Aberdeen Investment Funds (4 portfolios); Head of Investment Funds and Private Equity, Overseas Private Investment Corporation; President, First Manhattan Bancorporation, Inc.; Attorney, Simpson Thacher & Bartlett LLP | | 158 | | Vulcan Materials Company (construction materials company); Trilinc Global Impact Fund; Genesee & Wyoming, Inc. (railroads); Artio Global Investment LLC (mutual fund complex); Edgen Group, Inc. (specialized energy and infrastructure products distributor); Investment Company Institute (professional organization); Independent Directors Council (professional organization) |
Eli Jones - 1961 Trustee | | 2016 | | Professor and Dean, Mays Business School — Texas A&M University Formerly: Professor and Dean, Walton College of Business, University of Arkansas and E.J. Ourso College of Business, Louisiana State University; Director, Arvest Bank | | 158 | | Insperity, Inc. (formerly known as Administaff) (human resources provider) |
Anthony J. LaCava, Jr. - 1956 Trustee | | 2019 | | Formerly: Director and Member of the Audit Committee, Blue Hills Bank and Managing Partner, KPMG LLP | | 158 | | Blue Hills Bank; Chairman,Bentley University; Member, Business School Advisory Council; KPMG LLP |
Prema Mathai-Davis - 1950 Trustee | | 1998 | | Retired Co-Owner & Partner of Quantalytics Research, LLC, (a FinTech Investment Research Platform for the Self-Directed Investor) | | 158 | | None |
Teresa M. Ressel - 1962 Trustee | | 2017 | | Non-executive director and trustee of a number of public and private business corporations Formerly: Chief Financial Officer, Olayan America, The Olayan Group (international investor/commercial/industrial); Chief Executive Officer, UBS Securities LLC; Group Chief Operating Officer, Americas, UBS AG; Assistant Secretary for Management & Budget and CFO, US Department of the Treasury | | 158 | | Atlantic Power Corporation (power generation company); ON Semiconductor Corp. (semiconductor supplier) |
Ann Barnett Stern - 1957 Trustee | | 2017 | | President and Chief Executive Officer, Houston Endowment Inc. (private philanthropic institution) Formerly: Executive Vice President and General Counsel, Texas Children’s Hospital; Attorney, Beck, Redden and Secrest, LLP; Business Law Instructor, University of St.Thomas; Attorney, Andrews & Kurth LLP | | 158 | | Federal Reserve Bank of Dallas |
Raymond Stickel, Jr. - 1944 Trustee | | 2005 | | Retired Formerly: Director, Mainstay VP Series Funds, Inc. (25 portfolios); Partner, Deloitte & Touche | | 158 | | None |
Robert C. Troccoli - 1949 Trustee | | 2016 | | Adjunct Professor, University of Denver — Daniels College of Business Formerly: Senior Partner, KPMG LLP | | 158 | | None |
Christopher L. Wilson - 1957 Trustee | | 2017 | | Non-executive director and trustee of a number of public and private business corporations Formerly: Director, TD Asset Management USA Inc. (mutual fund complex) (22 portfolios); Managing Partner, CT2, LLC (investing and consulting firm); President/Chief Executive Officer, Columbia Funds, Bank of America Corporation; President/Chief Executive Officer, CDC IXIS Asset Management Services, Inc.; Principal & Director of Operations, Scudder Funds, Scudder, Stevens & Clark, Inc.; Assistant Vice President, Fidelity Investments | | 158 | | ISO New England, Inc.(non-profit organization managing regional electricity market) |
T-2 Invesco Limited Term Municipal Income Fund
Trustees and Officers–(continued)
| | | | | | | | |
Name, Year of Birth and
Position(s) Held with the Trust | | Trustee and/
or Officer Since | | Principal Occupation(s) During Past 5 Years | | Number of
Funds in Fund
Complex
Overseen by
Trustee | | Other Directorship(s)
Held by Trustee During
Past 5 Years |
| Other Officers | | | | | | | | |
Sheri Morris – 1964 President, Principal Executive Officer and Treasurer | | 1999 | | President, Principal Executive Officer and Treasurer, The Invesco Funds; Vice President, Invesco Advisers, Inc. (formerly known as Invesco Institutional (N.A.), Inc.) (registered investment adviser); and Vice President, Invesco Exchange-Traded Fund Trust, Invesco Exchange-Traded Fund Trust II, Invesco India Exchange-Traded Fund Trust, Invesco Actively Managed Exchange-Traded Fund Trust, Invesco Actively Managed Exchange-Traded Commodity Fund Trust and Invesco Exchange-Traded Self-Indexed Fund Trust Formerly: Vice President and Principal Financial Officer, The Invesco Funds; Vice President, Invesco AIM Advisers, Inc., Invesco AIM Capital Management, Inc. and Invesco AIM Private Asset Management, Inc.; Assistant Vice President and Assistant Treasurer, The Invesco Funds and Assistant Vice President, Invesco Advisers, Inc., Invesco AIM Capital Management, Inc. and Invesco AIM Private Asset Management, Inc.; and Treasurer, Invesco Exchange-Traded Fund Trust, Invesco Exchange-Traded Fund Trust II, Invesco India Exchange-Traded Fund Trust and Invesco Actively Managed Exchange-Traded Fund Trust | | N/A | | N/A |
Russell C. Burk – 1958 Senior Vice President and Senior Officer | | 2005 | | Senior Vice President and Senior Officer, The Invesco Funds | | N/A | | N/A |
Jeffrey H. Kupor – 1968 Senior Vice President, Chief Legal Officer and Secretary | | 2018 | | Head of Legal of the Americas, Invesco Ltd.; Senior Vice President and Secretary, Invesco Advisers, Inc. (formerly known as Invesco Institutional (N.A.), Inc.) (registered investment adviser); Senior Vice President and Secretary, Invesco Distributors, Inc. (formerly known as Invesco AIM Distributors, Inc.); Vice President and Secretary, Invesco Investment Services, Inc. (formerly known as Invesco AIM Investment Services, Inc.) Senior Vice President, Chief Legal Officer and Secretary, The Invesco Funds; Secretary and General Counsel, Invesco Investment Advisers LLC (formerly known as Van Kampen Asset Management); Secretary and General Counsel, Invesco Capital Markets, Inc. (formerly known as Van Kampen Funds Inc.) and Chief Legal Officer, Invesco Exchange-Traded Fund Trust, Invesco Exchange-Traded Fund Trust II, Invesco India Exchange-Traded Fund Trust, Invesco Actively Managed Exchange-Traded Fund Trust, Invesco Actively Managed Exchange-Traded Commodity Fund Trust and Invesco Exchange-Traded Self-Indexed Fund Trust; Secretary, Invesco Indexing LLC; Secretary, W.L. Ross & Co., LLC; Secretary and Vice President, Jemstep, Inc. Formerly: Head of Legal, Worldwide Institutional, Invesco Ltd.; Secretary and General Counsel, INVESCO Private Capital Investments, Inc.; Senior Vice President, Secretary and General Counsel, Invesco Management Group, Inc. (formerly known as Invesco AIM Management Group, Inc.); Assistant Secretary, INVESCO Asset Management (Bermuda) Ltd.; Secretary and General Counsel, Invesco Private Capital, Inc.; Assistant Secretary and General Counsel, INVESCO Realty, Inc.; Secretary and General Counsel, Invesco Senior Secured Management, Inc.; and Secretary, Sovereign G./P. Holdings Inc. | | N/A | | N/A |
Andrew R. Schlossberg – 1974 Senior Vice President | | 2019 | | Head of the Americas and Senior Managing Director, Invesco Ltd.; Director and Senior Vice President, Invesco Advisers, Inc. (formerly known as Invesco Institutional (N.A.), Inc.) (registered investment adviser); Director and Chairman, Invesco Investment Services, Inc. (formerly known as Invesco AIM Investment Services, Inc.) (registered transfer agent); Senior Vice President, The Invesco Funds; Director, Invesco Investment Advisers LLC (formerly known as Van Kampen Asset Management) and Invesco UK Limited; Director, President and Chairman, Invesco Insurance Agency, Inc.; Director and Chief Executive, Invesco Asset Management Limited and Invesco Fund Managers Limited Formerly: Assistant Vice President, The Invesco Funds; Senior Vice President, Invesco Advisers, Inc. (formerly known as Invesco Institutional (N.A.), Inc.) (registered investment adviser); Director and Chief Executive, Invesco Administration Services Limited and Invesco Global Investment Funds Limited; Director, Invesco Distributors, Inc.; Head of EMEA, Invesco Ltd.; President, Invesco Actively Managed Exchange-Traded Commodity Fund Trust, Invesco Actively Managed Exchange-Traded Fund Trust, Invesco Exchange-Traded Fund Trust, Invesco Exchange-Traded Fund Trust II and Invesco India Exchange-Traded Fund Trust; Managing Director and Principal Executive Officer, Invesco Capital Management LLC | | N/A | | N/A |
John M. Zerr – 1962 Senior Vice President | | 2006 | | Chief Operating Officer of the Americas; Senior Vice President, Invesco Advisers, Inc. (formerly known as Invesco Institutional (N.A.), Inc.) (registered investment adviser); Senior Vice President, Invesco Distributors, Inc. (formerly known as Invesco AIM Distributors, Inc.); Director and Vice President, Invesco Investment Services, Inc. (formerly known as Invesco AIM Investment Services, Inc.) Senior Vice President, The Invesco Funds; Managing Director, Invesco Capital Management LLC; Director, Invesco Investment Advisers LLC (formerly known as Van Kampen Asset Management); Senior Vice President, Invesco Capital Markets, Inc. (formerly known as Van Kampen Funds Inc.); Manager, Invesco Indexing LLC; Invesco Canada Funds Advisory Board Member; Director, President Chief Executive Officer, Invesco Corporate Class Inc. (corporate mutual fund company); and Director, Chairman, President and Chief Executive Officer, Invesco Canada Ltd. (formerly known as Invesco Trimark Ltd./Invesco Trimark Ltèe) (registered investment adviser and registered transfer agent) | | N/A | | N/A |
T-3 Invesco Limited Term Municipal Income Fund
Trustees and Officers–(continued)
| | | | | | | | |
Name, Year of Birth and Position(s) Held with the Trust | | Trustee and/ or Officer Since | | Principal Occupation(s) During Past 5 Years | | Number of Funds in Fund Complex Overseen by Trustee | | Other Directorship(s)
Held by Trustee During Past 5 Years |
| Other Officers–(continued) | | | | | | | | |
| | | | | Formerly: Director and Senior Vice President, Invesco Management Group, Inc. (formerly known as Invesco AIM Management Group, Inc.); Secretary and General Counsel, Invesco Management Group, Inc. (formerly known as Invesco AIM Management Group, Inc.); Secretary, Invesco Investment Services, Inc. (formerly known as Invesco AIM Investment Services, Inc.); Chief Legal Officer and Secretary, The Invesco Funds; Secretary and General Counsel, Invesco Investment Advisers LLC (formerly known as Van Kampen Asset Management); Secretary and General Counsel, Invesco Capital Markets, Inc. (formerly known as Van Kampen Funds Inc.); Chief Legal Officer, Invesco Exchange-Traded Fund Trust, Invesco Exchange-Traded Fund Trust II, Invesco India Exchange-Traded Fund Trust, Invesco Actively Managed Exchange-Traded Fund Trust, Invesco Actively Managed Exchange-Traded Commodity Fund Trust and Invesco Exchange-Traded Self-Indexed Fund Trust; Secretary, Invesco Indexing LLC; Director, Secretary, General Counsel and Senior Vice President, Van Kampen Exchange Corp.; Director, Vice President and Secretary, IVZ Distributors, Inc. (formerly known as INVESCO Distributors, Inc.); Director and Vice President, INVESCO Funds Group, Inc.; Director and Vice President, Van Kampen Advisors Inc.; Director, Vice President, Secretary and General Counsel, Van Kampen Investor Services Inc.; Director and Secretary, Invesco Distributors, Inc. (formerly known as Invesco AIM Distributors, Inc.); Director, Senior Vice President, General Counsel and Secretary, Invesco AIM Advisers, Inc. and Van Kampen Investments Inc.; Director, Vice President and Secretary, Fund Management Company; Director, Senior Vice President, Secretary, General Counsel and Vice President, Invesco AIM Capital Management, Inc.; Chief Operating Officer and General Counsel, Liberty Ridge Capital, Inc. (an investment adviser) | | | | |
Gregory G. McGreevey – 1962 Senior Vice President | | 2012 | | Senior Managing Director, Invesco Ltd.; Director, Chairman, President, and Chief Executive Officer, Invesco Advisers, Inc. (formerly known as Invesco Institutional (N.A.), Inc.) (registered investment adviser); Director, Invesco Mortgage Capital, Inc. and Invesco Senior Secured Management, Inc.; and Senior Vice President, The Invesco Funds Formerly: Senior Vice President, Invesco Management Group, Inc. and Invesco Advisers, Inc.; Assistant Vice President, The Invesco Funds | | N/A | | N/A |
Kelli Gallegos – 1970 Vice President, Principal Financial Officer and Assistant Treasurer | | 2008 | | Vice President and Treasurer, Invesco Exchange-Traded Fund Trust, Invesco Exchange-Traded Fund Trust II, Invesco India Exchange-Traded Fund Trust, Invesco Actively Managed Exchange-Traded Fund Trust, Invesco Actively Managed Exchange-Traded Commodity Fund Trust and Invesco Exchange- Traded Self-Indexed Fund Trust; Vice President, Principal Financial Officer and Assistant Treasurer, The Invesco Funds; Principal Financial and Accounting Officer — Pooled Investments, Invesco Capital Management LLC Formerly: Assistant Treasurer, Invesco Exchange-Traded Fund Trust, Invesco Exchange-Traded Fund Trust II, Invesco India Exchange-Traded Fund Trust, Invesco Actively Managed Exchange-Traded Fund Trust, Invesco Actively Managed Exchange-Traded Commodity Fund Trust and Invesco Exchange-Traded Self-Indexed Fund Trust; Assistant Treasurer, Invesco Capital Management LLC; Assistant Vice President, The Invesco Funds | | N/A | | N/A |
Tracy Sullivan — 1962 Vice President, Chief Tax Officer and Assistant Treasurer | | 2008 | | Vice President, Chief Tax Officer and Assistant Treasurer, The Invesco Funds; Assistant Treasurer, Invesco Capital Management LLC, Invesco Exchange-Traded Fund Trust, Invesco Exchange-Traded Fund Trust II, Invesco India Exchange-Traded Fund Trust, Invesco Actively Managed Exchange-Traded Fund Trust, Invesco Actively Managed Exchange-Traded Commodity Fund Trust and Invesco Exchange-Traded Self-Indexed Fund Trust Formerly: Assistant Vice President, The Invesco Funds | | N/A | | N/A |
Crissie M. Wisdom – 1969 Anti-Money Laundering Compliance Officer | | 2013 | | Anti-Money Laundering Compliance Officer, Invesco Advisers, Inc. ( formerly known as Invesco Institutional (N.A.), Inc.) (registered investment adviser), Invesco Capital Markets, Inc. (formerly known as Van Kampen Funds Inc.), Invesco Distributors, Inc., Invesco Investment Services, Inc., The Invesco Funds, and Invesco Exchange-Traded Fund Trust, Invesco Exchange-Traded Fund Trust II, Invesco India Exchange-Traded Fund Trust, Invesco Actively Managed Exchange-Traded Fund Trust, Invesco Actively Managed Exchange-Traded Commodity Fund Trust and Invesco Exchange-Traded Self-Indexed Fund Trust; Anti-Money Laundering Compliance Officer and Bank Secrecy Act Officer, INVESCO National Trust Company and Invesco Trust Company; and Fraud Prevention Manager and Controls and Risk Analysis Manager for Invesco Investment Services, Inc. Formerly: Anti-Money Laundering Compliance Officer, Van Kampen Exchange Corp. and Invesco Management Group, Inc. | | N/A | | N/A |
Robert R. Leveille – 1969 Chief Compliance Officer | | 2016 | | Chief Compliance Officer, Invesco Advisers, Inc. (registered investment adviser); and Chief Compliance Officer, The Invesco Funds Formerly: Chief Compliance Officer, Putnam Investments and the Putnam Funds | | N/A | | N/A |
The Statement of Additional Information of the Trust includes additional information about the Fund’s Trustees and is available upon request, without charge, by calling 1.800.959.4246. Please refer to the Fund’s Statement of Additional Information for information on the Fund’ssub-advisers.
| | | | | | |
Office of the Fund 11 Greenway Plaza, Suite 1000 Houston, TX 77046-1173 | | Investment Adviser Invesco Advisers, Inc. 1555 Peachtree Street, N.E. Atlanta, GA 30309 | | Distributor Invesco Distributors, Inc. 11 Greenway Plaza, Suite 1000 Houston, TX 77046-1173 | | Auditors PricewaterhouseCoopers LLP 1000 Louisiana Street, Suite 5800 Houston, TX 77002-5021 |
| | | |
Counsel to the Fund Stradley Ronon Stevens & Young, LLP 2005 Market Street, Suite 2600 Philadelphia, PA 19103-7018 | | Counsel to the Independent Trustees Goodwin Procter LLP 901 New York Avenue, N.W. Washington, D.C. 20001 | | Transfer Agent Invesco Investment Services, Inc. 11 Greenway Plaza, Suite 1000 Houston, TX 77046-1173 | | Custodian State Street Bank and Trust Company 225 Franklin Street Boston, MA 02110-2801 |
T-4 Invesco Limited Term Municipal Income Fund
Explore High-Conviction Investing with Invesco

Go paperless with eDelivery
Visit invesco.com/edelivery to enjoy the convenience and security of anytime electronic access to your investment documents.
With eDelivery, you can elect to have any or all of the following materials delivered straight to your inbox to download, save and print from your own computer:
| ∎ | Fund reports and prospectuses |
Invesco mailing information
Send general correspondence to Invesco Investment Services, Inc., P.O. Box 219078, Kansas City, MO 64121-9078.
Important notice regarding delivery of security holder documents
To reduce Fund expenses, only one copy of most shareholder documents may be mailed to shareholders with multiple accounts at the same address (Householding). Mailing of your shareholder documents may be householded indefinitely unless you instruct us otherwise. If you do not want the mailing of these documents to be combined with those for other members of your household, please contact Invesco Investment Services, Inc. at 800 959 4246 or contact your financial institution. We will begin sending you individual copies for each account within 30 days after receiving your request.
Fund holdings and proxy voting information
The Fund provides a complete list of its holdings four times in each fiscal year, at the quarter ends. For the second and fourth quarters, the lists appear in the Fund’s semiannual and annual reports to shareholders. For the first and third quarters, the Fund files the lists with the Securities and Exchange Commission (SEC) on FormN-Q (or any successor Form). The most recent list of portfolio holdings is available at invesco.com/completeqtrholdings. Shareholders can also look up the Fund’s FormsN-Q (or any successor Form) on the SEC website at sec.gov. The SEC file numbers for the Fund are shown below.
A description of the policies and procedures that the Fund uses to determine how to vote proxies relating to portfolio securities is available without charge, upon request, from our Client Services department at 800 959 4246 or at invesco.com/proxyguidelines. The information is also available on the SEC website, sec.gov.
| | |
Information regarding how the Fund voted proxies related to its portfolio securities during the most recent12-month period ended June 30 is available at invesco.com/proxysearch. The information is also available on the SEC website, sec.gov. Invesco Advisers, Inc. is an investment adviser; it provides investment advisory services to individual and institutional clients and does not sell securities. Invesco Distributors, Inc. is the US distributor for Invesco Ltd.’s retail mutual funds, exchange-traded funds and institutional money market funds. Both are wholly owned, indirect subsidiaries of Invesco Ltd. | |  |
| | | | | | | | |
| SEC file numbers:811-07890 and033-66242 | | Invesco Distributors, Inc. | | LTMI-AR-1 | | 04252019 | | 1440 |
Letters to Shareholders
| | |
 | | Dear Shareholders: This annual report includes information about your Fund, including performance data and a complete list of its investments as of the close of the reporting period. Inside is a discussion of how your Fund was managed and the factors that affected its performance during the reporting period. Philip Taylor, whose messages to shareholders have appeared here for the last 13 years, transitioned to a senior advisory role on March 1, prior to his retirement from the firm at the end of the year, and I assumed his role as Head of the Americas and Senior Managing Director, Invesco Ltd. All of us at Invesco are indebted to Phil for his many years of dedicated service to the company and to its funds’ shareholders. I’m excited about this new opportunity, and I look forward to communicating with fund shareholders going forward. The reporting period proved to be an increasingly volatile time for markets. Amid corporate tax |
cuts and improving global growth, several US equity indexes redefined highs during the first half of the reporting period. The ebullience, however, ended in October as global equities, in particular US stocks, sold off sharply and continued this downward spiral for the rest of 2018. The catalyst for thesell-off was a combination of ongoing trade conflicts between the US and China, fears of a global economic slowdown and rising US interest rates. Gains posted earlier in the year for global equities were erased, while US Treasury bonds, along with government and municipal bonds, rallied. The reporting period ended on a positive note, however, as global equities bounced back strongly at the outset of 2019, mitigating some of the losses from thesell-off in late 2018. Given the strong economy during the reporting period, the US Federal Reserve (the Fed) raised the federal funds rate four times. At its December 2018 meeting, however, the Fed delivered a more “dovish hike” by simultaneously raising rates while reducing guidance for 2019 rate increases. At its first meeting in 2019, the Fed left rates unchanged. As 2019 unfolds, we’ll see how the interplay of interest rates, economic data, geopolitics and a host of other factors affect US and over-seas equity and fixed income markets.
Investor uncertainty and market volatility, such as we witnessed during the reporting period, are unfortunate facts of life when it comes to investing. That’s why Invesco encourages investors to work with a professional financial adviser who can stress the importance of starting to save and invest early and the importance of adhering to a disciplined investment plan. A financial adviser who knows your unique financial situation, investment goals and risk tolerance can be an invaluable partner as you seek to achieve your financial goals. He or she can offer a long-term perspective when markets are volatile and time-tested advice and guidance when your financial situation or investment goals change.
Visit our website for more information on your investments
Our website,invesco.com/us, offers a wide range of market insights and investment perspectives. On the website, you’ll find detailed information about our funds, including performance, holdings and portfolio manager commentaries. You can access information about your account by completing a simple, secure online registration. To do so, select “Log In” on the right side of the homepage, and then select “Register for Individual Account Access.”
In addition to the resources accessible on our website and through our mobile app, you can obtain timely updates to help you stay informed about the markets and the economy by connecting with Invesco on Twitter, LinkedIn or Facebook. You can access our blog atblog.invesco.us.com. Our goal is to provide you the information you want, when and where you want it.
Finally, I’m pleased to share with you Invesco’s commitment to both the Principles for Responsible Investment and to considering environmental, social and governance issues in our robust investment process. I invite you to learn more atinvesco.com/esg.
Have questions?
For questions about your account, contact an Invesco client services representative at 800 959 4246.
All of us at Invesco look forward to serving your investment management needs. Thank you for investing with us.
Sincerely,

Andrew Schlossberg
Head of the Americas,
Senior Managing Director, Invesco Ltd.
| | |
| 2 | | Invesco Municipal Income Fund |
| | | | |
 | | Dear Fellow Shareholders: Among the many important lessons I’ve learned in more than 40 years in a variety of business endeavors is the value of a trusted advocate. As independent chair of the Invesco Funds Board, I can assure you that the members of the Board are strong advocates for the interests of investors in Invesco’s mutual funds. We work hard to represent your interests through oversight of the quality of the investment management services your funds receive and other matters important to your investment, including but not limited to: |
| | ∎ | | Ensuring that Invesco offers a diverse lineup of mutual funds that your financial adviser can use to strive to meet your financial needs as your investment goals change over time. |
| | ∎ | | Monitoring how the portfolio management teams of the Invesco funds are performing in light of changing economic and market conditions. |
| ∎ | | Assessing each portfolio management team’s investment performance within the context of the investment strategy described in the fund’s prospectus. |
| ∎ | | Monitoring for potential conflicts of interests that may impact the nature of the services that your funds receive. |
We believe one of the most important services we provide our fund shareholders is the annual review of the funds’ advisory andsub-advisory contracts with Invesco Advisers and its affiliates. This review is required by the Investment Company Act of 1940 and focuses on the nature and quality of the services Invesco provides as the adviser to the Invesco funds and the reasonableness of the fees that it charges for those services. Each year, we spend months carefully reviewing information received from Invesco and a variety of independent sources, such as performance and fee data prepared by Lipper, Inc. (a subsidiary of Broadridge Financial Solutions, Inc.), an independent, third-party firm widely recognized as a leader in its field. We also meet with our independent legal counsel and other independent advisers to review and help us assess the information that we have received. Our goal is to assure that you receive quality investment management services for a reasonable fee.
I trust the measures outlined above provide assurance that you have a worthy advocate when it comes to choosing the Invesco Funds. On behalf of the Board, we look forward to continuing to represent your interests and serving your needs.
Sincerely,

Bruce L. Crockett
Independent Chair
Invesco Funds Board of Trustees
| | |
| 3 | | Invesco Municipal Income Fund |
Management’s Discussion of Fund Performance
| | | | | | | | |
| | |
Performance summary For the fiscal year ended February 28, 2019, Class A shares of Invesco Municipal Income Fund (the Fund), at net asset value (NAV), underperformed the S&P Municipal Bond 5+ Year Investment Grade Index, the Fund’s style-specific benchmark. Your Fund’s long-term performance appears later in this report. | | | | | |
| | | |
Fund vs. Indexes | | | | | | | | |
Total returns, 2/28/18 to 2/28/19, at net asset value (NAV). Performance shown does not include applicable contingent deferred sales charges (CDSC) orfront-end sales charges, which would have reduced performance. | | | | | |
Class A Shares | | | 2.78 | % | | | | |
Class C Shares | | | 2.08 | | | | | |
Class Y Shares | | | 3.11 | | | | | |
Investor Class Shares | | | 2.88 | | | | | |
Class R6 Shares | | | 3.18 | | | | | |
S&P Municipal Bond Indexq(Broad Market Index) | | | 4.03 | | | | | |
S&P Municipal Bond 5+ Year Investment Grade Indexq (Style-Specific Index) | | | 4.49 | | | | | |
Lipper General Municipal Debt Funds Index⬛(Peer Group Index) | | | 3.75 | | | | | |
Source(s):qRIMES Technologies Corp.;⬛Lipper Inc. | | | | | | | | |
Market conditions and your Fund
The broad municipal bond market experienced positive returns for the fifth consecutive year in 2018. During the fiscal year, investment grade municipals returned 4.13% and high yield municipals returned 6.96%.1 This strong performance included investment grade municipals returning 1.30% and high yield municipals returning 1.22% for the first two months of 2019.1
The first half of the fiscal year began with supportive technical conditions (supply and demand balances) in place as new issuance of municipal bonds totaled $187 billion – down 8% from the same time period in 2017.2 However, fund flows into the municipal bond market remained positive, totaling $6.5 billion from March through August 2018.3 The high yield municipal bond market outperformed the investment grade bond segment, led by strong performance of tobacco bonds and improved price discovery on Puerto Rico bonds as a result of developments in the commonwealth’s debt restructuring.
Municipal bonds withstood headwinds from interest rate movements that had the10-year US Treasury yield breaching 3.00% in April 2018.4 During the fiscal year, the US Federal Reserve (the Fed) raised the federal funds rate four times: in March, June, September and December 2018.5 This series of anticipated rate hikes reflected increased confidence in the US economy amid low unemployment, relatively stable inflation and overall robust economic growth. This expansionary monetary policy significantly flattened the US Treasury yield curve with a slight inversion on the short end occurring in December 2018.
In September 2018, market conditions weakened in stark contrast to the first half of the fiscal year, and thus, exposed the municipal bond market to more sensitivity relating to the month’ssell-off in US Treasuries. Both investment grade municipals and high yield municipals posted negative returns for the months of September and October 2018. The municipal yield curve continued to steepen, showing confidence in strong gross domestic product growth, as well as rising concern that an impending trade war between the US and China could increase inflation pressures.
As anticipated, US midterm election results had a positive impact on municipal securities as perceived threats to municipal tax exemptions, further tax reform and changes to the Affordable Care Act were greatly reduced. News of a possible ban on flavorede-cigarettes and menthol cigarettes made headlines, which caused a short-lived decline in valuations for Tobacco Master Settlement Agreement (Tobacco MSA) bonds, primarily below investment grade securities. Meanwhile,year-end demand for yield and coupon payments caused the municipal bond asset class to end 2018 on a strong note.
The Fed’s dovish stance to begin calendar year 2019 took the market by surprise, leading economists to change their predictions from two interest rate increases in 2019, to just one. Additionally, the US government shutdown, which lasted a total of 35 days, along with ongoingUS-China trade negotiations and Brexit developments, created a challenging market environment. Despite these challenges, the municipal market performed positively as technical conditions continued to provide tailwinds, driven particularly by the insatiable demand for maturities (10 years and shorter) from US retail separately managed accounts (SMAs).
Flows into the municipal bond asset class were positive for six of the 12 months covered by the fiscal year. With slowing economic growth and the Fed’s interest rate policy detour, investor demand for municipal securities spiked, bringing record net inflows of more than $18.9 billion for the first two months of 2019.3
At the close of the fiscal year, we believed municipal fundamentals remained strong and ramifications of the Tax Cuts and Jobs Act of 2017 had not
| | | | |
| | |
Portfolio Composition | | | | |
By credit sector, based on total investments | |
| |
Revenue Bonds | | | 81.6 | % |
Pre-Refunded Bonds | | | 10.0 | |
General Obligation Bonds | | | 8.1 | |
Other | | | 0.3 | |
| | | | | | |
| |
| Top Five Debt Holdings | |
| | % of total net assets | |
| | |
1. | | New Jersey (State of ) Transportation Trust Fund Authority | | | 2.0 | % |
2. | | Chicago (City of) Metropolitan Water Reclamation District | | | 1.5 | |
3. | | New York (City of) Municipal Water Finance Authority; Series 2012 FF | | | 1.4 | |
4. | | Chicago (City of) | | | 1.3 | |
5. | | New York (City of) Transitional Finance Authority | | | 1.3 | |
| | | | |
| | |
Total Net Assets | | $ | 2.8 billion | |
| |
Total Number of Holdings | | | 860 | |
The Fund’s holdings are subject to change, and there is no assurance that the Fund will continue to hold any particular security.
Data presented here are as of February 28, 2019.
| | |
| 4 | | Invesco Municipal Income Fund |
yet been fully realized. As a result, we believe demand for tax-exempt investments from retail investors could continue as taxes become front of mind.
During the fiscal year, security selection in the dedicated tax sector contributed to the Fund’s performance relative to its style-specific benchmark. Security selection in bonds rated just below investment grade also significantly contributed to relative return. On a state level, security selection in Wisconsin domiciled bonds also added to the Fund’s relative performance.
Security selection in and overweight allocation to the pre-refunded bonds sector detracted from the Fund’s performance relative to its style-specific benchmark over the fiscal year. Security selection in and underweight exposure to investment grade issues also detracted from the Fund’s relative performance. On a state level, security selection in Texas holdings was a slight detractor from the Fund’s relative return.
During the fiscal year, leverage contributed to the Fund’s performance relative to its style-specific benchmark. The Fund achieved a leveraged position through the use of inverse floating rate securities or 0tender option bonds (TOBs). The Fund uses leverage because we believe that, over time, leveraging provides opportunities for additional income and total return for shareholders. However, the use of leverage also can expose shareholders to additional volatility. For more information about the Fund’s use of leverage, see the Notes to Financial Statements later in this report.
We wish to remind you that the Fund is subject to interest rate risk, meaning when interest rates rise, the value of fixed income securities tends to fall. The degree to which the value of fixed income securities may decline due to rising interest rates may vary depending on the speed and magnitude of the increase in interest rates, as well as individual security characteristics, such as price, maturity, duration and coupon and market forces, such as supply and demand for similar securities. We are monitoring interest rates, and the market, economic and geopolitical factors that may impact the direction, speed and magnitude of changes to interest rates across the maturity spectrum, including the potential impact of monetary policy changes by the Fed and certain foreign central banks. If interest rates rise faster than expected, markets may experience increased volatility, which may affect the value and/or liquidity of certain of the Fund’s investments.
Thank you for investing in Invesco Municipal Income Fund and for sharing our long-term investment horizon.
1 Source: FactSet Research Systems Inc.
2 Source: The Bond Buyer
3 Source: Strategic Insight
4 Source: US Department of the Treasury
5 Source: US Federal Reserve
The views and opinions expressed in management’s discussion of Fund performance are those of Invesco Advisers, Inc. These views and opinions are subject to change at any time based on factors such as market and economic conditions. These views and opinions may not be relied upon as investment advice or recommendations, or as an offer for a particular security. The information is not a complete analysis of every aspect of any market, country, industry, security or the Fund. Statements of fact are from sources considered reliable, but Invesco Advisers, Inc. makes no representation or warranty as to their completeness or accuracy. Although historical performance is no guarantee of future results, these insights may help you understand our investment management philosophy.
See important Fund and, if applicable, index disclosures later in this report.
| | |
 | | Mark Paris Portfolio Manager and Chief Investment Officer and Head of Municipal Strategies for Invesco Fixed Income, is |
| manager of Invesco Municipal Income Fund. He joined Invesco in 2010. Mr. Paris earned a BBA in finance from Baruch College – The City University of New York. |
| |
 | | John (Jack) Connelly Portfolio Manager, is manager of Invesco Municipal Income Fund. He joined Invesco in 2016. Mr. Connelly |
| earned a BA in philosophy from Wheaton College and masters degrees from the University of Rhode Island and Yale University. |
| |
 | | Tim O’Reilly Portfolio Manager, is manager of Invesco Municipal Income Fund. He joined Invesco in 2010. Mr. O’Reilly |
| earned a BS in finance from Eastern Illinois University and an MBA in finance from the University of Illinois at Chicago. |
| | |
 | | James Phillips Portfolio Manager, is manager of Invesco Municipal Income Fund. He joined Invesco in 2010. Mr. Phillips earned |
| a BA in American literature from Empire State College, the independent study division of the State University of New York, and an MBA in finance from the University at Albany, State University of New York. |
| |
 | | John Schorle Portfolio Manager, is manager of Invesco Municipal Income Fund. He joined Invesco in 2010. Mr. Schorle earned a BA |
| degree in economics from DePaul University. He is also a Certified Public Accountant. |
| |
 | | Julius Williams Portfolio Manager, is manager of Invesco Municipal Income Fund. He joined Invesco in 2010. Mr. Williams earned a BA |
| in economics and sociology and a Master of Education degree in educational psychology from the University of Virginia. |
5 Invesco Municipal Income Fund
Your Fund’s Long-Term Performance
Results of a $10,000 Investment — Oldest Share Class(es)
Fund and index data from 2/28/09
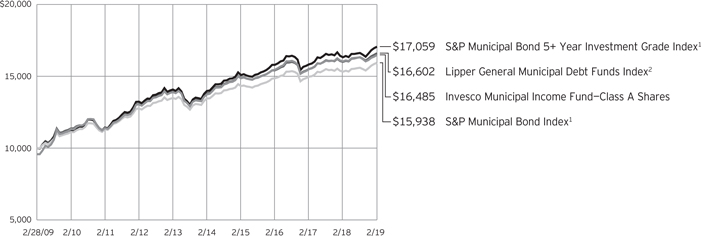
1 Source: RIMES Technologies Corp.
2 Source: Lipper Inc.
Past performance cannot guarantee comparable future results.
The data shown in the chart include reinvested distributions, applicable sales charges and Fund expenses including
management fees. Index results include reinvested dividends, but they do not reflect sales charges. Performance of the peer group, if applicable, reflects fund expenses and management fees; performance
of a market index does not. Performance shown in the chart and table(s) does not reflect deduction of taxes a shareholder would pay on Fund distributions or sale of Fund shares.
| | |
| 6 | | Invesco Municipal Income Fund |
| | | | |
| |
Average Annual Total Returns | |
As of 2/28/19, including maximum applicable sales charges | |
| |
Class A Shares | | | | |
Inception (8/1/90) | | | 4.74 | % |
10 Years | | | 5.13 | |
5 Years | | | 2.81 | |
1 Year | | | -1.62 | |
| |
Class C Shares* | | | | |
Inception (8/13/93) | | | 3.83 | % |
10 Years | | | 4.79 | |
5 Years | | | 2.94 | |
1 Year | | | 1.09 | |
| |
Class Y Shares | | | | |
Inception (8/12/05) | | | 3.92 | % |
10 Years | | | 5.86 | |
5 Years | | | 3.97 | |
1 Year | | | 3.11 | |
| |
Investor Class Shares | | | | |
10 Years | | | 5.65 | % |
5 Years | | | 3.82 | |
1 Year | | | 2.88 | |
| |
Class R6 Shares | | | | |
10 Years | | | 5.64 | % |
5 Years | | | 3.83 | |
1 Year | | | 3.18 | |
* Effective January 26, 2019, Class C share performance includes the conversion to A shares after 10 years. | |
Effective June 1, 2010, Class A, Class C and Class I shares of the predecessor fund, Van Kampen Municipal Income Fund, advised by Van Kampen Asset Management were reorganized into Class A, Class C and Class Y shares, respectively, of Invesco Van Kampen Municipal Income Fund (renamed Invesco Municipal Income Fund). Returns shown above, prior to June 1, 2010, for Class A, Class C and Class Y shares are blended returns of the predecessor fund and Invesco Municipal Income Fund. Share class returns will differ from the predecessor fund because of different expenses.
Investor Class shares incepted on July 15, 2013. Performance shown prior to that date is that of Class A shares and includes the12b-1 fees applicable to Class A shares.
Class R6 shares incepted on April 4, 2017. Performance shown prior to that date is that of Class A shares and includes the12b-1 fees applicable to Class A shares.
The performance data quoted represent past performance and cannot guarantee comparable future
| | | | |
| |
Average Annual Total Returns | |
As of 12/31/18, the most recent calendar quarter end, including maximum applicable sales charges | |
| |
Class A Shares | | | | |
Inception (8/1/90) | | | 4.72 | % |
10 Years | | | 5.71 | |
5 Years | | | 3.28 | |
1 Year | | | –4.05 | |
| |
Class C Shares | | | | |
Inception (8/13/93) | | | 3.33 | % |
10 Years | | | 5.36 | |
5 Years | | | 3.40 | |
1 Year | | | –1.50 | |
| |
Class Y Shares | | | | |
Inception (8/12/05) | | | 3.87 | % |
10 Years | | | 6.43 | |
5 Years | | | 4.46 | |
1 Year | | | 0.48 | |
| |
Investor Class Shares | | | | |
10 Years | | | 6.23 | % |
5 Years | | | 4.31 | |
1 Year | | | 0.33 | |
| |
Class R6 Shares | | | | |
10 Years | | | 6.22 | % |
5 Years | | | 4.29 | |
1 Year | | | 0.53 | |
results; current performance may be lower or higher. Please visit invesco.com/performance for the most recentmonth-end performance. Performance figures reflect reinvested distributions, changes in net asset value and the effect of the maximum sales charge unless otherwise stated. Investment return and principal value will fluctuate so that you may have a gain or loss when you sell shares.
The total annual Fund operating expense ratio set forth in the most recent Fund prospectus as of the date of this report for Class A, Class C, Class Y, Investor Class and Class R6 shares was 1.10%, 1.85%, 0.85%, 1.03% and 0.79%, respectively. The expense ratios presented above may vary from the expense ratios presented in other sections of this report that are based on expenses incurred during the period covered by this report.
Class A share performance reflects the maximum 4.25% sales charge, and Class C share performance reflects the applicable contingent deferred sales charge (CDSC) for the period involved. The CDSC on Class C shares is 1% for the first year after purchase. Class Y, Investor Class and Class R6 shares do
not have afront-end sales charge or a CDSC; therefore, performance is at net asset value.
The performance of the Fund’s share classes will differ primarily due to different sales charge structures and class expenses.
Fund performance reflects any applicable fee waivers and/or expense reimbursements. Had the adviser not waived fees and/or reimbursed expenses currently or in the past, returns would have been lower. See current prospectus for more information.
7 Invesco Municipal Income Fund
Invesco Municipal Income Fund’s investment objective is to provide investors with a high level of current income exempt from federal income tax, consistent with preservation of capital.
| ∎ | | Unless otherwise stated, information presented in this report is as of February 28, 2019, and is based on total net assets. |
| ∎ | | Unless otherwise noted, all data provided by Invesco. |
| ∎ | | To access your Fund’s reports/prospectus, visit invesco.com/fundreports. |
About share classes
| ∎ | | Class YandInvestor Class sharesare available to only certain investors. Please see the prospectus for more information. |
| ∎ | | Class R6 sharesare available for use by retirement plans that meet certain standards and for institutional investors. Class R6 shares are also available through intermediaries that have established an agreement with Invesco Distributors, Inc. to make such shares available for use in retail omnibus accounts. See the prospectus for more information. |
Principal risks of investing in the Fund
| ∎ | | Alternative minimum tax risk.All or a portion of the Fund’s otherwisetax-exempt income may be taxable to those shareholders subject to the federal alternative minimum tax. |
| ∎ | | Changing fixed income market conditionsrisk.The current low interest rate environment was created in part by the Federal Reserve Board (FRB) and certain foreign central banks keeping the federal funds and equivalent foreign rates near historical lows. Increases in the federal funds and equivalent foreign rates may expose fixed income markets to heightened volatility and reduced liquidity for certain fixed income investments, particularly those with longer maturities. In addition, decreases in fixed income dealer market-making capacity may also potentially lead to heightened volatility and reduced liquidity in the fixed income markets. As a result, the value of the Fund’s investments and share price may decline. Changes in central bank policies could also result in higher than normal shareholder redemptions, which could potentially increase portfolio turnover and the Fund’s transaction costs. |
| ∎ | | Debt securities risk.The prices of debt securities held by the Fund will be affected by changes in interest rates, the creditworthiness of the issuer and other |
| | | factors. An increase in prevailing interest rates typically causes the value of existing debt securities to fall and often has a greater impact on longer-duration debt securities and higher quality debt securities. Falling interest rates will cause the Fund to reinvest the proceeds of debt securities that have been repaid by the issuer at lower interest rates. Falling interest rates may also reduce the Fund’s distributable income because interest payments on floating rate debt instruments held by the Fund will decline. The Fund could lose money on investments in debt securities if the issuer or borrower fails to meet its obligations to make interest payments and/or to repay principal in a timely manner. Changes in an issuer’s financial strength, the market’s perception of such strength or in the credit rating of the issuer or the security may affect the value of debt securities. The Adviser’s credit analysis may fail to anticipate such changes, which could result in buying a debt security at an inopportune time or failing to sell a debt security in advance of a price decline or other credit event. |
| ∎ | | Derivatives risk.The value of a derivative instrument depends largely on (and is derived from) the value of an underlying security, currency, commodity, interest rate, index or other asset (each referred to as an underlying asset). In addition to risks relating to the underlying assets, the use of derivatives may include other, possibly greater, risks, including counterparty, leverage and liquidity risks. Counterparty risk is the risk that the counterparty to the derivative contract will default on its obligation to pay the Fund the amount owed or otherwise perform under the derivative contract. Derivatives create leverage risk because they do not require payment up front equal to the economic exposure created by holding a position in the derivative. As a result, an adverse change in the value of the underlying asset could result in |
This report must be accompanied or preceded by a currently effective Fund prospectus, which contains more complete information, including sales charges and expenses. Investors should read it carefully before investing.
NOT FDIC INSURED | MAY LOSE VALUE | NO BANK GUARANTEE
| | the Fund sustaining a loss that is substantially greater than the amount invested in the derivative or the anticipated value of the underlying asset, which may make the Fund’s returns more volatile and increase the risk of loss. Derivative instruments may also be less liquid than more traditional investments and the Fund may be unable to sell or close out its derivative positions at a desirable time or price. This risk may be more acute under adverse market conditions, during which the Fund may be most in need of liquidating its derivative positions. Derivatives may also be harder to value, less tax efficient and subject to changing government regulation that could impact the Fund’s ability to use certain derivatives or their cost. Derivatives strategies may not always be successful. For example, derivatives used for hedging or to gain or limit exposure to a particular market segment may not provide the expected benefits, particularly during adverse market conditions. |
| ∎ | | High yield debt securities (junk bond) risk. Investments in high yield debt securities (“junk bonds”) and other lower-rated securities will subject the Fund to substantial risk of loss. These securities are considered to be speculative with respect to the issuer’s ability to pay interest and principal when due, are more susceptible to default or decline in market value and are less liquid than investment grade debt securities. Prices of high yield debt securities tend to be very volatile. |
| ∎ | | Inverse floating rate obligations risk.The price of inverse floating rate obligations (inverse floaters) is expected to decline when interest rates rise, and generally will decline further than the price of a bond with a similar maturity. The price of inverse floaters is typically more volatile than the price of bonds with similar maturities. These risks can be particularly high if leverage is used in the formula that determines the interest payable by the inverse floater, which may make the Fund’s returns more volatile and increase the risk of loss. Additionally, these securities may lose some or all of their principal and, in some cases, the Fund could lose money in excess of its investment. |
| | |
| 8 | | Invesco Municipal Income Fund |
| ∎ | | Liquidity risk.The Fund may be unable to sell illiquid investments at the time or price it desires and, as a result, could lose its entire investment in such investments. Liquid securities can become illiquid during periods of market stress. If a significant amount of the Fund’s securities become illiquid, the Fund may not be able to timely pay redemption proceeds and may need to sell securities at significantly reduced prices. |
| ∎ | | Management risk.The Fund is actively managed and depends heavily on the Adviser’s judgment about markets, interest rates or the attractiveness, relative values, liquidity, or potential appreciation of particular investments made for the Fund’s portfolio. The Fund could experience losses if these judgments prove to be incorrect. Additionally, legislative, regulatory, or tax developments may adversely affect management of the Fund and, therefore, the ability of the Fund to achieve its investment objective. |
| ∎ | | Market risk.The market values of the Fund’s investments, and therefore the value of the Fund’s shares, will go up and down, sometimes rapidly or unpredictably. Market risk may affect a single issuer, industry or section of the economy, or it may affect the market as a whole. Individual stock prices tend to go up and down more dramatically than those of certain other types of investments, such as bonds. During a general downturn in the financial markets, multiple asset classes may decline in value. When markets perform well, there can be no assurance that specific investments held by the Fund will rise in value. |
| ∎ | | Medium- and lower-grade municipal securitiesrisk.Medium- and lower-grade municipal securities generally involve more volatility and greater risks, including credit, market, liquidity and management risks, than higher-grade securities. Furthermore, many issuers of medium- and lower-grade securities choose not to have a rating assigned to their obligations. As such, the Fund’s portfolio may consist of a higher portion of unrated securities than an investment company investing solely in higher-grade securities. Unrated securities may not be as attractive to as many buyers as are rated securities, which may have the effect of limiting the Fund’s ability to sell such securities at their fair value. |
| ∎ | | Municipal issuer focus risk.The municipal issuers in which the Fund invests may be located in the same geographic area or may pay their |
| | | interest obligations from revenue of similar projects, such as hospitals, airports, utility systems and housing finance agencies. This may make the Fund’s investments more susceptible to similar social, economic, political or regulatory occurrences, making the Fund more susceptible to experience a drop in its share price than if the Fund had been more diversified across issuers that did not have similar characteristics. |
| ∎ | | Municipal securities risk.The risk of a municipal obligation generally depends on the financial and credit status of the issuer. Constitutional amendments, legislative enactments, executive orders, administrative regulations, voter initiatives, and the issuer’s regional economic conditions may affect the municipal security’s value, interest payments, repayment of principal and the Fund’s ability to sell the security. Failure of a municipal security issuer to comply with applicable tax requirements may make income paid thereon taxable, resulting in a decline in the security’s value. In addition, there could be changes in applicable tax laws or tax treatments that reduce or eliminate the current federal income tax exemption on municipal securities or otherwise adversely affect the current federal or state tax status of municipal securities. |
| ∎ | | Variable-rate demand notes risk.The absence of an active secondary market for certain variable and floating rate notes could make it difficult to dispose of these instruments, which could result in a loss. |
| ∎ | | When-issued, delayed delivery and forwardcommitment risks.When-issued and delayed delivery transactions subject the Fund to market risk because the value or yield of a security at delivery may be more or less than the purchase price or yield generally available when delivery occurs, and counterparty risk because the Fund relies on the buyer or seller, as the case may be, to consummate the transaction. These transactions also have a leveraging effect on the Fund because the Fund commits to purchase securities that it does not have to pay for until a later date, which increases the Fund’s overall investment exposure and, as a result, its volatility. |
| ∎ | | Zero coupon orpay-in-kind securitiesrisk.The value, interest rates, and liquidity ofnon-cash paying instruments, such as zero coupon and pay-in-kind securities, are subject to greater fluctuation than other types of securities. The higher yields and interest rates onpay-in-kind securities reflect the payment deferral and increased credit risk associated with such instruments and that such investments may represent a higher credit risk than loans that periodically pay interest. |
About indexes used in this report
| ∎ | | TheS&P Municipal Bond Indexis a broad, market value-weighted index that seeks to measure the performance of the US municipal bond market. |
| ∎ | | TheS&P Municipal Bond 5+ Year InvestmentGrade Indexseeks to measure the performance of investment grade US municipal bonds with maturities equal to or greater than five years. |
| ∎ | | TheLipper General Municipal DebtFunds Indexis an unmanaged index considered representative of general municipal debt funds tracked by Lipper. |
Other information
| ∎ | | CPA® and Certified Public Accountant® are trademarks owned by the American Institute of Certified Public Accountants. |
| ∎ | | The returns shown in management’s discussion of Fund performance are based on net asset values (NAVs) calculated for shareholder transactions. Generally accepted accounting principles require adjustments to be made to the net assets of the Fund at period end for financial reporting purposes, and as such, the NAVs for shareholder transactions and the returns based on those NAVs may differ from the NAVs and returns reported in the Financial Highlights. |
| ∎ | | Industry classifications used in this report are generally according to the Global Industry Classification Standard, which was developed by and is the exclusive property and a service mark of MSCI Inc. and Standard & Poor’s. |
9 Invesco Municipal Income Fund
Schedule of Investments
February 28, 2019
| | | | | | | | | | | | | | | | |
| | | Interest
Rate | | | Maturity
Date | | | Principal
Amount
(000) | | | Value | |
Municipal Obligations–112.69%(a) | | | | | | | | | | | | | | | | |
| | | | |
Alabama–1.75% | | | | | | | | | | | | | | | | |
Alabama (State of) Special Care Facilities Financing Authority (Ascension Health Senior Credit Group); Series 2016 B, Ref. RB | | | 5.00% | | | | 11/15/2046 | | | $ | 11,790 | | | $ | 13,011,208 | |
Alabaster (City of) Board of Education; | | | | | | | | | | | | | | | | |
Series 2014 A, Limited Special Tax GO Wts. (INS - AGM)(b) | | | 5.00% | | | | 09/01/2039 | | | | 2,725 | | | | 3,039,083 | |
Series 2014 A, Limited Special Tax GO Wts. (INS - AGM)(b) | | | 5.00% | | | | 09/01/2044 | | | | 2,725 | | | | 3,027,639 | |
Auburn University; Series 2011 A, General Fee RB(c)(d) | | | 5.00% | | | | 06/01/2021 | | | | 1,000 | | | | 1,074,550 | |
Birmingham (City of) Special Care Facilities Financing Authority (Children’s Hospital); Series 2009, Health Care Facility RB(c)(d) | | | 6.00% | | | | 06/01/2019 | | | | 1,000 | | | | 1,010,430 | |
Birmingham (City of) Special Care Facilities Financing Authority (Methodist Home for the Aging); Series 2016, RB | | | 5.75% | | | | 06/01/2035 | | | | 4,200 | | | | 4,597,068 | |
Birmingham (City of) Water Works Board; Series 2015 A, Ref. Water RB(e) | | | 5.00% | | | | 01/01/2042 | | | | 10,005 | | | | 11,024,710 | |
Huntsville (City of) Special Care Facilities Financing Authority (Redstone Village); Series 2007, Retirement Facility RB(f) | | | 5.50% | | | | 01/01/2043 | | | | 900 | | | | 637,911 | |
Lower Alabama Gas District (The); Series 2016 A, Gas Project RB(e) | | | 5.00% | | | | 09/01/2046 | | | | 6,000 | | | | 7,024,020 | |
Mobile (City of) Industrial Development Board (Mobile Energy Services Co.); Series 1995, Ref. Solid Waste Disposal RB | | | 6.95% | | | | 01/01/2020 | | | | 3 | | | | 0 | |
Selma (City of) Industrial Development Board; Series 2009 A, Gulf Opportunity Zone RB | | | 6.25% | | | | 11/01/2033 | | | | 4,100 | | | | 4,205,042 | |
| | | | | | | | | | | | | | | | 48,651,661 | |
| | | | |
Alaska–0.73% | | | | | | | | | | | | | | | | |
| | | | |
Alaska (State of) Industrial Development & Export Authority (Providence Health Services); | | | | | | | | | | | | | | | | |
Series 2011 A, RB | | | 5.00% | | | | 10/01/2040 | | | | 1,250 | | | | 1,323,938 | |
Series 2011 A, RB | | | 5.50% | | | | 10/01/2041 | | | | 3,000 | | | | 3,227,010 | |
Alaska Municipal Bond Bank Authority; Series 2017 A, Master Resolution RB(e) | | | 5.50% | | | | 10/01/2042 | | | | 9,000 | | | | 10,580,940 | |
Matanuska-Susitna (Borough of) (Goose Creek Correctional Center); Series 2009, Lease RB(c)(d) | | | 6.00% | | | | 09/01/2019 | | | | 5,000 | | | | 5,107,255 | |
| | | | | | | | | | | | | | | | 20,239,143 | |
| | | | |
Arizona–2.81% | | | | | | | | | | | | | | | | |
| | | | |
Arizona (State of) Health Facilities Authority (Catholic Healthcare West); Series 2011B-1, RB | | | 5.25% | | | | 03/01/2039 | | | | 5,000 | | | | 5,286,150 | |
Arizona (State of) Industrial Development Authority (Basis Schools); Series 2017 A, Ref. Education RB(g) | | | 5.25% | | | | 07/01/2047 | | | | 4,500 | | | | 4,634,730 | |
Arizona (State of) Industrial Development Authority (Kaizen Education Foundation); Series 2016, Education RB(g) | | | 5.50% | | | | 07/01/2036 | | | | 5,840 | | | | 6,104,201 | |
Arizona (State of) Industrial Development Authority (Pinecrest Academy of Nevada-Horizon, Inspirada and St. Rose Campus Projects); Series 2018 A, Education RB(g) | | | 5.75% | | | | 07/15/2048 | | | | 3,150 | | | | 3,303,720 | |
Glendale (City of) Industrial Development Authority (Midwestern University); | | | | | | | | | | | | | | | | |
Series 2010, RB | | | 5.00% | | | | 05/15/2035 | | | | 1,000 | | | | 1,033,200 | |
Series 2010, RB | | | 5.13% | | | | 05/15/2040 | | | | 2,150 | | | | 2,221,939 | |
Glendale (City of) Industrial Development Authority (The Beatitudes Campus); | | | | | | | | | | | | | | | | |
Series 2017, Ref. RB | | | 5.00% | | | | 11/15/2032 | | | | 2,560 | | | | 2,615,962 | |
Series 2017, Ref. RB | | | 5.00% | | | | 11/15/2036 | | | | 2,200 | | | | 2,221,472 | |
Goodyear (City of); Series 2010, Sub. Lien Water & Sewer RB | | | 5.63% | | | | 07/01/2039 | | | | 1,000 | | | | 1,048,690 | |
Maricopa (County of) Industrial Development Authority (Paradise Schools); Series 2016, Ref. Education RB(g) | | | 5.00% | | | | 07/01/2036 | | | | 2,500 | | | | 2,586,575 | |
Phoenix (City of) Industrial Development Authority (Career Success Schools); | | | | | | | | | | | | | | | | |
Series 2009, Education RB | | | 7.00% | | | | 01/01/2039 | | | | 600 | | | | 604,500 | |
Series 2009, Education RB | | | 7.13% | | | | 01/01/2045 | | | | 1,240 | | | | 1,250,032 | |
Phoenix (City of) Industrial Development Authority (Great Hearts Academies); | | | | | | | | | | | | | | | | |
Series 2012, Education RB(c)(d) | | | 6.30% | | | | 07/01/2021 | | | | 1,000 | | | | 1,104,400 | |
Series 2012, Education RB(c)(d) | | | 6.40% | | | | 07/01/2021 | | | | 400 | | | | 442,668 | |
Phoenix (City of) Industrial Development Authority (Legacy Traditional Schools); Series 2014 A, Education Facility RB(g) | | | 6.50% | | | | 07/01/2034 | | | | 1,095 | | | | 1,195,422 | |
See accompanying Notes to Financial Statements which are an integral part of the financial statements.
10 Invesco Municipal Income Fund
| | | | | | | | | | | | | | | | |
| | | Interest
Rate | | | Maturity
Date | | | Principal
Amount
(000) | | | Value | |
| | | | |
Arizona–(continued) | | | | | | | | | | | | | | | | |
| | | | |
Phoenix (City of) Industrial Development Authority (Rowan University); | | | | | | | | | | | | | | | | |
Series 2012, Lease RB | | | 5.25% | | | | 06/01/2034 | | | $ | 3,000 | | | $ | 3,262,320 | |
Series 2012, Lease RB | | | 5.00% | | | | 06/01/2042 | | | | 5,000 | | | | 5,338,800 | |
Pima (County of) Industrial Development Authority (American Leadership Academy); | | | | | | | | | | | | | | | | |
Series 2017, Education Facility RB(g) | | | 4.75% | | | | 06/15/2037 | | | | 2,000 | | | | 1,963,900 | |
Series 2017, Education Facility RB(g) | | | 5.00% | | | | 06/15/2047 | | | | 5,000 | | | | 4,895,850 | |
Pima (County of) Industrial Development Authority (Desert Heights Charter School); Series 2014, Ref. Education Facility RB | | | 7.00% | | | | 05/01/2034 | | | | 1,000 | | | | 1,089,860 | |
Pima (County of) Industrial Development Authority (Grande Innovations Academy); Series 2018, Education Facility RB(g) | | | 5.25% | | | | 07/01/2048 | | | | 5,000 | | | | 4,745,500 | |
Pima (County of) Industrial Development Authority (Tucson Electric Power Co.); Series 2010 A, IDR | | | 5.25% | | | | 10/01/2040 | | | | 1,925 | | | | 2,005,619 | |
Pinal (County of) Electric District No. 3; Series 2011, Ref. Electrical System RB(c)(d) | | | 5.25% | | | | 07/01/2021 | | | | 2,000 | | | | 2,163,520 | |
Salt Verde Financial Corp.; Series 2007, Sr. Gas RB | | | 5.00% | | | | 12/01/2037 | | | | 8,615 | | | | 10,203,089 | |
University Medical Center Corp.; Series 2009, Hospital RB(c)(d) | | | 6.00% | | | | 07/01/2019 | | | | 1,250 | | | | 1,267,925 | |
Verrado Community Facilities District No. 1; | | | | | | | | | | | | | | | | |
Series 2013 A, Ref. Unlimited Tax GO Bonds(g) | | | 6.00% | | | | 07/15/2027 | | | | 2,000 | | | | 2,130,580 | |
Series 2013 B, Unlimited Tax GO Bonds(g) | | | 5.70% | | | | 07/15/2029 | | | | 775 | | | | 812,053 | |
Series 2013 B, Unlimited Tax GO Bonds(g) | | | 6.00% | | | | 07/15/2033 | | | | 710 | | | | 744,847 | |
Yavapai (County of) Industrial Development Authority (Northern Arizona Healthcare System); | | | | | | | | | | | | | | | | |
Series 2011, Ref. Hospital Facility RB | | | 5.25% | | | | 10/01/2025 | | | | 1,000 | | | | 1,080,400 | |
Series 2011, Ref. Hospital Facility RB | | | 5.25% | | | | 10/01/2026 | | | | 500 | | | | 539,545 | |
| | | | | | | | | | | | | | | | 77,897,469 | |
| | | | |
Arkansas–0.34% | | | | | | | | | | | | | | | | |
| | | | |
Arkansas State University (Jonesboro Campus); Series 2009, Housing System RB | | | 5.00% | | | | 03/01/2034 | | | | 1,825 | | | | 1,825,000 | |
Little Rock (City of); Series 2009, Library Construction & Improvement Limited Tax GO Bonds | | | 4.60% | | | | 03/01/2024 | | | | 1,495 | | | | 1,495,000 | |
Pulaski (County of) Public Facilities Board; Series 2014, Healthcare RB | | | 5.00% | | | | 12/01/2042 | | | | 5,530 | | | | 5,981,359 | |
| | | | | | | | | | | | | | | | 9,301,359 | |
| | | | |
California–10.48% | | | | | | | | | | | | | | | | |
| | | | |
Anaheim (City of) Public Financing Authority (Electric System Distribution Facilities); Series 2011 A, RB(c)(d) | | | 5.38% | | | | 04/01/2021 | | | | 735 | | | | 795,167 | |
Bay Area Toll Authority (San Francisco Bay Area); Series 2017F-1, Toll Bridge
RB(e) | | | 5.00% | | | | 04/01/2056 | | | | 12,000 | | | | 13,392,480 | |
Beverly Hills Unified School District (Election of 2008); Series 2009, Unlimited Tax CAB GO Bonds(h) | | | 0.00% | | | | 08/01/2031 | | | | 40 | | | | 27,986 | |
Big Bear Lake (City of); Series 1996, Ref. Water RB(INS-NATL)(b) | | | 6.00% | | | | 04/01/2022 | | | | 1,240 | | | | 1,311,536 | |
California (County of) Tobacco Securitization Agency (Stanislaus County Tobacco Funding Corp.); | | | | | | | | | | | | | | | | |
Series 2006 A, Tobacco Settlement CAB Sub. RB(h) | | | 0.00% | | | | 06/01/2046 | | | | 20,000 | | | | 3,286,800 | |
California (State of); | | | | | | | | | | | | | | | | |
Series 2002, Unlimited Tax GO Bonds | | | 6.00% | | | | 04/01/2019 | | | | 3,500 | | | | 3,511,830 | |
Series 2010, Various Purpose Unlimited Tax GO Bonds | | | 5.50% | | | | 03/01/2040 | | | | 250 | | | | 258,123 | |
Series 2011, Various Purpose Unlimited Tax GO Bonds | | | 5.00% | | | | 10/01/2041 | | | | 5,000 | | | | 5,368,200 | |
Series 2012, Various Purpose Unlimited Tax GO Bonds | | | 5.00% | | | | 09/01/2036 | | | | 5,000 | | | | 5,476,450 | |
California (State of) Health Facilities Financing Authority (Catholic Healthcare West); Series 2009 A, RB(c)(d) | | | 6.00% | | | | 07/01/2019 | | | | 5,000 | | | | 5,073,700 | |
California (State of) Health Facilities Financing Authority (Children’s Hospital Los Angeles); Series 2010, RB(c)(d) | | | 5.25% | | | | 07/01/2020 | | | | 500 | | | | 524,700 | |
California (State of) Health Facilities Financing Authority (Lucile Salter Packard Children’s Hospital at Stanford); Series 2017, RB | | | 5.00% | | | | 11/15/2056 | | | | 3,000 | | | | 3,304,530 | |
California (State of) Health Facilities Financing Authority (The Episcopal Home); Series 2010 B, RB(c)(d) | | | 5.50% | | | | 02/01/2020 | | | | 1,000 | | | | 1,036,400 | |
California (State of) Municipal Finance Authority (Emerson College); | | | | | | | | | | | | | | | | |
Series 2011, RB(c)(d) | | | 5.00% | | | | 01/01/2022 | | | | 1,250 | | | | 1,373,825 | |
Series 2011, RB(c)(d) | | | 5.75% | | | | 01/01/2022 | | | | 450 | | | | 503,226 | |
Series 2011, RB | | | 5.00% | | | | 01/01/2028 | | | | 275 | | | | 295,127 | |
See accompanying Notes to Financial Statements which are an integral part of the financial statements.
11 Invesco Municipal Income Fund
| | | | | | | | | | | | | | | | |
| | | Interest
Rate | | | Maturity
Date | | | Principal
Amount
(000) | | | Value | |
| | | | |
California–(continued) | | | | | | | | | | | | | | | | |
| | | | |
California (State of) Municipal Finance Authority (Linxs APM); Series 2018 A, Sr.Lien RB(i) | | | 5.00% | | | | 12/31/2047 | | | $ | 12,550 | | | $ | 13,856,455 | |
California (State of) Pollution Control Finance Authority; | | | | | | | | | | | | | | | | |
Series 2012, Water Furnishing RB(g)(i) | | | 5.00% | | | | 07/01/2030 | | | | 3,160 | | | | 3,360,502 | |
Series 2012, Water Furnishing RB(g)(i) | | | 5.00% | | | | 07/01/2037 | | | | 6,955 | | | | 7,295,030 | |
California (State of) Pollution Control Financing Authority (San Diego County Water Authority); Ref. RB(g) | | | 5.00% | | | | 07/01/2039 | | | | 5,250 | | | | 5,885,775 | |
California (State of) Public Works Board (Various Correctional Facilities); Series 2014 A, Lease RB | | | 5.00% | | | | 09/01/2039 | | | | 2,500 | | | | 2,799,125 | |
California (State of) School Finance Authority (New Designs Charter School); Series 2012, Educational Facilities RB | | | 5.50% | | | | 06/01/2042 | | | | 2,000 | | | | 2,052,280 | |
California (State of) Statewide Communities Development Authority (Lancer Educational Student Housing); Series 2016, Ref. RB(g) | | | 5.00% | | | | 06/01/2046 | | | | 3,000 | | | | 3,169,440 | |
California (State of) Statewide Communities Development Authority (Loma Linda University Medical Center); | | | | | | | | | | | | | | | | |
Series 2016 A, RB(g) | | | 5.00% | | | | 12/01/2041 | | | | 6,475 | | | | 6,843,945 | |
Series 2016 A, RB(g) | | | 5.25% | | | | 12/01/2056 | | | | 6,150 | | | | 6,541,878 | |
California (State of) Statewide Communities Development Authority (Methodist Hospital); | | | | | | | | | | | | | | | | |
Series 2009, RB(c)(d) | | | 6.25% | | | | 08/01/2019 | | | | 1,650 | | | | 1,681,746 | |
California (State of) Statewide Communities Development Authority (Pooled Financing Program); | | | | | | | | | | | | | | | | |
Series 2004 A, Water & Wastewater RB(c)(d) | | | 5.25% | | | | 10/01/2013 | | | | 270 | | | | 270,772 | |
California (State of) Statewide Communities Development Authority (Southern California Presbyterian Homes); | | | | | | | | | | | | | | | | |
Series 2009, Senior Living RB(g) | | | 6.25% | | | | 11/15/2019 | | | | 110 | | | | 112,844 | |
Series 2009, Senior Living RB(g) | | | 6.63% | | | | 11/15/2024 | | | | 2,000 | | | | 2,056,740 | |
Clovis Unified School District (Election of 2004); Series 2004 A, Unlimited Tax CAB GO Bonds (INS -NATL)(b)(h) | | | 0.00% | | | | 08/01/2029 | | | | 1,585 | | | | 1,171,711 | |
Clovis Unified School District (Election of 2012); Series 2015 D, Unlimited Tax CAB GO Bonds(h) | | | 0.00% | | | | 08/01/2033 | | | | 3,270 | | | | 1,882,016 | |
Corona-Norco Unified School District (Election of 2006); Series 2009 C, Unlimited Tax CAB GO Bonds(INS-AGM)(b)(h) | | | 0.00% | | | | 08/01/2039 | | | | 1,000 | | | | 444,360 | |
Earlimart School District; Series 1994 1, Unlimited Tax GO Bonds(INS-AMBAC)(b) | | | 6.70% | | | | 08/01/2021 | | | | 205 | | | | 218,376 | |
El Segundo Unified School District (Election of 2008); | | | | | | | | | | | | | | | | |
Series 2009 A, Unlimited Tax CAB GO Bonds(h) | | | 0.00% | | | | 08/01/2032 | | | | 5,030 | | | | 3,271,512 | |
Series 2009 A, Unlimited Tax CAB GO Bonds(h) | | | 0.00% | | | | 08/01/2033 | | | | 4,185 | | | | 2,594,993 | |
Golden State Tobacco Securitization Corp.; Series 2018A-2, Ref. Tobacco Settlement Asset-Backed RB | | | 5.00% | | | | 06/01/2047 | | | | 5,000 | | | | 4,826,600 | |
Hacienda La Puente Unified School District Facilities Financing Authority (Unified School District GO Bond Program); Series 2007, RB(INS-AGM)(b) | | | 5.00% | | | | 08/01/2026 | | | | 2,000 | | | | 2,466,160 | |
Hayward Unified School District (Election of 2008); Series 2010 A, Unlimited Tax CAB GO Bonds(INS-AGM)(b)(h) | | | 0.00% | | | | 08/01/2034 | | | | 1,500 | | | | 875,760 | |
Inland Empire Tobacco Securitization Authority; Series 2007C-1, Asset-Backed Tobacco Settlement CAB Turbo RB(h) | | | 0.00% | | | | 06/01/2036 | | | | 25,000 | | | | 7,570,500 | |
Lancaster (City of) Redevelopment Agency (Combined Redevelopment Areas); Series 2009, Tax Allocation RB(c)(d) | | | 6.50% | | | | 08/01/2019 | | | | 2,000 | | | | 2,040,840 | |
Long Beach Unified School District (Election of 2008); | | | | | | | | | | | | | | | | |
Series 2009, Unlimited Tax GO Bonds(c)(d) | | | 5.75% | | | | 08/01/2019 | | | | 4,695 | | | | 4,777,773 | |
Series 2009, Unlimited Tax GO Bonds | | | 5.75% | | | | 08/01/2033 | | | | 305 | | | | 310,124 | |
Los Angeles (City of) Department of Airports (Los Angeles International Airport); | | | | | | | | | | | | | | | | |
Series 2017, Sub. RB(i) | | | 5.00% | | | | 05/15/2046 | | | | 6,000 | | | | 6,624,060 | |
Series 2018 A, Sub. RB(e)(i)(j) | | | 5.25% | | | | 05/15/2048 | | | | 12,000 | | | | 13,776,120 | |
Los Angeles (City of) Harbor Department; Series 2009 C, Ref. RB | | | 5.00% | | | | 08/01/2031 | | | | 1,500 | | | | 1,519,905 | |
Los Angeles Unified School District (Election of 2004); Series 2009 I, Unlimited Tax GO Bonds | | | 5.00% | | | | 07/01/2029 | | | | 3,000 | | | | 3,032,640 | |
Menifee Union School District (Election of 2008); Series 2009 C, Unlimited Tax CAB GO Bonds (INS-AGC)(b)(h) | | | 0.00% | | | | 08/01/2035 | | | | 3,260 | | | | 1,827,295 | |
Morongo Band of Mission Indians (The); Series 2018 A, Economic Development RB(g) | | | 5.00% | | | | 10/01/2042 | | | | 4,800 | | | | 5,084,496 | |
Mt. San Antonio (City of) Community College District (Election 2008); Series 2013 A, Unlimited Tax Conv. CAB GO Bonds(k) | | | 6.25% | | | | 08/01/2043 | | | | 6,965 | | | | 5,987,602 | |
See accompanying Notes to Financial Statements which are an integral part of the financial statements.
12 Invesco Municipal Income Fund
| | | | | | | | | | | | | | | | |
| | | Interest
Rate | | | Maturity
Date | | | Principal
Amount
(000) | | | Value | |
| | | | |
California–(continued) | | | | | | | | | | | | | | | | |
| | | | |
Norco (City of) Financing Authority; Series 2009, Ref. Enterprise RB (INS-AGM)(b) | | | 5.63% | | | | 10/01/2034 | | | $ | 1,500 | | | $ | 1,532,385 | |
Oakland (Port of); Series 2012 P, Ref. Sr. Lien RB(i) | | | 5.00% | | | | 05/01/2028 | | | | 2,000 | | | | 2,172,080 | |
Patterson Joint Unified School District (Election of 2008); | | | | | | | | | | | | | | | | |
Series 2009 B, Unlimited Tax CAB GO Bonds(INS-AGM)(b)(h) | | | 0.00% | | | | 08/01/2037 | | | | 1,170 | | | | 598,151 | |
Series 2009 B, Unlimited Tax CAB GO Bonds(INS-AGM)(b)(h) | | | 0.00% | | | | 08/01/2038 | | | | 4,770 | | | | 2,329,668 | |
Series 2009 B, Unlimited Tax CAB GO Bonds(INS-AGM)(b)(h) | | | 0.00% | | | | 08/01/2039 | | | | 5,010 | | | | 2,332,105 | |
Series 2009 B, Unlimited Tax CAB GO Bonds(INS-AGM)(b)(h) | | | 0.00% | | | | 08/01/2040 | | | | 5,260 | | | | 2,334,335 | |
Series 2009 B, Unlimited Tax CAB GO Bonds(INS-AGM)(b)(h) | | | 0.00% | | | | 08/01/2041 | | | | 5,520 | | | | 2,337,278 | |
Placentia-Yorba Linda Unified School District (Election of 2008); Series 2011 D, Unlimited Tax CAB GO Bonds(h) | | | 0.00% | | | | 08/01/2035 | | | | 1,500 | | | | 846,225 | |
Regents of the University of California; | | | | | | | | | | | | | | | | |
Series 2009 O, General RB(c)(d) | | | 5.25% | | | | 05/15/2019 | | | | 500 | | | | 503,814 | |
Series 2009 O, General RB(c)(d)(e) | | | 5.75% | | | | 05/15/2019 | | | | 13,775 | | | | 13,893,603 | |
Richmond (City of) Joint Powers Financing Authority (Point Potrero); Series 2009 A, Lease RB | | | 6.25% | | | | 07/01/2024 | | | | 2,500 | | | | 2,539,400 | |
Riverside (City of); Series 2008 D, Electric RB (INS-AGM)(b) | | | 5.00% | | | | 10/01/2038 | | | | 5,600 | | | | 5,615,232 | |
Riverside (County of) Transportation Commission; Series 2013 A, Sr. Lien Toll RB | | | 5.75% | | | | 06/01/2044 | | | | 2,500 | | | | 2,725,975 | |
Sacramento (County of); Series 2010, Sr. Airport System RB | | | 5.00% | | | | 07/01/2040 | | | | 4,300 | | | | 4,469,764 | |
San Buenaventura (City of) (Community Memorial Health System); | | | | | | | | | | | | | | | | |
Series 2011, RB | | | 6.25% | | | | 12/01/2020 | | | | 1,000 | | | | 1,067,010 | |
Series 2011, RB | | | 6.50% | | | | 12/01/2021 | | | | 2,000 | | | | 2,221,840 | |
Series 2011, RB | | | 6.50% | | | | 12/01/2022 | | | | 2,000 | | | | 2,218,080 | |
San Diego Community College District (Election of 2002); Series 2009, Unlimited Tax GO Bonds(c)(d)(e) | | | 5.25% | | | | 08/01/2019 | | | | 7,500 | | | | 7,618,575 | |
San Diego Unified School District; Series 2012R-2, Ref. Unlimited Tax Conv. CAB GO Bonds(k) | | | 6.63% | | | | 07/01/2041 | | | | 6,250 | | | | 5,195,562 | |
San Francisco (City & County of) Airport Commission (San Francisco International Airport); | | | | | | | | | | | | | | | | |
Series 2011 C, Ref. Second Series RB(i) | | | 5.00% | | | | 05/01/2023 | | | | 10,000 | | | | 10,646,700 | |
Series 2019 A, Ref. Second Series RB(i) | | | 5.00% | | | | 05/01/2039 | | | | 5,000 | | | | 5,769,850 | |
San Francisco (City & County of) Redevelopment Financing Authority (Mission Bay South Redevelopment); Series 2009 D, Tax Allocation RB(c)(d) | | | 6.00% | | | | 08/01/2019 | | | | 1,000 | | | | 1,018,650 | |
San Joaquin (County of) Transportation Authority (Measure K); Series 2011 A, Limited Sales Tax RB(c)(d) | | | 5.25% | | | | 03/01/2021 | | | | 1,500 | | | | 1,609,965 | |
San Joaquin Hills Transportation Corridor Agency; Series 2014 B, Ref. Jr. Lien Toll Road RB | | | 5.25% | | | | 01/15/2044 | | | | 5,000 | | | | 5,393,100 | |
San Jose (City of); | | | | | | | | | | | | | | | | |
Series 2011A-1, Airport RB(i) | | | 5.25% | | | | 03/01/2026 | | | | 2,730 | | | | 2,902,181 | |
Series 2011A-1, Airport RB(i) | | | 6.25% | | | | 03/01/2034 | | | | 2,500 | | | | 2,695,550 | |
San Mateo (City of) Foster School District (Election 2008); Series 2010, Unlimited Tax Conv. CAB GO Bonds(k) | | | 6.63% | | | | 08/01/2042 | | | | 1,410 | | | | 1,274,443 | |
Santa Margarita Water District (Community Facilities DistrictNo. 2013-1); Series 2013, Special Tax RB | | | 5.38% | | | | 09/01/2029 | | | | 2,530 | | | | 2,720,130 | |
Silicon Valley Tobacco Securitization Authority (Santa Clara); | | | | | | | | | | | | | | | | |
Series 2007 A, Tobacco Settlement CAB Turbo RB(h) | | | 0.00% | | | | 06/01/2036 | | | | 22,000 | | | | 7,978,740 | |
Series 2007 A, Tobacco Settlement CAB Turbo RB(h) | | | 0.00% | | | | 06/01/2041 | | | | 5,000 | | | | 1,308,200 | |
Torrance Unified School District (Election of 2008-Measure Z); Series 2009B-1, Unlimited Tax CAB GO Bonds(h) | | | 0.00% | | | | 08/01/2026 | | | | 1,250 | | | | 1,050,950 | |
Vernon (City of); | | | | | | | | | | | | | | | | |
Series 2009 A, Electric System RB(c)(d) | | | 5.13% | | | | 08/01/2019 | | | | 510 | | | | 517,594 | |
Series 2009 A, Electric System RB | | | 5.13% | | | | 08/01/2021 | | | | 1,105 | | | | 1,118,603 | |
West Contra Costa Unified School District; Series 2005, Unlimited Tax CAB GO Bonds(INS-NATL)(b)(h) | | | 0.00% | | | | 08/01/2027 | | | | 7,865 | | | | 6,352,954 | |
Western Riverside (County of) Water & Wastewater Financing Authority (Eastern Municipal Water District Improvement); Series 2009, RB(INS-AGC)(b) | | | 5.50% | | | | 09/01/2034 | | | | 1,000 | | | | 1,018,720 | |
Yosemite Community College District (Election of 2004); Series 2008 C, Unlimited Tax CAB GO Bonds (INS-AGM)(b)(h) | | | 0.00% | | | | 08/01/2024 | | | | 3,570 | | | | 3,187,046 | |
| | | | | | | | | | | | | | | | 290,883,913 | |
See accompanying Notes to Financial Statements which are an integral part of the financial statements.
13 Invesco Municipal Income Fund
| | | | | | | | | | | | | | | | |
| | | Interest
Rate | | | Maturity
Date | | | Principal
Amount
(000) | | | Value | |
Colorado–2.59% | | | | | | | | | | | | | | | | |
| | | | |
Amber Creak Metropolitan District; Series 2017 A, Ref. Limited Tax GO Bonds | | | 5.13% | | | | 12/01/2047 | | | $ | 1,075 | | | $ | 1,062,949 | |
Belleview Station Metropolitan District No. 2; | | | | | | | | | | | | | | | | |
Series 2017, Ref. Limited Tax GO Bonds | | | 5.00% | | | | 12/01/2036 | | | | 1,000 | | | | 1,017,890 | |
Series 2017, Ref. Limited Tax GO Bonds | | | 5.13% | | | | 12/01/2046 | | | | 2,375 | | | | 2,413,166 | |
Centerra Metropolitan District No. 1 (In the City of Loveland); Series 2017, Ref. Special Tax Allocation RB(g) | | | 5.00% | | | | 12/01/2037 | | | | 3,000 | | | | 3,047,820 | |
Colorado (State of) Health Facilities Authority (Adventist Health System/Sunbelt Obligated Group); Series 2018 A, Hospital RB | | | 5.00% | | | | 11/15/2048 | | | | 5,000 | | | | 5,610,100 | |
Colorado (State of) Health Facilities Authority (The Evangelical Lutheran Good Samaritan Society); Series 2013, RB | | | 5.63% | | | | 06/01/2043 | | | | 2,500 | | | | 2,714,500 | |
Series 2017, Ref. Hospital RB | | | 5.00% | | | | 06/01/2047 | | | | 3,500 | | | | 3,752,770 | |
Colorado (State of) High Performance Transportation Enterprise(C-470 Express Lanes); Series 2017, RB | | | 5.00% | | | | 12/31/2056 | | | | 6,250 | | | | 6,675,312 | |
Colorado (State of) Regional Transportation District (Denver Transit Partners Eagle P3); Series 2010, Private Activity RB | | | 6.50% | | | | 01/15/2030 | | | | 2,400 | | | | 2,486,808 | |
Series 2010, Private Activity RB | | | 6.00% | | | | 01/15/2041 | | | | 2,650 | | | | 2,719,510 | |
Colorado Springs (City of); Series 2010D-1, Utilities System RB(c)(d) | | | 5.25% | | | | 11/15/2020 | | | | 1,000 | | | | 1,060,500 | |
Denver (City & County of); Series 2018 A, Ref. Sub. Airport System RB(e)(i) | | | 5.25% | | | | 12/01/2043 | | | | 15,000 | | | | 17,295,750 | |
Denver (City & County of) (United Airlines, Inc.); Series 2017, Ref. Special Facilities Airport RB(i) | | | 5.00% | | | | 10/01/2032 | | | | 5,000 | | | | 5,315,700 | |
Denver (City of) Convention Center Hotel Authority; Series 2016, Ref. Sr. RB | | | 5.00% | | | | 12/01/2040 | | | | 2,500 | | | | 2,692,750 | |
Leyden Rock Metropolitan District No. 10; Series 2016 A, Limited Tax GO Bonds | | | 5.00% | | | | 12/01/2045 | | | | 1,250 | | | | 1,258,588 | |
Neu Towne Metropolitan District; Series 2018 A, Ref. & Improvement Limited Tax GO Bonds | | | 5.38% | | | | 12/01/2046 | | | | 3,000 | | | | 3,013,860 | |
Public Authority for Colorado Energy; Series 2008, Natural Gas Purchase RB | | | 6.50% | | | | 11/15/2038 | | | | 6,255 | | | | 8,775,890 | |
University of Colorado; Series 2009 A, Enterprise RB(c)(d) | | | 5.25% | | | | 06/01/2019 | | | | 1,075 | | | | 1,084,546 | |
| | | | | | | | | | | | | | | | 71,998,409 | |
| | | | |
Connecticut–1.12% | | | | | | | | | | | | | | | | |
Connecticut (State of) (Bradley International Airport); Series 2000 A, Special Obligation Parking RB(INS-ACA)(b)(i) | | | 6.60% | | | | 07/01/2024 | | | | 1,000 | | | | 1,002,850 | |
Connecticut (State of) Development Authority (Aquarion Water Co.); Series 2011, Water Facilities RB(b)(i) | | | 5.50% | | | | 04/01/2021 | | | | 3,000 | | | | 3,186,180 | |
Connecticut (State of) Health & Educational Facilities Authority (Church Home of Hartford, Inc.); Series 2016 A, Healthcare Facilities RB(g) | | | 5.00% | | | | 09/01/2046 | | | | 2,500 | | | | 2,542,150 | |
Series 2016 A, Healthcare Facilities RB(g) | | | 5.00% | | | | 09/01/2053 | | | | 1,700 | | | | 1,711,611 | |
Connecticut (State of) Health & Educational Facilities Authority (Duncaster, Inc.);
Series 2014 A, RB | | | 5.00% | | | | 08/01/2035 | | | | 1,000 | | | | 1,037,850 | |
Series 2014 A, RB | | | 5.00% | | | | 08/01/2044 | | | | 5,000 | | | | 5,156,800 | |
Connecticut (State of) Health & Educational Facilities Authority (Hartford Healthcare); Series 2011 A, RB | | | 5.00% | | | | 07/01/2026 | | | | 1,000 | | | | 1,063,870 | |
Series 2011 A, RB | | | 5.00% | | | | 07/01/2041 | | | | 5,700 | | | | 5,987,166 | |
Connecticut (State of) Health & Educational Facilities Authority (Western Connecticut Health Network); Series 2011 M, RB | | | 5.38% | | | | 07/01/2041 | | | | 5,000 | | | | 5,304,250 | |
Hamden (Town of) (Whitney Center); Series 2009 C, RB(d) | | | 5.50% | | | | 01/01/2022 | | | | 1,000 | | | | 944,200 | |
Harbor Point Infrastructure Improvement District (Harbor Point); Series 2010 A, Special Obligation Tax Allocation RB(c)(d) | | | 7.88% | | | | 04/01/2020 | | | | 3,000 | | | | 3,197,460 | |
| | | | | | | | | | | | | | | | 31,134,387 | |
| | | | |
Delaware–0.04% | | | | | | | | | | | | | | | | |
Delaware (State of) Economic Development Authority (Delmarva Power & Light Co.); Series 2010, Ref. Gas Facilities RB | | | 5.40% | | | | 02/01/2031 | | | | 1,050 | | | | 1,092,935 | |
See accompanying Notes to Financial Statements which are an integral part of the financial statements.
14 Invesco Municipal Income Fund
| | | | | | | | | | | | | | | | |
| | | Interest
Rate | | | Maturity
Date | | | Principal
Amount
(000) | | | Value | |
| | | | |
| District of Columbia–3.65% | | | | | | | | | | | | | | | | |
District of Columbia; | | | | | | | | | | | | | | | | |
Series 2006B-1, Ballpark RB(INS-NATL)(b) | | | 5.00% | | | | 02/01/2031 | | | $ | 10,655 | | | $ | 10,674,498 | |
Series 2009 A, Sec. Income Tax RB(e) | | | 5.00% | | | | 12/01/2023 | | | | 10,715 | | | | 10,977,410 | |
Series 2009 A, Sec. Income Tax RB(e) | | | 5.25% | | | | 12/01/2027 | | | | 6,860 | | | | 7,039,595 | |
Series 2009 B, Ref. Sec. Income Tax RB(e) | | | 5.00% | | | | 12/01/2024 | | | | 4,285 | | | | 4,389,940 | |
District of Columbia (Center for Strategic & International Studies, Inc.); | | | | | | | | | | | | | | | | |
Series 2011, RB(c)(d) | | | 6.38% | | | | 03/01/2021 | | | | 2,700 | | | | 2,916,918 | |
Series 2011, RB(c)(d) | | | 6.63% | | | | 03/01/2021 | | | | 1,100 | | | | 1,205,875 | |
District of Columbia (Georgetown University); | | | | | | | | | | | | | | | | |
Series 2017, Ref. RB(c)(d) | | | 5.00% | | | | 04/01/2042 | | | | 1,180 | | | | 1,434,892 | |
Series 2017, Ref. RB | | | 5.00% | | | | 04/01/2042 | | | | 7,125 | | | | 7,960,121 | |
District of Columbia (Ingleside at Rock Creek); Series 2017 A, RB | | | 5.00% | | | | 07/01/2052 | | | | 2,250 | | | | 2,268,135 | |
District of Columbia (Sibley Memorial Hospital); Series 2009, Hospital RB(c)(d) | | | 6.38% | | | | 10/01/2019 | | | | 2,200 | | | | 2,259,466 | |
District of Columbia Tobacco Settlement Financing Corp.; Series 2006 A, Asset-Backed CAB RB(h) | | | 0.00% | | | | 06/15/2046 | | | | 25,000 | | | | 3,834,250 | |
Metropolitan Washington Airports Authority; | | | | | | | | | | | | | | | | |
Series 2016 A, Ref. Airport System RB(i) | | | 5.00% | | | | 10/01/2034 | | | | 5,295 | | | | 5,999,182 | |
Series 2018 A, Ref. RB(i) | | | 5.00% | | | | 10/01/2043 | | | | 15,800 | | | | 17,798,068 | |
Metropolitan Washington Airports Authority (Dulles Metrorail and Capital Improvement); | | | | | | | | | | | | | | | | |
Series 2010 A, Dulles Toll Road CAB RB(INS-AGM)(b)(h) | | | 0.00% | | | | 10/01/2037 | | | | 17,565 | | | | 8,376,573 | |
Series 2014 A, Ref. Sr. Lien Dulles Toll Road RB | | | 5.00% | | | | 10/01/2053 | | | | 13,710 | | | | 14,175,866 | |
| | | | | | | | | | | | | | | | 101,310,789 | |
| | | | |
Florida–4.57% | | | | | | | | | | | | | | | | |
| | | | |
Broward (County of); Series 2015 A, Airport System RB(i) | | | 5.00% | | | | 10/01/2045 | | | | 5,030 | | | | 5,518,564 | |
Capital Trust Agency Inc. (Sarasota-Manatee Jewish Housing Council, Inc.); Series 2017, Ref. Retirement Facility RB(g) | | | 5.00% | | | | 07/01/2037 | | | | 2,765 | | | | 2,829,065 | |
Citizens Property Insurance Corp. (Coastal Account); Series 2011A-1, Sr. Sec. RB | | | 5.00% | | | | 06/01/2020 | | | | 3,000 | | | | 3,119,550 | |
Collier (County of) Industrial Development Authority (The Arlington of Naples); | | | | | | | | | | | | | | | | |
Series 2014 A, Continuing Care Community RB(g) | | | 7.25% | | | | 05/15/2026 | | | | 1,000 | | | | 991,220 | |
Series 2014 A, Continuing Care Community RB(g) | | | 7.75% | | | | 05/15/2035 | | | | 2,500 | | | | 2,457,525 | |
Davie (Town of) (Nova Southeastern University); Series 2013 A, Educational Facilities RB | | | 6.00% | | | | 04/01/2042 | | | | 3,250 | | | | 3,662,912 | |
Escambia (County of) Health Facilities Authority (Florida Health Care Facility Loan Veterans Health Administration Program); Series 2000, RB(c) | | | 5.95% | | | | 07/01/2020 | | | | 60 | | | | 63,350 | |
Florida (State of)Mid-Bay Bridge Authority; Series 1991 A, RB(c) | | | 6.88% | | | | 10/01/2022 | | | | 2,085 | | | | 2,288,996 | |
Florida (State of) North Broward Hospital District; Series 2017 B, Ref. RB | | | 5.00% | | | | 01/01/2048 | | | | 5,000 | | | | 5,314,700 | |
Florida Development Finance Corp. (Renaissance Charter School, Inc.);
Series 2015, Educational Facilities RB(g) | | | 6.00% | | | | 06/15/2035 | | | | 2,935 | | | | 3,027,452 | |
Highlands (County of) Health Facilities Authority (Trousdale Foundation Properties); Series 2018 A, Sr. Living RB | | | 6.00% | | | | 04/01/2038 | | | | 6,000 | | | | 6,142,920 | |
Hillsborough (County of) Aviation Authority (Tampa International Airport);
Series 2018 E, RB(e)(i) | | | 5.00% | | | | 10/01/2048 | | | | 15,000 | | | | 16,818,000 | |
Martin (County of) Health Facilities Authority (Martin Memorial Medical Center); Series 2012, RB | | | 5.50% | | | | 11/15/2042 | | | | 6,500 | | | | 6,931,665 | |
Miami (City of); Series 2009, Ref. Parking System RB(INS-AGC)(b) | | | 5.00% | | | | 10/01/2034 | | | | 500 | | | | 508,495 | |
Miami Beach (City of) Health Facilities Authority (Mount Sinai Medical Center); | | | | | | | | | | | | | | | | |
Series 2014, Ref. RB | | | 5.00% | | | | 11/15/2039 | | | | 1,010 | | | | 1,070,711 | |
Series 2014, Ref. RB | | | 5.00% | | | | 11/15/2044 | | | | 1,045 | | | | 1,101,670 | |
Miami-Dade (County of); | | | | | | | | | | | | | | | | |
Series 2009 C, Professional Sports Franchise Facility Tax RB(c)(d) | | | 5.75% | | | | 10/01/2019 | | | | 550 | | | | 563,068 | |
Series 2010 B, Aviation RB(INS-AGM)(b) | | | 5.00% | | | | 10/01/2035 | | | | 1,205 | | | | 1,256,586 | |
Series 2010, Water & Sewer System RB(c)(d) | | | 5.00% | | | | 10/01/2020 | | | | 4,500 | | | | 4,735,530 | |
Series 2012 A, Ref. Aviation RB(i) | | | 5.00% | | | | 10/01/2030 | | | | 2,000 | | | | 2,166,100 | |
Series 2012 B, Ref. Sub. Special Obligation RB (INS - AGM)(b) | | | 5.00% | | | | 10/01/2035 | | | | 3,800 | | | | 4,152,336 | |
Series 2017 B, Ref. Aviation RB(i) | | | 5.00% | | | | 10/01/2040 | | | | 6,000 | | | | 6,686,820 | |
See accompanying Notes to Financial Statements which are an integral part of the financial statements.
15 Invesco Municipal Income Fund
| | | | | | | | | | | | | | | | |
| | | Interest
Rate | | | Maturity
Date | | | Principal
Amount
(000) | | | Value | |
| | | | |
Florida–(continued) | | | | | | | | | | | | | | | | |
Miami-Dade (County of) (Jackson Health System); | | | | | | | | | | | | | | | | |
Series 2009, Public Facilities RB(c)(d) | | | 5.63% | | | | 06/01/2019 | | | $ | 1,000 | | | $ | 1,009,780 | |
Series 2009, Public Facilities RB(c)(d) | | | 5.75% | | | | 06/01/2019 | | | | 775 | | | | 782,812 | |
Miami-Dade (County of) (Miami International Airport); | | | | | | | | | | | | | | | | |
Series 2010, Aviation RB(c)(d) | | | 5.38% | | | | 10/01/2020 | | | | 2,455 | | | | 2,597,758 | |
Series 2010, Aviation RB | | | 5.38% | | | | 10/01/2035 | | | | 650 | | | | 683,131 | |
Miami-Dade (County of) Educational Facilities Authority (University of Miami); Series 2018 A, RB(e) | | | 5.00% | | | | 04/01/2053 | | | | 9,000 | | | | 9,938,880 | |
Miami-Dade (County of) Expressway Authority; Series 2010 A, Ref. Toll System RB(INS-AGM)(b) | | | 5.00% | | | | 07/01/2035 | | | | 3,350 | | | | 3,482,258 | |
Orange (County of) Health Facilities Authority (Orlando Health Obligated Group); Series 2019 A, RB | | | 5.00% | | | | 10/01/2047 | | | | 10,000 | | | | 11,167,300 | |
Palm Beach (County of) Health Facilities Authority (Bethesda Health Care System, Inc.); Series 2010 A, RB(c)(d) | | | 5.00% | | | | 07/01/2020 | | | | 625 | | | | 652,569 | |
Putnam (County of) Development Authority (Seminole Electric Cooperative); Series 2018 B, Ref. PCR | | | 5.00% | | | | 03/15/2042 | | | | 3,830 | | | | 4,270,029 | |
Reunion East Community Development District; | | | | | | | | | | | | | | | | |
Series 2005, Special Assessment RB(f) | | | 5.80% | | | | 05/01/2036 | | | | 197 | | | | 2 | |
Series2015-2, Special Assessment RB | | | 6.60% | | | | 05/01/2036 | | | | 240 | | | | 239,242 | |
Sunrise (City of); Series 1998, Ref. Utility System RB(c)(d) | | | 5.20% | | | | 10/01/2020 | | | | 1,725 | | | | 1,782,167 | |
Tallahassee (City of) (Tallahassee Memorial Health Care, Inc.); Series 2016, Health Facility RB | | | 5.00% | | | | 12/01/2055 | | | | 4,500 | | | | 4,792,815 | |
Tampa Bay Water; Series 2001 A, Ref. & Improvement Utility System RB(INS-NATL)(b) | | | 6.00% | | | | 10/01/2029 | | | | 3,000 | | | | 4,002,450 | |
| | | | | | | | | | | | | | | | 126,808,428 | |
| | | | |
Georgia–2.00% | | | | | | | | | | | | | | | | |
Atkinson & Coffee (Counties of) Joint Development Authority (SGC Real Estate Foundation II LLC); | | | | | | | | | | | | | | | | |
Series 2009, RB(c)(d) | | | 5.25% | | | | 06/01/2019 | | | | 1,000 | | | | 1,008,880 | |
Atlanta (City of); | | | | | | | | | | | | | | | | |
Series 2009 A, Water & Wastewater RB(c)(d) | | | 6.00% | | | | 11/01/2019 | | | | 2,000 | | | | 2,058,020 | |
Series 2009 B, Water & Wastewater RB(c)(d) | | | 5.25% | | | | 11/01/2019 | | | | 980 | | | | 1,003,638 | |
Series 2009 B, Water & Wastewater RB(c)(d) | | | 5.38% | | | | 11/01/2019 | | | | 980 | | | | 1,004,431 | |
Series 2009 B, Water & Wastewater RB(INS-AGM)(b) | | | 5.25% | | | | 11/01/2034 | | | | 520 | | | | 531,466 | |
Series 2009 B, Water & Wastewater RB(INS-AGM)(b) | | | 5.38% | | | | 11/01/2039 | | | | 520 | | | | 531,716 | |
Series 2010 C, Ref. General Airport RB | | | 5.25% | | | | 01/01/2030 | | | | 1,500 | | | | 1,587,690 | |
Series 2010 C, Ref. General Airport RB(INS-AGM)(b) | | | 5.25% | | | | 01/01/2030 | | | | 1,500 | | | | 1,589,070 | |
Series 2010 C, Ref. General Airport RB | | | 6.00% | | | | 01/01/2030 | | | | 1,000 | | | | 1,075,580 | |
Series 2015, Ref. Water & Wastewater RB(e) | | | 5.00% | | | | 11/01/2040 | | | | 18,420 | | | | 20,554,510 | |
DeKalb (County of) Private Hospital Authority (Children’s Healthcare of Atlanta, Inc.); Series 2009, RAC | | | 5.00% | | | | 11/15/2019 | | | | 600 | | | | 614,160 | |
Gainesville (City of) & Hall (County of) Development Authority (Acts Retirement-Life Community);
Series 2009A-2, Retirement Community RB(c)(d) | | | 6.38% | | | | 11/15/2019 | | | | 700 | | | | 722,561 | |
Gwinnett (County of) Hospital Authority (Gwinnett Hospital System, Inc.); Series 2007 D, RAC(INS-AGM)(b) | | | 5.50% | | | | 07/01/2034 | | | | 1,000 | | | | 1,009,730 | |
Macon-Bibb (County of) Hospital Authority (Medical Center of Central Georgia, Inc.); Series 2009, RAC(c)(d) | | | 5.00% | | | | 08/01/2019 | | | | 2,000 | | | | 2,027,360 | |
Macon-Bibb (County of) Urban Development Authority (Academy for Classical Education, Inc.);
Series 2017 A, RB(g) | | | 5.88% | | | | 06/15/2047 | | | | 1,680 | | | | 1,682,553 | |
Series 2017 A, RB(g) | | | 6.00% | | | | 06/15/2052 | | | | 1,530 | | | | 1,534,774 | |
Main Street Natural Gas, Inc.; Series 2019 A, RB | | | 5.00% | | | | 05/15/2043 | | | | 3,000 | | | | 3,256,410 | |
Marietta (City of) Developing Authority (Life University, Inc.);
Series 2017 A, Ref. University Facilities RB(g) | | | 5.00% | | | | 11/01/2037 | | | | 5,250 | | | | 5,587,260 | |
Rockdale (County of) Development Authority (Pratt Paper (GA), LLC);
Series 2018, Ref. RB(g)(i) | | | 4.00% | | | | 01/01/2038 | | | | 6,200 | | | | 6,218,042 | |
Savannah (City of) Economic Development Authority (SSU Community Development I, LLC);
Series 2010, RB(INS-AGM)(b) | | | 5.50% | | | | 06/15/2035 | | | | 1,020 | | | | 1,065,625 | |
Thomasville (City of) Hospital Authority (John D. Archbold Memorial Hospital, Inc.); Series 2010, RAC(c)(d) | | | 5.13% | | | | 11/02/2020 | | | | 750 | | | | 792,262 | |
| | | | | | | | | | | | | | | | 55,455,738 | |
See accompanying Notes to Financial Statements which are an integral part of the financial statements.
16 Invesco Municipal Income Fund
| | | | | | | | | | | | | | | | |
| | | Interest
Rate | | | Maturity
Date | | | Principal
Amount
(000) | | | Value | |
Guam–0.04% | | | | | | | | | | | | | | | | |
| | | | |
Guam (Territory of) Power Authority; Series 2010 A, RB(c)(d) | | | 5.00% | | | | 10/01/2020 | | | $ | 1,100 | | | $ | 1,158,102 | |
| | | | |
Hawaii–0.50% | | | | | | | | | | | | | | | | |
| | | | |
Hawaii (State of) Department of Budget & Finance; Series 2012, Ref. Special Purpose Senior Living RB | | | 5.25% | | | | 11/15/2037 | | | | 1,250 | | | | 1,361,275 | |
Hawaii (State of) Department of Budget & Finance (Hawaiian Electric Co., Inc. & Subsidiary); Series 2009, Special Purpose RB | | | 6.50% | | | | 07/01/2039 | | | | 2,000 | | | | 2,033,020 | |
Hawaii (State of) Department of Budget & Finance (Hawaiian Electric Co., Inc.); Series 2015, Ref. Special Purpose RB(i) | | | 3.25% | | | | 01/01/2025 | | | | 4,500 | | | | 4,571,640 | |
Hawaii (State of) Department of Budget & Finance (Kahala Nui); Series 2012, Ref. Special Purpose Senior Living RB | | | 5.13% | | | | 11/15/2032 | | | | 1,500 | | | | 1,639,755 | |
Honolulu (City & County of); Series 2009 A, Unlimited Tax GO Bonds(c)(d)(e) | | | 5.25% | | | | 04/01/2019 | | | | 4,120 | | | | 4,131,618 | |
| | | | | | | | | | | | | | | | 13,737,308 | |
| | | | |
Illinois–12.15% | | | | | | | | | | | | | | | | |
| | | | |
Bartlett (Village of) (Quarry Redevelopment); Series 2007, Ref. Sr. Lien Tax Increment Allocation RB (c) | | | 5.60% | | | | 01/01/2023 | | | | 1,610 | | | | 1,611,063 | |
Bolingbrook (Village of); Series 2005, Sales Tax Conv. CAB RB(k) | | | 6.25% | | | | 01/01/2024 | | | | 940 | | | | 916,857 | |
Chicago (City of); | | | | | | | | | | | | | | | | |
Series 2002 B, Unlimited Tax GO Bonds | | | 5.50% | | | | 01/01/2032 | | | | 3,300 | | | | 3,561,855 | |
Series 2007 E, Ref. Unlimited Tax GO Bonds | | | 5.50% | | | | 01/01/2035 | | | | 1,500 | | | | 1,608,540 | |
Series 2008 C, Ref. Second Lien Wastewater Transmission RB | | | 5.00% | | | | 01/01/2039 | | | | 5,000 | | | | 5,387,200 | |
Series 2011 A, Sales Tax RB(c)(d) | | | 5.00% | | | | 01/01/2022 | | | | 1,000 | | | | 1,090,620 | |
Series 2011, Tax Increment Allocation Revenue COP | | | 7.13% | | | | 05/01/2021 | | | | 2,674 | | | | 2,675,721 | |
Series 2014, Second Lien Waterworks RB | | | 5.00% | | | | 11/01/2044 | | | | 1,905 | | | | 2,072,259 | |
Series 2015 A, Unlimited Tax GO Bonds | | | 5.50% | | | | 01/01/2034 | | | | 4,440 | | | | 4,770,824 | |
Series 2015 A, Unlimited Tax GO Bonds | | | 5.50% | | | | 01/01/2035 | | | | 2,000 | | | | 2,144,720 | |
Series 2017 A, Ref. Unlimited Tax GO Bonds | | | 6.00% | | | | 01/01/2038 | | | | 8,500 | | | | 9,565,135 | |
Series 2017 A, Second Lien Wastewater Transmission RB(INS-AGM)(b) | | | 5.25% | | | | 01/01/2042 | | | | 2,000 | | | | 2,245,720 | |
Chicago (City of) (83rd/Stewart Redevelopment); Series 2013, Tax Increment Allocation Revenue COP(g) | | | 7.00% | | | | 01/15/2029 | | | | 3,244 | | | | 3,244,853 | |
Chicago (City of) (Cottage View Terrace Apartments); Series 2000 A, FHA /GNMA Collateralized MFH RB (CEP -GNMA)(i) | | | 6.13% | | | | 02/20/2042 | | | | 1,325 | | | | 1,326,047 | |
Chicago (City of) (Diversey/Narragansett); Series 2006, Tax Increment Allocation Revenue COP | | | 7.46% | | | | 02/15/2026 | | | | 384 | | | | 280,669 | |
Chicago (City of) (Midway Airport); | | | | | | | | | | | | | | | | |
Series 2013 A, Ref. Second Lien RB(i) | | | 5.50% | | | | 01/01/2032 | | | | 5,000 | | | | 5,503,700 | |
Series 2014 A, Ref. Second Lien RB(i) | | | 5.00% | | | | 01/01/2041 | | | | 2,725 | | | | 2,942,428 | |
Chicago (City of) (O’Hare International Airport); | | | | | | | | | | | | | | | | |
Series 2012 B, Ref. Sr. Lien General Airport RB(i) | | | 5.00% | | | | 01/01/2030 | | | | 5,000 | | | | 5,335,750 | |
Series 2016 C, Ref. Sr. Lien General Airport RB | | | 5.00% | | | | 01/01/2037 | | | | 2,500 | | | | 2,775,975 | |
Series 2017 D, Sr. Lien General Airport RB | | | 5.25% | | | | 01/01/2036 | | | | 4,600 | | | | 5,284,480 | |
Series 2017 D, Sr. Lien General Airport RB(e)(i) | | | 5.00% | | | | 01/01/2042 | | | | 2,500 | | | | 2,741,225 | |
Series 2017 D, Sr. Lien General Airport RB(e)(i) | | | 5.00% | | | | 01/01/2047 | | | | 7,500 | | | | 8,173,725 | |
Chicago (City of) (Roosevelt Square/ABLA Redevelopment); Series 2009 A, Ref. Tax Increment Allocation Revenue COP | | | 7.13% | | | | 03/15/2022 | | | | 1,484 | | | | 1,484,223 | |
Chicago (City of) Board of Education; | | | | | | | | | | | | | | | | |
Series 2017 H, Dedicated Unlimited Tax GO Bonds | | | 5.00% | | | | 12/01/2036 | | | | 5,750 | | | | 5,951,307 | |
Series 2018 C, Ref. Unlimited Tax GO Bonds | | | 5.00% | | | | 12/01/2023 | | | | 3,000 | | | | 3,175,200 | |
Series 2018 D, Ref. Unlimited Tax GO Bonds | | | 5.00% | | | | 12/01/2046 | | | | 3,000 | | | | 3,046,020 | |
Series 2018 E, Educational Purpose TAN, Floating Rate (1 mo. USD
LIBOR + 0.67%)(g)(l) | | | 2.63% | | | | 03/29/2019 | | | | 2,000 | | | | 2,000,000 | |
Chicago (City of) Metropolitan Water Reclamation District; | | | | | | | | | | | | | | | | |
Series 2011 B, Capital Improvement Limited Tax GO Bonds(e) | | | 5.00% | | | | 12/01/2024 | | | | 15,000 | | | | 16,244,250 | |
Series 2015 A, Unlimited Tax GO Green Bonds(e) | | | 5.00% | | | | 12/01/2044 | | | | 12,000 | | | | 13,149,480 | |
Series 2015 C, Limited Tax GO Green Bonds(e) | | | 5.00% | | | | 12/01/2027 | | | | 6,805 | | | | 7,794,991 | |
Series 2015 C, Limited Tax GO Green Bonds(e) | | | 5.00% | | | | 12/01/2028 | | | | 4,000 | | | | 4,572,680 | |
See accompanying Notes to Financial Statements which are an integral part of the financial statements.
17 Invesco Municipal Income Fund
| | | | | | | | | | | | | | | | |
| | | Interest
Rate | | | Maturity
Date | | | Principal
Amount
(000) | | | Value | |
| Illinois–(continued) | | | | | | | | | | | | | | | | |
Chicago (City of) Transit Authority; | | | | | | | | | | | | | | | | |
Series 2011, Sales Tax Receipts RB(e)(j) | | | 5.25% | | | | 12/01/2036 | | | $ | 12,000 | | | $ | 12,688,560 | |
Series 2014, Sales Tax Receipts RB | | | 5.00% | | | | 12/01/2044 | | | | 8,195 | | | | 8,881,495 | |
Cook County School District No. 122 (Ridgeland); Series 2000, Unlimited Tax CAB GO Bonds(c)(h) | | | 0.00% | | | | 12/01/2020 | | | | 4,050 | | | | 3,926,232 | |
Gilberts (Village of) Special Service Area No. 24 (The Conservancy); Series 2014 A, Special Tax RB | | | 5.38% | | | | 03/01/2034 | | | | 552 | | | | 528,626 | |
Illinois (State of); | | | | | | | | | | | | | | | | |
Series 1991, Civic Center RB(INS-AMBAC)(b) | | | 6.25% | | | | 12/15/2020 | | | | 955 | | | | 986,238 | |
Series 2012 A, Unlimited Tax GO Bonds | | | 5.00% | | | | 01/01/2031 | | | | 2,775 | | | | 2,840,434 | |
Series 2013, Unlimited Tax GO Bonds | | | 5.25% | | | | 07/01/2031 | | | | 4,000 | | | | 4,183,040 | |
Series 2014, Unlimited Tax GO Bonds | | | 5.25% | | | | 02/01/2033 | | | | 2,650 | | | | 2,760,929 | |
Series 2014, Unlimited Tax GO Bonds | | | 5.00% | | | | 05/01/2039 | | | | 4,710 | | | | 4,786,443 | |
Series 2018 A, Unlimited Tax GO Bonds | | | 6.00% | | | | 05/01/2028 | | | | 10,235 | | | | 11,920,295 | |
Illinois (State of) Department of Central Management Services; Series 1999, COP(INS-NATL)(b) | | | 5.85% | | | | 07/01/2019 | | | | 390 | | | | 391,217 | |
Illinois (State of) Finance Authority; Series 2009, RB(c)(d) | | | 6.13% | | | | 05/15/2019 | | | | 85 | | | | 85,740 | |
Illinois (State of) Finance Authority (Art Institute of Chicago); Series 2009 A, RB | | | 6.00% | | | | 03/01/2038 | | | | 2,500 | | | | 2,500,000 | |
Illinois (State of) Finance Authority (Centegra Health System); | | | | | | | | | | | | | | | | |
Series 2014 A, RB | | | 5.00% | | | | 09/01/2039 | | | | 1,865 | | | | 2,052,973 | |
Series 2014 A, RB | | | 5.00% | | | | 09/01/2042 | | | | 1,290 | | | | 1,413,982 | |
Illinois (State of) Finance Authority (DePaul University); Series 2011 A, RB(c)(d) | | | 6.00% | | | | 04/01/2021 | | | | 1,000 | | | | 1,086,430 | |
Illinois (State of) Finance Authority (Evangelical Hospitals); | | | | | | | | | | | | | | | | |
Series 1992 A, Ref. RB(c) | | | 6.25% | | | | 04/15/2022 | | | | 825 | | | | 880,061 | |
Series 1992 C, RB(c) | | | 6.25% | | | | 04/15/2022 | | | | 945 | | | | 1,008,069 | |
Illinois (State of) Finance Authority (Lutheran Home & Services); | | | | | | | | | | | | | | | | |
Series 2012, Ref. RB | | | 5.00% | | | | 05/15/2022 | | | | 1,535 | | | | 1,572,531 | |
Series 2012, Ref. RB | | | 5.50% | | | | 05/15/2027 | | | | 2,250 | | | | 2,340,608 | |
Illinois (State of) Finance Authority (Northwestern Memorial Hospital); | | | | | | | | | | | | | | | | |
Series 2009 A, RB(c)(d)(e) | | | 5.38% | | | | 08/15/2019 | | | | 1,000 | | | | 1,016,650 | |
Series 2009 A, RB(c)(d)(e) | | | 5.75% | | | | 08/15/2019 | | | | 2,000 | | | | 2,036,640 | |
Illinois (State of) Finance Authority (Park Place of Elmhurst); | | | | | | | | | | | | | | | | |
Series 2016 B, RB | | | 5.63% | | | | 05/15/2020 | | | | 871 | | | | 825,085 | |
Series 2016, RB | | | 2.00% | | | | 05/15/2055 | | | | 203 | | | | 10,030 | |
Illinois (State of) Finance Authority (Peace Village); Series 2013, RB | | | 6.75% | | | | 08/15/2033 | | | | 2,000 | | | | 2,085,360 | |
Illinois (State of) Finance Authority (Plymouth Place); | | | | | | | | | | | | | | | | |
Series 2015, Ref. RB | | | 5.00% | | | | 05/15/2037 | | | | 1,050 | | | | 1,070,654 | |
Series 2015, Ref. RB | | | 5.25% | | | | 05/15/2045 | | | | 2,355 | | | | 2,432,715 | |
Illinois (State of) Finance Authority (Resurrection Health Care Corp.); | | | | | | | | | | | | | | | | |
Series 2009, Ref. RB(c)(d) | | | 6.13% | | | | 05/15/2019 | | | | 2,785 | | | | 2,809,787 | |
Illinois (State of) Finance Authority (Riverside Health System); | | | | | | | | | | | | | | | | |
Series 2009, RB(c)(d) | | | 6.25% | | | | 11/15/2019 | | | | 1,205 | | | | 1,243,235 | |
Series 2009, RB | | | 6.25% | | | | 11/15/2035 | | | | 795 | | | | 817,912 | |
Illinois (State of) Finance Authority (Rosalind Franklin University Research Building); Series 2017, RB | | | 5.00% | | | | 08/01/2049 | | | | 2,450 | | | | 2,614,297 | |
Illinois (State of) Finance Authority (Rosalind Franklin University); Series 2017, Ref. RB | | | 5.00% | | | | 08/01/2047 | | | | 1,025 | | | | 1,096,371 | |
Illinois (State of) Finance Authority (Rush University Medical Center); Series 2015 A, Ref. RB | | | 5.00% | | | | 11/15/2038 | | | | 6,750 | | | | 7,320,982 | |
Illinois (State of) Finance Authority (Southern Illinois Healthcare Enterprises, Inc.); Series 2005, RB(c)(d) | | | 5.38% | | | | 03/01/2020 | | | | 1,000 | | | | 1,036,390 | |
Illinois (State of) Finance Authority (The Carle Foundation); | | | | | | | | | | | | | | | | |
Series 2011 A, RB | | | 5.75% | | | | 08/15/2034 | | | | 1,000 | | | | 1,078,950 | |
Series 2011 A, RB(INS-AGM)(b) | | | 6.00% | | | | 08/15/2041 | | | | 650 | | | | 705,965 | |
Series 2011 A, RB | | | 6.00% | | | | 08/15/2041 | | | | 4,000 | | | | 4,344,400 | |
Illinois (State of) Finance Authority (University of Chicago Medical); Series 2009D-1, VRD RB (LOC - PNC Bank N.A.)(l)(m) | | | 1.56% | | | | 08/01/2043 | | | | 1,850 | | | | 1,850,000 | |
Illinois (State of) Finance Authority (University of Chicago); Series 2015 A, RB(e) | | | 5.00% | | | | 10/01/2040 | | | | 10,000 | | | | 11,260,300 | |
See accompanying Notes to Financial Statements which are an integral part of the financial statements.
18 Invesco Municipal Income Fund
| | | | | | | | | | | | | | | | |
| | | Interest
Rate | | | Maturity
Date | | | Principal
Amount
(000) | | | Value | |
Illinois–(continued) | | | | | | | | | | | | | | | | |
| | | | |
Illinois (State of) Metropolitan Pier & Exposition Authority (McCormick Place Expansion); | | | | | | | | | | | | | | | | |
Series 2002, Ref. Dedicated State Tax Conv. CAB RB(INS-NATL)(b)(k) | | | 5.65% | | | | 06/15/2022 | | | $ | 16,340 | | | $ | 17,897,692 | |
Series 2002, Ref. Dedicated State Tax Conv. CAB RB(c)(k) | | | 5.65% | | | | 06/15/2022 | | | | 1,755 | | | | 1,970,444 | |
Series 2002, Ref. Dedicated State Tax RB(c) | | | 5.65% | | | | 06/15/2022 | | | | 1,905 | | | | 2,142,096 | |
Series 2012 A, RB | | | 5.00% | | | | 06/15/2042 | | | | 3,175 | | | | 3,246,088 | |
Illinois (State of) Sports Facilities Authority; | | | | | | | | | | | | | | | | |
Series 2014, Ref. RB (INS - AGM)(b) | | | 5.25% | | | | 06/15/2031 | | | | 2,630 | | | | 2,924,928 | |
Series 2014, Ref. RB (INS - AGM)(b) | | | 5.25% | | | | 06/15/2032 | | | | 2,395 | | | | 2,657,396 | |
Illinois (State of) Toll Highway Authority; | | | | | | | | | | | | | | | | |
Series 2013 A, RB(e) | | | 5.00% | | | | 01/01/2038 | | | | 8,000 | | | | 8,701,040 | |
Series 2015 A, RB(e) | | | 5.00% | | | | 01/01/2040 | | | | 14,190 | | | | 15,850,230 | |
McHenry (County of) Special Service Area (Wonder Lake Dredging);
Series 2010, Special Tax RB | | | 6.50% | | | | 03/01/2030 | | | | 3,820 | | | | 3,911,298 | |
Northern Illinois University; | | | | | | | | | | | | | | | | |
Series 2011, Ref. Auxiliary Facilities System RB(INS-AGM)(b) | | | 5.50% | | | | 04/01/2026 | | | | 2,000 | | | | 2,066,420 | |
Series 2011, Ref. Auxiliary Facilities System RB(INS-AGM)(b) | | | 5.25% | | | | 04/01/2028 | | | | 2,000 | | | | 2,060,280 | |
Plano (City of) Special Service Area No. 10 (Lakewood Springs Club);
Series 2007, Special Tax RB(f) | | | 5.80% | | | | 03/01/2037 | | | | 1,500 | | | | 165,000 | |
Railsplitter Tobacco Settlement Authority; | | | | | | | | | | | | | | | | |
Series 2010, RB | | | 5.25% | | | | 06/01/2021 | | | | 1,000 | | | | 1,069,820 | |
Series 2010, RB(c)(d) | | | 6.00% | | | | 06/01/2021 | | | | 10,000 | | | | 10,941,500 | |
Series 2017, RB | | | 5.00% | | | | 06/01/2026 | | | | 8,000 | | | | 9,360,000 | |
Sales Tax Securitization Corp.; Unsec. Bonds | | | 5.25% | | | | 01/01/2043 | | | | 5,000 | | | | 5,607,000 | |
United City of Yorkville (City of) Special Service AreaNo. 2004-107 (Raintree Village II); | | | | | | | | | | | | | | | | |
Series 2005, Special Tax RB(f) | | | 6.25% | | | | 03/01/2035 | | | | 958 | | | | 431,100 | |
University of Illinois; Series 2011 A, Auxiliary Facilities System RB | | | 5.13% | | | | 04/01/2036 | | | | 1,000 | | | | 1,044,580 | |
| | | | | | | | | | | | | | | | 337,214,055 | |
| | | | |
Indiana–1.77% | | | | | | | | | | | | | | | | |
| | | | |
Indiana (State of) Finance Authority (CWA Authority); Series 2011 B, Second Lien Wastewater Utility RB | | | 5.00% | | | | 10/01/2041 | | | | 11,000 | | | | 11,735,680 | |
Series 2016 A, First Lien Wastewater Utility Green RB(INS-NATL)(b) | | | 5.00% | | | | 10/01/2046 | | | | 15,000 | | | | 16,627,500 | |
Indiana (State of) Finance Authority (Good Samaritan Hospital); Series 2016 A, Health Facilities RB | | | 5.50% | | | | 04/01/2041 | | | | 4,555 | | | | 4,855,994 | |
Indiana (State of) Finance Authority (Ohio Valley Electric Corp.); | | | | | | | | | | | | | | | | |
Series 2012 A, Midwestern Disaster Relief RB | | | 5.00% | | | | 06/01/2032 | | | | 1,220 | | | | 1,223,892 | |
Series 2012 A, Midwestern Disaster Relief RB | | | 5.00% | | | | 06/01/2039 | | | | 2,500 | | | | 2,465,375 | |
Northern Indiana Commuter Transportation District; | | | | | | | | | | | | | | | | |
Series 2016, Limited Obligation RB | | | 5.00% | | | | 07/01/2035 | | | | 1,700 | | | | 1,917,923 | |
Series 2016, Limited Obligation RB | | | 5.00% | | | | 07/01/2041 | | | | 1,500 | | | | 1,662,630 | |
Valparaiso (City of) (Pratt Paper, LLC); Series 2013, Exempt Facilities RB(i) | | | 6.75% | | | | 01/01/2034 | | | | 1,500 | | | | 1,716,735 | |
Whiting (City of) (BP Products North America); Series 2014, Environmental Facilities Floating Rate RB | | | | | | | | | | | | | | | | |
(SIFMA Municipal Swap Index + 0.75%)(d)(i)(n) | | | 2.49% | | | | 12/02/2019 | | | | 7,000 | | | | 7,005,460 | |
| | | | | | | | | | | | | | | | 49,211,189 | |
| | | | |
Iowa–2.24% | | | | | | | | | | | | | | | | |
| | | | |
Ames (City of) (Mary Greeley Medical Center); | | | | | | | | | | | | | | | | |
Series 2011, Hospital RB(c)(d) | | | 5.25% | | | | 06/15/2020 | | | | 7,000 | | | | 7,311,430 | |
Series 2011, Hospital RB(c)(d) | | | 5.50% | | | | 06/15/2020 | | | | 1,000 | | | | 1,047,640 | |
Series 2011, Hospital RB(c)(d) | | | 5.63% | | | | 06/15/2020 | | | | 1,500 | | | | 1,573,830 | |
Iowa (State of) (IJOBS Program); | | | | | | | | | | | | | | | | |
Series 2009 A, Special Obligation RB(e)(j) | | | 5.00% | | | | 06/01/2019 | | | | 10,175 | | | | 10,259,249 | |
Series 2009 A, Special Obligation RB(e)(j) | | | 5.00% | | | | 06/01/2027 | | | | 9,300 | | | | 9,377,004 | |
Iowa (State of) Finance Authority (Iowa Fertilizer Co.); | | | | | | | | | | | | | | | | |
Series 2013, Midwestern Disaster Area RB(g) | | | 5.88% | | | | 12/01/2027 | | | | 6,795 | | | | 7,160,639 | |
Series 2013, Ref. Midwestern Disaster Area RB(d) | | | 5.25% | | | | 12/01/2037 | | | | 8,140 | | | | 8,671,461 | |
Iowa (State of) Finance Authority (Iowa Health System); Series 2008 A, Health Facilities RB(c)(d) | | | 5.25% | | | | 08/15/2019 | | | | 1,500 | | | | 1,524,150 | |
See accompanying Notes to Financial Statements which are an integral part of the financial statements.
19 Invesco Municipal Income Fund
| | | | | | | | | | | | | | | | |
| | | Interest
Rate | | | Maturity
Date | | | Principal
Amount
(000) | | | Value | |
Iowa–(continued) | | | | | | | | | | | | | | | | |
| | | | |
Iowa (State of) Finance Authority (Lifespace Communities, Inc.);
Series 2018 A, RB | | | 5.00% | | | | 05/15/2043 | | | $ | 4,760 | | | $ | 4,967,155 | |
Iowa (State of) Tobacco Settlement Authority; | | | | | | | | | | | | | | | | |
Series 2005 C, Asset-Backed RB | | | 5.63% | | | | 06/01/2046 | | | | 2,690 | | | | 2,685,266 | |
Series 2005 E, Asset-Backed CAB RB(h) | | | 0.00% | | | | 06/01/2046 | | | | 50,000 | | | | 5,398,500 | |
Iowa Student Loan Liquidity Corp.; Sr. Series 2011A-2, RB(i) | | | 5.70% | | | | 12/01/2027 | | | | 2,145 | | | | 2,232,065 | |
| | | | | | | | | | | | | | | | 62,208,389 | |
| | | | |
Kansas–0.70% | | | | | | | | | | | | | | | | |
| | | | |
Kansas (State of) Development Finance Authority (Adventist Health System); | | | | | | | | | | | | | | | | |
Series 2009, Hospital RB(c)(d) | | | 5.50% | | | | 11/15/2019 | | | | 35 | | | | 35,892 | |
Series 2009, Hospital RB | | | 5.50% | | | | 11/15/2029 | | | | 1,465 | | | | 1,500,790 | |
Kansas (State of) Development Finance Authority (University of Kansas Health System); | | | | | | | | | | | | | | | | |
Series 2011 H, Health Facilities RB | | | 5.38% | | | | 03/01/2029 | | | | 1,000 | | | | 1,032,970 | |
Series 2011 H, Health Facilities RB | | | 5.00% | | | | 03/01/2034 | | | | 1,000 | | | | 1,027,510 | |
Series 2011 H, Health Facilities RB | | | 5.13% | | | | 03/01/2039 | | | | 2,000 | | | | 2,054,480 | |
Kansas (State of) Municipal Energy Agency (Jameson Energy Center); Series 2013, Power Project RB | | | 5.25% | | | | 07/01/2044 | | | | 2,000 | | | | 2,220,460 | |
Lenexa (City of) (Lakeview Village, Inc.); Series 2018 A, Ref. Health Care Facilities RB | | | 5.00% | | | | 05/15/2039 | | | | 1,500 | | | | 1,546,755 | |
Wichita (City of) (Kansas Masonic Home); Series 2016II-A, Health Care Facilities RB | | | 5.38% | | | | 12/01/2046 | | | | 4,940 | | | | 5,131,178 | |
Wichita (City of) (Presbyterian Manors, Inc.); Series 2013IV-A, Health Care Facilities RB | | | 6.38% | | | | 05/15/2043 | | | | 1,500 | | | | 1,594,575 | |
Wyandotte (County of) & Kansas City (City of) Unified Government; | | | | | | | | | | | | | | | | |
Series 2009 A, Utility System RB | | | 5.00% | | | | 09/01/2029 | | | | 2,000 | | | | 2,000,000 | |
Series 2014 A, Ref. & Improvement Utility System RB | | | 5.00% | | | | 09/01/2044 | | | | 1,180 | | | | 1,301,517 | |
| | | | | | | | | | | | | | | | 19,446,127 | |
| | | | |
Kentucky–2.82% | | | | | | | | | | | | | | | | |
| | | | |
Christian (County of) (Jennie Stuart Medical Center, Inc.); | | | | | | | | | | | | | | | | |
Series 2016, Ref. Hospital RB | | | 5.38% | | | | 02/01/2036 | | | | 3,000 | | | | 3,243,240 | |
Series 2016, Ref. Hospital RB | | | 5.50% | | | | 02/01/2044 | | | | 5,000 | | | | 5,350,750 | |
Kentucky (State of) Economic Development Finance Authority (Baptist Healthcare System); | | | | | | | | | | | | | | | | |
Series 2017 B, RB | | | 5.00% | | | | 08/15/2046 | | | | 4,500 | | | | 4,862,205 | |
Kentucky (State of) Economic Development Finance Authority (Louisville Arena Authority, Inc.); | | | | | | | | | | | | | | | | |
Series 2017 A, Ref. RB(INS-AGM)(b) | | | 5.00% | | | | 12/01/2045 | | | | 12,000 | | | | 13,170,720 | |
Kentucky (State of) Economic Development Finance Authority (Next Generation Kentucky Information Highway); | | | | | | | | | | | | | | | | |
Series 2015 A, Sr. RB | | | 5.00% | | | | 07/01/2037 | | | | 1,700 | | | | 1,830,679 | |
Series 2015 A, Sr. RB | | | 5.00% | | | | 07/01/2040 | | | | 2,620 | | | | 2,761,480 | |
Series 2015 A, Sr. RB | | | 5.00% | | | | 01/01/2045 | | | | 14,260 | | | | 14,826,692 | |
Kentucky (State of) Economic Development Finance Authority (Owensboro Health, Inc.); Series 2017 A, Ref. Hospital RB | | | 5.00% | | | | 06/01/2045 | | | | 8,950 | | | | 9,440,192 | |
Kentucky (State of) Economic Development Finance Authority (Owensboro Medical Health System, Inc.); Series 2010 A, Hospital RB(c)(d) | | | 6.50% | | | | 06/01/2020 | | | | 3,200 | | | | 3,388,640 | |
Kentucky (State of) Property & Building Commission (No. 93); Series 2009, Ref. RB(INS-AGC)(b) | | | 5.25% | | | | 02/01/2028 | | | | 340 | | | | 340,901 | |
Kentucky (State of) Public Energy Authority; Series 2018 B, Gas Supply RB(d) | | | 4.00% | | | | 01/01/2025 | | | | 6,000 | | | | 6,442,020 | |
Louisville (City of) & Jefferson (County of) Metropolitan Government (Norton Healthcare, Inc.); | | | | | | | | | | | | | | | | |
Series 2013 A, Health System RB | | | 5.75% | | | | 10/01/2042 | | | | 5,870 | | | | 6,545,461 | |
Paducah (City of) Electric Plant Board; Series 2009 A, RB(c)(d) | | | 5.25% | | | | 04/01/2019 | | | | 6,000 | | | | 6,016,680 | |
| | | | | | | | | | | | | | | | 78,219,660 | |
| | | | |
Louisiana–2.27% | | | | | | | | | | | | | | | | |
| | | | |
Caddo & Bossier (Parishes of) Port Commission; Series 2011, Ref. Utility
RB(c)(d) | | | 5.00% | | | | 04/01/2021 | | | | 550 | | | | 586,960 | |
East Baton Rouge (Parish of) Industrial Development Board (ExxonMobil); Series 2010 A, VRD Gulf Opportunity Zone RB(l) | | | 1.56% | | | | 08/01/2035 | | | | 1,526 | | | | 1,526,000 | |
Jefferson (Parish of) Hospital Service District No. 1 (West Jefferson Medical Center); | | | | | | | | | | | | | | | | |
Series 2011 A, Ref. Hospital RB(c)(d) | | | 5.38% | | | | 01/01/2021 | | | | 400 | | | | 426,072 | |
Series 2011 A, Ref. Hospital RB(c)(d) | | | 6.00% | | | | 01/01/2021 | | | | 3,000 | | | | 3,227,200 | |
See accompanying Notes to Financial Statements which are an integral part of the financial statements.
20 Invesco Municipal Income Fund
| | | | | | | | | | | | | | | | |
| | | Interest
Rate | | | Maturity
Date | | | Principal
Amount
(000) | | | Value | |
| |
Louisiana–(continued) | | | | | | | | | | | | | | | | |
Lafayette (City of) Public Trust Financing Authority (Ragin’ Cajun Facilities-Housing & Parking); Series 2010, RB(c)(d) | | | 5.00% | | | | 10/01/2020 | | | $ | 1,000 | | | $ | 1,052,340 | |
| |
Louisiana (State of) Local Government Environmental Facilities & Community Development Authority (Jefferson Parish); Series 2009 A, RB(c)(d) | | | 5.38% | | | | 04/01/2019 | | | | 1,000 | | | | 1,002,910 | |
| |
Louisiana (State of) Local Government Environmental Facilities & Community Development Authority (Monroe Regional Airport Terminal); Series 2009, Airport RB(c)(d) | | | 5.50% | | | | 02/01/2020 | | | | 1,500 | | | | 1,552,515 | |
| |
Louisiana (State of) Public Facilities Authority (Christus Health); Series 2009 A,
Ref. RB(c) | | | 6.00% | | | | 07/01/2029 | | | | 1,600 | | | | 1,621,888 | |
| |
Louisiana (State of) Public Facilities Authority (Ochsner Clinic Foundation); Series 2002 B, RB(c)(d) | | | 5.50% | | | | 05/15/2026 | | | | 1,010 | | | | 1,245,835 | |
| |
Louisiana (State of) Public Facilities Authority (Provident Group-Flagship PropertiesLLC- Louisiana State University Nicholson Gateway); Series 2016, Lease RB | | | 5.00% | | | | 07/01/2051 | | | | 12,400 | | | | 13,243,448 | |
| |
New Orleans (City of); | | | | | | | | | | | | | | | | |
Series 2014, Ref. Sewerage Service RB | | | 5.00% | | | | 06/01/2044 | | | | 605 | | | | 644,270 | |
| |
Series 2015, Sewerage Service RB | | | 5.00% | | | | 06/01/2040 | | | | 3,000 | | | | 3,232,290 | |
| |
Series 2015, Sewerage Service RB | | | 5.00% | | | | 06/01/2045 | | | | 4,000 | | | | 4,270,520 | |
| |
Series 2015, Water System RB | | | 5.00% | | | | 12/01/2040 | | | | 3,000 | | | | 3,237,840 | |
| |
Series 2015, Water System RB | | | 5.00% | | | | 12/01/2045 | | | | 5,500 | | | | 5,878,400 | |
| |
New Orleans (City of) Aviation Board (Parking Facilities Corp. Consolitdated Garage System);
Series 2018 A, RB(INS-AGM)(b) | | | 5.00% | | | | 10/01/2048 | | | | 5,000 | | | | 5,606,000 | |
| |
Regional Transit Authority; Series 2010, Sales Tax RB(INS-AGM)(b) | | | 5.00% | | | | 12/01/2030 | | | | 2,580 | | | | 2,714,470 | |
| |
Terrebonne (Parish of); Series 2011 ST, Sales & Use Tax RB(c)(d) | | | 5.00% | | | | 04/01/2021 | | | | 2,645 | | | | 2,825,548 | |
| |
Tobacco Settlement Financing Corp.; Series 2013 A, Ref. Asset-Backed RB | | | 5.25% | | | | 05/15/2035 | | | | 8,500 | | | | 9,213,660 | |
| |
| | | | | | | | | | | | | | | 63,108,166 | |
| |
| | | | |
Maryland–1.88% | | | | | | | | | | | | | | | | |
Baltimore (City of); Series 2017, Ref. Convention Center Hotel RB | | | 5.00% | | | | 09/01/2042 | | | | 2,500 | | | | 2,706,550 | |
| |
Baltimore (City of) (East Baltimore Research Park); Series 2017, Ref. Special Obligation RB | | | 5.00% | | | | 09/01/2038 | | | | 1,650 | | | | 1,738,638 | |
| |
Maryland (State of) Health & Higher Educational Facilities Authority (Adventist Healthcare); | | | | | | | | | | | | | | | | |
Series 2011 A, RB | | | 6.25% | | | | 01/01/2031 | | | | 3,175 | | | | 3,502,692 | |
| |
Series 2011 A, RB | | | 6.13% | | | | 01/01/2036 | | | | 4,000 | | | | 4,353,680 | |
| |
Maryland (State of) Health & Higher Educational Facilities Authority (Charlestown Community); Series 2010, RB(c)(d) | | | 6.13% | | | | 01/01/2021 | | | | 4,250 | | | | 4,584,007 | |
| |
Maryland (State of) Health & Higher Educational Facilities Authority (Green Street Academy); | | | | | | | | | | | | | | | | |
Series 2017 A, RB(g) | | | 5.13% | | | | 07/01/2037 | | | | 1,265 | | | | 1,265,329 | |
| |
Series 2017 A, RB(g) | | | 5.25% | | | | 07/01/2047 | | | | 4,295 | | | | 4,201,713 | |
| |
Series 2017 A, RB(g) | | | 5.38% | | | | 07/01/2052 | | | | 1,530 | | | | 1,510,018 | |
| |
Maryland (State of) Health & Higher Educational Facilities Authority (LifeBridge Health); | | | | | | | | | | | | | | | | |
Series 2011, RB(c)(d) | | | 6.00% | | | | 07/01/2021 | | | | 1,000 | | | | 1,096,390 | |
| |
Series 2016, Ref. RB | | | 5.00% | | | | 07/01/2047 | | | | 5,000 | | | | 5,489,350 | |
| |
Maryland (State of) Health & Higher Educational Facilities Authority (MedStar Health); | | | | | | | | | | | | | | | | |
Series 2011, RB | | | 5.00% | | | | 08/15/2041 | | | | 5,000 | | | | 5,313,500 | |
| |
Series 2017 A, RB | | | 5.00% | | | | 05/15/2042 | | | | 5,000 | | | | 5,505,650 | |
| |
Maryland (State of) Transportation Authority; Series 2008, Grant & RAB | | | 5.25% | | | | 03/01/2020 | | | | 2,000 | | | | 2,003,440 | |
| |
Maryland Economic Development Corp. (Terminal); Series 2010 B, RB(c)(d) | | | 5.75% | | | | 06/01/2020 | | | | 1,460 | | | | 1,533,788 | |
| |
Maryland Economic Development Corp. (Transportation Facilities);
Series 2010 A, RB(c)(d) | | | 5.38% | | | | 06/01/2020 | | | | 1,030 | | | | 1,077,329 | |
| |
Prince Georges (County of), Maryland (Collington Episcopal Life Care Community, Inc.); | | | | | | | | | | | | | | | | |
Series 2017, Ref. RB | | | 5.25% | | | | 04/01/2037 | | | | 2,000 | | | | 2,101,940 | |
| |
Series 2017, Ref. RB | | | 5.25% | | | | 04/01/2047 | | | | 4,035 | | | | 4,199,063 | |
| |
| | | | | | | | | | | | | | | 52,183,077 | |
| |
| | | | |
Massachusetts–2.20% | | | | | | | | | | | | | | | | |
Boston (City of) Water & Sewer Commission; Series 1993 A, Sr. RB(INS-NATL)(b) | | | 5.25% | | | | 11/01/2019 | | | | 595 | | | | 609,351 | |
| |
Massachusetts (State of) Bay Transportation Authority; Series 2016 A, Ref. CAB Sales Tax RB (h) | | | 0.00% | | | | 07/01/2031 | | | | 13,000 | | | | 8,847,020 | |
| |
Massachusetts (State of) College Building Authority; Series 2009 A, RB(c)(d) | | | 5.50% | | | | 05/01/2019 | | | | 1,000 | | | | 1,006,320 | |
| |
Massachusetts (State of) Development Finance Agency; Series 2019 A, Ref. RB | | | 5.00% | | | | 07/01/2044 | | | | 4,000 | | | | 4,407,200 | |
| |
See accompanying Notes to Financial Statements which are an integral part of the financial statements.
21 Invesco Municipal Income Fund
| | | | | | | | | | | | | | | | |
| | | Interest
Rate | | | Maturity
Date | | | Principal
Amount
(000) | | | Value | |
| |
Massachusetts–(continued) | | | | | | | | | | | | | | | | |
Massachusetts (State of) Development Finance Agency (Care Group); | | | | | | | | | | | | | | | | |
Series 2016 I, Ref. RB | | | 5.00% | | | | 07/01/2036 | | | $ | 3,000 | | | $ | 3,324,210 | |
| |
Series 2016 I, Ref. RB | | | 5.00% | | | | 07/01/2038 | | | | 2,045 | | | | 2,250,931 | |
| |
Massachusetts (State of) Development Finance Agency (Caregroup); | | | | | | | | | | | | | | | | |
Series 2018J-2, RB | | | 5.00% | | | | 07/01/2043 | | | | 4,100 | | | | 4,525,744 | |
| |
Series 2018J-2, RB | | | 5.00% | | | | 07/01/2048 | | | | 5,000 | | | | 5,489,300 | |
| |
Massachusetts (State of) Development Finance Agency (Dominion Energy Brayton); Series 2009 1, Ref. Solid Waste Disposal RB(c)(d) | | | 5.75% | | | | 05/01/2019 | | | | 2,000 | | | | 2,013,440 | |
| |
Massachusetts (State of) Development Finance Agency (Emerson College); Series 2016 A, RB | | | 5.00% | | | | 01/01/2047 | | | | 8,000 | | | | 8,650,800 | |
| |
Massachusetts (State of) Development Finance Agency (International Charter School); | | | | | | | | | | | | | | | | |
Series 2015, Ref. RB | | | 5.00% | | | | 04/15/2040 | | | | 2,000 | | | | 2,090,660 | |
| |
Massachusetts (State of) Development Finance Agency (Lawrence General Hospital); | | | | | | | | | | | | | | | | |
Series 2017, Ref. RB | | | 5.00% | | | | 07/01/2042 | | | | 1,000 | | | | 1,049,970 | |
| |
Series 2017, Ref. RB | | | 5.00% | | | | 07/01/2047 | | | | 3,000 | | | | 3,138,120 | |
| |
Massachusetts (State of) Development Finance Agency (Lesley University); Series 2011B-1, RB(INS-AGM)(b) | | | 5.25% | | | | 07/01/2033 | | | | 750 | | | | 804,030 | |
| |
Massachusetts (State of) Development Finance Agency (Merrimack College); Series 2012 A, RB | | | 5.25% | | | | 07/01/2042 | | | | 1,050 | | | | 1,102,101 | |
| |
Massachusetts (State of) Development Finance Agency (Tufts Medical Center); Series 2011 I, RB(c)(d) | | | 6.75% | | | | 01/01/2021 | | | | 1,000 | | | | 1,089,580 | |
| |
Massachusetts (State of) Development Finance Agency (Umass Memorial); | | | | | | | | | | | | | | | | |
Series 2011 H, RB(c)(d) | | | 5.50% | | | | 07/01/2021 | | | | 950 | | | | 1,030,798 | |
| |
Series 2011 H, RB | | | 5.50% | | | | 07/01/2031 | | | | 50 | | | | 53,467 | |
| |
Massachusetts (State of) Health & Educational Facilities Authority (Harvard University); Series 1999 R, VRD RB(l) | | | 1.40% | | | | 11/01/2049 | | | | 3,900 | | | | 3,900,000 | |
| |
Massachusetts (State of) Port Authority; | | | | | | | | | | | | | | | | |
Series 2019 A, Ref. RB(i) | | | 5.00% | | | | 07/01/2039 | | | | 4,000 | | | | 4,610,200 | |
| |
Series 2019 A, Ref. RB(i) | | | 5.00% | | | | 07/01/2040 | | | | 1,000 | | | | 1,147,830 | |
| |
| | | | | | | | | | | | | | | 61,141,072 | |
| |
| | | | |
Michigan–2.05% | | | | | | | | | | | | | | | | |
Detroit (City of); Series 2006 B, Second Lien Water Supply System RB(c)(d) | | | 6.25% | | | | 07/01/2019 | | | | 1,000 | | | | 1,014,980 | |
| |
Michigan (State of) Building Authority (Facilities Program); Series 2011I-A, Ref. RB | | | 5.00% | | | | 10/15/2029 | | | | 500 | | | | 537,750 | |
| |
Michigan (State of) Finance Authority (Beaumont Health Credit Group); Series 2016, RB | | | 5.00% | | | | 11/01/2044 | | | | 9,000 | | | | 9,786,060 | |
| |
Michigan (State of) Finance Authority (Charter County of Wayne Criminal Justice Center); Series 2018, RB | | | 5.00% | | | | 11/01/2043 | | | | 2,500 | | | | 2,837,925 | |
| |
Michigan (State of) Finance Authority (Detroit Water & Sewerage Department); | | | | | | | | | | | | | | | | |
Series 2014C-1, Ref. Sr. Lien Local Government Loan Program RB | | | 5.00% | | | | 07/01/2044 | | | | 2,720 | | | | 2,880,099 | |
| |
Series 2014C-6, Ref. Sr. Lien Local Government Loan Program RB | | | 5.00% | | | | 07/01/2033 | | | | 1,355 | | | | 1,491,638 | |
| |
Series 2014D-1, Ref. Local Government Loan Program RB(INS-AGM)(b) | | | 5.00% | | | | 07/01/2037 | | | | 2,000 | | | | 2,201,220 | |
| |
Series 2014D-2, Ref. Local Government Loan Program RB(INS-AGM)(b) | | | 5.00% | | | | 07/01/2027 | | | | 4,000 | | | | 4,538,480 | |
| |
Series 2014D-4, Ref. Local Government Loan Program RB | | | 5.00% | | | | 07/01/2029 | | | | 1,355 | | | | 1,513,928 | |
| |
Michigan (State of) Finance Authority (Local Government Loan Program); Series 2014 F, Ref. RB | | | 4.50% | | | | 10/01/2029 | | | | 4,000 | | | | 4,242,160 | |
| |
Michigan (State of) Strategic Fund (Genesee Power Station); Series 1994, Ref. Solid Waste Disposal RB(i) | | | 7.50% | | | | 01/01/2021 | | | | 540 | | | | 532,640 | |
| |
Michigan (State of) Tobacco Settlement Finance Authority; Series 2007 A, Sr. Asset-Backed RB | | | 6.00% | | | | 06/01/2048 | | | | 5,000 | | | | 4,926,250 | |
| |
Oakland University Board of Trustees; | | | | | | | | | | | | | | | | |
Series 2016, General RB | | | 5.00% | | | | 03/01/2041 | | | | 5,000 | | | | 5,504,000 | |
| |
Series 2016, General RB | | | 5.00% | | | | 03/01/2047 | | | | 2,500 | | | | 2,732,350 | |
| |
Summit Academy North; | | | | | | | | | | | | | | | | |
Series 2016, Ref. Public School Academy RB | | | 5.00% | | | | 11/01/2031 | | | | 3,000 | | | | 2,985,900 | |
| |
Series 2016, Ref. Public School Academy RB | | | 5.00% | | | | 11/01/2035 | | | | 3,255 | | | | 3,133,654 | |
| |
See accompanying Notes to Financial Statements which are an integral part of the financial statements.
22 Invesco Municipal Income Fund
| | | | | | | | | | | | | | | | |
| | | Interest
Rate | | | Maturity
Date | | | Principal
Amount
(000) | | | Value | |
| |
Michigan–(continued) | | | | | | | | | | | | | | | | |
Wayne (County of) Airport Authority (Detroit Metropolitan Airport); | | | | | | | | | | | | | | | | |
Series 2012 B, RB(i) | | | 5.00% | | | | 12/01/2032 | | | $ | 1,500 | | | $ | 1,639,440 | |
| |
Series 2012 B, RB(i) | | | 5.00% | | | | 12/01/2037 | | | | 1,500 | | | | 1,632,705 | |
| |
Series 2012 D, Ref. RB(i) | | | 5.00% | | | | 12/01/2028 | | | | 2,500 | | | | 2,745,575 | |
| |
| | | | | | | | | | | | | | | 56,876,754 | |
| |
| | | | |
Minnesota–0.56% | | | | | | | | | | | | | | | | |
| | | | |
Minnesota (State of) Agricultural & Economic Development Board (Essentia Health Obligated Group);
Series 2008C-1, Health Care Facilities RB(INS-AGC)(b) | | | 5.00% | | | | 02/15/2030 | | | | 1,060 | | | | 1,086,754 | |
| |
Minnesota (State of) Higher Education Facilities Authority (Bethel University); Series 2017, Ref. RB | | | 5.00% | | | | 05/01/2047 | | | | 5,615 | | | | 5,946,117 | |
| |
St. Louis Park (City of) (Park Nicollet Health Services); Series 2009, Ref. Health Care Facilities RB(c)(d) | | | 5.75% | | | | 07/01/2019 | | | | 2,000 | | | | 2,026,400 | |
| |
St. Paul (City of) Housing & Redevelopment Authority (Fairview Health Services); Series 2017 A, Ref. Health Care System RB | | | 5.00% | | | | 11/15/2047 | | | | 3,000 | | | | 3,308,970 | |
| |
St. Paul (City of) Housing & Redevelopment Authority (Hmong College Prep Academy); Series 2016, Ref. Charter School Lease RB | | | 5.75% | | | | 09/01/2046 | | | | 2,000 | | | | 2,102,960 | |
| |
Woodbury (City of) Housing & Redevelopment Authority (St. Therese of Woodbury); Series 2014, RB | | | 5.25% | | | | 12/01/2049 | | | | 1,000 | | | | 1,023,280 | |
| |
| | | | | | | | | | | | | | | 15,494,481 | |
| |
| | | | |
Mississippi–0.98% | | | | | | | | | | | | | | | | |
| | | | |
Mississippi Business Finance Corp. (Chevron U.S.A., Inc.); | | | | | | | | | | | | | | | | |
Series 2010 I, VRD Gulf Opportunity Zone IDR(l) | | | 1.60% | | | | 12/01/2030 | | | | 4,000 | | | | 4,000,000 | |
| |
Series 2010 I, VRD Gulf Opportunity Zone IDR(l) | | | 1.60% | | | | 11/01/2035 | | | | 12,000 | | | | 12,000,000 | |
| |
Mississippi Business Finance Corp. (Chevron USA, Inc.); | | | | | | | | | | | | | | | | |
Series 2007 A, VRD Gulf Opportunity Zone RB(l) | | | 1.56% | | | | 12/01/2030 | | | | 3,300 | | | | 3,300,000 | |
| |
Series 2011 G, VRD Gulf Opportunity Zone IDR(l) | | | 1.60% | | | | 11/01/2035 | | | | 3,200 | | | | 3,200,000 | |
| |
Mississippi Business Finance Corp. (System Energy Resources, Inc.); Series 1998, PCR | | | 5.88% | | | | 04/01/2022 | | | | 1,240 | | | | 1,242,406 | |
| |
West Rankin Utility Authority; Series 2018, RB (INS - AGM)(b) | | | 5.00% | | | | 01/01/2048 | | | | 3,000 | | | | 3,314,850 | |
| |
| | | | | | | | | | | | | | | 27,057,256 | |
| |
| | | | |
Missouri–2.64% | | | | | | | | | | | | | | | | |
Bi-State Development Agency of the Missouri-Illinois Metropolitan District (Metrolink Cross County Extension); Series 2009, Mass Transit Sales Tax RB(INS-AGC)(b) | | | 5.00% | | | | 10/01/2039 | | | | 2,000 | | | | 2,034,440 | |
| |
Cape Girardeau (County of) Industrial Development Authority (St. Francis Medical Center); Series 2009 A, Health Facilities RB(c)(d) | | | 5.75% | | | | 06/01/2019 | | | | 2,150 | | | | 2,171,414 | |
| |
Kansas City (City of) Industrial Development Authority (Downtown Redevelopment District); Series 2011 A, Ref. RB | | | 5.50% | | | | 09/01/2024 | | | | 5,990 | | | | 6,504,961 | |
| |
Kansas City (City of) Industrial Development Authority (Ward Parkway Center Community | | | | | | | | | | | | | | | | |
Improvement District); Series 2016 A, Ref. Sr. Sales Tax RB(g) | | | 5.00% | | | | 04/01/2046 | | | | 1,150 | | | | 1,129,852 | |
| |
Kansas City (City of) Land Clearance for Redevelopment Authority (Convention Center Hotel); Series 2018 B, Tax Allocation RB(g) | | | 5.00% | | | | 02/01/2040 | | | | 1,500 | | | | 1,540,680 | |
| |
Kirkwood (City of) Industrial Development Authority (Aberdeen Heights); Series 2017, Ref. Retirement Community RB | | | 5.25% | | | | 05/15/2042 | | | | 2,250 | | | | 2,359,755 | |
| |
Missouri (State of) Health & Educational Facilities Authority (Children’s Mercy Hospital); | | | | | | | | | | | | | | | | |
Series 2009, RB(c)(d) | | | 5.63% | | | | 05/15/2019 | | | | 2,075 | | | | 2,091,434 | |
| |
Series 2009, RB | | | 5.63% | | | | 05/15/2039 | | | | 425 | | | | 428,349 | |
| |
Missouri (State of) Health & Educational Facilities Authority (Lutheran Senior Service); Series A, RB | | | 5.00% | | | | 02/01/2042 | | | | 3,000 | | | | 3,186,510 | |
| |
Missouri (State of) Health & Educational Facilities Authority (Lutheran Senior Services); | | | | | | | | | | | | | | | | |
Series 2010, Senior Living Facilities RB | | | 5.50% | | | | 02/01/2042 | | | | 950 | | | | 964,611 | |
| |
Series 2016, Ref. Senior Living Facilities RB | | | 5.00% | | | | 02/01/2046 | | | | 4,000 | | | | 4,164,160 | |
| |
Missouri (State of) Health & Educational Facilities Authority (Medical Research Lutheran Services); Series 2016 A, RB | | | 5.00% | | | | 02/01/2036 | | | | 3,200 | | | | 3,391,648 | |
| |
Missouri (State of) Health & Educational Facilities Authority (Mercy Health); Series 2017 C, Ref. Health Facilities RB(e) | | | 5.00% | | | | 11/15/2042 | | | | 25,000 | | | | 28,088,750 | |
| |
Raytown (City of) (Raytown Live Redevelopment Plan); Series 2007 1, Annual Appropriation- Supported Tax RB | | | 5.13% | | | | 12/01/2031 | | | | 3,325 | | | | 3,327,427 | |
| |
See accompanying Notes to Financial Statements which are an integral part of the financial statements.
23 Invesco Municipal Income Fund
| | | | | | | | | | | | | | | | |
| | | Interest
Rate | | | Maturity
Date | | | Principal
Amount
(000) | | | Value | |
| |
Missouri–(continued) | | | | | | | | | | | | | | | | |
St. Louis (City of) Industrial Development Authority (Ballpark Village Development); Series 2017 A, Ref. Financing RB | | | 4.38% | | | | 11/15/2035 | | | | $ 2,250 | | | | $ 2,285,910 | |
| |
St. Louis (County of) Industrial Development Authority (Friendship Village of Sunset Hills); | | | | | | | | | | | | | | | | |
Series 2013 A, Senior Living Facilities RB | | | 5.88% | | | | 09/01/2043 | | | | 1,750 | | | | 1,871,800 | |
| |
St. Louis (County of) Industrial Development Authority (Friendship Village West County); Series 2018 | | | | | | | | | | | | | | | | |
A, Senior Living Facilities RB | | | 5.13% | | | | 09/01/2048 | | | | 7,500 | | | | 7,649,625 | |
| |
| | | | | | | | | | | | | | | 73,191,326 | |
| |
| | | | |
Montana–0.14% | | | | | | | | | | | | | | | | |
Kalispell (City of) (Immanuel Lutheran Corp.); Series 2017, Ref. Housing & Healthcare Facilities RB | | | 5.25% | | | | 05/15/2047 | | | | 2,645 | | | | 2,717,473 | |
| |
Montana (State of) Facility Finance Authority (Benefit Health System Obligated Group); Series 2011 A, Hospital RB(c)(d) | | | 5.75% | | | | 01/01/2021 | | | | 1,000 | | | | 1,072,820 | |
| |
| | | | | | | | | | | | | | | 3,790,293 | |
| |
| | | | |
Nebraska–0.74% | | | | | | | | | | | | | | | | |
Central Plains Energy Project (No. 3); | | | | | | | | | | | | | | | | |
Series 2012, Gas RB(o) | | | 5.00% | | | | 09/01/2032 | | | | 4,900 | | | | 5,261,277 | |
| |
Series 2017 A, Ref. Gas RB | | | 5.00% | | | | 09/01/2037 | | | | 5,010 | | | | 5,816,309 | |
| |
Nebraska (State of) Municipal Energy Agency; Series 2009 A, Ref. Power Supply System RB(c)(d) | | | 5.38% | | | | 04/01/2019 | | | | 4,000 | | | | 4,011,640 | |
| |
Public Power Generation Agency (Whelan Energy Center Unit 2); Series 2016 A, Ref. RB | | | 5.00% | | | | 01/01/2037 | | | | 5,000 | | | | 5,543,100 | |
| |
| | | | | | | | | | | | | | | 20,632,326 | |
| |
| | | | |
Nevada–0.48% | | | | | | | | | | | | | | | | |
Clark (County of) (Las Vegas-McCarran International Airport); | | | | | | | | | | | | | | | | |
Series 2010 A, Passenger Facility Charge RB | | | 5.13% | | | | 07/01/2034 | | | | 2,000 | | | | 2,048,500 | |
| |
Series 2010 A, Passenger Facility Charge RB(INS-AGM)(b) | | | 5.25% | | | | 07/01/2039 | | | | 5,500 | | | | 5,632,550 | |
| |
Series 2010 A, Passenger Facility Charge RB | | | 5.25% | | | | 07/01/2042 | | | | 2,000 | | | | 2,046,060 | |
| |
Las Vegas (City of) Valley Water District; Series 2009 B, Limited Tax
GO Bonds(c)(d) | | | 5.00% | | | | 06/01/2019 | | | | 800 | | | | 806,728 | |
| |
Nevada (State of) Department of Business & Industry (Doral Academy of Nevada); Series 2017 A, RB(g) | | | 5.00% | | | | 07/15/2047 | | | | 2,900 | | | | 2,921,808 | |
| |
| | | | | | | | | | | | | | | 13,455,646 | |
| |
| | | | |
New Hampshire–0.31% | | | | | | | | | | | | | | | | |
New Hampshire (State of) Business Finance Authority (Huggins Hospital); Series 2009, First Mortgage RB(c)(d) | | | 6.88% | | | | 10/01/2019 | | | | 895 | | | | 921,689 | |
| |
New Hampshire (State of) Health & Education Facilities Authority (Southern New Hampshire University); Series 2012, RB | | | 5.00% | | | | 01/01/2042 | | | | 6,000 | | | | 6,387,660 | |
| |
New Hampshire (State of) Health & Education Facilities Authority (Wentworth Douglas Hospital); Series 2011 A, RB(c)(d) | | | 6.00% | | | | 01/01/2021 | | | | 1,100 | | | | 1,183,996 | |
| |
| | | | | | | | | | | | | | | 8,493,345 | |
| |
New Jersey–4.95% | | | | | | | | | | | | | | | | |
Gloucester (County of) Pollution Control Financing Authority (Logan); Series 2014 A, Ref. PCR(i) | | | 5.00% | | | | 12/01/2024 | | | | 4,000 | | | | 4,241,040 | |
| |
Landis Sewage Authority (Registered CARS); Series 1993, Sewer Floating Rate RB(INS-NATL)(b)(p) | | | 7.52% | | | | 09/19/2019 | | | | 300 | | | | 306,237 | |
| |
New Jersey (State of) Economic Development Authority; | | | | | | | | | | | | | | | | |
Series 2005N-1, Ref. School Facilities Construction RB (INS - NATL)(b)(e)(j) | | | 5.50% | | | | 09/01/2022 | | | | 7,500 | | | | 8,284,275 | |
| |
Series 2005, School Facilities Construction RB(INS-AMBAC)(b) | | | 5.50% | | | | 09/01/2024 | | | | 3,885 | | | | 4,476,414 | |
| |
Series 2009 BB, School Facilities Construction RB(c)(d) | | | 5.00% | | | | 09/01/2019 | | | | 1,750 | | | | 1,778,420 | |
| |
Series 2012 II, Ref. School Facilities Construction RB | | | 5.00% | | | | 03/01/2023 | | | | 2,150 | | | | 2,302,586 | |
| |
Series 2012, Ref. RB | | | 5.00% | | | | 06/15/2025 | | | | 3,000 | | | | 3,223,410 | |
| |
Series 2012, Ref. RB | | | 5.00% | | | | 06/15/2026 | | | | 1,000 | | | | 1,072,020 | |
| |
Series 2012, Ref. RB | | | 5.00% | | | | 06/15/2028 | | | | 3,000 | | | | 3,194,460 | |
| |
Series 2017 A, Ref. Motor Vehicle Surcharge Sub. RB | | | 5.00% | | | | 07/01/2033 | | | | 2,800 | | | | 3,033,660 | |
| |
See accompanying Notes to Financial Statements which are an integral part of the financial statements.
24 Invesco Municipal Income Fund
| | | | | | | | | | | | | | | | |
| | | Interest
Rate | | | Maturity
Date | | | Principal
Amount
(000) | | | Value | |
| |
New Jersey–(continued) | | | | | | | | | | | | | | | | |
New Jersey (State of) Economic Development Authority (Paterson Charter School for Science and Technology, Inc.); | | | | | | | | | | | | | | | | |
Series 2012C, RB | | | 5.00% | | | | 07/01/2032 | | | $ | 675 | | | $ | 621,182 | |
| |
Series 2012C, RB | | | 5.30% | | | | 07/01/2044 | | | | 2,380 | | | | 2,118,985 | |
| |
New Jersey (State of) Economic Development Authority (Provident Group-Montclair Properties LLC- Montclair State University Student Housing); Series 2010A, RB (c)(d) | | | 5.75% | | | | 06/01/2020 | | | | 3,020 | | | | 3,174,533 | |
| |
New Jersey (State of) Economic Development Authority (The Goethals Bridge Replacement); | | | | | | | | | | | | | | | | |
Series 2013, Private Activity RB(i) | | | 5.38% | | | | 01/01/2043 | | | | 1,500 | | | | 1,632,825 | |
| |
New Jersey (State of) Health Care Facilities Financing Authority (Barnabas Health); Series 2011A, Ref. RB (c)(d) | | | 5.63% | | | | 07/01/2021 | | | | 8,000 | | | | 8,714,560 | |
| |
New Jersey (State of) Health Care Facilities Financing Authority (Hackensack Meridian Health Obligated Group); Series 2017A, Ref. RB | | | 5.25% | | | | 07/01/2057 | | | | 6,375 | | | | 7,229,441 | |
| |
New Jersey (State of) Health Care Facilities Financing Authority (Princeton Healthcare System); | | | | | | | | | | | | | | | | |
Series 2016, Ref. RB | | | 5.00% | | | | 07/01/2039 | | | | 7,000 | | | | 7,910,070 | |
| |
New Jersey (State of) Higher Education Student Assistance Authority; Series 2009 A, Student Loan RB | | | 5.63% | | | | 06/01/2030 | | | | 1,000 | | | | 1,009,260 | |
| |
New Jersey (State of) Transportation Trust Fund Authority; | | | | | | | | | | | | | | | | |
Series 2006C, CAB Transportation System RB(INS-NATL)(b)(h) | | | 0.00% | | | | 12/15/2031 | | | | 7,410 | | | | 4,486,459 | |
| |
Series 2006C, Transportation System CAB RB(INS-AGC)(b)(h) | | | 0.00% | | | | 12/15/2026 | | | | 10,000 | | | | 7,872,100 | |
| |
Series 2010D, Transportation System RB | | | 5.25% | | | | 12/15/2023 | | | | 2,000 | | | | 2,244,520 | |
| |
Series 2015AA, Transportation Program RB | | | 5.25% | | | | 06/15/2041 | | | | 2,500 | | | | 2,663,525 | |
| |
Series 2015AA, Transportation Program RB | | | 5.00% | | | | 06/15/2045 | | | | 3,420 | | | | 3,566,273 | |
| |
Series 2018A, Ref. Federal Highway Reimbursement RN(e)(j) | | | 5.00% | | | | 06/15/2030 | | | | 5,000 | | | | 5,585,600 | |
| |
Series 2018A, Ref. Federal Highway Reimbursement RN(e)(j) | | | 5.00% | | | | 06/15/2031 | | | | 7,500 | | | | 8,323,575 | |
| |
Series 2018A, Ref. RB | | | 5.00% | | | | 12/15/2034 | | | | 8,000 | | | | 8,727,440 | |
| |
Subseries2016A-1, Federal Highway Reimbursement RN | | | 5.00% | | | | 06/15/2027 | | | | 10,000 | | | | 11,400,100 | |
| |
New Jersey (State of) Turnpike Authority; | | | | | | | | | | | | | | | | |
Series 2009I, RB(c)(d) | | | 5.00% | | | | 01/01/2020 | | | | 2,000 | | | | 2,056,300 | |
| |
Series 2016A, Ref. RB | | | 5.00% | | | | 01/01/2034 | | | | 5,000 | | | | 5,675,450 | |
| |
Tobacco Settlement Financing Corp.; Series 2018A, Ref. RB | | | 5.00% | | | | 06/01/2046 | | | | 10,000 | | | | 10,562,200 | |
| |
| | | | | | | | | | | | | | | 137,486,920 | |
| |
| | | | |
New Mexico–0.23% | | | | | | | | | | | | | | | | |
Farmington (City of) (Public Service Co. of New Mexico San Juan); | | | | | | | | | | | | | | | | |
Series 2010A, Ref. Floating Rate PCR(d) | | | 5.20% | | | | 06/01/2020 | | | | 2,000 | | | | 2,060,320 | |
| |
Series 2010C, Ref. PCR | | | 5.90% | | | | 06/01/2040 | | | | 4,100 | | | | 4,272,815 | |
| |
| | | | | | | | | | | | | | | 6,333,135 | |
| |
| | | | |
New York–9.36% | | | | | | | | | | | | | | | | |
Brooklyn Arena Local Development Corp. (Barclays Center); | | | | | | | | | | | | | | | | |
Series 2009, PILOT CAB RB(h) | | | 0.00% | | | | 07/15/2035 | | | | 5,000 | | | | 2,542,100 | |
| |
Series 2009, PILOT RB(c)(d) | | | 6.25% | | | | 01/15/2020 | | | | 2,710 | | | | 2,820,731 | |
| |
Series 2009, PILOT RB(c)(d) | | | 6.38% | | | | 01/15/2020 | | | | 1,130 | | | | 1,177,381 | |
| |
Erie Tobacco Asset Securitization Corp.; Series 2005 A, Tobacco Settlement Asset-Backed RB | | | 5.00% | | | | 06/01/2045 | | | | 5,850 | | | | 5,724,459 | |
| |
Long Island Power Authority; | | | | | | | | | | | | | | | | |
Series 2008A, Electric System General RB(c)(d) | | | 5.50% | | | | 05/01/2019 | | | | 5,000 | | | | 5,031,700 | |
| |
Series 2008A, Electric System General RB(c)(d) | | | 6.00% | | | | 05/01/2019 | | | | 5,000 | | | | 5,035,600 | |
| |
Metropolitan Transportation Authority; | | | | | | | | | | | | | | | | |
Series 2011A, RB(c)(d) | | | 5.00% | | | | 11/15/2021 | | | | 2,000 | | | | 2,183,760 | |
| |
Series 2013A, Transportation RB | | | 5.00% | | | | 11/15/2038 | | | | 3,025 | | | | 3,269,964 | |
| |
Metropolitan Transportation Authority (Climate Bond Certified); Subseries2017A-1, Revenue Green Bonds | | | 5.25% | | | | 11/15/2057 | | | | 2,280 | | | | 2,530,481 | |
| |
Nassau County Tobacco Settlement Corp.; Series2006A-2, Sr. Asset-Backed Conv. CAB RB(k) | | | 5.25% | | | | 06/01/2026 | | | | 4,900 | | | | 4,900,784 | |
| |
New York & New Jersey (States of) Port Authority; Ninety-Third Series 1994, Consolidated RB | | | 6.13% | | | | 06/01/2094 | | | | 5,250 | | | | 6,233,797 | |
| |
See accompanying Notes to Financial Statements which are an integral part of the financial statements.
25 Invesco Municipal Income Fund
| | | | | | | | | | | | | | | | |
| | | Interest
Rate | | | Maturity
Date | | | Principal
Amount
(000) | | | Value | |
| | | | |
| New York–(continued) | | | | | | | | | | | | | | | | |
New York & New Jersey (States of) Port Authority (JFK International Air Terminal LLC); Series 2010, Special Obligation RB | | | 6.00% | | | | 12/01/2042 | | | $ | 3,000 | | | $ | 3,170,820 | |
New York (City of); | | | | | | | | | | | | | | | | |
Series 2014I-2, VRD Unlimited Tax GO Bonds(l) | | | 1.56% | | | | 03/01/2040 | | | | 2,390 | | | | 2,390,000 | |
Series 2015 F, VRD Unlimited Tax GO Bonds(l) | | | 1.56% | | | | 06/01/2044 | | | | 10,725 | | | | 10,725,000 | |
Subseries 2015F-5, VRD Unlimited Tax GO Bonds(l) | | | 1.55% | | | | 06/01/2044 | | | | 500 | | | | 500,000 | |
New York (City of) Industrial Development Agency (Queens Baseball Stadium); Series 2009, PILOT RB(INS-AGC)(b) | | | 6.38% | | | | 01/01/2039 | | | | 1,000 | | | | 1,003,340 | |
New York (City of) Municipal Water Finance Authority; | | | | | | | | | | | | | | | | |
Series 2012 FF, Water & Sewer System RB(e) | | | 5.00% | | | | 06/15/2045 | | | | 28,610 | | | | 31,038,131 | |
Subseries 2012A-1, VRD Water & Sewer System RB(l) | | | 1.55% | | | | 06/15/2044 | | | | 8,260 | | | | 8,260,000 | |
New York (City of) Transitional Finance Authority; | | | | | | | | | | | | | | | | |
Subseries 2009A-1, Future Tax Sec. RB(c)(d)(e) | | | 5.00% | | | | 05/01/2019 | | | | 4,455 | | | | 4,480,082 | |
Subseries 2009A-1, Future Tax Sec. RB(e) | | | 5.00% | | | | 05/01/2028 | | | | 5,570 | | | | 5,598,964 | |
Subseries 2009A-1, Future Tax Sec. RB(c)(e) | | | 5.00% | | | | 05/01/2029 | | | | 4,455 | | | | 4,480,082 | |
Subseries 2013, Sub. Future Tax Sec. RB(e) | | | 5.00% | | | | 11/01/2038 | | | | 5,465 | | | | 6,099,978 | |
Subseries 2013, Sub. Future Tax Sec. RB(e) | | | 5.00% | | | | 11/01/2042 | | | | 12,625 | | | | 14,032,940 | |
New York (Counties of) Tobacco Trust VI; Subseries 2016A-1, Ref. Tobacco Settlement Pass Through RB | | | 5.75% | | | | 06/01/2043 | | | | 10,000 | | | | 11,096,500 | |
New York (State of); Series 2009 A, Unlimited Tax GO Bonds | | | 5.00% | | | | 02/15/2039 | | | | 500 | | | | 501,245 | |
New York (State of) Dormitory Authority; Series 2014 C, State Personal Income Tax RB(e) | | | 5.00% | | | | 03/15/2040 | | | | 12,030 | | | | 13,495,374 | |
New York (State of) Dormitory Authority (General Purpose); Series 2011 A, State Personal Income Tax RB(e) | | | 5.00% | | | | 03/15/2031 | | | | 21,885 | | | | 23,232,678 | |
New York (State of) Dormitory Authority (North Shore - Long Island Jewish Obligated Group); Series 2011 A, RB(c)(d) | | | 5.00% | | | | 05/01/2021 | | | | 2,000 | | | | 2,145,420 | |
New York (State of) Dormitory Authority (State University Dormitory Facilities); Series 2011A, Lease RB | | | 5.00% | | | | 07/01/2035 | | | | 1,000 | | | | 1,067,630 | |
New York (State of) Housing Finance Agency (160 Madison Avenue); Series 2013 A, VRD RB (LOC - Landesbank Hessen-thrgn)(l)(m) | | | 1.56% | | | | 11/01/2046 | | | | 5,500 | | | | 5,500,000 | |
New York (State of) Thruway Authority (Transportation); Series 2009 A, Personal Income Tax RB(e) | | | 5.00% | | | | 03/15/2019 | | | | 2,000 | | | | 2,002,160 | |
New York Liberty Development Corp. (3 World Trade Center); Series 2014, Class 1, Ref. Liberty RB(g) | | | 5.00% | | | | 11/15/2044 | | | | 10,905 | | | | 11,370,316 | |
New York Transportation Development Corp. (American Airlines, Inc.);
Series 2016, Ref. Special Facilities RB(i) | | | 5.00% | | | | 08/01/2026 | | | | 10,000 | | | | 10,476,500 | |
New York Transportation Development Corp. (Delta Air Lines, Inc. LaGuardia Airport Terminal C&D Redevelopment);
Series 2018, Special Facilities RB(i) | | | 5.00% | | | | 01/01/2036 | | | | 2,500 | | | | 2,801,900 | |
New York Transportation Development Corp. (LaGuardia Airport Terminal B Redevelopment); Series 2016 A, Special Facilities RB(i) | | | 5.00% | | | | 07/01/2046 | | | | 15,205 | | | | 16,105,136 | |
Rockland Tobacco Asset Securitization Corp.; | | | | | | | | | | | | | | | | |
Series 2001, Tobacco Settlement Asset-Backed RB | | | 5.63% | | | | 08/15/2035 | | | | 3,865 | | | | 3,962,475 | |
Series 2005 A, First Sub. Tobacco Settlement Asset-Backed RB(g)(h) | | | 0.00% | | | | 08/15/2045 | | | | 57,500 | | | | 9,038,425 | |
Suffolk (County of) Water Authority; Series 2011, Ref. RB | | | 5.00% | | | | 06/01/2040 | | | | 2,135 | | | | 2,278,259 | |
Triborough Bridge & Tunnel Authority; Series 1993 B, General Purpose RB(c) | | | 5.00% | | | | 01/01/2020 | | | | 685 | | | | 704,742 | |
TSASC, Inc.; Series 2016 B, Ref. Sub. Tobacco Settlement Turbo RB | | | 5.00% | | | | 06/01/2048 | | | | 11,000 | | | | 10,573,750 | |
| | | | | | | | | | | | | | | | 259,582,604 | |
| | | | |
North Carolina–0.60% | | | | | | | | | | | | | | | | |
| | | | |
North Carolina (State of) Department of Transportation(I-77 HOT Lanes); Series 2015, Private Activity RB(i) | | | 5.00% | | | | 06/30/2054 | | | | 5,475 | | | | 5,728,055 | |
North Carolina (State of) Medical Care Commission (Duke University Health System); Series 2009 A, Health Care Facilities RB(c)(d) | | | 5.00% | | | | 06/01/2019 | | | | 1,000 | | | | 1,008,310 | |
North Carolina (State of) Medical Care Commission (Lutheran Services); Series 2012, Ref. First Mortgage Health Care Facilities RB | | | 4.25% | | | | 03/01/2024 | | | | 1,480 | | | | 1,537,720 | |
North Carolina (State of) Turnpike Authority; Series 2018, Triangle Expressway System RB | | | 5.00% | | | | 01/01/2040 | | | | 7,000 | | | | 7,792,330 | |
Oak Island (Town of); Series 2009, Enterprise System RB(c)(d) | | | 6.00% | | | | 06/01/2019 | | | | 500 | | | | 505,355 | |
| | | | | | | | | | | | | | | | 16,571,770 | |
See accompanying Notes to Financial Statements which are an integral part of the financial statements.
26 Invesco Municipal Income Fund
| | | | | | | | | | | | | | | | |
| | | Interest
Rate | | | Maturity
Date | | | Principal
Amount
(000) | | | Value | |
North Dakota–0.68% | | | | | | | | | | | | | | | | |
| | | | |
Burleigh (County of) (University of Mary); Series 2016, Education Facilities RB | | | 5.20% | | | | 04/15/2046 | | | $ | 2,700 | | | $ | 2,695,950 | |
Cass (County of) (Essentia Health Obligated Group); Series 2008 A, Health Care Facilities RB(INS-AGC)(b) | | | 5.13% | | | | 02/15/2037 | | | | 1,000 | | | | 1,027,350 | |
Fargo (City of) (Sanford); Series 2011, Health System RB | | | 6.25% | | | | 11/01/2031 | | | | 1,250 | | | | 1,397,187 | |
McLean (County of) (Great River Energy); Series 2010 B, Solid Waste Facilities RB | | | 5.15% | | | | 07/01/2040 | | | | 2,000 | | | | 2,065,540 | |
Ward (County of) (Trinity Obligated Group); Series 2017 C, Health Care Facilities RB | | | 5.00% | | | | 06/01/2048 | | | | 11,065 | | | | 11,688,513 | |
| | | | | | | | | | | | | | | | 18,874,540 | |
| | | | |
Ohio–4.73% | | | | | | | | | | | | | | | | |
Adams (County of) (Adams County Hospital); Series 2005, Hospital Facility Improvement RB | | | 6.25% | | | | 09/01/2020 | | | | 2,760 | | | | 2,690,558 | |
Akron, Bath & Copley Joint Township Hospital District; Series 2016, Ref. RB | | | 5.25% | | | | 11/15/2046 | | | | 5,000 | | | | 5,505,350 | |
Akron, Bath & Copley Joint Township Hospital District (Medical Center of Akron); Series 2012, RB | | | 5.00% | | | | 11/15/2032 | | | | 1,000 | | | | 1,081,560 | |
Allen (County of) (Catholic Healthcare Partners); Series 2010 A, Hospital Facilities RB(c)(d) | | | 5.00% | | | | 06/01/2020 | | | | 1,025 | | | | 1,066,103 | |
American Municipal Power, Inc. (Greenup Hydroelectric); Series 2016 A, RB | | | 5.00% | | | | 02/15/2046 | | | | 10,000 | | | | 10,977,900 | |
Beavercreek City School District; Series 2009, School Improvement Unlimited Tax GO Bonds(c)(d) | | | 5.00% | | | | 06/01/2019 | | | | 1,000 | | | | 1,008,410 | |
Buckeye Tobacco Settlement Financing Authority; Series 2007A-2, Sr. Asset-Backed Turbo RB | | | 5.88% | | | | 06/01/2047 | | | | 15,575 | | | | 14,621,031 | |
Centerville (City of) (Graceworks Lutheran Services); | | | | | | | | | | | | | | | | |
Series 2017, Ref. Health Care RB | | | 5.25% | | | | 11/01/2047 | | | | 2,700 | | | | 2,794,743 | |
Series 2017, Ref. Health Care RB | | | 5.25% | | | | 11/01/2050 | | | | 2,500 | | | | 2,578,775 | |
Chillicothe (City of) (Adena Health System Obligated Group); Series 2017, Ref. & Improvement Hospital Facilities RB | | | 5.00% | | | | 12/01/2037 | | | | 5,000 | | | | 5,518,900 | |
Cleveland (City of); | | | | | | | | | | | | | | | | |
Series 1993 G, Ref. First Mortgage Waterworks Improvement RB(INS-NATL)(b) | | | 5.50% | | | | 01/01/2021 | | | | 1,245 | | | | 1,305,806 | |
Series 2008B-1, Public Power System CAB RB(INS-NATL)(b)(h) | | | 0.00% | | | | 11/15/2025 | | | | 2,895 | | | | 2,422,391 | |
Series 2012 A, Ref. Airport System RB | | | 5.00% | | | | 01/01/2029 | | | | 5,000 | | | | 5,378,250 | |
Cleveland (City of) & Cuyahoga (County of) Port Authority (Constellation Schools); | | | | | | | | | | | | | | | | |
Series 2014 A, Ref. & Improvement Lease RB | | | 5.75% | | | | 01/01/2024 | | | | 605 | | | | 623,930 | |
Series 2014 A, Ref. & Improvement Lease RB | | | 6.50% | | | | 01/01/2034 | | | | 2,450 | | | | 2,526,220 | |
Cuyahoga (County of) (Metrohealth System); | | | | | | | | | | | | | | | | |
Series 2017, Ref. Hospital RB | | | 5.50% | | | | 02/15/2052 | | | | 7,000 | | | | 7,608,580 | |
Series 2017, Ref. Hospital RB | | | 5.00% | | | | 02/15/2057 | | | | 2,150 | | | | 2,239,763 | |
Hamilton (County of) (Christ Hospital); | | | | | | | | | | | | | | | | |
Series 2012, Health Care Facilities RB | | | 5.25% | | | | 06/01/2027 | | | | 3,295 | | | | 3,607,926 | |
Series 2012, Health Care Facilities RB | | | 5.50% | | | | 06/01/2042 | | | | 6,000 | | | | 6,535,860 | |
Hamilton (County of) (Life Enriching Communities); | | | | | | | | | | | | | | | | |
Series 2016, Ref. Healthcare Improvement RB | | | 5.00% | | | | 01/01/2046 | | | | 6,505 | | | | 6,670,813 | |
Series 2016, Ref. Improvement Health Care RB | | | 5.00% | | | | 01/01/2051 | | | | 1,695 | | | | 1,733,222 | |
Lucas (County of), Ohio (ProMedica Healthcare System); Series 2018 A, Ref. Hospital RB | | | 5.25% | | | | 11/15/2048 | | | | 16,500 | | | | 17,935,335 | |
Middleburg Heights (City of) (Southwest General Health Center); | | | | | | | | | | | | | | | | |
Series 2011, Hospital Facilities RB | | | 5.13% | | | | 08/01/2031 | | | | 1,750 | | | | 1,871,625 | |
Series 2011, Hospital Facilities RB | | | 5.25% | | | | 08/01/2036 | | | | 1,500 | | | | 1,604,970 | |
Muskingum (County of) (Genesis Healthcare System); Series 2013, Hospital Facilities RB | | | 5.00% | | | | 02/15/2044 | | | | 7,740 | | | | 7,913,453 | |
Ohio (State of) (Portsmouth Bypass); Series 2015, Private Activity RB(i) | | | 5.00% | | | | 12/31/2025 | | | | 2,000 | | | | 2,223,840 | |
Ohio (State of) Air Quality Development Authority (Columbus Southern Power Co.); Series 2009 B, Ref. RB | | | 5.80% | | | | 12/01/2038 | | | | 3,000 | | | | 3,070,380 | |
Ohio (State of) Higher Educational Facility Commission (Cleveland Clinic Health System Obligated Group); Series 2013B-2, VRD Hospital RB(l) | | | 1.60% | | | | 01/01/2039 | | | | 2,200 | | | | 2,200,000 | |
Ohio (State of) Housing Finance Agency (Covenant House Apartments); Series 2008 C, MFH Mortgage RB (CEP -GNMA)(i) | | | 6.10% | | | | 09/20/2049 | | | | 2,845 | | | | 2,903,806 | |
Tuscarawas (County of) Economic Development and Finance Alliance (Ashland University); Series 2015, Ref. Higher Education Facilities Improvement RB | | | 6.00% | | | | 03/01/2045 | | | | 3,000 | | | | 3,019,440 | |
| | | | | | | | | | | | | | | | 131,238,940 | |
See accompanying Notes to Financial Statements which are an integral part of the financial statements.
27 Invesco Municipal Income Fund
| | | | | | | | | | | | | | | | |
| | | Interest
Rate | | | Maturity
Date | | | Principal
Amount
(000) | | | Value | |
Oklahoma–0.94% | | | | | | | | | | | | | | | | |
| | | | |
Oklahoma (State of) Development Finance Authority (OU Medicine); Series 2018 B, Health System RB | | | 5.25 | % | | | 08/15/2048 | | | $
|
8,500 |
| | $ | 9,302,570 | |
Oklahoma (State of) Development Finance Authority (Provident Oklahoma Education Resources, Inc.-Cross Village Student Housing); | | | | | | | | | | | | | | | | |
Series 2017, RB | | | 5.00 | % | | | 08/01/2052 | | | | 2,000 | | | | 1,871,760 | |
Series 2017, RB | | | 5.25 | % | | | 08/01/2057 | | | | 3,000 | | | | 2,808,000 | |
Oklahoma Development Finance Authority; Series 2018 B, Health System RB(e)(j) | | | 5.50 | % | | | 08/15/2057 | | | | 6,000 | | | | 6,617,640 | |
Tulsa (City of) Municipal Airport Trust (American Airlines Group, Inc.); Series 2015, Ref. RB(d)(i) | | | 5.00 | % | | | 06/01/2025 | | | | 5,000 | | | | 5,411,300 | |
| | | | | | | | | | | | | | | | 26,011,270 | |
| | | | |
Oregon–0.81% | | | | | | | | | | | | | | | | |
Beaverton School District; | | | | | | | | | | | | | | | | |
Series 2009, Limited Tax GO Bonds(c)(d) | | | 5.00 | % | | | 06/01/2019 | | | | 750 | | | | 756,308 | |
Series 2009, Limited Tax GO Bonds(c)(d) | | | 5.13 | % | | | 06/01/2019 | | | | 500 | | | | 504,355 | |
Clackamas (County of) Hospital Facility Authority (Mary’s Woods at Marylhurst, Inc.); | | | | | | | | | | | | | | | | |
Series 2018 A, Sr. Living RB | | | 5.00 | % | | | 05/15/2048 | | | | 1,090 | | | | 1,136,053 | |
Series 2018 A, Sr. Living RB | | | 5.00 | % | | | 05/15/2052 | | | | 500 | | | | 519,730 | |
Clackamas (County of) Hospital Facility Authority (Willamette View); Series 2017 A, Ref. Sr. Living RB | | | 5.00 | % | | | 11/15/2047 | | | | 5,375 | | | | 5,725,557 | |
Forest Grove (City of) (Pacific University); Series 2014 A, Ref. Campus Improvement RB | | | 5.25 | % | | | 05/01/2034 | | | | 2,000 | | | | 2,125,260 | |
Oregon (State of) Facilities Authority (Samaritan Health Services); Series 2010 A, Ref. RB | | | 5.00 | % | | | 10/01/2030 | | | | 1,500 | | | | 1,565,550 | |
Portland (City of); Series 2011 B, Central Eastside Urban Renewal & Redevelopment Tax Allocation RB | | | 5.25 | % | | | 06/15/2029 | | | | 900 | | | | 965,358 | |
Portland (Port of) (Portland International Airport); Series 24 B, Airport RB(i) | | | 5.00 | % | | | 07/01/2047 | | | | 3,000 | | | | 3,302,430 | |
Salem (City of) Hospital Facility Authority (Capital Manor, Inc.); | | | | | | | | | | | | | | | | |
Series 2012, Ref. RB | | | 5.75 | % | | | 05/15/2027 | | | | 1,000 | | | | 1,101,170 | |
Series 2012, Ref. RB | | | 5.63 | % | | | 05/15/2032 | | | | 1,000 | | | | 1,080,050 | |
Warm Springs Reservation Confederated Tribes of Oregon (Pelton Round Butte); Series 2009 B, Tribal Economic Development Hydroelectric RB | | | 6.38 | % | | | 11/01/2033 | | | | 3,500 | | | | 3,567,935 | |
| | | | | | | | | | | | | | | | 22,349,756 | |
| | | | |
Pennsylvania–2.71% | | | | | | | | | | | | | | | | |
Allegheny (County of) Higher Education Building Authority (Carnegie Mellon University); Series 2008 A, VRD University RB(l) | | | 1.56 | % | | | 12/01/2037 | | | | 2,000 | | | | 2,000,000 | |
Allegheny (County of) Higher Education Building Authority (Duquesne University); Series 2011 A, University RB(c)(d) | | | 5.25 | % | | | 03/01/2021 | | | | 700 | | | | 748,748 | |
Allegheny (County of) Hospital Development Authority (Allegheny Health Network Obligated Group Issue); Series 2018 A, Ref. RB | | | 5.00 | % | | | 04/01/2047 | | | | 7,500 | | | | 8,214,450 | |
Allegheny (County of) Port Authority; Series 2011, Ref. Special Transportation RB | | | 5.75 | % | | | 03/01/2029 | | | | 1,385 | | | | 1,490,315 | |
Delaware River Port Authority; Series 2010 D, RB(c)(d) | | | 5.00 | % | | | 01/01/2020 | | | | 1,000 | | | | 1,028,150 | |
Erie (City of) Parking Authority; | | | | | | | | | | | | | | | | |
Series 2010, Gtd. RB(c)(d) | | | 5.20 | % | | | 09/01/2020 | | | | 260 | | | | 273,465 | |
Series 2010, Gtd. RB(INS-AGM)(b) | | | 5.20 | % | | | 09/01/2035 | | | | 740 | | | | 772,101 | |
Lehigh (County of) General Purpose Authority (Bible Fellowship Church Homes, Inc.); Series 2013, RB | | | 4.75 | % | | | 07/01/2022 | | | | 2,125 | | | | 2,174,661 | |
Pennsylvania (State of) Economic Development Financing Authority (National Gypson Co.); Series 2014, Ref. Exempt Facilities RB(i) | | | 5.50 | % | | | 11/01/2044 | | | | 3,300 | | | | 3,429,624 | |
Pennsylvania (State of) Higher Educational Facilities Authority (Drexel University); | | | | | | | | | | | | | | | | |
Series 2011 A, RB(c)(d) | | | 5.13 | % | | | 05/01/2021 | | | | 470 | | | | 504,479 | |
Series 2011 A, RB | | | 5.13 | % | | | 05/01/2036 | | | | 30 | | | | 31,692 | |
Pennsylvania (State of) Turnpike Commission; | | | | | | | | | | | | | | | | |
Series 2009 A, Sub. RB(c)(d) | | | 5.00 | % | | | 06/01/2019 | | | | 5,850 | | | | 5,898,922 | |
Series 2018 B, Sub. Oil Franchise Tax RB | | | 5.25 | % | | | 12/01/2048 | | | | 7,995 | | | | 9,105,026 | |
Subseries 2010B-2, Sub. Conv. CAB Turnpike RB(c)(d)(k) | | | 5.75 | % | | | 12/01/2020 | | | | 4,550 | | | | 4,871,275 | |
Subseries 2010B-2, Sub. Conv. CAB Turnpike RB(c)(d)(k) | | | 6.00 | % | | | 12/01/2020 | | | | 2,750 | | | | 2,955,948 | |
Subseries 2014A-2, Sub. Conv. CAB RB(k) | | | 5.13 | % | | | 12/01/2040 | | | | 5,500 | | | | 4,734,455 | |
Subseries 2017B-1, Sub. Turnpike RB | | | 5.25 | % | | | 06/01/2047 | | | | 4,000 | | | | 4,432,720 | |
See accompanying Notes to Financial Statements which are an integral part of the financial statements.
28 Invesco Municipal Income Fund
| | | | | | | | | | | | | | | | |
| | | Interest
Rate | | | Maturity
Date | | | Principal
Amount
(000) | | | Value | |
Pennsylvania–(continued) | | | | | | | | | | | | | | | | |
| | | | |
Philadelphia (City of); | | | | | | | | | | | | | | | | |
Ninth Series 2010, Gas Works RB(c)(d) | | | 5.00% | | | | 08/01/2020 | | | $ | 500 | | | $ | 523,430 | |
Series 2017 B, Ref. Airport RB(i) | | | 5.00% | | | | 07/01/2047 | | | | 7,500 | | | | 8,252,325 | |
Philadelphia (City of) Authority for Industrial Development (Wesley Enhanced Living Obligated Group); | | | | | | | | | | | | | | | | |
Series 2017, Ref. Sr. Living Facilities RB | | | 5.00% | | | | 07/01/2042 | | | | 3,000 | | | | 3,046,740 | |
Philadelphia (City of) Industrial Development Authority (Thomas Jefferson University); Series 2017 A, Ref. RB | | | 5.00% | | | | 09/01/2042 | | | | 3,500 | | | | 3,857,070 | |
Philadelphia School District; Series 2007 A, Ref. Unlimited Tax GO Bonds(INS-NATL)(b) | | | 5.00% | | | | 06/01/2026 | | | | 2,360 | | | | 2,740,786 | |
Pittsburgh (City of) & Allegheny (County of) Sports & Exhibition Authority (Regional Asset District); | | | | | | | | | | | | | | | | |
Series 2010, Ref. Sales Tax RB(INS-AGM)(b) | | | 5.00% | | | | 02/01/2031 | | | | 2,000 | | | | 2,077,040 | |
State Public School Building Authority (Harrisburg School District); Series 2009, RB(c)(d) | | | 5.00% | | | | 05/15/2019 | | | | 2,000 | | | | 2,013,801 | |
| | | | | | | | | | | | | | | | 75,177,223 | |
| | | | |
Puerto Rico–1.01% | | | | | | | | | | | | | | | | |
| | | | |
Children’s Trust Fund; Series 2002, Tobacco Settlement Asset-Backed RB | | | 5.50% | | | | 05/15/2039 | | | | 6,450 | | | | 6,516,113 | |
Puerto Rico (Commonwealth of); Series 2006 A, Public Improvement Unlimited Tax GO Bonds, Floating Rate (INS - AGC) (CPI Rate + 1.00%)(b)(n) | | | 3.46% | | | | 07/01/2019 | | | | 2,500 | | | | 2,501,975 | |
Puerto Rico (Commonwealth of) Electric Power Authority; Series 2007 VV, Ref. RB(INS-NATL)(b) | | | 5.25% | | | | 07/01/2030 | | | | 2,700 | | | | 2,889,567 | |
Puerto Rico (Commonwealth of) Highway & Transportation Authority; | | | | | | | | | | | | | | | | |
Series 2007 N, Ref. Transportation RB (INS - AGC)(b) | | | 5.25% | | | | 07/01/2034 | | | | 2,500 | | | | 2,773,650 | |
Series 2007 N, Ref. Transportation RB (INS - AGC)(b) | | | 5.25% | | | | 07/01/2036 | | | | 4,100 | | | | 4,518,200 | |
Puerto Rico Sales Tax Financing Corp.; | | | | | | | | | | | | | | | | |
First Subseries 2009 A, RB(c)(d) | | | 5.50% | | | | 08/01/2019 | | | | 20 | | | | 20,314 | |
Series 2018A-1, CAB RB(h) | | | 0.00% | | | | 07/01/2027 | | | | 6,343 | | | | 4,610,092 | |
Series 2018A-1, CAB RB(h) | | | 0.00% | | | | 07/01/2029 | | | | 4,150 | | | | 2,678,908 | |
Series 2018A-1, RB | | | 4.50% | | | | 07/01/2034 | | | | 1,400 | | | | 1,401,750 | |
| | | | | | | | | | | | | | | | 27,910,569 | |
| | | | |
Rhode Island–0.10% | | | | | | | | | | | | | | | | |
| | | | |
Rhode Island (State of) Turnpike & Bridge Authority; Series 2010 A, RB | | | 5.00% | | | | 12/01/2035 | | | | 500 | | | | 523,600 | |
Rhode Island Economic Development Corp.; Series 2008 A, Airport RB(INS-AGC)(b)(i) | | | 5.25% | | | | 07/01/2028 | | | | 1,810 | | | | 1,814,579 | |
Rhode Island Health & Educational Building Corp. (Lifespan Obligated Group); Series 2009 A, Hospital Financing RB(c)(d) | | | 6.25% | | | | 05/15/2019 | | | | 500 | | | | 504,620 | |
| | | | | | | | | | | | | | | | 2,842,799 | |
| | | | |
South Carolina–1.47% | | | | | | | | | | | | | | | | |
| | | | |
Greenwood (County of) (Self Regional Healthcare); Series 2012 B, Ref. Hospital RB | | | 5.00% | | | | 10/01/2031 | | | | 2,120 | | | | 2,291,296 | |
Horry (County of); Series 2010 A, Airport RB | | | 5.00% | | | | 07/01/2040 | | | | 2,000 | | | | 2,075,220 | |
Piedmont Municipal Power Agency; | | | | | | | | | | | | | | | | |
Series 2011 C, Ref. Electric RB(INS-AGC)(b) | | | 5.00% | | | | 01/01/2030 | | | | 500 | | | | 531,000 | |
Series 2011 D, Ref. Electric RB(INS-AGC)(b) | | | 5.75% | | | | 01/01/2034 | | | | 1,000 | | | | 1,081,730 | |
South Carolina (State of) Jobs-Economic Development Authority (Lutheran Homes); | | | | | | | | | | | | | | | | |
Series 2013, Health Facilities RB | | | 5.00% | | | | 05/01/2028 | | | | 2,000 | | | | 2,049,620 | |
Series 2017, Ref. Health Facilities RB | | | 5.00% | | | | 05/01/2037 | | | | 2,860 | | | | 2,886,512 | |
South Carolina (State of) Jobs-Economic Development Authority (Palmetto Health Alliance); | | | | | | | | | | | | | | | | |
Series 2009, Ref. & Improvement Hospital RB(c)(d) | | | 5.75% | | | | 08/01/2019 | | | | 1,000 | | | | 1,016,720 | |
Series 2013 A, Ref. Hospital RB(c)(d) | | | 5.25% | | | | 08/01/2023 | | | | 3,850 | | | | 4,424,536 | |
South Carolina (State of) Ports Authority; Series 2015, RB(i) | | | 5.00% | | | | 07/01/2045 | | | | 10,000 | | | | 10,875,300 | |
South Carolina (State of) Public Service Authority; Series 2015 E, RB | | | 5.25% | | | | 12/01/2055 | | | | 7,365 | | | | 8,062,097 | |
South Carolina (State of) Public Service Authority (Santee Cooper Revenue Obligations); Series 2013 E, RB | | | 5.50% | | | | 12/01/2053 | | | | 5,000 | | | | 5,414,950 | |
| | | | | | | | | | | | | | | | 40,708,981 | |
| | | | |
South Dakota–0.21% | | | | | | | | | | | | | | | | |
| | | | |
Rapid City (City of); Series 2011 A, Ref. Airport RB | | | 6.75% | | | | 12/01/2031 | | | | 1,500 | | | | 1,553,700 | |
See accompanying Notes to Financial Statements which are an integral part of the financial statements.
29 Invesco Municipal Income Fund
| | | | | | | | | | | | | | | | |
| | | Interest
Rate | | | Maturity
Date | | | Principal
Amount
(000) | | | Value | |
South Dakota–(continued) | | | | | | | | | | | | | | | | |
| | | | |
South Dakota (State of) Health & Educational Facilities Authority (Avera Health); Series 2012 A, RB | | | 5.00% | | | | 07/01/2042 | | | $ | 4,000 | | | $ | 4,217,240 | |
| | | | | | | | | | | | | | | | 5,770,940 | |
| | | | |
Tennessee–1.24% | | | | | | | | | | | | | | | | |
| | | | |
Johnson City (City of) Health & Educational Facilities Board (Mountain States Health Alliance); Series 2010, Hospital RB(c)(d) | | | 5.63% | | | | 07/01/2020 | | | | 2,000 | | | | 2,103,180 | |
Knox (County of) Health, Educational and Housing Facility Board (Covenant Health); Series 2016 A, Ref. Hospital RB | | | 5.00% | | | | 01/01/2042 | | | | 14,000 | | | | 15,340,920 | |
Nashville (City of) & Davidson (County of) Metropolitan Government Health & Educational Facilities Board (Blakeford at Green Hills); | | | | | | | | | | | | | | | | |
Series 2012, Ref. & Improvement RB | | | 5.00% | | | | 07/01/2027 | | | | 2,000 | | | | 2,104,920 | |
Series 2012, Ref. & Improvement RB | | | 5.00% | | | | 07/01/2032 | | | | 1,500 | | | | 1,560,450 | |
Series 2012, Ref. & Improvement RB | | | 5.00% | | | | 07/01/2037 | | | | 1,100 | | | | 1,140,326 | |
Nashville (City of) & Davidson (County of) Metropolitan Government Health & Educational Facilities Board (Vanderbilt University Medical Center); | | | | | | | | | | | | | | | | |
Series 2016 A, RB | | | 5.00% | | | | 07/01/2046 | | | | 8,015 | | | | 8,757,509 | |
Series 2017 A, RB | | | 5.00% | | | | 07/01/2048 | | | | 1,500 | | | | 1,644,600 | |
Shelby (County of) Health, Educational & Housing Facilities Board (The Village at Germantown, Inc.); | | | | | | | | | | | | | | | | |
Series 2014, Residential Care Facility Mortgage RB | | | 5.00% | | | | 12/01/2034 | | | | 500 | | | | 510,715 | |
Series 2014, Residential Care Facility Mortgage RB | | | 5.25% | | | | 12/01/2044 | | | | 1,165 | | | | 1,199,787 | |
| | | | | | | | | | | | | | | | 34,362,407 | |
| | | | |
Texas–9.37% | | | | | | | | | | | | | | | | |
| | | | |
Aldine Independent School District; Series 2017 A, Ref. School Building Unlimited Tax GO (CEP -Texas Permanent School Fund)(e) | | | 5.00% | | | | 02/15/2045 | | | | 15,000 | | | | 16,980,900 | |
Angelina & Neches River Authority Industrial Development Corp. (Aspen Power LLC); Series 2007 A, Environmental Facilities RB(f)(i) | | | 6.50% | | | | 11/01/2029 | | | | 430 | | | | 4 | |
Arlington Higher Education Finance Corp. (Universal Academy); Series 2014 A, Education RB | | | 7.00% | | | | 03/01/2034 | | | | 1,000 | | | | 1,025,290 | |
Bexar (County of) (Motor Vehicle Rental Tax); Series 2009, Venue RB(INS-BHAC)(b) | | | 5.00% | | | | 08/15/2039 | | | | 1,020 | | | | 1,022,458 | |
Bexar (County of) Metropolitan Water District; Series 2009, Ref. Waterworks System RB(c)(d) | | | 5.00% | | | | 05/01/2019 | | | | 1,500 | | | | 1,508,250 | |
Bexar County Health Facilities Development Corp. (St. Luke’s Lutheran Hospital); Series 1991, Hospital RB(c) | | | 7.00% | | | | 05/01/2021 | | | | 500 | | | | 528,930 | |
Capital Area Cultural Education Facilities Finance Corp. (The Roman Catholic Diocese of Austin); Series 2005 B, RB | | | 6.13% | | | | 04/01/2045 | | | | 4,500 | | | | 4,660,020 | |
Central Texas Regional Mobility Authority; | | | | | | | | | | | | | | | | |
Series 2011, Sr. Lien RB(c)(d) | | | 5.75% | | | | 01/01/2021 | | | | 1,000 | | | | 1,070,950 | |
Series 2011, Sr. Lien RB(c)(d) | | | 6.00% | | | | 01/01/2021 | | | | 5,000 | | | | 5,377,100 | |
Series 2016, Ref. Sr. Lien RB | | | 5.00% | | | | 01/01/2046 | | | | 8,705 | | | | 9,488,450 | |
Clifton Higher Education Finance Corp. (Idea Public Schools); Series 2013, Education RB | | | 6.00% | | | | 08/15/2043 | | | | 2,000 | | | | 2,214,100 | |
Clifton Higher Education Finance Corp. (International Leadership of Texas); | | | | | | | | | | | | | | | | |
Series 2015 A, Education RB | | | 5.13% | | | | 08/15/2030 | | | | 2,000 | | | | 2,036,740 | |
Series 2018 D, Education RB | | | 6.00% | | | | 08/15/2038 | | | | 5,000 | | | | 5,186,100 | |
Dallas (City of) (Civic Center Convention Complex); Series 2009, Ref. & Improvement RB(INS-AGC)(b) | | | 5.25% | | | | 08/15/2034 | | | | 4,000 | | | | 4,053,760 | |
Decatur (City of) Hospital Authority (Wise Regional Health System); | | | | | | | | | | | | | | | | |
Series 2014 A, Ref. RB | | | 5.00% | | | | 09/01/2034 | | | | 1,250 | | | | 1,341,800 | |
Series 2014 A, Ref. RB | | | 5.25% | | | | 09/01/2044 | | | | 1,500 | | | | 1,589,055 | |
Galena Park Independent School District; Series 1996, Ref. Unlimited Tax CAB GO Bonds (CEP -Texas Permanent School Fund)(h) | | | 0.00% | | | | 08/15/2023 | | | | 2,000 | | | | 1,834,720 | |
Grand Parkway Transportation Corp.; Series 2013 B, Sub. Tier Toll RB | | | 5.25% | | | | 10/01/2051 | | | | 14,360 | | | | 15,720,754 | |
Gulf Coast Industrial Development Authority (ExxonMobil); Series 2012, VRD RB(l) | | | 1.45% | | | | 03/05/2019 | | | | 18,000 | | | | 18,000,000 | |
Harris (County of); | | | | | | | | | | | | | | | | |
Series 2007 C, Ref. Sub. Lien Toll Road Unlimited Tax GO Bonds(INS-AGM)(b) | | | 5.25% | | | | 08/15/2031 | | | | 6,665 | | | | 8,580,388 | |
Series 2009 A, Sr. Lien Toll Road RB(c)(d) | | | 5.00% | | | | 08/15/2019 | | | | 2,920 | | | | 2,964,150 | |
Series 2009, Sr. Lien Toll Road RB(c)(d) | | | 5.00% | | | | 08/15/2019 | | | | 570 | | | | 578,493 | |
Series 2009, Sr. Lien Toll Road RB | | | 5.00% | | | | 08/15/2038 | | | | 430 | | | | 436,175 | |
See accompanying Notes to Financial Statements which are an integral part of the financial statements.
30 Invesco Municipal Income Fund
| | | | | | | | | | | | | | | | |
| | | Interest
Rate | | | Maturity
Date | | | Principal
Amount
(000) | | | Value | |
Texas–(continued) | | | | | | | | | | | | | | | | |
Harris County Cultural Education Facilities Finance Corp. (TECO); Series 2009 A, Thermal Utility RB(c)(d) | | | 5.25% | | | | 11/15/2019 | | | $ | 1,100 | | | $ | 1,128,325 | |
Hopkins (County of) Hospital District; Series 2008, RB | | | 5.50% | | | | 02/15/2023 | | | | 1,480 | | | | 1,482,960 | |
Houston (City of) Convention & Entertainment Facilities Department; | | | | | | | | | | | | | | | | |
Series 2001 B, Hotel Occupancy Tax & Special CAB RB(INS-AGM)(b)(h) | | | 0.00% | | | | 09/01/2026 | | | | 8,750 | | | | 7,218,487 | |
Series 2001 B, Hotel Occupancy Tax & Special CAB RB(INS-AGM)(b)(h) | | | 0.00% | | | | 09/01/2027 | | | | 3,600 | | | | 2,854,368 | |
Houston Higher Education Finance Corp. (Cosmos Foundation, Inc.); | | | | | | | | | | | | | | | | |
Series 2011 A, RB(c)(d) | | | 6.88% | | | | 05/15/2021 | | | | 1,700 | | | | 1,882,648 | |
Series 2011, RB(c)(d) | | | 6.50% | | | | 05/15/2021 | | | | 1,740 | | | | 1,912,973 | |
Laredo Community College District; Series 2010, Combined Fee RB(c)(d) | | | 5.25% | | | | 08/01/2020 | | | | 1,000 | | | | 1,049,610 | |
Love Field Airport Modernization Corp. (Southwest Airlines Co.); | | | | | | | | | | | | | | | | |
Series 2010, Special Facilities RB | | | 5.25% | | | | 11/01/2040 | | | | 1,000 | | | | 1,039,080 | |
Series 2012, Special Facilities RB(i) | | | 5.00% | | | | 11/01/2028 | | | | 2,000 | | | | 2,167,660 | |
Lower Colorado River Authority; | | | | | | | | | | | | | | | | |
Series 2012 A, Ref. RB(c)(d) | | | 5.00% | | | | 05/15/2022 | | | | 10 | | | | 11,000 | |
Series 2012 A, Ref. RB | | | 5.00% | | | | 05/15/2030 | | | | 4,585 | | | | 4,991,460 | |
Lower Neches Valley Authority Industrial Development Corp. (Exxonmobil); Series 2010, VRD RB(l) | | | 1.50% | | | | 11/01/2038 | | | | 700 | | | | 700,000 | |
Mesquite Health Facilities Development Corporation (Christian Care Centers, Inc.); | | | | | | | | | | | | | | | | |
Series 2014, Ref. RB | | | 5.13% | | | | 02/15/2030 | | | | 1,750 | | | | 1,808,957 | |
Series 2014, Ref. RB | | | 5.13% | | | | 02/15/2042 | | | | 2,135 | | | | 2,153,019 | |
Mesquite Health Facility Development Corp. (Christian Care Centers, Inc.); Series 2016, Ref. Retirement Facility RB | | | 5.00% | | | | 02/15/2030 | | | | 280 | | | | 288,940 | |
New Hope Cultural Education Facilities Corp. (Presbyterian Village North); | | | | | | | | | | | | | | | | |
Series 2018, Ref. Retirement Facility RB | | | 5.00% | | | | 10/01/2035 | | | | 1,820 | | | | 1,830,938 | |
Series 2018, Ref. Retirement Facility RB | | | 5.00% | | | | 10/01/2039 | | | | 3,260 | | | | 3,226,813 | |
New Hope Cultural Education Facilities Finance Corp. (Longhorn Village); Series 2017, Ref. Retirement Facility RB | | | 5.00% | | | | 01/01/2042 | | | | 3,000 | | | | 3,022,980 | |
New Hope Cultural Education Facilities Finance Corp. (Morningside Ministries); Series 2013, First Mortgage RB | | | 6.50% | | | | 01/01/2043 | | | | 2,350 | | | | 2,551,959 | |
New Hope Cultural Education Facilities Finance Corp. (MRC SeniorLiving-The Langford); | | | | | | | | | | | | | | | | |
Series 2016 A, Retirement Facility RB | | | 5.00% | | | | 11/15/2026 | | | | 675 | | | | 678,827 | |
Series 2016 A, Retirement Facility RB | | | 5.38% | | | | 11/15/2036 | | | | 865 | | | | 865,735 | |
Series 2016 A, Retirement Facility RB | | | 5.50% | | | | 11/15/2046 | | | | 1,250 | | | | 1,252,225 | |
New Hope Cultural Education Facilities Finance Corp. (Tarleton State University); Series 2014 A, Student Housing RB | | | 5.00% | | | | 04/01/2046 | | | | 3,000 | | | | 3,103,020 | |
North East Texas Regional Mobility Authority; | | | | | | | | | | | | | | | | |
Series 2016 A, Sr. Lien RB | | | 5.00% | | | | 01/01/2041 | | | | 6,750 | | | | 7,336,440 | |
Series 2016, Sr. Lien RB | | | 5.00% | | | | 01/01/2036 | | | | 3,400 | | | | 3,747,480 | |
North Texas Tollway Authority; | | | | | | | | | | | | | | | | |
Series 2005 C, Dallas North Tollway System RB | | | 5.38% | | | | 01/01/2021 | | | | 185 | | | | 185,498 | |
Series 2008 D, Ref. First Tier System CAB RB(INS-AGC)(b)(h) | | | 0.00% | | | | 01/01/2028 | | | | 12,800 | | | | 10,077,952 | |
Series 2008 D, Ref. First Tier System CAB RB(INS-AGC)(b)(h) | | | 0.00% | | | | 01/01/2029 | | | | 2,165 | | | | 1,640,962 | |
Series 2008 D, Ref. First Tier System CAB RB(INS-AGC)(b)(h) | | | 0.00% | | | | 01/01/2031 | | | | 4,710 | | | | 3,287,015 | |
Series 2011, Ref. First Tier System RB | | | 5.00% | | | | 01/01/2038 | | | | 1,000 | | | | 1,048,470 | |
Pflugerville (City of); | | | | | | | | | | | | | | | | |
Series 2009, Limited Tax GO Bonds(c)(d) | | | 5.30% | | | | 08/01/2019 | | | | 860 | | | | 873,098 | |
Series 2009, Limited Tax GO Ctfs.(c)(d) | | | 5.38% | | | | 08/01/2019 | | | | 755 | | | | 766,725 | |
Port Beaumont Navigation District (Jefferson Energy Companies); Series 2016, Dock & Wharf Facility RB(d)(g)(i) | | | 7.25% | | | | 02/13/2020 | | | | 4,000 | | | | 4,123,720 | |
Pottsboro Higher Education Funance Corp. (Imagine International Academy of North Texas, LLC); | | | | | | | | | | | | | | | | |
Series 2016 A, Education RB | | | 5.00% | | | | 08/15/2046 | | | | 3,000 | | | | 2,929,860 | |
Red River Health Facilities Development Corp. (MRC Crossing);
Series 2014 A, Retirement Facility RB | | | 6.75% | | | | 11/15/2024 | | | | 850 | | | | 950,989 | |
Rowlett (City of) (Bayside Public Improvement District North Improvement Area); | | | | | | | | | | | | | | | | |
Series 2016, Special Assessment RB | | | 5.38% | | | | 09/15/2030 | | | | 400 | | | | 382,280 | |
Series 2016, Special Assessment RB | | | 5.75% | | | | 09/15/2036 | | | | 160 | | | | 151,386 | |
See accompanying Notes to Financial Statements which are an integral part of the financial statements.
31 Invesco Municipal Income Fund
| | | | | | | | | | | | | | | | |
| | | Interest
Rate | | | Maturity
Date | | | Principal
Amount
(000) | | | Value | |
Texas–(continued) | | | | | | | | | | | | | | | | |
Sachse (City of); Series 2009, Ref. & Improvement Limited Tax GO Bonds(INS-AGC)(b) | | | 5.25% | | | | 02/15/2031 | | | $ | 5 | | | $ | 5,013 | |
San Jacinto River Authority (Groundwater Reduction Plan Division); | | | | | | | | | | | | | | | | |
Series 2011, Special Project RB(INS-AGM)(b) | | | 5.00% | | | | 10/01/2032 | | | | 1,250 | | | | 1,271,463 | |
Series 2011, Special Project RB(INS-AGM)(b) | | | 5.00% | | | | 10/01/2037 | | | | 1,000 | | | | 1,016,240 | |
Tarrant County Cultural Education Facilities Finance Corp. (Air Force Village Obligated Group); Series 2009, Retirement Facility RB(c)(d) | | | 6.13% | | | | 11/15/2019 | | | | 2,000 | | | | 2,061,440 | |
Tarrant County Cultural Education Facilities Finance Corp. (Buckingham Senior Living Community, Inc.); Series 2007, Retirement Facility RB | | | 5.75% | | | | 11/15/2037 | | | | 345 | | | | 272,550 | |
Tarrant County Cultural Education Facilities Finance Corp. (C.C. Young Memorial Home);
Series 2007, Retirement Facility RB | | | 5.75% | | | | 02/15/2025 | | | | 1,735 | | | | 1,736,683 | |
Series 2007, Retirement Facility RB | | | 5.75% | | | | 02/15/2029 | | | | 1,500 | | | | 1,500,945 | |
Series 2017A, Retirement Facility RB | | | 6.38% | | | | 02/15/2052 | | | | 5,000 | | | | 5,288,300 | |
Texas (State of) Transportation Commission; | | | | | | | | | | | | | | | | |
Series 2019, First Tier Toll CAB RB(h) | | | 0.00% | | | | 08/01/2045 | | | | 4,000 | | | | 1,115,400 | |
Series 2019, First Tier Toll CAB RB(h) | | | 0.00% | | | | 08/01/2046 | | | | 3,180 | | | | 842,255 | |
Texas (State of) Transportation Commission (Central Texas Turnpike System); | | | | | | | | | | | | | | | | |
Series 2015 B, Ref. CAB RB(h) | | | 0.00% | | | | 08/15/2036 | | | | 7,670 | | | | 3,749,173 | |
Series 2015 B, Ref. CAB RB(h) | | | 0.00% | | | | 08/15/2037 | | | | 9,995 | | | | 4,655,071 | |
Texas (State of) Turnpike Authority (Central Texas Turnpike System); | | | | | | | | | | | | | | | | |
Series 2002 A, First Tier CAB RB(INS-BHAC)(b)(h) | | | 0.00% | | | | 08/15/2027 | | | | 970 | | | | 782,538 | |
Series 2002, First Tier CAB RB(c)(h) | | | 0.00% | | | | 08/15/2027 | | | | 30 | | | | 24,668 | |
Texas A&M University System Board of Regents; Series 2009 A, Financing System RB(c)(d) | | | 5.00% | | | | 05/15/2019 | | | | 1,610 | | | | 1,621,045 | |
Texas Municipal Gas Acquisition & Supply Corp. I; Series 2008 D, Sr. Lien Gas Supply RB | | | 6.25% | | | | 12/15/2026 | | | | 4,170 | | | | 4,823,898 | |
Texas Municipal Gas Acquisition & Supply Corp. III; | | | | | | | | | | | | | | | | |
Series 2012, Gas Supply RB | | | 5.00% | | | | 12/15/2023 | | | | 2,000 | | | | 2,199,820 | |
Series 2012, Gas Supply RB | | | 5.00% | | | | 12/15/2028 | | | | 6,310 | | | | 6,850,262 | |
Series 2012, Gas Supply RB | | | 5.00% | | | | 12/15/2031 | | | | 1,875 | | | | 2,013,919 | |
Series 2012, Gas Supply RB | | | 5.00% | | | | 12/15/2032 | | | | 3,865 | | | | 4,139,647 | |
Texas Private Activity Bond Surface Transportation Corp. (Blueridge Transportation Group, LLC SH 288 Toll Lanes); Series 2016,
Sr. Lien RB(i) | | | 5.00% | | | | 12/31/2045 | | | | 7,550 | | | | 8,052,377 | |
Texas Private Activity Bond Surface Transportation Corp. (NTE Mobility Partners LLC North Tarrant Express Management Lanes); Series 2009, Sr. Lien RB | | | 6.88% | | | | 12/31/2039 | | | | 5,460 | | | | 5,667,808 | |
Texas Private Activity Bond Surface Transportation Corp. (NTE Mobility Partners LLC); Series 2013, Sr. Lien RB(i) | | | 7.00% | | | | 12/31/2038 | | | | 3,475 | | | | 4,020,227 | |
Tyler Health Facilities Development Corp. (Mother Frances Hospital Regional Health Care Center); | | | | | | | | | | | | | | | | |
Series 2011, Hospital RB(c)(d) | | | 5.13% | | | | 07/01/2021 | | | | 1,655 | | | | 1,779,704 | |
Series 2011, Hospital RB(c)(d) | | | 5.25% | | | | 07/01/2021 | | | | 2,000 | | | | 2,156,380 | |
Ysleta Independent School District Public Facility Corp.; Series 2001, Ref. Lease RB(INS-AMBAC)(b) | | | 5.38% | | | | 11/15/2024 | | | | 1,300 | | | | 1,309,295 | |
| | | | | | | | | | | | | | | | 259,878,567 | |
| | | | |
Utah–0.60% | | | | | | | | | | | | | | | | |
| | | | |
Salt Lake City Corp Airport Revenue; Series 2017 A, Airport RB(e)(i) | | | 5.00% | | | | 07/01/2042 | | | | 14,000 | | | | 15,580,180 | |
Utah (State of) Charter School Finance Authority (Summit Academy); Series 2007 A, Charter School RB | | | 5.80% | | | | 06/15/2038 | | | | 1,085 | | | | 1,086,736 | |
| | | | | | | | | | | | | | | | 16,666,916 | |
| | | | |
Vermont–0.09% | | | | | | | | | | | | | | | | |
| | | | |
University of Vermont & State Agricultural College; Series 2009, RB | | | 5.13% | | | | 10/01/2039 | | | | 1,275 | | | | 1,296,981 | |
Vermont (State of) Economic Development Authority (Central Vermont Public Service Corp.); | | | | | | | | | | | | | | | | |
Series 2010, Recovery Zone Facility Bonds | | | 5.00% | | | | 12/15/2020 | | | | 1,250 | | | | 1,305,825 | |
| | | | | | | | | | | | | | | | 2,602,806 | |
See accompanying Notes to Financial Statements which are an integral part of the financial statements.
32 Invesco Municipal Income Fund
| | | | | | | | | | | | | | | | |
| | | Interest
Rate | | | Maturity
Date | | | Principal
Amount
(000) | | | Value | |
| | | | |
Virgin Islands–0.32% | | | | | | | | | | | | | | | | |
| | | | |
Virgin Islands (Government of) Public Finance Authority (Matching Fund Loan Note); | | | | | | | | | | | | | | | | |
Series 2009 B, Ref. Sr. Lien RB | | | 5.00% | | | | 10/01/2025 | | | $ | 5,500 | | | $ | 5,390,000 | |
Series 2010 A, Sr. Lien RB | | | 5.00% | | | | 10/01/2025 | | | | 850 | | | | 833,000 | |
Series 2010 A, Sr. Lien RB | | | 5.00% | | | | 10/01/2029 | | | | 2,750 | | | | 2,674,375 | |
| | | | | | | | | | | | | | | | 8,897,375 | |
| | | | |
Virginia–1.53% | | | | | | | | | | | | | | | | |
| | | | |
Ballston Quarter Communities Development Authority; Series 2016 A, Tax Allocation RB | | | 5.50% | | | | 03/01/2046 | | | | 2,500 | | | | 2,583,175 | |
Hanover (County of) Economic Development Authority (Covenant Woods); | | | | | | | | | | | | | | | | |
Series 2018, Ref. Care Facility RB | | | 5.00% | | | | 07/01/2048 | | | | 700 | | | | 731,451 | |
Series 2018, Ref. Care Facility RB | | | 5.00% | | | | 07/01/2051 | | | | 1,000 | | | | 1,042,800 | |
Tobacco Settlement Financing Corp.; Series 2007B-2, Sr. Tobacco Settlement Conv. CAB RB(k) | | | 5.20% | | | | 06/01/2046 | | | | 4,000 | | | | 3,970,840 | |
Virginia (State of) College Building Authority (Marymount University); Series 2015 A, Ref. Educational Facilities RB(g) | | | 5.00% | | | | 07/01/2045 | | | | 1,000 | | | | 1,028,860 | |
Virginia (State of) Small Business Financing Authority (95 Express Lanes, LLC); Series 2017, Sr. Lien RB(i) | | | 5.00% | | | | 07/01/2034 | | | | 5,000 | | | | 5,250,700 | |
Virginia (State of) Small Business Financing Authority (Elizabeth River Crossings Opco, LLC); | | | | | | | | | | | | | | | | |
Series 2012, Sr. Lien RB(i) | | | 5.00% | | | | 07/01/2027 | | | | 4,465 | | | | 4,743,973 | |
Series 2012, Sr. Lien RB(i) | | | 5.50% | | | | 01/01/2042 | | | | 4,920 | | | | 5,256,381 | |
Virginia (State of) Small Business Financing Authority (Express Lanes, LLC); | | | | | | | | | | | | | | | | |
Series 2012, Sr. Lien RB(i) | | | 5.00% | | | | 07/01/2034 | | | | 6,735 | | | | 7,072,693 | |
Series 2012, Sr. Lien RB(i) | | | 5.00% | | | | 01/01/2040 | | | | 2,535 | | | | 2,648,137 | |
Virginia (State of) Small Business Financing Authority (Transform 66P3); Series 2017, Sr. Lien Private Activity RB(i) | | | 5.00% | | | | 12/31/2052 | | | | 7,500 | | | | 8,075,550 | |
| | | | | | | | | | | | | | | | 42,404,560 | |
| | | | |
Washington–2.94% | | | | | | | | | | | | | | | | |
| | | | |
FYI Properties (Washington State District); Series 2009, Lease RB | | | 5.50% | | | | 06/01/2039 | | | | 1,000 | | | | 1,009,480 | |
Seattle (City of); Series 2008, Ref. & Improvement Municipal Light & Power RB(c)(d) | | | 5.75% | | | | 04/01/2019 | | | | 2,000 | | | | 2,006,380 | |
Seattle (Port of); Series 2018 A, RB(e)(i) | | | 5.00% | | | | 05/01/2043 | | | | 21,000 | | | | 23,216,130 | |
Washington (State of); Series 2010 B, Motor Vehicle Fuel Unlimited Tax GO
Bonds(e) | | | 5.00% | | | | 08/01/2030 | | | | 21,500 | | | | 21,802,935 | |
Washington (State of) Convention Center Public Facilities District; Series 2018,
RB(e) | | | 5.00% | | | | 07/01/2048 | | | | 15,000 | | | | 16,768,350 | |
Washington (State of) Health Care Facilities Authority (Fred Hutchinson Cancer Research Center); | | | | | | | | | | | | | | | | |
Series 2011, RB | | | 6.00% | | | | 01/01/2031 | | | | 1,500 | | | | 1,592,430 | |
Series 2011, RB | | | 5.63% | | | | 01/01/2035 | | | | 1,250 | | | | 1,314,363 | |
Washington (State of) Health Care Facilities Authority (MultiCare Health System);
Series 2008 B, RB(c)(d) | | | 6.00% | | | | 08/15/2019 | | | | 2,000 | | | | 2,038,400 | |
Washington (State of) Higher Education Facilities Authority (Whitworth University); | | | | | | | | | | | | | | | | |
Series 2009, Ref. RB(c)(d) | | | 5.38% | | | | 10/01/2019 | | | | 500 | | | | 510,520 | |
Series 2009, Ref. RB(c)(d) | | | 5.63% | | | | 10/01/2019 | | | | 1,500 | | | | 1,533,705 | |
Washington (State of) Housing Finance Commission (Bayview Manor Senior); Series 2016 A, Ref. RB(g) | | | 5.00% | | | | 07/01/2046 | | | | 2,500 | | | | 2,545,850 | |
Washington (State of) Housing Finance Commission (Heron’s Key Senior Living); | | | | | | | | | | | | | | | | |
Series 2015 A, RB(g) | | | 6.50% | | | | 07/01/2030 | | | | 800 | | | | 855,816 | |
Series 2015 A, RB(g) | | | 6.75% | | | | 07/01/2035 | | | | 820 | | | | 874,054 | |
Washington (State of) Housing Finance Commission (Presbyterian Retirement Communities Northwest); Series 2016, Ref. RB(g) | | | 5.00% | | | | 01/01/2036 | | | | 1,875 | | | | 1,993,331 | |
Washington (State of) Housing Finance Commission (The Hearthstone); | | | | | | | | | | | | | | | | |
Series 2018 A, Ref.Non-Profit RB(g) | | | 5.00% | | | | 07/01/2048 | | | | 2,000 | | | | 2,023,660 | |
Series 2018 A, Ref.Non-Profit RB(g) | | | 5.00% | | | | 07/01/2053 | | | | 1,500 | | | | 1,513,260 | |
| | | | | | | | | | | | | | | | 81,598,664 | |
| | | | |
West Virginia–0.28% | | | | | | | | | | | | | | | | |
| | | | |
Monongalia (County of) Commission Special District (University Town Centre Economic Opportunity Development District); Series 2017 A, Ref. Excise Tax & Improvement RB(g) | | | 5.50% | | | | 06/01/2037 | | | | 2,500 | | | | 2,563,000 | |
See accompanying Notes to Financial Statements which are an integral part of the financial statements.
33 Invesco Municipal Income Fund
| | | | | | | | | | | | | | | | |
| | | Interest
Rate | | | Maturity
Date | | | Principal
Amount
(000) | | | Value | |
West Virginia–(continued) | | | | | | | | | | | | | | | | |
West Virginia (State of) Economic Development Authority (Entsorga West Virginia LLC); | | | | | | | | | | | | | | | | |
Series 2016, Solid Waste Disposal Facilities RB(g)(i) | | | 6.75% | | | | 02/01/2026 | | | $ | 4,035 | | | $ | 3,892,645 | |
Series 2018, Solid Waste Disposal Facilities RB(g)(i) | | | 8.75% | | | | 02/01/2036 | | | | 1,300 | | | | 1,308,307 | |
| | | | | | | | | | | | 7,763,952 | |
| | | | |
Wisconsin–3.51% | | | | | | | | | | | | | | | | |
Public Finance Authority (American Dream at Meadowlands); Series 2017, Limited Obligation Grant RB(g) | | | 6.75% | | | | 08/01/2031 | | | | 3,000 | | | | 3,268,890 | |
Public Finance Authority (KU Campus Development Corporation – Central District Development Project); Series 2016, Lease Development RB(e) | | | 5.00% | | | | 03/01/2041 | | | | 10,000 | | | | 11,047,300 | |
Public Finance Authority (WhiteStone); Series 2017, Ref. Retirement Facility RB(g) | | | 5.00% | | | | 03/01/2052 | | | | 1,075 | | | | 1,122,472 | |
Superior (City of) (Superior Water, Light & Power Co.); Series 2007 A, Ref. Collateralized Utility RB(i) | | | 5.38% | | | | 11/01/2021 | | | | 2,000 | | | | 2,005,480 | |
Wisconsin (State of); | | | | | | | | | | | | | | | | |
Series 2009 A, General Fund Annual Appropriation RB(c)(d) | | | 5.38% | | | | 05/01/2019 | | | | 225 | | | | 226,379 | |
Series 2009 A, General Fund Annual Appropriation RB(c)(d) | | | 5.63% | | | | 05/01/2019 | | | | 475 | | | | 478,097 | |
Series 2009 A, General Fund Annual Appropriation RB | | | 5.38% | | | | 05/01/2025 | | | | 2,130 | | | | 2,142,695 | |
Series 2009 A, General Fund Annual Appropriation RB | | | 5.63% | | | | 05/01/2028 | | | | 4,525 | | | | 4,554,141 | |
Wisconsin (State of) Health & Educational Facilities Authority (American Baptist Homes of the Midwest Obligated Group); Series 2017, Ref. RB | | | 5.00% | | | | 08/01/2039 | | | | 3,500 | | | | 3,530,940 | |
Wisconsin (State of) Health & Educational Facilities Authority (Catholic Residential Services);
Series 2007, Ref. RB | | | 5.25% | | | | 05/01/2028 | | | | 1,250 | | | | 1,168,263 | |
Wisconsin (State of) Health & Educational Facilities Authority (Essentia Health Obligated Group); Series 2008 B, Health Care Facilities RB(INS-AGC)(b) | | | 5.13% | | | | 02/15/2030 | | | | 1,500 | | | | 1,539,600 | |
Wisconsin (State of) Health & Educational Facilities Authority (Froedtert & Community Health, Inc. Obligated Group); Series 2009, RB(c)(d) | | | 5.00% | | | | 04/01/2019 | | | | 750 | | | | 751,943 | |
Wisconsin (State of) Health & Educational Facilities Authority (Meriter Hospital, Inc.); | | | | | | | | | | | | | | | | |
Series 2011 A, RB(c)(d) | | | 5.50% | | | | 05/01/2021 | | | | 2,000 | | | | 2,160,340 | |
Series 2011 A, RB(c)(d) | | | 5.75% | | | | 05/01/2021 | | | | 1,000 | | | | 1,085,450 | |
Wisconsin (State of) Health & Educational Facilities Authority (Rogers Memorial Hospital, Inc.); Series 2014, Ref. RB | | | 5.00% | | | | 07/01/2044 | | | | 3,125 | | | | 3,328,719 | |
Wisconsin (State of) Health & Educational Facilities Authority (Saint John’s Communities, Inc.);
Series 2018 A, RB | | | 5.00% | | | | 09/15/2040 | | | | 1,000 | | | | 1,023,560 | |
Series 2018 A, RB | | | 5.00% | | | | 09/15/2045 | | | | 1,000 | | | | 1,020,680 | |
Series 2018 A, RB | | | 5.00% | | | | 09/15/2050 | | | | 4,000 | | | | 4,074,520 | |
Wisconsin (State of) Public Finance Authority (American Dream at Meadowlands); Series 2017, Limited Obligation PILOT RB(g) | | | 7.00% | | | | 12/01/2050 | | | | 7,000 | | | | 7,880,600 | |
Wisconsin (State of) Public Finance Authority (Denver International Aiport Great Hall); Series 2017, RB(i) | | | 5.00% | | | | 09/30/2049 | | | | 4,750 | | | | 5,122,780 | |
Wisconsin (State of) Public Finance Authority (KU Campus Development Corp. Central District Development); Series 2016, Lease Development RB | | | 5.00% | | | | 03/01/2036 | | | | 4,500 | | | | 5,038,695 | |
Wisconsin (State of) Public Finance Authority (Maryland Proton Treatment Center); Series 2018A-1, Sr. RB(g) | | | 6.25% | | | | 01/01/2038 | | | | 5,250 | | | | 5,436,952 | |
Wisconsin (State of) Public Finance Authority (Prime Healthcare Foundation, Inc.);
Series 2018 A, RB | | | 5.20% | | | | 12/01/2037 | | | | 5,000 | | | | 5,360,600 | |
Series 2018 A, RB | | | 5.35% | | | | 12/01/2045 | | | | 4,000 | | | | 4,265,920 | |
Wisconsin (State of) Public Finance Authority (Renown Regional Medical Center);
Series 2016 A, Ref. Hospital RB | | | 5.00% | | | | 06/01/2032 | | | | 2,000 | | | | 2,238,620 | |
Series 2016 A, Ref. Hospital RB | | | 5.00% | | | | 06/01/2034 | | | | 7,180 | | | | 7,948,475 | |
Wisconsin (State of) Public Finance Authority (Roseman University of Health Sciences); Series 2015, Ref. RB | | | 5.75% | | | | 04/01/2035 | | | | 1,955 | | | | 2,092,925 | |
Wisconsin (State of) Public Finance Authority (Wittenberg University); Series 2016, Higher Education Facility RB(g) | | | 5.25% | | | | 12/01/2039 | | | | 7,285 | | | | 7,584,413 | |
| | | | | | | | | | | | | | | | 97,499,449 | |
| | | | |
Wyoming–0.46% | | | | | | | | | | | | | | | | |
Campbell (County of) (Basin Electric Power Cooperative); Series 2009 A, Solid Waste Facilities RB | | | 5.75% | | | | 07/15/2039 | | | | 4,000 | | | | 4,055,600 | |
See accompanying Notes to Financial Statements which are an integral part of the financial statements.
34 Invesco Municipal Income Fund
| | | | | | | | | | | | | | | | |
| | | Interest
Rate | | | Maturity
Date | | | Principal
Amount
(000) | | | Value | |
Wyoming–(continued) | | | | | | | | | | | | | | | | |
West Park Hospital District (West Park Hospital); Series 2011 A, RB | | | 6.50% | | | | 06/01/2031 | | | $ | 1,000 | | | $ | 1,067,690 | |
Wyoming (State of) Municipal Power Agency; Series 2017 A, Ref. Power Supply RB (INS - BAM)(b)(e) | | | 5.00% | | | | 01/01/2047 | | | | 7,000 | | | | 7,728,980 | |
| | | | | | | | | | | | | | | | 12,852,270 | |
TOTAL INVESTMENTS IN SECURITIES(q)–112.69% (Cost $3,013,095,593) | | | | | | | | | | | | | | | 3,126,779,216 | |
FLOATING RATE NOTE OBLIGATIONS–(12.99)% | | | | | | | | | | | | | | | | |
Notes with interest and fee rates ranging from 2.23% to 2.66% at 02/28/2019 and contractual maturities of collateral ranging from 06/15/2021 to 04/01/2057 (See Note 1J)(r) | | | | | | | | | | | | | | | (360,420,000 | ) |
OTHER ASSETS LESS LIABILITIES–0.30% | | | | | | | | | | | | | | | 8,434,955 | |
NET ASSETS –100.00% | | | | | | | | | | | | | | $ | 2,774,794,171 | |
Abbreviations:
| | |
ACA | | - ACA Financial Guaranty Corp. |
AGC | | - Assured Guaranty Corp. |
AGM | | - Assured Guaranty Municipal Corp. |
AMBAC | | - American Municipal Bond Assurance Corp. |
BAM | | - Build America Mutual Assurance Co. |
BHAC | | - Berkshire Hathaway Assurance Corp. |
CAB | | - Capital Appreciation Bonds |
CARS | | - Convertible Auction Rate Security |
CEP | | - Credit Enhancement Provider |
Conv. | | - Convertible |
COP | | - Certificates of Participation |
CPI | | - Consumer Price Index |
Ctfs. | | - Certificates |
FHA | | - Federal Housing Adminstration |
GNMA | | - Government National Mortgage Association |
GO | | - General Obligation |
Gtd. | | - Guaranteed |
IDR | | - Industrial Development Revenue Bonds |
INS | | - Insurer |
Jr. | | - Junior |
LIBOR | | - London Interbank Offered Rate |
LOC | | - Letter of Credit |
MFH | | - Multi-Family Housing |
NATL | | - National Public Finance Guarantee Corp. |
PCR | | - Pollution Control Revenue Bonds |
PILOT | | - Payment-in-Lieu-of-Tax |
RAB | | - Revenue Anticipation Bonds |
RAC | | - Revenue Anticipation Certificates |
RB | | - Revenue Bonds |
Ref. | | - Refunding |
RN | | - Revenue Notes |
Sec. | | - Secured |
SIFMA | | - Securities Industry and Financial Markets Association |
Sr. | | - Senior |
Sub. | | - Subordinated |
Unsec. | | - Unsecured |
USD | | - U.S. Dollar |
VRD | | - Variable Rate Demand |
Wts. | | - Warrants |
See accompanying Notes to Financial Statements which are an integral part of the financial statements.
35 Invesco Municipal Income Fund
Notes to Schedule of Investments:
| (a) | Calculated as a percentage of net assets. Amounts in excess of 100% are due to the Fund’s use of leverage. |
| (b) | Principal and/or interest payments are secured by the bond insurance company listed. |
| (c) | Advance refunded; secured by an escrow fund of U.S. Government obligations or other highly rated collateral. |
| (d) | Security has an irrevocable call by the issuer or mandatory put by the holder. Maturity date reflects such call or put. |
| (e) | Underlying security related to TOB Trusts entered into by the Fund. See Note 1K. |
| (f) | Defaulted security. Currently, the issuer is in default with respect to principal and/or interest payments. The aggregate value of these securities at February 28, 2019 was $1,234,017, which represented less than 1% of the Fund’s Net Assets. |
| (g) | Security purchased or received in a transaction exempt from registration under the Securities Act of 1933, as amended (the “1933 Act”). The security may be resold pursuant to an exemption from registration under the 1933 Act, typically to qualified institutional buyers. The aggregate value of these securities at February 28, 2019 was $198,496,963, which represented 7.15% of the Fund’s Net Assets. |
| (h) | Zero coupon bond issued at a discount. |
| (i) | Security subject to the alternative minimum tax. |
| (j) | Security is subject to a reimbursement agreement which may require the Fund to pay amounts to a counterparty in the event of a significant decline in the market value of the security underlying the TOB Trusts. In case of a shortfall, the maximum potential amount of payments the Fund could ultimately be required to make under the agreement is $48,515,000. However, such shortfall payment would be reduced by the proceeds from the sale of the security underlying the TOB Trusts. |
| (k) | Convertible CAB. The interest rate shown represents the coupon rate at which the bond will accrue at a specified future date. |
| (l) | Demand security payable upon demand by the Fund at specified time intervals no greater than thirteen months. Interest rate is redetermined periodically by the issuer or agent based on current market conditions. Rate shown is the rate in effect on February 28, 2019. |
| (m) | Principal and interest payments are fully enhanced by a letter of credit from the bank listed or a predecessor bank, branch or subsidiary. |
| (n) | Interest or dividend rate is redetermined periodically. Rate shown is the rate in effect on February 28, 2019. |
| (o) | Security subject to crossover refunding. |
| (p) | Current coupon rate for inverse floating rate municipal obligations. This rate resets periodically as the rate on the related security changes. Positions in inverse floating rate municipal obligations have a total value of $306,237, which represented less than 1% of the Fund’s Net Assets. |
| (q) | Entities may either issue, guarantee, back or otherwise enhance the credit quality of a security. The entities are not primarily responsible for the issuer’s obligation but may be called upon to satisfy issuer’s obligations. No concentration of any single entity was greater than 5% each. |
| (r) | Floating rate note obligations related to securities held. The interest and fee rates shown reflect the rates in effect at February 28, 2019. At February 28, 2019, the Fund’s investments with a value of $566,807,179 are held by TOB Trusts and serve as collateral for the $360,420,000 in the floating rate note obligations outstanding at that date. |
| | | | | | | | | | | | | | | | | | | | |
| Open Futures Contracts(a) | |
| | | Number of | | | Expiration | | | Notional | | | | | | Unrealized | |
| Short Futures Contracts | | Contracts | | | Month | | | Value | | | Value | | | Appreciation | |
Interest Rate Risk | | | | | | | | | | | | | | | | | | | | |
U.S. Treasury 10 Year Notes | | | 1,308 | | | | June-2019 | | | | $(159,576,000) | | | | $466,949 | | | | $466,949 | |
| (a) | Futures contracts collateralized by $1,850,000 held with Goldman Sachs & Co. LLC, the futures commission merchant. |
See accompanying Notes to Financial Statements which are an integral part of the financial statements.
36 Invesco Municipal Income Fund
Statement of Assets and Liabilities
February 28, 2019
| | | | |
Assets: | | | | |
Investments in securities, at value (Cost $3,013,095,593) | | $ | 3,126,779,216 | |
Other investments: | | | | |
Variation margin receivable - futures contracts | | | 286,125 | |
Deposits with brokers: | | | | |
Cash collateral - exchange-traded futures contracts | | | 1,850,000 | |
Receivable for: | | | | |
Investments sold | | | 1,864,161 | |
Fund shares sold | | | 3,742,681 | |
Interest | | | 33,972,792 | |
Investment for trustee deferred compensation and retirement plans | | | 359,764 | |
Other assets | | | 68,985 | |
Total assets | | | 3,168,923,724 | |
| |
Liabilities: | | | | |
Floating rate note obligations | | | 360,420,000 | |
Payable for: | | | | |
Investments purchased | | | 13,237,592 | |
Dividends | | | 3,557,351 | |
Fund shares reacquired | | | 2,180,337 | |
Amount due custodian | | | 13,231,149 | |
Accrued fees to affiliates | | | 823,240 | |
Accrued trustees’ and officers’ fees and benefits | | | 8,305 | |
Accrued other operating expenses | | | 225,607 | |
Trustee deferred compensation and retirement plans | | | 445,972 | |
Total liabilities | | | 394,129,553 | |
Net assets applicable to shares outstanding | | $ | 2,774,794,171 | |
| |
Net assets consist of: | | | | |
Shares of beneficial interest | | $ | 2,773,244,496 | |
Distributable earnings | | | 1,549,675 | |
| | | $ | 2,774,794,171 | |
| | | | |
Net Assets: | | | | |
Class A | | $ | 1,982,214,154 | |
Class C | | $ | 133,292,401 | |
Class Y | | $ | 406,923,120 | |
Investor Class | | $ | 99,886,705 | |
Class R6 | | $ | 152,477,791 | |
|
Shares outstanding, no par value, with an unlimited number of shares authorized: | |
| |
Class A | | | 152,256,224 | |
Class C | | | 10,286,569 | |
Class Y | | | 31,262,467 | |
Investor Class | | | 7,665,041 | |
Class R6 | | | 11,713,640 | |
Class A: | | | | |
Net asset value per share | | $ | 13.02 | |
Maximum offering price per share (Net asset value of $13.02 ÷ 95.75%) | | $ | 13.60 | |
Class C: | | | | |
Net asset value and offering price per share | | $ | 12.96 | |
Class Y: | | | | |
Net asset value and offering price per share | | $ | 13.02 | |
Investor Class: | | | | |
Net asset value and offering price per share | | $ | 13.03 | |
Class R6: | | | | |
Net asset value and offering price per share | | $ | 13.02 | |
See accompanying Notes to Financial Statements which are an integral part of the financial statements.
37 Invesco Municipal Income Fund
Statement of Operations
For the year ended February 28, 2019
| | | | |
Investment income: | |
| |
Interest | | $ | 137,122,642 | |
| |
Expenses: | | | | |
| |
Advisory fees | | | 12,945,991 | |
Administrative services fees | | | 515,671 | |
Custodian fees | | | 46,256 | |
Distribution fees: | | | | |
Class A | | | 4,784,115 | |
Class C | | | 2,285,851 | |
Investor Class | | | 130,497 | |
Interest, facilities and maintenance fees | | | 4,460,002 | |
Transfer agent fees – A, C, Y and Investor | | | 2,197,884 | |
Transfer agent fees – R6 | | | 19,488 | |
Trustees’ and officers’ fees and benefits | | | 54,630 | |
Registration and filing fees | | | 192,529 | |
Reports to shareholders | | | 205,810 | |
Professional services fees | | | 121,767 | |
Taxes | | | 318,182 | |
Other | | | 172,667 | |
Total expenses | | | 28,451,340 | |
Less: Expense offset arrangement(s) | | | (7,165 | ) |
Net expenses | | | 28,444,175 | |
Net investment income | | | 108,678,467 | |
| |
Realized and unrealized gain (loss) from: | | | | |
| |
Net realized gain (loss) from: | | | | |
Investment securities (includes net gains (losses) from securities sold to affiliates of $(425,043)) | | | (9,582,888 | ) |
Futures contracts | | | (3,362,623 | ) |
| | | | (12,945,511 | ) |
Change in net unrealized appreciation (depreciation) of: | | | | |
Investment securities | | | (19,479,719 | ) |
Futures contracts | | | 466,949 | |
| | | | (19,012,770 | ) |
Net realized and unrealized gain (loss) | | | (31,958,281 | ) |
Net increase in net assets resulting from operations | | $ | 76,720,186 | |
See accompanying Notes to Financial Statements which are an integral part of the financial statements.
38 Invesco Municipal Income Fund
Statement of Changes in Net Assets
For the years ended February 28, 2019 and 2018
| | | | | | | | |
| | | 2019 | | | 2018 | |
Operations: | | | | | | | | |
| | |
Net investment income | | $ | 108,678,467 | | | $ | 113,405,960 | |
Net realized gain (loss) | | | (12,945,511 | ) | | | (4,995,559 | ) |
Change in net unrealized appreciation (depreciation) | | | (19,012,770 | ) | | | (11,621,085 | ) |
Net increase in net assets resulting from operations | | | 76,720,186 | | | | 96,789,316 | |
| | |
Distributions to shareholders from distributable earnings(1) : | | | | | | | | |
| | |
Class A | | | (77,364,929 | ) | | | (71,836,794 | ) |
Class B | | | – | | | | (110,613 | ) |
Class C | | | (7,492,837 | ) | | | (7,271,646 | ) |
Class Y | | | (18,467,349 | ) | | | (22,275,513 | ) |
Investor Class | | | (4,218,855 | ) | | | (4,100,245 | ) |
Class R6 | | | (6,411,966 | ) | | | (610,050 | ) |
Total distributions to shareholders from distributable earnings | | | (113,955,936 | ) | | | (106,204,861 | ) |
| | |
Share transactions–net: | | | | | | | | |
| | |
Class A | | | 71,379,669 | | | | 13,329,133 | |
Class B | | | – | | | | (6,474,856 | ) |
Class C | | | (110,909,622 | ) | | | (1,984,355 | ) |
Class Y | | | (29,817,647 | ) | | | (81,220,069 | ) |
Investor Class | | | (3,978,961 | ) | | | (3,044,329 | ) |
Class R6 | | | 13,133,390 | | | | 143,209,493 | |
Net increase (decrease) in net assets resulting from share transactions | | | (60,193,171 | ) | | | 63,815,017 | |
Net increase (decrease) in net assets | | | (97,428,921 | ) | | | 54,399,472 | |
| | |
Net assets: | | | | | | | | |
| | |
Beginning of year | | | 2,872,223,092 | | | | 2,817,823,620 | |
End of year | | $ | 2,774,794,171 | | | $ | 2,872,223,092 | |
| (1) | The Securities and Exchange Commission eliminated the requirement to disclose distribution components separately, except for tax return of capital. For the year ended February 28, 2018, distributions to shareholders from distributable earnings consisted of distributions from net investment income. |
See accompanying Notes to Financial Statements which are an integral part of the financial statements.
39 Invesco Municipal Income Fund
Statement of Cash Flows
For the year ended February 28, 2019
| | | | |
Cash provided by operating activities: | | | | |
Net increase in net assets resulting from operations | | $ | 76,720,186 | |
| |
Adjustments to reconcile the change in net assets from operations to net cash provided by operating activities: | | | | |
Purchases of investments | | | (830,084,833 | ) |
Proceeds from sales of investments | | | 872,183,271 | |
Purchases of short-term investments, net | | | (58,916,841 | ) |
Amortization of premium on investment securities | | | 15,017,125 | |
Accretion of discount on investment securities | | | (9,033,347 | ) |
Decrease in receivables and other assets | | | 1,239,728 | |
Decrease in accrued expenses and other payables | | | (100,110 | ) |
Increase in variation margin receivable - futures contracts | | | (286,125 | ) |
Net realized loss from investment securities | | | 9,582,888 | |
Net change in unrealized depreciation on investment securities | | | 19,479,719 | |
Increase in cash collateral - exchange-traded futures contracts | | | (1,850,000 | ) |
Net cash provided by operating activities | | | 93,951,661 | |
| |
Cash provided by (used in) financing activities: | | | | |
Dividends paid to shareholders from distributable earnings | | | (38,187,718 | ) |
Increase in payable for amount due custodian | | | 13,231,149 | |
Proceeds from shares of beneficial interest sold | | | 600,410,407 | |
Proceeds of TOB Trusts | | | 133,390,000 | |
Repayments of TOB Trusts | | | (68,040,000 | ) |
Disbursements from shares of beneficial interest reacquired | | | (738,503,378 | ) |
Net cash provided by (used in) financing activities | | | (97,699,540 | ) |
Net decrease in cash and cash equivalents | | | (3,747,879 | ) |
Cash and cash equivalents at beginning of period | | | 3,747,879 | |
Cash and cash equivalents at end of period | | $ | – | |
| |
Non-cash financing activities: | | | | |
| |
Value of shares of beneficial interest issued in reinvestment of dividends paid to shareholders | | $ | 75,728,263 | |
| |
Supplemental disclosure of cash flow information: | | | | |
Cash paid during the period for interest, facilities and maintenance fees | | $ | 4,460,002 | |
See accompanying Notes to Financial Statements which are an integral part of the financial statements.
40 Invesco Municipal Income Fund
Notes to Financial Statements
February 28, 2019
NOTE 1–Significant Accounting Policies
Invesco Municipal Income Fund (the “Fund”) is a series portfolio of AIMTax-Exempt Funds (InvescoTax-Exempt Funds) (the “Trust”). The Trust is a Delaware statutory trust registered under the Investment Company Act of 1940, as amended (the “1940 Act”), as anopen-end series management investment company authorized to issue an unlimited number of shares of beneficial interest. Information presented in these financial statements pertains only to the Fund. Matters affecting the Fund or each class will be voted on exclusively by the shareholders of the Fund or each class.
The Fund’s investment objective is to provide investors with a high level of current income exempt from federal income tax, consistent with preservation of capital.
The Fund currently consists of five different classes of shares: Class A, Class C, Class Y, Investor Class and Class R6. Class Y and Investor Class shares are available only to certain investors. Class A shares are sold with afront-end sales charge unless certain waiver criteria are met. Under certain circumstances, load waived shares may be subject to contingent deferred sales charges (“CDSC”). Class C shares are sold with a CDSC. Class Y, Investor Class and Class R6 shares are sold at net asset value.
The Fund is an investment company and accordingly follows the investment company accounting and reporting guidance in accordance with Financial Accounting Standards Board Accounting Standards Codification Topic 946,Financial Services – Investment Companies.
The following is a summary of the significant accounting policies followed by the Fund in the preparation of its financial statements.
| A. | Security Valuations – Securities, including restricted securities, are valued according to the following policy. |
Securities are fair valued using an evaluated quote provided by an independent pricing service approved by the Board of Trustees. Evaluated quotes provided by the pricing service may be determined without exclusive reliance on quoted prices, and may reflect appropriate factors such asinstitution-size trading in similar groups of securities, developments related to specific securities, dividend rate (for unlisted equities), yield (for debt obligations), quality, type of issue, coupon rate (for debt obligations), maturity (for debt obligations), individual trading characteristics and other market data. Pricing services generally value debt obligations assuming orderly transactions of institutional round lot size, but a fund may hold or transact in the same securities in smaller, odd lot sizes. Odd lots often trade at lower prices than institutional round lots. Debt obligations are subject to interest rate and credit risks. In addition, all debt obligations involve some risk of default with respect to interest and/or principal payments.
A security listed or traded on an exchange (except convertible securities) is valued at its last sales price or official closing price as of the close of the customary trading session on the exchange where the security is principally traded, or lacking any sales or official closing price on a particular day, the security may be valued at the closing bid price on that day. Securities traded in theover-the-counter market are valued based on prices furnished by independent pricing services or market makers. When such securities are valued by an independent pricing service they may be considered fair valued. Futures contracts are valued at the final settlement price set by an exchange on which they are principally traded. Listed options are valued at the mean between the last bid and asked prices from the exchange on which they are principally traded. Options not listed on an exchange are valued by an independent source at the mean between the last bid and asked prices. For purposes of determining net asset value (“NAV”) per share, futures and option contracts generally are valued 15 minutes after the close of the customary trading session of the New York Stock Exchange (“NYSE”).
Securities for which market quotations either are not readily available or became unreliable are valued at fair value as determined in good faith by or under the supervision of the Trust’s officers following procedures approved by the Board of Trustees. Some of the factors which may be considered in determining fair value are fundamental analytical data relating to the investment; the nature and duration of any restrictions on transferability or disposition; trading in similar securities by the same issuer or comparable companies; relevant political, economic or issuer specific news; and other relevant factors under the circumstances.
The Fund may invest in securities that are subject to interest rate risk, meaning the risk that the prices will generally fall as interest rates rise and, conversely, the prices will generally rise as interest rates fall. Specific securities differ in their sensitivity to changes in interest rates depending on their individual characteristics. Changes in interest rates may result in increased market volatility, which may affect the value and/or liquidity of certain Fund investments.
Valuations change in response to many factors including the historical and prospective earnings of the issuer, the value of the issuer’s assets, general economic conditions, interest rates, investor perceptions and market liquidity. Because of the inherent uncertainties of valuation, the values reflected in the financial statements may materially differ from the value received upon actual sale of those investments.
| B. | Securities Transactions and Investment Income– Securities transactions are accounted for on a trade date basis. Realized gains orlosses on sales are computed on the basis of specific identification of the securities sold. Interest income (net of withholding tax, if any) is recorded on the accrual basis from settlement date. Bond premiums and discounts are amortized and/or accreted over the lives of the respective securities.Pay-in-kind interest income andnon-cash dividend income received in the form of securitiesin-lieu of cash are recorded at the fair value of the securities received. Dividend income (net of withholding tax, if any) is recorded on theex-dividend date. |
The Fund may periodically participate in litigation related to Fund investments. As such, the Fund may receive proceeds from litigation settlements. Any proceeds received are included in the Statement of Operations as realized gain (loss) for investments no longer held and as unrealized gain (loss) for investments still held.
Brokerage commissions and mark ups are considered transaction costs and are recorded as an increase to the cost basis of securities purchased and/or a reduction of proceeds on a sale of securities. Such transaction costs are included in the determination of net realized and unrealized gain (loss) from investment securities reported in the Statement of Operations and the Statement of Changes in Net Assets and the net realized and unrealized gains (losses) on securities per share in the Financial Highlights. Transaction costs are included in the calculation of the Fund’s net asset value and, accordingly, they reduce the Fund’s total returns. These transaction costs are not considered operating expenses and are not reflected in net investment income reported in the Statement of Operations and the Statement of Changes in Net Assets, or the net investment income per share and the ratios of expenses and net investment income reported in the Financial Highlights, nor are they limited by any expense limitation arrangements between the Fund and the investment adviser.
41 Invesco Municipal Income Fund
The Fund allocates realized and unrealized capital gains and losses to a class based on the relative net assets of each class. The Fund allocates income to a class based on the relative value of the settled shares of each class.
| C. | Country Determination– For the purposes of making investment selection decisions and presentation in the Schedule of Investments, theinvestment adviser may determine the country in which an issuer is located and/or credit risk exposure based on various factors. These factors include the laws of the country under which the issuer is organized, where the issuer maintains a principal office, the country in which the issuer derives 50% or more of its total revenues and the country that has the primary market for the issuer’s securities, as well as other criteria. Among the other criteria that may be evaluated for making this determination are the country in which the issuer maintains 50% or more of its assets, the type of security, financial guarantees and enhancements, the nature of the collateral and the sponsor organization. Country of issuer and/or credit risk exposure has been determined to be the United States of America, unless otherwise noted. |
| D. | Distributions– Distributions from net investment income, if any, are declared daily and paid monthly. Distributions from net realized capitalgain, if any, are generally declared and paid annually and recorded on theex-dividend date. The Fund may elect to treat a portion of the proceeds from redemptions as distributions for federal income tax purposes. |
| E. | Federal Income Taxes– The Fund intends to comply with the requirements of Subchapter M of the Internal Revenue Code of 1986, asamended (the “Internal Revenue Code”), necessary to qualify as a regulated investment company and to distribute substantially all of the Fund’s taxable andtax-exempt earnings to shareholders. As such, the Fund will not be subject to federal income taxes on otherwise taxable income (including net realized capital gain) that is distributed to shareholders. Therefore, no provision for federal income taxes is recorded in the financial statements. |
The Fund recognizes the tax benefits of uncertain tax positions only when the position is more likely than not to be sustained. Management has analyzed the Fund’s uncertain tax positions and concluded that no liability for unrecognized tax benefits should be recorded related to uncertain tax positions. Management is not aware of any tax positions for which it is reasonably possible that the total amounts of unrecognized tax benefits will change materially in the next 12 months.
In addition, the Fund intends to invest in such municipal securities to allow it to qualify to pay shareholders “exempt-interest dividends”, as defined in the Internal Revenue Code.
The Fund files tax returns in the U.S. Federal jurisdiction and certain other jurisdictions. Generally, the Fund is subject to examinations by such taxing authorities for up to three years after the filing of the return for the tax period.
| F. | Expenses– Fees provided for under the Rule12b-1 plan of a particular class of the Fund are charged to the operations of such class. Transferagency fees and expenses and other shareholder recordkeeping fees and expenses attributable to Class R6 are charged to such class. Transfer agency fees and expenses and other shareholder recordkeeping fees and expenses relating to all other classes are allocated among those classes based on relative net assets. All other expenses are allocated among the classes based on relative net assets. |
| G. | Interest, Facilities and Maintenance Fees– Interest, Facilities and Maintenance Fees include interest and related borrowing costs suchas commitment fees and other expenses associated with lines of credit and interest and administrative expenses related to establishing and maintaining floating rate note obligations, if any. |
| H. | Accounting Estimates –The preparation of financial statements in conformity with accounting principles generally accepted in theUnited States of America (“GAAP”) requires management to make estimates and assumptions that affect the reported amounts of assets and liabilities at the date of the financial statements and the reported amounts of revenues and expenses during the reporting period including estimates and assumptions related to taxation. Actual results could differ from those estimates by a significant amount. In addition, the Fund monitors for material events or transactions that may occur or become known after theperiod-end date and before the date the financial statements are released to print. |
| I. | Indemnifications– Under the Trust’s organizational documents, each Trustee, officer, employee or other agent of the Fund is indemnifiedagainst certain liabilities that may arise out of the performance of their duties to the Fund. Additionally, in the normal course of business, the Fund enters into contracts, including the Fund’s servicing agreements, that contain a variety of indemnification clauses. The Fund’s maximum exposure under these arrangements is unknown as this would involve future claims that may be made against the Fund that have not yet occurred. The risk of material loss as a result of such indemnification claims is considered remote. |
| J. | Cash and Cash Equivalents –For the purposes of the Statement of Cash Flows, the Fund defines Cash and Cash Equivalents as cash(including foreign currency), money market funds and other investments held in lieu of cash and excludes investments made with cash collateral received. |
| K. | Floating Rate Note Obligations– The Fund invests in inverse floating rate securities, such as Tender Option Bonds (“TOBs”), for investmentpurposes and to enhance the yield of the Fund. Such securities may be purchased in the secondary market without first owning an underlying bond but generally are created through the sale of fixed rate bonds by the Fund to special purpose trusts established by a broker dealer or by the Fund (“TOB Trusts”) in exchange for cash and residual interests in the TOB Trusts’ assets and cash flows, which are in the form of inverse floating rate securities. The TOB Trusts finance the purchases of the fixed rate bonds by issuing floating rate notes to third parties and allowing the Fund to retain residual interests in the bonds. The floating rate notes issued by the TOB Trusts have interest rates that reset weekly and the floating rate note holders have the option to tender their notes to the TOB Trusts for redemption at par at each reset date. The residual interests held by the Fund (inverse floating rate securities) include the right of the Fund (1) to cause the holders of the floating rate notes to tender their notes at par at the next interest rate reset date, and (2) to transfer the municipal bond from the TOB Trust to the Fund, thereby collapsing the TOB Trust. Inverse floating rate securities tend to underperform the market for fixed rate bonds in a rising interest rate environment, but tend to outperform the market for fixed rate bonds when interest rates decline or remain relatively stable. |
The Fund generally invests in inverse floating rate securities that include embedded leverage, thus exposing the Fund to greater risks and increased costs. The primary risks associated with inverse floating rate securities are varying degrees of liquidity and decreases in the value of such securities in response to changes in interest rates to a greater extent than fixed rate securities having similar credit quality, redemption provisions and maturity, which may cause the Fund’s net asset value to be more volatile than if it had not invested in inverse floating rate securities. In certain instances, the short-term floating rate notes created by the TOB Trust may not be able to be sold to third parties or, in the case of holders tendering (or putting) such notes for repayment of principal, may not be able to be remarketed to third parties. In such cases, the TOB Trust holding the fixed rate bonds may be collapsed with the entity that contributed the fixed rate bonds to the TOB Trust. In the case where a TOB Trust is collapsed with the Fund, the Fund will be required to repay the principal amount of the tendered securities, which may require the
42 Invesco Municipal Income Fund
Fund to sell other portfolio holdings to raise cash to meet that obligation. The Fund could therefore be required to sell other portfolio holdings at a disadvantageous time or price to raise cash to meet this obligation, which risk will be heightened during times of market volatility, illiquidity or uncertainty. The embedded leverage in the TOB Trust could cause the Fund to lose more money than the value of the asset it has contributed to the TOB Trust and greater levels of leverage create the potential for greater losses. In addition, a Fund may enter into reimbursement agreements with the liquidity provider of certain TOB transactions in connection with certain residuals held by the Fund. These agreements commit a Fund to reimburse the liquidity provider to the extent that the liquidity provider must provide cash to a TOB Trust, including following the termination of a TOB Trust resulting from a mandatory tender event (“liquidity shortfall”). The reimbursement agreement will effectively make the Fund liable for the amount of the negative difference, if any, between the liquidation value of the underlying security and the purchase price of the floating rate notes issued by the TOB Trust.
The Fund accounts for the transfer of fixed rate bonds to the TOB Trusts as secured borrowings, with the securities transferred remaining in the Fund’s investment assets, and the related floating rate notes reflected as Fund liabilities under the captionFloating rate note obligations on the Statement of Assets and Liabilities. The carrying amount of the Fund’s floating rate note obligations as reported on the Statement of Assets and Liabilities approximates its fair value. The Fund records the interest income from the fixed rate bonds under the caption Interest and records the expenses related to floating rate obligations and any administrative expenses of the TOB Trusts as a component ofInterest, facilities andmaintenance feeson the Statement of Operations.
Final rules implementing section 619 of the Dodd-Frank Wall Street Reform and Consumer Protection Act (the “Volcker Rule”) prohibit banking entities from engaging in proprietary trading of certain instruments and limit such entities’ investments in, and relationships with, “covered funds”, as defined in the rules. These rules preclude banking entities and their affiliates from sponsoring and/or providing services for existing TOB Trusts. A new TOB structure is being utilized by the Fund wherein the Fund, as holder of the residuals, will perform certain duties previously performed by banking entities as “sponsors” of TOB Trusts. These duties may be performed by a third-party service provider. The Fund’s expanded role under the new TOB structure may increase its operational and regulatory risk. The new structure is substantially similar to the previous structure; however, pursuant to the Volcker Rule, the remarketing agent would not be able to repurchase tendered floaters for its own account upon a failed remarketing. In the event of a failed remarketing, a banking entity serving as liquidity provider may loan the necessary funds to the TOB Trust to purchase the tendered floaters. The TOB Trust, not the Fund, would be the borrower and the loan from the liquidity provider will be secured by the purchased floaters now held by the TOB Trust. However, as previously described, the Fund would bear the risk of loss with respect to any liquidity shortfall to the extent it entered into a reimbursement agreement with the liquidity provider.
Further, the SEC and various banking agencies have adopted rules implementing credit risk retention requirements for asset-backed securities (the “Risk Retention Rules”). The Risk Retention Rules require the sponsor of a TOB Trust to retain at least 5% of the credit risk of the underlying assets supporting the TOB Trust’s municipal bonds. The Fund has adopted policies intended to comply with the Risk Retention Rules. The Risk Retention Rules may adversely affect the Fund’s ability to engage in TOB Trust transactions or increase the costs of such transactions in certain circumstances.
There can be no assurances that the new TOB structure will continue to be a viable form of leverage. Further, there can be no assurances that alternative forms of leverage will be available to the Fund in order to maintain current levels of leverage. Any alternative forms of leverage may be less advantageous to the Fund, and may adversely affect the Fund’s net asset value, distribution rate and ability to achieve its investment objective.
TOBs are presently classified as private placement securities. Private placement securities are subject to restrictions on resale because they have not been registered under the Securities Act of 1933, as amended (the “1933 Act”), or are otherwise not readily marketable. As a result of the absence of a public trading market for these securities, they may be less liquid than publicly traded securities. Although atypical, these securities may be resold in privately negotiated transactions, the prices realized from these sales could be less than those originally paid by the Fund or less than what may be considered the fair value of such securities.
| L. | Other Risks– The value of, payment of interest on, repayment of principal for and the ability to sell a municipal security may be affected byconstitutional amendments, legislative enactments, executive orders, administrative regulations, voter initiatives and the economics of the regions in which the issuers are located. |
Since many municipal securities are issued to finance similar projects, especially those relating to education, health care, transportation and utilities, conditions in those sectors can affect the overall municipal securities market and the Fund’s investments in municipal securities.
There is some risk that a portion or all of the interest received from certaintax-free municipal securities could become taxable as a result of determinations by the Internal Revenue Service.
NOTE 2–Advisory Fees and Other Fees Paid to Affiliates
The Trust has entered into a master investment advisory agreement with Invesco Advisers, Inc. (the “Adviser” or “Invesco”). Under the terms of the investment advisory agreement, the Fund accrues daily and pays monthly an advisory fee to the Adviser based on the annual rate of the Fund’s average daily net assets as follows:
| | | | |
| Average Net Assets | | Rate | |
First $500 million | | | 0.50% | |
Over $500 million | | | 0.45% | |
For the year ended February 28, 2019, the effective advisory fees incurred by the Fund was 0.46%.
Under the terms of a mastersub-advisory agreement between the Adviser and each of Invesco Asset Management Deutschland GmbH, Invesco Asset Management Limited, Invesco Asset Management (Japan) Limited, Invesco Hong Kong Limited, Invesco Senior Secured Management, Inc. and Invesco Canada Ltd. and separatesub-advisory agreements with Invesco Capital Management LLC and Invesco Asset Management (India) Private Limited (collectively, the “AffiliatedSub-Advisers”) the Adviser, not the Fund, will pay 40% of the fees paid to the Adviser to any such AffiliatedSub-Adviser(s) that provide(s) discretionary investment management services to the Fund based on the percentage of assets allocated to such AffiliatedSub-Adviser(s).
43 Invesco Municipal Income Fund
The Adviser has contractually agreed, through at least June 30, 2019, to waive advisory fees and/or reimburse expenses of all shares to the extent necessary to limit total annual fund operating expenses after fee waiver and/or expense reimbursement (excluding certain items discussed below) of Class A, Class C, Class Y, Investor Class and Class R6 shares to 1.50%, 2.25%, 1.25%, 1.50% and 1.25%, respectively, of average daily net assets (the “expense limits”). In determining the Adviser’s obligation to waive advisory fees and/or reimburse expenses, the following expenses are not taken into account, and could cause the total annual fund operating expenses after fee waiver and/or expense reimbursement to exceed the numbers reflected above: (1) interest, facilities and maintenance fees; (2) taxes; (3) dividend expense on short sales; (4) extraordinary ornon-routine items, including litigation expenses; and (5) expenses that the Fund has incurred but did not actually pay because of an expense offset arrangement. Unless Invesco continues the fee waiver agreement, it will terminate on June 30, 2019. During its term, the fee waiver agreement cannot be terminated or amended to increase the expense limits or reduce the advisory fee waiver without approval of the Board of Trustees. The Adviser did not waive fees and/or reimburse expenses during the period under these expense limits.
The Trust has entered into a master administrative services agreement with Invesco pursuant to which the Fund has agreed to pay Invesco for certain administrative costs incurred in providing accounting services to the Fund. For the year ended February 28, 2019, expenses incurred under the agreement are shown in the Statement of Operations asAdministrative services fees. Also, Invesco has entered into asub-administration agreement whereby State Street Bank and Trust Company (“SSB”) serves as custodian and fund accountant and provides certain administrative services to the Fund.
The Trust has entered into a transfer agency and service agreement with Invesco Investment Services, Inc. (“IIS”) pursuant to which the Fund has agreed to pay IIS a fee for providing transfer agency and shareholder services to the Fund and reimburse IIS for certain expenses incurred by IIS in the course of providing such services. IIS may make payments to intermediaries that provide omnibus account services,sub-accounting services and/or networking services. All fees payable by IIS to intermediaries that provide omnibus account services orsub-accounting services are charged back to the Fund, subject to certain limitations approved by the Trust’s Board of Trustees. For the year ended February 28, 2019, expenses incurred under the agreement are shown in the Statement of Operations asTransfer agent fees.
Shares of the Fund are distributed by Invesco Distributors, Inc. (“IDI”). The Fund has adopted a distribution plan pursuant to Rule12b-1 under the 1940 Act, and a service plan (collectively, the “Plans”) for Class A shares, Class C shares and Investor Class shares to compensate IDI for the sale, distribution, shareholder servicing and maintenance of shareholder accounts for these shares. Under the Plans, the Fund will incur annual fees of up to 0.25% of Class A and Investor Class average daily net assets and up to 1.00% of Class C average daily net assets. The fees are accrued daily and paid monthly.
With respect to Class C shares, the Fund is authorized to reimburse in future years any distribution related expenses that exceed the maximum annual reimbursement rate for such class, so long as such reimbursement does not cause the Fund to exceed the Class C maximum annual reimbursement rate, respectively. With respect to Class A and Investor Class shares, distribution related expenses that exceed the maximum annual reimbursement rate for such class are not carried forward to future years and the Fund will not reimburse IDI for any such expenses.
For the year ended February 28, 2019, expenses incurred under these agreements are shown in the Statement of Operations asDistribution fees.Front-end sales commissions and CDSC (collectively, the “sales charges”) are not recorded as expenses of the Fund.Front-end sales commissions are deducted from proceeds from the sales of Fund shares prior to investment in Class A shares of the Fund. CDSC are deducted from redemption proceeds prior to remittance to the shareholder. During the year ended February 28, 2019, IDI advised the Fund that IDI retained $283,782 infront-end sales commissions from the sale of Class A shares and $68,568 and $4,728 from Class A and Class C shares, respectively, for CDSC imposed upon redemptions by shareholders.
Certain officers and trustees of the Trust are officers and directors of the Adviser, IIS and/or IDI.
NOTE 3–Additional Valuation Information
GAAP defines fair value as the price that would be received to sell an asset or paid to transfer a liability in an orderly transaction between market participants at the measurement date, under current market conditions. GAAP establishes a hierarchy that prioritizes the inputs to valuation methods, giving the highest priority to readily available unadjusted quoted prices in an active market for identical assets (Level 1) and the lowest priority to significant unobservable inputs (Level 3), generally when market prices are not readily available or are unreliable. Based on the valuation inputs, the securities or other investments are tiered into one of three levels. Changes in valuation methods may result in transfers in or out of an investment’s assigned level:
| | |
| Level 1 – | | Prices are determined using quoted prices in an active market for identical assets. |
| Level 2 – | | Prices are determined using other significant observable inputs. Observable inputs are inputs that other market participants may use in pricing a security. These may include quoted prices for similar securities, interest rates, prepayment speeds, credit risk, yield curves, loss severities, default rates, discount rates, volatilities and others. |
| Level 3 – | | Prices are determined using significant unobservable inputs. In situations where quoted prices or observable inputs are unavailable (for example, when there is little or no market activity for an investment at the end of the period), unobservable inputs may be used. Unobservable inputs reflect the Fund’s own assumptions about the factors market participants would use in determining fair value of the securities or instruments and would be based on the best available information. |
As of February 28, 2019, all of the securities in this Fund were valued based on Level 2 inputs (see the Schedule of Investments for security categories). The level assigned to the securities valuations may not be an indication of the risk or liquidity associated with investing in those securities. Because of the inherent uncertainties of valuation, the values reflected in the financial statements may materially differ from the value received upon actual sale of those investments.
| | | | | | | | | | | | | | | | |
| | | Level 1 | | | Level 2 | | | Level 3 | | | Total | |
Investments in Securities | | | | | | | | | | | | | | | | |
Municipal Obligations | | $ | – | | | $ | 3,126,779,216 | | | | $– | | | $ | 3,126,779,216 | |
44 Invesco Municipal Income Fund
| | | | | | | | | | | | | | | | |
| | | Level 1 | | | Level 2 | | | Level 3 | | | Total | |
Other Investments - Assets* | | | | | | | | | | | | | | | | |
Futures Contracts | | | 466,949 | | | | - | | | | - | | | | 466,949 | |
Total Investments | | $ | 466,949 | | | $ | 3,126,779,216 | | | | $- | | | $ | 3,127,246,165 | |
| * | Unrealized appreciation. |
NOTE 4–Derivative Investments
The Fund may enter into an International Swaps and Derivatives Association Master Agreement (“ISDA Master Agreement”) under which a fund may trade OTC derivatives. An OTC transaction entered into under an ISDA Master Agreement typically involves a collateral posting arrangement, payment netting provisions andclose-out netting provisions. These netting provisions allow for reduction of credit risk through netting of contractual obligations. The enforceability of the netting provisions of the ISDA Master Agreement depends on the governing law of the ISDA Master Agreement, among other factors.
For financial reporting purposes, the Fund does not offset OTC derivative assets or liabilities that are subject to ISDA Master Agreements in the Statement of Assets and Liabilities.
Value of Derivative Investments atPeriod-End
The table below summarizes the value of the Fund’s derivative investments, detailed by primary risk exposure, held as of February 28, 2019:
| | | | |
| | | Value | |
| | | Interest | |
| Derivative Assets | | Rate Risk | |
Unrealized appreciation on futures contracts — Exchange-Traded | | | $466,949 | |
Derivatives not subject to master netting agreements | | | (466,949 | ) |
Total Derivative Assets subject to master netting agreements | | | $- | |
Effect of Derivative Investments for the year ended February 28, 2019
The table below summarizes the gains (losses) on derivative investments, detailed by primary risk exposure, recognized in earnings during the period:
| | |
| | | Location of Gain (Loss) on |
| | | Statement of Operations |
| | | Interest |
| | | Rate Risk |
Realized (Loss): | | |
Futures contracts | | $(3,362,623) |
Change in Net Unrealized Appreciation: | | |
Futures contracts | | 466,949 |
Total | | $(2,895,674) |
The table below summarizes the four month average notional value of futures contracts outstanding during the period.
| | | | |
| | | Futures | |
| | | Contracts | |
Average notional value | | $ | 133,144,574 | |
NOTE 5–Security Transactions with Affiliated Funds
The Fund is permitted to purchase or sell securities from or to certain other Invesco Funds under specified conditions outlined in procedures adopted by the Board of Trustees of the Trust. The procedures have been designed to ensure that any purchase or sale of securities by the Fund from or to another fund or portfolio that is or could be considered an affiliate by virtue of having a common investment adviser (or affiliated investment advisers), common Trustees and/or common officers complies with Rule17a-7 of the 1940 Act. Further, as defined under the procedures, each transaction is effected at the current market price. Pursuant to these procedures, for the year ended February 28, 2019, the Fund engaged in securities purchases of $136,803,280 and securities sales of $117,340,462, which resulted in net realized gains (losses) of $(425,043).
NOTE 6–Expense Offset Arrangement(s)
The expense offset arrangement is comprised of transfer agency credits which result from balances in demand deposit accounts used by the transfer agent for clearing shareholder transactions. For the year ended February 28, 2019, the Fund received credits from this arrangement, which resulted in the reduction of the Fund’s total expenses of $7,165.
NOTE 7–Trustees’ and Officers’ Fees and Benefits
Trustees’ and Officers’ Fees and Benefitsinclude amounts accrued by the Fund to pay remuneration to certain Trustees and Officers of the Fund.Trustees have the option to defer compensation payable by the Fund, andTrustees’ and Officers’ Fees and Benefits also include amounts accrued by the
45 Invesco Municipal Income Fund
Fund to fund such deferred compensation amounts. Those Trustees who defer compensation have the option to select various Invesco Funds in which their deferral accounts shall be deemed to be invested. Finally, certain current Trustees were eligible to participate in a retirement plan that provided for benefits to be paid upon retirement to Trustees over a period of time based on the number of years of service. The Fund may have certain former Trustees who also participate in a retirement plan and receive benefits under such plan.Trustees’ and Officers’ Fees and Benefits include amounts accrued by the Fund to fund such retirement benefits. Obligations under the deferred compensation and retirement plans represent unsecured claims against the general assets of the Fund.
NOTE 8–Cash Balances and Borrowings
The Fund is permitted to temporarily carry a negative or overdrawn balance in its account with SSB, the custodian bank. Such balances, if any atperiod-end, are shown in the Statement of Assets and Liabilities under the payable captionAmount due custodian. To compensate the custodian bank for such overdrafts, the overdrawn Fund may either (1) leave funds as a compensating balance in the account so the custodian bank can be compensated by earning the additional interest; or (2) compensate by paying the custodian bank at a rate agreed upon by the custodian bank and Invesco, not to exceed the contractually agreed upon rate.
Inverse floating rate obligations resulting from the transfer of bonds to TOB Trusts are accounted for as secured borrowings. The average floating rate notes outstanding and average annual interest and fee rate related to inverse floating rate note obligations during the year ended February 28, 2019 were $345,224,231 and 2.42%, respectively.
NOTE 9–Distributions to Shareholders and Tax Components of Net Assets
Tax Character of Distributions to Shareholders Paid During the Fiscal Years Ended February 28, 2019 and 2018
| | | | | | | | |
| | | 2019 | | | 2018 | |
Ordinary income -tax-exempt | | $ | 113,955,936 | | | $ | 106,204,861 | |
| | |
Tax Components of Net Assets atPeriod-End: | | | | | | | | |
| | |
| | | | | | 2019 | |
Undistributedtax-exempt income | | | | | | $ | 2,409,722 | |
Net unrealized appreciation — investments | | | | | | | 115,935,189 | |
Temporary book/tax differences | | | | | | | (395,543 | ) |
Capital loss carryforward | | | | | | | (116,399,693 | ) |
Shares of beneficial interest | | | | | | | 2,773,244,496 | |
Total net assets | | | | | | $ | 2,774,794,171 | |
The difference between book-basis andtax-basis unrealized appreciation (depreciation) is due to differences in the timing of recognition of gains and losses on investments for tax and book purposes. The Fund’s net unrealized appreciation (depreciation) difference is attributable primarily to book to tax amortization differences, wash sales, futures contracts and defaulted bonds.
The temporary book/tax differences are a result of timing differences between book and tax recognition of income and/or expenses. The Fund’s temporary book/tax differences are the result of the trustee deferral of compensation and retirement plan benefits.
Capital loss carryforward is calculated and reported as of a specific date. Results of transactions and other activity after that date may affect the amount of capital loss carryforward actually available for the Fund to utilize. Capital losses generated in years beginning after December 22, 2010 can be carried forward for an unlimited period, whereas previous losses expire in eight tax years. Capital losses with an expiration period may not be used to offset capital gains until all net capital losses without an expiration date have been utilized. Capital loss carryforwards with no expiration date will retain their character as either short-term or long-term capital losses instead of as short-term capital losses as under prior law. The ability to utilize capital loss carryforwards in the future may be limited under the Internal Revenue Code and related regulations based on the results of future transactions.
The Fund has a capital loss carryforward as of February 28, 2019, as follows:
| | | | | | | | | | | | |
| Capital Loss Carryforward* | | | | | | | | | |
| Expiration | | Short-Term | | | Long-Term | | | Total | |
Not subject to expiration | | $ | 64,796,514 | | | $ | 51,603,179 | | | $ | 116,399,693 | |
| * | Capital loss carryforward as of the date listed above is reduced for limitations, if any, to the extent required by the Internal Revenue Code and may be further limited depending upon a variety of factors, including the realization of net unrealized gains or losses as of the date of any reorganization. |
NOTE 10–Investment Transactions
The aggregate amount of investment securities (other than short-term securities, U.S. Treasury obligations and money market funds, if any) purchased and sold by the Fund during the year ended February 28, 2019 was $835,538,748 and $872,975,432, respectively. Cost of
46 Invesco Municipal Income Fund
investments, including any derivatives, on a tax basis includes the adjustments for financial reporting purposes as of the most recently completed federal income tax reportingperiod-end.
Unrealized Appreciation (Depreciation) of Investments on a TaxBasis
| | | | |
Aggregate unrealized appreciation of investments | | $ | 131,591,493 | |
Aggregate unrealized (depreciation) of investments | | | (15,656,304 | ) |
Net unrealized appreciation of investments | | $ | 115,935,189 | |
Cost of investments for tax purposes is $3,011,310,976.
NOTE 11–Reclassification of Permanent Differences
Primarily as a result of differing book/tax treatment of expired capital loss carryforward, on February 28, 2019, undistributed net investment income (loss) was decreased by $797,572, undistributed net realized gain (loss) was increased by $21,367,030 and shares of beneficial interest was decreased by $20,569,458. This reclassification had no effect on the net assets of the Fund.
NOTE 12–Share Information
| | | | | | | | | | | | | | | | |
| | | Summary of Share Activity | |
| | | Years ended February 28, | |
| | | 2019(a) | | | 2018 | |
| | | Shares | | | Amount | | | Shares | | | Amount | |
Sold: | | | | | | | | | | | | | | | | |
Class A | | | 30,218,584 | | | $ | 393,104,282 | | | | 21,481,197 | | | $ | 287,419,728 | |
Class B(b) | | | – | | | | – | | | | 1,279 | | | | 17,054 | |
Class C | | | 4,608,638 | | | | 59,942,494 | | | | 5,735,029 | | | | 76,394,409 | |
Class Y | | | 6,256,742 | | | | 81,729,448 | | | | 13,027,920 | | | | 173,863,325 | |
Investor Class | | | 261,823 | | | | 3,422,112 | | | | 277,967 | | | | 3,720,348 | |
Class R6(c) | | | 4,806,957 | | | | 62,739,383 | | | | 11,000,198 | | | | 146,977,990 | |
| | | | |
Issued as reinvestment of dividends: | | | | | | | | | | | | | | | | |
Class A | | | 3,957,211 | | | | 51,652,444 | | | | 3,660,899 | | | | 48,900,506 | |
Class B(b) | | | – | | | | – | | | | 4,921 | | | | 65,728 | |
Class C | | | 425,215 | | | | 5,528,378 | | | | 416,219 | | | | 5,532,391 | |
Class Y | | | 780,837 | | | | 10,187,062 | | | | 941,278 | | | | 12,580,307 | |
Investor Class | | | 242,923 | | | | 3,175,244 | | | | 228,639 | | | | 3,056,843 | |
Class R6 | | | 397,222 | | | | 5,185,135 | | | | 44,372 | | | | 585,541 | |
| | | | |
Conversion of Class B shares to Class A shares:(d) | | | | | | | | | | | | | | | | |
Class A | | | – | | | | – | | | | 137,228 | | | | 1,830,616 | |
Class B | | | – | | | | – | | | | (137,426 | ) | | | (1,830,616 | ) |
| | | | |
Reacquired: | | | | | | | | | | | | | | | | |
Class A | | | (28,663,425 | ) | | | (373,377,057 | ) | | | (24,313,937 | ) | | | (324,821,717 | ) |
Class B(b) | | | – | | | | – | | | | (354,172 | ) | | | (4,727,022 | ) |
Class C | | | (13,646,095 | ) | | | (176,380,494 | ) | | | (6,311,525 | ) | | | (83,911,155 | ) |
Class Y | | | (9,358,723 | ) | | | (121,734,157 | ) | | | (20,051,195 | ) | | | (267,663,701 | ) |
Investor Class | | | (809,692 | ) | | | (10,576,317 | ) | | | (733,113 | ) | | | (9,821,520 | ) |
Class R6 | | | (4,206,115 | ) | | | (54,791,128 | ) | | | (328,994 | ) | | | (4,354,038 | ) |
Net increase (decrease) in share activity | | | (4,727,898 | ) | | $ | (60,193,171 | ) | | | 4,726,784 | | | $ | 63,815,017 | |
| (a) | There are entities that are record owners of more than 5% of the outstanding shares of the Fund and in the aggregate own 63% of the outstanding shares of the Fund. IDI has an agreement with these entities to sell Fund shares. The Fund, Invesco and/or Invesco affiliates may make payments to these entities, which are considered to be related to the Fund, for providing services to the Fund, Invesco and/or Invesco affiliates including but not limited to services such as securities brokerage, distribution, third party record keeping and account servicing. The Fund has no knowledge as to whether all or any portion of the shares owned of record by these entities are also owned beneficially. |
| (b) | Class B shares activity for the period March 1, 2017 through January 26, 2018 (date of conversion). |
| (c) | Commencement date of April 4, 2017. |
| (d) | Effective as of the close of business January 26, 2018, all outstanding Class B shares were converted to Class A shares. |
47 Invesco Municipal Income Fund
NOTE 13–Financial Highlights
The following schedule presents financial highlights for a share of the Fund outstanding throughout the periods indicated.
| | | | | | | | | | | | | | | | | | | | | | | | | | | | | | | | | | | | | | | | | | | | | | | | | | | | |
| | | Net asset
value,
beginning
of period | | | Net
investment
income(a) | | | Net gains
(losses)
on securities
(both
realized and
unrealized) | | | Total from
investment
operations | | | Dividends
from net
investment
income | | | Net asset
value, end
of period | | | Total
return (b) | | | Net assets,
end of period
(000’s omitted) | | | Ratio of
expenses
to average net assets
with fee waivers
and/or expenses
absorbed | | | Ratio of
expenses
to average net
assets without
fee waivers
and/or expenses
absorbed | | | Supplemental
ratio of
expenses to average net assets
with fee waivers
(excluding
interest,
facilities and
maintenance
fees) | | | Ratio of net
investment
income to average
net assets | | | Portfolio
turnover (c) | |
Class A | | | | | | | | | | | | | | | | | | | | | |
Year ended 02/28/19 | | $ | 13.19 | | | $ | 0.50 | | | $ | (0.14 | ) | | $ | 0.36 | | | $ | (0.53 | ) | | $ | 13.02 | | | | 2.78 | % | | $ | 1,982,214 | | | | 1.01 | %(d) | | | 1.01 | %(d) | | | 0.85 | %(d) | | | 3.85 | %(d) | | | 27 | % |
Year ended 02/28/18 | | | 13.22 | | | | 0.53 | | | | (0.06 | ) | | | 0.47 | | | | (0.50 | ) | | | 13.19 | | | | 3.53 | | | | 1,935,019 | | | | 1.10 | | | | 1.10 | | | | 0.87 | | | | 3.94 | | | | 17 | |
Year ended 02/28/17 | | | 13.70 | | | | 0.52 | | | | (0.47 | ) | | | 0.05 | | | | (0.53 | ) | | | 13.22 | | | | 0.28 | | | | 1,927,685 | | | | 0.99 | | | | 0.99 | | | | 0.83 | | | | 3.79 | | | | 25 | |
Year ended 02/29/16 | | | 13.75 | | | | 0.59 | | | | (0.06 | ) | | | 0.53 | | | | (0.58 | ) | | | 13.70 | | | | 3.94 | | | | 1,766,102 | | | | 0.93 | | | | 0.93 | | | | 0.85 | | | | 4.29 | | | | 12 | |
Year ended 02/28/15 | | | 13.25 | | | | 0.58 | | | | 0.49 | | | | 1.07 | | | | (0.57 | ) | | | 13.75 | | | | 8.20 | | | | 1,660,106 | | | | 0.93 | | | | 0.93 | | | | 0.87 | | | | 4.24 | | | | 10 | |
Class C | | | | | | | | | | | | | | | | | | | | | |
Year ended 02/28/19 | | | 13.12 | | | | 0.40 | | | | (0.13 | ) | | | 0.27 | | | | (0.43 | ) | | | 12.96 | | | | 2.08 | | | | 133,292 | | | | 1.76 | (d) | | | 1.76 | (d) | | | 1.60 | (d) | | | 3.10 | (d) | | | 27 | |
Year ended 02/28/18 | | | 13.16 | | | | 0.42 | | | | (0.07 | ) | | | 0.35 | | | | (0.39 | ) | | | 13.12 | | | | 2.68 | | | | 248,013 | | | | 1.85 | | | | 1.85 | | | | 1.62 | | | | 3.19 | | | | 17 | |
Year ended 02/28/17 | | | 13.64 | | | | 0.41 | | | | (0.47 | ) | | | (0.06 | ) | | | (0.42 | ) | | | 13.16 | | | | (0.48 | ) | | | 250,828 | | | | 1.74 | | | | 1.74 | | | | 1.58 | | | | 3.04 | | | | 25 | |
Year ended 02/29/16 | | | 13.68 | | | | 0.48 | | | | (0.05 | ) | | | 0.43 | | | | (0.47 | ) | | | 13.64 | | | | 3.24 | | | | 156,712 | | | | 1.68 | | | | 1.68 | | | | 1.60 | | | | 3.54 | | | | 12 | |
Year ended 02/28/15 | | | 13.19 | | | | 0.48 | | | | 0.48 | | | | 0.96 | | | | (0.47 | ) | | | 13.68 | | | | 7.34 | | | | 113,479 | | | | 1.68 | | | | 1.68 | | | | 1.62 | | | | 3.49 | | | | 10 | |
Class Y | | | | | | | | | | | | | | | | | | | | | |
Year ended 02/28/19 | | | 13.18 | | | | 0.54 | | | | (0.14 | ) | | | 0.40 | | | | (0.56 | ) | | | 13.02 | | | | 3.11 | | | | 406,923 | | | | 0.76 | (d) | | | 0.76 | (d) | | | 0.60 | (d) | | | 4.10 | (d) | | | 27 | |
Year ended 02/28/18 | | | 13.22 | | | | 0.56 | | | | (0.07 | ) | | | 0.49 | | | | (0.53 | ) | | | 13.18 | | | | 3.71 | | | | 442,757 | | | | 0.85 | | | | 0.85 | | | | 0.62 | | | | 4.19 | | | | 17 | |
Year ended 02/28/17 | | | 13.70 | | | | 0.55 | | | | (0.47 | ) | | | 0.08 | | | | (0.56 | ) | | | 13.22 | | | | 0.54 | | | | 524,417 | | | | 0.74 | | | | 0.74 | | | | 0.58 | | | | 4.04 | | | | 25 | |
Year ended 02/29/16 | | | 13.74 | | | | 0.62 | | | | (0.05 | ) | | | 0.57 | | | | (0.61 | ) | | | 13.70 | | | | 4.27 | | | | 449,882 | | | | 0.68 | | | | 0.68 | | | | 0.60 | | | | 4.54 | | | | 12 | |
Year ended 02/28/15 | | | 13.25 | | | | 0.61 | | | | 0.48 | | | | 1.09 | | | | (0.60 | ) | | | 13.74 | | | | 8.39 | | | | 427,397 | | | | 0.68 | | | | 0.68 | | | | 0.62 | | | | 4.49 | | | | 10 | |
Investor Class | | | | | | | | | | | | | | | | | | | | | | | | | | | | | |
Year ended 02/28/19 | | | 13.19 | | | | 0.52 | | | | (0.14 | ) | | | 0.38 | | | | (0.54 | ) | | | 13.03 | | | | 2.96 | (e) | | | 99,887 | | | | 0.88 | (d)(e) | | | 0.88 | (d)(e) | | | 0.72 | (d)(e) | | | 3.98 | (d)(e) | | | 27 | |
Year ended 02/28/18 | | | 13.24 | | | | 0.54 | | | | (0.08 | ) | | | 0.46 | | | | (0.51 | ) | | | 13.19 | | | | 3.48 | (e) | | | 105,159 | | | | 1.03 | (e) | | | 1.03 | (e) | | | 0.80 | (e) | | | 4.01 | (e) | | | 17 | |
Year ended 02/28/17 | | | 13.71 | | | | 0.53 | | | | (0.46 | ) | | | 0.07 | | | | (0.54 | ) | | | 13.24 | | | | 0.47 | (e) | | | 108,489 | | | | 0.87 | (e) | | | 0.87 | (e) | | | 0.71 | (e) | | | 3.91 | (e) | | | 25 | |
Year ended 02/29/16 | | | 13.76 | | | | 0.60 | | | | (0.06 | ) | | | 0.54 | | | | (0.59 | ) | | | 13.71 | | | | 4.06 | (e) | | | 114,690 | | | | 0.82 | (e) | | | 0.82 | (e) | | | 0.74 | (e) | | | 4.40 | (e) | | | 12 | |
Year ended 02/28/15 | | | 13.26 | | | | 0.59 | | | | 0.49 | | | | 1.08 | | | | (0.58 | ) | | | 13.76 | | | | 8.31 | (e) | | | 117,224 | | | | 0.81 | (e) | | | 0.81 | (e) | | | 0.75 | (e) | | | 4.36 | (e) | | | 10 | |
Class R6 | | | | | | | | | | | | | | | | | | | | | | | | | | | | | | | | | | | | | | | | | | | | | | | | | | | | |
Year ended 02/28/19 | | | 13.18 | | | | 0.54 | | | | (0.13 | ) | | | 0.41 | | | | (0.57 | ) | | | 13.02 | | | | 3.18 | | | | 152,478 | | | | 0.69 | (d) | | | 0.69 | (d) | | | 0.53 | (d) | | | 4.17 | (d) | | | 27 | |
Year ended 02/28/18(f) | | | 13.25 | | | | 0.51 | | | | (0.10 | ) | | | 0.41 | | | | (0.48 | ) | | | 13.18 | | | | 3.13 | | | | 141,275 | | | | 0.79 | (g) | | | 0.79 | (g) | | | 0.56 | (g) | | | 4.25 | (g) | | | 17 | |
| (a) | Calculated using average shares outstanding. |
| (b) | Includes adjustments in accordance with accounting principles generally accepted in the United States of America and as such, the net asset value for financial reporting purposes and the returns based upon those net asset values may differ from the net asset value and returns for shareholder transactions. Does not include sales charges and is not annualized for periods less than one year, if applicable. |
| (c) | Portfolio turnover is calculated at the fund level and is not annualized for periods less than one year, if applicable. |
| (d) | Ratios are based on average daily net assets (000’s omitted) of $1,913,644, $228,585, $430,174, $101,907 and $147,021 for Class A, Class C, Class Y, Investor Class and Class R6 shares, respectively. |
| (e) | The total return, ratio of expenses to average net assets and ratio of net investment income to average net assets reflect actual12b-1 fees of 0.13%, 0.18%, 0.13%, 0.14% and 0.13% for the years ended February 28, 2019, February 28, 2018, February 28, 2017, February 29, 2016 and February 28, 2015, respectively. |
| (f) | Commencement date of April 4, 2017. |
48 Invesco Municipal Income Fund
Report of Independent Registered Public Accounting Firm
To the Board of Trustees of AIMTax-Exempt Funds (InvescoTax-Exempt Funds)
and Shareholders of Invesco Municipal Income Fund:
Opinion on the Financial Statements
We have audited the accompanying statement of assets and liabilities, including the schedule of investments, of Invesco Municipal Income Fund (one of the funds constituting AIMTax-Exempt Funds (InvescoTax-Exempt Funds), hereafter referred to as the “Fund”) as of February 28, 2019, the related statements of operations and cash flows for the year ended February 28, 2019, the statement of changes in net assets for each of the two years in the period ended February 28, 2019, including the related notes, and the financial highlights for each of the periods indicated therein (collectively referred to as the “financial statements”). In our opinion, the financial statements present fairly, in all material respects, the financial position of the Fund as of February 28, 2019, the results of its operations and its cash flows for the year then ended, the changes in its net assets for each of the two years in the period ended February 28, 2019 and the financial highlights for each of the periods indicated therein in conformity with accounting principles generally accepted in the United States of America.
Basis for Opinion
These financial statements are the responsibility of the Fund’s management. Our responsibility is to express an opinion on the Fund’s financial statements based on our audits. We are a public accounting firm registered with the Public Company Accounting Oversight Board (United States) (PCAOB) and are required to be independent with respect to the Fund in accordance with the U.S. federal securities laws and the applicable rules and regulations of the Securities and Exchange Commission and the PCAOB.
We conducted our audits of these financial statements in accordance with the standards of the PCAOB. Those standards require that we plan and perform the audit to obtain reasonable assurance about whether the financial statements are free of material misstatement, whether due to error or fraud.
Our audits included performing procedures to assess the risks of material misstatement of the financial statements, whether due to error or fraud, and performing procedures that respond to those risks. Such procedures included examining, on a test basis, evidence regarding the amounts and disclosures in the financial statements. Our audits also included evaluating the accounting principles used and significant estimates made by management, as well as evaluating the overall presentation of the financial statements. Our procedures included confirmation of securities owned as of February 28, 2019 by correspondence with the custodian and brokers; when replies were not received from brokers, we performed other auditing procedures. We believe that our audits provide a reasonable basis for our opinion.
PricewaterhouseCoopers LLP
Houston, TX
April 29, 2019
We have served as the auditor of one or more of the investment companies in the Invesco group of investment companies since at least 1995. We have not been able to determine the specific year we began serving as auditor.
49 Invesco Municipal Income Fund
Calculating your ongoing Fund expenses
Example
As a shareholder of the Fund, you incur two types of costs: (1) transaction costs, which may include sales charges (loads) on purchase payments or contingent deferred sales charges on redemptions, if any; and (2) ongoing costs, including management fees, distribution and/or service(12b-1) fees, and other Fund expenses. This example is intended to help you understand your ongoing costs (in dollars) of investing in the Fund and to compare these costs with ongoing costs of investing in other mutual funds. The example is based on an investment of $1,000 invested at the beginning of the period and held for the entire period September 1, 2018 through February 28, 2019.
Actual expenses
The table below provides information about actual account values and actual expenses. You may use the information in this table, together with the amount you invested, to estimate the expenses that you paid over the period. Simply divide your account value by $1,000 (for example, an $8,600 account value divided by $1,000 = 8.6), then multiply the result by the number in the table under the heading entitled “Actual Expenses Paid During Period” to estimate the expenses you paid on your account during this period.
Hypothetical example for comparison purposes
The table below also provides information about hypothetical account values and hypothetical expenses based on the Fund’s actual expense ratio and an assumed rate of return of 5% per year before expenses, which is not the Fund’s actual return.
The hypothetical account values and expenses may not be used to estimate the actual ending account balance or expenses you paid for the period. You may use this information to compare the ongoing costs of investing in the Fund and other funds. To do so, compare this 5% hypothetical example with the 5% hypothetical examples that appear in the shareholder reports of the other funds.
Please note that the expenses shown in the table are meant to highlight your ongoing costs only and do not reflect any transaction costs, such as sales charges (loads) on purchase payments or contingent deferred sales charges on redemptions, if any. Therefore, the hypothetical information is useful in comparing ongoing costs only, and will not help you determine the relative total costs of owning different funds. In addition, if these transaction costs were included, your costs would have been higher.
| | | | | | | | | | | | |
| | | | | | | | | HYPOTHETICAL | | |
| | | | | ACTUAL | | (5% annual return before expenses) | | |
| | | Beginning | | Ending | | Expenses | | Ending | | Expenses | | Annualized |
| | | Account Value | | Account Value | | Paid During | | Account Value | | Paid During | | Expense |
| | | (09/01/18) | | (02/28/19)1 | | Period2 | | (02/28/19) | | Period2 | | Ratio |
Class A | | $1,000.00 | | $1,010.50 | | $4.34 | | $1,020.48 | | $4.36 | | 0.87% |
Class C | | 1,000.00 | | 1,006.60 | | 8.06 | | 1,016.76 | | 8.10 | | 1.62 |
Class Y | | 1,000.00 | | 1,011.80 | | 3.09 | | 1,021.72 | | 3.11 | | 0.62 |
Investor Class | | 1,000.00 | | 1,011.00 | | 3.79 | | 1,021.03 | | 3.81 | | 0.76 |
Class R6 | | 1,000.00 | | 1,012.10 | | 2.74 | | 1,022.07 | | 2.76 | | 0.55 |
| 1 | The actual ending account value is based on the actual total return of the Fund for the period September 1, 2018 through February 28, 2019, after actual expenses and will differ from the hypothetical ending account value which is based on the Fund’s expense ratio and a hypothetical annual return of 5% before expenses. |
| 2 | Expenses are equal to the Fund’s annualized expense ratio as indicated above multiplied by the average account value over the period, multiplied by 181/365 to reflect the most recent fiscal half year. |
50 Invesco Municipal Income Fund
Tax Information
Form1099-DIV, Form1042-S and other year–end tax information provide shareholders with actual calendar year amounts that should be included in their tax returns. Shareholders should consult their tax advisors.
The following distribution information is being provided as required by the Internal Revenue Code or to meet a specific state’s requirement.
The Fund designates the following amounts or, if subsequently determined to be different, the maximum amount allowable for its fiscal year ended February 28, 2019:
| | | | | | | | |
| | Federal and State Income Tax | | | | | | |
| | Qualified Dividend Income* | | | 0 | % | | |
| | Corporate Dividends Received Deduction* | | | 0 | % | | |
| | U.S. Treasury Obligations* | | | 0 | % | | |
| | Tax-Exempt Interest Dividends* | | | 99.10 | % | | |
| | * | The above percentages are based on ordinary income dividends paid to shareholders during the Fund’s fiscal year. |
51 Invesco Municipal Income Fund
Trustees and Officers
The address of each trustee and officer is AIMTax-Exempt Funds (InvescoTax-Exempt Funds) (the “Trust”), 11 Greenway Plaza, Suite 1000, Houston, Texas 77046-1173. The trustees serve for the life of the Trust, subject to their earlier death, incapacitation, resignation, retirement or removal as more specifically provided in the Trust’s organizational documents. Each officer serves for a one year term or until their successors are elected and qualified. Column two below includes length of time served with predecessor entities, if any.
| | | | | | | | |
Name, Year of Birth and
Position(s) Held with the Trust | | Trustee and/ or Officer Since | | Principal Occupation(s) During Past 5 Years | | Number of
Funds in Fund
Complex
Overseen by
Trustee | | Other Directorship(s)
Held by Trustee During
Past 5 Years |
| Interested Persons | | | | | | | | |
| Martin L. Flanagan1 – 1960 Trustee and Vice Chair | | 2007 | | Executive Director, Chief Executive Officer and President, Invesco Ltd. (ultimate parent of Invesco and a global investment management firm); Trustee and Vice Chair, The Invesco Funds; Vice Chair, Investment Company Institute; and Member of Executive Board, SMU Cox School of Business Formerly: Advisor to the Board, Invesco Advisers, Inc. (formerly known as Invesco Institutional (N.A.), Inc.); Chairman and Chief Executive Officer, Invesco Advisers, Inc. (registered investment adviser); Director, Chairman, Chief Executive Officer and President, Invesco Holding Company (US), Inc. (formerly IVZ Inc.) (holding company), Invesco Group Services, Inc. (service provider) and Invesco North American Holdings, Inc. (holding company); Director, Chief Executive Officer and President, Invesco Holding Company Limited (parent of Invesco and a global investment management firm); Director, Invesco Ltd.; Chairman, Investment Company Institute and President,Co-Chief Executive Officer,Co-President, Chief Operating Officer and Chief Financial Officer, Franklin Resources, Inc. (global investment management organization) | | 158 | | None |
| Philip A. Taylor2– 1954 Trustee | | 2006 | | Vice Chair, Invesco Ltd.; Director, Invesco Canada Ltd. (formerly known as Invesco Trimark Ltd./Invesco Trimark Ltèe) (registered investment adviser and registered transfer agent); Trustee, The Invesco Funds Formerly: Head of the Americas and Senior Managing Director, Invesco Ltd.; Director, Invesco Advisers, Inc. (formerly known as Invesco Institutional (N.A.), Inc.) (registered investment adviser); Director and Chairman, Invesco Investment Services, Inc. (formerly known as Invesco AIM Investment Services, Inc.) (registered transfer agent); Chief Executive Officer, Invesco Corporate Class Inc. (corporate mutual fund company); Chairman and Chief Executive Officer, Invesco Canada Ltd. (formerly known as Invesco Trimark Ltd./Invesco Trimark Ltèe) (registered investment adviser and registered transfer agent); Senior Vice President, The Invesco Funds; Director, Invesco Investment Advisers LLC (formerly known as Van Kampen Asset Management); Director, Chairman, Chief Executive Officer and President, Invesco Management Group, Inc. (formerly known as Invesco AIM Management Group, Inc.) (financial services holding company);Co-Chairman,Co-President andCo-Chief Executive Officer, Invesco Advisers, Inc. (formerly known as Invesco Institutional (N.A.), Inc.) (registered investment adviser); Director, Chief Executive Officer and President, Van Kampen Exchange Corp; President and Principal Executive Officer, The Invesco Funds (other than AIM Treasurer’s Series Trust (Invesco Treasurer’s Series Trust), Short-Term Investments Trust and Invesco Management Trust); Executive Vice President, The Invesco Funds (AIM Treasurer’s Series Trust (Invesco Treasurer’s Series Trust), Short-Term Investments Trust and Invesco Management Trust only); Director and President, INVESCO Funds Group, Inc. (registered investment adviser and registered transfer agent); Director and Chairman, IVZ Distributors, Inc. (formerly known as INVESCO Distributors, Inc.) (registered broker dealer); Director, President and Chairman, Invesco Inc. (holding company), Invesco Canada Holdings Inc. (holding company), Trimark Investments Ltd./ Placements Trimark Ltèe and Invesco Financial Services Ltd/Services Financiers Invesco Ltèe; Chief Executive Officer, Invesco Canada Fund Inc. (corporate mutual fund company); Director and Chairman, Van Kampen Investor Services Inc.; Director, Chief Executive Officer and President, 1371 Preferred Inc. (holding company) and Van Kampen Investments Inc.; Director and President, AIM GP Canada Inc. (general partner for limited partnerships) and Van Kampen Advisors, Inc.; Director and Chief Executive Officer, Invesco Trimark Dealer Inc. (registered broker dealer); Director, Invesco Distributors, Inc. (formerly known as Invesco AIM Distributors, Inc.) (registered broker dealer); Manager, Invesco Capital Management LLC; Director, Chief Executive Officer and President, Invesco Advisers, Inc.; Director, Chairman, Chief Executive Officer and President, Invesco AIM Capital Management, Inc.; President, Invesco Trimark Dealer Inc. and Invesco Trimark Ltd./Invesco Trimark Ltèe; Director and President, AIM Trimark Corporate Class Inc. and AIM Trimark Canada Fund Inc.; Senior Managing Director, Invesco Holding Company Limited; Director and Chairman, Fund Management Company (former registered broker dealer); President and Principal Executive Officer, The Invesco Funds (AIM Treasurer’s Series Trust (Invesco Treasurer’s Series Trust), and Short-Term Investments Trust only); President, AIM Trimark Global Fund Inc. and AIM Trimark Canada Fund Inc. | | 158 | | None |
| 1 | Mr. Flanagan is considered an interested person (within the meaning of Section 2(a)(19) of the 1940 Act) of the Trust because he is an officer of the Adviser to the Trust, and an officer and a director of Invesco Ltd., ultimate parent of the Adviser. |
| 2 | Mr. Taylor is considered an interested person (within the meaning of Section 2(a)(19) of the 1940 Act) of the Trust because he is an officer and a director of the Adviser. |
T-1 Invesco Municipal Income Fund
Trustees and Officers–(continued)
| | | | | | | | |
Name, Year of Birth and
Position(s) Held with the Trust | | Trustee and/ or Officer Since | | Principal Occupation(s) During Past 5 Years | | Number of
Funds in Fund
Complex
Overseen by
Trustee | | Other Directorship(s)
Held by Trustee During
Past 5 Years |
| Independent Trustees | | | | | | | | |
| Bruce L. Crockett – 1944 Trustee and Chair | | 1993 | | Chairman, Crockett Technologies Associates (technology consulting company) Formerly: Director, Captaris (unified messaging provider); Director, President and Chief Executive Officer, COMSAT Corporation; Chairman, Board of Governors of INTELSAT (international communications company); ACE Limited (insurance company); Independent Directors Council and Investment Company Institute: Member of the Audit Committee, Investment Company Institute; Member of the Executive Committee and Chair of the Governance Committee, Independent Directors Council | | 158 | | Director and Chairman of the Audit Committee, ALPS (Attorneys Liability Protection Society) (insurance company); Director and Member of the Audit Committee and Compensation Committee, Ferroglobe PLC (metallurgical company) |
| David C. Arch – 1945 Trustee | | 2010 | | Chairman of Blistex Inc. (consumer health care products manufacturer); Member, World Presidents’ Organization | | 158 | | Board member of the Illinois Manufacturers’ Association |
| Jack M. Fields – 1952 Trustee | | 1997 | | Chief Executive Officer, Twenty First Century Group, Inc. (government affairs company); and Chairman, Discovery Learning Alliance(non-profit) Formerly: Owner and Chief Executive Officer, Dos Angeles Ranch L.P. (cattle, hunting, corporate entertainment); Director, Insperity, Inc. (formerly known as Administaff) (human resources provider); Chief Executive Officer, Texana Timber LP (sustainable forestry company); Director of Cross Timbers Quail Research Ranch(non-profit); and member of the U.S. House of Representatives | | 158 | | None |
| Cynthia Hostetler – 1962 Trustee | | 2017 | | Non-Executive Director and Trustee of a number of public and private business corporations Formerly: Director, Aberdeen Investment Funds (4 portfolios); Head of Investment Funds and Private Equity, Overseas Private Investment Corporation; President, First Manhattan Bancorporation, Inc.; Attorney, Simpson Thacher & Bartlett LLP | | 158 | | Vulcan Materials Company (construction materials company); Trilinc Global Impact Fund; Genesee & Wyoming, Inc. (railroads); Artio Global Investment LLC (mutual fund complex); Edgen Group, Inc. (specialized energy and infrastructure products distributor); Investment Company Institute (professional organization); Independent Directors Council (professional organization) |
Eli Jones – 1961 Trustee | | 2016 | | Professor and Dean, Mays Business School - Texas A&M University Formerly: Professor and Dean, Walton College of Business, University of Arkansas and E.J. Ourso College of Business, Louisiana State University; Director, Arvest Bank | | 158 | | Insperity, Inc. (formerly known as Administaff) (human resources provider) |
| Anthony J. LaCava, Jr. – 1956 Trustee | | 2019 | | Formerly: Director and Member of the Audit Committee, Blue Hills Bank and Managing Partner, KPMG LLP | | 158 | | Blue Hills Bank; Chairman, Bentley University; Member, Business School Advisory Council; KPMG LLP |
Prema Mathai-Davis – 1950 Trustee | | 1998 | | Retired Co-Owner & Partner of Quantalytics Research, LLC, (a FinTech Investment Research Platform for the Self-Directed Investor) | | 158 | | None |
Teresa M. Ressel – 1962 Trustee | | 2017 | | Non-executive director and trustee of a number of public and private business corporations Formerly: Chief Financial Officer, Olayan America, The Olayan Group (international investor/commercial/industrial); Chief Executive Officer, UBS Securities LLC; Group Chief Operating Officer, Americas, UBS AG; Assistant Secretary for Management & Budget and CFO, US Department of the Treasury | | 158 | | Atlantic Power Corporation (power generation company); ON Semiconductor Corp. (semiconductor supplier) |
Ann Barnett Stern – 1957 Trustee | | 2017 | | President and Chief Executive Officer, Houston Endowment Inc. (private philanthropic institution) Formerly: Executive Vice President and General Counsel, Texas Children’s Hospital; Attorney, Beck, Redden and Secrest, LLP; Business Law Instructor, University of St. Thomas; Attorney, Andrews & Kurth LLP | | 158 | | Federal Reserve Bank of Dallas |
Raymond Stickel, Jr. – 1944 Trustee | | 2005 | | Retired Formerly: Director, Mainstay VP Series Funds, Inc. (25 portfolios); Partner, Deloitte & Touche | | 158 | | None |
Robert C. Troccoli – 1949 Trustee | | 2016 | | Adjunct Professor, University of Denver - Daniels College of Business Formerly: Senior Partner, KPMG LLP | | 158 | | None |
Christopher L. Wilson – 1957 Trustee | | 2017 | | Non-executive director and trustee of a number of public and private business corporations Formerly: Director, TD Asset Management USA Inc. (mutual fund complex) (22 portfolios); Managing Partner, CT2, LLC (investing and consulting firm); President/Chief Executive Officer, Columbia Funds, Bank of America Corporation; President/Chief Executive Officer, CDC IXIS Asset Management Services, Inc.; Principal & Director of Operations, Scudder Funds, Scudder, Stevens & Clark, Inc.; Assistant Vice President, Fidelity Investments | | 158 | | ISO New England, Inc. (non-profit organization managing regional electricity market) |
| | |
| T-2 | | Invesco Municipal Income Fund |
Trustees and Officers–(continued)
| | | | | | | | |
Name, Year of Birth and
Position(s) Held with the Trust | | Trustee and/ or Officer Since | | Principal Occupation(s) During Past 5 Years | | Number of
Funds in Fund
Complex
Overseen by
Trustee | | Other Directorship(s)
Held by Trustee During
Past 5 Years |
| Other Officers | | | | | | | | |
Sheri Morris – 1964 President, Principal Executive Officer and Treasurer | | 1999 | | President, Principal Executive Officer and Treasurer, The Invesco Funds; Vice President, Invesco Advisers, Inc. (formerly known as Invesco Institutional (N.A.), Inc.) (registered investment adviser); and Vice President, Invesco Exchange-Traded Fund Trust, Invesco Exchange-Traded Fund Trust II, Invesco India Exchange-Traded Fund Trust, Invesco Actively Managed Exchange-Traded Fund Trust, Invesco Actively Managed Exchange-Traded Commodity Fund Trust and Invesco Exchange-Traded Self-Indexed Fund Trust Formerly: Vice President and Principal Financial Officer, The Invesco Funds; Vice President, Invesco AIM Advisers, Inc., Invesco AIM Capital Management, Inc. and Invesco AIM Private Asset Management, Inc.; Assistant Vice President and Assistant Treasurer, The Invesco Funds and Assistant Vice President, Invesco Advisers, Inc., Invesco AIM Capital Management, Inc. and Invesco AIM Private Asset Management, Inc.; and Treasurer, Invesco Exchange-Traded Fund Trust, Invesco Exchange-Traded Fund Trust II, Invesco India Exchange-Traded Fund Trust and Invesco Actively Managed Exchange-Traded Fund Trust | | N/A | | N/A |
Russell C. Burk – 1958 Senior Vice President and Senior Officer | | 2005 | | Senior Vice President and Senior Officer, The Invesco Funds | | N/A | | N/A |
| Jeffrey H. Kupor – 1968 Senior Vice President, Chief Legal Officer and Secretary | | 2018 | | Head of Legal of the Americas, Invesco Ltd.; Senior Vice President and Secretary, Invesco Advisers, Inc. (formerly known as Invesco Institutional (N.A.), Inc.) (registered investment adviser); Senior Vice President and Secretary, Invesco Distributors, Inc. (formerly known as Invesco AIM Distributors, Inc.); Vice President and Secretary, Invesco Investment Services, Inc. (formerly known as Invesco AIM Investment Services, Inc.) Senior Vice President, Chief Legal Officer and Secretary, The Invesco Funds; Secretary and General Counsel, Invesco Investment Advisers LLC (formerly known as Van Kampen Asset Management); Secretary and General Counsel, Invesco Capital Markets, Inc. (formerly known as Van Kampen Funds Inc.) and Chief Legal Officer, Invesco Exchange-Traded Fund Trust, Invesco Exchange- Traded Fund Trust II, Invesco India Exchange-Traded Fund Trust, Invesco Actively Managed Exchange-Traded Fund Trust, Invesco Actively Managed Exchange-Traded Commodity Fund Trust and Invesco Exchange-Traded Self-Indexed Fund Trust; Secretary, Invesco Indexing LLC; Secretary, W. L. Ross & Co., LLC; Secretary and Vice President, Jemstep, Inc. Formerly: Head of Legal, Worldwide Institutional, Invesco Ltd.; Secretary and General Counsel, INVESCO Private Capital Investments, Inc.; Senior Vice President, Secretary and General Counsel, Invesco Management Group, Inc. (formerly known as Invesco AIM Management Group, Inc.); Assistant Secretary, INVESCO Asset Management (Bermuda) Ltd.; Secretary and General Counsel, Invesco Private Capital, Inc.; Assistant Secretary and General Counsel, INVESCO Realty, Inc.; Secretary and General Counsel, Invesco Senior Secured Management, Inc.; and Secretary, Sovereign G./P. Holdings Inc. | | N/A | | N/A |
| Andrew R. Schlossberg – 1974 Senior Vice President | | 2019 | | Head of the Americas and Senior Managing Director, Invesco Ltd.; Director and Senior Vice President, Invesco Advisers, Inc. (formerly known as Invesco Institutional (N.A.), Inc.) (registered investment adviser); Director and Chairman, Invesco Investment Services, Inc. (formerly known as Invesco AIM Investment Services, Inc.) (registered transfer agent); Senior Vice President, The Invesco Funds; Director, Invesco Investment Advisers LLC (formerly known as Van Kampen Asset Management)and Invesco UK Limited; Director, President and Chairman, Invesco Insurance Agency, Inc.; Director and Chief Executive, Invesco Asset Management Limited and Invesco Fund Managers Limited Formerly: Assistant Vice President, The Invesco Funds; Senior Vice President, Invesco Advisers, Inc. (formerly known as Invesco Institutional (N.A.), Inc.) (registered investment adviser); Director and Chief Executive, Invesco Administration Services Limited and Invesco Global Investment Funds Limited; Director, Invesco Distributors, Inc.; Head of EMEA, Invesco Ltd.; President, Invesco Actively Managed Exchange-Traded Commodity Fund Trust, Invesco Actively Managed Exchange-Traded Fund Trust, Invesco Exchange-Traded Fund Trust, Invesco Exchange-Traded Fund Trust II and Invesco India Exchange- Traded Fund Trust; Managing Director and Principal Executive Officer, Invesco Capital Management LLC | | N/A | | N/A |
John M. Zerr – 1962 Senior Vice President | | 2006 | | Chief Operating Officer of the Americas; Senior Vice President, Invesco Advisers, Inc. (formerly known as Invesco Institutional (N.A.), Inc.) (registered investment adviser); Senior Vice President, Invesco Distributors, Inc. (formerly known as Invesco AIM Distributors, Inc.); Director and Vice President, Invesco Investment Services, Inc. (formerly known as Invesco AIM Investment Services, Inc.) Senior Vice President, The Invesco Funds; Managing Director, Invesco Capital Management LLC; Director, Invesco Investment Advisers LLC (formerly known as Van Kampen Asset Management); Senior Vice President, Invesco Capital Markets, Inc. (formerly known as Van Kampen Funds Inc.); Manager, Invesco Indexing LLC; Invesco Canada Funds Advisory Board Member; Director, President Chief Executive Officer, Invesco Corporate Class Inc. (corporate mutual fund company); and Director, Chairman, President and Chief Executive Officer, Invesco Canada Ltd. (formerly known as Invesco Trimark Ltd./Invesco Trimark Ltèe) (registered investment adviser and registered transfer agent) | | N/A | | N/A |
| | |
| T-3 | | Invesco Municipal Income Fund |
Trustees and Officers–(continued)
| | | | | | | | |
Name, Year of Birth and
Position(s) Held with the Trust | | Trustee and/ or Officer Since | | Principal Occupation(s) During Past 5 Years | | Number of
Funds in Fund
Complex
Overseen by
Trustee | | Other Directorship(s)
Held by Trustee During
Past 5 Years |
| Other Officers–(continued) | | | | | | | | |
| | | | | Formerly: Director and Senior Vice President, Invesco Management Group, Inc. (formerly known as Invesco AIM Management Group, Inc.); Secretary and General Counsel, Invesco Management Group, Inc. (formerly known as Invesco AIM Management Group, Inc.); Secretary, Invesco Investment Services, Inc. (formerly known as Invesco AIM Investment Services, Inc.); Chief Legal Officer and Secretary, The Invesco Funds; Secretary and General Counsel, Invesco Investment Advisers LLC (formerly known as Van Kampen Asset Management); Secretary and General Counsel, Invesco Capital Markets, Inc. (formerly known as Van Kampen Funds Inc.); Chief Legal Officer, Invesco Exchange-Traded Fund Trust, Invesco Exchange-Traded Fund Trust II, Invesco India Exchange-Traded Fund Trust, Invesco Actively Managed Exchange-Traded Fund Trust, Invesco Actively Managed Exchange-Traded Commodity Fund Trust and Invesco Exchange-Traded Self-Indexed Fund Trust; Secretary, Invesco Indexing LLC; Director, Secretary, General Counsel and Senior Vice President, Van Kampen Exchange Corp.; Director, Vice President and Secretary, IVZ Distributors, Inc. (formerly known as INVESCO Distributors, Inc.);Director and Vice President, INVESCO Funds Group, Inc.; Director and Vice President, Van Kampen Advisors Inc.; Director, Vice President, Secretary and General Counsel, Van Kampen Investor Services Inc.; Director and Secretary, Invesco Distributors, Inc. (formerly known as Invesco AIM Distributors, Inc.);Director, Senior Vice President, General Counsel and Secretary, Invesco AIM Advisers, Inc. and Van Kampen Investments Inc.; Director, Vice President and Secretary, Fund Management Company; Director, Senior Vice President, Secretary, General Counsel and Vice President, Invesco AIM Capital Management, Inc.; Chief Operating Officer and General Counsel, Liberty Ridge Capital, Inc. (an investment adviser) | | | | |
Gregory G. McGreevey – 1962 Senior Vice President | | 2012 | | Senior Managing Director, Invesco Ltd.; Director, Chairman, President, and Chief Executive Officer, Invesco Advisers, Inc. (formerly known as Invesco Institutional (N.A.), Inc.) (registered investment adviser); Director, Invesco Mortgage Capital, Inc. and Invesco Senior Secured Management, Inc.; and Senior Vice President, The Invesco Funds Formerly: Senior Vice President, Invesco Management Group, Inc. and Invesco Advisers, Inc.; Assistant Vice President, The Invesco Funds | | N/A | | N/A |
Kelli Gallegos – 1970 Vice President, Principal Financial Officer and Assistant Treasurer | | 2008 | | Vice President and Treasurer, Invesco Exchange-Traded Fund Trust, Invesco Exchange-Traded Fund Trust II, Invesco India Exchange-Traded Fund Trust, Invesco Actively Managed Exchange-Traded Fund Trust, Invesco Actively Managed Exchange-Traded Commodity Fund Trust and Invesco Exchange- Traded Self-Indexed Fund Trust; Vice President, Principal Financial Officer and Assistant Treasurer, The Invesco Funds; Principal Financial and Accounting Officer — Pooled Investments, Invesco Capital Management LLC Formerly: Assistant Treasurer, Invesco Exchange-Traded Fund Trust, Invesco Exchange-Traded Fund Trust II, Invesco India Exchange-Traded Fund Trust, Invesco Actively Managed Exchange-Traded Fund Trust, Invesco Actively Managed Exchange-Traded Commodity Fund Trust and Invesco Exchange- Traded Self-Indexed Fund Trust; Assistant Treasurer, Invesco Capital Management LLC; Assistant Vice President, The Invesco Funds | | N/A | | N/A |
| Tracy Sullivan – 1962 Vice President, Chief Tax Officer and Assistant Treasurer | | 2008 | | Vice President, Chief Tax Officer and Assistant Treasurer, The Invesco Funds; Assistant Treasurer, Invesco Capital Management LLC, Invesco Exchange- Traded Fund Trust, Invesco Exchange-Traded Fund Trust II, Invesco India Exchange-Traded Fund Trust, Invesco Actively Managed Exchange-Traded Fund Trust, Invesco Actively Managed Exchange-Traded Commodity Fund Trust and Invesco Exchange-Traded Self-Indexed Fund Trust Formerly: Assistant Vice President, The Invesco Funds | | N/A | | N/A |
Crissie M. Wisdom – 1969 Anti-Money Laundering Compliance Officer | | 2013 | | Anti-Money Laundering Compliance Officer, Invesco Advisers, Inc.(formerly known as Invesco Institutional(N.A.), Inc.)(registered investment adviser), Invesco Capital Markets, Inc. (formerly known as Van Kampen Funds Inc.), Invesco Distributors, Inc., Invesco Investment Services, Inc., The Invesco Funds, and Invesco Exchange-Traded Fund Trust, Invesco Exchange-Traded Fund Trust II, Invesco India Exchange-Traded Fund Trust, Invesco Actively Managed Exchange- Traded Fund Trust, Invesco Actively Managed Exchange-Traded Commodity Fund Trust and Invesco Exchange-Traded Self-Indexed Fund Trust; Anti-Money Laundering Compliance Officer and Bank Secrecy Act Officer, INVESCO National Trust Company and Invesco Trust Company; and Fraud Prevention Manager and Controls and Risk Analysis Manager for Invesco Investment Services, Inc. Formerly: Anti-Money Laundering Compliance Officer, Van Kampen Exchange Corp. and Invesco Management Group, Inc. | | N/A | | N/A |
Robert R. Leveille – 1969 Chief Compliance Officer | | 2016 | | Chief Compliance Officer, Invesco Advisers, Inc. (registered investment adviser); and Chief Compliance Officer, The Invesco Funds Formerly: Chief Compliance Officer, Putnam Investments and the Putnam Funds | | N/A | | N/A |
The Statement of Additional Information of the Trust includes additional information about the Fund’s Trustees and is available upon request, without charge, by calling 1.800.959.4246. Please refer to the Fund’s Statement of Additional Information for information on the Fund’ssub-advisers.
| | | | | | |
| Office of the Fund | | Investment Adviser | | Distributor | | Auditors |
| 11 Greenway Plaza, Suite 1000 | | Invesco Advisers, Inc. | | Invesco Distributors, Inc. | | PricewaterhouseCoopers LLP |
| Houston, TX 77046-1173 | | 1555 Peachtree Street, N.E. | | 11 Greenway Plaza, Suite 1000 | | 1000 Louisiana Street, Suite 5800 |
| | Atlanta, GA 30309 | | Houston, TX 77046-1173 | | Houston, TX 77002-5021 |
| | | |
| Counsel to the Fund | | Counsel to the Independent Trustees | | Transfer Agent | | Custodian |
| Stradley Ronon Stevens & Young, LLP | | Goodwin Procter LLP | | Invesco Investment Services, Inc. | | State Street Bank and Trust Company |
| 2005 Market Street, Suite 2600 | | 901 New York Avenue, N.W. | | 11 Greenway Plaza, Suite 1000 | | 225 Franklin Street |
| Philadelphia, PA 19103-7018 | | Washington, D.C. 20001 | | Houston, TX 77046-1173 | | Boston, MA 02110-2801 |
| | |
| T-4 | | Invesco Municipal Income Fund |
Explore High-Conviction Investing with Invesco

Go paperless with eDelivery
Visit invesco.com/edelivery to enjoy the convenience and security of anytime electronic access to your investment documents.
With eDelivery, you can elect to have any or all of the following materials delivered straight to your inbox to download, save and print from your own computer:
| ∎ | | Fund reports and prospectuses |
Invesco mailing information
Send general correspondence to Invesco Investment Services, Inc., P.O. Box 219078, Kansas City, MO 64121-9078.
Important notice regarding delivery of security holder documents
To reduce Fund expenses, only one copy of most shareholder documents may be mailed to shareholders with multiple accounts at the same address (Householding). Mailing of your shareholder documents may be householded indefinitely unless you instruct us otherwise. If you do not want the mailing of these documents to be combined with those for other members of your household, please contact Invesco Investment Services, Inc. at 800 959 4246 or contact your financial institution. We will begin sending you individual copies for each account within 30 days after receiving your request.
Fund holdings and proxy voting information
The Fund provides a complete list of its holdings four times in each fiscal year, at the quarter ends. For the second and fourth quarters, the lists appear in the Fund’s semiannual and annual reports to shareholders. For the first and third quarters, the Fund files the lists with the Securities and Exchange Commission (SEC) on Form N-Q (or any successor Form). The most recent list of portfolio holdings is available at invesco.com/completeqtrholdings. Shareholders can also look up the Fund’s Forms N-Q (or any successor Form) on the SEC website at sec.gov. The SEC file numbers for the Fund are shown below.
A description of the policies and procedures that the Fund uses to determine how to vote proxies relating to portfolio securities is available without charge, upon request, from our Client Services department at 800 959 4246 or at invesco.com/proxyguidelines. The information is also available on the SEC website, sec.gov.
| | | | |
Information regarding how the Fund voted proxies related to its portfolio securities during the most recent 12-month period ended June 30 is available at invesco.com/proxysearch. The information is also available on the SEC website, sec.gov. Invesco Advisers, Inc. is an investment adviser; it provides investment advisory services to individual and institutional clients and does not sell securities. Invesco Distributors, Inc. is the US distributor for Invesco Ltd.’s retail mutual funds, exchange-traded funds and institutional money market funds. Both are wholly owned, indirect subsidiaries of Invesco Ltd. | | |  | |
SEC file numbers: 811-07890 and 033-66242 Invesco Distributors, Inc. VK-MINC-AR-1 04292019 1503 |
| | | | | | | | |
| | | | | |
 | | Annual Report to Shareholders | | | February 28, 2019 | | | |
| | | | | |
| | Invesco New York Tax Free Income Fund Nasdaq: A: VNYAX∎ C: VNYCX∎ Y: VNYYX∎ R6: VNYSX | | | |

Letters to Shareholders
| | |
 | | Dear Shareholders: This annual report includes information about your Fund, including performance data and a complete list of its investments as of the close of the reporting period. Inside is a discussion of how your Fund was managed and the factors that affected its performance during the reporting period. Philip Taylor, whose messages to shareholders have appeared here for the last 13 years, transitioned to a senior advisory role on March 1, prior to his retirement from the firm at the end of the year, and I assumed his role as Head of the Americas and Senior Managing Director, Invesco Ltd. All of us at Invesco are indebted to Phil for his many years of dedicated service to the company and to its funds’ shareholders. I’m excited about this new opportunity, and I look forward to communicating with fund shareholders going forward. The reporting period proved to be an increasingly volatile time for markets. Amid corporate tax cuts and improving global growth, several US equity indexes redefined highs during the first half of the reporting period. The ebullience, |
however, ended in October as global equities, in particular US stocks, sold off sharply and continued this downward spiral for the rest of 2018. The catalyst for the sell-off was a combination of ongoing trade conflicts between the US and China, fears of a global economic slowdown and rising US interest rates. Gains posted earlier in the year for global equities were erased, while US Treasury bonds, along with government and municipal bonds, rallied. The reporting period ended on a positive note, however, as global equities bounced back strongly at the outset of 2019, mitigating some of the losses from the sell-off in late 2018. Given the strong economy during the reporting period, the US Federal Reserve (the Fed) raised the federal funds rate four times. At its December 2018 meeting, however, the Fed delivered a more “dovish hike” by simultaneously raising rates while reducing guidance for 2019 rate increases. At its first meeting in 2019, the Fed left rates unchanged. As 2019 unfolds, we’ll see how the interplay of interest rates, economic data, geopolitics and a host of other factors affect US and over-seas equity and fixed income markets.
Investor uncertainty and market volatility, such as we witnessed during the reporting period, are unfortunate facts of life when it comes to investing. That’s why Invesco encourages investors to work with a professional financial adviser who can stress the importance of starting to save and invest early and the importance of adhering to a disciplined investment plan. A financial adviser who knows your unique financial situation, investment goals and risk tolerance can be an invaluable partner as you seek to achieve your financial goals. He or she can offer a long-term perspective when markets are volatile and time-tested advice and guidance when your financial situation or investment goals change.
Visit our website for more information on your investments
Our website,invesco.com/us, offers a wide range of market insights and investment perspectives. On the website, you’ll find detailed information about our funds, including performance, holdings and portfolio manager commentaries. You can access information about your account by completing a simple, secure online registration. To do so, select “Log In” on the right side of the homepage, and then select “Register for Individual Account Access.”
In addition to the resources accessible on our website and through our mobile app, you can obtain timely updates to help you stay informed about the markets and the economy by connecting with Invesco on Twitter, LinkedIn or Facebook. You can access our blog atblog.invesco.us.com. Our goal is to provide you the information you want, when and where you want it.
Finally, I’m pleased to share with you Invesco’s commitment to both the Principles for Responsible Investment and to considering environmental, social and governance issues in our robust investment process. I invite you to learn more atinvesco.com/esg.
Have questions?
For questions about your account, contact an Invesco client services representative at 800 959 4246.
All of us at Invesco look forward to serving your investment management needs. Thank you for investing with us.
Sincerely,

Andrew Schlossberg
Head of the Americas,
Senior Managing Director, Invesco Ltd.
| | |
| 2 | | Invesco New York Tax Free Income Fund |
| | | | |
 | | Dear Fellow Shareholders: |
| | Among the many important lessons I’ve learned in more than 40 years in a variety of business endeavors is the value of a trusted advocate. |
| | As independent chair of the Invesco Funds Board, I can assure you that the members of the Board are strong advocates for the interests of investors in Invesco’s mutual funds. We work hard to represent your interests through oversight of the quality of the investment management services your funds receive and other matters important to your investment, including but not limited to: |
| | ∎ | | Ensuring that Invesco offers a diverse lineup of mutual funds that your financial adviser can use to strive to meet your financial needs as your investment goals change over time. |
| | ∎ | | Monitoring how the portfolio management teams of the Invesco funds are performing in light of changing economic and market conditions. |
| ∎ | Assessing each portfolio management team’s investment performance within the context of the investment strategy described in the fund’s prospectus. |
| ∎ | Monitoring for potential conflicts of interests that may impact the nature of the services that your funds receive. |
We believe one of the most important services we provide our fund shareholders is the annual review of the funds’ advisory and sub-advisory contracts with Invesco Advisers and its affiliates. This review is required by the Investment Company Act of 1940 and focuses on the nature and quality of the services Invesco provides as the adviser to the Invesco funds and the reasonableness of the fees that it charges for those services. Each year, we spend months carefully reviewing information received from Invesco and a variety of independent sources, such as performance and fee data prepared by Lipper, Inc. (a subsidiary of Broadridge Financial Solutions, Inc.), an independent, third-party firm widely recognized as a leader in its field. We also meet with our independent legal counsel and other independent advisers to review and help us assess the information that we have received. Our goal is to assure that you receive quality investment management services for a reasonable fee.
I trust the measures outlined above provide assurance that you have a worthy advocate when it comes to choosing the Invesco Funds. On behalf of the Board, we look forward to continuing to represent your interests and serving your needs.
Sincerely,

Bruce L. Crockett
Independent Chair
Invesco Funds Board of Trustees
| | |
| 3 | | Invesco New York Tax Free Income Fund |
Management’s Discussion of Fund Performance
| | | | |
Performance summary For the fiscal year ended February 28, 2019, Class A shares of Invesco New York Tax Free Income Fund (the Fund), at net asset value (NAV), underperformed the S&P Municipal Bond New York 5+ Year Investment Grade Index, the Fund’s style-specific benchmark. Your Fund’s long-term performance appears later in this report. | | |
Fund vs. Indexes | | | | |
Total returns, 2/28/18 to 2/28/19, at net asset value (NAV). Performance shown does not include applicable contingent deferred sales charges (CDSC) or front-end sales charges, which would have reduced performance. | | |
| | |
| Class A Shares | | 2.52% | | |
| Class C Shares | | 1.72 | | |
| Class Y Shares | | 2.78 | | |
| Class R6 Shares | | 2.83 | | |
| S&P Municipal Bond Indexq (Broad Market Index) | | 4.03 | | |
S&P Municipal Bond New York 5+ Year Investment Grade Indexq (Style-Specific Index) | | 4.08 | | |
Lipper New York Municipal Debt Funds Index⬛ (Peer Group Index) | | 4.63 | | |
Source(s):qRIMES Technologies Corp.;⬛Lipper Inc. | | | | |
Market conditions and your Fund
New York benefits from a broad-based and well-diversified economy, with a median household income higher than the US national median household income. New York’s economy is subject to volatility due to the significance of the financial services industry to its economic base. New York’s gross state product, the value of all goods and services produced in the state, rose to $1.69 trillion in the third quarter of 2018, the third-highest in the US.1 In December 2018, the statewide unemployment rate was at its lowest level on record at 3.9%, which was in line with the national unemployment rate.2 New York has improved its financial management practices in recent years by enacting on-time budgets, developing a consensus revenue forecasting mechanism and maintaining a consistent budgeted expenditure growth rate. Although the state’s financial condition was strained during the 2007-2009 recession, we believe its approach to budgeting has become more
sustainable and more focused on structural solutions than in the past. We believe New York faces potential headwinds stemming from federal tax reform, rising health care expenditures and growing transportation needs. New York’s pension liabilities continue to be well funded compared to other states.
The broad municipal bond market experienced positive returns for the fifth consecutive year in 2018. During the fiscal year, investment grade municipals returned 4.13% and high yield municipals returned 6.96%.3 This strong performance included investment grade municipals returning 1.30% and high yield municipals returning 1.22% for the first two months of 2019.3
The first half of the fiscal year began with supportive technical conditions (supply and demand balances) in place as new issuance of municipal bonds totaled $187 billion — down 8% from the same time period in 2017.4 However, fund flows into the municipal bond market remained positive, totaling $6.5 billion from March through August 2018.5 The
high yield municipal bond market outperformed the investment grade bond segment, led by strong performance of tobacco bonds and improved price discovery on Puerto Rico bonds as a result of developments in the commonwealth’s debt restructuring.
Municipal bonds withstood headwinds from interest rate movements that had the 10-year US Treasury yield breaching 3.00% in April 2018.6 During the fiscal year, the US Federal Reserve (the Fed) raised the federal funds rate four times: in March, June, September and December 2018.7 This series of anticipated rate hikes reflected increased confidence in the US economy amid low unemployment, relatively stable inflation and overall robust economic growth. This expansionary monetary policy significantly flattened the US Treasury yield curve with a slight inversion on the short end occurring in December 2018.
In September 2018, market conditions weakened in stark contrast to the first half of the fiscal year, and thus, exposed the municipal bond market to more sensitivity relating to the month’s sell-off in US Treasuries. Both investment grade municipals and high yield municipals posted negative returns for the months of September and October 2018. The municipal yield curve continued to steepen, showing confidence in strong gross domestic product growth, as well as rising concern that an impending trade war between the US and China could increase inflation pressures.
As anticipated, US midterm election results had a positive impact on municipal securities as perceived threats to municipal tax exemptions, further tax reform and changes to the Affordable Care Act were greatly reduced. News of a possible ban on flavored e-cigarettes and menthol cigarettes made headlines, which caused a short-lived decline in
| | | | |
| Portfolio Composition | | | | |
By credit sector, based on total investments | |
| |
Revenue Bonds | | | 80.7 | % |
Pre-Refunded Bonds | | | 15.0 | |
General Obligation Bonds | | | 4.3 | |
| | | | | | |
| Top Five Debt Holdings | |
| | % of total net assets | |
| | |
1. | | MTA Hudson Rail Yards Trust Obligations; Series 2016 A | | | 3.4% | |
2. | | Brooklyn Arena Local Development Corp. (Barclays Center); Series 2016 A | | | 3.4 | |
3. | | New York & New Jersey (States of) Port Authority; Two Hundred Series 2017 | | | 2.4 | |
4. | | Sales Tax Asset Receivable Corp.; Series 2014 A | | | 2.1 | |
5. | | Triborough Bridge & Tunnel Authority | | | 2.1 | |
| | | | |
| Total Net Assets | | $ | 151.2 million | |
| |
| Total Number of Holdings | | | 164 | |
The Fund’s holdings are subject to change, and there is no assurance that the Fund will continue to hold any particular security.
Data presented here are as of February 28, 2019.
| | |
| 4 | | Invesco New York Tax Free Income Fund |
valuations for Tobacco Master Settlement Agreement (Tobacco MSA) bonds, primarily below investment grade securities. Meanwhile, year-end demand for yield and coupon payments caused the municipal bond asset class to end 2018 on a strong note.
The Fed’s dovish stance to begin calendar year 2019 took the market by surprise, leading economists to change their predictions from two interest rate increases in 2019, to just one. Additionally, the US government shutdown, which lasted a total of 35 days, along with ongoing US-China trade negotiations and Brexit developments, created a challenging market environment. Despite these challenges, the municipal market performed positively as technical conditions continued to provide tailwinds, driven particularly by the insatiable demand for maturities (10 years and shorter) from US retail separately managed accounts (SMAs).
Flows into the municipal bond asset class were positive for six of the 12 months covered by the fiscal year. With slowing economic growth and the Fed’s interest rate policy detour, investor demand for municipal securities spiked, bringing record net inflows of more than $18.9 billion for the first two months of 2019.5
At the close of the fiscal year, we believed municipal fundamentals remained strong and ramifications of the Tax Cuts and Jobs Act of 2017 had not yet been fully realized. As a result, demand for tax-exempt investments from retail investors could continue as taxes become front of mind.
Security selection in longer maturity bonds (25 years and greater) contributed to the Fund’s performance relative to its style-specific benchmark during the fiscal year. The Fund’s overweight allocation to revenue bonds compared to general obligation bonds also benefited relative performance. Security selection in non-investment grade bonds and non-rated bonds also aided the Fund’s relative return.
Overweight exposure to pre-refunded bonds detracted from the Fund’s performance relative to its style-specific benchmark during the fiscal year. On a sector level, overweight exposure to and bond selection in the tobacco industry detracted from the Fund’s relative performance. The Fund’s security selection in and overweight exposure to shorter duration bonds (3.99 years and less) was another detractor from relative performance.
During the fiscal year, leverage contributed to the Fund’s performance relative to its style-specific benchmark. The Fund
achieved a leveraged position through the use of inverse floating rate securities or tender option bonds (TOBs). The Fund uses leverage because we believe that, over time, leveraging provides opportunities for additional income and total return for shareholders. However, the use of leverage also can expose shareholders to additional volatility. For more information about the Fund’s use of leverage, see the Notes to Financial Statements later in this report.
We wish to remind you that the Fund is subject to interest rate risk, meaning when interest rates rise, the value of fixed income securities tends to fall. The degree to which the value of fixed income securities may decline due to rising interest rates may vary depending on the speed and magnitude of the increase in interest rates, as well as individual security characteristics, such as price, maturity, duration and coupon and market forces, such as supply and demand for similar securities. We are monitoring interest rates, and the market, economic and geopolitical factors that may impact the direction, speed and magnitude of changes to interest rates across the maturity spectrum, including the potential impact of monetary policy changes by the Fed and certain foreign central banks. If interest rates rise faster than expected, markets may experience increased volatility, which may affect the value and/or liquidity of certain of the Fund’s investments.
Thank you for investing in Invesco New York Tax Free Income Fund and for sharing our long-term investment horizon.
| 1 Source: | Bureau of Economic Analysis |
| 2 Source: | Bureau of Labor Statistics |
| 3 Source: | FactSet Research Systems Inc. |
| 5 Source: | Strategic Insight |
| 6 Source: | US Department of the Treasury |
| 7 Source: | US Federal Reserve |
The views and opinions expressed in management’s discussion of Fund performance are those of Invesco Advisers, Inc. These views and opinions are subject to change at any time based on factors such as market and economic conditions. These views and opinions may not be relied upon as investment advice or recommendations, or as an offer for a particular security. The information is not a complete analysis of every aspect of any market, country, industry, security or the Fund. Statements of fact are from sources considered reliable, but Invesco Advisers, Inc. makes no representation or warranty as to their completeness or accuracy. Although historical performance is no guarantee of future results, these insights may help you understand our investment management philosophy.
See important Fund and, if applicable, index disclosures later in this report.
| | |
| |
 | | Mark Paris Portfolio Manager and Chief Investment Officer and Head of Municipal Strategies for Invesco Fixed Income, is manager |
| of Invesco New York Tax Free Income Fund. He joined Invesco in 2010. Mr. Paris earned a BBA in finance from Baruch College – The City University of New York. |
| |
 | | John (Jack) Connelly Portfolio Manager, is manager of Invesco New York Tax Free Income Fund. He joined Invesco in 2016. Mr. Connelly |
| earned a BA in philosophy from Wheaton College and masters degrees from the University of Rhode Island and Yale University. |
| |
 | | Tim O’Reilly Portfolio Manager, is manager of Invesco New York Tax Free Income Fund. He joined Invesco in 2010. Mr. O’Reilly |
| earned a BS in finance from Eastern Illinois University and an MBA in finance from the University of Illinois at Chicago. |
| |
 | | James Phillips Portfolio Manager, is manager of Invesco New York Tax Free Income Fund. He joined Invesco in 2010. Mr. Phillips |
| earned a BA in American literature from Empire State College, the independent study division of the State University of New York, and an MBA in finance from the University at Albany, State University of New York. |
| |
 | | John Schorle Portfolio Manager, is manager of Invesco New York Tax Free Income Fund. He joined Invesco in 2010. Mr. Schorle |
| earned a BA degree in economics from DePaul University. He is also a Certified Public Accountant. |
| |
 | | Julius Williams Portfolio Manager, is manager of Invesco New York Tax Free Income Fund. He joined Invesco in 2010. Mr. Williams |
| earned a BA in economics and sociology and a Master of Education degree in educational psychology from the University of Virginia. |
5 Invesco New York Tax Free Income Fund
Your Fund’s Long-Term Performance
Results of a $10,000 Investment – Oldest Share Class(es)
Fund and index data from 2/28/09
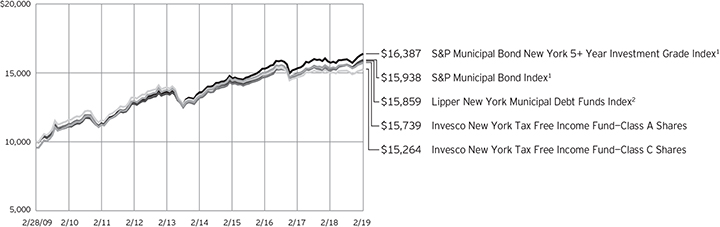
1 Source: RIMES Technologies Corp.
2 Source: Lipper Inc.
Past performance cannot guarantee comparable future results.
The data shown in the chart include reinvested distributions, applicable sales charges and Fund expenses including management fees. Index results include reinvested dividends, but they do not reflect sales charges. Performance of the
peer group, if applicable, reflects fund expenses and management fees; performance of a market index does not. Performance shown in the chart and table(s) does not reflect deduction of taxes a shareholder would pay on Fund distributions or sale of Fund shares.
6 Invesco New York Tax Free Income Fund
| | | | |
| Average Annual Total Returns | |
| As of 2/28/19, including maximum applicable sales charges | |
| |
| Class A Shares | | | | |
| Inception (7/29/94) | | | 4.70 | % |
| 10 Years | | | 4.64 | |
| 5 Years | | | 2.51 | |
| 1 Year | | | –1.84 | |
| |
| Class C Shares* | | | | |
| Inception (7/29/94) | | | 4.57 | % |
| 10 Years | | | 4.32 | |
| 5 Years | | | 2.64 | |
| 1 Year | | | 0.73 | |
| |
| Class Y Shares | | | | |
| 10 Years | | | 5.32 | % |
| 5 Years | | | 3.68 | |
| 1 Year | | | 2.78 | |
| |
| Class R6 Shares | | | | |
| 10 Years | | | 5.16 | % |
| 5 Years | | | 3.52 | |
| 1 Year | | | 2.83 | |
* Effective January 26, 2019, Class C share performance includes the conversion to A shares after 10 years. | |
Effective June 1, 2010, Class A and Class C shares of the predecessor fund, Van Kampen New York Tax-Free Income Fund, advised by Van Kampen Asset Management were reorganized into Class A and Class C shares, respectively, of Invesco Van Kampen New York Tax Free Income Fund (renamed Invesco New York Tax Free Income Fund). Returns shown above, prior to June 1, 2010, for Class A and Class C shares are blended returns of the predecessor fund and Invesco New York Tax Free Income Fund. Share class returns will differ from the predecessor fund because of different expenses.
Class Y shares incepted on June 1, 2010. Performance shown prior to that date is that of the predecessor fund’s Class A shares and includes the 12b-1 fees applicable to Class A shares.
Class R6 shares incepted on April 4, 2017. Performance shown prior to that date is that of Class A shares and includes the 12b-1 fees applicable to Class A shares.
The performance data quoted represent past performance and cannot guarantee comparable future results; current performance may be lower or higher. Please visit invesco.com/performance for the most recent month-end performance. Performance figures
| | | | |
| Average Annual Total Returns | | | | |
| As of 12/31/18, the most recent calendar quarter end, including maximum applicable sales charges | |
| |
| Class A Shares | | | | |
| Inception (7/29/94) | | | 4.69 | % |
| 10 Years | | | 5.18 | |
| 5 Years | | | 2.98 | |
| 1 Year | | | –4.04 | |
| |
| Class C Shares | | | | |
| Inception (7/29/94) | | | 4.10 | % |
| 10 Years | | | 4.86 | |
| 5 Years | | | 3.11 | |
| 1 Year | | | –1.54 | |
| |
| Class Y Shares | | | | |
| 10 Years | | | 5.86 | % |
| 5 Years | | | 4.13 | |
| 1 Year | | | 0.45 | |
| Class R6 Shares | | | | |
| |
| 10 Years | | | 5.69 | % |
| 5 Years | | | 3.97 | |
| 1 Year | | | 0.43 | |
reflect reinvested distributions, changes in net asset value and the effect of the maximum sales charge unless otherwise stated. Investment return and principal value will fluctuate so that you may have a gain or loss when you sell shares.
The total annual Fund operating expense ratio set forth in the most recent Fund prospectus as of the date of this report for Class A, Class C, Class Y and Class R6 shares was 1.36%, 2.11%, 1.11% and 1.06%, respectively. The expense ratios presented above may vary from the expense ratios presented in other sections of this report that are based on expenses incurred during the period covered by this report.
Class A share performance reflects the maximum 4.25% sales charge, and and Class C share performance reflects the applicable contingent deferred sales charge (CDSC) for the period involved. The CDSC on Class C shares is 1% for the first year after purchase. Class Y and Class R6 shares do not have a front-end sales charge or a CDSC; therefore, performance is at net asset value.
The performance of the Fund’s share classes will differ primarily due to different sales charge structures and class expenses.
Fund performance reflects any applicable fee waivers and/or expense reimbursements. Had the adviser not waived fees and/or reimbursed expenses currently or in the past, returns would have been lower. See current prospectus for more information.
7 Invesco New York Tax Free Income Fund
Invesco New York Tax Free Income Fund’s investment objective is to provide investors with a high level of current income exempt from federal, New York State and New York City income taxes, consistent with preservation of capital.
| ∎ | | Unless otherwise stated, information presented in this report is as of February 28, 2019, and is based on total net assets. |
| ∎ | | Unless otherwise noted, all data provided by Invesco. |
| ∎ | | To access your Fund’s reports/prospectus, visit invesco.com/fundreports. |
About share classes
| ∎ | | Class Y shares are available to only certain investors. Please see the prospectus for more information. |
| ∎ | | Class R6 shares are available for use by retirement plans that meet certain standards and for institutional investors. Class R6 shares are also available through intermediaries that have established an agreement with Invesco Distributors, Inc. to make such shares available for use in retail omnibus accounts. See the prospectus for more information. |
Principal risks of investing in the Fund
| ∎ | | Alternative minimum tax risk.A portion of the Fund’s otherwise tax-exempt income may be taxable to those shareholders subject to the federal alternative minimum tax. |
| ∎ | | Changing fixed income market conditions risk.The current low interest rate environment was created in part by the Federal Reserve Board (FRB) and certain foreign central banks keeping the federal funds and equivalent foreign rates near historical lows. Increases in the federal funds and equivalent foreign rates may expose fixed income markets to heightened volatility and reduced liquidity for certain fixed income investments, particularly those with longer maturities. In addition, decreases in fixed income dealer market-making capacity may also potentially lead to heightened volatility and reduced liquidity in the fixed income markets. As a result, the value of the Fund’s investments and share price may decline. Changes in central bank policies could also result in higher than normal shareholder redemptions, which could potentially increase portfolio turnover and the Fund’s transaction costs. |
| ∎ | | Debt securities risk.The prices of debt securities held by the Fund will be affected by changes in interest rates, the creditworthiness of the issuer and other |
| | | factors. An increase in prevailing interest rates typically causes the value of existing debt securities to fall and often has a greater impact on longer-duration debt securities and higher quality debt securities. Falling interest rates will cause the Fund to reinvest the proceeds of debt securities that have been repaid by the issuer at lower interest rates. Falling interest rates may also reduce the Fund’s distributable income because interest payments on floating rate debt instruments held by the Fund will decline. The Fund could lose money on investments in debt securities if the issuer or borrower fails to meet its obligations to make interest payments and/or to repay principal in a timely manner. Changes in an issuer’s financial strength, the market’s perception of such strength or in the credit rating of the issuer or the security may affect the value of debt securities. The Adviser’s credit analysis may fail to anticipate such changes, which could result in buying a debt security at an inopportune time or failing to sell a debt security in advance of a price decline or other credit event. |
| ∎ | | Derivatives risk.The value of a derivative instrument depends largely on (and is derived from) the value of an underlying security, currency, commodity, interest rate, index or other asset (each referred to as an underlying asset). In addition to risks relating to the underlying assets, the use of derivatives may include other, possibly greater, risks, including counterparty, leverage and liquidity risks. Counterparty risk is the risk that the counterparty to the derivative contract will default on its obligation to pay the Fund the amount owed or otherwise perform under the derivative contract. Derivatives create leverage risk because they do not require payment up front equal to the economic exposure created by holding a position in the derivative. As a result, an adverse change in the value of the underlying asset could result in |
This report must be accompanied or preceded by a currently effective Fund prospectus, which contains more complete information, including sales charges and expenses. Investors should read it carefully before investing.
NOT FDIC INSURED | MAY LOSE VALUE | NO BANK GUARANTEE
the Fund sustaining a loss that is substantially greater than the amount invested in the derivative or the anticipated value of the underlying asset, which may make the Fund’s returns more volatile and increase the risk of loss. Derivative instruments may also be less liquid than more traditional investments and the Fund may be unable to sell or close out its derivative positions at a desirable time or price. This risk may be more acute under adverse market conditions, during which the Fund may be most in need of liquidating its derivative positions. Derivatives may also be harder to value, less tax efficient and subject to changing government regulation that could impact the Fund’s ability to use certain derivatives or their cost. Derivatives strategies may not always be successful. For example, derivatives used for hedging or to gain or limit exposure to a particular market segment may not provide the expected benefits, particularly during adverse market conditions.
| ∎ | | High yield debt securities (junk bond) risk.Investments in high yield debt securities (“junk bonds”) and other lower-rated securities will subject the Fund to substantial risk of loss. These securities are considered to be speculative with respect to the issuer’s ability to pay interest and principal when due, are more susceptible to default or decline in market value and are less liquid than investment grade debt securities. Prices of high yield debt securities tend to be very volatile. |
| ∎ | | Inverse floating rate obligations risk. The price of inverse floating rate obligations (inverse floaters) is expected to decline when interest rates rise, and generally will decline further than the price of a bond with a similar maturity. The price of inverse floaters is typically more volatile than the price of bonds with similar maturities. These risks can be particularly high if leverage is used in the formula that determines the interest payable by the inverse floater, which may make the Fund’s returns more volatile and increase the risk of loss. Additionally, these securities may lose some or all of their principal and, in some cases, the Fund could lose money in excess of its investment. |
| | |
| 8 | | Invesco New York Tax Free Income Fund |
| ∎ | | Liquidity risk.The Fund may be unable to sell illiquid investments at the time or price it desires and, as a result, could lose its entire investment in such investments. Liquid securities can become illiquid during periods of market stress. If a significant amount of the Fund’s securities become illiquid, the Fund may not be able to timely pay redemption proceeds and may need to sell securities at significantly reduced prices. |
| ∎ | | Management risk.The Fund is actively managed and depends heavily on the Adviser’s judgment about markets, interest rates or the attractiveness, relative values, liquidity, or potential appreciation of particular investments made for the Fund’s portfolio. The Fund could experience losses if these judgments prove to be incorrect. Additionally, legislative, regulatory, or tax developments may adversely affect management of the Fund and, therefore, the ability of the Fund to achieve its investment objective. |
| ∎ | | Market risk.The market values of the Fund’s investments, and therefore the value of the Fund’s shares, will go up and down, sometimes rapidly or unpredictably. Market risk may affect a single issuer, industry or section of the economy, or it may affect the market as a whole. Individual stock prices tend to go up and down more dramatically than those of certain other types of investments, such as bonds. During a general downturn in the financial markets, multiple asset classes may decline in value. When markets perform well, there can be no assurance that specific investments held by the Fund will rise in value. |
| ∎ | | Medium- and lower-grade municipal securities risk.Medium- and lower-grade municipal securities generally involve more volatility and greater risks, including credit, market, liquidity and management risks, than higher-grade securities. Furthermore, many issuers of medium- and lower-grade securities choose not to have a rating assigned to their obligations. As such, the Fund’s portfolio may consist of a higher portion of unrated securities than an investment company investing solely in higher-grade securities. Unrated securities may not be as attractive to as many buyers as are rated securities, which may have the effect of limiting the Fund’s ability to sell such securities at their fair value. |
| ∎ | | Municipal issuer focus risk.The municipal issuers in which the Fund invests may be located in the same geographic area or may pay their interest obligations from revenue of similar projects, such as hospitals, airports, utility systems a |
| | | nd housing finance agencies. This may make the Fund’s investments more susceptible to similar social, economic, political or regulatory occurrences, making the Fund more susceptible to experience a drop in its share price than if the Fund had been more diversified across issuers that did not have similar characteristics. |
| ∎ | | Municipal securities risk.The risk of a municipal obligation generally depends on the financial and credit status of the issuer. Constitutional amendments, legislative enactments, executive orders, administrative regulations, voter initiatives, and the issuer’s regional economic conditions may affect the municipal security’s value, interest payments, repayment of principal and the Fund’s ability to sell the security. Failure of a municipal security issuer to comply with applicable tax requirements may make income paid thereon taxable, resulting in a decline in the security’s value. In addition, there could be changes in applicable tax laws or tax treatments that reduce or eliminate the current federal income tax exemption on municipal securities or otherwise adversely affect the current federal or state tax status of municipal securities. |
| ∎ | | New York and US territories municipal securities risk.The Fund is more susceptible to political, economic, regulatory or other factors affecting issuers of New York municipal securities than a fund that does not focus its investments in such issuers. As with New York municipal securities, events in any of the territories where the Fund is invested may affect the Fund’s investments and its performance. |
| ∎ | | Variable-rate demand notes risk.The absence of an active secondary market for certain variable and floating rate notes could make it difficult to dispose of these instruments, which could result in a loss. |
| ∎ | | When-issued, delayed delivery and forward commitment risks.When-issued and delayed delivery transactions subject the Fund to market risk because the value or yield of a security at delivery may be more or less than the purchase price or yield generally available when delivery occurs, and counterparty risk because the Fund relies on the buyer or seller, as the case may be, to consummate the transaction. These transactions also have a leveraging effect on the Fund because the Fund commits to purchase securities that it does not have to pay for until a later date, which increases the Fund’s overall investment exposure and, as a result, its volatility. |
| ∎ | | Zero coupon or pay-in-kind securities risk.The value, interest rates, and liquidity of non-cash paying instruments, such as zero coupon and pay-in-kind securities, are subject to greater fluctuation than other types of securities. The higher yields and interest rates on pay-in-kind securities reflect the payment deferral and increased credit risk associated with such instruments and that such investments may represent a higher credit risk than loans that periodically pay interest. |
About indexes used in this report
| ∎ | | TheS&P Municipal Bond Index is a broad, market value-weighted index that seeks to measure the performance of the US municipal bond market. |
| ∎ | | TheS&P Municipal Bond New York 5+ Year Investment Grade Index seeks to measure the performance of investment grade, New York-issued US municipals with maturities equal to or greater than five years. |
| ∎ | | TheLipper New York Municipal Debt Funds Index is an unmanaged index considered representative of New York municipal debt funds tracked by Lipper. |
| ∎ | | The Fund is not managed to track the performance of any particular index, including the index(es) described here, and consequently, the performance of the Fund may deviate significantly from the performance of the index(es). |
| ∎ | | A direct investment cannot be made in an index. Unless otherwise indicated, index results include reinvested dividends, and they do not reflect sales charges. Performance of the peer group, if applicable, reflects fund expenses; performance of a market index does not. |
Other information
| ∎ | | CPA® and Certified Public Accountant® are trademarks owned by the American Institute of Certified Public Accountants. |
| ∎ | | The returns shown in management’s discussion of Fund performance are based on net asset values (NAVs) calculated for shareholder transactions. Generally accepted accounting principles require adjustments to be made to the net assets of the Fund at period end for financial reporting purposes, and as such, the NAVs for shareholder transactions and the returns based on those NAVs may differ from the NAVs and returns reported in the Financial Highlights. |
| | |
| 9 | | Invesco New York Tax Free Income Fund |
Schedule of Investments
February 28, 2019
| | | | | | | | | | | | | | | | |
| | | Interest
Rate | | | Maturity
Date | | | Principal
Amount
(000) | | | Value | |
Municipal Obligations–111.67%(a) | | | | | | | | | | | | | | | | |
| New York–106.93% | | | | | | | | | | | | | | | | |
Albany (County of) Airport Authority; Series 2010 A, Ref. RB (INS-AGM)(b) | | | 5.00 | % | | | 12/15/2025 | | | $ | 500 | | | $ | 519,735 | |
Albany Capital Resource Corp. (St. Peter’s Hospital); Series 2011, RB(c)(d) | | | 6.25 | % | | | 11/15/2020 | | | | 1,000 | | | | 1,076,820 | |
Amherst Development Corp. (Daemen College); Series 2018, Ref. RB | | | 5.00 | % | | | 10/01/2048 | | | | 435 | | | | 464,667 | |
Battery Park City Authority; Series 2009 B, Sr. RB | | | 5.00 | % | | | 11/01/2034 | | | | 500 | | | | 510,580 | |
Brookhaven Local Development Corp. (Jefferson’s Ferry); Series 2016, Ref. RB | | | 5.25 | % | | | 11/01/2036 | | | | 490 | | | | 545,542 | |
Brooklyn Arena Local Development Corp. (Barclays Center); | | | | | | | | | | | | | | | | |
Series 2009, PILOT CAB RB(e) | | | 0.00 | % | | | 07/15/2034 | | | | 3,685 | | | | 1,992,995 | |
Series 2009, PILOT RB(c)(d) | | | 6.25 | % | | | 01/15/2020 | | | | 685 | | | | 712,989 | |
Series 2009, PILOT RB(c)(d) | | | 6.37 | % | | | 01/15/2020 | | | | 475 | | | | 494,917 | |
Series 2016 A, Ref. PILOT RB(f)(g) | | | 5.00 | % | | | 07/15/2042 | | | | 4,795 | | | | 5,158,988 | |
Buffalo & Erie County Industrial Land Development Corp. (Catholic Health System); Series 2015, RB | | | 5.25 | % | | | 07/01/2035 | | | | 1,000 | | | | 1,113,200 | |
Buffalo & Erie County Industrial Land Development Corp. (Orchard Park); Series 2015, Ref. RB | | | 5.00 | % | | | 11/15/2037 | | | | 1,035 | | | | 1,090,869 | |
Buffalo & Erie County Industrial Land Development Corp. (Tapestry Charter School); Series 2017 A, RB | | | 5.00 | % | | | 08/01/2037 | | | | 825 | | | | 865,359 | |
Build NYC Resource Corp.; Series 2015, RB | | | 5.00 | % | | | 07/01/2045 | | | | 1,160 | | | | 1,302,842 | |
Build NYC Resource Corp. (Bronx Charter School for Excellence); Series 2013 A, RB | | | 5.00 | % | | | 04/01/2033 | | | | 500 | | | | 520,140 | |
Build NYC Resource Corp. (Metropolitan Lighthouse Charter School); Series 2017 A, RB(h) | | | 5.00 | % | | | 06/01/2047 | | | | 1,250 | | | | 1,284,750 | |
Build NYC Resource Corp. (Pratt Paper Inc.); Series 2014, Ref. Solid Waste Disposal RB(h)(i) | | | 5.00 | % | | | 01/01/2035 | | | | 1,100 | | | | 1,170,356 | |
Build NYC Resource Corp. (YMCA of Greater New York); | | | | | | | | | | | | | | | | |
Series 2012, RB | | | 5.00 | % | | | 08/01/2032 | | | | 350 | | | | 374,731 | |
Series 2012, RB | | | 5.00 | % | | | 08/01/2042 | | | | 1,750 | | | | 1,860,757 | |
Dutchess County Local Development Corp. (Health Quest Systems, Inc.); Series 2014 A, RB | | | 5.00 | % | | | 07/01/2044 | | | | 600 | | | | 649,986 | |
Erie (County of) Industrial Development Agency (City of Buffalo School District); Series 2011 A, School Facility RB(g) | | | 5.25 | % | | | 05/01/2030 | | | | 2,850 | | | | 3,060,615 | |
Erie Tobacco Asset Securitization Corp.; Series 2005 A, Tobacco Settlement Asset-Backed RB | | | 5.00 | % | | | 06/01/2045 | | | | 1,275 | | | | 1,247,638 | |
Hempstead Town Local Development Corp. (Molloy College); Series 2009, RB(c)(d) | | | 5.75 | % | | | 07/01/2019 | | | | 1,340 | | | | 1,358,398 | |
Hudson Yards Infrastructure Corp.; | | | | | | | | | | | | | | | | |
Series 2012 A, Sr. RB(c)(d) | | | 5.75 | % | | | 02/15/2021 | | | | 865 | | | | 934,589 | |
Series 2012 A, Sr. RB | | | 5.75 | % | | | 02/15/2047 | | | | 535 | | | | 573,723 | |
Jefferson Civic Facility Development Corp. (Samaritan Medical Center); Series 2017 A, Ref. RB | | | 4.00 | % | | | 11/01/2047 | | | | 555 | | | | 511,499 | |
Livingston (County of) Industrial Development Agency (Nicholas H. Noyes Memorial Hospital); | | | | | | | | | | | | | | | | |
Series 2005, Civic Facility RB | | | 6.00 | % | | | 07/01/2030 | | | | 1,000 | | | | 1,010,810 | |
Long Island Power Authority; | | | | | | | | | | | | | | | | |
Series 2008 A, Electric System General RB(c)(d) | | | 5.50 | % | | | 05/01/2019 | | | | 355 | | | | 357,251 | |
Series 2016 B, Ref. RB | | | 5.00 | % | | | 09/01/2036 | | | | 655 | | | | 744,879 | |
Metropolitan Transportation Authority; | | | | | | | | | | | | | | | | |
Series 2009 B, Dedicated Tax Fund RB(c)(d) | | | 5.00 | % | | | 11/15/2019 | | | | 1,500 | | | | 1,536,345 | |
Series 2009 B, Dedicated Tax Fund RB(c)(d) | | | 5.25 | % | | | 11/15/2019 | | | | 615 | | | | 630,965 | |
Series 2012 H, RB(c)(d) | | | 5.00 | % | | | 11/15/2022 | | | | 410 | | | | 460,783 | |
Series 2012 H, RB | | | 5.00 | % | | | 11/15/2030 | | | | 340 | | | | 372,018 | |
Series 2013 E, RB(c)(d) | | | 5.00 | % | | | 11/15/2023 | | | | 1,000 | | | | 1,154,710 | |
Subseries 2002 G-1H, Ref. Floating Rate RB (1 mo. USD LIBOR + 0.82%)(d)(j) | | | 2.49 | % | | | 02/01/2022 | | | | 900 | | | | 906,480 | |
Metropolitan Transportation Authority (Climate Bond Certified); | | | | | | | | | | | | | | | | |
Series 2017, Dedicated Tax Fund Revenue Green Bonds | | | 5.25 | % | | | 11/15/2057 | | | | 935 | | | | 1,072,267 | |
Subseries 2017 A-1, Revenue Green Bonds | | | 5.25 | % | | | 11/15/2057 | | | | 745 | | | | 826,846 | |
Metropolitan Transportation Authority (Green Bonds); Series 2017 C-2, Ref. CAB RB(e) | | | 0.00 | % | | | 11/15/2040 | | | | 3,750 | | | | 1,577,700 | |
Monroe County Industrial Development Corp. (Nazareth College of Rochester); Series 2011, RB(c)(d) | | | 5.50 | % | | | 10/01/2021 | | | | 370 | | | | 406,156 | |
Monroe County Industrial Development Corp. (University of Rochester); | | | | | | | | | | | | | | | | |
Series 2011 A, RB(c)(d) | | | 5.00 | % | | | 07/01/2021 | | | | 875 | | | | 944,493 | |
Series 2015 A, Ref. RB | | | 5.00 | % | | | 07/01/2033 | | | | 785 | | | | 898,268 | |
See accompanying Notes to Financial Statements which are an integral part of the financial statements.
10 Invesco New York Tax Free Income Fund
| | | | | | | | | | | | | | | | |
| | | Interest
Rate | | | Maturity
Date | | | Principal
Amount
(000) | | | Value | |
| New York–(continued) | | | | | | | | | | | | | | | | |
MTA Hudson Rail Yards Trust Obligations; Series 2016 A, RB(f)(g) | | | 5.00 | % | | | 11/15/2051 | | | $ | 4,905 | | | $ | 5,196,357 | |
Nassau (County of) Industrial Development Agency (Amsterdam at Harborside); | | | | | | | | | | | | | | | | |
Series 2014 A, Continuing Care Retirement Community RB | | | 6.50 | % | | | 01/01/2032 | | | | 420 | | | | 429,925 | |
Series 2014 A, Continuing Care Retirement Community RB | | | 6.70 | % | | | 01/01/2049 | | | | 180 | | | | 180,185 | |
Series 2014 C, Continuing Care Retirement Community RB(k) | | | 2.00 | % | | | 01/01/2049 | | | | 65 | | | | 11,043 | |
Nassau County Local Economic Assistance Corp. (South Nassau Communities); Series 2012, Ref. RB | | | 5.00 | % | | | 07/01/2027 | | | | 930 | | | | 1,011,180 | |
Nassau County Local Economic Assistance Corp. (Winthrop University Hospital Association); | | | | | | | | | | | | | | | | |
Series 2012, Ref. RB | | | 5.00 | % | | | 07/01/2037 | | | | 750 | | | | 791,648 | |
Nassau County Tobacco Settlement Corp.; | | | | | | | | | | | | | | | | |
Series 2006 A-2, Sr. Asset-Backed Conv. CAB RB(l) | | | 5.25 | % | | | 06/01/2026 | | | | 1,000 | | | | 1,000,160 | |
Series 2006 A-3, Sr. Asset-Backed RB | | | 5.00 | % | | | 06/01/2035 | | | | 750 | | | | 728,025 | |
Series 2006 A-3, Sr. Asset-Backed RB | | | 5.13 | % | | | 06/01/2046 | | | | 615 | | | | 585,240 | |
New York & New Jersey (States of) Port Authority; Two Hundred Series 2017, Ref. Consolidated RB(g) | | | 5.25 | % | | | 10/15/2057 | | | | 3,115 | | | | 3,569,759 | |
New York & New Jersey (States of) Port Authority (JFK International Air Terminal LLC); | | | | | | | | | | | | | | | | |
Series 1997 6, Special Obligation RB (INS-NATL)(b)(i) | | | 5.75 | % | | | 12/01/2022 | | | | 1,645 | | | | 1,706,901 | |
Series 2010, Special Obligation RB | | | 6.00 | % | | | 12/01/2042 | | | | 860 | | | | 908,968 | |
New York (City of); | | | | | | | | | | | | | | | | |
Series 2016 B-1, Unlimited Tax GO Bonds | | | 5.00 | % | | | 12/01/2041 | | | | 1,000 | | | | 1,130,410 | |
Series 2018 E-1, Unlimited Tax GO Bonds | | | 5.25 | % | | | 03/01/2035 | | | | 1,000 | | | | 1,194,880 | |
Subseries 2008 G-1, Unlimited Tax GO Bonds | | | 6.25 | % | | | 12/15/2035 | | | | 10 | | | | 10,035 | |
Subseries 2012 G-7, VRD Unlimited Tax GO Bonds (LOC-MUFG Bank, Ltd.)(m)(n) | | | 1.58 | % | | | 04/01/2042 | | | | 450 | | | | 450,000 | |
Subseries 2015 F-5, VRD Unlimited Tax GO Bonds(m) | | | 1.55 | % | | | 06/01/2044 | | | | 2,250 | | | | 2,250,000 | |
New York (City of) Industrial Development Agency (Queens Baseball Stadium); Series 2006, PILOT RB (INS-AMBAC)(b) | | | 5.00 | % | | | 01/01/2036 | | | | 1,140 | | | | 1,142,998 | |
New York (City of) Municipal Water Finance Authority; | | | | | | | | | | | | | | | | |
Series 2009 FF-2, Water & Sewer System RB | | | 5.50 | % | | | 06/15/2040 | | | | 2,000 | | | | 2,021,000 | |
Series 2017 DD, Water & Sewer System RB(g) | | | 5.25 | % | | | 06/15/2047 | | | | 2,250 | | | | 2,588,108 | |
Subseries 2012 A-1, VRD Water & Sewer System RB(m) | | | 1.55 | % | | | 06/15/2044 | | | | 2,000 | | | | 2,000,000 | |
New York (City of) Transitional Finance Authority; | | | | | | | | | | | | | | | | |
Series 2018 S-3, Building Aid RB | | | 5.25 | % | | | 07/15/2045 | | | | 310 | | | | 360,846 | |
Series 2018 S-3, RB | | | 5.00 | % | | | 07/15/2043 | | | | 885 | | | | 1,010,307 | |
Subseries 2009 A-1, Future Tax Sec. RB(c)(d)(g) | | | 5.00 | % | | | 05/01/2019 | | | | 605 | | | | 608,406 | |
Subseries 2009 A-1, Future Tax Sec. RB(g) | | | 5.00 | % | | | 05/01/2028 | | | | 755 | | | | 758,926 | |
Subseries 2009 A-1, Future Tax Sec. RB(c)(g) | | | 5.00 | % | | | 05/01/2029 | | | | 605 | | | | 608,406 | |
Subseries 2011 E, Future Tax Sec. RB | | | 5.00 | % | | | 11/01/2024 | | | | 660 | | | | 705,870 | |
New York (City of) Trust for Cultural Resources (American Museum of Natural History); Series 2014 A, Ref. RB | | | 5.00 | % | | | 07/01/2041 | | | | 1,000 | | | | 1,127,960 | |
New York (City of) Trust for Cultural Resources (Carnegie Hall); Series 2009 A, RB | | | 5.00 | % | | | 12/01/2039 | | | | 850 | | | | 868,530 | |
New York (Counties of) Tobacco Trust V; | | | | | | | | | | | | | | | | |
Series 2005 S-1, Sub. Pass Through CAB RB(e) | | | 0.00 | % | | | 06/01/2038 | | | | 3,430 | | | | 1,069,337 | |
Series 2005 S-2, Sub. Pass Through CAB RB(e) | | | 0.00 | % | | | 06/01/2050 | | | | 6,770 | | | | 874,346 | |
New York (State of) Dormitory Authority; | | | | | | | | | | | | | | | | |
Series 2009 C, School Districts Bond Financing Program RB(c)(d) | | | 5.00 | % | | | 10/01/2019 | | | | 1,385 | | | | 1,412,880 | |
Series 2009 C, School Districts Bond Financing Program RB (INS-AGC)(b) | | | 5.00 | % | | | 10/01/2024 | | | | 115 | | | | 117,114 | |
Series 2016 A, Ref. School Districts Bond Financing Program RB | | | 5.00 | % | | | 10/01/2033 | | | | 600 | | | | 693,738 | |
New York (State of) Dormitory Authority (Brooklyn Law School); Series 2009, Ref. RB | | | 5.75 | % | | | 07/01/2033 | | | | 660 | | | | 666,996 | |
New York (State of) Dormitory Authority (City of New York); | | | | | | | | | | | | | | | | |
Series 2005 A, Court Facilities Lease RB (INS-AMBAC)(b) | | | 5.50 | % | | | 05/15/2027 | | | | 710 | | | | 884,887 | |
Series 2005 A, Court Facilities Lease RB (INS-AMBAC)(b) | | | 5.50 | % | | | 05/15/2030 | | | | 750 | | | | 962,932 | |
Series 2005 A, Court Facilities Lease RB (INS-AMBAC)(b) | | | 5.50 | % | | | 05/15/2031 | | | | 555 | | | | 712,565 | |
New York (State of) Dormitory Authority (Columbia University); Series 2011 A, RB | | | 5.00 | % | | | 10/01/2041 | | | | 510 | | | | 540,141 | |
New York (State of) Dormitory Authority (Education); Series 2008 B, State Personal Income Tax RB(c)(d) | | | 5.75 | % | | | 03/15/2019 | | | | 1,000 | | | | 1,001,300 | |
See accompanying Notes to Financial Statements which are an integral part of the financial statements.
11 Invesco New York Tax Free Income Fund
| | | | | | | | | | | | | | | | |
| | | Interest
Rate | | | Maturity
Date | | | Principal
Amount
(000) | | | Value | |
| New York–(continued) | | | | | | | | | | | | | | | | |
New York (State of) Dormitory Authority (Fashion Institute of Technology Student Housing Corp.); | | | | | | | | | | | | | | | | |
Series 2007, RB (INS-NATL)(b) | | | 5.25 | % | | | 07/01/2028 | | | $ | 935 | | | $ | 1,098,597 | |
New York (State of) Dormitory Authority (Fordham University); Series 2011 A, RB(c)(d) | | | 5.13 | % | | | 07/01/2021 | | | | 500 | | | | 541,130 | |
New York (State of) Dormitory Authority (General Purpose); Series 2018 A, Ref. State Personal Income Tax RB | | | 5.25 | % | | | 03/15/2038 | | | | 1,500 | | | | 1,786,305 | |
New York (State of) Dormitory Authority (Icahn School of Medicine at Mount Sinai); Series 2015, Ref. RB | | | 5.00 | % | | | 07/01/2045 | | | | 1,165 | | | | 1,282,945 | |
New York (State of) Dormitory Authority (Marymount Manhattan College); Series 2009, RB | | | 5.25 | % | | | 07/01/2029 | | | | 1,000 | | | | 1,009,930 | |
New York (State of) Dormitory Authority (Memorial Sloan-Kettering Cancer Center); Series 1998, RB (INS-NATL)(b) | | | 5.50 | % | | | 07/01/2023 | | | | 1,250 | | | | 1,406,875 | |
New York (State of) Dormitory Authority (Mount Sinai Hospital Obligated Group); Series 2011 A, RB | | | 5.00 | % | | | 07/01/2031 | | | | 875 | | | | 935,008 | |
New York (State of) Dormitory Authority (Mount Sinai School of Medicine of New York University); | | | | | | | | | | | | | | | | |
Series 2009, RB(c)(d) | | | 5.13 | % | | | 07/01/2019 | | | | 1,250 | | | | 1,264,437 | |
New York (State of) Dormitory Authority (New York University Hospitals Center); Series 2011 A, RB(c)(d) | | | 6.00 | % | | | 07/01/2020 | | | | 1,500 | | | | 1,587,375 | |
New York (State of) Dormitory Authority (New York University); Series 2001 1, RB (INS-BHAC)(b) | | | 5.50 | % | | | 07/01/2031 | | | | 1,070 | | | | 1,328,148 | |
New York (State of) Dormitory Authority (North Shore - Long Island Jewish Obligated Group); | | | | | | | | | | | | | | | | |
Series 2009 A, RB(c)(d) | | | 5.50 | % | | | 05/01/2019 | | | | 1,250 | | | | 1,257,925 | |
New York (State of) Dormitory Authority (Orange Regional Medical Center); | | | | | | | | | | | | | | | | |
Series 2015, Ref.RB (h) | | | 5.00 | % | | | 12/01/2045 | | | | 425 | | | | 455,430 | |
Series 2017, Ref.RB (h) | | | 5.00 | % | | | 12/01/2036 | | | | 1,300 | | | | 1,438,359 | |
New York (State of) Dormitory Authority (Pace University); | | | | | | | | | | | | | | | | |
Series 2013 A, RB(c)(d) | | | 5.00 | % | | | 05/01/2023 | | | | 20 | | | | 22,673 | |
Series 2013 A, RB | | | 5.00 | % | | | 05/01/2029 | | | | 980 | | | | 1,054,068 | |
New York (State of) Dormitory Authority (Pratt Institute); | | | | | | | | | | | | | | | | |
Series 2015 A, Ref. RB | | | 5.00 | % | | | 07/01/2044 | | | | 925 | | | | 1,021,450 | |
Series 2016, Ref. RB | | | 5.00 | % | | | 07/01/2039 | | | | 500 | | | | 559,075 | |
New York (State of) Dormitory Authority (Rochester Institute of Technology); Series 2010, RB | | | 5.00 | % | | | 07/01/2040 | | | | 1,250 | | | | 1,296,012 | |
New York (State of) Dormitory Authority (Rockefeller University); Series 2010 A, RB | | | 5.00 | % | | | 07/01/2041 | | | | 775 | | | | 806,845 | |
New York (State of) Dormitory Authority (St. John’s University); | | | | | | | | | | | | | | | | |
Series 2012, RB(c)(d) | | | 5.00 | % | | | 07/01/2022 | | | | 580 | | | | 643,991 | |
Series 2012, RB(c)(d) | | | 5.00 | % | | | 07/01/2022 | | | | 5 | | | | 5,543 | |
Series 2012, RB | | | 5.00 | % | | | 07/01/2030 | | | | 635 | | | | 692,582 | |
New York (State of) Dormitory Authority (St. Joseph’s College); Series 2010, RB | | | 5.25 | % | | | 07/01/2035 | | | | 500 | | | | 507,970 | |
New York (State of) Dormitory Authority (State University of New York); Series 2013 A, RB | | | 5.00 | % | | | 07/01/2029 | | | | 1,185 | | | | 1,328,859 | |
New York (State of) Dormitory Authority (The New School); | | | | | | | | | | | | | | | | |
Series 2010, RB(c)(d) | | | 5.50 | % | | | 07/01/2020 | | | | 1,245 | | | | 1,309,391 | |
Series 2011, Ref. RB | | | 5.00 | % | | | 07/01/2031 | | | | 750 | | | | 797,903 | |
New York (State of) Dormitory Authority (Touro College and University System); | | | | | | | | | | | | | | | | |
Series 2014 A, RB | | | 5.50 | % | | | 01/01/2039 | | | | 630 | | | | 682,737 | |
Series 2014 A, RB | | | 5.50 | % | | | 01/01/2044 | | | | 700 | | | | 754,740 | |
New York (State of) Power Authority; Series 2011 A, RB | | | 5.00 | % | | | 11/15/2038 | | | | 730 | | | | 788,604 | |
New York (State of) Thruway Authority; | | | | | | | | | | | | | | | | |
Series 2009 B, Second General Highway & Bridge Trust Fund RB(c)(d) | | | 5.00 | % | | | 04/01/2019 | | | | 500 | | | | 501,335 | |
Series 2014 J, RB | | | 5.00 | % | | | 01/01/2034 | | | | 1,620 | | | | 1,805,198 | |
New York Convention Center Development Corp. (Hotel Unit Fee Secured); | | | | | | | | | | | | | | | | |
Series 2015, Ref. RB | | | 5.00 | % | | | 11/15/2040 | | | | 1,500 | | | | 1,697,355 | |
Series 2016 B, CAB Sub. Lien RB(e) | | | 0.00 | % | | | 11/15/2044 | | | | 3,270 | | | | 1,110,492 | |
New York Liberty Development Corp. (3 World Trade Center); | | | | | | | | | | | | | | | | |
Series 2014, Class 1, Ref. Liberty RB(h) | | | 5.00 | % | | | 11/15/2044 | | | | 1,505 | | | | 1,569,218 | |
Series 2014, Class 3, Ref. Liberty RB(h) | | | 7.25 | % | | | 11/15/2044 | | | | 415 | | | | 483,766 | |
New York Liberty Development Corp. (4 World Trade Center); Series 2011, Ref. Liberty RB | | | 5.00 | % | | | 11/15/2031 | | | | 875 | | | | 940,931 | |
New York Liberty Development Corp. (7 World Trade Center); Series 2012, Class 2, Ref. Liberty RB | | | 5.00 | % | | | 09/15/2043 | | | | 1,410 | | | | 1,515,947 | |
New York Liberty Development Corp. (Bank of America Tower at One Bryant Park); Series 2010, Ref. Second Priority Liberty RB | | | 6.37 | % | | | 07/15/2049 | | | | 1,215 | | | | 1,259,299 | |
New York Liberty Development Corp. (Goldman Sachs Headquarters); Series 2007, RB | | | 5.50 | % | | | 10/01/2037 | | | | 855 | | | | 1,083,516 | |
See accompanying Notes to Financial Statements which are an integral part of the financial statements.
12 Invesco New York Tax Free Income Fund
| | | | | | | | | | | | | | | | |
| | | Interest
Rate | | | Maturity
Date | | | Principal
Amount
(000) | | | Value | |
| New York–(continued) | | | | | | | | | | | | | | | | |
New York State Environmental Facilities Corp. (Municipal Water Finance Authority); Series 2011 B, State Clean Water & Drinking Water Revolving Funds RB | | | 5.00 | % | | | 06/15/2031 | | | $ | 1,430 | | | $ | 1,530,214 | |
New York State Environmental Facilities Corp. (Pooled Financing Program); Series 2005 B, State Clean Water & Drinking Water Revolving Funds RB(c) | | | 5.50 | % | | | 04/15/2035 | | | | 615 | | | | 824,863 | |
New York Transportation Development Corp. (American Airlines, Inc.); Series 2016, Ref. Special Facilities
RB(i) | | | 5.00 | % | | | 08/01/2026 | | | | 1,070 | | | | 1,120,985 | |
New York Transportation Development Corp. (Delta Air Lines, Inc. LaGuardia Airport Terminal C&D Redevelopment); Series 2018, Special Facilities RB(i) | | | 5.00 | % | | | 01/01/2036 | | | | 1,545 | | | | 1,731,574 | |
New York Transportation Development Corp. (LaGuardia Airport Terminal B Redevelopment); | | | | | | | | | | | | | | | | |
Series 2016 A, Special Facilities RB(f)(g)(i) | | | 5.00 | % | | | 07/01/2046 | | | | 1,750 | | | | 1,853,600 | |
Niagara Area Development Corp. (Covanta); Series 2018 A, Ref. Solid Waste Disposal Facilities RB(h)(i) | | | 4.75 | % | | | 11/01/2042 | | | | 790 | | | | 784,399 | |
Niagara Frontier Transportation Authority (Buffalo Niagara International Airport); Series 2014 A, Ref. RB (i) | | | 5.00 | % | | | 04/01/2029 | | | | 725 | | | | 806,244 | |
Niagara Tobacco Asset Securitization Corp.; Series 2014, Ref. Asset Backed RB | | | 5.25 | % | | | 05/15/2040 | | | | 275 | | | | 288,470 | |
North Syracuse Central School District; Series 2007, Ref. Unlimited Tax GO Bonds (INS-NATL)(b) | | | 5.00 | % | | | 06/15/2023 | | | | 935 | | | | 1,054,858 | |
Onondaga Civic Development Corp. (Le Moyne College); Series 2010, RB | | | 5.37 | % | | | 07/01/2040 | | | | 1,065 | | | | 1,097,877 | |
Onondaga Civic Development Corp. (St. Joseph’s Hospital Health Center); Series 2014 A, RB(c)(d) | | | 5.13 | % | | | 07/01/2019 | | | | 750 | | | | 758,663 | |
Rensselaer (County of) Industrial Development Agency (Franciscan Heights, L.P.); Series 2004 A, IDR
(LOC-JP Morgan Chase Bank)(i)(n) | | | 5.37 | % | | | 12/01/2036 | | | | 1,000 | | | | 1,001,890 | |
Rockland Tobacco Asset Securitization Corp.; | | | | | | | | | | | | | | | | |
Series 2001, Tobacco Settlement Asset-Backed RB | | | 5.75 | % | | | 08/15/2043 | | | | 720 | | | | 738,166 | |
Series 2005 A, First Sub. Tobacco Settlement Asset-Backed RB(e)(h) | | | 0.00 | % | | | 08/15/2045 | | | | 4,000 | | | | 628,760 | |
Series 2005 C, Third Sub. Tobacco Settlement Asset-Backed RB(e)(h) | | | 0.00 | % | | | 08/15/2060 | | | | 25,000 | | | | 846,250 | |
Sales Tax Asset Receivable Corp.; Series 2014 A, Ref. RB(g) | | | 5.00 | % | | | 10/15/2031 | | | | 2,765 | | | | 3,183,842 | |
Suffolk (County of) Industrial Development Agency (Eastern Long Island Hospital Association); | | | | | | | | | | | | | | | | |
Series 2007, Civic Facility RB(h) | | | 5.37 | % | | | 01/01/2027 | | | | 820 | | | | 816,941 | |
Suffolk County Economic Development Corp. (Peconic Landing at Southold, Inc.); Series 2010, Ref. RB | | | 6.00 | % | | | 12/01/2040 | | | | 465 | | | | 487,827 | |
Suffolk Economic Development Corp. (Catholic Health Services); Series 2014 C, RB | | | 5.00 | % | | | 07/01/2032 | | | | 415 | | | | 451,520 | |
Syracuse (City of); Series 2011 A, Airport Terminal Security & Access Improvement Unlimited Tax GO
Bonds(i) | | | 5.00 | % | | | 11/01/2036 | | | | 1,000 | | | | 1,056,220 | |
Syracuse (City of) Industrial Development Agency (Carousel Center); Series 2016 A, Ref. PILOT RB(i) | | | 5.00 | % | | | 01/01/2035 | | | | 755 | | | | 816,246 | |
Tompkins (County of) Industrial Development Agency (Cornell University); Series 2008 A, Civic Facility RB | | | 5.00 | % | | | 07/01/2037 | | | | 250 | | | | 259,970 | |
Tompkins County Development Corp. (Tompkins Cortland Community College Foundation, Inc.); | | | | | | | | | | | | | | | | |
Series 2013 A, RB | | | 5.00 | % | | | 07/01/2032 | | | | 1,250 | | | | 1,231,987 | |
Triborough Bridge & Tunnel Authority; Series 2013 C, RB(g) | | | 5.00 | % | | | 11/15/2038 | | | | 2,790 | | | | 3,092,687 | |
Troy Capital Resource Corp. (Rensselaer Polytechnic Institute); Series 2010 A, RB | | | 5.00 | % | | | 09/01/2030 | | | | 1,250 | | | | 1,302,075 | |
TSASC, Inc.; | | | | | | | | | | | | | | | | |
Series 2016 B, Ref. Sub. Tobacco Settlement Turbo RB | | | 5.00 | % | | | 06/01/2048 | | | | 930 | | | | 893,963 | |
Series 2017 A, Ref. Tobacco Settlement RB | | | 5.00 | % | | | 06/01/2036 | | | | 1,345 | | | | 1,472,156 | |
United Nations Development Corp.; | | | | | | | | | | | | | | | | |
Series 2009 A, Ref. RB | | | 5.00 | % | | | 07/01/2025 | | | | 1,000 | | | | 1,010,320 | |
Series 2009 A, Ref. RB | | | 5.00 | % | | | 07/01/2026 | | | | 810 | | | | 818,335 | |
Westchester (County of) Industrial Development Agency (Million Air Two LLC General Aviation Facilities); | | | | | | | | | | | | | | | | |
Series 2017 A, Special Facility RB(h)(i) | | | 7.00 | % | | | 06/01/2046 | | | | 470 | | | | 508,484 | |
Westchester Local Development Corp. (Westchester Medical Center Obligated Group); Series 2016, Ref. RB | | | 5.00 | % | | | 11/01/2046 | | | | 1,000 | | | | 1,071,410 | |
Westchester Tobacco Asset Securitization Corp.; Series 2016 C, Ref. Sub. RB | | | 5.13 | % | | | 06/01/2051 | | | | 1,295 | | | | 1,306,590 | |
Yonkers Economic Development Corp. (Charter School of Educational Excellence); Series 2010 A, Educational RB | | | 6.25 | % | | | 10/15/2040 | | | | 1,000 | | | | 1,025,170 | |
| | | | | | | | | | | | | | | | 161,693,485 | |
See accompanying Notes to Financial Statements which are an integral part of the financial statements.
13 Invesco New York Tax Free Income Fund
| | | | | | | | | | | | | | | | |
| | | Interest
Rate | | | Maturity
Date | | | Principal
Amount
(000) | | | Value | |
| Guam–3.33% | | | | | | | | | | | | | | | | |
Guam (Territory of); | | | | | | | | | | | | | | | | |
Series 2011 A, Business Privilege Tax RB | | | 5.25 | % | | | 01/01/2036 | | | $ | 550 | | | $ | 574,387 | |
Series 2015 D, Ref. Business Privilege Tax RB | | | 5.00 | % | | | 11/15/2039 | | | | 750 | | | | 788,910 | |
Guam (Territory of) (Section 30); | | | | | | | | | | | | | | | | |
Series 2009 A, Limited Obligation RB(c)(d) | | | 5.62 | % | | | 12/01/2019 | | | | 135 | | | | 139,089 | |
Series 2009 A, Limited Obligation RB(c)(d) | | | 5.75 | % | | | 12/01/2019 | | | | 1,250 | | | | 1,289,000 | |
Guam (Territory of) Power Authority; | | | | | | | | | | | | | | | | |
Series 2010 A, RB(c)(d) | | | 5.50 | % | | | 10/01/2020 | | | | 450 | | | | 476,892 | |
Series 2012 A, Ref. RB | | | 5.00 | % | | | 10/01/2034 | | | | 610 | | | | 640,018 | |
Guam (Territory of) Waterworks Authority; | | | | | | | | | | | | | | | | |
Series 2010, Water & Wastewater System RB(c)(d) | | | 5.63 | % | | | 07/01/2020 | | | | 740 | | | | 778,473 | |
Series 2014 A, Ref. Water & Wastewater System RB | | | 5.00 | % | | | 07/01/2029 | | | | 325 | | | | 354,172 | |
| | | | | | | | | | | | | | | | 5,040,941 | |
| | | | |
| Virgin Islands–0.98% | | | | | | | | | | | | | | | | |
Virgin Islands (Government of) Port Authority; Series 2014 A, Ref. Marine RB(i) | | | 5.00 | % | | | 09/01/2029 | | | | 665 | | | | 653,296 | |
Virgin Islands (Government of) Public Finance Authority; Series 2015, RB(h) | | | 5.00 | % | | | 09/01/2030 | | | | 770 | | | | 828,959 | |
| | | | | | | | | | | | | | | | 1,482,255 | |
| | | | |
| Puerto Rico–0.43% | | | | | | | | | | | | | | | | |
Children’s Trust Fund; Series 2002, Tobacco Settlement Asset-Backed RB | | | 5.37 | % | | | 05/15/2033 | | | | 335 | | | | 338,239 | |
Puerto Rico Sales Tax Financing Corp.; Series 2018 A-1, CAB RB(e) | | | 0.00 | % | | | 07/01/2027 | | | | 420 | | | | 305,256 | |
| | | | | | | | | | | | | | | | 643,495 | |
TOTAL INVESTMENTS IN SECURITIES(o)–111.67% (Cost $162,342,034) | | | | | | | | | | | | | | | 168,860,176 | |
FLOATING RATE NOTE OBLIGATIONS–(12.15)% | | | | | | | | | | | | | | | | |
Notes with interest and fee rates ranging from 2.21% to 2.28% at 02/28/2019 and
contractual maturities of collateral ranging from 01/15/2027 to 10/15/2057 (See Note 1K)(p) | | | | | | | | | | | | | | | (18,370,000 | ) |
OTHER ASSETS LESS LIABILITIES–0.48% | | | | | | | | | | | | | | | 718,522 | |
NET ASSETS–100.00% | | | | | | | | | | | | | | $ | 151,208,698 | |
Investment Abbreviations:
| | |
| AGC | | - Assured Guaranty Corp. |
| AGM | | - Assured Guaranty Municipal Corp. |
| AMBAC | | - American Municipal Bond Assurance Corp. |
| BHAC | | - Berkshire Hathaway Assurance Corp. |
| CAB | | - Capital Appreciation Bonds |
| Conv. | | - Convertible |
| GO | | - General Obligation |
| IDR | | - Industrial Development Revenue Bonds |
| INS | | - Insurer |
| LIBOR | | - London Interbank Offered Rate |
| LOC | | - Letter of Credit |
| NATL | | - National Public Finance Guarantee Corp. |
| PILOT | | - Payment-in-Lieu-of-Tax |
| RB | | - Revenue Bonds |
| Ref. | | - Refunding |
| Sec. | | - Secured |
| Sr. | | - Senior |
| Sub. | | - Subordinated |
| USD | | - U.S. Dollar |
| VRD | | - Variable Rate Demand |
See accompanying Notes to Financial Statements which are an integral part of the financial statements.
14 Invesco New York Tax Free Income Fund
Notes to Schedule of Investments:
| (a) | Calculated as a percentage of net assets. Amounts in excess of 100% are due to the Fund’s use of leverage. |
| (b) | Principal and/or interest payments are secured by the bond insurance company listed. |
| (c) | Advance refunded; secured by an escrow fund of U.S. Government obligations or other highly rated collateral. |
| (d) | Security has an irrevocable call by the issuer or mandatory put by the holder. Maturity date reflects such call or put. |
| (e) | Zero coupon bond issued at a discount. |
| (f) | Security is subject to a reimbursement agreement which may require the Fund to pay amounts to a counterparty in the event of a significant decline in the market value of the security underlying the TOB Trusts. In case of a shortfall, the maximum potential amount of payments the Fund could ultimately be required to make under the agreement is $7,635,000. However, such shortfall payment would be reduced by the proceeds from the sale of the security underlying the TOB Trusts. |
| (g) | Underlying security related to TOB Trusts entered into by the Fund. See Note 1K. |
| (h) | Security purchased or received in a transaction exempt from registration under the Securities Act of 1933, as amended (the “1933 Act”). The security may be resold pursuant to an exemption from registration under the 1933 Act, typically to qualified institutional buyers. The aggregate value of these securities at February 28, 2019 was $10,815,672, which represented 7.15% of the Fund’s Net Assets. |
| (i) | Security subject to the alternative minimum tax. |
| (j) | Interest or dividend rate is redetermined periodically. Rate shown is the rate in effect on February 28, 2019. |
| (k) | Defaulted security. Currently, the issuer is partially or fully in default with respect to interest payments. The aggregate value of these securities at February 28, 2019 was $11,043, which represented less than 1% of the Fund’s Net Assets. |
| (l) | Convertible CAB. The interest rate shown represents the coupon rate at which the bond will accrue at a specified future date. |
| (m) | Demand security payable upon demand by the Fund at specified time intervals no greater than thirteen months. Interest rate is redetermined periodically by the issuer or agent based on current market conditions. Rate shown is the rate in effect on February 28, 2019. |
| (n) | Principal and interest payments are fully enhanced by a letter of credit from the bank listed or a predecessor bank, branch or subsidiary. |
| (o) | Entities may either issue, guarantee, back or otherwise enhance the credit quality of a security. The entities are not primarily responsible for the issuer’s obligation but may be called upon to satisfy issuer’s obligations. No concentration of any single entity was greater than 5% each. |
| (p) | Floating rate note obligations related to securities held. The interest and fee rates shown reflect the rates in effect at February 28, 2019. At February 28, 2019, the Fund’s investments with a value of $29,679,694 are held by TOB Trusts and serve as collateral for the $18,370,000 in the floating rate note obligations outstanding at that date. |
See accompanying Notes to Financial Statements which are an integral part of the financial statements.
15 Invesco New York Tax Free Income Fund
Statement of Assets and Liabilities
February 28, 2019
| | | | |
Assets: | | | | |
Investments in securities, at value
(Cost $162,342,034) | | $ | 168,860,176 | |
Receivable for: | | | | |
Fund shares sold | | | 89,715 | |
Interest | | | 1,735,208 | |
Investment for trustee deferred compensation and retirement plans | | | 42,453 | |
Other assets | | | 19,654 | |
Total assets | | | 170,747,206 | |
| |
Liabilities: | | | | |
Floating rate note obligations | | | 18,370,000 | |
Payable for: | | | | |
Dividends | | | 165,357 | |
Fund shares reacquired | | | 22,138 | |
Amount due custodian | | | 748,202 | |
Accrued fees to affiliates | | | 53,097 | |
Accrued trustees’ and officers’ fees and benefits | | | 3,204 | |
Accrued other operating expenses | | | 84,500 | |
Trustee deferred compensation and retirement plans | | | 92,010 | |
Total liabilities | | | 19,538,508 | |
Net assets applicable to shares outstanding | | $ | 151,208,698 | |
| |
Net assets consist of: | | | | |
Shares of beneficial interest | | $ | 152,498,635 | |
Distributable earnings | | | (1,289,937 | ) |
| | | $ | 151,208,698 | |
| | | | |
Net Assets: | | | | |
Class A | | $ | 116,332,921 | |
Class C | | $ | 15,702,914 | |
Class Y | | $ | 17,713,882 | |
Class R6 | | $ | 1,458,981 | |
|
Shares outstanding, no par value, with an unlimited number of shares authorized: | |
Class A | | | 7,672,410 | |
Class C | | | 1,037,584 | |
Class Y | | | 1,169,595 | |
Class R6 | | | 96,366 | |
Class A: | | | | |
Net asset value per share | | $ | 15.16 | |
Maximum offering price per share | | | | |
(Net asset value of $15.16 ÷ 95.75%) | | $ | 15.83 | |
Class C: | | | | |
Net asset value and offering price per share | | $ | 15.13 | |
Class Y: | | | | |
Net asset value and offering price per share | | $ | 15.15 | |
Class R6: | | | | |
Net asset value and offering price per share | | $ | 15.14 | |
See accompanying Notes to Financial Statements which are an integral part of the financial statements.
16 Invesco New York Tax Free Income Fund
Statement of Operations
For the year ended February 28, 2019
| | | | |
Investment income: | |
Interest | | $ | 7,478,082 | |
| |
Expenses: | | | | |
Advisory fees | | | 739,493 | |
Administrative services fees | | | 45,417 | |
Custodian fees | | | 2,517 | |
Distribution fees: | | | | |
Class A | | | 280,777 | |
Class C | | | 224,521 | |
Interest, facilities and maintenance fees | | | 352,323 | |
Transfer agent fees – A, C and Y | | | 136,507 | |
Transfer agent fees – R6 | | | 248 | |
Trustees’ and officers’ fees and benefits | | | 21,890 | |
Registration and filing fees | | | 62,751 | |
Reports to shareholders | | | 26,389 | |
Professional services fees | | | 83,506 | |
Other | | | 34,764 | |
Total expenses | | | 2,011,103 | |
Less: Fees waived and expense offset arrangement(s) | | | (299 | ) |
Net expenses | | | 2,010,804 | |
Net investment income | | | 5,467,278 | |
| |
Realized and unrealized gain (loss) from: | | | | |
Net realized gain (loss) from Investment securities | | | (589,504 | ) |
Change in net unrealized appreciation (depreciation) of Investment securities | | | (1,148,927 | ) |
Net realized and unrealized gain (loss) | | | (1,738,431 | ) |
Net increase in net assets resulting from operations | | $ | 3,728,847 | |
See accompanying Notes to Financial Statements which are an integral part of the financial statements.
17 Invesco New York Tax Free Income Fund
Statement of Changes in Net Assets
For the years ended February 28, 2019 and 2018
| | | | | | | | |
| | | 2019 | | | 2018 | |
Operations: | | | | | | | | |
Net investment income | | $ | 5,467,278 | | | $ | 5,736,380 | |
Net realized gain (loss) | | | (589,504 | ) | | | (389,280 | ) |
Change in net unrealized appreciation (depreciation) | | | (1,148,927 | ) | | | (883,331 | ) |
Net increase in net assets resulting from operations | | | 3,728,847 | | | | 4,463,769 | |
| | |
Distributions to shareholders from distributable earnings(1): | | | | | | | | |
Class A | | | (3,979,497 | ) | | | (4,010,509 | ) |
Class B | | | – | | | | (23,590 | ) |
Class C | | | (640,076 | ) | | | (689,764 | ) |
Class Y | | | (779,022 | ) | | | (784,509 | ) |
Class R6 | | | (67,660 | ) | | | (7,234 | ) |
Total distributions to shareholders from distributable earnings | | | (5,466,255 | ) | | | (5,515,606 | ) |
| | |
Share transactions–net: | | | | | | | | |
Class A | | | (409,875 | ) | | | (5,484,864 | ) |
Class B | | | – | | | | (1,090,313 | ) |
Class C | | | (8,898,379 | ) | | | (2,808,289 | ) |
Class Y | | | (3,899,868 | ) | | | 4,051,077 | |
Class R6 | | | (393,880 | ) | | | 1,898,366 | |
Net increase (decrease) in net assets resulting from share transactions | | | (13,602,002 | ) | | | (3,434,023 | ) |
Net increase (decrease) in net assets | | | (15,339,410 | ) | | | (4,485,860 | ) |
| | |
Net assets: | | | | | | | | |
Beginning of year | | | 166,548,108 | | | | 171,033,968 | |
End of year | | $ | 151,208,698 | | | $ | 166,548,108 | |
| (1) | The Securities and Exchange Commission eliminated the requirement to disclose distribution components separately, except for tax return of capital. For the year ended February 28, 2018, distributions to shareholders from distributable earnings consisted of distributions from net investment income. |
See accompanying Notes to Financial Statements which are an integral part of the financial statements.
18 Invesco New York Tax Free Income Fund
Statement of Cash Flows
For the year ended February 28, 2019
| | | | |
Cash provided by operating activities: | | | | |
Net increase in net assets resulting from operations | | $ | 3,728,847 | |
|
Adjustments to reconcile the change in net assets from operations to net cash provided by operating activities: | |
Purchases of investments | | | (12,607,652 | ) |
Proceeds from sales of investments | | | 25,785,451 | |
Proceeds from sales of short-term investments, net | | | 249,630 | |
Amortization of premium on investment securities | | | 979,335 | |
Accretion of discount on investment securities | | | (470,460 | ) |
Decrease in receivables and other assets | | | 197,475 | |
Increase in accrued expenses and other payables | | | 3,402 | |
Net realized loss from investment securities | | | 589,504 | |
Net change in unrealized depreciation on investment securities | | | 1,148,927 | |
Net cash provided by operating activities | | | 19,604,459 | |
| |
Cash provided by (used in) financing activities: | | | | |
Dividends paid to shareholders from distributable earnings | | | (1,688,788 | ) |
Increase in payable for amount due custodian | | | 748,202 | |
Proceeds from shares of beneficial interest sold | | | 28,690,821 | |
Proceeds of TOB Trusts | | | 3,190,000 | |
Repayments of TOB Trusts | | | (4,735,000 | ) |
Disbursements from shares of beneficial interest reacquired | | | (46,152,544 | ) |
Net cash provided by (used in) financing activities | | | (19,947,309 | ) |
Net decrease in cash and cash equivalents | | | (342,850 | ) |
Cash and cash equivalents at beginning of period | | | 342,850 | |
Cash and cash equivalents at end of period | | $ | – | |
| |
Non-cash financing activities: | | | | |
Value of shares of beneficial interest issued in reinvestment of dividends paid to shareholders | | $ | 3,761,088 | |
| |
Supplemental disclosure of cash flow information: | | | | |
Cash paid during the period for interest, facilities and maintenance fees | | $ | 352,323 | |
See accompanying Notes to Financial Statements which are an integral part of the financial statements.
19 Invesco New York Tax Free Income Fund
Notes to Financial Statements
February 28, 2019
NOTE 1–Significant Accounting Policies
Invesco New York Tax Free Income Fund (the “Fund”) is a series portfolio of AIMTax-Exempt Funds (InvescoTax-Exempt Funds) (the “Trust”). The Trust is a Delaware statutory trust registered under the Investment Company Act of 1940, as amended (the “1940 Act”), as anopen-end series management investment company authorized to issue an unlimited number of shares of beneficial interest. Information presented in these financial statements pertains only to the Fund. Matters affecting the Fund or each class will be voted on exclusively by the shareholders of the Fund or each class.
The Fund’s investment objective is to provide investors with a high level of current income exempt from federal, New York State and New York City income taxes, consistent with preservation of capital.
The Fund currently consists of four different classes of shares: Class A, Class C, Class Y and Class R6. Class Y shares are available only to certain investors. Class A shares are sold with afront-end sales charge unless certain waiver criteria are met. Under certain circumstances, load waived shares may be subject to contingent deferred sales charges (“CDSC”). Class C shares are sold with a CDSC. Class Y and Class R6 shares are sold at net asset value.
The Fund is an investment company and accordingly follows the investment company accounting and reporting guidance in accordance with Financial Accounting Standards Board Accounting Standards Codification Topic 946,Financial Services – Investment Companies.
The following is a summary of the significant accounting policies followed by the Fund in the preparation of its financial statements.
| A. | Security Valuations– Securities, including restricted securities, are valued according to the following policy. |
Securities are fair valued using an evaluated quote provided by an independent pricing service approved by the Board of Trustees. Evaluated quotes provided by the pricing service may be determined without exclusive reliance on quoted prices, and may reflect appropriate factors such asinstitution-size trading in similar groups of securities, developments related to specific securities, dividend rate (for unlisted equities), yield (for debt obligations), quality, type of issue, coupon rate (for debt obligations), maturity (for debt obligations), individual trading characteristics and other market data. Pricing services generally value debt obligations assuming orderly transactions of institutional round lot size, but a fund may hold or transact in the same securities in smaller, odd lot sizes. Odd lots often trade at lower prices than institutional round lots. Debt obligations are subject to interest rate and credit risks. In addition, all debt obligations involve some risk of default with respect to interest and/or principal payments.
Securities for which market quotations either are not readily available or became unreliable are valued at fair value as determined in good faith by or under the supervision of the Trust’s officers following procedures approved by the Board of Trustees. Some of the factors which may be considered in determining fair value are fundamental analytical data relating to the investment; the nature and duration of any restrictions on transferability or disposition; trading in similar securities by the same issuer or comparable companies; relevant political, economic or issuer specific news; and other relevant factors under the circumstances.
The Fund may invest in securities that are subject to interest rate risk, meaning the risk that the prices will generally fall as interest rates rise and, conversely, the prices will generally rise as interest rates fall. Specific securities differ in their sensitivity to changes in interest rates depending on their individual characteristics. Changes in interest rates may result in increased market volatility, which may affect the value and/or liquidity of certain Fund investments.
Valuations change in response to many factors including the historical and prospective earnings of the issuer, the value of the issuer’s assets, general economic conditions, interest rates, investor perceptions and market liquidity. Because of the inherent uncertainties of valuation, the values reflected in the financial statements may materially differ from the value received upon actual sale of those investments.
| B. | Securities Transactions and Investment Income– Securities transactions are accounted for on a trade date basis. Realized gains or losses on sales are computed on the basis of specific identification of the securities sold. Interest income (net of withholding tax, if any) is recorded on the accrual basis from settlement date. Bond premiums and discounts are amortized and/or accreted over the lives of the respective securities.Pay-in-kind interest income andnon-cash dividend income received in the form of securitiesin-lieu of cash are recorded at the fair value of the securities received. Dividend income (net of withholding tax, if any) is recorded on theex-dividend date. |
The Fund may periodically participate in litigation related to Fund investments. As such, the Fund may receive proceeds from litigation settlements. Any proceeds received are included in the Statement of Operations as realized gain (loss) for investments no longer held and as unrealized gain (loss) for investments still held.
Brokerage commissions and mark ups are considered transaction costs and are recorded as an increase to the cost basis of securities purchased and/or a reduction of proceeds on a sale of securities. Such transaction costs are included in the determination of net realized and unrealized gain (loss) from investment securities reported in the Statement of Operations and the Statement of Changes in Net Assets and the net realized and unrealized gains (losses) on securities per share in the Financial Highlights. Transaction costs are included in the calculation of the Fund’s net asset value and, accordingly, they reduce the Fund’s total returns. These transaction costs are not considered operating expenses and are not reflected in net investment income reported in the Statement of Operations and the Statement of Changes in Net Assets, or the net investment income per share and the ratios of expenses and net investment income reported in the Financial Highlights, nor are they limited by any expense limitation arrangements between the Fund and the investment adviser.
The Fund allocates realized and unrealized capital gains and losses to a class based on the relative net assets of each class. The Fund allocates income to a class based on the relative value of the settled shares of each class.
| C. | Country Determination– For the purposes of making investment selection decisions and presentation in the Schedule of Investments, the investment adviser may determine the country in which an issuer is located and/or credit risk exposure based on various factors. These factors include the laws of the country under which the issuer is organized, where the issuer maintains a principal office, the country in which the issuer derives 50% or more of its total revenues and the country that has the primary market for the issuer’s securities, as well as other criteria. Among the other criteria that may be evaluated for making this determination are the country in which the issuer maintains 50% or more of its assets, the type of security, financial guarantees and enhancements, the nature of the collateral and the sponsor organization. Country of issuer and/or credit risk exposure has been determined to be the United States of America, unless otherwise noted. |
20 Invesco New York Tax Free Income Fund
| D. | Distributions– Distributions from net investment income, if any, are declared daily and paid monthly. Distributions from net realized capital gain, if any, are generally declared and paid annually and recorded on theex-dividend date. The Fund may elect to treat a portion of the proceeds from redemptions as distributions for federal income tax purposes. |
| E. | Federal Income Taxes– The Fund intends to comply with the requirements of Subchapter M of the Internal Revenue Code of 1986, as amended (the “Internal Revenue Code”), necessary to qualify as a regulated investment company and to distribute substantially all of the Fund’s taxable andtax-exempt earnings to shareholders. As such, the Fund will not be subject to federal income taxes on otherwise taxable income (including net realized capital gain) that is distributed to shareholders. Therefore, no provision for federal income taxes is recorded in the financial statements. |
The Fund recognizes the tax benefits of uncertain tax positions only when the position is more likely than not to be sustained. Management has analyzed the Fund’s uncertain tax positions and concluded that no liability for unrecognized tax benefits should be recorded related to uncertain tax positions. Management is not aware of any tax positions for which it is reasonably possible that the total amounts of unrecognized tax benefits will change materially in the next 12 months.
In addition, the Fund intends to invest in such municipal securities to allow it to qualify to pay shareholders “exempt-interest dividends”, as defined in the Internal Revenue Code.
The Fund files tax returns in the U.S. Federal jurisdiction and certain other jurisdictions. Generally, the Fund is subject to examinations by such taxing authorities for up to three years after the filing of the return for the tax period.
| F. | Expenses– Fees provided for under the Rule12b-1 plan of a particular class of the Fund are charged to the operations of such class. Transfer agency fees and expenses and other shareholder recordkeeping fees and expenses attributable to Class R6 are charged to such class. Transfer agency fees and expenses and other shareholder recordkeeping fees and expenses relating to all other classes are allocated among those classes based on relative net assets. All other expenses are allocated among the classes based on relative net assets. |
| G. | Interest, Facilities and Maintenance Fees– Interest, Facilities and Maintenance Fees include interest and related borrowing costs such as commitment fees and other expenses associated with lines of credit and interest and administrative expenses related to establishing and maintaining floating rate note obligations, if any. |
| H. | Accounting Estimates– The preparation of financial statements in conformity with accounting principles generally accepted in the United States of America (“GAAP”) requires management to make estimates and assumptions that affect the reported amounts of assets and liabilities at the date of the financial statements and the reported amounts of revenues and expenses during the reporting period including estimates and assumptions related to taxation. Actual results could differ from those estimates by a significant amount. In addition, the Fund monitors for material events or transactions that may occur or become known after theperiod-end date and before the date the financial statements are released to print. |
| I. | Indemnifications– Under the Trust’s organizational documents, each Trustee, officer, employee or other agent of the Trust is indemnified against certain liabilities that may arise out of the performance of their duties to the Fund. Additionally, in the normal course of business, the Fund enters into contracts, including the Fund’s servicing agreements, that contain a variety of indemnification clauses. The Fund’s maximum exposure under these arrangements is unknown as this would involve future claims that may be made against the Fund that have not yet occurred. The risk of material loss as a result of such indemnification claims is considered remote. |
| J. | Cash and Cash Equivalents– For the purposes of the Statement of Cash Flows, the Fund defines Cash and Cash Equivalents as cash (including foreign currency), money market funds and other investments held in lieu of cash and excludes investments made with cash collateral received. |
| K. | Floating Rate Note Obligations– The Fund invests in inverse floating rate securities, such as Tender Option Bonds (“TOBs”), for investment purposes and to enhance the yield of the Fund. Such securities may be purchased in the secondary market without first owning an underlying bond but generally are created through the sale of fixed rate bonds by the Fund to special purpose trusts established by a broker dealer or by the Fund (“TOB Trusts”) in exchange for cash and residual interests in the TOB Trusts’ assets and cash flows, which are in the form of inverse floating rate securities. The TOB Trusts finance the purchases of the fixed rate bonds by issuing floating rate notes to third parties and allowing the Fund to retain residual interests in the bonds. The floating rate notes issued by the TOB Trusts have interest rates that reset weekly and the floating rate note holders have the option to tender their notes to the TOB Trusts for redemption at par at each reset date. The residual interests held by the Fund (inverse floating rate securities) include the right of the Fund (1) to cause the holders of the floating rate notes to tender their notes at par at the next interest rate reset date, and (2) to transfer the municipal bond from the TOB Trust to the Fund, thereby collapsing the TOB Trust. Inverse floating rate securities tend to underperform the market for fixed rate bonds in a rising interest rate environment, but tend to outperform the market for fixed rate bonds when interest rates decline or remain relatively stable. |
The Fund generally invests in inverse floating rate securities that include embedded leverage, thus exposing the Fund to greater risks and increased costs. The primary risks associated with inverse floating rate securities are varying degrees of liquidity and decreases in the value of such securities in response to changes in interest rates to a greater extent than fixed rate securities having similar credit quality, redemption provisions and maturity, which may cause the Fund’s net asset value to be more volatile than if it had not invested in inverse floating rate securities. In certain instances, the short-term floating rate notes created by the TOB Trust may not be able to be sold to third parties or, in the case of holders tendering (or putting) such notes for repayment of principal, may not be able to be remarketed to third parties. In such cases, the TOB Trust holding the fixed rate bonds may be collapsed with the entity that contributed the fixed rate bonds to the TOB Trust. In the case where a TOB Trust is collapsed with the Fund, the Fund will be required to repay the principal amount of the tendered securities, which may require the Fund to sell other portfolio holdings to raise cash to meet that obligation. The Fund could therefore be required to sell other portfolio holdings at a disadvantageous time or price to raise cash to meet this obligation, which risk will be heightened during times of market volatility, illiquidity or uncertainty. The embedded leverage in the TOB Trust could cause the Fund to lose more money than the value of the asset it has contributed to the TOB Trust and greater levels of leverage create the potential for greater losses. In addition, a Fund may enter into reimbursement agreements with the liquidity provider of certain TOB transactions in connection with certain residuals held by the Fund. These agreements commit a Fund to reimburse the liquidity provider to the extent that the liquidity provider must provide cash to a TOB Trust, including following the termination of a TOB Trust resulting from a mandatory tender event (“liquidity shortfall”). The reimbursement agreement will effectively make the Fund liable for the amount of the negative difference, if any, between the liquidation value of the underlying security and the purchase price of the floating rate notes issued by the TOB Trust.
21 Invesco New York Tax Free Income Fund
The Fund accounts for the transfer of fixed rate bonds to the TOB Trusts as secured borrowings, with the securities transferred remaining in the Fund’s investment assets, and the related floating rate notes reflected as Fund liabilities under the caption Floating rate note obligations on the Statement of Assets and Liabilities. The carrying amount of the Fund’s floating rate note obligations as reported on the Statement of Assets and Liabilities approximates its fair value. The Fund records the interest income from the fixed rate bonds under the caption Interest and records the expenses related to floating rate obligations and any administrative expenses of the TOB Trusts as a component ofInterest, facilities and maintenance fees on the Statement of Operations.
Final rules implementing section 619 of the Dodd-Frank Wall Street Reform and Consumer Protection Act (the “Volcker Rule”) prohibit banking entities from engaging in proprietary trading of certain instruments and limit such entities’ investments in, and relationships with, “covered funds”, as defined in the rules. These rules preclude banking entities and their affiliates from sponsoring and/or providing services for existing TOB Trusts. A new TOB structure is being utilized by the Fund wherein the Fund, as holder of the residuals, will perform certain duties previously performed by banking entities as “sponsors” of TOB Trusts. These duties may be performed by a third-party service provider. The Fund’s expanded role under the new TOB structure may increase its operational and regulatory risk. The new structure is substantially similar to the previous structure; however, pursuant to the Volcker Rule, the remarketing agent would not be able to repurchase tendered floaters for its own account upon a failed remarketing. In the event of a failed remarketing, a banking entity serving as liquidity provider may loan the necessary funds to the TOB Trust to purchase the tendered floaters. The TOB Trust, not the Fund, would be the borrower and the loan from the liquidity provider will be secured by the purchased floaters now held by the TOB Trust. However, as previously described, the Fund would bear the risk of loss with respect to any liquidity shortfall to the extent it entered into a reimbursement agreement with the liquidity provider.
Further, the SEC and various banking agencies have adopted rules implementing credit risk retention requirements for asset-backed securities (the “Risk Retention Rules”). The Risk Retention Rules require the sponsor of a TOB Trust to retain at least 5% of the credit risk of the underlying assets supporting the TOB Trust’s municipal bonds. The Fund has adopted policies intended to comply with the Risk Retention Rules. The Risk Retention Rules may adversely affect the Fund’s ability to engage in TOB Trust transactions or increase the costs of such transactions in certain circumstances.
There can be no assurances that the new TOB structure will continue to be a viable form of leverage. Further, there can be no assurances that alternative forms of leverage will be available to the Fund in order to maintain current levels of leverage. Any alternative forms of leverage may be less advantageous to the Fund, and may adversely affect the Fund’s net asset value, distribution rate and ability to achieve its investment objective.
TOBs are presently classified as private placement securities. Private placement securities are subject to restrictions on resale because they have not been registered under the Securities Act of 1933, as amended (the “1933 Act”), or are otherwise not readily marketable. As a result of the absence of a public trading market for these securities, they may be less liquid than publicly traded securities. Although atypical, these securities may be resold in privately negotiated transactions, the prices realized from these sales could be less than those originally paid by the Fund or less than what may be considered the fair value of such securities.
| L. | Other Risks– The value of, payment of interest on, repayment of principal for and the ability to sell a municipal security may be affected by constitutional amendments, legislative enactments, executive orders, administrative regulations, voter initiatives and the economics of the regions in which the issuers are located. |
Since many municipal securities are issued to finance similar projects, especially those relating to education, health care, transportation and utilities, conditions in those sectors can affect the overall municipal securities market and the Fund’s investments in municipal securities.
There is some risk that a portion or all of the interest received from certaintax-free municipal securities could become taxable as a result of determinations by the Internal Revenue Service.
NOTE 2–Advisory Fees and Other Fees Paid to Affiliates
The Trust has entered into a master investment advisory agreement with Invesco Advisers, Inc. (the “Adviser” or “Invesco”). Under the terms of the investment advisory agreement, the Fund accrues daily and pays monthly an advisory fee to the Adviser based on the annual rate of the Fund’s average daily net assets as follows:
| | | | |
| Average Daily Net Assets | | Rate |
First $500 million | | 0.47% |
Over $500 million | | 0.445% |
For the year ended February 28, 2019, the effective advisory fees incurred by the Fund was 0.47%.
Under the terms of a mastersub-advisory agreement between the Adviser and each of Invesco Asset Management Deutschland GmbH, Invesco Asset Management Limited, Invesco Asset Management (Japan) Limited, Invesco Hong Kong Limited, Invesco Senior Secured Management, Inc. and Invesco Canada Ltd. (collectively, the “AffiliatedSub-Advisers”) the Adviser, not the Fund, will pay 40% of the fees paid to the Adviser to any such AffiliatedSub-Adviser(s) that provide(s) discretionary investment management services to the Fund based on the percentage of assets allocated to such AffiliatedSub-Adviser(s).
The Adviser has contractually agreed, through at least June 30, 2019, to waive advisory fees and/or reimburse expenses of all shares to the extent necessary to limit total annual fund operating expenses after fee waiver and/or expense reimbursement (excluding certain items discussed below) of Class A, Class C, Class Y and Class R6 shares to 1.50%, 2.25%, 1.25% and 1.25%, respectively, of average daily net assets (the “expense limits”). In determining the Adviser’s obligation to waive advisory fees and/or reimburse expenses, the following expenses are not taken into account, and could cause the total annual fund operating expenses after fee waiver and/or expense reimbursement to exceed the numbers reflected above: (1) interest, facilities and maintenance fees; (2) taxes; (3) dividend expense on short sales; (4) extraordinary ornon-routine items, including litigation expenses; and (5) expenses that the Fund has incurred but did not actually pay because of an expense offset arrangement. Unless Invesco continues the fee waiver agreement, it will terminate on June 30, 2019. During its term, the fee waiver agreement cannot be terminated or amended to increase the expense limits or reduce the advisory fee waiver without approval of the Board of Trustees. The Adviser did not waive fees and/or reimburse expenses during the period under these expense limits.
22 Invesco New York Tax Free Income Fund
The Trust has entered into a master administrative services agreement with Invesco pursuant to which the Fund has agreed to pay Invesco for certain administrative costs incurred in providing accounting services to the Fund. For the year ended February 28, 2019, expenses incurred under the agreement are shown in the Statement of Operations asAdministrative services fees. Also, Invesco has entered into asub-administration agreement whereby State Street Bank and Trust Company (“SSB”) serves as custodian and fund accountant and provides certain administrative services to the Fund.
The Trust has entered into a transfer agency and service agreement with Invesco Investment Services, Inc. (“IIS”) pursuant to which the Fund has agreed to pay IIS a fee for providing transfer agency and shareholder services to the Fund and reimburse IIS for certain expenses incurred by IIS in the course of providing such services. IIS may make payments to intermediaries that provide omnibus account services,sub-accounting services and/or networking services. All fees payable by IIS to intermediaries that provide omnibus account services orsub-accounting services are charged back to the Fund, subject to certain limitations approved by the Trust’s Board of Trustees. For the year ended February 28, 2019, expenses incurred under the agreement are shown in the Statement of Operations asTransfer agent fees.
Shares of the Fund are distributed by Invesco Distributors, Inc. (“IDI”). The Fund has adopted a distribution plan pursuant to Rule12b-1 under the 1940 Act, and a service plan (collectively, the “Plans”) for Class A shares and Class C shares to compensate IDI for the sale, distribution, shareholder servicing and maintenance of shareholder accounts for these shares. Under the Plans, the Fund will incur annual fees of up to 0.25% of Class A average daily net assets and up to 1.00% of Class C average daily net assets. The fees are accrued daily and paid monthly.
With respect to Class C shares, the Fund is authorized to reimburse in future years any distribution related expenses that exceed the maximum annual reimbursement rate for such class, so long as such reimbursement does not cause the Fund to exceed the Class C maximum annual reimbursement rate, respectively. With respect to Class A shares, distribution related expenses that exceed the maximum annual reimbursement rate for such class are not carried forward to future years and the Fund will not reimburse IDI for any such expenses.
For the year ended February 28, 2019, expenses incurred under these agreements are shown in the Statement of Operations asDistribution fees.
Front-end sales commissions and CDSC (collectively, the “sales charges”) are not recorded as expenses of the Fund.Front-end sales commissions are deducted from proceeds from the sales of Fund shares prior to investment in Class A shares of the Fund. CDSC are deducted from redemption proceeds prior to remittance to the shareholder. During the year ended February 28, 2019, IDI advised the Fund that IDI retained $14,328 infront-end sales commissions from the sale of Class A shares and $243 and $26 from Class A and Class C shares, respectively, for CDSC imposed upon redemptions by shareholders.
Certain officers and trustees of the Trust are officers and directors of the Adviser, IIS and/or IDI.
NOTE 3–Additional Valuation Information
GAAP defines fair value as the price that would be received to sell an asset or paid to transfer a liability in an orderly transaction between market participants at the measurement date, under current market conditions. GAAP establishes a hierarchy that prioritizes the inputs to valuation methods, giving the highest priority to readily available unadjusted quoted prices in an active market for identical assets (Level 1) and the lowest priority to significant unobservable inputs (Level 3), generally when market prices are not readily available or are unreliable. Based on the valuation inputs, the securities or other investments are tiered into one of three levels. Changes in valuation methods may result in transfers in or out of an investment’s assigned level:
| | Level 1 – | Prices are determined using quoted prices in an active market for identical assets. |
| | Level 2 – | Prices are determined using other significant observable inputs. Observable inputs are inputs that other market participants may use in pricing a security. These may include quoted prices for similar securities, interest rates, prepayment speeds, credit risk, yield curves, loss severities, default rates, discount rates, volatilities and others. |
| | Level 3 – | Prices are determined using significant unobservable inputs. In situations where quoted prices or observable inputs are unavailable (for example, when there is little or no market activity for an investment at the end of the period), unobservable inputs may be used. Unobservable inputs reflect the Fund’s own assumptions about the factors market participants would use in determining fair value of the securities or instruments and would be based on the best available information. |
As of February 28, 2019, all of the securities in this Fund were valued based on Level 2 inputs (see the Schedule of Investments for security categories). The level assigned to the securities valuations may not be an indication of the risk or liquidity associated with investing in those securities. Because of the inherent uncertainties of valuation, the values reflected in the financial statements may materially differ from the value received upon actual sale of those investments.
NOTE 4–Security Transactions with Affiliated Funds
The Fund is permitted to purchase or sell securities from or to certain other Invesco Funds under specified conditions outlined in procedures adopted by the Board of Trustees of the Trust. The procedures have been designed to ensure that any purchase or sale of securities by the Fund from or to another fund or portfolio that is or could be considered an affiliate by virtue of having a common investment adviser (or affiliated investment advisers), common Trustees and/or common officers complies with Rule17a-7 of the 1940 Act. Further, as defined under the procedures, each transaction is effected at the current market price. Pursuant to these procedures, for the year ended February 28, 2019, the Fund engaged in securities purchases of $19,136,064 and securities sales of $19,759,887, which resulted in net realized gains (losses) of $0.
NOTE 5–Expense Offset Arrangement(s)
The expense offset arrangement is comprised of transfer agency credits which result from balances in demand deposit accounts used by the transfer agent for clearing shareholder transactions. For the year ended February 28, 2019, the Fund received credits from this arrangement, which resulted in the reduction of the Fund’s total expenses of $299.
23 Invesco New York Tax Free Income Fund
NOTE 6–Trustees’ and Officers’ Fees and Benefits
Trustees’ and Officers’ Fees and Benefits include amounts accrued by the Fund to pay remuneration to certain Trustees and Officers of the Fund. Trustees have the option to defer compensation payable by the Fund, andTrustees’ and Officers’ Fees and Benefits also include amounts accrued by the Fund to fund such deferred compensation amounts. Those Trustees who defer compensation have the option to select various Invesco Funds in which their deferral accounts shall be deemed to be invested. Finally, certain current Trustees were eligible to participate in a retirement plan that provided for benefits to be paid upon retirement to Trustees over a period of time based on the number of years of service. The Fund may have certain former Trustees who also participate in a retirement plan and receive benefits under such plan.Trustees’ and Officers’ Fees and Benefits include amounts accrued by the Fund to fund such retirement benefits. Obligations under the deferred compensation and retirement plans represent unsecured claims against the general assets of the Fund.
NOTE 7–Cash Balances and Borrowings
The Fund is permitted to temporarily carry a negative or overdrawn balance in its account with SSB, the custodian bank. Such balances, if any atperiod-end, are shown in the Statement of Assets and Liabilities under the payable captionAmount due custodian. To compensate the custodian bank for such overdrafts, the overdrawn Fund may either (1) leave funds as a compensating balance in the account so the custodian bank can be compensated by earning the additional interest; or (2) compensate by paying the custodian bank at a rate agreed upon by the custodian bank and Invesco, not to exceed the contractually agreed upon rate.
Inverse floating rate obligations resulting from the transfer of bonds to TOB Trusts are accounted for as secured borrowings. The average floating rate notes outstanding and average annual interest and fee rate related to inverse floating rate note obligations during the year ended February 28, 2019 were $19,481,923 and 2.46%, respectively.
NOTE 8–Distributions to Shareholders and Tax Components of Net Assets
Tax Character of Distributions to Shareholders Paid During the Fiscal Years Ended February 28, 2019 and 2018
| | | | | | | | |
| | | 2019 | | | 2018 | |
Ordinaryincome-Tax-Exempt | | $ | 5,466,255 | | | $ | 5,515,606 | |
Tax Components of Net Assets atPeriod-End:
| | | | |
| | | 2019 | |
Undistributedtax-exempt income | | $ | 361,438 | |
Net unrealized appreciation – investments | | | 6,417,318 | |
Temporary book/tax differences | | | (85,291 | ) |
Capital loss carryforward | | | (7,983,402 | ) |
Shares of beneficial interest | | | 152,498,635 | |
Total net assets | | $ | 151,208,698 | |
The difference between book-basis andtax-basis unrealized appreciation (depreciation) is due to differences in the timing of recognition of gains and losses on investments for tax and book purposes. The Fund’s net unrealized appreciation difference is attributable primarily to TOBS and book to tax accretion and amortization differences.
The temporary book/tax differences are a result of timing differences between book and tax recognition of income and/or expenses. The Fund’s temporary book/tax differences are the result of the trustee deferral of compensation and retirement plan benefits.
Capital loss carryforward is calculated and reported as of a specific date. Results of transactions and other activity after that date may affect the amount of capital loss carryforward actually available for the Fund to utilize. Capital losses generated in years beginning after December 22, 2010 can be carried forward for an unlimited period, whereas previous losses expire in eight tax years. Capital losses with an expiration period may not be used to offset capital gains until all net capital losses without an expiration date have been utilized. Capital loss carryforwards with no expiration date will retain their character as either short-term or long-term capital losses instead of as short-term capital losses as under prior law. The ability to utilize capital loss carryforwards in the future may be limited under the Internal Revenue Code and related regulations based on the results of future Transactions.
The Fund has a capital loss carryforward as of February 28, 2019, as follows:
| | | | | | | | | | | | |
| Capital Loss Carryforward* | |
| Expiration | | Short-Term | | | Long-Term | | | Total | |
Not subject to expiration | | $ | 4,533,856 | | | $ | 3,449,546 | | | $ | 7,983,402 | |
| * | Capital loss carryforward as of the date listed above is reduced for limitations, if any, to the extent required by the Internal Revenue Code and may be further limited depending upon a variety of factors, including the realization of net unrealized gains or losses as of the date of any reorganization. |
NOTE 9–Investment Transactions
The aggregate amount of investment securities (other than short-term securities, U.S. Treasury obligations and money market funds, if any) purchased and sold by the Fund during the year ended February 28, 2019 was $10,978,275 and $25,785,451, respectively. Cost of investments,
24 Invesco New York Tax Free Income Fund
including any derivatives, on a tax basis includes the adjustments for financial reporting purposes as of the most recently completed federal income tax reportingperiod-end.
| | | | |
| Unrealized Appreciation (Depreciation) of Investments on a Tax Basis | |
Aggregate unrealized appreciation of investments | | | $7,223,947 | |
Aggregate unrealized (depreciation) of investments | | | (806,629 | ) |
Net unrealized appreciation of investments | | | $6,417,318 | |
Cost of investments for tax purposes is $162,442,858.
NOTE 10–Reclassification of Permanent Differences
Primarily as a result of differing book/tax treatment of expired capital loss carryforward, on February 28, 2019, undistributed net investment income was decreased by $35,671, undistributed net realized gain (loss) was increased by $896,219 and shares of beneficial interest was decreased by $860,548. This reclassification had no effect on the net assets of the Fund.
NOTE 11–Share Information
| | | | | | | | | | | | | | | | |
| | | Summary of Share Activity | |
| | | Years ended February 28, | |
| | | 2019(a) | | | 2018 | |
| | | Shares | | | Amount | | | Shares | | | Amount | |
Sold: | | | | | | | | | | | | | | | | |
Class A | | | 1,267,360 | | | $ | 19,170,828 | | | | 724,199 | | | $ | 11,271,163 | |
Class B(b) | | | – | | | | – | | | | 5 | | | | 74 | |
Class C | | | 129,036 | | | | 1,951,016 | | | | 196,544 | | | | 3,066,984 | |
Class Y | | | 473,850 | | | | 7,187,607 | | | | 829,410 | | | | 12,855,431 | |
Class R6(c) | | | 27,499 | | | | 415,993 | | | | 124,987 | | | | 1,935,424 | |
| | | | |
Issued as reinvestment of dividends: | | | | | | | | | | | | | | | | |
Class A | | | 183,341 | | | | 2,783,424 | | | | 179,023 | | | | 2,783,344 | |
Class B(b) | | | – | | | | – | | | | 1,058 | | | | 16,523 | |
Class C | | | 30,033 | | | | 455,232 | | | | 30,677 | | | | 476,367 | |
Class Y | | | 30,552 | | | | 463,517 | | | | 31,271 | | | | 485,761 | |
Class R6 | | | 3,883 | | | | 58,915 | | | | 401 | | | | 6,138 | |
| | | | |
Conversion of Class B shares to Class A shares:(d) | | | | | | | | | | | | | | | | |
Class A | | | – | | | | – | | | | 36,618 | | | | 566,840 | |
Class B | | | – | | | | – | | | | (36,540 | ) | | | (566,840 | ) |
| | | | |
Reacquired: | | | | | | | | | | | | | | | | |
Class A | | | (1,474,610 | ) | | | (22,364,127 | ) | | | (1,295,841 | ) | | | (20,106,211 | ) |
Class B(b) | | | – | | | | – | | | | (34,561 | ) | | | (540,070 | ) |
Class C | | | (748,552 | ) | | | (11,304,627 | ) | | | (408,825 | ) | | | (6,351,640 | ) |
Class Y | | | (763,581 | ) | | | (11,550,992 | ) | | | (597,052 | ) | | | (9,290,115 | ) |
Class R6 | | | (57,590 | ) | | | (868,788 | ) | | | (2,814 | ) | | | (43,196 | ) |
Net increase (decrease) in share activity | | | (898,779 | ) | | $ | (13,602,002 | ) | | | (221,440 | ) | | $ | (3,434,023 | ) |
| (a) | There are entities that are record owners of more than 5% of the outstanding shares of the Fund and in the aggregate own 57% of the outstanding shares of the Fund. IDI has an agreement with these entities to sell Fund shares. The Fund, Invesco and/or Invesco affiliates may make payments to these entities, which are considered to be related to the Fund, for providing services to the Fund, Invesco and/or Invesco affiliates including but not limited to services such as securities brokerage, distribution, third party record keeping and account servicing. The Fund has no knowledge as to whether all or any portion of the shares owned of record by these entities are also owned beneficially. |
| (b) | Class B shares activity for the period March 1, 2017 through January 26, 2018 (date of conversion). |
| (c) | Commencement date of April 4, 2017. |
| (d) | Effective as of the close of business January 26, 2018, all outstanding Class B shares were converted to Class A shares. |
25 Invesco New York Tax Free Income Fund
NOTE 12—Financial Highlights
The following schedule presents financial highlights for a share of the Fund outstanding throughout the periods indicated.
| | | | | | | | | | | | | | | | | | | | | | | | | | | | | | | | | | | | | | | | | | | | | | | | | | | | | | | | | | | | | | | | | |
| | | Net asset
value,
beginning
of period | | Net
investment
income(a) | | Net gains
(losses)
on securities
(both
realized and
unrealized) | | Total from
investment
operations | | Dividends
from net
investment
income | | Net asset
value, end
of period | | Total
return(b) | | Net assets,
end of period
(000’s omitted) | | Ratio of
expenses
to average
net assets
with fee waivers
and/or expenses
absorbed | | Ratio of
expenses
to average net
assets without
fee waivers
and/or expenses
absorbed | | Supplemental Ratio of expenses to average net assets with fee waivers (excluding interest, facilities and maintenance fees) | | Ratio of net
investment
income
to average
net assets | | Portfolio
turnover(c) |
Class A | |
Year ended 02/28/19 | | | | $15.32 | | | | | $0.54 | | | | | $(0.16) | | | | | $0.38 | | | | | $(0.54) | | | | | $15.16 | | | | | 2.52 | % | | | | $116,333 | | | | | 1.21 | %(d) | | | | 1.21 | %(d) | | | | 0.99 | %(d) | | | | 3.54 | %(d) | | | | 6 | % |
Year ended 02/28/18 | | | | 15.42 | | | | | 0.54 | | | | | (0.12) | | | | | 0.42 | | | | | (0.52) | | | | | 15.32 | | | | | 2.71 | | | | | 117,918 | | | | | 1.36 | | | | | 1.36 | | | | | 0.98 | | | | | 3.46 | | | | | 14 | |
Year ended 02/28/17 | | | | 16.00 | | | | | 0.52 | | | | | (0.58) | | | | | (0.06) | | | | | (0.52) | | | | | 15.42 | | | | | (0.44) | | | | | 124,150 | | | | | 1.09 | | | | | 1.09 | | | | | 0.95 | | | | | 3.24 | | | | | 25 | |
Year ended 02/29/16 | | | | 16.01 | | | | | 0.58 | | | | | 0.00 | | | | | 0.58 | | | | | (0.59) | | | | | 16.00 | | | | | 3.73 | | | | | 132,678 | | | | | 1.00 | | | | | 1.00 | | | | | 0.95 | | | | | 3.67 | | | | | 7 | |
Year ended 02/28/15 | | | | 15.30 | | | | | 0.62 | | | | | 0.70 | | | | | 1.32 | | | | | (0.61) | | | | | 16.01 | | | | | 8.74 | | | | | 120,392 | | | | | 1.03 | | | | | 1.03 | | | | | 0.95 | | | | | 3.91 | | | | | 13 | |
Class C | |
Year ended 02/28/19 | | | | 15.30 | | | | | 0.43 | | | | | (0.17) | | | | | 0.26 | | | | | (0.43) | | | | | 15.13 | | | | | 1.72 | (e) | | | | 15,703 | | | | | 1.95 | (d)(e) | | | | 1.95 | (d)(e) | | | | 1.73 | (d)(e) | | | | 2.80 | (d)(e) | | | | 6 | |
Year ended 02/28/18 | | | | 15.40 | | | | | 0.42 | | | | | (0.11) | | | | | 0.31 | | | | | (0.41) | | | | | 15.30 | | | | | 2.00 | | | | | 24,888 | | | | | 2.11 | | | | | 2.11 | | | | | 1.73 | | | | | 2.71 | | | | | 14 | |
Year ended 02/28/17 | | | | 15.99 | | | | | 0.40 | | | | | (0.59) | | | | | (0.19) | | | | | (0.40) | | | | | 15.40 | | | | | (1.26) | | | | | 27,856 | | | | | 1.84 | | | | | 1.84 | | | | | 1.70 | | | | | 2.49 | | | | | 25 | |
Year ended 02/29/16 | | | | 15.99 | | | | | 0.46 | | | | | 0.01 | | | | | 0.47 | | | | | (0.47) | | | | | 15.99 | | | | | 3.02 | | | | | 25,833 | | | | | 1.75 | | | | | 1.75 | | | | | 1.70 | | | | | 2.92 | | | | | 7 | |
Year ended 02/28/15 | | | | 15.28 | | | | | 0.50 | | | | | 0.70 | | | | | 1.20 | | | | | (0.49) | | | | | 15.99 | | | | | 7.94 | | | | | 20,414 | | | | | 1.78 | | | | | 1.78 | | | | | 1.70 | | | | | 3.16 | | | | | 13 | |
Class Y | |
Year ended 02/28/19 | | | | 15.31 | | | | | 0.58 | | | | | (0.16) | | | | | 0.42 | | | | | (0.58) | | | | | 15.15 | | | | | 2.78 | | | | | 17,714 | | | | | 0.96 | (d) | | | | 0.96 | (d) | | | | 0.74 | (d) | | | | 3.79 | (d) | | | | 6 | |
Year ended 02/28/18 | | | | 15.40 | | | | | 0.58 | | | | | (0.11) | | | | | 0.47 | | | | | (0.56) | | | | | 15.31 | | | | | 3.03 | | | | | 21,868 | | | | | 1.11 | | | | | 1.11 | | | | | 0.73 | | | | | 3.71 | | | | | 14 | |
Year ended 02/28/17 | | | | 15.99 | | | | | 0.56 | | | | | (0.59) | | | | | (0.03) | | | | | (0.56) | | | | | 15.40 | | | | | (0.26) | | | | | 17,946 | | | | | 0.84 | | | | | 0.84 | | | | | 0.70 | | | | | 3.49 | | | | | 25 | |
Year ended 02/29/16 | | | | 16.00 | | | | | 0.62 | | | | | 0.00 | | | | | 0.62 | | | | | (0.63) | | | | | 15.99 | | | | | 3.99 | | | | | 11,125 | | | | | 0.75 | | | | | 0.75 | | | | | 0.70 | | | | | 3.92 | | | | | 7 | |
Year ended 02/28/15 | | | | 15.28 | | | | | 0.66 | | | | | 0.71 | | | | | 1.37 | | | | | (0.65) | | | | | 16.00 | | | | | 9.08 | | | | | 7,621 | | | | | 0.78 | | | | | 0.78 | | | | | 0.70 | | | | | 4.16 | | | | | 13 | |
Class R6 | |
Year ended 02/28/19 | | | | 15.30 | | | | | 0.59 | | | | | (0.17) | | | | | 0.42 | | | | | (0.58) | | | | | 15.14 | | | | | 2.83 | | | | | 1,459 | | | | | 0.88 | (d) | | | | 0.88 | (d) | | | | 0.66 | (d) | | | | 3.87 | (d) | | | | 6 | |
Year ended 02/28/18(f) | | | | 15.43 | | | | | 0.52 | | | | | (0.14) | | | | | 0.38 | | | | | (0.51) | | | | | 15.30 | | | | | 2.47 | | | | | 1,875 | | | | | 1.06 | (g) | | | | 1.06 | (g) | | | | 0.68 | (g) | | | | 3.76 | (g) | | | | 14 | |
| (a) | Calculated using average shares outstanding. |
| (b) | Includes adjustments in accordance with accounting principles generally accepted in the United States of America and as such, the net asset value for financial reporting purposes and the returns based upon those net asset values may differ from the net asset value and returns for shareholder transactions. Does not include sales charges and is not annualized for periods less than one year, if applicable. |
| (c) | Portfolio turnover is calculated at the fund level and is not annualized for periods less than one year, if applicable. |
| (d) | Ratios are based on average daily net assets (000’s omitted) of $112,311, $22,709, $20,560 and $1,759 for Class A, Class C, Class Y and Class R6 shares, respectively. |
| (e) | The total return, ratio of expenses to average net assets and ratio of net investment income to average net assets reflect actual12b-1 fees of 0.99% for the year ended February 28, 2019. |
| (f) | Commencement date of April 4, 2017. |
26 Invesco New York Tax Free Income Fund
Report of Independent Registered Public Accounting Firm
To the Board of Trustees of AIMTax-Exempt Funds (InvescoTax-Exempt Funds)
and Shareholders of Invesco New York Tax free Income Fund:
Opinion on the Financial Statements
We have audited the accompanying statement of assets and liabilities, including the schedule of investments, of Invesco New York Tax Free Income Fund (one of the funds constituting AIMTax-Exempt Funds (InvescoTax-Exempt Funds), hereafter referred to as the “Fund”) as of February 28, 2019, the related statements of operations and cash flows for the year ended February 28, 2019, the statement of changes in net assets for each of the two years in the period ended February 28, 2019, including the related notes, and the financial highlights for each of the periods indicated therein (collectively referred to as the “financial statements”). In our opinion, the financial statements present fairly, in all material respects, the financial position of the Fund as of February 28, 2019, the results of its operations and its cash flows for the year then ended, the changes in its net assets for each of the two years in the period ended February 28, 2019 and the financial highlights for each of the periods indicated therein in conformity with accounting principles generally accepted in the United States of America.
Basis for Opinion
These financial statements are the responsibility of the Fund’s management. Our responsibility is to express an opinion on the Fund’s financial statements based on our audits. We are a public accounting firm registered with the Public Company Accounting Oversight Board (United States) (PCAOB) and are required to be independent with respect to the Fund in accordance with the U.S. federal securities laws and the applicable rules and regulations of the Securities and Exchange Commission and the PCAOB.
We conducted our audits of these financial statements in accordance with the standards of the PCAOB. Those standards require that we plan and perform the audit to obtain reasonable assurance about whether the financial statements are free of material misstatement, whether due to error or fraud.
Our audits included performing procedures to assess the risks of material misstatement of the financial statements, whether due to error or fraud, and performing procedures that respond to those risks. Such procedures included examining, on a test basis, evidence regarding the amounts and disclosures in the financial statements. Our audits also included evaluating the accounting principles used and significant estimates made by management, as well as evaluating the overall presentation of the financial statements. Our procedures included confirmation of securities owned as of February 28, 2019 by correspondence with the custodian and brokers; when replies were not received from brokers, we performed other auditing procedures. We believe that our audits provide a reasonable basis for our opinion.
PricewaterhouseCoopers LLP
Houston, TX
April 29, 2019
We have served as the auditor of one or more of the investment companies in the Invesco group of investment companies since at least 1995. We have not been able to determine the specific year we began serving as auditor.
27 Invesco New York Tax Free Income Fund
Calculating your ongoing Fund expenses
Example
As a shareholder of the Fund, you incur two types of costs: (1) transaction costs, which may include sales charges (loads) on purchase payments or contingent deferred sales charges on redemptions, if any; and (2) ongoing costs, including management fees, distribution and/or service(12b-1) fees, and other Fund expenses. This example is intended to help you understand your ongoing costs (in dollars) of investing in the Fund and to compare these costs with ongoing costs of investing in other mutual funds. The example is based on an investment of $1,000 invested at the beginning of the period and held for the entire period September 1, 2018 through February 28, 2019.
Actual expenses
The table below provides information about actual account values and actual expenses. You may use the information in this table, together with the amount you invested, to estimate the expenses that you paid over the period. Simply divide your account value by $1,000 (for example, an $8,600 account value divided by $1,000 = 8.6), then multiply the result by the number in the table under the heading entitled “Actual Expenses Paid During Period” to estimate the expenses you paid on your account during this period.
Hypothetical example for comparison purposes
The table below also provides information about hypothetical account values and hypothetical expenses based on the Fund’s actual expense ratio and an assumed rate of return of 5% per year before expenses, which is not the Fund’s actual return.
The hypothetical account values and expenses may not be used to estimate the actual ending account balance or expenses you paid for the period. You may use this information to compare the ongoing costs of investing in the Fund and other funds. To do so, compare this 5% hypothetical example with the 5% hypothetical examples that appear in the shareholder reports of the other funds.
Please note that the expenses shown in the table are meant to highlight your ongoing costs only and do not reflect any transaction costs, such as sales charges (loads) on purchase payments or contingent deferred sales charges on redemptions, if any. Therefore, the hypothetical information is useful in comparing ongoing costs only, and will not help you determine the relative total costs of owning different funds. In addition, if these transaction costs were included, your costs would have been higher.
| | | | | | | | | | | | | | | | | | | | | | | | |
| | | Beginning
Account Value
(09/01/18) | | | ACTUAL | | | HYPOTHETICAL
(5% annual return before expenses) | | | Annualized
Expense
Ratio | |
| | Ending
Account Value
(02/28/19)1 | | | Expenses
Paid During
Period2 | | | Ending
Account Value
(02/28/19) | | | Expenses
Paid During
Period | |
| Class A | | | $1,000.00 | | | | $1,010.70 | | | | $4.54 | | | | $1,020.28 | | | | $4.56 | | | | 0.91 | % |
| Class C | | | 1,000.00 | | | | 1,006.40 | | | | 8.31 | | | | 1,016.51 | | | | 8.35 | | | | 1.67 | |
| Class Y | | | 1,000.00 | | | | 1,012.00 | | | | 3.29 | | | | 1,021.52 | | | | 3.31 | | | | 0.66 | |
| Class R6 | | | 1,000.00 | | | | 1,012.20 | | | | 2.94 | | | | 1,021.87 | | | | 2.96 | | | | 0.59 | |
| 1 | The actual ending account value is based on the actual total return of the Fund for the period September 1, 2018 through February 28, 2019, after actual expenses and will differ from the hypothetical ending account value which is based on the Fund’s expense ratio and a hypothetical annual return of 5% before expenses. |
| 2 | Expenses are equal to the Fund’s annualized expense ratio as indicated above multiplied by the average account value over the period, multiplied by 181/365 to reflect the most recent fiscal half year. |
28 Invesco New York Tax Free Income Fund
Tax Information
Form1099-DIV, Form1042-S and otheryear-end tax information provide shareholders with actual calendar year amounts that should be included in their tax returns. Shareholders should consult their tax advisors.
The following distribution information is being provided as required by the Internal Revenue Code or to meet a specific state’s requirement.
The Fund designates the following amounts or, if subsequently determined to be different, the maximum amount allowable for its fiscal year ended February 28, 2019:
| | | | | | |
| | | Federal and State Income Tax | |
| | | Qualified Dividend Income* | | | 0 | % |
| | Corporate Dividends Received Deduction* | | | 0 | % |
| | U.S. Treasury Obligations* | | | 0 | % |
| | Tax-Exempt Interest Dividends* | | | 100 | % |
| | * | The above percentages are based on ordinary income dividends paid to shareholders during the Fund’s fiscal year. |
29 Invesco New York Tax Free Income Fund
Trustees and Officers
The address of each trustee and officer is AIMTax-Exempt Funds (InvescoTax-Exempt Funds) (the “Trust”), 11 Greenway Plaza, Suite 1000, Houston, Texas 77046-1173. The trustees serve for the life of the Trust, subject to their earlier death, incapacitation, resignation, retirement or removal as more specifically provided in the Trust’s organizational documents. Each officer serves for a one year term or until their successors are elected and qualified. Column two below includes length of time served with predecessor entities, if any.
| | | | | | | | |
Name, Year of Birth and Position(s) Held with the Trust | | Trustee and/
or Officer Since | | Principal Occupation(s) During Past 5 Years | | Number of Funds in Fund Complex Overseen by
Trustee | | Other Directorship(s)
Held by Trustee During
Past 5 Years |
| Interested Persons | | | | | | | | |
| Martin L. Flanagan1 – 1960 Trustee and Vice Chair | | 2007 | | Executive Director, Chief Executive Officer and President, Invesco Ltd. (ultimate parent of Invesco and a global investment management firm); Trustee and Vice Chair, The Invesco Funds; Vice Chair, Investment Company Institute; and Member of Executive Board, SMU Cox School of Business Formerly: Advisor to the Board, Invesco Advisers, Inc. (formerly known as Invesco Institutional (N.A.), Inc.); Chairman and Chief Executive Officer, Invesco Advisers, Inc. (registered investment adviser); Director, Chairman, Chief Executive Officer and President, Invesco Holding Company (US), Inc. (formerly IVZ Inc.) (holding company), Invesco Group Services, Inc. (service provider) and Invesco North American Holdings, Inc. (holding company); Director, Chief Executive Officer and President, Invesco Holding Company Limited (parent of Invesco and a global investment management firm); Director, Invesco Ltd.; Chairman, Investment Company Institute and President,Co-Chief Executive Officer, Co-President, Chief Operating Officer and Chief Financial Officer, Franklin Resources, Inc. (global investment management organization) | | 158 | | None |
Philip A. Taylor2 – 1954 Trustee | | 2006 | | Vice Chair, Invesco Ltd.; Director, Invesco Canada Ltd. (formerly known as Invesco Trimark Ltd./Invesco Trimark Ltèe) (registered investment adviser and registered transfer agent); Trustee, The Invesco Funds Formerly: Head of the Americas and Senior Managing Director, Invesco Ltd.; Director, Invesco Advisers, Inc. (formerly known as Invesco Institutional (N.A.), Inc.) (registered investment adviser); Director and Chairman, Invesco Investment Services, Inc. (formerly known as Invesco AIM Investment Services, Inc.) (registered transfer agent); Chief Executive Officer, Invesco Corporate Class Inc. (corporate mutual fund company); Chairman and Chief Executive Officer, Invesco Canada Ltd. (formerly known as Invesco Trimark Ltd./Invesco Trimark Ltèe) (registered investment adviser and registered transfer agent); Senior Vice President, The Invesco Funds; Director, Invesco Investment Advisers LLC (formerly known as Van Kampen Asset Management); Director, Chairman, Chief Executive Officer and President, Invesco Management Group, Inc. (formerly known as Invesco AIM Management Group, Inc.) (financial services holding company);Co-Chairman,Co-President andCo-Chief Executive Officer, Invesco Advisers, Inc. (formerly known as Invesco Institutional (N.A.), Inc.) (registered investment adviser); Director, Chief Executive Officer and President, Van Kampen Exchange Corp; President and Principal Executive Officer, The Invesco Funds (other than AIM Treasurer’s Series Trust (Invesco Treasurer’s Series Trust), Short-Term Investments Trust and Invesco Management Trust); Executive Vice President, The Invesco Funds (AIM Treasurer’s Series Trust (Invesco Treasurer’s Series Trust), Short-Term Investments Trust and Invesco Management Trust only); Director and President, INVESCO Funds Group, Inc. (registered investment adviser and registered transfer agent); Director and Chairman, IVZ Distributors, Inc. (formerly known as INVESCO Distributors, Inc.) (registered broker dealer); Director, President and Chairman, Invesco Inc. (holding company), Invesco Canada Holdings Inc. (holding company), Trimark Investments Ltd./ Placements Trimark Ltèe and Invesco Financial Services Ltd/Services Financiers Invesco Ltèe; Chief Executive Officer, Invesco Canada Fund Inc. (corporate mutual fund company); Director and Chairman, Van Kampen Investor Services Inc.; Director, Chief Executive Officer and President, 1371 Preferred Inc. (holding company) and Van Kampen Investments Inc.; Director and President, AIM GP Canada Inc. (general partner for limited partnerships) and Van Kampen Advisors, Inc.; Director and Chief Executive Officer, Invesco Trimark Dealer Inc. (registered broker dealer); Director, Invesco Distributors, Inc. (formerly known as Invesco AIM Distributors, Inc.) (registered broker dealer); Manager, Invesco Capital Management LLC; Director, Chief Executive Officer and President, Invesco Advisers, Inc.; Director, Chairman, Chief Executive Officer and President, Invesco AIM Capital Management, Inc.; President, Invesco Trimark Dealer Inc. and Invesco Trimark Ltd./Invesco Trimark Ltèe; Director and President, AIM Trimark Corporate Class Inc. and AIM Trimark Canada Fund Inc.; Senior Managing Director, Invesco Holding Company Limited; Director and Chairman, Fund Management Company (former registered broker dealer); President and Principal Executive Officer, The Invesco Funds (AIM Treasurer’s Series Trust (Invesco Treasurer’s Series Trust), and Short-Term Investments Trust only); President, AIM Trimark Global Fund Inc. and AIM Trimark Canada Fund Inc. | | 158 | | None |
| 1 | Mr. Flanagan is considered an interested person (within the meaning of Section 2(a)(19) of the 1940 Act) of the Trust because he is an officer of the Adviser to the Trust, and an officer and a director of Invesco Ltd., ultimate parent of the Adviser. |
| 2 | Mr. Taylor is considered an interested person (within the meaning of Section 2(a)(19) of the 1940 Act) of the Trust because he is an officer and a director of the Adviser. |
T-1 Invesco New York Tax Free Income Fund
Trustees and Officers–(continued)
| | | | | | | | |
Name, Year of Birth and Position(s) Held with the Trust | | Trustee and/
or Officer Since | | Principal Occupation(s) During Past 5 Years | | Number of Funds in Fund Complex Overseen by Trustee | | Other Directorship(s) Held by Trustee During Past 5 Years |
| Independent Trustees | | | | | | | | |
Bruce L. Crockett – 1944 Trustee and Chair | | 1993 | | Chairman, Crockett Technologies Associates (technology consulting company) Formerly: Director, Captaris (unified messaging provider); Director, President and Chief Executive Officer, COMSAT Corporation; Chairman, Board of Governors of INTELSAT (international communications company); ACE Limited (insurance company); Independent Directors Council and Investment Company Institute: Member of the Audit Committee, Investment Company Institute; Member of the Executive Committee and Chair of the Governance Committee, Independent Directors Council | | 158 | | Director and Chairman of the Audit Committee, ALPS (Attorneys Liability Protection Society) (insurance company); Director and Member of the Audit Committee and Compensation Committee, Ferroglobe PLC (metallurgical company) |
David C. Arch – 1945 Trustee | | 2010 | | Chairman of Blistex Inc. (consumer health care products manufacturer); Member, World Presidents’ Organization | | 158 | | Board member of the Illinois Manufacturers’ Association |
Jack M. Fields – 1952 Trustee | | 1997 | | Chief Executive Officer, Twenty First Century Group, Inc. (government affairs company); and Chairman, Discovery Learning Alliance(non-profit) Formerly: Owner and Chief Executive Officer, Dos Angeles Ranch L.P. (cattle, hunting, corporate entertainment); Director, Insperity, Inc. (formerly known as Administaff) (human resources provider); Chief Executive Officer, Texana Timber LP (sustainable forestry company); Director of Cross Timbers Quail Research Ranch(non-profit); and member of the U.S. House of Representatives | | 158 | | None |
Cynthia Hostetler – 1962 Trustee | | 2017 | | Non-Executive Director and Trustee of a number of public and private business corporations Formerly: Director, Aberdeen Investment Funds (4 portfolios); Head of Investment Funds and Private Equity, Overseas Private Investment Corporation; President, First Manhattan Bancorporation, Inc.; Attorney, Simpson Thacher & Bartlett LLP | | 158 | | Vulcan Materials Company (construction materials company); Trilinc Global Impact Fund; Genesee & Wyoming, Inc. (railroads); Artio Global Investment LLC (mutual fund complex); Edgen Group, Inc. (specialized energy and infrastructure products distributor); Investment Company Institute (professional organization); Independent Directors Council (professional organization) |
Eli Jones – 1961 Trustee | | 2016 | | Professor and Dean, Mays Business School – Texas A&M University Formerly: Professor and Dean, Walton College of Business, University of Arkansas and E.J. Ourso College of Business, Louisiana State University; Director, Arvest Bank | | 158 | | Insperity, Inc. (formerly known as Administaff) (human resources provider) |
Anthony J. LaCava, Jr. – 1956 Trustee | | 2019 | | Formerly: Director and Member of the Audit Committee, Blue Hills Bank and Managing Partner, KPMG LLP | | 158 | | Blue Hills Bank; Chairman, Bentley University; Member, Business School Advisory Council; KPMG LLP |
Prema Mathai-Davis – 1950 Trustee | | 1998 | | Retired Co-Owner & Partner of Quantalytics Research, LLC, (a FinTech Investment Research Platform for the Self-Directed Investor) | | 158 | | None |
Teresa M. Ressel – 1962 Trustee | | 2017 | | Non-executive director and trustee of a number of public and private business corporations Formerly: Chief Financial Officer, Olayan America, The Olayan Group (international investor/commercial/industrial); Chief Executive Officer, UBS Securities LLC; Group Chief Operating Officer, Americas, UBS AG; Assistant Secretary for Management & Budget and CFO, US Department of the Treasury | | 158 | | Atlantic Power Corporation (power generation company); ON Semiconductor Corp. (semiconductor supplier) |
| Ann Barnett Stern – 1957 Trustee | | 2017 | | President and Chief Executive Officer, Houston Endowment Inc. (private philanthropic institution) Formerly: Executive Vice President and General Counsel, Texas Children’s Hospital; Attorney, Beck, Redden and Secrest, LLP; Business Law Instructor, University of St. Thomas; Attorney, Andrews & Kurth LLP | | 158 | | Federal Reserve Bank of Dallas |
| Raymond Stickel, Jr. – 1944 Trustee | | 2005 | | Retired Formerly: Director, Mainstay VP Series Funds, Inc. (25 portfolios); Partner, Deloitte & Touche | | 158 | | None |
| Robert C. Troccoli – 1949 Trustee | | 2016 | | Adjunct Professor, University of Denver – Daniels College of Business Formerly: Senior Partner, KPMG LLP | | 158 | | None |
| Christopher L. Wilson – 1957 Trustee | | 2017 | | Non-executive director and trustee of a number of public and private business corporations Formerly: Director, TD Asset Management USA Inc. (mutual fund complex) (22 portfolios); Managing Partner, CT2, LLC (investing and consulting firm); President/Chief Executive Officer, Columbia Funds, Bank of America Corporation; President/Chief Executive Officer, CDC IXIS Asset Management Services, Inc.; Principal & Director of Operations, Scudder Funds, Scudder, Stevens & Clark, Inc.; Assistant Vice President, Fidelity Investments | | 158 | | ISO New England, Inc.(non-profit organization managing regional electricity market) |
T-2 Invesco New York Tax Free Income Fund
Trustees and Officers–(continued)
| | | | | | | | |
Name, Year of Birth and
Position(s) Held with the Trust | | Trustee and/
or Officer Since | | Principal Occupation(s) During Past 5 Years | | Number of Funds in Fund Complex Overseen by Trustee | | Other Directorship(s)
Held by Trustee During
Past 5 Years |
| Other Officers | | | | | | | | |
Sheri Morris – 1964 President, Principal Executive Officer and Treasurer | | 1999 | | President, Principal Executive Officer and Treasurer, The Invesco Funds; Vice President, Invesco Advisers, Inc. (formerly known as Invesco Institutional (N.A.), Inc.) (registered investment adviser); and Vice President, Invesco Exchange-Traded Fund Trust, Invesco Exchange-Traded Fund Trust II, Invesco India Exchange-Traded Fund Trust, Invesco Actively Managed Exchange-Traded Fund Trust, Invesco Actively Managed Exchange-Traded Commodity Fund Trust and Invesco Exchange-Traded Self-Indexed Fund Trust Formerly: Vice President and Principal Financial Officer, The Invesco Funds; Vice President, Invesco AIM Advisers, Inc., Invesco AIM Capital Management, Inc. and Invesco AIM Private Asset Management, Inc.; Assistant Vice President and Assistant Treasurer, The Invesco Funds and Assistant Vice President, Invesco Advisers, Inc., Invesco AIM Capital Management, Inc. and Invesco AIM Private Asset Management, Inc.; and Treasurer, Invesco Exchange-Traded Fund Trust, Invesco Exchange-Traded Fund Trust II, Invesco India Exchange- Traded Fund Trust and Invesco Actively Managed Exchange-Traded Fund Trust | | N/A | | N/A |
Russell C. Burk – 1958 Senior Vice President and Senior Officer | | 2005 | | Senior Vice President and Senior Officer, The Invesco Funds | | N/A | | N/A |
Jeffrey H. Kupor – 1968 Senior Vice President, Chief Legal Officer and Secretary | | 2018 | | Head of Legal of the Americas, Invesco Ltd.; Senior Vice President and Secretary, Invesco Advisers, Inc. (formerly known as Invesco Institutional (N.A.), Inc.) (registered investment adviser); Senior Vice President and Secretary, Invesco Distributors, Inc. (formerly known as Invesco AIM Distributors, Inc.); Vice President and Secretary, Invesco Investment Services, Inc. (formerly known as Invesco AIM Investment Services, Inc.) Senior Vice President, Chief Legal Officer and Secretary, The Invesco Funds; Secretary and General Counsel, Invesco Investment Advisers LLC (formerly known as Van Kampen Asset Management); Secretary and General Counsel, Invesco Capital Markets, Inc. (formerly known as Van Kampen Funds Inc.) and Chief Legal Officer, Invesco Exchange-Traded Fund Trust, Invesco Exchange- Traded Fund Trust II, Invesco India Exchange-Traded Fund Trust, Invesco Actively Managed Exchange-Traded Fund Trust, Invesco Actively Managed Exchange-Traded Commodity Fund Trust and Invesco Exchange-Traded Self-Indexed Fund Trust; Secretary, Invesco Indexing LLC; Secretary, W.L. Ross & Co., LLC; Secretary and Vice President, Jemstep, Inc. Formerly: Head of Legal, Worldwide Institutional, Invesco Ltd.; Secretary and General Counsel, INVESCO Private Capital Investments, Inc.; Senior Vice President, Secretary and General Counsel, Invesco Management Group, Inc. (formerly known as Invesco AIM Management Group, Inc.); Assistant Secretary, INVESCO Asset Management (Bermuda) Ltd.; Secretary and General Counsel, Invesco Private Capital, Inc.; Assistant Secretary and General Counsel, INVESCO Realty, Inc.; Secretary and General Counsel, Invesco Senior Secured Management, Inc.; and Secretary, Sovereign G./P. Holdings Inc. | | N/A | | N/A |
Andrew R. Schlossberg – 1974 Senior Vice President | | 2019 | | Head of the Americas and Senior Managing Director, Invesco Ltd.; Director and Senior Vice President, Invesco Advisers, Inc. (formerly known as Invesco Institutional (N.A.), Inc.) (registered investment adviser); Director and Chairman, Invesco Investment Services, Inc. (formerly known as Invesco AIM Investment Services, Inc.) (registered transfer agent); Senior Vice President, The Invesco Funds; Director, Invesco Investment Advisers LLC (formerly known as Van Kampen Asset Management) and Invesco UK Limited; Director, President and Chairman, Invesco Insurance Agency, Inc.; Director and Chief Executive, Invesco Asset Management Limited and Invesco Fund Managers Limited Formerly: Assistant Vice President, The Invesco Funds; Senior Vice President, Invesco Advisers, Inc. (formerly known as Invesco Institutional (N.A.), Inc.) (registered investment adviser); Director and Chief Executive, Invesco Administration Services Limited and Invesco Global Investment Funds Limited; Director, Invesco Distributors, Inc.; Head of EMEA, Invesco Ltd.; President, Invesco Actively Managed Exchange-Traded Commodity Fund Trust, Invesco Actively Managed Exchange-Traded Fund Trust, Invesco Exchange-Traded Fund Trust, Invesco Exchange-Traded Fund Trust II and Invesco India Exchange-Traded Fund Trust; Managing Director and Principal Executive Officer, Invesco Capital Management LLC | | N/A | | N/A |
John M. Zerr – 1962 Senior Vice President | | 2006 | | Chief Operating Officer of the Americas; Senior Vice President, Invesco Advisers, Inc. (formerly known as Invesco Institutional (N.A.), Inc.) (registered investment adviser); Senior Vice President, Invesco Distributors, Inc. (formerly known as Invesco AIM Distributors, Inc.); Director and Vice President, Invesco Investment Services, Inc. (formerly known as Invesco AIM Investment Services, Inc.) Senior Vice President, The Invesco Funds; Managing Director, Invesco Capital Management LLC; Director, Invesco Investment Advisers LLC (formerly known as Van Kampen Asset Management); Senior Vice President, Invesco Capital Markets, Inc. (formerly known as Van Kampen Funds Inc.); Manager, Invesco Indexing LLC; Invesco Canada Funds Advisory Board Member; Director, President Chief Executive Officer, Invesco Corporate Class Inc. (corporate mutual fund company); and Director, Chairman, President and Chief Executive Officer, Invesco Canada Ltd. (formerly known as Invesco Trimark Ltd./Invesco Trimark Ltèe) (registered investment adviser and registered transfer agent) | | N/A | | N/A |
T-3 Invesco New York Tax Free Income Fund
Trustees and Officers–(continued)
| | | | | | | | |
Name, Year of Birth and
Position(s) Held with the Trust | | Trustee and/
or Officer Since | | Principal Occupation(s) During Past 5 Years | | Number of Funds in Fund Complex Overseen by Trustee | | Other Directorship(s)
Held by Trustee During
Past 5 Years |
| Other Officers–(continued) | | | | | | | | |
| | | | | Formerly: Director and Senior Vice President, Invesco Management Group, Inc. (formerly known as Invesco AIM Management Group, Inc.); Secretary and General Counsel, Invesco Management Group, Inc. (formerly known as Invesco AIM Management Group, Inc.); Secretary, Invesco Investment Services, Inc. (formerly known as Invesco AIM Investment Services, Inc.); Chief Legal Officer and Secretary, The Invesco Funds; Secretary and General Counsel, Invesco Investment Advisers LLC (formerly known as Van Kampen Asset Management); Secretary and General Counsel, Invesco Capital Markets, Inc. (formerly known as Van Kampen Funds Inc.); Chief Legal Officer, Invesco Exchange-Traded Fund Trust, Invesco Exchange-Traded Fund Trust II, Invesco IndiaExchange-Traded Fund Trust, Invesco Actively Managed Exchange-Traded Fund Trust, Invesco Actively Managed Exchange-Traded Commodity Fund Trust and Invesco Exchange- Traded Self-Indexed Fund Trust; Secretary, Invesco Indexing LLC; Director, Secretary, General Counsel and Senior Vice President, Van Kampen Exchange Corp.; Director, Vice President and Secretary, IVZ Distributors, Inc. (formerly known as INVESCO Distributors, Inc.); Director and Vice President, INVESCO Funds Group, Inc.; Director and Vice President, Van Kampen Advisors Inc.; Director, Vice President, Secretary and General Counsel, Van Kampen Investor Services Inc.; Director and Secretary, Invesco Distributors, Inc. (formerly known as Invesco AIM Distributors, Inc.); Director, Senior Vice President, General Counsel and Secretary, Invesco AIM Advisers, Inc. and Van Kampen Investments Inc.; Director, Vice President and Secretary, Fund Management Company; Director, Senior Vice President, Secretary, General Counsel and Vice President, Invesco AIM Capital Management, Inc.; Chief Operating Officer and General Counsel, Liberty Ridge Capital, Inc. (an investment adviser) | | | | |
Gregory G. McGreevey – 1962 Senior Vice President | | 2012 | | Senior Managing Director, Invesco Ltd.; Director, Chairman, President, and Chief Executive Officer, Invesco Advisers, Inc. (formerly known as Invesco Institutional (N.A.), Inc.) (registered investment adviser); Director, Invesco Mortgage Capital, Inc. and Invesco Senior Secured Management, Inc.; and Senior Vice President, The Invesco Funds Formerly: Senior Vice President, Invesco Management Group, Inc. and Invesco Advisers, Inc.; Assistant Vice President, The Invesco Funds | | N/A | | N/A |
Kelli Gallegos – 1970 Vice President, Principal Financial Officer and Assistant Treasurer | | 2008 | | Vice President and Treasurer, Invesco Exchange-Traded Fund Trust, InvescoExchange-Traded Fund Trust II, Invesco India Exchange-Traded Fund Trust, Invesco Actively Managed Exchange-Traded Fund Trust, Invesco Actively Managed Exchange-Traded Commodity Fund Trust and Invesco Exchange- Traded Self-Indexed Fund Trust; Vice President, Principal Financial Officer and Assistant Treasurer, The Invesco Funds; Principal Financial and Accounting Officer – Pooled Investments, Invesco Capital Management LLC Formerly: Assistant Treasurer, Invesco Exchange-Traded Fund Trust, InvescoExchange-Traded Fund Trust II, Invesco India Exchange-Traded Fund Trust, Invesco Actively Managed Exchange-Traded Fund Trust, Invesco Actively Managed Exchange-Traded Commodity Fund Trust and Invesco Exchange- Traded Self-Indexed Fund Trust; Assistant Treasurer, Invesco Capital Management LLC; Assistant Vice President, The Invesco Funds | | N/A | | N/A |
Tracy Sullivan – 1962 Vice President, Chief Tax Officer and Assistant Treasurer | | 2008 | | Vice President, Chief Tax Officer and Assistant Treasurer, The Invesco Funds; Assistant Treasurer, Invesco Capital Management LLC, Invesco Exchange- Traded Fund Trust, Invesco Exchange-Traded Fund Trust II, Invesco India Exchange-Traded Fund Trust, Invesco Actively Managed Exchange-Traded Fund Trust, Invesco Actively Managed Exchange-Traded Commodity Fund Trust and Invesco Exchange-Traded Self-Indexed Fund Trust Formerly: Assistant Vice President, The Invesco Funds | | N/A | | N/A |
Crissie M. Wisdom – 1969 Anti-Money Laundering Compliance Officer | | 2013 | | Anti-Money Laundering Compliance Officer, Invesco Advisers, Inc. (formerly known as Invesco Institutional (N.A.), Inc.) (registered investment adviser), Invesco Capital Markets, Inc. (formerly known as Van Kampen Funds Inc.), Invesco Distributors, Inc., Invesco Investment Services, Inc., The Invesco Funds, and Invesco Exchange-Traded Fund Trust, Invesco Exchange-Traded Fund Trust II, Invesco India Exchange-Traded Fund Trust, Invesco Actively Managed Exchange- Traded Fund Trust, Invesco Actively Managed Exchange-Traded Commodity Fund Trust and Invesco Exchange-Traded Self-Indexed Fund Trust; Anti-Money Laundering Compliance Officer and Bank Secrecy Act Officer, INVESCO National Trust Company and Invesco Trust Company; and Fraud Prevention Manager and Controls and Risk Analysis Manager for Invesco Investment Services, Inc. Formerly: Anti-Money Laundering Compliance Officer, Van Kampen Exchange Corp. and Invesco Management Group, Inc. | | N/A | | N/A |
| Robert R. Leveille – 1969 Chief Compliance Officer | | 2016 | | Chief Compliance Officer, Invesco Advisers, Inc. (registered investment adviser); and Chief Compliance Officer, The Invesco Funds Formerly: Chief Compliance Officer, Putnam Investments and the Putnam Funds | | N/A | | N/A |
The Statement of Additional Information of the Trust includes additional information about the Fund’s Trustees and is available upon request, without charge, by calling 1.800.959.4246. Please refer to the Fund’s Statement of Additional Information for information on the Fund’ssub-advisers.
| | | | | | |
Office of the Fund 11 Greenway Plaza, Suite 1000 Houston, TX 77046-1173 | | Investment Adviser Invesco Advisers, Inc. 1555 Peachtree Street, N.E. Atlanta, GA 30309 | | Distributor Invesco Distributors, Inc. 11 Greenway Plaza, Suite 1000 Houston, TX 77046-1173 | | Auditors PricewaterhouseCoopers LLP 1000 Louisiana Street, Suite 5800 Houston, TX 77002-5021 |
| | | |
| | | | | | |
Counsel to the Fund Stradley Ronon Stevens & Young, LLP 2005 Market Street, Suite 2600 Philadelphia, PA 19103-7018 | | Counsel to the Independent Trustees Goodwin Procter LLP 901 New York Avenue, N.W. Washington, D.C. 20001 | | Transfer Agent Invesco Investment Services, Inc. 11 Greenway Plaza, Suite 1000 Houston, TX 77046-1173 | | Custodian State Street Bank and Trust Company 225 Franklin Street Boston, MA 02110-2801 |
T-4 Invesco New York Tax Free Income Fund
Explore High-Conviction Investing with Invesco

Go paperless with eDelivery
Visit invesco.com/edelivery to enjoy the convenience and security of anytime electronic access to your investment documents. With eDelivery, you can elect to have any or all of the following materials delivered straight to your inbox to download, save and print from your own computer:
∎ Fund reports and prospectuses
∎ Quarterly statements
∎ Daily confirmations
∎ Tax forms
Invesco mailing information
Send general correspondence to Invesco Investment Services, Inc., P.O. Box 219078, Kansas City, MO 64121-9078.
Important notice regarding delivery of security holder documents
To reduce Fund expenses, only one copy of most shareholder documents may be mailed to shareholders with multiple accounts at the same address (Householding). Mailing of your shareholder documents may be householded indefinitely unless you instruct us otherwise. If you do not want the mailing of these documents to be combined with those for other members of your household, please contact Invesco Investment Services, Inc. at 800 959 4246 or contact your financial institution. We will begin sending you individual copies for each account within 30 days after receiving your request.
Fund holdings and proxy voting information
The Fund provides a complete list of its holdings four times in each fiscal year, at the quarter ends. For the second and fourth quarters, the lists appear in the Fund’s semiannual and annual reports to shareholders. For the first and third quarters, the Fund files the lists with the Securities and Exchange Commission (SEC) on FormN-Q (or any successor Form). The most recent list of portfolio holdings is available at invesco.com/completeqtrholdings. Shareholders can also look up the Fund’s FormsN-Q (or any successor Form) on the SEC website at sec.gov. The SEC file numbers for the Fund are shown below.
A description of the policies and procedures that the Fund uses to determine how to vote proxies relating to portfolio securities is available without charge, upon request, from our Client Services department at 800 959 4246 or at invesco.com/proxyguidelines. The information is also available on the SEC website, sec.gov.
| | |
Information regarding how the Fund voted proxies related to its portfolio securities during the most recent12-month period ended June 30 is available at invesco.com/proxysearch. The information is also available on the SEC website, sec.gov. Invesco Advisers, Inc. is an investment adviser; it provides investment advisory services to individual and institutional clients and does not sell securities. Invesco Distributors, Inc. is the US distributor for Invesco Ltd.’s retail mutual funds, exchange-traded funds and institutional money market funds. Both are wholly owned, indirect subsidiaries of Invesco Ltd. | |  |
| | | | | | | | |
| SEC file numbers:811-07890 and033-66242 | | Invesco Distributors, Inc. | | VK-NYTFI-AR-1 | | 04242019 | | 0756 |
| | | | |
| | |
 | | Annual Report to Shareholders | | February 28, 2019 |
| | |
| | InvescoTax-Exempt Cash Fund |
| | | | |
| | Nasdaq: | | |
| | A: ACSXX ◾ Investor: TEIXX ◾ R6: TSSXX |

Letters to Shareholders
| | | | |

Andrew Schlossberg | | | | Dear Shareholders: This annual report includes information about your Fund, including performance data and a complete list of its investments as of the close of the reporting period. Inside is a discussion of how your Fund was managed and the factors that affected its performance during the reporting period. Philip Taylor, whose messages to shareholders have appeared here for the last 13 years, transitioned to a senior advisory role on March 1, prior to his retirement at the end of the year, and I assumed his role as Head of the Americas and Senior Managing Director, Invesco Ltd. All of us at Invesco are indebted to Phil for his many years of dedicated service to the company and to its funds’ shareholders. I’m excited about this new opportunity, and I look forward to communicating with fund shareholders going forward. The reporting period proved to be an increasingly volatile time for markets. Amid corporate tax cuts and |
improving global growth, several US equity indexes redefined highs during the first half of the reporting period. The ebullience, however, ended in October as global equities, in particular US stocks, sold off sharply and continued this downward spiral for the rest of 2018. The catalyst for thesell-off was a combination of ongoing trade conflicts between the US and China, fears of a global economic slowdown and rising US interest rates. Gains posted earlier in the year for global equities were erased, while US Treasury bonds, along with government and municipal bonds, rallied. The reporting period ended on a positive note, however, as global equities bounced back strongly at the outset of 2019, mitigating some of the losses from thesell-off in late 2018. Given the strong economy during the reporting period, the US Federal Reserve (the Fed) raised the federal funds rate four times. At its December 2018 meeting, however, the Fed delivered a more “dovish hike” by simultaneously raising rates while reducing guidance for 2019 rate increases. At its first meeting in 2019, the Fed left rates unchanged. As 2019 unfolds, we’ll see how the interplay of interest rates, economic data, geopolitics and a host of other factors affect US and over-seas equity and fixed income markets.
Investor uncertainty and market volatility, such as we witnessed during the reporting period, are unfortunate facts of life when it comes to investing. That’s why Invesco encourages investors to work with a professional financial adviser who can stress the importance of starting to save and invest early and the importance of adhering to a disciplined investment plan. A financial adviser who knows your unique financial situation, investment goals and risk tolerance can be an invaluable partner as you seek to achieve your financial goals. He or she can offer a long-term perspective when markets are volatile and time-tested advice and guidance when your financial situation or investment goals change.
Visit our website for more information on your investments
Our website, invesco.com/us, offers a wide range of market insights and investment perspectives. On the website, you’ll find detailed information about our funds, including performance, holdings and portfolio manager commentaries. You can access information about your account by completing a simple, secure online registration. To do so, select “Log In” on the right side of the homepage, and then select “Register for Individual Account Access.”
In addition to the resources accessible on our website and through our mobile app, you can obtain timely updates to help you stay informed about the markets and the economy by connecting with Invesco on Twitter, LinkedIn or Facebook. You can access our blog at blog.invesco.us.com. Our goal is to provide you the information you want, when and where you want it.
Finally, I’m pleased to share with you Invesco’s commitment to both the Principles for Responsible Investment and to considering environmental, social and governance issues in our robust investment process. I invite you to learn more at invesco.com/esg.
Have questions?
For questions about your account, contact an Invesco client services representative at 800 959 4246.
All of us at Invesco look forward to serving your investment management needs. Thank you for investing with us.
Sincerely,

Andrew Schlossberg
Head of the Americas,
Senior Managing Director, Invesco Ltd.
2 Invesco Tax-Exempt Cash Fund
| | | | |

Bruce Crockett | | | | Dear Fellow Shareholders: Among the many important lessons I’ve learned in more than 40 years in a variety of business endeavors is the value of a trusted advocate. As independent chair of the Invesco Funds Board, I can assure you that the members of the Board are strong advocates for the interests of investors in Invesco’s mutual funds. We work hard to represent your interests through oversight of the quality of the investment management services your funds receive and other matters important to your investment, including but not limited to: ∎ Ensuring that Invesco offers a diverse lineup of mutual funds that your financial adviser can use to strive to meet your financial needs as your investment goals change over time. ∎ Monitoring how the portfolio management teams of the Invesco funds are performing in light of changing |
economic and market conditions.
∎ Assessing each portfolio management team’s investment performance within the context of the investment strategy described in the fund’s prospectus.
∎ Monitoring for potential conflicts of interests that may impact the nature of the services that your funds receive.
We believe one of the most important services we provide our fund shareholders is the annual review of the funds’ advisory andsub-advisory contracts with Invesco Advisers and its affiliates. This review is required by the Investment Company Act of 1940 and focuses on the nature and quality of the services Invesco provides as the adviser to the Invesco funds and the reasonableness of the fees that it charges for those services. Each year, we spend months carefully reviewing information received from Invesco and a variety of independent sources, such as performance and fee data prepared by Lipper, Inc. (a subsidiary of Broadridge Financial Solutions, Inc.), an independent, third-party firm widely recognized as a leader in its field. We also meet with our independent legal counsel and other independent advisers to review and help us assess the information that we have received. Our goal is to assure that you receive quality investment management services for a reasonable fee.
I trust the measures outlined above provide assurance that you have a worthy advocate when it comes to choosing the Invesco Funds.
On behalf of the Board, we look forward to continuing to represent your interests and serving your needs.
Sincerely,

Bruce L. Crockett
Independent Chair
Invesco Funds Board of Trustees
3 Invesco Tax-Exempt Cash Fund
Management’s Discussion of your Fund
About your Fund
This annual report for InvescoTax-Exempt Cash Fund covers the fiscal year ended February 28, 2019. As of that date, the Fund’s net assets totaled $38.6 million. As of the same date, the Fund’s weighted average maturity was 9 days and the Fund’s weighted average life was 9 days.1
Market conditions affecting money market funds
The largest development affecting money market funds and the money market fund industry during the fiscal year was the US Federal Reserve’s (the Fed) four interest rate hikes.
Money market investors benefited from the Fed’s decision to increase the fed funds rate by a total of 1.00% during the fiscal year.2 Four 0.25% hikes in March, June, September, and December 2018 raised the fed funds rate to a target level of 2.25% to 2.50%.2 Since 2006, there have been nine separate 0.25% rate hikes.2 Despite the uptick in volatility during the end of 2018, the ongoing positive health of the US economy, with low unemployment and moderate economic growth, provided the basis for the Fed’s decisions. However, recent Fed rhetoric and actions – the Fed left rates unchanged at its February 2019 meeting – have caused markets to begin contemplating a potential policy regime change. The change involves a shift in the Fed’s focus from a forward looking inflation constraint, effectively capping inflation at around 2%, to a framework that would allow symmetrical variation around a target of 2%.2 Under the new regime, the Fed would be willing to allow core personal consumption expenditure (PCE) inflation to increase to around 2.5% to compensate for inflation that has remained below target for a decade.2
At the close of the fiscal year, the US continued to be an outlier in terms of base rate borrowing costs as most major central banks continued to maintain interest rates at, near or below zero to fuel inflation and spur economic growth.
Many major central banks, including the European Central Bank, the Bank of Japan and the Reserve Bank of Australia, kept their base borrowing rates unchanged during 2018. The Bank of England and the Bank of Canada were the only other major central banks to increase their key rates in 2018.
Thank you for investing in InvescoTax-Exempt Cash Fund. We believe our long-term approach to short-term investing makes us a strong partner for investors seeking premier liquidity management.
| 1 | Weighted average maturity (WAM) is an average of the maturities of all securities held in the portfolio, weighted by each security’s percentage of net assets. The days to maturity for WAM is the lower of the stated maturity date or next interest rate reset date. WAM reflects how a portfolio would react to interest rate changes. |
Weighted average life (WAL) is an average of all the maturities of all securities held in the portfolio, weighted by each security’s percentage of net assets. The days to maturity for WAL is the lower of the stated maturity date or next demand feature date. WAL reflects how a portfolio would react to deteriorating credit (widening spreads) or tightening liquidity conditions.
| 2 | Source: US Federal Reserve |
Team managed by Invesco Advisers, Inc.
The views and opinions expressed in management’s discussion of Fund performance are those of Invesco Advisers, Inc. These views and opinions are subject to change at any time based on factors such as market and economic conditions. These views and opinions may not be relied upon as investment advice or recommendations, or as an offer for a particular security. The information is not a complete analysis of every aspect of any market, country, industry, security or the Fund. Statements of fact are from sources considered reliable, but Invesco Advisers, Inc. makes no representation or warranty as to their completeness or accuracy. Although historical performance is no guarantee of future results, these in sights may help you understand our investment management philosophy.
See important Fund and, if applicable, index disclosures later in this report.
| | | | |
Portfolio Composition by Maturity In days, as of 02/28/2019 | |
1-7 | | | 95.3 | % |
8-30 | | | 0.0 | |
31-60 | | | 2.0 | |
61-90 | | | 2.7 | |
91-180 | | | 0.0 | |
181+ | | | 0.0 | |
The number of days to maturity of each holding is determined in accordance with the provisions of Rule2a-7 under the Investment Company Act of 1940.
You could lose money by investing in the Fund. Although the Fund seeks to preserve your investment at $1.00 per share, it can
not guarantee it will do so. The Fund may impose a fee upon the sale of your shares or may temporarily suspend your ability to sell shares if the Fund’s liquidity falls below the required minimums because of market conditions or other factors. An investment in the Fund is not insured or guaranteed by the Federal Deposit Insurance Corporation or any other government agency. The Fund’s sponsor has no legal obligation to provide financial support to the Fund, and you should not expect that the sponsor will provide financial support to the Fund at any time.
4 Invesco Tax-Exempt Cash Fund
Invesco Tax Exempt Cash Fund’s investment objective is to providetax-exempt income consistent with preservation of capital and liquidity.
| ∎ | | Unless otherwise stated, information presented in this report is as of February 28, 2019, and is based on total net assets. |
| ∎ | | Unless otherwise noted, all data provided by Invesco. |
| ∎ | | To access your Fund’s reports/prospectus, visit invesco.com/fundreports. |
Principal risks of investing in the Fund
| ∎ | | Alternative minimum tax risk.A portion of the Fund’s otherwisetax-exempt income may be taxable to those shareholders subject to the federal alternative minimum tax. |
| ∎ | | Debt securities risk.The prices of debt securities held by the Fund will be affected by changes in interest rates, the creditworthiness of the issuer and other factors. An increase in prevailing interest rates typically causes the value of existing debt securities to fall and often has a greater impact on longer-duration debt securities and higher quality debt securities. Falling interest rates will cause the Fund to reinvest the proceeds of debt securities that have been repaid by the issuer at lower interest rates. Falling interest rates may also reduce the Fund’s distributable income because interest payments on floating rate debt instruments held by the Fund will decline. The Fund could lose money on investments in debt securities if the issuer or borrower fails to meet its obligations to make interest payments and/or to repay principal in a timely manner. Changes in an issuer’s financial strength, the market’s perception of such strength or in the credit rating of the issuer or the security may affect the value of debt securities. The Adviser’s credit analysis may fail to anticipate such changes, which could result in buying a debt security at an inopportune time or failing to sell a debt security in advance of a price decline or other credit event. |
| ∎ | | Foreign securities and credit exposure risk.US dollar-denominated securities carrying foreign credit exposure may be affected by unfavorable political, economic or governmental developments that could affect payments of principal and interest. Furthermore, the Fund’s foreign investments may be adversely affected by political and social instability, changes in economic |
| | or taxation policies, difficulty in enforcing obligations, decreased liquidity or increased volatility. Foreign investments also involve the risk of the possible seizure, nationalization or expropriation of the issuer or foreign deposits (in which the Fund could lose its entire investments in a certain market) and the possible adoption of foreign governmental restrictions such as exchange controls. |
| ∎ | | Management risk. The Fund is actively managed and depends heavily on the Adviser’s judgment about markets, interest rates or the attractiveness, relative values, liquidity, or potential appreciation of particular investments made for the Fund’s portfolio. The Fund could experience losses if these judgments prove to be incorrect. Additionally, legislative, regulatory, or tax developments may adversely affect management of the Fund and, therefore, the ability of the Fund to achieve its investment objective. |
| ∎ | | Market risk. The market values of the Fund’s investments, and therefore the value of the Fund’s shares, will go up and down, sometimes rapidly or unpredictably. Market risk may affect a single issuer, industry or section of the economy, or it may affect the market as a whole. Individual stock prices tend to go up and down more dramatically than those of certain other types of investments, such as bonds. During a general downturn in the financial markets, multiple asset classes may decline in value. When markets perform well, there can be no assurance that specific investments held by the Fund will rise in value. |
| ∎ | | Money market fund risk. Although the Fund seeks to preserve the value of your investment at $1.00 per share, you may lose money by investing in the Fund. The share price of money market funds can fall below the $1.00 share price. The Fund may impose a fee upon the sale of your shares or may temporarily suspend your ability |
| | to sell shares if the Fund’s liquidity falls below required minimums because of market conditions or other factors. The Fund’s sponsor has no legal obligation to provide financial support to the Fund, and you should not rely on or expect that the sponsor will enter into support agreements or take other actions to provide financial support to the Fund or maintain the Fund’s $1.00 share price at any time. The credit quality of the Fund’s holdings can change rapidly in certain markets, and the default of a single holding could have an adverse impact on the Fund’s share price. The Fund’s share price can also be negatively affected during periods of high redemption pressures, illiquid markets and/or significant market volatility. Furthermore, amendments to money market fund regulations could impact a money market fund’s operations and possibly negatively impact its return. |
| ∎ | | Municipal securities risk. The risk of a municipal obligation generally depends on the financial and credit status of the issuer. Constitutional amendments, legislative enactments, executive orders, administrative regulations, voter initiatives, and the issuer’s regional economic conditions may affect the municipal security’s value, interest payments, repayment of principal and the Fund’s ability to sell the security. Failure of a municipal security issuer to comply with applicable tax requirements may make income paid thereon taxable, resulting in a decline in the security’s value. In addition, there could be changes in applicable tax laws or tax treatments that reduce or eliminate the current federal income tax exemption on municipal securities or otherwise adversely affect the current federal or state tax status of municipal securities. |
| ∎ | | Repurchase agreement risk. The Fund is subject to the risk that the counterparty may default on its obligation to |
|
This report must be accompanied or preceded by a currently effective Fund prospectus, which contains more complete information, including sales charges and expenses. Investors should read it carefully before investing. |
|
| NOT FDIC INSURED | MAY LOSE VALUE | NO BANK GUARANTEE |
5 Invesco Tax-Exempt Cash Fund
| | | repurchase the underlying instruments collateralizing the repurchase agreement, which may cause the Fund to lose money. These risks are magnified to the extent that a repurchase agreement is secured by securities other than cash or US government securities. |
| ∎ | | US government obligations risk. Obligations of US government agencies and authorities receive varying levels of support and may not be backed by the full faith and credit of the US government, which could affect the Fund’s ability to recover should they default. No assurance can be given that the US government will provide financial support to its agencies and authorities if it is not obligated by law to do so. |
| ∎ | | Variable-rate demand notes risk. The absence of an active secondary market for certain variable and floating rate notes could make it difficult to dispose of these instruments, which could result in a loss. |
| ∎ | | Yield risk. The Fund’s yield will vary as the short-term securities in its portfolio mature or are sold and the proceeds are reinvested in other securities. When interest rates are very low, the Fund’s expenses could absorb all or a portion of the Fund’s income and yield. Additionally, inflation mayout-pace and diminish investment returns over time. |
6 Invesco Tax-Exempt Cash Fund
Schedule of Investments
February 28, 2019
| | | | | | | | | | | | | | |
| | | Interest Rate | | Maturity Date | | | Principal Amount (000) | | | Value | |
MunicipalObligations-99.09% | |
| Alabama-6.16% | |
Mobile (County of) Industrial Development Authority (SSAB Alabama Inc.); Series 2010 A, VRD Recovery Zone Facility RB(LOC-Swedbank AB)(a)(b)(c) | | 1.46% | | | 07/01/2040 | | | $ | 1,320 | | | $ | 1,320,000 | |
Tuscaloosa (County of) Industrial Development Authority (Hunt Refining); Series 2011 J, VRD Gulf Opportunity Zone RB(LOC-Bank of Nova Scotia)(a)(b)(c)(d) | | 1.43% | | | 04/01/2028 | | | | 1,060 | | | | 1,060,000 | |
| | | | | 2,380,000 | |
|
| Arizona-1.66% | |
Casa Grande (City of) Industrial Development Authority (Quail Gardens Apartments); Series 2001 A, Ref. VRD MFH RB(CEP-FNMA)(b) | | 1.46% | | | 06/15/2031 | | | | 640 | | | | 640,000 | |
|
| Arkansas-1.55% | |
Maumelle (City of), Arkansas (Kimberly-Clark Corp.); Series 2015, VRD Taxable IDR(b)(d) | | 2.40% | | | 08/01/2045 | | | | 600 | | | | 600,000 | |
|
| District ofColumbia-2.34% | |
Metropolitan Washington Airports Authority; Subseries 2010C-2, Ref. VRD Airport System RB(LOC-Sumitomo Mitsui Banking Corp.)(a)(b)(c) | | 1.42% | | | 10/01/2039 | | | | 905 | | | | 905,000 | |
|
| Florida-6.07% | |
Miami-Dade (County of); Series 2014 A, VRD Seaport RB(LOC-MUFG Bank, Ltd.)(a)(b)(c) | | 1.45% | | | 10/01/2050 | | | | 930 | | | | 930,000 | |
Palm Beach (County of) (Henry Morrison Flagler Museum); Series 2003, VRD RB(LOC-Northern Trust Co. (The))(b)(c) | | 1.48% | | | 11/01/2036 | | | | 400 | | | | 400,000 | |
Pinellas (County of) Health Facilities Authority (Baycare Health System); Series 2009A-2, VRD Health System RB(LOC-Northern Trust Co. (The))(b)(c) | | 1.45% | | | 11/01/2038 | | | | 770 | | | | 770,000 | |
Sarasota (County of) Public Hospital District (Sarasota Memorial Hospital); Series 2008 B, Ref. RB
(LOC-Wells Fargo Bank N.A.)(b)(c) | | 1.75% | | | 07/01/2037 | | | | 245 | | | | 245,000 | |
| | | | | 2,345,000 | |
|
| Georgia-6.75% | |
Atlanta (City of) Housing Authority (Villages of East Lake Phase II); Series 1999, VRD MFH RB(LOC-Bank of America, N.A.)(b)(c)(d)(e) | | 1.52% | | | 01/01/2029 | | | | 115 | | | | 115,000 | |
Atlanta (City of), Georgia Development Authority (Perkins + Will, Inc.); Series 2010, VRD Multi-Modal Recovery Zone RB(LOC-BMO Harris Bank N.A.)(b)(c) | | 1.43% | | | 11/01/2030 | | | | 570 | | | | 570,000 | |
Georgia (State of) Private Colleges & Universities Authority (Emory University);Series 2005 B-2, VRD RB(b) | | 1.47% | | | 09/01/2035 | | | | 600 | | | | 600,000 | |
Series 2019, Commercial Paper Notes | | 1.62% | | | 05/14/2019 | | | | 625 | | | | 625,000 | |
Houston (City of); Series 2018E-2, Commercial Paper Notes | | 1.81% | | | 03/05/2019 | | | | 500 | | | | 500,000 | |
Monroe (County of) Development Authority (Oglethorpe Power Corp. Scherer); Series 2010 A, Ref. VRD PCR(LOC-Bank of Montreal)(a)(b)(c) | | 1.42% | | | 01/01/2036 | | | | 200 | | | | 200,000 | |
| | | | | 2,610,000 | |
|
| Illinois-3.68% | |
Illinois (State of) Finance Authority (Northwestern University); Subseries 2008 B, VRD RB(b) | | 1.39% | | | 12/01/2046 | | | | 820 | | | | 820,000 | |
Illinois (State of) Finance Authority (The Catherine Cook School); Series 2007, VRD RB(LOC-Northern Trust Co. (The))(b)(c) | | 1.40% | | | 01/01/2037 | | | | 325 | | | | 325,000 | |
Illinois (State of) Finance Authority (Uhlich Children’s Home); Series 2002, VRD IDR(LOC-U.S. Bank N.A.)(b)(c) | | 1.43% | | | 10/01/2033 | | | | 275 | | | | 275,000 | |
| | | | | 1,420,000 | |
|
| Indiana-4.15% | |
Huntington (City of) (Huntington University); Series 2007, Ref. VRD Economic Development & Improvement RB(LOC-Wells Fargo Bank, N.A.)(b)(c) | | 1.85% | | | 08/01/2037 | | | | 100 | | | | 100,000 | |
Indiana (State of) Finance Authority (Ispat Inland Inc.); Series 2005, Ref. VRD Environmental Improvement RB(LOC-Rabobank Nederland)(a)(b)(c) | | 1.45% | | | 06/01/2035 | | | | 525 | | | | 525,000 | |
See accompanying Notes to Financial Statements which are an integral part of the financial statements.
7 Invesco Tax-Exempt Cash Fund
| | | | | | | | | | | | | | |
| | | Interest Rate | | Maturity Date | | | Principal Amount (000) | | | Value | |
| Indiana-(continued) | | | | | | | | | | | | | | |
Knox (City of) (J.W. Hicks, Inc.); Series 2005 A, VRD Economic Development RB(LOC-BMO Harris Bank N.A.)(b)(c)(e) | | 1.47% | | | 03/01/2022 | | | $ | 165 | | | $ | 165,000 | |
Purdue University; Series 2011 A, VRD COP(b) | | 1.27% | | | 07/01/2035 | | | | 554 | | | | 553,500 | |
Rockport (City of) (AEP Generating Company); Series 1995 A, Ref. VRD PCR
(LOC-MUFG Bank, Ltd.)(a)(b)(c) | | 1.43% | | | 07/01/2025 | | | | 260 | | | | 260,000 | |
| | | | | 1,603,500 | |
|
| Louisiana-2.63% | |
Calcasieu (Parish of) Public Trust Authority (WPT Corp.); Series 1997, VRD Solid Waste Disposal RB(LOC-Bank of America, N.A.)(b)(c)(e) | | 1.55% | | | 12/01/2027 | | | | 400 | | | | 400,000 | |
Louisiana (State of) Public Facilities Authority (CHRISTUS Health); Series 2009B-3, Ref. VRD RB(LOC-Bank of New York Mellon (The))(b)(c) | | 1.50% | | | 07/01/2047 | | | | 615 | | | | 615,000 | |
| | | | | 1,015,000 | |
|
| Maryland-2.33% | |
Maryland (State of) Health & Higher Educational Facilities Authority (Johns Hopkins Hospital); Series 2019 B, Commercial Paper Notes | | 1.63% | | | 03/05/2019 | | | | 500 | | | | 500,000 | |
Montgomery (County of); Series 2009 B, Commercial Paper BAN | | 1.80% | | | 05/09/2019 | | | | 400 | | | | 400,000 | |
| | | | | 900,000 | |
|
| Massachusetts-2.67% | |
Massachusetts (State of) Development Finance Agency (Milton Academy); Series 2009 B, VRD Taxable RB (LOC-TD Bank, N.A.)(b)(c) | | 2.45% | | | 03/01/2039 | | | | 1,030 | | | | 1,030,000 | |
|
| Michigan-1.33% | |
Oakland University Board of Trustees; Series 2008, Ref. VRD RB(LOC-JPMorgan Chase Bank, N.A.)(b)(c) | | 1.45% | | | 03/01/2031 | | | | 515 | | | | 515,000 | |
|
| Minnesota-3.55% | |
Minnetonka (City of) (Minnetonka Hills Apartments); Series 2001, Ref. VRD MFH RB(CEP-FNMA)(b) | | 1.52% | | | 11/15/2031 | | | | 670 | | | | 670,000 | |
St. Paul (City of) Housing & Redevelopment Authority (Highland Ridge, L.P.); Series 2003, Ref. VRD MFH RB(LOC-Freddie Mac)(b)(c) | | 1.75% | | | 10/01/2033 | | | | 700 | | | | 700,000 | |
| | | | | 1,370,000 | |
|
| Mississippi-3.09% | |
Mississippi Business Finance Corp. (Chevron U.S.A. Inc.); Series 2010 C, VRD Gulf Opportunity Zone
IDR(b) | | 1.37% | | | 12/01/2030 | | | | 1,195 | | | | 1,195,000 | |
|
| Missouri-3.40% | |
Bridgeton (City of) Industrial Development Authority (Stolze Printing); Series 2010, VRD RB(LOC-FHLB of Chicago)(b)(c) | | 1.46% | | | 11/01/2037 | | | | 790 | | | | 790,000 | |
Missouri (State of) Health & Educational Facilities Authority (Lutheran Senior Services); Series 2000, VRD RB(LOC-Bank of America, N.A.)(b)(c) | | 1.45% | | | 02/01/2031 | | | | 524 | | | | 524,000 | |
| | | | | 1,314,000 | |
|
| NewYork-6.35% | |
New York (City of); Subseries 2010G-4, VRD Unlimited Tax GO Bonds(CEP-Barclays Bank PLC)(b) | | 1.45% | | | 03/01/2039 | | | | 865 | | | | 865,000 | |
New York (State of) Energy Research & Development Authority (Consolidated Edison Co. of New York, Inc.); Subseries 2005A-2, VRD RB(LOC-Mizuho Bank, Ltd.)(a)(b)(c) | | 1.47% | | | 05/01/2039 | | | | 500 | | | | 500,000 | |
New York (State of) Housing Finance Agency (572 11th Ave. Housing); Series 2017 A, VRD Taxable RB(LOC-Bank of China Ltd.)(a)(b)(c) | | 2.55% | | | 11/01/2049 | | | | 500 | | | | 500,000 | |
New York (State of) Housing Finance Agency (Manhattan West Residential Housing);
Series2016B-1, VRD Taxable RB(LOC-Bank of China Ltd.)(a)(b)(c) | | 2.55% | | | 11/01/2049 | | | | 360 | | | | 360,000 | |
Series 2014 B, VRD RB(LOC-Bank of China Ltd.)(a)(b)(c) | | 2.60% | | | 11/01/2019 | | | | 230 | | | | 230,000 | |
| | | | | 2,455,000 | |
|
| NorthCarolina-1.18% | |
North Carolina (State of) Educational Facilities Finance Agency (Duke University); Series 1991 B, VRD
RB(b) | | 1.33% | | | 12/01/2021 | | | | 455 | | | | 455,000 | |
See accompanying Notes to Financial Statements which are an integral part of the financial statements.
8 Invesco Tax-Exempt Cash Fund
| | | | | | | | | | | | | | |
| | | Interest Rate | | Maturity Date | | | Principal Amount (000) | | | Value | |
| Ohio-5.12% | | | | | | | | | | | | | | |
Franklin (County of) (OhioHealth Corp.); Series 2009 A, Ref. VRD Hospital Facilities RB(b) | | 1.43% | | | 11/15/2041 | | | $ | 1,240 | | | $ | 1,240,000 | |
Lorain (County of) Port Authority (St. Ignatius High School); Series 2008, VRD Educational Facilities RB(LOC-U.S. Bank N.A.)(b)(c) | | 1.43% | | | 08/02/2038 | | | | 740 | | | | 740,000 | |
| | | | | 1,980,000 | |
|
| Oregon-1.35% | |
Portland (Port of), Oregon (Portland International Airport); Subseries 200818-A, Ref. VRD RB(LOC-Industrial & Commercial Bank of China Ltd.)(b)(c)(e) | | 1.55% | | | 07/01/2026 | | | | 520 | | | | 520,000 | |
|
| Pennsylvania-4.18% | |
Derry (Township of) Industrial & Commercial Development Authority (GIANT Center); Series 2001, VRD Facility Taxable RB(LOC-PNC Bank, N.A.)(b)(c) | | 2.47% | | | 11/01/2030 | | | | 190 | | | | 190,000 | |
Fayette (County of) Hospital Authority (Fayette Regional Health System); Series 2007 B, VRD Hospital RB(LOC-PNC Bank N.A.)(b)(c) | | 1.73% | | | 06/01/2037 | | | | 615 | | | | 615,000 | |
Lebanon (County of) Health Facilities Authority (E.C.C. Retirement Village); Series 2000, VRD RB (LOC - PNC Bank N.A.)(b)(c) | | 1.73% | | | 10/15/2025 | | | | 200 | | | | 200,000 | |
Ridley School District; Series 2009, VRD Limited Tax GO Bonds(LOC-TD Bank, N.A.)(b)(c) | | 1.44% | | | 11/01/2029 | | | | 170 | | | | 170,000 | |
Westmoreland (County of) Industrial Development Authority (Excela Health); Series 2005 A, VRD Health System RB(LOC-PNC Bank, N.A.)(b)(c) | | 1.43% | | | 07/01/2027 | | | | 440 | | | | 440,000 | |
| | | | | 1,615,000 | |
|
| Tennessee-1.09% | |
Clarksville (City of) Public Building Authority; Series 1994, VRD Pooled Financing RB(LOC-Bank of America, N.A.)(b)(c) | | 1.47% | | | 06/01/2024 | | | | 420 | | | | 420,000 | |
|
| Texas-11.68% | |
Harris (County of); Series 2019 C, GO Commercial Paper Notes | | 1.52% | | | 03/07/2019 | | | | 200 | | | | 200,000 | |
Harris (County of) Hospital District; Series 2010, Ref. VRD Sr. Lien RB(LOC-JPMorgan Chase Bank, N.A.)(b)(c) | | 1.46% | | | 02/15/2042 | | | | 100 | | | | 100,000 | |
San Gabriel Health Facilities Development Corp. (YMCA of Greater Williamson County); Series 2005, VRD RB(LOC-JPMorgan Chase Bank, N.A.)(b)(c) | | 1.52% | | | 04/01/2026 | | | | 403 | | | | 403,000 | |
Texas (State of) Department of Housing & Community Affairs (Costa Mariposa Apartments); Series 2009, VRD MFH RB(CEP-FHLMC)(b) | | 1.46% | | | 05/01/2042 | | | | 780 | | | | 780,000 | |
Texas (State of) Veterans Land Board; Series 2011C, VRD GO Veteran Bonds(b) | | 1.43% | | | 06/01/2042 | | | | 1,350 | | | | 1,350,000 | |
Texas A&M University System Board of Regents; Series 2019 B, Revenue Financing System Commercial Paper Notes | | 1.66% | | | 04/02/2019 | | | | 750 | | | | 750,000 | |
University of Texas System Board of Regents; Series 2008 B, VRD Financing System RB(b) | | 1.42% | | | 08/01/2025 | | | | 930 | | | | 930,000 | |
| | | | | 4,513,000 | |
|
| Utah-3.62% | |
Emery (County of) (Pacificorp); Series 1994, Ref. VRD PCR(LOC-Canadian Imperial Bank of Commerce)(a)(b)(c) | | 1.45% | | | 11/01/2024 | | | | 1,300 | | | | 1,300,000 | |
Utah (County of) (IHC Health Services, Inc.); Series 2002 B, VRD Hospital RB(b) | | 1.42% | | | 05/15/2035 | | | | 100 | | | | 100,000 | |
| | | | | 1,400,000 | |
|
| Virginia-4.66% | |
Norfolk (City of); Series 2007, VRD Unlimited Tax GO Bonds(b) | | 1.40% | | | 08/01/2037 | | | | 850 | | | | 850,000 | |
University of Virginia System Board of Regents;
Series 2019 A, Commercial Paper Notes | | 1.45% | | | 03/06/2019 | | | | 450 | | | | 450,000 | |
Series 2019 A, Commercial Paper Notes | | 1.45% | | | 03/05/2019 | | | | 500 | | | | 500,000 | |
| | | | | 1,800,000 | |
|
| Washington-3.14% | |
Washington (State of) Housing Finance Commission (Redmond Ridge Apartments); Series 2017, VRD MFH RB(LOC-FHLB of San Francisco)(b)(c) | | 1.51% | | | 11/01/2047 | | | | 1,215 | | | | 1,215,000 | |
See accompanying Notes to Financial Statements which are an integral part of the financial statements.
9 Invesco Tax-Exempt Cash Fund
| | | | | | | | | | | | | | | | |
| | | Interest Rate | | | Maturity Date | | | Principal Amount (000) | | | Value | |
| WestVirginia-2.51% | | | | | | | | | | | | | | | | |
West Virginia (State of) Hospital Finance Authority (Cabell Huntington Hosp, Inc.); Series 2008 B, Ref. VRD Improvement RB(LOC-Branch Banking & Trust Co.)(b)(c) | | | 1.44% | | | | 01/01/2034 | | | $ | 970 | | | $ | 970,000 | |
|
| Wisconsin-2.85% | |
Appleton (City of), Wisconsin (Great Northern Corp.); Series 2002 A, VRD IDR(LOC-Wells Fargo Bank, N.A.)(b)(c)(e) | | | 1.48% | | | | 09/01/2019 | | | | 1,100 | | | | 1,100,000 | |
TOTAL INVESTMENTS IN SECURITIES(f)(g)-99.09% (Cost $38,285,500) | | | | | | | | | | | | | | | 38,285,500 | |
OTHER ASSETS LESSLIABILITIES-0.91% | | | | | | | | | | | | | | | 351,720 | |
NETASSETS-100.00% | | | | | | | | | | | | | | $ | 38,637,220 | |
Investment Abbreviations:
| | |
| BAN | | - Bond Anticipation Notes |
| CEP | | - Credit Enhancement Provider |
| COP | | - Certificates of Participation |
| FHLB | | - Federal Home Loan Bank |
| FHLMC | | - Federal Home Loan Mortgage Corp. |
| FNMA | | - Federal National Mortgage Association |
| GO | | - General Obligation |
| IDR | | - Industrial Development Revenue Bonds |
| LOC | | - Letter of Credit |
| MFH | | - Multi-Family Housing |
| PCR | | - Pollution Control Revenue Bonds |
| RB | | - Revenue Bonds |
| Ref. | | - Refunding |
| Sr. | | - Senior |
| VRD | | - Variable Rate Demand |
Notes to Schedule of Investments:
| (a) | The security is credit guaranteed, enhanced or has credit risk by a foreign entity. The foreign credit exposure to countries other than the United States of America (as a percentage of net assets) is summarized as follows: Japan: 6.7%; Canada: 6.6%; other countries less than 5% each: 7.6%. |
| (b) | Demand security payable upon demand by the Fund at specified time intervals no greater than thirteen months. Interest rate is redetermined periodically by the issuer or agent based on current market conditions. Rate shown is the rate in effect on February 28, 2019. |
| (c) | Principal and interest payments are fully enhanced by a letter of credit from the bank listed or a predecessor bank, branch or subsidiary. |
| (d) | Security purchased or received in a transaction exempt from registration under the Securities Act of 1933, as amended (the “1933 Act”). The security may be resold pursuant to an exemption from registration under the 1933 Act, typically to qualified institutional buyers. The aggregate value of these securities at February 28, 2019 was $1,775,000, which represented 4.59% of the Fund’s Net Assets. |
| (e) | Security subject to the alternative minimum tax. |
| (f) | Also represents cost for federal income tax purposes. |
| (g) | This table provides a listing of those entities that have either issued, guaranteed, backed or otherwise enhanced the credit quality of more than 5% of the securities held in the portfolio. In instances where the entity has guaranteed, backed or otherwise enhanced the credit quality of a security, it is not primarily responsible for the issuer’s obligations but may be called upon to satisfy the issuer’s obligations. |
| | | | |
| Entities | | Percentage | |
Federal Home Loan Bank | | | 5.2 | % |
See accompanying Notes to Financial Statements which are an integral part of the financial statements.
10 Invesco Tax-Exempt Cash Fund
Statement of Assets and Liabilities
February 28, 2019
| | | | |
Assets: | |
Investments in securities, at value and cost | | $ | 38,285,500 | |
Cash | | | 6,629 | |
Receivable for: | | | | |
Investments sold | | | 405,000 | |
Fund shares sold | | | 94,951 | |
Interest | | | 55,684 | |
Investment for trustee deferred compensation and retirement plans | | | 36,305 | |
Other assets | | | 22,729 | |
Total assets | | | 38,906,798 | |
| |
Liabilities: | | | | |
Payable for: | | | | |
Fund shares reacquired | | | 149,453 | |
Dividends | | | 58 | |
Accrued fees to affiliates | | | 11,686 | |
Accrued trustees’ and officers’ fees and benefits | | | 2,988 | |
Accrued operating expenses | | | 65,688 | |
Trustee deferred compensation and retirement plans | | | 39,705 | |
Total liabilities | | | 269,578 | |
Net assets applicable to shares outstanding | | $ | 38,637,220 | |
| | | | |
Net assets consist of: | | | | |
Shares of beneficial interest | | $ | 38,629,377 | |
Distributable earnings | | | 7,843 | |
| | | $ | 38,637,220 | |
|
Net Assets: | |
Class A | | $ | 25,028,604 | |
Class Y | | $ | 8,113,801 | |
Investor Class | | $ | 5,484,813 | |
Class R6 | | $ | 10,002 | |
|
Shares outstanding, no par value, unlimited number of shares authorized: | |
Class A | | | 25,024,720 | |
Class Y | | | 8,112,533 | |
Investor Class | | | 5,483,962 | |
Class R6 | | | 10,000 | |
Net asset value and offering price per share for each class | | $ | 1.00 | |
See accompanying Notes to Financial Statements which are an integral part of the financial statements.
11 Invesco Tax-Exempt Cash Fund
Statement of Operations
For the year ended February 28, 2019
| | | | |
Investment income: | |
Interest | | $ | 554,450 | |
| |
Expenses: | | | | |
Advisory fees | | | 72,809 | |
Administrative services fees | | | 53,879 | |
Custodian fees | | | 772 | |
Distribution fees - Class A | | | 24,498 | |
Transfer agent fees - A, Y and Investor | | | 43,248 | |
Transfer agent fees - R6 | | | 12 | |
Trustees’ and officers’ fees and benefits | | | 20,240 | |
Registration and filing fees | | | 58,231 | |
Reports to shareholders | | | 18,783 | |
Professional services fees | | | 67,291 | |
Other | | | 18,666 | |
Total expenses | | | 378,429 | |
Less: Fees waived, expenses reimbursed and expense offset arrangement(s) | | | (4,949 | ) |
Net expenses | | | 373,480 | |
Net investment income | | | 180,970 | |
Net increase in net assets resulting from operations | | $ | 180,970 | |
See accompanying Notes to Financial Statements which are an integral part of the financial statements.
12 Invesco Tax-Exempt Cash Fund
Statement of Changes in Net Assets
For the years ended February 28, 2019 and 2018
| | | | | | | | |
| | | 2019 | | | 2018 | |
Operations: | | | | | |
Net investment income | | $ | 180,970 | | | $ | 54,342 | |
Net realized gain (loss) | | | - | | | | (1,172 | ) |
Net increase in net assets resulting from operations | | | 180,970 | | | | 53,170 | |
| | |
Distributions to shareholders from distributable earnings:(1) | | | | | | | | |
Class A | | | (115,146 | ) | | | (36,427 | ) |
Class Y | | | (35,381 | ) | | | (8,896 | ) |
Investor Class | | | (30,387 | ) | | | (9,153 | ) |
Class R6 | | | (56 | ) | | | (6 | ) |
Total distributions from distributable earnings | | | (180,970 | ) | | | (54,482 | ) |
| | |
Sharetransactions-net: | | | | | | | | |
Class A | | | 347,751 | | | | (5,975,463 | ) |
Class Y | | | 2,462,606 | | | | 1,075,761 | |
Investor Class | | | (316,256 | ) | | | (31,477 | ) |
Class R6 | | | - | | | | 10,000 | |
Net increase (decrease) in net assets resulting from share transactions | | | 2,494,101 | | | | (4,921,179 | ) |
Net increase (decrease) in net assets | | | 2,494,101 | | | | (4,922,491 | ) |
| | |
Net assets: | | | | | | | | |
Beginning of year | | | 36,143,119 | | | | 41,065,610 | |
End of year | | $ | 38,637,220 | | | $ | 36,143,119 | |
| (1) | The Securities and Exchange Commission eliminated the requirement to disclose distribution components separately, except for tax return of capital. For the year ended February 28, 2018, distributions to shareholders from distributable earnings consisted of distributions from net investment income. |
See accompanying Notes to Financial Statements which are an integral part of the financial statements.
13 Invesco Tax-Exempt Cash Fund
Notes to Financial Statements
February 28, 2019
NOTE 1–Significant Accounting Policies
InvescoTax-Exempt Cash Fund (the “Fund”) is a series portfolio of AIMTax-Exempt Funds (InvescoTax-Exempt Funds) (the “Trust”). The Trust is a Delaware statutory trust registered under the Investment Company Act of 1940, as amended (the “1940 Act”), as anopen-end series management investment company authorized to issue an unlimited number of shares of beneficial interest. Information presented in these financial statements pertains only to the Fund. Matters affecting the Fund or each class will be voted on exclusively by the shareholders of the Fund or each class.
The Fund’s investment objective is to providetax-exempt income consistent with preservation of capital and liquidity.
The Fund currently consists of four different classes of shares: Class A, Class Y, Investor Class and Class R6. Class Y and Investor Class shares are available only to certain investors. Under certain circumstances, Class A shares are subject to contingent deferred sales charges (“CDSC”). Class A, Class Y, Investor Class and Class R6 shares are sold at net asset value.
The Fund is an investment company and accordingly follows the investment company accounting and reporting guidance in accordance with Financial Accounting Standards Board Accounting Standards Codification Topic 946,Financial Services – Investment Companies.
The Fund is a “retail money market fund” as defined in Rule2a-7 under the 1940 Act, and will continue to seek to maintain a stable or constant NAV of $1.00 per share using an amortized cost method of valuation. “Retail money market funds” are required to adopt policies and procedures reasonably designed to limit investments in the Fund to accounts beneficially owned by natural persons.
The Fund may impose a fee upon the sale of shares or may temporarily suspend the ability to sell shares if the Fund’s liquidity falls below required minimums or because of market conditions or other factors. The following is a summary of the significant accounting policies followed by the Fund in the preparation of its financial statements.
| A. | Security Valuations– The Fund’s securities are recorded on the basis of amortized cost which approximates value as permitted by Rule2a-7 under the 1940 Act. This method values a security at its cost on the date of purchase and, thereafter, assumes a constant amortization to maturity of any premiums or accretion of any discounts. |
Because of the inherent uncertainties of valuation, the values reflected in the financial statements may materially differ from the value received upon actual sale of those investments.
The Fund may invest in securities that are subject to interest rate risk, meaning the risk that the prices will generally fall as interest rates rise and, conversely, the prices will generally rise as interest rates fall. Specific securities differ in their sensitivity to changes in interest rates depending on their individual characteristics. Changes in interest rates may result in increased market volatility, which may affect the value and/or liquidity of certain Fund investments.
| B. | Securities Transactions and Investment Income– Securities transactions are accounted for on a trade date basis. Realized gains or losses on sales are computed on the basis of specific identification of the securities sold. Interest income (net of withholding tax, if any) is recorded on the accrual basis from settlement date. Bond premiums and discounts are amortized and/or accreted over the lives of the respective securities. |
The Fund may periodically participate in litigation related to Fund investments. As such, the Fund may receive proceeds from litigation settlements. Any proceeds received are included in the Statement of Operations as realized gain (loss) for investments no longer held and as unrealized gain (loss) for investments still held.
Brokerage commissions and mark ups are considered transaction costs and are recorded as an increase to the cost basis of securities purchased and/or a reduction of proceeds on a sale of securities. Such transaction costs are included in the determination of net realized gain (loss) from investment securities reported in the Statement of Operations and the Statement of Changes in Net Assets and the net realized gains (losses) on securities per share in the Financial Highlights. Transaction costs are included in the calculation of the Fund’s net asset value and, accordingly, they reduce the Fund’s total returns. These transaction costs are not considered operating expenses and are not reflected in net investment income reported in the Statement of Operations and the Statement of Changes in Net Assets, or the net investment income per share and the ratios of expenses and net investment income reported in the Financial Highlights, nor are they limited by any expense limitation arrangements between the Fund and the investment adviser.
The Fund allocates realized capital gains and losses to a class based on the relative net assets of each class. The Fund allocates income to a class based on the relative value of the settled shares of each class.
| C. | Country Determination -For the purposes of making investment selection decisions and presentation in the Schedule of Investments, the investment adviser may determine the country in which an issuer is located and/or credit risk exposure based on various factors. These factors include the laws of the country under which the issuer is organized, where the issuer maintains a principal office, the country in which the issuer derives 50% or more of its total revenues and the country that has the primary market for the issuer’s securities, as well as other criteria. Among the other criteria that may be evaluated for making this determination are the country in which the issuer maintains 50% or more of its assets, the type of security, financial guarantees and enhancements, the nature of the collateral and the sponsor organization. Country of issuer and/or credit risk exposure has been determined to be the United States of America, unless otherwise noted. |
| D. | Distributions -Distributions from net investment income, if any, are declared daily and paid monthly. Distributions from net realized capital gain, if any, are generally declared and paid annually and recorded on theex-dividend date. The Fund may elect to treat a portion of the proceeds from redemptions as distributions for federal income tax purposes. |
| E. | Federal Income Taxes– The Fund intends to comply with the requirements of Subchapter M of the Internal Revenue Code of 1986, as amended (the “Internal Revenue Code”), necessary to qualify as a regulated investment company and to distribute substantially all of the Fund’s taxable andtax-exempt earnings to shareholders. As such, the Fund will not be subject to federal income taxes on otherwise taxable income (including net realized capital gain) that is distributed to shareholders. Therefore, no provision for federal income taxes is recorded in the financial statements. |
The Fund recognizes the tax benefits of uncertain tax positions only when the position is more likely than not to be sustained. Management has analyzed the Fund’s uncertain tax positions and concluded that no liability for unrecognized tax benefits should be recorded related to uncertain
14 Invesco Tax-Exempt Cash Fund
tax positions. Management is not aware of any tax positions for which it is reasonably possible that the total amounts of unrecognized tax benefits will change materially in the next 12 months.
In addition, the Fund intends to invest in such municipal securities to allow it to qualify to pay shareholders “exempt-interest dividends”, as defined in the Internal Revenue Code.
The Fund files tax returns in the U.S. Federal jurisdiction and certain other jurisdictions. Generally, the Fund is subject to examinations by such taxing authorities for up to three years after the filing of the return for the tax period.
| F. | Expenses– Fees provided for under the Rule 12b-1 plan of a particular class of the Fund are charged to the operations of such class. Transfer agency fees and expenses and other shareholder recordkeeping fees and expenses attributable to Class R6 are charged to such class. Transfer agency fees and expenses and other shareholder recordkeeping fees and expenses relating to all other classes are allocated among those classes based on relative net assets. All other expenses are allocated among the classes based on relative net assets. |
| G. | Accounting Estimates– The preparation of financial statements in conformity with accounting principles generally accepted in the United States of America (“GAAP”) requires management to make estimates and assumptions that affect the reported amounts of assets and liabilities at the date of the financial statements and the reported amounts of revenues and expenses during the reporting period including estimates and assumptions related to taxation. Actual results could differ from those estimates by a significant amount. In addition, the Fund monitors for material events or transactions that may occur or become known after theperiod-end date and before the date the financial statements are released to print. |
| H. | Indemnifications- Under the Trust’s organizational documents, each Trustee, officer, employee or other agent of the Trust is indemnified against certain liabilities that may arise out of the performance of their duties to the Fund. Additionally, in the normal course of business, the Fund enters into contracts, including the Fund’s servicing agreements, that contain a variety of indemnification clauses. The Fund’s maximum exposure under these arrangements is unknown as this would involve future claims that may be made against the Fund that have not yet occurred. The risk of material loss as a result of such indemnification claims is considered remote. |
| I. | Other Risks– The value of, payment of interest on, repayment of principal for and the ability to sell a municipal security may be affected by constitutional amendments, legislative enactments, executive orders, administrative regulations, voter initiatives and the economics of the regions in which the issuers are located. |
Since many municipal securities are issued to finance similar projects, especially those relating to education, health care, transportation and utilities, conditions in those sectors can affect the overall municipal securities market and the Fund’s investments in municipal securities.
There is some risk that a portion or all of the interest received from certaintax-free municipal securities could become taxable as a result of determinations by the Internal Revenue Service.
NOTE 2–Advisory Fees and Other Fees Paid to Affiliates
The Trust has entered into a master investment advisory agreement with Invesco Advisers, Inc. (the “Adviser” or “Invesco”). Under the terms of the investment advisory agreement, the Fund accrues daily and pays monthly an advisory fee to the Adviser at the annual rate of 0.20% of the Fund’s average daily net assets.
Under the terms of a mastersub-advisory agreement between the Adviser and each of Invesco Asset Management Deutschland GmbH, Invesco Asset Management Limited, Invesco Asset Management (Japan) Limited, Invesco Hong Kong Limited, Invesco Senior Secured Management, Inc. and Invesco Canada Ltd. and separatesub-advisory agreements with Invesco Capital Management LLC and Invesco Asset Management (India) Private Limited (collectively, the “AffiliatedSub-Advisers”) the Adviser, not the Fund, will pay 40% of the fees paid to the Adviser to any such AffiliatedSub-Adviser(s) that provide(s) discretionary investment management services to the Fund based on the percentage of assets allocated to such AffiliatedSub-Adviser(s).
Invesco and/or Invesco Distributors, Inc. (“IDI”) voluntarily agreed to waive fees and/or reimburse expenses in order to increase the Fund’s yield. Voluntary fee waivers and/or reimbursements may be modified at any time upon consultation with the Board of Trustees without further notice to investors.
For the year ended February 28, 2019, the Adviser waived advisory fees of $246 and reimbursed class level expenses of $1,344, $347 and $306 of Class A, Class Y and Investor Class shares, respectively.
The Trust has entered into a master administrative services agreement with Invesco pursuant to which the Fund has agreed to pay Invesco for certain administrative costs incurred in providing accounting services to the Fund. For the year ended February 28, 2019, expenses incurred under the agreement are shown in the Statement of Operations asAdministrative services fees. Also, Invesco has entered into asub-administration agreement where by The Bank of New York Mellon (“BNY Mellon”) serves as custodian and fund accountant and provides certain administrative services to the Fund.
The Trust has entered into a transfer agency and service agreement with Invesco Investment Services, Inc. (“IIS”) pursuant to which the Fund has agreed to pay IIS a fee for providing transfer agency and shareholder services to the Fund and reimburse IIS for certain expenses incurred by IIS in the course of providing such services. IIS may make payments to intermediaries that provide omnibus account services,sub-accounting services and/or networking services. All fees payable by IIS to intermediaries that provide omnibus account services orsub-accounting services are charged back to the Fund, subject to certain limitations approved by the Trust’s Board of Trustees. For the year ended February 28, 2019, expenses incurred under the agreement are shown in the Statement of Operations asTransfer agent fees.
The Trust has entered into master distribution agreements with IDI to serve as the distributor for the Class A, Class Y, Investor Class and Class R6 shares of the Fund. The Trust has adopted plans pursuant to Rule12b-1 under the 1940 Act with respect to the Fund’s Class A and Investor Class shares (collectively, the “Plans”). The Fund, pursuant to the Plans, pays IDI compensation up to a maximum annual rate of 0.10% of the Fund’s average daily net assets of Class A shares. The fees are accrued daily and paid monthly. Of the Rule12b-1 payments, up to 0.10% of the average daily net assets of Class A shares may be paid to furnish continuing personal shareholder services to customers who purchase and own the shares of such classes. Any amounts not paid as a service fee under the Plans would constitute an asset-based sales charge. Rules of the Financial Industry Regulatory Authority (“FINRA”) also impose a cap on the total sales charges, including asset-based sales charges, that may be paid by any class of shares of the Fund. Pursuant to the Plans, for the year ended February 28, 2019, the Class A shares paid $22,542 after IDI waived Plan fees of $1,956.
CDSC are not recorded as expenses of the Fund. CDSC are deducted from redemption proceeds prior to remittance to the shareholder. During the year ended February 28, 2019, IDI advised the Fund that IDI retained $590 from Class A for CDSC imposed for redemptions by shareholders.
15 Invesco Tax-Exempt Cash Fund
Certain officers and trustees of the Trust are officers and directors of the Adviser, IIS and/or IDI.
NOTE 3–Additional Valuation Information
GAAP defines fair value as the price that would be received to sell an asset or paid to transfer a liability in an orderly transaction between market participants at the measurement date, under current market conditions. GAAP establishes a hierarchy that prioritizes the inputs to valuation methods, giving the highest priority to readily available unadjusted quoted prices in an active market for identical assets (Level 1) and the lowest priority to significant unobservable inputs (Level 3), generally when market prices are not readily available or are unreliable. Based on the valuation inputs, the securities or other investments are tiered into one of three levels. Changes in valuation methods may result in transfers in or out of an investment’s assigned level:
| | Level 1 – | Prices are determined using quoted prices in an active market for identical assets. |
| | Level 2 – | Prices are determined using other significant observable inputs. Observable inputs are inputs that other market participants may use in pricing a security. These may include quoted prices for similar securities, interest rates, prepayment speeds, credit risk, yield curves, loss severities, default rates, discount rates, volatilities and others. |
| | Level 3 – | Prices are determined using significant unobservable inputs. In situations where quoted prices or observable inputs are unavailable (for example, when there is little or no market activity for an investment at the end of the period), unobservable inputs may be used. Unobservable inputs reflect the Fund’s own assumptions about the factors market participants would use in determining fair value of the securities or instruments and would be based on the best available information. |
As of February 28, 2019, all of the securities in this Fund were valued based on Level 2 inputs (see the Schedule of Investments for security categories). The level assigned to the securities valuations may not be an indication of the risk or liquidity associated with investing in those securities. Because of the inherent uncertainties of valuation, the values reflected in the financial statements may materially differ from the value received upon actual sale of those investments.
NOTE 4–Security Transactions with Affiliated Funds
The Fund is permitted to purchase or sell securities from or to certain other Invesco Funds under specified conditions outlined in procedures adopted by the Board of Trustees of the Trust. The procedures have been designed to ensure that any purchase or sale of securities by the Fund from or to another fund or portfolio that is or could be considered an affiliate by virtue of having a common investment adviser (or affiliated investment advisers), common Trustees and/or common officers complies with Rule17a-7 of the 1940 Act. Further, as defined under the procedures, each transaction is effected at the current market price. Pursuant to these procedures, for the year ended February 28, 2019, the Fund engaged in securities purchases of $20,595,468 and securities sales of $26,207,464, which did not result in any net realized gains (losses).
NOTE 5–Expense Offset Arrangement(s)
The expense offset arrangement is comprised of transfer agency credits which result from balances in demand deposit accounts used by the transfer agent for clearing shareholder transactions. For the year ended February 28, 2019, the Fund received credits from this arrangement, which resulted in the reduction of the Fund’s total expenses of $750.
NOTE 6–Trustees’ and Officers’ Fees and Benefits
Trustees’ and Officers’ Fees and Benefits include amounts accrued by the Fund to pay remuneration to certain Trustees and Officers of the Fund. Trustees have the option to defer compensation payable by the Fund, andTrustees’ and Officers’ Fees and Benefits also include amounts accrued by the Fund to fund such deferred compensation amounts. Those Trustees who defer compensation have the option to select various Invesco Funds in which their deferral accounts shall be deemed to be invested. Finally, certain current Trustees were eligible to participate in a retirement plan that provided for benefits to be paid upon retirement to Trustees over a period of time based on the number of years of service. The Fund may have certain former Trustees who also participate in a retirement plan and receive benefits under such plan.Trustees’ and Officers’ Fees and Benefits include amounts accrued by the Fund to fund such retirement benefits. Obligations under the deferred compensation and retirement plans represent unsecured claims against the general assets of the Fund.
NOTE 7–Cash Balances
The Fund is permitted to temporarily carry a negative or overdrawn balance in its account with BNY Mellon, the custodian bank. Such balances, if any atperiod-end, are shown in the Statement of Assets and Liabilities under the payable captionAmount due custodian. To compensate the custodian bank for such overdrafts, the overdrawn Fund may either (1) leave funds as a compensating balance in the account so the custodian bank can be compensated by earning the additional interest; or (2) compensate by paying the custodian bank at a rate agreed upon by the custodian bank and Invesco, not to exceed the contractually agreed upon rate.
NOTE 8–Distributions to Shareholders and Tax Components of Net Assets
Tax Character of Distributions to Shareholders Paid During the Fiscal Years Ended February 28, 2019 and 2018:
| | | | | | | | |
| | | 2019 | | | 2018 | |
Ordinary income | | $ | 14,899 | | | $ | 4,293 | |
Ordinaryincome-Tax-Exempt | | | 166,071 | | | | 50,189 | |
Total distributions | | $ | 180,970 | | | $ | 54,482 | |
16 Invesco Tax-Exempt Cash Fund
Tax Components of Net Assets atPeriod-End:
| | | | |
| | | 2019 | |
Undistributedtax-exempt income | | $ | 43,462 | |
Temporary book/tax differences | | | (34,018 | ) |
Capital loss carryforward | | | (1,601 | ) |
Shares of beneficial interest | | | 38,629,377 | |
Total net assets | | $ | 38,637,220 | |
The temporary book/tax differences are a result of timing differences between book and tax recognition of income and/or expenses. The Fund’s temporary book/tax differences are the result of the trustee deferral of compensation and retirement plan benefits.
Capital loss carryforward is calculated and reported as of a specific date. Results of transactions and other activity after that date may affect the amount of capital loss carryforward actually available for the Fund to utilize. Capital losses generated in years beginning after December 22, 2010 can be carried forward for an unlimited period, whereas previous losses expire in eight tax years. Capital losses with an expiration period may not be used to offset capital gains until all net capital losses without an expiration date have been utilized. Capital loss carryforwards with no expiration date will retain their character as either short-term or long-term capital losses instead of as short-term capital losses as under prior law. The ability to utilize capital loss carryforwards in the future may be limited under the Internal Revenue Code and related regulations based on the results of future transactions.
The Fund has a capital loss carryforward as of February 28, 2019, as follows:
| | | | | | |
| Capital Loss Carryforward* |
| Expiration | | Short-Term | | Long-Term | | Total |
Not subject to expiration | | $1,601 | | $– | | $1,601 |
| * | Capital loss carryforward as of the date listed above is reduced for limitations, if any, to the extent required by the Internal Revenue Code and may be further limited depending upon a variety of factors, including the realization of net unrealized gains or losses as of the date of any reorganization. |
NOTE 9–Reclassification of Permanent Differences
Primarily as a result of expired capital loss carryforward, on February 28, 2019, undistributed net realized gain (loss) was increased by $4,593 and shares of beneficial interest was decreased by $4,593. This reclassification had no effect on the net assets of the Fund.
NOTE 10–Share Information
| | | | | | | | | | | | | | | | |
| | | Summary of Share Activity | |
| | | Years ended February 28, | |
| | | 2019(a) | | | 2018 | |
| | | Shares | | | Amount | | | Shares | | | Amount | |
Sold: | | | | | | | | | | | | | | | | |
Class A | | | 17,545,142 | | | $ | 17,545,142 | | | | 11,613,206 | | | $ | 11,613,206 | |
Class Y | | | 16,044,088 | | | | 16,044,088 | | | | 11,113,143 | | | | 11,113,143 | |
Investor Class | | | 959,230 | | | | 959,230 | | | | 1,698,471 | | | | 1,698,471 | |
Class R6(b) | | | - | | | | - | | | | 10,000 | | | | 10,000 | |
| | | | |
Issued as reinvestment of dividends: | | | | | | | | | | | | | | | | |
Class A | | | 99,597 | | | | 99,597 | | | | 34,941 | | | | 34,941 | |
Class Y | | | 35,381 | | | | 35,381 | | | | 8,888 | | | | 8,888 | |
Investor Class | | | 30,387 | | | | 30,387 | | | | 9,113 | | | | 9,113 | |
| | | | |
Reacquired: | | | | | | | | | | | | | | | | |
Class A | | | (17,296,988 | ) | | | (17,296,988 | ) | | | (17,623,610 | ) | | | (17,623,610 | ) |
Class Y | | | (13,616,863 | ) | | | (13,616,863 | ) | | | (10,046,270 | ) | | | (10,046,270 | ) |
Investor Class | | | (1,305,873 | ) | | | (1,305,873 | ) | | | (1,739,061 | ) | | | (1,739,061 | ) |
Net increase (decrease) in share activity | | | 2,494,101 | | | $ | 2,494,101 | | | | (4,921,179 | ) | | $ | (4,921,179 | ) |
| (a) | There are entities that are record owners of more than 5% of the outstanding shares of the Fund and in the aggregate own 31% of the outstanding shares of the Fund. IDI has an agreement with these entities to sell Fund shares. The Fund, Invesco and/or Invesco affiliates may make payments to these entities, which are considered to be related to the Fund, for providing services to the Fund, Invesco and/or Invesco affiliates including but not limited to services such as securities brokerage, distribution, third party record keeping and account servicing. The Fund has no knowledge as to whether all or any portion of the shares owned of record by these entities are also owned beneficially. |
| (b) | Commencement date of April 4, 2017. |
17 Invesco Tax-Exempt Cash Fund
NOTE 11–Financial Highlights
The following schedule presents financial highlights for a share of the Fund outstanding throughout the periods indicated.
| | | | | | | | | | | | | | | | | | | | | | | | | | | | | | | | | | | | | | | | | | | | |
| | | Net asset
value,
beginning
of period | | | Net
investment
income(a) | | | Net gains
(losses)
on securities
(both
realized and
unrealized) | | | Total from
investment
operations | | | Dividends
from net
investment
income | | | Net asset
value, end
of period | | | Total
return(b) | | | Net assets,
end of period
(000’s omitted) | | | Ratio of
expenses
to average
net assets
with fee waivers
and/or expenses
absorbed | | | Ratio of
expenses
to average net
assets without
fee waivers
and/or expenses
absorbed | | | Ratio of net
investment
income
to average
net assets | |
Class A | | | | | | | | | | | | | | | | | | | | | | | | | | | | | | | | | | | | | | | | | | | | |
Year ended 02/28/19 | | | $1.00 | | | | $0.00 | | | | $ - | | | | $0.00 | | | | $(0.00) | | | | $1.00 | | | | 0.46% | | | | $25,029 | | | | 1.06%(c) | | | | 1.07%(c) | | | | 0.46%(c) | |
Year ended 02/28/18 | | | 1.00 | | | | 0.00 | | | | (0.00) | | | | 0.00 | | | | (0.00) | | | | 1.00 | | | | 0.15 | | | | 24,681 | | | | 0.80 | | | | 1.12 | | | | 0.15 | |
Year ended 02/28/17 | | | 1.00 | | | | 0.00 | | | | (0.00) | | | | 0.00 | | | | (0.00) | | | | 1.00 | | | | 0.18 | | | | 30,658 | | | | 0.42 | | | | 0.90 | | | | 0.14 | |
Year ended 02/29/16 | | | 1.00 | | | | 0.00 | | | | - | | | | 0.00 | | | | (0.00) | | | | 1.00 | | | | 0.11 | | | | 38,235 | | | | 0.00(d) | | | | 0.91 | | | | 0.11(d) | |
Year ended 02/28/15 | | | 1.00 | | | | 0.00 | | | | 0.00 | | | | 0.00 | | | | (0.00) | | | | 1.00 | | | | 0.11 | | | | 36,349 | | | | 0.00(d) | | | | 0.83 | | | | 0.09(d) | |
Class Y | | | | | | | | | | | | | | | | | | | | | | | | | | | | | | | | | | | | | | | | | | | | |
Year ended 02/28/19 | | | 1.00 | | | | 0.01 | | | | - | | | | 0.01 | | | | (0.01) | | | | 1.00 | | | | 0.55 | | | | 8,114 | | | | 0.96(c) | | | | 0.97(c) | | | | 0.56(c) | |
Year ended 02/28/18 | | | 1.00 | | | | 0.00 | | | | (0.00) | | | | 0.00 | | | | (0.00) | | | | 1.00 | | | | 0.17 | | | | 5,651 | | | | 0.79 | | | | 1.02 | | | | 0.16 | |
Year ended 02/28/17 | | | 1.00 | | | | 0.00 | | | | (0.00) | | | | 0.00 | | | | (0.00) | | | | 1.00 | | | | 0.19 | | | | 4,575 | | | | 0.41 | | | | 0.80 | | | | 0.15 | |
Year ended 02/29/16 | | | 1.00 | | | | 0.00 | | | | - | | | | 0.00 | | | | (0.00) | | | | 1.00 | | | | 0.11 | | | | 10,063 | | | | 0.00(d) | | | | 0.81 | | | | 0.11(d) | |
Year ended 02/28/15 | | | 1.00 | | | | 0.00 | | | | 0.00 | | | | 0.00 | | | | (0.00) | | | | 1.00 | | | | 0.11 | | | | 13,067 | | | | 0.00(d) | | | | 0.73 | | | | 0.09(d) | |
Investor Class | | | | | | | | | | | | | | | | | | | | | | | | | | | | | | | | | | | | | | | | | | | | |
Year ended 02/28/19 | | | 1.00 | | | | 0.01 | | | | - | | | | 0.01 | | | | (0.01) | | | | 1.00 | | | | 0.55 | | | | 5,485 | | | | 0.96(c) | | | | 0.97(c) | | | | 0.56(c) | |
Year ended 02/28/18 | | | 1.00 | | | | 0.00 | | | | (0.00) | | | | 0.00 | | | | (0.00) | | | | 1.00 | | | | 0.17 | | | | 5,801 | | | | 0.79 | | | | 1.02 | | | | 0.16 | |
Year ended 02/28/17 | | | 1.00 | | | | 0.00 | | | | (0.00) | | | | 0.00 | | | | (0.00) | | | | 1.00 | | | | 0.19 | | | | 5,833 | | | | 0.41 | | | | 0.80 | | | | 0.15 | |
Year ended 02/29/16 | | | 1.00 | | | | 0.00 | | | | - | | | | 0.00 | | | | (0.00) | | | | 1.00 | | | | 0.11 | | | | 7,455 | | | | 0.00(d) | | | | 0.81 | | | | 0.11(d) | |
Year ended 02/28/15 | | | 1.00 | | | | 0.00 | | | | 0.00 | | | | 0.00 | | | | (0.00) | | | | 1.00 | | | | 0.11 | | | | 10,218 | | | | 0.00(d) | | | | 0.73 | | | | 0.09(d) | |
Class R6 | | | | | | | | | | | | | | | | | | | | | | | | | | | | | | | | | | | | | | | | | | | | |
Year ended 02/28/19 | | | 1.00 | | | | 0.01 | | | | - | | | | 0.01 | | | | (0.01) | | | | 1.00 | | | | 0.57 | | | | 10 | | | | 0.95(c) | | | | 0.97(c) | | | | 0.57(c) | |
Year ended 02/28/18(e) | | | 1.00 | | | | 0.00 | | | | (0.00) | | | | 0.00 | | | | (0.00) | | | | 1.00 | | | | 0.17 | | | | 10 | | | | 0.95(f) | | | | 1.15(f) | | | | 0.00(f) | |
| (a) | Calculated using average shares outstanding. |
| (b) | Includes adjustments in accordance with accounting principles generally accepted in the United States of America and as such, the net asset value for financial reporting purposes and the returns based upon those net asset values may differ from the net asset value and returns for shareholder transactions. Does not include sales charges and is not annualized for periods less than one year, if applicable. |
| (c) | Ratios are based on average daily net assets (000’s omitted) of $24,498, $6,326, $5,570 and $10 for Class A, Class Y, Investor Class and Class R6 shares, respectively. |
| (d) | Ratios include an adjustment for an adviser expense reimbursement of $8,256 and $5,452 in excess of current period expenses for the years ended February 29, 2016 and February 28, 2015, respectively. Ratios excluding this adjustment would have been lower by 0.01% and 0.01% for the years ended February 29, 2016 and February 28, 2015, respectively. |
| (e) | Commencement date of April 4, 2017. |
18 Invesco Tax-Exempt Cash Fund
Report of Independent Registered Public Accounting Firm
To the Board of Trustees of AIMTax-Exempt Funds (InvescoTax-Exempt Funds)
and Shareholders of InvescoTax-Exempt Cash Fund:
Opinion on the Financial Statements
We have audited the accompanying statement of assets and liabilities, including the schedule of investments, of InvescoTax-Exempt Cash Fund (one of the funds constituting AIMTax-Exempt Funds (InvescoTax-Exempt Funds), hereafter referred to as the “Fund”) as of February 28, 2019, the related statement of operations for the year ended February 28, 2019, the statement of changes in net assets for each of the two years in the period ended February 28, 2019, including the related notes, and the financial highlights for each of the periods indicated therein (collectively referred to as the “financial statements”). In our opinion, the financial statements present fairly, in all material respects, the financial position of the Fund as of February 28, 2019, the results of its operations for the year then ended, the changes in its net assets for each of the two years in the period ended February 28, 2019 and the financial highlights for each of the periods indicated therein in conformity with accounting principles generally accepted in the United States of America.
Basis for Opinion
These financial statements are the responsibility of the Fund’s management. Our responsibility is to express an opinion on the Fund’s financial statements based on our audits. We are a public accounting firm registered with the Public Company Accounting Oversight Board (United States) (PCAOB) and are required to be independent with respect to the Fund in accordance with the U.S. federal securities laws and the applicable rules and regulations of the Securities and Exchange Commission and the PCAOB.
We conducted our audits of these financial statements in accordance with the standards of the PCAOB. Those standards require that we plan and perform the audit to obtain reasonable assurance about whether the financial statements are free of material misstatement, whether due to error or fraud.
Our audits included performing procedures to assess the risks of material misstatement of the financial statements, whether due to error or fraud, and performing procedures that respond to those risks. Such procedures included examining, on a test basis, evidence regarding the amounts and disclosures in the financial statements. Our audits also included evaluating the accounting principles used and significant estimates made by management, as well as evaluating the overall presentation of the financial statements. Our procedures included confirmation of securities owned as of February 28, 2019 by correspondence with the custodian. We believe that our audits provide a reasonable basis for our opinion.
PricewaterhouseCoopers LLP
Houston, TX
April 29, 2019
We have served as the auditor of one or more of the investment companies in the Invesco group of investment companies since at least 1995. We have not been able to determine the specific year we began serving as auditor.
19 Invesco Tax-Exempt Cash Fund
Calculating your ongoing Fund expenses
Example
As a shareholder of the Fund, you incur two types of costs: (1) transaction costs, which may include sales charges (loads) on purchase payments or contingent deferred sales charges on redemptions, if any; and (2) ongoing costs, including management fees, distribution and/or service(12b-1) fees, and other Fund expenses. This example is intended to help you understand your ongoing costs (in dollars) of investing in the Fund and to compare these costs with ongoing costs of investing in other mutual funds. The example is based on an investment of $1,000 invested at the beginning of the period and held for the entire period September 1, 2018 through February 28, 2019.
Actual expenses
The table below provides information about actual account values and actual expenses. You may use the information in this table, together with the amount you invested, to estimate the expenses that you paid over the period. Simply divide your account value by $1,000 (for example, an $8,600 account value divided by $1,000 = 8.6), then multiply the result by the number in the table under the heading entitled “Actual Expenses Paid During Period” to estimate the expenses you paid on your account during this period.
Hypothetical example for comparison purposes
The table below also provides information about hypothetical account values and hypothetical expenses based on the Fund’s actual expense ratio and an assumed rate of return of 5% per year before expenses, which is not the Fund’s actual return.
The hypothetical account values and expenses may not be used to estimate the actual ending account balance or expenses you paid for the period. You may use this information to compare the ongoing costs of investing in the Fund and other funds. To do so, compare this 5% hypothetical example with the 5% hypothetical examples that appear in the shareholder reports of the other funds.
Please note that the expenses shown in the table are meant to highlight your ongoing costs only and do not reflect any transaction costs, such as sales charges (loads) on purchase payments or contingent deferred sales charges on redemptions, if any. Therefore, the hypothetical information is useful in comparing ongoing costs only, and will not help you determine the relative total costs of owning different funds. In addition, if these transaction costs were included, your costs would have been higher.
| | | | | | | | | | | | |
Class | | Beginning
Account Value
(09/01/18) | | ACTUAL | | HYPOTHETICAL
(5% annual return before expenses) | | Annualized
Expense
Ratio |
| | Ending
Account Value
(02/28/19)1 | | Expenses
Paid During
Period2 | | Ending
Account Value
(02/28/19) | | Expenses
Paid During
Period2 |
| A | | $1,000.00 | | $1,002.90 | | $5.16 | | $1,019.64 | | $5.21 | | 1.04% |
| Y | | 1,000.00 | | 1,003.40 | | 4.67 | | 1,020.13 | | 4.71 | | 0.94 |
| Investor | | 1,000.00 | | 1,003.40 | | 4.67 | | 1,020.13 | | 4.71 | | 0.94 |
| R6 | | 1,000.00 | | 1,003.40 | | 4.72 | | 1,020.08 | | 4.76 | | 0.95 |
| 1 | The actual ending account value is based on the actual total return of the Fund for the period September 1, 2018 through February 28, 2019, after actual expenses and will differ from the hypothetical ending account value which is based on the Fund’s expense ratio and a hypothetical annual return of 5% before expenses. |
| 2 | Expenses are equal to the Fund’s annualized expense ratio as indicated above multiplied by the average account value over the period, multiplied by 181/365 to reflect the most recent fiscal half year. |
20 Invesco Tax-Exempt Cash Fund
Tax Information
Form1099-DIV, Form1042-S and otheryear-end tax information provide shareholders with actual calendar year amounts that should be included in their tax returns. Shareholders should consult their tax advisors.
The following distribution information is being provided as required by the Internal Revenue Code or to meet a specific state’s requirement.
The Fund designates the following amounts or, if subsequently determined to be different, the maximum amount allowable for its fiscal year ended
February 28, 2019:
| | | | | | |
Federal and State Income Tax | | | |
Qualified Dividend Income* | | | 0 | % |
Corporate Dividends Received Deduction* | | | 0 | % |
U.S. Treasury Obligations* | | | 0 | % |
Tax-Exempt Interest Dividends* | | | 91.76 | % |
| | * | The above percentages are based on ordinary income dividends paid to shareholders during the Fund’s fiscal year. |
21 Invesco Tax-Exempt Cash Fund
Trustees and Officers
The address of each trustee and officer is AIMTax-Exempt Funds (InvescoTax-Exempt Funds) (the “Trust”), 11 Greenway Plaza, Suite 1000, Houston, Texas 77046-1173. The trustees serve for the life of the Trust, subject to their earlier death, incapacitation, resignation, retirement or removal as more specifically provided in the Trust’s organizational documents. Each officer serves for a one year term or until their successors are elected and qualified. Column two below includes length of time served with predecessor entities, if any.
| | | | | | | | |
Name, Year of Birth and
Position(s) Held with the Trust | | Trustee and/
or Officer Since | | Principal Occupation(s) During Past 5 Years | | Number of
Funds in Fund
Complex
Overseen by
Trustee | | Other Directorship(s)
Held by Trustee During
Past 5 Years |
| Interested Persons | | | | | | | | |
| Martin L. Flanagan1 – 1960 Trustee and Vice Chair | | 2007 | | Executive Director, Chief Executive Officer and President, Invesco Ltd. (ultimate parent of Invesco and a global investment management firm); Trustee and Vice Chair, The Invesco Funds; Vice Chair, Investment Company Institute; and Member of Executive Board, SMU Cox School of Business Formerly: Advisor to the Board, Invesco Advisers, Inc. (formerly known as Invesco Institutional (N.A.), Inc.); Chairman and Chief Executive Officer, Invesco Advisers, Inc. (registered investment adviser); Director, Chairman, Chief Executive Officer and President, Invesco Holding Company (US), Inc. (formerly IVZ Inc.) (holding company), Invesco Group Services, Inc. (service provider) and Invesco North American Holdings, Inc. (holding company); Director, Chief Executive Officer and President, Invesco Holding Company Limited (parent of Invesco and a global investment management firm); Director, Invesco Ltd.; Chairman, Investment Company Institute and President,Co-Chief Executive Officer,Co-President, Chief Operating Officer and Chief Financial Officer, Franklin Resources, Inc. (global investment management organization) | | 158 | | None |
Philip A. Taylor2– 1954 Trustee | | 2006 | | Vice Chair, Invesco Ltd.; Director, Invesco Canada Ltd. (formerly known as Invesco Trimark Ltd./Invesco Trimark Ltèe) (registered investment adviser and registered transfer agent); Trustee, The Invesco Funds Formerly: Head of the Americas and Senior Managing Director, Invesco Ltd.; Director, Invesco Advisers, Inc. (formerly known as Invesco Institutional (N.A.), Inc.) (registered investment adviser); Director and Chairman, Invesco Investment Services, Inc. (formerly known as Invesco AIM Investment Services, Inc.) (registered transfer agent); Chief Executive Officer, Invesco Corporate Class Inc. (corporate mutual fund company); Chairman and Chief Executive Officer, Invesco Canada Ltd. (formerly known as Invesco Trimark Ltd./Invesco Trimark Ltèe) (registered investment adviser and registered transfer agent); Senior Vice President, The Invesco Funds; Director, Invesco Investment Advisers LLC (formerly known as Van Kampen Asset Management); Director, Chairman, Chief Executive Officer and President, Invesco Management Group, Inc. (formerly known as Invesco AIM Management Group, Inc.) (financial services holding company);Co-Chairman,Co-President andCo-Chief Executive Officer, Invesco Advisers, Inc. (formerly known as Invesco Institutional (N.A.), Inc.) (registered investment adviser); Director, Chief Executive Officer and President, Van Kampen Exchange Corp; President and Principal Executive Officer, The Invesco Funds (other than AIM Treasurer’s Series Trust (Invesco Treasurer’s Series Trust), Short-Term Investments Trust and Invesco Management Trust); Executive Vice President, The Invesco Funds (AIM Treasurer’s Series Trust (Invesco Treasurer’s Series Trust), Short-Term Investments Trust and Invesco Management Trust only); Director and President, INVESCO Funds Group, Inc. (registered investment adviser and registered transfer agent); Director and Chairman, IVZ Distributors, Inc. (formerly known as INVESCO Distributors, Inc.) (registered broker dealer); Director, President and Chairman, Invesco Inc. (holding company), Invesco Canada Holdings Inc. (holding company), Trimark Investments Ltd./ Placements Trimark Ltèe and Invesco Financial Services Ltd/Services Financiers Invesco Ltèe; Chief Executive Officer, Invesco Canada Fund Inc. (corporate mutual fund company); Director and Chairman, Van Kampen Investor Services Inc.; Director, Chief Executive Officer and President, 1371 Preferred Inc. (holding company) and Van Kampen Investments Inc.; Director and President, AIM GP Canada Inc. (general partner for limited partnerships) and Van Kampen Advisors, Inc.; Director and Chief Executive Officer, Invesco Trimark Dealer Inc. (registered broker dealer); Director, Invesco Distributors, Inc. (formerly known as Invesco AIM Distributors, Inc.) (registered broker dealer); Manager, Invesco Capital Management LLC; Director, Chief Executive Officer and President, Invesco Advisers, Inc.; Director, Chairman, Chief Executive Officer and President, Invesco AIM Capital Management, Inc.; President, Invesco Trimark Dealer Inc. and Invesco Trimark Ltd./Invesco Trimark Ltèe; Director and President, AIM Trimark Corporate Class Inc. and AIM Trimark Canada Fund Inc.; Senior Managing Director, Invesco Holding Company Limited; Director and Chairman, Fund Management Company (former registered broker dealer); President and Principal Executive Officer, The Invesco Funds (AIM Treasurer’s Series Trust (Invesco Treasurer’s Series Trust), and Short-Term Investments Trust only); President, AIM Trimark Global Fund Inc. and AIM Trimark Canada Fund Inc. | | 158 | | None |
| 1 | Mr. Flanagan is considered an interested person (within the meaning of Section 2(a)(19) of the 1940 Act) of the Trust because he is an officer of the Adviser to the Trust, and an officer and a director of Invesco Ltd., ultimate parent of the Adviser. |
| 2 | Mr. Taylor is considered an interested person (within the meaning of Section 2(a)(19) of the 1940 Act) of the Trust because he is an officer and a director of the Adviser. |
T-1 Invesco Tax-Exempt Cash Fund
Trustees and Officers–(continued)
| | | | | | | | |
Name, Year of Birth and
Position(s) Held with the Trust | | Trustee and/
or Officer Since | | Principal Occupation(s) During Past 5 Years | | Number of
Funds in Fund
Complex
Overseen by
Trustee | | Other Directorship(s)
Held by Trustee During
Past 5 Years |
| Independent Trustees | | | | | | | | |
| Bruce L. Crockett – 1944 Trustee and Chair | | 1993 | | Chairman, Crockett Technologies Associates (technology consulting company) Formerly: Director, Captaris (unified messaging provider); Director, President and Chief Executive Officer, COMSAT Corporation; Chairman, Board of Governors of INTELSAT (international communications company); ACE Limited (insurance company); Independent Directors Council and Investment Company Institute: Member of the Audit Committee, Investment Company Institute; Member of the Executive Committee and Chair of the Governance Committee, Independent Directors Council | | 158 | | Director and Chairman of the Audit Committee, ALPS (Attorneys Liability Protection Society) (insurance company); Director and Member of the Audit Committee and Compensation Committee, Ferroglobe PLC (metallurgical company) |
David C. Arch – 1945 Trustee | | 2010 | | Chairman of Blistex Inc. (consumer health care products manufacturer); Member, World Presidents’ Organization | | 158 | | Board member of the Illinois Manufacturers’ Association |
Jack M. Fields – 1952 Trustee | | 1997 | | Chief Executive Officer, Twenty First Century Group, Inc. (government affairs company); and Chairman, Discovery Learning Alliance(non-profit) Formerly: Owner and Chief Executive Officer, Dos Angeles Ranch L.P. (cattle, hunting, corporate entertainment); Director, Insperity, Inc. (formerly known as Administaff) (human resources provider); Chief Executive Officer, Texana Timber LP (sustainable forestry company); Director of Cross Timbers Quail Research Ranch(non-profit); and member of the U.S. House of Representatives | | 158 | | None |
Cynthia Hostetler – 1962 Trustee | | 2017 | | Non-Executive Director and Trustee of a number of public and private business corporations Formerly: Director, Aberdeen Investment Funds (4 portfolios); Head of Investment Funds and Private Equity, Overseas Private Investment Corporation; President, First Manhattan Bancorporation, Inc.; Attorney, Simpson Thacher & Bartlett LLP | | 158 | | Vulcan Materials Company (construction materials company); Trilinc Global Impact Fund; Genesee & Wyoming, Inc. (railroads); Artio Global Investment LLC (mutual fund complex); Edgen Group, Inc. (specialized energy and infrastructure products distributor); Investment Company Institute (professional organization); Independent Directors Council (professional organization) |
Eli Jones – 1961 Trustee | | 2016 | | Professor and Dean, Mays Business School–Texas A&M University Formerly: Professor and Dean, Walton College of Business, University of Arkansas and E.J. Ourso College of Business, Louisiana State University; Director, Arvest Bank | | 158 | | Insperity, Inc. (formerly known as Administaff) (human resources provider) |
Anthony J. LaCava, Jr. – 1956 Trustee | | 2019 | | Formerly: Director and Member of the Audit Committee, Blue Hills Bank and Managing Partner, KPMG LLP | | 158 | | Blue Hills Bank; Chairman, Bentley University; Member, Business School Advisory Council; KPMG LLP |
Prema Mathai-Davis – 1950 Trustee | | 1998 | | Retired Co-Owner & Partner of Quantalytics Research, LLC, (a FinTech Investment Research Platform for the Self-Directed Investor) | | 158 | | None |
Teresa M. Ressel – 1962 Trustee | | 2017 | | Non-executive director and trustee of a number of public and private business corporations Formerly: Chief Financial Officer, Olayan America, The Olayan Group (international investor/commercial/industrial); Chief Executive Officer, UBS Securities LLC; Group Chief Operating Officer, Americas, UBS AG; Assistant Secretary for Management & Budget and CFO, US Department of the Treasury | | 158 | | Atlantic Power Corporation (power generation company); ON Semiconductor Corp. (semiconductor supplier) |
Ann Barnett Stern – 1957 Trustee | | 2017 | | President and Chief Executive Officer, Houston Endowment Inc. (private philanthropic institution) Formerly: Executive Vice President and General Counsel, Texas Children’s Hospital; Attorney, Beck, Redden and Secrest, LLP; Business Law Instructor, University of St. Thomas; Attorney, Andrews & Kurth LLP | | 158 | | Federal Reserve Bank of Dallas |
Raymond Stickel, Jr. – 1944 Trustee | | 2005 | | Retired Formerly: Director, Mainstay VP Series Funds, Inc. (25 portfolios); Partner, Deloitte & Touche | | 158 | | None |
Robert C. Troccoli – 1949 Trustee | | 2016 | | Adjunct Professor, University of Denver – Daniels College of Business Formerly: Senior Partner, KPMG LLP | | 158 | | None |
Christopher L. Wilson – 1957 Trustee | | 2017 | | Non-executive director and trustee of a number of public and private business corporations Formerly: Director, TD Asset Management USA Inc. (mutual fund complex) (22 portfolios); Managing Partner, CT2, LLC (investing and consulting firm); President/Chief Executive Officer, Columbia Funds, Bank of America Corporation; President/Chief Executive Officer, CDC IXIS Asset Management Services, Inc.; Principal & Director of Operations, Scudder Funds, Scudder, Stevens & Clark, Inc.; Assistant Vice President, Fidelity Investments | | 158 | | ISO New England, Inc.(non-profit organization managing regional electricity market) |
T-2 Invesco Tax-Exempt Cash Fund
Trustees and Officers–(continued)
| | | | | | | | |
Name, Year of Birth and
Position(s) Held with the Trust | | Trustee and/
or Officer Since | | Principal Occupation(s) During Past 5 Years | | Number of
Funds in Fund
Complex Overseen
by Trustee | | Other Directorship(s)
Held by Trustee During
Past 5 Years |
| Other Officers | | | | | | | | |
| Sheri Morris – 1964 President, Principal Executive Officer and Treasurer | | 1999 | | President, Principal Executive Officer and Treasurer, The Invesco Funds; Vice President, Invesco Advisers, Inc. (formerly known as Invesco Institutional (N.A.), Inc.) (registered investment adviser); and Vice President, Invesco Exchange-Traded Fund Trust, Invesco Exchange-Traded Fund Trust II, Invesco India Exchange-Traded Fund Trust, Invesco Actively Managed Exchange-Traded Fund Trust, Invesco Actively Managed Exchange-Traded Commodity Fund Trust and Invesco Exchange-Traded Self-Indexed Fund Trust Formerly: Vice President and Principal Financial Officer, The Invesco Funds; Vice President, Invesco AIM Advisers, Inc., Invesco AIM Capital Management, Inc. and Invesco AIM Private Asset Management, Inc.; Assistant Vice President and Assistant Treasurer, The Invesco Funds and Assistant Vice President, Invesco Advisers, Inc., Invesco AIM Capital Management, Inc. and Invesco AIM Private Asset Management, Inc.; and Treasurer, Invesco Exchange-Traded Fund Trust, Invesco Exchange-Traded Fund Trust II, Invesco India Exchange-Traded Fund Trust and Invesco Actively Managed Exchange-Traded Fund Trust | | N/A | | N/A |
Russell C. Burk – 1958 Senior Vice President and Senior Officer | | 2005 | | Senior Vice President and Senior Officer, The Invesco Funds | | N/A | | N/A |
Jeffrey H. Kupor – 1968 Senior Vice President, Chief Legal Officer and Secretary | | 2018 | | Head of Legal of the Americas, Invesco Ltd.; Senior Vice President and Secretary, Invesco Advisers, Inc. (formerly known as Invesco Institutional (N.A.), Inc.) (registered investment adviser); Senior Vice President and Secretary, Invesco Distributors, Inc. (formerly known as Invesco AIM Distributors, Inc.); Vice President and Secretary, Invesco Investment Services, Inc. (formerly known as Invesco AIM Investment Services, Inc.) Senior Vice President, Chief Legal Officer and Secretary, The Invesco Funds; Secretary and General Counsel, Invesco Investment Advisers LLC (formerly known as Van Kampen Asset Management); Secretary and General Counsel, Invesco Capital Markets, Inc. (formerly known as Van Kampen Funds Inc.) and Chief Legal Officer, Invesco Exchange-Traded Fund Trust, Invesco Exchange-Traded Fund Trust II, Invesco India Exchange-Traded Fund Trust, Invesco Actively Managed Exchange-Traded Fund Trust, Invesco Actively Managed Exchange-Traded Commodity Fund Trust and Invesco Exchange-Traded Self-Indexed Fund Trust; Secretary, Invesco Indexing LLC; Secretary, W.L. Ross & Co., LLC; Secretary and Vice President, Jemstep, Inc. Formerly: Head of Legal, Worldwide Institutional, Invesco Ltd.; Secretary and General Counsel, INVESCO Private Capital Investments, Inc.; Senior Vice President, Secretary and General Counsel, Invesco Management Group, Inc. (formerly known as Invesco AIM Management Group, Inc.); Assistant Secretary, INVESCO Asset Management (Bermuda) Ltd.; Secretary and General Counsel, Invesco Private Capital, Inc.; Assistant Secretary and General Counsel, INVESCO Realty, Inc.; Secretary and General Counsel, Invesco Senior Secured Management, Inc.; and Secretary, Sovereign G./P. Holdings Inc. | | N/A | | N/A |
| Andrew R. Schlossberg – 1974 Senior Vice President | | 2019 | | Head of the Americas and Senior Managing Director, Invesco Ltd.; Director and Senior Vice President, Invesco Advisers, Inc. (formerly known as Invesco Institutional (N.A.), Inc.) (registered investment adviser); Director and Chairman, Invesco Investment Services, Inc. (formerly known as Invesco AIM Investment Services, Inc.) (registered transfer agent); Senior Vice President, The Invesco Funds; Director, Invesco Investment Advisers LLC (formerly known as Van Kampen Asset Management) and Invesco UK Limited; Director, President and Chairman, Invesco Insurance Agency, Inc.; Director and Chief Executive, Invesco Asset Management Limited and Invesco Fund Managers Limited Formerly: Assistant Vice President, The Invesco Funds; Senior Vice President, Invesco Advisers, Inc. (formerly known as Invesco Institutional (N.A.), Inc.) (registered investment adviser); Director and Chief Executive, Invesco Administration Services Limited and Invesco Global Investment Funds Limited; Director, Invesco Distributors, Inc.; Head of EMEA, Invesco Ltd.; President, Invesco Actively Managed Exchange-Traded Commodity Fund Trust, Invesco Actively Managed Exchange-Traded Fund Trust, Invesco Exchange-Traded Fund Trust, Invesco Exchange-Traded Fund Trust II and Invesco India Exchange-Traded Fund Trust; Managing Director and Principal Executive Officer, Invesco Capital Management LLC | | N/A | | N/A |
| John M. Zerr – 1962 Senior Vice President | | 2006 | | Chief Operating Officer of the Americas; Senior Vice President, Invesco Advisers, Inc. (formerly known as Invesco Institutional (N.A.), Inc.) (registered investment adviser); Senior Vice President, Invesco Distributors, Inc. (formerly known as Invesco AIM Distributors, Inc.); Director and Vice President, Invesco Investment Services, Inc. (formerly known as Invesco AIM Investment Services, Inc.) Senior Vice President, The Invesco Funds; Managing Director, Invesco Capital Management LLC; Director, Invesco Investment Advisers LLC (formerly known as Van Kampen Asset Management); Senior Vice President, Invesco Capital Markets, Inc. (formerly known as Van Kampen Funds Inc.); Manager, Invesco Indexing LLC; Invesco Canada Funds Advisory Board Member; Director, President Chief Executive Officer, Invesco Corporate Class Inc. (corporate mutual fund company); and Director, Chairman, President and Chief Executive Officer, Invesco Canada Ltd. (formerly known as Invesco Trimark Ltd./Invesco Trimark Ltèe) (registered investment adviser and registered transfer agent) | | N/A | | N/A |
T-3 Invesco Tax-Exempt Cash Fund
Trustees and Officers–(continued)
| | | | | | | | |
Name, Year of Birth and
Position(s) Held with the Trust | | Trustee and/
or Officer Since | | Principal Occupation(s) During Past 5 Years | | Number of
Funds in Fund
Complex Overseen
by Trustee | | Other Directorship(s)
Held by Trustee During
Past 5 Years |
| Other Officers–(continued) | | | | | | | | |
| | | | | Formerly: Director and Senior Vice President, Invesco Management Group, Inc. (formerly known as Invesco AIM Management Group, Inc.); Secretary and General Counsel, Invesco Management Group, Inc. (formerly known as Invesco AIM Management Group, Inc.); Secretary, Invesco Investment Services, Inc. (formerly known as Invesco AIM Investment Services, Inc.); Chief Legal Officer and Secretary, The Invesco Funds; Secretary and General Counsel, Invesco Investment Advisers LLC (formerly known as Van Kampen Asset Management); Secretary and General Counsel, Invesco Capital Markets, Inc. (formerly known as Van Kampen Funds Inc.); Chief Legal Officer, Invesco Exchange-Traded Fund Trust, Invesco Exchange-Traded Fund Trust II, Invesco India Exchange-Traded Fund Trust, Invesco Actively Managed Exchange-Traded Fund Trust, Invesco Actively Managed Exchange-Traded Commodity Fund Trust and Invesco Exchange-Traded Self-Indexed Fund Trust; Secretary, Invesco Indexing LLC; Director, Secretary, General Counsel and Senior Vice President, Van Kampen Exchange Corp.; Director, Vice President and Secretary, IVZ Distributors, Inc. (formerly known as INVESCO Distributors, Inc.); Director and Vice President, INVESCO Funds Group, Inc.; Director and Vice President, Van Kampen Advisors Inc.; Director, Vice President, Secretary and General Counsel, Van Kampen Investor Services Inc.; Director and Secretary, Invesco Distributors, Inc. (formerly known as Invesco AIM Distributors, Inc.); Director, Senior Vice President, General Counsel and Secretary, Invesco AIM Advisers, Inc. and Van Kampen Investments Inc.; Director, Vice President and Secretary, Fund Management Company; Director, Senior Vice President, Secretary, General Counsel and Vice President, Invesco AIM Capital Management, Inc.; Chief Operating Officer and General Counsel, Liberty Ridge Capital, Inc. (an investment adviser) | | | | |
| Gregory G. McGreevey – 1962 Senior Vice President | | 2012 | | Senior Managing Director, Invesco Ltd.; Director, Chairman, President, and Chief Executive Officer, Invesco Advisers, Inc. (formerly known as Invesco Institutional (N.A.), Inc.) (registered investment adviser); Director, Invesco Mortgage Capital, Inc. and Invesco Senior Secured Management, Inc.; and Senior Vice President, The Invesco Funds Formerly: Senior Vice President, Invesco Management Group, Inc. and Invesco Advisers, Inc.; Assistant Vice President, The Invesco Funds | | N/A | | N/A |
| Kelli Gallegos – 1970 Vice President, Principal Financial Officer and Assistant Treasurer | | 2008 | | Vice President and Treasurer, Invesco Exchange-Traded Fund Trust, Invesco Exchange-Traded Fund Trust II, Invesco India Exchange-Traded Fund Trust, Invesco Actively Managed Exchange-Traded Fund Trust, Invesco Actively Managed Exchange-Traded Commodity Fund Trust and Invesco Exchange-Traded Self-Indexed Fund Trust; Vice President, Principal Financial Officer and Assistant Treasurer, The Invesco Funds; Principal Financial and Accounting Officer – Pooled Investments, Invesco Capital Management LLC Formerly: Assistant Treasurer, Invesco Exchange-Traded Fund Trust, Invesco Exchange-Traded Fund Trust II, Invesco India Exchange-Traded Fund Trust, Invesco Actively Managed Exchange-Traded Fund Trust, Invesco Actively Managed Exchange-Traded Commodity Fund Trust and Invesco Exchange-Traded Self-Indexed Fund Trust; Assistant Treasurer, Invesco Capital Management LLC; Assistant Vice President, The Invesco Funds | | N/A | | N/A |
| Tracy Sullivan – 1962 Vice President, Chief Tax Officer and Assistant Treasurer | | 2008 | | Vice President, Chief Tax Officer and Assistant Treasurer, The Invesco Funds; Assistant Treasurer, Invesco Capital Management LLC, Invesco Exchange-Traded Fund Trust, Invesco Exchange-Traded Fund Trust II, Invesco India Exchange-Traded Fund Trust, Invesco Actively Managed Exchange-Traded Fund Trust, Invesco Actively Managed Exchange-Traded Commodity Fund Trust and Invesco Exchange-Traded Self-Indexed Fund Trust Formerly: Assistant Vice President, The Invesco Funds | | N/A | | N/A |
| Crissie M. Wisdom – 1969 Anti-Money Laundering Compliance Officer | | 2013 | | Anti-Money Laundering Compliance Officer, Invesco Advisers, Inc. (formerly known as Invesco Institutional (N.A.), Inc.) (registered investment adviser), Invesco Capital Markets, Inc. (formerly known as Van Kampen Funds Inc.), Invesco Distributors, Inc., Invesco Investment Services, Inc., The Invesco Funds, and Invesco Exchange-Traded Fund Trust, Invesco Exchange-Traded Fund Trust II, Invesco India Exchange-Traded Fund Trust, Invesco Actively Managed Exchange-Traded Fund Trust, Invesco Actively Managed Exchange-Traded Commodity Fund Trust and Invesco Exchange-Traded Self-Indexed Fund Trust; Anti-Money Laundering Compliance Officer and Bank Secrecy Act Officer, INVESCO National Trust Company and Invesco Trust Company; and Fraud Prevention Manager and Controls and Risk Analysis Manager for Invesco Investment Services, Inc. Formerly: Anti-Money Laundering Compliance Officer, Van Kampen Exchange Corp. and Invesco Management Group, Inc. | | N/A | | N/A |
| Robert R. Leveille – 1969 Chief Compliance Officer | | 2016 | | Chief Compliance Officer, Invesco Advisers, Inc. (registered investment adviser); and Chief Compliance Officer, The Invesco Funds Formerly: Chief Compliance Officer, Putnam Investments and the Putnam Funds | | N/A | | N/A |
The Statement of Additional Information of the Trust includes additional information about the Fund’s Trustees and is available upon request, without charge, by calling 1.800.959.4246. Please refer to the Fund’s Statement of Additional Information for information on the Fund’ssub-advisers.
| | | | | | |
Office of the Fund 11 Greenway Plaza, Suite 1000 Houston, TX 77046-1173 | | Investment Adviser Invesco Advisers, Inc. 1555 Peachtree Street, N.E. Atlanta, GA 30309 | | Distributor Invesco Distributors, Inc. 11 Greenway Plaza, Suite 1000 Houston, TX 77046-1173 | | Auditors PricewaterhouseCoopers LLP 1000 Louisiana Street, Suite 5800 Houston, TX 77002-5021 |
| | | |
| | | | | | |
Counsel to the Fund Stradley Ronon Stevens & Young, LLP 2005 Market Street, Suite 2600 Philadelphia, PA 19103-7018 | | Counsel to the Independent Trustees Goodwin Procter LLP 901 New York Avenue, N.W. Washington, D.C. 20001 | | Transfer Agent Invesco Investment Services, Inc. 11 Greenway Plaza, Suite 1000 Houston, TX 77046-1173 | | Custodian Bank of New York Mellon 2 Hanson Place Brooklyn, NY 11217-1431 |
T-4 Invesco Tax-Exempt Cash Fund
Explore High-Conviction Investing with Invesco

Go paperless with eDelivery
Visit invesco.com/edelivery to enjoy the convenience and security of anytime electronic access to your investment documents.
With eDelivery, you can elect to have any or all of the following materials delivered straight to your inbox to download, save and print from your own computer:
| ∎ | Fund reports and prospectuses |
Invesco mailing information
Send general correspondence to Invesco Investment Services, Inc., P.O. Box 219078, Kansas City, MO 64121-9078.
Important notice regarding delivery of security holder documents
To reduce Fund expenses, only one copy of most shareholder documents may be mailed to shareholders with multiple accounts at the same address (Householding). Mailing of your shareholder documents may be householded indefinitely unless you instruct us otherwise. If you do not want the mailing of these documents to be combined with those for other members of your household, please contact Invesco Investment Services, Inc. at 800 959 4246 or contact your financial institution. We will begin sending you individual copies for each account within 30 days after receiving your request.
Fund holdings and proxy voting information
The Fund provides a complete list of its holdings four times in each fiscal year, at the quarter-ends. For the second and fourth quarters, the list appears in the Fund’s semiannual and annual reports to shareholders. For the first and third quarters, the Fund files the lists with the Securities and Exchange Commission (SEC) on FormN-Q (or any successor Form). The most recent list of portfolio holdings is available at invesco.com/completeqtrholdings. Shareholders can also look up the Fund’s FormN-Q (or any successor Form) filings on the SEC website, sec.gov. The SEC file numbers for the Fund are shown below.
A description of the policies and procedures that the Fund uses to determine how to vote proxies relating to portfolio securities is available without charge, upon request, from our Client Services department at 800 959 4246, or at invesco.com/ proxyguidelines. The information is also available on the SEC website, sec.gov.
| | |
Information regarding how the Fund voted proxies related to its portfolio securities during the most recent12-month period ended June 30 is available at invesco.com/proxysearch. This information is also available on the SEC website, sec.gov. Invesco Advisers, Inc. is an investment adviser; it provides investment advisory services to individual and institutional clients and does not sell securities. Invesco Distributors, Inc. is the US distributor for Invesco Ltd.’s retail mutual funds, exchange-traded funds and institutional money market funds. Both are wholly owned, indirect subsidiaries of Invesco Ltd. | | |
| | | | | | |
| SEC file numbers: 811-07890 and 033-66242 | | Invesco Distributors, Inc. | | | | TEC-AR-1 |
There were no amendments to the Code of Ethics (the “Code”) that applies to the Registrant’s Principal Executive Officer (“PEO”) and Principal Financial Officer (“PFO”) during the period covered by the report. The Registrant did not grant any waivers, including implicit waivers, from any provisions of the Code to the PEO or PFO during the period covered by this report.
| ITEM 3. | AUDIT COMMITTEE FINANCIAL EXPERT. |
The Board of Trustees has determined that the Registrant has at least one audit committee financial expert serving on its Audit Committee. The Audit Committee financial experts are David C. Arch, Bruce L. Crockett, Cynthia Hostetler, Anthony J. LaCava, Jr., Teresa M. Ressel, Raymond Stickel, Jr. and Robert C. Troccoli. David C. Arch, Bruce L. Crockett, Cynthia Hostetler, Anthony J. LaCava, Jr., Teresa M. Ressel, Raymond Stickel, Jr. and Robert Troccoli are “independent” within the meaning of that term as used in FormN-CSR.
| ITEM 4. | PRINCIPAL ACCOUNTANT FEES AND SERVICES. |
PricewaterhouseCoopers LLP (“PwC”) informed the Trust that it has identified an issue related to its independence under Rule2-01(c)(1)(ii)(A) of RegulationS-X (referred to as the Loan Rule). The Loan Rule prohibits accounting firms, such as PricewaterhouseCoopers LLP, from being deemed independent if they have certain financial relationships with their audit clients or certain affiliates of those clients. The Trust is required under various securities laws to have its financial statements audited by an independent accounting firm.
The Loan Rule specifically provides that an accounting firm would not be independent if it or certain affiliates and covered persons receives a loan from a lender that is a record or beneficial owner of more than ten percent of an audit client’s equity securities (referred to as a “more than ten percent owner”). For purposes of the Loan Rule, audit clients include the Funds as well as all registered investment companies advised by the Adviser and its affiliates, including other subsidiaries of the Adviser’s parent company, Invesco Ltd. (collectively, the Invesco Fund Complex). PricewaterhouseCoopers LLP informed the Trust it and certain affiliates and covered persons have relationships with lenders who hold, as record owner, more than ten percent of the shares of certain funds within the Invesco Fund Complex.
On June 20, 2016, the SEC Staff issued a“no-action” letter to another mutual fund complex (see Fidelity Management & Research Company et al.,No-Action Letter) related to the audit independence issue described above. In that letter, the SEC confirmed that it would not recommend enforcement action against a fund that relied on audit services performed by an audit firm that was not in compliance with the Loan Rule in certain specified circumstances. On May 2, 2018, the SEC proposed amendments to the Loan Rule that, if adopted as proposed, would address many of the issues that led to issuance of theno-action letter. In connection with prior independence determinations, PricewaterhouseCoopers LLP communicated, as contemplated by theno-action letter, that it believes that it remains objective and impartial and that a reasonable investor possessing all the facts would conclude that PricewaterhouseCoopers LLP is able to exhibit the requisite objectivity and impartiality to report on the Funds’ financial statements as the independent registered public accounting firm. PricewaterhouseCoopers LLP also represented that it has complied with PCAOB Rule 3526(b)(1) and (2), which are conditions to the Funds relying on the no action letter, and affirmed that it is an independent accountant within the meaning of PCAOB Rule 3520. Therefore, the Adviser, the Funds and PricewaterhouseCoopers LLP concluded that PricewaterhouseCoopers LLP could continue as the Funds’ independent registered public
accounting firm. The Invesco Fund Complex relied upon theno-action letter in reaching this conclusion.
If in the future the independence of PricewaterhouseCoopers LLP is called into question under the Loan Rule by circumstances that are not addressed in the SEC’sno-action letter, the Funds will need to take other action in order for the Funds’ filings with the SEC containing financial statements to be deemed compliant with applicable securities laws. Such additional actions could result in additional costs, impair the ability of the Funds to issue new shares or have other material adverse effects on the Funds. The SECno-action relief was initially set to expire 18 months from issuance but has been extended by the SEC without an expiration date, except that theno-action letter will be withdrawn upon the effectiveness of any amendments to the Loan Rule designed to address the concerns expressed in the letter.
PwC advised the Registrant’s Audit Committee that PwC had identified two matters for consideration under the SEC’s auditor independence rules. PwC stated that a PwC manager and a PwC Senior Manager each held financial interests in investment companies within the Invesco Fund complex that were inconsistent with the requirements of Rule2-01(c)(1) of RegulationS-X.
PwC advised the Audit Committee that it believes its objectivity and impartiality had not been adversely affected by these matters as they related to the audit of the Registrant. In reaching this conclusion, PwC noted, among other things, that during the time of its audit, the engagement team was not aware of the investments, neither individual was in the chain of command of the audit or the audit partners of Invesco or the affiliate of the Registrant, the services each individual provided were not relied upon by the audit engagement team with respect to the audit of the affiliate of the Registrant and the investments were not material to the net worth of either individual or their immediate family members.
Additionally, PWC advised the Registrant’s Audit Committee that PwC had identified one matter for consideration under the SEC’s auditor independence rules. PwC stated that a PwC Director held a financial interest in an investment company within the Invesco Fund Complex that was inconsistent with the requirements of Rule2-01(c)(1)(i)(A) of RegulationS-X. PwC advised the Audit Committee that it believes its objectivity and impartiality had not been adversely affected by this matter as they related to the audit of Registrant. In reaching this conclusion, PwC noted, among other things, the engagement team was not aware of the investment, the PwC Director was not in the chain of command of the audit or audit partners of Invesco, the services provided by the individual were not relied upon by the audit engagement team with respect to the audit of the Registrant and the investment was not material to the net worth of the individual or his immediate family members.
(a) to (d)
Fees Billed by PwC Related to the Registrant
PwC billed the Registrant aggregate fees for services rendered to the Registrant for the last two fiscal years as follows:
| | | | | | | | |
| | | Fees Billed for
Services Rendered to
the Registrant for
fiscal year end 2019 | | | Fees Billed for
Services Rendered to
the Registrant for
fiscal year end 2018 | |
Audit Fees | | $ | 288,700 | | | $ | 245,100 | |
Audit-Related Fees(1) | | $ | 0 | | | $ | 33,000 | |
Tax Fees(2) | | $ | 38,025 | | | $ | 31,650 | |
All Other Fees | | $ | 0 | | | $ | 0 | |
| | | | | | | | |
Total Fees | | $ | 326,725 | | | $ | 309,750 | |
(g) PwC billed the Registrant aggregatenon-audit fees of $38,025 for the fiscal year ended 2019, and $64,650 for the fiscal year ended 2018, fornon-audit services rendered to the Registrant.
| (1) | Audit-Related Fees for the fiscal year end February 28, 2018 includes fees billed for reviewing regulatory filings. |
| (2) | Tax Fees for the fiscal year end February 28, 2019 includes fees billed for reviewing tax returns and/or services related to tax compliance. Tax Fees for fiscal year end February 28, 2018 included fees billed for reviewing tax returns and/or services related to tax compliance. |
Fees Billed by PwC Related to Invesco and Invesco Affiliates
PwC billed Invesco Advisers, Inc. (“Invesco”), the Registrant’s adviser, and any entity controlling, controlled by or under common control with Invesco that provides ongoing services to the Registrant (“Invesco Affiliates”) aggregate fees forpre-approvednon-audit services rendered to Invesco and Invesco Affiliates for the last two fiscal years as follows:
| | | | | | | | |
| | | Fees Billed for Non-
Audit Services
Rendered to Invesco
and Invesco
Affiliates for fiscal
year end 2019 That
Were Required
to bePre-Approved
by the Registrant’s
Audit Committee | | | Fees Billed for Non-
Audit Services
Rendered to Invesco
and Invesco Affiliates
for fiscal year end
2018 That Were
Required
to bePre-Approved
by the Registrant’s
Audit Committee | |
Audit-Related Fees(1) | | $ | 690,000 | | | $ | 662,000 | |
Tax Fees | | $ | 0 | | | $ | 0 | |
All Other Fees(2) | | $ | 0 | | | $ | 611,000 | |
| | | | | | | | |
Total Fees | | $ | 690,000 | | | $ | 1,273,000 | |
| (1) | Audit-Related Fees for the year end 2019 include fees billed related to reviewing controls at a service organization. Audit-Related Fees for the year end 2018 included fees billed related to reviewing controls at a service organization. |
| (2) | All Other Fees for the year end 2018 included fees billed related to the assessments for certain of the company’s risk management tools, current state analysis against regulatory requirements and identification of structural and organizational alternatives, informed by industry practices, for certain of the company’s administrative activities and functions. |
(e)(2) There were no amounts that werepre-approved by the Audit Committee pursuant to the de minimus exception under Rule2-01 of RegulationS-X.
(f) Not applicable.
(g) Including the fees for services not required to bepre-approved by the registrant’s audit committee, PwC billed Invesco and Invesco Affiliates aggregatenon-audit fees of $4,240,000 for the fiscal year ended February 28, 2019, and $4,101,000 for the fiscal year ended February 28, 2018, fornon-audit services rendered to Invesco and Invesco Affiliates.
PwC provided audit services to the Investment Company complex of approximately $25 million.
(h) The Audit Committee also has considered whether the provision ofnon-audit services that were rendered to Invesco and Invesco Affiliates that were not required to bepre-approved pursuant to SEC regulations, if any, is compatible with maintaining PwC’s independence.
(e)(1)
PRE-APPROVAL OF AUDIT ANDNON-AUDIT SERVICES
POLICIES AND PROCEDURES
As adopted by the Audit Committees
of the Invesco Funds (the “Funds”)
Last Amended March 29, 2017
| | I. | Statement of Principles |
The Audit Committees (the “Audit Committee”) of the Boards of Trustees of the Funds (the “Board”) have adopted these policies and procedures (the “Procedures”) with respect to thepre-approval of audit andnon-audit services to be provided by the Funds’ independent auditor (the “Auditor”) to the Funds, and to the Funds’ investment adviser(s) and any entity controlling, controlled by, or under common control with the investment adviser(s) that provides ongoing services to the Funds (collectively, “Service Affiliates”).
Under Section 202 of the Sarbanes-Oxley Act of 2002, all audit andnon-audit services provided to the Funds by the Auditor must be preapproved by the Audit Committee. Rule2-01 of RegulationS-X requires that the Audit Committee alsopre-approve a Service Affiliate’s engagement of the Auditor fornon-audit services if the engagement relates directly to the operations and financial reporting of the Funds (a “Service Affiliate’s Covered Engagement”).
These Procedures set forth the procedures and the conditions pursuant to which the Audit Committee maypre-approve audit andnon-audit services for the Funds and a Service Affiliate’s Covered Engagement pursuant to rules and regulations of the Securities and Exchange Commission (“SEC”) and other organizations and regulatory bodies applicable to the Funds (“Applicable Rules”).1 They address both generalpre-approvals without consideration of specificcase-by-case services (“general pre-approvals”) and pre-approvals on acase-by-case basis (“specific pre-approvals”). Any services requiringpre-approval that are not within the scope of generalpre-approvals hereunder are subject to specificpre-approval. These Procedures also address the delegation by the Audit Committee ofpre-approval authority to the Audit Committee Chair or Vice Chair.
| 1 | Applicable Rules include, for example, New York Stock Exchange (“NYSE”) rules applicable toclosed-end funds managed by Invesco and listed on NYSE. |
| | II. | Pre-Approval of Fund Audit Services |
The annual Fund audit services engagement, including terms and fees, is subject to specificpre-approval by the Audit Committee. Audit services include the annual financial statement audit and other procedures required to be performed by an independent auditor to be able to form an opinion on the Funds’ financial statements. The Audit Committee will receive, review and consider sufficient information concerning a proposed Fund audit engagement to make a reasonable evaluation of the Auditor’s qualifications and independence. The Audit Committee will oversee the Fund audit services engagement as necessary, including approving any changes in terms, audit scope, conditions and fees.
In addition to approving the Fund audit services engagement at least annually and specifically approving any changes, the Audit Committee may generally or specificallypre-approve engagements for other audit services, which are those services that only an independent auditor reasonably can provide. Other audit services may include services associated with SEC registration statements, periodic reports and other documents filed with the SEC.
| | III. | General and SpecificPre-Approval ofNon-Audit Fund Services |
The Audit Committee will consider, at least annually, the list of GeneralPre-ApprovedNon-Audit Services which list may be terminated or modified at any time by the Audit Committee. To inform the Audit Committee’s review and approval of GeneralPre-ApprovedNon-Audit Services, the Funds’ Treasurer (or his or her designee) and Auditor shall provide such information regarding independence or other matters as the Audit Committee may request.
Any services or fee ranges that are not within the scope of GeneralPre-ApprovedNon-Audit Services have not received generalpre-approval and require specificpre-approval. Each request for specificpre-approval by the Audit Committee for services to be provided by the Auditor to the Funds must be submitted to the Audit Committee by the Funds’ Treasurer (or his or her designee)and must include detailed information about the services to be provided, the fees or fee ranges to be charged, and other relevant information sufficient to allow the Audit Committee to consider whether topre-approve such engagement, including evaluating whether the provision of such services will impair the independence of the Auditor and is otherwise consistent with Applicable Rules.
| | IV. | Non-Audit Service Types |
The Audit Committee may provide either general or specificpre-approval of audit-related, tax or other services, each as described in more detail below.
“Audit-related services” are assurance and related services that are reasonably related to the performance of the audit or review of the Fund’s financial statements or that are traditionally performed by an independent auditor. Audit-related services include, among others, accounting consultations related to accounting, financial reporting or disclosure matters not classified as “Audit services”; assistance with understanding and implementing new accounting and financial reporting guidance from rulemaking authorities; services related to mergers, acquisitions or dispositions; compliance with ratings agency requirements and interfund lending activities; and assistance with internal control reporting requirements.
“Tax services” include, but are not limited to, the review and signing of the Funds’ federal tax returns, the review of required distributions by the Funds and consultations regarding tax matters such as the tax treatment of new investments or the impact of new regulations. The Audit Committee will not approve proposed services of the Auditor which the Audit Committee believes are to be provided in connection with a service or transaction initially recommended by the Auditor, the sole business purpose of which may be tax avoidance and the tax treatment of which may not be supported in the Internal Revenue Code and related regulations. The Audit Committee will consult with the Funds’ Treasurer (or his or her designee) and may consult with outside counsel or advisers as necessary to ensure the consistency of tax services rendered by the Auditor with the foregoing policy. The Auditor shall not represent any Fund or any Service Affiliate before a tax court, district court or federal court of claims.
Each request to provide tax services under either the general or specificpre-approval of the Audit Committee will include a description from the Auditor in writing of (i) the scope of the service, the fee structure for the engagement, and any side letter or other amendment to the engagement letter, or any other agreement (whether oral, written, or otherwise) between the Auditor and the Funds, relating to the service; and (ii) any compensation arrangement or other agreement, such as a referral agreement, a referral fee orfee-sharing arrangement, between the Auditor (or an affiliate of the Auditor) and any person (other than the Funds or Service Affiliates receiving the services) with respect to the promoting, marketing, or recommending of a transaction covered by the service. The Auditor will also discuss with the Audit Committee the potential effects of the services on the independence of the Auditor, and document the substance of its discussion with the Audit Committee.
The Audit Committee maypre-approve other non-audit services so long as the Audit Committee believes that the service will not impair the independence of the Auditor.Appendix I includes a list of services that the Auditor is prohibited from performing by the SEC rules.Appendix I also includes a list of services that would impair the Auditor’s independence unless the Audit Committee reasonably concludes that the results of the services will not be subject to audit procedures during an audit of the Funds’ financial statements.
| | V. | Pre-Approval of Service Affiliate’s Covered Engagements |
Rule2-01 of RegulationS-X requires that the Audit Committeepre-approve a Service Affiliate’s engagement of the Auditor fornon-audit services if the engagement relates directly to the operations and financial reporting of the Funds, defined above as a “Service Affiliate’s Covered Engagement”.
The Audit Committee may provide either general or specificpre-approval of any Service Affiliate’s Covered Engagement, including for audit-related, tax or other services, as described above, if the Audit Committee believes that the provision of the services to a Service Affiliate will not impair the independence of the Auditor with respect to the Funds. Any Service Affiliate’s Covered Engagements that are not within the scope of GeneralPre-ApprovedNon-Audit Services have not received generalpre-approval and require specificpre-approval.
Each request for specificpre-approval by the Audit Committee of a Service Affiliate’s Covered Engagement must be submitted to the Audit Committee by the Funds’ Treasurer (or his or her designee)and must include detailed information about the services to be provided, the fees or fee ranges to be charged, a description of the current status of thepre-approval process involving other audit committees in the Invesco investment company complex (as defined in Rule2-201 of RegulationS-X) with respect to the proposed engagement, and other relevant information sufficient to allow the Audit Committee to consider whether the provision of such services will impair the independence of the Auditor from the Funds. Additionally, the Funds’ Treasurer (or his or her designee) and the Auditor will provide the Audit Committee with a statement that the proposed engagement requirespre-approval by the Audit Committee, the proposed engagement, in their view, will not impair the independence of the Auditor and is consistent with Applicable Rules, and the description of the proposed engagement provided to the Audit Committee is consistent with that presented to or approved by the Invesco audit committee.
Information about all Service Affiliate engagements of the Auditor fornon-audit services, whether or not subject topre-approval by the Audit Committee, shall be provided to the Audit Committee at least quarterly, to allow the Audit Committee to consider whether the provision of such services is compatible with maintaining the Auditor’s independence from the Funds. The Funds’ Treasurer and Auditor shall provide the Audit Committee with sufficiently detailed information about the scope of services provided and the fees for such services, to ensure that the Audit Committee can adequately consider whether the provision of such services is compatible with maintaining the Auditor’s independence from the Funds.
| | VI. | Pre-Approved Fee Levels or Established Amounts |
Pre-approved fee levels or ranges for audit andnon-audit services to be provided by the Auditor to the Funds, and for a Service Affiliate’s Covered Engagement, under generalpre-approval or specificpre-approval will be set periodically by the Audit Committee. Any proposed fees exceeding 110% of the maximumpre-approved fee levels or ranges for such services or engagements will be promptly presented to the Audit Committee and will require specificpre-approval by the Audit Committee before payment of any additional fees is made.
The Audit Committee hereby delegates, subject to the dollar limitations set forth below, specific authority to its Chair, or in his or her absence, Vice Chair, topre-approve audit andnon-audit services proposed to be provided by the Auditor to the Funds and/or a Service Affiliate’s Covered Engagement, between Audit Committee meetings. Such delegation does not preclude the Chair or Vice Chair from declining, on a case by case basis, to exercise his or her delegated authority and instead convening the Audit Committee to consider andpre-approve any proposed services or engagements.
Notwithstanding the foregoing, the Audit Committee mustpre-approve: (a) anynon-audit services to be provided to the Funds for which the fees are estimated to exceed $500,000; (b) any Service Affiliate’s Covered Engagement for which the fees are estimated to exceed $500,000; or (c) any cost increase to any previously approved service or engagement that exceeds the greater of $250,000 or 50% of the previously approved fees up to a maximum increase of $500,000.
| | VIII. | Compliance with Procedures |
Notwithstanding anything herein to the contrary, failure topre-approve any services or engagements that are not required to bepre-approved pursuant to the de minimis exception provided for in Rule2-01(c)(7)(i)(C) of RegulationS-X shall not constitute a violation of these Procedures. The Audit Committee has designated the Funds’ Treasurer to ensure services and engagements arepre-approved in compliance with these Procedures. The Funds’ Treasurer will immediately report to the Chair of the Audit Committee, or the Vice Chair in his or her absence, any breach of these Procedures that comes to the attention of the Funds’ Treasurer or any services or engagements that are not required to bepre-approved pursuant to the de minimis exception provided for in Rule2-01(c)(7)(i)(C) of RegulationS-X.
On at least an annual basis, the Auditor will provide the Audit Committee with a summary of allnon-audit services provided to any entity in the investment company complex (as defined in section2-01(f)(14) of RegulationS-X, including the Funds and Service Affiliates) that were notpre-approved, including the nature of services provided and the associated fees.
| | IX. | Amendments to Procedures |
All material amendments to these Procedures must be approved in advance by the Audit Committee.Non-material amendments to these Procedures may be made by the Legal and Compliance Departments and will be reported to the Audit Committee at the next regularly scheduled meeting of the Audit Committee.
Appendix I
Non-Audit Services That May Impair the Auditor’s Independence
The Auditor is not independent if, at any point during the audit and professional engagement, the Auditor provides the followingnon-audit services:
| | • | | Broker-dealer, investment adviser, or investment banking services ; |
| | • | | Expert services unrelated to the audit; |
| | • | | Any service or product provided for a contingent fee or a commission; |
| | • | | Services related to marketing, planning, or opining in favor of the tax treatment of confidential transactions or aggressive tax position transactions, a significant purpose of which is tax avoidance; |
| | • | | Tax services for persons in financial reporting oversight roles at the Fund; and |
| | • | | Any other service that the Public Company Oversight Board determines by regulation is impermissible. |
An Auditor is not independent if, at any point during the audit and professional engagement, the Auditor provides the followingnon-audit services unless it is reasonable to conclude that the results of the services will not be subject to audit procedures during an audit of the Funds’ financial statements:
| | • | | Bookkeeping or other services related to the accounting records or financial statements of the audit client; |
| | • | | Financial information systems design and implementation; |
| | • | | Appraisal or valuation services, fairness opinions, orcontribution-in-kind reports; |
| | • | | Actuarial services; and |
| | • | | Internal audit outsourcing services. |
| ITEM 5. | AUDIT COMMITTEE OF LISTED REGISTRANTS. |
Not applicable.
| ITEM 6. | SCHEDULE OF INVESTMENTS. |
Investments in securities of unaffiliated issuers is included as part of the reports to stockholders filed under Item 1 of this Form.
| ITEM 7. | DISCLOSURE OF PROXY VOTING POLICIES AND PROCEDURES FOR CLOSED-END MANAGEMENT INVESTMENT COMPANIES. |
Not applicable.
| ITEM 8. | PORTFOLIO MANAGERS OFCLOSED-END MANAGEMENT INVESTMENT COMPANIES. |
Not applicable.
| ITEM 9. | PURCHASES OF EQUITY SECURITIES BYCLOSED-END MANAGEMENT INVESTMENT COMPANY AND AFFILIATED PURCHASERS. |
Not applicable.
| ITEM 10. | SUBMISSION OF MATTERS TO A VOTE OF SECURITY HOLDERS. |
None.
| ITEM 11. | CONTROLS AND PROCEDURES. |
| (a) | As of April 15, 2019, an evaluation was performed under the supervision and with the participation of the officers of the Registrant, including the Principal Executive Officer (“PEO”) and Principal Financial Officer (“PFO”), to assess the effectiveness of the Registrant’s disclosure controls and procedures, as that term is defined in Rule30a-3(c) under the Investment Company Act of 1940 (the “Act”), as amended. Based on that evaluation, the Registrant’s officers, including the PEO and PFO, concluded that, as of April 15, 2019, the Registrant’s disclosure controls and procedures were reasonably designed to ensure: (1) that information required to be disclosed by the Registrant on FormN-CSR is recorded, processed, summarized and reported within the time periods specified by the rules and forms of the Securities and Exchange Commission; and (2) |
| | that material information relating to the Registrant is made known to the PEO and PFO as appropriate to allow timely decisions regarding required disclosure. |
| (b) | There have been no changes in the Registrant’s internal control over financial reporting (as defined in Rule30a-3(d) under the Act) that occurred during the second fiscal quarter of the period covered by the report that has materially affected, or is reasonably likely to materially affect, the Registrant’s internal control over financial reporting. |
| ITEM 12. | DISCLOSURE OF SECURITIES LENDING ACTIVITIES FORCLOSED-END MANAGEMENT INVESTMENT COMPANIES |
Not applicable.
| | |
| |
| 13(a) (1) | | Code of Ethics. |
| |
| 13(a) (2) | | Certifications of principal executive officer and principal financial officer as required by Rule30a-2(a) under the Investment Company Act of 1940. |
| |
| 13(a) (3) | | Not applicable. |
| |
| 13(a) (4) | | Not applicable. |
| |
| 13(b) | | Certifications of principal executive officer and principal financial officer as required by Rule30a-2(b) under the Investment Company Act of 1940. |
SIGNATURES
Pursuant to the requirements of the Securities Exchange Act of 1934 and the Investment Company Act of 1940, the Registrant has duly caused this report to be signed on its behalf by the undersigned, thereunto duly authorized.
Registrant: AIMTax-Exempt Funds (InvescoTax-Exempt Funds)
| | |
| By: | | /s/ Sheri Morris |
| | Sheri Morris |
| | Principal Executive Officer |
| |
| Date: | | May 9, 2019 |
Pursuant to the requirements of the Securities and Exchange Act of 1934 and the Investment Company Act of 1940, this report has been signed below by the following persons on behalf of the Registrant and in the capacities and on the dates indicated.
| | |
| By: | | /s/ Sheri Morris |
| | Sheri Morris |
| | Principal Executive Officer |
| |
| Date: | | May 9, 2019 |
| |
| By: | | /s/ Kelli Gallegos |
| | Kelli Gallegos |
| | Principal Financial Officer |
| |
| Date: | | May 9, 2019 |
EXHIBIT INDEX
| | |
| 13(a) (1) | | Code of Ethics. |
| |
| 13(a) (2) | | Certifications of principal executive officer and principal financial officer as required by Rule 30a-2(a) under the Investment Company Act of 1940. |
| |
| 13(a) (3) | | Not applicable. |
| |
| 13(b) | | Certifications of principal executive officer and principal financial officer as required by Rule 30a-2(b) under the Investment Company Act of 1940. |