UNITED STATES
SECURITIES AND EXCHANGE COMMISSION
Washington, D.C. 20549
FORM N-CSR
CERTIFIED SHAREHOLDER REPORT OF REGISTERED
MANAGEMENT INVESTMENT COMPANIES
Investment Company Act file number 811-07896
GAMCO Global Series Funds, Inc.
(Exact name of registrant as specified in charter)
One Corporate Center
Rye, New York 10580-1422
(Address of principal executive offices) (Zip code)
John C. Ball
Gabelli Funds, LLC
One Corporate Center
Rye, New York 10580-1422
(Name and address of agent for service)
Registrant’s telephone number, including area code: 1-800-422-3554
Date of fiscal year end: December 31
Date of reporting period: December 31, 2024
Form N-CSR is to be used by management investment companies to file reports with the Commission not later than 10 days after the transmission to stockholders of any report that is required to be transmitted to stockholders under Rule 30e-1 under the Investment Company Act of 1940 (17 CFR 270.30e-1). The Commission may use the information provided on Form N-CSR in its regulatory, disclosure review, inspection, and policymaking roles.
A registrant is required to disclose the information specified by Form N-CSR, and the Commission will make this information public. A registrant is not required to respond to the collection of information contained in Form N-CSR unless the Form displays a currently valid Office of Management and Budget (“OMB”) control number. Please direct comments concerning the accuracy of the information collection burden estimate and any suggestions for reducing the burden to Secretary, Securities and Exchange Commission, 100 F Street, NE, Washington, DC 20549-1090. The OMB has reviewed this collection of information under the clearance requirements of 44 U.S.C. § 3507.
Item 1. Reports to Stockholders.
| (a) | Include a copy of the report transmitted to stockholders pursuant to Rule 30e-1 under the Act (17 CFR 270.30e-1). |
| | | |
| | | The Report to Shareholders is attached herewith. |
0000909504gabelli:MSCIEAFESmallCapIndex40586AdditionalIndexMember2021-12-31
The Gabelli Global Growth Fund
Annual Shareholder Report - December 31, 2024

This annual shareholder report contains important information about The Gabelli Global Growth Fund (the Fund) for the period of January 1, 2024 to December 31, 2024. The Fund’s investment objective primarily seeks to provide investors with appreciation of capital. Current income is a secondary objective of the Fund. The Fund’s investment strategy is to invest at least 65% of its total assets in common stocks of companies which the portfolio managers believe are likely to have rapid growth in revenues and earnings and potential for above average capital appreciation or are undervalued. The Global Growth Fund invests primarily in common stocks of foreign and domestic small-capitalization, mid-capitalization, and large-capitalization issuers. As a “global” fund, the Fund invests in securities of issuers, or related investments thereof, located in at least three countries, and at least 40% of the Fund’s total net assets are invested in securities of non-U.S. issuers. You may find additional information about the Fund at www.gabelli.com/funds/open_ends. You may also request information by contacting us at 800-GABELLI (800-422-3554).
What were the Fund costs for the last year?
(based on a hypothetical $10,000 investment)
| Class Name | Costs of a $10k Investment | Costs Paid as a % of a $10k Investment |
|---|
| The Gabelli Global Growth Fund - Class AAA | $103 | 0.90% |
|---|
How did the Fund perform?
In 2024, The Gabelli Global Growth Fund outperformed its broad-based benchmark, the MSCI AC World Index and its comparative benchmark, the Lipper Global Large-Cap Growth Fund Classification. Economic data generally came in stronger than anticipated during the year, and the Federal Reserve saw enough progress in inflation to support 100bps of policy rate cuts starting in September. Separately, the artificial intelligence space continued to mature this year, and early winners have emerged in the semiconductor and data center infrastructure sectors. Against this backdrop, many of our large technology holdings performed well.
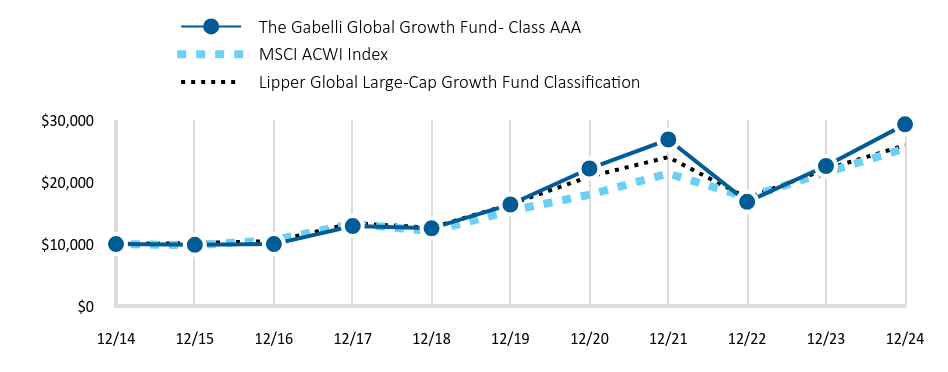
How has the Fund performed over the past 10 years?
The performance chart of the fund class presented reflects a hypothetical $10,000 investment, assuming the maximum sales charge, compared to a broad-based securities market index and more narrowly based indices reflecting market sectors in which the Fund invests over a 10-year period. The chart uses total return NAV performance and assumes reinvestment of dividends and capital gains distribution. Fund expenses were deducted.
Total Return Based on a $10,000 Investment
| The Gabelli Global Growth Fund - Class AAA | MSCI ACWI Index | Lipper Global Large-Cap Growth Fund Classification |
|---|
| 12/14 | 10,000 | 10,000 | 10,000 |
|---|
| 12/15 | 9,879 | 9,816 | 10,176 |
|---|
| 12/16 | 9,998 | 10,648 | 10,472 |
|---|
| 12/17 | 12,899 | 13,270 | 13,359 |
|---|
| 12/18 | 12,538 | 12,085 | 12,646 |
|---|
| 12/19 | 16,390 | 15,384 | 16,422 |
|---|
| 12/20 | 22,198 | 17,972 | 20,895 |
|---|
| 12/21 | 26,881 | 21,394 | 24,042 |
|---|
| 12/22 | 16,814 | 17,551 | 17,452 |
|---|
| 12/23 | 22,610 | 21,555 | 22,079 |
|---|
| 12/24 | 29,328 | 25,439 | 25,951 |
|---|
Average Annual Total Returns
| 1 Year | 5 Year | 10 Year |
|---|
| The Gabelli Global Growth Fund - Class AAA | 29.71% | 12.34% | 11.36% |
|---|
| MSCI ACWI Index | 18.02% | 10.58% | 9.79% |
|---|
| Lipper Global Large-Cap Growth Fund Classification | 17.54% | 9.58% | 10.00% |
|---|
- Total Net Assets$190,324,373
- Number of Portfolio Holdings47
- Portfolio Turnover Rate26%
- Management Fees$923,769
Past performance does not guarantee future results. Call 800-GABELLI (800-422-3554) or visit www.gabelli.com/funds/open_ends for current month-end performance. The table and graph presented above do not reflect the deduction of taxes a shareholder would pay on fund distributions or the redemption of fund shares.
What did the Fund invest in?
Top 10 Holdings (% of net assets)
| NVIDIA Corp. | 7.5% |
| Amazon.com Inc. | 6.5% |
| Meta Platforms Inc. | 5.5% |
| Microsoft Corp. | 5.4% |
| Netflix Inc. | 5.4% |
| Alphabet Inc. | 5.0% |
| Eli Lilly & Co. | 3.8% |
| Apple Inc. | 3.2% |
| Spotify Technology SA | 3.2% |
| Trane Technologies plc | 3.1% |
Portfolio Weighting (% of net assets)
| Common Stocks | 99.2% |
| U.S. Government Obligations | 0.9% |
| Other Assets and Liabilities (Net) | (0.1)% |
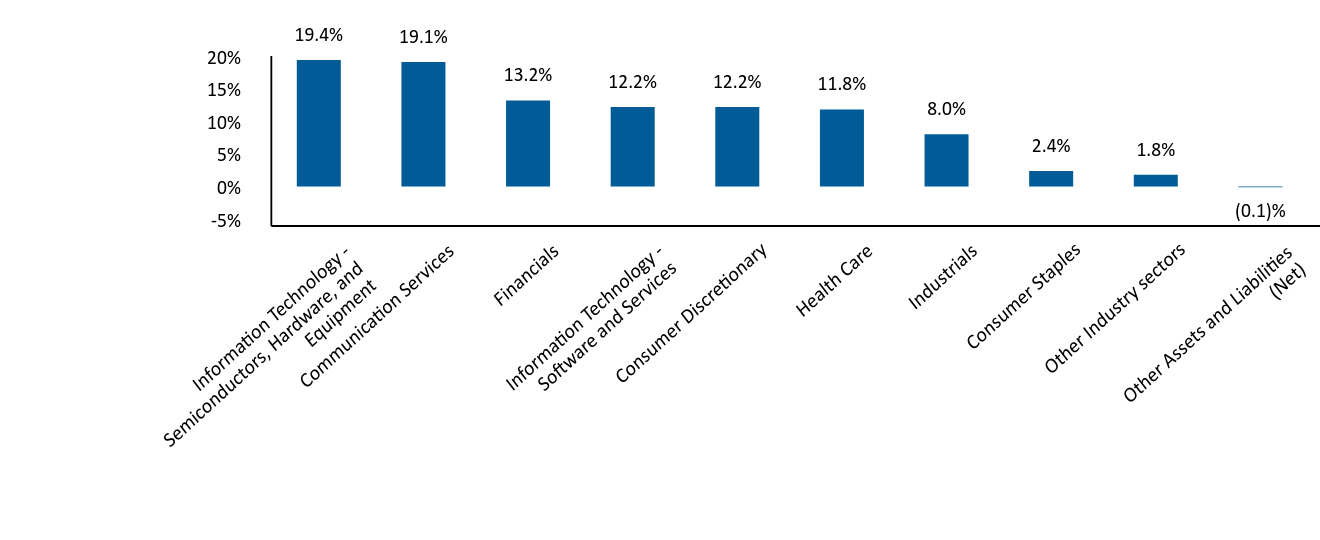
Industry Allocation (% of net assets)
| Industry Weighting | . |
|---|
| Information Technology - Semiconductors, Hardware, and Equipment | 19.4% |
| Communication Services | 19.1% |
| Financials | 13.2% |
| Information Technology - Software and Services | 12.2% |
| Consumer Discretionary | 12.2% |
| Health Care | 11.8% |
| Industrials | 8.0% |
| Consumer Staples | 2.4% |
| Other Industry sectors | 1.8% |
| Other Assets and Liabilities (Net) | (0.1)% |
The Gabelli Global Growth Fund
Annual Shareholder Report - December 31, 2024
Where can I find additional information about the Fund?
If you wish to view additional information about the Fund; including but not limited to financial statements or holdings, please visit www.gabelli.com/funds/open_ends.
Contact Us
Phone: 800-GABELLI (800-422-3554)
Email: info@gabelli.com
If you wish to receive a copy of this document at a new address, contact 800-GABELLI (800-422-3554)
The Gabelli Global Growth Fund
Annual Shareholder Report - December 31, 2024
This annual shareholder report contains important information about The Gabelli Global Growth Fund (the Fund) for the period of January 1, 2024 to December 31, 2024. The Fund’s investment objective primarily seeks to provide investors with appreciation of capital. Current income is a secondary objective of the Fund. The Fund’s investment strategy is to invest at least 65% of its total assets in common stocks of companies which the portfolio managers believe are likely to have rapid growth in revenues and earnings and potential for above average capital appreciation or are undervalued. The Global Growth Fund invests primarily in common stocks of foreign and domestic small-capitalization, mid-capitalization, and large-capitalization issuers. As a “global” fund, the Fund invests in securities of issuers, or related investments thereof, located in at least three countries, and at least 40% of the Fund’s total net assets are invested in securities of non-U.S. issuers. You may find additional information about the Fund at www.gabelli.com/funds/open_ends. You may also request information by contacting us at 800-GABELLI (800-422-3554).
What were the Fund costs for the last year?
(based on a hypothetical $10,000 investment)
| Class Name | Costs of a $10k Investment | Costs Paid as a % of a $10k Investment |
|---|
| The Gabelli Global Growth Fund - Class C | $103 | 0.90% |
|---|
How did the Fund perform?
In 2024, The Gabelli Global Growth Fund outperformed its broad-based benchmark, the MSCI AC World Index and its comparative benchmark, the Lipper Global Large-Cap Growth Fund Classification. Economic data generally came in stronger than anticipated during the year, and the Federal Reserve saw enough progress in inflation to support 100bps of policy rate cuts starting in September. Separately, the artificial intelligence space continued to mature this year, and early winners have emerged in the semiconductor and data center infrastructure sectors. Against this backdrop, many of our large technology holdings performed well.
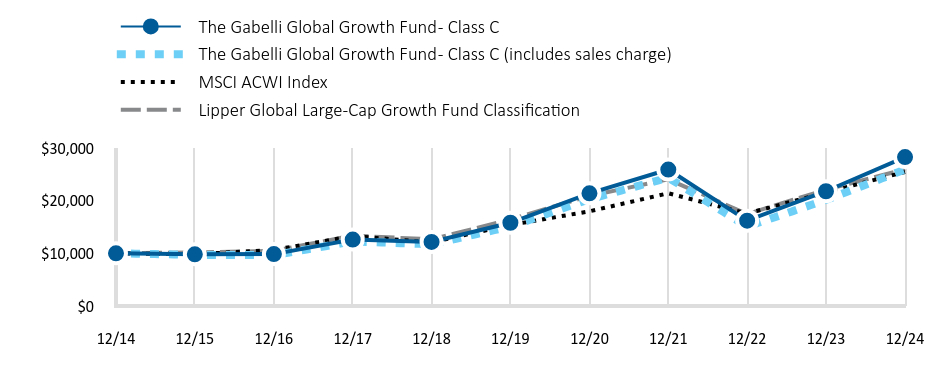
How has the Fund performed over the past 10 years?
The performance chart of the fund class presented reflects a hypothetical $10,000 investment, assuming the maximum sales charge, compared to a broad-based securities market index and more narrowly based indices reflecting market sectors in which the Fund invests over a 10-year period. The chart uses total return NAV performance and assumes reinvestment of dividends and capital gains distribution. Fund expenses were deducted.
Total Return Based on a $10,000 Investment
| The Gabelli Global Growth Fund - Class C | The Gabelli Global Growth Fund - Class C (includes sales charge) | MSCI ACWI Index | Lipper Global Large-Cap Growth Fund Classification |
|---|
| 12/14 | 10,000 | 10,000 | 10,000 | 10,000 |
|---|
| 12/15 | 9,806 | 9,708 | 9,816 | 10,176 |
|---|
| 12/16 | 9,848 | 9,653 | 10,648 | 10,472 |
|---|
| 12/17 | 12,610 | 12,263 | 13,270 | 13,359 |
|---|
| 12/18 | 12,168 | 11,716 | 12,085 | 12,646 |
|---|
| 12/19 | 15,797 | 15,092 | 15,384 | 16,422 |
|---|
| 12/20 | 21,390 | 20,286 | 17,972 | 20,895 |
|---|
| 12/21 | 25,900 | 24,359 | 21,394 | 24,042 |
|---|
| 12/22 | 16,200 | 15,085 | 17,551 | 17,452 |
|---|
| 12/23 | 21,783 | 20,133 | 21,555 | 22,079 |
|---|
| 12/24 | 28,257 | 25,915 | 25,439 | 25,951 |
|---|
Average Annual Total Returns
| 1 Year | 5 Year | 10 Year |
|---|
| The Gabelli Global Growth Fund - Class C | 29.72% | 12.34% | 10.95% |
|---|
| The Gabelli Global Growth Fund - Class C (includes sales charge) | 28.72% | 12.34% | 10.95% |
|---|
| MSCI ACWI Index | 18.02% | 10.58% | 9.79% |
|---|
| Lipper Global Large-Cap Growth Fund Classification | 17.54% | 9.58% | 10.00% |
|---|
- Total Net Assets$190,324,373
- Number of Portfolio Holdings47
- Portfolio Turnover Rate26%
- Management Fees$923,769
Past performance does not guarantee future results. Call 800-GABELLI (800-422-3554) or visit www.gabelli.com/funds/open_ends for current month-end performance. The table and graph presented above do not reflect the deduction of taxes a shareholder would pay on fund distributions or the redemption of fund shares.
What did the Fund invest in?
Top 10 Holdings (% of net assets)
| NVIDIA Corp. | 7.5% |
| Amazon.com Inc. | 6.5% |
| Meta Platforms Inc. | 5.5% |
| Microsoft Corp. | 5.4% |
| Netflix Inc. | 5.4% |
| Alphabet Inc. | 5.0% |
| Eli Lilly & Co. | 3.8% |
| Apple Inc. | 3.2% |
| Spotify Technology SA | 3.2% |
| Trane Technologies plc | 3.1% |
Portfolio Weighting (% of net assets)
| Common Stocks | 99.2% |
| U.S. Government Obligations | 0.9% |
| Other Assets and Liabilities (Net) | (0.1)% |
Industry Allocation (% of net assets)
| Industry Weighting | . |
|---|
| Information Technology - Semiconductors, Hardware, and Equipment | 19.4% |
| Communication Services | 19.1% |
| Financials | 13.2% |
| Information Technology - Software and Services | 12.2% |
| Consumer Discretionary | 12.2% |
| Health Care | 11.8% |
| Industrials | 8.0% |
| Consumer Staples | 2.4% |
| Other Industry sectors | 1.8% |
| Other Assets and Liabilities (Net) | (0.1)% |
The Gabelli Global Growth Fund
Annual Shareholder Report - December 31, 2024
Where can I find additional information about the Fund?
If you wish to view additional information about the Fund; including but not limited to financial statements or holdings, please visit www.gabelli.com/funds/open_ends.
Contact Us
Phone: 800-GABELLI (800-422-3554)
Email: info@gabelli.com
If you wish to receive a copy of this document at a new address, contact 800-GABELLI (800-422-3554)
The Gabelli Global Growth Fund
Annual Shareholder Report - December 31, 2024

This annual shareholder report contains important information about The Gabelli Global Growth Fund (the Fund) for the period of January 1, 2024 to December 31, 2024. The Fund’s investment objective primarily seeks to provide investors with appreciation of capital. Current income is a secondary objective of the Fund. The Fund’s investment strategy is to invest at least 65% of its total assets in common stocks of companies which the portfolio managers believe are likely to have rapid growth in revenues and earnings and potential for above average capital appreciation or are undervalued. The Global Growth Fund invests primarily in common stocks of foreign and domestic small-capitalization, mid-capitalization, and large-capitalization issuers. As a “global” fund, the Fund invests in securities of issuers, or related investments thereof, located in at least three countries, and at least 40% of the Fund’s total net assets are invested in securities of non-U.S. issuers. You may find additional information about the Fund at www.gabelli.com/funds/open_ends. You may also request information by contacting us at 800-GABELLI (800-422-3554).
What were the Fund costs for the last year?
(based on a hypothetical $10,000 investment)
| Class Name | Costs of a $10k Investment | Costs Paid as a % of a $10k Investment |
|---|
| The Gabelli Global Growth Fund - Class I | $103 | 0.90% |
|---|
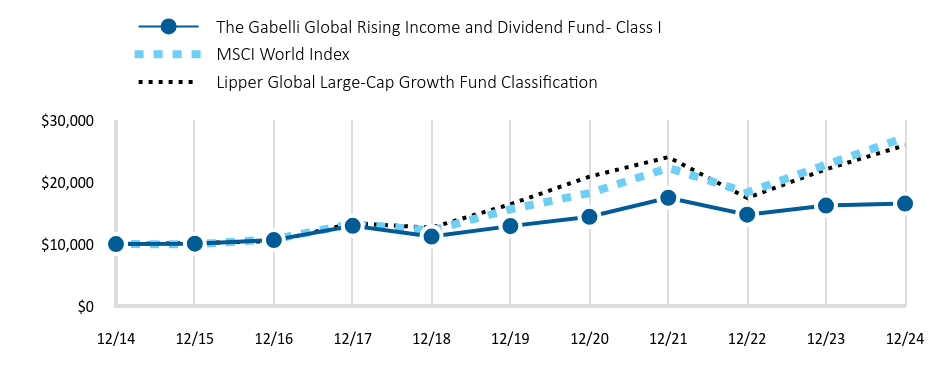
How did the Fund perform?
In 2024, The Gabelli Global Growth Fund outperformed its broad-based benchmark, the MSCI AC World Index and its comparative benchmark, the Lipper Global Large-Cap Growth Fund Classification. Economic data generally came in stronger than anticipated during the year, and the Federal Reserve saw enough progress in inflation to support 100bps of policy rate cuts starting in September. Separately, the artificial intelligence space continued to mature this year, and early winners have emerged in the semiconductor and data center infrastructure sectors. Against this backdrop, many of our large technology holdings performed well.
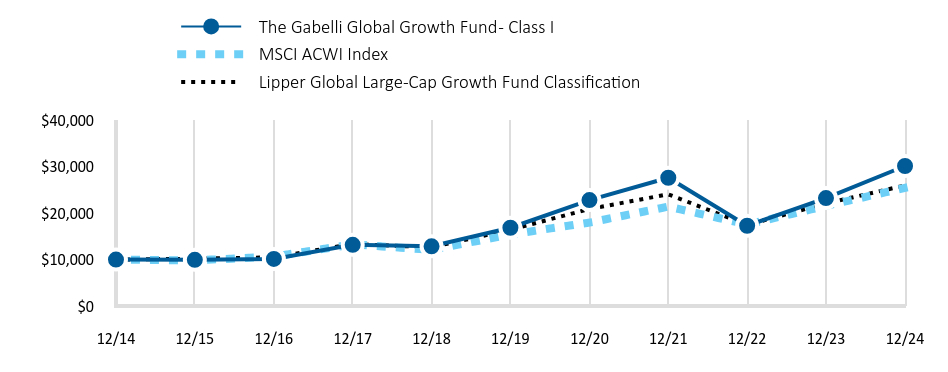
How has the Fund performed over the past 10 years?
The performance chart of the fund class presented reflects a hypothetical $10,000 investment, assuming the maximum sales charge, compared to a broad-based securities market index and more narrowly based indices reflecting market sectors in which the Fund invests over a 10-year period. The chart uses total return NAV performance and assumes reinvestment of dividends and capital gains distribution. Fund expenses were deducted.
Total Return Based on a $10,000 Investment
| The Gabelli Global Growth Fund - Class I | MSCI ACWI Index | Lipper Global Large-Cap Growth Fund Classification |
|---|
| 12/14 | 10,000 | 10,000 | 10,000 |
|---|
| 12/15 | 9,947 | 9,816 | 10,176 |
|---|
| 12/16 | 10,141 | 10,648 | 10,472 |
|---|
| 12/17 | 13,167 | 13,270 | 13,359 |
|---|
| 12/18 | 12,855 | 12,085 | 12,646 |
|---|
| 12/19 | 16,844 | 15,384 | 16,422 |
|---|
| 12/20 | 22,805 | 17,972 | 20,895 |
|---|
| 12/21 | 27,617 | 21,394 | 24,042 |
|---|
| 12/22 | 17,280 | 17,551 | 17,452 |
|---|
| 12/23 | 23,238 | 21,555 | 22,079 |
|---|
| 12/24 | 30,142 | 25,439 | 25,951 |
|---|
Average Annual Total Returns
| 1 Year | 5 Year | 10 Year |
|---|
| The Gabelli Global Growth Fund - Class I | 29.71% | 12.34% | 11.66% |
|---|
| MSCI ACWI Index | 18.02% | 10.58% | 9.79% |
|---|
| Lipper Global Large-Cap Growth Fund Classification | 17.54% | 9.58% | 10.00% |
|---|
- Total Net Assets$190,324,373
- Number of Portfolio Holdings47
- Portfolio Turnover Rate26%
- Management Fees$923,769
Past performance does not guarantee future results. Call 800-GABELLI (800-422-3554) or visit www.gabelli.com/funds/open_ends for current month-end performance. The table and graph presented above do not reflect the deduction of taxes a shareholder would pay on fund distributions or the redemption of fund shares.
What did the Fund invest in?
Top 10 Holdings (% of net assets)
| NVIDIA Corp. | 7.5% |
| Amazon.com Inc. | 6.5% |
| Meta Platforms Inc. | 5.5% |
| Microsoft Corp. | 5.4% |
| Netflix Inc. | 5.4% |
| Alphabet Inc. | 5.0% |
| Eli Lilly & Co. | 3.8% |
| Apple Inc. | 3.2% |
| Spotify Technology SA | 3.2% |
| Trane Technologies plc | 3.1% |
Portfolio Weighting (% of net assets)
| Common Stocks | 99.2% |
| U.S. Government Obligations | 0.9% |
| Other Assets and Liabilities (Net) | (0.1)% |
Industry Allocation (% of net assets)
| Industry Weighting | . |
|---|
| Information Technology - Semiconductors, Hardware, and Equipment | 19.4% |
| Communication Services | 19.1% |
| Financials | 13.2% |
| Information Technology - Software and Services | 12.2% |
| Consumer Discretionary | 12.2% |
| Health Care | 11.8% |
| Industrials | 8.0% |
| Consumer Staples | 2.4% |
| Other Industry sectors | 1.8% |
| Other Assets and Liabilities (Net) | (0.1)% |
The Gabelli Global Growth Fund
Annual Shareholder Report - December 31, 2024
Where can I find additional information about the Fund?
If you wish to view additional information about the Fund; including but not limited to financial statements or holdings, please visit www.gabelli.com/funds/open_ends.
Contact Us
Phone: 800-GABELLI (800-422-3554)
Email: info@gabelli.com
If you wish to receive a copy of this document at a new address, contact 800-GABELLI (800-422-3554)
The Gabelli Global Growth Fund
Annual Shareholder Report - December 31, 2024

This annual shareholder report contains important information about The Gabelli Global Growth Fund (the Fund) for the period of January 1, 2024 to December 31, 2024. The Fund’s investment objective primarily seeks to provide investors with appreciation of capital. Current income is a secondary objective of the Fund. The Fund’s investment strategy is to invest at least 65% of its total assets in common stocks of companies which the portfolio managers believe are likely to have rapid growth in revenues and earnings and potential for above average capital appreciation or are undervalued. The Global Growth Fund invests primarily in common stocks of foreign and domestic small-capitalization, mid-capitalization, and large-capitalization issuers. As a “global” fund, the Fund invests in securities of issuers, or related investments thereof, located in at least three countries, and at least 40% of the Fund’s total net assets are invested in securities of non-U.S. issuers. You may find additional information about the Fund at www.gabelli.com/funds/open_ends. You may also request information by contacting us at 800-GABELLI (800-422-3554).
What were the Fund costs for the last year?
(based on a hypothetical $10,000 investment)
| Class Name | Costs of a $10k Investment | Costs Paid as a % of a $10k Investment |
|---|
| The Gabelli Global Growth Fund - Class A | $103 | 0.90% |
|---|
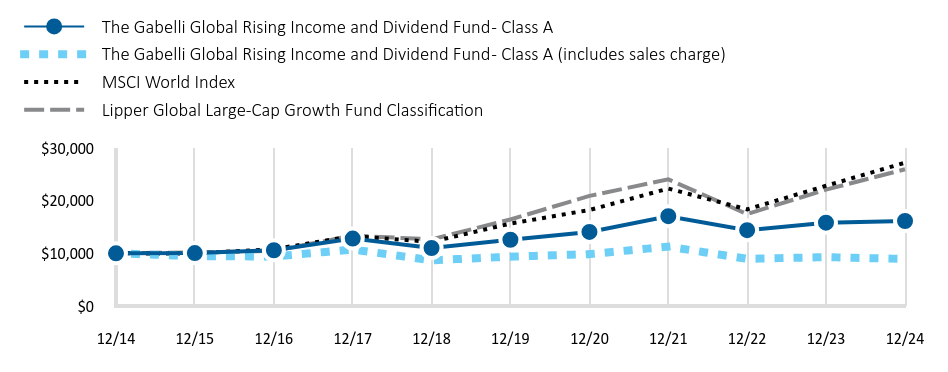
How did the Fund perform?
In 2024, The Gabelli Global Growth Fund outperformed its broad-based benchmark, the MSCI AC World Index and its comparative benchmark, the Lipper Global Large-Cap Growth Fund Classification. Economic data generally came in stronger than anticipated during the year, and the Federal Reserve saw enough progress in inflation to support 100bps of policy rate cuts starting in September. Separately, the artificial intelligence space continued to mature this year, and early winners have emerged in the semiconductor and data center infrastructure sectors. Against this backdrop, many of our large technology holdings performed well.
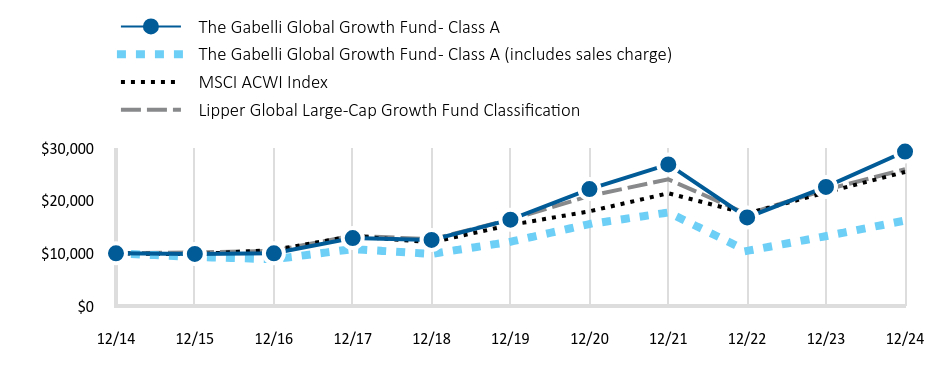
How has the Fund performed over the past 10 years?
The performance chart of the fund class presented reflects a hypothetical $10,000 investment, assuming the maximum sales charge, compared to a broad-based securities market index and more narrowly based indices reflecting market sectors in which the Fund invests over a 10-year period. The chart uses total return NAV performance and assumes reinvestment of dividends and capital gains distribution. Fund expenses were deducted.
Total Return Based on a $10,000 Investment
| The Gabelli Global Growth Fund - Class A | The Gabelli Global Growth Fund - Class A (includes sales charge) | MSCI ACWI Index | Lipper Global Large-Cap Growth Fund Classification |
|---|
| 12/14 | 10,000 | 10,000 | 10,000 | 10,000 |
|---|
| 12/15 | 9,877 | 9,309 | 9,816 | 10,176 |
|---|
| 12/16 | 10,000 | 8,884 | 10,648 | 10,472 |
|---|
| 12/17 | 12,899 | 10,799 | 13,270 | 13,359 |
|---|
| 12/18 | 12,537 | 9,893 | 12,085 | 12,646 |
|---|
| 12/19 | 16,391 | 12,190 | 15,384 | 16,422 |
|---|
| 12/20 | 22,191 | 15,554 | 17,972 | 20,895 |
|---|
| 12/21 | 26,871 | 17,752 | 21,394 | 24,042 |
|---|
| 12/22 | 16,805 | 10,463 | 17,551 | 17,452 |
|---|
| 12/23 | 22,603 | 13,263 | 21,555 | 22,079 |
|---|
| 12/24 | 29,318 | 16,214 | 25,439 | 25,951 |
|---|
Average Annual Total Returns
| 1 Year | 5 Year | 10 Year |
|---|
| The Gabelli Global Growth Fund - Class A | 29.71% | 12.33% | 11.36% |
|---|
| The Gabelli Global Growth Fund - Class A (includes sales charge) | 22.25% | 11.01% | 10.70% |
|---|
| MSCI ACWI Index | 18.02% | 10.58% | 9.79% |
|---|
| Lipper Global Large-Cap Growth Fund Classification | 17.54% | 9.58% | 10.00% |
|---|
- Total Net Assets$190,324,373
- Number of Portfolio Holdings47
- Portfolio Turnover Rate26%
- Management Fees$923,769
Past performance does not guarantee future results. Call 800-GABELLI (800-422-3554) or visit www.gabelli.com/funds/open_ends for current month-end performance. The table and graph presented above do not reflect the deduction of taxes a shareholder would pay on fund distributions or the redemption of fund shares.
What did the Fund invest in?
Top 10 Holdings (% of net assets)
| NVIDIA Corp. | 7.5% |
| Amazon.com Inc. | 6.5% |
| Meta Platforms Inc. | 5.5% |
| Microsoft Corp. | 5.4% |
| Netflix Inc. | 5.4% |
| Alphabet Inc. | 5.0% |
| Eli Lilly & Co. | 3.8% |
| Apple Inc. | 3.2% |
| Spotify Technology SA | 3.2% |
| Trane Technologies plc | 3.1% |
Portfolio Weighting (% of net assets)
| Common Stocks | 99.2% |
| U.S. Government Obligations | 0.9% |
| Other Assets and Liabilities (Net) | (0.1)% |
Industry Allocation (% of net assets)
| Industry Weighting | . |
|---|
| Information Technology - Semiconductors, Hardware, and Equipment | 19.4% |
| Communication Services | 19.1% |
| Financials | 13.2% |
| Information Technology - Software and Services | 12.2% |
| Consumer Discretionary | 12.2% |
| Health Care | 11.8% |
| Industrials | 8.0% |
| Consumer Staples | 2.4% |
| Other Industry sectors | 1.8% |
| Other Assets and Liabilities (Net) | (0.1)% |
The Gabelli Global Growth Fund
Annual Shareholder Report - December 31, 2024
Where can I find additional information about the Fund?
If you wish to view additional information about the Fund; including but not limited to financial statements or holdings, please visit www.gabelli.com/funds/open_ends.
Contact Us
Phone: 800-GABELLI (800-422-3554)
Email: info@gabelli.com
If you wish to receive a copy of this document at a new address, contact 800-GABELLI (800-422-3554)
The Gabelli Global Content & Connectivity Fund
Annual Shareholder Report - December 31, 2024

This annual shareholder report contains important information about The Gabelli Global Content & Connectivity Fund (the Fund) for the period of January 1, 2024 to December 31, 2024. The primary investment objective of The Gabelli Global Content & Connectivity Fund is capital appreciation. The Fund’s secondary investment objective is current income. The Fund’s investment strategy is to invest its net assets in common stocks of companies in the telecommunications, media, and information technology industries which Gabelli Funds, LLC (the Adviser), believes are likely to have rapid growth in revenues and earnings and potential for above average capital appreciation or are undervalued. In accordance with its concentration policy, the Fund will invest at least 25% of the value of its total assets in the telecommunications related industry, and not invest more than 25% of the value of its total assets in any other particular industry. You may find additional information about the Fund at www.gabelli.com/funds/open_ends. You may also request information by contacting us at 800-GABELLI (800-422-3554).
What were the Fund costs for the last year?
(based on a hypothetical $10,000 investment)
| Class Name | Costs of a $10k Investment | Costs Paid as a % of a $10k Investment |
|---|
| The Gabelli Global Content & Connectivity Fund - Class AAA | $100 | 0.90% |
|---|
How did the Fund perform?
For the fiscal year ended December 31, 2024, The Gabelli Global Content & Connectivity Fund outperformed its broad-based benchmark, MSCI AC World Index but underperformed its comparative benchmark, MSCI AC World Communication Services Index. The difference in performance was largely driven by the Fund’s lower weights in technology- and online-related mega-cap stocks, to avoid excessive concentration. Top contributors to our Fund included firms benefiting from strength and scale in digital advertising, continued optimism around artificial intelligence platforms and rising demand for AI chips, solid wireless operating performance, or announced merger and acquisition transactions.
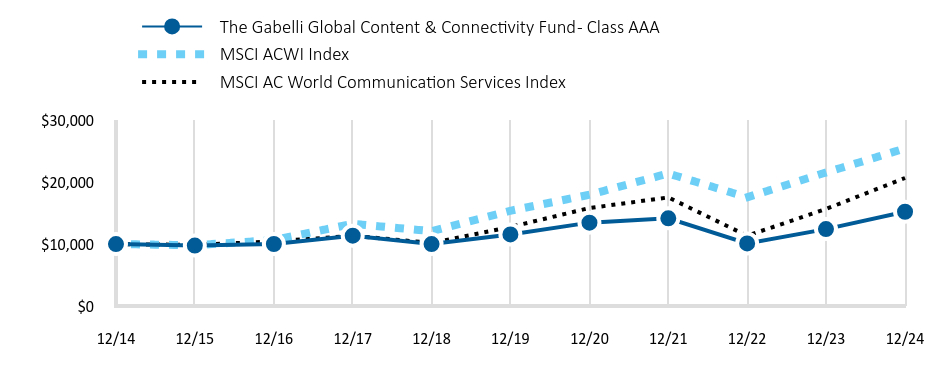
How has the Fund performed over the past 10 years?
The performance chart of the fund class presented reflects a hypothetical $10,000 investment, assuming the maximum sales charge, compared to a broad-based securities market index and more narrowly based indices reflecting market sectors in which the Fund invests over a 10-year period. The chart uses total return NAV performance and assumes reinvestment of dividends and capital gains distribution. Fund expenses were deducted.
Total Return Based on a $10,000 Investment
| The Gabelli Global Content & Connectivity Fund - Class AAA | MSCI ACWI Index | MSCI AC World Communication Services Index |
|---|
| 12/14 | 10,000 | 10,000 | 10,000 |
|---|
| 12/15 | 9,752 | 9,816 | 9,860 |
|---|
| 12/16 | 10,010 | 10,648 | 10,437 |
|---|
| 12/17 | 11,350 | 13,270 | 11,335 |
|---|
| 12/18 | 10,000 | 12,085 | 10,191 |
|---|
| 12/19 | 11,562 | 15,384 | 12,750 |
|---|
| 12/20 | 13,461 | 17,972 | 15,823 |
|---|
| 12/21 | 14,157 | 21,394 | 17,535 |
|---|
| 12/22 | 10,105 | 17,551 | 11,340 |
|---|
| 12/23 | 12,418 | 21,555 | 15,664 |
|---|
| 12/24 | 15,221 | 25,439 | 20,669 |
|---|
Average Annual Total Returns
| 1 Year | 5 Year | 10 Year |
|---|
| The Gabelli Global Content & Connectivity Fund - Class AAA | 22.57% | 5.65% | 4.29% |
|---|
| MSCI ACWI Index | 18.02% | 10.58% | 9.79% |
|---|
| MSCI AC World Communication Services Index | 31.95% | 10.14% | 7.53% |
|---|
- Total Net Assets$65,443,369
- Number of Portfolio Holdings48
- Portfolio Turnover Rate11%
- Management Fees$137,060
Past performance does not guarantee future results. Call 800-GABELLI (800-422-3554) or visit www.gabelli.com/funds/open_ends for current month-end performance. The table and graph presented above do not reflect the deduction of taxes a shareholder would pay on fund distributions or the redemption of fund shares.
What did the Fund invest in?
Top 10 Holdings (% of net assets)
| T-Mobile US Inc. | 9.1% |
| Meta Platforms Inc. | 8.5% |
| Alphabet Inc. | 7.8% |
| SoftBank Group Corp. | 6.6% |
| Deutsche Telekom AG | 5.0% |
| Prosus NV | 4.8% |
| Telephone and Data Systems Inc. | 3.9% |
| Microsoft Corp. | 3.9% |
| United States Cellular Corp. | 3.8% |
| Frontier Communications Parent Inc. | 3.5% |
Portfolio Weighting (% of net assets)
| Common Stocks | 101.0% |
| Preferred Stocks | 0.2% |
| Other Assets and Liabilities (Net) | (1.2)% |
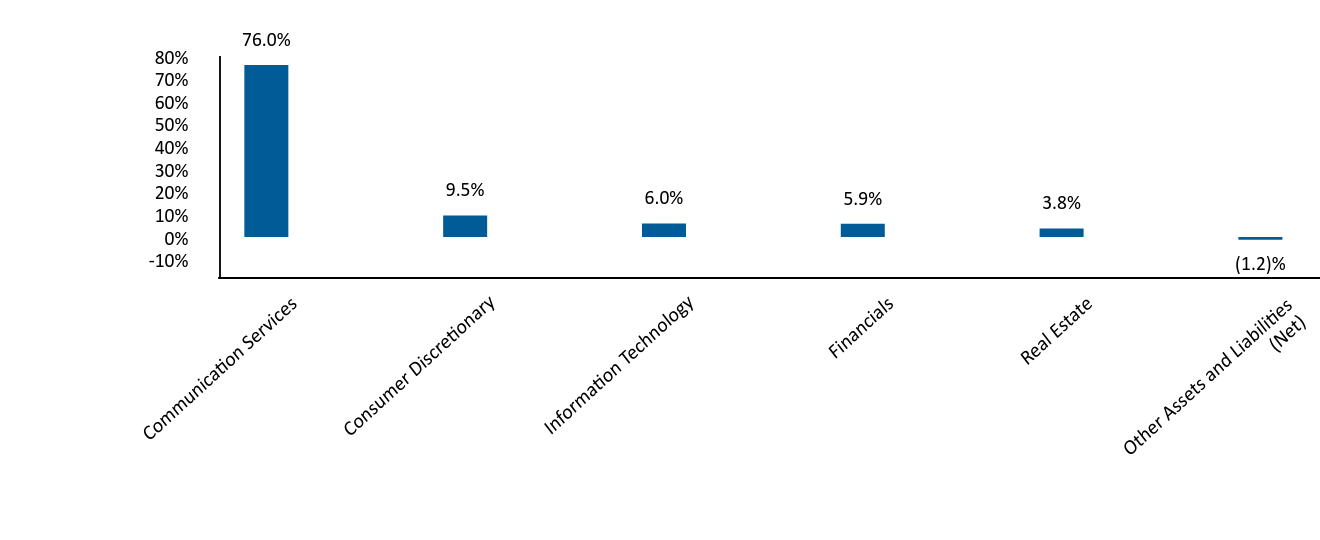
Industry Allocation (% of net assets)
| Industry Weighting | . |
|---|
| Communication Services | 76.0% |
| Consumer Discretionary | 9.5% |
| Information Technology | 6.0% |
| Financials | 5.9% |
| Real Estate | 3.8% |
| Other Assets and Liabilities (Net) | (1.2)% |
The Gabelli Global Content & Connectivity Fund
Annual Shareholder Report - December 31, 2024
Where can I find additional information about the Fund?
If you wish to view additional information about the Fund; including but not limited to financial statements or holdings, please visit www.gabelli.com/funds/open_ends.
Contact Us
Phone: 800-GABELLI (800-422-3554)
Email: info@gabelli.com
If you wish to receive a copy of this document at a new address, contact 800-GABELLI (800-422-3554)
The Gabelli Global Content & Connectivity Fund
Annual Shareholder Report - December 31, 2024

This annual shareholder report contains important information about The Gabelli Global Content & Connectivity Fund (the Fund) for the period of January 1, 2024 to December 31, 2024. The primary investment objective of The Gabelli Global Content & Connectivity Fund is capital appreciation. The Fund’s secondary investment objective is current income. The Fund’s investment strategy is to invest its net assets in common stocks of companies in the telecommunications, media, and information technology industries which Gabelli Funds, LLC (the Adviser), believes are likely to have rapid growth in revenues and earnings and potential for above average capital appreciation or are undervalued. In accordance with its concentration policy, the Fund will invest at least 25% of the value of its total assets in the telecommunications related industry, and not invest more than 25% of the value of its total assets in any other particular industry. You may find additional information about the Fund at www.gabelli.com/funds/open_ends. You may also request information by contacting us at 800-GABELLI (800-422-3554).
What were the Fund costs for the last year?
(based on a hypothetical $10,000 investment)
| Class Name | Costs of a $10k Investment | Costs Paid as a % of a $10k Investment |
|---|
| The Gabelli Global Content & Connectivity Fund - Class C | $101 | 0.90% |
|---|
How did the Fund perform?
For the fiscal year ended December 31, 2024, The Gabelli Global Content & Connectivity Fund outperformed its broad-based benchmark, MSCI AC World Index but underperformed its comparative benchmark, MSCI AC World Communication Services Index. The difference in performance was largely driven by the Fund’s lower weights in technology- and online-related mega-cap stocks, to avoid excessive concentration. Top contributors to our Fund included firms benefiting from strength and scale in digital advertising, continued optimism around artificial intelligence platforms and rising demand for AI chips, solid wireless operating performance, or announced merger and acquisition transactions.
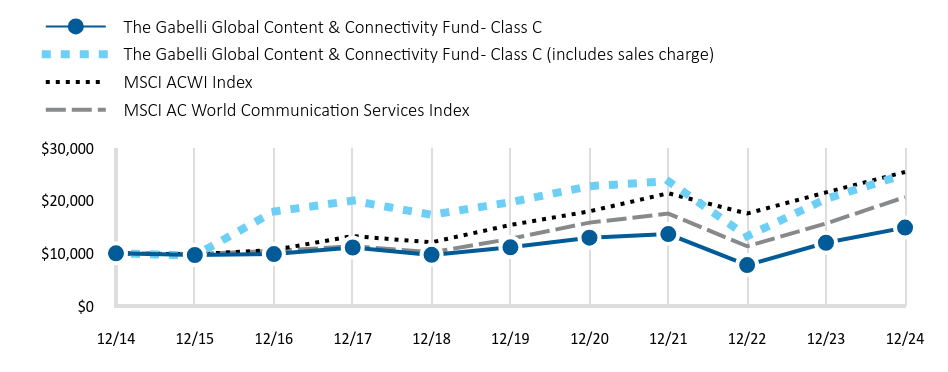
How has the Fund performed over the past 10 years?
The performance chart of the fund class presented reflects a hypothetical $10,000 investment, assuming the maximum sales charge, compared to a broad-based securities market index and more narrowly based indices reflecting market sectors in which the Fund invests over a 10-year period. The chart uses total return NAV performance and assumes reinvestment of dividends and capital gains distribution. Fund expenses were deducted.
Total Return Based on a $10,000 Investment
| The Gabelli Global Content & Connectivity Fund - Class C | The Gabelli Global Content & Connectivity Fund - Class C (includes sales charge) | MSCI ACWI Index | MSCI AC World Communication Services Index |
|---|
| 12/14 | 10,000 | 10,000 | 10,000 | 10,000 |
|---|
| 12/15 | 9,682 | 9,585 | 9,816 | 9,860 |
|---|
| 12/16 | 9,863 | 17,924 | 10,648 | 10,437 |
|---|
| 12/17 | 11,099 | 19,991 | 13,270 | 11,335 |
|---|
| 12/18 | 9,705 | 17,306 | 12,085 | 10,191 |
|---|
| 12/19 | 11,142 | 19,696 | 15,384 | 12,750 |
|---|
| 12/20 | 12,974 | 22,737 | 17,972 | 15,823 |
|---|
| 12/21 | 13,645 | 23,685 | 21,394 | 17,535 |
|---|
| 12/22 | 7,771 | 13,247 | 17,551 | 11,340 |
|---|
| 12/23 | 11,999 | 20,324 | 21,555 | 15,664 |
|---|
| 12/24 | 14,876 | 24,992 | 25,439 | 20,669 |
|---|
Average Annual Total Returns
| 1 Year | 5 Year | 10 Year |
|---|
| The Gabelli Global Content & Connectivity Fund - Class C | 22.57% | 5.54% | 3.85% |
|---|
| The Gabelli Global Content & Connectivity Fund - Class C (includes sales charge) | 21.57% | 5.54% | 3.85% |
|---|
| MSCI ACWI Index | 18.02% | 10.58% | 9.79% |
|---|
| MSCI AC World Communication Services Index | 31.95% | 10.14% | 7.53% |
|---|
- Total Net Assets$65,443,369
- Number of Portfolio Holdings48
- Portfolio Turnover Rate11%
- Management Fees$137,060
Past performance does not guarantee future results. Call 800-GABELLI (800-422-3554) or visit www.gabelli.com/funds/open_ends for current month-end performance. The table and graph presented above do not reflect the deduction of taxes a shareholder would pay on fund distributions or the redemption of fund shares.
What did the Fund invest in?
Top 10 Holdings (% of net assets)
| T-Mobile US Inc. | 9.1% |
| Meta Platforms Inc. | 8.5% |
| Alphabet Inc. | 7.8% |
| SoftBank Group Corp. | 6.6% |
| Deutsche Telekom AG | 5.0% |
| Prosus NV | 4.8% |
| Telephone and Data Systems Inc. | 3.9% |
| Microsoft Corp. | 3.9% |
| United States Cellular Corp. | 3.8% |
| Frontier Communications Parent Inc. | 3.5% |
Portfolio Weighting (% of net assets)
| Common Stocks | 101.0% |
| Preferred Stocks | 0.2% |
| Other Assets and Liabilities (Net) | (1.2)% |
Industry Allocation (% of net assets)
| Industry Weighting | . |
|---|
| Communication Services | 76.0% |
| Consumer Discretionary | 9.5% |
| Information Technology | 6.0% |
| Financials | 5.9% |
| Real Estate | 3.8% |
| Other Assets and Liabilities (Net) | (1.2)% |
The Gabelli Global Content & Connectivity Fund
Annual Shareholder Report - December 31, 2024
Where can I find additional information about the Fund?
If you wish to view additional information about the Fund; including but not limited to financial statements or holdings, please visit www.gabelli.com/funds/open_ends.
Contact Us
Phone: 800-GABELLI (800-422-3554)
Email: info@gabelli.com
If you wish to receive a copy of this document at a new address, contact 800-GABELLI (800-422-3554)
The Gabelli Global Content & Connectivity Fund
Annual Shareholder Report - December 31, 2024

This annual shareholder report contains important information about The Gabelli Global Content & Connectivity Fund (the Fund) for the period of January 1, 2024 to December 31, 2024. The primary investment objective of The Gabelli Global Content & Connectivity Fund is capital appreciation. The Fund’s secondary investment objective is current income. The Fund’s investment strategy is to invest its net assets in common stocks of companies in the telecommunications, media, and information technology industries which Gabelli Funds, LLC (the Adviser), believes are likely to have rapid growth in revenues and earnings and potential for above average capital appreciation or are undervalued. In accordance with its concentration policy, the Fund will invest at least 25% of the value of its total assets in the telecommunications related industry, and not invest more than 25% of the value of its total assets in any other particular industry. You may find additional information about the Fund at www.gabelli.com/funds/open_ends. You may also request information by contacting us at 800-GABELLI (800-422-3554).
What were the Fund costs for the last year?
(based on a hypothetical $10,000 investment)
| Class Name | Costs of a $10k Investment | Costs Paid as a % of a $10k Investment |
|---|
| The Gabelli Global Content & Connectivity Fund - Class I | $100 | 0.90% |
|---|
How did the Fund perform?
For the fiscal year ended December 31, 2024, The Gabelli Global Content & Connectivity Fund outperformed its broad-based benchmark, MSCI AC World Index but underperformed its comparative benchmark, MSCI AC World Communication Services Index. The difference in performance was largely driven by the Fund’s lower weights in technology- and online-related mega-cap stocks, to avoid excessive concentration. Top contributors to our Fund included firms benefiting from strength and scale in digital advertising, continued optimism around artificial intelligence platforms and rising demand for AI chips, solid wireless operating performance, or announced merger and acquisition transactions.
How has the Fund performed over the past 10 years?
The performance chart of the fund class presented reflects a hypothetical $10,000 investment, assuming the maximum sales charge, compared to a broad-based securities market index and more narrowly based indices reflecting market sectors in which the Fund invests over a 10-year period. The chart uses total return NAV performance and assumes reinvestment of dividends and capital gains distribution. Fund expenses were deducted.
Total Return Based on a $10,000 Investment
| The Gabelli Global Content & Connectivity Fund - Class I | MSCI ACWI Index | MSCI AC World Communication Services Index |
|---|
| 12/14 | 10,000 | 10,000 | 10,000 |
|---|
| 12/15 | 9,778 | 9,816 | 9,860 |
|---|
| 12/16 | 10,066 | 10,648 | 10,437 |
|---|
| 12/17 | 11,496 | 13,270 | 11,335 |
|---|
| 12/18 | 10,200 | 12,085 | 10,191 |
|---|
| 12/19 | 11,875 | 15,384 | 12,750 |
|---|
| 12/20 | 13,825 | 17,972 | 15,823 |
|---|
| 12/21 | 14,541 | 21,394 | 17,535 |
|---|
| 12/22 | 10,380 | 17,551 | 11,340 |
|---|
| 12/23 | 12,756 | 21,555 | 15,664 |
|---|
| 12/24 | 15,637 | 25,439 | 20,669 |
|---|
Average Annual Total Returns
| 1 Year | 5 Year | 10 Year |
|---|
| The Gabelli Global Content & Connectivity Fund - Class I | 22.58% | 5.66% | 4.57% |
|---|
| MSCI ACWI Index | 18.02% | 10.58% | 9.79% |
|---|
| MSCI AC World Communication Services Index | 31.95% | 10.14% | 7.53% |
|---|
- Total Net Assets$65,443,369
- Number of Portfolio Holdings48
- Portfolio Turnover Rate11%
- Management Fees$137,060
Past performance does not guarantee future results. Call 800-GABELLI (800-422-3554) or visit www.gabelli.com/funds/open_ends for current month-end performance. The table and graph presented above do not reflect the deduction of taxes a shareholder would pay on fund distributions or the redemption of fund shares.
What did the Fund invest in?
Top 10 Holdings (% of net assets)
| T-Mobile US Inc. | 9.1% |
| Meta Platforms Inc. | 8.5% |
| Alphabet Inc. | 7.8% |
| SoftBank Group Corp. | 6.6% |
| Deutsche Telekom AG | 5.0% |
| Prosus NV | 4.8% |
| Telephone and Data Systems Inc. | 3.9% |
| Microsoft Corp. | 3.9% |
| United States Cellular Corp. | 3.8% |
| Frontier Communications Parent Inc. | 3.5% |
Portfolio Weighting (% of net assets)
| Common Stocks | 101.0% |
| Preferred Stocks | 0.2% |
| Other Assets and Liabilities (Net) | (1.2)% |
Industry Allocation (% of net assets)
| Industry Weighting | . |
|---|
| Communication Services | 76.0% |
| Consumer Discretionary | 9.5% |
| Information Technology | 6.0% |
| Financials | 5.9% |
| Real Estate | 3.8% |
| Other Assets and Liabilities (Net) | (1.2)% |
The Gabelli Global Content & Connectivity Fund
Annual Shareholder Report - December 31, 2024
Where can I find additional information about the Fund?
If you wish to view additional information about the Fund; including but not limited to financial statements or holdings, please visit www.gabelli.com/funds/open_ends.
Contact Us
Phone: 800-GABELLI (800-422-3554)
Email: info@gabelli.com
If you wish to receive a copy of this document at a new address, contact 800-GABELLI (800-422-3554)
The Gabelli Global Content & Connectivity Fund
Annual Shareholder Report - December 31, 2024

This annual shareholder report contains important information about The Gabelli Global Content & Connectivity Fund (the Fund) for the period of January 1, 2024 to December 31, 2024. The primary investment objective of The Gabelli Global Content & Connectivity Fund is capital appreciation. The Fund’s secondary investment objective is current income. The Fund’s investment strategy is to invest its net assets in common stocks of companies in the telecommunications, media, and information technology industries which Gabelli Funds, LLC (the Adviser), believes are likely to have rapid growth in revenues and earnings and potential for above average capital appreciation or are undervalued. In accordance with its concentration policy, the Fund will invest at least 25% of the value of its total assets in the telecommunications related industry, and not invest more than 25% of the value of its total assets in any other particular industry. You may find additional information about the Fund at www.gabelli.com/funds/open_ends. You may also request information by contacting us at 800-GABELLI (800-422-3554).
What were the Fund costs for the last year?
(based on a hypothetical $10,000 investment)
| Class Name | Costs of a $10k Investment | Costs Paid as a % of a $10k Investment |
|---|
| The Gabelli Global Content & Connectivity Fund - Class A | $100 | 0.90% |
|---|
How did the Fund perform?
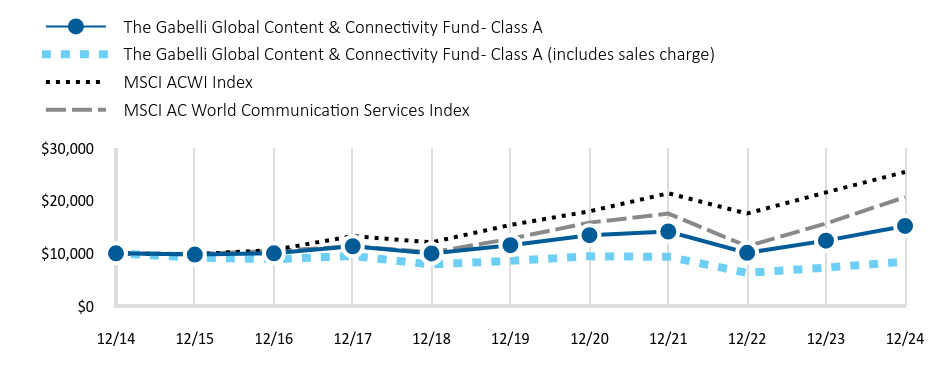
For the fiscal year ended December 31, 2024, The Gabelli Global Content & Connectivity Fund outperformed its broad-based benchmark, MSCI AC World Index but underperformed its comparative benchmark, MSCI AC World Communication Services Index. The difference in performance was largely driven by the Fund’s lower weights in technology- and online-related mega-cap stocks, to avoid excessive concentration. Top contributors to our Fund included firms benefiting from strength and scale in digital advertising, continued optimism around artificial intelligence platforms and rising demand for AI chips, solid wireless operating performance, or announced merger and acquisition transactions.
How has the Fund performed over the past 10 years?
The performance chart of the fund class presented reflects a hypothetical $10,000 investment, assuming the maximum sales charge, compared to a broad-based securities market index and more narrowly based indices reflecting market sectors in which the Fund invests over a 10-year period. The chart uses total return NAV performance and assumes reinvestment of dividends and capital gains distribution. Fund expenses were deducted.
Total Return Based on a $10,000 Investment
| The Gabelli Global Content & Connectivity Fund - Class A | The Gabelli Global Content & Connectivity Fund - Class A (includes sales charge) | MSCI ACWI Index | MSCI AC World Communication Services Index |
|---|
| 12/14 | 10,000 | 10,000 | 10,000 | 10,000 |
|---|
| 12/15 | 9,754 | 9,194 | 9,816 | 9,860 |
|---|
| 12/16 | 9,999 | 8,883 | 10,648 | 10,437 |
|---|
| 12/17 | 11,338 | 9,494 | 13,270 | 11,335 |
|---|
| 12/18 | 9,984 | 7,880 | 12,085 | 10,191 |
|---|
| 12/19 | 11,545 | 8,588 | 15,384 | 12,750 |
|---|
| 12/20 | 13,442 | 9,424 | 17,972 | 15,823 |
|---|
| 12/21 | 14,136 | 9,342 | 21,394 | 17,535 |
|---|
| 12/22 | 10,090 | 6,285 | 17,551 | 11,340 |
|---|
| 12/23 | 12,403 | 7,281 | 21,555 | 15,664 |
|---|
| 12/24 | 15,200 | 8,410 | 25,439 | 20,669 |
|---|
Average Annual Total Returns
| 1 Year | 5 Year | 10 Year |
|---|
| The Gabelli Global Content & Connectivity Fund - Class A | 22.55% | 5.66% | 4.28% |
|---|
| The Gabelli Global Content & Connectivity Fund - Class A (includes sales charge) | 15.51% | 4.41% | 3.66% |
|---|
| MSCI ACWI Index | 18.02% | 10.58% | 9.79% |
|---|
| MSCI AC World Communication Services Index | 31.95% | 10.14% | 7.53% |
|---|
- Total Net Assets$65,443,369
- Number of Portfolio Holdings48
- Portfolio Turnover Rate11%
- Management Fees$137,060
Past performance does not guarantee future results. Call 800-GABELLI (800-422-3554) or visit www.gabelli.com/funds/open_ends for current month-end performance. The table and graph presented above do not reflect the deduction of taxes a shareholder would pay on fund distributions or the redemption of fund shares.
What did the Fund invest in?
Top 10 Holdings (% of net assets)
| T-Mobile US Inc. | 9.1% |
| Meta Platforms Inc. | 8.5% |
| Alphabet Inc. | 7.8% |
| SoftBank Group Corp. | 6.6% |
| Deutsche Telekom AG | 5.0% |
| Prosus NV | 4.8% |
| Telephone and Data Systems Inc. | 3.9% |
| Microsoft Corp. | 3.9% |
| United States Cellular Corp. | 3.8% |
| Frontier Communications Parent Inc. | 3.5% |
Portfolio Weighting (% of net assets)
| Common Stocks | 101.0% |
| Preferred Stocks | 0.2% |
| Other Assets and Liabilities (Net) | (1.2)% |
Industry Allocation (% of net assets)
| Industry Weighting | . |
|---|
| Communication Services | 76.0% |
| Consumer Discretionary | 9.5% |
| Information Technology | 6.0% |
| Financials | 5.9% |
| Real Estate | 3.8% |
| Other Assets and Liabilities (Net) | (1.2)% |
The Gabelli Global Content & Connectivity Fund
Annual Shareholder Report - December 31, 2024
Where can I find additional information about the Fund?
If you wish to view additional information about the Fund; including but not limited to financial statements or holdings, please visit www.gabelli.com/funds/open_ends.
Contact Us
Phone: 800-GABELLI (800-422-3554)
Email: info@gabelli.com
If you wish to receive a copy of this document at a new address, contact 800-GABELLI (800-422-3554)
The Gabelli Global Mini Mites Fund
Annual Shareholder Report - December 31, 2024

This annual shareholder report contains important information about The Gabelli Global Mini Mites Fund (the Fund) for the period of January 1, 2024 to December 31, 2024. The Fund is a non-diversified open end management investment company whose investment objective is to provide investors with long term capital appreciation by investing primarily in micro-capitalization equity securities. The Fund’s investment strategy is to invest in common stocks of smaller companies that have a market capitalization (defined as shares outstanding times current market price) of $250 million or less at the time of the Fund's initial investment. These companies are called micro-cap companies. As a "global" fund, the Fund invests in securities of issuers located in at least three countries and at least 40% of its net assets are invested in securities of non U.S. issuers. You may find additional information about the Fund at www.gabelli.com/funds/open_ends. You may also request information by contacting us at 800-GABELLI (800-422-3554).
What were the Fund costs for the last year?
(based on a hypothetical $10,000 investment)
| Class Name | Costs of a $10k Investment | Costs Paid as a % of a $10k Investment |
|---|
| The Gabelli Global Mini Mites Fund - Class A | $95 | 0.90% |
|---|
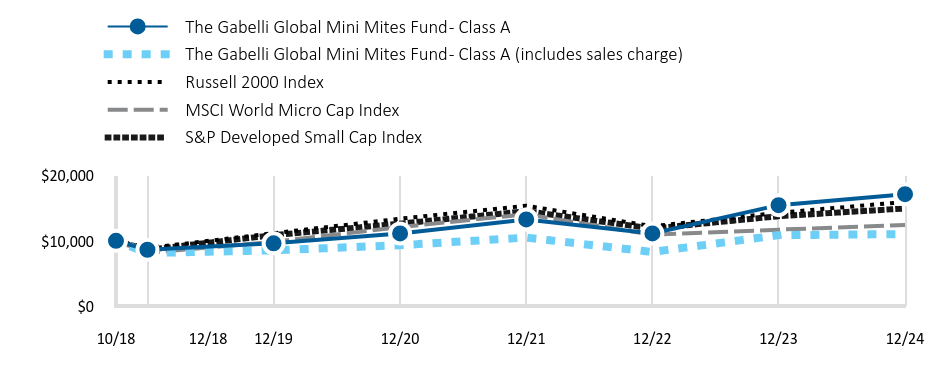
How did the Fund perform?
For the fiscal year ended December 31, 2024, the Gabelli Global Mini Mites Fund underperformed its broad-based benchmark, the Russell 2000 Index, while outperforming its comparative benchmarks, the MSCI World Micro-Cap and the S&P Developed Small Cap Indices. The year's second half performance accelerated in anticipation of a more favorable environment under a Trump administration. The new administration may fuel increased deal activity, higher domestic economic activity, and increased expectations of lower interest rates. The fund seeks to invest in companies that have market capitalizations of $250 million or less which are sensitive to these macro indicators.
How has the Fund performed since inception?
The performance chart of the fund class presented reflects a hypothetical $10,000 investment, assuming the maximum sales charge, compared to a broad-based securities market index and more narrowly based indices reflecting market sectors in which the Fund invests over a 10-year period. The chart uses total return NAV performance and assumes reinvestment of dividends and capital gains distribution. Fund expenses were deducted.
Total Return Based on a $10,000 Investment
| The Gabelli Global Mini Mites Fund - Class A | The Gabelli Global Mini Mites Fund - Class A (includes sales charge) | Russell 2000 Index | MSCI World Micro Cap Index | S&P Developed Small Cap Index |
|---|
| 10/18 | 10,000 | 10,000 | 10,000 | 10,000 | 10,000 |
|---|
| 12/18 | 8,628 | 8,132 | 8,899 | 8,157 | 8,620 |
|---|
| 12/19 | 9,618 | 8,543 | 11,170 | 9,844 | 10,873 |
|---|
| 12/20 | 11,133 | 9,330 | 13,400 | 12,120 | 12,635 |
|---|
| 12/21 | 13,291 | 10,498 | 15,385 | 14,080 | 14,553 |
|---|
| 12/22 | 11,142 | 8,295 | 12,241 | 10,938 | 11,888 |
|---|
| 12/23 | 15,479 | 10,861 | 14,313 | 11,718 | 13,778 |
|---|
| 12/24 | 17,164 | 11,040 | 15,965 | 12,436 | 14,969 |
|---|
Average Annual Total Returns
| 1 Year | 5 Year | Since Inception (10/1/2018) |
|---|
| The Gabelli Global Mini Mites Fund - Class A | 10.98% | 12.30% | 9.04% |
|---|
| The Gabelli Global Mini Mites Fund - Class A (includes sales charge) | 4.60% | 10.98% | 8.01% |
|---|
| Russell 2000 Index | 11.54% | 7.40% | 6.15% |
|---|
| MSCI World Micro Cap Index | 6.13% | 4.88% | 3.67% |
|---|
| S&P Developed Small Cap Index | 8.64% | 6.60% | 5.97% |
|---|
- Total Net Assets$12,664,636
- Number of Portfolio Holdings143
- Portfolio Turnover Rate26%
- Management Fees$(54,045)
Past performance does not guarantee future results. Call 800-GABELLI (800-422-3554) or visit www.gabelli.com/funds/open_ends for current month-end performance. The table and graph presented above do not reflect the deduction of taxes a shareholder would pay on fund distributions or the redemption of fund shares.
What did the Fund invest in?
Top 10 Holdings (% of net assets)
| Tredegar Corp. | 7.0% |
| Applied Optoelectronics Inc. | 4.4% |
| L.B. Foster Co. | 2.6% |
| Park-Ohio Holdings Corp. | 2.4% |
| Electromed Inc. | 2.1% |
| Ampco-Pittsburgh Corp. | 2.0% |
| Lee Enterprises Inc. | 2.0% |
| Clarus Corp. | 2.0% |
| Inspired Entertainment Inc. | 1.8% |
| Velan Inc. | 1.8% |
Portfolio Weighting (% of net assets)
| Common Stocks | 84.2% |
| U.S. Government Obligations | 14.6% |
| Other Assets and Liabilities (Net) | 1.2% |
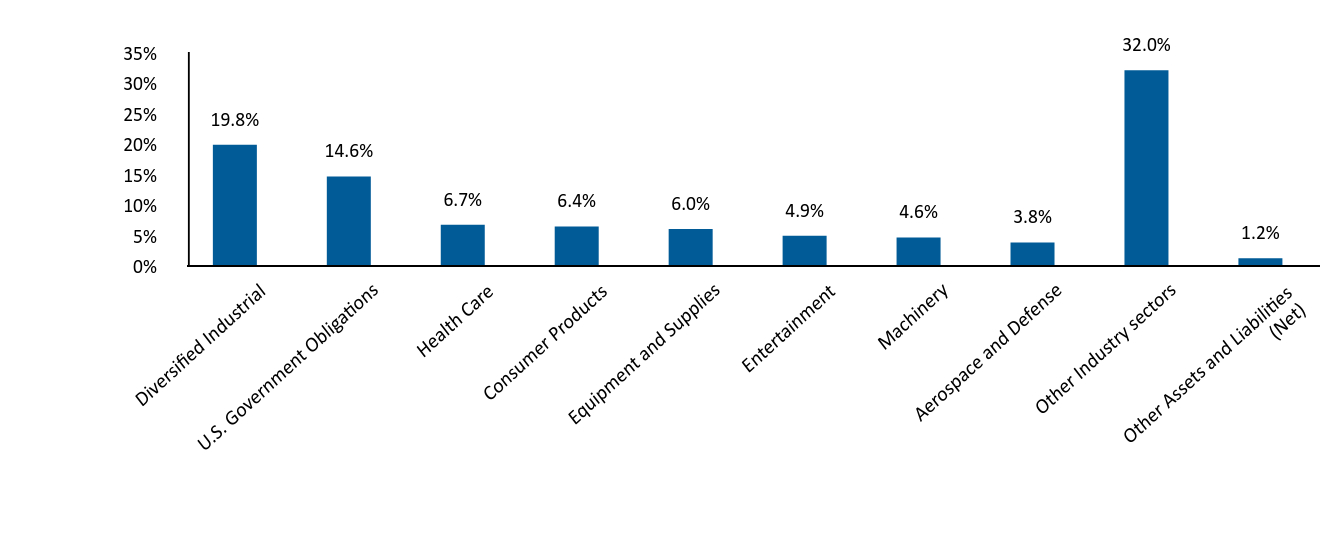
Industry Allocation (% of net assets)
| Industry Weighting | . |
|---|
| Diversified Industrial | 19.8% |
| U.S. Government Obligations | 14.6% |
| Health Care | 6.7% |
| Consumer Products | 6.4% |
| Equipment and Supplies | 6.0% |
| Entertainment | 4.9% |
| Machinery | 4.6% |
| Aerospace and Defense | 3.8% |
| Other Industry sectors | 32.0% |
| Other Assets and Liabilities (Net) | 1.2% |
The Gabelli Global Mini Mites Fund
Annual Shareholder Report - December 31, 2024
Where can I find additional information about the Fund?
If you wish to view additional information about the Fund; including but not limited to financial statements or holdings, please visit www.gabelli.com/funds/open_ends.
Contact Us
Phone: 800-GABELLI (800-422-3554)
Email: info@gabelli.com
If you wish to receive a copy of this document at a new address, contact 800-GABELLI (800-422-3554)
The Gabelli Global Mini Mites Fund
Annual Shareholder Report - December 31, 2024

This annual shareholder report contains important information about The Gabelli Global Mini Mites Fund (the Fund) for the period of January 1, 2024 to December 31, 2024. The Fund is a non-diversified open end management investment company whose investment objective is to provide investors with long term capital appreciation by investing primarily in micro-capitalization equity securities. The Fund’s investment strategy is to invest in common stocks of smaller companies that have a market capitalization (defined as shares outstanding times current market price) of $250 million or less at the time of the Fund's initial investment. These companies are called micro-cap companies. As a "global" fund, the Fund invests in securities of issuers located in at least three countries and at least 40% of its net assets are invested in securities of non U.S. issuers. You may find additional information about the Fund at www.gabelli.com/funds/open_ends. You may also request information by contacting us at 800-GABELLI (800-422-3554).
What were the Fund costs for the last year?
(based on a hypothetical $10,000 investment)
| Class Name | Costs of a $10k Investment | Costs Paid as a % of a $10k Investment |
|---|
| The Gabelli Global Mini Mites Fund - Class C | $95 | 0.90% |
|---|
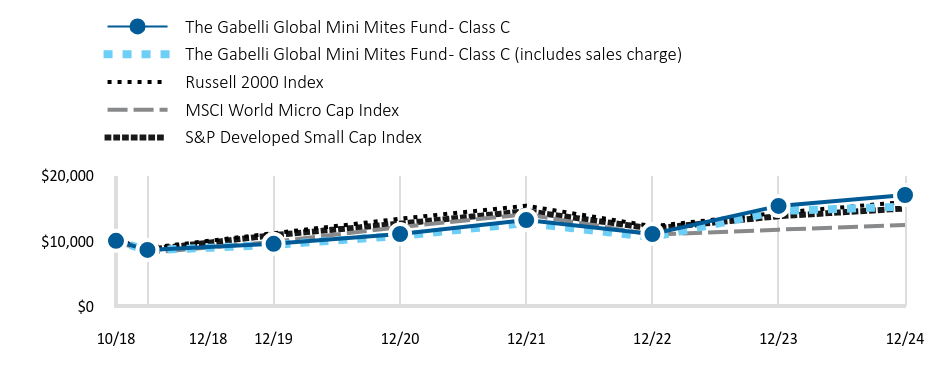
How did the Fund perform?
For the fiscal year ended December 31, 2024, the Gabelli Global Mini Mites Fund underperformed its broad-based benchmark, the Russell 2000 Index, while outperforming its comparative benchmarks, the MSCI World Micro-Cap and the S&P Developed Small Cap Indices. The year's second half performance accelerated in anticipation of a more favorable environment under a Trump administration. The new administration may fuel increased deal activity, higher domestic economic activity, and increased expectations of lower interest rates. The fund seeks to invest in companies that have market capitalizations of $250 million or less which are sensitive to these macro indicators.
How has the Fund performed since inception?
The performance chart of the fund class presented reflects a hypothetical $10,000 investment, assuming the maximum sales charge, compared to a broad-based securities market index and more narrowly based indices reflecting market sectors in which the Fund invests over a 10-year period. The chart uses total return NAV performance and assumes reinvestment of dividends and capital gains distribution. Fund expenses were deducted.
Total Return Based on a $10,000 Investment
| The Gabelli Global Mini Mites Fund - Class C | The Gabelli Global Mini Mites Fund - Class C (includes sales charge) | Russell 2000 Index | MSCI World Micro Cap Index | S&P Developed Small Cap Index |
|---|
| 10/18 | 10,000 | 10,000 | 10,000 | 10,000 | 10,000 |
|---|
| 12/18 | 8,612 | 8,538 | 8,899 | 8,157 | 8,620 |
|---|
| 12/19 | 9,545 | 9,377 | 11,170 | 9,844 | 10,873 |
|---|
| 12/20 | 11,054 | 10,766 | 13,400 | 12,120 | 12,635 |
|---|
| 12/21 | 13,191 | 12,741 | 15,385 | 14,080 | 14,553 |
|---|
| 12/22 | 11,048 | 10,564 | 12,241 | 10,938 | 11,888 |
|---|
| 12/23 | 15,363 | 14,585 | 14,313 | 11,718 | 13,778 |
|---|
| 12/24 | 17,035 | 15,242 | 15,965 | 12,436 | 14,969 |
|---|
Average Annual Total Returns
| 1 Year | 5 Year | Since Inception (10/1/2018) |
|---|
| The Gabelli Global Mini Mites Fund - Class C | 10.89% | 12.29% | 8.90% |
|---|
| The Gabelli Global Mini Mites Fund - Class C (includes sales charge) | 9.89% | 12.29% | 8.90% |
|---|
| Russell 2000 Index | 11.54% | 7.40% | 6.15% |
|---|
| MSCI World Micro Cap Index | 6.13% | 4.88% | 3.67% |
|---|
| S&P Developed Small Cap Index | 8.64% | 6.60% | 5.97% |
|---|
- Total Net Assets$12,664,636
- Number of Portfolio Holdings143
- Portfolio Turnover Rate26%
- Management Fees$(54,045)
Past performance does not guarantee future results. Call 800-GABELLI (800-422-3554) or visit www.gabelli.com/funds/open_ends for current month-end performance. The table and graph presented above do not reflect the deduction of taxes a shareholder would pay on fund distributions or the redemption of fund shares.
What did the Fund invest in?
Top 10 Holdings (% of net assets)
| Tredegar Corp. | 7.0% |
| Applied Optoelectronics Inc. | 4.4% |
| L.B. Foster Co. | 2.6% |
| Park-Ohio Holdings Corp. | 2.4% |
| Electromed Inc. | 2.1% |
| Ampco-Pittsburgh Corp. | 2.0% |
| Lee Enterprises Inc. | 2.0% |
| Clarus Corp. | 2.0% |
| Inspired Entertainment Inc. | 1.8% |
| Velan Inc. | 1.8% |
Portfolio Weighting (% of net assets)
| Common Stocks | 84.2% |
| U.S. Government Obligations | 14.6% |
| Other Assets and Liabilities (Net) | 1.2% |
Industry Allocation (% of net assets)
| Industry Weighting | . |
|---|
| Diversified Industrial | 19.8% |
| U.S. Government Obligations | 14.6% |
| Health Care | 6.7% |
| Consumer Products | 6.4% |
| Equipment and Supplies | 6.0% |
| Entertainment | 4.9% |
| Machinery | 4.6% |
| Aerospace and Defense | 3.8% |
| Other Industry sectors | 32.0% |
| Other Assets and Liabilities (Net) | 1.2% |
The Gabelli Global Mini Mites Fund
Annual Shareholder Report - December 31, 2024
Where can I find additional information about the Fund?
If you wish to view additional information about the Fund; including but not limited to financial statements or holdings, please visit www.gabelli.com/funds/open_ends.
Contact Us
Phone: 800-GABELLI (800-422-3554)
Email: info@gabelli.com
If you wish to receive a copy of this document at a new address, contact 800-GABELLI (800-422-3554)
The Gabelli Global Mini Mites Fund
Annual Shareholder Report - December 31, 2024

This annual shareholder report contains important information about The Gabelli Global Mini Mites Fund (the Fund) for the period of January 1, 2024 to December 31, 2024. The Fund is a non-diversified open end management investment company whose investment objective is to provide investors with long term capital appreciation by investing primarily in micro-capitalization equity securities. The Fund’s investment strategy is to invest in common stocks of smaller companies that have a market capitalization (defined as shares outstanding times current market price) of $250 million or less at the time of the Fund's initial investment. These companies are called micro-cap companies. As a "global" fund, the Fund invests in securities of issuers located in at least three countries and at least 40% of its net assets are invested in securities of non U.S. issuers. You may find additional information about the Fund at www.gabelli.com/funds/open_ends. You may also request information by contacting us at 800-GABELLI (800-422-3554).
What were the Fund costs for the last year?
(based on a hypothetical $10,000 investment)
| Class Name | Costs of a $10k Investment | Costs Paid as a % of a $10k Investment |
|---|
| The Gabelli Global Mini Mites Fund - Class I | $95 | 0.90% |
|---|
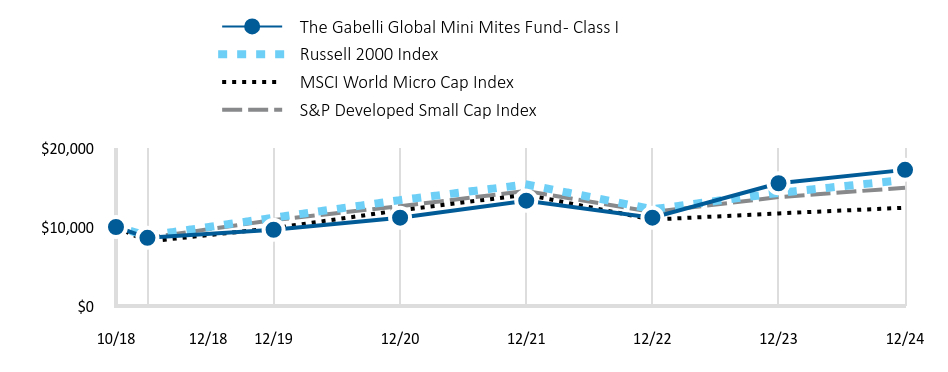
How did the Fund perform?
For the fiscal year ended December 31, 2024, the Gabelli Global Mini Mites Fund underperformed its broad-based benchmark, the Russell 2000 Index, while outperforming its comparative benchmarks, the MSCI World Micro-Cap and the S&P Developed Small Cap Indices. The year's second half performance accelerated in anticipation of a more favorable environment under a Trump administration. The new administration may fuel increased deal activity, higher domestic economic activity, and increased expectations of lower interest rates. The fund seeks to invest in companies that have market capitalizations of $250 million or less which are sensitive to these macro indicators.
How has the Fund performed since inception?
The performance chart of the fund class presented reflects a hypothetical $10,000 investment, assuming the maximum sales charge, compared to a broad-based securities market index and more narrowly based indices reflecting market sectors in which the Fund invests over a 10-year period. The chart uses total return NAV performance and assumes reinvestment of dividends and capital gains distribution. Fund expenses were deducted.
Total Return Based on a $10,000 Investment
| The Gabelli Global Mini Mites Fund - Class I | Russell 2000 Index | MSCI World Micro Cap Index | S&P Developed Small Cap Index |
|---|
| 10/18 | 10,000 | 10,000 | 10,000 | 10,000 |
|---|
| 12/18 | 8,624 | 8,899 | 8,157 | 8,620 |
|---|
| 12/19 | 9,645 | 11,170 | 9,844 | 10,873 |
|---|
| 12/20 | 11,176 | 13,400 | 12,120 | 12,635 |
|---|
| 12/21 | 13,327 | 15,385 | 14,080 | 14,553 |
|---|
| 12/22 | 11,172 | 12,241 | 10,938 | 11,888 |
|---|
| 12/23 | 15,535 | 14,313 | 11,718 | 13,778 |
|---|
| 12/24 | 17,225 | 15,965 | 12,436 | 14,969 |
|---|
Average Annual Total Returns
| 1 Year | 5 Year | Since Inception (10/1/2018) |
|---|
| The Gabelli Global Mini Mites Fund - Class I | 10.88% | 12.30% | 9.09% |
|---|
| Russell 2000 Index | 11.54% | 7.40% | 6.15% |
|---|
| MSCI World Micro Cap Index | 6.13% | 4.88% | 3.67% |
|---|
| S&P Developed Small Cap Index | 8.64% | 6.60% | 5.97% |
|---|
- Total Net Assets$12,664,636
- Number of Portfolio Holdings143
- Portfolio Turnover Rate26%
- Management Fees$(54,045)
Past performance does not guarantee future results. Call 800-GABELLI (800-422-3554) or visit www.gabelli.com/funds/open_ends for current month-end performance. The table and graph presented above do not reflect the deduction of taxes a shareholder would pay on fund distributions or the redemption of fund shares.
What did the Fund invest in?
Top 10 Holdings (% of net assets)
| Tredegar Corp. | 7.0% |
| Applied Optoelectronics Inc. | 4.4% |
| L.B. Foster Co. | 2.6% |
| Park-Ohio Holdings Corp. | 2.4% |
| Electromed Inc. | 2.1% |
| Ampco-Pittsburgh Corp. | 2.0% |
| Lee Enterprises Inc. | 2.0% |
| Clarus Corp. | 2.0% |
| Inspired Entertainment Inc. | 1.8% |
| Velan Inc. | 1.8% |
Portfolio Weighting (% of net assets)
| Common Stocks | 84.2% |
| U.S. Government Obligations | 14.6% |
| Other Assets and Liabilities (Net) | 1.2% |
Industry Allocation (% of net assets)
| Industry Weighting | . |
|---|
| Diversified Industrial | 19.8% |
| U.S. Government Obligations | 14.6% |
| Health Care | 6.7% |
| Consumer Products | 6.4% |
| Equipment and Supplies | 6.0% |
| Entertainment | 4.9% |
| Machinery | 4.6% |
| Aerospace and Defense | 3.8% |
| Other Industry sectors | 32.0% |
| Other Assets and Liabilities (Net) | 1.2% |
The Gabelli Global Mini Mites Fund
Annual Shareholder Report - December 31, 2024
Where can I find additional information about the Fund?
If you wish to view additional information about the Fund; including but not limited to financial statements or holdings, please visit www.gabelli.com/funds/open_ends.
Contact Us
Phone: 800-GABELLI (800-422-3554)
Email: info@gabelli.com
If you wish to receive a copy of this document at a new address, contact 800-GABELLI (800-422-3554)
The Gabelli Global Mini Mites Fund
Annual Shareholder Report - December 31, 2024

This annual shareholder report contains important information about The Gabelli Global Mini Mites Fund (the Fund) for the period of January 1, 2024 to December 31, 2024. The Fund is a non-diversified open end management investment company whose investment objective is to provide investors with long term capital appreciation by investing primarily in micro-capitalization equity securities. The Fund’s investment strategy is to invest in common stocks of smaller companies that have a market capitalization (defined as shares outstanding times current market price) of $250 million or less at the time of the Fund's initial investment. These companies are called micro-cap companies. As a "global" fund, the Fund invests in securities of issuers located in at least three countries and at least 40% of its net assets are invested in securities of non U.S. issuers. You may find additional information about the Fund at www.gabelli.com/funds/open_ends. You may also request information by contacting us at 800-GABELLI (800-422-3554).
What were the Fund costs for the last year?
(based on a hypothetical $10,000 investment)
| Class Name | Costs of a $10k Investment | Costs Paid as a % of a $10k Investment |
|---|
| The Gabelli Global Mini Mites Fund - Class AAA | $95 | 0.90% |
|---|
How did the Fund perform?
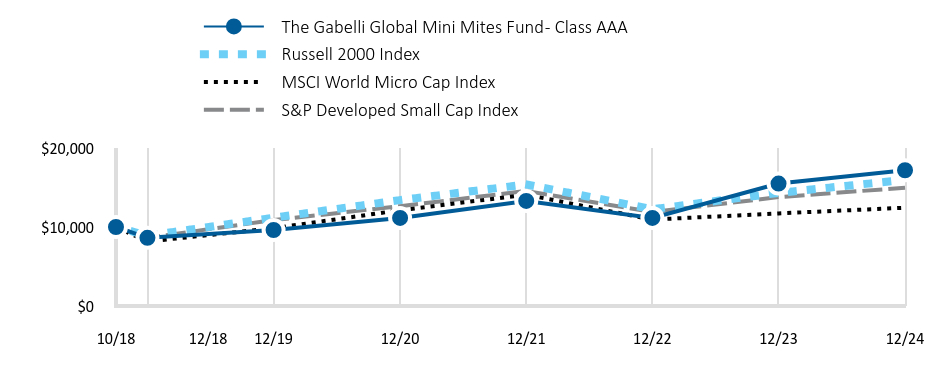
For the fiscal year ended December 31, 2024, the Gabelli Global Mini Mites Fund underperformed its broad-based benchmark, the Russell 2000 Index, while outperforming its comparative benchmarks, the MSCI World Micro-Cap and the S&P Developed Small Cap Indices. The year's second half performance accelerated in anticipation of a more favorable environment under a Trump administration. The new administration may fuel increased deal activity, higher domestic economic activity, and increased expectations of lower interest rates. The fund seeks to invest in companies that have market capitalizations of $250 million or less which are sensitive to these macro indicators.
How has the Fund performed since inception?
The performance chart of the fund class presented reflects a hypothetical $10,000 investment, assuming the maximum sales charge, compared to a broad-based securities market index and more narrowly based indices reflecting market sectors in which the Fund invests over a 10-year period. The chart uses total return NAV performance and assumes reinvestment of dividends and capital gains distribution. Fund expenses were deducted.
Total Return Based on a $10,000 Investment
| The Gabelli Global Mini Mites Fund - Class AAA | Russell 2000 Index | MSCI World Micro Cap Index | S&P Developed Small Cap Index |
|---|
| 10/18 | 10,000 | 10,000 | 10,000 | 10,000 |
|---|
| 12/18 | 8,629 | 8,899 | 8,157 | 8,620 |
|---|
| 12/19 | 9,620 | 11,170 | 9,844 | 10,873 |
|---|
| 12/20 | 11,147 | 13,400 | 12,120 | 12,635 |
|---|
| 12/21 | 13,293 | 15,385 | 14,080 | 14,553 |
|---|
| 12/22 | 11,144 | 12,241 | 10,938 | 11,888 |
|---|
| 12/23 | 15,495 | 14,313 | 11,718 | 13,778 |
|---|
| 12/24 | 17,181 | 15,965 | 12,436 | 14,969 |
|---|
Average Annual Total Returns
| 1 Year | 5 Year | Since Inception (10/1/2018) |
|---|
| The Gabelli Global Mini Mites Fund - Class AAA | 10.88% | 12.30% | 9.05% |
|---|
| Russell 2000 Index | 11.54% | 7.40% | 6.15% |
|---|
| MSCI World Micro Cap Index | 6.13% | 4.88% | 3.67% |
|---|
| S&P Developed Small Cap Index | 8.64% | 6.60% | 5.97% |
|---|
- Total Net Assets$12,664,636
- Number of Portfolio Holdings143
- Portfolio Turnover Rate26%
- Management Fees$(54,045)
Past performance does not guarantee future results. Call 800-GABELLI (800-422-3554) or visit www.gabelli.com/funds/open_ends for current month-end performance. The table and graph presented above do not reflect the deduction of taxes a shareholder would pay on fund distributions or the redemption of fund shares.
What did the Fund invest in?
Top 10 Holdings (% of net assets)
| Tredegar Corp. | 7.0% |
| Applied Optoelectronics Inc. | 4.4% |
| L.B. Foster Co. | 2.6% |
| Park-Ohio Holdings Corp. | 2.4% |
| Electromed Inc. | 2.1% |
| Ampco-Pittsburgh Corp. | 2.0% |
| Lee Enterprises Inc. | 2.0% |
| Clarus Corp. | 2.0% |
| Inspired Entertainment Inc. | 1.8% |
| Velan Inc. | 1.8% |
Portfolio Weighting (% of net assets)
| Common Stocks | 84.2% |
| U.S. Government Obligations | 14.6% |
| Other Assets and Liabilities (Net) | 1.2% |
Industry Allocation (% of net assets)
| Industry Weighting | . |
|---|
| Diversified Industrial | 19.8% |
| U.S. Government Obligations | 14.6% |
| Health Care | 6.7% |
| Consumer Products | 6.4% |
| Equipment and Supplies | 6.0% |
| Entertainment | 4.9% |
| Machinery | 4.6% |
| Aerospace and Defense | 3.8% |
| Other Industry sectors | 32.0% |
| Other Assets and Liabilities (Net) | 1.2% |
The Gabelli Global Mini Mites Fund
Annual Shareholder Report - December 31, 2024
Where can I find additional information about the Fund?
If you wish to view additional information about the Fund; including but not limited to financial statements or holdings, please visit www.gabelli.com/funds/open_ends.
Contact Us
Phone: 800-GABELLI (800-422-3554)
Email: info@gabelli.com
If you wish to receive a copy of this document at a new address, contact 800-GABELLI (800-422-3554)
The Gabelli Global Rising Income and Dividend Fund
Annual Shareholder Report - December 31, 2024

This annual shareholder report contains important information about The Gabelli Global Rising Income and Dividend Fund (the Fund) for the period of January 1, 2024 to December 31, 2024. The Fund’s investment objective is to provide investors with a high level of total return through a combination of current income and appreciation of capital. The Fund’s investment strategy is to invest 80% of its net assets in dividend paying securities (such as common and preferred stock) or other income producing securities (such as fixed income securities and securities that are convertible into common stock). The Fund will primarily invest in common stocks of foreign and domestic issuers that the Gabelli Funds, LLC (the Adviser) believes are likely to pay dividends and income and have the potential for above average capital appreciation and dividend increases. You may find additional information about the Fund at www.gabelli.com/funds/open_ends. You may also request information by contacting us at 800-GABELLI (800-422-3554).
What were the Fund costs for the last year?
(based on a hypothetical $10,000 investment)
| Class Name | Costs of a $10k Investment | Costs Paid as a % of a $10k Investment |
|---|
| The Gabelli Global Rising Income and Dividend Fund - Class AAA | $91 | 0.90% |
|---|
How did the Fund perform?
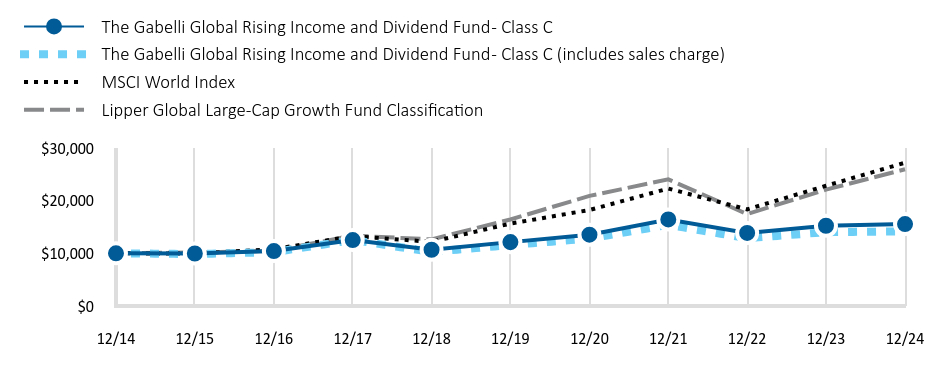
For the fiscal year ended December 31, 2024, The Gabelli Global Rising Income & Dividend Fund underperformed its broad-based benchmark, the MSCI World Index, and its comparative benchmark, the Lipper Global Large-Cap Growth Fund Classification. In 2024, US inflation improved substantially, running around 3%, close to the Federal Reserve’s long term target rate of 2% annually. Also in 2024, the Fed lowered short-term interest rates by 100 basis points and rates now stand at 4.5%. Although geopolitical risks in the Ukraine and the Middle East have remained high all year, inflation rates are generally coming down across the globe as supply chains get back to normal.
How has the Fund performed over the past 10 years?
The performance chart of the fund class presented reflects a hypothetical $10,000 investment, assuming the maximum sales charge, compared to a broad-based securities market index and more narrowly based indices reflecting market sectors in which the Fund invests over a 10-year period. The chart uses total return NAV performance and assumes reinvestment of dividends and capital gains distribution. Fund expenses were deducted.
Total Return Based on a $10,000 Investment
| The Gabelli Global Rising Income and Dividend Fund - Class AAA | MSCI World Index | Lipper Global Large-Cap Growth Fund Classification |
|---|
| 12/14 | 10,000 | 10,000 | 10,000 |
|---|
| 12/15 | 10,059 | 9,968 | 10,176 |
|---|
| 12/16 | 10,603 | 10,780 | 10,472 |
|---|
| 12/17 | 12,820 | 13,267 | 13,359 |
|---|
| 12/18 | 11,023 | 12,179 | 12,646 |
|---|
| 12/19 | 12,608 | 15,638 | 16,422 |
|---|
| 12/20 | 14,081 | 18,219 | 20,895 |
|---|
| 12/21 | 17,083 | 22,291 | 24,042 |
|---|
| 12/22 | 14,413 | 18,339 | 17,452 |
|---|
| 12/23 | 15,842 | 22,817 | 22,079 |
|---|
| 12/24 | 16,170 | 27,195 | 25,951 |
|---|
Average Annual Total Returns
| 1 Year | 5 Year | 10 Year |
|---|
| The Gabelli Global Rising Income and Dividend Fund - Class AAA | 2.07% | 5.10% | 4.92% |
|---|
| MSCI World Index | 19.19% | 11.70% | 10.52% |
|---|
| Lipper Global Large-Cap Growth Fund Classification | 17.54% | 9.58% | 10.00% |
|---|
- Total Net Assets$64,704,417
- Number of Portfolio Holdings183
- Portfolio Turnover Rate7%
- Management Fees$305,937
Past performance does not guarantee future results. Call 800-GABELLI (800-422-3554) or visit www.gabelli.com/funds/open_ends for current month-end performance. The table and graph presented above do not reflect the deduction of taxes a shareholder would pay on fund distributions or the redemption of fund shares.
What did the Fund invest in?
Top 10 Holdings (% of net assets)
| Sony Group Corp. | 7.2% |
| Berkshire Hathaway Inc. | 3.2% |
| CNH Industrial NV, New York | 2.4% |
| Herc Holdings Inc. | 2.1% |
| Nestlé SA | 1.8% |
| Mueller Industries Inc. | 1.8% |
| T-Mobile US Inc. | 1.8% |
| Traton SE | 1.6% |
| Deutsche Telekom AG | 1.5% |
| Enpro Inc. | 1.4% |
Portfolio Weighting (% of net assets)
| Common Stocks | 87.2% |
| U.S. Government Obligations | 12.8% |
Other Assets and Liabilities (Net)Footnote Reference* | (0.0)% |
| Footnote | Description |
Footnote* | Amount represents greater than (0.05)%. |
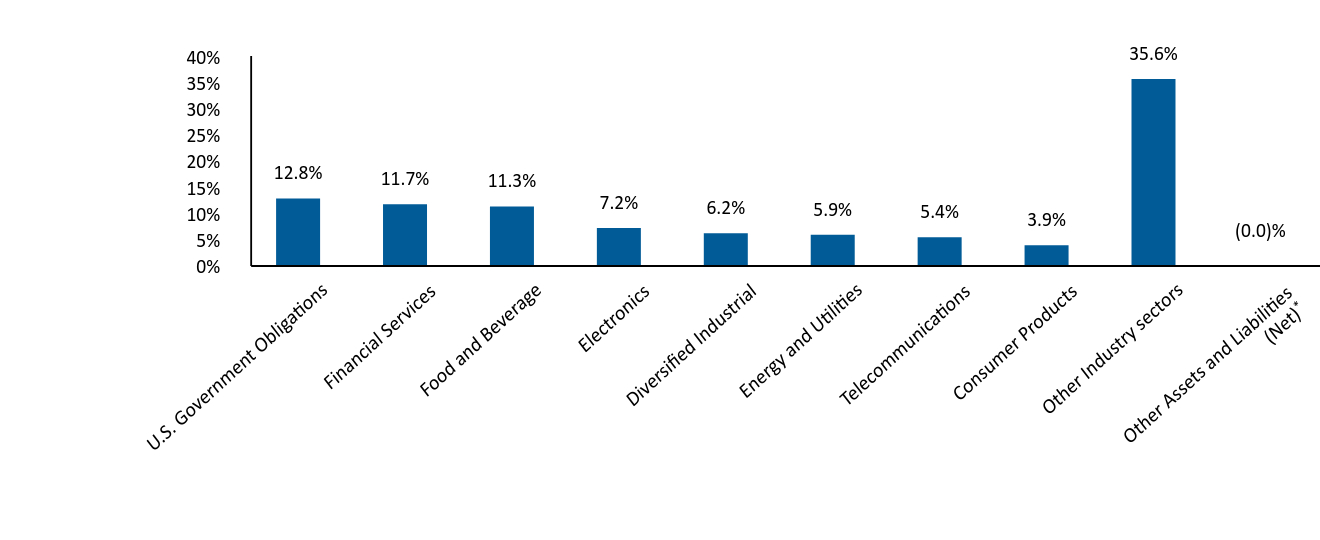
Industry Allocation (% of net assets)
| Industry Weighting | . |
|---|
| U.S. Government Obligations | 12.8% |
| Financial Services | 11.7% |
| Food and Beverage | 11.3% |
| Electronics | 7.2% |
| Diversified Industrial | 6.2% |
| Energy and Utilities | 5.9% |
| Telecommunications | 5.4% |
| Consumer Products | 3.9% |
| Other Industry sectors | 35.6% |
Other Assets and Liabilities (Net)Footnote Reference* | (0.0)% |
| Footnote | Description |
Footnote* | Amount represents greater than (0.05)%. |
The Gabelli Global Rising Income and Dividend Fund
Annual Shareholder Report - December 31, 2024
Where can I find additional information about the Fund?
If you wish to view additional information about the Fund; including but not limited to financial statements or holdings, please visit www.gabelli.com/funds/open_ends.
Contact Us
Phone: 800-GABELLI (800-422-3554)
Email: info@gabelli.com
If you wish to receive a copy of this document at a new address, contact 800-GABELLI (800-422-3554)
The Gabelli Global Rising Income and Dividend Fund
Annual Shareholder Report - December 31, 2024

This annual shareholder report contains important information about The Gabelli Global Rising Income and Dividend Fund (the Fund) for the period of January 1, 2024 to December 31, 2024. The Fund’s investment objective is to provide investors with a high level of total return through a combination of current income and appreciation of capital. The Fund’s investment strategy is to invest 80% of its net assets in dividend paying securities (such as common and preferred stock) or other income producing securities (such as fixed income securities and securities that are convertible into common stock). The Fund will primarily invest in common stocks of foreign and domestic issuers that the Gabelli Funds, LLC (the Adviser) believes are likely to pay dividends and income and have the potential for above average capital appreciation and dividend increases. You may find additional information about the Fund at www.gabelli.com/funds/open_ends. You may also request information by contacting us at 800-GABELLI (800-422-3554).
What were the Fund costs for the last year?
(based on a hypothetical $10,000 investment)
| Class Name | Costs of a $10k Investment | Costs Paid as a % of a $10k Investment |
|---|
| The Gabelli Global Rising Income and Dividend Fund - Class C | $91 | 0.90% |
|---|
How did the Fund perform?
For the fiscal year ended December 31, 2024, The Gabelli Global Rising Income & Dividend Fund underperformed its broad-based benchmark, the MSCI World Index, and its comparative benchmark, the Lipper Global Large-Cap Growth Fund Classification. In 2024, US inflation improved substantially, running around 3%, close to the Federal Reserve’s long term target rate of 2% annually. Also in 2024, the Fed lowered short-term interest rates by 100 basis points and rates now stand at 4.5%. Although geopolitical risks in the Ukraine and the Middle East have remained high all year, inflation rates are generally coming down across the globe as supply chains get back to normal.
How has the Fund performed over the past 10 years?
The performance chart of the fund class presented reflects a hypothetical $10,000 investment, assuming the maximum sales charge, compared to a broad-based securities market index and more narrowly based indices reflecting market sectors in which the Fund invests over a 10-year period. The chart uses total return NAV performance and assumes reinvestment of dividends and capital gains distribution. Fund expenses were deducted.
Total Return Based on a $10,000 Investment
| The Gabelli Global Rising Income and Dividend Fund - Class C | The Gabelli Global Rising Income and Dividend Fund - Class C (includes sales charge) | MSCI World Index | Lipper Global Large-Cap Growth Fund Classification |
|---|
| 12/14 | 10,000 | 10,000 | 10,000 | 10,000 |
|---|
| 12/15 | 9,963 | 9,863 | 9,968 | 10,176 |
|---|
| 12/16 | 10,422 | 10,219 | 10,780 | 10,472 |
|---|
| 12/17 | 12,505 | 12,519 | 13,267 | 13,359 |
|---|
| 12/18 | 10,673 | 10,273 | 12,179 | 12,646 |
|---|
| 12/19 | 12,125 | 11,568 | 15,638 | 16,422 |
|---|
| 12/20 | 13,538 | 12,800 | 18,219 | 20,895 |
|---|
| 12/21 | 16,424 | 15,401 | 22,291 | 24,042 |
|---|
| 12/22 | 13,864 | 12,869 | 18,339 | 17,452 |
|---|
| 12/23 | 15,235 | 14,013 | 22,817 | 22,079 |
|---|
| 12/24 | 15,549 | 14,162 | 27,195 | 25,951 |
|---|
Average Annual Total Returns
| 1 Year | 5 Year | 10 Year |
|---|
| The Gabelli Global Rising Income and Dividend Fund - Class C | 2.06% | 5.10% | 4.51% |
|---|
| The Gabelli Global Rising Income and Dividend Fund - Class C (includes sales charge) | 1.06% | 5.10% | 4.51% |
|---|
| MSCI World Index | 19.19% | 11.70% | 10.52% |
|---|
| Lipper Global Large-Cap Growth Fund Classification | 17.54% | 9.58% | 10.00% |
|---|
- Total Net Assets$64,704,417
- Number of Portfolio Holdings183
- Portfolio Turnover Rate7%
- Management Fees$305,937
Past performance does not guarantee future results. Call 800-GABELLI (800-422-3554) or visit www.gabelli.com/funds/open_ends for current month-end performance. The table and graph presented above do not reflect the deduction of taxes a shareholder would pay on fund distributions or the redemption of fund shares.
What did the Fund invest in?
Top 10 Holdings (% of net assets)
| Sony Group Corp. | 7.2% |
| Berkshire Hathaway Inc. | 3.2% |
| CNH Industrial NV, New York | 2.4% |
| Herc Holdings Inc. | 2.1% |
| Nestlé SA | 1.8% |
| Mueller Industries Inc. | 1.8% |
| T-Mobile US Inc. | 1.8% |
| Traton SE | 1.6% |
| Deutsche Telekom AG | 1.5% |
| Enpro Inc. | 1.4% |
Portfolio Weighting (% of net assets)
| Common Stocks | 87.2% |
| U.S. Government Obligations | 12.8% |
Other Assets and Liabilities (Net)Footnote Reference* | (0.0)% |
| Footnote | Description |
Footnote* | Amount represents greater than (0.05)%. |
Industry Allocation (% of net assets)
| Industry Weighting | . |
|---|
| U.S. Government Obligations | 12.8% |
| Financial Services | 11.7% |
| Food and Beverage | 11.3% |
| Electronics | 7.2% |
| Diversified Industrial | 6.2% |
| Energy and Utilities | 5.9% |
| Telecommunications | 5.4% |
| Consumer Products | 3.9% |
| Other Industry sectors | 35.6% |
Other Assets and Liabilities (Net)Footnote Reference* | (0.0)% |
| Footnote | Description |
Footnote* | Amount represents greater than (0.05)%. |
The Gabelli Global Rising Income and Dividend Fund
Annual Shareholder Report - December 31, 2024
Where can I find additional information about the Fund?
If you wish to view additional information about the Fund; including but not limited to financial statements or holdings, please visit www.gabelli.com/funds/open_ends.
Contact Us
Phone: 800-GABELLI (800-422-3554)
Email: info@gabelli.com
If you wish to receive a copy of this document at a new address, contact 800-GABELLI (800-422-3554)
The Gabelli Global Rising Income and Dividend Fund
Annual Shareholder Report - December 31, 2024

This annual shareholder report contains important information about The Gabelli Global Rising Income and Dividend Fund (the Fund) for the period of January 1, 2024 to December 31, 2024. The Fund’s investment objective is to provide investors with a high level of total return through a combination of current income and appreciation of capital. The Fund’s investment strategy is to invest 80% of its net assets in dividend paying securities (such as common and preferred stock) or other income producing securities (such as fixed income securities and securities that are convertible into common stock). The Fund will primarily invest in common stocks of foreign and domestic issuers that the Gabelli Funds, LLC (the Adviser) believes are likely to pay dividends and income and have the potential for above average capital appreciation and dividend increases. You may find additional information about the Fund at www.gabelli.com/funds/open_ends. You may also request information by contacting us at 800-GABELLI (800-422-3554).
What were the Fund costs for the last year?
(based on a hypothetical $10,000 investment)
| Class Name | Costs of a $10k Investment | Costs Paid as a % of a $10k Investment |
|---|
| The Gabelli Global Rising Income and Dividend Fund - Class I | $91 | 0.90% |
|---|
How did the Fund perform?
For the fiscal year ended December 31, 2024, The Gabelli Global Rising Income & Dividend Fund underperformed its broad-based benchmark, the MSCI World Index, and its comparative benchmark, the Lipper Global Large-Cap Growth Fund Classification. In 2024, US inflation improved substantially, running around 3%, close to the Federal Reserve’s long term target rate of 2% annually. Also in 2024, the Fed lowered short-term interest rates by 100 basis points and rates now stand at 4.5%. Although geopolitical risks in the Ukraine and the Middle East have remained high all year, inflation rates are generally coming down across the globe as supply chains get back to normal.
How has the Fund performed over the past 10 years?
The performance chart of the fund class presented reflects a hypothetical $10,000 investment, assuming the maximum sales charge, compared to a broad-based securities market index and more narrowly based indices reflecting market sectors in which the Fund invests over a 10-year period. The chart uses total return NAV performance and assumes reinvestment of dividends and capital gains distribution. Fund expenses were deducted.
Total Return Based on a $10,000 Investment
| The Gabelli Global Rising Income and Dividend Fund - Class I | MSCI World Index | Lipper Global Large-Cap Growth Fund Classification |
|---|
| 12/14 | 10,000 | 10,000 | 10,000 |
|---|
| 12/15 | 10,060 | 9,968 | 10,176 |
|---|
| 12/16 | 10,639 | 10,780 | 10,472 |
|---|
| 12/17 | 12,946 | 13,267 | 13,359 |
|---|
| 12/18 | 11,206 | 12,179 | 12,646 |
|---|
| 12/19 | 12,899 | 15,638 | 16,422 |
|---|
| 12/20 | 14,405 | 18,219 | 20,895 |
|---|
| 12/21 | 17,479 | 22,291 | 24,042 |
|---|
| 12/22 | 14,750 | 18,339 | 17,452 |
|---|
| 12/23 | 16,212 | 22,817 | 22,079 |
|---|
| 12/24 | 16,541 | 27,195 | 25,951 |
|---|
Average Annual Total Returns
| 1 Year | 5 Year | 10 Year |
|---|
| The Gabelli Global Rising Income and Dividend Fund - Class I | 2.03% | 5.10% | 5.16% |
|---|
| MSCI World Index | 19.19% | 11.70% | 10.52% |
|---|
| Lipper Global Large-Cap Growth Fund Classification | 17.54% | 9.58% | 10.00% |
|---|
- Total Net Assets$64,704,417
- Number of Portfolio Holdings183
- Portfolio Turnover Rate7%
- Management Fees$305,937
Past performance does not guarantee future results. Call 800-GABELLI (800-422-3554) or visit www.gabelli.com/funds/open_ends for current month-end performance. The table and graph presented above do not reflect the deduction of taxes a shareholder would pay on fund distributions or the redemption of fund shares.
What did the Fund invest in?
Top 10 Holdings (% of net assets)
| Sony Group Corp. | 7.2% |
| Berkshire Hathaway Inc. | 3.2% |
| CNH Industrial NV, New York | 2.4% |
| Herc Holdings Inc. | 2.1% |
| Nestlé SA | 1.8% |
| Mueller Industries Inc. | 1.8% |
| T-Mobile US Inc. | 1.8% |
| Traton SE | 1.6% |
| Deutsche Telekom AG | 1.5% |
| Enpro Inc. | 1.4% |
Portfolio Weighting (% of net assets)
| Common Stocks | 87.2% |
| U.S. Government Obligations | 12.8% |
Other Assets and Liabilities (Net)Footnote Reference* | (0.0)% |
| Footnote | Description |
Footnote* | Amount represents greater than (0.05)%. |
Industry Allocation (% of net assets)
| Industry Weighting | . |
|---|
| U.S. Government Obligations | 12.8% |
| Financial Services | 11.7% |
| Food and Beverage | 11.3% |
| Electronics | 7.2% |
| Diversified Industrial | 6.2% |
| Energy and Utilities | 5.9% |
| Telecommunications | 5.4% |
| Consumer Products | 3.9% |
| Other Industry sectors | 35.6% |
Other Assets and Liabilities (Net)Footnote Reference* | (0.0)% |
| Footnote | Description |
Footnote* | Amount represents greater than (0.05)%. |
The Gabelli Global Rising Income and Dividend Fund
Annual Shareholder Report - December 31, 2024
Where can I find additional information about the Fund?
If you wish to view additional information about the Fund; including but not limited to financial statements or holdings, please visit www.gabelli.com/funds/open_ends.
Contact Us
Phone: 800-GABELLI (800-422-3554)
Email: info@gabelli.com
If you wish to receive a copy of this document at a new address, contact 800-GABELLI (800-422-3554)
The Gabelli Global Rising Income and Dividend Fund
Annual Shareholder Report - December 31, 2024

This annual shareholder report contains important information about The Gabelli Global Rising Income and Dividend Fund (the Fund) for the period of January 1, 2024 to December 31, 2024. The Fund’s investment objective is to provide investors with a high level of total return through a combination of current income and appreciation of capital. The Fund’s investment strategy is to invest 80% of its net assets in dividend paying securities (such as common and preferred stock) or other income producing securities (such as fixed income securities and securities that are convertible into common stock). The Fund will primarily invest in common stocks of foreign and domestic issuers that the Gabelli Funds, LLC (the Adviser) believes are likely to pay dividends and income and have the potential for above average capital appreciation and dividend increases. You may find additional information about the Fund at www.gabelli.com/funds/open_ends. You may also request information by contacting us at 800-GABELLI (800-422-3554).
What were the Fund costs for the last year?
(based on a hypothetical $10,000 investment)
| Class Name | Costs of a $10k Investment | Costs Paid as a % of a $10k Investment |
|---|
| The Gabelli Global Rising Income and Dividend Fund - Class A | $91 | 0.90% |
|---|
How did the Fund perform?
For the fiscal year ended December 31, 2024, The Gabelli Global Rising Income & Dividend Fund underperformed its broad-based benchmark, the MSCI World Index, and its comparative benchmark, the Lipper Global Large-Cap Growth Fund Classification. In 2024, US inflation improved substantially, running around 3%, close to the Federal Reserve’s long term target rate of 2% annually. Also in 2024, the Fed lowered short-term interest rates by 100 basis points and rates now stand at 4.5%. Although geopolitical risks in the Ukraine and the Middle East have remained high all year, inflation rates are generally coming down across the globe as supply chains get back to normal.
How has the Fund performed over the past 10 years?
The performance chart of the fund class presented reflects a hypothetical $10,000 investment, assuming the maximum sales charge, compared to a broad-based securities market index and more narrowly based indices reflecting market sectors in which the Fund invests over a 10-year period. The chart uses total return NAV performance and assumes reinvestment of dividends and capital gains distribution. Fund expenses were deducted.
Total Return Based on a $10,000 Investment
| The Gabelli Global Rising Income and Dividend Fund - Class A | The Gabelli Global Rising Income and Dividend Fund - Class A (includes sales charge) | MSCI World Index | Lipper Global Large-Cap Growth Fund Classification |
|---|
| 12/14 | 10,000 | 10,000 | 10,000 | 10,000 |
|---|
| 12/15 | 10,041 | 9,463 | 9,968 | 10,176 |
|---|
| 12/16 | 10,581 | 9,399 | 10,780 | 10,472 |
|---|
| 12/17 | 12,796 | 10,713 | 13,267 | 13,359 |
|---|
| 12/18 | 11,003 | 8,681 | 12,179 | 12,646 |
|---|
| 12/19 | 12,582 | 9,356 | 15,638 | 16,422 |
|---|
| 12/20 | 14,053 | 9,849 | 18,219 | 20,895 |
|---|
| 12/21 | 17,048 | 11,260 | 22,291 | 24,042 |
|---|
| 12/22 | 14,385 | 8,955 | 18,339 | 17,452 |
|---|
| 12/23 | 15,809 | 9,276 | 22,817 | 22,079 |
|---|
| 12/24 | 16,135 | 8,923 | 27,195 | 25,951 |
|---|
Average Annual Total Returns
| 1 Year | 5 Year | 10 Year |
|---|
| The Gabelli Global Rising Income and Dividend Fund - Class A | 2.06% | 5.10% | 4.90% |
|---|
| The Gabelli Global Rising Income and Dividend Fund - Class A (includes sales charge) | (3.81)% | 3.86% | 4.28% |
|---|
| MSCI World Index | 19.19% | 11.70% | 10.52% |
|---|
| Lipper Global Large-Cap Growth Fund Classification | 17.54% | 9.58% | 10.00% |
|---|
- Total Net Assets$64,704,417
- Number of Portfolio Holdings183
- Portfolio Turnover Rate7%
- Management Fees$305,937
Past performance does not guarantee future results. Call 800-GABELLI (800-422-3554) or visit www.gabelli.com/funds/open_ends for current month-end performance. The table and graph presented above do not reflect the deduction of taxes a shareholder would pay on fund distributions or the redemption of fund shares.
What did the Fund invest in?
Top 10 Holdings (% of net assets)
| Sony Group Corp. | 7.2% |
| Berkshire Hathaway Inc. | 3.2% |
| CNH Industrial NV, New York | 2.4% |
| Herc Holdings Inc. | 2.1% |
| Nestlé SA | 1.8% |
| Mueller Industries Inc. | 1.8% |
| T-Mobile US Inc. | 1.8% |
| Traton SE | 1.6% |
| Deutsche Telekom AG | 1.5% |
| Enpro Inc. | 1.4% |
Portfolio Weighting (% of net assets)
| Common Stocks | 87.2% |
| U.S. Government Obligations | 12.8% |
Other Assets and Liabilities (Net)Footnote Reference* | (0.0)% |
| Footnote | Description |
Footnote* | Amount represents greater than (0.05)%. |
Industry Allocation (% of net assets)
| Industry Weighting | . |
|---|
| U.S. Government Obligations | 12.8% |
| Financial Services | 11.7% |
| Food and Beverage | 11.3% |
| Electronics | 7.2% |
| Diversified Industrial | 6.2% |
| Energy and Utilities | 5.9% |
| Telecommunications | 5.4% |
| Consumer Products | 3.9% |
| Other Industry sectors | 35.6% |
Other Assets and Liabilities (Net)Footnote Reference* | (0.0)% |
| Footnote | Description |
Footnote* | Amount represents greater than (0.05)%. |
The Gabelli Global Rising Income and Dividend Fund
Annual Shareholder Report - December 31, 2024
Where can I find additional information about the Fund?
If you wish to view additional information about the Fund; including but not limited to financial statements or holdings, please visit www.gabelli.com/funds/open_ends.
Contact Us
Phone: 800-GABELLI (800-422-3554)
Email: info@gabelli.com
If you wish to receive a copy of this document at a new address, contact 800-GABELLI (800-422-3554)
The Gabelli International Small Cap Fund
Annual Shareholder Report - December 31, 2024

This annual shareholder report contains important information about The Gabelli International Small Cap Fund (the Fund) for the period of January 1, 2024 to December 31, 2024. The Fund’s objective is to provide investors with appreciation of capital. Current income is a secondary objective. The investment strategy is to invest primarily in a portfolio of common stocks of non-U.S. companies. Under normal market conditions, the Fund will invest at least 80% of its net assets in the stocks of “small cap companies.” Gabelli Funds, LLC (the Adviser) currently characterizes small capitalization companies as those with total common stock market values of $3 billion or less at the time of investment. The Fund may invest in non-U.S. markets throughout the world, including emerging markets. Ordinarily, the Fund will invest in the securities of at least five countries outside the U.S. You may find additional information about the Fund at www.gabelli.com/funds/open_ends. You may also request information by contacting us at 800-GABELLI (800-422-3554).
What were the Fund costs for the last year?
(based on a hypothetical $10,000 investment)
| Class Name | Costs of a $10k Investment | Costs Paid as a % of a $10k Investment |
|---|
| The Gabelli International Small Cap Fund - Class AAA | $89 | 0.92% |
|---|
How did the Fund perform?
For the fiscal year ended December 31, 2024, The Gabelli International Small Cap Fund underperformed its broad-based benchmark, MSCI EAFE Index and its comparative, MSCI EAFE Small Cap Index. International markets have lagged the US for an extended period, by so much that the valuation discount is at a record level. Much of this can be explained by the tremendous earnings growth displayed by a small group of large capitalization US-based technology companies. Also, small capitalization equities as an asset class have been out of favor in most markets. Finally, returns from international investments were negatively impacted by the continued strength of the US dollar.
How has the Fund performed over the past 10 years?
The performance chart of the fund class presented reflects a hypothetical $10,000 investment, assuming the maximum sales charge, compared to a broad-based securities market index and more narrowly based indices reflecting market sectors in which the Fund invests over a 10-year period. The chart uses total return NAV performance and assumes reinvestment of dividends and capital gains distribution. Fund expenses were deducted.
Total Return Based on a $10,000 Investment
| The Gabelli International Small Cap Fund - Class AAA | MSCI EAFE Index | MSCI EAFE Small Cap Index |
|---|
| 12/14 | 10,000 | 10,000 | 10,000 |
|---|
| 12/15 | 10,019 | 9,961 | 11,423 |
|---|
| 12/16 | 10,131 | 10,111 | 11,288 |
|---|
| 12/17 | 12,977 | 12,702 | 15,378 |
|---|
| 12/18 | 10,269 | 11,005 | 12,701 |
|---|
| 12/19 | 12,932 | 13,499 | 16,259 |
|---|
| 12/20 | 15,410 | 14,616 | 19,965 |
|---|
| 12/21 | 16,051 | 16,338 | 21,682 |
|---|
| 12/22 | 11,958 | 14,049 | 15,743 |
|---|
| 12/23 | 12,714 | 16,697 | 17,524 |
|---|
| 12/24 | 11,946 | 17,424 | 17,748 |
|---|
Average Annual Total Returns
| 1 Year | 5 Year | 10 Year |
|---|
| The Gabelli International Small Cap Fund - Class AAA | (6.04)% | (1.57)% | 1.79% |
|---|
| MSCI EAFE Index | 4.35% | 5.24% | 5.71% |
|---|
| MSCI EAFE Small Cap Index | 2.32% | 2.74% | 5.95% |
|---|
- Total Net Assets$5,208,987
- Number of Portfolio Holdings51
- Portfolio Turnover Rate4%
- Management Fees$(135,783)
Past performance does not guarantee future results. Call 800-GABELLI (800-422-3554) or visit www.gabelli.com/funds/open_ends for current month-end performance. The table and graph presented above do not reflect the deduction of taxes a shareholder would pay on fund distributions or the redemption of fund shares.
What did the Fund invest in?
Top 10 Holdings (% of net assets)
| Siegfried Holding AG | 4.2% |
| Chemring Group plc | 3.6% |
| Endeavour Mining plc | 3.3% |
| Laurent-Perrier | 3.3% |
| Tamburi Investment Partners SpA | 3.0% |
| Genius Sports Ltd. | 3.0% |
| Alamos Gold Inc. | 3.0% |
| Westgold Resources Ltd. | 2.7% |
| Gerresheimer AG | 2.5% |
| Interparfums SA | 2.5% |
Portfolio Weighting (% of net assets)
| Common Stocks | 96.7% |
| U.S. Government Obligations | 3.3% |
| Preferred Stocks | 1.7% |
| Other Assets and Liabilities (Net) | (1.7)% |
Industry Allocation (% of net assets)
| Industry Weighting | . |
|---|
| Materials | 19.7% |
| Consumer Staples | 16.2% |
| Health Care | 16.1% |
| Consumer Discretionary | 15.9% |
| Industrials | 14.0% |
| Information Technology | 10.0% |
| Financials | 5.1% |
| U.S. Government Obligations | 3.3% |
| Other Industry sectors | 1.4% |
| Other Assets and Liabilities (Net) | (1.7)% |
The Gabelli International Small Cap Fund
Annual Shareholder Report - December 31, 2024
Where can I find additional information about the Fund?
If you wish to view additional information about the Fund; including but not limited to financial statements or holdings, please visit www.gabelli.com/funds/open_ends.
Contact Us
Phone: 800-GABELLI (800-422-3554)
Email: info@gabelli.com
If you wish to receive a copy of this document at a new address, contact 800-GABELLI (800-422-3554)
The Gabelli International Small Cap Fund
Annual Shareholder Report - December 31, 2024

This annual shareholder report contains important information about The Gabelli International Small Cap Fund (the Fund) for the period of January 1, 2024 to December 31, 2024. The Fund’s objective is to provide investors with appreciation of capital. Current income is a secondary objective. The investment strategy is to invest primarily in a portfolio of common stocks of non-U.S. companies. Under normal market conditions, the Fund will invest at least 80% of its net assets in the stocks of “small cap companies.” Gabelli Funds, LLC (the Adviser) currently characterizes small capitalization companies as those with total common stock market values of $3 billion or less at the time of investment. The Fund may invest in non-U.S. markets throughout the world, including emerging markets. Ordinarily, the Fund will invest in the securities of at least five countries outside the U.S. You may find additional information about the Fund at www.gabelli.com/funds/open_ends. You may also request information by contacting us at 800-GABELLI (800-422-3554).
What were the Fund costs for the last year?
(based on a hypothetical $10,000 investment)
| Class Name | Costs of a $10k Investment | Costs Paid as a % of a $10k Investment |
|---|
| The Gabelli International Small Cap Fund - Class C | $89 | 0.92% |
|---|
How did the Fund perform?
For the fiscal year ended December 31, 2024, The Gabelli International Small Cap Fund underperformed its broad-based benchmark, MSCI EAFE Index and its comparative, MSCI EAFE Small Cap Index. International markets have lagged the US for an extended period, by so much that the valuation discount is at a record level. Much of this can be explained by the tremendous earnings growth displayed by a small group of large capitalization US-based technology companies. Also, small capitalization equities as an asset class have been out of favor in most markets. Finally, returns from international investments were negatively impacted by the continued strength of the US dollar.
How has the Fund performed over the past 10 years?
The performance chart of the fund class presented reflects a hypothetical $10,000 investment, assuming the maximum sales charge, compared to a broad-based securities market index and more narrowly based indices reflecting market sectors in which the Fund invests over a 10-year period. The chart uses total return NAV performance and assumes reinvestment of dividends and capital gains distribution. Fund expenses were deducted.
Total Return Based on a $10,000 Investment
| The Gabelli International Small Cap Fund - Class C | The Gabelli International Small Cap Fund - Class C (includes sales charge) | MSCI EAFE Index | MSCI EAFE Small Cap Index |
|---|
| 12/14 | 10,000 | 10,000 | 10,000 | 10,000 |
|---|
| 12/15 | 9,940 | 9,840 | 9,961 | 11,423 |
|---|
| 12/16 | 10,024 | 9,825 | 10,111 | 11,288 |
|---|
| 12/17 | 12,710 | 12,359 | 12,702 | 15,378 |
|---|
| 12/18 | 9,872 | 9,503 | 11,005 | 12,701 |
|---|
| 12/19 | 12,242 | 11,690 | 13,499 | 16,259 |
|---|
| 12/20 | 14,591 | 13,816 | 14,616 | 19,965 |
|---|
| 12/21 | 15,204 | 14,258 | 16,338 | 21,682 |
|---|
| 12/22 | 11,320 | 10,510 | 14,049 | 15,743 |
|---|
| 12/23 | 12,043 | 11,076 | 16,697 | 17,524 |
|---|
| 12/24 | 11,307 | 10,295 | 17,424 | 17,748 |
|---|
Average Annual Total Returns
| 1 Year | 5 Year | 10 Year |
|---|
| The Gabelli International Small Cap Fund - Class C | (6.11)% | (1.58)% | 1.24% |
|---|
| The Gabelli International Small Cap Fund - Class C (includes sales charge) | (7.05)% | (1.58)% | 1.24% |
|---|
| MSCI EAFE Index | 4.35% | 5.24% | 5.71% |
|---|
| MSCI EAFE Small Cap Index | 2.32% | 2.74% | 5.95% |
|---|
- Total Net Assets$5,208,987
- Number of Portfolio Holdings51
- Portfolio Turnover Rate4%
- Management Fees$(135,783)
Past performance does not guarantee future results. Call 800-GABELLI (800-422-3554) or visit www.gabelli.com/funds/open_ends for current month-end performance. The table and graph presented above do not reflect the deduction of taxes a shareholder would pay on fund distributions or the redemption of fund shares.
What did the Fund invest in?
Top 10 Holdings (% of net assets)
| Siegfried Holding AG | 4.2% |
| Chemring Group plc | 3.6% |
| Endeavour Mining plc | 3.3% |
| Laurent-Perrier | 3.3% |
| Tamburi Investment Partners SpA | 3.0% |
| Genius Sports Ltd. | 3.0% |
| Alamos Gold Inc. | 3.0% |
| Westgold Resources Ltd. | 2.7% |
| Gerresheimer AG | 2.5% |
| Interparfums SA | 2.5% |
Portfolio Weighting (% of net assets)
| Common Stocks | 96.7% |
| U.S. Government Obligations | 3.3% |
| Preferred Stocks | 1.7% |
| Other Assets and Liabilities (Net) | (1.7)% |
Industry Allocation (% of net assets)
| Industry Weighting | . |
|---|
| Materials | 19.7% |
| Consumer Staples | 16.2% |
| Health Care | 16.1% |
| Consumer Discretionary | 15.9% |
| Industrials | 14.0% |
| Information Technology | 10.0% |
| Financials | 5.1% |
| U.S. Government Obligations | 3.3% |
| Other Industry sectors | 1.4% |
| Other Assets and Liabilities (Net) | (1.7)% |
The Gabelli International Small Cap Fund
Annual Shareholder Report - December 31, 2024
Where can I find additional information about the Fund?
If you wish to view additional information about the Fund; including but not limited to financial statements or holdings, please visit www.gabelli.com/funds/open_ends.
Contact Us
Phone: 800-GABELLI (800-422-3554)
Email: info@gabelli.com
If you wish to receive a copy of this document at a new address, contact 800-GABELLI (800-422-3554)
The Gabelli International Small Cap Fund
Annual Shareholder Report - December 31, 2024

This annual shareholder report contains important information about The Gabelli International Small Cap Fund (the Fund) for the period of January 1, 2024 to December 31, 2024. The Fund’s objective is to provide investors with appreciation of capital. Current income is a secondary objective. The investment strategy is to invest primarily in a portfolio of common stocks of non-U.S. companies. Under normal market conditions, the Fund will invest at least 80% of its net assets in the stocks of “small cap companies.” Gabelli Funds, LLC (the Adviser) currently characterizes small capitalization companies as those with total common stock market values of $3 billion or less at the time of investment. The Fund may invest in non-U.S. markets throughout the world, including emerging markets. Ordinarily, the Fund will invest in the securities of at least five countries outside the U.S. You may find additional information about the Fund at www.gabelli.com/funds/open_ends. You may also request information by contacting us at 800-GABELLI (800-422-3554).
What were the Fund costs for the last year?
(based on a hypothetical $10,000 investment)
| Class Name | Costs of a $10k Investment | Costs Paid as a % of a $10k Investment |
|---|
| The Gabelli International Small Cap Fund - Class I | $89 | 0.92% |
|---|
How did the Fund perform?
For the fiscal year ended December 31, 2024, The Gabelli International Small Cap Fund underperformed its broad-based benchmark, MSCI EAFE Index and its comparative, MSCI EAFE Small Cap Index. International markets have lagged the US for an extended period, by so much that the valuation discount is at a record level. Much of this can be explained by the tremendous earnings growth displayed by a small group of large capitalization US-based technology companies. Also, small capitalization equities as an asset class have been out of favor in most markets. Finally, returns from international investments were negatively impacted by the continued strength of the US dollar.
How has the Fund performed over the past 10 years?
The performance chart of the fund class presented reflects a hypothetical $10,000 investment, assuming the maximum sales charge, compared to a broad-based securities market index and more narrowly based indices reflecting market sectors in which the Fund invests over a 10-year period. The chart uses total return NAV performance and assumes reinvestment of dividends and capital gains distribution. Fund expenses were deducted.
Total Return Based on a $10,000 Investment
| The Gabelli International Small Cap Fund - Class I | MSCI EAFE Index | MSCI EAFE Small Cap Index |
|---|
| 12/14 | 10,000 | 10,000 | 10,000 |
|---|
| 12/15 | 10,120 | 9,961 | 11,423 |
|---|
| 12/16 | 10,269 | 10,111 | 11,288 |
|---|
| 12/17 | 13,249 | 12,702 | 15,378 |
|---|
| 12/18 | 10,480 | 11,005 | 12,701 |
|---|
| 12/19 | 13,209 | 13,499 | 16,259 |
|---|
| 12/20 | 15,733 | 14,616 | 19,965 |
|---|
| 12/21 | 16,391 | 16,338 | 21,682 |
|---|
| 12/22 | 12,199 | 14,049 | 15,743 |
|---|
| 12/23 | 12,981 | 16,697 | 17,524 |
|---|
| 12/24 | 12,188 | 17,424 | 17,748 |
|---|
Average Annual Total Returns
| 1 Year | 5 Year | 10 Year |
|---|
| The Gabelli International Small Cap Fund - Class I | (6.11)% | (1.60)% | 2.00% |
|---|
| MSCI EAFE Index | 4.35% | 5.24% | 5.71% |
|---|
| MSCI EAFE Small Cap Index | 2.32% | 2.74% | 5.95% |
|---|
- Total Net Assets$5,208,987
- Number of Portfolio Holdings51
- Portfolio Turnover Rate4%
- Management Fees$(135,783)
Past performance does not guarantee future results. Call 800-GABELLI (800-422-3554) or visit www.gabelli.com/funds/open_ends for current month-end performance. The table and graph presented above do not reflect the deduction of taxes a shareholder would pay on fund distributions or the redemption of fund shares.
What did the Fund invest in?
Top 10 Holdings (% of net assets)
| Siegfried Holding AG | 4.2% |
| Chemring Group plc | 3.6% |
| Endeavour Mining plc | 3.3% |
| Laurent-Perrier | 3.3% |
| Tamburi Investment Partners SpA | 3.0% |
| Genius Sports Ltd. | 3.0% |
| Alamos Gold Inc. | 3.0% |
| Westgold Resources Ltd. | 2.7% |
| Gerresheimer AG | 2.5% |
| Interparfums SA | 2.5% |
Portfolio Weighting (% of net assets)
| Common Stocks | 96.7% |
| U.S. Government Obligations | 3.3% |
| Preferred Stocks | 1.7% |
| Other Assets and Liabilities (Net) | (1.7)% |
Industry Allocation (% of net assets)
| Industry Weighting | . |
|---|
| Materials | 19.7% |
| Consumer Staples | 16.2% |
| Health Care | 16.1% |
| Consumer Discretionary | 15.9% |
| Industrials | 14.0% |
| Information Technology | 10.0% |
| Financials | 5.1% |
| U.S. Government Obligations | 3.3% |
| Other Industry sectors | 1.4% |
| Other Assets and Liabilities (Net) | (1.7)% |
The Gabelli International Small Cap Fund
Annual Shareholder Report - December 31, 2024
Where can I find additional information about the Fund?
If you wish to view additional information about the Fund; including but not limited to financial statements or holdings, please visit www.gabelli.com/funds/open_ends.
Contact Us
Phone: 800-GABELLI (800-422-3554)
Email: info@gabelli.com
If you wish to receive a copy of this document at a new address, contact 800-GABELLI (800-422-3554)
The Gabelli International Small Cap Fund
Annual Shareholder Report - December 31, 2024

This annual shareholder report contains important information about The Gabelli International Small Cap Fund (the Fund) for the period of January 1, 2024 to December 31, 2024. The Fund’s objective is to provide investors with appreciation of capital. Current income is a secondary objective. The investment strategy is to invest primarily in a portfolio of common stocks of non-U.S. companies. Under normal market conditions, the Fund will invest at least 80% of its net assets in the stocks of “small cap companies.” Gabelli Funds, LLC (the Adviser) currently characterizes small capitalization companies as those with total common stock market values of $3 billion or less at the time of investment. The Fund may invest in non-U.S. markets throughout the world, including emerging markets. Ordinarily, the Fund will invest in the securities of at least five countries outside the U.S. You may find additional information about the Fund at www.gabelli.com/funds/open_ends. You may also request information by contacting us at 800-GABELLI (800-422-3554).
What were the Fund costs for the last year?
(based on a hypothetical $10,000 investment)
| Class Name | Costs of a $10k Investment | Costs Paid as a % of a $10k Investment |
|---|
| The Gabelli International Small Cap Fund - Class A | $89 | 0.92% |
|---|
How did the Fund perform?
For the fiscal year ended December 31, 2024, The Gabelli International Small Cap Fund underperformed its broad-based benchmark, MSCI EAFE Index and its comparative, MSCI EAFE Small Cap Index. International markets have lagged the US for an extended period, by so much that the valuation discount is at a record level. Much of this can be explained by the tremendous earnings growth displayed by a small group of large capitalization US-based technology companies. Also, small capitalization equities as an asset class have been out of favor in most markets. Finally, returns from international investments were negatively impacted by the continued strength of the US dollar.
How has the Fund performed over the past 10 years?
The performance chart of the fund class presented reflects a hypothetical $10,000 investment, assuming the maximum sales charge, compared to a broad-based securities market index and more narrowly based indices reflecting market sectors in which the Fund invests over a 10-year period. The chart uses total return NAV performance and assumes reinvestment of dividends and capital gains distribution. Fund expenses were deducted.
Total Return Based on a $10,000 Investment
| The Gabelli International Small Cap Fund - Class A | The Gabelli International Small Cap Fund - Class A (includes sales charge) | MSCI EAFE Index | MSCI EAFE Small Cap Index |
|---|
| 12/14 | 10,000 | 10,000 | 10,000 | 10,000 |
|---|
| 12/15 | 10,011 | 9,435 | 9,961 | 11,423 |
|---|
| 12/16 | 10,124 | 8,992 | 10,111 | 11,288 |
|---|
| 12/17 | 12,933 | 10,826 | 12,702 | 15,378 |
|---|
| 12/18 | 10,126 | 7,990 | 11,005 | 12,701 |
|---|
| 12/19 | 12,644 | 9,402 | 13,499 | 16,259 |
|---|
| 12/20 | 15,062 | 10,557 | 14,616 | 19,965 |
|---|
| 12/21 | 15,701 | 10,371 | 16,338 | 21,682 |
|---|
| 12/22 | 11,689 | 7,277 | 14,049 | 15,743 |
|---|
| 12/23 | 12,430 | 7,293 | 16,697 | 17,524 |
|---|
| 12/24 | 11,678 | 6,458 | 17,424 | 17,748 |
|---|
Average Annual Total Returns
| 1 Year | 5 Year | 10 Year |
|---|
| The Gabelli International Small Cap Fund - Class A | (6.05)% | (1.58)% | 1.56% |
|---|
| The Gabelli International Small Cap Fund - Class A (includes sales charge) | (11.45)% | (2.74)% | 0.96% |
|---|
| MSCI EAFE Index | 4.35% | 5.24% | 5.71% |
|---|
| MSCI EAFE Small Cap Index | 2.32% | 2.74% | 5.95% |
|---|
- Total Net Assets$5,208,987
- Number of Portfolio Holdings51
- Portfolio Turnover Rate4%
- Management Fees$(135,783)
Past performance does not guarantee future results. Call 800-GABELLI (800-422-3554) or visit www.gabelli.com/funds/open_ends for current month-end performance. The table and graph presented above do not reflect the deduction of taxes a shareholder would pay on fund distributions or the redemption of fund shares.
What did the Fund invest in?
Top 10 Holdings (% of net assets)
| Siegfried Holding AG | 4.2% |
| Chemring Group plc | 3.6% |
| Endeavour Mining plc | 3.3% |
| Laurent-Perrier | 3.3% |
| Tamburi Investment Partners SpA | 3.0% |
| Genius Sports Ltd. | 3.0% |
| Alamos Gold Inc. | 3.0% |
| Westgold Resources Ltd. | 2.7% |
| Gerresheimer AG | 2.5% |
| Interparfums SA | 2.5% |
Portfolio Weighting (% of net assets)
| Common Stocks | 96.7% |
| U.S. Government Obligations | 3.3% |
| Preferred Stocks | 1.7% |
| Other Assets and Liabilities (Net) | (1.7)% |
Industry Allocation (% of net assets)
| Industry Weighting | . |
|---|
| Materials | 19.7% |
| Consumer Staples | 16.2% |
| Health Care | 16.1% |
| Consumer Discretionary | 15.9% |
| Industrials | 14.0% |
| Information Technology | 10.0% |
| Financials | 5.1% |
| U.S. Government Obligations | 3.3% |
| Other Industry sectors | 1.4% |
| Other Assets and Liabilities (Net) | (1.7)% |
The Gabelli International Small Cap Fund
Annual Shareholder Report - December 31, 2024
Where can I find additional information about the Fund?
If you wish to view additional information about the Fund; including but not limited to financial statements or holdings, please visit www.gabelli.com/funds/open_ends.
Contact Us
Phone: 800-GABELLI (800-422-3554)
Email: info@gabelli.com
If you wish to receive a copy of this document at a new address, contact 800-GABELLI (800-422-3554)
Item 2. Code of Ethics.
| (a) | The registrant, as of the end of the period covered by this report, has adopted a code of ethics that applies to the registrant’s principal executive officer, principal financial officer, principal accounting officer or controller, or persons performing similar functions, regardless of whether these individuals are employed by the registrant or a third party (the “Code of Ethics”). |
| (b) | There have been no amendments, during the period covered by this report, to a provision of the Code of Ethics that applies to the registrant’s principal executive officer, principal financial officer, principal accounting officer or controller, or persons performing similar functions, regardless of whether these individuals are employed by the registrant or a third party, and that relates to any element of the code of ethics definition enumerated in Item 2(b) of Form N-CSR. |
| (c) | The registrant has not granted any waivers, including an implicit waiver, from a provision of the code of ethics that applies to the registrant’s principal executive officer, principal financial officer, principal accounting officer or controller, or persons performing similar functions, regardless of whether these individuals are employed by the registrant or a third party, that relates to one or more of the items set forth in Item 2(b) of Form N-CSR. |
| (f) | A copy of the Code of Ethics is filed as an Exhibit. |
Item 3. Audit Committee Financial Expert.
As of the end of the period covered by the report, the registrant’s board of trustees has determined that Salvatore J. Zizza is qualified to serve as an audit committee financial expert serving on its audit committee and that he is “independent,” as defined by Item 3 of Form N-CSR.
Item 4. Principal Accountant Fees and Services.
Audit Fees
| (a) | The aggregate fees billed for each of the last two fiscal years for professional services rendered by the principal accountant for the audit of the registrant’s annual financial statements or services that are normally provided by the accountant in connection with statutory and regulatory filings or engagements for those fiscal years are $140,200 for 2023 and $144,600 for 2024. |
Audit-Related Fees
| (b) | The aggregate fees billed in each of the last two fiscal years for assurance and related services by the principal accountant that are reasonably related to the performance of the audit of the registrant’s financial statements and are not reported under paragraph (a) of this Item are $0 for 2023 and $0 for 2024. |
Tax Fees
| (c) | The aggregate fees billed in each of the last two fiscal years for professional services rendered by the principal accountant for tax compliance, tax advice, and tax planning are $19,760 for 2023 and $20,520 for 2024. |
All Other Fees
| (d) | The aggregate fees billed in each of the last two fiscal years for products and services provided by the principal accountant, other than the services reported in paragraphs (a) through (c) of this Item are $4,892 for 2023 and $4,786 for 2024. This relates to fees for PFIC Analyzer services. |
| | (e)(1) | Audit committee’s pre-approval policies and procedures described in paragraph (c)(7) of Rule 2-01 of Regulation S-X. |
| | Pre-Approval Policies and Procedures. The Audit Committee (“Committee”) of the registrant is responsible for pre-approving (i) all audit and permissible non-audit services to be provided by the independent registered public accounting firm to the registrant and (ii) all permissible non-audit services to be provided by the independent registered public accounting firm to the Adviser, Gabelli Funds, LLC, and any affiliate of Gabelli Funds, LLC (“Gabelli”) that provides services to the registrant (a “Covered Services Provider”) if the independent registered public accounting firm’s engagement related directly to the operations and financial reporting of the registrant. The Committee may delegate its responsibility to pre-approve any such audit and permissible non-audit services to the Chairperson of the Committee, and the Chairperson must report to the Committee, at its next regularly scheduled meeting after the Chairperson’s pre-approval of such services, his or her decision(s). The Committee may also establish detailed pre-approval policies and procedures for pre-approval of such services in accordance with applicable laws, including the delegation of some or all of the Committee’s pre-approval responsibilities to the other persons (other than Gabelli or the registrant’s officers). Pre-approval by the Committee of any permissible non-audit services is not required so long as: (i) the permissible non-audit services were not recognized by the registrant at the time of the engagement to be non-audit services; and (ii) such services are promptly brought to the attention of the Committee and approved by the Committee or Chairperson prior to the completion of the audit. |
| | (e)(2) | The percentage of services described in each of paragraphs (b) through (d) of this Item that were approved by the audit committee pursuant to paragraph (c)(7)(i)(C) of Rule 2-01 of Regulation S-X are as follows: |
| (f) | The percentage of hours expended on the principal accountant’s engagement to audit the registrant’s financial statements for the most recent fiscal year that were attributed to work performed by persons other than the principal accountant’s full-time, permanent employees was less than fifty percent. |
| (g) | The aggregate non-audit fees billed by the registrant’s accountant for services rendered to the registrant, and rendered to the registrant’s investment adviser (not including any sub-adviser whose role is primarily portfolio management and is subcontracted with or overseen by another investment adviser), and any entity controlling, controlled by, or under common control with the adviser that provides ongoing services to the registrant for each of the last two fiscal years of the registrant was $41,402 for 2023 and $59,170 for 2024. |
| (h) | The audit committee of the registrant’s board of trustees has considered whether the provision of non-audit services that were rendered to the registrant’s investment adviser (not including any sub-adviser whose role is primarily portfolio management and is subcontracted with or overseen by another investment adviser), and any entity controlling, controlled by, or under common control with the investment adviser that provides ongoing services to the registrant that were not pre-approved pursuant to paragraph (c)(7)(ii) of Rule 2-01 of Regulation S-X is compatible with maintaining the principal accountant’s independence. |
Item 5. Audit Committee of Listed Registrants.
Not applicable.
Item 6. Investments.
| (a) | Schedule of Investments in securities of unaffiliated issuers as of the close of the reporting period is included as part of the report to shareholders filed under Item 1(a) of this form. |
Item 7. Financial Statements and Financial Highlights for Open-End Management Investment Companies.
| (a) | An open-end management investment company registered on Form N-1A [17 CFR 239.15A and 17 CFR 274.11A] must file its most recent annual or semi-annual financial statements required, and for the periods specified, by Regulation S-X. |
| | | |
| | | The annual financial statements are attached herewith. |
| The Gabelli Global Content & Connectivity Fund Annual Report — December 31, 2024 |  |
| | | Sergey Dluzhevskiy, CFA, CPA Portfolio Manager BS, Case Western Reserve University MBA, The Wharton School University of Pennsylvania |
To Our Shareholders,
For the year ended December 31, 2024, the net asset value (NAV) total return per Class AAA Share of The Gabelli Global Content & Connectivity Fund was 22.4% compared with a total return of 32.0% for the Morgan Stanley Capital International (MSCI) All Country (AC) World Communication Services Index. Other classes of shares are available.
Enclosed are the financial statements, including the schedule of investments, as of December 31, 2024.
Summary of Portfolio Holdings (Unaudited)
The following table presents portfolio holdings as a percent of net assets as of December 31, 2024:
The Gabelli Global Content & Connectivity Fund
| Communication Services | | | 76.0 | % |
| Consumer Discretionary | | | 9.5 | % |
| Information Technology | | | 6.0 | % |
| Financials | | | 5.9 | % |
| Real Estate | | | 3.8 | % |
| Other Assets and Liabilities (Net) | | | (1.2 | )% |
| | | | 100.0 | % |
The Fund files a complete schedule of portfolio holdings with the Securities and Exchange Commission (the SEC) for the first and third quarters of each fiscal year on Form N-PORT. Shareholders may obtain this information at www.gabelli.com or by calling the Fund at 800-GABELLI (800-422-3554). The Fund’s Form N-PORT is available on the SEC’s website at www.sec.gov and may also be reviewed and copied at the SEC’s Public Reference Room in Washington, DC. Information on the operation of the Public Reference Room may be obtained by calling 800-SEC-0330.
Proxy Voting
The Fund files Form N-PX with its complete proxy voting record for the twelve months ended June 30, no later than August 31 of each year. A description of the Fund’s proxy voting policies, procedures, and how the Fund voted proxies relating to portfolio securities is available without charge, upon request, by (i) calling 800-GABELLI (800-422-3554); (ii) writing to The Gabelli Funds at One Corporate Center, Rye, NY 10580-1422; or (iii) visiting the SEC’s website at www.sec.gov.
The Gabelli Global Content & Connectivity Fund
Schedule of Investments — December 31, 2024
| | | | | | | | | Market | |
| Shares | | | | | Cost | | | Value | |
| | | | | COMMON STOCKS — 101.0% | | | | | | | | |
| | | | | COMMUNICATION SERVICES — 76.0% | | | | | | | | |
| | | | | Telecommunication Services — 51.4% | | | | | | | | |
| | | | | Wireless Telecommunication Services — 32.2% | | | | | | | | |
| | | | | Wireless Telecommunication Services — 32.2% | | | | | | | | |
| | 35,000 | | | America Movil SAB de CV, ADR | | $ | 117,404 | | | $ | 500,850 | |
| | 50,000 | | | Anterix Inc.† | | | 1,829,381 | | | | 1,533,500 | |
| | 10,000 | | | KDDI Corp. | | | 50,648 | | | | 320,443 | |
| | 80,000 | | | Millicom International Cellular SA, SDR | | | 1,268,262 | | | | 1,960,981 | |
| | 110,000 | | | MTN Group Ltd. | | | 446,156 | | | | 536,207 | |
| | 65,000 | | | Rogers Communications Inc., Cl. B | | | 2,063,042 | | | | 1,997,450 | |
| | 74,000 | | | SoftBank Group Corp. | | | 3,033,552 | | | | 4,319,743 | |
| | 20,000 | | | Sunrise Communications AG, Cl. A, ADR† | | | 697,757 | | | | 861,600 | |
| | 27,000 | | | T-Mobile US Inc. | | | 438,732 | | | | 5,959,710 | |
| | 40,000 | | | United States Cellular Corp.† | | | 1,055,188 | | | | 2,508,800 | |
| | 65,000 | | | Vodafone Group plc, ADR | | | 577,942 | | | | 551,850 | |
| | | | | | | | 11,578,064 | | | | 21,051,134 | |
| | | | | Diversified Telecommunication Services — 19.2% | | | | | | | | |
| | | | | Integrated Telecommunication Services — 18.4% | | | | | | | | |
| | 50,000 | | | AT&T Inc. | | | 876,092 | | | | 1,138,500 | |
| | 37,415,054 | | | Cable & Wireless Jamaica Ltd.†(a) | | | 499,070 | | | | 139,586 | |
| | 110,000 | | | Deutsche Telekom AG | | | 2,198,864 | | | | 3,291,828 | |
| | 65,000 | | | Frontier Communications Parent Inc.† | | | 1,279,742 | | | | 2,255,500 | |
| | 65,000 | | | Liberty Global Ltd., Cl. C† | | | 447,858 | | | | 854,100 | |
| | 32,000 | | | Telenor ASA | | | 446,392 | | | | 356,730 | |
| | 75,000 | | | Telephone and Data Systems Inc. | | | 824,142 | | | | 2,558,250 | |
| | 43,000 | | | TELUS Corp. | | | 289,917 | | | | 583,080 | |
| | 20,000 | | | Verizon Communications Inc. | | | 590,235 | | | | 799,800 | |
| | | | | | | | 7,452,312 | | | | 11,977,374 | |
| | | | | Alternative Carriers — 0.8% | | | | | | | | |
| | 32,000 | | | Telesat Corp.† | | | 415,380 | | | | 526,080 | |
| | | | | | | | | | | | | |
| | | | | Media & Entertainment — 24.6% | | | | | | | | |
| | | | | Interactive Media & Services — 16.4% | | | | | | | | |
| | | | | Interactive Media & Services — 16.4% | | | | | | | | |
| | 27,000 | | | Alphabet Inc., Cl. C | | | 1,314,743 | | | | 5,141,880 | |
| | 9,500 | | | Meta Platforms Inc., Cl. A | | | 1,353,958 | | | | 5,562,345 | |
| | | | | | | | 2,668,701 | | | | 10,704,225 | |
| | | | | | | | | Market | |
| Shares | | | | | Cost | | | Value | |
| | | | | Entertainment — 5.5% | | | | | | | | |
| | | | | Movies & Entertainment — 5.5% | | | | | | | | |
| | 13,000 | | | Atlanta Braves Holdings Inc., Cl. C† | | $ | 223,677 | | | $ | 497,380 | |
| | 240,000 | | | Bollore SE | | | 1,401,007 | | | | 1,476,708 | |
| | 60,000 | | | Manchester United plc, Cl. A† | | | 912,826 | | | | 1,041,000 | |
| | 5,000 | | | The Walt Disney Co. | | | 360,428 | | | | 556,750 | |
| | | | | | | | 2,897,938 | | | | 3,571,838 | |
| | | | | Media — 2.7% | | | | | | | | |
| | | | | Cable & Satellite — 2.7% | | | | | | | | |
| | 35,000 | | | Comcast Corp., Cl. A | | | 822,876 | | | | 1,313,550 | |
| | 100,000 | | | Grupo Televisa SAB, ADR | | | 176,022 | | | | 168,000 | |
| | 65,000 | | | WideOpenWest Inc.† | | | 228,929 | | | | 322,400 | |
| | | | | | | | 1,227,827 | | | | 1,803,950 | |
| | | | | TOTAL COMMUNICATION SERVICES | | | 26,240,222 | | | | 49,634,601 | |
| | | | | | | | | | | | | |
| | | | | CONSUMER DISCRETIONARY — 9.5% | | | | | | | | |
| | | | | Retailing — 8.1% | | | | | | | | |
| | | | | Internet & Direct Marketing Retail — 8.1% | | | | | | | | |
| | | | | Internet & Direct Marketing Retail — 8.1% | | | | | | | | |
| | 4,500 | | | Amazon.com Inc.† | | | 519,252 | | | | 987,255 | |
| | 80,000 | | | Prosus NV | | | 2,239,373 | | | | 3,177,988 | |
| | 35,000 | | | Zalando SE† | | | 787,574 | | | | 1,174,291 | |
| | | | | | | | 3,546,199 | | | | 5,339,534 | |
| | | | | Consumer Durables & Apparel — 1.4% | | | | | | | | |
| | | | | Household Durables — 1.4% | | | | | | | | |
| | | | | Consumer Electronics — 1.4% | | | | | | | | |
| | 42,500 | | | Sony Group Corp., ADR | | | 565,833 | | | | 899,300 | |
| | | | | | | | | | | | | |
| | | | | TOTAL CONSUMER DISCRETIONARY | | | 4,112,032 | | | | 6,238,834 | |
| | | | | | | | | | | | | |
| | | | | FINANCIALS — 5.9% | | | | | | | | |
| | | | | Financial Services — 5.9% | | | | | | | | |
| | | | | Financial Services — 5.9% | | | | | | | | |
| | | | | Transaction & Payment Processing Services — 3.2% | | | | | | | | |
| | 2,000 | | | Mastercard Inc., Cl. A | | | 292,729 | | | | 1,053,140 | |
| | 12,000 | | | PayPal Holdings Inc.† | | | 761,559 | | | | 1,024,200 | |
| | | | | | | | 1,054,288 | | | | 2,077,340 | |
| | | | | Multi-Sector Holdings — 2.7% | | | | | | | | |
| | 140,000 | | | Kinnevik AB, Cl. B | | | 1,286,878 | | | | 933,093 | |
| | 500,000 | | | VNV Global AB† | | | 996,322 | | | | 829,729 | |
| | 12,000 | | | Waterloo Investment Holdings Ltd.†(a) | | | 1,432 | | | | 6,000 | |
| | | | | | | | 2,284,632 | | | | 1,768,822 | |
See accompanying notes to financial statements.
The Gabelli Global Content & Connectivity Fund
Schedule of Investments (Continued) — December 31, 2024
| | | | | | | | | Market | |
| Shares | | | | | Cost | | | Value | |
| | | | | COMMON STOCKS (Continued) | | | | | | | | |
| | | | | FINANCIALS (Continued) | | | | | | | | |
| | | | | Banks — 0.0% | | | | | | | | |
| | | | | Banks — 0.0% | | | | | | | | |
| | | | | Diversified Banks — 0.0% | | | | | | | | |
| | 58 | | | Nedbank Group Ltd. | | $ | 622 | | | $ | 866 | |
| | | | | | | | | | | | | |
| | | | | Insurance — 0.0% | | | | | | | | |
| | | | | Insurance — 0.0% | | | | | | | | |
| | | | | Life & Health Insurance — 0.0% | | | | | | | | |
| | 4,460 | | | Old Mutual Ltd.(a) | | | 12,501 | | | | 5 | |
| | | | | | | | | | | | | |
| | | | | TOTAL FINANCIALS | | | 3,352,043 | | | | 3,847,033 | |
| | | | | | | | | | | | | |
| | | | | INFORMATION TECHNOLOGY — 5.8% | | | | | | | | |
| | | | | Software & Services — 3.9% | | | | | | | | |
| | | | | Software — 3.9% | | | | | | | | |
| | | | | Systems Software — 3.9% | | | | | | | | |
| | 6,000 | | | Microsoft Corp. | | | 743,640 | | | | 2,529,000 | |
| | | | | | | | | | | | | |
| | | | | Technology Hardware & Equipment — 1.9% | | | | | | | | |
| | | | | Technology Hardware, Storage & Peripherals — 1.9% | | | | | | | | |
| | | | | Technology Hardware, Storage & Peripherals — 1.9% | | | | | | | | |
| | 5,000 | | | Apple Inc. | | | 197,989 | | | | 1,252,100 | |
| | | | | | | | | | | | | |
| | | | | TOTAL INFORMATION TECHNOLOGY | | | 941,629 | | | | 3,781,100 | |
| | | | | | | | | | | | | |
| | | | | REAL ESTATE — 3.8% | | | | | | | | |
| | | | | Real Estate — 3.8% | | | | | | | | |
| | | | | Equity Real Estate Investment Trusts — 3.8% | | | | | | | | |
| | | | | Specialized REITs — 3.8% | | | | | | | | |
| | 4,000 | | | American Tower Corp., REIT | | | 728,473 | | | | 733,640 | |
| | 4,500 | | | Crown Castle Inc., REIT | | | 407,247 | | | | 408,420 | |
| | 1,400 | | | Equinix Inc., REIT | | | 109,097 | | | | 1,320,046 | |
| | | | | | | | 1,244,817 | | | | 2,462,106 | |
| | | | | TOTAL REAL ESTATE | | | 1,244,817 | | | | 2,462,106 | |
| | | | | | | | | | | | | |
| | | | | TOTAL COMMON STOCKS | | | 35,890,743 | | | | 65,963,674 | |
| | | | | | | | | Market | |
| Shares | | | | | Cost | | | Value | |
| | | | | CLOSED-END FUNDS — 0.0% | | | | | | | | |
| | | | | CONSUMER DISCRETIONARY — 0.0% | | | | | | | | |
| | | | | Retailing — 0.0% | | | | | | | | |
| | | | | Internet & Direct Marketing Retail — 0.0% | | | | | | | | |
| | | | | Internet & Direct Marketing Retail — 0.0% | | | | | | | | |
| | 5,800 | | | Altaba Inc., Escrow† | | $ | 0 | | | $ | 8,265 | |
| | | | | | | | | | | | | |
| | | | | PREFERRED STOCKS — 0.2% | | | | | | | | |
| | | | | INFORMATION TECHNOLOGY — 0.2% | | | | | | | | |
| | | | | Technology - Hardware and Equipment — 0.2% | | | | | | | | |
| | | | | Technology Hardware, Storage & Peripherals — 0.2% | | | | | | | | |
| | | | | Technology Hardware, Storage & Peripherals — 0.2% | | | | | | | | |
| | 3,000 | | | Samsung Electronics Co. Ltd., 10.630% | | | 103,426 | | | | 90,072 | |
| | | | | | | | | | | | | |
| | | | | TOTAL INVESTMENTS — 101.2% | | $ | 35,994,169 | | | | 66,062,011 | |
| | | | | | | | | | | | | |
| | | | | Other Assets and Liabilities (Net) — (1.2)% | | | | | | | (758,228 | ) |
| | | | | | | | | | | | | |
| | | | | NET ASSETS — 100.0% | | | | | | $ | 65,303,783 | |
| (a) | Security is valued using significant unobservable inputs and is classified as Level 3 in the fair value hierarchy. |
| † | Non-income producing security. |
| | |
| ADR | American Depositary Receipt |
| REIT | Real Estate Investment Trust |
| SDR | Swedish Depositary Receipt |
| Geographic Diversification | | % of
Market
Value | | | Market
Value | |
| North America | | | 64.4 | % | | $ | 42,571,041 | |
| Europe | | | 25.0 | | | | 16,509,898 | |
| Japan | | | 8.4 | | | | 5,539,486 | |
| Latin America | | | 1.2 | | | | 814,436 | |
| South Africa | | | 0.8 | | | | 537,078 | |
| Asia/Pacific | | | 0.2 | | | | 90,072 | |
| | | | 100.0 | % | | $ | 66,062,011 | |
See accompanying notes to financial statements.
The Gabelli Global Content & Connectivity Fund
Statement of Assets and Liabilities
December 31, 2024
| Assets: | | | | |
| Investments, at value (cost $35,994,169) | | $ | 66,062,011 | |
| Cash | | | 829 | |
| Foreign currency, at value (cost $6,015) | | | 3,209 | |
| Receivable from Adviser | | | 15,132 | |
| Dividends receivable | | | 60,501 | |
| Prepaid expenses | | | 11,694 | |
| Total Assets | | | 66,153,376 | |
| Liabilities: | | | | |
| Line of credit payable | | | 474,000 | |
| Payable for Fund shares redeemed | | | 208,682 | |
| Payable for investment advisory fees | | | 57,463 | |
| Payable for distribution fees | | | 11,641 | |
| Payable for accounting fees | | | 3,750 | |
| Payable for legal and audit fees | | | 51,183 | |
| Other accrued expenses | | | 42,874 | |
| Total Liabilities | | | 849,593 | |
| Commitments and Contingencies (See Note 3) | | | | |
| Net Assets | | | | |
| (applicable to 3,049,706 shares outstanding) | | $ | 65,303,783 | |
| | | | | |
| Net Assets Consist of: | | | | |
| Paid-in capital | | $ | 36,549,255 | |
| Total distributable earnings | | | 28,754,528 | |
| Net Assets | | $ | 65,303,783 | |
| | | | | |
| Shares of Capital Stock, each at $0.001 par value: | | | | |
| Class AAA: | | | | |
| Net Asset Value, offering, and redemption price per share ($52,559,031 ÷ 2,452,913 shares outstanding; 150,000,000 shares authorized) | | $ | 21.43 | |
| Class A: | | | | |
| Net Asset Value and redemption price per share ($233,686 ÷ 10,798 shares outstanding; 50,000,000 shares authorized) | | $ | 21.64 | |
| Maximum offering price per share (NAV ÷ 0.9425, based on maximum sales charge of 5.75% of the offering price) | | $ | 22.96 | |
| Class C: | | | | |
| Net Asset Value and redemption price per share ($212.22 ÷ 10.02 shares outstanding; 50,000,000 shares authorized) | | $ | 21.18 | |
| Class I: | | | | |
| Net Asset Value, offering, and redemption price per share ($12,510,854 ÷ 585,985 shares outstanding; 50,000,000 shares authorized) | | $ | 21.35 | |
Statement of Operations
For the Year Ended December 31, 2024
| Investment Income: | | | | |
| Dividends (net of foreign withholding taxes of $33,800) | | $ | 785,851 | |
| Non-cash dividends | | | 154,448 | |
| Interest | | | 6,962 | |
| Total Investment Income | | | 947,261 | |
| Expenses: | | | | |
| Investment advisory fees | | | 631,943 | |
| Distribution fees - Class AAA | | | 127,559 | |
| Distribution fees - Class A | | | 619 | |
| Distribution fees - Class C | | | 2 | |
| Legal and audit fees | | | 68,317 | |
| Shareholder services fees | | | 61,220 | |
| Shareholder communications expenses | | | 52,230 | |
| Registration expenses | | | 52,213 | |
| Accounting fees | | | 45,000 | |
| Directors’ fees | | | 11,373 | |
| Interest expense | | | 1,461 | |
| Custodian fees | | | 874 | |
| Miscellaneous expenses | | | 12,281 | |
| Total Expenses | | | 1,065,092 | |
| Less: | | | | |
| Expense reimbursements (See Note 3) | | | (494,883 | ) |
| Net Expenses | | | 570,209 | |
| Net Investment Income | | | 377,052 | |
| | | | | |
| Net Realized and Unrealized Gain/(Loss) on Investments, Forward Foreign Exchange Contracts, and Foreign Currency: | | | | |
| Net realized gain on investments | | | 2,640,680 | |
| Net realized gain on forward foreign exchange contracts | | | 80 | |
| Net realized gain on foreign currency transactions | | | 1,006 | |
| Net realized gain on investments, forward foreign exchange contracts, and foreign currency transactions | | | 2,641,766 | |
| Net change in unrealized appreciation/depreciation: | | | | |
| on investments | | | 9,612,347 | |
| on foreign currency translations | | | (3,113 | ) |
| Net change in unrealized appreciation/depreciation on investments and foreign currency translations | | | 9,609,234 | |
| Net Realized and Unrealized Gain/(Loss) on Investments, Forward Foreign Exchange Contracts, and Foreign Currency | | | 12,251,000 | |
| Net Increase in Net Assets Resulting from Operations | | $ | 12,628,052 | |
See accompanying notes to financial statements.
The Gabelli Global Content & Connectivity Fund
Statement of Changes in Net Assets
| | | Year Ended | | | Year Ended | |
| | | December 31,
2024 | | | December 31,
2023 | |
| Operations: | | | | | | | | |
| Net investment income | | $ | 377,052 | | | $ | 201,707 | |
| Net realized gain on investments, forward foreign exchange contracts, and foreign currency transactions | | | 2,641,766 | | | | 160,283 | |
| Net change in unrealized appreciation/depreciation on investments and foreign currency translations | | | 9,609,234 | | | | 11,064,862 | |
| Net Increase in Net Assets Resulting from Operations | | | 12,628,052 | | | | 11,426,852 | |
| | | | | | | | | |
| Distributions to Shareholders: | | | | | | | | |
| Accumulated earnings | | | | | | | | |
| Class AAA | | | (2,921,792 | ) | | | (153,363 | ) |
| Class A | | | (12,822 | ) | | | (709 | ) |
| Class C | | | (12 | ) | | | (1 | ) |
| Class I | | | (693,139 | ) | | | (34,335 | ) |
| | | | (3,627,765 | ) | | | (188,408 | ) |
| Return of capital | | | | | | | | |
| Class AAA | | | (434,902 | ) | | | — | |
| Class A | | | (1,908 | ) | | | — | |
| Class C | | | (2 | ) | | | — | |
| Class I | | | (103,172 | ) | | | — | |
| | | | (539,984 | ) | | | — | |
| Total Distributions to Shareholders | | | (4,167,749 | ) | | | (188,408 | ) |
| | | | | | | | | |
| Capital Share Transactions: | | | | | | | | |
| Class AAA | | | (2,113,768 | ) | | | (3,659,505 | ) |
| Class A | | | (25,466 | ) | | | (52,076 | ) |
| Class C | | | — | | | | 151 | |
| Class I | | | 220,678 | | | | (221,679 | ) |
| Net Decrease in Net Assets from Capital Share Transactions | | | (1,918,556 | ) | | | (3,933,109 | ) |
| | | | | | | | | |
| Redemption Fees | | | 219 | | | | 631 | |
| | | | | | | | | |
| Net Increase in Net Assets | | | 6,541,966 | | | | 7,305,966 | |
| | | | | | | | | |
| Net Assets: | | | | | | | | |
| Beginning of year | | | 58,761,817 | | | | 51,455,851 | |
| End of year | | $ | 65,303,783 | | | $ | 58,761,817 | |
See accompanying notes to financial statements.
The Gabelli Global Content & Connectivity Fund
Financial Highlights
Selected data for a share of capital stock outstanding throughout each year:
| | | | | | | Income (Loss) from Investment Operations | | | Distributions | | | | | | | | | | | | Ratios to Average Net Assets/Supplemental Data | |
Year Ended
December 31 | | Net Asset Value,
Beginning of Year | | | Net Investment
Income(a) | | | Net Realized
and Unrealized
Gain (Loss) on
Investments | | | Total from
Investment
Operations | | | Net Investment
Income | | | Net Realized
Gain on
Investments | | | Return of Capital | | | Total
Distributions | | | Redemption
Fees(a)(b) | | | Net Asset Value,
End of year | | | Total
Return† | | | Net Assets, End
of year
(in 000’s) | | | Net Investment
Income | | | Operating
Expenses Before
Reimbursement | | | Operating
Expenses Net of
Reimbursement(c)(d) | | | Portfolio
Turnover
Rate | |
| Class AAA | | | | | | | | | | | | | | | | | | | | | | | | | | | | | | | | | | | | | | | | | | | | | | | | | | | | | | | | | | | | | | | | |
| 2024 | | $ | 18.68 | | | $ | 0.13 | (e) | | $ | 4.06 | | | $ | 4.19 | | | $ | (0.49 | ) | | $ | (0.76 | ) | | $ | (0.19 | ) | | $ | (1.44 | ) | | $ | 0.00 | | | $ | 21.43 | | | $ | 22.35 | % | | $ | 52,559 | | | | 0.60 | %(e) | | | 1.73 | % | | | 0.90 | % | | | 11 | % |
| 2023 | | | 15.25 | | | | 0.06 | | | | 3.43 | | | | 3.49 | | | | (0.06 | ) | | | — | | | | — | | | | (0.06 | ) | | | 0.00 | | | | 18.68 | | | | 22.89 | | | | 47,834 | | | | 0.36 | | | | 1.90 | | | | 0.91 | | | | 11 | |
| 2022 | | | 21.86 | | | | 0.03 | | | | (6.29 | ) | | | (6.26 | ) | | | (0.35 | ) | | | — | | | | — | | | | (0.35 | ) | | | 0.00 | | | | 15.25 | | | | (28.62 | ) | | | 42,290 | | | | 0.18 | | | | 1.81 | | | | 0.97 | (f) | | | 17 | |
| 2021 | | | 22.18 | | | | 0.56 | (e) | | | 0.59 | | | | 1.15 | | | | (0.62 | ) | | | (0.85 | ) | | | — | | | | (1.47 | ) | | | — | | | | 21.86 | | | | 5.17 | | | | 65,025 | | | | 2.33 | (e) | | | 1.65 | | | | 0.90 | (f)(g) | | | 26 | |
| 2020 | | | 19.64 | | | | 0.11 | (e) | | | 3.11 | | | | 3.22 | | | | (0.46 | ) | | | (0.22 | ) | | | — | | | | (0.68 | ) | | | 0.00 | | | | 22.18 | | | | 16.42 | | | | 67,239 | | | | 0.57 | (e) | | | 1.77 | | | | 0.90 | (g) | | | 41 | |
| Class A | | | | | | | | | | | | | | | | | | | | | | | | | | | | | | | | | | | | | | | | | | | | | | | | | | | | | | | | | | | | | | | | |
| 2024 | | $ | 18.87 | | | $ | 0.13 | (e) | | $ | 4.09 | | | $ | 4.22 | | | $ | (0.50 | ) | | $ | (0.76 | ) | | $ | (0.19 | ) | | $ | (1.45 | ) | | $ | 0.00 | | | $ | 21.64 | | | $ | 22.27 | % | | $ | 234 | | | | 0.60 | %(e) | | | 1.73 | % | | | 0.90 | % | | | 11 | % |
| 2023 | | | 15.40 | | | | 0.06 | | | | 3.47 | | | | 3.53 | | | | (0.06 | ) | | | — | | | | — | | | | (0.06 | ) | | | 0.00 | | | | 18.87 | | | | 22.92 | | | | 224 | | | | 0.36 | | | | 1.90 | | | | 0.91 | | | | 11 | |
| 2022 | | | 22.07 | | | | 0.03 | | | | (6.35 | ) | | | (6.32 | ) | | | (0.35 | ) | | | — | | | | — | | | | (0.35 | ) | | | 0.00 | | | | 15.40 | | | | (28.62 | ) | | | 228 | | | | 0.19 | | | | 1.81 | | | | 0.97 | (f) | | | 17 | |
| 2021 | | | 22.38 | | | | 0.56 | (e) | | | 0.60 | | | | 1.16 | | | | (0.62 | ) | | | (0.85 | ) | | | — | | | | (1.47 | ) | | | — | | | | 22.07 | | | | 5.16 | | | | 428 | | | | 2.30 | (e) | | | 1.65 | | | | 0.90 | (f)(g) | | | 26 | |
| 2020 | | | 19.81 | | | | 0.11 | (e) | | | 3.14 | | | | 3.25 | | | | (0.46 | ) | | | (0.22 | ) | | | — | | | | (0.68 | ) | | | 0.00 | | | | 22.38 | | | | 16.43 | | | | 422 | | | | 0.59 | (e) | | | 1.77 | | | | 0.90 | (g) | | | 41 | |
| Class C | | | | | | | | | | | | | | | | | | | | | | | | | | | | | | | | | | | | | | | | | | | | | | | | | | | | | | | | | | | | | | | | |
| 2024 | | $ | 18.47 | | | $ | 0.12 | (e) | | $ | 4.02 | | | $ | 4.14 | | | $ | (0.49 | ) | | $ | (0.76 | ) | | $ | (0.18 | ) | | $ | (1.43 | ) | | $ | — | | | $ | 21.18 | | | $ | 22.34 | % | | $ | 0 | (h) | | | 0.57 | %(e) | | | 2.48 | % | | | 0.90 | % | | | 11 | % |
| 2023 | | | 12.00 | | | | 0.06 | | | | 6.47 | | | | 6.53 | | | | (0.06 | ) | | | — | | | | — | | | | (0.06 | ) | | | — | | | | 18.47 | | | | 54.42 | | | | 0 | (h) | | | 0.38 | | | | 2.64 | | | | 0.91 | | | | 11 | |
| 2022 | | | 21.24 | | | | 0.02 | | | | (9.26 | ) | | | (9.24 | ) | | | — | | | | — | | | | — | | | | — | | | | — | | | | 12.00 | | | | (43.50 | ) | | | 0 | (h) | | | 0.12 | | | | 2.56 | | | | 0.97 | (f) | | | 17 | |
| 2021 | | | 21.59 | | | | 0.64 | (e) | | | 0.48 | | | | 1.12 | | | | (0.62 | ) | | | (0.85 | ) | | | — | | | | (1.47 | ) | | | — | | | | 21.24 | | | | 5.17 | | | | 3 | | | | 2.76 | (e) | | | 2.40 | | | | 0.91 | (f)(g) | | | 26 | |
| 2020 | | | 19.13 | | | | 0.10 | (e) | | | 3.04 | | | | 3.14 | | | | (0.46 | ) | | | (0.22 | ) | | | — | | | | (0.68 | ) | | | — | | | | 21.59 | | | | 16.44 | | | | 49 | | | | 0.54 | (e) | | | 2.52 | | | | 0.90 | (g) | | | 41 | |
| Class I | | | | | | | | | | | | | | | | | | | | | | | | | | | | | | | | | | | | | | | | | | | | | | | | | | | | | | | | | | | | | | | | |
| 2024 | | $ | 18.62 | | | $ | 0.12 | (e) | | $ | 4.05 | | | $ | 4.17 | | | $ | (0.49 | ) | | $ | (0.76 | ) | | $ | (0.19 | ) | | $ | (1.44 | ) | | $ | 0.00 | | | $ | 21.35 | | | $ | 22.30 | % | | $ | 12,511 | | | | 0.59 | %(e) | | | 1.48 | % | | | 0.90 | % | | | 11 | % |
| 2023 | | | 15.20 | | | | 0.06 | | | | 3.42 | | | | 3.48 | | | | (0.06 | ) | | | — | | | | — | | | | (0.06 | ) | | | 0.00 | | | | 18.62 | | | | 22.90 | | | | 10,704 | | | | 0.36 | | | | 1.65 | | | | 0.91 | | | | 11 | |
| 2022 | | | 21.79 | | | | 0.03 | | | | (6.27 | ) | | | (6.24 | ) | | | (0.35 | ) | | | — | | | | — | | | | (0.35 | ) | | | 0.00 | | | | 15.20 | | | | (28.62 | ) | | | 8,938 | | | | 0.18 | | | | 1.56 | | | | 0.97 | (f) | | | 17 | |
| 2021 | | | 22.11 | | | | 0.55 | (e) | | | 0.60 | | | | 1.15 | | | | (0.62 | ) | | | (0.85 | ) | | | — | | | | (1.47 | ) | | | — | | | | 21.79 | | | | 5.18 | | | | 13,523 | | | | 2.32 | (e) | | | 1.40 | | | | 0.90 | (f)(g) | | | 26 | |
| 2020 | | | 19.58 | | | | 0.11 | (e) | | | 3.10 | | | | 3.21 | | | | (0.46 | ) | | | (0.22 | ) | | | — | | | | (0.68 | ) | | | 0.00 | | | | 22.11 | | | | 16.42 | | | | 13,931 | | | | 0.58 | (e) | | | 1.52 | | | | 0.90 | (g) | | | 41 | |
| † | Total return represents aggregate total return of a hypothetical investment at the beginning of the year and sold at the end of the year including reinvestment of distributions and does not reflect the applicable sales charges. |
| (a) | Per share amounts have been calculated using the average shares outstanding method. |
| (b) | Amount represents less than $0.005 per share. |
| (c) | Under an expense reimbursement agreement with the Adviser, the Adviser reimbursed expenses of $494,883, $527,312, $490,627, $589,925, and $591,218 for the years ended December 31, 2024, 2023, 2022, 2021, and 2020, respectively. |
| (d) | The Fund incurred interest expense. If interest expense had not been incurred, the ratio of operating expenses to average net assets would have been 0.90% and 0.96% for each Class for the years ended December 31, 2023 and 2022, respectively. For the years ended December 31, 2024, 2021, and 2020, the effect of interest expense was minimal. |
| (e) | Includes income resulting from special dividends. Without these dividends, the per share income amounts would have been $0.07, $0.05, and $0.09 (Class AAA), $0.08, $0.04, and $0.09 (Class A), $0.07, $0.15, and $0.08 (Class C), and $0.07, $0.05, and $0.09 (Class I), and the net investment income ratios would have been 0.35%, 0.20%, and 0.45% (Class AAA), 0.36%, 0.18%, and 0.47% (Class A), 0.33%, 0.63%, and 0.41% (Class C), and 0.35%, 0.20%, and 0.46% (Class I) for the years ended December 31, 2024, 2021, and 2020, respectively. |
| (f) | The Fund incurred tax expense for the years ended December 31, 2022 and 2021. If tax expense had not been incurred, the ratios of operating expenses to average net assets would have been 0.90% and 0.90% for each Class. |
| (g) | The Fund received credits from a designated broker who agreed to pay certain Fund operating expenses. For the years ended December 31, 2021 and 2020, there was no material impact to the expense ratios. |
| (h) | Actual number of shares outstanding is 10.02, 10.02, and 0.02 for the years ended December 31, 2024, 2023, and 2022, respectively. |
See accompanying notes to financial statements.
The Gabelli Global Content & Connectivity Fund
Notes to Financial Statements
1. Organization. The Gabelli Global Content & Connectivity Fund (the Fund), a series of the GAMCO Global Series Funds, Inc. (the Corporation), was incorporated on July 16, 1993 in Maryland. The Fund is a non-diversified open-end management investment company registered under the Investment Company Act of 1940, as amended (the 1940 Act), and is one of five separately managed portfolios (collectively, the Portfolios) of the Corporation. The Fund commenced investment operations on November 1, 1993.
The Fund’s investment objective primarily seeks to provide investors with appreciation of capital. The Fund may invest a high percentage of its assets in specific sectors of the market in order to achieve a potentially greater investment return. As a result, the Fund may be more susceptible to economic, political, and regulatory developments in a particular sector of the market, positive or negative, and may experience increased volatility to the Fund’s NAV and a magnified effect in its total return.
Gabelli Funds, LLC (the Adviser), with its principal offices located at One Corporate Center, Rye, New York 10580-1422, serves as investment adviser to the Fund. The Adviser makes investment decisions for the Fund and continuously reviews and administers the Fund’s investment program and manages the operations of the Fund under the general supervision of the Company’s Board of Directors (the Board).
2. Significant Accounting Policies. As an investment company, the Fund follows the investment company accounting and reporting guidance, which is part of U.S. generally accepted accounting principles (GAAP) that may require the use of management estimates and assumptions in the preparation of its financial statements. The Board has designated the Adviser as the valuation designee under Rule 2a-5. Actual results could differ from those estimates. The following is a summary of significant accounting policies followed by the Fund in the preparation of its financial statements.
Security Valuation. Portfolio securities listed or traded on a nationally recognized securities exchange or traded in the U.S. over-the-counter market for which market quotations are readily available are valued at the last quoted sale price or a market’s official closing price as of the close of business on the day the securities are being valued. If there were no sales that day, the security is valued at the average of the closing bid and asked prices or, if there were no asked prices quoted on that day, then the security is valued at the closing bid price on that day. If no bid or asked prices are quoted on such day, the security is valued at the most recently available price or, if the Board so determines, by such other method as the Board shall determine in good faith to reflect its fair market value. Portfolio securities traded on more than one national securities exchange or market are valued according to the broadest and most representative market, as determined by the Adviser.
Portfolio securities primarily traded on a foreign market are generally valued at the preceding closing values of such securities on the relevant market, but may be fair valued pursuant to procedures established by the Board if market conditions change significantly after the close of the foreign market, but prior to the close of business on the day the securities are being valued. Debt obligations for which market quotations are readily available are valued at the average of the latest bid and asked prices. If there were no asked prices quoted on such day, the security is valued using the closing bid price, unless the Board determines such amount does not reflect the security’s fair value, in which case these securities will be fair valued as determined by the Board. Such debt obligations are valued through prices provided by a pricing service approved by the Board. Certain securities are valued principally using dealer quotations.
Securities and assets for which market quotations are not readily available are fair valued as determined by the Board. Fair valuation methodologies and procedures may include, but are not limited to: analysis and review
The Gabelli Global Content & Connectivity Fund
Notes to Financial Statements (Continued)
of available financial and non-financial information about the company; comparisons with the valuation and changes in valuation of similar securities, including a comparison of foreign securities with the equivalent U.S. dollar value American Depositary Receipt securities at the close of the U.S. exchange; and evaluation of any other information that could be indicative of the value of the security.
The inputs and valuation techniques used to measure fair value of the Fund’s investments are summarized into three levels as described in the hierarchy below:
| ● | Level 1 — unadjusted quoted prices in active markets for identical securities; |
| ● | Level 2 — other significant observable inputs (including quoted prices for similar securities, interest rates, prepayment speeds, credit risk, etc.); and |
| ● | Level 3 — significant unobservable inputs (including the Board’s determinations as to the fair value of investments). |
A financial instrument’s level within the fair value hierarchy is based on the lowest level of any input both individually and in the aggregate that is significant to the fair value measurement. The inputs or methodology used for valuing securities are not necessarily an indication of the risk associated with investing in those securities. The summary of the Fund’s investments in securities by inputs used to value the Fund’s investments as of December 31, 2024 is as follows:
| | | Valuation Inputs | | | | |
| | | Level 1
Quoted Prices | | | Level 2 Other
Significant
Observable Inputs | | | Level 3 Significant
Unobservable
Inputs (a) | | | Total
Market Value
at 12/31/24 | |
| INVESTMENTS IN SECURITIES: | | | | | | | | | | | | | | | | |
| ASSETS (Market Value): | | | | | | | | | | | | | | | | |
| Common Stocks: | | | | | | | | | | | | | | | | |
| Communication Services | | $ | 49,495,015 | | | | — | | | $ | 139,586 | | | $ | 49,634,601 | |
| Financials | | | 3,841,028 | | | | — | | | | 6,005 | | | | 3,847,033 | |
| Other Industries (b) | | | 12,482,040 | | | | — | | | | — | | | | 12,482,040 | |
| Total Common Stocks | | | 65,818,083 | | | | — | | | | 145,591 | | | | 65,963,674 | |
| Closed-End Funds (b) | | | — | | | $ | 8,265 | | | | — | | | | 8,265 | |
| Preferred Stocks (b) | | | 90,072 | | | | — | | | | — | | | | 90,072 | |
| TOTAL INVESTMENTS IN SECURITIES – ASSETS | | $ | 65,908,155 | | | $ | 8,265 | | | $ | 145,591 | | | $ | 66,062,011 | |
| (a) | The inputs for these securities are not readily available and are derived based on the judgment of the Adviser according to procedures approved by the Board. |
| (b) | Please refer to the Schedule of Investments for the industry classifications of these portfolio holdings. |
At December 31, 2024, the total value of Level 3 investments for the Fund was less than 1% of total net assets.
General. The Fund uses recognized industry pricing services – approved by the Board and unaffiliated with the Adviser – to value most of its securities, and uses broker quotes provided by market makers of securities not valued by these and other recognized pricing sources. Several different pricing feeds are received to value domestic equity securities, international equity securities, preferred equity securities, and fixed income securities. The data within these feeds are ultimately sourced from major stock exchanges and trading systems where these securities trade. The prices supplied by external sources are checked by obtaining quotations or actual transaction prices from market participants. If a price obtained from the pricing source is deemed
The Gabelli Global Content & Connectivity Fund
Notes to Financial Statements (Continued)
unreliable, prices will be sought from another pricing service or from a broker/dealer that trades that security or similar securities.
Fair Valuation. Fair valued securities may be common or preferred equities, warrants, options, rights, or fixed income obligations. Where appropriate, Level 3 securities are those for which market quotations are not available, such as securities not traded for several days, or for which current bids are not available, or which are restricted as to transfer. When fair valuing a security, factors to consider include recent prices of comparable securities that are publicly traded, reliable prices of securities not publicly traded, the use of valuation models, current analyst reports, valuing the income or cash flow of the issuer, or cost if the preceding factors do not apply. A significant change in the unobservable inputs could result in a lower or higher value in Level 3 securities. The circumstances of Level 3 securities are frequently monitored to determine if fair valuation measures continue to apply.
The Adviser reports quarterly to the Board the results of the application of fair valuation policies and procedures. These may include backtesting the prices realized in subsequent trades of these fair valued securities to fair values previously recognized.
Foreign Currency Translations. The books and records of the Fund are maintained in U.S. dollars. Foreign currencies, investments, and other assets and liabilities are translated into U.S. dollars at current exchange rates. Purchases and sales of investment securities, income, and expenses are translated at the exchange rate prevailing on the respective dates of such transactions. Unrealized gains and losses that result from changes in foreign exchange rates and/or changes in market prices of securities have been included in unrealized appreciation/depreciation on investments and foreign currency translations. Net realized foreign currency gains and losses resulting from changes in exchange rates include foreign currency gains and losses between trade date and settlement date on investment securities transactions, foreign currency transactions, and the difference between the amounts of interest and dividends recorded on the books of the Fund and the amounts actually received. The portion of foreign currency gains and losses related to fluctuation in exchange rates between the initial purchase trade date and subsequent sale trade date is included in realized gain/(loss) on investments.
Foreign Securities. The Fund may directly purchase securities of foreign issuers. Investing in securities of foreign issuers involves special risks not typically associated with investing in securities of U.S. issuers. The risks include possible revaluation of currencies, the inability to repatriate funds, less complete financial information about companies, and possible future adverse political and economic developments. Moreover, securities of many foreign issuers and their markets may be less liquid and their prices more volatile than securities of comparable U.S. issuers.
Foreign Taxes. The Fund may be subject to foreign taxes on income, gains on investments, or currency repatriation, a portion of which may be recoverable. The Fund will accrue such taxes and recoveries as applicable, based upon its current interpretation of tax rules and regulations that exist in the markets in which it invests.
Restricted Securities. The Fund may invest up to 15% of its net assets in securities for which the markets are restricted. Restricted securities include securities whose disposition is subject to substantial legal or contractual restrictions. The sale of restricted securities often requires more time and results in higher brokerage charges or dealer discounts and other selling expenses than the sale of securities eligible for trading on national securities exchanges or in the over-the-counter markets. Restricted securities may sell at a price lower than similar securities that are not subject to restrictions on resale. Securities freely saleable among qualified institutional
The Gabelli Global Content & Connectivity Fund
Notes to Financial Statements (Continued)
investors under special rules adopted by the SEC may be treated as liquid if they satisfy liquidity standards established by the Board. The continued liquidity of such securities is not as well assured as that of publicly traded securities, and accordingly the Board will monitor their liquidity. At December 31, 2024, the Fund did not hold any restricted securities.
Investments in Other Investment Companies. The Fund may invest, from time to time, in shares of other investment companies (or entities that would be considered investment companies but are excluded from the definition pursuant to certain exceptions under the 1940 Act) (the Acquired Funds) in accordance with the 1940 Act and related rules. Shareholders in the Fund would bear the pro rata portion of the periodic expenses of the Acquired Funds in addition to the Fund’s expenses. For the year ended December 31, 2024, the Fund’s pro rata portion of the periodic expenses charged by the Acquired Funds was less than one basis point.
Securities Transactions and Investment Income. Securities transactions are accounted for on the trade date with realized gain/(loss) on investments determined by using the identified cost method. Interest income (including amortization of premium and accretion of discount) is recorded on an accrual basis. Premiums and discounts on debt securities are amortized using the effective yield to maturity method or amortized to earliest call date, if applicable. Dividend income is recorded on the ex-dividend date, except for certain dividends from foreign securities that are recorded as soon after the ex-dividend date as the Fund becomes aware of such dividends.
Determination of Net Asset Value and Calculation of Expenses. Certain administrative expenses are common to, and allocated among, various affiliated funds. Such allocations are made on the basis of the Fund’s average net assets or other criteria directly affecting the expenses as determined by the Adviser pursuant to procedures established by the Board.
In calculating the NAV per share of each class, investment income, realized and unrealized gains and losses, redemption fees, and expenses other than class specific expenses are allocated daily to each class of shares based upon the proportion of net assets of each class at the beginning of each day. Distribution expenses are borne solely by the class incurring the expense.
Distributions to Shareholders. Distributions to shareholders are recorded on the ex-dividend date. Distributions to shareholders are based on income and capital gains as determined in accordance with federal income tax regulations, which may differ from income and capital gains as determined under GAAP. These differences are primarily due to differing treatments of income and gains on various investment securities and foreign currency transactions, timing differences, and differing characterizations of distributions made by the Fund. Distributions from net investment income for federal income tax purposes include net realized gains on foreign currency transactions. These book/tax differences are either temporary or permanent in nature. To the extent these differences are permanent, adjustments are made to the appropriate capital accounts in the period when the differences arise. These reclassifications have no impact on the NAV of the Fund. For the year ended December 31, 2024, no reclassifications were made in the Fund.
The Gabelli Global Content & Connectivity Fund
Notes to Financial Statements (Continued)
The tax character of distributions paid during the years ended December 31, 2024 and 2023 was as follows:
| | | Year ended
December 31,
2024 | | | Year ended
December 31,
2023 | |
| Distributions paid from: | | | | | | | | |
| Ordinary income | | $ | 1,440,283 | | | $ | 188,408 | |
| Net long term capital gains | | | 2,187,482 | | | | — | |
| Return of capital | | | 539,984 | | | | — | |
| Total distributions paid | | $ | 4,167,749 | | | $ | 188,408 | |
Provision for Income Taxes. The Fund intends to continue to qualify as a regulated investment company under Subchapter M of the Internal Revenue Code of 1986, as amended (the Code). It is the policy of the Fund to comply with the requirements of the Code applicable to regulated investment companies and to distribute substantially all of its net investment company taxable income and net capital gains. Therefore, no provision for federal income taxes is required.
At December 31, 2024, the components of accumulated earnings/losses on a tax basis were as follows:
| Net unrealized appreciation on investments and foreign currency translations | | $ | 28,754,528 | |
The Fund is permitted to carry capital losses forward for an unlimited period. Capital losses that are carried forward will retain their character as either short term or long term capital losses.
The Fund utilized $354,304 of the capital loss carryforward for the year ended December 31, 2024.
At December 31, 2024, the temporary differences between book basis and tax basis unrealized appreciation were primarily due to mark-to-market adjustments on investments considered passive foreign investment companies.
The following summarizes the tax cost of investments and the related net unrealized appreciation at December 31, 2024:
| | | Cost | | | Gross
Unrealized
Appreciation | | | Gross
Unrealized
Depreciation | | | Net
Unrealized
Appreciation | |
| Investments | | $ | 37,303,855 | | | $ | 31,897,543 | | | $ | (3,139,387 | ) | | $ | 28,758,156 | |
The Fund is required to evaluate tax positions taken or expected to be taken in the course of preparing the Fund’s tax returns to determine whether the tax positions are “more-likely-than-not” of being sustained by the applicable tax authority. Income tax and related interest and penalties would be recognized by the Fund as tax expense in the Statement of Operations if the tax positions were deemed not to meet the more-likely-than-not threshold. During the year ended December 31, 2024, the Fund did not incur any income tax, interest, or penalties. As of December 31, 2024, the Adviser has reviewed all open tax years and concluded that there was no impact to the Fund’s net assets or results of operations. The Fund’s federal and state tax returns for the prior three fiscal years remain open, subject to examination. On an ongoing basis, the Adviser will monitor the Fund’s tax positions to determine if adjustments to this conclusion are necessary.
The Gabelli Global Content & Connectivity Fund
Notes to Financial Statements (Continued)
3. Investment Advisory Agreement and Other Transactions. The Fund has entered into an investment advisory agreement (the Advisory Agreement) with the Adviser which provides that the Fund will pay the Adviser a fee, computed daily and paid monthly, at the annual rate of 1.00% of the value of its average daily net assets. In accordance with the Advisory Agreement, the Adviser provides a continuous investment program for the Fund’s portfolio, oversees the administration of all aspects of the Fund’s business and affairs, and pays the compensation of all Officers and Directors of the Fund who are affiliated persons of the Adviser.
The Adviser has contractually agreed to waive its investment advisory fees and/or to reimburse expenses to the extent necessary to maintain the annualized total operating expenses of the Fund (excluding brokerage costs, acquired fund fees and expenses, interest, taxes, and extraordinary expenses) until at least April 30, 2025, at no more than an annual rate of 0.90% for all classes of shares. During the year ended December 31, 2024, the Adviser reimbursed expenses in the amount of $494,883. In addition, the Fund has agreed, during the two year period following any waiver or reimbursement by the Adviser, to repay such amount to the extent, that after giving effect to the repayment, such adjusted annualized total operating expenses of the Fund would not exceed 0.90% of the value of the Fund’s average daily net assets for each share class of the Fund. The agreement is renewable annually. At December 31, 2024, the cumulative contingent amount which the Fund may repay the Adviser, subject to the terms above, is $1,022,195:
| For the year ended December 31, 2023, expiring December 31, 2025 | | $ | 527,312 | |
| For the year ended December 31, 2024, expiring December 31, 2026 | | | 494,883 | |
| | | $ | 1,022,195 | |
4. Distribution Plan. The Fund’s Board has adopted a distribution plan (the Plan) for each class of shares, except for Class I Shares, pursuant to Rule 12b-1 under the 1940 Act. Under the Class AAA, Class A, and Class C Share Plans, payments are authorized to G.distributors, LLC (the Distributor), an affiliate of the Adviser, at annual rates of 0.25%, 0.25%, and 1.00%, respectively, of the average daily net assets of those classes, the annual limitations under each Plan. Such payments are accrued daily and paid monthly.
5. Portfolio Securities. Purchases and sales of securities during the year ended December 31, 2024, other than short term securities and U.S. Government obligations, aggregated $7,178,865 and $11,733,784, respectively.
6. Transactions with Affiliates and Other Arrangements. During the year ended December 31, 2024, the Fund paid brokerage commissions on security trades of $885 to G.research, LLC, an affiliate of the Adviser.
The cost of calculating the Fund’s NAV per share is a Fund expense pursuant to the Advisory Agreement. Under the sub-administration agreement with Bank of New York Mellon, the fees paid include the cost of calculating the Fund’s NAV. The Fund reimburses the Adviser for this service. During the year ended December 31, 2024, the Fund accrued $45,000 in accounting fees in the Statement of Operations.
The Corporation pays retainer and per meeting fees to Directors not affiliated with the Adviser, plus specified amounts to the Lead Director and Audit Committee Chairman. Directors are also reimbursed for out of pocket expenses incurred in attending meetings. Directors who are directors or employees of the Adviser or an affiliated company receive no compensation or expense reimbursement from the Corporation.
The Gabelli Global Content & Connectivity Fund
Notes to Financial Statements (Continued)
7. Line of Credit. The Fund participates in an unsecured and uncommitted line of credit, which expires on February 26, 2025 and may be renewed annually, of up to $150,000,000 under which it may borrow up to 10% of its net assets from the custodian for temporary borrowing purposes. Borrowings under this arrangement bear interest at a floating rate equal to the higher of the Overnight Federal Funds Rate plus 135 basis points or the Overnight Bank Funding Rate plus 135 basis points in effect on that day. This amount, if any, would be included in “Interest expense” in the Statement of Operations. At December 31, 2024, there was $474,000 outstanding under the line of credit.
The average daily amount of borrowings outstanding under the line of credit for 62 days of borrowings during the year ended December 31, 2024 was $205,371 with a weighted average interest rate of 6.47%. The maximum amount borrowed at any time during the year ended December 31, 2024 was $489,000.
8. Capital Stock. The Fund currently offers three classes of shares – Class AAA Shares, Class A Shares, and Class I Shares. Class AAA and Class A investors may purchase additional shares of the respective classes. Class C is closed to new and existing investors. The minimum investment for Class I shares is $1,000. Class AAA and Class I Shares are offered without a sales charge. Class A Shares are subject to a maximum front-end sales charge of 5.75%.
The Fund imposes a redemption fee of 2.00% on all classes of shares that are redeemed or exchanged on or before the seventh day after the date of a purchase. The redemption fee is deducted from the proceeds otherwise payable to the redeeming shareholders and is retained by the Fund as an increase in paid-in capital. The redemption fees retained by the Fund during the years ended December 31, 2024 and 2023, if any, can be found in the Statement of Changes in Net Assets under Redemption Fees.
The Gabelli Global Content & Connectivity Fund
Notes to Financial Statements (Continued)
Transactions in shares of capital stock were as follows:
| | | Year Ended
December 31,
2024 | | | Year Ended
December 31,
2023 | |
| | | Shares | | | Amount | | | Shares | | | Amount | |
| Class AAA | | | | | | | | | | | | | | | | |
| Shares sold | | | 10,484 | | | $ | 226,130 | | | | 12,289 | | | $ | 214,152 | |
| Shares issued upon reinvestment of distributions | | | 147,479 | | | | 3,198,819 | | | | 7,830 | | | | 145,873 | |
| Shares redeemed | | | (265,380 | ) | | | (5,538,717 | ) | | | (232,358 | ) | | | (4,019,530 | ) |
| Net decrease | | | (107,417 | ) | | $ | (2,113,768 | ) | | | (212,239 | ) | | $ | (3,659,505 | ) |
| Class A | | | | | | | | | | | | | | | | |
| Shares sold | | | 342 | | | $ | 7,711 | | | | 8 | | | $ | 156 | |
| Shares issued upon reinvestment of distributions | | | 500 | | | | 10,945 | | | | 29 | | | | 553 | |
| Shares redeemed | | | (1,909 | ) | | | (44,122 | ) | | | (3,001 | ) | | | (52,785 | ) |
| Net decrease | | | (1,067 | ) | | $ | (25,466 | ) | | | (2,964 | ) | | $ | (52,076 | ) |
| Class C | | | | | | | | | | | | | | | | |
| Shares issued upon reinvestment of distributions | | | – | | | | – | | | | 10 | | | $ | 151 | |
| Net increase | | | – | | | | – | | | | 10 | | | $ | 151 | |
| Class I | | | | | | | | | | | | | | | | |
| Shares sold | | | 36,254 | | | $ | 723,525 | | | | 37,489 | | | $ | 642,576 | |
| Shares issued upon reinvestment of distributions | | | 33,983 | | | | 734,373 | | | | 1,689 | | | | 31,356 | |
| Shares redeemed | | | (59,210 | ) | | | (1,237,220 | ) | | | (52,246 | ) | | | (895,611 | ) |
| Net increase/(decrease) | | | 11,027 | | | $ | 220,678 | | | | (13,068 | ) | | $ | (221,679 | ) |
9. Indemnifications. The Fund enters into contracts that contain a variety of indemnifications. The Fund’s maximum exposure under these arrangements is unknown. However, the Fund has not had prior claims or losses pursuant to these contracts. Management has reviewed the Fund’s existing contracts and expects the risk of loss to be remote.
10. Segment Reporting. In this reporting period, the Fund adopted FASB Accounting Standards Update 2023-07, Segment Reporting (Topic 280) - Improvements to Reportable Segment Disclosures (ASU 2023-07). Adoption of the new standard impacted financial statement disclosures only and did not affect the Fund’s financial position or results of operations. The Fund’s Principal Executive Officer and Principal Financial Officer act as the Fund’s chief operating decision maker (CODM), as defined in Topic 280, assessing performance and making decisions about resource allocation. The CODM has determined that the Fund has a single operating segment based on the fact that the CODM monitors the operating results of the Fund as a whole and the Fund’s long-term strategic asset allocation is guided by the Fund’s investment objective and principal investment strategies, and executed by the Fund’s portfolio management team, comprised of investment professionals employed by the Adviser. The financial information provided to and reviewed by the CODM is consistent with that presented in the Fund’s Schedule of Investments, Statements of Operations and Changes in Net Assets and Financial Highlights.
The Gabelli Global Content & Connectivity Fund
Notes to Financial Statements (Continued)
11. Subsequent Events. On February 26, 2025, the Fund renewed the unsecured and uncommitted line of credit, which expires on February 25, 2026 and may be renewed annually, of up to $150,000,000 under which it may borrow up to 10% of its net assets from the bank for temporary borrowing purposes.
Management has evaluated the impact on the Fund of all subsequent events occurring through the date the financial statements were issued and has determined that there were no other subsequent events requiring recognition or disclosure in the financial statements.
The Gabelli Global Content & Connectivity Fund
Report of Independent Registered Public Accounting Firm
To the Shareholders of The Gabelli Global Content & Connectivity Fund
and the Board of Directors of GAMCO Global Series Funds, Inc.
Opinion on the Financial Statements
We have audited the accompanying statement of assets and liabilities of Gabelli Global Content & Connectivity Fund (the “Fund”) (one of the portfolios constituting GAMCO Global Series Funds, Inc. (the “Corporation”)), including the schedule of investments, as of December 31, 2024, and the related statement of operations for the year then ended, the statements of changes in net assets for each of the two years in the period then ended, the financial highlights for each of the five years in the period then ended and the related notes (collectively referred to as the “financial statements”). In our opinion, the financial statements present fairly, in all material respects, the financial position of the Fund (one of the portfolios constituting GAMCO Global Series Funds, Inc.) at December 31, 2024, the results of its operations for the year then ended, the changes in its net assets for each of the two years in the period then ended and its financial highlights for each of the five years in the period then ended, in conformity with U.S. generally accepted accounting principles.
Basis for Opinion
These financial statements are the responsibility of the Corporation’s management. Our responsibility is to express an opinion on the Fund’s financial statements based on our audits. We are a public accounting firm registered with the Public Company Accounting Oversight Board (United States) (“PCAOB”) and are required to be independent with respect to the Corporation in accordance with the U.S. federal securities laws and the applicable rules and regulations of the Securities and Exchange Commission and the PCAOB.
We conducted our audits in accordance with the standards of the PCAOB. Those standards require that we plan and perform the audit to obtain reasonable assurance about whether the financial statements are free of material misstatement, whether due to error or fraud. The Corporation is not required to have, nor were we engaged to perform, an audit of the Corporation’s internal control over financial reporting. As part of our audits, we are required to obtain an understanding of internal control over financial reporting, but not for the purpose of expressing an opinion on the effectiveness of the Corporation’s internal control over financial reporting. Accordingly, we express no such opinion.
Our audits included performing procedures to assess the risks of material misstatement of the financial statements, whether due to error or fraud, and performing procedures that respond to those risks. Such procedures included examining, on a test basis, evidence regarding the amounts and disclosures in the financial statements. Our procedures included confirmation of securities owned as of December 31, 2024 by correspondence with the custodian, brokers and others; when replies were not received from brokers or others, we performed other auditing procedures. Our audits also included evaluating the accounting principles used and significant estimates made by management, as well as evaluating the overall presentation of the financial statements. We believe that our audits provide a reasonable basis for our opinion.

We have served as the auditor of one or more Gabelli Funds investment companies since 1992.
New York, New York
March 1, 2025
The Gabelli Global Content & Connectivity Fund
Liquidity Risk Management Program (Unaudited)
In accordance with Rule 22e-4 under the 1940 Act,the Fund has established a liquidity risk management program (the LRM Program) to govern its approach to managing liquidity risk. The LRM Program is administered by the Liquidity Committee (the Committee), which is comprised of members of Gabelli Funds, LLC management. The Board has designated the Committee to administer the LRM Program.
The LRM Program’s principal objectives include supporting the Fund’s compliance with limits on investments in illiquid assets and mitigating the risk that the Fund will be unable to meet its redemption obligations in a timely manner. The LRM Program also includes elements that support the management and assessment of liquidity risk, including an annual assessment of factors that influence the Fund’s liquidity and the monthly classification and re-classification of certain investments that reflect the Committee’s assessment of their relative liquidity under current market conditions.
At a meeting of the Board held on May 15, 2024, the Board received a written report from the Committee regarding the design and operational effectiveness of the LRM Program. The Committee determined, and reported to the Board, that the LRM Program is reasonably designed to assess and manage the Fund’s liquidity risk and has operated adequately and effectively since its implementation. The Committee reported that there were no liquidity events that impacted the Fund or its ability to timely meet redemptions without dilution to existing shareholders. The Committee noted that the Fund is primarily invested in highly liquid securities and, accordingly, continues to be exempt from the requirement to determine a “highly liquid investment minimum” as defined in the Rule 22e-4. Because of that continued qualification for the exemption, the Fund has not adopted a “highly liquid investment minimum” amount. The Committee further noted that while changes to the LRM Program were made during the Review Period and reported to the Board, no material changes were made to the LRM Program as a result of the Committee’s annual review.
There can be no assurance that the LRM Program will achieve its objectives in the future. Please refer to the Fund’s Prospectus for more information regarding its exposure to liquidity risk and other principal risks to which an investment in the Fund may be subject.
The Gabelli Global Content & Connectivity Fund
2024 TAX NOTICE TO SHAREHOLDERS (Unaudited)
For the year ended December 31, 2024, the Fund paid ordinary income distributions of $0.496388938, $0.496392012, $0.496388938, and $0.496382586 per share for Class AAA, Class A, Class C, and Class I Shares, respectively, return of capital distributions of $0.188358707, $0.188903034, $0.187610362, and $0.188164235 per share for Class AAA, Class A, Class C, and Class I Shares, respectively, and long term capital gains totaling $2,187,482, or the maximum allowable. The distributions of long term capital gains have been designated as a capital gain dividend by the Fund’s Board of Directors. For the year ended December 31, 2024, 30.34% of the ordinary income distribution qualifies for the dividends received deduction available to corporations. The Fund designates 54.59% of the ordinary income distribution as qualified dividend income pursuant to the Jobs and Growth Tax Relief Reconciliation Act of 2003. The Fund designates 0.52% of the ordinary income distribution as qualified interest income pursuant to the Tax Relief, Unemployment Reauthorization, and Job Creation Act of 2010.
U.S. Government Income:
The percentage of the ordinary income distribution paid by the Fund during the year ended December 31, 2024 which was derived from U.S. Treasury securities was 0.3%. Such income is exempt from state and local tax in all states. However, many states, including New York and California, allow a tax exemption for a portion of the income earned only if a mutual fund has invested at least 50% of its assets at the end of each quarter of the Fund’s fiscal year in U.S. Government securities. The Fund did not meet this strict requirement in 2024. Due to the diversity in state and local tax law, it is recommended that you consult your personal tax adviser as to the applicability of the information provided to your specific situation.
All designations are based on financial information available as of the date of this annual report and, accordingly, are subject to change. For each item, it is the intention of the Fund to designate the maximum amount permitted under the Internal Revenue Code and the regulations thereunder.
The Gabelli Global Growth Fund
Annual Report — December 31, 2024
(Y)our Portfolio Management Team
| |  | |  | |  | |
| | Caesar M. P. Bryan | | Howard F. Ward, CFA | | John Belton, CFA | |
| | Portfolio Manager | | Portfolio Manager | | Portfolio Manager | |
To Our Shareholders,
For the year ended December 31, 2024, the net asset value (NAV) total return per Class I Share of The Gabelli Global Growth Fund was 29.7% compared with a total return of 18.0% for the Morgan Stanley Capital International (MSCI) All Country (AC) World Index. Other classes of shares are available.
Enclosed are the financial statements, including the schedule of investments, as of December 31, 2024.
Summary of Portfolio Holdings (Unaudited)
The following table presents portfolio holdings as a percent of net assets as of December 31, 2024:
The Gabelli Global Growth Fund
| Information Technology - Semiconductors, Hardware, and Equipment | | | 19.4 | % |
| Communication Services | | | 19.1 | % |
| Financials | | | 13.2 | % |
| Information Technology - Software and Services | | | 12.2 | % |
| Consumer Discretionary | | | 12.2 | % |
| Health Care | | | 11.8 | % |
| Industrials | | | 8.0 | % |
| Consumer Staples | | | 2.4 | % |
| U.S. Government Obligations | | | 0.9 | % |
| Materials | | | 0.9 | % |
| Other Assets and Liabilities (Net) | | | (0.1 | )% |
| | | | 100.0 | % |
The Fund files a complete schedule of portfolio holdings with the Securities and Exchange Commission (the SEC) for the first and third quarters of each fiscal year on Form N-PORT. Shareholders may obtain this information at www.gabelli.com or by calling the Fund at 800-GABELLI (800-422-3554). The Fund’s Form N-PORT is available on the SEC’s website at www.sec.gov and may also be reviewed and copied at the SEC’s Public Reference Room in Washington, DC. Information on the operation of the Public Reference Room may be obtained by calling 800-SEC-0330.
Proxy Voting
The Fund files Form N-PX with its complete proxy voting record for the twelve months ended June 30, no later than August 31 of each year. A description of the Fund’s proxy voting policies, procedures, and how the Fund voted proxies relating to portfolio securities is available without charge, upon request, by (i) calling 800-GABELLI (800-422-3554); (ii) writing to The Gabelli Funds at One Corporate Center, Rye, NY 10580-1422; or (iii) visiting the SEC’s website at www.sec.gov.
The Gabelli Global Growth Fund
Schedule of Investments — December 31, 2024
| Shares | | | | | Cost | | | Market
Value | |
| | | | | COMMON STOCKS — 99.2% | | | | | | | | |
| | | | | INFORMATION TECHNOLOGY - SEMICONDUCTORS, HARDWARE, AND EQUIPMENT — 19.4% | | | | | | | | |
| | 24,300 | | | Apple Inc. | | $ | 377,306 | | | $ | 6,085,206 | |
| | 4,000 | | | Applied Materials Inc. | | | 821,544 | | | | 650,520 | |
| | 3,550 | | | ASML Holding NV | | | 932,177 | | | | 2,460,434 | |
| | 19,400 | | | Broadcom Inc. | | | 3,665,449 | | | | 4,497,696 | |
| | 16,830 | | | Eaton Corp. plc | | | 3,581,913 | | | | 5,585,372 | |
| | 8,200 | | | Keyence Corp. | | | 343,743 | | | | 3,368,178 | |
| | 106,000 | | | NVIDIA Corp. | | | 521,945 | | | | 14,234,740 | |
| | | | | | | | 10,244,077 | | | | 36,882,146 | |
| | | | | COMMUNICATION SERVICES — 19.1% | | | | | | | | |
| | 16,200 | | | Alphabet Inc., Cl. A | | | 238,018 | | | | 3,066,660 | |
| | 34,320 | | | Alphabet Inc., Cl. C | | | 1,992,787 | | | | 6,535,901 | |
| | 18,000 | | | Meta Platforms Inc., Cl. A | | | 3,309,299 | | | | 10,539,180 | |
| | 11,400 | | | Netflix Inc.† | | | 3,168,626 | | | | 10,161,048 | |
| | 13,400 | | | Spotify Technology SA† | | | 2,383,463 | | | | 5,994,892 | |
| | | | | | | | 11,092,193 | | | | 36,297,681 | |
| | | | | FINANCIALS — 13.2% | | | | | | | | |
| | 8,250 | | | Aon plc, Cl. A | | | 3,083,744 | | | | 2,963,070 | |
| | 11,055 | | | Chubb Ltd. | | | 2,517,684 | | | | 3,054,496 | |
| | 169,000 | | | Investor AB, Cl. B | | | 2,383,031 | | | | 4,470,984 | |
| | 25,500 | | | KKR & Co. Inc. | | | 2,575,602 | | | | 3,771,705 | |
| | 6,700 | | | Mastercard Inc., Cl. A | | | 93,730 | | | | 3,528,019 | |
| | 4,020 | | | S&P Global Inc. | | | 746,205 | | | | 2,002,081 | |
| | 17,000 | | | Visa Inc., Cl. A | | | 301,339 | | | | 5,372,680 | |
| | | | | | | | 11,701,335 | | | | 25,163,035 | |
| | | | | INFORMATION TECHNOLOGY - SOFTWARE AND SERVICES — 12.2% | | | | | | | | |
| | 2,310 | | | Adobe Inc.† | | | 157,141 | | | | 1,027,211 | |
| | 4,330 | | | Cadence Design Systems Inc.† | | | 1,008,211 | | | | 1,300,992 | |
| | 9,130 | | | CrowdStrike Holdings Inc., Cl. A† | | | 1,367,159 | | | | 3,123,921 | |
| | 2,910 | | | Intuit Inc. | | | 1,204,206 | | | | 1,828,935 | |
| | 24,400 | | | Microsoft Corp. | | | 786,952 | | | | 10,284,600 | |
| | 10,500 | | | Oracle Corp. | | | 2,004,752 | | | | 1,749,720 | |
| | 3,760 | | | ServiceNow Inc.† | | | 895,359 | | | | 3,986,051 | |
| | | | | | | | 7,423,780 | | | | 23,301,430 | |
| | | | | CONSUMER DISCRETIONARY — 12.2% | | | | | | | | |
| | 56,000 | | | Amazon.com Inc.† | | | 3,606,212 | | | | 12,285,840 | |
| | 52,000 | | | Chipotle Mexican Grill Inc.† | | | 1,645,829 | | | | 3,135,600 | |
| | 2,000 | | | Christian Dior SE | | | 290,698 | | | | 1,253,378 | |
| | 6,200 | | | LVMH Moet Hennessy Louis Vuitton SE | | | 1,876,976 | | | | 4,081,353 | |
| | 45,900 | | | On Holding AG, Cl. A† | | | 1,849,997 | | | | 2,513,943 | |
| | | | | | | | 9,269,712 | | | | 23,270,114 | |
| | | | | HEALTH CARE — 11.8% | | | | | | | | |
| | 35,000 | | | Boston Scientific Corp.† | | | 2,709,707 | | | | 3,126,200 | |
| Shares | | | | | Cost | | | Market
Value | |
| | 9,320 | | | Eli Lilly & Co. | | $ | 4,234,725 | | | $ | 7,195,040 | |
| | 8,400 | | | Intuitive Surgical Inc.† | | | 2,520,083 | | | | 4,384,464 | |
| | 34,600 | | | Novo Nordisk A/S, ADR | | | 2,027,860 | | | | 2,976,292 | |
| | 8,480 | | | Stryker Corp. | | | 2,754,677 | | | | 3,053,224 | |
| | 3,450 | | | Thermo Fisher Scientific Inc. | | | 473,104 | | | | 1,794,794 | |
| | | | | | | | 14,720,156 | | | | 22,530,014 | |
| | | | | INDUSTRIALS — 8.0% | | | | | | | | |
| | 10,800 | | | GE Vernova Inc. | | | 1,534,121 | | | | 3,552,444 | |
| | 19,850 | | | General Electric Co. | | | 3,046,199 | | | | 3,310,781 | |
| | 10,000 | | | Schneider Electric SE | | | 2,551,040 | | | | 2,495,363 | |
| | 15,800 | | | Trane Technologies plc | | | 3,216,017 | | | | 5,835,730 | |
| | | | | | | | 10,347,377 | | | | 15,194,318 | |
| | | | | CONSUMER STAPLES — 2.4% | | | | | | | | |
| | 12,750 | | | L’Oreal SA | | | 2,720,046 | | | | 4,514,843 | |
| | | | | | | | | | | | | |
| | | | | MATERIALS — 0.9% | | | | | | | | |
| | 3,900 | | | Linde plc | | | 1,455,680 | | | | 1,632,813 | |
| | | | | | | | | | | | | |
| | | | | TOTAL COMMON STOCKS | | | 78,974,356 | | | | 188,786,394 | |
| | | | | | | | | | | | | |
Principal
Amount | | | | | | | | | |
| | | | | U.S. GOVERNMENT OBLIGATIONS — 0.9% | | | | | | | | |
| $ | 1,805,000 | | | U.S. Treasury Bills, 4.383% to 4.448%††, 02/06/25 to 04/10/25 | | | 1,787,687 | | | | 1,788,523 | |
| | | | | | | | | | | | | |
| | | | | TOTAL INVESTMENTS — 100.1% | | $ | 80,762,043 | | | | 190,574,917 | |
| | | | | | | | | | | | | |
| | | | | Other Assets and Liabilities (Net) — (0.1)% | | | | | | | (250,544 | ) |
| | | | | | | | | | | | | |
| | | | | NET ASSETS—100.0% | | | | | | $ | 190,324,373 | |
| † | Non-income producing security. |
| †† | Represents annualized yields at dates of purchase. |
| | |
| ADR | American Depositary Receipt |
| Geographic Diversification | | % of
Market
Value | | | Market
Value | |
| United States | | | 77.4 | % | | $ | 147,555,030 | |
| Europe | | | 20.8 | | | | 39,651,709 | |
| Japan | | | 1.8 | | | | 3,368,178 | |
| | | | 100.0 | % | | $ | 190,574,917 | |
See accompanying notes to financial statements.
The Gabelli Global Growth Fund
Statement of Assets and Liabilities
December 31, 2024
| Assets: | | | |
| Investments, at value (cost $80,762,043) | | $ | 190,574,917 | |
| Receivable for Fund shares sold | | | 32,968 | |
| Receivable from Adviser | | | 28,728 | |
| Dividends receivable | | | 63,724 | |
| Prepaid expenses | | | 15,620 | |
| Total Assets | | | 190,715,957 | |
| Liabilities: | | | | |
| Payable to bank | | | 13,229 | |
| Payable for Fund shares redeemed | | | 49,966 | |
| Payable for investment advisory fees | | | 166,164 | |
| Payable for distribution fees | | | 25,164 | |
| Payable for accounting fees | | | 3,750 | |
| Payable for legal and audit fees | | | 50,700 | |
| Payable for shareholder services fees | | | 30,651 | |
| Payable for shareholder communications | | | 29,680 | |
| Other accrued expenses | | | 22,280 | |
| Total Liabilities | | | 391,584 | |
| Commitments and Contingencies (See Note 3) | | | | |
| Net Assets | | | | |
| (applicable to 3,250,532 shares outstanding) | | $ | 190,324,373 | |
| | | | | |
| Net Assets Consist of: | | | | |
| Paid-in capital | | $ | 82,728,899 | |
| Total distributable earnings | | | 107,595,474 | |
| Net Assets | | $ | 190,324,373 | |
| | | | | |
| Shares of Capital Stock, each at $0.001 par value: | | | | |
| Class AAA: | | | | |
| Net Asset Value, offering, and redemption price per share ($105,995,435 ÷ 1,827,833 shares outstanding; 75,000,000 shares authorized) | | $ | 57.99 | |
| Class A: | | | | |
| Net Asset Value and redemption price per share ($5,613,217 ÷ 96,861 shares outstanding; 50,000,000 shares authorized) | | $ | 57.95 | |
| Maximum offering price per share (NAV ÷ 0.9425, based on maximum sales charge of 5.75% of the offering price) | | $ | 61.49 | |
| Class C: | | | | |
| Net Asset Value and redemption price per share ($874,681 ÷ 18,726 shares outstanding; 25,000,000 shares authorized) | | $ | 46.71 | |
| Class I: | | | | |
| Net Asset Value, offering, and redemption price per share ($77,841,040 ÷ 1,307,112 shares outstanding; 25,000,000 shares authorized) | | $ | 59.55 | |
Statement of Operations
For the year Ended December 31, 2024
| Investment Income: | | | | |
| Dividends (net of foreign withholding taxes of $60,001) | | $ | 978,071 | |
| Interest | | | 272,640 | |
| Total Investment Income | | | 1,250,711 | |
| Expenses: | | | | |
| Investment advisory fees | | | 1,778,208 | |
| Distribution fees - Class AAA | | | 254,514 | |
| Distribution fees - Class A | | | 12,492 | |
| Distribution fees - Class C | | | 9,565 | |
| Shareholder services fees | | | 109,478 | |
| Registration expenses | | | 67,323 | |
| Legal and audit fees | | | 66,282 | |
| Shareholder communications expenses | | | 47,026 | |
| Accounting fees | | | 45,000 | |
| Directors’ fees | | | 31,396 | |
| Interest expense | | | 1,256 | |
| Custodian fees | | | 22 | |
| Miscellaneous expenses | | | 33,521 | |
| Total Expenses | | | 2,456,083 | |
| Less: | | | | |
| Expense reimbursements (See Note 3) | | | (854,439 | ) |
| Net Expenses | | | 1,601,644 | |
| Net Investment Loss | | | (350,933 | ) |
| | | | | |
| Net Realized and Unrealized Gain/(Loss) on Investments and Foreign Currency: | | | | |
| Net realized gain on investments | | | 11,082,720 | |
| Net realized gain on foreign currency transactions | | | 1,083 | |
| Net realized gain on investments and foreign currency transactions | | | 11,083,803 | |
| Net change in unrealized appreciation/depreciation: | | | | |
| on investments | | | 33,398,862 | |
| on foreign currency translations | | | (4,968 | ) |
| Net change in unrealized appreciation/depreciation on investments and foreign currency translations | | | 33,393,894 | |
| Net Realized and Unrealized Gain/(Loss) on Investments and Foreign Currency | | | 44,477,697 | |
| Net Increase in Net Assets Resulting from Operations | | $ | 44,126,764 | |
See accompanying notes to financial statements.
The Gabelli Global Growth Fund
Statement of Changes in Net Assets
| | | Year Ended | | | Year Ended | |
| | | December 31,
2024 | | | December 31,
2023 | |
| Operations: | | | | | | | | |
| Net investment loss | | $ | (350,933 | ) | | $ | (261,060 | ) |
| Net realized gain on investments and foreign currency transactions | | | 11,083,803 | | | | 4,159,268 | |
| Net change in unrealized appreciation/depreciation on investments and foreign currency translations | | | 33,393,894 | | | | 37,877,498 | |
| Net Increase in Net Assets Resulting from Operations | | | 44,126,764 | | | | 41,775,706 | |
| | | | | | | | | |
| Distributions to Shareholders: | | | | | | | | |
| Accumulated earnings | | | | | | | | |
| Class AAA | | | (2,432,607 | ) | | | (260,792 | ) |
| Class A | | | (128,907 | ) | | | (11,634 | ) |
| Class C | | | (20,414 | ) | | | (3,444 | ) |
| Class I | | | (1,784,023 | ) | | | (160,266 | ) |
| | | | (4,365,951 | ) | | | (436,136 | ) |
| Return of capital | | | | | | | | |
| Class AAA | | | (81,933 | ) | | | (6,126 | ) |
| Class A | | | (4,345 | ) | | | (273 | ) |
| Class C | | | (844 | ) | | | (81 | ) |
| Class I | | | (58,583 | ) | | | (3,765 | ) |
| | | | (145,705 | ) | | | (10,245 | ) |
| Total Distributions to Shareholders | | | (4,511,656 | ) | | | (446,381 | ) |
| | | | | | | | | |
| Capital Share Transactions: | | | | | | | | |
| Class AAA | | | (6,465,315 | ) | | | (7,956,793 | ) |
| Class A | | | 570,139 | | | | 28,713 | |
| Class C | | | (308,771 | ) | | | (186,309 | ) |
| Class I | | | 6,034,145 | | | | (13,069,374 | ) |
| Net Decrease in Net Assets from Capital Share Transactions | | | (169,802 | ) | | | (21,183,763 | ) |
| | | | | | | | | |
| Redemption Fees | | | 758 | | | | 65 | |
| | | | | | | | | |
| Net Increase in Net Assets | | | 39,446,064 | | | | 20,145,627 | |
| | | | | | | | | |
| Net Assets: | | | | | | | | |
| Beginning of year | | | 150,878,309 | | | | 130,732,682 | |
| End of year | | $ | 190,324,373 | | | $ | 150,878,309 | |
See accompanying notes to financial statements.
The Gabelli Global Growth Fund
Financial Highlights
Selected data for a share of capital stock outstanding throughout each year:
| | | | | | | Income (Loss) from Investment Operations | | | Distributions | | | | | | | | | | | | Ratios to Average Net Assets/Supplemental Data | |
| Year | | Net Asset Value,
Beginning of Year | | | Net Investment
Loss(a) | | | Net Realized
and Unrealized
Gain (Loss) on
Investments | | | Total from
Investment
Operations | | | Net Investment
Income | | | Net Realized
Gain on
Investments | | | Return of Capital | | | Total
Distributions | | | Redemption
Fees(a)(b) | | | Net Asset Value,
End of year | | | Total
Return† | | | Net Assets, End
of year
(in 000’s) | | | Net Investment
Loss | | | Operating
Expenses Before
Reimbursement | | | Operating
Expenses Net of
Reimbursement(c) | | | Portfolio
Turnover
Rate | |
| Class AAA | | | | | | | | | | | | | | | | | | | | | | | | | | | | | | | | | | | | | | | |
| 2024 | | $ | 45.77 | | | $ | (0.11 | ) | | $ | 13.74 | | | $ | 13.63 | | | $ | (0.06 | ) | | $ | (1.30 | ) | | $ | (0.05 | ) | | $ | (1.41 | ) | | $ | 0.00 | | | $ | 57.99 | | | | 29.71 | % | | $ | 105,995 | | | | (0.20 | )% | | | 1.48 | % | | | 0.90 | % | | | 26 | % |
| 2023 | | | 34.14 | | | | (0.08 | ) | | | 11.85 | | | | 11.77 | | | | (0.14 | ) | | | — | | | | (0.00 | )(b) | | | (0.14 | ) | | | 0.00 | | | | 45.77 | | | | 34.47 | | | | 89,342 | | | | (0.18 | ) | | | 1.61 | | | | 0.90 | | | | 37 | |
| 2022 | | | 54.68 | | | | (0.14 | ) | | | (20.34 | ) | | | (20.48 | ) | | | (0.00 | )(b) | | | (0.06 | ) | | | — | | | | (0.06 | ) | | | 0.00 | | | | 34.14 | | | | (37.45 | ) | | | 73,186 | | | | (0.34 | ) | | | 1.52 | | | | 0.90 | (d)(e) | | | 36 | |
| 2021 | | | 47.04 | | | | (0.25 | ) | | | 10.19 | | | | 9.94 | | | | (0.02 | ) | | | (2.28 | ) | | | — | | | | (2.30 | ) | | | 0.00 | | | | 54.68 | | | | 21.10 | | | | 126,055 | | | | (0.49 | ) | | | 1.50 | | | | 0.91 | (d) | | | 49 | |
| 2020 | | | 35.56 | | | | (0.05 | ) | | | 12.64 | | | | 12.59 | | | | (0.09 | ) | | | (1.02 | ) | | | — | | | | (1.11 | ) | | | 0.00 | | | | 47.04 | | | | 35.43 | | | | 115,210 | | | | (0.14 | ) | | | 1.57 | | | | 0.90 | | | | 50 | |
| Class A | | | | | | | | | | | | | | | | | | | | | | | | | | | | | | | | | | | | | | | |
| 2024 | | $ | 45.74 | | | $ | (0.11 | ) | | $ | 13.73 | | | $ | 13.62 | | | $ | (0.06 | ) | | $ | (1.30 | ) | | $ | (0.05 | ) | | $ | (1.41 | ) | | $ | 0.00 | | | $ | 57.95 | | | | 29.71 | % | | $ | 5,613 | | | | (0.20 | )% | | | 1.48 | % | | | 0.90 | % | | | 26 | % |
| 2023 | | | 34.11 | | | | (0.08 | ) | | | 11.85 | | | | 11.77 | | | | (0.14 | ) | | | — | | | | (0.00 | )(b) | | | (0.14 | ) | | | 0.00 | | | | 45.74 | | | | 34.50 | | | | 3,973 | | | | (0.19 | ) | | | 1.61 | | | | 0.90 | | | | 37 | |
| 2022 | | | 54.64 | | | | (0.14 | ) | | | (20.33 | ) | | | (20.47 | ) | | | (0.00 | )(b) | | | (0.06 | ) | | | — | | | | (0.06 | ) | | | 0.00 | | | | 34.11 | | | | (37.46 | ) | | | 2,957 | | | | (0.35 | ) | | | 1.52 | | | | 0.90 | (d)(e) | | | 36 | |
| 2021 | | | 47.01 | | | | (0.25 | ) | | | 10.18 | | | | 9.93 | | | | (0.02 | ) | | | (2.28 | ) | | | — | | | | (2.30 | ) | | | 0.00 | | | | 54.64 | | | | 21.09 | | | | 5,252 | | | | (0.49 | ) | | | 1.50 | | | | 0.91 | (d) | | | 49 | |
| 2020 | | | 35.55 | | | | (0.05 | ) | | | 12.62 | | | | 12.57 | | | | (0.09 | ) | | | (1.02 | ) | | | — | | | | (1.11 | ) | | | 0.00 | | | | 47.01 | | | | 35.38 | | | | 4,804 | | | | (0.12 | ) | | | 1.57 | | | | 0.90 | | | | 50 | |
| Class C | | | | | | | | | | | | | | | | | | | | | | | | | | | | | | | | | | | | | | | |
| 2024 | | $ | 36.88 | | | $ | (0.09 | ) | | $ | 11.07 | | | $ | 10.98 | | | $ | (0.06 | ) | | $ | (1.04 | ) | | $ | (0.05 | ) | | $ | (1.15 | ) | | $ | 0.00 | | | $ | 46.71 | | | | 29.72 | % | | $ | 875 | | | | (0.19 | )% | | | 2.23 | % | | | 0.90 | % | | | 26 | % |
| 2023 | | | 27.53 | | | | (0.06 | ) | | | 9.55 | | | | 9.49 | | | | (0.14 | ) | | | — | | | | (0.00 | )(b) | | | (0.14 | ) | | | 0.00 | | | | 36.88 | | | | 34.46 | | | | 952 | | | | (0.19 | ) | | | 2.36 | | | | 0.90 | | | | 37 | |
| 2022 | | | 44.09 | | | | (0.12 | ) | | | (16.39 | ) | | | (16.51 | ) | | | (0.00 | )(b) | | | (0.05 | ) | | | — | | | | (0.05 | ) | | | 0.00 | | | | 27.53 | | | | (37.45 | ) | | | 881 | | | | (0.36 | ) | | | 2.27 | | | | 0.90 | (d)(e) | | | 36 | |
| 2021 | | | 38.30 | | | | (0.21 | ) | | | 8.30 | | | | 8.09 | | | | (0.02 | ) | | | (2.28 | ) | | | — | | | | (2.30 | ) | | | 0.00 | | | | 44.09 | | | | 21.08 | | | | 2,411 | | | | (0.49 | ) | | | 2.25 | | | | 0.91 | (d) | | | 49 | |
| 2020 | | | 29.11 | | | | (0.04 | ) | | | 10.34 | | | | 10.30 | | | | (0.09 | ) | | | (1.02 | ) | | | — | | | | (1.11 | ) | | | 0.00 | | | | 38.30 | | | | 35.41 | | | | 2,376 | | | | (0.12 | ) | | | 2.32 | | | | 0.90 | | | | 50 | |
| Class I | | | | | | | | | | | | | | | | | | | | | | | | | | | | | | | | | | | | | | | |
| 2024 | | $ | 47.00 | | | $ | (0.11 | ) | | $ | 14.10 | | | $ | 13.99 | | | $ | (0.06 | ) | | $ | (1.33 | ) | | $ | (0.05 | ) | | $ | (1.44 | ) | | $ | 0.00 | | | $ | 59.55 | | | | 29.71 | % | | $ | 77,841 | | | | (0.20 | )% | | | 1.23 | % | | | 0.90 | % | | | 26 | % |
| 2023 | | | 35.05 | | | | (0.08 | ) | | | 12.17 | | | | 12.09 | | | | (0.14 | ) | | | — | | | | (0.00 | )(b) | | | (0.14 | ) | | | 0.00 | | | | 47.00 | | | | 34.48 | | | | 56,611 | | | | (0.18 | ) | | | 1.36 | | | | 0.90 | | | | 37 | |
| 2022 | | | 56.12 | | | | (0.14 | ) | | | (20.87 | ) | | | (21.01 | ) | | | (0.00 | )(b) | | | (0.06 | ) | | | — | | | | (0.06 | ) | | | 0.00 | | | | 35.05 | | | | (37.43 | ) | | | 53,709 | | | | (0.35 | ) | | | 1.27 | | | | 0.90 | (d)(e) | | | 36 | |
| 2021 | | | 48.23 | | | | (0.26 | ) | | | 10.45 | | | | 10.19 | | | | (0.02 | ) | | | (2.28 | ) | | | — | | | | (2.30 | ) | | | 0.00 | | | | 56.12 | | | | 21.10 | | | | 106,107 | | | | (0.50 | ) | | | 1.25 | | | | 0.91 | (d) | | | 49 | |
| 2020 | | | 36.45 | | | | (0.08 | ) | | | 12.97 | | | | 12.89 | | | | (0.09 | ) | | | (1.02 | ) | | | — | | | | (1.11 | ) | | | 0.00 | | | | 48.23 | | | | 35.39 | | | | 70,888 | | | | (0.18 | ) | | | 1.32 | | | | 0.90 | | | | 50 | |
| † | Total return represents aggregate total return of a hypothetical investment at the beginning of the year and sold at the end of the year including reinvestment of distributions and does not reflect the applicable sales charges. |
| (a) | Per share amounts have been calculated using the average shares outstanding method. |
| (b) | Amount represents less than $0.005 per share. |
| (c) | Under an expense reimbursement agreement with the Adviser, the Adviser reimbursed expenses of $854,439, $882,743, $880,676, $1,048,506, and $876,253 for the years ended December 31, 2024, 2023, 2022, 2021, and 2020, respectively. |
| (d) | The Fund incurred tax expense. For the year ended December 31, 2022, the impact was minimal. For the year ended December 31, 2021, if tax expense had not been incurred, the ratios of operating expenses to average net assets would have been 0.90% for each Class. |
| (e) | The Fund received credits from a designated broker who agreed to pay certain Fund operating expenses. For the year ended December 31, 2022, there was no material impact to the expense ratios. |
See accompanying notes to financial statements.
The Gabelli Global Growth Fund
Notes to Financial Statements
1. Organization. The Gabelli Global Growth Fund (the Fund), a series of the GAMCO Global Series Funds, Inc. (the Corporation), was incorporated on July 16, 1993 in Maryland. The Fund is a non-diversified open-end management investment company registered under the Investment Company Act of 1940, as amended (the 1940 Act), and is one of five separately managed portfolios (collectively, the Portfolios) of the Corporation. The Fund’s primary objective is capital appreciation. The Fund commenced investment operations on February 7, 1994.
Gabelli Funds, LLC (the Adviser), with its principal offices located at One Corporate Center, Rye, New York 10580-1422, serves as investment adviser to the Fund. The Adviser makes investment decisions for the Fund and continuously reviews and administers the Fund’s investment program and manages the operations of the Fund under the general supervision of the Company’s Board of Directors (the Board).
2. Significant Accounting Policies. As an investment company, the Fund follows the investment company accounting and reporting guidance, which is part of U.S. generally accepted accounting principles (GAAP) that may require the use of management estimates and assumptions in the preparation of its financial statements. The Board has designated the Adviser as the valuation designee under Rule 2a-5. Actual results could differ from those estimates. The following is a summary of significant accounting policies followed by the Fund in the preparation of its financial statements.
Security Valuation. Portfolio securities listed or traded on a nationally recognized securities exchange or traded in the U.S. over-the-counter market for which market quotations are readily available are valued at the last quoted sale price or a market’s official closing price as of the close of business on the day the securities are being valued. If there were no sales that day, the security is valued at the average of the closing bid and asked prices or, if there were no asked prices quoted on that day, then the security is valued at the closing bid price on that day. If no bid or asked prices are quoted on such day, the security is valued at the most recently available price or, if the Board so determines, by such other method as the Board shall determine in good faith to reflect its fair market value. Portfolio securities traded on more than one national securities exchange or market are valued according to the broadest and most representative market, as determined by the Adviser.
Portfolio securities primarily traded on a foreign market are generally valued at the preceding closing values of such securities on the relevant market, but may be fair valued pursuant to procedures established by the Board if market conditions change significantly after the close of the foreign market, but prior to the close of business on the day the securities are being valued. Debt obligations for which market quotations are readily available are valued at the average of the latest bid and asked prices. If there were no asked prices quoted on such day, the security is valued using the closing bid price, unless the Board determines such amount does not reflect the security’s fair value, in which case these securities will be fair valued as determined by the Board. Such debt obligations are valued through prices provided by a pricing service approved by the Board. Certain securities are valued principally using dealer quotations.
Securities and assets for which market quotations are not readily available are fair valued as determined by the Board. Fair valuation methodologies and procedures may include, but are not limited to: analysis and review of available financial and non-financial information about the company; comparisons with the valuation and changes in valuation of similar securities, including a comparison of foreign securities with the equivalent U.S. dollar value American Depositary Receipt securities at the close of the U.S. exchange; and evaluation of any other information that could be indicative of the value of the security.
The Gabelli Global Growth Fund
Notes to Financial Statements (Continued)
The Fund employs a fair value model to adjust prices to reflect events affecting the values of certain portfolio securities which occur between the close of trading on the principal market for such securities (foreign exchanges and over-the-counter markets) at the time when net asset values of the Fund are determined. If the Fund’s valuation committee believes that a particular event would materially affect net asset value, further adjustment is considered. Such securities are classified as Level 2 in the fair value hierarchy presented below.
The inputs and valuation techniques used to measure fair value of the Fund’s investments are summarized into three levels as described in the hierarchy below:
| ● | Level 1 — unadjusted quoted prices in active markets for identical securities; |
| ● | Level 2 — other significant observable inputs (including quoted prices for similar securities, interest rates, prepayment speeds, credit risk, etc.); and |
| ● | Level 3 — significant unobservable inputs (including the Board’s determinations as to the fair value of investments). |
A financial instrument’s level within the fair value hierarchy is based on the lowest level of any input both individually and in the aggregate that is significant to the fair value measurement. The inputs or methodology used for valuing securities are not necessarily an indication of the risk associated with investing in those securities. The summary of the Fund’s investments in securities by inputs used to value the Fund’s investments as of December 31, 2024 is as follows:
| | | Valuation Inputs | | | | |
| | | Level 1
Quoted Prices | | | Level 2 Other
Significant
Observable Inputs | | | Total
Market Value
at 12/31/24 | |
| INVESTMENTS IN SECURITIES: | | | | | | | | | | | | |
| ASSETS (Market Value): | | | | | | | | | | | | |
| Common Stocks (a) | | $ | 188,786,394 | | | | — | | | $ | 188,786,394 | |
| U.S. Government Obligations | | | — | | | $ | 1,788,523 | | | | 1,788,523 | |
| TOTAL INVESTMENTS IN SECURITIES – ASSETS | | $ | 188,786,394 | | | $ | 1,788,523 | | | $ | 190,574,917 | |
| (a) | Please refer to the Schedule of Investments for the industry classifications of these portfolio holdings. |
General. The Fund uses recognized industry pricing services – approved by the Board and unaffiliated with the Adviser – to value most of its securities, and uses broker quotes provided by market makers of securities not valued by these and other recognized pricing sources. Several different pricing feeds are received to value domestic equity securities, international equity securities, preferred equity securities, and fixed income securities. The data within these feeds are ultimately sourced from major stock exchanges and trading systems where these securities trade. The prices supplied by external sources are checked by obtaining quotations or actual transaction prices from market participants. If a price obtained from the pricing source is deemed unreliable, prices will be sought from another pricing service or from a broker/dealer that trades that security or similar securities.
Fair Valuation. Fair valued securities may be common or preferred equities, warrants, options, rights, or fixed income obligations. Where appropriate, Level 3 securities are those for which market quotations are not available, such as securities not traded for several days, or for which current bids are not available, or which are restricted as to transfer. When fair valuing a security, factors to consider include recent prices of comparable securities that are publicly traded, reliable prices of securities not publicly traded, the use of valuation models, current
The Gabelli Global Growth Fund
Notes to Financial Statements (Continued)
analyst reports, valuing the income or cash flow of the issuer, or cost if the preceding factors do not apply. A significant change in the unobservable inputs could result in a lower or higher value in Level 3 securities. The circumstances of Level 3 securities are frequently monitored to determine if fair valuation measures continue to apply.
The Adviser reports quarterly to the Board the results of the application of fair valuation policies and procedures. These may include backtesting the prices realized in subsequent trades of these fair valued securities to fair values previously recognized.
Foreign Currency Translations. The books and records of the Fund are maintained in U.S. dollars. Foreign currencies, investments, and other assets and liabilities are translated into U.S. dollars at current exchange rates. Purchases and sales of investment securities, income, and expenses are translated at the exchange rate prevailing on the respective dates of such transactions. Unrealized gains and losses that result from changes in foreign exchange rates and/or changes in market prices of securities have been included in unrealized appreciation/depreciation on investments and foreign currency translations. Net realized foreign currency gains and losses resulting from changes in exchange rates include foreign currency gains and losses between trade date and settlement date on investment securities transactions, foreign currency transactions, and the difference between the amounts of interest and dividends recorded on the books of the Fund and the amounts actually received. The portion of foreign currency gains and losses related to fluctuation in exchange rates between the initial purchase trade date and subsequent sale trade date is included in realized gain/(loss) on investments.
Foreign Securities. The Fund may directly purchase securities of foreign issuers. Investing in securities of foreign issuers involves special risks not typically associated with investing in securities of U.S. issuers. The risks include possible revaluation of currencies, the inability to repatriate funds, less complete financial information about companies, and possible future adverse political and economic developments. Moreover, securities of many foreign issuers and their markets may be less liquid and their prices more volatile than securities of comparable U.S. issuers.
Foreign Taxes. The Fund may be subject to foreign taxes on income, gains on investments, or currency repatriation, a portion of which may be recoverable. The Fund will accrue such taxes and recoveries as applicable, based upon its current interpretation of tax rules and regulations that exist in the markets in which it invests.
Securities Transactions and Investment Income. Securities transactions are accounted for on the trade date with realized gain/(loss) on investments determined by using the identified cost method. Interest income (including amortization of premium and accretion of discount) is recorded on an accrual basis. Premiums and discounts on debt securities are amortized using the effective yield to maturity method or amortized to earliest call date, if applicable. Dividend income is recorded on the ex-dividend date, except for certain dividends from foreign securities that are recorded as soon after the ex-dividend date as the Fund becomes aware of such dividends.
Determination of Net Asset Value and Calculation of Expenses. Certain administrative expenses are common to, and allocated among, various affiliated funds. Such allocations are made on the basis of the Fund’s average net assets or other criteria directly affecting the expenses as determined by the Adviser pursuant to procedures established by the Board.
In calculating the NAV per share of each class, investment income, realized and unrealized gains and losses, redemption fees, and expenses other than class specific expenses are allocated daily to each class of shares
The Gabelli Global Growth Fund
Notes to Financial Statements (Continued)
based upon the proportion of net assets of each class at the beginning of each day. Distribution expenses are borne solely by the class incurring the expense.
Distributions to Shareholders. Distributions to shareholders are recorded on the ex-dividend date. Distributions to shareholders are based on income and capital gains as determined in accordance with federal income tax regulations, which may differ from income and capital gains as determined under GAAP. These differences are primarily due to differing treatments of income and gains on various investment securities and foreign currency transactions held by the Fund, timing differences, and differing characterizations of distributions made by the Fund. Distributions from net investment income for federal income tax purposes include net realized gains on foreign currency transactions. These book/tax differences are either temporary or permanent in nature. To the extent these differences are permanent, adjustments are made to the appropriate capital accounts in the period when the differences arise. These reclassifications have no impact on the NAV per share of the Fund. For the year ended December 31, 2024, no reclassifications were made in the Fund.
The tax character of distributions paid during the fiscal years ended December 31, 2024 and 2023 was as follows:
| | | Year ended
December 31,
2024 | | | Year ended
December 31,
2023 | |
| Distributions paid from: | | | | | | | | |
| Ordinary income | | $ | 192,046 | | | $ | 436,136 | |
| Net long term capital gains | | | 4,173,905 | | | | — | |
| Return of capital | | | 145,705 | | | | 10,245 | |
| Total distributions paid | | $ | 4,511,656 | | | $ | 446,381 | |
Provision for Income Taxes. The Fund intends to continue to qualify as a regulated investment company under Subchapter M of the Internal Revenue Code of 1986, as amended (the Code). It is the policy of the Fund to comply with the requirements of the Code applicable to regulated investment companies and to distribute substantially all of its net investment company taxable income and net capital gains. Therefore, no provision for federal income taxes is required.
At December 31, 2024, the components of accumulated earnings/losses on a tax basis were as follows:
| Net unrealized appreciation on investments and foreign currency translations | | $ | 107,595,474 | |
The Fund is permitted to carry capital losses forward for an unlimited period. Capital losses that are carried forward will retain their character as either short term or long term capital losses.
The Fund utilized $6,779,678 of the capital loss carryover for the year ended December 31, 2024.
At December 31, 2024, the temporary differences between book basis and tax basis net unrealized appreciation on investments were due to deferral of losses from wash sales for tax purposes and mark-to-market adjustments on investments in passive foreign investment companies.
The Gabelli Global Growth Fund
Notes to Financial Statements (Continued)
The following summarizes the tax cost of investments and the related net unrealized appreciation at December 31, 2024:
| | | Cost | | | Gross
Unrealized
Appreciation | | | Gross
Unrealized
Depreciation | | | Net
Unrealized
Appreciation | |
| Investments | | $ | 82,975,475 | | | $ | 109,120,196 | | | $ | (1,520,754 | ) | | $ | 107,599,442 | |
The Fund is required to evaluate tax positions taken or expected to be taken in the course of preparing the Fund’s tax returns to determine whether the tax positions are “more-likely-than-not” of being sustained by the applicable tax authority. Income tax and related interest and penalties would be recognized by the Fund as tax expense in the Statement of Operations if the tax positions were deemed not to meet the more-likely-than-not threshold. During the year ended December 31, 2024, the Fund did not incur any income tax, interest, or penalties. As of December 31, 2024, the Adviser has reviewed all open tax years and concluded that there was no impact to the Fund’s net assets or results of operations. The Fund’s federal and state tax returns for the prior three fiscal years remain open, subject to examination. On an ongoing basis, the Adviser will monitor the Fund’s tax positions to determine if adjustments to this conclusion are necessary.
3. Investment Advisory Agreement and Other Transactions. The Fund has entered into an investment advisory agreement (the Advisory Agreement) with the Adviser which provides that the Fund will pay the Adviser a fee, computed daily and paid monthly, at the annual rate of 1.00% of the value of its average daily net assets. In accordance with the Advisory Agreement, the Adviser provides a continuous investment program for the Fund’s portfolio, oversees the administration of all aspects of the Fund’s business and affairs, and pays the compensation of all Officers and Directors of the Fund who are affiliated persons of the Adviser.
The Adviser has contractually agreed to waive its investment advisory fees and/or to reimburse expenses to the extent necessary to maintain the annualized total operating expenses of the Fund (excluding brokerage costs, acquired fund fees and expenses, interest, taxes, and extraordinary expenses) until at least April 30, 2025, at no more than an annual rate of 0.90% for all classes of shares. During the year ended December 31, 2024, the Adviser reimbursed the Fund in the amount of $854,439. In addition, the Fund has agreed, during the two year period following any waiver or reimbursement by the Adviser, to repay such amount to the extent, that after giving effect to the repayment, such adjusted annualized total operating expenses of the Fund would not exceed 0.90% of the value of the Fund’s average daily net assets for each share class of the Fund. The agreement is renewable annually. At December 31, 2024, the cumulative amount which the Fund may repay the Adviser, subject to the terms above, is $1,737,182:
| For the year ended December 31, 2023, expiring December 31, 2025 | | $ | 882,743 | |
| For the year ended December 31, 2024, expiring December 31, 2026 | | | 854,439 | |
| | | $ | 1,737,182 | |
4. Distribution Plan. The Fund’s Board has adopted a distribution plan (the Plan) for each class of shares, except for Class I Shares, pursuant to Rule 12b-1 under the 1940 Act. Under the Class AAA, Class A, and Class C Share Plans, payments are authorized to G.distributors, LLC (the Distributor), an affiliate of the Adviser, at annual rates of 0.25%, 0.25%, and 1.00%, respectively, of the average daily net assets of those classes, the annual limitations under each Plan. Such payments are accrued daily and paid monthly.
The Gabelli Global Growth Fund
Notes to Financial Statements (Continued)
5. Portfolio Securities. Purchases and sales of securities during the year ended December 31, 2024, other than short term securities and U.S. Government obligations, aggregated $45,127,815 and $51,170,317, respectively.
6. Transactions with Affiliates and Other Arrangements. During the year ended December 31, 2024, the Fund paid brokerage commissions on security trades of $42 to G.research, LLC, an affiliate of the Adviser. Additionally, the Distributor retained a total of $2,931 from investors representing commissions (sales charges and underwriting fees) on sales and redemptions of Fund shares.
The cost of calculating the Fund’s NAV per share is a Fund expense pursuant to the Advisory Agreement. Under the sub-administration agreement with Bank of New York Mellon, the fees paid include the cost of calculating the Fund’s NAV. The Fund reimburses the Adviser for this service. During the year ended December 31, 2024, the Fund accrued $45,000 in accounting fees in the Statement of Operations.
The Corporation pays retainer and per meeting fees to Directors not affiliated with the Adviser, plus specified amounts to the Lead Director and Audit Committee Chairman. Directors are also reimbursed for out of pocket expenses incurred in attending meetings. Directors who are directors or employees of the Adviser or an affiliated company receive no compensation or expense reimbursement from the Corporation.
7. Line of Credit. The Fund participates in an unsecured and uncommitted line of credit, which expires on February 26, 2025 and may be renewed annually, of up to $150,000,000 under which it may borrow up to 10% of its net assets from the custodian for temporary borrowing purposes. Borrowings under this arrangement bear interest at a floating rate equal to the higher of the Overnight Federal Funds Rate plus 135 basis points or the Overnight Bank Funding Rate plus 135 basis points in effect on that day. This amount, if any, would be included in “Interest expense” in the Statement of Operations. At December 31, 2024, there were no borrowings outstanding under the line of credit.
The average daily amount of borrowings outstanding under the line of credit for 5 days of borrowings during the year ended December 31, 2024 was $206,200 with a weighted average interest rate of 6.58%. The maximum amount borrowed at any time during the year ended December 31, 2024 was $240,000.
8. Capital Stock. The Fund currently offers three classes of shares – Class AAA Shares, Class A Shares, and Class I Shares. Class AAA and Class A investors may purchase additional shares of the respective classes. Class C is closed to new and existing investors. The minimum investment for Class I shares is $1,000. Class AAA and Class I Shares are offered without a sales charge. Class A Shares are subject to a maximum front-end sales charge of 5.75%.
The Fund imposes a redemption fee of 2.00% on all classes of shares that are redeemed or exchanged on or before the seventh day after the date of a purchase. The redemption fee is deducted from the proceeds otherwise payable to the redeeming shareholders and is retained by the Fund as an increase in paid-in capital. The redemption fees retained by the Fund during the years ended December 31, 2024 and 2023, if any, can be found in the Statement of Changes in Net Assets under Redemption Fees.
The Gabelli Global Growth Fund
Notes to Financial Statements (Continued)
Transactions in shares of capital stock were as follows:
| | | Year Ended
December 31,
2024 | | | Year Ended
December 31,
2023 | |
| | | Shares | | | Amount | | | Shares | | | Amount | |
| Class AAA | | | | | | | | | | | | | | | | |
| Shares sold | | | 19,470 | | | $ | 1,064,747 | | | | 16,251 | | | $ | 645,394 | |
| Shares issued upon reinvestment of distributions | | | 41,089 | | | | 2,422,607 | | | | 5,587 | | | | 256,436 | |
| Shares redeemed | | | (184,727 | ) | | | (9,952,669 | ) | | | (213,806 | ) | | | (8,858,623 | ) |
| Net decrease | | | (124,168 | ) | | $ | (6,465,315 | ) | | | (191,968 | ) | | $ | (7,956,793 | ) |
| Class A | | | | | | | | | | | | | | | | |
| Shares sold | | | 18,507 | | | $ | 1,015,449 | | | | 14,860 | | | $ | 617,664 | |
| Shares issued upon reinvestment of distributions | | | 2,165 | | | | 127,590 | | | | 246 | | | | 11,301 | |
| Shares redeemed | | | (10,674 | ) | | | (572,900 | ) | | | (14,942 | ) | | | (600,252 | ) |
| Net increase | | | 9,998 | | | $ | 570,139 | | | | 164 | | | $ | 28,713 | |
| Class C | | | | | | | | | | | | | | | | |
| Shares issued upon reinvestment of distributions | | | 448 | | | $ | 21,258 | | | | 95 | | | $ | 3,525 | |
| Shares redeemed | | | (7,549 | ) | | | (330,029 | ) | | | (6,265 | ) | | | (189,834 | ) |
| Net decrease | | | (7,101 | ) | | $ | (308,771 | ) | | | (6,170 | ) | | $ | (186,309 | ) |
| Class I | | | | | | | | | | | | | | | | |
| Shares sold | | | 290,453 | | | $ | 16,439,738 | | | | 176,877 | | | $ | 7,525,496 | |
| Shares issued upon reinvestment of distributions | | | 30,252 | | | | 1,831,749 | | | | 3,464 | | | | 163,257 | |
| Shares redeemed | | | (218,097 | ) | | | (12,237,342 | ) | | | (508,150 | ) | | | (20,758,127 | ) |
| Net increase/(decrease) | | | 102,608 | | | $ | 6,034,145 | | | | (327,809 | ) | | $ | (13,069,374 | ) |
9. Indemnifications. The Fund enters into contracts that contain a variety of indemnifications. The Fund’s maximum exposure under these arrangements is unknown. However, the Fund has not had prior claims or losses pursuant to these contracts. Management has reviewed the Fund’s existing contracts and expects the risk of loss to be remote.
10. Segment Reporting. In this reporting period, the Fund adopted FASB Accounting Standards Update 2023-07, Segment Reporting (Topic 280) - Improvements to Reportable Segment Disclosures (ASU 2023-07). Adoption of the new standard impacted financial statement disclosures only and did not affect the Fund’s financial position or results of operations. The Fund’s Principal Executive Officer and Principal Financial Officer act as the Fund’s chief operating decision maker (CODM), as defined in Topic 280, assessing performance and making decisions about resource allocation. The CODM has determined that the Fund has a single operating segment based on the fact that the CODM monitors the operating results of the Fund as a whole and the Fund’s long-term strategic asset allocation is guided by the Fund’s investment objective and principal investment strategies, and executed by the Fund’s portfolio management team, comprised of investment professionals employed by the Adviser. The financial information provided to and reviewed by the CODM is consistent with that presented in the Fund’s Schedule of Investments, Statements of Operations and Changes in Net Assets and Financial Highlights.
The Gabelli Global Growth Fund
Notes to Financial Statements (Continued)
11. Subsequent Events. On February 26, 2025, the Fund renewed the unsecured and uncommitted line of credit, which expires on February 25, 2026 and may be renewed annually, of up to $150,000,000 under which it may borrow up to 10% of its net assets from the bank for temporary borrowing purposes.
Management has evaluated the impact on the Fund of all subsequent events occurring through the date the financial statements were issued and has determined that there were no other subsequent events requiring recognition or disclosure in the financial statements.
The Gabelli Global Growth Fund
Report of Independent Registered Public Accounting Firm
To the Shareholders of The Gabelli Global Growth Fund
and the Board of Directors of GAMCO Global Series Funds, Inc.
Opinion on the Financial Statements
We have audited the accompanying statement of assets and liabilities of The Gabelli Global Growth Fund (the “Fund”) (one of the portfolios constituting GAMCO Global Series Funds, Inc. (the “Corporation”)), including the schedule of investments, as of December 31, 2024, and the related statement of operations for the year then ended, the statements of changes in net assets for each of the two years in the period then ended, the financial highlights for each of the five years in the period then ended and the related notes (collectively referred to as the “financial statements”). In our opinion, the financial statements present fairly, in all material respects, the financial position of the Fund (one of the portfolios constituting GAMCO Global Series Funds, Inc.) at December 31, 2024, the results of its operations for the year then ended, the changes in its net assets for each of the two years in the period then ended and its financial highlights for each of the five years in the period then ended, in conformity with U.S. generally accepted accounting principles.
Basis for Opinion
These financial statements are the responsibility of the Corporation’s management. Our responsibility is to express an opinion on the Fund’s financial statements based on our audits. We are a public accounting firm registered with the Public Company Accounting Oversight Board (United States) (“PCAOB”) and are required to be independent with respect to the Corporation in accordance with the U.S. federal securities laws and the applicable rules and regulations of the Securities and Exchange Commission and the PCAOB.
We conducted our audits in accordance with the standards of the PCAOB. Those standards require that we plan and perform the audit to obtain reasonable assurance about whether the financial statements are free of material misstatement, whether due to error or fraud. The Corporation is not required to have, nor were we engaged to perform, an audit of the Corporation’s internal control over financial reporting. As part of our audits, we are required to obtain an understanding of internal control over financial reporting but not for the purpose of expressing an opinion on the effectiveness of the Corporation’s internal control over financial reporting. Accordingly, we express no such opinion.
Our audits included performing procedures to assess the risks of material misstatement of the financial statements, whether due to error or fraud, and performing procedures that respond to those risks. Such procedures included examining, on a test basis, evidence regarding the amounts and disclosures in the financial statements. Our procedures included confirmation of securities owned as of December 31, 2024 by correspondence with the custodian, brokers and others; when replies were not received from brokers or others, we performed other auditing procedures. Our audits also included evaluating the accounting principles used and significant estimates made by management, as well as evaluating the overall presentation of the financial statements. We believe that our audits provide a reasonable basis for our opinion.

We have served as the auditor of one or more Gabelli Funds investment companies since 1992.
New York, New York
March 1, 2025
The Gabelli Global Growth Fund
Liquidity Risk Management Program (Unaudited)
In accordance with Rule 22e-4 under the 1940 Act,the Fund has established a liquidity risk management program (the LRM Program) to govern its approach to managing liquidity risk. The LRM Program is administered by the Liquidity Committee (the Committee), which is comprised of members of Gabelli Funds, LLC management. The Board has designated the Committee to administer the LRM Program.
The LRM Program’s principal objectives include supporting the Fund’s compliance with limits on investments in illiquid assets and mitigating the risk that the Fund will be unable to meet its redemption obligations in a timely manner. The LRM Program also includes elements that support the management and assessment of liquidity risk, including an annual assessment of factors that influence the Fund’s liquidity and the monthly classification and re-classification of certain investments that reflect the Committee’s assessment of their relative liquidity under current market conditions.
At a meeting of the Board held on May 15, 2024, the Board received a written report from the Committee regarding the design and operational effectiveness of the LRM Program. The Committee determined, and reported to the Board, that the LRM Program is reasonably designed to assess and manage the Fund’s liquidity risk and has operated adequately and effectively since its implementation. The Committee reported that there were no liquidity events that impacted the Fund or its ability to timely meet redemptions without dilution to existing shareholders. The Committee noted that the Fund is primarily invested in highly liquid securities and, accordingly, continues to be exempt from the requirement to determine a “highly liquid investment minimum” as defined in the Rule 22e-4. Because of that continued qualification for the exemption, the Fund has not adopted a “highly liquid investment minimum” amount. The Committee further noted that while changes to the LRM Program were made during the Review Period and reported to the Board, no material changes were made to the LRM Program as a result of the Committee’s annual review.
There can be no assurance that the LRM Program will achieve its objectives in the future. Please refer to the Fund’s Prospectus for more information regarding its exposure to liquidity risk and other principal risks to which an investment in the Fund may be subject.
Gabelli Funds and Your Personal Privacy
Who are we?
The Gabelli Funds are investment companies registered with the Securities and Exchange Commission under the Investment Company Act of 1940. We are managed by Gabelli Funds, LLC, which is affiliated with GAMCO Investors, Inc., a publicly held company with subsidiaries and affiliates that provide investment advisory services for a variety of clients.
What kind of non-public information do we collect about you if you become a fund shareholder?
If you apply to open an account directly with us, you will be giving us some non-public information about yourself. The non-public information we collect about you is:
| ● | Information you give us on your application form. This could include your name, address, telephone number, social security number, bank account number, and other information. |
| ● | Information about your transactions with us, any transactions with our affiliates, and transactions with the entities we hire to provide services to you. This would include information about the shares that you buy or redeem. If we hire someone else to provide services — like a transfer agent — we will also have information about the transactions that you conduct through them. |
What information do we disclose and to whom do we disclose it?
We do not disclose any non-public personal information about our customers or former customers to anyone other than our affiliates, our service providers who need to know such information, and as otherwise permitted by law. If you want to find out what the law permits, you can read the privacy rules adopted by the Securities and Exchange Commission. They are in volume 17 of the Code of Federal Regulations, Part 248. The Commission often posts information about its regulations on its website, www. sec.gov.
What do we do to protect your personal information?
We restrict access to non-public personal information about you to the people who need to know that information in order to provide services to you or the fund and to ensure that we are complying with the laws governing the securities business. We maintain physical, electronic, and procedural safeguards to keep your personal information.
This page was intentionally left blank.
The Gabelli Global Growth Fund
2024 TAX NOTICE TO SHAREHOLDERS (Unaudited)
During the year ended December 31, 2024, the Fund paid ordinary income distributions of $0.060214126 and return of capital distributions of $0.045685874 per share to shareholders in each Class of Shares, and long term capital gains totaling $4,173,905, or the maximum allowable. The distributions of long term capital gains have been designated as a capital gain dividend by the Fund’s Board of Directors. For the year ended December 31, 2024, 100% of the ordinary income distribution qualifies for the dividends received deduction available to corporations. The Fund designates 100% of the ordinary income distribution as qualified dividend income pursuant to the Jobs and Growth Tax Relief Reconciliation Act of 2003. The Fund designates 15.21% of the ordinary income distribution as qualified interest income pursuant to the Tax Relief, Unemployment Reauthorization, and Job Creation Act of 2010. Also for the year of 2024, the Fund did not have foreign tax credits.
U.S. Government Income:
The percentage of U.S. Government securities held as of December 31, 2024 was 0.9%. Due to the diversity in state and local tax law, it is recommended that you consult your personal tax adviser as to the applicability of the information provided to your specific situation.
All designations are based on financial information available as of the date of this annual report and, accordingly, are subject to change. For each item, it is the intention of the Fund to designate the maximum amount permitted under the Internal Revenue Code and the regulations thereunder.
The Gabelli Global Rising Income and Dividend Fund
Annual Report — December 31, 2024
To Our Shareholders,
For the year ended December 31, 2024, the net asset value (NAV) total return per Class AAA Share of The Gabelli Global Rising Income and Dividend Fund was 2.1% compared with a total return of 19.2% for the Morgan Stanley Capital International (MSCI) World Index. Other classes of shares are available.
Enclosed are the financial statements, including the schedule of investments, as of December 31, 2024.
Summary of Portfolio Holdings (Unaudited)
The following table presents portfolio holdings as a percent of net assets as of December 31, 2024:
The Gabelli Global Rising Income and Dividend Fund
| U.S. Government Obligations | | | 12.8 | % |
| Financial Services | | | 11.7 | % |
| Food and Beverage | | | 11.3 | % |
| Electronics | | | 7.2 | % |
| Diversified Industrial | | | 6.2 | % |
| Energy and Utilities | | | 5.9 | % |
| Telecommunications | | | 5.4 | % |
| Consumer Products | | | 3.9 | % |
| Automotive | | | 3.8 | % |
| Entertainment | | | 3.4 | % |
| Wireless Telecommunications | | | 3.4 | % |
| Building and Construction | | | 3.4 | % |
| Machinery | | | 3.3 | % |
| Equipment and Supplies | | | 2.4 | % |
| Broadcasting | | | 2.4 | % |
| Health Care | | | 2.1 | % |
| Business Services | | | 1.8 | % |
| Aerospace and Defense | | | 1.6 | % |
| Hotels and Gaming | | | 1.4 | % |
| Cable and Satellite | | | 1.3 | % |
| Retail | | | 1.2 | % |
| Specialty Chemicals | | | 1.2 | % |
| Consumer Services | | | 1.1 | % |
| Computer Software and Services | | | 0.9 | % |
| Automotive: Parts and Accessories | | | 0.7 | % |
| Publishing | | | 0.2 | % |
| Other Assets and Liabilities (Net) | | | (0.0 | )%* |
| | | | 100.0 | % |
| * | Amount represents greater than (0.05)%. |
The Fund files a complete schedule of portfolio holdings with the Securities and Exchange Commission (the SEC) for the first and third quarters of each fiscal year on Form N-PORT. Shareholders may obtain this information at www.gabelli.com or by calling the Fund at 800-GABELLI (800-422-3554). The Fund’s Form N-PORT is available on the SEC’s website at www.sec.gov and may also be reviewed and copied at the SEC’s Public Reference Room in Washington, DC. Information on the operation of the Public Reference Room may be obtained by calling 800-SEC-0330.
Proxy Voting
The Fund files Form N-PX with its complete proxy voting record for the twelve months ended June 30, no later than August 31 of each year. A description of the Fund’s proxy voting policies, procedures, and how each Fund voted proxies relating to portfolio securities is available without charge, upon request, by (i) calling 800-GABELLI (800-422-3554); (ii) writing to The Gabelli Funds at One Corporate Center, Rye, NY 10580-1422; or (iii) visiting the SEC’s website at www.sec.gov.
The Gabelli Global Rising Income and Dividend Fund
Schedule of Investments — December 31, 2024
| | | | | | | | | Market | |
| Shares | | | | | Cost | | | Value | |
| | | | | COMMON STOCKS — 87.2% | | | | | | | | |
| | | | | Aerospace and Defense — 1.6% | | | | | | | | |
| | 1,600 | | | L3Harris Technologies Inc. | | $ | 126,334 | | | $ | 336,448 | |
| | 100,000 | | | Rolls-Royce Holdings plc† | | | 276,321 | | | | 711,830 | |
| | | | | | | | 402,655 | | | | 1,048,278 | |
| | | | | Automotive — 3.8% | | | | | | | | |
| | 18,500 | | | Daimler Truck Holding AG | | | 513,134 | | | | 706,165 | |
| | 65,000 | | | Iveco Group NV | | | 503,617 | | | | 628,864 | |
| | 35,000 | | | Traton SE | | | 601,535 | | | | 1,013,320 | |
| | 1,000 | | | Volkswagen AG | | | 167,644 | | | | 95,454 | |
| | | | | | | | 1,785,930 | | | | 2,443,803 | |
| | | | | Automotive: Parts and Accessories — 0.7% | | | | | | | | |
| | 18,500 | | | Dana Inc. | | | 259,263 | | | | 213,860 | |
| | 2,000 | | | Genuine Parts Co. | | | 179,604 | | | | 233,520 | |
| | 600 | | | Linamar Corp. | | | 28,683 | | | | 23,705 | |
| | | | | | | | 467,550 | | | | 471,085 | |
| | | | | Broadcasting — 2.4% | | | | | | | | |
| | 75,000 | | | Canal+ France SA† | | | 291,065 | | | | 190,602 | |
| | 2,500 | | | Cogeco Inc. | | | 108,333 | | | | 102,560 | |
| | 33,000 | | | Paramount Global, Cl. A | | | 802,187 | | | | 735,900 | |
| | 32,000 | | | Sinclair Inc. | | | 636,033 | | | | 516,480 | |
| | | | | | | | 1,837,618 | | | | 1,545,542 | |
| | | | | Building and Construction — 3.4% | | | | | | | | |
| | 400 | | | Arcosa Inc. | | | 14,886 | | | | 38,696 | |
| | 500 | | | Chofu Seisakusho Co. Ltd. | | | 7,120 | | | | 6,152 | |
| | 7,000 | | | Herc Holdings Inc. | | | 220,504 | | | | 1,325,310 | |
| | 6,000 | | | Johnson Controls International plc | | | 211,053 | | | | 473,580 | |
| | 2,000 | | | Lennar Corp., Cl. B | | | 91,921 | | | | 264,300 | |
| | 300 | | | Sika AG | | | 82,192 | | | | 71,335 | |
| | | | | | | | 627,676 | | | | 2,179,373 | |
| | | | | Business Services — 1.8% | | | | | | | | |
| | 75,000 | | | Havas NV† | | | 149,559 | | | | 126,042 | |
| | 1,500 | | | ITOCHU Corp. | | | 77,722 | | | | 74,664 | |
| | 30,000 | | | JCDecaux SE† | | | 575,620 | | | | 471,105 | |
| | 1,500 | | | Marubeni Corp. | | | 24,211 | | | | 22,808 | |
| | 13,000 | | | Matthews International Corp., Cl. A | | | 387,651 | | | | 359,840 | |
| | 1,500 | | | Mitsubishi Corp. | | | 26,579 | | | | 24,825 | |
| | 1,500 | | | Mitsui & Co. Ltd. | | | 31,692 | | | | 31,564 | |
| | 1,500 | | | Sumitomo Corp. | | | 32,376 | | | | 32,680 | |
| | | | | | | | 1,305,410 | | | | 1,143,528 | |
| | | | | Cable and Satellite — 1.3% | | | | | | | | |
| | 5,105 | | | EchoStar Corp., Cl. A† | | | 83,409 | | | | 116,905 | |
| | 20,000 | | | Liberty Latin America Ltd., Cl. A† | | | 178,116 | | | | 127,200 | |
| | 595 | | | Liberty Latin America Ltd., Cl. C† | | | 4,248 | | | | 3,772 | |
| | | | | | | | | Market | |
| Shares | | | | | Cost | | | Value | |
| | 19,000 | | | Rogers Communications Inc., Cl. B | | $ | 667,343 | | | $ | 583,870 | |
| | | | | | | | 933,116 | | | | 831,747 | |
| | | | | Computer Software and Services — 0.9% | | | | | | | | |
| | 28,000 | | | Hewlett Packard Enterprise Co. | | | 379,309 | | | | 597,800 | |
| | | | | | | | | | | | | |
| | | | | Consumer Products — 3.9% | | | | | | | | |
| | 11,000 | | | Energizer Holdings Inc. | | | 363,992 | | | | 383,790 | |
| | 20,000 | | | Essity AB, Cl. A | | | 527,632 | | | | 534,172 | |
| | 2,000 | | | L’Oreal SA | | | 335,032 | | | | 708,211 | |
| | 7,500 | | | Salvatore Ferragamo SpA | | | 113,494 | | | | 52,595 | |
| | 10,000 | | | Scandinavian Tobacco Group A/S | | | 148,378 | | | | 132,376 | |
| | 6,800 | | | Spectrum Brands Holdings Inc. | | | 410,912 | | | | 574,532 | |
| | 18,600 | | | Unicharm Corp. | | | 125,119 | | | | 153,970 | |
| | | | | | | | 2,024,559 | | | | 2,539,646 | |
| | | | | Consumer Services — 1.1% | | | | | | | | |
| | 11,200 | | | Ashtead Group plc | | | 225,512 | | | | 696,156 | |
| | 200 | | | Boyd Group Services Inc. | | | 14,694 | | | | 30,162 | |
| | | | | | | | 240,206 | | | | 726,318 | |
| | | | | Diversified Industrial — 6.2% | | | | | | | | |
| | 1,000 | | | Aker ASA, Cl. A | | | 54,422 | | | | 48,228 | |
| | 11,300 | | | Ampco-Pittsburgh Corp.† | | | 47,826 | | | | 23,617 | |
| | 38,000 | | | Bollore SE | | | 213,935 | | | | 233,812 | |
| | 12,000 | | | Bouygues SA | | | 472,709 | | | | 354,758 | |
| | 1,200 | | | Crane Co. | | | 60,161 | | | | 182,100 | |
| | 5,400 | | | Enpro Inc. | | | 335,857 | | | | 931,230 | |
| | 7,000 | | | Hyster-Yale Inc. | | | 261,232 | | | | 356,510 | |
| | 12,000 | | | Jardine Matheson Holdings Ltd. | | | 632,767 | | | | 491,640 | |
| | 15,000 | | | Myers Industries Inc. | | | 234,455 | | | | 165,600 | |
| | 11,000 | | | Nilfisk Holding A/S† | | | 185,634 | | | | 159,518 | |
| | 2,600 | | | Park-Ohio Holdings Corp. | | | 46,751 | | | | 68,302 | |
| | 3,000 | | | Sulzer AG | | | 240,387 | | | | 433,034 | |
| | 3,600 | | | Svenska Cellulosa AB SCA, Cl. A | | | 23,715 | | | | 45,423 | |
| | 6,000 | | | Textron Inc. | | | 254,526 | | | | 458,940 | |
| | 2,500 | | | Trinity Industries Inc. | | | 47,038 | | | | 87,750 | |
| | | | | | | | 3,111,415 | | | | 4,040,462 | |
| | | | | Electronics — 7.2% | | | | | | | | |
| | 102,500 | | | Sony Group Corp. | | | 567,006 | | | | 2,194,684 | |
| | 115,000 | | | Sony Group Corp., ADR | | | 475,331 | | | | 2,433,400 | |
| | | | | | | | 1,042,337 | | | | 4,628,084 | |
| | | | | Energy and Utilities — 5.9% | | | | | | | | |
| | 4,000 | | | BP plc, ADR | | | 112,910 | | | | 118,240 | |
| | 7,500 | | | Cameco Corp. | | | 86,032 | | | | 385,425 | |
| | 600 | | | Cheniere Energy Inc. | | | 23,332 | | | | 128,922 | |
| | 2,000 | | | Innovex International Inc.† | | | 48,149 | | | | 27,940 | |
See accompanying notes to financial statements.
The Gabelli Global Rising Income and Dividend Fund
Schedule of Investments (Continued) — December 31, 2024
| | | | | | | | | Market | |
| Shares | | | | | Cost | | | Value | |
| | | | | COMMON STOCKS (Continued) | | | | | | | | |
| | | | | Energy and Utilities (Continued) | | | | | | | | |
| | 11,500 | | | Landis+Gyr Group AG | | $ | 691,957 | | | $ | 728,610 | |
| | 13,000 | | | National Fuel Gas Co. | | | 685,727 | | | | 788,840 | |
| | 16,041 | | | National Grid plc | | | 130,608 | | | | 190,776 | |
| | 9,700 | | | National Grid plc, ADR | | | 608,460 | | | | 576,374 | |
| | 17,000 | | | Severn Trent plc | | | 456,470 | | | | 533,760 | |
| | 10,500 | | | Shell plc | | | 226,095 | | | | 325,469 | |
| | | | | | | | 3,069,740 | | | | 3,804,356 | |
| | | | | Entertainment — 3.4% | | | | | | | | |
| | 20,000 | | | Corus Entertainment Inc., Cl. B† | | | 55,286 | | | | 1,252 | |
| | 134,000 | | | Grupo Televisa SAB, ADR | | | 592,783 | | | | 225,120 | |
| | 13,000 | | | International Game Technology plc | | | 153,742 | | | | 229,580 | |
| | 115,000 | | | ITV plc | | | 219,606 | | | | 105,961 | |
| | 10,000 | | | Manchester United plc, Cl. A† | | | 174,164 | | | | 173,500 | |
| | 40,000 | | | Ollamani SAB† | | | 99,811 | | | | 67,910 | |
| | 2,300 | | | Sphere Entertainment Co.† | | | 87,634 | | | | 92,736 | |
| | 45,000 | | | Tencent Music Entertainment Group, ADR | | | 385,810 | | | | 510,750 | |
| | 6,000 | | | Ubisoft Entertainment SA† | | | 102,307 | | | | 81,729 | |
| | 13,000 | | | Universal Music Group NV | | | 293,887 | | | | 332,881 | |
| | 75,000 | | | Vivendi SE | | | 216,875 | | | | 199,893 | |
| | 20,000 | | | Warner Bros Discovery Inc.† | | | 205,344 | | | | 211,400 | |
| | | | | | | | 2,587,249 | | | | 2,232,712 | |
| | | | | Equipment and Supplies — 2.4% | | | | | | | | |
| | 200 | | | AMETEK Inc. | | | 25,278 | | | | 36,052 | |
| | 5,000 | | | Ardagh Metal Packaging SA | | | 18,965 | | | | 15,050 | |
| | 3,000 | | | Graco Inc. | | | 71,740 | | | | 252,870 | |
| | 38,000 | | | Instalco AB | | | 178,549 | | | | 113,205 | |
| | 14,500 | | | Mueller Industries Inc. | | | 201,750 | | | | 1,150,720 | |
| | | | | | | | 496,282 | | | | 1,567,897 | |
| | | | | Financial Services — 11.7% | | | | | | | | |
| | 1,000 | | | American Express Co. | | | 80,155 | | | | 296,790 | |
| | 1,800 | | | American International Group Inc. | | | 63,440 | | | | 131,040 | |
| | 2,500 | | | Bank of America Corp. | | | 70,135 | | | | 109,875 | |
| | 3 | | | Berkshire Hathaway Inc., Cl. A† | | | 358,105 | | | | 2,042,760 | |
| | 10,000 | | | Citigroup Inc. | | | 485,856 | | | | 703,900 | |
| | 3,200 | | | Comerica Inc. | | | 134,262 | | | | 197,920 | |
| | 8,000 | | | Deutsche Bank AG | | | 59,019 | | | | 136,400 | |
| | 5,500 | | | EXOR NV | | | 262,676 | | | | 504,485 | |
| | 27,000 | | | FinecoBank Banca Fineco SpA | | | 182,261 | | | | 469,582 | |
| | 150,000 | | | GAM Holding AG† | | | 64,134 | | | | 14,495 | |
| | | | | | | | | Market | |
| Shares | | | | | Cost | | | Value | |
| | 1,000 | | | Julius Baer Group Ltd. | | $ | 47,234 | | | $ | 64,636 | |
| | 12,000 | | | Kinnevik AB, Cl. A | | | 237,125 | | | | 80,608 | |
| | 4,200 | | | Morgan Stanley | | | 102,566 | | | | 528,024 | |
| | 40,000 | | | Resona Holdings Inc. | | | 181,079 | | | | 290,953 | |
| | 4,000 | | | State Street Corp. | | | 246,331 | | | | 392,600 | |
| | 1,000 | | | T. Rowe Price Group Inc. | | | 71,771 | | | | 113,090 | |
| | 10,000 | | | The Bank of New York Mellon Corp. | | | 315,339 | | | | 768,300 | |
| | 1,500 | | | The PNC Financial Services Group Inc. | | | 102,907 | | | | 289,275 | |
| | 7,000 | | | UBS Group AG | | | 70,979 | | | | 212,240 | |
| | 3,200 | | | Wells Fargo & Co. | | | 103,165 | | | | 224,768 | |
| | | | | | | | 3,238,539 | | | | 7,571,741 | |
| | | | | Food and Beverage — 11.3% | | | | | | | | |
| | 5,000 | | | Danone SA | | | 335,187 | | | | 337,273 | |
| | 40,000 | | | Davide Campari-Milano NV | | | 131,897 | | | | 249,350 | |
| | 6,000 | | | Diageo plc, ADR | | | 665,410 | | | | 762,780 | |
| | 6,400 | | | Fomento Economico Mexicano SAB de CV, ADR | | | 514,524 | | | | 547,136 | |
| | 2,100 | | | General Mills Inc. | | | 141,575 | | | | 133,917 | |
| | 2,000 | | | Heineken NV | | | 133,145 | | | | 142,326 | |
| | 900 | | | Kellanova | | | 40,799 | | | | 72,873 | |
| | 4,000 | | | Kerry Group plc, Cl. A | | | 300,765 | | | | 376,635 | |
| | 53,000 | | | Kikkoman Corp. | | | 345,381 | | | | 593,679 | |
| | 15,000 | | | Maple Leaf Foods Inc. | | | 277,107 | | | | 212,251 | |
| | 3,000 | | | McCormick & Co. Inc. | | | 133,799 | | | | 227,400 | |
| | 3,000 | | | McCormick & Co. Inc., Non-Voting | | | 106,428 | | | | 228,720 | |
| | 3,600 | | | Molson Coors Beverage Co., Cl. B | | | 190,719 | | | | 206,352 | |
| | 14,000 | | | Nestlé SA | | | 1,013,818 | | | | 1,155,110 | |
| | 3,500 | | | Pernod Ricard SA | | | 398,941 | | | | 395,177 | |
| | 12,100 | | | Remy Cointreau SA | | | 892,126 | | | | 731,973 | |
| | 13,500 | | | The Campbell’s Company | | | 560,038 | | | | 565,380 | |
| | 5,400 | | | The Kraft Heinz Co. | | | 153,954 | | | | 165,834 | |
| | 625 | | | WK Kellogg Co. | | | 7,424 | | | | 11,244 | |
| | 11,000 | | | Yakult Honsha Co. Ltd. | | | 247,460 | | | | 208,821 | |
| | | | | | | | 6,590,497 | | | | 7,324,231 | |
| | | | | Health Care — 2.1% | | | | | | | | |
| | 20,000 | | | Achaogen Inc.†(a) | | | 4,200 | | | | 0 | |
| | 4,000 | | | Bristol-Myers Squibb Co. | | | 177,668 | | | | 226,240 | |
| | 2,500 | | | Cutera Inc.† | | | 1,523 | | | | 882 | |
| | 800 | | | GSK plc, ADR | | | 33,309 | | | | 27,056 | |
| | 9,000 | | | Haleon plc, ADR | | | 71,142 | | | | 85,860 | |
| | 700 | | | ICU Medical Inc.† | | | 39,966 | | | | 108,619 | |
| | 2,000 | | | Idorsia Ltd.† | | | 30,329 | | | | 1,812 | |
| | 1,400 | | | Johnson & Johnson | | | 159,572 | | | | 202,468 | |
| | 4,500 | | | Perrigo Co. plc | | | 158,588 | | | | 115,695 | |
| | 10,000 | | | Pfizer Inc. | | | 252,066 | | | | 265,300 | |
| | 5,000 | | | Roche Holding AG, ADR | | | 93,345 | | | | 174,400 | |
See accompanying notes to financial statements.
The Gabelli Global Rising Income and Dividend Fund
Schedule of Investments (Continued) — December 31, 2024
| | | | | | | | | Market | |
| Shares | | | | | Cost | | | Value | |
| | | | | COMMON STOCKS (Continued) | | | | | | | | |
| | | | | Health Care (Continued) | | | | | | | | |
| | 10,000 | | | Viatris Inc. | | $ | 128,514 | | | $ | 124,500 | |
| | | | | | | | 1,150,222 | | | | 1,332,832 | |
| | | | | Hotels and Gaming — 1.4% | | | | | | | | |
| | 6,500 | | | Caesars Entertainment Inc.† | | | 252,495 | | | | 217,230 | |
| | 190,000 | | | Mandarin Oriental International Ltd. | | | 306,552 | | | | 330,600 | |
| | 200,000 | | | The Hongkong & Shanghai Hotels Ltd. | | | 290,849 | | | | 160,172 | |
| | 2,400 | | | Wynn Resorts Ltd. | | | 212,794 | | | | 206,784 | |
| | | | | | | | 1,062,690 | | | | 914,786 | |
| | | | | Machinery — 3.3% | | | | | | | | |
| | 138,000 | | | CNH Industrial NV, New York | | | 1,117,995 | | | | 1,563,540 | |
| | 2,666 | | | NKT A/S† | | | 52,701 | | | | 190,529 | |
| | 1,500 | | | Tennant Co. | | | 117,695 | | | | 122,295 | |
| | 20,024 | | | Twin Disc Inc. | | | 271,588 | | | | 235,282 | |
| | | | | | | | 1,559,979 | | | | 2,111,646 | |
| | | | | Publishing — 0.2% | | | | | | | | |
| | 75,000 | | | Louis Hachette Group† | | | 99,680 | | | | 117,310 | |
| | 18,000 | | | The E.W. Scripps Co., Cl. A† | | | 166,663 | | | | 39,780 | |
| | | | | | | | 266,343 | | | | 157,090 | |
| | | | | Retail — 1.2% | | | | | | | | |
| | 4,000 | | | Nathan’s Famous Inc. | | | 232,477 | | | | 314,440 | |
| | 44,000 | | | Walgreens Boots Alliance Inc. | | | 909,023 | | | | 410,520 | |
| | 1,700 | | | Zalando SE† | | | 66,063 | | | | 57,037 | |
| | | | | | | | 1,207,563 | | | | 781,997 | |
| | | | | Specialty Chemicals — 1.2% | | | | | | | | |
| | 12,000 | | | Arcadium Lithium plc† | | | 69,497 | | | | 61,560 | |
| | 700 | | | Ashland Inc. | | | 35,829 | | | | 50,022 | |
| | 1,700 | | | Darling Ingredients Inc.† | | | 72,992 | | | | 57,273 | |
| | 3,500 | | | International Flavors & Fragrances Inc. | | | 298,759 | | | | 295,925 | |
| | 5,000 | | | Novonesis (Novozymes) B | | | 186,739 | | | | 283,156 | |
| | 200 | | | The Chemours Co. | | | 1,719 | | | | 3,380 | |
| | | | | | | | 665,535 | | | | 751,316 | |
| | | | | Telecommunications — 5.4% | | | | | | | | |
| | 2,000 | | | Cogeco Communications Inc. | | | 104,896 | | | | 93,708 | |
| | 13,000 | | | Deutsche Telekom AG | | | 261,363 | | | | 389,034 | |
| | 20,000 | | | Deutsche Telekom AG, ADR | | | 364,253 | | | | 597,000 | |
| | 280,000 | | | HKBN Ltd. | | | 200,879 | | | | 183,502 | |
| | 75,000 | | | Koninklijke KPN NV | | | 221,421 | | | | 273,076 | |
| | 26,000 | | | Liberty Global Ltd., Cl. A† | | | 286,925 | | | | 331,760 | |
| | 15,000 | | | Liberty Global Ltd., Cl. C† | | | 180,514 | | | | 197,100 | |
| | 5,000 | | | Orange Belgium SA† | | | 107,824 | | | | 76,860 | |
| | 60,000 | | | Pharol SGPS SA† | | | 30,852 | | | | 2,884 | |
| | | | | | | | | Market | |
| Shares | | | | | Cost | | | Value | |
| | 2,500 | | | Prosus NV | | $ | 64,782 | | | $ | 99,312 | |
| | 14,000 | | | Proximus SA | | | 165,324 | | | | 72,872 | |
| | 7,500 | | | Sunrise Communications AG, Cl. A, ADR† | | | 366,917 | | | | 323,100 | |
| | 100,000 | | | Telefonica Deutschland Holding AG | | | 291,775 | | | | 217,011 | |
| | 13,000 | | | VEON Ltd., ADR† | | | 250,770 | | | | 521,300 | |
| | 3,000 | | | Verizon Communications Inc. | | | 129,450 | | | | 119,970 | |
| | | | | | | | 3,027,945 | | | | 3,498,489 | |
| | | | | Wireless Telecommunications — 3.4% | | | | | | | | |
| | 20,000 | | | Millicom International Cellular SA, SDR | | | 373,012 | | | | 490,245 | |
| | 5,200 | | | T-Mobile US Inc. | | | 431,548 | | | | 1,147,796 | |
| | 66,200 | | | Vodafone Group plc, ADR | | | 802,287 | | | | 562,038 | |
| | | | | | | | 1,606,847 | | | | 2,200,079 | |
| | | | | TOTAL COMMON STOCKS | | | 40,687,212 | | | | 56,444,838 | |
| | | | | | | | | | | | | |
| | | | | WARRANTS — 0.0% | | | | | | | | |
| | | | | Diversified Industrial — 0.0% | | | | | | | | |
| | 8,000 | | | Ampco-Pittsburgh Corp., expire 08/01/25† | | | 5,466 | | | | 720 | |
Principal
Amount | | | | | | | | | |
| | | | | U.S. GOVERNMENT OBLIGATIONS — 12.8% | | | | | | | | |
| $ | 8,330,000 | | | U.S. Treasury Bills, 4.279% to 4.581%††, 01/16/25 to 05/15/25 | | | 8,285,236 | | | | 8,288,148 | |
| | | | | | | | | | | | | |
| | | | | TOTAL INVESTMENTS — 100.0% | | $ | 48,977,914 | | | | 64,733,706 | |
| | | | | | | | | | | | | |
| | | | | Other Assets and Liabilities (Net) — (0.0)% | | | | | | | (29,289 | ) |
| | | | | | | | | | | | | |
| | | | | NET ASSETS — 100.0% | | | | | | $ | 64,704,417 | |
| (a) | Security is valued using significant unobservable inputs and is classified as Level 3 in the fair value hierarchy. |
| † | Non-income producing security. |
| †† | Represents annualized yields at dates of purchase. |
| | |
| ADR | American Depositary Receipt |
| SDR | Swedish Depositary Receipt |
See accompanying notes to financial statements.
The Gabelli Global Rising Income and Dividend Fund
Schedule of Investments (Continued) — December 31, 2024
| | | % of | | | | |
| | | Market | | | Market | |
| Geographic Diversification | | Value | | | Value | |
| United States | | | 47.8 | % | | $ | 30,930,658 | |
| Europe | | | 36.7 | | | | 23,785,084 | |
| Japan | | | 9.4 | | | | 6,068,201 | |
| Asia/Pacific | | | 2.6 | | | | 1,676,665 | |
| Canada | | | 2.2 | | | | 1,432,932 | |
| Latin America | | | 1.3 | | | | 840,166 | |
| | | | 100.0 | % | | $ | 64,733,706 | |
See accompanying notes to financial statements.
The Gabelli Global Rising Income and Dividend Fund
Statement of Assets and Liabilities
December 31, 2024
| Assets: | | | | |
| Investments, at value (cost $48,977,914) | | $ | 64,733,706 | |
| Foreign currency, at value (cost $1,560) | | | 1,561 | |
| Dividends receivable | | | 158,836 | |
| Prepaid expenses | | | 6,653 | |
| Total Assets | | | 64,900,756 | |
| Liabilities: | | | | |
| Payable to bank | | | 45,177 | |
| Payable for investment advisory fees | | | 75,639 | |
| Payable for accounting fees | | | 3,750 | |
| Payable for distribution fees | | | 978 | |
| Payable for legal and audit fees | | | 34,800 | |
| Payable for shareholder communications | | | 18,409 | |
| Payable for custodian fees | | | 13,665 | |
| Other accrued expenses | | | 3,921 | |
| Total Liabilities | | | 196,339 | |
| Commitments and Contingencies (See Note 3) | | | | |
| Net Assets | | | | |
| (applicable to 2,150,558 shares outstanding) | | $ | 64,704,417 | |
| | | | | |
| Net Assets Consist of: | | | | |
| Paid-in capital | | $ | 50,306,555 | |
| Total distributable earnings | | | 14,397,862 | |
| Net Assets | | $ | 64,704,417 | |
| | | | | |
| Shares of Capital Stock, each at $0.001 par value: | | | | |
| Class AAA: | | | | |
| Net Asset Value, offering, and redemption price per share ($2,449,348 ÷ 81,653 shares outstanding; 75,000,000 shares authorized) | | $ | 30.00 | |
| Class A: | | | | |
| Net Asset Value and redemption price per share ($840,335 ÷ 27,954 shares outstanding; 50,000,000 shares authorized) | | $ | 30.06 | |
| Maximum offering price per share (NAV ÷ 0.9425, based on maximum sales charge of 5.75% of the offering price) | | $ | 31.89 | |
| Class C: | | | | |
| Net Asset Value and redemption price per share ($299,263 ÷ 12,083 shares outstanding; 25,000,000 shares authorized) | | $ | 24.77 | |
| Class I: | | | | |
| Net Asset Value, offering, and redemption price per share ($61,115,471 ÷ 2,028,868 shares outstanding; 25,000,000 shares authorized) | | $ | 30.12 | |
Statement of Operations
For the Year Ended December 31, 2024
| Investment Income: | | | | |
| Dividends (net of foreign withholding taxes of $113,495) | | $ | 1,307,948 | |
| Interest | | | 133,868 | |
| Total Investment Income | | | 1,441,816 | |
| Expenses: | | | | |
| Investment advisory fees | | | 588,489 | |
| Distribution fees - Class AAA | | | 6,514 | |
| Distribution fees - Class A | | | 2,110 | |
| Distribution fees - Class C | | | 3,273 | |
| Registration expenses | | | 52,458 | |
| Legal and audit fees | | | 49,969 | |
| Accounting fees | | | 45,000 | |
| Shareholder communications expenses | | | 21,720 | |
| Shareholder services fees | | | 15,047 | |
| Directors’ fees | | | 10,542 | |
| Interest expense | | | 382 | |
| Miscellaneous expenses | | | 19,263 | |
| Total Expenses | | | 814,767 | |
| Less: | | | | |
| Expense reimbursements (See Note 3) | | | (282,552 | ) |
| Expenses paid indirectly by broker (See Note 6) | | | (2,193 | ) |
| Total Reimbursements and Credits | | | (284,745 | ) |
| Net Expenses | | | 530,022 | |
| Net Investment Income | | | 911,794 | |
| | | | | |
| Net Realized and Unrealized Gain/(Loss) on Investments and Foreign Currency: | | | | |
| Net realized gain on investments | | | 419,641 | |
| Net realized loss on foreign currency transactions | | | (2,829 | ) |
| Net realized gain on investments and foreign currency transactions | | | 416,812 | |
| Net change in unrealized appreciation/depreciation: | | | | |
| on investments | | | (328,749 | ) |
| on foreign currency translations | | | (5,925 | ) |
| Net change in unrealized appreciation/depreciation on investments and foreign currency translations | | | (334,674 | ) |
| Net Realized and Unrealized Gain/(Loss) on Investments and Foreign Currency | | | 82,138 | |
| Net Increase in Net Assets Resulting from Operations | | $ | 993,932 | |
See accompanying notes to financial statements.
The Gabelli Global Rising Income and Dividend Fund
Statement of Changes in Net Assets
| | | Year Ended | | | Year Ended | |
| | | December 31,
2024 | | | December 31,
2023 | |
| Operations: | | | | | | | | |
| Net investment income | | $ | 911,794 | | | $ | 1,050,639 | |
| Net realized gain on investments and foreign currency transactions | | | 416,812 | | | | 40,397 | |
| Net change in unrealized appreciation/depreciation on investments and foreign currency translations | | | (334,674 | ) | | | 3,118,711 | |
| Net Increase in Net Assets Resulting from Operations | | | 993,932 | | | | 4,209,747 | |
| | | | | | | | | |
| Distributions to Shareholders: | | | | | | | | |
| Accumulated earnings | | | | | | | | |
| Class AAA | | | (73,273 | ) | | | (82,132 | ) |
| Class A | | | (25,163 | ) | | | (16,383 | ) |
| Class C | | | (10,352 | ) | | | (8,943 | ) |
| Class I | | | (1,812,941 | ) | | | (1,041,965 | ) |
| | | | (1,921,729 | ) | | | (1,149,423 | ) |
| Return of capital | | | | | | | | |
| Class AAA | | | (753 | ) | | | (12,973 | ) |
| Class A | | | (259 | ) | | | (2,592 | ) |
| Class C | | | (111 | ) | | | (1,231 | ) |
| Class I | | | (18,626 | ) | | | (165,033 | ) |
| | | | (19,749 | ) | | | (181,829 | ) |
| Total Distributions to Shareholders | | | (1,941,478 | ) | | | (1,331,252 | ) |
| | | | | | | | | |
| Capital Share Transactions: | | | | | | | | |
| Class AAA | | | (1,593,807 | ) | | | (161,018 | ) |
| Class A | | | 36,854 | | | | (61,769 | ) |
| Class C | | | (71,842 | ) | | | (72,679 | ) |
| Class I | | | 9,958,443 | | | | 2,217,107 | |
| Net Increase in Net Assets from Capital Share Transactions | | | 8,329,648 | | | | 1,921,641 | |
| | | | | | | | | |
| Net Increase in Net Assets | | | 7,382,102 | | | | 4,800,136 | |
| | | | | | | | | |
| Net Assets: | | | | | | | | |
| Beginning of year | | | 57,322,315 | | | | 52,522,179 | |
| End of year | | $ | 64,704,417 | | | $ | 57,322,315 | |
See accompanying notes to financial statements.
The Gabelli Global Rising Income and Dividend Fund
Financial Highlights
Selected data for a share of beneficial interest outstanding throughout each year:
| | | | | | | Income (Loss) from Investment Operations | | | Distributions | | | | | | | | | | | | Ratios to Average Net Assets/Supplemental Data | |
Year Ended
December 31 | | Net Asset Value,
Beginning of Year | | | Net Investment
Income(a) | | | Net Realized
and Unrealized
Gain (Loss) on
Investments | | | Total from
Investment
Operations | | | Net Investment
Income | | | Net Realized
Gain on
Investments | | | Return of Capital | | | Total
Distributions | | | Redemption
Fees(a)(b) | | | Net Asset Value,
End of year | | | Total
Return† | | | Net Assets, End
of year
(in 000’s) | | | Net Investment
Income | | | Operating
Expenses Before
Reimbursement | | | Operating
Expenses Net of
Reimbursement(c)(d)(e) | | | Portfolio
Turnover
Rate | |
| Class AAA | | | | | | | | | | | | | | | | | | | | | | | | | | | | | | | | | | | | | | | | | | | | | | | | |
| 2024 | | $ | 30.30 | | | $ | 0.44 | | | $ | 0.18 | | | $ | 0.62 | | | $ | (0.71 | ) | | $ | (0.20 | ) | | $ | (0.01 | ) | | $ | (0.92 | ) | | $ | — | | | $ | 30.00 | | | | 2.07 | % | | $ | 2,449 | | | | 1.42 | % | | | 1.61 | % | | | 0.90 | % | | | 7 | % |
| 2023 | | | 28.22 | | | | 0.48 | | | | 2.32 | | | | 2.80 | | | | (0.57 | ) | | | (0.05 | ) | | | (0.10 | ) | | | (0.72 | ) | | | — | | | | 30.30 | | | | 9.92 | | | | 4,081 | | | | 1.64 | | | | 1.71 | | | | 0.90 | | | | 9 | |
| 2022 | | | 34.68 | | | | 0.30 | | | | (5.73 | ) | | | (5.43 | ) | | | (0.26 | ) | | | (0.76 | ) | | | (0.01 | ) | | | (1.03 | ) | | | — | | | | 28.22 | | | | (15.63 | ) | | | 3,954 | | | | 1.01 | | | | 1.65 | | | | 0.90 | | | | 11 | |
| 2021 | | | 29.04 | | | | 0.39 | (f) | | | 5.79 | | | | 6.18 | | | | (0.17 | ) | | | (0.37 | ) | | | — | | | | (0.54 | ) | | | 0.00 | | | | 34.68 | | | | 21.32 | | | | 4,914 | | | | 1.21 | (f) | | | 1.62 | | | | 0.90 | | | | 10 | |
| 2020 | | | 26.18 | | | | 0.19 | | | | 2.87 | | | | 3.06 | | | | (0.20 | ) | | | — | | | | — | | | | (0.20 | ) | | | 0.00 | | | | 29.04 | | | | 11.68 | | | | 5,157 | | | | 0.79 | | | | 1.72 | | | | 0.90 | | | | 8 | |
| Class A | | | | | | | | | | | | | | | | | | | | | | | | | | | | | | | | | | | | | | | | | | | | | | | | | | | | | | | | | | | | | | | | |
| 2024 | | $ | 30.36 | | | $ | 0.46 | | | $ | 0.17 | | | $ | 0.63 | | | $ | (0.71 | ) | | $ | (0.21 | ) | | $ | (0.01 | ) | | $ | (0.93 | ) | | $ | — | | | $ | 30.06 | | | | 2.06 | % | | $ | 840 | | | | 1.50 | % | | | 1.61 | % | | | 0.90 | % | | | 7 | % |
| 2023 | | | 28.28 | | | | 0.49 | | | | 2.31 | | | | 2.80 | | | | (0.57 | ) | | | (0.05 | ) | | | (0.10 | ) | | | (0.72 | ) | | | — | | | | 30.36 | | | | 9.90 | | | | 813 | | | | 1.65 | | | | 1.71 | | | | 0.90 | | | | 9 | |
| 2022 | | | 34.75 | | | | 0.29 | | | | (5.73 | ) | | | (5.44 | ) | | | (0.26 | ) | | | (0.76 | ) | | | (0.01 | ) | | | (1.03 | ) | | | — | | | | 28.28 | | | | (15.62 | ) | | | 815 | | | | 0.97 | | | | 1.65 | | | | 0.90 | | | | 11 | |
| 2021 | | | 29.10 | | | | 0.39 | (f) | | | 5.80 | | | | 6.19 | | | | (0.17 | ) | | | (0.37 | ) | | | — | | | | (0.54 | ) | | | 0.00 | | | | 34.75 | | | | 21.31 | | | | 1,169 | | | | 1.19 | (f) | | | 1.62 | | | | 0.90 | | | | 10 | |
| 2020 | | | 26.23 | | | | 0.18 | | | | 2.89 | | | | 3.07 | | | | (0.20 | ) | | | — | | | | — | | | | (0.20 | ) | | | 0.00 | | | | 29.10 | | | | 11.69 | | | | 840 | | | | 0.76 | | | | 1.72 | | | | 0.90 | | | | 8 | |
| Class C | | | | | | | | | | | | | | | | | | | | | | | | | | | | | | | | | | | | | | | | | | | | | | | | | | | | | | | | | | | | | | | | |
| 2024 | | $ | 25.14 | | | $ | 0.36 | | | $ | 0.16 | | | $ | 0.52 | | | $ | (0.71 | ) | | $ | (0.17 | ) | | $ | (0.01 | ) | | $ | (0.89 | ) | | $ | — | | | $ | 24.77 | | | | 2.06 | % | | $ | 299 | | | | 1.40 | % | | | 2.36 | % | | | 0.90 | % | | | 7 | % |
| 2023 | | | 23.51 | | | | 0.40 | | | | 1.93 | | | | 2.33 | | | | (0.57 | ) | | | (0.04 | ) | | | (0.09 | ) | | | (0.70 | ) | | | — | | | | 25.14 | | | | 9.89 | | | | 373 | | | | 1.64 | | | | 2.46 | | | | 0.90 | | | | 9 | |
| 2022 | | | 28.93 | | | | 0.25 | | | | (4.77 | ) | | | (4.52 | ) | | | (0.26 | ) | | | (0.63 | ) | | | (0.01 | ) | | | (0.90 | ) | | | — | | | | 23.51 | | | | (15.59 | ) | | | 417 | | | | 1.00 | | | | 2.40 | | | | 0.90 | | | | 11 | |
| 2021 | | | 24.30 | | | | 0.34 | (f) | | | 4.83 | | | | 5.17 | | | | (0.17 | ) | | | (0.37 | ) | | | — | | | | (0.54 | ) | | | 0.00 | | | | 28.93 | | | | 21.32 | | | | 654 | | | | 1.23 | (f) | | | 2.38 | | | | 0.90 | | | | 10 | |
| 2020 | | | 21.94 | | | | 0.15 | | | | 2.41 | | | | 2.56 | | | | (0.20 | ) | | | — | | | | — | | | | (0.20 | ) | | | 0.00 | | | | 24.30 | | | | 11.65 | | | | 968 | | | | 0.74 | | | | 2.47 | | | | 0.90 | | | | 8 | |
| Class I | | | | | | | | | | | | | | | | | | | | | | | | | | | | | | | | | | | | | | | | | | | | | | | | | | | | | | | | | | | | | | | | |
| 2024 | | $ | 30.43 | | | $ | 0.48 | | | $ | 0.14 | | | $ | 0.62 | | | $ | (0.71 | ) | | $ | (0.21 | ) | | $ | (0.01 | ) | | $ | (0.93 | ) | | $ | — | | | $ | 30.12 | | | | 2.03 | % | | $ | 61,116 | | | | 1.56 | % | | | 1.36 | % | | | 0.90 | % | | | 7 | % |
| 2023 | | | 28.34 | | | | 0.51 | | | | 2.30 | | | | 2.81 | | | | (0.57 | ) | | | (0.05 | ) | | | (0.10 | ) | | | (0.72 | ) | | | — | | | | 30.43 | | | | 9.91 | | | | 52,055 | | | | 1.72 | | | | 1.46 | | | | 0.90 | | | | 9 | |
| 2022 | | | 34.82 | | | | 0.30 | | | | (5.75 | ) | | | (5.45 | ) | | | (0.26 | ) | | | (0.76 | ) | | | (0.01 | ) | | | (1.03 | ) | | | — | | | | 28.34 | | | | (15.61 | ) | | | 47,336 | | | | 0.99 | | | | 1.40 | | | | 0.90 | | | | 11 | |
| 2021 | | | 29.15 | | | | 0.39 | (f) | | | 5.82 | | | | 6.21 | | | | (0.17 | ) | | | (0.37 | ) | | | — | | | | (0.54 | ) | | | 0.00 | | | | 34.82 | | | | 21.34 | | | | 62,757 | | | | 1.20 | (f) | | | 1.37 | | | | 0.90 | | | | 10 | |
| 2020 | | | 26.28 | | | | 0.19 | | | | 2.88 | | | | 3.07 | | | | (0.20 | ) | | | — | | | | — | | | | (0.20 | ) | | | 0.00 | | | | 29.15 | | | | 11.67 | | | | 48,234 | | | | 0.79 | | | | 1.47 | | | | 0.90 | | | | 8 | |
| † | Total return represents aggregate total return of a hypothetical investment at the beginning of the year and sold at the end of the year including reinvestment of distributions and does not reflect the applicable sales charges. |
| (a) | Per share amounts have been calculated using the average shares outstanding method. |
| (b) | Amount represents less than $0.005 per share. |
| (c) | The Fund received credits from a designated broker who agreed to pay certain Fund operating expenses. For all years presented, there was no material impact on the expense ratios. |
| (d) | Under an expense reimbursement agreement with the Adviser, the Adviser reimbursed expenses of $282,552, $357,890, $295,664, $311,048, and $295,855 for the years ended December 31, 2024, 2023, 2022, 2021, and 2020, respectively. |
| (e) | The Fund incurred interest expense, the effect of which was minimal. |
| (f) | Includes income resulting from special dividends. Without these dividends, the per share income/(loss) amounts would have been $0.19 (Class AAA and Class A), $0.17 (Class C), and $0.19 (Class I), and the net investment income/(loss) ratios would have been 0.59% (Class AAA), 0.57% (Class A), (1.40%) (Class C), 0.58% (Class I), for the year ended December 31, 2021. |
See accompanying notes to financial statements.
The Gabelli Global Rising Income and Dividend Fund
Notes to Financial Statements
1. Organization. The Gabelli Global Rising Income and Dividend Fund (the Fund), a series of the GAMCO Global Series Funds, Inc. (the Corporation), was incorporated on July 16, 1993 in Maryland. Although the Fund is registered as a non-diversified fund, it has operated as a diversified fund for over three years. Therefore, the Investment Company Act of 1940, as amended (the 1940 Act) obliges the Fund to continue to operate as a diversified fund unless the Fund obtains shareholder approval to operate as a non-diversified fund. The Fund is one of five separately managed portfolios (collectively, the Portfolios) of the Corporation. The Fund’s primary objective is to seek to provide investors a high level of total return through a combination of income and capital appreciation. The Fund commenced investment operations on February 3, 1994.
Gabelli Funds, LLC (the Adviser), with its principal offices located at One Corporate Center, Rye, New York 10580-1422, serves as investment adviser to the Fund. The Adviser makes investment decisions for the Fund and continuously reviews and administers the Fund’s investment program and manages the operations of the Fund under the general supervision of the Company’s Board of Directors (the Board).
2. Significant Accounting Policies. As an investment company, the Fund follows the investment company accounting and reporting guidance, which is part of U.S. generally accepted accounting principles (GAAP) that may require the use of management estimates and assumptions in the preparation of its financial statements. The Board has designated the Adviser as the valuation designee under Rule 2a-5. Actual results could differ from those estimates. The following is a summary of significant accounting policies followed by the Fund in the preparation of its financial statements.
Security Valuation. Portfolio securities listed or traded on a nationally recognized securities exchange or traded in the U.S. over-the-counter market for which market quotations are readily available are valued at the last quoted sale price or a market’s official closing price as of the close of business on the day the securities are being valued. If there were no sales that day, the security is valued at the average of the closing bid and asked prices or, if there were no asked prices quoted on that day, then the security is valued at the closing bid price on that day. If no bid or asked prices are quoted on such day, the security is valued at the most recently available price or, if the Board so determines, by such other method as the Board shall determine in good faith to reflect its fair market value. Portfolio securities traded on more than one national securities exchange or market are valued according to the broadest and most representative market, as determined by the Adviser.
Portfolio securities primarily traded on a foreign market are generally valued at the preceding closing values of such securities on the relevant market, but may be fair valued pursuant to procedures established by the Board if market conditions change significantly after the close of the foreign market, but prior to the close of business on the day the securities are being valued. Debt obligations for which market quotations are readily available are valued at the average of the latest bid and asked prices. If there were no asked prices quoted on such day, the security is valued using the closing bid price, unless the Board determines such amount does not reflect the security’s fair value, in which case these securities will be fair valued as determined by the Board. Such debt obligations are valued through prices provided by a pricing service approved by the Board. Certain securities are valued principally using dealer quotations.
Securities and assets for which market quotations are not readily available are fair valued as determined by the Board. Fair valuation methodologies and procedures may include, but are not limited to: analysis and review of available financial and non-financial information about the company; comparisons with the valuation and changes in valuation of similar securities, including a comparison of foreign securities with the equivalent U.S.
The Gabelli Global Rising Income and Dividend Fund
Notes to Financial Statements (Continued)
dollar value American Depositary Receipt securities at the close of the U.S. exchange; and evaluation of any other information that could be indicative of the value of the security.
The Fund employs a fair value model to adjust prices to reflect events affecting the values of certain portfolio securities which occur between the close of trading on the principal market for such securities (foreign exchanges and over-the-counter markets) at the time when net asset values of the Fund are determined. If the Fund’s valuation committee believes that a particular event would materially affect net asset value, further adjustment is considered. Such securities are classified as Level 2 in the fair value hierarchy presented below.
The inputs and valuation techniques used to measure fair value of the Fund’s investments are summarized into three levels as described in the hierarchy below:
| ● | Level 1 — unadjusted quoted prices in active markets for identical securities; |
| ● | Level 2 — other significant observable inputs (including quoted prices for similar securities, interest rates, prepayment speeds, credit risk, etc.); and |
| ● | Level 3 — significant unobservable inputs (including the Board’s determinations as to the fair value of investments). |
A financial instrument’s level within the fair value hierarchy is based on the lowest level of any input both individually and in the aggregate that is significant to the fair value measurement. The inputs or methodology used for valuing securities are not necessarily an indication of the risk associated with investing in those securities. The summary of the Fund’s investments in securities by inputs used to value the Fund’s investments as of December 31, 2024 is as follows:
| | | Valuation Inputs | | | | |
| | | Level 1
Quoted Prices | | | Level 2 Other
Significant
Observable Inputs | | | Level 3 Significant
Unobservable
Inputs (a) | | | Total
Market Value
at 12/31/24 | |
| INVESTMENTS IN SECURITIES: | | | | | | | | | | | | | | | | |
| ASSETS (Market Value): | | | | | | | | | | | | | | | | |
| Common Stocks: | | | | | | | | | | | | | | | | |
| Health Care | | $ | 1,332,832 | | | | — | | | $ | 0 | | | $ | 1,332,832 | |
| Telecommunications | | | 3,281,478 | | | $ | 217,011 | | | | — | | | | 3,498,489 | |
| Other Industries (b) | | | 51,613,517 | | | | — | | | | — | | | | 51,613,517 | |
| Total Common Stocks | | | 56,227,827 | | | | 217,011 | | | | 0 | | | | 56,444,838 | |
| Warrants (b) | | | 720 | | | | — | | | | — | | | | 720 | |
| U.S. Government Obligations | | | — | | | | 8,288,148 | | | | — | | | | 8,288,148 | |
| TOTAL INVESTMENTS IN SECURITIES – ASSETS | | $ | 56,228,547 | | | $ | 8,505,159 | | | $ | 0 | | | $ | 64,733,706 | |
| (a) | The inputs for this security are not readily available and are derived based on the judgment of the Adviser according to procedures approved by the Board. |
| (b) | Please refer to the Schedule of Investments for the industry classifications of these portfolio holdings. |
At December 31, 2024, the total value of Level 3 investments for the Fund was less than 1% of total net assets.
General. The Fund uses recognized industry pricing services – approved by the Board and unaffiliated with the Adviser – to value most of its securities, and uses broker quotes provided by market makers of securities not valued by these and other recognized pricing sources. Several different pricing feeds are received to
The Gabelli Global Rising Income and Dividend Fund
Notes to Financial Statements (Continued)
value domestic equity securities, international equity securities, preferred equity securities, and fixed income securities. The data within these feeds are ultimately sourced from major stock exchanges and trading systems where these securities trade. The prices supplied by external sources are checked by obtaining quotations or actual transaction prices from market participants. If a price obtained from the pricing source is deemed unreliable, prices will be sought from another pricing service or from a broker/dealer that trades that security or similar securities.
Fair Valuation. Fair valued securities may be common or preferred equities, warrants, options, rights, or fixed income obligations. Where appropriate, Level 3 securities are those for which market quotations are not available, such as securities not traded for several days, or for which current bids are not available, or which are restricted as to transfer. When fair valuing a security, factors to consider include recent prices of comparable securities that are publicly traded, reliable prices of securities not publicly traded, the use of valuation models, current analyst reports, valuing the income or cash flow of the issuer, or cost if the preceding factors do not apply. A significant change in the unobservable inputs could result in a lower or higher value in Level 3 securities. The circumstances of Level 3 securities are frequently monitored to determine if fair valuation measures continue to apply.
The Adviser reports quarterly to the Board the results of the application of fair valuation policies and procedures. These may include backtesting the prices realized in subsequent trades of these fair valued securities to fair values previously recognized.
Foreign Currency Translations. The books and records of the Fund are maintained in U.S. dollars. Foreign currencies, investments, and other assets and liabilities are translated into U.S. dollars at current exchange rates. Purchases and sales of investment securities, income, and expenses are translated at the exchange rate prevailing on the respective dates of such transactions. Unrealized gains and losses that result from changes in foreign exchange rates and/or changes in market prices of securities have been included in unrealized appreciation/depreciation on investments and foreign currency translations. Net realized foreign currency gains and losses resulting from changes in exchange rates include foreign currency gains and losses between trade date and settlement date on investment securities transactions, foreign currency transactions, and the difference between the amounts of interest and dividends recorded on the books of the Fund and the amounts actually received. The portion of foreign currency gains and losses related to fluctuation in exchange rates between the initial purchase trade date and subsequent sale trade date is included in realized gain/(loss) on investments.
Foreign Securities. The Fund may directly purchase securities of foreign issuers. Investing in securities of foreign issuers involves special risks not typically associated with investing in securities of U.S. issuers. The risks include possible revaluation of currencies, the inability to repatriate funds, less complete financial information about companies, and possible future adverse political and economic developments. Moreover, securities of many foreign issuers and their markets may be less liquid and their prices more volatile than securities of comparable U.S. issuers.
Foreign Taxes. The Fund may be subject to foreign taxes on income, gains on investments, or currency repatriation, a portion of which may be recoverable. The Fund will accrue such taxes and recoveries as applicable, based upon its current interpretation of tax rules and regulations that exist in the markets in which it invests.
Restricted Securities. The Fund may invest up to 15% of its net assets in securities for which the markets are restricted. Restricted securities include securities whose disposition is subject to substantial legal or contractual
The Gabelli Global Rising Income and Dividend Fund
Notes to Financial Statements (Continued)
restrictions. The sale of restricted securities often requires more time and results in higher brokerage charges or dealer discounts and other selling expenses than does the sale of securities eligible for trading on national securities exchanges or in the over-the-counter markets. Restricted securities may sell at a price lower than similar securities that are not subject to restrictions on resale. Securities freely saleable among qualified institutional investors under special rules adopted by the SEC may be treated as liquid if they satisfy liquidity standards established by the Board. The continued liquidity of such securities is not as well assured as that of publicly traded securities, and accordingly the Board will monitor their liquidity. For the restricted securities the Fund held as of December 31, 2024, if any, refer to the Schedule of Investments.
Securities Transactions and Investment Income. Securities transactions are accounted for on the trade date with realized gain/(loss) on investments determined by using the identified cost method. Interest income (including amortization of premium and accretion of discount) is recorded on an accrual basis. Premiums and discounts on debt securities are amortized using the effective yield to maturity method or amortized to earliest call date, if applicable. Dividend income is recorded on the ex-dividend date, except for certain dividends from foreign securities that are recorded as soon after the ex-dividend date as the Fund becomes aware of such dividends.
Determination of Net Asset Value and Calculation of Expenses. Certain administrative expenses are common to, and allocated among, various affiliated funds. Such allocations are made on the basis of the fund’s average net assets or other criteria directly affecting the expenses as determined by the Adviser pursuant to procedures established by the Board.
In calculating the NAV per share of each class, investment income, realized and unrealized gains and losses, redemption fees, and expenses other than class specific expenses are allocated daily to each class of shares based upon the proportion of net assets of each class at the beginning of each day. Distribution expenses are borne solely by the class incurring the expense.
Distributions to Shareholders. Distributions to shareholders are recorded on the ex-dividend date. Distributions to shareholders are based on income and capital gains as determined in accordance with federal income tax regulations, which may differ from income and capital gains as determined under GAAP. These differences are primarily due to the reclassification of prior year return of capital and redesignation of dividends paid. These book/tax differences are either temporary or permanent in nature. To the extent these differences are permanent, adjustments are made to the appropriate capital accounts in the period when the differences arise. These reclassifications have no impact on the NAV of the Fund. For the year ended December 31, 2024, no reclassifications were made in the Fund.
The tax character of distributions paid during the years ended December 31, 2024 and 2023 was as follows:
| | | Year ended
December 31,
2024 | | | Year ended
December 31,
2023 | |
| Distributions paid from: | | | | | | | | |
| Ordinary income | | $ | 1,487,269 | | | $ | 1,053,332 | |
| Net long term capital gains | | | 434,460 | | | | 96,091 | |
| Return of capital | | | 19,749 | | | | 181,829 | |
| Total distributions paid | | $ | 1,941,478 | | | $ | 1,331,252 | |
The Gabelli Global Rising Income and Dividend Fund
Notes to Financial Statements (Continued)
Provision for Income Taxes. The Fund intends to continue to qualify as a regulated investment company under Subchapter M of the Internal Revenue Code of 1986, as amended (the Code). It is the policy of the Fund to comply with the requirements of the Code applicable to regulated investment companies and to distribute substantially all of its net investment company taxable income and net capital gains. Therefore, no provision for federal income taxes is required.
At December 31, 2024, the components of accumulated earnings/losses on a tax basis were as follows:
| Net unrealized appreciation on investments and foreign currency translations | | $ | 14,397,863 | |
At December 31, 2024, the temporary differences between book basis and tax basis net unrealized appreciation on investments were primarily due to deferral of losses from wash sales for tax purposes and prior year mark-to-market adjustments on investments no longer considered passive foreign investment companies.
The following summarizes the tax cost of investments and the related net unrealized appreciation at December 31, 2024:
| | | Cost | | | Gross
Unrealized
Appreciation | | | Gross
Unrealized
Depreciation | | | Net
Unrealized
Appreciation | |
| Investments | | $ | 50,334,255 | | | $ | 21,176,993 | | | $ | (6,777,542 | ) | | $ | 14,399,451 | |
The Fund is required to evaluate tax positions taken or expected to be taken in the course of preparing the Fund’s tax returns to determine whether the tax positions are “more-likely-than-not” of being sustained by the applicable tax authority. Income tax and related interest and penalties would be recognized by the Fund as tax expense in the Statement of Operations if the tax positions were deemed not to meet the more-likely-than-not threshold. During the year ended December 31, 2024, the Fund did not incur any income tax, interest, or penalties. As of December 31, 2024, the Adviser has reviewed all open tax years and concluded that there was no impact to the Fund’s net assets or results of operations. The Fund’s federal and state tax returns for the prior three fiscal years remain open, subject to examination. On an ongoing basis, the Adviser will monitor the Fund’s tax positions to determine if adjustments to this conclusion are necessary.
3. Investment Advisory Agreement and Other Transactions. The Fund has entered into an investment advisory agreement (the Advisory Agreement) with the Adviser which provides that the Fund will pay the Adviser a fee, computed daily and paid monthly, at the annual rate of 1.00% of the value of its average daily net assets. In accordance with the Advisory Agreement, the Adviser provides a continuous investment program for the Fund’s portfolio, oversees the administration of all aspects of the Fund’s business and affairs, and pays the compensation of all Officers and Directors of the Fund who are affiliated persons of the Adviser.
The Adviser has contractually agreed to waive its investment advisory fees and/or to reimburse expenses to the extent necessary to maintain the annualized total operating expenses of the Fund (excluding brokerage costs, acquired fund fees and expenses, interest, taxes, and extraordinary expenses) until at least April 30, 2025, at no more than an annual rate of 0.90% for all classes of shares. During the year ended December 31, 2024, the Adviser reimbursed expenses in the amount of $282,552. In addition, the Fund has agreed, during the two year period following any waiver or reimbursement by the Adviser, to repay such amount to the extent, after
The Gabelli Global Rising Income and Dividend Fund
Notes to Financial Statements (Continued)
giving effect to the repayment, such adjusted annualized total operating expenses of the Fund would not exceed 0.90% of the value of the Fund’s average daily net assets for each share class of the Fund. The agreement is renewable annually. At December 31, 2024, the cumulative amount which the Fund may repay the Adviser, subject to the terms above, is $640,442:
| For the year ended December 31, 2023, expiring December 31, 2025 | | $ | 357,890 | |
| For the year ended December 31, 2024, expiring December 31, 2026 | | | 282,552 | |
| | | $ | 640,442 | |
4. Distribution Plan. The Fund’s Board has adopted a distribution plan (the Plan) for each class of shares, except for Class I Shares, pursuant to Rule 12b-1 under the 1940 Act. Under the Class AAA, Class A, and Class C Share Plans, payments are authorized to G.distributors, LLC (the Distributor), an affiliate of the Adviser, at annual rates of 0.25%, 0.25%, and 1.00%, respectively, of the average daily net assets of those classes, the annual limitations under each Plan. Such payments are accrued daily and paid monthly.
5. Portfolio Securities. Purchases and sales of securities during the year ended December 31, 2024, other than short term securities and U.S. Government obligations, aggregated $4,358,897 and $3,674,552, respectively.
6. Transactions with Affiliates and Other Arrangements. During the year ended December 31, 2024, the Fund paid brokerage commissions on security trades of $1,584 to G.research, LLC, an affiliate of the Adviser. Additionally, the Distributor retained a total of $23 from investors representing commissions (sales charges and underwriting fees) on sales and redemptions of Fund shares.
The Fund received credits from a designated broker who agreed to pay certain Fund operating expenses. The amount of such expenses paid through this directed brokerage arrangement during this period was $2,193.
The Fund engaged in a sale transaction with a fund that has a common investment adviser. This sale transaction complied with Rule 17a-7 under the Act and amounted to $30,510 with a realized loss of $127,672.
The cost of calculating the Fund’s NAV per share is a Fund expense pursuant to the Advisory Agreement. Under the sub-administration agreement with Bank of New York Mellon, the fees paid include the cost of calculating the Fund’s NAV. The Fund reimburses the Adviser for this service. During the year ended December 31, 2024, the Fund accrued $45,000 in accounting fees in the Statement of Operations.
The Corporation pays retainer and per meeting fees to Directors not affiliated with the Adviser, plus specified amounts to the Lead Director and Audit Committee Chairman. Directors are also reimbursed for out of pocket expenses incurred in attending meetings. Directors who are directors or employees of the Adviser or an affiliated company receive no compensation or expense reimbursement from the Corporation.
7. Line of Credit. The Fund participates in an unsecured and uncommitted line of credit, which expires on February 26, 2025 and may be renewed annually, of up to $150,000,000 under which it may borrow up to 10% of its net assets from the bank for temporary borrowing purposes. Borrowings under this arrangement bear interest at a floating rate equal to the higher of the Overnight Federal Funds Rate plus 135 basis points or the Overnight Bank Funding Rate plus 135 basis points in effect on that day. This amount, if any, would be included in “Interest expense” in the Statement of Operations. During the year ended December 31, 2024, there were no borrowings under the line of credit.
8. Capital Stock. The Fund currently offers three classes of shares – Class AAA Shares, Class A Shares, and Class I Shares. Class AAA and Class A investors may purchase additional shares of the respective classes.
The Gabelli Global Rising Income and Dividend Fund
Notes to Financial Statements (Continued)
Class C is closed to new and existing investors. The minimum investment for Class I shares is $1,000. Class AAA and Class I Shares are offered without a sales charge. Class A Shares are subject to maximum front-end sales charge of 5.75%.
The Fund imposes a redemption fee of 2.00% on all classes of shares that are redeemed or exchanged on or before the seventh day after the date of a purchase. The redemption fee is deducted from the proceeds otherwise payable to the redeeming shareholders and is retained by the Fund as an increase in paid-in capital. The redemption fees retained by the Fund during the years ended December 31, 2024 and 2023, if any, can be found in the Statement of Changes in Net Assets under Redemption Fees.
Transactions in shares of capital stock were as follows:
| | | Year Ended
December 31,
2024 | | | Year Ended
December 31,
2023 | |
| | | Shares | | | Amount | | | Shares | | | Amount | |
| Class AAA | | | | | | | | | | | | | | | | |
| Shares sold | | | 266 | | | $ | 8,151 | | | | 460 | | | $ | 13,676 | |
| Shares issued upon reinvestment of distributions | | | 2,362 | | | | 71,139 | | | | 3,085 | | | | 93,767 | |
| Shares redeemed | | | (55,677 | ) | | | (1,673,097 | ) | | | (8,936 | ) | | | (268,461 | ) |
| Net decrease | | | (53,049 | ) | | $ | (1,593,807 | ) | | | (5,391 | ) | | $ | (161,018 | ) |
| Class A | | | | | | | | | | | | | | | | |
| Shares sold | | | 2,063 | | | $ | 64,175 | | | | 1,379 | | | $ | 41,508 | |
| Shares issued upon reinvestment of distributions | | | 799 | | | | 24,120 | | | | 591 | | | | 17,988 | |
| Shares redeemed | | | (1,671 | ) | | | (51,441 | ) | | | (4,044 | ) | | | (121,265 | ) |
| Net increase/(decrease) | | | 1,191 | | | $ | 36,854 | | | | (2,074 | ) | | $ | (61,769 | ) |
| Class C | | | | | | | | | | | | | | | | |
| Shares issued upon reinvestment of distributions | | | 420 | | | $ | 10,463 | | | | 403 | | | $ | 10,158 | |
| Shares redeemed | | | (3,187 | ) | | | (82,305 | ) | | | (3,278 | ) | | | (82,837 | ) |
| Net decrease | | | (2,767 | ) | | $ | (71,842 | ) | | | (2,875 | ) | | $ | (72,679 | ) |
| Class I | | | | | | | | | | | | | | | | |
| Shares sold | | | 278,797 | | | $ | 8,779,492 | | | | 577,974 | | | $ | 17,758,434 | |
| Shares issued upon reinvestment of distributions | | | 60,470 | | | | 1,829,222 | | | | 39,489 | | | | 1,205,195 | |
| Shares redeemed | | | (21,296 | ) | | | (650,271 | ) | | | (577,080 | ) | | | (16,746,522 | ) |
| Net increase | | | 317,971 | | | $ | 9,958,443 | | | | 40,383 | | | $ | 2,217,107 | |
9. Significant Shareholder. As of December 31, 2024, 81% of the Fund was beneficially owned by the Adviser and its affiliates, including managed accounts for which the affiliates of the Adviser have voting control but disclaim pecuniary interest.
10. Indemnifications. The Fund enters into contracts that contain a variety of indemnifications. The Fund’s maximum exposure under these arrangements is unknown. However, the Fund has not had prior claims or losses pursuant to these contracts. Management has reviewed the Fund’s existing contracts and expects the risk of loss to be remote.
11. Segment Reporting. In this reporting period, the Fund adopted FASB Accounting Standards Update 2023-07, Segment Reporting (Topic 280) - Improvements to Reportable Segment Disclosures (ASU 2023-
The Gabelli Global Rising Income and Dividend Fund
Notes to Financial Statements (Continued)
07). Adoption of the new standard impacted financial statement disclosures only and did not affect the Fund’s financial position or results of operations. The Fund’s Principal Executive Officer and Principal Financial Officer act as the Fund’s chief operating decision maker (CODM), as defined in Topic 280, assessing performance and making decisions about resource allocation. The CODM has determined that the Fund has a single operating segment based on the fact that the CODM monitors the operating results of the Fund as a whole and the Fund’s long-term strategic asset allocation is guided by the Fund’s investment objective and principal investment strategies, and executed by the Fund’s portfolio management team, comprised of investment professionals employed by the Adviser. The financial information provided to and reviewed by the CODM is consistent with that presented in the Fund’s Schedule of Investments, Statements of Operations and Changes in Net Assets and Financial Highlights.
12. Subsequent Events. On February 26, 2025, the Fund renewed the unsecured and uncommitted line of credit, which expires on February 25, 2026 and may be renewed annually, of up to $150,000,000 under which it may borrow up to 10% of its net assets from the bank for temporary borrowing purposes.
Management has evaluated the impact on the Fund of all subsequent events occurring through the date the financial statements were issued and has determined that there were no other subsequent events requiring recognition or disclosure in the financial statements.
The Gabelli Global Rising Income and Dividend Fund
Report of Independent Registered Public Accounting Firm
To the Shareholders of The Gabelli Global Rising Income and Dividend Fund
and the Board of Directors of GAMCO Global Series Funds, Inc.
Opinion on the Financial Statements
We have audited the accompanying statement of assets and liabilities of The Gabelli Global Rising Income and Dividend Fund (the “Fund”) (one of the portfolios constituting GAMCO Global Series Funds, Inc. (the “Corporation”)), including the schedule of investments, as of December 31, 2024, and the related statement of operations for the year then ended, the statements of changes in net assets for each of the two years in the period then ended, the financial highlights for each of the five years in the period then ended and the related notes (collectively referred to as the “financial statements”). In our opinion, the financial statements present fairly, in all material respects, the financial position of the Fund (one of the portfolios constituting GAMCO Global Series Funds, Inc.) at December 31, 2024, the results of its operations for the year then ended, the changes in its net assets for each of the two years in the period then ended and its financial highlights for each of the five years in the period then ended, in conformity with U.S. generally accepted accounting principles.
Basis for Opinion
These financial statements are the responsibility of the Corporation’s management. Our responsibility is to express an opinion on the Fund’s financial statements based on our audits. We are a public accounting firm registered with the Public Company Accounting Oversight Board (United States) (“PCAOB”) and are required to be independent with respect to the Corporation in accordance with the U.S. federal securities laws and the applicable rules and regulations of the Securities and Exchange Commission and the PCAOB.
We conducted our audits in accordance with the standards of the PCAOB. Those standards require that we plan and perform the audit to obtain reasonable assurance about whether the financial statements are free of material misstatement, whether due to error or fraud. The Corporation is not required to have, nor were we engaged to perform, an audit of the Corporation’s internal control over financial reporting. As part of our audits, we are required to obtain an understanding of internal control over financial reporting but not for the purpose of expressing an opinion on the effectiveness of the Corporation’s internal control over financial reporting. Accordingly, we express no such opinion.
Our audits included performing procedures to assess the risks of material misstatement of the financial statements, whether due to error or fraud, and performing procedures that respond to those risks. Such procedures included examining, on a test basis, evidence regarding the amounts and disclosures in the financial statements. Our procedures included confirmation of securities owned as of December 31, 2024 by correspondence with the custodian, brokers and others; when replies were not received from brokers or others, we performed other auditing procedures. Our audits also included evaluating the accounting principles used and significant estimates made by management, as well as evaluating the overall presentation of the financial statements. We believe that our audits provide a reasonable basis for our opinion.

We have served as the auditor of one or more Gabelli Funds investment companies since 1992.
New York, New York
March 1, 2025
The Gabelli Global Rising Income and Dividend Fund
Liquidity Risk Management Program (Unaudited)
In accordance with Rule 22e-4 under the 1940 Act,the Fund has established a liquidity risk management program (the LRM Program) to govern its approach to managing liquidity risk. The LRM Program is administered by the Liquidity Committee (the Committee), which is comprised of members of Gabelli Funds, LLC management. The Board has designated the Committee to administer the LRM Program.
The LRM Program’s principal objectives include supporting the Fund’s compliance with limits on investments in illiquid assets and mitigating the risk that the Fund will be unable to meet its redemption obligations in a timely manner. The LRM Program also includes elements that support the management and assessment of liquidity risk, including an annual assessment of factors that influence the Fund’s liquidity and the monthly classification and re-classification of certain investments that reflect the Committee’s assessment of their relative liquidity under current market conditions.
At a meeting of the Board held on May 15, 2024, the Board received a written report from the Committee regarding the design and operational effectiveness of the LRM Program. The Committee determined, and reported to the Board, that the LRM Program is reasonably designed to assess and manage the Fund’s liquidity risk and has operated adequately and effectively since its implementation. The Committee reported that there were no liquidity events that impacted the Fund or its ability to timely meet redemptions without dilution to existing shareholders. The Committee noted that the Fund is primarily invested in highly liquid securities and, accordingly, continues to be exempt from the requirement to determine a “highly liquid investment minimum” as defined in the Rule 22e-4. Because of that continued qualification for the exemption, the Fund has not adopted a “highly liquid investment minimum” amount. The Committee further noted that while changes to the LRM Program were made during the Review Period and reported to the Board, no material changes were made to the LRM Program as a result of the Committee’s annual review.
There can be no assurance that the LRM Program will achieve its objectives in the future. Please refer to the Fund’s Prospectus for more information regarding its exposure to liquidity risk and other principal risks to which an investment in the Fund may be subject.
Gabelli Funds and Your Personal Privacy
Who are we?
The Gabelli Funds are investment companies registered with the Securities and Exchange Commission under the Investment Company Act of 1940. We are managed by Gabelli Funds, LLC, which is affiliated with GAMCO Investors, Inc., a publicly held company with subsidiaries and affiliates that provide investment advisory services for a variety of clients.
What kind of non-public information do we collect about you if you become a fund shareholder?
If you apply to open an account directly with us, you will be giving us some non-public information about yourself. The non-public information we collect about you is:
| ● | Information you give us on your application form. This could include your name, address, telephone number, social security number, bank account number, and other information. |
| ● | Information about your transactions with us, any transactions with our affiliates, and transactions with the entities we hire to provide services to you. This would include information about the shares that you buy or redeem. If we hire someone else to provide services — like a transfer agent — we will also have information about the transactions that you conduct through them. |
What information do we disclose and to whom do we disclose it?
We do not disclose any non-public personal information about our customers or former customers to anyone other than our affiliates, our service providers who need to know such information, and as otherwise permitted by law. If you want to find out what the law permits, you can read the privacy rules adopted by the Securities and Exchange Commission. They are in volume 17 of the Code of Federal Regulations, Part 248. The Commission often posts information about its regulations on its website, www. sec.gov.
What do we do to protect your personal information?
We restrict access to non-public personal information about you to the people who need to know that information in order to provide services to you or the fund and to ensure that we are complying with the laws governing the securities business. We maintain physical, electronic, and procedural safeguards to keep your personal information.
This page was intentionally left blank.
This page was intentionally left blank.
The Gabelli Global Rising Income and Dividend Fund
2024 TAX NOTICE TO SHAREHOLDERS (Unaudited)
During the year ended December 31, 2024, the Fund paid to shareholders ordinary income distributions of $0.7125334 per share and return of capital distributions of $0.0094615 per share to shareholders in each Class of Shares, respectively, and long term capital gains of $434,460, or the maximum allowable. The distribution of long term capital gains has been designated as a capital gain dividend by the Fund’s Board of Directors. For the year ended December 31, 2024, 29.76% of the ordinary income distribution qualifies for the dividends received deduction available to corporations. The Fund designates 90.77% of the ordinary income distribution as qualified dividend income pursuant to the Jobs and Growth Tax Relief Reconciliation Act of 2003. The Fund designates 6.27% of the ordinary income distribution as qualified interest income pursuant to the Tax Relief, Unemployment Reauthorization, and Job Creation Act of 2010. The Fund designates 100% of the ordinary income distribution as qualified short term gain pursuant to the American Jobs Creation Act of 2004. Also during 2024, the Fund passed through foreign tax credits of $0.0493554 per share to each Class of Shares.
U.S. Government Income:
The percentage of the ordinary income distribution paid by the Fund during the year ended December 31, 2024 which was derived from U.S. Treasury securities was 5.84%. Such income is exempt from state and local tax in all states. However, many states, including New York and California, allow a tax exemption for a portion of the income earned only if a mutual fund has invested at least 50% of its assets at the end of each quarter of the Fund’s fiscal year in U.S. Government securities. The Fund did not meet this strict requirement in 2024. The percentage of U.S. Government securities held as of December 31, 2024 was 12.8%. Due to the diversity in state and local tax law, it is recommended that you consult your personal tax adviser as to the applicability of the information provided to your specific situation.
All designations are based on financial information available as of the date of this annual report and, accordingly, are subject to change. For each item, it is the intention of the Fund to designate the maximum amount permitted under the Internal Revenue Code and the regulations thereunder.
The Gabelli International Small Cap Fund
Annual Report — December 31, 2024
(Y)our Portfolio Management Team
| |  | |  | |  | |
| | Caesar M.P. Bryan
Portfolio Manager | | Gustavo Pifano
Portfolio Manager | | Ashish Sinha
Portfolio Manager | |
To Our Shareholders,
For the year ended December 31, 2024, the net asset value (NAV) total return per Class AAA Share of The Gabelli International Small Cap Fund was (6.0)% compared with a total return of 2.3% for the Morgan Stanley Capital International (MSCI) Europe, Australasia and Far East (EAFE) Small Cap Index. Other classes of shares are available.
Enclosed are the financial statements, including the schedule of investments, as of December 31, 2024.
Summary of Portfolio Holdings (Unaudited)
The following table presents portfolio holdings as a percent of net assets as of December 31, 2024:
The Gabelli International Small Cap Fund
| Materials | | | 19.7 | % |
| Consumer Staples | | | 16.2 | % |
| Health Care | | | 16.1 | % |
| Consumer Discretionary | | | 15.9 | % |
| Industrials | | | 14.0 | % |
| Information Technology | | | 10.0 | % |
| Financials | | | 5.1 | % |
| U.S. Government Obligations | | | 3.3 | % |
| Communication Services | | | 1.4 | % |
| Other Assets and Liabilities (Net) | | | (1.7 | )% |
| | | | 100.0 | % |
The Fund files a complete schedule of portfolio holdings with the Securities and Exchange Commission (the SEC) for the first and third quarters of each fiscal year on Form N-PORT. Shareholders may obtain this information at www.gabelli.com or by calling the Fund at 800-GABELLI (800-422-3554). The Fund’s Form N-PORT is available on the SEC’s website at www.sec.gov and may also be reviewed and copied at the SEC’s Public Reference Room in Washington, DC. Information on the operation of the Public Reference Room may be obtained by calling 800-SEC-0330.
Proxy Voting
The Fund files Form N-PX with its complete proxy voting record for the twelve months ended June 30, no later than August 31 of each year. A description of the Fund’s proxy voting policies, procedures, and how each Fund voted proxies relating to portfolio securities is available without charge, upon request, by (i) calling 800-GABELLI (800-422-3554); (ii) writing to The Gabelli Funds at One Corporate Center, Rye, NY 10580-1422; or (iii) visiting the SEC’s website at www.sec.gov.
The Gabelli International Small Cap Fund
Schedule of Investments — December 31, 2024
| Shares | | | | | Cost | | | Market
Value | |
| | | | | COMMON STOCKS — 96.7% | | | | | | | | |
| | | | | MATERIALS — 19.7% | | | | | | | | |
| | 8,350 | | | Alamos Gold Inc., Cl. A | | $ | 57,784 | | | $ | 154,052 | |
| | 8,000 | | | Eldorado Gold Corp.† | | | 86,947 | | | | 118,960 | |
| | 9,544 | | | Endeavour Mining plc | | | 133,761 | | | | 172,960 | |
| | 5,000 | | | Labrador Iron Ore Royalty Corp. | | | 90,519 | | | | 100,630 | |
| | 7,000 | | | Osisko Gold Royalties Ltd. | | | 84,549 | | | | 126,759 | |
| | 75,000 | | | Perseus Mining Ltd. | | | 76,499 | | | | 119,303 | |
| | 15,000 | | | Treatt plc | | | 96,439 | | | | 91,451 | |
| | 80,000 | | | Westgold Resources Ltd. | | | 132,212 | | | | 140,130 | |
| | | | | | | | 758,710 | | | | 1,024,245 | |
| | | | | CONSUMER STAPLES — 16.2% | | | | | | | | |
| | 15,000 | | | Austevoll Seafood ASA | | | 129,584 | | | | 128,872 | |
| | 5,500 | | | Fevertree Drinks plc | | | 138,747 | | | | 46,408 | |
| | 7,000 | | | Glanbia plc | | | 73,254 | | | | 96,655 | |
| | 3,130 | | | Interparfums SA | | | 95,671 | | | | 132,282 | |
| | 1,600 | | | Laurent-Perrier | | | 144,622 | | | | 170,708 | |
| | 2,500 | | | Milbon Co. Ltd. | | | 101,252 | | | | 55,690 | |
| | 4,000 | | | Sakata Seed Corp. | | | 118,342 | | | | 88,086 | |
| | 2,000 | | | Viscofan SA | | | 118,948 | | | | 126,374 | |
| | | | | | | | 920,420 | | | | 845,075 | |
| | | | | CONSUMER DISCRETIONARY — 15.9% | | | | | | | | |
| | 10,000 | | | Beneteau SACA | | | 168,177 | | | | 91,362 | |
| | 9,820 | | | Entain plc | | | 81,636 | | | | 84,482 | |
| | 18,000 | | | Genius Sports Ltd.† | | | 135,306 | | | | 155,700 | |
| | 2,200 | | | JINS Holdings Inc. | | | 125,148 | | | | 90,044 | |
| | 75,000 | | | Mandarin Oriental International Ltd. | | | 149,583 | | | | 130,500 | |
| | 20,000 | | | Piaggio & C SpA | | | 61,526 | | | | 45,163 | |
| | 1,500 | | | Sanrio Co. Ltd. | | | 49,471 | | | | 52,814 | |
| | 2,300 | | | Tokyotokeiba Co. Ltd. | | | 67,831 | | | | 66,364 | |
| | 10,000 | | | Zojirushi Corp. | | | 93,734 | | | | 114,398 | |
| | | | | | | | 932,412 | | | | 830,827 | |
| | | | | HEALTH CARE — 14.4% | | | | | | | | |
| | 6,212 | | | AddLife AB, Cl. B | | | 29,078 | | | | 77,089 | |
| | 1,000 | | | Bachem Holding AG | | | 28,410 | | | | 63,798 | |
| | 1,800 | | | Gerresheimer AG | | | 177,000 | | | | 132,382 | |
| | 7,000 | | | Mani Inc. | | | 88,794 | | | | 80,435 | |
| | 200 | | | Siegfried Holding AG | | | 66,163 | | | | 217,288 | |
| | 15,000 | | | Tristel plc | | | 71,265 | | | | 79,809 | |
| | 1,300 | | | Vetoquinol SA | | | 81,468 | | | | 100,861 | |
| | | | | | | | 542,178 | | | | 751,662 | |
| | | | | INDUSTRIALS — 14.0% | | | | | | | | |
| | 15,000 | | | Aida Engineering Ltd. | | | 152,919 | | | | 77,600 | |
| | 8,000 | | | AZ-COM MARUWA Holdings Inc. | | | 122,710 | | | | 56,437 | |
| | 45,000 | | | Chemring Group plc | | | 125,161 | | | | 185,062 | |
| | 2,000 | | | Clarkson plc | | | 78,000 | | | | 99,025 | |
| | 6,000 | | | Daiei Kankyo Co. Ltd. | | | 97,445 | | | | 110,242 | |
| Shares | | | | | Cost | | | Market
Value | |
| | 8,000 | | | Iveco Group NV | | $ | 78,499 | | | $ | 77,399 | |
| | 4,000 | | | Loomis AB | | | 148,615 | | | | 121,621 | |
| | | | | | | | 803,349 | | | | 727,386 | |
| | | | | INFORMATION TECHNOLOGY — 10.0% | | | | | | | | |
| | 4,000 | | | A&D HOLON Holdings Co. Ltd. | | | 53,479 | | | | 50,488 | |
| | 7,500 | | | GMO internet group Inc. | | | 198,867 | | | | 127,745 | |
| | 3,300 | | | Macnica Holdings Inc. | | | 62,714 | | | | 38,706 | |
| | 20,000 | | | NCC Group plc | | | 57,230 | | | | 37,707 | |
| | 6,000 | | | Optex Group Co. Ltd. | | | 98,632 | | | | 66,808 | |
| | 100,000 | | | Oxford Metrics plc | | | 116,940 | | | | 69,731 | |
| | 6,000 | | | PSI Software SE† | | | 157,350 | | | | 131,138 | |
| | | | | | | | 745,212 | | | | 522,323 | |
| | | | | FINANCIALS — 5.1% | | | | | | | | |
| | 17,000 | | | Polar Capital Holdings plc | | | 129,676 | | | | 108,114 | |
| | 18,000 | | | Tamburi Investment Partners SpA | | | 126,034 | | | | 156,434 | |
| | | | | | | | 255,710 | | | | 264,548 | |
| | | | | COMMUNICATION SERVICES — 1.4% | | | | | | | | |
| | 4,059 | | | Manchester United plc, Cl. A† | | | 75,780 | | | | 70,424 | |
| | | | | | | | | | | | | |
| | | | | TOTAL COMMON STOCKS | | | 5,033,771 | | | | 5,036,490 | |
| | | | | | | | | | | | | |
| | | | | PREFERRED STOCKS — 1.7% | | | | | | | | |
| | | | | HEALTH CARE — 1.7% | | | | | | | | |
| | 1,800 | | | Draegerwerk AG & Co KGaA, 0.190% | | | 156,593 | | | | 86,701 | |
Principal
Amount | | | | | | | | | |
| | | | | U.S. GOVERNMENT OBLIGATIONS — 3.3% | | | | | | | | |
| $ | 175,000 | | | U.S. Treasury Bill, 4.473%††, 02/06/25 | | | 174,225 | | | | 174,283 | |
| | | | | | | | | | | | | |
| | | | | TOTAL INVESTMENTS — 101.7% | | $ | 5,364,589 | | | | 5,297,474 | |
| | | | | | | | | | | | | |
| | | | | Other Assets and Liabilities (Net) — (1.7)% | | | | | | | (88,487 | ) |
| | | | | | | | | | | | | |
| | | | | NET ASSETS — 100.0% | | | | | | $ | 5,208,987 | |
| † | Non-income producing security. |
| †† | Represents annualized yield at date of purchase. |
See accompanying notes to financial statements.
The Gabelli International Small Cap Fund
Schedule of Investments (Continued) — December 31, 2024
Geographic Diversification | | % of
Market
Value | | | Market
Value | |
| Europe | | | 59.6 | % | | $ | 3,157,001 | |
| Japan | | | 20.3 | | | | 1,075,856 | |
| Canada | | | 9.4 | | | | 500,401 | |
| Asia/Pacific | | | 7.4 | | | | 389,933 | |
| United States | | | 3.3 | | | | 174,283 | |
| | | | 100.0 | % | | $ | 5,297,474 | |
See accompanying notes to financial statements.
The Gabelli International Small Cap Fund
Statement of Assets and Liabilities
December 31, 2024
| Assets: | | | | |
| Investments, at value (cost $5,364,589) | | $ | 5,297,474 | |
| Receivable for Fund shares sold | | | 15 | |
| Receivable from Adviser | | | 6,247 | |
| Dividends receivable | | | 18,793 | |
| Prepaid expenses | | | 10,118 | |
| Total Assets | | | 5,332,647 | |
| Liabilities: | | | | |
| Payable to bank | | | 50,111 | |
| Foreign currency overdraft, at value (cost $2,421) | | | 2,411 | |
| Payable for investment advisory fees | | | 4,536 | |
| Payable for distribution fees | | | 643 | |
| Payable for legal and audit fees | | | 33,600 | |
| Payable for shareholder communications | | | 15,482 | |
| Other accrued expenses | | | 16,877 | |
| Total Liabilities | | | 123,660 | |
| Commitments and Contingencies (See Note 3) | | | | |
| Net Assets | | | | |
| (applicable to 452,107 shares outstanding) | | $ | 5,208,987 | |
| | | | | |
| Net Assets Consist of: | | | | |
| Paid-in capital | | $ | 5,977,109 | |
| Total accumulated loss | | | (768,122 | ) |
| Net Assets | | $ | 5,208,987 | |
| | | | | |
| Shares of Capital Stock, each at $0.001 par value: | | | | |
| Class AAA: | | | | |
| Net Asset Value, offering, and redemption price per share ($2,894,780 ÷ 254,209 shares outstanding; 75,000,000 shares authorized) | | $ | 11.39 | |
| Class A: | | | | |
| Net Asset Value and redemption price per share ($23,258 ÷ 2,048 shares outstanding; 50,000,000 shares authorized) | | $ | 11.36 | |
| Maximum offering price per share (NAV ÷ 0.9425, based on maximum sales charge of 5.75% of the offering price) | | $ | 12.05 | |
| Class C: | | | | |
| Net Asset Value and redemption price per share ($7,140 ÷ 702 shares outstanding; 25,000,000 shares authorized) | | $ | 10.17 | |
| Class I: | | | | |
| Net Asset Value, offering, and redemption price per share ($2,283,809 ÷ 195,148 shares outstanding; 25,000,000 shares authorized) | | $ | 11.70 | |
Statement of Operations
For the Year Ended December 31, 2024
| Investment Income: | | | | |
| Dividends (net of foreign withholding taxes of $12,449) | | $ | 123,477 | |
| Interest | | | 5,724 | |
| Total Investment Income | | | 129,201 | |
| Expenses: | | | | |
| Investment advisory fees | | | 58,827 | |
| Distribution fees - Class AAA | | | 8,628 | |
| Distribution fees - Class A | | | 114 | |
| Distribution fees - Class C | | | 75 | |
| Legal and audit fees | | | 48,616 | |
| Registration expenses | | | 41,949 | |
| Shareholder communications expenses | | | 31,308 | |
| Administration out-of-pocket fees | | | 30,765 | |
| Shareholder services fees | | | 18,340 | |
| Custodian fees | | | 2,099 | |
| Interest expense | | | 1,222 | |
| Directors’ fees | | | 1,096 | |
| Miscellaneous expenses | | | 7,146 | |
| Total Expenses | | | 250,185 | |
| Less: | | | | |
| Expense reimbursements (See Note 3) | | | (194,610 | ) |
| Expenses paid indirectly by broker (See Note 6) | | | (1,408 | ) |
| Total Reimbursements and Credits | | | (196,018 | ) |
| Net Expenses | | | 54,167 | |
| Net Investment Income | | | 75,034 | |
| | | | | |
| Net Realized and Unrealized Loss on Investments and Foreign Currency: | | | | |
| Net realized loss on investments | | | (77,768 | ) |
| Net realized loss on foreign currency transactions | | | (1,192 | ) |
| Net realized loss on investments and foreign currency transactions | | | (78,960 | ) |
| Net change in unrealized appreciation/depreciation: | | | | |
| on investments | | | (333,786 | ) |
| on foreign currency translations | | | (671 | ) |
| Net change in unrealized appreciation/depreciation on investments and foreign currency translations | | | (334,457 | ) |
| Net Realized and Unrealized Loss on Investments and Foreign Currency | | | (413,417 | ) |
| Net Decrease in Net Assets Resulting from Operations | | $ | (338,383 | ) |
See accompanying notes to financial statements.
The Gabelli International Small Cap Fund
Statement of Changes in Net Assets
| | | Year Ended
December 31,
2024 | | | Year Ended
December 31,
2023 | |
| Operations: | | | | | | | | |
| Net investment income | | $ | 75,034 | | | $ | 65,073 | |
| Net realized loss on investments and foreign currency transactions | | | (78,960 | ) | | | (358,080 | ) |
| Net change in unrealized appreciation/depreciation on investments and foreign currency translations | | | (334,457 | ) | | | 717,009 | |
| Net Increase/(Decrease) in Net Assets Resulting from Operations | | | (338,383 | ) | | | 424,002 | |
| | | | | | | | | |
| Distributions to Shareholders: | | | | | | | | |
| Accumulated earnings | | | | | | | | |
| Class AAA | | | (15,699 | ) | | | (68,053 | ) |
| Class A | | | (127 | ) | | | (881 | ) |
| Class C | | | (43 | ) | | | (144 | ) |
| Class I | | | (12,068 | ) | | | (39,770 | ) |
| | | | (27,937 | ) | | | (108,848 | ) |
| Return of capital | | | | | | | | |
| Class AAA | | | (5,315 | ) | | | — | |
| Class A | | | (43 | ) | | | — | |
| Class C | | | (15 | ) | | | — | |
| Class I | | | (4,086 | ) | | | — | |
| | | | (9,459 | ) | | | — | |
| Total Distributions to Shareholders | | | (37,396 | ) | | | (108,848 | ) |
| | | | | | | | | |
| Capital Share Transactions: | | | | | | | | |
| Class AAA | | | (903,481 | ) | | | (397,634 | ) |
| Class A | | | (27,494 | ) | | | 766 | |
| Class C | | | 43 | | | | 129 | |
| Class I | | | 67,632 | | | | (334,878 | ) |
| Net Decrease in Net Assets from Capital Share Transactions | | | (863,300 | ) | | | (731,617 | ) |
| | | | | | | | | |
| Redemption Fees | | | 389 | | | | 99 | |
| | | | | | | | | |
| Net Decrease in Net Assets | | | (1,238,690 | ) | | | (416,364 | ) |
| | | | | | | | | |
| Net Assets: | | | | | | | | |
| Beginning of year | | | 6,447,677 | | | | 6,864,041 | |
| End of year | | $ | 5,208,987 | | | $ | 6,447,677 | |
See accompanying notes to financial statements.
The Gabelli International Small Cap Fund
Financial Highlights
Selected data for a share of capital stock outstanding throughout each year:
| | | | | | | Income (Loss) from Investment Operations | | | Distributions | | | | | | | | | | | | Ratios to Average Net Assets/Supplemental Data | |
Year Ended
December 31 | | Net Asset Value,
Beginning of Year | | | Net Investment
Income(a) | | | Net Realized
and Unrealized
Gain (Loss) on
Investments | | | Total from
Investment
Operations | | | Net Investment
Income | | | Net Realized
Gain on
Investments | | | Return of Capital | | | Total
Distributions | | | Redemption
Fees(a)(b) | | | Net Asset Value,
End of year | | | Total
Return† | | | Net Assets, End
of year
(in 000’s) | | | Net Investment
Income | | | Operating
Expenses Before
Reimbursement | | | Operating
Expenses Net of
Reimbursement(c)(d) | | | Portfolio
Turnover
Rate | |
| Class AAA | | | | | | | | | | | | | | | | | | | | | | | | | | | | | | | | | | | | | | | | | | | | | | | | | | | | | | | | | | | | | | | | |
| 2024 | | $ | 12.21 | | | $ | 0.15 | | | $ | (0.89 | ) | | $ | (0.74 | ) | | $ | (0.06 | ) | | $ | — | | | $ | (0.02 | ) | | $ | (0.08 | ) | | $ | 0.00 | | | $ | 11.39 | | | | (6.04 | )% | | $ | 2,895 | | | | 1.28 | % | | | 4.35 | % | | | 0.92 | %(e) | | | 4 | % |
| 2023 | | | 11.68 | | | | 0.12 | | | | 0.62 | | | | 0.74 | | | | (0.21 | ) | | | — | | | | — | | | | (0.21 | ) | | | 0.00 | | | | 12.21 | | | | 6.32 | | | | 4,010 | | | | 1.00 | | | | 4.02 | | | | 0.93 | (e) | | | 6 | |
| 2022 | | | 15.75 | | | | 0.18 | (f) | | | (4.20 | ) | | | (4.02 | ) | | | (0.05 | ) | | | — | | | | — | | | | (0.05 | ) | | | 0.00 | | | | 11.68 | | | | (25.50 | ) | | | 4,216 | | | | 1.48 | (f) | | | 3.64 | | | | 0.92 | (e)(g) | | | 5 | |
| 2021 | | | 15.44 | | | | 0.13 | (f) | | | 0.51 | | | | 0.64 | | | | (0.33 | ) | | | (0.00 | )(b) | | | — | | | | (0.33 | ) | | | 0.00 | | | | 15.75 | | | | 4.16 | | | | 6,191 | | | | 0.79 | (f) | | | 2.89 | | | | 0.92 | (g) | | | 15 | |
| 2020 | | | 13.06 | | | | 0.06 | | | | 2.44 | | | | 2.50 | | | | (0.12 | ) | | | — | | | | — | | | | (0.12 | ) | | | 0.00 | | | | 15.44 | | | | 19.16 | | | | 6,617 | | | | 0.51 | | | | 3.65 | | | | 0.91 | | | | 22 | |
| Class A | | | | | | | | | | | | | | | | | | | | | | | | | | | | | | | | | | | | | | | | | | | | | | | | | | | | | | | | | | | | | | | | |
| 2024 | | $ | 12.18 | | | $ | 0.16 | | | $ | (0.90 | ) | | $ | (0.74 | ) | | $ | (0.06 | ) | | $ | — | | | $ | (0.02 | ) | | $ | (0.08 | ) | | $ | 0.00 | | | $ | 11.36 | | | | (6.05 | )% | | $ | 23 | | | | 1.36 | % | | | 4.35 | % | | | 0.92 | %(e) | | | 4 | % |
| 2023 | | | 11.65 | | | | 0.12 | | | | 0.62 | | | | 0.74 | | | | (0.21 | ) | | | — | | | | — | | | | (0.21 | ) | | | 0.00 | | | | 12.18 | | | | 6.34 | | | | 52 | | | | 1.01 | | | | 4.02 | | | | 0.93 | (e) | | | 6 | |
| 2022 | | | 15.72 | | | | 0.17 | (f) | | | (4.19 | ) | | | (4.02 | ) | | | (0.05 | ) | | | — | | | | — | | | | (0.05 | ) | | | 0.00 | | | | 11.65 | | | | (25.55 | ) | | | 49 | | | | 1.40 | (f) | | | 3.64 | | | | 0.92 | (e)(g) | | | 5 | |
| 2021 | | | 15.40 | | | | 0.13 | (f) | | | 0.52 | | | | 0.65 | | | | (0.33 | ) | | | (0.00 | )(b) | | | — | | | | (0.33 | ) | | | 0.00 | | | | 15.72 | | | | 4.24 | | | | 104 | | | | 0.82 | (f) | | | 2.89 | | | | 0.92 | (g) | | | 15 | |
| 2020 | | | 13.03 | | | | 0.06 | | | | 2.43 | | | | 2.49 | | | | (0.12 | ) | | | — | | | | — | | | | (0.12 | ) | | | 0.00 | | | | 15.40 | | | | 19.13 | | | | 101 | | | | 0.50 | | | | 3.65 | | | | 0.91 | | | | 22 | |
| Class C | | | | | | | | | | | | | | | | | | | | | | | | | | | | | | | | | | | | | | | | | | | | | | | | | | | | | | | | | | | | | | | | |
| 2024 | | $ | 10.92 | | | $ | 0.14 | | | $ | (0.81 | ) | | $ | (0.67 | ) | | $ | (0.06 | ) | | $ | — | | | $ | (0.02 | ) | | $ | (0.08 | ) | | $ | 0.00 | | | $ | 10.17 | | | | (6.11 | )% | | $ | 7 | | | | 1.26 | % | | | 5.10 | % | | | 0.92 | %(e) | | | 4 | % |
| 2023 | | | 10.46 | | | | 0.11 | | | | 0.56 | | | | 0.67 | | | | (0.21 | ) | | | — | | | | — | | | | (0.21 | ) | | | 0.00 | | | | 10.92 | | | | 6.39 | | | | 8 | | | | 1.01 | | | | 4.77 | | | | 0.93 | (e) | | | 6 | |
| 2022 | | | 14.12 | | | | 0.15 | (f) | | | (3.76 | ) | | | (3.61 | ) | | | (0.05 | ) | | | — | | | | — | | | | (0.05 | ) | | | — | | | | 10.46 | | | | (25.55 | ) | | | 7 | | | | 1.36 | (f) | | | 4.39 | | | | 0.92 | (e)(g) | | | 5 | |
| 2021 | | | 13.87 | | | | 0.11 | (f) | | | 0.47 | | | | 0.58 | | | | (0.33 | ) | | | (0.00 | )(b) | | | — | | | | (0.33 | ) | | | 0.00 | | | | 14.12 | | | | 4.20 | | | | 16 | | | | 0.77 | (f) | | | 3.64 | | | | 0.92 | (g) | | | 15 | |
| 2020 | | | 11.74 | | | | 0.05 | | | | 2.20 | | | | 2.25 | | | | (0.12 | ) | | | — | | | | — | | | | (0.12 | ) | | | 0.00 | | | | 13.87 | | | | 19.19 | | | | 28 | | | | 0.48 | | | | 4.40 | | | | 0.91 | | | | 22 | |
| Class I | | | | | | | | | | | | | | | | | | | | | | | | | | | | | | | | | | | | | | | | | | | | | | | | | | | | | | | | | | | | | | | | |
| 2024 | | $ | 12.55 | | | $ | 0.16 | | | $ | (0.93 | ) | | $ | (0.77 | ) | | $ | (0.06 | ) | | $ | — | | | $ | (0.02 | ) | | $ | (0.08 | ) | | $ | 0.00 | | | $ | 11.70 | | | | (6.11 | )% | | $ | 2,284 | | | | 1.27 | % | | | 4.10 | % | | | 0.92 | %(e) | | | 4 | % |
| 2023 | | | 11.99 | | | | 0.12 | | | | 0.65 | | | | 0.77 | | | | (0.21 | ) | | | — | | | | — | | | | (0.21 | ) | | | 0.00 | | | | 12.55 | | | | 6.41 | | | | 2,378 | | | | 0.99 | | | | 3.77 | | | | 0.93 | (e) | | | 6 | |
| 2022 | | | 16.18 | | | | 0.19 | (f) | | | (4.33 | ) | | | (4.14 | ) | | | (0.05 | ) | | | — | | | | — | | | | (0.05 | ) | | | 0.00 | | | | 11.99 | | | | (25.57 | ) | | | 2,592 | | | | 1.52 | (f) | | | 3.39 | | | | 0.92 | (e)(g) | | | 5 | |
| 2021 | | | 15.85 | | | | 0.14 | (f) | | | 0.52 | | | | 0.66 | | | | (0.33 | ) | | | (0.00 | )(b) | | | — | | | | (0.33 | ) | | | 0.00 | | | | 16.18 | | | | 4.18 | | | | 4,376 | | | | 0.87 | (f) | | | 2.64 | | | | 0.92 | (g) | | | 15 | |
| 2020 | | | 13.41 | | | | 0.05 | | | | 2.51 | | | | 2.56 | | | | (0.12 | ) | | | — | | | | — | | | | (0.12 | ) | | | 0.00 | | | | 15.85 | | | | 19.11 | | | | 4,342 | | | | 0.39 | | | | 3.40 | | | | 0.91 | | | | 22 | |
| † | Total return represents aggregate total return of a hypothetical investment at the beginning of the year and sold at the end of the year including reinvestment of distributions and does not reflect the applicable sales charges. |
| (a) | Per share amounts have been calculated using the average shares outstanding method. |
| (b) | Amount represents less than $0.005 per share. |
| (c) | Under an expense reimbursement agreement with the Adviser, the Adviser reimbursed expenses of $194,610, $251,208, $205,704, $216,306, and $210,061 for the years ended December 31, 2024, 2023, 2022, 2021, and 2020, respectively. |
| (d) | The Fund incurred interest expense. If interest expense had not been incurred, the ratio of operating expenses to average net assets would have been 0.90%, 0.90%, 0.91%, and 0.90% for each Class for the years ended December 31, 2024, 2023, 2022, and 2020. For the year ended December 31, 2021, the effect of interest expense was minimal. |
| (e) | The Fund received credits from a designated broker who agreed to pay certain Fund operating expenses. For the fiscal years ended December 31, 2024 and 2023, if credits had not been received, the expense ratios would have been 0.94% and 0.95% for each Class, respectively. For the year ended December 31, 2022, there was no material impact to the expense ratios. |
| (f) | Includes income resulting from special dividends. Without these dividends, the per share income/(loss) amounts would have been $0.09 and $0.06 (Class AAA), $0.08 and $0.06 (Class A), $0.07 and $0.05 (Class C), and $0.10 and $0.07 (Class I), and the net investment income/(loss) ratios would have been 0.77% and 0.36% (Class AAA), 0.69% and 0.39% (Class A), 0.65% and 0.34% (Class C), and 0.81% and 0.44% (Class I) for the years ended December 31 2022 and 2021, respectively. |
| (g) | The Fund incurred tax expense for the years ended December 31, 2022 and 2021. If tax expense had not been incurred, the ratios of operating expenses to average net assets would have been 0.90% for each Class. |
See accompanying notes to financial statements.
The Gabelli International Small Cap Fund
Notes to Financial Statements
1. Organization. The Gabelli International Small Cap Fund (the Fund), a series of the GAMCO Global Series Funds, Inc. (the Corporation), was incorporated on July 16, 1993 in Maryland. Although the Fund is registered as a non-diversified fund, it has operated as a diversified fund for over three years. Therefore, the Investment Company Act of 1940, as amended (the 1940 Act) obliges the Fund to continue to operate as a diversified fund unless the Fund obtains shareholder approval to operate as a non-diversified fund. The Fund is one of five separately managed portfolios (collectively, the Portfolios) of the Corporation. The Fund’s primary objective is capital appreciation. The Fund commenced investment operations on May 11, 1998.
Gabelli Funds, LLC (the Adviser), with its principal offices located at One Corporate Center, Rye, New York 10580-1422, serves as investment adviser to the Fund. The Adviser makes investment decisions for the Fund and continuously reviews and administers the Fund’s investment program and manages the operations of the Fund under the general supervision of the Company’s Board of Directors (the Board).
2. Significant Accounting Policies. As an investment company, the Fund follows the investment company accounting and reporting guidance, which is part of U.S. generally accepted accounting principles (GAAP) that may require the use of management estimates and assumptions in the preparation of its financial statements. The Board has designated the Adviser as the valuation designee under Rule 2a-5. Actual results could differ from those estimates. The following is a summary of significant accounting policies followed by the Fund in the preparation of its financial statements.
Security Valuation. Portfolio securities listed or traded on a nationally recognized securities exchange or traded in the U.S. over-the-counter market for which market quotations are readily available are valued at the last quoted sale price or a market’s official closing price as of the close of business on the day the securities are being valued. If there were no sales that day, the security is valued at the average of the closing bid and asked prices or, if there were no asked prices quoted on that day, then the security is valued at the closing bid price on that day. If no bid or asked prices are quoted on such day, the security is valued at the most recently available price or, if the Board so determines, by such other method as the Board shall determine in good faith to reflect its fair market value. Portfolio securities traded on more than one national securities exchange or market are valued according to the broadest and most representative market, as determined by the Adviser.
Portfolio securities primarily traded on a foreign market are generally valued at the preceding closing values of such securities on the relevant market, but may be fair valued pursuant to procedures established by the Board if market conditions change significantly after the close of the foreign market, but prior to the close of business on the day the securities are being valued. Debt obligations for which market quotations are readily available are valued at the average of the latest bid and asked prices. If there were no asked prices quoted on such day, the security is valued using the closing bid price, unless the Board determines such amount does not reflect the security’s fair value, in which case these securities will be fair valued as determined by the Board. Such debt obligations are valued through prices provided by a pricing service approved by the Board. Certain securities are valued principally using dealer quotations.
Securities and assets for which market quotations are not readily available are fair valued as determined by the Board. Fair valuation methodologies and procedures may include, but are not limited to: analysis and review of available financial and non-financial information about the company; comparisons with the valuation and changes in valuation of similar securities, including a comparison of foreign securities with the equivalent U.S. dollar value American Depositary Receipt securities at the close of the U.S. exchange; and evaluation of any other information that could be indicative of the value of the security.
The Gabelli International Small Cap Fund
Notes to Financial Statements (Continued)
The Fund employs a fair value model to adjust prices to reflect events affecting the values of certain portfolio securities which occur between the close of trading on the principal market for such securities (foreign exchanges and over-the-counter markets) at the time when net asset values of the Fund are determined. If the Fund’s valuation committee believes that a particular event would materially affect net asset value, further adjustment is considered. Such securities are classified as Level 2 in the fair value hierarchy presented below.
The inputs and valuation techniques used to measure fair value of the Fund’s investments are summarized into three levels as described in the hierarchy below:
| ● | Level 1 — unadjusted quoted prices in active markets for identical securities; |
| ● | Level 2 — other significant observable inputs (including quoted prices for similar securities, interest rates, prepayment speeds, credit risk, etc.); and |
| ● | Level 3 — significant unobservable inputs (including the Board’s determinations as to the fair value of investments). |
A financial instrument’s level within the fair value hierarchy is based on the lowest level of any input both individually and in the aggregate that is significant to the fair value measurement. The inputs or methodology used for valuing securities are not necessarily an indication of the risk associated with investing in those securities. The summary of the Fund’s investments in securities by inputs used to value the Fund’s investments as of December 31, 2024 is as follows:
| | | Valuation Inputs | | | | |
| | | Level 1
Quoted Prices | | | Level 2 Other
Significant
Observable Inputs | | | Total
Market Value
at 12/31/24 | |
| INVESTMENTS IN SECURITIES: | | | | | | | | | | | | |
| ASSETS (Market Value): | | | | | | | | | | | | |
| Common Stocks (a) | | $ | 5,036,490 | | | | — | | | $ | 5,036,490 | |
| Preferred Stocks (a) | | | 86,701 | | | | — | | | | 86,701 | |
| U.S. Government Obligations | | | — | | | $ | 174,283 | | | | 174,283 | |
| TOTAL INVESTMENTS IN SECURITIES – ASSETS | | $ | 5,123,191 | | | $ | 174,283 | | | $ | 5,297,474 | |
| (a) | Please refer to the Schedule of Investments for the industry classifications of these portfolio holdings. |
General. The Fund uses recognized industry pricing services – approved by the Board and unaffiliated with the Adviser – to value most of its securities, and uses broker quotes provided by market makers of securities not valued by these and other recognized pricing sources. Several different pricing feeds are received to value domestic equity securities, international equity securities, preferred equity securities, and fixed income securities. The data within these feeds are ultimately sourced from major stock exchanges and trading systems where these securities trade. The prices supplied by external sources are checked by obtaining quotations or actual transaction prices from market participants. If a price obtained from the pricing source is deemed unreliable, prices will be sought from another pricing service or from a broker/dealer that trades that security or similar securities.
Fair Valuation. Fair valued securities may be common or preferred equities, warrants, options, rights, or fixed income obligations. Where appropriate, Level 3 securities are those for which market quotations are not available, such as securities not traded for several days, or for which current bids are not available, or which are restricted
The Gabelli International Small Cap Fund
Notes to Financial Statements (Continued)
as to transfer. When fair valuing a security, factors to consider include recent prices of comparable securities that are publicly traded, reliable prices of securities not publicly traded, the use of valuation models, current analyst reports, valuing the income or cash flow of the issuer, or cost if the preceding factors do not apply. A significant change in the unobservable inputs could result in a lower or higher value in Level 3 securities. The circumstances of Level 3 securities are frequently monitored to determine if fair valuation measures continue to apply.
The Adviser reports quarterly to the Board the results of the application of fair valuation policies and procedures. These may include backtesting the prices realized in subsequent trades of these fair valued securities to fair values previously recognized.
Foreign Currency Translations. The books and records of the Fund are maintained in U.S. dollars. Foreign currencies, investments, and other assets and liabilities are translated into U.S. dollars at current exchange rates. Purchases and sales of investment securities, income, and expenses are translated at the exchange rate prevailing on the respective dates of such transactions. Unrealized gains and losses that result from changes in foreign exchange rates and/or changes in market prices of securities have been included in unrealized appreciation/depreciation on investments and foreign currency translations. Net realized foreign currency gains and losses resulting from changes in exchange rates include foreign currency gains and losses between trade date and settlement date on investment securities transactions, foreign currency transactions, and the difference between the amounts of interest and dividends recorded on the books of the Fund and the amounts actually received. The portion of foreign currency gains and losses related to fluctuation in exchange rates between the initial purchase trade date and subsequent sale trade date is included in realized gain/(loss) on investments.
Foreign Securities. The Fund may directly purchase securities of foreign issuers. Investing in securities of foreign issuers involves special risks not typically associated with investing in securities of U.S. issuers. The risks include possible revaluation of currencies, the inability to repatriate funds, less complete financial information about companies, and possible future adverse political and economic developments. Moreover, securities of many foreign issuers and their markets may be less liquid and their prices more volatile than securities of comparable U.S. issuers.
Foreign Taxes. The Fund may be subject to foreign taxes on income, gains on investments, or currency repatriation, a portion of which may be recoverable. The Fund will accrue such taxes and recoveries as applicable, based upon its current interpretation of tax rules and regulations that exist in the markets in which it invests.
Securities Transactions and Investment Income. Securities transactions are accounted for on the trade date with realized gain/(loss) on investments determined by using the identified cost method. Interest income (including amortization of premium and accretion of discount) is recorded on an accrual basis. Premiums and discounts on debt securities are amortized using the effective yield to maturity method or amortized to earliest call date, if applicable. Dividend income is recorded on the ex-dividend date, except for certain dividends from foreign securities that are recorded as soon after the ex-dividend date as the Fund becomes aware of such dividends.
Determination of Net Asset Value and Calculation of Expenses. Certain administrative expenses are common to, and allocated among, various affiliated funds. Such allocations are made on the basis of the fund’s average net assets or other criteria directly affecting the expenses as determined by the Adviser pursuant to procedures established by the Board.
The Gabelli International Small Cap Fund
Notes to Financial Statements (Continued)
In calculating the NAV per share of each class, investment income, realized and unrealized gains and losses, redemption fees, and expenses other than class specific expenses are allocated daily to each class of shares based upon the proportion of net assets of each class at the beginning of each day. Distribution expenses are borne solely by the class incurring the expense.
Distributions to Shareholders. Distributions to shareholders are recorded on the ex-dividend date. Distributions to shareholders are based on income and capital gains as determined in accordance with federal income tax regulations, which may differ from income and capital gains as determined under GAAP. These differences are primarily due to differing treatments of income and gains on various investment securities and foreign currency transactions held by the Fund, timing differences, and differing characterizations of distributions made by the Fund. Distributions from net investment income for federal income tax purposes include net realized gains on foreign currency transactions. These book/tax differences are either temporary or permanent in nature. To the extent these differences are permanent, adjustments are made to the appropriate capital accounts in the period when the differences arise. These reclassifications have no impact on the NAV of the Fund. For the year ended December 31, 2024, no reclassifications were made in the Fund.
The tax character of distributions paid during the years ended December 31, 2024 and 2023 was as follows:
| | | Year ended
December 31,
2024 | | | Year ended
December 31,
2023 | |
| Distributions paid from: | | | | | | | | |
| Ordinary income | | $ | 27,937 | | | $ | 108,848 | |
| Return of capital | | | 9,459 | | | | — | |
| Total distributions paid | | $ | 37,396 | | | $ | 108,848 | |
Provision for Income Taxes. The Fund intends to continue to qualify as a regulated investment company under Subchapter M of the Internal Revenue Code of 1986, as amended (the Code). It is the policy of the Fund to comply with the requirements of the Code applicable to regulated investment companies and to distribute substantially all of its net investment company taxable income and net capital gains. Therefore, no provision for federal income taxes is required.
At December 31, 2024, the components of accumulated earnings/losses on a tax basis were as follows:
| Accumulated capital loss carryforwards | | $ | (647,524 | ) |
| Net unrealized depreciation on investments and foreign currency translations | | | (120,598 | ) |
| Total | | $ | (768,122 | ) |
The Fund is permitted to carry capital losses forward for an unlimited period. Capital losses that are carried forward will retain their character as either short term or long term capital losses. As of December 31, 2024, the Fund has a short term capital loss carryforward with no expiration of $36,314 and a long term capital loss carryforward with no expiration of $611,210.
At December 31, 2024, the temporary differences between book basis and tax basis unrealized depreciation were primarily due to mark-to-market adjustments on investments in passive foreign investment companies, and adjustments on the sale of securities no longer deemed passive foreign investment companies.
The Gabelli International Small Cap Fund
Notes to Financial Statements (Continued)
The following summarizes the tax cost of investments and the related net unrealized depreciation at December 31, 2024:
| | | Cost | | | Gross
Unrealized
Appreciation | | | Gross
Unrealized
Depreciation | | | Net
Unrealized
Depreciation | |
| Investments | | $ | 5,417,598 | | | $ | 1,032,424 | | | $ | (1,152,548 | ) | | $ | (120,124 | ) |
The Fund is required to evaluate tax positions taken or expected to be taken in the course of preparing the Fund’s tax returns to determine whether the tax positions are “more-likely-than-not” of being sustained by the applicable tax authority. Income tax and related interest and penalties would be recognized by the Fund as tax expense in the Statement of Operations if the tax positions were deemed not to meet the more-likely-than-not threshold. During the year ended December 31, 2024, the Fund did not incur any income tax, interest, or penalties. As of December 31, 2024, the Adviser has reviewed all open tax years and concluded that there was no impact to the Fund’s net assets or results of operations. The Fund’s federal and state tax returns for the prior three years remain open, subject to examination. On an ongoing basis, the Adviser will monitor the Fund’s tax positions to determine if adjustments to this conclusion are necessary.
3. Investment Advisory Agreement and Other Transactions. The Fund has entered into an investment advisory agreement (the Advisory Agreement) with the Adviser which provides that the Fund will pay the Adviser a fee, computed daily and paid monthly, at the annual rate of 1.00% of the value of its average daily net assets. In accordance with the Advisory Agreement, the Adviser provides a continuous investment program for the Fund’s portfolio, oversees the administration of all aspects of the Fund’s business and affairs, and pays the compensation of all Officers and Directors of the Fund who are affiliated persons of the Adviser.
The Adviser has contractually agreed to waive its investment advisory fees and/or to reimburse expenses to the extent necessary to maintain the annualized total operating expenses of the Fund (excluding brokerage costs, acquired fund fees and expenses, interest, taxes, and extraordinary expenses) until at least April 30, 2025, at no more than an annual rate of 0.90% for all classes of shares. During the year ended December 31, 2024, the Adviser reimbursed the Fund in the amount of $194,610. In addition, the Fund has agreed, during the two year period following any waiver or reimbursement by the Adviser, to repay such amount to the extent, that after giving effect to the repayment, such adjusted annualized total operating expenses of the Fund would not exceed 0.90% of the value of the Fund’s average daily net assets for each share class of the Fund. The arrangement is renewable annually. At December 31, 2024, the cumulative amount which the Fund may repay the Adviser, subject to the terms above, is $445,818:
| For the year ended December 31, 2023, expiring December 31, 2025 | | $ | 251,208 | |
| For the year ended December 31, 2024, expiring December 31, 2026 | | | 194,610 | |
| | | $ | 445,818 | |
4. Distribution Plan. The Fund’s Board has adopted a distribution plan (the Plan) for each class of shares, except for Class I Shares, pursuant to Rule 12b-1 under the 1940 Act. Under the Class AAA, Class A, and Class C Share Plans, payments are authorized to G.distributors, LLC (the Distributor), an affiliate of the Adviser, at annual rates of 0.25%, 0.25%, and 1.00%, respectively, of the average daily net assets of those classes, the annual limitations under each Plan. Such payments are accrued daily and paid monthly.
The Gabelli International Small Cap Fund
Notes to Financial Statements (Continued)
5. Portfolio Securities. Purchases and sales of securities during the year ended December 31, 2024, other than short term securities and U.S. Government obligations, aggregated $244,879 and $1,090,386, respectively.
6. Transactions with Affiliates and Other Arrangements. The cost of calculating the Fund’s NAV per share is a Fund expense pursuant to the Advisory Agreement. Under the sub-administration agreement with Bank of New York Mellon, the fees paid include the cost of calculating the Fund’s NAV. The Fund reimburses the Adviser for this service. The Adviser did not seek a reimbursement during the year ended December 31, 2024.
During the year ended December 31, 2024, the Fund received credits from a designated broker who agreed to pay certain Fund operating expenses. The amount of such expenses paid through this directed brokerage arrangement during this period was $1,408.
The Corporation pays retainer and per meeting fees to Directors not affiliated with the Adviser, plus specified amounts to the Lead Director and Audit Committee Chairman. Directors are also reimbursed for out of pocket expenses incurred in attending meetings. Directors who are directors or employees of the Adviser or an affiliated company receive no compensation or expense reimbursement from the Corporation.
7. Line of Credit. The Fund participates in an unsecured and uncommitted line of credit, which expires on February 26, 2025 and may be renewed annually, of up to $150,000,000 under which it may borrow up to 10% of its net assets from the bank for temporary borrowing purposes. Borrowings under this arrangement bear interest at a floating rate equal to the higher of the Overnight Federal Funds Rate plus 135 basis points or the Overnight Bank Funding Rate plus 135 basis points in effect on that day. This amount, if any, would be included in “Interest expense” in the Statement of Operations. During the year ended December 31, 2024, there were no borrowings under the line of credit.
8. Capital Stock. The Fund currently offers three classes of shares – Class AAA Shares, Class A Shares, and Class I Shares. Class AAA and Class A investors may purchase additional shares of the respective classes. Class C is closed to new and existing investors. The minimum investment for Class I shares is $1,000. Class AAA and Class I Shares are offered without a sales charge. Class A Shares are subject to a maximum front-end sales charge of 5.75%.
The Fund imposes a redemption fee of 2.00% on all classes of shares that are redeemed or exchanged on or before the seventh day after the date of a purchase. The redemption fee is deducted from the proceeds otherwise payable to the redeeming shareholders and is retained by the Fund as an increase in paid-in capital. The redemption fees retained by the Fund during the years ended December 31, 2024 and 2023, if any, can be found in the Statement of Changes in Net Assets under Redemption Fees.
The Gabelli International Small Cap Fund
Notes to Financial Statements (Continued)
Transactions in shares of capital stock were as follows:
| | | Year Ended
December 31,
2024 | | | Year Ended
December 31,
2023 | |
| | | Shares | | | Amount | | | Shares | | | Amount | |
| Class AAA | | | | | | | | | | | | | | | | |
| Shares sold | | | 2,541 | | | $ | 30,591 | | | | 2,701 | | | $ | 32,793 | |
| Shares issued upon reinvestment of distributions | | | 1,813 | | | | 20,721 | | | | 5,468 | | | | 67,259 | |
| Shares redeemed | | | (78,477 | ) | | | (954,793 | ) | | | (40,962 | ) | | | (497,686 | ) |
| Net decrease | | | (74,123 | ) | | $ | (903,481 | ) | | | (32,793 | ) | | $ | (397,634 | ) |
| Class A | | | | | | | | | | | | | | | | |
| Shares issued upon reinvestment of distributions | | | 15 | | | $ | 168 | | | | 72 | | | $ | 879 | |
| Shares redeemed | | | (2,237 | ) | | | (27,662 | ) | | | (10 | ) | | | (113 | ) |
| Net increase/(decrease) | | | (2,222 | ) | | $ | (27,494 | ) | | | 62 | | | $ | 766 | |
| Class C | | | | | | | | | | | | | | | | |
| Shares issued upon reinvestment of distributions | | | 6 | | | $ | 58 | | | | 13 | | | $ | 144 | |
| Shares redeemed | | | (2 | ) | | | (15 | ) | | | (1 | ) | | | (15 | ) |
| Net increase | | | 4 | | | $ | 43 | | | | 12 | | | $ | 129 | |
| Class I | | | | | | | | | | | | | | | | |
| Shares sold | | | 25,852 | | | $ | 313,315 | | | | 42,708 | | | $ | 531,641 | |
| Shares issued upon reinvestment of distributions | | | 1,318 | | | | 15,476 | | | | 3,011 | | | | 38,059 | |
| Shares redeemed | | | (21,523 | ) | | | (261,159 | ) | | | (72,369 | ) | | | (904,578 | ) |
| Net increase/(decrease) | | | 5,647 | | | $ | 67,632 | | | | (26,650 | ) | | $ | (334,878 | ) |
9. Indemnifications. The Fund enters into contracts that contain a variety of indemnifications. The Fund’s maximum exposure under these arrangements is unknown. However, the Fund has not had prior claims or losses pursuant to these contracts. Management has reviewed the Fund’s existing contracts and expects the risk of loss to be remote.
10. Segment Reporting. In this reporting period, the Fund adopted FASB Accounting Standards Update 2023-07, Segment Reporting (Topic 280) - Improvements to Reportable Segment Disclosures (ASU 2023-07). Adoption of the new standard impacted financial statement disclosures only and did not affect the Fund’s financial position or results of operations. The Fund’s Principal Executive Officer and Principal Financial Officer act as the Fund’s chief operating decision maker (CODM), as defined in Topic 280, assessing performance and making decisions about resource allocation. The CODM has determined that the Fund has a single operating segment based on the fact that the CODM monitors the operating results of the Fund as a whole and the Fund’s long-term strategic asset allocation is guided by the Fund’s investment objective and principal investment strategies, and executed by the Fund’s portfolio management team, comprised of investment professionals employed by the Adviser. The financial information provided to and reviewed by the CODM is consistent with that presented in the Fund’s Schedule of Investments, Statements of Operations and Changes in Net Assets and Financial Highlights.
The Gabelli International Small Cap Fund
Notes to Financial Statements (Continued)
11. Subsequent Events. On February 26, 2025, the Fund renewed the unsecured and uncommitted line of credit, which expires on February 25, 2026 and may be renewed annually, of up to $150,000,000 under which it may borrow up to 10% of its net assets from the bank for temporary borrowing purposes.
Management has evaluated the impact on the Fund of all subsequent events occurring through the date the financial statements were issued and has determined that there were no other subsequent events requiring recognition or disclosure in the financial statements.
The Gabelli International Small Cap Fund
Report of Independent Registered Public Accounting Firm
To the Shareholders of The Gabelli International Small Cap Fund
and the Board of Directors of GAMCO Global Series Funds, Inc.
Opinion on the Financial Statements
We have audited the accompanying statement of assets and liabilities of Gabelli International Small Cap Fund (the “Fund”) (one of the portfolios constituting GAMCO Global Series Funds, Inc. (the “Corporation”)), including the schedule of investments, as of December 31, 2024, and the related statement of operations for the year then ended, the statements of changes in net assets for each of the two years in the period then ended, the financial highlights for each of the five years in the period then ended and the related notes (collectively referred to as the “financial statements”). In our opinion, the financial statements present fairly, in all material respects, the financial position of the Fund (one of the portfolios constituting GAMCO Global Series Funds, Inc.) at December 31, 2024, the results of its operations for the year then ended, the changes in its net assets for each of the two years in the period then ended and its financial highlights for each of the five years in the period then ended, in conformity with U.S. generally accepted accounting principles.
Basis for Opinion
These financial statements are the responsibility of the Corporation’s management. Our responsibility is to express an opinion on the Fund’s financial statements based on our audits. We are a public accounting firm registered with the Public Company Accounting Oversight Board (United States) (“PCAOB”) and are required to be independent with respect to the Corporation in accordance with the U.S. federal securities laws and the applicable rules and regulations of the Securities and Exchange Commission and the PCAOB.
We conducted our audits in accordance with the standards of the PCAOB. Those standards require that we plan and perform the audit to obtain reasonable assurance about whether the financial statements are free of material misstatement, whether due to error or fraud. The Corporation is not required to have, nor were we engaged to perform, an audit of the Corporation’s internal control over financial reporting. As part of our audits, we are required to obtain an understanding of internal control over financial reporting but not for the purpose of expressing an opinion on the effectiveness of the Corporation’s internal control over financial reporting. Accordingly, we express no such opinion.
Our audits included performing procedures to assess the risks of material misstatement of the financial statements, whether due to error or fraud, and performing procedures that respond to those risks. Such procedures included examining, on a test basis, evidence regarding the amounts and disclosures in the financial statements. Our procedures included confirmation of securities owned as of December 31, 2024 by correspondence with the custodian, brokers and others; when replies were not received from brokers or others, we performed other auditing procedures. Our audits also included evaluating the accounting principles used and significant estimates made by management, as well as evaluating the overall presentation of the financial statements. We believe that our audits provide a reasonable basis for our opinion.

We have served as the auditor of one or more Gabelli Funds investment companies since 1992.
New York, New York
March 1, 2025
The Gabelli International Small Cap Fund
Liquidity Risk Management Program (Unaudited)
In accordance with Rule 22e-4 under the 1940 Act,the Fund has established a liquidity risk management program (the LRM Program) to govern its approach to managing liquidity risk. The LRM Program is administered by the Liquidity Committee (the Committee), which is comprised of members of Gabelli Funds, LLC management. The Board has designated the Committee to administer the LRM Program.
The LRM Program’s principal objectives include supporting the Fund’s compliance with limits on investments in illiquid assets and mitigating the risk that the Fund will be unable to meet its redemption obligations in a timely manner. The LRM Program also includes elements that support the management and assessment of liquidity risk, including an annual assessment of factors that influence the Fund’s liquidity and the monthly classification and re-classification of certain investments that reflect the Committee’s assessment of their relative liquidity under current market conditions.
At a meeting of the Board held on May 15, 2024, the Board received a written report from the Committee regarding the design and operational effectiveness of the LRM Program. The Committee determined, and reported to the Board, that the LRM Program is reasonably designed to assess and manage the Fund’s liquidity risk and has operated adequately and effectively since its implementation. The Committee reported that there were no liquidity events that impacted the Fund or its ability to timely meet redemptions without dilution to existing shareholders. The Committee noted that the Fund is primarily invested in highly liquid securities and, accordingly, continues to be exempt from the requirement to determine a “highly liquid investment minimum” as defined in the Rule 22e-4. Because of that continued qualification for the exemption, the Fund has not adopted a “highly liquid investment minimum” amount. The Committee further noted that while changes to the LRM Program were made during the Review Period and reported to the Board, no material changes were made to the LRM Program as a result of the Committee’s annual review.
There can be no assurance that the LRM Program will achieve its objectives in the future. Please refer to the Fund’s Prospectus for more information regarding its exposure to liquidity risk and other principal risks to which an investment in the Fund may be subject.
Gabelli Funds and Your Personal Privacy
Who are we?
The Gabelli Funds are investment companies registered with the Securities and Exchange Commission under the Investment Company Act of 1940. We are managed by Gabelli Funds, LLC, which is affiliated with GAMCO Investors, Inc., a publicly held company with subsidiaries and affiliates that provide investment advisory services for a variety of clients.
What kind of non-public information do we collect about you if you become a fund shareholder?
If you apply to open an account directly with us, you will be giving us some non-public information about yourself. The non-public information we collect about you is:
| ● | Information you give us on your application form. This could include your name, address, telephone number, social security number, bank account number, and other information. |
| ● | Information about your transactions with us, any transactions with our affiliates, and transactions with the entities we hire to provide services to you. This would include information about the shares that you buy or redeem. If we hire someone else to provide services — like a transfer agent — we will also have information about the transactions that you conduct through them. |
What information do we disclose and to whom do we disclose it?
We do not disclose any non-public personal information about our customers or former customers to anyone other than our affiliates, our service providers who need to know such information, and as otherwise permitted by law. If you want to find out what the law permits, you can read the privacy rules adopted by the Securities and Exchange Commission. They are in volume 17 of the Code of Federal Regulations, Part 248. The Commission often posts information about its regulations on its website, www. sec.gov.
What do we do to protect your personal information?
We restrict access to non-public personal information about you to the people who need to know that information in order to provide services to you or the fund and to ensure that we are complying with the laws governing the securities business. We maintain physical, electronic, and procedural safeguards to keep your personal information confidential.
The Gabelli International Small Cap Fund
2024 TAX NOTICE TO SHAREHOLDERS (Unaudited)
During the year ended December 31, 2024, the Fund paid to shareholders ordinary income distributions of $0.062155268 and return of capital distributions of $0.021044732 per share to shareholders in each Class of Shares. The Fund designates 100% of the ordinary income distribution as qualified dividend income pursuant to the Jobs and Growth Tax Relief Reconciliation Act of 2003. The Fund designates 5.96% of the ordinary income distribution as qualified interest income pursuant to the Tax Relief, Unemployment Reauthorization, and Job Creation Act of 2010. Also during 2024, the Fund passed through foreign tax credits of $0.02752336 per share to each Class of Shares.
U.S. Government Income:
The percentage of the ordinary income distribution paid by the Fund during the year ended December 31, 2024 which was derived from U.S. Treasury securities was 7.63%. Such income is exempt from state and local tax in all states. However, many states, including New York and California, allow a tax exemption for a portion of the income earned only if a mutual fund has invested at least 50% of its assets at the end of each quarter of the Fund’s fiscal year in U.S. Government securities. The Fund did not meet this strict requirement in 2024. The percentage of U.S. Government securities held as of December 31, 2024 was 3.3%. Due to the diversity in state and local tax law, it is recommended that you consult your personal tax adviser as to the applicability of the information provided to your specific situation.
All designations are based on financial information available as of the date of this annual report and, accordingly, are subject to change. For each item, it is the intention of the Fund to designate the maximum amount permitted under the Internal Revenue Code and the regulations thereunder.
The Gabelli Global Mini MitesTM Fund
Annual Report — December 31, 2024
To Our Shareholders,
For the year ended December 31, 2024, the net asset value (NAV) total return per Class AAA Share of The Gabelli Global Mini Mites Fund was 10.9% compared with a total return of 8.6% for the S&P Developed SmallCap Index. Other classes of shares are available.
Enclosed are the financial statements, including the schedule of investments, as of December 31, 2024.
Summary of Portfolio Holdings (Unaudited)
The following table presents portfolio holdings as a percent of net assets as of December 31, 2024:
The Gabelli Global Mini Mites Fund
| Diversified Industrial | | | 19.8 | % |
| U.S. Government Obligations | | | 14.6 | % |
| Health Care | | | 6.7 | % |
| Consumer Products | | | 6.4 | % |
| Equipment and Supplies | | | 6.0 | % |
| Entertainment | | | 4.9 | % |
| Machinery | | | 4.6 | % |
| Aerospace and Defense | | | 3.8 | % |
| Business Services | | | 2.9 | % |
| Food and Beverage | | | 2.9 | % |
| Hotels and Gaming | | | 2.8 | % |
| Automotive: Parts and Accessories | | | 2.8 | % |
| Retail | | | 2.5 | % |
| Specialty Chemicals | | | 2.2 | % |
| Metals and Mining | | | 2.1 | % |
| Publishing | | | 2.1 | % |
| Financial Services | | | 1.8 | % |
| Energy and Utilities | | | 1.6 | % |
| Building and Construction | | | 1.6 | % |
| Broadcasting | | | 1.6 | % |
| Agriculture | | | 1.3 | % |
| Consumer Services | | | 1.2 | % |
| Real Estate | | | 0.8 | % |
| Cable and Satellite | | | 0.8 | % |
| Computer Software and Services | | | 0.7 | % |
| Electronics | | | 0.2 | % |
| Wireless Telecommunications Services | | | 0.1 | % |
| Telecommunications | | | 0.0 | %* |
| Other Assets and Liabilities (Net) | | | 1.2 | % |
| | | | 100.0 | % |
| * | Amount represents less than 0.05%. |
The Fund files a complete schedule of portfolio holdings with the Securities and Exchange Commission (the SEC) for the first and third quarters of each fiscal year on Form N-PORT. Shareholders may obtain this information at www.gabelli.com or by calling the Fund at 800-GABELLI (800-422-3554). The Fund’s Form N-PORT is available on the SEC’s website at www.sec.gov and may also be reviewed and copied at the SEC’s Public Reference Room in Washington, DC. Information on the operation of the Public Reference Room may be obtained by calling 800-SEC-0330.
Proxy Voting
The Fund files Form N-PX with its complete proxy voting record for the twelve months ended June 30, no later than August 31 of each year. A description of the Fund’s proxy voting policies, procedures, and how each Fund voted proxies relating to portfolio securities is available without charge, upon request, by (i) calling 800-GABELLI (800-422-3554); (ii) writing to The Gabelli Funds at One Corporate Center, Rye, NY 10580-1422; or (iii) visiting the SEC’s website at www.sec.gov.
The Gabelli Global Mini Mites Fund
Schedule of Investments — December 31, 2024
| Shares | | | | | Cost | | | Market
Value | |
| | | | | COMMON STOCKS — 84.2% | | | | | | | | |
| | | | | Aerospace and Defense — 3.8% | | | | | | | | |
| | 500 | | | Astronics Corp.† | | $ | 8,165 | | | $ | 7,980 | |
| | 3,300 | | | Astronics Corp., Cl. B† | | | 52,925 | | | | 53,014 | |
| | 12,500 | | | Avio SpA | | | 138,124 | | | | 179,979 | |
| | 1,000 | | | CPI Aerostructures Inc.† | | | 2,388 | | | | 4,050 | |
| | 4,000 | | | Innovative Solutions and Support Inc.† | | | 27,868 | | | | 34,160 | |
| | 6,500 | | | Redwire Corp.† | | | 39,528 | | | | 106,990 | |
| | 4,800 | | | Triumph Group Inc.† | | | 50,133 | | | | 89,568 | |
| | | | | | | | 319,131 | | | | 475,741 | |
| | | | | Agriculture — 1.3% | | | | | | | | |
| | 5,800 | | | Limoneira Co. | | | 87,118 | | | | 141,868 | |
| | 3,501 | | | S&W Seed Co.† | | | 53,824 | | | | 27,900 | |
| | | | | | | | 140,942 | | | | 169,768 | |
| | | | | Automotive: Parts and Accessories — 2.8% | | | | | | | | |
| | 12,500 | | | Garrett Motion Inc.† | | | 68,625 | | | | 112,875 | |
| | 1,500 | | | Motorcar Parts of America Inc.† | | | 12,282 | | | | 11,400 | |
| | 700 | | | Smart Eye AB† | | | 5,647 | | | | 3,878 | |
| | 1,500 | | | Standard Motor Products Inc. | | | 46,076 | | | | 46,470 | |
| | 4,300 | | | Strattec Security Corp.† | | | 91,323 | | | | 177,160 | |
| | | | | | | | 223,953 | | | | 351,783 | |
| | | | | Broadcasting — 1.6% | | | | | | | | |
| | 6,500 | | | Beasley Broadcast Group Inc., Cl. A† | | | 100,330 | | | | 60,320 | |
| | 107,000 | | | Corus Entertainment Inc., Cl. B† | | | 109,217 | | | | 6,699 | |
| | 8,000 | | | Cumulus Media Inc., Cl. A† | | | 26,506 | | | | 5,224 | |
| | 14,000 | | | Townsquare Media Inc., Cl. A | | | 137,077 | | | | 127,260 | |
| | | | | | | | 373,130 | | | | 199,503 | |
| | | | | Building and Construction — 1.6% | | | | | | | | |
| | 59,026 | | | Armstrong Flooring Inc.† | | | 5,515 | | | | 0 | |
| | 7,200 | | | Gencor Industries Inc.† | | | 72,293 | | | | 127,080 | |
| | 1,925 | | | Neinor Homes SA | | | 24,184 | | | | 33,699 | |
| | 200 | | | The Monarch Cement Co. | | | 11,234 | | | | 43,668 | |
| | | | | | | | 113,226 | | | | 204,447 | |
| | | | | Business Services — 2.9% | | | | | | | | |
| | 400 | | | Boston Omaha Corp., Cl. A† | | | 6,934 | | | | 5,672 | |
| | 5,400 | | | Du-Art Film Laboratories Inc., Non-Voting†(a) | | | 0 | | | | 6,512 | |
| | 600 | | | Du-Art Film Laboratories Inc., Voting†(a) | | | 0 | | | | 724 | |
| | 4,000 | | | Ework Group AB | | | 33,432 | | | | 51,772 | |
| | 3,615 | | | Magnera Corp.† | | | 154,129 | | | | 65,692 | |
| | 1,000 | | | MIND Technology Inc.† | | | 5,335 | | | | 7,940 | |
| | 11,500 | | | Steel Connect Inc.† | | | 100,954 | | | | 143,405 | |
| Shares | | | | | Cost | | | Market
Value | |
| | 13,000 | | | TransAct Technologies Inc.† | | $ | 79,224 | | | $ | 53,170 | |
| | 80,002 | | | Trans-Lux Corp.† | | | 24,496 | | | | 33,921 | |
| | | | | | | | 404,504 | | | | 368,808 | |
| | | | | Cable and Satellite — 0.8% | | | | | | | | |
| | 19,000 | | | WideOpenWest Inc.† | | | 63,888 | | | | 94,240 | |
| | | | | | | | | | | | | |
| | | | | Computer Software and Services — 0.7% | | | | | | | | |
| | 17,000 | | | Alithya Group Inc., Cl. A† | | | 39,637 | | | | 17,595 | |
| | 900 | | | Asetek A/S† | | | 706 | | | | 320 | |
| | 500 | | | Daktronics Inc.† | | | 4,035 | | | | 8,430 | |
| | 4,000 | | | NextNav Inc.† | | | 11,169 | | | | 62,240 | |
| | 60,000 | | | Pacific Online Ltd. | | | 12,359 | | | | 2,356 | |
| | | | | | | | 67,906 | | | | 90,941 | |
| | | | | Consumer Products — 6.4% | | | | | | | | |
| | 10,000 | | | American Outdoor Brands Inc.† | | | 87,230 | | | | 152,400 | |
| | 2,000 | | | Aspen Group Inc.† | | | 244 | | | | 323 | |
| | 55,000 | | | Clarus Corp. | | | 305,409 | | | | 248,050 | |
| | 600 | | | CompX International Inc. | | | 8,618 | | | | 15,690 | |
| | 650,000 | | | Goodbaby International Holdings Ltd.† | | | 61,273 | | | | 74,485 | |
| | 3,200 | | | HG Holdings Inc.† | | | 28,992 | | | | 15,584 | |
| | 3,500 | | | Lifecore Biomedical Inc.† | | | 23,242 | | | | 26,005 | |
| | 12,000 | | | Lifetime Brands Inc. | | | 71,355 | | | | 70,920 | |
| | 3,000 | | | Marine Products Corp. | | | 35,678 | | | | 27,510 | |
| | 4,900 | | | Nobility Homes Inc. | | | 142,126 | | | | 161,700 | |
| | 100 | | | Oil-Dri Corp. of America | | | 2,550 | | | | 8,764 | |
| | 71,000 | | | Playmates Holdings Ltd. | | | 10,621 | | | | 5,211 | |
| | | | | | | | 777,338 | | | | 806,642 | |
| | | | | Consumer Services — 1.2% | | | | | | | | |
| | 270,000 | | | Tribal Group plc | | | 236,981 | | | | 156,838 | |
| | | | | | | | | | | | | |
| | | | | Diversified Industrial — 19.8% | | | | | | | | |
| | 122,000 | | | Ampco-Pittsburgh Corp.† | | | 411,462 | | | | 254,980 | |
| | 12,400 | | | Arq Inc.† | | | 23,301 | | | | 93,868 | |
| | 9,500 | | | Ascent Industries Co.† | | | 93,840 | | | | 106,210 | |
| | 1,000 | | | Burnham Holdings Inc., Cl. A | | | 13,820 | | | | 13,900 | |
| | 20,500 | | | Commercial Vehicle Group Inc.† | | | 140,342 | | | | 50,840 | |
| | 500 | | | Core Molding Technologies Inc.† | | | 5,890 | | | | 8,270 | |
| | 31,000 | | | Fluence Corp. Ltd.† | | | 7,941 | | | | 1,382 | |
| | 2,200 | | | Graham Corp.† | | | 16,345 | | | | 97,834 | |
| | 3,000 | | | INNOVATE Corp.† | | | 27,347 | | | | 14,820 | |
| | 44,000 | | | Intevac Inc.† | | | 221,234 | | | | 149,600 | |
| | 20,000 | | | Myers Industries Inc. | | | 307,124 | | | | 220,800 | |
| | 11,700 | | | Park-Ohio Holdings Corp. | | | 209,448 | | | | 307,359 | |
| | 3,000 | | | Perma-Fix Environmental Services Inc.† | | | 35,742 | | | | 33,210 | |
See accompanying notes to financial statements.
The Gabelli Global Mini Mites Fund
Schedule of Investments (Continued) — December 31, 2024
| Shares | | | | | Cost | | | Market
Value | |
| | | | COMMON STOCKS (Continued) | | | | | | |
| | | | | Diversified Industrial (Continued) | | | | | | | | |
| | 2,000 | | | Quest Resource Holding Corp.† | | $ | 18,917 | | | $ | 13,000 | |
| | 2,900 | | | Servotronics Inc.† | | | 33,957 | | | | 31,668 | |
| | 115,000 | | | Tredegar Corp.† | | | 682,844 | | | | 883,200 | |
| | 30,000 | | | Velan Inc.† | | | 117,469 | | | | 225,399 | |
| | | | | | | | 2,367,023 | | | | 2,506,340 | |
| | | | | Electronics — 0.2% | | | | | | | | |
| | 200 | | | Bel Fuse Inc., Cl. B | | | 2,432 | | | | 16,494 | |
| | 1,000 | | | Kopin Corp.† | | | 1,585 | | | | 1,360 | |
| | 300 | | | Ultralife Corp.† | | | 3,165 | | | | 2,235 | |
| | | | | | | | 7,182 | | | | 20,089 | |
| | | | | Energy and Utilities — 1.6% | | | | | | | | |
| | 2,900 | | | Capstone Green Energy Corp.† | | | 12,681 | | | | 609 | |
| | 400 | | | Consolidated Water Co. Ltd. | | | 4,084 | | | | 10,356 | |
| | 1,800 | | | DMC Global Inc.† | | | 20,771 | | | | 13,230 | |
| | 4,500 | | | Innovex International Inc.† | | | 92,573 | | | | 62,865 | |
| | 6,000 | | | RGC Resources Inc. | | | 115,807 | | | | 120,360 | |
| | | | | | | | 245,916 | | | | 207,420 | |
| | | | | Entertainment — 4.9% | | | | | | | | |
| | 65,000 | | | Entravision Communications Corp., Cl. A | | | 189,651 | | | | 152,750 | |
| | 25,000 | | | Inspired Entertainment Inc.† | | | 247,625 | | | | 226,250 | |
| | 85,000 | | | Ollamani SAB† | | | 158,616 | | | | 144,310 | |
| | 20,000 | | | Reading International Inc., Cl. A† | | | 77,056 | | | | 26,400 | |
| | 6,000 | | | Reservoir Media Inc.† | | | 41,793 | | | | 54,300 | |
| | 10,000 | | | Sportech plc†(a) | | | 37,134 | | | | 10,516 | |
| | | | | | | | 751,875 | | | | 614,526 | |
| | | | | Equipment and Supplies — 6.0% | | | | | | | | |
| | 15,200 | | | Applied Optoelectronics Inc.† | | | 47,353 | | | | 560,272 | |
| | 4,000 | | | Ilika plc† | | | 2,231 | | | | 1,077 | |
| | 3,200 | | | The Eastern Co. | | | 70,001 | | | | 84,928 | |
| | 8,000 | | | Titan Machinery Inc.† | | | 144,366 | | | | 113,040 | |
| | | | | | | | 263,951 | | | | 759,317 | |
| | | | | Financial Services — 1.8% | | | | | | | | |
| | 200,000 | | | GAM Holding AG† | | | 63,160 | | | | 19,326 | |
| | 700 | | | OceanFirst Financial Corp. | | | 10,321 | | | | 12,670 | |
| | 4,500 | | | Steel Partners Holdings LP† | | | 50,888 | | | | 191,520 | |
| | 4,500 | | | Tiny Ltd.† | | | 10,229 | | | | 5,103 | |
| | | | | | | | 134,598 | | | | 228,619 | |
| | | | | Food and Beverage — 2.9% | | | | | | | | |
| | 155,000 | | | China Foods Ltd. | | | 51,379 | | | | 49,893 | |
| | 5,000 | | | Corby Spirit and Wine Ltd., Cl. A | | | 60,487 | | | | 43,619 | |
| | 40,000 | | | Farmer Brothers Co.† | | | 201,502 | | | | 72,000 | |
| Shares | | | | | Cost | | | Market
Value | |
| | 2,500 | | | Lifeway Foods Inc.† | | $ | 41,027 | | | $ | 62,000 | |
| | 1,700 | | | Nathan’s Famous Inc. | | | 97,346 | | | | 133,637 | |
| | | | | | | | 451,741 | | | | 361,149 | |
| | | | | Health Care — 6.7% | | | | | | | | |
| | 45,000 | | | Accuray Inc.† | | | 133,928 | | | | 89,100 | |
| | 40,000 | | | Achaogen Inc.†(a) | | | 488 | | | | 0 | |
| | 5,000 | | | Axogen Inc.† | | | 39,137 | | | | 82,400 | |
| | 18,000 | | | Cutera Inc.† | | | 35,515 | | | | 6,352 | |
| | 400 | | | Daxor Corp.† | | | 4,127 | | | | 3,066 | |
| | 9,200 | | | Electromed Inc.† | | | 95,377 | | | | 271,860 | |
| | 3,000 | | | GRAIL Inc.† | | | 45,727 | | | | 53,550 | |
| | 65,000 | | | Harvard Bioscience Inc.† | | | 205,432 | | | | 137,150 | |
| | 8,000 | | | Neuronetics Inc.† | | | 14,920 | | | | 12,880 | |
| | 2,900 | | | Oncimmune Holdings plc† | | | 3,575 | | | | 521 | |
| | 1,600 | | | Option Care Health Inc.† | | | 15,886 | | | | 37,120 | |
| | 1,300 | | | Tristel plc | | | 4,856 | | | | 6,917 | |
| | 200 | | | Utah Medical Products Inc. | | | 13,410 | | | | 12,294 | |
| | 10,000 | | | Zimvie Inc.† | | | 150,101 | | | | 139,500 | |
| | | | | | | | 762,479 | | | | 852,710 | |
| | | | | Hotels and Gaming — 2.8% | | | | | | | | |
| | 3,800 | | | Canterbury Park Holding Corp. | | | 49,727 | | | | 79,838 | |
| | 17,000 | | | Full House Resorts Inc.† | | | 89,894 | | | | 69,360 | |
| | 7,000 | | | Genius Sports Ltd.† | | | 38,648 | | | | 60,550 | |
| | 6,700 | | | The Marcus Corp. | | | 91,803 | | | | 144,050 | |
| | | | | | | | 270,072 | | | | 353,798 | |
| | | | | Machinery — 4.6% | | | | | | | | |
| | 6,000 | | | CFT SpA†(a) | | | 33,163 | | | | 28,589 | |
| | 12,500 | | | L.B. Foster Co., Cl. A† | | | 166,957 | | | | 336,250 | |
| | 19,000 | | | Twin Disc Inc. | | | 202,970 | | | | 223,250 | |
| | | | | | | | 403,090 | | | | 588,089 | |
| | | | | Metals and Mining — 2.1% | | | | | | | | |
| | 5,000 | | | 5E Advanced Materials Inc.† | | | 7,350 | | | | 3,200 | |
| | 65,000 | | | NN Inc.† | | | 211,584 | | | | 212,550 | |
| | 20,000 | | | Sierra Metals Inc.† | | | 6,129 | | | | 11,360 | |
| | 40,000 | | | Western Copper & Gold Corp.† | | | 66,663 | | | | 42,000 | |
| | | | | | | | 291,726 | | | | 269,110 | |
| | | | | Publishing — 2.1% | | | | | | | | |
| | 2,000 | | | DallasNews Corp. | | | 7,902 | | | | 14,860 | |
| | 17,000 | | | Lee Enterprises Inc.† | | | 170,820 | | | | 251,260 | |
| | | | | | | | 178,722 | | | | 266,120 | |
| | | | | Real Estate — 0.8% | | | | | | | | |
| | 45,000 | | | Corem Property Group AB, Cl. B | | | 103,545 | | | | 27,210 | |
| | 7,507 | | | Gyrodyne LLC† | | | 61,771 | | | | 71,016 | |
| | 20,000 | | | Trinity Place Holdings Inc.† | | | 8,725 | | | | 1,338 | |
| | | | | | | | 174,041 | | | | 99,564 | |
See accompanying notes to financial statements.
The Gabelli Global Mini Mites Fund
Schedule of Investments (Continued) — December 31, 2024
| Shares | | | | | Cost | | | Market
Value | |
| | | | | COMMON STOCKS (Continued) | | | | | | | | |
| | | | | Retail — 2.5% | | | | | | | | |
| | 4,000 | | | Bassett Furniture Industries Inc. | | $ | 63,360 | | | $ | 55,320 | |
| | 24,000 | | | Sportsman’s Warehouse Holdings Inc.† | | | 71,471 | | | | 64,080 | |
| | 6,300 | | | Village Super Market Inc., Cl. A | | | 143,690 | | | | 200,907 | |
| | | | | | | | 278,521 | | | | 320,307 | |
| | | | | Specialty Chemicals — 2.2% | | | | | | | | |
| | 17,000 | | | American Vanguard Corp. | | | 237,694 | | | | 78,710 | |
| | 1,000 | | | Loop Industries Inc.† | | | 2,989 | | | | 1,200 | |
| | 33,000 | | | Treatt plc | | | 192,279 | | | | 201,193 | |
| | | | | | | | 432,962 | | | | 281,103 | |
| | | | | Telecommunications — 0.0% | | | | | | | | |
| | 700 | | | Bittium Oyj | | | 4,945 | | | | 4,612 | |
| | | | | | | | | | | | | |
| | | | | Wireless Telecommunications Services — 0.1% | | | | | | | | |
| | 22,877 | | | NII Holdings Inc., Escrow† | | | 442 | | | | 8,007 | |
| | | | | | | | | | | | | |
| | | | | TOTAL COMMON STOCKS | | | 9,740,285 | | | | 10,659,591 | |
| | | | | | | | | | | | | |
| | | | | RIGHTS — 0.0% | | | | | | | | |
| | | | | Health Care — 0.0% | | | | | | | | |
| | 16,000 | | | Epizyme Inc., CVR† | | | 0 | | | | 320 | |
| | 30,000 | | | Paratek Pharmaceuticals Inc., CVR† | | | 0 | | | | 600 | |
| | | | | TOTAL RIGHTS | | | 0 | | | | 920 | |
| | | | | | | | | | | | | |
| | | | | WARRANTS — 0.0% | | | | | | | | |
| | | | | Diversified Industrial — 0.0% | | | | | | | | |
| | 44,000 | | | Ampco-Pittsburgh Corp., expire 08/01/25† | | | 30,056 | | | | 3,960 | |
Principal
Amount | | | | | | | | | | | |
| | | | | U.S. GOVERNMENT OBLIGATIONS — 14.6% | | | | | | | | |
| $ | 1,860,000 | | | U.S. Treasury Bills, 4.235% to 4.522%††, 01/02/25 to 05/22/25 | | | 1,843,581 | | | | 1,844,407 | |
| | | | | | | | | | | | | |
| | | | | TOTAL INVESTMENTS — 98.8% | | $ | 11,613,922 | | | | 12,508,878 | |
| | | | | | | | | | | | | |
| | | | | Other Assets and Liabilities (Net) — 1.2% | | | | | | | 155,758 | |
| | | | | | | | | | | | | |
| | | | | NET ASSETS — 100.0% | | | | | | $ | 12,664,636 | |
| (a) | Security is valued using significant unobservable inputs and is classified as Level 3 in the fair value hierarchy. |
| † | Non-income producing security. |
| †† | Represents annualized yields at dates of purchase. |
| | |
| CVR | Contingent Value Right |
| Geographic Diversification | | % of
Market
Value | | | Market
Value | |
| United States | | | 87.7 | % | | $ | 10,969,420 | |
| Europe | | | 7.2 | | | | 899,872 | |
| Canada | | | 2.8 | | | | 352,975 | |
| Latin America | | | 1.2 | | | | 154,666 | |
| Asia/Pacific | | | 1.1 | | | | 131,945 | |
| | | | 100.0 | % | | $ | 12,508,878 | |
See accompanying notes to financial statements.
The Gabelli Global Mini Mites Fund
Statement of Assets and Liabilities
December 31, 2024
| Assets: | | | | |
| Investments, at value (cost $11,613,922) | | $ | 12,508,878 | |
| Receivable for Fund shares sold | | | 239,999 | |
| Dividends receivable | | | 3,566 | |
| Prepaid expenses | | | 8,335 | |
| Total Assets | | | 12,760,778 | |
| Liabilities: | | | | |
| Payable to bank | | | 25,519 | |
| Payable for investment advisory fees | | | 15,741 | |
| Payable for distribution fees | | | 40 | |
| Payable for legal and audit fees | | | 30,799 | |
| Payable for shareholder communications | | | 16,800 | |
| Other accrued expenses | | | 7,243 | |
| Total Liabilities | | | 96,142 | |
| Commitments and Contingencies (See Note 3) | | | | |
| Net Assets | | | | |
| (applicable to 1,143,008 shares outstanding) | | $ | 12,664,636 | |
| | | | | |
| Net Assets Consist of: | | | | |
| Paid-in capital | | $ | 11,897,162 | |
| Total distributable earnings | | | 767,474 | |
| Net Assets | | $ | 12,664,636 | |
| | | | | |
| Shares of Capital Stock, each at $0.001 par value: | | | | |
| Class AAA: | | | | |
| Net Asset Value, offering, and redemption price per share ($102,365 ÷ 9,239 shares outstanding; 75,000,000 shares authorized) | | $ | 11.08 | |
| Class A: | | | | |
| Net Asset Value and redemption price per share ($17,173 ÷ 1,550 shares outstanding; 50,000,000 shares authorized) | | $ | 11.08 | |
| Maximum offering price per share (NAV ÷ 0.9425, based on maximum sales charge of 5.75% of the offering price) | | $ | 11.76 | |
| Class C: | | | | |
| Net Asset Value and redemption price per share ($17,044 ÷ 1,545 shares outstanding; 25,000,000 shares authorized) | | $ | 11.03 | |
| Class I: | | | | |
| Net Asset Value, offering, and redemption price per share ($12,528,054 ÷ 1,130,674 shares outstanding; 25,000,000 shares authorized) | | $ | 11.08 | |
Statement of Operations
For the Year Ended December 31, 2024
| Investment Income: | | | | |
| Dividends (net of foreign withholding taxes of $1,513) | | $ | 98,718 | |
| Interest | | | 113,403 | |
| Total Investment Income | | | 212,121 | |
| Expenses: | | | | |
| Investment advisory fees | | | 113,694 | |
| Distribution fees - Class AAA | | | 232 | |
| Distribution fees - Class A | | | 39 | |
| Distribution fees - Class C | | | 155 | |
| Registration expenses | | | 59,462 | |
| Legal and audit fees | | | 45,813 | |
| Shareholder communications expenses | | | 23,114 | |
| Shareholder services fees | | | 12,492 | |
| Custodian fees | | | 2,852 | |
| Directors’ fees | | | 2,067 | |
| Miscellaneous expenses | | | 11,617 | |
| Total Expenses | | | 271,537 | |
| Less: | | | | |
| Expense reimbursements (See Note 3) | | | (167,739 | ) |
| Expenses paid indirectly by broker (See Note 6) | | | (1,474 | ) |
| Total Reimbursements and Credits | | | (169,213 | ) |
| Net Expenses | | | 102,324 | |
| Net Investment Income | | | 109,797 | |
| | | | | |
| Net Realized and Unrealized Gain on Investments and Foreign Currency: | | | | |
| Net realized gain on investments | | | 920,968 | |
| Net realized gain on foreign currency transactions | | | 164 | |
| Net realized gain on investments and foreign currency transactions | | | 921,132 | |
| Net change in unrealized appreciation/depreciation: | | | | |
| on investments | | | 165,841 | |
| on foreign currency translations | | | 1 | |
| Net change in unrealized appreciation/depreciation on investments and foreign currency translations | | | 165,842 | |
| Net Realized and Unrealized Gain on Investments and Foreign Currency | | | 1,086,974 | |
| Net Increase in Net Assets Resulting from Operations | | $ | 1,196,771 | |
See accompanying notes to financial statements.
The Gabelli Global Mini Mites Fund
Statement of Changes in Net Assets
| | | Year Ended | | | Year Ended | |
| | | December 31,
2024 | | | December 31,
2023 | |
| Operations: | | | | | | | | |
| Net investment income | | $ | 109,797 | | | $ | 59,359 | |
| Net realized gain on investments and foreign currency transactions | | | 921,132 | | | | 987,265 | |
| Net change in unrealized appreciation/depreciation on investments and foreign currency translations | | | 165,842 | | | | 1,667,229 | |
| Net Increase in Net Assets Resulting from Operations | | | 1,196,771 | | | | 2,713,853 | |
| | | | | | | | | |
| Distributions to Shareholders: | | | | | | | | |
| Accumulated earnings | | | | | | | | |
| Class AAA | | | (8,473 | ) | | | (9,263 | ) |
| Class A | | | (1,421 | ) | | | (1,554 | ) |
| Class C | | | (1,411 | ) | | | (1,543 | ) |
| Class I | | | (1,020,792 | ) | | | (1,060,429 | ) |
| Total Distributions to Shareholders | | | (1,032,097 | ) | | | (1,072,789 | ) |
| | | | | | | | | |
| Capital Share Transactions: | | | | | | | | |
| Class AAA | | | 8,473 | | | | 9,263 | |
| Class A | | | 1,421 | | | | 1,554 | |
| Class C | | | 1,411 | | | | 1,543 | |
| Class I | | | 937,980 | | | | 3,368,510 | |
| Net Increase in Net Assets from Capital Share Transactions | | | 949,285 | | | | 3,380,870 | |
| | | | | | | | | |
| Redemption Fees | | | 2 | | | | — | |
| | | | | | | | | |
| Net Increase in Net Assets | | | 1,113,961 | | | | 5,021,934 | |
| | | | | | | | | |
| Net Assets: | | | | | | | | |
| Beginning of year | | | 11,550,675 | | | | 6,528,741 | |
| End of year | | $ | 12,664,636 | | | $ | 11,550,675 | |
See accompanying notes to financial statements.
The Gabelli Global Mini Mites Fund
Financial Highlights
Selected data for a share of capital stock outstanding throughout each year:
| | | | | | | Income (Loss) from Investment Operations | | | Distributions | | | | | | | | | | | | Ratios to Average Net Assets/Supplemental Data | |
Year Ended December 31 | | Net Asset Value,
Beginning of Year | | | Net Investment
Income (Loss)(a) | | | Net Realized
and Unrealized
Gain (Loss) on
Investments | | | Total from
Investment
Operations | | | Net Investment
Income | | | Net Realized
Gain on
Investments | | | Total
Distributions | | | Redemption
Fees(a)(b) | | | Net Asset Value,
End of year | | | Total
Return† | | | Net Assets, End
of year
(in 000’s) | | | Net Investment
Income (Loss) | | | Operating
Expenses Before
Reimbursement | | | Operating
Expenses Net of
Reimbursement(c)(d) | | | Portfolio
Turnover
Rate | |
| Class AAA | | | | | | | | | | | | | | | | | | | | | | | | | | | | | | | | | | | | | | | | | | | | | | | | | | | | | | | | | | | | |
| 2024 | | $ | 10.90 | | | $ | 0.11 | | | $ | 1.07 | | | $ | 1.18 | | | $ | (0.11 | ) | | $ | (0.89 | ) | | $ | (1.00 | ) | | $ | 0.00 | | | $ | 11.08 | | | | 10.88 | % | | $ | 103 | | | | 0.96 | % | | | 2.63 | % | | | 0.90 | % | | | 26 | % |
| 2023 | | | 8.70 | | | | 0.07 | | | | 3.35 | | | | 3.42 | | | | (0.07 | ) | | | (1.15 | ) | | | (1.22 | ) | | | — | | | | 10.90 | | | | 39.05 | | | | 92 | | | | 0.74 | | | | 3.37 | | | | 0.90 | | | | 42 | |
| 2022 | | | 11.04 | | | | 0.05 | | | | (1.85 | ) | | | (1.80 | ) | | | (0.05 | ) | | | (0.49 | ) | | | (0.54 | ) | | | — | | | | 8.70 | | | | (16.17 | ) | | | 67 | | | | 0.52 | | | | 3.40 | | | | 0.90 | (e) | | | 30 | |
| 2021 | | | 10.67 | | | | (0.02 | ) | | | 2.04 | | | | 2.02 | | | | (0.07 | ) | | | (1.58 | ) | | | (1.65 | ) | | | 0.00 | | | | 11.04 | | | | 19.25 | | | | 83 | | | | (0.17 | ) | | | 3.49 | | | | 0.90 | (f) | | | 79 | |
| 2020 | | | 9.26 | | | | 0.05 | | | | 1.42 | | | | 1.47 | | | | (0.06 | ) | | | — | | | | (0.06 | ) | | | — | | | | 10.67 | | | | 15.87 | | | | 120 | | | | 0.61 | | | | 9.40 | | | | 0.90 | | | | 63 | |
| Class A | | | | | | | | | | | | | | | | | | | | | | | | | | | | | | | | | | | | | | | | | | | | | | | | | | | | | | | | | | | | |
| 2024 | | $ | 10.89 | | | $ | 0.11 | | | $ | 1.08 | | | $ | 1.19 | | | $ | (0.11 | ) | | $ | (0.89 | ) | | $ | (1.00 | ) | | $ | — | | | $ | 11.08 | | | | 10.98 | % | | $ | 17 | | | | 0.96 | % | | | 2.63 | % | | | 0.90 | % | | | 26 | % |
| 2023 | | | 8.70 | | | | 0.07 | | | | 3.34 | | | | 3.41 | | | | (0.07 | ) | | | (1.15 | ) | | | (1.22 | ) | | | — | | | | 10.89 | | | | 38.93 | | | | 16 | | | | 0.74 | | | | 3.37 | | | | 0.90 | | | | 42 | |
| 2022 | | | 11.04 | | | | 0.05 | | | | (1.85 | ) | | | (1.80 | ) | | | (0.05 | ) | | | (0.49 | ) | | | (0.54 | ) | | | — | | | | 8.70 | | | | (16.17 | ) | | | 11 | | | | 0.52 | | | | 3.40 | | | | 0.90 | (e) | | | 30 | |
| 2021 | | | 10.66 | | | | (0.02 | ) | | | 2.05 | | | | 2.03 | | | | (0.07 | ) | | | (1.58 | ) | | | (1.65 | ) | | | 0.00 | | | | 11.04 | | | | 19.38 | | | | 13 | | | | (0.18 | ) | | | 3.49 | | | | 0.90 | (f) | | | 79 | |
| 2020 | | | 9.26 | | | | 0.05 | | | | 1.41 | | | | 1.46 | | | | (0.06 | ) | | | — | | | | (0.06 | ) | | | — | | | | 10.66 | | | | 15.76 | | | | 11 | | | | 0.66 | | | | 9.40 | | | | 0.90 | | | | 63 | |
| Class C | | | | | | | | | | | | | | | | | | | | | | | | | | | | | | | | | | | | | | | | | | | | | | | | | | | | | | | | | | | | |
| 2024 | | $ | 10.85 | | | $ | 0.11 | | | $ | 1.07 | | | $ | 1.18 | | | $ | (0.11 | ) | | $ | (0.89 | ) | | $ | (1.00 | ) | | $ | — | | | $ | 11.03 | | | | 10.89 | % | | $ | 17 | | | | 0.96 | % | | | 3.38 | % | | | 0.90 | % | | | 26 | % |
| 2023 | | | 8.66 | | | | 0.07 | | | | 3.33 | | | | 3.40 | | | | (0.07 | ) | | | (1.14 | ) | | | (1.21 | ) | | | — | | | | 10.85 | | | | 39.06 | | | | 15 | | | | 0.74 | | | | 4.12 | | | | 0.90 | | | | 42 | |
| 2022 | | | 11.00 | | | | 0.05 | | | | (1.85 | ) | | | (1.80 | ) | | | (0.05 | ) | | | (0.49 | ) | | | (0.54 | ) | | | — | | | | 8.66 | | | | (16.25 | ) | | | 11 | | | | 0.52 | | | | 4.15 | | | | 0.90 | (e) | | | 30 | |
| 2021 | | | 10.63 | | | | (0.02 | ) | | | 2.04 | | | | 2.02 | | | | (0.07 | ) | | | (1.58 | ) | | | (1.65 | ) | | | 0.00 | | | | 11.00 | | | | 19.34 | | | | 13 | | | | (0.18 | ) | | | 4.24 | | | | 0.90 | (f) | | | 79 | |
| 2020 | | | 9.23 | | | | 0.05 | | | | 1.41 | | | | 1.46 | | | | (0.06 | ) | | | — | | | | (0.06 | ) | | | — | | | | 10.63 | | | | 15.81 | | | | 11 | | | | 0.66 | | | | 10.15 | | | | 0.90 | | | | 63 | |
| Class I | | | | | | | | | | | | | | | | | | | | | | | | | | | | | | | | | | | | | | | | | | | | | | | | | | | | | | | | | | | | |
| 2024 | | $ | 10.90 | | | $ | 0.11 | | | $ | 1.07 | | | $ | 1.18 | | | $ | (0.11 | ) | | $ | (0.89 | ) | | $ | (1.00 | ) | | $ | 0.00 | | | $ | 11.08 | | | | 10.88 | % | | $ | 12,528 | | | | 0.97 | % | | | 2.38 | % | | | 0.90 | % | | | 26 | % |
| 2023 | | | 8.70 | | | | 0.08 | | | | 3.34 | | | | 3.42 | | | | (0.07 | ) | | | (1.15 | ) | | | (1.22 | ) | | | — | | | | 10.90 | | | | 39.05 | | | | 11,428 | | | | 0.74 | | | | 3.12 | | | | 0.90 | | | | 42 | |
| 2022 | | | 11.04 | | | | 0.05 | | | | (1.85 | ) | | | (1.80 | ) | | | (0.05 | ) | | | (0.49 | ) | | | (0.54 | ) | | | — | | | | 8.70 | | | | (16.17 | ) | | | 6,440 | | | | 0.52 | | | | 3.15 | | | | 0.90 | (e) | | | 30 | |
| 2021 | | | 10.67 | | | | (0.02 | ) | | | 2.04 | | | | 2.02 | | | | (0.07 | ) | | | (1.58 | ) | | | (1.65 | ) | | | 0.00 | | | | 11.04 | | | | 19.25 | | | | 6,801 | | | | (0.18 | ) | | | 3.24 | | | | 0.90 | (f) | | | 79 | |
| 2020 | | | 9.26 | | | | 0.09 | | | | 1.38 | | | | 1.47 | | | | (0.06 | ) | | | — | | | | (0.06 | ) | | | — | | | | 10.67 | | | | 15.87 | | | | 3,922 | | | | 1.11 | | | | 9.15 | | | | 0.90 | | | | 63 | |
| † | Total return represents aggregate total return of a hypothetical investment at the beginning of the year and sold at the end of the year including reinvestment of distributions and does not reflect the applicable sales charges. |
| (a) | Per share amounts have been calculated using the average shares outstanding method. |
| (b) | Amount represents less than $0.005 per share. |
| (c) | Under an expense reimbursement agreement with the Adviser, the Adviser reimbursed expenses of $167,739, $176,163, $148,978, $147,312, and $163,109 for the years ended December 31, 2024, 2023, 2022, 2021, and 2020, respectively. |
| (d) | The Fund received credits from a designated broker who agreed to pay certain Fund operating expenses for the years ended December 31, 2024, 2023, 2022, 2021, and 2020. If such credits had not been received, the ratios of operating expenses to average net assets would have been 0.91%, 0.92%, 0.92%, 0.92%, and 0.96% for each Class, respectively. |
| (e) | The Fund incurred interest expense. For the year ended December 31, 2022, the impact was minimal. |
| (f) | The Fund incurred tax expense for the year ended December 31, 2021 and there was no material impact on the expense ratios. |
See accompanying notes to financial statements.
The Gabelli Global Mini Mites Fund
Notes to Financial Statements
1. Organization. The Gabelli Global Mini Mites Fund (the Fund), a series of the GAMCO Global Series Funds, Inc. (the Corporation), was incorporated on July 16, 1993 in Maryland. The Fund is a non-diversified open-end management investment company registered under the Investment Company Act of 1940, as amended (the 1940 Act), and is one of five separately managed portfolios (collectively, the Portfolios) of the Corporation. The Fund’s primary objective is long term capital appreciation by investing primarily in micro-capitalization equity securities. The Fund commenced investment operations on October 1, 2018.
Gabelli Funds, LLC (the Adviser), with its principal offices located at One Corporate Center, Rye, New York 10580-1422, serves as investment adviser to the Fund. The Adviser makes investment decisions for the Fund and continuously reviews and administers the Fund’s investment program and manages the operations of the Fund under the general supervision of the Company’s Board of Directors (the Board).
2. Significant Accounting Policies. As an investment company, the Fund follows the investment company accounting and reporting guidance, which is part of U.S. generally accepted accounting principles (GAAP) that may require the use of management estimates and assumptions in the preparation of its financial statements. The Board has designated the Adviser as the valuation designee under Rule 2a-5. Actual results could differ from those estimates. The following is a summary of significant accounting policies followed by the Fund in the preparation of its financial statements.
Security Valuation. Portfolio securities listed or traded on a nationally recognized securities exchange or traded in the U.S. over-the-counter market for which market quotations are readily available are valued at the last quoted sale price or a market’s official closing price as of the close of business on the day the securities are being valued. If there were no sales that day, the security is valued at the average of the closing bid and asked prices or, if there were no asked prices quoted on that day, then the security is valued at the closing bid price on that day. If no bid or asked prices are quoted on such day, the security is valued at the most recently available price or, if the Board so determines, by such other method as the Board shall determine in good faith to reflect its fair market value. Portfolio securities traded on more than one national securities exchange or market are valued according to the broadest and most representative market, as determined by the Adviser.
Portfolio securities primarily traded on a foreign market are generally valued at the preceding closing values of such securities on the relevant market, but may be fair valued pursuant to procedures established by the Board if market conditions change significantly after the close of the foreign market, but prior to the close of business on the day the securities are being valued. Debt obligations for which market quotations are readily available are valued at the average of the latest bid and asked prices. If there were no asked prices quoted on such day, the security is valued using the closing bid price, unless the Board determines such amount does not reflect the security’s fair value, in which case these securities will be fair valued as determined by the Board. Such debt obligations are valued through prices provided by a pricing service approved by the Board. Certain securities are valued principally using dealer quotations.
Securities and assets for which market quotations are not readily available are fair valued as determined by the Board. Fair valuation methodologies and procedures may include, but are not limited to: analysis and review of available financial and non-financial information about the company; comparisons with the valuation and changes in valuation of similar securities, including a comparison of foreign securities with the equivalent U.S. dollar value American Depositary Receipt securities at the close of the U.S. exchange; and evaluation of any other information that could be indicative of the value of the security.
The Gabelli Global Mini Mites Fund
Notes to Financial Statements (Continued)
The Fund employs a fair value model to adjust prices to reflect events affecting the values of certain portfolio securities which occur between the close of trading on the principal market for such securities (foreign exchanges and over-the-counter markets) at the time when net asset values of the Fund are determined. If the Fund’s valuation committee believes that a particular event would materially affect net asset value, further adjustment is considered. Such securities are classified as Level 2 in the fair value hierarchy presented below.
The inputs and valuation techniques used to measure fair value of the Fund’s investments are summarized into three levels as described in the hierarchy below:
| ● | Level 1 — unadjusted quoted prices in active markets for identical securities; |
| ● | Level 2 — other significant observable inputs (including quoted prices for similar securities, interest rates, prepayment speeds, credit risk, etc.); and |
| ● | Level 3 — significant unobservable inputs (including the Board’s determinations as to the fair value of investments). |
A financial instrument’s level within the fair value hierarchy is based on the lowest level of any input both individually and in the aggregate that is significant to the fair value measurement. The inputs or methodology used for valuing securities are not necessarily an indication of the risk associated with investing in those securities.
The summary of the Fund’s investments in securities by inputs used to value the Fund’s investments as of December 31, 2024 is as follows:
| | | Valuation Inputs | | | | |
| | | Level 1
Quoted Prices | | | Level 2 Other
Significant
Observable Inputs | | | Level 3 Significant
Unobservable
Inputs (a) | | | Total
Market Value
at 12/31/24 | |
| INVESTMENTS IN SECURITIES: | | | | | | | | | | | | | | | | |
| ASSETS (Market Value): | | | | | | | | | | | | | | | | |
| Common Stocks: | | | | | | | | | | | | | | | | |
| Business Services | | $ | 327,651 | | | $ | 33,921 | | | $ | 7,236 | | | $ | 368,808 | |
| Computer Software and Services | | | 90,621 | | | | 320 | | | | — | | | | 90,941 | |
| Consumer Products | | | 791,058 | | | | 15,584 | | | | — | | | | 806,642 | |
| Diversified Industrial | | | 2,474,672 | | | | 31,668 | | | | — | | | | 2,506,340 | |
| Energy and Utilities | | | 206,811 | | | | 609 | | | | — | | | | 207,420 | |
| Entertainment | | | 604,010 | | | | — | | | | 10,516 | | | | 614,526 | |
| Health Care | | | 852,710 | | | | — | | | | 0 | | | | 852,710 | |
| Machinery | | | 559,500 | | | | — | | | | 28,589 | | | | 588,089 | |
| Real Estate | | | 28,548 | | | | 71,016 | | | | — | | | | 99,564 | |
| Wireless Telecommunications Services | | | — | | | | 8,007 | | | | — | | | | 8,007 | |
| Other Industries (b) | | | 4,516,544 | | | | — | | | | — | | | | 4,516,544 | |
| Total Common Stocks | | | 10,452,125 | | | | 161,125 | | | | 46,341 | | | | 10,659,591 | |
| Rights (b) | | | — | | | | 920 | | | | — | | | | 920 | |
| Warrants (b) | | | 3,960 | | | | — | | | | — | | | | 3,960 | |
| U.S. Government Obligations | | | — | | | | 1,844,407 | | | | — | | | | 1,844,407 | |
| TOTAL INVESTMENTS IN SECURITIES – ASSETS | | $ | 10,456,085 | | | $ | 2,006,452 | | | $ | 46,341 | | | $ | 12,508,878 | |
The Gabelli Global Mini Mites Fund
Notes to Financial Statements (Continued)
| (a) | The inputs for these securities are not readily available and are derived based on the judgment of the Adviser according to procedures approved by the Board. |
| (b) | Please refer to the Schedule of Investments for the industry classifications of these portfolio holdings. |
At December 31, 2024, the total value of Level 3 investments for the Fund was less than 1% of total net assets.
General. The Fund uses recognized industry pricing services – approved by the Board and unaffiliated with the Adviser – to value most of its securities, and uses broker quotes provided by market makers of securities not valued by these and other recognized pricing sources. Several different pricing feeds are received to value domestic equity securities, international equity securities, preferred equity securities, and fixed income securities. The data within these feeds are ultimately sourced from major stock exchanges and trading systems where these securities trade. The prices supplied by external sources are checked by obtaining quotations or actual transaction prices from market participants. If a price obtained from the pricing source is deemed unreliable, prices will be sought from another pricing service or from a broker/dealer that trades that security or similar securities.
Fair Valuation. Fair valued securities may be common or preferred equities, warrants, options, rights, or fixed income obligations. Where appropriate, Level 3 securities are those for which market quotations are not available, such as securities not traded for several days, or for which current bids are not available, or which are restricted as to transfer. When fair valuing a security, factors to consider include recent prices of comparable securities that are publicly traded, reliable prices of securities not publicly traded, the use of valuation models, current analyst reports, valuing the income or cash flow of the issuer, or cost if the preceding factors do not apply. A significant change in the unobservable inputs could result in a lower or higher value in Level 3 securities. The circumstances of Level 3 securities are frequently monitored to determine if fair valuation measures continue to apply.
The Adviser reports quarterly to the Board the results of the application of fair valuation policies and procedures. These may include backtesting the prices realized in subsequent trades of these fair valued securities to fair values previously recognized.
Foreign Currency Translations. The books and records of the Fund are maintained in U.S. dollars. Foreign currencies, investments, and other assets and liabilities are translated into U.S. dollars at current exchange rates. Purchases and sales of investment securities, income, and expenses are translated at the exchange rate prevailing on the respective dates of such transactions. Unrealized gains and losses that result from changes in foreign exchange rates and/or changes in market prices of securities have been included in unrealized appreciation/depreciation on investments and foreign currency translations. Net realized foreign currency gains and losses resulting from changes in exchange rates include foreign currency gains and losses between trade date and settlement date on investment securities transactions, foreign currency transactions, and the difference between the amounts of interest and dividends recorded on the books of the Fund and the amounts actually received. The portion of foreign currency gains and losses related to fluctuation in exchange rates between the initial purchase trade date and subsequent sale trade date is included in realized gain/(loss) on investments.
Foreign Securities. The Fund may directly purchase securities of foreign issuers. Investing in securities of foreign issuers involves special risks not typically associated with investing in securities of U.S. issuers. The risks include possible revaluation of currencies, the inability to repatriate funds, less complete financial information about companies, and possible future adverse political and economic developments. Moreover, securities of
The Gabelli Global Mini Mites Fund
Notes to Financial Statements (Continued)
many foreign issuers and their markets may be less liquid and their prices more volatile than securities of comparable U.S. issuers.
Foreign Taxes. The Fund may be subject to foreign taxes on income, gains on investments, or currency repatriation, a portion of which may be recoverable. The Fund will accrue such taxes and recoveries as applicable, based upon its current interpretation of tax rules and regulations that exist in the markets in which it invests.
Restricted Securities. The Fund may invest up to 15% of its net assets in securities for which the markets are restricted. Restricted securities include securities whose disposition is subject to substantial legal or contractual restrictions. The sale of restricted securities often requires more time and results in higher brokerage charges or dealer discounts and other selling expenses than the sale of securities eligible for trading on national securities exchanges or in the over-the-counter markets. Restricted securities may sell at a price lower than similar securities that are not subject to restrictions on resale. Securities freely saleable among qualified institutional investors under special rules adopted by the SEC may be treated as liquid if they satisfy liquidity standards established by the Board. The continued liquidity of such securities is not as well assured as that of publicly traded securities, and accordingly the Board will monitor their liquidity. At December 31, 2024, the Fund did not hold any restricted securities.
Investments in Other Investment Companies. The Fund may invest, from time to time, in shares of other investment companies (or entities that would be considered investment companies but are excluded from the definition pursuant to certain exceptions under the 1940 Act) (the Acquired Funds) in accordance with the 1940 Act and related rules. Shareholders in the Fund would bear the pro rata portion of the periodic expenses of the Acquired Funds in addition to the Fund’s expenses. For the year ended December 31, 2024, the Fund’s pro rata portion of the periodic expenses charged by the Acquired Funds was less than one basis point.
Securities Transactions and Investment Income. Securities transactions are accounted for on the trade date with realized gain/(loss) on investments determined by using the identified cost method. Interest income (including amortization of premium and accretion of discount) is recorded on an accrual basis. Premiums and discounts on debt securities are amortized using the effective yield to maturity method or amortized to earliest call date, if applicable. Dividend income is recorded on the ex-dividend date, except for certain dividends from foreign securities that are recorded as soon after the ex-dividend date as the Fund becomes aware of such dividends.
Determination of Net Asset Value and Calculation of Expenses. Certain administrative expenses are common to, and allocated among, various affiliated funds. Such allocations are made on the basis of the Fund’s average net assets or other criteria directly affecting the expenses as determined by the Adviser pursuant to procedures established by the Board.
In calculating the NAV per share of each class, investment income, realized and unrealized gains and losses, redemption fees, and expenses other than class specific expenses are allocated daily to each class of shares based upon the proportion of net assets of each class at the beginning of each day. Distribution expenses are borne solely by the class incurring the expense.
Distributions to Shareholders. Distributions to shareholders are recorded on the ex-dividend date. Distributions to shareholders are based on income and capital gains as determined in accordance with federal income tax regulations, which may differ from income and capital gains as determined under GAAP. These differences are primarily due to differing treatments of income and gains on various investment securities and foreign currency
The Gabelli Global Mini Mites Fund
Notes to Financial Statements (Continued)
transactions held by the Fund, timing differences, and differing characterizations of distributions made by the Fund. Distributions from net investment income for federal income tax purposes include net realized gains on foreign currency transactions. These book/tax differences are either temporary or permanent in nature. To the extent these differences are permanent, adjustments are made to the appropriate capital accounts in the period when the differences arise. These reclassifications have no impact on the NAV per share of the Fund. For the year ended December 31, 2024, no reclassifications were made in the Fund.
The tax character of distributions paid during the years ended December 31, 2024 and 2023 was as follows:
| | | Year ended
December 31,
2024 | | | Year ended
December 31,
2023 | |
| Distributions paid from: | | | | | | | | |
| Ordinary income (inclusive of short term capital gains) | | $ | 166,654 | | | $ | 529,059 | |
| Net long term capital gains | | | 865,443 | | | | 543,730 | |
| Total distributions paid | | $ | 1,032,097 | | | $ | 1,072,789 | |
Provision for Income Taxes. The Fund intends to continue to qualify as a regulated investment company under Subchapter M of the Internal Revenue Code of 1986, as amended (the Code). It is the policy of the Fund to comply with the requirements of the Code applicable to regulated investment companies and to distribute substantially all of its net investment company taxable income and net capital gains. Therefore, no provision for federal income taxes is required.
At December 31, 2024, the components of accumulated earnings/losses on a tax basis were as follows:
| Undistributed ordinary income | | $ | 3,796 | |
| Undistributed long term capital gains | | | 25,889 | |
| Net unrealized appreciation on investments and foreign currency translations | | | 737,789 | |
| Total | | $ | 767,474 | |
At December 31, 2024, the temporary difference between book basis and tax basis unrealized appreciation was primarily due to deferral of losses from wash sales for tax purposes.
The following summarizes the tax cost of investments and the related net unrealized appreciation at December 31, 2024:
| | | Cost | | | Gross
Unrealized
Appreciation | | | Gross
Unrealized
Depreciation | | | Net
Unrealized
Appreciation | |
| Investments | | $ | 11,771,089 | | | $ | 2,825,506 | | | $ | (2,087,717 | ) | | $ | 737,789 | |
The Fund is required to evaluate tax positions taken or expected to be taken in the course of preparing the Fund’s tax returns to determine whether the tax positions are “more-likely-than-not” of being sustained by the applicable tax authority. Income tax and related interest and penalties would be recognized by the Fund as tax expense in the Statement of Operations if the tax positions were deemed not to meet the more-likely-than-not threshold. During the year ended December 31, 2024, the Fund did not incur any income tax, interest, or penalties. As of December 31, 2024, the Adviser has reviewed all open tax years and concluded that there was
The Gabelli Global Mini Mites Fund
Notes to Financial Statements (Continued)
no impact to the Fund’s net assets or results of operations. The Fund’s federal and state tax returns for the prior three fiscal years remain open, subject to examination. On an ongoing basis, the Adviser will monitor the Fund’s tax positions to determine if adjustments to this conclusion are necessary.
3. Investment Advisory Agreement and Other Transactions. The Fund has entered into an investment advisory agreement (the Advisory Agreement) with the Adviser which provides that the Fund will pay the Adviser a fee, computed daily and paid monthly, at the annual rate of 1.00% of the value of its average daily net assets. In accordance with the Advisory Agreement, the Adviser provides a continuous investment program for the Fund’s portfolio, oversees the administration of all aspects of the Fund’s business and affairs, and pays the compensation of all Officers and Directors of the Fund who are affiliated persons of the Adviser.
The Adviser has contractually agreed to waive its investment advisory fees and/or to reimburse expenses to the extent necessary to maintain the annualized total operating expenses of the Fund (excluding brokerage costs, acquired fund fees and expenses, interest, taxes, and extraordinary expenses) until at least April 30, 2025, at no more than an annual rate of 0.90% for all classes of shares. During the year ended December 31, 2024, the Adviser reimbursed the Fund in the amount of $167,739. In addition, the Fund has agreed, during the two year period following any waiver or reimbursement by the Adviser, to repay such amount to the extent, that after giving effect to the repayment, such adjusted annualized total operating expenses (continuing the same foregoing exclusions as above) of the Fund would not exceed 0.90% of the value of the Fund’s average daily net assets for each share class of the Fund. The agreement is renewable annually. At December 31, 2024, the cumulative amount which the Fund may repay the Adviser, subject to the terms above, is $343,902:
| For the year ended December 31, 2023, expiring December 31, 2025 | | $ | 176,163 | |
| For the year ended December 31, 2024, expiring December 31, 2026 | | | 167,739 | |
| | | $ | 343,902 | |
4. Distribution Plan. The Fund’s Board has adopted a distribution plan (the Plan) for each class of shares, except for Class I Shares, pursuant to Rule 12b-1 under the 1940 Act. Under the Class AAA, Class A, and Class C Share Plans, payments are authorized to G.distributors, LLC (the Distributor), an affiliate of the Adviser, at annual rates of 0.25%, 0.25%, and 1.00%, respectively, of the average daily net assets of those classes, the annual limitations under each Plan. Such payments are accrued daily and paid monthly.
5. Portfolio Securities. Purchases and sales of securities during the year ended December 31, 2024, other than short term securities and U.S. Government obligations, aggregated $3,776,774 and $2,437,953, respectively.
6. Transactions with Affiliates and Other Arrangements. During the year ended December 31, 2024, the Fund paid $4,164 in brokerage commissions on security trades to G.research, LLC, an affiliate of the Adviser.
During the year ended December 31, 2024, the Fund received credits from a designated broker who agreed to pay certain Fund operating expenses. The amount of such expenses paid through this directed brokerage arrangement during this period was $1,474.
The cost of calculating the Fund’s NAV per share is a Fund expense pursuant to the Advisory Agreement. Under the sub-administration agreement with Bank of New York Mellon, the fees paid include the cost of calculating the Fund’s NAV. The Fund reimburses the Adviser for this service. The Adviser did not seek a reimbursement during the year ended December 31, 2024.
The Gabelli Global Mini Mites Fund
Notes to Financial Statements (Continued)
The Corporation pays retainer and per meeting fees to Directors not affiliated with the Adviser, plus specified amounts to the Lead Director and Audit Committee Chairman. Directors are also reimbursed for out of pocket expenses incurred in attending meetings. Directors who are directors or employees of the Adviser or an affiliated company receive no compensation or expense reimbursement from the Corporation.
7. Line of Credit. The Fund participates in an unsecured and uncommitted line of credit, which expires on February 26, 2025 and may be renewed annually, of up to $150,000,000 under which it may borrow up to 10% of its net assets from the bank for temporary borrowing purposes. Borrowings under this arrangement bear interest at a floating rate equal to the higher of the Overnight Federal Funds Rate plus 135 basis points or the Overnight Bank Funding Rate plus 135 basis points in effect on that day. This amount, if any, would be included in “Interest expense” in the Statement of Operations. During the year ended December 31, 2024, there were no borrowings under the line of credit.
8. Capital Stock. The Fund currently offers three classes of shares – Class AAA Shares, Class A Shares, and Class I Shares. Class AAA and Class A investors may purchase additional shares of the respective classes. Class C is closed to new and existing investors. The minimum investment for Class I shares is $1,000. Class AAA and Class I Shares are offered without a sales charge. Class A Shares are subject to a maximum front-end sales charge of 5.75%.
The Fund imposes a redemption fee of 2.00% on all classes of shares that are redeemed or exchanged on or before the seventh day after the date of a purchase. The redemption fee is deducted from the proceeds otherwise payable to the redeeming shareholders and is retained by the Fund as an increase in paid-in capital. The redemption fees retained by the Fund during the years ended December 31, 2024 and 2023, if any, can be found in the Statement of Changes in Net Assets under Redemption Fees.
Transactions in shares of capital stock were as follows:
| | | Year Ended
December 31,
2024 | | | Year Ended
December 31,
2023 | |
| | | Shares | | | Amount | | | Shares | | | Amount | |
| Class AAA | | | | | | | | | | | | | | | | |
| Shares issued upon reinvestment of distributions | | | 770 | | | $ | 8,473 | | | | 838 | | | $ | 9,263 | |
| Net increase | | | 770 | | | $ | 8,473 | | | | 838 | | | $ | 9,263 | |
| Class A | | | | | | | | | | | | | | | | |
| Shares issued upon reinvestment of distributions | | | 128 | | | $ | 1,421 | | | | 141 | | | $ | 1,554 | |
| Net increase | | | 128 | | | $ | 1,421 | | | | 141 | | | $ | 1,554 | |
| Class C | | | | | | | | | | | | | | | | |
| Shares issued upon reinvestment of distributions | | | 129 | | | $ | 1,411 | | | | 140 | | | $ | 1,543 | |
| Net increase | | | 129 | | | $ | 1,411 | | | | 140 | | | $ | 1,543 | |
| Class I | | | | | | | | | | | | | | | | |
| Shares sold | | | 231,041 | | | $ | 2,540,433 | | | | 244,596 | | | $ | 2,652,277 | |
| Shares issued upon reinvestment of distributions | | | 92,374 | | | | 1,017,958 | | | | 95,556 | | | | 1,055,891 | |
| Shares redeemed | | | (241,330 | ) | | | (2,620,411 | ) | | | (31,989 | ) | | | (339,658 | ) |
| Net increase | | | 82,085 | | | $ | 937,980 | | | | 308,163 | | | $ | 3,368,510 | |
The Gabelli Global Mini Mites Fund
Notes to Financial Statements (Continued)
9. Significant Shareholder. As of December 31, 2024, approximately 57.1% of the Fund was beneficially owned by the Adviser and its affiliates, including managed accounts for which the affiliates of the Adviser have voting control but disclaim pecuniary interest.
10. Indemnifications. The Fund enters into contracts that contain a variety of indemnifications. The Fund’s maximum exposure under these arrangements is unknown. However, the Fund has not had prior claims or losses pursuant to these contracts. Management has reviewed the Fund’s existing contracts and expects the risk of loss to be remote.
11. Segment Reporting. In this reporting period, the Fund adopted FASB Accounting Standards Update 2023-07, Segment Reporting (Topic 280) - Improvements to Reportable Segment Disclosures (ASU 2023-07). Adoption of the new standard impacted financial statement disclosures only and did not affect the Fund’s financial position or results of operations. The Fund’s Principal Executive Officer and Principal Financial Officer act as the Fund’s chief operating decision maker (CODM), as defined in Topic 280, assessing performance and making decisions about resource allocation. The CODM has determined that the Fund has a single operating segment based on the fact that the CODM monitors the operating results of the Fund as a whole and the Fund’s long-term strategic asset allocation is guided by the Fund’s investment objective and principal investment strategies, and executed by the Fund’s portfolio management team, comprised of investment professionals employed by the Adviser. The financial information provided to and reviewed by the CODM is consistent with that presented in the Fund’s Schedule of Investments, Statements of Operations and Changes in Net Assets and Financial Highlights.
12. Subsequent Events. On February 26, 2025, the Fund renewed the unsecured and uncommitted line of credit, which expires on February 25, 2026 and may be renewed annually, of up to $150,000,000 under which it may borrow up to 10% of its net assets from the bank for temporary borrowing purposes.
Management has evaluated the impact on the Fund of all subsequent events occurring through the date the financial statements were issued and has determined that there were no other subsequent events requiring recognition or disclosure in the financial statements.
The Gabelli Global Mini Mites Fund
Report of Independent Registered Public Accounting Firm
To the Shareholders of The Gabelli Global Mini Mites Fund
and the Board of Directors of GAMCO Global Series Funds, Inc.
Opinion on the Financial Statements
We have audited the accompanying statement of assets and liabilities of Gabelli Global Mini Mites Fund (the “Fund”) (one of the portfolios constituting GAMCO Global Series Funds, Inc. (the “Corporation”)), including the schedule of investments, as of December 31, 2024, and the related statement of operations for the year then ended, the statements of changes in net assets for each of the two years in the period then ended, the financial highlights for each of the five years in the period then ended and the related notes (collectively referred to as the “financial statements”). In our opinion, the financial statements present fairly, in all material respects, the financial position of the Fund (one of the portfolios constituting GAMCO Global Series Funds, Inc.) at December 31, 2024, the results of its operations for the year then ended, the changes in its net assets for each of the two years in the period then ended and its financial highlights for each of the five years in the period then ended, in conformity with U.S. generally accepted accounting principles.
Basis for Opinion
These financial statements are the responsibility of the Corporation’s management. Our responsibility is to express an opinion on the Fund’s financial statements based on our audits. We are a public accounting firm registered with the Public Company Accounting Oversight Board (United States) (“PCAOB”) and are required to be independent with respect to the Corporation in accordance with the U.S. federal securities laws and the applicable rules and regulations of the Securities and Exchange Commission and the PCAOB.
We conducted our audits in accordance with the standards of the PCAOB. Those standards require that we plan and perform the audit to obtain reasonable assurance about whether the financial statements are free of material misstatement, whether due to error or fraud. The Corporation is not required to have, nor were we engaged to perform, an audit of the Corporation’s internal control over financial reporting. As part of our audits, we are required to obtain an understanding of internal control over financial reporting but not for the purpose of expressing an opinion on the effectiveness of the Corporation’s internal control over financial reporting. Accordingly, we express no such opinion.
Our audits included performing procedures to assess the risks of material misstatement of the financial statements, whether due to error or fraud, and performing procedures that respond to those risks. Such procedures included examining, on a test basis, evidence regarding the amounts and disclosures in the financial statements. Our procedures included confirmation of securities owned as of December 31, 2024 by correspondence with the custodian, brokers and others; when replies were not received from brokers or others, we performed other auditing procedures. Our audits also included evaluating the accounting principles used and significant estimates made by management, as well as evaluating the overall presentation of the financial statements. We believe that our audits provide a reasonable basis for our opinion.

We have served as the auditor of one or more Gabelli Funds investment companies since 1992.
New York, New York
March 1, 2025
The Gabelli Global Mini Mites Fund
Liquidity Risk Management Program (Unaudited)
In accordance with Rule 22e-4 under the 1940 Act,the Fund has established a liquidity risk management program (the LRM Program) to govern its approach to managing liquidity risk. The LRM Program is administered by the Liquidity Committee (the Committee), which is comprised of members of Gabelli Funds, LLC management. The Board has designated the Committee to administer the LRM Program.
The LRM Program’s principal objectives include supporting the Fund’s compliance with limits on investments in illiquid assets and mitigating the risk that the Fund will be unable to meet its redemption obligations in a timely manner. The LRM Program also includes elements that support the management and assessment of liquidity risk, including an annual assessment of factors that influence the Fund’s liquidity and the monthly classification and re-classification of certain investments that reflect the Committee’s assessment of their relative liquidity under current market conditions.
At a meeting of the Board held on May 15, 2024, the Board received a written report from the Committee regarding the design and operational effectiveness of the LRM Program. The Committee determined, and reported to the Board, that the LRM Program is reasonably designed to assess and manage the Fund’s liquidity risk and has operated adequately and effectively since its implementation. The Committee reported that there were no liquidity events that impacted the Fund or its ability to timely meet redemptions without dilution to existing shareholders. The Committee noted that the Fund is primarily invested in highly liquid securities and, accordingly, continues to be exempt from the requirement to determine a “highly liquid investment minimum” as defined in the Rule 22e-4. Because of that continued qualification for the exemption, the Fund has not adopted a “highly liquid investment minimum” amount. The Committee further noted that while changes to the LRM Program were made during the Review Period and reported to the Board, no material changes were made to the LRM Program as a result of the Committee’s annual review.
There can be no assurance that the LRM Program will achieve its objectives in the future. Please refer to the Fund’s Prospectus for more information regarding its exposure to liquidity risk and other principal risks to which an investment in the Fund may be subject.
The Gabelli Global Mini Mites Fund
2024 TAX NOTICE TO SHAREHOLDERS (Unaudited)
For the year ended December 31, 2024, the Fund paid to shareholders ordinary income distributions (comprised of net investment income and short term capital gains) totaling $0.1615, $0.1615, $0.1613, and $0.1615 per share for Class AAA, Class A, Class C, and Class I, respectively, and long term capital gains totaling $865,443, or the maximum allowable. For the year ended December 31, 2024, 45.15% of the ordinary income distribution qualifies for the dividends received deduction available to corporations. The Fund designates 55.8% of the ordinary income distribution as qualified dividend income pursuant to the Jobs and Growth Tax Relief Reconciliation Act of 2003. The Fund designates 60.51% of the ordinary income distribution as qualified interest income pursuant to the Tax Relief, Unemployment Reauthorization, and Job Creation Act of 2010. The Fund designates 100% of the ordinary income distribution as qualified short term gain pursuant to the American Jobs Creation Act of 2004. Also for the year of 2024, the Fund did not have foreign tax credits.
U.S. Government Income:
The percentage of the ordinary income distribution paid by the Fund during 2024 which was derived from U.S. Treasury securities was 34.2%. Such income is exempt from state and local tax in all states. However, many states, including New York and California, allow a tax exemption for a portion of the income earned only if a mutual fund has invested at least 50% of its assets at the end of each quarter of the Fund’s fiscal year in U.S. Government securities. The Fund did not meet this strict requirement in 2024. The percentage of U.S. Government securities held as of December 31, 2024 was 14.6%. Due to the diversity in state and local tax law, it is recommended that you consult your personal tax adviser as to the applicability of the information provided to your specific situation.
All designations are based on financial information available as of the date of this annual report and, accordingly, are subject to change. For each item, it is the intention of the Fund to designate the maximum amount permitted under the Internal Revenue Code and the regulations thereunder.
| (b) | An open-end management investment company registered on Form N-1A [17 CFR 239.15A and 17 CFR 274.11A] must file the information required by Item 13 of Form N-1A. |
| | | |
| | | The Financial Highlights are attached herewith. |
The Gabelli Global Content & Connectivity Fund
Financial Highlights
Selected data for a share of capital stock outstanding throughout each year:
| | | | | | | Income (Loss) from Investment Operations | | | Distributions | | | | | | | | | | | | Ratios to Average Net Assets/Supplemental Data | |
Year Ended
December 31 | | Net Asset Value,
Beginning of Year | | | Net Investment
Income(a) | | | Net Realized
and Unrealized
Gain (Loss) on
Investments | | | Total from
Investment
Operations | | | Net Investment
Income | | | Net Realized
Gain on
Investments | | | Return of Capital | | | Total
Distributions | | | Redemption
Fees(a)(b) | | | Net Asset Value,
End of year | | | Total
Return† | | | Net Assets, End
of year
(in 000’s) | | | Net Investment
Income | | | Operating
Expenses Before
Reimbursement | | | Operating
Expenses Net of
Reimbursement(c)(d) | | | Portfolio
Turnover
Rate | |
| Class AAA | | | | | | | | | | | | | | | | | | | | | | | | | | | | | | | | | | | | | | | | | | | | | | | | | | | | | | | | | | | | | | | | |
| 2024 | | $ | 18.68 | | | $ | 0.13 | (e) | | $ | 4.06 | | | $ | 4.19 | | | $ | (0.49 | ) | | $ | (0.76 | ) | | $ | (0.19 | ) | | $ | (1.44 | ) | | $ | 0.00 | | | $ | 21.43 | | | $ | 22.35 | % | | $ | 52,559 | | | | 0.60 | %(e) | | | 1.73 | % | | | 0.90 | % | | | 11 | % |
| 2023 | | | 15.25 | | | | 0.06 | | | | 3.43 | | | | 3.49 | | | | (0.06 | ) | | | — | | | | — | | | | (0.06 | ) | | | 0.00 | | | | 18.68 | | | | 22.89 | | | | 47,834 | | | | 0.36 | | | | 1.90 | | | | 0.91 | | | | 11 | |
| 2022 | | | 21.86 | | | | 0.03 | | | | (6.29 | ) | | | (6.26 | ) | | | (0.35 | ) | | | — | | | | — | | | | (0.35 | ) | | | 0.00 | | | | 15.25 | | | | (28.62 | ) | | | 42,290 | | | | 0.18 | | | | 1.81 | | | | 0.97 | (f) | | | 17 | |
| 2021 | | | 22.18 | | | | 0.56 | (e) | | | 0.59 | | | | 1.15 | | | | (0.62 | ) | | | (0.85 | ) | | | — | | | | (1.47 | ) | | | — | | | | 21.86 | | | | 5.17 | | | | 65,025 | | | | 2.33 | (e) | | | 1.65 | | | | 0.90 | (f)(g) | | | 26 | |
| 2020 | | | 19.64 | | | | 0.11 | (e) | | | 3.11 | | | | 3.22 | | | | (0.46 | ) | | | (0.22 | ) | | | — | | | | (0.68 | ) | | | 0.00 | | | | 22.18 | | | | 16.42 | | | | 67,239 | | | | 0.57 | (e) | | | 1.77 | | | | 0.90 | (g) | | | 41 | |
| Class A | | | | | | | | | | | | | | | | | | | | | | | | | | | | | | | | | | | | | | | | | | | | | | | | | | | | | | | | | | | | | | | | |
| 2024 | | $ | 18.87 | | | $ | 0.13 | (e) | | $ | 4.09 | | | $ | 4.22 | | | $ | (0.50 | ) | | $ | (0.76 | ) | | $ | (0.19 | ) | | $ | (1.45 | ) | | $ | 0.00 | | | $ | 21.64 | | | $ | 22.27 | % | | $ | 234 | | | | 0.60 | %(e) | | | 1.73 | % | | | 0.90 | % | | | 11 | % |
| 2023 | | | 15.40 | | | | 0.06 | | | | 3.47 | | | | 3.53 | | | | (0.06 | ) | | | — | | | | — | | | | (0.06 | ) | | | 0.00 | | | | 18.87 | | | | 22.92 | | | | 224 | | | | 0.36 | | | | 1.90 | | | | 0.91 | | | | 11 | |
| 2022 | | | 22.07 | | | | 0.03 | | | | (6.35 | ) | | | (6.32 | ) | | | (0.35 | ) | | | — | | | | — | | | | (0.35 | ) | | | 0.00 | | | | 15.40 | | | | (28.62 | ) | | | 228 | | | | 0.19 | | | | 1.81 | | | | 0.97 | (f) | | | 17 | |
| 2021 | | | 22.38 | | | | 0.56 | (e) | | | 0.60 | | | | 1.16 | | | | (0.62 | ) | | | (0.85 | ) | | | — | | | | (1.47 | ) | | | — | | | | 22.07 | | | | 5.16 | | | | 428 | | | | 2.30 | (e) | | | 1.65 | | | | 0.90 | (f)(g) | | | 26 | |
| 2020 | | | 19.81 | | | | 0.11 | (e) | | | 3.14 | | | | 3.25 | | | | (0.46 | ) | | | (0.22 | ) | | | — | | | | (0.68 | ) | | | 0.00 | | | | 22.38 | | | | 16.43 | | | | 422 | | | | 0.59 | (e) | | | 1.77 | | | | 0.90 | (g) | | | 41 | |
| Class C | | | | | | | | | | | | | | | | | | | | | | | | | | | | | | | | | | | | | | | | | | | | | | | | | | | | | | | | | | | | | | | | |
| 2024 | | $ | 18.47 | | | $ | 0.12 | (e) | | $ | 4.02 | | | $ | 4.14 | | | $ | (0.49 | ) | | $ | (0.76 | ) | | $ | (0.18 | ) | | $ | (1.43 | ) | | $ | — | | | $ | 21.18 | | | $ | 22.34 | % | | $ | 0 | (h) | | | 0.57 | %(e) | | | 2.48 | % | | | 0.90 | % | | | 11 | % |
| 2023 | | | 12.00 | | | | 0.06 | | | | 6.47 | | | | 6.53 | | | | (0.06 | ) | | | — | | | | — | | | | (0.06 | ) | | | — | | | | 18.47 | | | | 54.42 | | | | 0 | (h) | | | 0.38 | | | | 2.64 | | | | 0.91 | | | | 11 | |
| 2022 | | | 21.24 | | | | 0.02 | | | | (9.26 | ) | | | (9.24 | ) | | | — | | | | — | | | | — | | | | — | | | | — | | | | 12.00 | | | | (43.50 | ) | | | 0 | (h) | | | 0.12 | | | | 2.56 | | | | 0.97 | (f) | | | 17 | |
| 2021 | | | 21.59 | | | | 0.64 | (e) | | | 0.48 | | | | 1.12 | | | | (0.62 | ) | | | (0.85 | ) | | | — | | | | (1.47 | ) | | | — | | | | 21.24 | | | | 5.17 | | | | 3 | | | | 2.76 | (e) | | | 2.40 | | | | 0.91 | (f)(g) | | | 26 | |
| 2020 | | | 19.13 | | | | 0.10 | (e) | | | 3.04 | | | | 3.14 | | | | (0.46 | ) | | | (0.22 | ) | | | — | | | | (0.68 | ) | | | — | | | | 21.59 | | | | 16.44 | | | | 49 | | | | 0.54 | (e) | | | 2.52 | | | | 0.90 | (g) | | | 41 | |
| Class I | | | | | | | | | | | | | | | | | | | | | | | | | | | | | | | | | | | | | | | | | | | | | | | | | | | | | | | | | | | | | | | | |
| 2024 | | $ | 18.62 | | | $ | 0.12 | (e) | | $ | 4.05 | | | $ | 4.17 | | | $ | (0.49 | ) | | $ | (0.76 | ) | | $ | (0.19 | ) | | $ | (1.44 | ) | | $ | 0.00 | | | $ | 21.35 | | | $ | 22.30 | % | | $ | 12,511 | | | | 0.59 | %(e) | | | 1.48 | % | | | 0.90 | % | | | 11 | % |
| 2023 | | | 15.20 | | | | 0.06 | | | | 3.42 | | | | 3.48 | | | | (0.06 | ) | | | — | | | | — | | | | (0.06 | ) | | | 0.00 | | | | 18.62 | | | | 22.90 | | | | 10,704 | | | | 0.36 | | | | 1.65 | | | | 0.91 | | | | 11 | |
| 2022 | | | 21.79 | | | | 0.03 | | | | (6.27 | ) | | | (6.24 | ) | | | (0.35 | ) | | | — | | | | — | | | | (0.35 | ) | | | 0.00 | | | | 15.20 | | | | (28.62 | ) | | | 8,938 | | | | 0.18 | | | | 1.56 | | | | 0.97 | (f) | | | 17 | |
| 2021 | | | 22.11 | | | | 0.55 | (e) | | | 0.60 | | | | 1.15 | | | | (0.62 | ) | | | (0.85 | ) | | | — | | | | (1.47 | ) | | | — | | | | 21.79 | | | | 5.18 | | | | 13,523 | | | | 2.32 | (e) | | | 1.40 | | | | 0.90 | (f)(g) | | | 26 | |
| 2020 | | | 19.58 | | | | 0.11 | (e) | | | 3.10 | | | | 3.21 | | | | (0.46 | ) | | | (0.22 | ) | | | — | | | | (0.68 | ) | | | 0.00 | | | | 22.11 | | | | 16.42 | | | | 13,931 | | | | 0.58 | (e) | | | 1.52 | | | | 0.90 | (g) | | | 41 | |
| † | Total return represents aggregate total return of a hypothetical investment at the beginning of the year and sold at the end of the year including reinvestment of distributions and does not reflect the applicable sales charges. |
| (a) | Per share amounts have been calculated using the average shares outstanding method. |
| (b) | Amount represents less than $0.005 per share. |
| (c) | Under an expense reimbursement agreement with the Adviser, the Adviser reimbursed expenses of $494,883, $527,312, $490,627, $589,925, and $591,218 for the years ended December 31, 2024, 2023, 2022, 2021, and 2020, respectively. |
| (d) | The Fund incurred interest expense. If interest expense had not been incurred, the ratio of operating expenses to average net assets would have been 0.90% and 0.96% for each Class for the years ended December 31, 2023 and 2022, respectively. For the years ended December 31, 2024, 2021, and 2020, the effect of interest expense was minimal. |
| (e) | Includes income resulting from special dividends. Without these dividends, the per share income amounts would have been $0.07, $0.05, and $0.09 (Class AAA), $0.08, $0.04, and $0.09 (Class A), $0.07, $0.15, and $0.08 (Class C), and $0.07, $0.05, and $0.09 (Class I), and the net investment income ratios would have been 0.35%, 0.20%, and 0.45% (Class AAA), 0.36%, 0.18%, and 0.47% (Class A), 0.33%, 0.63%, and 0.41% (Class C), and 0.35%, 0.20%, and 0.46% (Class I) for the years ended December 31, 2024, 2021, and 2020, respectively. |
| (f) | The Fund incurred tax expense for the years ended December 31, 2022 and 2021. If tax expense had not been incurred, the ratios of operating expenses to average net assets would have been 0.90% and 0.90% for each Class. |
| (g) | The Fund received credits from a designated broker who agreed to pay certain Fund operating expenses. For the years ended December 31, 2021 and 2020, there was no material impact to the expense ratios. |
| (h) | Actual number of shares outstanding is 10.02, 10.02, and 0.02 for the years ended December 31, 2024, 2023, and 2022, respectively. |
See accompanying notes to financial statements.
The Gabelli Global Growth Fund
Financial Highlights
Selected data for a share of capital stock outstanding throughout each year:
| | | | | | | Income (Loss) from Investment Operations | | | Distributions | | | | | | | | | | | | Ratios to Average Net Assets/Supplemental Data | |
| Year | | Net Asset Value,
Beginning of Year | | | Net Investment
Loss(a) | | | Net Realized
and Unrealized
Gain (Loss) on
Investments | | | Total from
Investment
Operations | | | Net Investment
Income | | | Net Realized
Gain on
Investments | | | Return of Capital | | | Total
Distributions | | | Redemption
Fees(a)(b) | | | Net Asset Value,
End of year | | | Total
Return† | | | Net Assets, End
of year
(in 000’s) | | | Net Investment
Loss | | | Operating
Expenses Before
Reimbursement | | | Operating
Expenses Net of
Reimbursement(c) | | | Portfolio
Turnover
Rate | |
| Class AAA | | | | | | | | | | | | | | | | | | | | | | | | | | | | | | | | | | | | | | | |
| 2024 | | $ | 45.77 | | | $ | (0.11 | ) | | $ | 13.74 | | | $ | 13.63 | | | $ | (0.06 | ) | | $ | (1.30 | ) | | $ | (0.05 | ) | | $ | (1.41 | ) | | $ | 0.00 | | | $ | 57.99 | | | | 29.71 | % | | $ | 105,995 | | | | (0.20 | )% | | | 1.48 | % | | | 0.90 | % | | | 26 | % |
| 2023 | | | 34.14 | | | | (0.08 | ) | | | 11.85 | | | | 11.77 | | | | (0.14 | ) | | | — | | | | (0.00 | )(b) | | | (0.14 | ) | | | 0.00 | | | | 45.77 | | | | 34.47 | | | | 89,342 | | | | (0.18 | ) | | | 1.61 | | | | 0.90 | | | | 37 | |
| 2022 | | | 54.68 | | | | (0.14 | ) | | | (20.34 | ) | | | (20.48 | ) | | | (0.00 | )(b) | | | (0.06 | ) | | | — | | | | (0.06 | ) | | | 0.00 | | | | 34.14 | | | | (37.45 | ) | | | 73,186 | | | | (0.34 | ) | | | 1.52 | | | | 0.90 | (d)(e) | | | 36 | |
| 2021 | | | 47.04 | | | | (0.25 | ) | | | 10.19 | | | | 9.94 | | | | (0.02 | ) | | | (2.28 | ) | | | — | | | | (2.30 | ) | | | 0.00 | | | | 54.68 | | | | 21.10 | | | | 126,055 | | | | (0.49 | ) | | | 1.50 | | | | 0.91 | (d) | | | 49 | |
| 2020 | | | 35.56 | | | | (0.05 | ) | | | 12.64 | | | | 12.59 | | | | (0.09 | ) | | | (1.02 | ) | | | — | | | | (1.11 | ) | | | 0.00 | | | | 47.04 | | | | 35.43 | | | | 115,210 | | | | (0.14 | ) | | | 1.57 | | | | 0.90 | | | | 50 | |
| Class A | | | | | | | | | | | | | | | | | | | | | | | | | | | | | | | | | | | | | | | |
| 2024 | | $ | 45.74 | | | $ | (0.11 | ) | | $ | 13.73 | | | $ | 13.62 | | | $ | (0.06 | ) | | $ | (1.30 | ) | | $ | (0.05 | ) | | $ | (1.41 | ) | | $ | 0.00 | | | $ | 57.95 | | | | 29.71 | % | | $ | 5,613 | | | | (0.20 | )% | | | 1.48 | % | | | 0.90 | % | | | 26 | % |
| 2023 | | | 34.11 | | | | (0.08 | ) | | | 11.85 | | | | 11.77 | | | | (0.14 | ) | | | — | | | | (0.00 | )(b) | | | (0.14 | ) | | | 0.00 | | | | 45.74 | | | | 34.50 | | | | 3,973 | | | | (0.19 | ) | | | 1.61 | | | | 0.90 | | | | 37 | |
| 2022 | | | 54.64 | | | | (0.14 | ) | | | (20.33 | ) | | | (20.47 | ) | | | (0.00 | )(b) | | | (0.06 | ) | | | — | | | | (0.06 | ) | | | 0.00 | | | | 34.11 | | | | (37.46 | ) | | | 2,957 | | | | (0.35 | ) | | | 1.52 | | | | 0.90 | (d)(e) | | | 36 | |
| 2021 | | | 47.01 | | | | (0.25 | ) | | | 10.18 | | | | 9.93 | | | | (0.02 | ) | | | (2.28 | ) | | | — | | | | (2.30 | ) | | | 0.00 | | | | 54.64 | | | | 21.09 | | | | 5,252 | | | | (0.49 | ) | | | 1.50 | | | | 0.91 | (d) | | | 49 | |
| 2020 | | | 35.55 | | | | (0.05 | ) | | | 12.62 | | | | 12.57 | | | | (0.09 | ) | | | (1.02 | ) | | | — | | | | (1.11 | ) | | | 0.00 | | | | 47.01 | | | | 35.38 | | | | 4,804 | | | | (0.12 | ) | | | 1.57 | | | | 0.90 | | | | 50 | |
| Class C | | | | | | | | | | | | | | | | | | | | | | | | | | | | | | | | | | | | | | | |
| 2024 | | $ | 36.88 | | | $ | (0.09 | ) | | $ | 11.07 | | | $ | 10.98 | | | $ | (0.06 | ) | | $ | (1.04 | ) | | $ | (0.05 | ) | | $ | (1.15 | ) | | $ | 0.00 | | | $ | 46.71 | | | | 29.72 | % | | $ | 875 | | | | (0.19 | )% | | | 2.23 | % | | | 0.90 | % | | | 26 | % |
| 2023 | | | 27.53 | | | | (0.06 | ) | | | 9.55 | | | | 9.49 | | | | (0.14 | ) | | | — | | | | (0.00 | )(b) | | | (0.14 | ) | | | 0.00 | | | | 36.88 | | | | 34.46 | | | | 952 | | | | (0.19 | ) | | | 2.36 | | | | 0.90 | | | | 37 | |
| 2022 | | | 44.09 | | | | (0.12 | ) | | | (16.39 | ) | | | (16.51 | ) | | | (0.00 | )(b) | | | (0.05 | ) | | | — | | | | (0.05 | ) | | | 0.00 | | | | 27.53 | | | | (37.45 | ) | | | 881 | | | | (0.36 | ) | | | 2.27 | | | | 0.90 | (d)(e) | | | 36 | |
| 2021 | | | 38.30 | | | | (0.21 | ) | | | 8.30 | | | | 8.09 | | | | (0.02 | ) | | | (2.28 | ) | | | — | | | | (2.30 | ) | | | 0.00 | | | | 44.09 | | | | 21.08 | | | | 2,411 | | | | (0.49 | ) | | | 2.25 | | | | 0.91 | (d) | | | 49 | |
| 2020 | | | 29.11 | | | | (0.04 | ) | | | 10.34 | | | | 10.30 | | | | (0.09 | ) | | | (1.02 | ) | | | — | | | | (1.11 | ) | | | 0.00 | | | | 38.30 | | | | 35.41 | | | | 2,376 | | | | (0.12 | ) | | | 2.32 | | | | 0.90 | | | | 50 | |
| Class I | | | | | | | | | | | | | | | | | | | | | | | | | | | | | | | | | | | | | | | |
| 2024 | | $ | 47.00 | | | $ | (0.11 | ) | | $ | 14.10 | | | $ | 13.99 | | | $ | (0.06 | ) | | $ | (1.33 | ) | | $ | (0.05 | ) | | $ | (1.44 | ) | | $ | 0.00 | | | $ | 59.55 | | | | 29.71 | % | | $ | 77,841 | | | | (0.20 | )% | | | 1.23 | % | | | 0.90 | % | | | 26 | % |
| 2023 | | | 35.05 | | | | (0.08 | ) | | | 12.17 | | | | 12.09 | | | | (0.14 | ) | | | — | | | | (0.00 | )(b) | | | (0.14 | ) | | | 0.00 | | | | 47.00 | | | | 34.48 | | | | 56,611 | | | | (0.18 | ) | | | 1.36 | | | | 0.90 | | | | 37 | |
| 2022 | | | 56.12 | | | | (0.14 | ) | | | (20.87 | ) | | | (21.01 | ) | | | (0.00 | )(b) | | | (0.06 | ) | | | — | | | | (0.06 | ) | | | 0.00 | | | | 35.05 | | | | (37.43 | ) | | | 53,709 | | | | (0.35 | ) | | | 1.27 | | | | 0.90 | (d)(e) | | | 36 | |
| 2021 | | | 48.23 | | | | (0.26 | ) | | | 10.45 | | | | 10.19 | | | | (0.02 | ) | | | (2.28 | ) | | | — | | | | (2.30 | ) | | | 0.00 | | | | 56.12 | | | | 21.10 | | | | 106,107 | | | | (0.50 | ) | | | 1.25 | | | | 0.91 | (d) | | | 49 | |
| 2020 | | | 36.45 | | | | (0.08 | ) | | | 12.97 | | | | 12.89 | | | | (0.09 | ) | | | (1.02 | ) | | | — | | | | (1.11 | ) | | | 0.00 | | | | 48.23 | | | | 35.39 | | | | 70,888 | | | | (0.18 | ) | | | 1.32 | | | | 0.90 | | | | 50 | |
| † | Total return represents aggregate total return of a hypothetical investment at the beginning of the year and sold at the end of the year including reinvestment of distributions and does not reflect the applicable sales charges. |
| (a) | Per share amounts have been calculated using the average shares outstanding method. |
| (b) | Amount represents less than $0.005 per share. |
| (c) | Under an expense reimbursement agreement with the Adviser, the Adviser reimbursed expenses of $854,439, $882,743, $880,676, $1,048,506, and $876,253 for the years ended December 31, 2024, 2023, 2022, 2021, and 2020, respectively. |
| (d) | The Fund incurred tax expense. For the year ended December 31, 2022, the impact was minimal. For the year ended December 31, 2021, if tax expense had not been incurred, the ratios of operating expenses to average net assets would have been 0.90% for each Class. |
| (e) | The Fund received credits from a designated broker who agreed to pay certain Fund operating expenses. For the year ended December 31, 2022, there was no material impact to the expense ratios. |
See accompanying notes to financial statements.
The Gabelli Global Rising Income and Dividend Fund
Financial Highlights
Selected data for a share of beneficial interest outstanding throughout each year:
| | | | | | | Income (Loss) from Investment Operations | | | Distributions | | | | | | | | | | | | Ratios to Average Net Assets/Supplemental Data | |
Year Ended
December 31 | | Net Asset Value,
Beginning of Year | | | Net Investment
Income(a) | | | Net Realized
and Unrealized
Gain (Loss) on
Investments | | | Total from
Investment
Operations | | | Net Investment
Income | | | Net Realized
Gain on
Investments | | | Return of Capital | | | Total
Distributions | | | Redemption
Fees(a)(b) | | | Net Asset Value,
End of year | | | Total
Return† | | | Net Assets, End
of year
(in 000’s) | | | Net Investment
Income | | | Operating
Expenses Before
Reimbursement | | | Operating
Expenses Net of
Reimbursement(c)(d)(e) | | | Portfolio
Turnover
Rate | |
| Class AAA | | | | | | | | | | | | | | | | | | | | | | | | | | | | | | | | | | | | | | | | | | | | | | | | |
| 2024 | | $ | 30.30 | | | $ | 0.44 | | | $ | 0.18 | | | $ | 0.62 | | | $ | (0.71 | ) | | $ | (0.20 | ) | | $ | (0.01 | ) | | $ | (0.92 | ) | | $ | — | | | $ | 30.00 | | | | 2.07 | % | | $ | 2,449 | | | | 1.42 | % | | | 1.61 | % | | | 0.90 | % | | | 7 | % |
| 2023 | | | 28.22 | | | | 0.48 | | | | 2.32 | | | | 2.80 | | | | (0.57 | ) | | | (0.05 | ) | | | (0.10 | ) | | | (0.72 | ) | | | — | | | | 30.30 | | | | 9.92 | | | | 4,081 | | | | 1.64 | | | | 1.71 | | | | 0.90 | | | | 9 | |
| 2022 | | | 34.68 | | | | 0.30 | | | | (5.73 | ) | | | (5.43 | ) | | | (0.26 | ) | | | (0.76 | ) | | | (0.01 | ) | | | (1.03 | ) | | | — | | | | 28.22 | | | | (15.63 | ) | | | 3,954 | | | | 1.01 | | | | 1.65 | | | | 0.90 | | | | 11 | |
| 2021 | | | 29.04 | | | | 0.39 | (f) | | | 5.79 | | | | 6.18 | | | | (0.17 | ) | | | (0.37 | ) | | | — | | | | (0.54 | ) | | | 0.00 | | | | 34.68 | | | | 21.32 | | | | 4,914 | | | | 1.21 | (f) | | | 1.62 | | | | 0.90 | | | | 10 | |
| 2020 | | | 26.18 | | | | 0.19 | | | | 2.87 | | | | 3.06 | | | | (0.20 | ) | | | — | | | | — | | | | (0.20 | ) | | | 0.00 | | | | 29.04 | | | | 11.68 | | | | 5,157 | | | | 0.79 | | | | 1.72 | | | | 0.90 | | | | 8 | |
| Class A | | | | | | | | | | | | | | | | | | | | | | | | | | | | | | | | | | | | | | | | | | | | | | | | | | | | | | | | | | | | | | | | |
| 2024 | | $ | 30.36 | | | $ | 0.46 | | | $ | 0.17 | | | $ | 0.63 | | | $ | (0.71 | ) | | $ | (0.21 | ) | | $ | (0.01 | ) | | $ | (0.93 | ) | | $ | — | | | $ | 30.06 | | | | 2.06 | % | | $ | 840 | | | | 1.50 | % | | | 1.61 | % | | | 0.90 | % | | | 7 | % |
| 2023 | | | 28.28 | | | | 0.49 | | | | 2.31 | | | | 2.80 | | | | (0.57 | ) | | | (0.05 | ) | | | (0.10 | ) | | | (0.72 | ) | | | — | | | | 30.36 | | | | 9.90 | | | | 813 | | | | 1.65 | | | | 1.71 | | | | 0.90 | | | | 9 | |
| 2022 | | | 34.75 | | | | 0.29 | | | | (5.73 | ) | | | (5.44 | ) | | | (0.26 | ) | | | (0.76 | ) | | | (0.01 | ) | | | (1.03 | ) | | | — | | | | 28.28 | | | | (15.62 | ) | | | 815 | | | | 0.97 | | | | 1.65 | | | | 0.90 | | | | 11 | |
| 2021 | | | 29.10 | | | | 0.39 | (f) | | | 5.80 | | | | 6.19 | | | | (0.17 | ) | | | (0.37 | ) | | | — | | | | (0.54 | ) | | | 0.00 | | | | 34.75 | | | | 21.31 | | | | 1,169 | | | | 1.19 | (f) | | | 1.62 | | | | 0.90 | | | | 10 | |
| 2020 | | | 26.23 | | | | 0.18 | | | | 2.89 | | | | 3.07 | | | | (0.20 | ) | | | — | | | | — | | | | (0.20 | ) | | | 0.00 | | | | 29.10 | | | | 11.69 | | | | 840 | | | | 0.76 | | | | 1.72 | | | | 0.90 | | | | 8 | |
| Class C | | | | | | | | | | | | | | | | | | | | | | | | | | | | | | | | | | | | | | | | | | | | | | | | | | | | | | | | | | | | | | | | |
| 2024 | | $ | 25.14 | | | $ | 0.36 | | | $ | 0.16 | | | $ | 0.52 | | | $ | (0.71 | ) | | $ | (0.17 | ) | | $ | (0.01 | ) | | $ | (0.89 | ) | | $ | — | | | $ | 24.77 | | | | 2.06 | % | | $ | 299 | | | | 1.40 | % | | | 2.36 | % | | | 0.90 | % | | | 7 | % |
| 2023 | | | 23.51 | | | | 0.40 | | | | 1.93 | | | | 2.33 | | | | (0.57 | ) | | | (0.04 | ) | | | (0.09 | ) | | | (0.70 | ) | | | — | | | | 25.14 | | | | 9.89 | | | | 373 | | | | 1.64 | | | | 2.46 | | | | 0.90 | | | | 9 | |
| 2022 | | | 28.93 | | | | 0.25 | | | | (4.77 | ) | | | (4.52 | ) | | | (0.26 | ) | | | (0.63 | ) | | | (0.01 | ) | | | (0.90 | ) | | | — | | | | 23.51 | | | | (15.59 | ) | | | 417 | | | | 1.00 | | | | 2.40 | | | | 0.90 | | | | 11 | |
| 2021 | | | 24.30 | | | | 0.34 | (f) | | | 4.83 | | | | 5.17 | | | | (0.17 | ) | | | (0.37 | ) | | | — | | | | (0.54 | ) | | | 0.00 | | | | 28.93 | | | | 21.32 | | | | 654 | | | | 1.23 | (f) | | | 2.38 | | | | 0.90 | | | | 10 | |
| 2020 | | | 21.94 | | | | 0.15 | | | | 2.41 | | | | 2.56 | | | | (0.20 | ) | | | — | | | | — | | | | (0.20 | ) | | | 0.00 | | | | 24.30 | | | | 11.65 | | | | 968 | | | | 0.74 | | | | 2.47 | | | | 0.90 | | | | 8 | |
| Class I | | | | | | | | | | | | | | | | | | | | | | | | | | | | | | | | | | | | | | | | | | | | | | | | | | | | | | | | | | | | | | | | |
| 2024 | | $ | 30.43 | | | $ | 0.48 | | | $ | 0.14 | | | $ | 0.62 | | | $ | (0.71 | ) | | $ | (0.21 | ) | | $ | (0.01 | ) | | $ | (0.93 | ) | | $ | — | | | $ | 30.12 | | | | 2.03 | % | | $ | 61,116 | | | | 1.56 | % | | | 1.36 | % | | | 0.90 | % | | | 7 | % |
| 2023 | | | 28.34 | | | | 0.51 | | | | 2.30 | | | | 2.81 | | | | (0.57 | ) | | | (0.05 | ) | | | (0.10 | ) | | | (0.72 | ) | | | — | | | | 30.43 | | | | 9.91 | | | | 52,055 | | | | 1.72 | | | | 1.46 | | | | 0.90 | | | | 9 | |
| 2022 | | | 34.82 | | | | 0.30 | | | | (5.75 | ) | | | (5.45 | ) | | | (0.26 | ) | | | (0.76 | ) | | | (0.01 | ) | | | (1.03 | ) | | | — | | | | 28.34 | | | | (15.61 | ) | | | 47,336 | | | | 0.99 | | | | 1.40 | | | | 0.90 | | | | 11 | |
| 2021 | | | 29.15 | | | | 0.39 | (f) | | | 5.82 | | | | 6.21 | | | | (0.17 | ) | | | (0.37 | ) | | | — | | | | (0.54 | ) | | | 0.00 | | | | 34.82 | | | | 21.34 | | | | 62,757 | | | | 1.20 | (f) | | | 1.37 | | | | 0.90 | | | | 10 | |
| 2020 | | | 26.28 | | | | 0.19 | | | | 2.88 | | | | 3.07 | | | | (0.20 | ) | | | — | | | | — | | | | (0.20 | ) | | | 0.00 | | | | 29.15 | | | | 11.67 | | | | 48,234 | | | | 0.79 | | | | 1.47 | | | | 0.90 | | | | 8 | |
| † | Total return represents aggregate total return of a hypothetical investment at the beginning of the year and sold at the end of the year including reinvestment of distributions and does not reflect the applicable sales charges. |
| (a) | Per share amounts have been calculated using the average shares outstanding method. |
| (b) | Amount represents less than $0.005 per share. |
| (c) | The Fund received credits from a designated broker who agreed to pay certain Fund operating expenses. For all years presented, there was no material impact on the expense ratios. |
| (d) | Under an expense reimbursement agreement with the Adviser, the Adviser reimbursed expenses of $282,552, $357,890, $295,664, $311,048, and $295,855 for the years ended December 31, 2024, 2023, 2022, 2021, and 2020, respectively. |
| (e) | The Fund incurred interest expense, the effect of which was minimal. |
| (f) | Includes income resulting from special dividends. Without these dividends, the per share income/(loss) amounts would have been $0.19 (Class AAA and Class A), $0.17 (Class C), and $0.19 (Class I), and the net investment income/(loss) ratios would have been 0.59% (Class AAA), 0.57% (Class A), (1.40%) (Class C), 0.58% (Class I), for the year ended December 31, 2021. |
See accompanying notes to financial statements.
The Gabelli International Small Cap Fund
Financial Highlights
Selected data for a share of capital stock outstanding throughout each year:
| | | | | | | Income (Loss) from Investment Operations | | | Distributions | | | | | | | | | | | | Ratios to Average Net Assets/Supplemental Data | |
Year Ended
December 31 | | Net Asset Value,
Beginning of Year | | | Net Investment
Income(a) | | | Net Realized
and Unrealized
Gain (Loss) on
Investments | | | Total from
Investment
Operations | | | Net Investment
Income | | | Net Realized
Gain on
Investments | | | Return of Capital | | | Total
Distributions | | | Redemption
Fees(a)(b) | | | Net Asset Value,
End of year | | | Total
Return† | | | Net Assets, End
of year
(in 000’s) | | | Net Investment
Income | | | Operating
Expenses Before
Reimbursement | | | Operating
Expenses Net of
Reimbursement(c)(d) | | | Portfolio
Turnover
Rate | |
| Class AAA | | | | | | | | | | | | | | | | | | | | | | | | | | | | | | | | | | | | | | | | | | | | | | | | | | | | | | | | | | | | | | | | |
| 2024 | | $ | 12.21 | | | $ | 0.15 | | | $ | (0.89 | ) | | $ | (0.74 | ) | | $ | (0.06 | ) | | $ | — | | | $ | (0.02 | ) | | $ | (0.08 | ) | | $ | 0.00 | | | $ | 11.39 | | | | (6.04 | )% | | $ | 2,895 | | | | 1.28 | % | | | 4.35 | % | | | 0.92 | %(e) | | | 4 | % |
| 2023 | | | 11.68 | | | | 0.12 | | | | 0.62 | | | | 0.74 | | | | (0.21 | ) | | | — | | | | — | | | | (0.21 | ) | | | 0.00 | | | | 12.21 | | | | 6.32 | | | | 4,010 | | | | 1.00 | | | | 4.02 | | | | 0.93 | (e) | | | 6 | |
| 2022 | | | 15.75 | | | | 0.18 | (f) | | | (4.20 | ) | | | (4.02 | ) | | | (0.05 | ) | | | — | | | | — | | | | (0.05 | ) | | | 0.00 | | | | 11.68 | | | | (25.50 | ) | | | 4,216 | | | | 1.48 | (f) | | | 3.64 | | | | 0.92 | (e)(g) | | | 5 | |
| 2021 | | | 15.44 | | | | 0.13 | (f) | | | 0.51 | | | | 0.64 | | | | (0.33 | ) | | | (0.00 | )(b) | | | — | | | | (0.33 | ) | | | 0.00 | | | | 15.75 | | | | 4.16 | | | | 6,191 | | | | 0.79 | (f) | | | 2.89 | | | | 0.92 | (g) | | | 15 | |
| 2020 | | | 13.06 | | | | 0.06 | | | | 2.44 | | | | 2.50 | | | | (0.12 | ) | | | — | | | | — | | | | (0.12 | ) | | | 0.00 | | | | 15.44 | | | | 19.16 | | | | 6,617 | | | | 0.51 | | | | 3.65 | | | | 0.91 | | | | 22 | |
| Class A | | | | | | | | | | | | | | | | | | | | | | | | | | | | | | | | | | | | | | | | | | | | | | | | | | | | | | | | | | | | | | | | |
| 2024 | | $ | 12.18 | | | $ | 0.16 | | | $ | (0.90 | ) | | $ | (0.74 | ) | | $ | (0.06 | ) | | $ | — | | | $ | (0.02 | ) | | $ | (0.08 | ) | | $ | 0.00 | | | $ | 11.36 | | | | (6.05 | )% | | $ | 23 | | | | 1.36 | % | | | 4.35 | % | | | 0.92 | %(e) | | | 4 | % |
| 2023 | | | 11.65 | | | | 0.12 | | | | 0.62 | | | | 0.74 | | | | (0.21 | ) | | | — | | | | — | | | | (0.21 | ) | | | 0.00 | | | | 12.18 | | | | 6.34 | | | | 52 | | | | 1.01 | | | | 4.02 | | | | 0.93 | (e) | | | 6 | |
| 2022 | | | 15.72 | | | | 0.17 | (f) | | | (4.19 | ) | | | (4.02 | ) | | | (0.05 | ) | | | — | | | | — | | | | (0.05 | ) | | | 0.00 | | | | 11.65 | | | | (25.55 | ) | | | 49 | | | | 1.40 | (f) | | | 3.64 | | | | 0.92 | (e)(g) | | | 5 | |
| 2021 | | | 15.40 | | | | 0.13 | (f) | | | 0.52 | | | | 0.65 | | | | (0.33 | ) | | | (0.00 | )(b) | | | — | | | | (0.33 | ) | | | 0.00 | | | | 15.72 | | | | 4.24 | | | | 104 | | | | 0.82 | (f) | | | 2.89 | | | | 0.92 | (g) | | | 15 | |
| 2020 | | | 13.03 | | | | 0.06 | | | | 2.43 | | | | 2.49 | | | | (0.12 | ) | | | — | | | | — | | | | (0.12 | ) | | | 0.00 | | | | 15.40 | | | | 19.13 | | | | 101 | | | | 0.50 | | | | 3.65 | | | | 0.91 | | | | 22 | |
| Class C | | | | | | | | | | | | | | | | | | | | | | | | | | | | | | | | | | | | | | | | | | | | | | | | | | | | | | | | | | | | | | | | |
| 2024 | | $ | 10.92 | | | $ | 0.14 | | | $ | (0.81 | ) | | $ | (0.67 | ) | | $ | (0.06 | ) | | $ | — | | | $ | (0.02 | ) | | $ | (0.08 | ) | | $ | 0.00 | | | $ | 10.17 | | | | (6.11 | )% | | $ | 7 | | | | 1.26 | % | | | 5.10 | % | | | 0.92 | %(e) | | | 4 | % |
| 2023 | | | 10.46 | | | | 0.11 | | | | 0.56 | | | | 0.67 | | | | (0.21 | ) | | | — | | | | — | | | | (0.21 | ) | | | 0.00 | | | | 10.92 | | | | 6.39 | | | | 8 | | | | 1.01 | | | | 4.77 | | | | 0.93 | (e) | | | 6 | |
| 2022 | | | 14.12 | | | | 0.15 | (f) | | | (3.76 | ) | | | (3.61 | ) | | | (0.05 | ) | | | — | | | | — | | | | (0.05 | ) | | | — | | | | 10.46 | | | | (25.55 | ) | | | 7 | | | | 1.36 | (f) | | | 4.39 | | | | 0.92 | (e)(g) | | | 5 | |
| 2021 | | | 13.87 | | | | 0.11 | (f) | | | 0.47 | | | | 0.58 | | | | (0.33 | ) | | | (0.00 | )(b) | | | — | | | | (0.33 | ) | | | 0.00 | | | | 14.12 | | | | 4.20 | | | | 16 | | | | 0.77 | (f) | | | 3.64 | | | | 0.92 | (g) | | | 15 | |
| 2020 | | | 11.74 | | | | 0.05 | | | | 2.20 | | | | 2.25 | | | | (0.12 | ) | | | — | | | | — | | | | (0.12 | ) | | | 0.00 | | | | 13.87 | | | | 19.19 | | | | 28 | | | | 0.48 | | | | 4.40 | | | | 0.91 | | | | 22 | |
| Class I | | | | | | | | | | | | | | | | | | | | | | | | | | | | | | | | | | | | | | | | | | | | | | | | | | | | | | | | | | | | | | | | |
| 2024 | | $ | 12.55 | | | $ | 0.16 | | | $ | (0.93 | ) | | $ | (0.77 | ) | | $ | (0.06 | ) | | $ | — | | | $ | (0.02 | ) | | $ | (0.08 | ) | | $ | 0.00 | | | $ | 11.70 | | | | (6.11 | )% | | $ | 2,284 | | | | 1.27 | % | | | 4.10 | % | | | 0.92 | %(e) | | | 4 | % |
| 2023 | | | 11.99 | | | | 0.12 | | | | 0.65 | | | | 0.77 | | | | (0.21 | ) | | | — | | | | — | | | | (0.21 | ) | | | 0.00 | | | | 12.55 | | | | 6.41 | | | | 2,378 | | | | 0.99 | | | | 3.77 | | | | 0.93 | (e) | | | 6 | |
| 2022 | | | 16.18 | | | | 0.19 | (f) | | | (4.33 | ) | | | (4.14 | ) | | | (0.05 | ) | | | — | | | | — | | | | (0.05 | ) | | | 0.00 | | | | 11.99 | | | | (25.57 | ) | | | 2,592 | | | | 1.52 | (f) | | | 3.39 | | | | 0.92 | (e)(g) | | | 5 | |
| 2021 | | | 15.85 | | | | 0.14 | (f) | | | 0.52 | | | | 0.66 | | | | (0.33 | ) | | | (0.00 | )(b) | | | — | | | | (0.33 | ) | | | 0.00 | | | | 16.18 | | | | 4.18 | | | | 4,376 | | | | 0.87 | (f) | | | 2.64 | | | | 0.92 | (g) | | | 15 | |
| 2020 | | | 13.41 | | | | 0.05 | | | | 2.51 | | | | 2.56 | | | | (0.12 | ) | | | — | | | | — | | | | (0.12 | ) | | | 0.00 | | | | 15.85 | | | | 19.11 | | | | 4,342 | | | | 0.39 | | | | 3.40 | | | | 0.91 | | | | 22 | |
| † | Total return represents aggregate total return of a hypothetical investment at the beginning of the year and sold at the end of the year including reinvestment of distributions and does not reflect the applicable sales charges. |
| (a) | Per share amounts have been calculated using the average shares outstanding method. |
| (b) | Amount represents less than $0.005 per share. |
| (c) | Under an expense reimbursement agreement with the Adviser, the Adviser reimbursed expenses of $194,610, $251,208, $205,704, $216,306, and $210,061 for the years ended December 31, 2024, 2023, 2022, 2021, and 2020, respectively. |
| (d) | The Fund incurred interest expense. If interest expense had not been incurred, the ratio of operating expenses to average net assets would have been 0.90%, 0.90%, 0.91%, and 0.90% for each Class for the years ended December 31, 2024, 2023, 2022, and 2020. For the year ended December 31, 2021, the effect of interest expense was minimal. |
| (e) | The Fund received credits from a designated broker who agreed to pay certain Fund operating expenses. For the fiscal years ended December 31, 2024 and 2023, if credits had not been received, the expense ratios would have been 0.94% and 0.95% for each Class, respectively. For the year ended December 31, 2022, there was no material impact to the expense ratios. |
| (f) | Includes income resulting from special dividends. Without these dividends, the per share income/(loss) amounts would have been $0.09 and $0.06 (Class AAA), $0.08 and $0.06 (Class A), $0.07 and $0.05 (Class C), and $0.10 and $0.07 (Class I), and the net investment income/(loss) ratios would have been 0.77% and 0.36% (Class AAA), 0.69% and 0.39% (Class A), 0.65% and 0.34% (Class C), and 0.81% and 0.44% (Class I) for the years ended December 31 2022 and 2021, respectively. |
| (g) | The Fund incurred tax expense for the years ended December 31, 2022 and 2021. If tax expense had not been incurred, the ratios of operating expenses to average net assets would have been 0.90% for each Class. |
See accompanying notes to financial statements.
The Gabelli Global Mini Mites Fund
Financial Highlights
Selected data for a share of capital stock outstanding throughout each year:
| | | | | | | Income (Loss) from Investment Operations | | | Distributions | | | | | | | | | | | | Ratios to Average Net Assets/Supplemental Data | |
| Year Ended December 31 | | Net Asset Value,
Beginning of Year | | | Net Investment
Income (Loss)(a) | | | Net Realized
and Unrealized
Gain (Loss) on
Investments | | | Total from
Investment
Operations | | | Net Investment
Income | | | Net Realized
Gain on
Investments | | | Total
Distributions | | | Redemption
Fees(a)(b) | | | Net Asset Value,
End of year | | | Total
Return† | | | Net Assets, End
of year
(in 000’s) | | | Net Investment
Income (Loss) | | | Operating
Expenses Before
Reimbursement | | | Operating
Expenses Net of
Reimbursement(c)(d) | | | Portfolio
Turnover
Rate | |
| Class AAA | | | | | | | | | | | | | | | | | | | | | | | | | | | | | | | | | | | | | | | | | | | | | | | | | | | | | | | | | | | | |
| 2024 | | $ | 10.90 | | | $ | 0.11 | | | $ | 1.07 | | | $ | 1.18 | | | $ | (0.11 | ) | | $ | (0.89 | ) | | $ | (1.00 | ) | | $ | 0.00 | | | $ | 11.08 | | | | 10.88 | % | | $ | 103 | | | | 0.96 | % | | | 2.63 | % | | | 0.90 | % | | | 26 | % |
| 2023 | | | 8.70 | | | | 0.07 | | | | 3.35 | | | | 3.42 | | | | (0.07 | ) | | | (1.15 | ) | | | (1.22 | ) | | | — | | | | 10.90 | | | | 39.05 | | | | 92 | | | | 0.74 | | | | 3.37 | | | | 0.90 | | | | 42 | |
| 2022 | | | 11.04 | | | | 0.05 | | | | (1.85 | ) | | | (1.80 | ) | | | (0.05 | ) | | | (0.49 | ) | | | (0.54 | ) | | | — | | | | 8.70 | | | | (16.17 | ) | | | 67 | | | | 0.52 | | | | 3.40 | | | | 0.90 | (e) | | | 30 | |
| 2021 | | | 10.67 | | | | (0.02 | ) | | | 2.04 | | | | 2.02 | | | | (0.07 | ) | | | (1.58 | ) | | | (1.65 | ) | | | 0.00 | | | | 11.04 | | | | 19.25 | | | | 83 | | | | (0.17 | ) | | | 3.49 | | | | 0.90 | (f) | | | 79 | |
| 2020 | | | 9.26 | | | | 0.05 | | | | 1.42 | | | | 1.47 | | | | (0.06 | ) | | | — | | | | (0.06 | ) | | | — | | | | 10.67 | | | | 15.87 | | | | 120 | | | | 0.61 | | | | 9.40 | | | | 0.90 | | | | 63 | |
| Class A | | | | | | | | | | | | | | | | | | | | | | | | | | | | | | | | | | | | | | | | | | | | | | | | | | | | | | | | | | | | |
| 2024 | | $ | 10.89 | | | $ | 0.11 | | | $ | 1.08 | | | $ | 1.19 | | | $ | (0.11 | ) | | $ | (0.89 | ) | | $ | (1.00 | ) | | $ | — | | | $ | 11.08 | | | | 10.98 | % | | $ | 17 | | | | 0.96 | % | | | 2.63 | % | | | 0.90 | % | | | 26 | % |
| 2023 | | | 8.70 | | | | 0.07 | | | | 3.34 | | | | 3.41 | | | | (0.07 | ) | | | (1.15 | ) | | | (1.22 | ) | | | — | | | | 10.89 | | | | 38.93 | | | | 16 | | | | 0.74 | | | | 3.37 | | | | 0.90 | | | | 42 | |
| 2022 | | | 11.04 | | | | 0.05 | | | | (1.85 | ) | | | (1.80 | ) | | | (0.05 | ) | | | (0.49 | ) | | | (0.54 | ) | | | — | | | | 8.70 | | | | (16.17 | ) | | | 11 | | | | 0.52 | | | | 3.40 | | | | 0.90 | (e) | | | 30 | |
| 2021 | | | 10.66 | | | | (0.02 | ) | | | 2.05 | | | | 2.03 | | | | (0.07 | ) | | | (1.58 | ) | | | (1.65 | ) | | | 0.00 | | | | 11.04 | | | | 19.38 | | | | 13 | | | | (0.18 | ) | | | 3.49 | | | | 0.90 | (f) | | | 79 | |
| 2020 | | | 9.26 | | | | 0.05 | | | | 1.41 | | | | 1.46 | | | | (0.06 | ) | | | — | | | | (0.06 | ) | | | — | | | | 10.66 | | | | 15.76 | | | | 11 | | | | 0.66 | | | | 9.40 | | | | 0.90 | | | | 63 | |
| Class C | | | | | | | | | | | | | | | | | | | | | | | | | | | | | | | | | | | | | | | | | | | | | | | | | | | | | | | | | | | | |
| 2024 | | $ | 10.85 | | | $ | 0.11 | | | $ | 1.07 | | | $ | 1.18 | | | $ | (0.11 | ) | | $ | (0.89 | ) | | $ | (1.00 | ) | | $ | — | | | $ | 11.03 | | | | 10.89 | % | | $ | 17 | | | | 0.96 | % | | | 3.38 | % | | | 0.90 | % | | | 26 | % |
| 2023 | | | 8.66 | | | | 0.07 | | | | 3.33 | | | | 3.40 | | | | (0.07 | ) | | | (1.14 | ) | | | (1.21 | ) | | | — | | | | 10.85 | | | | 39.06 | | | | 15 | | | | 0.74 | | | | 4.12 | | | | 0.90 | | | | 42 | |
| 2022 | | | 11.00 | | | | 0.05 | | | | (1.85 | ) | | | (1.80 | ) | | | (0.05 | ) | | | (0.49 | ) | | | (0.54 | ) | | | — | | | | 8.66 | | | | (16.25 | ) | | | 11 | | | | 0.52 | | | | 4.15 | | | | 0.90 | (e) | | | 30 | |
| 2021 | | | 10.63 | | | | (0.02 | ) | | | 2.04 | | | | 2.02 | | | | (0.07 | ) | | | (1.58 | ) | | | (1.65 | ) | | | 0.00 | | | | 11.00 | | | | 19.34 | | | | 13 | | | | (0.18 | ) | | | 4.24 | | | | 0.90 | (f) | | | 79 | |
| 2020 | | | 9.23 | | | | 0.05 | | | | 1.41 | | | | 1.46 | | | | (0.06 | ) | | | — | | | | (0.06 | ) | | | — | | | | 10.63 | | | | 15.81 | | | | 11 | | | | 0.66 | | | | 10.15 | | | | 0.90 | | | | 63 | |
| Class I | | | | | | | | | | | | | | | | | | | | | | | | | | | | | | | | | | | | | | | | | | | | | | | | | | | | | | | | | | | | |
| 2024 | | $ | 10.90 | | | $ | 0.11 | | | $ | 1.07 | | | $ | 1.18 | | | $ | (0.11 | ) | | $ | (0.89 | ) | | $ | (1.00 | ) | | $ | 0.00 | | | $ | 11.08 | | | | 10.88 | % | | $ | 12,528 | | | | 0.97 | % | | | 2.38 | % | | | 0.90 | % | | | 26 | % |
| 2023 | | | 8.70 | | | | 0.08 | | | | 3.34 | | | | 3.42 | | | | (0.07 | ) | | | (1.15 | ) | | | (1.22 | ) | | | — | | | | 10.90 | | | | 39.05 | | | | 11,428 | | | | 0.74 | | | | 3.12 | | | | 0.90 | | | | 42 | |
| 2022 | | | 11.04 | | | | 0.05 | | | | (1.85 | ) | | | (1.80 | ) | | | (0.05 | ) | | | (0.49 | ) | | | (0.54 | ) | | | — | | | | 8.70 | | | | (16.17 | ) | | | 6,440 | | | | 0.52 | | | | 3.15 | | | | 0.90 | (e) | | | 30 | |
| 2021 | | | 10.67 | | | | (0.02 | ) | | | 2.04 | | | | 2.02 | | | | (0.07 | ) | | | (1.58 | ) | | | (1.65 | ) | | | 0.00 | | | | 11.04 | | | | 19.25 | | | | 6,801 | | | | (0.18 | ) | | | 3.24 | | | | 0.90 | (f) | | | 79 | |
| 2020 | | | 9.26 | | | | 0.09 | | | | 1.38 | | | | 1.47 | | | | (0.06 | ) | | | — | | | | (0.06 | ) | | | — | | | | 10.67 | | | | 15.87 | | | | 3,922 | | | | 1.11 | | | | 9.15 | | | | 0.90 | | | | 63 | |
| † | Total return represents aggregate total return of a hypothetical investment at the beginning of the year and sold at the end of the year including reinvestment of distributions and does not reflect the applicable sales charges. |
| (a) | Per share amounts have been calculated using the average shares outstanding method. |
| (b) | Amount represents less than $0.005 per share. |
| (c) | Under an expense reimbursement agreement with the Adviser, the Adviser reimbursed expenses of $167,739, $176,163, $148,978, $147,312, and $163,109 for the years ended December 31, 2024, 2023, 2022, 2021, and 2020, respectively. |
| (d) | The Fund received credits from a designated broker who agreed to pay certain Fund operating expenses for the years ended December 31, 2024, 2023, 2022, 2021, and 2020. If such credits had not been received, the ratios of operating expenses to average net assets would have been 0.91%, 0.92%, 0.92%, 0.92%, and 0.96% for each Class, respectively. |
| (e) | The Fund incurred interest expense. For the year ended December 31, 2022, the impact was minimal. |
| (f) | The Fund incurred tax expense for the year ended December 31, 2021 and there was no material impact on the expense ratios. |
See accompanying notes to financial statements.
Item 8. Changes in and Disagreements with Accountants for Open -End Management Investment Companies.
Not applicable.
Item 9. Proxy Disclosures for Open-End Management Investment Companies.
Not applicable.
Item 10. Remuneration Paid to Directors, Officers, and Others of Open-End Management Investment Companies.
Unless the following information is disclosed as part of the financial statements included in Item 7, an open-end management investment company registered on Form N-1A [17 CFR 239.15A and 17 CFR 274.11A] must disclose the aggregate remuneration paid by the company during the period covered by the report to:
| (1) | All directors and all members of any advisory board for regular compensation; |
| E. Val Cerutti | $10,000 |
| Anthony J. Colavita (deceased) | $10,064 |
| Werner J. Roeder | $12,410 |
| Anthonie C. van Ekris | $10,000 |
| Salvatore J. Zizza | $14,000 |
| (2) | Each director and each member of an advisory board for special compensation; $0 |
| (4) | Each person of whom any officer or director of the Fund is an affiliated person. $0 |
Item 11. Statement Regarding Basis for Approval of Investment Advisory Contract.
During the six months ended December 31, 2024, the Board of Directors of the Corporation approved the continuation of the investment advisory agreement with the Adviser for the Fund on the basis of the recommendation by the directors (the Independent Board Members) who are not interested persons of the Fund. The following paragraphs summarize the material information and factors considered by the Independent Board Members as well as their conclusions relative to such factors.
Nature, Extent, and Quality of Services. The Independent Board Members considered information regarding the Fund’s portfolio managers, the depth of the analyst pool available to the Adviser and the Fund’s portfolio managers, the scope of supervisory, administrative, shareholder, and other services supervised or provided by the Adviser, and the absence of significant service problems reported to the Board. The Independent Board Members noted the experience, length of service, and reputation of the Fund’s portfolio managers.
Investment Performance. The Independent Board Members reviewed the short, medium, and long term performance of the Fund (as of June 30, 2024) against a peer group of nine other comparable funds prepared by the Adviser (the “Adviser Peer Group”), and against a peer group prepared by Broadridge (the “Broadridge Performance Peer Group”) consisting of all retail and institutional telecommunication funds, regardless of asset size or primary channel of distribution. The Independent Board Members noted that the Fund’s performance was in the third quartile for the one year period and in the fourth quartile for the three-, five-, and ten-year periods, as measured against the Adviser Peer Group. Against the Broadridge Performance Peer Group, the Independent Board Members noted that the Fund’s performance was in the third quintile for the one-year, three-year, and five-year periods, and in the fourth quintile for the ten-year period. The Independent Board Members discussed the modest improvement in the Fund’s performance and also recalled the Adviser’s comprehensive discussion of performance earlier in the Meeting.
Profitability. The Independent Board Members reviewed summary data regarding the profitability of the Fund to the Adviser both with a pro rata administrative charge and with a standalone administrative charge and noted the impact of the expense limitation agreement. The Independent Board Members also noted that a substantial portion of the Fund’s portfolio transactions were executed by an affiliated broker of the Adviser and that another affiliated broker received distribution fees and minor amounts of sales commissions.
Economies of Scale. The Independent Board Members discussed the major elements of the Adviser’s cost structure and the relationship of those elements to potential economies of scale and reviewed data provided by the Adviser.
Sharing of Economies of Scale. The Independent Board Members noted that the investment management fee schedule for the Fund does not take into account any potential economies of scale that may develop.
Service and Cost Comparisons. The Independent Board Members compared the expense ratios of the investment management fee, other expenses, and total expenses of the Fund with similar expense ratios of the Adviser Peer Group and a peer group of four other telecommunications funds selected by Broadridge (the “Broadridge Expense Peer Group”), and noted that the Adviser’s management fee includes substantially all administrative services of the Fund as well as investment advisory services of the Adviser. The Independent Board Members noted that the Fund’s total expense ratio was slightly above the median in the Adviser Peer Group and in the second quintile in the Broadridge Expense Peer Group, and that the Fund’s size was generally smaller than average within both peer groups. The Independent Board Members also noted that the advisory fee structure was the same as that in effect for most of the Gabelli funds and noted the effect of the expense limitation agreement in place for the Fund. The Independent Board Members were presented with, but did not consider to be material to their decision, various information comparing the advisory fee with the fee for other types of accounts managed by the Adviser.
Conclusions. The Independent Board Members concluded that the Fund enjoyed highly experienced portfolio management services and good ancillary services. The Independent Board Members noted the modest improvement in the Fund’s performance and the steps the Adviser had taken to improve performance. The Independent Board Members also concluded that the Fund’s expense ratios and the profitability to the Adviser of managing the Fund were acceptable, and that economies of scale were not a significant factor in their thinking at this time. In this regard, the Independent Board Members noted the contractual Expense Deferral Agreement between the Adviser and the Company, on behalf of each Fund, pursuant to which the net expense ratio for each share class of each Fund was reduced to 0.90%. The Independent Board Members did not view the potential profitability of ancillary services as material to their decision. On the basis of the foregoing and without assigning particular weight to any single conclusion, the Independent Board Members determined to recommend continuation of the investment management agreement to the full Board.
Global Growth Fund
Nature, Extent, and Quality of Services. The Independent Board Members considered information regarding the Fund’s portfolio managers, the depth of the analyst pool available to the Adviser and the portfolio managers, the scope of supervisory, administrative, shareholder, and other services supervised or provided by the Adviser and the absence of significant service problems reported to the Board. The Independent Board Members noted the experience, length of service, and reputation of the Fund’s portfolio managers.
Investment Performance. The Independent Board Members reviewed the short, medium, and long term performance of the Fund (as of June 30, 2024) against a peer group of nine other comparable funds prepared by the Adviser (the “Adviser Peer Group”), and against a peer group prepared by Broadridge (the “Broadridge Performance Peer Group”) consisting of all retail and institutional global large cap growth funds, regardless of asset size or primary channel of distribution. The Independent Board Members noted that the Fund’s performance was in the first quartile for the one-year, three-year, five-year and ten-year periods, as measured against the Adviser Peer Group. Against the Broadridge Performance Peer Group, the Independent Board Members noted that the Fund’s performance was in the fifth quintile for the three-year period and the third quintile for the one-year, five-year, and ten-year periods. The Independent Board Members discussed this comparative data and also recalled the Adviser’s comprehensive discussion of performance earlier in the Meeting.
Profitability. The Independent Board Members reviewed summary data regarding the profitability of the Fund to the Adviser both with a pro rata administrative overhead charge and with a stand-alone administrative charge and noted the effect of the expense limitation agreement. The Independent Board Members also noted that a portion of the Fund’s portfolio transactions were executed by an affiliated broker of the Adviser and that another affiliated broker of the Adviser received distribution fees and minor amounts of sales commissions.
Economies of Scale. The Independent Board Members discussed the major elements of the Adviser’s cost structure and the relationship of those elements to potential economies of scale and reviewed data provided by the Adviser.
Sharing of Economies of Scale. The Independent Board Members noted that the investment management fee schedule for the Fund does not take into account any potential economies of scale that may develop.
Service and Cost Comparisons. The Independent Board Members compared the expense ratios of the investment management fee, other expenses, and total expenses of the Fund with similar expense ratios of the Adviser Peer Group and a peer group of eight other global large cap growth funds selected by Broadridge, and noted that the Adviser’s management fee includes substantially all administrative services of the Fund as well as investment advisory services. The Independent Board Members noted that the Fund’s total expense ratio was in the first quintile for the Broadridge peer group and the lowest in the Advisor peer group, but that the Fund’s size was below average within each peer group. The Independent Board Members also noted that the advisory fee structure was the same as that in effect for most of the Gabelli funds and noted the effect of the expense limitation agreement in place for the Fund. The Independent Board Members were presented with, but did not consider to be material to their decision, various information comparing the advisory fee with the fee for other types of accounts managed by the Adviser.
Conclusions. The Independent Board Members concluded that the Fund enjoyed highly experienced portfolio management services and good ancillary services and an acceptable performance record. The Independent Board Members also concluded that the Fund’s expense ratios and the profitability to the Adviser of managing the Fund were reasonable, and that economies of scale were not a significant factor in their thinking at this time. In this regard, the Independent Board Members noted the contractual Expense Deferral Agreement between the Adviser and the Company, on behalf of each Fund, pursuant to which the net expense ratio for each share class of each Fund was reduced to 0.90%. The Independent Board Members did not view the potential profitability of ancillary services as material to their decision. On the basis of the foregoing and without assigning particular weight to any single conclusion, the Independent Board Members determined to recommend continuation of the investment management agreement to the full Board.
International Small Cap Fund
Nature, Extent, and Quality of Services. The Independent Board Members considered information regarding the Fund’s portfolio managers, the depth of the analyst pool available to the Adviser and the portfolio manager, the scope of supervisory, administrative, shareholder, and other services supervised or provided by the Adviser, and the absence of significant service problems reported to the Board. The Independent Board Members noted the experience, length of service, and reputation of the Fund’s portfolio manager.
Investment Performance. The Independent Board Members reviewed the short, medium, and long-term performance of the Fund (as of June 30, 2024) against a peer group of seven other comparable funds prepared by the Adviser (the “Adviser Peer Group”), and against a peer group prepared by Broadridge (the “Broadridge Performance Peer Group”) consisting of all retail and institutional international small/mid-cap growth funds, regardless of asset size or primary channel of distribution. The Independent Board Members noted that the Fund’s performance was in the fourth quartile for the one-year, five-year, and ten-year periods, and in the third quartile for the three-year period, as measured against the Adviser Peer Group. Against the Broadridge Performance Peer Group, the Independent Board Members noted that the Fund’s performance was in the fifth quintile for the one-, three-, five- and ten-years periods. The Independent Board Members noted that at its current size, the Fund was not competitive among its peer group and encouraged the Adviser to continue to explore ways to increase the size of the Fund. The Independent Board Members also recalled the Adviser’s comprehensive discussion of performance earlier in the Meeting.
Profitability. The Independent Board Members reviewed summary data regarding the profitability of the Fund to the Adviser both with a pro rata administrative overhead charge and with a stand-alone administrative charge and noted the effect of the expense limitation agreement. The Independent Board Members also noted that a portion of the Fund’s portfolio transactions were executed by an affiliated broker of the Adviser and that another affiliated broker of the Adviser received distribution fees and minor amounts of sales commissions.
Economies of Scale. The Independent Board Members discussed the major elements of the Adviser’s cost structure and the relationship of those elements to potential economies of scale and reviewed data provided by the Adviser.
Sharing of Economies of Scale. The Independent Board Members noted that the investment management fee schedule for the Fund does not take into account any potential economies of scale that may develop or any losses or diminished profitability to the Adviser in prior years.
Service and Cost Comparisons. The Independent Board Members compared the expense ratios of the investment management fee, other expenses, and total expenses of the Fund with similar expense ratios of the Adviser Peer Group and a peer group of ten other international small/mid-cap growth funds selected by Broadridge (the “Broadridge Expense Peer Group”), and noted that the Adviser’s management fee includes substantially all administrative services of the Fund as well as investment advisory services. The Independent Board Members noted that the Fund’s total expense ratio after waivers was the lowest compared to the Adviser Peer Group, and the lowest compared to all of the funds included in the Broadridge Expense Peer Group. The Independent Board Members discussed how the Fund’s size was lower than average within both peer groups and that the Adviser had been waiving substantial portions of its fees in order to make the Fund a more attractive investment. The Independent Board Members also noted that the advisory fee structure was the same as that in effect for most of the Gabelli funds and noted the effect of the expense limitation agreement in place for the Fund. The Independent Board Members were presented with, but did not consider to be material to their decision, various information comparing the advisory fee to the fee for other types of accounts managed by the Adviser.
Conclusions. The Independent Board Members concluded that the Fund enjoyed highly experienced portfolio management services, an acceptable performance record, and good ancillary services. The Independent Board Members noted the contractual Expense Deferral Agreement between the Adviser and the Company, on behalf of each Fund, pursuant to which the net expense ratio for each share class of each Fund was reduced to 0.90%. The Independent Board Members did not view the potential profitability of ancillary services as material to their decision. On the basis of the foregoing and without assigning particular weight to any single conclusion, the Independent Board Members determined to recommend continuation of the investment management agreement to the full Board.
Global Rising Income and Dividend Fund
Nature, Extent and Quality of Services. The Independent Board Members considered information regarding the portfolio managers, the depth of the analyst pool available to the Adviser and the Fund’s portfolio managers, the scope of supervisory, administrative, shareholder and other services supervised or provided by the Adviser and the absence of significant service problems reported to the Board. The Independent Board Members noted the experience, length of service and reputation of the Fund’s portfolio managers.
Investment Performance. The Independent Board Members reviewed the short, medium, and long-term performance of the Fund (as of June 30, 2024) against a peer group of nine other comparable funds prepared by the Adviser (the “Adviser Peer Group”), and against a peer group prepared by Broadridge (the “Broadridge Performance Peer Group”) consisting of all retail and institutional global equity income funds, regardless of asset size or primary channel of distribution. The Independent Board Members noted that the Fund’s performance was in the fourth quartile for the one, three, five, and ten-year periods, as measured against the Adviser Peer Group. Against the Broadridge Performance Peer Group, the Independent Board Members noted that the Fund’s performance was in the fifth quintile for the one, three, and five -year periods, and in the fourth quintile for the ten-year period. The Independent Board Members recalled the Adviser’s comprehensive discussion of performance earlier in the Meeting.
Profitability. The Independent Board Members reviewed summary data regarding the profitability of the Fund to the Adviser both with a pro rata administrative overhead charge and with a stand-alone administrative charge and noted the effect of the expense limitation agreement. The Independent Board Members also noted that a portion of the Fund’s portfolio transactions were executed by an affiliated broker of the Adviser and that another affiliated broker of the Adviser received distribution fees and minor amounts of sales commissions.
Economies of Scale. The Independent Board Members discussed the major elements of the Adviser’s cost structure and the relationship of those elements to potential economies of scale and reviewed data provided by the Adviser.
Sharing of Economies of Scale. The Independent Board Members noted that the investment management fee schedule for the Fund does not take into account any potential economies of scale that may develop.
Service and Cost Comparisons. The Independent Board Members compared the expense ratios of the investment management fee, other expenses and total expenses of the Fund to similar expense ratios of the Adviser Peer Group and a peer group of nine other global equity income funds selected by Broadridge (the “Broadridge Expense Peer Group”), and noted that the Adviser’s management fee includes substantially all administrative services of the Fund as well as investment advisory services. The Board Members noted that the Fund’s total expense ratio was one of the lowest for the Adviser Peer Group and the lowest for the Broadridge Expense Peer Group and that, the Fund’s size was significantly lower than the average of the Adviser Peer Group, and lower than the average of the Broadridge Expense Peer Group. The Independent Board Members also noted that the advisory fee structure was the same as that in effect for most of the Gabelli funds and noted the effect of the expense limitation agreement in place for the Fund. The Independent Board Members were presented with, but did not consider to be material to their decision, various information comparing the advisory fee to the fee for other types of accounts managed by the Adviser.
Conclusions. The Independent Board Members concluded that the Fund enjoyed highly experienced portfolio management services and good ancillary services. The Independent Board Members noted the reasons for the Fund’s historical underperformance and certain improved performance metrics. The Independent Board Members also concluded that the Fund’s expense ratios and profitability to the Adviser were reasonable, and that economies of scale were not a significant factor in their thinking at this time. In this regard, the Independent Board Members noted the contractual Expense Deferral Agreement between the Adviser and the Company, on behalf of each Fund, pursuant to which the net expense ratio for each share class of each Fund was reduced to 0.90%. The Board Members did not view the potential profitability of ancillary services as material to their decision. On the basis of the foregoing and without assigning particular weight to any single conclusion, the Independent Board Members determined to recommend continuation of the investment management agreement to the full Board.
Global Mini MitesTM Fund
Nature, Extent and Quality of Services. The Independent Board Members considered information regarding the portfolio managers, the depth of the analyst pool available to the Adviser and the Fund’s portfolio managers, the scope of supervisory, administrative, shareholder and other services supervised or provided by the Adviser and the absence of significant service problems reported to the Board. The Independent Board Members noted the experience, length of service and reputation of the Fund’s portfolio managers.
Investment Performance. The Independent Board Members reviewed the short-term performance of the Fund (as of June 30, 2024) against a peer group of seven other comparable funds prepared by the Adviser (the “Adviser Peer Group”), and against a peer group prepared by Broadridge (the “Broadridge Performance Peer Group”) consisting of all retail and institutional global small/mid cap fund, regardless of asset size or primary channel of distribution. The Independent Board Members noted that the Fund’s performance was in the first quartile for the one-year period, in the third quartile for the three-year period, and in in the second quartile for the five-year period, as measured against the Adviser Peer Group. Against the Broadridge Performance Peer Group, the Independent Board Members noted that the Fund’s performance was in the second quintile for the one, three, and five-year periods. The Independent Board Members noted that at its current size, the Fund was not competitive among its peer groups and encouraged the Adviser to continue to explore ways to increase the size of the Fund. The Independent Board Members discussed the Adviser’s comprehensive performance discussion earlier in the Meeting.
Profitability. The Independent Board Members reviewed summary data regarding the profitability of the Fund to the Adviser both with a pro rata administrative overhead charge and with a stand-alone administrative charge and noted the effect of the expense limitation agreement. The Independent Board Members also noted that a portion of the Fund’s portfolio transactions were executed by an affiliated broker of the Adviser and that another affiliated broker of the Adviser received distribution fees and minor amounts of sales commissions.
Economies of Scale. The Independent Board Members discussed the major elements of the Adviser’s cost structure and the relationship of those elements to potential economies of scale and reviewed data provided by the Adviser.
Sharing of Economies of Scale. The Independent Board Members noted that the investment management fee schedule for the Fund does not take into account any potential economies of scale that may develop.
Service and Cost Comparisons. The Independent Board Members compared the expense ratios of the investment management fee, other expenses and total expenses of the Fund to similar expense ratios of the Adviser Peer Group and a peer group of nine other global small/mid cap funds selected by Broadridge (the “Broadridge Expense Peer Group”), and noted that the Adviser’s management fee includes substantially all administrative services of the Fund as well as investment advisory services. The Board Members noted that the Fund’s total expense ratio was the lowest for the Adviser Peer Group and the Broadridge Expense Peer Group. The Independent Board Members also noted that the advisory fee structure was the same as that in effect for most of the Gabelli funds and noted the effect of the expense limitation agreement in place for the Fund. The Independent Board Members were presented with, but did not consider to be material to their decision, various information comparing the advisory fee to the fee for other types of accounts managed by the Adviser.
Conclusions. The Independent Board Members concluded that the Fund enjoyed highly experienced portfolio management services, and good ancillary services and an acceptable performance record. The Independent Board Members also concluded that the Fund’s expense ratios and profitability to the Adviser were acceptable, and that economies of scale were not a significant factor in their thinking at this time. In this regard, the Independent Board Members noted the contractual Expense Deferral Agreement between the Adviser and the Company, on behalf of each Fund, pursuant to which the net expense ratio for each share class of each Fund was reduced to 0.90%. The Board Members did not view the potential profitability of ancillary services as material to their decision. On the basis of the foregoing and without assigning particular weight to any single conclusion, the Independent Board Members determined to recommend continuation of the investment management agreement to the full Board.
Based on a consideration of all these factors in their totality, the Board Members, including all of the Independent Board Members, determined that each Fund’s advisory fee was appropriate in light of the quality of services provided and in light of the other factors described above that the Board deemed relevant. Accordingly, the Board Members determined to approve the continuation of each Fund’s Advisory Agreement. The Board Members based their decision on evaluations of all these factors as a whole and did not consider any one factor as all-important or controlling.
Item 12. Disclosure of Proxy Voting Policies and Procedures for Closed-End Management Investment Companies.
Not applicable.
Item 13. Portfolio Managers of Closed-End Management Investment Companies.
Not applicable.
Item 14. Purchases of Equity Securities by Closed-End Management Investment Company and Affiliated Purchasers.
Not applicable.
Item 15. Submission of Matters to a Vote of Security Holders.
There have been no material changes to the procedures by which shareholders may recommend nominees to the registrant’s board of trustees, where those changes were implemented after the registrant last provided disclosure in response to the requirements of Item 407(c)(2)(iv) of Regulation S-K (17 CFR 229.407) (as required by Item 22(b)(15) of Schedule 14A (17 CFR 240.14a-101)), or this Item.
Item 16. Controls and Procedures.
| (a) | The registrant’s principal executive officer and principal financial officer have concluded, based on their evaluation of the effectiveness of the design and operation of the registrant’s disclosure controls and procedures (as defined in Rule 30a-3(c) under the Investment Company Act of 1940 (17 CFR 270.30a-3(c))) as of a date within 90 days of the filing date of this report, that the design and operation of such procedures are effective to provide reasonable assurance that information required to be disclosed by the registrant on Form N-CSR is recorded, processed, summarized and reported within the time periods specified in the Securities and Exchange Commission’s rules and forms, and that information required to be disclosed by the registrant in the reports that it files or submits on Form N-CSR is accumulated and communicated to the registrant’s management, including its principal executive and principal financial officers, as appropriate to allow timely decisions regarding required disclosure. |
| (b) | There were no changes in the registrant’s internal control over financial reporting (as defined in Rule 30a-3(d) under the 1940 Act (17 CFR 270.30a-3(d))) that occurred during the period covered by this report that have materially affected, or are reasonably likely to materially affect, the registrant’s internal control over financial reporting. |
Item 17. Disclosure of Securities Lending Activities for Closed-End Management Investment Companies.
Not applicable.
Item 18. Recovery of Erroneously Awarded Compensation.
Not Applicable.
Item 19. Exhibits.
| (a)(2) | | Any policy required by the listing standards adopted pursuant to Rule 10D-1 under the Exchange Act (17 CFR 240.10D-1) by the registered national securities exchange or registered national securities association upon which the registrant’s securities are listed. |
| (a)(3)(1) | | There were no written solicitations to purchase securities under Rule 23c-1 under the Act sent or given during the period covered by the report by or on behalf of the Registrant to 10 or more persons. |
| (a)(3)(2) | | There was no change in the Registrant’s independent public accountant during the period covered by the report. |
SIGNATURES
Pursuant to the requirements of the Securities Exchange Act of 1934 and the Investment Company Act of 1940, the registrant has duly caused this report to be signed on its behalf by the undersigned, thereunto duly authorized.
| (Registrant) | GAMCO Global Series Funds, Inc. | |
| | | |
| By (Signature and Title)* | /s/ John C. Ball | |
| | John C. Ball, Principal Executive Officer | |
| | | |
| Date | March 10, 2025 | |
Pursuant to the requirements of the Securities Exchange Act of 1934 and the Investment Company Act of 1940, this report has been signed below by the following persons on behalf of the registrant and in the capacities and on the dates indicated.
| By (Signature and Title)* | /s/ John C. Ball | |
| | John C. Ball, Principal Executive Officer | |
| | | |
| Date | March 10, 2025 | |
| By (Signature and Title)* | /s/ John C. Ball | |
| | John C. Ball, Principal Financial Officer and Treasurer | |
| | | |
| Date | March 10, 2025 | |
| * | Print the name and title of each signing officer under his or her signature. |