UNITED STATES
SECURITIES AND EXCHANGE COMMISSION
Washington, D.C. 20549
FORM N-CSR
CERTIFIED SHAREHOLDER REPORT OF REGISTERED MANAGEMENT
INVESTMENT COMPANIES
Investment Company Act file number 811-07912
Old Westbury Funds, Inc.
(Exact name of registrant as specified in charter)
760 Moore Rd.
King of Prussia, PA 19406
(Address of principal executive offices) (Zip code)
Andrew J. McNally
BNY Mellon Investment Servicing (US) Inc.
760 Moore Rd.
King of Prussia, PA 19406
(Name and address of agent for service)
Registrant’s telephone number, including area code: 800-607-2200
Date of fiscal year end: October 31
Date of reporting period: October 31, 2015
Form N-CSR is to be used by management investment companies to file reports with the Commission not later than 10 days after the transmission to stockholders of any report that is required to be transmitted to stockholders under Rule 30e-1 under the Investment Company Act of 1940 (17 CFR 270.30e-1). The Commission may use the information provided on Form N-CSR in its regulatory, disclosure review, inspection, and policymaking roles.
A registrant is required to disclose the information specified by Form N-CSR, and the Commission will make this information public. A registrant is not required to respond to the collection of information contained in Form N-CSR unless the Form displays a currently valid Office of Management and Budget (“OMB”) control number. Please direct comments concerning the accuracy of the information collection burden estimate and any suggestions for reducing the burden to Secretary, Securities and Exchange Commission, 100 F Street, NE, Washington, DC 20549. The OMB has reviewed this collection of information under the clearance requirements of 44 U.S.C. § 3507.
Item 1. Reports to Stockholders.
The Report to Shareholders is attached herewith.
Old Westbury Funds, Inc.
Annual Report
October 31, 2015
BESSEMER INVESTMENT MANAGEMENT LLC
Investment Adviser
Old Westbury Funds, Inc.
This report and the financial statements contained herein are submitted for the general information of the shareholders of the Funds. This report is not authorized for distribution to prospective investors in the Funds unless preceded or accompanied by an effective prospectus.
This Page Intentionally Left Blank
| Old Westbury Funds, Inc. |
| A Letter From the President (Unaudited) |
| |
| |
Dear Shareholders:
By and large, financial markets seemed to drift indecisively for much of the fiscal year. Notable exceptions were commodities and emerging markets, which trended sharply lower, and the U.S. dollar, which surged higher. Oil prices fell in response to rising global supplies and worries about a China slowdown, while other commodities followed oil to new lows. Further, diverging global interest-rate-policy expectations placed additional pressure on commodity markets as the dollar strengthened in response. Chinese stocks created some alarm as they began to fall precipitously in the summer, and a subsequent surprise 3% devaluation of the Chinese renminbi and weak manufacturing reports did not help matters.
Central bank actions remained at the forefront of investor minds for the entire fiscal year. The U.S. Federal Reserve (the “Fed”) put rate increases on hold throughout the year, though expectations rose for a September 2015 hike. Citing concern over developments outside the U.S., among other factors, the Fed left rates unchanged, disappointing markets. Meanwhile, the European Central Bank (ECB) and Bank of Japan maintained accommodative monetary stances, and both reiterated their willingness to ease further to support their respective economies, if inflation or growth trends were to worsen. China’s central bank, along with the Chinese government, continued to respond to a slowdown in economic growth with policies designed to make its financial systems more market-friendly, stimulate growth, and soften the transition to a consumption-driven economy.
The U.S. economy was again a bright spot in the year against a more muted backdrop for global economic growth. The labor market improved, as the unemployment rate fell to the 5% level, resulting from considerable job creation. Consumer sentiment remained positive, which manifested in higher retail sales, and vehicle sales were particularly strong. The manufacturing sector, however, slowed due to the stronger U.S. dollar, the slowdown in China, and the downturn in commodities prices.
Europe continued to struggle with low economic growth, though some underlying trends began to improve. The lending environment turned positive to some degree, as loans to households and non-financial companies began to show year-over-year improvement. The recovery in lending helped support the European consumer, propelling sentiment and retail sales higher. In Japan, the success of fiscal, monetary, and structural reform measures implemented by Prime Minister Abe has been mixed. While there has been an uptick in some economic data, like growth in the labor market, other data point to a still-fragile economy. Japanese wage growth remains lackluster, and capital expenditures from businesses are showing little improvement.
Emerging markets (EM) around the world continued to face challenging conditions. Lower energy prices hurt many countries dependent on oil exports. As expectations grew that the Fed would finally raise interest rates, investors worried that higher U.S. rates would make EM assets less attractive after accounting for risk. Many emerging countries grappled with high inflation (Argentina, Russia, Brazil) as well as a host of country-specific issues.
In this environment, our portfolio results varied. During a flat year for global large cap stocks, the strongest outperformance came from the Old Westbury Large Cap Strategies Fund thanks to good stock selection and exposure to U.S. companies. The Old Westbury Large Cap Core Fund, however, underperformed its benchmark due to stock selection in the industrial, information technology, and healthcare sectors. Smaller capitalization stocks fared better than global stocks overall, and the Old Westbury Small & Mid Cap Fund posted solid outperformance relative to its benchmark as a result of strong stock selection. The Old Westbury Fixed Income Fund underperformed, mainly due to an underweight position in bonds with a three- to five-year duration. The Old Westbury Municipal Bond Fund slightly underperformed; the Fund’s high-quality positioning was a detractor as lower-quality bonds generally performed well. Finally, the Old Westbury Strategic Opportunities Fund outperformed its primary benchmark. Contributors included quantitative equities, global corporate credit, non-agency mortgage-backed securities, and convertible bonds.
During the fiscal year, the Advisor, Bessemer Investment Management, LLC made several key changes. It added a new “Commodity Alpha” sleeve within the Old Westbury Strategic Opportunities Fund. Also in this Fund, the Advisor initiated positions in Master Limited Partnerships (MLPs) and energy infrastructure companies through sub-advisor TPH Asset Management, LLC. Finally, we instituted separate non-U.S. and U.S. sleeves for the Large Cap Core Fund, and established benchmarks for each respective sleeve.
At year-end, we remain committed to the Advisor’s longstanding investment approach, characterized by independent research, a global orientation, and long-term perspective. We believe these disciplines will continue to reap competitive long-term results for shareholders and position the Advisor to fulfill the central mandate of participating in strong market environments while preserving capital during difficult ones.
Sincerely,

David W. Rossmiller
President
Old Westbury Funds, Inc.
| Old Westbury Funds, Inc. |
| Large Cap Core Fund |
| Investment Adviser’s Report (Unaudited) |
| |
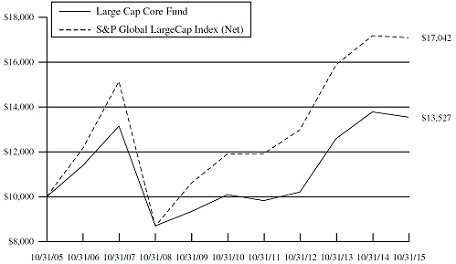
The return of the Old Westbury Large Cap Core Fund (the “Fund”) for the fiscal year ended October 31, 2015 was -1.70%. In comparison, the return of the S&P Global LargeCap Index (Net) (the “Index”) was -0.52%.
The Fund’s results were held back by stock selection in the industrial (8.39% of the Fund as of October 31, 2015), healthcare (12.39%), and information technology (16.03%) sectors. Stocks that experienced the largest declines included Community Health Systems, a U.S.-based operator of acute care hospitals (0.78%) which experienced weakness due to concerns over implementation of the Affordable Care Act. TIM Participacoes, a Brazilian telecommunications company (sold), declined significantly as consumer trends deteriorated, and the Brazilian currency, the real, weakened considerably against the U.S. dollar. Also, Teradata, a provider of enterprise big data analytics and services (sold) declined due to unfavorable developments in customer buying patterns.
The most significant positive contributors to the Fund’s relative performance during the year were an underweight position in the energy sector (4.60%), along with some positive stock selection in the sector; an underweight position in the materials sector (1.41%), along with some positive stock selection; and an overweight to the consumer discretionary sector (15.92%). Positive contributors included Aetna, a U.S. health insurer (1.40%) that has benefited from strong pricing and a successful acquisition integration, and Avago, a U.S. specialty semiconductor company that has also implemented a successful acquisition strategy, and where growth trends are strong. Nike (1.95%) posted strong results as consumers continue to shift to wearing sportswear. Finally, Raytheon (3.07%) benefitted from an improved outlook for defense spending.
At fiscal year-end, the Fund maintained overweight positions in consumer discretionary, utilities, and technology; these overweights were largely the result of specific stock positions. The Fund maintained underweight positions in financials, energy, and materials; the positions were due to a general caution over commodity prices along with stock-specific rationales. The Fund continues to be overweight U.S. stocks (57.53%) versus non-U.S. stocks (37.01%; the remainder was cash). Within non-U.S. stocks, the Fund is overweight Europe and Japan, and underweight emerging markets.
| Old Westbury Funds, Inc. | |
| Large Cap Core Fund | |
| Investment Adviser’s Report (Unaudited) - (Continued) | |
| | |
PORTFOLIO DIVERSIFICATION BY SECTOR*
| Sector: | | | |
| Banks | | 9.3 | % |
| Consumer Discretionary | | 17.0 | |
| Consumer Staples | | 10.2 | |
| Diversified Financials | | 5.9 | |
| Energy | | 4.6 | |
| Health Care | | 12.4 | |
| Industrials | | 7.3 | |
| Information Technology | | 16.1 | |
| Insurance | | 2.4 | |
| Materials | | 1.4 | |
| Real Estate | | 1.0 | |
| Telecommunication Services | | 2.1 | |
| Utilities | | 5.0 | |
| Other** | | 5.3 | |
| | | 100.0 | % |
| * | Stated as a percentage of net assets. |
| ** | Includes cash and equivalents, investment company, pending trades and Fund share transactions, interest and dividends receivable, prepaids and accrued expenses payable. |
| Old Westbury Funds, Inc. | |
| Large Cap Core Fund | |
| Investment Adviser’s Report (Unaudited) - (Concluded) | |
| | |
Average Annual Total Returns
For the Period Ended October 31, 2015
| Large Cap Core Fund | | | | |
| One Year | | | (1.70 | )% |
| Five Year | | | 6.04 | % |
| Ten Year | | | 3.07 | % |
| | | | | |
| S&P Global LargeCap Index (Net) | | | | |
| One Year | | | (0.52 | )% |
| Five Year | | | 7.45 | % |
| Ten Year | | | 5.47 | % |
On November 16, 2011, the Fund changed its name to Large Cap Core Fund (formerly U.S. Large Cap Fund) as part of a series of changes to the overall investment focus and strategies of the Fund. Prior to October 2, 2008, the Fund was named the Large Cap Equity Fund and operated under a different investment strategy. Prior to February 16, 2004, the Fund was named the Core Equities Fund and operated under a different investment strategy. The performance information shown above may not be representative of performance the Fund will achieve under its current investment strategy.
The performance data quoted represents past performance. Past performance does not guarantee future results and does not reflect the deduction of taxes that a shareholder may pay on Fund distributions or the redemption of Fund shares. Fund performance reflects fee waivers and/or expense reimbursements and reinvestments of distributions, if any. Without waivers/reimbursements, performance would have been lower. The investment return and principal value of an investment will fluctuate. Consequently, an investor’s shares, when redeemed, may be worth more or less than their original cost. Current performance may be lower or higher than the performance data quoted. To obtain performance information current to the most recent month end, please call 1-800-607-2200.
The Adviser has contractually committed through October 31, 2017, to waive its advisory fees to the extent necessary to maintain the net operating expense ratio of the Fund, excluding acquired fund fees, at 1.00%, as disclosed in the Funds’ prospectus dated April 2, 2015. The expense ratio, prior to fee waivers and including acquired Fund fees (if any), is stated in the prospectus as 1.04%. Additional information pertaining to the Fund’s expense ratio for the year ended October 31, 2015 can be found in the Financial Highlights.
The chart above illustrates the total value of a $10,000 investment for 10 years, with distributions reinvested. The S&P Global LargeCap Index (Net) also includes the reinvestment of distributions but does not include fees and expenses associated with an investment in the Fund. The S&P Global LargeCap Index (Net) is unmanaged. Investments cannot be made directly in an index.
Investments made in foreign and emerging country securities may involve additional risks, such as political and social instability, less liquidity and currency exchange rate volatility.
| Old Westbury Funds, Inc. |
| Large Cap Strategies Fund |
| Investment Adviser’s Report (Unaudited) |
| |
The return of the Old Westbury Large Cap Strategies Fund (the “Fund”) for the fiscal year ended October 31, 2015 was 2.01%. In comparison, the return of the S&P Global LargeCap Index (Net) (“the Index”) was -0.52%.
During the fiscal year, two of the Fund’s main components outperformed the Index, while two underperformed. Outperformers were Bessemer Investment Management LLC’s (“Bessemer”) Large Cap Global component (56.29% of the Fund as of October 31, 2015), which targets companies with sustainable competitive advantages and high returns on capital, and growth manager Sands Capital Management LLC (15.74%). Emerging markets manager Harding Loevner LP (2.60%) underperformed the Index. Bessemer’s Large Cap U.S. component (25.38%) underperformed the Index.
Stocks that contributed the most to relative performance were not top ten holdings. Two were held by Bessemer Large Cap Global. The first was Kraft Heinz, a global food company (1.23%) which was acquired. The second, Japanese consulting company Nomura Research Institute (1.04%), posted strong results as demand accelerated for its products and services; weakness in the yen versus the U.S. dollar. The third largest contributor, held by Bessemer Large Cap U.S., was automotive parts retailer AutoZone. (1.07%), which benefitted from continued strong demand for auto-related products.
Stocks that detracted from relative performance were also not top ten holdings. Schlumberger, the world’s largest oilfield services company (1.78%), and owned by both Bessemer Large Cap Global and Sands Capital for most of the year, saw a significant price decline as the deterioration in energy prices impacted the sector. Not owning Amazon for the majority of the year also hurt relative results, given Amazon’s considerable appreciation. Finally, apparel retailer Gap (0.64%), owned by Bessemer Large Cap U.S., experienced significant weakness as underlying trends in its business softened.
At fiscal year-end, the Fund was overweight the following sectors: consumer discretionary (14.62% versus the Index’s 11.77%), consumer staples (11.92% versus 10.78%), healthcare (15.12% versus 13.14%), industrials (11.15% versus 9.80%), and information technology (19.28% versus 15.26%). The Fund was underweight the following sectors: energy (3.31% versus the Index’s 7.07%), financials (15.47% versus 21.53%), materials (2.45% versus 3.73%), telecommunications (1.30% versus 4.12%), and utilities (0.25% versus 2.80%).
The Fund held a significant overweight to the U.S. (+4.0% as of 10/31/15), given the country’s improving economy and strengthening currency, combined with U.S. companies’ greater focus on economic value creation than companies in other global regions. At fiscal year-end, the Fund was underweight developed Europe, in-line with the benchmark in Japan, and slightly underweight emerging markets.
| Old Westbury Funds, Inc. |
| Large Cap Strategies Fund |
| Investment Adviser’s Report (Unaudited) - (Continued) |
| |
PORTFOLIO DIVERSIFICATION BY COUNTRY*
| Country: | | | |
| Argentina | | 0.2 | % |
| Belgium | | 0.3 | |
| Brazil | | 0.3 | |
| Canada | | 1.1 | |
| Chile | | 0.0 | *** |
| China | | 2.1 | |
| Columbia | | 0.0 | *** |
| Czech Republic | | 0.0 | *** |
| Denmark | | 0.6 | |
| Egypt | | 0.0 | *** |
| Finland | | 2.2 | |
| France | | 1.5 | |
| Georgia | | 0.0 | *** |
| Germany | | 0.6 | |
| Hong Kong | | 1.4 | |
| Hungary | | 0.0 | *** |
| India | | 2.0 | |
| Indonesia | | 0.1 | |
| Japan | | 3.4 | |
| Luxembourg | | 0.0 | *** |
| Mexico | | 0.2 | |
| Netherlands | | 2.9 | |
| Peru | | 0.0 | *** |
| Poland | | 0.0 | *** |
| Russia | | 0.1 | |
| Singapore | | 0.5 | |
| South Africa | | 0.6 | |
| South Korea | | 0.1 | |
| Sweden | | 2.2 | |
| Switzerland | | 2.5 | |
| Taiwan | | 0.3 | |
| Thailand | | 0.7 | |
| Turkey | | 0.1 | |
| United Arab Emirates | | 0.0 | *** |
| United Kingdom | | 2.0 | |
| United States | | 53.7 | |
| Other** | | 18.3 | |
| | | 100.0 | % |
| * | Stated as a percentage of net assets. |
| ** | Includes cash and equivalents, investment company, preferred stocks, participation notes, rights/warrants, exchange traded funds, U.S. government agencies, pending trades and Fund share transactions, interest and dividends receivable, prepaids and accrued expenses payable. |
| *** | Represents less than 0.1% of net assets. |
| Old Westbury Funds, Inc. | |
| Large Cap Strategies Fund | |
| Investment Adviser’s Report (Unaudited) - (Continued) | |
| | |

Average Annual Total Returns
For the Period Ended October 31, 2015
| Large Cap Strategies Fund | | | | |
| One Year | | | 2.01 | % |
| Five Year | | | 6.72 | % |
| Ten Year | | | 4.63 | % |
| | | | | |
| S&P Global LargeCap Index (Net) | | | | |
| One Year | | | (0.52 | )% |
| Five Year | | | 7.45 | % |
| Ten Year | | | 5.47 | % |
On November 16, 2011, the Fund changed its name to Large Cap Strategies Fund (formerly Non-U.S. Large Cap Fund) as part of a series of changes to the overall investment focus and strategies of the Fund. Prior to July 28, 2008, the Fund was named the International Fund and operated under a different investment strategy. The prior performance shown represents performance of the Fund’s prior strategy to invest in a diversified portfolio of foreign companies located outside of the U.S., at least 85% of which were listed on recognized foreign securities exchanges. The performance information shown above may not be representative of performance the Fund will achieve under its current investment strategy.
The performance data quoted represents past performance. Past performance does not guarantee future results and does not reflect the deduction of taxes that a shareholder may pay on Fund distributions or the redemption of Fund shares. Fund performance reflects fee waivers and/or expense reimbursements and reinvestments of distributions, if any. Without waivers/reimbursements, performance would be lower. The investment return and principal value of an investment will fluctuate. Consequently, an investor’s shares, when redeemed, may be worth more or less than their original cost. Current performance may be lower or higher than the performance data quoted. To obtain performance information current to the most recent month end, please call 1-800-607-2200.
| Old Westbury Funds, Inc. | |
| Large Cap Strategies Fund | |
| Investment Adviser’s Report (Unaudited) - (Concluded) | |
| | |
The Adviser has contractually committed through October 31, 2017, to waive its advisory fees to the extent necessary to maintain the net operating expense ratio of the Fund, excluding acquired fund fees, at 1.15% (current net operating expense is 1.11%), as disclosed in the Funds’ prospectus dated April 2, 2015. The expense ratio, prior to fee waivers and including acquired Fund fees (if any), is stated in the prospectus as 1.14%. Additional information pertaining to the Fund’s expense ratio for the year ended October 31, 2015 can be found in the Financial Highlights.
The chart shown on the previous page illustrates the total value of a $10,000 investment for 10 years, with distributions reinvested. The S&P Global LargeCap Index (Net) also includes the reinvestment of distributions but does not include fees and expenses associated with an investment in the Fund. The S&P Global LargeCap Index (Net) is unmanaged. Investments cannot be made directly in an index.
Investments made in foreign and emerging country securities may involve additional risks, such as political and social instability, less liquidity and currency exchange rate volatility.
| Old Westbury Funds, Inc. | |
| Small & Mid Cap Fund | |
| Investment Adviser’s Report (Unaudited) | |
| | |
The return of the Old Westbury Global Small & Mid Cap Fund (the “Fund”) for the fiscal year ended October 31, 2015 was 2.89%. In comparison, the return of the S&P Global MidSmallCap Index (Net) (the “Index”) was 1.49%.
Relative to the Index, strong outperformance came from the Bessemer Investment Management LLC’s mid cap segment (37.95%) of the Fund as of October 31, 2015). Small cap stocks in developed and emerging markets managed by London-based Mondrian Investment Partners Limited (14.10%) modestly underperformed. Global small cap stocks managed by Texas-based Dimensional Fund Advisors LP (19.87%) slightly outperformed. Small and mid cap stocks managed by Vermont-based Champlain Investment Partners LLC (15.83%) slightly underperformed.
The Fund benefited from excellent stock selection in the information technology and consumer discretionary sectors. In technology, strong performers included Vantiv (4.38%), a U.S. electronic payment processing and servicer provider, whose strong core transactions growth and financial results exceeded expectations. CoreLogic (3.84%), a consumer and financial services information provider, also performed well thanks to rebounding mortgage volumes and successful cost cutting. In the consumer discretionary sector, Advance Auto Parts (4.48%), an automotive aftermarket retailer, posted strong returns as it benefitted from accelerating industry growth along with significant accretion from a recent major acquisition. Snap-On Incorporated (4.03%), a leading professional auto and industrial tools marketer and manufacturer, exhibited consistent growth, leading to multiple expansion. From a sector allocation perspective, the Fund benefited from an overweight position in information technology and underweight positions in energy and materials.
Two sectors detracted: the Fund was overweight the underperforming industrials sector, and underweight the outperforming financials sector. Stocks that were challenged included Flowserve, an industrial pump and valve manufacturer (1.83%) which experienced weaker than expected new order volume as a result of meaningful exposure to energy markets. Also, Generac Holdings, a manufacturer of fixed and portable generators (sold), faced a lack of power outages and a decline in some industrial end market demand. Finally, NetApp, an enterprise storage technology company (sold), struggled with price deflation, obsolescence risk, and aggressive competition which led to management turnover and disappointing earnings.
At fiscal year-end, the Fund was overweight the industrial sector, which contains an abundance of small and mid cap companies with strong business models and healthy balance sheets. The Fund was underweight REITs within the financial sector, because of significant financial leverage and risk from rising interest rates.
The Fund was regionally overweight the U.S. market (53.20%) thanks to the country’s low interest rates, reasonable valuations, and promising earnings outlook. Conversely, the Fund was underweight emerging markets (4.97%).
| Old Westbury Funds, Inc. | |
| Small & Mid Cap Fund | |
| Investment Adviser’s Report (Unaudited) - (Continued) | |
| | |
PORTFOLIO DIVERSIFICATION BY COUNTRY*
| Australia | | 1.6 | % |
| Austria | | 0.2 | |
| Bahamas | | 0.0 | *** |
| Belgium | | 0.6 | |
| Bermuda | | 1.1 | |
| Brazil | | 0.5 | |
| Cambodia | | 0.0 | *** |
| Canada | | 1.8 | |
| Cayman Islands | | 0.0 | *** |
| Chile | | 0.0 | *** |
| China | | 1.0 | |
| Denmark | | 0.6 | |
| Faeroe Islands | | 0.0 | *** |
| Finland | | 0.5 | |
| France | | 2.7 | |
| Georgia | | 0.0 | *** |
| Germany | | 3.0 | |
| Gibraltar | | 0.0 | *** |
| Greece | | 0.0 | *** |
| Guernsey | | 0.0 | *** |
| Hong Kong | | 1.1 | |
| Hungary | | 0.0 | *** |
| India | | 1.3 | |
| Indonesia | | 0.3 | |
| Ireland | | 0.8 | |
| Israel | | 1.7 | |
| Italy | | 0.9 | |
| Japan | | 8.4 | |
| Jersey Channel Islands | | 0.0 | *** |
| Luxembourg | | 0.2 | |
| Malaysia | | 0.4 | |
| Malta | | 0.0 | *** |
| Martinique | | 0.0 | *** |
| Mexico | | 0.4 | |
| Mongolia | | 0.0 | *** |
| Netherlands | | 0.8 | |
| New Zealand | | 0.5 | |
| Norway | | 0.1 | |
| Peru | | 0.1 | |
| Philippines | | 0.2 | |
| Poland | | 0.1 | |
| Portugal | | 0.1 | |
| Qatar | | 0.0 | *** |
| Singapore | | 1.3 | |
| South Africa | | 0.5 | |
| South Korea | | 0.9 | |
| Spain | | 0.9 | |
| Sweden | | 0.8 | |
| Switzerland | | 1.4 | |
| Taiwan | | 0.7 | |
| Thailand | | 0.2 | |
| Turkey | | 0.1 | |
| Ukraine | | 0.0 | *** |
| United Arab Emirates | | 0.1 | |
| United Kingdom | | 5.9 | |
| United States | | 50.0 | |
| Other** | | 6.2 | |
| | | 100.0 | % |
| * | Stated as a percentage of net assets. |
| ** | Includes cash and equivalents, exchange traded funds, rights/warrants, U.S. Government agencies, investment companies, pending trades and Fund share transactions, interest and dividends receivable, prepaids and accrued expenses payable. |
| *** | Represents less than 0.1% of net assets. |
| Old Westbury Funds, Inc. | |
| Small & Mid Cap Fund | |
| Investment Adviser’s Report (Unaudited) - (Continued) | |
| | |

Average Annual Total Returns
For the Period Ended October 31, 2015
| Small & Mid Cap Fund | | | | |
| One Year | | | 2.89 | % |
| Five Year | | | 8.56 | % |
| Ten Year | | | 9.16 | % |
| | | | | |
| S&P Global MidSmallCap Index (Net) | | | | |
| One Year | | | 1.49 | % |
| Five Year | | | 8.39 | % |
| Ten Year | | | 6.95 | % |
Prior to October 2, 2008, the Fund was named Global Small Cap Fund and operated under a different investment strategy. The prior performance shown represents performance of the Fund’s prior strategy to invest at least 80% of its net assets plus any borrowings for investment purposes in securities of small-capitalization companies. Effective January 1, 2014, the Board approved changes to the Fund’s name (formerly Global Small & Mid Cap Fund), and investment strategies. The performance information shown above may not be representative of performance the Fund will achieve under its current investment strategy.
The performance data quoted represents past performance. Past performance does not guarantee future results and does not reflect the deduction of taxes that a shareholder may pay on Fund distributions or the redemption of Fund shares. Fund performance reflects fee waivers and/or expense reimbursements and reinvestments of distributions, if any. Without waivers/reimbursements, performance would be lower. The investment return and principal value of an investment will fluctuate. Consequently, an investor’s shares, when redeemed, may be worth more or less than their original cost. Current performance may be lower or higher than the performance data quoted. To obtain performance information current to the most recent month end, please call 1-800-607-2200.
The Adviser has contractually committed through October 31, 2017, to waive its advisory fees to the extent necessary to maintain the net operating expense ratio of the Fund, excluding acquired fund fees, at 1.11%, as disclosed in the Funds’ prospectus dated April 2, 2015. The expense ratio, prior to fee waivers and including acquired Fund fees (if any), is stated in the prospectus as 1.18%. Additional information pertaining to the Fund’s expense ratio for the year ended October 31, 2015 can be found in the Financial Highlights.
| Old Westbury Funds, Inc. | |
| Small & Mid Cap Fund | |
| Investment Adviser’s Report (Unaudited) - (Concluded) | |
| | |
The chart shown on the previous page illustrates the total value of a $10,000 investment from the Fund’s inception, with distributions reinvested. The S&P Global MidSmallCap Index (Net) also includes the reinvestment of distributions but does not include fees and expenses associated with an investment in the Fund. The S&P Global MidSmallCap Index (Net) is unmanaged. Investments cannot be made directly in an index.
Investments made in small-capitalization and mid-capitalization companies are subject to greater volatility and less liquidity compared to investments made in larger more established companies. Investments made in securities of companies in foreign and emerging countries may involve additional risks, such as political and social instability, less liquidity and currency exchange rate volatility.
| Old Westbury Funds, Inc. | |
| Strategic Opportunities Fund | |
| Investment Adviser’s Report (Unaudited) | |
| | |
The return of the Old Westbury Strategic Opportunities Fund (the “Fund”) for the fiscal year ended October 31, 2015 was 0.90%. In comparison, the return of the Fund’s primary benchmark the S&P Global Broad Market Index (Net) was 0.10% and the Fund’s secondary benchmark (60% S&P Global Broad Market Index (Net) and 40% BofA Merrill Lynch 1-10 Year AAA-A U.S Corporate & Government Index (Net) was 1.14%.
During the fiscal year, the Fund’s derivative strategies (45.68% of the Fund as of October 31, 2015) were ahead of the primary benchmark, mainly due to outperformance in European and Japanese equities. The Fund’s derivatives structures tend to perform well when financial markets are choppy, and this type of environment persisted for much of the year.
Other segments of the Fund that outperformed the primary benchmark included Bessemer Investment Management LLC’s (“Bessemer”) quantitative equities (13.85%), global corporate credit (2.68%, managed by sub-advisor Muzinich & Co., Inc.), non-agency mortgage-backed securities (16.79%, managed by sub-advisor BlackRock Financial Management, Inc.), and convertible bonds (5.25%). In quantitative equities, results were driven by strong stock selection, an overweight Japan position, and strength in dividend-paying growth stocks. Global corporate credit benefitted from the European Central Bank’s easy monetary policy, which has supported European high yield bonds. Finally, an improving housing market has boosted results in non-agency mortgage-backed securities.
Segments of the Fund that underperformed the primary benchmark included global government bonds (3.51%, managed by sub-advisor Franklin Advisers, Inc.) and Bessemer’s commodity alpha (1.51%). Global government bonds strongly underperformed due to weakness in emerging market currencies. Commodity alpha only slightly underperformed despite significant weakness in commodities, offset by strength in relative value trades.
The Fund’s primary benchmark consists of global equities, and the Fund’s secondary benchmark consists of equities and U.S. treasuries. Relative to the benchmarks, therefore, at year-end, the Fund was overweight convertible bonds, non-agency mortgage-backed securities, global government bonds, global corporate credit, and closed-end credit funds. The investment team views each of these asset classes as having a better risk-adjusted return profile than U.S. treasuries. The Fund does not own any U.S. treasuries, as this asset class does not currently fit the Fund’s criteria established for all investments: equity-like returns, facing a market dislocation, and upside potential greater than downside risk (positive asymmetry).
At year-end, the Fund had 68.13% of its assets in the U.S., 15.19% in developed Europe, 5.61% in Japan, and 10.79% in emerging markets. The Fund maintains significant exposure to the U.S. dollar, representing 88.12% of the Fund compared to 52.10% for the primary benchmark and 71.26% for the secondary benchmark.
Weights to various strategies within the Fund remained fairly steady throughout the year. A position in commodity alpha was initiated in May 2015 and a position in Master Limited Partnerships, via sub-advisor TPH Asset Management LLC, was initiated in late July 2015.
The recent weakness in high yield bonds is providing the Fund with an opportunity to add to credit closed-end funds trading at a significant discount to their net asset values (NAV). We believe a key item to watch in 2016 will be the Fed’s rate hike cycle. If the Fed raises policy rates too much and too quickly — ultimately causing the yield curve to invert —the Fund stands ready to take a more cautious stance on equities, with the concern that the current business cycle upturn may come to an end.
| Old Westbury Funds, Inc. | |
| Strategic Opportunities Fund | |
| Investment Adviser’s Report (Unaudited) - (Continued) | |
| | |
PORTFOLIO DIVERSIFICATION BY COUNTRY*
| Country: | | | | |
| Australia | | | 0.0 | % |
| Austria | | | 0.0 | *** |
| Belgium | | | 0.1 | |
| Bermuda | | | 0.5 | |
| Brazil | | | 0.3 | |
| Bulgaria | | | 0.0 | *** |
| Canada | | | 0.2 | |
| Cayman Islands | | | 2.3 | |
| China | | | 0.2 | |
| Croatia (Hrvatska) | | | 0.0 | *** |
| Czech Republic | | | 0.0 | *** |
| Egypt | | | 0.0 | *** |
| Finland | | | 0.1 | |
| France | | | 0.2 | |
| Germany | | | 0.3 | |
| Guernsey | | | 0.0 | *** |
| Hong Kong | | | 0.5 | |
| Hungary | | | 0.2 | |
| India | | | 0.0 | *** |
| Indonesia | | | 0.2 | |
| Ireland | | | 0.4 | |
| Israel | | | 0.0 | *** |
| Italy | | | 0.1 | |
| Japan | | | 1.4 | |
| Jersey Channel Islands | | | 0.0 | *** |
| Luxembourg | | | 0.5 | |
| Malaysia | | | 0.6 | |
| Mexico | | | 0.7 | |
| Monaco | | | 0.0 | *** |
| Netherlands | | | 0.6 | |
| New Zealand | | | 0.0 | *** |
| Norway | | | 0.1 | |
| Pakistan | | | 0.0 | *** |
| Philippines | | | 0.1 | |
| Poland | | | 0.2 | |
| Portugal | | | 0.1 | |
| Puerto Rico | | | 0.0 | *** |
| Serbia | | | 0.1 | |
| Singapore | | | 0.3 | |
| Slovenia | | | 0.1 | |
| South Africa | | | 0.0 | *** |
| South Korea | | | 0.9 | |
| Spain | | | 0.1 | |
| Sri Lanka | | | 0.0 | *** |
| Sweden | | | 0.0 | *** |
| Switzerland | | | 0.2 | |
| Taiwan | | | 0.3 | |
| Thailand | | | 0.0 | *** |
| Turkey | | | 0.0 | *** |
| Ukraine | | | 0.2 | |
| United Kingdom | | | 0.5 | |
| United States | | | 86.9 | |
| Other** | | | 0.5 | |
| | | | 100.0 | % |
| * | Stated as a percentage of net assets. |
| ** | Includes cash and equivalents, closed-end funds, exchange traded funds, purchased or written options, futures, swap agreements, pending trades and Fund share transactions, interest and dividends receivable, prepaids and accrued expenses payable. |
| *** | Represents less than 0.1% of net assets. |
| Old Westbury Funds, Inc. | |
| Strategic Opportunities Fund | |
| Investment Adviser’s Report (Unaudited) - (Continued) | |
| | |

Average Annual Total Returns
For the Period Ended October 31, 2015
| Strategic Opportunities Fund | | | | |
| One Year | | | 0.90 | % |
| Five Year | | | 5.07 | % |
| Since Inception (November 28, 2007) | | | 1.79 | % |
| | | | | |
| S&P Global Broad Market Index (Net) | | | | |
| One Year | | | 0.10 | % |
| Five Year | | | 7.74 | % |
| November 28, 2007 to October 31, 2015 | | | 2.76 | % |
| | | | | |
| Blended Index (Net) | | | | |
| One Year | | | 1.14 | % |
| Five Year | | | 5.72 | % |
| November 28, 2007 to October 31, 2015 | | | 3.50 | % |
Effective January 1, 2014, the Board approved changes to the Fund’s name (formerly Global Opportunities Fund), investment strategies and primary benchmark. The performance information shown above may not be representative of performance the Fund will achieve under its current investment strategy.
The performance data quoted represents past performance. Past performance does not guarantee future results and does not reflect the deduction of taxes that a shareholder may pay on Fund distributions or the redemption of Fund shares. Fund performance reflects fee waivers and/or expense reimbursements and reinvestments of distributions, if any. Without waivers/reimbursements, performance would be lower. The investment return and principal value of an investment will fluctuate. Consequently, an investor’s shares, when redeemed, may be worth more or less than their original cost. Current performance may be lower or higher than the performance data quoted. To obtain performance information current to the most recent month end, please call 1-800-607-2200.
| Old Westbury Funds, Inc. | |
| Strategic Opportunities Fund | |
| Investment Adviser’s Report (Unaudited) - (Concluded) | |
| | |
The Adviser has contractually committed through October 31, 2017, to waive its advisory fees to the extent necessary to maintain the net operating expense ratio of the Fund, excluding acquired fund fees, at 1.20%, as disclosed in the Funds’ prospectus dated April 2, 2015. The expense ratio, prior to fee waivers and including acquired Fund fees (if any), is stated in the prospectus as 1.30%. Additional information pertaining to the Fund’s expense ratio for the year ended October 31, 2015 can be found in the Financial Highlights.
The chart on the previous page illustrates the total value of a $10,000 investment from the Fund’s inception, with distributions reinvested. The Fund compares its performance to its primary benchmark, the S&P Global Broad Market Index (Net) and a secondary blended benchmark, consisting of a 60% weighting in the S&P Global Broad Market Index (Net) and a 40% weighting in the Bank of America Merrill Lynch 1-10 Year AAA-A US Corporate & Government Index (Net) (the “Blended Index”). The S&P Global Broad Market Index (Net) and the Blended Index (Net) also include the reinvestment of distributions but do not include fees and expenses associated with an investment in the Fund. The S&P Global Broad Market Index (Net) and the Blended Index (Net) are unmanaged. Investments cannot be made directly in an index.
Investments made in securities of companies in foreign and emerging countries may involve additional risks, such as political and social instability, less liquidity and currency exchange rate volatility. The Fund may invest in instruments that are volatile, speculative or otherwise risky. The Fund is non-diversified, meaning it may focus its assets in a smaller number of issuers and may be subject to more risk than a more diversified fund.
| Old Westbury Funds, Inc. | |
| Fixed Income Fund | |
| Investment Adviser’s Report (Unaudited) | |
| | |
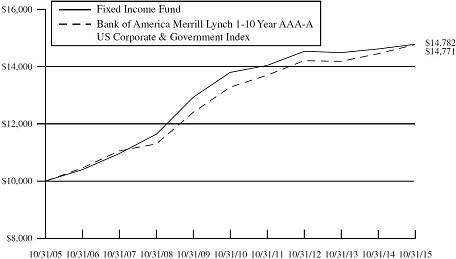
The Old Westbury Fixed Income Fund (the “Fund”) returned 1.06% for the fiscal year ended October 31, 2015. In comparison, the return of the Bank of America Merrill Lynch U.S. Corporate & Government 1-10 Years AAA-A US Corporate & Government Index (the “Index”) was 2.13%.
In the U.S., short-term interest rates rose slightly during the fiscal year, while longer-term rates dipped (termed a “flattening” of the yield curve). Strength in the U.S. economy, particularly an improvement in labor markets, was a driver of short-term yields, along with expectations for a rate increase from the Federal Reserve; Fed officials repeatedly communicated their comfort with implementing a hike by year end. Longer-term yields were impacted by additional factors, including inflation expectations, global bond market yields, fund flows, lower commodity prices, geopolitical tensions, and record-setting corporate debt issuance. Some of these forces had diverging impacts on yields. For example, a stronger labor market implies higher inflation, and therefore higher long-term rates. However, lower commodity prices are disinflationary. These opposing forces resulted in a fairly tight trading range for longer-term rates.
The Fund maintained a “barbell” structure throughout the year, meaning it was underweight bonds with intermediate maturities, and overweight bonds with shorter and longer-term maturities. The overweight to longer-term maturities helped performance, as did an overweight to corporate bonds — those rated single-A-or-better outperformed Treasuries on a total-return basis, most significantly in the shorter end of the curve, where the Fund’s corporate exposure is concentrated. Also, the roll-down benefit (lower yield as a bond ages) in the two and three-year part of the yield curve helped due to the Fund’s overweight in this segment. The Fund’s underweight position in bonds with intermediate-term duration (three to five years) was a detractor, however.
During the year, the Fund increased duration to be more closely aligned with the Index, while maintaining a barbell structure. This was accomplished by reducing an overweight position in bonds with 0-3 years duration, and initiating an overweight position in bonds with duration greater than 5 years. The Fund maintained a significant underweight position in intermediate duration bonds. Additionally, while the Fund remains overweight corporate bonds, the team gradually reduced the overweight as the credit cycle began to show signs of maturity. Of note, the overall duration of the Fund’s corporate exposure (1.58 years) is significantly lower than the duration of the Index’s corporate exposure (4.06 years). The credit quality of the Fund’s holdings did not change materially during the year.
At fiscal year end, the Fund maintained its barbell positioning. Credit represented approximately 49% of the market value of the Fund, including an allocation to high-quality asset-backed securities. Credit exposure is limited to investment-grade securities, with an emphasis on liquid, shorter-duration bonds. In the coming months, the team will closely watch developments in the U.S. and global economy that may drive changes in interest rates and the yield curve. On the credit side, in addition to general changes in the economy, the team will monitor corporate earnings and credit measures, spread movements, and the new-issue market.
| Old Westbury Funds, Inc. | |
| Fixed Income Fund | |
| Investment Adviser’s Report (Unaudited) - (Continued) | |
| | |
PORTFOLIO ASSET ALLOCATION*
| U.S. Government Agencies and Securities | | | 46.1 | % |
| Corporate Bonds | | | 41.5 | |
| Municipal Bonds | | | 4.0 | |
| Government Bonds | | | 0.3 | |
| Asset Backed Securities | | | 6.9 | |
| Collateralized Mortgage Obligations | | | 0.4 | |
| Other** | | | 0.8 | |
| | | | 100.0 | % |
| * | Stated as a percentage of net assets. |
| ** | Includes cash and equivalents, investment company, pending trades and Fund share transactions, interest and dividends receivable, prepaids and accrued expenses payable. |
| Old Westbury Funds, Inc. | |
| Fixed Income Fund | |
| Investment Adviser’s Report (Unaudited) - (Continued) | |
| | |
Average Annual Total Returns
For the Period Ended October 31, 2015
| Fixed Income Fund | | | | |
| One Year | | | 1.06 | % |
| Five Year | | | 1.39 | % |
| Ten Year | | | 3.99 | % |
| | | | | |
| Bank of America Merrill Lynch 1-10 Year AAA-A US Corporate & Government Index | | | | |
| One Year | | | 2.13 | % |
| Five Year | | | 2.15 | % |
| Ten Year | | | 3.98 | % |
The performance data quoted represents past performance. Past performance does not guarantee future results and does not reflect the deduction of taxes that a shareholder may pay on Fund distributions or the redemption of Fund shares. Fund performance reflects fee waivers and/or expense reimbursement and reinvestments of distributions, if any. Without waivers/reimbursements, performance would have been lower. The investment return and principal value of an investment will fluctuate. Consequently, an investor’s shares, when redeemed, may be worth more or less than their original cost. Current performance may be lower or higher than the performance data quoted. To obtain performance information current to the most recent month end, please call 1-800-607-2200.
The Adviser has contractually committed through October 31, 2017, to waive its advisory fees to the extent necessary to maintain the net operating expense ratio of the Fund, at 0.70% (current net operating expense ratio is 0.64%), as disclosed in the Funds’ prospectus dated April 2, 2015. The expense ratio, prior to fee waivers and including acquired Fund fees (if any), is stated in the prospectus as 0.75%. Additional information pertaining to the Fund’s expense ratio for the year ended October 31, 2015 can be found in the Financial Highlights.
| Old Westbury Funds, Inc. | |
| Fixed Income Fund | |
| Investment Adviser’s Report (Unaudited) - (Concluded) | |
| | |
The chart shown on the previous page illustrates the total value of a $10,000 investment for 10 years, with distributions reinvested. The Bank of America Merrill Lynch 1-10 Year AAA-A US Corporate & Government Index also includes the reinvestment of distributions but does not include fees and expenses associated with an investment in the Fund. The Bank of America Merrill Lynch 1-10 Year AAA-A US Corporate & Government Index is unmanaged. Investments cannot be made directly in an index.
The Fund is subject to risks such as credit, prepayment and interest rate risk associated with the underlying bond holdings in the Fund. The value of the Fund can decline as interest rates rise and an investor can lose principal.
| Old Westbury Funds, Inc. |
| Municipal Bond Fund |
| Investment Adviser’s Report (Unaudited) |
| |
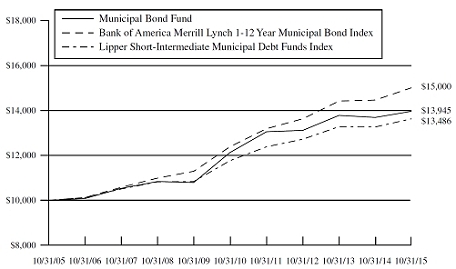
The return of the Old Westbury Municipal Bond Fund (the “Fund”) for the fiscal year ended October 31, 2015 was 1.51%. In comparison, the return of the Bank of America Merrill Lynch 1-12 Year Municipal Bond Index (the “Index”) was 2.04% and the return of the Fund’s other index, the Lipper Short-Intermediate Municipal Debt Funds Index was 0.97%.
U.S. economic growth was not robust, but remained strong enough to keep the market focused on the Federal Reserve and the possibility of a rate hike. While the Federal Reserve did not take action during the fiscal year, prospects of a rate increase did influence the municipal yield curve where shorter/intermediate yields rose and caused this portion of the yield curve to underperform. Yield spreads between long and short term municipal bonds narrowed; the greatest relative movement was evidenced in the two- and three- year area of the municipal yield curve.
Municipal tax receipts were stronger than generally expected and reflected underlying growth in the economy. However, the improvement in revenues will likely be tempered by rising expenses associated with deferred infrastructure needs and rising pension expenses. The Commonwealth of Puerto Rico cast a shadow over the municipal market as prospects of a default grew. With approximately $72 billion in debt outstanding, a default by the Commonwealth and its agencies would represent the largest of its kind in municipal market history. Despite the disruption this would cause to investors, we view the Commonwealth’s financial situation as largely unique and unlikely to trigger similar events on the U.S. mainland. However, large defaults often cause investors to reassess their needs for risk and reward, and may lead to a widening of credit spreads as the demand for risk slackens.
The Fund held a barbelled maturity structure which underweighted the middle three- to six- year maturity range. This structure proved beneficial when shorter/intermediate maturities experienced relative underperformance due to the compression of yield spreads between long and short term maturities. The Fund was positioned with a lower average duration (or price sensitivity) than the Index, which helped performance as the general trend in rates (for the portion of the curve where the Fund invests) was higher. The yield difference (or spread) between the highest Aaa rated securities and the lowest investment grade Baa rated bonds narrowed modestly over the course of the year. This caused lower quality bonds to outperform and placed a slight drag on the Fund’s performance, as the Fund is positioned with a higher quality bias.
The Fund made many small changes to duration and term structure over the course of the year. However, tactical changes were generally reflective of our base case scenario for the Federal Reserve to increase short-term rates, which we projected would push yields higher throughout the yield curve. We also projected that rates on shorter maturities would increase at a greater rate than on longer maturities. The Fund also continued to maintain a bias towards higher quality securities. Unlike corporate bonds, where credit spreads widened over the past year, municipal spreads remained fairly narrow. We believe that credit spreads in the municipal sector are vulnerable to some spread widening.
We expect the Federal Reserve to increase its short-term fed funds rate approximately four times in the coming year. However, we also acknowledge that future monetary action will be contingent on changes in the economy and expectations for inflation. Assuming our current projection stands, we believe the municipal yield curve will continue to flatten as the year progresses; this assumes the Federal Reserve will raise rates and inflation will move only modestly higher. Therefore, we will continue to position the portfolio in a barbell type maturity structure with higher exposures in both shorter (one- to two-year) and longer (seven- to 10-year) bonds. While we project that all interest rates will increase, we also anticipate that increases on longer maturities will be muted by limited growth in inflation.
We intend to maintain a higher quality portfolio for three reasons: first, it has been our experience that municipal credit spreads have a tendency to widen when interest rates initially go higher; second, we project that credit spreads may widen based on a Puerto Rico default; third, we believe there is greater relative value in lower quality corporate debt versus similarly rated municipal securities.
| Old Westbury Funds, Inc. |
| Municipal Bond Fund |
| Investment Adviser’s Report (Unaudited) - (Continued) |
| |
PORTFOLIO DIVERSIFICATION BY STATE*
| States: | | | | |
| Alabama | | | 1.4 | % |
| Alaska | | | 0.0 | *** |
| Arizona | | | 1.3 | |
| Arkansas | | | 0.1 | |
| California | | | 4.9 | |
| Colorado | | | 0.9 | |
| Connecticut | | | 2.6 | |
| District of Columbia | | | 0.5 | |
| Florida | | | 2.7 | |
| Georgia | | | 2.1 | |
| Hawaii | | | 1.0 | |
| Idaho | | | 0.1 | |
| Illinois | | | 1.6 | |
| Indiana | | | 1.5 | |
| Iowa | | | 0.2 | |
| Kansas | | | 0.5 | |
| Kentucky | | | 0.9 | |
| Louisiana | | | 0.3 | |
| Maine | | | 0.9 | |
| Maryland | | | 0.4 | |
| Massachusetts | | | 6.2 | |
| Michigan | | | 2.0 | |
| Minnesota | | | 1.6 | |
| Mississippi | | | 0.4 | |
| Missouri | | | 1.4 | |
| Nevada | | | 0.3 | |
| New Hampshire | | | 0.2 | |
| New Jersey | | | 5.3 | |
| New Mexico | | | 0.7 | |
| New York | | | 26.9 | |
| North Carolina | | | 2.5 | |
| Ohio | | | 3.2 | |
| Oklahoma | | | 0.9 | |
| Oregon | | | 0.5 | |
| Rhode Island | | | 0.3 | |
| South Carolina | | | 0.9 | |
| Tennessee | | | 0.1 | |
| Texas | | | 12.6 | |
| Utah | | | 0.3 | |
| Virginia | | | 3.1 | |
| Washington | | | 3.3 | |
| West Virginia | | | 0.0 | *** |
| Wisconsin | | | 1.2 | |
| Other** | | | 2.2 | |
| | | | 100.0 | % |
| * | Stated as a percentage of net assets. |
| ** | Includes cash and equivalents, investment company, pending trades and Fund share transactions, interest and dividends receivable, prepaids and accrued expenses payable. |
| *** | Represents less than 0.1% of net assets. |
| Old Westbury Funds, Inc. |
| Municipal Bond Fund |
| Investment Adviser’s Report (Unaudited) - (Continued) |
| |
Average Annual Total Returns
For the Period Ended October 31, 2015
| Municipal Bond Fund | | | | |
| One Year | | | 1.51 | % |
| Five Year | | | 1.64 | % |
| Ten Year | | | 3.38 | % |
| | | | | |
Bank of America Merrill Lynch
1-12 Year Municipal Bond Index | | | | |
| One Year | | | 2.04 | % |
| Five Year | | | 2.99 | % |
| Ten Year | | | 4.14 | % |
| | | | | |
Lipper Short-Intermediate
Municipal Debt Funds Index | | | | |
| One Year | | | 0.97 | % |
| Five Year | | | 2.09 | % |
| Ten Year | | | 3.04 | % |
The performance data quoted represents past performance. Past performance does not guarantee future results and does not reflect the deduction of taxes that a shareholder may pay on Fund distributions or the redemption of Fund shares. Fund performance reflects fee waivers and/or expense reimbursements and reinvestment of distributions, if any. Without waivers/reimbursements performance would have been lower. The investment return and principal value of an investment will fluctuate. Consequently, an investor’s shares, when redeemed, may be worth more or less than their original cost. Current performance may be lower or higher than the performance data quoted. To obtain performance information current to the most recent month end, please call 1-800-607-2200.
| Old Westbury Funds, Inc. |
| Municipal Bond Fund |
| Investment Adviser’s Report (Unaudited) - (Concluded) |
| |
The Adviser has contractually committed through October 31, 2017, to waive its advisory fees to the extent necessary to maintain the net operating expense ratio of the Fund, excluding acquired fund fees, at 0.70% (current net operating expense ratio is 0.60%), as disclosed in the Funds’ prospectus dated April 2, 2015. The expense ratio, prior to fee waivers and including acquired Fund fees (if any), is stated in the prospectus as 0.70%. Additional information pertaining to the Fund’s expense ratio for the year ended October 31, 2015 can be found in the Financial Highlights.
The chart shown on the previous page illustrates the total value of a $10,000 investment for 10 years, with distributions reinvested. The Bank of America Merrill Lynch 1-12 Year Municipal Bond Index and Lipper Short-Intermediate Municipal Debt Funds Index also include the reinvestment of distributions but do not include fees and expenses associated with an investment in the Fund. The Bank of America Merrill Lynch 1-12 Year Municipal Bond Index and the Lipper Short-Intermediate Municipal Debt Funds Index are unmanaged. Investments cannot be made directly in an index.
Municipal securities held by the Fund may be adversely affected by local political and economic factors. Income from the Fund may be subject to federal alternative minimum tax, state and local taxes.
This Page Intentionally Left Blank
| Old Westbury Funds, Inc. |
| Disclosure of Fund Expenses (Unaudited) |
| For the Period Ended October 31, 2015 |
| |
As a shareholder of Old Westbury Funds, Inc., you incur ongoing costs, including management fees and other Fund expenses. This example is intended to help you understand your ongoing costs (in dollars) of investing in the Funds and to compare these costs with the ongoing costs of investing in other mutual funds.
The example is based on an investment of $1,000 invested at the beginning of the period and held for the entire period from May 1, 2015 through October 31, 2015.
Actual Expenses
The table below provides information about actual account values and actual expenses. You may use the information below, together with the amount you invested, to estimate the expenses that you paid over the period. Simply divide your account value by $1,000 (for example, an $8,600 account value divided by $1,000 = 8.6), then multiply the result by the number in the table under the heading entitled “Actual Expenses Paid During Period” to estimate the expenses you paid on your account during this period.
| | | Actual | | Actual | | Actual | | Actual |
| | | Beginning | | Ending | | Expenses Paid | | Expense Ratio |
| | | Account Value | | Account Value | | During Period* | | During Period |
| | | 5/1/15 | | 10/31/15 | | 5/1/15-10/31/15 | | 5/1/15-10/31/15** |
| Large Cap Core Fund | | $ | 1,000.00 | | | $ | 931.10 | | | | $4.92 | | | | 1.01 | % |
| Large Cap Strategies Fund | | | 1,000.00 | | | | 970.90 | | | | 5.51 | | | | 1.11 | % |
| Small & Mid Cap Fund | | | 1,000.00 | | | | 974.70 | | | | 5.52 | | | | 1.11 | % |
| Strategic Opportunities Fund | | | 1,000.00 | | | | 968.40 | | | | 5.95 | | | | 1.20 | % |
| Fixed Income Fund | | | 1,000.00 | | | | 1,000.20 | | | | 3.23 | | | | 0.64 | % |
| Municipal Bond Fund | | | 1,000.00 | | | | 1,011.70 | | | | 3.04 | | | | 0.60 | % |
| * | Expenses are equal to the average account value times the Fund’s annualized expense ratio multiplied by 184/365 to reflect the one-half year period. |
| ** | Expense ratios are annualized and reflect existing expense waivers/reimbursements. |
| Old Westbury Funds, Inc. |
| Disclosure of Fund Expenses (Unaudited) - (Continued) |
| For the Period Ended October 31, 2015 |
| |
Hypothetical Example for Comparison Purposes
The table below provides information about hypothetical account values and hypothetical expenses based on each Fund’s actual expense ratio and an assumed rate of return of 5% per year before expenses, which is not the Fund’s actual return. The hypothetical account values and expenses may not be used to estimate the actual ending account balance or expenses you paid for the period. You may use this information to compare this 5% hypothetical example with the 5% hypothetical examples that appear in the shareholder reports of other funds.
| | | Hypothetical | | Hypothetical | | Hypothetical | | Hypothetical |
| | | Beginning | | Ending | | Expenses Paid | | Expense Ratio |
| | | Account Value | | Account Value | | During Period* | | During Period |
| | | 5/1/15 | | 10/31/15 | | 5/1/15-10/31/15 | | 5/1/15-10/31/15** |
| Large Cap Core Fund | | | $1,000.00 | | | | $1,020.11 | | | | $5.14 | | | | 1.01 | % |
| Large Cap Strategies Fund | | | 1,000.00 | | | | 1,019.61 | | | | 5.65 | | | | 1.11 | % |
| Small & Mid Cap Fund | | | 1,000.00 | | | | 1,019.61 | | | | 5.65 | | | | 1.11 | % |
| Strategic Opportunities Fund | | | 1,000.00 | | | | 1,019.16 | | | | 6.11 | | | | 1.20 | % |
| Fixed Income Fund | | | 1,000.00 | | | | 1,021.98 | | | | 3.26 | | | | 0.64 | % |
| Municipal Bond Fund | | | 1,000.00 | | | | 1,022.18 | | | | 3.06 | | | | 0.60 | % |
| * | Expenses are equal to the average account value times the Fund’s annualized expense ratio multiplied by 184/365 to reflect the one-half year period. |
| ** | Expense ratios are annualized and reflect existing expense waivers/reimbursements. |
Please note that the expenses shown in the tables are meant to highlight your ongoing costs only and do not reflect any transactional costs, such as sales charges (loads), redemption fees, or exchange fees. Therefore, these tables are useful in comparing ongoing costs only, and will not help you determine the relative total costs of owning different funds. In addition, if these transactional costs were included, your costs would have been higher.
| Old Westbury Funds, Inc. | |
| Large Cap Core Fund | |
| Portfolio of Investments | October 31, 2015 |
| | |
| Shares | | | | | Value | |
| COMMON STOCKS — 94.7% | | | | |
| Banks — 9.3% | | | | |
| | 606,380 | | | BNP Paribas SA - ADR | | $ | 18,427,888 | |
| | 307,225 | | | Citigroup, Inc. | | | 16,335,153 | |
| | 350,650 | | | DBS Group Holdings Ltd. – ADR | | | 17,146,785 | |
| | 455,115 | | | HSBC Holdings Plc - ADR | | | 17,781,343 | |
| | 1,519,295 | | | KeyCorp. | | | 18,869,644 | |
| | 400,645 | | | Morgan Stanley | | | 13,209,266 | |
| | 1,290,230 | | | Siam Commercial Bank Public Co. Ltd.(e) | | | 4,842,784 | |
| | | | | | | | 106,612,863 | |
| Consumer Discretionary — 17.0% | | | | |
| | 193,930 | | | Accor SA | | | 9,647,665 | |
| | 474,710 | | | Bridgestone Corp. - ADR | | | 8,706,181 | |
| | 355,020 | | | Dollar General Corp. | | | 24,059,705 | |
| | 2,367,010 | | | Kingfisher Plc | | | 12,884,491 | |
| | 173,045 | | | Macy’s, Inc. | | | 8,821,834 | |
| | 261,990 | | | Nielsen Holdings Plc | | | 12,447,145 | |
| | 171,060 | | | NIKE, Inc. - Class B | | | 22,413,992 | |
| | 1,373,750 | | | Nissan Motor Co. Ltd. | | | 14,418,284 | |
| | 337,335 | | | Pandora A/S - ADR | | | 9,740,548 | |
| | 175,370 | | | PVH Corp. | | | 15,949,902 | |
| | 121,315 | | | Royal Caribbean Cruises Ltd.(b) | | | 11,931,330 | |
| | 240,410 | | | Sky Plc - ADR | | | 16,275,756 | |
| | 297,300 | | | Tata Motors Ltd. - ADR(b) | | | 8,791,160 | |
| | 267,905 | | | Yum! Brands, Inc. | | | 18,997,144 | |
| | | | | | | | 195,085,137 | |
| Consumer Staples — 10.2% | | | | |
| | 231,845 | | | CVS Health Corp. | | | 22,901,649 | |
| | 895,340 | | | J Sainsbury Plc - ADR | | | 14,799,970 | |
| | 227,460 | | | PepsiCo, Inc. | | | 23,244,137 | |
| | 351,775 | | | Svenska Cellulosa AB SCA - ADR | | | 10,368,568 | |
| | 442,140 | | | Unilever NV | | | 19,992,519 | |
| | 209,000 | | | Wal-Mart Stores, Inc. | | | 11,963,159 | |
| | 619,935 | | | Wilmar International Ltd. - ADR | | | 13,725,361 | |
| | | | | | | | 116,995,363 | |
| Diversified Financials — 5.9% | | | | |
| | 485,115 | | | Discover Financial Services | | | 27,273,165 | |
| | 899,590 | | | ING Groep NV | | | 13,092,518 | |
| | 882,000 | | | Mediobanca SpA | | | 8,874,508 | |
| | 1,245,120 | | | ORIX Corp. | | | 18,382,210 | |
| | | | | | | | 67,622,401 | |
| Energy — 4.6% | | | | |
| | 135,935 | | | China Petroleum & Chemical Corp. - ADR | | | 9,798,195 | |
| | 466,270 | | | ConocoPhillips | | | 24,875,505 | |
| | 919,780 | | | Encana Corp. | | | 6,998,938 | |
| | 679,600 | | | ENI SpA | | | 11,105,210 | |
| | | | | | | | 52,777,848 | |
| Shares | | | | | Value | |
| Health Care — 12.4% | | | | |
| | 140,215 | | | Aetna, Inc. | | $ | 16,093,878 | |
| | 302,335 | | | AstraZeneca Plc | | | 19,344,535 | |
| | 320,370 | | | Community Health Systems, Inc.(b) | | | 8,983,175 | |
| | 813,810 | | | Pfizer, Inc. | | | 27,523,054 | |
| | 213,500 | | | St. Jude Medical, Inc. | | | 13,623,434 | |
| | 247,480 | | | Thermo Fisher Scientific, Inc. | | | 32,365,434 | |
| | 232,015 | | | Zimmer Holdings, Inc. | | | 24,261,809 | |
| | | | | | | | 142,195,319 | |
| Industrials — 7.3% | | | | |
| | 126,620 | | | Illinois Tool Works, Inc. | | | 11,641,443 | |
| | 330,290 | | | Itochu Corp. - ADR | | | 8,244,038 | |
| | 299,975 | | | Raytheon Co. | | | 35,217,065 | |
| | 198,870 | | | Union Pacific Corp. | | | 17,769,035 | |
| | 146,185 | | | United Rentals, Inc.(b) | | | 10,943,409 | |
| | | | | | | | 83,814,990 | |
| Information Technology — 16.1% | | | | |
| | 26,500 | | | Alphabet, Inc. - Class C(b) | | | 18,836,465 | |
| | 395,465 | | | Apple, Inc. | | | 47,258,068 | |
| | 122,050 | | | Atos SE | | | 9,737,104 | |
| | 176,445 | | | Avago Technologies Ltd. | | | 21,725,673 | |
| | 487,420 | | | CDW Corp. | | | 21,782,800 | |
| | 331,215 | | | Hitachi Ltd. - ADR | | | 19,134,291 | |
| | 2,135,970 | | | Nokia Oyj | | | 15,901,512 | |
| | 264,250 | | | NXP Semiconductors NV(b) | | | 20,703,988 | |
| | 902,340 | | | Telefonaktiebolaget LM Ericsson - B Shares | | | 8,803,137 | |
| | | | | | | | 183,883,038 | |
| Insurance — 2.4% | | | | |
| | 106,670 | | | ACE Ltd. | | | 12,111,312 | |
| | 166,680 | | | American International Group, Inc. | | | 10,510,841 | |
| | 822,929 | | | RSA Insurance Group Plc - ADR | | | 5,332,580 | |
| | | | | | | | 27,954,733 | |
| Materials — 1.4% | | | | |
| | 324,120 | | | Rio Tinto Ltd. | | | 11,706,717 | |
| | 364,215 | | | Sumitomo Metal Mining Co. Ltd. - ADR | | | 4,479,845 | |
| | | | | | | | 16,186,562 | |
| Real Estate — 1.0% | | | | |
| | 923,590 | | | Wharf Holdings Ltd. - ADR | | | 11,027,665 | |
| Telecommunication Services — 2.1% | | | | |
| | 271,345 | | | China Telecom Corp. Ltd. – ADR | | | 14,191,344 | |
| | 791,063 | | | KDDI Corp. - ADR | | | 9,548,130 | |
| | | | | | | | 23,739,474 | |
| Utilities — 5.0% | | | | |
| | 316,350 | | | American Water Works Co., Inc. | | | 18,145,835 | |
| | 285,960 | | | Edison International | | | 17,306,299 | |
| Old Westbury Funds, Inc. | |
| Large Cap Core Fund | |
| Portfolio of Investments - (Continued) | October 31, 2015 |
| | |
| Shares | | | | | Value | |
| Utilities (continued) | | | | |
| | 393,260 | | | Electric Power Development Co. Ltd. | | $ | 13,052,178 | |
| | 421,120 | | | Tokyo Gas Co. Ltd. - ADR | | | 8,342,387 | |
| | | | | | | | 56,846,699 | |
Total Common Stocks
(Cost $1,007,656,496) | | | 1,084,742,092 | |
| Shares | | | | | | |
| INVESTMENT COMPANY — 5.1% | | | | |
| | 58,996,999 | | | SEI Daily Income Trust Government II Fund, Class A, 0.01%(c) | | | 58,996,999 | |
Total Investment Company
(Cost $58,996,999) | | | 58,996,999 | |
TOTAL INVESTMENTS — 99.8%
(Cost $1,066,653,495)(a) | | | 1,143,739,091 | |
| OTHER ASSETS IN EXCESS OF LIABILITIES — 0.2% | | | 2,153,274 | |
| NET ASSETS — 100.0% | | $ | 1,145,892,365 | |
| (a) | Cost for federal income tax purposes is $1,068,472,331 and net unrealized appreciation of investments is as follows: |
| | Unrealized appreciation | | $ | 182,703,844 | |
| | Unrealized depreciation | | | (107,437,084 | ) |
| | Net unrealized appreciation | | $ | 75,266,760 | |
| (b) | Non-income producing security. |
| (c) | Rate shown represents current yield at October 31, 2015. |
| (e) | This security is considered either fully or partially illiquid. These securities or portions thereof have a value of $4,669,636 or 0.41% of net assets. |
| | |
| ADR- American Depositary Receipt |
| Old Westbury Funds, Inc. | |
| Large Cap Strategies Fund | |
| Portfolio of Investments | October 31, 2015 |
| | |
| Shares | | | | | Value | |
| COMMON STOCKS — 81.7% | | | | |
| ARGENTINA — 0.2% | | | | |
| | 243,000 | | | MercadoLibre, Inc. | | $ | 23,903,910 | |
| BELGIUM — 0.3% | | | | |
| | 433,000 | | | UCB SA | | | 37,482,417 | |
| BRAZIL — 0.3% | | | | |
| | 854,500 | | | AMBEV SA - ADR(b) | | | 4,161,415 | |
| | 740,220 | | | Banco Bradesco SA - ADR | | | 4,026,797 | |
| | 1,015,500 | | | BM&FBovespa SA - Bolsa de Valores Mercadorias e Futuros | | | 3,001,828 | |
| | 183,054 | | | Cia Brasileira de Distribuicao - ADR | | | 2,403,499 | |
| | 2,467,740 | | | Cielo SA | | | 23,426,109 | |
| | 480,920 | | | Itau Unibanco Holding SA - ADR | | | 3,294,302 | |
| | | | | | | | 40,313,950 | |
| CANADA — 1.1% | | | | |
| | 1,059,000 | | | Canadian Pacific Railway Ltd. | | | 148,815,578 | |
| CHILE — 0.0% | | | | |
| | 186,400 | | | Banco Santander Chile - ADR | | | 3,539,736 | |
| CHINA — 2.1% | | | | |
| | 158,200 | | | 51Job, Inc. - ADR(b) | | | 5,348,741 | |
| | 1,067,200 | | | Alibaba Group Holding Ltd. - ADR(b) | | | 89,463,376 | |
| | 1,242,500 | | | Anhui Conch Cement Co. Ltd. - H Shares | | | 3,807,367 | |
| | 469,400 | | | Baidu, Inc. - ADR(b) | | | 87,998,418 | |
| | 40,000 | | | CNOOC Ltd. - ADR | | | 4,547,200 | |
| | 83,200 | | | Ctrip.com International Ltd. - ADR(b) | | | 7,735,104 | |
| | 644,000 | | | ENN Energy Holdings Ltd. | | | 3,709,984 | |
| | 1,860,000 | | | Jiangsu Expressway Co. Ltd. - H Shares | | | 2,524,605 | |
| | 20,100,000 | | | Sinopharm Group Co. Ltd. - H Shares(f) | | | 83,246,458 | |
| | 466,600 | | | Tencent Holdings Ltd. | | | 8,825,583 | |
| | 860,000 | | | Tingyi Cayman Islands Holding Corp. | | | 1,477,976 | |
| | 1,587,000 | | | Want Want China Holdings Ltd. | | | 1,322,739 | |
| | | | | | | | 300,007,551 | |
| COLUMBIA — 0.0% | | | | |
| | 96,700 | | | Bancolombia SA - ADR | | | 3,347,754 | |
| CZECH REPUBLIC — 0.0% | | | | |
| | 23,088 | | | Komercni Banka AS | | | 4,778,475 | |
| DENMARK — 0.6% | | | | |
| | 1,705,000 | | | Novo Nordisk A/S - Class B | | | 90,575,022 | |
| EGYPT — 0.0% | | | | |
| | 290,800 | | | Commercial International Bank Egypt SAE - GDR | | | 1,701,179 | |
| FINLAND — 2.2% | | | | |
| | 1,650,000 | | | Kone Oyj - Class B | | | 70,508,478 | |
| Shares | | | | | Value | |
| FINLAND (continued) | | | | |
| | 4,870,000 | | | Sampo Oyj - A Shares(f) | | $ | 238,203,611 | |
| | | | | | | | 308,712,089 | |
| FRANCE — 1.5% | | | | |
| | 1,125,000 | | | L’Oreal SA | | | 205,421,551 | |
| GEORGIA — 0.0% | | | | |
| | 151,802 | | | Bank of Georgia Holdings Plc | | | 4,680,335 | |
| GERMANY — 0.6% | | | | |
| | 876,000 | | | Bayerische Motoren Werke AG | | | 89,933,097 | |
| HONG KONG — 1.4% | | | | |
| | 1,761,600 | | | AIA Group Ltd. | | | 10,364,225 | |
| | 307,128 | | | ASM Pacific Technology Ltd. | | | 2,191,337 | |
| | 1,675,249 | | | China Merchants Holdings International Co. Ltd. | | | 5,587,333 | |
| | 130,400 | | | China Mobile Ltd. - ADR | | | 7,864,424 | |
| | 2,875,718 | | | Jardine Matheson Holdings Ltd.(f) | | | 156,985,446 | |
| | 1,719,600 | | | Sands China Ltd. | | | 6,245,547 | |
| | 2,976,775 | | | Sino Biopharmaceutical Ltd. | | | 3,721,641 | |
| | | | | | | | 192,959,953 | |
| HUNGARY — 0.0% | | | | |
| | 220,406 | | | Richter Gedeon | | | 3,678,954 | |
| INDIA — 2.0% | | | | |
| | 1,453,221 | | | Ambuja Cements Ltd. | | | 4,602,404 | |
| | 2,618,000 | | | Asian Paints Ltd. | | | 33,279,389 | |
| | 890,900 | | | Axis Bank Ltd. | | | 6,481,504 | |
| | 1,082,100 | | | Bharti Airtel Ltd.(b) | | | 5,780,197 | |
| | 1,414,453 | | | Dabur India Ltd. | | | 5,838,988 | |
| | 126,233 | | | Eicher Motors Ltd. | | | 34,274,737 | |
| | 4,806,300 | | | Housing Development Finance Corp. | | | 92,444,688 | |
| | 6,847,000 | | | ITC Ltd. | | | 35,065,400 | |
| | 73,600 | | | Maruti Suzuki India Ltd. | | | 5,011,040 | |
| | 5,136,000 | | | Motherson Sumi Systems Ltd. | | | 19,331,230 | |
| | 506,100 | | | Sun Pharmaceutical Industries Ltd. | | | 6,889,605 | |
| | 5,445,000 | | | Titan Co. Ltd.(f) | | | 29,160,269 | |
| | | | | | | | 278,159,451 | |
| INDONESIA — 0.1% | | | | |
| | 6,479,000 | | | Astra International Tbk PT | | | 2,792,774 | |
| | 7,452,262 | | | Bank Rakyat Indonesia Persero Tbk PT | | | 5,730,415 | |
| | | | | | | | 8,523,189 | |
| JAPAN — 3.4% | | | | |
| | 7,770,000 | | | Astellas Pharma, Inc. | | | 113,649,209 | |
| | 372,000 | | | FANUC Corp. | | | 66,449,490 | |
| | 78,000 | | | Fast Retailing Co. Ltd. | | | 28,686,832 | |
| | 696,800 | | | Hoshizaki Electric Co. Ltd.(f) | | | 50,872,694 | |
| | 4,224,000 | | | Nomura Research Institute Ltd.(f) | | | 173,972,653 | |
| | 380,000 | | | Ono Pharmaceutical Co. Ltd. | | | 52,526,726 | |
| | | | | | | | 486,157,604 | |
| Old Westbury Funds, Inc. | |
| Large Cap Strategies Fund | |
| Portfolio of Investments - (Continued) | October 31, 2015 |
| | |
| Shares | | | | | Value | |
| LUXEMBOURG — 0.0% | | | | |
| | 184,000 | | | Tenaris SA - ADR | | $ | 4,649,680 | |
| MEXICO — 0.2% | | | | |
| | 133,591 | | | El Puerto de Liverpool SAB de CV | | | 1,861,141 | |
| | 28,000 | | | Fomento Economico Mexicano SAB de CV - ADR | | | 2,774,519 | |
| | 36,100 | | | Grupo Aeroportuario del Sureste SAB de CV - ADR | | | 5,586,114 | |
| | 1,246,600 | | | Grupo Financiero Banorte SAB de CV - Series O | | | 6,673,821 | |
| | 207,208 | | | Grupo Televisa SAB - ADR | | | 6,038,041 | |
| | | | | | | | 22,933,636 | |
| NETHERLANDS — 2.9% | | | | |
| | 697,000 | | | ASML Holding NV | | | 64,674,630 | |
| | 785,000 | | | Core Laboratories NV | | | 91,319,050 | |
| | 414,169 | | | Nostrum Oil & Gas Plc | | | 2,745,462 | |
| | 14,678,255 | | | Reed Elsevier NV(f) | | | 250,991,736 | |
| | | | | | | | 409,730,878 | |
| PERU — 0.0% | | | | |
| | 40,700 | | | CrediCorp Ltd. | | | 4,606,426 | |
| POLAND — 0.0% | | | | |
| | 111,286 | | | Bank Pekao SA | | | 4,326,917 | |
| RUSSIA — 0.1% | | | | |
| | 122,700 | | | Lukoil PJSC - ADR | | | 4,447,875 | |
| | 96,200 | | | Magnit PJSC Sponsored - GDR | | | 4,379,024 | |
| | 1,047,600 | | | Sberbank of Russia - ADR | | | 6,400,836 | |
| | | | | | | | 15,227,735 | |
| SINGAPORE — 0.5% | | | | |
| | 3,224,444 | | | Jardine Cycle & Carriage Ltd.(f) | | | 75,081,279 | |
| SOUTH AFRICA — 0.6% | | | | |
| | 258,700 | | | Aspen Pharmacare Holdings Ltd. | | | 5,810,141 | |
| | 628,780 | | | Discovery Ltd. | | | 6,724,434 | |
| | 165,659 | | | Massmart Holdings Ltd. | | | 1,375,285 | |
| | 461,700 | | | Naspers Ltd. - Class N | | | 67,625,255 | |
| | 159,000 | | | Sasol Ltd. | | | 5,091,814 | |
| | 304,900 | | | Standard Bank Group Ltd. | | | 3,171,057 | |
| | | | | | | | 89,797,986 | |
| SOUTH KOREA — 0.1% | | | | |
| | 132,273 | | | Hankook Tire Co. Ltd. | | | 5,076,044 | |
| | 24,200 | | | Samsung Electronics Co. Ltd. - GDR | | | 14,561,818 | |
| | | | | | | | 19,637,862 | |
| SWEDEN — 2.2% | | | | |
| | 2,500,000 | | | Atlas Copco AB - A Shares | | | 65,253,905 | |
| | 3,780,700 | | | Investor AB - B Shares(f) | | | 140,456,155 | |
| | 10,000,000 | | | Nordea Bank AB | | | 110,609,758 | |
| | | | | | | | 316,319,818 | |
| Shares | | | | | Value | |
| SWITZERLAND — 2.5% | | | | |
| | 173,100 | | | Coca-Cola HBC AG - CDI | | $ | 4,136,168 | |
| | 2,343,000 | | | Nestle SA | | | 179,200,567 | |
| | 608,097 | | | Roche Holding AG | | | 165,058,855 | |
| | | | | | | | 348,395,590 | |
| TAIWAN — 0.3% | | | | |
| | 529,000 | | | Advantech Co. Ltd. | | | 3,804,935 | |
| | 234,150 | | | Airtac International Group | | | 1,218,949 | |
| | 198,285 | | | Delta Electronics, Inc. | | | 1,013,917 | |
| | 423,330 | | | Hiwin Technologies Corp. | | | 2,366,793 | |
| | 2,294,250 | | | Hon Hai Precision Industry Co., Ltd. | | | 6,120,167 | |
| | 78,000 | | | Largan Precision Co. Ltd. | | | 6,090,840 | |
| | 214,000 | | | MediaTek, Inc. | | | 1,677,669 | |
| | 3,186,000 | | | Taiwan Semiconductor Manufacturing Co. Ltd. | | | 13,396,245 | |
| | | | | | | | 35,689,515 | |
| THAILAND — 0.7% | | | | |
| | 3,116,000 | | | Airports of Thailand Public Co. Ltd. | | | 26,107,205 | |
| | 45,561,000 | | | CP ALL Public Co. Ltd.(f) | | | 64,048,640 | |
| | 1,293,600 | | | Siam Commercial Bank Public Co. Ltd. | | | 4,855,433 | |
| | | | | | | | 95,011,278 | |
| TURKEY — 0.1% | | | | |
| | 1,036,069 | | | Arcelik AS | | | 5,650,510 | |
| | 1,441,700 | | | Turkiye Garanti Bankasi AS | | | 3,743,455 | |
| | | | | | | | 9,393,965 | |
| UNITED ARAB EMIRATES — 0.0% | | | | |
| | 84,100 | | | DP World Ltd. | | | 1,699,661 | |
| | 185,700 | | | MHP SA - GDR | | | 1,689,869 | |
| | | | | | | | 3,389,530 | |
| UNITED KINGDOM — 2.0% | | | | |
| | 3,497,000 | | | ARM Holdings Plc | | | 55,257,209 | |
| | 994,768 | | | ASOS Plc(b) | | | 50,008,296 | |
| | 223,200 | | | Hikma Pharmaceuticals Plc | | | 7,445,963 | |
| | 4,128,000 | | | Rolls-Royce Holdings Plc | | | 43,750,381 | |
| | 67,100 | | | SABMiller Plc | | | 4,116,378 | |
| | 5,598,800 | | | Sky Plc | | | 94,596,476 | |
| | 375,017 | | | Wolseley Plc | | | 22,066,963 | |
| | | | | | | | 277,241,666 | |
| UNITED STATES — 53.7% | | | | |
| | 62,000 | | | Alphabet, Inc. - Class A(b) | | | 45,718,180 | |
| | 188,000 | | | Alphabet, Inc. - Class C(b) | | | 133,632,280 | |
| | 1,300,762 | | | Altria Group, Inc. | | | 78,657,078 | |
| | 38,000 | | | Amazon.com, Inc.(b) | | | 23,784,200 | |
| | 3,294,665 | | | Apple, Inc. | | | 393,712,468 | |
| | 1,904,973 | | | Applied Materials, Inc. | | | 31,946,397 | |
| | 2,550,000 | | | Automatic Data Processing, Inc. | | | 221,824,500 | |
| | 164,190 | | | AutoZone, Inc.(b) | | | 128,792,278 | |
| | 2,738,357 | | | Bank of New York Mellon Corp. (The) | | | 114,052,569 | |
| Old Westbury Funds, Inc. | |
| Large Cap Strategies Fund | |
| Portfolio of Investments - (Continued) | October 31, 2015 |
| | |
| Shares | | | | | Value | |
| UNITED STATES (continued) | | | | |
| | 2,499,900 | | | Baxalta, Inc. | | $ | 86,146,554 | |
| | 2,219,100 | | | Baxter International, Inc. | | | 82,972,149 | |
| | 1,158,000 | | | Becton Dickinson and Co. | | | 165,038,160 | |
| | 831,000 | | | Berkshire Hathaway, Inc. - Class B(b) | | | 113,032,620 | |
| | 187,000 | | | Biogen Idec, Inc.(b) | | | 54,325,370 | |
| | 568,000 | | | BioMarin Pharmaceutical, Inc.(b) | | | 66,478,720 | |
| | 1,765,000 | | | Bristol-Myers Squibb Co. | | | 116,401,750 | |
| | 536,000 | | | Cerner Corp.(b) | | | 35,531,440 | |
| | 2,342,000 | | | Charles Schwab Corp. (The) | | | 71,477,840 | |
| | 4,409,200 | | | Coca-Cola Co. (The) | | | 186,729,620 | |
| | 2,244,400 | | | Colgate-Palmolive Co. | | | 148,915,940 | |
| | 4,159,000 | | | Discovery Communications, Inc. - Class A(b) | | | 122,440,960 | |
| | 295,000 | | | Edwards Lifesciences Corp.(b) | | | 46,359,250 | |
| | 4,822,493 | | | EMC Corp. | | | 126,445,766 | |
| | 1,123,000 | | | Facebook, Inc. - Class A(b) | | | 114,512,310 | |
| | 4,486,450 | | | Gap, Inc. (The) | | | 122,121,169 | |
| | 1,610,300 | | | Gilead Sciences, Inc. | | | 174,121,739 | |
| | 2,364,700 | | | Hewlett-Packard Co. | | | 63,752,312 | |
| | 275,000 | | | Illumina, Inc.(b) | | | 39,402,000 | |
| | 849,794 | | | Ingersoll-Rand Plc | | | 50,358,792 | |
| | 2,149,498 | | | JPMorgan Chase & Co. | | | 138,105,247 | |
| | 485,000 | | | Kansas City Southern | | | 40,138,600 | |
| | 2,049,600 | | | Kraft Heinz Co The | | | 159,807,312 | |
| | 954,000 | | | Las Vegas Sands Corp. | | | 47,232,540 | |
| | 281,000 | | | Linkedin Corp.(b) | | | 67,684,470 | |
| | 1,226,224 | | | Lockheed Martin Corp. | | | 269,560,822 | |
| | 239,000 | | | Markel Corp.(b)(f) | | | 207,452,000 | |
| | 2,661,500 | | | Mastercard, Inc. - Class A | | | 263,461,885 | |
| | 3,460,100 | | | Mattel, Inc. | | | 85,049,258 | |
| | 931,756 | | | Medidata Solutions, Inc.(b)(f) | | | 40,065,508 | |
| | 1,936,400 | | | Medtronic Plc | | | 143,138,688 | |
| | 3,015,200 | | | Merck & Co., Inc. | | | 164,810,832 | |
| | 634,000 | | | Monsanto Co. | | | 59,101,480 | |
| | 495,000 | | | NIKE, Inc. - Class B | | | 64,859,850 | |
| | 604,320 | | | Occidental Petroleum Corp. | | | 45,046,013 | |
| | 3,408,120 | | | Oracle Corp. | | | 132,371,381 | |
| | 1,801,700 | | | PepsiCo, Inc. | | | 184,115,723 | |
| | 1,818,900 | | | Philip Morris International, Inc. | | | 160,790,760 | |
| | 1,499,483 | | | PNC Financial Services Group, Inc. (The) | | | 135,343,336 | |
| | 1,082,100 | | | Praxair, Inc. | | | 120,210,489 | |
| | 156,600 | | | Priceline Group, Inc. (The)(b) | | | 227,733,984 | |
| | 1,622,367 | | | Quest Diagnostics, Inc. | | | 110,239,838 | |
| | 827,800 | | | Range Resources Corp. | | | 25,198,232 | |
| | 168,000 | | | Regeneron Pharmaceuticals, Inc.(b) | | | 93,641,520 | |
| | 1,551,300 | | | Schlumberger Ltd. | | | 121,249,608 | |
| | 3,522,700 | | | Texas Instruments, Inc. | | | 199,807,544 | |
| | 196,000 | | | Under Armour, Inc. - Class A(b) | | | 18,635,680 | |
| | 1,379,700 | | | United Technologies Corp. | | | 135,776,277 | |
| | 5,021,238 | | | US Bancorp | | | 211,795,819 | |
| | 2,034,000 | | | Verizon Communications, Inc. | | | 95,353,920 | |
| | 1,462,000 | | | Visa, Inc. - Class A | | | 113,421,960 | |
| Shares | | | | | Value | |
| UNITED STATES (continued) | | | | |
| | 800,000 | | | Wabtec Corp. | | $ | 66,296,000 | |
| | 1,195,000 | | | Walt Disney Co. (The) | | | 135,919,300 | |
| | 4,281,000 | | | Wells Fargo & Co. | | | 231,773,340 | |
| | 1,308,000 | | | Whole Foods Market, Inc. | | | 39,187,680 | |
| | 1,017,000 | | | Workday, Inc. - Class A(b) | | | 80,312,490 | |
| | | | | | | | 7,593,373,797 | |
Total Common Stocks
(Cost $9,830,585,561) | | | 11,557,499,353 | |
| PREFERRED STOCKS — 0.0% | | | | |
| SOUTH KOREA — 0.0% | | | | |
| | 6,100 | | | Samsung Electronics Co. Ltd. - GDR | | | 3,197,009 | |
Total Preferred Stocks
(Cost $2,996,268) | | | 3,197,009 | |
| PARTICIPATION NOTES — 0.1% | | | | |
| UNITED KINGDOM — 0.1% | | | | |
| | 124,008 | | | HSBC Bank Plc (Jarir Marketing) due 1/22/18(g) | | | 5,355,707 | |
| | 76,100 | | | HSBC Bank Plc (Qatar National Bank), due 9/12/16(g) | | | 3,870,020 | |
Total Participation Notes
(Cost $11,915,145) | | | 9,225,727 | |
| RIGHTS/WARRANTS — 0.0% | | | | |
| United Kingdom — 0.0% | | | | |
| | 672,631,200 | | | Rolls-Royce Holdings Plc | | | 1,036,923 | |
Total Rights/Warrants
(Cost $1,039,921) | | | 1,036,923 | |
| | | | | | | |
| Principal | | | | | | |
| Amount | | | | | | |
| U.S. GOVERNMENT AGENCIES — 1.1% | | | | |
| Federal Home Loan Bank — 1.1% | | | | |
| $ | 20,000,000 | | | 0.02%, 11/04/15(c) | | | 19,999,717 | |
| | 3,700,000 | | | 0.04%, 11/13/15(c) | | | 3,699,753 | |
| | 3,000,000 | | | 0.04%, 11/20/15(c) | | | 2,999,760 | |
| | 1,550,000 | | | 0.02%, 11/23/15(c) | | | 1,549,977 | |
| | 4,000,000 | | | 0.02%, 11/24/15(c) | | | 3,999,940 | |
| | 17,000,000 | | | 0.10%, 11/25/15(c) | | | 16,999,023 | |
| | 9,000,000 | | | 0.06%, 12/03/15(c) | | | 8,999,694 | |
| | 50,000,000 | | | 0.06%, 12/10/15(c) | | | 49,997,900 | |
| | 25,000,000 | | | 0.06%, 12/11/15(c) | | | 24,998,925 | |
| | 25,450,000 | | | 0.07%, 12/11/15(c) | | | 25,448,906 | |
Total U.S. Government Agencies
(Cost $158,690,109) | | | 158,693,595 | |
| Old Westbury Funds, Inc. | |
| Large Cap Strategies Fund | |
| Portfolio of Investments - (Continued) | October 31, 2015 |
| | |
| EXCHANGE TRADED FUNDS — 13.3% | | |
| | 1,850,000 | | | Energy Select Sector SPDR Fund | | $ | 125,855,500 | |
| | 12,100,000 | | | iShares MSCI EMU | | | 445,885,000 | |
| | 31,973,000 | | | iShares MSCI Japan Index Fund | | | 393,907,360 | |
| | 362,000 | | | SPDR S&P 500 ETF Trust | | | 75,270,660 | |
| | 7,560,000 | | | WisdomTree Europe Hedged Equity Fund | | | 459,496,800 | |
| | 7,100,000 | | | WisdomTree Japan Hedged Equity Fund | | | 378,359,000 | |
Total Exchange Traded Funds
(Cost $1,779,956,701) | | | 1,878,774,320 | |
| INVESTMENT COMPANY — 3.4% | | | | |
| | 478,051,300 | | | Federated Government Obligations Fund, 0.02%(d) | | | 478,051,300 | |
Total Investment Company
(Cost $478,051,300) | | | 478,051,300 | |
TOTAL INVESTMENTS — 99.6%
(Cost $12,263,235,005)(a) | | | 14,086,478,227 | |
| OTHER ASSETS IN EXCESS OF LIABILITIES — 0.4% | | | 54,922,939 | |
| NET ASSETS — 100.0% | | $ | 14,141,401,166 | |
| (a) | Cost for federal income tax purposes is $12,273,288,823 and net unrealized appreciation of investments is as follows: |
| | Unrealized appreciation | | $ | 2,106,830,724 | |
| | Unrealized depreciation | | | (293,641,320 | ) |
| | Net unrealized appreciation | | $ | 1,813,189,404 | |
| (b) | Non-income producing security. |
| (c) | The rate represents the annualized yield at time of purchase. |
| (d) | Rate shown represents current yield at October 31, 2015. |
| (f) | This security is considered either fully or partially illiquid. These securities or portions thereof have a value of $984,919,433 or 6.96% of net assets. |
| (g) | Security exempt from registration under Rule 144A of the Securities Act of 1933, as amended. The security may be resold in transactions exempt from registration normally to qualified institutional buyers. The security has been determined to be liquid in accordance with procedures adopted by the Fund’s Board of Directors. The aggregate value of these securities is $9,225,727 which is 0.07% of net assets. |
| | |
| ADR- American Depositary Receipt |
| CDI-Chess Depositary Interests |
| GDR-Global Depositary Receipt |
Portfolio diversification by Sector (Unaudited)
| | | Percentage |
| Sector | | of Net Assets |
| Banks | | | 6.0 | % |
| Consumer Discretionary | | | 10.6 | % |
| Consumer Staples | | | 10.4 | % |
| Diversified Financials | | | 4.1 | % |
| Energy | | | 2.1 | % |
| Health Care | | | 14.1 | % |
| Industrials | | | 9.0 | % |
| Information Technology | | | 19.7 | % |
| Insurance | | | 3.3 | % |
| Materials | | | 1.6 | % |
| Telecommunication Services | | | 0.8 | % |
| Utilities | | | 0.0 | % |
| Other* | | | 18.3 | % |
| | | | 100 | % |
| * | Includes cash and equivalents, preferred stocks, participation notes, rights/warrants, exchange traded funds, U.S. government agencies, investment company, pending trades and Fund share transactions, interest and dividends receivable, prepaids and accrued expenses payable. |
| Old Westbury Funds, Inc. | |
| Small & Mid Cap Fund | |
| Condensed Portfolio of Investments | October 31, 2015 |
| | |
| | | | | | Percentage of | | | | |
| Shares | | | | | Net Assets (%) | | | Value | |
| COMMON STOCKS — 93.8% | | | | | |
| AUSTRALIA — 1.6% | | | | | | | | |
| | 38,855,912 | | | Other Securities | | | 1.6 | | | $ | 86,485,058 | |
| AUSTRIA — 0.2% | | | | | | | | |
| | 453,698 | | | Other Securities | | | 0.2 | | | | 11,516,731 | |
| BAHAMAS — 0.0% | | | | | | | | |
| | 555 | | | Other Securities | | | 0.0 | | | | 86,494 | |
| BELGIUM — 0.6% | | | | | | | | |
| | 881,767 | | | Other Securities | | | 0.6 | | | | 30,744,413 | |
| BERMUDA — 1.1% | | | | | | | | |
| | 286,000 | | | Argo Group International Holdings Ltd.(b) | | | 0.3 | | | | 17,880,720 | |
| | 400,000 | | | Endurance Specialty Holdings Ltd. | | | 0.5 | | | | 25,252,000 | |
| | 597,362 | | | Other Securities | | | 0.3 | | | | 15,141,092 | |
| | | | | | | | | | | | 58,273,812 | |
| BRAZIL — 0.5% | | | | | | | | |
| | 6,143,449 | | | Other Securities | | | 0.5 | | | | 25,068,960 | |
| CAMBODIA — 0.0% | | | | | | | | |
| | 416,000 | | | Other Securities | | | 0.0 | | | | 295,203 | |
| CANADA — 1.8% | | | | | | | | |
| | 9,897,524 | | | Other Securities | | | 1.8 | | | | 97,842,173 | |
| CAYMAN ISLANDS — 0.0% | | | | | | | | |
| | 125,000 | | | Other Securities | | | 0.0 | | | | 65,005 | |
| CHILE — 0.0% | | | | | | | | |
| | 30,164,313 | | | Other Securities | | | 0.0 | | | | 2,166,198 | |
| CHINA — 1.0% | | | | | | | | |
| | 103,750,911 | | | Other Securities | | | 1.0 | | | | 56,069,054 | |
| DENMARK — 0.6% | | | | | | | | |
| | 353,398 | | | Chr. Hansen Holding A/S | | | 0.4 | | | | 21,238,218 | |
| | 645,564 | | | Other Securities | | | 0.2 | | | | 13,510,434 | |
| | | | | | | | | | | | 34,748,652 | |
| FAEROE ISLANDS — 0.0% | | | | | | | | |
| | 7,968 | | | Other Securities | | | 0.0 | | | | 250,464 | |
| FINLAND — 0.5% | | | | | | | | |
| | 2,042,157 | | | Other Securities | | | 0.5 | | | | 26,765,112 | |
| FRANCE — 2.7% | | | | | | | | |
| | 4,703,909 | | | Other Securities | | | 2.7 | | | | 145,648,464 | |
| GEORGIA — 0.0% | | | | | | | |
| | 3,670 | | | Other Securities | | | 0.0 | | | | 113,153 | |
| GERMANY — 3.0% | | | | | | | | |
| | 178,069 | | | MTU Aero Engines AG | | | 0.3 | | | | 16,481,633 | |
| | 4,151,974 | | | Other Securities | | | 2.7 | | | | 144,969,936 | |
| | | | | | | | | | | | 161,451,569 | |
| GIBRALTAR — 0.0% | | | | | | | | |
| | 92,066 | | | Other Securities | | | 0.0 | | | | 176,695 | |
| | | | | | Percentage of | | | | |
| Shares | | | | | Net Assets (%) | | | Value | |
| GREECE — 0.0% | | | | | | | | |
| | 730,831 | | | Other Securities | | | 0.0 | | | $ | 2,578,588 | |
| GUERNSEY — 0.0% | | | | | | | | |
| | 5,739 | | | Other Securities | | | 0.0 | | | | 3,804 | |
| HONG KONG — 1.1% | | | | | | | | |
| | 208,604,341 | | | Other Securities | | | 1.1 | | | | 61,044,707 | |
| HUNGARY — 0.0% | | | | | | | | |
| | 26,166 | | | Other Securities | | | 0.0 | | | | 63,650 | |
| INDIA — 1.3% | | | | | | | | |
| | 13,238,073 | | | Other Securities | | | 1.3 | | | | 70,506,165 | |
| INDONESIA — 0.3% | | | | | | | | |
| | 262,558,924 | | | Other Securities | | | 0.3 | | | | 19,042,738 | |
| IRELAND — 0.8% | | | | | | | | |
| | 300,000 | | | FleetMatics Group Plc(c) | | | 0.3 | | | | 16,698,000 | |
| | 4,444,418 | | | Other Securities | | | 0.5 | | | | 24,495,737 | |
| | | | | | | | | | | | 41,193,737 | |
| ISRAEL — 1.7% | | | | | | | | |
| | 982,500 | | | Check Point Software Technologies Ltd.(c) | | | 1.5 | | | | 83,453,550 | |
| | 4,388,489 | | | Other Securities | | | 0.2 | | | | 11,164,892 | |
| | | | | | | | | | | | 94,618,442 | |
| ITALY — 0.9% | | | | | | | | |
| | 14,293,135 | | | Other Securities | | | 0.9 | | | | 47,152,395 | |
| JAPAN — 8.4% | | | | | | | |
| | 64,259,041 | | | Other Securities | | | 8.4 | | | | 455,455,130 | |
| JERSEY CHANNEL ISLANDS — 0.0% | | | | | | | | |
| | 493,339 | | | Other Securities | | | 0.0 | | | | 1,507,351 | |
| LUXEMBOURG — 0.2% | | | | | | | |
| | 540,860 | | | Other Securities | | | 0.2 | | | | 13,402,008 | |
| MALAYSIA — 0.4% | | | | | | | | |
| | 35,989,688 | | | Other Securities | | | 0.4 | | | | 23,964,252 | |
| MALTA — 0.0% | | | | | | | | |
| | 12,947 | | | Other Securities | | | 0.0 | | | | 723,441 | |
| MARTINIQUE — 0.0% | | | | | | | |
| | 100,000 | | | Other Securities | | | 0.0 | | | | 146,569 | |
| MEXICO — 0.4% | | | | | | | | |
| | 12,293,540 | | | Other Securities | | | 0.4 | | | | 23,634,956 | |
| MONGOLIA — 0.0% | | | | | | | | |
| | 317,500 | | | Other Securities | | | 0.0 | | | | 8,889 | |
| NETHERLANDS — 0.8% | | | | | | | | |
| | 1,795,835 | | | Other Securities | | | 0.8 | | | | 42,150,729 | |
| NEW ZEALAND — 0.5% | | | | | | | | |
| | 7,917,590 | | | Other Securities | | | 0.5 | | | | 24,572,502 | |
| NORWAY — 0.1% | | | | | | | | |
| | 1,035,236 | | | Other Securities | | | 0.1 | | | | 4,306,123 | |
| PERU — 0.1% | | | | | | | | |
| | 3,665,026 | | | Other Securities | | | 0.1 | | | | 3,042,246 | |
| Old Westbury Funds, Inc. | |
| Small & Mid Cap Fund | |
| Condensed Portfolio of Investments - (Continued) | October 31, 2015 |
| | |
| | | | | | Percentage of | | | | |
| Shares | | | | | Net Assets (%) | | | Value | |
| PHILIPPINES — 0.2% | | | | | | | |
| | 49,954,373 | | | Other Securities | | | 0.2 | | | $ | 11,065,199 | |
| POLAND — 0.1% | | | | | |
| | 997,058 | | | Other Securities | | | 0.1 | | | | 4,085,774 | |
| PORTUGAL — 0.1% | | | | | |
| | 6,625,205 | | | Other Securities | | | 0.1 | | | | 4,258,503 | |
| QATAR — 0.0% | | | | | |
| | 18,031 | | | Other Securities | | | 0.0 | | | | 317,502 | |
| SINGAPORE — 1.3% | | | | | |
| | 53,692,022 | | | Other Securities | | | 1.3 | | | | 72,147,363 | |
| SOUTH AFRICA — 0.5% | | | | | |
| | 4,606,041 | | | Other Securities | | | 0.5 | | | | 28,592,837 | |
| SOUTH KOREA — 0.9% | | | | | |
| | 2,743,957 | | | Other Securities | | | 0.9 | | | | 50,860,972 | |
| SPAIN — 0.9% | | | | | |
| | 7,148,884 | | | Other Securities | | | 0.9 | | | | 47,804,416 | |
| SWEDEN — 0.8% | | | | | |
| | 3,455,044 | | | Other Securities | | | 0.8 | | | | 43,067,541 | |
| SWITZERLAND — 1.4% | | | | | |
| | 450,000 | | | Allied World Assurance Co. Holdings AG | | | 0.3 | | | | 16,362,000 | |
| | 1,101,287 | | | Other Securities | | | 1.1 | | | | 62,113,845 | |
| | | | | | | | | | | | 78,475,845 | |
| TAIWAN — 0.7% | | | | | |
| | 45,778,630 | | | Other Securities | | | 0.7 | | | | 37,981,205 | |
| THAILAND — 0.2% | | | | | |
| | 48,717,593 | | | Other Securities | | | 0.2 | | | | 13,012,283 | |
| TURKEY — 0.1% | | | | | |
| | 1,872,457 | | | Other Securities | | | 0.1 | | | | 2,943,677 | |
| UKRAINE — 0.0% | | | | | |
| | 11,788 | | | Other Securities | | | 0.0 | | | | 159,233 | |
| UNITED ARAB EMIRATES — 0.1% | | | | | |
| | 1,039,426 | | | Other Securities | | | 0.1 | | | | 4,078,056 | |
| UNITED KINGDOM — 5.9% | | | | | |
| | 517,333 | | | Croda International Plc | | | 0.4 | | | | 23,112,026 | |
| | 5,572,791 | | | Rotork Plc | | | 0.3 | | | | 16,099,478 | |
| | 38,777,372 | | | Other Securities | | | 5.2 | | | | 283,816,307 | |
| | | | | | | | | | | | 323,027,811 | |
| UNITED STATES — 50.0% | | | | | |
| | 553,587 | | | Advance Auto Parts, Inc. | | | 2.0 | | | | 109,848,268 | |
| | 800,000 | | | ANSYS, Inc.(b)(c) | | | 1.4 | | | | 76,248,000 | |
| | 350,000 | | | Blackbaud, Inc. | | | 0.4 | | | | 21,941,500 | �� |
| | 150,000 | | | Casey’s General Stores, Inc. | | | 0.3 | | | | 15,933,000 | |
| | 380,000 | | | CLARCOR, Inc. | | | 0.3 | | | | 18,946,800 | |
| | 335,000 | | | Cooper Cos., Inc. (The) | | | 0.9 | | | | 51,040,600 | |
| | 2,410,000 | | | CoreLogic, Inc.(b)(c) | | | 1.7 | | | | 93,941,800 | |
| | 525,000 | | | CR Bard, Inc. | | | 1.8 | | | | 97,833,750 | |
| | 500,000 | | | CST Brands, Inc. | | | 0.3 | | | | 17,965,000 | |
| | | | | | Percentage of | | | | |
| Shares | | | | | Net Assets (%) | | | Value | |
| UNITED STATES (continued) | | | | | |
| | 1,081,234 | | | Dun & Bradstreet Corp. (The)(b) | | | 2.3 | | | $ | 123,120,116 | |
| | 965,000 | | | Flowserve Corp. | | | 0.8 | | | | 44,737,400 | |
| | 400,000 | | | Guidewire Software, Inc.(c) | | | 0.4 | | | | 23,292,000 | |
| | 153,519 | | | Henry Schein, Inc.(c) | | | 0.4 | | | | 23,290,367 | |
| | 625,000 | | | IDEX Corp. | | | 0.9 | | | | 47,975,000 | |
| | 500,000 | | | IHS, Inc. - Class A(c) | | | 1.1 | | | | 59,770,000 | |
| | 1,096,200 | | | Ingredion, Inc.(b) | | | 1.9 | | | | 104,204,772 | |
| | 341,800 | | | Integra LifeScience Holdings Corp.(c) | | | 0.4 | | | | 20,361,026 | |
| | 680,000 | | | JM Smucker Co. (The) | | | 1.5 | | | | 79,825,200 | |
| | 335,000 | | | John Wiley & Sons, Inc. - Class A | | | 0.3 | | | | 17,530,550 | |
| | 1,725,000 | | | KAR Auction Services, Inc. | | | 1.2 | | | | 66,240,000 | |
| | 150,000 | | | Lancaster Colony Corp. | | | 0.3 | | | | 17,058,000 | |
| | 275,000 | | | LogMein, Inc.(c) | | | 0.3 | | | | 18,524,000 | |
| | 1,000,000 | | | Nasdaq, Inc. | | | 1.1 | | | | 57,890,000 | |
| | 2,675,000 | | | Newell Rubbermaid, Inc. | | | 2.1 | | | | 113,500,250 | |
| | 15,829,000 | | | Nexteer Automotive Group Ltd. | | | 0.3 | | | | 16,910,190 | |
| | 824,200 | | | Omnicom Group, Inc. | | | 1.1 | | | | 61,749,064 | |
| | 550,000 | | | Qualys, Inc.(c) | | | 0.4 | | | | 19,426,000 | |
| | 975,000 | | | Rockwell Collins, Inc. | | | 1.5 | | | | 84,552,000 | |
| | 19,854,500 | | | Samsonite International SA(b) | | | 1.1 | | | | 58,790,387 | |
| | 595,000 | | | Snap-on, Inc. | | | 1.8 | | | | 98,704,550 | |
| | 550,000 | | | Snyder’s-Lance, Inc. | | | 0.4 | | | | 19,547,000 | |
| | 885,000 | | | Spectrum Brands Holdings, Inc.(b) | | | 1.6 | | | | 84,827,250 | |
| | 230,000 | | | TreeHouse Foods, Inc.(c) | | | 0.4 | | | | 19,697,200 | |
| | 729,690 | | | Tupperware Brands Corp. | | | 0.8 | | | | 42,956,850 | |
| | 390,000 | | | UMB Financial Corp.(b) | | | 0.3 | | | | 19,141,200 | |
| | 435,000 | | | Universal Health Services, Inc., Series B | | | 1.0 | | | | 53,109,150 | |
| | 2,140,000 | | | Vantiv, Inc. - Class A(c) | | | 2.0 | | | | 107,321,000 | |
| | 530,000 | | | Varian Medical Systems, Inc.(c) | | | 0.8 | | | | 41,620,900 | |
| | 516,351 | | | Waters Corp.(c) | | | 1.2 | | | | 65,989,658 | |
| | 900,000 | | | Wolverine World Wide, Inc. | | | 0.3 | | | | 16,713,000 | |
| | 1,482,500 | | | Wyndham Worldwide Corp. | | | 2.2 | | | | 120,601,375 | |
| | 13,832,986 | | | Other Securities | | | 8.7 | | | | 471,543,381 | |
| | | | | | | | | | | | 2,724,217,554 | |
Total Common Stocks
(Cost $4,013,473,134) | | | | | | | 5,112,981,403 | |
| INVESTMENT COMPANY — 0.1% | | | | | |
| | 5,687,300 | | | SEI Daily Income Trust Government II Fund, Class A, 0.01%(d) | | | 0.1 | | | | 5,687,300 | |
Total Investment Company
(Cost $5,687,300) | | | | | | | 5,687,300 | |
| Old Westbury Funds, Inc. | |
| Small & Mid Cap Fund | |
| Condensed Portfolio of Investments - (Continued) | October 31, 2015 |
| | |
| | | | | | Percentage of | | | | |
| Shares | | | | | Net Assets (%) | | | Value | |
| EXCHANGE TRADED FUNDS — 4.1% | | | | | |
| | 348,000 | | | iShares Core S&P Small Cap ETF | | | 0.7 | | | $ | 39,341,400 | |
| | 234,861 | | | iShares MSCI Japan Small Cap Index Fund(b) | | | 0.2 | | | | 13,567,920 | |
| | 95,000 | | | iShares Russell Mid-Cap ETF | | | 0.3 | | | | 15,685,450 | |
| | 196,000 | | | SPDR Russell Nomura Small Cap Japan Fund(b) | | | 0.2 | | | | 10,461,500 | |
| | 1,123,500 | | | SPDR S&P Regional Banking ETF | | | 0.9 | | | | 48,119,505 | |
| | 723,000 | | | SPDR S&P Retail ETF | | | 0.6 | | | | 33,178,470 | |
| | 244,800 | | | Vanguard Small-Cap ETF | | | 0.5 | | | | 27,926,784 | |
| | 507,570 | | | WisdomTree Europe SmallCap Dividend Fund(b) | | | 0.5 | | | | 28,444,223 | |
| | 160,000 | | | WisdomTree Japan Small Cap Dividend Fund(b) | | | 0.2 | | | | 8,969,600 | |
Total Exchange Traded Funds
(Cost $208,361,550) | | | | | | 225,694,852 | |
| RIGHTS/WARRANTS—0.0% | | | | | |
| | 1,572,468 | | | Other Rights/Warrants | | | 0.0 | | | | 148,223 | |
Total Rights/Warrants
(Cost $ — ) | | | | | | | 148,223 | |
| | | | | | | | | | | | |
| Principal | | | | | | | | | | | |
| Amount | | | | | | | | | | | |
| U.S. GOVERNMENT AGENCIES — 0.6% | | | | | |
| Federal Home Loan Bank — 0.6% | | | | | |
| $ | 3,500,000 | | | 0.02%, 11/04/2015(e) | | | 0.1 | | | | 3,499,997 | |
| | 6,000,000 | | | 0.04%, 11/03/2015(e) | | | 0.1 | | | | 5,999,994 | |
| | 15,000,000 | | | 0.04%, 12/01/2015(e) | | | 0.3 | | | | 14,999,520 | |
| | 6,000,000 | | | 0.06%, 12/03/2015(e) | | | 0.1 | | | | 5,999,796 | |
Total U.S. Government Agencies
(Cost $30,499,280) | | | | | | 30,499,307 | |
| | | | | | Percentage of | | | | |
| Shares | | | | | Net Assets (%) | | | Value | |
| CASH SWEEP — 0.8% | | | | | |
| | 42,529,598 | | | Citibank - US Dollars on Deposit in Custody Account, 0.02%(d) | | | 0.8 | | | $ | 42,529,598 | |
Total Cash Sweep
(Cost $42,529,598) | | | | | | 42,529,598 | |
TOTAL INVESTMENTS — 99.4%
(Cost $4,300,550,862)(a) | | | | | | 5,417,540,683 | |
| OTHER ASSETS IN EXCESS OF LIABILITIES — 0.6% | | | | | | 32,068,011 | |
| NET ASSETS — 100.0% | | | | | $ | 5,449,608,694 | |
| (a) | Cost for federal income tax purposes is $4,316,140,170 and net unrealized appreciation of investments is as follows: |
| | |
| Unrealized appreciation | | $ | 1,272,367,771 | |
| Unrealized depreciation | | | (170,967,258 | ) |
| Net unrealized appreciation | | $ | 1,101,400,513 | |
| | |
| (b) | This security is considered either fully or partially illiquid. These securities, or portions thereof, have a value of $556,935,415 or 10.22% of net assets. |
| (c) | Non-income producing security. |
| (d) | The rate shown is the current yield as of October 31, 2015. |
| (e) | The rate represents the annualized yield at time of purchase. |
| | |
| | This Condensed Portfolio of Investments does not reflect the complete portfolio holdings of the Fund. It includes the Fund’s 50 largest holdings and each investment of any issuer that exceeds 1% of the Fund’s net assets. “Other Securities” represent all issues not required to be disclosed under the rules adopted by the U.S. Securities and Exchange Commission (“SEC”). The complete Portfolio of Investments is available (i) without charge, upon request, by calling (800) 607-2200; and (ii) on the SEC’s website at http://www.sec.gov. |
| | |
| | Level 3 common stocks and rights with a value of $3,289,234 (cost of $9,889,941) or 0.06% of net assets were fair valued by the Board of Directors. |
| Old Westbury Funds, Inc. | |
| Small & Mid Cap Fund | |
| Condensed Portfolio of Investments - (Continued) | October 31, 2015 |
| | |
Portfolio diversification by Sector (Unaudited)
| | | Percentage |
| Sector | | of Net Assets |
| Banks | | | 3.4 | % |
| Consumer Discretionary | | | 17.2 | % |
| Consumer Staples | | | 9.6 | % |
| Diversified Financials | | | 2.5 | % |
| Energy | | | 1.3 | % |
| Health Care | | | 11.9 | % |
| Industrials | | | 22.9 | % |
| Information Technology | | | 12.9 | % |
| Insurance | | | 2.3 | % |
| Materials | | | 5.7 | % |
| Real Estate | | | 2.4 | % |
| Telecommunication Services | | | 0.7 | % |
| Utilities | | | 1.0 | % |
| Other* | | | 6.2 | % |
| | | | 100 | % |
| * | Includes cash and equivalents, exchange traded funds, rights/warrants, U.S. government agencies, investment companies, pending trades and Fund share transactions, interest and dividends receivable, prepaids and accrued expenses payable. |
| Old Westbury Funds, Inc. | |
| Strategic Opportunities Fund | |
Consolidated Portfolio of Investments | October 31, 2015 |
| | |
| Shares | | | | | Value | |
| COMMON STOCKS — 15.1% | | |
| AUSTRALIA — 0.0% | | |
| | 122,801 | | | Cabcharge Australia Ltd. | | $ | 246,945 | |
| | 116,897 | | | CSR Ltd. | | | 230,905 | |
| | 107,271 | | | Downer EDI Ltd. | | | 271,557 | |
| | 83,269 | | | Mineral Resources Ltd. | | | 254,142 | |
| | 31,742 | | | Newcrest Mining Ltd.(b) | | | 278,639 | |
| | 66,313 | | | Sandfire Resources NL | | | 299,804 | |
| | 138,152 | | | Tox Free Solutions Ltd. | | | 283,726 | |
| | 12,157 | | | Woodside Petroleum Ltd. | | | 256,693 | |
| | | | | | | | 2,122,411 | |
| BELGIUM — 0.1% | | |
| | 31,584 | | | Cie d’Entreprises CFE(c) | | | 3,917,697 | |
| BERMUDA — 0.5% | | |
| | 25,288 | | | Argo Group International Holdings Ltd. | | | 1,581,006 | |
| | 65,338 | | | Aspen Insurance Holdings Ltd. | | | 3,176,080 | |
| | 97,786 | | | Assured Guaranty Ltd. | | | 2,683,248 | |
| | 21,754 | | | Axis Capital Holdings Ltd. | | | 1,174,716 | |
| | 176,067 | | | DHT Holdings, Inc. | | | 1,383,887 | |
| | 18,052 | | | Everest Re Group Ltd. | | | 3,212,714 | |
| | 62,314 | | | Golar LNG Ltd. | | | 1,807,729 | |
| | 16,301 | | | Helen of Troy Ltd.(b) | | | 1,617,222 | |
| | 42,497 | | | Lazard Ltd. - Class A(b) | | | 1,968,461 | |
| | 81,995 | | | RenaissanceRe Holdings Ltd. | | | 8,989,112 | |
| | 89,835 | | | Teekay Corp. | | | 2,886,399 | |
| | 59,288 | | | Validus Holdings Ltd. | | | 2,626,458 | |
| | | | | | | | 33,107,032 | |
| BRAZIL — 0.0% | | |
| | 19,901 | | | Arezzo Industria e Comercio SA | | | 108,367 | |
| | 14,950 | | | BB Seguridade Participacoes SA | | | 103,115 | |
| | 26,100 | | | CVC Brasil Operadora e Agencia de Viagens SA | | | 98,809 | |
| | 72,900 | | | Duratex SA | | | 120,979 | |
| | 10,128 | | | Linx SA | | | 123,431 | |
| | 49,880 | | | Marisa Lojas SA | | | 84,199 | |
| | 42,952 | | | Ser Educacional SA | | | 104,580 | |
| | | | | | | | 743,480 | |
| CANADA — 0.1% | | |
| | 210,511 | | | Canadian Solar, Inc.(b) | | | 4,595,455 | |
| | 57,667 | | | Domtar Corp. | | | 2,378,187 | |
| | 61,667 | | | Enbridge, Inc. | | | 2,632,564 | |
| | | | | | | | 9,606,206 | |
| CHINA — 0.2% | | |
| | 91,000 | | | Anhui Conch Cement Co. Ltd. - H Shares | | | 278,849 | |
| | 513,000 | | | ANTA Sports Products Ltd. | | | 1,439,598 | |
| | 1,610,000 | | | Bank of Communications Co. Ltd. - H Shares | | | 1,192,346 | |
| | 295,000 | | | Belle International Holdings Ltd. | | | 286,984 | |
| | 1,116,000 | | | China Dongxiang Group Co. Ltd. | | | 283,658 | |
| Shares | | | | | Value | |
| CHINA (continued) | | |
| | 1,246,000 | | | China National Materials Co. Ltd. - H Shares | | $ | 300,624 | |
| | 2,770,000 | | | Chongqing Rural Commercial Bank Co. Ltd. - H Shares | | | 1,747,645 | |
| | 513,000 | | | Fufeng Group Ltd. | | | 271,373 | |
| | 1,130,000 | | | Longfor Properties Co. Ltd. | | | 1,519,186 | |
| | 1,972,000 | | | Lonking Holdings Ltd. | | | 318,040 | |
| | 1,195,000 | | | Peak Sport Products Co. Ltd. | | | 360,785 | |
| | 872,000 | | | Qingling Motors Co. Ltd. - H Shares | | | 281,269 | |
| | 3,386,000 | | | Semiconductor Manufacturing International Corp.(b) | | | 314,546 | |
| | 3,554,000 | | | Shanghai Electric Group Co. Ltd. - H Shares | | | 2,205,602 | |
| | 438,000 | | | Shenzhen Expressway Co. Ltd. - H Shares | | | 338,505 | |
| | 577,000 | | | Sinotruk Hong Kong Ltd. | | | 241,205 | |
| | 1,246,000 | | | Xingda International Holdings Ltd. | | | 278,118 | |
| | 2,390,000 | | | Xinjiang Xinxin Mining Industry Co. Ltd. - H Shares(b) | | | 265,192 | |
| | | | | | | | 11,923,525 | |
| EGYPT — 0.0% | | |
| | 10,973 | | | Eastern Tobacco | | | 280,131 | |
| | 248,818 | | | Oriental Weavers | | | 340,225 | |
| | | | | | | | 620,356 | |
| FINLAND — 0.1% | | |
| | 768,377 | | | YIT OYJ | | | 4,047,291 | |
| FRANCE — 0.1% | | |
| | 247,295 | | | Peugeot SA(b) | | | 4,357,807 | |
| GERMANY — 0.2% | | |
| | 101,014 | | | Fresenius Medical Care AG & Co. KGaA | | | 9,096,347 | |
| | 158,554 | | | RHOEN-KLINIKUM AG | | | 4,731,966 | |
| | | | | | | | 13,828,313 | |
| GUERNSEY — 0.0% | | |
| | 23,409 | | | Amdocs Ltd. | | | 1,394,474 | |
| HONG KONG — 0.5% | | |
| | 4,772,000 | | | Anxin-China Holdings Ltd.(b)(d) | | | 88,906 | |
| | 14,720,000 | | | China Daye Non-Ferrous Metals Mining Ltd.(b) | | | 279,184 | |
| | 2,236,000 | | | China Lumena New Materials Corp.(b)(c)(d) | | | 0 | |
| | 897,985 | | | China Mobile Ltd. | | | 10,751,814 | |
| | 192,000 | | | China Unicom Hong Kong Ltd. | | | 237,071 | |
| | 11,122,000 | | | CP Pokphand Co. Ltd. | | | 1,334,537 | |
| | 218,000 | | | Cross-Harbour Holdings Ltd. (The) | | | 289,144 | |
| | 1,707,000 | | | GCL-Poly Energy Holdings Ltd.(b) | | | 354,588 | |
| | 9,957,000 | | | G-Resources Group Ltd. | | | 223,533 | |
| | 1,910,600 | | | Guangdong Investment Ltd. | | | 2,696,819 | |
| Old Westbury Funds, Inc. | |
| Strategic Opportunities Fund | |
Consolidated Portfolio of Investments - (Continued) | October 31, 2015 |
| | |
| Shares | | | | | Value | |
| HONG KONG (continued) | | |
| | 298,944 | | | Hang Seng Bank Ltd. | | $ | 5,500,144 | |
| | 1,091,000 | | | Link REIT (The) | | | 6,538,454 | |
| | 1,173,832 | | | MTR Corp. Ltd. | | | 5,331,056 | |
| | 215,000 | | | NWS Holdings Ltd. | | | 324,556 | |
| | 2,877,000 | | | PCCW Ltd. | | | 1,559,028 | |
| | 442,000 | | | Skyworth Digital Holdings Ltd. | | | 328,480 | |
| | 726,000 | | | Tysan Holdings Ltd. | | | 304,428 | |
| | 2,418,000 | | | United Energy Group Ltd.(b) | | | 327,575 | |
| | 462,000 | | | Yuexiu Transport Infrastructure Ltd. | | | 315,924 | |
| | | | | | | | 36,785,241 | |
| INDIA — 0.0% | | |
| | 14,282 | | | Hindustan Petroleum Corp. Ltd. | | | 167,955 | |
| | 92,250 | | | Reliance Industries Ltd. | | | 1,337,904 | |
| | 106,135 | | | Welspun Corp. Ltd. | | | 164,859 | |
| | | | | | | | 1,670,718 | |
| IRELAND — 0.1% | | |
| | 179,783 | | | King Digital Entertainment Plc(b) | | | 2,689,554 | |
| | 90,000 | | | Seagate Technology Plc | | | 3,425,400 | |
| | | | | | | | 6,114,954 | |
| ISRAEL — 0.0% | | |
| | 9,378 | | | Formula Systems 1985 Ltd. | | | 275,100 | |
| | 97,075 | | | Phoenix Holdings Ltd. (The)(b) | | | 255,411 | |
| | | | | | | | 530,511 | |
| JAPAN — 1.3% | | |
| | 113,000 | | | Ajinomoto Co, Inc. | | | 2,534,938 | |
| | 33,600 | | | Ariake Japan Co. Ltd. | | | 1,534,234 | |
| | 38,700 | | | Asunaro Aoki Construction Co. Ltd. | | | 287,997 | |
| | 68,000 | | | Bando Chemical Industries Ltd. | | | 286,832 | |
| | 19,300 | | | Brother Industries Ltd. | | | 249,187 | |
| | 16,700 | | | Cosmos Pharmaceutical Corp. | | | 2,093,901 | |
| | 52,810 | | | East Japan Railway Co. | | | 5,063,493 | |
| | 130,700 | | | Fancl Corp. | | | 1,841,303 | |
| | 13,500 | | | Foster Electric Co. Ltd. | | | 336,185 | |
| | 123,900 | | | Fuji Oil Holdings, Inc. | | | 1,757,825 | |
| | 16,700 | | | Fujimi, Inc. | | | 253,261 | |
| | 23,500 | | | Hakuto Co. Ltd. | | | 276,929 | |
| | 74,100 | | | Heiwa Corp. | | | 1,374,292 | |
| | 40,507 | | | Hisamitsu Pharmaceutical Co., Inc. | | | 1,581,072 | |
| | 17,300 | | | Hitachi Construction Machinery Co. Ltd. | | | 269,815 | |
| | 12,200 | | | Hitachi High-Technologies Corp. | | | 331,110 | |
| | 21,000 | | | Hitachi Kokusai Electric, Inc. | | | 292,368 | |
| | 8,400 | | | Honda Motor Co. Ltd. | | | 281,508 | |
| | 53,600 | | | Iino Kaiun Kaisha Ltd. | | | 244,303 | |
| | 14,000 | | | Japan Aviation Electronics Industry Ltd. | | | 251,413 | |
| | 20,900 | | | Kaga Electronics Co. Ltd. | | | 294,439 | |
| | 114,000 | | | Kawasaki Kisen Kaisha Ltd. | | | 257,910 | |
| Shares | | | | | Value | |
| JAPAN (continued) | | |
| | 228,900 | | | Kewpie Corp. | | $ | 5,262,025 | |
| | 109,000 | | | Kinden Corp. | | | 1,424,488 | |
| | 25,900 | | | Kobayashi Pharmaceutical Co. Ltd. | | | 2,021,861 | |
| | 385,000 | | | Lion Corp. | | | 3,736,098 | |
| | 81,000 | | | Maruzen Showa Unyu Co. Ltd. | | | 295,351 | |
| | 405,000 | | | Nakayama Steel Works Ltd.(b) | | | 271,857 | |
| | 36,300 | | | Nichicon Corp. | | | 293,902 | |
| | 289,000 | | | Nichirei Corp. | | | 1,894,415 | |
| | 113,000 | | | Nippon Chemi-Con Corp. | | | 264,076 | |
| | 61,000 | | | Nippon Thompson Co. Ltd. | | | 291,680 | |
| | 14,900 | | | Nissha Printing Co. Ltd. | | | 326,721 | |
| | 58,456 | | | Nitori Holdings Co. Ltd. | | | 4,597,227 | |
| | 122,000 | | | NS United Kaiun Kaisha Ltd. | | | 246,689 | |
| | 28,000 | | | Obic Co. Ltd. | | | 1,489,683 | |
| | 33,000 | | | OKUMA Corp. | | | 267,183 | |
| | 35,300 | | | Oracle Corp. Japan | | | 1,614,784 | |
| | 77,000 | | | Osaka Soda Co. Ltd. | | | 269,280 | |
| | 360,400 | | | Otsuka Holdings Co. Ltd. | | | 12,078,044 | |
| | 12,400 | | | Pack Corp. (The) | | | 295,537 | |
| | 141,700 | | | Pioneer Corp.(b) | | | 383,989 | |
| | 39,000 | | | Polatechno Co. Ltd. | | | 246,275 | |
| | 188,600 | | | Rohto Pharmaceutical Co. Ltd. | | | 3,132,132 | |
| | 63,100 | | | Sankyo Co. Ltd. | | | 2,447,236 | |
| | 65,000 | | | Sanyo Special Steel Co. Ltd. | | | 269,868 | |
| | 46,733 | | | Sawai Pharmaceutical Co. Ltd. | | | 3,009,161 | |
| | 16,100 | | | Seiko Epson Corp. | | | 247,764 | |
| | 44,000 | | | Seiko Holdings Corp. | | | 288,788 | |
| | 48,000 | | | Sohgo Security Services Co. Ltd. | | | 2,334,963 | |
| | 797,300 | | | Sumitomo Osaka Cement Co. Ltd. | | | 3,092,205 | |
| | 41,000 | | | Sumitomo Seika Chemicals Co. Ltd. | | | 287,785 | |
| | 37,000 | | | Takuma Co. Ltd. | | | 293,743 | |
| | 13,900 | | | Tamron Co. Ltd. | | | 279,797 | |
| | 69,100 | | | Tatsuta Electric Wire and Cable Co. Ltd. | | | 265,131 | |
| | 40,000 | | | Toenec Corp. | | | 311,262 | |
| | 165,000 | | | Tokyo Rope Manufacturing Co. Ltd.(b) | | | 257,065 | |
| | 14,300 | | | Tokyo Seimitsu Co. Ltd. | | | 318,897 | |
| | 41,600 | | | Tokyo Steel Manufacturing Co. Ltd. | | | 279,930 | |
| | 370,200 | | | TonenGeneral Sekiyu KK | | | 3,862,450 | |
| | 61,000 | | | Tsugami Corp. | | | 301,284 | |
| | 21,100 | | | Tsuruha Holdings, Inc. | | | 1,682,125 | |
| | 18,200 | | | Tsurumi Manufacturing Co. Ltd. | | | 335,283 | |
| | 90,528 | | | West Japan Railway Co. | | | 6,399,303 | |
| | 120,870 | | | Yamaguchi Financial Group, Inc. | | | 1,497,478 | |
| | 223,800 | | | Yokogawa Electric Corp. | | | 2,520,462 | |
| | | | | | | | 92,979,592 | |
| MALAYSIA — 0.2% | | |
| | 3,928,700 | | | Axiata Group Berhad | | | 5,642,476 | |
| Old Westbury Funds, Inc. | |
| Strategic Opportunities Fund | |
Consolidated Portfolio of Investments - (Continued) | October 31, 2015 |
| | |
| Shares | | | | | Value | |
| MALAYSIA (continued) | | |
| | 465,700 | | | Dayang Enterprise Holdings Berhad | | $ | 184,285 | |
| | 108,800 | | | Malaysian Pacific Industries Berhad | | | 176,015 | |
| | 259,700 | | | MBM Resources Berhad | | | 169,264 | |
| | 117,000 | | | Pharmaniaga Berhad | | | 175,936 | |
| | 2,949,100 | | | Sime Darby Berhad | | | 5,738,938 | |
| | 204,900 | | | Taliworks Corp. Berhad | | | 175,520 | |
| | 410,900 | | | Unisem M Berhad | | | 227,640 | |
| | | | | | | | 12,490,074 | |
| MEXICO — 0.0% | | |
| | 911,000 | | | Consorcio ARA SAB de CV(b) | | | 340,292 | |
| | 19,870 | | | Grupo Elektra SAB de CV | | | 395,769 | |
| | 523,200 | | | Grupo Famsa SAB de CV - Class A(b) | | | 411,774 | |
| | | | | | | | 1,147,835 | |
| MONACO — 0.0% | | |
| | 352,134 | | | Navios Maritime Acquisition Corp. | | | 1,260,640 | |
| NETHERLANDS — 0.2% | | |
| | 22,010 | | | Cimpress NV(b) | | | 1,736,589 | |
| | 23,947 | | | LyondellBasell Industries NV | | | 2,224,916 | |
| | 40,000 | | | NXP Semiconductors NV(b) | | | 3,134,000 | |
| | 130,808 | | | Unilever NV | | | 5,914,827 | |
| | | | | | | | 13,010,332 | |
| NEW ZEALAND — 0.0% | | |
| | 78,166 | | | SKY Network Television Ltd. | | | 240,302 | |
| NORWAY — 0.0% | | |
| | 128,165 | | | Nordic American Tankers Ltd. | | | 1,958,361 | |
| PAKISTAN — 0.0% | | |
| | 907,067 | | | Engro Corp. Ltd. | | | 2,627,150 | |
| PUERTO RICO — 0.0% | | |
| | 53,696 | | | Triple-S Management Corp.(b) | | | 1,105,601 | |
| SINGAPORE — 0.2% | | |
| | 198,600 | | | CWT Ltd. | | | 283,532 | |
| | 191,400 | | | Ho Bee Land Ltd. | | | 269,154 | |
| | 6,728,300 | | | Keppel REIT | | | 4,634,742 | |
| | 198,600 | | | United Engineers Ltd. | | | 282,114 | |
| | 393,800 | | | United Overseas Bank Ltd. | | | 5,714,865 | |
| | | | | | | | 11,184,407 | |
| SOUTH AFRICA — 0.0% | | |
| | 59,579 | | | African Rainbow Minerals Ltd. | | | 227,656 | |
| | 46,809 | | | Assore Ltd. | | | 264,233 | |
| | | | | | | | 491,889 | |
| SOUTH KOREA — 0.3% | | |
| | 27,776 | | | Dongbu Insurance Co. Ltd. | | | 1,666,487 | |
| | 7,204 | | | Dongwha Enterprise Co. Ltd.(b) | | | 284,988 | |
| | 6,040 | | | Dongwon Development Co. Ltd. | | | 226,755 | |
| Shares | | | | | Value | |
| SOUTH KOREA (continued) | | |
| | 18,855 | | | Green Cross Corp. | | $ | 3,001,783 | |
| | 82,794 | | | Green Cross Holdings Corp. | | | 2,981,179 | |
| | 2,704 | | | Hanil Cement Co. Ltd. | | | 278,690 | |
| | 6,172 | | | Hyundai Steel Co. | | | 282,059 | |
| | 41,834 | | | Kangwon Land, Inc. | | | 1,552,193 | |
| | 3,832 | | | LG Innotek Co. Ltd. | | | 311,588 | |
| | 130,002 | | | LG Uplus Corp. | | | 1,248,649 | |
| | 820,536 | | | Macquarie Korea Infrastructure Fund | | | 5,757,895 | |
| | 69,552 | | | Pan Ocean Co. Ltd.(b) | | | 245,557 | |
| | 45,259 | | | Partron Co. Ltd. | | | 390,243 | |
| | 7,262 | | | Samsung Securities Co. Ltd. | | | 307,666 | |
| | 10,058 | | | SK Hynix, Inc. | | | 270,848 | |
| | 57,091 | | | Tongyang Cement & Energy Corp.(b) | | | 281,436 | |
| | 124,170 | | | Tongyang, Inc.(b) | | | 328,927 | |
| | | | | | | | 19,416,943 | |
| SPAIN — 0.1% | | |
| | 134,815 | | | Abengoa Yield Plc | | | 2,498,122 | |
| | 1,773,701 | | | Tubacex SA(c) | | | 3,813,131 | |
| | | | | | | | 6,311,253 | |
| SWITZERLAND — 0.2% | | |
| | 50,454 | | | ACE Ltd. | | | 5,728,547 | |
| | 128,145 | | | Allied World Assurance Co. Holdings AG | | | 4,659,352 | |
| | 9,660 | | | Swisscom AG | | | 4,984,167 | |
| | | | | | | | 15,372,066 | |
| TAIWAN — 0.2% | | |
| | 627,000 | | | AU Optronics Corp. | | | 184,835 | |
| | 300,000 | | | China Steel Corp. | | | 181,589 | |
| | 229,990 | | | China Synthetic Rubber Corp. | | | 170,030 | |
| | 196,000 | | | Elan Microelectronics Corp. | | | 217,352 | |
| | 11,325,000 | | | First Financial Holding Co. Ltd. | | | 5,494,440 | |
| | 219,000 | | | Formosa Sumco Technology Corp. | | | 264,782 | |
| | 64,000 | | | Foxconn Technology Co. Ltd. | | | 168,361 | |
| | 8,918,790 | | | Hua Nan Financial Holdings Co. Ltd. | | | 4,299,569 | |
| | 310,000 | | | Inotera Memories, Inc.(b) | | | 239,685 | |
| | 135,000 | | | Nanya Technology Corp. | | | 166,549 | |
| | 53,000 | | | Novatek Microelectronics Corp. | | | 181,219 | |
| | 722,000 | | | Shinkong Synthetic Fibers Corp. | | | 197,717 | |
| | 54,000 | | | Simplo Technology Co. Ltd. | | | 192,123 | |
| | 10,535,000 | | | Taiwan Cooperative Financial Holding Co. Ltd. | | | 4,721,741 | |
| | 1,354,000 | | | Taiwan High Speed Rail Corp.(b) | | | 172,256 | |
| | 181,000 | | | Taiwan PCB Techvest Co. Ltd. | | | 202,112 | |
| | 81,000 | | | Tong Hsing Electronic Industries Ltd. | | | 205,847 | |
| | 270,000 | | | Wan Hai Lines Ltd. | | | 179,232 | |
| | | | | | | | 17,439,439 | |
| Old Westbury Funds, Inc. | |
| Strategic Opportunities Fund | |
Consolidated Portfolio of Investments - (Continued) | October 31, 2015 |
| | |
| Shares | | | | | Value | |
| THAILAND — 0.0% | | |
| | 163,100 | | | Bangkok Expressway Public Co. Ltd. - FOR(c) | | $ | 165,083 | |
| | 232,600 | | | Hana Microelectronics Public Co. Ltd. - FOR | | | 225,619 | |
| | 1,228,500 | | | SVI Public Co. Ltd.(b)(c) | | | 174,427 | |
| | 240,700 | | | Thai Vegetable Oil Public Co. Ltd. - FOR(c) | | | 179,336 | |
| | | | | | | | 744,465 | |
| TURKEY — 0.0% | | |
| | 38,680 | | | Cimsa Cimento Sanayi VE Ticaret AS | | | 210,953 | |
| | 120,200 | | | Enka Insaat ve Sanayi AS | | | 213,156 | |
| | 152,298 | | | Eregli Demir ve Celik Fabrikalari TAS | | | 216,270 | |
| | 122,038 | | | Soda Sanayii AS | | | 201,764 | |
| | 60,754 | | | Vestel Beyaz Esya Sanayi ve Ticaret AS | | | 266,739 | |
| | | | | | | | 1,108,882 | |
| UNITED KINGDOM — 0.3% | | |
| | 95,151 | | | British American Tobacco Plc | | | 5,661,270 | |
| | 142,401 | | | Cineworld Group Plc | | | 1,211,774 | |
| | 481,557 | | | John Wood Group Plc | | | 4,431,916 | |
| | 869,374 | | | Merlin Entertainments Plc | | | 5,559,233 | |
| | 122,708 | | | Rio Tinto Plc | | | 4,461,472 | |
| | | | | | | | 21,325,665 | |
| UNITED STATES — 10.2% | | |
| | 100,000 | | | A Schulman, Inc. | | | 3,589,000 | |
| | 110,000 | | | Aaron’s, Inc.(b) | | | 2,713,700 | |
| | 15,238 | | | Aetna, Inc. | | | 1,749,018 | |
| | 25,009 | | | AGCO Corp. | | | 1,210,186 | |
| | 31,155 | | | Alliance Resource Partners LP | | | 667,963 | |
| | 165,664 | | | Allstate Corp. (The) | | | 10,251,288 | |
| | 97,827 | | | Altria Group, Inc. | | | 5,915,599 | |
| | 40,000 | | | American Express Co. | | | 2,930,400 | |
| | 75,093 | | | American Financial Group, Inc. | | | 5,420,964 | |
| | 145,518 | | | American Water Works Co., Inc. | | | 8,346,912 | |
| | 28,410 | | | Amgen, Inc. | | | 4,493,894 | |
| | 46,035 | | | Antero Midstream Partners LP | | | 1,096,554 | |
| | 29,517 | | | Anthem, Inc. | | | 4,107,291 | |
| | 11,488 | | | Apple, Inc. | | | 1,372,816 | |
| | 78,693 | | | AptarGroup, Inc. | | | 5,788,657 | |
| | 32,057 | | | Archer-Daniels-Midland Co. | | | 1,463,723 | |
| | 117,866 | | | Arthur J Gallagher & Co. | | | 5,154,280 | |
| | 79,550 | | | Atlas Air Worldwide Holdings, Inc.(b) | | | 3,280,642 | |
| | 74,682 | | | Atwood Oceanics, Inc. | | | 1,235,987 | |
| | 30,514 | | | AutoNation, Inc.(b) | | | 1,928,180 | |
| | 95,701 | | | AVX Corp. | | | 1,291,963 | |
| | 75,000 | | | Badger Meter. Inc. | | | 4,543,500 | |
| | 110,536 | | | Baxter International, Inc. | | | 4,132,941 | |
| | 65,000 | | | Belden, Inc. | | | 4,161,950 | |
| | 25,454 | | | Berkshire Hathaway, Inc. - Class B(b) | | | 3,462,253 | |
| Shares | | | | | Value | |
| UNITED STATES (continued) | | |
| | 8,391 | | | Biogen Idec, Inc.(b) | | $ | 2,437,669 | |
| | 296,736 | | | Boardwalk Pipeline Partners LP | | | 3,804,156 | |
| | 85,000 | | | Bob Evans Farms, Inc. | | | 3,677,950 | |
| | 16,852 | | | Bunge Ltd. | | | 1,229,522 | |
| | 142,631 | | | Callaway Golf Co. | | | 1,419,178 | |
| | 234,940 | | | Calpine Corp.(b) | | | 3,643,919 | |
| | 32,950 | | | Cambrex Corp.(b) | | | 1,514,711 | |
| | 18,813 | | | Capital One Financial Corp. | | | 1,484,346 | |
| | 15,523 | | | Cardinal Health, Inc. | | | 1,275,991 | |
| | 33,137 | | | Carnival Corp. | | | 1,792,049 | |
| | 120,000 | | | Carpenter Technology Corp. | | | 3,997,200 | |
| | 36,348 | | | Cash America International, Inc. | | | 1,255,096 | |
| | 61,637 | | | Catalent, Inc.(b) | | | 1,638,311 | |
| | 35,884 | | | Cato Corp. (The) - Class A | | | 1,354,980 | |
| | 65,000 | | | CEB, Inc. | | | 4,859,400 | |
| | 12,571 | | | Celgene Corp.(b) | | | 1,542,587 | |
| | 40,168 | | | Centene Corp.(b) | | | 2,389,193 | |
| | 19,227 | | | Charles River Laboratories International, Inc.(b) | | | 1,254,369 | |
| | 35,000 | | | Cheesecake Factory, Inc. (The) | | | 1,687,000 | |
| | 78,235 | | | Chemtura Corp.(b) | | | 2,498,826 | |
| | 124,150 | | | Cheniere Energy Partners LP(b) | | | 3,477,441 | |
| | 98,427 | | | Cheniere Energy Partners LP Holdings LLC | | | 1,937,043 | |
| | 37,684 | | | Cheniere Energy, Inc.(b) | | | 1,866,112 | |
| | 21,411 | | | Children’s Place, Inc. (The) | | | 1,149,128 | |
| | 60,362 | | | Church & Dwight Co., Inc. | | | 5,196,565 | |
| | 28,008 | | | CIT Group, Inc. | | | 1,204,344 | |
| | 50,000 | | | Citigroup, Inc. | | | 2,658,500 | |
| | 65,000 | | | CLARCOR, Inc. | | | 3,240,900 | |
| | 46,451 | | | Clorox Co. (The) | | | 5,664,235 | |
| | 66,138 | | | Coca-Cola Co. (The) | | | 2,800,944 | |
| | 28,077 | | | Cognizant Technology Solutions Corp. - Class A(b) | | | 1,912,324 | |
| | 123,742 | | | Cohu, Inc. | | | 1,557,912 | |
| | 32,203 | | | Colfax Corp.(b) | | | 868,193 | |
| | 81,884 | | | Colgate-Palmolive Co. | | | 5,433,003 | |
| | 108,645 | | | Columbia Pipeline Group, Inc. | | | 2,256,557 | |
| | 35,000 | | | Community Health Systems, Inc.(b) | | | 981,400 | |
| | 85,000 | | | Computer Programs & Systems, Inc. | | | 3,230,850 | |
| | 42,335 | | | Consolidated Edison, Inc. | | | 2,783,526 | |
| | 67,529 | | | Convergys Corp. | | | 1,733,469 | |
| | 110,000 | | | Cooper Tire & Rubber Co. | | | 4,596,900 | |
| | 35,000 | | | Core-Mark Holding Co., Inc. | | | 2,845,150 | |
| | 72,403 | | | Corning, Inc. | | | 1,346,696 | |
| | 65,042 | | | Covanta Holding Corp. | | | 1,090,104 | |
| | 229,979 | | | Cowen Group, Inc. - Class A(b) | | | 968,212 | |
| | 18,435 | | | Curtiss-Wright Corp. | | | 1,282,339 | |
| | 60,671 | | | Danaher Corp. | | | 5,661,211 | |
| | 53,069 | | | Darden Restaurants, Inc. | | | 3,284,440 | |
| | 350,000 | | | Dean Foods Co. | | | 6,338,500 | |
| | 88 | | | Delek Logistics Partners LP | | | 2,882 | |
| | 22,505 | | | Discover Financial Services | | | 1,265,231 | |
| Old Westbury Funds, Inc. | |
| Strategic Opportunities Fund | |
Consolidated Portfolio of Investments - (Continued) | October 31, 2015 |
| | |
| Shares | | | | | Value | |
| UNITED STATES (continued) | | |
| | 148,359 | | | Dollar Tree, Inc.(b) | | $ | 9,716,031 | |
| | 90,780 | | | Dominion Midstream Partners LP | | | 2,973,953 | |
| | 108,113 | | | Dover Corp. | | | 6,965,721 | |
| | 54,971 | | | Dril-Quip, Inc.(b) | | | 3,384,015 | |
| | 71,741 | | | DST Systems, Inc. | | | 8,763,163 | |
| | 59,880 | | | Dyax Corp.(b) | | | 1,648,496 | |
| | 104,082 | | | Dynegy, Inc.(b) | | | 2,022,313 | |
| | 52,285 | | | East West Bancorp, Inc. | | | 2,111,791 | |
| | 71,717 | | | eBay, Inc.(b) | | | 2,000,904 | |
| | 28,945 | | | Edison International | | | 1,751,751 | |
| | 29,243 | | | Electronic Arts, Inc.(b) | | | 2,107,543 | |
| | 44,604 | | | Emergent BioSolutions, Inc.(b) | | | 1,434,019 | |
| | 109,050 | | | Emerson Electric Co. | | | 5,150,431 | |
| | 198,608 | | | Energy Transfer Equity LP | | | 4,280,002 | |
| | 86,846 | | | Energy Transfer Partners LP(b) | | | 3,835,119 | |
| | 110,452 | | | Enterprise Products Partners LP | | | 3,051,789 | |
| | 348,716 | | | EP Energy Corp. - Class A(b) | | | 1,921,425 | |
| | 62,435 | | | EQT GP Holdings LP | | | 1,650,781 | |
| | 31,900 | | | EQT Midstream Partners LP(b) | | | 2,361,876 | |
| | 71,759 | | | Exxon Mobil Corp. | | | 5,937,340 | |
| | 62,688 | | | Fifth Third Bancorp | | | 1,194,206 | |
| | 27,413 | | | First Solar, Inc.(b) | | | 1,564,460 | |
| | 15,568 | | | Fiserv, Inc.(b) | | | 1,502,468 | |
| | 60,361 | | | Flushing Financial Corp. | | | 1,269,995 | |
| | 29,446 | | | Franklin Resources, Inc. | | | 1,200,219 | |
| | 99,056 | | | Fulton Financial Corp. | | | 1,329,332 | |
| | 37,253 | | | GASLOG Ltd.(b) | | | 431,017 | |
| | 1,725,000 | | | General Motors Co., Escrow Shares(b)(d) | | | 258,750 | |
| | 82,723 | | | Gentex Corp. | | | 1,355,830 | |
| | 204,550 | | | Gilead Sciences, Inc. | | | 22,117,991 | |
| | 96,778 | | | Goodyear Tire & Rubber Co. (The) | | | 3,178,190 | |
| | 52,859 | | | Gorman-Rupp Co. (The) | | | 1,511,239 | |
| | 318,517 | | | Government Properties Income Trust, REIT | | | 5,185,457 | |
| | 3,327 | | | Graham Holdings Co. - Class B | | | 1,838,068 | |
| | 135,000 | | | Greif, Inc. - Class A | | | 4,425,300 | |
| | 46,665 | | | Hancock Holding Co. | | | 1,287,954 | |
| | 70,000 | | | Harley-Davidson, Inc. | | | 3,461,500 | |
| | 77,336 | | | Hawaiian Holdings, Inc.(b) | | | 2,683,559 | |
| | 95,000 | | | HNI Corp. | | | 4,079,300 | |
| | 50,562 | | | Hooker Furniture Corp. | | | 1,254,949 | |
| | 75,000 | | | Huron Consulting Group, Inc.(b) | | | 3,622,500 | |
| | 68,423 | | | IAC/InterActiveCorp | | | 4,585,025 | |
| | 61,218 | | | Illinois Tool Works, Inc. | | | 5,628,383 | |
| | 7,030 | | | Illumina, Inc.(b) | | | 1,007,258 | |
| | 54,772 | | | IMS Health Holdings, Inc.(b) | | | 1,490,894 | |
| | 25,798 | | | Innophos Holdings, Inc. | | | 1,096,157 | |
| | 42,005 | | | Insys Therapeutics, Inc.(b) | | | 1,082,049 | |
| | 47,928 | | | International Bancshares Corp. | | | 1,291,660 | |
| | 75,059 | | | Investment Technology Group, Inc. | | | 1,201,695 | |
| | 116,001 | | | IXYS Corp. | | | 1,445,372 | |
| Shares | | | | | Value | |
| UNITED STATES (continued) | | |
| | 58,192 | | | JetBlue Airways Corp.(b) | | $ | 1,445,489 | |
| | 55,161 | | | Johnson & Johnson | | | 5,572,916 | |
| | 94,708 | | | K12, Inc.(b) | | | 919,615 | |
| | 31,098 | | | Kaman Corp. | | | 1,209,401 | |
| | 188,983 | | | KB Home | | | 2,475,677 | |
| | 310,380 | | | KeyCorp | | | 3,854,920 | |
| | 89,699 | | | Kimberly-Clark Corp. | | | 10,737,867 | |
| | 71,264 | | | Kinder Morgan, Inc. | | | 1,949,070 | |
| | 40,474 | | | Korn/Ferry International | | | 1,472,039 | |
| | 50,332 | | | Lannett Co., Inc.(b) | | | 2,253,364 | |
| | 120,000 | | | Lexmark International, Inc. - Class A | | | 3,898,800 | |
| | 21,801 | | | Ligand Pharmaceuticals, Inc.(b) | | | 1,969,720 | |
| | 52,722 | | | Lincoln National Corp. | | | 2,821,154 | |
| | 26,859 | | | Lockheed Martin Corp. | | | 5,904,414 | |
| | 67,032 | | | Macquarie Infrastructure Corp. | | | 5,332,396 | |
| | 17,308 | | | Manpowergroup, Inc. | | | 1,588,528 | |
| | 29,911 | | | Marathon Petroleum Corp. | | | 1,549,390 | |
| | 27,106 | | | Marriott Vacations Worldwide Corp. | | | 1,745,626 | |
| | 94,392 | | | Marsh & McLennan Cos., Inc. | | | 5,261,410 | |
| | 77,612 | | | MasTec, Inc.(b) | | | 1,301,553 | |
| | 32,217 | | | MAXIMUS, Inc. | | | 2,197,199 | |
| | 66,112 | | | McCormick & Co., Inc. - Non Voting Shares | | | 5,552,086 | |
| | 117,487 | | | McDonald’s Corp. | | | 13,187,916 | |
| | 40,810 | | | Medivation, Inc.(b) | | | 1,716,469 | |
| | 17,190 | | | MEDNAX, Inc.(b) | | | 1,211,379 | |
| | 149,240 | | | Methode Electronics, Inc. | | | 4,974,169 | |
| | 38,689 | | | MetLife, Inc. | | | 1,949,152 | |
| | 7,075 | | | Mettler-Toledo International, Inc.(b) | | | 2,200,254 | |
| | 77,454 | | | Microsoft Corp. | | | 4,077,179 | |
| | 137,833 | | | MiMedx Group, Inc.(b) | | | 1,003,424 | |
| | 36,015 | | | MKS Instruments, Inc. | | | 1,269,169 | |
| | 22,342 | | | Molina Healthcare, Inc.(b) | | | 1,385,204 | |
| | 59,184 | | | MPLX LP(b) | | | 2,295,747 | |
| | 125,000 | | | NetApp, Inc. | | | 4,250,000 | |
| | 138,515 | | | NeuStar, Inc. - Class A(b) | | | 3,766,223 | |
| | 95,732 | | | New Residential Investment Corp., REIT | | | 1,161,229 | |
| | 59,093 | | | NewLink Genetics Corp.(b) | | | 2,261,489 | |
| | 282,813 | | | NexPoint Residential Trust, Inc., REIT(c) | | | 3,727,475 | |
| | 73,731 | | | NextEra Energy Partners LP | | | 1,936,176 | |
| | 34,620 | | | NextEra Energy, Inc. | | | 3,554,089 | |
| | 181,454 | | | NiSource, Inc. | | | 3,476,659 | |
| | 156,215 | | | Northwest Bancshares, Inc. | | | 2,102,654 | |
| | 61,138 | | | NRG Energy, Inc. | | | 788,069 | |
| | 134,124 | | | NRG Yield, Inc. - Class A | | | 1,841,523 | |
| | 28,295 | | | Nucor Corp. | | | 1,196,879 | |
| | 115,241 | | | Nustar GP Holding LLC | | | 3,366,190 | |
| | 31,477 | | | Oceaneering International, Inc. | | | 1,322,664 | |
| | 49,736 | | | Oil States International, Inc.(b) | | | 1,492,577 | |
| | 76,487 | | | Omnicom Group, Inc. | | | 5,730,406 | |
| | 29,708 | | | Outerwall, Inc. | | | 1,782,480 | |
| Old Westbury Funds, Inc. | |
| Strategic Opportunities Fund | |
Consolidated Portfolio of Investments - (Continued) | October 31, 2015 |
| | |
| Shares | | | | | Value | |
| UNITED STATES (continued) | | |
| | 20,977 | | | PACCAR, Inc. | | $ | 1,104,439 | |
| | 33,133 | | | PAREXEL International Corp.(b) | | | 2,091,355 | |
| | 139,401 | | | Pattern Energy Group, Inc. | | | 3,260,589 | |
| | 43,966 | | | Penske Automotive Group, Inc. | | | 2,147,299 | |
| | 192,631 | | | People’s United Financial, Inc. | | | 3,072,464 | |
| | 56,389 | | | PepsiCo, Inc. | | | 5,762,392 | |
| | 29,095 | | | PerkinElmer, Inc. | | | 1,502,466 | |
| | 64,408 | | | Philip Morris International, Inc. | | | 5,693,667 | |
| | 24,288 | | | Phillips 66 Partners LP | | | 1,472,824 | |
| | 82,374 | | | Plains GP Holdings LP - Class A | | | 1,280,916 | |
| | 160,356 | | | PPL Corp. | | | 5,516,246 | |
| | 47,927 | | | Praxair, Inc. | | | 5,324,210 | |
| | 62,005 | | | ProAssurance Corp. | | | 3,283,785 | |
| | 30,138 | | | Prosperity Bancshares, Inc. | | | 1,548,490 | |
| | 29,790 | | | Quest Diagnostics, Inc. | | | 2,024,231 | |
| | 35,606 | | | Quintiles Transnational Holdings, Inc.(b) | | | 2,266,322 | |
| | 131,310 | | | Radian Group, Inc. | | | 1,900,056 | |
| | 18,664 | | | Raytheon Co. | | | 2,191,154 | |
| | 16,651 | | | Reinsurance Group of America, Inc. | | | 1,502,586 | |
| | 160,000 | | | Rent-A-Center, Inc. | | | 2,942,400 | |
| | 80,000 | | | ResMed, Inc. | | | 4,608,800 | |
| | 180,786 | | | Rite Aid Corp.(b) | | | 1,424,594 | |
| | 68,340 | | | Rose Rock Midstream LP | | | 1,851,331 | |
| | 104,368 | | | Sanderson Farms, Inc. | | | 7,254,620 | |
| | 66,050 | | | Santander Consumer USA Holdings, Inc.(b) | | | 1,189,561 | |
| | 30,563 | | | Scholastic Corp. | | | 1,249,110 | |
| | 19,239 | | | Scotts Miracle-Gro Co. (The) - Class A | | | 1,272,852 | |
| | 380 | | | Seaboard Corp.(b) | | | 1,279,840 | |
| | 75,028 | | | SemGroup Corp. - Class A | | | 3,417,525 | |
| | 43,104 | | | Sempra Energy | | | 4,414,281 | |
| | 131,735 | | | Sonoco Products Co. | | | 5,623,767 | |
| | 26,743 | | | Spectra Energy Partners LP | | | 1,153,693 | |
| | 49,715 | | | Spirit AeroSystems Holdings, Inc. - Class A(b) | | | 2,621,969 | |
| | 57,500 | | | St. Jude Medical, Inc. | | | 3,669,075 | |
| | 25,000 | | | Stericycle, Inc.(b) | | | 3,034,250 | |
| | 250,000 | | | SunEdison, Inc.(b) | | | 1,825,000 | |
| | 84,865 | | | Sunoco Logistics Partners LP | | | 2,464,480 | |
| | 72,312 | | | Sunoco LP | | | 2,494,041 | |
| | 49,091 | | | SunPower Corp.(b) | | | 1,317,602 | |
| | 176,635 | | | Supernus Pharmaceuticals, Inc.(b) | | | 2,914,478 | |
| | 43,443 | | | Synchrony Financial(b) | | | 1,336,307 | |
| | 85,907 | | | Tallgrass Energy GP LP | | | 2,056,614 | |
| | 21,067 | | | Tallgrass Energy Partners LP(b) | | | 912,622 | |
| | 62,733 | | | TC PipeLines LP(b) | | | 3,240,787 | |
| | 91,207 | | | TEGNA, Inc. | | | 2,466,237 | |
| | 12,282 | | | Teledyne Technologies, Inc.(b) | | | 1,095,923 | |
| | 64,819 | | | Tessera Technologies, Inc. | | | 2,266,720 | |
| | 30,189 | | | Total System Services, Inc. | | | 1,583,413 | |
| | 60,000 | | | TreeHouse Foods, Inc.(b) | | | 5,138,400 | |
| Shares | | | | | Value | |
| UNITED STATES (continued) | | |
| | 73,388 | | | TriMas Corp.(b) | | $ | 1,468,494 | |
| | 74,665 | | | Trinity Industries, Inc. | | | 2,021,182 | |
| | 48,532 | | | Twenty-First Century Fox, Inc. | | | 1,489,447 | |
| | 152,452 | | | UGI Corp. | | | 5,590,415 | |
| | 25,672 | | | United Continental Holdings, Inc.(b) | | | 1,548,278 | |
| | 11,239 | | | UnitedHealth Group, Inc. | | | 1,323,729 | |
| | 20,000 | | | Universal Health Services, Inc., Series B | | | 2,441,800 | |
| | 8,532 | | | USANA Health Sciences, Inc.(b) | | | 1,097,215 | |
| | 39,289 | | | Valero Energy Corp. | | | 2,589,931 | |
| | 126,743 | | | Vectren Corp. | | | 5,763,004 | |
| | 60,000 | | | Viacom, Inc. - Class B | | | 2,958,600 | |
| | 83,872 | | | Voya Financial, Inc. | | | 3,402,687 | |
| | 64,811 | | | VWR Corp.(b) | | | 1,782,951 | |
| | 100 | | | Walgreens Boots Alliance, Inc. | | | 8,468 | |
| | 244,780 | | | Wal-Mart Stores, Inc. | | | 14,011,207 | |
| | 30,000 | | | Walt Disney Co. (The) | | | 3,412,200 | |
| | 11,744 | | | Waters Corp.(b) | | | 1,500,883 | |
| | 57,684 | | | Werner Enterprises, Inc. | | | 1,526,319 | |
| | 32,334 | | | Western Gas Equity Partners LP | | | 1,394,565 | |
| | 36,007 | | | Western Gas Partners LP | | | 1,840,678 | |
| | 36,363 | | | Western Refining Logistics LP | | | 942,893 | |
| | 85,615 | | | Western Union Co. (The) | | | 1,648,089 | |
| | 24,838 | | | Westlake Chemical Corp. | | | 1,496,986 | |
| | 33,896 | | | World Acceptance Corp.(b) | | | 1,292,454 | |
| | 33,674 | | | World Fuel Services Corp. | | | 1,497,146 | |
| | 22,210 | | | WR Berkley Corp. | | | 1,239,984 | |
| | 40,429 | | | Yahoo!, Inc.(b) | | | 1,440,081 | |
| | 50,000 | | | Yum! Brands, Inc. | | | 3,545,500 | |
| | | | | | | | 721,729,912 | |
Total Common Stocks
(Cost $1,019,111,641) | | 1,072,714,824 | |
| CLOSED-END FUNDS — 6.6% | | |
| UNITED STATES — 6.6% | | |
| | 279,124 | | | AllianceBernstein Global High Income Fund, Inc. | | | 3,209,926 | |
| | 426,882 | | | Apollo Tactical Income Fund, Inc.(c) | | | 6,275,165 | |
| | 525,715 | | | Ares Dynamic Credit Allocation Fund, Inc.(c) | | | 7,549,267 | |
| | 385,000 | | | Avenue Income Credit Strategies Fund(c) | | | 5,039,650 | |
| | 526,147 | | | Babson Capital Global Short Duration High Yield Fund(c) | | | 9,265,449 | |
| | 100,709 | | | Babson Capital Participation Investors(c) | | | 1,374,678 | |
| | 334,264 | | | Blackrock Corp. High Yield Fund, Inc. | | | 3,473,003 | |
| | 706,890 | | | BlackRock Credit Allocation Income Trust(c) | | | 8,857,332 | |
| | 3,970,654 | | | BlackRock Debt Strategies Fund, Inc.(c) | | | 13,738,463 | |
| | 250,000 | | | BlackRock Defined Opportunity Credit Trust(c) | | | 3,295,000 | |
| Old Westbury Funds, Inc. | |
| Strategic Opportunities Fund | |
Consolidated Portfolio of Investments - (Continued) | October 31, 2015 |
| | |
| Shares | | | | | Value | |
| UNITED STATES (continued) | | |
| | 825,000 | | | BlackRock Income Trust, Inc.(c) | | $ | 5,280,000 | |
| | 530,000 | | | Blackrock Limited Duration Income Trust(c) | | | 7,844,000 | |
| | 1,133,941 | | | Blackrock Multi-Sector Income Trust(c) | | | 18,494,578 | |
| | 1,115,616 | | | Blackstone/GSO Strategic Credit Fund(c) | | | 16,221,057 | |
| | 662,043 | | | Brookfield Mortgage Opportunity Income Fund, Inc.(c) | | | 9,844,579 | |
| | 241,686 | | | ClearBridge American Energy MLP Fund, Inc.(c) | | | 2,830,143 | |
| | 1,228,271 | | | ClearBridge Energy MLP Fund, Inc. | | | 24,356,614 | |
| | 651,696 | | | Cohen & Steers Limited Duration Preferred and Income Fund, Inc.(c) | | | 14,891,254 | |
| | 1,180,837 | | | Doubleline Income Solutions Fund(c) | | | 20,853,581 | |
| | 115,000 | | | Fiduciary/Claymore MLP Opportunity Fund | | | 1,960,750 | |
| | 420,000 | | | First Trust High Income Long/Short Fund(c) | | | 6,283,200 | |
| | 685,000 | | | First Trust Intermediate Duration Preferred & Income Fund(c) | | | 15,035,750 | |
| | 100,041 | | | Guggenheim Credit Allocation Fund(c) | | | 2,031,833 | |
| | 255,000 | | | Guggenheim Strategic Opportunities Fund(c) | | | 4,630,800 | |
| | 1,836,832 | | | Invesco Dynamic Credit Opportunities Fund(c) | | | 20,021,469 | |
| | 3,139,239 | | | Invesco Senior Income Trust(c) | | | 12,996,449 | |
| | 325,783 | | | KKR Income Opportunities Fund(c) | | | 4,828,104 | |
| | 470,024 | | | Legg Mason BW Global Income Opportunities Fund, Inc.(c) | | | 5,903,501 | |
| | 660,280 | | | New America High Income Fund(c) | | | 5,473,721 | |
| | 329,807 | | | NexPoint Credit Strategies Fund(c) | | | 7,532,792 | |
| | 180,000 | | | Nuveen Energy MLP Total Return Fund | | | 2,521,800 | |
| | 240,544 | | | Nuveen Mortgage Opportunity Term Fund(c) | | | 5,431,484 | |
| | 401,642 | | | Nuveen Preferred & Income Term Fund(c) | | | 9,394,406 | |
| | 1,621,635 | | | Nuveen Quality Preferred Income Fund(c) | | | 13,459,571 | |
| | 1,012,508 | | | PIMCO Corporate & Income Strategy Fund(c) | | | 13,932,110 | |
| | 1,375,000 | | | PIMCO Dynamic Credit Income Fund(c) | | | 25,795,000 | |
| | 1,005,865 | | | PIMCO Dynamic Income Fund(c) | | | 29,743,428 | |
| | 47,381 | | | PIMCO Income Strategy Fund II | | | 436,853 | |
| | 662,840 | | | Pioneer Floating Rate Trust(c) | | | 7,271,355 | |
| Shares | | | | | Value | |
| UNITED STATES (continued) | | |
| | 1,198,766 | | | Prudential Global Short Duration High Yield Fund, Inc.(c) | | $ | 17,442,045 | |
| | 984,139 | | | Prudential Short Duration High Yield Fund, Inc.(c) | | | 14,712,878 | |
| | 134,909 | | | Stone Harbor Emerging Markets Income Fund | | | 1,829,366 | |
| | 659,925 | | | Tortoise Energy Infrastructure Corp.(c) | | | 20,226,701 | |
| | 1,700,000 | | | Voya Prime Rate Trust(c) | | | 8,602,000 | |
| | 1,986,624 | | | Wells Fargo Advantage Income Opportunities Fund(c) | | | 15,654,597 | |
| | 1,052,619 | | | Western Asset High Income Fund II, Inc.(c) | | | 7,368,333 | |
| | 156,419 | | | Western Asset Mortgage Defined Opportunity Fund(c) | | | 3,791,597 | |
| | 50,000 | | | Western Asset Variable Rate Strategic Fund, Inc.(c) | | | 817,500 | |
Total Closed-End Funds
(Cost $526,847,497) | | 467,823,132 | |
| EXCHANGE TRADED FUNDS — 1.7% | | |
| UNITED STATES — 1.7% | | |
| | 18,360 | | | iShares Global ex USD High Yield Corporate Bond ETF | | | 855,943 | |
| | 7,300 | | | iShares iBoxx $ High Yield Corporate Bond ETF | | | 624,661 | |
| | 178,436 | | | iShares MSCI Canada Index Fund | | | 4,246,777 | |
| | 395,400 | | | iShares MSCI Germany Index Fund | | | 10,719,294 | |
| | 1,184,950 | | | iShares MSCI Singapore ETF | | | 13,176,644 | |
| | 846,800 | | | iShares MSCI Taiwan ETF | | | 11,770,520 | |
| | 24,000 | | | iShares US Preferred Stock ETF | | | 942,240 | |
| | 126,000 | | | PowerShares Senior Loan Portfolio | | | 2,898,000 | |
| | 75,000 | | | ProShares Short VIX Short-Term Futures ETF(b) | | | 4,563,750 | |
| | 110,000 | | | Schwab Short-Term U.S. Treasury ETF | | | 5,577,000 | |
| | 18,000 | | | Utilities Select Sector SPDR Fund | | | 787,500 | |
| | 125,000 | | | Vanguard FTSE Europe ETF | | | 6,510,000 | |
| | 20,000 | | | Vanguard Long-Term Bond ETF | | | 1,793,200 | |
| | 86,000 | | | Vanguard Short-Term Bond ETF | | | 6,900,640 | |
| | 360,000 | | | Vanguard Short-Term Corporate Bond ETF | | | 28,684,800 | |
| | 162,579 | | | WisdomTree Europe SmallCap Dividend Fund | | | 9,110,927 | |
| | 204,400 | | | WisdomTree Japan Hedged Equity Fund | | | 10,892,476 | |
Total Exchange Traded Funds
(Cost $122,623,595) | | 120,054,372 | |
| Old Westbury Funds, Inc. | |
| Strategic Opportunities Fund | |
Consolidated Portfolio of Investments - (Continued) | October 31, 2015 |
| | |
| Shares | | | | | Value | |
| PREFERRED STOCKS — 0.1% | | |
| UNITED STATES — 0.1% | | |
| | 3,500 | | | Actavis Plc | | $ | 3,671,465 | |
| | 35,000 | | | Exelon Corp. | | | 1,461,600 | |
| | 104,500 | | | New York Community Capital Trust V | | | 5,141,400 | |
Total Preferred Stocks
(Cost $10,150,125) | | 10,274,465 | |
| | | | |
| Contracts | | | | | | | |
| CALL OPTIONS PURCHASED — 0.0% | | |
| | 16,000 | | | iShares MSCI South Korea Capped ETF, Strike $54.00, Expires 01/15/16 | | | 3,376,000 | |
| | 75 | | | London Metal Exchange Nickel Futures, Strike $15,000.00, Expires 03/02/16 | | | 9,090 | |
| | 250 | | | London Metal Exchange Zinc Futures, Strike $1,750.00, Expires 03/01/16 | | | 600,750 | |
| | 250 | | | London Metal Exchange Zinc Futures, Strike $2,050.00, Expires 03/01/16 | | | 138,437 | |
| | 350 | | | New York Mercantile Exchange Natural Gas Futures, Strike $3.25, Expires 03/24/16 | | | 280,700 | |
| | 350 | | | New York Mercantile Exchange Natural Gas Futures, Strike $3.50, Expires 02/24/16 | | | 189,700 | |
Total Call Options Purchased
(Cost $3,624,591) | | 4,594,677 | |
| PUT OPTIONS PURCHASED — 0.0% | | |
| | 100 | | | Chicago Board of Trade Soybean Meal Futures, Strike $300.00, Expires 11/20/15 | | | 31,000 | |
| | 150 | | | Chicago Board of Trade Soybean Meal Futures, Strike $320.00, Expires 11/20/15 | | | 247,500 | |
Total Put Options Purchased
(Cost $325,325) | | 278,500 | |
| Principal | | | | | | |
| Amount | | | | | Value | |
| BANK LOANS — 0.1% | | |
| UNITED STATES — 0.1% | | |
| $ | 4,000,000 | | | Starwood Capital Corp./Schulte Hospitality Group, Mezzanine Term Loan,
0.00%, 06/30/17(c)(e) | | $ | 3,980,000 | |
| | 4,000,000 | | | Thor Equities 680 Madison Ave LLC, Mezzanine Loan,
5.22%, 08/09/17 | | | 4,000,000 | |
Total Bank Loans
(Cost $8,033,052) | | 7,980,000 | |
| CORPORATE BONDS — 7.9% | | |
| AUSTRALIA — 0.0% | | |
| | 838,000 | (f) | | Origin Energy Finance Ltd.,
4.00%, 09/16/74(g)(h) | | | 813,230 | |
| AUSTRIA — 0.0% | | |
| | 975,000 | | | JBS Investments GmbH,
7.75%, 10/28/20(h) | | | 1,038,862 | |
| | 750,000 | | | JBS Investments GmbH,
7.75%, 10/28/20(e) | | | 799,125 | |
| | 635,000 | (f) | | Sappi Papier Holding GmbH,
3.38%, 04/01/22(h) | | | 663,015 | |
| | | | | | | | 2,501,002 | |
| BELGIUM — 0.1% | | |
| | 5,000,000 | | | Sofina SA, Cnv.,
1.00%, 09/19/16(h) | | | 4,962,500 | |
| BERMUDA — 0.1% | | |
| | 7,000,000 | (i) | | Celestial Nutrifoods Ltd., Cnv.,
15.75%, 06/12/12(b)(c)(d)(j)(k) | | | 999,358 | |
| | 1,600,000 | | | Digicel Ltd.,
6.75%, 03/01/23(h) | | | 1,440,000 | |
| | 3,000,000 | | | Horizon Pharma Investment Ltd., Cnv.,
2.50%, 03/15/22(e) | | | 2,583,750 | |
| | | | | | | | 5,023,108 | |
| BULGARIA — 0.0% | | |
| | 500,000 | (l) | | Bulgarian Telecommunications Co. EAD,
6.63%, 11/15/18(h) | | | 542,980 | |
| CANADA — 0.1% | | |
| | 2,000,000 | | | 1011778 BC ULC/New Red Finance, Inc.,
6.00%, 04/01/22(e) | | | 2,092,500 | |
| | 125,000 | | | Gibson Energy, Inc.,
6.75%, 07/15/21(e) | | | 120,937 | |
| | 500,000 | | | Quebecor Media, Inc.,
5.75%, 01/15/23 | | | 510,050 | |
| | 700,000 | | | Ultra Petroleum Corp.,
5.75%, 12/15/18(e) | | | 469,000 | |
| Old Westbury Funds, Inc. | |
| Strategic Opportunities Fund | |
Consolidated Portfolio of Investments - (Continued) | October 31, 2015 |
| | |
| Principal | | | | | | |
| Amount | | | | | Value | |
| CANADA (continued) | | |
| $ | 1,175,000 | (l) | | Valeant Pharmaceuticals International, Inc.,
4.50%, 05/15/23(h) | | $ | 1,044,654 | |
| | | | | | | | 4,237,141 | |
| CAYMAN ISLANDS — 0.1% | | |
| | 550,000 | (m) | | Brakes Capital,
7.13%, 12/15/18(h) | | | 878,416 | |
| | 1,150,000 | | | Jafz Sukuk Ltd.,
7.00%, 06/19/19(h) | | | 1,303,295 | |
| | 650,000 | | | MAF Global Securities Ltd.,
7.13%, 04/29/49(g)(h) | | | 672,854 | |
| | 1,500,000 | | | Petrobras Global Finance BV,
7.88%, 03/15/19 | | | 1,421,250 | |
| | 2,000,000 | | | Petrobras Global Finance BV,
5.38%, 01/27/21 | | | 1,627,500 | |
| | 2,000,000 | | | Siem Industries, Inc., Cnv.,
1.00%, 09/12/19(h) | | | 1,841,000 | |
| | 330,000 | | | TAM Capital 3, Inc.,
8.38%, 06/03/21(h) | | | 265,650 | |
| | | | | | | | 8,009,965 | |
| CROATIA (HRVATSKA) — 0.0% | | |
| | 2,100,000 | (l) | | Agrokor dd,
9.13%, 02/01/20(h) | | | 2,482,461 | |
| CZECH REPUBLIC — 0.0% | | |
| | 825,000 | (l) | | CE Energy AS,
7.00%, 02/01/21(h) | | | 933,294 | |
| | 1,175,000 | (l) | | RPG Byty Sro,
6.75%, 05/01/20(h) | | | 1,353,593 | |
| | | | | | | | 2,286,887 | |
| FRANCE — 0.1% | | |
| | 500,000 | (f) | | Arkema SA,
4.75%, 10/29/46(g)(h) | | | 559,435 | |
| | 275,000 | (f) | | Autodis SA,
6.50%, 02/01/19(h) | | | 312,837 | |
| | 725,000 | (f) | | BUT SAS,
7.38%, 09/15/19(h) | | | 825,150 | |
| | 575,000 | (f) | | Horizon Holdings III SASU,
5.13%, 08/01/22(h) | | | 657,591 | |
| | 800,000 | (f) | | Loxam SAS,
4.88%, 07/23/21(h) | | | 910,510 | |
| | 2,300,000 | (f) | | Numericable-SFR SAS,
5.38%, 05/15/22(h) | | | 2,617,718 | |
| | 325,000 | | | Numericable-SFR SAS,
6.00%, 05/15/22(e) | | | 325,812 | |
| | 700,000 | (f) | | Numericable-SFR SAS,
5.63%, 05/15/24(h) | | | 787,691 | |
| | 700,000 | (f) | | Orange SA,
4.00%, 10/01/21(g)(h) | | | 789,484 | |
| | 650,000 | | | SPCM SA,
6.00%, 01/15/22(h) | | | 653,250 | |
| Principal | | | | | | |
| Amount | | | | | Value | |
| FRANCE (continued) | | |
| $ | 300,000 | (f) | | TDF Infrastructure SAS,
2.88%, 10/19/22(h) | | $ | 335,637 | |
| | | | | | | | 8,775,115 | |
| GERMANY — 0.1% | | |
| | 1,580,000 | (f) | | Deutsche Raststaetten Gruppe IV GmbH,
6.75%, 12/30/20(h) | | | 1,873,368 | |
| | 1,225,000 | (f) | | Rapid Holding GmbH,
6.63%, 11/15/20(h) | | | 1,367,008 | |
| | 1,000,000 | (f) | | Safari Holding Verwaltungs GmbH,
8.25%, 02/15/21(h) | | | 1,138,248 | |
| | 375,000 | (f) | | Unitymedia Hessen GmbH & Co. KG/Unitymedia NRW GmbH,
4.00%, 01/15/25(h) | | | 412,352 | |
| | 225,000 | (f) | | Unitymedia Hessen GmbH & Co. KG/Unitymedia NRW GmbH,
6.25%, 01/15/29(h) | | | 274,638 | |
| | | | | | | | 5,065,614 | |
| HONG KONG — 0.0% | | |
| | 9,700,000 | | | China Milk Products Group Ltd., Cnv.,
12.86%, 01/05/12(b)(c)(d)(j)(k) | | | 1,133,154 | |
| IRELAND — 0.2% | | |
| | 1,875,000 | (f) | | Ardagh Packaging Finance Plc/Ardagh Holdings USA, Inc.,
4.25%, 01/15/22(h) | | | 2,082,463 | |
| | 1,475,000 | (f) | | eircom Finance Ltd.,
9.25%, 05/15/20(h) | | | 1,743,049 | |
| | 5,000,000 | | | Jazz Investments I Ltd., Cnv.,
1.88%, 08/15/21 | | | 5,303,125 | |
| | 650,000 | | | MMC Norilsk Nickel OJSC via MMC Finance Ltd.,
4.38%, 04/30/18(h) | | | 652,590 | |
| | 225,000 | | | MMC Norilsk Nickel OJSC via MMC Finance Ltd.,
6.63%, 10/14/22(h) | | | 230,625 | |
| | 1,725,000 | | | Phosagro OAO via Phosagro Bond Funding Ltd.,
4.20%, 02/13/18(h) | | | 1,718,100 | |
| | 1,400,000 | (f) | | Russian Railways via RZD Capital Plc,
3.37%, 05/20/21(h) | | | 1,420,044 | |
| | | | | | | | 13,149,996 | |
| ITALY — 0.1% | | |
| | 1,525,000 | (m) | | Enel SpA,
7.75%, 09/10/75(g)(h) | | | 2,547,388 | |
| | 125,000 | (f) | | Finmeccanica SpA,
4.88%, 03/24/25 | | | 152,703 | |
| | 425,000 | (f) | | Snai SpA,
7.63%, 06/15/18(h) | | | 471,441 | |
| Old Westbury Funds, Inc. | |
| Strategic Opportunities Fund | |
Consolidated Portfolio of Investments - (Continued) | October 31, 2015 |
| | |
| Principal | | | | | | |
| Amount | | | | | Value | |
| ITALY (continued) | | |
| $ | 950,000 | (m) | | Telecom Italia SpA,
6.38%, 06/24/19 | | $ | 1,594,535 | |
| | | | | | | | 4,766,067 | |
| JAPAN — 0.0% | | |
| | 2,550,000 | (l) | | SoftBank Group Corp.,
4.75%, 07/30/25(h) | | | 2,786,330 | |
| JERSEY CHANNEL ISLANDS — 0.0% | | |
| | 525,000 | (m) | | CPUK Finance Ltd.,
7.00%, 08/28/20(h) | | | 820,464 | |
| | 600,000 | (f) | | Hastings Insurance Group Finance Plc,
8.00%, 10/21/20(h) | | | 989,249 | |
| | | | | | | | 1,809,713 | |
| LUXEMBOURG — 0.5% | | |
| | 825,000 | (f) | | Altice Financing SA,
5.25%, 02/15/23(h) | | | 916,284 | |
| | 975,000 | | | Altice Financing SA,
6.63%, 02/15/23(e) | | | 977,437 | |
| | 1,000,000 | | | Altice Finco SA,
8.13%, 01/15/24(e) | | | 995,000 | |
| | 675,000 | | | Altice Finco SA,
7.63%, 02/15/25(e) | | | 639,562 | |
| | 1,175,000 | (f) | | Altice Luxembourg SA,
7.25%, 05/15/22(h) | | | 1,253,326 | |
| | 550,000 | (f) | | Cirsa Funding Luxembourg SA,
5.88%, 05/15/23(h) | | | 570,334 | |
| | 1,000,000 | | | Cosan Luxembourg SA,
5.00%, 03/14/23(h) | | | 840,000 | |
| | 200,000 | (f) | | Dakar Finance SA, 9.00% cash or
9.25% payment-in-kind interest, 11/15/20(h)(n) | | | 220,324 | |
| | 400,000 | (f) | | Fiat Chrysler Finance Europe,
6.75%, 10/14/19(h) | | | 501,441 | |
| | 900,000 | (f) | | Garfunkelux Holdco 3 SA,
7.50%, 08/01/22(h) | | | 1,001,660 | |
| | 1,200,000 | | | Gazprom OAO Via Gaz Capital SA,
8.15%, 04/11/18(h) | | | 1,298,616 | |
| | 1,950,000 | | | Gazprom OAO Via Gaz Capital SA,
6.00%, 01/23/21(h) | | | 1,975,876 | |
| | 100,000 | (f) | | Gestamp Funding Luxembourg SA,
5.88%, 05/31/20(h) | | | 114,501 | |
| | 1,000,000 | (f) | | Grand City Properties SA,
3.75%, 02/18/49(g) | | | 1,041,902 | |
| | 2,200,000 | (f) | | Greif Nevada Holdings, Inc. SCS,
7.38%, 07/15/21(h) | | | 2,818,694 | |
| | 750,000 | (f) | | Intralot Capital Luxembourg SA,
6.00%, 05/15/21(h) | | | 763,707 | |
| | 1,675,000 | (o) | | Matterhorn Telecom SA,
3.63%, 05/01/22(h) | | | 1,499,595 | |
| | 630,000 | | | Minerva Luxembourg SA,
7.75%, 01/31/23(h) | | | 622,125 | |
| Principal | | | | | | |
| Amount | | | | | Value | |
| LUXEMBOURG (continued) | | |
| $ | 2,085,000 | | | Severstal OAO Via Steel Capital SA,
4.45%, 03/19/18(h) | | $ | 2,064,567 | |
| | 775,000 | (f) | | SIG Combibloc Holdings SCA,
7.75%, 02/15/23(h) | | | 899,528 | |
| | 8,000,000 | | | Subsea 7 SA, Cnv.,
1.00%, 10/05/17(h) | | | 7,400,000 | |
| | 400,000 | (f) | | Telecom Italia Finance SA,
7.75%, 01/24/33 | | | 584,090 | |
| | 1,400,000 | (f) | | Trinseo Materials Operating SCA/Trinseo Materials Finance, Inc.,
6.38%, 05/01/22(h) | | | 1,534,507 | |
| | 650,000 | | | Tupy Overseas SA,
6.63%, 07/17/24(h) | | | 588,250 | |
| | 600,000 | (f) | | Wind Acquisition Finance SA,
3.95%, 07/15/20(g)(h) | | | 657,316 | |
| | 1,700,000 | (f) | | Wind Acquisition Finance SA,
4.00%, 07/15/20(h) | | | 1,895,110 | |
| | | | | | | | 33,673,752 | |
| MEXICO — 0.0% | | |
| | 350,000 | (l) | | Cemex SAB de CV,
4.38%, 03/05/23(h) | | | 352,633 | |
| | 850,000 | | | Grupo Posadas SAB de CV,
7.88%, 06/30/22(h) | | | 816,000 | |
| | | | | | | | 1,168,633 | |
| NETHERLANDS — 0.4% | | |
| | 1,625,000 | (f) | | Cable Communications Systems NV,
7.50%, 11/01/20(h) | | | 1,885,213 | |
| | 1,175,000 | (f) | | Grupo Antolin Dutch BV,
5.13%, 06/30/22(h) | | | 1,321,213 | |
| | 606,000 | (f) | | Hydra Dutch Holdings 2 BV,
5.45%, 04/15/19(g)(h) | | | 630,646 | |
| | 400,000 | (f) | | Koninklijke KPN NV,
6.13%, 09/14/18(g)(h) | | | 463,612 | |
| | 1,150,000 | (m) | | Koninklijke KPN NV,
6.88%, 03/14/73(g)(h) | | | 1,839,312 | |
| | 1,225,000 | (f) | | LGE HoldCo VI BV,
7.13%, 05/15/24(h) | | | 1,463,054 | |
| | 1,750,000 | | | Lukoil International Finance BV,
3.42%, 04/24/18(h) | | | 1,705,655 | |
| | 600,000 | | | Majapahit Holding BV,
7.75%, 01/20/20(h) | | | 677,100 | |
| | 5,000,000 | | | NXP Semiconductors NV, Cnv.,
1.00%, 12/01/19(e) | | | 5,356,250 | |
| | 1,700,000 | (f) | | Samvardhana Motherson Automotive Systems Group BV,
4.13%, 07/15/21(h) | | | 1,809,194 | |
| | 200,000 | (f) | | Schaeffler Finance BV,
2.75%, 05/15/19(h) | | | 221,854 | |
| | 125,000 | (f) | | Schaeffler Finance BV,
3.25%, 05/15/25(h) | | | 136,583 | |
| Old Westbury Funds, Inc. | |
| Strategic Opportunities Fund | |
Consolidated Portfolio of Investments - (Continued) | October 31, 2015 |
| | |
| Principal | | | | | | |
| Amount | | | | | Value | |
| NETHERLANDS (continued) | | |
| $ | 3,350,000 | (f) | | Schaeffler Holding Finance BV,
6.88% cash or 11.13% payment-in-kind interest, 08/15/18(h)(n) | | $ | 3,821,972 | |
| | 2,600,000 | (f) | | Sonae Investments BV, Cnv.,
1.63%, 06/11/19(c)(h) | | | 2,833,359 | |
| | 1,200,000 | (f) | | Telefonica Europe BV,
7.63%, 09/18/21(g)(h) | | | 1,443,621 | |
| | 500,000 | (f) | | Telefonica Europe BV,
5.88%, 03/31/49(g)(h) | | | 563,571 | |
| | 539,000 | (f) | | United Group BV,
7.88%, 11/15/20(h) | | | 633,312 | |
| | 1,000,000 | | | VTR Finance BV,
6.88%, 01/15/24(e) | | | 967,500 | |
| | | | | | | | 27,773,021 | |
| NORWAY — 0.1% | | |
| | 775,000 | (f) | | Lock AS,
5.50%, 08/15/20(g)(h) | | | 854,360 | |
| | 1,150,000 | (f) | | Lock AS,
7.00%, 08/15/21(h) | | | 1,322,137 | |
| | 1,100,000 | (f) | | Silk Bidco AS,
7.50%, 02/01/22(h) | | | 1,275,056 | |
| | | | | | | | 3,451,553 | |
| POLAND — 0.0% | | |
| | 450,000 | (f) | | Play Finance 1 SA,
6.50%, 08/01/19(h) | | | 515,255 | |
| | 1,075,000 | (f) | | Play Finance 2 SA,
5.25%, 02/01/19(h) | | | 1,217,588 | |
| | | | | | | | 1,732,843 | |
| PORTUGAL — 0.0% | | |
| | 800,000 | (f) | | EDP - Energias de Portugal SA,
5.38%, 09/16/75(g)(h) | | | 875,997 | |
| SINGAPORE — 0.1% | | |
| | 5,000,000 | (f) | | OSIM International Ltd., Cnv.,
3.10%, 09/18/19(j) | | | 3,374,973 | |
| SPAIN — 0.0% | | |
| | 800,000 | (f) | | Cellnex Telecom SAU,
3.13%, 07/27/22(h) | | | 859,927 | |
| SWEDEN — 0.0% | | |
| | 1,125,000 | (l) | | Akelius Residential Property AB,
3.38%, 09/23/20(h) | | | 1,248,499 | |
| | 425,000 | (l) | | Verisure Holding AB,
6.00%, 11/01/22(h) | | | 477,867 | |
| | | | | | | | 1,726,366 | |
| TURKEY — 0.0% | | |
| | 650,000 | | | Turkiye Sise ve Cam Fabrikalari AS,
4.25%, 05/09/20(h) | | | 636,155 | |
| Principal | | | | | | |
| Amount | | | | | Value | |
| UNITED KINGDOM — 0.3% | | |
| $ | 825,000 | (f) | | Arqiva Broadcast Finance Plc,
9.50%, 03/31/20(h) | | $ | 1,381,507 | |
| | 125,000 | (l) | | Arrow Global Finance Plc,
5.22%, 11/01/21(g)(h) | | | 138,528 | |
| | 975,000 | (f) | | Boparan Finance Plc,
5.50%, 07/15/21(h) | | | 1,367,777 | |
| | 600,000 | (f) | | Cognita Financing Plc,
7.75%, 08/15/21(h) | | | 929,580 | |
| | 1,450,000 | (f) | | Co-operative Group Holdings 2011 Ltd., STEP,
5.63%, 07/08/20(h) | | | 2,361,579 | |
| | 375,000 | (f) | | Co-operative Group Holdings 2011 Ltd., STEP,
7.50%, 07/08/26 | | | 619,019 | |
| | 490,000 | (f) | | Debenhams Plc,
5.25%, 07/15/21(h) | | | 752,326 | |
| | 775,000 | (f) | | Infinis Plc,
7.00%, 02/15/19(h) | | | 1,207,991 | |
| | 300,000 | | | International Game Technology Plc,
5.63%, 02/15/20(e) | | | 303,750 | |
| | 725,000 | (l) | | International Game Technology Plc,
4.75%, 02/15/23(h) | | | 771,336 | |
| | 1,375,000 | | | Jaguar Land Rover Automotive Plc,
3.50%, 03/15/20(e) | | | 1,361,181 | |
| | 925,000 | (f) | | Jerrold Finco Plc,
9.75%, 09/15/18(h) | | | 1,565,005 | |
| | 850,000 | (f) | | Moy Park Bondco Plc,
6.25%, 05/29/21(h) | | | 1,338,172 | |
| | 1,050,000 | | | OAS Finance Ltd.,
8.00%, 07/02/21(b)(e)(k) | | | 84,000 | |
| | 675,000 | (f) | | Premier Foods Finance Plc,
6.50%, 03/15/21(h) | | | 966,954 | |
| | 950,000 | (f) | | Southern Water Greensands Financing Plc,
8.50%, 04/15/19(h) | | | 1,647,576 | |
| | 425,000 | (l) | | TA Manufacturing Ltd.,
3.63%, 04/15/23(h) | | | 444,675 | |
| | | | | | | | 17,240,956 | |
| UNITED STATES — 5.6% | | |
| | 4,000,000 | | | Acorda Therapeutics, Inc., Cnv.,
1.75%, 06/15/21 | | | 4,250,000 | |
| | 4,000,000 | | | Allscripts Healthcare Solutions, Inc., Cnv.,
1.25%, 07/01/20 | | | 4,157,500 | |
| | 1,500,000 | | | AMAG Pharmaceuticals, Inc., Cnv.,
2.50%, 02/15/19 | | | 2,435,625 | |
| | 1,250,000 | | | Antero Resources Corp.,
5.13%, 12/01/22 | | | 1,121,875 | |
| | 5,000,000 | | | Apollo Commercial Real Estate Finance, Inc., Cnv.,
5.50%, 03/15/19 | | | 5,012,500 | |
| | 6,000,000 | | | Ares Capital Corp., Cnv.,
5.13%, 06/01/16 | | | 6,045,000 | |
| Old Westbury Funds, Inc. | |
| Strategic Opportunities Fund | |
| Consolidated Portfolio of Investments - (Continued) | October 31, 2015 |
| | |
| Principal | | | | | | |
| Amount | | | | | Value | |
| UNITED STATES (continued) | | | | |
| $ | 1,900,000 | | | Argos Merger Sub, Inc.,
7.13%, 03/15/23(e) | | $ | 1,999,750 | |
| | 7,000,000 | | | Atlas Air Worldwide Holdings, Inc., Cnv.,
2.25%, 06/01/22 | | | 5,893,125 | |
| | 750,000 | | | Berry Plastics Corp.,
5.13%, 07/15/23 | | | 742,500 | |
| | 5,000,000 | | | BlackRock Kelso Capital Corp., Cnv.,
5.50%, 02/15/18 | | | 5,162,500 | |
| | 1,730,000 | | | Blackstone Mortgage Trust, Inc., Cnv.,
5.25%, 12/01/18 | | | 1,811,094 | |
| | 4,000,000 | | | Blucora, Inc., Cnv.,
4.25%, 04/01/19 | | | 3,620,000 | |
| | 1,450,000 | | | Blue Cube Spinco, Inc.,
9.75%, 10/15/23(e) | | | 1,562,375 | |
| | 600,000 | | | Blue Racer Midstream LLC/Blue Racer Finance Corp.,
6.13%, 11/15/22(e) | | | 561,000 | |
| | 500,000 | | | Brand Energy & Infrastructure Services, Inc.,
8.50%, 12/01/21(e) | | | 452,500 | |
| | 675,000 | | | BroadSoft, Inc., Cnv.,
1.50%, 07/01/18 | | | 704,531 | |
| | 5,000,000 | | | Brocade Communications Systems, Inc., Cnv.,
1.38%, 01/01/20(e) | | | 4,915,625 | |
| | 750,000 | | | California Resources Corp.,
5.50%, 09/15/21 | | | 515,625 | |
| | 1,000,000 | | | California Resources Corp.,
6.00%, 11/15/24 | | | 680,000 | |
| | 1,075,000 | | | Calumet Specialty Products Partners LP/Calumet Finance Corp.,
7.63%, 01/15/22 | | | 1,037,375 | |
| | 10,000,000 | | | Cardtronics, Inc., Cnv.,
1.00%, 12/01/20 | | | 9,420,000 | |
| | 2,000,000 | | | CCO Holdings LLC/CCO Holdings Capital Corp.,
5.88%, 05/01/27(e) | | | 2,000,000 | |
| | 725,000 | (l) | | Cemex Finance LLC,
5.25%, 04/01/21(h) | | | 798,442 | |
| | 2,000,000 | | | Cemex Finance LLC,
9.38%, 10/12/22(e) | | | 2,180,000 | |
| | 7,000,000 | | | Chart Industries, Inc., Cnv.,
2.00%, 08/01/18 | | | 6,107,500 | |
| | 300,000 | | | Chesapeake Energy Corp.,
4.88%, 04/15/22 | | | 186,000 | |
| | 1,000,000 | | | Chesapeake Energy Corp.,
5.75%, 03/15/23 | | | 630,000 | |
| | 6,000,000 | | | Ciena Corp. Cnv.,
0.88%, 06/15/17 | | | 5,992,500 | |
| | 7,000,000 | | | Colony Capital, Inc., Cnv.,
3.88%, 01/15/21 | | | 6,733,125 | |
| | 900,000 | | | Concho Resources, Inc.,
5.50%, 10/01/22 | | | 903,375 | |
| Principal | | | | | | |
| Amount | | | | | Value | |
| UNITED STATES (continued) | | | | |
| $ | 500,000 | | | CONSOL Energy, Inc.,
5.88%, 04/15/22 | | $ | 316,250 | |
| | 1,025,000 | | | Crestwood Midstream Partners LP/Crestwood Midstream Finance Corp.,
6.25%, 04/01/23(e) | | | 871,250 | |
| | 750,000 | | | Denbury Resources, Inc.,
5.50%, 05/01/22 | | | 525,000 | |
| | 250,000 | | | Denbury Resources, Inc.,
4.63%, 07/15/23 | | | 166,875 | |
| | 500,000 | | | Diamondback Energy, Inc.,
7.63%, 10/01/21 | | | 532,500 | |
| | 1,500,000 | | | DISH DBS Corp.,
7.88%, 09/01/19 | | | 1,645,935 | |
| | 5,000,000 | | | Echo Global Logistics, Inc., Cnv.,
2.50%, 05/01/20 | | | 4,712,500 | |
| | 500,000 | | | Eclipse Resources Corp.,
8.88%, 07/15/23(e) | | | 390,000 | |
| | 4,000,000 | | | Envestnet, Inc., Cnv.,
1.75%, 12/15/19 | | | 3,522,500 | |
| | 300,000 | | | EP Energy LLC/Everest Acquisition Finance, Inc.,
9.38%, 05/01/20 | | | 261,000 | |
| | 750,000 | | | EP Energy LLC/Everest Acquisition Finance, Inc.,
7.75%, 09/01/22 | | | 577,500 | |
| | 750,000 | | | Exterran Partners LP/EXLP Finance Corp.,
6.00%, 04/01/21 | | | 648,750 | |
| | 300,000 | | | Exterran Partners LP/EXLP Finance Corp.,
6.00%, 10/01/22 | | | 253,500 | |
| | 5,000,000 | | | Finisar Corp., Cnv.,
0.50%, 12/15/33 | | | 4,471,875 | |
| | 1,000,000 | | | Forum Energy Technologies, Inc.,
6.25%, 10/01/21 | | | 837,500 | |
| | 6,000,000 | | | General Cable Corp., Cnv.,STEP,
4.50%, 11/15/29 | | | 4,098,750 | |
| | 800,000 | | | Genesis Energy LP/Genesis Energy Finance Corp.,
5.63%, 06/15/24 | | | 707,000 | |
| | 6,000,000 | | | GNC Holdings, Inc., Cnv.,
1.50%, 08/15/20(e) | | | 4,920,000 | |
| | 900,000 | | | H&E Equipment Services, Inc.,
7.00%, 09/01/22 | | | 913,500 | |
| | 1,500,000 | | | Harron Communications LP/Harron Finance Corp.,
9.13%, 04/01/20(e) | | | 1,601,250 | |
| | 750,000 | | | Hilcorp Energy I LP/Hilcorp Finance Co.,
5.75%, 10/01/25(e) | | | 693,750 | |
| | 2,500,000 | | | Hologic, Inc., Cnv., STEP,
2.00%, 03/01/42 | | | 3,360,938 | |
| | 10,000,000 | | | Hologic, Inc., Cnv., STEP,
2.00%, 12/15/43 | | | 12,693,750 | |
| Old Westbury Funds, Inc. | |
| Strategic Opportunities Fund | |
| Consolidated Portfolio of Investments - (Continued) | October 31, 2015 |
| | |
| Principal | | | | | | |
| Amount | | | | | Value | |
| UNITED STATES (continued) | | | | |
| $ | 5,000,000 | | | HomeAway, Inc., Cnv.,
0.13%, 04/01/19 | | $ | 4,787,500 | |
| | 4,000,000 | | | Hornbeck Offshore Services, Inc., Cnv.,
1.50%, 09/01/19 | | | 2,957,500 | |
| | 2,000,000 | | | Huron Consulting Group Inc,
1.25%, 10/01/19 | | | 1,856,250 | |
| | 6,000,000 | | | Impax Laboratories, Inc., Cnv.,
2.00%, 06/15/22(e) | | | 5,520,000 | |
| | 5,000,000 | | | Isis Pharmaceuticals, Inc., Cnv.,
1.00%, 11/15/21(e) | | | 4,990,625 | |
| | 7,000,000 | | | JDS Uniphase Corp., Cnv.,
0.63%, 08/15/33 | | | 6,654,375 | |
| | 2,000,000 | | | KB Home, Cnv.,
1.38%, 02/01/19 | | | 1,838,750 | |
| | 500,000 | | | Laredo Petroleum, Inc.,
5.63%, 01/15/22 | | | 470,000 | |
| | 175,000 | | | Legacy Reserves LP/Legacy Reserves Finance Corp.,
8.00%, 12/01/20 | | | 124,250 | |
| | 1,000,000 | | | Legacy Reserves LP/Legacy Reserves Finance Corp.,
6.63%, 12/01/21 | | | 660,000 | |
| | 28,984,645 | | | Liberty Interactive LLC, Cnv.,
3.75%, 02/15/30(c) | | | 17,100,940 | |
| | 7,000,000 | | | LinkedIn Corp., Cnv.,
0.50%, 11/01/19(c)(e) | | | 7,599,375 | |
| | 7,000,000 | | | Live Nation Entertainment, Inc., Cnv.,
2.50%, 05/15/19 | | | 7,551,250 | |
| | 925,000 | | | MarkWest Energy Partners LP/MarkWest Energy Finance Corp.,
4.88%, 12/01/24 | | | 872,969 | |
| | 975,000 | | | Matador Resources Co.,
6.88%, 04/15/23 | | | 977,437 | |
| | 1,250,000 | | | Memorial Production Partners LP/Memorial Production Finance Corp.,
6.88%, 08/01/22 | | | 787,500 | |
| | 5,000,000 | | | MercadoLibre, Inc., Cnv.,
2.25%, 07/01/19 | | | 5,184,375 | |
| | 3,000,000 | | | Meritage Homes Corp., Cnv.,
1.88%, 09/15/32 | | | 2,990,625 | |
| | 8,000,000 | | | Meritor, Inc., Cnv., STEP,
4.00%, 02/15/27 | | | 7,865,000 | |
| | 5,000,000 | | | Micron Technology Inc., Series G, Cnv.,
3.00%, 11/15/43 | | | 4,525,000 | |
| | 1,500,000 | | | Micron Technology, Inc., Cnv., Series E,
1.63%, 02/15/33 | | | 2,421,375 | |
| | 1,325,000 | (l) | | MPT Operating Partnership LP/MPT Finance Corp., REIT,
5.75%, 10/01/20 | | | 1,548,539 | |
| Principal | | | | | | |
| Amount | | | | | Value | |
| UNITED STATES (continued) | | | | |
| $ | 900,000 | (l) | | MPT Operating Partnership LP/MPT Finance Corp., REIT,
4.00%, 08/19/22 | | $ | 1,001,660 | |
| | 2,000,000 | | | National Health Investors, Inc., Cnv.,
3.25%, 04/01/21 | | | 1,943,750 | |
| | 200,000 | | | Neptune Finco Corp., 10.13%,
01/15/23(e) | | | 211,500 | |
| | 275,000 | | | Neptune Finco Corp.,
6.63%, 10/15/25(e) | | | 289,437 | |
| | 200,000 | | | Neptune Finco Corp.,
10.88%, 10/15/25(e) | | | 213,500 | |
| | 1,500,000 | | | Netflix, Inc.,
5.50%, 02/15/22(e) | | | 1,582,500 | |
| | 300,000 | | | Newfield Exploration Co.,
5.75%, 01/30/22 | | | 304,500 | |
| | 500,000 | | | NuStar Logistics LP,
6.75%, 02/01/21 | | | 520,000 | |
| | 500,000 | | | Oasis Petroleum, Inc.,
7.25%, 02/01/19 | | | 477,500 | |
| | 350,000 | | | Oasis Petroleum, Inc.,
6.50%, 11/01/21 | | | 298,375 | |
| | 8,000,000 | | | ON Semiconductor Corp., Cnv.,
1.00%, 12/01/20(e) | | | 7,860,000 | |
| | 1,500,000 | | | Owens-Brockway Glass Container, Inc.,
6.38%, 08/15/25(e) | | | 1,597,500 | |
| | 750,000 | | | Pilgrim’s Pride Corp.,
5.75%, 03/15/25(e) | | | 766,875 | |
| | 7,000,000 | | | Priceline Group, Inc. (The), Cnv.,
0.90%, 09/15/21(c) | | | 7,428,750 | |
| | 200,000 | (l) | | PSPC Escrow Corp.,
6.00%, 02/01/23(h) | | | 181,222 | |
| | 300,000 | | | Rex Energy Corp.,
8.88%, 12/01/20 | | | 150,000 | |
| | 300,000 | | | Rex Energy Corp.,
6.25%, 08/01/22 | | | 123,000 | |
| | 500,000 | | | Rice Energy, Inc.,
6.25%, 05/01/22 | | | 452,500 | |
| | 150,000 | | | Rice Energy, Inc.,
7.25%, 05/01/23(e) | | | 138,750 | |
| | 3,000,000 | | | Rovi Corp., Cnv.,
0.50%, 03/01/20(e) | | | 2,238,750 | |
| | 500,000 | | | Sabine Pass Liquefaction LLC,
5.75%, 05/15/24 | | | 482,500 | |
| | 625,000 | | | Sabine Pass Liquefaction LLC,
5.63%, 03/01/25(e) | | | 599,219 | |
| | 500,000 | | | Safway Group Holding LLC/Safway Finance Corp.,
7.00%, 05/15/18(e) | | | 513,750 | |
| | 17,000,000 | | | SanDisk Corp., Cnv.,
0.50%, 10/15/20 | | | 17,924,375 | |
| | 611,000 | | | SEACOR Holdings, Inc., Cnv.,
3.00%, 11/15/28 | | | 497,583 | |
| | 12,000,000 | | | ShengdaTech, Inc., Cnv.,
6.50%, 12/15/15(b)(c)(d)(e)(k) | | | 1,200,000 | |
| Old Westbury Funds, Inc. | |
| Strategic Opportunities Fund | |
| Consolidated Portfolio of Investments - (Continued) | October 31, 2015 |
| | |
| Principal | | | | | | |
| Amount | | | | | Value | |
| UNITED STATES (continued) | | | | |
| $ | 5,000,000 | | | Shutterfly, Inc., Cnv.,
0.25%, 05/15/18 | | $ | 4,784,375 | |
| | 250,000 | | | SM Energy Co.,
6.50%, 11/15/21 | | | 246,250 | |
| | 500,000 | | | SM Energy Co.,
6.13%, 11/15/22 | | | 485,000 | |
| | 450,000 | | | SM Energy Co.,
5.63%, 06/01/25 | | | 409,500 | |
| | 2,595,000 | | | Southern Star Central Corp.,
5.13%, 07/15/22(e) | | | 2,517,150 | |
| | 15,000,000 | | | Starwood Property Trust, Inc., Cnv.,
3.75%, 10/15/17 | | | 14,878,125 | |
| | 9,900,000 | | | Starwood Property Trust, Inc., Cnv., REIT,
4.55%, 03/01/18 | | | 10,011,375 | |
| | 3,000,000 | | | Starwood Waypoint Residential Trust, Cnv.,
3.00%, 07/01/19 | | | 2,923,125 | |
| | 2,500,000 | | | Starwood Waypoint Residential Trust, Cnv., REIT,
4.50%, 10/15/17 | | | 2,560,937 | |
| | 8,000,000 | | | Tesla Motors, Inc., Cnv.,
0.25%, 03/01/19 | | | 7,220,000 | |
| | 4,000,000 | | | Tesla Motors, Inc., Cnv.,
1.25%, 03/01/21 | | | 3,495,000 | |
| | 500,000 | | | Tesoro Logistics LP/Tesoro Logistics Finance Corp.,
5.88%, 10/01/20 | | | 520,000 | |
| | 2,300,000 | | | Titan Machinery, Inc., Cnv.,
3.75%, 05/01/19 | | | 1,712,063 | |
| | 6,000,000 | | | TiVo, Inc., Cnv.,
2.00%, 10/01/21 | | | 5,287,500 | |
| | 1,500,000 | | | T-Mobile USA, Inc.,
6.63%, 04/01/23 | | | 1,532,340 | |
| | 1,250,000 | | | TPC Group, Inc.,
8.75%, 12/15/20(e) | | | 1,022,000 | |
| | 5,000,000 | | | Twitter, Inc., Cnv.,
0.25%, 09/15/19 | | | 4,431,250 | |
| | 800,000 | | | Unit Corp.,
6.63%, 05/15/21 | | | 640,000 | |
| | 9,000,000 | | | Vector Group Ltd., Cnv.,
1.75%, 04/15/20(g) | | | 10,355,625 | |
| | 2,370,000 | (m) | | Virgin Media Secured Finance Plc,
6.00%, 04/15/21(h) | | | 3,859,269 | |
| | 250,000 | (l) | | VWR Funding, Inc.,
4.63%, 04/15/22(h) | | | 262,404 | |
| | 27,800,000 | | | Washington Mutual Bank,
5.55%, 12/31/49(b)(k) | | | 6,428,750 | |
| | 24,750,000 | | | Washington Mutual Bank,
5.55%, 12/31/49(b)(k) | | | 5,723,438 | |
| | 4,800,000 | | | Washington Mutual Bank,
5.55%, 12/31/49(b)(k) | | | 1,110,000 | |
| | 3,000,000 | | | Washington Mutual Bank,
5.55%, 12/31/49(b)(k) | | | 693,750 | |
| Principal | | | | | | |
| Amount | | | | | Value | |
| UNITED STATES (continued) | | | | |
| $ | 2,000,000 | | | Washington Mutual Bank,
5.55%, 12/31/49(b)(k) | | $ | 462,500 | |
| | 5,000,000 | | | Web.com Group, Inc., Cnv.,
1.00%, 08/15/18 | | | 4,884,375 | |
| | 5,000,000 | | | WebMD Health Corp., Cnv.,
2.25%, 03/31/16 | | | 5,009,375 | |
| | 9,000,000 | | | WebMD Health Corp., Cnv.,
2.50%, 01/31/18 | | | 9,028,125 | |
| | 2,000,000 | | | WebMD Health Corp., Cnv.,
1.50%, 12/01/20 | | | 2,071,250 | |
| | 7,000,000 | | | Wright Medical Group, Inc., Cnv.,
2.00%, 02/15/20(e) | | | 6,615,000 | |
| | 2,000,000 | | | Yahoo!, Inc., Cnv.,
0.34%, 12/01/18(j) | | | 1,996,250 | |
| | | | | | | | 397,810,547 | |
Total Corporate Bonds
(Cost $592,113,670) | | | 558,669,986 | |
| GOVERNMENT BONDS — 3.2% | | | | |
| BRAZIL — 0.3% | | | | |
| | 4,270,000 | (f) | | Brazil Letras do Tesouro Nacional,
11.31%, 01/01/16(j) | | | 1,082,313 | |
| | 510,000 | (f) | | Brazil Letras do Tesouro Nacional,
11.29%, 07/01/16(j) | | | 120,557 | |
| | 1,620,000 | (f) | | Brazil Letras do Tesouro Nacional,
11.31%, 10/01/16(j) | | | 368,557 | |
| | 7,730,000 | (f) | | Brazil Letras do Tesouro Nacional,
15.26%, 01/01/19(j) | | | 1,257,173 | |
| | 13,920,000 | (f) | | Brazil Letras do Tesouro Nacional,
15.20%, 07/01/19(j) | | | 2,104,869 | |
| | 1,410,000 | (f) | | Brazil Notas do Tesouro Nacional, Series B,
6.00%, 05/15/19 | | | 991,672 | |
| | 160,000 | (f) | | Brazil Notas do Tesouro Nacional, Series B,
6.00%, 08/15/20 | | | 108,848 | |
| | 840,000 | (f) | | Brazil Notas do Tesouro Nacional, Series B,
6.00%, 08/15/22 | | | 557,271 | |
| | 1,292,000 | (f) | | Brazil Notas do Tesouro Nacional, Series B,
6.00%, 05/15/23 | | | 865,487 | |
| | 80,000 | (f) | | Brazil Notas do Tesouro Nacional, Series B,
6.00%, 08/15/24 | | | 52,253 | |
| | 2,400,000 | (f) | | Brazil Notas do Tesouro Nacional, Series B,
6.00%, 05/15/45 | | | 1,500,998 | |
| | 21,010,000 | (f) | | Brazil Notas do Tesouro Nacional, Series F,
3.84%, 01/01/17 | | | 5,341,674 | |
| | 7,570,000 | (f) | | Brazil Notas do Tesouro Nacional, Series F,
3.37%, 01/01/21 | | | 1,652,832 | |
| Old Westbury Funds, Inc. | |
| Strategic Opportunities Fund | |
| Consolidated Portfolio of Investments - (Continued) | October 31, 2015 |
| | |
| Principal | | | | | | |
| Amount | | | | | Value | |
| BRAZIL (continued) | | | | |
| $ | 3,200,000 | (f) | | Brazil Notas do Tesouro Nacional, Series F,
3.15%, 01/01/23 | | $ | 662,968 | |
| | 14,590,000 | (f) | | Brazil Notas do Tesouro Nacional, Series F,
2.89%, 01/01/25 | | | 2,900,892 | |
| | | | | | | | 19,568,364 | |
| HUNGARY — 0.1% | | | | |
| | 375,120,000 | (f) | | Hungary Government Bond,
6.75%, 11/24/17 | | | 1,477,257 | |
| | 22,290,000 | (f) | | Hungary Government Bond,
5.50%, 12/20/18 | | | 87,113 | |
| | 17,070,000 | (f) | | Hungary Government Bond,
5.50%, 06/24/25 | | | 70,688 | |
| | 1,444,000 | (f) | | Hungary Government International Bond,
6.00%, 01/11/19 | | | 1,835,048 | |
| | 2,800,000 | | | Hungary Government International Bond,
6.25%, 01/29/20 | | | 3,160,948 | |
| | 3,840,000 | | | Hungary Government International Bond,
6.38%, 03/29/21 | | | 4,415,616 | |
| | | | | | | | 11,046,670 | |
| INDONESIA — 0.2% | | | | |
| | 2,780,000,000 | (f) | | Indonesia Treasury Bill,
6.44%, 01/07/16(j) | | | 200,828 | |
| | 3,590,000,000 | (f) | | Indonesia Treasury Bond,
9.00%, 09/15/18 | | | 263,627 | |
| | 15,527,000,000 | (f) | | Indonesia Treasury Bond,
7.88%, 04/15/19 | | | 1,102,811 | |
| | 1,932,000,000 | (f) | | Indonesia Treasury Bond,
11.50%, 09/15/19 | | | 153,150 | |
| | 7,727,000,000 | (f) | | Indonesia Treasury Bond,
11.00%, 11/15/20 | | | 614,790 | |
| | 41,593,000,000 | (f) | | Indonesia Treasury Bond,
12.80%, 06/15/21 | | | 3,557,501 | |
| | 5,140,000,000 | (f) | | Indonesia Treasury Bond,
8.25%, 07/15/21 | | | 365,518 | |
| | 18,748,000,000 | (f) | | Indonesia Treasury Bond,
7.00%, 05/15/22 | | | 1,241,835 | |
| | 33,556,000,000 | (f) | | Indonesia Treasury Bond,
12.90%, 06/15/22 | | | 2,930,462 | |
| | 11,791,000,000 | (f) | | Indonesia Treasury Bond,
10.25%, 07/15/22 | | | 916,071 | |
| | 19,316,000,000 | (f) | | Indonesia Treasury Bond,
5.63%, 05/15/23 | | | 1,154,553 | |
| | 5,669,000,000 | (f) | | Indonesia Treasury Bond,
8.38%, 03/15/24 | | | 403,438 | |
| | 5,565,000,000 | (f) | | Indonesia Treasury Bond,
8.38%, 09/15/26 | | | 390,043 | |
| | 388,000,000 | (f) | | Indonesia Treasury Bond,
9.00%, 03/15/29 | | | 28,134 | |
| Principal | | | | | | |
| Amount | | | | | Value | |
| INDONESIA (continued) | | | | |
| $ | 4,640,000,000 | (f) | | Indonesia Treasury Bond,
8.38%, 03/15/34 | | $ | 315,974 | |
| | | | | | | | 13,638,735 | |
| IRELAND — 0.1% | | | | |
| | 3,489,060 | (f) | | Ireland Government Bond,
5.40%, 03/13/25 | | | 5,283,660 | |
| MALAYSIA — 0.4% | | | | |
| | 20,860,000 | (f) | | Bank Negara Malaysia Monetary Notes,
3.35%, 12/08/15(j) | | | 4,841,690 | |
| | 40,000 | (f) | | Bank Negara Malaysia Monetary Notes,
3.06%, 03/01/16(j) | | | 9,221 | |
| | 9,433,000 | (f) | | Bank Negara Malaysia Monetary Notes,
3.05%, 04/19/16(j) | | | 2,166,110 | |
| | 20,000 | (f) | | Bank Negara Malaysia Monetary Notes,
3.04%, 05/03/16(j) | | | 4,587 | |
| | 690,000 | (f) | | Bank Negara Malaysia Monetary Notes,
2.74%, 05/12/16(j) | | | 158,147 | |
| | 930,000 | (f) | | Bank Negara Malaysia Monetary Notes,
3.08%, 06/07/16(j) | | | 212,699 | |
| | 1,180,000 | (f) | | Bank Negara Malaysia Monetary Notes,
3.04%, 07/19/16(j) | | | 268,826 | |
| | 36,810,000 | (f) | | Bank Negara Malaysia Monetary Notes,
3.05%, 09/15/16(j) | | | 8,348,904 | |
| | 43,940,000 | (f) | | Bank Negara Malaysia Monetary Notes,
3.08%, 09/22/16(j) | | | 9,961,472 | |
| | 390,000 | (f) | | Bank Negara Malaysia Monetary Notes,
3.04%, 10/06/16(j) | | | 88,294 | |
| | 1,510,000 | (f) | | Bank Negara Malaysia Monetary Notes,
3.04%, 10/11/16(j) | | | 341,782 | |
| | 1,190,000 | (f) | | Bank Negara Malaysia Monetary Notes,
3.04%, 10/18/16(j) | | | 269,193 | |
| | 6,858,000 | (f) | | Malaysia Government Bond,
3.17%, 07/15/16 | | | 1,601,206 | |
| | 5,015,000 | (f) | | Malaysia Government Bond,
4.26%, 09/15/16 | | | 1,181,315 | |
| | 2,220,000 | (f) | | Malaysia Government Bond,
3.81%, 02/15/17 | | | 523,825 | |
| | 2,790,000 | (f) | | Malaysia Government Bond,
3.39%, 03/15/17 | | | 652,602 | |
| | 90,000 | (f) | | Malaysia Treasury Bill,
3.06%, 12/04/15(j) | | | 20,896 | |
| Old Westbury Funds, Inc. | |
| Strategic Opportunities Fund | |
| Consolidated Portfolio of Investments - (Continued) | October 31, 2015 |
| | |
| Principal | | | | | | |
| Amount | | | | | Value | |
| MALAYSIA (continued) | | | | |
| $ | 760,000 | (f) | | Malaysia Treasury Bill,
2.82%, 12/11/15(j) | | $ | 176,356 | |
| | 10,000 | (f) | | Malaysia Treasury Bill,
3.08%, 01/22/16(j) | | | 2,313 | |
| | 10,000 | (f) | | Malaysia Treasury Bill,
2.96%, 04/29/16(j) | | | 2,294 | |
| | 130,000 | (f) | | Malaysia Treasury Bill,
2.79%, 05/27/16(j) | | | 29,759 | |
| | 20,000 | (f) | | Malaysia Treasury Bill,
3.04%, 08/05/16(j) | | | 4,552 | |
| | | | | | | | 30,866,043 | |
| MEXICO — 0.7% | | | | |
| | 105,043,000 | (f) | | Mexican Bonos,
8.00%, 12/17/15 | | | 6,391,745 | |
| | 71,850,000 | (f) | | Mexican Bonos,
6.25%, 06/16/16 | | | 4,424,205 | |
| | 113,190,000 | (f) | | Mexican Bonos,
7.25%, 12/15/16 | | | 7,127,794 | |
| | 23,900,000 | (f) | | Mexican Bonos,
7.75%, 12/14/17 | | | 1,556,136 | |
| | 2,720,000 | (f) | | Mexican Udibonos,
5.00%, 06/16/16 | | | 904,406 | |
| | 2,712,000 | (f) | | Mexican Udibonos,
3.50%, 12/14/17 | | | 928,834 | |
| | 1,851,000 | (f) | | Mexican Udibonos,
4.00%, 06/13/19 | | | 647,458 | |
| | 1,465,000 | (f) | | Mexican Udibonos,
2.50%, 12/10/20 | | | 484,352 | |
| | 78,881,000 | (f) | | Mexico Cetes,
3.23%, 11/12/15(j) | | | 477,031 | |
| | 43,174,000 | (f) | | Mexico Cetes,
1.50%, 11/26/15(j) | | | 260,788 | |
| | 117,624,000 | (f) | | Mexico Cetes,
3.66%, 12/03/15(j) | | | 710,082 | |
| | 194,929,000 | (f) | | Mexico Cetes,
3.46%, 12/10/15(j) | | | 1,176,067 | |
| | 40,425,000 | (f) | | Mexico Cetes,
3.25%, 12/24/15(j) | | | 243,613 | |
| | 259,614,000 | (f) | | Mexico Cetes,
2.97%, 01/07/16(j) | | | 1,562,481 | |
| | 43,929,000 | (f) | | Mexico Cetes,
3.28%, 01/21/16(j) | | | 264,035 | |
| | 258,668,000 | (f) | | Mexico Cetes,
3.58%, 02/04/16(j) | | | 1,552,731 | |
| | 631,652,000 | (f) | | Mexico Cetes,
3.56%, 02/18/16(j) | | | 3,786,554 | |
| | 584,559,000 | (f) | | Mexico Cetes,
3.39%, 03/03/16(j) | | | 3,499,434 | |
| | 38,399,000 | (f) | | Mexico Cetes,
3.25%, 03/17/16(j) | | | 229,551 | |
| | 630,028,000 | (f) | | Mexico Cetes,
2.31%, 03/31/16(j) | | | 3,760,952 | |
| Principal | | | | | | |
| Amount | | | | | Value | |
| MEXICO (continued) | | | | |
| $ | 152,232,000 | (f) | | Mexico Cetes,
3.28%, 04/14/16(j) | | $ | 907,606 | |
| | 93,787,000 | (f) | | Mexico Cetes,
3.22%, 04/28/16(j) | | | 558,442 | |
| | 130,794,000 | (f) | | Mexico Cetes,
3.25%, 05/26/16(j) | | | 776,713 | |
| | 161,211,000 | (f) | | Mexico Cetes,
3.25%, 06/23/16(j) | | | 954,727 | |
| | 624,861,000 | (f) | | Mexico Cetes,
3.21%, 08/18/16(j) | | | 3,679,870 | |
| | 12,317,000 | (f) | | Mexico Cetes,
3.20%, 10/13/16(j) | | | 72,077 | |
| | | | | | | | 46,937,684 | |
| PHILIPPINES — 0.1% | | | | |
| | 970,000 | (f) | | Philippine Government Bond,
7.00%, 01/27/16 | | | 20,947 | |
| | 44,300,000 | (f) | | Philippine Government Bond,
1.63%, 04/25/16 | | | 942,450 | |
| | 312,450,000 | (f) | | Philippine Government Bond,
9.13%, 09/04/16 | | | 7,043,946 | |
| | 1,640,000 | (f) | | Philippine Treasury Bill,
1.37%, 11/04/15(j) | | | 35,020 | |
| | 4,060,000 | (f) | | Philippine Treasury Bill,
1.45%, 12/02/15(j) | | | 86,534 | |
| | 680,000 | (f) | | Philippine Treasury Bill,
1.06%, 02/03/16(j) | | | 14,501 | |
| | 4,510,000 | (f) | | Philippine Treasury Bill,
1.05%, 03/09/16(j) | | | 95,884 | |
| | 5,020,000 | (f) | | Philippine Treasury Bill,
1.37%, 09/07/16(j) | | | 105,772 | |
| | | | | | | | 8,345,054 | |
| POLAND — 0.2% | | | | |
| | 28,470,000 | (f) | | Poland Government Bond,
2.94%, 01/25/16(j) | | | 7,341,670 | |
| | 8,188,000 | (f) | | Poland Government Bond,
1.79%, 01/25/17(g) | | | 2,118,220 | |
| | 8,307,000 | (f) | | Poland Government Bond,
1.79%, 01/25/21(g) | | | 2,112,676 | |
| | | | | | | | 11,572,566 | |
| PORTUGAL — 0.0% | | | | |
| | 2,560,000 | | | Portugal Government International Bond,
5.13%, 10/15/24(e) | | | 2,703,360 | |
| SERBIA — 0.1% | | | | |
| | 1,540,000 | | | Republic of Serbia,
5.25%, 11/21/17(e) | | | 1,604,492 | |
| | 3,280,000 | | | Republic of Serbia,
7.25%, 09/28/21(e) | | | 3,748,712 | |
| | | | | | | | 5,353,204 | |
| Old Westbury Funds, Inc. | |
| Strategic Opportunities Fund | |
| Consolidated Portfolio of Investments - (Continued) | October 31, 2015 |
| | |
| Principal | | | | | | |
| Amount | | | | | Value | |
| SINGAPORE — 0.1% | | | | |
| $ | 9,420,000 | (f) | | Monetary Authority of Singapore,
0.97%, 11/06/15(j) | | $ | 6,723,590 | |
| SLOVENIA — 0.0% | | | | |
| | 2,660,000 | | | Slovenia Government International Bond,
5.50%, 10/26/22(e) | | | 3,010,210 | |
| | 400,000 | | | Slovenia Government International Bond,
5.85%, 05/10/23(e) | | | 462,500 | |
| | | | | | | | 3,472,710 | |
| SOUTH KOREA — 0.7% | | | | |
| | 2,734,100,000 | (f) | | Korea Monetary Stabilization Bond,
1.34%, 11/10/15(j) | | | 2,397,437 | |
| | 1,227,100,000 | (f) | | Korea Monetary Stabilization Bond,
2.90%, 12/02/15 | | | 1,077,692 | |
| | 483,000,000 | (f) | | Korea Monetary Stabilization Bond,
1.52%, 12/15/15(j) | | | 422,861 | |
| | 434,500,000 | (f) | | Korea Monetary Stabilization Bond,
1.49%, 01/05/16(j) | | | 380,082 | |
| | 1,085,200,000 | (f) | | Korea Monetary Stabilization Bond,
1.49%, 01/12/16(j) | | | 949,009 | |
| | 6,850,980,000 | (f) | | Korea Monetary Stabilization Bond,
2.80%, 04/02/16 | | | 6,041,344 | |
| | 26,400,000 | (f) | | Korea Monetary Stabilization Bond,
1.50%, 04/19/16(j) | | | 22,991 | |
| | 532,200,000 | (f) | | Korea Monetary Stabilization Bond,
1.74%, 05/09/16 | | | 467,287 | |
| | 6,862,000,000 | (f) | | Korea Monetary Stabilization Bond,
2.79%, 06/02/16 | | | 6,062,985 | |
| | 325,600,000 | (f) | | Korea Monetary Stabilization Bond,
1.62%, 06/09/16 | | | 285,716 | |
| | 77,500,000 | (f) | | Korea Monetary Stabilization Bond,
1.57%, 07/09/16 | | | 67,984 | |
| | 14,296,000,000 | (f) | | Korea Monetary Stabilization Bond,
2.46%, 08/02/16 | | | 12,624,093 | |
| | 2,506,200,000 | (f) | | Korea Monetary Stabilization Bond,
1.56%, 08/09/16 | | | 2,203,776 | |
| | 312,500,000 | (f) | | Korea Monetary Stabilization Bond,
1.52%, 09/09/16 | | | 273,993 | |
| | 2,990,700,000 | (f) | | Korea Monetary Stabilization Bond,
2.22%, 10/02/16 | | | 2,638,298 | |
| | 1,537,800,000 | (f) | | Korea Monetary Stabilization Bond,
1.53%, 10/08/16 | | | 1,348,195 | |
| | 6,521,400,000 | (f) | | Korea Monetary Stabilization Bond,
2.07%, 12/02/16 | | | 5,748,842 | |
| | 769,600,000 | (f) | | Korea Monetary Stabilization Bond,
1.96%, 02/02/17 | | | 677,955 | |
| | 2,153,100,000 | (f) | | Korea Treasury Bond,
2.75%, 06/10/16 | | | 1,902,298 | |
| | 1,634,040,000 | (f) | | Korea Treasury Bond,
3.00%, 12/10/16 | | | 1,455,034 | |
| | | | | | | | 47,047,872 | |
| Principal | | | | | | |
| Amount | | | | | Value | |
| SRI LANKA — 0.0% | | | | |
| $ | 120,600,000 | (f) | | Sri Lanka Government Bonds,
10.60%, 07/01/19 | | $ | 892,808 | |
| | 3,400,000 | (f) | | Sri Lanka Government Bonds,
10.60%, 09/15/19 | | | 25,172 | |
| | 20,380,000 | (f) | | Sri Lanka Government Bonds,
9.25%, 05/01/20 | | | 146,004 | |
| | 101,930,000 | (f) | | Sri Lanka Government Bonds,
11.00%, 08/01/21 | | | 770,474 | |
| | | | | | | | 1,834,458 | |
| UKRAINE — 0.2% | | | | |
| | 200,000 | | | Financing of Infrastrucural Projects State Enterprise,
7.40%, 04/20/18(e) | | | 156,500 | |
| | 100,000 | (f) | | Ukraine Government International Bond,
4.95%, 10/13/15(e) | | | 85,773 | |
| | 200,000 | | | Ukraine Government International Bond,
6.25%, 06/17/16(e) | | | 155,000 | |
| | 4,230,000 | | | Ukraine Government International Bond,
9.25%, 07/24/17(e) | | | 3,309,975 | |
| | 1,350,000 | | | Ukraine Government International Bond,
6.75%, 11/14/17(e) | | | 1,056,375 | |
| | 9,900,000 | | | Ukraine Government International Bond,
7.75%, 09/23/20(e) | | | 7,722,000 | |
| | 1,580,000 | | | Ukraine Government International Bond,
7.80%, 11/28/22(e) | | | 1,232,400 | |
| | | | | | | | 13,718,023 | |
Total Government Bonds
(Cost $250,838,360) | | | 228,111,993 | |
| ASSET-BACKED SECURITIES — 8.4% | | | | |
| CAYMAN ISLANDS — 2.2% | | | | |
| | 11,750,000 | | | Adams Mill CLO Ltd., Series 2014-1A, Class F, 5.98%, 07/15/26(c)(e)(g) | | | 8,888,621 | |
| | 7,500,000 | | | Adams Mill CLO Ltd., Series 2014-1A, Class SUB, 1.00%, 07/15/26(c)(e)(j) | | | 3,669,023 | |
| | 3,000,000 | | | ALM VI Ltd., Series 2012-6A, Class DR, 5.94%, 07/15/26(e)(g) | | | 2,867,236 | |
| | 2,000,000 | | | ALM XVI Ltd., Series 2015-16A, Class D, 5.61%, 07/15/27(e)(g) | | | 1,707,596 | |
| | 2,500,000 | | | Anchorage Capital CLO Ltd., Series 2015-6A, Class F, 6.22%, 04/15/27(e)(g) | | | 1,970,752 | |
| | 3,500,000 | | | Apidos CLO XIX, Series 2014-19A, Class E, 5.77%, 10/17/26(e)(g) | | | 3,012,374 | |
| | 5,000,000 | | | Apidos CLO XVIII, Series 2014-18A, Class D, 5.52%, 07/22/26(e)(g) | | | 4,262,465 | |
| Old Westbury Funds, Inc. | |
| Strategic Opportunities Fund | |
| Consolidated Portfolio of Investments - (Continued) | October 31, 2015 |
| | |
| Principal | | | | | | |
| Amount | | | | | Value | |
| CAYMAN ISLANDS (continued) | | | | |
| $ | 2,500,000 | | | Apidos CLO XX, Series 2015-20A, Class D, 5.92%, 01/16/27(e)(g) | | $ | 2,174,762 | |
| | 1,000,000 | | | Ares XXXIII CLO Ltd., Series 2015-1A, Class D, 6.56%, 12/05/25(e)(g) | | | 904,024 | |
| | 2,000,000 | | | Ares XXXVII CLO Ltd., Series 2015-4A, Class D2, 7.35%, 10/15/26(e)(g) | | | 1,900,000 | |
| | 650,000 | | | Atlas Senior Loan Fund Ltd., Series 2012-1A, Class B2L, 6.57%, 08/15/24(e)(g) | | | 635,577 | |
| | 5,000,000 | | | Atrium XI, Series 11A, Class E, 5.39%, 10/23/25(e)(g) | | | 4,285,539 | |
| | 2,000,000 | | | Atrium XII, Series 12A, Class E, 5.95%, 10/22/26(e)(g) | | | 1,832,600 | |
| | 2,500,000 | | | Babson CLO Ltd., Series 2014-3A, Class E1, 5.42%, 01/15/26(e)(g) | | | 2,080,745 | |
| | 750,000 | | | Babson CLO Ltd., Series 2015-2A, Class E, 5.84%, 07/20/27(e)(g) | | | 649,622 | |
| | 2,000,000 | | | Battalion CLO IX Ltd., Series 2015-9A, Class D, 4.22%, 07/15/28(e)(g) | | | 1,858,247 | |
| | 1,250,000 | | | Battalion CLO VII Ltd., Series 2014-7A, Class D, 5.62%, 10/17/26(e)(g) | | | 1,056,411 | |
| | 1,500,000 | | | Battalion CLO VIII Ltd., Series 2015-8A, Class D, 5.77%, 04/18/27(e)(g) | | | 1,274,433 | |
| | 2,500,000 | | | Benefit Street Partners CLO V Ltd., Series 2014-VA, Class E, 5.44%, 10/20/26(e)(g) | | | 2,117,018 | |
| | 1,250,000 | | | Benefit Street Partners CLO VI Ltd., Series 2015-VIA, Class D, 5.87%, 04/18/27(e)(g) | | | 1,080,318 | |
| | 2,250,000 | | | Benefit Street Partners CLO VIII Ltd., Series 2015-8A, Class C, 4.22%, 01/20/28(e)(g) | | | 2,087,145 | |
| | 1,250,000 | | | Benefit Street Partners CLO VIII Ltd., Series 2015-8A, Class D, 5.82%, 01/20/28(e)(g) | | | 1,057,500 | |
| | 650,000 | | | BlueMountain CLO Ltd., Series 2011-1A, Class E, 6.07%, 08/16/22(e)(g) | | | 653,234 | |
| | 1,250,000 | | | BlueMountain CLO Ltd., Series 2014-4A, Class E, 5.62%, 11/30/26(e)(g) | | | 1,089,786 | |
| | 1,500,000 | | | BlueMountain CLO Ltd., Series 2015-1A, Class D, 5.77%, 04/13/27(e)(g) | | | 1,317,137 | |
| | 500,000 | | | BlueMountain CLO Ltd., Series 2015-2A, Class E, 5.63%, 07/18/27(e)(g) | | | 429,172 | |
| | 1,500,000 | | | Carlyle Global Market Strategies CLO 2015-3 Ltd., Series 2015-3A, Class D, 6.16%, 07/28/28(e)(g) | | | 1,322,071 | |
| Principal | | | | | | |
| Amount | | | | | Value | |
| CAYMAN ISLANDS (continued) | | | | |
| $ | 1,500,000 | | | Carlyle Global Market Strategies CLO Ltd., Series 2015-1A, Class E1, 5.59%, 04/20/27(e)(g) | | $ | 1,303,144 | |
| | 1,000,000 | | | Carlyle Global Market Strategies CLO, Series 2015-2A, Class D, 5.57%, 04/27/27(e)(g) | | | 869,926 | |
| | 1,500,000 | | | CIFC Funding Ltd., Series 2012-2A, Class B2R, 6.08%, 05/26/27(e)(g) | | | 1,440,989 | |
| | 1,000,000 | | | Dryden Senior Loan Fund, Series 2014-36A, Class E, 5.51%, 11/09/25(e)(g) | | | 849,214 | |
| | 600,000 | | | Goldentree Loan Opportunities VI Ltd., Series 2012-6A, Class E, 5.82%, 04/17/22(e)(g) | | | 570,314 | |
| | 2,000,000 | | | Goldentree Loan Opportunities XI Ltd., Series 2015-11A, Class E, 5.87%, 04/18/27(e)(g) | | | 1,767,771 | |
| | 3,000,000 | | | Gramercy Park CLO Ltd., Series 2012-1AR, Class DR, 5.79%, 07/17/23(e)(g) | | | 2,948,798 | |
| | 21,500,000 | | | Jackson Mill CLO Ltd., Series 2015-1A, Class E, 5.22%, 04/15/27(c)(e)(g) | | | 17,640,292 | |
| | 20,000,000 | | | Jackson Mill CLO Ltd., Series 2015-1A, Class SUB, 1.00%, 04/15/27(c)(e)(j) | | | 14,122,800 | |
| | 8,000,000 | | | Jefferson Mill CLO Ltd., Series 2015-1A, Class F, 6.78%, 07/20/27(c)(e)(g) | | | 6,700,080 | |
| | 8,000,000 | | | Jefferson Mill CLO Ltd., Series 2015-1A, Class SUB, 1.00%, 07/20/27(c)(e)(j) | | | 4,157,040 | |
| | 1,500,000 | | | LCM XVIII LP, Series -18A, Class D, 4.12%, 04/20/27(e)(g) | | | 1,408,282 | |
| | 1,000,000 | | | LCM XVIII LP, Series 18A, Class E, 10.00%, 04/20/27(e)(j) | | | 732,070 | |
| | 1,000,000 | | | LCM XVIII LP, Series 18A, Class E, 5.64%, 04/20/27(e)(g) | | | 870,331 | |
| | 1,000,000 | | | Madison Park Funding Ltd., Series 2012-9A, Class E, 5.57%, 08/15/22(e)(g) | | | 923,641 | |
| | 1,000,000 | | | Madison Park Funding XV Ltd., Series 2014-15A, Class D, 5.75%, 01/27/26(e)(g) | | | 880,318 | |
| | 1,250,000 | | | Neuberger Berman CLO XII Ltd., Series 2012-12AR, Class ER, 6.55%, 07/25/23(e)(g) | | | 1,194,790 | |
| | 1,000,000 | | | Neuberger Berman CLO XVIII Ltd., Series 2014-18A, Class D, 5.53%, 11/14/25(e)(g) | | | 834,959 | |
| | 1,250,000 | | | Octagon Investment Partners XXII Ltd., Series 2014-1A, Class E1, 5.57%, 11/22/25(e)(g) | | | 1,064,166 | |
| | 5,000,000 | | | Octagon Loan Funding Ltd., Series 2014-1A, Class E, 5.52%, 11/18/26(e)(g) | | | 4,247,045 | |
| Old Westbury Funds, Inc. | |
| Strategic Opportunities Fund | |
| Consolidated Portfolio of Investments - (Continued) | October 31, 2015 |
| | |
| Principal | | | | | | |
| Amount | | | | | Value | |
| CAYMAN ISLANDS (continued) | | | | |
| $ | 1,375,000 | | | OHA Credit Partners XI Ltd., Series 2015-11A, Class E, 7.02%, 10/20/28(e)(g) | | $ | 1,270,938 | |
| | 1,750,000 | | | OZLM Funding III Ltd., Series 2013-3A, Class D, 5.32%, 01/22/25(e)(g) | | | 1,509,160 | |
| | 1,750,000 | | | OZLM Funding Ltd., Series 2012-1A, Class DR, 7.02%, 07/22/27(e)(g) | | | 1,717,108 | |
| | 2,500,000 | | | OZLM VII Ltd., Series 2014-7A, Class D, 5.32%, 07/17/26(e)(g) | | | 2,076,117 | |
| | 1,000,000 | | | OZLM XI Ltd., Series 2015-11A, Class D, 5.70%, 01/30/27(e)(g) | | | 858,272 | |
| | 1,250,000 | | | OZLM XIII Ltd., Series 2015-13A, Class D, 5.73%, 07/30/27(e)(g) | | | 1,055,811 | |
| | 2,000,000 | | | Regatta V Funding Ltd., Series 2014-1A, Class D, 5.20%, 10/25/26(e)(g) | | | 1,635,360 | |
| | 1,650,000 | | | Sound Point CLO III Ltd., Series 2013-2A, Class E, 4.92%, 07/15/25(e)(g) | | | 1,369,991 | |
| | 1,000,000 | | | Sound Point CLO IX Ltd., Series 2015-2A, Class E, 5.97%, 07/20/27(e)(g) | | | 852,200 | |
| | 1,000,000 | | | Stewart Park CLO Ltd., Series 2015-1A, Class E, 5.77%, 04/15/26(e)(g) | | | 869,746 | |
| | 1,500,000 | | | Symphony CLO XV Ltd., Series 2014-15A, Class E, 5.37%, 10/17/26(e)(g) | | | 1,290,461 | |
| | 1,000,000 | | | Voya CLO Ltd., Series 2012-2AR, Class ER, 6.32%, 10/15/22(e)(g) | | | 938,656 | |
| | 1,000,000 | | | Voya CLO Ltd., Series 2014-4A, Class D,
5.82%, 10/14/26(e)(g) | | | 844,584 | |
| | 3,750,000 | | | Voya CLO Ltd., Series 2015-1A, Class E, 6.82%, 04/18/27(e)(g) | | | 3,110,703 | |
| | 11,250,000 | | | Washington Mill CLO Ltd., Series 2014-1A, Class F, 5.79%, 04/20/26(c)(e)(g) | | | 8,110,237 | |
| | 17,600,000 | | | Washington Mill CLO Ltd., Series 2014-1A, Class SUB, 0.99%, 04/20/26(c)(e)(j) | | | 7,659,369 | |
| | | | | | | | 155,878,091 | |
| UNITED STATES — 6.2% | | | | |
| | 12,764,716 | | | Argent Mortgage Loan Trust, Series 2005-W1, Class A2, 0.44%, 05/25/35(g) | | | 9,911,419 | |
| | 10,176,409 | | | Bayview Financial Revolving Asset Trust, Series 2004-B, Class A1, 1.19%, 05/28/39(e)(g) | | | 8,037,705 | |
| | 3,169,240 | | | Bear Stearns Asset Backed Securities I Trust, Series 2006-EC2, Class M2, 0.62%, 02/25/36(g) | | | 2,702,386 | |
| | 9,203,609 | | | Bear Stearns Asset Backed Securities I Trust, Series 2006-HE10, Class 22A, 0.34%, 12/25/36(g) | | | 7,423,355 | |
| Principal | | | | | | |
| Amount | | | | | Value | |
| UNITED STATES (continued) | | | | |
| $ | 3,976,880 | | | Bear Stearns Asset-Backed Securities Trust, Series 2006-AC2, Class 22A1, 0.54%, 03/25/36(g) | | $ | 1,427,748 | |
| | 3,976,880 | | | Bear Stearns Asset-Backed Securities Trust, Series 2006-AC2, Class 22A3, 0.54%, 03/25/36(g) | | | 1,427,748 | |
| | 16,908,837 | | | Bear Stearns Asset-Backed Securities Trust, Series 2006-AQ1, Class 2A2, 0.40%, 10/25/36(g) | | | 13,389,022 | |
| | 8,000,000 | | | Bear Stearns Second Lien Trust, Series 2007-SV1A, Class M1, 1.00%, 12/25/36(e)(g) | | | 7,445,964 | |
| | 3,839,462 | | | Bombardier Capital Mortgage Securitization Pass-Through Certificates, Series 2000-A, Class A2, 7.58%, 06/15/30(g) | | | 2,094,937 | |
| | 3,599,496 | | | Bombardier Capital Mortgage Securitization Pass-Through Certificates, Series 2000-A, Class A3, 7.83%, 06/15/30(g) | | | 1,988,898 | |
| | 6,095,146 | | | Bombardier Capital Mortgage Securitization Pass-Through Certificates, Series 2000-A, Class A4, 8.29%, 06/15/30(g) | | | 3,443,916 | |
| | 3,800,000 | | | Carrington Mortgage Loan Trust Series, Series 2006-NC2, Class A3, 0.34%, 06/25/36(g) | | | 3,228,195 | |
| | 8,203,000 | | | Carrington Mortgage Loan Trust, Series 2006-FRE1, Class A3, 0.34%, 07/25/36(g) | | | 6,759,108 | |
| | 3,900,990 | | | Carrington Mortgage Loan Trust, Series 2007-FRE1, Class A2, 0.39%, 02/25/37(g) | | | 3,676,375 | |
| | 4,884,740 | | | Carrington Mortgage Loan Trust, Series 2007-FRE1, Class A4, 0.61%, 02/25/37(g) | | | 3,143,863 | |
| | 8,250,000 | | | Carrington Mortgage Loan Trust, Series 2007-RFC1, Class A3, 0.33%, 12/25/36(g) | | | 5,281,492 | |
| | 5,700,000 | | | Carrington Mortgage Loan Trust, Series 2007-RFC1, Class A4, 0.41%, 12/25/36(g) | | | 3,694,324 | |
| | 4,175,222 | | | Conseco Financial Corp., Series 1997-7, Class M1, 7.03%, 07/15/28. | | | 3,974,127 | |
| | 4,929,886 | | | Countrywide Asset-Backed Certificates Trust, Series 2006-9, Class 2AV, 0.32%, 10/25/46(g) | | | 3,712,579 | |
| | 2,375,347 | | | Countrywide Asset-Backed Certificates, Series 2006-11, Class 3AV2, 0.35%, 09/25/46(g) | | | 2,122,066 | |
| | 7,785,636 | | | Countrywide Asset-Backed Certificates, Series 2006-12, Class 2A2, 0.34%, 12/25/36(g) | | | 7,438,296 | |
| | 11,167,102 | | | Countrywide Asset-Backed Certificates, Series 2006-16, Class 1A, 0.33%, 12/25/46(g) | | | 8,251,260 | |
| Old Westbury Funds, Inc. | |
| Strategic Opportunities Fund | |
| Consolidated Portfolio of Investments - (Continued) | October 31, 2015 |
| | |
| Principal | | | | | | |
| Amount | | | | | Value | |
| UNITED STATES (continued) | | | | |
| $ | 6,046,521 | | | Countrywide Asset-Backed Certificates, Series 2006-19, Class 2A2, 0.35%, 03/25/37(g) | | $ | 5,602,012 | |
| | 6,802,415 | | | Countrywide Asset-Backed Certificates, Series 2006-BC5, Class 2A3, 0.36%, 03/25/37(g) | | | 6,926,078 | |
| | 3,277,619 | | | Countrywide Asset-Backed Certificates, Series 2006-S3, Class A3, STEP, 6.29%, 06/25/21 | | | 3,347,366 | |
| | 2,890,831 | | | Countrywide Asset-Backed Certificates, Series 2007-4, Class A2, 5.53%, 04/25/47(g) | | | 3,118,078 | |
| | 7,857,457 | | | Countrywide Asset-Backed Certificates, Series 2007-S3, Class A3, 0.57%, 05/25/37(g) | | | 6,727,109 | |
| | 4,165,827 | | | Countrywide Home Equity Loan Trust, Series 2006-S5, Class A4, 5.84%, 06/25/35 | | | 4,051,910 | |
| | 5,295,543 | | | Countrywide Home Equity Loan Trust, Series 2006-S5, Class A5, 6.16%, 06/25/35 | | | 4,811,984 | |
| | 3,540,359 | | | Countrywide Revolving Home Equity Loan Resecuritization Trust, Series 2006-RES, Class 4Q1B, 0.50%, 12/15/33(e)(g) | | | 2,879,020 | |
| | 3,317,662 | | | Countrywide Revolving Home Equity Loan Resecuritization Trust, Series 2006-RES, Class 4T1B, 0.44%, 02/15/30(e)(g) | | | 2,752,763 | |
| | 3,018,060 | | | Countrywide Revolving Home Equity Loan Resecuritization Trust, Series 2006-RES, Class 5B1B, 0.39%, 05/15/35(e)(g) | | | 2,536,589 | |
| | 3,189,363 | | | Credit-Based Asset Servicing & Securitization LLC Trust, Series 2006-CB9, Class A3, 0.35%, 11/25/36(g) | | | 1,755,039 | |
| | 8,137,330 | | | Fieldstone Mortgage Investment Trust, Series 2006-3, Class 2A3, 0.35%, 11/25/36(g) | | | 4,478,622 | |
| | 6,198,604 | | | First Franklin Mortgage Loan Trust Asset Backed Certificates, Series 2007-FF2, Class A2C, 0.35%, 03/25/37(g) | | | 3,963,235 | |
| | 8,779,895 | | | Fremont Home Loan Trust, Series 2006-3, Class 2A3, 0.37%, 02/25/37(g) | | | 4,912,441 | |
| | 7,601,843 | | | Fremont Home Loan Trust, Series 2006-E, Class 2A3, 0.34%, 01/25/37(g) | | | 3,922,824 | |
| | 6,005,938 | | | GFT Mortgage Loan Trust, Series 2015-GFT1, Class A, STEP, 3.72%, 01/25/55(e) | | | 5,936,870 | |
| | 5,954,269 | | | GMAC Mortgage Home Equity Loan Trust, Series 2005-HE3, Class A3, 0.43%, 02/25/36(g) | | | 5,525,264 | |
| Principal | | | | | | |
| Amount | | | | | Value | |
| UNITED STATES (continued) | | | | |
| $ | 4,928,859 | | | GMAC Mortgage Home Equity Loan Trust, Series 2006-HE1, Class A, 0.40%, 11/25/36(g) | | $ | 4,306,359 | |
| | 4,112,263 | | | Greenpoint Manufactured Housing, Series 1999-1, Class A5, 6.77%, 08/15/29(g) | | | 4,008,756 | |
| | 3,704,784 | | | Greenpoint Manufactured Housing, Series 2000-1, Class A4, 8.14%, 03/20/30(g) | | | 3,895,757 | |
| | 9,677,513 | | | Greenpoint Manufactured Housing, Series 2000-3, Class IA, 8.45%, 06/20/31(g) | | | 9,915,318 | |
| | 820,625 | | | GSAA Trust, Series 2006-7, Class AF2, 5.99%, 03/25/46(g) | | | 606,407 | |
| | 1,000,000 | | | Highbridge Loan Management Ltd., Series 2015-6A, Class E1, 5.75%, 03/17/27(e)(g) | | | 827,006 | |
| | 1,000,000 | | | Highbridge Loan Management Ltd., Series 2015-7A, Class D, 4.07%, 11/15/26(g) | | | 927,378 | |
| | 4,000,000 | | | Invitation Homes Trust, Series 2015-SFR3, Class E, 3.95%, 08/17/32(e)(g) | | | 3,925,360 | |
| | 1,623,391 | | | Irwin Home Equity Loan Trust, Series 2006-2, Class 2A2, STEP, 6.24%, 02/25/36(e) | | | 1,691,017 | |
| | 11,661,265 | | | Long Beach Mortgage Loan Trust, Series 2006-1, Class 1A, 0.42%, 02/25/36(g) | | | 9,446,823 | |
| | 23,720,284 | | | Long Beach Mortgage Loan Trust, Series 2006-1, Class 2A3, 0.39%, 02/25/36(g) | | | 14,737,887 | |
| | 1,504,347 | | | Long Beach Mortgage Loan Trust, Series 2006-10, Class 2A2, 0.31%, 11/25/36(g) | | | 597,623 | |
| | 20,750,527 | | | Long Beach Mortgage Loan Trust, Series 2006-10, Class 2A3, 0.36%, 11/25/36(g) | | | 8,344,741 | |
| | 4,078,573 | | | Long Beach Mortgage Loan Trust, Series 2006-10, Class 2A4, 0.42%, 11/25/36(g) | | | 1,664,564 | |
| | 9,106,333 | | | Long Beach Mortgage Loan Trust, Series 2006-2, Class 2A3, 0.39%, 03/25/46(g) | | | 4,304,096 | |
| | 22,621,695 | | | Long Beach Mortgage Loan Trust, Series 2006-6, Class 1A, 0.34%, 07/25/36(g) | | | 14,280,533 | |
| | 5,808,949 | | | Long Beach Mortgage Loan Trust, Series 2006-7, Class 2A2, 0.32%, 08/25/36(g) | | | 3,051,197 | |
| | 8,003,111 | | | Mastr Asset Backed Securities Trust, Series 2006-NC3, Class A4, 0.35%, 10/25/36(g) | | | 4,848,703 | |
| | 5,282,004 | | | Mastr Second Lien Trust, Series 2006-1, Class A, 0.51%, 03/25/36(g) | | | 1,177,506 | |
| Old Westbury Funds, Inc. | |
| Strategic Opportunities Fund | |
| Consolidated Portfolio of Investments - (Continued) | October 31, 2015 |
| | |
| Principal | | | | | | |
| Amount | | | | | Value | |
| UNITED STATES (continued) | | | | |
| $ | 1,923,281 | | | Morgan Stanley ABS Capital I, Series 2006-HE4, Class A4, 0.44%, 06/25/36(g) | | $ | 1,291,782 | |
| | 12,891,926 | | | Morgan Stanley ABS Capital I, Series 2006-HE6, Class A2C, 0.35%, 09/25/36(g) | | | 6,557,499 | |
| | 4,304,833 | | | Morgan Stanley ABS Capital I, Series 2007-HE1, Class A2D, 0.43%, 11/25/36(g) | | | 2,566,832 | |
| | 10,333,293 | | | Morgan Stanley ABS Capital I, Series 2007-NC3, Class A2B, 0.33%, 05/25/37(g) | | | 7,110,579 | |
| | 6,399,670 | | | Morgan Stanley Mortgage Loan Trust, Series 2006-12XS, Class A4, STEP, 6.01%, 10/25/36 | | | 3,403,300 | |
| | 1,000,000 | | | Neuberger Berman CLO Ltd., Series 2015-20A, Class D, 4.27%, 01/15/28(g) | | | 947,700 | |
| | 1,250,000 | | | Neuberger Berman CLO Ltd., Series 2015-20A, Class E, 6.77%, 01/15/28(g) | | | 1,151,125 | |
| | 3,935,877 | | | Oakwood Mortgage Investors, Inc., Series 1999-C, Class A2, 7.48%, 08/15/27 | | | 3,941,478 | |
| | 1,186,096 | | | Oakwood Mortgage Investors, Inc., Series 2001-D, Class A3, 5.90%, 09/15/22(g) | | | 945,151 | |
| | 2,201,207 | | | Oakwood Mortgage Investors, Inc., Series 2002-B, Class A4, 7.09%, 06/15/32(g) | | | 2,357,395 | |
| | 2,000,000 | | | OneMain Financial Issuance Trust, Series 2014-2A, Class C, 4.33%, 09/18/24(e) | | | 2,011,220 | |
| | 4,000,000 | | | OneMain Financial Issuance Trust, Series 2014-2A, Class D, 5.31%, 09/18/24(e) | | | 3,969,760 | |
| | 15,000,000 | | | OneMain Financial Issuance Trust, Series 2015-1A, Class C, 5.12%, 03/18/26(e) | | | 15,339,300 | |
| | 20,000,000 | | | OneMain Financial Issuance Trust, Series 2015-1A, Class D, 6.63%, 03/18/26(e) | | | 20,530,600 | |
| | 13,000,000 | | | OneMain Financial Issuance Trust, Series 2015-2A, Class D, 5.64%, 07/18/25(e) | | | 12,905,230 | |
| | 4,000,000 | | | OneMain Financial Issuance Trust, Series 2015-3A, Class D, 6.94%, 11/20/28(e) | | | 4,018,710 | |
| | 2,500,000 | | | Progress Residential Trust, Series 2014-SFR1, Class F, 4.90%, 10/17/31(e)(g) | | | 2,445,300 | |
| | 6,000,000 | | | Progress Residential Trust, Series 2015-SFR1, Class E, 4.20%, 02/17/32(e)(g) | | | 5,934,433 | |
| Principal | | | | | | |
| Amount | | | | | Value | |
| UNITED STATES (continued) | | | | |
| $ | 16,735,000 | | | Residential Asset Mortgage Products, Inc., Series 2006-RZ2, Class A3, 0.46%, 05/25/36(g) | | $ | 15,299,478 | |
| | 4,284,722 | | | Residential Asset Securities Corp. Trust, Series 2002-KS4, Class AIIA, 0.69%, 07/25/32(g) | | | 3,738,450 | |
| | 18,480,000 | | | Santander Drive Auto Receivables Trust, Series 2012-AA, 0.00%, 12/16/19(b)(d) | | | 7,392,000 | |
| | 20,980,000 | | | Santander Drive Auto Receivables Trust, Series 2014-S5, 0.00%, 12/16/19(b)(d) | | | 9,441,000 | |
| | 20,980,000 | | | Santander Drive Auto Receivables Trust, Series 2014-S6, 0.00%, 12/16/19(b)(d) | | | 12,168,400 | |
| | 2,000,000 | | | Silver Bay Realty Trust, Series 2014-1, Class E, 3.45%, 09/17/31(e)(g) | | | 1,944,900 | |
| | 4,397,493 | | | Soundview Home Equity Loan Trust, Series 2007-OPT1, Class 2A3, 0.40%, 06/25/37(g) | | | 2,696,604 | |
| | 5,000,000 | | | SpringCastle America Funding LLC, Series 2014-AA, Class B, 4.61%, 10/25/27(e) | | | 5,082,181 | |
| | 7,621,419 | | | US Residential Opportunity Fund Trust, Series 2015-1III, Class A, 3.72%, 01/27/35(e) | | | 7,603,840 | |
| | | | | | | | 439,173,265 | |
Total Asset-Backed Securities
(Cost $622,012,637) | | | 595,051,356 | |
NON-AGENCY MORTGAGE-BACKED
SECURITIES — 9.6% | | | | |
| COLLATERALIZED MORTGAGE OBLIGATIONS — 8.5% | | |
| | 2,455,137 | | | Adjustable Rate Mortgage Trust, Series 2005-3, Class 2A1, 2.71%, 07/25/35(g) | | | 2,327,541 | |
| | 3,276,964 | | | Adjustable Rate Mortgage Trust, Series 2007-1, Class 4A1, 3.83%, 03/25/37(g) | | | 2,573,792 | |
| | 3,616,852 | | | American Home Mortgage Assets Trust, Series 2007-3, Class 22A1, STEP, 6.25%, 06/25/37 | | | 2,607,338 | |
| | 268,493 | | | American Home Mortgage Assets Trust, Series 2007-4, Class A2, 0.39%, 08/25/37(g) | | | 263,737 | |
| | 2,511,469 | | | American Home Mortgage Investment Trust, Series 2005-2, Class 5A4D, STEP, 5.33%, 09/25/35 | | | 2,201,438 | |
| | 33 | | | Banc of America Alternative Loan Trust, Series 2005-9, Class 2CB1, 6.00%, 10/25/35 | | | 32 | |
| Old Westbury Funds, Inc. | |
| Strategic Opportunities Fund | |
| Consolidated Portfolio of Investments - (Continued) | October 31, 2015 |
| | |
| Principal | | | | |
| Amount | | | | | Value | |
| COLLATERALIZED MORTGAGE OBLIGATIONS (continued) | | | | |
| $ | 4,202,753 | | | Banc of America Funding Corp, Series 2007-1, Class TA5, STEP, 6.09%, 01/25/37 | | $ | 3,500,586 | |
| | 719,751 | | | Banc of America Funding Corp., Series 2005-F, Class 6A1, 2.86%, 09/20/35(g) | | | 697,282 | |
| | 1,572,562 | | | Banc of America Funding Corp., Series 2006-A, Class 3A2, 2.79%, 02/20/36(g) | | | 1,274,736 | |
| | 1,567,806 | | | Banc of America Funding Corp., Series 2006-E, Class 2A1, 2.80%, 06/20/36(g) | | | 1,289,162 | |
| | 9,148,616 | | | Banc of America Funding Corp., Series 2007-A, Class 2A1, 0.35%, 02/20/47(g) | | | 7,408,204 | |
| | 1,848,393 | | | Banc of America Mortgage Securities, Inc., Series 2005-I, Class 2A5, 2.80%, 10/25/35(g) | | | 1,624,612 | |
| | 9,620,966 | | | BCAP LLC Trust, Series 2007-AA2, Class 12A1, 0.41%, 05/25/47(g) | | | 7,132,751 | |
| | 5,811,732 | | | BCAP LLC Trust, Series 2010-RR11, Class 4A1, 2.56%, 03/27/47(e)(g) | | | 5,413,047 | |
| | 6,250,000 | | | BCAP LLC Trust, Series 2012-RR4, Class 8A4, 0.43%, 06/26/47(e)(g) | | | 5,368,570 | |
| | 4,254,090 | | | Bear Stearns Adjustable Rate Mortgage Trust, Series 2005-12, Class 23A1, 2.49%, 02/25/36(g) | | | 3,551,191 | |
| | 1,353,961 | | | Bear Stearns Adjustable Rate Mortgage Trust, Series 2005-6, Class 5A1, 2.66%, 08/25/35(g) | | | 1,196,757 | |
| | 7,281,232 | | | Bear Stearns Adjustable Rate Mortgage Trust, Series 2006-1, Class A1, 2.36%, 02/25/36(g) | | | 7,221,643 | |
| | 1,283,226 | | | Bear Stearns Adjustable Rate Mortgage Trust, Series 2007-3, Class 1A1, 2.79%, 05/25/47(g) | | | 1,144,694 | |
| | 7,203,754 | | | Bear Stearns Adjustable Rate Mortgage Trust, Series 2007-4, Class 12A1, 5.43%, 05/25/37(g) | | | 6,310,304 | |
| | 3,919,769 | | | Bear Stearns Alt-A Trust, Series 2005-9, Class 26A1, 4.25%, 11/25/35(g) | | | 2,933,030 | |
| | 3,916,171 | | | Bear Stearns Alt-A Trust, Series 2006-2, Class 11A1, 0.63%, 04/25/36(g) | | | 3,023,193 | |
| | 8,117,071 | | | Bear Stearns ALT-A Trust, Series 2006-6, Class 1A1, 0.51%, 11/25/36(g) | | | 6,087,560 | |
| | 3,819,664 | | | Bear Stearns Mortgage Funding Trust, Series 2006-SL4, Class A, 0.50%, 11/25/36(g) | | | 7,295,070 | |
| | 2,000,000 | | | BHMS Mortgage Trust, Series 2014-MZ, Class M, 7.37%, 07/01/21(e)(g) | | | 2,010,540 | |
| Principal | | | | | | |
| Amount | | | | | Value | |
| COLLATERALIZED MORTGAGE OBLIGATIONS (continued) | | | | |
| $ | 727,734 | | | Citigroup Mortgage Loan Trust, Inc., Series 2005-2, Class 1A1, 2.77%, 05/25/35(g) | | $ | 716,748 | |
| | 731,367 | | | Citigroup Mortgage Loan Trust, Inc., Series 2006-AR3, Class 1A2A, 5.23%, 06/25/36(g) | | | 696,473 | |
| | 7,050,183 | | | Citigroup Mortgage Loan Trust, Inc., Series 2007-9, Class 1A1, 5.75%, 04/25/47(e) | | | 5,875,286 | |
| | 999,364 | | | Countrywide Alternative Loan Trust, Series 2004-36CB, Class 1A1, 6.00%, 02/25/35 | | | 922,265 | |
| | 2,576,165 | | | Countrywide Alternative Loan Trust, Series 2005-31, Class 2A1, 0.49%, 08/25/35(g) | | | 2,204,115 | |
| | 4,556,131 | | | Countrywide Alternative Loan Trust, Series 2005-36, Class 2A1A, 0.50%, 08/25/35(g) | | | 3,626,801 | |
| | 7,661,742 | | | Countrywide Alternative Loan Trust, Series 2005-38, Class A3, 0.54%, 09/25/35(g) | | | 6,651,400 | |
| | 2,954,820 | | | Countrywide Alternative Loan Trust, Series 2005-63, Class 5A1, 2.51%, 12/25/35(g) | | | 2,503,332 | |
| | 222,965 | | | Countrywide Alternative Loan Trust, Series 2005-69, Class A1, 1.22%, 12/25/35(g) | | | 192,409 | |
| | 7,010,022 | | | Countrywide Alternative Loan Trust, Series 2005-7CB, Class 2A8, 0.64%, 04/25/35(g) | | | 5,750,632 | |
| | 3,674,090 | | | Countrywide Alternative Loan Trust, Series 2005-9CB, Class 1A3, 0.64%, 05/25/35(g) | | | 3,023,560 | |
| | 1,985,490 | | | Countrywide Alternative Loan Trust, Series 2005-J14, Class A3, 5.50%, 12/25/35 | | | 1,784,176 | |
| | 6,010,910 | | | Countrywide Alternative Loan Trust, Series 2006-12CB, Class A10, 0.54%, 05/25/36(g) | | | 3,866,028 | |
| | 3,444,373 | | | Countrywide Alternative Loan Trust, Series 2006-15CB, Class A1, 6.50%, 06/25/36 | | | 2,797,732 | |
| | 7,006,457 | | | Countrywide Alternative Loan Trust, Series 2006-20CB, Class A9, 6.00%, 07/25/36 | | | 5,877,043 | |
| | 3,379,462 | | | Countrywide Alternative Loan Trust, Series 2006-22R, Class 2A1, 6.25%, 05/25/36 | | | 2,360,440 | |
| | 2,618,721 | | | Countrywide Alternative Loan Trust, Series 2006-24CB, Class A13, 0.54%, 06/25/36(g) | | | 1,770,469 | |
| | 2,618,721 | | | Countrywide Alternative Loan Trust, Series 2006-24CB, Class A14, 6.95%, 06/25/36(g) | | | 676,271 | |
| Old Westbury Funds, Inc. | |
| Strategic Opportunities Fund | |
| Consolidated Portfolio of Investments - (Continued) | October 31, 2015 |
| | |
| Principal | | | | | | |
| Amount | | | | | Value | |
| COLLATERALIZED MORTGAGE OBLIGATIONS (continued) | | | | |
| $ | 2,699,534 | | | Countrywide Alternative Loan Trust, Series 2006-24CB, Class A15, 5.75%, 06/25/36 | | $ | 2,415,634 | |
| | 2,786,393 | | | Countrywide Alternative Loan Trust, Series 2006-2CB, Class A4, 0.59%, 03/25/36(g) | | | 1,803,283 | |
| | 7,826,753 | | | Countrywide Alternative Loan Trust, Series 2006-2CB, Class A6, 5.50%, 03/25/36 | | | 6,631,924 | |
| | 2,874,732 | | | Countrywide Alternative Loan Trust, Series 2006-41CB, Class 1A10, 6.00%, 01/25/37 | | | 2,521,564 | |
| | 2,082,343 | | | Countrywide Alternative Loan Trust, Series 2006-41CB, Class 1A4, 5.75%, 01/25/37 | | | 1,802,344 | |
| | 2,583,647 | | | Countrywide Alternative Loan Trust, Series 2006-45T1, Class 2A2, 6.00%, 02/25/37 | | | 2,241,693 | |
| | 5,907,713 | | | Countrywide Alternative Loan Trust, Series 2006-45T1, Class 2A5, 6.00%, 02/25/37 | | | 5,125,810 | |
| | 441,729 | | | Countrywide Alternative Loan Trust, Series 2006-6CB, Class 1A10, 5.50%, 05/25/36 | | | 413,300 | |
| | 1,253,226 | | | Countrywide Alternative Loan Trust, Series 2006-6CB, Class 1A2, 0.59%, 05/25/36(g) | | | 966,422 | |
| | 7,127,683 | | | Countrywide Alternative Loan Trust, Series 2006-7CB, Class 2A1, 6.50%, 05/25/36 | | | 5,261,124 | |
| | 5,527,796 | | | Countrywide Alternative Loan Trust, Series 2006-J7, Class 2A1, 2.14%, 11/20/36(g) | | | 4,030,538 | |
| | 11,998,053 | | | Countrywide Alternative Loan Trust, Series 2006-OA10, Class 2A1, 0.38%, 08/25/46(g) | | | 9,128,752 | |
| | 10,943,518 | | | Countrywide Alternative Loan Trust, Series 2006-OA14, Class 1A1, 1.95%, 11/25/46(g) | | | 9,195,772 | |
| | 6,718,545 | | | Countrywide Alternative Loan Trust, Series 2006-OA14, Class 2A1, 0.38%, 11/25/46(g) | | | 5,577,883 | |
| | 8,061,257 | | | Countrywide Alternative Loan Trust, Series 2006-OA14, Class 3A1, 1.07%, 11/25/46(g) | | | 6,478,927 | |
| | 2,650,000 | | | Countrywide Alternative Loan Trust, Series 2006-OA16, Class A1D, 0.47%, 10/25/46(g) | | | 2,058,663 | |
| | 6,448,580 | | | Countrywide Alternative Loan Trust, Series 2006-OA18, Class A1, 0.31%, 12/25/46(g) | | | 5,582,112 | |
| | 8,709,598 | | | Countrywide Alternative Loan Trust, Series 2006-OA21, Class A1, 0.38%, 03/20/47(g) | | | 6,732,175 | |
| Principal | | | | | | |
| Amount | | | | | Value | |
| COLLATERALIZED MORTGAGE OBLIGATIONS (continued) | | | | |
| $ | 3,764,168 | | | Countrywide Alternative Loan Trust, Series 2006-OA22, Class A1, 0.35%, 02/25/47(g) | | $ | 3,129,349 | |
| | 3,106,413 | | | Countrywide Alternative Loan Trust, Series 2006-OA3, Class 2A1, 0.40%, 05/25/36(g) | | | 2,496,609 | |
| | 10,766,782 | | | Countrywide Alternative Loan Trust, Series 2006-OA6, Class 1A1A, 0.40%, 07/25/46(g) | | | 8,376,768 | |
| | 8,416,773 | | | Countrywide Alternative Loan Trust, Series 2006-OA7, Class 1A1, 1.99%, 06/25/46(g) | | | 6,954,014 | |
| | 16,401,574 | | | Countrywide Alternative Loan Trust, Series 2006-OA8, Class 1A1, 0.38%, 07/25/46(g) | | | 13,478,979 | |
| | 10,767,291 | | | Countrywide Alternative Loan Trust, Series 2006-OC1, Class 1A1, 0.42%, 03/25/36(g) | | | 10,380,637 | |
| | 9,054,024 | | | Countrywide Alternative Loan Trust, Series 2006-OC10, Class 2A2A, 0.37%, 11/25/36(g) | | | 8,835,008 | |
| | 7,787,451 | | | Countrywide Alternative Loan Trust, Series 2006-OC3, Class 1A1, 0.37%, 04/25/46(g) | | | 6,651,823 | |
| | 3,859,058 | | | Countrywide Alternative Loan Trust, Series 2007-12T1, Class A22, 5.75%, 06/25/37 | | | 3,147,423 | |
| | 3,887,013 | | | Countrywide Alternative Loan Trust, Series 2007-12T1, Class A5, 6.00%, 06/25/37 | | | 3,227,734 | |
| | 2,034,068 | | | Countrywide Alternative Loan Trust, Series 2007-19, Class 1A34, 6.00%, 08/25/37 | | | 1,688,801 | |
| | 7,000,782 | | | Countrywide Alternative Loan Trust, Series 2007-22, Class 2A16, 6.50%, 09/25/37 | | | 5,484,063 | |
| | 7,340,433 | | | Countrywide Alternative Loan Trust, Series 2007-25, Class 1A3, 6.50%, 11/25/37 | | | 6,114,185 | |
| | 1,882,351 | | | Countrywide Alternative Loan Trust, Series 2007-9T1, Class 1A8, 6.00%, 05/25/37 | | | 1,450,733 | |
| | 6,968,524 | | | Countrywide Alternative Loan Trust, Series 2007-HY5R, Class 2A1B, 2.34%, 03/25/47(g) | | | 6,506,703 | |
| | 4,339,283 | | | Countrywide Alternative Loan Trust, Series 2007-J1, Class 3A4, STEP, 5.30%, 11/25/36 | | | 4,080,745 | |
| | 6,748,065 | | | Countrywide Alternative Loan Trust, Series 2007-OA2, Class 1A1, 1.06%, 03/25/47(g) | | | 5,089,093 | |
| | 5,498,703 | | | Countrywide Alternative Loan Trust, Series 2007-OA2, Class 2A1, 0.32%, 03/25/47(g) | | | 3,700,516 | |
| Old Westbury Funds, Inc. | |
| Strategic Opportunities Fund | |
| Consolidated Portfolio of Investments - (Continued) | October 31, 2015 |
| | |
| Principal | | | | | | |
| Amount | | | | | Value | |
| COLLATERALIZED MORTGAGE OBLIGATIONS (continued) | | | | |
| $ | 3,141,322 | | | Countrywide Alternative Loan Trust, Series 2008-1R, Class 2A3, 6.00%, 08/25/37 | | $ | 2,594,560 | |
| | 4,379,187 | | | Countrywide Home Loan Mortgage Pass-Through Trust, Series 2005-31, Class 2A3, 2.44%, 01/25/36(g) | | | 3,966,974 | |
| | 1,269,721 | | | Countrywide Home Loan Mortgage Pass-Through Trust, Series 2005-J3, Class 2A4, 4.50%, 09/25/35 | | | 1,231,936 | |
| | 4,055,659 | | | Countrywide Home Loan Mortgage Pass-Through Trust, Series 2006-HYB1, Class 2A1, 2.41%, 03/20/36(g) | | | 3,880,033 | |
| | 16,884,906 | | | Countrywide Home Loan Mortgage Pass-Through Trust, Series 2006-OA4, Class A1, 1.18%, 04/25/46(g) | | | 9,366,785 | |
| | 5,462,790 | | | Countrywide Home Loan Mortgage Pass-Through Trust, Series 2006-OA5, Class 3A1, 0.39%, 04/25/46(g) | | | 4,800,197 | |
| | 2,144,611 | | | Countrywide Home Loan Mortgage Pass-Through Trust, Series 2006-R2, Class AF1, 0.62%, 07/25/36(e)(g) | | | 1,958,650 | |
| | 4,497,965 | | | Countrywide Home Loan Mortgage Pass-Through Trust, Series 2007-21, Class 1A1, 6.25%, 02/25/38 | | | 4,022,088 | |
| | 508,488 | | | Credit Suisse Mortgage Capital Certificates, Series 2006-8, Class 1A1, 4.50%, 10/25/21 | | | 481,795 | |
| | 4,230,017 | | | Credit Suisse Mortgage Capital Certificates, Series 2006-9, Class 3A1, 6.00%, 11/25/36 | | | 4,077,263 | |
| | 853,545 | | | Credit Suisse Mortgage Capital Certificates, Series 2010-20R, Class 9A1, 2.51%, 01/27/36(e)(g) | | | 840,752 | |
| | 2,649,285 | | | Credit Suisse Mortgage Capital Certificates, Series 2011-5R, Class 2A1, 2.78%, 08/25/46(e)(g) | | | 2,594,383 | |
| | 7,446,016 | | | Credit Suisse Mortgage Capital Certificates, Series 2013-7R, Class 6A1, 3.72%, 06/26/47(e)(g) | | | 7,493,755 | |
| | 4,676,744 | | | Credit Suisse Mortgage Trust, Series 2014-2R, Class 17A3, 13.64%, 04/27/37(e)(g) | | | 3,709,288 | |
| | 7,000,000 | | | Credit Suisse Mortgage Trust, Series 2015-4R, Class 1A4, 0.35%, 05/25/28(e)(g) | | | 2,867,200 | |
| | 1,970,325 | | | Credit Suisse Mortgage Trust, Series 2015-5R, Class 3A1, 4.75%, 01/29/37(e) | | | 1,864,033 | |
| Principal | | | | | | |
| Amount | | | | | Value | |
| COLLATERALIZED MORTGAGE OBLIGATIONS (continued) | | | | |
| $ | 12,047,482 | | | Credit Suisse Mortgage Trust, Series 2015-6R, Class 5A1, 0.38%, 10/27/36(e)(g) | | $ | 5,901,206 | |
| | 7,711,504 | | | Credit Suisse Mortgage Trust, Series 2015-6R, Class 5A1, 0.38%, 01/27/37(e)(g) | | | 6,957,982 | |
| | 3,025,888 | | | Deutsche Alt-A Securities Mortgage Loan Trust, Series 2007-1, Class 1A3B, 0.34%, 08/25/37(g) | | | 2,569,481 | |
| | 3,516,003 | | | Deutsche Alt-A Securities Mortgage Loan Trust, Series 2007-OA2, Class A1, 0.99%, 04/25/47(g) | | | 3,072,333 | |
| | 3,882,083 | | | Deutsche Alt-A Securities Mortgage Loan Trust, Series 2007-OA4, Class 1A1B, 0.32%, 08/25/47(g) | | | 3,167,873 | |
| | 2,000,000 | | | Fannie Mae Connecticut Avenue Securities, Series 2014-C03, Class 1M2, 3.19%, 07/25/24(g) | | | 1,803,113 | |
| | 2,500,000 | | | Freddie Mac Structured Agency Credit Risk Debt Notes, Series 2014-HQ2, Class M3, 3.94%, 09/25/24(g) | | | 2,358,872 | |
| | 1,378,245 | | | GMAC Mortgage Corp. Loan Trust, Series 2005-AR6, Class 2A1, 3.11%, 11/19/35(g) | | | 1,268,732 | |
| | 6,350,914 | | | GreenPoint Mortgage Funding Trust, Series 2007-AR3, Class A1, 0.42%, 06/25/37(g) | | | 5,310,433 | |
| | 7,178,026 | | | GSMPS Mortgage Loan Trust, Series 2005-RP1, Class 1AF, 0.55%, 01/25/35(e)(g) | | | 6,034,704 | |
| | 2,613,837 | | | GSMPS Mortgage Loan Trust, Series 2006-RP1, Class 1AF1, 0.54%, 01/25/36(e)(g) | | | 2,275,766 | |
| | 1,307,154 | | | GSR Mortgage Loan Trust, Series 2005-AR1, Class 2A1, 2.66%, 01/25/35(g) | | | 1,314,404 | |
| | 2,003,200 | | | GSR Mortgage Loan Trust, Series 2005-AR3, Class 5A1, 2.70%, 05/25/35(g) | | | 1,925,540 | |
| | 594,887 | | | GSR Mortgage Loan Trust, Series 2006-4F, Class 1A1, 5.00%, 05/25/36 | | | 574,557 | |
| | 1,282,906 | | | GSR Mortgage Loan Trust, Series 2006-9F, Class 9A1, 6.00%, 08/25/21 | | | 1,263,291 | |
| | 2,069,569 | | | GSR Mortgage Loan Trust, Series 2006-AR1, Class 3A1, 2.81%, 01/25/36(g) | | | 1,871,211 | |
| | 2,042,495 | | | GSR Mortgage Loan Trust, Series 2007-4F, Class 3A1, 6.00%, 07/25/37 | | | 1,858,517 | |
| | 2,251,158 | | | Homebanc Mortgage Trust, Series 2006-1, Class 2A1, 2.22%, 04/25/37(g) | | | 1,692,538 | |
| Old Westbury Funds, Inc. | |
| Strategic Opportunities Fund | |
| Consolidated Portfolio of Investments - (Continued) | October 31, 2015 |
| | |
| Principal | | | | | | |
| Amount | | | | | Value | |
| COLLATERALIZED MORTGAGE OBLIGATIONS (continued) | | | | |
| $ | 2,751,721 | | | Homebanc Mortgage Trust, Series 2006-1, Class A1, 0.37%, 12/25/36(g) | | $ | 2,419,807 | |
| | 917,603 | | | Homebanc Mortgage Trust, Series 2007-1, Class 13A1, 5.72%, 04/25/47(g) | | | 717,293 | |
| | 6,756,759 | | | Impac CMB Trust, Series 2005-7, Class A1, 0.72%, 11/25/35(g) | | | 5,641,894 | |
| | 63,432,095 | | | IndyMac IMSC Mortgage Loan Trust, Series 2007-HOA1, Class AXPP, 7.80%, 07/25/47(j) | | | 5,815,391 | |
| | 4,522,540 | | | IndyMac INDX Mortgage Loan Trust, Series 2006-AR11, Class 4A1, 2.92%, 06/25/36(g) | | | 3,450,520 | |
| | 6,439,352 | | | IndyMac INDX Mortgage Loan Trust, Series 2006-AR33, Class 2A21, 2.93%, 01/25/37(g) | | | 5,239,355 | |
| | 12,833,270 | | | IndyMac INDX Mortgage Loan Trust, Series 2006-FLX1, Class A1, 0.41%, 11/25/36(g) | | | 10,917,331 | |
| | 810,417 | | | JPMorgan Alternative Loan Trust, Series 2007-A1, Class 1A1B, 0.26%, 03/25/37(g) | | | 852,056 | |
| | 5,422,776 | | | JPMorgan Alternative Loan Trust, Series 2007-A1, Class 1A3A, 0.35%, 03/25/37(g) | | | 5,092,541 | |
| | 5,744,835 | | | JPMorgan Mortgage Trust, Series 2007-A5, Class 2A1, 1.15%, 10/25/37(g) | | | 4,510,085 | |
| | 656,548 | | | JPMorgan Mortgage Trust, Series 2007-S2, Class 2A3, 5.50%, 06/25/37 | | | 640,051 | |
| | 5,180,934 | | | JPMorgan Resecuritization Trust, Series 2015-3, Class 2A1, 4.30%, 05/25/25(e)(g) | | | 5,127,525 | |
| | 8,429,058 | | | Lehman XS Trust, Series 2006-12N, Class A31A, 0.40%, 08/25/46(g) | | | 6,411,050 | |
| | 5,989,180 | | | Lehman XS Trust, Series 2007-20N, Class A1, 1.35%, 12/25/37(g) | | | 4,355,747 | |
| | 4,549,404 | | | LSTAR Securities Investment Trust, Series 2014-1, 3.29%, 09/01/21(e)(g) | | | 4,571,126 | |
| | 4,329,002 | | | LSTAR Securities Investment Trust, Series 2015-2, Class A, 2.19%, 01/01/20(e)(g) | | | 4,305,232 | |
| | 1,290,850 | | | Mastr Adjustable Rate Mortgages Trust, Series 2005-6, Class 5A2, 2.37%, 07/25/35(g) | | | 1,093,987 | |
| | 7,676,252 | | | Mastr Resecuritization Trust, Series 2008-3, Class A1, 0.63%, 08/25/37(e)(g) | | | 5,405,993 | |
| | 4,118,585 | | | Merrill Lynch Mortgage Investors Trust, Series 2006-A3, Class 3A1, 2.69%, 05/25/36(g) | | | 3,335,964 | |
| Principal | | | | | | |
| Amount | | | | | Value | |
| COLLATERALIZED MORTGAGE OBLIGATIONS (continued) | | | | |
| $ | 1,585,342 | | | Merrill Lynch Mortgage Investors, Inc., Series 2006-AF2, Class AF1, 6.25%, 10/25/36 | | $ | 1,369,073 | |
| | 12,243,618 | | | Morgan Stanley Re-REMIC Trust, Series 2010-R5, Class 7B, 0.49%, 05/26/37(e)(g) | | | 7,888,317 | |
| | 11,983,840 | | | Nomura Asset Acceptance Corp. Alternative Loan Trust, Series 2006-AF1, Class 1A2, 6.16%, 05/25/36(g) | | | 6,302,537 | |
| | 6,726,355 | | | Prime Mortgage Trust, Series 2006-DR1, Class 2A1, 5.50%, 05/25/35(e) | | | 6,561,877 | |
| | 2,938,982 | | | Prime Mortgage Trust, Series 2006-DR1, Class 2A2, 6.00%, 05/25/35(e) | | | 2,880,299 | |
| | 1,870,741 | | | Residential Accredit Loans, Inc., Series 2006-QS15, Class A1, 6.50%, 10/25/36 | | | 1,547,793 | |
| | 1,591,450 | | | Residential Accredit Loans, Inc., Series 2007-QS6, Class A1, 0.53%, 04/25/37(g) | | | 988,894 | |
| | 2,445,997 | | | Residential Funding Mortgage Securities I, Series 2005-SA5, Class 2A, 3.10%, 11/25/35(g) | | | 2,260,903 | |
| | 333,216 | | | Residential Funding Mortgage Securities I, Series 2006-S11, Class A2, 6.00%, 11/25/36 | | | 310,779 | |
| | 7,626,607 | | | Residential Funding Mortgage Securities I, Series 2006-SA2, Class 2A1, 3.61%, 08/25/36(g) | | | 6,574,537 | |
| | 4,079,049 | | | Structured Adjustable Rate Mortgage Loan Trust, Series 2005-11, Class 1A1, 2.47%, 05/25/35(g) | | | 3,507,216 | |
| | 4,076,376 | | | Structured Adjustable Rate Mortgage Loan Trust, Series 2006-9, Class 1A1, 2.64%, 10/25/36(g) | | | 2,997,041 | |
| | 7,065,792 | | | Structured Adjustable Rate Mortgage Loan Trust, Series 2006-9, Class 3A1, 4.44%, 10/25/36(g) | | | 4,846,402 | |
| | 922,745 | | | Structured Asset Mortgage Investments II Trust, Series 2005-AR8, Class A1A, 0.47%, 02/25/36(g) | | | 745,287 | |
| | 4,005,563 | | | Structured Asset Mortgage Investments II Trust, Series 2007-AR4, Class GA4B, 0.37%, 09/25/47(g) | | | 3,427,443 | |
| | 5,383,778 | | | Structured Asset Mortgage Investments, Inc., Series 2006-AR5, Class 4A1, 0.41%, 05/25/46(g) | | | 3,042,538 | |
| | 6,477,972 | | | Structured Asset Securities Corp, Series 2005-RF3, Class 1A, 0.54%, 06/25/35(e)(g) | | | 5,234,647 | |
| Old Westbury Funds, Inc. | |
| Strategic Opportunities Fund | |
| Consolidated Portfolio of Investments - (Continued) | October 31, 2015 |
| | |
| Principal | | | | | | |
| Amount | | | | | Value | |
| COLLATERALIZED MORTGAGE OBLIGATIONS (continued) | | | | |
| $ | 744,570 | | | Suntrust Adjustable Rate Mortgage Loan Trust, Series 2007-1, Class 2A1, 2.58%, 02/25/37(g) | | $ | 647,348 | |
| | 2,985,800 | | | Suntrust Adjustable Rate Mortgage Loan Trust, Series 2007-2, Class 3A3, 2.71%, 04/25/37(g) | | | 2,519,474 | |
| | 1,184,999 | | | Suntrust Adjustable Rate Mortgage Loan Trust, Series 2007-2, Class 4A1, 2.80%, 04/25/37(g) | | | 922,689 | |
| | 4,428,603 | | | Thornburg Mortgage Securities Trust, Series 2007-3, Class 4A1, 5.75%, 06/25/47(g) | | | 4,123,539 | |
| | 211,003 | | | WaMu Mortgage Pass-Through Certificates Trust, Series 2005-AR16, Class 1A1, 2.35%, 12/25/35(g) | | | 199,178 | |
| | 3,848,156 | | | WaMu Mortgage Pass-Through Certificates Trust, Series 2006-AR13, Class 2A, 2.14%, 10/25/46(g) | | | 3,435,364 | |
| | 8,755,995 | | | WaMu Mortgage Pass-Through Certificates Trust, Series 2006-AR19, Class 2A, 1.89%, 01/25/47(g) | | | 7,887,263 | |
| | 6,173,898 | | | WaMu Mortgage Pass-Through Certificates Trust, Series 2006-AR3, Class A1A, 1.20%, 02/25/46(g) | | | 5,660,609 | |
| | 2,422,396 | | | WaMu Mortgage Pass-Through Certificates Trust, Series 2007-HY7, Class 2A2, 2.23%, 07/25/37(g) | | | 2,058,559 | |
| | 5,231,034 | | | WaMu Mortgage Pass-Through Certificates Trust, Series 2007-OA4, Class 1A, 0.99%, 05/25/47(g) | | | 4,403,834 | |
| | 2,327,342 | | | Washington Mutual Alternative Mortgage Pass-Through Certificates, Series 2005-10, Class 2A6, 5.50%, 11/25/35 | | | 2,055,101 | |
| | 5,644,409 | | | Washington Mutual Alternative Mortgage Pass-Through Certificates, Series 2006-5, Class 3A3, STEP, 6.22%, 07/25/36 | | | 2,826,906 | |
| | 2,582,397 | | | Washington Mutual Mortgage Pass-Through Certificates, Series 2006-AR6, Class 2A, 1.16%, 08/25/46(g) | | | 1,745,111 | |
| | 575,742 | | | Wells Fargo Mortgage Backed Securities Trust, Series 2006-AR10, Class 3A1, 2.72%, 07/25/36(g) | | | 568,893 | |
| | 1,139,633 | | | Wells Fargo Mortgage Backed Securities Trust, Series 2006-AR8, Class 2A3, 2.71%, 04/25/36(g) | | | 1,112,186 | |
| | | | | | | | | |
| | | | | | | | 602,037,923 | |
| Principal | | | | | | |
| Amount | | | | | Value | |
| COMMERCIAL MORTGAGE-BACKED SECURITIES — 1.1% | | | | |
| $ | 5,020,000 | | | BXHTL Mortgage Trust, Series 2015-JWRZ, 3.77%, 05/15/29(e)(g) | | $ | 4,692,397 | |
| | 4,000,000 | | | BXHTL Mortgage Trust, Series 2015-JWRZ, 4.09%, 05/15/29(e)(g) | | | 3,760,000 | |
| | 3,000,000 | | | Carefree Portfolio Trust, Series 2014-CARE, Class E, 4.20%, 11/15/19(e)(g) | | | 3,018,142 | |
| | 1,500,000 | | | Carefree Portfolio Trust, Series 2014-CMZA, Class MZA, 6.17%, 11/15/19(e)(g) | | | 1,501,155 | |
| | 7,000,000 | | | CDGJ Commercial Mortgage Trust, Series 2014-BXCH, Class EPA, 4.45%, 12/15/27(e)(g) | | | 6,929,495 | |
| | 3,000,000 | | | Citigroup Commercial Mortgage Trust, Series 2015-P1, Class D, 3.23%, 09/15/48(e) | | | 2,252,822 | |
| | 1,000,000 | | | Commercial Mortgage Pass-Through Certificates, Series 2013-LC6, Class D, 4.29%, 01/10/23(e)(g) | | | 904,413 | |
| | 2,000,000 | | | Commercial Mortgage Trust, Series 2014-PAT, Class E, 3.35%, 08/15/27(e)(g) | | | 2,002,320 | |
| | 4,482,000 | | | Commercial Mortgage Trust, Series 2014-PAT, Class F, 2.64%, 08/15/27(e)(g) | | | 4,374,477 | |
| | 2,000,000 | | | Commercial Mortgage Trust, Series 2015-CR25, Class D, 3.80%, 08/10/48(g) | | | 1,542,006 | |
| | 15,000,000 | | | GAHR Commercial Mortgage Trust, Series 2015-NRF, Class FFX, 3.38%, 12/15/34(e)(g) | | | 13,872,142 | |
| | 10,000,000 | | | GAHR Commercial Mortgage Trust, Series 2015-NRF, Class GFX, 3.38%, 12/15/34(e)(g) | | | 9,144,978 | |
| | 3,000,000 | | | GS Mortgage Securities Trust, Series 2014-GSFL, Class D, 4.10%, 07/15/31(e)(g) | | | 2,978,389 | |
| | 1,000,000 | | | GS Mortgage Securities Trust, Series 2014-GSFL, Class E, 6.15%, 07/31/31(e)(g) | | | 989,612 | |
| | 1,200,000 | | | JPMorgan Chase Commercial Mortgage Securities Trust, Series 2006-LDP8, Class D, 5.62%, 05/15/45(g) | | | 1,203,564 | |
| | 5,380,000 | | | JPMorgan Chase Commercial Mortgage Securities Trust, Series 2007-CB20, Class AJ, 6.08%, 02/12/51(g) | | | 5,525,042 | |
| | 3,000,000 | | | JPMorgan Chase Commercial Mortgage Securities Trust, Series 2014-CBMZ, Class M, 6.42%, 10/15/19(e)(g) | | | 3,012,420 | |
| | 4,000,000 | | | Morgan Stanley Capital I Trust, Series 2006-HQ9, Class C, 5.84%, 07/12/44(g) | | | 4,075,659 | |
| Old Westbury Funds, Inc. | |
| Strategic Opportunities Fund | |
| Consolidated Portfolio of Investments - (Continued) | October 31, 2015 |
| | |
| Principal | | | | | | |
| Amount | | | | | Value | |
| COMMERCIAL MORTGAGE-BACKED SECURITIES (continued) | | | | |
| $ | 3,333,300 | | | Wachovia Bank Commercial Mortgage Trust, Series 2007-C33, Class AJ, 5.95%, 02/15/51(g) | | $ | 3,414,579 | |
| | 2,000,000 | | | Wells Fargo Commercial Mortgage Trust, Series 2015-NXS3, Class D, 3.15%, 09/15/57(e) | | | 1,460,065 | |
| | | | | | | | 76,653,677 | |
Total Non-Agency Mortgage-Backed Securities
(Cost $635,546,333) | | | 678,691,600 | |
| U.S. GOVERNMENT AGENCIES — 44.7% | | | | |
| Federal Farm Credit Bank — 0.6% | | | | |
| | 40,000,000 | | | 0.03%, 11/04/15(p) | | | 39,999,960 | |
| Federal Home Loan Bank — 44.1% | | | | |
| | 3,000,000 | | | 0.04%, 11/02/15(p) | | | 3,000,000 | |
| | 1,630,000 | | | 0.04%, 11/02/15(p) | | | 1,630,000 | |
| | 18,000,000 | | | 0.04%, 11/03/15(p) | | | 17,999,982 | |
| | 50,000,000 | | | 0.02%, 11/04/15(p) | | | 49,999,950 | |
| | 50,000,000 | | | 0.21%, 11/04/15(p) | | | 49,999,950 | |
| | 43,700,000 | | | 0.15%, 11/04/15(p) | | | 43,699,956 | |
| | 11,000,000 | | | 0.08%, 11/04/15(p) | | | 10,999,989 | |
| | 9,845,000 | | | 0.03%, 11/04/15(p) | | | 9,844,990 | |
| | 8,700,000 | | | 0.05%, 11/04/15(p) | | | 8,699,991 | |
| | 5,000,000 | | | 0.16%, 11/04/15(p) | | | 4,999,995 | |
| | 975,000 | | | 0.04%, 11/04/15(p) | | | 974,999 | |
| | 51,000,000 | | | 0.16%, 11/05/15(p) | | | 50,999,898 | |
| | 3,400,000 | | | 0.03%, 11/05/15(p) | | | 3,399,993 | |
| | 1,200,000 | | | 0.04%, 11/05/15(p) | | | 1,199,998 | |
| | 101,400,000 | | | 0.16%, 11/06/15(p) | | | 101,399,696 | |
| | 100,000,000 | | | 0.04%, 11/06/15(p) | | | 99,999,700 | |
| | 15,000,000 | | | 0.17%, 11/06/15(p) | | | 14,999,925 | |
| | 1,000,000 | | | 0.05%, 11/06/15(p) | | | 999,997 | |
| | 49,900,000 | | | 0.03%, 11/09/15(p) | | | 49,899,750 | |
| | 38,000,000 | | | 0.17%, 11/09/15(p) | | | 37,999,810 | |
| | 32,000,000 | | | 0.21%, 11/09/15(p) | | | 31,998,507 | |
| | 25,000,000 | | | 0.08%, 11/09/15(p) | | | 24,999,875 | |
| | 10,000,000 | | | 0.16%, 11/09/15(p) | | | 9,999,950 | |
| | 75,000,000 | | | 0.10%, 11/10/15(p) | | | 74,999,550 | |
| | 29,900,000 | | | 0.04%, 11/12/15(p) | | | 29,899,790 | |
| | 44,250,000 | | | 0.04%, 11/13/15(p) | | | 44,249,646 | |
| | 1,200,000 | | | 0.05%, 11/16/15(p) | | | 1,199,988 | |
| | 28,500,000 | | | 0.03%, 11/18/15(p) | | | 28,499,687 | |
| | 22,000,000 | | | 0.10%, 11/18/15(p) | | | 21,999,758 | |
| | 4,050,000 | | | 0.04%, 11/18/15(p) | | | 4,049,955 | |
| | 2,300,000 | | | 0.07%, 11/18/15(p) | | | 2,299,975 | |
| | 700,000 | | | 0.05%, 11/18/15(p) | | | 699,992 | |
| | 32,300,000 | | | 0.10%, 11/20/15(p) | | | 32,299,580 | |
| Principal | | | | | | |
| Amount | | | | | Value | |
| Federal Home Loan Bank (continued) | | | | |
| $ | 30,300,000 | | | 0.17%, 11/20/15(p) | | $ | 30,299,606 | |
| | 24,100,000 | | | 0.04%, 11/20/15(p) | | | 24,099,687 | |
| | 800,000 | | | 0.08%, 11/20/15(p) | | | 799,990 | |
| | 75,500,000 | | | 0.04%, 11/23/15(p) | | | 75,498,868 | |
| | 52,600,000 | | | 0.02%, 11/23/15(p) | | | 52,599,210 | |
| | 50,000,000 | | | 0.02%, 11/24/15(p) | | | 49,999,250 | |
| | 49,000,000 | | | 0.10%, 11/25/15(p) | | | 48,999,216 | |
| | 90,000,000 | | | 0.06%, 12/02/15(p) | | | 89,997,030 | |
| | 200,000,000 | | | 0.08%, 12/03/15(p) | | | 199,993,200 | |
| | 65,550,000 | | | 0.06%, 12/03/15(p) | | | 65,547,771 | |
| | 19,000,000 | | | 0.07%, 12/03/15(p) | | | 18,999,354 | |
| | 118,000,000 | | | 0.06%, 12/04/15(p) | | | 117,995,752 | |
| | 58,000,000 | | | 0.11%, 12/04/15(p) | | | 57,997,912 | |
| | 50,000,000 | | | 0.05%, 12/04/15(p) | | | 49,998,200 | |
| | 46,000,000 | | | 0.07%, 12/04/15(p) | | | 45,998,344 | |
| | 5,000,000 | | | 0.11%, 12/04/15(p) | | | 4,999,820 | |
| | 100,000,000 | | | 0.06%, 12/07/15(p) | | | 99,996,100 | |
| | 7,000,000 | | | 0.08%, 12/07/15(p) | | | 6,999,727 | |
| | 1,000,000 | | | 0.05%, 12/07/15(p) | | | 999,960 | |
| | 44,000,000 | | | 0.06%, 12/08/15(p) | | | 43,998,240 | |
| | 1,900,000 | | | 0.07%, 12/08/15(p) | | | 1,899,924 | |
| | 36,000,000 | | | 0.07%, 12/09/15(p) | | | 35,998,524 | |
| | 25,000,000 | | | 0.09%, 12/09/15(p) | | | 24,998,975 | |
| | 3,920,000 | | | 0.06%, 12/09/15(p) | | | 3,919,839 | |
| | 80,900,000 | | | 0.06%, 12/10/15(p) | | | 80,896,602 | |
| | 68,000,000 | | | 0.07%, 12/10/15(p) | | | 67,997,144 | |
| | 113,500,000 | | | 0.06%, 12/11/15(p) | | | 113,495,120 | |
| | 80,000,000 | | | 0.09%, 12/11/15(p) | | | 79,996,560 | |
| | 60,000,000 | | | 0.07%, 12/11/15(p) | | | 59,997,420 | |
| | 2,500,000 | | | 0.10%, 12/11/15(p) | | | 2,499,893 | |
| | 87,000,000 | | | 0.04%, 12/14/15(p) | | | 86,995,911 | |
| | 10,000,000 | | | 0.04%, 12/14/15(p) | | | 9,999,530 | |
| | 50,000,000 | | | 0.09%, 12/16/15(p) | | | 49,997,550 | |
| | 25,000,000 | | | 0.07%, 12/17/15(p) | | | 24,998,750 | |
| | 100,000,000 | | | 0.07%, 12/18/15(p) | | | 99,994,900 | |
| | 1,000,000 | | | 0.08%, 12/18/15(p) | | | 999,949 | |
| | 1,000,000 | | | 0.08%, 12/18/15(p) | | | 999,949 | |
| | 50,000,000 | | | 0.09%, 12/21/15(p) | | | 49,997,300 | |
| | 3,800,000 | | | 0.23%, 12/21/15(p) | | | 3,799,795 | |
| | 90,000,000 | | | 0.10%, 01/06/16(p) | | | 89,985,330 | |
| | 50,000,000 | | | 0.11%, 01/06/16(p) | | | 49,991,850 | |
| | 50,000,000 | | | 0.11%, 01/06/16(p) | | | 49,991,850 | |
| | 38,285,000 | | | 0.09%, 01/07/16(p) | | | 38,278,683 | |
| | 35,000,000 | | | 0.10%, 01/07/16(p) | | | 34,994,225 | |
| | 4,700,000 | | | 0.11%, 01/07/16(p) | | | 4,699,225 | |
| | 5,300,000 | | | 0.11%, 01/11/16(p) | | | 5,299,073 | |
| | 73,000,000 | | | 0.10%, 01/12/16(p) | | | 72,987,006 | |
| | 15,000,000 | | | 0.10%, 01/14/16(p) | | | 14,997,255 | |
| | 3,700,000 | | | 0.11%, 01/14/16(p) | | | 3,699,323 | |
| Old Westbury Funds, Inc. | |
| Strategic Opportunities Fund | |
| Consolidated Portfolio of Investments - (Continued) | October 31, 2015 |
| | |
| Principal | | | | | | |
| Amount | | | | | Value | |
| Federal Home Loan Bank (continued) | | | |
| $ | 9,700,000 | | | 0.12%, 01/19/16(p) | | $ | 9,698,109 | |
| | | | | | | | 3,129,867,623 | |
Total U.S. Government Agencies
(Cost $3,169,795,530) | | | 3,169,867,583 | |
| | | | | |
| Shares | | | | | | | |
| CASH SWEEP — 2.1% | | | | |
| UNITED STATES — 2.1% | | | | |
| | 147,142,081 | | | Citibank - US Dollars on Deposit in Custody Account, 0.02%(q) | | | 147,142,081 | |
Total Cash Sweep
(Cost $147,142,081) | | | 147,142,081 | |
TOTAL INVESTMENTS — 99.5%
(Cost $7,108,164,437)(a) | | | 7,061,254,569 | |
| OTHER ASSETS IN EXCESS OF LIABILITIES — 0.5% | | | 34,501,326 | |
| NET ASSETS — 100.0% | | $ | 7,095,755,895 | |
| | | | | | | | | |
| Contracts | | | | | Value | |
| CALL OPTIONS WRITTEN — 0.0% | | | | |
| | (500 | ) | | Citigroup, Inc., Strike $57.50, Expires 12/18/15 | | | (17,000 | ) |
| | (500 | ) | | Gilead Sciences, Inc., Strike $115.00, Expires 11/20/15 | | | (31,500 | ) |
| | (2,500 | ) | | iShares MSCI Germany ETF, Strike $32.00, Expires 01/15/16 | | | (12,500 | ) |
| | (500 | ) | | London Metal Exchange Zinc Futures, Strike $1,900.00, Expires 03/01/16 | | | (595,000 | ) |
| | (1 | ) | | Walgreen Co., Strike $57.50, Expires 01/15/16 | | | (2,760 | ) |
Total Call Options Written
(Premiums received $(1,456,082)) | | | (658,760 | ) |
| PUT OPTIONS WRITTEN — 0.0% | | | | |
| | (75 | ) | | London Metal Exchange Nickel Futures, Strike $9,000.00, Expires 12/20/15 | | | (30,442 | ) |
| | (300 | ) | | New York Mercantile Exchange Natural Gas Futures, Strike $1.85, Expires 02/24/16 | | | (156,900 | ) |
| | (500 | ) | | New York Mercantile Exchange Natural Gas Futures, Strike $2.30, Expires 02/24/16 | | | (898,000 | ) |
| | (75 | ) | | London Metal Exchange Nickel Futures, Strike $11,500.00, Expires 03/02/16 | | | (775,400 | ) |
| | (10 | ) | | COMEX Silver Futures, Strike $13.50, Expires 11/24/15 | | | (1,000 | ) |
| | | | | | | |
| Contracts | | | | | Value | |
| | (555) | | | S&P 500 Index, Strike $1,600.00, Expires 11/13/15 | | $ | (8,325 | ) |
Total Put Options Written
(Premiums received $(2,167,188)) | | | (1,870,067 | ) |
| | | | | | | | | |
| Contracts/ | | | | | | | |
| Notional | | | | | | | |
| Amount ($) | | | | | Value | |
| STRUCTURED OPTIONS — 1.3% | | | | |
| | 41,470 | | | Apple, Inc., One purchased call strike 120.57, One written call strike 156.74, One written put strike 120.57 with a barrier level strike of 102.48, Expires 01/20/17, Broker Bank of America N.A. | | | (150,018 | ) |
| $ | 16,400,000 | | | AUD/USD foreign exchange rate, One purchased call strike 0.775, One written call strike 0.72, One written put strike 0.775 with a barrier level strike of 0.80 ($10,000,000 notional amount), Expires 02/04/16, Broker Bank of America N.A.(r) | | | 889,989 | |
| $ | 23,850,000 | | | AUD/USD foreign exchange rate, One purchased put strike 0.76, One written put strike 0.71, One written call strike 0.77 with a barrier level strike of 0.79 ($15,000,000 notional amount), Expires 04/11/16, Broker Bank of America N.A.(r) | | | 955,738 | |
| $ | 78,125,000 | | | CAD/MXN foreign exchange rate, One written put strike 1.05, Expires 09/04/15, Broker Goldman Sachs International | | | (160,078 | ) |
| | 50 | | | Chicago Board of Trade Corn Futures, One written call strike 420.00, One written put strike 370.00, Expires 06/24/16, Broker Cargill, Inc. | | | (88,061 | ) |
| | 1,166,559 | | | ConocoPhillips, One purchased call strike 46.29, One written call strike 48.6045, One purchased put strike 46.29 with a barrier level strike of 34.7175 (216,029 contracts), One written put strike 46.29 with a barrier level strike of 34.7175 (216,029 contracts), Expires 11/18/16, Broker JPMorgan Chase Bank N.A.(s) | | | 1,142,896 | |
| Old Westbury Funds, Inc. | |
| Strategic Opportunities Fund | |
| Consolidated Portfolio of Investments - (Continued) | October 31, 2015 |
| | |
| Contracts/ | | | | | | |
| Notional | | | | | | |
| Amount ($) | | | | | Value | |
| | 174,624 | | | ConocoPhillips, One purchased call strike 58.4113, One written call strike 64.7106, One written put strike 57.266 with a barrier level strike of 37.2229, Expires 08/18/16, Broker JPMorgan Chase Bank N.A. | | $ | (660,418 | ) |
| | 3,295 | | | DAXK Index, One purchased call strike 4,553.00, One written call strike 5,190.42, One written put strike 4,553.00 with a barrier level strike of 3,505.81, Expires 12/18/15, Broker Goldman Sachs International | | | 1,875,904 | |
| | 2,113 | | | DAXK Index, One purchased call strike 4,731.94, One written call strike 5,347.0922, One written put strike 4,731.94 with a barrier level strike of 3,596.27, Expires 12/18/15, Broker JPMorgan Chase Bank N.A. | | | 1,078,905 | |
| | 3,007 | | | DAXK Index, One purchased call strike 4,988.05, One written put strike 4,988.05 with a barrier level strike of 4,401.95, Expires 06/16/16, Broker JPMorgan Chase Bank N.A. | | | 1,243,259 | |
| | 6,398 | | | DAXK Index, One purchased call strike 5,079.97, One written call strike 5,333.9685, One purchased put strike 4,978.3706 (1,969 contracts), One purchased put strike 4,978.3706 with a barrier level strike of 4,622.7727 (1,969 contracts), One written put strike 5,079.97 with a barrier level strike of 4,622.7727 (3,937 contracts), Expires 09/15/16, Broker Goldman Sachs International(s) | | | 469,178 | |
| | 3,904 | | | DAXK Index, One purchased call strike 5,122.64, One written put strike 5,122.64 with a barrier level strike of 4,564.27, Expires 11/17/16, Broker JPMorgan Chase Bank N.A. | | | 1,164,581 | |
| Contracts/ | | | | | | |
| Notional | | | | | | |
| Amount ($) | | | | | Value | |
| | 1,864 | | | DAXK Index, One purchased call strike 5,417.135, One purchased put strike 5,256.23, One written put strike 5,363.50 with a barrier level strike of 4,398.07 (3,729 contracts), Expires 09/15/16, Broker JPMorgan Chase Bank N.A.(s) | | $ | 85,261 | |
| | 4,762 | | | DAXK Index, One purchased call strike 5,670.00, One written call strike 5,953.50, One purchased put strike 5,556.60 (1,764 contracts), One purchased put strike 5,556.60 with a barrier level strike of 5,159.70 (1,764 contracts), One written put strike 5,670.00 with a barrier level strike of 5,159.70 (3,527 contracts), Expires 08/18/16, Broker Goldman Sachs International(s) | | | (401,841 | ) |
| | 5,313 | | | DAXK Index, One purchased call strike 5,702.50, One written call strike 5,987.625, One purchased put strike 5,588.45 (1,754 contracts), One purchased put strike 5,588.45 with a barrier level strike of 5,189.275 (1,754 contracts), One written put strike 5,702.50 with a barrier level strike of 5,189.275 (3,507 contracts), Expires 07/14/16, Broker Goldman Sachs International(s) | | | (369,635 | ) |
| | 5,891 | | | DAXK Index, One purchased call strike 5,813.84, One written call strike 6,104.532, One purchased put strike 5,697.5632 (1,720 contracts), One purchased put strike 5,697.5632 with a barrier level strike of 5,290.59 (1,720 contracts), One written put strike 5,813.84 with a barrier level strike of 5,290.59 (3,440 contracts), Expires 06/16/16, Broker JPMorgan Chase Bank N.A.(s) | | | (409,189 | ) |
| Old Westbury Funds, Inc. | |
| Strategic Opportunities Fund | |
| Consolidated Portfolio of Investments - (Continued) | October 31, 2015 |
| | |
| Contracts/ | | | | | | |
| Notional | | | | | | |
| Amount ($) | | | | | Value | |
| | 7,106 | | | DAXK Index, One purchased call strike 5,889.604, One written call strike 6,184.0842, One purchased put strike 5,771.812 (2,547 contracts), One purchased put strike 5,771.812 with a barrier level strike of 5,359.54 (2,547 contracts), One written put strike 5,889.604 with a barrier level strike of 5,359.54 (5,094 contracts), Expires 07/29/16, Broker Citibank N.A.(s) | | $ | (938,490 | ) |
| | 5,160 | | | DAXK Index, One purchased call strike 6,163.15, One written call strike 6,471.31, One purchased put strike 6,039.89 with a barrier level strike of 5,608.47 (1,623 contracts), One written put strike 6,163.15 with a barrier level strike of 5,608.47 (3,245 contracts), Expires 05/19/16, Broker Credit Suisse International(s) | | | (962,564 | ) |
| $ | 5,000,000 | | | EUR/MXN foreign exchange rate, One purchased call strike 17.75, One written put strike 20.10, Expires 02/23/16, Broker Bank of America N.A. | | | 51,288 | |
| $ | 30,500,000 | | | EUR/USD foreign exchange rate, One purchased call strike 1.11, One written call strike 1.04, One written call strike 1.11 with a barrier level strike of 1.15 ($15,000,000 notional amount), Expires 03/07/16, Broker Bank of America N.A.(r) | | | 341,772 | |
| $ | 24,300,000 | | | EUR/USD foreign exchange rate, One purchased call strike 1.12, One written call strike 1.05, One written put strike 1.12 with a barrier level strike of 1.17 ($10,000,000 notional amount), Expires 02/24/16, Broker Bank of America N.A.(r) | | | 441,318 | |
| $ | 27,050,000 | | | EUR/USD foreign exchange rate, One purchased call strike 1.15, One written call strike 1.08, One written put strike 1.15 with a barrier level strike of 1.20 ($10,000,000 notional amount), Expires 02/16/16, Broker Goldman Sachs International(r) | | | 813,001 | |
| Contracts/ | | | | | | |
| Notional | | | | | | |
| Amount ($) | | | | | Value | |
| $ | 21,800,000 | | | EUR/USD foreign exchange rate, One purchased call strike 1.225, One written call strike 1.15, One written put strike 1.225 with a barrier level strike of 1.27 ($10,000,000 notional amount), Expires 01/18/16, Broker Bank of America N.A.(r) | | $ | 1,182,462 | |
| $ | 57,600,000 | | | EUR/USD foreign exchange rate, One purchased put strike 1.085, One written put strike 1.03, One written call strike 1.085 with a barrier level strike of 1.13 ($20,000,000 notional amount), Expires 07/29/16, Broker JPMorgan Chase Bank N.A.(r) | | | (58,876 | ) |
| $ | 26,475,000 | | | EUR/USD foreign exchange rate, One purchased put strike 1.24, One written put strike 1.16, One written call strike 1.24 with a barrier level strike of 1.29 ($15,000,000 notional amount), Expires 12/07/15, Broker JPMorgan Chase Bank N.A.(r) | | | 1,593,140 | |
| $ | 42,500,000 | | | EUR/USD foreign exchange rate, One purchased put strike 1.25, One written put strike 1.17, One written call strike 1.25 with a barrier level strike of 1.28 ($25,000,000 notional amount), Expires 11/02/15, Broker JPMorgan Chase Bank N.A.(r) | | | 2,547,953 | |
| $ | 16,600,000 | | | EUR/USD foreign exchange rate, One purchased put strike 1.255, One written put strike 1.17, One written call strike 1.255 with a barrier level strike of 1.29 ($10,000,000 notional amount), Expires 12/15/15, Broker JPMorgan Chase Bank N.A.(r) | | | 1,042,314 | |
| $ | 16,900,000 | | | EUR/USD foreign exchange rate, One purchased put strike 1.28, One written put strike 1.21, One written call strike 1.28 with a barrier level strike of 1.33 ($10,000,000 notional amount), Expires 11/16/15, Broker Goldman Sachs International(r) | | | 842,502 | |
| Old Westbury Funds, Inc. | |
| Strategic Opportunities Fund | |
| Consolidated Portfolio of Investments - (Continued) | October 31, 2015 |
| | |
| Contracts/ | | | | | | |
| Notional | | | | | | |
| Amount ($) | | | | | Value | |
| $ | 10,000,000 | | | Euro STOXX 50 Index, One purchased call strike 2,595.70, Expires 01/19/18, Broker Citibank N.A. | | $ | 3,227,530 | |
| | 3,839 | | | Euro STOXX 50 Index, One purchased call strike 2,605.00, Expires 01/19/18, Broker JPMorgan Chase Bank N.A. | | | 3,176,645 | |
| | 3,764 | | | Euro STOXX 50 Index, One purchased call strike 2,657.00, Expires 01/19/18, Broker JPMorgan Chase Bank N.A. | | | 2,970,320 | |
| | 5,516 | | | Euro STOXX 50 Index, One purchased call strike 2,719.48, Expires 02/16/18, Broker JPMorgan Chase Bank N.A. | | | 4,125,256 | |
| | 5,505 | | | Euro STOXX 50 Index, One purchased call strike 2,725,10, Expires 12/21/18, One written put strike 2,725.10 with a barrier level strike of 2,125.58, Expires 12/16/16, Broker Goldman Sachs International | | | 3,854,990 | |
| $ | 10,000,000 | | | Euro STOXX 50 Index, One purchased call strike 2,730.95, Expires 05/18/18, Broker JPMorgan Chase Bank N.A. | | | 2,653,947 | |
| $ | 7,875,000 | | | Euro STOXX 50 Index, One purchased call strike 2,797.2047, Expires 12/21/18, One written put strike 2,797.2047 with a barrier level strike of 2,041.959 ($7,500,000 notional amount), Expires 12/16/16, Broker JPMorgan Chase Bank N.A.(r) | | | 1,855,677 | |
| | 5,339 | | | Euro STOXX 50 Index, One purchased call strike 2,810.00, Expires 06/15/18, Broker Goldman Sachs International | | | 3,570,121 | |
| | 11,500 | | | Euro STOXX 50 Index, One purchased call strike 3,004.34, One written call strike 3,154.557, One purchased put strike 2,944.2532 (3,329 contracts), One purchased put strike 2,944.2532 with a barrier level strike of 2,613.776 (3,329 contracts), One written put strike 3,004.34 with a barrier level strike of 2,613.776 (6,657 contracts), Expires 12/15/16, Broker JPMorgan Chase Bank N.A.(s) | | | 827,684 | |
| Contracts/ | | | | | | |
| Notional | | | | | | |
| Amount ($) | | | | | Value | |
| | 13,414 | | | Euro STOXX 50 Index, One purchased call strike 3,041.57, One written call strike 3,224.0642, One written put strike 3,041.57 with a barrier level strike of 2,767.83 (3,945 contracts), Expires 01/15/16, Broker JPMorgan Chase Bank N.A.(s) | | $ | 1,980,552 | |
| | 27,951 | | | Euro STOXX 50 Index, One purchased call strike 3,087.54, One written call strike 3,241.92, One written put strike 3,087.54 with a barrier level strike of 2,778.79 (6,478 contracts), Expires 12/15/16, Broker Credit Suisse International(s) | | | 1,642,540 | |
| | 4,750 | | | Euro STOXX 50 Index, One purchased call strike 3,158.20, One written put strike 3,158.20 with a barrier level strike of 2,662.36, Expires 10/20/16, Broker Credit Suisse International | | | 1,162,368 | |
| | 3,125 | | | Euro STOXX 50 Index, One purchased call strike 3,200.00, One written call strike 3,616.00, One written put strike 3,200.00 with a barrier level strike of 2,400.00, Expires 01/15/16, Broker BNP Paribas SA | | | 665,852 | |
| | 9,439 | | | Euro STOXX 50 Index, One purchased call strike 3,231.34, One written call strike 3,392.907, One purchased put strike 3,134.3998 (3,095 contracts), One written put strike 3,231.34 with a barrier level strike of 2,423.505 (6,189 contracts), Expires 09/15/16, Broker Goldman Sachs International(s) | | | 469,582 | |
| | 11,174 | | | Euro STOXX 50 Index, One purchased call strike 3,248.70, One written call strike 3,443.62, One written put strike 3,248.70 with a barrier level strike of 2,956.32 (3,694 contracts), Expires 12/18/15, Broker Credit Suisse International(s) | | | 1,351,456 | |
| | 3,822 | | | Euro STOXX 50 Index, One purchased call strike 3,270.22, One written put strike 3,270.22 with a barrier level strike of 2,812.39, Expires 09/20/16, Broker JPMorgan Chase Bank N.A. | | | 504,698 | |
| Old Westbury Funds, Inc. | |
| Strategic Opportunities Fund | |
| Consolidated Portfolio of Investments - (Continued) | October 31, 2015 |
| | |
| Contracts/ | | | | | | |
| Notional | | | | | | |
| Amount ($) | | | | | Value | |
| | 4,603 | | | Euro STOXX 50 Index, One purchased call strike 3,291.33, One written put strike 3,258.74 with a barrier level strike of 2,792.74, Expires 05/19/16, Broker Credit Suisse International | | $ | 668,049 | |
| | 2,981 | | | Euro STOXX 50 Index, One purchased call strike 3,354.40, One purchased put strike 3,220.224, One written put strike 3,354.40 with a barrier level strike of 2,636.56 (5,962 contracts), Expires 08/31/16, Broker JPMorgan Chase Bank N.A.(s) | | | 166,530 | |
| | 2,972 | | | Euro STOXX 50 Index, One purchased call strike 3,365.20, One purchased put strike 3,264.24, One written put strike 3,365.20 with a barrier level strike of 2,648.41 (5,943 contracts), Expires 07/14/16, Broker BNP Paribas SA(s) | | | 199,906 | |
| | 2,896 | | | Euro STOXX 50 Index, One purchased call strike 3,452.50, One purchased put strike 3,383.45, One written put strike 3,452.50 with a barrier level strike of 2,744.74 (5,793 contracts), Expires 06/30/16, Broker BNP Paribas SA(s) | | | 17,759 | |
| | 8,673 | | | Euro STOXX 50 Index, One purchased call strike 3,458.87, One written call strike 3,631.81, One purchased put strike 3,389.69 with a barrier level strike of 3,182.16 (4,337 contracts), One written put strike 3,458.87 with a barrier level strike of 3,182.16, Expires 01/14/16, Broker Credit Suisse International(s) | | | 307,092 | |
| | 2,872 | | | Euro STOXX 50 Index, One purchased call strike 3,482.44, One purchased put strike 3,343.15, One written put strike 3,482.44 with a barrier level strike of 2,761.58 (5,743 contracts), Expires 09/15/16, Broker Credit Suisse International(s) | | | (204,254 | ) |
| Contracts/ | | | | | | |
| Notional | | | | | | |
| Amount ($) | | | | | Value | |
| | 9,617 | | | Euro STOXX 50 Index, One purchased call strike 3,483.42, One written call strike 3,657.59, One purchased put strike 3,413.75 with a barrier level strike of 3,169.91 (2,871 contracts), One written put strike 3,483.42 with a barrier level strike of 3,169.91 (5,741 contracts), Expires 07/14/16, Broker Credit Suisse International(s) | | $ | (39,867 | ) |
| | 2,842 | | | Euro STOXX 50 Index, One purchased call strike 3,519.00, One purchased put strike 3,413.43, One written put strike 3,519.00 with a barrier level strike of 2,801.48 (5,683 contracts), Expires 09/15/16, Broker BNP Paribas SA(s) | | | (290,552 | ) |
| | 4,256 | | | Euro STOXX 50 Index, One purchased call strike 3,524.28, One purchased put strike 3,418.5516, One written put strike 3,524.28 with a barrier level strike of 2,822.9483 (8,512 contracts), Expires 08/18/16, Broker Goldman Sachs International(s) | | | (516,507 | ) |
| | 20,458 | | | Euro STOXX 50 Index, One purchased call strike 3,773.59, One written call strike 3,962.27, One purchased put strike 3,698.12 with a barrier level strike of 3,433.97 (5,300 contracts), One written put strike 3,773.59 with a barrier level strike of 3,433.97 (10,600 contracts), Expires 05/19/16, Broker Credit Suisse International(s) | | | (1,325,632 | ) |
| | 3,691 | | | Euro STOXX 50 Index, One purchased put strike 3,251.40, One written call strike 3,251.40 with a barrier level strike of 2,771.82, Expires 12/18/15, Broker JPMorgan Chase Bank N.A. | | | 729,165 | |
| Old Westbury Funds, Inc. | |
| Strategic Opportunities Fund | |
| Consolidated Portfolio of Investments - (Continued) | October 31, 2015 |
| | |
| Contracts/ | | | | | | |
| Notional | | | | | | |
| Amount ($) | | | | | Value | |
| | 330,472 | | | Euro STOXX Banks Index, One purchased call strike 131.63, One written call strike 138.2115, One purchased put strike 128.9974 (75,971 contracts), One purchased put strike 128.9974 with a barrier level strike of 114.518 (75,971 contracts), One written put strike 131.63 with a barrier level strike of 114.518 (151,941 contracts), Expires 11/17/16, Broker JPMorgan Chase Bank N.A.(s) | | $ | 523,237 | |
| | 110,862 | | | Euro STOXX Banks Index, One purchased call strike 135.3032, One written put strike 135.3032 with a barrier level strike of 112.1528, Expires 10/20/16, Broker BNP Paribas SA | | | 322,766 | |
| | 145,391 | | | Euro STOXX Banks Index, One purchased call strike 137.56, One written put strike 137.56 with a barrier level strike of 114.863, Expires 02/16/17, Broker Bank of America N.A. | | | 10,395 | |
| | 109,486 | | | Euro STOXX Banks Index, One purchased call strike 138.374, One written put strike 137.004 with a barrier level strike of 119.193, Expires 01/14/16, Broker Bank of America N.A. | | | 296,335 | |
| | 141,726 | | | Euro STOXX Banks Index, One purchased call strike 141.117, One written call strike 159.462, One written put strike 141.117 with a barrier level strike of 104.427, Expires 11/20/15, Broker Bank of America N.A. | | | 196,263 | |
| | 194,209 | | | Euro STOXX Banks Index, One purchased call strike 141.60, One written call strike 148.68, One purchased put strike 138.768 (70,621 contracts), One purchased put strike 138.768 with a barrier level strike of 124.608 (70,621 contracts), One written put strike 141.60 with a barrier level strike of 124.608 (141,243 contracts), Expires 04/14/16, Broker Bank of America N.A.(s) | | | 149,417 | |
| Contracts/ | | | | | | |
| Notional | | | | | | |
| Amount ($) | | | | | Value | |
| | 105,337 | | | Euro STOXX Banks Index, One purchased call strike 142.40, One written call strike 162.336, One written put strike 142.40 with a barrier level strike of 105.376, Expires 11/20/15, Broker Bank of America N.A. | | $ | 101,640 | |
| | 328,530 | | | Euro STOXX Banks Index, One purchased call strike 144.888, One written call strike 152.132, One purchased put strike 141.99 (69,019 contracts), One purchased put strike 141.99 with a barrier level strike of 131.848 (69,019 contracts), One written put strike 144.888 with a barrier level strike of 131.848 (138,038 contracts), Expires 09/29/16, Broker Bank of America N.A.(s) | | | (331,057 | ) |
| | 202,138 | | | Euro STOXX Banks Index, One purchased call strike 145.94, One written call strike 153.237, One purchased put strike 143.0212 (68,521 contracts), One purchased put strike 143.0212 with a barrier level strike of 132.805 (68,521 contracts), One written put strike 145.94 with a barrier level strike of 132.805 (137,043 contracts), Expires 02/18/16, Broker Bank of America N.A.(s) | | | (147,541 | ) |
| | 65,524 | | | Euro STOXX Banks Index, One purchased call strike 154.141, One purchased put strike 149.563, One written put strike 152.615 with a barrier level strike of 125.602 (131,048 contracts), Expires 11/20/15, Broker Bank of America N.A.(s) | | | 356,320 | |
| | 180,346 | | | Euro STOXX Banks Index, One purchased call strike 158.03, One written call strike 165.9315, One purchased put strike 154.87 (94,919 contracts), One written put strike 158.03 with a barrier level strike of 135.9058 (189,837 contracts), Expires 12/30/15, Broker BNP Paribas SA(s) | | | (349,654 | ) |
| Old Westbury Funds, Inc. | |
| Strategic Opportunities Fund | |
| Consolidated Portfolio of Investments - (Continued) | October 31, 2015 |
| | |
| Contracts/ | | | | | | |
| Notional | | | | | | |
| Amount ($) | | | | | Value | |
| | 344,451 | | | Euro STOXX Banks Index, One purchased call strike 160.73, One written call strike 168.767, One purchased put strike 157.515 (84,840 contracts), One purchased put strike 157.515 with a barrier level strike of 146.264 (84,840 contracts), One written put strike 160.73 with a barrier level strike of 146.264 (169,680 contracts), Expires 07/29/16, Broker Bank of America N.A.(s) | | $ | (1,848,662 | ) |
| | 303,828 | | | Euro STOXX Banks Index, One purchased call strike 161.44, One written call strike 169.512, One purchased put strike 158.211 (92,914 contracts), One written put strike 161.44 with a barrier level strike of 146.91 (185,828 contracts), Expires 05/19/16, Broker Bank of America N.A.(s) | | | (2,061,368 | ) |
| | 118,652 | | | Exxon Mobil Corp, One purchased call strike 87.65, One written call strike 93.55, One written put strike 84.28 with a barrier level strike of 57.31, Expires 04/15/16, Broker Bank of America N.A. | | | (68,593 | ) |
| | 114,247 | | | Exxon Mobil Corp, One purchased call strike 90.16, One written call strike 96.28, One written put strike 87.53 with a barrier level strike of 59.52, Expires 03/18/16, Broker Bank of America N.A. | | | (133,715 | ) |
| | 162,780 | | | Exxon Mobil Corp, One purchased call strike 93.992, One written call strike 101.3639, One written put strike 92.149 with a barrier level strike of 64.5043, Expires 02/19/16, Broker Goldman Sachs International | | | (411,882 | ) |
| | 1,681 | | | FTSE 100 Index, One purchased call strike 5,950.01, One purchased put strike 5,831.01, One written put strike 5,950.01 with a barrier level strike of 5,051.56 (3,361 contracts), Expires 12/15/16, Broker Credit Suisse International(s) | | | 603,743 | |
| Contracts/ | | | | | | |
| Notional | | | | | | |
| Amount ($) | | | | | Value | |
| | 3,267 | | | FTSE 100 Index, One purchased call strike 6,122.48, One written put strike 6,122.48 with a barrier level strike of 4,916.35, Expires 11/17/16, Broker Credit Suisse International | | $ | 671,713 | |
| | 3,204 | | | FTSE 100 Index, One purchased call strike 6,242.32, One written put strike 6,242.32 with a barrier level strike of 5,137.43, Expires 10/20/16, Broker Credit Suisse International | | | 340,585 | |
| | 113,148 | | | GameStop Corp., One purchased call strike 44.19, One written put strike 44.19 with a barrier level strike of 28.06, Expires 07/15/16, Broker Bank of America N.A. | | | 307,355 | |
| | 988 | | | IBEX 35 Index, One purchased call strike 10,118.92, One written put strike 10,118.92 with a barrier level level strike 8,778.1631, Expires 09/15/16, Broker Goldman Sachs International | | | 175,260 | |
| | 3,149 | | | IBEX 35 Index, One purchased call strike 11,062.23, One written call strike 11,615.34, One purchased call strike 10,840.9854, One purchased put strike 10,840.9854 with a barrier level level strike 9,865.30 (904 contracts), One written put strike 11,062.23 with a barrier level strike of 10,066.42 (1,808 contracts), Expires 07/14/16, Broker BNP Paribas SA(s) | | | (518,829 | ) |
| | 3,280 | | | IBEX 35 Index, One purchased call strike 11,585.31, One written call strike 12,164.58, One purchased put strike 11,353.60 with a barrier level strike of 10,542.63 (863 contracts), One written put strike 11,585.31 with a barrier level strike of 10,542.63 (1,726 contracts), Expires 05/20/16, Broker Citibank N.A.(s) | | | (815,432 | ) |
| Old Westbury Funds, Inc. | |
| Strategic Opportunities Fund | |
| Consolidated Portfolio of Investments - (Continued) | October 31, 2015 |
| | |
| Contracts/ | | | | | | |
| Notional | | | | | | |
| Amount ($) | | | | | Value | |
| | 5,571 | | | IBEX 35 Index, One purchased call strike 9,747.40, One written call strike 10,039.82, One purchased put strike 9,454.98 (1,026 contracts), One written put strike 9,747.40 with a barrier level strike of 7,310.55 (2,052 contracts), Expires 10/20/16, Broker Credit Suisse International(s) | | $ | 550,146 | |
| | 4,079 | | | IBEX 35 Index, One purchased call strike 9,863.96, One written call strike 10,258.5184, One purchased put strike 9,568.0412 (1,014 contracts), One written put strike 9,863.96 with a barrier level strike of 7,397.97 (2,028 contracts), Expires 10/31/16, Broker JPMorgan Chase Bank N.A.(s) | | | 410,854 | |
| | 10,558 | | | IBEX 35 Index, One purchased call strike 9,944.62, One written call strike 10,342.4048, One purchased put strike 9,745.7276 (2 011 contracts), One purchased put strike 9,745.7276 with a barrier level level strike 9,149.05 (2,011 contracts), One written put strike 9,944.62 with a barrier level level strike 9,149.05 (4,022 contracts), Expires 11/17/16, Broker JPMorgan Chase Bank N.A.(s) | | | 689,517 | |
| | 2,052,499 | | | iShares China Large-Cap ETF, One purchased call strike 35.81, One written call strike 37.24, One written put strike 35.81 with a barrier level strike of 32.23 (279,252 contracts), Expires 09/16/16, Broker Barclays Bank Plc(s) | | | 913,013 | |
| | 2,468,966 | | | iShares China Large-Cap ETF, One purchased call strike 36.25, One written call strike 37.3375, One written put strike 36.25 with a barrier level strike of 31.90 (275,862 contracts), Expires 10/20/16, Broker BNP Paribas SA(s) | | | 697,817 | |
| Contracts/ | | | | | | |
| Notional | | | | | | |
| Amount ($) | | | | | Value | |
| | 2,308,841 | | | iShares China Large-Cap ETF, One purchased call strike 37.508, One written call strike 38.6332, One written put strike 37.508 with a barrier level strike of 33.007 (266,610 contracts), Expires 11/18/16, Broker Goldman Sachs International(s) | | $ | 329,934 | |
| | 2,114,686 | | | iShares China Large-Cap ETF, One purchased call strike 38.54, One written call strike 39.6962, One written put strike 38.54 with a barrier level strike of 34.686 (259,471 contracts), Expires 12/15/16, Broker BNP Paribas SA(s) | | | 13,086 | |
| | 252,067 | | | iShares China Large-Cap ETF, One purchased call strike 39.672, One written put strike 39.672 with a barrier level strike of 30.726, Expires 08/18/16, Broker Goldman Sachs International | | | (453,670 | ) |
| | 291,804 | | | iShares iBoxx $ High Yield Corporate Bond ETF, One purchased call strike 83.10 with a barrier level strike of 94.24, One purchased put strike 85.67 with a barrier level strike of 64.26, One written put strike 85.67 with a barrier level strike of 77.11, Expires 12/16/16, Broker Bank of America N.A. | | | (119,640 | ) |
| | 382,114 | | | iShares MSCI EAFE Index Fund, One purchased call strike 61.50, One written call strike 63.96, One purchased put strike 61.50 (162,602 contracts), One written put strike 61.50 with a barrier level strike of 56.58 (325,203 contracts), Expires 12/30/15, Broker JPMorgan Chase Bank N.A.(s) | | | 174,134 | |
| | 244,763 | | | iShares MSCI EAFE Index Fund, One purchased call strike 61.8966, One purchased call strike 61.8966 with a barrier level strike of 70.4764, One purchased put strike 60.671 with a barrier level strike of 52.0912, One written put strike 61.2838 with a barrier level strike of 51.4784, Expires 12/16/16, Broker Goldman Sachs International | | | (99,618 | ) |
| Old Westbury Funds, Inc. | |
| Strategic Opportunities Fund | |
| Consolidated Portfolio of Investments - (Continued) | October 31, 2015 |
| | |
| Contracts/ | | | | | | |
| Notional | | | | | | |
| Amount ($) | | | | | Value | |
| | 243,273 | | | iShares MSCI EAFE Index Fund, One purchased call strike 62.2756, One written call strike 62.2756 with a barrier level strike of 70.291, One purchased put strike 61.0424 with a barrier level strike of 49.327, One written put strike 61.659 with a barrier level strike of 53.952, Expires 01/20/17, Broker JPMorgan Chase Bank N.A. | | $ | (187,595 | ) |
| | 237,117 | | | iShares MSCI EAFE Index Fund, One purchased call strike 63.26, One purchased put strike 61.99, One written put strike 63.26 with a barrier level strike of 53.30 (474,233 contracts), Expires 12/18/15, Broker Credit Suisse International(s) | | | 163,721 | |
| | 158,983 | | | iShares MSCI EAFE Index Fund, One purchased call strike 63.53, One written call strike 66.05, One purchased put strike 61.64, One written put strike 62.90 with a barrier level strike of 52.84, Expires 03/18/16, Broker BNP Paribas SA | | | 90,946 | |
| | 155,565 | | | iShares MSCI EAFE Index Fund, One purchased call strike 64.282, One purchased put strike 62.9964, One written put strike 64.282 with a barrier level strike of 53.4183 (311,129 contracts), Expires 11/30/15, Broker Goldman Sachs International(s) | | | 216,001 | |
| | 547,346 | | | iShares MSCI EAFE Index Fund, One purchased call strike 67.1677, One written call strike 69.8278, One purchased call strike 65.1727 (150,370 contracts), One written put strike 66.5027 with a barrier level strike of 52.9713 (300,740 contracts), Expires 05/19/16, Broker Citibank N.A.(s) | | | (605,860 | ) |
| | 940,749 | | | iShares MSCI Emerging Markets ETF, One purchased call strike 32.2084, One written put strike 31.8895 with a barrier level strike of 25.464, Expires 12/31/15, Broker JPMorgan Chase Bank N.A. | | | 2,359,750 | |
| Contracts/ | | | | | | |
| Notional | | | | | | |
| Amount ($) | | | | | Value | |
| | 300,404 | | | iShares MSCI Emerging Markets ETF, One purchased call strike 33.2885, One written put strike 33.2885 with a barrier level strike of 27.463, Expires 11/17/16, Broker BNP Paribas SA | | $ | 482,006 | |
| | 1,939,640 | | | iShares MSCI Emerging Markets ETF, One purchased call strike 34.5425, One written call strike 35.5788, One written put strike 34.5425 with a barrier level strike of 30.3974 (289,498 contracts), Expires 11/18/16, Broker BNP Paribas SA(s) | | | 173,918 | |
| | 1,719,346 | | | iShares MSCI Emerging Markets ETF, One purchased call strike 34.897, One written call strike 36.2929, One purchased put strike 34.1991 (429,836 contracts), One written put strike 34.897 with a barrier level strike of 28.807 (859,673 contracts), Expires 01/20/17, Broker JPMorgan Chase Bank N.A.(s) | | | 45,878 | |
| | 1,883,875 | | | iShares MSCI Emerging Markets ETF, One purchased call strike 35.565, One written call strike 36.632, One written put strike 35.565 with a barrier level strike of 31.6529 (281,175 contracts), Expires 12/16/16, Broker Goldman Sachs International(s) | | | (208,832 | ) |
| | 1,115,812 | | | iShares MSCI Emerging Markets ETF, One purchased call strike 37.82, One written call strike 39.3328, One purchased put strike 36.6854 (264,410 contracts), One written put strike 37.82 with a barrier level strike of 29.88 (528,821 contracts), Expires 07/14/16, Broker BNP Paribas SA(s) | | | (597,077 | ) |
| | 724,597 | | | iShares MSCI South Korea Index Fund, One purchased call strike 55.6861, One written call strike 59.0273, One written put strike 55.6861 with a barrier level strike of 50.6744 (269,367 contracts), Expires 01/15/16, Broker Citibank N.A.(s) | | | 10,137 | |
| Old Westbury Funds, Inc. | |
| Strategic Opportunities Fund | |
| Consolidated Portfolio of Investments - (Continued) | October 31, 2015 |
| | |
| Contracts/ | | | | | | |
| Notional | | | | | | |
| Amount ($) | | | | | Value | |
| | 465,362 | | | iShares MSCI South Korea Index Fund, One purchased call strike 56.73, One written call strike 60.1338, One written put strike 56.73 with a barrier level strike of 51.6243 (176,274 contracts), Expires 03/18/16, Broker JPMorgan Chase Bank N.A.(s) | | $ | (259,849 | ) |
| | 504,926 | | | iShares MSCI South Korea Index Fund, One purchased call strike 56.84, One written call strike 60.25, One written put strike 56.84 with a barrier level strike of 51.72 (175,932 contracts), Expires 04/15/16, Broker Bank of America N.A.(s) | | | (274,855 | ) |
| $ | 14,700,000 | | | iShares MSCI South Korea Index Fund, One purchased call strike 57.7534, One written call strike 68.865, One written put strike 57.7534 with a barrier level strike of 52.5556 ($5,000,000 notional amount), Expires 11/20/15, Broker Citibank N.A.(r) | | | (115,176 | ) |
| | 554,027 | | | iShares MSCI South Korea Index Fund, One purchased call strike 58.2102, One written call strike 61.1207, One written put strike 58.2102 with a barrier level strike of 52.9713 (171,791 contracts), Expires 05/20/16, Broker Citibank N.A.(s) | | | (569,074 | ) |
| | 2,606,052 | | | iShares MSCI Taiwan ETF, One purchased call strike 13.814, One written call strike 14.5047, One written put strike 13.814 with a barrier level strike of 12.4326 (723,903 contracts), Expires 08/18/16, Broker Goldman Sachs International(s) | | | (89,141 | ) |
| | 810,365 | | | Medtronic Plc, One purchased call strike 66.76, One written call strike 69.43, One written put strike 66.76 with a barrier level strike of 60.75 (149,790 contracts), Expires 11/18/16, Broker Credit Suisse International(s) | | | 804,329 | |
| Contracts/ | | | | | | |
| Notional | | | | | | |
| Amount ($) | | | | | Value | |
| | 48,086 | | | MSCI Singapore Free Index, One purchased call strike 311.9392, One written call strike 327.5361, One written put strike 311.9392 with a barrier level strike of 286.984, Expires 10/31/16, Broker BNP Paribas SA | | $ | 751,141 | |
| | 69,042 | | | MSCI Singapore Free Index, One purchased call strike 333.13256, One written call strike 353.120514, One written put strike 333.13256 with a barrier level strike of 306.481955 (30,018 contracts), Expires 10/31/16, Broker BNP Paribas SA(s) | | | (78,894 | ) |
| | 120,352 | | | MSCI Singapore Free Index, One purchased call strike 340.2515, One written call strike 357.2641, One written put strike 340.2515 with a barrier level strike of 313.0314 (44,085 contracts), Expires 11/30/16, Broker BNP Paribas SA(s) | | | (378,583 | ) |
| | 36,309 | | | MSCI Singapore Free Index, One purchased call strike 344.263, One written call strike 364.92, One written put strike 344.263 with a barrier level strike of 323.61, Expires 09/15/16, Broker BNP Paribas SA | | | (417,685 | ) |
| | 84,313 | | | MSCI Singapore Free Index, One purchased call strike 357.04, One written call strike 374.892, One written put strike 357.04 with a barrier level strike of 335.6176 (28,011 contracts), Expires 10/31/16, Broker BNP Paribas SA(s) | | | (676,721 | ) |
| | 27,094 | | | MSCI Singapore Free Index, One purchased call strike 369.0812, One written call strike 391.2261, One written put strike 369.0812 with a barrier level strike of 346.9363, Expires 09/30/16, Broker BNP Paribas SA | | | (952,711 | ) |
| | 113,400 | | | MSCI Singapore Free Index, One purchased call strike 373.52, One written call strike 399.67, One written put strike 373.52 with a barrier level strike of 339.90 (54,000 contracts), Expires 07/14/16, Broker UBS AG(s) | | | (1,374,630 | ) |
| Old Westbury Funds, Inc. | |
| Strategic Opportunities Fund | |
| Consolidated Portfolio of Investments - (Continued) | October 31, 2015 |
| | |
Contracts/
Notional
Amount ($) | | | | | Value | |
| | 10,315 | | | OMX Stockholm 30 Index , One purchased call strike 1,425.12, One purchased put strike 1,425.12, One written put strike 1,454.20 with a barrier level strike of 1,337.864, Expires 01/19/17, Broker BNP Paribas SA | | $ | 429,837 | |
| | 13,489 | | | OMX Stockholm 30 Index , One purchased call strike 1,482.73, One written put strike 1,376.7148, Expires 05/19/16, Broker JPMorgan Chase Bank N.A | | | 115,858 | |
| | 36,409 | | | OMX Stockholm 30 Index , One purchased call strike 1,557.3075, One written put strike 1,483.15 with a barrier level strike of 1,364.498 (13,485 contracts), Expires 05/19/16, Broker Goldman Sachs International(s) | | | 66,808 | |
| | 17,512 | | | Russell 2000 Index, One purchased call strike 1,142.07, One written call strike 1,210.5942, One purchased put strike 1,119.2286 (8,756 contracts), One written put strike 1,142.07 with a barrier level strike of 788.83, Expires 02/16/17, Broker BNP Paribas SA(s) | | | 78,304 | |
| | 17,400 | | | Russell 2000 Index, One purchased call strike 1,149.4305, One written call strike 1,218.3964, One purchased put strike 1,126.4419 (8,700 contracts), One written put strike 1,149.4305 with a barrier level strike of 837.705, Expires 11/17/16, Broker Goldman Sachs International(s) | | | 59,376 | |
| | 25,828 | | | Russell 2000 Index, One purchased call strike 1,161.5407, One written call strike 1,231.2331, One purchased put strike 1,138.3099 (12,914 contracts), One written put strike 1,161.5407 with a barrier level strike of 831.0823, Expires 01/19/17, Broker Goldman Sachs International(s) | | | (107,016 | ) |
Contracts/
Notional
Amount ($) | | | | | Value | |
| | 17,191 | | | Russell 2000 Index, One purchased call strike 1,163.41, One written call strike 1,233.2146, One purchased put strike 1,140.1418 (8,595 contracts), One written put strike 1,163.41 with a barrier level strike of 944.69, Expires 01/19/17, Broker BNP Paribas SA(s) | | $ | (44,516 | ) |
| | 25,982 | | | Russell 2000 Index, One purchased call strike 1,166.18, One written call strike 1,223.91, One purchased put strike 1,131.54 (12,991 contracts), One written put strike 1,154.63 with a barrier level strike of 789.77, Expires 12/15/16, Broker Credit Suisse International(s) | | | 68,954 | |
| | 16,916 | | | Russell 2000 Index, One purchased call strike 1,182.32, One written call strike 1,253.2592, One purchased put strike 1,135.0272 (8,458 contracts), One written put strike 1,182.32 with a barrier level strike of 869.0052, Expires 08/31/16, Broker JPMorgan Chase Bank N.A.(s) | | | (56,696 | ) |
| | 16,696 | | | Russell 2000 Index, One purchased call strike 1,197.90, One written call strike 1,281.753, One purchased put strike 1,161.963 (8,348 contracts), One written put strike 1,197.90 with a barrier level strike of 922.383, Expires 12/31/15, Broker JPMorgan Chase Bank N.A.(s) | | | 335,791 | |
| | 16,623 | | | Russell 2000 Index, One purchased call strike 1,203.1517, One written call strike 1,251.2778, One purchased put strike 1,130.9626 (8,312 contracts), One written put strike 1,203.1517 with a barrier level strike of 930.1566, Expires 03/17/16, Broker Goldman Sachs International(s) | | | (81,830 | ) |
| Old Westbury Funds, Inc. | |
| Strategic Opportunities Fund | |
| Consolidated Portfolio of Investments - (Continued) | October 31, 2015 |
| | |
Contracts/
Notional
Amount ($) | | | | | Value | |
| | 16,583 | | | Russell 2000 Index, One purchased call strike 1,206.02, One written call strike 1,278.3812, One purchased put strike 1,157.7792 (8,292 contracts), One written put strike 1,206.02 with a barrier level strike of 851.4501, Expires 10/20/16, Broker JPMorgan Chase Bank N.A.(s) | | $ | (159,619 | ) |
| | 16,511 | | | Russell 2000 Index, One purchased call strike 1,211.3449, One written call strike 1,284.0256, One purchased put strike 1,162.8911 (8,255 contracts), One written put strike 1,211.3449 with a barrier level strike of 889.1272, Expires 09/15/16, Broker Goldman Sachs International(s) | | | (211,611 | ) |
| | 17,599 | | | Russell 2000 Index, One purchased call strike 1,214.8418, One written call strike 1,287.7323, One purchased put strike 1,166.2482 (8,232 contracts), One written put strike 1,214.8418 with a barrier level strike of 886.8345 (16,463 contracts), Expires 09/15/16, Broker Goldman Sachs International(s) | | | (186,731 | ) |
| | 16,332 | | | Russell 2000 Index, One purchased call strike 1,224.6129, One written call strike 1,298.0897, One purchased put strike 1,187.8745 (8,166 contracts), One written put strike 1,224.6129 with a barrier level strike of 892.1305, Expires 05/19/16, Broker Goldman Sachs International(s) | | | 69,607 | |
| | 8,121 | | | Russell 2000 Index, One purchased call strike 1,231.30, One written call strike 1,305.18, One purchased put strike 1,206.68, One written put strike 1,231.30 with a barrier level strike of 948.10 (16,243 contracts), Expires 02/29/16, Broker UBS AG(s) | | | 9,747 | |
Contracts/
Notional
Amount ($) | | | | | Value | |
| | 16,167 | | | Russell 2000 Index, One purchased call strike 1,237.07, One written call strike 1,311.2942, One purchased put strike 1,199.9579 (8,084 contracts), One written put strike 1,237.07 with a barrier level strike of 917.2874, Expires 06/16/16, Broker Goldman Sachs International(s) | | $ | (129,960 | ) |
| | 24,210 | | | Russell 2000 Index, One purchased call strike 1,239.1588, One written call strike 1,325.8999, One purchased put strike 1,201.984, One written put strike 1,239.1588 with a barrier level strike of 954.1522 (12,105 contracts), Expires 03/31/16, Broker Goldman Sachs International(s) | | | (143,231 | ) |
| | 24,206 | | | Russell 2000 Index, One purchased call strike 1,239.35, One written call strike 1,326.10, One purchased put strike 2,235.01 on S&P 500 Index (7,248 contracts), One written put strike 44.63 on Utilities Sector SPDR Fund with a barrier level strike of 36.78 (678,963 contracts), Expires 04/14/16, Broker BNP Paribas SA(s) | | | 393,840 | |
| | 22,303 | | | Russell 2000 Index, One purchased call strike 1,242.00, One written call strike 1,304.10, One purchased put strike 1,204.74 (8,052 contracts), One written put strike 1,242.00 with a barrier level strike of 931.50 (16,103 contracts), Expires 08/18/16, Broker Credit Suisse International(s) | | | (273,862 | ) |
| | 8,128 | | | Russell 2000 Index, One purchased call strike 1,242.52, One purchased put strike 1,205.62, One written put strike 1,230.22 with a barrier level strike of 965.72 (16,257 contracts), Expires 04/15/16, Broker Credit Suisse International(s) | | | (220,839 | ) |
| Old Westbury Funds, Inc. | |
| Strategic Opportunities Fund | |
| Consolidated Portfolio of Investments - (Continued) | October 31, 2015 |
| | |
Contracts/
Notional
Amount ($) | | | | | Value | |
| | 20,091 | | | Russell 2000 Index, One purchased call strike 1,244.35, One written call strike 1,319.01, One purchased put strike 1,207.02 (10,045 contracts), One written put strike 1,244.35 with a barrier level strike of 905.89, Expires 06/16/16, Broker Credit Suisse International(s) | | $ | (119,168 | ) |
| | 20,054 | | | Russell 2000 Index, One purchased call strike 1,246.4592, One written call strike 1,308.7822, One purchased put strike 1,209.0655 (8,023 contracts), One written put strike 1,246.4592 with a barrier level strike of 1,034.5612 (16,045 contracts), Expires 10/20/16, Broker Goldman Sachs International(s) | | | (438,918 | ) |
| | 15,981 | | | Russell 2000 Index, One purchased call strike 1,251.4933, One written call strike 1,339.0978, One purchased put strike 1,213.9485 (7,990 contracts), One written put strike 1,251.4933 with a barrier level strike of 968.6558, Expires 04/29/16, Broker Goldman Sachs International(s) | | | (256,641 | ) |
| | 15,948 | | | Russell 2000 Index, One purchased call strike 1,254.09, One written call strike 1,329.3354, One purchased put strike 1,216.4673 (7,974 contracts), One written put strike 1,254.09 with a barrier level strike of 908.5882, Expires 08/18/16, Broker Goldman Sachs International(s) | | | (277,694 | ) |
| | 19,907 | | | Russell 2000 Index, One purchased call strike 1,255.83, One written call strike 1,331.18, One purchased put strike 1,230.71 (9,954 contracts), One written put strike 1,255.83 with a barrier level strike of 939.36, Expires 06/16/16, Broker Credit Suisse International(s) | | | (258,976 | ) |
Contracts/
Notional
Amount ($) | | | | | Value | |
| | 19,784 | | | Russell 2000 Index, One purchased call strike 1,263.65, One written call strike 1,339.469, One purchased put strike 1,225.7405 (9,892 contracts), One written put strike 1,263.65 with a barrier level strike of 928.78, Expires 08/18/16, Broker BNP Paribas SA(s) | | $ | (397,318 | ) |
| | 19,772 | | | Russell 2000 Index, One purchased call strike 1,264.44, One written call strike 1,340.3064, One purchased put strike 1,226.5068 (9,886 contracts), One written put strike 1,264.44 with a barrier level strike of 922.5354, Expires 09/15/16, Broker Goldman Sachs International(s) | | | (529,258 | ) |
| | 19,314 | | | Russell 2000 Index, One purchased call strike 1,294.37, One written call strike 1,372.0322, One purchased put strike 1,255.5389 (9,657 contracts), One written put strike 1,294.37 with a barrier level strike of 981.7796, Expires 07/14/16, Broker Goldman Sachs International(s) | | | (822,925 | ) |
| | 7,943 | | | S&P 500 Index, One purchased call strike 1,888.57, One written put strike 1,888.57 with a barrier level strike of 1,563.74, Expires 12/15/16, Broker Bank of America N.A. | | | 1,417,447 | |
| | 5,209 | | | S&P 500 Index, One purchased call strike 1,919.61, One written put strike 1,919.61 with a barrier level strike of 1,587.52, Expires 01/19/17, Broker Bank of America N.A. | | | 775,427 | |
| | 7,469 | | | S&P 500 Index, One purchased call strike 2,028.25, One written put strike 2,008.17 with a barrier level strike of 1,656.74, Expires 02/19/16, Broker Bank of America N.A. | | | 535,935 | |
| | 6,159 | | | S&P 500 Index, One purchased call strike 2,049.84, One written put strike 2,029.54 with a barrier level strike of 1,663.21, Expires 03/18/16, Broker Bank of America N.A. | | | 343,086 | |
| Old Westbury Funds, Inc. | |
| Strategic Opportunities Fund | |
| Consolidated Portfolio of Investments - (Continued) | October 31, 2015 |
| | |
Contracts/
Notional
Amount ($) | | | | | Value | |
| | 9,658 | | | S&P 500 Index, One purchased call strike 2,070.77, One written call strike 2,153.60, One purchased put strike 1,946.52 (4,829 contracts), One written put strike 2,070.77 with a barrier level strike of 1,680.43, Expires 03/17/16, Broker Bank of America N.A.(s) | | $ | 145,395 | |
| | 9,691 | | | S&P 500 Index, One purchased call strike 2,084.34, One written call strike 2,188.56, One written put strike 2,084.34 with a barrier level strike of 1,917.59 (4,798 contracts), Expires 12/31/15, Broker Bank of America N.A.(s) | | | 204,772 | |
| | 7,266 | | | S&P 500 Index, One purchased call strike 2,085.0844, One written call strike 2,374.106, One purchased put strike 2,023.1512, One written put strike 2,064.44 with a barrier level strike of 1,579.2966 (14,532 contracts), Expires 02/19/16, Broker Goldman Sachs International(s) | | | 405,749 | |
| | 14,659 | | | S&P 500 Index, One purchased call strike 2,087.67, One written call strike 2,170.35, One written put strike 2,087.67 with a barrier level strike of 1,901.64 (4,838 contracts), Expires 04/18/16, Broker Bank of America N.A.(s) | | | 194,240 | |
| | 7,236 | | | S&P 500 Index, One purchased call strike 2,093.59, One purchased put strike 2,052.13, One written put strike 2,072.86 with a barrier level strike of 1,671.76 (14,473 contracts), Expires 04/15/16, Broker Bank of America N.A.(s) | | | 250,877 | |
| | 4,766 | | | S&P 500 Index, One purchased call strike 2,098.41, One purchased put strike 2,056.44, One written put strike 2,098.41 with a barrier level strike of 1,694.47 (9,531 contracts), Expires 03/18/16, Broker Bank of America N.A.(s) | | | 125,551 | |
Contracts/
Notional
Amount ($) | | | | | Value | |
| | 7,144 | | | S&P 500 Index, One purchased call strike 2,099.6275, One purchased put strike 2,057.6349, One written put strike 2,099.6275 with a barrier level strike of 1,688.1005 (14,288 contracts), Expires 04/15/16, Broker Goldman Sachs International(s) | | $ | 127,129 | |
| | 9,510 | | | S&P 500 Index, One purchased call strike 2,103.066, One written call strike 2,229.25, One purchased put strike 2,039.974 (4,755 contracts), One written put strike 2,103.066 with a barrier level strike of 1,680.35, Expires 06/16/16, Broker BNP Paribas SA(s) | | | 113,133 | |
| | 11,242 | | | S&P 500 Index, One purchased call strike 2,108.0813, One written call strike 2,213.4854, One written put strike 2,108.0813 with a barrier level strike of 1,701.315 (5,692 contracts), Expires 01/14/16, Broker Citibank N.A.(s) | | | 95,315 | |
| | 21,553 | | | S&P 500 Index, One purchased call strike 2,110.1264, One written call strike 2,194.53, One purchased put strike 2,089.0251 (7,109 contracts), One written put strike 2,110.1264 with a barrier level strike of 1,941.32 (14,217 contracts), Expires 07/14/16, Broker BNP Paribas SA(s) | | | 28,875 | |
| | 12,685 | | | S&P 500 Index, One purchased call strike 2,111.38, One written call strike 2,195.00, One written put strike 2,111.38 with a barrier level strike of 1,902.34 (5,740 contracts), Expires 02/18/16, Broker Bank of America N.A.(s) | | | 65,502 | |
| | 5,913 | | | S&P 500 Index, One purchased call strike 2,113.89, One purchased put strike 2,050.47, One written put strike 2,113.89 with a barrier level strike of 1,682.66 (11,826 contracts), Expires 07/14/16, Broker Bank of America N.A.(s) | | | (72,213 | ) |
| Old Westbury Funds, Inc. | |
| Strategic Opportunities Fund | |
| Consolidated Portfolio of Investments - (Continued) | October 31, 2015 |
| | |
Contracts/
Notional
Amount ($) | | | | | Value | |
| | 21,363 | | | S&P 500 Index, One purchased call strike 2,127.464, One written call strike 87.8151 on iShare iBoxx High Yield Corp. Bond ETF (512,440 contracts), Expires 01/14/16, Broker BNP Paribas SA(s) | | $ | (262,250 | ) |
| | 4,692 | | | S&P 500 Index, One purchased call strike 2,131.30, One purchased put strike 2,067.36, One written put strike 2,131.30 with a barrier level strike of 1,705.04 (9,384 contracts), Expires 06/16/16, Broker Bank of America N.A.(s) | | | (102,507 | ) |
| | 9,433 | | | S&P 500 Index, One purchased call strike 2,141.40, One written put strike 5,672.08 on DAXK Index (3,023 contracts), Expires 06/16/16, Broker Bank of America N.A.(s) | | | (1,188,224 | ) |
| | 7,042 | | | S&P 500 Index, One purchased call strike 2,151.41, One purchased put strike 2,023.60, One written put strike 2,151.41 with a barrier level strike of 1,541.56 (14,084 contracts), Expires 01/19/17, Broker Bank of America N.A.(s) | | | (304,652 | ) |
| | 5,238 | | | S&P 500 Index, One purchased call strike 1,909.0325, One written put strike 1,909.0325 with a barrier level strike of 1,646.54, Expires 09/15/16, Broker JPMorgan Chase Bank N.A. | | | 831,900 | |
| | 25,967 | | | S&P 500 Index, One purchased call strike 1,916.45, One written put strike 1,878.87 with a barrier level strike of 1,628.04, Expires 01/14/16, Broker Credit Suisse International | | | 2,690,652 | |
| | 7,715 | | | S&P 500 Index, One purchased call strike 1,944.21, One written put strike 1,944.21 with a barrier level strike of 1,646.75, Expires 12/18/15, Broker Bank of America N.A. | | | 1,058,639 | |
Contracts/
Notional
Amount ($) | | | | | Value | |
| | 5,194 | | | S&P 500 Index, One purchased call strike 1,963.85, One purchased put strike 1,886.83, One written put strike 1,925.34 with a barrier level strike of 1,578.78 (10,388 contracts), Expires 02/18/16, Broker Credit Suisse International(s) | | $ | 682,758 | |
| | 17,292 | | | S&P 500 Index, One purchased call strike 1,966.27, One written call strike 2,044.92, One purchased put strike 1,907.28 (5,086 contracts), One written put strike 1,966.27 with a barrier level strike of 1,474.70 (10,172 contracts), Expires 10/31/16, Broker Credit Suisse International(s) | | | 490,817 | |
| | 5,080 | | | S&P 500 Index, One purchased call strike 1,968.64, One written put strike 1,968.64 with a barrier level strike of 1,685.16, Expires 11/20/14, Broker Bank of America N.A. | | | 562,717 | |
| | 5,054 | | | S&P 500 Index, One purchased call strike 1,998.49, One purchased put strike 1,939.13, One written put strike 1,978.70 with a barrier level strike of 1,691.79 (10,108 contracts), Expires 12/15/16, Broker Credit Suisse International(s) | | | 452,733 | |
| | 4,979 | | | S&P 500 Index, One purchased call strike 2,008.50, One purchased put strike 1,928.16, One written put strike 2,008.50 with a barrier level strike of 1,663.04 (9,958 contracts), Expires 03/17/16, Broker JPMorgan Chase Bank N.A.(s) | | | 371,098 | |
| | 4,975 | | | S&P 500 Index, One purchased call strike 2,010.00, One written put strike 2,010.00 with a barrier level strike of 1,736.64, Expires 11/20/15, Broker Credit Suisse International | | | 385,932 | |
| | 7,604 | | | S&P 500 Index, One purchased call strike 2,012.03, One written put strike 1,972.58 with a barrier level strike of 1,696.42, Expires 12/17/15, Broker Credit Suisse International | | | 609,719 | |
| Old Westbury Funds, Inc. | |
| Strategic Opportunities Fund | |
| Consolidated Portfolio of Investments - (Continued) | October 31, 2015 |
| | |
Contracts/
Notional
Amount ($) | | | | | Value | |
| | 12,425 | | | S&P 500 Index, One purchased call strike 2,012.0966, One purchased put strike 1,951.7337, One written put strike 2,012.0966 with a barrier level strike of 1,589.5563 (24,850 contracts), Expires 01/15/16, Broker Goldman Sachs International(s) | | $ | 1,152,653 | |
| | 9,946 | | | S&P 500 Index, One purchased call strike 2,031.14, One written call strike 2,212.13, One written put strike 89.55 on iShares iBoxx $High Yield Corporate Bond ETF with a barrier level strike of 70.928 (225,581 contracts), Expires 01/15/16, Broker Goldman Sachs International(s) | | | 639,986 | |
| | 12,305 | | | S&P 500 Index, One purchased call strike 2,031.71, One written put strike 2,031.71 with a barrier level strike of 1,757.43, Expires 01/15/16, Broker Credit Suisse International | | | 805,739 | |
| | 7,418 | | | S&P 500 Index, One purchased call strike 2,042.45, One written call strike 2,325.56, One purchased put strike 2,002.01, One written put strike 2,022.23 with a barrier level strike of 1,624.86 (14,835 contracts), Expires 11/20/15, Broker Credit Suisse International(s) | | | 435,747 | |
| | 4,877 | | | S&P 500 Index, One purchased call strike 2,050.74, One written put strike 2,050.74 with a barrier level strike of 1,768.76, Expires 01/19/16, Broker Bank of America N.A. | | | 221,778 | |
| | 6,089 | | | S&P 500 Index, One purchased call strike 2,052.8029, One purchased put strike 1,991.2188, One written put strike 2,052.8029 with a barrier level strike of 1,621.7143 (12,178 contracts), Expires 08/18/16, Broker Goldman Sachs International(s) | | | 177,000 | |
| | 7,296 | | | S&P 500 Index, One purchased call strike 2,055.83, One written put strike 2,055.83 with a barrier level strike of 1,786.52, Expires 01/15/16, Broker Bank of America N.A. | | | 312,339 | |
Contracts/
Notional
Amount ($) | | | | | Value | |
| | 18,226 | | | S&P 500 Index, One purchased call strike 2,058.62, One written call strike 2,140.15, One written put strike 2,058.62 with a barrier level strike of 1,875.18 (4,906 contracts), Expires 12/18/15, Broker Bank of America N.A.(s) | | $ | 627,000 | |
| | 4,836 | | | S&P 500 Index, One purchased call strike 2,067.94, One purchased put strike 1,985.22, One written put strike 2,067.94 with a barrier level strike of 1,604.72 (9,671 contracts), Expires 10/20/16, Broker Credit Suisse International(s) | | | 92,051 | |
| | 7,253 | | | S&P 500 Index, One purchased call strike 2,068.17, One purchased put strike 2,006.1249, One written put strike 2,068.17 with a barrier level strike of 1,634.8884 (14,506 contracts), Expires 08/18/16, Broker Goldman Sachs International(s) | | | 127,667 | |
| | 12,773 | | | S&P 500 Index, One purchased call strike 2,074.7185, One written call strike 2,178.4544, One written put strike 2,074.7185 with a barrier level strike of 1,887.9938 (14,460 contracts), One purchased put strike 2,033.2241 (7,230 contracts), One purchased put strike 2,033.2241 with a barrier level strike of 1,887.9938 (7,230 contracts), Expires 12/31/15, Broker Goldman Sachs International(s) | | | 483,625 | |
| | 7,219 | | | S&P 500 Index, One purchased call strike 2,077.81, One purchased put strike 1,994.70, One written put strike 2,098.59 with a barrier level strike of 1,585.37 (14,438 contracts), Expires 08/18/16, Broker Credit Suisse International(s) | | | 108,731 | |
| Old Westbury Funds, Inc. | |
| Strategic Opportunities Fund | |
| Consolidated Portfolio of Investments - (Continued) | October 31, 2015 |
| | |
Contracts/
Notional
Amount ($) | | | | | Value | |
| | 4,806 | | | S&P 500 Index, One purchased call strike 2,080.8252, One purchased put strike 1,997.5922, One written put strike 2,080.8252 with a barrier level strike of 1,637.8175 (9,612 contracts), 09/15/16, Broker Goldman Sachs International(s) | | $ | (19,332 | ) |
| | 9,455 | | | S&P 500 Index, One purchased call strike 2,083.49, One written call strike 2,187.6645, One purchased put strike 2,041.8202 (4,800 contracts), One purchased put strike 2,041.8202 with a barrier level strike of 1,895.9759 (4,800 contracts), One written put strike 2,083.49 with a barrier level strike of 1,895.9759 (9,599 contracts), Expires 04/14/16, Broker Goldman Sachs International(s) | | | 187,349 | |
| | 4,798 | | | S&P 500 Index, One purchased call strike 2,084.35, One purchased put strike 2,021.8195, One written put strike 2,084.35 with a barrier level strike of 1,644.5522 (9,595 contracts), Expires 08/18/16, Broker Goldman Sachs International(s) | | | 19,965 | |
| | 4,795 | | | S&P 500 Index, One purchased call strike 2,085.3301, One purchased put strike 2,022.7702, One written put strike 2,085.3301 with a barrier level strike of 1,668.2641 (9,591 contracts), Expires 09/15/16, Broker Goldman Sachs International(s) | | | (53,800 | ) |
| | 4,784 | | | S&P 500 Index, One purchased call strike 2,090.1919, One purchased put strike 2,048.38, One written put strike 2,090.1919 with a barrier level strike of 1,670.0634 (9,568 contracts), Expires 06/16/16, Broker Goldman Sachs International(s) | | | 62,689 | |
Contracts/
Notional
Amount ($) | | | | | Value | |
| | 10,617 | | | S&P 500 Index, One purchased call strike 2,090.89, One written call strike 2,195.4345, One purchased put strike 2,049.0722 (4,783 contracts), One purchased put strike 2,049.0722 with a barrier level strike of 1,902.71 (4,783 contracts), One written put strike 2,090.89 with a barrier level strike of 1,902.71 (9,565 contracts), Expires 08/18/16, Broker JPMorgan Chase Bank N.A.(s) | | $ | (14,214 | ) |
| | 11,950 | | | S&P 500 Index, One purchased call strike 2,092.1021, One written call strike 2,364.0753, One written put strike 2,092.1021 with a barrier level strike of 1,589.9976, Expires 01/15/16, Broker Goldman Sachs International | | | 310,233 | |
| | 7,212 | | | S&P 500 Index, One purchased call strike 2,100.53, One written call strike 2,287.70, One written put strike 2,058.93, One written put strike 2,079.73 with a barrier level strike of 1,672.10 (14,425 contracts), Expires 01/14/16, Broker Credit Suisse International(s) | | | 328,813 | |
| | 13,629 | | | S&P 500 Index, One purchased call strike 2,107.27, One written call strike 2,212.6335, One purchased put strike 2,001.9065 with a barrier level strike of 1,580.4525 (9,491 contracts), One written put strike 88.074 on iShares iBoxx High Yield Corp. Bond ETF with a barrier level strike of 74.8629 (227,082 contracts), Expires 08/18/16, Broker Goldman Sachs International(s) | | | (402,176 | ) |
| | 12,796 | | | S&P 500 Index, One purchased call strike 2,109.12, One written put strike 2,067.76 with a barrier level strike of 1,881.66 (9,672 contracts), Expires 01/15/16, Broker Bank of America N.A.(s) | | | 122,340 | |
| | 5,972 | | | S&P 500 Index, One purchased call strike 2,113.9098, One written put strike 1,988.331, Expires 01/14/16, Broker Goldman Sachs International | | | (1,301 | ) |
| Old Westbury Funds, Inc. | |
| Strategic Opportunities Fund | |
| Consolidated Portfolio of Investments - (Continued) | October 31, 2015 |
| | |
Contracts/
Notional
Amount ($) | | | | | Value | |
| | 5,903 | | | S&P 500 Index, One purchased call strike 2,117.66, One purchased put strike 2,054.13, One written put strike 2,117.66 with a barrier level strike of 1,685.66 (11,805 contracts), Expires 07/14/16, Broker Credit Suisse International(s) | | $ | (102,906 | ) |
| | 4,717 | | | S&P 500 Index, One purchased call strike 2,119.9811, One purchased put strike 2,077.5815, One written put strike 2,119.9811 with a barrier level strike of 1,710.8247 (9,434 contracts), Expires 06/16/16, Broker Goldman Sachs International(s) | | | (79,174 | ) |
| | 4,757 | | | S&P 500 Index, One purchased call strike 2,123.05, One purchased put strike 2,059.99, One written put strike 2,102.03 with a barrier level strike of 1,660.39 (9,515 contracts), Expires 02/29/16, Broker UBS AG(s) | | | 109,076 | |
| | 9,408 | | | S&P 500 Index, One purchased call strike 2,125.9333, One written call strike 2,253.4893, One purchased put strike 2,062.1553 (4,704 contracts), One written put strike 2,125.9333 with a barrier level strike of 1,709.2504, Expires 06/16/16, Broker Goldman Sachs International(s) | | | 3,299 | |
| | 7,122 | | | S&P 500 Index, One purchased call strike 2,127.26, One written put strike 2,000.89, Expires 12/31/15, Broker UBS AG | | | (50,296 | ) |
| | 17,308 | | | S&P 500 Index, One purchased put strike 2,001.9284, One purchased call strike 2,042.3714, One written put strike 2,022.1499 with a barrier level strike of 1,536.8339 (34,617 contracts), Expires 07/15/16, Broker Goldman Sachs International(s) | | | 1,364,809 | |
| | 128,254 | | | Schlumberger Ltd., One purchased call strike 81.0888, One written call strike 84.9873, One written put strike 77.97 with a barrier level strike of 46.782, Expires 02/19/16, Broker JPMorgan Chase Bank N.A. | | | 43,358 | |
Contracts/
Notional
Amount ($) | | | | | Value | |
| | 1,684,327 | | | Select Sector Financial SPDR Fund, One purchased call strike 22.65, One written call strike 23.556, One purchased put strike 23.81, One written put strike 22.65 with a barrier level strike of 20.385 (441,501 contracts), Expires 10/20/16, Broker JPMorgan Chase Bank N.A.(s) | | $ | 499,648 | |
| | 1,342,495 | | | Select Sector Financial SPDR Fund, One purchased call strike 23.65, One written call strike 25.07, One written put strike 23.65 with a barrier level strike of 21.52 (528,541 contracts), Expires 02/19/16, Broker Credit Suisse International(s) | | | 668,178 | |
| | 415,800 | | | Select Sector Financial SPDR Fund, One purchased call strike 24.53, One written call strike 25.73, One purchased put strike 23.81, One written put strike 24.05 with a barrier level strike of 18.28, Expires 11/20/15, Broker BNP Paribas SA | | | 156,478 | |
| | 1,223,796 | | | Select Sector Financial SPDR Fund, One purchased call strike 24.71, One written call strike 26.19, One written put strike 24.71 with a barrier level strike of 22.73 (485,633 contracts), Expires 06/16/16, Broker UBS AG(s) | | | 98,451 | |
| | 408,345 | | | Select Sector Financial SPDR Fund, One purchased call strike 24.734, One written put strike 24.489121 with a barrier level strike of 22.2851, Expires 02/18/16, Broker BNP Paribas SA | | | (91,581 | ) |
| | 1,286,172 | | | Select Sector Financial SPDR Fund, One purchased call strike 24.88, One written call strike 26.37, One written put strike 24.88 with a barrier level strike of 22.64 (502,412 contracts), Expires 01/15/16, Broker Bank of America N.A.(s) | | | 13,287 | |
| | 187,758 | | | SPDR Dow Jones Industrial Average ETF Trust, One purchased call strike 159.78, One written put strike 159.78 with a barrier level strike of 130.78, Expires 09/29/16, Broker Credit Suisse International | | | 2,797,858 | |
| Old Westbury Funds, Inc. | |
| Strategic Opportunities Fund | |
| Consolidated Portfolio of Investments - (Continued) | October 31, 2015 |
| | |
Contracts/
Notional
Amount ($) | | | | | Value | |
| | 92,210 | | | SPDR Dow Jones Industrial Average ETF Trust, One purchased call strike 162.67, One written put strike 162.67 with a barrier level strike of 128.24, Expires 01/19/17, Broker Credit Suisse International | | $ | 1,057,183 | |
| | 92,972 | | | SPDR Dow Jones Industrial Average ETF Trust, One purchased call strike 162.95, One written put strike 161.34 with a barrier level strike of 136.33, Expires 04/14/16, Broker Barclays Bank Plc | | | 1,346,241 | |
| | 93,440 | | | SPDR Dow Jones Industrial Average ETF Trust, One purchased call strike 163.7406, One written put strike 86.00 on iShares iBoxx High Yield Corp. Bond ETF with a barrier level strike of 73.96 (174,419 contracts), Expires 10/20/16, Broker JPMorgan Chase Bank N.A.(s) | | | 680,051 | |
| | 92,149 | | | SPDR Dow Jones Industrial Average ETF Trust, One purchased call strike 164.41, One written put strike 162.78 with a barrier level strike of 137.55, Expires 05/19/16, Broker Barclays Bank Plc | | | 1,191,487 | |
| | 120,330 | | | SPDR Dow Jones Industrial Average ETF Trust, One purchased call strike 166.21, One written put strike 166.21 with a barrier level strike of 137.54, Expires 12/15/16, Broker Credit Suisse International | | | 958,278 | |
| | 119,508 | | | SPDR Dow Jones Industrial Average ETF Trust, One purchased call strike 167.353, One written put strike 167.353 with a barrier level strike of 139.0703, Expires 11/17/16, Broker Goldman Sachs International(s) | | | 1,036,826 | |
| | 44,603 | | | SPDR Dow Jones Industrial Average ETF Trust, One purchased call strike 168.15, One written put strike 168.15 with a barrier level strike of 141.67, Expires 12/18/15, Broker Credit Suisse International | | | 388,430 | |
Contracts/
Notional
Amount ($) | | | | | Value | |
| | 89,793 | | | SPDR Dow Jones Industrial Average ETF Trust, One purchased call strike 168.72, One written put strike 167.05 with a barrier level strike of 147.84, Expires 03/18/16, Broker Barclays Bank Plc | | $ | 766,832 | |
| | 59,053 | | | SPDR Dow Jones Industrial Average ETF Trust, One purchased call strike 169.34, One written put strike 169.34 with a barrier level strike of 144.79, Expires 11/20/15, Broker Credit Suisse International | | | 439,022 | |
| | 29,525 | | | SPDR Dow Jones Industrial Average ETF Trust, One purchased call strike 169.35, One written put strike 169.35 with a barrier level strike of 140.5605, Expires 11/20/15, Broker Goldman Sachs International | | | 211,143 | |
| | 87,570 | | | SPDR Dow Jones Industrial Average ETF Trust, One purchased call strike 171.2922, One purchased put strike 166.1534, One written put strike 171.2922 with a barrier level strike of 143.029 (175,139 contracts), Expires 03/17/16, Broker BNP Paribas SA(s) | | | 489,870 | |
| | 87,499 | | | SPDR Dow Jones Industrial Average ETF Trust, One purchased call strike 173.1443, One purchased put strike 168.0014, One written put strike 171.43 with a barrier level strike of 146.95 (174,999 contracts), Expires 01/19/17, Broker BNP Paribas SA(s) | | | 316,401 | |
| | 57,394 | | | SPDR Dow Jones Industrial Average ETF Trust, One purchased call strike 174.2344, One purchased put strike 169.0074, One written put strike 174.2344 with a barrier level strike of 135.9028 (114,789 contracts), Expires 10/20/16, Broker Goldman Sachs International(s) | | | 114,541 | |
| Old Westbury Funds, Inc. | |
| Strategic Opportunities Fund | |
| Consolidated Portfolio of Investments - (Continued) | October 31, 2015 |
| | |
Contracts/
Notional
Amount ($) | | | | | Value | |
| | 57,148 | | | SPDR Dow Jones Industrial Average ETF Trust, One purchased call strike 174.983, One purchased put strike 167.9837, One written put strike 174.983 with a barrier level strike of 135.9618 (114,297 contracts), Expires 09/15/16, Broker Goldman Sachs International(s) | | $ | 66,749 | |
| | 70,724 | | | SPDR Dow Jones Industrial Average ETF Trust, One purchased call strike 176.744, One purchased put strike 171.4417, One written put strike 176.744 with a barrier level strike of 139.8045 (141,448 contracts), Expires 08/18/16, Broker Goldman Sachs International(s) | | | 27,893 | |
| | 56,240 | | | SPDR Dow Jones Industrial Average ETF Trust, One purchased call strike 177.81, One purchased put strike 174.25, One written put strike 177.81 with a barrier level strike of 136.91 (112,480 contracts), Expires 06/16/16, Broker UBS AG(s) | | | 106,363 | |
| | 56,590 | | | SPDR Dow Jones Industrial Average ETF Trust, One purchased call strike 178.4771, One purchased put strike 173.1758, One written put strike 176.71 with a barrier level strike of 140.4845 (113,180 contracts), Expires 04/15/16, Broker Goldman Sachs International(s) | | | 90,312 | |
| | 84,024 | | | SPDR Dow Jones Industrial Average ETF Trust, One purchased call strike 180.3052, One purchased put strike 176.7348, One written put strike 178.52 with a barrier level strike of 145.3153 (168,048 contracts), Expires 04/15/16, Broker Goldman Sachs International(s) | | | 21,720 | |
| | 55,432 | | | SPDR Dow Jones Industrial Average ETF Trust, One purchased call strike 180.40, One purchased put strike 174.99, One written put strike 180.40 with a barrier level strike of 142.88 (110,865 contracts), Expires 09/15/16, Broker BNP Paribas SA(s) | | | (185,224 | ) |
Contracts/
Notional
Amount ($) | | | | | Value | |
| | 110,877 | | | SPDR Dow Jones Industrial Average ETF Trust, One purchased call strike 182.18, One purchased put strike 176.77, One written put strike 180.38 with a barrier level strike of 145.21 (221,754 contracts), Expires 11/20/15, Broker Credit Suisse International(s) | | $ | 225,267 | |
| | 55,340 | | | SPDR Dow Jones Industrial Average ETF Trust, One purchased call strike 182.51, One purchased put strike 177.09, One written put strike 180.70 with a barrier level strike of 140.22 (110,681 contracts), Expires 03/18/16, Broker Credit Suisse International(s) | | | 417,080 | |
| | 68,310 | | | SPDR Dow Jones Industrial Average ETF Trust, One purchased call strike 182.99, One purchased put strike 177.5003, One written put strike 182.99 with a barrier level strike of 143.7752 (136,619 contracts), Expires 07/14/16, Broker Goldman Sachs International(s) | | | (271,661 | ) |
| | 154,727 | | | SPDR S&P 500 ETF Trust, One purchased call strike 193.2739, One written call strike 199.9649, One purchased put strike 189.4084, One written put strike 193.2739 with a barrier level strike of 161.3837 (104,018 contracts), Expires 11/17/15, Broker Citibank N.A.(s) | | | 450,386 | |
| | 926,871 | | | SPDR S&P Homebuilders ETF, One purchased call strike 35.28, One written call strike 37.04, One written put strike 35.28 with a barrier level strike of 32.10 (283,447 contracts), Expires 05/19/16, Broker UBS AG(s) | | | 294,571 | |
| | 953,282 | | | SPDR S&P Regional Banking ETF, One purchased call strike 42.1701, One written call strike 44.2786, One written put strike 42.1701 with a barrier level strike of 38.3748 (284,562 contracts), Expires 05/31/16, Broker Citibank N.A.(s) | | | 374,947 | |
| Old Westbury Funds, Inc. | |
| Strategic Opportunities Fund | |
| Consolidated Portfolio of Investments - (Continued) | October 31, 2015 |
| | |
Contracts/
Notional
Amount ($) | | | | | Value | |
| | 4,713 | | | Taiwan Stock Exchange Weighted Index, One purchased call strike 8,040.91, One written call strike 8,523.3646, One written put strike 8,040.91 with a barrier level strike of 7,397.6372 (1,244 contracts), Expires 10/19/16, Broker Goldman Sachs International(s) | | $ | 570,032 | |
| | 6,373 | | | Taiwan Stock Exchange Weighted Index, One purchased call strike 8,316.30, One written call strike 8,815.278, One written put strike 8,316.30 with a barrier level strike of 7,817.322 (1,503 contracts), Expires 09/19/16, Broker Goldman Sachs International(s) | | | 423,009 | |
| | 1,165 | | | Taiwan Stock Exchange Weighted Index, One purchased call strike 8,582.57, One written call strike 9,097.5242, One written put strike 8,582.57 with a barrier level strike of 8,067.6158, Expires 09/21/16, Broker BNP Paribas SA | | | 82,828 | |
| | 4,330 | | | Taiwan Stock Exchange Weighted Index, One purchased call strike 9,285.64, One written call strike 9,842.78, One written put strike 9,285.64 with a barrier level strike of 8,728.50 (1,077 contracts), Expires 07/20/16, Broker BNP Paribas SA(s) | | | (589,790 | ) |
| | 4,757 | | | Taiwan Stock Exchange Weighted Index, One purchased call strike 9,554.95, One written call strike 10,128.247, One written put strike 9,554.95 with a barrier level strike of 8,981.653 (1,570 contracts), Expires 06/15/16, Broker BNP Paribas SA(s) | | | (1,278,447 | ) |
| $ | 25,000,000 | | | USD/CAD foreign exchange rate, One written call strike 1.30, Expires 08/26/15, One purchased call strike 1.28 ($6,850,000 notional amount), Expires 12/18/15, Broker Goldman Sachs International(r) | | | 179,279 | |
Contracts/
Notional
Amount ($) | | | | | Value | |
| $ | 100,000,000 | | | USD/CNY (Offshore) foreign exchange rate, One purchased put strike 6.60, One written put strike 6.90, Expires 08/17/16, Broker BNP Paribas SA | | $ | 681,310 | |
| $ | 100,000,000 | | | USD/CNY (Offshore) foreign exchange rate, One purchased put strike 6.60, One written put strike 6.90, Expires 08/15/16, Broker Bank of America N.A. | | | 624,803 | |
| $ | 15,800,000 | | | USD/JPY foreign exchange rate, One purchased call strike 108.00, One written call strike 114.00, One written put strike 108.00 with a barrier level strike of 102.00 ($10,000,000 notional amount), Expires 11/10/15, Broker JPMorgan Chase Bank N.A.(r) | | | 782,420 | |
| $ | 14,800,000 | | | USD/JPY foreign exchange rate, One purchased call strike 108.00, One written call strike 115.00, One written put strike 108.00 with a barrier level strike of 103.00 ($10,000,000 notional amount), Expires 11/09/15, Broker Bank of America N.A.(r) | | | 858,259 | |
| $ | 62,000,000 | | | USD/JPY foreign exchange rate, One purchased call strike 112.00, One written call strike 120.00, One written put strike 112.00 with a barrier level strike of 109.00 ($40,000,000 notional amount), Expires 11/02/15, Broker Goldman Sachs International(r) | | | 4,090,339 | |
| $ | 29,000,000 | | | USD/JPY foreign exchange rate, One purchased call strike 113.50, One written call strike 121.00, One written put strike 113.50 with a barrier level strike of 110.00 ($15,000,000 notional amount), Expires 12/04/15, Broker Bank of America N.A.(r) | | | 1,482,516 | |
| $ | 18,475,000 | | | USD/JPY foreign exchange rate, One purchased call strike 114.50, One written call strike 122.00, One written put strike 114.50 with a barrier level strike of 110.50 ($10,000,000 notional amount), Expires 12/08/15, Broker JPMorgan Chase Bank N.A.(r) | | | 849,741 | |
| Old Westbury Funds, Inc. | |
| Strategic Opportunities Fund | |
| Consolidated Portfolio of Investments - (Continued) | October 31, 2015 |
| | |
Contracts/
Notional
Amount ($) | | | | | Value | |
| $ | 19,600,000 | | | USD/JPY foreign exchange rate, One purchased call strike 115.50, One written call strike 122.00, One written put strike 115.50 with a barrier level strike of 110.00 ($10,000,000 notional amount), Expires 12/14/15, Broker Bank of America N.A.(r) | | $ | 729,490 | |
| $ | 21,100,000 | | | USD/JPY foreign exchange rate, One purchased call strike 116.00, One written call strike 123.00, One written put strike 116.00 with a barrier level strike of 112.00 ($10,000,000 notional amount), Expires 12/08/15, Broker Bank of America N.A.(r) | | | 753,648 | |
| $ | 13,300,000 | | | USD/JPY foreign exchange rate, One purchased call strike 117.00, One written put strike 125.00, One written call strike 117.00 with a barrier level strike of 109.00 ($7,500,000 notional amount), Expires 03/17/16, Broker Goldman Sachs International(r) | | | 367,329 | |
| $ | 21,550,000 | | | USD/JPY foreign exchange rate, One purchased call strike 118.50, One written call strike 126.00, One written put strike 118.50 with a barrier level strike of 113.00 ($10,000,000 notional amount), Expires 12/23/15, Broker Bank of America N.A.(r) | | | 442,234 | |
| $ | 25,600,000 | | | USD/JPY foreign exchange rate, One purchased call strike 119.50, One written call strike 127.00, One written put strike 119.50 with a barrier level strike of 113.00 ($10,000,000 notional amount), Expires 01/04/16, Broker Bank of America N.A.(r) | | | 391,827 | |
| $ | 24,380,000 | | | USD/JPY foreign exchange rate, One purchased call strike 120.00, One written call strike 128.00, One written put strike 120.00 with a barrier level strike of 113.50 ($10,000,000 notional amount), Expires 02/22/16, Broker Bank of America N.A.(r) | | | 329,068 | |
Contracts/
Notional
Amount ($) | | | | | Value | |
| $ | 41,000,000 | | | USD/JPY foreign exchange rate, One purchased call strike 122.00, One written call strike 130.00, One written put strike 122.00 with a barrier level strike of 117.00 ($15,000,000 notional amount), Expires 01/05/16, Broker Bank of America N.A.(r) | | $ | 159,491 | |
| $ | 50,000,000 | | | USD/JPY foreign exchange rate, One purchased call strike 124.00, Expires 12/31/15, Broker Bank of America N.A. | | | 223,092 | |
| $ | 15,000,000 | | | USD/MXN foreign exchange rate, One purchased call strike 13.50, One written put strike 14.58, Expires 11/17/15, Broker Bank of America N.A. | | | (1,761,639 | ) |
| $ | 5,000,000 | | | USD/MXN foreign exchange rate, One purchased call strike 14.50, One written put strike 16.015, Expires 03/17/16, Broker Bank of America N.A. | | | (248,767 | ) |
| $ | 12,000,000 | | | USD/MXN foreign exchange rate, One purchased call strike 15.10, One written put strike 16.575, Expires 06/19/16, Broker Bank of America N.A. | | | 453,715 | |
| $ | 10,000,000 | | | USD/MXN foreign exchange rate, One purchased call strike 15.30, One written put strike 17.297, Expires 05/17/16, Broker Bank of America N.A. | | | (190,565 | ) |
| $ | 10,000,000 | | | USD/MXN foreign exchange rate, One purchased call strike 16.20, One written put strike 17.93, Expires 08/12/16, Broker Bank of America N.A. | | | 26,742 | |
| $ | 25,000,000 | | | USD/MXN foreign exchange rate, One purchased call strike 16.50, One written put strike 17.98, Expires 10/31/16, Broker JPMorgan Chase Bank N.A. | | | (65,403 | ) |
| $ | 20,000,000 | | | USD/MXN foreign exchange rate, One purchased put strike 13.60, One written call strike 14.5665, Expires 11/17/15, Broker Goldman Sachs International | | | (2,396,493 | ) |
| $ | 5,000,000 | | | USD/MXN foreign exchange rate, One purchased put strike 14.55, One written put strike 16.20, Expires 02/04/16, Broker Goldman Sachs International | | | (181,462 | ) |
| Old Westbury Funds, Inc. | |
| Strategic Opportunities Fund | |
| Consolidated Portfolio of Investments - (Continued) | October 31, 2015 |
| | |
Contracts/
Notional
Amount ($) | | | | | Value | |
| $ | 10,000,000 | | | USD/MXN foreign exchange rate, One purchased put strike 15.20, One written call strike 16.61, Expires 05/31/16, Broker JPMorgan Chase Bank N.A. | | $ | (384,896 | ) |
| $ | 35,000,000 | | | USD/MXN foreign exchange rate, One purchased put strike 16.45, One written call strike 18.361, Expires 12/15/16, Broker Bank of America N.A. | | | (59,197 | ) |
| $ | 15,000,000 | | | USD/MXN foreign exchange rate, One purchased put strike 16.65, One written call strike 17.87, Expires 01/30/17, Broker Bank of America N.A. | | | 22,346 | |
| | 763,255 | | | WisdomTree Japan Hedged Equity Fund, One purchased call strike 42.4616, One written call strike 44.5847, One written put strike 42.4616 with a barrier level strike of 38.640068 (215,002 contracts), Expires 11/20/15, Broker Goldman Sachs International(s) | | | 1,645,039 | |
| | 722,187 | | | WisdomTree Japan Hedged Equity Fund, One purchased call strike 43.13, One written call strike 45.53, One written put strike 43.13 with a barrier level strike of 43.60 (208,725 contracts), Expires 11/20/15, Broker Credit Suisse International(s) | | | 1,707,131 | |
| | 638,752 | | | WisdomTree Japan Hedged Equity Fund, One purchased call strike 45.3427, One written call strike 47.1564, One written put strike 45.3427 with a barrier level strike of 41.715313 (151,005 contracts), Expires 11/20/15, Broker Goldman Sachs International(s) | | | 1,229,855 | |
| | 655,278 | | | WisdomTree Japan Hedged Equity Fund, One purchased call strike 47.6473, One written call strike 50.0297, One written put strike 47.6473 with a barrier level strike of 43.359075 (191,602 contracts), Expires 11/20/15, Broker Goldman Sachs International(s) | | | 1,573,456 | |
Contracts/
Notional
Amount ($) | | | | | Value | |
| | 996,053 | | | WisdomTree Japan Hedged Equity Fund, One purchased call strike 48.681, One written call strike 51.36, One written put strike 48.681 with a barrier level strike of 49.184 (280,578 contracts), Expires 12/18/15, Broker Credit Suisse International(s) | | $ | 2,019,059 | |
| | 643,297 | | | WisdomTree Japan Hedged Equity Fund, One purchased call strike 48.96, One written call strike 51.4085, One written put strike 48.96 with a barrier level strike of 45.0437 (186,463 contracts), Expires 12/18/15, Broker Goldman Sachs International(s) | | | 1,282,269 | |
| | 479,862 | | | WisdomTree Japan Hedged Equity Fund, One purchased call strike 49.369, One written call strike 51.838, One written put strike 49.369 with a barrier level strike of 45.41993 (138,689 contracts), Expires 12/18/15, Broker Goldman Sachs International(s) | | | 923,478 | |
| | 631,442 | | | WisdomTree Japan Hedged Equity Fund, One purchased call strike 50.427, One written call strike 52.5781, One written put strike 47.7981 with a barrier level strike of 47.8461 (190,193 contracts), Expires 11/20/15, Broker Citibank N.A.(s) | | | 1,508,572 | |
| | 1,517,953 | | | WisdomTree Japan Hedged Equity Fund, One purchased call strike 51.8989, One written call strike 53.9543, One written put strike 51.385 with a barrier level strike of 47.7881 (291,914 contracts), Expires 11/18/16, Broker Goldman Sachs International(s) | | | 434,397 | |
| | 142,857 | | | WisdomTree Japan Hedged Equity Fund, One purchased call strike 52.50, One written call strike 54.08, One written put strike 52.50 with a barrier level strike of 47.78 (1,140 contracts), Expires 11/20/15, Broker BNP Paribas SA(s) | | | 1,063,289 | |
| Old Westbury Funds, Inc. | |
| Strategic Opportunities Fund | |
| Consolidated Portfolio of Investments - (Continued) | October 31, 2015 |
| | |
Contracts/
Notional
Amount ($) | | | | | Value | |
| | 809,031 | | | WisdomTree Japan Hedged Equity Fund, One purchased call strike 53.6815, One written call strike 55.8075, One written put strike 53.6815 with a barrier level strike of 48.898 (188,147 contracts), Expires 03/18/16, Broker JPMorgan Chase Bank N.A.(s) | | $ | 192,390 | |
| | 597,646 | | | WisdomTree Japan Hedged Equity Fund, One purchased call strike 54.38, One written call strike 57.099, One written put strike 54.38 with a barrier level strike of 49.4858 (183,891 contracts), Expires 08/31/16, Broker JPMorgan Chase Bank N.A.(s) | | | (219,773 | ) |
| | 370,879 | | | WisdomTree Japan Hedged Equity Fund, One purchased call strike 54.4653, One written put strike 54.4653 with a barrier level strike of 50.1512, Expires 10/31/16, Broker Goldman Sachs International | | | (420,057 | ) |
| | 948,890 | | | WisdomTree Japan Hedged Equity Fund, One purchased call strike 54.8219, One written call strike 56.9718, One written put strike 53.747 with a barrier level strike of 49.4472 (186,057 contracts), Expires 12/15/16, Broker Goldman Sachs International(s) | | | (120,185 | ) |
| | 803,879 | | | WisdomTree Japan Hedged Equity Fund, One purchased call strike 55.68, One written call strike 58.464, One written put strike 56.7936 with a barrier level strike of 51.2256 (215,517 contracts), Expires 04/15/16, Broker Goldman Sachs International(s) | | | (291,440 | ) |
| | 762,683 | | | WisdomTree Japan Hedged Equity Fund, One purchased call strike 56.511, One written call strike 58.7714, One written put strike 56.511 with a barrier level strike of 51.9901 (212,348 contracts), Expires 02/18/16, Broker Goldman Sachs International(s) | | | (435,898 | ) |
Contracts/
Notional
Amount ($) | | | | | Value | |
| | 478,545 | | | WisdomTree Japan Hedged Equity Fund, One purchased call strike 56.63, One written call strike 59.4615, One written put strike 56.63 with a barrier level strike of 52.0996 (176,585 contracts), Expires 12/31/15, Broker Goldman Sachs International(s) | | $ | (392,282 | ) |
| | 700,213 | | | WisdomTree Japan Hedged Equity Fund, One purchased call strike 56.697, One written call strike 59.5318, One written put strike 56.697 with a barrier level strike of 52.1612 (211,651 contracts), Expires 05/19/16, Broker Goldman Sachs International(s) | | | (521,455 | ) |
| | 174,551 | | | WisdomTree Japan Hedged Equity Fund, One purchased call strike 57.8629, One written put strike 57.8629 with a barrier level strike of 52.7068, Expires 01/14/16, Broker JPMorgan Chase Bank N.A. | | | (672,980 | ) |
| | 1,002,073 | | | WisdomTree Japan Hedged Equity Fund, One purchased call strike 57.88, One written call strike 60.774, One written put strike 58.4588 with a barrier level strike of 52.6708 (259,157 contracts), Expires 08/18/16, Broker JPMorgan Chase Bank N.A.(s) | | | (1,026,737 | ) |
| | 621,547 | | | WisdomTree Japan Hedged Equity Fund, One purchased call strike 57.92, One written call strike 60.816, One written put strike 58.4992 with a barrier level strike of 53.2864 (207,182 contracts), Expires 02/18/16, Broker Goldman Sachs International(s) | | | (803,267 | ) |
| | 716,415 | | | WisdomTree Japan Hedged Equity Fund, One purchased call strike 58.7927, One written call strike 61.1444, One written put strike 58.7927 with a barrier level strike of 54.0893 (204,107 contracts), Expires 02/18/16, Broker Citibank N.A.(s) | | | (940,111 | ) |
| Old Westbury Funds, Inc. | |
| Strategic Opportunities Fund | |
| Consolidated Portfolio of Investments - (Continued) | October 31, 2015 |
| | |
Contracts/
Notional
Amount ($) | | | | | Value | |
| | 537,653 | | | WisdomTree Japan Hedged Equity Fund, One purchased call strike 58.96, One written call strike 61.908, One written put strike 58.96 with a barrier level strike of 54.2432 (169,607 contracts), Expires 07/14/16, Broker Goldman Sachs International(s) | | $ | (890,259 | ) |
| | 211,291 | | | WisdomTree Japan Hedged Equity Fund, One purchased call strike 59.16, One written put strike 59.7516 with a barrier level strike of 54.6283, Expires 03/18/16, Broker Goldman Sachs International | | | (1,240,112 | ) |
Total Structured Options
(Premiums received $(1,275,291)) | $ | 88,786,389 | |
| | | | | | | | | |
| FUTURES CONTRACTS: SHORT POSITION |
| |
| Contracts | | | | | Unrealized
Appreciation | |
| | 220 | | | London Metal Exchange Zinc, December 2015 | | $ | 448,492 | |
| | 50 | | | Intercontinental Exchange Brent Crude Oil, June 2016 | | | 68,250 | |
| | | | | Net unrealized appreciation | | $ | 516,742 | |
| | | | | | | | | |
| FUTURES CONTRACTS: LONG POSITION |
| |
| Contracts | | | | | Unrealized
Appreciation/
(Depreciation) | |
| | 50 | | | COMEX Gold, December 2015 | | $ | 278,000 | |
| | 75 | | | COMEX Silver, December 2015 | | | 425,225 | |
| | 1,400 | | | Intercontinental Exchange Brent Crude Oil, December 2015 | | | (428,000 | ) |
| | 220 | | | London Metal Exchange Zinc, December 2015 | | | (272,140 | ) |
| | 125 | | | London Metal Exchange Zinc, January 2016 | | | (276,719 | ) |
| | 750 | | | Intercontinental Exchange Brent Crude Oil, March 2016 | | | (158,000 | ) |
| | 150 | | | Intercontinental Exchange Brent Crude Oil, June 2016 | | | (72,750 | ) |
| | | | | Net unrealized appreciation (depreciation) | | $ | (504,384 | ) |
Cash collateral of $5,243,772 for the open futures contracts is reflected in segregated cash for futures contracts in the Statements of Assets and Liabilities.
| | | Unrealized
Appreciation
(Depreciation) | |
| SWAP AGREEMENTS (PURCHASED) | | | | |
| Commodity Index Swap Agreement with Cargill, Inc. based on a basket of commodity Indexes, paying a fixed amount and paying the closing settlement price if over the target value of the basket and receiving the closing settlement price if under the target value of the basket on a monthly basis until the termination date, expiring 09/16/16 (Underlying notional amount $781,436) | | $ | (26,320 | ) |
| Commodity Index Swap Agreement with Cargill, Inc. based on the Chicago Board of Trade (“CBOT”) Wheat Index, paying a fixed amount per bushel and receiving the closing settlement price of CBOT December 2015 Wheat Futures contracts on the termination date, expiring 11/25/15 (Underlying notional amount $742,725) | | | (408,125 | ) |
| Commodity Index Swap Agreement with Cargill, Inc. based on the Intercontinental Exchange, Inc. (“ICE”) Cocoa Index, paying a fixed amount per metric ton and receiving the closing settlement price of ICE March 2017 Cocoa Futures contracts on the termination date, expiring 02/03/17 (Underlying notional amount $634,625) | | | (256,444 | ) |
| Commodity Index Swap Agreement with Cargill, Inc. based on the Kansas City Board of Trade (“KCBT”) and Chicago Board of Trade (“CBOT”) Wheat Index, paying a fixed amount per bushel and receiving the closing settlement price of KCBT December 2015 minus CBOT December 2015 Wheat Futures contracts on the termination date, expiring 11/25/15 (Underlying notional amount $354,323) | | | 0 | |
| Old Westbury Funds, Inc. | |
| Strategic Opportunities Fund | |
| Consolidated Portfolio of Investments - (Continued) | October 31, 2015 |
| | |
| | | Unrealized
Appreciation
(Depreciation) | |
| Commodity Index Swap Agreement with Macquarie Bank Ltd. based on the Kansas City Board of Trade (“KCBT”) and Chicago Board of Trade (“CBOT”) Wheat Index, paying a fixed amount per bushel and receiving the closing settlement price of KCBT December 2015 minus CBOT December 2015 Wheat Futures contracts on the termination date, expiring 11/25/15 (Underlying notional amount $3,625) | | $ | (3,625 | ) |
| Conditional Variance Swap with BNP Paribas SA receiving variance of a basket of the Hang Seng China Enterprises (“HSCEI”) Index over the volatility strike price of 23.70 with a knockout level of 130% of initial index level and the S&P 500 Index over the volatility strike price of 19.70 and paying variance of a basket of the HSCEI Index under the volatility strike price of 23.70 with a knockout level of 130% of initial index level and the S&P 500 Index under the volatility strike price of 19.70, expiring 12/28/18 (Underlying vega amount $500,000) | | | 6,026 | |
| Conditional Variance Swap with BNP Paribas SA receiving variance of a basket of the Nikkei 225 Index over the volatility strike price of 20.60 with a knockout level of 120% of initial index level and the S&P 500 Index over the volatility strike price of 23.00 and paying variance of a basket of the Nikkei 225 Index under the volatility strike price of 20.60 with a knockout level of 120% of initial index level and the S&P 500 Index under the volatility strike price of 23.00, expiring 12/21/18 (Underlying vega amount $200,000) | | | 289,036 | |
| Variance swap with Goldman Sachs International receiving variance of the Russell 2000 Index over the target volatility of 26.30 and paying variance of the Russell 2000 Index under the target volatility of 26.30, expiring 08/19/16 (Underlying vega amount $3,000,000) | | | 6,366 | |
| | | Unrealized
Appreciation
(Depreciation) | |
| Variance swap with UBS AG receiving variance of the S&P 500 Index over the target volatility of 28.60 and paying variance of the S&P 500 Index under the target volatility of 28.60, expiring 12/18/15 (Underlying vega amount $500,000) | | $ | (5,681,544 | ) |
| | | $ | (6,074,630 | ) |
| | | | | |
| | | Unrealized
Appreciation/
(Depreciation) | |
| SWAP AGREEMENTS (WRITTEN) | | | | |
| Commodity Index Swap Agreement with Cargill, Inc. based on the Chicago Board of Trade (“CBOT”) Soybean Meal Index, receiving a fixed amount per bushel and paying the closing settlement price of CBOT December 2015 Soybean Meal Futures contracts on the termination date, expiring 11/24/15 (Underlying notional amount $3,152,000) | | $ | 108,000 | |
| Commodity Index Swap Agreement with Cargill, Inc. based on the Chicago Board of Trade (“CBOT”) Wheat Index, receiving a fixed amount per bushel and paying the closing settlement price of CBOT May 2016 minus July 2016 Wheat Futures contracts on the termination date, expiring 04/27/16 (Underlying notional amount $7,188) | | | (2,188 | ) |
| Commodity Index Swap Agreement with Cargill, Inc. based on the Chicago Mercantile Exchange (“CME”) Live Cattle Index, receiving a fixed amount per pound and paying the closing settlement price of CME April 2016 minus June 2016 Live Cattle Futures contracts on the termination date, expiring 03/30/16 (Underlying notional amount $1,585,888) | | | (284,112 | ) |
| Old Westbury Funds, Inc. | |
| Strategic Opportunities Fund | |
| Consolidated Portfolio of Investments - (Continued) | October 31, 2015 |
| | |
| | | Unrealized
Appreciation/
(Depreciation) | |
| Commodity Index Swap Agreement with Cargill, Inc. based on the Intercontinental Exchange (“ICE”) Sugar Index, receiving a fixed amount per pound and paying the closing settlement price of ICE March 2016 minus May 2016 Sugar No. 11 Futures contracts on the termination date, expiring 02/25/16 (Underlying notional amount $263,200) | | $ | (1,108,800 | ) |
| Commodity Index Swap Agreement with Cargill, Inc. based on the Intercontinental Exchange (“ICE”) Sugar Index, receiving a fixed amount per pound and paying the closing settlement price of ICE May 2016 minus July 2016 Sugar No. 11 Futures contracts on the termination date, expiring 04/27/16 (Underlying notional amount $220,690) | | | (626,030 | ) |
| Commodity Index Swap Agreement with Cargill, Inc. based on the Intercontinental Exchange, Inc. (“ICE”) Cotton No. 2 Index, receiving a fixed amount per pound and paying the closing settlement price of ICE March 2016 Cotton No. 2 Futures contracts on the termination date, expiring 02/18/16 (Underlying notional amount $2,390,130) | | | 27,630 | |
| Commodity Index Swap Agreement with Cargill, Inc. based on the Kansas City Board of Trade (“KCBT”) and Chicago Board of Trade (“CBOT”) Wheat Index, receiving a fixed amount per bushel and paying the closing settlement price of KCBT July 2016 minus CBOT July 2016 Wheat Futures contracts on the termination date, expiring 06/28/16 (Underlying notional amount $287,474) | | | (287,474 | ) |
| | | Unrealized
Appreciation/
(Depreciation) | |
| Commodity Index Swap Agreement with Cargill, Inc. based on the Kansas City Board of Trade (“KCBT”) and Chicago Board of Trade (“CBOT”) Wheat Index, receiving a fixed amount per bushel and paying the closing settlement price of KCBT December 2015 minus CBOT December 2015 Wheat Futures contracts on the termination date, expiring 11/25/15 (Underlying notional amount $354,323) | | $ | (1,022,864 | ) |
| Commodity Index Swap Agreement with Macquarie Bank Ltd. based on the Kansas City Board of Trade (“KCBT”) and Chicago Board of Trade (“CBOT”) Wheat Index, receiving a fixed amount per bushel and paying the closing settlement price of KCBT December 2015 minus CBOT December 2015 Wheat Futures contracts on the termination date, expiring 11/25/15 (Underlying notional amount $3,625) | | | (35,312 | ) |
| Dividend swap with BNP Paribas SA receiving a payment if the dividends on the stocks in the STOXX50E Index are over the target value of 139 Euro and paying a payment if the dividends on the stocks in the STOXX50E Index are under the target value of 139 Euro, expiring 12/18/15 (Underlying notional amount Euro 100,000) | | | (2,718,391 | ) |
| Interest rate swap with JPMorgan Chase Bank N.A. receiving a fixed rate of 3.018% and paying a floating rate based on 3-month LIBOR, expiring 08/22/23 (Underlying notional amount $15,940,000) | | | (1,568,054 | ) |
| Interest rate swap with JPMorgan Chase Bank N.A. receiving a fixed rate of 3.848% and paying a floating rate based on 3-month LIBOR, expiring 08/22/43 (Underlying notional amount $9,110,000) | | | (2,524,206 | ) |
| Old Westbury Funds, Inc. | |
| Strategic Opportunities Fund | |
| Consolidated Portfolio of Investments - (Continued) | October 31, 2015 |
| | |
| | | Unrealized
Appreciation/
(Depreciation) | |
| Variance swap with Bank of America N.A. paying variance of the Merrill Lynch Core Portfolio Gross Index over the target volatility of 44.89 and receiving variance of the Merrill Lynch Core Portfolio Gross Index under the target volatility of 44.89, expiring 10/10/16 (Underlying vega amount $1,000,000) | | $ | 24,837 | |
| Variance swap with Bank of America N.A. paying variance of the Merrill Lynch Core Portfolio Gross Index over the target volatility of 46.24 and receiving variance of the Merrill Lynch Core Portfolio Gross Index under the target volatility of 46.24, expiring 09/23/16 (Underlying vega amount $1,000,000) | | | 182,226 | |
| Variance swap with Goldman Sachs International paying variance of the Goldman Sachs Momentum Builder Multi Asset 5 Index over the target volatility of 6.25 and receiving variance of the Goldman Sachs Momentum Builder Multi Asset 5 Index under the target volatility of 6.25, expiring 10/09/17 (Underlying vega amount $2,000,000) | | | (347,671 | ) |
| Variance swap with JPMorgan Chase Bank N.A. paying variance of the S&P 500 Index over the target volatility of 33.05 and receiving variance of the S&P 500 Index under the target volatility of 33.05, expiring 12/18/15 (Underlying vega amount $500,000) | | | 6,482,739 | |
| Variance swap with JPMorgan Chase Bank N.A. paying variance of the S&P 500 Index over the target volatility of 33.05 and receiving variance of the S&P 500 Index under the target volatility of 33.05, expiring 12/20/19 (Underlying vega amount $500,000) | | | 5,097,713 | |
| | | $ | 1,398,043 | |
At October 31, 2015, the Strategic Oportunities Fund held investments in restricted securities with a fair value of $1,200,000 or 0.02% of net assets, as follows:
Acquisition
Cost | | | Issuer | | Acquisition
Date | | 10/31/15
Carrying Value
Per Unit | |
| $ | 12,000,000 | | | ShengdaTech, Inc., Cnv.(b)(c)(d)(e)(k) | | 01/19/11 | | | $10.00 | |
| (a) | Cost for federal income tax purposes is $7,135,025,422 and net unrealized depreciation of investments is as follows: |
| | |
| Unrealized appreciation | | $ | 184,734,141 | |
| Unrealized depreciation | | | (258,504,994 | ) |
| Net unrealized depreciation | | $ | (73,770,853 | ) |
| (b) | Non-income producing security. |
| (c) | This security is considered either fully or partially illiquid. These securities, or portions thereof have a value of $402,007,532 or 5.67% of net assets. Included in this amount are securities which are also exempt from registration under Rule 144A of the Securities Act of 1933, as amended (see (e) below) that amount to $83,726,837 or 1.18% of net assets. |
| (d) | Level 3 fair valued security under procedures established by the Fund’s Board of Directors. The aggregate value of fair valued securities is $32,681,568, which is 0.46% of net assets. |
| (e) | Security exempt from registration under Rule 144A of the Securities Act of 1933, as amended. The security may be resold in transactions exempt from registration normally to qualified institutional buyers. The aggregate value is $550,731,759, which is 7.76% of net assets. These securities have been determined to be liquid in accordance with procedures adopted by the Fund’s Board of Directors except those also included in footnote (c) above. |
| (f) | Investment in non-U.S. Dollars. Principal amount reflects local currency. |
| (g) | Variable rate security. Rate shown is the rate as of October 31, 2015. |
| (h) | Security offered and sold outside of the United States, and thus is exempt from registration under Regulation S of the Securities Act of 1933. These securities have been deemed liquid under guidelines approved by the Fund’s Board of Directors except those also included in footnote (c) above. |
| (i) | Principal amount denoted in Singapore Dollars. |
| (j) | Zero coupon bond. The rate represents the yield at time of purchase. |
| (k) | Issuer filed for bankruptcy and/or is in default of interest payments. |
| (l) | Principal amount denoted in Euros. |
| (m) | Principal amount denoted in British Pounds. |
| (n) | Payment-in-kind (“PIK”) security. Income may be paid in additional securities or cash at the discretion of the issuer. |
| (o) | Principal amount denoted in Swiss Francs. |
| (p) | The rate represents the annualized yield at time of purchase. |
| (q) | Rate shown represents current yield at October 31, 2015. |
| (r) | Notional Amount is shown parenthetically for any leg of Structured Option which has a different notional amount than the amount shown under Notional Amount column. |
| (s) | Number of contracts are shown parenthetically for any leg of Structured Option which has a different number of contracts than the amount shown under contracts column. |
| Old Westbury Funds, Inc. | |
| Strategic Opportunities Fund | |
| Consolidated Portfolio of Investments - (Continued) | October 31, 2015 |
| | |
AUD — Australian Dollar
CAD — Canadian Dollar
CLO — Collateralized Loan Obligation
Cnv. — Convertible
COMEX — Commodity Exchange, Inc.
ETF — Exchange Traded Fund
EUR — Euro
FOR — Foreign Ownership Restrictions
JPY — Japanese Yen
LIBOR — London Interbank Offered Rate
MXN — Mexican Peso
REIT — Real Estate Investment Trust
STEP — Step Coupon Bond
Portfolio diversification by Sector (Unaudited)
| Sector | | Percentage
of Net Assets |
| Asset-Backed Securities | | | 8.4 | % |
| Banks | | | 0.7 | % |
| Collateralized Mortgage Obligations | | | 8.5 | % |
| Commercial Mortgage-Backed Securities | | | 1.1 | % |
| Consumer Discretionary | | | 3.1 | % |
| Consumer Staples | | | 2.0 | % |
| Diversified Financials | | | 1.3 | % |
| Energy | | | 2.1 | % |
| Government Bonds | | | 3.2 | % |
| Health Care | | | 3.0 | % |
| Industrials | | | 2.8 | % |
| Information Technology | | | 2.9 | % |
| Insurance | | | 1.1 | % |
| Materials | | | 1.1 | % |
| Real Estate | | | 1.0 | % |
| Telecommunication Services | | | 1.1 | % |
| U.S. Government Agencies | | | 44.7 | % |
| Utilities | | | 1.0 | % |
| Other* | | | 10.9 | % |
| | | | 100.0 | % |
| * | Includes cash and equivalents, closed-end funds, exchange traded funds, purchased or written options, futures, swap agreements, pending trades and Fund share transactions, interest and dividends receivable, prepaids and accrued expenses payable. |
| Old Westbury Funds, Inc. | |
| Fixed Income Fund | |
| Portfolio of Investments | October 31, 2015 |
| | |
Principal
Amount | | | | | Value | |
| CORPORATE BONDS — 41.5% | | | | |
| Banks — 6.5% | | | | |
| $ | 3,800,000 | | | Bank of America NA,
1.25%, 02/14/17 | | $ | 3,809,230 | |
| | 3,000,000 | | | Capital One NA,
1.65%, 02/05/18 | | | 2,982,981 | |
| | 5,000,000 | | | Commonwealth Bank of Australia,
1.13%, 03/13/17 | | | 5,004,995 | |
| | 2,000,000 | | | Commonwealth Bank of Australia,
2.25%, 03/16/17(b) | | | 2,031,724 | |
| | 6,125,000 | | | KFW,
1.25%, 02/15/17 | | | 6,159,906 | |
| | 10,000,000 | | | Wells Fargo & Co.,
1.25%, 07/20/16 | | | 10,043,420 | |
| | 8,000,000 | | | Westpac Banking Corp.,
1.55%, 05/25/18 | | | 7,969,904 | |
| | | | | | | | 38,002,160 | |
| Consumer Discretionary — 0.7% | | | | |
| | 2,000,000 | | | Hyundai Capital America,
1.45%, 02/06/17(b) | | | 1,991,424 | |
| | 1,820,000 | | | Whirlpool Corp.,
1.65%, 11/01/17 | | | 1,822,169 | |
| | | | | | | | 3,813,593 | |
| Consumer Staples — 4.0% | | | | |
| | 11,900,000 | | | Anheuser-Busch Inbev Worldwide Inc,
1.38%, 07/15/17 | | | 11,857,124 | |
| | 4,000,000 | | | Coca-Cola Co. (The),
1.15%, 04/01/18 | | | 4,003,296 | |
| | 4,500,000 | | | CVS Health Corp.,
1.90%, 07/20/18 | | | 4,534,254 | |
| | 3,000,000 | | | PepsiCo, Inc.,
1.00%, 10/13/17 | | | 2,994,132 | |
| | | | | | | | 23,388,806 | |
| Diversified Financials — 11.0% | | | | |
| | 3,520,000 | | | American Express Credit Corp. MTN,
2.38%, 03/24/17 | | | 3,574,535 | |
| | 5,000,000 | | | Daimler Finance North America LLC,
2.00%, 08/03/18(b) | | | 4,997,415 | |
| | 10,800,000 | | | Ford Motor Credit Co. LLC,
3.00%, 06/12/17 | | | 10,967,152 | |
| | 1,000,000 | | | Ford Motor Credit Co. LLC,
2.24%, 06/15/18 | | | 996,711 | |
| | 9,325,000 | | | General Electric Capital Corp,
2.90%, 01/09/17 | | | 9,534,924 | |
| | 1,400,000 | | | General Electric Capital Corp. MTN,
2.30%, 04/27/17 | | | 1,426,071 | |
Principal
Amount | | | | | Value | |
| Diversified Financials (continued) | | | | |
| $ | 2,930,000 | | | Goldman Sachs Group, Inc. (The),
5.95%, 01/18/18 | | $ | 3,197,137 | |
| | 6,010,000 | | | Goldman Sachs Group, Inc. (The),
2.63%, 01/31/19 | | | 6,110,565 | |
| | 6,000,000 | | | JPMorgan Chase & Co.,
0.95%, 01/28/19(c) | | | 5,938,050 | |
| | 12,000,000 | | | Morgan Stanley,
1.75%, 02/25/16 | | | 12,042,624 | |
| | 3,900,000 | | | Toronto-Dominion Bank (The),
0.77%, 07/02/19(c) | | | 3,864,389 | |
| | 1,775,000 | | | Toyota Motor Credit Corp. MTN,
1.13%, 05/16/17 | | | 1,779,223 | |
| | | | | | | | 64,428,796 | |
| Energy — 3.2% | | | | |
| | 3,000,000 | | | Cameron International Corp.,
1.15%, 12/15/16 | | | 2,991,465 | |
| | 3,000,000 | | | ConocoPhillips Co.,
1.50%, 05/15/18 | | | 2,997,621 | |
| | 1,000,000 | | | Energy Transfer Partners LP,
2.50%, 06/15/18 | | | 988,525 | |
| | 5,310,000 | | | Enterprise Products Operating LLC,
1.65%, 05/07/18 | | | 5,268,980 | |
| | 1,625,000 | | | Exxon Mobil Corp.,
1.31%, 03/06/18 | | | 1,633,668 | |
| | 1,700,000 | | | Occidental Petroleum Corp,
1.75%, 02/15/17 | | | 1,713,325 | |
| | 1,000,000 | | | Schlumberger Investment SA,
1.25%, 08/01/17(b) | | | 998,270 | |
| | 1,000,000 | | | Schlumberger Norge AS,
1.95%, 09/14/16(b) | | | 1,009,251 | |
| | 1,000,000 | | | Transcanada Pipelines Ltd.,
1.88%, 01/12/18 | | | 1,003,044 | |
| | | | | | | | 18,604,149 | |
| Health Care — 4.0% | | | | |
| | 6,000,000 | | | AbbVie, Inc.,
1.75%, 11/06/17 | | | 6,056,916 | |
| | 2,000,000 | | | Cardinal Health, Inc.,
1.95%, 06/15/18 | | | 2,009,414 | |
| | 3,000,000 | | | Gilead Sciences, Inc,,
1.85%, 09/04/18 | | | 3,030,264 | |
| | 2,000,000 | | | Johnson & Johnson,
1.13%, 11/21/17 | | | 2,005,844 | |
| | 5,000,000 | | | Takeda Pharmaceutical Co. Ltd.,
1.63%, 03/17/17(b) | | | 5,023,940 | |
| | 1,000,000 | | | UnitedHealth Group, Inc.,
1.40%, 10/15/17 | | | 1,002,013 | |
| | 3,950,000 | | | UnitedHealth Group, Inc.,
1.40%, 12/15/17 | | | 3,957,169 | |
| | | | | | | | 23,085,560 | |
| Old Westbury Funds, Inc. | |
| Fixed Income Fund | |
| Portfolio of Investments - (Continued) | October 31, 2015 |
| | |
Principal
Amount | | | | | Value | |
| Industrials — 3.0% | | | | |
| $ | 3,500,000 | | | 3M Co. MTN,
1.00%, 06/26/17 | | $ | 3,512,957 | |
| | 7,000,000 | | | Eaton Corp.,
5.60%, 05/15/18 | | | 7,632,975 | |
| | 216,968 | | | Federal Express Corp. 2012 Pass Through Trust,
2.63%, 01/15/18(b) | | | 218,722 | |
| | 6,460,000 | | | Precision Castparts Corp.,
1.25%, 01/15/18 | | | 6,429,864 | |
| | | | | | | | 17,794,518 | |
| Information Technology — 3.1% | | | | |
| | 10,000,000 | | | Apple, Inc.,
0.55%, 05/03/18(c) | | | 10,004,960 | |
| | 3,000,000 | | | Hewlett Packard Enterprise Co.,
2.45%, 10/05/17(b) | | | 3,008,769 | |
| | 3,000,000 | | | Microsoft Corp.,
1.30%, 11/03/18 | | | 3,002,316 | |
| | 1,900,000 | | | National Semiconductor Corp.,
6.60%, 06/15/17 | | | 2,061,390 | |
| | | | | | | | 18,077,435 | |
| Insurance — 2.1% | | | | |
| | 3,990,000 | | | Berkshire Hathaway Finance Corp.,
2.45%, 12/15/15 | | | 3,998,121 | |
| | 5,000,000 | | | New York Life Global Funding,
1.65%, 05/15/17(b) | | | 5,034,905 | |
| | 3,000,000 | | | New York Life Global Funding,
1.45%, 12/15/17(b) | | | 3,004,911 | |
| | | | | | | | 12,037,937 | |
| Materials — 0.2% | | | | |
| | 1,005,000 | | | Airgas, Inc.,
2.95%, 06/15/16 | | | 1,014,241 | |
| Telecommunication Services — 2.7% | | | | |
| | 4,000,000 | | | America Movil Sab de CV,
2.38%, 09/08/16 | | | 4,035,464 | |
| | 6,715,000 | | | AT&T, Inc.,
1.40%, 12/01/17 | | | 6,702,188 | |
| | 5,000,000 | | | Verizon Communications, Inc.,
1.35%, 06/09/17 | | | 5,005,345 | |
| | | | | | | | 15,742,997 | |
| Utilities — 1.0% | | | | |
| | 6,000,000 | | | Duke Energy Corp.,
1.63%, 08/15/17 | | | 6,020,394 | |
Total Corporate Bonds
(Cost $241,898,403) | | | 242,010,586 | |
Principal
Amount | | | | | Value | |
| ASSET-BACKED SECURITIES — 6.9% | | | | |
| CAYMAN ISLANDS — 3.5% | | | | |
| $ | 8,500,000 | | | Anchorage Capital CLO Ltd., Series 2013-1A, Class 1A,
1.48%, 07/13/25(b)(c) | | $ | 8,405,140 | |
| | 6,000,000 | | | OCP CLO Ltd., Series 2013-4A, Class A1A,
1.72%, 10/24/25(b)(c) | | | 5,926,200 | |
| | 787,712 | | | Sapphire Valley CDO I Ltd. Series 2006-1A, Class A,
0.59%, 12/15/22(b)(c) | | | 776,113 | |
| | 5,000,000 | | | Saratoga Investment Corp. CLO Ltd. Series 2013-1A, Class A1,
1.62%, 10/20/23(b)(c) | | | 4,962,450 | |
| | | | | | | | 20,069,903 | |
| UNITED STATES — 3.4% | | | | |
| | 2,500,000 | | | Ally Auto Receivables Trust Series 2014-1, Class A3,
0.97%, 10/15/18 | | | 2,498,790 | |
| | 2,000,000 | | | AmeriCredit Automobile Receivables Trust Series 2014-2, Class A3,
0.94%, 02/08/19 | | | 1,998,062 | |
| | 2,975,000 | | | CNH Equipment Trust 2015-A, Class A4,
1.85%, 04/15/21 | | | 2,975,967 | |
| | 2,500,000 | | | Fifth Third Auto Trust Series 2014-2, Class A3,
0.89%, 11/15/18 | | | 2,501,050 | |
| | 4,000,000 | | | Ford Credit Floorplan Master Owner Trust Series 2015-1, Class A1,
1.42%, 01/15/20 | | | 4,016,846 | |
| | 2,050,000 | | | Mercedes-Benz Auto Receivables Trust Series 2014-1, Class A3,
0.87%, 10/15/18 | | | 2,046,700 | |
| | 2,000,000 | | | Toyota Auto Receivables Owner Trust Series 2014-B, Class A4,
1.31%, 09/16/19 | | | 2,003,852 | |
| | 2,000,000 | | | World Omni Automobile Lease Securitization Trust, Series 2014-A, Class A3,
1.16%, 09/15/17 | | | 1,997,619 | |
| | | | | | | | 20,038,886 | |
Total Asset-Backed Securities
(Cost $40,243,982) | | | 40,108,789 | |
| MUNICIPAL BONDS — 4.0% | | | | |
| California — 0.7% | | | | |
| | 3,850,000 | | | Southern California Public Power Authority Refunding Revenue Bonds, Series B (AGM)
6.93%, 05/15/17 | | | 4,196,500 | |
| Old Westbury Funds, Inc. | |
| Fixed Income Fund | |
| Portfolio of Investments - (Continued) | October 31, 2015 |
| | |
Principal
Amount | | | | | Value | |
| District Of Columbia — 0.2% | | | | |
| $ | 1,310,000 | | | District of Columbia Build America Bonds GO
4.16%, 06/01/16 | | $ | 1,339,344 | |
| Georgia — 0.5% | | | | |
| | 3,085,000 | | | State of Georgia Taxable School Improvement GO, Series C-3
2.59%, 10/01/17 | | | 3,159,626 | |
| Illinois — 0.5% | | | | |
| | 2,600,000 | | | State of Illinois Public Improvements Revenue Bonds
1.56%, 06/15/17 | | | 2,611,154 | |
| Minnesota — 0.1% | | | | |
| | 605,000 | | | Duluth Independent School District No. 709 Build America Bonds COP (School District Credit)
4.00%, 02/01/16 | | | 608,594 | |
| New Jersey — 1.1% | | | | |
| | 1,500,000 | | | County of Monmouth Build America Bonds GO
3.75%, 11/01/16 | | | 1,548,735 | |
| | 100,000 | | | Morris County Improvement Authority Renewable Energy Revenue Bonds (County Guaranty)
2.27%, 06/15/16 | | | 101,135 | |
| | 4,600,000 | | | New Jersey Economic Development Authority School Facilities Construction Refunding Revenue Bonds, Series Q
1.10%, 06/15/16 | | | 4,614,536 | |
| | | | | | | | 6,264,406 | |
| New York — 0.5% | | | | |
| | 2,520,000 | | | Metropolitan Transportation Authority Highway Toll Build America Revenue Bonds
4.28%, 11/15/16 | | | 2,610,518 | |
| | 110,000 | | | New York State Dormitory Authority University & College Improvement Revenue Bonds, Series G
2.83%, 03/15/16 | | | 111,074 | |
| | | | | | | | 2,721,592 | |
| Ohio — 0.4% | | | | |
| | 2,115,000 | | | Ohio State Build America Revenue Bonds, Series
2 3.64%, 06/15/16 | | | 2,156,179 | |
Total Municipal Bonds
(Cost $22,716,559) | | | 23,057,395 | |
Principal
Amount | | | | | Value | |
| COLLATERALIZED MORTGAGE OBLIGATIONS — 0.4% | | |
| $ | 2,178,295 | | | JPMorgan Tax Exempt Pass Through Trust, Series 2012-AMT1, Class A, 3.00%, 01/27/38(b) | | $ | 2,175,377 | |
Total Collateralized Mortgage Obligations
(Cost $2,227,807) | | | 2,175,377 | |
| U.S. GOVERNMENT AGENCIES — 5.3% | | | | |
| Fannie Mae — 2.5% | | | | |
| | 6,720,000 | | | 0.88%, 12/20/17 | | | 6,724,213 | |
| | 7,575,000 | | | 1.13%, 10/19/18 | | | 7,582,825 | |
| | | | | | | | 14,307,038 | |
| Federal Home Loan Bank — 0.9% | | | | |
| | 5,200,000 | | | 0.63%, 10/26/17 | | | 5,181,389 | |
| | | | | | | | 5,181,389 | |
| Ginnie Mae — 0.0% | | | | |
| | 254 | | | 9.00%, 02/15/20(f) | | | 256 | |
| | | | | | | | 256 | |
| Overseas Private Investment Corp. — 1.0% | | | | |
| | 5,124,853 | | | 5.14%, 12/15/23 | | | 5,619,233 | |
| | | | | | | | 5,619,233 | |
| Private Export Funding Corp. — 0.3% | | | | |
| | 1,400,000 | | | 4.95%, 11/15/15 | | | 1,401,743 | |
| | 500,000 | | | 2.25%, 12/15/17 | | | 509,355 | |
| | | | | | | | 1,911,098 | |
| Small Business Administration — 0.5% | | | | |
| | 542,516 | | | 4.73%, 02/10/19 | | | 576,713 | |
| | 674,444 | | | 4.11%, 03/10/20 | | | 709,459 | |
| | 1,774,401 | | | 4.08%, 03/10/21 | | | 1,883,582 | |
| | | | | | | | 3,169,754 | |
| Tennessee Valley Authority — 0.1% | | | | |
| | 725,000 | | | 6.25%, 12/15/17 | | | 805,631 | |
| | | | | | | | 805,631 | |
Total U.S. Government Agencies
(Cost $30,324,013) | | | 30,994,399 | |
| U.S. GOVERNMENT SECURITIES — 40.8% | | | | |
| U.S. Treasury Notes — 40.8% | | | | |
| | 10,800,000 | | | 0.38%, 04/30/16 | | | 10,805,270 | |
| | 4,180,000 | | | 0.63%, 08/15/16 | | | 4,187,022 | |
| | 24,585,000 | | | 0.75%, 02/28/18 | | | 24,510,409 | |
| | 3,000,000 | | | 0.88%, 10/15/18 | | | 2,985,996 | |
| | 103,526,000 | | | 1.88%, 11/30/21 | | | 104,081,417 | |
| Old Westbury Funds, Inc. | |
| Fixed Income Fund | |
| Portfolio of Investments - (Continued) | October 31, 2015 |
| | |
Principal
Amount | | | | | Value | |
| U.S. Treasury Notes (continued) | | | | |
| $ | 21,540,000 | | | 0.63%, 01/15/24(d) | | $ | 21,954,199 | |
| | 68,115,000 | | | 2.38%, 08/15/24 | | | 69,642,275 | |
Total U.S. Government Securities
(Cost $236,316,621) | | | 238,166,588 | |
| GOVERNMENT BONDS — 0.3% | | | | |
| SOUTH KOREA — 0.3% | | | | |
| | 500,000 | | | Export-Import Bank of Korea,
1.25%, 11/20/15 | | | 499,985 | |
| | 1,400,000 | | | Export-Import Bank of Korea,
4.00%, 01/11/17 | | | 1,440,887 | |
| | | | | | | | 1,940,872 | |
Total Government Bonds
(Cost $1,899,291) | | | 1,940,872 | |
| | | | | | | | | |
| Shares | | | | | | | |
| INVESTMENT COMPANY — 0.5% | | | | |
| | 2,952,752 | | | SEI Daily Income Trust Government II Fund, Class A,
0.01%(e) | | | 2,952,752 | |
Total Investment Company
(Cost $2,952,752) | | | 2,952,752 | |
| | | | | |
| | | | Value | |
TOTAL INVESTMENTS — 99.7%
(Cost $578,579,428)(a) | | $ | 581,406,758 | |
| OTHER ASSETS IN EXCESS OF LIABILITIES — 0.3% | | | 1,797,566 | |
| NET ASSETS — 100.0% | | $ | 583,204,324 | |
| (a) | Cost for federal income tax purposes is $581,393,374 and net unrealized appreciation of investments is as follows: |
| | |
| | Unrealized appreciation | | $ | 4,036,700 | |
| | Unrealized depreciation | | | (4,023,316 | ) |
| | Net unrealized appreciation | | $ | 13,384 | |
| (b) | Security exempt from registration under Rule 144A of the Securities Act of 1933, as amended. The security may be resold in transactions exempt from registration normally to qualified institutional buyers. The security has been determined to be liquid in accordance with procedures adopted by the Fund’s Board of Directors. The aggregate value of these securities is $49,564,611 which is 8.5% of net assets. |
| (c) | Variable rate security. Rate shown is the rate as of October 31, 2015. |
| (d) | Inflation protected security. Principal amount reflects original security face amount. |
| (e) | Rate shown represents current yield at October 31, 2015. |
| (f) | This security is considered either fully or partially illiquid. These securities or portions thereof have a value of $256 or 0.00% of net assets. |
AGM — Assured Guaranty Municipal Corp.
CLO — Collateralized Loan Obligation
COP — Certificates of Participation
GO — General Obligations
MTN — Medium Term Note
| Old Westbury Funds, Inc. | |
| Municipal Bond Fund | |
| Portfolio of Investments | October 31, 2015 |
| | |
Principal
Amount | | | | | Value | |
| MUNICIPAL BONDS — 97.8% | | | |
| Alabama — 1.4% | | | | |
| $ | 5,000,000 | | | Alabama Federal Aid Highway Finance Authority Revenue Bonds,
5.00%, 09/01/20 | | $ | 5,829,250 | |
| | 3,030,000 | | | City of Huntsville School Capital Improvements Warrants Refunding GO,
5.00%, 09/01/22 | | | 3,680,390 | |
| | 2,990,000 | | | City of Huntsville School Capital Improvements Warrants Refunding GO,
5.00%, 09/01/24 | | | 3,717,766 | |
| | 3,660,000 | | | City of Huntsville School Capital Improvements Warrants Refunding GO,
5.00%, 09/01/26 | | | 4,510,840 | |
| | 1,500,000 | | | City of Huntsville Warrants Refunding GO, Series A,
5.00%, 08/01/26 | | | 1,847,040 | |
| | | | | | | | 19,585,286 | |
| Alaska — 0.0% | | | | |
| | 500,000 | | | Borough of Matanuska-Susitna School Improvements GO, Series B,
5.00%, 11/01/23 | | | 602,495 | |
| | | | | | | | | |
| Arizona — 1.3% | | | |
| | 2,095,000 | | | Arizona Department of Transportation State Highway Fund Refunding Revenue Bonds,
5.00%, 07/01/25 | | | 2,584,832 | |
| | 2,000,000 | | | Arizona Department of Transportation State Highway Fund Refunding Revenue Bonds, Sub-series A,
5.00%, 07/01/21 | | | 2,380,740 | |
| | 2,500,000 | | | Arizona School Facilities Board Advance Refunding COP, Series A,
5.00%, 09/01/23 | | | 3,008,575 | |
| | 1,000,000 | | | Arizona State Board of Regents Advance Refunding COP, Series A,
5.00%, 06/01/22 | | | 1,188,020 | |
| | 1,715,000 | | | Arizona State Board of Regents Advance Refunding COP, Series A,
5.00%, 06/01/24 | | | 2,063,111 | |
| | 350,000 | | | Arizona State Board of Regents Revenue Bonds, Series 2008-C, OID,
5.88%, 07/01/24 | | | 396,325 | |
Principal
Amount | | | | | Value | |
| Arizona (continued) | | | |
| $ | 2,010,000 | | | Arizona State Board of Regents Revenue Bonds, Series C,
5.00%, 07/01/17 | | $ | 2,156,388 | |
| | 200,000 | | | Maricopa County Community College District GO, Series C,
5.00%, 07/01/20 | | | 228,741 | |
| | 2,875,000 | | | Phoenix Civic Improvement Corp. Refunding Revenue Bonds,
5.00%, 07/01/20 | | | 3,355,671 | |
| | | | | | | | 17,362,403 | |
| Arkansas — 0.1% | | | | |
| | 590,000 | | | Fayetteville School District No 1 Refunding GO (State Aid Withholding),
2.00%, 06/01/16 | | | 595,994 | |
| | 910,000 | | | Rogers School District No 30 Refunding GO (State Aid Withholding),
3.00%, 02/01/16 | | | 916,288 | |
| | | | | | | | 1,512,282 | |
| California — 4.9% | | | | |
| | 2,000,000 | | | California State Public Works Board Correctional Facilities Improvements Revenue Bonds, Series D,
5.00%, 09/01/24 | | | 2,434,360 | |
| | 6,250,000 | | | California State Public Works Board Refunding Revenue Bonds, Series F,
5.00%, 05/01/24 | | | 7,582,563 | |
| | 3,525,000 | | | California State University Refunding Revenue Bonds, Series A,
5.00%, 11/01/24 | | | 4,397,896 | |
| | 1,750,000 | | | City & County of San Francisco Courthouse Project Refunding COP,
5.00%, 04/01/16 | | | 1,784,563 | |
| | 1,155,000 | | | City & County of San Francisco Juvenile Hall Project Refunding COP,
5.00%, 04/01/16 | | | 1,177,811 | |
| | 1,150,000 | | | City of Roseville Water Utility Advance Revenue Refunding COP,
5.00%, 12/01/22 | | | 1,388,326 | |
| | 9,250,000 | | | Los Angeles Community College District Refunding GO, Series A,
5.00%, 08/01/23 | | | 11,372,320 | |
| | 1,035,000 | | | Los Rios Community College District 2002 Election GO, Series D,
5.25%, 08/01/23 | | | 1,191,192 | |
| Old Westbury Funds, Inc. | |
| Municipal Bond Fund | |
| Portfolio of Investments - (Continued) | October 31, 2015 |
| | |
Principal
Amount | | | | | Value | |
| California (continued) | | | | |
| $ | 1,300,000 | | | San Mateo County Transportation Authority Advance Refunding Revenue Bonds, Series A,
5.00%, 06/01/23 | | $ | 1,602,653 | |
| | 750,000 | | | State of California Refunding GO,
5.00%, 03/01/23 | | | 911,123 | |
| | 8,000,000 | | | State of California Refunding GO,
5.00%, 03/01/24 | | | 9,790,640 | |
| | 8,000,000 | | | State of California Refunding GO,
5.00%, 10/01/25 | | | 9,810,240 | |
| | 10,000,000 | | | State of California Refunding GO, Series A, (State GTY),
5.00%, 07/01/22 | | | 10,319,000 | |
| | 3,000,000 | | | University of California Refunding Revenue Bonds, Series I,
5.00%, 05/15/23 | | | 3,677,970 | |
| | | | | | | | 67,440,657 | |
| Colorado — 0.9% | | | |
| | 500,000 | | | Adams & Weld Counties School District No 27J Brighton Co. Refunding GO, Series A, (State Aid Withholding),
5.00%, 12/01/19 | | | 577,709 | |
| | 300,000 | | | City of Commerce Advance Refunding Revenue Bonds. (BAM),
5.00%, 08/01/25 | | | 367,971 | |
| | 3,935,000 | | | Colorado Higher Education Refunding COP, Series A,
5.00%, 11/01/24 | | | 4,833,006 | |
| | 450,000 | | | Denver City & County School District No 1 Refunding GO, Series C (State Aid Withholding),
5.00%, 12/01/23 | | | 550,949 | |
| | 2,000,000 | | | El Paso County School District No 38 Lewis-Palmer Refunding GO (State Aid Withholding),
4.00%, 12/01/17 | | | 2,126,740 | |
| | 1,180,000 | | | Jefferson County School District GO, Series R-1, (State Aid Withholding),
5.00%, 12/15/22 | | | 1,433,688 | |
| | 1,600,000 | | | University of Colorado Refunding Revenue Bonds, Series A (NATL-RE),
4.50%, 06/01/21 | | | 1,693,248 | |
Principal
Amount | | | | | Value | |
| Colorado (continued) | | |
| $ | 370,000 | | | University of Northern Colorado Refunding Revenue Bonds, Series A (State Higher Education Intercept Program),
3.00%, 06/01/16 | | $ | 375,950 | |
| | | | | | | | 11,959,261 | |
| Connecticut — 2.6% | | | |
| | 3,100,000 | | | State of Connecticut Special Tax Revenue Public Improvements Revenue Bonds, Series A,
5.00%, 08/01/22 | | | 3,711,816 | |
| | 1,250,000 | | | State of Connecticut Special Tax Revenue Transportation Infrastructure Advance Refunding Revenue Bonds,
5.00%, 08/01/22 | | | 1,496,700 | |
| | 8,000,000 | | | State of Connecticut Special Tax Transportation Infrastructure Refunding Revenue Bonds,
5.00%, 09/01/25 | | | 9,652,160 | |
| | 2,000,000 | | | State of Connecticut Transportation Infrastructure Refunding Revenue Bonds,
5.00%, 09/01/24 | | | 2,434,360 | |
| | 8,000,000 | | | State of Connecticut Transportation Infrastructure Revenue Bonds, Series A,
5.00%, 10/01/19 | | | 9,186,960 | |
| | 2,000,000 | | | State of Connecticut Transportation Infrastructure Revenue Bonds, Series A,
5.00%, 09/01/25 | | | 2,413,040 | |
| | 5,000,000 | | | State of Connecticut Transportation Infrastructure Revenue Bonds, Series A,
5.00%, 09/01/27 | | | 5,940,700 | |
| | 1,000,000 | | | University of Connecticut University and College Improvements Revenue Bonds, Series A,
3.00%, 02/15/16 | | | 1,008,020 | |
| | | | | | | | 35,843,756 | |
| District Of Columbia — 0.5% | | | |
| | 5,000,000 | | | District of Columbia Public Improvement Revenue Bonds, Series C,
5.00%, 12/01/19 | | | 5,790,100 | |
| | 1,000,000 | | | District of Columbia Refunding Revenue Bonds, Series A,
5.00%, 12/01/20 | | | 1,181,140 | |
| | | | | | | | 6,971,240 | |
| Old Westbury Funds, Inc. | |
| Municipal Bond Fund | |
| Portfolio of Investments - (Continued) | October 31, 2015 |
| | |
Principal
Amount | | | | | Value | |
| Florida — 2.7% | | | |
| $ | 1,000,000 | | | County of Sarasota Refunding Revenue Bonds,
5.00%, 10/01/24 | | $ | 1,219,950 | |
| | 5,000,000 | | | Florida State Board of Education Lottery Refunding Revenue Bonds, Series A,
5.00%, 07/01/17 | | | 5,371,100 | |
| | 8,575,000 | | | Florida State Board of Education Lottery Revenue Bonds, Series A, OID,
5.50%, 07/01/27 | | | 9,651,163 | |
| | 4,165,000 | | | Florida State Board of Governors Refunding Revenue Bonds, Series A,
5.00%, 07/01/16 | | | 4,296,156 | |
| | 500,000 | | | Florida Water Pollution Control Financing Corp. Water Polution Control Revenue Bonds, Series A,
4.00%, 01/15/17 | | | 521,475 | |
| | 1,065,000 | | | Hillsborough County Community Investment Tax Revenue Bonds, (AMBAC),
5.00%, 11/01/16 | | | 1,113,873 | |
| | 1,200,000 | | | Lee County School Board Refunding COP,
5.00%, 08/01/25 | | | 1,406,448 | |
| | 4,000,000 | | | Miami-Dade County Refunding GO, Series B,
5.00%, 07/01/24 | | | 4,853,880 | |
| | 2,000,000 | | | Miami-Dade County Water & Sewer Refunding Revenue Bonds, (XLCA),
5.00%, 10/01/19 | | | 2,166,720 | |
| | 1,800,000 | | | Miami-Dade County Water & Sewer Refunding Revenue Bonds, Series B, (AGM),
5.25%, 10/01/16 | | | 1,880,586 | |
| | 2,000,000 | | | Orlando Utilities Commission Refunding Revenue Bonds, Series A,
5.00%, 10/01/20 | | | 2,346,580 | |
| | 500,000 | | | Palm Beach County Revenue Bonds, Series 2, OID,
5.25%, 11/01/25 | | | 563,585 | |
| | 1,975,000 | | | State of Florida Refunding GO, Series A,
4.00%, 01/01/17 | | | 2,056,844 | |
| | | | | | | | 37,448,360 | |
| Georgia — 2.1% | | | | |
| | 750,000 | | | Cherokee County Board of Education Advance Refunding GO, (State Aid Withholding),
5.00%, 02/01/23 | | | 912,818 | |
Principal
Amount | | | | | Value | |
| Georgia (continued) | | | |
| $ | 2,710,000 | | | Cobb County Development Authority Advance Refunding Revenue Bonds,
5.00%, 07/15/23 | | $ | 3,194,087 | |
| | 2,100,000 | | | Cobb County Development Authority Advance Refunding Revenue Bonds,
5.00%, 07/15/24 | | | 2,491,776 | |
| | 1,750,000 | | | Douglas County School District Refunding GO (State Aid Withholding),
4.00%, 04/01/16 | | | 1,777,493 | |
| | 395,000 | | | Fulton County Development Authority Georgia Tech Facilities Refunding Revenue Bonds, Series A,
4.00%, 05/01/16 | | | 402,351 | |
| | 375,000 | | | Fulton County Development Authority Georgia Tech Facilities Refunding Revenue Bonds, Series A,
5.00%, 05/01/23 | | | 452,039 | |
| | 1,000,000 | | | Fulton County Water & Sewer Refunding Revenue Bonds,
5.00%, 01/01/18 | | | 1,092,850 | |
| | 1,040,000 | | | Georgia State Road & Tollway Authority Federal Highway Grant Anticipation Refunding Revenue Bonds, Series A,
5.00%, 06/01/17 | | | 1,110,595 | |
| | 1,250,000 | | | Georgia State Road & Tollway Authority Federal Highway Grant Anticipation Revenue Bonds, Series A,
5.00%, 06/01/18 | | | 1,379,813 | |
| | 5,000,000 | | | Georgia State Road & Tollway Authority Highway Improvement Revenue Bonds, Series A,
5.00%, 06/01/20 | | | 5,664,750 | |
| | 2,025,000 | | | Georgia State Road & Tollway Authority Refunding Revenue Bonds, Series B, (State GTY),
5.00%, 10/01/19 | | | 2,338,065 | |
| | 630,000 | | | Gwinnett County Development Authority Refunding COP, Gwinnett Development Schools Project, (NATL-RE),
5.25%, 01/01/17 | | | 664,971 | |
| | 1,925,000 | | | State of Georgia Refunding GO, Series E-2,
4.00%, 09/01/18 | | | 2,100,676 | |
| | 2,860,000 | | | State of Georgia Refunding GO, Series E-2,
4.00%, 09/01/19 | | | 3,188,013 | |
| Old Westbury Funds, Inc. | |
| Municipal Bond Fund | |
| Portfolio of Investments - (Continued) | October 31, 2015 |
| | |
Principal
Amount | | | | | Value | |
| Georgia (continued) | | | | |
| $ | 1,500,000 | | | State of Georgia School Improvement GO, Series B,
5.00%, 01/01/18 | | $ | 1,641,990 | |
| | | | | | | | 28,412,287 | |
| Hawaii — 1.0% | | | |
| | 5,000,000 | | | City & County Honolulu Wastewater System Refunding Revenue Bonds, Junior Series A,
5.00%, 07/01/24 | | | 6,102,500 | |
| | 1,000,000 | | | State of Hawaii Department of Budget & Finance Queens Health System Refunding Revenue Bonds, Series A,
5.00%, 07/01/21 | | | 1,176,100 | |
| | 400,000 | | | State of Hawaii Refunding GO, Series DY,
5.00%, 02/01/18 | | | 438,091 | |
| | 5,000,000 | | | State of Hawaii Refunding GO, Series EP,
5.00%, 08/01/25 | | | 6,129,950 | |
| | | | | | | | 13,846,641 | |
| Idaho — 0.1% | | | |
| | 1,500,000 | | | Idaho Board Bank Authority Refunding Revenue Bonds, Series D,
5.00%, 09/15/23 | | | 1,800,015 | |
| Illinois — 1.6% | | | | |
| | 1,250,000 | | | Chicago Park District Alternative Revenue Source Refunding GO,
4.00%, 01/01/17 | | | 1,289,250 | |
| | 900,000 | | | Chicago Transit Authority Federal Transit Revenue Bonds, (AMBAC),
5.00%, 06/01/21 | | | 944,163 | |
| | 1,345,000 | | | City of Champaign Parking Facilities Improvements GO, Series 2008,
5.00%, 12/15/17 | | | 1,414,927 | |
| | 2,215,000 | | | Cook County Community College District No 508 University & College Improvements GO,
5.00%, 12/01/21 | | | 2,554,936 | |
| | 2,575,000 | | | Cook County Community College District No. 524 Moraine Valley GO, Series B, (NATL-RE),
5.00%, 12/01/25 | | | 2,794,313 | |
| | 3,000,000 | | | Illinois State Toll Highway Authority Refunding Revenue Bonds, Series B,
5.00%, 12/01/17 | | | 3,256,800 | |
Principal
Amount | | | | | Value | |
| Illinois (continued) | | | |
| $ | 2,000,000 | | | Metropolitan Water Reclamation District of Greater Chicago Refunding GO, Series D,
5.00%, 12/01/22 | | $ | 2,378,000 | |
| | 3,500,000 | | | State of Illinois Public Improvement Refunding Revenue Bonds,
5.00%, 06/15/18 | | | 3,842,160 | |
| | 2,500,000 | | | State of Illinois School Improvements GO,
3.00%, 02/01/16 | | | 2,513,400 | |
| | 780,000 | | | University of Illinois College Improvement Refunding Revenue Bonds, Series A,
5.00%, 04/01/21 | | | 903,271 | |
| | | | | | | | 21,891,220 | |
| Indiana — 1.5% | | | |
| | 580,000 | | | Anderson School Building Corp., First Mortgage Refunding Revenue Bonds, (AGM, State Aid Withholding),
5.00%, 01/15/16 | | | 585,597 | |
| | 1,050,000 | | | Avon Community School Building Corp., First Mortgage Refunding and Improvement Revenue Bonds, (AMBAC, State Aid Withholding),
5.00%, 07/15/16 | | | 1,084,713 | |
| | 650,000 | | | Avon Community School Building Corp., First Mortgage Refunding and Improvement Revenue Bonds, (AMBAC, State Aid Withholding),
5.00%, 01/15/17 | | | 685,347 | |
| | 500,000 | | | Carmel 2002 School Building Corp. Refunding Revenue Bonds, (State Aid Withholding),
5.00%, 07/15/16 | | | 516,495 | |
| | 500,000 | | | Center Grove School Building Corp. First Mortgage Refunding Revenue Bonds, Series A (State Aid Intercept Program),
5.00%, 07/15/20 | | | 568,839 | |
| | 650,000 | | | Decatur Township Marion County Multi-School Building Corp., First Mortgage Revenue Bonds, Series B, (AGM, State Aid Withholding),
5.00%, 07/15/18 | | | 683,657 | |
| Old Westbury Funds, Inc. | |
| Municipal Bond Fund | |
| Portfolio of Investments - (Continued) | October 31, 2015 |
| | |
Principal
Amount | | | | | Value | |
| Indiana (continued) | | |
| $ | 490,000 | | | East Noble Facilities School Building Corp., First Mortgage Refunding Revenue Bonds, (NATL-RE, State Aid Withholding),
5.00%, 07/15/16 | | $ | 498,845 | |
| | 1,330,000 | | | GCS School Building Corp. One, First Mortgage Refunding Revenue Bonds (State Aid Intercept Program),
5.00%, 01/15/22 | | | 1,569,932 | |
| | 1,350,000 | | | GCS School Building Corp. One, First Mortgage Refunding Revenue Bonds (State Aid Intercept Program),
5.00%, 07/15/22 | | | 1,607,297 | |
| | 5,000,000 | | | Indiana Finance Authority Southern Industrial Gas & Electric Refunding Revenue Bonds, Series E,
1.95%, 05/01/37(b) | | | 5,077,150 | |
| | 500,000 | | | Ivy Tech Community College University & College Improvements Revenue Bonds, Series R-1,
5.00%, 07/01/19 | | | 566,645 | |
| | 1,040,000 | | | Pike Township Multi-School Building Corp. School Improvements Revenue Bonds (State Aid Intercept Program),
3.00%, 01/15/16 | | | 1,045,782 | |
| | 1,060,000 | | | Pike Township Multi-School Building Corp. School Improvements Revenue Bonds (State Aid Intercept Program),
3.00%, 07/15/16 | | | 1,079,992 | |
| | 500,000 | | | Plainfield Elementary School Building Corp., First Mortgage Refunding Revenue Bonds, (NATL-RE, School Board Resolution Funding),
5.00%, 07/15/18 | | | 515,709 | |
| | 715,000 | | | Portage Township Multi-School Building Corp., First Mortgage Refunding Revenue Bonds, (NATL-RE, School Board Resolution Funding),
5.00%, 01/15/16 | | | 721,900 | |
| | 735,000 | | | Portage Township Multi-School Building Corp., First Mortgage Refunding Revenue Bonds, (NATL-RE, School Board Resolution Funding),
5.00%, 07/15/16 | | | 759,299 | |
Principal
Amount | | | | | Value | |
| Indiana (continued) | | | |
| $ | 570,000 | | | Portage Township Multi-School Building Corp., First Mortgage Refunding Revenue Bonds, (NATL-RE, School Board Resolution Funding),
5.00%, 07/15/17 | | $ | 612,385 | |
| | 765,000 | | | Vigo County Elementary School Building Corp., First Mortgage Refunding Revenue Bonds, (AGM, State Aid Withholding),
5.00%, 01/10/16 | | | 771,801 | |
| | 1,000,000 | | | Warsaw Multi-School Building Corp. Revenue Bonds, Series B (State Aid Withholding),
5.75%, 07/15/26 | | | 1,105,270 | |
| | 895,000 | | | Wayne Township School Building Corp., Marion County First Mortgage Refunding Revenue Bonds, (State Aid Intercept Program),
4.00%, 01/15/16 | | | 901,587 | |
| | | | | | | | 20,958,242 | |
| Iowa — 0.2% | | | |
| | 1,800,000 | | | Iowa Finance Authority Water Utilities Improvements Revenue Bonds,
5.00%, 08/01/20 | | | 2,115,234 | |
| | | | | | | | | |
| Kansas — 0.5% | | | |
| | 1,260,000 | | | Sedgwick County Public Building Commission Technical Education Complex Refunding Revenue Bonds, Series 2,
5.00%, 08/01/23 | | | 1,539,934 | |
| | 2,645,000 | | | Sedgwick County Public Building Commission Technical Education Complex Refunding Revenue Bonds, Series 2,
5.00%, 08/01/24 | | | 3,273,637 | |
| | 2,170,000 | | | Topeka Public Building Commission KBI Forensic Laboratory Project Revenue Bonds,
5.00%, 12/01/17 | | | 2,346,399 | |
| | | | | | | | 7,159,970 | |
| Kentucky — 0.9% | | | |
| | 3,500,000 | | | Kentucky Asset Liability Commission Federal Highway Trust First Series Revenue Bonds,
5.00%, 09/01/17 | | | 3,761,765 | |
| Old Westbury Funds, Inc. | |
| Municipal Bond Fund | |
| Portfolio of Investments - (Continued) | October 31, 2015 |
| | |
Principal
Amount | | | | | Value | |
| Kentucky (continued) | | | |
| $ | 8,185,000 | | | Kentucky Asset Liability Commission Highway Trust Refunding Revenue Bonds,
5.00%, 09/01/16 | | $ | 8,491,938 | |
| | 605,000 | | | Warren County School District Finance Corp. Refunding Revenue Bonds, Series B, (State Aid Intercept Program),
2.00%, 06/01/16 | | | 610,620 | |
| | | | | | | | 12,864,323 | |
| Louisiana — 0.3% | | | | |
| | 2,000,000 | | | Louisiana Public Facilities Authority Hurricane Recovery Program Revenue Bonds, (AMBAC),
5.00%, 06/01/16 | | | 2,054,780 | |
| | 2,000,000 | | | State of Louisiana Interstate 49 South Project Revenue Bonds,
5.00%, 09/01/22 | | | 2,335,080 | |
| | | | | | | | 4,389,860 | |
| Maine — 0.9% | | | |
| | 4,000,000 | | | Maine Governmental Facilities Authority Refunding Revenue Bonds, Series A,
5.00%, 10/01/16 | | | 4,171,160 | |
| | 2,250,000 | | | Maine Governmental Facilities Authority Refunding Revenue Bonds, Series A,
5.00%, 10/01/19 | | | 2,568,983 | |
| | 700,000 | | | Maine Health & Higher Educational Facilities Authority Refunding Revenue Bonds, Series A,
5.00%, 07/01/17 | | | 749,777 | |
| | 520,000 | | | Maine Health & Higher Educational Facilities Authority Refunding Revenue Bonds, Series A,
5.00%, 07/01/21 | | | 612,191 | |
| | 115,000 | | | Maine Health & Higher Educational Facilities Authority Refunding Revenue Bonds, Series B, (AMBAC, State Resolution Funding GTY),
5.00%, 07/01/16(c) | | | 118,606 | |
| | 1,800,000 | | | Maine Health & Higher Educational Facilities Authority University & College Improvements Revenue Bonds, Series A,
5.00%, 07/01/16 | | | 1,854,864 | |
Principal
Amount | | | | | Value | |
| Maine (continued) | | | |
| $ | 1,795,000 | | | Maine Municipal Bond Bank Refunding Revenue Bonds, Series C,
5.00%, 11/01/26 | | $ | 2,168,827 | |
| | | | | | | | 12,244,408 | |
| Maryland — 0.4% | | |
| | 1,000,000 | | | Maryland State Department of Transportation Highway Improvement Revenue Bonds,
5.00%, 10/01/20 | | | 1,176,410 | |
| | 1,300,000 | | | State of Maryland Public Improvements GO, Series A,
5.00%, 08/01/17 | | | 1,400,594 | |
| | 1,000,000 | | | State of Maryland Public Improvements GO, Series A,
5.00%, 08/01/17 | | | 1,077,380 | |
| | 2,000,000 | | | State of Maryland School Improvements GO, Series B,
5.00%, 08/01/17 | | | 2,154,760 | |
| | | | | | | | 5,809,144 | |
| Massachusetts — 6.2% | | | |
| | 4,000,000 | | | Berkshire Regional Transit Authority Cash Flow Management Revenue Notes,
1.50%, 09/23/16 | | | 4,028,960 | |
| | 4,000,000 | | | City of Lawrence Refunding GO Notes, Series B,
1.75%, 09/01/16 | | | 4,042,320 | |
| | 4,450,000 | | | Commonwealth of Massachusetts Highway Improvements Revenue Bonds, Series B,
4.00%, 06/15/17 | | | 4,702,226 | |
| | 4,000,000 | | | Commonwealth of Massachusetts Highway Improvements Revenue Bonds, Series B,
5.00%, 06/15/22 | | | 4,847,440 | |
| | 9,000,000 | | | Commonwealth of Massachusetts Public Improvements GO, Series A,
5.00%, 05/01/19 | | | 10,262,250 | |
| | 9,650,000 | | | Commonwealth of Massachusetts Public Improvements GO, Series C,
5.00%, 07/01/22 | | | 11,673,509 | |
| | 850,000 | | | Commonwealth of Massachusetts Refunding GO, Series A,
5.00%, 08/01/16 | | | 880,090 | |
| | 1,000,000 | | | Commonwealth of Massachusetts Refunding GO, Series B (AGM-CR),
5.25%, 08/01/28 | | | 1,289,590 | |
| Old Westbury Funds, Inc. | |
| Municipal Bond Fund | |
| Portfolio of Investments - (Continued) | October 31, 2015 |
| | |
Principal
Amount | | | | | Value | |
| Massachusetts (continued) | | | |
| $ | 2,000,000 | | | Commonwealth of Massachusetts Refunding GO, Series C (AMBAC),
5.50%, 12/01/24 | | $ | 2,561,060 | |
| | 5,000,000 | | | Greater Attleboro-Taunton Regional Transit Authority Cash Flow Management Revenue Notes,
1.50%, 08/26/16 | | | 5,035,300 | |
| | 4,500,000 | | | Lowell Regional Transit Authority Cash Flow Management Revenue Notes,
1.50%, 08/05/16 | | | 4,530,510 | |
| | 1,000,000 | | | Massachusetts Port Authority Refunding Revenue Bonds, Series C,
2.00%, 07/01/16 | | | 1,011,770 | |
| | 7,780,000 | | | Massachusetts State Water Pollution Abatement Trust Refunding Revenue Bonds, Sub-Series 16-B,
5.00%, 08/01/20 | | | 9,158,227 | |
| | 500,000 | | | Massachusetts Water Resources Authority Refunding Revenue Bonds, Series A,
5.00%, 08/01/22 | | | 606,795 | |
| | 4,500,000 | | | Massachusetts Water Resources Authority Refunding Revenue Bonds, Series A (NATL-RE, GO of Authority),
5.25%, 08/01/16 | | | 4,667,625 | |
| | 1,450,000 | | | Metrowest Regional Transit Authority Cash Flow Management Revenue Notes,
1.50%, 09/23/16 | | | 1,452,045 | |
| | 13,000,000 | | | Montachusett Regional Transit Authority Cash Flow Management Revenue Notes,
1.50%, 08/05/16 | | | 13,085,150 | |
| | 1,275,000 | | | Town of Belmont Municipal Purpose Loan Refunding GO,
4.00%, 04/15/16 | | | 1,296,994 | |
| | | | | | | | 85,131,861 | |
| Michigan — 2.0% | | | | |
| | 945,000 | | | Brighton Area School District School Improvements GO, Series I (Q-SBLF),
5.00%, 05/01/16 | | | 966,092 | |
| | 200,000 | | | Caledonia Community Schools Refunding GO, (Q-SBLF),
5.00%, 05/01/23 | | | 240,165 | |
| | 635,000 | | | Dexter Community Schools Refunding GO (Q-SBLF),
4.00%, 05/01/18 | | | 677,221 | |
Principal
Amount | | | | | Value | |
| Michigan (continued) |
| $ | 1,050,000 | | | Grand Blanc Community Schools Refunding GO, (Q-SBLF),
4.00%, 05/01/16 | | $ | 1,068,029 | |
| | 1,000,000 | | | Grand Valley State University & College Improvements Revenue Bonds, Series A,
5.00%, 12/01/23 | | | 1,184,970 | |
| | 400,000 | | | Hudsonville Public Schools Improvements GO, (Q-SBLF),
5.00%, 05/01/18 | | | 439,483 | |
| | 250,000 | | | Hudsonville Public Schools Improvements GO, (Q-SBLF),
5.00%, 05/01/19 | | | 282,115 | |
| | 1,295,000 | | | Lake Shore Public Schools Refunding GO, (Q-SBLF),
3.00%, 11/01/16 | | | 1,324,772 | |
| | 1,375,000 | | | Northville Public Schools Refunding GO, (Q-SBLF),
5.00%, 05/01/18 | | | 1,508,939 | |
| | 1,155,000 | | | River Rouge School District Refunding GO, (Q-SBLF),
5.00%, 05/01/16 | | | 1,180,780 | |
| | 775,000 | | | River Rouge School District Refunding GO, (Q-SBLF),
5.00%, 05/01/18 | | | 842,487 | |
| | 1,160,000 | | | River Rouge School District Refunding GO, (Q-SBLF),
5.00%, 05/01/21 | | | 1,333,629 | |
| | 1,000,000 | | | River Rouge School District Refunding GO, (Q-SBLF),
5.00%, 05/01/22 | | | 1,159,990 | |
| | 2,000,000 | | | Romulus Community Schools Refunding GO (Q-SBLF),
5.00%, 05/01/22 | | | 2,319,980 | |
| | 325,000 | | | State of Michigan Environmental Program Refunding GO, Series A,
5.00%, 05/01/16 | | | 332,631 | |
| | 5,000,000 | | | State of Michigan Trunk Line Refunding Revenue Bonds,
5.00%, 11/15/16 | | | 5,239,500 | |
| | 4,530,000 | | | University of Michigan Refunding Revenue Bonds, Series C,
4.00%, 04/01/19 | | | 4,990,656 | |
| | 2,045,000 | | | Ypsilanti School District Refunding GO (Assured GTY, Q-SBLF),
5.00%, 05/01/16 | | | 2,088,906 | |
| | | | | | | | 27,180,345 | |
| Old Westbury Funds, Inc. | |
| Municipal Bond Fund | |
| Portfolio of Investments - (Continued) | October 31, 2015 |
| | |
Principal
Amount | | | | | Value | |
| Minnesota — 1.6% | | | |
| $ | 450,000 | | | Minnesota Public Facilities Authority Clean Water Revenue Bonds, Series B,
5.00%, 03/01/16 | | $ | 457,145 | |
| | 5,425,000 | | | St. Paul Port Authority Anderson Office Building Refunding Revenue Bonds, Series 3,
5.00%, 12/01/19 | | | 6,221,444 | |
| | 1,875,000 | | | St. Paul Port Authority Anderson Office Building Refunding Revenue Bonds, Series 3,
5.00%, 12/01/21 | | | 2,228,288 | |
| | 1,520,000 | | | State of Minnesota Public Improvements COP,
4.50%, 06/01/16 | | | 1,557,362 | |
| | 1,000,000 | | | State of Minnesota Public Improvements COP,
5.00%, 06/01/23 | | | 1,199,000 | |
| | 1,395,000 | | | State of Minnesota Public Improvements COP,
5.00%, 06/01/24 | | | 1,688,996 | |
| | 2,740,000 | | | State of Minnesota Public Improvements COP,
5.00%, 06/01/25 | | | 3,310,358 | |
| | 2,910,000 | | | State of Minnesota Public Improvements COP,
5.00%, 06/01/26 | | | 3,478,236 | |
| | 1,000,000 | | | State of Minnesota Refunding Revenue Bonds, Series B,
5.00%, 03/01/21 | | | 1,183,520 | |
| | 1,000,000 | | | Waconia Independent School District No 110 Refunding GO, Series A, (School District Credit Program),
5.00%, 02/01/24 | | | 1,226,020 | |
| | | | | | | | 22,550,369 | |
| Mississippi — 0.4% | | | |
| | 1,810,000 | | | Mississippi Development Bank Department of Corrections Refunding Revenue Bonds, Series D,
5.00%, 08/01/18 | | | 2,007,887 | |
| | 570,000 | | | Mississippi Development Bank DeSoto County Highway Project Advance Refunding Revenue Bonds, Series S, (State Interception),
5.00%, 01/01/23 | | | 679,315 | |
| | 310,000 | | | Mississippi State University Educational Building Corp. Campus Improvements Project Revenue Bonds,
5.00%, 11/01/22 | | | 371,966 | |
Principal
Amount | | | | | Value | |
| Mississippi (continued) | | | |
| $ | 2,000,000 | | | State of Mississippi Public Improvements Revenue Bonds, Series E,
2.00%, 10/15/16 | | $ | 2,027,740 | |
| | | | | | | | 5,086,908 | |
| Missouri — 1.4% | | | |
| | 1,020,000 | | | County of Jackson Refunding Revenue Bonds,
4.00%, 12/01/21 | | | 1,153,589 | |
| | 300,000 | | | County of Jackson Refunding Revenue Bonds,
4.00%, 12/01/22 | | | 340,455 | |
| | 2,300,000 | | | County of Jackson Sports Complex Project Refunding Revenue Bonds, (State Appropriation, City Appropriation),
5.00%, 12/01/26 | | | 2,741,577 | |
| | 4,000,000 | | | Hazelwood School District Refunding GO, (State Aid Direct Deposit),
5.00%, 03/01/25 | | | 4,936,680 | |
| | 500,000 | | | Jackson County Reorganized School District No. 4 Blue Springs Refunding GO, Series B, (State Aid Direct Deposit),
5.00%, 03/01/18 | | | 543,789 | |
| | 2,225,000 | | | Missouri State Health & Educational Facilities Authority Columbia Arena Project Refunding Revenue Bonds,
5.00%, 10/01/19 | | | 2,556,036 | |
| | 2,000,000 | | | Missouri State Health & Educational Facilities Authority Columbia Arena Project Refunding Revenue Bonds,
5.00%, 10/01/21 | | | 2,384,360 | |
| | 300,000 | | | North Kansas City School District No 74 School Improvements Refunding GO, (State Aid Direct Deposit),
4.00%, 03/01/17 | | | 313,847 | |
| | 1,250,000 | | | North Kansas City School District No 74 School Improvements Refunding GO, (State Aid Direct Deposit),
5.00%, 03/01/24 | | | 1,526,588 | |
| | 1,800,000 | | | North Kansas City School District No 74 School Improvements Refunding GO, (State Aid Direct Deposit),
5.00%, 03/01/25 | | | 2,179,908 | |
| | | | | | | | 18,676,829 | |
| Old Westbury Funds, Inc. | |
| Municipal Bond Fund | |
| Portfolio of Investments - (Continued) | October 31, 2015 |
| | |
Principal
Amount | | | | | Value | |
| Nevada — 0.3% | | | |
| $ | 1,000,000 | | | Clark County School District School Improvements GO, Series C (AGM),
5.00%, 12/15/15(c) | | $ | 1,005,580 | |
| | 2,605,000 | | | Clark County Water Reclamation District GO, Series A,
5.25%, 07/01/20 | | | 3,000,673 | |
| | | | | | | | 4,006,253 | |
| New Hampshire — 0.2% | | | |
| | 2,250,000 | | | State of New Hampshire Highway Improvements Revenue Bonds,
5.00%, 09/01/19 | | | 2,565,945 | |
| New Jersey — 5.3% | | | |
| | 500,000 | | | Bergen County Improvement Authority Public Improvements Revenue Bonds, Series B (County GTY),
4.00%, 02/15/16 | | | 505,439 | |
| | 240,000 | | | Bergen County Improvement Authority Refunding Revenue Bonds, Series A (County GTY),
4.00%, 12/15/16 | | | 249,730 | |
| | 200,000 | | | Bergen County Improvement Authority Refunding Revenue Bonds, Series A (County GTY),
4.00%, 12/15/17 | | | 213,953 | |
| | 3,495,000 | | | County of Sussex Public Improvements Refunding GO,
2.00%, 02/15/16 | | | 3,513,314 | |
| | 2,000,000 | | | Garden State Preservation Trust Refunding Revenue Bonds, Series A,
5.00%, 11/01/17 | | | 2,155,720 | |
| | 735,000 | | | Middlesex County Improvement Authority Regional Educational Services Refunding Revenue Bonds, (County GTY),
3.00%, 07/15/16 | | | 748,443 | |
| | 200,000 | | | Monmouth County Improvement Authority Refunding Revenue Bonds (County GTY, Municipal Government GTY),
5.00%, 12/01/22 | | | 242,037 | |
| | 5,300,000 | | | New Jersey Building Authority Refunding Revenue Bonds, Series A,
5.00%, 06/15/16 | | | 5,430,380 | |
Principal
Amount | | | | | Value | |
| New Jersey (continued) | | |
| $ | 795,000 | | | New Jersey Economic Development Authority School Facilities Construction Refunding Revenue Bonds,
5.00%, 12/15/16(c) | | $ | 835,418 | |
| | 560,000 | | | New Jersey Economic Development Authority School Facilities Construction Refunding Revenue Bonds,
5.00%, 12/15/16 | | | 583,341 | |
| | 1,090,000 | | | New Jersey Economic Development Authority School Facilities Construction Refunding Revenue Bonds,
5.00%, 03/01/18(c) | | | 1,198,695 | |
| | 410,000 | | | New Jersey Economic Development Authority School Facilities Construction Refunding Revenue Bonds,
5.00%, 03/01/18 | | | 433,190 | |
| | 3,245,000 | | | New Jersey Economic Development Authority School Facilities Construction Refunding Revenue Bonds,
5.00%, 03/01/21 | | | 3,510,571 | |
| | 750,000 | | | New Jersey Economic Development Authority School Facilities Construction Refunding Revenue Bonds, Series K, (AMBAC),
5.25%, 12/15/16 | | | 754,364 | |
| | 5,000,000 | | | New Jersey Economic Development Authority School Facilities Construction Refunding Revenue Bonds, Series N-1, (AMBAC),
5.50%, 09/01/24 | | | 5,624,000 | |
| | 11,690,000 | | | New Jersey Economic Development Authority School Facility Construction Refunding Revenue Bonds, Series EE,
5.00%, 09/01/17 | | | 12,610,938 | |
| | 505,000 | | | New Jersey Educational Facilities Authority Higher Education Capital Improvement Revenue Bonds,
4.00%, 09/01/16 | | | 518,726 | |
| | 6,225,000 | | | New Jersey Educational Facilities Authority Higher Education Facilities Trust Fund Revenue Bonds,
5.00%, 06/15/16 | | | 6,390,959 | |
| Old Westbury Funds, Inc. | |
| Municipal Bond Fund | |
| Portfolio of Investments - (Continued) | October 31, 2015 |
| | |
Principal
Amount | | | | | Value | |
| New Jersey (continued) | | | |
| $ | 1,000,000 | | | New Jersey Educational Facilities Authority University and College Improvements Revenue Bonds,
5.00%, 06/15/23 | | $ | 1,074,550 | |
| | 25,000 | | | New Jersey Environmental Infrastructure Trust Revenue Bonds, Series 2012,
5.00%, 09/01/16(c) | | | 25,972 | |
| | 1,160,000 | | | New Jersey Environmental Infrastructure Trust Revenue Bonds, Series 2013,
5.00%, 09/01/16 | | | 1,205,379 | |
| | 15,000 | | | New Jersey Environmental Infrastructure Trust Revenue Bonds, Series A,
5.00%, 09/01/16(c) | | | 15,583 | |
| | 40,000 | | | New Jersey Sports & Exposition Authority Refunding Revenue Bonds, Series B (State Appropriation),
5.00%, 09/01/18(c) | | | 44,647 | |
| | 1,300,000 | | | New Jersey State Turnpike Authority Refunding Revenue Bonds, Series B,
5.00%, 01/01/20 | | | 1,496,352 | |
| | 9,220,000 | | | New Jersey State Turnpike Authority Refunding Revenue Bonds, Series C,
5.00%, 01/01/25 | | | 11,171,690 | |
| | 1,885,000 | | | New Jersey Transportation Trust Fund Authority Transit Improvement Revenue Bonds, Series A, (State Appropriation),
5.00%, 06/15/16 | | | 1,932,427 | |
| | 1,500,000 | | | New Jersey Transportation Trust Fund Authority Transit Improvements Refunding Revenue Bonds, Series A,
5.25%, 12/15/22 | | | 1,651,095 | |
| | 2,255,000 | | | New Jersey Transportation Trust Fund Authority Transit Improvements Revenue Bonds, Series AA, (State Aid Appropriation),
5.00%, 06/15/20 | | | 2,446,901 | |
| | 500,000 | | | New Jersey Transportation Trust Fund Authority Transit Improvements Revenue Bonds, Series B,
5.00%, 06/15/19 | | | 538,615 | |
| | 1,375,000 | | | New Jersey Transportation Trust Fund Authority Transportation Systems Refunding Revenue Bonds, Series B, (NATL-RE),
5.50%, 12/15/15 | | | 1,377,284 | |
Principal
Amount | | | | | Value | |
| New Jersey (continued) | | | |
| $ | 825,000 | | | New Jersey Transportation Trust Fund Authority Transportation Systems Refunding Revenue Bonds, Series B, (NATL-RE),
5.50%, 12/15/16 | | $ | 864,782 | |
| | 2,750,000 | | | New Jersey Transportation Trust Fund Authority Transportation Systems Refunding Revenue Bonds, Series B-5,
5.25%, 12/15/19(d) | | | 3,006,658 | |
| | | | | | | | 72,371,153 | |
| New Mexico — 0.7% | | | |
| | 4,805,000 | | | City of Albuquerque General Purpose Public Improvements GO, Series A,
5.00%, 07/01/16 | | | 4,956,309 | |
| | 1,000,000 | | | Gadsden Independent School District No 16 Refunding GO, Series B (State Aid Withholding),
4.00%, 08/15/16 | | | 1,027,540 | |
| | 250,000 | | | Gadsden Independent School District No 16 Refunding GO, Series B (State Aid Withholding),
4.00%, 08/15/17 | | | 264,343 | |
| | 800,000 | | | Santa Fe Public School District School Improvements GO (State Aid Withholding),
4.00%, 08/01/16 | | | 822,392 | |
| | 3,000,000 | | | State of New Mexico Severance Tax Permanent Fund Public Improvements Revenue Bonds, Series A,
5.00%, 07/01/16 | | | 3,094,470 | |
| | | | | | | | 10,165,054 | |
| New York — 26.9% | | | |
| | 4,300,000 | | | Bridgehampton Union Free School District Cash Flow Management GO, (State Aid Withholding),
1.50%, 06/28/16 | | | 4,326,918 | |
| | 1,725,000 | | | City of New York Advance Refunding GO, Series A,
5.00%, 08/01/24 | | | 2,096,427 | |
| | 10,000,000 | | | City of New York Advance Refunding GO, Series A,
5.00%, 08/01/25 | | | 12,109,100 | |
| | 5,000,000 | | | City of New York Public Improvements GO, Series C, Sub-Series C-A,
5.00%, 08/01/17(d) | | | 5,379,650 | |
| Old Westbury Funds, Inc. | |
| Municipal Bond Fund | |
| Portfolio of Investments - (Continued) | October 31, 2015 |
| | |
| Principal | | | | | | |
| Amount | | | | | Value | |
| New York (continued) | | | |
| $ | 3,330,000 | | | City of New York Public Improvements GO, Sub-Series D-1,
5.00%, 08/01/22 | | $ | 3,984,878 | |
| | 5,000,000 | | | City of New York Refunding GO, Series B,
5.00%, 08/01/17 | | | 5,379,650 | |
| | 1,855,000 | | | City of New York Refunding GO, Series C,
5.00%, 08/01/20 | | | 2,166,788 | |
| | 650,000 | | | City of New York Refunding GO, Series C,
5.00%, 08/01/22 | | | 777,829 | |
| | 8,170,000 | | | City of New York Refunding GO, Series D,
5.00%, 08/01/22 | | | 9,776,712 | |
| | 1,870,000 | | | City of New York Refunding GO, Series E,
5.00%, 08/01/16 | | | 1,936,479 | |
| | 4,000,000 | | | City of New York Refunding GO, Series E,
5.00%, 08/01/17 | | | 4,303,720 | |
| | 10,000,000 | | | City of New York Refunding GO, Series G,
5.00%, 08/01/17 | | | 10,759,300 | |
| | 10,000,000 | | | City of New York Refunding GO, Series G,
5.00%, 08/01/21 | | | 11,863,900 | |
| | 18,500,000 | | | City of New York Refunding GO, Series G,
5.00%, 08/01/22 | | | 22,138,210 | |
| | 3,360,000 | | | City of New York Refunding GO, Series I,
5.00%, 08/01/16 | | | 3,479,448 | |
| | 5,000,000 | | | Clarence Central School District Cash Flow Management GO, (State Aid Withholding),
1.75%, 06/28/16 | | | 5,034,450 | |
| | 3,500,000 | | | County of Rockland Cash Flow Management GO,
2.00%, 03/16/16 | | | 3,518,235 | |
| | 2,175,000 | | | County of Rockland Public Improvements GO, Series C, (AGM),
3.00%, 05/01/16 | | | 2,202,209 | |
| | 445,000 | | | County of Rockland Refunding GO (BAM),
2.00%, 02/15/16 | | | 447,007 | |
| | 505,000 | | | County of Rockland Refunding GO (BAM),
2.00%, 02/15/17 | | | 513,418 | |
| | 2,000,000 | | | Erie County Industrial Development Agency Refunding Revenue Bonds, Series B, (State Aid Withholding),
5.00%, 05/01/18 | | | 2,205,780 | |
| Principal | | | | | | |
| Amount | | | | | Value | |
| New York (continued) | | | |
| $ | 5,000,000 | | | Erie County Industrial Development Agency Refunding Revenue Bonds, Series B, (State Aid Withholding),
5.00%, 05/01/23 | | $ | 5,901,850 | |
| | 5,240,000 | | | Geneva City School District Cash Flow Management GO, (State Aid Withholding),
1.00%, 06/17/16 | | | 5,252,314 | |
| | 1,925,000 | | | Metropolitan Transportation Authority Refunding Revenue Bonds, Series F,
5.00%, 11/15/21 | | | 2,287,632 | |
| | 1,910,000 | | | Metropolitan Transportation Authority Transit Improvements Revenue Bonds, Series C,
5.00%, 11/15/21 | | | 2,269,806 | |
| | 2,500,000 | | | New York City Municipal Water Finance Authority Fiscal 2009 Revenue Bonds, Series A,
5.50%, 06/15/21 | | | 2,810,250 | |
| | 1,250,000 | | | New York City Municipal Water Finance Authority Fiscal 2014 Refunding Revenue Bonds, Series CC-2,
5.00%, 06/15/18 | | | 1,314,988 | |
| | 1,350,000 | | | New York City Transitional Finance Authority Future Tax Secured Advanced Refunding Revenue Bonds, Series C,
5.00%, 11/01/23 | | | 1,643,207 | |
| | 1,230,000 | | | New York City Transitional Finance Authority Future Tax Secured Refunding Revenue Bonds, Series B,
5.00%, 11/01/17(c) | | | 1,336,469 | |
| | 770,000 | | | New York City Transitional Finance Authority Future Tax Secured Refunding Revenue Bonds, Series B,
5.00%, 11/01/17 | | | 836,651 | |
| | 15,920,000 | | | New York City Transitional Finance Authority Future Tax Secured Refunding Revenue Bonds, Sub-Series B,
5.00%, 11/01/21 | | | 19,030,927 | |
| | 3,025,000 | | | New York City Transitional Finance Authority Future Tax Secured Refunding Revenue Bonds, Sub-Series G,
5.00%, 11/01/18 | | | 3,393,143 | |
| | 1,045,000 | | | New York City Transitional Finance Authority Future Tax Secured Refunding Revenue Bonds, Sub-Series G,
5.00%, 11/01/19 | | | 1,205,063 | |
| Old Westbury Funds, Inc. | |
| Municipal Bond Fund | |
| Portfolio of Investments - (Continued) | October 31, 2015 |
| | |
| Principal | | | | | | |
| Amount | | | | | Value | |
| New York (continued) | | | |
| $ | 2,425,000 | | | New York City Transitional Finance Authority Future Tax Secured Refunding Revenue Bonds, Sub-Series G,
5.00%, 11/01/21 | | $ | 2,898,869 | |
| | 935,000 | | | New York City Transitional Finance Authority Future Tax Secured Refunding Revenue Bonds, Sub-Series H,
5.00%, 11/01/18 | | | 1,048,790 | |
| | 1,535,000 | | | New York City Transitional Finance Authority Future Tax Secured Refunding Revenue Bonds, Sub-Series H,
5.00%, 11/01/21 | | | 1,834,954 | |
| | 1,725,000 | | | New York City Transitional Finance Authority Future Tax Secured Refunding Revenue Notes,
5.00%, 02/01/18 | | | 1,889,272 | |
| | 225,000 | | | New York City Transitional Finance Authority Future Tax Secured Refunding Revenue Notes,
5.00%, 02/01/18(c) | | | 246,004 | |
| | 4,700,000 | | | New York City Transitional Finance Authority Future Tax Secured Revenue Bonds,
5.00%, 02/01/17 | | | 4,967,477 | |
| | 515,000 | | | New York City Transitional Finance Authority Future Tax Secured Revenue Bonds, Sub-Series, F-1,
5.00%, 02/01/19 | | | 582,125 | |
| | 2,200,000 | | | New York City Transitional Finance Authority Public Improvements Revenue Bonds, Series A-1,
5.00%, 05/01/22 | | | 2,497,968 | |
| | 600,000 | | | New York City Transitional Finance Authority Refunding Revenue Bonds, Sub-Series G,
5.00%, 11/01/20 | | | 706,325 | |
| | 1,235,000 | | | New York City Transitional Finance Authority School Improvement Revenue Bonds, Sub-Series S-1A, (State Aid Withholding),
5.00%, 07/15/21 | | | 1,467,192 | |
| | 3,220,000 | | | New York Local Government Assistance Corp. Refunding Revenue Bonds, Series E, (AGM, GO of Corp.) OID,
5.25%, 04/01/16 | | | 3,287,008 | |
| Principal | | | | | | |
| Amount | | | | | Value | |
| New York (continued) | | | |
| $ | 700,000 | | | New York Local Government Assistance Corp. Refunding Revenue Bonds, Sub-Series A-5-6,
5.00%, 04/01/17 | | $ | 744,660 | |
| | 5,100,000 | | | New York Municipal Bond Bank Agency Refunding Revenue Bonds, (State Aid Withholding),
4.00%, 12/01/17 | | | 5,436,243 | |
| | 10,000,000 | | | New York Municipal Bond Bank Agency Refunding Revenue Bonds, (State Aid Withholding),
5.00%, 12/01/21 | | | 11,922,400 | |
| | 9,100,000 | | | New York State Dormitory Authority Advance Refunding Revenue Bonds, Series A,
5.00%, 03/15/23 | | | 11,085,711 | |
| | 7,790,000 | | | New York State Dormitory Authority Advance Refunding Revenue Bonds, Series E,
5.00%, 03/15/22 | | | 9,328,992 | |
| | 14,000,000 | | | New York State Dormitory Authority Advance Refunding Revenue Bonds, Series E,
5.00%, 03/15/24 | | | 17,027,080 | |
| | 900,000 | | | New York State Dormitory Authority Economic Development & Housing Revenue Bonds, Series A,
4.00%, 12/15/16 | | | 936,378 | |
| | 15,000 | | | New York State Dormitory Authority Mental Health Services Facility Refunding Revenue Bonds, (State Appropriation),
5.00%, 08/15/18(c) | | | 16,729 | |
| | 1,770,000 | | | New York State Dormitory Authority Mental Health Services Facility Refunding Revenue Bonds, Series A, (State Appropriation),
4.50%, 08/15/17 | | | 1,890,431 | |
| | 550,000 | | | New York State Dormitory Authority Mental Health Services Facility Revenue Bonds (NATL-RE, FGIC, State Appropriation),
5.00%, 02/15/16 | | | 551,957 | |
| | 2,110,000 | | | New York State Dormitory Authority Refunding Revenue Bonds,
5.00%, 08/15/18 | | | 2,346,383 | |
| | 750,000 | | | New York State Dormitory Authority Refunding Revenue Bonds, Series A,
4.00%, 07/01/16 | | | 768,383 | |
| Old Westbury Funds, Inc. | |
| Municipal Bond Fund | |
| Portfolio of Investments - (Continued) | October 31, 2015 |
| | |
| Principal | | | | | | |
| Amount | | | | | Value | |
| New York (continued) | | | |
| $ | 15,000,000 | | | New York State Dormitory Authority Refunding Revenue Bonds, Series A,
5.00%, 12/15/20 | | $ | 17,720,850 | |
| | 4,160,000 | | | New York State Dormitory Authority Refunding Revenue Bonds, Series A,
5.00%, 02/15/26 | | | 4,988,464 | |
| | 4,500,000 | | | New York State Dormitory Authority Refunding Revenue Bonds, Series E,
5.00%, 02/15/23 | | | 5,434,020 | |
| | 1,045,000 | | | New York State Dormitory Authority School Improvement Revenue Bonds, Series A,
5.00%, 03/15/21 | | | 1,236,350 | |
| | 7,700,000 | | | New York State Dormitory Authority School Improvement Revenue Bonds, Series A,
5.00%, 03/15/25 | | | 9,404,472 | |
| | 4,000,000 | | | New York State Dormitory Authority School Improvement Revenue Bonds, Series C,
5.00%, 03/15/17 | | | 4,243,760 | |
| | 2,850,000 | | | New York State Dormitory Authority School Improvement Revenue Bonds, Series G,
5.00%, 03/15/17 | | | 3,025,304 | |
| | 2,000,000 | | | New York State Environmental Facilities Corp. Refunding Revenue Bonds,
4.00%, 06/15/16 | | | 2,046,860 | |
| | 2,160,000 | | | New York State Housing Finance Agency Affordable Housing Revenue Bonds, Series E,
1.10%, 11/01/16 | | | 2,168,100 | |
| | 7,000,000 | | | New York State Thruway Authority Highway Improvement Refunding Revenue Bonds, Series B,
5.00%, 04/01/20 | | | 7,817,670 | |
| | 200,000 | | | New York State Thruway Authority Highway Improvement Revenue Bonds, Series A,
4.00%, 03/15/16 | | | 202,813 | |
| | 200,000 | | | New York State Thruway Authority Highway Improvement Revenue Bonds, Series A,
5.00%, 03/15/16 | | | 203,549 | |
| Principal | | | | | | |
| Amount | | | | | Value | |
| New York (continued) | | | |
| $ | 1,420,000 | | | New York State Thruway Authority Highway Improvement Revenue Bonds, Series A,
5.00%, 03/15/17 | | $ | 1,505,938 | |
| | 1,430,000 | | | New York State Thruway Authority Highway Improvement Revenue Bonds, Series A,
5.00%, 03/15/20 | | | 1,662,990 | |
| | 5,000,000 | | | New York State Thruway Authority Highway Improvement Revenue Bonds, Series A,
5.00%, 03/15/21 | | | 5,645,700 | |
| | 1,900,000 | | | New York State Thruway Authority Highway Improvement Revenue Bonds, Series B,
5.00%, 04/01/21 | | | 2,158,134 | |
| | 1,000,000 | | | New York State Thruway Authority Refunding Revenue Bonds,
5.00%, 01/01/25 | | | 1,208,020 | |
| | 410,000 | | | New York State Thruway Authority Refunding Revenue Bonds, Series A,
5.00%, 03/15/16 | | | 417,261 | |
| | 400,000 | | | New York State Thruway Authority Refunding Revenue Bonds, Series A,
5.00%, 03/15/17 | | | 424,431 | |
| | 8,000,000 | | | New York State Thruway Authority Refunding Revenue Bonds, Series A,
5.00%, 03/15/21 | | | 9,432,000 | |
| | 5,000,000 | | | New York State Thruway Authority Refunding Revenue Bonds, Series B,
5.00%, 04/01/21 | | | 5,582,550 | |
| | 1,000,000 | | | New York State Urban Development Corp. Economic Improvements Revenue Bonds, Series A1,
4.00%, 12/15/16 | | | 1,040,310 | |
| | 4,705,000 | | | New York State Urban Development Corp. Public Improvement Revenue Bonds, Series A-1,
5.00%, 03/15/22 | | | 5,615,747 | |
| | 3,550,000 | | | Port Authority of New York & New Jersey Refunding Revenue Bonds, Series 189,
5.00%, 05/01/23 | | | 4,315,096 | |
| | 14,390,000 | | | Sales Tax Asset Receivable Corp. Fiscal 2015 Refunding Revenue Bonds, Series A,
5.00%, 10/15/26 | | | 17,606,741 | |
| Old Westbury Funds, Inc. | |
| Municipal Bond Fund | |
| Portfolio of Investments - (Continued) | October 31, 2015 |
| | |
| Principal | | | | | | |
| Amount | | | | | Value | |
| New York (continued) | | | |
| $ | 5,390,000 | | | Triborough Bridge & Tunnel Authority Toll Road Refunding Revenue Bonds, Series B,
5.00%, 11/15/23 | | $ | 6,579,627 | |
| | 1,600,000 | | | Utility Debt Securitization Authority Restructuring Refunding Revenue Bonds,
5.00%, 12/15/24 | | | 1,943,984 | |
| | 1,000,000 | | | Utility Debt Securitization Authority Restructuring Refunding Revenue Bonds, Series TE,
5.00%, 12/15/18 | | | 1,051,530 | |
| | | | | | | | 369,846,010 | |
| North Carolina — 2.5% | | | | |
| | 680,000 | | | Appalachian State University Refunding Revenue Bonds,
5.00%, 05/01/20 | | | 785,570 | |
| | 905,000 | | | Buncombe County Refunding Revenue Bonds,
5.00%, 06/01/21 | | | 1,071,665 | |
| | 475,000 | | | Buncombe County Refunding Revenue Bonds, Series A,
5.00%, 06/01/16 | | | 488,124 | |
| | 1,355,000 | | | Cabarrus County School Improvement COP,
5.00%, 01/01/21 | | | 1,528,494 | |
| | 1,005,000 | | | City of Charlotte Equipment Acquisition Refunding COP,
5.00%, 12/01/16 | | | 1,055,320 | |
| | 3,015,000 | | | County of Mecklenburg Refunding GO, Series A,
5.00%, 12/01/22 | | | 3,693,586 | |
| | 245,000 | | | County of Wake Refunding GO, Series D,
4.00%, 02/01/16 | | | 247,320 | |
| | 2,840,000 | | | County of Wake School Improvements GO, Series A,
5.00%, 04/01/17 | | | 3,022,868 | |
| | 615,000 | | | Dare County Refunding Revenue Bonds, Series D,
4.00%, 06/01/17 | | | 648,622 | |
| | 675,000 | | | Dare County Refunding Revenue Bonds, Series D,
4.00%, 06/01/18 | | | 727,603 | |
| | 675,000 | | | Dare County Refunding Revenue Bonds, Series D,
5.00%, 06/01/21 | | | 804,479 | |
| | 1,565,000 | | | Johnston County School Improvements GO, (NATL-RE),
5.00%, 02/01/20 | | | 1,583,451 | |
| Principal | | | | | | |
| Amount | | | | | Value | |
| North Carolina (continued) | | | |
| $ | 325,000 | | | North Carolina State University At Raleigh Refunding Revenue Bonds, Series A,
5.00%, 10/01/21 | | $ | 388,268 | |
| | 2,000,000 | | | Orange County Public Facilities Co. Refunding Revenue Bonds,
5.00%, 10/01/21 | | | 2,386,860 | |
| | 2,320,000 | | | State of North Carolina Highway Improvements Revenue Bonds,
5.00%, 03/01/16 | | | 2,355,078 | |
| | 10,000,000 | | | State of North Carolina Refunding Revenue Bonds, Series B,
5.00%, 06/01/24 | | | 12,273,500 | |
| | 1,595,000 | | | Town of Cary Public Improvements GO,
5.00%, 03/01/17 | | | 1,692,295 | |
| | | | | | | | 34,753,103 | |
| Ohio — 3.2% | | | | |
| | 2,500,000 | | | City of Columbus GO, Series A,
5.00%, 02/15/22 | | | 3,009,225 | |
| | 2,000,000 | | | City of Columbus Refunding GO, Series 5,
5.00%, 08/15/23 | | | 2,451,280 | |
| | 1,600,000 | | | Cleveland Department of Public Utilities Division of Water Advance Refunding Revenue Bonds, Series Y,
5.00%, 01/01/26 | | | 1,893,504 | |
| | 1,100,000 | | | County of Cuyahoga Refunding Revenue Bonds,
5.00%, 12/01/22 | | | 1,336,907 | |
| | 1,000,000 | | | County of Hamilton Sewer System Refunding Revenue Bonds, Series A,
5.00%, 12/01/26 | | | 1,214,510 | |
| | 1,665,000 | | | County of Hamilton Sewer System Refunding Revenue Bonds, Series A,
5.00%, 12/01/27 | | | 2,005,559 | |
| | 1,000,000 | | | Greater Cleveland Regional Transit Authority Capital Improvements Advance Refunding Revenue Bonds,
5.00%, 12/01/23 | | | 1,221,830 | |
| | 2,365,000 | | | Ohio State Building Authority Facilities Administration Building Project Refunding Revenue Bonds, Series B, (NATL-RE, FGIC),
5.00%, 10/01/18 | | | 2,644,165 | |
| Old Westbury Funds, Inc. | |
| Municipal Bond Fund | |
| Portfolio of Investments - (Continued) | October 31, 2015 |
| | |
| Principal | | | | | | |
| Amount | | | | | Value | |
| Ohio (continued) | | | |
| $ | 5,000,000 | | | Ohio State Water Development Authority Refunding Revenue Bonds, Series B,
5.00%, 06/01/22 | | $ | 6,036,100 | |
| | 400,000 | | | RiverSouth Authority Area Redevelopment Refunding Revenue Bonds,
4.00%, 06/01/16 | | | 408,423 | |
| | 320,000 | | | RiverSouth Authority Area Redevelopment Refunding Revenue Bonds,
5.00%, 06/01/24 | | | 383,434 | |
| | 1,000,000 | | | State of Ohio Capital Facilities Lease Appropriation Refunding Revenue Bonds,
5.00%, 10/01/17 | | | 1,083,560 | |
| | 5,000,000 | | | State of Ohio Highway Improvements GO, Series Q,
5.00%, 05/01/16 | | | 5,117,900 | |
| | 8,000,000 | | | State of Ohio Highway Improvements GO, Series R,
4.00%, 05/01/16 | | | 8,149,280 | |
| | 625,000 | | | State of Ohio Highway Improvements Revenue Bonds,
5.00%, 12/15/24 | | | 765,325 | |
| | 500,000 | | | State of Ohio Refunding GO, Series B,
4.00%, 08/01/16 | | | 513,885 | |
| | 3,875,000 | | | State of Ohio University & College Improvements GO, Series A,
5.00%, 05/01/24 | | | 3,967,923 | |
| | 1,730,000 | | | University of Cincinnati College & University Refunding Revenue Bonds, Series A, (State Appropriation),
5.00%, 06/01/17 | | | 1,850,841 | |
| | | | | | | | 44,053,651 | |
| Oklahoma — 0.9% | | | | |
| | 4,400,000 | | | Oklahoma Capital Improvement Authority Refunding Revenue Bonds, Series B,
2.00%, 07/01/16 | | | 4,450,908 | |
| | 5,275,000 | | | Tulsa County Independent School District No 3 Broken Arrow Combined Purpose School Improvements GO,
2.00%, 04/01/16 | | | 5,313,930 | |
| | 2,680,000 | | | University of Oklahoma Refunding Revenue Bonds, Series C,
2.00%, 07/01/16 | | | 2,708,703 | |
| | | | | | | | 12,473,541 | |
| Principal | | | | | | |
| Amount | | | | | Value | |
| Oregon — 0.5% | | | |
| $ | 575,000 | | | City of Portland Water System Refunding Revenue Bonds,
5.00%, 10/01/16 | | $ | 599,817 | |
| | 1,300,000 | | | City of Portland Water System Refunding Revenue Bonds, Series A,
5.00%, 05/01/17 | | | 1,388,244 | |
| | 815,000 | | | Lane County School District No 19 Springfield School Improvements GO, Series B, (AGM, School Board GTY),
5.00%, 06/15/17 | | | 871,137 | |
| | 1,755,000 | | | Washington & Multnomah Counties School District No 48J Beaverton Refunding GO, Series B, (School Board GTY),
4.00%, 06/15/19 | | | 1,938,766 | |
| | 2,200,000 | | | Yamhill Clackamas & Washington Counties School District No 29J Newberg Refunding GO (NATL-RE, School Board GTY),
5.50%, 06/15/17 | | | 2,369,158 | |
| | | | | | | | 7,167,122 | |
| Rhode Island — 0.3% | | | | |
| | 3,000,000 | | | Rhode Island Convention Center Authority Refunding Revenue Bonds, Series A,
5.00%, 05/15/22 | | | 3,506,370 | |
| | 705,000 | | | Rhode Island Health & Educational Building Corp. Town of East Greenwich Revenue Bonds, Series A, (Municipal Government GTY),
4.00%, 05/15/18 | | | 756,070 | |
| | | | | | | | 4,262,440 | |
| South Carolina — 0.9% | | | | |
| | 4,530,000 | | | County of Charleston Refunding GO, Series A,
5.00%, 11/01/21 | | | 5,461,232 | |
| | 880,000 | | | Lexington County School District No 2 Refunding GO (South Carolina School District),
4.00%, 03/01/17 | | | 921,342 | |
| | 2,090,000 | | | Lexington County School District No 2 Refunding GO (South Carolina School District),
5.00%, 03/01/18 | | | 2,294,841 | |
| Old Westbury Funds, Inc. | |
| Municipal Bond Fund | |
| Portfolio of Investments - (Continued) | October 31, 2015 |
| | |
| Principal | | | | | | |
| Amount | | | | | Value | |
| South Carolina (continued) | | | |
| $ | 1,635,000 | | | Lexington County School District No 2 Refunding GO (South Carolina School District),
5.00%, 03/01/20 | | $ | 1,897,565 | |
| | 330,000 | | | State of South Carolina University & College Improvements GO, Series B,
5.00%, 03/01/19 | | | 375,035 | |
| | 680,000 | | | State of South Carolina University & College Improvements GO, Series E (State Aid Withholding),
5.00%, 03/01/19 | | | 772,800 | |
| | | | | | | | 11,722,815 | |
| Tennessee — 0.1% | | | | |
| | 900,000 | | | Tennessee State School Bond Authority Refunding Revenue Bonds (State Aid Intercept Program),
5.00%, 11/01/25 | | | 1,102,923 | |
| Texas — 12.6% | | | | |
| | 4,220,000 | | | Alamo Community College District Refunding GO,
4.00%, 02/15/17 | | | 4,414,373 | |
| | 800,000 | | | Austin Independent School District Refunding GO (PSF-GTD),
5.00%, 08/01/16 | | | 827,896 | |
| | 400,000 | | | Beaumont Independent School District Improvements GO, (PSF-GTD),
4.00%, 02/15/18 | | | 428,863 | |
| | 1,000,000 | | | City of Austin Water & Wastewater System Advance Refunding Revenue Bonds, Series A,
5.00%, 11/15/21 | | | 1,195,980 | |
| | 935,000 | | | City of Conroe Public Improvements GO,
5.00%, 03/01/25 | | | 1,135,511 | |
| | 2,500,000 | | | City of Dallas Refunding GO,
5.00%, 02/15/23 | | | 3,035,925 | |
| | 3,000,000 | | | City of Dallas Refunding GO,
5.00%, 02/15/24 | | | 3,673,320 | |
| | 1,000,000 | | | City of El Paso Water & Sewer Refunding Revenue Bonds,
5.00%, 03/01/25 | | | 1,203,470 | |
| | 1,250,000 | | | City of El Paso Water & Sewer Refunding Revenue Bonds,
5.00%, 03/01/26 | | | 1,487,650 | |
| Principal | | | | | | |
| Amount | | | | | Value | |
| Texas (continued) | | | |
| $ | 1,095,000 | | | City of Friendswood Waterworks & Sewer System Refunding Revenue Bonds, (AGM),
5.00%, 03/01/21 | | $ | 1,110,976 | |
| | 600,000 | | | City of League Waterworks & Sewer GO, Series A,
5.00%, 02/15/22 | | | 718,248 | |
| | 1,775,000 | | | City of Lubbock Public Improvement GO,
5.25%, 02/15/20 | | | 2,019,063 | |
| | 800,000 | | | City of San Antonio Water System Refunding Revenue Bonds, Series A,
3.00%, 05/15/16 | | | 811,832 | |
| | 1,505,000 | | | City of Southlake Refunding GO,
5.00%, 02/15/16 | | | 1,525,588 | |
| | 1,430,000 | | | Clear Creek Independent School District GO, (PSF-GTD), Series B,
3.00%, 02/15/35(b) | | | 1,487,486 | |
| | 260,000 | | | Coppell Independent School District School Building GO, (PSF-GTD),
4.00%, 08/15/16 | | | 267,639 | |
| | 875,000 | | | County of Bexar Limited Tax Refunding GO,
3.00%, 06/15/16 | | | 889,971 | |
| | 1,200,000 | | | County of Bexar Limited Tax Refunding GO,
4.00%, 06/15/16 | | | 1,227,888 | |
| | 580,000 | | | County of Bexar Limited Tax Refunding GO,
4.00%, 06/15/16 | | | 593,479 | |
| | 4,410,000 | | | County of Bexar Refunding GO,
5.00%, 06/15/22 | | | 5,331,999 | |
| | 675,000 | | | County of Collin Advance Refunding GO,
5.00%, 02/15/24 | | | 823,048 | |
| | 1,000,000 | | | County of Williamson Limited Tax Refunding GO,
5.00%, 02/15/21 | | | 1,183,730 | |
| | 360,000 | | | Crystal City Independent School District Advance Refunding GO, (PSF-GTD),
5.00%, 02/15/26 | | | 436,777 | |
| | 1,095,000 | | | Cypress-Fairbanks Independent School District Refunding GO, Series A, (PSF-GTD),
4.00%, 02/15/17 | | | 1,145,436 | |
| | 4,000,000 | | | Cypress-Fairbanks Independent School District School Improvements GO, Series B-2 (PSF-GTD),
3.00%, 02/15/40(b) | | | 4,161,040 | |
| Old Westbury Funds, Inc. | |
| Municipal Bond Fund | |
| Portfolio of Investments - (Continued) | October 31, 2015 |
| | |
| Principal | | | | | | |
| Amount | | | | | Value | |
| Texas (continued) | | | |
| $ | 2,000,000 | | | Dallas Area Rapid Transit Refunding Revenue Bonds, Series A,
5.00%, 12/01/25 | | $ | 2,447,320 | |
| | 1,120,000 | | | Dayton Independent School District School Improvements GO, (PSF-GTD),
5.00%, 02/15/22 | | | 1,335,578 | |
| | 245,000 | | | Deer Park Independent School District Limited Tax GO, (AGM),
5.00%, 02/15/17 | | | 259,379 | |
| | 7,630,000 | | | Denton Independent School District GO, (PSF-GTD),
2.00%, 08/01/43(b) | | | 7,718,584 | |
| | 3,955,000 | | | Dickinson Independent School District Refunding GO, (PSF-GTD),
5.00%, 02/15/25 | | | 4,809,043 | |
| | 1,500,000 | | | El Paso Independent School District Refunding GO (PSF-GTD),
5.00%, 08/15/25 | | | 1,820,295 | |
| | 520,000 | | | Forsan Independent School District Refunding GO (PSF-GTD),
4.00%, 02/15/17 | | | 543,951 | |
| | 4,700,000 | | | Fort Worth Independent School District Advance Refunding GO, (PSF-GTD),
5.00%, 02/15/24 | | | 5,774,984 | |
| | 1,650,000 | | | Frenship Independent School District Refunding GO (PSF-GTD),
5.00%, 02/15/26 | | | 1,981,337 | |
| | 250,000 | | | Frisco Independent School District School Building GO, Series A, (PSF-GTD),
6.13%, 08/15/21 | | | 289,385 | |
| | 13,000,000 | | | Goose Creek Consolidated Independent School District School Improvements GO, Series B, (PSF-GTD),
3.00%, 02/15/35(b) | | | 13,522,600 | |
| | 720,000 | | | Hallsville Independent School District Refunding GO, (PSF-GTD),
4.00%, 02/15/16 | | | 727,603 | |
| | 1,000,000 | | | Harris County Refunding GO, Series C, (AGM),
5.25%, 08/15/19 | | | 1,158,080 | |
| | 500,000 | | | Hidalgo County Certificates of Obligation GO, (NATL-RE),
4.50%, 08/15/19 | | | 516,639 | |
| Principal | | | | | | |
| Amount | | | | | Value | |
| Texas (continued) | | | |
| $ | 2,990,000 | | | Houston Community College System Student Fee Revenue Bonds, Senior Lien, (AGM),
5.25%, 04/15/21 | | $ | 3,300,272 | |
| | 135,000 | | | Joshua Independent School District Refunding GO, Series C (PSF-GTD),
5.45%, 02/15/16 | | | 137,021 | |
| | 1,750,000 | | | Lamar Consolidated Independent School District School Improvements GO, Series A, (PSF-GTD),
2.00%, 08/15/47(b) | | | 1,770,703 | |
| | 4,500,000 | | | Lower Colorado River Authority Refunding Revenue Bonds,
5.00%, 05/15/16 | | | 4,614,480 | |
| | 1,085,000 | | | Mercedes Independent School District Advance Refunding GO, (PSF-GTD),
5.00%, 08/15/22 | | | 1,304,886 | |
| | 8,585,000 | | | North East Independent School District School Improvements GO, Series B, (PSF-GTD),
2.00%, 08/01/42(b) | | | 8,684,672 | |
| | 250,000 | | | Pasadena Independent School District Advance Refunding GO, (PSF-GTD),
5.00%, 02/15/22 | | | 299,105 | |
| | 1,105,000 | | | Pasadena Independent School District GO, (PSF-GTD),
5.00%, 02/15/17 | | | 1,169,996 | |
| | 265,000 | | | Red Oak Independent School District School Improvements GO (PSF-GTD),
5.00%, 08/15/17(c) | | | 285,617 | |
| | 260,000 | | | Red Oak Independent School District School Improvements GO (PSF-GTD),
5.00%, 08/15/18 | | | 280,712 | |
| | 1,500,000 | | | Richardson Independent School District School Improvements GO, Series A, (PSF-GTD),
3.00%, 02/15/16 | | | 1,512,150 | |
| | 925,000 | | | Roma Independent School District Refunding GO, (PSF-GTD),
5.00%, 08/15/22 | | | 1,107,900 | |
| | 1,020,000 | | | Roma Independent School District Refunding GO, (PSF-GTD),
5.00%, 08/15/23 | | | 1,232,089 | |
| | 1,075,000 | | | Roma Independent School District Refunding GO, (PSF-GTD),
5.00%, 08/15/24 | | | 1,313,145 | |
| Old Westbury Funds, Inc. | |
| Municipal Bond Fund | |
| Portfolio of Investments - (Continued) | October 31, 2015 |
| | |
| Principal | | | | | | |
| Amount | | | | | Value | |
| Texas (continued) | | | |
| $ | 1,000,000 | | | Roma Independent School District Refunding GO, (PSF-GTD),
5.00%, 08/15/25 | | $ | 1,232,280 | |
| | 705,000 | | | San Elizario Independent School District School Improvements GO, (PSF-GTD),
5.00%, 05/01/25 | | | 871,902 | |
| | 1,100,000 | | | San Felipe-Del Rio Consolidated Independent School District Refunding GO, (PSF-GTD),
3.00%, 02/15/16 | | | 1,108,910 | |
| | 145,000 | | | Seagraves Independent School District School Building GO, (PSF-GTD),
4.00%, 02/15/19 | | | 158,167 | |
| | 2,695,000 | | | State of Texas Public Finance Authority Refunding GO,
5.00%, 10/01/20 | | | 3,170,425 | |
| | 1,390,000 | | | Texas State University Systems University and College Improvement Revenue Bonds,
5.00%, 03/15/17 | | | 1,476,291 | |
| | 6,950,000 | | | Texas Transportation Commission State Highway Fund First Tier Advance Refunding Revenue Bonds,
5.00%, 10/01/20 | | | 8,176,050 | |
| | 10,785,000 | | | Texas Transportation Commission State Highway Fund First Tier Advance Refunding Revenue Bonds,
5.00%, 10/01/24 | | | 13,313,867 | |
| | 1,070,000 | | | Texas Transportation Commission State Highway Fund Highway Improvements First Tier Revenue Bonds,
5.00%, 04/01/17 | | | 1,138,427 | |
| | 1,775,000 | | | Texas Transportation Commission State Highway Fund Highway Improvements First Tier Revenue Bonds, Series A,
5.00%, 04/01/16 | | | 1,809,985 | |
| | 3,150,000 | | | Tomball Independent School District School Improvements GO, Series B-3, (PSF-GTD),
2.00%, 02/15/43(b) | | | 3,190,226 | |
| | 4,850,000 | | | Tyler Independent School District Advance Refunding GO, (PSF-GTD),
5.00%, 02/15/23 | | | 5,856,666 | |
| | 1,000,000 | | | United Independent School District GO, (PSF-GTD),
5.00%, 08/15/22 | | | 1,199,840 | |
| Principal | | | | | | |
| Amount | | | | | Value | |
| Texas (continued) | | | |
| $ | 1,680,000 | | | United Independent School District GO, (PSF-GTD),
5.00%, 08/15/23 | | $ | 2,032,010 | |
| | 1,235,000 | | | United Independent School District GO, (PSF-GTD),
5.00%, 08/15/24 | | | 1,507,490 | |
| | 2,085,000 | | | United Independent School District GO, (PSF-GTD),
5.00%, 08/15/25 | | | 2,567,261 | |
| | 1,900,000 | | | University of North Texas Refunding Revenue Bonds,
5.00%, 04/15/20 | | | 2,207,268 | |
| | 4,580,000 | | | University of North Texas Refunding Revenue Bonds,
5.00%, 04/15/21 | | | 5,407,560 | |
| | 2,075,000 | | | University of Texas Financing Systems Refunding Revenue Bonds, Series A,
5.00%, 08/15/17 | | | 2,239,133 | |
| | 145,000 | | | Victoria Utility System, Water & Wastewater Authority Refunding Revenue Bonds, (AMBAC),
5.00%, 12/01/17 | | | 157,131 | |
| | 1,370,000 | | | Wichita Falls Independent School District Advance Refunding GO, (PSF-GTD),
5.00%, 02/01/25 | | | 1,684,018 | |
| | 1,210,000 | | | Wichita Falls Independent School District School Improvements GO (PSF-GTD),
5.00%, 02/01/23 | | | 1,457,179 | |
| | | | | | | | 173,016,800 | |
| Utah — 0.3% | | | | |
| | 1,975,000 | | | Alpine School District School Building GO, (School Board GTY),
5.00%, 03/15/21 | | | 2,272,040 | |
| | 125,000 | | | South Jordan Water Refunding Revenue Bonds, (AMBAC),
5.00%, 11/01/15 | | | 124,999 | |
| | 1,085,000 | | | Uintah County School District Refunding GO, (School Board GTY),
5.00%, 02/01/24 | | | 1,333,302 | |
| | | | | | | | 3,730,341 | |
| Virginia — 3.1% | | | | |
| | 155,000 | | | City of Norfolk Water Refunding Revenue Bonds,
5.00%, 11/01/22 | | | 185,575 | |
| | 600,000 | | | County of Prince William Facilities Refunding COP,
4.00%, 10/01/17 | | | 637,109 | |
| Old Westbury Funds, Inc. | |
| Municipal Bond Fund | |
| Portfolio of Investments - (Continued) | October 31, 2015 |
| | |
| Principal | | | | | | |
| Amount | | | | | Value | |
| Virginia (continued) | | | |
| $ | 1,350,000 | | | Fairfax County Economic Development Authority Community Services Facilities Project Revenue Bonds, Series A,
4.50%, 03/01/20 | | $ | 1,530,482 | |
| | 2,000,000 | | | Virginia College Building Authority Public Higher Education Refunding Revenue Bonds, Series B (State Interception),
5.00%, 09/01/21 | | | 2,338,840 | |
| | 5,000,000 | | | Virginia Commonwealth Transportation Board Transit Improvements Revenue Bonds,
5.00%, 03/15/23 | | | 5,941,350 | |
| | 1,225,000 | | | Virginia Commonwealth Transportation Board Transit Improvements Revenue Bonds,
5.00%, 09/15/25 | | | 1,462,491 | |
| | 325,000 | | | Virginia Commonwealth Transportation Board Transit Improvements Revenue Bonds,
5.00%, 09/15/26 | | | 385,089 | |
| | 2,465,000 | | | Virginia Public Building Authority Revenue Bonds, Series A,
5.00%, 08/01/21 | | | 2,937,886 | |
| | 1,250,000 | | | Virginia Public Building Authority Revenue Bonds, Series B (State Appropriation),
5.00%, 08/01/21 | | | 1,429,688 | |
| | 2,450,000 | | | Virginia Public School Authority Advance Refunding Revenue Bonds, (State Aid Withholding),
5.00%, 08/01/24 | | | 3,023,447 | |
| | 8,010,000 | | | Virginia Public School Authority School Improvements Revenue Bonds, Series II,
5.00%, 04/15/17 | | | 8,538,740 | |
| | 1,150,000 | | | Virginia Resources Authority Refunding Revenue Bonds,
5.00%, 11/01/25 | | | 1,420,906 | |
| | 10,000,000 | | | Virginia Resources Authority Refunding Revenue Bonds, Series B,
5.00%, 10/01/25 | | | 12,353,900 | |
| | | | | | | | 42,185,503 | |
| Principal | | | | | | |
| Amount | | | | | Value | |
| Washington — 3.3% | | | |
| $ | 1,025,000 | | | Benton County School District No 17 Kennewick School Improvements GO, (School Board GTY),
5.00%, 12/01/21 | | $ | 1,227,940 | |
| | 580,000 | | | Benton County School District No 17 Kennewick School Improvements GO, (School Board GTY),
5.00%, 12/01/23 | | | 706,730 | |
| | 100,000 | | | CDP-King County III Lease King Street Center Project Refunding Revenue Bonds, (NATL-RE),
5.00%, 06/01/17 | | | 106,609 | |
| | 2,525,000 | | | Clark County School District No 117 Camas Refunding GO, (School Board GTY),
5.00%, 12/01/17 | | | 2,750,457 | |
| | 800,000 | | | Island County School District No 201 Oak Harbor School Improvements GO, (School Board GTY),
5.00%, 12/01/16 | | | 839,880 | |
| | 680,000 | | | King County Public Transportation Sales Tax Refunding GO,
4.00%, 12/01/18 | | | 742,920 | |
| | 1,035,000 | | | King County Refunding GO,
5.00%, 07/01/25 | | | 1,292,653 | |
| | 1,500,000 | | | King County School District No. 414 Lake Washington GO, (School Board GTY),
5.00%, 12/01/20 | | | 1,686,090 | |
| | 1,180,000 | | | Nooksack Valley School District No 506 School Improvements GO, (School Board GTY),
5.00%, 12/01/24 | | | 1,438,503 | |
| | 1,000,000 | | | Pierce County School District No 403 Bethel Refunding GO, (School Board GTY),
3.00%, 06/01/16 | | | 1,015,150 | |
| | 10,000,000 | | | Snohomish County School District No 201 Refunding GO (School Board GTY),
5.00%, 12/01/25 | | | 12,220,800 | |
| | 1,315,000 | | | Spokane County School District No 363 West Valley Refunding GO, (School Board GTY),
5.00%, 12/01/18 | | | 1,479,428 | |
| | 2,000,000 | | | State of Washington Department of Ecology Refunding COP, Series B, (AMBAC),
5.00%, 04/01/16 | | | 2,039,320 | |
| | 745,000 | | | State of Washington Refunding GO, Series R-2006A (AMBAC),
5.00%, 07/01/17 | | | 745,507 | |
| Old Westbury Funds, Inc. | |
| Municipal Bond Fund | |
| Portfolio of Investments - (Continued) | October 31, 2015 |
| | |
| Principal | | | | | | |
| Amount | | | | | Value | |
| Washington (continued) | | | |
| $ | 2,000,000 | | | State of Washington Refunding GO, Series R-2012C,
5.00%, 07/01/23 | | $ | 2,409,600 | |
| | 9,375,000 | | | State of Washington Senior 520 Corridor Program Highway Improvements Revenue Bonds,
5.00%, 09/01/16 | | | 9,717,094 | |
| | 3,250,000 | | | State of Washington Senior 520 Corridor Program Highway Improvements Revenue Bonds,
5.00%, 09/01/19 | | | 3,699,833 | |
| | 1,435,000 | | | Washington Health Care Facilities Authority Advance Refunding Revenue Bonds, Series B,
5.00%, 08/15/24 | | | 1,735,073 | |
| | | | | | | | 45,853,587 | |
| West Virginia — 0.0% | | | | |
| | 125,000 | | | West Virginia University Revenue Bonds, Series A, (NATL-RE),
5.50%, 04/01/17 | | | 133,833 | |
| Wisconsin — 1.2% | | | | |
| | 1,390,000 | | | City of La Crosse Promissory Notes Public Improvements GO, Series A,
3.00%, 12/01/15 | | | 1,393,014 | |
| | 3,000,000 | | | Milwaukee Redevelopment Authority Public Schools Refunding Revenue Bonds,
4.00%, 08/01/16 | | | 3,078,510 | |
| | 1,925,000 | | | State of Wisconsin Public Improvements GO, Series A,
5.00%, 05/01/16 | | | 1,969,602 | |
| | 10,000,000 | | | State of Wisconsin Refunding GO, Series 1,
5.00%, 05/01/16 | | | 10,231,700 | |
| | | | | | | | 16,672,826 | |
Total Municipal Bonds
(Cost $1,318,825,171) | | | 1,344,926,296 | |
| U.S. GOVERNMENT SECURITIES — 0.9% | | | | |
| U.S. Treasury Notes — 0.9% | | | | |
| | 12,500,000 | | | 0.38%, 10/31/2016 | | | 12,490,075 | |
Total U.S. Government Securities
(Cost $12,481,097) | | | 12,490,075 | |
| Shares | | | | | Value | |
| INVESTMENT COMPANY — 0.9% | | | |
| | 11,452,700 | | | SEI Daily Income Trust Government II Fund, Class A,
0.01%(e) | | $ | 11,452,700 | |
Total Investment Company
(Cost $11,452,700) | | | 11,452,700 | |
TOTAL INVESTMENTS — 99.6%
(Cost $1,342,758,968)(a) | | $ | 1,368,869,071 | |
| OTHER ASSETS IN EXCESS OF LIABILITIES — 0.4% | | | 6,174,086 | |
| NET ASSETS — 100.0% | | $ | 1,375,043,157 | |
| (a) | Cost for federal income tax purposes is $1,342,798,410 and net unrealized appreciation of investments is as follows: |
| Unrealized appreciation | | $ | 27,080,446 | |
| Unrealized depreciation | | | (1,009,785 | ) |
| Net unrealized appreciation | | $ | 26,070,661 | |
| (b) | Variable rate security. Rate shown is the rate as of October 31, 2015. |
| (c) | These securities are pre-refunded; the date shown represents the pre-refunded date. Bonds which are pre-refunded are collateralized by U.S. Government securities which are held in escrow and are used to pay principal and interest on the municipal issue and to retire the bonds in full at the earliest refunding date. |
| (d) | The security is subject to remarketing prior to its stated maturity, and is subject to mandatory redemption at the stated maturity date. |
| (e) | Rate shown represents current yield at October 31, 2015. |
AGM — Assured Guaranty Municipal Corp.
AMBAC — Insured by AMBAC Indemnity Corp.
BAM — Build America Mutual Assurance Co.
COP — Certificates of Participation
FGIC — Insured by Financial Guaranty Insurance Corp.
GO — General Obligations
GTY — Guaranty
NATL-RE — Insured by National Public Finance Guarantee Corp.
OID — Original Issue Discount
PSF-GTD — Permanent School Fund Guarantee
Q–SBLF — Qualified-School Bond Loan Fund
XLCA — XL Capital Insurance
| Old Westbury Funds, Inc. | |
| Statements of Assets and Liabilities | |
| | October 31, 2015 |
| | |
| | | LARGE CAP CORE
FUND | | LARGE CAP
STRATEGIES
FUND | | SMALL & MID CAP
FUND |
| ASSETS: | | | | | | | | | | | | | | | |
| Investments, at fair value | | | $ | 1,143,739,091 | | | | $ | 14,086,478,227 | | | | $ | 5,417,540,683 | |
| Foreign currency, at value (Cost $0, $2,878,418 and $8,452,019, respectively) | | | | — | | | | | 2,874,590 | | | | | 8,481,685 | |
| Cash | | | | 1,230,206 | | | | | 171 | | | | | 1,701,515 | |
| Dividends and interest receivable | | | | 2,414,114 | | | | | 21,183,963 | | | | | 5,772,557 | |
| Receivable for Fund shares sold | | | | 999,819 | | | | | 3,014,237 | | | | | 3,752,909 | |
| Receivable for investments sold | | | | — | | | | | 376,428,166 | | | | | 25,973,836 | |
| Unrealized appreciation on forward foreign currency exchange contracts | | | | — | | | | | 17,633,952 | | | | | 5,393,170 | |
| Prepaid expenses | | | | 31,666 | | | | | 86,567 | | | | | 50,022 | |
| Total Assets | | | | 1,148,414,896 | | | | | 14,507,699,873 | | | | | 5,468,666,377 | |
| LIABILITIES: | | | | | | | | | | | | | | | |
| Payable to brokers for collateral | | | | — | | | | | 10,510,000 | | | | | 4,220,000 | |
| Payable for Fund shares redeemed | | | | 1,517,095 | | | | | 6,726,646 | | | | | 2,416,962 | |
| Payable for investments purchased | | | | — | | | | | 333,763,136 | | | | | 6,913,933 | |
| Unrealized depreciation on forward foreign currency exchange contracts | | | | — | | | | | 1,733,541 | | | | | 63,781 | |
| Deferred tax liability payable (Note 9) | | | | — | | | | | 145,571 | | | | | 132,127 | |
| Accrued expenses and other payables: | | | | | | | | | | | | | | | |
| Investment advisory | | | | 663,525 | | | | | 9,446,770 | | | | | 3,672,195 | |
| Administration | | | | 61,850 | | | | | 694,223 | | | | | 274,301 | |
| Shareholder servicing fee | | | | 193,564 | | | | | 2,321,881 | | | | | 907,242 | |
| Custody | | | | 24,940 | | | | | 353,162 | | | | | 158,869 | |
| Directors | | | | 39 | | | | | 470 | | | | | 183 | |
| Legal and Audit | | | | 33,977 | | | | | 341,938 | | | | | 171,202 | |
| Other | | | | 27,541 | | | | | 261,369 | | | | | 126,888 | |
| Total Liabilities | | | | 2,522,531 | | | | | 366,298,707 | | | | | 19,057,683 | |
| NET ASSETS | | | $ | 1,145,892,365 | | | | $ | 14,141,401,166 | | | | $ | 5,449,608,694 | |
| NET ASSETS consist of: | | | | | | | | | | | | | | | |
| Capital paid-in | | | $ | 1,045,889,342 | | | | $ | 12,023,450,879 | | | | $ | 4,083,049,533 | |
| Accumulated undistributed net investment income | | | | 9,899,378 | | | | | 92,767,985 | | | | | 22,476,044 | |
| Accumulated undistributed net realized gain on investments and foreign currency transactions | | | | 13,019,169 | | | | | 186,531,476 | | | | | 221,936,807 | |
| Net unrealized appreciation on investments and foreign currency transactions | | | | 77,084,476 | | | | | 1,838,650,826 | | | | | 1,122,146,310 | |
| NET ASSETS | | | $ | 1,145,892,365 | | | | $ | 14,141,401,166 | | | | $ | 5,449,608,694 | |
| Net Asset Value, maximum offering price and redemption price per share | | | $ | 13.92 | | | | $ | 13.01 | | | | $ | 15.86 | |
| Number of shares authorized | | | | 2,500,000,000 | | | | | 3,000,000,000 | | | | | 3,500,000,000 | |
| SHARES OF CAPITAL STOCK OUTSTANDING | | | | 82,347,051 | | | | | 1,087,236,588 | | | | | 343,611,972 | |
| INVESTMENTS, AT COST | | | $ | 1,066,653,495 | | | | $ | 12,263,235,005 | | | | $ | 4,300,550,862 | |
See Notes to Financial Statements.
| Old Westbury Funds, Inc. | |
| Statements of Assets and Liabilities - (Continued) | |
| | October 31, 2015 |
| | |
| | | STRATEGIC
OPPORTUNITIES
FUNDa |
| |
| ASSETS: | | | | | |
| Investments, at fair value | | | $ | 7,061,254,569 | |
| Foreign currency, at value (Cost $4,748,783) | | | | 4,680,208 | |
| Cash | | | | 23,048 | |
| Segregated cash for futures contracts (Note 6) | | | | 5,243,772 | |
| Segregated cash for options written | | | | 18,770,109 | |
| Due from brokers for collateral | | | | 17,270,000 | |
| Structured option contracts, at value (premium received $654,343) | | | | 132,558,250 | |
| Dividends and interest receivable | | | | 13,068,175 | |
| Receivable for Fund shares sold | | | | 2,694,018 | |
| Receivable for investments sold | | | | 211,822,950 | |
| Unrealized appreciation on swap contracts | | | | 12,224,573 | |
| Unrealized appreciation on forward foreign currency exchange contracts | | | | 9,679,970 | |
| Prepaid expenses | | | | 71,012 | |
| Total Assets | | | | 7,489,360,654 | |
| LIABILITIES: | | | | | |
| Payable to brokers for collateral | | | | 75,670,000 | |
| Written option contracts, at value (premium received $3,623,270) | | | | 2,528,827 | |
| Structured option contracts, at value (premium received $1,929,634) | | | | 43,771,861 | |
| Payable for Fund shares redeemed | | | | 3,064,069 | |
| Payable for investments purchased | | | | 231,898,842 | |
| Unrealized depreciation on swap contracts | | | | 16,901,160 | |
| Unrealized depreciation on forward foreign currency exchange contracts | | | | 11,775,433 | |
| Variation margin | | | | 225,928 | |
| Deferred tax liability payable (Note 9) | | | | 160,124 | |
| Accrued expenses and other payables: | | | | | |
| Investment advisory | | | | 5,200,660 | |
| Administration | | | | 366,864 | |
| Shareholder servicing fee | | | | 1,186,615 | |
| Custody | | | | 86,954 | |
| Directors | | | | 241 | |
| Legal and Audit | | | | 509,976 | |
| Other | | | | 257,205 | |
| Total Liabilities | | | | 393,604,759 | |
| NET ASSETS | | | $ | 7,095,755,895 | |
|
| NET ASSETS consist of: | | | | | |
| Capital paid-in | | | $ | 6,861,109,285 | |
| Accumulated undistributed net investment income | | | | 76,306,686 | |
| Accumulated undistributed net realized gain on investments, securities sold short, futures contracts, swap contracts, written options and foreign currency transactions | | | | 121,567,739 | |
| Net unrealized appreciation on investments, securities sold short, futures contracts, swap agreements, written options and foreign currency transactions | | | | 36,772,185 | |
| NET ASSETS | | | $ | 7,095,755,895 | |
| Net Asset Value, maximum offering price and redemption price per share | | | $ | 7.65 | |
| Number of shares authorized | | | | 3,500,000,000 | |
| SHARES OF CAPITAL STOCK OUTSTANDING | | | | 926,970,942 | |
| INVESTMENTS, AT COST | | | $ | 7,108,164,437 | |
| a | Consolidated Statement of Assets and Liabilities. |
See Notes to Financial Statements.
| Old Westbury Funds, Inc. | |
| Statements of Assets and Liabilities - (Continued) | |
| | October 31, 2015 |
| | |
| | | FIXED
INCOME
FUND | | MUNICIPAL
BOND
FUND |
| ASSETS: | | | | | | | | | | |
| Investments, at fair value | | | $ | 581,406,758 | | | | $ | 1,368,869,071 | |
| Cash | | | | 42 | | | | | 72 | |
| Dividends and interest receivable | | | | 3,091,717 | | | | | 14,848,270 | |
| Receivable for Fund shares sold | | | | 53,484 | | | | | 646,111 | |
| Receivable for investments sold | | | | 7,985,465 | | | | | — | |
| Prepaid expenses | | | | 27,374 | | | | | 35,348 | |
| Total Assets | | | | 592,564,840 | | | | | 1,384,398,872 | |
| LIABILITIES: | | | | | | | | | | |
| Payable for Fund shares redeemed | | | | 33,527 | | | | | 3,913,503 | |
| Payable for investments purchased | | | | 8,978,254 | | | | | 4,692,889 | |
| Accrued expenses and other payables: | | | | | | | | | | |
| Investment advisory | | | | 219,996 | | | | | 471,051 | |
| Administration | | | | 33,119 | | | | | 71,724 | |
| Shareholder servicing fee | | | | 49,691 | | | | | 116,386 | |
| Custody | | | | 7,454 | | | | | 17,457 | |
| Directors | | | | 20 | | | | | 47 | |
| Legal and Audit | | | | 24,380 | | | | | 42,946 | |
| Other | | | | 14,075 | | | | | 29,712 | |
| Total Liabilities | | | | 9,360,516 | | | | | 9,355,715 | |
| NET ASSETS | | | $ | 583,204,324 | | | | $ | 1,375,043,157 | |
| NET ASSETS consist of: | | | | | | | | | | |
| Capital paid-in | | | $ | 587,140,435 | | | | $ | 1,345,867,064 | |
| Accumulated undistributed net investment income | | | | 663,511 | | | | | 1,689,877 | |
| Accumulated undistributed net realized gain/(loss) on investments | | | | (7,426,952 | ) | | | | 1,376,113 | |
| Net unrealized appreciation on investments | | | | 2,827,330 | | | | | 26,110,103 | |
| NET ASSETS | | | $ | 583,204,324 | | | | $ | 1,375,043,157 | |
| Net Asset Value, maximum offering price and redemption price per share | | | $ | 11.19 | | | | $ | 12.00 | |
| Number of shares authorized | | | | 2,000,000,000 | | | | | 2,000,000,000 | |
| SHARES OF CAPITAL STOCK OUTSTANDING | | | | 52,104,534 | | | | | 114,608,516 | |
| INVESTMENTS, AT COST | | | $ | 578,579,428 | | | | $ | 1,342,758,968 | |
See Notes to Financial Statements.
| Old Westbury Funds, Inc. | |
| Statements of Operations | |
| | For the Year Ended October 31, 2015 |
| | |
| | | LARGE CAP CORE
FUND | | LARGE CAP
STRATEGIES
FUND | | SMALL & MID CAP
FUND |
| INVESTMENT INCOME: | | | | | | | | | | | | | | | |
| Interest | | | $ | 5,318 | | | | $ | 81,060 | | | | $ | 26,900 | |
| Dividends | | | | 23,784,618 | | | | | 282,595,591 | | | | | 100,057,825 | |
| Foreign tax withheld | | | | (755,520 | ) | | | | (9,353,255 | ) | | | | (4,797,059 | ) |
| Total investment income | | | | 23,034,416 | | | | | 273,323,396 | | | | | 95,287,666 | |
| EXPENSES: | | | | | | | | | | | | | | | |
| Investment advisory fees | | | | 7,569,568 | | | | | 111,662,731 | | | | | 48,599,360 | |
| Shareholder servicing fees | | | | 2,273,162 | | | | | 27,446,933 | | | | | 11,435,144 | |
| Administration and Accounting fees | | | | 531,717 | | | | | 6,173,085 | | | | | 2,585,637 | |
| Custodian fees | | | | 789,979 | | | | | 4,102,310 | | | | | 1,943,949 | |
| Directors fees and expenses | | | | 40,282 | | | | | 484,288 | | | | | 200,988 | |
| Insurance premiums | | | | 22,452 | | | | | 72,582 | | | | | 45,537 | |
| Interest expense | | | | — | | | | | — | | | | | 4,375 | |
| Legal and Audit fees | | | | 63,546 | | | | | 719,290 | | | | | 338,149 | |
| Printing and postage fees | | | | 11,605 | | | | | 153,460 | | | | | 57,707 | |
| Registration fees | | | | 41,460 | | | | | 150,241 | | | | | 34,837 | |
| Transfer agent fees | | | | 130,142 | | | | | 1,426,447 | | | | | 602,322 | |
| Miscellaneous expenses | | | | 22,595 | | | | | 158,775 | | | | | 406,453 | |
| Total expenses | | | | 11,496,508 | | | | | 152,550,142 | | | | | 66,254,458 | |
| Expenses waived by Adviser (Note 7) | | | | (79,057 | ) | | | | — | | | | | (2,785,037 | ) |
| Net expenses | | | | 11,417,451 | | | | | 152,550,142 | | | | | 63,469,421 | |
| NET INVESTMENT INCOME | | | | 11,616,965 | | | | | 120,773,254 | | | | | 31,818,245 | |
| NET REALIZED AND CHANGE IN UNREALIZED GAIN/(LOSS) ON INVESTMENTS, FOREIGN CURRENCY TRANSACTIONS, NET OF FOREIGN TAXES: | | | | | | | | | | | | | | | |
| Net realized gains/(loss) on: | | | | | | | | | | | | | | | |
| Investments | | | | 13,033,189 | | | | | 149,612,260 | | | | | 570,831,612 | |
| Foreign capital gains tax | | | | — | | | | | — | | | | | (134,181 | ) |
| Foreign currency transactions | | | | (93,734 | ) | | | | 35,520,148 | | | | | 16,864,653 | |
| Net change in unrealized appreciation/(depreciation) on: | | | | | | | | | | | | | | | |
| Investments | | | | (47,517,274 | ) | | | | (92,459,828 | ) | | | | (465,347,206 | ) |
| Foreign currency transactions | | | | (8,518 | ) | | | | 16,111,662 | | | | | 5,393,479 | |
| Foreign deferred taxes on unrealized appreciation | | | | — | | | | | 5,179,879 | | | | | 453,836 | |
| Net realized and change in unrealized gain (loss) on investments, foreign currency transactions, net of foreign taxes | | | | (34,586,337 | ) | | | | 113,964,121 | | | | | 128,062,193 | |
| NET INCREASE/(DECREASE) IN NET ASSETS RESULTING FROM OPERATIONS | | | $ | (22,969,372 | ) | | | $ | 234,737,375 | | | | $ | 159,880,438 | |
See Notes to Financial Statements.
| Old Westbury Funds, Inc. | |
| Statements of Operations - (Continued) | |
| | For the Year Ended October 31, 2015 |
| | |
| | | STRATEGIC
OPPORTUNITIES
FUNDa |
| INVESTMENT INCOME: | | | | | |
| Interest | | | $ | 92,172,341 | |
| Dividends | | | | 63,852,157 | |
| Foreign tax withheld | | | | (1,335,249 | ) |
| Total investment income | | | | 154,689,249 | |
| EXPENSES: | | | | | |
| Investment advisory fees | | | | 67,462,064 | |
| Shareholder servicing fees | | | | 13,115,256 | |
| Administration and Accounting fees | | | | 2,989,510 | |
| Custodian fees | | | | 655,479 | |
| Directors fees and expenses | | | | 229,899 | |
| Insurance premiums | | | | 42,883 | |
| Interest expense | | | | 63,253 | |
| Legal and Audit fees | | | | 946,569 | |
| Printing and postage fees | | | | 71,503 | |
| Registration fees | | | | 151,265 | |
| Transfer agent fees | | | | 688,914 | |
| Miscellaneous expenses | | | | 373,170 | |
| Total expenses | | | | 86,789,765 | |
| Expenses waived by Adviser (Note 7) | | | | (7,967,318 | ) |
| Net expenses | | | | 78,822,447 | |
| NET INVESTMENT INCOME | | | | 75,866,802 | |
| NET REALIZED AND CHANGE IN UNREALIZED GAIN/(LOSS) ON INVESTMENTS, SECURITIES SOLD SHORT, FUTURES CONTRACTS, SWAP AGREEMENTS, WRITTEN OPTIONS, FOREIGN CURRENCY TRANSACTIONS, NET OF FOREIGN TAXES: | | | | | |
| Net realized gain/(loss) on: | | | | | |
| Investments | | | | 188,834,583 | |
| Futures contracts | | | | (5,326,100 | ) |
| Swap agreements | | | | 2,745,924 | |
| Written options and structured options | | | | (1,147,479 | ) |
| Foreign currency transactions | | | | (23,266,006 | ) |
| Net change in unrealized appreciation/(depreciation) on: | | | | | |
| Investments | | | | (183,634,502 | ) |
| Futures contracts | | | | 1,699,747 | |
| Swap agreements | | | | (177,797 | ) |
| Written options and structured options | | | | (25,556,704 | ) |
| Foreign currency transactions | | | | (7,752,372 | ) |
| Foreign deferred taxes on unrealized appreciation | | | | (10,595 | ) |
| Net realized and change in unrealized gain/(loss) on investments, securities sold short, futures contracts, swap agreements, written options, foreign currency transactions, net of foreign taxes | | | | (53,591,301 | ) |
| NET INCREASE IN NET ASSETS RESULTING FROM OPERATIONS | | | $ | 22,275,501 | |
| a | Consolidated Statement of Operations. |
See Notes to Financial Statements.
| Old Westbury Funds, Inc. | |
| Statements of Operations - (Continued) | |
| | For the Year Ended October 31, 2015 |
| | |
| | | FIXED
INCOME
FUND | | MUNICIPAL
BOND
FUND |
| INVESTMENT INCOME: | | | | | | | | | | |
| Interest | | | $ | 9,780,283 | | | | $ | 24,850,750 | |
| Dividends | | | | 453 | | | | | 2,003 | |
| Total investment income | | | | 9,780,736 | | | | | 24,852,753 | |
| EXPENSES: | | | | | | | | | | |
| Investment advisory fees | | | | 2,591,035 | | | | | 5,376,348 | |
| Shareholder servicing fees | | | | 1,170,517 | | | | | 2,643,628 | |
| Administration and Accounting fees | | | | 284,478 | | | | | 611,035 | |
| Custodian fees | | | | 87,789 | | | | | 198,272 | |
| Directors fees and expenses | | | | 20,930 | | | | | 46,881 | |
| Insurance premiums | | | | 20,545 | | | | | 23,996 | |
| Legal and Audit fees | | | | 38,314 | | | | | 76,561 | |
| Printing and postage fees | | | | 8,473 | | | | | 13,413 | |
| Registration fees | | | | 26,986 | | | | | 39,855 | |
| Transfer agent fees | | | | 73,491 | | | | | 149,258 | |
| Miscellaneous expenses | | | | 20,994 | | | | | 73,556 | |
| Total expenses | | | | 4,343,552 | | | | | 9,252,803 | |
| Expenses waived by Shareholder Servicing Agent (Note 7) | | | | (585,259 | ) | | | | (1,321,814 | ) |
| Net expenses | | | | 3,758,293 | | | | | 7,930,989 | |
| NET INVESTMENT INCOME | | | | 6,022,443 | | | | | 16,921,764 | |
| NET REALIZED AND CHANGE IN UNREALIZED GAIN/(LOSS) ON INVESTMENTS | | | | | | | | | | |
| Net realized gain on: | | | | | | | | | | |
| Investments | | | | 1,337,614 | | | | | 1,455,987 | |
| Net change in unrealized appreciation (depreciation) on: | | | | | | | | | | |
| Investments | | | | (1,044,658 | ) | | | | 1,812,451 | |
| Net realized and change in unrealized gain on investments | | | | 292,956 | | | | | 3,268,438 | |
| NET INCREASE IN NET ASSETS RESULTING FROM OPERATIONS | | | $ | 6,315,399 | | | | $ | 20,190,202 | |
See Notes to Financial Statements.
| Old Westbury Funds, Inc. | |
| Statements of Changes in Net Assets | |
| | |
| | |
| | | LARGE CAP CORE FUND |
| | | FOR THE YEAR
ENDED
OCTOBER 31,
2015 | | FOR THE YEAR
ENDED
OCTOBER 31,
2014 |
| |
| FROM OPERATIONS: | | | | | | | | | | |
| Net investment income | | | $ | 11,616,965 | | | | $ | 13,642,821 | |
| Net realized gain on investments and foreign currency transactions | | | | 12,939,455 | | | | | 46,740,778 | |
| Net change in unrealized appreciation (depreciation) on investments, foreign currency transactions, net of foreign deferred taxes | | | | (47,525,792 | ) | | | | 22,996,640 | |
| Net increase in net assets resulting from operations | | | | (22,969,372 | ) | | | | 83,380,239 | |
| DISTRIBUTIONS TO SHAREHOLDERS FROM: | | | | | | | | | | |
| Net investment income | | | | (13,732,039 | ) | | | | (12,895,279 | ) |
| Capital gains | | | | (44,983,869 | ) | | | | — | |
| Net decrease in net assets from distributions | | | | (58,715,908 | ) | | | | (12,895,279 | ) |
| CAPITAL STOCK TRANSACTIONS (DOLLARS): | | | | | | | | | | |
| Proceeds from sale of capital stock | | | | 270,970,429 | | | | | 206,307,392 | |
| Reinvestment of distributions | | | | 28,093,739 | | | | | 2,896,311 | |
| Value of capital stock redeemed | | | | (100,859,768 | ) | | | | (86,173,315 | ) |
| Net increase (decrease) in net assets resulting from capital stock transactions | | | | 198,204,400 | | | | | 123,030,388 | |
| Net increase (decrease) in net assets | | | | 116,519,120 | | | | | 193,515,348 | |
| NET ASSETS: | | | | | | | | | | |
| Beginning of year | | | | 1,029,373,245 | | | | | 835,857,897 | |
| End of year | | | $ | 1,145,892,365 | | | | $ | 1,029,373,245 | |
| Undistributed net investment income | | | $ | 9,899,378 | | | | $ | 12,108,185 | |
| CAPITAL SHARE TRANSACTIONS: | | | | | | | | | | |
| Shares sold | | | | 18,673,538 | | | | | 14,328,803 | |
| Shares issued as reinvestment of distributions | | | | 2,032,832 | | | | | 211,564 | |
| Shares redeemed | | | | (6,977,713 | ) | | | | (5,980,788 | ) |
| Net increase (decrease) in shares outstanding | | | | 13,728,657 | | | | | 8,559,579 | |
See Notes to Financial Statements.
| Old Westbury Funds, Inc. | |
| Statements of Changes in Net Assets - (Continued) |
| | |
| | |
| LARGE CAP STRATEGIES FUND | | SMALL & MID CAP FUND |
FOR THE YEAR
ENDED
OCTOBER 31,
2015 | | FOR THE YEAR
ENDED
OCTOBER 31,
2014 | | FOR THE YEAR
ENDED
OCTOBER 31,
2015 | | FOR THE YEAR
ENDED
OCTOBER 31,
2014 |
| | | |
| | $ | 120,773,254 | | | | $ | 92,557,772 | | | | $ | 31,818,245 | | | | $ | 44,866,588 | |
| | | 185,132,408 | | | | | 409,236,798 | | | | | 587,562,084 | | | | | 445,518,876 | |
| | | | | | | | | | | | | | | | | | | |
| | | (71,168,287 | ) | | | | 565,026,772 | | | | | (459,499,891 | ) | | | | (119,121,973 | ) |
| | | 234,737,375 | | | | | 1,066,821,342 | | | | | 159,880,438 | | | | | 371,263,491 | |
| | |
| | | (92,723,523 | ) | | | | (66,469,461 | ) | | | | (48,279,762 | ) | | | | (51,208,459 | ) |
| | | (324,269,763 | ) | | | | — | | | | | (558,353,084 | ) | | | | (390,542,843 | ) |
| | |
| | | (416,993,286 | ) | | | | (66,469,461 | ) | | | | (606,632,846 | ) | | | | (441,751,302 | ) |
| | |
| | | 2,504,726,596 | | | | | 2,680,761,383 | | | | | 580,123,538 | | | | | 811,371,998 | |
| | | 187,760,218 | | | | | 11,583,648 | | | | | 324,318,415 | | | | | 209,463,388 | |
| | | (993,415,783 | ) | | | | (632,528,794 | ) | | | | (1,393,863,779 | ) | | | | (1,189,215,486 | ) |
| | |
| | | 1,699,071,031 | | | | | 2,059,816,237 | | | | | (489,421,826 | ) | | | | (168,380,100 | ) |
| | | 1,516,815,120 | | | | | 3,060,168,118 | | | | | (936,174,234 | ) | | | | (238,867,911 | ) |
| | |
| | | 12,624,586,046 | | | | | 9,564,417,928 | | | | | 6,385,782,928 | | | | | 6,624,650,839 | |
| | $ | 14,141,401,166 | | | | $ | 12,624,586,046 | | | | $ | 5,449,608,694 | | | | $ | 6,385,782,928 | |
| | $ | 92,767,985 | | | | $ | 78,166,067 | | | | $ | 22,476,044 | | | | $ | 18,889,982 | |
| | |
| | | 191,745,138 | | | | | 213,802,955 | | | | | 35,407,151 | | | | | 47,378,626 | |
| | | 15,032,844 | | | | | 964,500 | | | | | 19,926,717 | | | | | 12,297,298 | |
| | | (75,657,222 | ) | | | | (49,757,017 | ) | | | | (85,305,805 | ) | | | | (69,106,376 | ) |
| | | 131,120,760 | | | | | 165,010,438 | | | | | (29,971,937 | ) | | | | (9,430,452 | ) |
See Notes to Financial Statements.
| Old Westbury Funds, Inc. | |
| Statements of Changes in Net Assets - (Continued) |
| | |
| | |
| | | STRATEGIC OPPORTUNITIES
FUND |
| | | FOR THE YEAR
ENDED
OCTOBER 31,
2015a | | FOR THE YEAR
ENDED
OCTOBER 31,
2014 |
| |
| FROM OPERATIONS: | | | | | | | | | | |
| Net investment income | | | $ | 75,866,802 | | | | $ | 63,288,569 | |
| Net realized gain on investments, securities sold short, swap agreements, futures contracts, written options, foreign capital gains tax and foreign currency transactions | | | | 161,840,922 | | | | | 338,284,530 | |
| Net change in unrealized appreciation/(depreciation) on investments, securities sold short, futures contracts, written options, swap agreements, foreign currency transactions, net of foreign deferred taxes | | | | (215,432,223 | ) | | | | (86,962,867 | ) |
| Net increase in net assets resulting from operations | | | | 22,275,501 | | | | | 314,610,232 | |
| DISTRIBUTIONS TO SHAREHOLDERS FROM: | | | | | | | | | | |
| Net investment income | | | | (117,060,603 | ) | | | | (186,482,006 | ) |
| Capital gains | | | | (301,239,367 | ) | | | | (153,964,137 | ) |
| Net decrease in net assets from distributions | | | | (418,299,970 | ) | | | | (340,446,143 | ) |
| CAPITAL STOCK TRANSACTIONS (DOLLARS): | | | | | | | | | | |
| Proceeds from sale of capital stock | | | | 2,310,376,160 | | | | | 630,194,849 | |
| Reinvestment of distributions | | | | 145,499,270 | | | | | 102,748,773 | |
| Value of capital stock redeemed | | | | (562,647,104 | ) | | | | (846,246,562 | ) |
| Net increase/(decrease) in net assets resulting from capital stock transactions | | | | 1,893,228,326 | | | | | (113,302,940 | ) |
| Net increase/(decrease) in net assets | | | | 1,497,203,857 | | | | | (139,138,851 | ) |
| NET ASSETS: | | | | | | | | | | |
| Beginning of year | | | | 5,598,552,038 | | | | | 5,737,690,889 | |
| End of year | | | $ | 7,095,755,895 | | | | $ | 5,598,552,038 | |
| Undistributed net investment income | | | $ | 76,306,686 | | | | $ | 81,205,703 | |
| CAPITAL SHARE TRANSACTIONS: | | | | | | | | | | |
| Shares sold | | | | 297,763,432 | | | | | 78,391,251 | |
| Shares issued as reinvestment of distributions | | | | 19,094,392 | | | | | 13,105,711 | |
| Shares redeemed | | | | (72,368,368 | ) | | | | (105,589,503 | ) |
| Net increase/(decrease) in shares outstanding | | | | 244,489,456 | | | | | (14,092,541 | ) |
| a | Consolidated Statement of Changes in Net Assets. |
See Notes to Financial Statements.
| Old Westbury Funds, Inc. | |
| Statements of Changes in Net Assets - (Continued) |
| | |
| | |
| FIXED INCOME FUND | | MUNICIPAL BOND FUND |
FOR THE YEAR
ENDED
OCTOBER 31,
2015 | | FOR THE YEAR
ENDED
OCTOBER 31,
2014 | | FOR THE YEAR
ENDED
OCTOBER 31,
2015 | | FOR THE YEAR
ENDED
OCTOBER 31,
2014 |
| | | | | | | |
| | $ | 6,022,443 | | | | $ | 5,104,101 | | | | $ | 16,921,764 | | | | $ | 15,474,016 | |
| | | | | | | | | | | | | | | | | | | |
| | | 1,337,614 | | | | | 1,371,527 | | | | | 1,455,987 | | | | | 5,448,105 | |
| | | | | | | | | | | | | | | | | | | |
| | | (1,044,658 | ) | | | | (967,011 | ) | | | | 1,812,451 | | | | | 4,548,828 | |
| | | 6,315,399 | | | | | 5,508,617 | | | | | 20,190,202 | | | | | 25,470,949 | |
| | | | | | | | | | | | | | | | | | | |
| | | (7,734,614 | ) | | | | (9,650,970 | ) | | | | (16,554,029 | ) | | | | (15,616,330 | ) |
| | | — | | | | | (1,052,799 | ) | | | | (5,448,869 | ) | | | | (3,570,042 | ) |
| | | (7,734,614 | ) | | | | (10,703,769 | ) | | | | (22,002,898 | ) | | | | (19,186,372 | ) |
| | | | | | | | | | | | | | | | | | | |
| | | 153,102,338 | | | | | 134,848,809 | | | | | 356,508,102 | | | | | 337,937,951 | |
| | | 3,117,561 | | | | | 3,689,599 | | | | | 5,275,133 | | | | | 4,017,421 | |
| | | (135,312,765 | ) | | | | (103,070,727 | ) | | | | (311,036,793 | ) | | | | (266,823,072 | ) |
| | | 20,907,134 | | | | | 35,467,681 | | | | | 50,746,442 | | | | | 75,132,300 | |
| | | 19,487,919 | | | | | 30,272,529 | | | | | 48,933,746 | | | | | 81,416,877 | |
| | | | | | | | | | | | | | | | | | | |
| | | 563,716,405 | | | | | 533,443,876 | | | | | 1,326,109,411 | | | | | 1,244,692,534 | |
| | $ | 583,204,324 | | | | $ | 563,716,405 | | | | $ | 1,375,043,157 | | | | $ | 1,326,109,411 | |
| | $ | 663,511 | | | | $ | 688,399 | | | | $ | 1,689,877 | | | | $ | 1,322,142 | |
| | | | | | | | | | | | | | | | | | | |
| | | 13,624,788 | | | | | 12,002,312 | | | | | 29,807,851 | | | | | 28,291,690 | |
| | | 278,937 | | | | | 328,960 | | | | | 442,391 | | | | | 337,895 | |
| | | (12,034,135 | ) | | | | (9,157,280 | ) | | | | (25,955,796 | ) | | | | (22,385,830 | ) |
| | | 1,869,590 | | | | | 3,173,992 | | | | | 4,294,446 | | | | | 6,243,755 | |
See Notes to Financial Statements.
| Old Westbury Funds, Inc. | |
| Large Cap Core Fund | |
| Financial Highlights | |
| | |
For a Share Outstanding Throughout Each Period.
| | | YEAR ENDED OCTOBER 31, | |
| | | 2015 | | | 2014 | | | 2013 | | | 2012 | | | 2011 | |
| Net asset value, beginning of year | | $ | 15.00 | | | $ | 13.92 | | | $ | 11.53 | | | $ | 11.13 | | | $ | 11.48 | |
| | | | | | | | | | | | | | | | | | | | | |
| Investment operations: | | | | | | | | | | | | | | | | | | | | |
| Net investment income | | | 0.15 | a | | | 0.21 | a | | | 0.24 | a | | | 0.19 | a | | | 0.06 | a |
| Net realized and unrealized gains/(losses) on investments | | | (0.41 | ) | | | 1.08 | | | | 2.38 | | | | 0.25 | | | | (0.35 | ) |
| Total from investment operations | | | (0.26 | ) | | | 1.29 | | | | 2.62 | | | | 0.44 | | | | (0.29 | ) |
| | | | | | | | | | | | | | | | | | | | | |
| Distributions: | | | | | | | | | | | | | | | | | | | | |
| Net investment income | | | (0.19 | ) | | | (0.21 | ) | | | (0.23 | ) | | | (0.04 | ) | | | (0.06 | ) |
| Net realized gains | | | (0.63 | ) | | | — | | | | — | | | | — | | | | — | |
| Total distributions | | | (0.82 | ) | | | (0.21 | ) | | | (0.23 | ) | | | (0.04 | ) | | | (0.06 | ) |
| Net asset value, end of year | | $ | 13.92 | | | $ | 15.00 | | | $ | 13.92 | | | $ | 11.53 | | | $ | 11.13 | |
| Total return | | | (1.7 | )% | | | 9.4 | % | | | 23.1 | % | | | 3.9 | % | | | (2.6 | )% |
| | | | | | | | | | | | | | | | | | | | | |
| Annualized ratios/supplemental data: | | | | | | | | | | | | | | | | | | | | |
| Net assets at end of year(000’s) | | $ | 1,145,892 | | | $ | 1,029,373 | | | $ | 835,858 | | | $ | 569,710 | | | $ | 511,286 | |
| Ratio of expenses to average net assets before expense waivers | | | 1.01 | % | | | 1.04 | % | | | 1.06 | % | | | 1.07 | % | | | 1.00 | %b |
| Ratio of expenses to average net assets after expense waivers | | | 1.00 | % | | | 1.00 | % | | | 1.00 | % | | | 1.00 | % | | | 1.00 | % |
| Ratio of net investment income to average net assets | | | 1.02 | % | | | 1.46 | % | | | 1.91 | % | | | 1.69 | % | | | 0.46 | % |
| Portfolio turnover rate | | | 43 | % | | | 43 | % | | | 63 | % | | | 86 | % | | | 72 | % |
| a | Calculated using the average shares method for the period. |
| b | There were no voluntary fee reductions during the period. |
See Notes to Financial Statements.
| Old Westbury Funds, Inc. | |
| Large Cap Strategies Fund | |
| Financial Highlights | |
| | |
For a Share Outstanding Throughout Each Period.
| | | YEAR ENDED OCTOBER 31, | |
| | | 2015 | | | 2014 | | | 2013 | | | 2012 | | | 2011 | |
| Net asset value, beginning of year | | $ | 13.20 | | | $ | 12.09 | | | $ | 9.69 | | | $ | 9.12 | | | $ | 10.11 | |
| | | | | | | | | | | | | | | | | | | | | |
| Investment operations: | | | | | | | | | | | | | | | | | | | | |
| Net investment income | | | 0.12 | a | | | 0.10 | a | | | 0.11 | a | | | 0.09 | a | | | 0.13 | a |
| Net realized and unrealized gains/(losses) on investments and foreign currency transactions | | | 0.13 | | | | 1.09 | | | | 2.36 | | | | 0.63 | | | | (1.04 | ) |
| Total from investment operations | | | 0.25 | | | | 1.19 | | | | 2.47 | | | | 0.72 | | | | (0.91 | ) |
| | | | | | | | | | | | | | | | | | | | | |
| Distributions: | | | | | | | | | | | | | | | | | | | | |
| Net investment income | | | (0.10 | ) | | | (0.08 | ) | | | (0.07 | ) | | | (0.15 | ) | | | (0.08 | ) |
| Net realized gains | | | (0.34 | ) | | | — | | | | — | | | | — | | | | — | |
| Total distributions | | | (0.44 | ) | | | (0.08 | ) | | | (0.07 | ) | | | (0.15 | ) | | | (0.08 | ) |
| Net asset value, end of year | | $ | 13.01 | | | $ | 13.20 | | | $ | 12.09 | | | $ | 9.69 | | | $ | 9.12 | |
| Total return | | | 2.0 | % | | | 9.9 | % | | | 25.7 | % | | | 8.0 | % | | | (9.1 | )% |
| | | | | | | | | | | | | | | | | | | | | |
| Annualized ratios/supplemental data: | | | | | | | | | | | | | | | | | | | | |
| Net assets at end of year (000’s) | | $ | 14,141,401 | | | $ | 12,624,586 | | | $ | 9,564,418 | | | $ | 4,145,804 | | | $ | 2,444,714 | |
| Ratio of expenses to average net assets before expense waivers | | | 1.11 | %b | | | 1.12 | %b | | | 1.15 | %b | | | 1.18 | % | | | 1.08 | % |
| Ratio of expenses to average net assets after expense waivers | | | 1.11 | % | | | 1.12 | % | | | 1.15 | % | | | 1.15 | % | | | 1.05 | % |
| Ratio of net investment income to average net assets | | | 0.88 | % | | | 0.82 | % | | | 1.00 | % | | | 0.93 | % | | | 1.29 | % |
| Portfolio turnover rate | | | 61 | % | | | 51 | % | | | 42 | % | | | 55 | % | | | 158 | %c |
| a | Calculated using the average shares method for the period. |
| b | There were no voluntary fee reductions during the period. |
| c | The significant increase in rate is due to repositioning in October 2011 to reflect change in investment strategy. |
See Notes to Financial Statements.
| Old Westbury Funds, Inc. | |
| Small & Mid Cap Fund | |
| Financial Highlights | |
| | |
For a Share Outstanding Throughout Each Period.
| | | YEAR ENDED OCTOBER 31, | |
| | | 2015 | | | 2014 | | | 2013 | | | 2012 | | | 2011 | |
| Net asset value, beginning of year | | $ | 17.09 | | | $ | 17.30 | | | $ | 14.64 | | | $ | 14.34 | | | $ | 14.78 | |
| | | | | | | | | | | | | | | | | | | | | |
| Investment operations: | | | | | | | | | | | | | | | | | | | | |
| Net investment income | | | 0.09 | a | | | 0.12 | a | | | 0.12 | a | | | 0.11 | a | | | 0.09 | a |
| Net realized and unrealized gains on investments, foreign currency transactions and deferred taxes | | | 0.40 | | | | 0.83 | | | | 3.61 | | | | 0.95 | | | | 0.14 | |
| Total from investment operations | | | 0.49 | | | | 0.95 | | | | 3.73 | | | | 1.06 | | | | 0.23 | |
| | | | | | | | | | | | | | | | | | | | | |
| Distributions: | | | | | | | | | | | | | | | | | | | | |
| Net investment income | | | (0.13 | ) | | | (0.13 | ) | | | (0.16 | ) | | | (0.10 | ) | | | (0.08 | ) |
| Net realized gains | | | (1.59 | ) | | | (1.03 | ) | | | (0.91 | ) | | | (0.66 | ) | | | (0.59 | ) |
| Total distributions | | | (1.72 | ) | | | (1.16 | ) | | | (1.07 | ) | | | (0.76 | ) | | | (0.67 | ) |
| Net asset value, end of year | | $ | 15.86 | | | $ | 17.09 | | | $ | 17.30 | | | $ | 14.64 | | | $ | 14.34 | |
| Total return | | | 2.9 | % | | | 5.7 | % | | | 26.8 | % | | | 8.0 | % | | | 1.3 | % |
| | | | | | | | | | | | | | | | | | | | | |
| Annualized ratios/supplemental data: | | | | | | | | | | | | | | | | | | | | |
| Net assets at end of year (000’s) | | $ | 5,449,609 | | | $ | 6,385,783 | | | $ | 6,624,651 | | | $ | 4,876,907 | | | $ | 4,737,627 | |
| Ratio of expenses to average net assets before expense waivers | | | 1.16 | %b | | | 1.15 | %b | | | 1.16 | %b | | | 1.17 | %b | | | 1.18 | %b |
| Ratio of expenses to average net assets after expense waivers | | | 1.11 | % | | | 1.11 | % | | | 1.11 | % | | | 1.11 | % | | | 1.11 | % |
| Ratio of net investment income to average net assets | | | 0.56 | % | | | 0.67 | % | | | 0.73 | % | | | 0.78 | % | | | 0.62 | % |
| Portfolio turnover rate | | | 50 | % | | | 38 | % | | | 31 | % | | | 28 | % | | | 37 | % |
| a | Calculated using the average shares method for the period. |
| b | When counterparties post cash collateral with respect to various derivative transactions, the Fund invests the collateral and receives interest income on the investment and pays interest expense on the collateral to the counterparty. The interest income is included in investment income on the Statements of Operations, and the interest expense is included in the Fund’s overall expenses on the Statement of Operations and expense ratio. |
See Notes to Financial Statements.
| Old Westbury Funds, Inc. | |
| Strategic Opportunities Fund | |
| Financial Highlights | |
| | |
For a Share Outstanding Throughout Each Period.
| | | YEAR ENDED OCTOBER 31, | |
| | | 2015a | | | 2014 | | | 2013 | | | 2012 | | | 2011 | |
| Net asset value, beginning of year | | $ | 8.20 | | | $ | 8.24 | | | $ | 7.51 | | | $ | 7.23 | | | $ | 7.99 | |
| | | | | | | | | | | | | | | | | | | | | |
| Investment operations: | | | | | | | | | | | | | | | | | | | | |
| Net investment income | | | 0.09 | b | | | 0.09 | b | | | 0.15 | b | | | 0.22 | b | | | 0.32 | b |
| Net realized and unrealized gains/(losses) on investments, securities sold short, futures contracts, swap agreements, written options, foreign currency transactions and deferred taxes | | | (0.02 | ) | | | 0.36 | | | | 0.76 | | | | 0.41 | | | | (0.48 | ) |
| Total from investment operations | | | 0.07 | | | | 0.45 | | | | 0.91 | | | | 0.63 | | | | (0.16 | ) |
| | | | | | | | | | | | | | | | | | | | | |
| Distributions: | | | | | | | | | | | | | | | | | | | | |
| Net investment income | | | (0.17 | ) | | | (0.27 | ) | | | (0.18 | ) | | | (0.35 | ) | | | (0.60 | ) |
| Net realized gains | | | (0.45 | ) | | | (0.22 | ) | | | — | | | | — | | | | — | |
| Total distributions | | | (0.62 | ) | | | (0.49 | ) | | | (0.18 | ) | | | (0.35 | ) | | | (0.60 | ) |
| Net asset value, end of year | | $ | 7.65 | | | $ | 8.20 | | | $ | 8.24 | | | $ | 7.51 | | | $ | 7.23 | |
| Total return | | | 0.9 | % | | | 5.9 | % | | | 12.3 | % | | | 9.4 | % | | | (2.4 | )% |
| | | | | | | | | | | | | | | | | | | | | |
| Annualized ratios/supplemental data: | | | | | | | | | | | | | | | | | | | | |
| Net assets at end of year (000’s) | | $ | 7,095,756 | | | $ | 5,598,552 | | | $ | 5,737,691 | | | $ | 7,023,142 | | | $ | 4,383,994 | |
| Ratio of expenses to average net assets before expense waivers | | | 1.32 | %c | | | 1.32 | %c | | | 1.32 | %c | | | 1.35 | %c | | | 1.36 | %c |
| Ratio of expenses to average net assets after expense waivers | | | 1.20 | % | | | 1.20 | % | | | 1.20 | % | | | 1.20 | % | | | 1.20 | % |
| Ratio of net investment income to average net assets | | | 1.16 | % | | | 1.14 | % | | | 1.97 | % | | | 3.09 | % | | | 4.07 | % |
| Portfolio turnover rate | | | 70 | % | | | 82 | % | | | 61 | % | | | 122 | % | | | 84 | % |
| a | Consolidated Financial Highlights. |
| b | Calculated using the average shares method for the period. |
| c | When counterparties post cash collateral with respect to various derivative transactions, the Fund invests the collateral and receives interest income on the investment and pays interest expense on the collateral to the counterparty. The interest income is included in investment income on the Statements of Operations, and the interest expense is included in the Fund’s overall expenses on the Statement of Operations and expense ratio. |
See Notes to Financial Statements.
| Old Westbury Funds, Inc. | |
| Fixed Income Fund | |
| Financial Highlights | |
| | |
For a Share Outstanding Throughout Each Period.
| | | YEAR ENDED OCTOBER 31, | |
| | | 2015 | | | 2014 | | | 2013 | | | 2012 | | | 2011 | |
| Net asset value, beginning of year | | $ | 11.22 | | | $ | 11.34 | | | $ | 11.66 | | | $ | 11.80 | | | $ | 11.94 | |
| | | | | | | | | | | | | | | | | | | | | |
| Investment operations: | | | | | | | | | | | | | | | | | | | | |
| Net investment income | | | 0.12 | a | | | 0.11 | a | | | 0.14 | a | | | 0.20 | a | | | 0.27 | a |
| Net realized and unrealized gains/(losses) on investments | | | 0.00 | b | | | (0.01 | ) | | | (0.18 | ) | | | 0.20 | | | | (0.06 | ) |
| Total from investment operations | | | 0.12 | | | | 0.10 | | | | (0.04 | ) | | | 0.40 | | | | 0.21 | |
| | | | | | | | | | | | | | | | | | | | | |
| Distributions: | | | | | | | | | | | | | | | | | | | | |
| Net investment income | | | (0.15 | ) | | | (0.20 | ) | | | (0.22 | ) | | | (0.28 | ) | | | (0.32 | ) |
| Net realized gains | | | — | | | | (0.02 | ) | | | (0.06 | ) | | | (0.26 | ) | | | (0.03 | ) |
| Total distributions | | | (0.15 | ) | | | (0.22 | ) | | | (0.28 | ) | | | (0.54 | ) | | | (0.35 | ) |
| Net asset value, end of year | | $ | 11.19 | | | $ | 11.22 | | | $ | 11.34 | | | $ | 11.66 | | | $ | 11.80 | |
| Total return | | | 1.1 | % | | | 0.9 | % | | | (0.3 | )% | | | 3.5 | % | | | 1.9 | % |
| | | | | | | | | | | | | | | | | | | | | |
| Annualized ratios/supplemental data: | | | | | | | | | | | | | | | | | | | | |
| Net assets at end of year (000’s) | | $ | 583,204 | | | $ | 563,716 | | | $ | 533,444 | | | $ | 491,311 | | | $ | 457,065 | |
| Ratio of expenses to average net assets before expense waivers | | | 0.74 | % | | | 0.75 | % | | | 0.75 | % | | | 0.76 | % | | | 0.76 | % |
| Ratio of expenses to average net assets after expense waivers | | | 0.64 | % | | | 0.65 | % | | | 0.65 | % | | | 0.66 | % | | | 0.66 | % |
| Ratio of net investment income to average net assets | | | 1.03 | % | | | 0.94 | % | | | 1.26 | % | | | 1.69 | % | | | 2.29 | % |
| Portfolio turnover rate | | | 67 | % | | | 65 | % | | | 78 | % | | | 64 | % | | | 76 | % |
| a | Calculated using the average shares method for the period. |
| b | Amount is less than $0.005 per share. |
See Notes to Financial Statements.
| Old Westbury Funds, Inc. | |
| Municipal Bond Fund | |
| Financial Highlights | |
| | |
For a Share Outstanding Throughout Each Period.
| | | YEAR ENDED OCTOBER 31, | |
| | | 2015 | | | 2014 | | | 2013 | | | 2012 | | | 2011 | |
| Net asset value, beginning of year | | $ | 12.02 | | | $ | 11.96 | | | $ | 12.33 | | | $ | 11.96 | | | $ | 12.19 | |
| | | | | | | | | | | | | | | | | | | | | |
| Investment operations: | | | | | | | | | | | | | | | | | | | | |
| Net investment income | | | 0.15 | a | | | 0.14 | a | | | 0.17 | a | | | 0.19 | a | | | 0.21 | a |
| Net realized and unrealized gains/(losses) on investments | | | 0.03 | | | | 0.10 | | | | (0.25 | ) | | | 0.40 | | | | (0.16 | ) |
| Total from investment operations | | | 0.18 | | | | 0.24 | | | | (0.08 | ) | | | 0.59 | | | | 0.05 | |
| | | | | | | | | | | | | | | | | | | | | |
| Distributions: | | | | | | | | | | | | | | | | | | | | |
| Net investment income | | | (0.15 | ) | | | (0.15 | ) | | | (0.17 | ) | | | (0.19 | ) | | | (0.22 | ) |
| Net realized gains | | | (0.05 | ) | | | (0.03 | ) | | | (0.12 | ) | | | (0.03 | ) | | | (0.06 | ) |
| Total distributions | | | (0.20 | ) | | | (0.18 | ) | | | (0.29 | ) | | | (0.22 | ) | | | (0.28 | ) |
| Net asset value, end of year | | $ | 12.00 | | | $ | 12.02 | | | $ | 11.96 | | | $ | 12.33 | | | $ | 11.96 | |
| Total return | | | 1.5 | % | | | 2.0 | % | | | (0.7 | )% | | | 5.0 | % | | | 0.5 | % |
| | | | | | | | | | | | | | | | | | | | | |
| Annualized ratios/supplemental data: | | | | | | | | | | | | | | | | | | | | |
| Net assets at end of year (000’s) | | $ | 1,375,043 | | | $ | 1,326,109 | | | $ | 1,244,693 | | | $ | 1,098,750 | | | $ | 936,056 | |
| Ratio of expenses to average net assets before expense waivers | | | 0.70 | % | | | 0.70 | % | | | 0.71 | % | | | 0.73 | % | | | 0.73 | % |
| Ratio of expenses to average net assets after expense waivers | | | 0.60 | % | | | 0.60 | % | | | 0.61 | % | | | 0.63 | % | | | 0.63 | % |
| Ratio of net investment income to average net assets | | | 1.28 | % | | | 1.20 | % | | | 1.38 | % | | | 1.55 | % | | | 1.79 | % |
| Portfolio turnover rate | | | 31 | % | | | 55 | % | | | 51 | % | | | 34 | % | | | 64 | % |
| a | Calculated using the average shares method for the period. |
See Notes to Financial Statements.
| Old Westbury Funds, Inc. | |
| Notes To Financial Statements | |
| | October 31, 2015 |
| | |
Old Westbury Funds, Inc. (the “Corporation”) was organized as a Maryland corporation on August 26, 1993 and commenced operations on October 22, 1993. The Corporation is an open-end management investment company registered under the Investment Company Act of 1940, as amended (the “1940 Act”). The Corporation’s Articles of Restatement, as amended, permit the Corporation’s Board of Directors (the “Board”) to create an unlimited number of series, each with one or more separate classes of shares. At October 31, 2015, the Corporation consisted of six separate investment portfolios (each series individually referred to as a “Fund” and collectively as the “Funds”) shown below:
| Fund Name | | Investment Objective |
| Old Westbury Large Cap Core Fund (“Large Cap Core Fund”) | | Long-term capital appreciation. |
| Old Westbury Large Cap Strategies Fund (“Large Cap Strategies Fund”) | | Long-term capital appreciation. |
| Old Westbury Small & Mid Cap Fund (“Small & Mid Cap Fund”) | | Long-term capital appreciation. |
| Old Westbury Strategic Opportunities Fund (“Strategic Opportunities Fund”) | | Long-term capital appreciation. |
| Old Westbury Fixed Income Fund (“Fixed Income Fund”) | | Total return (consisting of current income and capital appreciation). |
| Old Westbury Municipal Bond Fund (“Municipal Bond Fund”) | | Total return (consisting of current income that is exempt from regular federal income tax and capital appreciation). |
The Corporation has authorized a total of 20 billion shares of common stock (par value $0.001 per share).
Under the Corporation’s organizational documents, its Officers and Directors are indemnified against certain liabilities arising out of the performance of their duties for the Corporation. In addition, in the normal course of business, the Corporation enters into contracts with vendors and others that provide for general indemnifications. The Corporation’s maximum exposure under these arrangements is unknown as this would involve future claims that may be made against the Corporation. However, based on experience, the Corporation expects the risk of loss to be remote.
| 2. | Basis for Consolidation for the Strategic Opportunities Fund: |
The consolidated financial statements of the Strategic Opportunities Fund include the financial results of its wholly-owned subsidiary (organized under the laws of the Cayman Islands), OWF Strategic Opportunities Fund, Ltd. (the “Subsidiary”). All material intercompany accounts and transactions have been eliminated. The Subsidiary commenced operations on May 1, 2015. The Strategic Opportunities Fund commenced reporting on a consolidated basis as of such commencement date. The Subsidiary is a commodity pool, as defined in the regulations of the Commodity Futures Trade Commission (the “CFTC”), and is operated by Bessemer Investment Management LLC (“BIM”)(“Adviser”), a commodity pool operator registered with the CFTC effective January 1, 2013. The Strategic Opportunities Fund seeks to gain exposure to commodities through direct investments in commodities-related instruments, derivatives and other investments and through investments in the Subsidiary. The Subsidiary has the same investment goal as the Strategic Opportunities Fund. The Subsidiary pursues its investment goal by investing in commodities-related instruments, derivatives and other investments. The Subsidiary (unlike the Strategic Opportunities Fund) may invest without limitation in these instruments. However, the Subsidiary is otherwise subject to the same fundamental, non-fundamental and certain other investment restrictions as the Strategic Opportunities Fund. The portion of the Strategic Opportunities Fund’s or Subsidiary’s assets exposed to any particular commodity, derivative or other investment will vary based on market conditions, but from time to time some exposure could be substantial. To the extent of the Strategic Opportunities Fund’s investment through the Subsidiary, it will be subject to the risks associated with the derivatives and other instruments in which the Subsidiary invests. As of October 31, 2015, the Subsidiary represented $92,155,783 or 1.30% of the Strategic Opportunities Fund’s net assets.
| 3. | Significant Accounting Policies: |
The following is a summary of the significant accounting policies followed by the Corporation in the preparation of its financial statements. The policies are in conformity with accounting principles generally accepted in the U.S. (“GAAP”). The preparation of financial statements in accordance with GAAP requires management to make estimates and assumptions that affect the reported amounts of assets and liabilities at the date of the financial statements and the reported amounts of income and expenses for the period. Actual results could differ from those estimates.
| Old Westbury Funds, Inc. | |
| Notes To Financial Statements - (Continued) | |
| | October 31, 2015 |
| | |
The Financial Accounting Standards Board (“FASB”) Accounting Standards Codification is the exclusive reference of authoritative GAAP recognized by the FASB to be applied by nongovernmental entities. Rules and interpretive releases of the Securities and Exchange Commission (“SEC”) under authority of federal laws are also sources of authoritative GAAP for SEC registrants such as the Corporation.
In August 2014, FASB issued Accounting Standards Update (“ASU”) No. 2014-15, “Presentation of Financial Statements – Going Concern (Subtopic 205-40): Disclosure of Uncertainties about an Entity’s Ability to Continue as a Going Concern.” Under GAAP, a reporting entity’s continued existence is the basis for preparing financial statements as a going concern (commonly referred to as the going concern basis of accounting) unless and until the entity’s liquidation becomes imminent. This ASU provides guidance in GAAP about management’s responsibility to evaluate whether there is substantial doubt about an entity’s ability to continue as a going concern and to provide related disclosures in the entity’s financial statements. The ASU becomes effective for all entities for the annual period ending after December 15, 2016, and for annual periods and interim periods thereafter. Management is evaluating the impact of this guidance on the Funds’ financial statement disclosures.
A. Valuation of Investments. Readily marketable equity securities listed on an exchange are valued, except as indicated below, at the last sale price reflected at the close of the regular trading session of the exchange on the business day as of which such value is being determined, and securities listed on NASDAQ are valued at the NASDAQ Official Closing Price (“NOCP”) and, if no NOCP is available, then at the last reported sales price. If there has been no sale on such day, the securities are valued at the mean of the closing bid and asked prices on such day. If no bid or asked prices are quoted on such day, then the securities are valued using a broker-dealer quote or an approved pricing service. Equity securities traded on more than one national securities exchange are valued at the last sale price on the business day as of which such value is being determined as reflected on the tape at the close of the exchange representing the principal market for such securities.
Readily marketable equity securities traded in the over-the-counter market (“OTC”), including listed securities whose primary market is believed by BIM, or a sub-adviser, as applicable, to be over-the-counter, are valued at the mean of the latest bid and asked prices using a broker-dealer or an approved pricing service.
Shares of open-end investment companies are valued at the latest net asset value (“NAV”) reported by the investment company. Shares of investment companies that are traded intra-day on an exchange (e.g., exchange traded funds) will be valued at the last sale price as reflected at the close of the regular trading session of such exchange.
Debt instruments are valued on the basis of prices obtained from a broker-dealer or an approved pricing service.
Foreign securities generally are valued in their national currency at the latest available quoted sale price as of the close of trading on the foreign exchange or other principal market on which the security is traded. In the absence of current trade activity, the securities will be valued at the mean of the latest bid/ask quotations. As described below, this value is then converted into its U.S. dollar equivalent using the daily rate of exchange at the time of a Fund’s NAV calculation (normally 4:00 p.m. Eastern Time).
Forward currency contracts are valued at the mean between the bid and the asked prices. Quotations are available for regularly scheduled settlement dates such as on a 1-,2-,3-,4-,5-,6-,9-, and 12-month basis. Over-the-counter derivatives, such as swaps and non-exchange traded options and futures are valued on the basis of counterparty valuation quotations or dealer quotations, subject to review by BIM, or a sub-adviser with BIM’s oversight where appropriate. An approved pricing service may also be used to price these instruments. Exchange-traded swaps, options and futures contracts and options thereon are valued at their last sale or settlement price as of the close of such exchanges or, if no sales are reported, at the mean between the last reported bid and asked prices. Repurchase agreements are valued at the original cost. Contracts for long puts and calls are valued at the bid price and short puts and calls are valued at the offering price of a broker-dealer or an exchange. Generally, options, rights/warrants and other “when-issued” securities follow the same pricing methods as equity securities.
Securities and other investments for which market quotations are not readily available are valued under the general supervision and responsibility of the Board and pursuant to policies and procedures established by the Board, which are designed to reflect, in good faith, the fair value of such investments. A market quotation is considered not readily available if, among other circumstances, the most recent reported price is deemed unreliable. For example, securities that may be subject to fair valuation include, but are not limited to: (1) securities in which trading has been halted pending further news; (2) illiquid securities in which there is no trading market and no broker coverage; (3) stale priced securities; (4) securities that may have defaulted or de-listed from an exchange and are no longer trading; (5) any other security for which the Funds’ Pricing Committee, with input from the Adviser or sub-advisers, as applicable, believes that the last trading price does not represent a reliable current price; or (6) other investments, including derivatives for which readily available market quotations are not generally available.
| Old Westbury Funds, Inc. | |
| Notes To Financial Statements - (Continued) | |
| | October 31, 2015 |
| | |
In addition, a Fund may fair value securities that trade on a foreign exchange because a significant event has occurred after the foreign exchange closes but before the time as of which a Fund’s share price is calculated. Foreign exchanges typically close before the time as of which Fund share prices are calculated, and may be closed altogether on some days a Fund is open. Such significant events affecting a foreign security may include, but are not limited to: (1) those relating to a single issuer; (2) governmental actions that affect securities in one sector or country; (3) natural disasters or armed conflicts affecting a country or region; or (4) significant market fluctuations. There is no single standard for determining the fair value of a security or investment, but, rather, several factors are considered including an evaluation of the forces that influence the market in which the security or investment is purchased or sold, in determining whether a market price is readily available and, if not, the security’s or other investment’s fair value.
In light of the judgment involved in fair value decisions, there can be no assurances that a fair value assigned to a particular security reflects a price for which a security has traded or will trade. Accordingly, when a Fund uses fair value to price securities, it may value those securities higher or lower than another fund that uses market quotations to price the same securities.
In the event of a change in the S&P 500 Index that is greater than predetermined levels approved by the Board, the Funds will utilize an approved pricing service that has been designated to determine fair value to price securities traded on any overseas exchange. Pricing Service Vendors base their valuations on a number of factors, including, but not limited to, actual transaction data, benchmark yields, market bids, market offers, quotations from dealers, credit risk spreads, interest rate spreads, proprietary pricing models, cash flows, prepayment information, default rates, delinquency and loss assumptions, collateral characteristics, credit enhancements, specific deal information and other relationships observed in markets of comparable securities. In addition, foreign securities held by a Fund may trade on weekends or other days when the Fund does not calculate NAV. As a result, the market value of these investments may change on days when shares of the Fund cannot be bought or sold. Such fair valuations are categorized as Level 2 in the fair value hierarchy. Foreign securities that are valued based on market quotations are categorized as Level 1 in the fair value hierarchy. The Large Cap Core Fund, Large Cap Strategies Fund, Small & Mid Cap Fund and the Strategic Opportunities Fund utilized a systematic fair valuation model provided by an independent third-party vendor to fair value certain securities 36 days during the year ended October 31, 2015. As a result on days when the index change exceeds predetermined levels, certain securities held by the Funds were transferred from Level 1 into Level 2. On any subsequent day when such index level is not exceeded, certain securities held by the Funds were transferred from Level 2 back into Level 1. As of October 31, 2015, foreign securities were not fair valued as the change in the S&P 500 Index did not exceed the Funds’ predetermined level. There were no other transfers between Level 1 and Level 2 during the year ended October 31, 2015.
The fair value of investments is determined in accordance with the valuation policies and procedures approved by the Board. The Funds’ Pricing Committee established by the Board (the “Pricing Committee”) reviews pricing methodologies on at least a quarterly basis. The Pricing Committee is responsible for (i) establishing valuation processes and (ii) determining the fair value of the Funds’ holdings for which price quotations are not readily available, unreliable or for which an approved valuation method is deemed not to represent fair value. These investments are either categorized as Level 2 or 3 depending on the observability of the inputs used. The Pricing Committee may consider one or more factors in determining an investment’s fair value. The factors to be taken into account, to the extent relevant, typically include, but are not limited to: fundamental analytical data relating to the investment, the nature and duration of any restrictions on disposition of the investments, an evaluation of the forces that influence the market in which the investments are purchased or sold, the type of investment, financial statements and company filings, lack of marketability, the cost at date of purchase, good faith recommendation of BIM or a sub-adviser, as applicable, and any other relevant matters. When the fair valuation of investments use significant unobservable inputs, such investments will be categorized as Level 3 in the fair value hierarchy.
The significant unobservable inputs used in fair value measurement of the Funds’ Level 3 investments may include, where applicable: (i) an estimation of a normalized earnings level or projected cash flows for the company; (ii) the discounts applied to the last available price of the investment or a selection of comparable investments due to the lack of marketability of the investment; (iii) values or bid offers by dealers or other third parties; and (iv) the value associated with the latest round of financing. Significant changes in any of those inputs in isolation may result in a significantly lower or higher fair value measurement. Generally, a change in the assumptions used for the normalized earnings level will be accompanied by a directionally similar change in the discounts applied to the list of comparable investments.
| Old Westbury Funds, Inc. | |
| Notes To Financial Statements - (Continued) | |
| | October 31, 2015 |
| | |
The Funds’ Pricing Committee employs various methods for calibrating the valuation approach related to investments categorized within Level 3 in the fair value hierarchy. These methods may include regular due diligence of the Funds’ pricing vendors including back testing of trigger related fair value prices, a regular review of key inputs and assumptions, reviews of missing and stale prices and price variance analysis, including investigation of unusual or unexpected pricing changes and reviews of any market related activities. Additionally, the pricing of all fair value holdings is subsequently reviewed and approved by the Funds’ Board.
B. Security Transactions and Related Investment Income. Security transactions are accounted for no later than the first NAV calculation on the first business day following the trade date. However, for financial reporting purposes, portfolio securities transactions are reported on trade date. Realized gains and losses on security transactions are determined using the identified cost method. Dividend income and other distributions from portfolio securities are recorded on the ex-dividend date, except for certain dividends from foreign securities where the ex-dividend dates may have passed are recorded as soon as the Funds are informed of the dividends. Upon notification from issuers, some of the dividend income received from a real estate investment trust may be redesignated as a reduction of cost of the related investment and/or realized gain. Dividend income is recorded net of foreign taxes withheld where recovery of such taxes is not assured. Interest income is recognized on an accrual basis and includes where applicable, the amortization of premiums and accretion of discounts.
C. Payment-In-Kind Securities. The Funds may invest in payment-in-kind securities (“PIKs”). PIKs give the issuer the option at each interest payment date of making interest payments in either cash or additional debt securities. Those additional debt securities usually have the same terms, including maturity dates and interest rates, and associated risks as the original bonds. The daily market quotations of the original bonds may include the accrued interest (referred to as a dirty price) and require a pro-rata adjustment from the unrealized appreciation or depreciation on investments to interest receivable on the Statement of Assets and Liabilities.
For the year ended October 31, 2015, there were no in-kind payments received by the Funds with respect to PIK securities.
D. Foreign Currency Transactions. The books and records of the Funds are maintained in U.S. dollars. Investments and other assets and liabilities of the Funds denominated in a foreign currency, if any, are translated into U.S. dollars at current exchange rates as of the date of the Statements of Assets and Liabilities. Purchases and sales of securities, income receipts and expense payments are translated into U.S. dollars at the exchange rate on the dates of the transactions.
The Funds do not isolate the portion of operations resulting from changes in foreign exchange rates on investments from fluctuations arising from changes in market prices of securities held. Such fluctuations are included with the net realized and unrealized gain/(loss) on investments, securities sold short, swap agreements, futures contracts and written options in the Statements of Operations.
Foreign security and currency transactions may involve certain risks not typically associated with those of U.S. companies, including the level of governmental supervision and regulation of foreign securities markets and the possibility of political and economic instability.
E. Securities Sold Short. The Funds may sell securities short. A short sale is a transaction in which a Fund sells securities it does not own, but has borrowed, in anticipation of a decline in the market price of the securities. A Fund is obligated to replace the borrowed securities at their market price at the time of settlement. A Fund’s obligation to replace the securities borrowed in connection with a short sale will be fully secured by collateral deposited with the broker. Short sales by a Fund involve certain risks and special considerations.
The Funds may not always be able to close out a short position on favorable terms. Short sales involve the risk that a Fund will incur a loss by subsequently buying a security at a higher price than the price at which it sold the security short. The amount of such loss is theoretically unlimited (since it is limited only by the increase in value of the security sold short by a Fund). In contrast, the risk of loss from a long position is limited to a Fund’s investment in the long position, since its value cannot fall below zero. Short selling is a form of leverage which may lead to higher volatility of a Fund’s NAV or greater losses for a Fund. To mitigate leverage risk, a Fund will always hold liquid assets (including its long positions) at least equal to its short position exposure, marked-to-market daily.
F. Collectibles. The Strategic Opportunities Fund may invest in collectibles, which are rare objects collected by investors. They can include stamps, coins, books, oriental rugs, antiques, sports and other memorabilia, photographs, art and wine. Collectibles are generally expected to rise in value during inflationary periods when investors are trying to move to assets viewed as an inflation hedge. Generally, collectibles can be expected to drop in value during periods of low inflation. Collectible trading
| Old Westbury Funds, Inc. | |
| Notes To Financial Statements - (Continued) | |
| | October 31, 2015 |
| | |
for profit is subject to certain risks and other considerations, including that collectibles: (i) have limited buying and selling markets; (ii) are often bought and sold at auction and subject to buyer and/or seller premiums; (iii) experience periods of high and low demand; (iv) must be insured, physically held and properly maintained; (v) may need to have their authenticity and provenance verified from time to time; and (vi) may not have representative market valuations available. The Strategic Opportunities Fund does not currently intend to invest more than 5% of its total assets in collectibles. As of October 31, 2015, the Strategic Opportunities Fund held no collectibles.
G. Commodities. In order to gain exposure to the commodities markets, the Strategic Opportunities Fund, directly or through its Subsidiary, may invest in commodities-related instruments, derivatives and other investments. Commodities are assets that have tangible properties, such as oil, agriculture products and precious metals. The value of commodities may be affected by, among other things, changes in overall market movements, commodity index volatility, changes in interest rates, or factors affecting a particular industry or commodity, such as drought, floods, weather, livestock disease, embargoes, tariffs and international economic, political and regulatory developments. These factors may have a larger impact on commodity prices and commodity-linked instruments than on traditional securities. Certain commodities are also subject to limited pricing flexibility because of supply and demand factors. Others are subject to broad price fluctuations as a result of the volatility of the prices for certain raw materials and the instability of supplies of other materials. These additional variables may create additional risks which subject the Strategic Opportunities Fund and its Subsidiary’s investments to greater volatility than investments in traditional securities.
H. Inflation-Protected Securities. The Funds may invest in inflation-protected securities, which unlike traditional debt securities that make fixed or variable principal and interest payments, are structured to provide protection against the negative effects of inflation. The value of the debt securities’ principal is adjusted to track changes in an official inflation measure. For example, the U.S. Treasury currently uses the Consumer Price Index for Urban Consumers as a measure of inflation for Treasury Inflation-Protected Securities (“TIPS”). Other inflation-protected securities may not carry a similar guarantee by their issuer. A Fund may buy TIPS that are designed to provide an investment vehicle that is not vulnerable to inflation. The interest rate paid by TIPS is fixed. The principal value rises or falls semi-annually based on the changes in the published Consumer Price Index. If inflation occurs, the principal and interest payments on TIPS are adjusted to protect investors from inflationary loss. If deflation occurs, the principal and interest payments will be adjusted downward, although the principal will not fall below its face amount at maturity.
I. When-Issued and Delayed Delivery Securities. The Funds may purchase or sell securities that they are entitled to receive on a when-issued basis. The Funds may also purchase or sell securities on a delayed delivery basis. When-issued and delayed delivery securities involve risk that the security a Fund buys will lose value prior to its delivery. There is also a risk that the security will not be issued or that the other party to the transaction will not meet its obligation. If this occurs, a Fund loses both the investment opportunity for the assets it set aside to pay for the security and any gain in the security’s price.
J. Loan Participations and Assignments. The Strategic Opportunities Fund and Fixed Income Fund may invest in fixed or floating rate loans to U.S. companies, foreign entities, and U.S. subsidiaries of foreign entities made by one or more financial institutions. The rate of interest on a fixed-rate loan is generally a set amount. The rate of interest payable on floating rate loans is the sum of a base lending rate plus a specified spread. Base lending rates are generally the London InterBank Offered Rate, the Certificate of Deposit Rate of a designated U.S. bank, the prime rate of a designated U.S. bank, the Federal Funds rate, or another base lending rate used by commercial lenders. The applicable spread may be fixed at time of issuance or may adjust upward or downward to reflect changes in credit quality of the borrower. A Fund may invest in loans that are investment grade, below investment grade (“junk”), or not rated by any nationally recognized statistical ratings organization. Loans that are rated lower than investment grade typically entail default and other risks greater than those associated with higher-rated loans. Generally, the lower the rating category, the riskier the investment. Typically, a Fund’s investments in loans are expected to take the form of loan participations and assignments of portions of loans from third parties.
Currently, the Strategic Opportunities Fund intends to invest in loans that are below investment grade and, to a lesser extent, unrated loans. The Strategic Opportunities Fund’s investments in loans are expected in most instances to be in the form of assignments. Generally, when a Fund purchases an assignment of a loan from a lender, it will step into the position of the lender and acquire direct rights against the borrower on the loan. Because assignments are arranged through private negotiations between potential assignees and potential assignors, however, the rights and obligations acquired by a Fund as the purchaser of an assignment may differ from, and be more limited than, those held by the assigning lender. The assignability of certain obligations may be restricted by the governing documentation as to the nature of the assignee such that the only way in which a Fund may acquire an interest in a loan is by purchasing a participation of interest and not an assignment. A Fund may have difficulty disposing of assignments and participation interests given these limitations and other factors.
| Old Westbury Funds, Inc. | |
| Notes To Financial Statements - (Continued) | |
| | October 31, 2015 |
| | |
K. Credit Enhancements. Certain obligations held by the Funds have credit enhancement or liquidity features that may, under certain circumstances, provide for repayment of principal and interest on the obligation upon demand date, interest rate reset date or final maturity. These enhancements may include: letters of credit; liquidity guarantees; and third party insurance (i.e., AMBAC and FGIC). The value of the obligations may be affected by changes in credit worthiness of the entities that provide any supporting letters of credit or other credit enhancements. The value of the obligations also will be affected by the exhaustion, termination or expiration of any credit enhancement.
L. Restricted and Illiquid Securities. The Funds may purchase securities which are subject to legal or contractual delays, restrictions, and costs on resale. Because of time limitations, the Funds might not be able to dispose of these securities at reasonable prices or at times advantageous to the Funds. Each Fund intends to limit the purchase of securities which have not been determined by BIM to be liquid, together with other securities considered to be illiquid, including repurchase agreements providing for settlement in more than seven days after notice, to not more than 15% of its net assets.
M. Distributions to Shareholders. Distributions from net investment income, if any, generally are declared and paid quarterly for the Fixed Income Fund and Municipal Bond Fund and at least annually for the Large Cap Core Fund, Large Cap Strategies Fund, Small & Mid Cap Fund and Strategic Opportunities Fund. Distributable net realized capital gains, if any, are declared and distributed at least annually. The amount and timing of dividends and distributions are determined in accordance with federal income tax regulations, which may differ from U.S. GAAP.
N. Expenses. Expenses that are directly related to one of the Funds are charged directly to that Fund on an accrual basis. Other operating expenses of the Corporation are prorated to each Fund on an accrual basis utilizing relative net assets or another reasonable basis.
| 4. | Market and Credit Risk: |
In the normal course of business, the Funds invest in securities and enter into transactions where risks exist due to fluctuations in the market (market risk) or failure of the issuer of a security to meet all its obligations (credit risk). The value of securities held by a Fund may decline in response to certain events, including those directly involving the issuers whose securities are owned by the Fund; changes or perceived changes in economic conditions; overall market changes; local, regional or global political, social or economic events or instability; and currency and interest rate and price fluctuations. Since 2008, the U.S. government has implemented various measures designed to stabilize the U.S. economy and support U.S. economic recovery, including by keeping the federal funds rate at or near zero percent and purchasing large quantities of securities issued or guaranteed by the U.S. government or its agencies and instrumentalities on the open market (“quantitative easing”). The Board of Governors of the Federal Reserve System has recently ended this quantitative easing and, to the extent it raises the federal funds rate, there is a risk that interest rates across the U.S. financial markets will rise suddenly and significantly, thereby exposing fixed income and related markets to heightened volatility and reduced liquidity. Such market events may cause a Fund to experience losses and/or high redemption requests, which may result in increased transactions costs and lower a Fund’s performance. Exposure to foreign markets through issuers or currencies can involve additional risks relating to market, economic, political, regulatory, geopolitical, or other conditions. In addition, the securities of foreign companies also may be subject to the imposition of economic sanctions or other government restrictions. The risks of foreign investments are increased in emerging markets which may experience hyperinflation and have far lower trading volumes and less liquidity than developed markets. Changes in foreign currency exchange rates can affect the value of a Fund’s portfolio. Depositary receipts are generally subject to the same risks as the foreign securities that they evidence or into which they may be converted. Similar to credit risk, a Fund may be exposed to counterparty risk, or the risk that an entity with which the Fund has unsettled or open transactions may default. Financial assets, which potentially expose a Fund to credit and counterparty risks, consist principally of investments and cash due from counterparties. The Funds’ Adviser and sub-advisers, as applicable, review the creditworthiness of counterparties that they believe entail material credit risk in relation to the investment policies of a Fund. The extent of a Fund’s exposure to credit and counterparty risks with respect to these financial assets is generally represented by their value recorded in the Fund’s Statements of Assets and Liabilities.
| 5. | Fair Value Measurements: |
The inputs and valuation techniques used to measure fair value of the Funds’ investments are summarized into three levels as described in the hierarchy below:
● Level 1 - quoted prices in active markets for identical securities.
| Old Westbury Funds, Inc. | |
| Notes To Financial Statements - (Continued) | |
| | October 31, 2015 |
| | |
● Level 2 - other significant observable inputs (including quoted prices for similar securities, interest rates, prepayment speeds, credit ratings, etc.).
● Level 3 - significant unobservable inputs (including the Funds’ own assumptions in determining the fair value of investments).
The inputs or methodology used for valuing securities are not necessarily an indication of the risk associated with investing in those securities.
The summary of inputs used to value the Funds’ investments as of October 31, 2015 is as follows:
| | | Level 1
Quoted Prices | | | Level 2
Significant
Observable
Inputs | | | Level 3
Significant
Unobservable
Inputs(d) | | | Total | |
Investments in Securities
Assets: | | | | | | | | | | | | | | | | |
| Large Cap Core Fund | | | | | | | | | | | | | | | | |
| Equity Securities(b) | | $ | 1,084,742,092 | (a) | | $ | — | | | $ | — | | | $ | 1,084,742,092 | |
| Investment Company | | | 58,996,999 | | | | — | | | | — | | | | 58,996,999 | |
| Total | | $ | 1,143,739,091 | | | $ | — | | | $ | — | | | $ | 1,143,739,091 | |
| | | | | | | | | | | | | | | | | |
| Large Cap Strategies Fund | | | | | | | | | | | | | | | | |
| Equity Securities:(b) | | $ | 11,475,947,734 | (a) | | $ | 95,011,278 | (e) | | $ | — | | | $ | 11,570,959,012 | |
| Exchange Traded Funds | | | 1,878,774,320 | (a) | | | — | | | | — | | | | 1,878,774,320 | |
| U.S. Government Agencies | | | — | | | | 158,693,595 | | | | — | | | | 158,693,595 | |
| Investment Company | | | 478,051,300 | | | | — | | | | — | | | | 478,051,300 | |
| Other Financial Instruments - Assets* | | | | | | | | | | | | | | | | |
| Foreign currency exchange contracts | | | — | | | | 17,633,952 | | | | — | | | | 17,633,952 | |
| Other Financial Instruments - Liabilities* | | | | | | | | | | | | | | | | |
| Foreign currency exchange contracts | | | — | | | | (1,733,541 | ) | | | — | | | | (1,733,541 | ) |
| Total | | $ | 13,832,773,354 | | | $ | 269,605,284 | | | $ | — | | | $ | 14,102,378,638 | |
| | | | | | | | | | | | | | | | | |
| Small & Mid Cap Fund | | | | | | | | | | | | | | | | |
| Equity Securities:(b) | | | | | | | | | | | | | | | | |
| Australia | | $ | 86,280,678 | | | $ | 161,340 | | | $ | 43,040 | | | $ | 86,485,058 | |
| Austria | | | 11,516,731 | | | | — | | | | — | | | | 11,516,731 | |
| Bahamas | | | 86,494 | | | | — | | | | — | | | | 86,494 | |
| Belgium | | | 30,744,413 | | | | — | | | | — | | | | 30,744,413 | |
| Bermuda | | | 58,273,812 | | | | — | | | | — | | | | 58,273,812 | |
| Brazil | | | 25,011,216 | | | | — | | | | 57,744 | | | | 25,068,960 | |
| Cambodia | | | 295,203 | | | | — | | | | — | | | | 295,203 | |
| Canada | | | 97,842,164 | | | | 9 | | | | — | | | | 97,842,173 | |
| Cayman Islands | | | 65,005 | | | | — | | | | — | | | | 65,005 | |
| Chile | | | 2,166,198 | | | | — | | | | — | | | | 2,166,198 | |
| China | | | 54,852,305 | | | | 828,857 | | | | 387,892 | | | | 56,069,054 | |
| Denmark | | | 34,748,652 | | | | — | | | | — | | | | 34,748,652 | |
| Faeroe Islands | | | 250,464 | | | | — | | | | — | | | | 250,464 | |
| Finland | | | 26,764,088 | | | | — | | | | 1,024 | | | | 26,765,112 | |
| France | | | 145,648,464 | | | | — | | | | — | | | | 145,648,464 | |
| Georgia | | | 113,153 | | | | — | | | | — | | | | 113,153 | |
| Germany | | | 161,451,569 | | | | — | | | | — | | | | 161,451,569 | |
| Gibraltar | | | 176,695 | | | | — | | | | — | | | | 176,695 | |
| Greece | | | 2,578,588 | | | | — | | | | — | | | | 2,578,588 | |
| Guernsey | | | 3,804 | | | | — | | | | — | | | | 3,804 | |
| Hong Kong | | | 59,631,197 | | | | 21,573 | | | | 1,391,937 | | | | 61,044,707 | |
| Hungary | | | 63,650 | | | | — | | | | — | | | | 63,650 | |
| Old Westbury Funds, Inc. | |
| Notes To Financial Statements - (Continued) | |
| | October 31, 2015 |
| | |
| | | Level 1
Quoted Prices | | | Level 2
Significant
Observable
Inputs | | | Level 3
Significant
Unobservable
Inputs(d) | | | Total | |
| India | | $ | 70,420,065 | | | $ | — | | | $ | 86,100 | | | $ | 70,506,165 | |
| Indonesia | | | 19,039,176 | | | | — | | | | 3,562 | | | | 19,042,738 | |
| Ireland | | | 41,193,737 | | | | — | | | | — | | | | 41,193,737 | |
| Israel | | | 94,618,442 | | | | — | | | | — | | | | 94,618,442 | |
| Italy | | | 47,152,395 | | | | — | | | | — | | | | 47,152,395 | |
| Japan | | | 455,455,130 | | | | — | | | | — | | | | 455,455,130 | |
| Jersey Channel Islands | | | 1,507,351 | | | | — | | | | — | | | | 1,507,351 | |
| Luxembourg | | | 11,668,133 | | | | 1,733,875 | | | | — | | | | 13,402,008 | |
| Malaysia | | | 23,964,252 | | | | — | | | | — | | | | 23,964,252 | |
| Malta | | | 723,441 | | | | — | | | | — | | | | 723,441 | |
| Martinique | | | 146,569 | | | | — | | | | — | | | | 146,569 | |
| Mexico | | | 23,154,858 | | | | 480,098 | | | | — | | | | 23,634,956 | |
| Mongolia | | | 8,889 | | | | — | | | | — | | | | 8,889 | |
| Netherlands | | | 42,150,729 | | | | — | | | | — | | | | 42,150,729 | |
| New Zealand | | | 24,572,502 | | | | — | | | | — | | | | 24,572,502 | |
| Norway | | | 4,306,123 | | | | — | | | | — | | | | 4,306,123 | |
| Peru | | | 3,042,246 | | | | — | | | | — | | | | 3,042,246 | |
| Philippines | | | 11,065,199 | | | | — | | | | — | | | | 11,065,199 | |
| Poland | | | 4,085,774 | | | | — | | | | — | | | | 4,085,774 | |
| Portugal | | | 4,258,503 | | | | — | | | | — | | | | 4,258,503 | |
| Qatar | | | 317,502 | | | | — | | | | — | | | | 317,502 | |
| Singapore | | | 72,053,073 | | | | — | | | | 94,290 | | | | 72,147,363 | |
| South Africa | | | 28,592,377 | | | | — | | | | 460 | | | | 28,592,837 | |
| South Korea | | | 50,860,972 | | | | — | | | | — | | | | 50,860,972 | |
| Spain | | | 47,695,204 | | | | 109,212 | | | | — | | | | 47,804,416 | |
| Sweden | | | 43,067,541 | | | | — | | | | — | | | | 43,067,541 | |
| Switzerland | | | 78,475,845 | | | | — | | | | — | | | | 78,475,845 | |
| Taiwan | | | 37,859,316 | | | | — | | | | 121,889 | | | | 37,981,205 | |
| Thailand | | | 26,042 | | | | 12,986,241 | | | | — | | | | 13,012,283 | |
| Turkey | | | 2,943,677 | | | | — | | | | — | | | | 2,943,677 | |
| Ukraine | | | 159,233 | | | | — | | | | — | | | | 159,233 | |
| United Arab Emirates | | | 4,078,056 | | | | — | | | | — | | | | 4,078,056 | |
| United Kingdom | | | 321,926,515 | | | | — | | | | 1,101,296 | | | | 323,027,811 | |
| United States | | | 2,724,217,554 | | | | — | | | | — | | | | 2,724,217,554 | |
| Total Equities | | $ | 5,093,370,964 | | | $ | 16,321,205 | | | $ | 3,289,234 | | | $ | 5,112,981,403 | |
| Exchange Traded Funds | | | 225,694,852 | | | | — | | | | — | | | | 225,694,852 | |
| Investment Company | | | 5,687,300 | | | | — | | | | — | | | | 5,687,300 | |
| Rights/Warrants | | | | | | | | | | | | | | | | |
| Australia | | | — | | | | 5 | | | | — | | | | 5 | |
| France | | | 31,557 | | | | | | | | | | | | 31,557 | |
| Hong Kong | | | 4,250 | | | | 560 | | | | — | | | | 4,810 | |
| Malaysia | | | 70,320 | | | | — | | | | — | | | | 70,320 | |
| South Korea | | | — | | | | 25,418 | | | | — | | | | 25,418 | |
| Spain | | | 13,805 | | | | — | | | | — | | | | 13,805 | |
| Thailand | | | 2,308 | | | | | | | | | | | | 2,308 | |
| Total Rights/Warrants | | $ | 122,240 | | | $ | 25,983 | | | $ | — | | | $ | 148,223 | |
| U.S. Government Agencies | | | — | | | | 30,499,307 | | | | — | | | | 30,499,307 | |
| Cash Sweep | | | 42,529,598 | | | | — | | | | — | | | | 42,529,598 | |
| Old Westbury Funds, Inc. | |
| Notes To Financial Statements - (Continued) | |
| | October 31, 2015 |
| | |
| | | Level 1
Quoted Prices | | | Level 2
Significant
Observable
Inputs | | | Level 3
Significant
Unobservable
Inputs(d) | | | Total | |
| Other financial instruments - Assets*: | | | | | | | | | | | | | | | | |
| Foreign currency exchange contracts | | $ | — | | | $ | 5,389,352 | | | $ | — | | | $ | 5,389,352 | |
| Other financial instruments -Liabilities*: | | | | | | | | | | | | | | | | |
| Foreign currency exchange contracts | | | — | | | | (58,985 | ) | | | — | | | | (58,985 | ) |
| Total | | $ | 5,367,404,954 | | | $ | 52,176,862 | | | $ | 3,289,234 | | | $ | 5,422,871,050 | |
| | | | | | | | | | | | | | | | | |
| Strategic Opportunities Fund | | | | | | | | | | | | | | | | |
| Equity Securities:(b) | | | | | | | | | | | | | | | | |
| Australia | | $ | 2,122,411 | | | $ | — | | | $ | — | | | $ | 2,122,411 | |
| Belgium | | | 3,917,697 | | | | — | | | | — | | | | 3,917,697 | |
| Bermuda | | | 33,107,032 | | | | — | | | | — | | | | 33,107,032 | |
| Brazil | | | 743,480 | | | | — | | | | — | | | | 743,480 | |
| Canada. | | | 9,606,206 | | | | — | | | | — | | | | 9,606,206 | |
| China | | | 11,923,525 | | | | — | | | | — | | | | 11,923,525 | |
| Egypt | | | 620,356 | | | | — | | | | — | | | | 620,356 | |
| Finland | | | 4,047,291 | | | | — | | | | — | | | | 4,047,291 | |
| France | | | 4,357,807 | | | | — | | | | — | | | | 4,357,807 | |
| Germany | | | 13,828,313 | | | | — | | | | — | | | | 13,828,313 | |
| Guernsey | | | 1,394,474 | | | | — | | | | — | | | | 1,394,474 | |
| Hong Kong | | | 36,696,335 | | | | — | | | | 88,906 | | | | 36,785,241 | |
| India | | | 1,670,718 | | | | — | | | | — | | | | 1,670,718 | |
| Ireland | | | 6,114,954 | | | | — | | | | — | | | | 6,114,954 | |
| Israel | | | 530,511 | | | | — | | | | — | | | | 530,511 | |
| Japan | | | 92,979,592 | | | | — | | | | — | | | | 92,979,592 | |
| Malaysia | | | 12,490,074 | | | | — | | | | — | | | | 12,490,074 | |
| Mexico | | | 1,147,835 | | | | — | | | | — | | | | 1,147,835 | |
| Monaco | | | 1,260,640 | | | | — | | | | — | | | | 1,260,640 | |
| Netherlands | | | 13,010,332 | | | | — | | | | — | | | | 13,010,332 | |
| New Zealand | | | 240,302 | | | | — | | | | — | | | | 240,302 | |
| Norway | | | 1,958,361 | | | | — | | | | — | | | | 1,958,361 | |
| Pakistan | | | 2,627,150 | | | | — | | | | — | | | | 2,627,150 | |
| Puerto Rico | | | 1,105,601 | | | | — | | | | — | | | | 1,105,601 | |
| Singapore | | | 11,184,407 | | | | — | | | | — | | | | 11,184,407 | |
| South Africa | | | 491,889 | | | | — | | | | — | | | | 491,889 | |
| South Korea | | | 19,416,943 | | | | — | | | | — | | | | 19,416,943 | |
| Spain | | | 6,311,253 | | | | — | | | | — | | | | 6,311,253 | |
| Switzerland | | | 15,372,066 | | | | — | | | | — | | | | 15,372,066 | |
| Taiwan | | | 17,439,439 | | | | — | | | | — | | | | 17,439,439 | |
| Thailand | | | — | | | | 744,465 | | | | — | | | | 744,465 | |
| Turkey | | | 1,108,882 | | | | — | | | | — | | | | 1,108,882 | |
| United Kingdom | | | 21,325,665 | | | | — | | | | — | | | | 21,325,665 | |
| United States | | | 721,471,162 | | | | — | | | | 258,750 | | | | 721,729,912 | |
| Total Equities | | $ | 1,071,622,703 | | | $ | 744,465 | | | $ | 347,656 | | | $ | 1,072,714,824 | |
| Closed-End Funds | | $ | 467,823,132 | (a) | | $ | — | | | $ | — | | | $ | 467,823,132 | |
| Exchange Traded Funds | | | 120,054,372 | (a) | | | — | | | | — | | | | 120,054,372 | |
| Preferred Stock | | | 10,274,465 | (a) | | | — | | | | — | | | | 10,274,465 | |
| Bank Loans | | | — | | | | 7,980,000 | (a) | | | — | | | | 7,980,000 | |
| Corporate Bonds | | | — | | | | 555,337,474 | (a) | | | 3,332,512 | (c) | | | 558,669,986 | |
| Government Bonds | | | — | | | | 228,111,993 | (a) | | | — | | | | 228,111,993 | |
| Asset-Backed Securities | | | — | | | | 566,049,956 | (a) | | | 29,001,400 | (f) | | | 595,051,356 | |
| Old Westbury Funds, Inc. | |
| Notes To Financial Statements - (Continued) | |
| | October 31, 2015 |
| | |
| | | Level 1
Quoted Prices | | | Level 2
Significant
Observable
Inputs | | | Level 3
Significant
Unobservable
Inputs(d) | | | Total | |
| Non-Agency Mortgage-Backed Securities | | $ | — | | | $ | 678,691,600 | (a) | | $ | — | | | $ | 678,691,600 | |
| U.S. Government Agencies | | | — | | | | 3,169,867,583 | | | | — | | | | 3,169,867,583 | |
| Cash Sweep | | | 147,142,081 | | | | — | | | | — | | | | 147,142,081 | |
| Other financial instruments - Assets*: | | | | | | | | | | | | | | | | |
| Commodity contracts | | | 2,717,144 | | | | 135,630 | | | | — | | | | 2,852,774 | |
| Equity contracts | | | 3,376,000 | | | | 120,498,067 | | | | — | | | | 123,874,067 | |
| Foreign exchange currency contracts | | | — | | | | 33,829,096 | | | | — | | | | 33,829,096 | |
|
| Other financial instruments - Liabilities*: | | | | | | | | | | | | | | | | |
| Commodity contracts | | | (3,664,351 | ) | | | (4,149,355 | ) | | | — | | | | (7,813,706 | ) |
| Equity contracts | | | (72,085 | ) | | | (46,924,030 | ) | | | — | | | | (46,996,115 | ) |
| Interest rate contracts | | | | | | | (4,092,260 | ) | | | — | | | | (4,092,260 | ) |
| Foreign exchange currency contracts | | | — | | | | (17,282,809 | ) | | | — | | | | (17,282,809 | ) |
| Total | | $ | 1,819,273,461 | | | $ | 5,288,797,410 | | | $ | 32,681,568 | | | $ | 7,140,752,439 | |
| | | | | | | | | | | | | | | | | |
| Fixed Income Fund | | | | | | | | | | | | | | | | |
| Corporate Bonds | | $ | — | | | $ | 242,010,586 | (a) | | $ | — | | | $ | 242,010,586 | |
| Asset-Backed Securities | | | — | | | | 40,108,789 | (a) | | | — | | | | 40,108,789 | |
| Municipal Bonds | | | — | | | | 23,057,395 | (a) | | | — | | | | 23,057,395 | |
| Collateralized Mortgage Obligations | | | — | | | | 2,175,377 | (a) | | | | | | | 2,175,377 | |
| U.S. Government Agencies | | | — | | | | 30,994,399 | | | | — | | | | 30,994,399 | |
| U.S. Government Securities | | | — | | | | 238,166,588 | | | | — | | | | 238,166,588 | |
| Government Bonds | | | — | | | | 1,940,872 | (a) | | | — | | | | 1,940,872 | |
| Investment Company | | | 2,952,752 | | | | — | | | | — | | | | 2,952,752 | |
| Total | | $ | 2,952,752 | | | $ | 578,454,006 | | | $ | — | | | $ | 581,406,758 | |
| | | | | | | | | | | | | | | | | |
| Municipal Bond Fund | | | | | | | | | | | | | | | | |
| Municipal Bonds | | $ | — | | | $ | 1,344,926,296 | (a) | | $ | — | | | $ | 1,344,926,296 | |
| U.S. Government Securities | | | — | | | | 12,490,075 | | | | — | | | | 12,490,075 | |
| Investment Company | | | 11,452,700 | | | | — | | | | — | | | | 11,452,700 | |
| Total | | $ | 11,452,700 | | | $ | 1,357,416,371 | | | $ | — | | | $ | 1,368,869,071 | |
| (a) | The breakdown of the Fund’s investments into major categories or countries is disclosed in the respective Fund’s Portfolio of Investments and in footnote 6 for derivatives. |
| (b) | At October 31, 2015, the change in the S&P 500 Index did not exceed the Funds’ predetermined level (see footnote 3.A) and no transfers between levels occurred for the Funds for this reason. Certain investments for reasons other than exceeding the predetermined level for the Small & Mid Cap Fund were transferred into Level 2 from Level 1 in the amount of $700,035, and out of Level 2 into Level 1 in the amount of $856,637. |
| (c) | Represents securities as disclosed in the Bermuda, Hong Kong and the United States sections of the Fund’s Portfolio of Investments. |
| (d) | The Small & Mid Cap Fund and Strategic Opportunities Fund held certain investments categorized as Level 3 that had a combined fair value as well as a change in NAV less than 1% of NAV for the respective Fund for the year ended October 31, 2015. There were transfers into Level 3 of $3,887,364 and out of Level 3 in the amount of $721,411 for the Small & Mid Cap Fund. In addition, there were no significant purchases and sales during the period. As of October 31, 2015, the percentage of NAV was 0.06% and 0.46% for the Small & Mid Cap Fund and Strategic Opportunities Fund, respectively. |
| (e) | Represents securities as disclosed in the Thailand section of the Fund’s Portfolio of Investments. |
| (f) | Represents securities as disclosed in the United States section of the Fund’s Portfolio of Investments. |
* Other financial instruments are exchange traded options and futures (Level 1), over-the-counter options (Level 2), forwards (Level 2) and swaps (Level 2). Futures, forwards and swaps are valued at the unrealized appreciation/(depreciation) on the instrument and options are shown at market value.
The Funds’ policy is to recognize transfers in and transfers out as of the beginning of the period.
| Old Westbury Funds, Inc. | |
| Notes To Financial Statements - (Continued) | |
| | October 31, 2015 |
| | |
| 6. | Derivative Instruments: |
The Funds engage in various portfolio investment strategies utilizing derivatives both to increase the return of the Funds and/or to economically hedge, or protect, their exposure to, for example, interest rate movements, movements in the securities or commodities markets and currency value fluctuations. Derivatives are subject to a number of risks, including changes in the market price of the underlying securities, credit risk with respect to the counterparty to the derivative instruments and the risk of loss due to changes in interest rates. The use of certain derivatives may also have a leveraging effect, which may increase the Fund’s sensitivity to adverse market movements and may exaggerate a loss. Losses may arise if the value of the contract decreases due to, among other potentially adverse events, an unfavorable change in the price of the underlying security or commodity or if the counterparty does not perform under the contract. The use of derivatives can lead to losses because of relatively small adverse movements in the price or value of the underlying security, asset, index or reference rate, which may be magnified by or potentially unlimited as a result of certain features of the derivatives.
The primary difference in risks associated with over-the-counter contracts and exchange-traded contracts is credit and liquidity risks. Over-the-counter contracts, as bilateral arrangements, contain credit risk from various counterparties for any unrealized gains for the duration of the contract. The credit risk related to exchange-traded contracts is minimal because the exchanges ensure that their contracts are always honored. The Funds may mitigate counterparty risk on derivatives through master netting agreements included within an International Swaps and Derivatives Association, Inc. (“ISDA”) Master Agreement between a Fund and each of its counterparties. The ISDA Master Agreement allows each Fund to offset with its counterparty certain derivative financial instruments’ payables and/or receivables with collateral held with each counterparty. The amount of collateral moved to/from applicable counterparties is based upon minimum transfer amounts of up to $1,000,000. To the extent amounts due to the Funds from their counterparties are not fully collateralized contractually or otherwise, the Funds bear the risk of loss from counterparty non-performance.
The Funds’ maximum risk of loss from counterparty credit risk on over-the-counter derivatives is generally the aggregate net unrealized gain in excess of any collateral pledged by the counterparty to the Funds. For over-the-counter purchased options, the Funds bear the risk of loss in the amount of the premiums paid and positive change in market value of the options should the counterparty not perform under the contracts. Written options by the Funds do not give rise to counterparty credit risk, as written options obligate the Funds to perform and not the counterparty. Certain ISDA Master Agreements allow counterparties to over-the-counter derivatives to terminate or require full collateralization of derivative contracts prior to maturity in the event a Fund’s net assets decline by a stated percentage or a Fund fails to meet the terms of its ISDA Master Agreements, which would cause the Funds to post additional collateral or accelerate payment of any net liability owed to the counterparty. There were no trigger events during the year ended October 31, 2015.
Cash collateral that has been pledged to cover obligations of a Fund and cash collateral received from the counterparty, if any, is reported separately on the Statement of Assets and Liabilities as due from brokers for collateral and payable to brokers for collateral, respectively. Non-cash collateral pledged by the Fund, if any, is noted in the Schedule of Investments.
When counterparties post cash collateral with respect to various derivative transactions, a Fund invests the collateral and receives interest income on the investment and pays interest expense on the collateral to the counterparty. The interest income is included in investment income on the Statements of Operations, and the interest expense is included in a Fund’s overall expenses on the Statements of Operations and expense ratio in the Financial Highlights.
As of October 31, 2015, the Funds had transactions subject to enforceable master netting arrangements (“MNA”). For reporting purposes, the Funds do not offset derivative assets and derivative liabilities that are subject to netting arrangements in the Statement of Assets and Liabilities. A reconciliation of the gross amounts on the Statement of Assets and Liabilities to the net amounts by counterparty, including any collateral exposure, is included in the following tables:
| Old Westbury Funds, Inc. | |
| Notes To Financial Statements - (Continued) | |
| | October 31, 2015 |
| | |
Large Cap Strategies Fund
| Counterparty | | Gross Amounts of
Assets
Presented
in the Statement
of Assets and
Liabilities (a) | | Derivatives
Available for
Offset (b) | | Non-Cash
Collateral
Received(c) | | Cash
Collateral
Received(c) | | Net
Amount of
Derivative
Assets (e) | |
| | | | | | | | | | | | | | | | | | | | | | | | | | | |
| Bank of New York Mellon Corp. | | | $ | 10,765,208 | | | | $ | (1,733,541 | ) | | | $ | — | | | | $ | (9,031,667 | ) | | | | $— | | |
| Citibank, N.A. | | | | 6,868,744 | | | | | — | | | | | (6,868,744 | ) | | | | — | | | | | — | | |
| Total | | | $ | 17,633,952 | | | | | | | | | | | | | | | | | | | | | | |
| | | | | | | | | | | | |
| Counterparty | | Gross Amounts of
Liabilities
Presented
in the Statement
of Assets and
Liabilities | | Derivatives
Available for
Offset (b) | | Non-Cash
Collateral
Pledged (c) | | Cash
Collateral
Pledged (c) | | Net
Amount of
Derivative
Liabilities(d) | |
| | | | | | | | | | | | | | | | | | | | | | | | | | | |
| Bank of New York Mellon Corp. | | | $ | 1,733,541 | | | | $ | (1,733,541 | ) | | | | $— | | | | | | | | | | $— | | |
| Total | | | $ | 1,733,541 | | | | | | | | | | | | | | | | | | | | | | |
| | | | | | | | | | | | | | | | | | | | | | | | | | | |
| | | | | | | | | | | | | | | | | | | | | | | | | | | |
| Small & Mid Cap Fund | | | | | | | | | | | | | | | | | | | | | | | |
| | | | | | | | | | | | | | | | | | | | | | | | |
| Counterparty | | Gross Amounts of
Assets
Presented
in the Statement
of Assets and
Liabilities | | Derivatives
Available for
Offset (b) | | Non-Cash
Collateral
Received(c) | | Cash
Collateral
Received(c) | | Net
Amount of
Derivative
Assets (e) | |
| | | | | | | | | | | | | | | | | | | | | | | | | | | |
| Bank of New York Mellon Corp. | | | $ | 2,216,453 | | | | $ | — | | | | $ | — | | | | $ | (2,216,453 | ) | | | $ | — | | |
| Barclays Bank Plc | | | | 75,305 | | | | | — | | | | | — | | | | | (75,305 | ) | | | | — | | |
| Citibank N.A. | | | | 2,108,338 | | | | | (58,985 | ) | | | | (2,048,353 | ) | | | | — | | | | | — | | |
| JPMorgan Chase Bank N.A. | | | | 989,256 | | | | | — | | | | | — | | | | | (989,256 | ) | | | | — | | |
| Derivatives not subject to a MNA or similar agreement (a) | | | | 3,818 | | | | | — | | | | | — | | | | | — | | | | | 3,818 | | |
| Total | | | $ | 5,393,170 | | | | | | | | | | | | | | | | | | | | | | |
| | | | | | | | | | | | | | | | | | | | | | | | | | | |
| Counterparty | | Gross Amounts of
Liabilities
Presented
in the Statement
of Assets and
Liabilities | | Derivatives
Available for
Offset (b) | | Non-Cash
Collateral
Pledged(c) | | Cash
Collateral
Pledged(c) | | Net
Amount of
Derivative
Liabilities(d) | |
| | | | | | | | | | | | | | | | | | | | | | | | | | | |
| Citbank N.A. | | | $ | 58,985 | | | | $ | (58,985 | ) | | | | $— | | | | | $— | | | | $ | — | | |
| Derivatives not subject to a MNA or similar agreement (a) | | | | 4,796 | | | | | — | | | | | — | | | | | — | | | | | 4,796 | | |
| Total | | | $ | 63,781 | | | | | | | | | | | | | | | | | | | | | | |
| | | | | | | | | | | | | | | | | | | | | | | | | | | |
| Old Westbury Funds, Inc. | |
| Notes To Financial Statements - (Continued) | |
| | October 31, 2015 |
| | |
Strategic Opportunities Fund
| Counterparty | | Gross Amounts of
Assets
Presented
in the Statement
of Assets and
Liabilities | | Derivatives
Available for
Offset (b) | | Non-Cash
Collateral
Received(c) | | Cash
Collateral Received(c) | | Net
Amount of
Derivative
Assets (e) | |
| | | | | | | | | | | | | | | | | | | | | | | | | | | |
| Barclays Bank Plc | | | $ | 4,508,981 | | | | $ | (478,275 | ) | | | $ | — | | | | $ | (4,030,706 | ) | | | $ | — | | |
| Bank of America N.A. | | | | 18,960,920 | | | | | (9,063,213 | ) | | | | — | | | | | (5,490,000 | ) | | | | 4,407,707 | | |
| BNP Paribus Group | | | | 7,544,422 | | | | | (7,544,422 | ) | | | | — | | | | | — | | | | | — | | |
| Citibank N.A. | | | | 7,044,537 | | | | | (6,067,388 | ) | | | | (642,510 | ) | | | | — | | | | | 334,639 | | |
| Cargill Inc. | | | | 135,630 | | | | | (135,630 | ) | | | | — | | | | | — | | | | | — | | |
| Credit Suisse International | | | | 26,095,874 | | | | | (3,508,068 | ) | | | | — | | | | | (22,587,806 | ) | | | | — | | |
| Goldman Sachs Group, Inc. | | | | 32,168,450 | | | | | (14,765,043 | ) | | | | (16,869,097 | ) | | | | — | | | | | 534,310 | | |
| JPMorgan Chase Bank, N.A. | | | | 54,746,429 | | | | | (15,903,495 | ) | | | | — | | | | | (38,842,934 | ) | | | | — | | |
| UBS AG | | | | 618,208 | | | | | (618,208 | ) | | | | — | | | | | — | | | | | — | | |
| Derivatives not subject to a MNA or similar agreement (a) | | | | 7,512,519 | | | | | — | | | | | — | | | | | — | | | | | 7,512,519 | | |
| Total | | | $ | 159,335,970 | | | | | | | | | | | | | | | | | | | | | | |
| | | | | | | | | | | | | | | | | | | | | | | | | | | |
| Counterparty | | Gross Amounts
of Liabilities
Presented
in the Statement
of Assets and
Liabilities | | Derivatives Available for Offset (b) | | Non-Cash
Collateral
Pledged (c) | | Cash
Collateral
Pledged (c) | | Net
Amount of
Derivative
Liabilities (d) | |
| | | | | | | | | | | | | | | | | | | | | | | | | | | |
| Barclays Bank Plc | | | $ | 478,275 | | | | $ | (478,275 | ) | | | $ | — | | | | $ | — | | | | $ | — | | |
| Bank of America N.A. | | | | 9,063,213 | | | | | (9,063,213 | ) | | | | — | | | | | — | | | | | — | | |
| Bank of New York Mellon Corp. | | | | 168,167 | | | | | — | | | | | — | | | | | — | | | | | 168,167 | | |
| BNP Paribus Group | | | | 9,828,225 | | | | | (7,544,422 | ) | | | | — | | | | | (2,283,803 | ) | | | | — | | |
| Citibank N.A. | | | | 6,067,388 | | | | | (6,067,388 | ) | | | | — | | | | | — | | | | | — | | |
| Cargill Inc. | | | | 4,110,418 | | | | | (135,630 | ) | | | | — | | | | | (3,510,000 | ) | | | | 464,788 | | |
| Credit Suisse International | | | | 3,508,068 | | | | | (3,508,068 | ) | | | | — | | | | | — | | | | | — | | |
| Goldman Sachs Group, Inc. | | | | 14,765,043 | | | | | (14,765,043 | ) | | | | — | | | | | — | | | | | — | | |
| JPMorgan Chase Bank, N.A. | | | | 15,903,495 | | | | | (15,903,495 | ) | | | | — | | | | | — | | | | | — | | |
| Macquarie Bank Limited | | | | 38,937 | | | | | — | | | | | — | | | | | — | | | | | 38,397 | | |
| UBS AG | | | | 7,546,901 | | | | | (618,208 | ) | | | | — | | | | | (6,630,000 | ) | | | | 298,693 | | |
| Derivatives not subject to a MNA or similar agreement (a) | | | | 3,725,079 | | | | | — | | | | | — | | | | | — | | | | | 3,725,079 | | |
| Total | | | $ | 75,203,209 | | | | | | | | | | | | | | | | | | | | | | |
| (a) | Includes derivatives (futures, exchange traded options and certain forward foreign currency exchange contracts) which are not subject to a MNA, or another similar arrangement. |
| | |
| (b) | The amount of derivatives available for offset is limited to the amount of assets and/or liabilities that are subject to a MNA. |
| | |
| (c) | Excess of collateral received from/payable to the individual counterparty is not shown for financial reporting purposes. |
| | |
| (d) | Represents the net amount payable to counterparty in the event of default. |
| | |
| (e) | Represents the net amount receivable from counterparty in the event of default. |
The Funds are subject to, among other risks, interest rate risk, equity price risk, commodity risk and foreign currency exchange risk in the normal course of pursuing their investment objectives by investing in various derivative financial instruments, as described below.
| Old Westbury Funds, Inc. | |
| Notes To Financial Statements - (Continued) | |
| | October 31, 2015 |
| | |
For open derivative instruments, please see the respective Fund’s Portfolio of Investments or details below:
| | | Fair Values of Derivative Instruments as of October 31, 2015 |
| | | Derivative Assets | | | Derivative Liabilities | |
| Large Cap Strategies Fund | | Statements of Assets
and Liabilities
Location | | Value | | | Statements of Assets
and Liabilities
Location | | Value | |
| Foreign Currency Exchange Risk | | Unrealized appreciation on forward foreign currency exchange contracts | | $ | 17,633,952 | | | Unrealized depreciation on forward foreign currency exchange contracts | | $ | 1,733,541 | |
| Total | | | | $ | 17,633,952 | | | | | $ | 1,733,541 | |
| | | | | | | | | | | | | |
| Small & Mid Cap Fund | | Statements of Assets
and Liabilities
Location | | Value | | | Statements of Assets
and Liabilities
Location | | Value | |
| Foreign Currency Exchange Risk | | Unrealized appreciation on forward foreign currency exchange contracts | | $ | 5,393,170 | | | Unrealized depreciation on forward foreign currency exchange contracts | | $ | 63,781 | |
| Total | | | | $ | 5,393,170 | | | | | $ | 63,781 | |
| | | | | | | | | | | | | |
| Strategic Opportunities Fund | | Statements of Assets
and Liabilities
Location | | Value | | | Statements of Assets
and Liabilities
Location | | Value | |
| | | | | | | | | | | | | |
| Commodity risk | | Investments, at value (purchased options) | | $ | 1,497,177 | | | Written option contracts, at value | | $ | 2,456,742 | |
| | | Unrealized appreciation on swap contracts | | | 135,630 | | | Unrealized depreciation on swap contracts | | | 4,061,294 | |
| | | | | | | | | Structured option contracts, at value | | | 88,061 | |
| | | | | | | | | Variation margin | | | 225,928 | |
| Interest Rate Risk | | | | | | | | Unrealized depreciation on swap contracts | | | 4,092,260 | |
| Equity Risk | | Unrealized appreciation on swap contracts | | | 12,088,943 | | | Unrealized depreciation on swap contracts | | | 8,747,606 | |
| | | Structured option contracts, at value | | | 108,409,124 | | | Structured option contracts, at value | | | 38,176,424 | |
| | | Investments, at value (purchased options) | | | 3,376,000 | | | Written option contracts, at value | | | 72,085 | |
| Foreign Currency Exchange Risk | | Structured option contracts, at value | | | 24,149,126 | | | Structured option contracts, at value | | | 5,507,376 | |
| | | Unrealized appreciation on forward foreign currency exchange contracts | | | 9,679,970 | | | Unrealized depreciation on forward foreign currency exchange contracts | | | 11,775,433 | |
| Total | | | | $ | 159,335,970 | | | | | $ | 75,203,209 | |
| | | The Effect of Derivative Instruments on the Statements of Operations | |
| | | Year Ended October 31, 2015 | |
| | | Net Realized Gain (Loss) from Derivatives Recognized in Income | |
| Large Cap Strategies Fund | | Options | | | Futures Contracts | | | Swaps | | | Foreign Currency
Exchange Contracts | | Total | |
| | | | | | | | | | | | | | | |
| Foreign Currency Exchange Risk | | $ | — | | | $ | — | | | $ | — | | | | $ | 37,119,561 | | | $ | 37,119,561 | |
| Total | | $ | — | | | $ | — | | | $ | — | | | | $ | 37,119,561 | | | $ | 37,119,561 | |
| | | | | | | | | | | | | | | | | | | |
| Small & Mid Cap Fund | | Options | | | Futures Contracts | | | Swaps | | | Foreign Currency
Exchange Contracts | | Total | |
| | | | | | | | | | | | | | | |
| Foreign Currency Exchange Risk | | $ | — | | | $ | — | | | $ | — | | | | $ | 17,866,879 | | | $ | 17,866,879 | |
| Total | | $ | — | | | $ | — | | | $ | — | | | | $ | 17,866,879 | | | $ | 17,866,879 | |
| Old Westbury Funds, Inc. | |
| Notes To Financial Statements - (Continued) | |
| | October 31, 2015 |
| | |
| | | The Effect of Derivative Instruments on the Statements of Operations | |
| | | Year Ended October 31, 2015 | |
| | | Net Realized Gain (Loss) from Derivatives Recognized in Income | |
| Strategic Opportunities Fund | | Options | | | Futures Contracts | | Swaps | | | Foreign Currency
Exchange Contracts | | Total | |
| Commodity Risk | | $ | 489,569 | | | | $ | 250,026 | | | $ | 2,186,263 | | | | $ | — | | | $ | 2,925,858 | |
| Interest Rate Risk | | | — | | | | | — | | | | (771,574 | ) | | | | — | | | | (771,574 | ) |
| Equity Risk | | | 151,829,190 | | | | | (5,576,126 | ) | | | 86,252 | | | | | — | | | | 146,339,316 | |
| Foreign Currency Exchange Risk | | | 19,475,735 | | | | | — | | | | 1,244,983 | | | | | 1,666,892 | | | | 22,387,610 | |
| Total | | $ | 171,794,494 | | | | $ | (5,326,100 | ) | | $ | 2,745,924 | | | | $ | 1,666,892 | | | $ | 170,881,210 | |
| | | | | | | | | | | | | | | | | | |
| | | | | | | | | | | | | | | | | | |
| | | Net Change in Unrealized Appreciation/(Depreciation) | |
| | | on Derivatives Recognized in Income | |
| | | | | | | | | | | | | Foreign Currency | | | |
| Large Cap Strategies Fund | | Options | | | Futures Contracts | | Swaps | | | Exchange Contracts | | Total | |
| Foreign Currency Exchange Risk | | $ | — | | | | $ | — | | | $ | — | | | | $ | 15,900,411 | | | $ | 15,900,411 | |
| Total | | $ | — | | | | $ | — | | | $ | — | | | | $ | 15,900,411 | | | $ | 15,900,411 | |
| | | | | | | | | | | | | | | | | | | | | | | |
| | | | | | | | | | | | | | | | Foreign Currency | | | | |
| Small & Mid Cap Fund | | Options | | | Futures Contracts | | Swaps | | | Exchange Contracts | | Total | |
| Foreign Currency Exchange Risk | | $ | — | | | | $ | — | | | $ | — | | | | $ | 5,145,569 | | | $ | 5,145,569 | |
| Total | | $ | — | | | | $ | — | | | $ | — | | | | $ | 5,145,569 | | | $ | 5,145,569 | |
| | | | | | | | | | | | | | | | | | | | | | | |
| | | | | | | | | | | | | | | | Foreign Currency | | | | |
| Strategic Opportunities Fund | | Options | | | Futures Contracts | | Swaps | | | Exchange Contracts | | Total | |
| Commodity Risk | | $ | (1,114,176 | ) | | | $ | 12,358 | | | $ | (3,925,664 | ) | | | $ | — | | | $ | (5,027,482 | ) |
| Interest Rate Risk | | | — | | | | | — | | | | (1,479,610 | ) | | | | — | | | | (1,479,610 | ) |
| Equity Risk. | | | (17,320,690 | ) | | | | 1,687,389 | | | | 3,877,314 | | | | | — | | | | (11,755,987 | ) |
| Foreign Currency Exchange Risk | | | (7,003,301 | ) | | | | — | | | | 1,350,163 | | | | | (8,012,277 | ) | | | (13,665,415 | ) |
| Total | | $ | (25,438,167 | ) | | | $ | 1,699,747 | | | $ | (177,797 | ) | | | $ | (8,012,277 | ) | | $ | (31,928,494 | ) |
For the year ended October 31, 2015, the quarterly average volume of derivative activities were as follows:
| | | Large Cap Strategies Fund | | | Small & Mid Cap Fund | | | Strategic Opportunities Fund | |
| Structured Options (Notional Amounts) | | | $— | | | | $— | | | | $5,248,441,029 | |
| Purchased Options (Cost $) | | | — | | | | — | | | | 3,230,096 | |
| Written Options (Premium Received $) | | | — | | | | — | | | | 3,350,525 | |
| Futures Long Position (Notional Amounts) | | | — | | | | — | | | | 13,542,214 | |
| Futures Short Position (Notional Amounts) | | | — | | | | — | | | | 53,884,196 | |
| Forward Currency Contracts Purchased (U.S. Dollar Amounts) | | | 60,033,977 | | | | — | | | | 820,744,244 | |
| Forward Currency Contracts Sold (U.S. Dollar Amounts) | | | 845,228,161 | | | | 340,827,980 | | | | 871,286,513 | |
| Currency Swaps (Notional Amount in U.S. Dollars) | | | — | | | | — | | | | 276,250 | |
| Equity Swaps (Notional Amount in U.S. Dollars) | | | — | | | | — | | | | 19,520,766 | |
| Interest Rate Swaps (Notional Amount in U.S. Dollars) | | | — | | | | — | | | | 25,050,000 | |
| Index Swaps as buyer (Notional Amount in U.S. Dollars) | | | — | | | | — | | | | 7,794,301 | |
| Index Swaps as writer (Notional Amount in U.S. Dollars) | | | — | | | | — | | | | 4,701,610 | |
A. Futures Contracts. The Funds purchased or sold futures contracts and options on futures contracts to gain exposure to, or hedge against, changes in the value of equity securities (equity risk), interest rates (interest rate risk) or commodity risk.
Futures contracts are agreements pursuant to which two parties agree to take or make delivery of an amount of cash equal to the difference between the value of the contract at the close of the last trading day and the price at which the contract was originally written. Upon entering into a futures contract, the Funds are required to pledge to a futures commission merchant an amount of cash, U.S. government securities, or other assets, equal to a certain percentage of the contract amount. This is
| Old Westbury Funds, Inc. | |
| Notes To Financial Statements - (Continued) | |
| | October 31, 2015 |
| | |
known as the initial margin deposit. Subsequent payments, known as variation margin, are made or received by the Funds each day, depending on the daily fluctuations in fair value of the underlying instrument. The Funds recognize an unrealized gain or loss equal to the variation margin. These futures contracts permit the Funds to meet their objectives at a lower cost than investing directly in the underlying instruments or commodities, while permitting the equivalent of an investment in a portfolio of the underlying instruments or commodities. A potential risk to the Funds is that the change in value of the underlying securities or commodities may not correlate to the change in value of the contracts. Listed futures contracts involve minimal counterparty risk since futures contracts are guaranteed against default by the exchange on which they trade.
B. Forward Foreign Currency Exchange Contracts. The Funds (except Municipal Bond Fund) may enter into forward foreign currency contracts (“Forward”) to hedge their exposure to changes in foreign currency exchange rates on foreign portfolio holdings (foreign currency exchange risk). In addition, certain Funds may use a Forward to provide exposure to the foreign currency market. A Forward is an agreement between two parties to purchase or sell a foreign currency at a future date at a negotiated forward rate. A Forward is marked-to-market daily and the change in market value is recorded by the Funds as unrealized appreciation or depreciation until the contract settlement date. The market value of the Forward is determined using the forward rate for the remainder of the outstanding period of the contract, through the delivery date. When a Forward is closed or settled, the Funds record a realized gain or loss equal to the fluctuation in rates during the period a Forward was open. Risks may arise upon entering into these contracts from, for example, the potential inability of the counterparties to meet the terms of their contracts, or if the foreign currency rates change unfavorably.
In the event of default by the counterparty to the transaction, the Funds’ maximum amount of loss, as either the buyer or seller, is the unrealized gain of the contract.
The Funds may be required to pledge to the broker an amount of cash, U.S. government securities or other assets, equal to a certain percentage of the contract amount.
As of October 31, 2015, the Large Cap Strategies Fund had the following open Forwards:
| | | | | | | | | | | | | Unrealized | |
| | | | | | | | | | | Settlement | | Appreciation | |
| Currency Purchased | | Currency Sold | | Counterparty | | Date | | (Depreciation) | |
| U.S. Dollar | | 150,000,000 | | Euro | | 137,264,340 | | Bank of New York Mellon Corp. | | 11/10/15 | | | $ | (963,409 | ) |
| U.S. Dollar | | 217,180,709 | | Euro | | 193,002,002 | | Bank of New York Mellon Corp. | | 12/03/15 | | | | 4,845,127 | |
| U.S. Dollar | | 75,800,282 | | Euro | | 66,991,501 | | Bank of New York Mellon Corp. | | 12/03/15 | | | | 2,098,045 | |
| U.S. Dollar | | 179,522,120 | | Japanese Yen | | 21,583,765,000 | | Bank of New York Mellon Corp. | | 12/17/15 | | | | 499,965 | |
| U.S. Dollar | | 79,245,670 | | Euro | | 70,308,787 | | Bank of New York Mellon Corp. | | 01/13/16 | | | | 1,817,988 | |
| Japanese Yen | | 28,836,000,000 | | U.S. Dollar | | 240,135,907 | | Bank of New York Mellon Corp. | | 01/22/16 | | | | (770,132 | ) |
| U.S. Dollar | | 240,869,858 | | Japanese Yen | | 28,836,000,000 | | Bank of New York Mellon Corp. | | 01/22/16 | | | | 1,504,083 | |
| U.S. Dollar | | 113,060,184 | | Euro | | 100,445,980 | | Citibank, N.A. | | 12/03/15 | | | | 2,552,234 | |
| U.S. Dollar | | 113,072,728 | | Euro | | 100,501,947 | | Citibank, N.A. | | 12/03/15 | | | | 2,503,205 | |
| U.S. Dollar | | 79,200,433 | | Euro | | 70,271,962 | | Citibank, N.A. | | 01/13/16 | | | | 1,813,305 | |
| | | | | | | | | | | | | | $ | 15,900,411 | |
As of October 31, 2015, the Small & Mid Cap Fund had the following open Forwards:
| Old Westbury Funds, Inc. | |
| Notes To Financial Statements - (Continued) | |
| | October 31, 2015 |
| | |
| | | | | | | | | | | | | Unrealized |
| | | | | | | | | | | Settlement | | Appreciation/ |
| Currency Purchased | | Currency Sold | | Counterparty | | Date | | (Depreciation) |
| U.S. Dollar | | 200,688,009 | | Euro | | 180,377,500 | | Bank of New York Mellon Corp. | | 12/08/15 | | | $ | 2,216,453 | |
| U.S. Dollar | | 45,000,002 | | Euro | | 40,851,082 | | Barclays Plc | | 11/04/15 | | | | 75,305 | |
| U.S. Dollar | | 105,974,659 | | Euro | | 94,326,719 | | Citibank, N.A. | | 01/08/16 | | | | 2,108,338 | |
| U.S. Dollar | | 9,859,947 | | New Zealand Dollar | | 14,745,500 | | Citibank, N.A. | | 01/29/16 | | | | (58,985 | ) |
| U.S. Dollar | | 50,430,156 | | Euro | | 44,900,000 | | JPMorgan Chase & Co. | | 01/08/16 | | | | 989,256 | |
|
| | | | | | | | | | | | | | $ | 5,330,367 | |
As of October 31, 2015, the Strategic Opportunities Fund had the following open Forwards:
| | | | | | | | | | | | | Unrealized |
| | | | | | | Settlement | | Appreciation/ |
| Currency Purchased | | Currency Sold | | Counterparty | | Date | | (Depreciation) |
| U.S. Dollar | | 3,913,011 | | Euro | | 3,535,300 | | Bank of America N.A. | | 03/29/16 | | | $ | 12,761 | |
| U.S. Dollar | | 500,841 | | Euro | | 451,900 | | Bank of America N.A. | | 03/29/16 | | | | 2,291 | |
| U.S. Dollar | | 3,912,930 | | Euro | | 3,552,300 | | Bank of America N.A. | | 03/29/16 | | | | (6,076 | ) |
| U.S. Dollar | | 2,347,810 | | Euro | | 2,117,500 | | Bank of America N.A. | | 03/30/16 | | | | 11,663 | |
| Australian Dollar | | 6,144,084 | | U.S. Dollar | | 4,436,557 | | Bank of New York Mellon Corp. | | 02/19/16 | | | | (79,036 | ) |
| Swedish Krona | | 164,370,000 | | U.S. Dollar | | 19,403,067 | | Bank of New York Mellon Corp. | | 03/18/16 | | | | (89,131 | ) |
| Chilean Unidad de Fomento | | 100,700,000 | | U.S. Dollar | | 147,384 | | Barclays Plc | | 11/05/15 | | | | (1,652 | ) |
| Swedish Krona | | 86,596,030 | | U.S. Dollar | | 10,000,000 | | Barclays Plc | | 11/13/15 | | | | 138,913 | |
| Chilean Unidad de Fomento | | 261,700,000 | | U.S. Dollar | | 374,178 | | Barclays Plc | | 12/02/15 | | | | 3,270 | |
| U.S. Dollar | | 215,913 | | Japanese Yen | | 25,530,000 | | Barclays Plc | | 12/22/15 | | | | 4,124 | |
| Japanese Yen | | 930,384,000 | | U.S. Dollar | | 7,775,984 | | Barclays Plc | | 01/15/16 | | | | (53,812 | ) |
| Singapore Dollar | | 4,400,417 | | U.S. Dollar | | 3,164,629 | | Barclays Plc | | 02/12/16 | | | | (33,691 | ) |
| U.S. Dollar | | 3,125,851 | | Singapore Dollar | | 4,400,417 | | Barclays Plc | | 02/12/16 | | | | (5,088 | ) |
| U.S. Dollar | | 1,161,987 | | Japanese Yen | | 137,140,000 | | Barclays Plc | | 02/25/16 | | | | 22,673 | |
| U.S. Dollar | | 3,771,936 | | Japanese Yen | | 447,710,000 | | Barclays Plc | | 02/26/16 | | | | 52,415 | |
| U.S. Dollar | | 1,995,954 | | Japanese Yen | | 238,049,400 | | Barclays Plc | | 03/09/16 | | | | 17,663 | |
| U.S. Dollar | | 1,235,649 | | Japanese Yen | | 146,370,000 | | Barclays Plc | | 03/28/16 | | | | 18,664 | |
| U.S. Dollar | | 1,747,966 | | Japanese Yen | | 205,823,000 | | Barclays Plc | | 05/26/16 | | | | 33,686 | |
| U.S. Dollar | | 3,167,842 | | Japanese Yen | | 393,370,000 | | Barclays Plc | | 06/10/16 | | | | (110,149 | ) |
| Indonesian Rupiah | | 61,200,000,000 | | U.S. Dollar | | 4,216,328 | | Barclays Plc | | 07/15/16 | | | | (128,515 | ) |
| U.S. Dollar | | 4,002,616 | | Indonesian Rupiah | | 61,200,000,000 | | Barclays Plc | | 07/15/16 | | | | (85,197 | ) |
| U.S. Dollar | | 1,518,492 | | Japanese Yen | | 185,480,000 | | Barclays Plc | | 07/29/16 | | | | (29,679 | ) |
| U.S. Dollar | | 382,751 | | Japanese Yen | | 47,210,000 | | Barclays Plc | | 08/12/16 | | | | (11,489 | ) |
| Singapore Dollar | | 1,151,000 | | U.S. Dollar | | 818,227 | | Barclays Plc | | 08/17/16 | | | | (3,027 | ) |
| U.S. Dollar | | 813,629 | | Singapore Dollar | | 1,151,000 | | Barclays Plc | | 08/17/16 | | | | (1,571 | ) |
| U.S. Dollar | | 598,931 | | Japanese Yen | | 73,417,000 | | Barclays Plc | | 08/24/16 | | | | (14,405 | ) |
| Chilean Unidad de Fomento | | 422,200,000 | | U.S. Dollar | | 614,825 | | Citibank, N.A. | | 11/09/15 | | | | (4,016 | ) |
| Chilean Unidad de Fomento | | 1,016,252,000 | | U.S. Dollar | | 1,474,860 | | Citibank, N.A. | | 11/10/15 | | | | (4,826 | ) |
| Euro | | 7,500,000 | | U.S. Dollar | | 8,473,050 | | Citibank, N.A. | | 11/13/15 | | | | (224,238 | ) |
| Polish Zloty | | 31,055,100 | | U.S. Dollar | | 8,318,507 | | Citibank, N.A. | | 11/13/15 | | | | (285,887 | ) |
| Old Westbury Funds, Inc. | |
| Notes To Financial Statements - (Continued) | |
| | October 31, 2015 |
| | |
| | | | | | | | | | | | | Unrealized |
| | | | | | | Settlement | | Appreciation/ |
| Currency Purchased | | Currency Sold | | Counterparty | | Date | | (Depreciation) |
| U.S. Dollar | | 7,494,272 | | United Kingdom Pound | | 4,814,313 | | Citibank, N.A. | | 11/13/15 | | | $ | 73,179 | |
| United Kingdom Pound | | 10,000,000 | | U.S. Dollar | | 15,522,303 | | Citibank, N.A. | | 11/13/15 | | | | (107,656 | ) |
| U.S. Dollar | | 907,993 | | Australian Dollar | | 1,138,000 | | Citibank, N.A. | | 11/19/15 | | | | 97,324 | |
| U.S. Dollar | | 1,529,122 | | Japanese Yen | | 177,080,000 | | Citibank, N.A. | | 11/19/15 | | | | 61,392 | |
| Euro | | 7,500,000 | | U.S. Dollar | | 8,239,148 | | Citibank, N.A. | | 11/20/15 | | | | 10,382 | |
| Japanese Yen | | 2,339,987,200 | | U.S. Dollar | | 18,902,158 | | Citibank, N.A. | | 11/20/15 | | | | 493,032 | |
| U.S. Dollar | | 6,833,332 | | United Kingdom Pound | | 4,379,819 | | Citibank, N.A. | | 11/20/15 | | | | 82,274 | |
| United Kingdom Pound | | 4,379,819 | | U.S. Dollar | | 6,829,667 | | Citibank, N.A. | | 11/20/15 | | | | (78,609 | ) |
| Indian Rupee | | 12,050,000 | | U.S. Dollar | | 178,360 | | Citibank, N.A. | | 12/11/15 | | | | 4,626 | |
| U.S. Dollar | | 33,355 | | Australian Dollar | | 43,500 | | Citibank, N.A. | | 12/18/15 | | | | 2,414 | |
| U.S. Dollar | | 337,314 | | Japanese Yen | | 39,830,000 | | Citibank, N.A. | | 12/22/15 | | | | 6,896 | |
| Canadian Dollar | | 2,668,288 | | U.S. Dollar | | 2,047,161 | | Citibank, N.A. | | 01/15/16 | | | | (7,359 | ) |
| Canadian Dollar | | 6,528,410 | | U.S. Dollar | | 5,061,646 | | Citibank, N.A. | | 01/15/16 | | | | (70,932 | ) |
| U.S. Dollar | | 5,000,000 | | Canadian Dollar | | 6,528,410 | | Citibank, N.A. | | 01/15/16 | | | | 9,286 | |
| U.S. Dollar | | 2,016,682 | | Canadian Dollar | | 2,668,288 | | Citibank, N.A. | | 01/15/16 | | | | (23,120 | ) |
| U.S. Dollar | | 8,338,409 | | Canadian Dollar | | 11,075,500 | | Citibank, N.A. | | 01/15/16 | | | | (128,377 | ) |
| U.S. Dollar | | 5,407,413 | | Euro | | 4,616,000 | | Citibank, N.A. | | 01/25/16 | | | | 322,725 | |
| U.S. Dollar | | 1,139,092 | | Euro | | 999,800 | | Citibank, N.A. | | 01/29/16 | | | | 37,679 | |
| U.S. Dollar | | 3,334,386 | | Euro | | 2,903,000 | | Citibank, N.A. | | 02/09/16 | | | | 135,496 | |
| Japanese Yen | | 1,165,172,000 | | U.S. Dollar | | 9,758,478 | | Citibank, N.A. | | 02/19/16 | | | | (80,092 | ) |
| Japanese Yen | | 1,774,177,500 | | U.S. Dollar | | 15,000,000 | | Citibank, N.A. | | 02/19/16 | | | | (262,970 | ) |
| U.S. Dollar | | 24,714,183 | | Canadian Dollar | | 32,314,635 | | Citibank, N.A. | | 02/19/16 | | | | 13,968 | |
| U.S. Dollar | | 1,185,084 | | Euro | | 1,080,000 | | Citibank, N.A. | | 03/10/16 | | | | (5,858 | ) |
| U.S. Dollar | | 14,249,655 | | Euro | | 13,298,791 | | Citibank, N.A. | | 03/16/16 | | | | (417,367 | ) |
| U.S. Dollar | | 700,585 | | Euro | | 620,368 | | Citibank, N.A. | | 03/29/16 | | | | 16,176 | |
| U.S. Dollar | | 1,056,513 | | Euro | | 952,000 | | Citibank, N.A. | | 04/08/16 | | | | 5,982 | |
| U.S. Dollar | | 2,289,744 | | Japanese Yen | | 284,100,000 | | Citibank, N.A. | | 06/10/16 | | | | (77,690 | ) |
| U.S. Dollar | | 66,719 | | Australian Dollar | | 87,700 | | Citibank, N.A. | | 06/20/16 | | | | 4,820 | |
| U.S. Dollar | | 439,996 | | Euro | | 398,462 | | Citibank, N.A. | | 07/28/16 | | | | (1,227 | ) |
| U.S. Dollar | | 375,468 | | Euro | | 341,847 | | Citibank, N.A. | | 08/10/16 | | | | (3,225 | ) |
| U.S. Dollar | | 59,812,404 | | Hong Kong Dollar | | 465,744,000 | | Citibank, N.A. | | 06/12/17 | | | | (299,796 | ) |
| Chilean Unidad de Fomento | | 111,242,000 | | U.S. Dollar | | 157,033 | | Deutsche Bank AG | | 11/02/15 | | | | 3,907 | |
| U.S. Dollar | | 161,220 | | Chilean Unidad de Fomento | | 111,242,000 | | Deutsche Bank AG | | 11/02/15 | | | | 280 | |
| U.S. Dollar | | 58,126 | | Euro | | 45,895 | | Deutsche Bank AG | | 11/03/15 | | | | 7,655 | |
| Chilean Unidad de Fomento | | 91,184,000 | | U.S. Dollar | | 133,466 | | Deutsche Bank AG | | 11/06/15 | | | | (1,492 | ) |
| Indian Rupee | | 58,118,733 | | U.S. Dollar | | 892,898 | | Deutsche Bank AG | | 11/06/15 | | | | (5,250 | ) |
| Indian Rupee | | 6,884,000 | | U.S. Dollar | | 106,522 | | Deutsche Bank AG | | 11/10/15 | | | | (1,449 | ) |
| U.S. Dollar | | 2,379,250 | | Euro | | 1,905,000 | | Deutsche Bank AG | | 11/10/15 | | | | 284,130 | |
| Chilean Unidad de Fomento | | 138,138,000 | | U.S. Dollar | | 200,520 | | Deutsche Bank AG | | 11/12/15 | | | | (756 | ) |
| Chilean Unidad de Fomento | | 100,900,000 | | U.S. Dollar | | 147,871 | | Deutsche Bank AG | | 11/12/15 | | | | (1,958 | ) |
| Chilean Unidad de Fomento | | 304,306,500 | | U.S. Dollar | | 440,641 | | Deutsche Bank AG | | 11/13/15 | | | | (639 | ) |
| Old Westbury Funds, Inc. | |
| Notes To Financial Statements - (Continued) | |
| | October 31, 2015 |
| | |
| | | | | | | | | | | | | Unrealized |
| | | | | | | Settlement | | Appreciation/ |
| Currency Purchased | | Currency Sold | | Counterparty | | Date | | (Depreciation) |
| Chilean Unidad de Fomento | | 118,660,000 | | U.S. Dollar | | 172,810 | | Deutsche Bank AG | | 11/16/15 | | | $ | (1,309 | ) |
| U.S. Dollar | | 230,497 | | Euro | | 184,184 | | Deutsche Bank AG | | 11/16/15 | | | | 27,916 | |
| U.S. Dollar | | 1,233,489 | | Japanese Yen | | 143,060,000 | | Deutsche Bank AG | | 11/18/15 | | | | 47,744 | |
| U.S. Dollar | | 63,451 | | Euro | | 50,759 | | Deutsche Bank AG | | 11/19/15 | | | | 7,620 | |
| Chilean Unidad de Fomento | | 29,726,000 | | U.S. Dollar | | 43,222 | | Deutsche Bank AG | | 11/30/15 | | | | (341 | ) |
| Chilean Unidad de Fomento | | 309,750,000 | | U.S. Dollar | | 449,343 | | Deutsche Bank AG | | 11/30/15 | | | | (2,511 | ) |
| Singapore Dollar | | 350,000 | | U.S. Dollar | | 258,493 | | Deutsche Bank AG | | 11/30/15 | | | | (8,917 | ) |
| Singapore Dollar | | 350,000 | | U.S. Dollar | | 262,497 | | Deutsche Bank AG | | 11/30/15 | | | | (12,920 | ) |
| U.S. Dollar | | 487,187 | | Singapore Dollar | | 700,000 | | Deutsche Bank AG | | 11/30/15 | | | | (11,966 | ) |
| Chilean Unidad de Fomento | | 111,242,000 | | U.S. Dollar | | 160,801 | | Deutsche Bank AG | | 12/02/15 | | | | (357 | ) |
| U.S. Dollar | | 835,959 | | Euro | | 670,000 | | Deutsche Bank AG | | 12/04/15 | | | | 98,824 | |
| Chilean Unidad de Fomento | | 304,306,500 | | U.S. Dollar | | 439,368 | | Deutsche Bank AG | | 12/11/15 | | | | (829 | ) |
| U.S. Dollar | | 3,608,615 | | Euro | | 2,900,000 | | Deutsche Bank AG | | 12/14/15 | | | | 417,225 | |
| Chilean Unidad de Fomento | | 82,860,000 | | U.S. Dollar | | 119,335 | | Deutsche Bank AG | | 12/17/15 | | | | 10 | |
| U.S. Dollar | | 104,520 | | Japanese Yen | | 12,210,000 | | Deutsche Bank AG | | 12/21/15 | | | | 3,233 | |
| Singapore Dollar | | 1,969,400 | | U.S. Dollar | | 1,470,415 | | Deutsche Bank AG | | 12/23/15 | | | | (67,277 | ) |
| U.S. Dollar | | 1,369,665 | | Singapore Dollar | | 1,969,400 | | Deutsche Bank AG | | 12/23/15 | | | | (33,473 | ) |
| Chilean Unidad de Fomento | | 275,762,000 | | U.S. Dollar | | 393,777 | | Deutsche Bank AG | | 01/06/16 | | | | 2,670 | |
| Chilean Unidad de Fomento | | 32,969,000 | | U.S. Dollar | | 47,078 | | Deutsche Bank AG | | 01/06/16 | | | | 319 | |
| Chilean Unidad de Fomento | | 118,660,000 | | U.S. Dollar | | 172,071 | | Deutsche Bank AG | | 01/15/16 | | | | (1,627 | ) |
| Indian Rupee | | 93,183,000 | | U.S. Dollar | | 1,414,764 | | Deutsche Bank AG | | 01/20/16 | | | | (9,306 | ) |
| U.S. Dollar | | 1,138,352 | | Euro | | 971,000 | | Deutsche Bank AG | | 01/20/16 | | | | 68,876 | |
| Chilean Unidad de Fomento | | 81,840,000 | | U.S. Dollar | | 119,387 | | Deutsche Bank AG | | 01/21/16 | | | | (1,900 | ) |
| Polish Zloty | | 11,489,000 | | Euro | | 2,695,556 | | Deutsche Bank AG | | 01/21/16 | | | | (2,603 | ) |
| U.S. Dollar | | 684,855 | | Euro | | 629,000 | | Deutsche Bank AG | | 01/22/16 | | | | (7,966 | ) |
| Indian Rupee | | 13,777,000 | | U.S. Dollar | | 208,983 | | Deutsche Bank AG | | 01/25/16 | | | | (1,358 | ) |
| U.S. Dollar | | 3,523,872 | | Euro | | 3,008,000 | | Deutsche Bank AG | | 01/25/16 | | | | 210,453 | |
| Chilean Unidad de Fomento | | 2,239,980,000 | | U.S. Dollar | | 3,215,590 | | Deutsche Bank AG | | 01/26/16 | | | | (1,461 | ) |
| Indian Rupee | | 22,003,000 | | U.S. Dollar | | 333,715 | | Deutsche Bank AG | | 01/27/16 | | | | (2,228 | ) |
| U.S. Dollar | | 1,099,492 | | Euro | | 997,000 | | Deutsche Bank AG | | 01/27/16 | | | | 1,213 | |
| Chilean Unidad de Fomento | | 29,726,000 | | U.S. Dollar | | 42,997 | | Deutsche Bank AG | | 01/28/16 | | | | (352 | ) |
| Indian Rupee | | 17,195,000 | | U.S. Dollar | | 261,063 | | Deutsche Bank AG | | 01/28/16 | | | | (2,054 | ) |
| Indian Rupee | | 61,156,466 | | U.S. Dollar | | 927,094 | | Deutsche Bank AG | | 01/29/16 | | | | (6,047 | ) |
| U.S. Dollar | | 1,818,422 | | Euro | | 1,580,000 | | Deutsche Bank AG | | 02/09/16 | | | | 77,379 | |
| U.S. Dollar | | 3,429,407 | | Euro | | 3,010,100 | | Deutsche Bank AG | | 02/26/16 | | | | 111,139 | |
| U.S. Dollar | | 428,298 | | Euro | | 380,000 | | Deutsche Bank AG | | 03/02/16 | | | | 9,344 | |
| U.S. Dollar | | 609,808 | | Euro | | 540,850 | | Deutsche Bank AG | | 03/04/16 | | | | 13,487 | |
| U.S. Dollar | | 120,568 | | Euro | | 107,000 | | Deutsche Bank AG | | 03/07/16 | | | | 2,585 | |
| U.S. Dollar | | 2,112,135 | | Euro | | 1,900,000 | | Deutsche Bank AG | | 03/09/16 | | | | 17,010 | |
| Old Westbury Funds, Inc. | |
| Notes To Financial Statements - (Continued) | |
| | October 31, 2015 |
| | |
| | | | | | | | | | | | | Unrealized |
| | | | | | | Settlement | | Appreciation/ |
| Currency Purchased | | Currency Sold | | Counterparty | | Date | | (Depreciation) |
| U.S. Dollar | | 1,938,956 | | Euro | | 1,720,000 | | Deutsche Bank AG | | 03/23/16 | | | $ | 41,675 | |
| U.S. Dollar | | 902,800 | | Euro | | 800,000 | | Deutsche Bank AG | | 03/29/16 | | | | 20,216 | |
| U.S. Dollar | | 677,792 | | Euro | | 615,000 | | Deutsche Bank AG | | 03/29/16 | | | | (695 | ) |
| U.S. Dollar | | 165,396 | | Euro | | 150,689 | | Deutsche Bank AG | | 03/31/16 | | | | (856 | ) |
| U.S. Dollar | | 803,722 | | Euro | | 742,242 | | Deutsche Bank AG | | 04/13/16 | | | | (15,440 | ) |
| U.S. Dollar | | 952,192 | | Euro | | 860,000 | | Deutsche Bank AG | | 04/27/16 | | | | 2,745 | |
| U.S. Dollar | | 757,944 | | Euro | | 684,003 | | Deutsche Bank AG | | 04/29/16 | | | | 2,750 | |
| U.S. Dollar | | 370,970 | | Euro | | 330,000 | | Deutsche Bank AG | | 05/09/16 | | | | 6,505 | |
| U.S. Dollar | | 3,400,343 | | Euro | | 3,001,450 | | Deutsche Bank AG | | 06/13/16 | | | | 81,653 | |
| U.S. Dollar | | 523,049 | | Euro | | 459,000 | | Deutsche Bank AG | | 06/15/16 | | | | 15,502 | |
| U.S. Dollar | | 100,082 | | Japanese Yen | | 12,230,000 | | Deutsche Bank AG | | 06/22/16 | | | | (1,873 | ) |
| U.S. Dollar | | 629,665 | | Euro | | 571,000 | | Deutsche Bank AG | | 07/25/16 | | | | (2,551 | ) |
| U.S. Dollar | | 261,250 | | Euro | | 230,990 | | Deutsche Bank AG | | 08/31/16 | | | | 5,188 | |
| U.S. Dollar | | 2,100,721 | | Euro | | 1,852,488 | | Deutsche Bank AG | | 10/11/16 | | | | 44,413 | |
| U.S. Dollar | | 419,942 | | Euro | | 373,000 | | Goldman Sachs Group, Inc. | | 11/09/15 | | | | 9,722 | |
| U.S. Dollar | | 421,120 | | Euro | | 377,000 | | Goldman Sachs Group, Inc. | | 11/13/15 | | | | 6,480 | |
| U.S. Dollar | | 559,219 | | Japanese Yen | | 66,920,000 | | Goldman Sachs Group, Inc. | | 11/13/15 | | | | 4,580 | |
| U.S. Dollar | | 768,675 | | Euro | | 682,000 | | Goldman Sachs Group, Inc. | | 11/16/15 | | | | 18,555 | |
| U.S. Dollar | | 830,650 | | Euro | | 740,000 | | Goldman Sachs Group, Inc. | | 11/23/15 | | | | 16,666 | |
| U.S. Dollar | | 137,195 | | Japanese Yen | | 16,246,000 | | Goldman Sachs Group, Inc. | | 01/08/16 | | | | 2,369 | |
| U.S. Dollar | | 1,095,097 | | Euro | | 996,000 | | Goldman Sachs Group, Inc. | | 01/27/16 | | | | (2,080 | ) |
| U.S. Dollar | | 1,387,305 | | Japanese Yen | | 162,280,000 | | Goldman Sachs Group, Inc. | | 01/27/16 | | | | 40,119 | |
| U.S. Dollar | | 293,123 | | Euro | | 255,000 | | Goldman Sachs Group, Inc. | | 02/09/16 | | | | 12,131 | |
| U.S. Dollar | | 521,897 | | Euro | | 475,000 | | Goldman Sachs Group, Inc. | | 02/12/16 | | | | (1,556 | ) |
| U.S. Dollar | | 272,926 | | Japanese Yen | | 32,163,000 | | Goldman Sachs Group, Inc. | | 02/12/16 | | | | 5,815 | |
| U.S. Dollar | | 1,815,309 | | Euro | | 1,580,000 | | Goldman Sachs Group, Inc. | | 02/17/16 | | | | 73,931 | |
| U.S. Dollar | | 2,505,710 | | Japanese Yen | | 295,495,910 | | Goldman Sachs Group, Inc. | | 02/17/16 | | | | 51,328 | |
| U.S. Dollar | | 940,000 | | Australian Dollar | | 1,354,684 | | Goldman Sachs Group, Inc. | | 04/06/16 | | | | (17,990 | ) |
| Indian Rupee | | 21,454,750 | | U.S. Dollar | | 324,571 | | HSBC Holdings Plc | | 11/05/15 | | | | 3,257 | |
| Indian Rupee | | 21,454,750 | | U.S. Dollar | | 330,646 | | HSBC Holdings Plc | | 11/05/15 | | | | (2,818 | ) |
| Singapore Dollar | | 1,468,000 | | U.S. Dollar | | 1,058,476 | | HSBC Holdings Plc | | 11/12/15 | | | | (11,040 | ) |
| U.S. Dollar | | 614,828 | | Japanese Yen | | 70,138,000 | | HSBC Holdings Plc | | 11/12/15 | | | | 33,523 | |
| U.S. Dollar | | 1,022,035 | | Singapore Dollar | | 1,468,000 | | HSBC Holdings Plc | | 11/12/15 | | | | (25,401 | ) |
| Indian Rupee | | 7,436,000 | | U.S. Dollar | | 115,119 | | HSBC Holdings Plc | | 11/13/15 | | | | (1,674 | ) |
| Indian Rupee | | 18,770,000 | | U.S. Dollar | | 288,311 | | HSBC Holdings Plc | | 11/13/15 | | | | (1,952 | ) |
| Indian Rupee | | 43,702,000 | | U.S. Dollar | | 675,706 | | HSBC Holdings Plc | | 11/13/15 | | | | (8,978 | ) |
| Singapore Dollar | | 864,000 | | U.S. Dollar | | 614,553 | | HSBC Holdings Plc | | 11/18/15 | | | | 1,796 | |
| U.S. Dollar | | 610,445 | | Singapore Dollar | | 864,000 | | HSBC Holdings Plc | | 11/18/15 | | | | (5,904 | ) |
| U.S. Dollar | | 319,333 | | Japanese Yen | | 37,330,000 | | HSBC Holdings Plc | | 11/24/15 | | | | 9,909 | |
| U.S. Dollar | | 887,553 | | Euro | | 720,487 | | HSBC Holdings Plc | | 12/09/15 | | | | 94,773 | |
| U.S. Dollar | | 2,278,663 | | Japanese Yen | | 285,300,000 | | HSBC Holdings Plc | | 12/09/15 | | | | (87,059 | ) |
| U.S. Dollar | | 104,575 | | Japanese Yen | | 12,230,000 | | HSBC Holdings Plc | | 12/21/15 | | | | 3,122 | |
| Singapore Dollar | | 1,574,000 | | U.S. Dollar | | 1,166,159 | | HSBC Holdings Plc | | 12/22/15 | | | | (44,690 | ) |
| U.S. Dollar | | 1,102,975 | | Singapore Dollar | | 1,574,000 | | HSBC Holdings Plc | | 12/22/15 | | | | (18,494 | ) |
| U.S. Dollar | | 800,111 | | Japanese Yen | | 98,220,000 | | HSBC Holdings Plc | | 01/19/16 | | | | (15,167 | ) |
| U.S. Dollar | | 1,706,568 | | Japanese Yen | | 199,698,335 | | HSBC Holdings Plc | | 01/28/16 | | | | 48,722 | |
| Indian Rupee | | 74,579,000 | | U.S. Dollar | | 1,130,999 | | HSBC Holdings Plc | | 01/29/16 | | | | (7,803 | ) |
| U.S. Dollar | | 2,107,933 | | Euro | | 1,856,000 | | HSBC Holdings Plc | | 02/10/16 | | | | 62,710 | |
| U.S. Dollar | | 3,509,113 | | Japanese Yen | | 413,370,000 | | HSBC Holdings Plc | | 02/12/16 | | | | 76,108 | |
| U.S. Dollar | | 1,183,380 | | Japanese Yen | | 145,609,000 | | HSBC Holdings Plc | | 02/24/16 | | | | (26,261 | ) |
| U.S. Dollar | | 434,532 | | Japanese Yen | | 51,260,000 | | HSBC Holdings Plc | | 02/25/16 | | | | 8,681 | |
| U.S. Dollar | | 1,963,142 | | Japanese Yen | | 234,458,000 | | HSBC Holdings Plc | | 02/29/16 | | | | 15,144 | |
| Old Westbury Funds, Inc. | |
| Notes To Financial Statements - (Continued) | |
| | October 31, 2015 |
| | |
| | | | | | | | | | | | | Unrealized |
| | | | | | | Settlement | | Appreciation/ |
| Currency Purchased | | Currency Sold | | Counterparty | | Date | | (Depreciation) |
| U.S. Dollar | | 456,782 | | Japanese Yen | | 54,300,000 | | HSBC Holdings Plc | | 03/04/16 | | | $ | 5,584 | |
| U.S. Dollar | | 320,227 | | Euro | | 288,000 | | HSBC Holdings Plc | | 03/09/16 | | | | 2,650 | |
| Mexican Peso | | 50,041,430 | | U.S. Dollar | | 3,146,073 | | HSBC Holdings Plc | | 03/11/16 | | | | (146,335 | ) |
| Singapore Dollar | | 2,488,300 | | U.S. Dollar | | 1,756,468 | | HSBC Holdings Plc | | 03/16/16 | | | | 12,632 | |
| U.S. Dollar | | 1,740,496 | | Singapore Dollar | | 2,488,300 | | HSBC Holdings Plc | | 03/16/16 | | | | (28,603 | ) |
| U.S. Dollar | | 1,986,671 | | Euro | | 1,864,543 | | HSBC Holdings Plc | | 04/18/16 | | | | (71,349 | ) |
| U.S. Dollar | | 2,583,803 | | Euro | | 2,263,000 | | HSBC Holdings Plc | | 04/20/16 | | | | 85,859 | |
| U.S. Dollar | | 3,379,502 | | Japanese Yen | | 418,940,000 | | HSBC Holdings Plc | | 06/10/16 | | | | (111,567 | ) |
| U.S. Dollar | | 3,284,103 | | Euro | | 2,975,000 | | HSBC Holdings Plc | | 08/05/16 | | | | (11,018 | ) |
| Singapore Dollar | | 864,000 | | U.S. Dollar | | 614,291 | | HSBC Holdings Plc | | 08/17/16 | | | | (2,359 | ) |
| U.S. Dollar | | 2,495,472 | | Japanese Yen | | 307,492,000 | | HSBC Holdings Plc | | 08/22/16 | | | | (73,188 | ) |
| Mexican Peso | | 102,610,000 | | U.S. Dollar | | 5,859,645 | | HSBC Holdings Plc | | 08/29/16 | | | | 204,055 | |
| U.S. Dollar | | 20,000,000 | | Mexican Peso | | 332,067,240 | | JPMorgan Chase Bank N.A. | | 11/06/15 | | | | (92,956 | ) |
| Indian Rupee | | 2,633,000 | | U.S. Dollar | | 40,755 | | JPMorgan Chase Bank N.A. | | 11/10/15 | | | | (567 | ) |
| U.S. Dollar | | 184,558 | | Euro | | 147,287 | | JPMorgan Chase Bank N.A. | | 11/12/15 | | | | 22,568 | |
| Euro | | 10,000,000 | | U.S. Dollar | | 11,041,541 | | JPMorgan Chase Bank N.A. | | 11/13/15 | | | | (43,124 | ) |
| Euro | | 17,846,658 | | U.S. Dollar | | 20,167,689 | | JPMorgan Chase Bank N.A. | | 11/13/15 | | | | (539,191 | ) |
| Malaysian Ringgit | | 127,940,010 | | U.S. Dollar | | 32,948,202 | | JPMorgan Chase Bank N.A. | | 11/13/15 | | | | (3,187,199 | ) |
| U.S. Dollar | | 20,465,592 | | Malaysian Ringgit | | 80,000,000 | | JPMorgan Chase Bank N.A. | | 11/13/15 | | | | 1,856,244 | |
| U.S. Dollar | | 11,744,245 | | Malaysian Ringgit | | 47,940,010 | | JPMorgan Chase Bank N.A. | | 11/13/15 | | | | 592,591 | |
| U.S. Dollar | | 20,000,000 | | Mexican Peso | | 339,632,200 | | JPMorgan Chase Bank N.A. | | 11/13/15 | | | | (539,827 | ) |
| Chilean Unidad de Fomento | | 41,242,000 | | U.S. Dollar | | 59,845 | | JPMorgan Chase Bank N.A. | | 11/16/15 | | | | (237 | ) |
| U.S. Dollar | | 3,984,998 | | Australian Dollar | | 4,954,000 | | JPMorgan Chase Bank N.A. | | 11/18/15 | | | | 455,769 | |
| U.S. Dollar | | 2,891,516 | | Australian Dollar | | 3,628,000 | | JPMorgan Chase Bank N.A. | | 11/19/15 | | | | 307,063 | |
| Euro | | 15,000,000 | | U.S. Dollar | | 16,480,680 | | JPMorgan Chase Bank N.A. | | 11/20/15 | | | | 18,380 | |
| U.S. Dollar | | 20,000,000 | | Mexican Peso | | 329,189,760 | | JPMorgan Chase Bank N.A. | | 11/20/15 | | | | 102,226 | |
| U.S. Dollar | | 11,427,594 | | Swedish Krona | | 98,313,000 | | JPMorgan Chase Bank N.A. | | 11/20/15 | | | | (84,923 | ) |
| Indian Rupee | | 2,633,000 | | U.S. Dollar | | 39,094 | | JPMorgan Chase Bank N.A. | | 12/03/15 | | | | 946 | |
| U.S. Dollar | | 714,045 | | Euro | | 572,000 | | JPMorgan Chase Bank N.A. | | 12/15/15 | | | | 84,555 | |
| Indian Rupee | | 488,000,000 | | Japanese Yen | | 882,792,000 | | JPMorgan Chase Bank N.A. | | 01/08/16 | | | | 48,532 | |
| Euro | | 18,783,717 | | U.S. Dollar | | 21,284,957 | | JPMorgan Chase Bank N.A. | | 01/15/16 | | | | (598,465 | ) |
| Japanese Yen | | 1,240,569,000 | | U.S. Dollar | | 10,383,642 | | JPMorgan Chase Bank N.A. | | 01/15/16 | | | | (86,940 | ) |
| Malaysian Ringgit | | 234,414,000 | | U.S. Dollar | | 54,000,000 | | JPMorgan Chase Bank N.A. | | 01/15/16 | | | | 369,589 | |
| U.S. Dollar | | 6,982,613 | | Euro | | 6,231,632 | | JPMorgan Chase Bank N.A. | | 01/15/16 | | | | 119,722 | |
| U.S. Dollar | | 20,000,000 | | Malaysian Ringgit | | 83,460,000 | | JPMorgan Chase Bank N.A. | | 01/15/16 | | | | 642,428 | |
| Indian Rupee | | 2,633,000 | | U.S. Dollar | | 40,068 | | JPMorgan Chase Bank N.A. | | 01/19/16 | | | | (348 | ) |
| Malaysian Ringgit | | 14,979,000 | | Euro | | 3,412,850 | | JPMorgan Chase Bank N.A. | | 01/19/16 | | | | (285,198 | ) |
| Euro | | 8,855,647 | | U.S. Dollar | | 10,000,000 | | JPMorgan Chase Bank N.A. | | 02/12/16 | | | | (241,028 | ) |
| U.S. Dollar | | 3,657,687 | | Euro | | 3,186,000 | | JPMorgan Chase Bank N.A. | | 02/17/16 | | | | 146,274 | |
| Euro | | 10,933,416 | | U.S. Dollar | | 12,500,000 | | JPMorgan Chase Bank N.A. | | 02/19/16 | | | | (451,315 | ) |
| Euro | | 15,000,000 | | U.S. Dollar | | 17,099,025 | | JPMorgan Chase Bank N.A. | | 02/19/16 | | | | (566,150 | ) |
| Singapore Dollar | | 2,807,550 | | U.S. Dollar | | 1,984,310 | | JPMorgan Chase Bank N.A. | | 03/03/16 | | | | 12,366 | |
| U.S. Dollar | | 511,403 | | Japanese Yen | | 60,600,000 | | JPMorgan Chase Bank N.A. | | 03/03/16 | | | | 7,869 | |
| U.S. Dollar | | 1,964,503 | | Singapore Dollar | | 2,807,550 | | JPMorgan Chase Bank N.A. | | 03/03/16 | | | | (32,172 | ) |
| U.S. Dollar | | 12,791,223 | | Euro | | 11,944,925 | | JPMorgan Chase Bank N.A. | | 03/16/16 | | | | (382,642 | ) |
| Australian Dollar | | 6,255,646 | | U.S. Dollar | | 4,486,699 | | JPMorgan Chase Bank N.A. | | 03/18/16 | | | | (55,329 | ) |
| Euro | | 22,000,000 | | U.S. Dollar | | 24,381,983 | | JPMorgan Chase Bank N.A. | | 03/18/16 | | | | (117,367 | ) |
| Euro | | 35,000,000 | | U.S. Dollar | | 38,827,145 | | JPMorgan Chase Bank N.A. | | 03/18/16 | | | | (224,346 | ) |
| Malaysian Ringgit | | 15,609,000 | | Japanese Yen | | 427,591,385 | | JPMorgan Chase Bank N.A. | | 04/08/16 | | | | 49,178 | |
| Malaysian Ringgit | | 10,882,486 | | Japanese Yen | | 306,019,424 | | JPMorgan Chase Bank N.A. | | 04/13/16 | | | | (32,408 | ) |
| U.S. Dollar | | 221,364 | | Euro | | 203,185 | | JPMorgan Chase Bank N.A. | | 04/21/16 | | | | (2,921 | ) |
| Old Westbury Funds, Inc. | |
| Notes To Financial Statements - (Continued) | |
| | October 31, 2015 |
| | |
| | | | | | | | | | | | | Unrealized |
| | | | | | | Settlement | | Appreciation/ |
| Currency Purchased | | Currency Sold | | Counterparty | | Date | | (Depreciation) |
| U.S. Dollar | | 3,020,000 | | Japanese Yen | | 360,802,420 | | JPMorgan Chase Bank N.A. | | 04/22/16 | | | $ | 18,217 | |
| U.S. Dollar | | 207,722 | | Euro | | 180,987 | | JPMorgan Chase Bank N.A. | | 05/20/16 | | | | 7,761 | |
| U.S. Dollar | | 480,506 | | Japanese Yen | | 57,068,000 | | JPMorgan Chase Bank N.A. | | 05/20/16 | | | | 5,288 | |
| U.S. Dollar | | 166,921 | | Australian Dollar | | 220,000 | | JPMorgan Chase Bank N.A. | | 06/20/16 | | | | 11,645 | |
| U.S. Dollar | | 2,487,982 | | Australian Dollar | | 3,281,000 | | JPMorgan Chase Bank N.A. | | 06/22/16 | | | | 172,429 | |
| Indonesian Rupiah | | 15,770,000,000 | | Australian Dollar | | 1,433,636 | | JPMorgan Chase Bank N.A. | | 06/23/16 | | | | 48,529 | |
| Indonesian Rupiah | | 6,910,000,000 | | Australian Dollar | | 629,498 | | JPMorgan Chase Bank N.A. | | 06/24/16 | | | | 20,213 | |
| U.S. Dollar | | 3,317,988 | | Euro | | 2,975,000 | | JPMorgan Chase Bank N.A. | | 07/29/16 | | | | 23,618 | |
| U.S. Dollar | | 1,773,396 | | Euro | | 1,606,300 | | JPMorgan Chase Bank N.A. | | 08/05/16 | | | | (5,748 | ) |
| U.S. Dollar | | 1,743,522 | | Euro | | 1,584,300 | | JPMorgan Chase Bank N.A. | | 08/11/16 | | | | (11,597 | ) |
| U.S. Dollar | | 1,795,551 | | Euro | | 1,612,000 | | JPMorgan Chase Bank N.A. | | 08/22/16 | | | | 9,104 | |
| U.S. Dollar | | 1,798,436 | | Japanese Yen | | 221,633,000 | | JPMorgan Chase Bank N.A. | | 08/22/16 | | | | (52,993 | ) |
| U.S. Dollar | | 1,242,439 | | Japanese Yen | | 146,373,000 | | JPMorgan Chase Bank N.A. | | 08/26/16 | | | | 19,536 | |
| U.S. Dollar | | 848,028 | | Euro | | 737,287 | | JPMorgan Chase Bank N.A. | | 08/29/16 | | | | 30,767 | |
| U.S. Dollar | | 947,298 | | Japanese Yen | | 112,727,000 | | JPMorgan Chase Bank N.A. | | 08/29/16 | | | | 5,401 | |
| U.S. Dollar | | 608,503 | | Japanese Yen | | 72,717,000 | | JPMorgan Chase Bank N.A. | | 08/31/16 | | | | 871 | |
| U.S. Dollar | | 4,530,000 | | Japanese Yen | | 535,701,945 | | JPMorgan Chase Bank N.A. | | 09/26/16 | | | | 49,690 | |
| Hong Kong Dollar | | 465,744,000 | | U.S. Dollar | | 60,000,000 | | JPMorgan Chase Bank N.A. | | 06/12/17 | | | | 112,200 | |
| Chilean Unidad de Fomento | | 81,840,000 | | U.S. Dollar | | 118,428 | | Morgan Stanley | | 11/17/15 | | | | (161 | ) |
| U.S. Dollar | | 894,458 | | Euro | | 816,000 | | Morgan Stanley | | 03/10/16 | | | | (5,364 | ) |
| U.S. Dollar | | 762,990 | | Euro | | 686,000 | | Morgan Stanley | | 06/06/16 | | | | 4,655 | |
| U.S. Dollar | | 455,013 | | Euro | | 403,000 | | Morgan Stanley | | 08/15/16 | | | | 8,504 | |
| U.S. Dollar | | 451,840 | | Euro | | 403,000 | | Morgan Stanley | | 08/17/16 | | | | 5,301 | |
| U.S. Dollar | | 417,975 | | Japanese Yen | | 50,022,000 | | Standard Chartered Bank | | 11/13/15 | | | | 3,389 | |
| U.S. Dollar | | 279,122 | | Japanese Yen | | 31,954,500 | | Standard Chartered Bank | | 11/16/15 | | | | 14,274 | |
| U.S. Dollar | | 669,156 | | Japanese Yen | | 78,840,000 | | Standard Chartered Bank | | 01/14/16 | | | | 14,796 | |
| U.S. Dollar | | 1,036,709 | | Japanese Yen | | 127,990,000 | | Standard Chartered Bank | | 01/19/16 | | | | (25,676 | ) |
| U.S. Dollar | | 1,404,159 | | Japanese Yen | | 166,449,000 | | Standard Chartered Bank | | 05/26/16 | | | | 17,821 | |
| Euro | | 12,500,000 | | U.S. Dollar | | 13,954,963 | | UBS AG | | 11/13/15 | | | | (206,942 | ) |
| U.S. Dollar | | 25,000,000 | | Mexican Peso | | 416,128,625 | | UBS AG | | 01/15/16 | | | | (52,145 | ) |
| Swedish Krona | | 41,051,225 | | U.S. Dollar | | 5,000,000 | | UBS AG | | 02/12/16 | | | | (181,344 | ) |
| | | | | | | | | | | | | | $ | (2,095,463 | ) |
C. Swap Agreements. The Funds entered into swap agreements, which are agreements involving two parties to exchange the return generated by a security, currency, commodity, interest rate, index, or other measures for the return generated by another instrument, for example, the agreement to pay interest in exchange for a market-linked return based on a notional amount. The Funds entered into total return, interest rate and other swap agreements. Interest rate swap agreements generally involve the agreement by the Funds to pay a counterparty a fixed or floating rate on a fixed notional amount and to receive a fixed or floating rate on a fixed notional amount, but may also involve the agreement to pay or receive payments derived from changes in interest rates. Periodic payments are generally made during the life of the swap agreement according to the terms and conditions of the agreement and at termination or maturity. Total return swap agreements involve the commitments to pay or receive an amount generally determined by reference to a security, index or other measure in exchange for a specific market linked return, based on notional amounts. To the extent that the total return of the security, index or other measure underlying the transaction exceeds or falls short of the offsetting interest rate-based obligation, the Funds receive or make a payment to the counterparty. Payments received or made by a Fund at the expiration or other termination of the swap agreements are recorded in the Statements of Operations as realized gains or losses, respectively. Swap agreements are marked-to-market daily based on dealer-supplied valuations, and changes in value, including the periodic amounts of interest to be paid or received on swaps, are recorded as unrealized appreciation/(depreciation). Risks may exceed amounts recognized on the
| Old Westbury Funds, Inc. | |
| Notes To Financial Statements - (Continued) | |
| | October 31, 2015 |
| | |
Statements of Assets and Liabilities. These risks include changes in the returns of the underlying instruments, failure of the counterparties to perform under the contracts’ terms and the possible lack of liquidity with respect to the swap agreements. Details of swap agreements open at period end are included in the Portfolios of Investments under the caption “Swap Agreements”.
D. Options. The Funds purchased and wrote (sold) put and call options on equity securities and stock index futures in order to gain exposure to or to protect against changes in the market.
Options on swaps (swaptions) are similar to options on securities except that instead of selling or purchasing the right to buy or sell a security, the writer or purchaser of the swaption is granting or buying the right to enter into a previously agreed upon swap agreement at any time before the expiration of the option.
A call option gives the purchaser of the option the right (but not the obligation) to buy, and obligates the seller to sell (when the option is exercised), the underlying instrument at the exercise price at any time or at a specified time during the option period. A put option gives the holder the right to sell and obligates the writer to buy the underlying instrument at the exercise price at any time or at a specified time during the option period. When a Fund purchases (writes) an option, an amount equal to the premium paid (received) by a Fund is reflected as an asset (liability). The amount of the asset (liability) is subsequently marked-to-market to reflect the current market value of the option purchased (written). When an instrument is purchased or sold through an exercise of an option, the related premium paid (or received) is added to (or deducted from) the basis of the instrument acquired or deducted from (or added to) the proceeds of the instrument sold. When an option expires (or a Fund enters into a closing transaction), a Fund realizes a gain or loss on the option to the extent of the premiums received or paid (or gain or loss to the extent the cost of the closing transaction exceeds the premium received or paid). When a Fund writes a call option, such option is “covered,” meaning that a Fund holds the underlying instrument subject to being called by the option counterparty, or cash in an amount sufficient to cover the obligation. When a Fund writes a put option, such option is covered by cash in an amount sufficient to cover the obligation.
In purchasing and writing options, a Fund bears certain risks, including the market risk of an unfavorable change in the price of the underlying instrument or the risk that a Fund may not be able to enter into a closing transaction due to an illiquid market. Exercise of a written option could result in a Fund purchasing or selling a security at a price different from the current market value.
A Fund may execute transactions in both listed and over-the-counter options. Listed options involve minimal counterparty risk since listed options are guaranteed against default by the exchange on which they trade. Transactions in certain over-the-counter options may expose a Fund to the risk of default by the counterparty to the transaction. In the event of default by the counterparty to the over-the-counter option transaction, a Fund’s maximum amount of loss is the premium paid and unrealized gain (as purchaser) or the unrealized gain of the contract less the premium received (as writer).
A summary of the Strategic Opportunities Fund’s written option transactions for the year ended October 31, 2015 is as follows:
| | | Number of | | | | |
| | | Options | | | Premiums | |
| | | Contracts | | | Received | |
| Contracts outstanding at October 31, 2014 | | | 39,003 | | | $ | 9,945,609 | |
| Options written | | | 80,829 | | | | 18,519,477 | |
| Options terminated in closing purchase transactions | | | (63,154 | ) | | | (8,267,917 | ) |
| Options exercised | | | (35,800 | ) | | | (10,214,834 | ) |
| Options expired | | | (15,362 | ) | | | (6,359,065 | ) |
| Contracts outstanding at October 31, 2015 | | | 5,516 | | | $ | 3,623,270 | |
The Strategic Opportunities Fund invests in structured options to increase or decrease its exposure to an underlying index or group of securities (equity risk) or to increase or decrease its exposure to changes in foreign currency exchange rates (foreign currency exchange risk). These structured options may consist of single or multiple OTC options which are priced as a single security. Structured options may only be exercised at the expiration date, but may be transferred/sold prior to the expiration date. The value of a structured option may either increase or decrease with the underlying index or group of securities, depending on the combination of options used. Structured options are issued in units whereby each unit represents a structure based on a specific index with an initial reference strike price. Generally, the basis of the contracts is the premium received
| Old Westbury Funds, Inc. | |
| Notes To Financial Statements - (Continued) | |
| | October 31, 2015 |
| | |
or paid which is recorded as an asset on the Statement of Assets and Liabilities. The amount of the asset is subsequently market-to-market to reflect the current market value of the structured option. When a structured option is transferred/sold or exercised, the Fund will record a realized gain or loss equal to the difference between the proceeds from (or cost of) the closing transaction and the Fund’s basis in the contract, if any. One type of structure involves the combination of selling a put while buying a call on a specific index. This option would rise in value as the underlying index increases and fall in value as the underlying index decreases. Alternatively, another structure involves the sale of a call and the purchase of a put. This option structure would rise in value as the underlying index decreases and fall in value as the underlying index increases. Upon the exercise of the structured option, the Fund will receive a payment from, or be required to remit a payment to the counterparty, depending on the value of the underlying index at exercise.
| 7. | Investment Advisory Fee,Administration Fee and Other Transactions: |
A. Investment Advisory Fees. The Funds’ investment adviser is BIM, a wholly-owned subsidiary of Bessemer Trust Company, N.A. (“Bessemer”). Bessemer is a subsidiary of The Bessemer Group, Incorporated (“BGI”). The investment advisory fee paid to BIM for advisory services is computed daily and paid monthly in accordance with the following schedule:
| | | | | Next $500 million | | |
| | | First $500 million of | | to $1 billion of | | Average net assets |
| | | average net assets | | average net assets | | exceeding $1 billion |
| Large Cap Core Fund | | | 0.70 | % | | | 0.65 | % | | | 0.60 | % |
| Fixed Income Fund | | | 0.45 | % | | | 0.40 | % | | | 0.35 | % |
| Municipal Bond Fund | | | 0.45 | % | | | 0.40 | % | | | 0.35 | % |
| | | | | | | |
| | | | | | | Average net assets |
| Small & Mid Cap Fund | | | | | | | | | | | 0.85 | % |
| | | | | | | |
| | | | | Next $1.25 billion | | |
| | | First $1.25 billion of | | to $2.5 billion of | | Average net assets |
| | | average net assets | | average net assets | | exceeding $2.5 billion |
| Large Cap Strategies Fund. | | | 0.90 | % | | | 0.85 | % | | | 0.80 | % |
| Strategic Opportunities Fund | | | 1.10 | % | | | 1.05 | % | | | 1.00 | % |
BIM has retained Harding Loevner LP (“Harding Loevner”) (effective February 20, 2015) and Sands Capital Management, LLC (“Sands”) as sub-advisers to manage a segment of the Large Cap Strategies Fund. Harding Loevner and Sands are paid for their services directly by BIM.
BIM has retained Dimensional Fund Advisors LP (“Dimensional”), Champlain Investment Partners, LLC (“Champlain”) and Mondrian Investment Partners Limited (“Mondrian”) as sub-advisers to each manage segments of the Small & Mid Cap Fund. Dimensional, Champlain and Mondrian are paid for their services directly by BIM.
BIM has retained Franklin Advisers, Inc. (“Franklin”), BlackRock Financial Management, Inc. (“BlackRock”), Muzinich & Co., Inc. (“Muzinich”) and TPH Asset Management LLC (“TPH”) as sub-advisers to each manage a segment of the Strategic Opportunities Fund. Franklin, BlackRock, Muzinich and TPH are paid for their services directly by BIM.
B. Administration, Fund Accounting, Transfer Agent and Underwriting Fees. The Corporation, on behalf of each Fund, has entered into an administrative oversight, supervision and coordination services agreement (the “Administrative Agreement”) with Bessemer, pursuant to which Bessemer and Bessemer Trust Company (“BTCO”), an affiliate of BIM, provide certain non-advisory services to the Funds, such as the maintenance of records, the provision of supervisory personnel and the monitoring of the other non-advisory service providers. Under the Administrative Agreement, each Fund pays an annual fee of 0.03% of its average daily net assets for such services. BNY Mellon Investment Servicing (US) Inc. (“BNY Mellon”) acts as administrator, fund accounting agent and transfer agent for the Funds pursuant to an Administration and Accounting Services Agreement and a Transfer Agency Services Agreement, respectively. Certain Officers of the Funds are also employees of BNY Mellon.
The Corporation entered into an Underwriting Agreement with Foreside Funds Distributors LLC for the limited purpose of acting as statutory underwriter to facilitate the registration and distribution of shares of the Funds.
C. Distribution and Shareholder Servicing Fees. The Funds have adopted a shareholder servicing plan (the “Shareholder Servicing Plan”) with Bessemer, pursuant to which Bessemer serves as a shareholder servicing agent and provides certain shareholder support services. Bessemer may engage shareholder sub-servicing agents, such as broker/dealers, banks, trust
| Old Westbury Funds, Inc. | |
| Notes To Financial Statements - (Continued) | |
| | October 31, 2015 |
| | |
companies, investment advisers, and other financial institutions and intermediaries to provide certain shareholder support services and is solely responsible for paying each such shareholder sub-servicing agent from the fee it receives from each of the Funds. Each Fund pays for shareholder support services an annual fee of 0.20% of its average daily net assets; however, with respect to the Fixed Income Fund and the Municipal Bond Fund, Bessemer has contractually committed to waive its shareholder servicing fee to the extent necessary to maintain a maximum shareholder servicing fee at 0.10% through October 31, 2017. The shareholder servicing fee commitment arrangements may be changed or terminated at any time with the approval of the Board. For the year ended October 31, 2015, Bessemer waived shareholder servicing fees in the amount of $585,259 with respect to the Fixed Income Fund and $1,321,814 with respect to the Municipal Bond Fund.
D. Custody Fees. The Large Cap Core Fund, Large Cap Strategies Fund, Fixed Income Fund and Municipal Bond Fund have each retained BTCO, a wholly-owned subsidiary of BGI, to serve as their custodian, and the Small & Mid Cap Fund has retained BTCO to serve as their co-custodian. Pursuant to the Funds’ Custody Agreements, BTCO is responsible for maintaining the custody of these Funds’ securities and cash. BTCO serves as custodian for the Small & Mid Cap Fund only with respect to equity securities of U.S. companies (other than exchange-traded funds) and securities in the form of depositary receipts directly managed by BIM, income, other payments and distributions issued with respect to such securities, proceeds of the sale of such securities, and cash, cash equivalents and money market instruments received and held by BTCO from time to time on behalf of the Small & Mid Cap Fund. For providing these services, BTCO receives a fee calculated and paid monthly at the annual rate of 0.075% of the average daily net assets of the non-U.S. investments for Large Cap Core Fund and Large Cap Strategies Fund and 0.015% of the average daily net assets of each of the Fixed Income Fund and Municipal Bond Fund or portion thereof for the Small & Mid Cap Fund and U.S. investments for Large Cap Core Fund and Large Cap Strategies Fund. The Strategic Opportunities Fund and the Subsidiary have retained Citibank, N.A. (“Citibank”) to serve as their custodian and the Small & Mid Cap Fund has retained Citibank to serve as its co-custodian. Citibank is responsible for maintaining the custody of these Funds’ securities and cash and assets of the Small & Mid Cap Fund managed by the sub-advisers. For providing these services, Citibank receives a fee from each Fund calculated daily and paid monthly based on safekeeping and transaction fees that vary by country.
E. Fee Waivers. BIM may voluntarily waive a portion of its advisory fee to limit the Funds’ total expenses. BIM may terminate this voluntary waiver at any time. BIM, however, does not have the ability to recapture fees currently being waived at a later date. BIM has contractually committed through October 31, 2017 to waive its advisory fees to the extent necessary to maintain the net operating expense ratios, excluding fund transaction costs, investment interest expense, dividend expenses associated with securities sold short and acquired fund fees and expenses, if any, of the Large Cap Core Fund at 1.00%, the Large Cap Strategies Fund at 1.15%, the Small & Mid Cap Fund at 1.11%, the Strategic Opportunities Fund at 1.20%, the Fixed Income Fund at 0.70% and the Municipal Bond Fund at 0.70%. Any waiver amounts are disclosed in the Statements of Operations. For the year ended October 31, 2015, BIM waived $79,057 for the Large Cap Core Fund, $2,785,037 for the Small & Mid Cap Fund and $7,967,318 for the Strategic Opportunities Fund. The Fixed Income Fund and Municipal Bond Fund had shareholder servicing fee waivers of $585,259 and $1,321,814, respectively. The contractual advisory fee waivers and the shareholder servicing fee waivers may be changed or terminated at any time with the approval of the Board.
F. Board of Directors’ Fees. Each Director who is not an “interested person” of the Corporation (as that term is defined under the 1940 Act) (each, an “Independent Director”) receives from the Funds a total annual retainer of $120,000 (plus $50,000 for serving as the Board’s Chairperson, $10,000 as the Board’s Vice Chairperson, $20,000 as the Audit Committee Chairperson, $10,000 as the Pricing Committee Liaison and $10,000 each as the Nominating Committee Chairperson and the Governance Committee Chairperson) and receives for attendance at Board and committee meetings the following:
| | | Noticed to be
In-Person
(whether participating
by phone or in-person) | | | Noticed to be
telephonic | |
| Regular Board Meeting | | $ | 9,000 | | | $ | 4,500 | |
| Special Board Meeting | | | 6,000 | | | | 3,000 | |
| Audit Committee Meeting | | | 5,000 | | | | 2,500 | |
| Nominating Committee Meeting | | | 5,000 | | | | 2,500 | |
| Governance Committee Meeting | | | 5,000 | | | | 2,500 | |
Each Independent Director is reimbursed for all out-of-pocket expenses relating to attendance at meetings of the Board and any Board committee. Directors who are not Independent Directors, officers or employees of BIM and BNY Mellon do not receive compensation from the Funds. Fees paid are allocated to the Funds on a pro rata basis based on net assets.
| Old Westbury Funds, Inc. | |
| Notes To Financial Statements - (Continued) | |
| | October 31, 2015 |
| | |
G. Interest Expense. When cash balances are overdrawn, the Funds are charged by BTCO an overdraft fee equal to 2.25% above the federal funds rate on outstanding balances. Citibank, N.A. charges 2.00% above the London InterBank Offered Rate for any overdrawn cash balances. These amounts, if any, are included in “interest expense” in the Statements of Operations when such expenses are incurred.
| 8. | Securities Transactions: |
Investment transactions for the year ended October 31, 2015, excluding short-term investments and U.S. Government securities, were as follows:
| | | Purchases | | | Sales | |
| Large Cap Core Fund | | $ | 597,888,001 | | | $ | 460,972,835 | |
| Large Cap Strategies Fund | | | 8,969,658,431 | | | | 8,111,266,698 | |
| Small & Mid Cap Fund | | | 2,799,722,267 | | | | 3,752,490,357 | |
| Strategic Opportunities Fund (Consolidated) | | | 3,030,810,060 | | | | 2,313,660,015 | |
| Fixed Income Fund | | | 399,282,624 | | | | 388,159,611 | |
| Municipal Bond Fund | | | 455,747,478 | | | | 405,311,522 | |
Purchase and sales of U.S. Government Securities, excluding those with maturity of one year or less during the year ended October 31, 2015 were as follows:
| | | Purchases | | | Sales | |
| Fixed Income Fund | | $ | 190,925,114 | | | $ | 127,564,144 | |
| Municipal Bond Fund | | | 57,380,098 | | | | — | |
It is the policy of each Fund to qualify as a regulated investment company by complying with the provisions available to certain investment companies as defined in Subchapter M of the Internal Revenue Code of 1986, as amended (the “Code”), and to make distributions from net investment income and net realized capital gains sufficient to relieve it from all, or substantially all, federal income taxes. Federal income tax regulations differ from accounting principles generally accepted in the U.S.; therefore, distributions determined in accordance with tax regulations may differ in amount or character from net investment income and realized gains for financial reporting purposes. Financial reporting records are adjusted for permanent book/tax differences to reflect tax character within the components of net assets in the Statements of Assets and Liabilities. These permanent differences primarily arise from paydowns, real estate investment trusts, passive foreign investment companies, partnerships, utilization of earnings and profits on shareholder redemptions and the tax treatment of foreign currency gains/losses. Financial records are not adjusted for temporary differences. Temporary differences primarily arise from the tax treatment of wash sales, passive foreign investment companies, and index options.
Permanent differences as of October 31, 2015, were as follows:
| | | Increase/(Decrease)
Undistributed
Net Investment Income | | Increase/(Decrease)
Net Realized Gains | | Net Unrealized
Appreciation
(Depreciation) | | Increase/
(Decrease)
Paid-in-Capital |
| Large Cap Core Fund | | $ | (93,734 | ) | | $ | 93,734 | | | $ | — | | | $ | — | |
| Large Cap Strategies Fund | | | (13,447,813 | ) | | | 13,447,813 | | | | — | | | | — | |
| Small & Mid Cap Fund | | | 20,047,579 | | | | (96,499,886 | ) | | | 76,452,307 | | | | — | |
| Strategic Opportunities Fund | | | 36,294,784 | | | | (38,896,307 | ) | | | — | | | | 2,601,523 | |
| Fixed income Fund | | | 1,687,283 | | | | (1,687,284 | ) | | | 1 | | | | — | |
By investing in the Subsidiary, the Strategic Opportunities Fund will gain exposure to commodities and commodity-linked instruments within the limits of Subchapter M of the Code.
| Old Westbury Funds, Inc. | |
| Notes To Financial Statements - (Continued) | |
| | October 31, 2015 |
| | |
The Funds may be subject to taxes imposed by other countries in which they invest. Such taxes are generally based on income earned as well as capital gains and in certain situations, unrealized gains. These taxes are accrued and applied to net investment income, net realized gains and unrealized gains, if applicable, as such income and/or gains are earned.
The Funds may also be subject to capital gains tax in India on gains realized upon the sale of Indian securities. The Funds may accrue a deferred tax liability for unrealized gains on India, Indonesia and Pakistan securities based on existing tax rates and holding periods of the securities. As of October 31, 2015, the Large Cap Strategies Fund, the Small & Mid Cap Fund and the Strategic Opportunities Fund recorded liabilities of $145,571, $129,465 and $86,321, respectively, in the Statements of Assets and Liabilities as an estimate for potential future India, Indonesia and Pakistan capital gain taxes.
The tax character of distributions from the Funds during the year ended October 31, 2015 was as follows (amounts in thousands):
| | | Large Cap
Core Fund | | Large Cap
Strategies Fund | | Small & Mid Cap
Fund | | Strategic
Opportunities
Fund | | Fixed
Income
Fund | | Municipal
Bond
Fund | |
| Distributions paid from: | | | | | | | | | | | | | | | | | | | | | | | | | | | | | | | |
| Ordinary Income | | | $ | 13,732 | | | | $ | 92,723 | | | | $ | 48,279 | | | | $ | 219,097 | | | | $ | 7,735 | | | | $ | 201 | | |
| Net Long Term Capital Gains | | | | 44,984 | | | | | 324,270 | | | | | 558,353 | | | | | 199,203 | | | | | | | | | | 5,449 | | |
| Total Taxable Distributions | | | | 58,716 | | | | | 416,993 | | | | | 606,632 | | | | | 418,300 | | | | | 7,735 | | | | | 5,650 | | |
| Tax Exempt Distributions | | | | — | | | | | — | | | | | — | | | | | — | | | | | — | | | | | 16,353 | | |
| Total Distributions Paid | | | $ | 58,716 | | | | $ | 416,993 | | | | $ | 606,632 | | | | $ | 418,300 | | | | $ | 7,735 | | | | $ | 22,003 | | |
| | | | | | | | | | | | | | | | | | | | | | | | | | | | | | | | |
| The tax character of distributions from the Funds during the year ended October 31, 2014 was as follows (amounts in thousands): |
| |
| | | Large Cap
Core Fund | | Large Cap Strategies
Fund | | Small & Mid Cap
Fund | | Strategic
Opportunities
Fund | | Fixed
Income
Fund | | Municipal
Bond
Fund | |
| Distributions paid from: | | | | | | | | | | | | | | | | | | | | | | | | | | | | | | | |
| Ordinary Income | | | $ | 12,895 | | | | $ | 66,469 | | | | $ | 63,156 | | | | $ | 230,891 | | | | $ | 9,651 | | | | $ | 9 | | |
| Net Long Term Capital Gains | | | | — | | | | | — | | | | | 378,595 | | | | | 109,555 | | | | | 1,053 | | | | | 3,570 | | |
| Total Taxable Distributions | | | | 12,895 | | | | | 66,469 | | | | | 441,751 | | | | | 340,446 | | | | | 10,704 | | | | | 3,579 | | |
| Tax Exempt Distributions | | | | — | | | | | — | | | | | — | | | | | — | | | | | — | | | | | 15,607 | | |
| Total Distributions Paid | | | $ | 12,895 | | | | $ | 66,469 | | | | $ | 441,751 | | | | $ | 340,446 | | | | $ | 10,704 | | | | $ | 19,186 | | |
The difference in classification between the amounts reflected above and the Statements of Changes in Net Assets is primarily due to short-term capital gain distributions.
As of and during the period ended October 31, 2015, the Funds did not have any liabilities for any uncertain tax positions. The Funds recognize interest and penalties, if any, related to unrecognized tax positions as income tax expense in the Statements of Operations. During the year, the Funds did not incur any interest or penalties. The statute of limitation on each Fund’s U.S. federal income tax returns remains open for each of the four years ended October 31, 2015. The statutes of limitations on each Fund’s state and local tax returns may remain open for an additional year depending upon the jurisdiction.
| Old Westbury Funds, Inc. | |
| Notes To Financial Statements - (Continued) | |
| | October 31, 2015 |
| | |
At October 31, 2015, the components of accumulated earnings/(deficits) on a tax basis were as follows:
| | | Large Cap Core
Fund | | Large Cap Strategies
Fund | | Small & Mid Cap
Fund | | Strategic
Opportunities
Fund | | Fixed
Income
Fund | | Municipal
Bond
Fund | |
| Undistributed Tax Exempt Income | | | $ | — | | | | $ | — | | | | $ | — | | | | $ | — | | | | $ | — | | | | $ | 1,689,877 | | |
| Undistributed Ordinary Income | | | | 11,661,215 | | | | | 92,840,697 | | | | | 37,134,010 | | | | | 87,550,794 | | | | | 663,511 | | | | | 363,007 | | |
| Undistributed Realized Capital Gains | | | | 13,076,168 | | | | | 212,412,994 | | | | | 228,197,940 | | | | | 128,106,546 | | | | | — | | | | | 1,052,548 | | |
| Accumulated Earnings | | | | 24,737,383 | | | | | 305,253,691 | | | | | 265,331,950 | | | | | 215,657,340 | | | | | 663,511 | | | | | 3,105,432 | | |
| Other Accumulated Earnings | | | | — | | | | | — | | | | | — | | | | | — | | | | | — | | | | | — | | |
| Deferred Qualified Late-Year Losses | | | | — | | | | | — | | | | | — | | | | | — | | | | | — | | | | | — | | |
| Capital Loss Carryforwards | | | | — | | | | | — | | | | | — | | | | | — | | | | | (4,613,007 | ) | | | | — | | |
| Unrealized Appreciation/Depreciation | | | | 75,265,640 | | | | | 1,812,696,596 | | | | | 1,101,227,212 | | | | | 19,026,222 | | | | | 13,385 | | | | | 26,070,661 | | |
| Other Temporary Differences | | | | — | | | | | — | | | | | — | | | | | (36,952 | ) | | | | — | | | | | — | | |
| Total Accumulated Earnings/(Deficits) | | | $ | 100,003,023 | | | | $ | 2,117,950,287 | | | | $ | 1,366,559,162 | | | | $ | 234,646,610 | | | | $ | (3,936,111 | ) | | | $ | 29,176,093 | | |
As of October 31, 2015, the Fixed Income Fund had a long-term capital loss carryforward of $4,613,007 available to offset future realized capital gains in accordance with the Regulated Investment Company Modernization Act of 2010. This capital loss carryforward is not subject to expiration and must first be utilized to offset future realized gains of the same character.
The capital loss carryforward will reduce the applicable Fund’s taxable income arising from future net realized gains on investments, if any, to the extent permitted by the Code, and thus will reduce the amount of the distributions to shareholders which would otherwise be necessary to relieve the Funds of any liability for federal tax.
Under current tax law, ordinary losses incurred after December 31 of a Fund’s fiscal year may be deferred and treated as occurring on the first business day of the following fiscal year for tax purposes.
The Strategic Opportunities Fund may invest in floating rate loan interests. In connection with these investments, the Strategic Opportunities Fund may also enter into bridge loan commitments (“commitments”). Bridge loan commitments may obligate the Strategic Opportunities Fund to furnish temporary financing to a borrower until permanent financing can be arranged. As of October 31, 2015, the Strategic Opportunities Fund had no outstanding bridge loan commitments. In connection with these commitments, the Strategic Opportunities Fund earns a commitment fee, typically set as a percentage of the commitment amount. Such fee income, which is included in interest income in the Statements of Operations, is recognized ratably over the commitment period.
Management has evaluated the impact of all subsequent events on the Funds and has determined that there were no subsequent events requiring recognition or disclosure in the financial statements.
| 12. | Additional Tax Information (Unaudited) |
Qualified Dividend Income (Unaudited)
The Funds designate a portion of the income dividends distributed during the fiscal year ended October 31, 2015, as Qualified Dividend Income (“QDI”) as defined in the Code as follows:
| Large Cap Core Fund | | 100.00 | % |
| Large Cap Strategies Fund | | 100.00 | % |
| Small & Mid Cap Fund | | 100.00 | % |
| Strategic Opportunities Fund | | 8.98 | % |
Qualified Interest Income (Unaudited)
The Funds designate a portion of the income dividends distributed during the fiscal year ended October 31, 2015, as Qualified Interest Income as defined in the Code as follows:
| Old Westbury Funds, Inc. | |
| Notes To Financial Statements - (Continued) | |
| | October 31, 2015 |
| | |
| Large Cap Core Fund | | 0.01 | % |
| Large Cap Strategies Fund | | 0.06 | % |
| Small & Mid Cap Fund | | 0.03 | % |
| Strategic Opportunities Fund | | 49.61 | % |
| Fixed Income Fund | | 91.31 | % |
| Municipal Bond Fund | | 1.06 | % |
Dividends Received Deduction (Unaudited)
For the fiscal year ended October 31, 2015, the following percentage of income dividends paid by the Funds qualifies for the Dividends Received Deduction available to corporations:
| Large Cap Core Fund | | 59.07 | % |
| Large Cap Strategies Fund | | 100.00 | % |
| Small & Mid Cap Fund | | 54.52 | % |
| Strategic Opportunities Fund | | 5.74 | % |
Long Term Capital Gain Dividends (Unaudited)
The Funds designate Long-Term Capital Gain dividends pursuant to Section 852(b)(3) of the Code for the fiscal year ended October 31, 2015 as follows:
| Large Cap Core Fund | $ | 44,983,869 | |
| Large Cap Strategies Fund | | 324,269,763 | |
| Small & Mid Cap Fund | | 629,500,159 | |
| Strategic Opportunities Fund | | 199,203,307 | |
| Municipal Bond Fund | | 5,448,869 | |
U.S. Government Income (Unaudited)
The percentages of the ordinary income dividends paid by the Funds during the fiscal year ended October 31, 2015 which were derived from U.S. Treasury securities were as follows:
| Large Cap Core Fund | | 0.05 | % |
| Large Cap Strategies Fund | | 0.00 | % |
| Small & Mid Cap Fund | | 0.01 | % |
| Strategic Opportunities Fund | | 0.00 | % |
| Fixed Income Fund | | 28.23 | % |
| Municipal Bond Fund | | 19.42 | % |
Tax Exempt Distributions (Unaudited)
The Municipal Bond Fund designates $16,353,374 as tax exempt dividends paid for the fiscal year ended October 31, 2015.
| Report of Independent Registered Public Accounting Firm | |
| | |
| | |
| | |
To the Board of Directors and Shareholders of
Old Westbury Funds, Inc.
We have audited the accompanying statements of assets and liabilities of Old Westbury Funds, Inc. (comprising, respectively, Large Cap Core Fund, Large Cap Strategies Fund, Small & Mid Cap Fund, Strategic Opportunities Fund (consolidated), Fixed Income Fund, and Municipal Bond Fund (collectively, the “Funds”)), including the portfolios of investments of Large Cap Core Fund, Large Cap Strategies Fund, Strategic Opportunities Fund (consolidated), Fixed Income Fund, and Municipal Bond Fund and the condensed portfolio of investments of Small & Mid Cap Fund, as of October 31, 2015, and the related statements of operations for the year then ended, the statements of changes in net assets for each of the two years in the period then ended and the financial highlights for each of the five years in the period then ended. These financial statements and financial highlights are the responsibility of the Funds’ management. Our responsibility is to express an opinion on these financial statements and financial highlights based on our audits.
We conducted our audits in accordance with the standards of the Public Company Accounting Oversight Board (United States). Those standards require that we plan and perform the audit to obtain reasonable assurance about whether the financial statements and financial highlights are free of material misstatement. We were not engaged to perform an audit of the Funds’ internal control over financial reporting. Our audits included consideration of internal control over financial reporting as a basis for designing audit procedures that are appropriate in the circumstances, but not for the purpose of expressing an opinion on the effectiveness of the Funds’ internal control over financial reporting. Accordingly, we express no such opinion. An audit also includes examining, on a test basis, evidence supporting the amounts and disclosures in the financial statements and financial highlights, assessing the accounting principles used and significant estimates made by management, and evaluating the overall financial statement presentation. Our procedures included confirmation of securities owned as of October 31, 2015, by correspondence with the custodians and brokers. We believe that our audits provide a reasonable basis for our opinion.
In our opinion, the financial statements and financial highlights referred to above present fairly, in all material respects, the financial position of each of the respective Funds comprising Old Westbury Funds, Inc. at October 31, 2015, and the results of their operations for the year then ended, the changes in their net assets for each of the two years in the period then ended and the financial highlights for each of the five years in the period then ended, in conformity with U.S. generally accepted accounting principles.

New York, New York
December 28, 2015
| Old Westbury Funds, Inc. | |
| Directors and Officers of Old Westbury Funds, Inc. (Unaudited) | |
| | |
| | |
Independent and Interested Directors. The following table sets forth certain information with respect to the Directors of the Corporation, each of which, under current Board policy, may serve until the end of the calandar year during which he or she reaches the applicable mandatory retirement age established by the Board.
| Name, Address, and Age | | Position(s)
Held with
the Corporation | | Term
of Office
and Length
of Time
Serves as a
Director of
the
Corporation | | Principal Occupation(s)
During Past 5 Years | | Number of
Portfolios in
Fund
Complex
Overseen by
Director | | Other
Director-
ships1
Held by
Director
During
Past 5
Years |
| Interested Director | | | | | | | | | | |
| | | | | | | | | | | |
Jeffrey J. Glowacki2
10250 Constellation
Boulevard, Suite 2600
Los Angeles, CA
90067
Age: 48 | | Director | | Indefinite term;
3 Years | | Managing Director and Western Region Head, Bessemer Trust Company, N.A. (since January 1, 2014); Managing Director and Senior Resident Officer of Bessemer Trust Company, N.A. (2005 - 2013) | | 6 | | 0 |
| | | | | | | | | | | |
| Independent Directors | | | | | | | | | | |
| | | | | | | | | | | |
Eugene P. Beard
630 Fifth Avenue
New York, NY 10111
Age: 80 | | Chairperson &
Director | | Indefinite term;
17 Years | | Chairman and Chief Executive Officer, Westport Asset Fund, Inc. | | 6 | | 43 |
| | | | | | | | | | | |
Patricia L. Francy
630 Fifth Avenue
New York, NY 10111
Age: 70 | | Vice
Chairperson &
Director | | Indefinite term;
11 Years | | Director, various corporate, not-for-profit and foundation boards. | | 6 | | 14 |
| | | | | | | | | | | |
J. David Officer
630 Fifth Avenue
New York, NY 10111
Age: 67 | | Director | | Indefinite term;
4 Years | | Independent Director, various investment companies, not-for profit boards; Consultant Fidelity (2011); Pershing LLC (2010). | | 6 | | 125 |
| | | | | | | | | | | |
Alexander Ellis III
630 Fifth Avenue
New York, NY 10111
Age: 66 | | Director | | Indefinite term;
2 Year | | General Partner, Rockport Capital Partners (2000-Present). | | 6 | | 16 |
| Old Westbury Funds, Inc. | |
| Directors and Officers of Old Westbury Funds, Inc. (Unaudited) - (Continued) | |
| | |
| | |
| 1 | Directorships held during the last five years in (1) any other investment companies registered under the 1940 Act, (2) any company with a class of securities registered pursuant to Section 12 of the Exchange Act or (3) any company subject to the requirements of Section 15(d) of the Exchange Act. |
| 2 | Directors who are or may be deemed “interested persons” (as defined under the 1940 Act) of the Corporation, BIM (as defined below) or Bessemer (as defined below) are referred to as Interested Directors. Mr. Glowacki is deemed an Interested Director by virtue of his positions as Managing Director and Western Region Head of Bessemer Trust Company, N.A. |
| 3 | Mr. Beard serves, or has served, as Director of the following entities: Cambridge Solutions PLC., Huntsworth PLC., Marc USA Corp., One to One Interactive, Inc., Cambridge Technology, Inc., BBH Fund, Inc., BBH Trust, BBH US Money Market Portfolio, BBH Common Settlement Fund, BBH Common Settlement Fund II, Mattel, Inc., and Catalina Marketing Corporation. |
| 4 | Ms. Francy serves as Director of Siebert Financial Corp. |
| 5 | Mr. Officer serves, or has served, as Director of the following entities: DBX ETF Trust (5), Dreyfus Transfer, Inc.; Dreyfus Service Organization, Inc.; Seven Six Seven Agency, Inc.; Mellon Residential Funding Corp.; Mellon United National Bank; Dreyfus Fund International Limited; Man Long Short Fund; GLG International Small Cap Fund; BNY Mellon Funds Trust; Ilex Partners (Asia) LLC; and The Dreyfus Corporation. |
| 6 | Mr. Ellis serves as Director of Clean Diesel Technologies Inc. |
| Old Westbury Funds, Inc. | |
| Directors and Officers of Old Westbury Funds, Inc. (Unaudited) - (Continued) |
| |
| | |
Officers. The table below sets forth certain information with respect to the Officers of the Corporation:
| Name, Address, and Age | | Position(s)
Held with
the Corporation | | Term of
Office
and Length of
Time Served
as
an Officer of
the
Corporation | | Principal Occupation(s)
During Past 5 Years |
| | | | | | | |
David W. Rossmiller
630 Fifth Avenue
New York, NY 10111
Age: 57 | | President &
Chief Executive
Officer | | Indefinite;
3 Years | | Managing Director and Head of Fixed Income, Bessemer Trust Company, N.A. (Since 2010). |
| | | | | | | |
Steven L. Williamson
630 Fifth Avenue
New York, NY 10111
Age: 62 | | Chief Legal
Officer | | Indefinite;
12 Years | | Managing Director and General Counsel, The Bessemer Group, Incorporated and principal bank subsidiaries (Since 2007). |
| | | | | | | |
Matthew A. Rizzi
630 Fifth Avenue
New York, NY 10111
Age: 42 | | Vice President
Treasurer | | Indefinite;
1 Year
1 Year | | Principal and Head of Trust Accounting and Fees, Bessemer Trust Company, N.A. (Since 2015); Senior Vice President and Head of Trust Accounting, Bessemer Trust Company, N.A. (2007-2014). |
| | | | | | | |
Nicola R. Knight
630 Fifth Avenue
New York, NY 10111
Age: 52 | | Chief Compliance
Officer
Assistant Secretary | | Indefinite;
Since March
2015
6 Years | | Principal and Associate General Counsel of Bessemer Trust Company, N.A. (Since 2007). |
| | | | | | | |
Richard Murtagh
630 Fifth Avenue
New York, NY 10111
Age: 54 | | Vice President &
Assitant
Treasurer | | Indefinite;
1 Year | | Principal, Managing Director and Corporate Controller, Bessemer Trust Company, N.A. (Since 2010). |
| Old Westbury Funds, Inc. | |
| Directors and Officers of Old Westbury Funds, Inc. (Unaudited) - (Continued) |
| |
| | |
| Name, Address, and Age | | Position(s)
Held with
the Corporation | | Term of
Office
and Length of
Time Served
as
an Officer of
the
Corporation | | Principal Occupation(s)
During Past 5 Years |
| | | | | | | |
David Schwart
801 Brickell Avenue
Suite 2250
Miami, FL 33131
Age: 45 | | Anti-Money
Laundering
Compliance
Officer | | Indefinite; Since June 2015 | | Vice President & Associate Director of Bank Compliance, Bessemer Trust Company, N.A. (Since April 2013); Vice President & Internal Audit Manager, BNP Paribas (2009 to March 2013). |
| | | | | | | |
Andrew J. McNally
760 Moore Road
King of Prussia, PA
19406
Age: 44 | | Vice President
Assistant Treasurer | | Indefinite; 9 Years
6 Years | | Vice President and Senior Director of Fund Accounting & Administration, BNY Mellon Investment Servicing (US) Inc. (“BNY Mellon”) (financial services company) (Since 2007). |
| | | | | | | |
Jack Jafolla
760 Moore Road
King of Prussia, PA
19406
Age: 45 | | Assistant Treasurer | | Indefinite; 9 Years | | Senior Manager of NAV Operations, BNY Mellon (Since 2008) |
| | | | | | | |
William H. Wallace, III
301 Bellevue Parkway
Wilmington, DE
19809
Age: 45 | | Secretary | | Indefinite; Since October 2015 | | Vice President and Manager of BNY Mellon (Since 2010). |
The Statement of Additional Information (“SAI”) includes additional information about the Corporation’s Directors and Officers and is available upon request, without charge. To obtain a copy of the SAI, please call (800) 607-2200.
| Additional Information (Unaudited) |
| | |
| | |
| | |
Information on Proxy Voting:
The Funds’ proxy voting guidelines, used to determine how to vote proxies relating to portfolio securities and information regarding how the Funds voted proxies relating to portfolio securities during the most recent 12-month period ended June 30 is available (i) without charge, upon request, by calling (800) 607-2200; and (ii) on the U.S. Securities and Exchange Commission’s (“SEC”) website at http://www.sec.gov.
Information on Form N-Q:
The Funds provide a complete list of the Funds’ holdings four times in each fiscal year, at the quarter-ends. For the second and fourth quarters, the Schedule of Investments appear in the Funds’ semi-annual and annual reports to shareholders. For the first and third quarters, the Funds file the Schedule of Investments with the SEC on Form N-Q. Shareholders can obtain the Funds’ Form N-Q (i) without charge, upon request, by calling (800) 607-2200; and (ii) on the SEC’s website at http://www.sec.gov. The Fund’s N-Q may be reviewed or copied at the SEC Public Reference Room in Washington D.C. Information on the operation of the Public Reference Room may be obtained by calling (800) SEC-0330.
| Old Westbury Funds, Inc. | |
| Renewal of Investment Advisory Agreement and Sub-Advisory Agreements (Unaudited) |
| |
| | |
At a meeting held on July 22, 2015, the Board of Directors (the “Board” or the “Directors”) of Old Westbury Funds, Inc. (the “Corporation”), including the Directors who are not “interested persons” (as defined under the Investment Company Act of 1940 (the “1940 Act”)) of any party to the agreements defined below (“Independent Directors”), unanimously approved the continuation of the following investment advisory and sub-advisory agreements (collectively, the “Agreements”): (1) an investment advisory agreement between Bessemer Investment Management LLC (“BIM” or the “Adviser”) and the Corporation on behalf of Old Westbury Large Cap Core Fund (“Large Cap Core Fund”), Old Westbury Large Cap Strategies Fund (“Large Cap Strategies Fund”), Old Westbury Small & Mid Cap Fund (“Small & Mid Cap Fund”), Old Westbury Strategic Opportunities Fund (“Strategic Opportunities Fund”), Old Westbury Fixed Income Fund (“Fixed Income Fund”), and Old Westbury Municipal Bond Fund (“Municipal Bond Fund”) (each, a “Fund” and, collectively, the “Funds”), (2) a sub-advisory agreement among BIM, Dimensional Fund Advisors LP (“Dimensional”) and the Corporation on behalf of the Small & Mid Cap Fund, (3) a sub-advisory agreement among BIM, Champlain Investment Partners, LLC (“Champlain”) and the Corporation on behalf of the Small & Mid Cap Fund, (4) a sub-advisory agreement among BIM, Mondrian Investment Partners Limited (“Mondrian”) and the Corporation on behalf of the Small & Mid Cap Fund, (5) a sub-advisory agreement among BIM, Franklin Advisers, Inc. (“Franklin”) and the Corporation on behalf of the Strategic Opportunities Fund, (6) a sub-advisory agreement among BIM, BlackRock Financial Management, Inc. (“BlackRock”) and the Corporation on behalf of the Strategic Opportunities Fund, (7) a sub-advisory agreement among BIM, Sands Capital Management, LLC (“Sands”) and the Corporation on behalf of the Large Cap Strategies Fund, and (8) a sub-advisory agreement among BIM, Muzinich & Co, Inc. (“Muzinich” and, collectively with Dimensional, Champlain, Mondrian, Franklin, BlackRock, and Sands, the “Sub-Advisers”) and the Corporation on behalf of the Strategic Opportunities Fund. At both the meeting of the Board held on July 22, 2015 and the meeting of the Board held on April 21, 2015, the Board had requested and received substantial information regarding the Adviser, each of the Sub-Advisers, and the Agreements, as well as related matters pertaining to the fee rates charged and services provided by affiliated service providers. The Directors reviewed detailed due diligence questionnaires from BIM and each of the Sub-Advisers, as well as substantial information concerning, among other things, each Fund’s performance, comparative fee and expense information as well as information regarding BIM and each of the Sub-Advisers relating to their respective organizations, compliance and regulatory processes and programs and financial conditions. The Directors also discussed and considered economies of scale and how the Adviser shared those economies with the Funds’ shareholders. The Board received and discussed information concerning BIM’s and each Sub-Adviser’s performance, the use of affiliated brokers to execute transactions, the use of soft dollars, best execution, portfolio manager compensation, and whether there are any other direct or indirect benefits received by the Adviser or Sub-Adviser in managing the Funds. In addition, the Adviser supplied the Directors with additional information concerning its estimated profitability from managing the Funds. Moreover, the Board had received and considered materials and presentations throughout the course of the year relating to the investment management, performance and operation of the Funds.
The Board considered information about BIM and the Sub-Advisers, the performance of the Funds and certain additional factors described above and below that it deemed relevant. The following summary details the materials and factors that the Board considered, among others, and the conclusions they reached, in approving the continuance of the Agreements.
(1) The nature, extent and quality of services provided by the Adviser and Sub-Advisers.
The Board considered the scope and quality of services provided by the Adviser and Sub-Advisers, particularly the qualifications, capabilities and experience of the investment, operational, compliance, legal and other personnel who are responsible for providing services to the Funds. The Board also considered the fact that the Adviser and Sub-Advisers pay the costs of all investment and management facilities necessary for the efficient conduct of their respective services. The Board further considered the role and efforts of the Adviser in providing oversight of the various Sub-Advisers for the Funds, including in overseeing the service of, and in monitoring the performance of, each Sub-Adviser, as well as determining the appropriate allocation of assets to Sub-Advisers. The Board also considered the Adviser’s role in making recommendations to the Board regarding retaining or replacing Sub-Advisers where appropriate and in conducting the necessary searches and due diligence of prospective new sub-advisers. In this regard, the Board noted the information that it had received regarding the Adviser’s on-going due diligence with respect to each Sub-Adviser, including the Adviser’s review of, among other things, each Sub-Adviser’s investment process, compliance program and performance. The Board also considered the role of the Pricing Committee in the valuation of the Funds’ portfolio instruments, including its role in determining fair values for securities pursuant to the Corporation’s Valuation Policies, as well as its role in selecting and monitoring pricing service providers and, foreign fair value service providers.
In addition, the Board considered that the Adviser manages the overall investment program of the Funds and that the Adviser keeps the Board informed of important developments affecting the Funds, both in connection with the Board’s annual review of the Advisory and Sub-Advisory Agreements and at each Board meeting. The Board also noted that it received in-person reports from each Sub-Adviser throughout the year. The Board evaluated these factors based on its direct experience with the
| Old Westbury Funds, Inc. | |
| Renewal of Investment Advisory Agreement and Sub-Advisory Agreements (Unaudited) - (Continued) |
| |
| | |
Adviser, and in consultation with Counsel to the Corporation and Counsel to the Independent Directors, as well as Counsel to the Independent Directors alone. The Board also considered the Adviser’s effectiveness in ensuring that the Funds are in compliance with their respective investment policies and restrictions and the requirements of the 1940 Act and related securities regulations. The Board further noted the Adviser’s and its affiliates’ efforts to oversee the Funds’ other service providers, including those providing administrative, accounting and custodial services.
Based on these factors, as well as other factors discussed herein, the Board concluded that the nature, quality and extent of services provided by the Adviser and Sub-Advisers have been and continue to be satisfactory.
(2) The performance of the Funds and the Adviser and Sub-Advisers.
The Board’s analysis of the Funds’ performance included the discussion and review of the performance data of each of the Funds against securities benchmarks as well as against a competitive group of similar funds, based on, in part, information provided by an independent, third-party mutual fund data provider. The Board considered that for some Funds, like the Strategic Opportunities Fund, the investment strategy employed by the Fund was distinct from any securities benchmark and was different than that employed by other funds, making performance comparisons against benchmarks and industry peers difficult or less meaningful. The Board reviewed comparative performance over long-, intermediate- and short-term periods. In reviewing performance, the Board placed greater emphasis on longer term performance than on shorter term performance, taking into account that over short periods of time underperformance may be transitory. The Board also considered the performance of the Funds in the context of whether the Funds were meeting the expectations of the clients invested in the Funds. In this regard, the Board considered that the Fixed Income Fund and the Municipal Bond Fund were designed as conservative investment products and that clients were most interested in capital preservation when investing in those particular Funds. As a result, the Board determined that the Fixed Income Fund and Municipal Bond Fund appeared to be meeting their investment objectives even though both Funds had underperformed their competitive peer groups in recent years.
The Board considered the performance of each of the Sub-Advisers both against comparative benchmarks as well as against similarly managed accounts managed by such Sub-Adviser. In this regard, the Board noted that the recent underperformance by certain Sub-Advisers was the result of a very short period of underperformance and that otherwise performance was competitive. When reviewing Sub-Adviser performance against similarly managed accounts, the Board considered, among other things, differences in the nature of such accounts from a regulatory and tax perspective and differences in the investment mandate from that of the Funds. In evaluating the Funds’ performance, the Board also considered the principal role of the Funds as part of the asset allocation strategy for client accounts maintained by Bessemer and its affiliates.
(3) The cost of the advisory and sub-advisory services and the profits to the Adviser and its affiliates from the relationship with the Funds.
In connection with the Board’s consideration of the level of the advisory and sub-advisory fees, the Board considered a number of factors. The Board’s analysis of each Fund’s advisory fees and estimated expenses included a discussion and review of data concerning the current fee and expense ratios of each Fund compared to a peer group of similar funds and noted that each Fund’s advisory fee and expenses were generally in line with those of their representative group. The Board also noted the applicable advisory fee breakpoints as well as the Adviser’s contractual commitment to waive advisory fees for certain of the Funds. Additionally, the Board considered the Adviser’s profitability. With respect to the sub-advisory agreements with the Sub-Advisers, the Board noted that the Sub-Advisers’ fees were paid entirely by the Adviser so that no additional expenses would be borne by shareholders for the engagement of the Sub-Advisers. The Board noted that Sub-Advisory fee levels were arrived at pursuant to an arms-length negotiation between the Adviser and each Sub-Adviser. The Board also considered fee data from the Sub-Advisers with respect to similarly managed accounts and considered the relevance of differences in the services provided to separate accounts as they relate to differences in the fees charged in connection with the Funds.
Based on this analysis as well as other factors described herein, including the fact that the Funds are intended principally to satisfy asset allocation requirements of client accounts maintained by Bessemer and its affiliates, the Board concluded that the advisory fee schedule for each Fund was fair and reasonable in light of the quality of services provided by the Adviser and Sub-Advisers.
(4) The extent to which economies of scale will be realized as the Funds grow and whether fee levels reflect those economies of scale.
The Board considered the information provided by the Adviser relating to economies of scale. In this regard, the Board noted the current advisory fee breakpoint levels at $500 million and $1 billion with respect to Large Cap Core Fund, Fixed Income
| Old Westbury Funds, Inc. | |
| Renewal of Investment Advisory Agreement and Sub-Advisory Agreements (Unaudited) - (Continued) |
| |
| | |
Fund and Municipal Bond Fund, and at $1.25 billion and $2.5 billion for the Strategic Opportunities Fund and Large Cap Strategies Fund. The Board also considered the experience of the Adviser in managing the Funds, as well as the Adviser’s profitability analysis. With respect to the Small & Mid Cap Fund, the Board determined that it would continue to monitor whether breakpoints would be appropriate should this Fund continue to grow in size. The Board also noted other areas where each Fund may share in economies of scale, including through potential lower fees charged by third-party service providers based on the combined size of the Funds.
(5) Ancillary benefits and other factors.
In addition to the above factors, the Board also discussed other benefits received by the Adviser, the Sub-Advisers and their affiliates from the management of the Funds (such as soft-dollar credits), including the ability to market their advisory services for similar products in the future. In addition, the Board discussed the compensation payable by the Funds to affiliates of the Adviser for other services including administrative services, shareholder servicing and custody. The Board considered comparative information relating to the fees charged for these services and reviewed reports from the Adviser and its affiliates regarding their capabilities and experience in providing these services. The Board also discussed the use of the Funds as asset allocation investment vehicles for clients of Bessemer and its affiliates, with the resulting expectation that the asset sizes of the Funds would grow as Bessemer’s client base grows. The Board concluded that advisory and sub-advisory fees were reasonable in light of these fall-out benefits.
Conclusion:
The Board, including all of the Independent Directors, concluded that the fees payable under the Investment Advisory Agreement and Sub-Advisory Agreements were fair and reasonable with respect to the services that BIM and each Sub-Adviser provides, in light of the factors described above that the Board deemed relevant. The Board based its decision on an evaluation of all these factors as a whole and did not consider any one factor as all-important or controlling. The Independent Directors were also assisted by the advice of Counsel to the Independent Directors, as well as Counsel to the Corporation, in making this determination.
| Old Westbury Funds, Inc. | |
| Approval of New Sub-Advisory Agreement with TPH Asset Management LLC (Unaudited) |
| |
| | |
At a meeting held on July 22, 2015, the Board of Directors including the Independent Directors unanimously approved a new Sub-Advisory Agreement among Bessemer Investment Management LLC (“BIM” or the “Adviser”), TPH Asset Management LLC (“TPH”) and the Corporation on behalf of the Old Westbury Strategic Opportunities Fund (the “Fund”) (the “Sub-Advisory Agreement”). The Board noted that, as a key threshold matter, the fees payable to TPH under the Sub-Advisory Agreement would be paid by the Adviser from the advisory fees that it receives from the Fund.
In approving the Sub-Advisory Agreement with TPH, the Board considered the overall fairness of the Sub-Advisory Agreement and whether the Sub-Advisory Agreement was in the best interests of the Fund. The Board noted that it had received and reviewed information from the Adviser with respect to TPH at the July 22, 2015 meeting. The Board also noted that it had received and reviewed substantial information regarding TPH, and the services to be provided by TPH to the Fund under the Sub-Advisory Agreement. This information, which included a detailed due diligence questionnaire from TPH, as well as information concerning its organization, compliance program and financial condition, formed, in part, the primary (but not exclusive) basis for the Board’s determinations. The Board also noted that the Independent Directors had met in executive session with their counsel and counsel to the Corporation, as well as with the Adviser to discuss the Adviser’s recommendation regarding TPH’s appointment. During the executive session, the Independent Directors reviewed their legal responsibilities in approving the Sub-Advisory Agreement and discussed materials and other information provided to them. The Board concluded that they had received adequate information to make a reasonable determination with respect to the approval of the Sub-Advisory Agreement.
The Board’s conclusions are based on the comprehensive consideration of all information presented to it and are not the result of any single controlling factor.
The following summary details the factors considered by the Board and the conclusions that formed the basis for the Board’s approval of the proposed Sub-Advisory Agreement.
(1) The nature, extent and quality of services to be provided by TPH.
The Board considered the scope and quality of services to be provided by TPH, including the fact that TPH pays the costs of all investment and management facilities necessary for the efficient conduct of its services. The Board also considered, among other things, the qualifications and experience of the individual portfolio managers responsible for managing TPH’s portion of the Fund, as well as the compliance, operational and trading capabilities of TPH.
Based on these considerations, as well as those discussed below, the Board concluded that the nature, extent and quality of services to be provided by TPH were satisfactory.
(2) The performance of TPH.
The Board considered the performance data provided by TPH with respect to other accounts and determined that, while TPH had begun managing this strategy only in 2013, since that time it had demonstrated an ability to appropriately manage assets in the style expected to be used by TPH in connection with the Fund.
(3) The cost of the advisory services and comparative fee rates.
The Board noted that TPH’s fee would be paid entirely by BIM. The Directors reviewed the level of the proposed fee against a number of different benchmarks and peer comparisons. Based on these considerations, as well as other factors described herein, the Board, including all of the Independent Directors, concluded that TPH’s sub-advisory fee was fair and reasonable in light of the quality of services to be provided by TPH.
(4) The extent to which economies of scale will be realized as the Fund grows and whether fee levels reflect those economies of scale.
The Board discussed whether any economies of scale would be realized with respect to the management of the Fund and whether the Fund would benefit from any such economies of scale. The Board noted in this regard that the proposed sub-advisory fee contained breakpoints and that BIM would bear TPH’s sub-advisory fee. The Directors undertook to continue to monitor the appropriateness of the sub-advisory fee, taking into account the potential impact of economies of scale, as the mandate grew.
| Old Westbury Funds, Inc. | |
| Approval of New Sub-Advisory Agreement with TPH Asset Management LLC (Unaudited) - (Continued) |
| |
| | |
(5) Ancillary benefits and other factors.
In addition to the above factors, the Board also discussed whether there were other benefits received by BIM, TPH, or their affiliates, from TPH’s relationship with the Fund. The Board concluded that any such fall-out benefits (such as soft dollar-credits) resulting from the proposed engagement of TPH were such that it did not affect the Board’s conclusion that the proposed sub-advisory fee was reasonable.
Conclusion:
The Board, including all of the Independent Directors, concluded that the fee to be paid to TPH under the Sub-Advisory Agreement was fair and reasonable with respect to the services that TPH would provide, in light of the factors described above that the Board deemed relevant. The Board based its decision on an evaluation of all these factors as a whole and did not consider any one factor as all-important or controlling. The Independent Directors were also assisted by the advice of Counsel to the Independent Directors, as well as Counsel to the Corporation, in making this determination.
Investment Adviser: Bessemer Investment Management LLC 630 Fifth Avenue New York, NY 10111 (212) 708-9100 Distributor: Foreside Funds Distributors LLC 400 Berwyn Park 899 Cassatt Road Berwyn, PA 19312 Custodians: Bessemer Trust Company 100 Woodbridge Center Drive Woodbridge, NJ 07095 Citibank, N.A. 388 Greenwich Street New York, NY 10013 | Administrator: BNY Mellon Investment Servicing (US) Inc. 760 Moore Road King of Prussia, PA 19406 Transfer Agent: BNY Mellon Investment Servicing (US) Inc. 760 Moore Road King of Prussia, PA 19406 Independent Registered Public Accounting Firm: Ernst & Young LLP 5 Times Square New York, NY 10036 |
Mutual funds are not bank deposits or obligations, are not guaranteed by any bank, and are not insured or guaranteed by the U.S. government, the Federal Deposit Insurance Corporation, the Federal Reserve Board, or any other government agency. Investment in mutual funds involves investment risks, including possible loss of principal.
This report is authorized for distribution to prospective investors only when preceded or accompanied by the Funds’ prospectus which contains facts concerning the Funds’ objectives and policies, management fees, expenses and other information.
The information in this report is based on data obtained from recognized services and sources and is believed to be reliable. Any opinions, projections, or recommendations in this report are subject to change without notice and are not intended as individual investment advice. Furthermore, Bessemer Investment Management LLC and its affiliates, as agents for their clients, and any of its officers or employees may have a beneficial interest or position in any of the securities mentioned, which may be contrary to any opinion or projection expressed in this report.
Cusip 680414307
Cusip 680414604
Cusip 680414109
Cusip 680414406
Cusip 680414505
Cusip 680414802
(A21-AR2015)
(12/15)
Item 2. Code of Ethics.
| (a) | The registrant, as of the end of the period covered by this report, has adopted a code of ethics that applies to the registrant’s principal executive officer, principal financial officer, principal accounting officer or controller, or persons performing similar functions, regardless of whether these individuals are employed by the registrant or a third party. |
The Code of Ethics for Principal Executive and Principal Financial Officers is attached as an Exhibit under Item 12 (a)(1).
| (c) | There have been no amendments, during the period covered by this report, to a provision of the code of ethics that applies to the registrant’s principal executive officer, principal financial officer, principal accounting officer or controller, or persons performing similar functions, regardless of whether these individuals are employed by the registrant or a third party, and that relates to any element of the code of ethics description. |
| (d) | The registrant has not granted any waivers, including an implicit waiver, from a provision of the code of ethics that applies to the registrant’s principal executive officer, principal financial officer, principal accounting officer or controller, or persons performing similar functions, regardless of whether these individuals are employed by the registrant or a third party, that relates to one or more of the items set forth in paragraph (b) of this item’s instructions. |
Item 3. Audit Committee Financial Expert.
The registrant’s board of directors has determined that the registrant has two audit committee financial experts serving on its audit committee and those persons (Patricia L. Francy and J. David Officer) are “independent” for purposes of this Item 3 of Form N-CSR.
Item 4. Principal Accountant Fees and Services.
Audit Fees
| (a) | The aggregate fees billed for each of the last two fiscal years for professional services rendered by the principal accountant for the audit of the registrant’s annual financial statements or services that are normally provided by the accountant in connection with statutory and regulatory filings or engagements for those fiscal years are $792,000 in 2015 and $810,224 in 2014. |
Audit-Related Fees
| (b) | The aggregate fees billed in each of the last two fiscal years for assurance and related services by the principal accountant that are reasonably related to the performance of the audit of the registrant’s financial statements and are not reported under paragraph (a) of this Item are $13,957 in 2015 and $6,857 in 2014. Fees for both 2015 and 2014 relate to the review of financial statement data incorporated in the Funds periodic N-1A filings. |
Tax Fees
| (c) | The aggregate fees billed in each of the last two fiscal years for professional services rendered by the principal accountant for tax compliance, tax advice, and tax planning are $250,577 in 2015 and $218,344 in 2014. Fees for both 2015 and 2014 relate to the review of federal income and excise tax returns, review of capital gains distribution calculations and certain global tax compliance services. |
All Other Fees
| (d) | The aggregate fees billed in each of the last two fiscal years for products and services provided by the principal accountant, other than the services reported in paragraphs (a) through (c) of this Item are $51,800 in 2015 and $49,852 in 2014. Fees for both 2015 and 2014 relate to the review of holdings for the Funds affiliated custodian under Rule 17f-2 and regulatory reporting for OWF Real Return Fund Ltd. in 2014 and regulatory reporting for OWF Strategic Opportunities Fund Ltd. in 2015. |
| (e) | (1) | Disclose the audit committee’s pre-approval policies and procedures described in paragraph (c)(7) of Rule 2-01 of Regulation S-X. |
| | Before an auditor is engaged by the Funds to render audit services, the Audit Committee reviews and approves the engagement, including all related fees. The Audit Committee also reviews and approves in advance, unless excepted under Rule 2-01(c)(7) of Regulation S-X, any proposal that the Funds employ their auditor to render “permissible non-audit services” to the Funds, including all related fees. In addition, the Audit Committee reviews and approves in advance, unless excepted under Rule 2-01(c)(7) of Regulation S-X, any proposal that the Adviser, and any entity controlling, controlled by, or under common control with the Adviser that provides ongoing services to the Funds, employ the Funds’ Auditor to render non-audit services, if such engagement would relate directly to the operations and financial reporting of the Funds. As a part of its review, the Audit Committee considers whether the provision of such services does not impact the Auditor’s independence. |
| (e) | (2) | The percentage of services described in each of paragraphs (b) through (d) of this Item that were approved by the audit committee pursuant to paragraph (c)(7)(i)(C) of Rule 2-01 of Regulation S-X are as follows: |
| (f) | The percentage of hours expended on the principal accountant’s engagement to audit the registrant’s financial statements for the most recent fiscal year that were attributed to work performed by persons other than the principal accountant’s full-time, permanent employees was zero percent. |
| (g) | The aggregate non-audit fees billed by the registrant’s accountant for services rendered to the registrant, and rendered to the registrant’s investment adviser (not including any sub-adviser whose role is primarily portfolio management and is subcontracted with or overseen by another investment adviser), and any entity controlling, controlled by, or under common control with the adviser that provides ongoing services to the registrant for each of the last two fiscal years of the registrant was $302,377 in 2015 and $268,196 in 2014. |
| (h) | The registrant’s audit committee of the board of directors has considered whether the provision of non-audit services that were rendered to the registrant’s investment adviser (not including any sub-adviser whose role is primarily portfolio management and is subcontracted with or overseen by another investment adviser), and any entity controlling, controlled by, or under common control with the investment adviser that provides ongoing services to the registrant that were not pre-approved pursuant to paragraph (c)(7)(ii) of Rule 2-01 of Regulation S-X is compatible with maintaining the principal accountant’s independence. |
Item 5. Audit Committee of Listed Registrants.
Not applicable.
Item 6. Investments.
| (a) | The Schedule of Investments in securities of unaffiliated issuers as of the close of reporting period for the Old Westbury Small & Mid Cap Fund is listed below. The Schedules of Investments in securities of unaffiliated issuers as of the close of the reporting period for the Old Westbury Large Cap Core Fund, Old Westbury Large Cap Strategies Fund, Old Westbury Strategic Opportunities Fund, Old Westbury Fixed Income Fund and Old Westbury Municipal Bond Fund are included as part of the report to shareholders filed under Item 1 of this form. |
| Old Westbury Funds, Inc. | |
| Small & Mid Cap Fund | |
| Portfolio of Investments | October 31, 2015 |
| | |
| Shares | | | | | Value | |
| COMMON STOCKS — 93.8% | | | |
| AUSTRALIA — 1.6% | | | | |
| | 29,208 | | | Acrux Ltd. | | $ | 15,309 | |
| | 135,571 | | | Adelaide Brighton Ltd. | | | 405,071 | |
| | 69,555 | | | AED Oil Ltd.(b)(c)(d) | | | 0 | |
| | 34,185 | | | Ainsworth Game Technology Ltd. | | | 77,520 | |
| | 119,863 | | | Alcyone Resources Ltd.(b)(c)(d) | | | 17 | |
| | 155,615 | | | ALS Ltd. | | | 571,490 | |
| | 13,518 | | | Altium Ltd. | | | 43,379 | |
| | 620,028 | | | Alumina Ltd. | | | 479,723 | |
| | 32,208 | | | Amalgamated Holdings Ltd. | | | 321,545 | |
| | 32,227 | | | Ansell Ltd. | | | 462,379 | |
| | 14,818 | | | AP Eagers Ltd. | | | 112,747 | |
| | 298,227 | | | APN News & Media Ltd.(d) | | | 109,523 | |
| | 48,666 | | | Aquarius Platinum Ltd.(d) | | | 8,502 | |
| | 4,250 | | | Arb Corp Ltd. | | | 44,824 | |
| | 129,172 | | | Aristocrat Leisure Ltd. | | | 858,488 | |
| | 1,547,765 | | | Arrium Ltd. | | | 110,371 | |
| | 455,767 | | | Asciano Ltd. | | | 2,665,057 | |
| | 76,846 | | | ASG Group Ltd.(d) | | | 60,279 | |
| | 18,459 | | | ASX Ltd. | | | 542,583 | |
| | 14,463 | | | Atlas Iron Ltd. | | | 289 | |
| | 82,510 | | | Ausdrill Ltd. | | | 20,299 | |
| | 253,296 | | | Ausnet Services | | | 261,003 | |
| | 28,194 | | | Austal Ltd. | | | 45,840 | |
| | 17,417 | | | Austbrokers Holdings Ltd. | | | 116,624 | |
| | 188,262 | | | Australian Agricultural Co. Ltd.(d) | | | 202,717 | |
| | 141,784 | | | Australian Pharmaceutical Industries Ltd. | | | 200,190 | |
| | 97,516 | | | Automotive Holdings Group Ltd. | | | 295,539 | |
| | 156,976 | | | Bank of Queensland Ltd. | | | 1,463,048 | |
| | 636,439 | | | Beach Energy Ltd. | | | 290,460 | |
| | 11,095 | | | Bega Cheese Ltd. | | | 45,889 | |
| | 352,728 | | | Bendigo & Adelaide Bank Ltd. | | | 2,691,371 | |
| | 163,094 | | | Billabong International Ltd.(d) | | | 85,482 | |
| | 2,067 | | | Blackmores Ltd. | | | 247,141 | |
| | 183,375 | | | BlueScope Steel Ltd. | | | 583,210 | |
| | 385,623 | | | Boral Ltd. | | | 1,482,182 | |
| | 15,029 | | | Breville Group Ltd. | | | 70,412 | |
| | 17,433 | | | Brickworks Ltd. | | | 180,629 | |
| | 17,980 | | | BT Investment Management Ltd. | | | 146,294 | |
| | 53,909 | | | Cabcharge Australia Ltd. | | | 108,408 | |
| | 279,117 | | | Carnarvon Petroleum Ltd.(d) | | | 23,885 | |
| | 16,047 | | | carsales.com Ltd. | | | 112,142 | |
| | 129,012 | | | Cash Converters International Ltd. | | | 47,379 | |
| | 9,912 | | | Cedar Woods Properties Ltd. | | | 29,687 | |
| | 80,706 | | | Challenger Ltd. | | | 473,648 | |
| | 3,919,941 | | | Charter Hall Retail REIT | | | 11,852,097 | |
| | 18,195 | | | Cimic Group Ltd. | | | 359,662 | |
| | 84,396 | | | Coal of Africa Ltd.(d) | | | 3,129 | |
| | 108,165 | | | Coca-Cola Amatil Ltd. | | | 702,676 | |
| | 14,586 | | | Cochlear Ltd. | | | 925,192 | |
| Shares | | | | | Value | |
| AUSTRALIA (continued) | | | | |
| | 119,759 | | | Coffey International Ltd.(d) | | $ | 35,013 | |
| | 10,611 | | | Collins Foods Ltd. | | | 26,635 | |
| | 85,798 | | | Computershare Ltd. | | | 661,382 | |
| | 6,689 | | | Corporate Travel Management Ltd. | | | 53,757 | |
| | 2,733,399 | | | Costa Group Holdings Ltd.(d) | | | 4,541,599 | |
| | 14,117 | | | Credit Corp. Group Ltd. | | | 88,286 | |
| | 30,098 | | | CSG Ltd. | | | 34,555 | |
| | 302,614 | | | CSR Ltd. | | | 597,749 | |
| | 23,943 | | | Dick Smith Holdings Ltd. | | | 11,866 | |
| | 15,520 | | | Domino’s Pizza Enterprises Ltd. | | | 517,396 | |
| | 258,769 | | | Downer EDI Ltd. | | | 655,074 | |
| | 46,652 | | | Drillsearch Energy Ltd.(d) | | | 26,281 | |
| | 132,240 | | | DUET Group | | | 222,548 | |
| | 51,932 | | | DuluxGroup Ltd. | | | 218,493 | |
| | 399,693 | | | Echo Entertainment Group Ltd. | | | 1,456,456 | |
| | 13,853 | | | Elders Ltd.(d) | | | 42,280 | |
| | 307,875 | | | Emeco Holdings Ltd.(d) | | | 12,075 | |
| | 37,250 | | | Energy Resources of Australia Ltd.(d) | | | 9,031 | |
| | 48,647 | | | Energy World Corp. Ltd.(d) | | | 8,673 | |
| | 17 | | | Equity Trustees Ltd. | | | 280 | |
| | 6,453 | | | ERM Power Ltd. | | | 7,547 | |
| | 458,102 | | | Evolution Mining Ltd. | | | 458,974 | |
| | 775,588 | | | Fairfax Media Ltd. | | | 522,652 | |
| | 43,260 | | | FAR Ltd.(d) | | | 2,560 | |
| | 16,777 | | | Finbar Group Ltd. | | | 13,758 | |
| | 1,598 | | | Fleetwood Corp. Ltd.(d) | | | 1,761 | |
| | 9,044 | | | Flight Centre Travel Group Ltd. | | | 244,750 | |
| | 23,059 | | | Folkestone Education Trust REIT | | | 36,504 | |
| | 397,219 | | | Fortescue Metals Group Ltd. | | | 592,006 | |
| | 18,176 | | | G.U.D. Holdings Ltd. | | | 104,209 | |
| | 6,608 | | | G8 Education Ltd. | | | 14,136 | |
| | 57,126 | | | GrainCorp Ltd. - Class A | | | 368,665 | |
| | 16,663 | | | Greencross Ltd. | | | 74,384 | |
| | 66,510 | | | GWA Group Ltd. | | | 117,622 | |
| | 28,670 | | | Hansen Technologies Ltd. | | | 62,560 | |
| | 241,775 | | | Harvey Norman Holdings Ltd. | | | 686,190 | |
| | 1,000 | | | HFA Holdings Ltd. | | | 2,032 | |
| | 28,596 | | | Hills Ltd. | | | 8,870 | |
| | 12,050 | | | IMF Bentham Ltd. | | | 12,374 | |
| | 463,090 | | | Incitec Pivot Ltd. | | | 1,304,405 | |
| | 105,134 | | | Independence Group NL | | | 207,670 | |
| | 72,251 | | | Infigen Energy(d) | | | 19,321 | |
| | 40,796 | | | Infomedia Ltd. | | | 21,382 | |
| | 782,895 | | | Invocare Ltd. | | | 6,202,509 | |
| | 53,982 | | | IOOF Holdings Ltd. | | | 359,539 | |
| | 34,010 | | | Iress Ltd. | | | 227,731 | |
| | 21,267 | | | JB Hi-Fi Ltd. | | | 272,372 | |
| | 35,487 | | | Kingsgate Consolidated Ltd.(d) | | | 16,702 | |
| | 72,663 | | | Lend Lease Group | | | 673,607 | |
| | 39,250 | | | M2 Group Ltd. | | | 277,092 | |
| | 39,514 | | | MACA Ltd. | | | 24,373 | |
| | 328,362 | | | Macmahon Holdings Ltd.(d) | | | 23,181 | |
| | 24,272 | | | Macquarie Atlas Roads Group | | | 70,618 | |
| Old Westbury Funds, Inc. | |
| Small & Mid Cap Fund | |
| Portfolio of Investments - (Continued) | October 31, 2015 |
| | |
| Shares | | | | | Value | |
| AUSTRALIA (continued) | | | | |
| | 16,274 | | | Magellan Financial Group Ltd. | | $ | 261,460 | |
| | 34,583 | | | Mayne Pharma Group Ltd.(d) | | | 25,278 | |
| | 18,709 | | | McMillan Shakespeare Ltd. | | | 167,701 | |
| | 198,975 | | | Medibank Pvt Ltd. | | | 334,858 | |
| | 10,438 | | | Melbourne IT Ltd. | | | 14,217 | |
| | 17,031 | | | Mesoblast Ltd.(b)(d) | | | 41,414 | |
| | 51,147 | | | Metals X Ltd. | | | 50,150 | |
| | 36,321 | | | Metcash Ltd. | | | 30,822 | |
| | 52,702 | | | Mincor Resources NL | | | 9,771 | |
| | 14,861 | | | Mineral Resources Ltd. | | | 45,357 | |
| | 732,000 | | | MMG Ltd.(d) | | | 161,500 | |
| | 26,875 | | | Monadelphous Group Ltd. | | | 132,619 | |
| | 59,782 | | | Mortgage Choice Ltd. | | | 80,145 | |
| | 45,677 | | | Mount Gibson Iron Ltd.(d) | | | 7,003 | |
| | 144,229 | | | Myer Holdings Ltd. | | | 98,736 | |
| | 1,050 | | | MyState Ltd. | | | 3,235 | |
| | 24,976 | | | Navitas Ltd. | | | 74,804 | |
| | 128,661 | | | New Hope Corp. Ltd. | | | 176,156 | |
| | 64,588 | | | Newcrest Mining Ltd.(d) | | | 566,970 | |
| | 52,364 | | | Newsat Ltd.(b)(c)(d) | | | 1,609 | |
| | 127,143 | | | NIB Holdings Ltd. | | | 327,303 | |
| | 25,509 | | | Nine Entertainment Co. Holdings Ltd. | | | 28,195 | |
| | 69,743 | | | Noble Mineral Resources Ltd.(b)(c)(d) | | | 0 | |
| | 150,444 | | | Northern Star Resources Ltd. | | | 296,097 | |
| | 41,135 | | | Nufarm Ltd. | | | 245,520 | |
| | 170,332 | | | OceanaGold Corp. | | | 325,658 | |
| | 37,238 | | | Orica Ltd. | | | 437,616 | |
| | 6,370 | | | Orocobre Ltd.(d) | | | 8,154 | |
| | 56,154 | | | Orora Ltd. | | | 93,701 | |
| | 116,008 | | | OZ Minerals Ltd. | | | 360,682 | |
| | 23,610 | | | OzForex Group Ltd. | | | 47,815 | |
| | 472,664 | | | Pacific Brands Ltd.(d) | | | 242,680 | |
| | 3,507 | | | Pacific Current Group Ltd. | | | 19,131 | |
| | 2,105,155 | | | Pact Group Holdings Ltd. | | | 7,701,074 | |
| | 94,113 | | | Paladin Energy Ltd.(d) | | | 16,442 | |
| | 143,129 | | | Panoramic Resources Ltd. | | | 30,620 | |
| | 19,902 | | | Peet Ltd. | | | 14,476 | |
| | 4,770 | | | Perpetual Ltd. | | | 152,761 | |
| | 80,915 | | | Perseus Mining Ltd.(d) | | | 21,638 | |
| | 48,159 | | | Platinum Asset Mangement Ltd. | | | 254,132 | |
| | 67,411 | | | Platinum Australia Ltd.(c)(d) | | | 7 | |
| | 85,726 | | | PMP Ltd. | | | 31,788 | |
| | 24,941 | | | Premier Investments Ltd. | | | 243,482 | |
| | 134,354 | | | Primary Health Care Ltd. | | | 355,447 | |
| | 54,609 | | | Prime Media Group Ltd. | | | 19,860 | |
| | 103,197 | | | Programmed Maintenance Services Ltd. | | | 214,146 | |
| | 349,744 | | | Qantas Airways Ltd. | | | 985,137 | |
| | 95,953 | | | Qube Holdings Ltd. | | | 156,691 | |
| | 31,502 | | | RCG Corp Ltd. | | | 32,236 | |
| | 47,987 | | | RCR Tomlinson Ltd. | | | 78,363 | |
| | 6,531 | | | REA Group Ltd. | | | 223,688 | |
| | 30,974 | | | Reckon Ltd. | | | 52,568 | |
| | 8,498 | | | Reece Australia Ltd. | | | 206,401 | |
| Shares | | | | | Value | |
| AUSTRALIA (continued) | | | | |
| | 99,706 | | | Regis Resources Ltd. | | $ | 147,889 | |
| | 570 | | | Reject Shop Ltd. (The) | | | 4,674 | |
| | 51,024 | | | Resolute Mining Ltd.(d) | | | 13,644 | |
| | 27,877 | | | Retail Food Group Ltd. | | | 92,040 | |
| | 101,020 | | | Ridley Corp. Ltd. | | | 94,369 | |
| | 4,191 | | | Ruralco Holdings Ltd. | | | 10,580 | |
| | 34,014 | | | SAI Global Ltd. | | | 106,481 | |
| | 10,681 | | | Sandfire Resources NL | | | 48,289 | |
| | 287,008 | | | Santos Ltd. | | | 1,195,244 | |
| | 383,311 | | | Saracen Mineral Holdings Ltd.(d) | | | 158,536 | |
| | 55,405 | | | Seek Ltd. | | | 506,904 | |
| | 11,618 | | | Select Harvests Ltd. | | | 84,173 | |
| | 74,750 | | | Senex Energy Ltd.(d) | | | 9,861 | |
| | 16,377 | | | Servcorp Ltd. | | | 79,413 | |
| | 19,063 | | | Seven Group Holdings Ltd. | | | 68,649 | |
| | 260,645 | | | Seven West Media Ltd. | | | 125,459 | |
| | 5,711,851 | | | Shopping Centres Australasia Property Group REIT | | | 8,390,617 | |
| | 212,165 | | | Sigma Pharmaceuticals Ltd. | | | 127,088 | |
| | 9,054 | | | Sirtex Medical Ltd. | | | 245,666 | |
| | 14,279 | | | Slater & Gordon Ltd. | | | 28,205 | |
| | 12,014 | | | SMS Management & Technology Ltd. | | | 41,979 | |
| | 16,155 | | | Sonic Healthcare Ltd. | | | 222,108 | |
| | 171,101 | | | Southern Cross Media Group Ltd. | | | 119,572 | |
| | 98,163 | | | Spark Infrastructure Group | | | 145,600 | |
| | 62,936 | | | St Barbara Ltd.(d) | | | 60,139 | |
| | 74,283 | | | Steadfast Group Ltd. | | | 79,457 | |
| | 137,375 | | | STW Communications Group Ltd. | | | 72,982 | |
| | 63,254 | | | Sunland Group Ltd. | | | 71,719 | |
| | 22,520 | | | Super Retail Group Ltd. | | | 155,130 | |
| | 298,223 | | | Tabcorp Holdings Ltd. | | | 1,003,767 | |
| | 53,076 | | | Tassal Group Ltd. | | | 160,099 | |
| | 341,492 | | | Tatts Group Ltd. | | | 964,330 | |
| | 42,660 | | | Technology One Ltd. | | | 117,120 | |
| | 523,796 | | | Ten Network Holdings Ltd.(d) | | | 61,631 | |
| | 69,352 | | | TFS Corp. Ltd. | | | 86,793 | |
| | 58,736 | | | Thorn Group Ltd. | | | 88,795 | |
| | 3,021 | | | Tiger Resources Ltd.(d) | | | 153 | |
| | 66,000 | | | Tox Free Solutions Ltd. | | | 135,546 | |
| | 38,929 | | | TPG Telecom Ltd. | | | 307,028 | |
| | 171,833 | | | Transfield Services Ltd.(d) | | | 123,147 | |
| | 456,872 | | | Transpacific Industries Group Ltd. | | | 221,541 | |
| | 239,665 | | | Treasury Wine Estates Ltd. | | | 1,210,006 | |
| | 31,955 | | | Treasury Wine Estates Ltd. - Entitlement Interim Shares | | | 161,333 | |
| | 134,568 | | | Troy Resources Ltd.(d) | | | 30,707 | |
| | 33,081 | | | UGL Ltd. | | | 53,785 | |
| | 144,020 | | | UXC Ltd. | | | 123,241 | |
| | 60,726 | | | Village Roadshow Ltd. | | | 326,076 | |
| | 492,324 | | | Virgin Australia Holdings Ltd.(d) | | | 168,516 | |
| Old Westbury Funds, Inc. | |
| Small & Mid Cap Fund | |
| Portfolio of Investments - (Continued) | October 31, 2015 |
| | |
| Shares | | | | | Value | |
| AUSTRALIA (continued) | | | | |
| | 521,584 | | | Virgin Australia Holdings Ltd. - CVR Shares(b)(c)(d) | | $ | 0 | |
| | 21,545 | | | Virtus Health Ltd. | | | 96,945 | |
| | 59,457 | | | Vocus Communications Ltd. | | | 276,016 | |
| | 38,160 | | | Washington H. Soul Pattinson & Co. Ltd. | | | 438,111 | |
| | 7,324 | | | Webjet Ltd. | | | 26,166 | |
| | 40,542 | | | Western Areas NL | | | 69,096 | |
| | 19,953 | | | Whitehaven Coal Ltd.(d) | | | 14,513 | |
| | | | | | | | 86,485,058 | |
| AUSTRIA — 0.2% | | | | |
| | 1,036 | | | Agrana Beteiligungs AG | | | 93,976 | |
| | 401 | | | AMAG Austria Metall AG | | | 14,596 | |
| | 24,805 | | | ams AG | | | 795,507 | |
| | 10,618 | | | Andritz AG | | | 534,765 | |
| | 5,240 | | | Austria Technologie & Systemtechnik AG | | | 89,544 | |
| | 6,441 | | | BUWOG AG | | | 137,053 | |
| | 19,561 | | | CA Immobilien Anlagen AG | | | 383,635 | |
| | 827 | | | DO & CO AG | | | 77,636 | |
| | 3,052 | | | EVN AG | | | 33,729 | |
| | 589 | | | Flughafen Wien AG | | | 55,514 | |
| | 1,625 | | | Lenzing AG | | | 124,299 | |
| | 1,068 | | | Mayr Melnhof Karton AG | | | 126,192 | |
| | 14,426 | | | Oesterreichische Post AG | | | 525,084 | |
| | 101,173 | | | OMV AG | | | 2,692,369 | |
| | 3,404 | | | Palfinger AG | | | 95,751 | |
| | 44,807 | | | POLYTEC Holding AG | | | 338,745 | |
| | 6,198 | | | RHI AG | | | 140,198 | |
| | 516 | | | Rosenbauer International AG | | | 43,408 | |
| | 43,288 | | | S IMMO AG | | | 384,621 | |
| | 8,134 | | | Schoeller-Bleckmann Oilfield Equipment AG | | | 488,820 | |
| | 2,386 | | | Semperit AG Holding | | | 82,649 | |
| | 22,305 | | | Strabag SE | | | 512,261 | |
| | 2,205 | | | UNIQA Insurance Group AG | | | 20,491 | |
| | 4,874 | | | Verbund AG | | | 68,979 | |
| | 6,198 | | | Vienna Insurance Group AG Wiener Versicherung Gruppe | | | 198,471 | |
| | 69,490 | | | Voestalpine AG | | | 2,516,718 | |
| | 40,993 | | | Wienerberger AG | | | 755,732 | |
| | 1,597 | | | Wolford AG | | | 39,373 | |
| | 6,441 | | | Zumtobel Group AG | | | 146,615 | |
| | | | | | | | 11,516,731 | |
| BAHAMAS — 0.0% | | | | |
| | 555 | | | United International Enterprises | | | 86,494 | |
| BELGIUM — 0.6% | | | | |
| | 14,846 | | | Ackermans & van Haaren NV | | | 2,261,069 | |
| | 383 | | | Aedifica SA REIT | | | 25,687 | |
| | 125,362 | | | Ageas | | | 5,539,678 | |
| | 97,067 | | | AGFA - Gevaert NV(d) | | | 413,510 | |
| | 22,952 | | | AGFA - Gevaert NV - VVPR Strip(b)(c)(d) | | | 0 | |
| | 129 | | | Banque Nationale de Belgique | | | 446,900 | |
| Shares | | | | | Value | |
| BELGIUM (continued) | | | | |
| | 6,918 | | | Barco NV | | $ | 454,617 | |
| | 12,559 | | | Bekaert SA | | | 372,884 | |
| | 93,781 | | | BHF Kleinwort Benson Group(d) | | | 536,257 | |
| | 20,731 | | | Bpost SA | | | 519,084 | |
| | 6,094 | | | Cie d’Entreprises CFE | | | 755,903 | |
| | 1,433 | | | Cie Immobiliere de Belgique SA | | | 77,214 | |
| | 2,727 | | | Cie Maritime Belge SA(d) | | | 48,190 | |
| | 1,454 | | | Cofinimmo SA REIT | | | 162,287 | |
| | 27,394 | | | Colruyt SA | | | 1,356,626 | |
| | 23,480 | | | Deceuninck NV | | | 61,090 | |
| | 12,200 | | | Deceuninck NV- VVPR Strip(b)(c)(d) | | | 0 | |
| | 66,513 | | | Delhaize Group | | | 6,173,835 | |
| | 10,300 | | | D’ieteren SA NV | | | 348,627 | |
| | 9,725 | | | Econocom Group SA | | | 86,943 | |
| | 2,295 | | | Elia System Operator SA NV | | | 111,068 | |
| | 10,018 | | | Euronav NV | | | 148,004 | |
| | 9,180 | | | EVS Broadcast Equipment SA | | | 267,815 | |
| | 5,314 | | | Exmar NV | | | 57,261 | |
| | 7,223 | | | Fagron NV | | | 177,481 | |
| | 2,849 | | | Galapagos NV(d) | | | 137,848 | |
| | 972 | | | Intervest Offices & Warehouses NV REIT | | | 24,584 | |
| | 13,050 | | | Ion Beam Applications | | | 465,672 | |
| | 151 | | | Jensen-Group NV | | | 3,449 | |
| | 13,835 | | | Kinepolis Group NV | | | 574,924 | |
| | 297 | | | Lotus Bakeries | | | 542,068 | |
| | 10,380 | | | Melexis NV | | | 506,227 | |
| | 25,122 | | | Mobistar SA(d) | | | 615,218 | |
| | 15,645 | | | Nyrstar - VVPR Strip(b)(c)(d) | | | 0 | |
| | 31,275 | | | Nyrstar NV(d) | | | 47,839 | |
| | 66,642 | | | Proximus SADP | | | 2,309,510 | |
| | 1,265 | | | RealDolmen(d) | | | 22,862 | |
| | 8,109 | | | Recticel SA | | | 48,420 | |
| | 118 | | | Resilux | | | 21,605 | |
| | 30 | | | Retail Estates NV REIT | | | 2,487 | |
| | 5,564 | | | Sioen Industries NV | | | 108,174 | |
| | 2,171 | | | Sipef NV | | | 117,290 | |
| | 12,977 | | | Solvay SA | | | 1,466,973 | |
| | 17,583 | | | Telenet Group Holding NV(d) | | | 1,023,216 | |
| | 20,843 | | | Tessenderlo Chemie NV(d) | | | 673,161 | |
| | 1,410 | | | Tessenderlo Chemie NV - VVPR Strip(b)(c)(d) | | | 0 | |
| | 31,709 | | | Umicore SA | | | 1,347,680 | |
| | 1,563 | | | Van de Velde NV | | | 101,888 | |
| | 6,098 | | | Viohalco SA(d) | | | 14,900 | |
| | 2,031 | | | Warehouses De Pauw CVA REIT | | | 166,388 | |
| | | | | | | | 30,744,413 | |
| BERMUDA — 1.1% | | | | |
| | 286,000 | | | Argo Group International Holdings Ltd.(c) | | | 17,880,720 | |
| | 400,000 | | | Endurance Specialty Holdings Ltd. | | | 25,252,000 | |
| Old Westbury Funds, Inc. | |
| Small & Mid Cap Fund | |
| Portfolio of Investments - (Continued) | October 31, 2015 |
| | |
| Shares | | | | | Value | |
| BERMUDA (continued) | | | | |
| | 14,312 | | | Frontline Ltd.(d) | | $ | 44,805 | |
| | 80,000 | | | Helen of Troy Ltd.(d) | | | 7,936,800 | |
| | 102,290 | | | Hiscox Ltd. | | | 1,525,645 | |
| | 115,000 | | | James River Group Holdings Ltd. | | | 3,384,449 | |
| | 54,709 | | | Seadrill Ltd. | | | 342,545 | |
| | 33,651 | | | Seadrill Ltd. | | | 217,722 | |
| | 197,400 | | | Wilson Sons Ltd. - BDR(c) | | | 1,689,126 | |
| | | | | | | | 58,273,812 | |
| BRAZIL — 0.5% | | | | |
| | 2,300 | | | Aliansce Shopping Centers SA | | | 6,232 | |
| | 283,400 | | | Alupar Investimento SA - Units | | | 1,164,743 | |
| | 1,754 | | | Banco ABC Brasil SA - BDR(d) | | | 3,684 | |
| | 29,307 | | | Banco ABC Brasil SA - Preference Shares | | | 64,594 | |
| | 15,800 | | | Banco Daycoval SA - Preference Shares | | | 36,053 | |
| | 16,000 | | | Banco Industrial e Comercial SA - Preference Shares(b)(c)(d) | | | 34,227 | |
| | 20,647 | | | Banco Pine SA - Preference Shares | | | 21,415 | |
| | 16,200 | | | Banco Sofisa SA - Preference Shares | | | 8,779 | |
| | 140,783 | | | BM&FBovespa SA - Bolsa de Valores Mercadorias e Futuros | | | 416,156 | |
| | 18,392 | | | BR Malls Participacoes SA | | | 53,413 | |
| | 51,518 | | | Braskem SA - Class A, Preference Shares | | | 290,950 | |
| | 13,800 | | | Centrais Eletricas Brasileiras SA - Preference B Shares | | | 33,744 | |
| | 3,200 | | | Centrais Eletricas Santa Catarina - Preference Shares | | | 10,571 | |
| | 36,400 | | | CETIP SA - Mercados Organizados | | | 321,852 | |
| | 12,086 | | | Cia Brasileira de Distribuicao - Preference Shares | | | 159,014 | |
| | 2,800 | | | Cia de Gas de Sao Paulo - Class A, Preference Shares | | | 29,332 | |
| | 4,000 | | | Cia de Saneamento do Parana - Preference Shares | | | 3,889 | |
| | 1,857 | | | Cia de Transmissao de Energia Eletrica Paulista - Preference Shares | | | 21,379 | |
| | 10,800 | | | Cia Energetica de Sao Paulo - Class B, Preference Shares | | | 45,367 | |
| | 2,075 | | | Cia Energetica do Ceara - Class A, Preference Shares | | | 21,253 | |
| | 29,106 | | | Cia Hering | | | 114,339 | |
| | 14,000 | | | Cia Paranaense de Energia - Class B, Preference Shares | | | 117,981 | |
| | 5,720 | | | Contax Participacoes SA - Units | | | 2,225 | |
| | 400 | | | Cyrela Commercial Properties SA Empreendimentos e Participacoes | | | 889 | |
| | 113,479 | | | Duratex SA | | | 188,320 | |
| | 15,500 | | | EDP - Energias do Brasil SA | | | 45,336 | |
| Shares | | | | | Value | |
| BRAZIL (continued) | | | | |
| | 390,320 | | | Embraer SA | | $ | 2,862,208 | |
| | 14,569 | | | Equatorial Energia SA | | | 129,916 | |
| | 29,000 | | | Estacio Participacoes SA | | | 116,254 | |
| | 44,700 | | | Even Construtora e Incorporadora SA | | | 46,363 | |
| | 22,869 | | | Ez Tec Empreendimentos e Participacoes SA | | | 75,310 | |
| | 174,178 | | | Fibria Celulose SA | | | 2,377,444 | |
| | 451,000 | | | Fleury SA | | | 1,916,711 | |
| | 179,400 | | | GAEC Educacao SA | | | 618,693 | |
| | 25,600 | | | Grendene SA | | | 119,817 | |
| | 15,700 | | | Hypermarcas SA(d) | | | 71,242 | |
| | 316,400 | | | Iguatemi Empresa de Shopping Centers SA | | | 1,749,141 | |
| | 4,434 | | | JHSF Participacoes SA | | | 2,012 | |
| | 496,100 | | | JSL SA | | | 1,206,627 | |
| | 34,900 | | | Klabin SA - Units | | | 198,456 | |
| | 214,184 | | | Kroton Educacional SA | | | 547,602 | |
| | 105,700 | | | Linx SA(c) | | | 1,288,172 | |
| | 14,075 | | | Localiza Rent a Car SA | | | 94,891 | |
| | 22,050 | | | Lojas Americanas SA | | | 66,895 | |
| | 57,300 | | | Lojas Americanas SA - Preference Shares | | | 248,274 | |
| | 161,000 | | | Lojas Renner SA | | | 772,322 | |
| | 3,300 | | | M Dias Branco SA | | | 59,813 | |
| | 249,500 | | | Mahle-Metal Leve SA | | | 1,514,513 | |
| | 824,500 | | | Makira II - Redeemable Shares(b)(d) | | | 23,517 | |
| | 46,943 | | | Marcopolo SA - Preference Shares | | | 23,736 | |
| | 91,384 | | | Marfrig Global Foods SA(d) | | | 150,942 | |
| | 4,950 | | | Marisa Lojas SA | | | 8,356 | |
| | 27,800 | | | Minerva SA(d) | | | 91,981 | |
| | 8,450 | | | Multiplan Empreendimentos Imobiliarios SA | | | 92,179 | |
| | 9,700 | | | Multiplus SA | | | 86,372 | |
| | 587,600 | | | Odontoprev SA | | | 1,505,358 | |
| | 131,200 | | | Ouro Fino Saude Animal Participacoes SA(c) | | | 1,173,692 | |
| | 16,200 | | | Parana Banco SA - Preference Shares | | | 38,646 | |
| | 44,555 | | | Porto Seguro SA | | | 373,511 | |
| | 5,800 | | | Profarma Distribuidora de Produtos Farmaceuticos SA(d) | | | 8,994 | |
| | 38,309 | | | Raia Drogasil SA | | | 397,240 | |
| | 6,200 | | | Rodobens Negocios Imobiliarios SA | | | 7,717 | |
| | 1,250 | | | Santos Brasil Participacoes SA - Units | | | 4,632 | |
| | 16,200 | | | Sao Martinho SA | | | 186,635 | |
| | 10,100 | | | SLC Agricola SA | | | 45,098 | |
| | 11,100 | | | Somos Educacao SA | | | 38,136 | |
| | 121,173 | | | Sul America SA - Units | | | 594,782 | |
| | 134,153 | | | Suzano Papel e Celulose SA - Class A, Preference Shares | | | 575,704 | |
| | 31,700 | | | Tim Participacoes SA | | | 69,457 | |
| Old Westbury Funds, Inc. | |
| Small & Mid Cap Fund | |
| Portfolio of Investments - (Continued) | October 31, 2015 |
| | |
| Shares | | | | | Value | |
| BRAZIL (continued) | | | | |
| | 11,821 | | | Totvs SA | | $ | 104,739 | |
| | 4,500 | | | Transmissora Alianca de Energia Eletrica SA - Units | | | 23,220 | |
| | 61,300 | | | Usinas Siderurgicas de Minas Gerais SA - Class A, Preference shares | | | 44,188 | |
| | 8,958 | | | Valid Solucoes e Servicos de Seguranca em Meios de Pagamento e Identificacao SA | | | 101,715 | |
| | | | | | | | 25,068,960 | |
| CAMBODIA — 0.0% | | | | |
| | 416,000 | | | NagaCorp Ltd. | | | 295,203 | |
| CANADA — 1.8% | | | | |
| | 8,517 | | | 5N Plus, Inc.(d) | | | 7,946 | |
| | 2,275 | | | Absolute Software Corp. | | | 15,015 | |
| | 908 | | | Acadian Timber Corp. | | | 12,701 | |
| | 82,684 | | | Advantage Oil & Gas Ltd.(d) | | | 459,707 | |
| | 27,538 | | | Aecon Group, Inc. | | | 318,216 | |
| | 2,700 | | | AG Growth International, Inc. | | | 70,701 | |
| | 19,184 | | | AGF Management Ltd. - Class B | | | 79,664 | |
| | 3,110 | | | AGT Food & Ingredients, Inc. | | | 69,521 | |
| | 14,900 | | | Aimia, Inc. | | | 137,879 | |
| | 2,500 | | | Air Canada(d) | | | 20,572 | |
| | 1,100 | | | Akita Drilling Ltd. - Class A | | | 6,898 | |
| | 40,968 | | | Alamos Gold, Inc. | | | 157,593 | |
| | 3,300 | | | Alaris Royalty Corp. | | | 70,210 | |
| | 2,681 | | | Algoma Central Corp. | | | 31,431 | |
| | 46,800 | | | Algonquin Power & Utilities Corp. | | | 361,129 | |
| | 22,944 | | | AltaGas Ltd. | | | 592,375 | |
| | 4,000 | | | Altus Group Ltd. | | | 58,275 | |
| | 4,968 | | | Amaya, Inc.(d) | | | 111,016 | |
| | 20,500 | | | Amerigo Resources Ltd.(d) | | | 4,782 | |
| | 8,100 | | | Atco Ltd. - Class I | | | 231,367 | |
| | 21,880 | | | Athabasca Oil Corp.(d) | | | 26,103 | |
| | 11,000 | | | ATS Automation Tooling Systems, Inc.(d) | | | 115,838 | |
| | 18,016 | | | AuRico Metals, Inc.(d) | | | 10,885 | |
| | 1,900 | | | AutoCanada, Inc. | | | 46,032 | |
| | 5,900 | | | Avigilon Corp.(d) | | | 66,192 | |
| | 285,186 | | | B2Gold Corp.(d) | | | 307,519 | |
| | 4,279 | | | Badger Daylighting Ltd. | | | 67,019 | |
| | 46,920 | | | Bankers Petroleum Ltd.(d) | | | 78,942 | |
| | 36,000 | | | Banro Corp.(d) | | | 7,158 | |
| | 839 | | | Baytex Energy Corp. | | | 3,415 | |
| | 37,600 | | | Bellatrix Exploration Ltd.(d) | | | 61,823 | |
| | 67,000 | | | Birchcliff Energy Ltd.(d) | | | 292,062 | |
| | 6,842 | | | Bird Construction, Inc. | | | 68,598 | |
| | 9,550 | | | Black Diamond Group Ltd. | | | 61,422 | |
| | 57,600 | | | BlackBerry Ltd.(d) | | | 419,798 | |
| | 91,800 | | | BlackPearl Resources, Inc.(d) | | | 61,780 | |
| | 1,600 | | | Boardwalk Real Estate Investment Trust, REIT | | | 65,733 | |
| | 3,200 | | | Boralex, Inc. - Class A | | | 34,065 | |
| Shares | | | | | Value | |
| CANADA (continued) | | | | |
| | 17,348 | | | Boulder Energy Ltd.(d) | | $ | 66,601 | |
| | 3,200 | | | BRP, Inc.(d) | | | 57,608 | |
| | 1,308,357 | | | CAE, Inc. | | | 14,768,545 | |
| | 25,425 | | | Canaccord Genuity Group, Inc. | | | 98,581 | |
| | 46,850 | | | Canacol Energy Ltd.(d) | | | 108,562 | |
| | 11,200 | | | Canadian Apartment Properties REIT | | | 230,578 | |
| | 45,555 | | | Canadian Energy Services & Technology Corp. | | | 196,838 | |
| | 150,680 | | | Canadian Oil Sands Ltd. | | | 1,137,360 | |
| | 3,400 | | | Canadian Real Estate Investment Trust | | | 110,742 | |
| | 60,200 | | | Canadian Western Bank | | | 1,156,949 | |
| | 10,832 | | | Canam Group, Inc. - Class A | | | 125,501 | |
| | 44,643 | | | Canfor Corp.(d) | | | 631,612 | |
| | 13,488 | | | Canfor Pulp Products, Inc. | | | 140,388 | |
| | 8,000 | | | CanWel Building Materials Group Ltd. | | | 33,038 | |
| | 44,088 | | | Canyon Services Group, Inc. | | | 164,538 | |
| | 6,900 | | | Capital Power Corp. | | | 99,152 | |
| | 58,401 | | | Capstone Infrastructure Corp. | | | 142,921 | |
| | 43,552 | | | Cascades, Inc. | | | 310,420 | |
| | 15,007 | | | CCL Industries, Inc. - Class B | | | 2,126,068 | |
| | 27,957 | | | Celestica, Inc.(d) | | | 313,437 | |
| | 86,207 | | | Centerra Gold, Inc. | | | 485,228 | |
| | 2,955 | | | Cervus Equipment Corp. | | | 34,169 | |
| | 4,700 | | | Chartwell Retirement Residences - Units | | | 45,469 | |
| | 28,569 | | | Chinook Energy, Inc.(d) | | | 12,454 | |
| | 6,000 | | | Cineplex, Inc. | | | 231,217 | |
| | 1,200 | | | Clarke, Inc. | | | 9,425 | |
| | 139,701 | | | Claude Resources, Inc.(d) | | | 76,923 | |
| | 3,297 | | | Clearwater Seafoods, Inc. - Units | | | 31,644 | |
| | 9,100 | | | Cogeco Cable, Inc. | | | 469,963 | |
| | 3,464 | | | Cogeco, Inc. | | | 146,815 | |
| | 9,700 | | | Colliers International Group, Inc. | | | 480,919 | |
| | 28,271 | | | COM DEV International Ltd. | | | 122,372 | |
| | 7,800 | | | Cominar Real Estate Investment Trust | | | 91,744 | |
| | 10,252 | | | Computer Modelling Group Ltd. | | | 97,220 | |
| | 3,297 | | | Constellation Software, Inc. | | | 1,424,599 | |
| | 1,912 | | | Corby Spirit and Wine Ltd. | | | 29,142 | |
| | 35,674 | | | Corus Entertainment, Inc. - Class B | | | 340,207 | |
| | 50,217 | | | Cott Corp. | | | 524,214 | |
| | 54,055 | | | Crew Energy, Inc.(d) | | | 183,959 | |
| | 46,438 | | | Delphi Energy Corp.(d) | | | 25,925 | |
| | 6,900 | | | Descartes Systems Group, Inc. (The)(d) | | | 120,734 | |
| | 27,100 | | | Detour Gold Corp.(d) | | | 301,341 | |
| | 23,169 | | | DH Corp. | | | 625,471 | |
| | 1,071 | | | DHX Media Ltd. - Variable Voting | | | 6,896 | |
| | 1,759 | | | DirectCash Payments, Inc. | | | 17,407 | |
| Old Westbury Funds, Inc. | |
| Small & Mid Cap Fund | |
| Portfolio of Investments - (Continued) | October 31, 2015 |
| | |
| Shares | | | | | Value | |
| CANADA (continued) | | | | |
| | 43,862 | | | Dollarama, Inc. | | $ | 2,962,932 | |
| | 38,640 | | | Dominion Diamond Corp. | | | 408,681 | |
| | 11,696 | | | Dominion Diamond Corp. | | | 123,510 | |
| | 12,800 | | | Dorel Industries, Inc. - Class B | | | 325,482 | |
| | 2,900 | | | Dream Office Real Estate Investment Trust | | | 46,552 | |
| | 27,489 | | | Dundee Precious Metals, Inc.(d) | | | 36,369 | |
| | 683 | | | E-L Financial Corp. Ltd. | | | 349,967 | |
| | 183,999 | | | Eldorado Gold Corp. | | | 643,068 | |
| | 1,800 | | | Emera, Inc. | | | 58,972 | |
| | 19,068 | | | Enbridge Income Fund Holdings, Inc. | | | 468,680 | |
| | 8,100 | | | Endeavour Silver Corp.(d) | | | 13,380 | |
| | 12,473 | | | EnerCare, Inc. | | | 145,658 | |
| | 43,875 | | | Enerflex Ltd. | | | 423,449 | |
| | 936 | | | Energy Fuels, Inc.(d) | | | 2,548 | |
| | 2,342 | | | Enghouse Systems Ltd. | | | 106,801 | |
| | 34,600 | | | Ensign Energy Services, Inc. | | | 217,507 | |
| | 7,766 | | | Entertainment One Ltd. | | | 26,302 | |
| | 14,642 | | | Epsilon Energy Ltd.(d) | | | 30,234 | |
| | 3,442 | | | Equitable Group, Inc. | | | 152,726 | |
| | 20,491 | | | Essential Energy Services Trust(d) | | | 10,656 | |
| | 1,900 | | | Evertz Technologies Ltd. | | | 22,856 | |
| | 3,224 | | | Exchange Income Corp. | | | 61,196 | |
| | 5,600 | | | Exco Technologies Ltd. | | | 62,441 | |
| | 38 | | | EXFO, Inc.(d) | | | 121 | |
| | 10,800 | | | Extendicare, Inc. | | | 70,948 | |
| | 3,100 | | | Fiera Capital Corp. | | | 27,667 | |
| | 76,082 | | | Finning International, Inc. | | | 1,216,055 | |
| | 7,834 | | | First Capital Realty Inc. | | | 116,048 | |
| | 26,208 | | | First Majestic Silver Corp.(d) | | | 86,585 | |
| | 9,700 | | | FirstService Corp. - Subord Voting Shares | | | 341,236 | |
| | 35,000 | | | Fortuna Silver Mines, Inc.(d) | | | 91,274 | |
| | 1,088 | | | Gamehost, Inc. | | | 8,570 | |
| | 23,321 | | | Genworth MI Canada, Inc. | | | 576,604 | |
| | 36,082 | | | Gibson Energy, Inc. | | | 480,965 | |
| | 5,865 | | | Gluskin Sheff + Associates, Inc. | | | 99,484 | |
| | 2,537 | | | GMP Capital, Inc. | | | 7,916 | |
| | 61,130 | | | Golden Star Resources Ltd.(d) | | | 12,856 | |
| | 37,045 | | | Gran Tierra Energy, Inc.(d) | | | 89,524 | |
| | 18,096 | | | Granite Oil Corp. | | | 103,101 | |
| | 1,295 | | | Granite Real Estate Investment Trust | | | 37,743 | |
| | 18,452 | | | Great Canadian Gaming Corp.(d) | | | 254,710 | |
| | 5,535 | | | Guardian Capital Group Ltd. - Class A | | | 75,770 | |
| | 5,100 | | | Guyana Goldfields, Inc.(d) | | | 12,715 | |
| | 8,500 | | | H&R Real Estate Investment Trust | | | 136,380 | |
| | 6,200 | | | Heroux-Devtek, Inc.(d) | | | 57,846 | |
| | 3,040 | | | High Liner Foods, Inc. | | | 29,968 | |
| | 2,065 | | | HNZ Group, Inc. | | | 24,794 | |
| | 21,000 | | | Home Capital Group, Inc. | | | 511,510 | |
|
| Shares | | | | | Value | |
| CANADA (continued) | | | | |
| | 26,227 | | | Horizon North Logistics, Inc. | | $ | 45,129 | |
| | 40,000 | | | HudBay Minerals, Inc. | | | 207,709 | |
| | 43,300 | | | Hudson’s Bay Co. | | | 752,684 | |
| | 10,968 | | | IAMGOLD Corp.(d) | | | 19,795 | |
| | 9,300 | | | IMAX Corp.(d) | | | 357,027 | |
| | 21,600 | | | Imperial Metals Corp.(d) | | | 130,829 | |
| | 23,900 | | | Industrial Alliance Insurance and Financial Services, Inc. | | | 784,116 | |
| | 19,579 | | | Innergex Renewable Energy, Inc. | | | 158,417 | |
| | 11,529 | | | Interfor Corp.(d) | | | 109,506 | |
| | 25,626 | | | Intertape Polymer Group, Inc. | | | 287,695 | |
| | 22,616 | | | Jean Coutu Group PJC, Inc. (The) Class A | | | 344,705 | |
| | 10,100 | | | Just Energy Group, Inc. | | | 74,228 | |
| | 95,796 | | | Katanga Mining Ltd.(d) | | | 12,821 | |
| | 1,300 | | | K-Bro Linen, Inc. | | | 50,107 | |
| | 8,230 | | | Keyera Corp. | | | 253,962 | |
| | 2,900 | | | Killam Properties, Inc. | | | 23,087 | |
| | 1,953 | | | Kingsway Financial Services, Inc.(d) | | | 8,140 | |
| | 66,700 | | | Kinross Gold Corp.(d) | | | 134,155 | |
| | 36,600 | | | Kirkland Lake Gold, Inc.(d) | | | 155,346 | |
| | 16,100 | | | Klondex Mines Ltd.(d) | | | 39,524 | |
| | 6,230 | | | Knight Therapeutics, Inc.(d) | | | 37,115 | |
| | 221,844 | | | Lake Shore Gold Corp.(d) | | | 196,803 | |
| | 13,545 | | | Laurentian Bank of Canada | | | 548,699 | |
| | 8,626 | | | Leon’s Furniture Ltd. | | | 93,345 | |
| | 22,110 | | | Linamar Corp. | | | 1,284,903 | |
| | 6,511 | | | Liquor Stores N.A. Ltd. | | | 60,549 | |
| | 70,300 | | | Lucara Dianmond Corp.(d) | | | 88,708 | |
| | 272,628 | | | Lundin Mining Corp.(d) | | | 919,463 | |
| | 16,046 | | | MacDonald Dettwiler & Associates Ltd. | | | 956,428 | |
| | 9,230 | | | Magellan Aerospace Corp. | | | 122,540 | |
| | 500 | | | Mainstreet Equity Corp.(d) | | | 12,431 | |
| | 24,900 | | | Major Drilling Group International, Inc. | | | 79,026 | |
| | 152,729 | | | Mandalay Resources Corp. | | | 94,609 | |
| | 10,728 | | | Manitoba Telecom Services, Inc. | | | 235,711 | |
| | 35,000 | | | Maple Leaf Foods, Inc. | | | 556,478 | |
| | 36,498 | | | Martinrea International, Inc. | | | 309,546 | |
| | 6,800 | | | Medical Facilities Corp. | | | 87,730 | |
| | 44,700 | | | MEG Energy Corp.(d) | | | 371,930 | |
| | 3,348 | | | Melcor Developments Ltd. | | | 39,174 | |
| | 13,200 | | | Methanex Corp. | | | 527,075 | |
| | 503 | | | Methanex Corp. | | | 20,068 | |
| | 11,507 | | | Mitel Networks Corp.(d) | | | 90,025 | |
| | 168,687 | | | Morguard Real Estate Investment Trust | | | 1,864,123 | |
| | 10,302 | | | Morneau Shepell, Inc. | | | 121,881 | |
| | 2,186 | | | MTY Food Group, Inc. | | | 50,688 | |
| | 22,000 | | | Mullen Group Ltd. | | | 293,760 | |
| | 127,236 | | | Nevsun Resources Ltd. | | | 380,462 | |
| | 7,829 | | | New Flyer Industries, Inc. | | | 113,519 | |
| Old Westbury Funds, Inc. | |
| Small & Mid Cap Fund | |
| Portfolio of Investments - (Continued) | October 31, 2015 |
| | |
| Shares | | | | | Value | |
| CANADA (continued) | | | | |
| | 39,800 | | | New Gold, Inc.(d) | | $ | 98,617 | |
| | 20,348 | | | Newalta Corp. | | | 116,088 | |
| | 6,702 | | | Norbord, Inc. | | | 126,649 | |
| | 498 | | | North American Energy Partners, Inc. | | | 1,143 | |
| | 14,146 | | | North West Co. Inc., (The) | | | 313,730 | |
| | 327,700 | | | Northern Property Real Estate Investment Trust | | | 4,633,812 | |
| | 13,829 | | | Northland Power, Inc. | | | 178,732 | |
| | 17,600 | | | NuVista Energy Ltd.(d) | | | 62,184 | |
| | 9,271 | | | Open Text Corp.(e) | | | 430,174 | |
| | 9,240 | | | Osisko Gold Royalties Ltd. | | | 95,961 | |
| | 1,900 | | | Ovivo, Inc.(d) | | | 1,758 | |
| | 9,400 | | | Painted Pony Petroleum Ltd.(d) | | | 32,062 | |
| | 12,837 | | | Pan American Silver Corp. | | | 97,176 | |
| | 11,236 | | | Pan American Silver Corp. | | | 85,241 | |
| | 68,524 | | | Parex Resources, Inc.(d) | | | 514,611 | |
| | 24,088 | | | Parkland Fuel Corp. | | | 419,090 | |
| | 203,489 | | | Pason Systems, Inc. | | | 2,994,133 | |
| | 19,173 | | | Penn West Petroleum Ltd. | | | 22,287 | |
| | 21,800 | | | Peyto Exploration & Development Corp. | | | 450,138 | |
| | 5,653 | | | Pizza Pizza Royalty Corp. | | | 59,141 | |
| | 2,100 | | | Points International Ltd.(d) | | | 21,697 | |
| | 53,100 | | | Precision Drilling Corp.(e) | | | 211,165 | |
| | 7,336 | | | Premium Brands Holdings Corp. | | | 192,825 | |
| | 26,929 | | | Primero Mining Corp.(d) | | | 61,989 | |
| | 37,060 | | | Progressive Waste Solutions Ltd. | | | 891,072 | |
| | 816 | | | Progressive Waste Solutions Ltd. | | | 19,625 | |
| | 9,335 | | | Pulse Seismic, Inc. | | | 16,491 | |
| | 9,900 | | | Pure Industrial Real Estate Trust REIT | | | 33,616 | |
| | 5,060 | | | QLT, Inc.(d) | | | 13,892 | |
| | 27,400 | | | Quebecor, Inc. - Class B | | | 645,187 | |
| | 14,785 | | | Questerre Energy Corp. - Class A(d) | | | 2,488 | |
| | 10,943 | | | RB Energy, Inc.(c)(d) | | | 9 | |
| | 13,400 | | | Redknee Solutions, Inc.(d) | | | 37,097 | |
| | 10,717 | | | Reitmans (Canada) Ltd. - Class A | | | 39,832 | |
| | 4,400 | | | Richelieu Hardware Ltd. | | | 231,273 | |
| | 20,367 | | | Richmont Mines, Inc.(d) | | | 61,992 | |
| | 350,000 | | | Ritchie Bros Auctioneers, Inc. | | | 9,089,500 | |
| | 238,056 | | | Ritchie Bros. Auctioneers, Inc. | | | 6,178,970 | |
| | 59,932 | | | RMP Energy, Inc.(d) | | | 82,042 | |
| | 2,900 | | | Rocky Mountain Dealerships, Inc. | | | 15,170 | |
| | 26,754 | | | Rogers Sugar, Inc. | | | 83,069 | |
| | 41,707 | | | RONA, Inc. | | | 435,378 | |
| | 15,500 | | | Russel Metals, Inc. | | | 241,817 | |
| | 33,588 | | | Sandstorm Gold Ltd.(d) | | | 88,106 | |
| | 131,200 | | | Sandvine Corp.(d) | | | 268,902 | |
| | 2,551 | | | Sears Canada, Inc.(d) | | | 18,673 | |
| | 13,945 | | | Secure Energy Services, Inc. | | | 92,675 | |
| Shares | | | | | Value | |
| CANADA (continued) | | | | |
| | 127,201 | | | SEMAFO, Inc.(d) | | $ | 288,916 | |
| | 14,000 | | | ShawCor Ltd. | | | 297,109 | |
| | 2,282 | | | Sienna Senior Living, Inc. | | | 30,296 | |
| | 15,000 | | | Sierra Wireless, Inc.(d) | | | 374,082 | |
| | 16,299 | | | Silver Standard Resources, Inc.(d) | | | 112,308 | |
| | 3,400 | | | Smart Real Estate Investment Trust | | | 80,762 | |
| | 50,961 | | | SNC-Lavalin Group, Inc. | | | 1,633,355 | |
| | 19,231 | | | Sprott, Inc. | | | 37,944 | |
| | 4,087 | | | Stantec, Inc. | | | 102,543 | |
| | 3,200 | | | Stantec, Inc. | | | 80,318 | |
| | 7,060 | | | Stella-Jones, Inc. | | | 259,810 | |
| | 500 | | | Strad Energy Services Ltd. | | | 841 | |
| | 18,500 | | | Street Capital Group, Inc.(d) | | | 21,647 | |
| | 2,100 | | | Stuart Olson, Inc. | | | 9,877 | |
| | 22,548 | | | Student Transportation, Inc. | | | 93,634 | |
| | 20,826 | | | SunOpta, Inc.(d) | | | 111,966 | |
| | 21,000 | | | Superior Plus Corp. | | | 171,520 | |
| | 21,013 | | | Taseko Mines Ltd.(d) | | | 10,606 | |
| | 29,951 | | | Tembec, Inc.(d) | | | 26,570 | |
| | 175,990 | | | Teranga Gold Corp.(d) | | | 72,679 | |
| | 42,529 | | | Teranga Gold Corp. - CDI(d) | | | 17,893 | |
| | 8,624 | | | TMX Group Ltd. | | | 304,241 | |
| | 26,912 | | | TORC Oil & Gas Ltd. | | | 136,453 | |
| | 23,345 | | | Toromont Industries Ltd. | | | 607,548 | |
| | 10,300 | | | Torstar Corp. - Class B | | | 31,902 | |
| | 22,950 | | | Total Energy Services, Inc. | | | 257,477 | |
| | 13,378 | | | Transalta Corp. | | | 62,074 | |
| | 30,590 | | | Transcontinental, Inc. - Class A | | | 471,389 | |
| | 18,100 | | | TransForce, Inc. | | | 354,082 | |
| | 13,500 | | | TransGlobe Energy Corp. | | | 36,754 | |
| | 25,788 | | | Trinidad Drilling Ltd. | | | 44,768 | |
| | 6,856 | | | Uni-Select, Inc. | | | 339,759 | |
| | 3,080 | | | Valener, Inc. | | | 39,642 | |
| | 32,400 | | | Veresen, Inc. | | | 281,976 | |
| | 9,795 | | | Vermilion Energy, Inc. | | | 345,078 | |
| | 536 | | | Vermilion Energy, Inc. | | | 18,860 | |
| | 8,202 | | | Wajax Corp. | | | 150,479 | |
| | 17,300 | | | West Fraser Timber Co. Ltd. | | | 612,168 | |
| | 14,897 | | | Western Energy Services Corp. | | | 47,052 | |
| | 170,938 | | | Western Forest Products, Inc. | | | 252,302 | |
| | 6,800 | | | Westjet Airlines Ltd. | | | 125,849 | |
| | 1,400 | | | Westshore Terminals Investment Corp. | | | 23,351 | |
| | 7,900 | | | Whistler Blackcomb Holdings, Inc. | | | 121,859 | |
| | 103,511 | | | Whitecap Resources, Inc. | | | 919,060 | |
| | 91,300 | | | Wi-Lan, Inc. | | | 169,669 | |
| | 4,348 | | | Winpak Ltd. | | | 131,378 | |
| | 7,231 | | | WSP Global, Inc. | | | 251,725 | |
| | 416 | | | Xtreme Drilling & Coil Services Corp.(d) | | | 639 | |
| | 252,826 | | | Yamana Gold, Inc. | | | 552,984 | |
| | 3,119 | | | Yangarra Resources Ltd.(d) | | | 1,694 | |
| | 18,314 | | | Yellow Pages Ltd.(d) | | | 237,118 | |
| Old Westbury Funds, Inc. | |
| Small & Mid Cap Fund | |
| Portfolio of Investments - (Continued) | October 31, 2015 |
| | |
| Shares | | | | | Value | |
| CANADA (continued) | | | | |
| | 6,007 | | | ZCL Composites, Inc. | | $ | 28,482 | |
| | | | | | | | 97,842,173 | |
| CAYMAN ISLANDS — 0.0% | | | | |
| | 125,000 | | | Endeavour Mining Corp.(d) | | | 65,005 | |
| CHILE — 0.0% | | | | |
| | 79,358 | | | AES Gener SA | | | 38,008 | |
| | 302,903 | | | Aguas Andinas SA - Class A | | | 158,453 | |
| | 109,821 | | | Banmedica SA | | | 179,449 | |
| | 28,820,129 | | | CorpBanca SA | | | 264,426 | |
| | 45,839 | | | E.Cl SA | | | 66,284 | |
| | 9,007 | | | Embotelladora Andina SA - Class B, Preference Shares | | | 33,030 | |
| | 34,238 | | | Empresa Nacional de Telecomunicaciones SA | | | 316,853 | |
| | 11,402 | | | Forus SA | | | 32,975 | |
| | 12,790 | | | Gasco SA | | | 86,738 | |
| | 312,074 | | | Inversiones Aguas Metropolitanas SA | | | 444,498 | |
| | 3,187 | | | Latam Airlines Group SA - BDR(d) | | | 7,330 | |
| | 43,624 | | | Multiexport Foods SA | | | 4,849 | |
| | 33,652 | | | Parque Arauco SA | | | 56,360 | |
| | 22,204 | | | PAZ Corp. SA | | | 9,600 | |
| | 154,380 | | | Sigdo Koppers SA | | | 185,510 | |
| | 1,023 | | | Sociedad Matriz SAAM SA | | | 67 | |
| | 59,147 | | | Sonda SA | | | 95,184 | |
| | 109,535 | | | Vina Concha y Toro SA | | | 186,584 | |
| | | | | | | | 2,166,198 | |
| CHINA — 1.0% | | | | |
| | 81,000 | | | 361 Degrees International Ltd. | | | 28,844 | |
| | 1,194,000 | | | AAC Technologies Holdings, Inc. | | | 7,610,198 | |
| | 597,250 | | | Agile Property Holdings Ltd. | | | 325,958 | |
| | 182,000 | | | Angang Steel Co. Ltd. - H Shares | | | 76,082 | |
| | 2,000 | | | Anhui Expressway Co. Ltd. - H Shares | | | 1,721 | |
| | 104,000 | | | ANTA Sports Products Ltd. | | | 291,848 | |
| | 174,000 | | | Anton Oilfield Services Group(d) | | | 23,123 | |
| | 415,500 | | | Asia Cement China Holdings Corp. | | | 130,269 | |
| | 96,000 | | | Aupu Group Holding Co. Ltd. | | | 25,639 | |
| | 140,000 | | | AVIC International Holdings Ltd. | | | 79,839 | |
| | 444,000 | | | AviChina Industry & Technology Co. - H Shares | | | 363,765 | |
| | 14,000 | | | Bank of Chongqing Co. Ltd. - H Shares | | | 10,495 | |
| | 104,000 | | | Baoye Group Co. Ltd. - H Shares | | | 71,922 | |
| | 314,000 | | | BBMG Corp. - H Shares | | | 221,606 | |
| | 924,000 | | | Beijing Capital International Airport Co. Ltd. - H Shares | | | 993,074 | |
| Shares | | | | | Value | |
| CHINA (continued) | | | | |
| | 642,000 | | | Beijing Capital Land Ltd. - H Shares | | $ | 309,793 | |
| | 184,000 | | | Beijing North Star Co. Ltd. - H Shares | | | 59,825 | |
| | 544,000 | | | Belle International Holdings Ltd. | | | 529,218 | |
| | 47,000 | | | Boer Power Holdings Ltd. | | | 76,892 | |
| | 494,000 | | | BYD Electronic International Co. Ltd.(d) | | | 324,421 | |
| | 358,656 | | | Central China Real Estate Ltd. | | | 72,188 | |
| | 32,000 | | | Changshouhua Food Co. Ltd. | | | 19,322 | |
| | 249,000 | | | Chaowei Power Holdings Ltd.(d) | | | 160,311 | |
| | 908,000 | | | Chigo Holding Ltd.(d) | | | 15,347 | |
| | 70,000 | | | China Animal Healthcare Ltd.(b)(c)(d) | | | 17,612 | |
| | 781,000 | | | China Aoyuan Property Group Ltd. | | | 174,326 | |
| | 21,000 | | | China Child Care Corp. Ltd. | | | 2,845 | |
| | 562,000 | | | China Communications Services Corp. Ltd. - H Shares | | | 226,233 | |
| | 10,500 | | | China Conch Venture Holdings Ltd. | | | 23,979 | |
| | 121,000 | | | China Datang Corp. Renewable Power Co. Ltd. - H Shares(d) | | | 16,236 | |
| | 65,000 | | | China Dredging Environment Protection Holdings Ltd.(d) | | | 9,141 | |
| | 437,500 | | | China Galaxy Securities Co. Ltd. - H Shares | | | 381,583 | |
| | 36,800 | | | China Gold International Resources Corp. Ltd.(d) | | | 49,251 | |
| | 23,308 | | | China Great Star International Ltd.(d) | | | 50,090 | |
| | 216,500 | | | China Hongqiao Group Ltd. | | | 113,130 | |
| | 140,000 | | | China Huishan Dairy Holdings Co. Ltd. | | | 53,286 | |
| | 151,500 | | | China Huiyuan Juice Group Ltd.(d) | | | 68,414 | |
| | 30,700 | | | China International Marine Containers Group Co. Ltd. - H Shares | | | 54,741 | |
| | 32,000 | | | China ITS Holdings Co. Ltd.(d) | | | 3,964 | |
| | 631,000 | | | China Lesso Group Holdings. Ltd. | | | 513,716 | |
| | 66,000 | | | China Lilang Ltd. | | | 56,372 | |
| | 111,000 | | | China Longyuan Power Group Corp. - H Shares | | | 101,969 | |
| | 211,000 | | | China Machinery Engineering Corp. - H Shares | | | 184,032 | |
| | 135,000 | | | China Medical System Holdings Ltd. | | | 186,373 | |
| | 132,000 | | | China Mengniu Dairy Co. Ltd. | | | 256,486 | |
| | 138,000 | | | China Molybdenum Co. Ltd. - H Shares | | | 77,096 | |
| | 638,084 | | | China National Building Material Co. Ltd. - H Shares | | | 399,286 | |
| | 544,000 | | | China National Materials Co. Ltd. - H Shares | | | 131,252 | |
| Old Westbury Funds, Inc. | |
| Small & Mid Cap Fund | |
| Portfolio of Investments - (Continued) | October 31, 2015 |
| | |
| Shares | | | | | Value | |
| CHINA (continued) | | | | |
| | 648,400 | | | China SCE Property Holdings Ltd. | | $ | 142,219 | |
| | 309,488 | | | China Shanshui Cement Group Ltd.(b)(c)(d) | | | 165,314 | |
| | 49,000 | | | China Shineway Pharmaceutical Group Ltd. | | | 63,727 | |
| | 961,093 | | | China Shipping Container Lines Co. Ltd. - H Shares(c)(d) | | | 393,856 | |
| | 600,000 | | | China Shipping Development Co. Ltd., H Shares(c) | | | 435,001 | |
| | 153,000 | | | China Suntien Green Energy Corp. Ltd. - H Shares | | | 27,439 | |
| | 164,000 | | | China Taifeng Beddings Holdings Ltd.(b)(c)(d) | | | 8,570 | |
| | 101,500 | | | China ZhengTong Auto Services Holdings Ltd. | | | 45,442 | |
| | 330,000 | | | China Zhongwang Holdings Ltd. | | | 146,040 | |
| | 246,000 | | | Chinasoft International Ltd.(d) | | | 107,279 | |
| | 30,000 | | | Chongqing Iron & Steel Co. Ltd. - H Shares(d) | | | 4,838 | |
| | 270,000 | | | Chongqing Machinery & Electric Co. Ltd. - H Shares | | | 38,668 | |
| | 367,000 | | | Chongqing Rural Commercial Bank Co. Ltd. - H Shares | | | 231,547 | |
| | 58,000 | | | Chu Kong Petroleum & Natural Gas Steel Pipe Holdings Ltd.(d) | | | 9,878 | |
| | 584,000 | | | Coolpad Group Ltd.(d) | | | 102,475 | |
| | 322,443 | | | Country Garden Holdings Co. Ltd. | | | 123,143 | |
| | 4,949,000 | | | CPMC Holdings Ltd.(c) | | | 2,783,996 | |
| | 200,000 | | | CSPC Pharmaceutical Group Ltd. | | | 186,824 | |
| | 9,208,000 | | | CT Environmental Group Ltd. | | | 3,278,982 | |
| | 104,000 | | | Da Ming International Holdings, Ltd. | | | 29,386 | |
| | 408,000 | | | Dalian Port PDA Co. Ltd. - H Shares | | | 147,921 | |
| | 192,000 | | | Daphne International Holdings Ltd.(d) | | | 34,681 | |
| | 37,200 | | | Dongfang Electric Corp. Ltd. - H Shares | | | 44,685 | |
| | 459,000 | | | Dongyue Group Ltd. | | | 126,141 | |
| | 130,000 | | | ENN Energy Holdings Ltd. | | | 748,910 | |
| | 861,000 | | | Evergrande Real Estate Group Ltd. | | | 662,086 | |
| | 774,000 | | | Fantasia Holdings Group Co. Ltd. | | | 92,873 | |
| | 651,000 | | | FIH Mobile Ltd. | | | 311,616 | |
| | 4,259,000 | | | Fu Shou Yuan International Group Ltd. | | | 2,912,381 | |
| | 583,600 | | | Fufeng Group Ltd. | | | 308,719 | |
| | 2,830,000 | | | Geely Automobile Holdings Ltd. | | | 1,522,605 | |
| | 148,000 | | | Golden Eagle Retail Group Ltd. | | | 190,380 | |
| | 1,180,600 | | | GOME Electrical Appliances Holdings Ltd. | | | 217,823 | |
| Shares | | | | | Value | |
| CHINA (continued) | | | | |
| | 144,000 | | | Goodbaby International Holdings Ltd.(d) | | $ | 66,514 | |
| | 226,000 | | | Greatview Aseptic Packaging Co. Ltd. | | | 106,139 | |
| | 41,000 | | | Greenland Hong Kong Holdings Ltd.(d) | | | 17,404 | |
| | 225,500 | | | Greentown China Holdings Ltd.(d) | | | 198,134 | |
| | 612,000 | | | Guangshen Railway Co. Ltd. - H Shares | | | 317,426 | |
| | 60,000 | | | Guangzhou Baiyunshan Pharmaceutical Holdings Co. Ltd. - H Shares | | | 169,535 | |
| | 155,600 | | | Guangzhou R&F Properties Co. Ltd. - H Shares | | | 154,986 | |
| | 2,287,000 | | | Haitian International Holdings Ltd. | | | 4,018,907 | |
| | 232,000 | | | Harbin Electric Co. Ltd. - H Shares | | | 138,890 | |
| | 5,418,000 | | | Hilong Holding Ltd. | | | 1,153,420 | |
| | 38,000 | | | Hisense Kelon Electrical Holdings Co. Ltd. - H Shares(d) | | | 19,415 | |
| | 32,000 | | | HNA Infrastructure Company Ltd. | | | 36,746 | |
| | 82,000 | | | HOSA International Ltd. | | | 33,855 | |
| | 82,000 | | | Huadian Fuxin Energy Corp. Ltd. | | | 25,286 | |
| | 138,000 | | | Huadian Power International Corp. Ltd. - H Shares | | | 101,489 | |
| | 1,622,000 | | | Huaneng Renewables Corp. Ltd. - H Shares | | | 506,443 | |
| | 23,000 | | | Huishang Bank Corp. Ltd. - H Shares | | | 9,911 | |
| | 77,000 | | | Intime Retail Group Co. Ltd. | | | 85,240 | |
| | 50,000 | | | Jiangsu Expressway Co. Ltd. - H Shares | | | 67,866 | |
| | 424,000 | | | Jiangxi Copper Co. Ltd. - H Shares | | | 561,278 | |
| | 92,000 | | | Jingwei Textile Machinery - H Shares | | | 138,405 | |
| | 1,235,000 | | | Kaisa Group Holdings Ltd.(b)(c)(d) | | | 93,215 | |
| | 376,000 | | | Kingdee International Software Group Co. Ltd. | | | 155,725 | |
| | 465,000 | | | KWG Property Holding Ltd. | | | 337,174 | |
| | 15,200 | | | Li Heng Chemical Fibre Technologies Ltd.(d) | | | 4,666 | |
| | 91,000 | | | Lianhua Supermarket Holdings Co. Ltd. - H Shares(d) | | | 42,620 | |
| | 128,000 | | | Lifetech Scientific Corp.(d) | | | 24,607 | |
| | 7,800 | | | Livzon Pharmaceutical Group, Inc.(b)(c) | | | 39,852 | |
| | 528,500 | | | Longfor Properties Co. Ltd. | | | 710,522 | |
| | 652,000 | | | Lonking Holdings Ltd. | | | 105,153 | |
| | 910,000 | | | Maanshan Iron & Steel Co. Ltd. - H Shares(d) | | | 196,075 | |
| Old Westbury Funds, Inc. | |
| Small & Mid Cap Fund | |
| Portfolio of Investments - (Continued) | October 31, 2015 |
| | |
| Shares | | | | | Value | |
| CHINA (continued) | | | | |
| | 512,000 | | | Maoye International Holdings Ltd. | | $ | 66,059 | |
| | 3,617,000 | | | Microport Scientific Corp.(c)(d) | | | 1,512,022 | |
| | 138,000 | | | Minth Group Ltd. | | | 286,662 | |
| | 80,000 | | | NVC Lighting Holdings Ltd. | | | 10,322 | |
| | 132,000 | | | O-Net Communications Group Ltd.(d) | | | 38,831 | |
| | 49,800 | | | Pacific Online Ltd. | | | 16,706 | |
| | 197,000 | | | Powerlong Real Estate Holdings Ltd. | | | 38,889 | |
| | 58,000 | | | Qingling Motors Co. Ltd. - H Shares | | | 18,708 | |
| | 261,000 | | | Qunxing Paper Holdings Co. Ltd.(b)(c)(d) | | | 12,729 | |
| | 67,000 | | | Real Gold Mining Ltd.(b)(c)(d) | | | 2,274 | |
| | 4,122,145 | | | Renhe Commercial Holdings Co. Ltd.(d) | | | 215,399 | |
| | 214,000 | | | Sany Heavy Equipment International Holdings Co. Ltd.(d) | | | 52,184 | |
| | 10,766,806 | | | Semiconductor Manufacturing International Corp.(d) | | | 1,000,194 | |
| | 70,000 | | | Shandong Chenming Paper Holdings Ltd. - H Shares | | | 39,197 | |
| | 28,000 | | | Shandong Weigao Group Medical Polymer Co. Ltd. - H Shares | | | 19,436 | |
| | 325,235 | | | Shanghai Jin Jiang International Hotels Group Co. Ltd. - H Shares | | | 101,549 | |
| | 123,700 | | | Shanghai Pharmaceuticals Holding Co. Ltd. - H Shares | | | 286,643 | |
| | 32,000 | | | Shenzhen Expressway Co. Ltd. - H Shares | | | 24,731 | |
| | 66,000 | | | Shenzhou International Group Holdings Ltd. | | | 325,717 | |
| | 837,881 | | | Shui On Land Ltd. | | | 231,345 | |
| | 102,000 | | | Sichuan Expressway Co. Ltd. - H Shares | | | 35,664 | |
| | 212,000 | | | Sihuan Pharmaceutical Holdings Group Ltd.(b)(c) | | | 45,266 | |
| | 73,000 | | | SinoMedia Holding Ltd. | | | 23,452 | |
| | 1,833,062 | | | Sino-Ocean Land Holdings Ltd. | | | 1,071,371 | |
| | 12,500 | | | Sinopec Engineering Group Co. Ltd. | | | 10,806 | |
| | 224,000 | | | Sinopec Shanghai Petrochemical Co. Ltd. - H Shares(d) | | | 93,639 | |
| | 13,200 | | | Sinopharm Group Co. Ltd. - H Shares | | | 54,669 | |
| | 780,000 | | | Sinotrans Ltd. - H Shares | | | 426,702 | |
| | 334,000 | | | Sinotruk Hong Kong Ltd. | | | 139,623 | |
| | 364,000 | | | SOHO China Ltd. | | | 187,856 | |
| | 6,000 | | | Springland International Holdings Ltd. | | | 1,510 | |
| | 658,000 | | | Sunac China Holdings Ltd. | | | 405,805 | |
| | 60,000 | | | Sunny Optical Technology Group Co. Ltd. | | | 140,583 | |
| Shares | | | | | Value | |
| CHINA (continued) | | | | |
| | 76,000 | | | TCL Communication Technology Holdings Ltd. | | $ | 56,775 | |
| | 36,000 | | | Tian Shan Development Holdings Ltd. | | | 15,096 | |
| | 340,000 | | | Tiangong International Co. Ltd. | | | 31,585 | |
| | 420,000 | | | Tianneng Power International Ltd.(d) | | | 305,628 | |
| | 1,913,000 | | | Tong Ren Tang Technologies Co. Ltd. - H Shares | | | 2,996,390 | |
| | 22,800 | | | Tonly Electronics Holdings Ltd. | | | 14,120 | |
| | 1,265,500 | | | Travelsky Technology Ltd. - H Shares | | | 1,874,428 | |
| | 210,000 | | | Trigiant Group Ltd. | | | 44,435 | |
| | 201,000 | | | Trony Solar Holdings Co. Ltd.(b)(c)(d) | | | 3,060 | |
| | 20,000 | | | Tsingtao Brewery Co. Ltd. - H Shares | | | 95,864 | |
| | 63,400 | | | Uni-President China Holdings Ltd. | | | 52,107 | |
| | 124,000 | | | Universal Health International Group Holding Ltd. | | | 49,116 | |
| | 439,200 | | | V1 Group Ltd. | | | 33,433 | |
| | 177,000 | | | Weiqiao Textile Co. - H Shares | | | 80,158 | |
| | 1,066,000 | | | West China Cement Ltd. | | | 184,301 | |
| | 582,000 | | | Wuzhou International Holdings Ltd.(d) | | | 90,860 | |
| | 626,000 | | | Xiamen International Port Co. Ltd. - H Shares | | | 159,921 | |
| | 138,000 | | | Xingye Copper International Group Ltd.(d) | | | 15,312 | |
| | 62,200 | | | Xinjiang Goldwind Science & Technology Co. Ltd. - H Shares | | | 117,328 | |
| | 217,000 | | | Xinjiang Xinxin Mining Industry Co. Ltd. - H Shares(d) | | | 24,078 | |
| | 212,000 | | | Xinyi Solar Holdings Ltd. | | | 84,793 | |
| | 283,000 | | | Xiwang Special Steel Co. Ltd. | | | 52,944 | |
| | 149,000 | | | XTEP International Holdings Ltd. | | | 77,282 | |
| | 52,000 | | | Yanzhou Coal Mining Co. Ltd. - H Shares | | | 25,092 | |
| | 4,457,500 | | | Yestar International Holdings Co. Ltd. | | | 1,782,862 | |
| | 49,500 | | | Youyuan International Holdings Ltd. | | | 16,477 | |
| | 650,000 | | | Yuanda China Holdings Ltd. | | | 31,869 | |
| | 531,760 | | | Yuzhou Properties Co. Ltd. | | | 127,613 | |
| | 387,000 | | | Zall Development Group Ltd. | | | 85,383 | |
| | 97,500 | | | Zhaojin Mining Industry Co. Ltd. - H Shares | | | 55,351 | |
| | 96,000 | | | Zhejiang Expressway Co. Ltd. - H Shares | | | 118,659 | |
| | 40,000 | | | Zhejiang Glass Co. Ltd. - H Shares(b)(c)(d) | | | 0 | |
| | 166,000 | | | Zhong An Real Estate Ltd.(d) | | | 18,205 | |
| Old Westbury Funds, Inc. | |
| Small & Mid Cap Fund | |
| Portfolio of Investments - (Continued) | October 31, 2015 |
| | |
| Shares | | | | | Value | |
| CHINA (continued) | | | | |
| | 24,000 | | | Zhuzhou CSR Times Electric Co. Ltd. - H Shares | | $ | 156,530 | |
| | | | | | | | 56,069,054 | |
| DENMARK — 0.6% | | | | |
| | 742 | | | ALK-Abello A/S | | | 80,738 | |
| | 32,552 | | | Alm Brand A/S | | | 184,781 | |
| | 8,231 | | | Amagerbanken A/S(b)(c)(d) | | | 0 | |
| | 1,801 | | | Ambu A/S - B Shares | | | 48,860 | |
| | 1,663 | | | Bang & Olufsen A/S(d) | | | 10,936 | |
| | 6,285 | | | Bavarian Nordic A/S(d) | | | 252,054 | |
| | 1,079 | | | Brodrene Hartmann A/S | | | 38,022 | |
| | 353,398 | | | Chr. Hansen Holding A/S | | | 21,238,218 | |
| | 5,133 | | | D/S Norden A/S(d) | | | 102,322 | |
| | 12,175 | | | Dfds A/S | | | 369,791 | |
| | 23,297 | | | DSV A/S | | | 944,610 | |
| | 9,621 | | | FLSmidth & Co. A/S | | | 364,280 | |
| | 3,180 | | | Genmab A/S(d) | | | 313,670 | |
| | 81,337 | | | GN Store Nord A/S | | | 1,483,466 | |
| | 8,562 | | | H. Lundbeck A/S(d) | | | 251,974 | |
| | 1,804 | | | H+H International A/S - Class B(d) | | | 14,895 | |
| | 825 | | | Harboes Bryggeri A/S - Class B | | | 12,590 | |
| | 2,037 | | | IC Group A/S | | | 56,013 | |
| | 15,839 | | | ISS A/S | | | 557,442 | |
| | 34,273 | | | Jyske Bank A/S(d) | | | 1,673,135 | |
| | 12,405 | | | NKT Holding A/S | | | 675,271 | |
| | 1,470 | | | Nordjyske Bank A/S | | | 24,383 | |
| | 1,113 | | | PER Aarsleff A/S - Class B | | | 374,154 | |
| | 1,525 | | | Ringkjoebing Landbobank A/S | | | 326,255 | |
| | 1,648 | | | Rockwool International A/S - Class B | | | 258,049 | |
| | 9,265 | | | Royal Unibrew A/S | | | 366,510 | |
| | 7,654 | | | Santa Fe Group A/S(d) | | | 60,940 | |
| | 9,377 | | | Schouw & Co. | | | 490,808 | |
| | 8,811 | | | SimCorp A/S | | | 431,953 | |
| | 1,324 | | | Solar A/S - Class B | | | 80,525 | |
| | 21,891 | | | Spar Nord Bank A/S | | | 209,797 | |
| | 28,395 | | | Sydbank A/S | | | 934,031 | |
| | 219,403 | | | TDC A/S | | | 1,150,011 | |
| | 21,852 | | | TK Development A/S(d) | | | 26,581 | |
| | 27,770 | | | Topdanmark AS(d) | | | 739,458 | |
| | 18,025 | | | Tryg A/S | | | 324,231 | |
| | 3,200 | | | William Demant Holding A/S(d) | | | 277,898 | |
| | | | | | | | 34,748,652 | |
| FAEROE ISLANDS — 0.0% | | | | |
| | 7,482 | | | Bakkafrost | | | 240,396 | |
| | 486 | | | BankNordik | | | 10,068 | |
| | | | | | | | 250,464 | |
| FINLAND — 0.5% | | | | |
| | 3,779 | | | Ahlstrom Oyj | | | 30,627 | |
| | 29,532 | | | Aktia Bank Oyj | | | 356,249 | |
| | 17,970 | | | Amer Sports Oyj | | | 504,293 | |
| Shares | | | | | Value | |
| FINLAND (continued) | | | | |
| | 1,322 | | | Atria Oyj | | $ | 11,993 | |
| | 4,574 | | | Cargotec Oyj - Class B | | | 163,066 | |
| | 97,834 | | | Caverion Corp. | | | 852,059 | |
| | 194,952 | | | Citycon Oyj | | | 513,652 | |
| | 2,317 | | | Comptel Oyj | | | 3,032 | |
| | 24,710 | | | Cramo Oyj | | | 453,778 | |
| | 57,662 | | | Elisa Oyj | | | 2,173,627 | |
| | 16,218 | | | Finnair Oyj(d) | | | 67,056 | |
| | 3,396 | | | Finnlines Oyj(d) | | | 64,979 | |
| | 7,981 | | | Fiskars Oyj Abp | | | 164,995 | |
| | 8,344 | | | F-Secure Oyj | | | 24,957 | |
| | 7,348 | | | HKScan Oyj - A Shares | | | 29,574 | |
| | 40,848 | | | Huhtamaki Oyj | | | 1,441,884 | |
| | 17,769 | | | Kemira Oyj | | | 210,638 | |
| | 14,135 | | | Kesko OYJ - B Shares | | | 451,385 | |
| | 2,280 | | | Kesko Oyj - Class A | | | 70,352 | |
| | 22,442 | | | Konecranes Oyj | | | 601,905 | |
| | 23,076 | | | Lassila & Tikanoja OYJ | | | 446,102 | |
| �� | 74 | | | Lemminkainen Oyj(d) | | | 1,065 | |
| | 75,818 | | | Metsa Board Oyj | | | 482,731 | |
| | 27,237 | | | Metso Oyj | | | 667,013 | |
| | 80,024 | | | Neste Oyj | | | 1,952,685 | |
| | 61,462 | | | Nokian Renkaat Oyj | | | 2,320,252 | |
| | 2,393 | | | Olvi Oyj - Class A | | | 58,024 | |
| | 27,474 | | | Oriola-KD Oyj - Class B(d) | | | 134,442 | |
| | 8,412 | | | Orion Oyj - Class A | | | 299,153 | |
| | 21,898 | | | Orion Oyj - Class B | | | 783,086 | |
| | 14,520 | | | Outokumpu Oyj(d) | | | 49,434 | |
| | 9,969 | | | PKC Group Oyj | | | 183,620 | |
| | 1,919 | | | Poyry Oyj(d) | | | 8,373 | |
| | 38,176 | | | Raisio Oyj - V Shares | | | 180,095 | |
| | 75,089 | | | Ramirent Oyj | | | 584,607 | |
| | 267 | | | Saga Furs Oyj | | | 5,341 | |
| | 62,070 | | | Sanoma Oyj | | | 272,339 | |
| | 80,880 | | | Sponda Oyj | | | 343,663 | |
| | 6,761 | | | Stockmann Oyj Abp - Class B(d) | | | 52,564 | |
| | 293,089 | | | Stora Enso Oyj - Class R | | | 2,721,785 | |
| | 163,338 | | | Talvivaara Mining Co. Plc(b)(c)(d) | | | 1,024 | |
| | 4,690 | | | Technopolis Oyj | | | 18,928 | |
| | 36,054 | | | Tieto Oyj | | | 924,960 | |
| | 22,998 | | | Tikkurila Oyj | | | 422,086 | |
| | 216,315 | | | UPM-Kymmene Oyj | | | 4,055,698 | |
| | 15,354 | | | Uponor Oyj | | | 204,803 | |
| | 3,684 | | | Vaisala Oyj - Class A | | | 98,402 | |
| | 46,101 | | | Valmet Oyj | | | 486,165 | |
| | 15,103 | | | Wartsila Oyj Abp | | | 645,388 | |
| | 32,499 | | | YIT OYJ | | | 171,183 | |
| | | | | | | | 26,765,112 | |
| FRANCE — 2.7% | | | | |
| | 25,010 | | | Accor SA | | | 1,244,202 | |
| | 6,551 | | | Actia Group | | | 38,468 | |
| | 5,380 | | | Aeroports de Paris | | | 676,508 | |
| | 61,181 | | | Air France-KLM(d) | | | 448,810 | |
| Old Westbury Funds, Inc. | |
| Small & Mid Cap Fund | |
| Portfolio of Investments - (Continued) | October 31, 2015 |
| | |
| Shares | | | | | Value | |
| FRANCE (continued) | | | | |
| | 13,900 | | | Akka Technologies SA | | $ | 383,657 | |
| | 21,709 | | | Albioma SA | | | 353,310 | |
| | 360,370 | | | Alcatel-Lucent(d) | | | 1,465,843 | |
| | 31,661 | | | Alstom SA(d) | | | 1,032,643 | |
| | 28,310 | | | Altamir | | | 319,094 | |
| | 136 | | | Altarea SCA REIT | | | 25,611 | |
| | 13,714 | | | Alten SA | | | 711,805 | |
| | 37,226 | | | Altran Technologies SA | | | 464,619 | |
| | 24,749 | | | APRIL SA(c) | | | 351,077 | |
| | 42,415 | | | Arkema SA | | | 3,106,801 | |
| | 3,122 | | | Assystem | | | 65,229 | |
| | 51,892 | | | Atos SE | | | 4,139,925 | |
| | 560 | | | Axway Software SA | | | 14,921 | |
| | 4,971 | | | Beneteau SA | | | 75,518 | |
| | 8,051 | | | BioMerieux | | | 935,792 | |
| | 72,207 | | | Boiron SA(c) | | | 6,382,369 | |
| | 106,370 | | | Bollore SA | | | 526,598 | |
| | 8,998 | | | Bonduelle SCA | | | 224,213 | |
| | 19,160 | | | Bourbon SA | | | 282,539 | |
| | 20,290 | | | Bouygues SA | | | 768,980 | |
| | 73,197 | | | Bureau Veritas SA | | | 1,655,702 | |
| | 158 | | | Burelle SA | | | 116,374 | |
| | 11,880 | | | Caisse Regionale de Credit Agricole Mutuel Nord de France | | | 213,202 | |
| | 26,120 | | | Cap Gemini SA | | | 2,327,414 | |
| | 92,370 | | | Carrefour SA | | | 3,013,721 | |
| | 15,993 | | | Casino Guichard Perrachon SA | | | 920,488 | |
| | 13,052 | | | Cegedim SA(d) | | | 462,873 | |
| | 2,386 | | | Cegid Group SA | | | 112,297 | |
| | 6,528 | | | Chargeurs SA | | | 55,992 | |
| | 3,649 | | | Cie des Alpes | | | 67,894 | |
| | 27,190 | | | Cie Generale des Etablissements Michelin - Class B | | | 2,708,894 | |
| | 23,540 | | | CNP Assurances | | | 336,256 | |
| | 30,050 | | | Coface SA(d) | | | 243,307 | |
| | 21,920 | | | Dassault Systemes SA | | | 1,731,655 | |
| | 58,242 | | | Derichebourg SA(d) | | | 179,264 | |
| | 1,675 | | | Devoteam SA | | | 54,613 | |
| | 15,013 | | | Edenred | | | 276,114 | |
| | 30,573 | | | Eiffage SA | | | 1,907,913 | |
| | 490 | | | Electricite de Strasbourg SA | | | 57,003 | |
| | 779 | | | Esso SA Francaise(d) | | | 44,647 | |
| | 11,074 | | | Euler Hermes Group | | | 1,038,134 | |
| | 71,368 | | | Eutelsat Communications SA | | | 2,355,180 | |
| | 1,226 | | | Exel Industries SA - Class A | | | 62,690 | |
| | 1,633 | | | Faiveley Transport SA | | | 172,390 | |
| | 19,271 | | | Faurecia | | | 763,525 | |
| | 2,670 | | | FFP | | | 195,395 | |
| | 1,000 | | | Fimalac | | | 89,841 | |
| | 4,430 | | | Fonciere Des Regions REIT | | | 417,727 | |
| | 11,234 | | | GameLoft SA(d) | | | 64,238 | |
| | 210,096 | | | Gaztransport Et Technigaz SA(c) | | | 10,511,962 | |
| | 6,915 | | | Gecina SA REIT | | | 885,115 | |
| | 4,254 | | | GL Events | | | 81,068 | |
| Shares | | | | | Value | |
| FRANCE (continued) | | | | |
| | 1,072 | | | Groupe Crit | | $ | 58,116 | |
| | 147,086 | | | Groupe Eurotunnel SE | | | 2,061,417 | |
| | 7,871 | | | Groupe Fnac SA(d) | | | 510,579 | |
| | 1,572 | | | Guerbet | | | 106,658 | |
| | 6,054 | | | Haulotte Group SA | | | 85,879 | |
| | 7,408 | | | Havas SA | | | 64,274 | |
| | 418 | | | HiPay Group SA(d) | | | 4,270 | |
| | 1,746 | | | ICADE REIT | | | 129,330 | |
| | 3,690 | | | Iliad SA | | | 776,443 | |
| | 16,263 | | | Imerys SA | | | 1,113,970 | |
| | 43,901 | | | Ingenico Group SA | | | 5,184,815 | |
| | 1,996 | | | Interparfums SA | | | 51,141 | |
| | 17,871 | | | Ipsen SA | | | 1,128,409 | |
| | 13,266 | | | IPSOS | | | 269,513 | |
| | 3,503 | | | Jacquet Metal Service | | | 51,136 | |
| | 7,047 | | | JCDecaux SA | | | 287,109 | |
| | 31,020 | | | Klepierre REIT | | | 1,472,749 | |
| | 243,925 | | | Korian SA | | | 9,228,529 | |
| | 31,108 | | | Lagardere SCA | | | 906,851 | |
| | 936 | | | Laurent-Perrier | | | 81,096 | |
| | 1,830 | | | Le Noble Age(d) | | | 43,467 | |
| | 2,183 | | | Lectra | | | 25,806 | |
| | 37,840 | | | Legrand SA | | | 2,078,042 | |
| | 896 | | | Linedata Services | | | 30,051 | |
| | 245,816 | | | LISI(c) | | | 6,000,918 | |
| | 438 | | | Maisons France Confort SA | | | 19,136 | |
| | 2,938 | | | Manitou BF SA | | | 40,643 | |
| | 7,220 | | | Manutan International(c) | | | 366,724 | |
| | 9,780 | | | Mercialys SA REIT | | | 224,824 | |
| | 8,434 | | | Mersen | | | 158,408 | |
| | 30,873 | | | Metropole Television SA | | | 594,286 | |
| | 30,667 | | | MGI Coutier | | | 547,998 | |
| | 6,144 | | | Montupet | | | 482,734 | |
| | 1,975 | | | Mr Bricolage | | | 28,103 | |
| | 104,090 | | | Natixis SA | | | 638,701 | |
| | 1,247 | | | Naturex(d) | | | 87,761 | |
| | 13,008 | | | Nexans SA(d) | | | 517,885 | |
| | 9,400 | | | Nexity SA | | | 416,466 | |
| | 241 | | | NextRadioTV | | | 9,469 | |
| | 1,540 | | | Norbert Dentressangle SA | | | 335,305 | |
| | 15,700 | | | Numericable-SFR SAS(d) | | | 711,298 | |
| | 5,485 | | | Oeneo SA | | | 38,602 | |
| | 3,092 | | | Onxeo SA(d) | | | 12,355 | |
| | 8,604 | | | Orpea | | | 690,682 | |
| | 1,719 | | | Parrot SA(d) | | | 77,880 | |
| | 79,170 | | | Peugeot SA(d) | | | 1,395,126 | |
| | 13,486 | | | Pharmagest Inter@ctive(c) | | | 366,298 | |
| | 1,273 | | | Pierre & Vacances SA(d) | | | 34,884 | |
| | 25,703 | | | Plastic Omnium SA | | | 743,634 | |
| | 506 | | | Plastivaloire | | | 37,859 | |
| | 431 | | | PSB Industries SA | | | 25,778 | |
| | 30,930 | | | Publicis Groupe | | | 2,008,760 | |
| | 4,837 | | | Rallye SA | | | 89,599 | |
| | 28,970 | | | Renault SA | | | 2,731,089 | |
| | 79,155 | | | Rexel SA | | | 1,081,942 | |
| | 523 | | | Rothschild & Co. | | | 15,016 | |
| Old Westbury Funds, Inc. | |
| Small & Mid Cap Fund | |
| Portfolio of Investments - (Continued) | October 31, 2015 |
| | |
| Shares | | | | | Value | |
| FRANCE (continued) | | | | |
| | 151,356 | | | Rubis SCA | | $ | 12,148,359 | |
| | 8,556 | | | Saft Groupe SA | | | 221,102 | |
| | 1,023 | | | Sartorius Stedim Biotech | | | 361,500 | |
| | 2,288 | | | Savencia SA | | | 142,657 | |
| | 92,928 | | | SCOR SE | | | 3,461,118 | |
| | 6,771 | | | SEB SA | | | 688,581 | |
| | 117,560 | | | Sequana SA(d) | | | 506,758 | |
| | 7,304 | | | Societe BIC SA | | | 1,165,019 | |
| | 320 | | | Societe Internationale de Plantations d’Heveas SA(d) | | | 9,195 | |
| | 11,804 | | | Societe Television Francaise 1 | | | 152,064 | |
| | 13,730 | | | Sodexo SA | | | 1,222,501 | |
| | 2,401 | | | Solocal Group(d) | | | 19,567 | |
| | 602 | | | Somfy SA | | | 188,137 | |
| | 5,427 | | | Sopra Steria Group | | | 617,668 | |
| | 12,209 | | | Ste Industrielle d’Aviation Latecoere SA(d) | | | 55,716 | |
| | 1,615 | | | Stef SA | | | 118,952 | |
| | 76,119 | | | Suez Environnement Co. | | | 1,448,921 | |
| | 1,654 | | | Sword Group | | | 43,270 | |
| | 20,120 | | | Synergie SA | | | 538,743 | |
| | 15,150 | | | Tarkett SA | | | 452,311 | |
| | 128,112 | | | Technicolor SA | | | 868,938 | |
| | 64,113 | | | Technip SA | | | 3,349,192 | |
| | 25,468 | | | Teleperformance SA | | | 2,001,861 | |
| | 3,928 | | | Tessi SA(c) | | | 494,574 | |
| | 17,890 | | | Thales SA | | | 1,297,024 | |
| | 497,665 | | | Theolia SA(d) | | | 322,882 | |
| | 260 | | | Thermador Groupe | | | 24,302 | |
| | 2,556 | | | Trigano SA | | | 122,940 | |
| | 83,993 | | | UBISOFT Entertainment(d) | | | 2,519,199 | |
| | 22,145 | | | Valeo SA | | | 3,426,292 | |
| | 1,621 | | | Valneva SE(d) | | | 6,043 | |
| | 70,410 | | | Veolia Environnement SA | | | 1,639,504 | |
| | 602 | | | Vetoquinol SA | | | 25,255 | |
| | 2,449 | | | Vicat | | | 157,004 | |
| | 7,449 | | | Vilmorin & Cie SA | | | 525,062 | |
| | 596 | | | Virbac SA | | | 118,855 | |
| | 449 | | | Vranken - Pommery Monopole SA | | | 14,170 | |
| | 4,010 | | | Wendel SA | | | 481,308 | |
| | 49,450 | | | Zodiac Aerospace | | | 1,250,687 | |
| | | | | | | | 145,648,464 | |
| GEORGIA — 0.0% | | | | |
| | 3,670 | | | Bank of Georgia Holdings Plc | | | 113,153 | |
| GERMANY — 3.0% | | | | |
| | 15,926 | | | Aareal Bank AG | | | 606,827 | |
| | 7,530 | | | Aareal Bank AG | | | 286,915 | |
| | 27,620 | | | Adidas AG | | | 2,476,864 | |
| | 2,898 | | | Adler Modemaerkte AG | | | 33,302 | |
| | 99,717 | | | ADVA Optical Networking SE(d) | | | 1,079,871 | |
| | 2,793 | | | Air Berlin Plc(d) | | | 2,792 | |
| | 19,015 | | | Aixtron SE(d) | | | 121,068 | |
| | 4,617 | | | Allgeier SE | | | 85,397 | |
| Shares | | | | | Value | |
| GERMANY (continued) | | | | |
| | 6,126 | | | Alstria Office REIT AG | | $ | 85,519 | |
| | 5,182 | | | Amadeus Fire AG | | | 432,394 | |
| | 13,961 | | | Aurubis AG | | | 934,536 | |
| | 17,022 | | | Axel Springer SE | | | 957,251 | |
| | 310 | | | Basler AG | | | 15,183 | |
| | 3,784 | | | Bauer AG | | | 79,893 | |
| | 7,518 | | | BayWa AG | | | 254,588 | |
| | 6,276 | | | Bechtle AG | | | 579,718 | |
| | 15,880 | | | Beiersdorf AG | | | 1,509,279 | |
| | 1,027 | | | Bertrandt AG | | | 120,501 | |
| | 7,116 | | | Bijou Brigitte AG | | | 395,246 | |
| | 24,171 | | | Bilfinger SE | | | 1,084,317 | |
| | 2,505 | | | Biotest AG | | | 37,766 | |
| | 2,694 | | | Biotest AG - Preference Shares | | | 37,919 | |
| | 35,060 | | | Borussia Dortmund GmbH & Co. KGaA | | | 156,143 | |
| | 43,875 | | | Brenntag AG | | | 2,651,181 | |
| | 3,635 | | | CANCOM SE | | | 142,801 | |
| | 8,816 | | | Carl Zeiss Meditec AG | | | 258,359 | |
| | 2,761 | | | CENIT AG | | | 54,650 | |
| | 4,110 | | | CENTROTEC Sustainable AG | | | 65,669 | |
| | 8,870 | | | Cewe Stiftung & Co. KGaA | | | 532,953 | |
| | 13,929 | | | Comdirect Bank AG | | | 167,721 | |
| | 158,420 | | | Commerzbank AG(d) | | | 1,743,808 | |
| | 4,097 | | | CompuGroup Medical AG | | | 120,741 | |
| | 205,116 | | | Constantin Medien AG(c)(d) | | | 415,699 | |
| | 28,668 | | | CTS Eventim AG & Co KGaA | | | 1,122,440 | |
| | 1,776 | | | Deag Deutsche Entertainment AG(d) | | | 7,484 | |
| | 12,208 | | | Deutsche Beteiligungs AG | | | 347,024 | |
| | 31,530 | | | Deutsche Boerse AG | | | 2,903,778 | |
| | 154,753 | | | Deutsche Lufthansa AG(d) | | | 2,285,439 | |
| | 17,900 | | | Deutsche Rohstoff AG(c) | | | 339,938 | |
| | 81,478 | | | Deutsche Wohnen AG | | | 2,298,619 | |
| | 30,691 | | | Deutz AG | | | 115,187 | |
| | 34,460 | | | DMG Mori AG | | | 1,368,161 | |
| | 2,601 | | | Dr Hoenle AG | | | 71,448 | |
| | 1,053 | | | Draegerwerk AG & Co. KGaA | | | 67,484 | |
| | 14,383 | | | Drillisch AG | | | 741,941 | |
| | 92,023 | | | Duerr AG | | | 7,667,403 | |
| | 1,537 | | | Eckert & Ziegler AG | | | 32,409 | |
| | 6,212 | | | Elmos Semiconductor AG | | | 92,219 | |
| | 370,688 | | | ElringKlinger AG | | | 8,301,327 | |
| | 908 | | | Euromicron AG(d) | | | 8,400 | |
| | 10,490 | | | Evonik Industries AG | | | 381,243 | |
| | 138,020 | | | Fielmann AG | | | 9,675,576 | |
| | 1,910 | | | First Sensor AG(d) | | | 23,765 | |
| | 19,763 | | | Fraport AG Frankfurt Airport Services Worldwide | | | 1,253,959 | |
| | 89,296 | | | Freenet AG | | | 3,012,603 | |
| | 31,670 | | | Fresenius Medical Care AG & Co. KGaA | | | 2,851,895 | |
| | 66,220 | | | Fresenius SE & Co. KGaA | | | 4,860,658 | |
| | 22,279 | | | Fuchs Petrolub SE | | | 922,759 | |
| | 23,177 | | | Fuchs Petrolub SE - Preference Shares | | | 1,111,598 | |
| Old Westbury Funds, Inc. | |
| Small & Mid Cap Fund | |
| Portfolio of Investments - (Continued) | October 31, 2015 |
| | |
| Shares | | | | | Value | |
| GERMANY (continued) | | | | |
| | 75,405 | | | GEA Group AG | | $ | 3,023,646 | |
| | 19,993 | | | Gerresheimer AG | | | 1,560,297 | |
| | 869 | | | Gerry Weber International AG | | | 14,152 | |
| | 2,345 | | | Gesco AG | | | 166,015 | |
| | 17,123 | | | GFK SE | | | 631,347 | |
| | 5,545 | | | GFT Technologies SE | | | 163,841 | |
| | 5,876 | | | Grammer AG | | | 156,854 | |
| | 1,925 | | | Grenkeleasing AG | | | 353,404 | |
| | 1,190 | | | H&R AG(d) | | | 10,747 | |
| | 6,986 | | | Hamborner AG REIT | | | 74,271 | |
| | 5,599 | | | Hamburger Hafen und Logistik AG | | | 80,995 | |
| | 9,830 | | | Hannover Rueck SE | | | 1,137,166 | |
| | 18,000 | | | HeidelbergCement AG | | | 1,341,617 | |
| | 118,849 | | | Heidelberger Druckmaschinen AG(d) | | | 341,760 | |
| | 11,311 | | | Hochtief AG | | | 1,052,765 | |
| | 2,277 | | | Homag Group AG | | | 87,875 | |
| | 648 | | | Hornbach Baumarkt AG | | | 23,159 | |
| | 12,811 | | | HUGO BOSS AG | | | 1,318,460 | |
| | 12,049 | | | Indus Holding AG | | | 569,737 | |
| | 154,130 | | | Infineon Technologies AG | | | 1,897,431 | |
| | 502 | | | Init Innovation In Traffic Systems AG | | | 11,228 | |
| | 1,494 | | | Isra Vision AG | | | 88,863 | |
| | 11,957 | | | Jenoptik AG | | | 193,152 | |
| | 3,178 | | | Jungheinrich AG | | | 234,389 | |
| | 75,757 | | | K+S AG | | | 1,912,294 | |
| | 2,490 | | | Kabel Deutschland Holding AG | | | 316,938 | |
| | 17,523 | | | KION Group AG | | | 790,229 | |
| | 19,662 | | | Kloeckner & Co. SE | | | 175,371 | |
| | 1,427 | | | Koenig & Bauer AG(d) | | | 44,722 | |
| | 5,079 | | | Kontron AG(d) | | | 17,314 | |
| | 12,247 | | | Krones AG | | | 1,473,335 | |
| | 740 | | | Ksb AG | | | 317,115 | |
| | 210 | | | KSB AG | | | 92,532 | |
| | 10,885 | | | KUKA AG | | | 920,350 | |
| | 1,917 | | | KWS Saat SE | | | 620,182 | |
| | 67,359 | | | Lanxess AG | | | 3,618,385 | |
| | 7,228 | | | Leg Immobilien AG | | | 576,647 | |
| | 798 | | | Leifheit AG | | | 41,309 | |
| | 6,072 | | | Leoni AG | | | 247,720 | |
| | 4,388 | | | LPKF Laser & Electronics AG | | | 40,822 | |
| | 4,700 | | | MAN SE | | | 490,167 | |
| | 1,101 | | | Manz AG(d) | | | 50,850 | |
| | 77,291 | | | Metro AG | | | 2,382,356 | |
| | 101,641 | | | MLP AG | | | 441,602 | |
| | 178,069 | | | MTU Aero Engines AG | | | 16,481,633 | |
| | 2,623 | | | MVV Energie AG | | | 59,361 | |
| | 6,204 | | | Nemetschek AG | | | 257,369 | |
| | 2,244 | | | Nexus AG | | | 40,370 | |
| | 21,300 | | | Nordex SE(d) | | | 696,587 | |
| | 199,859 | | | NORMA Group SE | | | 10,255,801 | |
| | 1,516 | | | OHB SE | | | 32,058 | |
| | 37,382 | | | OSRAM Licht AG | | | 2,199,642 | |
| | 17,064 | | | Patrizia Immobilien AG(d) | | | 469,392 | |
| Shares | | | | | Value | |
| GERMANY (continued) | | | | |
| | 4,505 | | | Pfeiffer Vacuum Technology AG | | $ | 561,775 | |
| | 17,767 | | | PNE Wind AG | | | 46,206 | |
| | 386 | | | Progress-Werk Oberkirch AG | | | 14,580 | |
| | 35,080 | | | ProSiebenSat.1 Media SE | | | 1,897,540 | |
| | 678 | | | Puma SE | | | 151,797 | |
| | 29,897 | | | QSC AG | | | 52,470 | |
| | 870 | | | R Stahl AG | | | 27,730 | |
| | 13,568 | | | Rational AG | | | 5,386,886 | |
| | 19,717 | | | Rheinmetall AG | | | 1,241,500 | |
| | 15,291 | | | RHOEN-KLINIKUM AG | | | 456,352 | |
| | 16,332 | | | SAF-Holland SA | | | 238,502 | |
| | 9,704 | | | Salzgitter AG | | | 280,167 | |
| | 1,934 | | | Sartorius AG - Preference Shares | | | 437,680 | |
| | 1,579 | | | Schaltbau Holding AG | | | 87,894 | |
| | 6,126 | | | SGL Carbon SE(d) | | | 112,634 | |
| | 7,152 | | | Sixt SE | | | 397,647 | |
| | 3,115 | | | Sixt SE - Preference Shares | | | 134,156 | |
| | 977 | | | Softing AG | | | 12,645 | |
| | 16,990 | | | Software AG | | | 493,887 | |
| | 49,185 | | | Stada Arzneimittel AG | | | 1,872,468 | |
| | 2,392 | | | Sto Se & CO KGAA | | | 311,830 | |
| | 7,599 | | | STRATEC Biomedical AG | | | 442,881 | |
| | 11,191 | | | Stroeer SE | | | 706,252 | |
| | 22,636 | | | Suedzucker AG | | | 422,910 | |
| | 1,278 | | | Surteco SE | | | 24,945 | |
| | 4,961 | | | Suss Microtec AG(d) | | | 37,664 | |
| | 42,586 | | | Symrise AG | | | 2,805,100 | |
| | 13,715 | | | TAG Immobilien AG | | | 177,587 | |
| | 32,248 | | | Takkt AG | | | 598,945 | |
| | 40,147 | | | Talanx AG | | | 1,287,787 | |
| | 423 | | | Technotrans AG | | | 8,303 | |
| | 68,760 | | | Telefonica Deutschland Holding AG | | | 442,784 | |
| | 22,110 | | | Tlg Immobilien AG | | | 416,243 | |
| | 4,964 | | | Tomorrow Focus AG(d) | | | 18,205 | |
| | 143,671 | | | TUI AG(c) | | | 2,677,718 | |
| | 53,473 | | | United Internet AG | | | 2,778,670 | |
| | 19,170 | | | Vib Vermoegen AG | | | 367,851 | |
| | 26,022 | | | Villeroy & Boch AG | | | 384,015 | |
| | 41,110 | | | Vonovia SE | | | 1,371,569 | |
| | 1,861 | | | Vossloh AG(d) | | | 137,010 | |
| | 8,812 | | | VTG AG | | | 287,748 | |
| | 9,072 | | | Wacker Chemie AG | | | 796,686 | |
| | 17,355 | | | Wacker Neuson SE | | | 241,323 | |
| | 822 | | | Washtec AG | | | 25,626 | |
| | 15,110 | | | Wincor Nixdorf AG | | | 775,705 | |
| | 13,310 | | | Wirecard AG | | | 687,981 | |
| | 1,653 | | | XING AG | | | 326,463 | |
| | | | | | | | 161,451,569 | |
| GIBRALTAR — 0.0% | | | | |
| | 23,380 | | | 888 Holdings Plc | | | 58,209 | |
| Old Westbury Funds, Inc. | |
| Small & Mid Cap Fund | |
| Portfolio of Investments - (Continued) | October 31, 2015 |
| | |
| Shares | | | | | Value | |
| GIBRALTAR (continued) | | | | |
| | 68,686 | | | Bwin Party Digital Entertainment Plc | | $ | 118,486 | |
| | | | | | | | 176,695 | |
| GREECE — 0.0% | | | | |
| | 45,756 | | | Aegean Airlines SA(c) | | | 354,725 | |
| | 96 | | | Alapis Holding Industrial and Commercial SA of Pharmaceutical Chemical Products(b)(c)(d) | | | 0 | |
| | 2,153 | | | Athens Water Supply & Sewage Co. SA (The)(c) | | | 13,637 | |
| | 32,394 | | | Ellaktor SA(c)(d) | | | 63,407 | |
| | 10,168 | | | Frigoglass SAIC(c)(d) | | | 25,270 | |
| | 14,537 | | | GEK Terna Holding Real Estate Construction SA(c)(d) | | | 29,893 | |
| | 28,930 | | | Grivalia Properties REIC AE REIT(c) | | | 263,093 | |
| | 5,827 | | | Hellenic Exchanges - Athens Stock Exchange SA(c) | | | 33,256 | |
| | 170,009 | | | Intralot SA-Integrated Lottery Systems & Services(c)(d) | | | 282,295 | |
| | 7,101 | | | JUMBO SA(c) | | | 68,716 | |
| | 1,715 | | | Lamda Development SA(c)(d) | | | 8,675 | |
| | 132,453 | | | Marfin Investment Group Holdings SA(c)(d) | | | 12,235 | |
| | 41,173 | | | Metka SA(c) | | | 395,259 | |
| | 34,370 | | | Motor Oil (Hellas) Corinth Refineries SA(c)(d) | | | 422,926 | |
| | 61,455 | | | Mytilineos Holdings SA(c) | | | 327,758 | |
| | 22,848 | | | Proton Bank SA(b)(c)(d) | | | 0 | |
| | 3,988 | | | Sarantis SA(c) | | | 32,233 | |
| | 12,534 | | | T Bank SA(b)(c)(d) | | | 0 | |
| | 71,586 | | | Terna Energy SA(c) | | | 226,712 | |
| | 647 | | | Thessaloniki Port Authority SA(c) | | | 18,498 | |
| | 31,091 | | | TT Hellenic Postbank SA(b)(c)(d) | | | 0 | |
| | | | | | | | 2,578,588 | |
| GUERNSEY — 0.0% | | | | |
| | 5,739 | | | Raven Russia Ltd.(d) | | | 3,804 | |
| HONG KONG — 1.1% | | | | |
| | 375,000 | | | Agritrade Resources Ltd. | | | 80,316 | |
| | 26,000 | | | Allied Group Ltd. | | | 124,119 | |
| | 1,415,693 | | | Allied Properties HK Ltd. | | | 303,209 | |
| | 138,000 | | | AMVIG Holdings Ltd. | | | 63,386 | |
| | 520,000 | | | Anxin-China Holdings Ltd.(b)(c)(d) | | | 9,688 | |
| | 570,000 | | | APAC Resources Ltd.(d) | | | 6,692 | |
| | 182,250 | | | APT Satellite Holdings Ltd. | | | 180,120 | |
| | 144,000 | | | Asia Financial Holdings Ltd. | | | 55,738 | |
| | 58,000 | | | Asia Satellite Telecommunications Holdings Ltd. | | | 86,357 | |
| | 297,877 | | | Asia Standard International Group Ltd. | | | 56,112 | |
| | 364,100 | | | ASM Pacific Technology Ltd. | | | 2,597,829 | |
| Shares | | | | | Value | |
| HONG KONG (continued) | | | | |
| | 74,000 | | | Associated International Hotels Ltd. | | $ | 206,229 | |
| | 275,000 | | | Auto Italia Holdings Ltd.(d) | | | 14,015 | |
| | 52,000 | | | Beijing Enterprises Holdings Ltd. | | | 329,755 | |
| | 700,000 | | | Beijing Enterprises Water Group Ltd. | | | 559,053 | |
| | 504,000 | | | Bel Global Resources Holdings Ltd.(b)(c)(d) | | | 0 | |
| | 70,400 | | | Bonjour Holdings Ltd. | | | 2,770 | |
| | 426,000 | | | Bosideng International Holdings Ltd. | | | 41,223 | |
| | 218,000 | | | Bossini International Holdings Ltd. | | | 18,845 | |
| | 25,000 | | | Bracell Ltd. | | | 2,968 | |
| | 92,000 | | | Bright Smart Securities & Commodities Group Ltd. | | | 29,082 | |
| | 393,000 | | | Brightoil Petroleum Holdings Ltd.(d) | | | 140,455 | |
| | 72,000 | | | Brilliance China Automotive Holdings Ltd. | | | 100,142 | |
| | 56,897 | | | Brilliant Circle Holdings International Ltd. | | | 10,057 | |
| | 1,644,354 | | | Brockman Mining Ltd.(d) | | | 35,006 | |
| | 608,000 | | | Burwill Holdings Ltd.(d) | | | 22,749 | |
| | 496,791 | | | C C Land Holdings Ltd. | | | 127,553 | |
| | 48,000 | | | Cafe de Coral Holdings Ltd. | | | 162,568 | |
| | 92,000 | | | Carrianna Group Holdings Co. Ltd. | | | 9,615 | |
| | 554,800 | | | Century City International Holdings Ltd. | | | 38,654 | |
| | 1,604,275 | | | Champion Technology Holdings Ltd.(d) | | | 31,462 | |
| | 125,144 | | | Cheuk Nang Holdings Ltd. | | | 92,034 | |
| | 85,873 | | | Chevalier International Holdings Ltd. | | | 148,466 | |
| | 14,020 | | | Chia Tai Enterprises International Ltd.(d) | | | 5,155 | |
| | 684,000 | | | China Aerospace International Holdings Ltd. | | | 99,724 | |
| | 168,137 | | | China Agri-Industries Holdings Ltd.(d) | | | 62,043 | |
| | 136,000 | | | China All Access Holdings Ltd. | | | 47,202 | |
| | 2,392,000 | | | China Billion Resources Ltd.(b)(c)(d) | | | 0 | |
| | 79,500 | | | China Culiangwang Beverages Holdings, Ltd.(d) | | | 1,323 | |
| | 2,520,000 | | | China Daye Non-Ferrous Metals Mining Ltd.(d) | | | 47,795 | |
| | 1,478,000 | | | China Energy Development Holdings Ltd.(d) | | | 29,558 | |
| | 46,000 | | | China Everbright International Ltd. | | | 74,425 | |
| | 525,600 | | | China Fiber Optic Network System Group Ltd.(d) | | | 63,067 | |
| | 62,000 | | | China Foods Ltd.(d) | | | 28,398 | |
| | 224,000 | | | China Gas Holdings Ltd. | | | 357,216 | |
| | 206,000 | | | China Glass Holdings Ltd.(d) | | | 28,439 | |
| Old Westbury Funds, Inc. | |
| Small & Mid Cap Fund | |
| Portfolio of Investments - (Continued) | October 31, 2015 |
| | |
| Shares | | | | | Value | |
| HONG KONG (continued) | | | | |
| | 6,603,000 | | | China High Precision Automation Group Ltd.(b)(c)(d) | | $ | 194,880 | |
| | 287,000 | | | China High Speed Transmission Equipment Group Co. Ltd.(d) | | | 258,465 | |
| | 1,816,000 | | | China Jinmao Holdings Group Ltd. | | | 501,412 | |
| | 10,378,000 | | | China Lumena New Materials Corp.(b)(c)(d) | | | 0 | |
| | 1,858,000 | | | China Lumena New Materials Corp.(b)(d) | | | 0 | |
| | 142,518 | | | China Merchants Holdings International Co. Ltd. | | | 475,330 | |
| | 888,000 | | | China Merchants Land Ltd. | | | 189,043 | |
| | 216,000 | | | China Metal International Holdings, Inc. | | | 57,410 | |
| | 193,200 | | | China Metal Recycling Holdings Ltd.(b)(c)(d) | | | 44,071 | |
| | 492,557 | | | China New Town Development Co. Ltd.(d) | | | 19,701 | |
| | 1,110,000 | | | China Oil and Gas Group Ltd.(d) | | | 77,336 | |
| | 24,500 | | | China Overseas Grand Oceans Group Ltd. | | | 7,808 | |
| | 136,000 | | | China Power International Development Ltd. | | | 85,980 | |
| | 400,000 | | | China Power New Energy Development Co. Ltd. | | | 27,869 | |
| | 251,000 | | | China Properties Group Ltd.(d) | | | 51,815 | |
| | 251,327 | | | China Resources Beer Holdings Co. Ltd. | | | 476,025 | |
| | 286,440 | | | China Resources Cement Holdings Ltd. | | | 115,676 | |
| | 70,800 | | | China Resources Gas Group Ltd. | | | 195,027 | |
| | 3,668,600 | | | China Singyes Solar Technologies Holdings Ltd. | | | 2,882,586 | |
| | 270,000 | | | China Smarter Energy Group Holdings Ltd.(d) | | | 22,992 | |
| | 1,230,000 | | | China South City Holdings Ltd. | | | 295,177 | |
| | 4,250,000 | | | China Star Entertainment Ltd.(d) | | | 19,740 | |
| | 275,440 | | | China State Construction International Holdings Ltd. | | | 419,347 | |
| | 727,500 | | | China Strategic Holdings Ltd.(d) | | | 22,903 | |
| | 220,000 | | | China Ting Group Holdings Ltd.(d) | | | 13,483 | |
| | 800,000 | | | China Travel International Investment Hong Kong Ltd. | | | 363,327 | |
| | 86,000 | | | China Water Affairs Group Ltd. | | | 45,493 | |
| | 27,000 | | | Chinese Estates Holdings Ltd. | | | 62,914 | |
| | 141,000 | | | Chow Sang Sang Holdings International Ltd. | | | 275,065 | |
| | 110,000 | | | Chu Kong Shipping Enterprises Group Co. Ltd. | | | 32,926 | |
| | 237,500 | | | Chuang’s Consortium International Ltd. | | | 27,579 | |
| Shares | | | | | Value | |
| HONG KONG (continued) | | | | |
| | 90,000 | | | CIMC Enric Holdings Ltd. | | $ | 59,570 | |
| | 1,555,000 | | | CITIC Resources Holdings Ltd.(d) | | | 234,737 | |
| | 649,000 | | | CITIC Telecom International Holdings Ltd. | | | 269,628 | |
| | 508,000 | | | Citychamp Watch & Jewellery Group Ltd.(d) | | | 78,652 | |
| | 1,052,000 | | | CK Life Sciences International Holdings, Inc. | | | 99,084 | |
| | 60,000 | | | Clear Media Ltd. | | | 60,382 | |
| | 142,000 | | | CNT Group Ltd. | | | 6,412 | |
| | 177,000 | | | Coastal Greenland Ltd.(d) | | | 4,545 | |
| | 185,130 | | | Comba Telecom Systems Holdings Ltd. | | | 38,217 | |
| | 520,000 | | | Concord New Energy Group Ltd. | | | 35,559 | |
| | 124,000 | | | Cosco International Holdings Ltd.(b)(c) | | | 71,354 | |
| | 511,420 | | | COSCO Pacific Ltd.(b)(c) | | | 661,627 | |
| | 1,402,000 | | | CP Pokphand Co. Ltd. | | | 168,227 | |
| | 27,000 | | | Cross-Harbour Holdings Ltd. (The) | | | 35,811 | |
| | 2,429,335 | | | CSI Properties Ltd. | | | 81,494 | |
| | 3,656,000 | | | CST Mining Group Ltd.(d) | | | 40,567 | |
| | 84,924 | | | Dah Sing Banking Group Ltd. | | | 161,507 | |
| | 60,678 | | | Dah Sing Financial Holdings Ltd. | | | 340,945 | |
| | 101,000 | | | Dan Form Holdings Co. Ltd. | | | 16,419 | |
| | 80,000 | | | Dawnrays Pharmaceutical Holdings Ltd. | | | 66,575 | |
| | 244,000 | | | DBA Telecommunication Asia Holdings Ltd.(b)(c)(d) | | | 4,132 | |
| | 160,550 | | | Dickson Concepts International Ltd. | | | 60,072 | |
| | 261,000 | | | Digital China Holdings Ltd. | | | 267,377 | |
| | 108,000 | | | Dynasty Fine Wines Group Ltd.(b)(c)(d) | | | 3,762 | |
| | 92,000 | | | Eagle Nice International Holdings Ltd. | | | 22,790 | |
| | 244,200 | | | EcoGreen International Group Ltd. | | | 56,083 | |
| | 168,234 | | | EganaGoldpfeil Holdings Ltd.(b)(c)(d) | | | 0 | |
| | 621,000 | | | Emperor Capital Group Ltd. | | | 52,080 | |
| | 325,000 | | | Emperor Entertainment Hotel Ltd. | | | 64,576 | |
| | 386,416 | | | Emperor International Holdings Ltd. | | | 74,784 | |
| | 130,000 | | | Emperor Watch & Jewellery Ltd. | | | 3,472 | |
| | 861,400 | | | Esprit Holdings Ltd. | | | 970,250 | |
| | 220,000 | | | EVA Precision Industrial Holdings Ltd. | | | 52,512 | |
| | 9,500 | | | Fairwood Holdings Ltd. | | | 29,417 | |
| | 574,862 | | | Far East Consortium International Ltd. | | | 209,901 | |
| | 88,000 | | | Far East Horizon Ltd. | | | 73,460 | |
| | 1,198,000 | | | First Pacific Co. Ltd. | | | 820,760 | |
| Old Westbury Funds, Inc. | |
| Small & Mid Cap Fund | |
| Portfolio of Investments - (Continued) | October 31, 2015 |
| | |
| Shares | | | | | Value | |
| HONG KONG (continued) | | | | |
| | 272,000 | | | First Shanghai Investments Ltd. | | $ | 42,464 | |
| | 276,000 | | | Fountain SET Holdings Ltd. | | | 34,542 | |
| | 114,000 | | | Future Bright Holdings Ltd. | | | 13,532 | |
| | 522,000 | | | GCL New Energy Holdings Ltd.(d) | | | 38,389 | |
| | 1,591,000 | | | GCL-Poly Energy Holdings Ltd.(d) | | | 330,492 | |
| | 116,000 | | | Genting Hong Kong Ltd. | | | 35,920 | |
| | 2,406,000 | | | Get Nice Holdings Ltd. | | | 99,337 | |
| | 266,000 | | | Giordano International Ltd. | | | 143,457 | |
| | 875,200 | | | Global Bio-Chem Technology Group Co. Ltd.(d) | | | 34,441 | |
| | 2,382,000 | | | Global Brands Group Holding Ltd.(d) | | | 494,803 | |
| | 1,547,000 | | | Glorious Property Holdings Ltd.(d) | | | 199,597 | |
| | 70,000 | | | Glorious Sun Enterprises Ltd. | | | 12,193 | |
| | 220,000 | | | Gold Peak Industries Holding Ltd. | | | 25,830 | |
| | 180,000 | | | Goldbond Group Holdings Ltd. | | | 8,825 | |
| | 365,382 | | | Golden Meditech Holdings Ltd. | | | 53,742 | |
| | 150,000 | | | Golden Resources Development International Ltd. | | | 9,193 | |
| | 214,000 | | | Goldin Properties Holdings Ltd.(d) | | | 184,440 | |
| | 118,000 | | | Goldlion Holdings Ltd. | | | 49,937 | |
| | 16,000 | | | Good Friend International Holdings, Inc. | | | 3,964 | |
| | 159,685 | | | Great Eagle Holdings Ltd. | | | 526,405 | |
| | 12,162,000 | | | G-Resources Group Ltd. | | | 273,035 | |
| | 336,000 | | | Guangdong Investment Ltd. | | | 474,265 | |
| | 150,666 | | | Guangdong Land Holdings Ltd.(d) | | | 33,630 | |
| | 64,000 | | | Guangnan Holdings Ltd. | | | 8,835 | |
| | 14,000 | | | Guoco Group Ltd. | | | 160,762 | |
| | 129,600 | | | Guotai Junan International Holdings Ltd. | | | 48,157 | |
| | 26,000 | | | Haier Electronics Group Co. Ltd. | | | 50,453 | |
| | 480,246 | | | Haitong International Securities Group Ltd. | | | 267,058 | |
| | 270,000 | | | Hang Lung Group Ltd. | | | 980,634 | |
| | 88,845 | | | Hanison Construction Holdings Ltd. | | | 16,392 | |
| | 370,000 | | | Hao Tian Development Group Ltd.(d) | | | 23,153 | |
| | 114,000 | | | Harbour Centre Development Ltd. | | | 191,505 | |
| | 245,400 | | | Hengdeli Holdings Ltd. | | | 37,045 | |
| | 124,244 | | | HK Electric Investments & HK Electric Investments Ltd. | | | 95,380 | |
| | 4,835,065 | | | HKBN Ltd.(d) | | | 5,820,344 | |
| | 1,211,035 | | | HKC Holdings Ltd.(d) | | | 28,281 | |
| | 365,200 | | | HKR International Ltd. | | | 163,032 | |
| | 90,000 | | | Hon Kwok Land Investment Co. Ltd. | | | 31,352 | |
| | 6,000 | | | Hong Kong Aircraft Engineering Co. Ltd. | | | 48,190 | |
| Shares | | | | | Value | |
| HONG KONG (continued) | | | | |
| | 57,000 | | | Hong Kong Ferry (Holdings) Co. Ltd. | | $ | 66,556 | |
| | 305,651 | | | Hongkong & Shanghai Hotels Ltd. (The) | | | 347,824 | |
| | 669,700 | | | Hongkong Chinese Ltd. | | | 115,784 | |
| | 12,650 | | | Hopewell Highway Infrastructure Ltd. | | | 5,827 | |
| | 143,500 | | | Hopewell Holdings Ltd. | | | 519,337 | |
| | 194,000 | | | Hopson Development Holdings Ltd.(d) | | | 164,700 | |
| | 522,000 | | | Hsin Chong Construction Group Ltd. | | | 61,288 | |
| | 24,000 | | | Hua Han Bio-Pharmaceutical Holdings Ltd. | | | 3,499 | |
| | 439,000 | | | Huabao International Holdings Ltd. | | | 184,083 | |
| | 239,631 | | | Hung Hing Printing Group Ltd. | | | 30,609 | |
| | 651,000 | | | Hutchison Telecommunications Hong Kong Holdings Ltd. | | | 241,061 | |
| | 49,000 | | | Hysan Development Co. Ltd. | | | 217,796 | |
| | 335,000 | | | I-CABLE Communications Ltd.(d) | | | 23,340 | |
| | 1,160,000 | | | Imagi International Holdings Ltd.(d) | | | 16,912 | |
| | 646,250 | | | International Standard Resources Holdings Ltd.(d) | | | 13,174 | |
| | 235,000 | | | IPE Group Ltd. | | | 33,959 | |
| | 28,266 | | | IRC Ltd.(d) | | | 966 | |
| | 398,000 | | | IT Ltd. | | | 122,215 | |
| | 126,000 | | | ITC Corp. Ltd. | | | 11,542 | |
| | 95,905 | | | ITC Properties Group Ltd. | | | 45,660 | |
| | 65,000 | | | Jinhui Holdings Co. Ltd.(d) | | | 8,722 | |
| | 141,125 | | | Johnson Electric Holdings Ltd. | | | 518,025 | |
| | 616,000 | | | Ju Teng International Holdings Ltd. | | | 337,780 | |
| | 311,099 | | | K Wah International Holdings Ltd. | | | 134,866 | |
| | 84,000 | | | Kader Holdings Co. Ltd.(d) | | | 7,478 | |
| | 1,940,000 | | | Kai Yuan Holdings Ltd.(d) | | | 20,024 | |
| | 42,000 | | | Keck Seng Investments | | | 37,174 | |
| | 113,500 | | | Kerry Logistics Network Ltd. | | | 169,285 | |
| | 404,000 | | | Kerry Properties Ltd. | | | 1,198,875 | |
| | 150,200 | | | Kingboard Chemical Holdings Ltd. | | | 212,783 | |
| | 473,000 | | | Kingboard Laminates Holdings Ltd. | | | 197,729 | |
| | 74,000 | | | Kingmaker Footwear Holdings Ltd. | | | 17,854 | |
| | 1,866,000 | | | Kingston Financial Group Ltd.(d) | | | 741,527 | |
| | 344,000 | | | Ko Yo Chemical Group Ltd.(d) | | | 36,838 | |
| | 376,000 | | | Kowloon Development Co. Ltd. | | | 425,939 | |
| | 1,070,000 | | | Kunlun Energy Co. Ltd. | | | 875,261 | |
| | 2,159,000 | | | Lai Fung Holdings Ltd. | | | 36,770 | |
| | 3,304,750 | | | Lai Sun Development Co. Ltd. | | | 60,547 | |
| | 603,200 | | | Lai Sun Garment International Ltd. | | | 74,713 | |
| Old Westbury Funds, Inc. | |
| Small & Mid Cap Fund | |
| Portfolio of Investments - (Continued) | October 31, 2015 |
| | |
| Shares | | | | | Value | |
| HONG KONG (continued) | | | | |
| | 9,000 | | | Lam Soon Hong Kong Ltd. | | $ | 6,038 | |
| | 68,000 | | | Landsea Green Properties Co. Ltd. | | | 6,405 | |
| | 127,600 | | | Le Saunda Holdings Ltd. | | | 34,079 | |
| | 24,000 | | | Lee & Man Chemical Co. Ltd. | | | 9,909 | |
| | 549,200 | | | Lee & Man Paper Manufacturing Ltd. | | | 342,958 | |
| | 15,000 | | | Lee’s Pharmaceutical Holdings Ltd. | | | 19,431 | |
| | 364,000 | | | Li & Fung Ltd. | | | 295,874 | |
| | 131,000 | | | Lifestyle International Holdings Ltd. | | | 189,640 | |
| | 1,314,000 | | | Lippo China Resources Ltd. | | | 51,708 | |
| | 78,000 | | | Lippo Ltd. | | | 43,274 | |
| | 116,000 | | | Liu Chong Hing Investment Ltd. | | | 137,244 | |
| | 546,600 | | | Loudong General Nice Resources China Holdings Ltd.(d) | | | 46,546 | |
| | 170,000 | | | Luen Thai Holdings Ltd. | | | 25,882 | |
| | 156,000 | | | Luk Fook Holdings International Ltd. | | | 403,556 | |
| | 1,444,000 | | | Magnificent Estates | | | 40,988 | |
| | 145,600 | | | Man Wah Holdings Ltd. | | | 166,817 | |
| | 7,700 | | | Mandarin Oriental International Ltd. | | | 11,781 | |
| | 2,400,000 | | | Mason Financial Holdings Ltd.(d) | | | 89,799 | |
| | 132,000 | | | Melco International Development Ltd. | | | 205,393 | |
| | 162,000 | | | Midland Holdings Ltd.(d) | | | 70,229 | |
| | 84,000 | | | MIN XIN Holdings Ltd. | | | 72,614 | |
| | 429,000 | | | Mingfa Group International Co. Ltd.(d) | | | 104,059 | |
| | 344,000 | | | Minmetals Land Ltd. | | | 35,507 | |
| | 39,000 | | | Miramar Hotel & Investment Co. Ltd. | | | 65,616 | |
| | 1,371,148 | | | Nan Hai Corp. Ltd.(d) | | | 29,013 | |
| | 150,000 | | | Natural Beauty Bio-Technology Ltd. | | | 16,644 | |
| | 361,500 | | | Neo-Neon Holdings Ltd.(d) | | | 50,839 | |
| | 1,440,000 | | | Neptune Group Ltd.(d) | | | 15,235 | |
| | 872,000 | | | New Century Group Hong Kong Ltd. | | | 16,426 | |
| | 1,369,100 | | | New World China Land Ltd. | | | 909,719 | |
| | 516,000 | | | Newocean Energy Holdings Ltd. | | | 211,710 | |
| | 362,000 | | | Next Digital Ltd. | | | 26,622 | |
| | 312,000 | | | Nine Dragons Paper Holdings Ltd. | | | 207,313 | |
| | 925,700 | | | Noble Group Ltd. | | | 333,699 | |
| | 330,859 | | | NWS Holdings Ltd. | | | 499,452 | |
| | 400,500 | | | O Luxe Holdings Ltd.(d) | | | 14,469 | |
| | 315,000 | | | Orange Sky Golden Harvest Entertainment Holdings Ltd.(d) | | | 24,385 | |
| | 72,500 | | | Orient Overseas International Ltd. | | | 346,570 | |
| Shares | | | | | Value | |
| HONG KONG (continued) | | | | |
| | 111,200 | | | Oriental Watch Holdings | | $ | 15,208 | |
| | 118,000 | | | Overseas Chinese Town Asia Holdings Ltd. | | | 53,286 | |
| | 1,340,246 | | | Pacific Andes International Holdings Ltd.(d) | | | 25,765 | |
| | 4,779,000 | | | Pacific Basin Shipping Ltd. | | | 1,418,174 | |
| | 105,000 | | | Pacific Textile Holdings Ltd. | | | 150,105 | |
| | 227,240 | | | Paliburg Holdings Ltd. | | | 71,538 | |
| | 20,000 | | | Pan Asia Environmental Protection Group Ltd. | | | 2,632 | |
| | 785,394 | | | PCCW Ltd. | | | 425,600 | |
| | 48,000 | | | Peace Mark Holdings Ltd.(b)(c)(d) | | | 0 | |
| | 296,000 | | | Phoenix Satellite Television Holdings Ltd. | | | 71,035 | |
| | 368,000 | | | Pico Far East Holdings Ltd. | | | 97,809 | |
| | 54,000 | | | Playmates Holdings Ltd. | | | 61,869 | |
| | 244,000 | | | Playmates Toys Ltd. | | | 51,630 | |
| | 950,000 | | | PME Group Ltd.(d) | | | 18,631 | |
| | 318,000 | | | Poly Property Group Co. Ltd. | | | 103,393 | |
| | 460,000 | | | Polytec Asset Holdings Ltd. | | | 57,570 | |
| | 132,000 | | | Pou Sheng International Holdings Ltd.(d) | | | 21,118 | |
| | 78,000 | | | Public Financial Holdings Ltd. | | | 37,940 | |
| | 692,000 | | | PYI Corp. Ltd. | | | 15,267 | |
| | 118,000 | | | Real Nutriceutical Group Ltd.(b) | | | 15,225 | |
| | 346,200 | | | Regal Hotels International Holdings Ltd. | | | 179,117 | |
| | 5,581,033 | | | REXLot Holdings Ltd.(b)(c) | | | 316,834 | |
| | 240,000 | | | SA SA International Holdings Ltd. | | | 77,104 | |
| | 139,000 | | | Samson Holding Ltd. | | | 17,575 | |
| | 116,000 | | | SAS Dragon Holdings Ltd. | | | 22,001 | |
| | 92,000 | | | SEA Holdings Ltd. | | | 96,622 | |
| | 143,516 | | | Shanghai Industrial Holdings Ltd. | | | 379,594 | |
| | 789,000 | | | Shanghai Industrial Urban Development Group Ltd. | | | 153,716 | |
| | 1,190,000 | | | Shanghai Zendai Property Ltd.(d) | | | 31,168 | |
| | 438,000 | | | Shangri-La Asia Ltd. | | | 402,364 | |
| | 195,000 | | | Shenwan Hongyuan HK Ltd. | | | 86,045 | |
| | 489,520 | | | Shenzhen International Holdings Ltd. | | | 746,539 | |
| | 330,638 | | | Shenzhen Investment Ltd. | | | 134,378 | |
| | 339,129 | | | Shimao Property Holdings Ltd. | | | 598,571 | |
| | 2,408,000 | | | Shougang Concord International Enterprises Co. Ltd.(d) | | | 100,973 | |
| | 23,826 | | | Shun Ho Tech Holdings Ltd.(d) | | | 8,146 | |
| | 657,750 | | | Shun Tak Holdings Ltd. | | | 263,080 | |
| | 278,000 | | | Silver Grant International Industries Ltd. | | | 37,662 | |
| | 92,000 | | | Sing Tao News Corp. Ltd. | | | 12,820 | |
| | 652,000 | | | Singamas Container Holdings Ltd. | | | 78,234 | |
| | 240,000 | | | Sino Biopharmaceutical Ltd. | | | 300,054 | |
| Old Westbury Funds, Inc. | |
| Small & Mid Cap Fund | |
| Portfolio of Investments - (Continued) | October 31, 2015 |
| | |
| Shares | | | | | Value | |
| HONG KONG (continued) | | | | |
| | 3,935,000 | | | Sino Oil And Gas Holdings Ltd.(d) | | $ | 97,479 | |
| | 716,000 | | | Sinofert Holdings Ltd. | | | 126,561 | |
| | 38,000 | | | SIS International Holdings | | | 21,573 | |
| | 61,000 | | | SITC International Holdings Co. Ltd. | | | 31,403 | |
| | 60,000 | | | Sitoy Group Holdings Ltd. | | | 28,720 | |
| | 781,000 | | | SJM Holdings Ltd. | | | 651,959 | |
| | 608,252 | | | Skyworth Digital Holdings Ltd. | | | 452,034 | |
| | 67,643 | | | SmarTone Telecommunications Holding Ltd. | | | 120,439 | |
| | 1,267,934 | | | SMI Holdings Group Ltd. | | | 111,242 | |
| | 76,843 | | | SOCAM Development Ltd.(d) | | | 45,607 | |
| | 6,500 | | | Soundwill Holdings Ltd. | | | 8,378 | |
| | 1,392,000 | | | South China Holdings Co. Ltd.(d) | | | 91,595 | |
| | 340,000 | | | South Sea Petroleum Holdings Ltd.(d) | | | 9,519 | |
| | 360,000 | | | Sparkle Roll Group Ltd.(d) | | | 16,257 | |
| | 1,413,428 | | | SRE Group Ltd.(b)(c)(d) | | | 70,210 | |
| | 4,102,010 | | | SSY Group Ltd. | | | 1,032,039 | |
| | 151,000 | | | Stella International Holdings Ltd. | | | 373,672 | |
| | 60,500 | | | Stelux Holdings International Ltd. | | | 6,401 | |
| | 204,000 | | | Success Universe Group Ltd.(d) | | | 5,054 | |
| | 251,000 | | | Sun Art Retail Group Ltd. | | | 205,966 | |
| | 16,000 | | | Sun Hing Vision Group Holdings Ltd. | | | 6,069 | |
| | 382,801 | | | Sun Hung Kai & Co. Ltd. | | | 258,309 | |
| | 263,000 | | | TAI Cheung Holdings Ltd. | | | 211,402 | |
| | 6,000 | | | Tan Chong International Ltd. | | | 2,020 | |
| | 6,000 | | | Tao Heung Holdings Ltd. | | | 1,897 | |
| | 456,000 | | | TCC International Holdings Ltd. | | | 90,016 | |
| | 90,000 | | | TCL Multimedia Technology Holdings Ltd. | | | 40,294 | |
| | 202,000 | | | Techtronic Industries Co. Ltd. | | | 741,478 | |
| | 70,900 | | | Television Broadcasts Ltd. | | | 258,879 | |
| | 125,000 | | | Texhong Textile Group Ltd. | | | 92,735 | |
| | 286,000 | | | Texwinca Holdings Ltd. | | | 278,598 | |
| | 185,800 | | | Tian An China Investment Co. Ltd. | | | 111,471 | |
| | 1,208,000 | | | Tianjin Port Development Holdings Ltd. | | | 202,617 | |
| | 130,000 | | | Tibet 5100 Water Resources Holdings Ltd. | | | 42,268 | |
| | 2,380,000 | | | Titan Petrochemicals Group Ltd.(b)(c)(d) | | | 154 | |
| | 124,252 | | | Tomson Group Ltd. | | | 27,253 | |
| | 1,080,000 | | | Tongda Group Holdings Ltd. | | | 221,557 | |
| | 62,000 | | | Top Spring International Holdings Ltd. | | | 25,918 | |
| | 136,000 | | | Towngas China Co. Ltd. | | | 92,999 | |
| | 406,000 | | | TPV Technology Ltd. | | | 59,717 | |
| | 58,000 | | | Tradelink Electronic Commerce Ltd. | | | 12,198 | |
| Shares | | | | | Value | |
| HONG KONG (continued) | | | | |
| | 80,800 | | | Transport International Holdings Ltd. | | $ | 218,404 | |
| | 162,000 | | | Trinity Ltd. | | | 23,828 | |
| | 394,000 | | | Truly International Holdings Ltd. | | | 94,044 | |
| | 233,000 | | | TSC Group Holdings Ltd.(d) | | | 46,596 | |
| | 1,082,000 | | | United Energy Group Ltd.(d) | | | 146,582 | |
| | 288,500 | | | United Laboratories International Holdings Ltd. (The)(d) | | | 154,103 | |
| | 44,000 | | | Up Energy Development Group Ltd.(d) | | | 3,009 | |
| | 100,000 | | | Value Partners Group Ltd. | | | 106,701 | |
| | 188,000 | | | Varitronix International Ltd. | | | 128,800 | |
| | 687,683 | | | Victory City International Holdings Ltd. | | | 84,290 | |
| | 162,000 | | | Vitasoy International Holdings Ltd. | | | 270,049 | |
| | 483,600 | | | VST Holdings Ltd. | | | 142,261 | |
| | 31,200 | | | VTech Holdings Ltd. | | | 379,000 | |
| | 132,622 | | | Wasion Group Holdings Ltd. | | | 147,841 | |
| | 496,000 | | | Welling Holding Ltd. | | | 83,194 | |
| | 68,000 | | | Wing On Co. International Ltd. | | | 211,880 | |
| | 220,000 | | | Wing Tai Properties Ltd. | | | 126,313 | |
| | 1,290,000 | | | Xinyi Glass Holdings Ltd. | | | 670,748 | |
| | 30,000 | | | YGM Trading Ltd. | | | 23,998 | |
| | 3,293,000 | | | Yingde Gases Group Co. Ltd. | | | 1,474,300 | |
| | 84,000 | | | Yip’s Chemical Holdings Ltd. | | | 34,573 | |
| | 155,500 | | | Yue Yuen Industrial Holdings Ltd. | | | 568,785 | |
| | 480,946 | | | Yuexiu Property Co. Ltd. | | | 83,151 | |
| | 58,191 | | | Yuexiu Transport Infrastructure Ltd. | | | 39,792 | |
| | 306,000 | | | Zhuhai Holdings Investment Group Ltd. | | | 44,613 | |
| | | | | | | | 61,044,707 | |
| HUNGARY — 0.0% | | | | |
| | 24,646 | | | Magyar Telekom Telecommunications Plc(d) | | | 34,195 | |
| | 1,520 | | | OTP Bank Plc | | | 29,455 | |
| | | | | | | | 63,650 | |
| INDIA — 1.3% | | | | |
| | 293 | | | 3M India Ltd.(d) | | | 52,350 | |
| | 4,102 | | | Aarti Industries | | | 32,141 | |
| | 2,732 | | | ABG Shipyard Ltd.(d) | | | 5,299 | |
| | 12,155 | | | ACC Ltd. | | | 256,623 | |
| | 47,479 | | | Adani Power Ltd.(d) | | | 22,888 | |
| | 6,435 | | | Aditya Birla Nuvo Ltd. | | | 203,272 | |
| | 33,300 | | | Aegis Logistics Ltd. | | | 50,909 | |
| | 124,095 | | | AIA Engineering Ltd. | | | 1,821,497 | |
| | 5,142 | | | Ajanta Pharma Ltd. | | | 121,922 | |
| | 19,534 | | | Alembic Ltd. | | | 12,824 | |
| | 16,675 | | | Alembic Pharmaceuticals Ltd. | | | 173,244 | |
| | 36,030 | | | Allahabad Bank | | | 41,436 | |
| | 810 | | | Allcargo Logistics Ltd. | | | 3,869 | |
| Old Westbury Funds, Inc. | |
| Small & Mid Cap Fund | |
| Portfolio of Investments - (Continued) | October 31, 2015 |
| | |
| Shares | | | | | Value | |
| INDIA (continued) | | | |
| | 241,287 | | | Alok Industries Ltd.(d) | | $ | 24,924 | |
| | 1,082 | | | Alstom India Ltd. | | | 10,248 | |
| | 212,512 | | | Amara Raja Batteries Ltd. | | | 2,938,321 | |
| | 17,157 | | | Ambuja Cements Ltd. | | | 54,337 | |
| | 11,406 | | | Amtek Auto Ltd. | | | 6,973 | |
| | 44,785 | | | Anant Raj Ltd. | | | 25,941 | |
| | 32,399 | | | Andhra Bank | | | 32,352 | |
| | 153,989 | | | Apollo Hospitals Enterprise Ltd. | | | 3,093,566 | |
| | 9,461 | | | Apollo Tyres Ltd. | | | 24,766 | |
| | 4,919 | | | Arvind Infrastructure Ltd.(d) | | | 4,599 | |
| | 49,192 | | | Arvind Ltd. | | | 208,903 | |
| | 198,118 | | | Ashok Leyland Ltd.(d) | | | 284,087 | |
| | 2,229 | | | Atul Ltd. | | | 56,974 | |
| | 17,706 | | | Aurobindo Pharma Ltd.(d) | | | 226,511 | |
| | 3,198 | | | Bajaj Corp. Ltd. | | | 20,031 | |
| | 364,617 | | | Bajaj Electricals Ltd. | | | 1,370,697 | |
| | 4,584 | | | Bajaj Finance Ltd. | | | 366,352 | |
| | 12,411 | | | Bajaj Finserv Ltd. | | | 373,783 | |
| | 19,521 | | | Bajaj Holdings & Investment Ltd. | | | 495,561 | |
| | 15,043 | | | Balkrishna Industries Ltd. | | | 150,269 | |
| | 97,217 | | | Ballarpur Industries Ltd. | | | 27,077 | |
| | 3,642 | | | Balmer Lawrie & Co. Ltd. | | | 32,402 | |
| | 38,808 | | | Balrampur Chini Mills Ltd.(d) | | | 36,079 | |
| | 104,590 | | | Bank of Baroda | | | 256,413 | |
| | 9,497 | | | Bank of India | | | 19,083 | |
| | 17,071 | | | Bank of Maharashtra | | | 8,765 | |
| | 3,185 | | | BASF India Ltd. | | | 43,894 | |
| | 5,028 | | | Bata India Ltd. | | | 38,700 | |
| | 1,828 | | | BEML Ltd. - Partly Paid Shares | | | 32,606 | |
| | 1,066,121 | | | Berger Paints India Ltd. | | | 3,617,094 | |
| | 7,437 | | | Bharat Electronics Ltd.(d) | | | 141,559 | |
| | 2,296 | | | Bharat Forge Ltd.(d) | | | 30,195 | |
| | 10,128 | | | Biocon Ltd. | | | 70,514 | |
| | 5,808 | | | Birla Corp. Ltd. | | | 38,286 | |
| | 22,927 | | | Blue Dart Express Ltd. | | | 2,669,384 | |
| | 5,788 | | | Britannia Industries Ltd. | | | 286,269 | |
| | 16,510 | | | Cadila Healthcare Ltd. | | | 105,308 | |
| | 14,495 | | | Cairn India Ltd.(d) | | | 34,028 | |
| | 19,327 | | | Canara Bank | | | 81,898 | |
| | 7,476 | | | Carborundum Universal Ltd. | | | 20,079 | |
| | 5,310 | | | Ceat Ltd. | | | 87,888 | |
| | 11,486 | | | Century Plyboards India Ltd.(d) | | | 30,761 | |
| | 9,871 | | | Century Textiles & Industries Ltd. | | | 83,717 | |
| | 6,433 | | | CESC Ltd. | | | 57,237 | |
| | 91,441 | | | Chambal Fertilizers and Chemicals Ltd. | | | 80,463 | |
| | 56,756 | | | Chennai Super Kings Cricket Ltd.(b)(c)(d) | | | 1,954 | |
| | 36,243 | | | City Union Bank Ltd. | | | 49,862 | |
| | 7,502 | | | Colgate-Palmolive India Ltd. | | | 109,680 | |
| | 3,973 | | | Container Corp. of India Ltd. | | | 80,570 | |
| | 10,814 | | | Coromandel International Ltd. | | | 30,988 | |
| | 41,645 | | | Corp. Bank | | | 27,787 | |
| | 21,138 | | | Cox & Kings Ltd. | | | 87,551 | |
| Shares | | | | | Value | |
| INDIA (continued) | | | | |
| | 84,163 | | | Crisil Ltd. | | $ | 2,526,371 | |
| | 38,317 | | �� | Crompton Greaves Ltd. | | | 102,030 | |
| | 18,918 | | | Cummins India Ltd. | | | 310,846 | |
| | 16,196 | | | Cyient Ltd. | | | 133,085 | |
| | 4,199 | | | Dalmia Bharat Ltd. | | | 45,145 | |
| | 6,484 | | | DB Corp. Ltd. | | | 32,427 | |
| | 18,464 | | | DB Realty Ltd.(d) | | | 17,462 | |
| | 27,921 | | | DCB Bank Ltd.(d) | | | 37,088 | |
| | 17,752 | | | Deepak Fertilizers & Petrochemicals Corp. Ltd. | | | 39,432 | |
| | 12,047 | | | Delta Corp Ltd. | | | 15,569 | |
| | 43,420 | | | Dena Bank | | | 27,941 | |
| | 15,060 | | | Divi’s Laboratories Ltd. | | | 265,927 | |
| | 4,597 | | | DLF Ltd. | | | 8,196 | |
| | 3,993 | | | eClerx Services Ltd. | | | 111,675 | |
| | 22,258 | | | EID Parry India Ltd. | | | 59,183 | |
| | 160,497 | | | Emami Ltd.(d) | | | 2,632,008 | |
| | 25,985 | | | Engineers India Ltd. | | | 78,100 | |
| | 8,345 | | | Eros International Media Ltd.(d) | | | 35,356 | |
| | 17,285 | | | Escorts Ltd. | | | 46,608 | |
| | 45,444 | | | Essar Oil Ltd.(d) | | | 133,039 | |
| | 20,879 | | | Essel Propack Ltd. | | | 50,772 | |
| | 72,861 | | | Exide Industries Ltd. | | | 166,696 | |
| | 247 | | | FAG Bearings India Ltd. | | | 15,679 | |
| | 15,298 | | | FDC Ltd. | | | 56,245 | |
| | 294,564 | | | Federal Bank Ltd. | | | 244,550 | |
| | 4,296 | | | Federal-Mogul Goetze India Ltd.(d) | | | 23,595 | |
| | 14,606 | | | Finolex Cables Ltd. | | | 56,048 | |
| | 14,293 | | | Finolex Industries Ltd. | | | 68,539 | |
| | 911,482 | | | Fortis Healthcare Ltd.(d) | | | 2,163,453 | |
| | 31,884 | | | Future Retail Ltd. | | | 57,942 | |
| | 7,516 | | | Gateway Distriparks Ltd. | | | 38,400 | |
| | 810 | | | GlaxoSmithKline Consumer Healthcare Ltd. | | | 74,527 | |
| | 18,031 | | | Glenmark Pharmaceuticals Ltd. | | | 273,590 | |
| | 24,402 | | | GMR Infrastructure Ltd. | | | 4,892 | |
| | 7,585 | | | Godfrey Phillips India, Ltd. | | | 109,083 | |
| | 12,899 | | | Godrej Industries Ltd. | | | 77,281 | |
| | 5,642 | | | Godrej Properties Ltd. | | | 29,658 | |
| | 8,033 | | | Great Eastern Shipping Co. Ltd. (The) | | | 46,425 | |
| | 20,917 | | | Greaves Cotton Ltd. | | | 40,157 | |
| | 770 | | | Greenlam Industries Ltd. | | | 4,779 | |
| | 770 | | | Greenply Industries Ltd. | | | 10,930 | |
| | 2,596 | | | Grindwell Norton Ltd. | | | 29,331 | |
| | 15,133 | | | Gujarat Alkalies & Chemicals(d) | | | 38,791 | |
| | 3,890 | | | Gujarat Flourochemicals Ltd. | | | 38,439 | |
| | 357,226 | | | Gujarat Pipavav Port Ltd.(d) | | | 882,063 | |
| | 42,802 | | | Gujarat State Fertilizers & Chemicals Ltd. | | | 47,390 | |
| | 26,093 | | | Gujarat State Petronet Ltd. | | | 51,691 | |
| | 27,765 | | | Hathway Cable & Datacom Ltd.(d) | | | 17,400 | |
| | 25,011 | | | Havells India Ltd. | | | 97,066 | |
| | 11,965 | | | HCL Infosystems Ltd.(d) | | | 10,043 | |
| Old Westbury Funds, Inc. | |
| Small & Mid Cap Fund | |
| Portfolio of Investments - (Continued) | October 31, 2015 |
| | |
| Shares | | | | | Value | |
| INDIA (continued) | | | | |
| | 849 | | | HEG Ltd.(d) | | $ | 2,126 | |
| | 16,680 | | | Hexa Tradex Ltd.(d) | | | 4,352 | |
| | 65,708 | | | Hexaware Technologies Ltd. | | | 241,283 | |
| | 9,679 | | | Hindalco Industries Ltd. | | | 12,450 | |
| | 6,147 | | | Hindustan Petroleum Corp. Ltd. | | | 72,288 | |
| | 207 | | | Honeywell Automation India Ltd. | | | 29,939 | |
| | 28,793 | | | Housing Development & Infrastructure Ltd.(d) | | | 32,012 | |
| | 426,273 | | | HSIL Ltd. | | | 1,825,906 | |
| | 4,443 | | | Huhtamaki PPL Ltd. | | | 18,249 | |
| | 23,341 | | | ICRA Ltd. | | | 1,388,673 | |
| | 46,836 | | | IDBI Bank Ltd. | | | 61,390 | |
| | 73,673 | | | IDFC Bank Ltd.(b)(c)(d) | | | 81,233 | |
| | 73,673 | | | IDFC Ltd. | | | 66,350 | |
| | 77,633 | | | IIFL Holdings Ltd. | | | 228,937 | |
| | 56,756 | | | India Cements Ltd. (The)(d) | | | 68,138 | |
| | 14,343 | | | Indian Bank | | | 27,404 | |
| | 9,700 | | | Intellect Design Arena Ltd.(d) | | | 36,992 | |
| | 167,711 | | | Ipca Laboratories Ltd. | | | 1,999,725 | |
| | 8,799 | | | IRB Infrastructure Developers Ltd. | | | 33,132 | |
| | 8,006 | | | Jagran Prakashan Pvt Ltd.(d) | | | 17,091 | |
| | 66,242 | | | Jain Irrigation Systems Ltd. - DVR | | | 62,648 | |
| | 128,214 | | | Jammu & Kashmir Bank Ltd. (The) | | | 163,247 | |
| | 6,226 | | | Jindal Poly Films Ltd. | | | 52,451 | |
| | 29,253 | | | Jindal Saw Ltd. | | | 29,031 | |
| | 7,796 | | | JK Lakshmi Cement Ltd. | | | 44,680 | |
| | 13,845 | | | JK Tyre & Industries Ltd. | | | 21,484 | |
| | 21,254 | | | JSW Energy Ltd. | | | 30,347 | |
| | 14,416 | | | JSW Steel Ltd. | | | 200,836 | |
| | 98,644 | | | Jubilant Foodworks Ltd. | | | 2,210,942 | |
| | 23,442 | | | Jubilant Organosys Ltd.(d) | | | 146,923 | |
| | 2,239 | | | Kajaria Ceramics Ltd. | | | 31,081 | |
| | 90,563 | | | Kakinada Fertilizers Ltd.(b)(c)(d) | | | 2,913 | |
| | 11,421 | | | Kalpataru Power Transmission Ltd. | | | 45,486 | |
| | 3,530 | | | Kansai Nerolac Paints Ltd. | | | 13,446 | |
| | 22,504 | | | Karnataka Bank Ltd. (The) | | | 44,323 | |
| | 3,825 | | | Karur Vysya Bank Ltd. (The) | | | 24,676 | |
| | 942 | | | Kaya Ltd.(d) | | | 15,509 | |
| | 8,595 | | | KEC International Ltd. | | | 17,606 | |
| | 13,854 | | | Kesoram Industries Ltd.(d) | | | 17,215 | |
| | 1,197 | | | Kirloskar Oil Engines Ltd. | | | 4,969 | |
| | 34,008 | | | Kotak Mahindra Bank Ltd. | | | 357,879 | |
| | 24,476 | | | KPIT Technologies Ltd. | | | 51,241 | |
| | 657 | | | Lakshmi Machine Works Ltd. | | | 35,906 | |
| | 8,542 | | | Maharashtra Seamless Ltd. | | | 19,981 | |
| | 237 | | | Mahindra Lifespace Developers Ltd. | | | 1,805 | |
| | 6,707 | | | Marico Ltd. | | | 39,742 | |
| | 1,453,417 | | | Marksans Pharma Ltd. | | | 2,171,951 | |
| | 26,103 | | | MAX India Ltd. | | | 211,417 | |
| Shares | | | | | Value | |
| INDIA (continued) | | | | |
| | 15,382 | | | MindTree Ltd. | | $ | 369,408 | |
| | 815 | | | Monsanto India Ltd. | | | 29,512 | |
| | 11,049 | | | Mphasis Ltd. | | | 80,215 | |
| | 550 | | | MRF Ltd. | | | 334,582 | |
| | 48,388 | | | NCC Ltd. | | | 59,499 | |
| | 91,063 | | | NHPC Ltd. | | | 25,293 | |
| | 16,197 | | | NIIT Technologies Ltd. | | | 140,232 | |
| | 1,671 | | | Nirvikara Paper Mills Ltd.(d) | | | 1,359 | |
| | 68,634 | | | NRB Bearings Ltd. | | | 151,616 | |
| | 11,606 | | | Oil India Ltd. | | | 72,092 | |
| | 36,200 | | | OMAXE Ltd. | | | 74,843 | |
| | 3,399 | | | Oracle Financial Sevices Software Ltd. | | | 201,831 | |
| | 16,955 | | | Oriental Bank of Commerce | | | 34,950 | |
| | 13,721 | | | Page Industries Ltd. | | | 2,955,207 | |
| | 8,697 | | | Parsvnath Developers Ltd.(d) | | | 2,342 | |
| | 6,026 | | | PC Jeweller Ltd. | | | 41,162 | |
| | 1,578 | | | Persistent Systems Ltd. | | | 15,583 | |
| | 51,330 | | | Petronet LNG Ltd. | | | 152,470 | |
| | 1,475 | | | Pfizer Ltd. | | | 57,494 | |
| | 267,807 | | | Phoenix Mills Ltd. (The) | | | 1,368,646 | |
| | 147,741 | | | PI Industries Ltd. | | | 1,511,211 | |
| | 229,377 | | | Pidilite Industries Ltd. | | | 1,971,354 | |
| | 14,082 | | | Polaris Consulting & Services Ltd. | | | 41,398 | |
| | 13,598 | | | Prestige Estates Projects Ltd. | | | 42,337 | |
| | 1,520 | | | Procter & Gamble Hygiene & Health Care Ltd. | | | 141,427 | |
| | 81,828 | | | PTC India Financial Services Ltd. | | | 59,231 | |
| | 66,948 | | | PTC India Ltd. | | | 66,338 | |
| | 36,362 | | | Rain Industries Ltd. | | | 20,617 | |
| | 373,051 | | | Rallis India Ltd. | | | 1,182,608 | |
| | 16,737 | | | Ramco Cements Ltd. (The) | | | 92,682 | |
| | 4,423 | | | Ratnamani Metals & Tubes Ltd. | | | 43,431 | |
| | 12,772 | | | Raymond Ltd. | | | 82,189 | |
| | 57,342 | | | Redington India Ltd. | | | 104,470 | |
| | 79,906 | | | Reliance Communications Ltd.(d) | | | 92,079 | |
| | 7,440 | | | Reliance Infrastructure Ltd. | | | 45,139 | |
| | 40,214 | | | Reliance Power Ltd.(d) | | | 31,047 | |
| | 38,166 | | | Rolta India Ltd. | | | 57,560 | |
| | 816 | | | Sanofi India Ltd. | | | 56,820 | |
| | 2,527 | | | Shoppers Stop Ltd. | | | 15,055 | |
| | 13,529 | | | Shyam Century Ferrous Ltd.(c)(d) | | | 1,977 | |
| | 7,106 | | | Siemens Ltd. | | | 144,333 | |
| | 77,746 | | | Sintex Industries Ltd.(d) | | | 120,227 | |
| | 15,463 | | | SJVN Ltd. | | | 6,756 | |
| | 73,856 | | | SKF India Ltd. | | | 1,411,566 | |
| | 7,092 | | | Sobha Ltd. | | | 35,219 | |
| | 401,240 | | | South Indian Bank Ltd. (The) | | | 125,570 | |
| | 6,622 | | | SRF Ltd. | | | 134,001 | |
| | 13,529 | | | Star Ferro and Cement Ltd. | | | 27,847 | |
| | 5,304 | | | State Bank of Bikaner & Jaipur | | | 42,610 | |
| | 2,126 | | | State Bank of Travancore | | | 13,769 | |
| Old Westbury Funds, Inc. | |
| Small & Mid Cap Fund | |
| Portfolio of Investments - (Continued) | October 31, 2015 |
| | |
| Shares | | | | | Value | |
| INDIA (continued) | | | | |
| | 2,418 | | | Sterlite Technologies Ltd. | | $ | 3,467 | |
| | 113,112 | | | Strides Arcolab Ltd. | | | 2,239,304 | |
| | 15,536 | | | Sun Pharmaceutical Industries Ltd. | | | 211,494 | |
| | 14,358 | | | Sun TV Network Ltd.(d) | | | 87,198 | |
| | 21,387 | | | Sundram Fasteners Ltd. | | | 54,822 | |
| | 6,405 | | | Supreme Industries Ltd. | | | 61,756 | |
| | 43,231 | | | Symphony Ltd. | | | 1,362,724 | |
| | 30,834 | | | Syndicate Bank | | | 44,308 | |
| | 13,597 | | | Tata Chemicals Ltd. | | | 84,990 | |
| | 7,145 | | | Tata Communications Ltd. | | | 46,908 | |
| | 1,202 | | | Tata Consultancy Services, Ltd. | | | 45,898 | |
| | 75,981 | | | Tata Power Co. Ltd. | | | 80,056 | |
| | 14,209 | | | Tata Tea Ltd.(d) | | | 29,018 | |
| | 4,509 | | | Thermax Ltd. | | | 58,677 | |
| | 45,835 | | | Titan Co. Ltd. | | | 245,466 | |
| | 139,718 | | | Torrent Pharmaceuticals Ltd. | | | 3,295,224 | |
| | 10,413 | | | Transport Corp. of India Ltd. | | | 44,707 | |
| | 274,616 | | | Tree House Education and Accessories Ltd. | | | 1,154,022 | |
| | 104 | | | Trent Ltd. | | | 2,220 | |
| | 13,660 | | | Triveni Turbine Ltd. | | | 22,660 | |
| | 697 | | | TTK Prestige Ltd. | | | 46,953 | |
| | 23,147 | | | Tube Investments of India Ltd. | | | 140,593 | |
| | 103,009 | | | TV18 Broadcast Ltd.(d) | | | 50,602 | |
| | 8,017 | | | TVS Motor Co. Ltd. | | | 32,573 | |
| | 5,706 | | | UCO Bank | | | 4,453 | |
| | 6,802 | | | Unichem Laboratories Ltd. | | | 29,162 | |
| | 13,827 | | | Union Bank of India | | | 33,137 | |
| | 7,841 | | | United Breweries Ltd. | | | 112,620 | |
| | 136,278 | | | United Phosphorus Ltd.(d) | | | 958,711 | |
| | 1,544 | | | VA Tech Wabag Ltd. | | | 15,143 | |
| | 1,130 | | | Vakrangee Ltd. | | | 2,264 | |
| | 6,257 | | | Vardhman Textiles Ltd. | | | 69,483 | |
| | 18,900 | | | Videocon Industries Ltd. | | | 38,815 | |
| | 36,860 | | | Vijaya Bank | | | 20,815 | |
| | 10,224 | | | Voltas Ltd. | | | 44,349 | |
| | 902 | | | VST Industries Ltd. | | | 22,130 | |
| | 563 | | | WABCO India Ltd. | | | 57,147 | |
| | 50,842 | | | Welspun Corp. Ltd. | | | 78,973 | |
| | 1,076 | | | Wockhardt Ltd. | | | 24,649 | |
| | 39,669 | | | Yes Bank Ltd. | | | 460,554 | |
| | 72,088 | | | Zee Entertainment Enterprises Ltd. | | | 450,819 | |
| | 4,219 | | | Zensar Technologies Ltd. | | | 62,189 | |
| | | | | | | | 70,506,165 | |
| INDONESIA — 0.3% | | | | |
| | 242,553 | | | Adhi Karya Persero Tbk PT | | | 39,517 | |
| | 660,600 | | | Agung Podomoro Land Tbk PT(d) | | | 13,321 | |
| | 4,863,600 | | | AKR Corporindo Tbk PT | | | 2,096,456 | |
| | 1,513,429 | | | Aneka Tambang Persero Tbk PT(d) | | | 41,796 | |
| | 52,891,500 | | | Arwana Citramulia Tbk PT(c) | | | 1,688,664 | |
| | 28,100 | | | Asahimas Flat Glass Tbk PT | | | 13,550 | |
| Shares | | | | | Value | |
| INDONESIA (continued) | | | | |
| | 31,750,200 | | | Bakrie & Brothers Tbk PT(d) | | $ | 115,982 | |
| | 5,078,900 | | | Bakrie Sumatera Plantations Tbk PT(d) | | | 18,553 | |
| | 9,876,000 | | | Bakrie Telecom Tbk PT(d) | | | 36,077 | |
| | 1,518,266 | | | Bank Bukopin Tbk PT | | | 77,646 | |
| | 805,216 | | | Bank Danamon Indonesia Tbk PT | | | 162,367 | |
| | 3,011,250 | | | Bank Pan Indonesia Tbk PT(d) | | | 204,599 | |
| | 556,300 | | | Bank Pembangunan Daerah Jawa Barat Dan Banten Tbk PT | | | 30,685 | |
| | 2,452,700 | | | Bank Tabungan Negara Persero Tbk PT | | | 212,343 | |
| | 141,100 | | | Bank Tabungan Pensiunan Nasional Tbk PT(d) | | | 26,957 | |
| | 54,000 | | | Bayan Resources Tbk PT(d) | | | 32,449 | |
| | 560,000 | | | Budi Starch & Sweetener Tbk PT(d) | | | 2,864 | |
| | 2,251,200 | | | Bumi Serpong Damai Tbk PT | | | 266,443 | |
| | 5,067,590 | | | Ciputra Development Tbk PT | | | 401,705 | |
| | 63,310 | | | Ciputra Property Tbk PT | | | 2,151 | |
| | 188,820 | | | Ciputra Surya Tbk PT | | | 31,246 | |
| | 542,500 | | | Citra Marga Nusaphala Persada Tbk PT(d) | | | 65,397 | |
| | 6,654,200 | | | Darma Henwa Tbk PT(d) | | | 24,308 | |
| | 393,500 | | | Elnusa Tbk PT | | | 9,890 | |
| | 299,400 | | | Energi Mega Persada Tbk PT(d) | | | 1,094 | |
| | 16,286,700 | | | Express Transindo Utama Tbk PT(d) | | | 272,486 | |
| | 947,000 | | | Gajah Tunggal Tbk PT | | | 40,820 | |
| | 2,161,000 | | | Global Mediacom Tbk PT | | | 137,357 | |
| | 1,043,600 | | | Holcim Indonesia Tbk PT | | | 80,057 | |
| | 487,300 | | | Indika Energy Tbk PT(d) | | | 6,480 | |
| | 29,200 | | | Indo Tambangraya Megah Tbk PT | | | 18,079 | |
| | 122,300 | | | Indosat Tbk PT(d) | | | 37,438 | |
| | 158,000 | | | Intiland Development Tbk PT | | | 5,829 | |
| | 449,100 | | | Japfa Comfeed Indonesia Tbk PT(d) | | | 14,437 | |
| | 10,777,836 | | | Kawasan Industri Jababeka Tbk PT | | | 159,847 | |
| | 60,600 | | | Lippo Cikarang Tbk PT(d) | | | 35,419 | |
| | 8,121,650 | | | Lippo Karawaci Tbk PT | | | 706,101 | |
| | 14,336,700 | | | Malindo Feedmill Tbk PT(c) | | | 1,167,885 | |
| | 1,332,600 | | | Matahari Putra Prima Tbk PT | | | 218,571 | |
| | 1,040,367 | | | Mayora Indah Tbk PT(c) | | | 2,075,033 | |
| | 810,300 | | | Medco Energi Internasional Tbk PT | | | 63,639 | |
| | 515,000 | | | Media Nusantara Citra Tbk PT | | | 67,162 | |
| | 106,200 | | | Mitra Adiperkasa Tbk PT(d) | | | 26,768 | |
| | 5,385,600 | | | MNC Investama Tbk PT | | | 82,235 | |
| | 651,200 | | | Multipolar Tbk PT | | | 15,605 | |
| | 26,286,500 | | | Nippon Indosari Corpindo Tbk PT(c) | | | 2,294,967 | |
| | 1,292,700 | | | Pakuwon Jati Tbk PT | | | 40,233 | |
| | 4,283,000 | | | Panin Financial Tbk PT(d) | | | 68,527 | |
| Old Westbury Funds, Inc. | |
| Small & Mid Cap Fund | |
| Portfolio of Investments - (Continued) | October 31, 2015 |
| | |
| Shares | | | | | Value | |
| INDONESIA (continued) | | | | |
| | 139,100 | | | Pembangunan Perumahan Persero Tbk PT | | $ | 38,719 | |
| | 840,000 | | | Perusahaan Perkebunan London Sumatra Indonesia Tbk PT | | | 95,123 | |
| | 398,800 | | | Ramayana Lestari Sentosa Tbk PT | | | 18,356 | |
| | 8,825,400 | | | Sawit Sumbermas Sarana Tbk PT | | | 1,225,078 | |
| | 4,107,500 | | | Selamat Sempurna Tbk PT(c) | | | 1,471,948 | |
| | 3,065,800 | | | Sentul City Tbk PT | | | 16,575 | |
| | 2,696,300 | | | Siloam International Hospitals Tbk PT | | | 2,147,191 | |
| | 117,500 | | | Sinar Mas Agro Resources & Technology Tbk PT | | | 40,347 | |
| | 2,506,800 | | | Summarecon Agung Tbk PT | | | 255,488 | |
| | 1,475,000 | | | Surya Semesta Internusa Tbk PT | | | 69,507 | |
| | 458,600 | | | Tiga Pilar Sejahtera Food Tbk | | | 53,105 | |
| | 166,600 | | | Tower Bersama Infrastructure Tbk PT(d) | | | 87,028 | |
| | 4,875,000 | | | Truba Alam Manunggal Engineering PT(b)(c)(d) | | | 3,562 | |
| | 1,152,000 | | | Tunas Baru Lampung Tbk PT | | | 40,399 | |
| | 539,500 | | | Tunas Ridean Tbk PT | | | 21,481 | |
| | 1,938,200 | | | Visi Media Asia Tbk PT(d) | | | 41,065 | |
| | 744,885 | | | Waskita Karya Persero Tbk PT | | | 88,706 | |
| | 363,252 | | | Wijaya Karya Persero Tbk PT | | | 78,025 | |
| | | | | | | | 19,042,738 | |
| IRELAND — 0.8% | | | | |
| | 98,086 | | | C&C Group Plc | | | 391,533 | |
| | 8,890 | | | DCC Plc | | | 713,332 | |
| | 6,992 | | | FBD Holdings Plc(d) | | | 53,437 | |
| | 300,000 | | | FleetMatics Group Plc(d) | | | 16,698,000 | |
| | 276,610 | | | Fyffes Plc | | | 472,687 | |
| | 498,495 | | | Glanbia Plc | | | 9,669,722 | |
| | 92,111 | | | Grafton Group Plc - Units(c) | | | 957,064 | |
| | 241,450 | | | Green REIT Plc | | | 418,179 | |
| | 128,605 | | | Greencore Group Plc | | | 598,734 | |
| | 10,120 | | | Icon Plc(d) | | | 646,364 | |
| | 16,165 | | | IFG Group Plc | | | 39,107 | |
| | 1,691,770 | | | Independent News & Media Plc(d) | | | 310,679 | |
| | 102,090 | | | Irish Continental Group Plc - Units | | | 555,703 | |
| | 322,540 | | | Irish Residential Properties REIT Plc | | | 397,243 | |
| | 34,335 | | | James Hardie Industries Plc - CDI | | | 448,062 | |
| | 198,664 | | | Kenmare Resources Plc(d) | | | 6,117 | |
| | 44,346 | | | Kingspan Group Plc(d)(e) | | | 1,074,295 | |
| | 25,551 | | | Kingspan Group Plc(e) | | | 618,981 | |
| | 18,814 | | | Paddy Power Plc | | | 2,176,464 | |
| | 107,448 | | | Smurfit Kappa Group Plc(d) | | | 3,063,765 | |
| | 70,777 | | | Tarsus Group Plc(c) | | | 244,405 | |
| | 286,210 | | | Total Produce Plc(d) | | | 435,902 | |
| Shares | | | | | Value | |
| IRELAND (continued) | | | |
| | 164,349 | | | United Drug Plc(d)(e) | | $ | 1,203,962 | |
| | | | | | | | 41,193,737 | |
| ISRAEL — 1.7% | | | | |
| | 0 | | | Africa Israel Investments Ltd.(d) | | | 0 | |
| | 5,289 | | | Airport City Ltd.(d) | | | 51,531 | |
| | 1,512 | | | Alrov Properties and Lodging | | | 32,458 | |
| | 11,742 | | | AudioCodes Ltd.(d) | | | 40,848 | |
| | 28 | | | Bayside Land Corp. | | | 8,626 | |
| | 7,207 | | | Cellcom Israel Ltd.(d) | | | 53,645 | |
| | 982,500 | | | Check Point Software Technologies Ltd.(d) | | | 83,453,550 | |
| | 0 | | | Clal Biotechnology Industries Ltd.(d) | | | 0 | |
| | 12,818 | | | Clal Insurance Enterprise Holdings Ltd.(d) | | | 195,095 | |
| | 4,759 | | | Compugen Ltd.(d) | | | 29,852 | |
| | 13,567 | | | Delek Automotive Systems Ltd. | | | 128,441 | |
| | 1,507 | | | Delek Group Ltd. | | | 364,174 | |
| | 3,947 | | | Delta-Galil Industries Ltd. | | | 124,455 | |
| | 11,921 | | | Direct Insurance Financial Investments Ltd. | | | 87,594 | |
| | 9,607 | | | Elbit Systems Ltd. | | | 761,528 | |
| | 905 | | | Electra Ltd. | | | 115,196 | |
| | 1 | | | Electra Real Estate Ltd.(d) | | | 1 | |
| | 1,009 | | | Equital Ltd.(d) | | | 17,691 | |
| | 0 | | | Evogene Ltd.(d) | | | 4 | |
| | 3,272 | | | EZchip Semiconductor Ltd.(d) | | | 79,839 | |
| | 14,334 | | | First International Bank of Israel Ltd. | | | 180,940 | |
| | 3,427 | | | Formula Systems 1985 Ltd. | | | 100,530 | |
| | 11,000 | | | Frutarom Industries Ltd. | | | 475,350 | |
| | 1,135 | | | Hadera Paper Ltd.(d) | | | 32,268 | |
| | 66,902 | | | Harel Insurance Investments & Financial Services Ltd. | | | 282,710 | |
| | 270 | | | Industrial Buildings Corp. Ltd. | | | 249 | |
| | 378,008 | | | Israel Discount Bank Ltd. - Class A(d) | | | 689,552 | |
| | 2,874 | | | Ituran Location & Control Ltd. | | | 59,023 | |
| | 4,804 | | | Jerusalem Oil Exploration(d) | | | 191,953 | |
| | 4,100 | | | Magic Software Enterprises Ltd. | | | 22,391 | |
| | 16,429 | | | Matrix IT Ltd. | | | 100,974 | |
| | 1,459 | | | Melisron Ltd. | | | 50,936 | |
| | 17,166 | | | Menorah Mivtachim Holdings Ltd. | | | 150,091 | |
| | 181,361 | | | Migdal Insurance & Financial Holding Ltd. | | | 164,948 | |
| | 1,190 | | | Mivtach Shamir Holdings Ltd. | | | 23,793 | |
| | 76,835 | | | Mizrahi Tefahot Bank Ltd. | | | 932,152 | |
| | 7,596 | | | Naphtha Israel Petroleum Corp. Ltd.(d) | | | 42,447 | |
| | 736 | | | Neto ME Holdings Ltd. | | | 44,912 | |
| | 13,509 | | | NICE-Systems Ltd. | | | 829,921 | |
| | 10,309 | | | Nova Measuring Instruments Ltd.(d) | | | 107,695 | |
| | 391,918 | | | Oil Refineries Ltd.(d) | | | 143,330 | |
| | 7,203 | | | Osem Investments Ltd. | | | 139,140 | |
| Old Westbury Funds, Inc. | |
| Small & Mid Cap Fund | |
| Portfolio of Investments - (Continued) | October 31, 2015 |
| | |
| Shares | | | | | Value | |
| ISRAEL (continued) | | | | |
| | 12,789 | | | Partner Communications Co. Ltd.(d) | | $ | 58,042 | |
| | 2,872 | | | Paz Oil Co. Ltd. | | | 428,668 | |
| | 43,581 | | | Phoenix Holdings Ltd. (The)(d) | | | 114,665 | |
| | 1,121 | | | Plasson Industries Ltd. | | | 34,449 | |
| | 1 | | | Protalix Biotherapeutics, Inc.(d) | | | 1 | |
| | 715 | | | Rami Levy Chain Stores Hashikma Marketing 2006 Ltd. | | | 33,577 | |
| | 2,898,000 | | | Sarine Technologies Ltd.(c) | | | 3,227,125 | |
| | 68,879 | | | Shikun & Binui Ltd. | | | 125,327 | |
| | 35,913 | | | Shufersal Ltd.(d) | | | 102,841 | |
| | 6,039 | | | Strauss Group Ltd.(d) | | | 86,516 | |
| | 5,737 | | | Summit Real Estate Holdings Ltd.(d) | | | 24,866 | |
| | 3,108 | | | Tower Semiconductor Ltd.(d) | | | 42,489 | |
| | 8,078 | | | Union Bank of Israel(d) | | | 30,043 | |
| | | | | | | | 94,618,442 | |
| ITALY — 0.9% | | | | |
| | 374,596 | | | A2A SpA | | | 513,670 | |
| | 3,408 | | | ACEA SpA | | | 48,981 | |
| | 11,518 | | | Alerion Cleanpower SpA | | | 32,475 | |
| | 77,028 | | | Amplifon SpA | | | 599,280 | |
| | 47,882 | | | Ansaldo STS SpA | | | 509,422 | |
| | 54,745 | | | Arnoldo Mondadori Editore SpA(d) | | | 66,822 | |
| | 5,010 | | | Ascopiave SpA | | | 11,790 | |
| | 18,124 | | | Astaldi SpA | | | 145,888 | |
| | 24,730 | | | ASTM SpA | | | 331,771 | |
| | 14,058 | | | Autogrill SpA(d) | | | 130,937 | |
| | 22,498 | | | Azimut Holding SpA | | | 541,557 | |
| | 18,640 | | | Banca Generali SpA | | | 574,749 | |
| | 20,408 | | | Banca IFIS SpA | | | 503,815 | |
| | 391,750 | | | Banca Monte Dei Paschi di Siena SpA(d) | | | 720,278 | |
| | 227,107 | | | Banca Popolare dell’Emilia Romagna Scarl | | | 1,834,328 | |
| | 1,869,294 | | | Banca Popolare di Milano Scarl | | | 1,757,512 | |
| | 197,161 | | | Banca Popolare di Sondrio SCARL | | | 900,621 | |
| | 111,681 | | | Banco di Desio e della Brianza SpA | | | 382,185 | |
| | 151,313 | | | Banco Popolare SC(d) | | | 2,264,587 | |
| | 11,802 | | | BasicNet SpA | | | 51,523 | |
| | 2,317 | | | Biesse SpA | | | 38,015 | |
| | 11,109 | | | Brembo SpA | | | 489,740 | |
| | 41,617 | | | Buzzi Unicem SpA | | | 704,310 | |
| | 35,620 | | | Buzzi Unicem SpA | | | 359,968 | |
| | 6,232 | | | Cairo Communication SpA | | | 31,414 | |
| | 62,771 | | | Cementir Holding SpA | | | 351,343 | |
| | 196,531 | | | CIR-Compagnie Industriali Riunite SpA(d) | | | 217,196 | |
| | 56,572 | | | Credito Emiliano SpA | | | 405,294 | |
| | 216,734 | | | Credito Valtellinese SC(d) | | | 272,890 | |
| | 4,557 | | | Danieli & C Officine Meccaniche SpA | | | 97,516 | |
| Shares | | | | | Value | |
| ITALY (continued) | | | | |
| | 4,885 | | | Datalogic SpA | | $ | 82,296 | |
| | 36,080 | | | Davide Campari-Milano SpA | | | 309,071 | |
| | 167,031 | | | DeA Capital SpA | | | 270,003 | |
| | 23,657 | | | Delclima | | | 115,764 | |
| | 21,994 | | | De’Longhi SpA | | | 538,858 | |
| | 17,130 | | | DiaSorin SpA | | | 767,420 | |
| | 2,953 | | | Ei Towers SpA | | | 179,087 | |
| | 534 | | | El.En. SpA | | | 24,910 | |
| | 244,139 | | | Enel Green Power SpA | | | 516,800 | |
| | 2,445 | | | Engineering SpA | | | 149,489 | |
| | 51,308 | | | ERG SpA | | | 728,393 | |
| | 5,852 | | | Esprinet SpA | | | 52,768 | |
| | 9,629 | | | Eurotech SpA(d) | | | 18,424 | |
| | 18,250 | | | Exor SpA | | | 906,098 | |
| | 224,045 | | | Falck Renewables SpA | | | 280,617 | |
| | 248,856 | | | Finmeccanica SpA(d) | | | 3,256,489 | |
| | 34,243 | | | FNM SpA | | | 19,298 | |
| | 58,626 | | | Gruppo Editoriale L’Espresso SpA(d) | | | 63,372 | |
| | 51,774 | | | Hera SpA | | | 136,071 | |
| | 365,573 | | | Immobiliare Grande Distribuzione SIIQ SpA REIT | | | 365,621 | |
| | 83,830 | | | IMMSI SpA(d) | | | 46,092 | |
| | 10,415 | | | Industria Macchine Automatiche SpA | | | 538,513 | |
| | 198,830 | | | Intek Group SpA(d) | | | 61,504 | |
| | 7,391 | | | Interpump Group SpA | | | 108,909 | |
| | 61,258 | | | Iren SpA | | | 101,044 | |
| | 84,914 | | | Italcementi SpA | | | 943,095 | |
| | 15,120 | | | Italmobiliare SpA | | | 411,677 | |
| | 14,268 | | | Italmobiliare SpA | | | 616,610 | |
| | 2,492 | | | La Doria SpA | | | 33,624 | |
| | 23,268 | | | Maire Tecnimont SpA(d) | | | 67,191 | |
| | 1,779 | | | Mariella Burani SpA(b)(c)(d) | | | 0 | |
| | 9,386 | | | MARR SpA | | | 191,254 | |
| | 341,913 | | | Mediaset SpA | | | 1,737,049 | |
| | 250,502 | | | Mediobanca SpA | | | 2,520,501 | |
| | 30,322 | | | Mediolanum SpA | | | 247,243 | |
| | 143,220 | | | Moleskine SpA | | | 261,909 | |
| | 19,054 | | | Moncler SpA | | | 306,958 | |
| | 166,177 | | | Parmalat SpA | | | 432,355 | |
| | 50,326 | | | Piaggio & C SpA | | | 124,960 | |
| | 69,418 | | | Prysmian SpA | | | 1,499,993 | |
| | 57,434 | | | Recordati SpA | | | 1,427,987 | |
| | 98,937 | | | Reno de Medici SpA(d) | | | 36,338 | |
| | 831 | | | Reply SpA | | | 106,002 | |
| | 70,103 | | | Retelit SpA(d) | | | 46,253 | |
| | 2,248 | | | Sabaf SpA | | | 30,282 | |
| | 10,617 | | | Safilo Group SpA(d) | | | 132,044 | |
| | 10,214 | | | Saipem SpA(d) | | | 95,976 | |
| | 97,977 | | | Salini Impregilo SpA | | | 406,181 | |
| | 16,278 | | | Salvatore Ferragamo SpA | | | 442,133 | |
| | 56,253 | | | Saras SpA(d) | | | 111,036 | |
| | 3,675 | | | SAVE SpA | | | 53,627 | |
| | 58,300 | | | Societa Cattolica di Assicurazioni SCRL | | | 456,781 | |
| Old Westbury Funds, Inc. | |
| Small & Mid Cap Fund | |
| Portfolio of Investments - (Continued) | October 31, 2015 |
| | |
| Shares | | | | | Value | |
| ITALY (continued) | | | | |
| | 66,730 | | | Societa Iniziative Autostradali e Servizi SpA | | $ | 765,350 | |
| | 125,769 | | | Sogefi SpA(d) | | | 304,264 | |
| | 42,310 | | | SOL SpA(c) | | | 347,085 | |
| | 303,504 | | | Terna Rete Elettrica Nazionale SpA | | | 1,544,587 | |
| | 4,631,702 | | | Tiscali SpA(d) | | | 310,179 | |
| | 4,588 | | | Tod’s SpA | | | 384,696 | |
| | 6,610 | | | Uni Land SpA(b)(c)(d) | | | 0 | |
| | 393,215 | | | Unione di Banche Italiane SpA | | | 2,944,637 | |
| | 254,003 | | | Unipol Gruppo Finanziario SpA | | | 1,184,293 | |
| | 459,272 | | | UnipolSai SpA | | | 1,109,065 | |
| | 45,274 | | | Vittoria Assicurazioni SpA | | | 501,341 | |
| | 13,735 | | | Yoox Net-A-Porter Group SpA(d) | | | 465,949 | |
| | 3,856 | | | Zignago Vetro SpA | | | 25,102 | |
| | | | | | | | 47,152,395 | |
| JAPAN — 8.4% | | | | |
| | 124,000 | | | 77 Bank Ltd. (The) | | | 690,544 | |
| | 2,900 | | | A&D Co. Ltd. | | | 10,718 | |
| | 26,500 | | | Accordia Golf Co. Ltd. | | | 241,348 | |
| | 46,000 | | | Achilles Corp. | | | 57,181 | |
| | 6,400 | | | Adastria Co. Ltd. | | | 362,244 | |
| | 32,000 | | | ADEKA Corp. | | | 474,153 | |
| | 5,800 | | | Aderans Co. Ltd. | | | 40,759 | |
| | 10,400 | | | Advan Co. Ltd. | | | 96,786 | |
| | 166 | | | Advance Residence Investment Corp. REIT | | | 355,606 | |
| | 2,200 | | | Advanex, Inc. | | | 32,215 | |
| | 20,400 | | | Advantest Corp. | | | 164,153 | |
| | 10,200 | | | Aeon Delight Co. Ltd. | | | 295,426 | |
| | 18,100 | | | Aeon Fantasy Co. Ltd. | | | 295,942 | |
| | 13,700 | | | Aeon Financial Service Co. Ltd. | | | 345,707 | |
| | 35,400 | | | Aeon Mall Co. Ltd. | | | 596,405 | |
| | 3,100 | | | Agro-Kanesho Co. Ltd. | | | 25,150 | |
| | 72,800 | | | Ahresty Corp. | | | 494,101 | |
| | 3,900 | | | Ai Holdings Corp. | | | 95,569 | |
| | 18,100 | | | Aica Kogyo Co. Ltd. | | | 361,639 | |
| | 3,300 | | | Aichi Bank Ltd. (The) | | | 184,594 | |
| | 3,800 | | | Aichi Corp. | | | 24,311 | |
| | 111,000 | | | Aichi Steel Corp. | | | 485,688 | |
| | 16,000 | | | Aichi Tokei Denki Co. Ltd. | | | 43,225 | |
| | 23,700 | | | Aida Engineering Ltd. | | | 227,828 | |
| | 14,100 | | | Ain Pharmaciez, Inc. | | | 673,042 | |
| | 3,700 | | | Aiphone Co. Ltd. | | | 57,124 | |
| | 72,000 | | | Air Water, Inc. | | | 1,187,967 | |
| | 11,300 | | | Airport Facilities Co. Ltd. | | | 51,504 | |
| | 44,900 | | | Aisan Industry Co. Ltd. | | | 453,577 | |
| | 44,600 | | | Aizawa Securities Co. Ltd. | | | 269,810 | |
| | 29,900 | | | Akebono Brake Industry Co. Ltd. | | | 87,963 | |
| | 145,000 | | | Akita Bank Ltd. (The) | | | 478,246 | |
| | 3,400 | | | Alconix Corp. | | | 47,956 | |
| | 87,700 | | | Alfresa Holdings Corp. | | | 1,695,567 | |
| | 33,600 | | | Alinco, Inc. | | | 318,820 | |
| Shares | | | | | Value | |
| JAPAN (continued) | | | | |
| | 49,700 | | | Allied Telesis Holdings KK(d) | | $ | 27,183 | |
| | 3,100 | | | Alpen Co. Ltd. | | | 50,994 | |
| | 2,800 | | | Alpha Corp. | | | 30,559 | |
| | 13,500 | | | Alpine Electronics, Inc. | | | 179,448 | |
| | 28,400 | | | Alps Electric Co. Ltd. | | | 891,986 | |
| | 3,300 | | | Alps Logistics Co. Ltd. | | | 39,133 | |
| | 66,400 | | | Amada Holdings Co. Ltd. | | | 595,933 | |
| | 16,800 | | | Amano Corp. | | | 220,250 | |
| | 10,200 | | | Amiyaki Tei Co. Ltd. | | | 363,471 | |
| | 7,100 | | | Amuse, Inc. | | | 288,895 | |
| | 31,900 | | | Anest Iwata Corp. | | | 226,554 | |
| | 24,300 | | | Anritsu Corp. | | | 159,490 | |
| | 12,100 | | | AOI Electronics Co. Ltd. | | | 353,965 | |
| | 3,300 | | | AOI Pro, Inc. | | | 25,378 | |
| | 39,900 | | | AOKI Holdings, Inc. | | | 490,029 | |
| | 145,000 | | | Aomori Bank Ltd. (The) | | | 474,642 | |
| | 6,400 | | | Aoyama Trading Co. Ltd. | | | 234,955 | |
| | 148,000 | | | Aozora Bank Ltd. | | | 543,333 | |
| | 9,700 | | | Arakawa Chemical Industries Ltd. | | | 97,104 | |
| | 2,500 | | | Arata Corp. | | | 53,037 | |
| | 16,000 | | | Araya Industrial Co. Ltd. | | | 19,359 | |
| | 19,000 | | | Arcland Sakamoto Co. Ltd. | | | 417,254 | |
| | 9,738 | | | Arcs Co. Ltd. | | | 197,552 | |
| | 238,800 | | | Arealink Co. Ltd. | | | 290,906 | |
| | 2,700 | | | Argo Graphics, Inc. | | | 39,291 | |
| | 130,900 | | | Ariake Japan Co. Ltd. | | | 5,977,119 | |
| | 10,200 | | | Arisawa Manufacturing Co. Ltd. | | | 63,481 | |
| | 31,100 | | | Artnature, Inc. | | | 299,995 | |
| | 3,290 | | | As One Corp. | | | 117,237 | |
| | 13,800 | | | Asahi Diamond Industrial Co. Ltd. | | | 146,955 | |
| | 38,050 | | | Asahi Holdings, Inc. | | | 563,166 | |
| | 9,400 | | | Asahi Intecc Co. Ltd. | | | 366,122 | |
| | 13,000 | | | Asahi Kogyosha Co. Ltd. | | | 49,772 | |
| | 27,000 | | | Asahi Organic Chemicals Industry Co. Ltd. | | | 50,120 | |
| | 13,000 | | | Asanuma Corp. | | | 32,858 | |
| | 4,500 | | | Asatsu-DK, Inc. | | | 111,241 | |
| | 2,300 | | | Asax Co. Ltd. | | | 30,573 | |
| | 79,200 | | | Ashikaga Holdings Co. Ltd. | | | 357,703 | |
| | 33,000 | | | Ashimori Industry Co. Ltd. | | | 52,507 | |
| | 38,100 | | | Asia Pile Holdings Corp. | | | 235,540 | |
| | 24,500 | | | Asics Corp. | | | 683,206 | |
| | 9,000 | | | ASKA Pharmaceutical Co. Ltd. | | | 108,594 | |
| | 1,600 | | | ASKUL Corp. | | | 59,136 | |
| | 10,400 | | | Asunaro Aoki Construction Co. Ltd. | | | 77,395 | |
| | 10,200 | | | Atom Corp. | | | 55,366 | |
| | 41,000 | | | Atsugi Co. Ltd. | | | 40,093 | |
| | 46,600 | | | Autobacs Seven Co. Ltd. | | | 820,627 | |
| | 34,500 | | | Avex Group Holdings, Inc. | | | 408,842 | |
| | 57,000 | | | Awa Bank Ltd. (The) | | | 317,900 | |
| | 16,900 | | | Axial Retailing, Inc. | | | 632,332 | |
| | 9,300 | | | Azbil Corp. | | | 236,604 | |
| | 29,800 | | | Bandai Namco Holdings, Inc. | | | 737,159 | |
| Old Westbury Funds, Inc. | |
| Small & Mid Cap Fund | |
| Portfolio of Investments - (Continued) | October 31, 2015 |
| | |
| Shares | | | | | Value | |
| JAPAN (continued) | | | | |
| | 96,000 | | | Bando Chemical Industries Ltd. | | $ | 404,939 | |
| | 5,400 | | | Bank of Iwate Ltd. (The) | | | 241,203 | |
| | 411,000 | | | Bank of Kochi Ltd. (The)(c) | | | 517,709 | |
| | 137,000 | | | Bank of Kyoto Ltd. (The) | | | 1,397,588 | |
| | 60,000 | | | Bank of Nagoya Ltd. (The) | | | 223,751 | |
| | 22,800 | | | Bank of Okinawa Ltd. (The) | | | 900,323 | |
| | 139,000 | | | Bank of Saga Ltd. (The) | | | 316,773 | |
| | 25,700 | | | Bank of the Ryukyus Ltd. | | | 368,877 | |
| | 14,400 | | | Belc Co. Ltd. | | | 540,582 | |
| | 34,500 | | | Belluna Co. Ltd. | | | 198,131 | |
| | 15,500 | | | Benesse Holdings, Inc. | | | 418,103 | |
| | 8,700 | | | Bic Camera, Inc. | | | 71,160 | |
| | 58,600 | | | Bit-Isle, Inc. | | | 443,858 | |
| | 21,900 | | | BML, Inc. | | | 648,815 | |
| | 3,400 | | | Bookoff Corp. | | | 26,119 | |
| | 2,100 | | | Broadleaf Co. Ltd. | | | 24,225 | |
| | 38,800 | | | Brother Industries Ltd. | | | 500,956 | |
| | 77,800 | | | Bunka Shutter Co. Ltd. | | | 607,339 | |
| | 800 | | | C Uyemura & Co. Ltd. | | | 41,833 | |
| | 110,000 | | | Calsonic Kansei Corp. | | | 884,230 | |
| | 900 | | | Can Do Co. Ltd. | | | 11,836 | |
| | 19,000 | | | Canon Electronics, Inc. | | | 326,088 | |
| | 12,000 | | | Canon Marketing Japan, Inc. | | | 183,575 | |
| | 21,000 | | | Capcom Co. Ltd. | | | 445,513 | |
| | 3,400 | | | Carlit Holdings Co. Ltd. | | | 14,849 | |
| | 31,400 | | | Casio Computer Co. Ltd. | | | 596,410 | |
| | 5,800 | | | Cawachi Ltd. | | | 100,840 | |
| | 117,000 | | | Central Glass Co. Ltd. | | | 581,752 | |
| | 1,700 | | | Central Security Patrols Co. Ltd. | | | 22,456 | |
| | 1,300 | | | Central Sports Co. Ltd. | | | 24,326 | |
| | 36,050 | | | Century Tokyo Leasing Corp. | | | 1,235,326 | |
| | 93,600 | | | Chiba Kogyo Bank Ltd. (The) | | | 550,725 | |
| | 1,500 | | | Chino Corp. | | | 13,574 | |
| | 4,000 | | | Chiyoda Co. Ltd. | | | 133,256 | |
| | 20,900 | | | Chiyoda Integre Co. Ltd. | | | 508,341 | |
| | 3,800 | | | Chori Co. Ltd. | | | 53,818 | |
| | 40,300 | | | Chubu Shiryo Co. Ltd. | | | 347,661 | |
| | 188,000 | | | Chuetsu Pulp & Paper Co. Ltd. | | | 336,521 | |
| | 152,600 | | | Chugai Mining Co. Ltd.(d) | | | 32,880 | |
| | 6,000 | | | Chugai Ro Co. Ltd. | | | 11,436 | |
| | 66,500 | | | Chugoku Bank Ltd. (The) | | | 950,630 | |
| | 23,000 | | | Chugoku Marine Paints Ltd. | | | 165,824 | |
| | 32,000 | | | Chukyo Bank Ltd. (The) | | | 66,827 | |
| | 131,000 | | | Citizen Holdings Co. Ltd. | | | 1,000,928 | |
| | 38,400 | | | CKD Corp. | | | 352,591 | |
| | 94,000 | | | Clarion Co. Ltd. | | | 324,057 | |
| | 11,000 | | | Cleanup Corp. | | | 69,827 | |
| | 3,100 | | | CMIC Holdings Co. Ltd. | | | 38,766 | |
| | 4,800 | | | CMK Corp. | | | 9,189 | |
| | 25,723 | | | Coca-Cola East Japan Co. Ltd. | | | 363,239 | |
| | 17,800 | | | Coca-Cola West Co. Ltd. | | | 362,136 | |
| | 2,290 | | | Cocokara Fine, Inc. | | | 91,471 | |
| | 6,700 | | | COLOPL Inc.(d) | | | 110,325 | |
| | 6,400 | | | Colowide Co. Ltd. | | | 87,193 | |
| | 6,100 | | | Computer Engineering & Consulting Ltd. | | | 54,393 | |
| Shares | | | | | Value | |
| JAPAN (continued) | | | | |
| | 27,900 | | | COMSYS Holdings Corp. | | $ | 366,929 | |
| | 26,700 | | | CONEXIO Corp. | | | 270,607 | |
| | 7,500 | | | COOKPAD, Inc. | | | 144,195 | |
| | 5,200 | | | Corona Corp. | | | 51,367 | |
| | 25,200 | | | Cosmo Energy Holdings Co. Ltd.(d) | | | 344,785 | |
| | 3,200 | | | Cosmos Pharmaceutical Corp. | | | 401,226 | |
| | 14,700 | | | Create Restaurants Holdings, Inc. | | | 383,732 | |
| | 7,800 | | | Create SD Holdings Co. Ltd. | | | 461,523 | |
| | 47,100 | | | Credit Saison Co. Ltd. | | | 976,192 | |
| | 6,200 | | | CTI Engineering Co. Ltd. | | | 61,810 | |
| | 12,200 | | | CyberAgent, Inc. | | | 505,511 | |
| | 191,000 | | | Dai Nippon Toryo Co. Ltd. | | | 292,823 | |
| | 9,100 | | | Daibiru Corp. | | | 77,976 | |
| | 48,900 | | | Daicel Corp. | | | 651,622 | |
| | 6,000 | | | Dai-Dan Co. Ltd. | | | 42,761 | |
| | 17,000 | | | Daido Kogyo Co. Ltd. | | | 32,402 | |
| | 6,600 | | | Daido Metal Co. Ltd. | | | 62,407 | |
| | 326,000 | | | Daido Steel Co. Ltd. | | | 1,256,235 | |
| | 4,300 | | | Daidoh Ltd. | | | 17,924 | |
| | 11,200 | | | Daifuku Co. Ltd. | | | 167,346 | |
| | 51,000 | | | Daihatsu Diesel Manufacturing Co. Ltd. | | | 332,618 | |
| | 82,000 | | | Daihen Corp. | | | 411,121 | |
| | 85,000 | | | Daiho Corp. | | | 377,559 | |
| | 13,000 | | | Daiichi Jitsugyo Co. Ltd. | | | 55,913 | |
| | 6,100 | | | Daiichi Kigenso Kagaku-Kogyo Co. Ltd. | | | 243,151 | |
| | 39,500 | | | Dai-ichi Seiko Co. Ltd. | | | 529,307 | |
| | 15,000 | | | Daiichikosho Co. Ltd. | | | 502,196 | |
| | 102,000 | | | Daiken Corp. | | | 299,229 | |
| | 24,600 | | | Daiken Medical Co. Ltd. | | | 210,589 | |
| | 19,000 | | | Daiki Aluminium Industry Co. Ltd. | | | 52,117 | |
| | 22,700 | | | Daikoku Denki Co. Ltd. | | | 294,026 | |
| | 7,400 | | | Daikokutenbussan Co. Ltd. | | | 255,109 | |
| | 203,000 | | | Daikyo, Inc. | | | 353,278 | |
| | 6,100 | | | Daikyonishikawa Corp. | | | 327,066 | |
| | 39,000 | | | Dainichiseika Color & Chemicals Manufacturing Co. Ltd. | | | 185,837 | |
| | 37,000 | | | Daio Paper Corp. | | | 367,639 | |
| | 200,000 | | | Daisan Bank Ltd. (The) | | | 298,334 | |
| | 4,910 | | | Daiseki Co. Ltd. | | | 79,426 | |
| | 129,000 | | | Daishi Bank Ltd. (The) | | | 586,898 | |
| | 6,000 | | | Daishinku Corp. | | | 12,232 | |
| | 246,000 | | | Daito Bank Ltd. (The) | | | 393,453 | |
| | 17,260 | | | Daito Pharmaceutical Co. Ltd. | | | 415,516 | |
| | 60 | | | Daiwa House Residential Investment Corp. REIT | | | 121,919 | |
| | 8,800 | | | Daiwa Industries Ltd. | | | 58,560 | |
| | 228,000 | | | Daiwabo Holdings Co. Ltd. | | | 451,579 | |
| | 10,400 | | | DC Co. Ltd. | | | 31,544 | |
| | 43,860 | | | DCM Holdings Co. Ltd. | | | 292,594 | |
| | 47,400 | | | Dena Co. Ltd. | | | 766,759 | |
| Old Westbury Funds, Inc. | |
| Small & Mid Cap Fund | |
| Portfolio of Investments - (Continued) | October 31, 2015 |
| | |
| Shares | | | | | Value | |
| JAPAN (continued) | | | | |
| | 272,000 | | | Denka Co. Ltd. | | $ | 1,273,556 | |
| | 11,000 | | | Denki Kogyo Co. Ltd. | | | 47,220 | |
| | 20,500 | | | Denyo Co. Ltd. | | | 334,673 | |
| | 14,000 | | | Descente Ltd. | | | 180,641 | |
| | 508,000 | | | DIC Corp. | | | 1,389,243 | |
| | 24,200 | | | Digital Arts, Inc. | | | 411,322 | |
| | 5,600 | | | Disco Corp. | | | 515,588 | |
| | 23,000 | | | DKS Co. Ltd. | | | 72,620 | |
| | 23,900 | | | DMG Mori Co. Ltd. | | | 344,626 | |
| | 13,400 | | | Don Quijote Co. Ltd. | | | 496,934 | |
| | 4,000 | | | Doshisha Co. Ltd. | | | 74,053 | |
| | 5,674 | | | Doutor Nichires Holdings Co. Ltd. | | | 82,945 | |
| | 114,000 | | | Dowa Holdings Co. Ltd. | | | 1,001,409 | |
| | 17,800 | | | Dr Ci Labo Co. Ltd. | | | 322,456 | |
| | 400 | | | DSB Co. Ltd. | | | 3,822 | |
| | 11,400 | | | DTS Corp. | | | 270,947 | |
| | 2,300 | | | Dunlop Sports Co. Ltd. | | | 23,139 | |
| | 12,100 | | | Duskin Co. Ltd. | | | 208,669 | |
| | 9,600 | | | Dydo Drinco, Inc. | | | 411,304 | |
| | 2,000 | | | Dynic Corp. | | | 2,818 | |
| | 14,700 | | | Eagle Industry Co. Ltd. | | | 298,702 | |
| | 242,000 | | | Ebara Corp. | | | 1,056,882 | |
| | 800 | | | Ebara Jitsugyo Co. Ltd. | | | 9,865 | |
| | 63,000 | | | EDION Corp. | | | 475,619 | |
| | 12,300 | | | eGuarantee, Inc. | | | 255,133 | |
| | 192,000 | | | Ehime Bank Ltd. (The) | | | 397,779 | |
| | 8,000 | | | Eidai Co. Ltd. | | | 28,441 | |
| | 134,000 | | | Eighteenth Bank Ltd. (The) | | | 408,652 | |
| | 16,000 | | | Eiken Chemical Co. Ltd. | | | 282,025 | |
| | 3,400 | | | Eizo Corp. | | | 80,104 | |
| | 22,000 | | | Elecom Co. Ltd. | | | 268,551 | |
| | 700 | | | Elematec Corp. | | | 17,304 | |
| | 3,500 | | | Endo Lighting Corp. | | | 35,734 | |
| | 11,700 | | | en-japan, Inc. | | | 313,661 | |
| | 13,300 | | | Enplas Corp. | | | 492,674 | |
| | 39,600 | | | EPS Holdings Inc. | | | 390,191 | |
| | 4,200 | | | ESPEC Corp. | | | 39,609 | |
| | 2,300 | | | Excel Co. Ltd. | | | 29,963 | |
| | 23,500 | | | Exedy Corp. | | | 544,705 | |
| | 12,800 | | | Ezaki Glico Co. Ltd. | | | 615,232 | |
| | 6,700 | | | F@N Communications, Inc. | | | 48,250 | |
| | 3,000 | | | FALCO HOLDINGS Co. Ltd. | | | 37,068 | |
| | 10,400 | | | FamilyMart Co. Ltd. | | | 427,911 | |
| | 263,900 | | | FCC Co. Ltd. | | | 4,710,704 | |
| | 217,580 | | | Feed One Co. Ltd. | | | 257,843 | |
| | 19,300 | | | Ferrotec Corp. | | | 189,209 | |
| | 145,100 | | | FIDEA Holdings Co. Ltd. | | | 316,245 | |
| | 17,800 | | | Fields Corp. | | | 268,910 | |
| | 9,300 | | | Financial Products Group Co. Ltd. | | | 73,910 | |
| | 3,000 | | | Findex, Inc. | | | 20,088 | |
| | 8,500 | | | FJ Next Co. Ltd. | | | 38,953 | |
| | 25,900 | | | Foster Electric Co. Ltd. | | | 644,978 | |
| | 2,200 | | | FP Corp. | | | 90,520 | |
| | 5,400 | | | France Bed Holdings Co. Ltd. | | | 42,557 | |
| Shares | | | | | Value | |
| JAPAN (continued) | | | | |
| | 53,500 | | | F-Tech, Inc. | | $ | 490,354 | |
| | 37,300 | | | Fudo Tetra Corp. | | | 48,221 | |
| | 5,500 | | | Fuji Co. Ltd. | | | 112,944 | |
| | 10,600 | | | Fuji Corp. Ltd. | | | 60,085 | |
| | 267,000 | | | Fuji Electric Co. Ltd. | | | 1,201,467 | |
| | 110,600 | | | Fuji Kiko Co. Ltd. | | | 456,442 | |
| | 12,000 | | | Fuji Kyuko Co. Ltd. | | | 114,660 | |
| | 13,700 | | | Fuji Media Holdings, Inc. | | | 163,941 | |
| | 13,800 | | | Fuji Oil Co. Ltd. | | | 43,343 | |
| | 9,600 | | | Fuji Oil Holdings, Inc. | | | 136,200 | |
| | 14,300 | | | Fuji Pharma Co. Ltd. | | | 250,757 | |
| | 2,900 | | | Fuji Seal International, Inc. | | | 99,133 | |
| | 7,900 | | | Fuji Soft, Inc. | | | 151,951 | |
| | 213,000 | | | Fujibo Holdings, Inc. | | | 395,392 | |
| | 4,600 | | | Fujicco Co. Ltd. | | | 92,290 | |
| | 56,000 | | | Fujikura Kasei Co. Ltd. | | | 264,523 | |
| | 238,000 | | | Fujikura Ltd. | | | 1,232,701 | |
| | 1,200 | | | Fujikura Rubber Ltd. | | | 5,947 | |
| | 2,200 | | | Fujimi, Inc. | | | 33,364 | |
| | 24,300 | | | Fujimori Kogyo Co. Ltd. | | | 674,608 | |
| | 10,500 | | | Fujio Food System Co. Ltd. | | | 233,024 | |
| | 25,300 | | | Fujisash Co. Ltd.(d) | | | 24,321 | |
| | 2,200 | | | Fujishoji Co. Ltd. | | | 22,516 | |
| | 13,000 | | | Fujita Kanko, Inc. | | | 50,418 | |
| | 27,300 | | | Fujitec Co. Ltd. | | | 297,049 | |
| | 32,900 | | | Fujitsu Frontech Ltd. | | | 428,870 | |
| | 24,000 | | | Fujitsu General Ltd. | | | 303,903 | |
| | 123,000 | | | Fujiya Co. Ltd.(d) | | | 200,804 | |
| | 7,700 | | | FuKoKu Co. Ltd. | | | 66,044 | |
| | 47,000 | | | Fukuda Corp. | | | 472,454 | |
| | 8,100 | | | Fukuda Denshi Co. Ltd. | | | 396,039 | |
| | 222,000 | | | Fukui Bank Ltd. (The) | | | 467,291 | |
| | 103,000 | | | Fukuoka Financial Group, Inc. | | | 547,137 | |
| | 343,000 | | | Fukushima Bank Ltd. (The) | | | 272,876 | |
| | 14,400 | | | Fukushima Industries Corp. | | | 314,922 | |
| | 70,000 | | | Fukuyama Transporting Co. Ltd. | | | 381,702 | |
| | 6,300 | | | FULLCAST Holdings Co. Ltd. | | | 41,297 | |
| | 3,000 | | | Funai Soken Holdings, Inc. | | | 46,242 | |
| | 58,000 | | | Furukawa Battery Co. Ltd. (The) | | | 410,475 | |
| | 66,000 | | | Furukawa Co. Ltd. | | | 156,974 | |
| | 313,000 | | | Furukawa Electric Co. Ltd. | | | 575,835 | |
| | 12,800 | | | Furuno Electric Co. Ltd. | | | 87,405 | |
| | 4,000 | | | Furusato Industries Ltd. | | | 59,302 | |
| | 3,500 | | | Fuso Chemical Co. Ltd. | | | 44,609 | |
| | 11,000 | | | Fuso Pharmaceutical Industries Ltd. | | | 25,615 | |
| | 156,800 | | | Futaba Industrial Co. Ltd. | | | 678,293 | |
| | 42,300 | | | Future Architect, Inc. | | | 232,059 | |
| | 14,200 | | | Fuyo General Lease Co. Ltd. | | | 641,336 | |
| | 20,000 | | | Gakken Holdings Co. Ltd. | | | 38,949 | |
| | 30,200 | | | Gecoss Corp. | | | 262,783 | |
| | 14,800 | | | Genki Sushi Co. Ltd. | | | 273,752 | |
| | 1,000 | | | Genky Stores, Inc. | | | 34,640 | |
| | 40,100 | | | Geo Holdings Corp. | | | 603,145 | |
| Old Westbury Funds, Inc. | |
| Small & Mid Cap Fund | |
| Portfolio of Investments - (Continued) | October 31, 2015 |
| | |
| Shares | | | | | Value | |
| JAPAN (continued) | | | | |
| | 28,200 | | | GLOBERIDE, Inc. | | $ | 372,978 | |
| | 42,200 | | | Glory Ltd. | | | 1,075,371 | |
| | 235 | | | GLP J - REIT | | | 234,474 | |
| | 85,300 | | | GMO Click Holdings, Inc. | | | 588,836 | |
| | 30,400 | | | GMO Internet, Inc. | | | 434,070 | |
| | 11,000 | | | GMO Payment Gateway, Inc. | | | 437,101 | |
| | 34,000 | | | Godo Steel Ltd. | | | 60,015 | |
| | 4,880 | | | Goldcrest Co. Ltd. | | | 92,043 | |
| | 3,800 | | | Goldwin, Inc. | | | 217,917 | |
| | 16,300 | | | Gree, Inc. | | | 82,939 | |
| | 191,000 | | | GS Yuasa Corp. | | | 731,267 | |
| | 24,000 | | | GSI Creos Corp. | | | 22,872 | |
| | 30,100 | | | G-Tekt Corp. | | | 374,909 | |
| | 10,800 | | | Gulliver International Co. Ltd. | | | 109,996 | |
| | 16,000 | | | Gun-Ei Chemical Industry Co. Ltd. | | | 39,248 | |
| | 153,600 | | | GungHo Online Entertainment, Inc. | | | 502,793 | |
| | 151,000 | | | Gunma Bank Ltd. (The) | | | 957,280 | |
| | 48,000 | | | Gunze Ltd. | | | 153,145 | |
| | 23,000 | | | Gurunavi, Inc. | | | 422,375 | |
| | 7,200 | | | H.I.S. Co. Ltd. | | | 244,037 | |
| | 41,635 | | | H2O Retailing Corp. | | | 816,691 | |
| | 185,000 | | | Hachijuni Bank Ltd. (The) | | | 1,272,479 | |
| | 2,800 | | | Hagihara Industries, Inc. | | | 48,937 | |
| | 3,500 | | | Hakudo Co. Ltd. | | | 39,417 | |
| | 63,300 | | | Hakuhodo DY Holdings, Inc. | | | 671,451 | |
| | 4,800 | | | Hakuto Co. Ltd. | | | 56,564 | |
| | 19,000 | | | Hamakyorex Co. Ltd. | | | 385,763 | |
| | 17,100 | | | Hamamatsu Photonics KK | | | 439,297 | |
| | 126,000 | | | Haneda Zenith Holdings Co. Ltd. | | | 235,982 | |
| | 108,000 | | | Hanwa Co. Ltd. | | | 450,186 | |
| | 28,000 | | | Happinet Corp. | | | 291,207 | |
| | 7,400 | | | Hard Off Corp. Co. Ltd. | | | 94,071 | |
| | 2,400 | | | Harmonic Drive Systems, Inc. | | | 41,091 | |
| | 90,200 | | | Haseko Corp. | | | 927,639 | |
| | 20,860 | | | Hazama Ando Corp. | | | 123,946 | |
| | 17,600 | | | Heiwa Corp. | | | 326,417 | |
| | 4,000 | | | Heiwa Real Estate Co. Ltd. | | | 48,529 | |
| | 31,000 | | | Heiwado Co. Ltd. | | | 701,077 | |
| | 16,800 | | | Hibiya Engineering Ltd. | | | 219,415 | |
| | 12,288 | | | Hiday Hidaka Corp. | | | 306,003 | |
| | 133,000 | | | Higashi-Nippon Bank Ltd. (The) | | | 451,894 | |
| | 1,600 | | | Hikari Tsushin, Inc. | | | 122,649 | |
| | 10,900 | | | HI-LEX Corp. | | | 336,024 | |
| | 3,200 | | | Hiramatsu, Inc. | | | 16,998 | |
| | 2,925 | | | Hirose Electric Co. Ltd. | | | 357,777 | |
| | 247,000 | | | Hiroshima Bank Ltd. (The) | | | 1,385,755 | |
| | 18,300 | | | Hisamitsu Pharmaceutical Co., Inc. | | | 714,287 | |
| | 33,800 | | | Hitachi Capital Corp. | | | 978,959 | |
| | 38,200 | | | Hitachi Chemical Co. Ltd. | | | 611,605 | |
| | 51,000 | | | Hitachi Construction Machinery Co. Ltd. | | | 795,409 | |
| Shares | | | | | Value | |
| JAPAN (continued) | | | | |
| | 20,500 | | | Hitachi High-Technologies Corp. | | $ | 556,373 | |
| | 8,700 | | | Hitachi Koki Co. Ltd. | | | 63,806 | |
| | 54,000 | | | Hitachi Kokusai Electric, Inc. | | | 751,802 | |
| | 36,300 | | | Hitachi Transport System Ltd. | | | 643,756 | |
| | 51,500 | | | Hitachi Zosen Corp. | | | 283,811 | |
| | 34,800 | | | Hochiki Corp. | | | 348,087 | |
| | 10,000 | | | Hodogaya Chemical Co. Ltd. | | | 13,922 | |
| | 121,000 | | | Hogy Medical Co. Ltd. | | | 5,835,916 | |
| | 32,400 | | | Hokkaido Electric Power Co., Inc.(d) | | | 348,246 | |
| | 25,000 | | | Hokkan Holdings Ltd. | | | 64,225 | |
| | 12,000 | | | Hokko Chemical Industry Co. Ltd. | | | 45,247 | |
| | 61,000 | | | Hokkoku Bank Ltd. (The) | | | 227,985 | |
| | 289,000 | | | Hokuetsu Bank Ltd. (The) | | | 605,925 | |
| | 35,100 | | | Hokuetsu Industries Co. Ltd. | | | 248,408 | |
| | 43,500 | | | Hokuetsu Kishu Paper Co. Ltd. | | | 304,612 | |
| | 871,000 | | | Hokuhoku Financial Group, Inc. | | | 1,948,869 | |
| | 25,000 | | | Hokuriku Electric Industry Co. Ltd. | | | 35,220 | |
| | 37,600 | | | Hokuriku Electric Power Co. | | | 564,608 | |
| | 45,900 | | | Hokuriku Electrical Construction Co. Ltd. | | | 399,015 | |
| | 44,900 | | | Hokuto Corp. | | | 880,363 | |
| | 3,320 | | | Honeys Co. Ltd. | | | 27,458 | |
| | 9,600 | | | Hoosiers Holdings | | | 36,993 | |
| | 32,400 | | | Horiba Ltd. | | | 1,286,119 | |
| | 7,500 | | | Hoshizaki Electric Co. Ltd. | | | 547,568 | |
| | 14,000 | | | Hosokawa Micron Corp. | | | 70,075 | |
| | 30,000 | | | House Foods Group, Inc. | | | 521,091 | |
| | 5,500 | | | Howa Machinery Ltd. | | | 31,541 | |
| | 96,000 | | | Hyakugo Bank Ltd. (The) | | | 494,837 | |
| | 166,000 | | | Hyakujushi Bank Ltd. (The) | | | 628,673 | |
| | 118,200 | | | Ibiden Co. Ltd. | | | 1,643,653 | |
| | 32,100 | | | IBJ Leasing Co. Ltd. | | | 682,062 | |
| | 1,200 | | | Ichibanya Co. Ltd. | | | 53,402 | |
| | 133,800 | | | Ichigo, Inc. | | | 348,166 | |
| | 19,000 | | | Ichikoh Industries Ltd. | | | 33,065 | |
| | 7,300 | | | ICHINEN Holdings Co. Ltd. | | | 63,399 | |
| | 58,200 | | | Ichiyoshi Securities Co. Ltd. | | | 540,666 | |
| | 1,500 | | | Icom, Inc. | | | 31,338 | |
| | 7,000 | | | Idec Corp. | | | 58,938 | |
| | 49,250 | | | Idemitsu Kosan Co. Ltd. | | | 811,786 | |
| | 11,400 | | | Ihara Chemical Industry Co. Ltd. | | | 140,197 | |
| | 35,036 | | | Iida Group Holdings Co. Ltd. | | | 662,569 | |
| | 39,100 | | | Iino Kaiun Kaisha Ltd. | | | 178,213 | |
| | 5,680 | | | IJT Technology Holdings Co. Ltd. | | | 18,828 | |
| | 14,000 | | | Ikegami Tsushinki Co. Ltd. | | | 17,751 | |
| | 3,000 | | | Ikyu Corp. | | | 57,380 | |
| | 10,900 | | | Imasen Electric Industrial | | | 99,181 | |
| | 3,500 | | | Inaba Denki Sangyo Co. Ltd. | | | 109,928 | |
| | 300 | | | Inaba Seisakusho Co. Ltd. | | | 3,220 | |
| Old Westbury Funds, Inc. | |
| Small & Mid Cap Fund | |
| Portfolio of Investments - (Continued) | October 31, 2015 |
| | |
| Shares | | | | | Value | |
| JAPAN (continued) | | | | |
| | 13,200 | | | Inabata & Co. Ltd. | | $ | 154,239 | |
| | 5,600 | | | Inageya Co. Ltd. | | | 56,617 | |
| | 3,300 | | | Ines Corp. | | | 29,809 | |
| | 4,200 | | | I-Net Corp. | | | 41,488 | |
| | 36,200 | | | Infocom Corp. | | | 315,591 | |
| | 35,500 | | | Information Services International-Dentsu Ltd. | | | 557,492 | |
| | 2,400 | | | Innotech Corp. | | | 9,567 | |
| | 18,300 | | | Intage Holdings, Inc. | | | 261,299 | |
| | 4,500 | | | Internet Initiative Japan, Inc. | | | 84,802 | |
| | 1,100 | | | Inui Warehouse Co. Ltd. | | | 8,988 | |
| | 6,000 | | | Iriso Electronics Co. Ltd. | | | 266,015 | |
| | 5,000 | | | Ise Chemicals Corp. | | | 25,566 | |
| | 39,000 | | | Iseki & Co. Ltd. | | | 64,639 | |
| | 45,600 | | | Isetan Mitsukoshi Holdings Ltd. | | | 738,775 | |
| | 570,000 | | | Ishihara Sangyo Kaisha Ltd.(d) | | | 557,388 | |
| | 62,666 | | | IT Holdings Corp. | | | 1,560,548 | |
| | 14,000 | | | Ito En Ltd. | | | 294,224 | |
| | 82,400 | | | Itochu Enex Co. Ltd. | | | 665,100 | |
| | 11,200 | | | Itochu Techno-Solutions Corp. | | | 246,888 | |
| | 1,300 | | | Itochu-Shokuhin Co. Ltd. | | | 45,247 | |
| | 35,000 | | | Itoham Foods, Inc. | | | 179,539 | |
| | 27,600 | | | Itoki Corp. | | | 202,420 | |
| | 28,700 | | | IwaiCosmo Holdings, Inc. | | | 322,034 | |
| | 35,000 | | | Iwasaki Electric Co. Ltd. | | | 71,642 | |
| | 32,000 | | | Iwatani Corp. | | | 178,470 | |
| | 11,000 | | | Iwatsu Electric Co. Ltd.(d) | | | 7,384 | |
| | 93,800 | | | Iyo Bank Ltd. (The) | | | 1,017,521 | |
| | 11,000 | | | Izumi Co. Ltd. | | | 412,033 | |
| | 46,000 | | | Izutsuya Co. Ltd.(d) | | | 24,778 | |
| | 13,900 | | | J Trust Co. Ltd. | | | 112,655 | |
| | 28,700 | | | J. Front Retailing Co. Ltd. | | | 476,153 | |
| | 102,000 | | | Jaccs Co. Ltd. | | | 430,248 | |
| | 5,800 | | | Jafco Co. Ltd. | | | 223,742 | |
| | 900 | | | Jalux, Inc. | | | 18,340 | |
| | 1,900 | | | Jamco Corp. | | | 80,459 | |
| | 8,300 | | | Janome Sewing Machine Co. Ltd.(d) | | | 61,285 | |
| | 12,500 | | | Japan Airport Terminal Co. Ltd. | | | 683,683 | |
| | 23,000 | | | Japan Aviation Electronics Industry Ltd. | | | 413,036 | |
| | 10,800 | | | Japan Communications, Inc.(d) | | | 26,850 | |
| | 7,700 | | | Japan Digital Laboratory Co. Ltd. | | | 98,970 | |
| | 28,400 | | | Japan Display, Inc.(d) | | | 89,905 | |
| | 600 | | | Japan Drilling Co. Ltd. | | | 13,152 | |
| | 340 | | | Japan Hotel REIT Investment Corp. | | | 236,960 | |
| | 3,900 | | | Japan Medical Dynamic Marketing, Inc. | | | 20,717 | |
| | 7,600 | | | Japan Petroleum Exploration Co. Ltd. | | | 229,253 | |
| | 84 | | | Japan Prime Realty Investment Corp. REIT | | | 274,617 | |
| | 42,000 | | | Japan Pulp & Paper Co. Ltd. | | | 116,251 | |
| | 96,000 | | | Japan Radio Co. Ltd. | | | 344,477 | |
| Shares | | | | | Value | |
| JAPAN (continued) | | | | |
| | 247 | | | Japan Retail Fund Investment Corp. REIT | | $ | 480,204 | |
| | 101,000 | | | Japan Steel Works Ltd. (The) | | | 378,321 | |
| | 86,000 | | | Japan Transcity Corp. | | | 311,444 | |
| | 31,000 | | | Japan Wool Textile Co. Ltd. (The) | | | 253,045 | |
| | 1,000 | | | Jastec Co. Ltd. | | | 9,679 | |
| | 6,000 | | | JBCC Holdings, Inc. | | | 38,286 | |
| | 12,400 | | | JCU Corp. | | | 442,380 | |
| | 55,000 | | | Jeol Ltd. | | | 334,549 | |
| | 77,000 | | | JGC Corp. | | | 1,227,712 | |
| | 157,200 | | | Jimoto Holdings, Inc. | | | 270,967 | |
| | 1,500 | | | Jin Co. Ltd. | | | 55,876 | |
| | 5,000 | | | JK Holdings Co. Ltd. | | | 21,173 | |
| | 9,000 | | | JMS Co. Ltd. | | | 21,555 | |
| | 28,000 | | | Joban Kosan Co. Ltd. | | | 34,806 | |
| | 39,000 | | | J-Oil Mills, Inc. | | | 113,118 | |
| | 20,000 | | | Joshin Denki Co. Ltd. | | | 153,311 | |
| | 86,000 | | | Joyo Bank Ltd. (The) | | | 450,418 | |
| | 12,600 | | | Jp-Holdings, Inc. | | | 33,413 | |
| | 5,400 | | | JSP Corp. | | | 116,395 | |
| | 55,700 | | | JSR Corp. | | | 886,713 | |
| | 35,700 | | | JTEKT Corp. | | | 621,873 | |
| | 22,400 | | | Juki Corp. | | | 280,487 | |
| | 170,000 | | | Juroku Bank Ltd. (The) | | | 763,570 | |
| | 64,900 | | | JVC Kenwood Corp. | | | 171,030 | |
| | 5,200 | | | K&O Energy Group, Inc. | | | 66,923 | |
| | 212,300 | | | kabu.com Securities Co. Ltd. | | | 703,737 | |
| | 1,000 | | | Kabuki-Za Co. Ltd. | | | 41,518 | |
| | 10,500 | | | Kaga Electronics Co. Ltd. | | | 147,924 | |
| | 106,000 | | | Kajima Corp. | | | 612,265 | |
| | 43,800 | | | Kakaku.com, Inc. | | | 825,402 | |
| | 4,500 | | | Kaken Pharmaceutical Co. Ltd. | | | 313,251 | |
| | 11,300 | | | Kameda Seika Co. Ltd. | | | 440,594 | |
| | 43,400 | | | Kamei Corp. | | | 436,266 | |
| | 92,000 | | | Kamigumi Co. Ltd. | | | 797,481 | |
| | 13,000 | | | Kanaden Corp. | | | 102,992 | |
| | 3,000 | | | Kanagawa Chuo Kotsu Co. Ltd. | | | 17,602 | |
| | 6,000 | | | Kanamoto Co. Ltd. | | | 121,969 | |
| | 18,000 | | | Kandenko Co. Ltd. | | | 127,985 | |
| | 160,000 | | | Kaneka Corp. | | | 1,429,353 | |
| | 1,300 | | | Kaneko Seeds Co. Ltd. | | | 13,143 | |
| | 370,000 | | | Kanematsu Corp. | | | 616,309 | |
| | 8,000 | | | Kanematsu Electronics Ltd. | | | 122,847 | |
| | 27,000 | | | Kansai Paint Co. Ltd. | | | 414,610 | |
| | 1,600 | | | Kansai Super Market Ltd. | | | 10,793 | |
| | 20,700 | | | Kansai Urban Banking Corp. | | | 238,615 | |
| | 57,000 | | | Kanto Denka Kogyo Co. Ltd. | | | 449,217 | |
| | 4,400 | | | Kappa Create Co. Ltd.(d) | | | 43,610 | |
| | 32,300 | | | Kasai Kogyo Co. Ltd. | | | 405,523 | |
| | 8,100 | | | Katakura Industries Co. Ltd. | | | 90,149 | |
| | 6,200 | | | Kato Sangyo Co. Ltd. | | | 152,033 | |
| | 130,000 | | | Kato Works Co. Ltd. | | | 562,360 | |
| | 2,400 | | | KAWADA Technologies, Inc. | | | 85,324 | |
| | 3,200 | | | Kawai Musical Instruments Manufacturing Co. Ltd. | | | 59,508 | |
| Old Westbury Funds, Inc. | |
| Small & Mid Cap Fund | |
| Portfolio of Investments - (Continued) | October 31, 2015 |
| | |
| Shares | | | | | Value | |
| JAPAN (continued) | | | | |
| | 851,000 | | | Kawasaki Kisen Kaisha Ltd. | | $ | 1,925,276 | |
| | 3,400 | | | Kawasumi Laboratories, Inc. | | | 24,260 | |
| | 107,000 | | | Keihan Electric Railway Co. Ltd. | | | 763,462 | |
| | 55,000 | | | Keihanshin Building Co. Ltd. | | | 305,834 | |
| | 15,000 | | | Keihin Co. Ltd. (The) | | | 23,618 | |
| | 32,700 | | | Keihin Corp. | | | 537,638 | |
| | 100,000 | | | Keikyu Corp. | | | 827,878 | |
| | 58,000 | | | Keisei Electric Railway Co. Ltd. | | | 720,494 | |
| | 101,000 | | | Keiyo Bank Ltd. (The) | | | 511,403 | |
| | 11,100 | | | Keiyo Co. Ltd. | | | 45,625 | |
| | 27,100 | | | Kenedix, Inc. | | | 98,815 | |
| | 26,900 | | | Kenko Mayonnaise Co. Ltd. | | | 359,127 | |
| | 18,600 | | | Kewpie Corp. | | | 427,583 | |
| | 1,825 | | | KEY Coffee, Inc. | | | 29,340 | |
| | 2,000 | | | KFC Holdings Japan Ltd. | | | 38,038 | |
| | 23,000 | | | Kikkoman Corp. | | | 727,148 | |
| | 8,200 | | | Kimoto Co. Ltd. | | | 17,872 | |
| | 82,200 | | | Kimura Chemical Plants Co. Ltd. | | | 354,222 | |
| | 8,000 | | | Kinden Corp. | | | 104,550 | |
| | 20,000 | | | Kintetsu Department Store Co. Ltd.(d) | | | 54,529 | |
| | 9,000 | | | Kintetsu World Express, Inc. | | | 170,498 | |
| | 17,000 | | | Kinugawa Rubber Industrial Co. Ltd. | | | 95,658 | |
| | 2,600 | | | Kissei Pharmaceutical Co. Ltd. | | | 67,332 | |
| | 185,000 | | | Kitagawa Iron Works Co. Ltd. | | | 482,929 | |
| | 10,700 | | | Kita-Nippon Bank Ltd. (The) | | | 294,833 | |
| | 114,000 | | | Kitano Construction Corp. | | | 303,257 | |
| | 7,900 | | | Kito Corp. | | | 63,045 | |
| | 34,300 | | | Kitz Corp. | | | 159,178 | |
| | 38,900 | | | Kiyo Bank Ltd. (The) | | | 595,734 | |
| | 4,200 | | | KLab, Inc.(d) | | | 42,881 | |
| | 135,000 | | | KNT-CT Holdings Co. Ltd.(d) | | | 317,726 | |
| | 18,000 | | | KNT-CT Holdings Co. Ltd.(d) | | | 42,363 | |
| | 20,800 | | | Koa Corp. | | | 174,267 | |
| | 22,000 | | | Koatsu Gas Kogyo Co. Ltd. | | | 113,218 | |
| | 8,600 | | | Kobayashi Pharmaceutical Co. Ltd. | | | 671,352 | |
| | 9,600 | | | Kohnan Shoji Co. Ltd. | | | 140,973 | |
| | 1,300 | | | Kohsoku Corp. | | | 9,610 | |
| | 3,000 | | | Koike Sanso Kogyo Co. Ltd. | | | 8,503 | |
| | 16,400 | | | Koito Manufacturing Co. Ltd. | | | 628,574 | |
| | 2,600 | | | Kokusai Co. Ltd. | | | 32,233 | |
| | 13,800 | | | Kokuyo Co. Ltd. | | | 154,960 | |
| | 12,000 | | | KOMAIHALTEC, Inc. | | | 22,276 | |
| | 23,100 | | | Komatsu Wall Industry Co. Ltd. | | | 387,074 | |
| | 22,300 | | | Komeri Co. Ltd. | | | 480,484 | |
| | 4,600 | | | Konaka Co. Ltd. | | | 24,016 | |
| | 25,000 | | | Konami Holdings Corp. | | | 571,393 | |
| | 6,300 | | | Kondotec, Inc. | | | 40,723 | |
| | 67,600 | | | Konica Minolta, Inc. | | | 700,817 | |
| | 17,500 | | | Konishi Co. Ltd. | | | 323,403 | |
| | 31,700 | | | Konoike Transport Co. Ltd. | | | 395,101 | |
| | 5,500 | | | Kose Corp. | | | 541,933 | |
| Shares | | | | | Value | |
| JAPAN (continued) | | | | |
| | 255,000 | | | Kosei Securities Co. Ltd. | | $ | 393,055 | |
| | 11,100 | | | Koshidaka Holdings Co. Ltd. | | | 201,634 | |
| | 6,100 | | | Kotobuki Spirits Co. Ltd. | | | 214,084 | |
| | 2,000 | | | Kourakuen Holdings Corp. | | | 25,524 | |
| | 253,000 | | | Krosaki Harima Corp. | | | 517,867 | |
| | 4,200 | | | KRS Corp. | | | 90,286 | |
| | 22,028 | | | K’s Holdings Corp. | | | 782,216 | |
| | 2,000 | | | KU Holdings Co. Ltd. | | | 13,723 | |
| | 49,000 | | | Kumagai Gumi Co. Ltd. | | | 147,808 | |
| | 9,500 | | | Kura Corp. | | | 288,535 | |
| | 82,000 | | | Kurabo Industries Ltd. | | | 146,101 | |
| | 43,000 | | | Kuraray Co. Ltd. | | | 534,516 | |
| | 66,000 | | | Kureha Corp. | | | 253,783 | |
| | 40,000 | | | Kurimoto Ltd. | | | 68,948 | |
| | 20,800 | | | Kurita Water Industries Ltd. | | | 472,813 | |
| | 24,800 | | | Kuroda Electric Co. Ltd. | | | 506,399 | |
| | 12,400 | | | Kusuri No Aoki Co. Ltd. | | | 594,978 | |
| | 145,000 | | | KYB Corp. | | | 416,964 | |
| | 43,000 | | | Kyodo Printing Co. Ltd. | | | 119,731 | |
| | 2,000 | | | Kyoei Sangyo Co. Ltd. | | | 2,983 | |
| | 6,700 | | | Kyoei Steel Ltd. | | | 111,546 | |
| | 10,800 | | | Kyokuto Kaihatsu Kogyo Co. Ltd. | | | 115,276 | |
| | 51,200 | | | Kyokuto Securities Co. Ltd. | | | 663,602 | |
| | 16,000 | | | Kyokuyo Co. Ltd. | | | 34,739 | |
| | 19,000 | | | KYORIN Holdings, Inc. | | | 321,679 | |
| | 2,520 | | | Kyoritsu Maintenance Co. Ltd. | | | 174,168 | |
| | 400 | | | Kyoritsu Printing Co. Ltd. | | | 1,031 | |
| | 18,000 | | | Kyosan Electric Manufacturing Co. Ltd. | | | 50,866 | |
| | 900 | | | Kyoto Kimono Yuzen Co. Ltd. | | | 7,309 | |
| | 67,400 | | | Kyowa Electronic Instruments Co. Ltd. | | | 250,230 | |
| | 47,500 | | | Kyowa Exeo Corp. | | | 498,736 | |
| | 30,000 | | | Kyudenko Corp. | | | 623,270 | |
| | 125,940 | | | Kyushu Financial Group, Inc.(d) | | | 968,528 | |
| | 23,300 | | | LAC Co. Ltd. | | | 284,613 | |
| | 6,400 | | | Lasertec Corp. | | | 70,327 | |
| | 600 | | | LEC, Inc. | | | 6,703 | |
| | 174,500 | | | Leopalace21 Corp.(d) | | | 937,068 | |
| | 21,000 | | | Life Corp. | | | 529,916 | |
| | 8,000 | | | Lintec Corp. | | | 189,011 | |
| | 54,000 | | | Lion Corp. | | | 524,024 | |
| | 6,000 | | | Look, Inc. | | | 9,049 | |
| | 23,300 | | | M3, Inc. | | | 455,110 | |
| | 6,200 | | | Mabuchi Motor Co. Ltd. | | | 310,334 | |
| | 20,750 | | | Macnica Fuji Electronics Holdings, Inc.(d) | | | 280,977 | |
| | 10,000 | | | Maeda Corp. | | | 73,175 | |
| | 27,300 | | | Maeda Kosen Co. Ltd. | | | 210,174 | |
| | 60,000 | | | Maeda Road Construction Co. Ltd. | | | 1,101,351 | |
| | 3,900 | | | Maezawa Kasei Industries Co. Ltd. | | | 34,097 | |
| Old Westbury Funds, Inc. | |
| Small & Mid Cap Fund | |
| Portfolio of Investments - (Continued) | October 31, 2015 |
| | |
| Shares | | | | | Value | |
| JAPAN (continued) | | | | |
| | 45,000 | | | Makino Milling Machine Co. Ltd. | | $ | 352,407 | |
| | 2,300 | | | Mandom Corp. | | | 91,775 | |
| | 900 | | | Mani, Inc. | | | 16,476 | |
| | 3,300 | | | Mars Engineering Corp. | | | 56,445 | |
| | 7,700 | | | Marubun Corp. | | | 55,770 | |
| | 68,000 | | | Marudai Food Co. Ltd. | | | 253,021 | |
| | 4,000 | | | Marufuji Sheet Piling Co. Ltd. | | | 9,480 | |
| | 11,700 | | | Maruha Nichiro Corp. | | | 176,465 | |
| | 60,300 | | | Marui Group Co. Ltd. | | | 786,044 | |
| | 13,800 | | | Maruichi Steel Tube Ltd. | | | 355,664 | |
| | 45,900 | | | Marusan Securities Co. Ltd. | | | 448,464 | |
| | 2,900 | | | Maruwa Co. Ltd. | | | 64,936 | |
| | 20,000 | | | Maruyama Manufacturing Co., Inc. | | | 32,817 | |
| | 20,000 | | | Maruzen Showa Unyu Co. Ltd. | | | 72,926 | |
| | 6,400 | | | Marvelous, Inc. | | | 51,605 | |
| | 4,200 | | | Matsuda Sangyo Co. Ltd. | | | 49,424 | |
| | 83,400 | | | Matsui Construction Co. Ltd. | | | 472,741 | |
| | 16,400 | | | Matsui Securities Co. Ltd. | | | 145,829 | |
| | 14,800 | | | Matsumotokiyoshi Holdings Co. Ltd. | | | 638,999 | |
| | 3,800 | | | Matsuya Co. Ltd. | | | 46,512 | |
| | 700 | | | Matsuya Foods Co. Ltd. | | | 14,195 | |
| | 6,000 | | | Max Co. Ltd. | | | 61,009 | |
| | 2,400 | | | Maxvalu Nishinihon Co. Ltd. | | | 33,274 | |
| | 3,700 | | | Maxvalu Tokai Co. Ltd. | | | 56,664 | |
| | 8,400 | | | MEC Co. Ltd. | | | 49,772 | |
| | 48,900 | | | Medipal Holdings Corp. | | | 860,724 | |
| | 50,800 | | | Megachips Corp. | | | 516,546 | |
| | 22,200 | | | Megmilk Snow Brand Co. Ltd. | | | 464,163 | |
| | 213,000 | | | Meidensha Corp. | | | 753,717 | |
| | 5,500 | | | Meiko Network Japan Co. Ltd. | | | 65,542 | |
| | 85,000 | | | Meisei Industrial Co. Ltd. | | | 401,508 | |
| | 6,000 | | | Meitec Corp. | | | 219,524 | |
| | 14,700 | | | Meiwa Corp. | | | 53,601 | |
| | 1,000 | | | Melco Holdings, Inc. | | | 17,411 | |
| | 2,400 | | | Message Co. Ltd. | | | 59,428 | |
| | 262,000 | | | Michinoku Bank Ltd. (The) | | | 453,783 | |
| | 4,400 | | | Micronics Japan Co. Ltd. | | | 45,032 | |
| | 283,000 | | | Mie Bank Ltd. (The) | | | 612,107 | |
| | 4,100 | | | Mikuni Corp. | | | 16,581 | |
| | 11,037 | | | Milbon Co. Ltd. | | | 413,876 | |
| | 5,600 | | | Mimasu Semiconductor Industry Co. Ltd. | | | 53,090 | |
| | 95,000 | | | Minato Bank Ltd. (The) | | | 161,391 | |
| | 5,100 | | | Ministop Co. Ltd. | | | 94,671 | |
| | 151,100 | | | Miraca Holdings, Inc. | | | 6,774,269 | |
| | 16,940 | | | Mirait Holdings Corp. | | | 147,683 | |
| | 13,700 | | | Misawa Homes Co. Ltd. | | | 82,879 | |
| | 559,800 | | | MISUMI Group, Inc. | | | 7,371,527 | |
| | 14,900 | | | Mitani Corp. | | | 370,432 | |
| | 78,500 | | | Mito Securities Co. Ltd. | | | 258,913 | |
| | 7,200 | | | Mitsuba Corp. | | | 114,501 | |
| | 138,000 | | | Mitsubishi Gas Chemical Co., Inc. | | | 775,371 | |
| Shares | | | | | Value | |
| JAPAN (continued) | | | | |
| | 14,000 | | | Mitsubishi Logistics Corp. | | $ | 202,569 | |
| | 138,000 | | | Mitsubishi Materials Corp. | | | 484,893 | |
| | 11,800 | | | Mitsubishi Nichiyu Forklift Co. Ltd. | | | 50,360 | |
| | 124,000 | | | Mitsubishi Paper Mills Ltd.(d) | | | 85,290 | |
| | 7,500 | | | Mitsubishi Pencil Co. Ltd. | | | 338,112 | |
| | 9,400 | | | Mitsubishi Research Institute, Inc. | | | 234,085 | |
| | 12,300 | | | Mitsubishi Shokuhin Co. Ltd. | | | 314,966 | |
| | 51,000 | | | Mitsubishi Steel Manufacturing Co. Ltd. | | | 98,475 | |
| | 51,000 | | | Mitsuboshi Belting Ltd. | | | 426,444 | |
| | 649,000 | | | Mitsui Chemicals, Inc. | | | 2,479,398 | |
| | 334,000 | | | Mitsui Engineering & Shipbuilding Co. Ltd. | | | 517,593 | |
| | 46,800 | | | Mitsui High-Tec, Inc. | | | 276,526 | |
| | 14,000 | | | Mitsui Home Co. Ltd. | | | 67,407 | |
| | 41,000 | | | Mitsui Matsushima Co. Ltd. | | | 40,433 | |
| | 368,000 | | | Mitsui Mining & Smelting Co. Ltd. | | | 713,616 | |
| | 320,000 | | | Mitsui Osk Lines Ltd. | | | 861,855 | |
| | 91,000 | | | Mitsui Sugar Co. Ltd. | | | 367,258 | |
| | 44,000 | | | Mitsui-Soko Holdings Co. Ltd. | | | 142,935 | |
| | 20,800 | | | Mitsumi Electric Co. Ltd. | | | 127,037 | |
| | 10,200 | | | Miura Co. Ltd. | | | 122,650 | |
| | 10,000 | | | Mixi, Inc. | | | 384,520 | |
| | 30,000 | | | Miyaji Engineering Group, Inc. | | | 54,695 | |
| | 131,000 | | | Miyazaki Bank Ltd. (The) | | | 460,297 | |
| | 18,000 | | | Miyoshi Oil & Fat Co. Ltd. | | | 20,287 | |
| | 42,000 | | | Mizuno Corp. | | | 207,094 | |
| | 2,100 | | | Mochida Pharmaceutical Co. Ltd. | | | 124,778 | |
| | 1,800 | | | Modec, Inc. | | | 24,926 | |
| | 124,700 | | | Monex Group, Inc. | | | 353,422 | |
| | 124,100 | | | Money Partners Group Co. Ltd. | | | 443,251 | |
| | 23,200 | | | Money Square Holdings, Inc. | | | 327,995 | |
| | 6,600 | | | Monogatari Corp. (The) | | | 282,224 | |
| | 4,700 | | | Monotaro Co. Ltd. | | | 122,106 | |
| | 130 | | | Mori Trust Sogo Reit, Inc. | | | 230,977 | |
| | 26,000 | | | Morinaga & Co. Ltd. | | | 133,371 | |
| | 162,000 | | | Morinaga Milk Industry Co. Ltd. | | | 738,377 | |
| | 8,400 | | | Morita Holdings Corp. | | | 90,356 | |
| | 22,000 | | | Mory Industries, Inc. | | | 63,993 | |
| | 6,200 | | | MTI Ltd. | | | 39,973 | |
| | 2,000 | | | Murakami Corp. | | | 36,927 | |
| | 282,700 | | | Musashi Seimitsu Industry Co. Ltd. | | | 5,772,543 | |
| | 24,100 | | | Musashino Bank Ltd. (The) | | | 924,695 | |
| | 54,400 | | | Nabtesco Corp. | | | 1,100,893 | |
| | 5,100 | | | NAC Co. Ltd. | | | 35,079 | |
| | 18,000 | | | Nachi-Fujikoshi Corp. | | | 81,445 | |
| | 800 | | | Nafco Co. Ltd. | | | 11,615 | |
| | 3,900 | | | Nagaileben Co. Ltd. | | | 66,772 | |
| | 35,000 | | | NaganoBank Ltd. (The) | | | 58,590 | |
| | 64,900 | | | Nagase & Co. Ltd. | | | 813,200 | |
| | 7,000 | | | Nagatanien Holdings Co. Ltd. | | | 61,664 | |
| Old Westbury Funds, Inc. | |
| Small & Mid Cap Fund | |
| Portfolio of Investments - (Continued) | October 31, 2015 |
| | |
| Shares | | | | | Value | |
| JAPAN (continued) | | | | |
| | 138,000 | | | Nagoya Railroad Co. Ltd. | | $ | 574,095 | |
| | 22,000 | | | Nakabayashi Co. Ltd. | | | 56,518 | |
| | 17,700 | | | Nakanishi, Inc. | | | 605,059 | |
| | 6,400 | | | Nakano Corp. | | | 39,725 | |
| | 8,600 | | | Nakano Refrigerators Co. Ltd. | | | 214,163 | |
| | 27,000 | | | Nakayama Steel Works Ltd.(d) | | | 18,124 | |
| | 45,700 | | | Namura Shipbuilding Co. Ltd. | | | 404,472 | |
| | 109,000 | | | Nankai Electric Railway Co. Ltd. | | | 560,040 | |
| | 245,000 | | | Nanto Bank Ltd. (The) | | | 781,677 | |
| | 3,600 | | | Natori Co. Ltd. | | | 46,958 | |
| | 21,700 | | | ND Software Co. Ltd. | | | 251,401 | |
| | 9,000 | | | NDS Co. Ltd. | | | 22,226 | |
| | 3,300 | | | NEC Capital Solutions Ltd. | | | 47,830 | |
| | 10,300 | | | NEC Networks & System Integration Corp. | | | 194,016 | |
| | 18,100 | | | NET One Systems Co. Ltd. | | | 112,047 | |
| | 9,900 | | | Neturen Co. Ltd. | | | 71,212 | |
| | 28,300 | | | Nexon Co. Ltd. | | | 395,876 | |
| | 5,600 | | | Next Co. Ltd. | | | 41,813 | |
| | 113,800 | | | NHK Spring Co. Ltd. | | | 1,170,347 | |
| | 24,000 | | | Nice Holdings, Inc. | | | 34,010 | |
| | 6,000 | | | Nichia Steel Works Ltd. | | | 12,928 | |
| | 38,000 | | | Nichias Corp. | | | 241,535 | |
| | 6,000 | | | Nichiban Co. Ltd. | | | 28,789 | |
| | 7,600 | | | Nichicon Corp. | | | 61,533 | |
| | 33,900 | | | Nichiha Corp. | | | 460,728 | |
| | 14,000 | | | Nichii Gakkan Co. | | | 97,108 | |
| | 21,850 | | | Nichi-Iko Pharmaceutical Co. Ltd. | | | 612,025 | |
| | 159,000 | | | Nichirei Corp. | | | 1,042,256 | |
| | 67,000 | | | Nichireki Co. Ltd. | | | 533,579 | |
| | 375,300 | | | Nifco, Inc. | | | 14,602,084 | |
| | 3,900 | | | NIFTY Corp. | | | 35,972 | |
| | 8,900 | | | Nihon Dempa Kogyo Co. Ltd. | | | 62,765 | |
| | 1,400 | | | Nihon Eslead Corp. | | | 13,307 | |
| | 86,300 | | | Nihon House Holdings Co. Ltd. | | | 349,005 | |
| | 14,000 | | | Nihon Kohden Corp. | | | 274,617 | |
| | 3,400 | | | Nihon M&A Center, Inc. | | | 141,162 | |
| | 20,200 | | | Nihon Nohyaku Co. Ltd. | | | 132,245 | |
| | 30,800 | | | Nihon Parkerizing Co. Ltd. | | | 276,937 | |
| | 2,800 | | | Nihon Plast Co. Ltd. | | | 18,772 | |
| | 1,100 | | | Nihon Tokushu Toryo Co. Ltd. | | | 9,617 | |
| | 1,600 | | | Nihon Trim Co. Ltd. | | | 59,932 | |
| | 15,300 | | | Nihon Unisys Ltd. | | | 169,394 | |
| | 15,000 | | | Nihon Yamamura Glass Co. Ltd. | | | 22,748 | |
| | 85,300 | | | Nikkiso Co. Ltd. | | | 692,749 | |
| | 7,000 | | | Nikko Co. Ltd. | | | 23,088 | |
| | 27,000 | | | Nikkon Holdings Co. Ltd. | | | 525,590 | |
| | 57,000 | | | Nippo Corp. | | | 1,000,936 | |
| | 2,000 | | | Nippon Air Conditioning Services Co. Ltd. | | | 20,071 | |
| | 8,000 | | | Nippon Beet Sugar Manufacturing Co. Ltd. | | | 12,530 | |
| Shares | | | | | Value | |
| JAPAN (continued) | | | | |
| | 22,000 | | | Nippon Carbide Industries Co. Inc. | | $ | 34,275 | |
| | 15,000 | | | Nippon Carbon Co. Ltd. | | | 42,388 | |
| | 31,000 | | | Nippon Chemical Industrial Co. Ltd. | | | 71,418 | |
| | 251,000 | | | Nippon Chemi-Con Corp. | | | 586,575 | |
| | 44,000 | | | Nippon Chemiphar Co. Ltd. | | | 216,226 | |
| | 577,900 | | | Nippon Coke & Engineering Co. Ltd. | | | 483,699 | |
| | 18,600 | | | Nippon Commercial Development Co. Ltd. | | | 306,892 | |
| | 14,900 | | | Nippon Concrete Industries Co. Ltd. | | | 48,280 | |
| | 19,205 | | | Nippon Denko Co. Ltd. | | | 38,993 | |
| | 20,000 | | | Nippon Densetsu Kogyo Co. Ltd. | | | 381,371 | |
| | 209,000 | | | Nippon Electric Glass Co. Ltd. | | | 1,034,002 | |
| | 132,000 | | | Nippon Express Co. Ltd. | | | 685,871 | |
| | 6,100 | | | Nippon Fine Chemical Co. Ltd. | | | 46,760 | |
| | 113,000 | | | Nippon Flour Mills Co. Ltd. | | | 705,138 | |
| | 11,400 | | | Nippon Gas Co. Ltd. | | | 290,031 | |
| | 7,500 | | | Nippon Hume Corp. | | | 47,920 | |
| | 20,000 | | | Nippon Kanzai Co. Ltd. | | | 309,273 | |
| | 24,000 | | | Nippon Kayaku Co. Ltd. | | | 251,993 | |
| | 16,000 | | | Nippon Kinzoku Co. Ltd.(d) | | | 18,696 | |
| | 47,000 | | | Nippon Koei Co. Ltd. | | | 190,462 | |
| | 7,000 | | | Nippon Koshuha Steel Co. Ltd. | | | 5,801 | |
| | 788,900 | | | Nippon Light Metal Holdings Co. Ltd. | | | 1,359,834 | |
| | 89,000 | | | Nippon Paper Industries Co. Ltd. | | | 1,658,747 | |
| | 230,000 | | | Nippon Parking Development Co. Ltd. | | | 264,937 | |
| | 16,000 | | | Nippon Pillar Packing Co. Ltd. | | | 134,980 | |
| | 28,800 | | | Nippon Piston Ring Co. Ltd. | | | 482,347 | |
| | 4,000 | | | Nippon Rietec Co. Ltd. | | | 28,541 | |
| | 67,000 | | | Nippon Road Co. Ltd. (The) | | | 367,564 | |
| | 16,000 | | | Nippon Seiki Co. Ltd. | | | 336,123 | |
| | 4,000 | | | Nippon Seisen Co. Ltd. | | | 17,701 | |
| | 16,000 | | | Nippon Sharyo Ltd.(d) | | | 38,585 | |
| | 349,000 | | | Nippon Sheet Glass Co. Ltd.(d) | | | 303,679 | |
| | 15,000 | | | Nippon Shokubai Co. Ltd. | | | 1,183,393 | |
| | 33,700 | | | Nippon Signal Co. Ltd. | | | 352,165 | |
| | 54,000 | | | Nippon Soda Co. Ltd. | | | 422,441 | |
| | 115,480 | | | Nippon Steel & Sumikin Bussan Corp. | | | 403,850 | |
| | 89,500 | | | Nippon Suisan Kaisha Ltd. | | | 301,869 | |
| | 81,000 | | | Nippon Synthetic Chemical Industry Co. Ltd. (The) | | | 604,798 | |
| | 26,000 | | | Nippon Thompson Co. Ltd. | | | 124,323 | |
| | 18,000 | | | Nippon Valqua Industries Ltd. | | | 44,601 | |
| | 24,700 | | | Nippon Yakin Kogyo Co. Ltd.(d) | | | 34,387 | |
| | 409,000 | | | Nippon Yusen KK | | | 1,077,832 | |
| | 64,900 | | | Nipro Corp. | | | 732,525 | |
| | 1,000 | | | Nishikawa Rubber Co. Ltd. | | | 15,381 | |
| Old Westbury Funds, Inc. | |
| Small & Mid Cap Fund | |
| Portfolio of Investments - (Continued) | October 31, 2015 |
| | |
| Shares | | | | | Value | |
| JAPAN (continued) | | | | |
| | 126,000 | | | Nishimatsu Construction Co. Ltd. | | $ | 504,334 | |
| | 301,000 | | | Nishi-Nippon City Bank Ltd. (The) | | | 888,009 | |
| | 28,000 | | | Nishi-Nippon Railroad Co. Ltd. | | | 145,720 | |
| | 6,200 | | | Nishio Rent All Co. Ltd. | | | 145,353 | |
| | 27,200 | | | Nissan Chemical Industries Ltd. | | | 680,733 | |
| | 29,600 | | | Nissan Shatai Co. Ltd. | | | 345,378 | |
| | 89,100 | | | Nissan Tokyo Sales Holdings Co. Ltd. | | | 234,803 | |
| | 12,600 | | | Nissei ASB Machine Co. Ltd. | | | 259,998 | |
| | 11,000 | | | Nissei Build Kogyo Co. Ltd. | | | 33,911 | |
| | 2,600 | | | Nissei Plastic Industrial Co. Ltd. | | | 22,150 | |
| | 17,700 | | | Nissha Printing Co. Ltd. | | | 388,117 | |
| | 172,100 | | | Nisshin Fudosan Co. Ltd.(c) | | | 597,579 | |
| | 29,000 | | | Nisshin Oillio Group Ltd. (The) | | | 108,146 | |
| | 41,360 | | | Nisshin Seifun Group, Inc. | | | 636,835 | |
| | 51,324 | | | Nisshin Steel Co. Ltd. | | | 532,507 | |
| | 86,000 | | | Nisshinbo Holdings, Inc. | | | 1,175,222 | |
| | 23,000 | | | Nissin Corp. | | | 67,664 | |
| | 40,700 | | | Nissin Electric Co. Ltd. | | | 273,874 | |
| | 58,600 | | | Nissin Kogyo Co. Ltd. | | | 907,627 | |
| | 1,500 | | | Nissin Sugar Co. Ltd. | | | 35,552 | |
| | 4,100 | | | Nissui Pharmaceutical Co. Ltd. | | | 45,121 | |
| | 6,000 | | | Nitta Corp. | | | 164,581 | |
| | 77,000 | | | Nittetsu Mining Co. Ltd. | | | 341,386 | |
| | 80,000 | | | Nitto Boseki Co. Ltd. | | | 243,308 | |
| | 21,500 | | | Nitto Kogyo Corp. | | | 417,991 | |
| | 2,600 | | | Nitto Kohki Co. Ltd. | | | 55,374 | |
| | 12,000 | | | Nitto Seiko Co. Ltd. | | | 31,524 | |
| | 57,400 | | | Nittoc Construction Co. Ltd. | | | 257,342 | |
| | 2,200 | | | NJS Co. Ltd. | | | 26,691 | |
| | 1,200 | | | Noevir Holdings Co. Ltd. | | | 30,281 | |
| | 143,000 | | | NOF Corp. | | | 1,028,624 | |
| | 9,200 | | | Nohmi Bosai Ltd. | | | 114,819 | |
| | 3,600 | | | Nojima Corp. | | | 42,960 | |
| | 11,400 | | | Nomura Co. Ltd. | | | 155,313 | |
| | 70,600 | | | Nomura Real Estate Holdings, Inc. | | | 1,520,588 | |
| | 1 | | | Nomura Real Estate Master Fund, Inc. REIT(d) | | | 1,267 | |
| | 33,000 | | | Noritake Co. Ltd. | | | 76,572 | |
| | 9,000 | | | Noritz Corp. | | | 141,560 | |
| | 249,300 | | | North Pacific Bank Ltd. | | | 964,806 | |
| | 3,900 | | | NS Solutions Corp. | | | 191,655 | |
| | 175,000 | | | NS United Kaiun Kaisha Ltd. | | | 353,858 | |
| | 3,100 | | | NSD Co. Ltd. | | | 43,416 | |
| | 214,000 | | | NTN Corp. | | | 1,076,473 | |
| | 8,400 | | | NTT Urban Development Corp. | | | 84,021 | |
| | 8,300 | | | Nuflare Technology, Inc. | | | 372,802 | |
| | 8,300 | | | Obara Group, Inc. | | | 350,104 | |
| | 79,000 | | | Obayashi Corp. | | | 696,577 | |
| | 68,000 | | | Obayashi Road Corp. | | | 482,373 | |
| | 7,200 | | | Obic Co. Ltd. | | | 383,061 | |
| | 10,100 | | | Odelic Co. Ltd. | | | 274,115 | |
| | 211,000 | | | Oenon Holdings, Inc. | | | 388,183 | |
| Shares | | | | | Value | |
| JAPAN (continued) | | | | |
| | 127,000 | | | Ogaki Kyoritsu Bank Ltd. (The) | | $ | 497,812 | |
| | 23,300 | | | Ohashi Technica, Inc. | | | 263,759 | |
| | 1,800 | | | Ohsho Food Service Corp. | | | 60,264 | |
| | 35,345 | | | Oiles Corp. | | | 565,309 | |
| | 113,000 | | | Oita Bank Ltd. (The) | | | 478,520 | |
| | 142,000 | | | Oji Holdings Corp. | | | 740,184 | |
| | 11,100 | | | Okabe Co. Ltd. | | | 89,135 | |
| | 14,000 | | | Okamoto Industries, Inc. | | | 127,505 | |
| | 11,900 | | | Okamura Corp. | | | 111,140 | |
| | 165,000 | | | Okasan Securities Group, Inc. | | | 979,034 | |
| | 194,000 | | | Oki Electric Industry Co. Ltd. | | | 329,577 | |
| | 3,200 | | | Okinawa Cellular Telephone Co. | | | 89,633 | |
| | 16,950 | | | Okinawa Electric Power Co., Inc. (The) | | | 418,447 | |
| | 33,000 | | | OKK Corp. | | | 39,654 | |
| | 169,000 | | | OKUMA Corp. | | | 1,368,302 | |
| | 48,000 | | | Okumura Corp. | | | 256,170 | |
| | 145,000 | | | Okura Industrial Co. Ltd.(c) | | | 414,560 | |
| | 14,000 | | | Okuwa Co. Ltd. | | | 117,527 | |
| | 2,600 | | | ONO Sokki Co. Ltd. | | | 20,469 | |
| | 2,400 | | | Onoken Co. Ltd. | | | 21,162 | |
| | 26,000 | | | Onward Holdings Co. Ltd. | | | 164,183 | |
| | 26,500 | | | Open House Co. Ltd. | | | 488,187 | |
| | 6,400 | | | OPT Holding, Inc. | | | 33,944 | |
| | 1,800 | | | Optex Co. Ltd. | | | 34,368 | |
| | 9,000 | | | Organo Corp. | | | 37,143 | |
| | 121,500 | | | Orient Corp.(d) | | | 244,671 | |
| | 12,000 | | | Origin Electric Co. Ltd. | | | 33,612 | |
| | 185 | | | Orix JREIT, Inc. REIT | | | 249,896 | |
| | 2,400 | | | Osaka Organic Chemical Industry Ltd. | | | 12,490 | |
| | 24,000 | | | Osaka Soda Co. Ltd. | | | 83,931 | |
| | 8,600 | | | Osaka Steel Co. Ltd. | | | 155,223 | |
| | 2,100 | | | OSAKA Titanium Technologies Co. Ltd. | | | 57,516 | |
| | 5,000 | | | Osaki Electric Co. Ltd. | | | 25,773 | |
| | 20,200 | | | OSG Corp. | | | 383,510 | |
| | 12,200 | | | OSJB Holdings Corp. | | | 23,456 | |
| | 7,900 | | | Otsuka Corp. | | | 384,296 | |
| | 3,500 | | | Otsuka Kagu Ltd. | | | 48,699 | |
| | 2,700 | | | Oyo Corp. | | | 34,905 | |
| | 64,700 | | | Pacific Industrial Co. Ltd. | | | 725,978 | |
| | 31,000 | | | Pacific Metals Co. Ltd. | | | 83,492 | |
| | 5,350 | | | Pack Corp. (The) | | | 127,510 | |
| | 1,400 | | | Pal Co. Ltd. | | | 31,580 | |
| | 8,350 | | | PALTAC Corp. | | | 165,173 | |
| | 19,000 | | | PanaHome Corp. | | | 136,198 | |
| | 7,900 | | | Panasonic Industrial Devices SUNX Co. Ltd. | | | 43,602 | |
| | 10,100 | | | Paramount Bed Holdings Co. Ltd. | | | 325,590 | |
| | 4,500 | | | Parco Co. Ltd. | | | 39,156 | |
| | 31,200 | | | Park24 Co. Ltd. | | | 657,767 | |
| | 3,000 | | | Pasco Corp. | | | 8,055 | |
| | 39,700 | | | Pasona Group, Inc. | | | 303,993 | |
| Old Westbury Funds, Inc. | |
| Small & Mid Cap Fund | |
| Portfolio of Investments - (Continued) | October 31, 2015 |
| | |
| Shares | | | | | Value | |
| JAPAN (continued) | | | | |
| | 2,500 | | | PC Depot Corp. | | $ | 18,377 | |
| | 57,100 | | | Penta-Ocean Construction Co. Ltd. | | | 261,202 | |
| | 700 | | | PIA Corp. | | | 12,692 | |
| | 49,000 | | | Pigeon Corp. | | | 1,386,716 | |
| | 13,500 | | | Pilot Corp. | | | 576,158 | |
| | 9,500 | | | Piolax, Inc. | | | 505,428 | |
| | 271,200 | | | Pioneer Corp.(d) | | | 734,917 | |
| | 5,700 | | | Plenus Co. Ltd. | | | 88,521 | |
| | 2,600 | | | Pocket Card Co. Ltd. | | | 12,669 | |
| | 2,100 | | | Pola Orbis Holdings, Inc. | | | 134,524 | |
| | 24,000 | | | Poletowin Pitcrew Holdings, Inc. | | | 206,447 | |
| | 112,200 | | | Press Kogyo Co. Ltd. | | | 485,360 | |
| | 600 | | | Pressance Corp. | | | 24,140 | |
| | 3,000 | | | Prestige International, Inc. | | | 29,485 | |
| | 106,000 | | | Prima Meat Packers Ltd. | | | 297,787 | |
| | 6,800 | | | Pronexus, Inc. | | | 50,322 | |
| | 2,000 | | | Proto Corp. | | | 26,088 | |
| | 3,400 | | | PS Mitsubishi Construction Co. Ltd. | | | 11,411 | |
| | 45,000 | | | Qol Co. Ltd. | | | 537,748 | |
| | 49,200 | | | Raito Kogyo Co. Ltd. | | | 474,590 | |
| | 24,800 | | | Raysum Co. Ltd. | | | 249,295 | |
| | 1,900 | | | Relo Holdings, Inc. | | | 205,793 | |
| | 35,600 | | | Renaissance, Inc. | | | 374,675 | |
| | 176,840 | | | Rengo Co. Ltd. | | | 845,584 | |
| | 36,700 | | | Resorttrust, Inc. | | | 948,902 | |
| | 3,000 | | | Rheon Automatic Machinery Co. Ltd. | | | 14,544 | |
| | 22,000 | | | Rhythm Watch Co. Ltd. | | | 30,994 | |
| | 17,600 | | | Ricoh Leasing Co. Ltd. | | | 536,007 | |
| | 4,400 | | | Right On Co. Ltd. | | | 42,115 | |
| | 147,000 | | | Riken Corp. | | | 555,498 | |
| | 6,500 | | | Riken Keiki Co. Ltd. | | | 82,900 | |
| | 19,000 | | | Riken Technos Corp. | | | 63,769 | |
| | 1,400 | | | Riken Vitamin Co. Ltd. | | | 45,653 | |
| | 3,000 | | | Ringer Hut Co. Ltd. | | | 61,407 | |
| | 3,000 | | | Rinnai Corp. | | | 239,413 | |
| | 900 | | | Rion Co. Ltd. | | | 13,820 | |
| | 33,600 | | | Riso Kagaku Corp. | | | 613,972 | |
| | 1,800 | | | Rock Field Co. Ltd. | | | 44,109 | |
| | 24,900 | | | Rohto Pharmaceutical Co. Ltd. | | | 413,521 | |
| | 18,200 | | | Roland DG Corp. | | | 417,332 | |
| | 43,000 | | | Round One Corp. | | | 195,276 | |
| | 8,600 | | | Royal Holdings Co. Ltd. | | | 151,731 | |
| | 64,000 | | | Royal Hotel Ltd. (The)(d) | | | 161,763 | |
| | 50,000 | | | Ryobi Ltd. | | | 186,045 | |
| | 12,000 | | | Ryoden Trading Co. Ltd. | | | 78,860 | |
| | 3,300 | | | Ryohin Keikaku Co. Ltd. | | | 668,095 | |
| | 12,500 | | | Ryosan Co. Ltd. | | | 304,550 | |
| | 5,100 | | | Ryoyo Electro Corp. | | | 63,185 | |
| | 19,200 | | | S Foods, Inc. | | | 335,248 | |
| | 3,300 | | | Sac’s Bar Holdings, Inc. | | | 52,753 | |
| | 36,000 | | | Saibu Gas Co. Ltd. | | | 81,147 | |
| | 4,700 | | | Saizeriya Co. Ltd. | | | 107,071 | |
| Shares | | | | | Value | |
| JAPAN (continued) | | | | |
| | 28,000 | | | Sakai Chemical Industry Co. Ltd. | | $ | 83,302 | |
| | 18,000 | | | Sakai Heavy Industries Ltd. | | | 35,651 | |
| | 7,600 | | | Sakai Moving Service Co. Ltd. | | | 381,039 | |
| | 18,000 | | | Sakai Ovex Co. Ltd. | | | 30,281 | |
| | 9,300 | | | Sakata INX Corp. | | | 85,547 | |
| | 4,600 | | | Sakata Seed Corp. | | | 97,970 | |
| | 39,500 | | | SAMTY Co. Ltd. | | | 403,936 | |
| | 3,300 | | | San-A Co. Ltd. | | | 141,112 | |
| | 86,000 | | | San-Ai Oil Co. Ltd. | | | 660,661 | |
| | 42,000 | | | Sanden Holdings Corp. | | | 145,836 | |
| | 1,100 | | | Sanei Architecture Planning Co. Ltd. | | | 12,142 | |
| | 30,950 | | | Sangetsu Co. Ltd. | | | 497,067 | |
| | 85,000 | | | San-In Godo Bank Ltd. (The) | | | 791,042 | |
| | 146,000 | | | Sanken Electric Co. Ltd. | | | 511,792 | |
| | 8,900 | | | Sanki Engineering Co. Ltd. | | | 74,050 | |
| | 8,000 | | | Sanko Metal Industrial Co. Ltd. | | | 17,966 | |
| | 3,400 | | | Sankyo Co. Ltd. | | | 131,864 | |
| | 12,500 | | | Sankyo Seiko Co. Ltd. | | | 47,858 | |
| | 27,400 | | | Sankyo Tateyama, Inc. | | | 383,287 | |
| | 193,000 | | | Sankyu, Inc. | | | 1,095,591 | |
| | 14,600 | | | Sanoh Industrial Co. Ltd. | | | 93,042 | |
| | 3,800 | | | Sanrio Co. Ltd. | | | 101,558 | |
| | 6,800 | | | Sanshin Electronics Co. Ltd. | | | 72,750 | |
| | 49,200 | | | Santen Pharmaceutical Co. Ltd. | | | 673,152 | |
| | 64,000 | | | Sanwa Holdings Corp. | | | 519,765 | |
| | 19,000 | | | Sanyo Chemical Industries Ltd. | | | 141,551 | |
| | 18,000 | | | Sanyo Denki Co. Ltd. | | | 110,384 | |
| | 2,000 | | | Sanyo Electric Railway Co. Ltd. | | | 7,790 | |
| | 4,300 | | | Sanyo Housing Nagoya Co. Ltd. | | | 43,011 | |
| | 10,000 | | | Sanyo Industries Ltd. | | | 14,419 | |
| | 101,000 | | | Sanyo Shokai Ltd. | | | 296,296 | |
| | 204,000 | | | Sanyo Special Steel Co. Ltd. | | | 846,971 | |
| | 3,300 | | | Sanyo Trading Co. Ltd. | | | 44,084 | |
| | 197,000 | | | Sapporo Holdings Ltd. | | | 816,276 | |
| | 1,500 | | | SATO Holdings Corp. | | | 32,829 | |
| | 2,700 | | | Sato Shoji Corp. | | | 16,625 | |
| | 4,100 | | | Satori Electric Co. Ltd. | | | 27,929 | |
| | 38,100 | | | Sawada Holdings Co. Ltd. | | | 383,305 | |
| | 10,400 | | | Sawai Pharmaceutical Co. Ltd. | | | 669,661 | |
| | 35,000 | | | SAXA Holdings, Inc. | | | 71,932 | |
| | 161,380 | | | SBI Holdings, Inc. | | | 1,846,903 | |
| | 8,500 | | | SBS Holdings, Inc. | | | 79,034 | |
| | 12,000 | | | SCREEN Holdings Co. Ltd. | | | 71,600 | |
| | 10,900 | | | Scroll Corp. | | | 39,745 | |
| | 21,597 | | | SCSK Corp. | | | 833,132 | |
| | 18,800 | | | Sega Sammy Holdings, Inc. | | | 199,264 | |
| | 4,000 | | | Seibu Electric Industry Co. Ltd. | | | 14,121 | |
| | 18,000 | | | Seika Corp. | | | 41,170 | |
| | 81,000 | | | Seikitokyu Kogyo Co. Ltd. | | | 399,395 | |
| | 54,000 | | | Seiko Holdings Corp. | | | 354,421 | |
| | 78,000 | | | Seino Holdings Co. Ltd. | | | 933,389 | |
| | 25,300 | | | Seiren Co. Ltd. | | | 299,818 | |
| | 27,400 | | | Sekisui Jushi Corp. | | | 369,436 | |
| | 10,000 | | | Sekisui Plastics Co. Ltd. | | | 32,734 | |
| Old Westbury Funds, Inc. | |
| Small & Mid Cap Fund | |
| Portfolio of Investments - (Continued) | October 31, 2015 |
| | |
| Shares | | | | | Value | |
| JAPAN (continued) |
| | 79,000 | | | Senko Co. Ltd. | | $ | 550,584 | |
| | 2,000 | | | Senshu Electric Co. Ltd. | | | 28,872 | |
| | 167,220 | | | Senshu Ikeda Holdings, Inc. | | | 724,754 | |
| | 11,800 | | | Senshukai Co. Ltd. | | | 79,012 | |
| | 2,600 | | | Septeni Holdings Co. Ltd. | | | 48,328 | |
| | 2,000 | | | Seria Co. Ltd. | | | 85,522 | |
| | 95,200 | | | Seven Bank Ltd. | | | 437,066 | |
| | 333,000 | | | Sharp Corp.(d) | | | 367,026 | |
| | 24,800 | | | Shibaura Electronics Co. Ltd. | | | 356,576 | |
| | 1,000 | | | Shibaura Mechatronics Corp. | | | 2,121 | |
| | 17,000 | | | Shibusawa Warehouse Co. Ltd. (The) | | | 43,532 | |
| | 7,700 | | | Shibuya Kogyo Co. Ltd. | | | 119,453 | |
| | 1,400 | | | Shidax Corp. | | | 5,836 | |
| | 162,000 | | | Shiga Bank Ltd. (The) | | | 871,285 | |
| | 44,000 | | | Shikibo Ltd. | | | 44,850 | |
| | 137,000 | | | Shikoku Bank Ltd. (The) | | | 299,727 | |
| | 22,000 | | | Shikoku Chemicals Corp. | | | 217,867 | |
| | 37,100 | | | Shikoku Electric Power Co., Inc. | | | 634,577 | |
| | 6,900 | | | Shima Seiki Manufacturing Ltd. | | | 103,840 | |
| | 19,349 | | | Shimachu Co. Ltd. | | | 425,880 | |
| | 70,000 | | | Shimadzu Corp. | | | 1,099,279 | |
| | 7,700 | | | Shimamura Co. Ltd. | | | 872,288 | |
| | 2,700 | | | Shimizu Bank Ltd. (The) | | | 67,125 | |
| | 81,000 | | | Shimizu Corp. | | | 713,541 | |
| | 3,100 | | | Shin Nippon Air Technologies Co. Ltd. | | | 27,771 | |
| | 204,000 | | | Shinagawa Refractories Co. Ltd. | | | 459,833 | |
| | 17,000 | | | Shindengen Electric Manufacturing Co. Ltd. | | | 62,692 | |
| | 2,000 | | | Shin-Keisei Electric Railway Co. Ltd. | | | 7,143 | |
| | 25,500 | | | Shinko Electric Industries Co. Ltd. | | | 156,377 | |
| | 9,200 | | | Shinko Plantech Co. Ltd. | | | 74,411 | |
| | 8,800 | | | Shinko Shoji Co. Ltd. | | | 98,596 | |
| | 8,000 | | | Shinmaywa Industries Ltd. | | | 88,174 | |
| | 8,400 | | | Shinnihon Corp. | | | 40,166 | |
| | 254,000 | | | Shinsei Bank Ltd. | | | 536,753 | |
| | 30,000 | | | Shinsho Corp. | | | 63,893 | |
| | 900 | | | Shinwa Co. Ltd. | | | 12,731 | |
| | 21,000 | | | Ship Healthcare Holdings, Inc. | | | 512,339 | |
| | 112,000 | | | Shiroki Corp. | | | 327,637 | |
| | 3,000 | | | Shizuki Electric Co., Inc. | | | 14,196 | |
| | 60,000 | | | Shizuoka Gas Co. Ltd. | | | 406,232 | |
| | 7,000 | | | Shochiku Co. Ltd. | | | 62,070 | |
| | 23,100 | | | Shoei Co. Ltd. | | | 400,665 | |
| | 3,000 | | | Shoei Foods Corp. | | | 32,593 | |
| | 11,000 | | | Shoko Co. Ltd. | | | 8,295 | |
| | 1,000 | | | Showa Aircraft Industry Co. Ltd. | | | 10,143 | |
| | 92,800 | | | Showa Corp. | | | 867,477 | |
| | 1,368,620 | | | Showa Denko KK | | | 1,735,302 | |
| | 89,000 | | | Showa Sangyo Co. Ltd. | | | 335,585 | |
| | 147,600 | | | Showa Shell Sekiyu KK | | | 1,308,793 | |
| Shares | | | | | Value | |
| JAPAN (continued) |
| | 15,400 | | | Siix Corp. | | $ | 436,463 | |
| | 16,000 | | | Sinanen Holdings Co. Ltd. | | | 59,799 | |
| | 31,000 | | | Sinfonia Technology Co. Ltd. | | | 53,949 | |
| | 32,800 | | | Sinko Industries Ltd. | | | 349,011 | |
| | 13,000 | | | Sintokogio Ltd. | | | 112,364 | |
| | 122,200 | | | SKY Perfect JSAT Holdings, Inc. | | | 648,115 | |
| | 8,000 | | | SMK Corp. | | | 41,236 | |
| | 2,800 | | | SMS Co. Ltd. | | | 46,895 | |
| | 3,700 | | | SNT Corp. | | | 17,876 | |
| | 17,500 | | | Sodick Co. Ltd. | | | 130,376 | |
| | 3,600 | | | Soft99 Corp. | | | 23,837 | |
| | 11,700 | | | Sogo Medical Co. Ltd. | | | 435,829 | |
| | 9,400 | | | Sohgo Security Services Co. Ltd. | | | 457,264 | |
| | 608,800 | | | Sojitz Corp. | | | 1,352,104 | |
| | 93,000 | | | Sotetsu Holdings, Inc. | | | 532,552 | |
| | 18,500 | | | Sparx Group Co. Ltd. | | | 50,286 | |
| | 700 | | | SPK Corp. | | | 13,023 | |
| | 13,400 | | | Square Enix Holdings Co. Ltd. | | | 364,233 | |
| | 15,600 | | | SRA Holdings, Inc. | | | 322,291 | |
| | 300 | | | ST Corp. | | | 2,576 | |
| | 11,500 | | | St. Marc Holdings Co. Ltd. | | | 343,561 | |
| | 31,000 | | | Stanley Electric Co. Ltd. | | | 597,033 | |
| | 13,500 | | | Star Micronics Co. Ltd. | | | 184,930 | |
| | 20,700 | | | Start Today Co. Ltd. | | | 699,035 | |
| | 6,900 | | | Starts Corp., Inc. | | | 108,758 | |
| | 2,200 | | | Starzen Co. Ltd. | | | 57,247 | |
| | 25,200 | | | Stella Chemifa Corp. | | | 247,468 | |
| | 19,000 | | | Studio Alice Co. Ltd. | | | 358,208 | |
| | 2,700 | | | Sugi Holdings Co. Ltd. | | | 132,237 | |
| | 2,700 | | | Sugimoto & Co. Ltd. | | | 31,392 | |
| | 35,400 | | | Sumco Corp. | | | 360,249 | |
| | 4,800 | | | Sumida Corp. | | | 32,300 | |
| | 22,000 | | | Suminoe Textile Co. Ltd. | | | 63,263 | |
| | 118,000 | | | Sumitomo Bakelite Co. Ltd. | | | 487,959 | |
| | 22,400 | | | Sumitomo Dainippon Pharma Co. Ltd. | | | 249,301 | |
| | 35,600 | | | Sumitomo Densetsu Co. Ltd. | | | 471,146 | |
| | 92,300 | | | Sumitomo Forestry Co. Ltd. | | | 1,112,924 | |
| | 144,000 | | | Sumitomo Heavy Industries Ltd. | | | 656,335 | |
| | 303,800 | | | Sumitomo Mitsui Construction Co. Ltd. | | | 297,078 | |
| | 293,000 | | | Sumitomo Osaka Cement Co. Ltd. | | | 1,136,355 | |
| | 13,000 | | | Sumitomo Precision Products Co. Ltd. | | | 51,173 | |
| | 20,180 | | | Sumitomo Real Estate Sales Co. Ltd. | | | 468,085 | |
| | 42,700 | | | Sumitomo Riko Co. Ltd. | | | 347,842 | |
| | 44,500 | | | Sumitomo Rubber Industries Ltd. | | | 668,219 | |
| | 89,000 | | | Sumitomo Seika Chemicals Co. Ltd. | | | 624,704 | |
| | 21,000 | | | Sumitomo Warehouse Co. Ltd. (The) | | | 112,248 | |
| | 33,300 | | | Sun Frontier Fudousan Co. Ltd. | | | 270,992 | |
| Old Westbury Funds, Inc. | |
| Small & Mid Cap Fund | |
| Portfolio of Investments - (Continued) | October 31, 2015 |
| | |
| Shares | | | | | Value | |
| JAPAN (continued) |
| | 10,500 | | | Sundrug Co. Ltd. | | $ | 558,631 | |
| | 3,600 | | | Sun-Wa Technos Corp. | | | 30,251 | |
| | 24,670 | | | Suzuken Co. Ltd. | | | 951,677 | |
| | 76,000 | | | SWCC Showa Holdings Co. Ltd.(d) | | | 50,385 | |
| | 5,400 | | | Systena Corp. | | | 52,760 | |
| | 19,300 | | | T&K Toka Co. Ltd. | | | 356,507 | |
| | 3,200 | | | T. Hasegawa Co. Ltd. | | | 42,191 | |
| | 24,000 | | | T. RAD Co. Ltd. | | | 39,977 | |
| | 1,600 | | | Tabuchi Electric Co. Ltd. | | | 11,072 | |
| | 3,240 | | | Tachibana Eletech Co. Ltd. | | | 36,677 | |
| | 6,700 | | | Tachi-S Co. Ltd. | | | 94,279 | |
| | 40,000 | | | Tadano Ltd. | | | 481,976 | |
| | 27,500 | | | Taiho Kogyo Co. Ltd. | | | 319,964 | |
| | 8,000 | | | Taikisha Ltd. | | | 194,713 | |
| | 3,000 | | | Taiko Bank Ltd. (The) | | | 5,867 | |
| | 13,200 | | | Taiko Pharmaceutical Co. Ltd. | | | 208,277 | |
| | 3,000 | | | Taiyo Holdings Co. Ltd. | | | 103,920 | |
| | 21,000 | | | Taiyo Nippon Sanso Corp. | | | 218,754 | |
| | 60,700 | | | Taiyo Yuden Co. Ltd. | | | 862,687 | |
| | 161,000 | | | Takagi Securities Co. Ltd. | | | 285,522 | |
| | 1,400 | | | Takamatsu Construction Group Co. Ltd. | | | 29,260 | |
| | 17,700 | | | Takara Holdings, Inc. | | | 128,053 | |
| | 65,100 | | | Takara Leben Co. Ltd. | | | 341,496 | |
| | 31,000 | | | Takara Standard Co. Ltd. | | | 235,319 | |
| | 6,400 | | | Takasago International Corp. | | | 169,984 | |
| | 13,000 | | | Takasago Thermal Engineering Co. Ltd. | | | 187,777 | |
| | 18,000 | | | Takashima & Co. Ltd. | | | 39,082 | |
| | 104,000 | | | Takashimaya Co. Ltd. | | | 936,836 | |
| | 16,100 | | | Takata Corp.(d) | | | 183,989 | |
| | 3,530 | | | Take And Give Needs Co. Ltd. | | | 20,156 | |
| | 30,800 | | | Takeei Corp. | | | 298,888 | |
| | 25,100 | | | Takeuchi Manufacturing Co. Ltd. | | | 479,244 | |
| | 10,000 | | | Takihyo Co. Ltd. | | | 38,038 | |
| | 87,000 | | | Takiron Co. Ltd. | | | 374,907 | |
| | 33,000 | | | Takisawa Machine Tool Co. Ltd. | | | 45,943 | |
| | 48,000 | | | Takuma Co. Ltd. | | | 381,072 | |
| | 6,800 | | | Tama Home Co. Ltd. | | | 25,415 | |
| | 4,000 | | | Tamron Co. Ltd. | | | 80,517 | |
| | 34,000 | | | Tamura Corp. | | | 109,323 | |
| | 42,600 | | | Tanseisha Co. Ltd. | | | 317,373 | |
| | 500 | | | TASAKI & Co. Ltd. | | | 8,523 | |
| | 118,200 | | | Tatsuta Electric Wire and Cable Co. Ltd. | | | 453,523 | |
| | 68,000 | | | Tayca Corp. | | | 285,705 | |
| | 19,000 | | | TBK Co. Ltd. | | | 75,578 | |
| | 600 | | | Techno Medica Co. Ltd. | | | 13,758 | |
| | 1,200 | | | Techno Ryowa Ltd. | | | 6,901 | |
| | 779,000 | | | Teijin Ltd. | | | 2,775,918 | |
| | 3,400 | | | Teikoku Sen-I Co. Ltd. | | | 43,137 | |
| | 12,000 | | | Tekken Corp. | | | 33,712 | |
| | 33,900 | | | Temp Holdings Co. Ltd. | | | 509,891 | |
| Shares | | | | | Value | |
| JAPAN (continued) |
| | 23,700 | | | T-Gaia Corp. | | $ | 363,543 | |
| | 16,300 | | | THK Co. Ltd. | | | 310,277 | |
| | 7,400 | | | TKC Corp. | | | 175,633 | |
| | 59,000 | | | Toa Corp. | | | 134,947 | |
| | 6,000 | | | Toa Corp. | | | 60,960 | |
| | 58,000 | | | Toa Oil Co. Ltd. | | | 73,059 | |
| | 77,000 | | | Toa Road Corp. | | | 305,652 | |
| | 2,400 | | | Toabo Corp. | | | 13,087 | |
| | 42,250 | | | Toagosei Co. Ltd. | | | 357,131 | |
| | 10,100 | | | Tobishima Corp.(d) | | | 17,912 | |
| | 5,000 | | | Tobu Store Co. Ltd. | | | 12,596 | |
| | 24,600 | | | TOC Co. Ltd. | | | 181,845 | |
| | 12,100 | | | Tocalo Co. Ltd. | | | 245,068 | |
| | 94,000 | | | Tochigi Bank Ltd. (The) | | | 540,615 | |
| | 72,000 | | | Toda Corp. | | | 394,398 | |
| | 3,000 | | | Toda Kogyo Corp. | | | 8,204 | |
| | 600 | | | Toei Animation Co. Ltd. | | | 25,905 | |
| | 20,000 | | | Toei Co. Ltd. | | | 179,498 | |
| | 23,000 | | | Toenec Corp. | | | 178,976 | |
| | 115,000 | | | Toho Bank Ltd. (The) | | | 425,997 | |
| | 12,300 | | | Toho Co. Ltd. | | | 322,102 | |
| | 4,000 | | | Toho Co. Ltd. | | | 74,086 | |
| | 110,000 | | | Toho Gas Co. Ltd. | | | 678,213 | |
| | 8,000 | | | Toho Holdings Co. Ltd. | | | 178,537 | |
| | 3,300 | | | Toho Titanium Co. Ltd.(d) | | | 43,510 | |
| | 150,000 | | | Toho Zinc Co. Ltd. | | | 418,911 | |
| | 26,000 | | | Tohoku Bank Ltd. (The) | | | 33,181 | |
| | 10,000 | | | Tokai Carbon Co. Ltd. | | | 27,513 | |
| | 9,200 | | | Tokai Corp. | | | 296,196 | |
| | 67,900 | | | TOKAI Holdings Corp. | | | 289,223 | |
| | 12,000 | | | Tokai Lease Co. Ltd. | | | 21,977 | |
| | 63,000 | | | Tokai Rika Co. Ltd. | | | 1,383,525 | |
| | 31,800 | | | Tokai Tokyo Financial Holdings, Inc. | | | 195,275 | |
| | 6,790 | | | Token Corp. | | | 541,309 | |
| | 30,840 | | | Tokushu Tokai Paper Co. Ltd. | | | 103,252 | |
| | 54,000 | | | Tokuyama Corp.(d) | | | 109,638 | |
| | 77,000 | | | Tokyo Dome Corp. | | | 359,891 | |
| | 1,100 | | | Tokyo Electron Device Ltd. | | | 14,239 | |
| | 5,000 | | | Tokyo Energy & Systems, Inc. | | | 48,935 | |
| | 40,000 | | | Tokyo Keiki, Inc. | | | 79,556 | |
| | 25,600 | | | Tokyo Ohka Kogyo Co. Ltd. | | | 825,259 | |
| | 4,000 | | | Tokyo Rakutenchi Co. Ltd. | | | 16,475 | |
| | 146,000 | | | Tokyo Rope Manufacturing Co. Ltd.(d) | | | 227,463 | |
| | 2,500 | | | Tokyo Sangyo Co. Ltd. | | | 11,250 | |
| | 19,300 | | | Tokyo Seimitsu Co. Ltd. | | | 430,399 | |
| | 27,500 | | | Tokyo Steel Manufacturing Co. Ltd. | | | 185,050 | |
| | 50,500 | | | Tokyo Tatemono Co. Ltd. | | | 631,512 | |
| | 154,000 | | | Tokyo Tekko Co. Ltd. | | | 718,505 | |
| | 20,000 | | | Tokyo Theaters Co., Inc. | | | 22,209 | |
| | 17,875 | | | Tokyo Ty Financial Group, Inc. | | | 563,639 | |
| | 7,000 | | | Tokyotokeiba Co. Ltd. | | | 16,533 | |
| | 4,800 | | | Tokyu Construction Co. Ltd. | | | 36,914 | |
| | 62,300 | | | Tokyu Fudosan Holdings Corp. | | | 441,423 | |
| Old Westbury Funds, Inc. | |
| Small & Mid Cap Fund | |
| Portfolio of Investments - (Continued) | October 31, 2015 |
| | |
| Shares | | | | | Value | |
| JAPAN (continued) |
| | 27,000 | | | Toli Corp. | | $ | 77,193 | |
| | 28,000 | | | Tomato Bank Ltd. | | | 39,446 | |
| | 1,100 | | | Tomen Devices Corp. | | | 18,186 | |
| | 15,200 | | | Tomoe Corp. | | | 46,732 | |
| | 2,600 | | | Tomoe Engineering Co. Ltd. | | | 32,815 | |
| | 41,000 | | | Tomoku Co. Ltd. | | | 88,680 | |
| | 78,100 | | | TOMONY Holdings, Inc. | | | 304,840 | |
| | 24,800 | | | Tomy Co. Ltd. | | | 125,572 | |
| | 15,000 | | | Tonami Holdings Co. Ltd. | | | 49,225 | |
| | 50 | | | Top REIT, Inc. | | | 188,324 | |
| | 7,000 | | | Topcon Corp. | | | 102,097 | |
| | 15,700 | | | Toppan Forms Co. Ltd. | | | 203,747 | |
| | 34,500 | | | Topre Corp. | | | 755,072 | |
| | 186,000 | | | Topy Industries Ltd. | | | 422,342 | |
| | 22,600 | | | Toridoll.corp | | | 288,048 | |
| | 2,300 | | | Torigoe Co. Ltd. (The) | | | 15,077 | |
| | 1,000 | | | Torii Pharmaceutical Co. Ltd. | | | 24,240 | |
| | 5,000 | | | Torishima Pump Manufacturing Co. Ltd. | | | 39,032 | |
| | 43,000 | | | Tosei Corp. | | | 268,327 | |
| | 45,000 | | | Toshiba Machine Co. Ltd. | | | 156,253 | |
| | 11,000 | | | Toshiba Plant Systems & Services Corp. | | | 118,596 | |
| | 82,000 | | | Toshiba TEC Corp. | | | 298,997 | |
| | 1,000 | | | Tosho Co. Ltd. | | | 26,519 | |
| | 14,000 | | | Tosho Printing Co. Ltd. | | | 59,170 | |
| | 182,000 | | | Tosoh Corp. | | | 933,604 | |
| | 7,500 | | | Totetsu Kogyo Co. Ltd. | | | 163,027 | |
| | 23,500 | | | TOTO Ltd. | | | 804,301 | |
| | 8,000 | | | Tottori Bank Ltd. (The) | | | 14,121 | |
| | 333,000 | | | Towa Bank Ltd. (The) | | | 292,517 | |
| | 58,600 | | | Towa Corp. | | | 317,597 | |
| | 6,900 | | | Towa Pharmaceutical Co. Ltd. | | | 472,313 | |
| | 70,600 | | | Toyo Construction Co. Ltd. | | | 327,637 | |
| | 3,000 | | | Toyo Denki Seizo - Toyo Electric Manufacturing Co. Ltd. | | | 11,014 | |
| | 16,000 | | | Toyo Engineering Corp. | | | 40,573 | |
| | 89,000 | | | Toyo Ink SC Holdings Co. Ltd. | | | 369,512 | |
| | 28,000 | | | Toyo Kohan Co. Ltd. | | | 90,959 | |
| | 2,500 | | | Toyo Machinery & Metal Co. Ltd. | | | 9,344 | |
| | 140,000 | | | Toyo Securities Co. Ltd. | | | 455,954 | |
| | 74,900 | | | Toyo Seikan Group Holdings Ltd. | | | 1,459,889 | |
| | 18,400 | | | Toyo Suisan Kaisha Ltd. | | | 683,119 | |
| | 1,400 | | | Toyo Tanso Co. Ltd. | | | 20,292 | |
| | 48,300 | | | Toyo Tire & Rubber Co. Ltd. | | | 1,027,481 | |
| | 20,000 | | | Toyo Wharf & Warehouse Co. Ltd. | | | 31,657 | |
| | 544,000 | | | Toyobo Co. Ltd. | | | 802,453 | |
| | 54,700 | | | Toyoda Gosei Co. Ltd. | | | 1,268,340 | |
| | 29,100 | | | Toyota Boshoku Corp. | | | 627,723 | |
| | 13,900 | | | TPR Co. Ltd. | | | 343,152 | |
| | 1,200 | | | Trancom Co. Ltd. | | | 58,076 | |
| | 17,200 | | | Transcosmos, Inc. | | | 483,202 | |
| Shares | | | | | Value | |
| JAPAN (continued) |
| | 15,600 | | | Trend Micro, Inc. | | $ | 612,132 | |
| | 2,600 | | | Trusco Nakayama Corp. | | | 91,788 | |
| | 30,600 | | | TS Tech Co. Ltd. | | | 846,971 | |
| | 19,900 | | | TSI Holdings Co. Ltd. | | | 140,506 | |
| | 74,000 | | | Tsubakimoto Chain Co. | | | 546,399 | |
| | 8,000 | | | Tsubakimoto Kogyo Co. Ltd. | | | 22,408 | |
| | 7,000 | | | Tsudakoma Corp.(d) | | | 7,019 | |
| | 118,000 | | | Tsugami Corp. | | | 582,813 | |
| | 29,800 | | | Tsukada Global Holdings, Inc. | | | 191,884 | |
| | 14,500 | | | Tsukishima Kikai Co. Ltd. | | | 139,509 | |
| | 94,733 | | | Tsukuba Bank Ltd. | | | 335,220 | |
| | 2,500 | | | Tsukui Corp. | | | 26,974 | |
| | 10,200 | | | Tsumura & Co. | | | 247,329 | |
| | 9,800 | | | Tsuruha Holdings, Inc. | | | 781,271 | |
| | 1,200 | | | Tsurumi Manufacturing Co. Ltd. | | | 22,107 | |
| | 600 | | | Tsutsumi Jewelry Co. Ltd. | | | 12,013 | |
| | 7,000 | | | TTK Co. Ltd. | | | 26,974 | |
| | 2,400 | | | Tv Tokyo Holdings Corp. | | | 42,761 | |
| | 505,840 | | | UACJ Corp. | | | 989,295 | |
| | 685,800 | | | Ube Industries Ltd. | | | 1,449,233 | |
| | 23,000 | | | Uchida Yoko Co. Ltd. | | | 74,144 | |
| | 6,000 | | | Ueki Corp. | | | 12,381 | |
| | 2,500 | | | UKC Holdings Corp. | | | 50,427 | |
| | 24,000 | | | Ulvac, Inc. | | | 430,795 | |
| | 14,000 | | | Uniden Holdings Corp. | | | 22,392 | |
| | 28,400 | | | Unipres Corp. | | | 651,927 | |
| | 2,600 | | | United Arrows Ltd. | | | 112,687 | |
| | 9,300 | | | United Super Markets Holdings, Inc. | | | 81,540 | |
| | 67,000 | | | Unitika Ltd.(d) | | | 33,869 | |
| | 4,700 | | | Universal Entertainment Corp. | | | 85,688 | |
| | 1,600 | | | Unizo Holdings Co. Ltd. | | | 68,418 | |
| | 206,200 | | | UNY Group Holdings Co. Ltd. | | | 1,148,309 | |
| | 108,880 | | | Usen Corp.(d) | | | 291,441 | |
| | 68,600 | | | U-Shin Ltd. | | | 429,212 | |
| | 7,900 | | | Ushio, Inc. | | | 109,528 | |
| | 19,400 | | | USS Co. Ltd. | | | 345,814 | |
| | 46,000 | | | UT Group Co. Ltd.(d) | | | 251,976 | |
| | 8,800 | | | Utoc Corp. | | | 36,463 | |
| | 9,500 | | | Valor Holdings Co. Ltd. | | | 223,428 | |
| | 2,500 | | | Village Vanguard Co. Ltd. | | | 36,877 | |
| | 16,700 | | | Vital KSK Holdings, Inc. | | | 122,063 | |
| | 74,700 | | | VT Holdings Co. Ltd. | | | 464,902 | |
| | 15,000 | | | Wacoal Holdings Corp. | | | 189,442 | |
| | 21,700 | | | Wacom Co. Ltd. | | | 81,642 | |
| | 33,000 | | | Wakachiku Construction Co. Ltd. | | | 42,115 | |
| | 44,500 | | | Wakita & Co. Ltd. | | | 352,548 | |
| | 7,600 | | | Warabeya Nichiyo Co. Ltd. | | | 149,141 | |
| | 5,500 | | | WATAMI Co. Ltd.(d) | | | 38,696 | |
| | 9,000 | | | Weathernews, Inc. | | | 291,249 | |
| | 10,740 | | | Welcia Holdings Co. Ltd. | | | 533,128 | |
| | 13,300 | | | Wellnet Corp. | | | 263,972 | |
| | 13,600 | | | WIN-Partners Co. Ltd. | | | 192,273 | |
| | 10,600 | | | WirelessGate, Inc. | | | 150,036 | |
| | 12,000 | | | Wowow, Inc. | | | 329,659 | |
| Old Westbury Funds, Inc. | |
| Small & Mid Cap Fund | |
| Portfolio of Investments - (Continued) | October 31, 2015 |
| | |
| Shares | | | | | Value | |
| JAPAN (continued) |
| | 8,600 | | | Xebio Holdings Co. Ltd. | | $ | 155,152 | |
| | 4,000 | | | Yachiyo Industry Co. Ltd. | | | 36,364 | |
| | 4,500 | | | Yahagi Construction Co. Ltd. | | | 38,895 | |
| | 11,200 | | | YAMABIKO Corp. | | | 104,046 | |
| | 144,200 | | | Yamada Denki Co. Ltd. | | | 653,662 | |
| | 42,000 | | | Yamagata Bank Ltd. (The) | | | 164,283 | |
| | 104,000 | | | Yamaguchi Financial Group, Inc. | | | 1,288,473 | |
| | 23,800 | | | Yamaha Corp. | | | 596,627 | |
| | 40,100 | | | Yamaichi Electronics Co. Ltd. | | | 358,232 | |
| | 102,000 | | | Yamanashi Chuo Bank Ltd. (The) | | | 480,965 | |
| | 51,000 | | | Yamatane Corp. | | | 78,188 | |
| | 8,400 | | | Yamato Kogyo Co. Ltd. | | | 225,541 | |
| | 800 | | | Yamaya Corp. | | | 16,700 | |
| | 91,000 | | | Yamazaki Baking Co. Ltd. | | | 1,766,910 | |
| | 100 | | | Yamazawa Co. Ltd. | | | 1,405 | |
| | 12,300 | | | Yamazen Corp. | | | 110,595 | |
| | 8,100 | | | Yaoko Co. Ltd. | | | 328,578 | |
| | 700 | | | Yashima Denki Co. Ltd. | | | 3,394 | |
| | 61,800 | | | Yaskawa Electric Corp. | | | 741,067 | |
| | 6,000 | | | Yasuda Logistics Corp. | | | 48,032 | |
| | 21,100 | | | Yellow Hat Ltd. | | | 466,693 | |
| | 3,200 | | | Yodogawa Steel Works Ltd. | | | 56,750 | |
| | 6,500 | | | Yokogawa Bridge Holdings Corp. | | | 60,599 | |
| | 85,500 | | | Yokogawa Electric Corp. | | | 962,911 | |
| | 22,300 | | | Yokohama Reito Co. Ltd. | | | 178,703 | |
| | 77,400 | | | Yokohama Rubber Co. Ltd. (The) | | | 1,500,920 | |
| | 1,500 | | | Yomeishu Seizo Co. Ltd. | | | 24,364 | |
| | 500 | | | Yondoshi Holdings, Inc. | | | 10,641 | |
| | 12,200 | | | Yonekyu Corp. | | | 224,851 | |
| | 2,100 | | | Yonex Co. Ltd. | | | 53,514 | |
| | 30,500 | | | Yorozu Corp. | | | 656,406 | |
| | 3,900 | | | Yoshinoya Holdings Co. Ltd. | | | 48,188 | |
| | 17,700 | | | Yuasa Trading Co. Ltd. | | | 414,667 | |
| | 27,000 | | | Yuken Kogyo Co. Ltd. | | | 52,805 | |
| | 5,600 | | | Yumeshin Holdings Co. Ltd. | | | 32,625 | |
| | 51,000 | | | Yurtec Corp. | | | 493,221 | |
| | 8,000 | | | Yusen Logistics Co. Ltd. | | | 94,075 | |
| | 900 | | | Yushiro Chemical Industry Co. Ltd. | | | 10,464 | |
| | 10,300 | | | Zenkoku Hosho Co. Ltd. | | | 351,243 | |
| | 25,000 | | | Zenrin Co. Ltd. | | | 366,703 | |
| | 14,300 | | | Zensho Holdings Co. Ltd. | | | 135,214 | |
| | 111,000 | | | Zeon Corp. | | | 913,425 | |
| | 1,500 | | | ZERIA Pharmaceutical Co. Ltd. | | | 22,462 | |
| | 4,000 | | | Zojirushi Corp. | | | 57,346 | |
| | 2,400 | | | Zuken, Inc. | | | 22,594 | |
| | | | | | | | 455,455,130 | |
| JERSEY CHANNEL ISLANDS — 0.0% |
| | 435,661 | | | Centamin Plc | | | 427,145 | |
| | 51,777 | | | Phoenix Group Holdings | | | 682,852 | |
| Shares | | | | | Value | |
| JERSEY CHANNEL ISLANDS (continued) |
| | 5,901 | | | Randgold Resources Ltd. | | $ | 397,354 | |
| | | | | | | | 1,507,351 | |
| LUXEMBOURG — 0.2% |
| | 22,999 | | | APERAM SA(d) | | | 710,547 | |
| | 53,621 | | | d’Amico International Shipping SA(d) | | | 41,216 | |
| | 3,069 | | | Eurofins Scientific SE(c) | | | 1,111,162 | |
| | 18,670 | | | Grand City Properties SA | | | 372,833 | |
| | 49,500 | | | L’Occitane International SA | | | 99,886 | |
| | 10,810 | | | Millicom International Cellular SA | | | 603,540 | |
| | 56,058 | | | Mouwasat Medical Services Co.(d) | | | 1,733,875 | |
| | 18,520 | | | Orion Engineered Carbons SA | | | 241,871 | |
| | 100,579 | | | Regus Plc | | | 518,803 | |
| | 207,034 | | | Stabilus SA(c)(d) | | | 7,968,275 | |
| | | | | | | | 13,402,008 | |
| MALAYSIA — 0.4% |
| | 174,100 | | | Aeon Co. (M) Berhad | | | 114,689 | |
| | 323,590 | | | Affin Holdings Berhad | | | 180,023 | |
| | 96,700 | | | AirAsia Berhad | | | 33,314 | |
| | 410,300 | | | Alliance Financial Group Berhad | | | 341,917 | |
| | 20,100 | | | Amway Malaysia Holdings Berhad | | | 46,226 | |
| | 1,127,600 | | | APM Automotive Holdings Berhad(c) | | | 1,076,155 | |
| | 32,700 | | | Batu Kawan Berhad | | | 133,510 | |
| | 95,933 | | | Berjaya Assets Berhad | | | 17,865 | |
| | 327,300 | | | Berjaya Corp. Berhad | | | 31,618 | |
| | 19,519 | | | Berjaya Sports Toto Berhad | | | 14,539 | |
| | 133,600 | | | BIMB Holdings Berhad | | | 127,505 | |
| | 486,500 | | | Bintulu Port Holdings Berhad(c) | | | 809,701 | |
| | 365,904 | | | Boustead Holdings Berhad | | | 344,100 | |
| | 46,400 | | | Bursa Malaysia Berhad | | | 91,590 | |
| | 94,300 | | | Cahya Mata Sarawak Berhad | | | 116,777 | |
| | 33,700 | | | Carlsberg Brewery-Malaysia Berhad | | | 97,429 | |
| | 98,060 | | | CB Industrial Product Holding Berhad | | | 45,195 | |
| | 3,350 | | | Dayang Enterprise Holdings Berhad | | | 1,326 | |
| | 6,413,886 | | | Dialog Group Berhad | | | 2,388,784 | |
| | 234,500 | | | DRB-Hicom Berhad | | | 73,145 | |
| | 467,874 | | | Eastern & Oriental Berhad | | | 173,166 | |
| | 98,700 | | | Evergreen Fibreboard Berhad(d) | | | 51,004 | |
| | 15,900 | | | Fraser & Neave Holdings Berhad | | | 66,842 | |
| | 75,300 | | | Genting Plantations Berhad | | | 187,549 | |
| | 23,300 | | | Globetronics Technology Berhad | | | 33,735 | |
| | 75,000 | | | Glomac Berhad | | | 15,887 | |
| | 48,000 | | | Guinness Anchor Berhad | | | 159,777 | |
| Old Westbury Funds, Inc. | |
| Small & Mid Cap Fund | |
| Portfolio of Investments - (Continued) | October 31, 2015 |
| | |
| Shares | | | | | Value | |
| MALAYSIA (continued) |
| | 41,100 | | | GuocoLand Malaysia Berhad | | $ | 13,011 | |
| | 499,380 | | | HAP Seng Consolidated Berhad | | | 703,270 | |
| | 93,500 | | | Hap Seng Plantations Holdings Berhad | | | 52,235 | |
| | 2,712,360 | | | Hartalega Holdings Berhad | | | 3,289,431 | |
| | 19,992 | | | Hock Seng LEE Berhad | | | 8,609 | |
| | 51,500 | | | Hong Leong Industries Berhad | | | 75,164 | |
| | 34,033 | | | Hua Yang Berhad | | | 14,735 | |
| | 21,720 | | | Hume Industries Berhad | | | 17,594 | |
| | 1,015,580 | | | IJM Corp. Berhad | | | 784,852 | |
| | 105,900 | | | IJM Plantations Berhad | | | 86,524 | |
| | 59,062 | | | Inari Amertron Berhad | | | 49,081 | |
| | 9,300 | | | Jaya Tiasa Holdings Berhad | | | 2,641 | |
| | 218,400 | | | JCY International Berhad | | | 39,654 | |
| | 59,079 | | | K&N Kenanga Holdings Berhad | | | 8,114 | |
| | 73,100 | | | Keck Seng (Malaysia) Berhad | | | 85,930 | |
| | 45,100 | | | Kian JOO CAN Factory Berhad(d) | | | 33,489 | |
| | 1,976,800 | | | KKB Engineering Berhad(c) | | | 786,855 | |
| | 244,200 | | | KLCCP Stapled Group | | | 399,042 | |
| | 310,080 | | | KNM Group Berhad(d) | | | 38,255 | |
| | 21,600 | | | Kossan Rubber Industries | | | 40,978 | |
| | 1,940,188 | | | KPJ Healthcare Berhad | | | 1,928,446 | |
| | 178,999 | | | KSL Holdings Berhad | | | 65,416 | |
| | 294,400 | | | Kulim Malaysia Berhad | | | 228,201 | |
| | 35,950 | | | Kumpulan Fima Berhad | | | 14,895 | |
| | 102,500 | | | Kumpulan Perangsang Selangor Berhad | | | 30,540 | |
| | 60,900 | | | Lafarge Malaysia Berhad | | | 129,001 | |
| | 306,100 | | | Land & General Berhad | | | 29,926 | |
| | 157,800 | | | Landmarks Berhad(d) | | | 39,670 | |
| | 34,400 | | | LBS Bina Group Berhad | | | 11,451 | |
| | 79,000 | | | Lingkaran Trans Kota Holdings Berhad | | | 94,704 | |
| | 17,100 | | | LPI Capital Berhad | | | 59,309 | |
| | 62,600 | | | Magnum Berhad | | | 39,198 | |
| | 618,973 | | | Mah Sing Group Berhad | | | 190,187 | |
| | 73,050 | | | Malayan Flour Mills Berhad | | | 22,956 | |
| | 71,823 | | | Malaysia Airports Holdings Berhad | | | 88,608 | |
| | 111,780 | | | Malaysia Building Society Berhad | | | 42,152 | |
| | 58,700 | | | Malaysian Bulk Carriers Berhad | | | 12,297 | |
| | 32,000 | | | Malaysian Pacific Industries Berhad | | | 51,769 | |
| | 291,250 | | | Malaysian Resources Corp. Berhad | | | 86,100 | |
| | 37,180 | | | MBM Resources Berhad | | | 24,233 | |
| | 12,100 | | | Media Prima Berhad | | | 3,915 | |
| | 18,700 | | | Mega First Corp. Berhad | | | 10,969 | |
| | 81,000 | | | MKH Berhad | | | 43,932 | |
| | 355,200 | | | MMC Corp. Berhad | | | 184,380 | |
| | 45,500 | | | MNRB Holdings Berhad | | | 36,328 | |
| | 51,500 | | | Muhibbah Engineering M Berhad | | | 26,373 | |
| | 680,100 | | | Mulpha International Berhad(d) | | | 48,285 | |
| | 35,600 | | | My EG Services Berhad | | | 24,529 | |
| Shares | | | | | Value | |
| MALAYSIA (continued) |
| | 50,500 | | | Naim Holdings Berhad | | $ | 26,214 | |
| | 376,400 | | | Nam Cheong Ltd. | | | 45,139 | |
| | 22,000 | | | NCB Holdings Berhad | | | 21,918 | |
| | 5,000 | | | Nestle Malaysia Berhad | | | 84,171 | |
| | 102,200 | | | Oriental Holdings Berhad | | | 167,003 | |
| | 326,790 | | | OSK Holdings Berhad | | | 127,795 | |
| | 30,500 | | | Padini Holdings Berhad | | | 10,862 | |
| | 71,912 | | | Pantech Group Holdings Berhad | | | 10,629 | |
| | 107,600 | | | POS Malaysia Berhad | | | 97,181 | |
| | 111,200 | | | Press Metal Berhad | | | 60,311 | |
| | 119,500 | | | Protasco Berhad | | | 47,009 | |
| | 2,848,900 | | | QL Resources Berhad | | | 2,679,133 | |
| | 180,900 | | | SapuraKencana Petroleum Berhad | | | 88,850 | |
| | 19,800 | | | Sarawak Oil Palms Berhad | | | 22,307 | |
| | 7,600 | | | Scientex Berhad | | | 13,551 | |
| | 2,300 | | | Selangor Properties Berhad | | | 2,838 | |
| | 51,500 | | | Shangri-La Hotels (Malaysia) Berhad | | | 73,006 | |
| | 16,900 | | | Shell Refining Co. Federation of Malaya Berhad(d) | | | 22,345 | |
| | 149,660 | | | Sunway Berhad | | | 107,995 | |
| | 14,966 | | | Sunway Construction Group Berhad(d) | | | 4,529 | |
| | 94,300 | | | Supermax Corp. Berhad | | | 49,389 | |
| | 27,000 | | | Syarikat Takaful Malaysia Berhad | | | 23,946 | |
| | 89,164 | | | Ta Ann Holdings Berhad | | | 80,322 | |
| | 445,000 | | | TA Enterprise Berhad | | | 64,740 | |
| | 195,360 | | | TA Global Berhad | | | 12,960 | |
| | 126,800 | | | TAN Chong Motor Holdings Berhad | | | 73,790 | |
| | 386,300 | | | TDM Berhad | | | 61,596 | |
| | 54,040 | | | TH Plantations Berhad | | | 16,479 | |
| | 132,360 | | | Time dotCom Berhad | | | 215,362 | |
| | 17,800 | | | Tiong NAM Logistics Holdings | | | 5,842 | |
| | 52,860 | | | Top Glove Corp. Berhad | | | 116,769 | |
| | 157,116 | | | Tropicana Corp. Berhad(d) | | | 35,293 | |
| | 43,600 | | | TSH Resources Berhad | | | 20,805 | |
| | 70,300 | | | UEM Edgenta Berhad | | | 54,492 | |
| | 120,408 | | | UEM Sunrise Berhad | | | 35,035 | |
| | 167,600 | | | Unisem M Berhad | | | 92,851 | |
| | 15,000 | | | United Malacca Berhad | | | 21,159 | |
| | 31,900 | | | United Plantations Berhad | | | 196,776 | |
| | 276,000 | | | VS Industry Berhad | | | 99,581 | |
| | 95,155 | | | Wah Seong Corp. Berhad | | | 26,358 | |
| | 193,838 | | | WCT Holdings Berhad | | | 61,815 | |
| | 3,401,950 | | | Wellcall Holdings Berhad(c) | | | 1,868,855 | |
| | 170,700 | | | WTK Holdings Berhad | | | 44,503 | |
| | 47,600 | | | Yinson Holdings Berhad | | | 32,575 | |
| | 137,514 | | | YNH Property Berhad(d) | | | 59,858 | |
| | 25,600 | | | Zhulian Corp. Berhad | | | 9,713 | |
| | | | | | | | 23,964,252 | |
| Old Westbury Funds, Inc. | |
| Small & Mid Cap Fund | |
| Portfolio of Investments - (Continued) | October 31, 2015 |
| | |
| Shares | | | | | Value | |
| MALTA — 0.0% |
| | 4,778 | | | Tiso Blackstar Group SE | | $ | 3,453 | |
| | 8,169 | | | Unibet Group Plc - SDR | | | 719,988 | |
| | | | | | | | 723,441 | |
| MARTINIQUE — 0.0% |
| | 100,000 | | | MGM China Holdings Ltd. | | | 146,569 | |
| MEXICO — 0.4% |
| | 10,100 | | | Alpek SAB de CV | | | 14,565 | |
| | 35,265 | | | Alsea SAB de CV | | | 115,566 | |
| | 147,316 | | | Arca Continental SAB de CV | | | 941,004 | |
| | 1,864,200 | | | Asesor de Activos Prisma SAPI de CV REIT | | | 1,441,223 | |
| | 203,861 | | | Axtel SAB de CV - CPO Units(d) | | | 87,998 | |
| | 22,734 | | | Banregio Grupo Financiero SAB de CV | | | 121,695 | |
| | 2,584 | | | Bio Pappel SAB de CV(d) | | | 3,054 | |
| | 1,166,800 | | | Bolsa Mexicana de Valores SAB de CV | | | 1,949,635 | |
| | 1,800 | | | Cia Minera Autlan SAB de CV - Series B(d) | | | 1,009 | |
| | 201,125 | | | Consorcio ARA SAB de CV(d) | | | 75,128 | |
| | 140,111 | | | Controladora Comercial Mexicana SAB de CV - Units | | | 409,871 | |
| | 1,568,370 | | | Corp Inmobiliaria Vesta SAB de CV | | | 2,571,254 | |
| | 800 | | | Corp. Actinver SAB de CV(d) | | | 726 | |
| | 78,869 | | | Corp. GEO SAB de CV - Series B(d) | | | 2 | |
| | 61,938 | | | Corp. Interamericana de Entretenimiento SAB de CV - Series B(d) | | | 46,422 | |
| | 27,300 | | | Corp. Moctezuma SAB de CV | | | 90,819 | |
| | 2,674,900 | | | Fibra Shop Portafolios Inmobiliarios SAPI de CV REIT(c) | | | 2,741,652 | |
| | 36,127 | | | Fibra Uno Administracion SA de CV REIT | | | 79,219 | |
| | 5,418 | | | Fresnillo Plc | | | 60,972 | |
| | 121,017 | | | Genomma Lab Internacional SAB de CV - Class B(d) | | | 88,797 | |
| | 53,869 | | | Gruma SAB de CV - Series B | | | 826,732 | |
| | 29,269 | | | Grupo Aeromexico SAB de CV(d) | | | 51,387 | |
| | 75,068 | | | Grupo Aeroportuario del Centro Norte SAB de CV | | | 385,570 | |
| | 320,108 | | | Grupo Aeroportuario del Pacifico SAB de CV - Series B | | | 2,887,170 | |
| | 123,044 | | | Grupo Aeroportuario del Sureste SAB de CV - Series B | | | 1,906,840 | |
| | 1,600 | | | Grupo Carso SAB de CV - Series A1 | | | 7,160 | |
| | 120,492 | | | Grupo Cementos de Chihuahua SAB de CV | | | 342,850 | |
| | 45,878 | | | Grupo Comercial Chedraui SA de CV | | | 126,542 | |
| Shares | | | | | Value | |
| MEXICO (continued) |
| | 70,593 | | | Grupo Famsa SAB de CV - Class A(d) | | $ | 55,559 | |
| | 12,100 | | | Grupo Financiero Interacciones SA de CV | | | 78,309 | |
| | 52,942 | | | Grupo Herdez SAB de CV | | | 147,148 | |
| | 57,500 | | | Grupo Industrial Maseca SAB de CV - Series B | | | 80,065 | |
| | 12,400 | | | Grupo Industrial Saltillo SAB de CV | | | 24,308 | |
| | 17,079 | | | Grupo KUO SAB de CV - Series B | | | 31,660 | |
| | 36,100 | | | Grupo Simec SAB de CV - Series B(d) | | | 98,960 | |
| | 19,508 | | | Grupo Sports World SAB de CV(d) | | | 23,845 | |
| | 264,100 | | | Impulsora del Desarrollo y El Empleo en America Latina SAB de CV(d) | | | 483,662 | |
| | 49,176 | | | Industrias Bachoco SAB de CV - Series B | | | 224,090 | |
| | 170,175 | | | Industrias CH SAB de CV - Series B(d) | | | 617,636 | |
| | 110,913 | | | Kimberly-Clark de Mexico SAB de CV - Class A | | | 265,434 | |
| | 1,485,400 | | | Macquarie Mexico Real Estate Management SA de CV REIT | | | 2,055,736 | |
| | 100 | | | Medica Sur SAB de CV - Series B | | | 303 | |
| | 33,400 | | | Megacable Holdings SAB de CV - CPO Shares | | | 127,289 | |
| | 349,076 | | | Mexichem SAB de CV | | | 908,099 | |
| | 83,226 | | | OHL Mexico SAB de CV(d) | | | 109,992 | |
| | 53,106 | | | Organizacion Cultiba SAB de CV | | | 70,860 | |
| | 146,807 | | | Organizacion Soriana SAB de CV - Series B(d) | | | 352,668 | |
| | 37,295 | | | Promotora y Operadora de Infraestructura SAB de CV(d) | | | 468,891 | |
| | 23,143 | | | Qualitas Controladora SAB de CV - Class I(d) | | | 28,849 | |
| | 67,123 | | | Urbi Desarrollos Urbanos SAB de CV(c)(d) | | | 5 | |
| | 2,315 | | | Vitro SAB de CV - Series A | | | 6,726 | |
| | | | | | | | 23,634,956 | |
| MONGOLIA — 0.0% |
| | 317,500 | | | Mongolian Mining Corp.(d) | | | 8,889 | |
| NETHERLANDS — 0.8% |
| | 40,727 | | | Aalberts Industries NV | | | 1,324,082 | |
| | 9,586 | | | Accell Group NV | | | 199,862 | |
| | 17,270 | | | Aercap Holdings NV(d) | | | 716,705 | |
| | 54,861 | | | AMG Advanced Metallurgical Group NV | | | 452,459 | |
| | 17,212 | | | Amsterdam Commodities NV | | | 433,243 | |
| | 25,264 | | | Arcadis NV | | | 637,587 | |
| | 13,720 | | | ASM International NV | | | 525,110 | |
| | 16,840 | | | Avg Technologies NV(d) | | | 399,107 | |
| Old Westbury Funds, Inc. | |
| Small & Mid Cap Fund | |
| Portfolio of Investments - (Continued) | October 31, 2015 |
| | |
| Shares | | | | | Value | |
| NETHERLANDS (continued) |
| | 21,067 | | | BE Semiconductor Industries NV | | $ | 456,377 | |
| | 12,481 | | | Beter Bed Holding NV | | | 298,582 | |
| | 103,303 | | | BinckBank NV | | | 911,277 | |
| | 159,127 | | | Boskalis Westminster | | | 7,740,420 | |
| | 20,432 | | | Brunel International NV | | | 383,754 | |
| | 6,490 | | | Cimpress NV(d) | | | 512,061 | |
| | 4,038 | | | Corbion NV | | | 99,265 | |
| | 1,638 | | | Delta Lloyd NV | | | 12,933 | |
| | 8,680 | | | Euronext NV(c) | | | 381,608 | |
| | 8,757 | | | Fugro NV(d) | | | 166,111 | |
| | 22,590 | | | Gemalto NV | | | 1,417,185 | |
| | 9,850 | | | GrandVision NV | | | 272,359 | |
| | 7,230 | | | Heijmans NV - CVA(d) | | | 60,821 | |
| | 654 | | | Hunter Douglas NV | | | 27,149 | |
| | 32,959 | | | KAS Bank NV - CVA | | | 388,529 | |
| | 16,234 | | | Kendrion NV | | | 390,953 | |
| | 56,564 | | | Koninklijke BAM Groep NV(d) | | | 312,372 | |
| | 54,668 | | | Koninklijke DSM NV | | | 2,919,218 | |
| | 4,501 | | | Koninklijke Ten Cate NV | | | 121,857 | |
| | 12,374 | | | Koninklijke Vopak NV | | | 497,679 | |
| | 12,080 | | | Lucas Bols NV(d) | | | 261,026 | |
| | 431 | | | Nederland Apparatenfabriek | | | 14,221 | |
| | 32,930 | | | Nn Group NV | | | 1,034,562 | |
| | 13,255 | | | Ordina NV(d) | | | 15,975 | |
| | 101,030 | | | PostNL NV(d) | | | 417,283 | |
| | 47,868 | | | PostNL NV(d) | | | 197,709 | |
| | 324,675 | | | QIAGEN NV(c)(d) | | | 7,876,059 | |
| | 50,935 | | | Randstad Holding NV | | | 3,043,061 | |
| | 15,410 | | | Refresco Gerber NV(d) | | | 252,151 | |
| | 99,492 | | | SBM Offshore NV(d) | | | 1,363,751 | |
| | 10,543 | | | Sligro Food Group NV | | | 387,806 | |
| | 86,230 | | | SNS REAAL NV(b)(c)(d) | | | 0 | |
| | 25,921 | | | TKH Group NV | | | 982,107 | |
| | 26,513 | | | TNT Express NV | | | 223,036 | |
| | 38,013 | | | TomTom NV(d) | | | 413,496 | |
| | 25,705 | | | USG People NV | | | 409,864 | |
| | 45,708 | | | Wessanen | | | 491,570 | |
| | 79,979 | | | Wolters Kluwer NV | | | 2,708,387 | |
| | | | | | | | 42,150,729 | |
| NEW ZEALAND — 0.5% |
| | 7,184 | | | a2 Milk Co. Ltd.(d) | | | 3,697 | |
| | 328,864 | | | Air New Zealand Ltd. | | | 648,028 | |
| | 3,645,746 | | | Auckland International Airport Ltd. | | | 12,985,432 | |
| | 37,567 | | | Chorus Ltd.(d) | | | 72,372 | |
| | 223,018 | | | Contact Energy Ltd. | | | 783,775 | |
| | 19,426 | | | Ebos Group Ltd. | | | 179,556 | |
| | 94,067 | | | Fisher & Paykel Healthcare Corp. Ltd. | | | 495,566 | |
| | 72,194 | | | Fletcher Building Ltd. | | | 364,690 | |
| | 31,055 | | | Freightways Ltd. | | | 123,860 | |
| | 34,123 | | | Genesis Energy Ltd. | | | 43,093 | |
| | 53,576 | | | Heartland New Zealand Ltd. | | | 45,349 | |
| | 67,426 | | | Infratil Ltd. | | | 141,766 | |
| Shares | | | | | Value | |
| NEW ZEALAND (continued) |
| | 52,582 | | | Kathmandu Holdings Ltd. | | $ | 55,901 | |
| | 70,342 | | | Kiwi Property Group Ltd. REIT | | | 64,780 | |
| | 27,669 | | | Mainfreight Ltd. | | | 290,409 | |
| | 28,706 | | | Metlifecare Ltd. | | | 86,695 | |
| | 23,445 | | | Mighty River Power Ltd. | | | 44,452 | |
| | 39,566 | | | New Zealand Oil & Gas Ltd. | | | 11,655 | |
| | 8,819 | | | New Zealand Refining Co. Ltd. (The) | | | 20,543 | |
| | 121,885 | | | Nuplex Industries Ltd. | | | 351,596 | |
| | 45,243 | | | NZX Ltd. | | | 29,411 | |
| | 73,491 | | | PGG Wrightson Ltd. | | | 20,652 | |
| | 80,140 | | | Pike River Coal Ltd.(b)(c)(d) | | | 0 | |
| | 53,513 | | | Port of Tauranga Ltd. | | | 652,253 | |
| | 19,670 | | | Restaurant Brands New Zealand Ltd. | | | 57,008 | |
| | 29,633 | | | Ryman Healthcare Ltd. | | | 158,320 | |
| | 15,128 | | | Sanford Ltd. | | | 50,707 | |
| | 74,844 | | | Skellerup Holdings Ltd. | | | 77,541 | |
| | 182,421 | | | SKY Network Television Ltd. | | | 560,809 | |
| | 1,653,867 | | | SKYCITY Entertainment Group Ltd. | | | 4,490,857 | |
| | 415,362 | | | Spark New Zealand Ltd. | | | 945,040 | |
| | 55,636 | | | Summerset Group Holdings Ltd. | | | 148,058 | |
| | 47,121 | | | Tower Ltd. | | | 66,688 | |
| | 75,946 | | | Trade Me Group Ltd. | | | 188,222 | |
| | 29,035 | | | TrustPower Ltd. | | | 153,356 | |
| | 35,771 | | | Vector Ltd. | | | 79,934 | |
| | 43,509 | | | Warehouse Group Ltd. (The) | | | 80,431 | |
| | | | | | | | 24,572,502 | |
| NORWAY — 0.1% |
| | 57,584 | | | ABG Sundal Collier Holding ASA | | | 43,374 | |
| | 1,087 | | | AF Gruppen ASA | | | 16,119 | |
| | 9,669 | | | Aker ASA - Class A | | | 190,609 | |
| | 25,444 | | | Aker Solutions ASA(d) | | | 33,240 | |
| | 458 | | | American Shipping ASA | | | 1,941 | |
| | 18,135 | | | Atea ASA | | | 168,613 | |
| | 44,307 | | | Austevoll Seafood ASA | | | 272,462 | |
| | 3,350 | | | Bonheur ASA | | | 22,572 | |
| | 68,000 | | | BW Offshore Ltd. | | | 28,331 | |
| | 13,163 | | | Det Norske Oljeselskap ASA(d) | | | 80,790 | |
| | 77,998 | | | DNO ASA(d) | | | 78,211 | |
| | 6,614 | | | Ekornes ASA | | | 70,447 | |
| | 39,730 | | | Electromagnetic GeoServices ASA(d) | | | 2,993 | |
| | 733 | | | Farstad Shipping ASA | | | 1,027 | |
| | 7,368 | | | Fred Olsen Energy ASA(d) | | | 34,123 | |
| | 2,000 | | | Ganger Rolf ASA | | | 12,534 | |
| | 13,224 | | | Golden Ocean Group Ltd.(d) | | | 25,680 | |
| | 7,433 | | | Grieg Seafood ASA | | | 26,507 | |
| | 14,061 | | | Hexagon Composites ASA | | | 21,679 | |
| | 4,846 | | | Hoegh LNG Holdings Ltd. | | | 58,174 | |
| | 194,372 | | | Kongsberg Automotive ASA(d) | | | 112,093 | |
| | 5,470 | | | Kongsberg Gruppen ASA | | | 85,622 | |
| Old Westbury Funds, Inc. | |
| Small & Mid Cap Fund | |
| Portfolio of Investments - (Continued) | October 31, 2015 |
| | |
| Shares | | | | | Value | |
| NORWAY (continued) |
| | 4,182 | | | Leroy Seafood Group ASA | | $ | 146,672 | |
| | 12,242 | | | Marine Harvest ASA | | | 164,106 | |
| | 10,381 | | | Nordic Semiconductor ASA(d) | | | 49,909 | |
| | 23,394 | | | Opera Software ASA | | | 146,062 | |
| | 42,479 | | | ProSafe SE | | | 117,487 | |
| | 12,159 | | | Salmar ASA | | | 198,911 | |
| | 5,087 | | | Sevan Marine ASA(d) | | | 9,519 | |
| | 6,632 | | | Solstad Offshore ASA | | | 20,294 | |
| | 29,923 | | | SpareBank 1 SMN | | | 187,530 | |
| | 12,056 | | | SpareBank 1 SR-Bank ASA | | | 57,607 | |
| | 157,016 | | | Storebrand ASA(d) | | | 549,397 | |
| | 37,647 | | | TGS Nopec Geophysical Co. ASA | | | 742,151 | |
| | 26,311 | | | Tomra Systems ASA | | | 281,016 | |
| | 23,900 | | | Vard Holdings Ltd.(d) | | | 6,483 | |
| | 12,901 | | | Veidekke ASA | | | 163,981 | |
| | 3,880 | | | Wilh Wilhelmsen Holding ASA | | | 77,857 | |
| | | | | | | | 4,306,123 | |
| PERU — 0.1% |
| | 1,162,608 | | | Alicorp SA(d) | | | 1,975,442 | |
| | 2,502,418 | | | Ferreycorp SAA(c) | | | 1,066,804 | |
| | | | | | | | 3,042,246 | |
| PHILIPPINES — 0.2% |
| | 23,966 | | | Belle Corp. | | | 1,771 | |
| | 19,250 | | | Cebu Air, Inc. | | | 36,674 | |
| | 114,843 | | | China Banking Corp. | | | 98,114 | |
| | 1,179,066 | | | Concepcion Industrial Corp. | | | 1,171,007 | |
| | 12,522,200 | | | D&L Industries, Inc. | | | 2,607,677 | |
| | 72,800 | | | EEI Corp. | | | 11,708 | |
| | 726,600 | | | Energy Development Corp. | | | 103,046 | |
| | 2,735,375 | | | Filinvest Land, Inc. | | | 101,656 | |
| | 124,300 | | | First Gen Corp. | | | 67,168 | |
| | 156,680 | | | First Philippine Holdings Corp. | | | 236,426 | |
| | 14,287,500 | | | GMA Holdings, Inc. - PDR(c) | | | 2,181,880 | |
| | 1,412,000 | | | Lopez Holdings Corp. | | | 204,472 | |
| | 3,768,800 | | | Manila Water Co., Inc. | | | 1,915,793 | |
| | 9,720,696 | | | Megaworld Corp. | | | 973,731 | |
| | 777,000 | | | Metro Pacific Investments Corp. | | | 86,628 | |
| | 623,000 | | | Pepsi-Cola Products Philippines, Inc. | | | 55,886 | |
| | 39,900 | | | Puregold Price Club, Inc. | | | 30,679 | |
| | 75,400 | | | Rizal Commercial Banking Corp. | | | 50,004 | |
| | 495,300 | | | Robinsons Land Corp. | | | 323,712 | |
| | 19,800 | | | San Miguel Corp. | | | 20,299 | |
| | 119,451 | | | Security Bank Corp. | | | 362,537 | |
| | 49,350 | | | Semirara Mining and Power Corp. | | | 141,136 | |
| | 6 | | | Top Frontier Investment Holdings, Inc.(d) | | | 14 | |
| | 161,290 | | | Union Bank of Philippines, Inc. | | | 196,359 | |
| | 729,800 | | | Vista Land & Lifescapes, Inc. | | | 86,822 | |
| | | | | | | | 11,065,199 | |
| Shares | | | | | Value | |
| POLAND — 0.1% |
| | 1,192 | | | Alior Bank SA(d) | | $ | 25,059 | |
| | 1,432 | | | AmRest Holdings SE(d) | | | 66,943 | |
| | 30,577 | | | Asseco Poland SA | | | 452,046 | |
| | 10,935 | | | Bank Handlowy w Warszawie SA | | | 222,670 | |
| | 89,911 | | | Bank Millennium SA(d) | | | 142,393 | |
| | 37,571 | | | Boryszew SA | | | 48,904 | |
| | 3,498 | | | Budimex SA | | | 189,865 | |
| | 683 | | | CCC SA | | | 29,870 | |
| | 2,131 | | | CD Projekt Red SA(d) | | | 14,669 | |
| | 10,830 | | | Ciech SA(d) | | | 209,602 | |
| | 14,658 | | | Cyfrowy Polsat SA(d) | | | 94,487 | |
| | 1,000 | | | Dom Development SA | | | 13,511 | |
| | 56,228 | | | Enea SA(d) | | | 186,682 | |
| | 13,280 | | | Eurocash SA | | | 179,353 | |
| | 5,542 | | | Farmacol SA(d) | | | 91,799 | |
| | 125,804 | | | Getin Holding SA(d) | | | 52,088 | |
| | 230,777 | | | Getin Noble Bank SA(d) | | | 47,776 | |
| | 11,908 | | | Grupa Azoty SA(d) | | | 283,775 | |
| | 119 | | | Grupa Azoty Zaklady Chemiczne Police SA | | | 765 | |
| | 3,848 | | | Grupa Kety SA | | | 276,824 | |
| | 36,553 | | | Grupa Lotos SA(d) | | | 269,204 | |
| | 4,256 | | | Impexmetal SA(d) | | | 2,963 | |
| | 2,438 | | | Inter Cars SA | | | 149,270 | |
| | 635 | | | KRUK SA | | | 30,227 | |
| | 226 | | | LPP SA | | | 426,595 | |
| | 1,171 | | | Lubelski Wegiel Bogdanka SA | | | 12,488 | |
| | 169,484 | | | Netia SA | | | 242,098 | |
| | 32,745 | | | Orange Polska SA | | | 60,078 | |
| | 9,643 | | | Orbis SA | | | 147,227 | |
| | 1,623 | | | Pelion SA | | | 25,544 | |
| | 85,476 | | | Synthos SA | | | 81,620 | |
| | 884 | | | Warsaw Stock Exchange | | | 9,379 | |
| | | | | | | | 4,085,774 | |
| PORTUGAL — 0.1% |
| | 16,720 | | | Altri SGPS SA | | | 79,079 | |
| | 31,522 | | | Banco BPI SA(d) | | | 38,337 | |
| | 4,464,593 | | | Banco Comercial Portugues SA(d) | | | 256,766 | |
| | 1,231,589 | | | Banco Espirito Santo SA(b)(c)(d) | | | 0 | |
| | 2,336 | | | Corticeira Amorim SGPS SA | | | 12,587 | |
| | 21,040 | | | Ctt-Correios de Portugal SA | | | 239,117 | |
| | 58,922 | | | Galp Energia SGPS SA | | | 637,375 | |
| | 31,264 | | | Jeronimo Martins SGPS SA | | | 439,541 | |
| | 22,362 | | | Mota-Engil SGPS SA | | | 56,189 | |
| | 109,899 | | | NOS SGPS SA | | | 913,509 | |
| | 212,940 | | | Portucel SA | | | 867,561 | |
| | 119,269 | | | REN - Redes Energeticas Nacionais SGPS SA | | | 364,215 | |
| | 291,274 | | | Sonae SGPS SA | | | 348,486 | |
| | 11,475 | | | Teixeira Duarte SA | | | 5,741 | |
| | | | | | | | 4,258,503 | |
| Old Westbury Funds, Inc. | |
| Small & Mid Cap Fund | |
| Portfolio of Investments - (Continued) | October 31, 2015 |
| | |
| Shares | | | | | Value | |
| QATAR — 0.0% |
| | 18,031 | | | Gulf International Services QSC | | $ | 317,502 | |
| SINGAPORE — 1.3% |
| | 23,000 | | | Abterra Ltd.(d) | | | 5,910 | |
| | 2,373,000 | | | Ascendas India Trust - Unit | | | 1,482,172 | |
| | 7,381,000 | | | Ascendas Real Estate Investment Trust | | | 12,592,326 | |
| | 155,400 | | | ASL Marine Holdings Ltd.(c) | | | 38,270 | |
| | 30,300 | | | Biosensors International Group Ltd.(b)(d) | | | 14,708 | |
| | 7,400 | | | Bonvests Holdings Ltd. | | | 6,524 | |
| | 25,598 | | | Boustead Projects Ltd.(d) | | | 15,440 | |
| | 85,329 | | | Boustead Singapore Ltd. | | | 58,169 | |
| | 16,000 | | | Breadtalk Group Ltd. | | | 13,591 | |
| | 43,000 | | | Bukit Sembawang Estates Ltd. | | | 144,878 | |
| | 29,217 | | | Cape Plc | | | 103,594 | |
| | 10,594,700 | | | CapitaLand Mall Trust REIT | | | 14,974,307 | |
| | 42,000 | | | China Aviation Oil Singapore Corp. Ltd. | | | 21,586 | |
| | 203,700 | | | China Merchants Holdings Pacific Ltd. | | | 138,863 | |
| | 161,400 | | | Chip Eng Seng Corp. Ltd. | | | 78,920 | |
| | 118,800 | | | ComfortDelGro Corp. Ltd. | | | 257,800 | |
| | 161,000 | | | Cosco Corp. Singapore Ltd.(b)(c) | | | 43,097 | |
| | 56,000 | | | CSE Global Ltd. | | | 19,787 | |
| | 156,000 | | | CW Group Holdings Ltd. | | | 77,692 | |
| | 86,900 | | | CWT Ltd. | | | 124,063 | |
| | 15,600 | | | Eu Yan Sang International Ltd. | | | 4,900 | |
| | 405,720 | | | Ezion Holdings Ltd. | | | 202,730 | |
| | 4,071,902 | | | Ezra Holdings Ltd.(d) | | | 354,609 | |
| | 130,121 | | | Far East Orchard Ltd. | | | 139,790 | |
| | 73,900 | | | First Resources Ltd. | | | 99,173 | |
| | 183,000 | | | FJ Benjamin Holdings Ltd. | | | 12,410 | |
| | 164,000 | | | Fragrance Group Ltd. | | | 22,243 | |
| | 15,000 | | | Frasers Centrepoint Ltd. | | | 17,453 | |
| | 111,000 | | | Gallant Venture Ltd.(d) | | | 18,224 | |
| | 2,000 | | | GK Goh Holdings Ltd. | | | 1,178 | |
| | 52,560 | | | Global Premium Hotels Ltd. | | | 10,880 | |
| | 12,000 | | | GMG Global Ltd.(d) | | | 3,298 | |
| | 58,000 | | | GP Industries Ltd. | | | 28,153 | |
| | 48,960 | | | GSH Corp. Ltd. | | | 9,436 | |
| | 118,666 | | | Guocoland Ltd. | | | 157,555 | |
| | 84,000 | | | GuocoLeisure Ltd. | | | 53,666 | |
| | 21,000 | | | Hanwell Holdings Ltd.(d) | | | 3,972 | |
| | 32,000 | | | Hiap Hoe Ltd. | | | 15,647 | |
| | 135,000 | | | Ho Bee Land Ltd. | | | 189,842 | |
| | 274,800 | | | Hong Fok Corp. Ltd. | | | 141,235 | |
| | 131,000 | | | Hong Leong Asia Ltd. | | | 80,420 | |
| | 9,000 | | | Hour Glass Ltd. (The) | | | 4,722 | |
| | 271,000 | | | Hutchison Port Holdings Trust - Units | | | 150,405 | |
| | 5,422,500 | | | Hyflux Ltd. | | | 2,632,094 | |
| | 186,000 | | | Indofood Agri Resources Ltd. | | | 75,680 | |
| | 26,100 | | | Jiutian Chemical Group Ltd.(d) | | | 578 | |
| | 92,950 | | | Jurong Technologies Industrial Corp. Ltd.(b)(c)(d) | | | 0 | |
| Shares | | | | | Value | |
| SINGAPORE (continued) |
| | 304,000 | | | K1 Ventures Ltd. | | $ | 43,401 | |
| | 27,378 | | | Keppel Infrastructure Trust | | | 10,162 | |
| | 10,000 | | | Keppel Telecommunications & Transportation Ltd. | | | 10,350 | |
| | 202,000 | | | Lian Beng Group Ltd. | | | 76,422 | |
| | 42,000 | | | Low Keng Huat Singapore Ltd. | | | 18,738 | |
| | 75,000 | | | Lum Chang Holdings Ltd. | | | 20,879 | |
| | 39,000 | | | M1 Ltd. | | | 79,063 | |
| | 289,800 | | | Metro Holdings Ltd. | | | 186,180 | |
| | 101,000 | | | Mewah International, Inc. | | | 22,350 | |
| | 308,000 | | | Midas Holdings Ltd. | | | 69,255 | |
| | 308,700 | | | Neptune Orient Lines Ltd.(d) | | | 219,257 | |
| | 252,300 | | | Olam International Ltd. | | | 360,197 | |
| | 32,238 | | | OM Holdings Ltd.(d) | | | 3,563 | |
| | 59,000 | | | OSIM International Ltd. | | | 57,277 | |
| | 33,750 | | | Otto Marine Ltd.(d) | | | 8,673 | |
| | 100,000 | | | OUE Ltd. | | | 127,775 | |
| | 66,000 | | | Oxley Holdings Ltd. | | | 19,787 | |
| | 21,000 | | | Pan-United Corp. Ltd. | | | 10,044 | |
| | 340,200 | | | Penguin International Ltd. | | | 36,427 | |
| | 71,000 | | | Petra Foods Ltd. | | | 122,650 | |
| | 121,070 | | | QAF Ltd. | | | 90,312 | |
| | 176,250 | | | Raffles Education Corp. Ltd.(b)(c) | | | 36,485 | |
| | 31,629 | | | Raffles Medical Group Ltd. | | | 97,084 | |
| | 20,100 | | | Religare Health Trust - Units | | | 14,276 | |
| | 199,000 | | | Rickmers Maritime - Units | | | 29,121 | |
| | 93,000 | | | Rotary Engineering Ltd. | | | 26,222 | |
| | 217,500 | | | Roxy-Pacific Holdings Ltd(c) | | | 65,984 | |
| | 3,985 | | | S I2I Ltd.(d) | | | 2,247 | |
| | 4,134,000 | | | SATS Ltd. | | | 11,184,139 | |
| | 16,900 | | | Sembcorp Industries Ltd. | | | 43,188 | |
| | 307,000 | | | Sembcorp Marine Ltd. | | | 512,799 | |
| | 97,000 | | | Sheng Siong Group Ltd. | | | 58,855 | |
| | 229,200 | | | SHS Holdings Ltd. | | | 41,720 | |
| | 4,430,500 | | | SIA Engineering Co. Ltd.(c) | | | 12,618,813 | |
| | 100,500 | | | Sim Lian Group Ltd. | | | 65,283 | |
| | 592,000 | | | Sinarmas Land Ltd. | | | 202,841 | |
| | 148,400 | | | Singapore Post Ltd. | | | 200,741 | |
| | 135,800 | | | Singapore Press Holdings Ltd. | | | 386,781 | |
| | 174,000 | | | Singapore Reinsurance Corp. Ltd. | | | 40,988 | |
| | 63,000 | | | SMRT Corp. Ltd. | | | 65,658 | |
| | 458,000 | | | Stamford Land Corp. Ltd. | | | 168,370 | |
| | 2,582,300 | | | StarHub Ltd. | | | 6,635,934 | |
| | 36,600 | | | Sunningdale Tech Ltd. | | | 22,207 | |
| | 136,000 | | | SunVic Chemical Holdings Ltd.(d) | | | 22,814 | |
| | 82,000 | | | Super Group Ltd. | | | 52,680 | |
| | 7,000 | | | Tat Hong Holdings Ltd. | | | 2,798 | |
| | 54,000 | | | Technovator International Ltd.(d) | | | 34,000 | |
| | 133,000 | | | Tiong Woon Corp. Holding Ltd. | | | 19,462 | |
| | 378,314 | | | Tuan Sing Holdings Ltd. | | | 91,817 | |
| | 186,250 | | | UMS Holdings Ltd. | | | 67,140 | |
| | 336,254 | | | United Engineers Ltd. | | | 477,654 | |
| Old Westbury Funds, Inc. | |
| Small & Mid Cap Fund | |
| Portfolio of Investments - (Continued) | October 31, 2015 |
| | |
| Shares | | | | | Value | |
| SINGAPORE (continued) |
| | 412,716 | | | United Industrial Corp. Ltd. | | $ | 907,392 | |
| | 219,657 | | | UOB-Kay Hian Holdings Ltd. | | | 225,788 | |
| | 161,711 | | | UOL Group Ltd. | | | 757,245 | |
| | 40,600 | | | Venture Corp. Ltd. | | | 239,676 | |
| | 156,229 | | | Vibrant Group Ltd. | | | 40,705 | |
| | 201,812 | | | Wheelock Properties (Singapore) Ltd. | | | 219,690 | |
| | 140,420 | | | Wing Tai Holdings Ltd. | | | 174,911 | |
| | 1,436 | | | XP Power Ltd. | | | 32,099 | |
| | 97,000 | | | Yongnam Holdings Ltd.(d) | | | 27,004 | |
| | | | | | | | 72,147,363 | |
| SOUTH AFRICA — 0.5% |
| | 1,904 | | | Adbee Rf Ltd.(d) | | | 4,675 | |
| | 13,497 | | | Adcock Ingram Holdings Ltd. | | | 50,715 | |
| | 95,496 | | | Advtech Ltd. | | | 87,429 | |
| | 58,115 | | | Aeci Ltd. | | | 399,779 | |
| | 109,566 | | | African Bank Investments Ltd.(b)(c)(d) | | | 460 | |
| | 76,288 | | | AngloGold Ashanti Ltd.(d) | | | 648,991 | |
| | 6,924 | | | Astral Foods Ltd. | | | 87,057 | |
| | 69,764 | | | AVI Ltd. | | | 444,122 | |
| | 105,076 | | | Barloworld Ltd. | | | 593,601 | |
| | 28,795 | | | Blue Label Telecoms Ltd. | | | 24,240 | |
| | 3,333 | | | Capitec Bank Holdings Ltd. | | | 144,143 | |
| | 4,294 | | | Cashbuild Ltd. | | | 102,548 | |
| | 16,438 | | | Caxton and CTP Publishers and Printers Ltd. | | | 21,369 | |
| | 4,704 | | | City Lodge Hotels Ltd. | | | 50,816 | |
| | 348,378 | | | Clicks Group Ltd. | | | 2,545,055 | |
| | 1,776 | | | Consolidated Infrastructure Group Ltd.(d) | | | 4,488 | |
| | 40,612 | | | Coronation Fund Managers Ltd. | | | 214,226 | |
| | 67,017 | | | DataTec Ltd. | | | 286,925 | |
| | 4,599 | | | Distell Group Ltd. | | | 59,193 | |
| | 165,998 | | | EOH Holdings Ltd. | | | 1,835,226 | |
| | 1,244 | | | Famous Brands Ltd. | | | 12,117 | |
| | 19,374 | | | Foschini Group Ltd. (The) | | | 197,912 | |
| | 293,909 | | | Gold Fields Ltd. | | | 775,814 | |
| | 7,837 | | | Grand Parade Investments Ltd. | | | 2,962 | |
| | 63,300 | | | Grindrod Ltd. | | | 68,473 | |
| | 71,271 | | | Harmony Gold Mining Co. Ltd.(d) | | | 50,676 | |
| | 7,349 | | | Hudaco Industries Ltd. | | | 57,883 | |
| | 21,515 | | | Hyprop Investments Ltd. | | | 195,110 | |
| | 67,405 | | | Imperial Holdings Ltd. | | | 877,984 | |
| | 131,664 | | | Investec Plc | | | 1,100,109 | |
| | 164 | | | Invicta Holdings Ltd. | | | 723 | |
| | 8,718 | | | JSE Ltd. | | | 84,100 | |
| | 33,715 | | | KAP Industrial Holdings Ltd. | | | 17,906 | |
| | 13,417 | | | Lewis Group Ltd. | | | 58,054 | |
| | 25,495 | | | Liberty Holdings Ltd. | | | 249,700 | |
| | 67,214 | | | Life Healthcare Group Holdings Ltd. | | | 187,475 | |
| | 20,504 | | | Metair Investments Ltd. | | | 45,337 | |
| | 302,992 | | | MMI Holdings Ltd. | | | 549,541 | |
| Shares | | | | | Value | |
| SOUTH AFRICA (continued) |
| | 231,628 | | | Mondi Plc | | $ | 5,370,421 | |
| | 4,329 | | | Mota-Engil Africa NV | | | 28,548 | |
| | 24,133 | | | Mpact Ltd. | | | 84,350 | |
| | 51,923 | | | Mr Price Group Ltd. | | | 797,286 | |
| | 118,366 | | | Nampak Ltd. | | | 191,845 | |
| | 67,640 | | | Netcare Ltd. | | | 192,622 | |
| | 59,703 | | | Northam Platinum Ltd.(d) | | | 130,976 | |
| | 201,274 | | | Oceana Group Ltd. | | | 1,500,065 | |
| | 87,024 | | | Omnia Holdings Ltd. | | | 965,256 | |
| | 50,737 | | | Peregrine Holdings Ltd. | | | 112,883 | |
| | 17,069 | | | Pick’n Pay Stores Ltd. | | | 82,514 | |
| | 120,570 | | | Pioneer Foods Group Ltd. | | | 1,729,398 | |
| | 4,870 | | | PPC Ltd. | | | 5,859 | |
| | 43,439 | | | PSG Group Ltd. | | | 837,831 | |
| | 22,032 | | | Redefine Properties Ltd. REIT | | | 18,404 | |
| | 18,485 | | | Resilient Property Income Fund Ltd. REIT | | | 162,958 | |
| | 22,339 | | | Reunert Ltd. | | | 108,927 | |
| | 8,543 | | | Santam Ltd. | | | 137,661 | |
| | 223,632 | | | Sappi Ltd.(d) | | | 883,119 | |
| | 300,480 | | | Sibanye Gold Ltd. | | | 505,468 | |
| | 38,542 | | | Spar Group Ltd. (The) | | | 553,775 | |
| | 4,194 | | | Sun International Ltd. | | | 29,021 | |
| | 173,715 | | | Super Group Ltd.(d) | | | 408,712 | |
| | 104,458 | | | Telkom SA SOC Ltd. | | | 548,746 | |
| | 4,245 | | | Tiger Brands Ltd. | | | 97,127 | |
| | 7,382 | | | Tongaat Hulett Ltd. | | | 63,157 | |
| | 24,146 | | | Trencor Ltd. | | | 91,863 | |
| | 94,685 | | | Truworths International Ltd. | | | 641,428 | |
| | 76,034 | | | Tsogo Sun Holdings Ltd. | | | 136,256 | |
| | 3,138 | | | Wilson Bayly Holmes-Ovcon Ltd. | | | 29,366 | |
| | 17,625 | | | Zeder Investments Ltd. | | | 10,061 | |
| | | | | | | | 28,592,837 | |
| SOUTH KOREA — 0.9% |
| | 416 | | | Aekyung Petrochemical Co. Ltd. | | | 22,551 | |
| | 1,398 | | | AfreecaTV Co. Ltd. | | | 31,147 | |
| | 821 | | | AJ Rent A Car Co. Ltd.(d) | | | 7,634 | |
| | 1,228 | | | AK Holdings, Inc. | | | 92,635 | |
| | 3,839 | | | Anapass, Inc. | | | 44,618 | |
| | 61 | | | Asia Cement Co. Ltd. | | | 5,779 | |
| | 299 | | | ASIA Holdings Co. Ltd. | | | 30,685 | |
| | 2,330 | | | Asia Paper Manufacturing Co. Ltd. | | | 39,854 | |
| | 5,278 | | | Asiana Airlines, Inc.(d) | | | 22,431 | |
| | 2,778 | | | AtlasBX Co. Ltd. | | | 88,210 | |
| | 4,460 | | | Baiksan Co. Ltd. | | | 17,663 | |
| | 772 | | | Basic House Co. Ltd. (The)(d) | | | 6,602 | |
| | 1,005 | | | Binggrae Co. Ltd. | | | 60,209 | |
| | 1,230 | | | Bioland Ltd. | | | 27,134 | |
| | 70,676 | | | BNK Financial Group, Inc. | | | 867,913 | |
| | 1,587 | | | Bukwang Pharmaceutical Co. Ltd. | | | 35,010 | |
| | 2,010 | | | Byucksan Corp. | | | 16,643 | |
| Old Westbury Funds, Inc. | |
| Small & Mid Cap Fund | |
| Portfolio of Investments - (Continued) | October 31, 2015 |
| | |
| Shares | | | | | Value | |
| SOUTH KOREA (continued) | | | | |
| | 7,205 | | | Cheil Worldwide, Inc.(d) | | $ | 126,398 | |
| | 602 | | | Chongkundang Holdings Corp. | | | 42,138 | |
| | 73 | | | Chosun Refractories Co. Ltd. | | | 6,051 | |
| | 624 | | | CJ CGV Co. Ltd. | | | 56,924 | |
| | 1,720 | | | CJ CheilJedang Corp. | | | 528,047 | |
| | 8,812 | | | CJ E&M Corp.(d) | | | 646,185 | |
| | 1,463 | | | CJ Korea Express Co. Ltd.(d) | | | 250,239 | |
| | 930 | | | CKD Bio Corp. | | | 16,111 | |
| | 1,263 | | | Com2uSCorp(d) | | | 127,402 | |
| | 544 | | | Cosmax BTI, Inc. | | | 34,022 | |
| | 146 | | | Crown Confectionery Co. Ltd. | | | 75,046 | |
| | 3,620 | | | Dae Dong Industrial Co. Ltd. | | | 31,213 | |
| | 16,020 | | | Dae Won Kang Up Co. Ltd. | | | 69,628 | |
| | 8,001 | | | Daeduck Electronics Co. | | | 51,583 | |
| | 3,310 | | | Daeduck GDS Co. Ltd. | | | 28,250 | |
| | 1,201 | | | Daehan Steel Co. Ltd. | | | 10,166 | |
| | 3,830 | | | Dae-Il Corp.(d) | | | 29,328 | |
| | 11,609 | | | Daelim Industrial Co. Ltd. | | | 761,680 | |
| | 2,161 | | | Daesang Corp. | | | 58,951 | |
| | 3,927 | | | Daesang Holdings Co. Ltd. | | | 73,542 | |
| | 2,180 | | | Daesung Holdings Co. Ltd. | | | 22,755 | |
| | 3,074 | | | Daewon San Up Co. Ltd. | | | 17,931 | |
| | 9,448 | | | Daewoo International Corp. | | | 165,333 | |
| | 58,094 | | | Daewoo Securities Co. Ltd. | | | 565,627 | |
| | 844 | | | Daewoong Co. Ltd. | | | 47,158 | |
| | 859 | | | Daewoong Pharmaceutical Co. Ltd. | | | 57,415 | |
| | 7,916 | | | Daishin Securities Co. Ltd. | | | 72,907 | |
| | 12,865 | | | Dasan Networks, Inc.(d) | | | 69,964 | |
| | 19,689 | | | Dayou Automotive Seat Technology Co. Ltd. | | | 44,557 | |
| | 3,090 | | | DCM Corp. | | | 30,357 | |
| | 39,722 | | | DGB Financial Group, Inc. | | | 369,329 | |
| | 1,360 | | | Dong Ah Tire & Rubber Co. Ltd. | | | 29,764 | |
| | 647 | | | Dong-A Socio Holdings Co. Ltd. | | | 92,222 | |
| | 1,950 | | | Dong-Ah Geological Engineering Co. Ltd. | | | 13,615 | |
| | 13,634 | | | Dongbu Insurance Co. Ltd. | | | 818,004 | |
| | 905 | | | Dongbu Securities Co. Ltd. | | | 3,227 | |
| | 772 | | | Dong-IL Corp. | | | 46,318 | |
| | 604 | | | Dongil Industries Co. Ltd. | | | 30,411 | |
| | 10,139 | | | Dongjin Semichem Co. Ltd. | | | 46,068 | |
| | 1,064 | | | DongKook Pharmaceutical Co. Ltd. | | | 46,011 | |
| | 2,076 | | | Dongkuk Industries Co. Ltd. | | | 6,637 | |
| | 18,158 | | | Dongkuk Steel Mill Co. Ltd.(d) | | | 108,943 | |
| | 694 | | | Dongkuk Structures & Construction Co. Ltd. | | | 2,258 | |
| | 3,480 | | | Dongsuh Cos., Inc. | | | 103,022 | |
| | 9,440 | | | DONGSUNG Corp. | | | 52,994 | |
| | 4,803 | | | Dongwha Pharmaceutical Co. Ltd. | | | 29,154 | |
| | 360 | | | Dongwon F&B Co. Ltd. | | | 118,890 | |
| | 267 | | | Dongwon Industries Co. Ltd. | | | 74,944 | |
| Shares | | | | | Value | |
| SOUTH KOREA (continued) | | | | |
| | 221 | | | Dongyang E&P, Inc. | | $ | 2,491 | |
| | 1,630 | | | Doosan Corp. | | | 157,989 | |
| | 2,462 | | | DRB Holding Co. Ltd. | | | 31,637 | |
| | 12,773 | | | DY Corp. | | | 77,643 | |
| | 156 | | | e Tec E&C Ltd. | | | 21,442 | |
| | 270 | | | E1 Corp. | | | 16,341 | |
| | 1,441 | | | Eagon Industries Co. Ltd. | | | 21,488 | |
| | 17,017 | | | Easy Bio, Inc. | | | 108,516 | |
| | 5,009 | | | e-LITECOM Co. Ltd. | | | 87,873 | |
| | 305 | | | Eo Technics Co. Ltd. | | | 26,700 | |
| | 12,586 | | | Eugene Corp. | | | 61,934 | |
| | 13,874 | | | Eugene Investment & Securities Co. Ltd.(d) | | | 34,075 | |
| | 3,164 | | | Eugene Technology Co. Ltd. | | | 32,194 | |
| | 4,964 | | | Eusu Holdings Co. Ltd.(d) | | | 38,448 | |
| | 5,387 | | | EVERDIGM Corp. | | | 50,796 | |
| | 656 | | | Fila Korea Ltd. | | | 57,541 | |
| | 2,079 | | | Fursys, Inc. | | | 63,279 | |
| | 520 | | | Gaon Cable Co. Ltd. | | | 9,556 | |
| | 2,530 | | | Global & Yuasa Battery Co. Ltd. | | | 90,543 | |
| | 2,787 | | | Global Display Co. Ltd. | | | 9,986 | |
| | 237 | | | Golfzon Co. Ltd.(d) | | | 20,768 | |
| | 3,423 | | | Grand Korea Leisure Co. Ltd. | | | 95,479 | |
| | 289 | | | Green Cross Corp. | | | 46,010 | |
| | 6,488 | | | Green Cross Holdings Corp. | | | 233,615 | |
| | 11,788 | | | GS Engineering & Construction Corp.(d) | | | 240,920 | |
| | 2,304 | | | GS Global Corp. | | | 12,530 | |
| | 17,541 | | | GS Holdings Corp. | | | 772,386 | |
| | 7,580 | | | GS Retail Co. Ltd. | | | 382,973 | |
| | 2,130 | | | Halla Corp.(d) | | | 7,221 | |
| | 197,259 | | | Han Kuk Carbon Co. Ltd. | | | 1,029,508 | |
| | 3,827 | | | Hana Micron, Inc. | | | 21,786 | |
| | 717 | | | Hana Tour Service, Inc. | | | 79,244 | |
| | 2,251 | | | Hancom, Inc. | | | 41,168 | |
| | 174 | | | Handok, Inc. | | | 3,808 | |
| | 6,705 | | | Handsome Co. Ltd. | | | 228,489 | |
| | 1,474 | | | Hanil Cement Co. Ltd. | | | 151,919 | |
| | 2,710 | | | Hanjin Heavy Industries & Construction Holdings Co. Ltd. | | | 15,665 | |
| | 1,969 | | | Hanjin Kal Corp. | | | 37,565 | |
| | 1,870 | | | Hanjin Transportation Co. Ltd. | | | 72,910 | |
| | 90 | | | Hankook Shell Oil Co. Ltd. | | | 40,025 | |
| | 1,771 | | | Hankook Tire Co. Ltd. | | | 67,963 | |
| | 680 | | | Hankuk Paper Manufacturing Co. Ltd. | | | 20,936 | |
| | 890 | | | Hanmi Pharm Co. Ltd.(d) | | | 403,605 | |
| | 2,520 | | | Hanmi Semiconductor Co. Ltd. | | | 23,873 | |
| | 12,680 | | | Hanon Systems | | | 499,392 | |
| | 956 | | | Hansae Co. Ltd. | | | 47,127 | |
| | 3,000 | | | Hansae Yes24 Holdings Co. Ltd. | | | 56,050 | |
| | 2,694 | | | Hansol Chemical Co. Ltd. | | | 158,325 | |
| | 520 | | | Hansol Holdings Co. Ltd.(d) | | | 3,275 | |
| | 24,530 | | | Hansol HomeDeco Co. Ltd.(d) | | | 33,136 | |
| Old Westbury Funds, Inc. | |
| Small & Mid Cap Fund | |
| Portfolio of Investments - (Continued) | October 31, 2015 |
| | |
| Shares | | | | | Value | |
| SOUTH KOREA (continued) | | | |
| | 744 | | | Hansol Logistics Co. Ltd. | | $ | 2,741 | |
| | 3,623 | | | Hansol Paper Co. Ltd.(d) | | | 65,465 | |
| | 13,078 | | | Hanwha Chemical Corp. | | | 255,239 | |
| | 18,918 | | | Hanwha Corp. | | | 623,105 | |
| | 770 | | | Hanwha Galleria Timeworld Co. Ltd. | | | 70,918 | |
| | 4,700 | | | Hanwha General Insurance Co. Ltd.(d) | | | 31,043 | |
| | 9,373 | | | Hanwha Investment & Securities Co. Ltd. | | | 36,915 | |
| | 3,343 | | | Hanyang Eng Co. Ltd. | | | 27,564 | |
| | 2,720 | | | Hanyang Securities Co. Ltd. | | | 20,280 | |
| | 4,708 | | | Harim Holdings Co. Ltd.(d) | | | 19,678 | |
| | 4,910 | | | Heung-A Shipping Co. Ltd. | | | 8,334 | |
| | 7,231 | | | Hite Jinro Co. Ltd. | | | 145,248 | |
| | 2,043 | | | Hite Jinro Holdings Co. Ltd. | | | 24,461 | |
| | 5,450 | | | HMC Investment Securities Co. Ltd. | | | 49,239 | |
| | 7,616 | | | Hotel Shilla Co. Ltd. | | | 734,845 | |
| | 700 | | | HS R&A Co. Ltd. | | | 25,144 | |
| | 4,768 | | | Huchems Fine Chemical Corp. | | | 78,418 | |
| | 2,950 | | | Humax Co. Ltd. | | | 44,895 | |
| | 1,732 | | | Huons Co. Ltd. | | | 141,440 | |
| | 462 | | | Husteel Co. Ltd. | | | 7,254 | |
| | 6,850 | | | Huvis Corp. | | | 51,012 | |
| | 62,741 | | | Huvitz Co. Ltd. | | | 888,792 | |
| | 37,641 | | | Hy-Lok Corp. | | | 1,053,241 | |
| | 7,624 | | | Hyosung Corp. | | | 782,429 | |
| | 3,447 | | | Hyundai BNG Steel Co. Ltd. | | | 31,294 | |
| | 1,266 | | | Hyundai C&F, Inc.(d) | | | 40,255 | |
| | 1,840 | | | Hyundai Corp. | | | 54,068 | |
| | 3,720 | | | Hyundai Department Store Co. Ltd. | | | 409,508 | |
| | 33,280 | | | Hyundai Development Co-Engineering & Construction | | | 1,344,278 | |
| | 1,811 | | | Hyundai Elevator Co. Ltd.(d) | | | 83,239 | |
| | 23,201 | | | Hyundai Engineering & Construction Co. Ltd. | | | 704,140 | |
| | 4,090 | | | Hyundai Engineering Plastics Co. Ltd. | | | 32,109 | |
| | 12,136 | | | Hyundai Greenfood Co. Ltd. | | | 253,887 | |
| | 704 | | | Hyundai Home Shopping Network Corp. | | | 75,337 | |
| | 12,260 | | | Hyundai Hy Communications & Network Co. Ltd. | | | 35,273 | |
| | 1,492 | | | Hyundai Livart Furniture Co. Ltd. | | | 65,828 | |
| | 28,641 | | | Hyundai Marine & Fire Insurance Co. Ltd. | | | 852,912 | |
| | 22,357 | | | Hyundai Securities Co. Ltd. | | | 135,705 | |
| | 3,671 | | | Hyundai Wia Corp. | | | 429,875 | |
| | 6,050 | | | Il Dong Pharmaceutical Co. Ltd. | | | 137,180 | |
| | 4,214 | | | Iljin Electric Co. Ltd. | | | 21,069 | |
| | 5,949 | | | Iljin Holdings Co. Ltd. | | | 62,879 | |
| | 803 | | | Ilshin Spinning Co. Ltd. | | | 111,288 | |
| Shares | | | | | Value | |
| SOUTH KOREA (continued) | | | |
| | 2,000 | | | iMarketKorea, Inc. | | $ | 52,103 | |
| | 1,599 | | | InBody Co. Ltd. | | | 68,866 | |
| | 4,561 | | | Innox Corp.(d) | | | 54,009 | |
| | 680 | | | Intelligent Digital Integrated Security Co. Ltd. | | | 11,840 | |
| | 5,692 | | | Interflex Co. Ltd.(d) | | | 62,909 | |
| | 18,445 | | | Interpark Holdings Corp. | | | 189,296 | |
| | 1,419 | | | INTOPS Co. Ltd. | | | 21,160 | |
| | 5,477 | | | IS Dongseo Co. Ltd. | | | 205,138 | |
| | 15,507 | | | IsuPetasys Co. Ltd. | | | 68,690 | |
| | 2,800 | | | Jahwa Electronics Co. Ltd. | | | 27,630 | |
| | 17,236 | | | JB Financial Group Co. Ltd. | | | 89,805 | |
| | 3,330 | | | Jeil Pharmaceutical Co. | | | 71,271 | |
| | 6,008 | | | KB Capital Co. Ltd. | | | 134,120 | |
| | 11,141 | | | KB Insurance Co. Ltd. | | | 259,457 | |
| | 7,300 | | | KC Green Holdings Co. Ltd. | | | 62,047 | |
| | 10,532 | | | KC Tech Co. Ltd. | | | 88,964 | |
| | 253 | | | KCC Corp. | | | 90,654 | |
| | 2,126 | | | KCP Co. Ltd.(d) | | | 58,089 | |
| | 2,519 | | | KEPCO Plant Service & Engineering Co. Ltd. | | | 229,793 | |
| | 13,960 | | | Keyang Electric Machinery Co. Ltd. | | | 59,450 | |
| | 2,369 | | | KH Vatec Co. Ltd. | | | 41,767 | |
| | 1,110 | | | KISCO Corp. | | | 47,076 | |
| | 6,150 | | | Kishin Corp. | | | 40,621 | |
| | 2,418 | | | KISWIRE Ltd. | | | 87,490 | |
| | 3,098 | | | KIWOOM Securities Co. Ltd. | | | 159,513 | |
| | 9,767 | | | Koentec Co. Ltd. | | | 24,117 | |
| | 2,185 | | | Koh Young Technology, Inc. | | | 63,726 | |
| | 143,658 | | | Kolao Holdings | | | 1,713,740 | |
| | 1,176 | | | Kolon Corp. | | | 66,121 | |
| | 2,983 | | | Kolon Industries, Inc. | | | 162,488 | |
| | 461 | | | Kolon Life Science, Inc. | | | 65,508 | |
| | 1,632 | | | KONA I Co. Ltd. | | | 52,465 | |
| | 3,631 | | | Kook Soon Dang Brewery Co. Ltd. | | | 21,307 | |
| | 3,069 | | | Korea Circuit Co. Ltd. | | | 29,746 | |
| | 2,939 | | | Korea Electric Terminal Co. Ltd. | | | 254,187 | |
| | 820 | | | Korea Export Packaging Industrial Co. Ltd. | | | 15,105 | |
| | 1,060 | | | Korea Flange Co. Ltd. | | | 12,924 | |
| | 1,290 | | | Korea Gas Corp. | | | 48,203 | |
| | 15,405 | | | Korea Investment Holdings Co. Ltd. | | | 824,266 | |
| | 1,694 | | | Korea Kolmar Co. Ltd. | | | 133,434 | |
| | 2,027 | | | Korea Kolmar Holdings Co. Ltd. | | | 117,703 | |
| | 668 | | | Korea PetroChemical Ind Co. Ltd. | | | 103,711 | |
| | 1,632 | | | Korea United Pharm, Inc. | | | 26,769 | |
| | 7,494 | | | Korean Air Lines Co. Ltd.(d) | | | 202,789 | |
| | 42,765 | | | Korean Reinsurance Co. | | | 510,157 | |
| | 2,714 | | | Kortek Corp. | | | 32,019 | |
| | 787 | | | KPX Chemical Co. Ltd. | | | 39,279 | |
| | 1,913 | | | Kukdo Chemical Co. Ltd. | | | 103,029 | |
| Old Westbury Funds, Inc. | |
| Small & Mid Cap Fund | |
| Portfolio of Investments - (Continued) | October 31, 2015 |
| | |
| Shares | | | | | Value | |
| SOUTH KOREA (continued) | | | |
| | 2,220 | | | Kumho Petrochemical Co. Ltd. | | $ | 112,942 | |
| | 865 | | | Kumkang Kind Co. Ltd. | | | 47,421 | |
| | 1,030 | | | Kunsul Chemical Industrial Co. Ltd. | | | 40,340 | |
| | 22,130 | | | Kwang Dong Pharmaceutical Co. Ltd. | | | 226,143 | |
| | 4,902 | | | Kyobo Securities Co. Ltd. | | | 42,353 | |
| | 1,380 | | | Kyung Dong Navien Co. Ltd. | | | 45,756 | |
| | 101 | | | Kyungbang Ltd. | | | 17,010 | |
| | 5,351 | | | Kyungchang Industrial Co. Ltd. | | | 32,245 | |
| | 1,746 | | | Kyungdong Pharm Co. Ltd. | | | 33,464 | |
| | 17,150 | | | Kyung-In Synthetic Corp. | | | 59,872 | |
| | 1,856 | | | LEENO Industrial, Inc. | | | 71,225 | |
| | 2,220 | | | LF Corp. | | | 61,632 | |
| | 491 | | | LG Hausys Ltd. | | | 73,216 | |
| | 3,281 | | | LG Innotek Co. Ltd. | | | 266,785 | |
| | 6,921 | | | LG International Corp. | | | 212,174 | |
| | 71,227 | | | LG Uplus Corp. | | | 684,124 | |
| | 5,383 | | | Lock & Lock Co. Ltd. | | | 57,841 | |
| | 403 | | | Lotte Chilsung Beverage Co. Ltd. | | | 789,350 | |
| | 363 | | | Lotte Confectionary Co. Ltd. | | | 633,312 | |
| | 192 | | | Lotte Food Co. Ltd. | | | 151,404 | |
| | 480 | | | LOTTE Himart Co. Ltd. | | | 24,504 | |
| | 5,839 | | | Lotte Non-Life Insurance Co. Ltd.(d) | | | 14,494 | |
| | 2,471 | | | LS Industrial Systems Co. Ltd. | | | 107,722 | |
| | 16,340 | | | Macquarie Korea Infrastructure Fund | | | 114,662 | |
| | 48 | | | Maeil Dairy Industry Co. Ltd. | | | 1,646 | |
| | 6,134 | | | Medy-Tox, Inc. | | | 2,619,749 | |
| | 450 | | | MegaStudyEdu Co. Ltd.(d) | | | 25,302 | |
| | 4,961 | | | Meritz Financial Group, Inc. | | | 63,750 | |
| | 20,522 | | | Meritz Fire & Marine Insurance Co. Ltd. | | | 289,816 | |
| | 135,059 | | | Meritz Securities Co. Ltd. | | | 604,185 | |
| | 44 | | | Mi Chang Oil Industrial Co. Ltd. | | | 2,972 | |
| | 7,984 | | | Mirae Asset Securities Co. Ltd. | | | 178,932 | |
| | 10,335 | | | MK Electron Co. Ltd. | | | 63,730 | |
| | 9,910 | | | Moorim P&P Co. Ltd. | | | 46,766 | |
| | 8,590 | | | Motonic Corp. | | | 94,561 | |
| | 1,038 | | | Muhak Co. Ltd.(d) | | | 43,703 | |
| | 2,496 | | | Namhae Chemical Corp. | | | 22,003 | |
| | 1,118 | | | NCSoft Corp. | | | 185,835 | |
| | 2,438 | | | Neowiz Games Corp.(d) | | | 38,921 | |
| | 3,444 | | | NEPES Corp.(d) | | | 20,180 | |
| | 2,915 | | | Nexen Corp. | | | 216,314 | |
| | 2,396 | | | Nexen Tire Corp. | | | 27,742 | |
| | 18,756 | | | NH Investment & Securities Co. Ltd. | | | 166,164 | |
| | 2,105 | | | NICE Holdings Co. Ltd. | | | 46,991 | |
| | 5,313 | | | NICE Information Service Co. Ltd. | | | 55,691 | |
| | 5,182 | | | NK Co. Ltd. | | | 26,409 | |
| | 588 | | | Nong Shim Holdings Co. Ltd. | | | 77,365 | |
| | 1,420 | | | NongShim Co. Ltd. | | | 459,611 | |
| Shares | | | | | Value | |
| SOUTH KOREA (continued) | | | |
| | 800 | | | Noroo Holdings Co. Ltd. | | $ | 20,175 | |
| | 2,740 | | | NPC | | | 17,545 | |
| | 1,774 | | | OCI Co. Ltd. | | | 127,909 | |
| | 537 | | | OCI Materials Co. Ltd. | | | 43,759 | |
| | 2,234 | | | Osstem Implant Co. Ltd.(d) | | | 130,899 | |
| | 327 | | | Ottogi Corp. | | | 300,884 | |
| | 2,944 | | | Pan-Pacific Co. Ltd. | | | 11,014 | |
| | 1,530 | | | PaperCorea, Inc.(d) | | | 1,349 | |
| | 1,581 | | | Paradise Co. Ltd.(d) | | | 29,954 | |
| | 4,829 | | | Partron Co. Ltd. | | | 41,638 | |
| | 9,216 | | | Poongsan Corp. | | | 208,159 | |
| | 2,204 | | | Poongsan Holdings Corp. | | | 77,620 | |
| | 3,440 | | | POSCO Chemtech Co. Ltd. | | | 43,300 | |
| | 15,438 | | | Posco ICT Co. Ltd. | | | 67,640 | |
| | 601 | | | Posco M-Tech Co. Ltd.(d) | | | 1,260 | |
| | 287 | | | Pulmuone Co. Ltd. | | | 46,698 | |
| | 131,567 | | | Pyeong Hwa Automotive Co. Ltd. | | | 1,684,907 | |
| | 6,560 | | | S&T Dynamics Co. Ltd. | | | 79,695 | |
| | 3,244 | | | S&T Holdings Co. Ltd. | | | 75,690 | |
| | 3,260 | | | S&T Motiv Co. Ltd. | | | 207,315 | |
| | 2,112 | | | S-1 Corp. | | | 183,402 | |
| | 1,110 | | | Sajo Industries Co. Ltd.(d) | | | 66,694 | |
| | 422 | | | Sam Yung Trading Co. Ltd. | | | 8,532 | |
| | 381 | | | Samchully Co. Ltd. | | | 34,255 | |
| | 1,716 | | | SAMHWA Paints Industrial Co. Ltd. | | | 20,170 | |
| | 23,040 | | | Samick Musical Instruments Co. Ltd. | | | 82,051 | |
| | 4,310 | | | Samick THK Co. Ltd. | | | 32,324 | |
| | 3,350 | | | Samjin Pharmaceutical Co. Ltd. | | | 71,846 | |
| | 670 | | | Samkwang Glass Co. Ltd. | | | 56,301 | |
| | 217 | | | Samlip General Foods Co. Ltd. | | | 53,677 | |
| | 3,396 | | | Samsung Card Co. Ltd. | | | 114,982 | |
| | 6,984 | | | Samsung Electro-Mechanics Co. Ltd. | | | 399,418 | |
| | 2,470 | | | Samsung Fine Chemicals Co. Ltd. | | | 81,355 | |
| | 2,960 | | | Samsung Securities Co. Ltd. | | | 125,405 | |
| | 2,751 | | | Samyang Holdings Corp. | | | 387,295 | |
| | 10,570 | | | Savezone I&C Corp. | | | 55,815 | |
| | 5,185 | | | SBS Media Holdings Co. Ltd. | | | 17,737 | |
| | 7,130 | | | Seah Besteel Corp. | | | 179,806 | |
| | 485 | | | SeAH Holdings Corp. | | | 74,448 | |
| | 1,408 | | | SeAH Steel Corp. | | | 78,919 | |
| | 3,695 | | | Sebang Co. Ltd. | | | 58,177 | |
| | 42,886 | | | Seegene, Inc.(d) | | | 1,487,778 | |
| | 5,490 | | | Sejong Industrial Co. Ltd. | | | 53,212 | |
| | 2,631 | | | Seobu T&D(d) | | | 52,041 | |
| | 60,865 | | | Seohee Construction Co. Ltd.(d) | | | 58,460 | |
| | 8,449 | | | Seoul Semiconductor Co. Ltd.(d) | | | 140,810 | |
| | 3,879 | | | Seoyon Co. Ltd. | | | 41,680 | |
| | 2,690 | | | Sewon Cellontech Co. Ltd.(d) | | | 9,651 | |
| Old Westbury Funds, Inc. | |
| Small & Mid Cap Fund | |
| Portfolio of Investments - (Continued) | October 31, 2015 |
| | |
| Shares | | | | | Value | |
| SOUTH KOREA (continued) | | | |
| | 520 | | | Sewon Precision Industry Co. Ltd. | | $ | 11,107 | |
| | 1,290 | | | SFA Engineering Corp. | | | 49,561 | |
| | 15,920 | | | Shin Poong Pharmaceutical Co. Ltd. | | | 58,022 | |
| | 2,335 | | | Shinsegae Co. Ltd. | | | 476,196 | |
| | 342 | | | Shinsegae Information & Communication Co. Ltd. | | | 36,148 | |
| | 176 | | | Shinsegae International Co. Ltd. | | | 17,136 | |
| | 30,047 | | | Shinsung Solar Energy Co. Ltd.(d) | | | 38,348 | |
| | 22,990 | | | Shinsung Tongsang Co. Ltd.(d) | | | 38,617 | |
| | 15,480 | | | Shinwon Corp.(d) | | | 25,663 | |
| | 1,305 | | | Silicon Works Co. Ltd. | | | 38,919 | |
| | 1,338 | | | Silla Co. Ltd. | | | 20,363 | |
| | 1,760 | | | SIMPAC, Inc. | | | 9,942 | |
| | 1,888 | | | SJM Co. Ltd. | | | 10,996 | |
| | 6,916 | | | SK Chemicals Co. Ltd. | | | 410,089 | |
| | 1,888 | | | SK Gas Ltd. | | | 141,097 | |
| | 9,924 | | | SK Networks Co. Ltd. | | | 61,718 | |
| | 39,972 | | | SK Securities Co. Ltd.(d) | | | 41,197 | |
| | 10,160 | | | SKC Co. Ltd. | | | 342,662 | |
| | 2,927 | | | SL Corp. | | | 43,646 | |
| | 3,825 | | | Songwon Industrial Co. Ltd. | | | 36,906 | |
| | 2,204 | | | Soulbrain Co. Ltd. | | | 77,040 | |
| | 3,036 | | | Ssangyong Cement Industrial Co. Ltd.(d) | | | 48,068 | |
| | 7,407 | | | STS Semiconductor & Telecommunications(d) | | | 17,737 | |
| | 1,402 | | | Suheung Co. Ltd. | | | 61,366 | |
| | 620 | | | Sungchang Enterprise Holdings Ltd.(d) | | | 16,016 | |
| | 5,826 | | | Sungshin Cement Co. Ltd.(d) | | | 58,257 | |
| | 214 | | | Sunjin Co. Ltd. | | | 5,237 | |
| | 141 | | | Suprema, Inc.(d) | | | 2,554 | |
| | 6,520 | | | Tae Kyung Industrial Co. Ltd. | | | 35,058 | |
| | 220 | | | Taekwang Industrial Co. Ltd. | | | 214,201 | |
| | 10,606 | | | Taeyoung Engineering & Construction Co. Ltd.(d) | | | 54,795 | |
| | 16,710 | | | Tailim Packaging Industrial Co. Ltd. | | | 46,903 | |
| | 16,250 | | | TK Chemical Corp.(d) | | | 37,487 | |
| | 3,460 | | | TK Corp.(d) | | | 34,295 | |
| | 16,256 | | | Tongyang Life Insurance Co. Ltd. | | | 198,913 | |
| | 3,450 | | | Tovis Co. Ltd. | | | 30,413 | |
| | 1,704 | | | TS Corp. | | | 33,630 | |
| | 1,935 | | | Unid Co. Ltd. | | | 86,732 | |
| | 1,454 | | | Value Added Technologies Co. Ltd. | | | 49,676 | |
| | 1,205 | | | Vieworks Co. Ltd. | | | 40,641 | |
| | 2,705 | | | Wonik IPS Co. Ltd.(d) | | | 22,398 | |
| | 5,662 | | | Woongjin Thinkbig Co. Ltd.(d) | | | 40,626 | |
| | 4,055 | | | Y G-1 Co. Ltd. | | | 39,125 | |
| | 1,080 | | | YESCO Co. Ltd. | | | 35,477 | |
| | 1,004 | | | YG Entertainment, Inc. | | | 40,026 | |
| | 9,270 | | | Yoosung Enterprise Co. Ltd. | | | 34,070 | |
| Shares | | | | | Value | |
| SOUTH KOREA (continued) | | | |
| | 5,543 | | | Youlchon Chemical Co. Ltd. | | $ | 60,047 | |
| | 262 | | | Young Poong Corp. | | | 287,728 | |
| | 2,354 | | | Young Poong Precision Corp. | | | 19,223 | |
| | 3,086 | | | Youngone Corp. | | | 129,660 | |
| | 1,498 | | | Youngone Holdings Co. Ltd. | | | 94,606 | |
| | 454 | | | Yuhan Corp. | | | 112,699 | |
| | | | | | | | 50,860,972 | |
| SPAIN — 0.9% | | | |
| | 6,952 | | | Abengoa SA | | | 8,295 | |
| | 60,180 | | | Abertis Infraestructuras SA | | | 999,934 | |
| | 11,710 | | | Acciona SA | | | 985,212 | |
| | 19,655 | | | Acerinox SA | | | 212,765 | |
| | 80,227 | | | ACS Actividades de Construccion y Servicios SA | | | 2,730,019 | |
| | 12,110 | | | Aena SA(d) | | | 1,351,652 | |
| | 19,684 | | | Almirall SA | | | 379,446 | |
| | 67,000 | | | Amadeus IT Holding SA | | | 2,855,704 | |
| | 7,200 | | | Atresmedia Corp. de Medios de Comunicaion SA | | | 92,397 | |
| | 1,834,512 | | | Banco de Sabadell SA | | | 3,548,469 | |
| | 605,370 | | | Banco Popular Espanol SA | | | 2,307,300 | |
| | 757,400 | | | Bankia SA | | | 976,130 | |
| | 178,993 | | | Bankinter SA | | | 1,298,486 | |
| | 1,315 | | | Baron de Ley(d) | | | 133,976 | |
| | 17,990 | | | Bolsas y Mercados Espanoles SHMSF SA | | | 646,598 | |
| | 20,024 | | | Caja de Ahorros del Mediterraneo(b)(c)(d) | | | 0 | |
| | 4,948 | | | Cementos Portland Valderrivas SA(d) | | | 27,749 | |
| | 11,410 | | | Cia de Distribucion Integral Logista Holdings SA | | | 228,042 | |
| | 16,842 | | | Cie Automotive SA | | | 270,211 | |
| | 452 | | | Construcciones y Auxiliar de Ferrocarriles SA | | | 126,199 | |
| | 7,750 | | | Corp. Financiera Alba SA | | | 342,511 | |
| | 197,780 | | | Distribuidora Internacional de Alimentacion SA | | | 1,258,825 | |
| | 8,393 | | | Duro Felguera SA | | | 19,751 | |
| | 27,960 | | | Ebro Foods SA | | | 530,680 | |
| | 152,602 | | | EDP Renovaveis SA | | | 1,109,720 | |
| | 8,592 | | | Elecnor SA | | | 75,869 | |
| | 126,044 | | | Enagas SA | | | 3,819,242 | |
| | 47,905 | | | Ence Energia y Celulosa SA | | | 168,045 | |
| | 18,452 | | | Ercros SA(d) | | | 16,557 | |
| | 15,889 | | | Faes Farma SA | | | 42,807 | |
| | 62,797 | | | Ferrovial SA | | | 1,585,497 | |
| | 9,353 | | | Fluidra SA | | | 32,912 | |
| | 5,505 | | | Fomento de Construcciones y Contratas SA(d) | | | 42,012 | |
| | 104,222 | | | Gamesa Corp. Tecnologica SA | | | 1,648,633 | |
| | 18,930 | | | Grifols SA | | | 878,035 | |
| | 24,580 | | | Grifols SA - Class B, Preference Shares | | | 854,940 | |
| | 32,474 | | | Grupo Catalana Occidente SA | | | 1,009,880 | |
| | 1,413 | | | Iberpapel Gestion SA | | | 25,622 | |
| Old Westbury Funds, Inc. | |
| Small & Mid Cap Fund | |
| Portfolio of Investments - (Continued) | October 31, 2015 |
| | |
| Shares | | | | | Value | |
| SPAIN (continued) |
| | 26,421 | | | Indra Sistemas SA(d) | | $ | 283,537 | |
| | 67,738 | | | Inmobiliaria Colonial SA(d) | | | 50,205 | |
| | 1,502 | | | Laboratorios Farmaceuticos Rovi SA | | | 22,595 | |
| | 595,581 | | | Liberbank SA(d) | | | 369,381 | |
| | 435,492 | | | Mapfre SA | | | 1,295,395 | |
| | 62,845 | | | Mediaset Espana Comunicacion SA | | | 763,984 | |
| | 11,410 | | | Melia Hotels International SA | | | 165,119 | |
| | 9,143 | | | Miquel y Costas & Miquel SA | | | 326,758 | |
| | 14,127 | | | NH Hotel Group SA(d) | | | 86,529 | |
| | 6,808 | | | Obrascon Huarte Lain SA | | | 54,606 | |
| | 13,616 | | | Obrascon Huarte Lain SA - New Issue Shares 2015 | | | 109,212 | |
| | 63,403 | | | Papeles y Cartones de Europa SA | | | 360,458 | |
| | 9,252 | | | Pescanova SA(b)(c)(d) | | | 0 | |
| | 1,765 | | | Prim SA | | | 17,293 | |
| | 889,006 | | | Prosegur Cia de Seguridad SA | | | 3,959,263 | |
| | 45,411 | | | Red Electrica Corp. SA | | | 4,004,885 | |
| | 114,480 | | | Sacyr SA | | | 289,039 | |
| | 12,977 | | | Tecnicas Reunidas SA | | | 578,940 | |
| | 41,405 | | | Tubacex SA | | | 89,013 | |
| | 13,978 | | | Vidrala SA | | | 662,640 | |
| | 12,350 | | | Viscofan SA | | | 721,677 | |
| | 6,359 | | | Vocento SA(d) | | | 12,027 | |
| | 69,264 | | | Zardoya Otis SA | | | 853,061 | |
| | 19,936 | | | Zeltia SA(d) | | | 88,677 | |
| | | | | | | | 47,804,416 | |
| SWEDEN — 0.8% | | | |
| | 5,518 | | | AAK AB | | | 397,531 | |
| | 10,741 | | | Acando AB | | | 17,538 | |
| | 3,083 | | | AddNode Group AB | | | 21,020 | |
| | 12,158 | | | AddTech AB - Class B | | | 172,902 | |
| | 637,917 | | | AF AB - B Shares(c) | | | 9,445,313 | |
| | 2,072 | | | Atrium Ljungberg AB - Class B | | | 32,134 | |
| | 2,441 | | | Avanza Bank Holding AB | | | 96,285 | |
| | 32,596 | | | Axfood AB | | | 587,933 | |
| | 5,502 | | | B&B Tools AB - Class B | | | 71,805 | |
| | 6,098 | | | Beijer Alma AB | | | 141,323 | |
| | 2,816 | | | Beijer Ref AB | | | 62,625 | |
| | 16,416 | | | Betsson AB | | | 267,081 | |
| | 15,334 | | | Bilia AB | | | 321,270 | |
| | 79,471 | | | BillerudKorsnas AB | | | 1,440,860 | |
| | 4,165 | | | BioGaia AB - Class B | | | 135,038 | |
| | 8,156 | | | Biotage AB | | | 18,520 | |
| | 140,078 | | | Boliden AB | | | 2,682,346 | |
| | 2,022 | | | Bulten AB | | | 19,999 | |
| | 29,620 | | | Bure Equity AB | | | 191,549 | |
| | 24,627 | | | Byggmax Group AB | | | 199,615 | |
| | 8,237 | | | Castellum AB | | | 123,407 | |
| | 1,272 | | | Catena AB | | | 17,866 | |
| | 7,218 | | | Clas Ohlson AB - Class B | | | 109,619 | |
| | 56,029 | | | Cloetta AB - B Shares(d) | | | 167,230 | |
| | 11,559 | | | Doro AB(d) | | | 67,512 | |
| Shares | | | | | Value | |
| SWEDEN (continued) | | | |
| | 13,655 | | | Duni AB | | $ | 207,377 | |
| | 52,670 | | | Elekta AB - Class B | | | 407,191 | |
| | 511,964 | | | Eltel AB(c)(d) | | | 5,632,859 | |
| | 1,207 | | | Enea AB | | | 11,585 | |
| | 7,041 | | | Fabege AB | | | 111,999 | |
| | 2,223 | | | Fagerhult AB | | | 37,989 | |
| | 35,969 | | | Getinge AB - Class B | | | 900,535 | |
| | 22,187 | | | Gunnebo AB | | | 103,098 | |
| | 3,932 | | | Haldex AB | | | 37,854 | |
| | 56,900 | | | Hexpol AB | | | 554,112 | |
| | 5,834 | | | Hiq International AB | | | 33,118 | |
| | 440 | | | HMS Networks AB | | | 11,304 | |
| | 15,282 | | | Holmen AB - Class B | | | 460,953 | |
| | 22,054 | | | Husqvarna AB - Class A | | | 144,427 | |
| | 123,031 | | | Husqvarna AB - Class B | | | 811,466 | |
| | 11,328 | | | Industrial & Financial Systems - Class B | | | 438,214 | |
| | 5,489 | | | Indutrade AB | | | 262,129 | |
| | 31,357 | | | Intrum Justitia AB | | | 1,126,768 | |
| | 13,671 | | | JM AB | | | 386,917 | |
| | 27,115 | | | KappAhl AB | | | 92,038 | |
| | 6,706 | | | KNOW IT AB | | | 42,778 | |
| | 13,464 | | | Kungsleden AB | | | 100,859 | |
| | 8,118 | | | Lagercrantz Group AB - B Shares | | | 61,525 | |
| | 18,526 | | | Lindab International AB | | | 125,877 | |
| | 22,722 | | | Loomis AB - Class B | | | 589,090 | |
| | 68,030 | | | Lundin Petroleum AB(d) | | | 983,397 | |
| | 147,237 | | | Meda AB - Class A | | | 2,166,276 | |
| | 310 | | | Medivir AB - Class B(d) | | | 2,758 | |
| | 9,858 | | | Mekonomen AB | | | 233,655 | |
| | 12,606 | | | Modern Times Group MTG AB - Class B | | | 358,104 | |
| | 4,122 | | | MQ Holding AB | | | 20,505 | |
| | 3,624 | | | Munksjo Oyj | | | 33,794 | |
| | 5,655 | | | Mycronic AB | | | 40,376 | |
| | 2,664 | | | NCC AB - Class A | | | 82,007 | |
| | 40,560 | | | NCC AB - Class B | | | 1,252,850 | |
| | 2,159 | | | Nederman Holding AB | | | 56,859 | |
| | 100,020 | | | Net Insight AB - Class B(d) | | | 31,609 | |
| | 4,881 | | | Netent AB | | | 277,656 | |
| | 16,043 | | | New Wave Group AB - Class B | | | 71,356 | |
| | 13,554 | | | Nibe Industrier AB - Class B | | | 436,435 | |
| | 61,798 | | | Nobia AB | | | 758,049 | |
| | 8,614 | | | Nolato AB - B Shares | | | 236,434 | |
| | 16,154 | | | Nordnet AB - Class B | | | 57,291 | |
| | 53,368 | | | Opus Group AB | | | 34,981 | |
| | 117,641 | | | Peab AB | | | 897,087 | |
| | 12,951 | | | Pricer AB - B Shares(d) | | | 14,098 | |
| | 5,327 | | | Proffice AB - Class B | | | 12,844 | |
| | 33,581 | | | Ratos AB - Class B | | | 196,528 | |
| | 32,557 | | | Rezidor Hotel Group AB | | | 138,329 | |
| | 10,568 | | | Saab AB - Class B | | | 297,735 | |
| | 166 | | | Sagax AB - Class B | | | 1,331 | |
| | 48,567 | | | SAS AB(d) | | | 93,797 | |
| | 4,652 | | | Sectra AB - B Shares | | | 57,173 | |
| Old Westbury Funds, Inc. | |
| Small & Mid Cap Fund | |
| Portfolio of Investments - (Continued) | October 31, 2015 |
| | |
| Shares | | | | | Value | |
| SWEDEN (continued) | | |
| | 89,672 | | | Securitas AB - Class B | | $ | 1,171,339 | |
| | 3,842 | | | Semcon AB | | | 16,504 | |
| | 7,282 | | | SkiStar AB | | | 105,690 | |
| | 31,885 | | | SSAB - A Shares(d) | | | 115,706 | |
| | 63,742 | | | SSAB AB - B Shares(d) | | | 203,272 | |
| | 13,858 | | | Sweco AB - Class B | | | 202,755 | |
| | 2,770 | | | Systemair AB | | | 37,042 | |
| | 167,979 | | | Tele2 AB - B Shares | | | 1,681,058 | |
| | 3,356 | | | Transcom Worldwide AB(d) | | | 31,719 | |
| | 54,462 | | | Trelleborg AB - Class B | | | 920,497 | |
| | 3,694 | | | Vitrolife AB | | | 85,826 | |
| | 17,204 | | | Wallenstam AB | | | 152,436 | |
| | | | | | | | 43,067,541 | |
| SWITZERLAND — 1.4% | | | |
| | 7,763 | | | AFG Arbonia-Forster Holding AG(d) | | | 75,239 | |
| | 450,000 | | | Allied World Assurance Co. Holdings AG | | | 16,362,000 | |
| | 4,301 | | | Allreal Holding AG | | | 570,015 | |
| | 553 | | | Alpiq Holding AG | | | 58,408 | |
| | 934 | | | ALSO Holding AG | | | 57,167 | |
| | 314 | | | APG SGA SA | | | 126,512 | |
| | 33,554 | | | Aryzta AG | | | 1,508,564 | |
| | 11,931 | | | Ascom Holding AG | | | 226,320 | |
| | 827 | | | Autoneum Holding AG | | | 152,022 | |
| | 83 | | | Bachem Holding AG - Class B | | | 4,224 | |
| | 32,904 | | | Baloise Holding AG | | | 3,951,343 | |
| | 640 | | | Bank Coop AG | | | 26,547 | |
| | 277 | | | Banque Cantonale de Geneve | | | 71,741 | |
| | 1,539 | | | Banque Cantonale Vaudoise | | | 948,203 | |
| | 486 | | | Barry Callebaut AG | | | 583,623 | |
| | 942 | | | Basler Kantonalbank | | | 64,328 | |
| | 1,342 | | | Belimo Holding AG | | | 2,878,284 | |
| | 61 | | | Bell AG | | | 167,612 | |
| | 1,144 | | | Berner Kantonalbank AG | | | 212,956 | |
| | 528 | | | BKW AG | | | 20,058 | |
| | 4,131 | | | Bobst Group SA | | | 174,902 | |
| | 1,166 | | | Bossard Holding AG(d) | | | 113,539 | |
| | 2,624 | | | Bucher Industries AG | | | 597,830 | |
| | 31,558 | | | Burckhardt Compression Holding AG(c) | | | 11,014,730 | |
| | 232 | | | Burkhalter Holding AG | | | 24,785 | |
| | 1,012 | | | Calida Holding AG | | | 34,196 | |
| | 36 | | | Carlo Gavazzi Holding AG | | | 7,575 | |
| | 1,410 | | | Cembra Money Bank AG | | | 84,162 | |
| | 178 | | | Cham Paper Holding AG | | | 45,335 | |
| | 230 | | | Cicor Technologies | | | 5,585 | |
| | 40 | | | Cie Financiere Tradition SA | | | 2,503 | |
| | 117,388 | | | Clariant AG | | | 2,161,426 | |
| | 25,725 | | | Coca-Cola HBC AG - CDI | | | 614,691 | |
| | 1,178 | | | Coltene Holding AG | | | 77,048 | |
| | 140 | | | Conzzeta AG | | | 86,752 | |
| | 32,592 | | | Daetwyler Holding AG | | | 4,573,332 | |
| | 821 | | | dorma+kaba Holding AG | | | 512,476 | |
| | 2,326 | | | Dufry AG(d) | | | 272,733 | |
| Shares | | | | | Value | |
| SWITZERLAND (continued) | |
| | 11,406 | | | EFG International AG | | $ | 114,585 | |
| | 844 | | | Emmi AG | | | 381,890 | |
| | 894 | | | EMS-Chemie Holding AG | | | 378,511 | |
| | 2,730 | | | Energiedienst Holding AG | | | 68,909 | |
| | 2,933 | | | Flughafen Zuerich AG | | | 2,222,487 | |
| | 350 | | | Forbo Holding AG | | | 398,351 | |
| | 891 | | | Galenica AG | | | 1,307,046 | |
| | 48,934 | | | GAM Holding AG | | | 896,055 | |
| | 3,045 | | | Gategroup Holding AG | | | 114,290 | |
| | 2,399 | | | Georg Fischer AG | | | 1,475,636 | |
| | 259 | | | Gurit Holding AG | | | 145,163 | |
| | 5,418 | | | Helvetia Holdings AG | | | 2,836,577 | |
| | 3,758 | | | Highlight Communications AG | | | 19,629 | |
| | 201 | | | HOCHDORF Holding AG | | | 33,878 | |
| | 1,537 | | | Huber & Suhner AG | | | 66,319 | |
| | 5,293 | | | Implenia AG | | | 262,388 | |
| | 249 | | | Inficon Holding AG | | | 71,290 | |
| | 136 | | | Interroll Holding AG | | | 105,256 | |
| | 104 | | | Intershop Holding AG | | | 44,138 | |
| | 3,902 | | | Julius Baer Group Ltd. | | | 193,906 | |
| | 1 | | | Jungfraubahn Holding AG | | | 96 | |
| | 1,015 | | | Kardex AG | | | 75,834 | |
| | 1,169 | | | Komax Holding AG | | | 194,902 | |
| | 19,796 | | | Kudelski SA(d) | | | 266,363 | |
| | 325 | | | Kuoni Reisen Holding AG | | | 67,338 | |
| | 26,185 | | | LafargeHolcim Ltd.(d) | | | 1,479,453 | |
| | 161 | | | LEM Holding SA | | | 113,610 | |
| | 13,174 | | | Logitech International SA | | | 193,921 | |
| | 16,086 | | | Lonza Group AG | | | 2,362,980 | |
| | 1,144 | | | Luzerner Kantonalbank AG | | | 422,150 | |
| | 275 | | | MCH Group AG | | | 16,428 | |
| | 80 | | | Metall Zug AG - Class B | | | 203,956 | |
| | 1,111 | | | Meyer Burger Technology AG(d) | | | 7,958 | |
| | 8,521 | | | Micronas Semiconductor Holding AG | | | 36,206 | |
| | 5,152 | | | Mobilezone Holding AG | | | 76,359 | |
| | 2,099 | | | Mobimo Holding AG | | | 453,161 | |
| | 111,727 | | | OC Oerlikon Corp AG(d) | | | 1,072,679 | |
| | 2,840 | | | Orascom Development Holding AG(d) | | | 37,208 | |
| | 8,851 | | | Oriflame Holding AG(d) | | | 122,972 | |
| | 2,459 | | | Orior AG | | | 138,069 | |
| | 1,572 | | | Panalpina Welttransport Holding AG | | | 179,712 | |
| | 3,238 | | | Partners Group Holding AG | | | 1,172,749 | |
| | 281 | | | Phoenix Mecano AG | | | 133,542 | |
| | 140 | | | Plazza AG(d) | | | 27,831 | |
| | 1,315 | | | Rieter Holding AG | | | 216,584 | |
| | 154 | | | Romande Energie Holding SA | | | 145,205 | |
| | 78 | | | Schaffner Holding AG | | | 16,792 | |
| | 129,528 | | | Schmolz & Bickenbach AG(d) | | | 70,762 | |
| | 225 | | | Schweiter Technologies AG | | | 180,510 | |
| | 763 | | | Siegfried Holding AG | | | 152,839 | |
| | 441 | | | Sika AG | | | 1,447,321 | |
| | 1,983 | | | Sonova Holding AG | | | 270,833 | |
| Old Westbury Funds, Inc. | |
| Small & Mid Cap Fund | |
| Portfolio of Investments - (Continued) | October 31, 2015 |
| | |
| Shares | | | | | Value | |
| SWITZERLAND (continued) | | | |
| | 813 | | | St. Galler Kantonalbank AG | | $ | 294,044 | |
| | 202,144 | | | STMicroelectronics NV | | | 1,399,746 | |
| | 75,490 | | | Stmicroelectronics NV(c) | | | 521,319 | |
| | 1,057 | | | Straumann Holding AG | | | 299,418 | |
| | 4,456 | | | Sulzer AG | | | 450,356 | |
| | 8,673 | | | Swiss Life Holding AG | | | 2,071,623 | |
| | 896 | | | Swissquote Group Holding SA | | | 21,574 | |
| | 953 | | | Tamedia AG | | | 160,625 | |
| | 717 | | | Tecan Group AG | | | 97,781 | |
| | 4,539 | | | Temenos Group AG | | | 212,382 | |
| | 4,427 | | | Valiant Holding AG | | | 511,919 | |
| | 1,547 | | | Valora Holding AG | | | 311,450 | |
| | 457 | | | Vaudoise Assurances Holding SA | | | 236,718 | |
| | 24 | | | Vetropack Holding AG | | | 36,906 | |
| | 10,047 | | | Vontobel Holding AG | | | 495,514 | |
| | 1,437 | | | Walter Meier AG | | | 48,993 | |
| | 62 | | | Ypsomed Holding AG | | | 8,154 | |
| | 3,383 | | | Zehnder Group AG | | | 115,339 | |
| | 52 | | | Zug Estates Holding AG - B Shares | | | 74,913 | |
| | 31 | | | Zuger Kantonalbank AG | | | 145,678 | |
| | | | | | | | 78,475,845 | |
| TAIWAN — 0.7% | | | |
| | 61,000 | | | Accton Technology Corp. | | | 38,332 | |
| | 302,878 | | | Acer, Inc.(d) | | | 128,751 | |
| | 64,765 | | | Achem Technology Corp. | | | 26,733 | |
| | 26,497 | | | Action Electronics Co. Ltd.(d) | | | 3,787 | |
| | 9,000 | | | Actron Technology Corp. | | | 31,050 | |
| | 9,470 | | | Adlink Technology, Inc. | | | 25,554 | |
| | 54,060 | | | Advancetek Enterprise Co. Ltd. | | | 30,890 | |
| | 306,694 | | | Airtac International Group | | | 1,596,602 | |
| | 22,045 | | | Alltek Technology Corp. | | | 16,739 | |
| | 29,050 | | | Altek Corp. | | | 24,250 | |
| | 78,000 | | | Ambassador Hotel (The) | | | 67,276 | |
| | 18,000 | | | AMPOC Far-East Co. Ltd. | | | 11,478 | |
| | 24,139 | | | Anpec Electronics Corp. | | | 15,355 | |
| | 42,000 | | | APCB, Inc. | | | 17,660 | |
| | 164,230 | | | Ardentec Corp. | | | 125,208 | |
| | 63,427 | | | Arima Communications Corp.(d) | | | 17,604 | |
| | 28,000 | | | Asia Optical Co., Inc.(d) | | | 26,824 | |
| | 30,100 | | | Asia Vital Components Co. Ltd. | | | 24,385 | |
| | 11,000 | | | Aten International Co. Ltd. | | | 24,498 | |
| | 40,000 | | | AU Optronics Corp. | | | 11,792 | |
| | 44,800 | | | Audix Corp. | | | 48,507 | |
| | 19,000 | | | Aurora Corp. | | | 29,966 | |
| | 87,991 | | | Bank of Kaohsiung Co. Ltd. | | | 24,123 | |
| | 903,350 | | | BES Engineering Corp. | | | 213,152 | |
| | 28,000 | | | Biostar Microtech International Corp.(d) | | | 6,098 | |
| | 1,000 | | | Boardtek Electronics Corp. | | | 1,241 | |
| | 13,000 | | | C Sun Manufacturing Ltd. | | | 6,047 | |
| | 145,781 | | | Capital Securities Corp. | | | 43,379 | |
| Shares | | | | | Value | |
| TAIWAN (continued) | | | |
| | 69,000 | | | Career Technology Manufacturing Co. Ltd. | | $ | 56,750 | |
| | 13,000 | | | Casetek Holdings Ltd. | | | 57,264 | |
| | 149,000 | | | Cathay Real Estate Development Co. Ltd. | | | 64,486 | |
| | 19,760 | | | Central Reinsurance Co. Ltd. | | | 9,404 | |
| | 28,000 | | | Chailease Holding Co. Ltd. | | | 53,734 | |
| | 47,000 | | | ChainQui Construction Development Co. Ltd. | | | 32,503 | |
| | 87,000 | | | Champion Building Materials Co. Ltd.(d) | | | 18,760 | |
| | 1,923 | | | Chang Wah Electromaterials, Inc. | | | 4,905 | |
| | 75,185 | | | Charoen Pokphand Enterprise | | | 51,067 | |
| | 11,000 | | | Chaun-Choung Technology Corp. | | | 25,752 | |
| | 13,000 | | | CHC Resources Corp. | | | 25,669 | |
| | 731,920 | | | Cheng Loong Corp. | | | 259,278 | |
| | 110,797 | | | Cheng Uei Precision Industry Co. Ltd. | | | 162,457 | |
| | 311,659 | | | Chia Hsin Cement Corp. | | | 103,683 | |
| | 118,527 | | | Chicony Electronics Co. Ltd. | | | 283,324 | |
| | 48,120 | | | Chien Kuo Construction Co. Ltd. | | | 14,600 | |
| | 11,164 | | | Chilisin Electronics Corp. | | | 16,043 | |
| | 541,744 | | | China Airlines Ltd.(d) | | | 194,413 | |
| | 64,000 | | | China Chemical & Pharmaceutical Co. Ltd. | | | 36,669 | |
| | 11,000 | | | China Ecotek Corp. | | | 20,635 | |
| | 180,907 | | | China General Plastics Corp. | | | 79,967 | |
| | 314,108 | | | China Life Insurance Co. Ltd. | | | 260,277 | |
| | 63,077 | | | China Metal Products | | | 56,542 | |
| | 395,881 | | | China Petrochemical Development Corp.(d) | | | 100,972 | |
| | 21,114 | | | China Steel Chemical Corp. | | | 79,998 | |
| | 37,000 | | | China Steel Structure Co. Ltd. | | | 21,769 | |
| | 202,321 | | | China Synthetic Rubber Corp. | | | 149,574 | |
| | 96,000 | | | China Wire & Cable Co. Ltd.(d) | | | 34,895 | |
| | 66,883 | | | Chin-Poon Industrial Co. Ltd. | | | 90,239 | |
| | 45,000 | | | Chipbond Technology Corp. | | | 64,318 | |
| | 12,751 | | | Chipmos Technologies, Inc. | | | 12,746 | |
| | 35,876 | | | Chroma ATE, Inc. | | | 64,097 | |
| | 92,000 | | | Chun Yu Works & Co. Ltd. | | | 39,675 | |
| | 162,779 | | | Chun Yuan Steel | | | 48,337 | |
| | 77,779 | | | Chung Hwa Pulp Corp. | | | 23,863 | |
| | 69,125 | | | Chung-Hsin Electric & Machinery Manufacturing Corp. | | | 37,050 | |
| | 228,000 | | | Chunghwa Picture Tubes Ltd.(d) | | | 6,040 | |
| | 4,000 | | | Cleanaway Co. Ltd. | | | 19,714 | |
| | 51,348 | | | Clevo Co. | | | 55,518 | |
| | 26,300 | | | CoAsia Microelectronics Corp.(d) | | | 19,808 | |
| | 53,182 | | | Collins Co. Ltd. | | | 20,396 | |
| | 57,000 | | | Compal Electronics, Inc. | | | 35,643 | |
| Old Westbury Funds, Inc. | |
| Small & Mid Cap Fund | |
| Portfolio of Investments - (Continued) | October 31, 2015 |
| | |
| Shares | | | | | Value | |
| TAIWAN (continued) | | | |
| | 366,000 | | | Compeq Manufacturing Co. Ltd. | | $ | 240,704 | |
| | 51,000 | | | Concord Securities Co. Ltd.(d) | | | 10,306 | |
| | 158,873 | | | Continental Holdings Corp.(d) | | | 52,120 | |
| | 244,500 | | | Coretronic Corp. | | | 225,946 | |
| | 50,000 | | | Coxon Precise Industrial Co. Ltd. | | | 89,639 | |
| | 21,151 | | | CTBC Financial Holding Co. Ltd. | | | 11,630 | |
| | 162,838 | | | CTCI Corp. | | | 212,680 | |
| | 2,638 | | | Cub Elecparts, Inc. | | | 33,232 | |
| | 9,660 | | | Cyberlink Corp. | | | 20,681 | |
| | 10,000 | | | Cyberpower Systems, Inc. | | | 31,112 | |
| | 76,000 | | | DA CIN Construction Co. Ltd. | | | 34,531 | |
| | 15,678 | | | Da-Li Development Co. Ltd. | | | 10,287 | |
| | 70,000 | | | Darfon Electronics Corp. | | | 36,657 | |
| | 66,201 | | | Delpha Construction Co. Ltd.(d) | | | 35,279 | |
| | 24,000 | | | Depo Auto Parts Industrial Co. Ltd. | | | 80,583 | |
| | 17,000 | | | DFI, Inc. | | | 21,051 | |
| | 65,904 | | | D-Link Corp.(d) | | | 21,011 | |
| | 20,183 | | | Dynamic Electronics Co. Ltd.(d) | | | 5,881 | |
| | 54,000 | | | E Ink Holdings, Inc.(d) | | | 26,448 | |
| | 63,675 | | | Eastern Media International Corp.(d) | | | 14,828 | |
| | 13,541 | | | Edom Technology Co. Ltd. | | | 8,905 | |
| | 34,320 | | | Elan Microelectronics Corp. | | | 38,059 | |
| | 14,000 | | | E-LIFE MALL Corp. | | | 25,271 | |
| | 14,400 | | | Elite Advanced Laser Corp. | | | 60,992 | |
| | 94,967 | | | Elite Material Co. Ltd. | | | 195,121 | |
| | 14,000 | | | Elite Semiconductor Memory Technology, Inc. | | | 12,614 | |
| | 96,489 | | | Elitegroup Computer Systems Co. Ltd. | | | 67,172 | |
| | 13,000 | | | eMemory Technology, Inc. | | | 134,151 | |
| | 8,480 | | | ENG Electric Co. Ltd. | | | 4,258 | |
| | 133,000 | | | EnTie Commercial Bank Co. Ltd. | | | 62,273 | |
| | 75,015 | | | Epistar Corp. | | | 67,936 | |
| | 105,806 | | | Eternal Materials Co. Ltd. | | | 100,384 | |
| | 68,000 | | | E-Ton Solar Tech Co. Ltd.(d) | | | 25,345 | |
| | 474,272 | | | Eva Airways Corp.(d) | | | 279,039 | |
| | 40,000 | | | Everest Textile Co. Ltd. | | | 20,207 | |
| | 99,000 | | | Evergreen International Storage & Transport Corp. | | | 41,169 | |
| | 297,138 | | | Evergreen Marine Corp. Taiwan Ltd. | | | 132,718 | |
| | 100,231 | | | Everlight Chemical Industrial Corp. | | | 64,529 | |
| | 75,643 | | | Everlight Electronics Co. Ltd. | | | 115,223 | |
| | 35,373 | | | Excelsior Medical Co. Ltd. | | | 53,501 | |
| | 192,062 | | | Far Eastern Department Stores Ltd. | | | 116,550 | |
| | 688,085 | | | Far Eastern International Bank | | | 214,076 | |
| | 478 | | | Faraday Technology Corp. | | | 782 | |
| Shares | | | | | Value | |
| TAIWAN (continued) | | | |
| | 43,000 | | | Farglory F T Z Investment Holding Co. Ltd.(d) | | $ | 20,862 | |
| | 156,133 | | | Federal Corp. | | | 71,181 | |
| | 56,320 | | | Feng Hsin Steel Co. Ltd. | | | 65,058 | |
| | 19,000 | | | First Copper Technology Co. Ltd. | | | 4,302 | |
| | 62,293 | | | First Hotel | | | 37,610 | |
| | 108,000 | | | First Insurance Co. Ltd. (The) | | | 43,581 | |
| | 11,045 | | | FLEXium Interconnect, Inc. | | | 31,029 | |
| | 9,955 | | | Flytech Technology Co. Ltd. | | | 31,892 | |
| | 48,000 | | | Formosa Advanced Technologies Co. Ltd. | | | 30,163 | |
| | 9,764 | | | Formosa International Hotels Corp. | | | 67,523 | |
| | 48,203 | | | Formosa Oilseed Processing Co. Ltd. | | | 34,597 | |
| | 120,000 | | | Formosa Taffeta Co. Ltd. | | | 119,026 | |
| | 188,000 | | | Formosan Rubber Group, Inc. | | | 106,557 | |
| | 108,628 | | | Formosan Union Chemical | | | 51,531 | |
| | 33,000 | | | Fortune Electric Co. Ltd. | | | 15,909 | |
| | 55,439 | | | Founding Construction & Development Co. Ltd. | | | 29,117 | |
| | 90,321 | | | Froch Enterprise Co. Ltd. | | | 27,822 | |
| | 61,518 | | | FSP Technology, Inc. | | | 38,468 | |
| | 15,000 | | | Fubon No. 1 REIT | | | 7,351 | |
| | 89,000 | | | Fubon No. 2 REIT | | | 34,269 | |
| | 52,800 | | | Fullerton Technology Co. Ltd. | | | 39,360 | |
| | 105,412 | | | Fwusow Industry Co. Ltd. | | | 47,895 | |
| | 34,639 | | | G Shank Enterprise Co. Ltd. | | | 23,901 | |
| | 7,535 | | | GeoVision, Inc. | | | 18,731 | |
| | 77,000 | | | Getac Technology Corp. | | | 52,656 | |
| | 183,781 | | | Gigabyte Technology Co. Ltd. | | | 192,479 | |
| | 2,400 | | | Gigasolar Materials Corp. | | | 46,575 | |
| | 290,000 | | | Ginko International Co. Ltd. | | | 3,090,856 | |
| | 2,474 | | | Gintech Energy Corp.(d) | | | 1,825 | |
| | 12,000 | | | Global Lighting Technologies, Inc. | | | 24,249 | |
| | 76,650 | | | Globe Union Industrial Corp. | | | 36,243 | |
| | 164,770 | | | Gold Circuit Electronics Ltd.(d) | | | 57,607 | |
| | 370,852 | | | Goldsun Building Materials Co. Ltd. | | | 108,525 | |
| | 7,000 | | | Gourmet Master Co. Ltd. | | | 42,694 | |
| | 344,000 | | | Grand Pacific Petrochemical | | | 169,014 | |
| | 19,000 | | | Grape King Bio Ltd. | | | 104,764 | |
| | 59,000 | | | Great China Metal Industry | | | 52,433 | |
| | 66,000 | | | Great Taipei Gas Co. Ltd. | | | 44,930 | |
| | 127,946 | | | Great Wall Enterprise Co. Ltd. | | | 77,642 | |
| | 27,000 | | | GTM Holdings Corp.(d) | | | 10,105 | |
| | 35,000 | | | Hannstar Board Corp. | | | 11,536 | |
| | 618,000 | | | HannStar Display Corp.(d) | | | 81,287 | |
| | 30,300 | | | Harvatek Corp. | | | 12,227 | |
| | 110,000 | | | Hey Song Corp. | | | 108,091 | |
| | 66,666 | | | Highwealth Construction Corp. | | | 98,571 | |
| | 7,000 | | | Hiroca Holdings Ltd. | | | 27,600 | |
| | 620 | | | Hitron Technology, Inc. | | | 262 | |
| | 13,309 | | | Hiwin Technologies Corp. | | | 74,409 | |
| Old Westbury Funds, Inc. | |
| Small & Mid Cap Fund | |
| Portfolio of Investments - (Continued) | October 31, 2015 |
| | |
| Shares | | | | | Value | |
| TAIWAN (continued) | | | |
| | 92,506 | | | Ho Tung Chemical Corp.(d) | | $ | 21,429 | |
| | 139,000 | | | Hocheng Corp. | | | 35,538 | |
| | 28,800 | | | Holiday Entertainment Co. Ltd. | | | 48,616 | |
| | 28,294 | | | Holy Stone Enterprise Co. Ltd. | | | 28,762 | |
| | 62,000 | | | Hong Tai Electric Industrial | | | 15,794 | |
| | 17,507 | | | Hota Industrial Manufacturing Co. Ltd. | | | 58,243 | |
| | 68,678 | | | Hsin Kuang Steel Co. Ltd. | | | 29,300 | |
| | 56,993 | | | Hsing TA Cement Co.(b) | | | 18,434 | |
| | 11,000 | | | Hu Lane Associate, Inc. | | | 50,996 | |
| | 253,000 | | | HUA ENG Wire & Cable Co. Ltd.(d) | | | 56,034 | |
| | 479 | | | Huaku Development Co. Ltd. | | | 910 | |
| | 31,000 | | | Hung Ching Development & Construction Co. Ltd. | | | 16,425 | |
| | 109,514 | | | Hung Poo Real Estate Development Corp. | | | 73,373 | |
| | 102,000 | | | Hung Sheng Construction Ltd. | | | 49,329 | |
| | 41,991 | | | Hwa Fong Rubber Co. Ltd. | | | 16,945 | |
| | 34,341 | | | Ichia Technologies, Inc. | | | 19,781 | |
| | 22,000 | | | I-Chiun Precision Industry Co. Ltd. | | | 7,658 | |
| | 31,000 | | | ILI Technology Corp. | | | 47,030 | |
| | 3,000 | | | Infortrend Technology, Inc. | | | 1,294 | |
| | 440,155 | | | Inventec Corp. | | | 253,543 | |
| | 2,000 | | | I-Sheng Electric Wire & Cable Co. Ltd. | | | 1,950 | |
| | 44,691 | | | ITE Technology, Inc. | | | 38,271 | |
| | 14,000 | | | Jess-Link Products Co. Ltd. | | | 14,835 | |
| | 139,723 | | | Jih Sun Financial Holdings Co. Ltd. | | | 31,591 | |
| | 4,680 | | | Johnson Health Tech Co. Ltd. | | | 8,592 | |
| | 13,000 | | | Kaulin Manufacturing Co. Ltd. | | | 7,028 | |
| | 165,823 | | | KEE TAI Properties Co. Ltd. | | | 87,347 | |
| | 142,825 | | | Kenda Rubber Industrial Co. Ltd. | | | 230,537 | |
| | 24,000 | | | Kenmec Mechanical Engineering Co. Ltd. | | | 9,315 | |
| | 62,000 | | | Kerry TJ Logistics Co. Ltd. | | | 74,102 | |
| | 171,000 | | | Kindom Construction Corp. | | | 96,394 | |
| | 132,000 | | | King Slide Works Co. Ltd. | | | 1,734,194 | |
| | 157,184 | | | King Yuan Electronics Co. Ltd. | | | 100,711 | |
| | 331,185 | | | King’s Town Bank Co. Ltd. | | | 264,226 | |
| | 27,062 | | | King’s Town Construction Co. Ltd. | | | 15,464 | |
| | 16,000 | | | Kinik Co. | | | 28,192 | |
| | 244,343 | | | Kinpo Electronics, Inc.(d) | | | 79,783 | |
| | 56,000 | | | Kinsus Interconnect Technology Corp. | | | 115,403 | |
| | 534,123 | | | KMC Kuei Meng International, Inc. | | | 2,196,480 | |
| | 16,328 | | | KS Terminals, Inc. | | | 19,943 | |
| | 11,000 | | | Kung Long Batteries Industrial Co. Ltd. | | | 40,830 | |
| | 40,000 | | | Kung Sing Engineering Corp.(d) | | | 14,108 | |
| | 152,982 | | | Kuoyang Construction Co. Ltd. | | | 53,250 | |
| Shares | | | | | Value | |
| TAIWAN (continued) | | | |
| | 191,040 | | | Kwong Fong Industries Corp.(b) | | $ | 102,983 | |
| | 111,770 | | | KYE Systems Corp.(d) | | | 34,946 | |
| | 32,000 | | | L&K Engineering Co. Ltd. | | | 18,482 | |
| | 237,714 | | | Lealea Enterprise Co. Ltd. | | | 69,271 | |
| | 43,000 | | | LEE CHI Enterprises Co. Ltd. | | | 16,425 | |
| | 60,638 | | | Leofoo Development Co. Ltd. | | | 20,080 | |
| | 167,788 | | | Li Peng Enterprise Co. Ltd.(d) | | | 47,344 | |
| | 32,080 | | | Lian Hwa Food Corp. | | | 27,323 | |
| | 292,616 | | | Lien Hwa Industrial Corp. | | | 180,274 | |
| | 70,000 | | | Lingsen Precision Industries Ltd. | | | 21,239 | |
| | 53,882 | | | Lite-On Semiconductor Corp. | | | 38,009 | |
| | 75,000 | | | Lite-On Technology Corp. | | | 78,088 | |
| | 64,000 | | | Long Bon International Co. Ltd. | | | 40,710 | |
| | 292,934 | | | Long Chen Paper Co. Ltd. | | | 106,477 | |
| | 6,000 | | | Longwell Co. | | | 4,463 | |
| | 9,451 | | | Lotes Co. Ltd. | | | 31,296 | |
| | 69,000 | | | Lucky Cement Corp. | | | 21,785 | |
| | 13,939 | | | Lumax International Corp. Ltd. | | | 19,966 | |
| | 183,509 | | | Macronix International(d) | | | 26,964 | |
| | 7,632 | | | Makalot Industrial Co. Ltd. | | | 58,304 | |
| | 44,000 | | | Marketech International Corp. | | | 30,631 | |
| | 145,892 | | | Masterlink Securities Corp. | | | 42,019 | |
| | 2,152 | | | Mayer Steel Pipe Corp. | | | 895 | |
| | 31,440 | | | Meiloon Industrial Co. Ltd. | | | 12,106 | |
| | 146,188 | | | Mercuries & Associates Holding Ltd. | | | 96,142 | |
| | 1,921 | | | Mercuries Life Insurance Co. Ltd. | | | 1,178 | |
| | 35,130 | | | Merida Industry Co. Ltd. | | | 206,147 | |
| | 27,091 | | | Merry Electronics Co. Ltd. | | | 52,157 | |
| | 160,404 | | | Micro-Star International Co. Ltd. | | | 163,549 | |
| | 37,369 | | | Mirle Automation Corp. | | | 32,979 | |
| | 70,822 | | | Mosel Vitelic, Inc.(d) | | | 5,039 | |
| | 111,000 | | | Motech Industries Inc.(d) | | | 145,146 | |
| | 4,000 | | | Nak Sealing Technologies Corp. | | | 8,995 | |
| | 24,000 | | | Namchow Chemical Industrial Co. Ltd. | | | 52,193 | |
| | 28,590 | | | Nan Kang Rubber Tire Co. Ltd.(d) | | | 25,320 | |
| | 49,000 | | | Nan Ren Lake Leisure Amusement Co. Ltd. | | | 13,947 | |
| | 38,000 | | | Nan Ya Printed Circuit Board Corp. | | | 38,569 | |
| | 35,969 | | | Nantex Industry Co. Ltd. | | | 30,414 | |
| | 21,000 | | | National Petroleum Co. Ltd. | | | 23,385 | |
| | 123,662 | | | Neo Solar Power Corp. | | | 84,375 | |
| | 10,000 | | | New Era Electronics Co. Ltd. | | | 6,838 | |
| | 34,043 | | | Nichidenbo Corp. | | | 26,164 | |
| | 40,267 | | | Nien Hsing Textile Co. Ltd. | | | 26,110 | |
| | 4,000 | | | Nishoku Technology, Inc. | | | 5,187 | |
| | 32,000 | | | Novatek Microelectronics Corp. | | | 109,415 | |
| | 23,000 | | | Ocean Plastics Co. Ltd.(d) | | | 20,334 | |
| | 171,000 | | | OptoTech Corp. | | | 55,045 | |
| Old Westbury Funds, Inc. | |
| Small & Mid Cap Fund | |
| Portfolio of Investments - (Continued) | October 31, 2015 |
| | |
| Shares | | | | | Value | |
| TAIWAN (continued) | | | |
| | 71,000 | | | Orient Semiconductor Electronics Ltd.(d) | | $ | 25,807 | |
| | 93,500 | | | Oriental Union Chemical Corp. | | | 70,132 | |
| | 555,000 | | | Pacific Hospital Supply Co. Ltd. | | | 1,157,408 | |
| | 159,453 | | | Pan Jit International, Inc. | | | 63,362 | |
| | 11,000 | | | Parade Technologies Ltd. | | | 85,049 | |
| | 4,242 | | | Paragon Technologies Co. Ltd. | | | 4,750 | |
| | 13,166 | | | PChome Online, Inc. | | | 148,031 | |
| | 70,746 | | | Phihong Technology Co. Ltd. | | | 20,899 | |
| | 11,000 | | | Phison Electronics Corp. | | | 79,797 | |
| | 21,000 | | | Pixart Imaging, Inc. | | | 47,158 | |
| | 7,000 | | | Portwell, Inc. | | | 9,013 | |
| | 269,200 | | | Powertech Technology, Inc. | | | 597,052 | |
| | 9,100 | | | Poya International Co. Ltd. | | | 103,716 | |
| | 430,807 | | | President Securities Corp. | | | 192,422 | |
| | 312,370 | | | Prince Housing & Development Corp. | | | 97,184 | |
| | 121,000 | | | Prodisc Technology, Inc.(b)(c)(d) | | | 0 | |
| | 26,000 | | | Promate Electronic Co. Ltd. | | | 22,585 | |
| | 16,000 | | | Promise Technology, Inc. | | | 8,970 | |
| | 755,520 | | | Qisda Corp. | | | 257,166 | |
| | 66,008 | | | Radiant Opto-Electronics Corp. | | | 205,363 | |
| | 135,677 | | | Radium Life Tech Co. Ltd. | | | 52,451 | |
| | 36,825 | | | Realtek Semiconductor Corp. | | | 77,249 | |
| | 45,771 | | | Rechi Precision Co. Ltd. | | | 32,499 | |
| | 35,616 | | | Rich Development Co. Ltd. | | | 11,465 | |
| | 2,856 | | | Richtek Technology Corp. | | | 16,671 | |
| | 18,000 | | | Ruentex Development Co. Ltd. | | | 21,929 | |
| | 102,781 | | | Ruentex Industries Ltd. | | | 189,963 | |
| | 75,335 | | | Sampo Corp. | | | 30,400 | |
| | 34,557 | | | San Fang Chemical Industry Co. Ltd. | | | 43,059 | |
| | 17,600 | | | San Shing Fastech Corp. | | | 35,999 | |
| | 273,080 | | | Sanyang Motor Co. Ltd.(d) | | | 182,538 | |
| | 37,000 | | | Sercomm Corp. | | | 86,164 | |
| | 23,152 | | | Sesoda Corp. | | | 24,283 | |
| | 28,000 | | | Sheng Yu Steel Co. Ltd. | | | 15,353 | |
| | 90,000 | | | Shihlin Electric & Engineering Corp. | | | 110,617 | |
| | 23,000 | | | Shihlin Paper Corp.(d) | | | 21,609 | |
| | 1,062,606 | | | Shin Kong Financial Holding Co. Ltd. | | | 254,985 | |
| | 67,000 | | | Shin Kong No.1 REIT | | | 28,894 | |
| | 3,000 | | | Shin Zu Shing Co. Ltd. | | | 9,703 | |
| | 75,658 | | | Shining Building Business Co. Ltd.(d) | | | 27,151 | |
| | 119,000 | | | Shinkong Insurance Co. Ltd. | | | 82,294 | |
| | 198,314 | | | Shinkong Synthetic Fibers Corp. | | | 54,307 | |
| | 46,000 | | | Shinkong Textile Co. Ltd. | | | 53,774 | |
| | 95,000 | | | Sigurd Microelectronics Corp. | | | 64,087 | |
| | 42,000 | | | Simplo Technology Co. Ltd. | | | 149,429 | |
| | 68,316 | | | Sinbon Electronics Co. Ltd. | | | 121,634 | |
| | 57,170 | | | Sincere Navigation Corp. | | | 31,787 | |
| | 6,487 | | | Sinmag Equipment Corp. | | | 22,680 | |
| Shares | | | | | Value | |
| TAIWAN (continued) | | | |
| | 116,000 | | | Sino-American Silicon Products, Inc. | | $ | 144,538 | |
| | 151,000 | | | Sinon Corp. | | | 65,584 | |
| | 14,564 | | | Sinphar Pharmaceutical Co. Ltd. | | | 13,212 | |
| | 44,487 | | | Sinyi Realty, Inc. | | | 38,919 | |
| | 14,000 | | | Sirtec International Co. Ltd. | | | 17,293 | |
| | 12,000 | | | Sitronix Technology Corp. | | | 33,749 | |
| | 60,000 | | | Siward Crystal Technology Co. Ltd. | | | 36,318 | |
| | 14,013 | | | Solartech Energy Corp. | | | 7,856 | |
| | 15,000 | | | Sonix Technology Co. Ltd. | | | 17,142 | |
| | 132,000 | | | Southeast Cement Co. Ltd. | | | 61,398 | |
| | 5,198 | | | Sporton International, Inc. | | | 31,543 | |
| | 8,560 | | | Standard Chemical & Pharmaceutical Co. Ltd. | | | 9,229 | |
| | 70,481 | | | Standard Foods Corp. | | | 170,647 | |
| | 33,000 | | | Stark Technology, Inc. | | | 26,023 | |
| | 20,000 | | | Sunonwealth Electric Machine Industry Co. Ltd. | | | 10,689 | |
| | 43,000 | | | Sunrex Technology Corp. | | | 19,339 | |
| | 13,000 | | | Sunspring Metal Corp. | | | 18,681 | |
| | 35,138 | | | Supreme Electronics Co. Ltd. | | | 15,045 | |
| | 90,874 | | | Sweeten Construction Co. Ltd. | | | 43,948 | |
| | 15,000 | | | Syncmold Enterprise Corp. | | | 23,565 | |
| | 191,875 | | | TA Chen Stainless Pipe Co. Ltd. | | | 93,090 | |
| | 676,807 | | | TA Chong Bank Ltd.(d) | | | 287,706 | |
| | 107,340 | | | Ta Ya Electric Wire & Cable(d) | | | 16,003 | |
| | 53,000 | | | Tah Hsin Industrial Corp. | | | 38,529 | |
| | 3,251 | | | TA-I Technology Co. Ltd. | | | 1,472 | |
| | 750,159 | | | Taichung Commercial Bank Co. Ltd. | | | 228,998 | |
| | 11,000 | | | Taiflex Scientific Co. Ltd. | | | 13,384 | |
| | 35,000 | | | Tainan Enterprises Co. Ltd. | | | 28,301 | |
| | 878,045 | | | Tainan Spinning Co. Ltd. | | | 417,878 | |
| | 71,716 | | | Taisun Enterprise Co. Ltd.(d) | | | 22,864 | |
| | 116,924 | | | Taita Chemical Co. Ltd.(d) | | | 32,848 | |
| | 12,000 | | | Taiwan Acceptance Corp. | | | 28,167 | |
| | 2,205,184 | | | Taiwan Business Bank(d) | | | 567,200 | |
| | 31,088 | | | Taiwan Cogeneration Corp. | | | 21,882 | |
| | 6,000 | | | Taiwan FamilyMart Co. Ltd. | | | 39,182 | |
| | 16,000 | | | Taiwan Fertilizer Co. Ltd. | | | 20,478 | |
| | 79,320 | | | Taiwan Fire & Marine Insurance Co. Ltd. | | | 53,998 | |
| | 44,000 | | | Taiwan FU Hsing Industrial Co. Ltd. | | | 73,325 | |
| | 162,223 | | | Taiwan Glass Industrial Corp.(d) | | | 64,213 | |
| | 42,081 | | | Taiwan Hon Chuan Enterprise Co. Ltd. | | | 66,887 | |
| | 30,000 | | | Taiwan Hopax Chemicals Manufacturing Co. Ltd. | | | 18,066 | |
| | 145,643 | | | Taiwan Land Development Corp. | | | 48,228 | |
| | 11,548 | | | Taiwan Line Tek Electronic | | | 5,674 | |
| | 46,150 | | | Taiwan Mask Corp. | | | 11,145 | |
| | 49,544 | | | Taiwan Navigation Co. Ltd. | | | 20,756 | |
| Old Westbury Funds, Inc. | |
| Small & Mid Cap Fund | |
| Portfolio of Investments - (Continued) | October 31, 2015 |
| | |
| Shares | | | | | Value | |
| TAIWAN (continued) | | | |
| | 130,032 | | | Taiwan Paiho Ltd. | | $ | 312,027 | |
| | 102,000 | | | Taiwan PCB Techvest Co. Ltd. | | | 113,897 | |
| | 60,120 | | | Taiwan Pulp & Paper Corp.(d) | | | 19,908 | |
| | 56,408 | | | Taiwan Secom Co. Ltd. | | | 169,762 | |
| | 48,000 | | | Taiwan Semiconductor Co. Ltd. | | | 41,992 | |
| | 85,010 | | | Taiwan Sogo Shin Kong Security Co. Ltd. | | | 102,650 | |
| | 57,500 | | | Taiwan Styrene Monomer(d) | | | 25,063 | |
| | 52,875 | | | Taiwan Surface Mounting Technology Corp. | | | 49,433 | |
| | 123,469 | | | Taiwan TEA Corp. | | | 54,197 | |
| | 71,000 | | | Taiwan Union Technology Corp. | | | 60,801 | |
| | 61,322 | | | Taiyen Biotech Co. Ltd. | | | 45,902 | |
| | 1,170,000 | | | Teco Electric and Machinery Co. Ltd. | | | 1,023,550 | |
| | 31,000 | | | Test Research, Inc. | | | 54,526 | |
| | 24,000 | | | Test Rite International Co. Ltd. | | | 15,045 | |
| | 17,000 | | | Thinking Electronic Industrial Co. Ltd. | | | 23,225 | |
| | 25,525 | | | Thye Ming Industrial Co, Ltd. | | | 23,745 | |
| | 41,000 | | | T-Mac Techvest PCB Co. Ltd. | | | 15,661 | |
| | 220,100 | | | Ton Yi Industrial Corp. | | | 107,801 | |
| | 8,000 | | | Tong Hsing Electronic Industries Ltd. | | | 20,331 | |
| | 28,834 | | | Tong Yang Industry Co. Ltd. | | | 31,664 | |
| | 86,946 | | | Tong-Tai Machine & Tool Co. Ltd. | | | 64,680 | |
| | 57,512 | | | Topco Scientific Co. Ltd. | | | 91,414 | |
| | 50,049 | | | Topoint Technology Co. Ltd. | | | 40,855 | |
| | 8,000 | | | Toung Loong Textile Manufacturing Co. | | | 24,224 | |
| | 13,137 | | | Transcend Information, Inc. | | | 36,704 | |
| | 7,988 | | | Tsann Kuen Enterprise Co. Ltd. | | | 5,389 | |
| | 36,942 | | | TSRC Corp. | | | 25,319 | |
| | 22,000 | | | Ttet Union Corp. | | | 50,555 | |
| | 116,315 | | | Tung Ho Steel Enterprise Corp. | | | 63,239 | |
| | 105,000 | | | Tung Thih Electronic Co. Ltd. | | | 865,202 | |
| | 91,815 | | | TXC Corp. | | | 107,474 | |
| | 37,000 | | | TYC Brother Industrial Co. Ltd. | | | 26,898 | |
| | 176,303 | | | Tycoons Group Enterprise(d) | | | 22,158 | |
| | 75,458 | | | Tyntek Corp. | | | 35,796 | |
| | 22,000 | | | U-Ming Marine Transport Corp. | | | 26,091 | |
| | 394,686 | | | Union Bank of Taiwan | | | 116,715 | |
| | 32,762 | | | Union Insurance Co. Ltd. | | | 18,216 | |
| | 258,037 | | | Unitech Printed Circuit Board Corp. | | | 92,203 | |
| | 56,000 | | | United Integrated Services Co. Ltd. | | | 66,154 | |
| | 294,433 | | | Universal Cement Corp. | | | 208,149 | |
| | 103,922 | | | UPC Technology Corp. | | | 31,788 | |
| | 62,337 | | | USI Corp. | | | 26,019 | |
| | 77,000 | | | Vanguard International Semiconductor Corp. | | | 99,501 | |
| | 56,800 | | | Ve Wong Corp. | | | 37,618 | |
| | 28,000 | | | Visual Photonics Epitaxy Co. Ltd. | | | 33,207 | |
| Shares | | | | | Value | |
| TAIWAN (continued) | | | |
| | 1,212 | | | Wafer Works Corp.(d) | | $ | 414 | |
| | 84,000 | | | Wah Lee Industrial Corp. | | | 117,862 | |
| | 974,000 | | | Walsin Lihwa Corp.(d) | | | 235,523 | |
| | 172,942 | | | Walsin Technology Corp. | | | 95,891 | |
| | 185,000 | | | Walton Advanced Engineering, Inc. | | | 54,708 | |
| | 183,300 | | | Wan Hai Lines Ltd. | | | 121,679 | |
| | 53,000 | | | Wei Chuan Foods Corp.(d) | | | 31,672 | |
| | 30,100 | | | Weikeng Industrial Co. Ltd. | | | 18,127 | |
| | 28,006 | | | Win Semiconductors Corp. | | | 38,174 | |
| | 517,977 | | | Winbond Electronics Corp.(d) | | | 125,571 | |
| | 44,673 | | | Wintek Corp.(b)(c)(d) | | | 472 | |
| | 94,297 | | | Wisdom Marine Lines Co. Ltd. | | | 107,039 | |
| | 186,319 | | | Wistron Corp. | | | 94,125 | |
| | 32,850 | | | Wistron NeWeb Corp. | | | 86,822 | |
| | 128,865 | | | WPG Holdings Co. Ltd. | | | 134,964 | |
| | 60,120 | | | WT Microelectronics Co. Ltd. | | | 67,503 | |
| | 17,000 | | | WUS Printed Circuit Co. Ltd. | | | 13,877 | |
| | 10,204 | | | Xxentria Technology Materials Corp. | | | 29,892 | |
| | 199,786 | | | Yageo Corp. | | | 315,709 | |
| | 1,046,600 | | | Yang Ming Marine Transport Corp.(d) | | | 318,847 | |
| | 48,769 | | | YC Co. Ltd. | | | 18,027 | |
| | 70,077 | | | YC INOX Co. Ltd. | | | 42,309 | |
| | 162,624 | | | YFY, Inc. | | | 56,106 | |
| | 31,348 | | | Yi Jinn Industrial Co. Ltd. | | | 13,229 | |
| | 143,321 | | | Yieh Phui Enterprise Co. Ltd. | | | 34,171 | |
| | 11,110 | | | Youngtek Electronics Corp. | | | 16,273 | |
| | 352,000 | | | Yulon Motor Co. Ltd. | | | 374,082 | |
| | 29,000 | | | Yung Chi Paint & Varnish Manufacturing Co. Ltd. | | | 59,673 | |
| | 28,350 | | | YungShin Global Holding Corp. | | | 41,438 | |
| | 75,000 | | | Yungtay Engineering Co. Ltd. | | | 121,290 | |
| | 7,000 | | | Zeng Hsing Industrial Co. Ltd. | | | 29,433 | |
| | 27,000 | | | Zenitron Corp. | | | 13,224 | |
| | 26,000 | | | Zhen Ding Technology Holding Ltd. | | | 74,323 | |
| | 72,826 | | | Zig Sheng Industrial Co. Ltd. | | | 21,222 | |
| | 26,169 | | | Zinwell Corp. | | | 32,244 | |
| | 4,000 | | | Zippy Technology Corp. | | | 4,713 | |
| | | | | | | | 37,981,205 | |
| THAILAND — 0.2% | | | |
| | 84,800 | | | Amata Corp. Public Co. Ltd. - FOR | | | 32,664 | |
| | 714,300 | | | Ananda Development Public Co. Ltd. - FOR | | | 83,545 | |
| | 723,268 | | | AP Thailand Public Co. Ltd. - FOR | | | 122,010 | |
| | 369,200 | | | Asia Plus Group Holdings Securities Plc | | | 38,407 | |
| | 230,200 | | | Bangchak Petroleum Public Co. Ltd. (The) - FOR | | | 232,999 | |
| | 8,125 | | | Bangkok Aviation Fuel Services Public Co. Ltd. - FOR | | | 6,054 | |
| Old Westbury Funds, Inc. | |
| Small & Mid Cap Fund | |
| Portfolio of Investments - (Continued) | October 31, 2015 |
| | |
| Shares | | | | | Value | |
| THAILAND (continued) | | | | |
| | 10,504,250 | | | Bangkok Chain Hospital Public Co. Ltd. - FOR(c) | | $ | 1,963,963 | |
| | 29,000 | | | Bangkok Expressway Public Co. Ltd. - FOR | | | 29,353 | |
| | 27,700 | | | Bangkok Insurance Public Co. Ltd. - FOR | | | 277,253 | |
| | 1,742,100 | | | Bangkok Land Public Co. Ltd. - FOR | | | 76,899 | |
| | 248,800 | | | Banpu Public Co. Ltd. - FOR | | | 151,795 | |
| | 55,800 | | | Berli Jucker Public Co. Ltd. - FOR | | | 58,832 | |
| | 564,708 | | | Cal-Comp Electronics Thailand Public Co. Ltd. - FOR | | | 50,489 | |
| | 93,900 | | | Central Plaza Hotel Public Co. Ltd. - FOR | | | 100,322 | |
| | 202,622 | | | CH Karnchang Public Co. Ltd. - FOR | | | 160,935 | |
| | 29,800 | | | Charoong Thai Wire & Cable Public Co. Ltd. - FOR | | | 7,960 | |
| | 248,600 | | | Delta Electronics Thailand Public Co. Ltd. - FOR | | | 590,615 | |
| | 13,400 | | | Dhipaya Insurance Public Co. Ltd. - FOR | | | 14,411 | |
| | 499,200 | | | Dynasty Ceramic Public Co. Ltd. | | | 56,983 | |
| | 7,839,000 | | | Eastern Water Resources Development and Management Public Co. Ltd. - FOR(c) | | | 2,490,496 | |
| | 31,500 | | | Electricity Generating Public Co. Ltd. - FOR | | | 137,717 | |
| | 166,300 | | | Erawan Group Public Co. Ltd. (The) - FOR | | | 18,609 | |
| | 541,100 | | | Esso Thailand Public Co. Ltd. - FOR(d) | | | 85,195 | |
| | 1,210,200 | | | G J Steel Public Co. Ltd. - FOR(d) | | | 7,486 | |
| | 72,000 | | | GFPT Public Co. Ltd. - FOR | | | 21,255 | |
| | 256,400 | | | Grand Canal Land Public Co. Ltd. - FOR | | | 21,771 | |
| | 119,900 | | | Hana Microelectronics Public Co. Ltd. - FOR | | | 116,301 | |
| | 449,640 | | | Home Product Center Public Co. Ltd. - FOR | | | 88,493 | |
| | 63,100 | | | ICC International Public Co. Ltd. - FOR | | | 68,524 | |
| | 734,300 | | | IRPC Public Co. Ltd. - FOR | | | 84,233 | |
| | 314,991 | | | Italian-Thai Development Public Co. Ltd. - FOR(d) | | | 73,063 | |
| | 647,400 | | | Jasmine International Public Co. Ltd. | | | 120,133 | |
| | 43,700 | | | KCE Electronics Public Co. Ltd. - FOR | | | 75,869 | |
| | 178,900 | | | KGI Securities Thailand Public Co. Ltd. - FOR | | | 17,001 | |
| | 288,060 | | | Khon Kaen Sugar Industry Public Co. Ltd. | | | 33,206 | |
| | 81,600 | | | Kiatnakin Bank Public Co. Ltd. - FOR | | | 76,857 | |
| Shares | | | | | Value | |
| THAILAND (continued) | | | | |
| | 59,000 | | | Land and Houses Public Co. Ltd. - FOR | | $ | 14,100 | |
| | 90,560 | | | Land and Houses Public Co. Ltd. - NVDR | | | 21,770 | |
| | 21,900 | | | Lanna Resources Public Co. Ltd. - FOR | | | 6,711 | |
| | 420,630 | | | Loxley Public Co. Ltd. - FOR | | | 31,931 | |
| | 104,200 | | | LPN Development Public Co. Ltd. - FOR | | | 52,441 | |
| | 85,600 | | | Major Cineplex Group Public Co. Ltd. - FOR | | | 74,607 | |
| | 30,600 | | | Maybank Kim Eng Securities Thailand Public Co. Ltd. - FOR | | | 19,788 | |
| | 369,000 | | | MBK Public Co. Ltd. - FOR | | | 145,245 | |
| | 34,000 | | | Mermaid Maritime Public Co. Ltd. | | | 4,272 | |
| | 3,100 | | | Muang Thai Insurance Public Co. Ltd. - FOR | | | 13,161 | |
| | 126,800 | | | Polyplex Public Co. Ltd. - FOR | | | 30,659 | |
| | 248,250 | | | Precious Shipping Public Co. Ltd. - FOR(d) | | | 47,462 | |
| | 40,700 | | | Pruksa Real Estate Public Co. Ltd. - FOR | | | 32,040 | |
| | 939,331 | | | Quality Houses Public Co. Ltd. - FOR | | | 67,609 | |
| | 90,300 | | | Ratchaburi Electricity Generating Holding Public Co. Ltd. - FOR | | | 134,558 | |
| | 34,100 | | | Regional Container Lines Public Co. Ltd. - FOR | | | 6,471 | |
| | 88,600 | | | Robinson Department Store Public Co. Ltd. - FOR | | | 98,395 | |
| | 69,300 | | | Saha-Union Public Co. Ltd. - FOR | | | 74,040 | |
| | 94,400 | | | Samart Corp. Public Co. Ltd. - FOR | | | 54,144 | |
| | 35,700 | | | Samart Telcoms Public Co. Ltd. - FOR | | | 17,766 | |
| | 2,562,000 | | | Sansiri Public Co. Ltd. - FOR | | | 123,175 | |
| | 526,176 | | | SC Asset Corp. Public Co. Ltd. - FOR | | | 42,606 | |
| | 13,500 | | | Siam City Cement Public Co. Ltd. - FOR | | | 128,291 | |
| | 56,041 | | | Siam Future Development Public Co. Ltd. - FOR | | | 9,296 | |
| | 49,028 | | | Siam Global House Public Co. Ltd - FOR | | | 14,336 | |
| | 221,900 | | | Siamgas & Petrochemicals Public Co. Ltd. - FOR | | | 70,499 | |
| | 99,500 | | | Sino-Thai Engineering & Construction Public Co. Ltd. - FOR | | | 70,637 | |
| | 92,817 | | | Somboon Advance Technology Public Co. Ltd. - FOR | | | 45,146 | |
| | 56,200 | | | SPCG Public Co. Ltd. | | | 37,922 | |
| | 81,900 | | | Sri Trang Agro-Industry Public Co. Ltd. - FOR | | | 26,020 | |
| Old Westbury Funds, Inc. | |
| Small & Mid Cap Fund | |
| Portfolio of Investments - (Continued) | October 31, 2015 |
| | |
| Shares | | | | | Value | |
| THAILAND (continued) | | | | |
| | 364,000 | | | Srithai Superware Public Co. Ltd. - FOR | | $ | 23,948 | |
| | 141,350 | | | STP & I Public Co. Ltd. - FOR | | | 53,253 | |
| | 165,400 | | | Supalai Public Co. Ltd. - FOR | | | 87,891 | |
| | 1,330,700 | | | Tata Steel Thailand Public Co. Ltd. - FOR(d) | | | 22,074 | |
| | 4,380 | | | Thai Agro Energy | | | 394 | |
| | 410,100 | | | Thai Airways International Public Co. Ltd. - FOR(d) | | | 116,455 | |
| | 22,200 | | | Thai Carbon Black Public Co. Ltd. - FOR(d) | | | 15,417 | |
| | 15,000 | | | Thai Central Chemical Public Co. Ltd. - FOR | | | 11,492 | |
| | 433,200 | | | Thai Oil Public Co. Ltd. - FOR | | | 660,746 | |
| | 18,200 | | | Thai Stanley Electric Public Co. Ltd. - FOR | | | 90,571 | |
| | 55,000 | | | Thai Vegetable Oil Public Co. Ltd. - FOR | | | 40,978 | |
| | 67,100 | | | Thaicom Public Co. Ltd. - FOR | | | 58,955 | |
| | 159,600 | | | Thanachart Capital Public Co. Ltd. - FOR | | | 150,323 | |
| | 17,300 | | | Thitikorn Public Co. Ltd. - FOR | | | 4,621 | |
| | 187,184 | | | Thoresen Thai Agencies Public Co. Ltd. - FOR | | | 54,207 | |
| | 6,053,782 | | | Ticon Industrial Connection Public Co. Ltd. - FOR(c) | | | 2,042,465 | |
| | 80,900 | | | Tisco Financial Group Public Co. Ltd. - FOR | | | 84,158 | |
| | 1,614,800 | | | TPI Polene Public Co. Ltd. - FOR | | | 114,411 | |
| | 62,900 | | | TTCL Public Co. Ltd. | | | 39,791 | |
| | 33,400 | | | TTW Public Co. Ltd. - FOR | | | 10,142 | |
| | 67,100 | | | Unique Engineering & Construction Public Co. Ltd. - FOR | | | 40,561 | |
| | 176,100 | | | Vanachai Group Public Co. Ltd. - FOR | | | 80,209 | |
| | 808,000 | | | Vibhavadi Medical Center Public Co. Ltd. - FOR | | | 34,530 | |
| | 256,900 | | | Vinythai Public Co. Ltd. - FOR | | | 67,895 | |
| | | | | | | | 13,012,283 | |
| TURKEY — 0.1% | | | | |
| | 5,489 | | | Adana Cimento Sanayii T.A.S. - Class A | | | 12,369 | |
| | 8,195 | | | Akcansa Cimento AS | | | 38,511 | |
| | 0 | | | Akenerji Elektrik Uretim AS - Placement Shares(d) | | | 0 | |
| | 13,189 | | | Akfen Holding AS | | | 37,051 | |
| | 0 | | | Akmerkez Gayrimenkul Yatirim Ortakligi AS REIT | | | 2 | |
| | 33,491 | | | Aksa Akrilik Kimya Sanayii AS | | | 122,917 | |
| | 47,331 | | | Aksigorta AS | | | 30,197 | |
| | 1 | | | Alarko Holding AS | | | 1 | |
| | 43,803 | | | Albaraka Turk Katilim Bankasi AS | | | 20,884 | |
| | 31,268 | | | Anadolu Anonim Turk Sigorta Sirketi | | | 16,516 | |
| Shares | | | | | Value | |
| TURKEY (continued) | | | | |
| | 1 | | | Anadolu Cam Sanayii AS(d) | | $ | 1 | |
| | 28,943 | | | Anadolu Hayat Emeklilik AS | | | 53,610 | |
| | 32,317 | | | Arcelik AS | | | 176,250 | |
| | 3,111 | | | Aselsan Elektronik Sanayi Ve Ticaret AS | | | 14,886 | |
| | 302,203 | | | Asya Katilim Bankasi AS(d) | | | 82,926 | |
| | 1 | | | Aygaz AS | | | 4 | |
| | 1 | | | Baticim Bati Anadolu Cimento Sanayii AS | | | 2 | |
| | 0 | | | Bolu Cimento Sanayii AS(d) | | | 0 | |
| | 12,360 | | | Borusan Mannesmann Boru Sanayi ve Ticaret AS | | | 26,540 | |
| | 6,211 | | | Boyner Perakende Ve Tekstil Yatirimlari AS(d) | | | 128,038 | |
| | 13,888 | | | Brisa Bridgestone Sabanci Sanayi ve Ticaret AS | | | 39,872 | |
| | 0 | | | Celebi Hava Servisi AS | | | 5 | |
| | 9,101 | | | Cimsa Cimento Sanayi VE Ticaret AS | | | 49,635 | |
| | 11,012 | | | Deva Holding AS(d) | | | 14,126 | |
| | 0 | | | Dogan Sirketler Grubu Holding AS(d) | | | 0 | |
| | 46,860 | | | Dogus Otomotiv Servis ve Ticaret AS | | | 170,377 | |
| | 7,481 | | | Emlak Konut Gayrimenkul Yatirim Ortakligi AS REIT | | | 7,262 | |
| | 1 | | | Eregli Demir ve Celik Fabrikalari TAS | | | 1 | |
| | 4,905 | | | Ford Otomotiv Sanayi AS | | | 57,708 | |
| | 17,776 | | | Gentas Genel Metal Sanayi ve Ticaret AS | | | 6,890 | |
| | 67,762 | | | Global Yatirim Holding AS(d) | | | 41,372 | |
| | 1,959 | | | Goltas Goller Bolgesi Cimento Sanayi ve Ticaret AS | | | 42,534 | |
| | 1,254 | | | Goodyear Lastikleri TAS | | | 29,292 | |
| | 15,729 | | | Gozde Girisim Sermayesi Yatirim Ortakligi AS(d) | | | 12,948 | |
| | 64,549 | | | GSD Holding AS | | | 26,569 | |
| | 20,444 | | | Gubre Fabrikalari TAS | | | 46,212 | |
| | 1 | | | Hurriyet Gazetecilik ve Matbaacilik AS(d) | | | 0 | |
| | 0 | | | IS Finansal Kiralama AS | | | 0 | |
| | 11,328 | | | IS Yatirim Menkul Degerler AS | | | 3,847 | |
| | 25,002 | | | Izmir Demir Celik Sanayi AS(d) | | | 15,780 | |
| | 30,850 | | | Kardemir Karabuk Demir Celik Sanayi ve Ticaret AS - Class A | | | 17,142 | |
| | 0 | | | Kardemir Karabuk Demir Celik Sanayi ve Ticaret AS - Class B | | | 0 | |
| | 41,670 | | | Kardemir Karabuk Demir Celik Sanayi ve Ticaret AS - Class D | | | 18,724 | |
| | 100,082 | | | Karsan Otomotiv Sanayii Ve Ticaret AS(d) | | | 47,374 | |
| | 428 | | | Kartonsan Karton Sanayi ve Ticaret AS(d) | | | 32,401 | |
| | 242 | | | Konya Cimento Sanayii AS | | | 24,902 | |
| Old Westbury Funds, Inc. | |
| Small & Mid Cap Fund | |
| Portfolio of Investments - (Continued) | October 31, 2015 |
| | |
| Shares | | | | | Value | |
| TURKEY (continued) | | | | |
| | 21,755 | | | Koza Altin Isletmeleri AS | | $ | 122,378 | |
| | 4,718 | | | Mardin Cimento Sanayii ve Ticaret AS | | | 7,266 | |
| | 0 | | | Menderes Tekstil Sanayi ve Ticaret AS(d) | | | 0 | |
| | 13,216 | | | Metro Ticari ve Mali Yatirimlar Holding AS(d) | | | 3,037 | |
| | 5,288 | | | Migros Ticaret AS(d) | | | 31,198 | |
| | 0 | | | NET Holding AS(d) | | | 0 | |
| | 4,289 | | | Netas Telekomunikasyon AS(d) | | | 15,374 | |
| | 2,524 | | | Otokar Otomotiv Ve Savunma Sanayi AS | | | 67,658 | |
| | 39,957 | | | Petkim Petrokimya Holding AS(d) | | | 58,934 | |
| | 5,817 | | | Pinar SUT Mamulleri Sanayii AS | | | 38,010 | |
| | 102,805 | | | Sarkuysan Elektrolitik Bakir Sanayi ve Ticaret AS | | | 86,394 | |
| | 127,519 | | | Sekerbank TAS(d) | | | 67,797 | |
| | 102,576 | | | Selcuk Ecza Deposu Ticaret ve Sanayi AS | | | 84,794 | |
| | 27,716 | | | Soda Sanayii AS | | | 45,822 | |
| | 24,515 | | | TAV Havalimanlari Holding AS | | | 192,561 | |
| | 20,668 | | | Tofas Turk Otomobil Fabrikasi AS | | | 136,469 | |
| | 54,502 | | | Trakya Cam Sanayii AS | | | 36,081 | |
| | 0 | | | Turcas Petrol AS | | | 0 | |
| | 1 | | | Turk Hava Yollari AO(d) | | | 2 | |
| | 1,453 | | | Turk Traktor ve Ziraat Makineleri AS | | | 34,588 | |
| | 1 | | | Turkiye Sinai Kalkinma Bankasi AS | | | 0 | |
| | 133,273 | | | Turkiye Sise ve Cam Fabrikalari AS | | | 152,683 | |
| | 43,081 | | | Turkiye Vakiflar Bankasi TAO | | | 61,473 | |
| | 20,894 | | | Ulker Biskuvi Sanayi AS | | | 141,184 | |
| | 55,650 | | | Vestel Elektonik Sanayi ve Ticaret AS(d) | | | 94,296 | |
| | 0 | | | Zorlu Enerji Elektrik Uretim AS(d) | | | 0 | |
| | | | | | | | 2,943,677 | |
| UKRAINE — 0.0% | | | | |
| | 11,788 | | | Kernel Holding SA | | | 159,233 | |
| UNITED ARAB EMIRATES — 0.1% | | | | |
| | 135,053 | | | Al Noor Hospitals Group Plc | | | 2,448,392 | |
| | 803,345 | | | Gulf Marine Services Plc(c) | | | 1,442,771 | |
| | 101,028 | | | Lamprell Plc(d) | | | 186,893 | |
| | | | | | | | 4,078,056 | |
| UNITED KINGDOM — 5.9% | | | | |
| | 1,160 | | | 4imprint Group Plc | | | 23,158 | |
| | 1 | | | Acacia Mining Plc | | | 3 | |
| | 25,242 | | | Admiral Group Plc | | | 627,665 | |
| | 129,757 | | | Afren Plc(b)(c)(d) | | | 3,571 | |
| | 125,479 | | | Alent Plc | | | 964,866 | |
| | 64,414 | | | Amec Foster Wheeler Plc | | | 706,024 | |
| | 133,911 | | | Amlin Plc | | | 1,360,414 | |
| Shares | | | | | Value | |
| UNITED KINGDOM (continued) | | | | |
| | 8,207 | | | Anglo Pacific Group Plc | | $ | 9,078 | |
| | 1,031 | | | Anglo-Eastern Plantations Plc | | | 9,465 | |
| | 47,156 | | | Ashmore Group Plc | | | 196,277 | |
| | 171,956 | | | Ashtead Group Plc | | | 2,650,860 | |
| | 57,144 | | | Assura Plc | | | 49,552 | |
| | 5,635 | | | Avon Rubber Plc | | | 98,683 | |
| | 112,769 | | | Babcock International Group Plc | | | 1,675,854 | |
| | 183,990 | | | Balfour Beatty Plc(d) | | | 706,825 | |
| | 16,302 | | | BARR (A.G.) Plc | | | 133,069 | |
| | 585,612 | | | Barratt Developments Plc | | | 5,529,495 | |
| | 313,627 | | | BBA Aviation Plc | | | 922,006 | |
| | 276,516 | | | Beazley Plc | | | 1,549,935 | |
| | 78,149 | | | Bellway Plc | | | 3,127,502 | |
| | 49,371 | | | Berendsen Plc | | | 780,127 | |
| | 57,955 | | | Berkeley Group Holdings Plc | | | 2,964,400 | |
| | 2,780 | | | Betfair Group Plc | | | 138,297 | |
| | 3,046 | | | Big Yellow Group Plc REIT | | | 35,218 | |
| | 9,080 | | | Bloomsbury Publishing Plc | | | 23,271 | |
| | 1,360,709 | | | Bodycote Plc | | | 10,802,939 | |
| | 86,952 | | | Booker Group Plc | | | 249,457 | |
| | 2,938 | | | Boot (Henry) Plc | | | 10,462 | |
| | 72,461 | | | Bovis Homes Group Plc | | | 1,144,979 | |
| | 5,675 | | | Braemar Shipping Services Plc | | | 41,118 | |
| | 1,304,657 | | | Brammer Plc | | | 4,630,900 | |
| | 42,050 | | | Brewin Dolphin Holdings Plc | | | 175,025 | |
| | 3,999 | | | British Polythene Industries Plc | | | 46,236 | |
| | 34,518 | | | Britvic Plc | | | 371,957 | |
| | 3,588 | | | BTG Plc(d) | | | 30,532 | |
| | 57,058 | | | Bunzl Plc | | | 1,635,179 | |
| | 391,725 | | | Cable & Wireless Communications Plc | | | 444,456 | |
| | 31,393 | | | Capital & Counties Properties Plc | | | 215,117 | |
| | 91,052 | | | Capital & Regional Plc | | | 98,256 | |
| | 221,512 | | | Carillion Plc | | | 1,043,225 | |
| | 52,386 | | | Chemring Group Plc | | | 138,903 | |
| | 54,990 | | | Chesnara Plc | | | 276,357 | |
| | 56,551 | | | Cineworld Group Plc | | | 481,226 | |
| | 1,606 | | | Clarkson Plc | | | 60,162 | |
| | 55,392 | | | Close Brothers Group Plc | | | 1,250,137 | |
| | 94,320 | | | CNH Industrial NV | | | 637,872 | |
| | 219,654 | | | Cobham Plc | | | 939,662 | |
| | 27,870 | | | Communisis Plc | | | 22,341 | |
| | 50,718 | | | Computacenter Plc | | | 591,481 | |
| | 7,150 | | | Concentric AB | | | 82,643 | |
| | 28,341 | | | Connect Group Plc | | | 73,072 | |
| | 5,916 | | | Consort Medical Plc | | | 89,012 | |
| | 1,730 | | | Costain Group Plc | | | 10,028 | |
| | 10,889 | | | Cranswick Plc | | | 287,887 | |
| | 8,161 | | | Crest Nicholson Holdings Plc | | | 68,440 | |
| | 4,000 | | | Creston Plc | | | 9,311 | |
| | 517,333 | | | Croda International Plc | | | 23,112,026 | |
| | 23,730 | | | Daily Mail & General Trust Plc - Class A | | | 273,999 | |
| | 53,781 | | | Dairy Crest Group Plc | | | 533,930 | |
| Old Westbury Funds, Inc. | |
| Small & Mid Cap Fund | |
| Portfolio of Investments - (Continued) | October 31, 2015 |
| | |
| Shares | | | | | Value | |
| UNITED KINGDOM (continued) | | | | |
| | 25,624 | | | Darty Plc | | $ | 38,909 | |
| | 4,483 | | | De La Rue Plc | | | 31,998 | |
| | 295,249 | | | Debenhams Plc | | | 407,135 | |
| | 8,007 | | | Dechra Pharmaceuticals Plc | | | 119,671 | |
| | 5,405 | | | Derwent London Plc REIT | | | 323,293 | |
| | 26,201 | | | Development Securities Plc | | | 96,333 | |
| | 66,863 | | | Devro Plc | | | 292,734 | |
| | 34,544 | | | Dialog Semiconductor Plc(d) | | | 1,278,240 | |
| | 6,579 | | | Dignity Plc | | | 246,555 | |
| | 1,086,746 | | | Diploma Plc | | | 10,747,171 | |
| | 573,958 | | | Direct Line Insurance Group Plc | | | 3,489,687 | |
| | 192,886 | | | Dixons Carphone Plc | | | 1,371,683 | |
| | 42,149 | | | Domino’s Pizza Group Plc | | | 708,894 | |
| | 17,926 | | | Drax Group Plc | | | 72,016 | |
| | 196,550 | | | DS Smith Plc | | | 1,172,610 | |
| | 6,273 | | | Dunelm Group Plc | | | 91,579 | |
| | 25,606 | | | E2V Technologies Plc | | | 92,172 | |
| | 230,794 | | | Electrocomponents Plc | | | 729,726 | |
| | 2,579,999 | | | Elementis Plc | | | 9,330,759 | |
| | 250,645 | | | Enterprise Inns Plc(d) | | | 415,372 | |
| | 19,328 | | | Essentra Plc | | | 250,881 | |
| | 6,807 | | | Euromoney Institutional Investor Plc | | | 99,532 | |
| | 63,893 | | | Fenner Plc | | | 149,962 | |
| | 8,537 | | | Fidessa Group Plc | | | 257,816 | |
| | 315,745 | | | Fortune Oil Plc(b)(c)(d) | | | 1,825 | |
| | 3,248 | | | Fuller Smith & Turner Plc - Class A | | | 59,084 | |
| | 112,080 | | | G4S Plc | | | 419,341 | |
| | 23,516 | | | Galliford Try Plc | | | 542,694 | |
| | 5,545 | | | Games Workshop Group Plc | | | 47,848 | |
| | 30,949 | | | Gem Diamonds Ltd. | | | 47,234 | |
| | 16,644 | | | Genus Plc | | | 373,328 | |
| | 380,796 | | | GKN Plc | | | 1,685,956 | |
| | 5,199 | | | Go-Ahead Group Plc | | | 194,357 | |
| | 8,861 | | | Great Portland Estates Plc REIT | | | 121,506 | |
| | 995,699 | | | Greene King Plc | | | 12,333,417 | |
| | 42,366 | | | Greggs Plc | | | 775,896 | |
| | 52,704 | | | Halfords Group Plc | | | 353,348 | |
| | 813,753 | | | Halma Plc | | | 9,577,917 | |
| | 47,098 | | | Hammerson Plc REIT | | | 462,137 | |
| | 35,661 | | | Hansteen Holdings Plc REIT | | | 68,224 | |
| | 48,772 | | | Hargreaves Lansdown Plc | | | 1,085,693 | |
| | 162,908 | | | Hays Plc | | | 353,853 | |
| | 7,436 | | | Headlam Group Plc | | | 62,016 | |
| | 45,677 | | | Helical Bar Plc | | | 310,884 | |
| | 1,668,493 | | | HellermannTyton Group Plc | | | 12,189,350 | |
| | 342,353 | | | Henderson Group Plc | | | 1,515,224 | |
| | 71,298 | | | Hikma Pharmaceuticals Plc | | | 2,378,505 | |
| | 38,157 | | | Hill & Smith Holdings Plc | | | 401,464 | |
| | 337 | | | Hilton Food Group Plc | | | 2,416 | |
| | 5,026 | | | Hogg Robinson Group Plc | | | 4,804 | |
| | 429,996 | | | Home Retail Group Plc | | | 744,412 | |
| | 118,642 | | | HomeServe Plc | | | 738,723 | |
| | 211,194 | | | Howden Joinery Group Plc | | | 1,509,366 | |
| Shares | | | | | Value | |
| UNITED KINGDOM (continued) | | | | |
| | 157,885 | | | Hunting Plc | | $ | 875,733 | |
| | 246,887 | | | ICAP Plc | | | 1,674,636 | |
| | 57,706 | | | IG Group Holdings Plc | | | 672,086 | |
| | 26,778 | | | Imagination Technologies Group Plc(d) | | | 91,437 | |
| | 22,425 | | | IMI Plc | | | 329,454 | |
| | 127,273 | | | Inchcape Plc | | | 1,568,643 | |
| | 263,879 | | | Informa Plc | | | 2,310,589 | |
| | 60,633 | | | Inmarsat Plc | | | 920,693 | |
| | 447,863 | | | Innovation Group Plc | | | 274,443 | |
| | 37,089 | | | InterContinental Hotels Group Plc | | | 1,487,151 | |
| | 1,455,547 | | | Interserve Plc(c) | | | 12,487,079 | |
| | 41,164 | | | Intertek Group Plc | | | 1,665,775 | |
| | 65,119 | | | Intu Properties Plc REIT | | | 347,439 | |
| | 42,317 | | | IP Group Plc(d) | | | 155,130 | |
| | 19,803 | | | ITE Group Plc | | | 42,816 | |
| | 34,279 | | | J D Wetherspoon Plc | | | 409,279 | |
| | 475,305 | | | J Sainsbury Plc | | | 1,951,983 | |
| | 8,667 | | | James Fisher & Sons Plc | | | 128,199 | |
| | 28,273 | | | Jardine Lloyd Thompson Group Plc | | | 412,972 | |
| | 29,512 | | | JD Sports Fashion Plc | | | 439,259 | |
| | 9,180 | | | John Menzies Plc | | | 57,173 | |
| | 214,396 | | | John Wood Group Plc | | | 1,973,152 | |
| | 16,171 | | | Johnson Matthey Plc | | | 644,417 | |
| | 953 | | | Johnston Press Plc(d) | | | 1,006 | |
| | 47,912 | | | Jupiter Fund Management Plc | | | 333,038 | |
| | 134,990 | | | Kcom Group Plc | | | 181,047 | |
| | 32,608 | | | Keller Group Plc | | | 409,937 | |
| | 23,449 | | | Kier Group Plc | | | 497,769 | |
| | 84,172 | | | Ladbrokes Plc | | | 137,025 | |
| | 1,443,209 | | | Laird Plc | | | 7,539,981 | |
| | 29,845 | | | Lancashire Holdings Ltd. | | | 327,813 | |
| | 35,863 | | | Lavendon Group Plc | | | 83,206 | |
| | 20,610 | | | Londonmetric Property Plc REIT | | | 53,759 | |
| | 73,424 | | | Lookers Plc | | | 199,101 | |
| | 5,374 | | | Low & Bonar Plc | | | 5,551 | |
| | 6,395 | | | LSL Property Services Plc | | | 32,582 | |
| | 545,879 | | | Man Strategic Holdings Plc(d) | | | 1,406,184 | |
| | 43,460 | | | Marshalls Plc | | | 232,147 | |
| | 203,490 | | | Marston’s Plc | | | 506,937 | |
| | 20,613 | | | McBride Plc | | | 51,081 | |
| | 391,647 | | | McBride Plc - Redeemable ‘B’ Shares(b)(c)(d) | | | 604 | |
| | 9,060 | | | McColl’s Retail Group Plc | | | 20,531 | |
| | 18,776 | | | Mears Group Plc | | | 119,832 | |
| | 270,937 | | | Meggitt Plc | | | 1,476,896 | |
| | 461,992 | | | Melrose Industries Plc | | | 1,895,885 | |
| | 19,068 | | | Merlin Entertainments Plc | | | 121,931 | |
| | 31,505 | | | Michael Page International Plc | | | 240,314 | |
| | 7,044 | | | Micro Focus International Plc | | | 136,389 | |
| | 57,677 | | | Millennium & Copthorne Hotels Plc | | | 428,301 | |
| | 67,961 | | | Mitchells & Butlers Plc(d) | | | 371,613 | |
| Old Westbury Funds, Inc. | |
| Small & Mid Cap Fund | |
| Portfolio of Investments - (Continued) | October 31, 2015 |
| | |
| Shares | | | | | Value | |
| UNITED KINGDOM (continued) | | | | |
| | 134,023 | | | Mitie Group Plc | | $ | 664,041 | |
| | 112,692 | | | Moneysupermarket.com Group Plc | | | 580,589 | |
| | 99,199 | | | Morgan Advanced Materials Plc | | | 427,882 | |
| | 14,135 | | | Morgan Sindall Group Plc | | | 162,339 | |
| | 18,180 | | | Mothercare Plc(d) | | | 66,352 | |
| | 28,165 | | | N Brown Group Plc | | | 162,778 | |
| | 204,239 | | | National Express Group Plc | | | 942,671 | |
| | 3,594 | | | NCC Group Plc | | | 15,292 | |
| | 69,409 | | | Northgate Plc | | | 433,779 | |
| | 23,821 | | | Novae Group Plc | | | 318,749 | |
| | 358,182 | | | Oxford Instruments Plc | | | 2,868,526 | |
| | 104,482 | | | Pace Plc | | | 600,142 | |
| | 5,048 | | | PayPoint Plc | | | 77,041 | |
| | 182,997 | | | Pendragon Plc | | | 126,243 | |
| | 14,289 | | | Pennon Group Plc | | | 178,646 | |
| | 152,395 | | | Persimmon Plc | | | 4,684,522 | |
| | 73,384 | | | Petrofac Ltd. | | | 953,671 | |
| | 36,290 | | | Photo-Me International Plc | | | 88,812 | |
| | 26,456 | | | Playtech Plc | | | 349,114 | |
| | 238,526 | | | Premier Foods Plc(d) | | | 125,021 | |
| | 17,849 | | | Provident Financial Plc | | | 954,801 | |
| | 78,418 | | | PZ Cussons Plc | | | 363,875 | |
| | 195,364 | | | QinetiQ Group Plc | | | 674,624 | |
| | 11,181 | | | Rank Group Plc | | | 47,797 | |
| | 2,451 | | | Rathbone Brothers Plc | | | 85,317 | |
| | 83,996 | | | Redrow Plc | | | 600,952 | |
| | 8,153 | | | Renishaw Plc | | | 237,547 | |
| | 51,233 | | | Renold Plc(d) | | | 51,140 | |
| | 195,018 | | | Rentokil Initial Plc | | | 464,485 | |
| | 17,851 | | | Restaurant Group Plc (The) | | | 197,311 | |
| | 503,230 | | | Rexam Plc | | | 4,189,187 | |
| | 7,870 | | | Ricardo Plc | | | 109,798 | |
| | 13,079 | | | Rightmove Plc | | | 774,038 | |
| | 17,462 | | | Robert Walters Plc | | | 101,486 | |
| | 5,572,791 | | | Rotork Plc | | | 16,099,478 | |
| | 173,243 | | | Royal Mail Plc | | | 1,189,263 | |
| | 50,809 | | | RPC Group Plc | | | 509,907 | |
| | 124,524 | | | RPS Group Plc | | | 451,118 | |
| | 192,274 | | | RSA Insurance Group Plc | | | 1,247,582 | |
| | 13,220 | | | Safestore Holdings Plc REIT | | | 66,336 | |
| | 120,583 | | | Sage Group Plc (The) | | | 1,013,099 | |
| | 22,285 | | | Savills Plc | | | 314,686 | |
| | 23,087 | | | SDL Plc | | | 138,092 | |
| | 71,325 | | | Segro Plc REIT | | | 494,573 | |
| | 159,868 | | | Senior Plc | | | 558,951 | |
| | 76,015 | | | Severfield Plc | | | 72,361 | |
| | 41,002 | | | Severn Trent Plc | | | 1,417,763 | |
| | 19,812 | | | Shaftesbury Plc REIT | | | 287,248 | |
| | 187,716 | | | Shanks Group Plc | | | 274,189 | |
| | 296,710 | | | SIG Plc | | | 610,637 | |
| | 9,250 | | | Skyepharma Plc(d) | | | 44,918 | |
| | 79,757 | | | Smiths Group Plc | | | 1,182,805 | |
| | 68,000 | | | Soco International Plc | | | 185,546 | |
| | 345,425 | | | Spectris Plc | | | 8,876,849 | |
| | 183,962 | | | Speedy Hire Plc | | | 85,787 | |
| Shares | | | | | Value | |
| UNITED KINGDOM (continued) | | | | |
| | 306,651 | | | Spirax-Sarco Engineering Plc | | $ | 14,375,741 | |
| | 129,217 | | | Spirent Communications Plc | | | 146,412 | |
| | 15,991 | | | Sportech Plc(d) | | | 15,222 | |
| | 38,490 | | | Sports Direct International Plc(d) | | | 413,571 | |
| | 19,974 | | | St. Ives Plc | | | 56,965 | |
| | 96,548 | | | St. James’s Place Plc | | | 1,435,539 | |
| | 76,073 | | | St. Modwen Properties Plc | | | 515,886 | |
| | 51,017 | | | Stagecoach Group Plc | | | 272,119 | |
| | 6,843 | | | Stallergenes Greer Plc(d) | | | 304,759 | |
| | 32,001 | | | Sthree Plc | | | 177,597 | |
| | 7,112 | | | Stobart Group Ltd. | | | 12,142 | |
| | 3,783 | | | Stock Spirits Group Plc | | | 11,110 | |
| | 3,594 | | | Stolt-Nielsen Ltd. | | | 48,643 | |
| | 56,188 | | | Subsea 7 SA(d) | | | 438,103 | |
| | 8,341 | | | SuperGroup Plc(d) | | | 187,990 | |
| | 30,559 | | | Synergy Health Plc(b) | | | 1,095,296 | |
| | 54,149 | | | Synthomer Plc | | | 276,388 | |
| | 90,072 | | | Talktalk Telecom Group Plc | | | 351,301 | |
| | 98,325 | | | Tate & Lyle Plc | | | 905,673 | |
| | 2,231,492 | | | Taylor Wimpey Plc | | | 6,811,299 | |
| | 5,162 | | | Ted Baker Plc | | | 240,880 | |
| | 38,081 | | | Telecity Group Plc | | | 689,788 | |
| | 7,470 | | | Telecom Plus Plc | | | 121,030 | |
| | 94,379 | | | Thomas Cook Group Plc(d) | | | 178,812 | |
| | 3,226 | | | Topps Tiles Plc | | | 7,236 | |
| | 102,700 | | | Travis Perkins Plc | | | 3,033,440 | |
| | 16,317 | | | Trifast Plc | | | 28,298 | |
| | 146,603 | | | Trinity Mirror Plc | | | 385,333 | |
| | 43,591 | | | TT electronics Plc | | | 85,847 | |
| | 95,743 | | | Tullett Prebon Plc | | | 519,245 | |
| | 44,430 | | | UBM Plc | | | 350,684 | |
| | 265,850 | | | Ultra Electronics Holdings Plc | | | 6,897,476 | |
| | 8,896 | | | UNITE Group Plc (The) | | | 91,198 | |
| | 33,592 | | | United Utilities Group Plc | | | 511,896 | |
| | 6,032 | | | UTV Media Plc | | | 16,970 | |
| | 109,386 | | | Vectura Group Plc(d) | | | 294,763 | |
| | 175,420 | | | Vesuvius Plc | | | 966,232 | |
| | 459,851 | | | Victrex Plc | | | 13,114,699 | |
| | 11,826 | | | Vitec Group Plc (The) | | | 117,407 | |
| | 1,370 | | | VP Plc | | | 15,629 | |
| | 14,613 | | | Weir Group Plc (The) | | | 240,366 | |
| | 43,316 | | | WH Smith Plc | | | 1,138,524 | |
| | 577,376 | | | William Hill Plc | | | 2,822,438 | |
| | 15,003 | | | Wilmington Plc | | | 62,678 | |
| | 18,060 | | | Wincanton Plc(d) | | | 56,170 | |
| | 881,903 | | | WM Morrison Supermarkets Plc | | | 2,290,816 | |
| | 14,657 | | | Workspace Group Plc REIT | | | 216,348 | |
| | 9,126 | | | WS Atkins Plc | | | 193,865 | |
| | 12,348 | | | Xaar Plc | | | 97,272 | |
| | 77,049 | | | Xchanging Plc | | | 199,547 | |
| | 7,017 | | | Zeal Network SE(c) | | | 321,922 | |
| | | | | | | | 323,027,811 | |
| UNITED STATES — 50.0% | | | | |
| | 210,000 | | | Aceto Corp. | | | 6,333,600 | |
| Old Westbury Funds, Inc. | |
| Small & Mid Cap Fund | |
| Portfolio of Investments - (Continued) | October 31, 2015 |
| | |
| Shares | | | | | Value | |
| UNITED STATES (continued) | | | | |
| | 450,000 | | | Actuant Corp. - Class A | | $ | 10,260,000 | |
| | 553,587 | | | Advance Auto Parts, Inc. | | | 109,848,268 | |
| | 55,898 | | | Alacer Gold Corp.(d) | | | 108,581 | |
| | 150,000 | | | American Vanguard Corp. | | | 2,011,499 | |
| | 800,000 | | | ANSYS, Inc.(c)(d) | | | 76,248,000 | |
| | 31,200 | | | Argonaut Gold, Inc.(d) | | | 32,212 | |
| | 400,000 | | | B&G Foods, Inc. | | | 14,516,000 | |
| | 9,026 | | | Bizlink Holding, Inc. | | | 40,871 | |
| | 350,000 | | | Blackbaud, Inc. | | | 21,941,500 | |
| | 128,754 | | | Boart Longyear Ltd.(d) | | | 9,181 | |
| | 15,700 | | | Boston Beer Co., Inc. (The) - Class A(d) | | | 3,447,563 | |
| | 250,000 | | | Brady Corp. - Class A | | | 5,687,500 | |
| | 57,800 | | | Bright Horizons Family Solutions, Inc.(d) | | | 3,700,355 | |
| | 260,000 | | | Bryn Mawr Bank Corp.(c) | | | 7,573,800 | |
| | 200,000 | | | Cantel Medical Corp. | | | 11,856,000 | |
| | 280,000 | | | Cardiovascular Systems, Inc.(d) | | | 3,835,999 | |
| | 150,000 | | | Casey’s General Stores, Inc. | | | 15,933,000 | |
| | 409,400 | | | Cepheid, Inc.(d) | | | 13,673,960 | |
| | 380,000 | | | CLARCOR, Inc. | | | 18,946,800 | |
| | 275,000 | | | Community Bank System, Inc.(c) | | | 11,209,000 | |
| | 335,000 | | | Cooper Cos., Inc. (The) | | | 51,040,600 | |
| | 2,410,000 | | | CoreLogic, Inc.(c)(d) | | | 93,941,800 | |
| | 525,000 | | | CR Bard, Inc. | | | 97,833,750 | |
| | 500,000 | | | CST Brands, Inc. | | | 17,965,000 | |
| | 750,000 | | | CVB Financial Corp. | | | 13,087,500 | |
| | 5,985 | | | Diligent Corp.(d) | | | 24,195 | |
| | 1,081,234 | | | Dun & Bradstreet Corp. (The)(c) | | | 123,120,116 | |
| | 72,100 | | | El Pollo Loco Holdings, Inc.(d) | | | 827,707 | |
| | 125,000 | | | Esterline Technologies Corp.(d) | | | 9,631,250 | |
| | 350,000 | | | Financial Engines, Inc. | | | 11,256,000 | |
| | 325,000 | | | First Financial Bankshares, Inc.(c) | | | 10,809,500 | |
| | 965,000 | | | Flowserve Corp. | | | 44,737,400 | |
| | 600,000 | | | Forum Energy Technologies, Inc.(d) | | | 7,950,000 | |
| | 500,000 | | | Fresh Market, Inc. (The)(d) | | | 12,460,000 | |
| | 37,300 | | | German American Bancorp, Inc. | | | 1,168,609 | |
| | 400,000 | | | Globus Medical, Inc. - Class A(d) | | | 8,940,000 | |
| | 125,000 | | | Gorman-Rupp Co. (The)(c) | | | 3,573,749 | |
| | 400,000 | | | Guidewire Software, Inc.(d) | | | 23,292,000 | |
| | 150,000 | | | Halyard Health, Inc.(d) | | | 4,451,999 | |
| | 140,000 | | | HB Fuller Co. | | | 5,318,600 | |
| | 153,519 | | | Henry Schein, Inc.(d) | | | 23,290,367 | |
| | 185,000 | | | Hibbett Sports, Inc.(d) | | | 6,319,600 | |
| | 125,000 | | | ICU Medical, Inc.(d) | | | 13,746,250 | |
| | 625,000 | | | IDEX Corp. | | | 47,975,000 | |
| | 500,000 | | | IHS, Inc. - Class A(d) | | | 59,770,000 | |
| | 160,000 | | | Independent Bank Corp. | | | 7,478,400 | |
| | 1,096,200 | | | Ingredion, Inc.(c) | | | 104,204,772 | |
| | 200,000 | | | Innospec, Inc. | | | 11,048,000 | |
| Shares | | | | | Value | |
| UNITED STATES (continued) | | | | |
| | 300,000 | | | Insulet Corp.(d) | | $ | 8,970,000 | |
| | 341,800 | | | Integra LifeScience Holdings Corp.(d) | | | 20,361,026 | |
| | 680,000 | | | JM Smucker Co. (The) | | | 79,825,200 | |
| | 60,000 | | | John Bean Technologies Corp. | | | 2,691,599 | |
| | 335,000 | | | John Wiley & Sons, Inc. - Class A | | | 17,530,550 | |
| | 1,725,000 | | | KAR Auction Services, Inc. | | | 66,240,000 | |
| | 150,000 | | | Lancaster Colony Corp. | | | 17,058,000 | |
| | 275,000 | | | LogMein, Inc.(d) | | | 18,524,000 | |
| | 250,000 | | | Lydall, Inc.(c)(d) | | | 8,557,500 | |
| | 300,000 | | | Masimo Corp.(d) | | | 11,904,000 | |
| | 225,000 | | | Medidata Solutions, Inc.(d) | | | 9,675,000 | |
| | 325,000 | | | Mentor Graphics Corp. | | | 8,840,000 | |
| | 677 | | | Movie Gallery, Inc.(b)(c)(d) | | | 0 | |
| | 1,000,000 | | | Nasdaq, Inc. | | | 57,890,000 | |
| | 11,400 | | | National Beverage Corp.(d) | | | 429,095 | |
| | 100,000 | | | Navigators Group, Inc. (The)(c)(d) | | | 8,535,000 | |
| | 185,000 | | | NBT Bancorp, Inc. | | | 5,200,350 | |
| | 2,675,000 | | | Newell Rubbermaid, Inc. | | | 113,500,250 | |
| | 15,829,000 | | | Nexteer Automotive Group Ltd. | | | 16,910,190 | |
| | 325,000 | | | NIC, Inc. | | | 6,165,250 | |
| | 250,000 | | | NuVasive, Inc.(d) | | | 11,790,000 | |
| | 300,000 | | | Omnicell, Inc.(d) | | | 8,160,000 | |
| | 824,200 | | | Omnicom Group, Inc. | | | 61,749,064 | |
| | 0 | | | Ormat Technologies, Inc. | | | 11 | |
| | 135,000 | | | Owens & Minor, Inc. | | | 4,839,749 | |
| | 3,184 | | | Performance Sports Group Ltd.(d) | | | 36,525 | |
| | 100,000 | | | Phibro Animal Health Corp. - Class A | | | 3,335,999 | |
| | 475,000 | | | PROS Holdings, Inc.(c)(d) | | | 11,409,500 | |
| | 200,000 | | | Prosperity Bancshares, Inc. | | | 10,276,000 | |
| | 300,000 | | | QLIK Technologies, Inc.(d) | | | 9,411,000 | |
| | 550,000 | | | Qualys, Inc.(d) | | | 19,426,000 | |
| | 110,000 | | | Raven Industries, Inc. | | | 2,003,099 | |
| | 200,000 | | | RBC Bearings, Inc.(c)(d) | | | 13,678,000 | |
| | 66,803 | | | REC Silicon ASA(d) | | | 11,990 | |
| | 975,000 | | | Rockwell Collins, Inc. | | | 84,552,000 | |
| | 19,854,500 | | | Samsonite International SA(c) | | | 58,790,387 | |
| | 100,000 | | | Sensient Technologies Corp. | | | 6,527,000 | |
| | 41,559 | | | Sims Metal Management Ltd. | | | 291,615 | |
| | 595,000 | | | Snap-on, Inc. | | | 98,704,550 | |
| | 550,000 | | | Snyder’s-Lance, Inc. | | | 19,547,000 | |
| | 885,000 | | | Spectrum Brands Holdings, Inc.(c) | | | 84,827,250 | |
| | 65,000 | | | SPS Commerce, Inc.(d) | | | 4,668,299 | |
| | 140,000 | | | Standex International Corp.(c) | | | 12,560,800 | |
| | 150,000 | | | STERIS Corp. | | | 11,242,500 | |
| | 100,000 | | | Stock Yards Bancorp, Inc.(c) | | | 3,767,999 | |
| | 18,200 | | | Tahoe Resources, Inc. | | | 151,991 | |
| | 230,000 | | | TreeHouse Foods, Inc.(d) | | | 19,697,200 | |
| | 633,000 | | | TriMas Corp.(c)(d) | | | 12,666,330 | |
| | 729,690 | | | Tupperware Brands Corp. | | | 42,956,850 | |
| | 390,000 | | | UMB Financial Corp.(c) | | | 19,141,200 | |
| Old Westbury Funds, Inc. | |
| Small & Mid Cap Fund | |
| Portfolio of Investments - (Continued) | October 31, 2015 |
| | |
| Shares | | | | | Value | |
| UNITED STATES (continued) | | | | |
| | 435,000 | | | Universal Health Services, Inc., Series B | | $ | 53,109,150 | |
| | 2,140,000 | | | Vantiv, Inc. - Class A(d) | | | 107,321,000 | |
| | 530,000 | | | Varian Medical Systems, Inc.(d) | | | 41,620,900 | |
| | 210,000 | | | Washington Trust Bancorp, Inc.(c) | | | 8,148,000 | |
| | 516,351 | | | Waters Corp.(d) | | | 65,989,658 | |
| | 200,000 | | | West Pharmaceutical Services, Inc. | | | 12,002,000 | |
| | 170,000 | | | WEX, Inc.(d) | | | 15,284,700 | |
| | 900,000 | | | Wolverine World Wide, Inc. | | | 16,713,000 | |
| | 350,000 | | | Woodward, Inc. | | | 15,925,000 | |
| | 1,482,500 | | | Wyndham Worldwide Corp. | | | 120,601,375 | |
| | | | | | | | 2,724,217,554 | |
Total Common Stocks
(Cost $4,013,473,134) | | | 5,112,981,403 | |
| INVESTMENT COMPANY — 0.1% | |
| | 5,687,300 | | | SEI Daily Income Trust Government II Fund, Class A, 0.01% (f) | | | 5,687,300 | |
Total Investment Company
(Cost $5,687,300) | | | 5,687,300 | |
| EXCHANGE TRADED FUNDS — 4.1% | |
| | 348,000 | | | iShares Core S&P Small Cap ETF | | | 39,341,400 | |
| | 234,861 | | | iShares MSCI Japan Small Cap Index Fund(c) | | | 13,567,920 | |
| | 95,000 | | | iShares Russell Mid-Cap ETF | | | 15,685,450 | |
| | 196,000 | | | SPDR Russell Nomura Small Cap Japan Fund(c) | | | 10,461,500 | |
| | 1,123,500 | | | SPDR S&P Regional Banking ETF | | | 48,119,505 | |
| | 723,000 | | | SPDR S&P Retail ETF | | | 33,178,470 | |
| | 244,800 | | | Vanguard Small-Cap ETF | | | 27,926,784 | |
| | 507,570 | | | WisdomTree Europe SmallCap Dividend Fund(c) | | | 28,444,223 | |
| | 160,000 | | | WisdomTree Japan Small Cap Dividend Fund(c) | | | 8,969,600 | |
Total Exchange Traded Funds
(Cost $208,361,550) | | | 225,694,852 | |
| RIGHTS/WARRANTS — 0.0% | | | | |
| Banks — 0.0% | | | | |
| | 30,322 | | | Mediolanum SpA Rights, Expire 11/26/15(b)(d) | | | 0 | |
| | 27,816 | | | Taichung Commercial Bank Co. Ltd. Rights, Expire 11/23/15(c)(d) | | | 0 | |
| | | | | | | | 0 | |
| Consumer Discretionary — 0.0% | | | | |
| | 1,710 | | | Centrebet Litigation Rights(b)(c)(d) | | | 0 | |
| Shares | | | | | Value | |
| Consumer Discretionary (continued) | | | | |
| | 1,710 | | | Centrebet Litigation Units(b)(c)(d) | | $ | 0 | |
| | 7,800 | | | Miramar Hotel & Investment Co. Ltd. Rights, Expire 1/19/18(d) | | | 1,369 | |
| | 128,112 | | | Technicolor SA Rights, Expire 11/4/15(d) | | | 31,557 | |
| | 99,096 | | | Ten Networks Rights, Expire 1/18/12(b)(c)(d) | | | 0 | |
| | | | | | | | 32,926 | |
| Consumer Staples — 0.0% | | | | |
| | 43,425 | | | Real Nutriceutical Group Ltd. Rights, Expire 11/6/15(c)(d) | | | 560 | |
| Diversified Financials — 0.0% | | | | |
| | 6,955 | | | Mirae Asset Securities Co. Ltd. Rights, Expire 11/5/15(c)(d) | | | 16,472 | |
| Energy — 0.0% | | | | |
| | 2,545 | | | FAR Ltd. Rights, Expire 11/18/15(c)(d) | | | 5 | |
| Health Care — 0.0% | | | | |
| | 9,812 | | | Intercell Contigent Value Rights(b)(c)(d) | | | 0 | |
| | 201,026 | | | KPJ Healthcare Berhad Warrants, Expire 1/23/19(c)(d) | | | 24,801 | |
| | 9,600 | | | Ligand Pharmaceuticals Contingent Value Rights(b)(c)(d) | | | 0 | |
| | | | | | | | 24,801 | |
| Industrials — 0.0% | | | | |
| | 428,722 | | | Dialog Group Berhad Warrants, Expire 2/12/17(d) | | | 40,916 | |
| | 563 | | | Sewon Cellontech Co. Ltd. Rights, Expire 10/27/15(d) | | | 533 | |
| | | | | | | | 41,449 | |
| Information Technology — 0.0% | | | | |
| | 161,562 | | | International Standard Resources Holdings Ltd. Rights, Expire 10/5/15(d) | | | 0 | |
| | 77,000 | | | Ju Teng International Holdings Ltd. Warrants, Expire 10/14/16(d) | | | 2,881 | |
| | | | | | | | 2,881 | |
| Materials — 0.0% | | | | |
| | 63,403 | | | Papeles y Cartones de Europa SA Rights, Expire 11/12/15(d) | | | 13,805 | |
| | 937 | | | SK Chemicals Co. Ltd. Rights, Expire 11/20/15(c)(d) | | | 7,890 | |
| | 104 | | | Sung Chang Rights, Expire 12/14/15(c)(d) | | | 523 | |
| | | | | | | | 22,218 | |
| Old Westbury Funds, Inc. | |
| Small & Mid Cap Fund | |
| Portfolio of Investments - (Continued) | October 31, 2015 |
| | |
| Shares | | | | | Value | |
| Real Estate — 0.0% | | | | |
| | 81,376 | | | Eastern & Oriental Berhad Warrants, Expire 2/19/18(d) | | $ | 4,073 | |
| | 25,640 | | | Grand Canal Land Public Co. Ltd. Warrants, Expire 6/29/18(d) | | | 1,290 | |
| | 8,600 | | | LBS Bina Group Berhad Rights, Expire 6/11/18(d) | | | 530 | |
| | 149,625 | | | Raimon Land Public Co. Ltd. Warrants, Expire 4/9/18(d) | | | 841 | |
| | | | | | | | 6,734 | |
| Telecommunication Services — 0.0% | | | | |
| | 5,007 | | | Loxley Public Co. Ltd. Warrants, Expire 9/30/17(d) | | | 177 | |
| | Total Rights/Warrants
(Cost $ — ) | | 148,223 | |
| | | | | | | |
Principal
Amount | | | | | | |
| U.S. GOVERNMENT AGENCIES — 0.6% |
| Federal Home Loan Bank — 0.6% | | | | |
| $ | 3,500,000 | | | 0.02%, 11/04/2015(g) | | | 3,499,997 | |
| | 6,000,000 | | | 0.04%, 11/03/2015(g) | | | 5,999,994 | |
| | 15,000,000 | | | 0.04%, 12/01/2015(g) | | | 14,999,520 | |
| | 6,000,000 | | | 0.06%, 12/03/2015(g) | | | 5,999,796 | |
Total U.S. Government Agencies
(Cost $30,499,280) | | | 30,499,307 | |
| | | | | | | | | |
| Shares | | | | | | | |
| CASH SWEEP — 0.8% | | | | |
| | 42,529,598 | | | Citibank - US Dollars on Deposit in Custody Account, 0.02%(f) | | | 42,529,598 | |
Total Cash Sweep
(Cost $42,529,598) | | | 42,529,598 | |
TOTAL INVESTMENTS — 99.4%
(Cost $4,300,550,862)(a) | | | 5,417,540,683 | |
| OTHER ASSETS IN EXCESS OF LIABILITIES — 0.6% | | | 32,068,011 | |
| NET ASSETS — 100.0% | | $ | 5,449,608,694 | |
| (a) | Cost for federal income tax purposes is $4,316,140,170 and net unrealized appreciation of investments is as follows: |
| Unrealized appreciation | | $ | 1,272,367,771 | |
| Unrealized depreciation | | | (170,967,258 | ) |
| Net unrealized appreciation | | $ | 1,101,400,513 | |
| (b) | Level 3 fair valued security under procedures established by the Fund’s Board of Directors. The aggregate value of fair valued securities is $3,289,234, which is 0.06% of net assets and the cost is $9,889,941. |
| (c) | This security is considered either fully or partially illiquid. These securities, or portions thereof, have a value of $556,935,415 or 10.22% of net assets. |
| (d) | Non-income producing security. |
| (e) | Securities incorporated in the same country but traded on different exchanges. |
| (f) | The rate shown is the current yield as of October 31, 2015. |
| (g) | The rate represents the annualized yield at time of purchase. |
BDR — Brazilian Depositary Receipt
CDI — CHESS Depositary Interests
CPO — Certificate of Participation-Common
CVR — Contingent Value Rights
DVR — Differential Voting Rights
FOR — Foreign Ownership Restrictions
NVDR — Non Voting Depositary Receipt
PDR — Phillippine Depositary Receipt
REIT — Real Estate Investment Trust
SDR — Swedish Depositary Receipt
VVPR — Voter Verified Paper Record
Portfolio diversification by Sector (Unaudited)
| Sector | | Percentage
of Net Assets |
| Banks | | | 3.4 | % |
| Consumer Discretionary | | | 17.2 | % |
| Consumer Staples | | | 9.6 | % |
| Diversified Financials | | | 2.5 | % |
| Energy | | | 1.3 | % |
| Health Care | | | 11.9 | % |
| Industrials | | | 22.9 | % |
| Information Technology | | | 12.9 | % |
| Insurance | | | 2.3 | % |
| Materials | | | 5.7 | % |
| Real Estate | | | 2.4 | % |
| Telecommunication Services | | | 0.7 | % |
| Utilities | | | 1.0 | % |
| Other* | | | 6.2 | % |
| Total | | | 100.0 | % |
| * | Includes cash and equivalents, exchange traded funds, rights/warrants, U.S. government agencies, investment companies, pending trades and Fund share transactions, interest and dividends receivable, prepaids, and accrued expenses payable. |
The Board of Directors and Shareholders of Small & Mid Cap Fund, a fund comprised within the Old Westbury Funds, Inc.
We have audited the accompanying statements of assets and liabilities of Small & Mid Cap Fund (the “Fund”) (one of the funds comprising the Old Westbury Funds, Inc.), including the condensed portfolio of investments as of October 31, 2015, and the related statements of operations for the year then ended, the statements of changes in net assets for each of the two years in the period then ended (collectively, the “financial statements”), the financial highlights for each of the five years in the period then ended (the financial statements and financial highlights are included in Item 1 of this Form N-CSR) and the portfolio of investments as of October 31, 2015 (included in Item 6 of this Form N-CSR). These financial statements, financial highlights and portfolio of investments are the responsibility of the Fund’s management. Our responsibility is to express an opinion on these financial statements, financial highlights and portfolio of investments based on our audits.
We conducted our audits in accordance with the standards of the Public Company Accounting Oversight Board (United States). Those standards require that we plan and perform the audit to obtain reasonable assurance about whether the financial statements, financial highlights and portfolio of investments are free of material misstatement. An audit includes examining, on a test basis, evidence supporting the amounts and disclosures in the financial statements and portfolio of investments. Our procedures included confirmation of securities owned as of October 31, 2015, by correspondence with the custodians and brokers. An audit also includes assessing the accounting principles used and significant estimates made by management, and evaluating the overall financial statement presentation. We believe that our audits provide a reasonable basis for our opinion.
In our opinion, the financial statements, financial highlights and portfolio of investments referred to above present fairly, in all material respects, the financial position of Small & Mid Cap Fund at October 31, 2015, and the results of its operations for the year then ended, the changes in its net assets for each of the two years in the period then ended and the financial highlights for each of the five years in the period then ended, in conformity with U.S. generally accepted accounting principles.

New York, New York
December 28, 2015
Item 7. Disclosure of Proxy Voting Policies and Procedures for Closed-End Management Investment Companies.
Not applicable.
Item 8. Portfolio Managers of Closed-End Management Investment Companies.
Not applicable.
Item 9. Purchases of Equity Securities by Closed-End Management Investment Company and Affiliated Purchasers.
Not applicable.
Item 10. Submission of Matters to a Vote of Security Holders.
There have been no material changes to the procedures by which the shareholders may recommend nominees to the registrant’s board of directors, where those changes were implemented after the registrant last provided disclosure in response to the requirements of Item 407(c)(2)(iv) of Regulation S-K (17 CFR 229.407) (as required by Item 22(b)(15) of Schedule 14A (17 CFR 240.14a-101)), or this Item.
Item 11. Controls and Procedures.
| (a) | The registrant’s principal executive and principal financial officers, or persons performing similar functions, have concluded that the registrant’s disclosure controls and procedures (as defined in Rule 30a-3(c) under the Investment Company Act of 1940, as amended (the “1940 Act”) (17 CFR 270.30a-3(c))) are effective, as of a date within 90 days of the filing date of the report that includes the disclosure required by this paragraph, based on their evaluation of these controls and procedures required by Rule 30a-3(b) under the 1940 Act (17 CFR 270.30a-3(b)) and Rules 13a-15(b) or 15d-15(b) under the Securities Exchange Act of 1934, as amended (17 CFR 240.13a-15(b) or 240.15d-15(b)). |
| (b) | There were no changes in the registrant’s internal control over financial reporting (as defined in Rule 30a-3(d) under the 1940 Act (17 CFR 270.30a-3(d)) that occurred during the registrant’s second fiscal quarter of the period covered by this report that has materially affected, or is reasonably likely to materially affect, the registrant’s internal control over financial reporting. |
Item 12. Exhibits.
| | (a)(1) | Code of ethics, or any amendment thereto, that is the subject of disclosure required by Item 2 is attached hereto. |
| (a)(2) | Certifications pursuant to Rule 30a-2(a) under the 1940 Act (17 CFR 270.30a-2(a)) are attached hereto. |
| | (b) | Certifications pursuant to Rule 30a-2(b) under the 1940 Act (17 CFR 270.30a-2(b)) are attached hereto. |
| (12.other) | Not applicable. |
SIGNATURES
Pursuant to the requirements of the Securities Exchange Act of 1934 and the Investment Company Act of 1940, the registrant has duly caused this report to be signed on its behalf by the undersigned, thereunto duly authorized.
| (Registrant) | Old Westbury Funds, Inc. |
| By (Signature and Title)* | /s/ David W. Rossmiller |
| | David W. Rossmiller, President |
| | (Principal Executive Officer) |
Pursuant to the requirements of the Securities Exchange Act of 1934 and the Investment Company Act of 1940, this report has been signed below by the following persons on behalf of the registrant and in the capacities and on the dates indicated.
| By (Signature and Title)* | /s/ David W. Rossmiller |
| | David W. Rossmiller, President |
| | (Principal Executive Officer) |
| By (Signature and Title)* | /s/ Matthew A. Rizzi |
| | Matthew A. Rizzi, Treasurer |
| | (Principal Financial Officer) |
* Print the name and title of each signing officer under his or her signature.