UNITED STATES
SECURITIES AND EXCHANGE COMMISSION
Washington, D.C. 20549
FORM N-CSR
CERTIFIED SHAREHOLDER REPORT OF REGISTERED MANAGEMENT
INVESTMENT COMPANIES
Investment Company Act file number 811-07912
| | Old Westbury Funds, Inc. | |
| | (Exact name of registrant as specified in charter) | |
| | 760 Moore Rd. | |
| | King of Prussia, PA 19406 | |
| | (Address of principal executive offices) (Zip code) | |
| | Andrew J. McNally | |
| | BNY Mellon Investment Servicing (US) Inc. | |
| | 760 Moore Rd. | |
| | King of Prussia, PA 19406 | |
| | (Name and address of agent for service) | |
Registrant’s telephone number, including area code: 800-607-2200
Date of fiscal year end: October 31
Date of reporting period: October 31, 2017
Form N-CSR is to be used by management investment companies to file reports with the Commission not later than 10 days after the transmission to stockholders of any report that is required to be transmitted to stockholders under Rule 30e-1 under the Investment Company Act of 1940 (17 CFR 270.30e-1). The Commission may use the information provided on Form N-CSR in its regulatory, disclosure review, inspection, and policymaking roles.
A registrant is required to disclose the information specified by Form N-CSR, and the Commission will make this information public. A registrant is not required to respond to the collection of information contained in Form N-CSR unless the Form displays a currently valid Office of Management and Budget (“OMB”) control number. Please direct comments concerning the accuracy of the information collection burden estimate and any suggestions for reducing the burden to Secretary, Securities and Exchange Commission, 100 F Street, NE, Washington, DC 20549. The OMB has reviewed this collection of information under the clearance requirements of 44 U.S.C. § 3507.
Item 1. Reports to Stockholders.
The Report to Shareholders is attached herewith.
Old Westbury Funds, Inc.
Annual Report
October 31, 2017
BESSEMER INVESTMENT MANAGEMENT LLC
Investment Adviser
Old Westbury Funds, Inc.
This Page Intentionally Left Blank
| Old Westbury Funds, Inc. |
| A Letter from the President (Unaudited) |
| |
| |
Dear Shareholders:
The fiscal year ended October 31, 2017, started off with a bang. Global equities rallied sharply after the unexpected election of Donald Trump to be the United States of America’s 45th president in November 2016. The victory led investors to reposition for the policy trends they expected could unfold in the year/years ahead. These included higher U.S. growth, inflation, and interest rates — driven by potential tax reform, deregulation, and increased infrastructure spending. In the months that followed, despite a number of policy disappointments in the U.S., global equities rose steadily, with volatility at exceptionally low levels. For the fiscal year, global equities, as measured by the MSCI All Country World Index, returned over 23%.
Throughout the year, economic data signaled an improving global economy while corporate earnings also showed positive trends. The brighter economic picture included global business sentiment rising to its highest levels so far in this economic cycle and a healthy U.S. employment market. Upbeat economic data trends were reflected in central bank actions through gradual movements to tighten monetary policy. The U.S. Federal Reserve raised interest rates three times and announced plans for balance-sheet normalization. The European Central Bank kept rates steady, but announced it would reduce its monthly bond purchases by one-half. The Bank of England raised rates 25 basis points, its first increase in a decade.
A number of key political events passed with outcomes that we believe kept investors comfortable holding risk in their portfolios. In France, Emmanuel Macron was elected as president, defeating far-right populist candidate Marine Le Pen. In Germany, elections resulted in a win for Angela Merkel, securing her fourth term as Chancellor — though her party overall performed worse than expected as the far-right party gathered strength. In the U.S., President Trump and Democrats struck a deal to extend the debt ceiling deadline until December 15. Financial markets largely shrugged off heightened geopolitical risks, including the ongoing civil war in Syria and an escalation in tensions with North Korea.
In the U.S., the increase in investors’ risk appetites was detrimental to bonds, which were flat for the year. Interest rates rose across the yield curve and the curve flattened as shorter-term yields rose more than longer ones. Short-term rates were driven by expectations for central bank tightening, while long-term rates reflected subdued inflation trends.
A notable and somewhat surprising development for the year was significant weakness in the U.S. dollar, which began a descent at the start of 2017. Several factors contributed to this decline, including disappointment in the Trump administration’s ability to pass pro-growth legislation; the administration’s statements that had a “weak-dollar” bias, calling into question the historical preference of the U.S. government for a strong-dollar policy; and strong growth momentum outside the U.S., which has offset support for the dollar provided by Fed rate hikes.
In this environment, our portfolio results largely reflected a more defensive posture, which detracted from results. Overall, Bessemer Investment Management LLC (the “Adviser”) has remained moderately optimistic on the economic cycle and equities, but has been cognizant of risks related to increasingly stretched valuations, tightening monetary policy, political and geopolitical events, and an extended economic cycle (and bull market).
The Old Westbury Large Cap Strategies Fund underperformed as its U.S. value-oriented and managed volatility equity strategies detracted from relative performance, as did cash holdings. The Old Westbury Small & Mid Cap Strategies Fund’s underperformance was also a function of underperformance from a managed volatility strategy and elevated cash holdings, as well as a terminated emerging-market strategy and a mid-cap strategy. The Old Westbury All Cap Core Fund underperformed as a result of stock selection in the consumer, financials, and industrials sectors, and an excess cash position throughout the year. The Old Westbury Fixed Income Fund slightly underperformed, mainly due to its barbell yield-curve exposure, meaning it was underweight bonds with intermediate maturities and overweight bonds with shorter- and longer-term maturities. While such a structure is typically advantageous in a rising rate environment, this year, it slightly detracted from performance due to the slow movement of the Fed. The Old Westbury Municipal Bond Fund slightly underperformed, also due to its barbell structure and holding shorter duration bonds than the benchmark. The Old Westbury Strategic Opportunities Fund underperformed its primary benchmark (a global equity benchmark) though exceeded its secondary benchmark. As this Fund invests in a variety of asset classes, it is not surprising that it underperformed during a very strong year for global equities.
At year-end, we remain committed to the Adviser’s longstanding investment approach, characterized by independent research, a global orientation, and long-term perspective. We believe these disciplines will continue to reap competitive long-term results for shareholders by allowing the Funds to participate in strong market environments while seeking to preserve capital during difficult times.
Sincerely,

David W. Rossmiller
President
Old Westbury Funds, Inc.
| Old Westbury Funds, Inc. |
| All Cap Core Fund |
| Investment Adviser’s Report (Unaudited) |
| |
The return of the Old Westbury All Cap Core Fund (the “Fund”) for the fiscal year ended October 31, 2017 was 21.8%. In comparison, the return of its primary benchmark, the MSCI ACWI Investable Market Index (Net)a, was 23.5%. The Fund’s secondary benchmark, a blend of 90% MSCI USA Index (Gross) and 10% MSCI ACWI ex USA Index (Net)a, returned 23.6%.
On December 30, 2016, the Fund’s name was changed from “Old Westbury Large Cap Core”, and its investment strategy was broadened to include stocks of any market capitalization. At that time, the Fund’s primary benchmark was also changed from the MSCI ACWI Large Cap Index (Net)a to the MSCI ACWI Investable Market Index (Net)a.
The most significant positive contributors to the Fund’s relative performance during the year were an overweight position in the information technology sector (22.0% of the Fund during the fiscal year) and an underweight position in telecommunications services (0.1%). Stock selection within healthcare and materials contributed positively to results, but overall selection detracted from the Fund’s performance. Stocks that contributed the most included Apple, Alphabet Inc., Broadcom Limited, Microsoft, and Visa. Apple appreciated significantly as the market anticipated the company’s newest iPhone launch. Alphabet, Broadcom, and Microsoft benefited from continued digital transformation in companies throughout the global economy. Finally, Visa advanced materially as worldwide electronic payments volumes accelerated and Visa completed its acquisition and integration of Visa Europe.
The Fund’s results were held back by negative stock selection in the consumer, financials, and industrials sectors, and an excess cash position throughout the fiscal year (4.1%). Stocks with the largest negative contributions included Advance Auto Parts, Aramark, Altria Group, and CVS Health Corp. Advance Auto Parts was pressured over fears of Amazon disruption and weaker-than-expected results. Aramark declined on overall weaker consumer spending. Altria shares were negatively affected on concerns over potential new tobacco regulations, and CVS Health suffered under increasing concerns over industry-wide prescription drug pricing.
At fiscal-year end, versus its primary benchmark, the Fund maintained overweight positions in the technology, healthcare, and consumer discretionary sectors and underweight positions in financials, real estate, energy, and materials. Relative to the primary benchmark, the Fund continued to be significantly overweight U.S. stocks (89%) versus non-U.S. stocks (7%); the remainder was cash.
| a | The Net version of each index reflects no deductions for fees, expenses or income taxes. |
The performance data quoted represents past performance. Past performance does not guarantee future results and does not reflect the deduction of taxes that a shareholder may pay on Fund distributions or the redemption of Fund shares. Fund performance reflects fee waivers and/or expense reimbursements and reinvestments of distributions, if any. Without waivers/ reimbursements, performance would have been lower. The investment return and principal value of an investment will fluctuate. Consequently, an investor’s shares, when redeemed, may be worth more or less than their original cost. Current performance may be lower or higher than the performance data quoted. To obtain performance information current to the most recent month end, please call 1-800-607-2200.
| Old Westbury Funds, Inc. | |
| All Cap Core Fund | |
| Investment Adviser’s Report (Unaudited) - (Continued) | |
| | |
PORTFOLIO DIVERSIFICATION BY SECTOR*
| Sector: | | | |
| Banks | | | 7.2 | % |
| Consumer Discretionary | | | 13.6 | |
| Consumer Staples | | | 7.3 | |
| Diversified Financials | | | 2.9 | |
| Energy | | | 4.2 | |
| Health Care | | | 16.3 | |
| Industrials | | | 11.0 | |
| Information Technology | | | 24.5 | |
| Insurance | | | 2.5 | |
| Materials | | | 4.3 | |
| Utilities | | | 2.9 | |
| Other** | | | 3.3 | |
| | | | 100.0 | % |
| * | Stated as a percentage of net assets. |
| ** | Includes cash and equivalents, investment company, pending trades and Fund share transactions, interest and dividends receivable, prepaids and accrued expenses payable. |
| Old Westbury Funds, Inc. | |
| All Cap Core Fund | |
| Investment Adviser’s Report (Unaudited) - (Continued) | |
| | |

Average Annual Total Returns
For the Period Ended October 31, 2017
| All Cap Core Fund | | | |
| One Year | | | 21.81 | % |
| Five Year | | | 10.20 | % |
| Ten Year | | | 2.38 | % |
| | | | | |
| MSCI ACWI IMI (Net) | | | | |
| One Year | | | 23.52 | % |
| Five Year | | | 11.02 | % |
| Ten Year | | | 3.98 | % |
| | | | | |
| Blended Index (Net) | | | | |
| One Year | | | 23.56 | % |
| Five Year | | | 14.34 | % |
| Ten Year | | | 6.90 | % |
| | | | | |
| MSCI ACWI Large Cap Index (Net) | | | | |
| One Year | | | 23.46 | % |
| Five Year | | | 10.68 | % |
| Ten Year | | | 3.61 | % |
On December 30, 2016, the Fund changed its name to All Cap Core Fund (formerly Large Cap Core Fund) as part of a series of changes to the overall investment focus and strategies of the Fund. Prior to November 16, 2011, the Fund was named the U.S. Large Cap Fund and operated under a different investment strategy. Prior to October 2, 2008, the Fund was named the Large Cap Equity Fund and operated under a different investment strategy. The performance information shown above may not be representative of performance the Fund will achieve under its current investment strategy.
The performance data quoted represents past performance. Past performance does not guarantee future results and does not reflect the deduction of taxes that a shareholder may pay on Fund distributions or the redemption of Fund shares. Fund performance reflects fee waivers and/or expense reimbursements and reinvestments of distributions, if any. Without waivers/reimbursements, performance would have been lower. The investment return and principal value of an investment will fluctuate. Consequently, an investor’s shares, when redeemed, may be worth more or less than their original cost. Current performance may be lower or higher than the performance data quoted. To obtain performance information current to the most recent month end, please call 1-800-607-2200.
The Adviser previously contractually committed through October 31, 2017, to waive its advisory fees to the extent necessary to maintain the net operating expense ratio of the Fund, excluding Fund transaction costs, investment interest expense,
| Old Westbury Funds, Inc. | |
| All Cap Core Fund | |
| Investment Adviser’s Report (Unaudited) - (Concluded) | |
| | |
dividend expenses associated with securities sold short and acquired fund fees and expenses (if any), at 1.00%, as disclosed in the Funds’ prospectus dated March 1, 2016. The Board has approved, the termination of this fee waiver agreement. The expense ratio, prior to fee waivers and including acquired fund fees and expenses (if any), is stated in the prospectus dated March 1, 2017 as 1.05%. Additional information pertaining to the Fund’s expense ratio for the year ended October 31, 2017 can be found in the Financial Highlights.
The chart shown on the previous page illustrates the total value of a $10,000 investment from the Fund’s inception, with distributions reinvested. On December 30, 2016, the Fund changed its primary benchmark from the MSCI All Country World (AWCI) Large Cap Index (Net) to the MSCI ACWI Investable Market Index (IMI) (Net) to more closely reflect the Fund’s current investment strategy. In addition, effective March 1, 2017, the Fund also compares its performance to a blended benchmark, as a secondary benchmark, consisting of a 90% weighting in the MSCI USA Index (Gross) and a 10% weighting in the MSCI ACWI ex USA Index (Net) (the “Blended Index”). The MSCI ACWI IMI (Net), the Blended Index (Net), and the MSCI ACWI Large Cap Index (Net) also include the reinvestment of distributions but do not include fees, expenses and income taxes associated with an investment in the Fund. The MSCI ACWI IMI (Net), the Blended Index (Net), and the MSCI ACWI Large Cap Index (Net) are unmanaged. Investments cannot be made directly in an index.
Investments made in foreign and emerging country securities may involve additional risks, such as political and social instability, less liquidity and currency exchange rate volatility.
| Old Westbury Funds, Inc. |
| Large Cap Strategies Fund |
| Investment Adviser’s Report (Unaudited) |
| |
The return of the Old Westbury Large Cap Strategies Fund (the “Fund”) for the fiscal year ended October 31, 2017, was 16.7%. In comparison, the return of the MSCI All Country World Large Cap Index (Net)a (“the Index”) was 23.5%.
During the fiscal year, underperformance relative to the Index was from U.S. large cap value-oriented stocks (22.2%) and large cap managed volatility equities (6.2%), both managed by Bessemer Investment Management LLC (“Bessemer”). Bessemer’s large cap global strategy was near-neutral (36.6%). Cash holdings detracted from performance. Relative outperformance was achieved by large cap global growth stocks managed by Sands Capital Management LLC (10.8%) and large cap emerging-market stocks managed by Harding Loevner LP (5.9%).
Stock selection in the financials and consumer discretionary sectors were the largest detractors overall. Individual stocks that detracted from relative performance were energy exploration and production company Range Resources, toy manufacturer Mattel, and auto parts retailer AutoZone. In the case of Range Resources, back-to-back warm winter seasons negatively impacted demand and pricing for natural gas, which in turn weakened Range’s financial strength. New management at Mattel decided that a deeper-than-expected restructuring was required to turn around the business, leading to lower earnings and a dividend reduction. Autozone’s business slowdown fueled investor concerns that Amazon may be having an impact on the retail auto parts industry.
The Fund benefited from a moderate overweight to the technology sector. Individual stocks that contributed the most to relative performance were industrial conglomerate General Electric and Chinese Internet company Tencent Holdings. General Electric’s contribution was due to the Fund’s underweight position in the company as it suffered significant share decline during the year coupled with GE’s large representation in the Index. Tencent Holdings’ online gaming business continued to excel in 2017. Additionally, the company improved monetization across its newer video and payment ventures which led to outsized growth in both top and bottom lines.
At fiscal year-end, the Fund was overweight the following sectors: consumer discretionary (13.9% versus the Index’s 11.0%), consumer staples (13.4% versus 9.5%), and energy (8.4% versus 6.8%).The Fund was underweight the following sectors: financials (13.3% versus the Index’s 19.6%), healthcare (9.0% versus 11.5%), technology (18.8% versus 19.5%), real estate (0.3% versus 2.2%), telecom (2.2% versus 3.4%), and utilities (0.6% versus 2.7%). The industrials sector weighting was neutral (9.5% versus the Index’s 9.5%), as was the materials sector (4.1% versus 4.3%).
The Fund held an overweight to the U.S. for most of the fiscal year, given the country’s improving economy and potential for progress on the policy front. Closer to fiscal year end, the Fund began to increase exposure to developed Europe given improving growth prospects and relatively attractive valuations in the region. The Fund also slightly boosted its emerging markets exposure. As of fiscal year end, the Fund was underweight the U.S., neutral developed Europe, and overweight emerging markets.
| a | The Net version of the index reflects no deductions for fees, expenses or income taxes. |
| Old Westbury Funds, Inc. | |
| Large Cap Strategies Fund | |
| Investment Adviser’s Report (Unaudited) - (Continued) | |
| | |
PORTFOLIO DIVERSIFICATION BY COUNTRY*
| Country: | | | | |
| Australia | | | 0.1 | % |
| Austria | | | 0.1 | |
| Belgium | | | 0.4 | |
| Bermuda | | | 0.3 | |
| Brazil | | | 1.3 | |
| Canada | | | 2.5 | |
| Chile | | | 0.1 | |
| China | | | 4.6 | |
| Columbia | | | 0.1 | |
| Czech Republic | | | 0.1 | |
| Denmark | | | 0.5 | |
| Egypt | | | 0.0 | *** |
| Finland | | | 1.9 | |
| France | | | 2.7 | |
| Georgia | | | 0.1 | |
| Germany | | | 2.2 | |
| Greece | | | 0.0 | *** |
| Hong Kong | | | 1.3 | |
| Hungary | | | 0.1 | |
| India | | | 2.5 | |
| Indonesia | | | 0.3 | |
| Italy | | | 0.4 | |
| Japan | | | 3.6 | |
| Kenya | | | 0.1 | |
| Luxembourg | | | 0.1 | |
| Malaysia | | | 0.0 | *** |
| Mexico | | | 0.3 | |
| Netherlands | | | 2.2 | |
| Norway | | | 0.1 | |
| Pakistan | | | 0.0 | *** |
| Peru | | | 0.1 | |
| Philippines | | | 0.0 | *** |
| Poland | | | 0.2 | |
| Portugal | | | 0.0 | *** |
| Qatar | | | 0.0 | *** |
| Russia | | | 0.3 | |
| Singapore | | | 0.5 | |
| South Africa | | | 0.7 | |
| South Korea | | | 1.6 | |
| Spain | | | 0.5 | |
| Sweden | | | 2.4 | |
| Switzerland | | | 2.0 | |
| Taiwan | | | 0.9 | |
| Thailand | | | 0.6 | |
| Turkey | | | 0.1 | |
| United Arab Emirates | | | 0.1 | |
| United Kingdom | | | 4.7 | |
| United States | | | 47.3 | |
| Other** | | | 10.0 | |
| | | | 100.0 | % |
| Old Westbury Funds, Inc. | |
| Large Cap Strategies Fund | |
| Investment Adviser’s Report (Unaudited) - (Continued) | |
| | |
| * | Stated as a percentage of net assets. |
| ** | Includes cash and equivalents, exchange traded funds, U.S. government agencies, investment company, pending trades and Fund share transactions, interest and dividends receivable, prepaids and accrued expenses payable. |
| *** | Represents less than 0.1% of net assets. |
| Old Westbury Funds, Inc. | |
| Large Cap Strategies Fund | |
| Investment Adviser’s Report (Unaudited) - (Continued) | |
| | |

Average Annual Total Returns
For the Period Ended October 31, 2017
| Large Cap Strategies Fund | | | | |
| One Year | | | 16.72 | % |
| Five Year | | | 10.89 | % |
| Ten Year | | | 2.63 | % |
| | | | | |
| MSCI ACWI Large Cap Index (Net) | | | | |
| One Year | | | 23.46 | % |
| Five Year | | | 10.68 | % |
| Ten Year | | | 3.61 | % |
On November 16, 2011, the Fund changed its name to Large Cap Strategies Fund (formerly Non-U.S. Large Cap Fund) as part of a series of changes to the overall investment focus and strategies of the Fund. Prior to July 28, 2008, the Fund was named the International Fund and operated under a different investment strategy. The prior performance shown represents performance of the Fund’s prior strategy to invest in a diversified portfolio of foreign companies located outside of the U.S., at least 85% of which were listed on recognized foreign securities exchanges. The performance information shown above may not be representative of performance the Fund will achieve under its current investment strategy.
The performance data quoted represents past performance. Past performance does not guarantee future results and does not reflect the deduction of taxes that a shareholder may pay on Fund distributions or the redemption of Fund shares. Fund performance reflects fee waivers and/or expense reimbursements and reinvestments of distributions, if any. Without waivers/reimbursements, performance would be lower. The investment return and principal value of an investment will fluctuate. Consequently, an investor’s shares, when redeemed, may be worth more or less than their original cost. Current performance may be lower or higher than the performance data quoted. To obtain performance information current to the most recent month end, please call 1-800-607-2200.
| Old Westbury Funds, Inc. | |
| Large Cap Strategies Fund | |
| Investment Adviser’s Report (Unaudited) - (Concluded) | |
| | |
The Adviser has contractually committed through October 31, 2019, to waive its advisory fees to the extent necessary to maintain the net operating expense ratio of the Fund, excluding, Fund transaction costs, investment interest expense, dividend expenses associated with securities sold short and acquired fund fees and expenses (if any) at 1.15%, (current net operating expense is 1.11%). The expense ratio, prior to fee waivers and including acquired fund fees and expenses (if any), is stated in the prospectus dated March 1, 2017 as 1.15%. Additional information pertaining to the Fund’s expense ratio for the year ended October 31, 2017 can be found in the Financial Highlights.
The chart shown on the previous page illustrates the total value of a $10,000 investment for 10 years, with distributions reinvested. The MSCI ACWI Large Cap Index (Net) also includes the reinvestment of distributions but not fees, expenses and income taxes associated with an investment in the Fund. The MSCI ACWI Large Cap Index (Net) is unmanaged. Investments cannot be made directly in an index.
Investments made in foreign and emerging country securities may involve additional risks, such as political and social instability, less liquidity and currency exchange rate volatility.
| Old Westbury Funds, Inc. | |
| Small & Mid Cap Strategies Fund | |
| Investment Adviser’s Report (Unaudited) | |
| | |
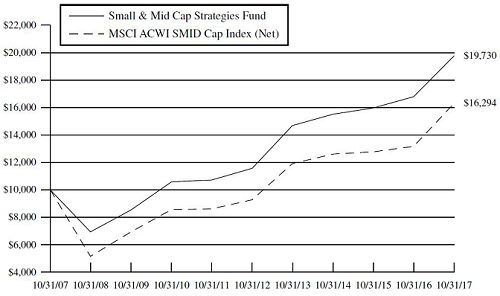
The return of the Old Westbury Small & Mid Cap Strategies Fund (the “Fund”) for the fiscal year ended October 31, 2017, was 17.6%. In comparison, the return of the MSCI All Country World Small Mid Cap Index (Net)a (the “Index”) was 23.7%.
Relative to the Index, underperformance came from small- and mid-cap stocks managed by Bessemer Investment Management LLC (“Bessemer”)(32.0%), U.S. small- and mid-cap stocks managed by Vermont-based Champlain Investment Partners LLC (16.7%), and small- and mid-cap managed volatility stocks managed by Bessemer (3.7%). A terminated emerging-market small- and mid-cap strategy managed by Mondrian also detracted from performance, as did elevated cash holdings during the latter half of the fiscal year. Relative outperformance came from non-U.S. value-oriented stocks managed by Texas-based Dimensional Fund Advisors LP (20.5%), developed-market small-cap stocks managed by London-based Mondrian Investment Partners Ltd. (10.6%), and managed volatility U.S. small cap stocks managed by Boston-based Martingale Asset Management LP (7.4%).
Stock selection in the industrial and consumer discretionary sectors drove most of the underperformance for the year. Individual stocks that detracted from relative performance were automotive parts retailer Advance Auto Parts, as well as consumer products companies Spectrum Brands and Newell Brands. Advance Auto Parts was hurt by a collapse in profitability due to internal challenges and industry softness. Spectrum Brands and Newell Brands had a difficult year due to inventory destocking at retailers, internal execution issues, and valuation multiple contraction due to the threat from e-commerce disruption.
The Fund benefited from underweight positions in the energy and real estate sectors. Individual stocks that contributed the most to relative performance were hospitality and lodging company Wyndham Worldwide; medical device firm C.R. Bard, and ANSYS, which provides engineering simulation software for a number of industries. Wyndham Worldwide benefited from improved business execution, announced a spin-out of its Timeshare division to unlock shareholder value, and experienced subsequent valuation multiple expansion. C.R. Bard continued to see improving results, and is currently being acquired by Becton Dickinson. ANSYS performed well as organic revenue growth accelerated under the leadership of a new Chief Executive Officer.
At fiscal year-end, the Fund was overweight the consumer staples, healthcare, and industrials sectors. The Fund was underweight energy, financials, materials, real estate, telecom, and utilities. Neutral positions were held in the consumer discretionary and technology sectors.
The Fund was regionally overweight the U.S. market (57.3%). Conversely, the Fund was underweight developed Europe (14.6%), Japan (5.2%), and emerging markets (7.0%).
| a | The Net version of the index reflects no deductions for fees, expenses or income taxes. |
| Old Westbury Funds, Inc. | |
| Small & Mid Cap Strategies Fund | |
| Investment Adviser’s Report (Unaudited) - (Continued) | |
| | |
PORTFOLIO DIVERSIFICATION BY COUNTRY*
| Country: | | | | |
| Argentina | | | 0.0 | *** |
| Australia | | | 1.7 | % |
| Austria | | | 0.2 | |
| Belgium | | | 0.4 | |
| Bermuda | | | 0.8 | |
| Brazil | | | 0.5 | |
| Cambodia | | | 0.0 | *** |
| Canada | | | 2.4 | |
| Cayman Islands | | | 0.0 | *** |
| Chile | | | 0.1 | |
| China | | | 1.5 | |
| Cyprus | | | 0.0 | *** |
| Denmark | | | 0.4 | |
| Faeroe Islands | | | 0.0 | *** |
| Finland | | | 0.4 | |
| France | | | 1.9 | |
| Gabon | | | 0.0 | *** |
| Georgia | | | 0.0 | *** |
| Germany | | | 2.6 | |
| Gibraltar | | | 0.0 | *** |
| Greece | | | 0.0 | *** |
| Hong Kong | | | 1.2 | |
| Hungary | | | 0.0 | *** |
| India | | | 0.8 | |
| Indonesia | | | 0.1 | |
| Ireland | | | 1.5 | |
| Isle of Man | | | 0.0 | *** |
| Israel | | | 1.2 | |
| Italy | | | 0.6 | |
| Japan | | | 5.2 | |
| Jersey Channel Islands | | | 0.0 | *** |
| Jordan | | | 0.0 | *** |
| Liechtenstein | | | 0.0 | *** |
| Luxembourg | | | 0.3 | |
| Macau | | | 0.0 | *** |
| Malaysia | | | 0.2 | |
| Malta | | | 0.0 | *** |
| Mexico | | | 0.2 | |
| Monaco | | | 0.0 | *** |
| Netherlands | | | 0.7 | |
| New Zealand | | | 0.6 | |
| Norway | | | 0.2 | |
| Panama | | | 0.0 | *** |
| Peru | | | 0.0 | *** |
| Philippines | | | 0.1 | |
| Poland | | | 0.2 | |
| Portugal | | | 0.0 | *** |
| Puerto Rico | | | 0.0 | *** |
| Romania | | | 0.0 | *** |
| Russia | | | 0.1 | |
| Singapore | | | 0.8 | |
| South Africa | | | 0.3 | |
| South Korea | | | 0.9 | |
| Spain | | | 0.4 | |
| Sweden | | | 0.9 | |
| Switzerland | | | 1.2 | |
| Taiwan | | | 1.2 | |
| Thailand | | | 0.2 | |
| Turkey | | | 0.1 | |
| United Kingdom | | | 5.1 | |
| United States | | | 53.4 | |
| Other** | | | 9.4 | |
| | | | 100.0 | % |
| * | Stated as a percentage of net assets. |
| ** | Includes cash and equivalents, exchange traded funds, rights/warrants, U.S. Government securities, U.S. Government agencies, investment company, pending trades and Fund share transactions, interest and dividends receivable, prepaids and accrued expenses payable. |
| *** | Represents less than 0.1% of net assets. |
| Old Westbury Funds, Inc. | |
| Small & Mid Cap Strategies Fund | |
| Investment Adviser’s Report (Unaudited) - (Continued) | |
| | |
Average Annual Total Returns
For the Period Ended October 31, 2017
| Small & Mid Cap Strategies Fund | | | | |
| One Year | | | 17.64 | % |
| Five Year | | | 11.26 | % |
| Ten Year | | | 7.03 | % |
| | | | | |
| MSCI ACWI SMID Cap Index (Net) | | | | |
| One Year | | | 23.67 | % |
| Five Year | | | 11.90 | % |
| Ten Year | | | 5.00 | % |
On December 30, 2016, the Fund changed its name to Small & Mid Cap Strategies Fund (formerly Small & Mid Cap Fund) as part of a series of changes to the overall investment focus and strategies of the Fund. Prior to October 2, 2008, the Fund was named Global Small Cap Fund and operated under a different investment strategy including at least 80% of its net assets plus any borrowings for investment purposes in securities of small-capitalization companies. The performance information shown above may not be representative of performance the Fund will achieve under its current investment strategy.
The performance data quoted represents past performance. Past performance does not guarantee future results and does not reflect the deduction of taxes that a shareholder may pay on Fund distributions or the redemption of Fund shares. Fund performance reflects fee waivers and/or expense reimbursements and reinvestments of distributions, if any. Without waivers/reimbursements, performance would be lower. The investment return and principal value of an investment will fluctuate. Consequently, an investor’s shares, when redeemed, may be worth more or less than their original cost. Current performance may be lower or higher than the performance data quoted. To obtain performance information current to the most recent month end, please call 1-800-607-2200.
| Old Westbury Funds, Inc. | |
| Small & Mid Cap Strategies Fund | |
| Investment Adviser’s Report (Unaudited) - (Concluded) | |
| | |
The Adviser has contractually committed through October 31, 2019, to waive its advisory fees to the extent necessary to maintain the net operating expense ratio of the Fund, excluding Fund transaction costs, investment interest expense, dividend expenses associated with securities sold short and acquired fund fees and expenses (if any), at 1.11%, as disclosed in the Funds’ prospectus dated March 1, 2017. The expense ratio, prior to fee waivers and including acquired fund fees and expenses (if any), is stated in the prospectus as 1.17%. Additional information pertaining to the Fund’s expense ratio for the year ended October 31, 2017 can be found in the Financial Highlights.
The chart shown on the previous page illustrates the total value of a $10,000 investment for 10 years, with distributions reinvested. The MSCI ACWI SMID Cap Index (Net) also includes the reinvestment of distributions but not fees, expenses and income taxes associated with an investment in the Fund. The MSCI ACWI SMID Cap Index (Net) is unmanaged. Investments cannot be made directly in an index.
Investments made in small-capitalization and mid-capitalization companies are subject to greater volatility and less liquidity compared to investments made in larger and more established companies. Investments made in securities of companies in foreign and emerging countries may involve additional risks, such as political and social instability, less liquidity and currency exchange rate volatility.
| Old Westbury Funds, Inc. | |
| Strategic Opportunities Fund | |
| Investment Adviser’s Report (Unaudited) | |
| | |
The return of the Old Westbury Strategic Opportunities Fund (the “Fund”) for the fiscal year ended October 31, 2017, was 14.1%. In comparison, the return of the Fund’s primary benchmark, the MSCI All Country World Investable Index (IMI) (Net)a, was 23.5%. The return for the Fund’s secondary benchmark, the BofA Merrill Lynch 1-10 Year AAA-A U.S. Corporate & Government Index (Net)a (40%) and the MSCI All Country World (IMI) (Net)a (60%), was 13.7%.
During the fiscal year, segments of the Fund that outperformed the primary benchmark included Bessemer Investment Management LLC’s (“Bessemer”) equities (49% of the Fund as of October 31, 2017), and collateralized loan obligations (7%, managed by Bessemer and BlackRock Financial Management Inc.). Futures and exchange-traded-funds (ETFs) performed well given a strong global market backdrop, as did strong country and sector selection within equity-linked derivative investments. Collateralized loan obligations benefited from robust investor demand and security selection within the Fund.
Despite strong performance from the Fund’s equity positions, the overall Fund allocation to equities (49% of the Fund as of October 31, 2017) was the largest detractor to relative performance to the primary benchmark, as global equities were one of the best performing asset classes in fiscal year 2017. As an asset allocation strategy encompassing a variety of asset classes that have historically had significantly less volatility than global equities, the Fund’s underperformance is not surprising in a strong year for global equities. Additionally, the U.S. dollar overweight and therefore underweights in other currencies were detractors in absolute and relative terms. Other segments of the Fund that underperformed included Bessemer’s quantitative equities (9%), global high yield (4%, managed by Muzinich & Co., Inc.) and convertible bonds (7%). While adding absolute returns, quantitative equities lagged global equities due to their lower-risk portfolio construction. Global high yield benefited from currency fluctuations, although did not keep pace with global equities. Convertible bonds remain conservatively managed relative to other asset classes within the portfolio.
The Fund’s primary benchmark consists of global equities, and the Fund’s secondary benchmark consists of equities and U.S. treasuries. Relative to the benchmarks, therefore, at year-end, the Fund was overweight convertible bonds, collateralized loan obligations, non-agency mortgage-backed securities, global high yield, and closed-end credit funds. The investment team views each of these asset classes as having a better risk-adjusted return profile than U.S. treasuries. The Fund has limited interest rate risk — despite U.S. Treasuries comprising 40% of the secondary benchmark — as this asset class does not currently fit the Adviser’s criteria of equity-like returns, facing a market dislocation, and upside potential greater than downside risk (positive asymmetry).
At year-end, the Fund had 68.0% of its assets in the U.S., 17.0% in developed Europe, 5.8% in Japan, 7.8% in emerging markets, and 1.4% in other developed markets. The Fund maintains significant exposure to the U.S. dollar, representing 80.0% of the Fund compared to 52.0% for the primary benchmark and 71.2% for the secondary benchmark.
| a | The Net version of each index reflects no deductions for fees, expenses or income taxes. |
| Old Westbury Funds, Inc. | |
| Strategic Opportunities Fund | |
| Investment Adviser’s Report (Unaudited) - (Continued) | |
| | |
PORTFOLIO DIVERSIFICATION BY COUNTRY*
| Country: | | | | |
| Argentina | | | 0.0 | *** |
| Austria | | | 0.1 | |
| Belgium | | | 0.0 | *** |
| Bermuda | | | 0.6 | |
| Brazil | | | 0.1 | |
| Bulgaria | | | 0.0 | *** |
| Canada | | | 0.1 | |
| Cayman Islands | | | 6.6 | |
| China | | | 0.2 | |
| Czech Republic | | | 0.0 | *** |
| Denmark | | | 0.0 | *** |
| Dominican Republic | | | 0.0 | *** |
| Egypt | | | 0.0 | *** |
| Finland | | | 0.0 | *** |
| France | | | 0.9 | |
| Germany | | | 0.5 | |
| Guernsey | | | 0.0 | *** |
| Hong Kong | | | 0.2 | |
| Hungary | | | 0.0 | *** |
| Indonesia | | | 0.1 | |
| Ireland | | | 0.1 | |
| Israel | | | 0.0 | *** |
| Italy | | | 0.1 | |
| Japan | | | 0.8 | |
| Jersey Channel Islands | | | 0.4 | |
| Luxembourg | | | 0.8 | |
| Malaysia | | | 0.0 | *** |
| Morocco and Antilles | | | 0.1 | |
| Netherlands | | | 0.9 | |
| Norway | | | 0.0 | *** |
| Pakistan | | | 0.0 | *** |
| Peru | | | 0.0 | *** |
| Qatar | | | 0.1 | |
| Slovenia | | | 0.0 | *** |
| South Africa | | | 0.0 | *** |
| South Korea | | | 0.1 | |
| Spain | | | 0.3 | |
| Sweden | | | 0.2 | |
| Switzerland | | | 0.1 | |
| Taiwan | | | 0.8 | |
| Turkey | | | 0.1 | |
| United Arab Emirates | | | 0.0 | *** |
| United Kingdom | | | 0.9 | |
| United States | | | 62.8 | |
| Other** | | | 22.0 | |
| | | | 100.0 | % |
| * | Value of Investments in Portfolio as a percentage of net assets. |
| ** | Includes cash and equivalents, closed-end funds, options, exchange traded funds, rights/warrants, structured options, futures, swap agreements, pending trades and Fund share transactions, interest and dividends receivable, prepaids and accrued expenses payable. |
| *** | Represents less than 0.1% of net assets. |
| Old Westbury Funds, Inc. | |
| Strategic Opportunities Fund | |
| Investment Adviser’s Report (Unaudited) - (Continued) | |
| | |

Average Annual Total Returns
For the Period Ended October 31, 2017
| Strategic Opportunities Fund | | | | |
| One Year | | | 14.14 | % |
| Five Year | | | 6.51 | % |
| Since Inception (November 28, 2007) | | | 2.80 | % |
| | | | | |
| MSCI ACWI IMI Index (Net) | | | | |
| One Year | | | 23.52 | % |
| Five Year | | | 11.02 | % |
| November 28, 2007 to October 31, 2017 | | | 4.66 | % |
| | | | | |
| Blended Index (Net) | | | | |
| One Year | | | 13.66 | % |
| Five Year | | | 7.18 | % |
| November 28, 2007 to October 31, 2017 | | | 4.40 | % |
Effective January 1, 2014, the Board approved changes to the Fund’s name (formerly Global Opportunities Fund), investment strategies and primary benchmark. The performance information shown above may not be representative of performance the Fund will achieve under its current investment strategy.
| Old Westbury Funds, Inc. | |
| Strategic Opportunities Fund | |
| Investment Adviser’s Report (Unaudited) - (Concluded) | |
| | |
The performance data quoted represents past performance. Past performance does not guarantee future results and does not reflect the deduction of taxes that a shareholder may pay on Fund distributions or the redemption of Fund shares. Fund performance reflects fee waivers and/or expense reimbursements and reinvestments of distributions, if any. Without waivers/reimbursements, performance would be lower. The investment return and principal value of an investment will fluctuate. Consequently, an investor’s shares, when redeemed, may be worth more or less than their original cost. Current performance may be lower or higher than the performance data quoted. To obtain performance information current to the most recent month end, please call 1-800-607-2200.
The Adviser has contractually committed through October 31, 2019, to waive its advisory fees to the extent necessary to maintain the net operating expense ratio of the Fund, excluding Fund transaction costs, investment interest expense, dividend expenses associated with securities sold short and acquired fund fees and expenses (if any), at 1.20%, as disclosed in the Funds’ prospectus dated March 1, 2017. The expense ratio, prior to fee waivers and including acquired fund fees and expenses (if any), is stated in the prospectus as 1.48%. Additional information pertaining to the Fund’s expense ratio for the year ended October 31, 2017 can be found in the Financial Highlights.
The chart shown on the previous page illustrates the total value of a $10,000 investment from the Fund’s inception, with distributions reinvested. The Fund compares its performance to its primary benchmark, the MSCI ACWI IMI Index (Net) and a blended benchmark consisting of a 60% weighting in the MSCI ACWI IMI Index (Net) and a 40% weighting in the Bank of America Merrill Lynch 1-10 Year AAA-A U.S. Corporate & Government Index (the “Blended Index”). The MSCI ACWI IMI (Net) and the Blended Index (Net) also include the reinvestment of distributions but do not include fees, expenses and income taxes associated with an investment in the Fund. The MSCI ACWI IMI (Net) and the Blended Index (Net) are unmanaged. Investments cannot be made directly in an index.
Investments made in securities of companies in foreign and emerging countries may involve additional risks, such as political and social instability, less liquidity and currency exchange rate volatility. The Fund may invest in instruments that are volatile, speculative or otherwise risky. The Fund is non-diversified, meaning it may focus its assets in a smaller number of issuers and may be subject to more risk than a more diversified fund.
| Old Westbury Funds, Inc. | |
| Fixed Income Fund | |
| Investment Adviser’s Report (Unaudited) | |
| | |
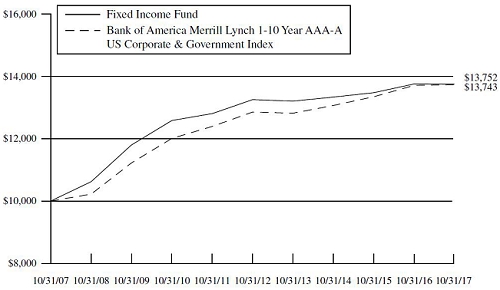
The Old Westbury Fixed Income Fund (the “Fund”) returned -0.1% for the fiscal year ended October 31, 2017. In comparison, the return of the Bank of America Merrill Lynch U.S. Corporate & Government 1-10 Year AAA-A U.S. Corporate & Government Index was 0.2%.
Global economic growth improved through the course of the year, and this growth was largely synchronized across major and developing economies. With economies on stronger footing and a healthier banking system, global central banks began slowly moving toward normalization of monetary policy. The U.S. Federal Reserve (Fed) raised interest rates three times over the fiscal year, and in September, announced that it would begin to allow its balance-sheet holdings to slowly roll off, by no more than $10 billion per month. Interest rates rose across the yield curve and the curve flattened as shorter-term yields rose more than longer ones. Expectations for the Fed to continue on the path of slowly raising rates pushed short-term yields higher; meanwhile, the rise in longer-term yields has been more subdued with tepid inflation results. During the year, credit spreads contracted, and corporate bonds outperformed Treasuries and U.S. agency bonds.
The Fund maintained a barbell yield-curve exposure throughout the year, meaning it was underweight bonds with intermediate maturities, and overweight bonds with shorter- and longer-term maturities. A barbell position is typically advantageous in a rising-rate environment. For the year, this structure had a slightly negative influence on performance because the Fed moved so slowly. The Fund also had a lower duration (price sensitivity to interest-rate moves) than the benchmark, which had a slightly positive effect on performance. Corporate credit outperformed Treasuries and agency bonds, so the Fund’s portfolio overweight to corporates had a slightly positive effect on relative performance.
Further improving U.S. economic strength and a slowly moving Fed are expected as 2018 approaches, however, there is a wide range of potential policy outcomes that could cause market volatility. The team’s overall outlook for investment-grade fixed income is mildly positive for 2018, with the balance of market risks likely to push yields marginally higher. The Fund’s current strategy is to maintain the portfolio duration at, or slightly lower than, that of the benchmark. Exposure to asset-backed securities (ABS), which have more staying power in the later stages of a credit cycle, and CLOs, whose underlying securities are floating-rate, tend to maintain their principal value, and produce rising income as market yields rise, has been maintained. Exposure has also been maintained in U.S. Treasury Inflation-Protected Securities (TIPS), which help protect against inflation.
At fiscal year-end, the Fund maintained its barbell positioning. Credit represented approximately 42% of the market value of the Fund. Credit exposure is limited to investment-grade securities, with an emphasis on liquid, shorter-duration bonds. In the coming months, the team will closely watch developments in the U.S. and global economy that may drive changes in interest rates and the yield curve.
| Old Westbury Funds, Inc. | |
| Fixed Income Fund | |
| Investment Adviser’s Report (Unaudited) - (Continued) | |
| | |
PORTFOLIO ASSET ALLOCATION*
| U.S. Government Agencies and Securities | | | 57.3 | % |
| Corporate Bonds | | | 32.8 | |
| Government Bonds | | | 0.4 | |
| Asset Backed Securities | | | 8.3 | |
| Collateralized Mortgage Obligations | | | 0.2 | |
| Other** | | | 1.0 | |
| | | | 100.0 | % |
| * | Stated as a percentage of net assets. |
| ** | Includes cash and equivalents, investment company, pending trades and Fund share transactions, interest and dividends receivable, prepaids and accrued expenses payable. |
| Old Westbury Funds, Inc. | |
| Fixed Income Fund | |
| Investment Adviser’s Report (Unaudited) - (Continued) | |
| | |
Average Annual Total Returns
For the Period Ended October 31, 2017
| Fixed Income Fund | | | | |
| One Year | | | -0.09 | % |
| Five Year | | | 0.73 | % |
| Ten Year | | | 3.24 | % |
| | | | | |
| Bank of America Merrill Lynch 1-10 Year AAA-A U.S. Corporate & Government Index | | | | |
| One Year | | | 0.19 | % |
| Five Year | | | 1.34 | % |
| Ten Year | | | 3.23 | % |
The performance data quoted represents past performance. Past performance does not guarantee future results and does not reflect the deduction of taxes that a shareholder may pay on Fund distributions or the redemption of Fund shares. Fund performance reflects fee waivers and/or expense reimbursement and reinvestments of distributions, if any. Without waivers/reimbursements, performance would have been lower. The investment return and principal value of an investment will fluctuate. Consequently, an investor’s shares, when redeemed, may be worth more or less than their original cost. Current performance may be lower or higher than the performance data quoted. To obtain performance information current to the most recent month end, please call 1-800-607-2200.
The Adviser has contractually committed through October 31, 2019, to waive its advisory fees to the extent necessary to maintain the net operating expense ratio of the Fund, excluding Fund transaction costs, investment interest expense, dividend expenses associated with securities sold short and acquired fund fees and expenses (if any) at 0.70% (current net operating expense ratio is 0.62%). The expense ratio, prior to fee waivers and including acquired fund fees (if any), is stated in the prospectus dated March 1, 2017 as 0.74%. Additional information pertaining to the Fund’s expense ratio for the year ended October 31, 2017 can be found in the Financial Highlights.
| Old Westbury Funds, Inc. | |
| Fixed Income Fund | |
| Investment Adviser’s Report (Unaudited) - (Concluded) | |
| | |
The chart shown on the previous page illustrates the total value of a $10,000 investment for 10 years, with distributions reinvested. The Bank of America Merrill Lynch 1-10 Year AAA-A U.S. Corporate & Government Index also includes the reinvestment of distributions but does not include fees, expenses and income taxes associated with an investment in the Fund. The Bank of America Merrill Lynch 1-10 Year AAA-A U.S. Corporate & Government Index is unmanaged. Investments cannot be made directly in an index.
The Fund is subject to risks such as credit, prepayment and interest rate risk associated with the underlying bond holdings in the Fund. The value of the Fund can decline as interest rates rise and an investor can lose principal.
| Old Westbury Funds, Inc. | |
| Municipal Bond Fund | |
| Investment Adviser’s Report (Unaudited) | |
| | |
The return of the Old Westbury Municipal Bond Fund (the “Fund”) for the fiscal year ended October 31, 2017, was 0.5%. In comparison, the return of the BofA Merrill Lynch 1-12 Year AAA-AA Municipal Securities Index (the “benchmark”) was 1.2%, and the return of the Fund’s other index, the Lipper Short-Intermediate Municipal Debt Funds Index, was 0.9%.
Strong global demand for fixed income securities by central banks and low inflation are two factors that have kept yields low. In addition, tight supplies of municipal bonds continue to keep yield levels historically low when compared to the Treasury sector. These influences resulted in a flatter yield curve over the year. Throughout the year, the Fund used a barbell maturity structure, which typically outperforms during periods when yields between short and long maturities narrow. The Fund was underweight in the two- to four-year maturity range. At the same time, the Fund held an overweight in both one-year and shorter maturities and four- to ten-year maturities.
The Fund held a shorter duration, or less price sensitivity, in a period where prices advanced, and this lack of price sensitivity placed a drag on performance relative to the benchmark. In terms of credit quality, the Fund holds an A-rated component in the portfolio. This compares to the benchmark where all holdings are rated AA or higher. The Fund’s credit profile was a positive contributor to relative performance.
The Fund currently views municipal bond prices as somewhat overvalued when compared to levels available on other fixed income alternatives. In addition, prospects for federal tax reform and lower corporate tax rates create the potential for banks and insurance companies to sell their municipal holdings which are already at high historical prices. These factors make prices on tax-exempt securities vulnerable and have led the Fund to hold a position of Treasury securities as a hedge against municipal underperformance. The Fund plans to sell Treasury securities and return proceeds to the municipal market when the relationship between the two sectors returns to a more historically normal relationship.
| Old Westbury Funds, Inc. | |
| Municipal Bond Fund | |
| Investment Adviser’s Report (Unaudited) - (Continued) | |
| | |
PORTFOLIO DIVERSIFICATION BY STATE*
| States: | | | | |
| Alabama | | | 1.0 | % |
| Arizona | | | 0.7 | |
| California | | | 5.0 | |
| Colorado | | | 0.7 | |
| Connecticut | | | 3.8 | |
| District of Columbia | | | 0.3 | |
| Florida | | | 1.1 | |
| Georgia | | | 4.8 | |
| Hawaii | | | 0.6 | |
| Idaho | | | 0.1 | |
| Illinois | | | 1.7 | |
| Indiana | | | 0.2 | |
| Iowa | | | 0.6 | |
| Kansas | | | 0.2 | |
| Kentucky | | | 0.3 | |
| Louisiana | | | 0.1 | |
| Maine | | | 0.1 | |
| Maryland | | | 2.7 | |
| Massachusetts | | | 9.9 | |
| Michigan | | | 0.5 | |
| Minnesota | | | 2.4 | |
| Mississippi | | | 0.5 | |
| Missouri | | | 1.9 | |
| Nevada | | | 0.1 | |
| New Hampshire | | | 0.1 | |
| New Jersey | | | 1.6 | |
| New Mexico | | | 0.2 | |
| New York | | | 17.3 | |
| North Carolina | | | 1.9 | |
| Ohio | | | 2.7 | |
| Oklahoma | | | 0.4 | |
| Oregon | | | 0.2 | |
| Pennsylvania | | | 0.8 | |
| Rhode Island | | | 1.6 | |
| South Carolina | | | 0.9 | |
| Tennessee | | | 0.3 | |
| Texas | | | 14.4 | |
| Utah | | | 0.1 | |
| Virginia | | | 2.8 | |
| Washington | | | 1.8 | |
| Wisconsin | | | 0.1 | |
| Other** | | | 13.5 | |
| | | | 100.0 | % |
| * | Stated as a percentage of net assets. |
| ** | Includes cash and equivalents, investment company, U.S. Government securities, pending trades and Fund share transactions, interest and dividends receivable, prepaids and accrued expenses payable. |
| Old Westbury Funds, Inc. | |
| Municipal Bond Fund | |
| Investment Adviser’s Report (Unaudited) - (Continued) | |
| | |

Average Annual Total Returns
For the Period Ended October 31, 2017
| Municipal Bond Fund | | | | |
| One Year | | | 0.45 | % |
| Five Year | | | 1.06 | % |
| Ten Year | | | 2.91 | % |
| | | | | |
Bank of America Merrill Lynch
1-12 Year AAA-AA Municipal
Securities Index | | | | |
| One Year | | | 1.19 | % |
| Five Year | | | 1.75 | % |
| Ten Year | | | 3.43 | % |
| | | | | |
Lipper Short-Intermediate
Municipal Debt Funds Index | | | | |
| One Year | | | 0.93 | % |
| Five Year | | | 1.23 | % |
| Ten Year | | | 2.64 | % |
The performance data quoted represents past performance. Past performance does not guarantee future results and does not reflect the deduction of taxes that a shareholder may pay on Fund distributions or the redemption of Fund shares. Fund performance reflects fee waivers and/or expense reimbursements and reinvestment of distributions, if any. Without waivers/reimbursements performance would have been lower. The investment return and principal value of an investment will fluctuate. Consequently, an investor’s shares, when redeemed, may be worth more or less than their original cost. Current performance may be lower or higher than the performance data quoted. To obtain performance information current to the most recent month end, please call 1-800-607-2200.
| Old Westbury Funds, Inc. | |
| Municipal Bond Fund | |
| Investment Adviser’s Report (Unaudited) - (Concluded) | |
| | |
The Adviser has contractually committed through October 31, 2019, to waive its advisory fees to the extent necessary to maintain the net operating expense ratio of the Fund, excluding Fund transaction costs, investment interest expense, dividend expenses associated with securities sold short and acquired fund fees and expenses (if any) at 0.70% (current net operating expense ratio is 0.57%). The expense ratio, prior to fee waivers and including acquired fund fees (if any), is stated in the prospectus dated March 1, 2017 as 0.69%. Additional information pertaining to the Fund’s expense ratio for the year ended October 31, 2017 can be found in the Financial Highlights.
The chart shown on the previous page illustrates the total value of a $10,000 investment for 10 years, with distributions reinvested. The Bank of America Merrill Lynch 1-12 Year AAA-AA Municipal Securities Index and the Lipper Short-Intermediate Municipal Debt Funds Index also include the reinvestment of distributions but do not include fees, expenses and income taxes associated with an investment in the Fund. The Bank of America Merrill Lynch 1-12 Year AAA-AA Municipal Securities Index and the Lipper Short-Intermediate Municipal Debt Funds Index are unmanaged. Investments cannot be made directly in an index.
Municipal securities held by the Fund may be adversely affected by local political and economic factors. Income from the Fund may be subject to federal alternative minimum tax, state and local taxes.
| Old Westbury Funds, Inc. |
| Disclosure of Fund Expenses (Unaudited) |
| For the Period Ended October 31, 2017 |
| |
As a shareholder of Old Westbury Funds, Inc., you incur ongoing costs, including management fees and other Fund expenses. This example is intended to help you understand your ongoing costs (in dollars) of investing in the Funds and to compare these costs with the ongoing costs of investing in other mutual funds.
The example is based on an investment of $1,000 invested at the beginning of the period and held for the entire period from May 1, 2017 through October 31, 2017.
Actual Expenses
The table below provides information about actual account values and actual expenses. You may use the information below, together with the amount you invested, to estimate the expenses that you paid over the period. Simply divide your account value by $1,000 (for example, an $8,600 account value divided by $1,000 = 8.6), then multiply the result by the number in the table under the heading entitled “Actual Expenses Paid During Period” to estimate the expenses you paid on your account during this period.
| | | Actual
Beginning
Account Value
05/1/17 | | Actual
Ending
Account Value
10/31/17 | | Actual
Expenses Paid
During Period*
05/1/17-10/31/17 | | Actual
Expense Ratio
During Period**
05/1/17-10/31/17 |
| All Cap Core Fund | | | $1,000.00 | | | | $1,090.60 | | | | $5.16 | | | | 0.98 | % |
| Large Cap Strategies Fund | | | 1,000.00 | | | | 1,073.00 | | | | 5.80 | | | | 1.11 | % |
| Small & Mid Cap Strategies Fund | | | 1,000.00 | | | | 1,061.90 | | | | 5.77 | | | | 1.11 | % |
| Strategic Opportunities Fund | | | 1,000.00 | | | | 1,060.00 | | | | 6.23 | | | | 1.20 | % |
| Fixed Income Fund | | | 1,000.00 | | | | 1,006.30 | | | | 3.14 | | | | 0.62 | % |
| Municipal Bond Fund | | | 1,000.00 | | | | 1,009.10 | | | | 2.89 | | | | 0.57 | % |
| * | Expenses are equal to the average account value times the Fund’s annualized expense ratio multiplied by 184/365 to reflect the one-half year period. |
| ** | Expense ratios are annualized and reflect existing expense waivers/reimbursements. |
| Old Westbury Funds, Inc. |
| Disclosure of Fund Expenses (Unaudited) - (Continued) |
| For the Period Ended October 31, 2017 |
| |
Hypothetical Example for Comparison Purposes
The table below provides information about hypothetical account values and hypothetical expenses based on each Fund’s actual expense ratio and an assumed rate of return of 5% per year before expenses, which is not the Fund’s actual return. The hypothetical account values and expenses may not be used to estimate the actual ending account balance or expenses you paid for the period. You may use this information to compare this 5% hypothetical example with the 5% hypothetical examples that appear in the shareholder reports of other funds.
| | | Hypothetical
Beginning
Account Value
5/1/17 | | Hypothetical
Ending
Account Value
10/31/17 | | Hypothetical
Expenses Paid
During Period*
5/1/17-10/31/17 | | Hypothetical
Expense Ratio
During Period**
05/1/17-10/31/17 |
| All Cap Core Fund | | | $1,000.00 | | | | $1,020.27 | | | | $4.99 | | | | 0.98 | % |
| Large Cap Strategies Fund | | | 1,000.00 | | | | 1,019.61 | | | | 5.65 | | | | 1.11 | % |
| Small & Mid Cap Strategies Fund | | | 1,000.00 | | | | 1,019.61 | | | | 5.65 | | | | 1.11 | % |
| Strategic Opportunities Fund | | | 1,000.00 | | | | 1,019.16 | | | | 6.11 | | | | 1.20 | % |
| Fixed Income Fund | | | 1,000.00 | | | | 1,022.08 | | | | 3.16 | | | | 0.62 | % |
| Municipal Bond Fund | | | 1,000.00 | | | | 1,022.33 | | | | 2.91 | | | | 0.57 | % |
| * | Expenses are equal to the average account value times the Fund’s annualized expense ratio multiplied by 184/365 to reflect the one-half year period. |
| ** | Expense ratios are annualized and reflect existing expense waivers/reimbursements. |
Please note that the expenses shown in the tables are meant to highlight your ongoing costs only and do not reflect any transactional costs, such as sales charges (loads), redemption fees, or exchange fees. Therefore, these tables are useful in comparing ongoing costs only, and will not help you determine the relative total costs of owning different funds. In addition, if these transactional costs were included, your costs would have been higher.
| Old Westbury Funds, Inc. | |
| All Cap Core Fund | |
| Portfolio of Investments | October 31, 2017 |
| | |
| Shares | | | | | Value | |
| COMMON STOCKS — 96.7% | | | | |
| Banks — 7.2% | | | | |
| | 401,070 | | | Citigroup, Inc. | | $ | 29,478,645 | |
| | 1,991,445 | | | KeyCorp | | | 36,343,871 | |
| | 696,970 | | | Morgan Stanley | | | 34,848,500 | |
| | 2,169,900 | | | Nordea Bank AB | | | 26,230,657 | |
| | | | | | | | 126,901,673 | |
| Consumer Discretionary — 13.6% | | | | |
| | 88,230 | | | Advance Auto Parts, Inc. | | | 7,211,920 | |
| | 48,186 | | | Amazon.com, Inc.(a) | | | 53,259,022 | |
| | 968,810 | | | Comcast Corp. - Class A | | | 34,906,224 | |
| | 419,150 | | | Hanesbrands, Inc. | | | 9,430,875 | |
| | 167,200 | | | Home Depot, Inc. (The) | | | 27,718,416 | |
| | 212,365 | | | Newell Brands, Inc. | | | 8,660,245 | |
| | 451,460 | | | NIKE, Inc. - Class B | | | 24,825,785 | |
| | 24,638 | | | Priceline Group, Inc. (The)(a) | | | 47,106,870 | |
| | 1,353,455 | | | Samsonite International SA | | | 5,647,058 | |
| | 128,315 | | | SIX Flags Entertainment Corp. | | | 8,056,899 | |
| | 128,060 | | | Wyndham Worldwide Corp. | | | 13,683,211 | |
| | | | | | | | 240,506,525 | |
| Consumer Staples — 7.3% | | | | |
| | 561,000 | | | Altria Group, Inc. | | | 36,027,420 | |
| | 795,000 | | | Church & Dwight Co., Inc. | | | 35,910,150 | |
| | 52,635 | | | JM Smucker Co. (The) | | | 5,581,942 | |
| | 385,925 | | | PepsiCo, Inc. | | | 42,540,513 | |
| | 75,425 | | | Spectrum Brands Holdings, Inc. | | | 8,290,716 | |
| | | | | | | | 128,350,741 | |
| Diversified Financials — 2.9% | | | |
| | 588,010 | | | Discover Financial Services | | | 39,120,305 | |
| | 168,245 | | | Nasdaq, Inc. | | | 12,222,999 | |
| | | | | | | | 51,343,304 | |
| Energy — 4.2% | | | | |
| | 720,705 | | | ConocoPhillips | | | 36,864,061 | |
| | 982,790 | | | Encana Corp. | | | 11,495,466 | |
| | 1,596,340 | | | ENI SpA | | | 26,107,322 | |
| | | | | | | | 74,466,849 | |
| Health Care — 16.3% | | | | |
| | 122,300 | | | Alexion Pharmaceuticals, Inc.(a) | | | 14,634,418 | |
| | 782,400 | | | Baxter International, Inc. | | | 50,441,328 | |
| | 273,500 | | | Bristol-Myers Squibb Co. | | | 16,864,010 | |
| | 41,215 | | | Cooper Cos., Inc. (The) | | | 9,902,316 | |
| | 573,700 | | | Danaher Corp. | | | 52,935,299 | |
| | 134,000 | | | DENTSPLY SIRONA, Inc. | | | 8,183,380 | |
| | 515,000 | | | Eli Lilly & Co. | | | 42,199,100 | |
| | 79,285 | | | Laboratory Corp of America Holdings(a) | | | 12,186,897 | |
| | 98,660 | | | STERIS Plc | | | 9,207,938 | |
| | 204,905 | | | Thermo Fisher Scientific, Inc. | | | 39,716,736 | |
| | 51,060 | | | Waters Corp.(a) | | | 10,010,313 | |
| | 348,000 | | | Zoetis, Inc. | | | 22,209,360 | |
| | | | | | | | 288,491,095 | |
| Shares | | | | | Value | |
| Industrials — 11.0% | | | | |
| | 96,325 | | | Allegion Plc | | $ | 8,032,542 | |
| | 116,230 | | | Dover Corp. | | | 11,098,803 | |
| | 92,680 | | | Dun & Bradstreet Corp. (The) | | | 10,827,804 | |
| | 631,784 | | | Fortive Corp. | | | 45,652,712 | |
| | 55,435 | | | IDEX Corp. | | | 7,107,321 | |
| | 347,500 | | | J.B. Hunt Transport Services, Inc. | | | 36,970,525 | |
| | 195,690 | | | KAR Auction Services, Inc. | | | 9,262,008 | |
| | 250,885 | | | Raytheon Co. | | | 45,209,477 | |
| | 70,060 | | | Snap-on, Inc. | | | 11,054,067 | |
| | 131,035 | | | Wabtec Corp. | | | 10,024,178 | |
| | | | | | | | 195,239,437 | |
| Information Technology — 24.5% | | | | |
| | 153,400 | | | Alibaba Group Holding Ltd. - ADR(a) | | | 28,362,126 | |
| | 65,540 | | | Alphabet, Inc. - Class C(a) | | | 66,630,586 | |
| | 68,611 | | | ANSYS, Inc.(a) | | | 9,379,810 | |
| | 318,270 | | | Apple, Inc. | | | 53,800,361 | |
| | 157,919 | | | Broadcom Ltd. | | | 41,676,403 | |
| | 80,415 | | | Check Point Software Technologies Ltd.(a) | | | 9,465,650 | |
| | 210,090 | | | CoreLogic, Inc.(a) | | | 9,853,221 | |
| | 580,000 | | | Fidelity National Information Services, Inc. | | | 53,800,800 | |
| | 868,000 | | | Microsoft Corp. | | | 72,200,240 | |
| | 227,200 | | | PayPal Holdings, Inc.(a) | | | 16,485,632 | |
| | 173,910 | | | Vantiv, Inc. - Class A(a) | | | 12,173,700 | |
| | 555,500 | | | Visa, Inc. - Class A | | | 61,093,890 | |
| | | | | | | | 434,922,419 | |
| Insurance — 2.5% | | | | |
| | 296,085 | | | CHUBB Ltd. | | | 44,655,540 | |
| Materials — 4.3% | | | | |
| | 201,040 | | | Axalta Coating Systems Ltd.(a) | | | 6,684,579 | |
| | 685,500 | | | DowDuPont, Inc. | | | 49,568,505 | |
| | 386,690 | | | Rio Tinto Ltd. | | | 20,553,977 | |
| | | | | | | | 76,807,061 | |
| Utilities — 2.9% | | | | |
| | 311,340 | | | American Water Works Co., Inc. | | | 27,323,198 | |
| | 302,905 | | | Edison International | | | 24,217,255 | |
| | | | | | | | 51,540,453 | |
Total Common Stocks
(Cost $1,374,731,690) | | | 1,713,225,097 | |
| | | | | | | | | |
| INVESTMENT COMPANY — 3.4% | | | | |
| | 60,598,377 | | | SEI Daily Income Trust Government II Fund, Class A, 0.88%(b) | | | 60,598,377 | |
Total Investment Company
(Cost $60,598,377) | | | 60,598,377 | |
See Notes to Financial Statements.
| Old Westbury Funds, Inc. | |
| All Cap Core Fund | |
| Portfolio of Investments - (Continued) | October 31, 2017 |
| | |
| | | Value | |
TOTAL INVESTMENTS — 100.1%
(Cost $1,435,330,067) | | $ | 1,773,823,474 | |
| LIABILITIES IN EXCESS OF OTHER ASSETS — (0.1)% | | | (1,455,878 | ) |
| NET ASSETS — 100.0% | | $ | 1,772,367,596 | |
| (a) | Non-income producing security. |
| (b) | The rate shown represents the current yield as of October 31, 2017. |
The following abbrevation is used in the report:
ADR-American Depositary Receipt
See Notes to Financial Statements.
| Old Westbury Funds, Inc. | |
| Large Cap Strategies Fund | |
| Portfolio of Investments | |
| | October 31, 2017 |
| Shares | | | | | Value | |
| COMMON STOCKS — 89.0% |
| AUSTRALIA — 0.1% | | | |
| | 105,904 | | | Caltex Australia Ltd. | | $ | 2,776,901 | |
| | 419,644 | | | Oil Search Ltd. | | | 2,370,271 | |
| | 508,710 | | | Origin Energy Ltd.(a) | | | 3,091,373 | |
| | 629,037 | | | Santos Ltd.(a) | | | 2,166,454 | |
| | 258,945 | | | Woodside Petroleum Ltd. | | | 6,090,189 | |
|
| | | | | | | | 16,495,188 | |
| AUSTRIA — 0.1% |
| | 33,025 | | | Andritz AG | | | 1,867,293 | |
| | 117,749 | | | OMV AG | | | 7,074,706 | |
| | 79,179 | | | Raiffeisen Bank International AG(a) | | | 2,758,648 | |
|
| | | | | | | | 11,700,647 | |
| BELGIUM — 0.4% |
| | 118,145 | | | Anheuser-Busch Inbev SA/NV | | | 14,457,101 | |
| | 380,999 | | | Colruyt SA(b) | | | 19,487,543 | |
| | 220,000 | | | Galapagos NV - ADR(a)(b) | | | 21,445,600 | |
| | 20,522 | | | Groupe Bruxelles Lambert SA | | | 2,203,567 | |
| | 52,504 | | | KBC Groep NV | | | 4,361,267 | |
| | 19,005 | | | Solvay SA | | | 2,823,697 | |
| | 39,289 | | | Telenet Group Holding NV(a) | | | 2,717,572 | |
| | 58,888 | | | Umicore SA | | | 2,632,015 | |
|
| | | | | | | | 70,128,362 | |
| BERMUDA — 0.3% |
| | 23,235 | | | Aspen Insurance Holdings Ltd. | | | 996,782 | |
| | 47,698 | | | Axis Capital Holdings Ltd. | | | 2,594,294 | |
| | 7,979 | | | Everest Re Group Ltd. | | | 1,894,614 | |
| | 256,922 | | | RenaissanceRe Holdings Ltd. | | | 35,547,728 | |
| | 335,531 | | | Validus Holdings, Ltd. | | | 17,474,454 | |
|
| | | | | | | | 58,507,872 | |
| BRAZIL — 1.3% |
| | 20,048,307 | | | Ambev SA(b) | | | 127,964,005 | |
| | 1,666,300 | | | Ambev SA - ADR | | | 10,547,679 | |
| | 2,180 | | | Banco Bradesco SA(b) | | | 21,871 | |
| | 1,376,927 | | | Banco Bradesco SA - ADR | | | 14,554,118 | |
| | 1,799 | | | Banco do Brasil SA | | | 19,017 | |
| | 1,731 | | | BB Seguridade Participacoes SA | | | 14,610 | |
| | 1,232,031 | | | BM&FBovespa SA - Bolsa de Valores Mercadorias e Futuros | | | 9,046,368 | |
| | 353,600 | | | Cia Brasileira de Distribuicao - ADR(a) | | | 8,214,127 | |
| | 1,278 | | | Cia de Saneamento Basico do Estado de Sao Paulo | | | 11,693 | |
| | 5,886 | | | Cia Siderurgica Nacional SA(a) | | | 15,240 | |
| | 2,551 | | | Cielo SA | | | 17,421 | |
| | 114,123 | | | Cosan SA Industria e Comercio | | | 1,301,950 | |
| | 5,230 | | | Duratex SA | | | 15,348 | |
| | 2,855 | | | EDP - Energias do Brasil SA | | | 12,725 | |
| | 1,214 | | | Engie Brasil Energia SA | | | 13,378 | |
| | 757 | | | Equatorial Energia SA | | | 14,141 | |
| | 1,099,537 | | | Fibria Celulose SA | | | 17,548,628 | |
| Shares | | | | | Value | |
| BRAZIL (continued) | | | |
| | 1,584,862 | | | Itau Unibanco Holding SA - ADR | | $ | 20,302,082 | |
| | 7,101 | | | JBS SA | | | 16,324 | |
| | 2,772 | | | Kroton Educacional SA | | | 15,371 | |
| | 1,564 | | | Lojas Renner SA | | | 16,447 | |
| | 1,732 | | | Natura Cosmeticos SA | | | 16,392 | |
| | 3,455 | | | Odontoprev SA | | | 16,582 | |
| | 966,942 | | | Petroleo Brasileiro SA(a) | | | 5,140,195 | |
| | 1,471 | | | Porto Seguro SA | | | 16,080 | |
| | 5,228 | | | Rumo SA(a) | | | 20,248 | |
| | 2,569 | | | Sul America SA - Units | | | 14,096 | |
| | 4,266 | | | Tim Participacoes SA | | | 15,792 | |
| | 117,372 | | | Ultrapar Participacoes SA | | | 2,812,938 | |
| | 2,525 | | | Vale SA | | | 24,908 | |
| | 1,153,746 | | | WEG SA | | | 7,551,035 | |
|
| | | | | | | | 225,310,809 | |
| CANADA — 2.5% | | | |
| | 56,440 | | | AltaGas Ltd. | | | 1,286,645 | |
| | 105,444 | | | ARC Resources Ltd. | | | 1,285,663 | |
| | 137,830 | | | Cameco Corp. | | | 1,119,648 | |
| | 381,595 | | | Canadian Natural Resources Ltd. | | | 13,316,337 | |
| | 1,028,700 | | | Canadian Pacific Railway Ltd.(b) | | | 178,357,969 | |
| | 322,247 | | | Cenovus Energy, Inc. | | | 3,127,302 | |
| | 186,235 | | | Crescent Point Energy Corp. | | | 1,531,628 | |
| | 549,997 | | | Enbridge, Inc. | | | 21,143,918 | |
| | 334,232 | | | Encana Corp. | | | 3,909,434 | |
| | 116,239 | | | Husky Energy, Inc.(a) | | | 1,506,485 | |
| | 101,903 | | | Imperial Oil Ltd. | | | 3,304,087 | |
| | 137,356 | | | Inter Pipeline Ltd. | | | 2,793,754 | |
| | 62,977 | | | Keyera Corp. | | | 1,854,016 | |
| | 124,447 | | | Pembina Pipeline Corp. | | | 4,114,150 | |
| | 69,211 | | | Peyto Exploration & Development Corp. | | | 944,201 | |
| | 64,147 | | | PrairieSky Royalty Ltd. | | | 1,707,471 | |
| | 1,529,200 | | | Restaurant Brands International, Inc.(b) | | | 98,771,028 | |
| | 82,626 | | | Seven Generations Energy Ltd. - Class A(a) | | | 1,247,620 | |
| | 383,000 | | | Shopify, Inc. - Class A(a) | | | 38,104,670 | |
| | 580,268 | | | Suncor Energy, Inc. | | | 19,700,596 | |
| | 58,382 | | | Tourmaline Oil Corp.(a) | | | 1,068,444 | |
| | 297,803 | | | TransCanada Corp. | | | 14,138,775 | |
| | 45,198 | | | Vermilion Energy, Inc. | | | 1,542,569 | |
| | 244,692 | | | Waste Connections, Inc. | | | 17,292,384 | |
|
| | | | | | | | 433,168,794 | |
| CHILE — 0.1% | | | |
| | 246 | | | Banco de Credito e Inversiones | | | 16,543 | |
| | 363,500 | | | Banco Santander Chile - ADR | | | 11,370,280 | |
| | 1,060 | | | Cia Cervecerias Unidas SA | | | 15,297 | |
| | 110,741 | | | Empresas COPEC SA | | | 1,706,589 | |
| | 75,576 | | | Enel Americas SA | | | 16,259 | |
See Notes to Financial Statements.
| Old Westbury Funds, Inc. | |
| Large Cap Strategies Fund | |
| Portfolio of Investments - (Continued) | |
| | October 31, 2017 |
| Shares | | | | | Value | |
| CHILE (continued) | | | |
| | 113,249 | | | Enel Chile SA | | $ | 13,201 | |
|
| | | | | | | | 13,138,169 | |
| CHINA — 4.6% | | | |
| | 288,600 | | | 51Job, Inc. - ADR(a) | | | 17,864,340 | |
| | 840,915 | | | AAC Technologies Holdings, Inc. | | | 15,392,450 | |
| | 64,730 | | | Agricultural Bank of China Ltd. - H Shares | | | 30,451 | |
| | 13,370 | | | Air China Ltd. - H Shares | | | 12,734 | |
| | 674,941 | | | Alibaba Group Holding Ltd. - ADR(a) | | | 124,789,841 | |
| | 3,785 | | | Anhui Conch Cement Co. Ltd. - H Shares | | | 16,180 | |
| | 4,085 | | | ANTA Sports Products Ltd. | | | 18,274 | |
| | 299,551 | | | Baidu, Inc. - ADR(a)(b) | | | 73,072,471 | |
| | 176,346 | | | Bank of China Ltd. - H Shares | | | 87,931 | |
| | 24,991 | | | Bank of Communications Co. Ltd. - H Shares | | | 18,836 | |
| | 9,492 | | | Beijing Capital International Airport Co. Ltd. - H Shares | | | 15,574 | |
| | 37,406 | | | China Cinda Asset Management Co. Ltd. - H Shares | | | 14,528 | |
| | 23,463 | | | China Communications Services Corp. Ltd. - H Shares | | | 14,226 | |
| | 182,576 | | | China Construction Bank Corp. - H Shares | | | 162,885 | |
| | 29,483 | | | China Everbright Bank Co. Ltd. - H Shares | | | 13,907 | |
| | 8,441 | | | China Evergrande Group(a) | | | 32,514 | |
| | 36,806 | | | China Huarong Asset Management Co. Ltd. - H Shares | | | 17,315 | |
| | 13,993 | | | China Life Insurance Co. Ltd. - H Shares | | | 46,276 | |
| | 8,018 | | | China Medical System Holdings Ltd. | | | 14,820 | |
| | 9,780 | | | China Merchants Bank Co. Ltd. - H Shares | | | 37,295 | |
| | 16,286 | | | China Minsheng Banking Corp. Ltd. - H Shares | | | 15,761 | |
| | 4,391 | | | China Pacific Insurance Group Co. Ltd. - H Shares | | | 21,641 | |
| | 9,157,606 | | | China Petroleum & Chemical Corp. - H Shares | | | 6,726,111 | |
| | 17,611 | | | China Railway Group Ltd. - H Shares | | | 14,154 | |
| | 14,183,941 | | | China Shenhua Energy Co. Ltd. - H Shares | | | 33,889,899 | |
| | 16,469 | | | China Southern Airlines Co. Ltd. - H Shares | | | 12,160 | |
| | 37,536 | | | China Telecom Corp. Ltd. - H Shares | | | 18,813 | |
| | 20,665 | | | Chongqing Rural Commercial Bank Co. Ltd. - H Shares | | | 14,039 | |
| | 6,026,961 | | | CNOOC Ltd. | | | 8,204,467 | |
| | 130,362 | | | CNOOC Ltd. - ADR | | | 17,820,485 | |
| Shares | | | | | Value | |
| CHINA (continued) | | | |
| | 11,965 | | | CSPC Pharmaceutical Group Ltd. | | $ | 20,797 | |
| | 148,473 | | | Ctrip.com International Ltd. - ADR(a)(b) | | | 7,110,372 | |
| | 2,558,273 | | | ENN Energy Holdings Ltd. | | | 18,757,302 | |
| | 9,481 | | | Geely Automobile Holdings Ltd. | | | 29,349 | |
| | 4,941 | | | Haitian International Holdings Ltd. | | | 14,789 | |
| | 2,063,972 | | | Huaneng Power International, Inc. - H Shares | | | 1,381,026 | |
| | 161,734 | | | Industrial & Commercial Bank of China Ltd. - H Shares | | | 128,327 | |
| | 396,801 | | | JD.Com, Inc. - ADR(a)(b) | | | 14,887,974 | |
| | 3,635,559 | | | Jiangsu Expressway Co. Ltd. - H Shares | | | 5,573,523 | |
| | 21,840 | | | Lenovo Group Ltd. | | | 12,654 | |
| | 379 | | | Momo, Inc. - ADR(a)(b) | | | 11,548 | |
| | 21,735 | | | NetEase, Inc. - ADR(b) | | | 6,127,531 | |
| | 273 | | | New Oriental Education & Technology Group, Inc. - ADR(b) | | | 22,725 | |
| | 33,074 | | | People’s Insurance Co. Group of China Ltd. (The) - H Shares | | | 15,729 | |
| | 7,494,928 | | | PetroChina Co. Ltd. - H Shares | | | 4,890,043 | |
| | 11,058 | | | PICC Property & Casualty Co. Ltd. - H Shares | | | 21,914 | |
| | 10,889 | | | Ping An Insurance Group Co. of China Ltd. - H Shares | | | 95,611 | |
| | 28,020 | | | Shanghai Electric Group Co. Ltd. - H Shares(a) | | | 12,714 | |
| | 1,962,000 | | | Shenzhou International Group Holdings Ltd. | | | 16,749,455 | |
| | 33,372 | | | Sihuan Pharmaceutical Holdings Group Ltd. | | | 12,063 | |
| | 28,824 | | | Sino-Ocean Land Holdings Ltd. | | | 18,806 | |
| | 25,292 | | | Sinopec Shanghai Petrochemical Co. Ltd. - H Shares | | | 15,075 | |
| | 35,203,067 | | | Sinopharm Group Co. Ltd. - H Shares(b) | | | 157,482,893 | |
| | 5,565,794 | | | Tencent Holdings Ltd. | | | 249,559,661 | |
| | 1,239 | | | Vipshop Holdings Ltd. - ADR(a)(b) | | | 9,788 | |
| | 20,265 | | | Want Want China Holdings Ltd. | | | 16,573 | |
| | 110,300 | | | Weibo Corp. - ADR(a) | | | 10,219,295 | |
| | 15,331 | | | Weichai Power Co. Ltd. - H Shares | | | 19,062 | |
| | 10,505 | | | Zhejiang Expressway Co. Ltd. - H Shares | | | 12,994 | |
| | 2,857 | | | Zhuzhou CRRC Times Electric Co. Ltd. - H Shares | | | 16,718 | |
|
| | | | | | | | 791,656,689 | |
| COLUMBIA — 0.1% | | | |
| | 1,332 | | | Bancolombia SA | | | 12,348 | |
| | 222,400 | | | Bancolombia SA - ADR | | | 8,395,599 | |
See Notes to Financial Statements.
| Old Westbury Funds, Inc. | |
| Large Cap Strategies Fund | |
| Portfolio of Investments - (Continued) | |
| | October 31, 2017 |
| Shares | | | | | Value | |
| COLUMBIA (continued) | | | |
| | 2,649,125 | | | Ecopetrol SA | | $ | 1,449,941 | |
|
| | | | | | | | 9,857,888 | |
| CZECH REPUBLIC — 0.1% | | | |
| | 787 | | | CEZ AS | | | 17,255 | |
| | 271,440 | | | Komercni Banka AS | | | 11,668,850 | |
| | 4,037 | | | Moneta Money Bank AS | | | 13,799 | |
| | 733 | | | O2 Czech Republic AS | | | 8,927 | |
| | | | | | | | 11,708,831 | |
| DENMARK — 0.5% | | | |
| | 18,575 | | | Carlsberg A/S - Class B | | | 2,121,154 | |
| | 23,666 | | | Coloplast A/S - Class B | | | 2,081,993 | |
| | 117,398 | | | Danske Bank A/S | | | 4,478,517 | |
| | 122,000 | | | Genmab A/S(a) | | | 24,635,855 | |
| | 44,416 | | | H. Lundbeck A/S | | | 2,639,270 | |
| | 51,373 | | | ISS A/S | | | 2,174,502 | |
| | 71,829 | | | Jyske Bank A/S | | | 4,059,057 | |
| | 333,849 | | | Novo Nordisk A/S - Class B | | | 16,608,181 | |
| | 58,737 | | | Novozymes A/S - B Shares | | | 3,243,833 | |
| | 36,910 | | | Pandora A/S | | | 3,484,010 | |
| | 151,417 | | | Sydbank A/S | | | 5,906,644 | |
| | 331,522 | | | TDC A/S | | | 1,960,096 | |
| | 55,976 | | | Vestas Wind Systems A/S | | | 4,937,577 | |
| | | | | | | | 78,330,689 | |
| EGYPT — 0.0% | | | | |
| | 1,207,817 | | | Commercial International Bank Egypt SAE - GDR | | | 5,513,685 | |
| FINLAND — 1.9% | | | |
| | 2,129,118 | | | Kone Oyj - Class B(b) | | | 115,250,342 | |
| | 57,395 | | | Metso Oyj | | | 2,086,593 | |
| | 123,065 | | | Neste Oyj | | | 6,856,536 | |
| | 586,055 | | | Nokia Oyj | | | 2,878,119 | |
| | 65,079 | | | Nokian Renkaat Oyj | | | 2,984,531 | |
| | 31,752 | | | Orion Oyj - Class B | | | 1,301,918 | |
| | 3,522,480 | | | Sampo Oyj - A Shares(b) | | | 184,560,095 | |
| | 119,813 | | | UPM-Kymmene Oyj | | | 3,600,754 | |
| | 39,729 | | | Wartsila Oyj Abp | | | 2,559,190 | |
| | | | | | | | 322,078,078 | |
| FRANCE — 2.7% | | | | |
| | 67,492 | | | Air Liquide SA | | | 8,592,950 | |
| | 79,035 | | | Airbus SE | | | 8,078,606 | |
| | 29,097 | | | Arkema SA | | | 3,675,764 | |
| | 28,361 | | | Atos SE | | | 4,407,042 | |
| | 376,340 | | | AXA SA | | | 11,367,179 | |
| | 130,989 | | | BioMerieux(b) | | | 10,274,904 | |
| | 203,656 | | | BNP Paribas SA | | | 15,903,805 | |
| | 80,019 | | | Bouygues SA | | | 3,841,654 | |
| | 34,248 | | | Capgemini SE | | | 4,162,914 | |
| | 15,384 | | | Christian Dior SE | | | 5,281,933 | |
| | 41,920 | | | Cie de Saint-Gobain | | | 2,459,104 | |
| | 41,210 | | | Cie Generale des Etablissements Michelin | | | 5,962,028 | |
| | 113,959 | | | CNP Assurances | | | 2,651,583 | |
| Shares | | | | | Value | |
| FRANCE (continued) | | | |
| | 242,577 | | | Credit Agricole SA | | $ | 4,232,834 | |
| | 79,467 | | | Danone SA | | | 6,492,656 | |
| | 108,551 | | | Edenred | | | 3,129,528 | |
| | 21,585 | | | Eiffage SA | | | 2,255,100 | |
| | 332,777 | | | Engie SA | | | 5,624,586 | |
| | 32,701 | | | Essilor International SA | | | 4,140,573 | |
| | 26,488 | | | Eurazeo SA | | | 2,462,500 | |
| | 76,305 | | | Eutelsat Communications SA | | | 1,911,891 | |
| | 5,258 | | | Hermes International | | | 2,728,895 | |
| | 22,630 | | | Imerys SA | | | 2,061,131 | |
| | 21,224 | | | Ingenico Group SA | | | 2,060,395 | |
| | 6,090 | | | Kering | | | 2,791,463 | |
| | 48,128 | | | Klepierre REIT | | | 1,914,233 | |
| | 62,281 | | | Lagardere SCA | | | 2,051,294 | |
| | 42,079 | | | Legrand SA | | | 3,125,731 | |
| | 783,752 | | | L’Oreal SA(b) | | | 174,419,695 | |
| | 47,689 | | | LVMH Moet Hennessy Louis Vuitton SE | | | 14,226,485 | |
| | 430,529 | | | Orange SA | | | 7,063,649 | |
| | 18,733 | | | Pernod-Ricard SA | | | 2,809,470 | |
| | 174,827 | | | Peugeot SA | | | 4,147,274 | |
| | 33,039 | | | Publicis Groupe SA | | | 2,153,646 | |
| | 69,945 | | | Safran SA | | | 7,367,820 | |
| | 172,018 | | | Sanofi | | | 16,288,490 | |
| | 88,636 | | | Schneider Electric SE | | | 7,790,031 | |
| | 52,085 | | | SCOR SE | | | 2,162,624 | |
| | 158,640 | | | Societe Generale SA | | | 8,833,044 | |
| | 110,010 | | | Suez Environnement Co. | | | 1,934,991 | |
| | 35,096 | | | Thales SA | | | 3,658,082 | |
| | 1,128,205 | | | TOTAL SA | | | 62,910,229 | |
| | 15,646 | | | Unibail-Rodamco SE | | | 3,915,692 | |
| | 66,598 | | | Valeo SA | | | 4,507,203 | |
| | 165,641 | | | Veolia Environnement SA | | | 3,924,539 | |
| | 89,856 | | | Vinci SA | | | 8,797,406 | |
|
| | | | | | | | 470,552,646 | |
| GEORGIA — 0.1% | | | |
| | 204,802 | | | BGEO Group Plc | | | 9,683,438 | |
| GERMANY — 2.1% | | | | |
| | 24,368 | | | Adidas AG | | | 5,422,964 | |
| | 71,775 | | | Allianz SE | | | 16,667,070 | |
| | 166,199 | | | BASF SE | | | 18,124,535 | |
| | 138,530 | | | Bayer AG | | | 18,024,649 | |
| | 1,332,673 | | | Bayerische Motoren Werke AG | | | 135,831,804 | |
| | 18,727 | | | Beiersdorf AG | | | 2,100,701 | |
| | 169,158 | | | Commerzbank AG(a) | | | 2,318,218 | |
| | 26,353 | | | Continental AG | | | 6,688,937 | |
| | 45,024 | | | Covestro AG | | | 4,319,468 | |
| | 122,861 | | | Daimler AG | | | 10,202,638 | |
| | 327,762 | | | Deutsche Bank AG | | | 5,326,018 | |
| | 21,127 | | | Deutsche Boerse AG | | | 2,182,395 | |
| | 85,648 | | | Deutsche Lufthansa AG | | | 2,733,617 | |
| | 130,508 | | | Deutsche Post AG | | | 5,977,512 | |
| | 611,454 | | | Deutsche Telekom AG | | | 11,139,620 | |
| | 56,134 | | | Deutsche Wohnen AG | | | 2,390,900 | |
See Notes to Financial Statements.
| Old Westbury Funds, Inc. | |
| Large Cap Strategies Fund | |
| Portfolio of Investments - (Continued) | |
| | October 31, 2017 |
| Shares | | | | | Value | |
| GERMANY (continued) | | | | |
| | 33,965 | | | Fresenius Medical Care AG & Co. KGaA | | $ | 3,284,613 | |
| | 65,867 | | | Fresenius SE & Co. KGaA | | | 5,501,960 | |
| | 17,734 | | | Hannover Rueck SE | | | 2,223,774 | |
| | 16,338 | | | Henkel AG & Co. KGaA | | | 2,059,188 | |
| | 10,766 | | | Hochtief AG | | | 1,899,927 | |
| | 37,958 | | | HUGO BOSS AG | | | 3,397,508 | |
| | 175,565 | | | Infineon Technologies AG | | | 4,806,932 | |
| | 23,960 | | | Linde AG | | | 5,174,476 | |
| | 20,460 | | | Merck KGaA | | | 2,189,998 | |
| | 88,021 | | | Metro AG | | | 1,148,350 | |
| | 88,021 | | | Metro Wholesale & Food Specialist AG(a) | | | 1,680,999 | |
| | 30,343 | | | Muenchener Rueckversicherungs-Gesellschaft AG | | | 6,788,013 | |
| | 84,603 | | | ProSiebenSat.1 Media SE | | | 2,951,073 | |
| | 175,803 | | | RWE AG(a) | | | 4,394,665 | |
| | 152,503 | | | SAP SE | | | 17,348,620 | |
| | 120,026 | | | Siemens AG | | | 17,126,998 | |
| | 54,566 | | | United Internet AG | | | 3,452,008 | |
| | 73,959 | | | Vonovia SE | | | 3,253,066 | |
| | 394,575 | | | Zalando SE(a) | | | 19,742,998 | |
|
| | | | | | | | 357,876,212 | |
| GREECE — 0.0% | | | | |
| | 11,917 | | | Eurobank Ergasias SA(a) | | | 9,731 | |
| | 730 | | | Hellenic Telecommunications Organization SA | | | 8,673 | |
|
| | | | | | | | 18,404 | |
| HONG KONG — 1.3% | | | | |
| | 3,435,000 | | | AIA Group Ltd. | | | 25,845,938 | |
| | 754,109 | | | ASM Pacific Technology Ltd. | | | 10,971,284 | |
| | 6,276 | | | China Everbright Ltd. | | | 14,883 | |
| | 3,386,570 | | | China Merchants Holdings International Co. Ltd. | | | 10,591,985 | |
| | 12,421 | | | China Mobile Ltd. | | | 124,745 | |
| | 119,700 | | | China Mobile Ltd. - ADR | | | 6,038,865 | |
| | 8,023 | | | China Overseas Land & Investment Ltd. | | | 26,019 | |
| | 4,017 | | | China Resources Gas Group Ltd. | | | 14,701 | |
| | 5,799 | | | China Resources Land Ltd. | | | 17,282 | |
| | 6,767 | | | China Resources Power Holdings Co. Ltd. | | | 13,011 | |
| | 532,835 | | | China State Construction International Holdings Ltd. | | | 748,567 | |
| | 15,212 | | | China Unicom Hong Kong Ltd.(a) | | | 21,605 | |
| | 12,123 | | | CITIC Ltd. | | | 17,746 | |
| | 15,680 | | | Far East Horizon Ltd. | | | 15,577 | |
| | 864,032 | | | Guangdong Investment Ltd. | | | 1,251,514 | |
| | 5,179 | | | Haier Electronics Group Co. Ltd. | | | 13,642 | |
| | 424,100 | | | Hong Kong Exchanges and Clearing Ltd. | | | 11,807,435 | |
| Shares | | | | | Value | |
| HONG KONG (continued) | | | | |
| | 1,459,775 | | | Jardine Matheson Holdings Ltd.(b) | | $ | 93,513,187 | |
| | 156,455 | | | Jardine Strategic Holdings Ltd. | | | 6,561,723 | |
| | 1,562,690 | | | Kunlun Energy Co. Ltd. | | | 1,448,233 | |
| | 9,370 | | | Nine Dragons Paper Holdings Ltd. | | | 17,199 | |
| | 2,806,600 | | | Sands China Ltd. | | | 13,221,031 | |
| | 17,541,397 | | | Sino Biopharmaceutical Ltd. | | | 20,483,776 | |
| | 7,964,724 | | | Sun Art Retail Group Ltd. | | | 8,044,970 | |
| | 2,155,965 | | | Yue Yuen Industrial Holdings Ltd. | | | 8,263,049 | |
|
| | | | | | | | 219,087,967 | |
| HUNGARY — 0.1% | | | | |
| | 122,642 | | | MOL Hungarian Oil & Gas Plc | | | 1,468,626 | |
| | 487 | | | OTP Bank Plc | | | 19,640 | |
| | 625,738 | | | Richter Gedeon Nyrt | | | 15,566,839 | |
|
| | | | | | | | 17,055,105 | |
| INDIA — 2.5% | | | | |
| | 3,485 | | | Ambuja Cements Ltd. | | | 15,146 | |
| | 1,542,775 | | | Asian Paints Ltd. | | | 28,126,458 | |
| | 1,286 | | | Aurobindo Pharma Ltd. | | | 15,089 | |
| | 2,929 | | | Axis Bank Ltd.(b) | | | 23,657 | |
| | 316 | | | Bajaj Auto Ltd. | | | 15,890 | |
| | 664 | | | Bajaj Finance Ltd. | | | 18,459 | |
| | 280,570 | | | Bharat Petroleum Corp. Ltd. | | | 2,346,052 | |
| | 1,021,971 | | | Bharti Airtel Ltd.(b) | | | 7,844,900 | |
| | 1,234,000 | | | Bharti Infratel Ltd. | | | 8,423,693 | |
| | 1,708 | | | Cadila Healthcare Ltd. | | | 13,276 | |
| | 343,874 | | | Coal India Ltd. | | | 1,520,778 | |
| | 3,025 | | | Dabur India Ltd. | | | 15,545 | |
| | 75,266 | | | Eicher Motors Ltd. | | | 37,456,110 | |
| | 1,398 | | | Glenmark Pharmaceuticals Ltd. | | | 13,332 | |
| | 686 | | | Grasim Industries Ltd. | | | 12,996 | |
| | 1,357 | | | HCL Technologies Ltd. | | | 17,930 | |
| | 241 | | | Hero Motocorp Ltd. | | | 14,325 | |
| | 235,984 | | | Hindustan Petroleum Corp. Ltd. | | | 1,629,122 | |
| | 1,422 | | | Hindustan Unilever Ltd. | | | 27,167 | |
| | 7,017,133 | | | Housing Development Finance Corp. Ltd.(b) | | | 184,974,860 | |
| | 3,941 | | | ICICI Bank Ltd.(b) | | | 18,260 | |
| | 842 | | | Indiabulls Housing Finance Ltd. | | | 16,172 | |
| | 204,050 | | | Indian Oil Corp. Ltd. | | | 1,308,957 | |
| | 4,152 | | | Infosys Ltd. | | | 59,093 | |
| | 7,261 | | | ITC Ltd. | | | 29,786 | |
| | 4,217 | | | JSW Steel Ltd. | | | 16,827 | |
| | 850 | | | Larsen & Toubro Ltd. | | | 16,040 | |
| | 1,203 | | | LIC Housing Finance Ltd. | | | 11,120 | |
| | 845 | | | Lupin Ltd.(b) | | | 13,412 | |
| | 2,729 | | | Marico Ltd. | | | 13,282 | |
| | 630,738 | | | Maruti Suzuki India Ltd.(b) | | | 79,960,591 | |
| | 4,545,843 | | | Motherson Sumi Systems Ltd. | | | 25,630,845 | |
| | 128 | | | Nestle India Ltd. | | | 14,306 | |
| | 598,470 | | | Oil & Natural Gas Corp. Ltd. | | | 1,765,716 | |
| | 7,335 | | | Power Finance Corp Ltd. | | | 15,769 | |
See Notes to Financial Statements.
| Old Westbury Funds, Inc. | |
| Large Cap Strategies Fund | |
| Portfolio of Investments - (Continued) | |
| | October 31, 2017 |
| Shares | | | | | Value | |
| INDIA (continued) | | | | |
| | 1,215,555 | | | Reliance Industries Ltd. | | $ | 17,656,830 | |
| | 5,249 | | | Rural Electrification Corp. Ltd.(b) | | | 14,036 | |
| | 51 | | | Shree Cement Ltd. | | | 14,906 | |
| | 2,480 | | | Sun Pharmaceutical Industries Ltd. | | | 21,170 | |
| | 1,108 | | | Tata Consultancy Services, Ltd. | | | 44,887 | |
| | 3,818 | | | Tata Motors Ltd.(a) | | | 25,252 | |
| | 3,248 | | | Tata Motors Ltd. - Class A - DVR(a) | | | 12,078 | |
| | 10,815 | | | Tata Power Co. Ltd. | | | 14,176 | |
| | 2,360 | | | Tech Mahindra Ltd. | | | 17,564 | |
| | 3,209,000 | | | Titan Co. Ltd. | | | 31,472,563 | |
| | 1,029 | | | UPL Ltd.(b) | | | 12,698 | |
| | 3,586 | | | Vedanta Ltd.(b) | | | 18,373 | |
| | 3,512 | | | Wipro Ltd. | | | 15,944 | |
| | 3,530 | | | Yes Bank Ltd.(b) | | | 17,126 | |
|
| | | | | | | | 430,772,564 | |
| INDONESIA — 0.3% | | | | |
| | 10,188,609 | | | Adaro Energy Tbk PT | | | 1,371,002 | |
| | 19,410,829 | | | Astra International Tbk PT | | | 11,449,706 | |
| | 20,587 | | | Bank Central Asia Tbk PT | | | 31,725 | |
| | 29,520 | | | Bank Mandiri Persero Tbk PT | | | 15,345 | |
| | 28,048 | | | Bank Negara Indonesia Persero Tbk PT | | | 15,717 | |
| | 14,592,166 | | | Bank Rakyat Indonesia Persero Tbk PT | | | 16,784,353 | |
| | 2,320 | | | Gudang Garam Tbk PT | | | 11,974 | |
| | 46,173 | | | Hanjaya Mandala Sampoerna Tbk PT | | | 13,550 | |
| | 20,290 | | | Indofood CBP Sukses Makmur Tbk PT | | | 13,165 | |
| | 34,249 | | | Jasa Marga Persero Tbk PT | | | 16,414 | |
| | 114,199 | | | Kalbe Farma Tbk PT | | | 13,472 | |
| | 13,304 | | | Matahari Department Store Tbk PT | | | 8,436 | |
| | 100,539 | | | Media Nusantara Citra Tbk PT | | | 11,564 | |
| | 68,965 | | | Surya Citra Media Tbk PT | | | 10,933 | |
| | 108,485 | | | Telekomunikasi Indonesia Persero Tbk PT | | | 32,236 | |
| | 2,386,180 | | | Unilever Indonesia Tbk PT(b) | | | 8,726,601 | |
| | 4,164,995 | | | United Tractors Tbk PT | | | 10,648,568 | |
|
| | | | | | | | 49,174,761 | |
| ITALY — 0.4% | | | | |
| | 318,455 | | | Assicurazioni Generali SpA | | | 5,801,692 | |
| | 72,270 | | | Atlantia SpA | | | 2,357,143 | |
| | 1,269,282 | | | Enel SpA | | | 7,873,132 | |
| | 1,084,215 | | | ENI SpA | | | 17,731,780 | |
| | 41,968 | | | Ferrari NV | | | 5,030,411 | |
| | 2,021,946 | | | Intesa Sanpaolo SpA | | | 6,797,288 | |
| | 33,622 | | | Luxottica Group SpA | | | 1,928,463 | |
| | 48,560 | | | Recordati SpA | | | 2,257,513 | |
| | 869,328 | | | Saipem SpA(a) | | | 3,653,592 | |
| | 1,216,407 | | | Snam SpA | | | 6,214,660 | |
| | 2,812,440 | | | Telecom Italia SpA/Milano(a) | | | 2,440,672 | |
| Shares | | | | | Value | |
| ITALY (continued) | | | | |
| | 363,375 | | | Terna Rete Elettrica Nazionale SpA | | $ | 2,192,576 | |
| | 317,436 | | | Unicredit SpA(a) | | | 6,075,242 | |
| | 1,059,700 | | | UnipolSai Assicurazioni SpA | | | 2,414,469 | |
|
| | | | | | | | 72,768,633 | |
| JAPAN — 3.6% | | | | |
| | 27,370 | | | Adastria Co. Ltd. | | | 594,074 | |
| | 636,760 | | | Asahi Kasei Corp. | | | 7,666,544 | |
| | 284,890 | | | Bandai Namco Holdings, Inc. | | | 9,708,885 | |
| | 117,285 | | | Benesse Holdings, Inc. | | | 3,955,745 | |
| | 287,760 | | | Canon Marketing Japan, Inc.(b) | | | 7,207,603 | |
| | 67,000 | | | Fast Retailing Co. Ltd. | | | 22,161,470 | |
| | 1,090,000 | | | Hoshizaki Corp.(b) | | | 102,668,308 | |
| | 42,181 | | | Idemitsu Kosan Co. Ltd. | | | 1,222,342 | |
| | 263,779 | | | Inpex Corp. | | | 2,794,264 | |
| | 954,684 | | | JX Holdings, Inc. | | | 4,896,633 | |
| | 112,230 | | | Kaken Pharmaceutical Co. Ltd. | | | 5,665,540 | |
| | 4,165,000 | | | KDDI Corp. | | | 110,768,744 | |
| | 25,785 | | | Megmilk Snow Brand Co. Ltd. | | | 718,864 | |
| | 340,205 | | | Mitsubishi Tanabe Pharma Corp. | | | 7,462,040 | |
| | 241,545 | | | Morinaga Milk Industry Co. Ltd. | | | 9,261,989 | |
| | 316,462 | | | Nikon Corp. | | | 5,964,365 | |
| | 379,514 | | | Nippon Telegraph & Telephone Corp. | | | 18,267,272 | |
| | 4,734,000 | | | Nomura Research Institute Ltd.(b) | | | 199,218,944 | |
| | 2,720,150 | | | NTT Data Corp. | | | 31,506,421 | |
| | 464,558 | | | Osaka Gas Co. Ltd. | | | 8,941,433 | |
| | 279,000 | | | PeptiDream, Inc.(a) | | | 8,808,847 | |
| | 133,420 | | | Sawai Pharmaceutical Co. Ltd. | | | 7,544,880 | |
| | 126,897 | | | Showa Shell Sekiyu KK | | | 1,486,538 | |
| | 470,150 | | | Terumo Corp. | | | 19,454,340 | |
| | 248,501 | | | Tokyo Gas Co. Ltd. | | | 6,164,181 | |
| | 361,320 | | | Toray Industries, Inc. | | | 3,633,696 | |
| | 344,403 | | | Toyo Suisan Kaisha Ltd. | | | 13,190,933 | |
| | 443,916 | | | Zensho Holdings Co. Ltd. | | | 8,202,520 | |
|
| | | | | | | | 629,137,415 | |
| KENYA — 0.1% | | | | |
| | 1,197,379 | | | East African Breweries Ltd. | | | 2,816,005 | |
| | 35,141,070 | | | Safaricom Ltd. | | | 8,637,082 | |
|
| | | | | | | | 11,453,087 | |
| LUXEMBOURG — 0.1% | | | | |
| | 106,138 | | | Arcelormittal(a) | | | 3,043,271 | |
| | 31,988 | | | RTL Group SA | | | 2,373,166 | |
| | 129,046 | | | Tenaris SA | | | 1,766,250 | |
| | 359,300 | | | Tenaris SA - ADR | | | 9,790,925 | |
|
| | | | | | | | 16,973,612 | |
| MALAYSIA — 0.0% | | | | |
| | 18,597 | | | AirAsia Berhad | | | 14,672 | |
| | 12,227 | | | AMMB Holdings Berhad | | | 12,361 | |
| | 23,102 | | | Astro Malaysia Holdings Berhad | | | 15,334 | |
See Notes to Financial Statements.
| Old Westbury Funds, Inc. | |
| Large Cap Strategies Fund | |
| Portfolio of Investments - (Continued) | |
| | October 31, 2017 |
| Shares | | | | | Value | |
| MALAYSIA (continued) |
| | 1,329 | | | British American Tobacco Malaysia Berhad | | $ | 12,306 | |
| | 11,509 | | | DiGi.com Berhad | | | 13,593 | |
| | 27,179 | | | IOI Properties Group Berhad | | | 12,776 | |
| | 7,433 | | | Malayan Banking Berhad | | | 16,241 | |
| | 7,846 | | | MISC Berhad | | | 12,881 | |
| | 222,060 | | | Petronas Dagangan Berhad | | | 1,256,775 | |
| | 6,110 | | | Public Bank Berhad | | | 29,529 | |
| | 6,938 | | | Tenaga Nasional Berhad | | | 24,583 | |
| | 16,191 | | | Westports Holdings Berhad | | | 14,189 | |
| | | | | | | | 1,435,240 | |
| MEXICO — 0.3% |
| | 9,234 | | | Alfa SAB de CV - Series A | | | 9,643 | |
| | 65,979 | | | America Movil SAB de CV - Series L | | | 56,888 | |
| | 30,872 | | | Cemex SAB de CV - CPO - Units(a) | | | 25,104 | |
| | 1,620 | | | Coca-Cola Femsa SAB de CV - Series L | | | 10,951 | |
| | 1,602 | | | El Puerto de Liverpool SAB de CV - Class C1 | | | 10,935 | |
| | 7,259 | | | Fibra Uno Administracion SA de CV REIT | | | 11,389 | |
| | 97,200 | | | Fomento Economico Mexicano SAB de CV - ADR | | | 8,529,299 | |
| | 4,062 | | | Fomento Economico Mexicano SAB de CV - Units | | | 35,385 | |
| | 9,118 | | | Gentera SAB de CV | | | 9,227 | |
| | 1,197 | | | Grupo Aeroportuario del Pacifico SAB de CV - Series B | | | 11,381 | |
| | 70,400 | | | Grupo Aeroportuario del Sureste SAB de CV - ADR | | | 12,586,816 | |
| | 636 | | | Grupo Aeroportuario del Sureste SAB de CV - Series B | | | 11,372 | |
| | 2,673,214 | | | Grupo Financiero Banorte SAB de CV - Series O | | | 15,839,822 | |
| | 7,523 | | | Grupo Mexico SAB de CV - Series B | | | 24,466 | |
| | 388,752 | | | Grupo Televisa SAB - ADR | | | 8,509,781 | |
| | 4,229 | | | Grupo Televisa SAB - Units | | | 18,511 | |
| | 574 | | | Industrias Penoles SAB de CV | | | 13,383 | |
| | 6,715 | | | Kimberly-Clark de Mexico SAB de CV - Class A | | | 11,551 | |
| | 1,133 | | | Promotora y Operadora de Infraestructura SAB de CV | | | 10,773 | |
| | 13,039 | | | Wal-Mart de Mexico SAB de CV | | | 29,191 | |
| | | | | | | | 45,765,868 | |
| NETHERLANDS — 2.2% |
| | 378,933 | | | Aegon NV | | | 2,237,015 | |
| | 39,666 | | | Akzo Nobel NV | | | 3,591,971 | |
| | 396,000 | | | ASML Holding NV | | | 71,577,000 | |
| | 57,571 | | | ASML Holding NV | | | 10,381,128 | |
| | 19,114 | | | Core Laboratories NV | | | 1,909,489 | |
| | 32,404 | | | Gemalto NV | | | 1,282,602 | |
| Shares | | | | | Value | |
| NETHERLANDS (continued) |
| | 21,503 | | | Heineken Holding NV | | $ | 1,996,306 | |
| | 26,122 | | | Heineken NV | | | 2,545,623 | |
| | 498,351 | | | ING Groep NV | | | 9,206,792 | |
| | 304,515 | | | Koninklijke Ahold Delhaize NV | | | 5,730,407 | |
| | 28,636 | | | Koninklijke DSM NV | | | 2,443,040 | |
| | 821,434 | | | Koninklijke KPN NV | | | 2,836,094 | |
| | 146,280 | | | Koninklijke Philips NV | | | 5,956,129 | |
| | 85,890 | | | Koninklijke Vopak NV | | | 3,719,319 | |
| | 102,841 | | | NN Group NV | | | 4,307,803 | |
| | 808,669 | | | Nostrum Oil & Gas Plc(a) | | | 4,042,647 | |
| | 44,868 | | | NXP Semiconductor NV(a) | | | 5,251,799 | |
| | 35,676 | | | Randstad Holding NV | | | 2,195,050 | |
| | 1,458,853 | | | Royal Dutch Shell Plc - A Shares | | | 45,833,169 | |
| | 1,229,781 | | | Royal Dutch Shell Plc - B Shares | | | 39,551,017 | |
| | 2,510,436 | | | Unilever NV | | | 145,936,200 | |
| | 94,818 | | | Wolters Kluwer NV | | | 4,647,681 | |
| | | | | | | | 377,178,281 | |
| NORWAY — 0.1% |
| | 177,712 | | | Marine Harvest ASA | | | 3,470,258 | |
| | 508,141 | | | Statoil ASA | | | 10,289,731 | |
| | 234,177 | | | Telenor ASA | | | 4,974,254 | |
| | | | | | | | 18,734,243 | |
| PAKISTAN — 0.0% |
| | 1,043,482 | | | Engro Corp. Ltd. | | | 2,754,155 | |
| | 1,681 | | | Lucky Cement Ltd. | | | 7,769 | |
| | 6,925 | | | MCB Bank Ltd. | | | 13,068 | |
| | 6,186 | | | United Bank Ltd. | | | 10,517 | |
| | | | | | | | 2,785,509 | |
| PERU — 0.1% |
| | 55,852 | | | Credicorp. Ltd. | | | 11,697,643 | |
| PHILIPPINES — 0.0% |
| | 17,646 | | | Ayala Land, Inc. | | | 14,766 | |
| | 49,288 | | | DMCI Holdings, Inc. | | | 14,646 | |
| | 112,897 | | | Energy Development Corp. | | | 12,618 | |
| | 8,580 | | | JG Summit Holdings, Inc. | | | 12,781 | |
| | 3,373 | | | Jollibee Foods Corp. | | | 16,269 | |
| | 760,500 | | | Universal Robina Corp. | | | 2,106,567 | |
| | | | | | | | 2,177,647 | |
| POLAND — 0.2% |
| | 822 | | | Alior Bank SA(a) | | | 16,334 | |
| | 226,300 | | | Bank Pekao SA | | | 7,392,154 | |
| | 1,522 | | | Cyfrowy Polsat SA | | | 10,604 | |
| | 81,501 | | | Grupa Lotos SA | | | 1,478,457 | |
| | 70,600 | | | ING Bank Slaski SA(a) | | | 3,840,382 | |
| | 583,271 | | | Polski Koncern Naftowy ORLEN SA | | | 20,623,079 | |
| | 5,087,033 | | | Polskie Gornictwo Naftowe I Gazownictwo SA(b) | | | 9,349,648 | |
| | 9,665 | | | Synthos SA | | | 13,090 | |
| | | | | | | | 42,723,748 | |
See Notes to Financial Statements.
| Old Westbury Funds, Inc. | |
| Large Cap Strategies Fund | |
| Portfolio of Investments - (Continued) | |
| | October 31, 2017 |
| Shares | | | | | Value | |
| PORTUGAL — 0.0% |
| | 675,143 | | | EDP - Energias de Portugal SA | | $ | 2,408,866 | |
| | 152,028 | | | Galp Energia SGPS SA | | | 2,826,352 | |
| | | | | | | | 5,235,218 | |
| QATAR — 0.0% |
| | 1,611 | | | Doha Bank QPSC | | | 12,477 | |
| | 3,993 | | | Ezdan Holding Group QSC | | | 10,418 | |
| | 461 | | | Industries Qatar QSC | | | 12,091 | |
| | 58 | | | Qatar Electricity & Water Co. QSC | | | 2,915 | |
| | 196,315 | | | Qatar Gas Transport Co. Ltd. | | | 816,800 | |
| | 529 | | | Qatar Islamic Bank SAQ | | | 14,092 | |
| | 537 | | | Qatar National Bank QPSC | | | 17,918 | |
| | | | | | | | 886,711 | |
| RUSSIA — 0.3% |
| | 327,500 | | | Lukoil PJSC - ADR | | | 17,367,325 | |
| | 26,890 | | | Magnit PJSC | | | 3,546,912 | |
| | 87,644 | | | NovaTek PJSC - GDR | | | 10,000,180 | |
| | 1,867,600 | | | Sberbank of Russia PJSC - ADR | | | 26,781,384 | |
| | | | | | | | 57,695,801 | |
| SINGAPORE — 0.5% |
| | 2,874,000 | | | Jardine Cycle & Carriage Ltd.(b) | | | 83,051,031 | |
| SOUTH AFRICA — 0.7% |
| | 437,458 | | | Aspen Pharmacare Holdings Ltd. | | | 9,883,898 | |
| | 1,807 | | | Barclays Africa Group Ltd. | | | 17,911 | |
| | 642 | | | Bid Corp. Ltd. | | | 14,122 | |
| | 1,019 | | | Bidvest Group Ltd. (The) | | | 12,360 | |
| | 214 | | | Capitec Bank Holdings Ltd. | | | 14,225 | |
| | 2,719 | | | Coronation Fund Managers Ltd. | | | 13,721 | |
| | 1,011,880 | | | Discovery Ltd. | | | 10,488,269 | |
| | 7,554 | | | FirstRand Ltd. | | | 27,382 | |
| | 1,494,993 | | | Gold Fields Ltd. | | | 5,967,812 | |
| | 1,533 | | | Hyprop Investments Ltd. - REIT | | | 11,531 | |
| | 6,567 | | | Life Healthcare Group Holdings Ltd. | | | 12,169 | |
| | 1,552 | | | Massmart Holdings Ltd. | | | 11,751 | |
| | 527 | | | Mondi Ltd. | | | 12,641 | |
| | 1,148 | | | Mr Price Group Ltd. | | | 14,229 | |
| | 3,035 | | | MTN Group Ltd. | | | 26,354 | |
| | 284,885 | | | Naspers Ltd. - Class N | | | 69,414,115 | |
| | 856 | | | Nedbank Group Ltd. | | | 12,555 | |
| | 3,026 | | | RMB Holdings Ltd. | | | 13,376 | |
| | 2,841 | | | Sanlam Ltd. | | | 14,206 | |
| | 2,070 | | | Sappi Ltd. | | | 13,865 | |
| | 401,376 | | | Sasol Ltd. | | | 11,743,415 | |
| | 1,060 | | | Spar Group Ltd. (The) | | | 12,472 | |
| | 1,313,365 | | | Standard Bank Group Ltd. | | | 15,234,152 | |
| | 5,356 | | | Steinhoff International Holdings NV | | | 23,263 | |
| | 2,496 | | | Telkom SA SOC Ltd. | | | 9,349 | |
| | 456 | | | Tiger Brands Ltd. | | | 12,449 | |
| | 2,552 | | | Truworths International Ltd. | | | 13,602 | |
| | 1,253 | | | Vodacom Group Ltd. | | | 13,612 | |
| Shares | | | | | Value | |
| SOUTH AFRICA (continued) |
| | 2,896 | | | Woolworths Holdings Ltd. | | $ | 11,542 | |
| | | | | | | | 123,070,348 | |
| SOUTH KOREA — 0.7% |
| | 28,215 | | | Amorepacific Corp. | | | 7,907,806 | |
| | 115 | | | AMOREPACIFIC Group | | | 14,730 | |
| | 155 | | | BGF retail Co. Ltd.(b)(c) | | | 10,943 | |
| | 1,420 | | | BNK Financial Group, Inc. | | | 12,599 | |
| | 142 | | | Celltrion, Inc.(a) | | | 21,940 | |
| | 826 | | | Cheil Worldwide, Inc. | | | 15,335 | |
| | 84 | | | CJ Corp. | | | 13,983 | |
| | 202 | | | CJ E&M Corp. | | | 15,235 | |
| | 149 | | | Coway Co. Ltd. | | | 12,940 | |
| | 1,331 | | | DGB Financial Group, Inc. | | | 12,415 | |
| | 232 | | | Dongbu Insurance Co. Ltd. | | | 14,599 | |
| | 732 | | | Doosan Heavy Industries & Construction Co. Ltd. | | | 11,434 | |
| | 21,300 | | | GS Retail Co. Ltd. | | | 634,998 | |
| | 680 | | | Hana Financial Group, Inc. | | | 29,103 | |
| | 280,218 | | | Hankook Tire Co. Ltd. | | | 13,506,290 | |
| | 1,441 | | | Hanon Systems | | | 16,721 | |
| | 27,823 | | | Hanssem Co. Ltd. | | | 4,234,232 | |
| | 506 | | | Hanwha Chemical Corp. | | | 13,753 | |
| | 326 | | | Hanwha Corp. | | | 12,992 | |
| | 2,291 | | | Hanwha Life Insurance Co. Ltd. | | | 16,196 | |
| | 92 | | | Hyosung Corp. | | | 11,045 | |
| | 333 | | | Hyundai Development Co-Engineering & Construction | | | 11,919 | |
| | 342 | | | Hyundai Engineering & Construction Co. Ltd. | | | 11,554 | |
| | 394 | | | Hyundai Marine & Fire Insurance Co. Ltd. | | | 15,949 | |
| | 138 | | | Hyundai Mobis Co. Ltd. | | | 32,826 | |
| | 282 | | | Hyundai Motor Co. | | | 40,525 | |
| | 39 | | | Hyundai Robotics Co. Ltd.(a) | | | 15,717 | |
| | 1,109 | | | Industrial Bank of Korea | | | 15,194 | |
| | 447 | | | Kangwon Land, Inc. | | | 13,685 | |
| | 871 | | | KB Financial Group Inc. | | | 45,402 | |
| | 354 | | | KEPCO Plant Service & Engineering Co. Ltd. | | | 13,050 | |
| | 621 | | | Kia Motors Corp. | | | 19,622 | |
| | 17,054 | | | Korea Electric Power Corp. | | | 596,704 | |
| | 286 | | | Korea Gas Corp.(a) | | | 10,428 | |
| | 405 | | | Korean Air Lines Co. Ltd.(a) | | | 11,441 | |
| | 472 | | | KT Corp. | | | 12,365 | |
| | 279 | | | KT&G Corp. | | | 26,397 | |
| | 93 | | | LG Chem Ltd. | | | 33,494 | |
| | 637,610 | | | LG Display Co. Ltd. | | | 16,675,122 | |
| | 251 | | | LG Electronics, Inc. | | | 20,387 | |
| | 14,722 | | | LG Household & Health Care Ltd. | | | 15,466,411 | |
| | 984 | | | LG Uplus Corp. | | | 11,286 | |
| | 46 | | | Lotte Chemical Corp. | | | 15,171 | |
| | 13,464 | | | NAVER Corp. | | | 10,743,800 | |
| | 148 | | | POSCO | | | 42,999 | |
See Notes to Financial Statements.
| Old Westbury Funds, Inc. | |
| Large Cap Strategies Fund | |
| Portfolio of Investments - (Continued) | |
| | October 31, 2017 |
| Shares | | | | | Value | |
| SOUTH KOREA (continued) |
| | 162 | | | S-1 Corp. | | $ | 13,245 | |
| | 157 | | | Samsung C&T Corp. | | | 20,740 | |
| | 407 | | | Samsung Card Co. Ltd. | | | 13,314 | |
| | 208 | | | Samsung Electronics Co. Ltd. | | | 511,297 | |
| | 37,560 | | | Samsung Electronics Co. Ltd. - GDR | | | 46,164,252 | |
| | 65 | | | Samsung Fire & Marine Insurance Co. Ltd. | | | 15,839 | |
| | 146 | | | Samsung Life Insurance Co. Ltd. | | | 17,593 | |
| | 101 | | | Samsung SDI Co. Ltd. | | | 18,571 | |
| | 87 | | | Samsung SDS Co. Ltd. | | | 16,074 | |
| | 995 | | | Shinhan Financial Group Co. Ltd. | | | 44,583 | |
| | 83 | | | SK Holdings Co. Ltd. | | | 21,447 | |
| | 1,241 | | | SK Hynix, Inc. | | | 91,052 | |
| | 25,154 | | | SK Innovation Co. Ltd. | | | 4,602,642 | |
| | 57 | | | SK Telecom Co. Ltd. | | | 13,432 | |
| | 857 | | | Woori Bank | | | 12,545 | |
| | | | | | | | 122,017,363 | |
| SPAIN — 0.5% |
| | 162,189 | | | Abertis Infraestructuras SA | | | 3,508,352 | |
| | 62,986 | | | ACS Actividades de Construccion y Servicios SA | | | 2,483,915 | |
| | 10,514 | | | Aena SA | | | 1,928,938 | |
| | 99,369 | | | Amadeus IT Holding SA | | | 6,742,433 | |
| | 939,371 | | | Banco Bilbao Vizcaya Argentaria SA | | | 8,220,919 | |
| | 968,701 | | | Banco de Sabadell SA | | | 1,939,704 | |
| | 2,215,700 | | | Banco Santander SA(b) | | | 15,028,913 | |
| | 421,132 | | | Distribuidora Internacional de Alimentacion SA | | | 2,060,333 | |
| | 68,134 | | | Enagas SA | | | 1,962,718 | |
| | 135,287 | | | Endesa SA | | | 3,096,624 | |
| | 667,246 | | | Iberdrola SA | | | 5,392,499 | |
| | 194,740 | | | Industria de Diseno Textil SA | | | 7,280,519 | |
| | 568,991 | | | Mapfre SA | | | 1,861,774 | |
| | 114,437 | | | Red Electrica Corp SA | | | 2,534,069 | |
| | 617,734 | | | Repsol SA | | | 11,574,237 | |
| | 131,935 | | | Siemens Gamesa Renewable Energy SA | | | 1,913,371 | |
| | 601,299 | | | Telefonica SA | | | 6,308,008 | |
| | | | | | | | 83,837,326 | |
| SWEDEN — 2.4% |
| | 113,750 | | | Assa Abloy AB | | | 2,400,916 | |
| | 3,419,825 | | | Atlas Copco AB - A Shares(b) | | | 150,001,462 | |
| | 825,093 | | | Atlas Copco AB - B Shares | | | 32,770,532 | |
| | 116,280 | | | Boliden AB | | | 4,069,692 | |
| | 94,452 | | | Electrolux AB - Class B | | | 3,339,580 | |
| | 95,261 | | | Essity AB- Class B(a) | | | 2,848,164 | |
| | 100,172 | | | Getinge AB - B Shares | | | 1,971,935 | |
| | 186,787 | | | Hennes & Mauritz AB - B Shares | | | 4,689,951 | |
| | 108,763 | | | Industrivarden AB - C Shares | | | 2,795,840 | |
| | 113,098 | | | Investor AB - B Shares | | | 5,605,151 | |
| Shares | | | | | Value | |
| SWEDEN (continued) |
| | 102,152 | | | Kinnevik AB - Class B | | $ | 3,351,926 | |
| | 25,158 | | | L E Lundbergforetagen AB - B Shares | | | 1,963,861 | |
| | 70,683 | | | Lundin Petroleum AB(a) | | | 1,662,454 | |
| | 484,614 | | | Nordea Bank AB | | | 5,858,216 | |
| | 242,293 | | | Sandvik AB | | | 4,425,245 | |
| | 240,875 | | | Skandinaviska Enskilda Banken AB - Class A | | | 2,969,343 | |
| | 156,125 | | | SKF AB | | | 3,631,009 | |
| | 11,500,000 | | | Svenska Handelsbanken AB - A Shares(b) | | | 164,842,056 | |
| | 142,642 | | | Swedbank AB - A Shares | | | 3,540,641 | |
| | 86,013 | | | Swedish Match AB | | | 3,240,520 | |
| | 474,064 | | | Telefonaktiebolaget LM Ericsson - B Shares | | | 2,984,259 | |
| | 301,266 | | | Volvo AB - B Shares | | | 5,970,153 | |
| | | | | | | | 414,932,906 | |
| SWITZERLAND — 2.0% |
| | 313,809 | | | ABB Ltd. | | | 8,203,417 | |
| | 38,460 | | | Adecco Group AG | | | 3,051,280 | |
| | 12,733 | | | Baloise Holding AG | | | 2,007,619 | |
| | 1,881 | | | CHUBB Ltd. | | | 283,692 | |
| | 57,325 | | | Cie Financiere Richemont SA | | | 5,286,323 | |
| | 415,300 | | | Coca-Cola HBC AG - CDI | | | 14,037,673 | |
| | 298,305 | | | Credit Suisse Group | | | 4,703,391 | |
| | 2,653 | | | EMS-Chemie Holding AG | | | 1,739,149 | |
| | 5,819 | | | Geberit AG | | | 2,634,050 | |
| | 1,457 | | | Givaudan SA | | | 3,253,843 | |
| | 11,697 | | | Kuehne + Nagel International AG | | | 2,042,417 | |
| | 37,326 | | | LafargeHolcim Ltd. | | | 2,108,275 | |
| | 11,768 | | | Lonza Group AG | | | 3,125,866 | |
| | 2,382,956 | | | Nestle SA | | | 200,400,951 | |
| | 339,516 | | | Novartis AG | | | 27,973,954 | |
| | 4,302 | | | Partners Group Holding AG | | | 2,893,442 | |
| | 119,606 | | | Roche Holding AG | | | 27,634,123 | |
| | 864 | | | SGS SA | | | 2,133,911 | |
| | 494 | | | Sika AG | | | 3,656,783 | |
| | 14,229 | | | Sonova Holding AG | | | 2,568,679 | |
| | 5,839 | | | Swiss Life Holding AG | | | 2,029,735 | |
| | 21,651 | | | Swiss Prime Site AG | | | 1,847,925 | |
| | 51,048 | | | Swiss Re AG | | | 4,802,140 | |
| | 3,992 | | | Swisscom AG | | | 2,016,707 | |
| | 459,160 | | | UBS Group AG | | | 7,814,902 | |
| | 321,317 | | | Weatherford International Plc(a) | | | 1,114,970 | |
| | 16,952 | | | Zurich Financial Services AG | | | 5,174,043 | |
| | | | | | | | 344,539,260 | |
| TAIWAN — 0.9% |
| | 15,540 | | | Advanced Semiconductor Engineering, Inc. | | | 18,730 | |
| | 1,292,871 | | | Advantech Co. Ltd. | | | 8,830,764 | |
| | 504,740 | | | Airtac International Group | | | 8,175,384 | |
| | 1,438 | | | Asustek Computer, Inc. | | | 12,444 | |
| | 1,795 | | | Catcher Technology Co. Ltd. | | | 19,045 | |
See Notes to Financial Statements.
| Old Westbury Funds, Inc. | |
| Large Cap Strategies Fund | |
| Portfolio of Investments - (Continued) | |
| | October 31, 2017 |
| Shares | | | | | Value | |
| TAIWAN (continued) |
| | 15,587 | | | Cathay Financial Holding Co. Ltd. | | $ | 25,738 | |
| | 5,044 | | | Chailease Holding Co. Ltd. | | | 13,012 | |
| | 25,300 | | | Chang Hwa Commercial Bank Ltd. | | | 13,716 | |
| | 5,488 | | | Chicony Electronics Co. Ltd. | | | 13,738 | |
| | 48,208 | | | China Development Financial Holding Corp. | | | 14,770 | |
| | 22,710 | | | China Steel Corp. | | | 18,486 | |
| | 7,686 | | | Chunghwa Telecom Co. Ltd. | | | 26,249 | |
| | 33,008 | | | CTBC Financial Holding Co. Ltd. | | | 21,123 | |
| | 4,451 | | | Delta Electronics, Inc. | | | 21,399 | |
| | 24,231 | | | E.Sun Financial Holding Co. Ltd. | | | 14,743 | |
| | 878,478 | | | Eclat Textile Co. Ltd. | | | 10,500,549 | |
| | 3,012 | | | Feng TAY Enterprise Co. Ltd. | | | 13,582 | |
| | 21,096 | | | First Financial Holding Co. Ltd. | | | 13,605 | |
| | 5,902 | | | Formosa Chemicals & Fibre Corp. | | | 17,925 | |
| | 571,425 | | | Formosa Petrochemical Corp. | | | 1,998,884 | |
| | 2,048,283 | | | Formosa Plastics Corp. | | | 6,241,390 | |
| | 15,356 | | | Fubon Financial Holding Co. Ltd. | | | 24,465 | |
| | 1,999 | | | Globalwafers Co. Ltd. | | | 23,099 | |
| | 4,465,277 | | | Hon Hai Precision Industry Co. Ltd. | | | 16,582,205 | |
| | 27,726 | | | Innolux Corp. | | | 12,135 | |
| | 3,297,618 | | | Kinsus Interconnect Technology Corp. | | | 8,309,785 | |
| | 93,238 | | | Largan Precision Co. Ltd. | | | 17,667,905 | |
| | 8,332 | | | Lite-On Technology Corp. | | | 11,755 | |
| | 2,916 | | | MediaTek, Inc. | | | 33,115 | |
| | 17,242 | | | Mega Financial Holding Co. Ltd. | | | 13,549 | |
| | 5,900 | | | Micro-Star International Co. Ltd. | | | 14,379 | |
| | 8,723 | | | Nan Ya Plastics Corp. | | | 21,519 | |
| | 1,217 | | | Nien Made Enterprise Co. Ltd. | | | 12,671 | |
| | 2,319,962 | | | Novatek Microelectronics Corp. | | | 8,576,925 | |
| | 5,585 | | | Pegatron Corp. | | | 14,444 | |
| | 1,126 | | | Phison Electronics Corp. | | | 13,385 | |
| | 9,909 | | | Pou Chen Corp. | | | 12,485 | |
| | 1,673 | | | President Chain Store Corp. | | | 15,033 | |
| | 52,171 | | | Shin Kong Financial Holding Co. Ltd. | | | 16,693 | |
| | 11,622 | | | Taiwan Cement Corp. | | | 12,909 | |
| | 26,889 | | | Taiwan Cooperative Financial Holding Co. Ltd. | | | 14,532 | |
| | 3,562 | | | Taiwan Mobile Co. Ltd. | | | 12,696 | |
| | 6,397,478 | | | Taiwan Semiconductor Manufacturing Co. Ltd. | | | 51,545,521 | |
| | 4,168 | | | Transcend Information, Inc. | | | 11,830 | |
| | 8,322,523 | | | Uni-President Enterprises Corp. | | | 17,384,869 | |
| | 3,553,403 | | | Vanguard International Semiconductor Corp.(b) | | | 6,739,324 | |
| Shares | | | | | Value | |
| TAIWAN (continued) |
| | 5,947 | | | Zhen Ding Technology Holding Ltd. | | $ | 14,907 | |
| | | | | | | | 163,137,411 | |
| THAILAND — 0.6% |
| | 18,447,000 | | | Airports of Thailand Public Co. Ltd. | | | 33,040,232 | |
| | 24,548,000 | | | CP ALL Public Co. Ltd.(b) | | | 51,726,671 | |
| | 3,001,000 | | | Siam Commercial Bank Public Co. Ltd. | | | 13,234,392 | |
| | | | | | | | 98,001,295 | |
| TURKEY — 0.1% |
| | 6,171 | | | Akbank Turk AS | | | 16,283 | |
| | 1,313 | | | Anadolu Efes Biracilik Ve Malt Sanayii AS | | | 7,601 | |
| | 1,064,767 | | | Arcelik AS | | | 5,815,653 | |
| | 443 | | | BIM Birlesik Magazalar AS | | | 9,033 | |
| | 6,378 | | | Eregli Demir ve Celik Fabrikalari TAS | | | 14,963 | |
| | 838 | | | Ford Otomotiv Sanayi AS | | | 11,829 | |
| | 4,426 | | | Haci Omer Sabanci Holding AS | | | 12,297 | |
| | 1,616 | | | TAV Havalimanlari Holding AS | | | 8,038 | |
| | 1,259 | | | Tofas Turk Otomobil Fabrikasi AS | | | 10,248 | |
| | 45,194 | | | Tupras Turkiye Petrol Rafinerileri AS | | | 1,626,176 | |
| | 3,464,938 | | | Turkiye Garanti Bankasi AS | | | 9,526,513 | |
| | 3,685 | | | Turkiye Halk Bankasi AS | | | 10,744 | |
| | 6,529 | | | Turkiye Is Bankasi - Class C | | | 12,288 | |
| | 7,005 | | | Turkiye Sise ve Cam Fabrikalari AS | | | 8,217 | |
| | 7,533 | | | Turkiye Vakiflar Bankasi TAO - Class D | | | 12,570 | |
| | 10,891 | | | Yapi ve Kredi Bankasi AS(a) | | | 13,206 | |
| | | | | | | | 17,115,659 | |
| UNITED ARAB EMIRATES — 0.1% |
| | 6,968 | | | Abu Dhabi Commercial Bank PJSC | | | 14,021 | |
| | 15,835 | | | DAMAC Properties Dubai Co. PJSC | | | 17,031 | |
| | 455,600 | | | DP World Ltd. | | | 10,820,500 | |
| | 8,690 | | | Dubai Islamic Bank PJSC | | | 14,481 | |
| | 5,698,820 | | | Emaar Properties PJSC | | | 12,863,523 | |
| | 3,114 | | | Emirates Telecommunications Group Co. PJSC | | | 15,135 | |
| | 4,627 | | | First Abu Dhabi Bank PJSC | | | 13,039 | |
| | | | | | | | 23,757,730 | |
| UNITED KINGDOM — 4.7% |
| | 543,389 | | | Abcam Plc | | | 7,180,907 | |
| | 860 | | | Aon Plc | | | 123,350 | |
| | 472,768 | | | ASOS Plc(a) | | | 35,771,709 | |
| | 6,374,819 | | | BP Plc | | | 43,197,012 | |
| | 48,548 | | | Coca-Cola European Partners Plc | | | 1,991,447 | |
See Notes to Financial Statements.
| Old Westbury Funds, Inc. | |
| Large Cap Strategies Fund | |
| Portfolio of Investments - (Continued) | |
| | October 31, 2017 |
| Shares | | | | | Value | |
| UNITED KINGDOM (continued) |
| | 6,565,846 | | | Compass Group Plc(b) | | $ | 144,148,107 | |
| | 207,187 | | | Petrofac Ltd. | | | 1,153,806 | |
| | 1,816,501 | | | Reckitt Benckiser Group Plc | | | 162,487,007 | |
| | 11,495,646 | | | RELX NV(b) | | | 259,645,625 | |
| | 141,726,000 | | | Rolls-Royce Holdings Plc | | | 188,233 | |
| | 3,081,000 | | | Rolls-Royce Holdings Plc | | | 39,815,295 | |
| | 91,448 | | | TechnipFMC Plc(a) | | | 2,504,761 | |
| | 45,459 | | | TechnipFMC Plc(a) | | | 1,235,921 | |
| | 37,138 | | | Ultra Electronics Holdings Plc | | | 899,681 | |
| | 2,113,600 | | | Whitbread Plc(b) | | | 103,668,665 | |
| | | | | | | | 804,011,526 | |
| UNITED STATES — 47.3% |
| | 185 | | | Affiliated Managers Group, Inc. | | | 34,503 | |
| | 2,645 | | | Aflac, Inc. | | | 221,889 | |
| | 1,309,988 | | | AGNC Investment Corp. REIT | | | 26,370,058 | |
| | 1,781 | | | Allstate Corp. (The) | | | 167,165 | |
| | 6,469 | | | Ally Financial Inc. | | | 169,035 | |
| | 36,500 | | | Alphabet, Inc. - Class A(a) | | | 37,705,960 | |
| | 234,000 | | | Alphabet, Inc. - Class C(a) | | | 237,893,760 | |
| | 246,400 | | | Amazon.com, Inc.(a) | | | 272,340,992 | |
| | 294,807 | | | Amdocs Ltd. | | | 19,191,936 | |
| | 2,512 | | | American Express Co. | | | 239,946 | |
| | 1,282 | | | American Financial Group, Inc. | | | 135,238 | |
| | 3,217 | | | American International Group, Inc. | | | 207,850 | |
| | 503 | | | Ameriprise Financial, Inc. | | | 78,740 | |
| | 2,470,846 | | | Anadarko Petroleum Corp. | | | 121,985,667 | |
| | 53,787 | | | Andeavor | | | 5,714,331 | |
| | 1,194,024 | | | Annaly Capital Management, Inc., REIT | | | 13,683,515 | |
| | 57,472 | | | Antero Resources Corp.(a) | | | 1,114,957 | |
| | 137,853 | | | Apache Corp. | | | 5,702,979 | |
| | 1,278,909 | | | Apple, Inc. | | | 216,186,777 | |
| | 93,920 | | | Assurant, Inc. | | | 9,453,047 | |
| | 1,640,000 | | | Automatic Data Processing, Inc. | | | 190,666,400 | |
| | 277,497 | | | AutoZone, Inc.(a) | | | 163,584,482 | |
| | 137,517 | | | Baker Hughes a GE Co. | | | 4,322,159 | |
| | 3,698,168 | | | Ball Corp.(b) | | | 158,762,352 | |
| | 35,062 | | | Bank of America Corp. | | | 960,348 | |
| | 2,508,047 | | | Bank of New York Mellon Corp. (The) | | | 129,039,018 | |
| | 1,514 | | | BB&T Corp. | | | 74,549 | |
| | 922,000 | | | Becton Dickinson and Co. | | | 192,393,740 | |
| | 915,063 | | | Berkshire Hathaway, Inc. - Class B(a) | | | 171,061,877 | |
| | 146,510 | | | Big Lots, Inc. | | | 7,517,428 | |
| | 336,000 | | | BioMarin Pharmaceutical, Inc.(a) | | | 27,582,240 | |
| | 271 | | | BlackRock Inc. | | | 127,595 | |
| | 276 | | | Brighthouse Financial, Inc.(a) | | | 17,162 | |
| | 78,380 | | | Brinker International, Inc. | | | 2,407,834 | |
| | 145,201 | | | Cabot Oil & Gas Corp. | | | 4,022,068 | |
| | 3,170,300 | | | Campbell Soup Co.(b) | | | 150,177,111 | |
| | 2,825 | | | Capital One Financial Corp. | | | 260,409 | |
| | 387,859 | | | CBOE Holdings, Inc. | | | 43,851,339 | |
| Shares | | | | | Value | |
| UNITED STATES (continued) |
| | 1,398,540 | | | Charles Schwab Corp. (The) | | $ | 62,710,534 | |
| | 16,475 | | | Cheesecake Factory, Inc. (The) | | | 737,092 | |
| | 60,319 | | | Cheniere Energy, Inc.(a) | | | 2,819,310 | |
| | 1,292,068 | | | Chevron Corp. | | | 149,737,761 | |
| | 100,000 | | | Chipotle Mexican Grill, Inc.(a) | | | 27,190,000 | |
| | 30,170 | | | Cimarex Energy Co. | | | 3,527,778 | |
| | 9,874 | | | Citigroup, Inc. | | | 725,739 | |
| | 3,117 | | | Citizens Financial Group Inc. | | | 118,477 | |
| | 209,456 | | | Clorox Co. (The) | | | 26,502,468 | |
| | 289 | | | CME Group, Inc. | | | 39,642 | |
| | 1,969,200 | | | Cognizant Technology Solutions Corp. - Class A | | | 149,009,364 | |
| | 2,242,400 | | | Colgate-Palmolive Co. | | | 157,977,080 | |
| | 73,020 | | | Conagra Brands, Inc. | | | 2,494,363 | |
| | 48,713 | | | Concho Resources, Inc.(a) | | | 6,537,772 | |
| | 420,496 | | | ConocoPhillips | | | 21,508,370 | |
| | 38,404 | | | Continental Resources, Inc.(a) | | | 1,563,427 | |
| | 333,200 | | | Costco Wholesale Corp. | | | 53,671,856 | |
| | 58,675 | | | Cracker Barrel Old Country Store, Inc. | | | 9,160,928 | |
| | 406,237 | | | Darden Restaurants, Inc. | | | 33,421,118 | |
| | 176,053 | | | Devon Energy Corp. | | | 6,496,356 | |
| | 26,020 | | | Diamondback Energy, Inc.(a) | | | 2,788,303 | |
| | 2,927 | | | Discover Financial Services | | | 194,733 | |
| | 472 | | | East West Bancorp, Inc. | | | 28,244 | |
| | 352,000 | | | Edwards Lifesciences Corp.(a) | | | 35,984,960 | |
| | 198,561 | | | EOG Resources, Inc. | | | 19,830,287 | |
| | 55,450 | | | EQT Corp. | | | 3,467,843 | |
| | 576,099 | | | Equity Commonwealth REIT(a) | | | 17,311,775 | |
| | 1,411,138 | | | Exxon Mobil Corp. | | | 117,618,352 | |
| | 555,000 | | | Facebook, Inc. - Class A(a) | | | 99,933,300 | |
| | 4,455 | | | Fifth Third Bancorp | | | 128,750 | |
| | 2,267 | | | Franklin Resources, Inc. | | | 95,509 | |
| | 889,202 | | | Gilead Sciences, Inc. | | | 66,654,582 | |
| | 1,641 | | | Goldman Sachs Group, Inc. (The) | | | 397,910 | |
| | 285,395 | | | Halliburton Co. | | | 12,197,782 | |
| | 286,809 | | | Heartland Express, Inc. | | | 6,117,636 | |
| | 33,146 | | | Helmerich & Payne, Inc. | | | 1,800,159 | |
| | 87,515 | | | Hess Corp. | | | 3,864,662 | |
| | 4,288,600 | | | Hewlett Packard Enterprise Co. | | | 59,697,312 | |
| | 64,885 | | | HollyFrontier Corp. | | | 2,397,501 | |
| | 212,000 | | | Illumina, Inc.(a) | | | 43,500,280 | |
| | 332,000 | | | Incyte Corp.(a) | | | 37,599,000 | |
| | 385 | | | Intercontinental Exchange, Inc. | | | 25,449 | |
| | 1,323 | | | Invesco, Ltd.(b) | | | 47,350 | |
| | 1,259,600 | | | Johnson & Johnson | | | 175,600,836 | |
| | 1,804,418 | | | JPMorgan Chase & Co. | | | 181,542,495 | |
| | 147,657 | | | Kaman Corp. | | | 8,259,933 | |
| | 683,634 | | | Kinder Morgan, Inc. | | | 12,380,612 | |
| | 2,129,000 | | | Kraft Heinz Co. (The) | | | 164,635,570 | |
| | 567,000 | | | Las Vegas Sands Corp. | | | 35,936,460 | |
| | 3,034 | | | Leucadia National Corp. | | | 76,760 | |
| | 2,264 | | | Lincoln National Corp. | | | 171,566 | |
| | 437,446 | | | Lockheed Martin Corp. | | | 134,803,359 | |
| | 2,039 | | | Loews Corp. | | | 100,951 | |
See Notes to Financial Statements.
| Old Westbury Funds, Inc. | |
| Large Cap Strategies Fund | |
| Portfolio of Investments - (Continued) | |
| | October 31, 2017 |
| Shares | | | | | Value | |
| UNITED STATES (continued) |
| | 1,585,843 | | | Lyondellbasell Industries NV - Class A | | $ | 164,182,326 | |
| | 288,269 | | | Marathon Oil Corp. | | | 4,099,185 | |
| | 187,526 | | | Marathon Petroleum Corp. | | | 11,202,803 | |
| | 169,000 | | | Markel Corp.(a)(b) | | | 183,246,700 | |
| | 1,688 | | | Marsh & McLennan Cos., Inc. | | | 136,610 | |
| | 1,448,000 | | | Mastercard, Inc. - Class A | | | 215,418,960 | |
| | 386,000 | | | Medidata Solutions, Inc.(a) | | | 29,038,780 | |
| | 860,100 | | | Merck & Co., Inc. | | | 47,382,909 | |
| | 3,056 | | | MetLife, Inc. | | | 163,740 | |
| | 4,185,900 | | | Mondelez International, Inc. - Class A | | | 173,421,837 | |
| | 563 | | | Moody’s Corp. | | | 80,177 | |
| | 5,756 | | | Morgan Stanley | | | 287,799 | |
| | 408,504 | | | Motorola Solutions, Inc. | | | 36,985,952 | |
| | 296 | | | MSCI, Inc. | | | 34,739 | |
| | 71,875 | | | Murphy Oil Corp. | | | 1,922,656 | |
| | 116,328 | | | National Oilwell Varco, Inc. | | | 3,977,254 | |
| | 203,000 | | | Netflix, Inc.(a) | | | 39,875,290 | |
| | 5,534 | | | New York Community Bancorp, Inc. | | | 69,507 | |
| | 53,172 | | | Newfield Exploration Co.(a) | | | 1,637,166 | |
| | 814,000 | | | NIKE, Inc. - Class B | | | 44,761,860 | |
| | 355,762 | | | NiSource, Inc. | | | 9,381,444 | |
| | 151,631 | | | Noble Energy, Inc. | | | 4,225,956 | |
| | 33,468 | | | Northrop Grumman Corp. | | | 9,890,798 | |
| | 172,675 | | | Northwest Natural Gas Co.(b) | | | 11,456,986 | |
| | 2,338,572 | | | Occidental Petroleum Corp. | | | 151,001,594 | |
| | 79,587 | | | ONEOK, Inc. | | | 4,319,186 | |
| | 1,570,320 | | | Oracle Corp. | | | 79,929,288 | |
| | 60,585 | | | Parsley Energy, Inc. - Class A(a) | | | 1,611,561 | |
| | 1,597,900 | | | PepsiCo, Inc. | | | 176,136,517 | |
| | 1,680,200 | | | Philip Morris International, Inc. | | | 175,816,128 | |
| | 149,792 | | | Phillips 66 | | | 13,643,055 | |
| | 55,198 | | | Pioneer Natural Resources Co. | | | 8,261,485 | |
| | 1,178 | | | PNC Financial Services Group, Inc. (The) | | | 161,139 | |
| | 156,568 | | | Priceline Group, Inc. (The)(a) | | | 299,351,753 | |
| | 1,749 | | | Principal Financial Group, Inc. | | | 115,172 | |
| | 735 | | | Progressive Corp. (The) | | | 35,758 | |
| | 2,363 | | | Prudential Financial, Inc. | | | 261,017 | |
| | 3,066,800 | | | QUALCOMM, Inc. | | | 156,437,468 | |
| | 1,644,340 | | | Quest Diagnostics, Inc.(b) | | | 154,206,205 | |
| | 1,983,357 | | | Range Resources Corp. | | | 35,918,595 | |
| | 174,396 | | | Raytheon Co. | | | 31,426,159 | |
| | 123,000 | | | Regeneron Pharmaceuticals, Inc.(a) | | | 49,522,260 | |
| | 3,956 | | | Regions Financial Corp. | | | 61,239 | |
| | 1,016 | | | Reinsurance Group of America, Inc. | | | 151,770 | |
| | 100,560 | | | Republic Services, Inc. | | | 6,543,439 | |
| | 848 | | | S&P Global Inc. | | | 132,687 | |
| | 474,451 | | | Schlumberger Ltd. | | | 30,364,864 | |
| | 179 | | | Signature Bank(a) | | | 23,272 | |
| | 632,000 | | | Starbucks Corp. | | | 34,658,880 | |
| Shares | | | | | Value | |
| UNITED STATES (continued) |
| | 675 | | | State Street Corp. | | $ | 62,099 | |
| | 1,611 | | | SunTrust Banks, Inc. | | | 96,998 | |
| | 169 | | | SVB Financial Group(a) | | | 37,058 | |
| | 3,218,062 | | | Synchrony Financial | | | 104,973,182 | |
| | 1,495 | | | T Rowe Price Group, Inc. | | | 138,886 | |
| | 73,322 | | | Targa Resources Corp. | | | 3,042,863 | |
| | 218,951 | | | Target Corp. | | | 12,926,867 | |
| | 863 | | | TD Ameritrade Holding Corp. | | | 43,141 | |
| | 2,560,000 | | | Texas Instruments, Inc. | | | 247,526,400 | |
| | 1,330,100 | | | TJX Cos., Inc. (The) | | | 92,840,980 | |
| | 366 | | | Torchmark Corp. | | | 30,792 | |
| | 1,733 | | | Travelers Cos., Inc. (The) | | | 229,536 | |
| | 891,200 | | | UnitedHealth Group, Inc. | | | 187,348,064 | |
| | 2,969 | | | Unum Group | | | 154,507 | |
| | 3,931,559 | | | US Bancorp | | | 213,798,178 | |
| | 113,758 | | | Vail Resorts, Inc. | | | 26,052,857 | |
| | 159,642 | | | Valero Energy Corp. | | | 12,594,157 | |
| | 3,435,865 | | | Verizon Communications, Inc. | | | 164,474,858 | |
| | 784,000 | | | Visa, Inc. - Class A | | | 86,224,320 | |
| | 619 | | | Voya Financial, Inc. | | | 24,859 | |
| | 1,026,200 | | | Wabtec Corp. | | | 78,504,300 | |
| | 1,084,800 | | | Walgreens Boots Alliance, Inc. | | | 71,889,696 | |
| | 482,060 | | | Wal-Mart Stores, Inc. | | | 42,088,659 | |
| | 530,000 | | | Walt Disney Co. (The) | | | 51,839,300 | |
| | 486,878 | | | Waste Management, Inc. | | | 40,006,765 | |
| | 16,581 | | | Wells Fargo & Co. | | | 930,857 | |
| | 466,100 | | | Whirlpool Corp. | | | 76,407,773 | |
| | 287,829 | | | Williams Cos., Inc. (The) | | | 8,203,127 | |
| | 562,000 | | | Workday, Inc. - Class A(a) | | | 62,376,380 | |
| | 1,810 | | | WR Berkley Corp. | | | 124,130 | |
| | 900 | | | Yum China Holdings, Inc.(a) | | | 36,315 | |
| | | | | | | | 8,164,565,941 | |
Total Common Stocks
(Cost $12,062,397,755) | | | 15,340,503,250 | |
| MASTER LIMITED PARTNERSHIPS — 0.0% | |
| UNITED STATES — 0.0% | | | | |
| | 47,468 | | | Plains GP Holdings LP - Class A(b) | | | 968,347 | |
Total Master Limited Partnerships
(Cost $1,402,335) | | | 968,347 | |
| PREFERRED STOCKS — 1.0% | | | | |
| BRAZIL — 0.0% | | | | |
| | 6,600 | | | Banco Bradesco SA | | | 70,130 | |
| | 1,235 | | | Braskem SA - Class A | | | 19,631 | |
| | 4,257 | | | Gerdau SA - Preference Shares | | | 14,249 | |
| | 6,920 | | | Itau Unibanco Holding SA | | | 89,290 | |
| | 9,859 | | | Itausa - Investimentos Itau SA(b) | | | 31,795 | |
| | 3,028 | | | Lojas Americanas SA - Preference Shares(b) | | | 16,189 | |
| | 1,273,734 | | | Petroleo Brasileiro SA(a) | | | 6,541,354 | |
| | 922 | | | Telefonica Brasil SA | | | 14,228 | |
See Notes to Financial Statements.
| Old Westbury Funds, Inc. | |
| Large Cap Strategies Fund | |
| Portfolio of Investments - (Continued) | |
| | October 31, 2017 |
| Shares | | | | | Value | |
| BRAZIL (continued) |
| | 3,763 | | | Vale SA(b) | | $ | 34,475 | |
| | | | | | | | 6,831,341 | |
| CHILE — 0.0% |
| | 3,307 | | | Embotelladora Andina SA - Class B | | | 16,954 | |
| | 391 | | | Sociedad Quimica y Minera de Chile SA - Class B | | | 23,354 | |
| | | | | | | | 40,308 | |
| COLUMBIA — 0.0% |
| | 1,257 | | | Bancolombia SA | | | 11,983 | |
| GERMANY — 0.1% |
| | 36,344 | | | Fuchs Petrolub SE | | | 2,040,349 | |
| | 28,104 | | | Henkel AG & Co. KGaA | | | 3,944,800 | |
| | 163,300 | | | Schaeffler AG | | | 2,584,138 | |
| | 16,054 | | | Volkswagen AG | | | 2,915,407 | |
| | | | | | | | 11,484,694 | |
| SOUTH KOREA — 0.9% |
| | 25 | | | LG Household & Health Care Ltd. | | | 14,616 | |
| | 76,740 | | | Samsung Electronics Co. Ltd.(b) | | | 153,432,052 | |
| | 9,400 | | | Samsung Electronics Co. Ltd. - GDR | | | 9,397,063 | |
| | | | | | | | 162,843,731 | |
Total Preferred Stocks
(Cost $116,890,162) | | | 181,212,057 | |
| RIGHTS/WARRANTS — 0.0% | | | | |
| China — 0.0% | | | | |
| | 452 | | | CTBH Financial Rights(a) | | | 0 | |
| Hong Kong — 0.0% | | | | |
| | 4,431 | | | China Literature Rights, Expiring 11/03/17(a) | | | 0 | |
Total Rights/Warrants
(Cost $0) | | | 0 | |
Principal
Amount | | | | | Value | |
| U.S. GOVERNMENT AGENCIES — 5.0% | | | | |
| Federal Home Loan Bank — 5.0% | | | | |
| $ | 223,000,000 | | | 1.01%, 11/10/17(d) | | | 222,943,581 | |
| | 10,000,000 | | | 1.01%, 11/14/17(d) | | | 9,996,349 | |
| | 180,000,000 | | | 1.02%, 11/17/17(d) | | | 179,919,180 | |
| | 130,000,000 | | | 1.01%, 11/20/17(d) | | | 129,930,710 | |
| | 70,000,000 | | | 1.01%, 11/21/17(d) | | | 69,960,730 | |
| | 12,000,000 | | | 1.02%, 11/27/17(d) | | | 11,991,252 | |
| | 100,000,000 | | | 1.02%, 12/01/17(d) | | | 99,913,300 | |
| | 25,000,000 | | | 1.02%, 12/04/17(d) | | | 24,976,175 | |
| | 40,000,000 | | | 1.02%, 12/05/17(d) | | | 39,960,720 | |
Principal
Amount | | | | | Value | |
| Federal Home Loan Bank (continued) | | | | |
| $ | 75,000,000 | | | 0.00%, 12/11/17(d) | | $ | 74,913,300 | |
Total U.S. Government Agencies
(Cost $864,509,887) | | | 864,505,297 | |
| | | | | | | | | |
| Shares | | | | | | | |
| EXCHANGE TRADED FUNDS — 3.7% | | | | |
| | 131,300 | | | iShares Edge MSCI USA Momentum Factor ETF | | | 13,195,650 | |
| | 110,750 | | | iShares Global Infrastructure ETF | | | 5,043,555 | |
| | 1,277,000 | | | iShares MSCI ACWI ex US ETF(b) | | | 62,930,560 | |
| | 1,001,075 | | | iShares S&P 500 Index Fund | | | 259,088,221 | |
| | 52,300 | | | iShares US Financials ETF | | | 5,997,763 | |
| | 64,500 | | | iShares US Technology ETF | | | 10,422,555 | |
| | 7,027,000 | | | VanEck Vectors Gold Miners ETF | | | 157,966,960 | |
| | 1,608,555 | | | VanEck Vectors Junior Gold Miners ETF | | | 51,457,674 | |
| | 298,000 | | | Vanguard Financials ETF | | | 19,971,960 | |
| | 254,500 | | | Vanguard Information Technology ETF | | | 41,542,035 | |
| | 45,200 | | | Vanguard Materials ETF | | | 6,023,351 | |
Total Exchange Traded Funds
(Cost $623,373,998) | | | 633,640,284 | |
| INVESTMENT COMPANY — 1.3% | | | | |
| | 225,875,865 | | | Federated Government Obligations Fund, 0.68%(e) | | | 225,875,865 | |
Total Investment Company
(Cost $225,875,865) | | | 225,875,865 | |
TOTAL INVESTMENTS — 100.0%
(Cost $13,894,450,002) | | $ | 17,246,705,100 | |
| LIABILITIES IN EXCESS OF OTHER ASSETS — 0.0% | | | (3,226,332 | ) |
| NET ASSETS — 100.0% | | $ | 17,243,478,768 | |
| (a) | Non-income producing security. |
| (b) | This security is considered either fully or partially illiquid. These securities, or portions thereof, have a value of $1,578,640,002 or 9.16% of net assets. |
| (c) | Security is valued using significant unobservable inputs and is classified as Level 3 in the fair value hierarchy. The Aggregate value of the fair valued securities is $10,943 which is less than 0.01% of net assets. |
| (d) | The rate represents the annualized yield at time of purchase. |
| (e) | The rate shown represents the current yield as of October 31, 2017. |
See Notes to Financial Statements.
| Old Westbury Funds, Inc. | |
| Large Cap Strategies Fund | |
| Portfolio of Investments - (Continued) | |
| | October 31, 2017 |
The following abbreviations are used in the report:
ADR-American Depositary Receipt
CDI-Chess Depositary Interests
CPO-Certificate of Participation
DVR-Differential Voting Rights
GDR-Global Depositary Receipt
REIT-Real Estate Investment Trust
Portfolio Diversification by Sector (Unaudited)
| | | |
| Sector | | Percentage
of Net Assets |
| Information Technology | | | 18.3 | % |
| Consumer Discretionary | | | 13.6 | |
| Consumer Staples | | | 13.2 | |
| Industrials | | | 9.3 | |
| Health Care | | | 8.6 | |
| Energy | | | 8.3 | |
| Banks | | | 6.2 | |
| Diversified Financials | | | 3.3 | |
| Insurance | | | 3.2 | |
| Materials | | | 2.8 | |
| Telecommunication Services | | | 2.1 | |
| Utilities | | | 0.6 | |
| Real Estate | | | 0.5 | |
| Other* | | | 10.0 | |
| | | | 100.0 | % |
| * | Includes cash and equivalents, exchange traded funds, rights/warrants, U.S. Government agencies, investment company, pending trades and Fund share transactions, interest and dividends receivable, prepaids and accrued expenses payable. |
See Notes to Financial Statements.
| Old Westbury Funds, Inc. | |
| Small & Mid Cap Strategies Fund | |
| Condensed Portfolio of Investments | |
| | October 31, 2017 |
| Shares | | | | | Percentage of
Net Assets (%) | | | Value | |
| COMMON STOCKS — 90.6% | | | | |
| ARGENTINA — 0.0% | | | | | | | | |
| | 3,549 | | | Other Securities | | | 0.0 | | | $ | 852,860 | |
| AUSTRALIA — 1.7% | | | | | | | | |
| | 34,418,832 | | | Other Securities | | | 1.7 | | | | 109,966,618 | |
| AUSTRIA — 0.2% | | | | | | | | |
| | 373,883 | | | Other Securities | | | 0.2 | | | | 12,812,250 | |
| BELGIUM — 0.4% | | | | | | | | |
| | 674,174 | | | Other Securities | | | 0.4 | | | | 23,906,321 | |
| BERMUDA — 0.8% | | | | | | | | |
| | 403,425 | | | Argo Group International Holdings Ltd.(a) | | | 0.4 | | | | 25,395,604 | |
| | 473,001 | | | Other Securities | | | 0.4 | | | | 25,881,863 | |
| | | | | | | | | | | | 51,277,467 | |
| BRAZIL — 0.5% | | | | | | | | |
| | 4,808,431 | | | Other Securities | | | 0.5 | | | | 30,638,448 | |
| CAMBODIA — 0.0% | | | | | | | | |
| | 320,000 | | | Other Securities | | | 0.0 | | | | 258,415 | |
| CANADA — 2.4% | | | | | | | | |
| | 1,328,652 | | | CAE, Inc. | | | 0.4 | | | | 23,543,124 | |
| | 789,000 | | | Ritchie Bros Auctioneers, Inc. | | | 0.3 | | | | 22,115,670 | |
| | 8,667,929 | | | Other Securities | | | 1.7 | | | | 114,099,783 | |
| | | | | | | | | | | | 159,758,577 | |
| CAYMAN ISLANDS — 0.0% | | | | | | | | |
| | 37,682 | | | Other Securities | | | 0.0 | | | | 1,017,744 | |
| CHILE — 0.1% | | | | | | | | |
| | 49,832,011 | | | Other Securities | | | 0.1 | | | | 7,285,558 | |
| CHINA — 1.5% | | | | | | | | |
| | 122,136,986 | �� | | Other Securities | | | 1.5 | | | | 99,510,403 | |
| CYPRUS — 0.0% | | | | | | | | |
| | 23,857 | | | Other Securities | | | 0.0 | | | | 169,406 | |
| DENMARK — 0.4% | | | | | | | | |
| | 1,150,490 | | | Other Securities | | | 0.4 | | | | 28,217,583 | |
| FAEROE ISLANDS — 0.0% | | | | | | | | |
| | 8,144 | | | Other Securities | | | 0.0 | | | | 346,481 | |
| FINLAND — 0.4% | | | | | | | | |
| | 1,625,034 | | | Other Securities | | | 0.4 | | | | 27,798,398 | |
| FRANCE — 1.9% | | | | | | | | |
| | 2,984,486 | | | Other Securities | | | 1.9 | | | | 127,008,993 | |
| GABON — 0.0% | | | | | | | | |
| | 72 | | | Other Securities | | | 0.0 | | | | 11,791 | |
| GEORGIA — 0.0% | | | | | | | | |
| | 5,317 | | | Other Securities | | | 0.0 | | | | 251,398 | |
| GERMANY — 2.6% | | | | | | | | |
| | 3,290,667 | | | Other Securities | | | 2.6 | | | | 172,650,406 | |
| GIBRALTAR — 0.0% | | | | | | | | |
| | 23,380 | | | Other Securities | | | 0.0 | | | | 77,847 | |
| Shares | | | | | Percentage of
Net Assets (%) | | | Value | |
| GREECE — 0.0% | | | | | | | | |
| | 3,158,945 | | | Other Securities | | | 0.0 | | | $ | 2,906,356 | |
| HONG KONG — 1.2% | | | | | | | | |
| | 143,872,080 | | | Other Securities | | | 1.2 | | | | 79,441,509 | |
| HUNGARY — 0.0% | | | | | | | | |
| | 58,553 | | | Other Securities | | | 0.0 | | | | 373,437 | |
| INDIA — 0.8% | | | | | | | | |
| | 15,842,558 | | | Other Securities | | | 0.8 | | | | 50,188,951 | |
| INDONESIA — 0.1% | | | | | | | | |
| | 151,554,364 | | | Other Securities | | | 0.1 | | | | 8,439,619 | |
| IRELAND — 1.5% | | | | | | | | |
| | 826,557 | | | Allegion Plc | | | 1.1 | | | | 68,926,588 | |
| | 1,772,801 | | | Other Securities | | | 0.4 | | | | 26,187,171 | |
| | | | | | | | | | | | 95,113,759 | |
| ISLE OF MAN — 0.0% | | | | | | | | |
| | 101,926 | | | Other Securities | | | 0.0 | | | | 1,042,246 | |
| ISRAEL — 1.2% | | | | | | | | |
| | 561,733 | | | Check Point Software Technologies Ltd.(b) | | | 1.0 | | | | 66,121,591 | |
| | 7,144,140 | | | Other Securities | | | 0.2 | | | | 14,624,576 | |
| | | | | | | | | | | | 80,746,167 | |
| ITALY — 0.6% | | | | | | | | |
| | 6,796,747 | | | Other Securities | | | 0.6 | | | | 39,536,797 | |
| JAPAN — 5.2% | | | | | | | | |
| | 325,700 | | | Nifco, Inc. | | | 0.3 | | | | 21,196,781 | |
| | 19,088,520 | | | Other Securities | | | 4.9 | | | | 318,680,216 | |
| | | | | | | | | | | | 339,876,997 | |
| JERSEY CHANNEL ISLANDS — 0.0% | | | | | | | | |
| | 477,993 | | | Other Securities | | | 0.0 | | | | 2,111,923 | |
| JORDAN — 0.0% | | | | | | | | |
| | 29,542 | | | Other Securities | | | 0.0 | | | | 456,708 | |
| LIECHTENSTEIN — 0.0% | | | | | | | | |
| | 1,192 | | | Other Securities | | | 0.0 | | | | 119,786 | |
| LUXEMBOURG — 0.3% | | | | | | | | |
| | 493,376 | | | Other Securities | | | 0.3 | | | | 17,948,417 | |
| MACAU — 0.0% | | | | | | | | |
| | 99,000 | | | Other Securities | | | 0.0 | | | | 15,863 | |
| MALAYSIA — 0.2% | | | | | | | | |
| | 19,992,948 | | | Other Securities | | | 0.2 | | | | 11,298,392 | |
| MALTA — 0.0% | | | | | | | | |
| | 54,127 | | | Other Securities | | | 0.0 | | | | 691,163 | |
| MEXICO — 0.2% | | | | | | | | |
| | 3,856,537 | | | Other Securities | | | 0.2 | | | | 10,327,082 | |
| MONACO — 0.0% | | | | | | | | |
| | 17,500 | | | Other Securities | | | 0.0 | | | | 239,972 | |
| NETHERLANDS — 0.7% | | | | | | | | |
| | 2,038,768 | | | Other Securities | | | 0.7 | | | | 43,210,252 | |
See Notes to Financial Statements.
| Old Westbury Funds, Inc. | |
| Small & Mid Cap Strategies Fund | |
| Condensed Portfolio of Investments - (Continued) | |
| | October 31, 2017 |
| Shares | | | | | Percentage of
Net Assets (%) | | | Value | |
| NEW ZEALAND — 0.6% | | | | | | | | |
| | 14,240,250 | | | Other Securities | | | 0.6 | | | $ | 41,053,792 | |
| NORWAY — 0.2% | | | | | | | | |
| | 3,102,984 | | | Other Securities | | | 0.2 | | | | 9,922,352 | |
| PANAMA — 0.0% | | | | | | | | |
| | 841 | | | Other Securities | | | 0.0 | | | | 103,603 | |
| PERU — 0.0% | | | | | | | | |
| | 69,232 | | | Other Securities | | | 0.0 | | | | 749,055 | |
| PHILIPPINES — 0.1% | | | | | | | | |
| | 13,992,065 | | | Other Securities | | | 0.1 | | | | 3,933,311 | |
| POLAND — 0.2% | | | | | | | | |
| | 2,633,317 | | | Other Securities | | | 0.2 | | | | 10,140,017 | |
| PORTUGAL — 0.0% | | | | | | | | |
| | 3,449,944 | | | Other Securities | | | 0.0 | | | | 2,364,843 | |
| PUERTO RICO — 0.0% | | | | | | | | |
| | 86,700 | | | Other Securities | | | 0.0 | | | | 1,300,500 | |
| ROMANIA — 0.0% | | | | | | | | |
| | 13,747 | | | Other Securities | | | 0.0 | | | | 192,183 | |
| RUSSIA — 0.1% | | | | | | | | |
| | 2,673,223 | | | Other Securities | | | 0.1 | | | | 4,822,033 | |
| SINGAPORE — 0.8% | | | | | | | | |
| | 31,136,384 | | | Other Securities | | | 0.8 | | | | 52,173,563 | |
| SOUTH AFRICA — 0.3% | | | | | | | | |
| | 5,928,901 | | | Other Securities | | | 0.3 | | | | 20,614,347 | |
| SOUTH KOREA — 0.9% | | | | | | | | |
| | 3,451,567 | | | Other Securities | | | 0.9 | | | | 58,874,407 | |
| SPAIN — 0.4% | | | | | | | | |
| | 3,405,427 | | | Other Securities | | | 0.4 | | | | 24,871,882 | |
| SWEDEN — 0.9% | | | | | | | | |
| | 3,632,952 | | | Other Securities | | | 0.9 | | | | 58,928,672 | |
| SWITZERLAND — 1.2% | | | | | | | | |
| | 1,398,579 | | | Other Securities | | | 1.2 | | | | 81,580,696 | |
| TAIWAN — 1.2% | | | | | | | | |
| | 94,640,455 | | | Other Securities | | | 1.2 | | | | 81,110,100 | |
| THAILAND — 0.2% | | | | | | | | |
| | 48,022,102 | | | Other Securities | | | 0.2 | | | | 11,758,868 | |
| TURKEY — 0.1% | | | | | | | | |
| | 7,941,584 | | | Other Securities | | | 0.1 | | | | 8,727,426 | |
| UNITED KINGDOM — 5.1% | | | | | | | | |
| | 397,317 | | | Croda International Plc | | | 0.4 | | | | 22,078,737 | |
| | 846,861 | | | STERIS Plc(a) | | | 1.2 | | | | 79,037,537 | |
| | 32,347,761 | | | Other Securities | | | 3.5 | | | | 231,103,378 | |
| | | | | | | | | | | | 332,219,652 | |
| UNITED STATES — 53.4% | | | | | | | | |
| | 755,687 | | | Advance Auto Parts, Inc. | | | 0.9 | | | | 61,769,855 | |
| | 598,824 | | | ANSYS, Inc.(b) | | | 1.3 | | | | 81,865,229 | |
| | 1,725,795 | | | Axalta Coating Systems Ltd.(b) | | | 0.9 | | | | 57,382,684 | |
| | 402,451 | | | Blackbaud, Inc. | | | 0.6 | | | | 40,768,286 | |
| Shares | | | | | Percentage of
Net Assets (%) | | | Value | |
| UNITED STATES (continued) | | | | | | | | |
| | 405,400 | | | CommVault Systems, Inc.(b) | | | 0.3 | | | $ | 21,101,070 | |
| | 464,417 | | | CONMED Corp.(a) | | | 0.4 | | | | 24,251,856 | |
| | 319,220 | | | Cooper Cos., Inc. (The) | | | 1.2 | | | | 76,695,797 | |
| | 1,801,569 | | | CoreLogic, Inc.(a)(b) | | | 1.3 | | | | 84,493,586 | |
| | 1,139,400 | | | DENTSPLY SIRONA, Inc. | | | 1.1 | | | | 69,583,158 | |
| | 995,500 | | | Dover Corp. | | | 1.5 | | | | 95,060,295 | |
| | 794,152 | | | Dun & Bradstreet Corp. (The)(a) | | | 1.4 | | | | 92,780,778 | |
| | 591,377 | | | Financial Engines, Inc.(a) | | | 0.3 | | | | 21,348,710 | |
| | 305,000 | | | Guidewire Software, Inc.(b) | | | 0.4 | | | | 24,393,900 | |
| | 3,594,109 | | | Hanesbrands, Inc. | | | 1.2 | | | | 80,867,453 | |
| | 452,674 | | | HB Fuller Co. | | | 0.4 | | | | 25,743,570 | |
| | 111,377 | | | ICU Medical, Inc.(b) | | | 0.3 | | | | 21,284,145 | |
| | 430,832 | | | IDEX Corp.(a) | | | 0.8 | | | | 55,236,971 | |
| | 673,948 | | | Integra LifeScience Holdings Corp.(b) | | | 0.5 | | | | 31,527,287 | |
| | 450,800 | | | JM Smucker Co. (The) | | | 0.7 | | | | 47,807,340 | |
| | 481,625 | | | John Wiley & Sons, Inc. - Class A(a) | | | 0.4 | | | | 26,320,806 | |
| | 1,641,755 | | | KAR Auction Services, Inc.(a) | | | 1.2 | | | | 77,704,264 | |
| | 673,400 | | | Laboratory Corp of America Holdings(b) | | | 1.6 | | | | 103,508,314 | |
| | 220,617 | | | LogMein, Inc. | | | 0.4 | | | | 26,705,688 | |
| | 1,441,000 | | | Nasdaq, Inc.(a) | | | 1.6 | | | | 104,688,650 | |
| | 450,000 | | | New Relic, Inc.(b) | | | 0.4 | | | | 23,098,500 | |
| | 1,818,900 | | | Newell Brands, Inc. | | | 1.1 | | | | 74,174,742 | |
| | 385,000 | | | NuVasive, Inc.(b) | | | 0.3 | | | | 21,841,050 | |
| | 421,043 | | | Omnicell, Inc.(b) | | | 0.3 | | | | 20,967,941 | |
| | 525,984 | | | Qualys, Inc.(a)(b) | | | 0.4 | | | | 27,824,554 | |
| | 11,694,600 | | | Samsonite International SA(a) | | | 0.7 | | | | 48,793,708 | |
| | 1,099,664 | | | SIX Flags Entertainment Corp. | | | 1.1 | | | | 69,047,903 | |
| | 589,128 | | | Snap-on, Inc. | | | 1.4 | | | | 92,952,616 | |
| | 811,000 | | | Snyder’s-Lance, Inc.(a) | | | 0.5 | | | | 30,517,930 | |
| | 646,803 | | | Spectrum Brands Holdings, Inc.(a) | | | 1.1 | | | | 71,096,586 | |
| | 1,489,500 | | | Vantiv, Inc. - Class A(b) | | | 1.6 | | | | 104,265,000 | |
| | 1,123,982 | | | Wabtec Corp.(a) | | | 1.3 | | | | 85,984,623 | |
| | 401,851 | | | Waters Corp.(b) | | | 1.2 | | | | 78,782,889 | |
| | 1,100,600 | | | Welbilt, Inc.(b) | | | 0.4 | | | | 24,279,236 | |
| | 175,353 | | | WEX, Inc.(b) | | | 0.3 | | | | 21,671,877 | |
| | 947,444 | | | Wolverine World Wide, Inc. | | | 0.4 | | | | 25,865,221 | |
| | 276,270 | | | Woodward, Inc. | | | 0.3 | | | | 21,363,959 | |
| | 996,731 | | | Wyndham Worldwide Corp. | | | 1.6 | | | | 106,500,707 | |
| | 37,707,045 | | | Other Securities | | | 18.3 | | | | 1,200,910,638 | |
| | | | | | | | | | | | 3,502,829,372 | |
Total Common Stocks
(Cost $4,406,488,739) | | | | | | | 5,946,173,034 | |
| INVESTMENT COMPANY — 0.5% | | | | | |
| | 30,936,229 | | | SEI Daily Income Trust Government II Fund, Class A 0.88%(c) | | | 0.5 | | | | 30,936,229 | |
Total Investment Company
(Cost $30,936,229) | | | | | | | 30,936,229 | |
See Notes to Financial Statements.
| Old Westbury Funds, Inc. | |
| Small & Mid Cap Strategies Fund | |
| Condensed Portfolio of Investments - (Continued) | |
| | October 31, 2017 |
| Shares | | | | | Percentage of
Net Assets (%) | | | Value | |
| EXCHANGE TRADED FUNDS — 3.1% | | | | | |
| | 2,231,500 | | | SPDR S&P Oil & Gas Exploration & Production ETF | | | 1.2 | | | $ | 76,495,820 | |
| | 2,178,600 | | | VanEck Vectors Gold Miners ETF | | | 0.7 | | | | 48,974,928 | |
| | 1,565,365 | | | VanEck Vectors Junior Gold Miners ETF | | | 0.8 | | | | 50,076,026 | |
| | 1,164,000 | | | VanEck Vectors Oil Services ETF | | | 0.4 | | | | 28,215,360 | |
Total Exchange Traded Funds
(Cost $208,953,327) | | | | | | | 203,762,134 | |
| | | | | | | | | | | | | |
| RIGHTS/WARRANTS — 0.0% | | | | | | | | |
| AUSTRALIA — 0.0% | | | | | | | | |
| | 12,061 | | | Other Securities | | | 0.0 | | | | 2,149 | |
| AUSTRIA — 0.0% | | | | | | | | |
| | 9,812 | | | Other Securities | | | 0.0 | | | | 0 | |
| BRAZIL — 0.0% | | | | | | | | |
| | 25,249 | | | Other Securities | | | 0.0 | | | | 1,507 | |
| CHILE — 0.0% | | | | | | | | |
| | 933,622 | | | Other Securities | | | 0.0 | | | | 8,655 | |
| CHINA — 0.0% | | | | | | | | |
| | 18,134 | | | Other Securities | | | 0.0 | | | | 0 | |
| FRANCE — 0.0% | | | | | | | | |
| | 34,332 | | | Other Securities | | | 0.0 | | | | 1,600 | |
| INDIA — 0.0% | | | | | | | | |
| | 10,042 | | | Other Securities | | | 0.0 | | | | 3,484 | |
| MALAYSIA — 0.0% | | | | | | | | |
| | 161,393 | | | Other Securities | | | 0.0 | | | | 5,711 | |
| SOUTH KOREA — 0.0% | | | | | | | | |
| | 7,032 | | | Other Securities | | | 0.0 | | | | 31,989 | |
| SPAIN — 0.0% | | | | | | | | |
| | 163,639 | | | Other Securities | | | 0.0 | | | | 60,147 | |
| TAIWAN — 0.0% | | | | | | | | |
| | 104,411 | | | Other Securities | | | 0.0 | | | | 10,023 | |
| THAILAND — 0.0% | | | | | | | | |
| | 73,140 | | | Other Securities | | | 0.0 | | | | 38,431 | |
| UNITED STATES — 0.0% | | | | | | | | |
| | 9,600 | | | Other Securities | | | 0.0 | | | | 0 | |
Total Rights/Warrants
(Cost $93,858) | | | | | | | 163,696 | |
Principal
Amount | | | | | Percentage of
Net Assets (%) | | | Value | |
| U.S. GOVERNMENT AGENCIES — 3.5% | | | | | |
| Federal Home Loan Bank — 3.5% | | | | | |
| $ | 8,000,000 | | | 0.50%, 11/01/2017(d) | | | 0.1 | | | $ | 8,000,000 | |
| | 5,000,000 | | | 1.01%, 11/08/2017(d) | | | 0.1 | | | | 4,999,020 | |
| | 72,000,000 | | | 1.01%, 11/10/2017(d) | | | 1.1 | | | | 71,981,784 | |
| | 29,000,000 | | | 1.01%, 11/13/2017(d) | | | 0.4 | | | | 28,990,227 | |
| | 20,000,000 | | | 1.02%, 11/17/2017(d) | | | 0.3 | | | | 19,991,020 | |
| | 17,000,000 | | | 1.02%, 11/22/2017(d) | | | 0.3 | | | | 16,989,987 | |
| | 26,000,000 | | | 1.02%, 12/04/2017(d) | | | 0.4 | | | | 25,975,222 | |
| | 54,000,000 | | | 1.02%, 12/06/2017(d) | | | 0.8 | | | | 53,945,406 | |
Total U.S. Government Agencies
(Cost $230,874,583) | | | | 230,872,666 | |
| | | | | | | | | | | | | |
| U.S. GOVERNMENT SECURITIES — 0.5% | | | | | |
| U.S. Treasury Bills — 0.5% | | | | | | | | |
| | 30,000,000 | | | 0.88%, 11/02/2017(d) | | | 0.5 | | | | 29,999,234 | |
Total U.S. Government Securities
(Cost $29,999,267) | | | | | | | 29,999,234 | |
| | | | | | | | | | | | | |
| Shares | | | | | | | | | | | |
| CASH SWEEP — 1.5% | | | | | | | | |
| | 99,156,152 | | | Citibank - US Dollars on Deposit in Custody Account, 0.10%(c) | | | 1.5 | | | $ | 99,156,152 | |
Total Cash Sweep
(Cost $99,156,152) | | | | | | | 99,156,152 | |
TOTAL INVESTMENTS — 99.7%
(Cost $5,006,502,155) | | | $ | 6,541,063,145 | |
| OTHER ASSETS IN EXCESS OF LIABILITIES — 0.3% | | | | 21,318,125 | |
| NET ASSETS — 100.0% | | | | | | $ | 6,562,381,270 | |
| (a) | This security is considered either fully or partially illiquid. These securities, or portions thereof, have a value of $476,084,778 or 7.25% of net assets. |
| (b) | Non-income producing security. |
| (c) | The rate shown represents the current yield as of October 31, 2017. |
| (d) | The rate represents the annualized yield at time of purchase. |
See Notes to Financial Statements.
| Old Westbury Funds, Inc. | |
| Small & Mid Cap Strategies Fund | |
| Condensed Portfolio of Investments - (Continued) | |
| | October 31, 2017 |
Forward Foreign Currency Exchange Contracts outstanding at October 31, 2017:
| Currency Purchased | | Currency Sold | | Counterparty | | Settlement
Date | | | Unrealized
Appreciation | |
| USD | | 28,929,616 | | NZD | | 41,822,000 | | Citibank N.A. | | 01/31/18 | | | $ | 354,673 | |
| | | | | | | | | | | | | | $ | 354,673 | |
This Condensed Portfolio of Investments does not reflect the complete portfolio holdings of the Fund. It includes the Fund’s 50 largest holdings and each investment of any issuer that exceeds 1% of the Fund’s net assets. “Other Securities” represent all issues not required to be disclosed under the rules adopted by the U.S. Securities and Exchange Commission (“SEC”). The complete Portfolio of Investments is available (i) without charge, upon request, by calling (800) 607-2200; and (ii) on the SEC’s website at http://www.sec.gov.
Level 3 common stocks and rights with a value of $1,541,852 (cost of $9,019,653) or 0.02% of net assets were fair valued by the Board of Directors.
The following abbreviations are used in the report:
NZD — New Zealand Dollar
USD — U.S. Dollar
| Portfolio Diversification by Sector (Unaudited) |
| | | | |
| Sector | | Percentage
of Net Assets |
| Industrials | | | 20.9 | % |
| Consumer Discretionary | | | 14.7 | |
| Information Technology | | | 13.5 | |
| Health Care | | | 12.7 | |
| Consumer Staples | | | 6.6 | |
| Materials | | | 5.9 | |
| Banks | | | 4.4 | |
| Diversified Financials | | | 3.3 | |
| Real Estate | | | 2.8 | |
| Insurance | | | 2.3 | |
| Utilities | | | 2.0 | |
| Energy | | | 0.9 | |
| Telecommunication Services | | | 0.4 | |
| Financials | | | 0.2 | |
| Other* | | | 9.4 | |
| Total | | | 100.0 | % |
| * | Includes cash and equivalents, exchange traded funds, rights/warrants, U.S. government agencies, U.S government securitities, investment company, pending trades and Fund share transactions, interest and dividends receivable, prepaids and accrued expenses payable. |
See Notes to Financial Statements.
| Old Westbury Funds, Inc. | |
| Strategic Opportunities Fund | |
| Consolidated Portfolio of Investments | October 31, 2017 |
| | |
| Shares | | | | | Value | |
| COMMON STOCKS — 9.6% | | | |
| BELGIUM — 0.0% | | | | |
| | 24,233 | | | Colruyt SA | | $ | 1,239,483 | |
| BERMUDA — 0.5% | | | | |
| | 47,577 | | | Aspen Insurance Holdings Ltd. | | | 2,041,053 | |
| | 166,532 | | | Axis Capital Holdings Ltd. | | | 9,057,675 | |
| | 19,737 | | | Everest Re Group Ltd. | | | 4,686,550 | |
| | 40,926 | | | Renaissancere Holdings Ltd. | | | 5,662,521 | |
| | 73,736 | | | Validus Holdings, Ltd. | | | 3,840,171 | |
|
| | | | | | | | 25,287,970 | |
| BRAZIL — 0.0% | | | | |
| | 146,300 | | | Fibria Celulose SA | | | 2,334,950 | |
| CANADA — 0.0% | | | | |
| | 21,416 | | | Waste Connections, Inc. | | | 1,513,114 | |
| CHINA — 0.2% | | | | |
| | 1,831,000 | | | China Lesso Group Holdings Ltd. | | | 1,222,795 | |
| | 8,612,000 | | | China SCE Property Holdings Ltd. | | | 3,885,744 | |
| | 2,948,000 | | | China Shenhua Energy Co. Ltd. - H Shares | | | 7,043,700 | |
|
| | | | | | | | 12,152,239 | |
| DENMARK — 0.0% | | | | |
| | 14,642 | | | ALK-Abello A/S | | | 2,290,875 | |
| EGYPT — 0.0% | | | | |
| | 85,356 | | | Eastern Tobacco | | | 1,535,772 | |
| FRANCE — 0.1% | | | | |
| | 48,315 | | | BioMerieux | | | 3,789,875 | |
| GERMANY — 0.2% | | | | |
| | 71,119 | | | Daimler AG | | | 5,905,872 | |
| | 6,181 | | | Rational AG | | | 4,053,563 | |
|
| | | | | | | | 9,959,435 | |
| HONG KONG — 0.2% | | | | |
| | 4,772,000 | | | Anxin-China Holdings Ltd.(a)(b)(c) | | | 44,164 | |
| | 2,236,000 | | | China Lumena New Materials Corp.(a)(b)(c) | | | 0 | |
| | 237,500 | | | CK Infrastructure Holdings, Ltd. | | | 2,067,097 | |
| | 2,689,500 | | | Hopewell Highway Infrastructure Ltd.(a) | | | 1,668,570 | |
| | 154,000 | | | VTech Holdings Ltd. | | | 2,189,171 | |
| | 1,740,500 | | | Yue Yuen Industrial Holdings Ltd. | | | 6,670,719 | |
|
| | | | | | | | 12,639,721 | |
| INDONESIA — 0.1% | | | | |
| | 257,300 | | | Gudang Garam Tbk PT | | | 1,328,000 | |
| | 391,000 | | | Unilever Indonesia Tbk PT | | | 1,429,943 | |
|
| | | | | | | | 2,757,943 | |
| ISRAEL — 0.0% | | | | |
| | 3,402,861 | | | Oil Refineries Ltd. | | | 1,748,179 | |
| Shares | | | | | Value | |
| JAPAN — 0.8% | | | | |
| | 51,700 | | | Adastria Co. Ltd. | | $ | 1,122,163 | |
| | 158,900 | | | Duskin Co. Ltd. | | | 4,332,175 | |
| | 114,000 | | | Fukuyama Transporting Co. Ltd.(a) | | | 3,684,535 | |
| | 26,400 | | | Kura Corp. | | | 1,179,473 | |
| | 42,200 | | | Mochida Pharmaceutical Co. Ltd.(a) | | | 3,073,005 | |
| | 98,700 | | | Nikon Corp. | | | 1,860,201 | |
| | 187,000 | | | Nippon Kayaku Co. Ltd. | | | 2,957,003 | |
| | 27,100 | | | Nippon Telegraph & Telephone Corp. | | | 1,304,413 | |
| | 437,700 | | | NTT Data Corp. | | | 5,069,706 | |
| | 72,200 | | | Osaka Gas Co. Ltd. | | | 1,389,646 | |
| | 28,800 | | | Paramount Bed Holdings Co. Ltd. | | | 1,262,636 | |
| | 250,800 | | | Takasago Thermal Engineering Co. Ltd.(a) | | | 4,395,976 | |
| | 58,400 | | | Toyo Suisan Kaisha Ltd. | | | 2,236,771 | |
| | 262,900 | | | Yokogawa Electric Corp. | | | 4,943,320 | |
| | 186,200 | | | Zensho Holdings Co. Ltd. | | | 3,440,536 | |
|
| | | | | | | | 42,251,559 | |
| LUXEMBOURG — 0.0% | | | | |
| | 1,185,250 | | | L’Occitane International SA(a) | | | 2,251,571 | |
| MALAYSIA — 0.0% | | | | |
| | 3,287,200 | | | Sunway Real Estate Investment Trust, REIT(a) | | | 1,335,534 | |
| MOROCCO AND ANTILLES — 0.1% | | | | |
| | 61,761 | | | Attijariwafa Bank | | | 3,075,501 | |
| NETHERLANDS — 0.1% | | | | |
| | 127,785 | | | Aalberts Industries NV | | | 6,303,066 | |
| PAKISTAN — 0.0% | | | | |
| | 424,300 | | | Engro Corp. Ltd. | | | 1,119,893 | |
| | 196,550 | | | Lucky Cement Ltd. | | | 908,401 | |
|
| | | | | | | | 2,028,294 | |
| QATAR — 0.1% | | | | |
| | 102,265 | | | Ooredoo QSC | | | 2,412,513 | |
| SOUTH AFRICA — 0.0% | | | | |
| | 345,580 | | | Gold Fields Ltd. | | | 1,379,509 | |
| SOUTH KOREA — 0.1% | | | | |
| | 35,424 | | | GS Retail Co. Ltd. | | | 1,056,064 | |
| | 144,751 | | | LG Display Co. Ltd. | | | 3,785,607 | |
| | 225,721 | | | LG Uplus Corp. | | | 2,588,936 | |
|
| | | | | | | | 7,430,607 | |
| SWITZERLAND — 0.1% | | | | |
| | 24,355 | | | Schindler Holding AG | | | 5,519,637 | |
| TAIWAN — 0.8% | | | | |
| | 9,518,250 | | | Chang Hwa Commercial Bank Ltd.(a) | | | 5,160,012 | |
| | 8,950,339 | | | E.Sun Financial Holding Co. Ltd. | | | 5,445,671 | |
| | 7,903,980 | | | First Financial Holding Co. Ltd. | | | 5,097,313 | |
See Notes to Financial Statements.
| Old Westbury Funds, Inc. | |
| Strategic Opportunities Fund | |
| Consolidated Portfolio of Investments - (Continued) | October 31, 2017 |
| | |
| Shares | | | | | Value | |
| TAIWAN (continued) | | | | |
| | 1,065,880 | | | Foxconn Technology Co. Ltd. | | $ | 3,396,312 | |
| | 1,367,000 | | | Hon Hai Precision Industry Co. Ltd. | | | 5,076,477 | |
| | 9,385,950 | | | Hua Nan Financial Holdings Co. Ltd. | | | 5,134,972 | |
| | 1,797,000 | | | LCY Chemical Corp. | | | 2,454,829 | |
| | 759,000 | | | Novatek Microelectronics Corp. | | | 2,806,031 | |
| | 2,262,000 | | | Siliconware Precision Industries Co. Ltd. | | | 3,585,059 | |
| | 2,011,000 | | | Uni-President Enterprises Corp. | | | 4,200,766 | |
|
| | | | | | | | 42,357,442 | |
| UNITED ARAB EMIRATES — 0.0% | | | | |
| | 443,572 | | | Emirates Telecommunications Group Co. PJSC | | | 2,155,871 | |
| UNITED KINGDOM — 0.1% | | | | |
| | 507,704 | | | Cineworld Group Plc | | | 4,480,753 | |
| UNITED STATES — 6.1% | | | | |
| | 24,953 | | | 3M Co. | | | 5,743,931 | |
| | 86,109 | | | AGNC Investment Corp. REIT | | | 1,733,374 | |
| | 117,986 | | | Altria Group, Inc. | | | 7,577,061 | |
| | 52,941 | | | American Financial Group, Inc. | | | 5,584,746 | |
| | 28,607 | | | Amgen, Inc. | | | 5,012,518 | |
| | 70,463 | | | Amphenol Corp. Class A | | | 6,130,281 | |
| | 262,679 | | | Annaly Capital Management, Inc., REIT | | | 3,010,301 | |
| | 17,313 | | | Anthem, Inc. | | | 3,622,053 | |
| | 442,833 | | | Apollo Investment Corp. | | | 2,621,571 | |
| | 58,655 | | | Aptargroup, Inc. | | | 5,107,091 | |
| | 91,414 | | | Arthur J Gallagher & Co. | | | 5,789,249 | |
| | 436,407 | | | AT&T, Inc. | | | 14,685,095 | |
| | 42,594 | | | Automatic Data Processing, Inc. | | | 4,951,978 | |
| | 12,378 | | | BlackRock, Inc. | | | 5,827,934 | |
| | 157,370 | | | Brinker International, Inc. | | | 4,834,406 | |
| | 122,448 | | | Brown & Brown, Inc. | | | 6,102,808 | |
| | 19,880 | | | Cardinal Health, Inc. | | | 1,230,572 | |
| | 68,050 | | | CBOE Holdings, Inc. | | | 7,693,733 | |
| | 50,000 | | | Celgene Corp.(c) | | | 5,048,500 | |
| | 46,457 | | | Cheesecake Factory, Inc. (The) | | | 2,078,486 | |
| | 69,631 | | | Clorox Co. (The) | | | 8,810,410 | |
| | 132,742 | | | Conagra Brands, Inc. | | | 4,534,467 | |
| | 16,475 | | | Consolidated Edison, Inc. | | | 1,417,674 | |
| | 16,366 | | | Cracker Barrel Old Country Store, Inc. | | | 2,555,223 | |
| | 104,142 | | | Darden Restaurants, Inc. | | | 8,567,762 | |
| | 57,949 | | | Dr Pepper Snapple Group, Inc. | | | 4,963,911 | |
| | 88,864 | | | Equity Commonwealth REIT(c) | | | 2,670,363 | |
| | 54,870 | | | Estee Lauder Cos., Inc. (The) - Class A | | | 6,135,015 | |
| | 26,219 | | | General Dynamics Corp. | | | 5,321,933 | |
| | 1,725,000 | | | General Motors Co., Escrow Shares(a)(b)(c) | | | 258,750 | |
| | 46,408 | | | IDEX Corp. | | | 5,949,970 | |
| | 35,974 | | | Illinois Tool Works, Inc. | | | 5,630,650 | |
| | 50,151 | | | Jack Henry & Associates, Inc. | | | 5,523,130 | |
| | 45,240 | | | JM Smucker Co. (The) | | | 4,797,702 | |
| Shares | | | | | Value | |
| UNITED STATES (continued) | | | | |
| | 39,158 | | | Johnson & Johnson | | $ | 5,459,017 | |
| | 5,355 | | | Lockheed Martin Corp. | | | 1,650,197 | |
| | 111,611 | | | Loews Corp. | | | 5,525,860 | |
| | 66,664 | | | Marsh & McLennan Cos., Inc. | | | 5,395,118 | |
| | 54,252 | | | McCormick & Co., Inc. - Non Voting Shares | | | 5,399,701 | |
| | 62,188 | | | Motorola Solutions, Inc. | | | 5,630,502 | |
| | 84,303 | | | NIC, Inc. | | | 1,433,151 | |
| | 78,636 | | | NiSource, Inc. | | | 2,073,631 | |
| | 4,913 | | | Northrop Grumman Corp. | | | 1,451,939 | |
| | 65,517 | | | Northwest Natural Gas Co. | | | 4,347,053 | |
| | 64,934 | | | Omnicom Group, Inc. | | | 4,362,915 | |
| | 45,914 | | | PepsiCo, Inc. | | | 5,061,100 | |
| | 100,000 | | | PG&E Corp. | | | 5,777,000 | |
| | 22,794 | | | ProAssurance Corp. | | | 1,277,604 | |
| | 36,443 | | | Quest Diagnostics, Inc. | | | 3,417,625 | |
| | 25,231 | | | Raytheon Co. | | | 4,546,626 | |
| | 40,236 | | | Reinsurance Group of America, Inc. | | | 6,010,454 | |
| | 81,343 | | | Republic Services, Inc. | | | 5,292,989 | |
| | 95,557 | | | RPM International, Inc. | | | 5,096,055 | |
| | 102,278 | | | Sonoco Products Co. | | | 5,296,978 | |
| | 112,038 | | | Southern Co. (The) | | | 5,848,384 | |
| | 36,037 | | | Stanley Black & Decker, Inc. | | | 5,821,777 | |
| | 36,324 | | | Stryker Corp. | | | 5,625,498 | |
| | 65,851 | | | T Rowe Price Group, Inc. | | | 6,117,558 | |
| | 41,588 | | | Target Corp. | | | 2,455,356 | |
| | 29,456 | | | Thermo Fisher Scientific, Inc. | | | 5,709,456 | |
| | 81,983 | | | Travelers Cos., Inc. (The) | | | 10,858,648 | |
| | 110,523 | | | Unum Group. | | | 5,751,617 | |
| | 8,475 | | | Vail Resorts, Inc. | | | 1,940,945 | |
| | 56,318 | | | Verizon Communications, Inc. | | | 2,695,943 | |
| | 121,263 | | | Wal-Mart Stores, Inc. | | | 10,587,473 | |
| | 49,928 | | | Walt Disney Co. (The) | | | 4,883,457 | |
| | 70,468 | | | Waste Management, Inc. | | | 5,790,356 | |
| | 76,966 | | | WR Berkley Corp. | | | 5,278,328 | |
|
| | | | | | | | 335,392,959 | |
Total Common Stocks
(Cost $482,770,213) | | | 535,624,372 | |
| |
|
| CLOSED-END FUNDS — 4.0% | | | | |
| UNITED STATES — 4.0% | | | | |
| | 327,779 | | | AllianceBernstein Global High Income Fund, Inc.(a) | | | 4,244,738 | |
| | 242,711 | | | Apollo Tactical Income Fund, Inc.(a) | | 3,907,647 | |
| | 380,115 | | | Ares Dynamic Credit Allocation Fund, Inc.(a) | | | 6,252,892 | |
| | 180,658 | | | Barings Global Short Duration High Yield Fund(a) | | | 3,732,394 | |
| | 62,159 | | | Barings Participation Investors(a) | | | 896,954 | |
| | 299,790 | | | BlackRock Credit Allocation Income Trust(a) | | | 4,005,195 | |
See Notes to Financial Statements.
| Old Westbury Funds, Inc. | |
| Strategic Opportunities Fund | |
| Consolidated Portfolio of Investments - (Continued) | October 31, 2017 |
| | |
| Shares | | | | | Value | |
| UNITED STATES (continued) | | | | |
| | 165,570 | | | Blackrock Defined Opportunity Credit Trust(a)(b) | | $ | 0 | |
| | 598,000 | | | BlackRock Income Trust, Inc.(a) | | | 3,707,600 | |
| | 413,675 | | | Blackrock Limited Duration Income Trust(a) | | | 6,639,484 | |
| | 569,397 | | | Blackrock Multi-Sector Income Trust(a) | | | 10,562,314 | |
| | 823,586 | | | Blackstone/GSO Strategic Credit Fund(a) | | | 13,062,074 | |
| | 202,889 | | | Brookfield Real Assets Income Fund, Inc(a) | | | 4,847,018 | |
| | 466,845 | | | Cohen & Steers Limited Duration Preferred and Income Fund, Inc.(a) | | | 12,390,066 | |
| | 186,550 | | | Cohen & Steers Quality Income Realty Fund, Inc. | | | 2,331,875 | |
| | 149,228 | | | Cohen & Steers REIT and Preferred Income Fund, Inc.(a) | | | 3,165,126 | |
| | 401,757 | | | Doubleline Income Solutions Fund | | | 8,408,774 | |
| | 106,106 | | | Eaton Vance Municipal Income Trust(a) | | | 1,329,508 | |
| | 113,768 | | | First Trust High Income Long/Short Fund | | | 1,923,817 | |
| | 368,105 | | | First Trust Intermediate Duration Preferred & Income Fund(a) | | | 9,129,004 | |
| | 16,621 | | | Guggenheim Credit Allocation Fund | | | 376,133 | |
| | 151,895 | | | Guggenheim Strategic Opportunities Fund(a) | | | 3,236,883 | |
| | 215,060 | | | Invesco Advantage Municipal Income Trust II(a) | | | 2,415,812 | |
| | 823,711 | | | Invesco Dynamic Credit Opportunities Fund(a) | | | 9,793,924 | |
| | 2,391,677 | | | Invesco Senior Income Trust(a) | | | 10,595,129 | |
| | 100,000 | | | Invesco Value Municipal Income Trust | | | 1,469,000 | |
| | 134,052 | | | KKR Income Opportunities Fund(a) | | | 2,261,457 | |
| | 157,191 | | | Legg Mason BW Global Income Opportunities Fund, Inc.(a) | | | 2,043,483 | |
| | 322,701 | | | NexPoint Credit Strategies Fund(a) | | | 7,641,560 | |
| | 111,600 | | | Nuveen Credit Strategies Income Fund | | | 931,860 | |
| | 153,000 | | | Nuveen Enhanced AMT-Free Municipal Credit Opportunities Fund | | | 2,321,010 | |
| | 77,740 | | | Nuveen Mortgage Opportunity Term Fund(a) | | | 2,008,024 | |
| | 831,320 | | | Nuveen Preferred & Income Securities Fund(a) | | | 8,554,283 | |
| | 206,585 | | | Nuveen Preferred & Income Term Fund(a) | | | 5,199,744 | |
| | 621,803 | | | PIMCO Dynamic Credit Income Fund | | | 14,133,582 | |
| Shares | | | | | Value | |
| UNITED STATES (continued) | | | | |
| | 627,384 | | | PIMCO Income Strategy Fund II(a) | | $ | 6,706,735 | |
| | 488,946 | | | Pioneer Floating Rate Trust(a) | | | 5,882,020 | |
| | 311,352 | | | Pioneer Municipal High Income Advantage Trust(a) | | 3,552,526 | |
| | 332,733 | | | Prudential Global Short Duration High Yield Fund, Inc.(a) | | | 4,904,485 | |
| | 486,973 | | | Prudential Short Duration High Yield Fund, Inc.(a) | | | 7,377,641 | |
| | 81,873 | | | Stone Harbor Emerging Markets Income Fund | | | 1,368,917 | |
| | 1,571,093 | | | Voya Prime Rate Trust(a) | | | 8,059,707 | |
| | 765,400 | | | Wells Fargo Advantage Income Opportunities Fund(a) | | | 6,513,554 | |
| | 486,959 | | | Western Asset High Income Fund II, Inc.(a) | | | 3,472,018 | |
|
Total Closed-End Funds
(Cost $209,567,355) | | | 221,355,967 | |
| EXCHANGE TRADED FUNDS — 15.4% | | | | |
| UNITED STATES — 15.4% | | | | |
| | 725,000 | | | Alerian MLP ETF | | | 7,772,000 | |
| | 168,790 | | | Consumer Discretionary Select Sector SPDR Fund | | | 15,526,992 | |
| | 450,000 | | | Energy Select Sector SPDR Fund | | | 30,559,500 | |
| | 1,400,000 | | | Financial Select Sector SPDR Fund | | | 37,240,000 | |
| | 359,595 | | | Health Care Select Sector SPDR Fund | | | 29,166,750 | |
| | 990,000 | | | iShares Edge MSCI Minimum Volatility USA ETF | | | 50,806,800 | |
| | 50,000 | | | iShares Global Healthcare ETF | | | 5,543,000 | |
| | 2,896,135 | | | iShares MSCI EAFE ETF | | | 201,657,880 | |
| | 925,000 | | | iShares MSCI Emerging Markets Index Fund | | | 42,809,000 | |
| | 1,292,835 | | | iShares MSCI Germany ETF | | | 42,754,053 | |
| | 1,228,750 | | | iShares MSCI Japan ETF | | | 72,066,188 | |
| | 155,000 | | | iShares MSCI Taiwan Capped ETF | | | 5,905,500 | |
| | 660,000 | | | iShares MSCI United Kingdom ETF | | | 23,139,600 | |
| | 200,000 | | | iShares Russell 1000 Value ETF | | | 23,878,000 | |
| | 90,000 | | | iShares US Aerospace & Defense ETF | | | 16,242,300 | |
| | 511,000 | | | iShares US Preferred Stock ETF | | | 19,668,390 | |
| | 200,000 | | | Materials Select Sector SPDR Fund | | | 11,800,000 | |
| | 219,600 | | | SPDR S&P Dividend ETF | | | 20,308,608 | |
| | 77,107 | | | Technology Select Sector SPDR Fund | | | 4,853,886 | |
| | 825,000 | | | VanEck Vectors Russia ETF | | | 17,976,750 | |
| | 1,315,000 | | | Vanguard FTSE Europe ETF | | | 77,059,000 | |
| | 455,000 | | | Vanguard Total Stock Market ETF | | | 60,210,150 | |
See Notes to Financial Statements.
| Old Westbury Funds, Inc. | |
| Strategic Opportunities Fund | |
| Consolidated Portfolio of Investments - (Continued) | October 31, 2017 |
| | |
| Shares | | | | | Value | |
| UNITED STATES (continued) | | | | |
| | 530,000 | | | WisdomTree Europe Hedged Equity Fund | | $ | 35,197,300 | |
Total Exchange Traded Funds
(Cost $784,084,016) | | | 852,141,647 | |
| | | | | | | | | |
| PREFERRED STOCKS — 0.1% | | | | |
| UNITED STATES — 0.1% | | | | |
| | 104,500 | | | New York Community Capital Trust V, 6.00%(a) | | | 5,277,250 | |
Total Preferred Stocks
(Cost $5,090,925) | | | 5,277,250 | |
| | | | | | | | | |
| RIGHTS/WARRANTS — 0.0% | | | | |
| UNITED STATES — 0.0% | | | | |
| | 136,053 | | | KKR Income Opportunities Fund(a)(c) | | $ | 43,265 | |
Total Rights/Warrants
(Cost $0) | | | 43,265 | |
| | | | | | | | | |
| Contracts | | | | | | | |
| CALL OPTIONS PURCHASED — 0.0% | | | | |
| | 125,000 | | | PowerShares DB US Dollar Index Bullish Fund, Strike $25.00, Expires 01/19/18, (Notional amount $312,500,000) | | | 1,875,000 | |
Total Call Options Purchased
(Cost $1,667,748) | | | 1,875,000 | |
| | | | | | | | | |
Principal
Amount | | | | | Value | |
| BANK LOANS — 1.2% | | | | |
| BELGIUM — 0.0% | | | | |
| | 1,000,000 | (d) | | ADB Safegate BVBA First Lien Term Loan,
(EURIBOR + 3.500%), 3.50%, 10/02/24(e) | | | 1,175,042 | |
| CAYMAN ISLANDS — 0.0% | | | | |
| | 1,000,000 | (f) | | Richmond Cayman LP First Lien Term Loan B,
(LIBOR + 4.250%), 4.65%, 03/03/24(e) | | | 1,323,695 | |
| FINLAND — 0.0% | | | | |
| | 1,000,000 | (d) | | Nordic Packaging & Container Finland Holdings First Lien Term Loan B,
(EURIBOR + 5.000%), 5.00%, 11/04/23(e) | | | 1,174,751 | |
Principal
Amount | | | | | Value | |
| FRANCE — 0.1% | | | | |
| | 2,000,000 | (d) | | Assystem First Lien Term Loan B,
(EURIBOR + 4.750%), 4.75%, 09/28/24(e) | | $ | 2,296,221 | |
| | 2,000,000 | (d) | | Hera SAS First Lien Term Loan B,
(EURIBOR + 3.500%), 3.50%, 09/20/24(e) | | | 2,334,079 | |
| | | | | | | | 4,630,300 | |
| GERMANY — 0.2% | | | | |
| | 20,000,000 | (d) | | Amedes Holding AG First Lien Term Loan B,
(EURIBOR + 4.750%), 4.75%, 08/19/22(e) | | | 2,231,898 | |
| | 2,000,000 | (d) | | ColourOz Investment 1 GmbH First Lien Term Loan B,
(EURIBOR + 3.000%), 3.00%, 09/07/21(e) | | | 2,278,446 | |
| | 435,134 | (d) | | Douglas GmbH First Lien Term Loan B1,
(EURIBOR + 3.500%), 3.50%, 08/13/22(e) | | | 508,229 | |
| | 225,273 | (d) | | Douglas GmbH First Lien Term Loan B2,
(EURIBOR + 3.500%), 3.50%, 08/13/22(e) | | | 263,115 | |
| | 393,673 | (d) | | Douglas GmbH First Lien Term Loan B3,
(EURIBOR + 3.500%), 3.50%, 08/13/22(e) | | | 459,803 | |
| | 394,803 | (d) | | Douglas GmbH First Lien Term Loan B4,
(EURIBOR + 3.500%), 3.50%, 08/13/22(e) | | | 461,124 | |
| | 88,027 | (d) | | Douglas GmbH First Lien Term Loan B5,
(EURIBOR + 3.500%), 3.50%, 08/13/22(e) | | | 102,814 | |
| | 297,227 | (d) | | Douglas GmbH First Lien Term Loan B6,
(EURIBOR + 3.500%), 3.50%, 08/13/22(e) | | | 347,156 | |
| | 165,864 | (d) | | Douglas GmbH First Lien Term Loan B7,
(EURIBOR + 3.500%), 3.50%, 08/13/22(e) | | | 193,726 | |
| | 2,000,000 | (d) | | OEP Trafo BidCo GmbH First Lien Term Loan B,
(EURIBOR + 4.000%), 4.00%, 06/30/24(e) | | | 2,320,380 | |
| | 1,000,000 | (d) | | Riemser Arzneimittel AG First Lien Term Loan B,
(EURIBOR + 5.500%), 5.50%, 06/29/23(e) | | | 1,141,261 | |
See Notes to Financial Statements.
| Old Westbury Funds, Inc. | |
| Strategic Opportunities Fund | |
| Consolidated Portfolio of Investments - (Continued) | October 31, 2017 |
| | |
Principal
Amount | | | | | Value | |
| GERMANY (continued) | | | | |
| | 2,000,000 | (d) | | SLV GmbH First Lien Term Loan B,
(EURIBOR + 4.250%), 4.25%, 12/16/23(e) | | $ | 2,242,335 | |
| | | | | | | | 12,550,287 | |
| JERSEY CHANNEL ISLANDS — 0.1% | | | | |
| | 1,000,000 | (f) | | Capri Acquisitions Bidco Ltd. First Lien Term Loan B,
(EURIBOR + 3.250%), 3.25%, 10/04/24(e) | | | 1,170,837 | |
| | 2,510,000 | (f) | | L1R HB Finance Ltd. First Lien Term Loan B,
(LIBOR + 5.250%), 5.25%, 08/31/24(e) | | | 3,250,302 | |
| | | | | | | | 4,421,139 | |
| LUXEMBOURG — 0.2% | | | | |
| | 1,994,962 | (d) | | Allnex Sarl First Lien Term Loan B1,
(EURIBOR + 3.250%), 3.25%, 09/13/23(e) | | | 2,332,289 | |
| | 2,000,000 | (d) | | Coveris Holdings SA First Lien Term Loan,
(EURIBOR + 4.000%), 4.00%, 06/26/22(e) | | | 2,281,940 | |
| | 2,000,000 | (d) | | Orbiter Group Sarl First Lien Term Loan B,
(EURIBOR + 3.500%), 3.50%, 07/12/24(e) | | | 2,348,430 | |
| | 2,175,000 | (d) | | Swissport Financing Sarl First Lien Term Loan B,
(EURIBOR + 3.750%), 3.75%, 02/10/22(e) | | | 2,556,071 | |
| | | | | | | | 9,518,730 | |
| NETHERLANDS — 0.1% | | | | |
| | 2,000,000 | (d) | | Fugue Finance BV First Lien Term Loan B,
(EURIBOR + 3.250%), 3.25%, 06/26/24(e) | | | 2,338,109 | |
| | 2,000,000 | (d) | | Refresco Group NV First Lien Term Loan B,
(EURIBOR + 2.750%), 2.75%, 07/21/24(e) | | | 2,338,063 | |
| | 1,000,000 | (d) | | UPC Broadband Holding BV First Lien Term Loan,
(EURIBOR + 2.750%), 2.75%, 10/15/26(e) | | | 1,168,123 | |
| | | | | | | | 5,844,295 | |
| SPAIN — 0.0% | | | | |
| | 2,000,000 | (d) | | Dorna Sports SL First Lien Term Loan B,
(EURIBOR + 3.250%), 3.25%, 04/12/24(e) | | | 2,336,735 | |
Principal
Amount | | | | | Value | |
| SWITZERLAND — 0.0% | | | | |
| | 1,000,000 | (d) | | Avaloq Group AG First Lien Term Loan B,
(EURIBOR + 4.250%), 4.25%, 06/08/24(e) | | $ | 1,162,671 | |
| UNITED KINGDOM — 0.3% | | | | |
| | 1,000,000 | (d) | | Belron Finance Ltd. First Lien Term Loan B,
(EURIBOR + 2.750%), 2.75%, 10/25/24(e) | | | 1,173,097 | |
| | 1,680,000 | (f) | | Camelia Bidco Ltd. First Lien Term Loan B,
(LIBOR + 4.750%), 4.75%, 10/05/24(e) | | | 2,232,332 | |
| | 2,000,000 | (d) | | Eg Finco Ltd. First Lien Term Loan D2,
(EURIBOR + 4.000%), 4.00%, 01/31/23(e) | | | 2,340,043 | |
| | 2,500,000 | (d) | | HNVR Holdco Ltd. First Lien Term Loan B,
(EURIBOR + 5.000%), 5.00%, 09/12/23(e) | | | 2,918,793 | |
| | 600,000 | (d) | | Inovyn Finance Plc, First Lien Term Loan B,
(EURIBOR + 2.250%), 2.25%, 05/10/24(e) | | | 699,175 | |
| | 1,000,000 | (d) | | Inovyn Finance Plc, First Lien Term Loan B,
(EURIBOR + 2.250%), 3.00%, 04/11/24(e) | | | 1,165,292 | |
| | 1,979,000 | (d) | | Interoute Finco Plc, First Lien Term Loan B,
(EURIBOR + 3.250%), 3.25%, 10/09/23(e) | | | 2,315,472 | |
| | 2,000,000 | (d) | | Shilton Bidco Ltd. First Lien Term Loan B1,
(EURIBOR + 3.250%), 3.25%, 07/31/24(e) | | | 2,335,523 | |
| | | | | | | | 15,179,727 | |
| UNITED STATES — 0.2% | | | | |
| | 1,603,000 | (d) | | Avantor, Inc. First Lien Term Loan,
(EURIBOR + 4.250%), 4.25%, 09/22/24(e) | | | 1,877,262 | |
| | 2,000,000 | (d) | | Canyon Valor Cos Inc. First Lien Term Loan B,
(EURIBOR + 4.250%), 4.25%, 06/16/23(e) | | | 2,364,644 | |
| | 2,000,000 | (d) | | Gates Global LLC First Lien Term Loan B1,
(EURIBOR + 3.500%), 3.50%, 03/31/24(e) | | | 2,346,123 | |
See Notes to Financial Statements.
| Old Westbury Funds, Inc. | |
| Strategic Opportunities Fund | |
| Consolidated Portfolio of Investments - (Continued) | October 31, 2017 |
| | |
Principal
Amount | | | | | Value | |
| UNITED STATES (continued) |
| $ | 2,233,491 | | | Lone Star LPST Future Funding Term Loan,
(LIBOR + 3.750%),
5.06%, 10/09/18(a)(e) | | $ | 2,233,491 | |
| | | | | | | | 8,821,520 | |
Total Bank Loans
(Cost $68,952,996) | | | 68,138,892 | |
| | | | | |
| CORPORATE BONDS — 10.1% |
| ARGENTINA — 0.0% |
| $ | 1,000,000 | | | Aeropuertos Argentina 2000 SA,
6.88%, 02/01/27(g) | | $ | 1,077,500 | |
| | 850,000 | | | Arcor SAIC,
6.00%, 07/06/23(g) | | | 914,600 | |
| | | | | | | | 1,992,100 | |
| AUSTRIA — 0.1% |
| | 1,400,000 | (h) | | Raiffeisen Bank International AG,
(12 yr. Euro Swap+ 5.954%),
6.13%, 12/15/49(g)(i) | | | 1,768,927 | |
| | 1,000,000 | (h) | | Steinhoff Finance Holding GmbH., Cnv,
1.25%, 08/11/22(g) | | | 1,057,194 | |
| | | | | | | | 2,826,121 | |
| BERMUDA — 0.1% |
| | 1,150,000 | | | Ooredoo International Finance Ltd.,
4.75%, 02/16/21(g) | | | 1,213,250 | |
| | 950,000 | | | Tengizchevroil Finance Co. International Ltd.,
4.00%, 08/15/26(g) | | | 934,144 | |
| | | | | | | | 2,147,394 | |
| BRAZIL — 0.1% |
| | 1,225,000 | (d) | | Votorantim Cimentos SA,
3.50%, 07/13/22(g) | | | 1,485,088 | |
| | 844,000 | | | Votorantim SA,
6.63%, 09/25/19(g) | | | 894,218 | |
| | | | | | | | 2,379,306 | |
| BULGARIA — 0.0% |
| | 1,500,000 | (d) | | Bulgarian Telecommunications Co. EAD,
6.63%, 11/15/18(g) | | | 1,754,787 | |
| CANADA — 0.1% |
| | 1,000,000 | | | First Quantum Minerals Ltd.,
7.00%, 02/15/21(j) | | | 1,037,500 | |
| | 150,000 | | | GFL Environmental, Inc,
5.63%, 05/01/22(j) | | | 155,625 | |
| | 800,000 | | | Lions Gate Entertainment Corp.,
5.88%, 11/01/24(j) | | | 848,000 | |
Principal
Amount | | | | | Value | |
| CANADA (continued) |
| $ | 425,000 | | | Telesat Canada / Telesat LLC,
8.88%, 11/15/24(j) | | $ | 476,000 | |
| | 200,000 | | | Valeant Pharmaceuticals International, Inc.,
6.50%, 03/15/22(j) | | | 212,000 | |
| | 600,000 | | | Valeant Pharmaceuticals International, Inc.,
7.00%, 03/15/24(j) | | | 649,500 | |
| | | | | | | | 3,378,625 | |
| CAYMAN ISLANDS — 0.1% |
| | 1,000,000 | | | Petrobras Global Finance BV,
5.38%, 01/27/21 | | | 1,051,250 | |
| | 421,000 | | | Suzano Trading Ltd.,
5.88%, 01/23/21(g) | | | 452,575 | |
| | 3,350,000 | | | Vale Overseas, Ltd.,
5.88%, 06/10/21 | | | 3,680,879 | |
| | | | | | | | 5,184,704 | |
| CZECH REPUBLIC — 0.0% |
| | 725,000 | (d) | | EP Energy AS,
4.38%, 05/01/18(g) | | | 861,749 | |
| | 800,000 | (d) | | RESIDOMO SRO,
3.38%, 10/15/24(g) | | | 954,058 | |
| | | | | | | | 1,815,807 | |
| DOMINICAN REPUBLIC — 0.0% |
| | 920,000 | | | Aeropuertos Dominicanos Siglo XXI SA,
6.75%, 03/30/29(g) | | | 998,200 | |
| FRANCE — 0.7% |
| | 600,000 | (h) | | Areva SA,
3.25%, 09/04/20(g) | | | 741,977 | |
| | 200,000 | (h) | | Areva SA,
3.50%, 03/22/21 | | | 249,394 | |
| | 7,000,000 | | | Carrefour SA., Cnv.,
1.00%, 06/14/23(g)(k) | | | 6,513,500 | |
| | 1,100,000 | (h) | | Casino Guichard Perrachon SA,
4.50%, 03/07/24(g) | | | 1,448,098 | |
| | 800,000 | (h) | | Electricite de France SA,
(8 yr. Euro Swap + 2.441%),
4.13%, 01/29/49(g)(i) | | | 1,013,419 | |
| | 900,000 | (h) | | Electricite de France SA,
(7 yr. Euro Swap + 3.021%),
4.25%, 12/29/49(g)(i) | | | 1,117,871 | |
| | 425,000 | (h) | | Loxam SAS,
6.00%, 04/15/25(g) | | | 540,928 | |
| | 1,500,000 | (h) | | NEW Areva Holding SA,
4.88%, 09/23/24 | | | 1,968,304 | |
| | 825,000 | (h) | | Numericable-SFR SAS,
5.63%, 05/15/24(g) | | | 1,045,050 | |
| | 5,000,000 | (f) | | Orange SA., Cnv.,
0.38%, 06/27/21(g) | | | 6,575,644 | |
| | 525,000 | (h) | | PSA Tresorerie GIE,
6.00%, 09/19/33 | | | 798,144 | |
See Notes to Financial Statements.
| Old Westbury Funds, Inc. | |
| Strategic Opportunities Fund | |
| Consolidated Portfolio of Investments - (Continued) | October 31, 2017 |
| | |
Principal
Amount | | | | | Value | |
| FRANCE (continued) |
| $ | 5,000,000 | (h) | | Rallye SA., Cnv,
5.25%, 02/01/22(a)(g) | | $ | 6,438,706 | |
| | 275,000 | (h) | | Solvay Finance SA,
(5 yr. Euro Swap + 5.223%),
5.87%, 06/03/49(g)(i) | | | 386,803 | |
| | 275,000 | (h) | | Solvay Finance SA,
(5 yr. Euro Swap + 3.700%),
5.43%, 11/12/49(g)(i) | | | 378,888 | |
| | 30,000,000 | (h) | | Veolia Environnement SA., Cnv,
31.00%, 03/15/21(a)(g)(k) | | | 10,396,282 | |
| | | | | | | | 39,613,008 | |
| GERMANY — 0.1% |
| | 550,000 | (h) | | DEMIRE Deutsche Mittelstand Real Estate AG,
2.88%, 07/15/22(g) | | | 656,940 | |
| | 325,000 | (h) | | IHO Verwaltungs GmbH, 3.25% cash or 4.00% payment-in-kind interest,
3.25%, 09/15/23(g)(l) | | | 397,051 | |
| | 200,000 | (h) | | IHO Verwaltungs GmbH, 3.75% cash or 4.50% payment-in-kind interest,
3.75%, 09/15/26(g)(l) | | | 249,278 | |
| | 1,650,000 | (h) | | Senvion Holding GmbH,
3.88%, 10/25/22(g) | | | 1,974,857 | |
| | 475,000 | (h) | | Unitymedia Hessen GmbH & Co. KG/Unitymedia NRW GmbH,
4.63%, 02/15/26(g) | | | 605,923 | |
| | | | | | | | 3,884,049 | |
| GUERNSEY — 0.0% |
| | 1,050,000 | (h) | | Globalworth Real Estate Investments, Ltd., REIT,
2.88%, 06/20/22(g) | | | 1,254,009 | |
| HONG KONG — 0.0% |
| | 9,700,000 | | | China Milk Products Group Ltd., Cnv.,
13.00%, 12/31/49(b)(c)(k)(m) | | | 0 | |
| HUNGARY — 0.0% |
| | 775,000 | (h) | | MOL Hungarian Oil & Gas Plc,
2.63%, 04/28/23(g) | | | 972,054 | |
| INDONESIA — 0.0% |
| | 800,000 | | | Perusahaan Listrik Negara PT,
5.50%, 11/22/21(g) | | | 874,600 | |
| IRELAND — 0.1% |
| | 650,000 | | | MMC Norilsk Nickel OJSC via MMC Finance Ltd.,
4.38%, 04/30/18(g) | | | 655,496 | |
| | 1,750,000 | | | Phosagro OAO via Phosagro Bond Funding DAC,
3.95%, 11/03/21(g) | | | 1,769,950 | |
| | 975,000 | (h) | | Russian Railways via RZD Capital Plc,
2.18%, 02/26/18 | | | 981,773 | |
| | 450,000 | | | Smurfit Kappa Acquisitions,
4.88%, 09/15/18(j) | | | 456,885 | |
Principal
Amount | | | | | Value | |
| IRELAND (continued) |
| $ | 1,360,000 | (f) | | Virgin Media Receivables Financing Notes I DAC,
5.50%, 09/15/24(g) | | $ | 1,880,087 | |
| | | | | | | | 5,744,191 | |
| ITALY — 0.1% |
| | 2,625,000 | (f) | | Enel SpA,
(5 yr. GBP Swap + 5.662%),
7.75%, 09/10/75(g)(i) | | | 3,992,923 | |
| | 725,000 | (h) | | Wind Tre SpA,
2.63%, 01/20/23(g) | | | 848,316 | |
| | 2,230,000 | (h) | | Wind Tre SpA,
(3 mo. EURIBOR + 2.750%),
2.75%, 01/20/24(g)(n) | | | 2,610,602 | |
| | | | | | | | 7,451,841 | |
| JERSEY CHANNEL ISLANDS — 0.3% |
| | 1,600,000 | (d) | | Adient Global Holdings Ltd.,
3.50%, 08/15/24(g) | | | 1,967,664 | |
| | 825,000 | (f) | | Kennedy Wilson Europe Real Estate Plc,
3.95%, 06/30/22(g) | | | 1,148,029 | |
| | 1,200,000 | (d) | | Kennedy Wilson Europe Real Estate Plc,
3.25%, 11/12/25(g) | | | 1,477,621 | |
| | 1,650,000 | (d) | | LHC3 Plc, 4.13% cash or 4.88 payment-in-kind interest,
4.13%, 08/15/24(g)(l) | | | 1,985,851 | |
| | 1,375,000 | (d) | | Lincoln Finance Ltd.,
6.88%, 04/15/21(g) | | | 1,690,465 | |
| | 350,000 | (d) | | Mercury Bondco Plc, 7.13% cash or
7.88% payment-in-kind interest,
7.13%, 05/30/21(g)(l) | | | 424,918 | |
| | 1,700,000 | (d) | | Mercury Bondco Plc, 8.25% cash or
9.00% payment-in-kind interest,
8.25%, 05/30/21(g)(l) | | | 2,088,365 | |
| | 5,000,000 | (f) | | Remgro Jersey GBP Ltd., Cnv.,
2.63%, 03/22/21(g) | | | 6,418,923 | |
| | | | | | | | 17,201,836 | |
| LUXEMBOURG — 0.6% |
| | 125,000 | (h) | | Altice Financing SA,
6.50%, 01/15/22(g) | | | 151,358 | |
| | 650,000 | (h) | | Altice Finco SA,
4.75%, 01/15/28 | | | 764,708 | |
| | 2,375,000 | (h) | | Altice Luxembourg SA,
7.25%, 05/15/22(g) | | | 2,946,341 | |
| | 430,000 | (f) | | Cabot Financial Luxembourg SA,
6.50%, 04/01/21(g) | | | 589,663 | |
| | 675,000 | (h) | | Cirsa Funding Luxembourg SA,
5.88%, 05/15/23(g) | | | 826,570 | |
| | 1,280,000 | (h) | | Crystal Almond SARL,
10.00%, 11/01/21(g) | | | 1,685,737 | |
See Notes to Financial Statements.
| Old Westbury Funds, Inc. | |
| Strategic Opportunities Fund | |
| Consolidated Portfolio of Investments - (Continued) | October 31, 2017 |
| | |
Principal
Amount | | | | | Value | |
| LUXEMBOURG (continued) |
| $ | 269,247 | (h) | | Dakar Finance SA, 9.00% cash or 9.25% payment-in-kind interest,
9.00%, 11/15/20(g)(l) | | $ | 315,200 | |
| | 1,200,000 | (h) | | Garfunkelux Holdco 3 SA,
7.50%, 08/01/22(g) | | | 1,500,184 | |
| | 125,000 | (f) | | Garfunkelux Holdco 3 SA,
8.50%, 11/01/22(g) | | | 179,134 | |
| | 855,000 | (f) | | Gazprom OAO Via Gaz Capital SA,
5.34%, 09/25/20(g) | | | 1,220,822 | |
| | 800,000 | | | Gazprom OAO Via Gaz Capital SA,
6.51%, 03/07/22(g) | | | 885,962 | |
| | 600,000 | (h) | | Grand City Properties SA,
(5 yr. Euro Swap + 3.888%),
3.75%, 12/18/49(i) | | | 755,535 | |
| | 2,200,000 | (h) | | Greif Nevada Holdings, Inc. SCS,
7.38%, 07/15/21(g) | | | 3,076,228 | |
| | 1,000,000 | | | Intelsat Jackson Holdings SA,
8.00%, 02/15/24(j) | | | 1,060,000 | |
| | 1,615,000 | (h) | | Intralot Capital Luxembourg SA,
5.25%, 09/15/24(g) | | | 1,918,857 | |
| | 1,475,000 | (o) | | Matterhorn Telecom SA,
3.63%, 05/01/22(g) | | | 1,519,132 | |
| | 975,000 | | | Minerva Luxembourg SA,
6.50%, 09/20/26(g) | | | 1,011,075 | |
| | 400,000 | (h) | | SES SA,
(5 yr. Euro Swap + 4.664%),
4.63%, 01/02/49(g)(i) | | | 504,380 | |
| | 2,150,000 | (h) | | SES SA,
(5 yr. Euro Swap + 5.401%),
5.63%, 12/29/49(g)(i) | | | 2,817,480 | |
| | 1,000,000 | (h) | | Takko Luxembourg 2 SCA,
9.88%, 04/15/19(g) | | | 1,193,679 | |
| | 675,000 | (h) | | Takko Luxembourg 2 SCA,
5.38%, 11/15/23(g) | | | 788,436 | |
| | 900,000 | (h) | | Telecom Italia Finance SA,
7.75%, 01/24/33 | | | 1,632,094 | |
| | 125,000 | (h) | | Telecom Italia Finance SA,
7.75%, 01/24/33 | | | 226,680 | |
| | 900,000 | | | Ultrapar International SA,
5.25%, 10/06/26(g) | | | 922,257 | |
| | 1,000,000 | | | VM Holding SA,
5.38%, 05/04/27(g) | | | 1,056,200 | |
| | 1,600,000 | (h) | | Wind Acquisition Finance SA,
7.00%, 04/23/21(g) | | | 1,932,811 | |
| | | | | | | | 31,480,523 | |
| NETHERLANDS — 0.6% |
| | 1,000,000 | | | AT Securities BV,
(5 yr. Swap Semi 30/360 US + 3.546%),
5.25%, 06/21/49(g)(i) | | | 1,010,000 | |
| | 2,000,000 | (h) | | ATF Netherlands BV,
(5 yr. Euro Swap + 4.375%),
3.75%, 01/20/43(g)(i) | | | 2,464,822 | |
| | 4,000,000 | (h) | | Bayer Capital Corp. BV., Cnv.,
5.63%, 11/22/19(j) | | | 5,562,156 | |
Principal
Amount | | | | | Value | |
| NETHERLANDS (continued) |
| $ | 850,000 | (h) | | Constellium NV,
7.00%, 01/15/23(g) | | $ | 1,052,500 | |
| | 850,000 | (h) | | Digi Communications NV,
5.00%, 10/15/23(g) | | | 1,062,203 | |
| | 950,000 | | | Embraer Netherlands Finance BV,
5.05%, 06/15/25 | | | 1,002,250 | |
| | 600,000 | | | Majapahit Holding BV,
7.75%, 01/20/20(g) | | | 662,280 | |
| | 700,000 | (h) | | NE Property Cooperatief UA,
3.75%, 02/26/21(g) | | | 890,749 | |
| | 250,000 | | | Petrobras Global Finance BV,
6.13%, 01/17/22 | | | 270,250 | |
| | 800,000 | | | Petrobras Global Finance BV,
8.75%, 05/23/26 | | | 969,000 | |
| | 1,000,000 | | | Petrobras Global Finance BV,
7.38%, 01/17/27 | | | 1,110,500 | |
| | 400,000 | (h) | | Repsol International Finance BV,
(6 yr. Euro Swap + 3.560%),
3.88%, 03/25/49(g)(i) | | | 504,776 | |
| | 4,000,000 | (h) | | Sonae Investments BV, Cnv.,
1.63%, 06/11/19(a)(g) | | | 4,687,541 | |
| | 1,000,000 | (h) | | Telefonica Europe BV,
(8 yr. Euro Swap + 5.586%),
7.63%, 09/18/21(g)(i) | | | 1,421,093 | |
| | 600,000 | (h) | | Telefonica Europe BV,
(10 yr. Euro Swap + 4.301%),
5.88%, 03/31/49(g)(i) | | | 820,450 | |
| | 800,000 | (f) | | Telefonica Europe BV,
(5 yr. GBP Swap + 4.458%),
6.75%, 11/26/49(g)(i) | | | 1,176,524 | |
| | 700,000 | (h) | | TenneT Holding BV,
(5 yr. Euro Swap + 2.533%),
3.00%, 06/01/49(g)(i) | | | 850,850 | |
| | 2,000,000 | | | VimpelCom Holdings BV,
3.95%, 06/16/21(g) | | | 2,010,400 | |
| | 400,000 | (h) | | Volkswagen International Finance NV,
(7 yr. Euro Swap + 2.534%),
3.75%, 03/24/49(g)(i) | | | 500,629 | |
| | 800,000 | (h) | | Volkswagen International Finance NV,
(10 yr. Euro Swap + 3.370%),
3.88%, 06/14/49(g)(i) | | | 974,979 | |
| | 750,000 | (h) | | Volkswagen International Finance NV,
(10 yr. Euro Swap + 3.350%),
5.13%, 09/04/49(g)(i) | | | 1,019,940 | |
| | 600,000 | (h) | | Vonovia Finance BV,
(5 yr. Euro Swap + 3.390%),
4.00%, 12/17/49(g)(i) | | | 771,153 | |
| | 1,350,000 | (h) | | Ziggo Secured Finance BV,
4.25%, 01/15/27(g) | | | 1,682,278 | |
| | | | | | | | 32,477,323 | |
See Notes to Financial Statements.
| Old Westbury Funds, Inc. | |
| Strategic Opportunities Fund | |
| Consolidated Portfolio of Investments - (Continued) | October 31, 2017 |
| | |
Principal
Amount | | | | | Value | |
| NORWAY — 0.0% |
| $ | 1,300,000 | (h) | | Nassa Topco AS,
2.88%, 04/06/24(g) | | $ | 1,542,840 | |
| PERU — 0.0% | | | |
| | 800,000 | | | InRetail Consumer,
5.25%, 10/10/21(g) | | | 841,200 | |
| SLOVENIA — 0.0% |
| | 675,000 | (h) | | United Group BV,
(3 mo. EURIBOR + 4.375%),
4.38%, 07/01/23(g)(n) | | | 796,102 | |
| | 750,000 | (h) | | United Group BV,
4.88%, 07/01/24(g) | | | 915,711 | |
| | | | | | | | 1,711,813 | |
| SPAIN — 0.3% |
| | 2,000,000 | (h) | | Corp. Economica Delta SA, Cnv.,
1.00%, 12/01/23(a)(g) | | | 2,414,733 | |
| | 800,000 | (h) | | Ibercaja Banco SA,
(5 yr. Euro Swap + 4.551%),
5.00%, 07/28/25(g)(i) | | | 957,506 | |
| | 725,000 | (h) | | Masaria Investments SAU,
5.00%, 09/15/24(g) | | | 856,233 | |
| | 525,000 | (h) | | Masaria Investments SAU,
(3 mo. EURIBOR + 5.250%),
5.25%, 09/15/24(g)(n) | | | 614,194 | |
| | 1,000,000 | (h) | | Naviera Armas SA,
(3 mo. EURIBOR + 6.500%),
6.50%, 07/31/23(g)(n) | | | 1,249,760 | |
| | 9,000,000 | (h) | | Telefonica Participaciones SAU., Cnv.,
0.03%, 03/09/21(g)(k) | | | 10,496,226 | |
| | | | | | | | 16,588,652 | |
| SWEDEN — 0.2% |
| | 650,000 | (d) | | Corral Petroleum Holdings AB,
11.75% cash or 13.25% payment-in-kind interest,
11.75%, 05/15/21(g)(l) | | | 856,990 | |
| | 775,000 | (d) | | Fastighets AB Balder,
(5 yr. Euro Swap + 2.895%),
3.00%, 03/07/78(g)(i) | | | 918,313 | |
| | 550,000 | (d) | | Intrum Justitia AB,
2.75%, 07/15/22(g) | | | 656,372 | |
| | 1,300,000 | (d) | | Intrum Justitia AB,
3.13%, 07/15/24(g) | | | 1,553,797 | |
| | 57,000,000 | (h) | | Recipharm AB., Cnv,
2.75%, 10/06/21(a)(g) | | | 6,658,902 | |
| | | | | | | | 10,644,374 | |
| TURKEY — 0.1% |
| | 850,000 | | | Tupras Turkiye Petrol Rafinerileri AS,
4.13%, 05/02/18(g) | | | 852,652 | |
| | 1,100,000 | | | Turk Telekomunikasyon AS,
4.88%, 06/19/24(g) | | | 1,112,518 | |
Principal
Amount | | | | | Value | |
| TURKEY (continued) |
| $ | 1,300,000 | | | Turkiye Sise ve Cam Fabrikalari AS,
4.25%, 05/09/20(g) | | $ | 1,315,070 | |
| | | | | | | | 3,280,240 | |
| UNITED ARAB EMIRATES — 0.0% |
| | 775,000 | | | DAE Funding LLC,
5.00%, 08/01/24(j) | | | 791,469 | |
| UNITED KINGDOM — 0.5% |
| | 975,000 | (h) | | Arqiva Broadcast Finance Plc,
9.50%, 03/31/20(g) | | | 1,362,925 | |
| | 1,000,000 | (h) | | Cognita Financing Plc,
7.75%, 08/15/21(g) | | | 1,381,935 | |
| | 350,000 | (h) | | Co-operative Group Holdings 2011 Ltd., STEP,
6.88%, 07/08/20(g) | | | 518,074 | |
| | 450,000 | (h) | | Drax Finco Plc,
(3 mo. LIBOR GBP + 4.000%),
4.45%, 05/01/22(g)(n) | | | 610,216 | |
| | 4,000,000 | | | Inmarsat Plc, Cnv.,
3.88%, 09/09/23(g) | | | 4,280,000 | |
| | 1,340,000 | (d) | | Inovyn Finance Plc,
6.25%, 05/15/21(g) | | | 1,611,628 | |
| | 1,075,000 | (d) | | International Game Technology Plc,
4.75%, 02/15/23(g) | | | 1,411,870 | |
| | 170,000 | (h) | | Iron Mountain Europe Plc, REIT,
6.13%, 09/15/22(g) | | | 235,945 | |
| | 1,375,000 | | | Jaguar Land Rover Automotive Plc,
3.50%, 03/15/20(j) | | | 1,385,313 | |
| | 625,000 | (h) | | Jerrold Finco Plc,
6.25%, 09/15/21(g) | | | 869,520 | |
| | 540,000 | (h) | | Kirs Midco 3 Plc,
8.38%, 07/15/23(g) | | | 742,300 | |
| | 375,000 | (h) | | Newday Bondco Plc,
7.38%, 02/01/24(g) | | | 473,244 | |
| | 1,050,000 | | | OAS Finance Ltd.,
8.00%, 07/02/21(c)(j)(m) | | | 78,750 | |
| | 1,100,000 | (d) | | TA Manufacturing Ltd.,
3.63%, 04/15/23(g) | | | 1,323,325 | |
| | 450,000 | (d) | | Titan Global Finance Plc,
3.50%, 06/17/21(g) | | | 562,165 | |
| | 875,000 | (d) | | Travelex Financing Plc,
8.00%, 05/15/22(g) | | | 1,043,797 | |
| | 950,000 | | | Vedanta Resources Plc,
6.38%, 07/30/22(g) | | | 993,890 | |
| | 5,000,000 | (h) | | Vodafone Group Plc, Cnv.,
1.00%, 11/26/20(g)(k) | | | 6,487,522 | |
| | | | | | | | 25,372,419 | |
| UNITED STATES — 6.0% |
| | 5,000,000 | | | Aceto Corp., Cnv,
2.00%, 11/01/20. | | | 4,384,375 | |
| | 16,000,000 | | | Akamai Technologies, Inc., Cnv.,
1.00%, 02/15/19(k) | | | 15,720,000 | |
See Notes to Financial Statements.
| Old Westbury Funds, Inc. | |
| Strategic Opportunities Fund | |
| Consolidated Portfolio of Investments - (Continued) | October 31, 2017 |
| | |
Principal
Amount | | | | | Value | |
| UNITED STATES (continued) |
| $ | 1,425,000 | (d) | | Alliance Data Systems Corp.,
4.50%, 03/15/22(g) | | $ | 1,733,780 | |
| | 775,000 | (d) | | Alliance Data Systems Corp.,
5.25%, 11/15/23(g) | | | 965,726 | |
| | 10,000,000 | | | Allscripts Healthcare Solutions, Inc., Cnv.,
1.25%, 07/01/20 | | | 10,362,500 | |
| | 4,000,000 | | | Apollo Commercial Real Estate Finance, Inc., Cnv. REIT,
5.50%, 03/15/19 | | | 4,300,000 | |
| | 5,000,000 | | | Ares Capital Corp., Cnv.,
3.75%, 02/01/22(j) | | | 5,096,875 | |
| | 1,125,000 | | | Belo Corp.,
7.75%, 06/01/27 | | | 1,279,687 | |
| | 6,000,000 | | | Blackhawk Network Holdings, Inc., Cnv,
1.50%, 01/15/22 | | | 6,003,750 | |
| | 15,000,000 | | | Cardtronics, Inc., Cnv.,
1.00%, 12/01/20(a) | | | 13,837,500 | |
| | 1,000,000 | | | CCO Holdings LLC/CCO Holdings Capital Corp.,
5.50%, 05/01/26(j) | | | 1,025,000 | |
| | 840,000 | | | Cequel Communications Holdings I LLC/Cequel Capital Corp.,
6.38%, 09/15/20(j) | | | 856,901 | |
| | 450,000 | | | Cheniere Energy Partners LP,
5.25%, 10/01/25(j) | | | 463,500 | |
| | 8,000,000 | | | Colony Capital, Inc., Cnv. REIT,
3.88%, 01/15/21 | | | 8,045,000 | |
| | 5,000,000 | | | Cornerstone OnDemand, Inc., Cnv.,
1.50%, 07/01/18 | | | 5,031,250 | |
| | 850,000 | | | CSC Holdings LLC,
10.88%, 10/15/25(j) | | | 1,041,250 | |
| | 12,000,000 | | | CSG Systems International, Inc., Cnv,
4.25%, 03/15/36(a) | | | 13,005,000 | |
| | 1,000,000 | | | DISH DBS Corp.,
5.88%, 11/15/24 | | | 998,750 | |
| | 11,000,000 | | | DISH Network Corp., Cnv.,
2.38%, 03/15/24(j) | | | 10,566,875 | |
| | 1,000,000 | | | Dollar Tree, Inc.,
5.75%, 03/01/23 | | | 1,048,750 | |
| | 4,000,000 | | | Echo Global Logistics, Inc., Cnv,
2.50%, 05/01/20 | | | 3,960,000 | |
| | 675,000 | (d) | | Equinix, Inc., REIT,
2.88%, 10/01/25 | | | 806,418 | |
| | 9,000,000 | | | Extra Space Storage LP, Cnv.,
3.13%, 10/01/35(j) | | | 9,804,375 | |
| | 13,000,000 | | | Finisar Corp., Cnv,
0.50%, 12/15/36(j) | | | 12,415,000 | |
| | 1,000,000 | | | Freeport-McMoRan, Inc.,
2.30%, 11/14/17 | | | 1,000,000 | |
| | 875,000 | (d) | | Gates Global LLC / Gates Global Co.,
5.75%, 07/15/22(g) | | | 1,040,240 | |
Principal
Amount | | | | | Value | |
| UNITED STATES (continued) |
| $ | 16,426,000 | | | Huron Consulting Group, Inc., Cnv.,
1.25%, 10/01/19(a) | | $ | 15,399,375 | |
| | 5,000,000 | | | Knowles Corp., Cnv.,
3.25%, 11/01/21 | | | 5,875,000 | |
| | 700,000 | (d) | | Levi Strauss & Co.,
3.38%, 03/15/27 | | | 857,184 | |
| | 2,000,000 | | | Liberty Expedia Holdings, Inc., Cnv.,
1.00%, 06/30/47(j) | | | 2,045,000 | |
| | 21,295,885 | | | Liberty Interactive LLC, Cnv.,
3.75%, 02/15/30(a) | | | 14,720,781 | |
| | 900,000 | | | MPH Acquisition Holdings LLC,
7.13%, 06/01/24(j) | | | 968,625 | |
| | 1,000,000 | (d) | | MPT Operating Partnership LP / MPT Finance Corp., REIT,
3.33%, 03/24/25 | | | 1,227,006 | |
| | 650,000 | (d) | | MPT Operating Partnership LP/MPT Finance Corp., REIT,
4.00%, 08/19/22 | | | 840,978 | |
| | 10,600,000 | | | Nuance Communications, Inc., Cnv.,
2.75%, 11/01/31 | | | 10,600,000 | |
| | 9,000,000 | | | Nuance Communications, Inc., Cnv.,
1.50%, 11/01/35 | | | 8,780,625 | |
| | 14,000,000 | | | Nuance Communications, Inc., Cnv.,
1.00%, 12/15/35 | | | 12,853,750 | |
| | 75,000 | | | Pilgrim’s Pride Corp.,
5.75%, 03/15/25(j) | | | 79,406 | |
| | 300,000 | | | Pilgrim’s Pride Corp.,
5.88%, 09/30/27(j) | | | 312,000 | |
| | 500,000 | (d) | | Quintiles IMS, Inc,
3.50%, 10/15/24(g) | | | 612,368 | |
| | 9,500,000 | | | Redwood Trust, Inc., Cnv., REIT,
4.63%, 04/15/18 | | | 9,547,500 | |
| | 4,000,000 | | | Redwood Trust, Inc., Cnv., REIT,
4.75%, 08/15/23 | | | 3,925,000 | |
| | 325,000 | (d) | | Silgan Holdings, Inc.,
3.25%, 03/15/25(g) | | | 393,310 | |
| | 3,395,000 | | | Southern Star Central Corp.,
5.13%, 07/15/22(j) | | | 3,539,288 | |
| | 15,000,000 | | | Spirit Realty Capital, Inc., Cnv. REIT,
2.88%, 05/15/19 | | | 14,981,250 | |
| | 725,000 | | | Sprint Communications, Inc.,
7.00%, 08/15/20 | | | 780,970 | |
| | 1,000,000 | | | Sprint Corp.,
7.63%, 02/15/25 | | | 1,096,250 | |
| | 1,475,000 | | | Standard Industries, Inc.,
5.50%, 02/15/23(j) | | | 1,556,125 | |
| | 7,000,000 | | | Starwood Property Trust, Inc., Cnv. REIT,
4.38%, 04/01/23 | | | 7,105,000 | |
| | 9,000,000 | | | Synaptics, Inc., Cnv.,
0.50%, 06/15/22(j) | | | 8,088,750 | |
| | 1,000,000 | | | T-Mobile USA, Inc.,
6.50%, 01/15/26 | | | 1,106,370 | |
| | 26,500,000 | | | Twitter, Inc., Cnv.,
0.25%, 09/15/19 | | | 25,108,750 | |
See Notes to Financial Statements.
| Old Westbury Funds, Inc. | |
| Strategic Opportunities Fund | |
| Consolidated Portfolio of Investments - (Continued) | October 31, 2017 |
| | |
Principal
Amount | | | | | Value | |
| UNITED STATES (continued) |
| $ | 9,500,000 | | | Vector Group Ltd., Cnv.,
1.75%, 04/15/20(p) | | $ | 10,675,625 | |
| | 8,000,000 | | | VEREIT, Inc., Cnv., REIT,
3.00%, 08/01/18 | | | 8,020,000 | |
| | 14,000,000 | | | Verint Systems, Inc., Cnv.,
1.50%, 06/01/21(a) | | | 13,711,250 | |
| | 42,119,000 | | | Washington Mutual Bank/Debt Not Acquired By JPMorgan Escrow,
0.00%, 02/04/49(c)(m) | | | 0 | |
| | 21,131,000 | | | Washington Mutual Bank/Debt Not Acquired By JPMorgan Escrow,
0.00%, 06/16/49(c)(m) | | | 0 | |
| | 9,840,000 | | | Washington Mutual Bank/Debt Not Acquired By JPMorgan Escrow,
0.00%, 11/06/49(c)(m) | | | 0 | |
| | 3,000,000 | | | Washington Mutual Bank/Debt Not Acquired By JPMorgan Escrow,
0.00%, 12/31/49(c)(m) | | | 0 | |
| | 11,500,000 | | | Web.com Group, Inc., Cnv.,
1.00%, 08/15/18 | | | 11,442,500 | |
| | 900,000 | | | XPO Logistics, Inc.,
6.13%, 09/01/23(j) | | | 947,250 | |
| | 2,000,000 | | | Zillow Group, Inc., Cnv.,
2.00%, 12/01/21(j) | | | 2,192,500 | |
| | | | | | | | 334,182,288 | |
Total Corporate Bonds
(Cost $555,931,075) | | | 558,385,773 | |
| | | | | |
| ASSET-BACKED SECURITIES — 14.9% |
| CAYMAN ISLANDS — 6.5% |
| Collateralized Loan Obligations — 4.7% |
| | 11,750,000 | | | Adams Mill CLO Ltd., Series 2014-1A, Class F, 7.05%, 07/15/26(a)(j)(n) | | | 10,578,882 | |
| | 7,500,000 | | | Adams Mill CLO Ltd., Series 2014-1A, Class SUB, 11.30%, 07/15/26(a)(j)(p) | | | 3,114,086 | |
| | 2,000,000 | | | American Money Management Corp. CLO Ltd., Series 2015-17A, Class E, 8.07%, 11/15/27(j)(n) | | | 2,020,601 | |
| | 1,000,000 | | | American Money Management Corp. CLO Ltd., Series 2016-18A, Class D, 6.32%, 05/26/28(j)(n) | | | 1,007,552 | |
| | 750,000 | | | American Money Management Corp. CLO Ltd., Series 2016-18A, Class E1, 7.99%, 05/26/28(j)(n) | | | 752,863 | |
| | 1,000,000 | | | American Money Management Corp. CLO Ltd., Series 2016-18A, Class E2, 8.57%, 05/26/28(j)(n) | | | 1,003,128 | |
| | 1,000,000 | | | Anchorage Capital CLO Ltd., Series 2012-1A, Class DR, 8.61%, 01/13/27(j)(n) | | | 1,006,182 | |
Principal
Amount | | | | | Value | |
| CAYMAN ISLANDS (continued) |
| Collateralized Loan Obligations (continued) |
| $ | 5,500,000 | | | Anchorage Capital CLO Ltd., Series 2015-6A, Class ER, 7.71%, 07/15/30(j)(n) | | $ | 5,285,213 | |
| | 4,940,000 | | | Anchorage Capital CLO Ltd., Series 2016-8A, Class E, 7.88%, 07/28/28(j)(n) | | | 4,982,636 | |
| | 1,000,000 | | | Anchorage Capital CLO Ltd., Series 2016-9A, Class E, 8.61%, 01/15/29(j)(n) | | | 1,032,075 | |
| | 500,000 | | | Annisa CLO Ltd., Series 2016-2A, Class E, 8.61%, 07/20/28(j)(n) | | | 504,753 | |
| | 1,000,000 | | | Apartment Investment and Management Co. CLO., Series 2015-AA, Class E, 9.18%, 01/15/28(n) | | | 1,024,522 | |
| | 3,500,000 | | | Apidos CLO XIX, Series 2014-19A, Class E, 6.80%, 10/17/26(j)(n) | | | 3,505,776 | |
| | 1,000,000 | | | Apidos CLO XV, Series 2013-15A, Class D, 6.11%, 10/20/25(j)(n) | | | 995,377 | |
| | 5,000,000 | | | Apidos CLO XVIII, Series 2014-18A, Class D, 6.56%, 07/22/26(j)(n) | | | 5,022,868 | |
| | 2,500,000 | | | Apidos CLO XX, Series 2015-20A, Class D, 6.96%, 01/16/27(j)(n) | | | 2,502,374 | |
| | 2,000,000 | | | Apidos CLO XX, Series 2015-20A, Class E, 7.91%, 01/16/27(j)(n) | | | 1,963,641 | |
| | 1,000,000 | | | Apidos CLO XXII, Series 2015-22A, Class D, 7.36%, 10/20/27(j)(n) | | | 1,008,255 | |
| | 2,533,500 | | | Apidos CLO XXIII, Series 2015-23A, Class D2, 7.31%, 01/14/27(j)(n) | | | 2,549,678 | |
| | 5,250,000 | | | Ares XXXIII CLO Ltd., Series 2015-1A, Class D, 7.55%, 12/05/25(j)(n) | | | 5,250,158 | |
| | 3,500,000 | | | Ares XXXIX CLO Ltd., Series 2016-39A, Class E, 8.60%, 07/18/28(j)(n) | | | 3,568,137 | |
| | 4,000,000 | | | Ares XXXVII CLO Ltd., Series 2015- 4A, Class D1, 8.16%, 10/15/26(j)(n) | | | 4,000,000 | |
| | 3,000,000 | | | Ares XXXVII CLO Ltd., Series 2015-4A, Class D2, 8.38%, 10/15/26(j)(n) | | | 3,000,000 | |
| | 7,000,000 | | | Ares XXXVII CLO Ltd., Series 2015-4A, Class D3, 0.00%, 10/15/30 | | | 7,000,000 | |
| | 2,500,000 | | | Babson CLO Ltd., Series 2016-1A, Class E, 7.91%, 04/23/27(j)(n) | | | 2,522,367 | |
| | 1,000,000 | | | Babson CLO Ltd., Series 2016-2A, Class E, 8.26%, 07/20/28(j)(n) | | | 1,019,811 | |
| | 2,000,000 | | | Battalion CLO IX Ltd., Series 2015-9A, Class D, 5.26%, 07/15/28(j)(n) | | | 2,009,955 | |
| | 2,750,000 | | | Benefit Street Partners CLO IX Ltd., Series 2016-9A, Class E, 8.03%, 07/20/28(j)(n) | | | 2,762,565 | |
See Notes to Financial Statements.
| Old Westbury Funds, Inc. | |
| Strategic Opportunities Fund | |
| Consolidated Portfolio of Investments - (Continued) | October 31, 2017 |
| | |
Principal
Amount | | | | | Value | |
| CAYMAN ISLANDS (continued) |
| Collateralized Loan Obligations (continued) |
| $ | 2,250,000 | | | Benefit Street Partners CLO VIII Ltd., Series 2015-8A, Class C, 5.26%, 01/20/28(j)(n) | | $ | 2,261,008 | |
| | 1,250,000 | | | Benefit Street Partners CLO VIII Ltd., Series 2015-8A, Class D, 6.86%, 01/20/28(j)(n) | | | 1,243,721 | |
| | 1,000,000 | | | Birchwood Park CLO Ltd., Series 2014-1A, Class D1, 4.81%, 07/15/26(j)(n) | | | 1,000,244 | |
| | 1,250,000 | | | BlueMountain CLO Ltd., Series 2014-4A, Class E, 6.62%, 11/30/26(j)(n) | | | 1,253,125 | |
| | 1,000,000 | | | BlueMountain CLO Ltd., Series 2015-1A, Class C, 5.11%, 04/13/27(j)(n) | | | 1,007,134 | |
| | 1,500,000 | | | BlueMountain CLO Ltd., Series 2015-1A, Class D, 6.81%, 04/13/27(j)(n) | | | 1,495,873 | |
| | 1,000,000 | | | BlueMountain CLO Ltd., Series 2015-4A, Class D2, 5.41%, 01/20/27(j)(n) | | | 1,001,722 | |
| | 1,000,000 | | | BlueMountain CLO Ltd., Series 2016-2A, Class D, 8.32%, 08/20/28(j)(n) | | | 1,017,273 | |
| | 1,000,000 | | | Burnham Park CLO Ltd., Series 2016-1A, Class E, 8.21%, 10/20/29(j)(n) | | | 1,020,196 | |
| | 2,000,000 | | | Canyon Capital CLO Ltd., Series 2012-1A, Class DR, 5.46%, 01/15/26(j)(n) | | | 2,030,950 | |
| | 1,000,000 | | | Canyon Capital CLO Ltd., Series 2016-1A, Class E, 8.86%, 04/15/28(j)(n) | | | 999,881 | |
| | 1,000,000 | | | Canyon Capital CLO Ltd., Series 2016-2A, Class E, 8.11%, 10/15/28(j)(n) | | | 1,021,423 | |
| | 1,500,000 | | | Carlyle Global Market Strategies CLO Ltd., Series 2015-1A, Class E1, 6.66%, 04/20/27(j)(n) | | | 1,500,942 | |
| | 1,000,000 | | | Carlyle Global Market Strategies CLO Ltd., Series 2015-2A, Class D, 6.67%, 04/27/27(j)(n) | | | 1,002,701 | |
| | 2,500,000 | | | Carlyle Global Market Strategies CLO Ltd., Series 2015-3A, Class D, 7.08%, 07/28/28(j)(n) | | | 2,515,597 | |
| | 1,000,000 | | | Carlyle Global Market Strategies CLO Ltd., Series 2015-4A, Class D, 7.46%, 10/20/27(j)(n) | | | 1,014,306 | |
| | 1,942,622 | | | Carlyle Global Market Strategies CLO Ltd., Series 2015-4A, Class SBB1, 9.86%, 10/20/27(j)(n) | | | 1,854,862 | |
| | 750,000 | | | Carlyle Global Market Strategies CLO Ltd., Series 2016-1A, Class D, 8.96%, 04/20/27(j)(n) | | | 760,796 | |
Principal
Amount | | | | | Value | |
| CAYMAN ISLANDS (continued) |
| Collateralized Loan Obligations (continued) |
| $ | 1,000,000 | | | Carlyle Global Market Strategies CLO Ltd., Series 2016-3A, Class D, 8.36%, 10/20/29(j)(n) | | $ | 1,012,148 | |
| | 1,000,000 | | | Cole Park CLO Ltd., Series 2015-1A, Class E, 7.46%, 10/20/28(j)(n) | | | 1,007,921 | |
| | 1,000,000 | | | Cumberland Park CLO Ltd., Series 2015-2A, Class E, 6.36%, 07/20/26(j)(n) | | | 997,458 | |
| | 1,500,000 | | | Galaxy XXI CLO Ltd., Series 2015-21A, Class E2, 7.86%, 01/20/28(j)(n) | | | 1,502,366 | |
| | 21,500,000 | | | Jackson Mill CLO Ltd., Series 2015-1A, Class E, 6.36%, 04/15/27(a)(j)(n) | | | 21,207,508 | |
| | 20,000,000 | | | Jackson Mill CLO Ltd., Series 2015-1A, Class SUB, 1.00%, 04/15/27(a)(j)(p) | | | 13,109,608 | |
| | 8,000,000 | | | Jefferson Mill CLO Ltd., Series 2015-1A, Class F, 7.86%, 07/20/27(a)(j)(n) | | | 7,471,991 | |
| | 8,000,000 | | | Jefferson Mill CLO Ltd., Series 2015-1A, Class SUB, 7.38%, 07/20/27(a)(j)(p) | | | 4,154,860 | |
| | 1,000,000 | | | Mill Creek CLO Ltd., Series 2016-1A, Class E, 9.11%, 04/20/28(j)(n) | | | 1,036,636 | |
| | 625,000 | | | Neuberger Berman CLO XVII Ltd., Series 2014-17A, Class DR, 5.01%, 04/22/29(j)(n) | | | 635,806 | |
| | 1,000,000 | | | Neuberger Berman CLO XVIII Ltd, Series 2014-18A, Class CR, 5.56%, 11/14/27(j)(n) | | | 1,016,282 | |
| | 1,000,000 | | | Neuberger Berman CLO XX Ltd., Series 2015-20A, Class D, 5.31%, 01/15/28(j)(n) | | | 1,000,033 | |
| | 3,250,000 | | | Neuberger Berman CLO XX Ltd., Series 2015-20A, Class E, 7.81%, 01/15/28(j)(n) | | | 3,251,006 | |
| | 750,000 | | | Neuberger Berman CLO XXI Ltd., Series 2016-21A, Class D, 6.31%, 04/20/27(j)(n) | | | 750,292 | |
| | 2,000,000 | | | Neuberger Berman CLO XXI Ltd., Series 2016-21A, Class E, 8.36%, 04/20/27(j)(n) | | | 2,004,384 | |
| | 1,000,000 | | | Neuberger Berman CLO XXII Ltd., Series 2016-22A, Class E, 8.10%, 10/17/27(j)(n) | | | 1,011,101 | |
| | 1,250,000 | | | Neuberger Berman CLO XXIII Ltd., Series 2016-23A, Class E, 7.93%, 10/17/27(j)(n) | | | 1,265,159 | |
| | 1,000,000 | | | Rockford Tower CLO Ltd., Series 2017-2A, Class E, 7.32%, 10/15/29(j)(n) | | | 982,500 | |
| | 21,000,000 | | | Romark CLO Ltd., Series 2017-1A, Class D, 8.01%, 10/23/30(j)(n) | | | 20,713,770 | |
See Notes to Financial Statements.
| Old Westbury Funds, Inc. | |
| Strategic Opportunities Fund | |
| Consolidated Portfolio of Investments - (Continued) | October 31, 2017 |
| | |
Principal
Amount | | | | | Value | |
| CAYMAN ISLANDS (continued) |
| Collateralized Loan Obligations (continued) |
| $ | 5,000,000 | | | Romark CLO Ltd., Series 2017-1A, Class SUB, 0.00%, 10/23/30(j)(p) | | $ | 4,537,500 | |
| | 1,250,000 | | | Shackleton CLO Ltd., Series 2017-10A, Class E, 7.58%, 04/20/29(j)(n) | | | 1,245,209 | |
| | 1,650,000 | | | Sound Point CLO III Ltd., Series 2013-2A, Class E, 5.96%, 07/15/25(j)(n) | | | 1,621,938 | |
| | 1,000,000 | | | Sound Point CLO IX Ltd., Series 2015-2A, Class E, 6.86%, 07/20/27(j)(n) | | | 989,103 | |
| | 5,000,000 | | | Sound Point CLO X Ltd., Series 2015-3A, Class E, 8.11%, 01/20/28(j)(n) | | | 5,002,315 | |
| | 3,200,000 | | | Sound Point CLO XI Ltd., Series 2016-1A, Class E, 8.31%, 07/20/28(j)(n) | | | 3,207,188 | |
| | 2,000,000 | | | Sound Point CLO XII Ltd., Series 2016-2A,Class E, 7.76%, 10/20/28(j)(n) | | | 2,017,706 | |
| | 1,750,000 | | | Sound Point CLO XIV Ltd., Series 2016-3A, Class E, 8.01%, 01/23/29(j)(n) | | | 1,757,042 | |
| | 1,000,000 | | | Stewart Park CLO Ltd., Series 2015-1A, Class E, 6.81%, 04/15/26(j)(n) | | | 992,149 | |
| | 1,500,000 | | | Symphony CLO XV Ltd., Series 2014-15A, Class E, 6.40%, 10/17/26(j)(n) | | | 1,488,509 | |
| | 1,000,000 | | | Symphony CLO XVI Ltd., Series 2015-16A, Class E, 6.81%, 07/15/28(j)(n) | | | 1,008,793 | |
| | 1,000,000 | | | TCI-Symphony CLO Ltd., Series 2017-1A, Class E, 7.72%, 07/15/30(j)(n) | | | 1,003,046 | |
| | 1,740,000 | | | THL Credit Wind River CLO Ltd., Series 2015-1A, Class E1, 6.91%, 07/20/27(j)(n) | | | 1,739,866 | |
| | 5,000,000 | | | TICP CLO I Ltd., Series 2015-1A, Class D, 4.91%, 07/20/27(j)(n) | | | 4,994,883 | |
| | 1,250,000 | | | Vibrant CLO IV Ltd., Series 2016-4A, Class D, 5.86%, 07/20/28(j)(n) | | | 1,264,840 | |
| | 1,000,000 | | | Voya CLO Ltd., Series 2014-1A, Class C, 4.75%, 04/18/26(j)(n) | | | 999,924 | |
| | 1,500,000 | | | Voya CLO Ltd., Series 2016-2A, Class D, 8.31%, 07/19/28(j)(n) | | | 1,505,043 | |
| | 1,000,000 | | | Voya CLO Ltd., Series 2016-3A, Class D, 8.20%, 10/18/27(j)(n) | | | 1,004,526 | |
| | 11,250,000 | | | Washington Mill CLO Ltd., Series 2014-1A, Class F, 6.86%, 04/20/26(a)(j)(n) | | | 10,030,485 | |
| | 17,600,000 | | | Washington Mill CLO Ltd., Series 2014-1A, Class SUB, 11.00%, 04/20/26(a)(j)(p) | | | 5,712,895 | |
Principal
Amount | | | | | Value | |
| CAYMAN ISLANDS (continued) |
| Collateralized Loan Obligations (continued) |
| $ | 4,250,000 | | | Webster Park CLO Ltd., Series 2015-1A, Class C, 5.41%, 01/20/27(j)(n) | | $ | 4,250,208 | |
| | 2,650,000 | | | Webster Park CLO Ltd., Series 2015-1A, Class D, 7.46%, 01/20/27(j)(n) | | | 2,674,546 | |
| | 1,000,000 | | | Westcott Park CLO Ltd., Series 2016-1A, Class D, 5.71%, 07/20/28(j)(n) | | | 1,013,487 | |
| | 1,000,000 | | | Westcott Park CLO Ltd., Series 2016-1A, Class E, 8.56%, 07/20/28(j)(n) | | | 1,016,652 | |
| | 1,500,000 | | | York CLO-1 Ltd., Series 2014-1A, Class E, 6.81%, 01/22/27(j)(n) | | | 1,489,494 | |
| | 1,000,000 | | | York CLO-2 Ltd., Series 2015-1A, Class E, 7.61%, 10/22/27(j)(n) | | | 998,096 | |
| | 4,500,000 | | | York CLO-3 Ltd., Series 2016-1A, Class ER, 7.76%, 10/20/29(j)(n) | | | 4,487,569 | |
| | 1,647,750 | | | York CLO-3 Ltd., Series 2016-1A, Class FR, 8.61%, 10/20/29(j)(n) | | | 1,486,753 | |
| | 5,000,000 | | | York CLO-3 Ltd., Series 2016-1A, Class SUB, 2.40%, 10/20/29(j)(p) | | | 4,400,000 | |
| | 1,000,000 | | | York CLO-4 Ltd., Series 2016-2A, Class E, 8.30%, 01/20/30(j)(n) | | | 1,010,914 | |
| | | | | | | | 264,076,717 | |
| Other Asset-Backed Securities — 1.8% |
| | 2,800,000 | | | ALM Loan Funding Ltd., Series 2012-6A, Class DRR, 6.81%, 07/15/26(j)(n) | | | 2,786,218 | |
| | 1,000,000 | | | ALM Loan Funding Ltd., Series 2013-7RA, Class DR, 8.50%, 10/15/28(j)(n) | | | 1,020,915 | |
| | 2,000,000 | | | ALM Loan Funding Ltd., Series 2015-16A, Class D, 6.71%, 07/15/27(j)(n) | | | 1,956,618 | |
| | 1,100,000 | | | ALM Loan Funding Ltd., Series 2015-17A, Class C1, 5.51%, 01/15/28(j)(n) | | | 1,116,644 | |
| | 1,000,000 | | | ALM Loan Funding Ltd., Series 2016-18A, Class D, 8.96%, 07/15/27(j)(n) | | | 1,011,527 | |
| | 1,000,000 | | | Atrium VIII, Series 8A, Class DR, 5.36%, 10/23/24(j)(n) | | | 1,000,085 | |
| | 1,750,000 | | | Atrium VIII, Series 8A, Class ER, 8.61%, 10/23/24(j)(n) | | | 1,760,697 | |
| | 5,000,000 | | | Atrium VIII, Series 8A, Class SUB, 1.00%, 10/23/24(j)(p) | | | 3,618,181 | |
| | 5,000,000 | | | Atrium XI, Series 11A, Class E, 6.46%, 10/23/25(j)(n) | | | 5,000,000 | |
| | 2,000,000 | | | Atrium XII, Series 12A, Class E, 7.31%, 10/22/26(j)(n) | | | 2,027,098 | |
| | 7,552,500 | | | Atrium XIII, Series 13A, Class E, 6.05%, 11/21/30(j)(n) | | | 7,552,500 | |
See Notes to Financial Statements.
| Old Westbury Funds, Inc. | |
| Strategic Opportunities Fund | |
| Consolidated Portfolio of Investments - (Continued) | October 31, 2017 |
| | |
Principal
Amount | | | | | Value | |
| CAYMAN ISLANDS (continued) |
| Other Asset-Backed Securities (continued) |
| $ | 12,131,250 | | | Atrium XIII, Series 13A, Class SUB, 0.00%, 11/21/30(j)(p) | | $ | 10,915,796 | |
| | 1,500,000 | | | CIFC Funding Ltd., Series 2012-2A, Class B2R, 7.07%, 12/05/24(j)(n) | | | 1,505,357 | |
| | 1,000,000 | | | CIFC Funding Ltd., Series 2014-1A, Class E, 5.85%, 04/18/25(j)(n) | | | 994,863 | |
| | 2,500,000 | | | CIFC Funding Ltd., Series 2014-2A, Class B1L, 4.82%, 05/24/26(j)(n) | | | 2,500,526 | |
| | 2,000,000 | | | CIFC Funding Ltd., Series 2014-3A, Class E, 7.41%, 10/19/27(j)(n) | | | 1,998,284 | |
| | 1,000,000 | | | CIFC Funding Ltd., Series 2014-5A, Class E2, 7.60%, 01/17/27(j)(n) | | | 1,004,109 | |
| | 3,250,000 | | | CIFC Funding Ltd., Series 2016-1A, Class E, 8.11%, 10/21/28(j)(n) | | | 3,300,713 | |
| | 1,000,000 | | | Dryden Senior Loan Fund, Series 2014-34A, Class DR, 4.76%, 10/15/26(j)(n) | | | 1,005,839 | |
| | 1,000,000 | | | Dryden Senior Loan Fund, Series 2015-37A, Class E, 6.76%, 04/15/27(j)(n) | | | 1,004,981 | |
| | 1,000,000 | | | Dryden Senior Loan Fund, Series 2016-43A, Class E, 8.61%, 07/20/29(j)(n) | | | 1,007,936 | |
| | 3,000,000 | | | Goldentree Loan Opportunities XI Ltd., Series 2015-11A, Class E, 6.85%, 04/18/27(j)(n) | | | 3,005,121 | |
| | 962,500 | | | Highbridge Loan Management Ltd., Series 2015-5A, Class E, 6.73%, 01/29/26(j)(n) | | | 963,520 | |
| | 1,000,000 | | | Highbridge Loan Management Ltd., Series 2015-6A, Class E1, 6.84%, 05/05/27(j)(n) | | | 991,688 | |
| | 1,000,000 | | | Highbridge Loan Management Ltd., Series 2015-7A, Class D, 5.07%, 11/15/26(j)(n) | | | 1,012,969 | |
| | 1,000,000 | | | Highbridge Loan Management Ltd., Series 2015-7A, Class E, 7.07%, 11/15/26(j)(n) | | | 1,001,495 | |
| | 1,750,000 | | | Highbridge Loan Management Ltd., Series 2016-10A, Class D, 7.86%, 01/20/28(j)(n) | | | 1,788,882 | |
| | 500,000 | | | Highbridge Loan Management Ltd., Series 2016-8A, Class D, 6.21%, 04/20/27(j)(n) | | | 511,656 | |
| | 1,000,000 | | | Highbridge Loan Management Ltd., Series 2016-8A, Class E, 9.26%, 04/20/27(j)(n) | | | 1,007,741 | |
| | 1,000,000 | | | Highbridge Loan Management Ltd., Series 2016-9A, Class D2, 7.81%, 07/19/27(j)(n) | | | 1,013,216 | |
| | 1,000,000 | | | LCM Ltd. Partnership XVII LP, Series 17A, Class D, 4.86%, 10/15/26(j)(n) | | | 1,006,499 | |
Principal
Amount | | | | | Value | |
| CAYMAN ISLANDS (continued) |
| Other Asset-Backed Securities (continued) |
| $ | 1,500,000 | | | LCM Ltd. Partnership XVIII LP, Series 18A, Class D, 5.16%, 04/20/27(j)(n) | | $ | 1,501,155 | |
| | 1,000,000 | | | LCM Ltd. Partnership XVIII LP, Series 18A, Class E, 6.71%, 04/20/27(j)(n) | | | 1,003,441 | |
| | 500,000 | | | LCM Ltd. Partnership XVIII LP, Series 18A, Class INC, 5.00%, 04/20/27(j)(k) | | | 305,703 | |
| | 1,350,000 | | | LCM Ltd. Partnership XXI LP, Series 21A, Class D, 6.46%, 04/20/28(j)(n) | | | 1,360,318 | |
| | 1,000,000 | | | LCM Ltd. Partnership XXI LP, Series 21A, Class E, 9.01%, 04/20/28(j)(n) | | | 1,018,105 | |
| | 750,000 | | | LCM XX LLC, Series 20A, Class E, 7.46%, 10/20/27(j)(n) | | | 752,409 | |
| | 1,000,000 | | | Madison Park Funding XIX Ltd., Series 2015-19A, Class D, 7.81%, 01/22/28(j)(n) | | | 1,005,757 | |
| | 2,000,000 | | | Madison Park Funding XVI, Ltd., Series 2015-16A, Class D, 6.86%, 04/20/26(j)(n) | | | 2,001,073 | |
| | 1,000,000 | | | Madison Park Funding XX Ltd., Series 2016-20A, Class E, 8.77%, 04/27/27(j)(n) | | | 1,013,585 | |
| | 1,000,000 | | | Oak Hill Credit Partners XII Ltd., Series 2015-12A, Class D1, 5.56%, 01/23/27(j)(n) | | | 1,000,279 | |
| | 1,000,000 | | | Octagon Investment Partners 26 Ltd., Series 2016-1A, Class D, 6.31%, 04/15/27(j)(n) | | | 1,012,338 | |
| | 2,000,000 | | | Octagon Investment Partners 26 Ltd., Series 2016-1A, Class E, 9.21%, 04/15/27(j)(n) | | | 2,000,641 | |
| | 2,500,000 | | | Octagon Investment Partners 27 Ltd., Series 2016-1A, Class E, 8.46%, 07/15/27(j)(n) | | | 2,510,005 | |
| | 1,100,000 | | | Octagon Investment Partners XXI Ltd., Series 2014-1A, Class C, 4.96%, 11/14/26(j)(n) | | | 1,101,626 | |
| | 1,000,000 | | | Octagon Investment Partners XXI Ltd., Series 2014-1A, Class D, 7.91%, 11/14/26(j)(n) | | | 1,010,906 | |
| | 1,375,000 | | | OHA Credit Partners XI Ltd., Series 2015-11A, Class E, 8.06%, 10/20/28(j)(n) | | | 1,383,923 | |
| | 2,250,000 | | | OZLM Funding II Ltd., Series 2012-2A, Class DR, 8.68%, 10/30/27(j)(n) | | | 2,251,581 | |
| | 3,750,000 | | | OZLM IX Ltd., Series 2014-9A, Class CR, 4.91%, 01/20/27(j)(n) | | | 3,773,597 | |
| | 1,000,000 | | | OZLM XI Ltd., Series 2015-11A, Class CR, 4.98%, 10/30/30(j)(n) | | | 996,790 | |
See Notes to Financial Statements.
| Old Westbury Funds, Inc. | |
| Strategic Opportunities Fund | |
| Consolidated Portfolio of Investments - (Continued) | October 31, 2017 |
| | |
Principal
Amount | | | | | Value | |
| CAYMAN ISLANDS (continued) |
| Other Asset-Backed Securities (continued) |
| $ | 500,000 | | | OZLM XII Ltd., Series 2015-12A, Class D, 6.78%, 04/30/27(j)(n) | | $ | 498,036 | |
| | 1,200,000 | | | OZLM XIV Ltd., Series 2015-14A, Class C, 5.71%, 01/15/29(j)(n) | | | 1,200,530 | |
| | 1,500,000 | | | OZLM XIV Ltd., Series 2015-14A, Class D, 7.71%, 01/15/29(j)(n) | | | 1,500,119 | |
| | 1,000,000 | | | OZLM XV Ltd., Series 2016-15A, Class D, 8.51%, 01/20/29(j)(n) | | | 1,021,534 | |
| | | | | | | | 97,615,125 | |
| | | | | | | | 361,691,842 | |
| NETHERLANDS — 0.1% |
| Collateralized Loan Obligations — 0.1% |
| | 5,000,000 | (h) | | Accunia European CLO I BV, Series 1A, Class C, 3.20%, 07/15/29(j)(n) | | | 5,907,820 | |
| UNITED STATES — 8.3% |
| Collateralized Loan Obligations — 0.7% |
| | 19,150,874 | | | Atrium XIII Warehouse, 10.15%,(a)(j) | | | 19,150,874 | |
| | 13,634,250 | | | Cedar Funding VII CLO Ltd., 10.15%,(a)(j) | | | 13,634,250 | |
| | 1,000,000 | | | Teacher’s Insurance & Annuity CLO II Ltd., Series 2017-1A, Class E, 7.21%, 04/20/29(j)(n) | | | 1,006,212 | |
| | 2,500,000 | | | THL Credit Wind River CLO Ltd., 10.15%,(j) | | | 2,500,000 | |
| | | | | | | | 36,291,336 | |
| Other Asset-Backed Securities — 7.6% |
| | 13,769,882 | | | Argent Mortgage Loan Trust, Series 2005-W1, Class A2, 1.72%, 05/25/35(n) | | | 12,334,501 | |
| | 4,894,598 | | | Argent Securities, Inc. Asset-Backed Pass-Through Certificates Series 2005-W5, Class M1, 1.70%, 01/25/36(n) | | | 2,743,558 | |
| | 6,380,000 | | | Asset Backed Securities Corp. Home Equity Loan Trust, Series 2006-HE1, Class M2, 1.66%, 01/25/36(n) | | | 4,404,203 | |
| | 1,000,000 | | | Atlas Senior Loan Fund II Ltd., Series 2012-2A, Class DR, 5.28%, 01/30/24(j)(n) | | | 1,001,093 | |
| | 5,000,000 | | | Bank of America Manufactured Housing Contract Trust, Series 1998-2, Class B1, 7.93%, 12/10/25(p) | | | 3,948,486 | |
| | 13,458,330 | | | Bayview Financial Revolving Asset Trust, Series 2004-B, Class A1, 2.24%, 05/28/39(j)(n) | | | 12,242,839 | |
| | 2,971,677 | | | Bayview Financial Revolving Asset Trust, Series 2004-B, Class A2, 2.54%, 05/28/39(n) | | | 1,961,307 | |
Principal
Amount | | | | | Value | |
| UNITED STATES (continued) |
| Other Asset-Backed Securities (continued) |
| $ | 5,838,424 | | | Bayview Financial Revolving Asset Trust, Series 2005-E, Class A2A, 2.17%, 12/28/40(j)(n) | | $ | 5,174,347 | |
| | 3,169,240 | | | Bear Stearns Asset Backed Securities I Trust, Series 2006-EC2, Class M2, 1.66%, 02/25/36(n) | | | 3,000,321 | |
| | 2,119,752 | | | Bear Stearns Asset Backed Securities I Trust, Series 2006-HE1, Class 1M4, 1.92%, 12/25/35(n) | | | 1,956,423 | |
| | 3,208,354 | | | Bear Stearns Asset-Backed Securities Trust, Series 2006-AC2, Class 22A1, 1.59%, 03/25/36(n) | | | 948,795 | |
| | 3,208,354 | | | Bear Stearns Asset-Backed Securities Trust, Series 2006-AC2, Class 22A3, 1.59%, 03/25/36(n) | | | 948,795 | |
| | 12,087,274 | | | Bear Stearns Asset-Backed Securities Trust, Series 2006-AQ1, Class 2A2, 1.44%, 10/25/36(n) | | | 12,618,804 | |
| | 6,992,810 | | | Bear Stearns Asset-Backed Securities Trust, Series 2006-HE10, Class 22A, 1.38%, 12/25/36(n) | | | 7,302,595 | |
| | 8,000,000 | | | Bear Stearns Second Lien Trust, Series 2007-SV1A, Class M1, 2.44%, 01/25/36(j)(n) | | | 7,722,206 | |
| | 3,790,504 | | | Bombardier Capital Mortgage Securitization Pass-Through Certificates, Series 2000-A, Class A2, 7.58%, 06/15/30(p) | | | 1,530,105 | |
| | 3,553,597 | | | Bombardier Capital Mortgage Securitization Pass-Through Certificates, Series 2000-A, Class A3, 7.83%, 06/15/30(p) | | | 1,534,181 | |
| | 6,017,425 | | | Bombardier Capital Mortgage Securitization Pass-Through Certificates, Series 2000-A, Class A4, 8.29%, 06/15/30(p) | | | 2,789,660 | |
| | 7,279,140 | | | Carrington Mortgage Loan Trust, Series 2006-FRE1, Class A3, 1.39%, 07/25/36(n) | | | 6,997,931 | |
| | 10,409,443 | | | Carrington Mortgage Loan Trust, Series 2006-FRE2, Class A3, 1.40%, 10/25/36(n) | | | 6,979,123 | |
| | 7,439,664 | | | Carrington Mortgage Loan Trust, Series 2006-FRE2, Class A4, 1.49%, 10/25/36(n) | | | 5,029,955 | |
| | 4,884,740 | | | Carrington Mortgage Loan Trust, Series 2007-FRE1, Class A4, 1.66%, 02/25/37(n) | | | 3,641,342 | |
| | 8,250,000 | | | Carrington Mortgage Loan Trust, Series 2007-RFC1, Class A3, 1.38%, 12/25/36(n) | | | 6,978,943 | |
| | 12,415,000 | | | Carrington Mortgage Loan Trust, Series 2007-RFC1, Class A4, 1.46%, 10/25/36(n) | | | 8,728,202 | |
See Notes to Financial Statements.
| Old Westbury Funds, Inc. | |
| Strategic Opportunities Fund | |
| Consolidated Portfolio of Investments - (Continued) | October 31, 2017 |
| | |
Principal
Amount | | | | | Value | |
| UNITED STATES (continued) |
| Other Asset-Backed Securities (continued) |
| $ | 11,484,036 | | | Conseco Finance Securitizations Corp., Series 2000-1, Class A5, 8.06%, 09/01/29(p) | | $ | 6,419,236 | |
| | 14,350,622 | | | Conseco Finance Securitizations Corp., Series 2000-4, Class A5, 7.97%, 05/01/32 | | | 7,539,461 | |
| | 3,952,305 | | | Conseco Financial Corp., Series 1997-7, Class M1, 7.03%, 07/15/28(p) | | | 3,840,771 | |
| | 2,829,024 | | | Conseco Financial Corp., Series 1998-2, Class M1, 6.94%, 12/01/28(p) | | | 2,664,651 | |
| | 4,346,171 | | | Conseco Financial Corp., Series 1999-5, Class A5, 7.86%, 03/01/30(p) | | | 3,545,411 | |
| | 3,346,406 | | | Conseco Financial Corp., Series 1999-5, Class A6, 7.50%, 03/01/30(p) | | | 2,645,754 | |
| | 1,157,598 | | | Countrywide Asset-Backed Certificates, Series 2006-11, Class 3AV2, 1.40%, 09/25/46(n) | | | 1,128,594 | |
| | 565,646 | | | Countrywide Asset-Backed Certificates, Series 2006-S3, Class A3, STEP, 6.79%, 06/25/21 | | | 721,218 | |
| | 15,962,731 | | | Countrywide Asset-Backed Certificates, Series 2007-S3, Class A3, 1.62%, 05/25/37(n) | | | 14,506,019 | |
| | 2,726,933 | | | Countrywide Home Equity Loan Trust, Series 2006-S5, Class A4, 5.84%, 06/25/35 | | | 2,881,023 | |
| | 2,238,531 | | | Countrywide Revolving Home Equity Loan Resecuritization Trust, Series 2006-RES, Class 4Q1B, 1.54%, 12/15/33(j)(n) | | | 1,878,286 | |
| | 1,912,713 | | | Countrywide Revolving Home Equity Loan Resecuritization Trust, Series 2006-RES, Class 4T1B, 1.48%, 02/15/30(j)(n) | | | 1,713,137 | |
| | 1,764,922 | | | Countrywide Revolving Home Equity Loan Resecuritization Trust, Series 2006-RES, Class 5B1B, 1.43%, 05/15/35(j)(n) | | | 1,579,524 | |
| | 3,783,424 | | | Countrywide Revolving Home Equity Loan Resuritization Trust, Series 2006-RES, Class 5F1A, 1.48%, 12/15/35(j)(n) | | | 3,518,584 | |
| | 2,776,495 | | | Credit-Based Asset Servicing & Securitization LLC Trust, Series 2006-CB9, Class A3, 1.39%, 11/25/36(n) | | | 1,819,941 | |
| | 5,000,000 | | | First Franklin Mortgage Loan Trust, Series 2006-FF4, Class M1, 1.60%, 03/25/36(n) | | | 3,746,691 | |
Principal
Amount | | | | | Value | |
| UNITED STATES (continued) |
| Other Asset-Backed Securities (continued) |
| $ | 10,844,320 | | | First Franklin Mortgage Loan Trust, Series 2006-FF8, Class M1, 1.49%, 07/25/36(n) | | $ | 5,988,431 | |
| | 5,766,684 | | | First Franklin Mortgage Loan Trust, Series 2006-FFH1, Class M2, 1.64%, 01/25/36(n) | | | 3,696,220 | |
| | 5,235,793 | | | First Franklin Mortgage Loan Trust, Series 2007-FF2, Class A2C, 1.39%, 03/25/37(n) | | | 3,488,750 | |
| | 2,561,136 | | | GMAC Mortgage Home Equity Loan Trust, Series 2005-HE3, Class A3, 1.48%, 02/25/36(n) | | | 2,865,959 | |
| | 1,925,242 | | | GMAC Mortgage Home Equity Loan Trust, Series 2006-HE1, Class A, 1.45%, 11/25/36(n) | | | 1,944,731 | |
| | 3,123,145 | | | Greenpoint Manufactured Housing, Series 1999-1, Class A5, 6.77%, 08/15/29(p) | | | 3,068,851 | |
| | 3,075,497 | | | Greenpoint Manufactured Housing, Series 2000-1, Class A4, 8.14%, 03/20/30(p) | | | 3,227,569 | |
| | 8,179,299 | | | Greenpoint Manufactured Housing, Series 2000-3, Class IA, 8.45%, 06/20/31(p) | | | 8,147,525 | |
| | 620,254 | | | GSAA Trust, Series 2006-7, Class AF2, 5.99%, 03/25/46(p) | | | 446,271 | |
| | 6,739,570 | | | GSAMP Trust, Series 2006-FM2, Class A2B, 1.36%, 09/25/36(n) | | | 3,303,877 | |
| | 4,375,000 | | | Home Equity Asset Trust, Series 2007-1, Class 2A3, 1.39%, 05/25/37(n) | | | 3,620,301 | |
| | 3,277,000 | | | Invitation Homes Trust, Series 2015-SFR3, Class E, 4.99%, 08/17/32(j)(n) | | | 3,304,560 | |
| | 133,603 | | | Irwin Home Equity Loan Trust, Series 2006-2, Class 2A2, STEP, 6.24%, 02/25/36(j) | | | 134,025 | |
| | 4,000,000 | | | JPMorgan Mortgage Acquisition Corp., Series 2006-CW1,Class M1, 1.51%, 05/25/36(n) | | | 3,510,215 | |
| | 407,619 | | | Lehman ABS Mortgage Loan Trust, Series 2007-1, Class 2A1, 1.33%, 06/25/37(j)(n) | | | 285,830 | |
| | 12,353,010 | | | Lehman ABS Mortgage Loan Trust, Series 2007-1, Class 2A4, 1.54%, 06/25/37(j)(n) | | | 8,942,912 | |
| | 8,388,555 | | | Lehman ABS Mortgage Loan Trust, Series 2007-1,Class 2A2, 1.44%, 06/25/37(j)(n) | | | 5,506,096 | |
| | 1,348,906 | | | Long Beach Mortgage Loan Trust, Series 2006-10, Class 2A2, 1.35%, 11/25/36(n) | | | 690,603 | |
| | 18,606,416 | | | Long Beach Mortgage Loan Trust, Series 2006-10, Class 2A3, 1.40%, 11/25/36(n) | | | 9,606,276 | |
See Notes to Financial Statements.
| Old Westbury Funds, Inc. | |
| Strategic Opportunities Fund | |
| Consolidated Portfolio of Investments - (Continued) | October 31, 2017 |
| | |
Principal
Amount | | | | | Value | |
| UNITED STATES (continued) |
| Other Asset-Backed Securities (continued) |
| $ | 3,657,142 | | | Long Beach Mortgage Loan Trust, Series 2006-10, Class 2A4, 1.46%, 11/25/36(n) | | $ | 1,882,900 | |
| | 9,843,899 | | | Long Beach Mortgage Loan Trust, Series 2006-2, Class 2A3, 1.43%, 03/25/46(n) | | | 5,059,767 | |
| | 25,592,036 | | | Long Beach Mortgage Loan Trust, Series 2006-5, Class 2A4, 1.48%, 06/25/36(n) | | | 13,395,925 | |
| | 6,956,160 | | | Long Beach Mortgage Loan Trust, Series 2006-9, Class 2A3, 1.40%, 10/25/36(n) | | | 2,979,199 | |
| | 4,000,000 | | | Madison Avenue Manufactured Housing Contract Trust, Series 2002-A, Class B2, 4.49%, 03/25/32(n) | | | 4,110,084 | |
| | 4,669,462 | | | Mastr Second Lien Trust, Series 2006-1, Class A, 1.56%, 03/25/36(n) | | | 1,016,692 | |
| | 3,658,029 | | | Merit Securities Corp., Series 13, Class M2, STEP, 7.85%, 12/28/33 | | | 2,751,250 | |
| | 1,625,392 | | | Morgan Stanley ABS Capital I, Series 2006-HE4, Class A4, 1.48%, 06/25/36(n) | | | 1,114,834 | |
| | 8,323,497 | | | Morgan Stanley ABS Capital I, Series 2007-NC1, Class A1, 1.37%, 11/25/36(n) | | | 5,307,512 | |
| | 8,569,112 | | | Morgan Stanley ABS Capital I, Series 2007-NC3, Class A2B, 1.38%, 05/25/37(n) | | | 6,577,978 | |
| | 6,284,398 | | | Morgan Stanley Capital I, Series 2006-NC2, Class M1, 1.60%, 02/25/36(n) | | | 4,621,120 | |
| | 5,679,337 | | | Morgan Stanley Mortgage Loan Trust, Series 2006-12XS, Class A4, STEP, 6.01%, 10/25/36 | | | 2,618,405 | |
| | 3,504,035 | | | Nomura Asset Acceptance Corp. Alternative Loan Trust, Series 2006-S5, Class A1, 1.64%, 10/25/36(j)(n) | | | 3,123,364 | |
| | 3,000,143 | | | Oakwood Mortgage Investors, Inc., Series 1999-C, Class A2, 7.48%, 08/15/27 | | | 2,915,161 | |
| | 10,992,139 | | | Oakwood Mortgage Investors, Inc., Series 2000-D, Class A4, 7.40%, 07/15/30(p) | | | 6,501,326 | |
| | 8,719,289 | | | Oakwood Mortgage Investors, Inc., Series 2001-C, Class A2, 5.92%, 06/15/31(p) | | | 2,710,935 | |
| | 6,049,324 | | | Oakwood Mortgage Investors, Inc., Series 2001-C, Class A3, 6.61%, 06/15/31(p) | | | 2,091,462 | |
| | 6,912,659 | | | Oakwood Mortgage Investors, Inc., Series 2001-C, Class A4, 7.41%, 06/15/31(p) | | | 2,667,294 | |
Principal
Amount | | | | | Value | |
| UNITED STATES (continued) |
| Other Asset-Backed Securities (continued) |
| $ | 969,617 | | | Oakwood Mortgage Investors, Inc., Series 2001-D, Class A3, 5.90%, 09/15/22(p) | | $ | 811,453 | |
| | 3,897,138 | | | Oakwood Mortgage Investors, Inc., Series 2002-A, Class M1, 7.76%, 03/15/32(p) | | | 3,343,198 | |
| | 1,602,574 | | | Oakwood Mortgage Investors, Inc., Series 2002-B, Class A4, 7.09%, 06/15/32(p) | | | 1,747,637 | |
| | 2,000,000 | | | OneMain Financial Issuance Trust, Series 2014-2A, Class C, 4.33%, 09/18/24(j) | | | 2,010,834 | |
| | 4,000,000 | | | OneMain Financial Issuance Trust, Series 2014-2A, Class D, 5.31%, 09/18/24(j) | | | 4,054,400 | |
| | 15,000,000 | | | OneMain Financial Issuance Trust, Series 2015-1A, Class C, 5.12%, 03/18/26(j) | | | 15,250,869 | |
| | 3,000,000 | | | OneMain Financial Issuance Trust, Series 2015-1A, Class D, 6.63%, 03/18/26(a)(j) | | | 3,079,821 | |
| | 10,000,000 | | | OneMain Financial Issuance Trust, Series 2015-2A, Class D, 5.64%, 07/18/25(j) | | | 10,019,648 | |
| | 4,000,000 | | | OneMain Financial Issuance Trust, Series 2015-3A, Class D, 6.94%, 11/20/28(j) | | | 3,993,090 | |
| | 4,148,509 | | | Option One Mortgage Loan Trust, Series 2007-FXD2, Class 1A1, STEP, 5.82%, 03/25/37 | | | 4,079,212 | |
| | 4,279,142 | | | Preston Ridge Partners Mortgage LLC, Series 2017-1A, Class A1, STEP, 4.25%, 01/25/22(j) | | | 4,288,571 | |
| | 4,000,000 | | | Residential Asset Securities Corp, Series 2006-KS4, Class M2, 1.53%, 06/25/36(n) | | | 3,175,737 | |
| | 3,491,556 | | | Residential Asset Securities Corp. Trust, Series 2002-KS4, Class AIIA, 1.73%, 07/25/32(n) | | | 3,161,694 | |
| | 3,825,000 | | | Residential Asset Securities Corp., Class M4, 1.82%, 11/25/35(n) | | | 3,154,373 | |
| | 4,095,107 | | | SACO I Trust, Series 2006-7, Class A1, 1.50%, 07/25/36(n) | | | 4,380,458 | |
| | 5,845,867 | | | Saxon Asset Securities Trust, Series 2006-2, Class M3, 1.56%, 09/25/36(n) | | | 1,811,077 | |
| | 7,686,404 | | | Saxon Asset Securities Trust, Series 2007-1, Class M1, 1.53%, 01/25/47(n) | | | 4,630,675 | |
| | 10,644,384 | | | Securitized Asset Backed Receivables LLC Trust, Series 2006-WM4, Class A1, 1.43%, 11/25/36(n) | | | 6,559,405 | |
See Notes to Financial Statements.
| Old Westbury Funds, Inc. | |
| Strategic Opportunities Fund | |
| Consolidated Portfolio of Investments - (Continued) | October 31, 2017 |
| | |
Principal
Amount | | | | | Value | |
| UNITED STATES (continued) | | | |
| Other Asset-Backed Securities (continued) |
| $ | 4,674,000 | | | Structured Asset Investment Loan Trust, Series 2005-9, Class M2, 1.69%, 11/25/35(n) | | $ | 2,501,058 | |
| | 4,936,478 | | | Structured Asset Investment Loan Trust, Series 2005-HE1, Class M3, 1.99%, 07/25/35(n) | | | 2,645,196 | |
| | 2,878,526 | | | Structured Asset Securities Corp. Mortgage Loan Trust, Series 2007-WF1, Class M1, 1.68%, 02/25/37(n) | | | 1,873,156 | |
| | 526,785 | | | US Residential Opportunity Fund II Trust, Series 2016-1II, Class A, STEP, 3.47%, 07/27/36(j) | | | 523,959 | |
| | 631,699 | | | US Residential Opportunity Fund II Trust, Series 2016-3II, Class A, STEP, 3.60%, 10/27/36(j) | | | 633,424 | |
| | 1,014,468 | | | US Residential Opportunity Fund IV Trust, Series 2016-3IV, Class A, STEP, 3.60%, 10/27/36(j) | | | 1,017,228 | |
| | 3,055,000 | | | Velocity Commercial Capital Loan Trust, Series 2017-1, Class M6, 7.95%, 05/25/47(j)(p) | | | 2,780,576 | |
| | 1,128,251 | | | Wachovia Amortization Controlled Heloc NIM Trust, Series 2006-N1, Class N1, 5.68%, 08/12/47(j) | | | 1,126,294 | |
| | 10,774,211 | | | Yale Mortgage Loan Trust, Series 2007-1, Class A, 1.64%, 06/25/37(j)(n) | | | 4,824,264 | |
| | | | | | | | 423,367,533 | |
| | | | | | | | 459,658,869 | |
Total Asset-Backed Securities
(Cost $824,522,014) | | | 827,258,531 | |
NON-AGENCY MORTGAGE-BACKED
SECURITIES — 9.2% | |
| COLLATERALIZED MORTGAGE OBLIGATIONS — 8.0% | |
| | 1,311,331 | | | Adjustable Rate Mortgage Trust, Series 2005-3, Class 2A1, 3.53%, 07/25/35(p) | | | 1,246,842 | |
| | 2,669,342 | | | Adjustable Rate Mortgage Trust, Series 2007-1, Class 4A1, 4.53%, 03/25/37(p) | | | 2,336,917 | |
| | 5,858,382 | | | Ajax Mortgage Loan Trust, Series 2016-A, Class A, STEP, 4.25%, 08/25/64(j) | | | 5,929,136 | |
| | 2,749,511 | | | American Home Mortgage Assets Trust, Series 2006-2, Class 1A1, (12 mo. Federal Reserve Cumulative Average US + 0.960%), 1.90%, 09/25/46(n) | | | 2,291,836 | |
Principal
Amount | | | | | Value | |
| COLLATERALIZED MORTGAGE OBLIGATIONS (continued) | | | | |
| $ | 2,554,279 | | | American Home Mortgage Assets Trust, Series 2007-3, Class 22A1, STEP, 6.25%, 06/25/37 | | $ | 2,048,632 | |
| | 1,977,829 | | | American Home Mortgage Investment Trust, Series 2005-2, Class 5A4D, STEP, 5.33%, 09/25/35 | | | 1,705,445 | |
| | 447,297 | | | Banc of America Funding Corp., Series 2005-F, Class 6A1, 3.61%, 09/20/35(p) | | | 443,315 | |
| | 1,079,135 | | | Banc of America Funding Corp., Series 2006-A, Class 3A2, 3.68%, 02/20/36(p) | | | 974,754 | |
| | 978,991 | | | Banc of America Funding Corp., Series 2006-E, Class 2A1, 3.71%, 06/20/36(p) | | | 955,510 | |
| | 2,720,570 | | | Banc of America Funding Corp., Series 2007-1, Class TA5, STEP, 6.09%, 01/25/37 | | | 2,494,804 | |
| | 1,134,441 | | | Banc of America Mortgage Securities, Inc., Series 2005-I, Class 2A5, 3.60%, 10/25/35(p) | | | 1,080,236 | |
| | 2,850,238 | | | Bear Stearns Adjustable Rate Mortgage Trust, Series 2005-12, Class 23A1, 3.31%, 02/25/36(p) | | | 2,806,061 | |
| | 735,137 | | | Bear Stearns Adjustable Rate Mortgage Trust, Series 2005-6, Class 5A1, 3.47%, 08/25/35(p) | | | 670,174 | |
| | 790,122 | | | Bear Stearns Adjustable Rate Mortgage Trust, Series 2007-3, Class 1A1, 3.67%, 05/25/47(p) | | | 753,348 | |
| | 2,781,667 | | | Bear Stearns Alt-A Trust, Series 2006-2, Class 11A1, (1 mo. LIBOR US + 0.440%), 1.68%, 04/25/36(n) | | | 2,791,337 | |
| | 6,201,000 | | | Bear Stearns ALT-A Trust, Series 2006-6, Class 1A1, (1 mo. LIBOR US + 0.320%), 1.56%, 11/25/36(n) | | | 6,159,602 | |
| | 3,311,081 | | | Bear Stearns Mortgage Funding Trust, Series 2006-SL1, Class A1, (1 mo. LIBOR US + 0.280%), 1.52%, 08/25/36(n) | | | 3,337,354 | |
| | 2,404,985 | | | Bear Stearns Mortgage Funding Trust, Series 2006-SL4, Class A, (1 mo. LIBOR US + 0.300%), 1.54%, 11/25/36(n) | | | 6,786,108 | |
| | 6,052,538 | | | Chase Mortgage Finance Trust, Series 2007-S6, Class 1A1, 6.00%, 12/01/37 | | | 5,080,352 | |
| | 2,596,739 | | | Chase Mortgage Trust, Series 2016-1, Class M4, 3.75%, 04/25/45(j)(p) | | | 2,466,903 | |
| | 3,094,080 | | | CHL Mortgage Pass-Through Trust, Series 2005-J2, Class 2A4, (1 mo. LIBOR US + 1.400%), 2.64%, 08/25/35(n) | | | 2,696,732 | |
See Notes to Financial Statements.
| Old Westbury Funds, Inc. | |
| Strategic Opportunities Fund | |
| Consolidated Portfolio of Investments - (Continued) | October 31, 2017 |
| | |
Principal
Amount | | | | | Value | |
| COLLATERALIZED MORTGAGE OBLIGATIONS (continued) | | | | |
| $ | 5,576,620 | | | Citicorp Mortgage Securities Trust, Series 2008-2, Class 1A1, 6.50%, 06/01/38 | | $ | 4,809,826 | |
| | 485,463 | | | Citigroup Mortgage Loan Trust, Inc., Series 2005-2, Class 1A1, 3.33%, 05/25/35(p) | | | 493,362 | |
| | 432,732 | | | Citigroup Mortgage Loan Trust, Inc., Series 2006-AR3, Class 1A2A, 3.36%, 06/25/36(p) | | | 411,331 | |
| | 5,199,655 | | | Citigroup Mortgage Loan Trust, Inc., Series 2007-9, Class 1A1, 5.75%, 04/25/47(j) | | | 3,993,589 | |
| | 698,501 | | | Countrywide Alternative Loan Trust, Series 2004-36CB, Class 1A1, 6.00%, 02/25/35 | | | 648,422 | |
| | 1,733,794 | | | Countrywide Alternative Loan Trust, Series 2005-31, Class 2A1, (1 mo. LIBOR US + 0.300%), 1.54%, 08/25/35(n) | | | 1,602,525 | |
| | 4,640,164 | | | Countrywide Alternative Loan Trust, Series 2005-38, Class A3, (1 mo. LIBOR US + 0.350%), 1.59%, 09/25/35(n) | | | 4,406,023 | |
| | 10,631,631 | | | Countrywide Alternative Loan Trust, Series 2005-53T2, Class 2A7, (1 mo. LIBOR US + 5.500%), 4.26%, 11/25/35(n) | | | 1,811,714 | |
| | 1,882,161 | | | Countrywide Alternative Loan Trust, Series 2005-63, Class 5A1, 3.28%, 12/25/35(p) | | | 1,723,953 | |
| | 154,229 | | | Countrywide Alternative Loan Trust, Series 2005-69, Class A1, (12 mo. Federal Reserve Cumulative Average US + 1.000%), 1.94%, 12/25/35(n) | | | 145,820 | |
| | 2,340,578 | | | Countrywide Alternative Loan Trust, Series 2005-9CB, Class 1A3, (1 mo. LIBOR US + 0.450%), 1.69%, 05/25/35(n) | | | 2,078,861 | |
| | 1,346,528 | | | Countrywide Alternative Loan Trust, Series 2005-J14, Class A3, 5.50%, 12/25/35 | | | 1,144,807 | |
| | 4,400,141 | | | Countrywide Alternative Loan Trust, Series 2006-12CB, Class A10, (1 mo. LIBOR US + 0.350%), 1.59%, 05/25/36(n) | | | 2,537,798 | |
| | 2,632,715 | | | Countrywide Alternative Loan Trust, Series 2006-15CB, Class A1, 6.50%, 06/25/36 | | | 2,115,009 | |
| | 5,378,378 | | | Countrywide Alternative Loan Trust, Series 2006-20CB, Class A9, 6.00%, 07/25/36 | | | 4,293,782 | |
| | 2,443,228 | | | Countrywide Alternative Loan Trust, Series 2006-22R, Class 2A1, 6.25%, 05/25/36 | | | 1,855,978 | |
Principal
Amount | | | | | Value | |
| COLLATERALIZED MORTGAGE OBLIGATIONS (continued) | | | | |
| $ | 1,883,740 | | | Countrywide Alternative Loan Trust, Series 2006-24CB, Class A13, (1 mo. LIBOR US + 0.350%), 1.59%, 06/25/36(n) | | $ | 1,218,037 | |
| | 1,883,740 | | | Countrywide Alternative Loan Trust, Series 2006-24CB, Class A14, (1 mo. LIBOR US + 7.150%), 5.91%, 06/25/36(n) | | | 472,969 | |
| | 1,941,871 | | | Countrywide Alternative Loan Trust, Series 2006-24CB, Class A15, 5.75%, 06/25/36 | | | 1,637,034 | |
| | 2,032,054 | | | Countrywide Alternative Loan Trust, Series 2006-2CB, Class A4, (1 mo. LIBOR US + 0.400%), 1.64%, 03/25/36(n) | | | 1,202,046 | |
| | 5,707,875 | | | Countrywide Alternative Loan Trust, Series 2006-2CB, Class A6, 5.50%, 03/25/36 | | | 4,508,227 | |
| | 2,146,482 | | | Countrywide Alternative Loan Trust, Series 2006-41CB, Class 1A10, 6.00%, 01/25/37 | | | 1,863,836 | |
| | 1,554,270 | | | Countrywide Alternative Loan Trust, Series 2006-41CB, Class 1A4, 5.75%, 01/25/37 | | | 1,326,649 | |
| | 2,028,568 | | | Countrywide Alternative Loan Trust, Series 2006-45T1, Class 2A2, 6.00%, 02/25/37 | | | 1,743,352 | |
| | 4,638,482 | | | Countrywide Alternative Loan Trust, Series 2006-45T1, Class 2A5, 6.00%, 02/25/37 | | | 3,986,313 | |
| | 291,852 | | | Countrywide Alternative Loan Trust, Series 2006-6CB, Class 1A10, 5.50%, 05/25/36 | | | 267,086 | |
| | 828,011 | | | Countrywide Alternative Loan Trust, Series 2006-6CB, Class 1A2, (1 mo. LIBOR US + 0.400%), 1.64%, 05/25/36(n) | | | 661,941 | |
| | 5,101,729 | | | Countrywide Alternative Loan Trust, Series 2006-7CB, Class 2A1, 6.50%, 05/25/36 | | | 3,769,579 | |
| | 3,905,131 | | | Countrywide Alternative Loan Trust, Series 2006-J7, Class 2A1, (Cost of Funds for the 11th District of San Franciso + 1.500%), 2.23%, 11/20/46(n) | | | 2,670,260 | |
| | 8,286,647 | | | Countrywide Alternative Loan Trust, Series 2006-OA14, Class 1A1, (12 mo. Federal Reserve Cumulative Average US + 1.730%), 2.67%, 11/25/46(n) | | | 7,495,334 | |
| | 4,763,988 | | | Countrywide Alternative Loan Trust, Series 2006-OA14, Class 2A1, (1 mo. LIBOR US + 0.190%), 1.43%, 11/25/46(n) | | | 3,936,893 | |
See Notes to Financial Statements.
| Old Westbury Funds, Inc. | |
| Strategic Opportunities Fund | |
| Consolidated Portfolio of Investments - (Continued) | October 31, 2017 |
| | |
Principal
Amount | | | | | Value | |
| COLLATERALIZED MORTGAGE OBLIGATIONS (continued) | | | | |
| $ | 5,674,029 | | | Countrywide Alternative Loan Trust, Series 2006-OA14, Class 3A1, (12 mo. Federal Reserve Cumulative Average US + 0.850%), 1.79%, 11/25/46(n) | | $ | 4,964,564 | |
| | 4,096,744 | | | Countrywide Alternative Loan Trust, Series 2006-OA18, Class A1, (1 mo. LIBOR US + 0.120%), 1.36%, 12/25/46(n) | | | 3,840,333 | |
| | 6,148,580 | | | Countrywide Alternative Loan Trust, Series 2006-OA21, Class A1, (1 mo. LIBOR US + 0.190%), 1.43%, 03/20/47(n) | | | 5,230,534 | |
| | 2,644,314 | | | Countrywide Alternative Loan Trust, Series 2006-OA22, Class A1, (1 mo. LIBOR US + 0.160%), 1.40%, 02/25/47(n) | | | 2,535,167 | |
| | 1,502,461 | | | Countrywide Alternative Loan Trust, Series 2006-OA3, Class 2A1, (1 mo. LIBOR US + 0.210%), 1.45%, 05/25/36(n) | | | 1,295,174 | |
| | 7,611,479 | | | Countrywide Alternative Loan Trust, Series 2006-OA6, Class 1A1A, (1 mo. LIBOR US + 0.210%), 1.45%, 07/25/46(n) | | | 6,486,125 | |
| | 12,464,353 | | | Countrywide Alternative Loan Trust, Series 2006-OA8, Class 1A1, (1 mo. LIBOR US + 0.190%), 1.43%, 07/25/46(n) | | | 11,617,568 | |
| | 7,226,501 | | | Countrywide Alternative Loan Trust, Series 2006-OC1, Class 1A1, (1 mo. LIBOR US + 0.230%), 1.47%, 03/25/36(n) | | | 6,090,476 | |
| | 5,460,390 | | | Countrywide Alternative Loan Trust, Series 2006-OC3, Class 1A1, (1 mo. LIBOR US + 0.180%), 1.42%, 04/25/46(n) | | | 4,866,663 | |
| | 2,997,816 | | | Countrywide Alternative Loan Trust, Series 2007-12T1, Class A22, 5.75%, 06/25/37 | | | 2,464,301 | |
| | 3,019,533 | | | Countrywide Alternative Loan Trust, Series 2007-12T1, Class A5, 6.00%, 06/25/37 | | | 2,542,514 | |
| | 1,519,351 | | | Countrywide Alternative Loan Trust, Series 2007-19, Class 1A34, 6.00%, 08/25/37 | | | 1,239,899 | |
| | 5,660,002 | | | Countrywide Alternative Loan Trust, Series 2007-22, Class 2A16, 6.50%, 09/25/37 | | | 4,061,499 | |
| | 5,649,585 | | | Countrywide Alternative Loan Trust, Series 2007-25, Class 1A3, 6.50%, 11/25/37 | | | 4,439,817 | |
| | 1,514,151 | | | Countrywide Alternative Loan Trust, Series 2007-9T1, Class 1A8, 6.00%, 05/25/37 | | | 1,126,996 | |
Principal
Amount | | | | | Value | |
| COLLATERALIZED MORTGAGE OBLIGATIONS (continued) | | | | |
| $ | 1,405,621 | | | Countrywide Alternative Loan Trust, Series 2007-J1, Class 3A4, STEP, 4.73%, 11/25/36 | | $ | 1,136,599 | |
| | 14,645,980 | | | Countrywide Alternative Loan Trust, Series 2007-OA2, Class 1A1, (12 mo. Federal Reserve Cumulative Average US + 0.840%), 1.78%, 03/25/47(n) | | | 11,969,275 | |
| | 1,513,604 | | | Countrywide Alternative Loan Trust, Series 2007-OA3, Class 1A2, (1 mo. LIBOR US + 0.180%), 1.42%, 04/25/47(n) | | | 234,582 | |
| | 572,208 | | | Countrywide Alternative Loan Trust, Series 2007-OA8, Class 2A2, (1 mo. LIBOR US + 0.230%), 1.47%, 06/25/47(n) | | | 42,692 | |
| | 3,879,339 | | | Countrywide Alternative Loan Trust, Series 2007-OH2, Class A2A, (1 mo. LIBOR US + 0.240%), 1.48%, 08/25/47(n) | | | 2,957,972 | |
| | 2,346,417 | | | Countrywide Alternative Loan Trust, Series 2008-1R, Class 2A3, 6.00%, 08/25/37 | | | 1,914,450 | |
| | 3,069,596 | | | Countrywide Home Loan Mortgage Pass-Through Trust, Series 2005-31, Class 2A3, 3.16%, 01/25/36(p) | | | 2,920,949 | |
| | 864,561 | | | Countrywide Home Loan Mortgage Pass-Through Trust, Series 2005-J3, Class 2A4, 4.50%, 09/25/35 | | | 827,483 | |
| | 1,473,346 | | | Countrywide Home Loan Mortgage Pass-Through Trust, Series 2006-HYB1, Class 2A1, 3.12%, 03/20/36(p) | | | 1,453,177 | |
| | 12,974,870 | | | Countrywide Home Loan Mortgage Pass-Through Trust, Series 2006-OA4, Class A1, 1.90%, 04/01/46 | | | 7,351,804 | |
| | 4,276,665 | | | Countrywide Home Loan Mortgage Pass-Through Trust, Series 2006-OA5, Class 3A1, (1 mo. LIBOR US + 0.200%), 1.44%, 04/25/46(n) | | | 3,952,143 | |
| | 1,358,257 | | | Countrywide Home Loan Mortgage Pass-Through Trust, Series 2006-R2, Class AF1, (1 mo. LIBOR US + 0.420%), 1.66%, 07/25/36(j)(n) | | | 1,253,514 | |
| | 2,949,821 | | | Countrywide Home Loan Mortgage Pass-Through Trust, Series 2007-21, Class 1A1, 6.25%, 02/25/38 | | | 2,523,665 | |
| | 140,719 | | | Credit Suisse Mortgage Capital Certificates, Series 2006-8, Class 1A1, 4.50%, 10/25/21 | | | 132,661 | |
See Notes to Financial Statements.
| Old Westbury Funds, Inc. | |
| Strategic Opportunities Fund | |
| Consolidated Portfolio of Investments - (Continued) | October 31, 2017 |
| | |
Principal
Amount | | | | | Value | |
| COLLATERALIZED MORTGAGE OBLIGATIONS (continued) | | | | |
| $ | 3,552,862 | | | Credit Suisse Mortgage Capital Certificates, Series 2006-9, Class 3A1, 6.00%, 11/25/36 | | $ | 3,382,483 | |
| | 321,282 | | | Credit Suisse Mortgage Capital Certificates, Series 2010-20R, Class 9A1, 3.45%, 01/27/36(j)(p) | | | 323,823 | |
| | 15,340,447 | | | Credit Suisse Mortgage Trust Mortgage-Backed Trust, 6.50%, 02/01/47(j)(k) | | | 15,325,720 | |
| | 3,289,857 | | | Credit Suisse Mortgage Trust Mortgage-Backed Trust, Series 2007-3, Class 1A1A, 5.84%, 04/25/37(p) | | | 1,663,046 | |
| | 4,256,697 | | | Credit Suisse Mortgage Trust, Series 2014-2R, Class 17A3, 4.09%, 04/27/37(j)(p) | | | 3,292,442 | |
| | 7,000,000 | | | Credit Suisse Mortgage Trust, Series 2015-4R, Class 1A4, (1 mo. LIBOR US + 0.150%), 1.39%, 10/27/36(j)(n) | | | 4,326,916 | |
| | 4,613,125 | | | Credit Suisse Mortgage Trust, Series 2015-6R, Class 5A1, (1 mo. LIBOR US + 0.180%), 1.42%, 03/27/36(j)(n) | | | 4,411,996 | |
| | 12,047,482 | | | Credit Suisse Mortgage Trust, Series 2015-6R, Class 5A2, (1 mo. LIBOR US + 0.180%), 1.42%, 03/27/36(j)(n) | | | 6,686,353 | |
| | 56,714,600 | | | Credit Suisse Mortgage Trust, Series 2017-1, 8.75%, 03/25/21(j) | | | 40,735,460 | |
| | 7,845,290 | | | Credit Suisse Mortgage-Backed Pass-Through Certificates, Series 2005-10, Class 10A1, (1 mo. LIBOR US + 1.350%), 2.59%, 11/25/35(n) | | | 3,344,555 | |
| | 578,539 | | | Deutsche Alt-A Securities Mortgage Loan Trust, Series 2007-1, Class 1A3B, (1 mo. LIBOR US + 0.140%), 1.38%, 08/25/37(n) | | | 570,259 | |
| | 2,835,159 | | | Deutsche Alt-A Securities Mortgage Loan Trust, Series 2007-OA2, Class A1, (12 mo. Federal Reserve Cumulative Average US + 0.770%), 1.71%, 04/25/47(n) | | | 2,493,429 | |
| | 2,760,094 | | | Deutsche Alt-A Securities Mortgage Loan Trust, Series 2007-OA4, Class 1A1B, (1 mo. LIBOR US + 0.130%), 1.37%, 08/25/47(n) | | | 2,577,643 | |
| | 857,257 | | | GMAC Mortgage Corp. Loan Trust, Series 2005-AR6, Class 2A1, 3.71%, 11/19/35(p) | | | 829,327 | |
| | 5,674,513 | | | GSMPS Mortgage Loan Trust, Series 2005-RP1, Class 1AF, (1 mo. LIBOR US + 0.350%), 1.59%, 01/25/35(j)(n) | | | 5,074,115 | |
Principal
Amount | | | | | Value | |
| COLLATERALIZED MORTGAGE OBLIGATIONS (continued) | | | |
| $ | 2,071,974 | | | GSMPS Mortgage Loan Trust, Series 2006-RP1, Class 1AF1, (1 mo. LIBOR US + 0.350%), 1.59%, 01/25/36(j)(n) | | $ | 1,786,695 | |
| | 751,780 | | | GSR Mortgage Loan Trust, Series 2005-AR1, Class 2A1, 3.65%, 01/25/35(p) | | | 758,876 | |
| | 212,900 | | | GSR Mortgage Loan Trust, Series 2006-4F, Class 1A1, 5.00%, 05/25/36 | | | 212,696 | |
| | 576,787 | | | GSR Mortgage Loan Trust, Series 2006-9F, Class 9A1, 6.00%, 08/25/21 | | | 571,350 | |
| | 1,027,108 | | | GSR Mortgage Loan Trust, Series 2006-AR1, Class 3A1, 3.67%, 01/25/36(p) | | | 999,596 | |
| | 1,314,800 | | | GSR Mortgage Loan Trust, Series 2007-4F, Class 3A1, 6.00%, 07/25/37 | | | 1,212,833 | |
| | 2,446,677 | | | HarborView Mortgage Loan Trust, Series 2007-3, Class 2A1B, (1 mo. LIBOR US + 0.230%), 1.47%, 05/19/47(n) | | | 1,934,838 | |
| | 4,016,920 | | | HarborView Mortgage Loan Trust, Series 2007-4, Class 2A2, (1 mo. LIBOR US + 0.250%), 1.49%, 07/19/47(n) | | | 3,473,750 | |
| | 1,451,896 | | | Homebanc Mortgage Trust, Series 2006-1, Class 2A1, 3.20%, 04/25/37(p) | | | 1,304,634 | |
| | 47,105,917 | | | IndyMac IMSC Mortgage Loan Trust, Series 2007-HOA1, Class AXPP, 1.99%, 07/25/47 | | | 2,098,472 | |
| | 6,434,243 | | | IndyMac INDX Mortgage Loan Trust, Series 2006-AR33, Class 2A21, 3.75%, 01/25/37(p) | | | 5,622,389 | |
| | 3,163,132 | | | JPMorgan Alternative Loan Trust, Series 2007-A1, Class 1A3A, (1 mo. LIBOR US + 0.150%), 1.39%, 03/25/37(n) | | | 3,254,624 | |
| | 3,661,184 | | | JPMorgan Mortgage Trust, Series 2007-A5, Class 2A1, 1.94%, 10/25/37(p) | | | 2,992,681 | |
| | 327,562 | | | JPMorgan Mortgage Trust, Series 2007-S2, Class 2A3, 5.50%, 06/25/37 | | | 315,747 | |
| | 3,339,513 | | | JPMorgan Resecuritization Trust, Series 2015-3, Class 2A1, 4.30%, 11/26/36(j)(p) | | | 3,321,030 | |
| | 4,810,537 | | | Lehman XS Trust, Series 2007-20N, Class A1, (1 mo. LIBOR US + 1.150%), 2.39%, 12/25/37(n) | | | 4,739,041 | |
| | 2,410,120 | | | LSTAR Securities Investment Ltd., Series 2016-5, Class A1, (1 mo. LIBOR US + 2.000%), 3.24%, 11/01/21(j)(n) | | | 2,410,868 | |
See Notes to Financial Statements.
| Old Westbury Funds, Inc. | |
| Strategic Opportunities Fund | |
| Consolidated Portfolio of Investments - (Continued) | October 31, 2017 |
| | |
Principal
Amount | | | | | Value | |
| COLLATERALIZED MORTGAGE OBLIGATIONS (continued) | | | | |
| $ | 3,395,331 | | | LSTAR Securities Investment Ltd., Series 2017-2, Class A1, (1 mo. LIBOR US + 2.000%), 3.24%, 02/01/22(j)(n) | | $ | 3,399,856 | |
| | 4,028,017 | | | MASTR Reperforming Loan Trust, Series 2006-2, Class 1A1, 4.44%, 05/25/36(j)(p) | | | 3,554,683 | |
| | 2,680,659 | | | MASTR Resecuritization Trust, Series 2008-3, Class A1, 1.67%, 08/25/37(j)(p) | | | 2,005,859 | |
| | 3,924,139 | | | Merrill Lynch Alternative Note Asset Trust, Series 2007-OAR2, Class A2, (1 mo. LIBOR US + 0.210%), 1.45%, 04/25/37(n) | | | 3,270,960 | |
| | 2,727,052 | | | Merrill Lynch Mortgage Investors Trust, Series 2006-A3, Class 3A1, 3.60%, 05/25/36(p) | | | 2,550,568 | |
| | 997,968 | | | Merrill Lynch Mortgage Investors, Inc., Series 2006-AF2, Class AF1, 6.25%, 10/25/36 | | | 837,574 | |
| | 9,065,609 | | | Morgan Stanley Re-REMIC Trust, Series 2010-R5, Class 7B, STEP, 1.83%, 05/26/37(j) | | | 7,623,831 | |
| | 3,720,731 | | | Morgan Stanley Resecuritization Trust, Series 2015-R6, Class 3A, (1 mo. LIBOR US + 0.160%), 1.40%, 07/26/45(n) | | | 3,413,681 | |
| | 5,689,988 | | | Prime Mortgage Trust, Series 2006-DR1, Class 2A1, 5.50%, 05/25/35(j) | | | 5,432,976 | |
| | 2,468,185 | | | Prime Mortgage Trust, Series 2006-DR1, Class 2A2, 6.00%, 05/25/35(j) | | | 2,396,560 | |
| | 1,192,613 | | | Residential Accredit Loans, Inc., Series 2006-QS15, Class A1, 6.50%, 10/25/36 | | | 1,109,334 | |
| | 211,913 | | | Residential Funding Mortgage Securities I, Series 2006-S11, Class A2, 6.00%, 11/25/36 | | | 198,551 | |
| | 5,100,619 | | | Residential Funding Mortgage Securities I, Series 2006-SA2, Class 2A1, 4.48%, 08/25/36(p) | | | 4,327,758 | |
| | 11,379,000 | | | Seasoned Credit Risk Transfer Trust, Series 2017-3, Class B, 19.73%, 07/01/56(j)(k) | | | 768,083 | |
| | 19,344,366 | | | Seasoned Credit Risk Transfer Trust, Series 2017-3, Class BIO, 1.09%, 07/01/56(j)(p) | | | 1,910,256 | |
| | 2,774,969 | | | Structured Adjustable Rate Mortgage Loan Trust, Series 2005-11, Class 1A1, 3.36%, 05/25/35(p) | | | 2,337,029 | |
| | 4,850,384 | | | Structured Asset Mortgage Investments II Trust, Series 2006-AR5, Class 4A1, (1 mo. LIBOR US + 0.220%), 1.46%, 05/25/46(n) | | | 2,730,561 | |
Principal
Amount | | | | | Value | |
| COLLATERALIZED MORTGAGE OBLIGATIONS (continued) | | | | |
| $ | 3,178,436 | | | Structured Asset Mortgage Investments II Trust, Series 2007-AR4, Class GA4B, (1 mo. LIBOR US + 0.180%), 1.42%, 09/25/47(n) | | $ | 3,007,635 | |
| | 4,927,490 | | | Structured Asset Securities Corp., Series 2005-RF3, Class 1A, (1 mo. LIBOR US + 0.350%), 1.59%, 06/25/35(j)(n) | | | 4,302,120 | |
| | 1,736,008 | | | Suntrust Adjustable Rate Mortgage Loan Trust, Series 2007-2, Class 3A3, 3.61%, 04/25/37(p) | | | 1,472,337 | |
| | 659,223 | | | Suntrust Adjustable Rate Mortgage Loan Trust, Series 2007-2, Class 4A1, 3.63%, 04/25/37(p) | | | 542,264 | |
| | 2,509,825 | | | Thornburg Mortgage Securities Trust, Series 2007-3, Class 4A1, (12 mo. LIBOR US + 1.250%), 3.02%, 06/25/47(n) | | | 2,210,799 | |
| | 4,977,540 | | | Voyager STICS Delaware Trust, Series 2009-1, Class CAA1, (1 mo. LIBOR US + 0.320%), 1.56%, 04/26/37(j)(n) | | | 4,716,785 | |
| | 1,737,087 | | | Washington Mutual Alternative Mortgage Pass-Through Certificates, Series 2005-10, Class 2A6, 5.50%, 11/25/35 | | | 1,585,316 | |
| | 4,994,378 | | | Washington Mutual Alternative Mortgage Pass-Through Certificates, Series 2006-5, Class 3A3, STEP, 6.22%, 07/25/36 | | | 2,259,095 | |
| | 139,900 | | | Washington Mutual Mortgage Pass-Through Certificates Trust, Series 2005-AR16, Class 1A1, 2.93%, 12/25/35(p) | | | 136,102 | |
| | 2,929,548 | | | Washington Mutual Mortgage Pass-Through Certificates Trust, Series 2006-AR13, Class 2A, (Cost of Funds for the 11th District of San Franciso + 1.500%), 2.23%, 10/25/46(n) | | | 2,787,642 | |
| | 1,752,987 | | | Washington Mutual Mortgage Pass-Through Certificates Trust, Series 2007-HY7, Class 2A2, 3.02%, 07/25/37(p) | | | 1,457,656 | |
| | 4,038,859 | | | Washington Mutual Mortgage Pass-Through Certificates Trust, Series 2007-OA4, Class 1A, (12 mo. Federal Reserve Cumulative Average US + 0.770%), 1.71%, 05/25/47(n) | | | 3,861,542 | |
| | 2,201,110 | | | Washington Mutual Mortgage Pass-Through Certificates, Series 2006-AR6, Class 2A, (12 mo. Federal Reserve Cumulative Average US + 0.960%), 1.90%, 08/25/46(n) | | | 1,605,946 | |
See Notes to Financial Statements.
| Old Westbury Funds, Inc. | |
| Strategic Opportunities Fund | |
| Consolidated Portfolio of Investments - (Continued) | October 31, 2017 |
| | |
Principal
Amount | | | | | Value | |
| COLLATERALIZED MORTGAGE OBLIGATIONS (continued) | | | |
| $ | 16,317,482 | | | Wells Fargo Alternative Loan Trust, Series 2007-PA1, Class A2, (1 mo. LIBOR US + 6.680%), 5.44%, 03/25/37(n) | | $ | 2,555,422 | |
| | 4,860,882 | | | Wells Fargo Mortgage Backed Securities Trust, Series 2005-AR16, Class CRB1, 3.41%, 10/25/35(p) | | | 4,152,357 | |
| | 45,639 | | | Wells Fargo Mortgage Backed Securities Trust, Series 2006-AR10, Class 3A1, 3.40%, 07/25/36(p) | | | 45,493 | |
| | 633,399 | | | Wells Fargo Mortgage Backed Securities Trust, Series 2006-AR8, Class 2A3, 3.57%, 04/25/36(p) | | | 639,656 | |
| | | | | | | | 444,614,324 | |
COMMERCIAL MORTGAGE-BACKED
SECURITIES — 1.2% | |
| | 1,967,064 | | | Bayview Commercial Asset Trust, Series 2005-4A, Class M2, (1 mo. LIBOR US + 0.470%), 1.71%, 01/25/36(j)(n) | | | 1,813,202 | |
| | 16,642,666 | | | Bayview Commercial Asset Trust, Series 2007-4A, Class A1, (1 mo. LIBOR US + 0.450%), 1.69%, 09/25/37(j)(n) | | | 15,784,071 | |
| | 2,217,106 | | | Bayview Commercial Asset Trust, Series 2007-5A, Class A3, (1 mo. LIBOR US + 1.000%), 2.24%, 10/25/37(j)(n) | | | 2,138,318 | |
| | 7,628,500 | | | Bayview Commercial Asset Trust, Series 2007-5A, Class A4, (1 mo. LIBOR US + 1.500%), 2.74%, 10/25/37(j)(n) | | | 4,956,558 | |
| | 10,127,000 | | | Bayview Commercial Asset Trust, Series 2007-6A, Class A4A, (1 mo. LIBOR US + 1.500%), 2.74%, 12/25/37(j)(n) | | | 7,456,728 | |
| | 340,000 | | | CFCRE Commercial Mortgage Trust, Series 2016-C3, Class D, 3.05%, 01/10/48(j)(p) | | | 249,038 | |
| | 2,000,000 | | | Commercial Mortgage Trust, Series 2014-PAT, Class E, (1 mo. LIBOR US + 3.150%), 4.38%, 08/13/27(j)(n) | | | 2,031,385 | |
| | 4,482,000 | | | Commercial Mortgage Trust, Series 2014-PAT, Class F, (1 mo. LIBOR US + 2.441%), 3.68%, 08/13/27(j)(n) | | | 4,476,529 | |
| | 460,000 | | | Commercial Mortgage Trust, Series 2015-CR25, Class D, 3.80%, 08/10/48(p) | | | 382,871 | |
| | 15,000,000 | | | GAHR Commercial Mortgage Trust, Series 2015-NRF, Class FFX, 3.38%, 12/15/34(j)(p) | | | 14,893,307 | |
Principal
Amount | | | | | Value | |
| COMMERCIAL MORTGAGE-BACKED SECURITIES (continued) | | | |
| $ | 1,880,000 | | | GAHR Commercial Mortgage Trust, Series 2015-NRF, Class GFX, 3.38%, 12/15/34(j)(p) | | $ | 1,851,639 | |
| | 4,302,000 | | | Lehman Brothers Small Balance Commercial Mortgage Trust, Series 2006-3A, Class M1, (1 mo. LIBOR US + 0.290%), 1.53%, 12/25/36(j)(n) | | | 3,435,282 | |
| | 3,881,000 | | | Velocity Commercial Capital Loan Trust, Series 2016-1, Class M5, 7.80%, 04/25/46(j)(p) | | | 4,151,835 | |
| | | | | | | | 63,620,763 | |
Total Non-Agency Mortgage-Backed Securities
(Cost $490,000,899) | | | 508,235,087 | |
| U.S. GOVERNMENT SPONSORED AGENCY MORTGAGE-BACKED SECURITIES — 0.7% | | | | |
| COLLATERALIZED MORTGAGE OBLIGATIONS — 0.7% | |
| | 3,223,880 | | | Fannie Mae Connecticut Avenue Securities, Series 2016-C02, Class 1M2, 7.24%, 09/25/28(p) | | | 3,725,593 | |
| | 6,138,160 | | | Fannie Mae Connecticut Avenue Securities, Series 2017-C01, Class 1B1, 6.99%, 07/25/29(j)(p) | | | 6,931,328 | |
| | 11,500,000 | | | Fannie Mae Connecticut Avenue Securities, Series 2017-C01, Class 1M2, 4.79%, 07/25/29(j)(p) | | | 12,237,030 | |
| | 2,000,000 | | | Fannie Mae Connecticut Avenue Securities, Series 2017-C03, Class 1B1, 6.09%, 10/25/29(p) | | | 2,110,552 | |
| | 909,422 | | | Fannie Mae Connecticut Avenue Securities, Series 2017-C03, Class 1M2, 4.24%, 10/25/29(j)(p) | | | 940,862 | |
| | 4,750,000 | | | Freddie Mac Structured Agency Credit Risk Program, Series 2017-DNA1, Class B1, 6.19%, 07/25/29(p) | | | 5,086,421 | |
| | 1,375,000 | | | Freddie Mac Structured Agency Credit Risk Program, Series 2017-DNA1, Class B2, 11.24%, 07/25/29(p) | | | 1,262,430 | |
| | 6,000,000 | | | Freddie Mac Structured Agency Credit Risk Program, Series 2017-DNA1, Class M2, 4.49%, 07/25/29(p) | | | 6,311,337 | |
| Total U.S. Government Sponsored Agency Mortgage-Backed Securities | | | | |
| (Cost $36,038,332) | | | 38,605,553 | |
| U.S. GOVERNMENT AGENCIES — 28.2% | | | | |
| Federal Home Loan Bank — 28.2% | | | | |
| | 5,000,000 | | | 0.50%, 11/01/17(q) | | | 5,000,000 | |
See Notes to Financial Statements.
| Old Westbury Funds, Inc. | |
| Strategic Opportunities Fund | |
| Consolidated Portfolio of Investments - (Continued) | October 31, 2017 |
| | |
Principal
Amount | | | | | Value | |
| Federal Home Loan Bank (continued) | | | | |
| $ | 17,000,000 | | | 1.02%, 11/02/17(q) | | $ | 16,999,524 | |
| | 150,000,000 | | | 1.02%, 11/06/17(q) | | | 149,979,000 | |
| | 94,000,000 | | | 1.00%, 11/07/17(q) | | | 93,984,208 | |
| | 51,700,000 | | | 1.02%, 11/08/17(q) | | | 51,689,867 | |
| | 304,000,000 | | | 1.02%, 11/10/17(q) | | | 303,923,088 | |
| | 84,000,000 | | | 1.01%, 11/13/17(q) | | | 83,971,692 | |
| | 59,000,000 | | | 1.01%, 11/14/17(q) | | | 58,978,465 | |
| | 220,000,000 | | | 1.01%, 11/15/17(q) | | | 219,913,540 | |
| | 33,300,000 | | | 1.01%, 11/17/17(q) | | | 33,285,048 | |
| | 168,000,000 | | | 1.02%, 11/22/17(q) | | | 167,901,048 | |
| | 30,000,000 | | | 1.02%, 12/04/17(q) | | | 29,971,410 | |
| | 50,000,000 | | | 1.01%, 12/05/17(q) | | | 49,950,900 | |
| | 158,000,000 | | | 1.02%, 12/06/17(q) | | | 157,840,262 | |
| | 67,000,000 | | | 1.01%, 12/08/17(q) | | | 66,928,377 | |
| | 26,000,000 | | | 1.02%, 12/11/17(q) | | | 25,969,944 | |
| | 44,400,000 | | | 1.07%, 01/16/18(q) | | | 44,295,038 | |
| | 5,000,000 | | | 1.13%, 02/07/18(q) | | | 4,984,485 | |
Total U.S. Government Agencies
(Cost $1,565,579,859) | | | 1,565,565,896 | |
| U.S. GOVERNMENT SECURITIES — 4.0% | | | | |
| U.S. Treasury Bills — 4.0% | | | | |
| | 54,000,000 | | | 0.88%, 11/02/17(q) | | | 53,998,622 | |
| | 50,000,000 | | | 1.01%, 11/09/17(q) | | | 49,989,597 | |
| | 34,000,000 | | | 1.02%, 11/16/17(q) | | | 33,986,400 | |
| | 24,000,000 | | | 0.97%, 11/30/17(q) | | | 23,980,474 | |
| | 4,000,000 | | | 0.00%, 12/14/17(q) | | | 3,995,508 | |
| | 9,000,000 | | | 1.01%, 02/01/18(q) | | | 8,973,895 | |
| | 50,000,000 | | | 1.05%, 03/29/18(q) | | | 49,750,756 | |
Total U.S. Government Securities
(Cost $224,712,897) | | | 224,675,252 | |
| | | | | | | | | |
| Shares | | | | | | | |
| CASH SWEEP — 2.4% | | | | |
| UNITED STATES — 2.4% | | | | |
| | 133,881,469 | | | Citibank - US Dollars on Deposit in Custody Account, 0.10%(r) | | | 133,881,469 | |
Total Cash Sweep
(Cost $133,881,469) | | | 133,881,469 | |
TOTAL INVESTMENTS — 99.8%
(Cost $5,382,799,798) | | | 5,541,063,954 | |
| OTHER ASSETS IN EXCESS OF LIABILITIES — 0.2% | | | 8,484,154 | |
| NET ASSETS — 100.0% | | $ | 5,549,548,108 | |
| Contracts | | | | | Value | |
| CALL OPTIONS WRITTEN — 0.0% | | | | |
| | (100,000 | ) | | PowerShares DB US Dollar Index Bullish Fund, Strike $26.00, Expires 01/19/18, (Notional amount $260,000,000) | | $ | (600,000 | ) |
Total Call Options Written
(Premiums received $(125,845)) | | | (600,000 | ) |
| | | | | | | | | |
| Units | | | | | Value | |
| STRUCTURED OPTIONS — 1.7% | | | | |
| Equity Options — 1.7% | | | | |
| | 50,000,000 | (s) | | Absolute Dispersion Option on Stock Basket, One purchased call strike of 20%, Expires 08/17/18, Broker Societe Generale (Notional amount $50,000,000)(t) | | $ | 713,500 | |
| | 50,000,000 | (s) | | Absolute Dispersion Option on Stock Basket, One purchased call strike of 22%, Expires 08/24/18, Broker BNP Paribas SA (Notional amount $50,000,000)(u) | | | 1,519,700 | |
| | 3,832 | | | DAXK Index, One purchased call strike 5,219.79 (Notional amount $20,000,000), One written put strike 5,219.79 (Notional amount $20,000,000), Expires 12/14/17, Broker Citibank N.A. | | | 4,025,978 | |
| | 327,225 | | | Euro STOXX 50 Dividend Index Option, One purchased put strike 110 (Notional amount $36,000,000), Expires 12/20/19, Broker UBS AG | | | 249,788 | |
| | 660,000 | | | Euro STOXX 50 Dividend Index Option, One purchased put strike 110.00 (Notional amount $73,000,000), Expires 12/20/19, Broker BNP Paribas SA | | | 727,123 | |
| | 15,000 | | | Euro STOXX 50 Dividend Index Option, One written put strike 2,650.00 (Notional amount $40,000,000), Expires 12/20/19, Broker BNP Paribas SA | | | (2,467,820 | ) |
| | 3,852 | | | Euro STOXX 50 Index, One purchased call strike 2,595.70, Expires 01/19/18, Broker Citibank N.A.(Notional amount $10,000,000) | | | 4,148,170 | |
| | 5,505 | | | Euro STOXX 50 Index, One purchased call strike 2,725,10, Expires 12/21/18, Broker Goldman Sachs International(Notional amount $15,000,000) | | | 4,842,029 | |
See Notes to Financial Statements.
| Old Westbury Funds, Inc. | |
| Strategic Opportunities Fund | |
| Consolidated Portfolio of Investments - (Continued) | October 31, 2017 |
| | |
| Units | | | | | Value | |
| Equity Options (continued) | | | | |
| | 2,815 | | | Euro STOXX 50 Index, One purchased call strike 2,797.2047, Expires 12/21/18, Broker JPMorgan Chase Bank N.A.(Notional amount $7,875,000) | | $ | 2,264,209 | |
| | 5,339 | | | Euro STOXX 50 Index, One purchased call strike 2,810.00, Expires 06/15/18, Broker Goldman Sachs International(Notional amount $15,000,000) | | | 4,201,191 | |
| | 7,563 | | | Euro STOXX 50 Index, One purchased call strike 3,540.75 (Notional amount $30,000,000), One written put strike 3,471.33 with a barrier level strike of 3,087.75 (Notional amount $30,000,000), Expires 12/15/17, Broker Citibank N.A. | | | 1,301,331 | |
| | 7,385 | | | Euro STOXX 50 Index, One written put strike 2,650.00 (Notional amount $19,570,250), Expires 12/20/19, Broker UBS AG | | | (956,011 | ) |
| | 4,422 | | | FTSE 100 Index, One purchased call strike 6,784.37 (Notional amount $30,000,000), One purchased put strike 6,648.68 (Notional amount $30,000,000), One written put strike 6,784.37 with a barrier level strike of 5,291.81 (8,843 contracts) (Notional amount $60,000,000), Expires 11/16/17, Broker Credit Suisse International(v) | | | 3,054,247 | |
| | 1,174 | | | FTSE MIB Index, One purchased call strike 17,205.81 (Notional amount $20,000,000), One purchased put strike 16,865.10 (Notional amount $20,000,000), One written put strike 17,035.46 with a barrier level strike of 12,846.44 (2,348 contracts) (Notional amount $40,000,000), Expires 12/14/17, Broker JPMorgan Chase Bank N.A.(v) | | | 6,506,761 | |
| Units | | | | | Value | |
| Equity Options (continued) | | | | |
| | 891 | | | FTSE MIB Index, One purchased call strike 22,671.4383 (Notional amount $20,000,000), One written put strike 22,446.9686 with a barrier level strike of 20,202.2717 (Notional amount $20,000,000), Expires 01/18/18, Broker JPMorgan Chase Bank N.A. | | $ | 352,280 | |
| | 2,346,041 | | | iShares MSCI Brazil Index, One purchased call strike 34.78 (Notional amount $80,000,000), One written call strike 37.51 (Notional amount $80,000,000), One written put strike 34.10 with a barrier level strike of 28.99 (586,510 contracts) (Notional amount $20,000,000), Expires on 05/18/18, Broker Barclays Bank Plc(v) | | | 3,736,071 | |
| | 171,356 | | | iShares NASDAQ Biotechnology Index, One purchased call strike 275.30 (Notional amount $46,000,000), One written call strike 307.37 (Notional amount $46,000,000), One written put strike 267.28 with a barrier level strike of 240.55 (74,828 contracts) (Notional amount $20,000,000), Expires 10/17/17, Broker Barclays Bank Plc(v) | | | 5,023,406 | |
| | 661,563 | | | iShares Russell 1000 Value ETF, One purchased call strike 114.50 (Notional amount $75,000,000), One written put strike 48.89 on Utilities Select Sector SPDR Fund with a barrier level strike of 37.38 (1,534,103 contracts) (Notional amount $75,000,000), Expires 02/16/18, Broker Bank of America N.A. | | | 3,820,911 | |
| | 1,440,181 | | | Materials Select Sector SPDR, One purchased call strike 52.5976 (Notional amount $75,000,000), One written put strike 48.9402 on Utilities Select Sector SPDR with a barrier level strike of 40.6204 (1,532,482 contracts) (Notional amount $75,000,000), Expires 02/16/18, Broker JPMorgan Chase Bank N.A.(v) | | | 9,486,922 | |
See Notes to Financial Statements.
| Old Westbury Funds, Inc. | |
| Strategic Opportunities Fund | |
| Consolidated Portfolio of Investments - (Continued) | October 31, 2017 |
| | |
| Units | | | | | Value | |
| Equity Options (continued) | | | | |
| | 7,005 | | | S&P 500 Index, One purchased call strike 2,162.75 (Notional amount $15,000,000), One purchased put strike 2,119.93 (Notional amount $15,000,000), One written call strike 2,141.34 with a barrier level strike of 1,724.85 (14,010 contracts) (Notional amount $30,000,000), Expires 11/16/17, Broker Bank of America N.A.(v) | | $ | 2,872,591 | |
| | 18,306 | | | S&P 500 Index, One purchased call strike 2,206.93 (Notional amount $40,000,000), One purchased put strike 2,163.23 (Notional amount $40,000,000), One written put strike 2,185.08 with a barrier level strike of 1,780.40 (36,612 contracts) (Notional amount $80,000,000), Expires 12/14/17, Broker Bank of America N.A.(v) | | | 6,706,429 | |
| | 19,862 | | | S&P 500 Index, One purchased call strike 2,542.5235 (Notional amount $50,000,000), One written put strike 2,391.4825 (Notional amount $47,000,000), Expires 11/16/17, Broker Credit Suisse International | | | 794,193 | |
| | 29,434 | | | S&P 500 Index, One purchased call strike 2,573.53 (Notional amount $75,000,000), One written put strike with a barrier level strike of 2,548.05 (Notional amount $75,000,000), Expires 12/14/17, Broker Credit Suisse International | | | 564,204 | |
| | 19,439 | | | S&P 500 Index, One purchased call strike 2,597.84 (Notional amount $50,000,000), One written put strike 2,443.52 (Notional amount $50,000,000), Expires 11/30/17, Broker Bank of America N.A. | | | 81,455 | |
| | 2,489 | | | SPDR Dow Jones Industrial Average ETF Trust, One purchased call strike 20,289.89 (Notional amount $50,000,000), One written call strike 48.93 on Utilities Select Sector SPDR with a barrier level strike of 36.84(1,021,868 contracts) (Notional amount $50,000,000), Expires 02/15/18, Broker Credit Suisse International(v) | | | 7,611,141 | |
| Units | | | | | Value | |
| Equity Options (continued) | | | | |
| | 3,675 | | | SPDR Dow Jones Industrial Average ETF Trust, One purchased put strike 20,406.62 (Notional amount $75,000,000), One purchased call strike 20,610.6862 (Notional amount $75,000,000), One written put strike 49.5524 on Utilities Select Sector SPDR with a barrier level strike of 40.0383 (1,513,549 contracts) (Notional amount $75,000,000), Expires 03/15/18, Broker Citibank N.A.(v) | | $ | 10,191,463 | |
| | 986,995 | | | SPDR S&P Oil & Gas Exploration & Production ETF, One purchased call strike 31.0032 (Notional amount $30,000,000), One written call strike 33.4348 (Notional amount $30,000,000), One written put strike 30.3953 with a barrier level strike of 21.8846 (493,497 contracts) (Notional amount $15,000,000), Expires 12/29/17, Broker BNP Paribas SA(v) | | | 1,705,544 | |
| | 1,972,704 | | | SPDR S&P Oil & Gas Exploration & Production ETF, One purchased call strike 31.0234 (Notional amount $60,000,000), One written call strike 33.4566 (Notional amount $60,000,000), One written put strike 30.4151 with a barrier level strike of 23.1155 (Notional amount $20,000,000), Expires 12/29/17, Broker BNP Paribas SA | | | 3,822,011 | |
| | 3,805 | | | Swiss Market Index, One purchased call strike 7,963.92 (Notional amount $30,000,000), One purchased put strike 7,727.36 (Notional amount $30,000,000), One written put strike 7,885.07 with a barrier level strike of 6,185.84 (7,609 contracts) (Notional amount $60,000,000), Expires 11/16/17, Broker JPMorgan Chase Bank N.A.(v) | | | 4,850,639 | |
| | | | | | | | 91,749,456 | |
See Notes to Financial Statements.
| Old Westbury Funds, Inc. | |
| Strategic Opportunities Fund | |
| Consolidated Portfolio of Investments - (Continued) | October 31, 2017 |
| | |
| Units | | | | | Value | |
| Foreign Currency Options — 0.0% | | | | |
| | 10,000,000 | (s) | | USD/JPY foreign exchange rate, One purchased call strike 119.000, Expires 02/20/18, Broker Bank of America N.A.(Notional amount $10,000,000) | | $ | 1,261,790 | |
Total Structured Options
(Premiums paid $3,225,220) | | $ | 93,011,246 | |
| | | | | | | | | |
| | | | | | | Unrealized
Appreciation/
(Depreciation) | |
| SWAP AGREEMENTS | | | | |
| Total Return Swaps | | | | |
| Total return swap with Barclays Capital, Inc. receiving total return of the Barclays Japan Value Equity ER JPY Index over the initial equity level of 256.9172 and paying fixed interest rate of 0.45% at expiration date expiring 08/08/18 (Notional amount JPY 8,301,876,729) | | $ | 4,222,007 | |
| Total return swap with Barclays Capital, Inc. receiving total return of the Barclays Japan Value Equity ER JPY Index over the initial equity level of 259.663500 and paying fixed interest rate of 0.45% at expiration date expiring 08/08/18 (Notional amount JPY 8,212,509,424) | | | 6,607,270 | |
| Total return swap with Barclays Capital, Inc. receiving total return of the Shiller Barclays CAPE US Sector ER USD Index over the initial equity level of 520.3363 and paying fixed interest rate of 0.45% at expiration date expiring 08/27/18 (Notional amount $247,794,032) | | | 7,371,870 | |
| Total return swap with BNP Paribas SA based on a basket of indices, receiving an amount if the price return is over the basket level on valuation date and paying a floating amount of 0.30% with quarterly payments until expiration date, expiring 07/30/18 (Notional amount EUR 100,000,000)(w) | | | 396,729 | |
| | | | | | | Unrealized
Appreciation/
(Depreciation) | |
| Total Return Swaps (continued) | | | | |
| Total return swap with BNP Paribas SA based on a basket of indices, receiving an amount if the price return is over the basket level on valuation date and paying a floating amount of 0.30% with quarterly payments until expiration date, expiring 03/28/18 (Notional amount EUR 100,000,000)(x) | | $ | 4,160,230 | |
| Total return swap with BNP Paribas SA based on a basket of indices, receiving an amount if the price return is over the target spread of 131.2557 and paying an amount if the price return is under the target spread of 131.2557 with quarterly payments until expiration date, expiring 10/08/18 (Notional amount EUR 17,100,000)(y) | | | (1,017,731 | ) |
| | | | | | | | 21,740,375 | |
| Variance Swaps | | | | |
| Conditional Variance Swap with BNP Paribas SA receiving variance of the Hang Seng China Enterprises (“HSCEI”) Index over the volatility strike price of 23.70 with a knockout level of 130% of initial index level and the S&P 500 Index over the volatility strike price of 19.70 and paying variance of the HSCEI Index under the volatility strike price of 23.70 with a knockout level of 130% of initial index level and the S&P 500 Index under the volatility strike price of 19.70 at expiration date, expiring 12/28/18 (Vega notional amount $500,000) | | | 1,174,180 | |
| Conditional Variance Swap with JPMorgan Chase Bank N.A. receiving variance of difference between Hang Seng China Enterprises Index (“HSCEI”) and S&P 500 Index over the volatility strike of 22.5% with a condition that knockout level is between 70% and 120% of initial index level with a knockout level of 130% of initial index level at expiration date expiring 12/21/18 (Vega notional amount $500,000) | | | 438,367 | |
See Notes to Financial Statements.
| Old Westbury Funds, Inc. | |
| Strategic Opportunities Fund | |
| Consolidated Portfolio of Investments - (Continued) | October 31, 2017 |
| | |
| | | Unrealized
Appreciation/
(Depreciation) | |
| Variance Swaps (continued) | | | | |
| Conditional Variance Swap with Societe Generale receiving variance of difference between Hang Seng China Enterprises Index (“HSCEI”) and S&P 500 Index over the volatility strike price of 4.6 with a condition that knockout level is between 65% and 115% of initial index level with a knockout level of 130% at expiration date, expiring 12/21/18 (Vega notional amount $1,000,000) | | $ | 630,000 | |
| Conditional Variance Swap with Societe Generale receiving variance of difference between Hang Seng China Enterprises Index (“HSCEI”) and S&P 500 Index over the volatility strike price of 4.8 with a condition that knockout level is between 70% and 120% of initial index level with a knockout level of 130% at expiration date, expiring 12/21/18 (Vega notional amount $1,000,000) | | | 542,000 | |
| Conditional Variance Swap with Societe Generale receiving variance of Hang Seng China Enterprises Index (“HSCEI”) over the volatility strike price of 20.8 with a condition that knockout level is between 70% and 120% of initial index level with a knockout level of 130% and the S&P 500 Index over the volatility strike price of 15.80 of initial index level at expiration date, expiring 12/21/18 (Vega notional amount $1,000,000) | | | 403,000 | |
| Conditional Variance swap with UBS AG receiving variance of difference between S&P/ASX 200 Index and Nikkei 225 Index over the volatility strike price of 334.9 with a condition that knockout level is between 70% and 115% of initial index level with a knockout level of 120% at expiration date, expiring 12/13/19 (Vega notional amount $800,000) | | | (180,480 | ) |
| | | Unrealized
Appreciation/
(Depreciation) | |
| Variance Swaps (continued) | | | | |
| Conditional Variance swap with UBS AG receiving variance of difference between S&P/ASX 200 Index and Nikkei 225 Index over the volatility strike price of 357.21 with a condition that knockout level is between 70% and 115% of initial index level with a knockout level of 120% at expiration date, expiring 12/13/19 (Vega notional amount $500,000) | | $ | (64,313 | ) |
| Variance swap with Bank of America N.A. paying variance of the Merrill Lynch Core Portfolio Gross Index over the target volatility of 44.89 and receiving variance of the Merrill Lynch Core Portfolio Gross Index under the target volatility of 44.89 at expiration date, expiring 11/17/17 (Vega notional amount $1,000,000) | | | 1,976,944 | |
| Variance swap with BNP Paribas receiving an amount if the volatility of AUD/JPY foreign exchange rate is over 13.3675 and paying an amount if the volatility of S&P/ASX 200 Index is under 17.1175 at expiration date, expiring 12/20/18 (Vega notional amount $500,000) | | | 1,275,847 | |
| Variance swap with BNP Paribas receiving an amount if the volatility of AUD/USD foreign exchange rate is over 10.25 and paying an amount if the volatility of S&P/ASX 200 Index is under 16.05 at expiration date, expiring 06/21/18 (Vega notional amount AUD 1,000,000) | | | 1,217,462 | |
| Variance swap with BNP Paribas receiving an amount if the volatility of AUD/USD foreign exchange rate is over 10.95 and paying an amount if the volatility of S&P/ASX 200 Index is under 16.95 at expiration date, expiring 06/21/18 (Vega notional amount AUD 630,000) | | | 1,200,444 | |
| Variance swap with BNP Paribas SA paying variance of the Hang Seng China Enterprises Index over the target volatility of 25.65 and receiving variance of the Hang Seng China Enterprises Index under the target volatility of 25.65 at expiration date, expiring 12/28/18 (Vega notional amount HKD 3,900,000) | | | 1,232,827 | |
See Notes to Financial Statements.
| Old Westbury Funds, Inc. | |
| Strategic Opportunities Fund | |
| Consolidated Portfolio of Investments - (Continued) | October 31, 2017 |
| | |
| | | Unrealized
Appreciation/
(Depreciation) | |
| Variance Swaps (continued) | | | | |
| Variance swap with BNP Paribas SA paying variance of the S&P/ASX 200 Index over the target volatility of 15.80 and receiving variance of the AUD/USD foreign exchange rate under the target volatility of 9.70 at expiration date, expiring 12/20/18 (Vega notional amount AUD 1,300,000) | | $ | 1,919,636 | |
| Variance swap with Goldman Sachs International paying variance of the Goldman Sachs Momentum Builder Multi Asset 5 Index over the target volatility of 5.50 and receiving variance of the Goldman Sachs Momentum Builder Multi Asset 5 under the target volatility of 5.50 at expiration date expiring 10/30/18 (Notional amount $1,000,000) | | | (1,065,985 | ) |
| Variance swap with Goldman Sachs International paying variance of the Goldman Sachs Momentum Builder Multi Asset 5 Index over the target volatility of 6.15 and receiving variance of the Goldman Sachs Momentum Builder Multi Asset 5 Index under the target volatility of 6.15 at expiration date, expiring 05/10/19 (Vega notional amount $3,000,000) | | | 6,501 | |
| Variance swap with Goldman Sachs International paying variance of the Goldman Sachs Momentum Builder Multi Asset 5 Index over the target volatility of 6.15 and receiving variance of the Goldman Sachs Momentum Builder Multi Asset 5 Index under the target volatility of 6.15 at expiration date, expiring 05/29/18 (Vega notional amount $1,000,000) | | | 440,654 | |
| Variance swap with Goldman Sachs International paying variance of the Goldman Sachs Momentum Builder Multi Asset 5 Index over the target volatility of 6.15 and receiving variance of the Goldman Sachs Momentum Builder Multi Asset 5 Index under the target volatility of 6.15 at expiration date, expiring 05/29/18 (Vega notional amount $1,000,000) | | | 435,960 | |
| | | Unrealized
Appreciation/
(Depreciation) | |
| Variance Swaps (continued) | | | | |
| Variance swap with Goldman Sachs International paying variance of the Goldman Sachs Momentum Builder Multi Asset 5 Index over the target volatility of 6.20 and receiving variance of the Goldman Sachs Momentum Builder Multi Asset 5 Index under the target volatility of 6.20 at expiration date, expiring 11/09/18 (Vega notional amount $3,000,000) | | $ | 1,416,585 | |
| Variance swap with Goldman Sachs International paying variance of the Goldman Sachs Momentum Builder Multi Asset 5 Index over the target volatility of 6.25 and receiving variance of the Goldman Sachs Momentum Builder Multi Asset 5 Index under the target volatility of 6.25 at expiration date, expiring 11/06/17 (Vega notional amount $2,000,000) | | | 1,841,074 | |
| Variance swap with Goldman Sachs International receiving NASDAQ 100 Index over the initial equity level of 17.9 and paying NASDAQ 100 Index under the initial equity level of 17.9 at expiration date, expiring 12/15/17 (Notional amount $500,000) | | | 1,885,931 | |
| Variance swap with Goldman Sachs International receiving S&P 500 Index over the initial equity level of 13.3 and paying S&P 500 Index under the initial equity level of 13.3 at expiration date, expiring 12/15/17 (Notional amount $500,000) | | | (1,877,493 | ) |
| Variance swap with JPMorgan Chase Bank N.A. paying variance of the S&P 500 Index over the target volatility of 33.05 and receiving variance of the S&P 500 Index under the target volatility of 33.05 at expiration date, expiring 12/20/19 (Vega notional amount $500,000) | | | 6,252,698 | |
| Variance swap with Societe Generale paying variance of the Hang Seng China Enterprises Index over the target volatility of 25.65 and receiving variance of the Hang Seng China Enterprises Index under the target volatility of 25.65 at expiration date, expiring 12/28/18 (Vega notional amount HKD 3,899,275) | | | 1,179,669 | |
See Notes to Financial Statements.
| Old Westbury Funds, Inc. | |
| Strategic Opportunities Fund | |
| Consolidated Portfolio of Investments - (Continued) | October 31, 2017 |
| | |
| | | Unrealized
Appreciation/
(Depreciation) | |
| Variance Swaps (continued) | | | | |
| Variance swap with Societe Generale paying variance of the NASDAQ 100 Index over the target volatility of 17.80 and receiving variance of the NASDAQ 100 Index under the target volatility of 17.80 at expiration date expiring 12/15/17 (Vega notional amount $500,000) | | $ | 1,919,117 | |
| Variance swap with Societe Generale paying variance of the NASDAQ 100 Index over the target volatility of 17.95 and receiving variance of the NASDAQ 100 Index under the target Volatility of 17.95 at expiration date expiring 12/15/17 (Vega notional amount $500,000) | | | 2,003,451 | |
| Variance swap with Societe Generale receiving an amount if the volatility of AUD/USD foreign exchange rate is over 10.25 and paying an amount if the volatility of S&P/ASX 200 Index is under 16.10 at expiration date, expiring 06/21/18 (Vega notional amount AUD 1,340,000) | | | 1,555,149 | |
| Variance swap with Societe Generale receiving an amount if the volatility of AUD/USD foreign exchange rate is over 16.20 and paying an amount if the volatility of S&P/ASX 200 Index is under 16.20 at expiration date, expiring 06/21/18 (Vega notional amount AUD 660,000) | | | 971,881 | |
| Variance swap with Societe Generale receiving an amount if the volatility of Euro STOXX 50 index is over 16.45 and paying an amount if the volatility of Euro STOXX 50 index is under 16.45 at expiration date, expiring 12/15/17 (Vega notional amount EUR 426,000) | | | (2,473,438 | ) |
| Variance swap with Societe Generale receiving an amount if the volatility of Euro STOXX 50 index is over 16.6 and paying an amount if the volatility of Euro STOXX 50 index is under 16.6 at expiration date, expiring 12/15/17 (Vega notional amount EUR 420,805) | | | (2,457,287 | ) |
| | | Unrealized
Appreciation/
(Depreciation) | |
| Variance Swaps (continued) | | | | |
| Variance swap with Societe Generale receiving an amount if the volatility of NASDAQ 100 index is over 18.5 and paying an amount if the volatility of Russell 2000 index is under 18.5 at expiration date, expiring 03/16/18 (Vega notional amount $500,000) | | $ | 228,910 | |
| Variance Swap with Societe Generale receiving variance of difference between Hang Seng China Enterprises Index (“HSCEI”) and S&P 500 Index (“SPX”) over the volatility strike price of 4.2 with a condition that knockout level is between 65% and 115% of initial index level at expiration date expiring 12/21/18 (Vega notional amount $1,000,000) | | | 1,417,000 | |
| Variance swap with UBS AG receiving variance of the Franklin Floating Rate Fund over the target volatility of 4.00 and paying variance of the Franklin Floating Rate Fund under the target volatility of 4.00 at expiration date, expiring 12/28/18 (Vega notional amount $62,500) | | | 247,044 | |
| | | | 25,693,335 | |
| Volatility Swaps | | | | |
| Volatility swap with Bank of America N.A. receiving an amount if the volatility of CHF/USD foreign exchange rate is over 7.45 and paying an amount if the volatility of CHF/USD foreign exchange rate is under 7.45 at expiration date, expiring 05/10/18 (Vega notional amount $1,000,000) | | | (195,854 | ) |
| Volatility swap with Bank of America N.A. receiving an amount if the volatility of CHF/USD foreign exchange rate is over 7.60 and paying an amount if the volatility of CHF/USD foreign exchange rate is under 7.60 at expiration date, expiring 05/11/18 (Vega notional amount $1,000,000) | | | (57,776 | ) |
See Notes to Financial Statements.
| Old Westbury Funds, Inc. | |
| Strategic Opportunities Fund | |
| Consolidated Portfolio of Investments - (Continued) | October 31, 2017 |
| | |
| | | Unrealized
Appreciation/
(Depreciation) | |
| Volatility Swaps (continued) | | | | |
| Volatility swap with BNP Paribas SA based on a basket of equities and index, receiving an amount if the final realized volatility is over the target strike price of 15.43 and paying an amount if the final realized volatility is under the target strike price of 15.43 at expiration date, expiring 01/19/18 (Vega notional amount $300,000)(z) | | $ | (193,832 | ) |
| Volatility swap with BNP Paribas SA based on a basket of equities and index, receiving an amount if the final realized volatility is over the target strike price of 16.36 and paying an amount if the final realized volatility is under the target strike price of 16.36 at expiration date, expiring 01/19/18 (Vega notional amount $500,000)(aa) | | | (35,062 | ) |
| Volatility swap with BNP Paribas SA based on the Hang Seng Index, receiving an amount if the final realized volatility is over the target strike price of 15.80 and paying based on the USD/KRW foreign exchange rate an amount if the final realized volatility is under the target strike price of 9.35 at expiration date, expiring 12/28/17 (Vega notional amount $1,000,000) | | | (888,312 | ) |
| Volatility swap with JPMorgan Chase Bank N.A. based on a basket of securities and index, receiving variance if the basket volatility strike over the target strike price of 15.76 and paying variance if the basket volatility strike under the target strike price of 15.76 at expiration date, expiring 01/18/19 (Vega notional amount $300,000)(ab) | | | (371,146 | ) |
| Volatility swap with JPMorgan Chase Bank N.A. based on a basket of securities and index, receiving variance if the basket volatility strike over the target strike price of 17.00 and paying variance if the basket volatility strike under the target strike price of 17.00 at expiration date, expiring 01/19/18 (Vega notional amount $500,000)(ac) | | | (996,338 | ) |
| | | Unrealized
Appreciation/
(Depreciation) | |
| Volatility Swaps (continued) | | | | |
| Volatility swap with JPMorgan Chase Bank N.A. receiving an amount if the volatility of CHF/USD foreign exchange rate is over 7.32 and paying an amount if the volatility of CHF/USD foreign exchange rate is under 7.32 at expiration date, expiring 05/10/18 (Vega notional amount $1,000,000) | | $ | 259,659 | |
| Volatility Swap with Societe Generale based on a basket of securities and index, receiving variance if the basket volatility strike over the target strike price of 12 and paying variance if the basket volatility strike under the target strike price of 12 at expiration date, expiring 01/19/18 (Vega notional amount $499,996)(ad) | | | 638,086 | |
| Volatility Swap with Societe Generale based on a basket of securities and index, receiving variance if the basket volatility strike over the target strike price of 16.41 and paying variance if the basket volatility strike under the target strike price of 16.41 at expiration date, expiring 01/19/18 (Vega notional amount $500,000)(ae) | | | (781,615 | ) |
| Volatility Swap with Societe Generale based on a basket of securities and index, receiving variance if the basket volatility strike over the target strike price of 20.1 and paying variance if the basket volatility strike under the target strike price of 20.1 at expiration date, expiring 01/19/18 (Vega notional amount $437,500)(af) | | | 344,431 | |
| Volatility Swap with UBS AG based on a basket of securities and index, receiving variance if the basket volatility strike over the target strike price of 14.87 and paying variance if the basket volatility strike under the target strike price of 14.87 at expiration date, expiring 01/19/18 (Vega notional amount $500,000)(ag) | | | (164,772 | ) |
| | | | (2,442,531 | ) |
| | | $ | 44,991,179 | |
See Notes to Financial Statements.
| Old Westbury Funds, Inc. | |
| Strategic Opportunities Fund | |
| Consolidated Portfolio of Investments - (Continued) | October 31, 2017 |
| | |
| (a) | This security is considered either fully or partially illiquid. These securities, or portions thereof, have a value of $328,689,861 or 5.92% of net assets. Included in this amount are securities which are also exempt from registration under Rule 144A of the Securities Act of 1933, as amended (see (j) below) that amount to $111,245,260 or 2.00% of net assets. |
| (b) | Level 3 fair valued security under procedures established by the Fund’s Board of Directors. The aggregate value of fair valued securities is $302,914, which is 0.01% of net assets. |
| (c) | Non-income producing security. |
| (d) | Principal amount denoted in Euros. |
| (e) | Variable rate security. Rate shown is the rate in effect as of period end. |
| (f) | Principal amount denoted in British Pounds. |
| (g) | Security offered and sold outside of the United States, and thus is exempt from registration under Regulation S of the Securities Act of 1933. These securities have been deemed liquid under guidelines approved by the Fund’s Board of Directors except those also included in footnote (a) above. |
| (h) | Investment in non-U.S. Dollars. Principal amount reflects local currency. |
| (i) | Variable rate security. Security may be issued at a fixed coupon rate, which converts to a variable rate at a specified date. Rate shown is the rate in effect as of period end. |
| (j) | Security exempt from registration under Rule 144A of the Securities Act of 1933, as amended. The security may be resold in transactions exempt from registration normally to qualified institutional buyers. The aggregate value is $800,104,856, which is 14.42% of net assets. These securities have been determined to be liquid in accordance with procedures adopted by the Fund’s Board of Directors except those also included in footnote (a) above. |
| (k) | Zero coupon bond. The rate represents the yield at time of purchase. |
| (l) | Payment-in-kind (“PIK”) security. Income may be paid in additional securities or cash at the discretion of the issuer. |
| (m) | Issuer filed for bankruptcy and/or is in default of interest payments. |
| (n) | Floating rate security. Rate shown is the rate in effect as of period end. |
| (o) | Principal amount denoted in Swiss Francs. |
| (p) | Variable or floating rate security, which interest rate adjusts periodically based on changes in current interest rates and prepayments on the underlying pool of assets. Rate shown is the rate in effect as of period end. |
| (q) | The rate represents the annualized yield at time of purchase. |
| (r) | The rate shown represents the current yield as of October 31, 2017. |
| (s) | Number of units is not applicable to this derivative and therefore notional amount is disclosed. |
| (t) | The following table represents the individual positions underlying the basket structured options with Societe Generale, as of October 31, 2017, expiration date August 17, 2018: |
| Reference Entity |
| Alphabet, Inc. - Class A |
| Amazon.com, Inc. |
| Analog Devices, Inc. |
| Apple, Inc. |
| Broadcom Ltd. |
| Facebook, Inc. - Class A |
| Gartner, Inc. |
| Netflix, Inc. |
| NVIDIA Corp. |
| ServiceNow, Inc. |
| Skyworks Solutions, Inc. |
| Splunk, Inc. |
| Western Digital Corp. |
| (u) | The following table represents the individual positions underlying the basket structured options with BNP Paribas SA, as of October 31, 2017, expiration date August 24, 2018: |
| Reference Entity |
| Allergan Plc |
| Alphabet, Inc. - Class A |
| Amazon.com, Inc. |
| Anadarko Petroleum Corp. |
| Apple, Inc. |
| Barrick Gold Corp. |
| Eli Lilly & Co. |
| Facebook, Inc. - Class A |
| Freeport-McMoRan, Inc. |
| Gilead Sciences, Inc. |
| Goldcorp, Inc. |
| Halliburton Co. |
| Hess Corp. |
| Incyte Corp. |
| Netflix, Inc. |
| Newmont Mining Corp. |
| Regeneron Pharmaceuticals, Inc. |
| United States Steel Corp. |
| (v) | Number of contracts are shown parenthetically for any leg of Structured Option which has a different number of contracts than the amount shown under contracts column. |
| (w) | The following table represents the individual long position underlying the basket swap with BNP Paribas SA, as of October 31, 2017, expiration date July 30, 2018: |
| Reference Entity — Long |
| BNP Paribas Equity Low Volatility Europe Index |
| BNP Paribas Equity Momentum Europe Index |
| BNP Paribas Equity Quality Europe Index |
| BNP Paribas Equity Value Europe Index |
| BNP Paribas High Dividend Yield Europe Equity Long Term Return Index |
See Notes to Financial Statements.
| Old Westbury Funds, Inc. | |
| Strategic Opportunities Fund | |
| Consolidated Portfolio of Investments - (Continued) | October 31, 2017 |
| | |
| (x) | The following table represents the individual long and short positions underlying the basket swap with BNP Paribas SA, as of October 31, 2017, expiration date March 28, 2018: |
| Reference Entity — Long |
| BNP Paribas Equity Low Volatility Europe Index |
| BNP Paribas Equity Momentum Europe Index |
| BNP Paribas Equity Quality Europe Index |
| BNP Paribas Equity Value Europe Index |
| BNP Paribas High Dividend Yield Europe Equity Long Term Return Index |
| (y) | The following table represents the individual long and short positions underlying the basket swap with BNP Paribas SA, as of October 31, 2017, expiration date October 8, 2018: |
| Reference Entity — Long |
| BNP Paribas USD Long-Term Treasury Bond Futures Index |
| |
| Reference Entity — Short |
| BNP Paribas EUR 30 Year Futures Index |
| (z) | The following table represents the individual long and short positions underlying the basket swap with BNP Paribas SA, as of October 31, 2017, expiration date January 19, 2018: |
| Reference Entity — Long |
| Altaba, Inc. |
| Eastman Chemical Co. |
| Hologic, Inc. |
| Lennar Corp. |
| Mohawk Industries, Inc. |
Occidental Petroleum Corp.
Oracle Corp. |
Phillips 66
VeriSign, Inc. |
| Reference Entity — Short |
| S&P 500 Index |
| (aa) | The following table represents the individual long and short positions underlying the basket swap with BNP Paribas SA, as of October 31, 2017, expiration date January 19, 2018: |
| Reference Entity — Long |
| AbbVie, Inc. |
| Akamai Technologies, Inc. |
| Alibaba Group Holding Ltd. |
Amazon.com, Inc.
Apple, Inc. |
Baidu, Inc.
Broadcom Ltd. |
| EOG Resources, Inc. |
| E-Trade Financial Corp. |
| Facebook, Inc. |
| Gilead Sciences, Inc. |
| Halliburton Co. |
| Micron Technology, Inc. |
| Priceline Group, Inc. (The) |
| Salesforce.com, Inc. |
| Whirlpool Corp. |
| Reference Entity — Short |
| S&P 500 Index |
| (ab) | The following table represents the individual long and short positions underlying the basket swap with JPMorgan Chase Bank N.A., as of October 31, 2017, expiration date January 18, 2019: |
| Reference Entity — Long |
| Altaba, Inc. |
| Eastman Chemical Co. |
| Lennar Corp. |
| Occidental Petroleum Corp. |
| Oracle Corp. |
Phillips 66
VeriSign, Inc. |
| |
| Reference Entity — Short |
| S&P 500 Index |
| (ac) | The following table represents the individual long and short positions underlying the basket swap with JPMorgan Chase Bank N.A., as of October 31, 2017, expiration date January 19, 2018: |
| | |
| Reference Entity — Long |
| AbbVie, Inc. |
| Amazon.com, Inc. |
| Apple, Inc. |
| Biogen, Inc. |
| Chevron Corp. |
| Exxon Mobil Corp. |
| Halliburton Co. |
| Microsoft Corp. |
| Netflix, Inc. |
| Phillips 66 |
| |
| Reference Entity — Short |
| S&P 500 Index |
| (ad) | The following table represents the individual long and short positions underlying the basket swap with Societe Generale, as of October 31, 2017, expiration date January 19, 2018: |
| | |
| Reference Entity — Long |
| Andeavor Corp. |
| Axalta Coating Systems Ltd. |
| Ball Corp. |
| BioMarin Pharmaceutical, Inc. |
| Cardinal Health, Inc. |
| Cheniere Energy, Inc. |
| Concho Resources, Inc. |
| Cree, Inc. |
| HCA Healthcare, Inc. |
| IAC/InterActiveCorp. |
| Sealed Air Corp. |
| Splunk, Inc. |
| VeriFone Systems, Inc. |
| Zoetis, Inc. |
| |
| Reference Entity — Short |
| S&P 500 Index |
See Notes to Financial Statements.
| Old Westbury Funds, Inc. | |
| Strategic Opportunities Fund | |
| Consolidated Portfolio of Investments - (Continued) | October 31, 2017 |
| | |
| (ae) | The following table represents the individual long and short positions underlying the basket swap with Societe Generale, as of October 31, 2017, expiration date January 19, 2018: |
Reference Entity — Long
AbbVie, Inc.
Amazon.com, Inc.
Apple, Inc.
CA, Inc.
Chevron Corp.
Exxon Mobil Corp.
Halliburton Co.
Microsoft Corp.
Netflix, Inc.
Phillips 66
Reference Entity — Short
S&P 500 Index
| (af) | The following table represents the individual long and short positions underlying the basket swap with Societe Generale, as of October 31, 2017, expiration date January 19, 2018: |
Reference Entity — Long
Allergan Plc
Alphabet, Inc.
Expedia, Inc.
Intuitive Surgical, Inc.
PayPal Holdings, Inc.
PulteGroup, Inc.
Teradata Corp.
Reference Entity — Short
Russell 2000 Index
| (ag) | The following table represents the individual long and short positions underlying the basket swap with UBS AG, as of October 31, 2017, expiration date January 19, 2018: |
| | |
| Reference Entity — Long |
| Andeavor Corp. |
| Citrix Systems, Inc. |
| Expedia, Inc. |
| F5 Networks, Inc. |
| Intuitive Surgical, Inc. |
| Molson Coors Brewing Co. |
Phillips 66
Valero Energy Corp. |
| |
| Reference Entity — Short |
| S&P 500 Index |
Futures contracts outstanding at October 31, 2017:
| Description | | Number of
Contracts | | Expiration
Date | | Current
Notional
Amount | | Value/Unrealized
Appreciation
(Depreciation) | |
| Long Contracts: | | | | | | | | | | | | | | |
| Chicago Board of Trade U.S. Treasury Long Bond | | | 597 | | | December 2017 | | | 91,023,844 | | | $ | (1,766,595 | ) |
| Chicago Board of Trade, 5 Year U.S. Treasury Note | | | 2,320 | | | December 2017 | | | 271,875,000 | | | | (2,733,062 | ) |
| | | | | | | | | | | | | | (4,499,657 | ) |
| Short Contracts: | | | | | | | | | | | | | | |
| Eurex Euro-Buxl 30-year Bond | | | (470 | ) | | December 2017 | | | (90,947,256 | ) | | | 7,802 | |
| Chicago Mercantile Exchange E-Mini S&P 500 Index | | | (471 | ) | | December 2017 | | | (60,587,085 | ) | | | (662,494 | ) |
| FTSE MIB Index | | | (224 | ) | | December 2017 | | | (29,711,676 | ) | | | (508,788 | ) |
| | | | | | | | | | | | | | (1,163,480 | ) |
| Total | | | | | | | | | | | | $ | (5,663,137 | ) |
See Notes to Financial Statements.
| Old Westbury Funds, Inc. | |
| Strategic Opportunities Fund | |
| Consolidated Portfolio of Investments - (Continued) | October 31, 2017 |
| | |
Forwards foreign currency exchange contracts outstanding at October 31, 2017:
| Currency Purchased | | Currency Sold | | Counterparty | | Settlement
Date | | Unrealized
Appreciation/
(Depreciation) | |
| GBP | | 72,221,925 | | USD | | 95,699,972 | | Bank of New York Mellon Corp. | | 11/29/17 | | $ | | 302,544 | |
| ARS | | 77,250,000 | | USD | | 4,303,621 | | Barclays Bank Plc | | 11/15/17 | | | | 29,572 | |
| BRL | | 80,490,760 | | USD | | 24,000,000 | | Barclays Bank Plc | | 03/29/18 | | | | 158,243 | |
| RUB | | 507,710,000 | | USD | | 8,449,160 | | Barclays Bank Plc | | 03/29/18 | | | | 55,487 | |
| INR | | 675,850,000 | | USD | | 9,993,003 | | Barclays Bank Plc | | 05/31/18 | | | | 217,792 | |
| USD | | 10,244,032 | | INR | | 675,850,000 | | Barclays Bank Plc | | 05/31/18 | | | | 33,237 | |
| BRL | | 33,830,000 | | USD | | 10,000,000 | | Barclays Bank Plc | | 07/31/18 | | | | 1,552 | |
| USD | | 7,181,748 | | EUR | | 6,000,000 | | Barclays Bank Plc | | 08/31/18 | | | | 58,238 | |
| USD | | 10,000,000 | | EUR | | 8,237,958 | | Barclays Bank Plc | | 09/28/18 | | | | 201,253 | |
| USD | | 6,004,065 | | EUR | | 5,000,000 | | Barclays Bank Plc | | 09/28/18 | | | | 56,750 | |
| USD | | 10,000,000 | | EUR | | 8,219,004 | | Barclays Bank Plc | | 03/29/19 | | | | 100,061 | |
| ARS | | 89,750,000 | | USD | | 5,000,000 | | JPMorgan Chase Bank N.A. | | 11/08/17 | | | | 56,860 | |
| USD | | 5,131,504 | | ARS | | 89,750,000 | | JPMorgan Chase Bank N.A. | | 11/08/17 | | | | 74,643 | |
| JPY | | 3,904,824,900 | | USD | | 34,380,065 | | JPMorgan Chase Bank N.A. | | 11/29/17 | | | | 5,120 | |
| EUR | | 7,925,000 | | USD | | 8,944,242 | | JPMorgan Chase Bank N.A. | | 02/28/18 | | | | 353,539 | |
| IDR | | 139,100,000,000 | | USD | | 10,000,000 | | JPMorgan Chase Bank N.A. | | 03/29/18 | | | | 79,513 | |
| RUB | | 1,105,131,100 | | USD | | 18,000,000 | | JPMorgan Chase Bank N.A. | | 03/29/18 | | | | 512,043 | |
| USD | | 10,123,726 | | IDR | | 139,100,000,000 | | JPMorgan Chase Bank N.A. | | 03/29/18 | | | | 44,213 | |
| IDR | | 676,575,000 | | USD | | 9,856,862 | | JPMorgan Chase Bank N.A. | | 05/31/18 | | | | 364,886 | |
| USD | | 10,233,306 | | INR | | 676,575,000 | | JPMorgan Chase Bank N.A. | | 05/31/18 | | | | 11,558 | |
| USD | | 8,330,133 | | EUR | | 7,000,000 | | JPMorgan Chase Bank N.A. | | 07/31/18 | | | | 36,442 | |
| USD | | 6,129,000 | | EUR | | 5,000,000 | | JPMorgan Chase Bank N.A. | | 08/30/19 | | | | 40,753 | |
| INR | | 350,374,000 | | USD | | 5,000,000 | | UBS AG | | 02/09/18 | | | | 357,014 | |
| EUR | | 6,000,000 | | USD | | 6,511,002 | | UBS AG | | 04/30/18 | | | | 554,804 | |
| USD | | 22,153,940 | | JPY | | 2,409,688,500 | | UBS AG | | 05/31/18 | | | | 711,422 | |
| | | | | | | | | | | | | | | 4,417,539 | |
| USD | | 13,601,750 | | EUR | | 11,877,805 | | Bank of New York Mellon Corp. | | 06/29/18 | | | | (441,452 | ) |
| USD | | 4,153,226 | | ARS | | 77,250,000 | | Barclays Bank Plc | | 11/15/17 | | | | (179,967 | ) |
| CHF | | 9,665,310 | | USD | | 9,777,836 | | Barclays Bank Plc | | 11/29/17 | | | | (71,137 | ) |
| ARS | | 53,700,000 | | USD | | 3,000,000 | | Barclays Bank Plc | | 02/28/18 | | | | (168,288 | ) |
| USD | | 2,708,018 | | ARS | | 53,700,000 | | Barclays Bank Plc | | 02/28/18 | | | | (123,694 | ) |
| USD | | 6,568,750 | | SEK | | 57,000,000 | | Barclays Bank Plc | | 02/28/18 | | | | (292,203 | ) |
| USD | | 9,582,139 | | BRL | | 33,468,710 | | Barclays Bank Plc | | 03/29/18 | | | | (463,054 | ) |
| USD | | 8,084,554 | | RUB | | 507,710,000 | | Barclays Bank Plc | | 03/29/18 | | | | (420,092 | ) |
| ARS | | 53,610,000 | | USD | | 3,000,000 | | Barclays Bank Plc | | 04/30/18 | | | | (263,050 | ) |
| USD | | 2,615,122 | | ARS | | 53,610,000 | | Barclays Bank Plc | | 04/30/18 | | | | (121,828 | ) |
| USD | | 20,023,367 | | EUR | | 17,899,389 | | Barclays Bank Plc | | 05/31/18 | | | | (1,098,691 | ) |
| USD | | 3,336,600 | | EUR | | 3,000,000 | | Barclays Bank Plc | | 03/29/19 | | | | (276,954 | ) |
| ARS | | 89,450,000 | | USD | | 5,000,000 | | JPMorgan Chase Bank N.A. | | 11/29/17 | | | | (26,733 | ) |
| EUR | | 50,000,000 | | USD | | 59,166,070 | | JPMorgan Chase Bank N.A. | | 11/29/17 | | | | (830,319 | ) |
| USD | | 4,506,297 | | ARS | | 89,450,000 | | JPMorgan Chase Bank N.A. | | 11/29/17 | | | | (466,969 | ) |
| ARS | | 90,000,000 | | USD | | 4,953,220 | | JPMorgan Chase Bank N.A. | | 12/28/17 | | | | (29,145 | ) |
| USD | | 4,466,501 | | ARS | | 90,000,000 | | JPMorgan Chase Bank N.A. | | 12/28/17 | | | | (457,574 | ) |
| AUD | | 51,048,687 | | USD | | 40,069,186 | | JPMorgan Chase Bank N.A. | | 01/29/18 | | | | (1,029,797 | ) |
| USD | | 6,074,995 | | GBP | | 4,800,000 | | JPMorgan Chase Bank N.A. | | 02/01/18 | | | | (319,149 | ) |
| ARS | | 27,300,000 | | USD | | 1,500,000 | | JPMorgan Chase Bank N.A. | | 02/28/18 | | | | (60,414 | ) |
| USD | | 1,378,092 | | ARS | | 27,300,000 | | JPMorgan Chase Bank N.A. | | 02/28/18 | | | | (61,494 | ) |
| USD | | 4,000,000 | | EUR | | 3,635,617 | | JPMorgan Chase Bank N.A. | | 02/28/18 | | | | (265,384 | ) |
| USD | | 8,645,881 | | EUR | | 7,925,000 | | JPMorgan Chase Bank N.A. | | 02/28/18 | | | | (651,899 | ) |
| USD | | 5,000,000 | | EUR | | 4,604,119 | | JPMorgan Chase Bank N.A. | | 03/28/18 | | | | (410,959 | ) |
| USD | | 5,111,779 | | RUB | | 313,281,150 | | JPMorgan Chase Bank N.A. | | 03/29/18 | | | | (135,991 | ) |
| USD | | 12,667,572 | | RUB | | 791,849,950 | | JPMorgan Chase Bank N.A. | | 03/29/18 | | | | (596,700 | ) |
| USD | | 6,557,890 | | GBP | | 5,000,000 | | JPMorgan Chase Bank N.A. | | 07/27/18 | | | | (139,109 | ) |
| IDR | | 69,645,000,000 | | USD | | 5,000,000 | | JPMorgan Chase Bank N.A. | | 07/31/18 | | | | (34,579 | ) |
| USD | | 5,822,525 | | EUR | | 5,000,000 | | JPMorgan Chase Bank N.A. | | 07/31/18 | | | | (101,540 | ) |
| USD | | 5,000,000 | | EUR | | 4,355,128 | | JPMorgan Chase Bank N.A. | | 07/31/18 | | | | (160,012 | ) |
| USD | | 18,134,338 | | EUR | | 16,380,224 | | JPMorgan Chase Bank N.A. | | 03/29/19 | | | | (1,595,937 | ) |
| EUR | | 30,767,264 | | USD | | 36,400,504 | | UBS AG | | 11/29/17 | | | | (503,875 | ) |
| USD | | 12,004,047 | | EUR | | 11,000,000 | | UBS AG | | 04/30/18 | | | | (949,931 | ) |
See Notes to Financial Statements.
| Old Westbury Funds, Inc. | |
| Strategic Opportunities Fund | |
| Consolidated Portfolio of Investments - (Continued) | October 31, 2017 |
| | |
| Currency Purchased | | Currency Sold | | Counterparty | | Settlement
Date | | Unrealized Appreciation/ (Depreciation) | |
| JPY | | 682,298,840 | | USD | | 6,200,000 | | UBS AG | | 05/31/18 | | $ | | (128,591 | ) |
| | | | | | | | | | | | | | | (12,876,511 | ) |
| | | | | | | | | | | | | $ | | (8,458,972 | ) |
The following abbreviations are used in the report:
ARS — Argentine Peso
AUD — Australian Dollar
BRL — Brazil Real
CHF — Swiss Franc
CLO — Collateralized Loan Obligation
Cnv. — Convertible
ETF — Exchange Traded Fund
EUR — Euro
EURIBOR — Euro Interbank Offered Rate
GBP — British Pound
HKD - Hong Kong Dollar
IDR — Indonesian Rupiah
INR — Indian Rupee
JPY — Japanese Yen
LIBOR — London Interbank Offered Rate
REIT — Real Estate Investment Trust
RUB — Russian Ruble
SEK — Swedish Krona
STEP — Step Coupon Bond
USD — U.S. Dollar
See Notes to Financial Statements.
| Old Westbury Funds, Inc. | |
| Strategic Opportunities Fund | |
| Consolidated Portfolio of Investments - (Continued) | October 31, 2017 |
| | |
Portfolio Diversification by Sector (Unaudited)
| Sector | | Percentage
of Net Assets |
| Asset-Backed Securities | | | 14.3 | % |
| Banks | | | 0.6 | |
| Collateralized Mortgage Obligations | | | 8.7 | |
| Commercial Mortgage-Backed Securities | | | 1.2 | |
| Consumer Discretionary | | | 3.2 | |
| Consumer Staples | | | 1.8 | |
| Diversified Financials | | | 2.2 | |
| Energy | | | 0.5 | |
| Health Care | | | 0.9 | |
| Industrials | | | 2.7 | |
| Information Technology | | | 3.7 | |
| Insurance | | | 1.3 | |
| Materials | | | 0.9 | |
| Real Estate | | | 1.5 | |
| Telecommunication Services | | | 1.6 | |
| U.S. Government Agencies and Securities | | | 32.2 | |
| Utilities | | | 0.7 | |
| Other* | | | 22.0 | |
| | | | 100.0 | % |
| | * | Includes cash and equivalents, closed-end funds, options, exchange traded funds, rights/warrants, structured options, futures, swap agreements, pending trades and Fund share transactions, interest and dividends receivable, prepaids and accrued expenses payable. |
See Notes to Financial Statements.
| Old Westbury Funds, Inc. | |
| Fixed Income Fund | |
| Portfolio of Investments | October 31, 2017 |
| | |
Principal
Amount | | | | | Value | |
| CORPORATE BONDS — 32.8% |
| Banks — 5.6% | | | | |
| $ | 2,800,000 | | | Banco Santander SA,
3.50%, 04/11/22 | | $ | 2,869,065 | |
| | 2,650,000 | | | Bank of Montreal MTN,
1.35%, 08/28/18 | | | 2,643,409 | |
| | 3,080,000 | | | Capital One Financial Corp.,
3.75%, 03/09/27 | | | 3,115,140 | |
| | 2,000,000 | | | Capital One NA,
1.85%, 09/13/19 | | | 1,987,483 | |
| | 7,785,000 | | | Citigroup, Inc.,
(3 mo. LIBOR US + 1.390%),
3.67%, 07/24/28(a) | | | 7,868,903 | |
| | 2,770,000 | | | Cooperatieve Rabobank UA,
4.38%, 08/04/25 | | | 2,933,904 | |
| | 2,750,000 | | | Cooperatieve Rabobank UA,
3.75%, 07/21/26 | | | 2,799,509 | |
| | 3,000,000 | | | HSBC Holdings Plc,
(3 mo. LIBOR US + 1.546%),
4.04%, 03/13/28(a) | | | 3,141,993 | |
| | 2,500,000 | | | International Bank For Reconstruction & Development,
1.38%, 04/10/18 | | | 2,498,380 | |
| | 2,260,000 | | | Sumitomo Mitsui Banking Corp.,
1.95%, 07/23/18 | | | 2,263,862 | |
| | 5,000,000 | | | Sumitomo Mitsui Trust Bank Ltd,
2.05%, 10/18/19(b) | | | 4,984,276 | |
| | 1,375,000 | | | Svenska Handelsbanken AB,
1.50%, 09/06/19 | | | 1,363,592 | |
| | 8,000,000 | | | Westpac Banking Corp.,
1.55%, 05/25/18 | | | 8,000,758 | |
| | | | | | | | 46,470,274 | |
| Consumer Discretionary — 4.1% | | | | |
| | 2,160,000 | | | Amazon.com, Inc.,
2.60%, 12/05/19 | | | 2,195,904 | |
| | 3,000,000 | | | Amazon.com, Inc.,
3.15%, 08/22/27(b) | | | 3,017,952 | |
| | 1,690,000 | | | American Honda Finance Corp.,
1.50%, 11/19/18 | | | 1,687,406 | |
| | 1,800,000 | | | American Honda Finance Corp. MTN,
1.55%, 12/11/17 | | | 1,800,207 | |
| | 3,435,000 | | | Carnival Corp.,
1.88%, 12/15/17 | | | 3,436,610 | |
| | 6,000,000 | | | Daimler Finance North America LLC,
2.00%, 08/03/18(b) | | | 6,010,813 | |
| | 5,750,000 | | | Discovery Communications LLC,
4.90%, 03/11/26 | | | 6,179,905 | |
| | 2,911,000 | | | Ecolab, Inc.,
2.25%, 01/12/20 | | | 2,924,342 | |
Principal
Amount | | | | | Value | |
| Consumer Discretionary (continued) |
| $ | 1,697,000 | | | Ford Motor Credit Co. LLC,
2.02%, 05/03/19 | | $ | 1,695,798 | |
| | 3,000,000 | | | Hasbro, Inc.,
3.50%, 09/15/27 | | | 2,969,204 | |
| | 2,215,000 | | | Time Warner, Inc.,
2.10%, 06/01/19 | | | 2,216,791 | |
| | | | | | | | 34,134,932 | |
| Consumer Staples — 3.3% |
| | 3,000,000 | | | Anheuser-Busch Inbev Finance, Inc.,
1.90%, 02/01/19 | | | 3,002,943 | |
| | 5,000,000 | | | BAT Capital Corp.,
3.56%, 08/15/27(b) | | | 5,012,400 | |
| | 4,000,000 | | | Coca-Cola Co. (The),
1.15%, 04/01/18 | | | 3,994,770 | |
| | 5,870,000 | | | Costco Wholesale Corp.,
2.15%, 05/18/21 | | | 5,876,976 | |
| | 3,000,000 | | | CVS Health Corp.,
2.80%, 07/20/20 | | | 3,035,656 | |
| | 2,077,000 | | | Sysco Corp.,
1.90%, 04/01/19 | | | 2,076,239 | |
| | 4,000,000 | | | Wal-Mart Stores, Inc.,
1.90%, 12/15/20 | | | 3,991,575 | |
| | | | | | | | 26,990,559 | |
| Diversified Financials — 2.8% | | | | |
| | 3,950,000 | | | Aercap Ireland Capital DAC/Aercap Global Aviation Trust,
4.50%, 05/15/21 | | | 4,194,869 | |
| | 6,160,000 | | | Goldman Sachs Group, Inc. (The),
(3 mo. LIBOR US + 1.000%),
2.36%, 07/24/23(c) | | | 6,199,186 | |
| | 6,065,000 | | | JPMorgan Chase & Co.,
3.20%, 06/15/26 | | | 6,059,162 | |
| | 3,000,000 | | | Morgan Stanley,
2.45%, 02/01/19 | | | 3,015,645 | |
| | 3,900,000 | | | Toronto-Dominion Bank (The),
(3 mo. LIBOR US + 0.440%),
1.78%, 07/02/19(c) | | | 3,915,521 | |
| | | | | | | | 23,384,383 | |
| Energy — 4.0% | | | | |
| | 6,000,000 | | | BP Capital Markets Plc,
3.28%, 09/19/27 | | | 6,036,347 | |
| | 3,315,000 | | | ConocoPhillips Co.,
4.95%, 03/15/26 | | | 3,765,348 | |
| | 2,000,000 | | | Enbridge, Inc.,
2.90%, 07/15/22 | | | 2,011,510 | |
| | 3,075,000 | | | Energy Transfer LP,
3.60%, 02/01/23 | | | 3,134,614 | |
See Notes to Financial Statements.
| Old Westbury Funds, Inc. | |
| Fixed Income Fund | |
| Portfolio of Investments - (Continued) | October 31, 2017 |
| | |
Principal
Amount | | | | | Value | |
| Energy (continued) |
| $ | 5,310,000 | | | Enterprise Products Operating LLC,
1.65%, 05/07/18 | | $ | 5,308,601 | |
| | 2,845,000 | | | HollyFrontier Corp.,
5.88%, 04/01/26 | | | 3,157,699 | |
| | 2,605,000 | | | Kinder Morgan Energy Partners LP,
5.95%, 02/15/18 | | | 2,634,539 | |
| | 6,000,000 | | | Shell International Finance BV,
1.25%, 11/10/17 | | | 5,999,940 | |
| | 1,000,000 | | | TransCanada Pipelines Ltd.,
1.88%, 01/12/18 | | | 1,000,643 | |
| | | | | | | | 33,049,241 | |
| Health Care — 3.5% |
| | 5,010,000 | | | AbbVie, Inc.,
2.50%, 05/14/20 | | | 5,050,617 | |
| | 4,000,000 | | | Amgen, Inc.,
2.20%, 05/22/19 | | | 4,016,293 | |
| | 2,000,000 | | | Johnson & Johnson,
1.13%, 11/21/17 | | | 1,999,956 | |
| | 5,000,000 | | | Kaiser Foundation Hospitals,
3.15%, 05/01/27 | | | 5,042,345 | |
| | 3,000,000 | | | Medtronic, Inc.,
2.50%, 03/15/20 | | | 3,041,245 | |
| | 3,955,000 | | | Shire Acquisitions Investments Ireland DAC,
1.90%, 09/23/19 | | | 3,939,206 | |
| | 3,950,000 | | | UnitedHealth Group, Inc.,
1.40%, 12/15/17 | | | 3,950,055 | |
| | 2,000,000 | | | Zoetis, Inc.,
3.00%, 09/12/27 | | | 1,958,006 | |
| | | | | | | | 28,997,723 | |
| Industrials — 4.7% |
| | 6,115,000 | | | Caterpillar Financial Services Corp. MTN,
1.35%, 05/18/19 | | | 6,067,633 | |
| | 5,400,000 | | | Eaton Corp.,
5.60%, 05/15/18 | | | 5,512,648 | |
| | 28,840 | | | Federal Express Corp. 2012 Pass Through Trust,
2.63%, 01/15/18(b) | | | 28,850 | |
| | 1,700,000 | | | Honeywell International Inc,
1.40%, 10/30/19 | | | 1,690,430 | |
| | 6,000,000 | | | Northrop Grumman Corp.,
2.55%, 10/15/22 | | | 6,008,082 | |
| | 3,000,000 | | | Penske Truck Leasing Co.,
LP / PTL Finance Corp.,
2.70%, 03/14/23(b) | | | 2,965,163 | |
| | 6,460,000 | | | Precision Castparts Corp.,
1.25%, 01/15/18 | | | 6,457,758 | |
Principal
Amount | | | | | Value | |
| Industrials (continued) |
| $ | 10,000,000 | | | Siemens Financieringsmaatschappij NV,
2.20%, 03/16/20(b) | | $ | 10,050,890 | |
| | | | | | | | 38,781,454 | |
| Information Technology — 2.5% |
| | 6,110,000 | | | Apple, Inc.,
(3 mo. LIBOR US + 0.350%),
1.66%, 05/11/22(c) | | | 6,154,136 | |
| | 4,000,000 | | | IBM Credit LLC,
1.80%, 01/20/21 | | | 3,953,961 | |
| | 2,750,000 | | | Oracle Corp.,
5.75%, 04/15/18 | | | 2,800,962 | |
| | 2,000,000 | | | QUALCOMM, Inc.,
3.25%, 05/20/27 | | | 1,999,796 | |
| | 5,540,000 | | | VMware, Inc.,
2.30%, 08/21/20 | | | 5,528,303 | |
| | | | | | | | 20,437,158 | |
| Insurance — 0.4% |
| | 3,000,000 | | | New York Life Global Funding,
1.45%, 12/15/17(b) | | | 2,999,904 | |
| Materials — 0.1% |
| | 1,000,000 | | | Mexichem SAB de CV,
4.00%, 10/04/27(b) | | | 999,500 | |
| Telecommunication Services — 0.5% |
| | 4,200,000 | | | Alibaba Group Holding Ltd.,
2.50%, 11/28/19 | | | 4,228,140 | |
| Utilities — 1.3% |
| | 3,000,000 | | | Berkshire Hathaway Energy Co,
2.00%, 11/15/18 | | | 3,007,303 | |
| | 5,000,000 | | | Enel Finance International NV,
2.88%, 05/25/22(b) | | | 5,029,890 | |
| | 2,310,000 | | | NextEra Energy Capital Holdings, Inc.,
2.30%, 04/01/19 | | | 2,317,370 | |
| | | | | | | | 10,354,563 | |
Total Corporate Bonds
(Cost $270,217,208) | | | 270,827,831 | |
| | | | | | | | | |
| ASSET-BACKED SECURITIES — 8.3% | | | | |
| CANADA — 0.5% | | | | |
| Other Asset-Backed Securities — 0.5% | | | | |
| | 4,750,000 | | | Golden Credit Card Trust Series 2017-2A, Class A,
1.98%, 04/15/22(b) | | | 4,743,062 | |
| | | | | | | | 4,743,062 | |
See Notes to Financial Statements.
| Old Westbury Funds, Inc. | |
| Fixed Income Fund | |
| Portfolio of Investments - (Continued) | October 31, 2017 |
| | |
Principal
Amount | | | | | Value | |
| CAYMAN ISLANDS — 3.2% |
| Collateralized Loan Obligations — 3.0% |
| $ | 3,000,000 | | | Apex Credit CLO Ltd., Series 2017-1A, Class A1, (3 mo. LIBOR US + 1.470%), 2.83%, 04/24/29(b)(c) | | $ | 3,047,107 | |
| | 5,000,000 | | | Black Diamond CLO Ltd., Series 2014-1A, Class A1R, (3 mo. LIBOR US + 1.150%), 2.50%, 10/17/26(b)(c) | | | 5,012,043 | |
| | 4,000,000 | | | Crestline Denali CLO XV Ltd., Series 2017-1A, Class A, (3 mo. LIBOR US + 1.300%), 2.66%, 04/20/30(b)(c) | | | 3,995,487 | |
| | 2,400,000 | | | OCP CLO Ltd., Series 2012-2A, Class A1R, (3 mo. LIBOR US + 1.400%), 2.71%, 11/22/25(b)(c) | | | 2,419,527 | |
| | 5,000,000 | | | Saratoga Investment Corp. CLO Ltd., Series 2013-1A, Class A2R, (3 mo. LIBOR US + 1.750%), 3.11%, 10/20/25(b)(c) | | | 4,999,765 | |
| | 5,000,000 | | | THL Credit Wind River CLO Ltd., Series 2017-2A, Class A, (3 mo. LIBOR US + 1.230%), 2.54%, 07/20/30(b)(c) | | | 5,004,877 | |
| | | | | | | | 24,478,806 | |
| Other Asset-Backed Securities — 0.2% |
| | 2,000,000 | | | Securitized Term Auto Receivables Trust Series 2016-1A, Class A3, 1.52%, 03/25/20(b) | | | 1,991,388 | |
| | | | | | | | 1,991,388 | |
| | | | | | | | | |
| UNITED STATES — 4.6% |
| Other Asset-Backed Securities — 4.6% |
| | 3,000,000 | | | Ally Auto Receivables Trust, Series 2017-2, Class A3, 1.78%, 08/16/21 | | | 2,996,677 | |
| | 1,250,000 | | | CarMax Auto Owner Trust Series 2017-2, Class A3, 1.93%, 03/15/22 | | | 1,248,011 | |
| | 2,975,000 | | | Chase Issuance Trust, Series 2012-A4, Class A4, 1.58%, 08/16/21 | | | 2,960,096 | |
| | 4,250,000 | | | Chesapeake Funding II LLC, Series 2017-4A, Class A1, 2.12%, 11/15/29(b) | | | 4,249,701 | |
| | 2,975,000 | | | CNH Equipment Trust 2015-A, Class A4, 1.85%, 04/15/21 | | | 2,976,476 | |
| | 1,585,016 | | | Enterprise Fleet Financing LLC Series 2016-2, Class A2, 1.74%, 02/22/22(b) | | | 1,583,831 | |
| | 1,000,000 | | | Enterprise Fleet Financing LLC, Series 2017-1, Class A2, 2.13%, 07/20/22(b) | | | 1,002,360 | |
| | 1,500,000 | | | Enterprise Fleet Financing LLC, Series 2017-2, Class A3, 2.22%, 01/20/23(b) | | | 1,496,564 | |
Principal
Amount | | | | | Value | |
| UNITED STATES (continued) |
| Other Asset-Backed Securities (continued) |
| $ | 4,000,000 | | | Ford Credit Floorplan Master Owner Trust Series 2015-1, Class A1, 1.42%, 01/15/20 | | $ | 3,999,400 | |
| | 2,000,000 | | | GM Financial Consumer Automobile Series 2017-1A, Class A4, 2.06%, 05/16/23(b) | | | 1,999,315 | |
| | 5,000,000 | | | Hertz Vehicle Financing LLC Series 2016-3A, Class A, 2.27%, 07/25/20(b) | | | 4,983,892 | |
| | 917,757 | | | Toyota Auto Receivables Owner Trust Series 2014-B, Class A4, 1.31%, 09/16/19 | | | 917,444 | |
| | 2,000,000 | | | Toyota Auto Receivables Owner Trust, Series 2017-A, Class A4, 2.10%, 09/15/22 | | | 2,003,926 | |
| | 2,650,000 | | | Verizon Owner Trust Series 2017-1A, Class A, 2.06%, 09/20/21(b) | | | 2,654,098 | |
| | 1,750,000 | | | Verizon Owner Trust Series 2017-3A, Class A1A, 2.06%, 04/20/22(b) | | | 1,750,288 | |
| | 1,000,000 | | | World Omni Automobile Lease Securitization Trust Series 2016-A, Class A3, 1.45%, 08/15/19 | | | 996,587 | |
| | | | | | | | 37,818,666 | |
Total Asset-Backed Securities
(Cost $69,038,163) | | | 69,031,922 | |
| | | | | | | | | |
| COLLATERALIZED MORTGAGE OBLIGATIONS — 0.2% |
| $ | 1,412,814 | | | JPMorgan Tax Exempt Pass Through Trust, Series 2012-AMT1, Class A, 3.00%, 01/27/38(b) | | $ | 1,372,236 | |
Total Collateralized Mortgage Obligations
(Cost $1,442,335) | | | 1,372,236 | |
| U.S. GOVERNMENT AGENCIES — 5.1% | | | | |
| Fannie Mae — 2.4% | | | | |
| | 6,720,000 | | | 0.88%, 12/20/17 | | | 6,718,085 | |
| | 7,802,000 | | | 1.88%, 02/19/19 | | | 7,835,892 | |
| | 5,000,000 | | | 1.00%, 02/26/19 | | | 4,963,990 | |
| | | | | | | | 19,517,967 | |
| Federal Home Loan Bank — 2.1% | | | | |
| | 5,000,000 | | | 0.88%, 10/01/18 | | | 4,972,265 | |
| | 12,485,000 | | | 1.13%, 06/21/19 | | | 12,391,537 | |
| | | | | | | | 17,363,802 | |
See Notes to Financial Statements.
| Old Westbury Funds, Inc. | |
| Fixed Income Fund | |
| Portfolio of Investments - (Continued) | October 31, 2017 |
| | |
Principal
Amount | | | | | Value | |
| Overseas Private Investment Corp. — 0.3% |
| $ | 2,694,172 | | | 5.14%, 12/15/23 | | $ | 2,952,177 | |
| Private Export Funding Corp. — 0.1% |
| | 500,000 | | | 2.25%, 12/15/17 | | | 500,654 | |
| Small Business Administration — 0.1% | | | | |
| | 163,630 | | | 4.73%, 02/10/19 | | | 167,793 | |
| | 265,312 | | | 4.11%, 03/10/20 | | | 272,243 | |
| | 852,763 | | | 4.08%, 03/10/21 | | | 880,958 | |
| | | | | | | | 1,320,994 | |
| Tennessee Valley Authority — 0.1% |
| | 725,000 | | | 6.25%, 12/15/17 | | | 729,478 | |
Total U.S. Government Agencies
(Cost $42,296,411) | | | 42,385,072 | |
| U.S. GOVERNMENT SECURITIES — 52.2% |
| U.S. Treasury Notes — 52.2% |
| | 1,615,000 | | | 0.88%, 11/30/17 | | | 1,614,681 | |
| | 2,680,000 | | | 0.88%, 05/31/18 | | | 2,672,874 | |
| | 21,195,000 | | | 1.13%, 01/31/19 | | | 21,092,337 | |
| | 22,223,000 | | | 1.38%, 09/30/19 | | | 22,134,455 | |
| | 17,217,000 | | | 1.38%, 12/15/19 | | | 17,129,570 | |
| | 41,134,000 | | | 1.50%, 06/15/20 | | | 40,931,543 | |
| | 14,476,000 | | | 1.38%, 09/15/20 | | | 14,340,853 | |
| | 51,401,000 | | | 1.88%, 11/30/21 | | | 51,366,867 | |
| | 48,702,000 | | | 1.75%, 01/31/23 | | | 47,948,641 | |
| | 27,926,450 | | | 0.63%, 01/15/24(d) | | | 28,452,437 | |
| | 81,115,000 | | | 2.38%, 08/15/24 | | | 81,929,318 | |
| | 83,155,000 | | | 2.00%, 02/15/25 | | | 81,709,532 | |
| | 19,888,000 | | | 2.25%, 11/15/25 | | | 19,810,313 | |
Total U.S. Government Securities
(Cost $433,293,479) | | | 431,133,421 | |
Principal
Amount | | | | | Value | |
| GOVERNMENT BONDS — 0.4% |
| JAPAN — 0.4% |
| $ | 3,000,000 | | | Japan Bank For International Cooperation,
2.25%, 02/24/20 | | $ | 3,010,150 | |
Total Government Bonds
(Cost $2,993,618) | | | 3,010,150 | |
| | | | | | | | | |
| Shares | | | | | | | |
| INVESTMENT COMPANY — 0.6% |
| | 4,796,537 | | | SEI Daily Income Trust Government II Fund, Class A, 0.88%(e) | | | 4,796,537 | |
Total Investment Company
(Cost $4,796,537) | | | 4,796,537 | |
TOTAL INVESTMENTS — 99.6%
(Cost $824,077,751) | $ | 822,557,169 | |
| OTHER ASSETS IN EXCESS OF LIABILITIES — 0.4% | | | 2,988,000 | |
| NET ASSETS — 100.0% | | $ | 825,545,169 | |
| (a) | Variable rate security. Security may be issued at a fixed coupon rate, which converts to a variable rate at a specified date. Rate shown is the rate in effect as of period end. |
| (b) | Security exempt from registration under Rule 144A of the Securities Act of 1933, as amended. The security may be resold in transactions exempt from registration normally to qualified institutional buyers. The security has been determined to be liquid in accordance with procedures adopted by the Fund’s Board of Directors. The aggregate value of these securities is $93,405,179 which is 11.31% of net assets. |
| (c) | Floating rate security. Rate shown is the rate in effect as of period end. |
| (d) | Inflation protected security. Principal amount reflects original security face amount. |
| (e) | The rate shown represents the current yield at October 31, 2017. |
The following abbreviations are used in the report:
| | CLO — Collateralized Loan Obligation
LIBOR — London Interbank Offered Rate
MTN — Medium Term Note |
See Notes to Financial Statements.
| Old Westbury Funds, Inc. | |
| Municipal Bond Fund | |
| Portfolio of Investments | October 31, 2017 |
| | |
Principal
Amount | | | | | Value | |
| MUNICIPAL BONDS — 86.5% |
| Alabama — 1.0% |
| $ | 2,000,000 | | | Alabama Federal Aid Highway Finance Authority Highway Improvements Revenue Bonds, Series A
5.00%, 09/01/22 | | $ | 2,323,940 | |
| | 1,750,000 | | | Alabama Federal Aid Highway Finance Authority Public Improvement Revenue Bonds
5.00%, 09/01/21 | | | 1,987,650 | |
| | 5,000,000 | | | Alabama Federal Aid Highway Finance Authority Revenue Bonds
5.00%, 09/01/20 | | | 5,509,450 | |
| | 3,030,000 | | | City of Huntsville School Capital Improvements Warrants Refunding GO
5.00%, 09/01/22 | | | 3,520,769 | |
| | 2,990,000 | | | City of Huntsville School Capital Improvements Warrants Refunding GO
5.00%, 09/01/24 | | | 3,604,445 | |
| | 3,660,000 | | | City of Huntsville School Capital Improvements Warrants Refunding GO
5.00%, 09/01/26 | | | 4,399,100 | |
| | 1,500,000 | | | City of Huntsville Warrants Refunding GO, Series A 5.00%, 08/01/26 | | | 1,800,480 | |
| | | | | | | | 23,145,834 | |
| Arizona — 0.7% |
| | 875,000 | | | Arizona Department of Transportation State Highway Fund Refunding Revenue Bonds
5.00%, 07/01/25 | | | 1,053,115 | |
| | 2,390,000 | | | Arizona School Facilities Board Advance Refunding COP, Series A
5.00%, 09/01/23 | | | 2,815,802 | |
| | 150,000 | | | Arizona State Board of Regents Advance Refunding COP, Series A
5.00%, 06/01/22 | | | 172,079 | |
| | 1,715,000 | | | Arizona State Board of Regents Advance Refunding COP, Series A
5.00%, 06/01/24 | | | 2,029,565 | |
| | 350,000 | | | Arizona State Board of Regents Revenue Bonds, Series 2008-C, OID
5.88%, 07/01/24 | | | 361,113 | |
| | 5,000,000 | | | City of Phoenix Advance Refunding GO
5.00%, 07/01/25 | | | 6,112,450 | |
Principal
Amount | | | | | Value | |
| Arizona (continued) |
| $ | 200,000 | | | Maricopa County Community College District GO, Series C
5.00%, 07/01/20 | | $ | 212,479 | |
| | 2,875,000 | | | Phoenix Civic Improvement Corp. Refunding Revenue Bonds
5.00%, 07/01/20 | | | 3,157,354 | |
| | | | | | | | 15,913,957 | |
| California — 5.0% |
| | 5,000,000 | | | California Infrastructure & Economic Development Bank Refunding Revenue Bonds
1.33%, 04/01/38(a) | | | 5,022,050 | |
| | 700,000 | | | California Municipal Finance Authority Channing House Project Advance Refunding Revenue Bonds (State Appropriation)
5.00%, 05/15/25 | | | 850,045 | |
| | 6,250,000 | | | California State Current Refunding GO - Group C
5.00%, 08/01/27 | | | 7,467,063 | |
| | 2,000,000 | | | California State Public Works Board Correctional Facilities Improvements Revenue Bonds, Series D
5.00%, 09/01/24 | | | 2,405,300 | |
| | 1,035,000 | | | Los Rios Community College District 2002 Election GO, Series D
5.25%, 08/01/23 | | | 1,109,675 | |
| | 1,000,000 | | | San Diego Regional Building Authority Advance Refunding Revenue Bonds, Series A
5.00%, 10/15/24 | | | 1,224,340 | |
| | 7,000,000 | | | State of California Public Improvements GO
5.00%, 09/01/22 | | | 8,155,140 | |
| | 20,000,000 | | | State of California Refunding GO
5.00%, 08/01/21 | | | 22,713,200 | |
| | 10,000,000 | | | State of California Refunding GO
5.00%, 09/01/22 | | | 11,650,200 | |
| | 8,000,000 | | | State of California Refunding GO
5.00%, 03/01/24 | | | 9,577,920 | |
| | 8,000,000 | | | State of California Refunding GO
5.00%, 10/01/25 | | | 9,582,400 | |
| | 18,720,000 | | | State of California Refunding GO
5.00%, 09/01/27 | | | 23,040,389 | |
See Notes to Financial Statements.
| Old Westbury Funds, Inc. | |
| Municipal Bond Fund | |
| Portfolio of Investments - (Continued) | October 31, 2017 |
| | |
Principal
Amount | | | | | Value | |
| California (continued) | | | | |
| $ | 7,430,000 | | | State of California School Improvements GO
5.00%, 11/01/28 | | $ | 9,212,531 | |
| | | | | | | | 112,010,253 | |
| Colorado — 0.7% | | | | |
| | 500,000 | | | Adams & Weld Counties School District No 27J Brighton Co. Refunding GO, Series A, (State Aid Withholding)
5.00%, 12/01/19 | | | 539,245 | |
| | 800,000 | | | City & County of Broomfield Advance Refunding COP
5.00%, 12/01/21 | | | 912,808 | |
| | 3,935,000 | | | Colorado Higher Education Refunding COP, Series A
5.00%, 11/01/24 | | | 4,719,324 | |
| | 2,000,000 | | | Denver City & County School District No 1 Refunding GO (State Aid Intercept Program)
5.00%, 12/01/24 | | | 2,420,700 | |
| | 100,000 | | | Denver City & County School District No 1 Refunding GO, Series C (State Aid Withholding)
5.00%, 12/01/23 | | | 118,985 | |
| | 975,000 | | | EI Paso Country School District No 20 Academy School Improvements GO (State Aid Withholding)
5.00%, 12/15/25 | | | 1,189,919 | |
| | 2,000,000 | | | El Paso County School District No 38 Lewis-Palmer Refunding GO (State Aid Withholding)
4.00%, 12/01/17 | | | 2,004,940 | |
| | 1,180,000 | | | Jefferson County School District GO, Series R-1, (State Aid Withholding)
5.00%, 12/15/22 | | | 1,376,435 | |
| | 230,000 | | | Weld County School District No Re-1 School Improvements GO, (AGM, State Aid Withholding)
5.00%, 12/15/23 | | | 271,876 | |
| | 2,280,000 | | | Western State Colorado University Refunding Revenue Bonds (State Aid Intercept Program)
5.00%, 05/15/26 | | | 2,760,533 | |
| | | | | | | | 16,314,765 | |
Principal
Amount | | | | | Value | |
| Connecticut — 3.8% | | | | |
| $ | 4,500,000 | | | Hartford County Metropolitan District Cash Flow Management GO Notes, Series B
3.00%, 08/01/18 | | $ | 4,540,185 | |
| | 2,000,000 | | | Hartford County Metropolitan District Refunding Notes GO
5.00%, 03/01/25 | | | 2,272,200 | |
| | 1,695,000 | | | Hartford County Metropolitan District Refunding Notes GO, Series C (AGM)
5.00%, 11/01/23 | | | 1,976,862 | |
| | 5,860,000 | | | Hartford County Metropolitan District Refunding Notes GO, Series C, (AGM)
5.00%, 11/01/25 | | | 6,925,289 | |
| | 7,000,000 | | | State of Connecticut Advance Refunding GO, Series B
5.00%, 05/15/24 | | | 8,168,580 | |
| | 8,000,000 | | | State of Connecticut Advance Refunding GO, Series B
5.00%, 05/15/25 | | | 9,389,920 | |
| | 1,805,000 | | | State of Connecticut Advance Refunding GO, Series B
5.00%, 05/15/27 | | | 2,119,593 | |
| | 6,000,000 | | | State of Connecticut Public Improvements GO, Series F
5.00%, 11/15/26 | | | 7,038,180 | |
| | 3,100,000 | | | State of Connecticut Special Tax Revenue Public Improvements Revenue Bonds, Series A
5.00%, 08/01/22 | | | 3,531,148 | |
| | 1,250,000 | | | State of Connecticut Special Tax Revenue Transportation Infrastructure Advance Refunding Revenue Bonds
5.00%, 08/01/22 | | | 1,423,850 | |
| | 8,000,000 | | | State of Connecticut Special Tax Transportation Infrastructure Refunding Revenue Bonds
5.00%, 09/01/25 | | | 9,352,400 | |
| | 2,000,000 | | | State of Connecticut Transportation Infrastructure Refunding Revenue Bonds
5.00%, 09/01/24 | | | 2,340,860 | |
| | 8,000,000 | | | State of Connecticut Transportation Infrastructure Revenue Bonds, Series A
5.00%, 10/01/19 | | | 8,538,800 | |
| | 5,000,000 | | | State of Connecticut Transportation Infrastructure Revenue Bonds, Series A
5.00%, 09/01/27 | | | 5,773,450 | |
See Notes to Financial Statements.
| Old Westbury Funds, Inc. | |
| Municipal Bond Fund | |
| Portfolio of Investments - (Continued) | October 31, 2017 |
| | |
Principal
Amount | | | | | Value | |
| Connecticut (continued) | | | | |
| $ | 10,000,000 | | | State of Connecticut Water & Sewer System Improvements GO, Series E
5.00%, 10/15/23 | | $ | 11,596,500 | |
| | | | | | | | 84,987,817 | |
| District Of Columbia — 0.3% | | | | |
| | 5,000,000 | | | District of Columbia Public Improvement Revenue Bonds, Series C
5.00%, 12/01/19 | | | 5,394,600 | |
| | 1,000,000 | | | District of Columbia Refunding Revenue Bonds, Series A
5.00%, 12/01/20 | | | 1,112,970 | |
| | | | | | | | 6,507,570 | |
| Florida — 1.1% | | | | |
| | 4,790,000 | | | County of Miami-Dade Public Improvements GO
5.00%, 07/01/24 | | | 5,731,762 | |
| | 1,000,000 | | | County of Sarasota Refunding Revenue Bonds
5.00%, 10/01/24 | | | 1,202,820 | |
| | 8,575,000 | | | Florida State Board of Education Lottery Revenue Bonds, Series A, OID
5.50%, 07/01/27 | | | 8,914,141 | |
| | 1,200,000 | | | Lee County School Board Refunding COP
5.00%, 08/01/25 | | | 1,421,976 | |
| | 4,000,000 | | | Miami-Dade County Refunding GO, Series B
5.00%, 07/01/24 | | | 4,786,440 | |
| | 2,000,000 | | | Orlando Utilities Commission Refunding Revenue Bonds, Series A
5.00%, 10/01/20 | | | 2,215,140 | |
| | 500,000 | | | Palm Beach County Revenue Bonds, Series 2, OID
5.25%, 11/01/25 | | | 520,625 | |
| | | | | | | | 24,792,904 | |
| Georgia — 4.8% | | | | |
| | 1,570,000 | | | Athens Housing Authority Advance Refunding Revenue Bonds
5.00%, 06/15/27 | | | 1,912,715 | |
| | 1,755,000 | | | Athens Housing Authority Advance Refunding Revenue Bonds
5.00%, 06/15/28 | | | 2,116,372 | |
| | 2,000,000 | | | Cherokee County Board of Education Advance Refunding GO
5.00%, 08/01/23 | | | 2,368,300 | |
Principal
Amount | | | | | Value | |
| Georgia (continued) | | | | |
| $ | 750,000 | | | Cherokee County Board of Education Advance Refunding GO, (State Aid Withholding)
5.00%, 02/01/23 | | $ | 880,313 | |
| | 260,000 | | | Cobb County Development Authority Advance Refunding Revenue Bonds
5.00%, 07/15/21 | | | 291,951 | |
| | 2,710,000 | | | Cobb County Development Authority Advance Refunding Revenue Bonds
5.00%, 07/15/23 | | | 3,160,348 | |
| | 2,100,000 | | | Cobb County Development Authority Advance Refunding Revenue Bonds
5.00%, 07/15/24 | | | 2,484,615 | |
| | 12,000,000 | | | County of Fulton Cash Flow Management GO Notes
2.00%, 12/29/17 | | | 12,020,280 | |
| | 235,000 | | | Fulton County Development Authority Georgia Tech Facilities Refunding Revenue Bonds, Series A
5.00%, 05/01/23 | | | 273,122 | |
| | 1,000,000 | | | Fulton County Water & Sewer Refunding Revenue Bonds
5.00%, 01/01/18 | | | 1,006,550 | |
| | 1,250,000 | | | Georgia State Road & Tollway Authority Federal Highway Grant Anticipation Revenue Bonds, Series A
5.00%, 06/01/18 | | | 1,278,350 | |
| | 5,000,000 | | | Georgia State Road & Tollway Authority Highway Improvement Revenue Bonds, Series A
5.00%, 06/01/20 | | | 5,301,400 | |
| | 2,000,000 | | | Georgia State Road & Tollway Authority Refunding Revenue Bonds, Series B
5.00%, 06/01/21 | | | 2,247,580 | |
| | 2,025,000 | | | Georgia State Road & Tollway Authority Refunding Revenue Bonds, Series B, (State GTY)
5.00%, 10/01/19 | | | 2,174,546 | |
| | 8,100,000 | | | Private Colleges & Universities Authority Refunding Revenue Bonds, Series B-2
0.86%, 09/01/35(a) | | | 8,100,000 | |
| | 1,095,000 | | | South Regional Joint Development Authority Advance Refunding Revenue Bonds
5.00%, 08/01/25 | | | 1,311,394 | |
See Notes to Financial Statements.
| Old Westbury Funds, Inc. | |
| Municipal Bond Fund | |
| Portfolio of Investments - (Continued) | October 31, 2017 |
| | |
Principal
Amount | | | | | Value | |
| Georgia (continued) | | | | |
| $ | 1,555,000 | | | South Regional Joint Development Authority Advance Refunding Revenue Bonds
5.00%, 08/01/26 | | $ | 1,883,152 | |
| | 1,100,000 | | | South Regional Joint Development Authority Advance Refunding Revenue Bonds
5.00%, 08/01/26 | | | 1,332,133 | |
| | 4,000,000 | | | State of Georgia Advance Refunding GO, Series C-1
5.00%, 07/01/23 | | | 4,743,040 | |
| | 7,650,000 | | | State of Georgia Advance Refunding GO, Series E
5.00%, 12/01/26 | | | 9,575,811 | |
| | 1,950,000 | | | State of Georgia Public Improvements GO, Series A-2
5.00%, 02/01/25 | | | 2,342,633 | |
| | 1,925,000 | | | State of Georgia Refunding GO, Series E-2
4.00%, 09/01/18 | | | 1,972,625 | |
| | 2,860,000 | | | State of Georgia Refunding GO, Series E-2
4.00%, 09/01/19 | | | 3,010,922 | |
| | 1,500,000 | | | State of Georgia School Improvement GO, Series B
5.00%, 01/01/18 | | | 1,509,930 | |
| | 28,020,000 | | | State of Georgia University and College Improvements GO, Series A-1
5.00%, 02/01/24 | | | 33,624,841 | |
| | | | | | | | 106,922,923 | |
| Hawaii — 0.6% | | | | |
| | 5,815,000 | | | State of Hawaii Advance Refunding GO
5.00%, 10/01/23 | | | 6,911,825 | |
| | 1,000,000 | | | State of Hawaii Department of Budget & Finance Queens Health System Refunding Revenue Bonds, Series A
5.00%, 07/01/21 | | | 1,127,440 | |
| | 400,000 | | | State of Hawaii Refunding GO, Series DY
5.00%, 02/01/18 | | | 403,931 | |
| | 5,000,000 | | | State of Hawaii Refunding GO, Series EP
5.00%, 08/01/25 | | | 6,008,650 | |
| | | | | | | | 14,451,846 | |
Principal
Amount | | | | | Value | |
| Idaho — 0.1% | | | | |
| $ | 1,000,000 | | | Canyon County School District No 131 Nampa Advance Refunding GO, (School Board GTY)
5.00%, 09/15/25 | | $ | 1,220,670 | |
| | 1,500,000 | | | Idaho Board Bank Authority Refunding Revenue Bonds, Series D
5.00%, 09/15/23 | | | 1,734,930 | |
| | | | | | | | 2,955,600 | |
| Illinois — 1.7% | | | | |
| | 2,575,000 | | | Cook County Community College District No. 524 Moraine Valley GO, Series B, (NATL-RE)
5.00%, 12/01/25 | | | 2,582,983 | |
| | 12,200,000 | | | Illinois Finance Authority University & College Improvements Revenue Bonds
0.90%, 12/01/46(a) | | | 12,200,000 | |
| | 10,000,000 | | | Illinois Finance Authority University & College Improvements Revenue Bonds
0.90%, 12/01/46(a) | | | 10,000,000 | |
| | 3,000,000 | | | Illinois State Toll Highway Authority Refunding Revenue Bonds, Series B
5.00%, 12/01/17 | | | 3,009,420 | |
| | 3,250,000 | | | Metropolitan Water Reclamation District of Greater Chicago Current Refunding GO, Series A
5.00%, 12/01/24 | | | 3,857,653 | |
| | 2,000,000 | | | Metropolitan Water Reclamation District of Greater Chicago Refunding GO, Series D
5.00%, 12/01/22 | | | 2,306,220 | |
| | 3,500,000 | | | State of Illinois Public Improvement Refunding Revenue Bonds
5.00%, 06/15/18 | | | 3,580,255 | |
| | 780,000 | | | University of Illinois College Improvement Refunding Revenue Bonds, Series A
5.00%, 04/01/21 | | | 857,103 | |
| | | | | | | | 38,393,634 | |
| Indiana — 0.2% | | | | |
| | 500,000 | | | Center Grove School Building Corp. First Mortgage Refunding Revenue Bonds, Series A (State Aid Intercept Program)
5.00%, 07/15/20 | | | 546,450 | |
See Notes to Financial Statements.
| Old Westbury Funds, Inc. | |
| Municipal Bond Fund | |
| Portfolio of Investments - (Continued) | October 31, 2017 |
| | |
Principal
Amount | | | | | Value | |
| Indiana (continued) | | | | |
| $ | 1,330,000 | | | GCS School Building Corp. One, First Mortgage Refunding Revenue Bonds (State Aid Intercept Program)
5.00%, 01/15/22 | | $ | 1,512,476 | |
| | 250,000 | | | GCS School Building Corp. One, First Mortgage Refunding Revenue Bonds (State Aid Intercept Program)
5.00%, 07/15/22 | | | 287,375 | |
| | 500,000 | | | Ivy Tech Community College University & College Improvements Revenue Bonds, Series R-1
5.00%, 07/01/19 | | | 531,540 | |
| | 1,000,000 | | | Warsaw Multi-School Building Corp. Revenue Bonds, Series B (State Aid Withholding)
5.75%, 07/15/26 | | | 1,009,580 | |
| | | | | | | | 3,887,421 | |
| Iowa — 0.6% | | | | |
| | 5,675,000 | | | County of Polk Current Refunding GO, Series C
5.00%, 06/01/21 | | | 6,413,601 | |
| | 4,000,000 | | | County of Polk Current Refunding GO, Series C
5.00%, 06/01/26 | | | 4,966,720 | |
| | 1,800,000 | | | Iowa Finance Authority Water Utilities Improvements Revenue Bonds
5.00%, 08/01/20 | | | 1,984,788 | |
| | | | | | | | 13,365,109 | |
| Kansas — 0.2% | | | | |
| | 1,260,000 | | | Sedgwick County Public Building Commission Technical Education Complex Refunding Revenue Bonds, Series 2
5.00%, 08/01/23 | | | 1,492,029 | |
| | 2,170,000 | | | Topeka Public Building Commission KBI Forensic Laboratory Project Revenue Bonds
5.00%, 12/01/17 | | | 2,176,836 | |
| | | | | | | | 3,668,865 | |
| Kentucky — 0.3% | | | | |
| | 5,000,000 | | | Kentucky Turnpike Authority Advance Refunding Revenue Bonds, Series A
5.00%, 07/01/24 | | | 5,938,200 | |
Principal
Amount | | | | | Value | |
| Louisiana — 0.1% | | | | |
| $ | 375,000 | | | Consolidated Government of The City of Baton Rouge & Parish of East Baton Rouge Advance Refunding Revenue Bonds, Series A-1
5.00%, 08/01/26 | | $ | 460,133 | |
| | 2,000,000 | | | State of Louisiana Interstate 49 South Project Revenue Bonds
5.00%, 09/01/22 | | | 2,291,780 | |
| | | | | | | | 2,751,913 | |
| Maine — 0.1% | | | | |
| | 2,250,000 | | | Maine Governmental Facilities Authority Refunding Revenue Bonds, Series A
5.00%, 10/01/19 | | | 2,409,503 | |
| | 165,000 | | | Maine Health & Higher Educational Facilities Authority Refunding Revenue Bonds, Series A
5.00%, 07/01/21 | | | 185,209 | |
| | 5,000 | | | Maine Health & Higher Educational Facilities Authority Refunding Revenue Bonds, Series A
5.00%, 07/01/21(b) | | | 5,644 | |
| | | | | | | | 2,600,356 | |
| Maryland — 2.7% | | | | |
| | 1,200,000 | | | County of Baltimore Refunding GO, (Special Assessment)
5.00%, 02/01/29 | | | 1,456,152 | |
| | 1,500,000 | | | County of Frederick Refunding GO, Series A
5.00%, 02/01/25 | | | 1,832,700 | |
| | 3,110,000 | | | County of Prince George’s Public School Improvements GO, Series A
5.00%, 07/01/24 | | | 3,760,488 | |
| | 9,355,000 | | | County of Prince George’s Public School Improvements GO, Series A
5.00%, 07/01/25 | | | 11,496,360 | |
| | 1,000,000 | | | Maryland State Department of Transportation Highway Improvement Revenue Bonds
5.00%, 10/01/20 | | | 1,106,060 | |
| | 15,000,000 | | | State of Maryland Advance Refunding GO, Series B
5.00%, 08/01/22 | | | 17,434,050 | |
| | 10,000,000 | | | State of Maryland Department of Transportation Transit Improvements Revenue Bonds
5.00%, 11/01/26 | | | 12,029,400 | |
See Notes to Financial Statements.
| Old Westbury Funds, Inc. | |
| Municipal Bond Fund | |
| Portfolio of Investments - (Continued) | October 31, 2017 |
| | |
Principal
Amount | | | | | Value | |
| Maryland (continued) | | | | |
| $ | 3,000,000 | | | State of Maryland Public Improvements GO,
Series A
5.00%, 03/15/25 | | $ | 3,671,310 | |
| | 6,375,000 | | | State of Maryland School Improvements GO, Series 1
5.00%, 06/01/23 | | | 7,538,884 | |
| | | | | | | | 60,325,404 | |
| Massachusetts — 9.9% | | | | |
| | 6,200,000 | | | Brockton Area Transit Authority Cash Flow Management Revenue Notes
2.00%, 08/03/18 | | | 6,233,604 | |
| | 5,750,000 | | | Cape Cod Regional Transit Authority Cash Flow Management Revenue Notes
2.00%, 07/27/18 | | | 5,785,535 | |
| | 7,000,000 | | | Commonwealth of Massachusetts Advance Refunding GO, Series A
5.00%, 07/01/25 | | | 8,551,830 | |
| | 5,705,000 | | | Commonwealth of Massachusetts Advance Refunding GO, Series B
5.00%, 07/01/27 | | | 7,128,112 | |
| | 11,500,000 | | | Commonwealth of Massachusetts Advance Refunding GO, Series C
5.00%, 10/01/22 | | | 13,387,840 | |
| | 10,000,000 | | | Commonwealth of Massachusetts Cash Flow Management GO Notes, Series C
2.00%, 06/25/18 | | | 10,058,400 | |
| | 2,900,000 | | | Commonwealth of Massachusetts Highway Improvements Revenue Bonds, Series B
5.00%, 06/15/22 | | | 3,361,158 | |
| | 9,000,000 | | | Commonwealth of Massachusetts Public Improvements GO, Series A
5.00%, 05/01/19 | | | 9,519,840 | |
| | 8,000,000 | | | Commonwealth of Massachusetts Refunding GO, Series C, (AGM)
5.25%, 11/01/26 | | | 10,101,120 | |
| | 7,470,000 | | | Commonwealth of Massachusetts Transportation Fund Advance Refunding Revenue Bonds, Series A
5.00%, 06/01/27 | | | 9,202,293 | |
| | 5,500,000 | | | Greater Attleboro-Taunton Regional Transit Authority Cash Flow Management Revenue Notes
2.00%, 08/24/18 | | | 5,533,495 | |
Principal
Amount | | | | | Value | |
| Massachusetts (continued) | | | | |
| $ | 5,250,000 | | | Lowell Regional Transit Authority Cash Flow Management Revenue Notes
2.00%, 08/10/18 | | $ | 5,277,563 | |
| | 1,500,000 | | | Marthas Vineyard Regional Transit Authority Cash Flow Management Revenue Notes
1.50%, 05/11/18 | | | 1,503,405 | |
| | 8,500,000 | | | Massachusetts Clean Water Trust Advance Refunding Revenue Bonds, Series 2017
5.00%, 08/01/21 | | | 9,659,825 | |
| | 20,000,000 | | | Massachusetts Health & Educational Facilities Authority, University and College Improvements Revenue Bonds
0.86%, 07/01/31(a) | | | 20,000,000 | |
| | 4,000,000 | | | Massachusetts Health & Educational Facilities Authority, University and College Improvements Revenue Bonds, Series Y
0.90%, 07/01/35(a) | | | 4,000,000 | |
| | 7,780,000 | | | Massachusetts State Water Pollution Abatement Trust Refunding Revenue Bonds, Sub-Series 16-B
5.00%, 08/01/20 | | | 8,585,386 | |
| | 500,000 | | | Massachusetts Water Resources Authority Refunding Revenue Bonds, Series A
5.00%, 08/01/22 | | | 581,885 | |
| | 8,535,000 | | | Massachusetts Water Resources Authority Refunding Revenue Bonds, Series B
5.25%, 08/01/26 | | | 10,789,691 | |
| | 2,700,000 | | | Massachusetts Water Resources Authority Refunding Revenue Bonds, Series C
5.00%, 08/01/22 | | | 3,142,179 | |
| | 4,800,000 | | | Massachusetts Water Resources Authority Refunding Revenue Bonds, Series C
5.00%, 08/01/23 | | | 5,707,104 | |
| | 14,845,000 | | | Massachusetts Water Resources Authority Refunding Revenue Bonds, Series E, (GO of Authority)
0.94%, 08/01/37(a) | | | 14,845,000 | |
| | 15,000,000 | | | Montachusett Regional Transit Authority Cash Flow Management Revenue Notes
2.00%, 08/03/18 | | | 15,081,300 | |
| | 13,100,000 | | | Pioneer Valley Transit Authority Cash Flow Management Revenue Notes
2.00%, 07/20/18 | | | 13,179,779 | |
See Notes to Financial Statements.
| Old Westbury Funds, Inc. | |
| Municipal Bond Fund | |
| Portfolio of Investments - (Continued) | October 31, 2017 |
| | |
Principal
Amount | | | | | Value | |
| Massachusetts (continued) | | | | |
| $ | 3,209,000 | | | Town of Littleton Cash Flow Management GO Notes
2.00%, 05/18/18 | | $ | 3,225,430 | |
| | 6,015,000 | | | Town of Sandwich Cash Flow Management GO Notes
2.00%, 02/16/18 | | | 6,011,030 | |
| | 5,000,000 | | | Town of Stow Cash Flow Management Refunding GO Notes
2.00%, 05/01/18 | | | 5,028,150 | |
| | 6,000,000 | | | Town of Topsfield Cash Flow Management GO Notes
2.00%, 03/09/18 | | | 6,021,300 | |
| | | | | | | | 221,502,254 | |
| Michigan — 0.5% | | | | |
| | 200,000 | | | Caledonia Community Schools Refunding GO, (Q-SBLF)
5.00%, 05/01/23 | | | 233,353 | |
| | 635,000 | | | Dexter Community Schools Refunding GO (Q-SBLF)
4.00%, 05/01/18 | | | 644,455 | |
| | 1,225,000 | | | Grand Valley State University & College Advance Refunding Revenue Bonds, Series A
5.00%, 12/01/25 | | | 1,470,613 | |
| | 1,000,000 | | | Grand Valley State University & College Improvements Revenue Bonds, Series A
5.00%, 12/01/23 | | | 1,172,190 | |
| | 400,000 | | | Hudsonville Public Schools Improvements GO, (Q-SBLF)
5.00%, 05/01/18 | | | 407,835 | |
| | 250,000 | | | Hudsonville Public Schools Improvements GO, (Q-SBLF)
5.00%, 05/01/19 | | | 264,363 | |
| | 1,375,000 | | | Northville Public Schools Refunding GO, (Q-SBLF)
5.00%, 05/01/18 | | | 1,401,936 | |
| | 1,000,000 | | | University of Michigan Advance Refunding Revenue Bonds, Series A
5.00%, 04/01/22 | | | 1,153,560 | |
| | 4,530,000 | | | University of Michigan Refunding Revenue Bonds, Series C
4.00%, 04/01/19 | | | 4,717,044 | |
| | | | | | | | 11,465,349 | |
| Minnesota — 2.4% | | | | |
| | 1,515,000 | | | Cambridge Independent School District No 911 School Building Refunding GO, Series D, (School District Credit Program)
5.00%, 02/01/24 | | | 1,807,122 | |
Principal
Amount | | | | | Value | |
| Minnesota (continued) | | | | |
| $ | 1,000,000 | | | City of Rochester Advance Refunding GO, Series B
5.00%, 12/01/24 | | $ | 1,217,760 | |
| | 9,875,000 | | | County of Hennepin Public Improvements GO, Series C
0.90%, 12/01/33(a) | | | 9,875,000 | |
| | 800,000 | | | Fulda Independent School District No 505 Cash Flow Management GO Notes (School District Credit Program)
2.00%, 09/28/18 | | | 805,528 | |
| | 2,200,000 | | | Sartell-St Stephen Independent School District No 748 GO (School District Credit Program), Series A
5.00%, 02/01/25 | | | 2,659,646 | |
| | 5,425,000 | | | St. Paul Port Authority Anderson Office Building Refunding Revenue Bonds, Series 3
5.00%, 12/01/19 | | | 5,831,007 | |
| | 16,495,000 | | | State of Minnesota Advance Refunding GO, Series D
5.00%, 08/01/25 | | | 20,228,643 | |
| | 1,000,000 | | | State of Minnesota Public Improvements COP
5.00%, 06/01/23 | | | 1,169,740 | |
| | 1,395,000 | | | State of Minnesota Public Improvements COP
5.00%, 06/01/24 | | | 1,660,343 | |
| | 2,740,000 | | | State of Minnesota Public Improvements COP
5.00%, 06/01/25 | | | 3,257,449 | |
| | 2,910,000 | | | State of Minnesota Public Improvements COP
5.00%, 06/01/26 | | | 3,445,731 | |
| | 1,000,000 | | | State of Minnesota Refunding Revenue Bonds, Series B
5.00%, 03/01/21 | | | 1,121,240 | |
| | 1,000,000 | | | Waconia Independent School District No 110 Refunding GO, Series A, (School District Credit Program)
5.00%, 02/01/24 | | | 1,190,210 | |
| | | | | | | | 54,269,419 | |
| Mississippi — 0.5% | | | | |
| | 650,000 | | | Delta State University Educational Building Corp., Facilities Refunding Revenue
5.00%, 12/01/23 | | | 762,736 | |
| | 1,810,000 | | | Mississippi Development Bank Department of Corrections Refunding Revenue Bonds, Series D
5.00%, 08/01/18 | | | 1,862,906 | |
See Notes to Financial Statements.
| Old Westbury Funds, Inc. | |
| Municipal Bond Fund | |
| Portfolio of Investments - (Continued) | October 31, 2017 |
| | |
Principal
Amount | | | | | Value | |
| Mississippi (continued) | | | | |
| $ | 570,000 | | | Mississippi Development Bank DeSoto County Highway Project Advance Refunding Revenue Bonds, Series S, (State Aid Intercept Program)
5.00%, 01/01/23 | | $ | 659,849 | |
| | 4,560,000 | | | Mississippi Development Bank Harrison County Highway Refunding Revenue Bonds, Series A
5.00%, 01/01/25 | | | 5,435,155 | |
| | 310,000 | | | Mississippi State University Educational Building Corp. Campus Improvements Project Revenue Bonds
5.00%, 11/01/22 | | | 360,102 | |
| | 475,000 | | | Mississippi State University Educational Building Corp. New Facilities and Refinancing Advance Refunding Revenue Bonds
5.00%, 08/01/24 | | | 568,152 | |
| | 830,000 | | | University of Mississippi Educational Building Corp. Facilities Financing Project Advance Refunding Revenue Bonds, Series A
5.00%, 10/01/25 | | | 1,006,666 | |
|
| | | | | | | | 10,655,566 | |
|
| Missouri — 1.9% | | | | |
| | 570,000 | | | County of Jackson Refunding Revenue Bonds
4.00%, 12/01/21 | | | 624,771 | |
| | 300,000 | | | County of Jackson Refunding Revenue Bonds
4.00%, 12/01/22 | | | 331,749 | |
| | 2,300,000 | | | County of Jackson Sports Complex Project Refunding Revenue Bonds, (State Appropriation, City Appropriation)
5.00%, 12/01/26 | | | 2,733,343 | |
| | 4,000,000 | | | Hazelwood School District Refunding GO, (State Aid Direct Deposit)
5.00%, 03/01/25 | | | 4,762,520 | |
| | 915,000 | | | Missouri State Environmental Improvement & Energy Resources Authority Advance Refunding Revenue Bonds, Series B
5.00%, 01/01/25 | | | 1,113,006 | |
Principal
Amount | | | | | Value | |
|
| Missouri (continued) | | | | |
| $ | 2,225,000 | | | Missouri State Health & Educational Facilities Authority Columbia Arena Project Refunding Revenue Bonds
5.00%, 10/01/19 | | $ | 2,388,426 | |
| | 2,000,000 | | | Missouri State Health & Educational Facilities Authority Columbia Arena Project Refunding Revenue Bonds
5.00%, 10/01/21 | | | 2,270,000 | |
| | 850,000 | | | North Kansas City School District No 74 School Improvements Refunding GO, (State Aid Direct Deposit)
5.00%, 03/01/24 | | | 1,018,224 | |
| | 1,800,000 | | | North Kansas City School District No 74 School Improvements Refunding GO, (State Aid Direct Deposit)
5.00%, 03/01/25 | | | 2,149,074 | |
| | 24,245,000 | | | University of Missouri Refunding Revenue Bonds, Series B
0.92%, 11/01/31(a) | | | 24,245,000 | |
|
| | | | | | | | 41,636,113 | |
|
| Nevada — 0.1% | | | | |
| | 2,605,000 | | | Clark County Water Reclamation District GO, Series A
5.25%, 07/01/20 | | | 2,782,713 | |
|
| New Hampshire — 0.1% | | | | |
| | 2,250,000 | | | State of New Hampshire Highway Improvements Revenue Bonds
5.00%, 09/01/19 | | | 2,397,960 | |
|
| New Jersey — 1.6% | | | | |
| | 200,000 | | | Bergen County Improvement Authority Refunding Revenue Bonds, Series A (County GTY)
4.00%, 12/15/17 | | | 200,725 | |
| | 9,000,000 | | | County of Middlesex GO Refunding Notes
2.00%, 06/13/18 | | | 9,054,180 | |
| | 2,000,000 | | | Garden State Preservation Trust Refunding Revenue Bonds, Series A
5.00%, 11/01/17 | | | 2,000,000 | |
| | 200,000 | | | Monmouth County Improvement Authority Refunding Revenue Bonds (County GTY, Municipal Government GTY)
5.00%, 12/01/22 | | | 234,009 | |
See Notes to Financial Statements.
| Old Westbury Funds, Inc. | |
| Municipal Bond Fund | |
| Portfolio of Investments - (Continued) | October 31, 2017 |
| | |
Principal
Amount | | | | | Value | |
| New Jersey (continued) | | | | |
| $ | 1,090,000 | | | New Jersey Economic Development Authority School Facilities Construction Refunding Revenue Bonds
5.00%, 03/01/18(b) | | $ | 1,104,443 | |
| | 410,000 | | | New Jersey Economic Development Authority School Facilities Construction Refunding Revenue Bonds
5.00%, 03/01/18 | | | 414,440 | |
| | 40,000 | | | New Jersey Sports & Exposition Authority Refunding Revenue Bonds, Series B (State Appropriation)
5.00%, 09/01/18(b) | | | 41,276 | |
| | 1,300,000 | | | New Jersey State Turnpike Authority Refunding Revenue Bonds, Series B
5.00%, 01/01/20 | | | 1,403,155 | |
| | 9,220,000 | | | New Jersey State Turnpike Authority Refunding Revenue Bonds, Series C
5.00%, 01/01/25 | | | 11,009,786 | |
| | 2,000,000 | | | New Jersey Transportation Trust Fund Authority Refunding Revenue Bonds, Series A
5.25%, 12/15/21 | | | 2,225,580 | |
| | 1,500,000 | | | New Jersey Transportation Trust Fund Authority Transit Improvements Refunding Revenue Bonds, Series A
5.25%, 12/15/22 | | | 1,687,815 | |
| | 1,575,000 | | | New Jersey Transportation Trust Fund Authority Transit Improvements Revenue Bonds
5.00%, 06/15/24 | | | 1,785,026 | |
| | 500,000 | | | New Jersey Transportation Trust Fund Authority Transit Improvements Revenue Bonds, Series B
5.00%, 06/15/19 | | | 523,609 | |
| | 1,000,000 | | | New Jersey Turnpike Authority Advance Refunding Revenue Bonds, Series B
5.00%, 01/01/27 | | | 1,225,620 | |
| | 2,000,000 | | | New Jersey Turnpike Authority Highway Improvements Revenue Bonds Series A
5.00%, 01/01/29 | | | 2,407,160 | |
|
| | | | | | | | 35,316,824 | |
|
| New Mexico — 0.2% | | | | |
| | 4,700,000 | | | University of New Mexico/The Refunding Revenue Bonds, Series C
0.90%, 06/01/30(a) | | | 4,700,000 | |
Principal
Amount | | | | | Value | |
| New York — 17.3% | | | | |
| $ | 5,500,000 | | | City of New York Advance Refunding GO, Series 2015-A
5.00%, 08/01/24 | | $ | 6,582,455 | |
| | 30,000,000 | | | City of New York Advance Refunding GO, Series C
5.00%, 08/01/22 | | | 34,674,000 | |
| | 8,200,000 | | | City of New York Public Improvements GO, Sub-Series B-3 (TD Bank N.A.)
0.91%, 09/01/27(a) | | | 8,200,000 | |
| | 3,010,000 | | | City of New York Public Improvements GO, Sub-Series D-1
5.00%, 08/01/22 | | | 3,478,958 | |
| | 1,855,000 | | | City of New York Refunding GO, Series C
5.00%, 08/01/20 | | | 2,040,129 | |
| | 650,000 | | | City of New York Refunding GO, Series C
5.00%, 08/01/22 | | | 751,270 | |
| | 8,170,000 | | | City of New York Refunding GO, Series D
5.00%, 08/01/22 | | | 9,442,886 | |
| | 2,500,000 | | | City of New York Refunding GO, Series G
5.00%, 08/01/21 | | | 2,825,425 | |
| | 18,500,000 | | | City of New York Refunding GO, Series G
5.00%, 08/01/22 | | | 21,382,300 | |
| | 6,000,000 | | | County of Rockland Cash Flow Management GO Notes
2.50%, 03/22/18 | | | 6,025,020 | |
| | 2,000,000 | | | Erie County Industrial Development Agency Refunding Revenue Bonds, Series B, (State Aid Withholding)
5.00%, 05/01/18 | | | 2,039,480 | |
| | 5,000,000 | | | Erie County Industrial Development Agency Refunding Revenue Bonds, Series B, (State Aid Withholding)
5.00%, 05/01/23 | | | 5,615,900 | |
| | 5,000,000 | | | Metropolitan Transportation Authority Advance Refunding Revenue Bonds, Series C-2B
5.00%, 11/15/34(a) | | | 5,409,400 | |
| | 240,000 | | | Metropolitan Transportation Authority Current Refunding Revenue Bonds, Series B
5.00%, 11/15/28 | | | 289,550 | |
| | 875,000 | | | Metropolitan Transportation Authority Current Refunding Revenue Bonds, Series B
5.00%, 11/15/29 | | | 1,049,379 | |
See Notes to Financial Statements.
| Old Westbury Funds, Inc. | |
| Municipal Bond Fund | |
| Portfolio of Investments - (Continued) | October 31, 2017 |
| | |
Principal
Amount | | | | | Value | |
| New York (continued) | | | | |
| $ | 1,925,000 | | | Metropolitan Transportation Authority Refunding Revenue Bonds, Series F
5.00%, 11/15/21 | | $ | 2,191,959 | |
| | 1,910,000 | | | Metropolitan Transportation Authority Transit Improvements Revenue Bonds, Series C
5.00%, 11/15/21 | | | 2,174,879 | |
| | 2,500,000 | | | New York City Municipal Water Finance Authority Fiscal 2009 Revenue Bonds, Series A
5.50%, 06/15/21 | | | 2,568,950 | |
| | 10,000,000 | | | New York City Municipal Water Finance Authority Water and Sewer System Revenue Bonds, Series B-1B
0.91%, 06/15/24(a)(c) | | | 10,000,000 | |
| | 2,500,000 | | | New York City Transitional Finance Authority Building Aid Revenue Public Improvements Revenue Bonds, Series S-1, (State Aid Withholding)
5.00%, 07/15/24 | | | 2,999,450 | |
| | 680,000 | | | New York City Transitional Finance Authority Building Aid School Improvements Revenue Bonds, Series S-1A, (State Aid Withholding)
5.00%, 07/15/21(b) | | | 769,338 | |
| | 295,000 | | | New York City Transitional Finance Authority Building Aid School Improvements Revenue Bonds, Series S-1A, (State Aid Withholding)
5.00%, 07/15/21 | | | 333,869 | |
| | 1,350,000 | | | New York City Transitional Finance Authority Future Tax Secured Advanced Refunding Revenue Bonds, Series C
5.00%, 11/01/23 | | | 1,602,990 | |
| | 2,200,000 | | | New York City Transitional Finance Authority Future Tax Secured Public Improvements Revenue Bonds
5.00%, 05/01/22(b) | | | 2,327,072 | |
| | 1,230,000 | | | New York City Transitional Finance Authority Future Tax Secured Refunding Revenue Bonds, Series B
5.00%, 11/01/17(b) | | | 1,230,000 | |
| | 770,000 | | | New York City Transitional Finance Authority Future Tax Secured Refunding Revenue Bonds, Series B
5.00%, 11/01/17 | | | 770,000 | |
Principal
Amount | | | | | Value | |
| New York (continued) | | | | |
| $ | 15,920,000 | | | New York City Transitional Finance Authority Future Tax Secured Refunding Revenue Bonds, Sub-Series B
5.00%, 11/01/21 | | $ | 18,160,422 | |
| | 3,025,000 | | | New York City Transitional Finance Authority Future Tax Secured Refunding Revenue Bonds, Sub-Series G
5.00%, 11/01/18 | | | 3,144,457 | |
| | 1,045,000 | | | New York City Transitional Finance Authority Future Tax Secured Refunding Revenue Bonds, Sub-Series G
5.00%, 11/01/19 | | | 1,123,992 | |
| | 2,425,000 | | | New York City Transitional Finance Authority Future Tax Secured Refunding Revenue Bonds, Sub-Series G
5.00%, 11/01/21 | | | 2,766,270 | |
| | 935,000 | | | New York City Transitional Finance Authority Future Tax Secured Refunding Revenue Bonds, Sub-Series H
5.00%, 11/01/18 | | | 971,923 | |
| | 1,535,000 | | | New York City Transitional Finance Authority Future Tax Secured Refunding Revenue Bonds, Sub-Series H
5.00%, 11/01/21 | | | 1,751,021 | |
| | 1,725,000 | | | New York City Transitional Finance Authority Future Tax Secured Refunding Revenue Notes
5.00%, 02/01/18 | | | 1,742,181 | |
| | 225,000 | | | New York City Transitional Finance Authority Future Tax Secured Refunding Revenue Notes
5.00%, 02/01/18(b) | | | 227,195 | |
| | 515,000 | | | New York City Transitional Finance Authority Future Tax Secured Revenue Bonds, Sub-Series, F-1
5.00%, 02/01/19 | | | 539,869 | |
| | 9,000,000 | | | New York City Transitional Finance Authority Future Tax Secured Revenue Public Improvements Revenue Bonds
5.00%, 02/01/31 | | | 10,797,660 | |
| | 600,000 | | | New York City Transitional Finance Authority Refunding Revenue Bonds, Sub-Series G
5.00%, 11/01/20 | | | 665,802 | |
See Notes to Financial Statements.
| Old Westbury Funds, Inc. | |
| Municipal Bond Fund | |
| Portfolio of Investments - (Continued) | October 31, 2017 |
| | |
Principal
Amount | | | | | Value | |
| New York (continued) | | | | |
| $ | 4,875,000 | | | New York City Water & Sewer System Refunding Revenue Bonds, Series F-2
0.92%, 06/15/33(a) | | $ | 4,875,000 | |
| | 8,000,000 | | | New York Local Government Assistance Corp. Refunding Revenue Bonds, Sub-Lien Series B-3V
0.92%, 04/01/24(a) | | | 8,000,000 | |
| | 5,100,000 | | | New York Municipal Bond Bank Agency Refunding Revenue Bonds, (State Aid Withholding)
4.00%, 12/01/17 | | | 5,112,393 | |
| | 5,000,000 | | | New York Municipal Bond Bank Agency Refunding Revenue Bonds, (State Aid Withholding)
5.00%, 12/01/21 | | | 5,715,700 | |
| | 9,100,000 | | | New York State Dormitory Authority Advance Refunding Revenue Bonds, Series A
5.00%, 03/15/23 | | | 10,711,337 | |
| | 7,790,000 | | | New York State Dormitory Authority Advance Refunding Revenue Bonds, Series E
5.00%, 03/15/22 | | | 8,967,381 | |
| | 14,000,000 | | | New York State Dormitory Authority Advance Refunding Revenue Bonds, Series E
5.00%, 03/15/24 | | | 16,758,840 | |
| | 15,000 | | | New York State Dormitory Authority Mental Health Services Facility Refunding Revenue Bonds, (State Appropriation)
5.00%, 08/15/18(b) | | | 15,458 | |
| | 1,000,000 | | | New York State Dormitory Authority NYU Hospital Center Advance Refunding Revenue
5.00%, 07/01/25 | | | 1,202,280 | |
| | 2,110,000 | | | New York State Dormitory Authority Refunding Revenue Bonds
5.00%, 08/15/18 | | | 2,175,051 | |
| | 15,000,000 | | | New York State Dormitory Authority Refunding Revenue Bonds, Series A
5.00%, 12/15/20 | | | 16,720,350 | |
| | 4,160,000 | | | New York State Dormitory Authority Refunding Revenue Bonds, Series A
5.00%, 02/15/26 | | | 4,912,502 | |
| | 8,570,000 | | | New York State Dormitory Authority Refunding Revenue Bonds, Series D
0.90%, 07/01/31(a) | | | 8,570,000 | |
Principal
Amount | | | | | Value | |
| New York (continued) | | | | |
| $ | 4,500,000 | | | New York State Dormitory Authority Refunding Revenue Bonds, Series E
5.00%, 02/15/23 | | $ | 5,279,940 | |
| | 1,045,000 | | | New York State Dormitory Authority School Improvement Revenue Bonds, Series A
5.00%, 03/15/21 | | | 1,173,148 | |
| | 7,700,000 | | | New York State Dormitory Authority School Improvement Revenue Bonds, Series A
5.00%, 03/15/25 | | | 9,299,983 | |
| | 1,000,000 | | | New York State Dormitory Authority School Improvement Revenue Bonds, Series A
5.00%, 02/15/27 | | | 1,230,630 | |
| | 6,290,000 | | | New York State Dormitory Authority School Improvement Revenue Bonds, Series A
5.00%, 03/15/27 | | | 7,833,943 | |
| | 3,750,000 | | | New York State Environmental Facilities Corp Water Utility Improvements Refunding Revenue
5.00%, 06/15/25 | | | 4,603,763 | |
| | 3,800,000 | | | New York State Thruway Authority Highway & Bridge Trust Fund Highway Improvements Refunding Revenue Bonds, Series B
5.00%, 04/01/20 | | | 3,938,966 | |
| | 3,200,000 | | | New York State Thruway Authority Highway & Bridge Trust Fund Highway Improvements Refunding Revenue Bonds, Series B
5.00%, 04/01/20(b) | | | 3,313,152 | |
| | 2,510,000 | | | New York State Thruway Authority Highway & Bridge Trust Fund Highway Improvements Refunding Revenue Bonds, Series B
5.00%, 04/01/21(b) | | | 2,598,754 | |
| | 2,490,000 | | | New York State Thruway Authority Highway & Bridge Trust Fund Highway Improvements Refunding Revenue Bonds, Series B
5.00%, 04/01/21 | | | 2,580,835 | |
| | 1,430,000 | | | New York State Thruway Authority Highway Improvement Revenue Bonds, Series A
5.00%, 03/15/20 | | | 1,557,599 | |
See Notes to Financial Statements.
| Old Westbury Funds, Inc. | |
| Municipal Bond Fund | |
| Portfolio of Investments - (Continued) | October 31, 2017 |
| | |
Principal
Amount | | | | | Value | |
| New York (continued) | | | | |
| $ | 5,000,000 | | | New York State Thruway Authority Highway Improvement Revenue Bonds, Series A
5.00%, 03/15/21 | | $ | 5,268,450 | |
| | 1,900,000 | | | New York State Thruway Authority Highway Improvement Revenue Bonds, Series B
5.00%, 04/01/21 | | | 2,003,664 | |
| | 8,000,000 | | | New York State Thruway Authority Refunding Revenue Bonds, Series A
5.00%, 03/15/21 | | | 8,859,600 | |
| | 2,000,000 | | | New York State Urban Development Corp Advance Refunding Revenue Bonds, Series A
5.00%, 03/15/24 | | | 2,394,120 | |
| | 2,105,000 | | | New York State Urban Development Corp Advance Refunding Revenue Bonds, Series A
5.00%, 03/15/27 | | | 2,567,637 | |
| | 11,000,000 | | | New York State Urban Development Corp Advance Refunding Revenue Bonds, Series A
5.00%, 03/15/28 | | | 13,531,870 | |
| | 14,720,000 | | | New York State Urban Development Corp Personal Income Tax Advance Refunding Revenue, Series A
5.00%, 03/15/25 | | | 17,889,069 | |
| | 4,705,000 | | | New York State Urban Development Corp. Public Improvement Revenue Bonds, Series A-1
5.00%, 03/15/22 | | | 5,416,114 | |
| | 3,630,000 | | | Triborough Bridge & Tunnel Authority Highway Improvements Revenue Bonds, Series A
5.00%, 11/15/24 | | | 4,394,442 | |
| | 2,325,000 | | | Triborough Bridge & Tunnel Authority Highway Improvements Revenue Bonds, Series A
5.00%, 11/15/27 | | | 2,902,646 | |
| | 3,000,000 | | | Triborough Bridge & Tunnel Authority Refunding Revenue Bonds, Series B
0.92%, 01/01/32(a)(c) | | | 3,000,000 | |
Principal
Amount | | | | | Value | |
| New York (continued) | | | | |
| $ | 1,600,000 | | | Utility Debt Securitization Authority Restructuring Refunding Revenue Bonds
5.00%, 12/15/24 | | $ | 1,868,064 | |
|
| | | | | | | | 385,908,132 | |
|
| North Carolina — 1.9% | | | | |
| | 680,000 | | | Appalachian State University Refunding Revenue Bonds
5.00%, 05/01/20 | | | 743,206 | |
| | 905,000 | | | Buncombe County Refunding Revenue Bonds
5.00%, 06/01/21 | | | 1,020,415 | |
| | 1,355,000 | | | Cabarrus County School Improvement COP
5.00%, 01/01/21 | | | 1,415,772 | |
| | 3,015,000 | | | County of Mecklenburg Refunding GO, Series A
5.00%, 12/01/22 | | | 3,534,153 | |
| | 3,325,000 | | | County of Wake Advance Refunding Revenue, Series A
5.00%, 12/01/26 | | | 4,124,530 | |
| | 675,000 | | | Dare County Refunding Revenue Bonds, Series D
4.00%, 06/01/18 | | | 686,489 | |
| | 675,000 | | | Dare County Refunding Revenue Bonds, Series D
5.00%, 06/01/21 | | | 757,303 | |
| | 1,000,000 | | | Durham Capital Financing Corp Advance Refunding Revenue Bonds
5.00%, 12/01/25 | | | 1,226,150 | |
| | 325,000 | | | North Carolina State University At Raleigh Refunding Revenue Bonds, Series A
5.00%, 10/01/21 | | | 369,938 | |
| | 2,000,000 | | | Orange County Public Facilities Co. Refunding Revenue Bonds
5.00%, 10/01/21 | | | 2,279,000 | |
| | 10,000,000 | | | Raleigh Durham Airport Authority Refunding Revenue Bonds, Series C
0.90%, 05/01/36(a)(c) | | | 10,000,000 | |
| | 3,250,000 | | | State of North Carolina Advance Refunding Revenue Bonds
5.00%, 03/01/22 | | | 3,717,805 | |
| | 10,000,000 | | | State of North Carolina Refunding Revenue Bonds, Series B
5.00%, 06/01/24 | | | 12,018,600 | |
|
| | | | | | | | 41,893,361 | |
See Notes to Financial Statements.
| Old Westbury Funds, Inc. | |
| Municipal Bond Fund | |
| Portfolio of Investments - (Continued) | October 31, 2017 |
| | |
Principal
Amount | | | | | Value | |
| Ohio — 2.7% | | | | |
| $ | 1,175,000 | | | Central Ohio Solid Waste Authority Advance Refunding GO
5.00%, 12/01/23 | | $ | 1,396,582 | |
| | 1,000,000 | | | Central Ohio Solid Waste Authority Advance Refunding GO
5.00%, 12/01/24 | | | 1,208,870 | |
| | 1,285,000 | | | Central Ohio Solid Waste Authority Advance Refunding GO
5.00%, 12/01/25 | | | 1,573,444 | |
| | 3,500,000 | | | City of Columbus GO, Series A
4.00%, 08/15/25 | | | 4,026,820 | |
| | 1,745,000 | | | City of Columbus Refunding GO, Series 1
5.00%, 07/01/21 | | | 1,977,260 | |
| | 5,000,000 | | | City of Columbus Refunding GO, Series 1
5.00%, 07/01/26 | | | 6,210,100 | |
| | 2,000,000 | | | City of Columbus Refunding GO, Series 5
5.00%, 08/15/23 | | | 2,377,960 | |
| | 1,100,000 | | | County of Cuyahoga Refunding Revenue Bonds
5.00%, 12/01/22 | | | 1,286,472 | |
| | 1,000,000 | | | County of Hamilton Sewer System Refunding Revenue Bonds, Series A
5.00%, 12/01/26 | | | 1,208,870 | |
| | 1,515,000 | | | County of Hamilton Sewer System Refunding Revenue Bonds, Series A
5.00%, 12/01/27 | | | 1,824,742 | |
| | 1,000,000 | | | Greater Cleveland Regional Transit Authority Capital Improvements Advance Refunding Revenue Bonds
5.00%, 12/01/23 | | | 1,190,490 | |
| | 2,365,000 | | | Ohio State Building Authority Facilities Administration Building Project Refunding Revenue Bonds, Series B, (NATL-RE, FGIC)
5.00%, 10/01/18 | | | 2,449,289 | |
| | 6,000,000 | | | Ohio State University, University and College Improvements Revenue Bonds, Series B
0.86%, 06/01/35(a) | | | 6,000,000 | |
| | 3,000,000 | | | Ohio Water Development Authority Revenue Bonds
5.00%, 06/01/26 | | | 3,706,350 | |
| | 320,000 | | | RiverSouth Authority Area Redevelopment Refunding Revenue Bonds
5.00%, 06/01/24 | | | 375,990 | |
Principal
Amount | | | | | Value | |
| Ohio (continued) | | | | |
| $ | 1,445,000 | | | State of Ohio Department of Administration Telecommunications Improvements COP
5.00%, 09/01/24 | | $ | 1,731,674 | |
| | 300,000 | | | State of Ohio Department of Administration Telecommunications Improvements COP
5.00%, 09/01/24 | | | 359,517 | |
| | 210,000 | | | State of Ohio Highway Improvements Revenue Bonds
5.00%, 12/15/24 | | | 252,844 | |
| | 6,630,000 | | | State of Ohio Highway Improvements Revenue Bonds, Series 2016-1
4.00%, 12/15/17 | | | 6,653,205 | |
| | 2,000,000 | | | State of Ohio Highway Improvements Revenue Bonds, Series 2016-1
5.00%, 12/15/20 | | | 2,222,880 | |
| | 5,000,000 | | | State of Ohio Highway Improvements Revenue Bonds, Series 2016-1
5.00%, 12/15/24 | | | 6,020,100 | |
| | 2,000,000 | | | State of Ohio Mental Health Facility Improvements Revenue
5.00%, 06/01/25 | | | 2,421,620 | |
| | 1,415,000 | | | State of Ohio Public Improvements Revenue Bonds, Series A
5.00%, 02/01/24 | | | 1,680,454 | |
| | 2,000,000 | | | University of Cincinnati Advance Refunding Revenue, Series A
5.00%, 06/01/26 | | | 2,451,440 | |
|
| | | | | | | | 60,606,973 | |
|
| Oklahoma — 0.4% | | | | |
| | 4,000,000 | | | City of Oklahoma City Public Improvements GO
5.00%, 03/01/26 | | | 4,940,720 | |
| | 2,000,000 | | | University of Oklahoma Advance Refunding Revenue Bonds, Series B
5.00%, 07/01/25 | | | 2,414,840 | |
| | 1,250,000 | | | University of Oklahoma Refunding Revenue Bonds, Series A
5.00%, 07/01/25 | | | 1,509,275 | |
|
| | | | | | | | 8,864,835 | |
|
| Oregon — 0.2% | | | | |
| | 3,095,000 | | | State of Oregon Advance Refunding GO, Series L
5.00%, 08/01/22 | | | 3,597,226 | |
See Notes to Financial Statements.
| Old Westbury Funds, Inc. | |
| Municipal Bond Fund | |
| Portfolio of Investments - (Continued) | October 31, 2017 |
| | |
Principal
Amount | | | | | Value | |
| Oregon (continued) | | | | |
| $ | 1,755,000 | | | Washington & Multnomah Counties School District No 48J Beaverton Refunding GO, Series B, (School Board GTY)
4.00%, 06/15/19 | | $ | 1,836,450 | |
|
| | | | | | | | 5,433,676 | |
|
| Pennsylvania — 0.8% | | | | |
| | 10,000,000 | | | Commonwealth of Pennsylvania Public Improvements GO, Series 2
5.00%, 09/15/20 | | | 10,991,100 | |
| | 1,000,000 | | | Lancaster County Hospital Authority Advance Refunding Revenue Bonds
5.00%, 08/15/26 | | | 1,219,990 | |
| | 3,000,000 | | | Pennsylvania State University Advance Refunding Revenue, Series B
5.00%, 09/01/26 | | | 3,705,990 | |
| | 1,240,000 | | | Pennsylvania State University, University and College Improvements Revenue, Series A
5.00%, 09/01/26 | | | 1,531,809 | |
|
| | | | | | | | 17,448,889 | |
|
| Rhode Island — 1.6% | | | |
| | 6,950,000 | | | Rhode Island Commerce Corp Grant Anticipation Current Refunding Revenue
5.00%, 06/15/23 | | | 8,133,446 | |
| | 3,000,000 | | | Rhode Island Convention Center Authority Refunding Revenue Bonds, Series A
5.00%, 05/15/22 | | | 3,421,980 | |
| | 705,000 | | | Rhode Island Health & Educational Building Corp. Town of East Greenwich Revenue Bonds, Series A, (Municipal Government GTY)
4.00%, 05/15/18 | | | 715,899 | |
| | 21,000,000 | | | Rhode Island Health & Educational Building Corp. University and College Improvements Revenue Bonds, Series A
0.88%, 05/01/35(a) | | | 21,000,000 | |
| | 850,000 | | | State of Rhode Island School for the Deaf Project Advance Refunding COP, Series D
5.00%, 04/01/24 | | | 1,006,706 | |
| | 960,000 | | | State of Rhode Island University & College Improvements COP, Series A
5.00%, 06/01/24 | | | 1,139,990 | |
Principal
Amount | | | | | Value | |
| Rhode Island (continued) | | | |
| $ | 1,010,000 | | | State of Rhode Island University & College Improvements COP, Series A
5.00%, 06/01/25 | | $ | 1,213,475 | |
|
| | | | | | | | 36,631,496 | |
|
| South Carolina — 0.9% | | | | |
| | 1,865,000 | | | City of Charleston Waterworks & Sewer System Advance Refunding Revenue Bonds
5.00%, 01/01/24 | | | 2,238,168 | |
| | 2,090,000 | | | Lexington County School District No 2 Refunding GO (South Carolina School District)
5.00%, 03/01/18 | | | 2,117,337 | |
| | 1,635,000 | | | Lexington County School District No 2 Refunding GO (South Carolina School District)
5.00%, 03/01/20 | | | 1,778,520 | |
| | 2,350,000 | | | Lexington County School District No 2 School Improvements GO (South Carolina School District)
5.00%, 03/01/26 | | | 2,894,542 | |
| | 1,500,000 | | | State of South Carolina Advance Refunding GO, Series B (State Aid Withholding)
5.00%, 04/01/26 | | | 1,861,290 | |
| | 330,000 | | | State of South Carolina University & College Improvements GO, Series B
5.00%, 03/01/19 | | | 346,949 | |
| | 1,485,000 | | | State of South Carolina University & College Improvements GO, Series B (State Aid Withholding)
5.00%, 04/01/22 | | | 1,715,101 | |
| | 680,000 | | | State of South Carolina University & College Improvements GO, Series E (State Aid Withholding)
5.00%, 03/01/19 | | | 714,925 | |
| | 4,680,000 | | | State of South Carolina University & College Improvements Refunding GO, Series A (State Aid Withholding)
5.00%, 04/01/22 | | | 5,405,166 | |
|
| | | | | | | | 19,071,998 | |
See Notes to Financial Statements.
| Old Westbury Funds, Inc. | |
| Municipal Bond Fund | |
| Portfolio of Investments - (Continued) | October 31, 2017 |
| | |
Principal
Amount | | | | | Value | |
| Tennessee — 0.3% | | | | |
| $ | 2,000,000 | | | Metropolitan Government of Nashville & Davidson County Advance Refunding Revenue, Series B
5.00%, 05/15/23 | | $ | 2,361,200 | |
| | 1,600,000 | | | Metropolitan Government of Nashville & Davidson County Advance Refunding Revenue, Series B
5.00%, 05/15/25 | | | 1,956,784 | |
| | 400,000 | | | Metropolitan Government of Nashville & Davidson County Electric System Revenue, Series A
5.00%, 05/15/23 | | | 472,239 | |
| | 900,000 | | | Tennessee State School Bond Authority Refunding Revenue Bonds (State Aid Intercept Program)
5.00%, 11/01/25 | | | 1,085,922 | |
|
| | | | | | | | 5,876,145 | |
|
| Texas — 14.4% | | | |
| | 2,250,000 | | | Alief Independent School District School Improvements GO, (PSF-GTD)
5.00%, 02/15/28 | | | 2,770,088 | |
| | 1,000,000 | | | Allen Independent School District Current Refunding GO, Series A (PSF-GTD)
5.00%, 02/15/22 | | | 1,148,330 | |
| | 860,000 | | | Alvin Independent School District Improvements Refunding GO, Series A, (PSF-GTD)
5.00%, 02/15/25 | | | 1,038,631 | |
| | 1,720,000 | | | Alvin Independent School District Improvements Refunding GO, Series A, (PSF-GTD)
5.00%, 02/15/26 | | | 2,103,336 | |
| | 1,100,000 | | | Amarillo College District Refunding GO
4.00%, 02/15/20 | | | 1,166,407 | |
| | 485,000 | | | Aransas Pass Independent School District Improvements GO, (PSF-GTD)
5.00%, 02/15/23 | | | 566,912 | |
| | 1,950,000 | | | Austin Community College District Refunding GO
5.00%, 08/01/27 | | | 2,371,844 | |
| | 1,000,000 | | | Austin Independent School District Refunding GO, Series B, (PSF-GTD)
5.00%, 08/01/21 | | | 1,133,700 | |
Principal
Amount | | | | | Value | |
| Texas (continued) | | | | |
| $ | 400,000 | | | Beaumont Independent School District Improvements GO, (PSF-GTD)
4.00%, 02/15/18 | | $ | 403,367 | |
| | 5,310,000 | | | Beaumont Independent School District Refunding GO, (PSF-GTD)
5.00%, 02/15/26 | | | 6,493,440 | |
| | 3,070,000 | | | Beaumont Independent School District Refunding GO, (PSF-GTD)
5.00%, 02/15/28 | | | 3,768,057 | |
| | 1,075,000 | | | Bonham Independent School District Improvements GO, (PSF-GTD)
5.00%, 08/01/27 | | | 1,313,285 | |
| | 1,605,000 | | | Brock Independent School District Refunding GO, (PSF-GTD)
5.00%, 08/15/25 | | | 1,950,524 | |
| | 1,000,000 | | | Burleson Independent School District Refunding GO, (PSF-GTD)
5.00%, 08/01/25 | | | 1,214,290 | |
| | 1,000,000 | | | City of Austin Water & Wastewater System Advance Refunding Revenue Bonds, Series A
5.00%, 11/15/21 | | | 1,140,360 | |
| | 2,360,000 | | | City of Bryan Waterworks & Sewer Current Refunding Revenue
4.00%, 07/01/21 | | | 2,583,681 | |
| | 2,450,000 | | | City of Bryan Waterworks & Sewer Current Refunding Revenue
4.00%, 07/01/22 | | | 2,723,690 | |
| | 2,535,000 | | | City of Cedar Park Public Improvements Refunding GO
5.00%, 02/15/20 | | | 2,749,131 | |
| | 4,020,000 | | | City of College Station Improvements Advance Refunding GO
5.00%, 02/15/25 | | | 4,864,079 | |
| | 935,000 | | | City of Conroe Public Improvements GO
5.00%, 03/01/25 | | | 1,115,707 | |
| | 2,075,000 | | | City of Denton Public Improvements GO
5.00%, 02/15/23 | | | 2,433,477 | |
| | 1,715,000 | | | City of Denton Public Improvements GO
5.00%, 02/15/24 | | | 2,051,020 | |
| | 1,290,000 | | | City of Denton Public Improvements GO
5.00%, 02/15/28 | | | 1,554,605 | |
See Notes to Financial Statements.
| Old Westbury Funds, Inc. | |
| Municipal Bond Fund | |
| Portfolio of Investments - (Continued) | October 31, 2017 |
| | |
Principal
Amount | | | | | Value | |
| Texas (continued) | | | | |
| $ | 830,000 | | | City of El Paso Municipal Drainage Utility System Sewer Improvement Revenue Bonds
5.00%, 03/01/24 | | $ | 981,683 | |
| | 350,000 | | | City of El Paso Water & Sewer Refunding Revenue Bonds
5.00%, 03/01/25 | | | 417,645 | |
| | 1,250,000 | | | City of El Paso Water & Sewer Refunding Revenue Bonds
5.00%, 03/01/26 | | | 1,489,938 | |
| | 5,145,000 | | | City of Fort Worth Water & Sewer System Improvements Revenue
5.00%, 02/15/25 | | | 6,248,757 | |
| | 1,325,000 | | | City of Lubbock Prerefunded Public Improvements GO
5.25%, 02/15/20(b) | | | 1,392,906 | |
| | 450,000 | | | City of Lubbock Unrefunded Public Improvements GO
5.25%, 02/15/20 | | | 473,777 | |
| | 2,240,000 | | | City of McKinney Waterworks & Sewer System Revenue Sewer Improvements
5.00%, 03/15/25 | | | 2,701,686 | |
| | 2,360,000 | | | City of McKinney Waterworks & Sewer System Revenue Sewer Improvements
5.00%, 03/15/26 | | | 2,878,681 | |
| | 2,440,000 | | | City of Plano Advance Refunding GO
5.00%, 09/01/23 | | | 2,888,082 | |
| | 1,180,000 | | | City of Plano Waterworks & Sewer System Water Utility Improvement Revenue Bonds
5.00%, 05/01/26 | | | 1,446,066 | |
| | 1,505,000 | | | Clint Independent School District Advance Refunding GO, (PSF-GTD)
5.00%, 08/15/25 | | | 1,828,996 | |
| | 1,195,000 | | | Connally Independent School District Refunding GO, (PSF-GTD)
5.00%, 08/15/25 | | | 1,452,260 | |
| | 2,130,000 | | | County of Bexar Advance Refunding GO
5.00%, 06/15/26 | | | 2,584,499 | |
| | 2,910,000 | | | County of Bexar Refunding GO
5.00%, 06/15/22 | | | 3,358,664 | |
| | 675,000 | | | County of Collin Advance Refunding GO
5.00%, 02/15/24 | | | 803,702 | |
| | 3,440,000 | | | County of Dallas Public Improvements GO
5.00%, 08/15/26 | | | 4,230,271 | |
| | 1,500,000 | | | County of Denton Advance Refunding GO
5.00%, 07/15/24 | | | 1,807,020 | |
Principal
Amount | | | | | Value | |
| Texas (continued) | | |
| $ | 1,590,000 | | | County of Harris Advance Refunding Revenue, Series A
5.00%, 08/15/25 | | $ | 1,937,415 | |
| | 1,000,000 | | | County of Williamson Limited Tax Refunding GO
5.00%, 02/15/21 | | | 1,118,630 | |
| | 360,000 | | | Crystal City Independent School District Advance Refunding GO, (PSF-GTD)
5.00%, 02/15/26 | | | 433,688 | |
| | 750,000 | | | Dallas Area Rapid Transit Refunding Revenue Bonds, Series A
5.00%, 12/01/25 | | | 903,893 | |
| | 1,120,000 | | | Dayton Independent School District School Improvements GO, (PSF-GTD)
5.00%, 02/15/22 | | | 1,283,621 | |
| | 1,085,000 | | | Denver City Independent School District School Building GO, Series A, (PSF-GTD)
5.00%, 02/15/25 | | | 1,318,590 | |
| | 2,665,000 | | | Eagle Mountain & Saginaw Independent School District Refunding GO, (PSF-GTD)
5.00%, 08/15/25 | | | 3,262,386 | |
| | 1,835,000 | | | Eagle Mountain & Saginaw Independent School District Refunding GO, (PSF-GTD)
5.00%, 08/15/27 | | | 2,229,947 | |
| | 3,000,000 | | | Edinburg Consolidated Independent School District Advance Refunding GO, (PSF-GTD)
5.00%, 02/15/25 | | | 3,620,850 | |
| | 1,500,000 | | | El Paso Independent School District Refunding GO (PSF-GTD)
5.00%, 08/15/25 | | | 1,809,555 | |
| | 6,000,000 | | | Fort Bend Independent School District Refunding GO, (PSF-GTD), Series A
5.00%, 08/15/25 | | | 7,242,480 | |
| | 4,320,000 | | | Fort Worth Independent School District School Building GO, (PSF-GTD)
5.00%, 02/15/22 | | | 4,966,618 | |
| | 885,000 | | | Frenship Independent School District Refunding GO (PSF-GTD)
5.00%, 02/15/26 | | | 1,055,486 | |
| | 250,000 | | | Frisco Independent School District School Building GO, Series A, (PSF-GTD)
6.13%, 08/15/21 | | | 259,963 | |
See Notes to Financial Statements.
| Old Westbury Funds, Inc. | |
| Municipal Bond Fund | |
| Portfolio of Investments - (Continued) | October 31, 2017 |
| | |
Principal
Amount | | | | | Value | |
| Texas (continued) | | | | |
| $ | 2,500,000 | | | Frisco Independent School District School Improvements GO, Series A, (PSF-GTD)
5.00%, 08/15/25 | | $ | 3,064,475 | |
| | 1,385,000 | | | Goose Creek Consolidated Independent School District Advance Refunding GO, (PSF-GTD), Series A
5.00%, 02/15/25 | | | 1,682,124 | |
| | 1,095,000 | | | Graham Independent School District Refunding GO, Series B (PSF-GTD)
5.00%, 02/15/21 | | | 1,224,528 | |
| | 1,000,000 | | | Harris County Refunding GO, Series C, (AGM)
5.25%, 08/15/19 | | | 1,073,000 | |
| | 2,730,000 | | | Hays Consolidated Independent School District Advance Refunding GO, (PSF-GTD)
5.00%, 08/15/27 | | | 3,349,819 | |
| | 2,030,000 | | | Houston Community College System University & College Improvements Revenue Bonds (AGM)
5.25%, 04/15/21 | | | 2,069,240 | |
| | 960,000 | | | Houston Community College System University & College Improvements Revenue Bonds (AGM)
5.25%, 04/15/21(b) | | | 978,250 | |
| | 3,750,000 | | | Houston Independent School District School Improvement Refunding GO, (PSF-GTD), Series A
5.00%, 02/15/25 | | | 4,557,338 | |
| | 2,455,000 | | | Irving Independent School District Advance Refunding GO, (PSF-GTD)
5.00%, 02/15/24 | | | 2,939,249 | |
| | 585,000 | | | Kaufman Independent School District School Building Refunding GO, (PSF-GTD)
5.00%, 02/15/24 | | | 696,928 | |
| | 500,000 | | | Kaufman Independent School District School Building Refunding GO, (PSF-GTD)
5.00%, 02/15/25 | | | 603,475 | |
| | 1,000,000 | | | Klein Independent School District School Improvements GO, (PSF-GTD)
5.00%, 08/01/23 | | | 1,184,150 | |
| | 1,835,000 | | | Longview Independent School District Advance Refunding GO, (PSF-GTD)
5.00%, 02/15/21 | | | 2,048,282 | |
Principal
Amount | | | | | Value | |
| Texas (continued) | | | | |
| $ | 1,860,000 | | | Longview Independent School District Advance Refunding GO, (PSF-GTD)
5.00%, 02/15/23 | | $ | 2,172,089 | |
| | 1,760,000 | | | Longview Independent School District Advance Refunding GO, (PSF-GTD)
5.00%, 02/15/24 | | | 2,093,274 | |
| | 225,000 | | | Longview Independent School District Advance Refunding GO, (PSF-GTD)
5.00%, 02/15/26 | | | 275,146 | |
| | 2,670,000 | | | Magnolia Independent School District School Improvement Advance Refunding GO, (PSF-GTD)
5.00%, 08/15/25 | | | 3,268,507 | |
| | 3,410,000 | | | Manor Independent School District Advance Refunding GO, (PSF-GTD)
5.00%, 08/01/24 | | | 4,093,091 | |
| | 1,005,000 | | | Mesquite Independent School District Advance Refunding GO, (PSF-GTD), Series A
5.00%, 08/15/23 | | | 1,191,267 | |
| | 1,060,000 | | | Mesquite Independent School District Advance Refunding GO, (PSF-GTD), Series A
5.00%, 08/15/24 | | | 1,279,505 | |
| | 1,110,000 | | | Mesquite Independent School District Advance Refunding GO, (PSF-GTD), Series A
5.00%, 08/15/25 | | | 1,358,818 | |
| | 1,435,000 | | | Mesquite Independent School District Advance Refunding GO, (PSF-GTD), Series B
5.00%, 08/15/23 | | | 1,700,963 | |
| | 1,650,000 | | | Mesquite Independent School District Advance Refunding GO, (PSF-GTD), Series B
5.00%, 08/15/25 | | | 2,019,864 | |
| | 585,000 | | | Mesquite Independent School District Advance Refunding GO, (PSF-GTD), Series B
5.00%, 08/15/26 | | | 723,622 | |
| | 980,000 | | | Mesquite Independent School District Current Refunding GO, Series A (PSF-GTD)
5.00%, 08/15/24 | | | 1,182,938 | |
| | 1,170,000 | | | Mesquite Independent School District Current Refunding GO, Series A (PSF-GTD)
5.00%, 08/15/25 | | | 1,432,267 | |
| | 1,000,000 | | | Mesquite Independent School District Improvements GO, Series C, (PSF-GTD)
5.00%, 08/15/21 | | | 1,135,050 | |
See Notes to Financial Statements.
| Old Westbury Funds, Inc. | |
| Municipal Bond Fund | |
| Portfolio of Investments - (Continued) | October 31, 2017 |
| | |
Principal
Amount | | | | | Value | |
| Texas (continued) | | | | |
| $ | 595,000 | | | Mesquite Independent School District Improvements GO, Series C, (PSF-GTD)
5.00%, 08/15/26 | | $ | 735,991 | |
| | 1,585,000 | | | Mesquite Independent School District School Improvements GO, Series B (PSF-GTD)
5.00%, 08/15/26 | | | 1,960,582 | |
| | 1,000,000 | | | New Caney Independent School District Advance Refunding GO, (PSF-GTD)
5.00%, 02/15/27 | | | 1,242,520 | |
| | 250,000 | | | Northside Independent School District School Improvements GO, (PSF-GTD)
5.00%, 08/15/26 | | | 309,239 | |
| | 1,145,000 | | | Palestine Independent School District Advance Refunding GO, (PSF-GTD)
5.00%, 02/15/23 | | | 1,338,379 | |
| | 250,000 | | | Pasadena Independent School District Advance Refunding GO, (PSF-GTD)
5.00%, 02/15/22 | | | 287,419 | |
| | 750,000 | | | Pharr San Juan Alamo Independent School District Advance Refunding GO, (PSF-GTD)
5.00%, 02/01/27 | | | 898,275 | |
| | 1,525,000 | | | Plano Independent School District School Improvement GO, (PSF-GTD)
5.00%, 02/15/23 | | | 1,786,782 | |
| | 2,595,000 | | | Port Arthur Independent School District Advance Refunding GO, (PSF-GTD), Series B
5.00%, 02/15/25 | | | 3,153,678 | |
| | 1,000,000 | | | Prosper Independent School District School Building School Improvement GO, (PSF-GTD)
5.00%, 02/15/25 | | | 1,206,950 | |
| | 925,000 | | | Roma Independent School District Refunding GO, (PSF-GTD)
5.00%, 08/15/22 | | | 1,072,103 | |
| | 1,020,000 | | | Roma Independent School District Refunding GO, (PSF-GTD)
5.00%, 08/15/23 | | | 1,204,100 | |
| | 1,075,000 | | | Roma Independent School District Refunding GO, (PSF-GTD)
5.00%, 08/15/24 | | | 1,290,753 | |
Principal
Amount | | | | | Value | |
| Texas (continued) | | | | |
| $ | 1,000,000 | | | Roma Independent School District Refunding GO, (PSF-GTD)
5.00%, 08/15/25 | | $ | 1,215,280 | |
| | 705,000 | | | San Elizario Independent School District School Improvements GO, (PSF-GTD)
5.00%, 05/01/25 | | | 853,755 | |
| | 145,000 | | | Seagraves Independent School District School Building GO, (PSF-GTD)
4.00%, 02/15/19 | | | 150,277 | |
| | 450,000 | | | Spring Independent School District Advance Refunding GO (PSF-GTD)
5.00%, 08/15/27 | | | 552,168 | |
| | 1,000,000 | | | Spring Independent School District Advance Refunding GO, (PSF- GTD)
5.00%, 08/15/26 | | | 1,236,960 | |
| | 2,160,000 | | | Spring Independent School District Advance Refunding GO, (PSF-GTD)
5.00%, 08/15/22 | | | 2,510,006 | |
| | 8,000,000 | | | State of Texas Housing GO, Series D
0.92%, 06/01/45(a)(c) | | | 8,000,000 | |
| | 5,000,000 | | | State of Texas Public Finance Authority Advance Refunding GO
5.00%, 10/01/26 | | | 6,205,200 | |
| | 2,695,000 | | | State of Texas Public Finance Authority Refunding GO
5.00%, 10/01/20 | | | 2,984,093 | |
| | 3,200,000 | | | State of Texas Transportation Commission Advance Refunding GO, Series F
5.00%, 10/01/25 | | | 3,920,384 | |
| | 6,500,000 | | | State of Texas Transportation Commission Highway Improvement GO
5.00%, 04/01/25 | | | 7,907,250 | |
| | 1,000,000 | | | Sulphur Springs Independent School District Advance Refunding GO, (PSF- GTD)
5.00%, 08/15/26 | | | 1,229,730 | |
| | 1,000,000 | | | Texas Transportation Commission State Highway Fund First Tier Advance Refunding Revenue Bonds
5.00%, 10/01/22 | | | 1,164,680 | |
| | 5,785,000 | | | Texas Transportation Commission State Highway Fund First Tier Advance Refunding Revenue Bonds
5.00%, 10/01/24 | | | 7,000,024 | |
See Notes to Financial Statements.
| Old Westbury Funds, Inc. | |
| Municipal Bond Fund | |
| Portfolio of Investments - (Continued) | October 31, 2017 |
| | |
Principal
Amount | | | | | Value | |
| Texas (continued) | | | | |
| $ | 3,225,000 | | | Texas Transportation Commission State Highway Fund First Tier Advance Refunding Revenue Bonds, Series A
5.00%, 04/01/21 | | $ | 3,618,708 | |
| | 9,250,000 | | | Texas Transportation Commission State Highway Fund Highway Improvements Revenue Bonds Series A
5.00%, 10/01/26 | | | 11,505,243 | |
| | 1,000,000 | | | Trinity River Authority Central Regional Wastewater System Advance Refunding Revenue Bonds
5.00%, 08/01/24 | | | 1,202,430 | |
| | 4,850,000 | | | Tyler Independent School District Advance Refunding GO, (PSF-GTD)
5.00%, 02/15/23 | | | 5,687,886 | |
| | 500,000 | | | United Independent School District GO, (PSF-GTD)
5.00%, 08/15/22 | | | 581,020 | |
| | 1,680,000 | | | United Independent School District GO, (PSF-GTD)
5.00%, 08/15/23 | | | 1,991,371 | |
| | 935,000 | | | United Independent School District GO, (PSF-GTD)
5.00%, 08/15/24 | | | 1,128,620 | |
| | 2,085,000 | | | United Independent School District GO, (PSF-GTD)
5.00%, 08/15/25 | | | 2,552,374 | |
| | 1,635,000 | | | United Independent School District GO, (PSF-GTD)
5.00%, 08/15/26 | | | 2,022,430 | |
| | 1,000,000 | | | United Independent School District GO, (PSF-GTD)
5.00%, 08/15/27 | | | 1,251,280 | |
| | 220,000 | | | University of North Texas Prerefunded Refunding Revenue
5.00%, 04/15/20(b) | | | 239,865 | |
| | 420,000 | | | University of North Texas Prerefunded Refunding Revenue
5.00%, 04/15/21(b) | | | 471,542 | |
| | 1,480,000 | | | University of North Texas Unrefunded Refunding Revenue
5.00%, 04/15/20 | | | 1,615,154 | |
| | 27,900,000 | | | University of Texas Financing Systems Refunding Revenue Bonds, Series B
0.87%, 08/01/25(a) | | | 27,900,000 | |
Principal
Amount | | | | | Value | |
| Texas (continued) | | | | |
| $ | 15,000,000 | | | University of Texas Financing Systems Refunding Revenue Bonds, Series B
0.87%, 08/01/32(a) | | $ | 15,000,000 | |
| | 9,000,000 | | | University of Texas System University & College Improvements Revenue Bonds, Series J
5.00%, 08/15/26 | | | 11,140,830 | |
| | 2,000,000 | | | University of Texas System University and College Improvements Revenue, Series D
5.00%, 08/15/23 | | | 2,367,040 | |
| | 145,000 | | | Victoria Utility System, Water & Wastewater Authority Refunding Revenue Bonds, (AMBAC)
5.00%, 12/01/17 | | | 145,465 | |
| | 325,000 | | | Waco Independent School District Advance Refunding GO, (PSF- GTD)
5.00%, 08/15/27 | | | 398,787 | |
| | 640,000 | | | Wall Independent School District School Improvements GO, (PSF-GTD)
5.00%, 02/15/27 | | | 764,288 | |
| | 1,210,000 | | | Wichita Falls Independent School District School Improvements GO (PSF-GTD)
5.00%, 02/01/23 | | | 1,417,563 | |
| | | | | | | | 320,901,449 | |
| Utah — 0.1% | | | | |
| | 1,975,000 | | | Alpine School District School Building GO, (School Board GTY)
5.00%, 03/15/21 | | | 2,114,830 | |
| | 1,085,000 | | | Uintah County School District Refunding GO, (School Board GTY)
5.00%, 02/01/24 | | | 1,300,600 | |
| | | | | | | | 3,415,430 | |
| Virginia — 2.8% | | | | |
| | 5,000,000 | | | Country of Fairfax School Improvements GO, Series A, (State Aid Withholding)
5.00%, 10/01/27 | | | 6,266,600 | |
| | 2,160,000 | | | County of Fairfax Sewer Improvement Revenue Bonds
5.00%, 07/15/22 | | | 2,449,634 | |
See Notes to Financial Statements.
| Old Westbury Funds, Inc. | |
| Municipal Bond Fund | |
| Portfolio of Investments - (Continued) | October 31, 2017 |
| | |
Principal
Amount | | | | | Value | |
| Virginia (continued) | | | | |
| $ | 1,350,000 | | | Fairfax County Economic Development Authority Community Services Facilities Project Revenue Bonds, Series A
4.50%, 03/01/20 | | $ | 1,452,060 | |
| | 6,025,000 | | | Hampton Roads Sanitation District Refunding Revenue Bonds, Series B
0.90%, 08/01/46(a) | | | 6,025,000 | |
| | 1,170,000 | | | Prince William County Industrial Development Authority Public Improvements Refunding Revenue Bonds, Series A
5.00%, 10/01/24 | | | 1,413,196 | |
| | 1,000,000 | | | Virginia College Building Authority Advance Refunding Revenue, Series A
5.00%, 09/01/28 | | | 1,222,680 | |
| | 2,000,000 | | | Virginia College Building Authority Public Higher Education Refunding Revenue Bonds, Series B (State Aid Intercept Program)
5.00%, 09/01/21 | | | 2,206,140 | |
| | 500,000 | | | Virginia College Building Authority, University and College Improvements Revenue, Series A
5.00%, 02/01/27 | | | 591,530 | |
| | 5,000,000 | | | Virginia Commonwealth Transportation Board Transit Improvements Revenue Bonds
5.00%, 03/15/23 | | | 5,746,500 | |
| | 5,000,000 | | | Virginia Commonwealth Transportation Board Transit Improvements Revenue Bonds
5.00%, 05/15/27 | | | 6,140,850 | |
| | 2,465,000 | | | Virginia Public Building Authority Revenue Bonds, Series A
5.00%, 08/01/21 | | | 2,795,532 | |
| | 1,250,000 | | | Virginia Public Building Authority Revenue Bonds, Series B (State Appropriation)
5.00%, 08/01/21 | | | 1,334,113 | |
| | 5,000,000 | | | Virginia Public School Authority Advance Refunding Revenue Bonds
5.00%, 02/01/24 | | | 5,957,550 | |
| | 2,450,000 | | | Virginia Public School Authority Advance Refunding Revenue Bonds, (State Aid Withholding)
5.00%, 08/01/24 | | | 2,947,693 | |
Principal
Amount | | | | | Value | |
| Virginia (continued) | | | | |
| $ | 5,000,000 | | | Virginia Public School Authority Refunding Revenue Bonds, Series A, (State Aid Withholding)
5.00%, 08/01/25 | | $ | 6,107,550 | |
| | 1,500,000 | | | Virginia Resources Authority Advance Refunding Revenue
5.00%, 11/01/26 | | | 1,867,455 | |
| | 5,810,000 | | | Virginia Resources Authority Advance Refunding Revenue Bonds
5.00%, 10/01/22 | | | 6,784,744 | |
| | 1,120,000 | | | Virginia Resources Authority Refunding Revenue Bonds
5.00%, 11/01/25 | | | 1,348,110 | |
| | 30,000 | | | Virginia Resources Authority Refunding Revenue Bonds
5.00%, 11/01/25(b) | | | 36,263 | |
| | | | | | | | 62,693,200 | |
| Washington — 1.8% | | | | |
| | 1,025,000 | | | Benton County School District No 17 Kennewick School Improvements GO, (School Board GTY)
5.00%, 12/01/21 | | | 1,171,719 | |
| | 1,050,000 | | | Chelan County School District No 228 Cascade School Improvements GO, (School Board GTY)
5.00%, 12/01/26 | | | 1,277,808 | |
| | 2,100,000 | | | City of Seattle Public Improvements GO, Series A
5.00%, 11/01/24 | | | 2,546,103 | |
| | 1,600,000 | | | Clark County Public Utility District No 1 Refunding Revenue Bonds
5.00%, 01/01/27 | | | 1,918,512 | |
| | 2,525,000 | | | Clark County School District No 117 Camas Refunding GO, (School Board GTY)
5.00%, 12/01/17 | | | 2,533,156 | |
| | 825,000 | | | Clark County School District No 117 Camas School Improvements GO, (School Board GTY)
5.00%, 12/01/24 | | | 996,707 | |
| | 3,900,000 | | | Energy Northwest Refunding Revenue Bonds, Series A
5.00%, 07/01/28 | | | 4,485,975 | |
| | 680,000 | | | King County Public Transportation Sales Tax Refunding GO
4.00%, 12/01/18 | | | 701,046 | |
| | 1,035,000 | | | King County Refunding GO
5.00%, 07/01/25 | | | 1,253,551 | |
See Notes to Financial Statements.
| Old Westbury Funds, Inc. | |
| Municipal Bond Fund | |
| Portfolio of Investments - (Continued) | October 31, 2017 |
| | |
Principal
Amount | | | | | Value | |
| Washington (continued) | | | | |
| $ | 1,500,000 | | | King County School District No. 414 Lake Washington GO, (School Board GTY)
5.00%, 12/01/20 | | $ | 1,563,810 | |
| | 1,180,000 | | | Nooksack Valley School District No 506 School Improvements GO, (School Board GTY)
5.00%, 12/01/24 | | | 1,420,390 | |
| | 750,000 | | | Port of Seattle Inter Lien Refunding Revenue Bonds
5.00%, 02/01/27 | | | 910,095 | |
| | 1,120,000 | | | Skagit County Consolidated School District No 320 Mount Vernon School Improvements Refunding GO, (School Board GTY)
5.00%, 12/01/23 | | | 1,333,349 | |
| | 5,000,000 | | | Snohomish County School District No 201 Refunding GO (School Board GTY)
5.00%, 12/01/25 | | | 6,019,650 | |
| | 1,315,000 | | | Spokane County School District No 363 West Valley Refunding GO, (School Board GTY)
5.00%, 12/01/18 | | | 1,369,060 | |
| | 800,000 | | | State of Washington Refunding GO, Series R-2012C
5.00%, 07/01/23 | | | 926,832 | |
| | 3,250,000 | | | State of Washington Senior 520 Corridor Program Highway Improvements Revenue Bonds
5.00%, 09/01/19 | | | 3,471,065 | |
| | 4,435,000 | | | Yakima County School District No 7 Yakima Advance Refunding GO, (School Board GTY)
5.00%, 12/01/24 | | | 5,358,057 | |
| | | | | | | | 39,256,885 | |
| Wisconsin — 0.1% | | | | |
| | 1,200,000 | | | State of Wisconsin General Fund Advance Refunding Revenue Bonds, Series B
5.00%, 05/01/27 | | | 1,453,944 | |
Total Municipal Bonds
(Cost $1,920,056,876) | | | 1,933,116,982 | |
| U.S. GOVERNMENT SECURITIES — 12.4% | | | | |
| U.S. Treasury Notes — 12.4% | | | | |
| | 50,000,000 | | | 0.75%, 02/28/2018 | | | 49,922,500 | |
| | 35,000,000 | | | 1.13%, 02/28/2021 | | | 34,231,641 | |
| | 65,000,000 | | | 1.13%, 06/30/2021 | | | 63,341,992 | |
Principal
Amount | | | | | Value | |
| U.S. Treasury Notes (continued) | | | | |
| $ | 115,000,000 | | | 1.88%, 05/31/2022 | | $ | 114,528,321 | |
| | 16,000,000 | | | 2.00%, 08/15/2025 | | | 15,669,375 | |
Total U.S. Government Securities
(Cost $278,010,379) | | | 277,693,829 | |
| | | | | | | | | |
| Shares | | | | | | | |
| INVESTMENT COMPANY — 0.3% | | | | |
| | 5,837,878 | | | SEI Daily Income Trust Government II Fund, Class A, 0.88%(d) | | | 5,837,878 | |
TOTAL INVESTMENTS — 99.2%
(Cost $2,203,905,133) | | $ | 2,216,648,689 | |
| OTHER ASSETS IN EXCESS OF LIABILITIES — 0.8% | | | 18,854,503 | |
| NET ASSETS — 100.0% | | $ | 2,235,503,192 | |
| (a) | Variable or floating rate security, which interest rate adjusts periodically based on changes in current interest rates and prepayments on the underlying pool of assets. Rate shown is the rate in effect as of period end. |
| (b) | These securities are pre-refunded; the date shown represents the pre-refunded date. Bonds which are pre-refunded are collateralized by U.S. Government securities which are held in escrow and are used to pay principal and interest on the municipal issue and to retire the bonds in full at the earliest refunding date. |
| (c) | The security is subject to remarketing prior to its stated maturity, and is subject to mandatory redemption at the stated maturity date. |
| (d) | The rate shown represents the current yield at October 31, 2017. |
The following abbreviations are used in the report:
AGM — Assured Guaranty Municipal Corp.
AMBAC — Insured by AMBAC Indemnity Corp.
COP — Certificates of Participation
FGIC — Insured by Financial Guaranty Insurance Corp.
GO — General Obligations
GTY — Guaranty
NATL-RE — Insured by National Public Finance Guarantee Corp.
OID — Original Issue Discount
PSF-GTD — Permanent School Fund Guarantee
Q–SBLF — Qualified-School Bond Loan Fund
See Notes to Financial Statements.
| Old Westbury Funds, Inc. | |
| Statements of Assets and Liabilities | |
| | October 31, 2017 |
| | |
| | | ALL CAP CORE
FUND | | LARGE CAP
STRATEGIES
FUND | | SMALL & MID CAP
STRATEGIES
FUND |
| ASSETS: | | | | | | | | | | | | | | | |
| Investments, at fair value | | | $ | 1,773,823,474 | | | | $ | 17,246,705,100 | | | | $ | 6,541,063,145 | |
| Foreign currency, at value (Cost $0, $841,787 and $2,525,929, respectively) | | | | — | | | | | 844,491 | | | | | 2,509,887 | |
| Cash | | | | 2 | | | | | 1,265,976 | | | | | 15,352,107 | |
| Dividends and interest receivable | | | | 753,754 | | | | | 23,128,516 | | | | | 4,991,144 | |
| Receivable for Fund shares sold | | | | 327,457 | | | | | 7,906,726 | | | | | 2,407,493 | |
| Receivable for investments sold | | | | 243,517 | | | | | 83,767,335 | | | | | 10,632,051 | |
| Unrealized appreciation on forward foreign currency exchange contracts | | | | — | | | | | — | | | | | 354,673 | |
| Prepaid expenses | | | | 25,018 | | | | | 76,927 | | | | | 41,222 | |
| Total Assets | | | | 1,775,173,222 | | | | | 17,363,695,071 | | | | | 6,577,351,722 | |
| LIABILITIES: | | | | | | | | | | | | | | | |
| Payable for Fund shares redeemed | | | | 1,350,473 | | | | | 7,539,641 | | | | | 3,586,437 | |
| Payable for investments purchased | | | | — | | | | | 95,683,773 | | | | | 4,085,753 | |
| Deferred tax liability (Note 9) | | | | — | | | | | 990,860 | | | | | 1,153,404 | |
| Accrued expenses and other payables: | | | | | | | | | | | | | | | |
| Investment advisory | | | | 998,367 | | | | | 11,435,032 | | | | | 4,300,726 | |
| Administration | | | | 90,639 | | | | | 852,182 | | | | | 327,324 | |
| Shareholder servicing fee | | | | 288,223 | | | | | 2,820,231 | | | | | 1,076,288 | |
| Custody | | | | 26,220 | | | | | 526,750 | | | | | 111,087 | |
| Legal and Audit | | | | 30,734 | | | | | 242,624 | | | | | 125,043 | |
| Other | | | | 20,970 | | | | | 125,210 | | | | | 204,390 | |
| Total Liabilities | | | | 2,805,626 | | | | | 120,216,303 | | | | | 14,970,452 | |
| NET ASSETS | | | $ | 1,772,367,596 | | | | $ | 17,243,478,768 | | | | $ | 6,562,381,270 | |
| NET ASSETS consist of: | | | | | | | | | | | | | | | |
| Capital paid-in | | | $ | 1,400,277,069 | | | | $ | 12,950,241,197 | | | | $ | 4,586,354,856 | |
| Accumulated undistributed net investment income | | | | 8,109,244 | | | | | 99,067,585 | | | | | 24,074,288 | |
| Accumulated undistributed net realized gain/(loss) on investments and foreign currency transactions | | | | 25,487,071 | | | | | 842,973,100 | | | | | 418,228,473 | |
| Net unrealized appreciation on investments and foreign currency transactions | | | | 338,494,212 | | | | | 3,351,196,886 | | | | | 1,533,723,653 | |
| NET ASSETS | | | $ | 1,772,367,596 | | | | $ | 17,243,478,768 | | | | $ | 6,562,381,270 | |
| Net Asset Value, maximum offering price and redemption price per share | | | $ | 16.50 | | | | $ | 14.85 | | | | $ | 17.49 | |
| Number of shares authorized | | | | 2,500,000,000 | | | | | 3,000,000,000 | | | | | 3,500,000,000 | |
| SHARES OF CAPITAL STOCK OUTSTANDING | | | | 107,420,895 | | | | | 1,161,075,287 | | | | | 375,111,383 | |
| INVESTMENTS, AT COST | | | $ | 1,435,330,067 | | | | $ | 13,894,450,002 | | | | $ | 5,006,502,155 | |
See Notes to Financial Statements.
| Old Westbury Funds, Inc. | |
| Statements of Assets and Liabilities - (Continued) | |
| | October 31, 2017 |
| | |
| | | STRATEGIC
OPPORTUNITIES
FUNDa |
| ASSETS: | | | | | |
| Investments, at fair value | | | $ | 5,541,063,954 | |
| Foreign currency, at value (Cost $64,311,221) | | | | 57,562,952 | |
| Cash | | | | 2,866,891 | |
| Segregated cash for futures contracts (Note 6) | | | | 5,181,400 | |
| Segregated foreign currency for futures contracts (Note 6) | | | | 5,903,861 | |
| Due from broker for collateral | | | | 2,018,692 | |
| Due from broker for derivative contracts pending settlement | | | | 6,506,389 | |
| Structured option contracts, at value (Premium paid $9,225,953) | | | | 96,435,077 | |
| Dividends and interest receivable | | | | 10,754,784 | |
| Receivable for Fund shares sold | | | | 712,869 | |
| Receivable for investments sold | | | | 10,344,814 | |
| Unrealized appreciation on swap contracts | | | | 57,812,613 | |
| Unrealized appreciation on forward foreign currency exchange contracts | | | | 4,417,539 | |
| Prepaid expenses | | | | 37,650 | |
| Total Assets | | | | 5,801,619,485 | |
| LIABILITIES: | | | | | |
| Payable to brokers for collateral | | | | 76,684,297 | |
| Written option contracts, at value (Premium received $125,845) | | | | 600,000 | |
| Structured option contracts, at value (Premium received $6,000,733) | | | | 3,423,831 | |
| Payable for Fund shares redeemed | | | | 2,893,501 | |
| Payable for investments purchased | | | | 136,349,085 | |
| Unrealized depreciation on swap contracts | | | | 12,821,434 | |
| Unrealized depreciation on forward foreign currency exchange contracts | | | | 12,876,511 | |
| Variation margin | | | | 693,670 | |
| Accrued expenses and other payables: | | | | | |
| Investment advisory | | | | 4,202,769 | |
| Administration | | | | 285,951 | |
| Shareholder servicing fee | | | | 906,626 | |
| Custody | | | | 39,076 | |
| Legal and Audit | | | | 221,876 | |
| Other | | | | 72,750 | |
| Total Liabilities | | | | 252,071,377 | |
| NET ASSETS | | | $ | 5,549,548,108 | |
| NET ASSETS consist of: | | | | | |
| Capital paid-in | | | $ | 4,919,497,371 | |
| Accumulated undistributed net investment income | | | | 163,409,734 | |
| Accumulated undistributed net realized gain on investments, securities sold short, futures contracts, swap agreements, written options and foreign currency transactions | | | | 186,193,542 | |
| Net unrealized appreciation on investments, securities sold short, futures contracts, swap agreements, written options and foreign currency transactions | | | | 280,447,461 | |
| NET ASSETS | | | $ | 5,549,548,108 | |
| Net Asset Value, maximum offering price and redemption price per share | | | $ | 8.30 | |
| Number of shares authorized | | | | 3,500,000,000 | |
| SHARES OF CAPITAL STOCK OUTSTANDING | | | | 668,966,259 | |
| INVESTMENTS, AT COST | | | $ | 5,382,799,798 | |
| a | Consolidated Statement of Assets and Liabilities. | |
See Notes to Financial Statements.
| Old Westbury Funds, Inc. | |
| Statements of Assets and Liabilities - (Continued) | |
| | October 31, 2017 |
| | |
| | | FIXED
INCOME
FUND | | MUNICIPAL
BOND
FUND |
| ASSETS: | | | | | | | | | | |
| Investments, at fair value | | | $ | 822,557,169 | | | | $ | 2,216,648,689 | |
| Cash | | | | — | | | | | 1 | |
| Dividends and interest receivable | | | | 4,106,058 | | | | | 20,049,460 | |
| Receivable for Fund shares sold | | | | 25,833 | | | | | 836,937 | |
| Receivable for investments sold | | | | — | | | | | 125,499 | |
| Prepaid expenses | | | | 21,904 | | | | | 26,643 | |
| Total Assets | | | | 826,710,964 | | | | | 2,237,687,229 | |
| LIABILITIES: | | | | | | | | | | |
| Payable for Fund shares redeemed | | | | 723,912 | | | | | 1,092,292 | |
| Accrued expenses and other payables: | | | | | | | | | | |
| Investment advisory | | | | 291,569 | | | | | 704,005 | |
| Administration | | | | 43,881 | | | | | 111,843 | |
| Shareholder servicing fee | | | | 67,755 | | | | | 183,532 | |
| Custody | | | | 10,164 | | | | | 27,529 | |
| Legal and Audit | | | | 21,238 | | | | | 41,722 | |
| Other | | | | 7,276 | | | | | 23,114 | |
| Total Liabilities | | | | 1,165,795 | | | | | 2,184,037 | |
| NET ASSETS | | | $ | 825,545,169 | | | | $ | 2,235,503,192 | |
| NET ASSETS consist of: | | | | | | | | | | |
| Capital paid-in | | | $ | 837,603,377 | | | | $ | 2,221,850,705 | |
| Accumulated undistributed net investment income | | | | 1,263,897 | | | | | 2,478,028 | |
| Accumulated undistributed net realized loss on investments | | | | (11,801,523 | ) | | | | (1,569,097 | ) |
| Net unrealized appreciation/(depreciation) on investments | | | | (1,520,582 | ) | | | | 12,743,556 | |
| NET ASSETS | | | $ | 825,545,169 | | | | $ | 2,235,503,192 | |
| Net Asset Value, maximum offering price and redemption price per share | | | $ | 11.11 | | | | $ | 11.95 | |
| Number of shares authorized | | | | 2,000,000,000 | | | | | 2,000,000,000 | |
| SHARES OF CAPITAL STOCK OUTSTANDING | | | | 74,337,070 | | | | | 187,049,517 | |
| INVESTMENTS, AT COST | | | $ | 824,077,751 | | | | $ | 2,203,905,133 | |
See Notes to Financial Statements.
| Old Westbury Funds, Inc. | |
| Statements of Operations | |
| | For the Year Ended October 31, 2017 |
| | |
| | | ALL CAP CORE
FUND | | LARGE CAP
STRATEGIES
FUND | | SMALL & MID CAP
STRATEGIES
FUND |
| INVESTMENT INCOME: | | | | | | | | | | | | | | | |
| Interest | | | $ | 14,097 | | | | $ | 2,578,705 | | | | $ | 806,490 | |
| Dividends | | | | 25,541,462 | | | | | 309,427,688 | | | | | 105,533,972 | |
| Foreign tax withheld | | | | (517,743 | ) | | | | (13,718,070 | ) | | | | (4,648,315 | ) |
| Total investment income | | | | 25,037,816 | | | | | 298,288,323 | | | | | 101,692,147 | |
| EXPENSES: | | | | | | | | | | | | | | | |
| Investment advisory fees | | | | 10,483,817 | | | | | 129,007,113 | | | | | 50,795,891 | |
| Shareholder servicing fees | | | | 3,028,863 | | | | | 31,783,028 | | | | | 11,951,974 | |
| Administration and Accounting fees | | | | 705,350 | | | | | 7,164,319 | | | | | 2,709,723 | |
| Custodian fees | | | | 303,814 | | | | | 5,525,110 | | | | | 1,750,112 | |
| Directors fees and expenses | | | | 44,415 | | | | | 470,956 | | | | | 177,007 | |
| Insurance premiums | | | | 26,674 | | | | | 83,576 | | | | | 44,834 | |
| Interest expense | | | | — | | | | | — | | | | | 2,939 | |
| Legal and Audit fees | | | | 80,625 | | | | | 722,595 | | | | | 312,904 | |
| Printing and postage fees | | | | 10,731 | | | | | 108,151 | | | | | 45,043 | |
| Registration fees | | | | 38,783 | | | | | 106,866 | | | | | 68,340 | |
| Transfer agent fees | | | | 168,216 | | | | | 1,633,437 | | | | | 621,875 | |
| Miscellaneous expenses | | | | 21,659 | | | | | 105,093 | | | | | 440,981 | |
| Total expenses | | | | 14,912,947 | | | | | 176,710,244 | | | | | 68,921,623 | |
| Expenses waived by Adviser (Note 7) | | | | — | | | | | — | | | | | (2,585,158 | ) |
| Net expenses | | | | 14,912,947 | | | | | 176,710,244 | | | | | 66,336,465 | |
| NET INVESTMENT INCOME | | | | 10,124,869 | | | | | 121,578,079 | | | | | 35,355,682 | |
| NET REALIZED AND CHANGE IN UNREALIZED GAIN/(LOSS) ON INVESTMENTS, FOREIGN CURRENCY TRANSACTIONS, NET OF FOREIGN TAXES: | | | | | | | | | | | | | | | |
| Net realized gains/(loss) on: | | | | | | | | | | | | | | | |
| Investments | | | | 51,188,785 | | | | | 853,762,518 | | | | | 444,043,736 | |
| Foreign capital gains tax | | | | — | | | | | — | | | | | (50,282 | ) |
| Forward foreign currency exchange contracts | | | | — | | | | | 7,974,588 | | | | | 782,394 | |
| Foreign currency transactions | | | | (120,647 | ) | | | | (1,482,181 | ) | | | | (2,453,982 | ) |
| Net change in unrealized appreciation/(depreciation) on: | | | | | | | | | | | | | | | |
| Investments | | | | 234,995,476 | | | | | 1,472,568,875 | | | | | 483,459,400 | |
| Foreign currency transactions | | | | 33,474 | | | | | 520,111 | | | | | 98,262 | |
| Forward foreign currency exchange contracts | | | | — | | | | | (7,438,173 | ) | | | | 280,015 | |
| Foreign deferred taxes on unrealized appreciation | | | | — | | | | | 2,252,488 | | | | | (698,705 | ) |
| Net realized and change in unrealized gain/(loss) on investments, foreign currency transactions, net of foreign taxes | | | | 286,097,088 | | | | | 2,328,158,226 | | | | | 925,460,838 | |
| NET INCREASE IN NET ASSETS RESULTING FROM OPERATIONS | | | $ | 296,221,957 | | | | $ | 2,449,736,305 | | | | $ | 960,816,520 | |
See Notes to Financial Statements.
| Old Westbury Funds, Inc. | |
| Statements of Operations - (Continued) | |
| | For the Year Ended October 31, 2017 |
| | |
| | | STRATEGIC
OPPORTUNITIES
FUNDa |
| INVESTMENT INCOME: | | | | | |
| Interest | | | $ | 142,989,097 | |
| Dividends | | | | 67,037,416 | |
| Foreign tax withheld | | | | (939,578 | ) |
| Total investment income | | | | 209,086,935 | |
| EXPENSES: | | | | | |
| Investment advisory fees | | | | 59,228,123 | |
| Shareholder servicing fees | | | | 11,470,624 | |
| Administration and Accounting fees | | | | 2,653,180 | |
| Custodian fees | | | | 407,042 | |
| Directors fees and expenses | | | | 173,689 | |
| Insurance premiums | | | | 46,195 | |
| Legal and Audit fees | | | | 510,403 | |
| Printing and postage fees | | | | 45,511 | |
| Registration fees | | | | 54,213 | |
| Transfer agent fees | | | | 598,288 | |
| Miscellaneous expenses | | | | 239,405 | |
| Total expenses | | | | 75,426,673 | |
| Expenses waived by Adviser (Note 7) | | | | (6,593,225 | ) |
| Net expenses | | | | 68,833,448 | |
| NET INVESTMENT INCOME | | | | 140,253,487 | |
| NET REALIZED AND CHANGE IN UNREALIZED GAIN/(LOSS) ON INVESTMENTS, SECURITIES SOLD SHORT, FUTURES CONTRACTS, SWAP AGREEMENTS, WRITTEN OPTIONS, FOREIGN CURRENCY TRANSACTIONS, NET OF FOREIGN TAXES: | | | | | |
| Net realized gain/(loss) on: | | | | | |
| Investments | | | | 131,112,785 | |
| Futures contracts | | | | 21,690,189 | |
| Swap agreements | | | | 61,015,334 | |
| Written options and structured options | | | | 234,335,261 | |
| Forward foreign currency exchange contracts | | | | 5,347,251 | |
| Foreign currency transactions | | | | (5,979,376 | ) |
| Foreign capital gains tax | | | | (79,229 | ) |
| Net change in unrealized appreciation/(depreciation) on: | | | | | |
| Investments | | | | 147,670,358 | |
| Securities sold short | | | | 1,871,202 | |
| Futures contracts | | | | (3,296,684 | ) |
| Swap agreements | | | | 33,506,361 | |
| Written options and structured options | | | | (13,573,692 | ) |
| Forward foreign currency exchange contracts | | | | (224,369 | ) |
| Foreign currency transactions | | | | (130,810 | ) |
| Foreign deferred taxes on unrealized depreciation | | | | 4,779 | |
| Net realized and change in unrealized gain/(loss) on investments, securities sold short, futures contracts, swap agreements, written options, foreign currency transactions, net of foreign taxes | | | | 613,269,360 | |
| NET INCREASE IN NET ASSETS RESULTING FROM OPERATIONS | | | $ | 753,522,847 | |
| a | Consolidated Statement of Operations. |
See Notes to Financial Statements.
| Old Westbury Funds, Inc. | |
| Statements of Operations - (Continued) | |
| | For the Year Ended October 31, 2017 |
| | |
| | | FIXED
INCOME
FUND | | MUNICIPAL
BOND
FUND |
| INVESTMENT INCOME: | | | | | | | | | | |
| Interest | | | $ | 15,038,471 | | | | $ | 36,556,373 | |
| Dividends | | | | 38,637 | | | | | 283,107 | |
| Total investment income | | | | 15,077,108 | | | | | 36,839,480 | |
| EXPENSES: | | | | | | | | | | |
| Investment advisory fees | | | | 3,414,313 | | | | | 8,148,411 | |
| Shareholder servicing fees | | | | 1,582,156 | | | | | 4,227,663 | |
| Administration and Accounting fees | | | | 374,488 | | | | | 958,840 | |
| Custodian fees | | | | 118,662 | | | | | 317,075 | |
| Directors fees and expenses | | | | 23,423 | | | | | 62,655 | |
| Insurance premiums | | | | 24,600 | | | | | 29,987 | |
| Interest expense | | | | — | | | | | 115 | |
| Legal and Audit fees | | | | 46,004 | | | | | 92,004 | |
| Printing and postage fees | | | | 5,120 | | | | | 13,616 | |
| Registration fees | | | | 29,722 | | | | | 44,841 | |
| Transfer agent fees | | | | 93,851 | | | | | 230,117 | |
| Miscellaneous expenses | | | | 22,333 | | | | | 71,888 | |
| Total expenses | | | | 5,734,672 | | | | | 14,197,212 | |
| Expenses waived by Shareholder Servicing Agent (Note 7) | | | | (791,078 | ) | | | | (2,113,832 | ) |
| Net expenses | | | | 4,943,594 | | | | | 12,083,380 | |
| NET INVESTMENT INCOME | | | | 10,133,514 | | | | | 24,756,100 | |
| NET REALIZED AND CHANGE IN UNREALIZED GAIN/(LOSS) ON INVESTMENTS | | | | | | | | | | |
| Net realized gain/(loss) on: | | | | | | | | | | |
| Investments | | | | (3,474,710 | ) | | | | (1,529,655 | ) |
| Net change in unrealized appreciation/(depreciation) on: | | | | | | | | | | |
| Investments | | | | (7,223,117 | ) | | | | (12,618,806 | ) |
| Net realized and change in unrealized gain/(loss) on investments | | | | (10,697,827 | ) | | | | (14,148,461 | ) |
| NET INCREASE/(DECREASE) IN NET ASSETS RESULTING FROM OPERATIONS | | | $ | (564,313 | ) | | | $ | 10,607,639 | |
See Notes to Financial Statements.
| Old Westbury Funds, Inc. | |
| Statements of Changes in Net Assets | |
| | |
| | |
| | | ALL CAP CORE FUND |
| | | FOR THE YEAR
ENDED
OCTOBER 31,
2017 | | FOR THE YEAR
ENDED
OCTOBER 31,
2016 |
| FROM OPERATIONS: | | | | | | | | | | |
| Net investment income | | | $ | 10,124,869 | | | | $ | 12,473,350 | |
| Net realized gain/(loss) on investments and foreign currency transactions | | | | 51,068,138 | | | | | (23,392,246 | ) |
| Net change in unrealized appreciation/(depreciation) on investments, foreign currency transactions, net of foreign deferred taxes | | | | 235,028,950 | | | | | 26,380,786 | |
| Net increase in net assets resulting from operations | | | | 296,221,957 | | | | | 15,461,890 | |
| DISTRIBUTIONS TO SHAREHOLDERS FROM: | | | | | | | | | | |
| Net investment income | | | | (13,751,936 | ) | | | | (12,767,618 | ) |
| Capital gains | | | | — | | | | | (13,076,789 | ) |
| Net decrease in net assets from distributions | | | | (13,751,936 | ) | | | | (25,844,407 | ) |
| CAPITAL STOCK TRANSACTIONS (DOLLARS): | | | | | | | | | | |
| Proceeds from sale of capital stock | | | | 410,170,510 | | | | | 268,944,429 | |
| Reinvestment of distributions | | | | 4,963,160 | | | | | 13,209,958 | |
| Value of capital stock redeemed | | | | (171,433,102 | ) | | | | (171,467,228 | ) |
| Net increase in net assets resulting from capital stock transactions | | | | 243,700,568 | | | | | 110,687,159 | |
| Net increase in net assets | | | | 526,170,589 | | | | | 100,304,642 | |
| NET ASSETS: | | | | | | | | | | |
| Beginning of year | | | | 1,246,197,007 | | | | | 1,145,892,365 | |
| End of year | | | $ | 1,772,367,596 | | | | $ | 1,246,197,007 | |
| Undistributed net investment income | | | $ | 8,109,244 | | | | $ | 9,635,381 | |
| CAPITAL SHARE TRANSACTIONS: | | | | | | | | | | |
| Shares sold | | | | 27,459,497 | | | | | 20,570,567 | |
| Shares issued as reinvestment of distributions | | | | 349,518 | | | | | 1,012,257 | |
| Shares redeemed | | | | (11,396,186 | ) | | | | (12,921,809 | ) |
| Net increase in shares outstanding | | | | 16,412,829 | | | | | 8,661,015 | |
See Notes to Financial Statements.
| Old Westbury Funds, Inc. | |
| Statements of Changes in Net Assets - (Continued) | |
| | |
| | |
| LARGE CAP STRATEGIES FUND | | SMALL & MID CAP STRATEGIES FUND |
FOR THE YEAR
ENDED
OCTOBER 31,
2017 | | FOR THE YEAR
ENDED
OCTOBER 31,
2016 | | FOR THE YEAR
ENDED
OCTOBER 31,
2017 | | FOR THE YEAR
ENDED
OCTOBER 31,
2016 |
| | | | | | | |
| | $ | 121,578,079 | | | | $ | 93,243,807 | | | | $ | 35,355,682 | | | | $ | 32,496,703 | |
| | | 860,254,925 | | | | | 170,409,214 | | | | | 442,321,866 | | | | | 328,653,233 | |
| | | | | | | | | | | | | | | | | | | |
| | | 1,467,903,301 | | | | | 44,642,759 | | | | | 483,138,972 | | | | | (71,561,629 | ) |
| | | 2,449,736,305 | | | | | 308,295,780 | | | | | 960,816,520 | | | | | 289,588,307 | |
| | | | | | | | | | | | | | | | | | | |
| | | (109,523,510 | ) | | | | (109,206,576 | ) | | | | (30,569,468 | ) | | | | (41,515,802 | ) |
| | | (151,604,603 | ) | | | | (212,416,103 | ) | | | | (298,283,586 | ) | | | | (228,201,193 | ) |
| | | | | | | | | | | | | | | | | | | |
| | | (261,128,113 | ) | | | | (321,622,679 | ) | | | | (328,853,054 | ) | | | | (269,716,995 | ) |
| | | | | | | | | | | | | | | | | | | |
| | | 1,831,878,570 | | | | | 1,921,668,809 | | | | | 895,995,983 | | | | | 775,408,537 | |
| | | 123,183,224 | | | | | 166,548,307 | | | | | 188,125,990 | | | | | 159,969,805 | |
| | | (1,496,082,470 | ) | | | | (1,620,400,131 | ) | | | | (625,327,694 | ) | | | | (933,234,823 | ) |
| | | | | | | | | | | | | | | | | | | |
| | | 458,979,324 | | | | | 467,816,985 | | | | | 458,794,279 | | | | | 2,143,519 | |
| | | 2,647,587,516 | | | | | 454,490,086 | | | | | 1,090,757,745 | | | | | 22,014,831 | |
| | | | | | | | | | | | | | | | | | | |
| | | 14,595,891,252 | | | | | 14,141,401,166 | | | | | 5,471,623,525 | | | | | 5,449,608,694 | |
| | $ | 17,243,478,768 | | | | $ | 14,595,891,252 | | | | $ | 6,562,381,270 | | | | $ | 5,471,623,525 | |
| | $ | 99,067,585 | | | | $ | 88,579,044 | | | | $ | 24,074,288 | | | | $ | 17,748,968 | |
| | | | | | | | | | | | | | | | | | | |
| | | 133,829,033 | | | | | 155,007,934 | | | | | 55,186,332 | | | | | 53,021,050 | |
| | | 9,497,550 | | | | | 13,388,128 | | | | | 12,384,858 | | | | | 10,860,136 | |
| | | (108,984,517 | ) | | | | (128,899,429 | ) | | | | (38,512,284 | ) | | | | (61,440,681 | ) |
| | | 34,342,066 | | | | | 39,496,633 | | | | | 29,058,906 | | | | | 2,440,505 | |
See Notes to Financial Statements.
| Old Westbury Funds, Inc. | |
| Statements of Changes in Net Assets - (Continued) | |
| | |
| | |
| | | STRATEGIC OPPORTUNITIES
FUND |
| | | FOR THE YEAR | | FOR THE YEAR |
| | | ENDED | | ENDED |
| | | OCTOBER 31, | | OCTOBER 31, |
| | | 2017a | | 2016a |
| FROM OPERATIONS: | | | | | | | | | | |
| Net investment income | | | $ | 140,253,487 | | | | $ | 106,351,867 | |
| Net realized gain/(loss) on investments, securities sold short, swap agreements, futures contracts, written options, foreign capital gains tax and foreign currency transactions | | | | 447,442,215 | | | | | (174,541,583 | ) |
| Net change in unrealized appreciation/(depreciation) on investments, securities sold short, futures contracts, written options, swap agreements, foreign currency transactions, net of foreign deferred taxes | | | | 165,827,145 | | | | | 77,848,131 | |
| Net increase/(decrease) in net assets resulting from operations | | | | 753,522,847 | | | | | 9,658,415 | |
| DISTRIBUTIONS TO SHAREHOLDERS FROM: | | | | | | | | | | |
| Net investment income | | | | (111,738,489 | ) | | | | (105,784,964 | ) |
| Capital gains | | | | — | | | | | (128,054,530 | ) |
| Net decrease in net assets from distributions | | | | (111,738,489 | ) | | | | (233,839,494 | ) |
| CAPITAL STOCK TRANSACTIONS (DOLLARS): | | | | | | | | | | |
| Proceeds from sale of capital stock | | | | 674,275,647 | | | | | 1,138,862,753 | |
| Reinvestment of distributions | | | | 33,139,282 | | | | | 112,339,997 | |
| Value of capital stock redeemed | | | | (1,733,704,369 | ) | | | | (2,188,724,376 | ) |
| Net increase/(decrease) in net assets resulting from capital stock transactions | | | | (1,026,289,440 | ) | | | | (937,521,626 | ) |
| Net increase/(decrease) in net assets | | | | (384,505,082 | ) | | | | (1,161,702,705 | ) |
| NET ASSETS: | | | | | | | | | | |
| Beginning of year | | | | 5,934,053,190 | | | | | 7,095,755,895 | |
| End of year | | | $ | 5,549,548,108 | | | | $ | 5,934,053,190 | |
| Undistributed net investment income | | | $ | 163,409,734 | | | | $ | 85,974,455 | |
| CAPITAL SHARE TRANSACTIONS: | | | | | | | | | | |
| Shares sold | | | | 87,048,713 | | | | | 161,379,147 | |
| Shares issued as reinvestment of distributions | | | | 4,454,204 | | | | | 15,410,151 | |
| Shares redeemed | | | | (223,013,057 | ) | | | | (303,283,841 | ) |
| Net increase/(decrease) in shares outstanding | | | | (131,510,140 | ) | | | | (126,494,543 | ) |
| a | Consolidated Statement of Changes in Net Assets. |
See Notes to Financial Statements.
| Old Westbury Funds, Inc. | |
| Statements of Changes in Net Assets - (Continued) | |
| | |
| | |
| FIXED INCOME FUND | | MUNICIPAL BOND FUND |
| FOR THE YEAR | | FOR THE YEAR | | FOR THE YEAR | | FOR THE YEAR |
| ENDED | | ENDED | | ENDED | | ENDED |
| OCTOBER 31, | | OCTOBER 31, | | OCTOBER 31, | | OCTOBER 31, | |
| 2017 | | 2016 | | 2017 | | 2016 |
| | | | | | | | | | | | | | | | | | | |
| | $ | 10,133,514 | | | | $ | 7,136,031 | | | | $ | 24,756,100 | | | | $ | 20,073,688 | |
| | | | | | | | | | | | | | | | | | | |
| | | (3,474,710 | ) | | | | 2,141,711 | | | | | (1,529,655 | ) | | | | 9,373,093 | |
| | | | | | | | | | | | | | | | | | | |
| | | (7,223,117 | ) | | | | 2,875,205 | | | | | (12,618,806 | ) | | | | (747,741 | ) |
| | | (564,313 | ) | | | | 12,152,947 | | | | | 10,607,639 | | | | | 28,699,040 | |
| | | | | | | | | | | | | | | | | | | |
| | | (11,203,970 | ) | | | | (8,506,761 | ) | | | | (24,052,772 | ) | | | | (19,986,880 | ) |
| | | — | | | | | — | | | | | (9,374,029 | ) | | | | (1,416,604 | ) |
| | | (11,203,970 | ) | | | | (8,506,761 | ) | | | | (33,426,801 | ) | | | | (21,403,484 | ) |
| | | | | | | | | | | | | | | | | | | |
| | | 186,418,308 | | | | | 298,387,151 | | | | | 516,856,601 | | | | | 846,467,718 | |
| | | 6,088,035 | | | | | 4,352,215 | | | | | 9,250,202 | | | | | 5,542,028 | |
| | | (140,609,434 | ) | | | | (104,173,333 | ) | | | | (322,920,119 | ) | | | | (179,212,789 | ) |
| | | 51,896,909 | | | | | 198,566,033 | | | | | 203,186,684 | | | | | 672,796,957 | |
| | | 40,128,626 | | | | | 202,212,219 | | | | | 180,367,522 | | | | | 680,092,513 | |
| | | | | | | | | | | | | | | | | | | |
| | | 785,416,543 | | | | | 583,204,324 | | | | | 2,055,135,670 | | | | | 1,375,043,157 | |
| | $ | 825,545,169 | | | | $ | 785,416,543 | | | | $ | 2,235,503,192 | | | | $ | 2,055,135,670 | |
| | $ | 1,263,897 | | | | $ | 770,831 | | | | $ | 2,478,028 | | | | $ | 1,776,685 | |
| | | | | | | | | | | | | | | | | | | |
| | | 16,797,735 | | | | | 26,401,431 | | | | | 43,464,407 | | | | | 69,733,595 | |
| | | 549,399 | | | | | 386,760 | | | | | 782,318 | | | | | 459,206 | |
| | | (12,660,942 | ) | | | | (9,241,847 | ) | | | | (27,216,140 | ) | | | | (14,782,785 | ) |
| | | 4,686,192 | | | | | 17,546,344 | | | | | 17,030,585 | | | | | 55,410,016 | |
See Notes to Financial Statements.
| Old Westbury Funds, Inc. | |
| All Cap Core Fund | |
| Financial Highlights | |
| | |
For a Share Outstanding Throughout Each Period.
| | | YEAR ENDED OCTOBER 31, | |
| | | 2017 | | | 2016 | | | 2015 | | | 2014 | | | 2013 | |
| Net asset value, beginning of year | | $ | 13.69 | | | $ | 13.92 | | | $ | 15.00 | | | $ | 13.92 | | | $ | 11.53 | |
| | | | | | | | | | | | | | | | | | | | | |
| Investment operations: | | | | | | | | | | | | | | | | | | | | |
| Net investment income | | | 0.10 | a | | | 0.14 | a | | | 0.15 | a | | | 0.21 | a | | | 0.24 | a |
| Net realized and unrealized gains/(losses) on investments | | | 2.86 | | | | (0.05 | ) | | | (0.41 | ) | | | 1.08 | | | | 2.38 | |
| Total from investment operations | | | 2.96 | | | | 0.09 | | | | (0.26 | ) | | | 1.29 | | | | 2.62 | |
| | | | | | | | | | | | | | | | | | | | | |
| Distributions: | | | | | | | | | | | | | | | | | | | | |
| Net investment income | | | (0.15 | ) | | | (0.16 | ) | | | (0.19 | ) | | | (0.21 | ) | | | (0.23 | ) |
| Net realized gains | | | — | | | | (0.16 | ) | | | (0.63 | ) | | | — | | | | — | |
| Total distributions | | | (0.15 | ) | | | (0.32 | ) | | | (0.82 | ) | | | (0.21 | ) | | | (0.23 | ) |
| Net asset value, end of year | | $ | 16.50 | | | $ | 13.69 | | | $ | 13.92 | | | $ | 15.00 | | | $ | 13.92 | |
| Total return | | | 21.8 | % | | | 0.7 | % | | | (1.7 | )% | | | 9.4 | % | | | 23.1 | % |
| | | | | | | | | | | | | | | | | | | | | |
| Annualized ratios/supplemental data: | | | | | | | | | | | | | | | | | | | | |
| Net assets at end of year (000’s) | | $ | 1,772,368 | | | $ | 1,246,197 | | | $ | 1,145,892 | | | $ | 1,029,373 | | | $ | 835,858 | |
| Ratio of expenses to average net assets before expense waivers | | | 0.99 | %b | | | 1.00 | %b | | | 1.01 | % | | | 1.04 | % | | | 1.06 | % |
| Ratio of expenses to average net assets after expense waivers | | | 0.99 | % | | | 1.00 | % | | | 1.00 | % | | | 1.00 | % | | | 1.00 | % |
| Ratio of net investment income to average net assets | | | 0.67 | % | | | 1.07 | % | | | 1.02 | % | | | 1.46 | % | | | 1.91 | % |
| Portfolio turnover rate | | | 57 | % | | | 34 | % | | | 43 | % | | | 43 | % | | | 63 | % |
| a | Calculated using the average shares method for the period. |
| b | There were no voluntary fee reductions during the period. |
See Notes to Financial Statements.
| Old Westbury Funds, Inc. | |
| Large Cap Strategies Fund | |
| Financial Highlights | |
| | |
For a Share Outstanding Throughout Each Period.
| | | YEAR ENDED OCTOBER 31, | |
| | | 2017 | | | 2016 | | | 2015 | | | 2014 | | | 2013 | |
| Net asset value, beginning of year | | $ | 12.95 | | | $ | 13.01 | | | $ | 13.20 | | | $ | 12.09 | | | $ | 9.69 | |
| | | | | | | | | | | | | | | | | | | | | |
| Investment operations: | | | | | | | | | | | | | | | | | | | | |
| Net investment income | | | 0.11 | a | | | 0.08 | a | | | 0.12 | a | | | 0.10 | a | | | 0.11 | a |
| Net realized and unrealized gains on investments and foreign currency transactions | | | 2.02 | | | | 0.16 | | | | 0.13 | | | | 1.09 | | | | 2.36 | |
| Total from investment operations | | | 2.13 | | | | 0.24 | | | | 0.25 | | | | 1.19 | | | | 2.47 | |
| | | | | | | | | | | | | | | | | | | | | |
| Distributions: | | | | | | | | | | | | | | | | | | | | |
| Net investment income | | | (0.10 | ) | | | (0.10 | ) | | | (0.10 | ) | | | (0.08 | ) | | | (0.07 | ) |
| Net realized gains | | | (0.13 | ) | | | (0.20 | ) | | | (0.34 | ) | | | — | | | | — | |
| Total distributions | | | (0.23 | ) | | | (0.30 | ) | | | (0.44 | ) | | | (0.08 | ) | | | (0.07 | ) |
| Net asset value, end of year | | $ | 14.85 | | | $ | 12.95 | | | $ | 13.01 | | | $ | 13.20 | | | $ | 12.09 | |
| Total return | | | 16.7 | % | | | 1.9 | % | | | 2.0 | % | | | 9.9 | % | | | 25.7 | % |
| | | | | | | | | | | | | | | | | | | | | |
| Annualized ratios/supplemental data: | | | | | | | | | | | | | | | | | | | | |
| Net assets at end of year (000’s) | | $ | 17,243,479 | | | $ | 14,595,891 | | | $ | 14,141,401 | | | $ | 12,624,586 | | | $ | 9,564,418 | |
| Ratio of expenses to average net assets before expense waivers | | | 1.11 | %b | | | 1.11 | %b | | | 1.11 | %b | | | 1.12 | %b | | | 1.15 | %b |
| Ratio of expenses to average net assets after expense waivers | | | 1.11 | % | | | 1.11 | % | | | 1.11 | % | | | 1.12 | % | | | 1.15 | % |
| Ratio of net investment income to average net assets | | | 0.77 | % | | | 0.67 | % | | | 0.88 | % | | | 0.82 | % | | | 1.00 | % |
| Portfolio turnover rate | | | 61 | % | | | 50 | % | | | 61 | % | | | 51 | % | | | 42 | % |
| a | Calculated using the average shares method for the period. |
| b | There were no voluntary fee reductions during the period. |
See Notes to Financial Statements.
| Old Westbury Funds, Inc. | |
| Small & Mid Cap Strategies Fund | |
| Financial Highlights | |
| | |
For a Share Outstanding Throughout Each Period.
| | | YEAR ENDED OCTOBER 31, | |
| | | 2017 | | | 2016 | | | 2015 | | | 2014 | | | 2013 | |
| Net asset value, beginning of year | | $ | 15.81 | | | $ | 15.86 | | | $ | 17.09 | | | $ | 17.30 | | | $ | 14.64 | |
| | | | | | | | | | | | | | | | | | | | | |
| Investment operations: | | | | | | | | | | | | | | | | | | | | |
| Net investment income | | | 0.10 | a | | | 0.09 | a | | | 0.09 | a | | | 0.12 | a | | | 0.12 | a |
| Net realized and unrealized gains on investments, foreign currency transactions and deferred taxes | | | 2.54 | | | | 0.66 | | | | 0.40 | | | | 0.83 | | | | 3.61 | |
| Total from investment operations | | | 2.64 | | | | 0.75 | | | | 0.49 | | | | 0.95 | | | | 3.73 | |
| | | | | | | | | | | | | | | | | | | | | |
| Distributions: | | | | | | | | | | | | | | | | | | | | |
| Net investment income | | | (0.09 | ) | | | (0.12 | ) | | | (0.13 | ) | | | (0.13 | ) | | | (0.16 | ) |
| Net realized gains | | | (0.87 | ) | | | (0.68 | ) | | | (1.59 | ) | | | (1.03 | ) | | | (0.91 | ) |
| Total distributions | | | (0.96 | ) | | | (0.80 | ) | | | (1.72 | ) | | | (1.16 | ) | | | (1.07 | ) |
| Net asset value, end of year | | $ | 17.49 | | | $ | 15.81 | | | $ | 15.86 | | | $ | 17.09 | | | $ | 17.30 | |
| Total return | | | 17.6 | % | | | 5.1 | % | | | 2.9 | % | | | 5.7 | % | | | 26.8 | % |
| | | | | | | | | | | | | | | | | | | | | |
| Annualized ratios/supplemental data: | | | | | | | | | | | | | | | | | | | | |
| Net assets at end of year (000’s) | | $ | 6,562,381 | | | $ | 5,471,624 | | | $ | 5,449,609 | | | $ | 6,385,783 | | | $ | 6,624,651 | |
| Ratio of expenses to average net assets before expense waivers | | | 1.15 | %b | | | 1.16 | %b | | | 1.16 | %b | | | 1.15 | %b | | | 1.16 | %b |
| Ratio of expenses to average net assets after expense waivers | | | 1.11 | % | | | 1.11 | % | | | 1.11 | % | | | 1.11 | % | | | 1.11 | % |
| Ratio of net investment income to average net assets | | | 0.59 | % | | | 0.61 | % | | | 0.56 | % | | | 0.67 | % | | | 0.73 | % |
| Portfolio turnover rate | | | 45 | % | | | 48 | % | | | 50 | % | | | 38 | % | | | 31 | % |
| a | Calculated using the average shares method for the period. |
| b | When counterparties post cash collateral with respect to various derivative transactions, the Fund may invest the collateral and receive interest income on the investment and pays interest expense on the collateral to the counterparty. The interest income is included in investment income on the Statements of Operations, and the interest expense is included in the Fund’s overall expenses on the Statements of Operations and expense ratio. |
See Notes to Financial Statements.
| Old Westbury Funds, Inc. | |
| Strategic Opportunities Fund | |
| Financial Highlights | |
| | |
For a Share Outstanding Throughout Each Period.
| | | YEAR ENDED OCTOBER 31, | |
| | | 2017a | | | 2016a | | | 2015a | | | 2014 | | | 2013 | |
| Net asset value, beginning of year | | $ | 7.41 | | | $ | 7.65 | | | $ | 8.20 | | | $ | 8.24 | | | $ | 7.51 | |
| | | | | | | | | | | | | | | | | | | | | |
| Investment operations: | | | | | | | | | | | | | | | | | | | | |
| Net investment income | | | 0.19 | b | | | 0.12 | b | | | 0.09 | b | | | 0.09 | b | | | 0.15 | b |
| Net realized and unrealized gains/(losses) on investments, securities sold short, futures contracts, swap agreements, written options, foreign currency transactions and deferred taxes | | | 0.84 | | | | (0.10 | ) | | | (0.02 | ) | | | 0.36 | | | | 0.76 | |
| Total from investment operations | | | 1.03 | | | | 0.02 | | | | 0.07 | | | | 0.45 | | | | 0.91 | |
| | | | | | | | | | | | | | | | | | | | | |
| Distributions: | | | | | | | | | | | | | | | | | | | | |
| Net investment income | | | (0.14 | ) | | | (0.12 | ) | | | (0.17 | ) | | | (0.27 | ) | | | (0.18 | ) |
| Net realized gains | | | — | | | | (0.14 | ) | | | (0.45 | ) | | | (0.22 | ) | | | — | |
| Total distributions | | | (0.14 | ) | | | (0.26 | ) | | | (0.62 | ) | | | (0.49 | ) | | | (0.18 | ) |
| Net asset value, end of year | | $ | 8.30 | | | $ | 7.41 | | | $ | 7.65 | | | $ | 8.20 | | | $ | 8.24 | |
| Total return | | | 14.1 | % | | | 0.2 | % | | | 0.9 | % | | | 5.9 | % | | | 12.3 | % |
| | | | | | | | | | | | | | | | | | | | | |
| Annualized ratios/supplemental data: | | | | | | | | | | | | | | | | | | | | |
| Net assets at end of year (000’s) | | $ | 5,549,548 | | | $ | 5,934,053 | | | $ | 7,095,756 | | | $ | 5,598,552 | | | $ | 5,737,691 | |
| Ratio of expenses to average net assets before expense waivers | | | 1.32 | %c | | | 1.32 | %c | | | 1.32 | %c | | | 1.32 | %c | | | 1.32 | %c |
| Ratio of expenses to average net assets after expense waivers | | | 1.20 | % | | | 1.20 | % | | | 1.20 | % | | | 1.20 | % | | | 1.20 | % |
| Ratio of net investment income to average net assets | | | 2.45 | % | | | 1.67 | % | | | 1.16 | % | | | 1.14 | % | | | 1.97 | % |
| Portfolio turnover rate | | | 111 | % | | | 114 | % | | | 70 | % | | | 82 | % | | | 61 | % |
| a | Consolidated Financial Highlights. |
| b | Calculated using the average shares method for the period. |
| c | When counterparties post cash collateral with respect to various derivative transactions, the Fund may invest the collateral and receive interest income on the investment and pays interest expense on the collateral to the counterparty. The interest income is included in investment income on the Statements of Operations, and the interest expense is included in the Fund’s overall expenses on the Statements of Operations and expense ratio. |
See Notes to Financial Statements.
| Old Westbury Funds, Inc. | |
| Fixed Income Fund | |
| Financial Highlights | |
| | |
For a Share Outstanding Throughout Each Period.
| | | YEAR ENDED OCTOBER 31, | |
| | | 2017 | | | 2016 | | | 2015 | | | 2014 | | | 2013 | |
| Net asset value, beginning of year | | $ | 11.28 | | | $ | 11.19 | | | $ | 11.22 | | | $ | 11.34 | | | $ | 11.66 | |
| | | | | | | | | | | | | | | | | | | | | |
| Investment operations: | | | | | | | | | | | | | | | | | | | | |
| Net investment income | | | 0.14 | a | | | 0.12 | a | | | 0.12 | a | | | 0.11 | a | | | 0.14 | a |
| Net realized and unrealized gains/(losses) on investments | | | (0.15 | ) | | | 0.11 | | | | — | b | | | (0.01 | ) | | | (0.18 | ) |
| Total from investment operations | | | (0.01 | ) | | | 0.23 | | | | 0.12 | | | | 0.10 | | | | (0.04 | ) |
| | | | | | | | | | | | | | | | | | | | | |
| Distributions: | | | | | | | | | | | | | | | | | | | | |
| Net investment income | | | (0.16 | ) | | | (0.14 | ) | | | (0.15 | ) | | | (0.20 | ) | | | (0.22 | ) |
| Net realized gains | | | — | | | | — | | | | — | | | | (0.02 | ) | | | (0.06 | ) |
| Total distributions | | | (0.16 | ) | | | (0.14 | ) | | | (0.15 | ) | | | (0.22 | ) | | | (0.28 | ) |
| Net asset value, end of year | | $ | 11.11 | | | $ | 11.28 | | | $ | 11.19 | | | $ | 11.22 | | | $ | 11.34 | |
| Total return | | | (0.1 | )% | | | 2.1 | % | | | 1.1 | % | | | 0.9 | % | | | (0.3 | )% |
| | | | | | | | | | | | | | | | | | | | | |
| Annualized ratios/supplemental data: | | | | | | | | | | | | | | | | | | | | |
| Net assets at end of year (000’s) | | $ | 825,545 | | | $ | 785,417 | | | $ | 583,204 | | | $ | 563,716 | | | $ | 533,444 | |
| Ratio of expenses to average net assets before expense waivers | | | 0.72 | % | | | 0.74 | % | | | 0.74 | % | | | 0.75 | % | | | 0.75 | % |
| Ratio of expenses to average net assets after expense waivers | | | 0.62 | % | | | 0.64 | % | | | 0.64 | % | | | 0.65 | % | | | 0.65 | % |
| Ratio of net investment income to average net assets | | | 1.28 | % | | | 1.07 | % | | | 1.03 | % | | | 0.94 | % | | | 1.26 | % |
| Portfolio turnover rate | | | 70 | % | | | 68 | % | | | 67 | % | | | 65 | % | | | 78 | % |
| a | Calculated using the average shares method for the period. |
| b | Amount is less than $0.005 per share. |
See Notes to Financial Statements.
| Old Westbury Funds, Inc. | |
| Municipal Bond Fund | |
| Financial Highlights | |
| | |
For a Share Outstanding Throughout Each Period.
| | | YEAR ENDED OCTOBER 31, | |
| | | 2017 | | | 2016 | | | 2015 | | | 2014 | | | 2013 | |
| Net asset value, beginning of year | | $ | 12.09 | | | $ | 12.00 | | | $ | 12.02 | | | $ | 11.96 | | | $ | 12.33 | |
| | | | | | | | | | | | | | | | | | | | | |
| Investment operations: | | | | | | | | | | | | | | | | | | | | |
| Net investment income | | | 0.14 | a | | | 0.14 | a | | | 0.15 | a | | | 0.14 | a | | | 0.17 | a |
| Net realized and unrealized gains/(losses) on investments | | | (0.08 | ) | | | 0.10 | | | | 0.03 | | | | 0.10 | | | | (0.25 | ) |
| Total from investment operations | | | 0.06 | | | | 0.24 | | | | 0.18 | | | | 0.24 | | | | (0.08 | ) |
| | | | | | | | | | | | | | | | | | | | | |
| Distributions: | | | | | | | | | | | | | | | | | | | | |
| Net investment income | | | (0.14 | ) | | | (0.14 | ) | | | (0.15 | ) | | | (0.15 | ) | | | (0.17 | ) |
| Net realized gains | | | (0.06 | ) | | | (0.01 | ) | | | (0.05 | ) | | | (0.03 | ) | | | (0.12 | ) |
| Total distributions | | | (0.20 | ) | | | (0.15 | ) | | | (0.20 | ) | | | (0.18 | ) | | | (0.29 | ) |
| Net asset value, end of year | | $ | 11.95 | | | $ | 12.09 | | | $ | 12.00 | | | $ | 12.02 | | | $ | 11.96 | |
| Total return | | | 0.5 | % | | | 2.1 | % | | | 1.5 | % | | | 2.0 | % | | | (0.7 | )% |
| | | | | | | | | | | | | | | | | | | | | |
| Annualized ratios/supplemental data: | | | | | | | | | | | | | | | | | | | | |
| Net assets at end of year (000’s) | | $ | 2,235,503 | | | $ | 2,055,136 | | | $ | 1,375,043 | | | $ | 1,326,109 | | | $ | 1,244,693 | |
| Ratio of expenses to average net assets before expense waivers | | | 0.67 | % | | | 0.69 | % | | | 0.70 | % | | | 0.70 | % | | | 0.71 | % |
| Ratio of expenses to average net assets after expense waivers | | | 0.57 | % | | | 0.59 | % | | | 0.60 | % | | | 0.60 | % | | | 0.61 | % |
| Ratio of net investment income to average net assets | | | 1.17 | % | | | 1.17 | % | | | 1.28 | % | | | 1.20 | % | | | 1.38 | % |
| Portfolio turnover rate | | | 31 | % | | | 44 | % | | | 31 | % | | | 55 | % | | | 51 | % |
| a | Calculated using the average shares method for the period. |
See Notes to Financial Statements.
| Old Westbury Funds, Inc. | |
| Notes to Financial Statements | |
| | October 31, 2017 |
| | |
Old Westbury Funds, Inc. (the “Corporation”) was organized as a Maryland corporation on August 26, 1993 and commenced operations on October 22, 1993. The Corporation is an open-end management investment company registered under the Investment Company Act of 1940, as amended (the “1940 Act”). The Corporation’s Board of Directors (the “Board”) are permitted to create an unlimited number of series, each with one or more separate classes of shares. As of October 31, 2017, the Corporation consisted of six separate investment portfolios (each series individually referred to as a “Fund” and collectively as the “Funds”) shown below:
| Fund Name | | Investment Objective |
| Old Westbury All Cap Core Fund (Formerly Old Westbury Large Cap Core Fund) (“All Cap Core Fund”) | | Long-term capital appreciation. |
| Old Westbury Large Cap Strategies Fund (“Large Cap Strategies Fund”) | | Long-term capital appreciation. |
| Old Westbury Small & Mid Cap Strategies Fund (Formerly Old Westbury Small & Mid Cap Fund) (“Small & Mid Cap Strategies Fund”) | | Long-term capital appreciation. |
| Old Westbury Strategic Opportunities Fund (“Strategic Opportunities Fund”) | | Long-term capital appreciation. |
| Old Westbury Fixed Income Fund (“Fixed Income Fund”) | | Total return (consisting of current income and capital appreciation). |
| Old Westbury Municipal Bond Fund (“Municipal Bond Fund”) | | Total return (consisting of current income that is exempt from regular federal income tax and capital appreciation). |
The Corporation has authorized a total of 20 billion shares of common stock (par value $0.001 per share).
Under the Corporation’s organizational documents, its Officers and Directors are indemnified against certain liabilities arising out of the performance of their duties for the Corporation. In addition, in the normal course of business, the Corporation enters into contracts with vendors and others that provide for general indemnifications. The Corporation’s maximum exposure under these arrangements is unknown as this would involve future claims that may be made against the Corporation. However, based on experience, the Corporation expects the risk of loss to be remote.
| 2. | Basis for Consolidation for the Strategic Opportunities Fund: |
The consolidated financial statements of the Strategic Opportunities Fund include the financial results of its wholly-owned subsidiary (organized under the laws of the Cayman Islands), OWF Strategic Opportunities Fund Ltd. (the “Subsidiary”). All material intercompany accounts and transactions have been eliminated. The Subsidiary commenced operations on May 1, 2015. The Strategic Opportunities Fund commenced reporting on a consolidated basis as of such commencement date. The Subsidiary is a commodity pool, as defined in the regulations of the Commodity Futures Trade Commission (the “CFTC”), and is operated by Bessemer Investment Management LLC (“BIM” or the “Adviser”), a commodity pool operator registered with the CFTC effective January 1, 2013. The Strategic Opportunities Fund seeks to gain exposure to commodities through direct investments in commodities-related instruments, derivatives and other investments and through investments in the Subsidiary. The Subsidiary has the same investment goal as the Strategic Opportunities Fund. The Subsidiary pursues its investment goal by investing in commodities-related instruments, derivatives and other investments. The Subsidiary (unlike the Strategic Opportunities Fund) may invest without limitation in these instruments. However, the Subsidiary is otherwise subject to the same fundamental, non-fundamental and certain other investment restrictions as the Strategic Opportunities Fund. The portion of the Strategic Opportunities Fund’s or Subsidiary’s assets exposed to any particular commodity, derivative or other investment will vary based on market conditions, but from time to time, some exposure could be substantial. To the extent of the Strategic Opportunities Fund’s investment through the Subsidiary, it will be subject to the risks associated with the derivatives and other instruments in which the Subsidiary invests. As of October 31, 2017, the Subsidiary represented $71,862,229 or 1.29% of the Strategic Opportunities Fund’s net assets.
| 3. | Significant Accounting Policies: |
The following is a summary of the significant accounting policies followed by the Corporation in the preparation of its financial statements. The policies are in conformity with accounting principles generally accepted in the U.S. (“GAAP”). The preparation of financial statements in accordance with GAAP requires management to make estimates and assumptions that affect
| Old Westbury Funds, Inc. | |
| Notes to Financial Statements - (Continued) | |
| | October 31, 2017 |
| | |
the reported amounts of assets and liabilities at the date of the financial statements and the reported amounts of income and expenses for the period. Actual results could differ from those estimates.
The Financial Accounting Standards Board (“FASB”) Accounting Standards Codification is the exclusive reference of authoritative GAAP recognized by the FASB to be applied by nongovernmental entities. Rules and interpretive releases of the Securities and Exchange Commission (“SEC”) under authority of federal laws are also sources of authoritative GAAP for SEC registrants such as the Corporation.
A. Valuation of Investments. Readily marketable equity securities listed on an exchange are valued, except as indicated below, at the last sale price reflected at the close of the regular trading session of the exchange on the business day as of which such value is being determined, and securities listed on NASDAQ are valued at the NASDAQ Official Closing Price (“NOCP”) and, if no NOCP is available, then at the last reported sales price. If there has been no sale on such day, the securities are valued at the mean of the closing bid and asked prices on such day. If no bid or asked prices are quoted on such day, then the securities are valued using a broker-dealer quote or an approved pricing service. Equity securities traded on more than one national securities exchange are valued at the last sale price on the business day as of which such value is being determined as reflected on the tape at the close of the exchange representing the principal market for such securities.
Readily marketable equity securities traded in the over-the-counter market (“OTC”), including listed securities whose primary market is believed by BIM, or a sub-adviser, as applicable, to be over-the-counter, are valued at the mean of the latest bid and asked prices using a broker-dealer or an approved pricing service.
Shares of open-end investment companies are valued at the latest net asset value (“NAV”) reported by the investment company. Shares of investment companies that are traded intra-day on an exchange, such as exchange traded funds and closed-end funds, will be valued at the last sale price as reflected at the close of the regular trading session of such exchange.
Debt instruments are valued on the basis of prices obtained from a broker-dealer or an approved pricing service.
Foreign securities generally are valued in their national currency at the latest available quoted sale price as of the close of trading on the foreign exchange or other principal market on which the security is traded. In the absence of current trade activity, the securities will be valued at the mean of the latest bid/ask quotations. As described below, this value is then converted into its U.S. dollar equivalent using the daily rate of exchange at the time of a Fund’s NAV calculation (normally 4:00 p.m. Eastern Time).
Forward currency contracts are valued at the mean between the bid and the asked prices. Quotations are available for regularly scheduled settlement dates such as on a 1-,2-,3-,4-,5-,6-,9-, and 12-month basis. Over-the-counter derivatives, such as swaps and non-exchange traded options and futures are valued on the basis of counterparty valuation quotations or dealer quotations, subject to review by BIM, or a sub-adviser with BIM’s oversight where appropriate. An approved pricing service may also be used to price these instruments. Exchange-traded swaps, options and futures contracts and options thereon are valued at their last sale or settlement price as of the close of such exchanges or, if no sales are reported, at the mean between the last reported bid and asked prices. Repurchase agreements are valued at the original cost. Contracts for long puts and calls are valued at the bid price and short puts and calls are valued at the offering price of a broker-dealer or an exchange. Generally, options, rights/warrants and other “when-issued” securities follow the same pricing methods as equity securities.
Securities and other investments for which market quotations are not readily available are valued under the general supervision and responsibility of the Board and pursuant to policies and procedures established by the Board, which are designed to reflect, in good faith, the fair value of such investments. A market quotation is considered not readily available if, among other circumstances, the most recent reported price is deemed unreliable. For example, securities that may be subject to fair valuation include, but are not limited to: (1) securities in which trading has been halted pending further news; (2) illiquid securities in which there is no trading market and no broker coverage; (3) stale priced securities; (4) securities that may have defaulted or de-listed from an exchange and are no longer trading; (5) any other security for which the Funds’ Pricing Committee, with input from the Adviser or sub-advisers, as applicable, believes that the last trading price does not represent a reliable current price; or (6) other investments, including derivatives for which readily available market quotations are not generally available. In addition, a Fund may fair value securities that trade on a foreign exchange because a significant event has occurred after the foreign exchange closes but before the time as of which a Fund’s share price is calculated. Foreign exchanges typically close before the time as of which Fund share prices are calculated, and may be closed altogether on some days a Fund is open. Such significant events affecting a foreign security may include, but are not limited to: (1) those relating to a single issuer; (2) governmental actions that affect securities in one sector or country; (3) natural disasters or armed conflicts affecting a country or
| Old Westbury Funds, Inc. | |
| Notes to Financial Statements - (Continued) | |
| | October 31, 2017 |
| | |
region; or (4) significant market fluctuations. There is no single standard for determining the fair value of a security or investment, but, rather, several factors are considered, including an evaluation of the forces that influence the market in which the security or investment is purchased or sold, in determining whether a market price is readily available and, if not, the security’s or other investment’s fair value.
In light of the judgment involved in fair value decisions, there can be no assurances that a fair value assigned to a particular security reflects a price for which a security has traded or will trade. Accordingly, when a Fund uses fair value to price securities, it may value those securities higher or lower than another fund that uses market quotations to price the same securities.
In the event of a change in the S&P 500 Index that is greater than predetermined levels approved by the Board, the Funds will utilize an approved pricing service that has been designated to determine fair value to price securities traded on any overseas exchange. Pricing Service Vendors base their valuations on a number of factors, including, but not limited to, actual transaction data, benchmark yields, market bids, market offers, quotations from dealers, credit risk spreads, interest rate spreads, proprietary pricing models, cash flows, prepayment information, default rates, delinquency and loss assumptions, collateral characteristics, credit enhancements, specific deal information and other relationships observed in markets of comparable securities. In addition, foreign securities held by a Fund may trade on weekends or other days when the Fund does not calculate NAV. As a result, the market value of these investments may change on days when shares of the Fund cannot be bought or sold. Such fair valuations are categorized as Level 2 in the fair value hierarchy. Foreign securities that are valued based on market quotations are categorized as Level 1 in the fair value hierarchy. The All Cap Core Fund, Large Cap Strategies Fund, Small & Mid Cap Strategies Fund and the Strategic Opportunities Fund utilized a systematic fair valuation model provided by an independent third-party vendor to fair value certain securities 3 days during the year ended October 31, 2017. As a result on days when the index change exceeds predetermined levels, certain securities held by the Funds were transferred from Level 1 into Level 2. On any subsequent day when such index level is not exceeded, certain securities held by the Funds were transferred from Level 2 back into Level 1. As of October 31, 2017, foreign securities were not fair valued as the change in the S&P 500 Index did not exceed the Funds’ predetermined level. There were no other transfers between Level 1 and Level 2 during the year ended October 31, 2017.
The fair value of investments is determined in accordance with the valuation policies and procedures approved by the Board. The Funds’ Pricing Committee established by the Board (the “Pricing Committee”) reviews pricing methodologies on at least a quarterly basis. The Pricing Committee is responsible for (i) establishing valuation processes and (ii) determining the fair value of the Funds’ holdings for which price quotations are not readily available, unreliable or for which an approved valuation method is deemed not to represent fair value. These investments are either categorized as Level 2 or 3 depending on the observability of the inputs used. The Pricing Committee may consider one or more factors in determining an investment’s fair value. The factors to be taken into account, to the extent relevant, typically include, but are not limited to: fundamental analytical data relating to the investment, the nature and duration of any restrictions on disposition of the investments, an evaluation of the forces that influence the market in which the investments are purchased or sold, the type of investment, financial statements and company filings, lack of marketability, the cost at date of purchase, good faith recommendation of BIM or a sub-adviser, as applicable, and any other relevant matters. When the fair valuation of investments use significant unobservable inputs, such investments will be categorized as Level 3 in the fair value hierarchy.
The significant unobservable inputs used in fair value measurement of the Funds’ Level 3 investments may include, where applicable: (i) an estimation of a normalized earnings level or projected cash flows for the company; (ii) the discounts applied to the last available price of the investment or a selection of comparable investments due to the lack of marketability of the investment; (iii) values or bid offers by dealers or other third parties; and (iv) the value associated with the latest round of financing. Significant changes in any of those inputs in isolation may result in a significantly lower or higher fair value measurement. Generally, a change in the assumptions used for the normalized earnings level will be accompanied by a directionally similar change in the discounts applied to the list of comparable investments.
The Funds’ Pricing Committee employs various methods for calibrating the valuation approach related to investments categorized within Level 3 in the fair value hierarchy. These methods may include regular due diligence of the Funds’ pricing vendors including back testing of trigger related fair value prices, a regular review of key inputs and assumptions, reviews of missing and stale prices and price variance analysis, including investigation of unusual or unexpected pricing changes and reviews of any market related activities. Additionally, the pricing of all fair value holdings is subsequently reviewed and approved by the Funds’ Board.
| Old Westbury Funds, Inc. | |
| Notes to Financial Statements - (Continued) | |
| | October 31, 2017 |
| | |
B. Security Transactions and Related Investment Income. Security transactions are accounted for no later than the first NAV calculation on the first business day following the trade date. However, for financial reporting purposes, portfolio securities transactions are reported on trade date. Realized gains and losses on security transactions are determined using the identified cost method for maximum tax benefit to shareholders. Dividend income and other distributions from portfolio securities are recorded on the ex-dividend date, except for certain dividends from foreign securities where the ex-dividend dates may have passed are recorded as soon as the Funds are informed of the dividends. Upon notification from issuers, some of the dividend income received from a real estate investment trust may be redesignated as a reduction of cost of the related investment and/or realized gain. Dividend income is recorded net of foreign taxes withheld where recovery of such taxes is not assured. Interest income is recognized on an accrual basis and includes where applicable, the amortization of premiums and accretion of discounts.
C. Payment-In-Kind Securities. The Funds may invest in payment-in-kind securities (“PIKs”). PIKs give the issuer the option at each interest payment date of making interest payments in either cash or additional debt securities. Those additional debt securities usually have the same terms, including maturity dates and interest rates, and associated risks as the original bonds. The daily market quotations of the original bonds may include the accrued interest (referred to as a dirty price) and require a pro-rata adjustment from the unrealized appreciation or depreciation on investments to interest receivable on the Statements of Assets and Liabilities.
For the year ended October 31, 2017, there were no in-kind payments received by the Funds with respect to PIK securities.
D. Foreign Currency Transactions. The books and records of the Funds are maintained in U.S. dollars. Investments and other assets and liabilities of the Funds denominated in a foreign currency, if any, are translated into U.S. dollars at current exchange rates as of the date of the Statements of Assets and Liabilities. Purchases and sales of securities, income receipts and expense payments are translated into U.S. dollars at the exchange rate on the dates of the transactions.
The Funds do not isolate the portion of operations resulting from changes in foreign exchange rates on investments from fluctuations arising from changes in market prices of securities held. Such fluctuations are included with the net realized and change in unrealized gain/(loss) on investments, securities sold short, futures contracts, swap agreements, written options and foreign currency transactions in the Statements of Operations.
Foreign security and currency transactions may involve certain risks not typically associated with those of U.S. companies, including the level of governmental supervision and regulation of foreign securities markets and the possibility of political and economic instability.
E. Securities Sold Short. The Funds may sell securities short. A short sale is a transaction in which a Fund sells securities it does not own, but has borrowed, in anticipation of a decline in the market price of the securities. A Fund is obligated to replace the borrowed securities at their market price at the time of settlement. A Fund’s obligation to replace the securities borrowed in connection with a short sale will be fully secured by collateral deposited with the broker. Short sales by a Fund involve certain risks and special considerations.
The Funds may not always be able to close out a short position on favorable terms. Short sales involve the risk that a Fund will incur a loss by subsequently buying a security at a higher price than the price at which it sold the security short. The amount of such loss is theoretically unlimited (since it is limited only by the increase in value of the security sold short by a Fund). In contrast, the risk of loss from a long position is limited to a Fund’s investment in the long position, since its value cannot fall below zero. Short selling is a form of leverage which may lead to higher volatility of a Fund’s NAV or greater losses for a Fund. To mitigate leverage risk, a Fund will always hold liquid assets (including its long positions) at least equal to its short position exposure, marked-to-market daily. The Funds had no short sales outstanding at October 31, 2017.
F. Collectibles. The Strategic Opportunities Fund may invest in collectibles, which are rare objects collected by investors. They can include stamps, coins, books, oriental rugs, antiques, sports and other memorabilia, photographs, art and wine. Collectibles are generally expected to rise in value during inflationary periods when investors are trying to move to assets viewed as an inflation hedge. Generally, collectibles can be expected to drop in value during periods of low inflation. Collectible trading for profit is subject to certain risks and other considerations, including that collectibles: (i) have limited buying and selling markets; (ii) are often bought and sold at auction and subject to buyer and/or seller premiums; (iii) experience periods of high and low demand; (iv) must be insured, physically held and properly maintained; (v) may need to have their authenticity and provenance verified from time to time; and (vi) may not have representative market valuations available. The Strategic Opportunities Fund does not currently intend to invest more than 5% of its total assets in collectibles. As of October 31, 2017, the Strategic Opportunities Fund held no collectibles.
| Old Westbury Funds, Inc. | |
| Notes to Financial Statements - (Continued) | |
| | October 31, 2017 |
| | |
G. Commodities. In order to gain exposure to the commodities markets, the Strategic Opportunities Fund, directly or through its Subsidiary, may invest in commodities-related instruments, derivatives and other investments. Commodities are assets that have tangible properties, such as oil, agriculture products and precious metals. The value of commodities may be affected by, among other things, changes in overall market movements, commodity index volatility, changes in interest rates, or factors affecting a particular industry or commodity, such as drought, floods, weather, livestock disease, embargoes, tariffs and international economic, political and regulatory developments. These factors may have a larger impact on commodity prices and commodity-linked instruments than on traditional securities. Certain commodities are also subject to limited pricing flexibility because of supply and demand factors. Others are subject to broad price fluctuations as a result of the volatility of the prices for certain raw materials and the instability of supplies of other materials. These additional variables may create additional risks which subject the Strategic Opportunities Fund and its Subsidiary’s investments to greater volatility than investments in traditional securities.
H. Inflation-Protected Securities. The Funds may invest in inflation-protected securities, which unlike traditional debt securities that make fixed or variable principal and interest payments, are structured to provide protection against the negative effects of inflation. The value of the debt securities’ principal is adjusted to track changes in an official inflation measure. For example, the U.S. Treasury currently uses the Consumer Price Index for Urban Consumers as a measure of inflation for Treasury Inflation-Protected Securities (“TIPS”). Other inflation-protected securities may not carry a similar guarantee by their issuer. A Fund may buy TIPS that are designed to provide an investment vehicle that is not vulnerable to inflation. The interest rate paid by TIPS is fixed. The principal value rises or falls semi-annually based on the changes in the published Consumer Price Index. If inflation occurs, the principal and interest payments on TIPS are adjusted to protect investors from inflationary loss. If deflation occurs, the principal and interest payments will be adjusted downward, although the principal will not fall below its face amount at maturity.
I. When-Issued and Delayed Delivery Securities. The Funds may purchase or sell securities that they are entitled to receive on a when-issued basis. The Funds may also purchase or sell securities on a delayed delivery basis. When-issued and delayed delivery securities involve risk that the security a Fund buys will lose value prior to its delivery. There is also a risk that the security will not be issued or that the other party to the transaction will not meet its obligation. If this occurs, a Fund loses both the investment opportunity for the assets it set aside to pay for the security and any gain in the security’s price.
J. Loan Participations and Assignments. The Strategic Opportunities Fund and Fixed Income Fund may invest in fixed or floating rate loans to U.S. companies, foreign entities, and U.S. subsidiaries of foreign entities made by one or more financial institutions. The rate of interest on a fixed-rate loan is generally a set amount. The rate of interest payable on floating rate loans is the sum of a base lending rate plus a specified spread. Base lending rates are generally the London InterBank Offered Rate, the Certificate of Deposit Rate of a designated U.S. bank, the prime rate of a designated U.S. bank, the Federal Funds rate, or another base lending rate used by commercial lenders. The applicable spread may be fixed at time of issuance or may adjust upward or downward to reflect changes in credit quality of the borrower. A Fund may invest in loans that are investment grade, below investment grade (“junk”), or not rated by any nationally recognized statistical ratings organization. Loans that are rated lower than investment grade typically entail default and other risks greater than those associated with higher-rated loans. Generally, the lower the rating category, the riskier the investment. Typically, a Fund’s investments in loans are expected to take the form of loan participations and assignments of portions of loans from third parties.
Currently, the Strategic Opportunities Fund intends to invest in loans that are below investment grade and, to a lesser extent, unrated loans. The Strategic Opportunities Fund’s investments in loans are expected in most instances to be in the form of assignments. Generally, when a Fund purchases an assignment of a loan from a lender, it will step into the position of the lender and acquire direct rights against the borrower on the loan. Because assignments are arranged through private negotiations between potential assignees and potential assignors, however, the rights and obligations acquired by a Fund as the purchaser of an assignment may differ from, and be more limited than, those held by the assigning lender. The assignability of certain obligations may be restricted by the governing documentation as to the nature of the assignee such that the only way in which a Fund may acquire an interest in a loan is by purchasing a participation of interest and not an assignment. A Fund may have difficulty disposing of assignments and participation interests given these limitations and other factors.
K. Credit Enhancements. Certain obligations held by the Funds have credit enhancement or liquidity features that may, under certain circumstances, provide for repayment of principal and interest on the obligation upon demand date, interest rate reset date or final maturity. These enhancements may include: letters of credit; liquidity guarantees; and third party insurance (i.e., AMBAC and FGIC). The value of the obligations may be affected by changes in credit worthiness of the entities that provide any supporting letters of credit or other credit enhancements. The value of the obligations also will be affected by the exhaustion, termination or expiration of any credit enhancement.
| Old Westbury Funds, Inc. | |
| Notes to Financial Statements - (Continued) | |
| | October 31, 2017 |
| | |
L. Restricted and Illiquid Securities. The Funds may purchase securities which are subject to legal or contractual delays, restrictions, and costs on resale. Because of time limitations, the Funds might not be able to dispose of these securities at reasonable prices or at times advantageous to the Funds. Each Fund intends to limit the purchase of securities which have not been determined by BIM to be liquid, together with other securities considered to be illiquid, including repurchase agreements providing for settlement in more than seven days after notice, to not more than 15% of its net assets.
M. Distributions to Shareholders. Distributions from net investment income, if any, generally are declared and paid quarterly for the Fixed Income Fund and Municipal Bond Fund and at least annually for the All Cap Core Fund, Large Cap Strategies Fund, Small & Mid Cap Strategies Fund and Strategic Opportunities Fund. Distributable net realized capital gains, if any, are declared and distributed at least annually. The amount and timing of dividends and distributions are determined in accordance with federal income tax regulations, which may differ from U.S. GAAP.
N. Expenses. Expenses that are directly related to one of the Funds are charged directly to that Fund on an accrual basis. Other operating expenses of the Corporation are prorated to each Fund on an accrual basis utilizing relative net assets or another reasonable basis.
| 4. | Market and Credit Risk: |
In the normal course of business, the Funds invest in securities and enter into transactions where risks exist due to fluctuations in the market (market risk) or failure of the issuer of a security to meet all its obligations (credit risk). The value of securities held by a Fund may decline in response to certain events, including those directly involving the issuers whose securities are owned by the Fund; changes or perceived changes in economic conditions; overall market changes; local, regional or global political, social or economic events or instability; and currency and interest rate and price fluctuations. Since 2008, the U.S. government has implemented various measures designed to stabilize the U.S. economy and support U.S. economic recovery, including by keeping the federal funds rate at or near zero percent and purchasing large quantities of securities issued or guaranteed by the U.S. government or its agencies and instrumentalities on the open market (“quantitative easing”). The Board of Governors of the Federal Reserve System has recently ended this quantitative easing and, to the extent it raises the federal funds rate, there is a risk that interest rates across the U.S. financial markets will rise suddenly and significantly, thereby exposing fixed income and related markets to heightened volatility and reduced liquidity. Such market events may cause a Fund to experience losses and/or high redemption requests, which may result in increased transactions costs and lower a Fund’s performance. Exposure to foreign markets through issuers or currencies can involve additional risks relating to market, economic, political, regulatory, geopolitical, or other conditions. In addition, the securities of foreign companies also may be subject to the imposition of economic sanctions or other government restrictions. The risks of foreign investments are increased in emerging markets which may experience hyperinflation and have far lower trading volumes and less liquidity than developed markets. Changes in foreign currency exchange rates can affect the value of a Fund’s portfolio. Depositary receipts are generally subject to the same risks as the foreign securities that they evidence or into which they may be converted. Similar to credit risk, a Fund may be exposed to counterparty risk, or the risk that an entity with which the Fund has unsettled or open transactions may default. Financial assets, which potentially expose a Fund to credit and counterparty risks, consist principally of investments, receivables for securities sold and cash due from brokers. The Funds’ Adviser and sub-advisers, as applicable, review the creditworthiness of counterparties that they believe entail material credit risk in relation to the investment policies of a Fund. The extent of a Fund’s exposure to credit and counterparty risks with respect to these financial assets is generally represented by their values recorded in the Fund’s Statements of Assets and Liabilities.
| 5. | Fair Value Measurements: |
The inputs and valuation techniques used to measure fair value of the Funds’ investments are summarized into three levels as described in the hierarchy below:
• Level 1 - quoted prices generally in active markets for identical securities.
• Level 2 - other significant observable inputs (including quoted prices for similar securities, interest rates, prepayment speeds, credit ratings, etc.).
• Level 3 - significant unobservable inputs (including the Funds’ own assumptions in determining the fair value of investments).
The inputs or methodology used for valuing securities are not necessarily an indication of the risk associated with investing in those securities.
| Old Westbury Funds, Inc. |
| Notes to Financial Statements - (Continued) |
| October 31, 2017 |
| |
The summary of inputs used to value the Funds’ investments as of October 31, 2017 is as follows:
| | | Level 1
Quoted Prices | | | Level 2
Significant
Observable
Inputs | | | Level 3
Significant
Unobservable
Inputs(c) | | Total | |
| All Cap Core Fund | | | | | | | | | | | | | | | | | |
| Equity Securities(b) | | $ | 1,713,225,097(a | ) | | $ | — | | | | $ | — | | | $ | 1,713,225,097 | |
| Investment Company | | | 60,598,377 | | | | — | | | | | — | | | | 60,598,377 | |
| Total | | $ | 1,773,823,474 | | | $ | — | | | | $ | — | | | $ | 1,773,823,474 | |
| Large Cap Strategies Fund | | | | | | | | | | | | | | | | | |
| Equity Securities(b) | | $ | 15,238,755,867(a | ) | | $ | 101,736,440(d | ) | | | $ | 10,943(e | ) | | $ | 15,340,503,250 | |
| Master Limited Partnerships | | | 968,347(a | ) | | | — | | | | | — | | | | 968,347 | |
| Preferred Stocks | | | 181,212,057 | | | | — | | | | | — | | | | 181,212,057 | |
| Exchange Traded Funds | | | 633,640,284(a | ) | | | — | | | | | — | | | | 633,640,284 | |
| U.S. Government Agencies | | | — | | | | 864,505,297 | | | | | — | | | | 864,505,297 | |
| Investment Company | | | 225,875,865 | | | | — | | | | | — | | | | 225,875,865 | |
| Total | | $ | 16,280,452,420 | | | $ | 966,241,737 | | | | $ | 10,943 | | | $ | 17,246,705,100 | |
| | | | | | | | | | | | | | | | | | |
| Small & Mid Cap Strategies Fund | | | | | | | | | | | | | | | | | |
| Equity Securities(b) | | | | | | | | | | | | | | | | | |
| Argentina | | $ | 852,860 | | | $ | — | | | | $ | — | | | $ | 852,860 | |
| Australia | | | 109,815,117 | | | | 94,822 | | | | | 56,679 | | | | 109,966,618 | |
| Austria | | | 12,812,250 | | | | — | | | | | — | | | | 12,812,250 | |
| Belgium | | | 23,906,321 | | | | — | | | | | — | | | | 23,906,321 | |
| Bermuda | | | 51,277,467 | | | | — | | | | | — | | | | 51,277,467 | |
| Brazil | | | 30,597,901 | | | | — | | | | | 40,547 | | | | 30,638,448 | |
| Cambodia | | | 258,415 | | | | — | | | | | — | | | | 258,415 | |
| Canada | | | 159,758,566 | | | | 11 | | | | | — | | | | 159,758,577 | |
| Cayman Islands | | | 1,017,744 | | | | — | | | | | — | | | | 1,017,744 | |
| Chile | | | 7,285,558 | | | | — | | | | | — | | | | 7,285,558 | |
| China | | | 89,408,810 | | | | 9,769,831 | | | | | 331,762 | | | | 99,510,403 | |
| Cyprus | | | 169,406 | | | | — | | | | | — | | | | 169,406 | |
| Denmark | | | 28,217,583 | | | | — | | | | | — | | | | 28,217,583 | |
| Faeroe Islands | | | 346,481 | | | | — | | | | | — | | | | 346,481 | |
| Finland | | | 27,797,313 | | | | — | | | | | 1,085 | | | | 27,798,398 | |
| France | | | 127,008,993 | | | | — | | | | | — | | | | 127,008,993 | |
| Gabon | | | 11,791 | | | | — | | | | | — | | | | 11,791 | |
| Georgia | | | 251,398 | | | | — | | | | | — | | | | 251,398 | |
| Germany | | | 172,650,406 | | | | — | | | | | — | | | | 172,650,406 | |
| Gibraltar | | | 77,847 | | | | — | | | | | — | | | | 77,847 | |
| Greece | | | 2,906,356 | | | | — | | | | | — | | | | 2,906,356 | |
| Hong Kong | | | 78,841,459 | | | | — | | | | | 600,050 | | | | 79,441,509 | |
| Hungary | | | 373,437 | | | | — | | | | | — | | | | 373,437 | |
| India | | | 50,091,026 | | | | — | | | | | 97,925 | | | | 50,188,951 | |
| Indonesia | | | 8,399,616 | | | | — | | | | | 40,003 | | | | 8,439,619 | |
| Ireland | | | 95,113,759 | | | | — | | | | | — | | | | 95,113,759 | |
| Isle of Man | | | 1,042,246 | | | | — | | | | | — | | | | 1,042,246 | |
| Israel | | | 80,746,167 | | | | — | | | | | — | | | | 80,746,167 | |
| Italy | | | 39,536,797 | | | | — | | | | | — | | | | 39,536,797 | |
| Japan | | | 339,876,997 | | | | — | | | | | — | | | | 339,876,997 | |
| Jersey Channel Islands | | | 2,111,923 | | | | — | | | | | — | | | | 2,111,923 | |
| Jordan | | | 456,708 | | | | — | | | | | — | | | | 456,708 | |
| Liechtenstein | | | 119,786 | | | | — | | | | | — | | | | 119,786 | |
| Old Westbury Funds, Inc. |
| Notes to Financial Statements - (Continued) |
| October 31, 2017 |
| |
| | | Level 1
Quoted Prices | | Level 2
Significant
Observable
Inputs | | Level 3
Significant
Unobservable
Inputs(c) | | Total |
| Luxembourg | | | $ | 17,948,417 | | | | $ | — | | | | $ | — | | | | $ | 17,948,417 | |
| Macau | | | | 15,863 | | | | | — | | | | | — | | | | | 15,863 | |
| Malaysia | | | | 11,248,907 | | | | | — | | | | | 49,485 | | | | | 11,298,392 | |
| Malta | | | | 691,163 | | | | | — | | | | | — | | | | | 691,163 | |
| Mexico | | | | 10,269,172 | | | | | 57,910 | | | | | — | | | | | 10,327,082 | |
| Monaco | | | | 239,972 | | | | | — | | | | | — | | | | | 239,972 | |
| Netherlands | | | | 43,210,252 | | | | | — | | | | | — | | | | | 43,210,252 | |
| New Zealand | | | | 41,053,792 | | | | | — | | | | | — | | | | | 41,053,792 | |
| Norway | | | | 9,922,352 | | | | | — | | | | | — | | | | | 9,922,352 | |
| Panama | | | | 103,603 | | | | | — | | | | | — | | | | | 103,603 | |
| Peru | | | | 749,055 | | | | | — | | | | | — | | | | | 749,055 | |
| Philippines | | | | 3,933,311 | | | | | — | | | | | — | | | | | 3,933,311 | |
| Poland | | | | 10,140,017 | | | | | — | | | | | — | | | | | 10,140,017 | |
| Portugal | | | | 2,364,843 | | | | | — | | | | | — | | | | | 2,364,843 | |
| Puerto Rico | | | | 1,300,500 | | | | | — | | | | | — | | | | | 1,300,500 | |
| Romania | | | | 192,183 | | | | | — | | | | | — | | | | | 192,183 | |
| Russia | | | | 4,822,033 | | | | | — | | | | | — | | | | | 4,822,033 | |
| Singapore | | | | 52,132,700 | | | | | — | | | | | 40,863 | | | | | 52,173,563 | |
| South Africa | | | | 20,614,347 | | | | | — | | | | | — | | | | | 20,614,347 | |
| South Korea | | | | 58,651,841 | | | | | — | | | | | 222,566 | | | | | 58,874,407 | |
| Spain | | | | 24,871,882 | | | | | — | | | | | — | | | | | 24,871,882 | |
| Sweden | | | | 58,928,672 | | | | | — | | | | | — | | | | | 58,928,672 | |
| Switzerland | | | | 81,580,696 | | | | | — | | | | | — | | | | | 81,580,696 | |
| Taiwan | | | | 81,064,870 | | | | | — | | | | | 45,230 | | | | | 81,110,100 | |
| Thailand | | | | 17,066 | | | | | 11,728,459 | | | | | 13,343 | | | | | 11,758,868 | |
| Turkey | | | | 8,727,426 | | | | | — | | | | | — | | | | | 8,727,426 | |
| United Kingdom | | | | 332,218,938 | | | | | — | | | | | 714 | | | | | 332,219,652 | |
| United States | | | | 3,502,480,442 | | | | | 348,930 | | | | | — | | | | | 3,502,829,372 | |
| Total Equities | | | $ | 5,922,632,819 | | | | $ | 21,999,963 | | | | $ | 1,540,252 | | | | $ | 5,946,173,034 | |
| Exchange Traded Funds | | | | 203,762,134 | | | | | — | | | | | — | | | | | 203,762,134 | |
| Investment Company | | | | 30,936,229 | | | | | — | | | | | — | | | | | 30,936,229 | |
| Rights/Warrants | | | | | | | | | | | | | | | | | | | | |
| Australia | | | | 2,149 | | | | | — | | | | | — | | | | | 2,149 | |
| Brazil | | | | 1,507 | | | | | — | | | | | — | | | | | 1,507 | |
| Chile | | | | 8,655 | | | | | — | | | | | — | | | | | 8,655 | |
| France | | | | — | | | | | — | | | | | 1,600 | | | | | 1,600 | |
| India | | | | — | | | | | 3,484 | | | | | — | | | | | 3,484 | |
| Malaysia | | | | 5,711 | | | | | — | | | | | — | | | | | 5,711 | |
| South Korea | | | | — | | | | | 31,989 | | | | | — | | | | | 31,989 | |
| Spain | | | | 60,147 | | | | | — | | | | | — | | | | | 60,147 | |
| Taiwan | | | | — | | | | | 10,023 | | | | | — | | | | | 10,023 | |
| Thailand | | | | — | | | | | 38,431 | | | | | — | | | | | 38,431 | |
| Total Rights/Warrants | | | $ | 78,169 | | | | $ | 83,927 | | | | $ | 1,600 | | | | $ | 163,696 | |
| U.S. Government Agencies | | | | — | | | | | 230,872,666 | | | | | — | | | | | 230,872,666 | |
| U.S. Government Securities | | | | — | | | | | 29,999,234 | | | | | — | | | | | 29,999,234 | |
| Cash Sweep | | | | 99,156,152 | | | | | — | | | | | — | | | | | 99,156,152 | |
| Old Westbury Funds, Inc. |
| Notes to Financial Statements - (Continued) |
| October 31, 2017 |
| |
| | | Level 1
Quoted Prices | | Level 2
Significant
Observable
Inputs | | Level 3
Significant
Unobservable
Inputs(c) | | Total |
| Other financial instruments - Assets* | | | | | | | | | | | | | | | | | | | | |
| Foreign currency exchange contracts | | | $ | — | | | | $ | 354,673 | | | | $ | — | | | | $ | 354,673 | |
| Total | | | $ | 6,256,565,503 | | | | $ | 283,310,463 | | | | $ | 1,541,852 | | | | $ | 6,541,417,818 | |
| Strategic Opportunities Fund | | | | | | | | | | | | | | | | | | | | |
| Equity Securities(b) | | | | | | | | | | | | | | | | | | | | |
| Belgium | | | $ | 1,239,483 | | | | $ | — | | | | $ | — | | | | $ | 1,239,483 | |
| Bermuda | | | | 25,287,970 | | | | | — | | | | | — | | | | | 25,287,970 | |
| Brazil | | | | 2,334,950 | | | | | — | | | | | — | | | | | 2,334,950 | |
| Canada | | | | 1,513,114 | | | | | — | | | | | — | | | | | 1,513,114 | |
| China | | | | 12,152,239 | | | | | — | | | | | — | | | | | 12,152,239 | |
| Denmark | | | | 2,290,875 | | | | | — | | | | | — | | | | | 2,290,875 | |
| Egypt | | | | 1,535,772 | | | | | — | | | | | — | | | | | 1,535,772 | |
| France | | | | 3,789,875 | | | | | — | | | | | — | | | | | 3,789,875 | |
| Germany | | | | 9,959,435 | | | | | — | | | | | — | | | | | 9,959,435 | |
| Hong Kong | | | | 12,595,557 | | | | | — | | | | | 44,164 | | | | | 12,639,721 | |
| Indonesia | | | | 2,757,943 | | | | | — | | | | | — | | | | | 2,757,943 | |
| Israel | | | | 1,748,179 | | | | | — | | | | | — | | | | | 1,748,179 | |
| Japan | | | | 42,251,559 | | | | | — | | | | | — | | | | | 42,251,559 | |
| Luxembourg | | | | 2,251,571 | | | | | — | | | | | — | | | | | 2,251,571 | |
| Malaysia | | | | 1,335,534 | | | | | — | | | | | — | | | | | 1,335,534 | |
| Morocco and Antilles | | | | 3,075,501 | | | | | — | | | | | — | | | | | 3,075,501 | |
| Netherlands | | | | 6,303,066 | | | | | — | | | | | — | | | | | 6,303,066 | |
| Pakistan | | | | 2,028,294 | | | | | — | | | | | — | | | | | 2,028,294 | |
| Qatar | | | | 2,412,513 | | | | | — | | | | | — | | | | | 2,412,513 | |
| South Africa | | | | 1,379,509 | | | | | — | | | | | — | | | | | 1,379,509 | |
| South Korea | | | | 7,430,607 | | | | | — | | | | | — | | | | | 7,430,607 | |
| Switzerland | | | | 5,519,637 | | | | | — | | | | | — | | | | | 5,519,637 | |
| Taiwan | | | | 42,357,442 | | | | | — | | | | | — | | | | | 42,357,442 | |
| United Arab Emirates | | | | 2,155,871 | | | | | — | | | | | — | | | | | 2,155,871 | |
| United Kingdom | | | | 4,480,753 | | | | | — | | | | | — | | | | | 4,480,753 | |
| United States | | | | 335,134,209 | | | | | — | | | | | 258,750 | | | | | 335,392,959 | |
| Total Equities | | | $ | 535,321,458 | | | | $ | — | | | | $ | 302,914 | | | | $ | 535,624,372 | |
| Closed-End Funds | | | | 221,355,967(a | ) | | | | — | | | | | — | | | | | 221,355,967 | |
| Exchange Traded Funds | | | | 852,141,647(a | ) | | | | — | | | | | — | | | | | 852,141,647 | |
| Preferred Stocks | | | | 5,277,250(a | ) | | | | — | | | | | — | | | | | 5,277,250 | |
| Bank Loans | | | | — | | | | | 68,138,892(a | ) | | | | — | | | | | 68,138,892 | |
| Rights/Warrants | | | | 43,265 | | | | | — | | | | | — | | | | | 43,265 | |
| Corporate Bonds | | | | — | | | | | 558,385,773(a | ) | | | | — | | | | | 558,385,773 | |
| Asset-Backed Securities | | | | — | | | | | 827,258,531(a | ) | | | | — | | | | | 827,258,531 | |
| Non-Agency Mortgage-Backed Securities | | | | — | | | | | 508,235,087(a | ) | | | | — | | | | | 508,235,087 | |
| U.S. Government Sponsored Agency Mortgage-Backed Securities | | | | — | | | | | 38,605,553 | | | | | — | | | | | 38,605,553 | |
| U.S. Government Agencies | | | | — | | | | | 1,565,565,896 | | | | | — | | | | | 1,565,565,896 | |
| U.S. Government Securities | | | | — | | | | | 224,675,252 | | | | | — | | | | | 224,675,252 | |
| Cash Sweep | | | | 133,881,469 | | | | | — | | | | | — | | | | | 133,881,469 | |
| Other financial instruments - Assets* | | | | | | | | | | | | | | | | | | | | |
| Equity contracts | | | | — | | | | | 152,479,197 | | | | | — | | | | | 152,479,197 | |
| Interest rate contracts | | | | 7,802 | | | | | 247,044 | | | | | — | | | | | 254,846 | |
| Foreign currency exchange contracts | | | | 1,875,000 | | | | | 5,938,988 | | | | | — | | | | | 7,813,988 | |
| Old Westbury Funds, Inc. |
| Notes to Financial Statements - (Continued) |
| October 31, 2017 |
| |
| | | Level 1
Quoted Prices | | Level 2
Significant
Observable
Inputs | | Level 3
Significant
Unobservable
Inputs(c) | | Total |
| Other financial instruments - Liabilities* | | | | | | | | | | | | | | | | | | | | |
| Equity contracts | | | $ | (1,171,282 | ) | | | $ | (14,973,904 | ) | | | $ | — | | | | $ | (16,145,186 | ) |
| Interest rate contracts | | | | (4,499,657 | ) | | | | (1,017,731 | ) | | | | — | | | | | (5,517,388 | ) |
| Foreign currency exchange contracts | | | | (600,000 | ) | | | | (13,130,141 | ) | | | | — | | | | | (13,730,141 | ) |
| Total | | | $ | 1,743,632,919 | | | | $ | 3,920,408,437 | | | | $ | 302,914 | | | | $ | 5,664,344,270 | |
| Fixed Income Fund | | | | | | | | | | | | | | | | | | | | |
| Corporate Bonds | | | $ | — | | | | $ | 270,827,831(a | ) | | | $ | — | | | | $ | 270,827,831 | |
| Asset-Backed Securities | | | | — | | | | | 69,031,922(a | ) | | | | — | | | | | 69,031,922 | |
| Collateralized Mortgage Obligations | | | | — | | | | | 1,372,236(a | ) | | | | — | | | | | 1,372,236 | |
| U.S. Government Agencies | | | | — | | | | | 42,385,072 | | | | | — | | | | | 42,385,072 | |
| U.S. Government Securities | | | | — | | | | | 431,133,421 | | | | | — | | | | | 431,133,421 | |
| Government Bonds | | | | — | | | | | 3,010,150(a | ) | | | | — | | | | | 3,010,150 | |
| Investment Company | | | | 4,796,537 | | | | | — | | | | | — | | | | | 4,796,537 | |
| Total | | | $ | 4,796,537 | | | | $ | 817,760,632 | | | | $ | — | | | | | 822,557,169 | |
| Municipal Bond Fund | | | | | | | | | | | | | | | | | | | | |
| Municipal Bonds | | | $ | — | | | | $ | 1,933,116,982(a | ) | | | $ | — | | | | $ | 1,933,116,982 | |
| U.S. Government Securities | | | | — | | | | | 277,693,829 | | | | | — | | | | | 277,693,829 | |
| Investment Company | | | | 5,837,878 | | | | | — | | | | | — | | | | | 5,837,878 | |
| Total | | | $ | 5,837,878 | | | | $ | 2,210,810,811 | | | | $ | — | | | | $ | 2,216,648,689 | |
| (a) | The breakdown of the Fund’s investments into major categories or countries is disclosed in the respective Fund’s Portfolio of Investments and in footnote 6 for derivatives. |
| (b) | At October 31, 2017, the change in the S&P 500 Index did not exceed the Funds’ predetermined level (see footnote 3.A) and no transfers between levels occurred for the Funds for this reason. Certain Investments for reasons other than exceeding the predetermined level for the Small & Mid Cap Strategies Fund were transferred from Level 2 into Level 1 in the amount of $85,875 and from Level 1 into Level 2 in the amount of $58,985. |
| (c) | The Large Cap Strategies Fund, The Small & Mid Cap Strategies Fund and Strategic Opportunities Fund held certain investments categorized as Level 3 that had a combined fair value less than 1% of NAV for the respective Fund for the period ended October 31, 2017. |
| | There were transfers into Level 3 of $3,511,876 and out of Level 3 in the amount of $162,586 for the Small & Mid Cap Strategies Fund. In addition, there were no significant purchases and sales during the period. As of October 31, 2017, the percentage of NAV was 0.02% and 0.01% for the Small & Mid Cap Strategies Fund and Strategic Opportunities Fund, respectively. The Funds’ instrument types classified as Level 3 investments have no significant unobservable inputs to disclose, as they are generally valued using last trade price or broker quote. |
| (d) | Represents securities as disclosed in the Russia, Thailand, United Kingdom and Rights/warrants sections of the Fund’s Portfolio of Investments. |
| (e) | Represents securities in the South Korea section of the Fund’s portfolio of investments. |
* Other financial instruments are exchange traded options and futures (Level 1), over-the-counter options (Level 2), forwards (Level 2) and swaps (Level 2). Futures, forwards and swaps are valued at the unrealized appreciation/(depreciation) on the instrument and options are shown at market value.
The Funds’ policy is to recognize transfers in and transfers out as of the beginning of the period.
| Old Westbury Funds, Inc. |
| Notes to Financial Statements - (Continued) |
| October 31, 2017 |
| |
| 6. | Derivative Instruments: |
The Funds engage in various portfolio investment strategies utilizing derivatives both to increase the return of the Funds and/or to economically hedge, or protect, their exposure to, for example, interest rate movements, movements in the securities or commodities markets and currency value fluctuations. Derivatives are subject to a number of risks, including changes in the market price of the underlying securities, credit risk with respect to the counterparty to the derivative instruments and the risk of loss due to changes in interest rates. The use of certain derivatives may also have a leveraging effect, which may increase the Fund’s sensitivity to adverse market movements and may exaggerate a loss. Losses may arise if the value of the contract decreases due to, among other potentially adverse events, an unfavorable change in the price of the underlying security or commodity or if the counterparty does not perform under the contract. The use of derivatives can lead to losses because of relatively small adverse movements in the price or value of the underlying security, asset, index or reference rate, which may be magnified by or potentially unlimited as a result of certain features of the derivatives.
The primary difference in risks associated with over-the-counter contracts and exchange-traded contracts is credit and liquidity risks. Over-the-counter contracts, as bilateral arrangements, contain credit risk from various counterparties for any unrealized gains for the duration of the contract. The credit risk related to exchange-traded contracts is minimal because the exchanges ensure that their contracts are always honored. The Funds may mitigate counterparty risk on derivatives through master netting agreements included within an International Swaps and Derivatives Association, Inc. (“ISDA”) Master Agreement between a Fund and each of its counterparties. The ISDA Master Agreement allows each Fund to offset with its counterparty certain derivative financial instruments’ payables and/or receivables with collateral held with each counterparty. The amount of collateral moved to/from applicable counterparties is based upon minimum transfer amounts of up to $250,000. To the extent amounts due to the Funds from their counterparties are not fully collateralized contractually or otherwise, the Funds bear the risk of loss from counterparty non-performance.
The Funds’ maximum risk of loss from counterparty credit risk on over-the-counter derivatives is generally the aggregate net unrealized gain in excess of any collateral pledged by the counterparty to the Funds. For over-the-counter purchased options, the Funds bear the risk of loss in the amount of the premiums paid and positive change in market value of the options should the counterparty not perform under the contracts. Written options by the Funds do not give rise to counterparty credit risk, as written options obligate the Funds to perform and not the counterparty. Certain ISDA Master Agreements allow counterparties to over-the-counter derivatives to terminate or require full collateralization of derivative contracts prior to maturity in the event a Fund’s net assets decline by a stated percentage or a Fund fails to meet the terms of its ISDA Master Agreements, which would cause the Funds to post additional collateral or accelerate payment of any net liability owed to the counterparty. There were no trigger events during the year ended October 31, 2017.
Cash collateral that has been pledged to cover obligations of a Fund and cash collateral received from the counterparty, if any, is reported separately on the Statements of Assets and Liabilities as due from brokers for collateral and payable to brokers for collateral, respectively. Non-cash collateral pledged by the Fund, if any, is noted in the Portfolio of Investments.
When counterparties post cash collateral with respect to various derivative transactions, a Fund may invest the collateral and receives interest income on the investment and pays interest expense on the collateral to the counterparty. The interest income is included in investment income on the Statements of Operations, and the interest expense is included in a Fund’s overall expenses on the Statements of Operations and expense ratio in the Financial Highlights.
| Old Westbury Funds, Inc. |
| Notes to Financial Statements - (Continued) |
| October 31, 2017 |
| |
As of October 31, 2017, the Funds had transactions subject to enforceable master netting arrangements (“MNA”). For reporting purposes, the Funds do not offset derivative assets and derivative liabilities that are subject to netting arrangements or another similar arrangement in the Statements of Assets and Liabilities. A reconciliation of the gross amounts on the Statements of Assets and Liabilities to the net amounts by counterparty, including any collateral exposure, is included in the following tables:
Small & Mid Cap Strategies Fund
| Counterparty | | Gross Amounts of
Assets
Presented
in the Statement
of Assets and
Liabilities | | Derivatives
Available for
Offset (b) | | Non-Cash
Collateral
Received (c) | | Cash
Collateral
Received (c) | | Net
Amount of
Derivative
Assets (e) | |
| | | | | | | | | | | | |
| Citibank N.A. | | | $ | 354,673 | | | | | $— | | | | | $— | | | | | $— | | | | $ | 354,673 | | |
| Total | | | $ | 354,673 | | | | | | | | | | | | | | | | | | | | | | |
| | | | | | | | | | | | | | | | | | | | | | | | | | | |
| Strategic Opportunities Fund | | | | | | | | | | | |
| Counterparty | | Gross Amounts of
Assets
Presented
in the Statement
of Assets and
Liabilities | | Derivatives
Available for
Offset (b) | | Non-Cash
Collateral
Received (c) | | Cash
Collateral
Received (c) | | Net
Amount of
Derivative
Assets (e) | |
| | | | | | | | | | | | |
| Barclays Bank Plc | | | $ | 27,872,809 | | | | $ | (3,478,958 | ) | | | $ | — | | | | $ | (24,393,851 | ) | | | $ | — | | |
| Bank of America N.A. | | | | 16,720,120 | | | | | (253,630 | ) | | | | (16,466,490 | ) | | | | — | | | | | — | | |
| Bank of New York Mellon Corp. | | | | 302,544 | | | | | (302,544 | ) | | | | — | | | | | — | | | | | — | | |
| BNP Paribas SA | | | | 20,351,733 | | | | | (4,602,757 | ) | | | | (15,748,976 | ) | | | | — | | | | | — | | |
| Citibank N.A. | | | | 19,666,942 | | | | | — | | | | | — | | | | | (19,434,297 | ) | | | | 232,645 | | |
| Credit Suisse International | | | | 12,023,785 | | | | | — | | | | | — | | | | | (11,760,000 | ) | | | | 263,785 | | |
| Goldman Sachs International | | | | 15,069,925 | | | | | (2,943,478 | ) | | | | — | | | | | (12,126,447 | ) | | | | — | | |
| JPMorgan Chase Bank, N.A. | | | | 31,991,105 | | | | | (8,741,188 | ) | | | | (23,249,917 | ) | | | | — | | | | | — | | |
| Societe Generale | | | | 12,546,194 | | | | | (5,712,340 | ) | | | | — | | | | | (6,750,000 | ) | | | | 83,854 | | |
| UBS AG | | | | 2,120,072 | | | | | (2,120,072 | ) | | | | — | | | | | — | | | | | — | | |
| Derivatives not subject to a MNA or similar agreement (a) | | | | 1,875,000 | | | | | — | | | | | — | | | | | — | | | | | 1,875,000 | | |
| Total | | | $ | 160,540,229 | | | | | | | | | | | | | | | | | | | | | | |
| Old Westbury Funds, Inc. |
| Notes to Financial Statements - (Continued) |
| October 31, 2017 |
| |
Strategic Opportunities Fund
| Counterparty | | Gross Amounts
of Liabilities
Presented
in the Statement
of Assets and
Liabilities | | Derivatives
Available for
Offset (b) | | Non-Cash
Collateral
Pledged (c) | | Cash
Collateral
Pledged (c) | | Net
Amount of
Derivative
Liabilities (d) | |
| | | | | | | | | | | | | | | | | | | | | | |
| Barclays Bank Plc | | | $ | 3,478,958 | | | | $ | (3,478,958 | ) | | | | $— | | | | $ | — | | | | $ | — | | |
| Bank of America N.A. | | | | 253,630 | | | | | (253,630 | ) | | | | — | | | | | — | | | | | — | | |
| Bank of New York Mellon Corp. | | | | 441,452 | | | | | (302,544 | ) | | | | — | | | | | (138,908 | ) | | | | — | | |
| BNP Paribas SA | | | | 4,602,757 | | | | | (4,602,757 | ) | | | | — | | | | | — | | | | | — | | |
| Goldman Sachs Group, Inc. | | | | 2,943,478 | | | | | (2,943,478 | ) | | | | — | | | | | — | | | | | — | | |
| JPMorgan Chase Bank, N.A. | | | | 8,741,188 | | | | | (8,741,188 | ) | | | | — | | | | | — | | | | | — | | |
| Societe Generale | | | | 5,712,340 | | | | | (5,712,340 | ) | | | | — | | | | | — | | | | | — | | |
| UBS AG | | | | 2,947,973 | | | | | (2,120,072 | ) | | | | — | | | | | (827,901 | ) | | | | — | | |
| Derivatives not subject to a MNA or similar agreement (a) | | | | 1,293,670 | | | | | — | | | | | — | | | | | — | | | | | 1,293,670 | | |
| Total | | | $ | 30,415,446 | | | | | | | | | | | | | | | | | | | | | | |
| | |
| (a) | Includes financial instruments (futures, centrally cleared options and/or forward currency contracts) which are not subject to a MNA, or another similar arrangement. |
| | |
| (b) | The amount of derivatives available for offset is limited to the amount of assets and/or liabilities that are subject to a MNA. or another similar arrangement. |
| | |
| (c) | Excess of collateral received from/payable to the individual counterparty is not shown for financial reporting purposes. |
| | |
| (d) | Represents the net amount payable to counterparty in the event of default. |
| | |
| (e) | Represents the net amount receivable from counterparty in the event of default. |
The Funds are subject to, among other risks, interest rate risk, equity price risk, commodity risk and foreign currency exchange risk in the normal course of pursuing their investment objectives by investing in various derivative financial instruments, as described below.
| Old Westbury Funds, Inc. |
| Notes to Financial Statements - (Continued) |
| October 31, 2017 |
| |
For open derivative instruments, please see the respective Fund’s Portfolio of Investments or details below:
| | | Fair Values of Derivative Instruments as of October 31, 2017 | | | |
| | | Derivative Assets | | | Derivative Liabilities | |
| Small & Mid Cap Strategies Fund | | Statements of Assets
and Liabilities
Location | | Value | | | Statements of Assets
and Liabilities
Location | | Value | |
| Foreign Currency Exchange Risk | | Unrealized appreciation on forward foreign currency exchange contracts | | $ | 354,673 | | | Unrealized depreciation on forward foreign currency exchange contracts | | $ | — | |
| Total | | | | $ | 354,673 | | | | | $ | — | |
| | | | | | | | | | | | | |
| Strategic Opportunities Fund | | Statements of Assets
and Liabilities
Location | | Value | | | Statements of Assets
and Liabilities
Location | | Value | |
| Equity Risk | | Unrealized appreciation on swap agreements | | $ | 57,305,910 | | | Unrealized depreciation on swap agreements | | $ | 11,550,073 | |
| | | | | | | | | Variation Margin | | | 693,670 | |
| | | | | | | | | | | | | |
| | | Structured option contracts, at value | | | 95,173,287 | | | Structured option contracts, at value | | | 3,423,831 | |
| Foreign Currency Exchange Risk | | Unrealized appreciation on swap agreements | | | 259,659 | | | Unrealized depreciation on swap agreements | | | 253,630 | |
| | | Investments at value (Purchased options) | | | 1,875,000 | | | Written option contracts, at value | | | 600,000 | |
| | | Structured option contracts, at value | | | 1,261,790 | | | | | | | |
| | | Unrealized appreciation on forward foreign currency exchange contracts | | | 4,417,539 | | | Unrealized depreciation on forward foreign currency exchange contracts | | | 12,876,511 | |
| Interest Rate Risk | | Unrealized appreciation on swap agreements | | | 247,044 | | | Unrealized depreciation on swap agreements | | | 1,017,731 | |
| Total | | | | $ | 160,540,229 | | | | | $ | 30,415,446 | |
| | | The Effect of Derivative Instruments on the Statements of Operations | | |
| | | Year Ended October 31, 2017 | | |
| | | Net Realized Gain/(Loss) from Derivatives Recognized in Income | | |
| Large Cap Strategies Fund | | Written Options and Structured Options | | Futures Contracts | | Swap Agreements | | Foreign Currency
Exchange Contracts | | Total | | |
| Foreign Currency Exchange Risk | | | $— | | | | $— | | | | $— | | | | $ | 7,974,588 | | | $ | 7,974,588 | | |
| Total | | | $— | | | | $— | | | | $— | | | | $ | 7,974,588 | | | $ | 7,974,588 | | |
| | | | | | | | | | | | | | | | | | | | | | | |
| Small & Mid Cap Strategies Fund | | Written Options and Structured Options | | Futures Contracts | | Swap Agreements | | Foreign Currency
Exchange Contracts | | Total | | |
| Foreign Currency Exchange Risk | | | $— | | | | $— | | | | $— | | | | $ | 782,394 | | | $ | 782,394 | | |
| Total | | | $— | | | | $— | | | | $— | | | | $ | 782,394 | | | $ | 782,394 | | |
| Old Westbury Funds, Inc. |
| Notes to Financial Statements - (Continued) |
| October 31, 2017 |
| |
| | | The Effect of Derivative Instruments on the Statements of Operations | | |
| | | Year Ended October 31, 2017 | | |
| | | Net Realized Gain/(Loss) from Derivatives Recognized in Income | | |
| Strategic Opportunities Fund | | Written Options and Structured Options | | Futures Contracts | | Swap Agreements | | Foreign Currency
Exchange Contracts | | | Total | | |
| Commodity Risk | | | $ | (7,957,626 | ) | | | $ | 383,567 | | | | $ | 4,475,593 | | | | $ | — | | | | $ | (3,098,466 | ) | |
| Interest Rate Risk | | | | 3,732,059 | | | | | (614,508 | ) | | | | — | | | | | — | | | | | 3,117,551 | | |
| Equity Risk | | | | 243,435,423 | | | | | 21,921,130 | | | | | 55,472,475 | | | | | — | | | | | 320,829,028 | | |
| Foreign Currency Exchange Risk | | | | (4,874,595 | ) | | | | — | | | | | 1,067,266 | | | | | 5,347,251 | | | | | 1,539,922 | | |
| Total | | | $ | 234,335,261 | | | | $ | 21,690,189 | | | | $ | 61,015,334 | | | | $ | 5,347,251 | | | | $ | 322,388,035 | | |
| | | | | |
| | | | | |
| | | Net Change in Unrealized Appreciation/(Depreciation) | | |
| | | on Derivatives Recognized in Income | | |
| Large Cap Strategies Fund | | Written Options and Structured Options | | Futures Contracts | | Swap Agreements | | Foreign Currency
Exchange Contracts | | | Total | | |
| Foreign Currency Exchange Risk | | | $ | — | | | | $ | — | | | | $ | — | | | | $ | (7,438,173 | ) | | | $ | (7,438,173 | ) | |
| Total | | | $ | — | | | | $ | — | | | | $ | — | | | | $ | (7,438,173 | ) | | | $ | (7,438,173 | ) | |
| | | | | | | | | | | | | | | | | | | | | | | | | | | |
| Small & Mid Cap Strategies Fund | | Written Options and Structured Options | | Futures Contracts | | Swap Agreements | | Foreign Currency
Exchange Contracts | | | Total | | |
| Foreign Currency Exchange Risk | | | $ | — | | | | $ | — | | | | $ | — | | | | $ | 280,015 | | | | $ | 280,015 | | |
| Total | | | $ | — | | | | $ | — | | | | $ | — | | | | $ | 280,015 | | | | $ | 280,015 | | |
| | | | | | | | | | | | | | | | | | | | | | | | | | | |
| Strategic Opportunities Fund | | Purchased Options,
Written Options and Structured Options | | Futures Contracts | | Swap Agreements | | Foreign Currency
Exchange Contracts | | | Total | | |
| Commodity Risk | | | $ | (86,220 | ) | | | $ | 2,366,453 | | | | $ | (1,486,304 | ) | | | $ | — | | | | $ | 793,929 | | |
| Interest Rate Risk | | | | — | | | | | (4,491,855 | ) | | | | (770,687 | ) | | | | — | | | | | (5,262,542 | ) | |
| Equity Risk | | | | (14,319,388 | ) | | | | (1,171,282 | ) | | | | 35,906,048 | | | | | — | | | | | 20,415,378 | | |
| Foreign Currency Exchange Risk | | | | 3,458,718 | | | | | — | | | | | (142,696 | ) | | | | (224,369 | ) | | | | 3,091,653 | | |
| Total | | | $ | (10,946,890 | ) | | | $ | (3,296,684 | ) | | | $ | 33,506,361 | | | | $ | (224,369 | ) | | | $ | 19,038,418 | | |
For the year ended October 31, 2017, the quarterly average volume of derivative activities were as follows:
| | | Small & Mid Cap Strategies Fund | | | Strategic Opportunities Fund | |
| Structured Options (Notional Amounts) | | | | $— | | | | $ | 2,836,577,688 | |
| Purchased Options (Cost $) | | | | — | | | | | 416,937 | |
| Written Options (Premium Received $) | | | | — | | | | | 31,461 | |
| Futures Long Position (Notional Amounts) | | | | — | | | | | 349,049,883 | |
| Futures Short Position (Notional Amounts) | | | | — | | | | | 72,846,970 | |
| Forward Currency Contracts Purchased (U.S. Dollar Amounts) | | | | 31,247,147 | | | | | 277,703,419 | |
| Forward Currency Contracts Sold (U.S. Dollar Amounts) | | | | — | | | | | 452,405,863 | |
| Currency Swaps (Notional Amount in U.S. Dollars) | | | | — | | | | | 2,657,070 | |
| Equity Swaps (Notional Amount in U.S. Dollars) | | | | — | | | | | 327,664,626 | |
| Interest Rate Swaps (Notional Amount in U.S. Dollars) | | | | — | | | | | 4,321,875 | |
| Commodity Swaps (Notional Amount in U.S. Dollars) | | | | — | | | | | 7,932,228 | |
A. Futures Contracts. The Funds purchased or sold futures contracts and options on futures contracts to gain exposure to, or hedge against, changes in the value of equity securities (equity risk), interest rates (interest rate risk) or commodity risk.
Futures contracts are agreements pursuant to which two parties agree to take or make delivery of an amount of cash equal to the difference between the value of the contract at the close of the last trading day and the price at which the contract was originally written. Upon entering into a futures contract, the Funds are required to pledge to a futures commission merchant an amount of cash, U.S. government securities, or other assets, equal to a certain percentage of the contract amount. This is known as the initial margin deposit. Subsequent payments, known as variation margin, are made or received by the Funds
| Old Westbury Funds, Inc. |
| Notes to Financial Statements - (Continued) |
| October 31, 2017 |
| |
each day, depending on the daily fluctuations in fair value of the underlying instrument. The Funds recognize an unrealized gain or loss equal to the variation margin. These futures contracts permit the Funds to meet their objectives at a lower cost than investing directly in the underlying instruments or commodities, while permitting the equivalent of an investment in a portfolio of the underlying instruments or commodities. A potential risk to the Funds is that the change in value of the underlying securities or commodities may not correlate to the change in value of the contracts. Listed futures contracts involve minimal counterparty risk since futures contracts are guaranteed against default by the exchange on which they trade.
B. Forward Foreign Currency Exchange Contracts. The Funds (except Municipal Bond Fund) may enter into forward foreign currency contracts (“Forward”) to hedge their exposure to changes in foreign currency exchange rates on foreign portfolio holdings (foreign currency exchange risk). In addition, certain Funds may use a Forward to provide exposure to the foreign currency market. A Forward is an agreement between two parties to purchase or sell a foreign currency at a future date at a negotiated forward rate. A Forward is marked-to-market daily and the change in market value is recorded by the Funds as unrealized appreciation or depreciation until the contract settlement date. The market value of the Forward is determined using the forward rate for the remainder of the outstanding period of the contract, through the delivery date. When a Forward is closed or settled, the Funds record a realized gain or loss equal to the fluctuation in rates during the period a Forward was open. Risks may arise upon entering into these contracts from, for example, the potential inability of the counterparties to meet the terms of their contracts, or if the foreign currency rates change unfavorably.
In the event of default by the counterparty to the transaction, the Funds’ maximum amount of loss, as either the buyer or seller, is the unrealized gain on the contract.
The Funds may be required to pledge to the broker an amount of cash, U.S. government securities or other assets, equal to a certain percentage of the contract amount.
C. Swap Agreements. The Funds entered into swap agreements, which are agreements involving two parties to exchange the return generated by a security, currency, commodity, interest rate, index, or other measures for the return generated by another instrument, for example, the agreement to pay interest in exchange for a market-linked return based on a notional amount. The Funds entered into total return, interest rate and other swap agreements. Interest rate swap agreements generally involve the agreement by the Funds to pay a counterparty a fixed or floating rate on a fixed notional amount and to receive a fixed or floating rate on a fixed notional amount, but may also involve the agreement to pay or receive payments derived from changes in interest rates. Periodic payments are generally made during the life of the swap agreement according to the terms and conditions of the agreement and at termination or maturity. Total return swap agreements involve the commitments to pay or receive an amount generally determined by reference to a security, index or other measure in exchange for a specific market linked return, based on notional amounts. To the extent that the total return of the security, index or other measure underlying the transaction exceeds or falls short of the offsetting interest rate-based obligation, the Funds receive or make a payment to the counterparty. Payments received or made by a Fund at the expiration or other termination of the swap agreements are recorded in the Statements of Operations as realized gains or losses, respectively. Swap agreements are marked-to-market daily based on counterparty valuation quotations, and changes in value, including the periodic amounts of interest to be paid or received on swaps, are recorded as unrealized appreciation/(depreciation). Risks may exceed amounts recognized on the Statements of Assets and Liabilities. These risks include changes in the returns of the underlying instruments, failure of the counterparties to perform under the contracts’ terms and the possible lack of liquidity with respect to the swap agreements. Details of swap agreements open at period end are included in the Portfolios of Investments under the caption “Swap Agreements”.
D. Options. The Funds purchased and wrote (sold) put and call options on equity securities and stock index futures in order to gain exposure to or to protect against changes in the market.
Options on swaps (swaptions) are similar to options on securities except that instead of selling or purchasing the right to buy or sell a security, the writer or purchaser of the swaption is granting or buying the right to enter into a previously agreed upon swap agreement at any time before the expiration of the option.
A call option gives the purchaser of the option the right (but not the obligation) to buy, and obligates the seller to sell (when the option is exercised), the underlying instrument at the exercise price at any time or at a specified time during the option period. A put option gives the holder the right to sell and obligates the writer to buy the underlying instrument at the exercise price at any time or at a specified time during the option period. When a Fund purchases (writes) an option, an amount equal to the premium paid (received) by a Fund is reflected as an asset (liability). The amount of the asset (liability) is subsequently marked-to-market to reflect the current market value of the option purchased (written). When an instrument is purchased or
| Old Westbury Funds, Inc. |
| Notes to Financial Statements - (Continued) |
| October 31, 2017 |
| |
sold through an exercise of an option, the related premium paid (or received) is added to (or deducted from) the basis of the instrument acquired or deducted from (or added to) the proceeds of the instrument sold. When an option expires (or a Fund enters into a closing transaction), a Fund realizes a gain or loss on the option to the extent of the premiums received or paid (or gain or loss to the extent the cost of the closing transaction exceeds the premium received or paid). When a Fund writes a call option, such option is “covered,” meaning that a Fund holds the underlying instrument subject to being called by the option counterparty, or cash in an amount sufficient to cover the obligation. When a Fund writes a put option, such option is covered by cash in an amount sufficient to cover the obligation.
In purchasing and writing options, a Fund bears certain risks, including the market risk of an unfavorable change in the price of the underlying instrument or the risk that a Fund may not be able to enter into a closing transaction due to an illiquid market. Exercise of a written option could result in a Fund purchasing or selling a security at a price different from the current market value.
A Fund may execute transactions in both listed and over-the-counter options. Listed options involve minimal counterparty risk since listed options are guaranteed against default by the exchange on which they trade. Transactions in certain over-the-counter options may expose a Fund to the risk of default by the counterparty to the transaction. In the event of default by the counterparty to the over-the-counter option transaction, a Fund’s maximum amount of loss is the premium paid and unrealized gain (as purchaser) or the unrealized gain of the contract less the premium received (as writer).
The Strategic Opportunities Fund invests in structured options to increase or decrease its exposure to an underlying index or group of securities (equity risk) or to increase or decrease its exposure to changes in foreign currency exchange rates (foreign currency exchange risk). These structured options may consist of single or multiple OTC options which are priced as a single security. Structured options may only be exercised at the expiration date, but may be transferred/sold prior to the expiration date. The value of a structured option may either increase or decrease with the underlying index or group of securities, depending on the combination of options used. Structured options are issued in units whereby each unit represents a structure based on a specific index with an initial reference strike price. Generally, the basis of the contracts is the premium received or paid which is recorded as an asset on the Statements of Assets and Liabilities. The amount of the asset is subsequently market-to-market to reflect the current market value of the structured option. When a structured option is transferred/sold or exercised, the Fund will record a realized gain or loss equal to the difference between the proceeds from (or cost of) the closing transaction and the Fund’s basis in the contract, if any. One type of structure involves the combination of selling a put while buying a call on a specific index. This option would rise in value as the underlying index increases and fall in value as the underlying index decreases. Alternatively, another structure involves the sale of a call and the purchase of a put. This option structure would rise in value as the underlying index decreases and fall in value as the underlying index increases. Upon the exercise of the structured option, the Fund will receive a payment from, or be required to remit a payment to the counterparty, depending on the value of the underlying index at exercise.
| 7. | Investment Advisory Fee, Administration Fee and Other Transactions: |
A. Investment Advisory Fees. The Funds’ investment adviser is BIM, a wholly-owned subsidiary of Bessemer Trust Company, N.A. (“Bessemer”). Bessemer is a subsidiary of The Bessemer Group, Incorporated (“BGI”). The investment advisory fee paid to BIM for advisory services is computed daily and paid monthly in accordance with the following schedule:
| | | First $500 million of
average net assets | | Next $500 million
to $1 billion of
average net assets | | Average net assets
exceeding $1 billion | | Blended
Advisory Rate |
| All Cap Core Fund (prior to 12/30/16) | | | 0.70 | % | | | 0.65 | % | | | 0.60 | % | | | 0.69 | % |
| All Cap Core Fund (from 12/30/16 to 10/31/17) | | | 0.75 | % | | | 0.70 | % | | | 0.65 | % | | | 0.69 | % |
| Fixed Income Fund | | | 0.45 | % | | | 0.40 | % | | | 0.35 | % | | | 0.43 | % |
| Municipal Bond Fund | | | 0.45 | % | | | 0.40 | % | | | 0.35 | % | | | 0.39 | % |
| | | | | | | | | | | | | | | | | |
| | | | | | | | | | | | | | | Average net assets |
| Small & Mid Cap Strategies Fund | | | | | | | | | | | | | | | 0.85 | % |
| | | | | | | | | | | | | | | | | |
| | | First $1.25 billion of
average net assets | | Next $1.25 billion
to $2.5 billion of
average net assets | | Average net assets
exceeding $2.5 billion | | Blended
Advisory Rate |
| Large Cap Strategies Fund | | | 0.90 | % | | | 0.85 | % | | | 0.80 | % | | | 0.81 | % |
| Old Westbury Funds, Inc. |
| Notes to Financial Statements - (Continued) |
| October 31, 2017 |
| |
| | | First $1.25 billion of
average net assets | | Next $1.25 billion
to $2.5 billion of
average net assets | | Average net assets
exceeding $2.5 billion | | Blended
Advisory Rate |
| Strategic Opportunities Fund | | | 1.10 | % | | | 1.05 | % | | | 1.00 | % | | | 1.03 | % |
BIM has retained Harding Loevner LP (“Harding Loevner”) and Sands Capital Management, LLC (“Sands”) as sub-advisers to manage a segment of the Large Cap Strategies Fund. Harding Loevner and Sands are paid for their services directly by BIM.
BIM has retained Baillie Gifford Overseas Limited (effective 9/5/17) (“Baillie Gifford”), Dimensional Fund Advisors LP (“Dimensional”), Champlain Investment Partners, LLC (“Champlain”), Martingale Asset Management, L.P. (“Martingale”), Mondrian Investment Partners Limited (“Mondrian”) and Polunin Capital Partners Limited (effective 9/5/17) (“Polunin”) as sub-advisers to each manage segments of the Small & Mid Cap Strategies Fund. Baillie Gifford, Dimensional, Champlain, Martingale, Mondrian and Polunin are paid for their services directly by BIM.
BIM has retained BlackRock Financial Management, Inc. (“BlackRock”) and Muzinich & Co., Inc. (“Muzinich”) as sub-advisers to each manage a segment of the Strategic Opportunities Fund. BlackRock and Muzinich are paid for their services directly by BIM.
B. Administration, Fund Accounting, Transfer Agent and Underwriting Fees. The Corporation, on behalf of each Fund, has entered into an administrative oversight, supervision and coordination services agreement (the “Administrative Agreement”) with Bessemer, pursuant to which Bessemer and Bessemer Trust Company (“BTCO”), an affiliate of BIM, provide certain non-advisory services to the Funds, such as the maintenance of records, the provision of supervisory personnel and the monitoring of the other non-advisory service providers. Under the Administrative Agreement, each Fund pays an annual fee of 0.03% of its average daily net assets for such services. BNY Mellon Investment Servicing (US) Inc. (“BNY Mellon”) acts as administrator, fund accounting agent and transfer agent for the Funds pursuant to an Administration and Accounting Services Agreement and a Transfer Agency Services Agreement, respectively. Certain Officers of the Funds are also employees of BNY Mellon.
The Corporation entered into an Underwriting Agreement with Foreside Funds Distributors LLC for the limited purpose of acting as statutory underwriter to facilitate the registration and distribution of shares of the Funds.
C. Distribution and Shareholder Servicing Fees. The Funds have adopted a shareholder servicing plan (the “Shareholder Servicing Plan”) with Bessemer, pursuant to which Bessemer serves as a shareholder servicing agent and provides certain shareholder support services. Bessemer may engage shareholder sub-servicing agents, such as broker/dealers, banks, trust companies, investment advisers, and other financial institutions and intermediaries to provide certain shareholder support services and is solely responsible for paying each such shareholder sub-servicing agent from the fee it receives from each of the Funds. Each Fund pays for shareholder support services an annual fee of 0.20% of its average daily net assets; however, with respect to the Fixed Income Fund and the Municipal Bond Fund, Bessemer has contractually committed to waive its shareholder servicing fee to the extent necessary to maintain a maximum shareholder servicing fee at 0.10% through October 31, 2019. The shareholder servicing fee commitment arrangements may be changed or terminated at any time with the approval of the Board. Bessemer, however, does not have the ability to recapture fees currently being waived at a later date. For the year ended October 31 , 2017, Bessemer waived shareholder servicing fees in the amount of $791,078 with respect to the Fixed Income Fund and $2,113,832 with respect to the Municipal Bond Fund.
D. Custody Fees. The All Cap Core Fund, Large Cap Strategies Fund, Fixed Income Fund and Municipal Bond Fund have each retained BTCO, a wholly-owned subsidiary of BGI, to serve as their custodian, and the Small & Mid Cap Strategies Fund has retained BTCO to serve as their co-custodian. Pursuant to the Funds’ Custody Agreements, BTCO is responsible for maintaining the custody of these Funds’ securities and cash. BTCO serves as custodian for the Small & Mid Cap Strategies Fund only with respect to equity securities of U.S. companies (other than exchange-traded funds) and securities in the form of depositary receipts directly managed by BIM, income, other payments and distributions issued with respect to such securities, proceeds of the sale of such securities, and cash, cash equivalents and money market instruments received and held by BTCO from time to time on behalf of the Small & Mid Cap Strategies Fund. For providing these services, BTCO receives a fee calculated and paid monthly at the annual rate of 0.075% of the average daily net assets of the non-U.S. investments for All Cap Core Fund and Large Cap Strategies Fund and 0.015% of the average daily net assets of each of the Fixed Income Fund and Municipal Bond Fund or portion thereof for the Small & Mid Cap Strategies Fund and U.S. investments for All Cap Core Fund and Large Cap Strategies Fund. The Strategic Opportunities Fund and the Subsidiary have retained Citibank, N.A. (“Citibank”) to serve as
| Old Westbury Funds, Inc. |
| Notes to Financial Statements - (Continued) |
| October 31, 2017 |
| |
their custodian and the Small & Mid Cap Strategies Fund has retained Citibank to serve as its co-custodian. Citibank is responsible for maintaining the custody of these Funds’ securities and cash and assets of the Small & Mid Cap Strategies Fund managed by the sub-advisers. For providing these services, Citibank receives a fee from each Fund calculated daily and paid monthly based on safekeeping and transaction fees that vary by country.
E. Fee Waivers. BIM may voluntarily waive a portion of its advisory fee to limit the Funds’ total expenses. BIM may terminate this voluntary waiver at any time. BIM, however, does not have the ability to recapture fees currently being waived at a later date. BIM has contractually committed through October 31, 2019 to waive its advisory fees to the extent necessary to maintain the net operating expense ratios, excluding fund transaction costs, investment interest expense, dividend expenses associated with securities sold short and acquired fund fees and expenses, if any, of the Large Cap Strategies Fund at 1.15%, the Small & Mid Cap Strategies Fund at 1.11%, the Strategic Opportunities Fund at 1.20%, the Fixed Income Fund at 0.70% and the Municipal Bond Fund at 0.70%. Any waiver amounts are disclosed in the Statements of Operations. For the year ended October 31, 2017 , BIM waived $2,585,158 for the Small & Mid Cap Strategies Fund and $6,593,225 for the Strategic Opportunities Fund. The Fixed Income Fund and Municipal Bond Fund had shareholder servicing fee waivers of $791,078 and $2,113,832, respectively. The contractual advisory fee waivers and the shareholder servicing fee waivers may be changed or terminated at any time with the approval of the Board.
F. Board of Directors’ Fees. Each Director who is not an “interested person” of the Corporation (as that term is defined under the 1940 Act) (each, an “Independent Director”) receives from the Funds a total annual retainer of $120,000 (plus $50,000 for serving as the Board’s Chairperson, $20,000 as the Audit Committee Chairperson, $10,000 each as the Pricing Committee Liaison, the Nominating Committee Chairperson and the Governance Committee Chairperson) and receives for attendance at Board and committee meetings the following:
| | | Noticed to be
In-Person
(whether participating
by phone or in-person) | | Noticed to be
Telephonic |
| Regular Board Meeting | | | $9,000 | | | | $4,500 | |
| Special Board Meeting | | | 6,000 | | | | 3,000 | |
| Audit Committee Meeting | | | 5,000 | | | | 2,500 | |
| Nominating Committee Meeting | | | 5,000 | | | | 2,500 | |
| Governance Committee Meeting | | | 5,000 | | | | 2,500 | |
Each Independent Director is reimbursed for all out-of-pocket expenses relating to attendance at meetings of the Board and any Board committee. Directors who are not Independent Directors, officers or employees of BIM and BNY Mellon do not receive compensation from the Funds. Fees paid are allocated to the Funds on a pro rata basis based on net assets.
| 8. | Securities Transactions: |
Investment transactions for the year ended October 31, 2017, excluding short-term debt investments and U.S. Government securities, were as follows:
| | | Purchases | | | Sales | |
| All Cap Core Fund | | $ | 1,074,880,448 | | | $ | 832,831,080 | |
| Large Cap Strategies Fund | | | 9,419,608,124 | | | | 9,587,193,777 | |
| Small & Mid Cap Strategies Fund | | | 2,579,980,243 | | | | 2,677,972,370 | |
| Strategic Opportunities Fund (Consolidated) | | | 3,896,131,196 | | | | 3,823,695,300 | |
| Fixed Income Fund | | | 245,842,479 | | | | 249,017,655 | |
| Municipal Bond Fund | | | 810,692,118 | | | | 609,575,527 | |
Purchase and sales of U.S. Government Securities, excluding those with maturity of one year or less during the year ended October 31, 2017 were as follows:
| | | Purchases | | | Sales | |
| Fixed Income Fund | | $ | 345,467,731 | | | $ | 297,344,931 | |
| Municipal Bond Fund | | | 236,482,813 | | | | 8,713,633 | |
| Old Westbury Funds, Inc. |
| Notes to Financial Statements - (Continued) |
| October 31, 2017 |
| |
It is the policy of each Fund to qualify as a regulated investment company by complying with the provisions available to certain investment companies as defined in Subchapter M of the Internal Revenue Code of 1986, as amended (the “Code”), and to make distributions from net investment income and net realized capital gains sufficient to relieve it from all, or substantially all, federal income taxes. Federal income tax regulations differ from accounting principles generally accepted in the U.S.; therefore, distributions determined in accordance with tax regulations may differ in amount or character from net investment income and realized gains for financial reporting purposes. Financial reporting records are adjusted for permanent book/tax differences to reflect tax character within the components of net assets in the Statements of Assets and Liabilities. These permanent differences primarily arise from paydowns, real estate investment trusts, passive foreign investment companies, partnerships, utilization of earnings and profits on shareholder redemptions and the tax treatment of foreign currency gains/losses. Financial records are not adjusted for temporary differences. Temporary differences primarily arise from the tax treatment of wash sales, passive foreign investment companies, and index options.
As of October 31, 2017, the tax cost of investments and the breakdown of unrealized appreciation (depreciation) for each Fund were as follows:
| | | Cost of
Investments
Federal
Income Tax
Purposes | | | Gross
Unrealized
Appreciation
on Investments | | | Gross
Unrealized
Depreciation
on Investments | | | Net
Unrealized
Appreciation
(Depreciation)
on Investments | |
| All Cap Core Fund | | $ | 1,435,333,660 | | | $ | 359,140,401 | | | $ | (20,649,783 | ) | | $ | 338,490,618 | |
| Large Cap Strategies Fund | | | 13,918,499,670 | | | | 3,682,371,044 | | | | (354,165,614 | ) | | | 3,328,205,430 | |
| Small & Mid Cap Strategies Fund | | | 5,020,920,315 | | | | 1,671,481,781 | | | | (151,338,951 | ) | | | 1,520,142,830 | |
| Strategic Opportunities Fund | | | 5,410,169,136 | | | | 408,284,114 | | | | (148,896,895 | ) | | | 259,387,219 | |
| Fixed Income Fund | | | 826,476,118 | | | | 1,646,770 | | | | (5,565,719 | ) | | | (3,918,949 | ) |
| Municipal Bond Fund | | | 2,203,944,575 | | | | 20,887,157 | | | | (8,183,043 | ) | | | 12,704,114 | |
Permanent differences as of October 31, 2017, were as follows:
| | | Increase/(Decrease)
Undistributed
Net Investment Income | | Increase/(Decrease)
Net Realized Gains | | Net Unrealized
Appreciation
(Depreciation) | | Increase/
(Decrease)
Paid-in-Capital |
| All Cap Core Fund | | $ | 2,100,930 | | | $ | (2,100,930 | ) | | | $— | | | $ | — | |
| Large Cap Strategies Fund | | | (1,566,028 | ) | | | 1,572,019 | | | | — | | | | (5,991 | ) |
| Small & Mid Cap Strategies Fund | | | 1,539,106 | | | | (19,395,328 | ) | | | — | | | | 17,856,222 | |
| Strategic Opportunities Fund | | | 48,920,281 | | | | (83,304,765 | ) | | | — | | | | 34,384,484 | |
| Fixed Income Fund | | | 1,563,522 | | | | (1,563,522 | ) | | | — | | | | — | |
| Municipal Bond Fund | | | (1,985 | ) | | | 1,985 | | | | — | | | | — | |
By investing in the Subsidiary, the Strategic Opportunities Fund will gain exposure to commodities and commodity-linked instruments within the limits of Subchapter M of the Code.
The Funds may be subject to taxes imposed by other countries in which they invest. Such taxes are generally based on income earned as well as capital gains and in certain situations, unrealized gains. These taxes are accrued and applied to net investment income, net realized gains and unrealized gains, if applicable, as such income and/or gains are earned.
The Funds may accrue a deferred tax liability for unrealized gains on India and Pakistan securities based on existing tax rates and holding periods of the securities. As of October 31, 2017, the Large Cap Strategies Fund and the Small & Mid Cap Strategies Fund recorded liabilities of $990,860, and $1,153,404, respectively, in the Statements of Assets and Liabilities as an estimate for potential future India and Pakistan capital gain taxes.
The tax character of distributions from the Funds during the year ended October 31, 2017 was as follows (amounts in thousands):
| Old Westbury Funds, Inc. |
| Notes to Financial Statements - (Continued) |
| October 31, 2017 |
| |
| | | All Cap
Core Fund | | Large Cap Strategies
Fund | | Small & Mid Cap
Strategies Fund | | Strategic
Opportunities
Fund | | Fixed
Income
Fund | | Municipal
Bond
Fund | |
| Distributions paid from: | | | | | | | | | | | | | | | | | | | | | | | | | | | | | | | |
| Ordinary Income | | | $ | 13,752 | | | | $ | 109,523 | | | | $ | 30,569 | | | | $ | 111,738 | | | | $ | 11,204 | | | | $ | 8,607 | | |
| Net Long Term Capital Gains | | | | — | | | | | 151,605 | | | | | 298,284 | | | | | — | | | | | — | | | | | 2,686 | | |
| Total Taxable Distributions | | | | 13,752 | | | | | 261,128 | | | | | 328,853 | | | | | 111,738 | | | | | 11,204 | | | | | 11,293 | | |
| Tax Exempt Distributions | | | | — | | | | | — | | | | | — | | | | | — | | | | | — | | | | | 22,134 | | |
| Total Distributions Paid | | | $ | 13,752 | | | | $ | 261,128 | | | | $ | 328,853 | | | | $ | 111,738 | | | | $ | 11,204 | | | | $ | 33,427 | | |
The tax character of distributions from the Funds during the year ended October 31, 2016 was as follows (amounts in thousands):
| | | All Cap
Core Fund | | Large Cap Strategies
Fund | | Small & Mid Cap
Strategies Fund | | Strategic
Opportunities
Fund | | Fixed
Income
Fund | | Municipal
Bond
Fund | |
| Distributions paid from: | | | | | | | | | | | | | | | | | | | | | | | | | | | | | | | |
| Ordinary Income | | | $ | 12,768 | | | | $ | 109,207 | | | | $ | 43,722 | | | | $ | 106,192 | | | | $ | 8,507 | | | | $ | 1,369 | | |
| Net Long Term Capital Gains | | | | 13,076 | | | | | 212,416 | | | | | 250,506 | | | | | 127,647 | | | | | — | | | | | 1,053 | | |
| Total Taxable Distributions | | | | 25,844 | | | | | 321,623 | | | | | 294,228 | | | | | 233,839 | | | | | 8,507 | | | | | 2,422 | | |
| Tax Exempt Distributions | | | | — | | | | | — | | | | | — | | | | | — | | | | | — | | | | | 18,981 | | |
| Total Distributions Paid | | | $ | 25,844 | | | | $ | 321,623 | | | | $ | 294,228 | | | | $ | 233,839 | | | | $ | 8,507 | | | | $ | 21,403 | | |
The difference in classification between the amounts reflected above and the Statements of Changes in Net Assets is primarily due to short-term capital gain distributions.
As of and during the year ended October 31, 2017, the Funds did not have any liabilities for any uncertain tax positions. The Funds recognize interest and penalties, if any, related to unrecognized tax positions as income tax expense in the Statements of Operations. During the year, the Funds did not incur any interest or penalties. The statute of limitation on each Fund’s U.S. federal income tax returns remains open for each of the four years ended October 31, 2017. The statutes of limitations on each Fund’s state and local tax returns may remain open for an additional year depending upon the jurisdiction.
As of October 31, 2017, the components of accumulated earnings/(deficits) on a tax basis were as follows:
| | | All Cap Core
Fund | | Large Cap Strategies
Fund | | Small & Mid Cap
Strategies
Fund | | Strategic
Opportunities
Fund | | Fixed
Income
Fund | | Municipal
Bond
Fund | |
| Undistributed Tax Exempt Income | | | $ | — | | | | $ | — | | | | $ | — | | | | $ | — | | | | $ | — | | | | $ | 2,478,028 | | |
| Undistributed Ordinary Income | | | | 8,109,243 | | | | | 100,838,951 | | | | | 33,865,393 | | | | | 272,321,254 | | | | | 1,263,897 | | | | | — | | |
| Undistributed Long-Term Capital Gains | | | | 25,490,664 | | | | | 865,251,402 | | | | | 423,210,201 | | | | | 82,586,827 | | | | | — | | | | | — | | |
| Accumulated Earnings | | | | 33,599,907 | | | | | 966,090,353 | | | | | 457,075,594 | | | | | 354,908,081 | | | | | 1,263,897 | | | | | 2,478,028 | | |
| Other Accumulated Earnings | | | | — | | | | | — | | | | | — | | | | | — | | | | | — | | | | | — | | |
| Deferred Qualified Late-Year Losses | | | | — | | | | | — | | | | | — | | | | | — | | | | | — | | | | | — | | |
| Capital Loss Carryforwards | | | | — | | | | | — | | | | | — | | | | | — | | | | | (9,403,156 | ) | | | | (1,529,654 | ) | |
| Unrealized Appreciation/(Depreciation) | | | | 338,490,618 | | | | | 3,327,147,217 | | | | | 1,518,950,821 | | | | | 275,169,143 | | | | | (3,918,949 | ) | | | | 12,704,114 | | |
| Other Temporary Differences | | | | — | | | | | — | | | | | — | | | | | (26,488 | ) | | | | — | | | | | — | | |
| Total Accumulated Earnings/(Deficits) | | | $ | 372,090,525 | | | | $ | 4,293,237,570 | | | | $ | 1,976,026,415 | | | | $ | 630,050,736 | | | | $ | (12,058,208 | ) | | | $ | 13,652,488 | | |
The All Cap Core Fund utilized capital loss carryforwards of $23,056,130, and Strategic Opportunities Fund utilized capital loss carryforwards of $181,782,212 in the current year.
As of October 31, 2017, the Fixed Income Fund had a short-term capital loss carryforward of $2,516,017, and a long-term capital loss carryforward of $6,887,139 and the Municipal Bond Fund had a short-term capital loss carryforward of $1,529,654 available to offset future realized capital gains in accordance with the Regulated Investment Company Modernization Act of 2010. This capital loss carryforward is not subject to expiration and must first be utilized to offset future realized gains of the same character.
| Old Westbury Funds, Inc. |
| Notes to Financial Statements - (Continued) |
| October 31, 2017 |
| |
The capital loss carryforward will reduce the applicable Fund’s taxable income arising from future net realized gains on investments, if any, to the extent permitted by the Code, and thus will reduce the amount of the distributions to shareholders which would otherwise be necessary to relieve the Funds of any liability for federal tax.
Under current tax law, ordinary losses incurred after December 31 of a Fund’s fiscal year may be deferred and treated as occurring on the first business day of the following fiscal year for tax purposes.
The Strategic Opportunities Fund may invest in floating rate loan interests. In connection with these investments, the Strategic Opportunities Fund may also enter into bridge loan commitments (“commitments”). Bridge loan commitments may obligate the Strategic Opportunities Fund to furnish temporary financing to a borrower until permanent financing can be arranged. As of October 31, 2017, the Strategic Opportunities Fund had no outstanding bridge loan commitments. In connection with these commitments, the Strategic Opportunities Fund would earn a commitment fee, typically set as a percentage of the commitment amount. Such fee income, which would be included in interest income in the Statements of Operations, is recognized ratably over the commitment period.
Management has evaluated the impact of all subsequent events on the Funds and has determined that there were no subsequent events requiring recognition or disclosure in the financial statements.
| 12. | Additional Tax Information (Unaudited) |
Qualified Dividend Income (Unaudited)
The Funds designate a portion of the income dividends distributed during the fiscal year ended October 31, 2017, as Qualified Dividend Income (“QDI”) as defined in the Code as follows:
| All Cap Core Fund | | | 100.00 | % |
| Large Cap Strategies Fund | | | 100.00 | % |
| Small & Mid Cap Strategies Fund | | | 100.00 | % |
| Strategic Opportunities Fund | | | 12.37 | % |
Qualified Interest Income (Unaudited)
The Funds designate a portion of the income dividends distributed during the fiscal year ended October 31, 2017, as Qualified Interest Income as defined in the Code as follows:
| All Cap Core Fund | | | 0.43 | % |
| Large Cap Strategies Fund | | | 0.35 | % |
| Small & Mid Cap Strategies Fund | | | 0.57 | % |
| Strategic Opportunities Fund | | | 59.79 | % |
| Fixed Income Fund | | | 95.81 | % |
| Municipal Bond Fund | | | 6.91 | % |
Qualified Short Term Gain (Unaudited)
The Funds designate a portion of the income dividends distributed during the fiscal year ended October 31, 2016, as Qualified Short-Term Gain as defined in the Code as follows:
| Strategic Opportunities Fund | | | 100.00 | % |
| Old Westbury Funds, Inc. |
| Notes to Financial Statements - (Continued) |
| October 31, 2017 |
| |
Dividends Received Deduction (Unaudited)
For the fiscal year ended October 31, 2017, the following percentage of income dividends paid by the Funds qualifies for the Dividends Received Deduction available to corporations:
| All Cap Core Fund | | | 75.07 | % |
| Large Cap Strategies Fund | | | 75.90 | % |
| Small & Mid Cap Strategies Fund | | | 91.02 | % |
| Strategic Opportunities Fund | | | 9.15 | % |
Long Term Capital Gain Dividends (Unaudited)
The Funds designate Long-Term Capital Gain dividends pursuant to Section 852(b)(3) of the Code for the fiscal year ended October 31, 2017 as follows:
| Large Cap Strategies Fund | | $ | 151,604,603 | |
| Small & Mid Cap Strategies Fund | | | 314,622,440 | |
| Strategic Opportunities Fund | | | — | |
| Municipal Bond Fund | | | 2,685,368 | |
U.S. Government Income (Unaudited)
The percentages of the ordinary income dividends paid by the Funds during the fiscal year ended October 31, 2017 which were derived from U.S. Treasury securities were as follows:
| All Cap Core Fund | | | 0.05 | % |
| Large Cap Strategies Fund | | | 0.28 | % |
| Small & Mid Cap Strategies Fund | | | 0.45 | % |
| Strategic Opportunities Fund | | | 3.60 | % |
| Fixed Income Fund | | | 38.70 | % |
| Municipal Bond Fund | | | 20.09 | % |
Tax Exempt Distributions (Unaudited)
The Municipal Bond Fund designates $22,134,133 as tax exempt dividends paid for the fiscal year ended October 31, 2017.
| Report of Independent Registered Public Accounting Firm |
| |
| |
| |
To the Board of Directors and Shareholders of
Old Westbury Funds, Inc.
We have audited the accompanying statements of assets and liabilities of Old Westbury Funds, Inc. (comprising, respectively, All Cap Core Fund, Large Cap Strategies Fund, Small & Mid Cap Strategies Fund, Strategic Opportunities Fund (consolidated), Fixed Income Fund and Municipal Bond Fund (collectively, the “Funds”)), including the portfolios of investments of All Cap Core Fund, Large Cap Strategies Fund, Strategic Opportunities Fund (consolidated), Fixed Income Fund and Municipal Bond Fund and the condensed portfolio of investments of Small & Mid Cap Strategies Fund, as of October 31, 2017, and the related statements of operations for the year then ended, the statements of changes in net assets for each of the two years in the period then ended and the financial highlights for each of the five years in the period then ended. These financial statements and financial highlights are the responsibility of the Funds’ management. Our responsibility is to express an opinion on these financial statements and financial highlights based on our audits.
We conducted our audits in accordance with the standards of the Public Company Accounting Oversight Board (United States). Those standards require that we plan and perform the audit to obtain reasonable assurance about whether the financial statements and financial highlights are free of material misstatement. We were not engaged to perform an audit of the Funds’ internal control over financial reporting. Our audits included consideration of internal control over financial reporting as a basis for designing audit procedures that are appropriate in the circumstances, but not for the purpose of expressing an opinion on the effectiveness of the Funds’ internal control over financial reporting. Accordingly, we express no such opinion. An audit also includes examining, on a test basis, evidence supporting the amounts and disclosures in the financial statements and financial highlights, assessing the accounting principles used and significant estimates made by management, and evaluating the overall financial statement presentation. Our procedures included confirmation of securities owned as of October 31, 2017, by correspondence with the custodians and brokers or by other appropriate auditing procedures where replies from brokers were not received. We believe that our audits provide a reasonable basis for our opinion.
In our opinion, the financial statements and financial highlights referred to above present fairly, in all material respects, the financial position of each of the respective funds comprising Old Westbury Funds, Inc. at October 31, 2017, the results of their operations for the year then ended, the changes in their net assets for each of the two years in the period then ended and the financial highlights for each of the five years in the period then ended in conformity with U.S. generally accepted accounting principles.

New York, New York
December 28, 2017
| Old Westbury Funds, Inc. |
| Directors and Officers of Old Westbury Funds, Inc. (Unaudited) |
| |
| |
Independent and Interested Directors. The following table sets forth certain information with respect to the Directors of the Corporation, each of which, under current Board policy, may serve until the end of the calendar year during which he or she reaches the applicable mandatory retirement age established by the Board.
| Name, Address, and Age | | Position(s)
Held with
the Corporation | | Term
of Office
and Length
of Time
Served as a
Director of
the
Corporation | | Principal Occupation(s)
During Past 5 Years | | Number of
Portfolios in
Fund
Complex
Overseen by
Director | | Other
Director-
ships1
Held by
Director
During
Past 5
Years |
| Interested Director | | | | | | | | | | |
| | | | | | | | | | | |
Jeffrey J. Glowacki2
10250 Constellation
Boulevard, Suite 2600
Los Angeles, CA
90067
Age: 50 | | Director | | Indefinite term; 5 Years | | Managing Director and Western Region Head, Bessemer Trust Company, N.A. (since January 1, 2014); Managing Director and Senior Resident Officer of Bessemer Trust Company, N.A. (2005-2013). | | 6 | | 0 |
| | | | | | | | | | | |
| Independent Directors | | | | | | | | | | |
| | | | | | | | | | | |
Alexander Ellis III
630 Fifth Avenue
New York, NY 10111
Age: 68 | | Chairman & Director | | Indefinite term; 4 Years | | General Partner, Rockport Capital Partners (2000-Present). | | 6 | | 13 |
| | | | | | | | | | | |
Patricia L. Francy
630 Fifth Avenue
New York, NY 10111
Age: 72 | | Director | | Indefinite term; 13 Years | | Director, corporate, and foundation boards. | | 6 | | 14 |
| | | | | | | | | | | |
J. David Officer
630 Fifth Avenue
New York, NY 10111
Age: 69 | | Director | | Indefinite term; 6 Years | | Independent Director; Consultant, Fidelity (2011). | | 6 | | 45 |
| | | | | | | | | | | |
R. Keith Walton
630 Fifth Avenue
New York, NY 10111
Age: 53 | | Director | | Indefinite term; 1 Year | | Vice President, Strategy, Arizona State University (Since 2013); Vice President, Global Government & Affairs, Alcoa Inc. (commercial manufacturing company) (2010-2012). | | 6 | | 56 |
| Old Westbury Funds, Inc. |
| Directors and Officers of Old Westbury Funds, Inc. (Unaudited) - (Continued) |
| |
| |
| 1 | Directorships held during the last five years in (1) any other investment companies registered under the 1940 Act, (2) any company with a class of securities registered pursuant to Section 12 of the Securities and Exchange Act of 1934, as amended, or (3) any company subject to the requirements of Section 15(d) of the Exchange Act. |
| 2 | Directors who are or may be deemed “interested persons” (as defined under the 1940 Act) of the Corporation, BIM (as defined below) or Bessemer (as defined below) are referred to as Interested Directors. Mr. Glowacki is deemed an Interested Director by virtue of his positions as Managing Director and Western Region Head of Bessemer Trust Company, N.A. |
| 3 | Mr. Ellis has served as Director of Clean Diesel Technologies Inc. |
| 4 | Ms. Francy has served as Director of Siebert Financial Corp. |
| 5 | Mr. Officer serves, or has served, as Director of the following entities: DBX ETF Trust (40); Man Long Short Fund; GLG International Small Cap Fund; and Ilex Partners (Asia) LLC. |
| 6 | Mr. Walton serves as Director of the following entities: Blue Crest Capital Management, LLC Funds, Global Infrastructure Partners, Systematica Investments Limited, Zweig Fund Inc. and Zweig Total Return Fund Inc. |
| Old Westbury Funds, Inc. |
| Directors and Officers of Old Westbury Funds, Inc. (Unaudited) - (Continued) |
| |
| |
Officers. The table below sets forth certain information with respect to the Officers of the Corporation:
| Name, Address, and Age | | Position(s)
Held with
the Corporation | | Term of
Office
and Length of
Time Served
as
an Officer of
the
Corporation | | Principal Occupation(s)
During Past 5 Years | | | | |
| | | | | | | | | | | |
David W. Rossmiller
630 Fifth Avenue
New York, NY 10111
Age: 59 | | President & Chief Executive Officer | | Indefinite; 5 Years | | Managing Director and Head of Fixed Income, Bessemer Trust Company, N.A. (Since 2010). | | | | |
| | | | | | | | | | | |
Steven L. Williamson
630 Fifth Avenue
New York, NY 10111
Age: 64 | | Chief Legal Officer | | Indefinite; 14 Years | | Managing Director and General Counsel, The Bessemer Group, Incorporated and principal bank subsidiaries (Since 2007). | | | | |
| | | | | | | | | | | |
Matthew A. Rizzi
630 Fifth Avenue
New York, NY 10111
Age: 44 | | Vice President & Treasurer | | Indefinite; 3 Years | | Principal and Head of Trust Accounting and Fees, Bessemer Trust Company, N.A. (Since 2015); Senior Vice President and Head of Trust Accounting, Bessemer Trust Company, N.A. (2007-2014). | | | | |
| | | | | | | | | | | |
Nicola R. Knight
630 Fifth Avenue
New York, NY 10111
Age: 54 | | Assistant Secretary | | Indefinite; 8 Years | | Principal and Associate General Counsel of Bessemer Trust Company, N.A. (Since 2007). | | | | |
| | | | | | | | | | | |
Thomas G. Kennedy
630 Fifth Avenue
New York, NY 10111
Age: 47 | | Chief Compliance Officer | | Indefinite; 1 Year | | Chief Compliance Officer of Bessemer Investment Management LLC (Since July 2016); Principal and Director of Investment Management Compliance, Bessemer Trust Company, N.A. (Since July 2016) Head of Alternatives Compliance, Aberdeen Asset Management Inc. (January 2016-April 2016); Managing Director and Chief Compliance Officer, Arden Asset Management LLC (2008-2015). | | | | |
| | | | | | | | | | | |
Richard Murtagh
630 Fifth Avenue
New York, NY 10111
Age: 56 | | Vice President & Assitant Treasurer | | Indefinite; 3 Years | | Principal, Managing Director and Corporate Controller, Bessemer Trust Company, N.A. (Since 2010). | | | | |
| Old Westbury Funds, Inc. |
| Directors and Officers of Old Westbury Funds, Inc. (Unaudited) - (Continued) |
| |
| |
| Name, Address, and Age | | Position(s)
Held with
the Corporation | | Term of
Office
and Length of
Time Served
as
an Officer of
the
Corporation | | Principal Occupation(s)
During Past 5 Years | | | | |
| | | | | | | | | | | |
David Schwart
801 Brickell Avenue
Suite 2250
Miami, FL 33131
Age: 47 | | Vice President & Anti-Money Laundering Compliance Officer | | Indefinite; 2 Years | | Vice President and Associate Director of Bank Compliance, Bessemer Trust Company, N.A. (Since April 2013); Vice President and Internal Audit Manager, BNP Paribas, N.A. (2009-March 2013). | | | | |
| | | | | | | | | | | |
Andrew J. McNally
760 Moore Road
King of Prussia, PA
19406
Age: 46 | | Vice President
Assistant Treasurer
| | Indefinite; 11 Years
8 Years
| | Vice President and Senior Director of Fund Accounting & Administration, The Bank of New York Mellon (“BNY Mellon”) (formerly, PNC Global Investment Servicing (U.S.) Inc.) (financial services company) (Since 2007). | | | | |
| | | | | | | | | | | |
Jack Jafolla
760 Moore Road
King of Prussia, PA
19406
Age: 47 | | Assistant Treasurer | | Indefinite; 11 Years | | Senior Manager of NAV Operations, BNY Mellon (Since 2008). | | | | |
| | | | | | | | | | | |
Lisa M. King
301 Bellevue Parkway
Wilmington, DE
19809
Age: 49 | | Secretary | | Indefinite; 1 Year | | Vice President and Counsel, BNY Mellon (Since 2016); Counsel, Stradley Ronon Stevens & Young LLP (2007-2016). | | | | |
| | | | | | | | | | | |
William H. Wallace, III
301 Bellevue Parkway
Wilmington, DE
19809
Age: 47
| | Assistant Secretary | | Indefinite; 1 Year | | Vice President and Manager of BNY Mellon (Since 2010). | | | | |
The Statement of Additional Information (“SAI”) includes additional information about the Corporation’s Directors and Officers and is available upon request, without charge. To obtain a copy of the SAI, please call (800) 607-2200.
| Old Westbury Funds, Inc. |
| Additional Information (Unaudited) |
| |
| |
Information on Proxy Voting:
The Funds’ proxy voting guidelines, used to determine how to vote proxies relating to portfolio securities and information regarding how the Funds voted proxies relating to portfolio securities during the most recent 12-month period ended June 30 is available (i) without charge, upon request, by calling (800) 607-2200; and (ii) on the U.S. Securities and Exchange Commission’s (“SEC”) website at http://www.sec.gov.
Information on Form N-Q:
The Funds provide a complete list of the Funds’ holdings four times in each fiscal year, at the quarter-ends. For the second and fourth quarters, the Schedule of Investments appear in the Funds’ semi-annual and annual reports to shareholders. For the first and third quarters, the Funds file the Schedule of Investments with the SEC on Form N-Q. Shareholders can obtain the Funds’ Form N-Q (i) without charge, upon request, by calling (800) 607-2200; and (ii) on the SEC’s website at http://www.sec.gov. The Fund’s N-Q may be reviewed or copied at the SEC Public Reference Room in Washington D.C. Information on the operation of the Public Reference Room may be obtained by calling (800) SEC-0330.
| Old Westbury Funds, Inc. |
| Renewal of Investment Advisory Agreement and Sub-Advisory Agreements (Unaudited) |
| |
| |
At a meeting held on July 26, 2017, the Board of Directors (the “Board” or the “Directors”) of Old Westbury Funds, Inc. (the “Corporation”), including the Directors who are not “interested persons” (as defined under the Investment Company Act of 1940 (the “1940 Act”)) of any party to the agreements defined below (“Independent Directors”), unanimously approved the continuation of the following investment advisory and sub-advisory agreements (collectively, the “Agreements”): (1) an investment advisory agreement between Bessemer Investment Management LLC (“BIM” or the “Adviser”) and the Corporation on behalf of Old Westbury All Cap Core Fund (“All Cap Core Fund”), Old Westbury Large Cap Strategies Fund (“Large Cap Strategies Fund”), Old Westbury Small & Mid Cap Strategies Fund (“Small & Mid Cap Strategies Fund”), Old Westbury Strategic Opportunities Fund (“Strategic Opportunities Fund”), Old Westbury Fixed Income Fund (“Fixed Income Fund”), and Old Westbury Municipal Bond Fund (“Municipal Bond Fund”) (each, a “Fund” and, collectively, the “Funds”), (2) a sub-advisory agreement among BIM, Dimensional Fund Advisors LP (“Dimensional”) and the Corporation on behalf of the Small & Mid Cap Strategies Fund, (3) a sub-advisory agreement among BIM, Champlain Investment Partners, LLC (“Champlain”) and the Corporation on behalf of the Small & Mid Cap Strategies Fund, (4) a sub-advisory agreement among BIM, BlackRock Financial Management, Inc. (“BlackRock”) and the Corporation on behalf of the Strategic Opportunities Fund, (5) a sub-advisory agreement among BIM, Mondrian Investment Partners Limited (“Mondrian”) and the Corporation on behalf of the Small & Mid Cap Strategies Fund, (6) a sub-advisory agreement among BIM, Sands Capital Management, LLC (“Sands”) and the Corporation on behalf of the Large Cap Strategies Fund, (7) a sub-advisory agreement among BIM, Muzinich & Co, Inc. (“Muzinich”) and the Corporation on behalf of the Strategic Opportunities Fund, (8) a sub-advisory agreement among BIM, Harding Loevner LP (“Harding Loevner”) and the Corporation on behalf of the Large Cap Strategies Fund, and (9) a sub-advisory agreement among BIM, Martingale Asset Management, L.P. (“Martingale”) and the Corporation on behalf of the Small & Mid Cap Strategies Fund (Martingale, Dimensional, Champlain, BlackRock, Mondrian, Sands, Muzinich and Harding Loevner together, the “Sub-Advisers”). At both the meeting of the Board held on July 26, 2017 and the meeting of the Board held on April 24, 2017, the Board had requested and received substantial information regarding the Adviser, each of the Sub-Advisers, and the Agreements, as well as related matters pertaining to the fee rates charged and services provided by affiliated service providers. The Directors reviewed detailed due diligence questionnaires from BIM and each of the Sub-Advisers, as well as substantial information concerning, among other things, each Fund’s performance, comparative fee and expense information as well as information regarding BIM and each of the Sub-Advisers relating to their respective organizations, compliance and regulatory processes and programs and financial conditions. The Directors also discussed and considered economies of scale and how the Adviser shared those economies with the Funds’ shareholders. The Board received and discussed information concerning BIM’s and each Sub-Adviser’s performance, the use of affiliated brokers to execute transactions, the use of soft dollars, best execution, portfolio manager compensation, and whether there are any other direct or indirect benefits received by the Adviser or the Sub-Advisers in managing the Funds. In addition, the Adviser supplied the Directors with additional information concerning its estimated profitability from managing the Funds. Moreover, the Board had received and considered materials and presentations throughout the course of the year relating to the investment management, performance and operation of the Funds.
The Board considered information about BIM and the Sub-Advisers, the performance of the Funds and certain additional factors described above and below that it deemed relevant. The following summary details the materials and factors that the Board considered, among others, and the conclusions they reached, in approving the continuance of the Agreements.
(1) The nature, extent and quality of services provided by the Adviser and Sub-Advisers.
The Board considered the scope and quality of services provided by the Adviser and Sub-Advisers, particularly the qualifications, capabilities and experience of the investment, operational, compliance, legal and other personnel who are responsible for providing services to the Funds. The Board also considered the fact that the Adviser and Sub-Advisers pay the costs of all investment and management facilities necessary for the efficient conduct of their respective services. The Board further considered the role and efforts of the Adviser in providing oversight of the various Sub-Advisers for the Funds, including in overseeing the service of, and in monitoring the performance of, each Sub-Adviser, as well as determining the appropriate allocation of assets to Sub-Advisers. The Board also considered the Adviser’s role in making recommendations to the Board regarding retaining or replacing Sub-Advisers where appropriate and in conducting the necessary searches and due diligence of prospective new sub-advisers. In this regard, the Board noted the information that it had received regarding the Adviser’s on-going due diligence with respect to each Sub-Adviser, including the Adviser’s review of, among other things, each Sub-Adviser’s investment process, compliance program and performance. The Board also considered the role of the Pricing Committee in the valuation of the Funds’ portfolio instruments, including its role in determining fair values for securities pursuant to the Corporation’s Valuation Policies, as well as its role in selecting and monitoring pricing service providers and, foreign fair value service providers.
In addition, the Board considered that the Adviser manages the overall investment program of the Funds and that the Adviser keeps the Board informed of important developments affecting the Funds, both in connection with the Board’s annual review
| Old Westbury Funds, Inc. |
| Renewal of Investment Advisory Agreement and Sub-Advisory Agreements (Unaudited) - (Continued) |
| |
| |
of the Advisory and Sub-Advisory Agreements and at each Board meeting. The Board also noted that it received in-person reports from each Sub-Adviser on a rotating schedule. The Board evaluated these factors based on its direct experience with the Adviser, and in consultation with Counsel to the Corporation and Counsel to the Independent Directors, as well as Counsel to the Independent Directors alone. The Board also considered the Adviser’s effectiveness in ensuring that the Funds are in compliance with their respective investment policies and restrictions and the requirements of the 1940 Act and related securities regulations. The Board further noted the Adviser’s and its affiliates’ efforts to oversee the Funds’ other service providers, including those providing administrative, accounting and custodial services.
Based on these factors, as well as other factors discussed herein, the Board concluded that the nature, quality and extent of services provided by the Adviser and Sub-Advisers have been and continue to be satisfactory.
(2) The performance of the Funds and the Adviser and Sub-Advisers.
The Board’s analysis of the Funds’ performance included the discussion and review of the performance data of each of the Funds against securities benchmarks as well as against a competitive group of similar funds, based on, in part, information provided by an independent, third-party mutual fund data provider. The Board considered that for some Funds, like the Strategic Opportunities Fund, the investment strategy employed by the Fund was distinct from any securities benchmark and was different than that employed by other funds, making performance comparisons against benchmarks and industry peers difficult or less meaningful. The Board reviewed comparative performance over long-, intermediate- and short-term periods. In reviewing performance, the Board placed greater emphasis on longer-term performance than on shorter-term performance, taking into account that over short periods of time underperformance may be transitory. The Board also considered the performance of the Funds in the context of whether the Funds were meeting the expectations of the clients invested in the Funds. In this regard, the Board considered that the Fixed Income Fund and the Municipal Bond Fund were designed as conservative investment products and that clients were most interested in capital preservation when investing in those particular Funds. As a result, the Board determined that the Fixed Income Fund and Municipal Bond Fund appeared to be meeting their investment objectives even though both Funds may have underperformed their competitive peer groups during certain periods.
The Board considered the performance of the Adviser and each of the Sub-Advisers both against comparative benchmarks as well as against similarly managed accounts, if applicable, managed by the Adviser and Sub-Advisers. When reviewing performance against similarly managed accounts, the Board considered, among other things, differences in the nature of such accounts from a regulatory and tax perspective and differences in the investment mandate from that of the Funds. In evaluating the Funds’ performance, the Board also considered the principal role of the Funds as part of the asset allocation strategy for client accounts maintained by Bessemer and its affiliates.
(3) The cost of the advisory and sub-advisory services and the profits to the Adviser and its affiliates from the relationship with the Funds.
In connection with the Board’s consideration of the level of the advisory and sub-advisory fees, the Board considered a number of factors. The Board’s analysis of each Fund’s advisory fees and expenses included a discussion and review of data concerning the current fee and expense ratios of each Fund compared to a peer group of similar funds and noted that each Fund’s advisory fee and expenses were generally in line with those of their representative group. The Board also noted the applicable advisory fee breakpoints as well as the Adviser’s contractual commitment to waive advisory fees for certain of the Funds. Additionally, the Board considered the Adviser’s profitability. With respect to the Sub-Advisory Agreements with the Sub-Advisers, the Board noted that the Sub-Advisers’ fees were paid entirely by the Adviser so that no additional expenses would be borne by shareholders for the engagement of the Sub-Advisers. The Board noted that Sub-Advisory fee levels were arrived at pursuant to an arms-length negotiation between the Adviser and each Sub-Adviser. The Board also considered fee data from the Sub-Advisers with respect to similarly managed accounts and considered the relevance of differences in the services provided to separate accounts as they relate to differences in the fees charged in connection with the Funds.
Based on this analysis as well as other factors described herein, including the fact that the Funds are intended principally to satisfy asset allocation requirements of client accounts maintained by Bessemer and its affiliates, the Board concluded that the advisory fee schedule for each Fund was fair and reasonable in light of the quality of services provided by the Adviser and Sub-Advisers.
| Old Westbury Funds, Inc. |
| Renewal of Investment Advisory Agreement and Sub-Advisory Agreements (Unaudited) - (Continued) |
| |
| |
(4) The extent to which economies of scale will be realized as the Funds grow and whether fee levels reflect those economies of scale.
The Board considered the information provided by the Adviser relating to economies of scale. In this regard, the Board noted the current advisory fee breakpoint levels at $500 million and $1 billion with respect to All Cap Core Fund, Fixed Income Fund and Municipal Bond Fund, and at $1.25 billion and $2.5 billion for the Strategic Opportunities Fund and Large Cap Strategies Fund. The Board also considered the experience of the Adviser in managing the Funds, as well as the Adviser’s profitability analysis. With respect to the Small & Mid Cap Strategies Fund, the Board determined that it would continue to monitor whether breakpoints would be appropriate should this Fund continue to grow in size. The Board also noted other areas where each Fund may share in economies of scale, including through potential lower fees charged by third-party service providers based on the combined size of the Funds.
(5) Ancillary benefits and other factors.
In addition to the above factors, the Board also discussed other benefits received by the Adviser, the Sub-Advisers and their affiliates from the management of the Funds (such as soft-dollar credits), including the ability to market their advisory services for similar products in the future. In addition, the Board discussed the compensation payable by the Funds to affiliates of the Adviser for other services including administrative services, shareholder servicing and custody. The Board considered comparative information relating to the fees charged for these services and reviewed reports from the Adviser and its affiliates regarding their capabilities and experience in providing these services. The Board also discussed the use of the Funds as asset allocation investment vehicles for clients of Bessemer and its affiliates, with the resulting expectation that the asset sizes of the Funds would grow as Bessemer’s client base grows. The Board concluded that advisory and sub-advisory fees were reasonable in light of these fall-out benefits.
Conclusion:
The Board, including all of the Independent Directors, concluded that the fees payable under the Advisory Agreement and Sub-Advisory Agreements were fair and reasonable with respect to the services that BIM and each Sub-Adviser provide, in light of the factors described above that the Board deemed relevant. The Board based its decision on an evaluation of all these factors as a whole and did not consider any one factor as all-important or controlling. The Independent Directors were also assisted by the advice of Counsel to the Independent Directors, as well as Counsel to the Corporation, in making this determination.
| Old Westbury Funds, Inc. |
Approval of New Sub-Advisory Agreements with Baillie Gifford Overseas Limited and
Polunin Capital Partners Limited |
| (Unaudited) |
| |
At a meeting held on July 26, 2017, the Board of Directors, including the Independent Directors, unanimously approved a new Sub-Advisory Agreement among BIM, Baillie Gifford Overseas Limited (“Baillie Gifford”), and the Corporation on behalf of the Old Westbury Small & Mid Cap Strategies Fund (the “Fund”) and a new Sub-Advisory Agreement among BIM, Polunin Capital Partners Limited (“Polunin”), and the Corporation on behalf of the Fund (together, the “Sub-Advisory Agreements”). The Board noted that the fees payable to Baillie Gifford and Polunin under the Sub-Advisory Agreements would be paid by the Adviser from the advisory fees that it receives from the Fund.
In approving the Sub-Advisory Agreements with Baillie Gifford and Polunin, the Board considered the overall fairness of each of the Sub-Advisory Agreements and whether each of the agreements were in the best interest of the Fund. The Board noted that it had received and reviewed substantial information regarding Baillie Gifford and Polunin, and the services to be provided by Baillie Gifford and Polunin to the Fund under the Sub-Advisory Agreements. This information, which included responses to detailed due diligence questionnaires from Baillie Gifford and Polunin, as well as information concerning their organization, compliance program and financial condition, formed, in part, the primary (but not exclusive) basis for the Board’s determinations. The Board also noted that the Independent Directors had met in executive session with their Counsel and Counsel to the Corporation, as well as with BIM to discuss BIM’s recommendation regarding Baillie Gifford’s and Polunin’s appointments. During the executive session, the Independent Directors reviewed their legal responsibilities in approving the Sub-Advisory Agreements and discussed materials and other information provided to them. The Board concluded that they had received adequate information to make a reasonable determination with respect to the approval of each of the Sub-Advisory Agreements.
The Board’s conclusions are based on the comprehensive consideration of all information presented to it and are not the result of any single controlling factor.
The following summary details the factors considered by the Board and the conclusions that formed the basis for the Board’s approval of each of the proposed Sub-Advisory Agreements.
(1) The nature, extent and quality of services to be provided by Polunin and Baillie Gifford.
The Board considered the scope and quality of services to be provided by Polunin and Baillie Gifford, including the fact that Polunin and Baillie Gifford pay the costs of all investment and management facilities necessary for the efficient conduct of their services. The Board also considered, among other things, the qualifications and experience of the individual portfolio managers responsible for managing each of Polunin’s and Baillie Gifford’s portions of the Fund, as well as the compliance, operational and trading capabilities of Polunin and Baillie Gifford.
Based on these considerations, as well as those discussed below, the Board concluded that the nature, extent and quality of services to be provided by each of Polunin and Baillie Gifford were satisfactory.
(2) The performance of Polunin and Baillie Gifford.
The Board considered the performance data provided by Polunin and Baillie Gifford with respect to other accounts and determined that Polunin and Baillie Gifford had demonstrated an ability to appropriately manage assets in the style expected to be used by them in connection with the Fund.
(3) The cost of the advisory services and comparative fee rates.
As previously discussed, the Board noted that Polunin’s and Baillie Gifford’s fees would be paid entirely by BIM. The Directors reviewed the level of the proposed fees against benchmarks and peer comparisons. Based on these considerations, as well as other factors described herein, the Board, including all of the Independent Directors, concluded that Polunin’s and Baillie Gifford’s sub-advisory fees were fair and reasonable in light of the quality of services to be provided by Polunin and Baillie Gifford, respectively.
(4) The extent to which economies of scale will be realized as the Fund grows and whether fee levels reflect those economies of scale.
The Board discussed whether any economies of scale would be realized with respect to the management of the Fund and whether the Fund would benefit from any such economies of scale. The Board noted in this regard that BIM would bear Polunin’s and Baillie Gifford’s sub-advisory fees. The Directors undertook to continue to monitor the appropriateness of the sub-advisory fees, taking into account the potential impact of economies of scale, as the mandate grew.
| Old Westbury Funds, Inc. |
Approval of New Sub-Advisory Agreements with Baillie Gifford Overseas Limited and
Polunin Capital Partners Limited |
| (Unaudited) - (Continued) |
| |
(5) Ancillary benefits and other factors.
In addition to the above factors, the Board also discussed whether there were other benefits received by BIM, Polunin or Baillie Gifford, or their affiliates, from Polunin’s and Baillie Gifford’s relationships with the Fund. The Board concluded that any such fall-out benefits resulting from the proposed engagements of Polunin and Baillie Gifford were such that it did not affect the Board’s conclusion that the proposed sub-advisory fees were reasonable.
Conclusion:
The Board, including all of the Independent Directors, concluded that the fees to be paid to Polunin and Baillie Gifford under each of the Sub-Advisory Agreements were fair and reasonable with respect to the services that Polunin and Baillie Gifford would each provide, in light of the factors described above that the Board deemed relevant. The Board based its decision on an evaluation of all these factors as a whole and did not consider any one factor as all-important or controlling. The Independent Directors were also assisted by the advice of Counsel to the Independent Directors, as well as Counsel to the Corporation, in making this determination.
This Page Intentionally Left Blank
This Page Intentionally Left Blank
| Investment Adviser: | Administrator: |
| Bessemer Investment Management LLC | BNY Mellon Investment Servicing (US) Inc. |
| 630 Fifth Avenue | 760 Moore Road |
| New York, NY 10111 | King of Prussia, PA 19406 |
| (212) 708-9100 | |
| Distributor: | Transfer Agent: |
| BNY Mellon Investment Servicing (US) Inc. |
| Foreside Funds Distributors LLC | 760 Moore Road |
| 400 Berwyn Park | King of Prussia, PA 19406 |
| 899 Cassatt Road | |
| Berwyn, PA 19312 | Independent Registered Public Accounting Firm: |
| Custodians: | Ernst & Young LLP |
| 5 Times Square |
| Bessemer Trust Company | New York, NY 10036 |
| 100 Woodbridge Center Drive | |
| Woodbridge, NJ 07095 | |
| | |
| Citibank, N.A. | |
| 388 Greenwich Street | |
| New York, NY 10013 | |
Mutual funds are not bank deposits or obligations, are not guaranteed by any bank, and are not insured or guaranteed by the U.S. government, the Federal Deposit Insurance Corporation, the Federal Reserve Board, or any other government agency. Investment in mutual funds involves investment risks, including possible loss of principal.
This report is authorized for distribution to prospective investors only when preceded or accompanied by the Funds’ prospectus which contains facts concerning the Funds’ objectives and policies, management fees, expenses and other information.
The information in this report is based on data obtained from recognized services and sources and is believed to be reliable. Any opinions, projections, or recommendations in this report are subject to change without notice and are not intended as individual investment advice. Furthermore, Bessemer Investment Management LLC and its affiliates, as agents for their clients, and any of its officers or employees may have a beneficial interest or position in any of the securities mentioned, which may be contrary to any opinion or projection expressed in this report.
Cusip 680414307
Cusip 680414604
Cusip 680414109
Cusip 680414406
Cusip 680414505
Cusip 680414802
(A21-AR2017)
(12/17)
Item 2. Code of Ethics.
| (a) | The registrant, as of the end of the period covered by this report, has adopted a code of ethics that applies to the registrant’s principal executive officer, principal financial officer, principal accounting officer or controller, or persons performing similar functions, regardless of whether these individuals are employed by the registrant or a third party. |
| | The Code of Ethics for Principal Executive and Principal Financial Officers is attached as an Exhibit under Item 12 (a)(1). |
| (c) | There have been no amendments, during the period covered by this report, to a provision of the code of ethics that applies to the registrant’s principal executive officer, principal financial officer, principal accounting officer or controller, or persons performing similar functions, regardless of whether these individuals are employed by the registrant or a third party, and that relates to any element of the code of ethics description. |
| (d) | The registrant has not granted any waivers, including an implicit waiver, from a provision of the code of ethics that applies to the registrant’s principal executive officer, principal financial officer, principal accounting officer or controller, or persons performing similar functions, regardless of whether these individuals are employed by the registrant or a third party, that relates to one or more of the items set forth in paragraph (b) of this item’s instructions. |
Item 3. Audit Committee Financial Expert.
The registrant’s board of directors has determined that the registrant has three audit committee financial experts serving on its audit committee and those persons (Patricia L. Francy and J. David Officer and R. Keith Walton) are “independent” for purposes of this Item 3 of Form N-CSR.
Item 4. Principal Accountant Fees and Services.
Audit Fees
| (a) | The aggregate fees billed for each of the last two fiscal years for professional services rendered by the principal accountant for the audit of the registrant's annual financial statements or services that are normally provided by the accountant in connection with statutory and regulatory filings or engagements for those fiscal years are $685,000 in 2017 and $695,750 in 2016. |
Audit-Related Fees
| (b) | The aggregate fees billed in each of the last two fiscal years for assurance and related services by the principal accountant that are reasonably related to the performance of the audit of the registrant's financial statements and are not reported under paragraph (a) of this Item are $7,400 in 2017 and $14,600 in 2016. Fees for both 2017 and 2016 relate to the review of financial statement data incorporated in the Funds periodic N-1A filings. |
Tax Fees
| (c) | The aggregate fees billed in each of the last two fiscal years for professional services rendered by the principal accountant for tax compliance, tax advice, and tax planning are $192,948 in 2017 and $268,233 in 2016. Fees for both 2017 and 2016 relate to the review of federal income and excise tax returns, review of capital gains distribution calculations and certain global tax compliance services. |
All Other Fees
| (d) | The aggregate fees billed in each of the last two fiscal years for products and services provided by the principal accountant, other than the services reported in paragraphs (a) through (c) of this Item are $54,000 in 2017 and $53,400 in 2016. Fees for both 2017 and 2016 relate to the review of holdings for the Funds affiliated custodian under Rule 17f-2 and regulatory reporting for OWF Strategic Opportunities Fund Ltd. |
| (e) | (1) | Disclose the audit committee's pre-approval policies and procedures described in paragraph (c)(7) of Rule 2-01 of Regulation S-X. |
| | Before an auditor is engaged by the Funds to render audit services, the Audit Committee reviews and approves the engagement, including all related fees. The Audit Committee also reviews and approves in advance, unless excepted under Rule 2-01(c)(7) of Regulation S-X, any proposal that the Funds employ their auditor to render “permissible non-audit services” to the Funds, including all related fees. In addition, the Audit Committee reviews and approves in advance, unless excepted under Rule 2-01(c)(7) of Regulation S-X, any proposal that the Adviser, and any entity controlling, controlled by, or under common control with the Adviser that provides ongoing services to the Funds, employ the Funds’ Auditor to render non-audit services, if such engagement would relate directly to the operations and financial reporting of the Funds. As a part of its review, the Audit Committee considers whether the provision of such services does not impact the Auditor’s independence. |
| (e) | (2) | The percentage of services described in each of paragraphs (b) through (d) of this Item that were approved by the audit committee pursuant to paragraph (c)(7)(i)(C) of Rule 2-01 of Regulation S-X are as follows: |
(b) 100%
(c) 100%
(d) 100%
| (f) | The percentage of hours expended on the principal accountant's engagement to audit the registrant's financial statements for the most recent fiscal year that were attributed to work performed by persons other than the principal accountant's full-time, permanent employees was less than fifty percent. |
| (g) | The aggregate non-audit fees billed by the registrant's accountant for services rendered to the registrant, and rendered to the registrant's investment adviser (not including any sub-adviser whose role is primarily portfolio management and is subcontracted with or overseen by another investment adviser), and any entity controlling, controlled by, or under common control with the adviser that provides ongoing services to the registrant for each of the last two fiscal years of the registrant was $1,477,912 in 2017 and $321,633 in 2016. |
| (h) | The registrant's audit committee of the board of directors has considered whether the provision of non-audit services that were rendered to the registrant's investment adviser (not including any sub-adviser whose role is primarily portfolio management and is subcontracted with or overseen by another investment adviser), and any entity controlling, controlled by, or under common control with the investment adviser that provides ongoing services to the registrant that were not pre-approved pursuant to paragraph (c)(7)(ii) of Rule 2-01 of Regulation S-X is compatible with maintaining the principal accountant's independence. |
Item 5. Audit Committee of Listed Registrants.
Not applicable.
Item 6. Investments.
| (a) | The Schedule of Investments in securities of unaffiliated issuers as of the close of reporting period for the Old Westbury Small & Mid Cap Strategies Fund is listed below. The Schedules of Investments in securities of unaffiliated issuers as of the close of the reporting period for the Old Westbury All Cap Core Fund, Old Westbury Large Cap Strategies Fund, Old Westbury Strategic Opportunities Fund, Old Westbury Fixed Income Fund and Old Westbury Municipal Bond Fund |
| Old Westbury Funds, Inc. | |
| Small & Mid Cap Strategies Fund | |
| Portfolio of Investments | October 31, 2017 |
| | |
| Shares | | | | | Value | |
| COMMON STOCKS — 90.6% | | | |
| ARGENTINA — 0.0% | | | |
| | 3,549 | | | MercadoLibre, Inc. | | $ | 852,860 | |
| AUSTRALIA — 1.7% | | | |
| | 1,547,765 | | | A.C.N. 004 410 833 Ltd.(a)(b) | | | 23,265 | |
| | 29,208 | | | Acrux Ltd.(b) | | | 3,688 | |
| | 99,433 | | | Adelaide Brighton Ltd. | | | 472,588 | |
| | 69,555 | | | AED Oil Ltd.(a)(b)(c) | | | 0 | |
| | 34,185 | | | Ainsworth Game Technology Ltd.(b) | | | 59,653 | |
| | 105,636 | | | ALS Ltd. | | | 633,045 | |
| | 13,518 | | | Altium Ltd. | | | 123,945 | |
| | 475,084 | | | Alumina Ltd. | | | 850,838 | |
| | 60,601 | | | Ansell Ltd. | | | 1,113,145 | |
| | 14,818 | | | AP Eagers Ltd. | | | 85,171 | |
| | 4,250 | | | Arb Corp Ltd. | | | 59,232 | |
| | 1,933 | | | Asaleo Care Ltd. | | | 2,190 | |
| | 9,691 | | | AUB Group Ltd. | | | 98,127 | |
| | 94,887 | | | Ausdrill Ltd. | | | 157,589 | |
| | 173,833 | | | Ausnet Services | | | 235,487 | |
| | 39,283 | | | Austal Ltd. | | | 53,065 | |
| | 188,262 | | | Australian Agricultural Co. Ltd.(b) | | | 211,807 | |
| | 141,784 | | | Australian Pharmaceutical Industries Ltd. | | | 163,314 | |
| | 93,769 | | | Automotive Holdings Group Ltd. | | | 232,522 | |
| | 90,884 | | | Bank of Queensland Ltd. | | | 929,297 | |
| | 299,483 | | | Beach Energy Ltd. | | | 223,479 | |
| | 12,766 | | | Bega Cheese Ltd. | | | 71,813 | |
| | 152,761 | | | Bendigo & Adelaide Bank Ltd. | | | 1,330,502 | |
| | 2,067 | | | Blackmores Ltd. | | | 252,674 | |
| | 231,682 | | | BlueScope Steel Ltd. | | | 2,276,764 | |
| | 339,952 | | | Boral Ltd. | | | 1,860,306 | |
| | 15,029 | | | Breville Group Ltd. | | | 134,004 | |
| | 17,433 | | | Brickworks Ltd. | | | 189,328 | |
| | 17,980 | | | BT Investment Management Ltd. | | | 148,344 | |
| | 16,047 | | | carsales.com Ltd. | | | 168,381 | |
| | 96,536 | | | Cash Converters International Ltd. | | | 26,598 | |
| | 3,423 | | | Cedar Woods Properties Ltd. | | | 15,011 | |
| | 187,629 | | | Challenger Ltd. | | | 1,909,907 | |
| | 3,287,015 | | | Charter Hall Retail REIT(a) | | | 10,213,824 | |
| | 456,872 | | | Cleanaway Waste Management Ltd. | | | 524,501 | |
| | 75,240 | | | Coca-Cola Amatil Ltd. | | | 469,318 | |
| | 8,941 | | | Cochlear Ltd. | | | 1,203,821 | |
| | 24,170 | | | Collins Foods Ltd. | | | 102,482 | |
| | 32,117 | | | Computershare Ltd. | | | 382,969 | |
| | 7,007 | | | Corporate Travel Management Ltd. | | | 128,922 | |
| | 2,184,574 | | | Costa Group Holdings Ltd. | | | 10,382,909 | |
| | 8,836 | | | Credit Corp. Group Ltd. | | | 135,659 | |
| | 302,614 | | | CSR Ltd. | | | 1,097,812 | |
| | 17,343 | | | Decmil Group Ltd. | | | 16,857 | |
| | 15,520 | | | Domino’s Pizza Enterprises Ltd. | | | 553,408 | |
| Shares | | | | | Value | |
| AUSTRALIA (continued) | | | |
| | 333,327 | | | Downer EDI Ltd. | | $ | 1,783,234 | |
| | 51,932 | | | DuluxGroup Ltd. | | | 292,930 | |
| | 21,626 | | | Eclipx Group Ltd. | | | 67,034 | |
| | 307,875 | | | Emeco Holdings Ltd.(b)(c) | | | 56,552 | |
| | 32,208 | | | Event Hospitality and Entertainment Ltd. | | | 329,330 | |
| | 597,107 | | | Evolution Mining Ltd. | | | 1,078,512 | |
| | 715,392 | | | Fairfax Media Ltd. | | | 602,279 | |
| | 9,044 | | | Flight Centre Travel Group Ltd. | | | 323,942 | |
| | 11,536 | | | G.U.D. Holdings Ltd. | | | 105,419 | |
| | 54,236 | | | G8 Education Ltd. | | | 189,284 | |
| | 53,688 | | | GrainCorp Ltd. - Class A | | | 349,266 | |
| | 16,663 | | | Greencross Ltd. | | | 67,719 | |
| | 7,628 | | | GWA Group Ltd. | | | 14,829 | |
| | 30,383 | | | Hansen Technologies Ltd. | | | 78,830 | |
| | 164,992 | | | Harvey Norman Holdings Ltd. | | | 477,326 | |
| | 89,017 | | | Healthscope Ltd. | | | 133,533 | |
| | 1,000 | | | HFA Holdings Ltd. | | | 2,334 | |
| | 39,987 | | | Iluka Resources Ltd. | | | 287,372 | |
| | 12,050 | | | IMF Bentham Ltd. | | | 21,488 | |
| | 721,969 | | | Incitec Pivot Ltd. | | | 2,110,778 | |
| | 89,744 | | | Independence Group NL | | | 275,430 | |
| | 2,591,585 | | | Inghams Group Ltd.(a) | | | 7,041,326 | |
| | 1,213,526 | | | Invocare Ltd.(a) | | | 15,761,284 | |
| | 61,813 | | | IOOF Holdings Ltd. | | | 509,041 | |
| | 22,132 | | | Iress Ltd. | | | 199,030 | |
| | 24,489 | | | JB Hi-Fi Ltd. | | | 429,207 | |
| | 35,487 | | | Kingsgate Consolidated Ltd.(b) | | | 11,000 | |
| | 19,560 | | | Link Administration Holdings Ltd. | | | 123,205 | |
| | 37,216 | | | MACA Ltd. | | | 59,530 | |
| | 328,362 | | | Macmahon Holdings Ltd.(b) | | | 60,315 | |
| | 29,947 | | | Macquarie Atlas Roads Group | | | 136,603 | |
| | 16,274 | | | Magellan Financial Group Ltd. | | | 302,291 | |
| | 18,709 | | | McMillan Shakespeare Ltd. | | | 225,524 | |
| | 87,069 | | | Medibank Private Ltd. | | | 204,580 | |
| | 11,923 | | | Melbourne IT Ltd. | | | 28,197 | |
| | 111,652 | | | Metcash Ltd. | | | 229,869 | |
| | 53,989 | | | Mineral Resources Ltd. | | | 718,977 | |
| | 886,000 | | | MMG Ltd.(b) | | | 400,900 | |
| | 34,246 | | | Monadelphous Group Ltd. | | | 444,787 | |
| | 34,487 | | | Mortgage Choice Ltd. | | | 58,332 | |
| | 366,646 | | | Myer Holdings Ltd. | | | 214,669 | |
| | 1,050 | | | MyState Ltd. | | | 3,841 | |
| | 24,976 | | | Navitas Ltd. | | | 91,180 | |
| | 120,898 | | | New Hope Corp. Ltd. | | | 185,059 | |
| | 130,310 | | | NIB Holdings Ltd. | | | 628,317 | |
| | 150,444 | | | Northern Star Resources Ltd. | | | 601,044 | |
| | 33,366 | | | Nufarm Ltd. | | | 231,873 | |
| | 7,415 | | | Nufarm Ltd.(b) | | | 51,530 | |
| | 170,332 | | | OceanaGold Corp. | | | 456,824 | |
| | 9,172 | | | oOh!media Ltd. | | | 30,747 | |
| | 92,294 | | | Orica Ltd. | | | 1,474,201 | |
| | 6,370 | | | Orocobre Ltd.(b) | | | 23,596 | |
| | 130,800 | | | Orora Ltd. | | | 340,367 | |
| | 124,310 | | | OZ Minerals Ltd. | | | 765,883 | |
| Old Westbury Funds, Inc. | |
| Small & Mid Cap Strategies Fund | |
| Portfolio of Investments - (Continued) | October 31, 2017 |
| | |
| Shares | | | | | Value | |
| AUSTRALIA (continued) | | | |
| | 1,639,072 | | | Pact Group Holdings Ltd. | | $ | 7,275,900 | |
| | 13,359 | | | Peet Ltd. | | | 14,928 | |
| | 5,607 | | | Perpetual Ltd. | | | 208,043 | |
| | 48,159 | | | Platinum Asset Mangement Ltd. | | | 269,067 | |
| | 58,151 | | | PMP Ltd.(b) | | | 33,379 | |
| | 11,475 | | | Premier Investments Ltd. | | | 116,279 | |
| | 50,905 | | | Primary Health Care Ltd. | | | 133,244 | |
| | 50,519 | | | Qantas Airways Ltd. | | | 237,788 | |
| | 194,951 | | | Qube Holdings Ltd. | | | 383,459 | |
| | 111,348 | | | Quintis Ltd.(a) | | | 20,027 | |
| | 40,693 | | | RCR Tomlinson Ltd. | | | 133,921 | |
| | 30,974 | | | Reckon Ltd. | | | 29,514 | |
| | 8,332 | | | Reece Ltd. | | | 282,433 | |
| | 99,706 | | | Regis Resources Ltd. | | | 296,846 | |
| | 190,599 | | | Resolute Mining Ltd. | | | 150,251 | |
| | 8,395 | | | Retail Food Group Ltd. | | | 28,271 | |
| | 101,020 | | | Ridley Corp. Ltd. | | | 112,108 | |
| | 4,184 | | | Ruralco Holdings Ltd. | | | 9,222 | |
| | 28,716 | | | Sandfire Resources NL | | | 126,153 | |
| | 177,820 | | | Santos Ltd.(b) | | | 612,426 | |
| | 222,211 | | | Saracen Mineral Holdings Ltd.(b) | | | 247,451 | |
| | 86,638 | | | Seek Ltd. | | | 1,218,087 | |
| | 13,321 | | | Select Harvests Ltd. | | | 47,918 | |
| | 16,377 | | | Servcorp Ltd. | | | 69,815 | |
| | 21,331 | | | Seven Group Holdings Ltd. | | | 216,316 | |
| | 63,604 | | | Seven West Media Ltd. | | | 32,859 | |
| | 6,302,616 | | | Shopping Centres Australasia Property Group REIT(a) | | | 11,335,727 | |
| | 212,165 | | | Sigma Healthcare Ltd. | | | 122,597 | |
| | 9,054 | | | Sirtex Medical Ltd. | | | 94,657 | |
| | 149,883 | | | Southern Cross Media Group Ltd. | | | 128,479 | |
| | 112,599 | | | Spark Infrastructure Group | | | 218,892 | |
| | 62,936 | | | St Barbara Ltd. | | | 139,688 | |
| | 237,816 | | | Star Entertainment Group Ltd. | | | 1,046,573 | |
| | 74,283 | | | Steadfast Group Ltd. | | | 152,365 | |
| | 37,756 | | | Sunland Group Ltd. | | | 49,413 | |
| | 22,520 | | | Super Retail Group Ltd. | | | 133,921 | |
| | 237,680 | | | Tabcorp Holdings Ltd. | | | 816,770 | |
| | 70,795 | | | Tassal Group Ltd. | | | 228,111 | |
| | 341,492 | | | Tatts Group Ltd. | | | 1,089,876 | |
| | 42,660 | | | Technology One Ltd. | | | 164,555 | |
| | 36,550 | | | Ten Network Holdings Ltd.(a)(b)(c) | | | 0 | |
| | 4,364 | | | Tiger Resources Ltd.(a)(b)(c) | | | 127 | |
| | 57,260 | | | Tox Free Solutions Ltd. | | | 107,369 | |
| | 8,735 | | | TPG Telecom Ltd. | | | 36,101 | |
| | 47,759 | | | Treasury Wine Estates Ltd. | | | 572,045 | |
| | 207,285 | | | Troy Resources Ltd.(b) | | | 16,658 | |
| | 28,287 | | | Village Roadshow Ltd.(b) | | | 81,186 | |
| | 492,324 | | | Virgin Australia Holdings Ltd.(b) | | | 69,708 | |
| | 521,584 | | | Virgin Australia Holdings Ltd. - CVR Shares(a)(b)(c) | | 0 | |
| | 12,200 | | | Virtus Health Ltd. | | | 51,168 | |
| Shares | | | | | Value | |
| AUSTRALIA (continued) | | | |
| | 34,479 | | | Vocus Group Ltd. | | $ | 75,999 | |
| | 9,912 | | | Webjet Ltd. | | | 87,241 | |
| | 50,095 | | | Western Areas NL | | | 106,969 | |
| | 43,208 | | | Westgold Resources Ltd.(b) | | | 62,005 | |
| | 110,400 | | | Whitehaven Coal Ltd. | | | 315,165 | |
| | 27,345 | | | Worleyparsons Ltd.(b) | | | 293,209 | |
| | 65,654 | | | WPP AUNZ Ltd. | | | 46,228 | |
| | | | | | | | 109,966,618 | |
| AUSTRIA — 0.2% | | | |
| | 1,139 | | | Agrana Beteiligungs AG | | | 141,367 | |
| | 14,870 | | | ams AG | | | 1,355,612 | |
| | 11,400 | | | Andritz AG | | | 644,576 | |
| | 17,053 | | | Austria Technologie & Systemtechnik AG | | | 365,302 | |
| | 23,704 | | | BUWOG AG | | | 683,663 | |
| | 5,680 | | | CA Immobilien Anlagen AG | | | 162,100 | |
| | 697 | | | DO & CO AG | | | 36,962 | |
| | 5,480 | | | EVN AG | | | 86,495 | |
| | 3,513 | | | FACC AG(b) | | | 61,279 | |
| | 1,017 | | | Flughafen Wien AG | | | 40,953 | |
| | 924 | | | Kapsch TrafficCom AG | | | 53,676 | |
| | 1,397 | | | Lenzing AG | | | 189,092 | |
| | 1,068 | | | Mayr Melnhof Karton AG | | | 155,134 | |
| | 8,170 | | | Oesterreichische Post AG | | | 363,162 | |
| | 1,990 | | | Palfinger AG | | | 88,086 | |
| | 5,197 | | | POLYTEC Holding AG | | | 129,550 | |
| | 646 | | | Porr Ag | | | 20,208 | |
| | 49,153 | | | Raiffeisen Bank International AG(b) | | | 1,712,522 | |
| | 6,198 | | | Rhi Magnesita NV(b) | | | 275,216 | |
| | 516 | | | Rosenbauer International AG | | | 32,572 | |
| | 5,208 | | | S IMMO AG | | | 91,756 | |
| | 3,572 | | | S&T AG | | | 69,034 | |
| | 1,691 | | | Schoeller-Bleckmann Oilfield Equipment AG(b) | | | 157,857 | |
| | 1,824 | | | Semperit AG Holding | | | 53,330 | |
| | 18,977 | | | Strabag SE | | | 793,140 | |
| | 26,142 | | | Telekom Austria AG | | | 245,195 | |
| | 333 | | | UBM Development AG | | | 15,167 | |
| | 38,384 | | | UNIQA Insurance Group AG | | | 393,730 | |
| | 21,803 | | | Verbund AG | | | 529,913 | |
| | 10,623 | | | Vienna Insurance Group AG Wiener Versicherung Gruppe | | | 311,397 | |
| | 48,015 | | | Voestalpine AG | | | 2,641,865 | |
| | 31,255 | | | Wienerberger AG | | | 803,147 | |
| | 1,581 | | | Wolford AG(b) | | | 29,319 | |
| | 4,663 | | | Zumtobel Group AG | | | 79,873 | |
| | | | | | | | 12,812,250 | |
| BELGIUM — 0.4% | | | |
| | 10,354 | | | Ackermans & van Haaren NV | | | 1,773,548 | |
| | 1,443 | | | Aedifica SA REIT(a) | | | 137,496 | |
| | 112,398 | | | Ageas | | | 5,452,445 | |
| | 62,671 | | | AGFA - Gevaert NV(b) | | | 294,710 | |
| | 320 | | | Ascencio REIT | | | 21,515 | |
| Old Westbury Funds, Inc. | |
| Small & Mid Cap Strategies Fund | |
| Portfolio of Investments - (Continued) | October 31, 2017 |
| | |
| Shares | | | | | Value | |
| BELGIUM (continued) | | | |
| | 419 | | | Atenor | | $ | 23,625 | |
| | 96 | | | Banque Nationale de Belgique | | | 319,262 | |
| | 1,888 | | | Barco NV | | | 193,335 | |
| | 1,791 | | | Befimmo SA REIT | | | 111,280 | |
| | 21,523 | | | Bekaert SA | | | 1,018,010 | |
| | 15,744 | | | Bpost SA | | | 444,088 | |
| | 1,079 | | | Celyad SA(b) | | | 62,881 | |
| | 4,522 | | | Cie d’Entreprises CFE | | | 661,328 | |
| | 1,352 | | | Cie Immobiliere de Belgique SA | | | 83,657 | |
| | 1,861 | | | Cofinimmo SA REIT | | | 236,180 | |
| | 55,428 | | | Colruyt SA | | | 2,835,061 | |
| | 40,458 | | | Deceuninck NV | | | 150,195 | |
| | 12,200 | | | Deceuninck NV- VVPR Strip(a)(b)(c) | | | 0 | |
| | 9,907 | | | D’ieteren SA/NV | | | 453,125 | |
| | 30,060 | | | Econocom Group SA/NV | | | 231,382 | |
| | 2,685 | | | Elia System Operator SA NV | | | 155,756 | |
| | 78,187 | | | Euronav NV | | | 647,915 | |
| | 3,009 | | | EVS Broadcast Equipment SA | | | 113,213 | |
| | 6,033 | | | Exmar NV(b) | | | 40,071 | |
| | 2,258 | | | Fagron NV(b) | | | 29,288 | |
| | 15,640 | | | Galapagos NV(b) | | | 1,517,398 | |
| | 101 | | | Home Invest Belgium REIT | | | 11,118 | |
| | 972 | | | Intervest Offices & Warehouses NV REIT | | | 24,785 | |
| | 460 | | | Jensen-Group NV | | | 22,154 | |
| | 3,601 | | | Kinepolis Group NV | | | 243,288 | |
| | 47 | | | Lotus Bakeries | | | 119,350 | |
| | 4,584 | | | MDxHealth(b) | | | 25,492 | |
| | 4,096 | | | Melexis NV | | | 410,373 | |
| | 547 | | | Montea SCA REIT | | | 27,493 | |
| | 6,369 | | | Nyrstar NV(b) | | | 50,857 | |
| | 21,787 | | | Ontex Group NV | | | 766,306 | |
| | 14,808 | | | Orange Belgium SA | | | 342,998 | |
| | 540 | | | Picanol | | | 60,952 | |
| | 29,109 | | | Proximus SADP | | | 966,706 | |
| | 1,089 | | | RealDolmen | | | 31,757 | |
| | 22,770 | | | Recticel SA | | | 225,451 | |
| | 530 | | | Resilux | | | 93,038 | |
| | 624 | | | Retail Estates NV REIT | | | 50,016 | |
| | 4,023 | | | Sioen Industries NV | | | 122,450 | |
| | 2,261 | | | Sipef NV | | | 166,320 | |
| | 4,857 | | | Telenet Group Holding NV(b) | | | 335,953 | |
| | 222 | | | TER Beke SA | | | 44,789 | |
| | 15,963 | | | Tessenderlo Chemie NV(b) | | | 766,093 | |
| | 38,370 | | | Umicore SA | | | 1,714,958 | |
| | 1,138 | | | Van de Velde NV | | | 62,959 | |
| | 1,885 | | | Warehouses De Pauw CVA REIT | | | 203,831 | |
| | 95 | | | Wereldhave Belgium NV REIT | | | 10,070 | |
| | | | | | | | 23,906,321 | |
| BERMUDA — 0.8% | | | |
| | 403,425 | | | Argo Group International Holdings Ltd.(a) | | | 25,395,604 | |
| Shares | | | | | Value | |
| BERMUDA (continued) | | | |
| | 72,422 | | | Aspen Insurance Holdings Ltd. | | $ | 3,106,904 | |
| | 8,668 | | | Assured Guaranty Ltd. | | | 321,583 | |
| | 76,330 | | | Axis Capital Holdings Ltd. | | | 4,151,589 | |
| | 26,400 | | | Bank Of NT Butterfield & Son Ltd. (The) | | | 986,040 | |
| | 15,400 | | | Blue Capital Reinsurance Holdings Ltd. | | | 204,050 | |
| | 400 | | | Enstar Group Ltd.(b) | | | 91,120 | |
| | 19,650 | | | Everest Re Group Ltd. | | | 4,665,893 | |
| | 87,972 | | | Hiscox Ltd. | | | 1,668,469 | |
| | 34,000 | | | James River Group Holdings Ltd. | | | 1,438,880 | |
| | 6,163 | | | Maiden Holdings Ltd. | | | 50,845 | |
| | 7,258 | | | Marvell Technology Group Ltd. | | | 134,055 | |
| | 35,842 | | | RenaissanceRe Holdings Ltd. | | | 4,959,099 | |
| | 3,009 | | | Third Point Reinsurance Ltd.(b) | | | 50,250 | |
| | 2,929 | | | Triton International Ltd. | | | 116,867 | |
| | 72,172 | | | Validus Holdings Ltd. | | | 3,758,718 | |
| | 4,386 | | | XL Group Ltd. | | | 177,501 | |
| | | | | | | | 51,277,467 | |
| BRAZIL — 0.5% | | | |
| | 6,300 | | | AES Tiete Energia SA - Units | | | 24,997 | |
| | 22,467 | | | Aliansce Shopping Centers SA(b) | | | 120,051 | |
| | 32,600 | | | Alpargatas SA - Preference Shares | | | 173,897 | |
| | 6,100 | | | Alupar Investimento SA - Units | | | 33,509 | |
| | 6,100 | | | Arezzo Industria e Comercio SA | | | 94,279 | |
| | 31,778 | | | B2W Cia Digital(b) | | | 205,455 | |
| | 20,166 | | | Banco ABC Brasil SA - Preference Shares | | | 109,975 | |
| | 127,187 | | | Banco do Estado do Rio Grande do Sul SA - Class B, Preference Shares | | | 587,472 | |
| | 16,000 | | | Banco Industrial e Comercial SA - Preference Shares(a)(b)(c) | | | 40,547 | |
| | 56,005 | | | BR Malls Participacoes SA | | | 217,768 | |
| | 10,249 | | | BR Properties SA | | | 32,928 | |
| | 37,153 | | | Brasil Brokers Participacoes SA(b) | | | 12,607 | |
| | 8,600 | | | Brasilagro - Co Brasileira de Propriedades Agricolas | | | 33,361 | |
| | 58,726 | | | Cia Brasileira de Distribuicao - Preference Shares(b) | | 1,369,370 | |
| | 1,850 | | | Cia de Gas de Sao Paulo - COMGAS - Class A, Preference Shares | | | 28,610 | |
| | 11,800 | | | Cia de Locacao das Americas | | | 58,977 | |
| | 24,300 | | | Cia de Saneamento Basico do Estado de Sao Paulo | | | 222,327 | |
| | 2,800 | | | Cia de Saneamento de Minas Gerais-COPASA | | | 34,066 | |
| | 10,700 | | | Cia de Saneamento do Parana - Preference Shares | | | 35,489 | |
| | 3,700 | | | Cia de Transmissao de Energia Eletrica Paulista - Preference Shares | | | 74,943 | |
| Old Westbury Funds, Inc. | |
| Small & Mid Cap Strategies Fund | |
| Portfolio of Investments - (Continued) | October 31, 2017 |
| | |
| Shares | | | | | Value | |
| BRAZIL (continued) | | | |
| | 264,900 | | | Cia Energetica de Minas Gerais - ADR | | $ | 627,813 | |
| | 19,900 | | | Cia Energetica de Minas Gerais - Preference Shares | | | 47,084 | |
| | 1,833 | | | Cia Energetica do Ceara - Class A, Preference Shares | | | 29,456 | |
| | 16,200 | | | Cia Ferro Ligas da Bahia-FERBASA - Preference Shares | | | 83,493 | |
| | 31,800 | | | Cia Hering | | | 283,850 | |
| | 3,400 | | | Cia Paranaense de Energia - Class B, Preference Shares | | | 26,139 | |
| | 137,000 | | | Cia Siderurgica Nacional SA(b) | | | 354,718 | |
| | 2,128 | | | Construtora Tenda SA(b) | | | 11,189 | |
| | 21,562 | | | Cosan Logistica SA(b) | | | 61,694 | |
| | 5,584 | | | Cosan Logistica SA(b) | | | 15,875 | |
| | 17,800 | | | Cosan SA Industria e Comercio | | | 203,068 | |
| | 9,600 | | | CVC Brasil Operadora e Agencia de Viagens SA | | | 127,480 | |
| | 74,588 | | | Cyrela Brazil Realty SA Empreendimentos e Participacoes | | | 291,849 | |
| | 30,000 | | | Direcional Engenharia SA(b) | | | 54,199 | |
| | 202,995 | | | Duratex SA | | | 595,712 | |
| | 22,800 | | | EcoRodovias Infraestrutura e Logistica SA | | | 85,100 | |
| | 25,500 | | | EDP - Energias do Brasil SA | | | 113,652 | |
| | 7,300 | | | Eletropaulo Metropolitana Eletricidade de Sao Paulo SA - Preference Shares | | | 32,737 | |
| | 222,272 | | | Embraer SA | | | 1,068,792 | |
| | 42,200 | | | Embraer SA - ADR | | | 807,708 | |
| | 3,000 | | | Engie Brasil Energia SA | | | 33,060 | |
| | 16,700 | | | Equatorial Energia SA | | | 311,967 | |
| | 29,000 | | | Estacio Participacoes SA | | | 260,985 | |
| | 6,600 | | | Eternit SA(b) | | | 2,179 | |
| | 69,200 | | | Even Construtora e Incorporadora SA(b) | | | 113,807 | |
| | 20,700 | | | Exactech, Inc. | | | 866,295 | |
| | 20,600 | | | Ez Tec Empreendimentos e Participacoes SA | | | 135,893 | |
| | 417,018 | | | Fibria Celulose SA | | | 6,655,614 | |
| | 28,600 | | | Fleury SA | | | 251,090 | |
| | 8,000 | | | Fras-Le SA | | | 13,548 | |
| | 7,100 | | | GAEC Educacao SA | | | 53,500 | |
| | 34,100 | | | Gerdau SA | | | 112,996 | |
| | 88,300 | | | Gerdau SA - Preference Shares | | | 295,566 | |
| | 8,200 | | | Gol-Linhas Aereas Inteligentes SA - Preference Shares(b) | | | 34,767 | |
| | 12,200 | | | Grendene SA | | | 102,186 | |
| | 3,100 | | | Guararapes Confeccoes SA | | | 148,305 | |
| | 45,131 | | | Hypermarcas SA | | | 473,342 | |
| | 10,300 | | | Iguatemi Empresa de Shopping Centers SA | | | 121,032 | |
| | 44,800 | | | International Meal Company Alimentacao SA | | | 143,659 | |
| | 47,172 | | | Iochpe-Maxion SA | | | 322,719 | |
| Shares | | | | | Value | |
| BRAZIL (continued) | | | |
| | 7,000 | | | JSL SA(b) | | $ | 19,858 | |
| | 65,500 | | | Klabin SA - Units | | | 379,429 | |
| | 138,684 | | | Kroton Educacional SA | | | 769,030 | |
| | 9,000 | | | Light SA(b) | | | 50,127 | |
| | 8,400 | | | Linx SA | | | 53,487 | |
| | 20,574 | | | Localiza Rent a Car SA | | | 361,946 | |
| | 33,406 | | | Lojas Americanas SA | | | 147,663 | |
| | 15,044 | | | Lojas Americanas SA - Preference Shares | | | 80,433 | |
| | 127,053 | | | Lojas Renner SA | | | 1,336,051 | |
| | 20,700 | | | M Dias Branco SA | | | 306,137 | |
| | 15,700 | | | Magnesita Refratarios SA | | | 221,248 | |
| | 600 | | | Mahle-Metal Leve SA | | | 3,965 | |
| | 12,687 | | | Marcopolo SA(b) | | | 12,915 | |
| | 258,700 | | | Marcopolo SA - Preference Shares(b) | | | 314,745 | |
| | 25,184 | | | Marfrig Global Foods SA(b) | | | 49,039 | |
| | 12,201 | | | Marisa Lojas SA(b) | | | 29,614 | |
| | 24,900 | | | Mills Estruturas e Servicos de Engenharia SA(b) | | | 32,730 | |
| | 11,800 | | | Minerva SA | | | 41,338 | |
| | 60,800 | | | MRV Engenharia e Participacoes SA | | | 235,483 | |
| | 10,000 | | | Multiplan Empreendimentos Imobiliarios SA | | | 218,843 | |
| | 6,500 | | | Multiplus SA | | | 75,624 | |
| | 30,900 | | | Natura Cosmeticos SA | | | 292,442 | |
| | 33,761 | | | Odontoprev SA | | | 162,030 | |
| | 48,400 | | | Paranapanema SA(b) | | | 22,045 | |
| | 51,655 | | | Porto Seguro SA | | | 564,663 | |
| | 60,000 | | | Portobello SA | | | 108,397 | |
| | 3,200 | | | Profarma Distribuidora de Produtos Farmaceuticos SA(b) | | | 8,090 | |
| | 3,800 | | | Prumo Logistica SA(b) | | | 12,929 | |
| | 58,000 | | | Qualicorp SA | | | 620,194 | |
| | 8,400 | | | Raia Drogasil SA | | | 202,136 | |
| | 70,700 | | | Randon Participacoes SA - Preference Shares | | | 151,069 | |
| | 714 | | | Restoque Comercio e Confeccoes de Roupas SA(b) | | | 9,604 | |
| | 41,490 | | | Rumo SA(b) | | | 160,694 | |
| | 42,550 | | | Santos Brasil Participacoes SA(b) | | | 45,525 | |
| | 56,483 | | | Sao Martinho SA | | | 318,044 | |
| | 6,300 | | | Ser Educacional SA | | | 59,297 | |
| | 700 | | | Ser Educacional SA(b) | | | 6,589 | |
| | 16,500 | | | SLC Agricola SA | | | 111,318 | |
| | 11,600 | | | Smiles Fidelidade SA | | | 299,494 | |
| | 2,800 | | | Sonae Sierra Brasil SA | | | 23,701 | |
| | 14,900 | | | Springs Global Participacoes SA(b) | | | 54,657 | |
| | 167,612 | | | Sul America SA - Units | | | 919,706 | |
| | 116,559 | | | Suzano Papel e Celulose SA - Class A, Preference Shares(b) | | | 721,880 | |
| | 15,000 | | | T4F Entretenimento SA | | | 40,901 | |
| | 7,400 | | | Technos SA | | | 9,750 | |
| Old Westbury Funds, Inc. | |
| Small & Mid Cap Strategies Fund | |
| Portfolio of Investments - (Continued) | October 31, 2017 |
| | |
| Shares | | | | | Value | |
| BRAZIL (continued) | | | |
| | 68,500 | | | Tim Participacoes SA | | $ | 253,580 | |
| | 17,621 | | | Totvs SA | | | 175,063 | |
| | 32,800 | | | TPI - Triunfo Participacoes e Investimentos SA(b) | | | 38,502 | |
| | 23,200 | | | Transmissora Alianca de Energia Eletrica SA - Units | | | 145,740 | |
| | 32,900 | | | Tupy SA | | | 175,196 | |
| | 15,400 | | | Unipar Carbocloro SA - Preference Shares | | | 62,282 | |
| | 3,700 | | | Usinas Siderurgicas de Minas Gerais SA(b) | | | 13,573 | |
| | 167,500 | | | Usinas Siderurgicas de Minas Gerais SA - Class A, Preference Shares(b) | | | 450,585 | |
| | 14,589 | | | Valid Solucoes e Servicos de Seguranca em Meios de Pagamento e Identificacao SA | | | 81,657 | |
| | 92,200 | | | Via Varejo SA - Units(b) | | | 631,333 | |
| | 12,400 | | | Wiz Solucoes e Corretagem de Seguros SA | | | 61,331 | |
| | | | | | | | 30,638,448 | |
| CAMBODIA — 0.0% | | | |
| | 320,000 | | | NagaCorp Ltd. | | | 258,415 | |
| CANADA — 2.4% | | | |
| | 2,275 | | | Absolute Software Corp. | | | 14,725 | |
| | 2,408 | | | Acadian Timber Corp. | | | 36,565 | |
| | 83,136 | | | Advantage Oil & Gas Ltd.(b) | | | 440,136 | |
| | 27,538 | | | Aecon Group, Inc. | | | 414,746 | |
| | 1,900 | | | AG Growth International, Inc. | | | 74,374 | |
| | 20,000 | | | AGF Management Ltd. - Class B | | | 128,827 | |
| | 1,910 | | | AGT Food & Ingredients, Inc. | | | 34,244 | |
| | 2,500 | | | Air Canada(b) | | | 49,531 | |
| | 1,200 | | | AirBoss of America Corp. | | | 10,743 | |
| | 40,768 | | | Alamos Gold, Inc. - Class A | | | 258,177 | |
| | 2,681 | | | Algoma Central Corp. | | | 27,120 | |
| | 44,100 | | | Algonquin Power & Utilities Corp. | | | 472,073 | |
| | 2,050 | | | Alio Gold, Inc.(b) | | | 8,136 | |
| | 19,458 | | | AltaGas Ltd. | | | 443,578 | |
| | 4,000 | | | Altus Group Ltd. | | | 109,232 | |
| | 1,400 | | | Andrew Peller Ltd. | | | 13,402 | |
| | 55,510 | | | ARC Resources Ltd. | | | 676,825 | |
| | 7,300 | | | Atco Ltd. - Class I | | | 264,704 | |
| | 51,400 | | | Athabasca Oil Corp.(b) | | | 46,217 | |
| | 15,400 | | | ATS Automation Tooling Systems, Inc.(b) | | | 177,265 | |
| | 2,554 | | | AutoCanada, Inc. | | | 46,147 | |
| | 2,400 | | | Avigilon Corp.(b) | | | 35,588 | |
| | 267,386 | | | B2Gold Corp.(b) | | | 679,812 | |
| | 2,400 | | | Badger Daylighting Ltd. | | | 54,638 | |
| | 5,740 | | | Bellatrix Exploration Ltd.(b) | | | 13,748 | |
| | 12,200 | | | Birchcliff Energy Ltd. | | | 49,647 | |
| | 176,217 | | | BlackBerry Ltd.(b) | | | 1,928,675 | |
| | 8,400 | | | Bombardier, Inc. - Class A(b) | | | 17,906 | |
| | 76,155 | | | Bombardier, Inc. - Class B(b) | | | 161,153 | |
| Shares | | | | | Value | |
| CANADA (continued) | | | |
| | 69,385 | | | Bonavista Energy Corp. | | $ | 147,364 | |
| | 8,200 | | | Boralex, Inc. - Class A | | | 145,682 | |
| | 1,328,652 | | | CAE, Inc. | | | 23,543,124 | |
| | 16,500 | | | Calfrac Well Services Ltd.(b) | | | 66,506 | |
| | 500 | | | Calian Group Ltd. | | | 12,875 | |
| | 40,400 | | | Cameco Corp. | | | 328,185 | |
| | 18,300 | | | Canaccord Genuity Group, Inc. | | | 60,853 | |
| | 35,750 | | | Canacol Energy Ltd.(b) | | | 113,615 | |
| | 6,800 | | | Canadian Apartment Properties REIT | | | 179,580 | |
| | 3,400 | | | Canadian Real Estate Investment Trust REIT | | | 122,812 | |
| | 22,300 | | | Canadian Western Bank | | | 628,154 | |
| | 26,643 | | | Canfor Corp.(b) | | | 529,927 | |
| | 11,757 | | | Canfor Pulp Products, Inc. | | | 128,406 | |
| | 8,000 | | | CanWel Building Materials Group Ltd. | | | 41,113 | |
| | 72,367 | | | Capstone Mining Corp.(b) | | | 82,458 | |
| | 43,552 | | | Cascades, Inc. | | | 524,609 | |
| | 31,157 | | | Celestica, Inc.(b) | | | 312,753 | |
| | 67,326 | | | Centerra Gold, Inc.(b) | | | 457,155 | |
| | 18,544 | | | CES Energy Solutions Corp. | | | 99,900 | |
| | 2,700 | | | Chesswood Group Ltd. | | | 26,956 | |
| | 13,300 | | | CI Financial Corp. | | | 295,670 | |
| | 227,698 | | | Cineplex, Inc. | | | 6,886,889 | |
| | 68,500 | | | City Office REIT Inc. | | | 893,240 | |
| | 6,800 | | | Cogeco Communications Inc. | | | 488,877 | |
| | 3,464 | | | Cogeco, Inc. | | | 236,124 | |
| | 9,700 | | | Colliers International Group, Inc. | | | 568,496 | |
| | 3,600 | | | Cominar Real Estate Investment Trust | | | 38,620 | |
| | 6,825 | | | Computer Modelling Group Ltd. | | | 54,120 | |
| | 49,000 | | | Copper Mountain Mining Corp.(b) | | | 59,251 | |
| | 1,912 | | | Corby Spirit and Wine Ltd. | | | 32,457 | |
| | 3,800 | | | Corus Entertainment, Inc. - Class B | | | 35,258 | |
| | 50,217 | | | Cott Corp. | | | 752,807 | |
| | 43,200 | | | Crescent Point Energy Corp. | | | 355,284 | |
| | 18,491 | | | Crew Energy, Inc.(b) | | | 62,635 | |
| | 48,220 | | | Delphi Energy Corp.(b) | | | 44,852 | |
| | 10,500 | | | Denison Mines Corp.(b) | | | 4,314 | |
| | 6,900 | | | Descartes Systems Group, Inc. (The)(b) | | | 200,031 | |
| | 35,700 | | | Detour Gold Corp.(b) | | | 380,494 | |
| | 4,300 | | | DHX Media Ltd. | | | 14,166 | |
| | 11,696 | | | Dominion Diamond Corp. | | | 166,668 | |
| | 11,430 | | | Dominion Diamond Corp.(b) | | | 162,666 | |
| | 11,361 | | | Dorel Industries, Inc. - Class B | | | 296,244 | |
| | 91,300 | | | ECN Capital Corp. | | | 299,356 | |
| | 664 | | | E-L Financial Corp. Ltd. | | | 425,653 | |
| | 9,887 | | | Eldorado Gold Corp. | | | 12,415 | |
| | 91,300 | | | Element Fleet Management Corp. | | | 703,451 | |
| | 33,669 | | | Empire Co. Ltd. - Class A | | | 582,768 | |
| Old Westbury Funds, Inc. |
| Small & Mid Cap Strategies Fund |
| Portfolio of Investments - (Continued) | October 31, 2017 |
| |
| Shares | | | | | Value | |
| CANADA (continued) | | | |
| | 4,200 | | | Enbridge Income Fund Holdings, Inc. | | $ | 97,895 | |
| | 18,173 | | | EnerCare, Inc. | | | 283,280 | |
| | 41,281 | | | Enerflex Ltd. | | | 561,570 | |
| | 26,031 | | | Enerplus Corp. | | | 238,700 | |
| | 2,342 | | | Enghouse Systems Ltd. | | | 98,974 | |
| | 6,417 | | | Ensign Energy Services, Inc. | | | 33,028 | |
| | 50,333 | | | Entertainment One Ltd. | | | 188,917 | |
| | 17,570 | | | Epsilon Energy Ltd.(b) | | | 43,581 | |
| | 3,142 | | | Equitable Group, Inc. | | | 146,128 | |
| | 2,800 | | | Evertz Technologies Ltd. | | | 40,933 | |
| | 3,224 | | | Exchange Income Corp. | | | 86,716 | |
| | 8,800 | | | Exco Technologies Ltd. | | | 71,418 | |
| | 38 | | | EXFO, Inc.(b) | | | 147 | |
| | 10,800 | | | Extendicare, Inc. | | | 78,440 | |
| | 1,000 | | | Fiera Capital Corp. | | | 10,898 | |
| | 76,082 | | | Finning International, Inc. | | | 1,855,313 | |
| | 7,834 | | | First Capital Realty Inc. | | | 124,241 | |
| | 21,951 | | | First Majestic Silver Corp.(b) | | | 147,860 | |
| | 1,563 | | | First National Financial Corp. | | | 34,771 | |
| | 202,903 | | | First Quantum Minerals Ltd. | | | 2,269,506 | |
| | 9,700 | | | FirstService Corp. - Voting Shares | | | 675,263 | |
| | 35,000 | | | Fortuna Silver Mines, Inc.(b) | | | 147,314 | |
| | 1,000 | | | GDI Integrated Facility Services, Inc.(b) | | | 11,922 | |
| | 23,321 | | | Genworth MI Canada, Inc. | | | 724,703 | |
| | 3,400 | | | Gluskin Sheff + Associates, Inc. | | | 42,536 | |
| | 400 | | | goeasy Ltd. | | | 9,689 | |
| | 56,629 | | | Gran Tierra Energy, Inc.(b) | | | 123,345 | |
| | 10,752 | | | Great Canadian Gaming Corp.(b) | | | 255,528 | |
| | 8,500 | | | H&R Real Estate Investment Trust | | | 141,129 | |
| | 10,074 | | | Heroux-Devtek, Inc.(b) | | | 114,944 | |
| | 4,040 | | | High Liner Foods, Inc. | | | 44,499 | |
| | 7,648 | | | Home Capital Group, Inc. | | | 82,758 | |
| | 40,445 | | | HudBay Minerals, Inc. | | | 300,649 | |
| | 104,563 | | | IAMGOLD Corp.(b) | | | 573,836 | |
| | 7,400 | | | IMAX Corp. | | | 179,450 | |
| | 18,778 | | | Imperial Metals Corp.(b) | | | 43,230 | |
| | 36,900 | | | Industrial Alliance Insurance and Financial Services, Inc. | | | 1,672,098 | |
| | 674,632 | | | Innergex Renewable Energy, Inc.(a) | | | 7,368,084 | |
| | 27,000 | | | Interfor Corp.(b) | | | 439,501 | |
| | 15,926 | | | Intertape Polymer Group, Inc. | | | 235,045 | |
| | 18,416 | | | Jean Coutu Group PJC, Inc. (The) Class A | | | 349,449 | |
| | 10,100 | | | Just Energy Group, Inc. | | | 56,211 | |
| | 1,300 | | | K-Bro Linen, Inc. | | | 39,360 | |
| | 8,800 | | | Kelt Exploration Ltd.(b) | | | 48,226 | |
| | 20,366 | | | Keyera Corp. | | | 599,566 | |
| | 1,953 | | | Kingsway Financial Services, Inc.(b) | | | 10,673 | |
| | 514,345 | | | Kinross Gold Corp.(b) | | | 2,033,299 | |
| | 36,601 | | | Kirkland Lake Gold Ltd. | | | 429,248 | |
| Shares | | | | | Value | |
| CANADA (continued) | | | |
| | 16,100 | | | Klondex Mines Ltd.(b) | | $ | 46,549 | |
| | 14,535 | | | Laurentian Bank of Canada | | | 675,994 | |
| | 8,626 | | | Leon’s Furniture Ltd. | | | 130,851 | |
| | 17,910 | | | Linamar Corp. | | | 1,086,733 | |
| | 5,500 | | | Liquor Stores NA Ltd. | | | 41,822 | |
| | 70,300 | | | Lucara Dianmond Corp. | | | 122,607 | |
| | 1,327 | | | Lululemon Athletica, Inc.(b) | | | 81,624 | |
| | 164,691 | | | Lundin Mining Corp. | | | 1,256,150 | |
| | 7,130 | | | Magellan Aerospace Corp. | | | 106,776 | |
| | 500 | | | Mainstreet Equity Corp.(b) | | | 14,635 | |
| | 24,900 | | | Major Drilling Group International, Inc.(b) | | | 133,369 | |
| | 47,229 | | | Mandalay Resources Corp. | | | 10,800 | |
| | 19,300 | | | Maple Leaf Foods, Inc. | | | 500,564 | |
| | 28,898 | | | Martinrea International, Inc. | | | 283,358 | |
| | 7,862 | | | Maxar Technologies Ltd. | | | 497,340 | |
| | 1,818 | | | Maxar Technologies Ltd. | | | 115,079 | |
| | 2,100 | | | Mediagrif Interactive Technologies, Inc. | | | 21,894 | |
| | 12,500 | | | MEG Energy Corp.(b) | | | 55,519 | |
| | 2,123 | | | Melcor Developments Ltd. | | | 24,766 | |
| | 2,617 | | | Mercer International, Inc. | | | 38,470 | |
| | 13,200 | | | Methanex Corp.(d) | | | 643,500 | |
| | 1,803 | | | Methanex Corp.(d) | | | 87,865 | |
| | 6,054 | | | Mitel Networks Corp.(b) | | | 52,042 | |
| | 10,302 | | | Morneau Shepell, Inc. | | | 171,607 | |
| | 2,186 | | | MTY Food Group, Inc. | | | 86,298 | |
| | 38,700 | | | Mullen Group Ltd. | | | 507,861 | |
| | 7,829 | | | New Flyer Industries, Inc. | | | 332,191 | |
| | 122,558 | | | New Gold, Inc.(b) | | | 405,645 | |
| | 4,802 | | | Norbord, Inc. | | | 173,082 | |
| | 10,846 | | | North West Co., Inc. (The) | | | 264,656 | |
| | 16,129 | | | Northland Power, Inc. | | | 308,428 | |
| | 324,613 | | | Northview Apartment Real Estate Investment Trust | | | 5,857,678 | |
| | 2,700 | | | NorthWest Healthcare Properties Real Estate Investment Trust | | | 23,796 | |
| | 65,000 | | | NuVista Energy Ltd.(b) | | | 404,077 | |
| | 8,600 | | | Osisko Gold Royalties Ltd. | | | 108,258 | |
| | 26,536 | | | Pan American Silver Corp. | | | 433,593 | |
| | 12,837 | | | Pan American Silver Corp. | | | 209,628 | |
| | 6,332 | | | Paramount Resources Ltd. - Class A(b) | | | 108,372 | |
| | 54,424 | | | Parex Resources, Inc.(b) | | | 723,910 | |
| | 45,056 | | | Parkland Fuel Corp. | | | 915,020 | |
| | 14,000 | | | Pason Systems, Inc. | | | 203,256 | |
| | 5,653 | | | Pizza Pizza Royalty Corp. | | | 75,192 | |
| | 56,600 | | | Precision Drilling Corp.(b) | | | 169,787 | |
| | 6,936 | | | Premium Brands Holdings Corp. | | | 561,289 | |
| | 6,820 | | | Pulse Seismic, Inc.(b) | | | 17,657 | |
| | 6,200 | | | Pure Industrial Real Estate Trust REIT | | | 32,007 | |
| | 33,200 | | | Quarterhill, Inc. | | | 62,792 | |
| | 26,700 | | | Quebecor, Inc. - Class B | | | 1,007,485 | |
| Old Westbury Funds, Inc. |
| Small & Mid Cap Strategies Fund |
| Portfolio of Investments - (Continued) | October 31, 2017 |
| |
| Shares | | | | | Value | |
| CANADA (continued) |
| | 14,785 | | | Questerre Energy Corp. - Class A(b) | | $ | 8,481 | |
| | 10,943 | | | RB Energy, Inc.(a)(b) | | | 11 | |
| | 13,200 | | | Richelieu Hardware Ltd. | | | 345,731 | |
| | 20,367 | | | Richmont Mines, Inc.(b) | | | 177,290 | |
| | 789,000 | | | Ritchie Bros Auctioneers, Inc. | | | 22,115,670 | |
| | 369,843 | | | Ritchie Bros. Auctioneers, Inc.(d) | | | 10,372,002 | |
| | 3,100 | | | Rocky Mountain Dealerships, Inc. | | | 28,258 | |
| | 26,754 | | | Rogers Sugar, Inc. | | | 131,686 | |
| | 13,600 | | | Russel Metals, Inc. | | | 304,026 | |
| | 33,588 | | | Sandstorm Gold Ltd.(b) | | | 144,756 | |
| | 27,414 | | | Secure Energy Services, Inc. | | | 178,708 | |
| | 118,801 | | | SEMAFO, Inc.(b) | | | 298,361 | |
| | 7,250 | | | Seven Generations Energy Ltd. - Class A(b) | | | 109,472 | |
| | 11,300 | | | ShawCor Ltd. | | | 244,902 | |
| | 76,500 | | | Sherritt International Corp.(b) | | | 78,273 | |
| | 6,082 | | | Sienna Senior Living, Inc. | | | 83,774 | |
| | 12,100 | | | Sierra Wireless, Inc.(b) | | | 270,681 | |
| | 3,400 | | | Smart Real Estate Investment Trust REIT | | | 76,375 | |
| | 5,900 | | | SNC-Lavalin Group, Inc. | | | 265,800 | |
| | 28,100 | | | Sprott, Inc. | | | 46,394 | |
| | 48,544 | | | SSR Mining, Inc.(b) | | | 466,212 | |
| | 12,222 | | | Stantec, Inc. | | | 349,200 | |
| | 4,087 | | | Stantec, Inc. | | | 116,888 | |
| | 19,615 | | | Stars Group, Inc. (The)(b) | | | 394,854 | |
| | 7,060 | | | Stella-Jones, Inc. | | | 275,811 | |
| | 2,100 | | | Stuart Olson, Inc. | | | 8,676 | |
| | 22,548 | | | Student Transportation, Inc. | | | 131,957 | |
| | 19,026 | | | SunOpta, Inc.(b) | | | 176,972 | |
| | 20,300 | | | Superior Plus Corp. | | | 204,400 | |
| | 42,709 | | | Surge Energy, Inc. | | | 71,507 | |
| | 32,400 | | | Tamarack Valley Energy Ltd.(b) | | | 75,845 | |
| | 15,975 | | | Tembec, Inc.(b) | | | 58,075 | |
| | 14,598 | | | Teranga Gold Corp.(b) | | | 29,646 | |
| | 21,164 | | | TFI International, Inc. | | | 510,850 | |
| | 2,400 | | | Theratechnologies, Inc.(b) | | | 14,231 | |
| | 4,501 | | | TMX Group Ltd. | | | 245,931 | |
| | 44,000 | | | TORC Oil & Gas Ltd. | | | 231,579 | |
| | 20,645 | | | Toromont Industries Ltd. | | | 910,070 | |
| | 17,764 | | | Total Energy Services, Inc. | | | 209,158 | |
| | 31,186 | | | Tourmaline Oil Corp.(b) | | | 570,732 | |
| | 17,123 | | | TransAlta Corp. | | | 101,270 | |
| | 13,378 | | | TransAlta Corp. | | | 79,599 | |
| | 502,377 | | | Transalta Renewables, Inc. | | | 5,416,684 | |
| | 30,590 | | | Transcontinental, Inc. - Class A | | | 679,093 | |
| | 55,852 | | | Trican Well Service Ltd.(b) | | | 209,970 | |
| | 101,200 | | | Turquoise Hill Resources Ltd.(b) | | | 309,068 | |
| | 6,497 | | | Uni-Select, Inc. | | | 140,405 | |
| | 3,080 | | | Valener, Inc. | | | 52,881 | |
| | 9,795 | | | Vermilion Energy, Inc. | | | 334,303 | |
| | 1,936 | | | Vermilion Energy, Inc. | | | 66,074 | |
| Shares | | | | | Value | |
| CANADA (continued) |
| | 3,202 | | | Wajax Corp. | | $ | 58,227 | |
| | 63,793 | | | Waste Connections, Inc. | | | 4,507,195 | |
| | 20,400 | | | Wesdome Gold Mines Ltd.(b) | | | 28,305 | |
| | 7,900 | | | West Fraser Timber Co. Ltd. | | | 480,515 | |
| | 148,038 | | | Western Forest Products, Inc. | | | 300,643 | |
| | 6,800 | | | Westjet Airlines Ltd. | | | 142,104 | |
| | 8,613 | | | Westshore Terminals Investment Corp. | | | 164,302 | |
| | 55,124 | | | Whitecap Resources, Inc. | | | 395,666 | |
| | 4,348 | | | Winpak Ltd. | | | 167,840 | |
| | 327,069 | | | WSP Global, Inc. | | | 14,658,654 | |
| | 132,566 | | | Yamana Gold, Inc. | | | 344,234 | |
| | 11,914 | | | Yellow Pages Ltd.(b) | | | 76,465 | |
| | 6,007 | | | ZCL Composites, Inc. | | | 63,325 | |
| | | | | | | | 159,758,577 | |
| CAYMAN ISLANDS — 0.0% |
| | 8,082 | | | Bitauto Holdings Ltd. | | | 365,064 | |
| | 29,600 | | | Greenlight Capital Re Ltd. - Class A(b) | | | 652,680 | |
| | | | | | | | 1,017,744 | |
| CHILE — 0.1% |
| | 253,140 | | | AES Gener SA | | | 87,407 | |
| | 1,830,940 | | | Aguas Andinas SA - Class A | | | 1,192,866 | |
| | 61,605 | | | Banmedica SA | | | 200,365 | |
| | 107,384 | | | Besalco SA | | | 125,964 | |
| | 49,097 | | | CAP SA | | | 534,231 | |
| | 18,740 | | | Cia Cervecerias Unidas SA | | | 270,431 | |
| | 4,698,243 | | | Cia Sud Americana de Vapores SA(b) | | | 267,670 | |
| | 47,017 | | | Coca-Cola Embonor SA - Class B, Preference Shares | | | 128,910 | |
| | 465,357 | | | Colbún SA | | | 109,859 | |
| | 46,074 | | | Embotelladora Andina SA - Class B | | | 236,208 | |
| | 35,206 | | | Empresa Nacional de Telecomunicaciones SA | | | 409,207 | |
| | 17,319 | | | Empresas Hites SA | | | 19,048 | |
| | 493,391 | | | Empresas La Polar SA(b) | | | 56,467 | |
| | 1,369,725 | | | Enel Chile SA | | | 159,667 | |
| | 756,521 | | | Engie Energia Chile SA | | | 1,609,204 | |
| | 364,029 | | | Enjoy SA(b) | | | 36,148 | |
| | 10,794 | | | Forus SA | | | 46,978 | |
| | 152,426 | | | Grupo Security SA | | | 69,017 | |
| | 263,298 | | | Inversiones Aguas Metropolitanas SA | | | 478,442 | |
| | 5,968 | | | Inversiones La Construccion SA | | | 101,291 | |
| | 37,586,978 | | | Itau CorpBanca | | | 350,387 | |
| | 273,781 | | | Masisa SA(b) | | | 21,061 | |
| | 6,895 | | | Parque Arauco SA | | | 19,781 | |
| | 49,518 | | | PAZ Corp. SA | | | 85,584 | |
| | 11,951 | | | Ripley Corp. SA | | | 12,527 | |
| | 141,573 | | | Salfacorp SA | | | 243,796 | |
| | 120,485 | | | Sigdo Koppers SA | | | 233,947 | |
| | 507,222 | | | Sociedad Matriz SAAM SA | | | 53,013 | |
| | 29,332 | | | Socovesa SA | | | 18,592 | |
| Old Westbury Funds, Inc. |
| Small & Mid Cap Strategies Fund |
| Portfolio of Investments - (Continued) | October 31, 2017 |
| |
| Shares | | | | | Value | |
| CHILE (continued) |
| | 28,425 | | | SONDA SA | | $ | 55,367 | |
| | 29,577 | | | Vina Concha y Toro SA | | | 52,123 | |
| | | | | | | | 7,285,558 | |
| CHINA — 1.5% |
| | 22,302 | | | 21Vianet Group, Inc. - ADR(b) | | | 167,488 | |
| | 3,212 | | | 500.Com Ltd. - Class A - ADR(b) | | | 30,225 | |
| | 2,280 | | | 51Job, Inc. - ADR(b) | | | 141,132 | |
| | 9,841 | | | 58.Com Inc. - ADR(b) | | | 661,020 | |
| | 1,877,250 | | | Agile Property Holdings Ltd. | | | 2,733,556 | |
| | 2,409,000 | | | Agricultural Bank of China Ltd. - H Shares | | | 1,133,262 | |
| | 2,870,000 | | | Aluminum Corp. of China Ltd. - H Shares(b) | | | 2,310,303 | |
| | 1,230,000 | | | Angang Steel Co. Ltd. - H Shares | | | 1,076,845 | |
| | 91,000 | | | ANTA Sports Products Ltd. | | | 407,094 | |
| | 410,000 | | | Anton Oilfield Services Group(b) | | | 48,876 | |
| | 210,000 | | | Asia Cement China Holdings Corp. | | | 73,218 | |
| | 128,813 | | | Asia Plastic Recycling Holding Ltd. | | | 54,883 | |
| | 164,000 | | | AVIC International Holdings Ltd. | | | 153,039 | |
| | 849,000 | | | AviChina Industry & Technology Co. - H Shares | | | 492,985 | |
| | 270,500 | | | Baic Motor Corp. Ltd. | | | 316,567 | |
| | 1,749,000 | | | Bank of China Ltd. - H Shares | | | 872,101 | |
| | 140,500 | | | Bank of Chongqing Co. Ltd. - H Shares | | | 114,001 | |
| | 1,257,000 | | | Bank of Communications Co. Ltd. - H Shares | | | 947,415 | |
| | 104,000 | | | Baoye Group Co. Ltd. - H Shares(b) | | | 73,187 | |
| | 27,775 | | | Baozun, Inc. - ADR(b) | | | 871,857 | |
| | 1,089,000 | | | BBMG Corp. - H Shares | | | 543,006 | |
| | 306,000 | | | Beijing Capital International Airport Co. Ltd. - H Shares | | | 502,064 | |
| | 446,000 | | | Beijing Capital Land Ltd. - H Shares | | | 240,111 | |
| | 176,000 | | | Beijing North Star Co. Ltd. - H Shares | | | 65,424 | |
| | 34,000 | | | Beijing Urban Construction Design & Development Group Co. Ltd. | | | 19,655 | |
| | 15,000 | | | Bloomage BioTechnology Corp. Ltd.(a)(c) | | �� | 31,225 | |
| | 343,000 | | | BYD Electronic International Co. Ltd. | | | 927,692 | |
| | 72,000 | | | Cabbeen Fashion Ltd. | | | 19,658 | |
| | 206,000 | | | CAR, Inc.(b) | | | 183,518 | |
| | 5,000 | | | Cayman Engley Industrial Co. Ltd. | | | 28,266 | |
| | 287,656 | | | Central China Real Estate Ltd.(b) | | | 137,903 | |
| Shares | | | | | Value | |
| CHINA (continued) | | | |
| | 120,000 | | | Central China Securities Co. Ltd. | | $ | 55,221 | |
| | 32,000 | | | Changshouhua Food Co. Ltd. | | | 15,709 | |
| | 140,000 | | | Chaowei Power Holdings Ltd. | | | 78,960 | |
| | 70,000 | | | China Animal Healthcare Ltd.(a)(b)(c) | | | 8,748 | |
| | 1,116,000 | | | China Aoyuan Property Group Ltd. | | | 676,632 | |
| | 196,000 | | | China BlueChemical Ltd. - H Shares | | | 58,538 | |
| | 708,000 | | | China Coal Energy Co. Ltd. - H Shares | | | 323,988 | |
| | 846,000 | | | China Communications Services Corp. Ltd. - H Shares | | | 512,931 | |
| | 33,000 | | | China Conch Venture Holdings Ltd. | | | 67,257 | |
| | 967,000 | | | China Construction Bank Corp. - H Shares | | | 862,707 | |
| | 121,000 | | | China Datang Corp. Renewable Power Co. Ltd. - H Shares | | | 15,975 | |
| | 102,000 | | | China Eastern Airlines Corp. Ltd. - H Shares | | | 51,775 | |
| | 268,000 | | | China Energy Engineering Corp. Ltd. | | | 47,407 | |
| | 31,600 | | | China Everbright Water Ltd. | | | 11,243 | |
| | 186,000 | | | China Financial Services Holdings Ltd. | | | 16,212 | |
| | 29,004 | | | China Gold International Resources Corp. Ltd.(b) | | | 44,964 | |
| | 25,638 | | | China Great Star International Ltd.(b) | | | 24,371 | |
| | 124,000 | | | China Greenland Broad Greenstate Group Co. Ltd. | | | 23,524 | |
| | 592,500 | | | China Harmony New Energy Auto Holding Ltd.(b) | | | 349,360 | |
| | 259,000 | | | China Hongqiao Group Ltd.(b) | | | 310,744 | |
| | 472,000 | | | China Huishan Dairy Holdings Co. Ltd.(a)(b)(c) | | | 472 | |
| | 79,500 | | | China Huiyuan Juice Group Ltd.(b) | | | 25,272 | |
| | 244,800 | | | China International Capital Corp. Ltd. | | | 504,574 | |
| | 59,100 | | | China International Marine Containers Group Co. Ltd. - H Shares | | | 117,724 | |
| | 2,216,000 | | | China Lesso Group Holdings Ltd. | | | 1,479,909 | |
| | 173,000 | | | China Lilang Ltd. | | | 134,605 | |
| | 76,000 | | | China Maple Leaf Educational Systems Ltd. | | | 82,416 | |
| | 138,000 | | | China Medical System Holdings Ltd. | | | 255,077 | |
| | 70,000 | | | China Meidong Auto Holdings Ltd. | | | 23,239 | |
| | 201,000 | | | China Mengniu Dairy Co. Ltd. | | | 556,516 | |
| | 337,000 | | | China Merchants Bank Co. Ltd. - H Shares | | | 1,285,122 | |
| Old Westbury Funds, Inc. |
| Small & Mid Cap Strategies Fund |
| Portfolio of Investments - (Continued) | October 31, 2017 |
| |
| Shares | | | | | Value | |
| CHINA (continued) |
| | 863,000 | | | China Minsheng Banking Corp. Ltd. - H Shares | | $ | 835,190 | |
| | 1,510,084 | | | China National Building Material Co. Ltd. - H Shares | | | 1,273,663 | |
| | 975,000 | | | China National Materials Co. Ltd. - H Shares | | | 673,629 | |
| | 92,000 | | | China Oilfield Services Ltd. | | | 81,488 | |
| | 682,000 | | | China Railway Construction Corp. Ltd. - H Shares | | | 855,844 | |
| | 1,285,000 | | | China Railway Group Ltd. - H Shares | | | 1,032,757 | |
| | 143,000 | | | China Railway Signal & Communication Corp. Ltd. | | | 112,546 | |
| | 1,012,000 | | | China Reinsurance Group Corp. | | | 224,416 | |
| | 138,000 | | | China Sanjiang Fine Chemicals Co. Ltd. | | | 58,905 | |
| | 6,735,400 | | | China SCE Property Holdings Ltd. | | | 3,039,020 | |
| | 91,000 | | | China Shineway Pharmaceutical Group Ltd. | | | 85,268 | |
| | 250,000 | | | China Silver Group Ltd. | | | 86,202 | |
| | 352,000 | | | China Southern Airlines Co. Ltd. - H Shares | | | 259,892 | |
| | 236,500 | | | China Sunshine Paper Holdings Co. Ltd. | | | 70,331 | |
| | 111,000 | | | China Suntien Green Energy Corp. Ltd. - H Shares | | | 31,444 | |
| | 164,000 | | | China Taifeng Beddings Holdings Ltd.(a)(b)(c) | | | 4,257 | |
| | 649,500 | | | China ZhengTong Auto Services Holdings Ltd. | | | 683,518 | |
| | 788,000 | | | China Zhongwang Holdings Ltd. | | | 464,635 | |
| | 434,000 | | | Chinasoft International Ltd. | | | 253,121 | |
| | 138,000 | | | Chongqing Machinery & Electric Co. Ltd. - H Shares | | | 16,805 | |
| | 703,000 | | | Chongqing Rural Commercial Bank Co. Ltd. - H Shares | | | 477,594 | |
| | 1,930,000 | | | CIFI Holdings Group Co. Ltd. | | | 1,076,153 | |
| | 36,000 | | | Colour Life Services Group Co. Ltd. | | | 21,412 | |
| | 85,000 | | | Consun Pharmaceutical Group Ltd. | | | 78,230 | |
| | 1,015,600 | | | Coolpad Group Ltd.(a)(b)(c) | | | 40,656 | |
| | 280,093 | | | COSCO Shipping Development Co. Ltd. - H Shares(b) | | | 62,830 | |
| | 390,000 | | | COSCO SHIPPING Energy Transportation Co. Ltd. - H Shares(c) | | | 228,459 | |
| | 300,000 | | | COSCO Shipping Holdings Co. Ltd. - H Shares(b) | | | 164,586 | |
| | 330,000 | | | Cosmo Lady China Holdings Co. Ltd. | | | 131,976 | |
| | 123,000 | | | CPMC Holdings Ltd. | | | 103,112 | |
| | 532,000 | | | CSPC Pharmaceutical Group Ltd. | | | 924,696 | |
| | 182,000 | | | CT Environmental Group Ltd. | | | 27,995 | |
| Shares | | | | | Value | |
| CHINA (continued) |
| | 104,000 | | | Da Ming International Holdings Ltd. | | $ | 42,126 | |
| | 324,000 | | | Dali Foods Group Co. Ltd. | | | 250,847 | |
| | 645,000 | | | Dalian Port PDA Co. Ltd. - H Shares | | | 112,441 | |
| | 244,000 | | | Datang International Power Generation Co .Ltd. - H Shares(b) | | | 82,257 | |
| | 474,000 | | | Dongfeng Motor Group Co. Ltd. - H Shares | | | 650,114 | |
| | 240,000 | | | Dongyue Group Ltd. | | | 174,430 | |
| | 95,000 | | | Dynagreen Environmental Protection Group Co. Ltd. - H Shares | | | 57,233 | |
| | 7,659 | | | Ehi Car Services Ltd. - ADR(b) | | | 87,849 | |
| | 44,000 | | | ENN Energy Holdings Ltd. | | | 322,609 | |
| | 1,567,500 | | | Fantasia Holdings Group Co. Ltd. | | | 223,027 | |
| | 32,000 | | | First Tractor Co. Ltd. - H Shares | | | 15,628 | |
| | 83,000 | | | Fu Shou Yuan International Group Ltd. | | | 58,302 | |
| | 454,600 | | | Fufeng Group Ltd. | | | 327,486 | |
| | 1,214,000 | | | Future Land Development Holdings Ltd. | | | 583,549 | |
| | 51,600 | | | Fuyao Glass Industry Group Co. Ltd. | | | 196,442 | |
| | 86,000 | | | Golden Eagle Retail Group Ltd. | | | 104,174 | |
| | 1,007,600 | | | GOME Electrical Appliances Holdings Ltd. | | | 129,156 | |
| | 434,000 | | | Goodbaby International Holdings Ltd. | | | 236,988 | |
| | 92,951 | | | Grand Baoxin Auto Group Ltd.(b) | | | 50,042 | |
| | 223,000 | | | Greatview Aseptic Packaging Co. Ltd. | | | 139,493 | |
| | 351,000 | | | Greenland Hong Kong Holdings Ltd. | | | 168,270 | |
| | 945,000 | | | Greentown China Holdings Ltd. | | | 1,179,827 | |
| | 61,000 | | | Guangdong Yueyun Transportation Co. Ltd. - H Shares | | | 39,096 | |
| | 94,000 | | | Guangshen Railway Co. Ltd. - H Shares | | | 54,703 | |
| | 1,291,600 | | | Guangzhou R&F Properties Co. Ltd. - H Shares | | | 2,751,608 | |
| | 58,000 | | | Guolian Securities Co. Ltd - H Shares | | | 28,400 | |
| | 86,000 | | | Haichang Ocean Park Holdings Ltd.(b) | | | 20,614 | |
| | 94,000 | | | Haitian International Holdings Ltd. | | | 281,347 | |
| | 150,000 | | | Harbin Bank Co. Ltd. - H Shares(b) | | | 45,184 | |
| | 108,000 | | | Harbin Electric Co. Ltd. - H Shares | | | 50,806 | |
| | 58,000 | | | HC International, Inc. | | | 45,723 | |
| Old Westbury Funds, Inc. |
| Small & Mid Cap Strategies Fund |
| Portfolio of Investments - (Continued) | October 31, 2017 |
| |
| Shares | | | | | Value | |
| CHINA (continued) |
| | 21,000 | | | Health and Happiness H&H International Holdings Ltd.(b) | | $ | 109,692 | |
| | 114,000 | | | Hengan International Group Co. Ltd. | | | 1,123,721 | |
| | 41,000 | | | Hengshi Mining Investments Ltd.(b) | | | 10,196 | |
| | 29,000 | | | Hiroca Holdings Ltd. | | | 111,060 | |
| | 33,000 | | | HNA Infrastructure Company Ltd. - H Shares | | | 35,532 | |
| | 68,000 | | | HOSA International Ltd. | | | 20,048 | |
| | 138,000 | | | Huan Yue Interactive Holdings Ltd.(b) | | | 15,036 | |
| | 2,228,000 | | | Huaneng Renewables Corp. Ltd. - H Shares | | | 765,381 | |
| | 277,000 | | | Huishang Bank Corp. Ltd. - H Shares | | | 140,250 | |
| | 1,383,000 | | | Industrial & Commercial Bank of China Ltd. - H Shares | | | 1,097,338 | |
| | 27,100 | | | Inner Mongolia Yitai Coal Co. Ltd. - H Shares | | | 31,924 | |
| | 24,700 | | | JD.Com, Inc. - ADR(b) | | | 926,744 | |
| | 90,000 | | | Jiangsu Expressway Co. Ltd. - H Shares | | | 137,975 | |
| | 169,000 | | | Jiangxi Copper Co. Ltd. - H Shares | | | 269,485 | |
| | 13,935 | | | Jinkosolar Holding Co., Ltd. - ADR(b) | | | 371,089 | |
| | 1,285,000 | | | Kaisa Group Holdings Ltd.(b) | | | 820,276 | |
| | 186,000 | | | Kangda International Environmental Co. Ltd. | | | 46,968 | |
| | 7,000 | | | Kasen International Holdings Ltd.(b) | | | 1,104 | |
| | 26,568 | | | Kingcan Holdings Ltd. | | | 22,287 | |
| | 908,000 | | | Kingdee International Software Group Co. Ltd.(b) | | | 486,508 | |
| | 755,000 | | | KWG Property Holding Ltd. | | | 749,058 | |
| | 96,500 | | | Legend Holdings Corp. | | | 253,576 | |
| | 2,302,000 | | | Lenovo Group Ltd. | | | 1,333,740 | |
| | 326,000 | | | Leoch International Technology Ltd. | | | 63,935 | |
| | 450,000 | | | Leyou Technologies Holdings Ltd.(b) | | | 115,941 | |
| | 398,000 | | | Lifetech Scientific Corp.(b) | | | 98,462 | |
| | 850,000 | | | Logan Property Holdings Co. Ltd. | | | 786,654 | |
| | 460,000 | | | Lonking Holdings Ltd. | | | 206,373 | |
| | 238,000 | | | Luye Pharma Group Ltd. | | | 158,638 | |
| | 2,850,000 | | | Maanshan Iron & Steel Co. Ltd. - H Shares(b) | | | 1,337,068 | |
| | 5,414,000 | | | Microport Scientific Corp. | | | 5,343,631 | |
| | 54,000 | | | Minth Group Ltd. | | | 291,409 | |
| | 95,000 | | | Mobile Internet China Holding Ltd. | | | 27,277 | |
| | 393,800 | | | Modern Land China Co. Ltd. | | | 77,232 | |
| | 14,295 | | | New Oriental Education & Technology Group, Inc. - ADR | | | 1,189,916 | |
| Shares | | | | | Value | |
| CHINA (continued) |
| | 2,060 | | | Noah Holdings Ltd. - ADR(b) | | $ | 80,793 | |
| | 5,100 | | | On-Bright Electronics, Inc. | | | 36,441 | |
| | 54,000 | | | O-Net Technologies Group Ltd.(b) | | | 39,039 | |
| | 162,000 | | | Ozner Water International Holding Ltd.(b) | | | 51,291 | |
| | 456,500 | | | Parkson Retail Group Ltd. | | | 69,633 | |
| | 19,900 | | | Poly Culture Group Corp. Ltd. | | | 47,853 | |
| | 1,899,000 | | | Postal Savings Bank of China Co. Ltd. - Class H | | | 1,146,498 | |
| | 900,000 | | | Powerlong Real Estate Holdings Ltd. | | | 428,000 | |
| | 81,000 | | | PW Medtech Group Ltd.(b) | | | 16,924 | |
| | 34,000 | | | Q Technology Group Co. Ltd. | | | 76,007 | |
| | 169,000 | | | Qingdao Port International Co. Ltd. | | | 119,362 | |
| | 342,000 | | | Qinhuangdao Port Co. Ltd.(b) | | | 116,610 | |
| | 261,000 | | | Qunxing Paper Holdings Co. Ltd.(a)(b)(c) | | | 12,646 | |
| | 67,000 | | | Real Gold Mining Ltd.(a)(b)(c) | | | 2,259 | |
| | 222,400 | | | Red Star Macalline Group Corp. Ltd. - H Shares | | | 265,692 | |
| | 140,000 | | | Redco Properties Group Ltd. | | | 69,629 | |
| | 128,000 | | | Ronshine China Holdings Ltd.(b) | | | 144,220 | |
| | 840,480 | | | Semiconductor Manufacturing International
Corp.(b) | | | 1,288,505 | |
| | 115,000 | | | Shandong Chenming Paper Holdings Ltd. - H Shares | | | 209,027 | |
| | 1,120,000 | | | Shandong Weigao Group Medical Polymer Co. Ltd. - H Shares | | | 803,958 | |
| | 464,000 | | | Shanghai Dasheng Agricultural Finance Technology Co. Ltd. - H Shares | | | 38,660 | |
| | 388,000 | | | Shanghai Electric Group Co. Ltd. - H Shares(b) | | | 176,061 | |
| | 42,500 | | | Shanghai Fosun Pharmaceutical Group Co. Ltd. - H Shares | | | 212,189 | |
| | 24,000 | | | Shanghai Fudan Microelectronics Group Co., Ltd. - H Shares(b) | | | 21,627 | |
| | 10,300 | | | Shanghai Haohai Biological Technology Co. Ltd. | | | 50,369 | |
| | 517,235 | | | Shanghai Jin Jiang International Hotels Group Co. Ltd. - H Shares | | | 186,304 | |
| | 58,300 | | | Shanghai Pharmaceuticals Holding Co. Ltd. - H Shares | | | 150,581 | |
| | 510,000 | | | Shanghai Prime Machinery Co. Ltd. - H Shares | | | 104,597 | |
| | 77,500 | | | Shengjing Bank Co. Ltd. - H Shares | | | 60,697 | |
| | 56,000 | | | Shenzhen Expressway Co. Ltd. - H Shares | | | 57,282 | |
| | 50,000 | | | Shenzhou International Group Holdings Ltd. | | | 426,846 | |
| | 793,881 | | | Shui On Land Ltd. | | | 196,399 | |
| Old Westbury Funds, Inc. |
| Small & Mid Cap Strategies Fund |
| Portfolio of Investments - (Continued) | October 31, 2017 |
| |
| Shares | | | | | Value | |
| CHINA (continued) | | | | |
| | 681,000 | | | Sihuan Pharmaceutical Holdings Group Ltd. | | $ | 246,164 | |
| | 6,000 | | | Silergy Corp. | | | 129,511 | |
| | 67,636 | | | Sino Grandness Food Industry Group Ltd.(b) | | | 10,420 | |
| | 3,040,062 | | | Sino-Ocean Land Holdings Ltd. | | | 1,983,479 | |
| | 140,000 | | | Sinopec Engineering Group Co. Ltd. - H Shares | | | 120,055 | |
| | 610,000 | | | Sinopec Shanghai Petrochemical Co. Ltd. - H Shares | | | 363,589 | |
| | 114,000 | | | Sinosoft Technology Group Ltd. | | | 34,925 | |
| | 852,000 | | | Sinotrans Ltd. - H Shares | | | 409,542 | |
| | 290,000 | | | Sinotruk Hong Kong Ltd. | | | 385,110 | |
| | 398,500 | | | SOHO China Ltd. | | | 230,884 | |
| | 8,914 | | | Sohu.Com, Inc.(b) | | | 510,148 | |
| | 294,000 | | | Springland International Holdings Ltd. | | | 53,890 | |
| | 100,000 | | | Sun King Power Electronics Group | | | 23,073 | |
| | 563,000 | | | Sunac China Holdings Ltd. | | | 2,865,011 | |
| | 82,000 | | | Sunny Optical Technology Group Co. Ltd. | | | 1,200,349 | |
| | 25,000 | | | Sunshine 100 China Holdings Ltd.(b) | | | 11,761 | |
| | 27,456 | | | TAL Education Group - ADR | | | 755,040 | |
| | 1,840 | | | Tarena International, Inc. - ADR | | | 26,955 | |
| | 255,000 | | | Tenwow International Holdings Ltd. | | | 57,201 | |
| | 36,000 | | | Tian Shan Development Holdings Ltd. | | | 14,444 | |
| | 128,000 | | | Tiangong International Co. Ltd. | | | 15,095 | |
| | 44,000 | | | Tianjin Capital Environmental Protection Group Co. Ltd. - H Shares | | | 28,031 | |
| | 284,000 | | | Tianneng Power International Ltd. | | | 273,756 | |
| | 350,000 | | | Tingyi Cayman Islands Holding Corp. | | | 551,824 | |
| | 64,000 | | | Tong Ren Tang Technologies Co. Ltd. - H Shares | | | 89,912 | |
| | 12,800 | | | Tonly Electronics Holdings Ltd. | | | 15,767 | |
| | 78,500 | | | Travelsky Technology Ltd. - H Shares | | | 203,258 | |
| | 210,000 | | | Trigiant Group Ltd. | | | 27,995 | |
| | 201,000 | | | Trony Solar Holdings Co. Ltd.(a)(b)(c) | | | 3,040 | |
| | 521,900 | | | Ubs Beijing Capital Retailing A Shares Pnote(b) | | | 696,001 | |
| | 518,400 | | | Ubs Beijing Hualian Pnote(b) | | | 456,721 | |
| | 586,700 | | | Ubs China Railway Tielong (Connect) Pnote(b) | | | 984,219 | |
| | 840,500 | | | Ubs Daqin Railway (Connect) Pnote(b) | | | 1,153,855 | |
| | 635,700 | | | Ubs Guangxi Liugong Machinery (Sz Connect) Pnote(b) | | | 852,563 | |
| Shares | | | | | Value | |
| CHINA (continued) | | | | |
| | 56,798 | | | Ubs Mls Co. Ltd. (Sz Connect) Pnote(b) | | $ | 435,708 | |
| | 657,300 | | | Ubs Ping An Bank (Sz Connect) A Shares Pnote(b) | | | 1,144,300 | |
| | 1,297,300 | | | Ubs Rizhao Port A Shares Pnote(b) | | | 831,764 | |
| | 562,300 | | | Ubs Shandong Haihua Co.-A Pnote(b) | | | 927,171 | |
| | 1,364,000 | | | Ubs Shandong Nanshan Aluminum (Connect) A Shares Pnote(b) | | | 796,330 | |
| | 779,000 | | | Ubs Shenzhen Airport A Shares Pnote(b) | | | 1,036,522 | |
| | 187,200 | | | Ubs Xiamen King Long Motor Pnote(b) | | | 454,677 | |
| | 623,400 | | | Uni-President China Holdings Ltd. | | | 521,005 | |
| | 888,000 | | | Want Want China Holdings Ltd. | | | 726,208 | |
| | 864,000 | | | Weichai Power Co. Ltd. - H Shares | | | 1,074,269 | |
| | 312,000 | | | Welling Holding Ltd. | | | 63,589 | |
| | 1,172,000 | | | West China Cement Ltd.(b) | | | 186,285 | |
| | 454,000 | | | Wuzhou International Holdings Ltd.(b) | | | 54,121 | |
| | 862,000 | | | Xiamen International Port Co. Ltd. - H Shares | | | 166,844 | |
| | 453,101 | | | Xingda International Holdings Ltd. | | | 173,077 | |
| | 15,000 | | | Xingfa Aluminium Holdings Ltd.(b) | | | 11,133 | |
| | 86,240 | | | Xinjiang Goldwind Science & Technology Co. Ltd. - H Shares | | | 109,218 | |
| | 217,000 | | | Xinjiang Xinxin Mining Industry Co. Ltd. - H Shares(b) | | | 29,763 | |
| | 658,000 | | | Xinyi Solar Holdings Ltd. | | | 227,728 | |
| | 222,500 | | | XTEP International Holdings Ltd. | | | 73,583 | |
| | 34,500 | | | Yangtze Optical Fibre and Cable Joint Stock Ltd. Co. - H Shares | | | 128,467 | |
| | 218,000 | | | Yanzhou Coal Mining Co. Ltd. - H Shares | | | 217,402 | |
| | 308,000 | | | Yashili International Holdings Ltd.(b) | | | 69,090 | |
| | 15,000 | | | Yichang HEC Changjiang Pharmaceutical Co. Ltd. - H Shares | | | 43,261 | |
| | 10,088 | | | Yirendai Ltd. - ADR | | | 437,718 | |
| | 251,500 | | | Youyuan International Holdings Ltd.(b) | | | 158,610 | |
| | 2,796,760 | | | Yuzhou Properties Co. Ltd. | | | 1,380,204 | |
| | 4,979 | | | YY Inc. - ADR(b) | | | 450,052 | |
| | 178,000 | | | Zhaojin Mining Industry Co. Ltd. - H Shares | | | 146,253 | |
| | 62,000 | | | Zhejiang Expressway Co. Ltd. - H Shares | | | 76,691 | |
| Old Westbury Funds, Inc. | |
| Small & Mid Cap Strategies Fund | |
| Portfolio of Investments - (Continued) | October 31, 2017 |
| | |
| Shares | | | | | Value | |
| CHINA (continued) | | | | |
| | 40,000 | | | Zhejiang Glass Co. Ltd. - H Shares(a)(b)(c) | | $ | 0 | |
| | 332,000 | | | Zhong An Real Estate Ltd.(b) | | | 43,833 | |
| | 319,500 | | | Zhongsheng Group Holdings Ltd. | | | 656,086 | |
| | 62,200 | | | Zhuzhou CRRC Times Electric Co. Ltd. - H Shares | | | 363,964 | |
| | 274,000 | | | Zijin Mining Group Co. Ltd. - Class H | | | 94,829 | |
| | 1,540,400 | | | Zoomlion Heavy Industry Science and Technology Co. Ltd. - H Shares | | | 746,368 | |
| | | | | | | | 99,510,403 | |
| CYPRUS — 0.0% | | | | |
| | 23,857 | | | Songa Offshore(b) | | | 169,406 | |
| DENMARK — 0.4% | | | | |
| | 12,751 | | | ALK-Abello A/S | | | 1,995,010 | |
| | 36,992 | | | Alm Brand A/S | | | 382,182 | |
| | 8,231 | | | Amagerbanken A/S(a)(b)(c) | | | 0 | |
| | 5,774 | | | Ambu A/S - B Shares | | | 532,366 | |
| | 7,172 | | | Bang & Olufsen A/S(b) | | | 166,158 | |
| | 481 | | | Bassett Furniture Industries, Inc. | | | 18,663 | |
| | 3,706 | | | Bavarian Nordic A/S(b) | | | 150,253 | |
| | 1,472 | | | Brodrene Hartmann A/S | | | 79,957 | |
| | 42,729 | | | Chr. Hansen Holding A/S | | | 3,738,976 | |
| | 17,912 | | | Columbus A/S | | | 37,011 | |
| | 11,507 | | | D/S Norden A/S(b) | | | 239,390 | |
| | 17,125 | | | Dfds A/S | | | 993,200 | |
| | 8,768 | | | FLSmidth & Co. A/S | | | 601,164 | |
| | 4,056 | | | Genmab A/S(b) | | | 819,041 | |
| | 60,956 | | | GN Store Nord A/S | | | 2,016,202 | |
| | 9,156 | | | H. Lundbeck A/S | | | 544,064 | |
| | 4,951 | | | H+H International A/S - Class B(b) | | | 100,752 | |
| | 825 | | | Harboes Bryggeri A/S - Class B | | | 14,399 | |
| | 3,213 | | | IC Group A/S | | | 78,964 | |
| | 72,808 | | | ISS A/S | | | 3,081,796 | |
| | 26,206 | | | Jyske Bank A/S | | | 1,480,901 | |
| | 8,356 | | | Matas A/S | | | 93,524 | |
| | 5,088 | | | Nilfisk Holding A/S(b) | | | 244,514 | |
| | 5,088 | | | NKT A/S(b) | | | 217,992 | |
| | 1,254 | | | NNIT A/S | | | 35,726 | |
| | 2,218 | | | Nordjyske Bank A/S | | | 42,011 | |
| | 1,840 | | | Parken Sport & Entertainment A/S | | | 21,026 | |
| | 12,552 | | | Per Aarsleff A/S | | | 347,780 | |
| | 7,650 | | | Ringkjoebing Landbobank A/S | | | 382,006 | |
| | 481 | | | Rockwool International A/S - A Shares | | | 119,266 | |
| | 2,414 | | | Rockwool International A/S - B Shares | | | 655,624 | |
| | 9,265 | | | Royal Unibrew A/S | | | 533,427 | |
| | 1,028 | | | RTX A/S | | | 30,494 | |
| | 7,117 | | | Santa Fe Group A/S(b) | | | 55,704 | |
| | 6,565 | | | Schouw & Co. | | | 682,885 | |
| Shares | | | | | Value | |
| DENMARK (continued) | | | | |
| | 8,811 | | | SimCorp A/S | | $ | 538,184 | |
| | 1,591 | | | Solar A/S - Class B | | | 102,235 | |
| | 28,027 | | | Spar Nord Bank A/S | | | 356,466 | |
| | 36,294 | | | Sydbank A/S | | | 1,415,797 | |
| | 561,792 | | | TDC A/S | | | 3,321,549 | |
| | 132 | | | Tivoli A/S | | | 11,530 | |
| | 21,852 | | | TK Development A/S(b) | | | 32,154 | |
| | 16,542 | | | Topdanmark A/S(b) | | | 679,987 | |
| | 29,778 | | | Tryg A/S | | | 708,994 | |
| | 17,964 | | | William Demant Holding A/S(b) | | | 518,259 | |
| | | | | | | | 28,217,583 | |
| FAEROE ISLANDS — 0.0% | | | | |
| | 7,482 | | | Bakkafrost | | | 334,253 | |
| | 662 | | | BankNordik P/F | | | 12,228 | |
| | | | | | | | 346,481 | |
| FINLAND — 0.4% | | | | |
| | 22,392 | | | Afarak Group Oyj | | | 21,780 | |
| | 5,418 | | | Aktia Bank Oyj | | | 58,568 | |
| | 4,177 | | | Alma Media Oyj | | | 33,816 | |
| | 14,605 | | | Amer Sports Oyj | | | 363,560 | |
| | 897 | | | Asiakastieto Group Oyj | | | 23,823 | |
| | 5,440 | | | Aspo Oyj | | | 58,172 | |
| | 6,463 | | | Atria Oyj | | | 90,115 | |
| | 954 | | | BasWare Oyj(b) | | | 47,007 | |
| | 12,077 | | | Bittium Oyj | | | 87,080 | |
| | 10,302 | | | Cargotec Oyj - Class B | | | 608,414 | |
| | 24,833 | | | Caverion Corp.(b) | | | 188,024 | |
| | 40,986 | | | Citycon Oyj | | | 100,068 | |
| | 22,539 | | | Cramo Oyj | | | 500,412 | |
| | 29,832 | | | Elisa Oyj | | | 1,201,995 | |
| | 862 | | | Ferratum Oyj | | | 27,106 | |
| | 37,096 | | | Finnair Oyj | | | 483,966 | |
| | 7,981 | | | Fiskars Oyj Abp | | | 199,320 | |
| | 12,148 | | | F-Secure Oyj | | | 62,263 | |
| | 10,645 | | | HKScan Oyj - A Shares | | | 39,059 | |
| | 21,678 | | | Huhtamaki Oyj | | | 923,704 | |
| | 2,500 | | | Ilkka-Yhtyma Oyj | | | 10,105 | |
| | 63,837 | | | Kemira Oyj | | | 899,762 | |
| | 2,280 | | | Kesko Oyj - A Shares | | | 115,609 | |
| | 13,340 | | | Kesko OYJ - B Shares | | | 681,389 | |
| | 35,936 | | | Konecranes Oyj | | | 1,655,983 | |
| | 9,402 | | | Lassila & Tikanoja Oyj | | | 199,325 | |
| | 2,070 | | | Lemminkainen Oyj | | | 55,483 | |
| | 75,818 | | | Metsa Board Oyj | | | 562,576 | |
| | 21,925 | | | Metso Oyj | | | 797,082 | |
| | 79,905 | | | Neste Oyj | | | 4,451,887 | |
| | 16,916 | | | Nokian Renkaat Oyj | | | 775,770 | |
| | 4,247 | | | Olvi Oyj - Class A | | | 138,767 | |
| | 27,474 | | | Oriola Oyj - Class B | | | 103,050 | |
| | 6,792 | | | Orion Oyj - Class A | | | 278,569 | |
| | 21,898 | | | Orion Oyj - Class B | | | 897,877 | |
| | 146,050 | | | Outokumpu Oyj | | | 1,381,425 | |
| | 25,811 | | | Outotec Oyj(b) | | | 205,501 | |
| Old Westbury Funds, Inc. | |
| Small & Mid Cap Strategies Fund | |
| Portfolio of Investments - (Continued) | October 31, 2017 |
| | |
| Shares | | | | | Value | |
| FINLAND (continued) | | | | |
| | 845 | | | Ponsse Oyj | | $ | 26,517 | |
| | 3,126 | | | Poyry Oyj(b) | | | 17,842 | |
| | 45,285 | | | Raisio Oyj - V Shares | | | 187,263 | |
| | 31,582 | | | Ramirent Oyj | | | 290,627 | |
| | 681 | | | Revenio Group Oyj | | | 29,200 | |
| | 52,835 | | | Sanoma Oyj | | | 627,142 | |
| | 7,186 | | | SRV Group Oyj | | | 34,571 | |
| | 8,661 | | | Stockmann OYJ Abp - Class B(b) | | | 55,690 | |
| | 299,539 | | | Stora Enso Oyj - Class R | | | 4,685,967 | |
| | 163,338 | | | Talvivaara Mining Co. Plc(a)(b)(c) | | | 1,085 | |
| | 18,666 | | | Technopolis Oyj | | | 84,146 | |
| | 1,099 | | | Teleste OYJ | | | 10,177 | |
| | 16,141 | | | Tieto Oyj | | | 494,676 | |
| | 7,655 | | | Tikkurila Oyj | | | 151,320 | |
| | 15,354 | | | Uponor Oyj | | | 309,233 | |
| | 3,483 | | | Vaisala Oyj - Class A | | | 188,983 | |
| | 54,430 | | | Valmet Oyj | | | 1,055,656 | |
| | 15,103 | | | Wartsila Oyj Abp | | | 972,878 | |
| | 32,499 | | | YIT Oyj | | | 247,013 | |
| | | | | | | | 27,798,398 | |
| FRANCE — 1.9% | | | | |
| | 4,968 | | | ABC Arbitrage | | | 35,821 | |
| | 8,307 | | | Actia Group | | | 63,671 | |
| | 135,901 | | | Air France-KLM(b) | | | 2,129,192 | |
| | 1,984 | | | Akka Technologies SA | | | 119,713 | |
| | 12,747 | | | Albioma SA | | | 303,797 | |
| | 33,754 | | | Alstom SA | | | 1,365,919 | |
| | 353 | | | Altarea SCA REIT | | | 79,463 | |
| | 5,734 | | | Alten SA | | | 501,945 | |
| | 25,305 | | | Altran Technologies SA | | | 468,087 | |
| | 4,680 | | | Amplitude Surgical SAS(b) | | | 23,223 | |
| | 656 | | | ANF Immobilier REIT | | | 16,926 | |
| | 1,649 | | | Antalis International SAS(b) | | | 4,015 | |
| | 2,203 | | | APRIL SA | | | 36,696 | |
| | 304 | | | Argan SA REIT | | | 13,803 | |
| | 50,239 | | | Arkema SA | | | 6,346,589 | |
| | 3,814 | | | Assystem | | | 147,543 | |
| | 1,208 | | | Aubay | | | 48,631 | |
| | 612 | | | Bastide le Confort Medical | | | 32,957 | |
| | 12,712 | | | Beneteau SA | | | 228,629 | |
| | 1,510 | | | Bigben Interactive(b) | | | 23,728 | |
| | 5,973 | | | BioMerieux | | | 468,528 | |
| | 85,016 | | | Boiron SA(a) | | | 7,674,891 | |
| | 10,155 | | | Bonduelle SCA | | | 479,431 | |
| | 3,861 | | | Bourbon SA | | | 34,496 | |
| | 52,614 | | | Bureau Veritas SA | | | 1,409,304 | |
| | 130 | | | Burelle SA | | | 194,293 | |
| | 8,854 | | | Casino Guichard Perrachon SA | | | 505,726 | |
| | 479 | | | Catering International Services | | | 9,569 | |
| | 1,749 | | | Cegedim SA(b) | | | 68,047 | |
| | 45,377 | | | Cellectis SA(b) | | | 1,565,107 | |
| | 9,020 | | | Chargeurs SA | | | 254,478 | |
| | 110 | | | Chargeurs SA(b) | | | 2,950 | |
| Shares | | | | | Value | |
| FRANCE (continued) | | | | |
| | 5,908 | | | Cie des Alpes | | $ | 187,395 | |
| | 17,825 | | | Coface SA(b) | | | 194,761 | |
| | 69,200 | | | Derichebourg SA | | | 738,446 | |
| | 1,675 | | | Devoteam SA | | | 156,558 | |
| | 19,338 | | | Edenred | | | 557,515 | |
| | 35,398 | | | Eiffage SA | | | 3,698,219 | |
| | 410 | | | Electricite de Strasbourg SA | | | 59,665 | |
| | 19,910 | | | Elior Group | | | 565,425 | |
| | 21,415 | | | Elis SA | | | 558,649 | |
| | 1,851 | | | Eramet(b) | | | 152,525 | |
| | 1,990 | | | Esso SA Francaise(b) | | | 135,907 | |
| | 5,729 | | | Euler Hermes Group | | | 664,740 | |
| | 23,263 | | | Europcar Groupe SA | | | 332,762 | |
| | 84,618 | | | Eutelsat Communications SA | | | 2,120,181 | |
| | 1,226 | | | Exel Industries SA - Class A | | | 163,018 | |
| | 43,377 | | | Faurecia | | | 3,153,432 | |
| | 590 | | | Fleury Michon SA | | | 34,865 | |
| | 2,326 | | | Fonciere Des Regions REIT | | | 236,886 | |
| | 41,109 | | | Gaztransport Et Technigaz SA | | | 2,012,161 | |
| | 2,777 | | | Gecina SA REIT | | | 450,606 | |
| | 6,371 | | | GL Events | | | 194,066 | |
| | 1,737 | | | Groupe Crit | | | 163,891 | |
| | 68,766 | | | Groupe Eurotunnel SE | | | 864,301 | |
| | 4,051 | | | Groupe Fnac SA(b)(d) | | | 382,884 | |
| | 1,024 | | | Groupe Fnac SA(b)(d) | | | 96,779 | |
| | 1,726 | | | Groupe Open | | | 58,305 | |
| | 1,572 | | | Guerbet | | | 141,547 | |
| | 4,545 | | | Haulotte Group SA | | | 82,855 | |
| | 238 | | | HERIGE SADCS | | | 10,563 | |
| | 3,255 | | | ICADE REIT | | | 284,369 | |
| | 301 | | | ID Logistics Group(b) | | | 51,716 | |
| | 11,216 | | | Imerys SA | | | 1,021,549 | |
| | 114,320 | | | Ingenico Group SA | | | 11,098,021 | |
| | 1,622 | | | Interparfums SA | | | 60,460 | |
| | 5,550 | | | Ipsen SA | | | 671,058 | |
| | 20,380 | | | IPSOS | | | 753,259 | |
| | 6,546 | | | Jacquet Metal Service | | | 211,711 | |
| | 10,725 | | | JCDecaux SA | | | 410,395 | |
| | 375,900 | | | Korian SA | | | 12,216,487 | |
| | 71,674 | | | Lagardere SCA | | | 2,360,663 | |
| | 863 | | | Laurent-Perrier | | | 80,934 | |
| | 1,403 | | | Le Belier | | | 77,056 | |
| | 1,830 | | | Le Noble Age | | | 128,284 | |
| | 4,484 | | | Lectra | | | 131,206 | |
| | 1,180 | | | Linedata Services | | | 53,813 | |
| | 202,041 | | | LISI(a) | | | 9,272,686 | |
| | 438 | | | Maisons France Confort SA | | | 30,607 | |
| | 3,615 | | | Manitou BF SA | | | 143,172 | |
| | 72 | | | Manutan International | | | 7,104 | |
| | 5,255 | | | Mersen | | | 230,466 | |
| | 13,382 | | | METabolic EXplorer SA(b) | | | 34,605 | |
| | 10,264 | | | Metropole Television SA | | | 237,327 | |
| | 5,327 | | | MGI Coutier | | | 216,436 | |
| | 1,975 | | | Mr Bricolage | | | 38,742 | |
| | 1,247 | | | Naturex(b) | | | 141,625 | |
| | 22,346 | | | Neopost SA | | | 823,581 | |
| Old Westbury Funds, Inc. | |
| Small & Mid Cap Strategies Fund | |
| Portfolio of Investments - (Continued) | October 31, 2017 |
| | |
| Shares | | | | | Value | |
| FRANCE (continued) | | | | |
| | 16,113 | | | Nexans SA | | $ | 1,054,830 | |
| | 7,196 | | | Nexity SA | | | 442,164 | |
| | 4,931 | | | Nicox(b) | | | 50,483 | |
| | 1,512 | | | NRJ Group(b) | | | 19,092 | |
| | 5,591 | | | Oeneo SA | | | 61,610 | |
| | 4,277 | | | OL Groupe SA(b) | | | 14,149 | |
| | 6,110 | | | Orpea | | | 732,007 | |
| | 6,929 | | | Parrot SA(b) | | | 86,362 | |
| | 2,367 | | | Pierre & Vacances SA(b) | | | 126,555 | |
| | 17,792 | | | Plastic Omnium SA | | | 741,955 | |
| | 6,264 | | | Plastivaloire | | | 160,453 | |
| | 769 | | | PSB Industries SA | | | 42,540 | |
| | 19,054 | | | Rallye SA | | | 325,823 | |
| | 79,980 | | | Rexel SA | | | 1,427,748 | |
| | 188 | | | Robertet SA | | | 87,914 | |
| | 2,055 | | | Rothschild & Co. | | | 73,788 | |
| | 259,786 | | | Rubis SCA | | | 16,304,713 | |
| | 5,534 | | | Sartorius Stedim Biotech | | | 377,172 | |
| | 2,786 | | | Savencia SA | | | 266,112 | |
| | 54,627 | | | SCOR SE | | | 2,268,171 | |
| | 6,771 | | | SEB SA | | | 1,261,951 | |
| | 988 | | | Seche Environnement SA | | | 35,792 | |
| | 2,032 | | | Societe BIC SA | | | 214,614 | |
| | 436 | | | Societe pour l’Informatique Industrielle | | | 11,300 | |
| | 49,337 | | | Solocal Group(b) | | | 54,597 | |
| | 2,470 | | | Somfy SA | | | 250,315 | |
| | 2,659 | | | Sopra Steria Group | | | 498,826 | |
| | 16,659 | | | SPIE SA | | | 438,170 | |
| | 38,627 | | | Ste Industrielle d’Aviation Latecoere SA(b) | | | 244,771 | |
| | 1,739 | | | Stef SA | | | 192,176 | |
| | 32,625 | | | Suez Environnement Co. | | | 573,849 | |
| | 4,082 | | | Synergie SA | | | 221,104 | |
| | 145,000 | | | Talend SA - ADR(a)(b) | | | 6,004,450 | |
| | 9,324 | | | Tarkett SA | | | 396,754 | |
| | 13,384 | | | Technicolor SA | | | 47,426 | |
| | 14,768 | | | Teleperformance SA | | | 2,157,193 | |
| | 36,528 | | | Television Francaise 1 | | | 519,531 | |
| | 436 | | | Tessi SA | | | 88,106 | |
| | 83 | | | TFF Group | | | 15,179 | |
| | 826 | | | Thermador Groupe | | | 100,960 | |
| | 957 | | | Touax SA(b) | | | 15,083 | |
| | 1,951 | | | Trigano SA | | | 314,758 | |
| | 42,609 | | | UBISOFT Entertainment(b) | | | 3,250,966 | |
| | 305 | | | Union Financiere de France BQE SA | | | 11,547 | |
| | 106,014 | | | Vallourec SA(b) | | | 580,528 | |
| | 10,371 | | | Valneva SE(b) | | | 33,584 | |
| | 602 | | | Vetoquinol SA | | | 38,856 | |
| | 7,551 | | | Vicat SA | | | 584,128 | |
| | 1,831 | | | VIEL & Cie SA | | | 11,389 | |
| | 2,914 | | | Vilmorin & Cie SA | | | 280,647 | |
| | 596 | | | Virbac SA(b) | | | 76,749 | |
| | 627 | | | Vranken - Pommery Monopole SA | | | 17,602 | |
| Shares | | | | | Value | |
| FRANCE (continued) | | | | |
| | 340 | | | Worldline S.A.(b) | | $ | 16,632 | |
| | 6,029 | | | Zodiac Aerospace | | | 172,412 | |
| | | | | | | | 127,008,993 | |
| GABON — 0.0% | | | | |
| | 72 | | | Total Gabon | | | 11,791 | |
| GEORGIA — 0.0% | | | | |
| | 5,317 | | | BGEO Group Plc | | | 251,398 | |
| GERMANY — 2.6% | | | | |
| | 19,639 | | | Aareal Bank AG | | | 812,229 | |
| | 25,024 | | | ADVA Optical Networking SE(b) | | | 155,365 | |
| | 40,347 | | | AIXTRON SE(b) | | | 629,776 | |
| | 174 | | | All for One Steeb AG | | | 12,167 | |
| | 4,617 | | | Allgeier SE | | | 122,271 | |
| | 9,399 | | | Alstria Office REIT AG | | | 133,078 | |
| | 1,125 | | | Amadeus Fire AG | | | 103,421 | |
| | 352 | | | Atoss Software AG | | | 29,698 | |
| | 23,296 | | | Aurubis AG | | | 1,906,327 | |
| | 24,594 | | | Axel Springer SE | | | 1,658,737 | |
| | 310 | | | Basler AG | | | 63,392 | |
| | 6,954 | | | Bauer AG | | | 222,598 | |
| | 6,968 | | | BayWa AG | | | 271,908 | |
| | 4,340 | | | Bechtle AG | | | 345,944 | |
| | 2,119 | | | Bertrandt AG | | | 198,699 | |
| | 1,508 | | | Bijou Brigitte AG | | | 94,329 | |
| | 10,155 | | | Bilfinger SE | | | 408,575 | |
| | 2,505 | | | Biotest AG | | | 79,660 | |
| | 256 | | | Biotest AG - Preference Shares | | | 6,769 | |
| | 48,216 | | | Borussia Dortmund GmbH & Co. KGaA | | | 400,227 | |
| | 42,784 | | | Brenntag AG | | | 2,422,822 | |
| | 2,756 | | | CANCOM SE | | | 203,278 | |
| | 6,532 | | | Carl Zeiss Meditec AG | | | 348,179 | |
| | 2,761 | | | CENIT AG | | | 65,256 | |
| | 5,549 | | | CENTROTEC Sustainable AG | | | 119,967 | |
| | 3,390 | | | Cewe Stiftung & Co. KGaA | | | 330,715 | |
| | 6,990 | | | Comdirect Bank AG | | | 97,382 | |
| | 39,273 | | | Commerzbank AG(b) | | | 538,215 | |
| | 4,968 | | | CompuGroup Medical SE | | | 285,471 | |
| | 10,956 | | | Constantin Medien AG(b) | | | 24,222 | |
| | 16,237 | | | CropEnergies AG | | | 172,114 | |
| | 9,664 | | | CTS Eventim AG & Co KGaA | | | 399,177 | |
| | 183,814 | | | Deutsche Lufthansa AG | | | 5,866,769 | |
| | 36,249 | | | Deutsche Pfandbriefbank AG | | | 520,419 | |
| | 62,704 | | | Deutz AG | | | 531,736 | |
| | 3,960 | | | Dic Asset AG | | | 46,359 | |
| | 7,566 | | | DMG Mori AG | | | 438,107 | |
| | 2,100 | | | Dr Hoenle AG | | | 97,603 | |
| | 1,716 | | | Draegerwerk AG & Co. KGaA | | | 152,015 | |
| | 5,318 | | | Draegerwerk AG & Co. KGaA - Preference Shares | | | 611,104 | |
| | 6,958 | | | Drillisch AG | | | 489,543 | |
| | 88,092 | | | Duerr AG | | | 12,144,358 | |
| | 2,478 | | | Eckert & Ziegler AG | | | 104,419 | |
| Old Westbury Funds, Inc. | |
| Small & Mid Cap Strategies Fund | |
| Portfolio of Investments - (Continued) | October 31, 2017 |
| | |
| Shares | | | | | Value | |
| GERMANY (continued) | | | | |
| | 7,759 | | | Elmos Semiconductor AG | | $ | 219,489 | |
| | 21,112 | | | ElringKlinger AG | | | 367,286 | |
| | 182,583 | | | Fielmann AG | | | 16,004,299 | |
| | 2,636 | | | First Sensor AG(b) | | | 64,773 | |
| | 5,207 | | | Francotyp-Postalia Holding AG | | | 29,720 | |
| | 27,736 | | | Fraport AG Frankfurt Airport Services Worldwide | | | 2,631,831 | |
| | 34,885 | | | Freenet AG | | | 1,165,637 | |
| | 9,156 | | | Fuchs Petrolub SE | | | 514,017 | |
| | 7,844 | | | Fuchs Petrolub SE | | | 390,656 | |
| | 28,744 | | | GEA Group AG | | | 1,386,005 | |
| | 85,179 | | | Gerresheimer AG | | | 6,770,822 | |
| | 10,596 | | | Gerry Weber International AG | | | 131,080 | |
| | 6,342 | | | Gesco AG | | | 225,281 | |
| | 3,907 | | | GFT Technologies SE | | | 58,641 | |
| | 9,049 | | | Grammer AG | | | 524,875 | |
| | 5,775 | | | GRENKE AG | | | 565,136 | |
| | 5,430 | | | H&R GmbH & Co. KGaA(b) | | | 95,857 | |
| | 8,905 | | | Hamborner AG REIT | | | 94,249 | |
| | 14,465 | | | Hamburger Hafen und Logistik AG | | | 461,678 | |
| | 172,589 | | | Heidelberger Druckmaschinen AG(b) | | | 687,558 | |
| | 19,225 | | | Hella KGaA Hueck & Co | | | 1,156,886 | |
| | 3,483 | | | Hochtief AG | | | 614,661 | |
| | 11,858 | | | HolidayCheck Group AG(b) | | | 39,159 | |
| | 2,152 | | | Hornbach Baumarkt AG | | | 78,211 | |
| | 13,464 | | | HUGO BOSS AG | | | 1,205,123 | |
| | 10,263 | | | Indus Holding AG | | | 718,845 | |
| | 958 | | | Isra Vision AG | | | 185,132 | |
| | 8,050 | | | Jenoptik AG | | | 271,043 | |
| | 149,421 | | | Jost Werke AG(a)(b) | | | 6,834,190 | |
| | 13,209 | | | Jungheinrich AG - Preference Shares | | | 599,920 | |
| | 66,118 | | | K+S AG | | | 1,603,505 | |
| | 37,788 | | | KION Group AG | | | 3,024,431 | |
| | 28,513 | | | Kloeckner & Co. SE | | | 335,787 | |
| | 4,252 | | | Koenig & Bauer AG | | | 330,609 | |
| | 8,718 | | | Krones AG | | | 1,102,342 | |
| | 210 | | | KSB AG | | | 114,726 | |
| | 516 | | | KWS Saat SE | | | 217,765 | |
| | 56,757 | | | Lanxess AG | | | 4,434,884 | |
| | 5,043 | | | Leg Immobilien AG | | | 512,242 | |
| | 1,596 | | | Leifheit AG | | | 56,768 | |
| | 23,169 | | | Leoni AG | | | 1,537,799 | |
| | 1,170 | | | Manz AG(b) | | | 52,048 | |
| | 1,297 | | | MasterFlex SE | | | 12,117 | |
| | 99,555 | | | Metro Wholesale & Food Specialist AG(b) | | | 1,901,272 | |
| | 23,264 | | �� | MLP AG | | | 159,749 | |
| | 16,492 | | | Morphosys AG(b) | | | 1,432,350 | |
| | 115,639 | | | MTU Aero Engines AG | | | 19,498,119 | |
| | 44,471 | | | Nemetschek SE | | | 3,969,589 | |
| | 2,244 | | | Nexus AG | | | 68,106 | |
| | 143,567 | | | NORMA Group SE | | | 9,768,135 | |
| | 2,536 | | | OHB SE | | | 123,022 | |
| Shares | | | | | Value | |
| GERMANY (continued) | | | | |
| | 33,352 | | | OSRAM Licht AG | | $ | 2,551,672 | |
| | 541 | | | paragon AG | | | 47,100 | |
| | 23,955 | | | Patrizia Immobilien AG(b) | | | 505,341 | |
| | 1,780 | | | Pfeiffer Vacuum Technology AG | | | 285,823 | |
| | 56,197 | | | PNE Wind AG | | | 168,235 | |
| | 1,310 | | | Progress-Werk Oberkirch AG | | | 73,810 | |
| | 20,822 | | | ProSiebenSat.1 Media SE | | | 726,301 | |
| | 322 | | | Puma SE | | | 145,757 | |
| | 47,795 | | | QSC AG | | | 95,815 | |
| | 870 | | | R Stahl AG | | | 32,242 | |
| | 16,118 | | | Rational AG | | | 10,570,350 | |
| | 25,667 | | | Rheinmetall AG | | | 3,027,192 | |
| | 77,419 | | | RHOEN-KLINIKUM AG | | | 2,700,935 | |
| | 8,336 | | | RIB Software AG | | | 205,225 | |
| | 233,027 | | | RWE AG(b) | | | 5,825,132 | |
| | 17,769 | | | SAF-Holland SA | | | 351,973 | |
| | 12,816 | | | Salzgitter AG | | | 619,691 | |
| | 6,413 | | | Sartorius AG - Preference Shares | | | 597,689 | |
| | 1,391 | | | Schaltbau Holding AG(b) | | | 49,103 | |
| | 330 | | | Secunet Security Networks AG | | | 31,909 | |
| | 3,648 | | | SHW AG | | | 144,712 | |
| | 1,480 | | | Siltronic AG(b) | | | 219,290 | |
| | 7,992 | | | Sixt Leasing SE | | | 177,299 | |
| | 6,938 | | | Sixt SE | | | 645,326 | |
| | 8,410 | | | Sixt SE - Preference Shares | | | 542,818 | |
| | 8,180 | | | SMA Solar Technology AG | | | 379,185 | |
| | 977 | | | Softing AG | | | 10,454 | |
| | 16,554 | | | Software AG | | | 842,856 | |
| | 1,462 | | | Sto Se & Co. KGAA - Preference Shares | | | 221,391 | |
| | 6,642 | | | Stroeer SE & Co. KGaA | | | 424,757 | |
| | 22,636 | | | Suedzucker AG | | | 448,248 | |
| | 5,516 | | | Suess MicroTec AG(b) | | | 105,953 | |
| | 4,187 | | | Surteco SE | | | 125,393 | |
| | 18,609 | | | Symrise AG | | | 1,448,219 | |
| | 13,159 | | | TAG Immobilien AG | | | 226,322 | |
| | 19,992 | | | Takkt AG | | | 414,637 | |
| | 28,133 | | | Talanx AG | | | 1,104,865 | |
| | 423 | | | Technotrans AG | | | 24,526 | |
| | 4,769 | | | TLG Immobilien AG | | | 110,381 | |
| | 8,774 | | | Tom Tailor Holding AG(b) | | | 90,696 | |
| | 524 | | | Traffic Systems SE | | | 11,884 | |
| | 67,209 | | | Uniper SE | | | 1,888,315 | |
| | 21,585 | | | United Internet AG | | | 1,365,531 | |
| | 14,542 | | | VERBIO Vereinigte BioEnergie AG | | | 136,767 | |
| | 4,362 | | | Villeroy & Boch AG - Preference Shares | | | 101,876 | |
| | 3,481 | | | Vossloh AG(b) | | | 219,975 | |
| | 8,913 | | | VTG AG | | | 516,052 | |
| | 10,394 | | | Wacker Chemie AG | | | 1,621,792 | |
| | 10,042 | | | Wacker Neuson SE | | | 327,235 | |
| | 1,892 | | | Washtec AG | | | 167,077 | |
| | 16,854 | | | Wirecard AG | | | 1,659,917 | |
| Old Westbury Funds, Inc. | |
| Small & Mid Cap Strategies Fund | |
| Portfolio of Investments - (Continued) | October 31, 2017 |
| | |
| Shares | | | | | Value | |
| GERMANY (continued) | | | | |
| | 6,076 | | | Wuestenrot & Wuerttem-bergische AG | | $ | 163,281 | |
| | 472 | | | XING AG | | | 140,256 | |
| | | | | | | | 172,650,406 | |
| GIBRALTAR — 0.0% | | | | |
| | 23,380 | | | 888 Holdings Plc | | | 77,847 | |
| GREECE — 0.0% | | | | |
| | 96 | | | Alapis Holding Industrial and Commercial SA of Pharmaceutical Chemical Products(a)(b)(c) | | | 0 | |
| | 507,838 | | | Alpha Bank AE(b) | | | 1,011,559 | |
| | 801,389 | | | Eurobank Ergasias SA(b) | | | 654,382 | |
| | 36,614 | | | Intralot SA-Integrated Lottery Systems & Services(b) | | | 45,635 | |
| | 1,689,985 | | | National Bank of Greece SA(b) | | | 559,076 | |
| | 49,761 | | | OPAP SA | | | 557,614 | |
| | 22,848 | | | Proton Bank SA(a)(b)(c) | | | 0 | |
| | 3,238 | | | Sarantis SA | | | 46,582 | |
| | 12,534 | | | T Bank SA(a)(b)(c) | | | 0 | |
| | 2,904 | | | Terna Energy SA | | | 14,106 | |
| | 647 | | | Thessaloniki Port Authority SA | | | 17,402 | |
| | 31,091 | | | TT Hellenic Postbank SA(a)(b)(c) | | | 0 | |
| | | | | | | | 2,906,356 | |
| HONG KONG — 1.2% | | | | |
| | 375,000 | | | Agritrade Resources Ltd. | | | 96,617 | |
| | 900,000 | | | Alibaba Pictures Group Ltd.(b) | | | 146,512 | |
| | 1,415,693 | | | Allied Properties HK Ltd. | | | 301,234 | |
| | 58,000 | | | AMVIG Holdings Ltd. | | | 16,430 | |
| | 520,000 | | | Anxin-China Holdings Ltd.(a)(b)(c) | | | 4,812 | |
| | 144,250 | | | APT Satellite Holdings Ltd. | | | 68,414 | |
| | 144,000 | | | Asia Financial Holdings Ltd. | | | 85,831 | |
| | 500 | | | Asia Satellite Telecommunications Holdings Ltd. | | | 461 | |
| | 296,200 | | | ASM Pacific Technology Ltd. | | | 4,309,316 | |
| | 74,000 | | | Associated International Hotels Ltd.(a) | | | 241,880 | |
| | 275,000 | | | Auto Italia Holdings Ltd.(b) | | | 5,499 | |
| | 704,000 | | | AVIC International Holding HK Ltd.(b) | | | 46,925 | |
| | 135,000 | | | Beijing Enterprises Holdings Ltd. | | | 802,068 | |
| | 466,000 | | | Beijing Enterprises Water Group Ltd. | | | 391,250 | |
| | 504,000 | | | Bel Global Resources Holdings Ltd.(a)(b)(c) | | | 0 | |
| | 92,000 | | | Bright Smart Securities & Commodities Group Ltd. | | | 29,128 | |
| | 355,000 | | | Brightoil Petroleum Holdings Ltd.(a)(b)(c) | | | 68,257 | |
| | 196,000 | | | Brilliance China Automotive Holdings Ltd. | | | 495,439 | |
| | 1,644,354 | | | Brockman Mining Ltd.(b) | | | 21,710 | |
| Shares | | | | | Value | |
| HONG KONG (continued) | | | | |
| | 398,186 | | | C C Land Holdings Ltd.(b) | | $ | 86,769 | |
| | 44,000 | | | Cafe de Coral Holdings Ltd. | | | 135,360 | |
| | 28,000 | | | Canvest Environmental Protection Group Co. Ltd. | | | 15,613 | |
| | 92,000 | | | Carrianna Group Holdings Co. Ltd. | | | 10,849 | |
| | 208,000 | | | Cathay Pacific Airways Ltd.(b) | | | 355,670 | |
| | 166,800 | | | Century City International Holdings Ltd. | | | 15,822 | |
| | 564,000 | | | CGN New Energy Holdings Co. Ltd. | | | 84,585 | |
| | 80,213 | | | Champion Technology Holdings Ltd.(b) | | | 10,488 | |
| | 134,359 | | | Cheuk Nang Holdings Ltd. | | | 86,629 | |
| | 85,873 | | | Chevalier International Holdings Ltd. | | | 142,656 | |
| | 504,000 | | | China Aerospace International Holdings Ltd. | | | 63,312 | |
| | 872,137 | | | China Agri-Industries Holdings Ltd. | | | 425,929 | |
| | 204,000 | | | China All Access Holdings Ltd. | | | 59,882 | |
| | 53,000 | | | China Animation Characters Co. Ltd. | | | 20,381 | |
| | 2,040,000 | | | China Daye Non-Ferrous Metals Mining Ltd.(b) | | | 29,810 | |
| | 950,000 | | | China Ever Grand Financial Leasing Group Co. Ltd.(b) | | | 8,037 | |
| | 87,000 | | | China Everbright International Ltd. | | | 122,670 | |
| | 525,600 | | | China Fiber Optic Network System Group Ltd.(a)(b)(c) | | | 8,846 | |
| | 20,000 | | | China Flavors & Fragrances Co. Ltd. | | | 5,332 | |
| | 442,000 | | | China Foods Ltd. | | | 279,317 | |
| | 90,000 | | | China Gas Holdings Ltd. | | | 273,412 | |
| | 208,000 | | | China Grand Pharmaceutical and Healthcare Holdings Ltd.(b) | | | 76,520 | |
| | 6,603,000 | | | China High Precision Automation Group Ltd.(a)(b)(c) | | | 193,611 | |
| | 54,000 | | | China High Speed Transmission Equipment Group Co. Ltd. | | | 58,836 | |
| | 2,684,000 | | | China Jinmao Holdings Group Ltd. | | | 1,204,143 | |
| | 12,236,000 | | | China Lumena New Materials Corp.(a)(b)(c) | | | 0 | |
| | 193,200 | | | China Metal Recycling Holdings Ltd.(a)(b)(c) | | | 0 | |
| | 492,557 | | | China New Town Development Co. Ltd.(b) | | | 22,729 | |
| | 484,000 | | | China Oceanwide Holdings Ltd.(b) | | | 40,326 | |
| | 1,210,000 | | | China Oil and Gas Group Ltd. | | | 82,203 | |
| | 580,500 | | | China Overseas Grand Oceans Group Ltd. | | | 340,052 | |
| | 245,000 | | | China Overseas Property Holdings Ltd. | | | 59,041 | |
| Old Westbury Funds, Inc. | |
| Small & Mid Cap Strategies Fund | |
| Portfolio of Investments - (Continued) | October 31, 2017 |
| | |
| Shares | | | | | Value | |
| HONG KONG (continued) | | | | |
| | 85,000 | | | China Power International Development Ltd. | | $ | 27,021 | |
| | 195,000 | | | China Properties Group Ltd.(b) | | | 43,742 | |
| | 245,102 | | | China Resources Beer Holdings Co. Ltd. | | | 706,898 | |
| | 428,440 | | | China Resources Cement Holdings Ltd. | | | 289,420 | |
| | 70,800 | | | China Resources Gas Group Ltd. | | | 259,100 | |
| | 44,000 | | | China Resources Power Holdings Co. Ltd. | | | 84,600 | |
| | 168,000 | | | China Ruifeng Renewable Energy Holdings Ltd.(b) | | | 14,428 | |
| | 86,920 | | | China Singyes Solar Technologies Holdings Ltd. | | | 31,196 | |
| | 2,166,000 | | | China South City Holdings Ltd. | | | 605,261 | |
| | 910,000 | | | China Starch Holdings Ltd. | | | 35,577 | |
| | 1,471,716 | | | China State Construction International Holdings Ltd. | | | 2,067,579 | |
| | 284,000 | | | China Taiping Insurance Holdings Co. Ltd. | | | 935,576 | |
| | 528,000 | | | China Traditional Chinese Medical Co. Ltd. | | | 302,530 | |
| | 1,214,000 | | | China Travel International Investment Hong Kong Ltd. | | | 449,722 | |
| | 666,000 | | | China Unicom Hong Kong Ltd.(b) | | | 945,892 | |
| | 28,000 | | | China Vast Industrial Urban Development Co. Ltd. | | | 15,290 | |
| | 84,000 | | | China Water Affairs Group Ltd. | | | 61,158 | |
| | 128,000 | | | China Water Industry Group Ltd.(b) | | | 27,728 | |
| | 103,000 | | | Chow Sang Sang Holdings International Ltd. | | | 224,711 | |
| | 110,000 | | | Chu Kong Shipping Enterprises Group Co. Ltd. | | | 28,059 | |
| | 237,500 | | | Chuang’s Consortium International Ltd. | | | 55,407 | |
| | 90,000 | | | CIMC Enric Holdings Ltd.(b) | | | 60,912 | |
| | 185,000 | | | CITIC Dameng Holdings Ltd.(b) | | | 11,738 | |
| | 769,000 | | | CITIC Resources Holdings Ltd. | | | 83,786 | |
| | 649,000 | | | CITIC Telecom International Holdings Ltd. | | | 185,514 | |
| | 274,000 | | | Citychamp Watch & Jewellery Group Ltd. | | | 68,839 | |
| | 490,000 | | | CK Life Sciences International Holdings, Inc. | | | 37,686 | |
| | 47,000 | | | Clear Media Ltd. | | | 53,920 | |
| | 95,000 | | | CNQC International Holdings Ltd. | | | 34,584 | |
| | 224,007 | | | Comba Telecom Systems Holdings Ltd. | | | 41,061 | |
| | 1,400,000 | | | Concord New Energy Group Ltd. | | | 68,193 | |
| | 2,865 | | | COSCO Shipping Ports Ltd. | | | 3,320 | |
| | 93,000 | | | Cowell e Holdings, Inc. | | | 45,538 | |
| | 2,052,000 | | | CP Pokphand Co. Ltd. | | | 165,709 | |
| Shares | | | | | Value | |
| HONG KONG (continued) | | | | |
| | 1,359,335 | | | CSI Properties Ltd. | | $ | 69,697 | |
| | 530,000 | | | Dah Chong Hong Holdings Ltd. | | | 248,648 | |
| | 84,924 | | | Dah Sing Banking Group Ltd. | | | 187,888 | |
| | 60,678 | | | Dah Sing Financial Holdings Ltd. | | | 407,559 | |
| | 80,000 | | | Dawnrays Pharmaceutical Holdings Ltd. | | | 47,376 | |
| | 244,000 | | | DBA Telecommunication Asia Holdings Ltd.(a)(b)(c) | | | 2,052 | |
| | 209,500 | | | Digital China Holdings Ltd.(b) | | | 126,752 | |
| | 108,000 | | | Dynasty Fine Wines Group Ltd.(a)(b)(c) | | | 3,738 | |
| | 92,000 | | | Eagle Nice International Holdings Ltd. | | | 45,874 | |
| | 168,234 | | | EganaGoldpfeil Holdings Ltd.(a)(b)(c) | | | 0 | |
| | 386,416 | | | Emperor International Holdings Ltd. | | | 136,707 | |
| | 518,000 | | | EVA Precision Industrial Holdings Ltd. | | | 71,710 | |
| | 9,500 | | | Fairwood Holdings Ltd. | | | 37,993 | |
| | 591,893 | | | Far East Consortium International Ltd. | | | 323,207 | |
| | 457,000 | | | Far East Horizon Ltd. | | | 453,989 | |
| | 622,000 | | | First Pacific Co. Ltd. | | | 473,592 | |
| | 168,000 | | | First Shanghai Investments Ltd.(b) | | | 22,827 | |
| | 30,000 | | | Fountain SET Holdings Ltd. | | | 4,499 | |
| | 272,500 | | | Fullshare Holdings Ltd. | | | 116,665 | |
| | 546,000 | | | GCL-New Energy Holdings Ltd.(b) | | | 39,893 | |
| | 5,030,000 | | | GCL-Poly Energy Holdings Ltd.(b) | | | 863,973 | |
| | 1,326,000 | | | Gemdale Properties & Investment Corp. Ltd. | | | 135,976 | |
| | 60,150 | | | Get Nice Financial Group Ltd. | | | 17,425 | |
| | 2,406,000 | | | Get Nice Holdings Ltd. | | | 103,316 | |
| | 266,000 | | | Giordano International Ltd. | | | 150,365 | |
| | 471,000 | | | Glorious Property Holdings Ltd.(b) | | | 51,318 | |
| | 220,000 | | | Gold Peak Industries Holdings Ltd. | | | 23,406 | |
| | 86,000 | | | Goldlion Holdings Ltd. | | | 33,732 | |
| | 16,000 | | | Good Friend International Holdings, Inc. | | | 3,917 | |
| | 84,000 | | | Guangdong Investment Ltd. | | | 121,670 | |
| | 14,000 | | | Guoco Group Ltd. | | | 221,447 | |
| | 241,600 | | | Guotai Junan International Holdings Ltd. | | | 77,112 | |
| | 93,000 | | | Haier Electronics Group Co. Ltd. | | | 244,975 | |
| | 420,102 | | | Haitong International Securities Group Ltd. | | | 238,015 | |
| | 181,000 | | | Hang Lung Group Ltd. | | | 635,706 | |
| | 133,267 | | | Hanison Construction Holdings Ltd. | | | 24,599 | |
| | 114,000 | | | Harbour Centre Development Ltd. | | | 215,977 | |
| Old Westbury Funds, Inc. | |
| Small & Mid Cap Strategies Fund | |
| Portfolio of Investments - (Continued) | October 31, 2017 |
| | |
| Shares | | | | | Value | |
| HONG KONG (continued) | | | | |
| | 204,000 | | | Hi Sun Technology (China) Ltd.(b) | | $ | 46,807 | |
| | 4,871,565 | | | HKBN Ltd.(a) | | | 4,945,624 | |
| | 65,441 | | | HKC Holdings Ltd. | | | 53,518 | |
| | 102,400 | | | HKR International Ltd. | | | 65,367 | |
| | 90,000 | | | Hon Kwok Land Investment Co. Ltd. | | | 59,643 | |
| | 9,600 | | | Hong Kong Aircraft Engineering Co. Ltd. | | | 64,788 | |
| | 253,651 | | | Hongkong & Shanghai Hotels Ltd. (The) | | | 412,922 | |
| | 12,650 | | | Hopewell Highway Infrastructure Ltd. | | | 7,848 | |
| | 135,500 | | | Hopewell Holdings Ltd. | | | 520,192 | |
| | 208,000 | | | Hopson Development Holdings Ltd. | | | 212,762 | |
| | 188,000 | | | Hsin Chong Group Holdings Ltd.(a)(b)(c) | | | 3,164 | |
| | 220,000 | | | Hua Han Health Industry Holdings Ltd.(a)(b)(c) | | | 14,946 | |
| | 527,000 | | | Hutchison Telecommunications Hong Kong Holdings Ltd. | | | 189,146 | |
| | 44,000 | | | Hysan Development Co. Ltd. | | | 212,629 | |
| | 175,000 | | | IPE Group Ltd. | | | 43,966 | |
| | 398,000 | | | IT Ltd. | | | 206,107 | |
| | 66,905 | | | ITC Properties Group Ltd. | | | 24,870 | |
| | 95,125 | | | Johnson Electric Holdings Ltd. | | | 383,480 | |
| | 1,094,000 | | | Joy City Property Ltd. | | | 190,714 | |
| | 538,000 | | | Ju Teng International Holdings Ltd. | | | 191,714 | |
| | 521,002 | | | K Wah International Holdings Ltd. | | | 299,188 | |
| | 84,000 | | | Kader Holdings Co. Ltd. | | | 10,983 | |
| | 1,500,000 | | | Kai Yuan Holdings Ltd.(b) | | | 10,575 | |
| | 153,000 | | | Kerry Logistics Network Ltd. | | | 211,024 | |
| | 206,000 | | | Kerry Properties Ltd. | | | 926,834 | |
| | 350,200 | | | Kingboard Chemical Holdings Ltd. | | | 2,076,134 | |
| | 111,500 | | | Kingboard Laminates Holdings Ltd. | | | 187,229 | |
| | 74,000 | | | Kingmaker Footwear Holdings Ltd. | | | 23,714 | |
| | 1,428,000 | | | Kingston Financial Group Ltd. | | | 1,101,925 | |
| | 328,000 | | | Kowloon Development Co. Ltd. | | | 365,781 | |
| | 1,248,000 | | | Kunlun Energy Co. Ltd. | | | 1,156,592 | |
| | 43,180 | | | Lai Fung Holdings Ltd. | | | 72,507 | |
| | 41,495 | | | Lai Sun Development Co. Ltd. | | | 74,997 | |
| | 120,640 | | | Lai Sun Garment International Ltd. | | | 235,670 | |
| | 9,000 | | | Lam Soon Hong Kong Ltd. | | | 12,459 | |
| | 68,000 | | | Landsea Green Properties Co. Ltd. | | | 7,409 | |
| | 24,000 | | | Lee & Man Chemical Co. Ltd. | | | 13,382 | |
| | 751,200 | | | Lee & Man Paper Manufacturing Ltd. | | | 916,685 | |
| | 40,500 | | | Lee’s Pharmaceutical Holdings Ltd. | | | 36,288 | |
| Shares | | | | | Value | |
| HONG KONG (continued) | | | | |
| | 1,704,000 | | | Li & Fung Ltd. | | $ | 858,400 | |
| | 131,000 | | | Lifestyle China Group Ltd.(b) | | | 43,659 | |
| | 606,318 | | | Link REIT (The) | | | 5,094,489 | |
| | 106,000 | | | Luk Fook Holdings International Ltd. | | | 448,381 | |
| | 1,298,000 | | | Magnificent Hotel Investment Ltd. | | | 39,099 | |
| | 260,000 | | | Man Wah Holdings Ltd. | | | 234,625 | |
| | 3,700 | | | Mandarin Oriental International Ltd. | | | 8,139 | |
| | 150,000 | | | Melco International Development Ltd. | | | 410,503 | |
| | 109,000 | | | Ming Fai International Holdings Ltd. | | | 16,906 | |
| | 429,000 | | | Mingfa Group International Co. Ltd.(a)(b)(c) | | | 12,373 | |
| | 702,000 | | | Minmetals Land Ltd. | | | 104,381 | |
| | 48,000 | | | Miramar Hotel & Investment Co. Ltd. | | | 103,612 | |
| | 282,000 | | | National Agricultural Holdings Ltd.(a)(b)(c) | | | 16,133 | |
| | 97,000 | | | New World Department Store China Ltd.(b) | | | 21,386 | |
| | 366,000 | | | Newocean Energy Holdings Ltd.(b) | | | 93,360 | |
| | 362,000 | | | Next Digital Ltd.(b) | | | 22,737 | |
| | 825,000 | | | Nine Dragons Paper Holdings Ltd. | | | 1,514,344 | |
| | 1,450,000 | | | North Mining Shares Co. Ltd.(b) | | | 29,738 | |
| | 22,164 | | | NWS Holdings Ltd. | | | 44,831 | |
| | 22,500 | | | Orient Overseas International Ltd. | | | 216,596 | |
| | 4,000 | | | Overseas Chinese Town Asia Holdings Ltd. | | | 1,548 | |
| | 1,340,246 | | | Pacific Andes International Holdings Ltd.(a)(b)(c) | | | 4,707 | |
| | 614,000 | | | Pacific Basin Shipping Ltd.(b) | | | 140,093 | |
| | 320,000 | | | Pacific Plywood Holdings Ltd.(b) | | | 19,279 | |
| | 105,000 | | | Pacific Textile Holdings Ltd. | | | 110,499 | |
| | 201,240 | | | Paliburg Holdings Ltd. | | | 86,930 | |
| | 2,809,071 | | | PCCW Ltd. | | | 1,548,313 | |
| | 48,000 | | | Peace Mark Holdings Ltd.(a)(b)(c) | | | 0 | |
| | 408,000 | | | Phoenix Satellite Television Holdings Ltd. | | | 59,620 | |
| | 368,000 | | | Pico Far East Holdings Ltd. | | | 155,664 | |
| | 540,000 | | | Playmates Holdings Ltd. | | | 71,987 | |
| | 116,000 | | | Playmates Toys Ltd. | | | 18,289 | |
| | 2,421,000 | | | Poly Property Group Co. Ltd.(b) | | | 1,173,043 | |
| | 460,000 | | | Polytec Asset Holdings Ltd. | | | 37,147 | |
| | 597,000 | | | Pou Sheng International Holdings Ltd. | | | 109,430 | |
| | 314,200 | | | Regal Hotels International Holdings Ltd. | | | 223,525 | |
| | 21,000 | | | Road King Infrastructure Ltd. | | | 34,509 | |
| | 14,000 | | | Rotam Global Agrosciences Ltd. | | | 14,297 | |
| Old Westbury Funds, Inc. | |
| Small & Mid Cap Strategies Fund | |
| Portfolio of Investments - (Continued) | October 31, 2017 |
| | |
| Shares | | | | | Value | |
| HONG KONG (continued) | | | | |
| | 199,800 | | | SA SA International Holdings Ltd. | | $ | 72,479 | |
| | 116,000 | | | SAS Dragon Holdings Ltd. | | | 37,916 | |
| | 36,495 | | | Seaspan Corp. | | | 255,465 | |
| | 252,516 | | | Shanghai Industrial Holdings Ltd. | | | 775,214 | |
| | 411,000 | | | Shanghai Industrial Urban Development Group Ltd. | | | 88,507 | |
| | 400,000 | | | Shanghai Zendai Property Ltd.(b) | | | 6,101 | |
| | 234,000 | | | Shangri-La Asia Ltd. | | | 465,516 | |
| | 120,000 | | | Shenwan Hongyuan HK Ltd. | | | 43,531 | |
| | 386,685 | | | Shenzhen International Holdings Ltd. | | | 738,535 | |
| | 2,122,659 | | | Shenzhen Investment Ltd. | | | 946,863 | |
| | 841,129 | | | Shimao Property Holdings Ltd. | | | 1,761,741 | |
| | 842,000 | | | Shougang Fushan Resources Group Ltd. | | | 181,321 | |
| | 652,000 | | | Singamas Container Holdings Ltd. | | | 135,391 | |
| | 1,356,000 | | | Sino Biopharmaceutical Ltd. | | | 1,583,454 | |
| | 2,225,000 | | | Sino Oil And Gas Holdings Ltd.(b) | | | 43,066 | |
| | 344,000 | | | Sinofert Holdings Ltd.(b) | | | 60,851 | |
| | 330,000 | | | Sinopec Kantons Holdings Ltd. | | | 213,616 | |
| | 61,000 | | | SITC International Holdings Co. Ltd. | | | 58,800 | |
| | 56,000 | | | SJM Holdings Ltd. | | | 48,094 | |
| | 290,000 | | | Skyfame Realty Holdings Ltd.(b) | | | 95,906 | |
| | 3,890,878 | | | Skyworth Digital Holdings Ltd. | | | 1,790,480 | |
| | 21,643 | | | SmarTone Telecommunications Holding Ltd. | | | 26,938 | |
| | 154,386 | | | SMI Holdings Group Ltd. | | | 79,158 | |
| | 7,500 | | | Soundwill Holdings Ltd. | | | 16,228 | |
| | 1,740,000 | | | South China Holdings Co. Ltd.(b) | | | 63,566 | |
| | 269,212 | | | SSY Group Ltd. | | | 128,025 | |
| | 90,500 | | | Stella International Holdings Ltd. | | | 147,326 | |
| | 1,039,000 | | | Sun Art Retail Group Ltd. | | | 1,049,468 | |
| | 271,801 | | | Sun Hung Kai & Co. Ltd. | | | 174,549 | |
| | 576,000 | | | TCC International Holdings Ltd.(a)(c) | | | 267,275 | |
| | 173,000 | | | TCL Multimedia Technology Holdings Ltd. | | | 93,137 | |
| | 35,500 | | | Television Broadcasts Ltd. | | | 134,239 | |
| | 93,500 | | | Texhong Textile Group Ltd. | | | 128,959 | |
| | 224,000 | | | Texwinca Holdings Ltd. | | | 135,237 | |
| | 185,800 | | | Tian An China Investment Co. Ltd.(b) | | | 138,611 | |
| | 1,258,000 | | | Tianjin Port Development Holdings Ltd. | | | 196,729 | |
| | 164,000 | | | Tianyi Summi Holdings Ltd. | | | 23,544 | |
| | 184,000 | | | Tibet Water Resources Ltd.(b) | | | 75,945 | |
| | 278,644 | | | Tomson Group Ltd. | | | 128,939 | |
| | 330,000 | | | Tongda Group Holdings Ltd. | | | 93,483 | |
| Shares | | | | | Value | |
| HONG KONG (continued) | | | | |
| | 62,000 | | | Top Spring International Holdings Ltd. | | $ | 37,511 | |
| | 81,027 | | | Towngas China Co. Ltd. | | | 66,472 | |
| | 468,000 | | | TPV Technology Ltd. | | | 79,786 | |
| | 58,000 | | | Tradelink Electronic Commerce Ltd. | | | 10,260 | |
| | 80,800 | | | Transport International Holdings Ltd. | | | 258,410 | |
| | 368,000 | | | Truly International Holdings Ltd. | | | 142,456 | |
| | 233,000 | | | TSC Group Holdings Ltd.(b) | | | 23,594 | |
| | 100,000 | | | Tsui Wah Holdings Ltd. | | | 15,125 | |
| | 2,002,000 | | | United Energy Group Ltd.(b) | | | 109,064 | |
| | 288,500 | | | United Laboratories International Holdings Ltd. (The)(b) | | | 251,098 | |
| | 154,500 | | | Universal Medical Financial & Technical Advisory Services Co. Ltd. | | | 163,186 | |
| | 44,000 | | | Up Energy Development Group Ltd.(a)(b)(c) | | | 136 | |
| | 111,210 | | | Valuetronics Holdings Ltd. | | | 84,442 | |
| | 42,000 | | | Vinda International Holdings Ltd. | | | 84,846 | |
| | 152,000 | | | Vitasoy International Holdings Ltd. | | | 351,486 | |
| | 483,600 | | | VST Holdings Ltd. | | | 225,020 | |
| | 290,300 | | | VTech Holdings Ltd. | | | 4,126,730 | |
| | 68,622 | | | Wasion Group Holdings Ltd. | | | 35,272 | |
| | 68,000 | | | Wing On Co. International Ltd. | | | 240,572 | |
| | 220,000 | | | Wing Tai Properties Ltd. | | | 152,280 | |
| | 450,000 | | | Xinyi Glass Holdings Ltd. | | | 435,499 | |
| | 3,000 | | | YGM Trading Ltd. | | | 3,034 | |
| | 1,300,872 | | | Yue Yuen Industrial Holdings Ltd. | | | 4,985,781 | |
| | 3,862,946 | | | Yuexiu Property Co. Ltd. | | | 747,693 | |
| | 32,191 | | | Yuexiu Transport Infrastructure Ltd. | | | 23,603 | |
| | 306,000 | | | Zhuhai Holdings Investment Group Ltd. | | | 45,892 | |
| | | | | | | | 79,441,509 | |
| HUNGARY — 0.0% | | | | |
| | 46,808 | | | Magyar Telekom Telecommunications Plc | | | 81,250 | |
| | 11,745 | | | Richter Gedeon Nyrt | | | 292,187 | |
| | | | | | | | 373,437 | |
| INDIA — 0.8% | | | | |
| | 293 | | | 3M India Ltd.(b) | | | 64,191 | |
| | 2,639 | | | 5Paisa Capital Ltd.(a)(b)(c) | | | 10,644 | |
| | 4,102 | | | Aarti Industries | | | 60,373 | |
| | 1,662 | | | ABB India Ltd. | | | 35,560 | |
| | 2,329 | | | ACC Ltd. | | | 65,065 | |
| | 59,679 | | | Adani Enterprises Ltd. | | | 121,899 | |
| | 151,284 | | | Adani Power Ltd.(b) | | | 76,493 | |
| | 84,016 | | | Adani Transmission Ltd(b) | | | 269,801 | |
| Old Westbury Funds, Inc. | |
| Small & Mid Cap Strategies Fund | |
| Portfolio of Investments - (Continued) | October 31, 2017 |
| | |
| Shares | | | | | Value | |
| INDIA (continued) | | | | |
| | 98,716 | | | Aditya Birla Capital Ltd.(b) | | $ | 271,132 | |
| | 33,462 | | | Aditya Birla Fashion and Retail Ltd.(b) | | | 81,057 | |
| | 12,792 | | | Aegis Logistics Ltd. | | | 45,918 | |
| | 2,325 | | | AIA Engineering Ltd. | | | 49,414 | |
| | 3,985 | | | Ajanta Pharma Ltd. | | | 75,063 | |
| | 250 | | | Akzo Nobel India Ltd. | | | 7,385 | |
| | 13,659 | | | Alembic Pharmaceuticals Ltd. | | | 106,442 | |
| | 787 | | | Alkem Laboratories Ltd. | | | 22,768 | |
| | 20,057 | | | Allahabad Bank(b) | | | 24,277 | |
| | 9,410 | | | Allcargo Logistics Ltd. | | | 25,221 | |
| | 2,907 | | | Amara Raja Batteries Ltd. | | | 31,399 | |
| | 31,772 | | | Ambuja Cements Ltd. | | | 138,083 | |
| | 28,807 | | | Anant Raj Ltd. | | | 26,796 | |
| | 41,733 | | | Andhra Bank(b) | | | 42,557 | |
| | 4,489 | | | Apar Industries Ltd. | | | 53,161 | |
| | 8,379 | | | Apollo Hospitals Enterprise Ltd. | | | 134,350 | |
| | 85,067 | | | Apollo Tyres Ltd. | | | 323,083 | |
| | 50,716 | | | Arvind Ltd. | | | 314,023 | |
| | 152,423 | | | Ashok Leyland Ltd. | | | 308,747 | |
| | 11,792 | | | Ashoka Buildcon Ltd. | | | 38,769 | |
| | 3,992 | | | Astral Polytechnik Ltd. | | | 46,945 | |
| | 2,224 | | | Atul Ltd. | | | 82,330 | |
| | 37,449 | | | Aurobindo Pharma Ltd. | | | 439,412 | |
| | 6,484 | | | Bajaj Corp. Ltd. | | | 46,604 | |
| | 4,605 | | | Bajaj Electricals Ltd. | | | 27,585 | |
| | 102,837 | | | Bajaj Hindusthan Sugar Ltd.(b) | | | 23,657 | |
| | 13,089 | | | Bajaj Holdings & Investment Ltd. | | | 599,967 | |
| | 5,131 | | | Balkrishna Industries Ltd. | | | 135,061 | |
| | 12,833 | | | Balmer Lawrie & Co. Ltd. | | | 46,758 | |
| | 48,952 | | | Balrampur Chini Mills Ltd. | | | 129,576 | |
| | 33,529 | | | Bank of Baroda | | | 87,949 | |
| | 213,818 | | | Bank of India(b) | | | 630,845 | |
| | 1,330 | | | BASF India Ltd. | | | 35,714 | |
| | 5,028 | | | Bata India Ltd. | | | 62,963 | |
| | 2,183 | | | BEML Ltd. - Partly Paid Shares | | | 57,754 | |
| | 9,384 | | | Berger Paints India Ltd. | | | 38,545 | |
| | 19,283 | | | Bharat Electronics Ltd. | | | 54,957 | |
| | 4,628 | | | Bharat Financial Inclusion Ltd.(b) | | | 69,669 | |
| | 24,210 | | | Bharat Forge Ltd. | | | 260,971 | |
| | 521,900 | | | Bharat Heavy Electricals Ltd. | | | 789,644 | |
| | 112,524 | | | Bharti Airtel Ltd. | | | 863,762 | |
| | 3,536 | | | Birla Corp. Ltd. | | | 62,148 | |
| | 4,707 | | | Bliss Gvs Pharma Ltd. | | | 12,619 | |
| | 634 | | | Blue Dart Express Ltd. | | | 41,044 | |
| | 2,155 | | | Blue Star Ltd. | | | 26,998 | |
| | 10,347 | | | Bodal Chemicals Ltd. | | | 28,691 | |
| | 18,485 | | | Bombay Dyeing & Manufacturing Co. Ltd. | | | 55,437 | |
| | 13,389 | | | Brigade Enterprises Ltd. | | | 54,675 | |
| | 1,291 | | | Britannia Industries Ltd. | | | 92,473 | |
| | 6,303 | | | Cadila Healthcare Ltd. | | | 48,992 | |
| | 8,545 | | | Can Fin Homes Ltd. | | | 63,344 | |
| | 129,651 | | | Canara Bank | | | 811,879 | |
| Shares | | | | | Value | |
| INDIA (continued) | | | | |
| | 4,224 | | | Capital First Ltd. | | $ | 49,211 | |
| | 7,476 | | | Carborundum Universal Ltd. | | | 41,702 | |
| | 8,239 | | | Castrol India Ltd. | | | 50,868 | |
| | 10,399 | | | Ceat Ltd. | | | 268,423 | |
| | 4,533 | | | Century Plyboards India Ltd. | | | 19,760 | |
| | 6,416 | | | Century Textiles & Industries Ltd. | | | 134,677 | |
| | 1,713 | | | CESC Ltd. | | | 26,941 | |
| | 64,732 | | | CG Power and Industrial Solutions Ltd.(b) | | | 82,850 | |
| | 57,473 | | | Chambal Fertilizers and Chemicals Ltd. | | | 133,675 | |
| | 3,941 | | | Chennai Petroleum Corp Ltd. | | | 28,524 | |
| | 56,756 | | | Chennai Super Kings Cricket Ltd.(a)(b)(c) | | | 370 | |
| | 6,538 | | | Cholamandalam Investment and Finance Co. Ltd. | | | 116,202 | |
| | 26,937 | | | Cipla Ltd. | | | 261,006 | |
| | 11,146 | | | City Union Bank Ltd. | | | 27,800 | |
| | 7,047 | | | Coffee Day Enterprises Ltd.(b) | | | 24,202 | |
| | 6,394 | | | Colgate-Palmolive India Ltd. | | | 105,099 | |
| | 2,891 | | | Container Corp. of India Ltd. | | | 61,700 | |
| | 14,352 | | | Coromandel International Ltd. | | | 114,169 | |
| | 23,636 | | | Corp. Bank(b) | | | 16,531 | |
| | 50,107 | | | Cox & Kings Ltd. | | | 202,103 | |
| | 47,727 | | | Crompton Greaves Consumer Electricals Ltd. | | | 162,955 | |
| | 2,991 | | | Cummins India Ltd. | | | 41,798 | |
| | 14,681 | | | Cyient Ltd. | | | 122,521 | |
| | 56,562 | | | Dabur India Ltd. | | | 290,664 | |
| | 4,361 | | | Dalmia Bharat Ltd. | | | 201,459 | |
| | 5,461 | | | Dalmia Bharat Sugar & Industries Ltd. | | | 15,475 | |
| | 6,484 | | | DB Corp. Ltd. | | | 36,238 | |
| | 27,921 | | | DCB Bank Ltd. | | | 76,709 | |
| | 9,427 | | | DCM Shriram Ltd. | | | 76,235 | |
| | 9,279 | | | Deepak Fertilizers & Petrochemicals Corp. Ltd. | | | 67,926 | |
| | 4,866 | | | Deepak Nitrite Ltd. | | | 16,314 | |
| | 8,598 | | | Delta Corp Ltd. | | | 35,237 | |
| | 22,736 | | | DEN Networks Ltd.(b) | | | 30,065 | |
| | 66,017 | | | Dewan Housing Finance Corp. Ltd. | | | 655,112 | |
| | 16,231 | | | Dhampur Sugar Mills Ltd. | | | 79,525 | |
| | 285,784 | | | Dish TV India Ltd.(b) | | | 342,608 | |
| | 5,976 | | | Dishman Carbogen Amcis Ltd.(b) | | | 27,415 | |
| | 9,900 | | | Divi’s Laboratories Ltd. | | | 134,886 | |
| | 409,859 | | | DLF Ltd. | | | 1,274,101 | |
| | 1,513 | | | Dr Lal Pathlabs Ltd. | | | 18,046 | |
| | 9,101 | | | Dr Reddys Laboratories Ltd. | | | 341,179 | |
| | 5,192 | | | eClerx Services Ltd. | | | 102,608 | |
| | 31,357 | | | EID Parry India Ltd. | | | 180,020 | |
| | 4,882 | | | EIH Ltd. | | | 11,607 | |
| | 45,194 | | | Electrosteel Castings Ltd. | | | 22,258 | |
| | 3,704 | | | Elgi Equipments Ltd. | | | 13,790 | |
| | 6,196 | | | Emami Ltd. | | | 120,364 | |
| Old Westbury Funds, Inc. | |
| Small & Mid Cap Strategies Fund | |
| Portfolio of Investments - (Continued) | October 31, 2017 |
| | |
| Shares | | | | | Value | |
| INDIA (continued) | | | | |
| | 9,996 | | | Escorts Ltd. | | $ | 117,312 | |
| | 20,879 | | | Essel Propack Ltd. | | | 91,950 | |
| | 4,683 | | | Eveready Industries India Ltd.(b) | | | 24,387 | |
| | 37,997 | | | Exide Industries Ltd. | | | 122,460 | |
| | 9,612 | | | FDC Ltd. | | | 28,352 | |
| | 89,105 | | | Federal Bank Ltd. | | | 167,490 | |
| | 4,296 | | | Federal-Mogul Goetze India Ltd.(b) | | | 33,259 | |
| | 11,892 | | | Finolex Cables Ltd. | | | 112,951 | |
| | 12,286 | | | Finolex Industries Ltd. | | | 135,860 | |
| | 92,745 | | | Firstsource Solutions Ltd.(b) | | | 62,788 | |
| | 14,906 | | | Fortis Healthcare Ltd.(b) | | | 33,116 | |
| | 14,283 | | | Future Retail Ltd.(b) | | | 114,789 | |
| | 11,802 | | | Gabriel India Ltd. | | | 36,005 | |
| | 2,880 | | | GAIL India Ltd. | | | 20,685 | |
| | 8,390 | | | Gateway Distriparks Ltd. | | | 34,281 | |
| | 10,841 | | | Gayatri Projects Ltd.(b) | | | 32,571 | |
| | 18,405 | | | Genus Power Infrastructures Ltd. | | | 17,561 | |
| | 12,605 | | | GHCL Ltd. | | | 44,254 | |
| | 7,393 | | | GIC Housing Finance Ltd. | | | 55,073 | |
| | 220 | | | Gillette India Ltd. | | | 20,295 | |
| | 810 | | | GlaxoSmithKline Consumer Healthcare Ltd. | | | 63,408 | |
| | 261 | | | GlaxoSmithKline Pharmaceuticals Ltd. | | | 10,421 | |
| | 14,696 | | | Glenmark Pharmaceuticals Ltd. | | | 140,150 | |
| | 198,377 | | | GMR Infrastructure Ltd.(b) | | | 58,804 | |
| | 998 | | | Godfrey Phillips India Ltd. | | | 15,525 | |
| | 5,642 | | | Godrej Properties Ltd.(b) | | | 59,171 | |
| | 21,363 | | | Granules India Ltd. | | | 46,010 | |
| | 8,395 | | | Graphite India Ltd. | | | 64,403 | |
| | 51,208 | | | Grasim Industries Ltd. | | | 970,142 | |
| | 9,635 | | | Great Eastern Shipping Co. Ltd. (The) | | | 58,103 | |
| | 16,172 | | | Greaves Cotton Ltd. | | | 32,084 | |
| | 770 | | | Greenlam Industries Ltd. | | | 11,207 | |
| | 3,850 | | | Greenply Industries Ltd. | | | 16,557 | |
| | 5,192 | | | Grindwell Norton Ltd. | | | 38,096 | |
| | 8,265 | | | Gruh Finance Ltd. | | | 63,553 | |
| | 6,920 | | | Gujarat Ambuja Exports Ltd. | | | 18,413 | |
| | 10,988 | | | Gujarat Flourochemicals Ltd. | | | 157,734 | |
| | 1,569 | | | Gujarat Gas Ltd. | | | 22,103 | |
| | 21,698 | | | Gujarat Mineral Development Corp. Ltd. | | | 58,641 | |
| | 13,800 | | | Gujarat Narmada Valley Fertilizers & Chemicals Ltd. | | | 111,514 | |
| | 10,870 | | | Gujarat Pipavav Port Ltd. | | | 23,789 | |
| | 27,992 | | | Gujarat State Fertilizers & Chemicals Ltd. | | | 69,384 | |
| | 27,120 | | | Gujarat State Petronet Ltd. | | | 85,625 | |
| | 1,481 | | | Hatsun Agro Products Ltd. | | | 16,299 | |
| | 9,482 | | | Havells India Ltd. | | | 70,964 | |
| | 11,965 | | | HCL Infosystems Ltd.(b) | | | 8,830 | |
| | 3,112 | | | HEG Ltd.(b) | | | 82,204 | |
| | 14,346 | | | HeidelbergCement India Ltd. | | | 32,913 | |
| Shares | | | | | Value | |
| INDIA (continued) | | | | |
| | 1,292 | | | Heritage Foods Ltd. | | $ | 15,604 | |
| | 23,347 | | | Hexaware Technologies Ltd. | | | 102,657 | |
| | 3,702 | | | Hikal Ltd. | | | 14,457 | |
| | 274,868 | | | Himachal Futuristic Communications Ltd.(b) | | | 125,188 | |
| | 8,085 | | | Himadri Chemicals & Industries Ltd. | | | 21,651 | |
| | 6,475 | | | Himatsingka Seide Ltd. | | | 36,743 | |
| | 188,770 | | | Hindalco Industries Ltd. | | | 779,313 | |
| | 2,430 | | | Hinduja Global Solutions Ltd. | | | 21,658 | |
| | 98,252 | | | Hindustan Construction Co. Ltd.(b) | | | 60,449 | |
| | 21,974 | | | Hindustan Petroleum Corp. Ltd. | | | 151,698 | |
| | 207 | | | Honeywell Automation India Ltd. | | | 50,590 | |
| | 28,793 | | | Housing Development & Infrastructure Ltd.(b) | | | 26,272 | |
| | 10,019 | | | HSIL Ltd. | | | 65,686 | |
| | 8,648 | | | HT Media Ltd. | | | 13,679 | |
| | 4,443 | | | Huhtamaki PPL Ltd. | | | 17,698 | |
| | 40,703 | | | IDBI Bank Ltd.(b) | | | 39,370 | |
| | 366,841 | | | Idea Cellular Ltd.(b) | | | 525,869 | |
| | 98,225 | | | IDFC Bank Ltd. | | | 85,909 | |
| | 73,673 | | | IDFC Ltd. | | | 71,601 | |
| | 1,838 | | | IFB Industries Ltd.(b) | | | 27,286 | |
| | 73,581 | | | IFCI Ltd.(b) | | | 27,548 | |
| | 65,995 | | | IIFL Holdings Ltd. | | | 623,767 | |
| | 64,338 | | | India Cements Ltd. (The) | | | 192,901 | |
| | 78,978 | | | Indiabulls Housing Finance Ltd. | | | 1,516,917 | |
| | 30,078 | | | Indiabulls Ventures Ltd. | | | 132,764 | |
| | 1,701 | | | Indian Hume Pipe Co. Ltd. | | | 13,330 | |
| | 1,383 | | | Indraprastha Gas Ltd. | | | 33,846 | |
| | 8,625 | | | Inox Leisure Ltd.(b) | | | 32,465 | |
| | 11,904 | | | Intellect Design Arena Ltd.(b) | | | 25,831 | |
| | 4,901 | | | Interglobe Aviation Ltd. | | | 94,420 | |
| | 2,682 | | | International Paper APPM Ltd.(b) | | | 11,911 | |
| | 5,383 | | | Ipca Laboratories Ltd. | | | 44,321 | |
| | 7,797 | | | IRB Infrastructure Developers Ltd. | | | 29,198 | |
| | 7,958 | | | J Kumar Infraprojects Ltd. | | | 32,540 | |
| | 22,401 | | | Jagran Prakashan Pvt Ltd. | | | 61,440 | |
| | 157,842 | | | Jain Irrigation Systems Ltd. - DVR | | | 249,662 | |
| | 216,544 | | | Jaiprakash Associates Ltd.(b) | | | 61,849 | |
| | 33,310 | | | Jamna Auto Industries Ltd. | | | 33,890 | |
| | 133,928 | | | Jaypee Infratech Ltd.(b) | | | 27,604 | |
| | 9,791 | | | JBF Industries Ltd. | | | 33,483 | |
| | 9,545 | | | Jindal Poly Films Ltd. | | | 59,248 | |
| | 29,253 | | | Jindal Saw Ltd. | | | 56,364 | |
| | 60,947 | | | Jindal Steel & Power Ltd.(b) | | | 153,470 | |
| | 2,351 | | | JITF Infralogistics Ltd.(b) | | | 1,377 | |
| | 1,701 | | | JK Cement Ltd. | | | 26,325 | |
| | 21,600 | | | JK Paper Ltd. | | | 37,800 | |
| | 30,727 | | | JK Tyre & Industries Ltd. | | | 69,095 | |
| | 103,647 | | | JM Financial Ltd. | | | 263,313 | |
| Old Westbury Funds, Inc. | |
| Small & Mid Cap Strategies Fund | |
| Portfolio of Investments - (Continued) | October 31, 2017 |
| | |
| Shares | | | | | Value | |
| INDIA (continued) | | | | |
| | 219,780 | | | JSW Energy Ltd. | | $ | 289,777 | |
| | 255,874 | | | JSW Steel Ltd. | | | 1,020,987 | |
| | 6,067 | | | Jubilant Foodworks Ltd. | | | 152,927 | |
| | 22,225 | | | Jubilant Organosys Ltd. | | | 219,724 | |
| | 6,571 | | | Just Dial Ltd.(b) | | | 47,255 | |
| | 2,020 | | | Jyothy Laboratories Ltd. | | | 12,269 | |
| | 8,493 | | | Kajaria Ceramics Ltd. | | | 89,190 | |
| | 13,606 | | | Kalpataru Power Transmission Ltd. | | | 78,616 | |
| | 10,556 | | | Kalyani Steels Ltd. | | | 68,522 | |
| | 7,451 | | | Kansai Nerolac Paints Ltd. | | | 59,031 | |
| | 23,836 | | | Karnataka Bank Ltd. (The) | | | 59,800 | |
| | 26,068 | | | Karur Vysya Bank Ltd. (The) | | | 51,072 | |
| | 2,611 | | | Kaveri Seed Co. Ltd. | | | 23,167 | |
| | 942 | | | Kaya Ltd.(b) | | | 13,635 | |
| | 12,734 | | | KCP Ltd. | | | 24,123 | |
| | 22,177 | | | KEC International Ltd. | | | 100,252 | |
| | 7,194 | | | Kolte-Patil Developers Ltd. | | | 28,106 | |
| | 40,378 | | | KPIT Technologies Ltd. | | | 92,418 | |
| | 858 | | | KPR Mill Ltd. | | | 10,416 | |
| | 4,012 | | | KRBL Ltd. | | | 39,961 | |
| | 59,988 | | | L&T Finance Holdings Ltd. | | | 186,295 | |
| | 635 | | | Lakshmi Machine Works Ltd. | | | 57,404 | |
| | 12,239 | | | Lakshmi Vilas Bank Ltd. (The) | | | 28,457 | |
| | 94,778 | | | LIC Housing Finance Ltd. | | | 876,061 | |
| | 1,512 | | | Linde India Ltd. | | | 10,072 | |
| | 21,539 | | | Mahindra & Mahindra Financial Services Ltd. | | | 143,541 | |
| | 3,236 | | | Mahindra CIE Automotive Ltd.(b) | | | 12,503 | |
| | 3,376 | | | Mahindra Holidays & Resorts India Ltd. | | | 19,694 | |
| | 3,461 | | | Mahindra Lifespace Developers Ltd. | | | 23,642 | |
| | 208,274 | | | Manappuram Finance Ltd. | | | 324,126 | |
| | 13,303 | | | Mangalore Refinery & Petrochemicals Ltd. | | | 29,236 | |
| | 49,699 | | | Marico Ltd. | | | 241,891 | |
| | 11,396 | | | Max Ltd.(b) | | | 23,884 | |
| | 14,107 | | | Mcleod Russel India Ltd. | | | 36,143 | |
| | 16,866 | | | Meghmani Organics Ltd. | | | 30,805 | |
| | 57,898 | | | Mercator Ltd. | | | 40,851 | |
| | 1,637 | | | Merck Ltd. | | | 28,107 | |
| | 2,158 | | | Minda Industries Ltd. | | | 27,325 | |
| | 40,920 | | | MindTree Ltd. | | | 303,025 | |
| | 4,232 | | | Mirza International Ltd. | | | 10,444 | |
| | 111,404 | | | Motherson Sumi Systems Ltd. | | | 628,130 | |
| | 10,261 | | | Mphasis Ltd. | | | 109,864 | |
| | 310 | | | MRF Ltd. | | | 317,903 | |
| | 139,156 | | | Mundra Port and Special Economic Zone Ltd. | | | 924,574 | |
| | 11,659 | | | Muthoot Finance Ltd. | | | 88,795 | |
| | 63,997 | | | National Aluminium Co. Ltd. | | | 94,556 | |
| | 5,329 | | | Nava Bharat Ventures Ltd. | | | 11,609 | |
| | 1,175 | | | Navin Fluorine International Ltd. | | | 13,465 | |
| Shares | | | | | Value | |
| INDIA (continued) | | | | |
| | 12,073 | | | Navneet Education Ltd. | | $ | 31,025 | |
| | 107,246 | | | NCC Ltd. | | | 180,230 | |
| | 1,485 | | | NESCO Ltd. | | | 11,768 | |
| | 35,322 | | | NHPC Ltd. | | | 15,569 | |
| | 11,497 | | | NIIT Technologies Ltd. | | | 120,160 | |
| | 534 | | | Nilkamal Ltd. | | | 13,261 | |
| | 34,676 | | | NOCIL Ltd. | | | 98,185 | |
| | 8,471 | | | Oberoi Realty Ltd. | | | 62,089 | |
| | 2,889 | | | OCL India Ltd. | | | 64,307 | |
| | 12,774 | | | Oil India Ltd. | | | 72,783 | |
| | 10,701 | | | OMAXE Ltd. | | | 33,860 | |
| | 953 | | | Oracle Financial Sevices Software Ltd. | | | 51,486 | |
| | 6,159 | | | Orient Cement Ltd. | | | 16,008 | |
| | 703 | | | Page Industries Ltd. | | | 216,597 | |
| | 13,240 | | | Patel Engineering Ltd.(b) | | | 16,649 | |
| | 24,262 | | | PC Jeweller Ltd. | | | 131,403 | |
| | 7,587 | | | Persistent Systems Ltd. | | | 76,349 | |
| | 34,067 | | | Petronet LNG Ltd. | | | 136,670 | |
| | 765 | | | Pfizer Ltd. | | | 20,492 | |
| | 7,094 | | | Phillips Carbon Black Ltd. | | | 101,227 | |
| | 4,125 | | | Phoenix Mills Ltd. (The) | | | 33,473 | |
| | 7,720 | | | PI Industries Ltd. | | | 97,830 | |
| | 7,666 | | | Pidilite Industries Ltd. | | | 92,530 | |
| | 4,946 | | | Piramal Enterprises Ltd. | | | 209,875 | |
| | 14,053 | | | Polaris Consulting & Services Ltd.(b) | | | 61,140 | |
| | 1,665 | | | Polyplex Corp. Ltd. | | | 14,485 | |
| | 121,130 | | | Power Finance Corp. Ltd. | | | 260,414 | |
| | 15,982 | | | Prakash Industries Ltd.(b) | | | 36,580 | |
| | 38,916 | | | Prestige Estates Projects Ltd. | | | 182,680 | |
| | 1,144 | | | Procter & Gamble Hygiene & Health Care Ltd. | | | 153,224 | |
| | 101,946 | | | PTC India Financial Services Ltd. | | | 63,587 | |
| | 54,787 | | | PTC India Ltd. | | | 104,125 | |
| | 305,472 | | | Punjab National Bank(b) | | | 929,792 | |
| | 2,139 | | | PVR Ltd. | | | 45,809 | |
| | 11,659 | | | Radico Khaitan Ltd. | | | 39,466 | |
| | 66,516 | | | Rain Industries Ltd. | | | 278,146 | |
| | 23,629 | | | Rajesh Exports Ltd. | | | 285,370 | |
| | 8,005 | | | Rallis India Ltd. | | | 30,273 | |
| | 10,488 | | | Ramco Cements Ltd. (The) | | | 116,723 | |
| | 1,209 | | | Ramkrishna Forgings Ltd. | | | 14,198 | |
| | 38,276 | | | Rashtriya Chemicals & Fertilizers Ltd. | | | 53,362 | |
| | 2,663 | | | Ratnamani Metals & Tubes Ltd. | | | 36,392 | |
| | 1,973 | | | Raymond Ltd. | | | 27,180 | |
| | 86,199 | | | Redington India Ltd. | | | 209,871 | |
| | 99,093 | | | Reliance Capital Ltd. | | | 882,977 | |
| | 59,490 | | | Reliance Infrastructure Ltd. | | | 461,757 | |
| | 71,926 | | | Reliance Power Ltd.(b) | | | 45,307 | |
| | 2,134 | | | Repco Home Finance Ltd. | | | 20,396 | |
| | 315,023 | | | Rural Electrification Corp. Ltd. | | | 842,380 | |
| | 816 | | | Sanofi India Ltd. | | | 52,655 | |
| | 247 | | | Schaeffler India Ltd. | | | 19,669 | |
| Old Westbury Funds, Inc. | |
| Small & Mid Cap Strategies Fund | |
| Portfolio of Investments - (Continued) | October 31, 2017 |
| | |
| Shares | | | | | Value | |
| INDIA (continued) | | | | |
| | 5,871 | | | Sequent Scientific Ltd. | | $ | 9,980 | |
| | 38,111 | | | Shipping Corporation of India Ltd.(b) | | | 54,309 | |
| | 2,527 | | | Shoppers Stop Ltd. | | | 20,579 | |
| | 310 | | | Shriram City Union Finance Ltd. | | | 11,038 | |
| | 27,457 | | | Shriram Transport Finance Co. Ltd. | | | 495,124 | |
| | 3,021 | | | Sical Logistics Ltd.(b) | | | 10,709 | |
| | 2,703 | | | Siemens Ltd. | | | 53,093 | |
| | 1,002 | | | Simplex Infrastructures Ltd. | | | 8,378 | |
| | 129,196 | | | Sintex Plastics Technology Ltd.(b) | | | 185,403 | |
| | 2,280 | | | Siyaram Silk Mills Ltd. | | | 20,859 | |
| | 15,463 | | | SJVN Ltd. | | | 8,463 | |
| | 1,544 | | | SKF India Ltd. | | | 39,188 | |
| | 13,396 | | | Sobha Ltd. | | | 105,261 | |
| | 1,625 | | | Somany Ceramics Ltd. | | | 21,302 | |
| | 10,072 | | | Sonata Software Ltd. | | | 28,060 | |
| | 195,503 | | | South Indian Bank Ltd. (The) | | | 92,211 | |
| | 30,215 | | | SREI Infrastructure Finance Ltd. | | | 53,506 | |
| | 6,128 | | | SRF Ltd. | | | 159,801 | |
| | 780,364 | | | Steel Authority of India Ltd.(b) | | | 939,744 | |
| | 24,084 | | | Sterlite Technologies Ltd. | | | 105,935 | |
| | 4,387 | | | Strides Shasun Ltd. | | | 56,135 | |
| | 4,094 | | | Sudarshan Chemical Industries | | | 25,248 | |
| | 10,616 | | | Sun TV Network Ltd. | | | 140,380 | |
| | 6,937 | | | Sundram Fasteners Ltd. | | | 55,349 | |
| | 16,204 | | | Sunteck Realty Ltd. | | | 88,086 | |
| | 4,767 | | | Supreme Industries Ltd. | | | 83,239 | |
| | 8,752 | | | Suven Life Sciences Ltd. | | | 29,031 | |
| | 99,039 | | | Suzlon Energy Ltd.(b) | | | 25,918 | |
| | 516 | | | Swaraj Engines Ltd. | | | 16,662 | |
| | 1,972 | | | Symphony Ltd. | | | 44,463 | |
| | 21,028 | | | Syndicate Bank(b) | | | 26,784 | |
| | 2,674 | | | Syngene International Ltd. | | | 20,861 | |
| | 2,501 | | | T&D India Ltd. | | | 15,098 | |
| | 13,420 | | | TAKE Solutions Ltd. | | | 35,875 | |
| | 6,237 | | | Tamil Nadu Newsprint & Papers Ltd. | | | 34,988 | |
| | 13,597 | | | Tata Chemicals Ltd. | | | 153,853 | |
| | 4,668 | | | Tata Communications Ltd. | | | 49,328 | |
| | 4,448 | | | Tata Elxsi Ltd. | | | 57,661 | |
| | 27,232 | | | Tata Power Co. Ltd. | | | 35,695 | |
| | 132,102 | | | Tata Steel Ltd. | | | 1,435,411 | |
| | 70,598 | | | Tata Tea Ltd. | | | 247,366 | |
| | 4,213 | | | TCI Express Ltd. | | | 36,688 | |
| | 53,878 | | | Tech Mahindra Ltd. | | | 400,979 | |
| | 4,740 | | | Techno Electric & Engineering Co. Ltd.(b) | | | 26,480 | |
| | 2,619 | | | Thermax Ltd. | | | 40,036 | |
| | 23,147 | | | Ti Financial Holdings Ltd. | | | 210,202 | |
| | 31,953 | | | Time Technoplast Ltd. | | | 92,004 | |
| | 2,787 | | | Timken India Ltd. | | | 33,338 | |
| | 12,914 | | | Titagarh Wagons Ltd. | | | 28,631 | |
| | 24,556 | | | Titan Co. Ltd. | | | 240,835 | |
| Shares | | | | | Value | |
| INDIA (continued) | | | | |
| | 4,248 | | | Torrent Pharmaceuticals Ltd. | | $ | 83,283 | |
| | 13,348 | | | Torrent Power Ltd. | | | 55,909 | |
| | 6,820 | | | Transport Corp. of India Ltd. | | | 29,419 | |
| | 1,040 | | | Trent Ltd. | | | 4,747 | |
| | 42,672 | | | Trident Ltd. | | | 67,726 | |
| | 15,309 | | | Triveni Engineering & Industries Ltd. | | | 22,336 | |
| | 5,808 | | | Triveni Turbine Ltd. | | | 11,706 | |
| | 344 | | | TTK Prestige Ltd. | | | 34,751 | |
| | 23,147 | | | Tube Investments Of India Ltd.(a)(c) | | | 86,911 | |
| | 1,892 | | | TV Today Network Ltd. | | | 10,440 | |
| | 77,904 | | | TV18 Broadcast Ltd.(b) | | | 52,440 | |
| | 18,756 | | | TVS Motor Co. Ltd. | | | 209,448 | |
| | 302 | | | TVS Srichakra Ltd. | | | 14,925 | |
| | 16,121 | | | Uflex Ltd. | | | 113,370 | |
| | 2,581 | | | Ufo Moviez India Ltd. | | | 17,272 | |
| | 5,484 | | | Unichem Laboratories Ltd. | | | 25,840 | |
| | 269,730 | | | Union Bank of India(b) | | | 734,799 | |
| | 2,382,923 | | | Unitech Ltd.(b) | | | 246,492 | |
| | 3,158 | | | United Breweries Ltd. | | | 50,090 | |
| | 6,109 | | | United Spirits Ltd.(b) | | | 287,793 | |
| | 63,786 | | | UPL Ltd. | | | 787,142 | |
| | 7,625 | | | VA Tech Wabag Ltd. | | | 69,079 | |
| | 17,091 | | | Vakrangee Ltd. | | | 148,372 | |
| | 5,952 | | | Vardhman Textiles Ltd. | | | 118,514 | |
| | 107,548 | | | Vedanta Ltd. | | | 551,013 | |
| | 624 | | | Vesuvius India Ltd. | | | 12,963 | |
| | 16,629 | | | V-Guard Industries Ltd. | | | 55,134 | |
| | 18,328 | | | Videocon Industries Ltd.(b) | | | 4,513 | |
| | 30,234 | | | Vijaya Bank | | | 30,784 | |
| | 8,545 | | | VIP Industries Ltd. | | | 38,153 | |
| | 10,224 | | | Voltas Ltd. | | | 89,594 | |
| | 2,640 | | | VRL Logistics Ltd. | | | 14,581 | |
| | 629 | | | VST Industries Ltd. | | | 30,583 | |
| | 420 | | | VST Tillers Tractors Ltd. | | | 14,400 | |
| | 368 | | | WABCO India Ltd. | | | 36,147 | |
| | 34,344 | | | Welspun Corp. Ltd. | | | 77,679 | |
| | 8,145 | | | West Coast Paper Mills Ltd. | | | 23,446 | |
| | 3,983 | | | Wockhardt Ltd. | | | 39,786 | |
| | 59,727 | | | Zee Entertainment Enterprises Ltd. | | | 499,698 | |
| | 3,524 | | | Zensar Technologies Ltd. | | | 43,066 | |
| | 888 | | | Zydus Wellness Ltd. | | | 12,496 | |
| | | | | | | | 50,188,951 | |
| INDONESIA — 0.1% | | | | |
| | 890,900 | | | Ace Hardware Indonesia Tbk PT | | | 82,439 | |
| | 4,404,900 | | | Adaro Energy Tbk PT | | | 592,733 | |
| | 242,553 | | | Adhi Karya Persero Tbk PT | | | 39,166 | |
| | 2,440,500 | | | Agung Podomoro Land Tbk PT | | | 47,146 | |
| | 187,800 | | | AKR Corporindo Tbk PT | | | 103,160 | |
| | 2,912,400 | | | Alam Sutera Realty Tbk PT | | | 87,184 | |
| | 517,329 | | | Aneka Tambang Persero Tbk PT(b) | | | 24,603 | |
| Old Westbury Funds, Inc. | |
| Small & Mid Cap Strategies Fund | |
| Portfolio of Investments - (Continued) | October 31, 2017 |
| | |
| Shares | | | | | Value | |
| INDONESIA (continued) | | | | |
| | 706,700 | | | Arwana Citramulia Tbk PT | | $ | 20,009 | |
| | 28,100 | | | Asahimas Flat Glass Tbk PT | | | 13,882 | |
| | 121,100 | | | Astra Agro Lestari Tbk PT | | | 130,141 | |
| | 339,200 | | | Asuransi Kresna Mitra Tbk PT(b) | | | 21,884 | |
| | 31,750,200 | | | Bakrie & Brothers Tbk PT(b) | | | 117,051 | |
| | 9,876,000 | | | Bakrie Telecom Tbk PT(a)(b)(c) | | | 36,409 | |
| | 1,260,766 | | | Bank Bukopin Tbk PT | | | 51,593 | |
| | 916,916 | | | Bank Danamon Indonesia Tbk PT | | | 344,794 | |
| | 2,438,350 | | | Bank Pan Indonesia Tbk PT(b) | | | 195,967 | |
| | 754,000 | | | Bank Pembangunan Daerah Jawa Barat Dan Banten Tbk PT | | | 136,206 | |
| | 1,534,500 | | | Bank Pembangunan Daerah Jawa Timur Tbk PT | | | 78,634 | |
| | 1,035,224 | | | Bank Permata Tbk PT(b) | | | 49,614 | |
| | 1,306,100 | | | Bank Tabungan Negara Persero Tbk PT | | | 265,794 | |
| | 60,500 | | | Bank Tabungan Pensiunan Nasional Tbk PT | | | 11,375 | |
| | 2,538,800 | | | Barito Pacific Tbk PT(b) | | | 378,129 | |
| | 2,167,400 | | | Bekasi Fajar Industrial Estate Tbk PT | | | 45,386 | |
| | 40,300 | | | Blue Bird Tbk PT | | | 13,550 | |
| | 806,900 | | | Bumi Serpong Damai Tbk PT | | | 102,331 | |
| | 430,000 | | | Charoen Pokphand Indonesia Tbk PT | | | 104,627 | |
| | 3,628,701 | | | Ciputra Development Tbk PT | | | 323,740 | |
| | 644,973 | | | Citra Marga Nusaphala Persada Tbk PT(b) | | | 64,438 | |
| | 617,700 | | | Delta Dunia Makmur Tbk PT(b) | | | 41,218 | |
| | 765,500 | | | Eagle High Plantations Tbk PT(b) | | | 13,772 | |
| | 374,800 | | | Erajaya Swasembada Tbk PT | | | 21,832 | |
| | 47,800 | | | Fajar Surya Wisesa Tbk PT | | | 18,503 | |
| | 870,500 | | | Gajah Tunggal Tbk PT | | | 44,608 | |
| | 2,470,800 | | | Global Mediacom Tbk PT | | | 106,575 | |
| | 5,879,000 | | | Hanson International Tbk PT(b) | | | 51,150 | |
| | 1,043,600 | | | Holcim Indonesia Tbk PT(b) | | | 63,482 | |
| | 533,800 | | | Indah Kiat Pulp and Paper Corp. Tbk PT | | | 207,616 | |
| | 365,600 | | | Indika Energy Tbk PT(b) | | | 60,653 | |
| | 101,500 | | | Indo Tambangraya Megah Tbk PT | | | 166,142 | |
| | 1,260,200 | | | Intiland Development Tbk PT | | | 36,052 | |
| | 1,762,000 | | | Japfa Comfeed Indonesia Tbk PT | | | 178,636 | |
| | 161,509 | | | Jasa Marga Persero Tbk PT | | | 77,405 | |
| | 168,400 | | | Jaya Real Property Tbk PT | | | 11,237 | |
| | 8,204,340 | | | Kawasan Industri Jababeka Tbk PT | | | 183,898 | |
| | 1,235,800 | | | Kmi Wire & Cable Tbk PT | | | 40,092 | |
| | 334,200 | | | Krakatau Steel Persero Tbk PT(b) | | | 12,124 | |
| Shares | | | | | Value | |
| INDONESIA (continued) | | | | |
| | 883,300 | | | Kresna Graha Investama PT Tbk(b) | | $ | 39,728 | |
| | 49,800 | | | Link Net Tbk PT | | | 18,323 | |
| | 187,000 | | | Lippo Cikarang Tbk PT(b) | | | 52,394 | |
| | 6,494,050 | | | Lippo Karawaci Tbk PT | | | 330,389 | |
| | 306,100 | | | Matahari Putra Prima Tbk PT(b) | | | 13,090 | |
| | 1,857,675 | | | Mayora Indah Tbk PT | | | 280,791 | |
| | 2,388,900 | | | Medco Energi Internasional Tbk PT(b) | | | 139,151 | |
| | 916,500 | | | Media Nusantara Citra Tbk PT | | | 105,419 | |
| | 131,300 | | | Mitra Adiperkasa Tbk PT | | | 63,411 | |
| | 232,900 | | | Mitra Pinasthika Mustika Tbk PT | | | 18,631 | |
| | 115,500 | | | Mnc Land Tbk PT(b) | | | 10,454 | |
| | 2,149,700 | | | Modernland Realty Tbk PT | | | 52,306 | |
| | 198,000 | | | Nippon Indosari Corpindo Tbk PT | | | 18,541 | |
| | 3,181,300 | | | Nusantara Infrastructure Tbk PT(b) | | | 44,568 | |
| | 2,076,200 | | | Pakuwon Jati Tbk PT | | | 96,443 | |
| | 332,600 | | | Pan Brothers Tbk PT | | | 11,918 | |
| | 3,272,600 | | | Panin Financial Tbk PT(b) | | | 56,946 | |
| | 786,793 | | | Pembangunan Perumahan Persero Tbk PT | | | 165,335 | |
| | 347,200 | | | Perusahaan Gas Negara Persero Tbk | | | 47,104 | |
| | 1,418,000 | | | Perusahaan Perkebunan London Sumatra Indonesia Tbk PT | | | 157,875 | |
| | 1,230,300 | | | Salim Ivomas Pratama Tbk PT | | | 47,171 | |
| | 143,800 | | | Samindo Resources Tbk PT | | | 7,051 | |
| | 198,800 | | | Sawit Sumbermas Sarana Tbk PT | | | 21,914 | |
| | 157,200 | | | Selamat Sempurna Tbk PT | | | 14,952 | |
| | 376,100 | | | Semen Indonesia Persero Tbk PT | | | 302,267 | |
| | 117,500 | | | Sinar Mas Agro Resources & Technology Tbk PT | | | 33,312 | |
| | 6,746,600 | | | Sri Rejeki Isman Tbk PT | | | 181,070 | |
| | 292,700 | | | Sumber Alfaria Trijaya Tbk PT | | | 14,999 | |
| | 523,400 | | | Summarecon Agung Tbk PT | | | 39,942 | |
| | 357,600 | | | Surya Semesta Internusa Tbk PT | | | 15,556 | |
| | 154,200 | | | Tambang Batubara Bukit Asam Persero Tbk PT | | | 130,466 | |
| | 1,797,800 | | | Timah Persero Tbk PT | | | 108,696 | |
| | 586,900 | | | Tiphone Mobile Indonesia Tbk PT | | | 48,250 | |
| | 193,600 | | | Tower Bersama Infrastructure Tbk PT | | | 97,068 | |
| | 4,875,000 | | | Truba Alam Manunggal Engineering PT(a)(b)(c) | | | 3,594 | |
| | 1,281,200 | | | Tunas Baru Lampung Tbk PT | | | 131,781 | |
| | 539,500 | | | Tunas Ridean Tbk PT | | | 45,746 | |
| | 43,000 | | | United Tractors Tbk PT | | | 109,937 | |
| | 578,300 | | | Vale Indonesia Tbk PT(b) | | | 125,361 | |
| | 1,938,200 | | | Visi Media Asia Tbk PT(b) | | | 40,300 | |
| | 694,685 | | | Waskita Karya Persero Tbk PT | | | 108,589 | |
| Old Westbury Funds, Inc. | |
| Small & Mid Cap Strategies Fund | |
| Portfolio of Investments - (Continued) | October 31, 2017 |
| | |
| Shares | | | | | Value | |
| INDONESIA (continued) | | | | |
| | 320,700 | | | Wijaya Karya Persero Tbk PT | | $ | 46,583 | |
| | 903,700 | | | XL Axiata Tbk PT(b) | | | 225,217 | |
| | | | | | | | 8,439,619 | |
| IRELAND — 1.5% | | | | |
| | 826,557 | | | Allegion Plc | | | 68,926,588 | |
| | 3,987 | | | Anglo-Eastern Plantations PLC | | | 43,713 | |
| | 549,198 | | | Bank Of Ireland Group Plc(b) | | | 4,304,124 | |
| | 99,747 | | | C&C Group Plc | | | 342,296 | |
| | 6,171 | | | COSMO Pharmaceuticals NV | | | 893,810 | |
| | 3,336 | | | Datalex PLC | | | 13,795 | |
| | 8,890 | | | DCC PLC | | | 843,035 | |
| | 3,350 | | | Endo International Plc(b) | | | 21,373 | |
| | 5,572 | | | FBD Holdings Plc(b) | | | 58,090 | |
| | 644,304 | | | Glanbia Plc | | | 12,451,080 | |
| | 55,515 | | | Grafton Group Plc - Units | | | 606,445 | |
| | 83,881 | | | Greencore Group PLC | | | 214,791 | |
| | 55,324 | | | Hibernia REIT plc | | | 95,055 | |
| | 16,165 | | | IFG Group Plc | | | 34,459 | |
| | 25,492 | | | Irish Continental Group Plc - Units | | | 169,852 | |
| | 789 | | | Jazz Pharmaceuticals Plc(b) | | | 111,667 | |
| | 430 | | | Kenmare Resources Plc(b) | | | 1,633 | |
| | 12,297 | | | Kingspan Group Plc(d) | | | 514,237 | |
| | 6,121 | | | Kingspan Group PLC | | | 257,252 | |
| | 11,560 | | | Paddy Power Betfair Plc | | | 1,182,285 | |
| | 1,200 | | | Perrigo Co. Plc | | | 97,188 | |
| | 100,315 | | | Smurfit Kappa Group Plc | | | 2,991,992 | |
| | 4,022 | | | Tarsus Group Plc | | | 16,439 | |
| | 75,135 | | | United Drug Plc | | | 922,560 | |
| | | | | | | | 95,113,759 | |
| ISLE OF MAN — 0.0% | | | | |
| | 19,921 | | | GVC Holdings Plc | | | 248,043 | |
| | 52,500 | | | Paysafe Group Plc(b) | | | 408,604 | |
| | 29,505 | | | Playtech Plc | | | 385,599 | |
| | �� | | | | | | 1,042,246 | |
| ISRAEL — 1.2% | | | | |
| | 7,252 | | | Airport City Ltd.(b) | | | 92,928 | |
| | 931 | | | Alrov Properties and Lodging | | | 29,834 | |
| | 3,712 | | | AudioCodes Ltd.(b) | | | 25,616 | |
| | 28 | | | Bayside Land Corp. | | | 13,073 | |
| | 561,733 | | | Check Point Software Technologies Ltd.(b) | | | 66,121,591 | |
| | 7,778 | | | Clal Insurance Enterprise Holdings Ltd.(b) | | | 149,187 | |
| | 9,651 | | | Delek Automotive Systems Ltd. | | | 72,466 | |
| | 771 | | | Delek Group Ltd. | | | 126,513 | |
| | 3,947 | | | Delta-Galil Industries Ltd. | | | 128,120 | |
| | 9,680 | | | Direct Insurance Financial Investments Ltd. | | | 107,982 | |
| | 56,421 | | | El Al Israel Airlines | | | 30,860 | |
| | 905 | | | Electra Ltd. | | | 205,943 | |
| | 1,009 | | | Equital Ltd.(b) | | | 23,242 | |
| Shares | | | | | Value | |
| ISRAEL (continued) | | | | |
| | 14,334 | | | First International Bank of Israel Ltd. | | $ | 272,090 | |
| | 3,036 | | | Formula Systems 1985 Ltd. | | | 124,587 | |
| | 9,837 | | | Frutarom Industries Ltd. | | | 809,868 | |
| | 1,135 | | | Hadera Paper Ltd.(b) | | | 77,810 | |
| | 43,055 | | | Harel Insurance Investments & Financial Services Ltd. | | | 294,064 | |
| | 850 | | | Hilan Ltd. | | | 16,675 | |
| | 1 | | | Industrial Buildings Corp. Ltd.(b) | | | 1 | |
| | 274,008 | | | Israel Discount Bank Ltd. - Class A(b) | | | 727,653 | |
| | 4,804 | | | Jerusalem Oil Exploration(b) | | | 257,986 | |
| | 4,100 | | | Magic Software Enterprises Ltd. | | | 34,989 | |
| | 16,429 | | | Matrix IT Ltd. | | | 180,562 | |
| | 1,459 | | | Melisron Ltd. | | | 76,101 | |
| | 15,752 | | | Menora Mivtachim Holdings Ltd. | | | 194,862 | |
| | 34,854 | | | Migdal Insurance & Financial Holding Ltd. | | | 40,484 | |
| | 76,835 | | | Mizrahi Tefahot Bank Ltd. | | | 1,386,249 | |
| | 7,596 | | | Naphtha Israel Petroleum Corp. Ltd. | | | 44,160 | |
| | 736 | | | Neto ME Holdings Ltd. | | | 73,616 | |
| | 1,810 | | | Nice Ltd. | | | 149,169 | |
| | 7,762 | | | Nova Measuring Instruments Ltd.(b) | | | 235,863 | |
| | 3,514,144 | | | Oil Refineries Ltd. | | | 1,805,349 | |
| | 75,901 | | | Orbotech Ltd.(b) | | | 3,394,293 | |
| | 5,275 | | | Partner Communications Co. Ltd.(b) | | | 28,073 | |
| | 2,872 | | | Paz Oil Co. Ltd. | | | 468,981 | |
| | 14,145 | | | Phoenix Holdings Ltd. (The)(b) . | | | 70,057 | |
| | 1,121 | | | Plasson Industries Ltd. | | | 53,038 | |
| | 715 | | | Rami Levy Chain Stores Hashikma Marketing 2006 Ltd. | | | 34,986 | |
| | 1,316 | | | Sapiens International Corp NV(b)(d) | | | 18,156 | |
| | 800 | | | Sapiens International Corp. NV(b) | | | 11,175 | |
| | 2,783,400 | | | Sarine Technologies Ltd.(a) | | | 1,990,914 | |
| | 68,879 | | | Shikun & Binui Ltd. | | | 162,923 | |
| | 35,913 | | | Shufersal Ltd. | | | 228,249 | |
| | 6,039 | | | Strauss Group Ltd. | | | 122,778 | |
| | 3,075 | | | Summit Real Estate Holdings Ltd. | | | 23,447 | |
| | 664 | | | Taro Pharmaceutical Industries Ltd.(b) | | | 74,647 | |
| | 3,108 | | | Tower Semiconductor Ltd.(b) | | | 102,993 | |
| | 6,295 | | | Union Bank of Israel(b) | | | 31,964 | |
| | | | | | | | 80,746,167 | |
| ITALY — 0.6% | | | | |
| | 898,515 | | | A2A SpA | | | 1,543,786 | |
| | 25,860 | | | ACEA SpA | | | 421,120 | |
| | 8,753 | | | Aeffe SpA(b) | | | 25,123 | |
| Old Westbury Funds, Inc. | |
| Small & Mid Cap Strategies Fund | |
| Portfolio of Investments - (Continued) | October 31, 2017 |
| | |
| Shares | | | | | Value | |
| ITALY (continued) | | | | |
| | 14,575 | | | Amplifon SpA | | $ | 221,389 | |
| | 31,512 | | | Anima Holding SpA | | | 239,695 | |
| | 21,662 | | | Ansaldo STS SpA(b) | | | 299,011 | |
| | 89,441 | | | Arnoldo Mondadori Editore SpA(b) | | | 231,500 | |
| | 22,281 | | | Ascopiave SpA | | | 93,590 | |
| | 40,350 | | | Astaldi SpA | | | 279,660 | |
| | 23,294 | | | Autogrill SpA | | | 304,715 | |
| | 19,613 | | | Azimut Holding SpA | | | 387,471 | |
| | 10,128 | | | Banca Generali SpA | | | 333,636 | |
| | 11,800 | | | Banca IFIS SpA | | | 643,414 | |
| | 36,629 | | | Banca Mediolanum SpA | | | 312,111 | |
| | 109,428 | | | Banca Popolare di Sondrio SCPA | | | 433,133 | |
| | 90,926 | | | Banca Profilo SpA | | | 26,553 | |
| | 20,838 | | | Banca Sistema SpA | | | 58,692 | |
| | 112,913 | | | Banco BPM SpA(b) | | | 393,791 | |
| | 10,567 | | | Banco di Desio e della Brianza SpA | | | 30,157 | |
| | 15,143 | | | BasicNet SpA | | | 62,090 | |
| | 22,339 | | | BE | | | 23,432 | |
| | 4,057 | | | Biesse SpA | | | 180,903 | |
| | 117,410 | | | BPER Banca | | | 572,225 | |
| | 27,525 | | | Brembo SpA | | | 454,646 | |
| | 2,597 | | | Brunello Cucinelli SpA | | | 87,184 | |
| | 21,385 | | | Buzzi Unicem SpA | | | 596,104 | |
| | 22,083 | | | Cairo Communication SpA | | | 111,897 | |
| | 1,027 | | | Cembre SpA | | | 28,711 | |
| | 28,463 | | | Cementir Holding SpA | | | 241,867 | |
| | 40,991 | | | Cerved Information Solutions SpA | | | 527,619 | |
| | 188,481 | | | CIR-Compagnie Industriali Riunite SpA | | | 283,222 | |
| | 28,212 | | | Credito Emiliano SpA | | | 247,292 | |
| | 5,049 | | | Danieli & C Officine Meccaniche SpA | | | 120,861 | |
| | 4,885 | | | Datalogic SpA | | | 194,096 | |
| | 78,394 | | | Davide Campari-Milano SpA | | | 628,262 | |
| | 9,415 | | | De’ Longhi SpA | | | 308,723 | |
| | 3,485 | | | DiaSorin SpA | | | 317,047 | |
| | 2,953 | | | Ei Towers SpA | | | 172,678 | |
| | 2,136 | | | El.En. SpA | | | 60,461 | |
| | 21,581 | | | Emak SpA | | | 46,557 | |
| | 34,953 | | | ERG SpA | | | 584,260 | |
| | 7,087 | | | Esprinet SpA | | | 33,979 | |
| | 3,153 | | | Eurotech SpA(b) | | | 4,980 | |
| | 114,391 | | | Falck Renewables SpA | | | 199,073 | |
| | 1,070 | | | Fila SpA | | | 23,220 | |
| | 72,388 | | | Fincantieri SpA(b) | | | 90,055 | |
| | 67,104 | | | FinecoBank Banca Fineco SpA | | | 627,673 | |
| | 58,249 | | | FNM SpA | | | 46,342 | |
| | 65,158 | | | GEDI Gruppo Editoriale SpA(b) | | | 57,987 | |
| | 14,723 | | | Geox SpA | | | 64,313 | |
| | 3,426 | | | Gruppo Mutuionline SpA | | | 52,638 | |
| | 297,877 | | | Hera SpA | | | 958,364 | |
| Shares | | | | | Value | |
| ITALY (continued) | | | | |
| | 34,030 | | | Immobiliare Grande Distribuzione SIIQ SpA REIT | | $ | 39,343 | |
| | 172,287 | | | IMMSI SpA(b) | | | 128,441 | |
| | 3,035 | | | Industria Macchine Automatiche SpA | | | 272,220 | |
| | 22,679 | | | Infrastrutture Wireless Italiane SPA | | | 154,939 | |
| | 128,806 | | | Intek Group SpA(b) | | | 44,997 | |
| | 8,170 | | | Interpump Group SpA | | | 275,131 | |
| | 61,258 | | | Iren SpA | | | 168,544 | |
| | 34,122 | | | Italgas SpA | | | 199,331 | |
| | 3,287 | | | Italmobiliare SpA | | | 88,447 | |
| | 91,700 | | | Juventus Football Club SpA(b) | | | 79,792 | |
| | 4,568 | | | La Doria SpA | | | 86,626 | |
| | 218,720 | | | Leonardo SpA | | | 3,778,326 | |
| | 23,268 | | | Maire Tecnimont SpA | | | 130,532 | |
| | 1,779 | | | Mariella Burani SpA(a)(b)(c) | | | 0 | |
| | 6,331 | | | MARR SpA | | | 161,726 | |
| | 1,350 | | | Massimo Zanetti Beverage Group SpA | | | 13,052 | |
| | 462,698 | | | Mediaset SpA(b) | | | 1,699,923 | |
| | 185,015 | | | Mediobanca SpA | | | 2,027,993 | |
| | 25,555 | | | Moncler SpA | | | 725,737 | |
| | 3,949 | | | Nice SpA | | | 16,965 | |
| | 38,588 | | | OVS SpA | | | 288,574 | |
| | 4,871 | | | Panariagroup Industrie Ceramiche SpA | | | 36,313 | |
| | 48,389 | | | Parmalat SpA | | | 183,189 | |
| | 101,272 | | | Piaggio & C SpA | | | 331,250 | |
| | 194,542 | | | Poste Italiane SpA | | | 1,421,991 | |
| | 1,015 | | | Prima Industrie SpA | | | 49,835 | |
| | 42,317 | | | Prysmian SpA | | | 1,459,071 | |
| | 15,155 | | | RAI Way SpA | | | 91,885 | |
| | 19,423 | | | Recordati SpA | | | 902,959 | |
| | 54,124 | | | Reno de Medici SpA | | | 37,796 | |
| | 3,324 | | | Reply SpA | | | 176,716 | |
| | 29,208 | | | Retelit SpA(b) | | | 49,061 | |
| | 15,984 | | | Rizzoli Corriere Della Sera Mediagroup SpA(b) | | | 24,000 | |
| | 2,521 | | | Sabaf SpA | | | 61,521 | |
| | 1,494 | | | SAES Getters SpA | | | 45,822 | |
| | 5,491 | | | Safilo Group SpA(b) | | | 34,699 | |
| | 58,929 | | | Saipem SpA(b) | | | 247,665 | |
| | 123,151 | | | Salini Impregilo SpA | | | 520,732 | |
| | 9,274 | | | Salvatore Ferragamo SpA | | | 243,495 | |
| | 298,524 | | | Saras SpA | | | 797,010 | |
| | 6,627 | | | Servizi Italia SpA | | | 44,541 | |
| | 316 | | | Sesa SpA | | | 10,012 | |
| | 26,947 | | | Snaitech SpA(b) | | | 48,214 | |
| | 47,277 | | | Societa Cattolica di Assicurazioni SCRL | | | 512,432 | |
| | 42,701 | | | Societa Iniziative Autostradali e Servizi SpA | | | 726,705 | |
| | 15,060 | | | Sogefi SpA(b) | | | 73,679 | |
| | 15,067 | | | SOL SpA | | | 181,651 | |
| | 116,292 | | | Terna Rete Elettrica Nazionale SpA | | | 701,697 | |
| Old Westbury Funds, Inc. | |
| Small & Mid Cap Strategies Fund | |
| Portfolio of Investments - (Continued) | October 31, 2017 |
| | |
| Shares | | | | | Value | |
| ITALY (continued) | | | | |
| | 20,102 | | | Tiscali SpA(b) | | $ | 920 | |
| | 3,726 | | | Tod’s SpA | | | 247,827 | |
| | 6,610 | | | Uni Land SpA(a)(b)(c) | | | 0 | |
| | 348,379 | | | Unione di Banche Italiane SpA | | | 1,636,222 | |
| | 207,824 | | | Unipol Gruppo Finanziario SpA | | | 937,832 | |
| | 322,477 | | | UnipolSai Assicurazioni SpA | | | 734,746 | |
| | 10,439 | | | Vittoria Assicurazioni SpA | | | 146,040 | |
| | 56,569 | | | Yoox Net-A-Porter Group SpA(b) | | | 2,115,209 | |
| | 3,856 | | | Zignago Vetro SpA | | | 36,113 | |
| | | | | | | | 39,536,797 | |
| JAPAN — 5.2% | | | | |
| | 11,400 | | | 77 Bank Ltd. (The) | | | 287,644 | |
| | 2,700 | | | A&D Co. Ltd. | | | 12,728 | |
| | 4,600 | | | Achilles Corp. | | | 92,320 | |
| | 70,900 | | | Adastria Co. Ltd. | | | 1,538,905 | |
| | 102,600 | | | ADEKA Corp. | | | 1,761,358 | |
| | 2,500 | | | Advan Co. Ltd. | | | 23,614 | |
| | 1,800 | | | Advanex, Inc. | | | 51,053 | |
| | 20,400 | | | Advantest Corp. | | | 460,908 | |
| | 1,200 | | | Aeon Delight Co. Ltd. | | | 44,642 | |
| | 2,200 | | | Aeon Fantasy Co. Ltd. | | | 85,907 | |
| | 4,700 | | | Aeon Mall Co. Ltd. | | | 83,290 | |
| | 11,700 | | | Ahresty Corp. | | | 94,769 | |
| | 3,900 | | | Ai Holdings Corp. | | | 95,283 | |
| | 5,900 | | | Aica Kogyo Co. Ltd. | | | 204,960 | |
| | 2,700 | | | Aichi Bank Ltd. (The) | | | 165,745 | |
| | 9,700 | | | Aichi Corp. | | | 71,403 | |
| | 5,500 | | | Aichi Steel Corp. | | | 221,780 | |
| | 1,600 | | | Aichi Tokei Denki Co. Ltd. | | | 57,412 | |
| | 9,500 | | | Aida Engineering Ltd. | | | 110,118 | |
| | 3,800 | | | Ain Holdings, Inc. | | | 259,004 | |
| | 41,700 | | | Air Water, Inc. | | | 793,622 | |
| | 4,700 | | | Airport Facilities Co. Ltd. | | | 25,917 | |
| | 15,000 | | | Aisan Industry Co. Ltd. | | | 170,309 | |
| | 11,000 | | | Akebono Brake Industry Co. Ltd.(b) | | | 37,246 | |
| | 4,400 | | | Akita Bank Ltd. (The) | | | 140,082 | |
| | 500 | | | Albis Co. Ltd. | | | 18,579 | |
| | 6,800 | | | Alconix Corp. | | | 118,950 | |
| | 5,900 | | | Alinco, Inc. | | | 65,224 | |
| | 3,100 | | | Alpen Co. Ltd. | | | 61,479 | |
| | 2,800 | | | Alpha Corp. | | | 56,416 | |
| | 10,600 | | | Alpine Electronics, Inc. | | | 233,432 | |
| | 6,600 | | | Alps Logistics Co. Ltd. | | | 48,758 | |
| | 800 | | | Altech Corp. | | | 27,580 | |
| | 24,900 | | | Amada Holdings Co. Ltd. | | | 306,802 | |
| | 10,100 | | | Amano Corp. | | | 247,115 | |
| | 500 | | | Amiyaki Tei Co. Ltd. | | | 23,394 | |
| | 3,700 | | | Anest Iwata Corp. | | | 37,259 | |
| | 1,200 | | | Anicom Holdings, Inc. | | | 30,954 | |
| | 1,900 | | | Anritsu Corp. | | | 17,763 | |
| | 300 | | | AOI Electronics Co. Ltd. | | | 14,010 | |
| | 3,300 | | | AOI TYO Holdings, Inc. | | | 35,175 | |
| | 20,300 | | | AOKI Holdings, Inc. | | | 281,367 | |
| Shares | | | | | Value | |
| JAPAN (continued) | | | | |
| | 5,000 | | | Aomori Bank Ltd. (The) | | $ | 160,283 | |
| | 9,900 | | | Aoyama Trading Co. Ltd. | | | 365,683 | |
| | 6,100 | | | Arakawa Chemical Industries Ltd. | | | 147,048 | |
| | 2,500 | | | Arata Corp. | | | 105,976 | |
| | 12,300 | | | Arcland Sakamoto Co. Ltd. | | | 199,582 | |
| | 800 | | | Arcland Service Holdings Co., Ltd. | | | 17,618 | |
| | 9,738 | | | Arcs Co. Ltd. | | | 217,019 | |
| | 118,800 | | | Ariake Japan Co. Ltd. | | | 9,058,493 | |
| | 2,090 | | | As One Corp. | | | 114,145 | |
| | 3,100 | | | Asahi Co. Ltd. | | | 37,569 | |
| | 11,600 | | | Asahi Diamond Industrial Co. Ltd. | | | 112,016 | |
| | 4,350 | | | Asahi Holdings, Inc. | | | 94,035 | |
| | 67,700 | | | Asahi Intecc Co. Ltd. | | | 3,905,826 | |
| | 1,800 | | | Asahi Kogyosha Co. Ltd. | | | 57,069 | |
| | 4,600 | | | Asahi Yukizai Corp. | | | 60,400 | |
| | 24,000 | | | Asanuma Corp. | | | 88,439 | |
| | 2,300 | | | Asax Co. Ltd. | | | 36,794 | |
| | 2,700 | | | Ashimori Industry Co. Ltd. | | | 74,324 | |
| | 6,000 | | | Asia Pile Holdings Corp. | | | 33,772 | |
| | 11,900 | | | Asics Corp. | | | 180,742 | |
| | 2,400 | | | ASKA Pharmaceutical Co. Ltd. | | | 45,359 | |
| | 400 | | | Asti Corp. | | | 15,918 | |
| | 6,700 | | | Asunaro Aoki Construction Co. Ltd. | | | 60,456 | |
| | 1,000 | | | Ateam, Inc. | | | 26,340 | |
| | 10,200 | | | Atom Corp. | | | 74,366 | |
| | 15,400 | | | Autobacs Seven Co. Ltd. | | | 263,834 | |
| | 4,000 | | | Avex Group Holdings, Inc. | | | 55,090 | |
| | 53,000 | | | Awa Bank Ltd. (The) | | | 357,047 | |
| | 3,800 | | | Axial Retailing, Inc. | | | 154,400 | |
| | 9,300 | | | Azbil Corp. | | | 404,046 | |
| | 19,900 | | | Bando Chemical Industries Ltd. | | | 218,243 | |
| | 4,400 | | | Bank of Iwate Ltd. (The) | | | 180,133 | |
| | 10,100 | | | Bank of Kyoto Ltd. (The) | | | 525,852 | |
| | 3,700 | | | Bank of Nagoya Ltd. (The) | | | 146,757 | |
| | 6,600 | | | Bank of Okinawa Ltd. (The) | | | 267,297 | |
| | 4,100 | | | Bank of Saga Ltd. (The) | | | 101,792 | |
| | 9,500 | | | Bank of the Ryukyus Ltd. | | | 143,538 | |
| | 2,200 | | | Belc Co. Ltd. | | | 122,475 | |
| | 1,300 | | | Bell System24 Holdings, Inc. | | | 14,143 | |
| | 17,300 | | | Belluna Co. Ltd. | | | 195,358 | |
| | 2,200 | | | Benefit One, Inc. | | | 42,063 | |
| | 3,500 | | | Benesse Holdings, Inc. | | | 118,047 | |
| | 8,700 | | | Bic Camera, Inc. | | | 106,507 | |
| | 4,800 | | | BML, Inc. | | | 105,621 | |
| | 1,400 | | | Bookoff Corp. | | | 10,059 | |
| | 2,800 | | | Broadleaf Co. Ltd. | | | 22,901 | |
| | 20,000 | | | Bunka Shutter Co. Ltd. | | | 169,737 | |
| | 1,200 | | | C Uyemura & Co. Ltd. | | | 74,403 | |
| | 900 | | | Can Do Co. Ltd. | | | 14,057 | |
| | 2,500 | | | Canon Electronics, Inc. | | | 55,934 | |
| | 94,900 | | | Canon Marketing Japan, Inc. | | | 2,376,986 | |
| | 5,300 | | | Capcom Co. Ltd. | | | 133,823 | |
| Old Westbury Funds, Inc. | |
| Small & Mid Cap Strategies Fund | |
| Portfolio of Investments - (Continued) | October 31, 2017 |
| | |
| Shares | | | | | Value | |
| JAPAN (continued) | | | | |
| | 3,400 | | | Carlit Holdings Co. Ltd. | | $ | 25,327 | |
| | 14,400 | | | Casio Computer Co. Ltd. | | | 211,241 | |
| | 3,700 | | | Cawachi Ltd. | | | 90,527 | |
| | 21,800 | | | Central Glass Co. Ltd. | | | 484,487 | |
| | 900 | | | Central Security Patrols Co. Ltd. | | | 16,266 | |
| | 1,300 | | | Central Sports Co. Ltd. | | | 46,647 | |
| | 15,600 | | | Chiba Kogyo Bank Ltd. (The) | | | 88,081 | |
| | 1,300 | | | Chino Corp. | | | 15,286 | |
| | 4,000 | | | Chiyoda Co. Ltd. | | | 101,983 | |
| | 2,900 | | | Chiyoda Integre Co. Ltd. | | | 70,367 | |
| | 3,800 | | | Chori Co. Ltd. | | | 69,079 | |
| | 9,900 | | | Chubu Shiryo Co. Ltd. | | | 176,137 | |
| | 6,000 | | | Chuetsu Pulp & Paper Co. Ltd. | | | 115,562 | |
| | 150,500 | | | Chugai Mining Co. Ltd.(b) | | | 43,679 | |
| | 25,600 | | | Chugoku Bank Ltd. (The) | | | 363,157 | |
| | 21,700 | | | Chugoku Marine Paints Ltd. | | | 182,829 | |
| | 3,200 | | | Chukyo Bank Ltd. (The) | | | 64,982 | |
| | 14,000 | | | CI Takiron Corp. | | | 88,527 | |
| | 4,600 | | | Ci:z Holdings Co. Ltd. | | | 168,700 | |
| | 71,100 | | | Citizen Watch Co. Ltd. | | | 517,750 | |
| | 12,600 | | | CKD Corp. | | | 246,227 | |
| | 21,000 | | | Clarion Co. Ltd. | | | 79,416 | |
| | 7,000 | | | Cleanup Corp. | | | 55,468 | |
| | 3,000 | | | CMIC Holdings Co. Ltd. | | | 44,220 | |
| | 12,900 | | | CMK Corp. | | | 132,738 | |
| | 2,290 | | | Cocokara Fine, Inc. | | | 127,082 | |
| | 4,500 | | | COLOPL Inc. | | | 49,708 | |
| | 6,400 | | | Colowide Co. Ltd. | | | 119,608 | |
| | 4,700 | | | Computer Engineering & Consulting Ltd. | | | 111,811 | |
| | 15,400 | | | COMSYS Holdings Corp. | | | 387,489 | |
| | 4,500 | | | CONEXIO Corp. | | | 82,595 | |
| | 19,200 | | | Cosmo Energy Holdings Co. Ltd. | | | 437,342 | |
| | 1,500 | | | Cosmos Pharmaceutical Corp. | | | 311,200 | |
| | 4,100 | | | Create Restaurants Holdings, Inc. | | | 43,811 | |
| | 5,400 | | | Create SD Holdings Co. Ltd. | | | 135,065 | |
| | 30,100 | | | Credit Saison Co. Ltd. | | | 601,974 | |
| | 4,700 | | | CTI Engineering Co. Ltd. | | | 44,849 | |
| | 12,000 | | | CyberAgent, Inc. | | | 369,377 | |
| | 3,900 | | | D.A. Consortium Holdings, Inc. | | | 64,380 | |
| | 8,600 | | | Dai Nippon Toryo Co. Ltd. | | | 130,999 | |
| | 9,100 | | | Daibiru Corp. | | | 106,522 | |
| | 3,000 | | | Dai-Dan Co. Ltd. | | | 76,646 | |
| | 3,400 | | | Daido Kogyo Co. Ltd. | | | 55,079 | |
| | 11,600 | | | Daido Metal Co. Ltd. | | | 106,711 | |
| | 14,800 | | | Daido Steel Co. Ltd. | | | 930,654 | |
| | 10,000 | | | Daihatsu Diesel Manufacturing Co. Ltd. | | | 75,546 | |
| | 26,000 | | | Daihen Corp. | | | 233,235 | |
| | 34,000 | | | Daiho Corp. | | | 164,461 | |
| | 2,600 | | | Daiichi Jitsugyo Co. Ltd. | | | 76,144 | |
| | 1,000 | | | Daiichi Kigenso Kagaku-Kogyo Co. Ltd. | | | 14,423 | |
| | 1,500 | | | Dai-ichi Seiko Co. Ltd. | | | 37,848 | |
| Shares | | | | | Value | |
| JAPAN (continued) | | | | |
| | 6,600 | | | Daiichikosho Co. Ltd. | | $ | 309,960 | |
| | 4,600 | | | Daiken Corp. | | | 124,199 | |
| | 19,000 | | | Daiki Aluminium Industry Co. Ltd. | | | 154,734 | |
| | 2,300 | | | Daikoku Denki Co. Ltd. | | | 35,095 | |
| | 400 | | | Daikokutenbussan Co. Ltd. | | | 18,152 | |
| | 8,600 | | | Daikyo, Inc. | | | 164,656 | |
| | 4,800 | | | Daikyonishikawa Corp. | | | 81,010 | |
| | 6,000 | | | Dainichiseika Color & Chemicals Manufacturing Co. Ltd. | | | 273,339 | |
| | 37,000 | | | Daio Paper Corp. | | | 441,898 | �� |
| | 4,910 | | | Daiseki Co. Ltd. | | | 120,478 | |
| | 6,400 | | | Daishi Bank Ltd. (The) | | | 311,262 | |
| | 5,700 | | | Daito Bank Ltd. (The) | | | 85,221 | |
| | 3,760 | | | Daito Pharmaceutical Co. Ltd. | | | 96,030 | |
| | 10,200 | | | Daiwabo Holdings Co. Ltd. | | | 403,228 | |
| | 113,680 | | | DCM Holdings Co. Ltd. | | | 1,039,771 | |
| | 7,500 | | | DeNA Co. Ltd. | | | 175,256 | |
| | 33,200 | | | Denka Co. Ltd. | | | 1,099,318 | |
| | 5,700 | | | Denyo Co. Ltd. | | | 95,297 | |
| | 87,300 | | | Descente Ltd. | | | 1,208,480 | |
| | 9,200 | | | Dexerials Corp. | | | 103,324 | |
| | 37,400 | | | DIC Corp. | | | 1,378,180 | |
| | 1,400 | | | Digital Arts, Inc. | | | 57,069 | |
| | 26,400 | | | Digital Garage, Inc. | | | 564,893 | |
| | 1,900 | | | Dip Corp. | | | 46,153 | |
| | 23,000 | | | DKS Co. Ltd. | | | 157,574 | |
| | 3,500 | | | DMG Mori Co. Ltd. | | | 69,751 | |
| | 4,000 | | | Doshisha Co. Ltd. | | | 87,525 | |
| | 5,674 | | | Doutor Nichires Holdings Co. Ltd. | | | 134,334 | |
| | 15,200 | | | Dowa Holdings Co. Ltd. | | | 635,645 | |
| | 400 | | | DSB Co. Ltd. | | | 2,790 | |
| | 3,200 | | | DTS Corp. | | | 95,545 | |
| | 2,300 | | | Dunlop Sports Co. Ltd. | | | 33,983 | |
| | 500 | | | DyDo Group Holdings, Inc. | | | 24,449 | |
| | 400 | | | Dynic Corp. | | | 4,408 | |
| | 7,900 | | | Eagle Industry Co. Ltd. | | | 152,018 | |
| | 35,500 | | | Ebara Corp. | | | 1,267,578 | |
| | 1,400 | | | Ebara Jitsugyo Co. Ltd. | | | 21,535 | |
| | 1,100 | | | Eco’s Co Ltd/Japan | | | 12,306 | |
| | 46,900 | | | EDION Corp. | | | 471,867 | |
| | 700 | | | eGuarantee, Inc. | | | 19,639 | |
| | 10,400 | | | Ehime Bank Ltd. (The) | | | 133,721 | |
| | 8,000 | | | Eidai Co. Ltd. | | | 39,330 | |
| | 41,000 | | | Eighteenth Bank Ltd. (The) | | | 109,617 | |
| | 1,900 | | | Eiken Chemical Co. Ltd. | | | 74,443 | |
| | 2,800 | | | Elecom Co. Ltd. | | | 55,948 | |
| | 700 | | | Elematec Corp. | | | 15,963 | |
| | 2,600 | | | Endo Lighting Corp. | | | 29,680 | |
| | 3,000 | | | en-japan, Inc. | | | 115,035 | |
| | 5,500 | | | EPS Holdings Inc. | | | 107,722 | |
| | 4,800 | | | Es-Con Japan Ltd. | | | 22,627 | |
| | 4,200 | | | ESPEC Corp. | | | 95,188 | |
| | 2,300 | | | Excel Co. Ltd. | | | 51,116 | |
| Old Westbury Funds, Inc. | |
| Small & Mid Cap Strategies Fund | |
| Portfolio of Investments - (Continued) | October 31, 2017 |
| | |
| Shares | | | | | Value | |
| JAPAN (continued) | | | | |
| | 15,200 | | | Exedy Corp. | | $ | 451,836 | |
| | 5,200 | | | Ezaki Glico Co. Ltd. | | | 287,657 | |
| | 5,800 | | | F@N Communications, Inc. | | | 59,732 | |
| | 3,000 | | | FALCO HOLDINGS Co. Ltd. | | | 46,726 | |
| | 231,000 | | | FCC Co. Ltd. | | | 5,529,942 | |
| | 35,680 | | | Feed One Co. Ltd. | | | 91,942 | |
| | 9,700 | | | Ferrotec Holdings Corp. | | | 197,830 | |
| | 26,400 | | | FIDEA Holdings Co. Ltd. | | | 49,919 | |
| | 9,300 | | | Financial Products Group Co. Ltd. | | | 107,146 | |
| | 8,500 | | | FJ Next Co. Ltd. | | | 72,587 | |
| | 11,400 | | | Foster Electric Co. Ltd. | | | 265,387 | |
| | 2,200 | | | FP Corp. | | | 115,122 | |
| | 5,400 | | | France Bed Holdings Co. Ltd. | | | 49,961 | |
| | 7,100 | | | F-Tech, Inc. | | | 117,704 | |
| | 9,400 | | | Fudo Tetra Corp. | | | 15,955 | |
| | 3,700 | | | Fuji Co. Ltd. | | | 87,306 | |
| | 10,600 | | | Fuji Corp. Ltd. | | | 76,350 | |
| | 114,000 | | | Fuji Electric Co. Ltd. | | | 819,120 | |
| | 13,000 | | | Fuji Kiko Co. Ltd. | | | 84,376 | |
| | 6,000 | | | Fuji Kyuko Co. Ltd. | | | 133,345 | |
| | 13,800 | | | Fuji Oil Co. Ltd. | | | 53,159 | |
| | 9,600 | | | Fuji Oil Holdings, Inc. | | | 257,508 | |
| | 2,200 | | | Fuji Pharma Co. Ltd. | | | 79,425 | |
| | 5,800 | | | Fuji Seal International, Inc. | | | 189,499 | |
| | 3,800 | | | Fuji Soft, Inc. | | | 114,797 | |
| | 3,500 | | | Fujibo Holdings, Inc. | | | 110,044 | |
| | 2,700 | | | Fujicco Co. Ltd. | | | 60,836 | |
| | 10,700 | | | Fujikura Kasei Co. Ltd. | | | 67,190 | |
| | 159,300 | | | Fujikura Ltd. | | | 1,375,776 | |
| | 1,200 | | | Fujikura Rubber Ltd. | | | 9,825 | |
| | 2,200 | | | Fujimi, Inc. | | | 54,214 | |
| | 4,300 | | | Fujimori Kogyo Co. Ltd. | | | 147,865 | |
| | 1,300 | | | Fujita Kanko, Inc. | | | 41,216 | |
| | 14,100 | | | Fujitec Co. Ltd. | | | 208,329 | |
| | 6,200 | | | Fujitsu Frontech Ltd. | | | 108,073 | |
| | 8,000 | | | Fujitsu General Ltd. | | | 152,183 | |
| | 1,200 | | | Fujiya Co. Ltd. | | | 27,144 | |
| | 7,000 | | | FuKoKu Co. Ltd. | | | 68,027 | |
| | 2,000 | | | Fukuda Corp. | | | 121,894 | |
| | 4,300 | | | Fukui Bank Ltd. (The) | | | 114,208 | |
| | 1,300 | | | Fukui Computer Holdings, Inc. | | | 32,470 | |
| | 89,000 | | | Fukuoka Financial Group, Inc. | | | 454,765 | |
| | 7,400 | | | Fukushima Bank Ltd. (The) | | | 59,158 | |
| | 3,100 | | | Fukushima Industries Corp. | | | 119,414 | |
| | 5,600 | | | Fukuyama Transporting Co. Ltd. | | | 180,995 | |
| | 6,300 | | | FULLCAST Holdings Co. Ltd. | | | 115,800 | |
| | 1,000 | | | Fumakilla Ltd. | | | 17,800 | |
| | 3,600 | | | Funai Soken Holdings, Inc. | | | 131,551 | |
| | 4,400 | | | Furukawa Co. Ltd. | | | 79,251 | |
| | 26,400 | | | Furukawa Electric Co. Ltd. | | | 1,597,397 | |
| | 7,200 | | | Furuno Electric Co. Ltd. | | | 49,201 | |
| | 4,000 | | | Furusato Industries Ltd. | | | 65,151 | |
| | 3,500 | | | Fuso Chemical Co. Ltd. | | | 111,429 | |
| Shares | | | | | Value | |
| JAPAN (continued) | | | | |
| | 1,100 | | | Fuso Pharmaceutical Industries Ltd. | | $ | 27,562 | |
| | 24,900 | | | Futaba Industrial Co. Ltd. | | | 239,792 | |
| | 3,200 | | | Future Corp. | | | 32,139 | |
| | 8,900 | | | Fuyo General Lease Co. Ltd. | | | 578,435 | |
| | 500 | | | G-7 Holdings, Inc. | | | 10,593 | |
| | 2,000 | | | Gakken Holdings Co. Ltd. | | | 57,693 | |
| | 8,000 | | | Gecoss Corp. | | | 90,058 | |
| | 1,300 | | | Genki Sushi Co. Ltd. | | | 35,728 | |
| | 800 | | | Genky Stores, Inc. | | | 29,409 | |
| | 11,700 | | | Geo Holdings Corp. | | | 189,847 | |
| | 2,100 | | | Gfoot Co. Ltd. | | | 14,018 | |
| | 700 | | | Giken Ltd. | | | 20,039 | |
| | 2,500 | | | GLOBERIDE, Inc. | | | 43,446 | |
| | 12,100 | | | Glory Ltd. | | | 449,074 | |
| | 8,000 | | | GMO Internet, Inc. | | | 122,633 | |
| | 1,600 | | | GMO Payment Gateway, Inc. | | | 116,512 | |
| | 3,400 | | | Godo Steel Ltd. | | | 68,147 | |
| | 2,280 | | | Goldcrest Co. Ltd. | | | 49,107 | |
| | 78,000 | | | GS Yuasa Corp. | | | 388,954 | |
| | 2,400 | | | GSI Creos Corp. | | | 38,183 | |
| | 8,300 | | | G-Tekt Corp. | | | 176,066 | |
| | 31,900 | | | GungHo Online Entertainment, Inc. | | | 85,568 | |
| | 48,300 | | | Gunma Bank Ltd. (The) | | | 308,393 | |
| | 3,900 | | | Gunze Ltd. | | | 176,641 | |
| | 3,500 | | | Gurunavi, Inc. | | | 44,972 | |
| | 6,500 | | | H.I.S. Co. Ltd. | | | 216,943 | |
| | 27,635 | | | H2O Retailing Corp. | | | 507,227 | |
| | 62,900 | | | Hachijuni Bank Ltd. (The) | | | 390,549 | |
| | 3,200 | | | Hagihara Industries, Inc. | | | 55,442 | |
| | 700 | | | Hagiwara Electric Co. Ltd. | | | 21,208 | |
| | 3,500 | | | Hakudo Co. Ltd. | | | 69,597 | |
| | 4,800 | | | Hakuto Co. Ltd. | | | 73,707 | |
| | 6,600 | | | Hamakyorex Co. Ltd. | | | 184,293 | |
| | 9,800 | | | Haneda Zenith Holdings Co. Ltd. | | | 35,768 | |
| | 62,400 | | | Hanwa Co. Ltd. | | | 2,351,559 | |
| | 7,000 | | | Happinet Corp. | | | 120,109 | |
| | 5,000 | | | Hard Off Corp. Co. Ltd. | | | 51,141 | |
| | 3,200 | | | Harima Chemicals Group, Inc. | | | 25,441 | |
| | 2,400 | | | Harmonic Drive Systems, Inc. | | | 124,111 | |
| | 50,900 | | | Haseko Corp. | | | 734,145 | |
| | 24,260 | | | Hazama Ando Corp. | | | 196,717 | |
| | 71,131 | | | Heiwa Corp. | | | 1,306,826 | |
| | 5,500 | | | Heiwa Real Estate Co. Ltd. | | | 95,242 | |
| | 17,000 | | | Heiwado Co. Ltd. | | | 369,289 | |
| | 5,000 | | | Hibiya Engineering Ltd. | | | 107,955 | |
| | 3,870 | | | Hiday Hidaka Corp. | | | 112,998 | |
| | 4,700 | | | HI-LEX Corp. | | | 118,797 | |
| | 3,200 | | | Hiramatsu, Inc. | | | 17,589 | |
| | 200 | | | Hirata Corp. | | | 22,374 | |
| | 52,000 | | | Hiroshima Bank Ltd. (The) | | | 436,287 | |
| | 20,700 | | | Hitachi Capital Corp. | | | 501,912 | |
| | 11,000 | | | Hitachi Kokusai Electric, Inc. | | | 303,285 | |
| | 2,300 | | | Hitachi Maxell Ltd. | | | 51,965 | |
| Old Westbury Funds, Inc. | |
| Small & Mid Cap Strategies Fund | |
| Portfolio of Investments - (Continued) | October 31, 2017 |
| | |
| Shares | | | | | Value | |
| JAPAN (continued) | | | | |
| | 16,800 | | | Hitachi Transport System Ltd. | | $ | 413,554 | |
| | 59,200 | | | Hitachi Zosen Corp. | | | 310,305 | |
| | 8,000 | | | Hochiki Corp. | | | 164,777 | |
| | 1,000 | | | Hodogaya Chemical Co. Ltd. | | | 69,830 | |
| | 129,400 | | | Hogy Medical Co. Ltd. | | | 8,842,514 | |
| | 12,800 | | | Hokkaido Electric Power Co., Inc.(b) | | | 100,302 | |
| | 25,000 | | | Hokkan Holdings Ltd. | | | 95,642 | |
| | 10,000 | | | Hokko Chemical Industry Co. Ltd. | | | 61,035 | |
| | 3,400 | | | Hokkoku Bank Ltd. (The) | | | 154,593 | |
| | 6,700 | | | Hokuetsu Bank Ltd. (The) | | | 161,394 | |
| | 7,100 | | | Hokuetsu Industries Co. Ltd. | | | 69,561 | |
| | 43,500 | | | Hokuetsu Kishu Paper Co. Ltd. | | | 277,362 | |
| | 12,500 | | | Hokuhoku Financial Group, Inc. | | | 204,367 | |
| | 1,700 | | | Hokuriku Electric Industry Co. Ltd. | | | 23,324 | |
| | 4,000 | | | Hokuriku Electric Power Co. | | | 35,179 | |
| | 3,400 | | | Hokuriku Electrical Construction Co. Ltd. | | | 31,008 | |
| | 2,500 | | | Hokuto Corp. | | | 43,490 | |
| | 2,800 | | | H-One Co. Ltd. | | | 39,991 | |
| | 3,320 | | | Honeys Holdings Co. Ltd. | | | 34,980 | |
| | 9,600 | | | Hoosiers Holdings | | | 90,508 | |
| | 7,700 | | | Horiba Ltd. | | | 454,395 | |
| | 1,400 | | | Hosokawa Micron Corp. | | | 88,404 | |
| | 4,600 | | | House Foods Group, Inc. | | | 136,133 | |
| | 3,300 | | | Howa Machinery Ltd. | | | 53,372 | |
| | 44,000 | | | Hyakugo Bank Ltd. (The) | | | 204,705 | |
| | 26,000 | | | Hyakujushi Bank Ltd. (The) | | | 93,751 | |
| | 39,300 | | | Ibiden Co. Ltd. | | | 650,824 | |
| | 8,500 | | | IBJ Leasing Co. Ltd. | | | 220,751 | |
| | 400 | | | Ichibanya Co. Ltd. | | | 15,479 | |
| | 1,200 | | | Ichiken Co., Ltd. | | | 29,983 | |
| | 14,000 | | | Ichikoh Industries Ltd. | | | 108,597 | |
| | 7,300 | | | ICHINEN Holdings Co. Ltd. | | | 103,428 | |
| | 4,500 | | | Ichiyoshi Securities Co. Ltd. | | | 51,251 | |
| | 4,300 | | | Idec Corp. | | | 90,383 | |
| | 7,200 | | | IDOM, Inc. | | | 52,177 | |
| | 46,400 | | | Iino Kaiun Kaisha Ltd. | | | 217,095 | |
| | 4,580 | | | IJT Technology Holdings Co. Ltd. | | | 42,294 | |
| | 2,600 | | | Imagica Robot Holdings, Inc. | | | 21,677 | |
| | 5,200 | | | Imasen Electric Industrial | | | 66,724 | |
| | 3,500 | | | Inaba Denki Sangyo Co. Ltd. | | | 152,830 | |
| | 13,200 | | | Inabata & Co. Ltd. | | | 190,039 | |
| | 5,600 | | | Inageya Co. Ltd. | | | 91,999 | |
| | 3,300 | | | Ines Corp. | | | 30,706 | |
| | 1,980 | | | I-Net Corp. | | | 30,822 | |
| | 3,000 | | | Infocom Corp. | | | 76,804 | |
| | 134,400 | | | Infomart Corp. | | | 1,007,069 | |
| | 2,300 | | | Information Services International-Dentsu Ltd. | | | 50,974 | |
| | 2,400 | | | Innotech Corp. | | | 20,643 | |
| | 2,800 | | | Intage Holdings, Inc. | | | 36,618 | |
| Shares | | | | | Value | |
| JAPAN (continued) | | | | |
| | 7,500 | | | Internet Initiative Japan, Inc. | | $ | 156,523 | |
| | 1,000 | | | I-O Data Device, Inc. | | | 9,982 | |
| | 3,000 | | | Iriso Electronics Co. Ltd. | | | 167,803 | |
| | 5,500 | | | Iseki & Co. Ltd. | | | 121,653 | |
| | 34,300 | | | Isetan Mitsukoshi Holdings Ltd. | | | 370,436 | |
| | 15,900 | | | Ishihara Sangyo Kaisha Ltd.(b) | | | 237,441 | |
| | 11,000 | | | Ito En Ltd. | | | 383,580 | |
| | 26,200 | | | Itochu Enex Co. Ltd. | | | 265,675 | |
| | 7,100 | | | Itochu Techno-Solutions Corp. | | | 274,746 | |
| | 1,300 | | | Itochu-Shokuhin Co. Ltd. | | | 59,223 | |
| | 14,000 | | | Itoham Yonekyu Holdings, Inc. | | | 133,099 | |
| | 16,200 | | | Itoki Corp. | | | 123,810 | |
| | 3,100 | | | IwaiCosmo Holdings, Inc. | | | 39,450 | |
| | 2,300 | | | Iwasaki Electric Co. Ltd. | | | 37,199 | |
| | 6,400 | | | Iwatani Corp. | | | 191,935 | |
| | 31,500 | | | Iyo Bank Ltd. (The) | | | 269,276 | |
| | 7,500 | | | Izumi Co. Ltd. | | | 387,186 | |
| | 13,900 | | | J Trust Co. Ltd. | | | 101,709 | |
| | 42,500 | | | J. Front Retailing Co. Ltd. | | | 623,455 | |
| | 1,500 | | | JAC Recruitment Co. Ltd. | | | 27,611 | |
| | 7,600 | | | Jaccs Co. Ltd. | | | 188,822 | |
| | 900 | | | Jalux, Inc. | | | 22,218 | |
| | 1,900 | | | Jamco Corp. | | | 39,419 | |
| | 4,000 | | | Japan Airport Terminal Co. Ltd. | | | 141,067 | |
| | 7,400 | | | Japan Asia Group Ltd. | | | 30,718 | |
| | 13,000 | | | Japan Aviation Electronics Industry Ltd. | | | 235,979 | |
| | 164,100 | | | Japan Display, Inc.(b) | | | 350,700 | |
| | 600 | | | Japan Drilling Co. Ltd.(b) | | | 11,414 | |
| | 1,900 | | | Japan Lifeline Co. Ltd. | | | 90,902 | |
| | 1,500 | | | Japan Material Co. Ltd. | | | 43,270 | |
| | 3,900 | | | Japan Medical Dynamic Marketing, Inc. | | | 37,523 | |
| | 900 | | | Japan Property Management Center Co., Ltd. | | | 12,071 | |
| | 4,200 | | | Japan Pulp & Paper Co. Ltd. | | | 176,377 | |
| | 13,700 | | | Japan Securities Finance Co. Ltd. | | | 76,389 | |
| | 17,600 | | | Japan Steel Works Ltd. (The) | | | 443,463 | |
| | 20,000 | | | Japan Transcity Corp. | | | 85,660 | |
| | 18,800 | | | Japan Wool Textile Co. Ltd. (The) | | | 167,986 | |
| | 6,000 | | | JBCC Holdings, Inc. | | | 55,407 | |
| | 1,000 | | | JCU Corp. | | | 43,094 | |
| | 6,000 | | | Jeol Ltd. | | | 31,555 | |
| | 41,900 | | | Jimoto Holdings, Inc. | | | 81,438 | |
| | 1,500 | | | JINS, Inc. | | | 77,833 | |
| | 3,600 | | | JK Holdings Co. Ltd. | | | 28,368 | |
| | 3,500 | | | JMS Co. Ltd. | | | 21,455 | |
| | 2,800 | | | Joban Kosan Co. Ltd. | | | 45,950 | |
| | 3,400 | | | J-Oil Mills, Inc. | | | 121,850 | |
| | 7,500 | | | Joshin Denki Co. Ltd. | | | 258,234 | |
| | 8,500 | | | JP-Holdings, Inc. | | | 29,752 | |
| | 4,900 | | | JSP Corp. | | | 157,508 | |
| | 35,100 | | | JSR Corp. | | | 675,421 | |
| | 3,200 | | | Juki Corp. | | | 49,475 | |
| Old Westbury Funds, Inc. | |
| Small & Mid Cap Strategies Fund | |
| Portfolio of Investments - (Continued) | October 31, 2017 |
| | |
| Shares | | | | | Value | |
| JAPAN (continued) | | | | |
| | 4,000 | | | Juroku Bank Ltd. (The) | | $ | 134,031 | |
| | 3,300 | | | Justsystems Corp. | | | 70,496 | |
| | 64,900 | | | JVC Kenwood Corp. | | | 202,625 | |
| | 27,900 | | | kabu.com Securities Co. Ltd. | | | 88,334 | |
| | 2,900 | | | Kadokawa Dwango Corp. | | | 33,284 | |
| | 9,700 | | | Kaga Electronics Co. Ltd. | | | 288,343 | |
| | 1,400 | | | Kagome Co. Ltd. | | | 46,418 | |
| | 14,700 | | | Kakaku.com, Inc. | | | 200,775 | |
| | 25,500 | | | Kaken Pharmaceutical Co. Ltd. | | | 1,287,278 | |
| | 1,000 | | | Kameda Seika Co. Ltd. | | | 45,205 | |
| | 13,800 | | | Kamei Corp. | | | 231,932 | |
| | 13,500 | | | Kamigumi Co. Ltd. | | | 321,160 | |
| | 1,800 | | | Kanaden Corp. | | | 20,564 | |
| | 1,000 | | | Kanagawa Chuo Kotsu Co. Ltd. | | | 33,156 | |
| | 7,600 | | | Kanamoto Co. Ltd. | | | 247,641 | |
| | 157,000 | | | Kandenko Co. Ltd. | | | 1,539,554 | |
| | 105,000 | | | Kaneka Corp. | | | 860,648 | |
| | 1,300 | | | Kaneko Seeds Co. Ltd. | | | 19,368 | |
| | 44,000 | | | Kanematsu Corp. | | | 575,032 | |
| | 1,800 | | | Kanematsu Electronics Ltd. | | | 55,802 | |
| | 5,700 | | | Kansai Urban Banking Corp. | | | 72,337 | |
| | 7,400 | | | Kanto Denka Kogyo Co. Ltd. | | | 77,186 | |
| | 11,900 | | | Kasai Kogyo Co. Ltd. | | | 177,393 | |
| | 1,000 | | | Katakura & Co-op Agri Corp. | | | 12,093 | |
| | 2,600 | | | Kato Sangyo Co. Ltd. | | | 80,718 | |
| | 4,500 | | | Kato Works Co. Ltd. | | | 140,099 | |
| | 2,400 | | | KAWADA Technologies, Inc. | | | 140,996 | |
| | 2,300 | | | Kawai Musical Instruments Manufacturing Co. Ltd. | | | 48,526 | |
| | 67,000 | | | Kawasaki Kisen Kaisha Ltd.(b) | | | 1,739,449 | |
| | 8,200 | | | Keihan Holdings Co. Ltd. | | | 249,523 | |
| | 15,900 | | | Keihanshin Building Co. Ltd. | | | 111,029 | |
| | 30,200 | | | Keihin Corp. | | | 550,588 | |
| | 40,000 | | | Keiyo Bank Ltd. (The) | | | 194,187 | |
| | 7,800 | | | Keiyo Co. Ltd. | | | 52,409 | |
| | 27,100 | | | Kenedix, Inc. | | | 157,540 | |
| | 2,600 | | | Kenko Mayonnaise Co. Ltd. | | | 67,615 | |
| | 6,600 | | | Kewpie Corp. | | | 163,803 | |
| | 1,825 | | | KEY Coffee, Inc. | | | 34,300 | |
| | 2,000 | | | KFC Holdings Japan Ltd. | | | 35,319 | |
| | 500 | | | Kinki Sharyo Co. Ltd. (The)(b) | | | 11,688 | |
| | 1,400 | | | Kintetsu Department Store Co. Ltd.(b) | | | 45,803 | |
| | 5,800 | | | Kintetsu World Express, Inc. | | | 99,213 | |
| | 5,900 | | | Kitagawa Iron Works Co. Ltd. | | | 160,077 | |
| | 1,600 | | | Kitamura Co. Ltd. | | | 10,511 | |
| | 2,600 | | | Kita-Nippon Bank Ltd. (The) | | | 80,489 | |
| | 21,000 | | | Kitano Construction Corp. | | | 94,191 | |
| | 7,900 | | | Kito Corp. | | | 100,674 | |
| | 34,300 | | | Kitz Corp. | | | 292,005 | |
| | 20,700 | | | Kiyo Bank Ltd. (The) | | | 353,541 | |
| | 7,300 | | | Koa Corp. | | | 151,515 | |
| | 22,000 | | | Koatsu Gas Kogyo Co. Ltd. | | | 165,428 | |
| | 1,000 | | | Kobe Bussan Co. Ltd. | | | 42,918 | |
| | 116,400 | | | Kobe Steel Ltd.(b) | | | 972,517 | |
| | 9,600 | | | Kohnan Shoji Co. Ltd. | | | 204,318 | |
| Shares | | | | | Value | |
| JAPAN (continued) | | | | |
| | 1,300 | | | Kohsoku Corp. | | $ | 15,092 | |
| | 300 | | | Koike Sanso Kogyo Co. Ltd. | | | 7,902 | |
| | 13,800 | | | Kokuyo Co. Ltd. | | | 246,132 | |
| | 800 | | | KOMAIHALTEC, Inc. | | | 18,448 | |
| | 3,400 | | | Komatsu Wall Industry Co. Ltd. | | | 64,798 | |
| | 9,900 | | | Komeri Co. Ltd. | | | 294,723 | |
| | 6,300 | | | Kondotec, Inc. | | | 66,765 | |
| | 27,500 | | | Konica Minolta, Inc. | | | 238,952 | |
| | 6,300 | | | Konishi Co.Ltd. | | | 108,985 | |
| | 10,700 | | | Konoike Transport Co. Ltd. | | | 164,210 | |
| | 5,100 | | | Kosaido Co. Ltd.(b) | | | 23,099 | |
| | 500 | | | Koshidaka Holdings Co. Ltd. | | | 20,162 | |
| | 3,400 | | | Kotobuki Spirits Co. Ltd. | | | 139,642 | |
| | 2,000 | | | Kourakuen Holdings Corp. | | | 39,893 | |
| | 2,500 | | | Krosaki Harima Corp. | | | 106,855 | |
| | 4,200 | | | KRS Corp. | | | 119,309 | |
| | 22,056 | | | K’s Holdings Corp. | | | 503,949 | |
| | 2,000 | | | KU Holdings Co. Ltd. | | | 18,733 | |
| | 4,700 | | | Kumagai Gumi Co. Ltd. | | | 148,393 | |
| | 12,067 | | | Kumiai Chemical Industry Co. Ltd. | | | 81,717 | |
| | 2,100 | | | Kura Corp. | | | 93,822 | |
| | 63,000 | | | Kurabo Industries Ltd. | | | 182,288 | |
| | 6,400 | | | Kureha Corp. | | | 374,302 | |
| | 2,100 | | | Kurimoto Ltd. | | | 43,919 | |
| | 8,100 | | | Kurita Water Industries Ltd. | | | 255,741 | |
| | 900 | | | Kuriyama Holdings Corp. | | | 15,181 | |
| | 9,500 | | | Kuroda Electric Co. Ltd. | | | 168,770 | |
| | 2,000 | | | Kusuri No Aoki Holdings Co. Ltd. | | | 110,813 | |
| | 11,100 | | | KYB Corp. | | | 715,562 | |
| | 3,300 | | | Kyodo Printing Co. Ltd. | | | 109,705 | |
| | 6,700 | | | Kyoei Steel Ltd. | | | 116,729 | |
| | 9,600 | | | Kyokuto Kaihatsu Kogyo Co. Ltd. | | | 170,884 | |
| | 1,400 | | | Kyokuto Securities Co. Ltd. | | | 20,636 | |
| | 1,600 | | | Kyokuyo Co. Ltd. | | | 51,572 | |
| | 6,500 | | | KYORIN Holdings, Inc. | | | 132,853 | |
| | 3,540 | | | Kyoritsu Maintenance Co. Ltd. | | | 111,146 | |
| | 400 | | | Kyoritsu Printing Co. Ltd. | | | 1,252 | |
| | 18,000 | | | Kyosan Electric Manufacturing Co. Ltd. | | | 102,581 | |
| | 3,500 | | | Kyowa Electronic Instruments Co. Ltd. | | | 13,944 | |
| | 19,800 | | | Kyowa Exeo Corp. | | | 428,546 | |
| | 2,700 | | | Kyowa Leather Cloth Co. Ltd. | | | 23,033 | |
| | 7,000 | | | Kyudenko Corp. | | | 308,430 | |
| | 125,940 | | | Kyushu Financial Group, Inc. | | | 794,151 | |
| | 7,000 | | | Lasertec Corp. | | | 152,245 | |
| | 1,200 | | | LEC, Inc. | | | 31,513 | |
| | 88,600 | | | Leopalace21 Corp. | | | 657,653 | |
| | 2,400 | | | Life Corp. | | | 63,533 | |
| | 55,400 | | | Lifull Co. Ltd. | | | 423,399 | |
| | 3,800 | | | Link and Motivation, Inc. | | | 25,900 | |
| | 8,000 | | | Lintec Corp. | | | 220,923 | |
| Old Westbury Funds, Inc. | |
| Small & Mid Cap Strategies Fund | |
| Portfolio of Investments - (Continued) | October 31, 2017 |
| | |
| Shares | | | | | Value | |
| JAPAN (continued) | | | | |
| | 400 | | | M&A Capital Partners Co. Ltd.(b) | | $ | 20,861 | |
| | 17,000 | | | M3, Inc. | | | 504,595 | |
| | 3,700 | | | Mabuchi Motor Co. Ltd. | | | 192,313 | |
| | 10,450 | | | Macnica Fuji Electronics Holdings, Inc. | | | 217,078 | |
| | 10,000 | | | Maeda Corp. | | | 124,885 | |
| | 2,400 | | | Maeda Kosen Co. Ltd. | | | 41,434 | |
| | 29,000 | | | Maeda Road Construction Co. Ltd. | | | 621,547 | |
| | 32,000 | | | Makino Milling Machine Co. Ltd. | | | 298,879 | |
| | 4,100 | | | Mamezou Holdings Co. Ltd. | | | 47,020 | |
| | 4,600 | | | Mandom Corp. | | | 136,538 | |
| | 1,800 | | | Mani, Inc. | | | 51,211 | |
| | 7,700 | | | Marubun Corp. | | | 66,568 | |
| | 38,000 | | | Marudai Food Co. Ltd. | | | 177,459 | |
| | 400 | | | Marufuji Sheet Piling Co. Ltd. | | | 12,242 | |
| | 11,700 | | | Maruha Nichiro Corp. | | | 359,628 | |
| | 27,000 | | | Marui Group Co. Ltd. | | | 409,613 | |
| | 6,900 | | | Maruichi Steel Tube Ltd. | | | 209,358 | |
| | 7,800 | | | Marusan Securities Co. Ltd. | | | 71,000 | |
| | 2,500 | | | Maruwa Co. Ltd. | | | 144,673 | |
| | 2,000 | | | Maruyama Manufacturing Co., Inc. | | | 34,440 | |
| | 20,000 | | | Maruzen Showa Unyu Co. Ltd. | | | 94,279 | |
| | 6,400 | | | Marvelous, Inc. | | | 60,226 | |
| | 2,900 | | | Matsuda Sangyo Co. Ltd. | | | 41,419 | |
| | 7,700 | | | Matsui Construction Co. Ltd. | | | 68,464 | |
| | 16,400 | | | Matsui Securities Co. Ltd. | | | 136,877 | |
| | 7,200 | | | Matsumotokiyoshi Holdings Co. Ltd. | | | 515,439 | |
| | 700 | | | Matsuya Foods Co. Ltd. | | | 26,811 | |
| | 6,000 | | | Max Co. Ltd. | | | 84,535 | |
| | 2,400 | | | Maxvalu Nishinihon Co. Ltd. | | | 35,819 | |
| | 3,700 | | | Maxvalu Tokai Co. Ltd. | | | 72,793 | |
| | 4,400 | | | MCJ Co. Ltd. | | | 46,165 | |
| | 31,590 | | | Mebuki Financial Group, Inc. | | | 130,577 | |
| | 2,900 | | | MEC Co. Ltd. | | | 46,444 | |
| | 17,500 | | | Medipal Holdings Corp. | | | 322,897 | |
| | 1,400 | | | Megachips Corp. | | | 45,803 | |
| | 97,162 | | | Megmilk Snow Brand Co. Ltd. | | | 2,708,795 | |
| | 45,000 | | | Meidensha Corp. | | | 176,509 | |
| | 6,300 | | | Meiko Electronics Co. Ltd. | | | 114,692 | |
| | 2,600 | | | Meiko Network Japan Co. Ltd. | | | 30,046 | |
| | 12,000 | | | Meisei Industrial Co. Ltd. | | | 83,585 | |
| | 5,500 | | | Meitec Corp. | | | 267,490 | |
| | 13,200 | | | Meiwa Corp. | | | 60,367 | |
| | 1,400 | | | Menicon Co. Ltd. | | | 63,040 | |
| | 500 | | | Metawater Co. Ltd. | | | 13,236 | |
| | 4,500 | | | Michinoku Bank Ltd. (The) | | | 75,986 | |
| | 4,400 | | | Micronics Japan Co. Ltd. | | | 43,418 | |
| | 1,000 | | | Mie Bank Ltd. (The) | | | 23,851 | |
| | 4,300 | | | Mie Kotsu Group Holdings, Inc. | | | 18,530 | |
| | 5,900 | | | Mikuni Corp. | | | 30,666 | |
| Shares | | | | | Value | |
| JAPAN (continued) | | | | |
| | 1,237 | | | Milbon Co. Ltd. | | $ | 77,132 | |
| | 6,700 | | | Mimasu Semiconductor Industry Co. Ltd. | | | 118,556 | |
| | 6,300 | | | Minato Bank Ltd. (The) | | | 118,736 | |
| | 2,900 | | | Ministop Co. Ltd. | | | 58,661 | |
| | 10,800 | | | Miraca Holdings, Inc. | | | 500,558 | |
| | 16,940 | | | Mirait Holdings Corp. | | | 219,599 | |
| | 2,300 | | | Miroku Jyoho Service Co. Ltd. | | | 53,482 | |
| | 8,500 | | | Misawa Homes Co. Ltd. | | | 75,129 | |
| | 382,100 | | | MISUMI Group, Inc. | | | 10,417,396 | |
| | 6,400 | | | Mitani Corp. | | | 253,006 | |
| | 6,900 | | | Mito Securities Co. Ltd. | | | 23,606 | |
| | 6,000 | | | Mitsuba Corp. | | | 99,046 | |
| | 7,000 | | | Mitsubishi Logistics Corp. | | | 180,071 | |
| | 55,400 | | | Mitsubishi Materials Corp. | | | 2,090,198 | |
| | 11,800 | | | Mitsubishi Nichiyu Forklift Co. Ltd. | | | 86,447 | |
| | 6,600 | | | Mitsubishi Paper Mills Ltd.(b) | | | 44,346 | |
| | 4,200 | | | Mitsubishi Pencil Co. Ltd. | | | 99,030 | |
| | 1,600 | | | Mitsubishi Research Institute, Inc. | | | 47,351 | |
| | 2,800 | | | Mitsubishi Shokuhin Co. Ltd. | | | 82,617 | |
| | 2,400 | | | Mitsubishi Steel Manufacturing Co. Ltd. | | | 59,311 | |
| | 74,600 | | | Mitsubishi UFJ Lease & Finance Co. Ltd. | | | 389,714 | |
| | 13,000 | | | Mitsuboshi Belting Ltd. | | | 161,778 | |
| | 4,300 | | | Mitsui Engineering & Shipbuilding Co. Ltd. | | | 55,780 | |
| | 5,300 | | | Mitsui High-Tec, Inc. | | | 110,796 | |
| | 14,000 | | | Mitsui Home Co. Ltd. | | | 92,221 | |
| | 2,100 | | | Mitsui Matsushima Co. Ltd. | | | 26,300 | |
| | 16,100 | | | Mitsui Mining & Smelting Co. Ltd. | | | 831,160 | |
| | 42,900 | | | Mitsui Osk Lines Ltd. | | | 1,301,658 | |
| | 2,700 | | | Mitsui Sugar Co. Ltd. | | | 92,133 | |
| | 47,000 | | | Mitsui-Soko Holdings Co. Ltd.(b) | | | 145,499 | |
| | 1,300 | | | Mixi, Inc. | | | 63,111 | |
| | 1,800 | | | Miyaji Engineering Group, Inc. | | | 49,233 | |
| | 4,300 | | | Miyazaki Bank Ltd. (The) | | | 153,538 | |
| | 1,800 | | | Miyoshi Oil & Fat Co. Ltd. | | | 23,682 | |
| | 3,800 | | | Mizuno Corp. | | | 107,445 | |
| | 27,464 | | | Mochida Pharmaceutical Co. Ltd. | | | 1,999,929 | |
| | 4,300 | | | Modec, Inc. | | | 98,627 | |
| | 30,200 | | | Monex Group, Inc. | | | 95,616 | |
| | 600 | | | Monogatari Corp. (The) | | | 44,114 | |
| | 22,200 | | | Monotaro Co. Ltd. | | | 607,203 | |
| | 900 | | | Moresco Corp. | | | 16,495 | |
| | 5,200 | | | Morinaga & Co. Ltd. | | | 295,888 | |
| | 66,823 | | | Morinaga Milk Industry Co. Ltd. | | | 2,562,317 | |
| | 8,400 | | | Morita Holdings Corp. | | | 143,983 | |
| | 2,400 | | | Mory Industries, Inc. | | | 74,192 | |
| | 3,000 | | | Mr Max Corp. | | | 19,683 | |
| | 6,200 | | | MTI Ltd. | | | 37,133 | |
| | 1,900 | | | Mugen Estate Co. Ltd. | | | 19,551 | |
| Old Westbury Funds, Inc. | |
| Small & Mid Cap Strategies Fund | |
| Portfolio of Investments - (Continued) | October 31, 2017 |
| | |
| Shares | | | | | Value | |
| JAPAN (continued) | | | | |
| | 218,100 | | | Musashi Seimitsu Industry Co. Ltd. | | $ | 6,895,647 | |
| | 2,700 | | | Musashino Bank Ltd. (The) | | | 86,909 | |
| | 10,800 | | | Nabtesco Corp. | | | 426,472 | |
| | 5,100 | | | NAC Co. Ltd. | | | 43,328 | |
| | 40,000 | | | Nachi-Fujikoshi Corp. | | | 244,141 | |
| | 800 | | | Nafco Co. Ltd. | | | 12,376 | |
| | 1,800 | | | Nagaileben Co. Ltd. | | | 44,674 | |
| | 3,500 | | | Nagano Bank Ltd. | | | 61,040 | |
| | 1,700 | | | Nagano Keiki Co. Ltd. | | | 19,211 | |
| | 34,600 | | | Nagase & Co. Ltd. | | | 583,944 | |
| | 5,000 | | | Nagatanien Holdings Co. Ltd. | | | 59,584 | |
| | 11,000 | | | Nakabayashi Co. Ltd. | | | 70,718 | |
| | 2,500 | | | Nakanishi, Inc. | | | 113,012 | |
| | 2,500 | | | Nakano Corp. | | | 14,093 | |
| | 3,800 | | | Nakayama Steel Works Ltd. | | | 26,168 | |
| | 8,000 | | | Nankai Electric Railway Co. Ltd. | | | 205,866 | |
| | 1,400 | | | Nanto Bank Ltd. (The) | | | 39,277 | |
| | 1,100 | | | Natori Co. Ltd. | | | 19,851 | |
| | 900 | | | NDS Co. Ltd. | | | 30,315 | |
| | 4,700 | | | NEC Capital Solutions Ltd. | | | 92,590 | |
| | 9,300 | | | NEC Networks & System Integration Corp. | | | 230,159 | |
| | 11,000 | | | NET One Systems Co. Ltd. | | | 135,535 | |
| | 75,300 | | | NHK Spring Co. Ltd. | | | 852,965 | |
| | 1,800 | | | Nice Holdings, Inc. | | | 25,455 | |
| | 31,000 | | | Nichias Corp. | | | 402,137 | |
| | 3,000 | | | Nichiban Co. Ltd. | | | 66,725 | |
| | 5,900 | | | Nichiha Corp. | | | 236,612 | |
| | 12,300 | | | Nichii Gakkan Co. | | | 126,023 | |
| | 10,150 | | | Nichi-Iko Pharmaceutical Co. Ltd. | | | 156,751 | |
| | 24,000 | | | Nichirei Corp. | | | 614,643 | |
| | 15,600 | | | Nichireki Co. Ltd. | | | 196,466 | |
| | 1,200 | | | Nichirin Co. Ltd. | | | 43,428 | |
| | 325,700 | | | Nifco, Inc. | | | 21,196,781 | |
| | 5,500 | | | Nihon Dempa Kogyo Co. Ltd. | | | 42,663 | |
| | 2,300 | | | Nihon Eslead Corp. | | | 41,770 | |
| | 14,900 | | | Nihon House Holdings Co. Ltd. | | | 81,507 | |
| | 8,700 | | | Nihon Kohden Corp. | | | 192,279 | |
| | 247,800 | | | Nihon M&A Center, Inc. | | | 11,790,141 | |
| | 14,500 | | | Nihon Nohyaku Co. Ltd. | | | 83,528 | |
| | 12,000 | | | Nihon Parkerizing Co. Ltd. | | | 194,925 | |
| | 2,800 | | | Nihon Plast Co. Ltd. | | | 29,895 | |
| | 1,100 | | | Nihon Tokushu Toryo Co. Ltd. | | | 19,871 | |
| | 600 | | | Nihon Trim Co. Ltd. | | | 23,350 | |
| | 15,300 | | | Nihon Unisys Ltd. | | | 252,432 | |
| | 3,000 | | | Nihon Yamamura Glass Co. Ltd. | | | 5,250 | |
| | 19,300 | | | Nikkiso Co. Ltd. | | | 179,922 | |
| | 17,000 | | | Nikkon Holdings Co. Ltd. | | | 432,980 | |
| | 136,658 | | | Nikon Corp. | | | 2,575,596 | |
| | 400 | | | Nippi, Inc. | | | 15,109 | |
| | 28,000 | | | Nippo Corp. | | | 582,384 | |
| Shares | | | | | Value | |
| JAPAN (continued) | | | | |
| | 4,000 | | | Nippon Air Conditioning Services Co. Ltd. | | $ | 26,595 | |
| | 1,700 | | | Nippon Carbide Industries Co. Inc. | | | 36,241 | |
| | 3,100 | | | Nippon Chemical Industrial Co. Ltd. | | | 70,858 | |
| | 1,000 | | | Nippon Chemi-Con Corp. | | | 34,431 | |
| | 300 | | | Nippon Chemiphar Co. Ltd. | | | 13,799 | |
| | 7,500 | | | Nippon Concrete Industries Co. Ltd. | | | 31,529 | |
| | 8,000 | | | Nippon Densetsu Kogyo Co. Ltd. | | | 172,587 | |
| | 21,400 | | | Nippon Electric Glass Co. Ltd. | | | 866,690 | |
| | 47,100 | | | Nippon Express Co. Ltd. | | | 2,970,028 | |
| | 2,300 | | | Nippon Fine Chemical Co. Ltd. | | | 21,421 | |
| | 15,500 | | | Nippon Flour Mills Co. Ltd. | | | 236,784 | |
| | 5,400 | | | Nippon Gas Co. Ltd. | | | 170,494 | |
| | 7,500 | | | Nippon Hume Corp. | | | 51,581 | |
| | 62,896 | | | Nippon Kayaku Co. Ltd. | | | 994,565 | |
| | 900 | | | Nippon Kinzoku Co. Ltd. | | | 24,854 | |
| | 1,300 | | | Nippon Kodoshi Corp. | | | 26,365 | |
| | 8,700 | | | Nippon Koei Co. Ltd. | | | 318,297 | |
| | 2,100 | | | Nippon Koshuha Steel Co. Ltd. | | | 17,749 | |
| | 336,100 | | | Nippon Light Metal Holdings Co. Ltd. | | | 981,357 | |
| | 56,500 | | | Nippon Paper Industries Co. Ltd. | | | 1,121,006 | |
| | 37,600 | | | Nippon Parking Development Co. Ltd. | | | 54,893 | |
| | 4,700 | | | Nippon Piston Ring Co. Ltd. | | | 100,279 | |
| | 15 | | | Nippon Prologis REIT, Inc. REIT | | | 31,503 | |
| | 4,000 | | | Nippon Rietec Co. Ltd. | | | 43,973 | |
| | 3,000 | | | Nippon Road Co. Ltd. (The) | | | 172,024 | |
| | 800 | | | Nippon Seisen Co. Ltd. | | | 38,697 | |
| | 9,000 | | | Nippon Sharyo Ltd.(b) | | | 25,329 | |
| | 27,300 | | | Nippon Sheet Glass Co. Ltd.(b) | | | 217,286 | |
| | 6,000 | | | Nippon Shokubai Co. Ltd. | | | 449,057 | |
| | 11,400 | | | Nippon Signal Co. Ltd. | | | 125,124 | |
| | 32,000 | | | Nippon Soda Co. Ltd. | | | 198,971 | |
| | 8,748 | | | Nippon Steel & Sumikin Bussan Corp. | | | 480,850 | |
| | 51,100 | | | Nippon Suisan Kaisha Ltd. | | | 310,092 | |
| | 8,000 | | | Nippon Thompson Co. Ltd. | | | 46,295 | |
| | 4,300 | | | Nippon Valqua Industries Ltd. | | | 99,383 | |
| | 64,000 | | | Nippon Yusen KK(b) | | | 1,341,295 | |
| | 32,800 | | | Nipro Corp. | | | 475,680 | |
| | 14,600 | | | Nishimatsu Construction Co. Ltd. | | | 439,136 | |
| | 3,500 | | | Nishimatsuya Chain Co. Ltd. | | | 38,415 | |
| | 19,200 | | | Nishi-Nippon Financial Holdings, Inc. | | | 221,711 | |
| | 5,600 | | | Nishi-Nippon Railroad Co. Ltd. | | | 148,982 | |
| | 3,900 | | | Nishio Rent All Co. Ltd. | | | 135,311 | |
| | 24,300 | | | Nissan Shatai Co. Ltd. | | | 257,094 | |
| | 9,600 | | | Nissan Tokyo Sales Holdings Co. Ltd. | | | 34,447 | |
| Old Westbury Funds, Inc. | |
| Small & Mid Cap Strategies Fund | |
| Portfolio of Investments - (Continued) | October 31, 2017 |
| | |
| Shares | | | | | Value | |
| JAPAN (continued) | | | | |
| | 1,200 | | | Nissei ASB Machine Co. Ltd. | | $ | 53,085 | |
| | 5,500 | | | Nissei Build Kogyo Co. Ltd. | | | 62,495 | |
| | 1,500 | | | Nissei Plastic Industrial Co. Ltd. | | | 19,894 | |
| | 4,500 | | | Nissha Printing Co. Ltd. | | | 143,661 | |
| | 6,800 | | | Nisshin Fudosan Co. Ltd. | | | 47,664 | |
| | 8,000 | | | Nisshin Oillio Group Ltd. (The) | | | 262,082 | |
| | 9,824 | | | Nisshin Steel Co. Ltd. | | | 142,213 | |
| | 55,568 | | | Nisshinbo Holdings, Inc. | | | 661,704 | |
| | 5,600 | | | Nissin Corp. | | | 171,883 | |
| | 7,000 | | | Nissin Electric Co. Ltd. | | | 85,265 | |
| | 19,400 | | | Nissin Kogyo Co. Ltd. | | | 356,931 | |
| | 3,200 | | | Nitta Corp. | | | 131,287 | |
| | 1,900 | | | Nitta Gelatin, Inc. | | | 13,535 | |
| | 14,400 | | | Nitto Boseki Co. Ltd. | | | 481,879 | |
| | 10,100 | | | Nitto Kogyo Corp. | | | 172,145 | |
| | 2,600 | | | Nitto Kohki Co. Ltd. | | | 64,140 | |
| | 12,000 | | | Nitto Seiko Co. Ltd. | | | 69,337 | |
| | 13,100 | | | Nittoc Construction Co. Ltd. | | | 70,970 | |
| | 3,200 | | | Noda Corp. | | | 37,177 | |
| | 1,200 | | | Noevir Holdings Co. Ltd. | | | 72,081 | |
| | 196,834 | | | NOF Corp. | | | 5,643,365 | |
| | 2,700 | | | Nohmi Bosai Ltd. | | | 45,354 | |
| | 6,500 | | | Nojima Corp. | | | 150,917 | |
| | 43,900 | | | NOK Corp. | | | 1,068,302 | |
| | 5,000 | | | Nomura Co. Ltd. | | | 103,909 | |
| | 58,300 | | | Nomura Real Estate Holdings, Inc. | | | 1,274,648 | |
| | 2,100 | | | Noritake Co. Ltd. | | | 100,840 | |
| | 3,800 | | | Noritsu Koki Co. Ltd. | | | 58,552 | |
| | 6,600 | | | Noritz Corp. | | | 120,733 | |
| | 62,900 | | | North Pacific Bank Ltd. | | | 209,657 | |
| | 1,000 | | | Nozawa Corp. | | | 12,726 | |
| | 4,100 | | | NS Solutions Corp. | | | 98,944 | |
| | 4,600 | | | NS United Kaiun Kaisha Ltd. | | | 105,913 | |
| | 3,100 | | | NSD Co. Ltd. | | | 61,861 | |
| | 150,700 | | | NTN Corp. | | | 723,646 | |
| | 8,400 | | | NTT Urban Development Corp. | | | 86,360 | |
| | 400 | | | Nuflare Technology, Inc. | | | 20,650 | |
| | 2,200 | | | Obara Group, Inc. | | | 126,538 | |
| | 1,800 | | | Odelic Co. Ltd. | | | 79,785 | |
| | 27,000 | | | Oenon Holdings, Inc. | | | 78,361 | |
| | 3,500 | | | Ogaki Kyoritsu Bank Ltd. (The) | | | 99,270 | |
| | 4,500 | | | Ohashi Technica, Inc. | | | 66,527 | |
| | 900 | | | Ohsho Food Service Corp. | | | 37,558 | |
| | 7,245 | | | Oiles Corp. | | | 141,835 | |
| | 4,600 | | | Oita Bank Ltd. (The) | | | 184,680 | |
| | 11,100 | | | Okabe Co. Ltd. | | | 105,919 | |
| | 8,000 | | | Okamoto Industries, Inc. | | | 86,751 | |
| | 900 | | | Okamoto Machine Tool Works Ltd. | | | 24,102 | |
| | 11,900 | | | Okamura Corp. | | | 132,391 | |
| | 11,000 | | | Okasan Securities Group, Inc. | | | 67,139 | |
| | 3,200 | | | Okinawa Cellular Telephone Co. | | | 110,743 | |
| | 2,337 | | | Okinawa Electric Power Co., Inc. (The) | | | 53,130 | |
| Shares | | | | | Value | |
| JAPAN (continued) | | | | |
| | 1,800 | | | OKK Corp. | | $ | 19,899 | |
| | 7,000 | | | OKUMA Corp. | | | 425,399 | |
| | 4,800 | | | Okumura Corp. | | | 183,000 | |
| | 26,000 | | | Okura Industrial Co. Ltd. | | | 175,384 | |
| | 10,000 | | | Okuwa Co. Ltd. | | | 101,139 | |
| | 2,600 | | | ONO Sokki Co. Ltd. | | | 17,127 | |
| | 2,400 | | | Onoken Co. Ltd. | | | 40,631 | |
| | 26,000 | | | Onward Holdings Co. Ltd. | | | 218,601 | |
| | 4,800 | | | Open House Co. Ltd. | | | 184,055 | |
| | 3,400 | | | OPT Holding, Inc. | | | 36,839 | |
| | 1,800 | | | Optex Group Co. Ltd. | | | 74,086 | |
| | 1,800 | | | Organo Corp. | | | 47,491 | |
| | 18,000 | | | Orient Corp. | | | 28,970 | |
| | 2,000 | | | Origin Electric Co. Ltd. | | | 35,882 | |
| | 6,400 | | | Osaka Organic Chemical Industry Ltd. | | | 76,380 | |
| | 4,800 | | | Osaka Soda Co. Ltd. | | | 125,546 | |
| | 16,000 | | | Osaki Electric Co. Ltd. | | | 116,793 | |
| | 12,500 | | | OSG Corp. | | | 269,117 | |
| | 12,200 | | | OSJB Holdings Corp. | | | 37,553 | |
| | 500 | | | OUG Holdings, Inc. | | | 12,005 | |
| | 8,000 | | | Outsourcing Inc. | | | 109,687 | |
| | 24,900 | | | Pacific Industrial Co. Ltd. | | | 321,474 | |
| | 3,100 | | | Pacific Metals Co. Ltd.(b) | | | 92,287 | |
| | 2,450 | | | Pack Corp. (The) | | | 84,787 | |
| | 1,400 | | | PAL Group Holdings Co. Ltd. | | | 39,585 | |
| | 5,050 | | | PALTAC Corp. | | | 199,637 | |
| | 53,999 | | | Paramount Bed Holdings Co. Ltd. | | | 2,367,398 | |
| | 4,500 | | | Parco Co. Ltd. | | | 59,799 | |
| | 60,741 | | | Park24 Co. Ltd. | | | 1,399,065 | |
| | 3,000 | | | Pasco Corp. | | | 9,076 | |
| | 1,900 | | | Pasona Group, Inc. | | | 26,602 | |
| | 9,100 | | | PC Depot Corp. | | | 69,067 | |
| | 4,100 | | | Pegasus Sewing Machine Manufacturing Co. Ltd. | | | 27,296 | |
| | 57,100 | | | Penta-Ocean Construction Co. Ltd. | | | 375,126 | |
| | 26,700 | | | PeptiDream, Inc.(b) | | | 842,997 | |
| | 700 | | | PIA Corp. | | | 35,460 | |
| | 18,300 | | | Pigeon Corp. | | | 644,576 | |
| | 6,200 | | | Pilot Corp. | | | 311,350 | |
| | 6,600 | | | Piolax, Inc. | | | 181,390 | |
| | 141,100 | | | Pioneer Corp.(b) | | | 271,764 | |
| | 3,500 | | | Plenus Co. Ltd. | | | 71,074 | |
| | 2,600 | | | Pocket Card Co. Ltd. | | | 24,467 | |
| | 62,000 | | | Press Kogyo Co. Ltd. | | | 344,611 | |
| | 4,000 | | | Pressance Corp. | | | 53,612 | |
| | 6,000 | | | Prestige International, Inc. | | | 64,535 | |
| | 15,000 | | | Prima Meat Packers Ltd. | | | 97,753 | |
| | 2,300 | | | Proto Corp. | | | 33,052 | |
| | 6,400 | | | PS Mitsubishi Construction Co. Ltd. | | | 40,807 | |
| | 3,700 | | | Qol Co. Ltd. | | | 67,782 | |
| | 17,400 | | | Raito Kogyo Co. Ltd. | | | 177,206 | |
| | 2,000 | | | Rasa Industries Ltd. | | | 40,016 | |
| Old Westbury Funds, Inc. |
| Small & Mid Cap Strategies Fund |
| Portfolio of Investments - (Continued) | October 31, 2017 |
| |
| Shares | | | | | Value | |
| JAPAN (continued) | | | | |
| | 2,000 | | | Raysum Co. Ltd. | | $ | 17,677 | |
| | 2,300 | | | Relia, Inc. | | | 26,943 | |
| | 19,000 | | | Relo Group, Inc. | | | 468,880 | |
| | 2,000 | | | Renesas Easton Co. Ltd. | | | 13,016 | |
| | 111,840 | | | Rengo Co. Ltd. | | | 728,846 | |
| | 519,900 | | | Resorttrust, Inc. | | | 10,173,497 | |
| | 3,000 | | | Rheon Automatic Machinery Co. Ltd. | | | 45,090 | |
| | 9,200 | | | Ricoh Leasing Co. Ltd. | | | 329,308 | |
| | 4,800 | | | Right On Co. Ltd. | | | 39,850 | |
| | 2,900 | | | Riken Corp. | | | 149,967 | |
| | 6,500 | | | Riken Keiki Co. Ltd. | | | 139,712 | |
| | 19,000 | | | Riken Technos Corp. | | | 116,134 | |
| | 900 | | | Riken Vitamin Co. Ltd. | | | 34,510 | |
| | 3,000 | | | Ringer Hut Co. Ltd. | | | 64,905 | |
| | 16,200 | | | Riso Kagaku Corp. | | | 308,884 | |
| | 8,500 | | | Riso Kyoiku Co. Ltd. | | | 67,279 | |
| | 1,800 | | | Rock Field Co. Ltd. | | | 31,550 | |
| | 11,400 | | | Rohto Pharmaceutical Co. Ltd. | | | 261,777 | |
| | 1,400 | | | Rokko Butter Co. Ltd. | | | 31,372 | |
| | 1,300 | | | Roland DG Corp. | | | 35,728 | |
| | 1,700 | | | Rorze Corp. | | | 44,629 | |
| | 25,800 | | | Round One Corp. | | | 332,186 | |
| | 5,400 | | | Royal Holdings Co. Ltd. | | | 139,055 | |
| | 13,600 | | | Ryobi Ltd. | | | 347,700 | |
| | 3,000 | | | Ryoden Corp. | | | 46,330 | |
| | 7,500 | | | Ryosan Co. Ltd. | | | 302,427 | |
| | 66,900 | | | S Foods, Inc. | | | 2,535,852 | |
| | 1,700 | | | Sac’s Bar Holdings, Inc. | | | 20,647 | |
| | 2,200 | | | Saibu Gas Co. Ltd. | | | 54,891 | |
| | 4,700 | | | Saizeriya Co. Ltd. | | | 144,466 | |
| | 5,600 | | | Sakai Chemical Industry Co. Ltd. | | | 139,378 | |
| | 1,400 | | | Sakai Heavy Industries Ltd. | | | 45,187 | |
| | 1,800 | | | Sakai Moving Service Co. Ltd. | | | 104,006 | |
| | 1,800 | | | Sakai Ovex Co. Ltd. | | | 36,853 | |
| | 9,300 | | | Sakata INX Corp. | | | 178,467 | |
| | 5,100 | | | SAMTY Co. Ltd. | | | 72,213 | |
| | 2,300 | | | San-A Co. Ltd. | | | 105,387 | |
| | 31,000 | | | San-Ai Oil Co. Ltd. | | | 366,967 | |
| | 8,400 | | | Sanden Holdings Corp.(b) | | | 169,840 | |
| | 1,900 | | | Sanei Architecture Planning Co. Ltd. | | | 42,076 | |
| | 20,350 | | | Sangetsu Corp. | | | 372,441 | |
| | 40,800 | | | San-In Godo Bank Ltd. (The) | | | 371,741 | |
| | 34,000 | | | Sanken Electric Co. Ltd. | | | 211,407 | |
| | 800 | | | Sanko Metal Industrial Co. Ltd. | | | 28,847 | |
| | 4,900 | | | Sankyo Co. Ltd. | | | 157,508 | |
| | 12,300 | | | Sankyo Tateyama, Inc. | | | 178,488 | |
| | 10,400 | | | Sankyu, Inc. | | | 428,055 | |
| | 14,600 | | | Sanoh Industrial Co. Ltd. | | | 128,274 | |
| | 4,600 | | | Sanoyas Holdings Corp. | | | 12,905 | |
| | 1,800 | | | Sansei Technologies, Inc. | | | 15,213 | |
| | 6,800 | | | Sanshin Electronics Co. Ltd. | | | 102,384 | |
| | 30,800 | | | Sanwa Holdings Corp. | | | 384,374 | |
| | 3,800 | | | Sanyo Chemical Industries Ltd. | | | 198,848 | |
| Shares | | | | | Value | | |
| JAPAN (continued) |
| | 1,800 | | | Sanyo Denki Co. Ltd. | | $ | 118,728 | |
| | 400 | | | Sanyo Electric Railway Co. Ltd. | | | 10,135 | |
| | 2,400 | | | Sanyo Housing Nagoya Co. Ltd. | | | 26,067 | |
| | 800 | | | Sanyo Industries Ltd. | | | 15,577 | |
| | 12,000 | | | Sanyo Special Steel Co. Ltd. | | | 306,161 | |
| | 2,100 | | | Sanyo Trading Co. Ltd. | | | 54,095 | |
| | 13,000 | | | Sapporo Holdings Ltd. | | | 409,305 | |
| | 1,500 | | | SATO Holdings Corp. | | | 36,265 | |
| | 2,700 | | | Sato Shoji Corp. | | | 29,302 | |
| | 4,100 | | | Satori Electric Co. Ltd. | | | 38,150 | |
| | 7,800 | | | Sawada Holdings Co. Ltd. | | | 69,490 | |
| | 33,292 | | | Sawai Pharmaceutical Co. Ltd. | | | 1,882,657 | |
| | 3,500 | | | SAXA Holdings, Inc. | | | 66,118 | |
| | 94,980 | | | SBI Holdings, Inc. | | | 1,486,033 | |
| | 8,500 | | | SBS Holdings, Inc. | | | 66,831 | |
| | 1,900 | | | Scala, Inc. | | | 13,268 | |
| | 2,900 | | | SCREEN Holdings Co. Ltd. | | | 224,695 | |
| | 5,800 | | | Scroll Corp. | | | 24,382 | |
| | 800 | | | SCSK Corp. | | | 34,264 | |
| | 50,900 | | | Sega Sammy Holdings, Inc. | | | 711,315 | |
| | 800 | | | Seibu Electric Industry Co. Ltd. | | | 17,885 | |
| | 3,200 | | | Seika Corp. | | | 84,570 | |
| | 11,400 | | | Seikitokyu Kogyo Co. Ltd. | | | 64,367 | |
| | 10,800 | | | Seiko Holdings Corp. | | | 267,471 | |
| | 38,300 | | | Seino Holdings Co. Ltd. | | | 554,770 | |
| | 12,300 | | | Seiren Co. Ltd. | | | 212,563 | |
| | 6,600 | | | Sekisui Plastics Co. Ltd. | | | 86,255 | |
| | 35,500 | | | Senko Group Holdings Co. Ltd. | | | 255,701 | |
| | 2,000 | | | Senshu Electric Co. Ltd. | | | 44,149 | |
| | 83,320 | | | Senshu Ikeda Holdings, Inc. | | | 319,489 | |
| | 8,800 | | | Senshukai Co. Ltd. | | | 54,330 | |
| | 13,000 | | | Septeni Holdings Co. Ltd. | | | 36,472 | |
| | 32,062 | | | Seria Co. Ltd. | | | 1,821,560 | |
| | 70,200 | | | Seven Bank Ltd. | | | 258,068 | |
| | 1,200 | | | Shibaura Electronics Co. Ltd. | | | 48,758 | |
| | 11,000 | | | Shibaura Mechatronics Corp. | | | 47,307 | |
| | 3,400 | | | Shibusawa Warehouse Co. Ltd. (The) | | | 62,914 | |
| | 4,400 | | | Shibuya Corp. | | | 167,750 | |
| | 1,400 | | | Shidax Corp. | | | 5,454 | |
| | 42,000 | | | Shiga Bank Ltd. (The) | | | 238,987 | |
| | 4,400 | | | Shikibo Ltd. | | | 61,953 | |
| | 4,000 | | | Shikoku Bank Ltd. (The) | | | 62,055 | |
| | 14,000 | | | Shikoku Chemicals Corp. | | | 232,215 | |
| | 8,100 | | | Shikoku Electric Power Co., Inc. | | | 105,288 | |
| | 4,900 | | | Shima Seiki Manufacturing Ltd. | | | 273,647 | |
| | 12,749 | | | Shimachu Co. Ltd. | | | 358,235 | |
| | 1,800 | | | Shimizu Bank Ltd. (The) | | | 59,997 | |
| | 3,100 | | | Shin Nippon Air Technologies Co. Ltd. | | | 44,385 | |
| | 3,200 | | | Shinagawa Refractories Co. Ltd. | | | 107,647 | |
| | 700 | | | Shindengen Electric Manufacturing Co. Ltd. | | | 47,280 | |
| | 20,700 | | | Shinko Electric Industries Co. Ltd. | | | 157,473 | |
| Old Westbury Funds, Inc. |
| Small & Mid Cap Strategies Fund |
| Portfolio of Investments - (Continued) | October 31, 2017 |
| |
| Shares | | | | | Value | |
| JAPAN (continued) | | | | |
| | 12,700 | | | Shinko Plantech Co. Ltd. | | $ | 109,012 | |
| | 18,000 | | | Shinmaywa Industries Ltd. | | | 175,560 | |
| | 8,400 | | | Shinnihon Corp. | | | 74,245 | |
| | 2,800 | | | Shinoken Group Co. Ltd. | | | 68,310 | |
| | 2,200 | | | Shinsho Corp. | | | 63,172 | |
| | 900 | | | Shinwa Co. Ltd. | | | 20,413 | |
| | 8,800 | | | Ship Healthcare Holdings, Inc. | | | 273,585 | |
| | 3,000 | | | Shizuki Electric Co., Inc. | | | 19,128 | |
| | 27,900 | | | Shizuoka Gas Co. Ltd. | | | 216,173 | |
| | 700 | | | Shochiku Co. Ltd. | | | 103,795 | |
| | 800 | | | Shoei Co. Ltd. | | | 26,701 | |
| | 2,400 | | | Shoei Foods Corp. | | | 96,566 | |
| | 1,000 | | | Showa Aircraft Industry Co. Ltd. | | | 12,348 | |
| | 19,600 | | | Showa Corp. | | | 254,944 | |
| | 40,200 | | | Showa Denko KK | | | 1,334,638 | |
| | 6,400 | | | Showa Sangyo Co. Ltd. | | | 166,438 | |
| | 96,500 | | | Showa Shell Sekiyu KK | | | 1,130,452 | |
| | 2,600 | | | Siix Corp. | | | 110,329 | |
| | 3,000 | | | Sinanen Holdings Co. Ltd. | | | 66,857 | |
| | 31,000 | | | Sinfonia Technology Co. Ltd. | | | 125,412 | |
| | 2,600 | | | Sinko Industries Ltd. | | | 42,257 | |
| | 1,400 | | | SK-Electronics Co. Ltd. | | | 15,058 | |
| | 101,000 | | | SKY Perfect JSAT Holdings, Inc. | | | 465,450 | |
| | 2,800 | | | Skylark Co. Ltd. | | | 41,740 | |
| | 17,000 | | | SMK Corp. | | | 79,689 | |
| | 2,800 | | | SMS Co. Ltd. | | | 83,849 | |
| | 9,300 | | | Sodick Co. Ltd. | | | 127,512 | |
| | 2,400 | | | Softbank Technology Corp. | | | 44,431 | |
| | 2,700 | | | Sogo Medical Co. Ltd. | | | 149,360 | |
| | 2,400 | | | Sohgo Security Services Co. Ltd. | | | 114,823 | |
| | 315,700 | | | Sojitz Corp. | | | 946,781 | |
| | 1,700 | | | Soken Chemical & Engineering Co. Ltd. | | | 36,869 | |
| | 6,000 | | | Sotetsu Holdings, Inc. | | | 153,925 | |
| | 18,500 | | | Sparx Group Co. Ltd. | | | 45,068 | |
| | 700 | | | SPK Corp. | | | 20,223 | |
| | 5,000 | | | Square Enix Holdings Co. Ltd. | | | 200,959 | |
| | 300 | | | ST Corp. | | | 7,390 | |
| | 3,000 | | | St. Marc Holdings Co. Ltd. | | | 90,497 | |
| | 5,600 | | | Star Micronics Co. Ltd. | | | 98,008 | |
| | 19,400 | | | Start Today Co. Ltd. | | | 527,206 | |
| | 4,900 | | | Starts Corp., Inc. | | | 132,298 | |
| | 2,200 | | | Starzen Co. Ltd. | | | 107,383 | |
| | 3,200 | | | Stella Chemifa Corp. | | | 122,703 | |
| | 1,300 | | | Studio Alice Co. Ltd. | | | 30,000 | |
| | 2,700 | | | Sugi Holdings Co. Ltd. | | | 136,775 | |
| | 2,700 | | | Sugimoto & Co. Ltd. | | | 41,674 | |
| | 10,500 | | | Sumco Corp. | | | 227,813 | |
| | 4,800 | | | Sumida Corp. | | | 82,994 | |
| | 7,000 | | | Suminoe Textile Co. Ltd. | | | 19,639 | |
| | 104,000 | | | Sumitomo Bakelite Co. Ltd. | | | 840,561 | |
| | 6,900 | | | Sumitomo Densetsu Co. Ltd. | | | 139,147 | |
| | 67,800 | | | Sumitomo Forestry Co. Ltd. | | | 1,135,317 | |
| Shares | | | | | Value | |
| JAPAN (continued) | | | | |
| | 27,400 | | | Sumitomo Heavy Industries Ltd. | | $ | 1,142,219 | |
| | 25,300 | | | Sumitomo Mitsui Construction Co. Ltd. | | | 154,864 | |
| | 471,474 | | | Sumitomo Osaka Cement Co. Ltd. | | | 2,147,870 | |
| | 7,000 | | | Sumitomo Precision Products Co. Ltd. | | | 22,594 | |
| | 19,100 | | | Sumitomo Riko Co. Ltd. | | | 183,769 | |
| | 37,900 | | | Sumitomo Rubber Industries Ltd. | | | 714,635 | |
| | 3,800 | | | Sumitomo Seika Chemicals Co. Ltd. | | | 201,187 | |
| | 7,500 | | | Sun Frontier Fudousan Co. Ltd. | | | 89,772 | |
| | 2,200 | | | Suncall Corp. | | | 13,718 | |
| | 3,600 | | | Sun-Wa Technos Corp. | | | 67,628 | |
| | 9,990 | | | Suzuken Co. Ltd. | | | 358,025 | |
| | 4,200 | | | SWCC Showa Holdings Co. Ltd.(b) | | | 39,080 | |
| | 1,700 | | | Systena Corp. | | | 52,254 | |
| | 7,000 | | | T&K Toka Co. Ltd. | | | 81,017 | |
| | 3,200 | | | T. Hasegawa Co. Ltd. | | | 64,757 | |
| | 3,000 | | | T. RAD Co. Ltd. | | | 124,005 | |
| | 3,240 | | | Tachibana Eletech Co. Ltd. | | | 54,710 | |
| | 6,700 | | | Tachi-S Co. Ltd. | | | 124,625 | |
| | 36,700 | | | Tadano Ltd. | | | 553,542 | |
| | 3,000 | | | Taihei Dengyo Kaisha Ltd. | | | 76,171 | |
| | 33,430 | | | Taiheiyo Cement Corp. | | | 1,328,909 | |
| | 9,600 | | | Taiho Kogyo Co. Ltd. | | | 142,685 | |
| | 5,000 | | | Taikisha Ltd. | | | 144,673 | |
| | 700 | | | Taiko Pharmaceutical Co. Ltd. | | | 14,430 | |
| | 300 | | | Taisei Lamick Co., Ltd. | | | 8,166 | |
| | 3,000 | | | Taiyo Holdings Co. Ltd. | | | 143,529 | |
| | 38,500 | | | Taiyo Yuden Co. Ltd. | | | 662,970 | |
| | 3,300 | | | Takaoka Toko Co. Ltd. | | | 53,721 | |
| | 17,700 | | | Takara Holdings, Inc. | | | 172,011 | |
| | 13,600 | | | Takara Leben Co. Ltd. | | | 62,076 | |
| | 11,000 | | | Takara Standard Co. Ltd. | | | 186,905 | |
| | 5,200 | | | Takasago International Corp. | | | 179,728 | |
| | 134,900 | | | Takasago Thermal Engineering Co. Ltd. | | | 2,364,502 | |
| | 1,800 | | | Takashima & Co. Ltd. | | | 35,840 | |
| | 115,000 | | | Takashimaya Co. Ltd. | | | 1,049,822 | |
| | 3,100 | | | Take And Give Needs Co. Ltd. | | | 23,556 | |
| | 2,600 | | | Takeei Corp. | | | 26,113 | |
| | 5,700 | | | Takeuchi Manufacturing Co. Ltd. | | | 119,008 | |
| | 3,300 | | | Takisawa Machine Tool Co.Ltd. | | | 60,018 | |
| | 9,000 | | | Takuma Co. Ltd. | | | 110,180 | |
| | 6,800 | | | Tama Home Co. Ltd. | | | 44,075 | |
| | 1,900 | | | Tamron Co. Ltd. | | | 39,385 | |
| | 29,000 | | | Tamura Corp. | | | 196,640 | |
| | 1,950 | | | Tanseisha Co. Ltd. | | | 23,066 | |
| | 16,300 | | | Tatsuta Electric Wire and Cable Co. Ltd. | | | 118,840 | |
| | 9,000 | | | Tayca Corp. | | | 211,020 | |
| Old Westbury Funds, Inc. |
| Small & Mid Cap Strategies Fund |
| Portfolio of Investments - (Continued) | October 31, 2017 |
| |
| Shares | | | | | Value | |
| JAPAN (continued) | | | | |
| | 10,700 | | | TBK Co. Ltd. | | $ | 49,028 | |
| | 600 | | | Techno Medica Co. Ltd. | | | 10,416 | |
| | 58,600 | | | Teijin Ltd. | | | 1,233,277 | |
| | 1,200 | | | Tekken Corp. | | | 40,051 | |
| | 900 | | | T-Gaia Corp. | | | 18,229 | |
| | 7,900 | | | THK Co. Ltd. | | | 286,250 | |
| | 21,266 | | | TIS, Inc. | | | 656,468 | |
| | 6,000 | | | Toa Corp. | | | 62,900 | |
| | 5,200 | | | Toa Corp.(b) | | | 112,685 | |
| | 58,000 | | | Toa Oil Co. Ltd. | | | 77,024 | |
| | 2,200 | | | Toa Road Corp. | | | 89,873 | |
| | 39,450 | | | Toagosei Co. Ltd. | | | 508,629 | |
| | 56,100 | | | Tobishima Corp. | | | 83,382 | |
| | 500 | | | Tobu Store Co. Ltd. | | | 13,544 | |
| | 17,100 | | | TOC Co. Ltd. | | | 152,344 | |
| | 2,200 | | | Tocalo Co. Ltd. | | | 88,422 | |
| | 34,700 | | | Tochigi Bank Ltd. (The) | | | 156,555 | |
| | 34,000 | | | Toda Corp. | | | 275,397 | |
| | 300 | | | Toda Kogyo Corp. | | | 12,427 | |
| | 2,000 | | | Toei Co. Ltd. | | | 216,173 | |
| | 4,200 | | | Toenec Corp. | | | 122,079 | |
| | 59,000 | | | Toho Bank Ltd. (The) | | | 226,235 | |
| | 4,000 | | | Toho Co. Ltd. | | | 100,928 | |
| | 3,200 | | | Toho Gas Co. Ltd. | | | 89,073 | |
| | 6,900 | | | Toho Holdings Co. Ltd. | | | 134,838 | |
| | 5,000 | | | Toho Titanium Co. Ltd. | | | 44,677 | |
| | 6,800 | | | Toho Zinc Co. Ltd. | | | 328,323 | |
| | 2,600 | | | Tohoku Bank Ltd. (The) | | | 35,763 | |
| | 15,000 | | | Tokai Carbon Co. Ltd. | | | 148,278 | |
| | 2,400 | | | Tokai Corp. | | | 107,436 | |
| | 19,000 | | | TOKAI Holdings Corp. | | | 151,225 | |
| | 1,200 | | | Tokai Lease Co. Ltd. | | | 22,458 | |
| | 17,100 | | | Tokai Rika Co. Ltd. | | | 355,821 | |
| | 20,000 | | | Tokai Tokyo Financial Holdings, Inc. | | | 129,810 | |
| | 700 | | | Token Corp. | | | 84,095 | |
| | 3,084 | | | Tokushu Tokai Paper Co. Ltd. | | | 124,087 | |
| | 10,800 | | | Tokuyama Corp. | | | 304,419 | |
| | 11,750 | | | Tokyo Century Corp. | | | 508,938 | |
| | 28,100 | | | Tokyo Dome Corp. | | | 262,206 | |
| | 1,100 | | | Tokyo Electron Device Ltd. | | | 21,467 | |
| | 7,000 | | | Tokyo Energy & Systems, Inc. | | | 81,201 | |
| | 2,600 | | | Tokyo Individualized Educational Institute, Inc. | | | 22,889 | |
| | 5,000 | | | Tokyo Keiki, Inc. | | | 66,840 | |
| | 8,800 | | | Tokyo Ohka Kogyo Co. Ltd. | | | 319,247 | |
| | 400 | | | Tokyo Rakutenchi Co. Ltd. | | | 20,580 | |
| | 5,300 | | | Tokyo Rope Manufacturing Co. Ltd. | | | 82,223 | |
| | 2,500 | | | Tokyo Sangyo Co. Ltd. | | | 11,763 | |
| | 6,800 | | | Tokyo Seimitsu Co. Ltd. | | | 267,323 | |
| | 27,500 | | | Tokyo Steel Manufacturing Co. Ltd. | | | 236,049 | |
| | 44,400 | | | Tokyo Tatemono Co. Ltd. | | | 617,355 | |
| | 4,400 | | | Tokyo Tekko Co. Ltd. | | | 82,772 | |
| | 6,275 | | | Tokyo Ty Financial Group, Inc. | | | 167,767 | |
| Shares | | | | | Value | |
| JAPAN (continued) | | | | |
| | 1,700 | | | Tokyotokeiba Co. Ltd. | | $ | 51,506 | |
| | 12,500 | | | Tokyu Construction Co. Ltd. | | | 109,604 | |
| | 197,600 | | | Tokyu Fudosan Holdings Corp. | | | 1,285,994 | |
| | 27,000 | | | Toli Corp. | | | 97,832 | |
| | 1,100 | | | Tomen Devices Corp. | | | 31,199 | |
| | 7,300 | | | Tomoe Corp. | | | 30,239 | |
| | 1,300 | | | Tomoe Engineering Co. Ltd. | | | 24,764 | |
| | 8,200 | | | Tomoku Co. Ltd. | | | 152,454 | |
| | 26,700 | | | TOMONY Holdings, Inc. | | | 127,506 | |
| | 11,800 | | | Tomy Co. Ltd. | | | 189,912 | |
| | 1,700 | | | Tonami Holdings Co. Ltd. | | | 84,174 | |
| | 8,100 | | | Topcon Corp. | | | 169,758 | |
| | 17,200 | | | Toppan Forms Co. Ltd. | | | 176,682 | |
| | 8,100 | | | Topre Corp. | | | 237,219 | |
| | 7,200 | | | Topy Industries Ltd. | | | 244,105 | |
| | 4,000 | | | TORIDOLL Holdings Corp. | | | 128,402 | |
| | 2,500 | | | Torii Pharmaceutical Co. Ltd. | | | 67,499 | |
| | 5,000 | | | Torishima Pump Manufacturing Co. Ltd. | | | 51,669 | |
| | 12,100 | | | Tosei Corp. | | | 118,334 | |
| | 26,000 | | | Toshiba Machine Co. Ltd. | | | 160,063 | |
| | 9,300 | | | Toshiba Plant Systems & Services Corp. | | | 159,655 | |
| | 41,000 | | | Toshiba TEC Corp. | | | 238,345 | |
| | 2,000 | | | Tosho Co. Ltd. | | | 55,055 | |
| | 5,900 | | | Totetsu Kogyo Co. Ltd. | | | 196,658 | |
| | 9,400 | | | Towa Bank Ltd. (The) | | | 99,121 | |
| | 5,500 | | | Towa Corp. | | | 94,033 | |
| | 3,300 | | | Towa Pharmaceutical Co. Ltd. | | | 170,072 | |
| | 23,700 | | | Toyo Construction Co. Ltd. | | | 119,433 | |
| | 600 | | | Toyo Denki Seizo KK | | | 10,606 | |
| | 3,200 | | | Toyo Engineering Corp. | | | 38,106 | |
| | 89,000 | | | Toyo Ink SC Holdings Co. Ltd. | | | 520,514 | |
| | 2,600 | | | Toyo Kohan Co. Ltd. | | | 11,044 | |
| | 2,100 | | | Toyo Machinery & Metal Co. Ltd. | | | 16,068 | |
| | 16,000 | | | Toyo Securities Co. Ltd. | | | 44,325 | |
| | 48,300 | | | Toyo Seikan Group Holdings Ltd. | | | 846,593 | |
| | 95,232 | | | Toyo Suisan Kaisha Ltd. | | | 3,647,468 | |
| | 700 | | | Toyo Tanso Co. Ltd. | | | 19,669 | |
| | 29,200 | | | Toyo Tire & Rubber Co. Ltd. | | | 655,880 | |
| | 2,000 | | | Toyo Wharf & Warehouse Co. Ltd. | | | 33,666 | |
| | 47,000 | | | Toyobo Co. Ltd. | | | 900,690 | |
| | 36,000 | | | Toyoda Gosei Co. Ltd. | | | 870,041 | |
| | 9,200 | | | Toyota Boshoku Corp. | | | 183,830 | |
| | 5,100 | | | TPR Co. Ltd. | | | 178,739 | |
| | 1,200 | | | Trancom Co. Ltd. | | | 72,820 | |
| | 3,000 | | | Transcosmos, Inc. | | | 69,469 | |
| | 5,200 | | | Trusco Nakayama Corp. | | | 132,578 | |
| | 10,900 | | | TS Tech Co. Ltd. | | | 387,283 | |
| | 47,000 | | | Tsubakimoto Chain Co. | | | 400,536 | |
| | 1,600 | | | Tsubakimoto Kogyo Co. Ltd. | | | 41,201 | |
| | 7,000 | | | Tsudakoma Corp.(b) | | | 12,497 | |
| | 20,833 | | | Tsukuba Bank Ltd. | | | 76,403 | |
| Old Westbury Funds, Inc. |
| Small & Mid Cap Strategies Fund |
| Portfolio of Investments - (Continued) | October 31, 2017 |
| |
| Shares | | | | | Value | |
| JAPAN (continued) | | | | |
| | 5,000 | | | Tsukui Corp. | | $ | 35,794 | |
| | 8,800 | | | Tsumura & Co. | | | 325,826 | |
| | 1,200 | | | Tsurumi Manufacturing Co. Ltd. | | | 20,221 | |
| | 7,000 | | | TTK Co. Ltd. | | | 34,106 | |
| | 2,400 | | | Tv Tokyo Holdings Corp. | | | 49,940 | |
| | 12,184 | | | UACJ Corp. | | | 355,753 | |
| | 32,780 | | | Ube Industries Ltd. | | | 998,924 | |
| | 4,200 | | | Uchida Yoko Co. Ltd. | | | 132,791 | |
| | 600 | | | Ueki Corp. | | | 14,348 | |
| | 2,500 | | | UKC Holdings Corp. | | | 42,786 | |
| | 7,200 | | | Ulvac, Inc. | | | 505,941 | |
| | 18,500 | | | Unipres Corp. | | | 492,986 | |
| | 2,600 | | | United Arrows Ltd. | | | 96,953 | |
| | 9,300 | | | United Super Markets Holdings, Inc. | | | 86,616 | |
| | 6,200 | | | Unitika Ltd.(b) | | | 54,363 | |
| | 3,900 | | | Universal Entertainment Corp. | | | 126,736 | |
| | 3,700 | | | Unizo Holdings Co. Ltd. | | | 97,784 | |
| | 8,600 | | | U-Shin Ltd.(b) | | | 57,785 | |
| | 2,100 | | | UT Group Co. Ltd.(b) | | | 42,737 | |
| | 8,800 | | | Utoc Corp. | | | 41,173 | |
| | 600 | | | V Technology Co. Ltd. | | | 104,534 | |
| | 9,500 | | | Valor Holdings Co. Ltd. | | | 215,307 | |
| | 2,200 | | | Vector, Inc. | | | 28,848 | |
| | 1,400 | | | Village Vanguard Co. Ltd. | | | 14,135 | |
| | 11,200 | | | Vital KSK Holdings, Inc. | | | 90,522 | |
| | 16,200 | | | VT Holdings Co. Ltd. | | | 87,479 | |
| | 11,500 | | | Wacoal Holdings Corp. | | | 327,184 | |
| | 3,300 | | | Wakachiku Construction Co. Ltd. | | | 54,881 | |
| | 5,900 | | | Wakita & Co. Ltd. | | | 72,281 | |
| | 7,600 | | | Warabeya Nichiyo Holdings Co. Ltd. | | | 187,084 | |
| | 2,700 | | | WATAMI Co. Ltd. | | | 35,191 | |
| | 600 | | | Weathernews, Inc. | | | 19,313 | |
| | 6,680 | | | Welcia Holdings Co. Ltd. | | | 252,619 | |
| | 5,900 | | | West Holdings Corp. | | | 38,657 | |
| | 1,000 | | | Wowow, Inc. | | | 31,089 | |
| | 6,500 | | | Xebio Holdings Co. Ltd. | | | 123,763 | |
| | 1,000 | | | Y.A.C. Holdings Co. Ltd. | | | 10,035 | |
| | 4,000 | | | Yachiyo Industry Co. Ltd. | | | 53,472 | |
| | 6,000 | | | Yahagi Construction Co. Ltd. | | | 53,929 | |
| | 600 | | | Yakuodo Co. Ltd. | | | 16,754 | |
| | 9,600 | | | YAMABIKO Corp. | | | 129,683 | |
| | 253,172 | | | Yamada Denki Co. Ltd. | | | 1,340,394 | |
| | 8,400 | | | Yamagata Bank Ltd. (The) | | | 196,804 | |
| | 51,000 | | | Yamaguchi Financial Group, Inc. | | | 613,588 | |
| | 5,400 | | | Yamaichi Electronics Co. Ltd. | | | 110,797 | |
| | 45,000 | | | Yamanashi Chuo Bank Ltd. (The) | | | 199,068 | |
| | 5,100 | | | Yamatane Corp. | | | 90,782 | |
| | 2,600 | | | Yamato Corp. | | | 19,185 | |
| | 800 | | | Yamaya Corp. | | | 16,759 | |
| | 100 | | | Yamazawa Co. Ltd. | | | 1,529 | |
| | 10,300 | | | Yamazen Corp. | | | 117,036 | |
| Shares | | | | | Value | |
| JAPAN (continued) | | | | |
| | 1,200 | | | Yaoko Co. Ltd. | | $ | 58,573 | |
| | 700 | | | Yashima Denki Co. Ltd. | | | 5,929 | |
| | 4,700 | | | Yellow Hat Ltd. | | | 143,846 | |
| | 10,100 | | | Yokogawa Bridge Holdings Corp. | | | 214,249 | |
| | 127,500 | | | Yokogawa Electric Corp. | | | 2,397,388 | |
| | 22,300 | | | Yokohama Reito Co. Ltd. | | | 211,419 | |
| | 42,500 | | | Yokohama Rubber Co. Ltd. (The) | | | 945,649 | |
| | 1,000 | | | Yokowo Co. Ltd. | | | 12,990 | |
| | 1,400 | | | Yondoshi Holdings, Inc. | | | 38,415 | |
| | 8,300 | | | Yorozu Corp. | | | 167,964 | |
| | 2,700 | | | Yoshinoya Holdings Co. Ltd. | | | 44,784 | |
| | 6,800 | | | Yuasa Trading Co. Ltd. | | | 249,083 | |
| | 2,700 | | | Yuken Kogyo Co. Ltd. | | | 63,615 | |
| | 2,700 | | | Yumeshin Holdings Co. Ltd. | | | 18,997 | |
| | 15,000 | | | Yurtec Corp. | | | 130,337 | |
| | 8,000 | | | Yusen Logistics Co. Ltd. | | | 92,731 | |
| | 900 | | | Yushiro Chemical Industry Co. Ltd. | | | 13,543 | |
| | 2,400 | | | Zenrin Co. Ltd. | | | 75,670 | |
| | 14,300 | | | Zensho Holdings Co. Ltd. | | | 264,230 | |
| | 52,000 | | | Zeon Corp. | | | 687,358 | |
| | 1,500 | | | ZERIA Pharmaceutical Co. Ltd. | | | 26,173 | |
| | 1,000 | | | ZIGExN Co., Ltd.(b) | | | 13,702 | |
| | 4,000 | | | Zojirushi Corp. | | | 35,988 | |
| | | | | | | | 339,876,997 | |
| JERSEY CHANNEL ISLANDS — 0.0% | | | | |
| | 400,611 | | | Centamin Plc | | | 741,173 | |
| | 24,590 | | | Novocure Ltd.(b) | | | 531,144 | |
| | 49,289 | | | Phoenix Group Holdings | | | 495,554 | |
| | 3,503 | | | Randgold Resources Ltd. | | | 344,052 | |
| | | | | | | | 2,111,923 | |
| JORDAN — 0.0% | | | | |
| | 29,542 | | | Hikma Pharmaceuticals Plc | | | 456,708 | |
| LIECHTENSTEIN — 0.0% | | | | |
| | 502 | | | Liechtensteinische Landesbank AG | | | 25,033 | |
| | 690 | | | VP Bank AG | | | 94,753 | |
| | | | | | | | 119,786 | |
| LUXEMBOURG — 0.3% | | | | |
| | 19,503 | | | APERAM SA | | | 1,049,234 | |
| | 53,577 | | | B&M European Value Retail SA | | | 282,711 | |
| | 60,129 | | | d’Amico International Shipping SA(b) | | | 18,323 | |
| | 1,249 | | | Eurofins Scientific SE | | | 781,280 | |
| | 22,500 | | | L’Occitane International SA | | | 42,742 | |
| | 197,324 | | | SES SA | | | 3,208,745 | |
| | 137,705 | | | Stabilus SA | | | 12,508,429 | |
| | 1,389 | | | Sword Group | | | 56,953 | |
| | | | | | | | 17,948,417 | |
| Old Westbury Funds, Inc. |
| Small & Mid Cap Strategies Fund |
| Portfolio of Investments - (Continued) | October 31, 2017 |
| |
| Shares | | | | | Value | |
| MACAU — 0.0% | | | | |
| | 99,000 | | | Macau Legend Development Ltd.(b) | | $ | 15,863 | |
| MALAYSIA — 0.2% | | | | |
| | 45,000 | | | 7-Eleven Malaysia Holdings Berhad | | | 16,582 | |
| | 75,100 | | | Aeon Co. (M) Berhad | | | 36,721 | |
| | 9,450 | | | Aeon Credit Service M Berhad | | | 31,028 | |
| | 314,490 | | | Affin Holdings Berhad | | | 190,172 | |
| | 585,500 | | | AirAsia Berhad | | | 461,927 | |
| | 402,900 | | | AirAsia X Berhad(b) | | | 35,689 | |
| | 297,900 | | | Alliance Financial Group Berhad | | | 259,655 | |
| | 844,400 | | | Ammb Holdings Berhad | | | 853,675 | |
| | 20,100 | | | Amway Malaysia Holdings Berhad | | | 34,042 | |
| | 39,200 | | | Ann Joo Resources Berhad | | | 34,723 | |
| | 29,700 | | | APM Automotive Holdings Berhad | | | 25,606 | |
| | 146,000 | | | Astro Malaysia Holdings Berhad | | | 96,908 | |
| | 32,700 | | | Batu Kawan Berhad | | | 152,937 | |
| | 855,519 | | | Berjaya Corp. Berhad(b) | | | 67,698 | |
| | 99,600 | | | Berjaya Land Berhad(b) | | | 8,940 | |
| | 75,119 | | | Berjaya Sports Toto Berhad | | | 42,763 | |
| | 95,200 | | | Bermaz Auto Berhad | | | 45,874 | |
| | 59,100 | | | BIMB Holdings Berhad | | | 61,285 | |
| | 579,307 | | | Boustead Holdings Berhad | | | 413,253 | |
| | 59,400 | | | Boustead Plantation Berhad | | | 22,590 | |
| | 5,000 | | | British American Tobacco Malaysia Berhad | | | 46,297 | |
| | 596,400 | | | Bumi Armada Berhad(b) | | | 102,840 | |
| | 64,500 | | | Bursa Malaysia Berhad | | | 152,204 | |
| | 60,400 | | | Cahya Mata Sarawak Berhad | | | 52,788 | |
| | 19,400 | | | Carlsberg Brewery-Malaysia Berhad | | | 73,045 | |
| | 98,060 | | | CB Industrial Product Holding Berhad | | | 44,704 | |
| | 70,800 | | | Datasonic Group Berhad | | | 20,570 | |
| | 93,460 | | | Dialog Group Berhad | | | 49,892 | |
| | 151,900 | | | DRB-Hicom Berhad | | | 60,997 | |
| | 2,300 | | | Dutch Lady Milk Industries Berhad | | | 32,619 | |
| | 181,174 | | | Eastern & Oriental Berhad | | | 65,905 | |
| | 150,900 | | | Eco World Development Group Berhad(b) | | | 55,249 | |
| | 180,600 | | | Ekovest Berhad(c) | | | 49,485 | |
| | 275,850 | | | Evergreen Fibreboard Berhad | | | 50,172 | |
| | 636,100 | | | Felda Global Ventures Holdings Berhad | | | 286,985 | |
| | 2,200 | | | Fraser & Neave Holdings Berhad | | | 13,148 | |
| | 225,400 | | | Gadang Holdings Berhad | | | 67,085 | |
| | 158,800 | | | Gamuda Berhad | | | 196,929 | |
| | 31,000 | | | Genting Plantations Berhad | | | 78,205 | |
| | 44,550 | | | George Kent Malaysia Berhad | | | 34,095 | |
| | 23,300 | | | Globetronics Technology Berhad | | | 36,270 | |
| Shares | | | | | Value | |
| MALAYSIA (continued) | | | | |
| | 27,600 | | | Goldis Berhad | | $ | 18,157 | |
| | 41,100 | | | GuocoLand Malaysia Berhad | | | 11,359 | |
| | 28,500 | | | Hai-O Enterprise Berhad | | | 36,690 | |
| | 240,680 | | | HAP Seng Consolidated Berhad | | | 527,580 | |
| | 93,500 | | | Hap Seng Plantations Holdings Berhad | | | 58,969 | |
| | 59,800 | | | Hartalega Holdings Berhad | | | 107,636 | |
| | 26,100 | | | Heineken Malaysia Berhad | | | 117,014 | |
| | 44,500 | | | Hengyuan Refining Co Berhad(b) | | | 89,032 | |
| | 47,600 | | | Heveaboard Berhad | | | 18,777 | |
| | 240,700 | | | Hibiscus Petroleum Berhad(b) | | | 40,368 | |
| | 39,700 | | | Hong Leong Industries Berhad | | | 90,119 | |
| | 519,180 | | | IJM Corp. Berhad | | | 391,209 | |
| | 36,700 | | | IJM Plantations Berhad | | | 24,880 | |
| | 52,754 | | | Inari Amertron Berhad | | | 35,016 | |
| | 104,400 | | | Insas Berhad | | | 24,291 | |
| | 217,600 | | | Ioi Properties Group Berhad | | | 102,285 | |
| | 59,079 | | | Kenanga Investment Bank Berhad | | | 7,466 | |
| | 45,100 | | | Kian JOO CAN Factory Berhad | | | 31,427 | |
| | 33,300 | | | Kossan Rubber Industries | | | 56,791 | |
| | 262,100 | | | KPJ Healthcare Berhad | | | 63,149 | |
| | 293,574 | | | KSL Holdings Berhad(b) | | | 87,375 | |
| | 35,950 | | | Kumpulan Fima Berhad | | | 14,266 | |
| | 486,980 | | | Land & General Berhad | | | 25,307 | |
| | 157,800 | | | Landmarks Berhad(b) | | | 27,210 | |
| | 134,300 | | | LBS Bina Group Berhad | | | 60,908 | |
| | 79,000 | | | Lingkaran Trans Kota Holdings Berhad | | | 109,911 | |
| | 14,100 | | | LPI Capital Berhad | | | 60,683 | |
| | 15,900 | | | Magni-Tech Industries Berhad | | | 26,140 | |
| | 430,873 | | | Mah Sing Group Berhad | | | 156,737 | |
| | 83,300 | | | Malakoff Corp Berhad | | | 20,267 | |
| | 73,050 | | | Malayan Flour Mills Berhad | | | 33,475 | |
| | 137,923 | | | Malaysia Airports Holdings Berhad | | | 269,754 | |
| | 340,001 | | | Malaysia Building Society Berhad | | | 89,146 | |
| | 27,400 | | | Malaysian Pacific Industries Berhad | | | 90,093 | |
| | 248,800 | | | Malaysian Resources Corp. Berhad | | | 62,296 | |
| | 82,600 | | | Malton Berhad | | | 24,194 | |
| | 71,500 | | | Matrix Concepts Holdings Berhad | | | 38,000 | |
| | 36,900 | | | Mega First Corp. Berhad | | | 30,594 | |
| | 125,370 | | | MKH Berhad | | | 61,301 | |
| | 316,100 | | | MMC Corp. Berhad | | | 148,586 | |
| | 68,250 | | | MNRB Holdings Berhad(b) | | | 37,079 | |
| | 84,500 | | | Mudajaya Group Berhad(b) | | | 23,952 | |
| | 103,000 | | | Muhibbah Engineering M Berhad | | | 69,340 | |
| | 191,100 | | | My EG Services Berhad | | | 98,857 | |
| | 31,800 | | | Naim Holdings Berhad(b) | | | 8,788 | |
| | 33,800 | | | Padini Holdings Berhad | | | 37,684 | |
| Old Westbury Funds, Inc. |
| Small & Mid Cap Strategies Fund |
| Portfolio of Investments - (Continued) | October 31, 2017 |
| |
| Shares | | | | | Value | |
| MALAYSIA (continued) | | | | |
| | 2,600 | | | Panasonic Manufacturing Malaysia Berhad | | $ | 23,964 | |
| | 45,300 | | | Paramount Corp. Berhad | | | 18,726 | |
| | 31,100 | | | Pestech International Berhad | | | 12,195 | |
| | 23,600 | | | Petron Malaysia Refining & Marketing Berhad | | | 65,223 | |
| | 94,300 | | | POS Malaysia Berhad | | | 122,288 | |
| | 311,360 | | | Press Metal Berhad | | | 325,812 | |
| | 148,550 | | | Protasco Berhad | | | 40,002 | |
| | 57,980 | | | QL Resources Berhad | | | 53,276 | |
| | 1,175,100 | | | Sapura Energy Berhad | | | 444,115 | |
| | 64,857 | | | Sarawak Oil Palms Berhad | | | 70,165 | |
| | 26,600 | | | Scientex Berhad | | | 55,921 | |
| | 51,400 | | | Shangri-La Hotels (Malaysia) Berhad | | | 63,135 | |
| | 124,600 | | | SKP Resources Berhad | | | 52,094 | |
| | 150,917 | | | SP Setia Berhad | | | 116,570 | |
| | 60,223 | | | Sunway Berhad | | | 24,610 | |
| | 88,466 | | | Sunway Construction Group Berhad | | | 48,062 | |
| | 129,900 | | | Supermax Corp. Berhad | | | 54,310 | |
| | 35,000 | | | Syarikat Takaful Malaysia Berhad | | | 31,829 | |
| | 52,236 | | | Ta Ann Holdings Berhad | | | 45,530 | |
| | 269,700 | | | TA Enterprise Berhad | | | 40,772 | |
| | 195,360 | | | TA Global Berhad | | | 17,536 | |
| | 126,800 | | | TAN Chong Motor Holdings Berhad | | | 48,522 | |
| | 33,400 | | | TH Plantations Berhad | | | 8,678 | |
| | 21,800 | | | Thong Guan Industries Berhad | | | 23,018 | |
| | 34,760 | | | Time dotCom Berhad | | | 75,374 | |
| | 76,500 | | | Tiong NAM Logistics Holdings | | | 26,925 | |
| | 79,220 | | | Top Glove Corp. Berhad | | | 119,761 | |
| | 159,001 | | | Tropicana Corp. Berhad | | | 37,558 | |
| | 43,600 | | | TSH Resources Berhad | | | 17,508 | |
| | 51,400 | | | Tune Protect Group Berhad | | | 14,812 | |
| | 41,800 | | | UEM Edgenta Berhad | | | 26,066 | |
| | 341,908 | | | UEM Sunrise Berhad(b) | | | 89,646 | |
| | 55,400 | | | UMW Holdings Berhad(b) | | | 68,571 | |
| | 564,026 | | | UMW Oil & Gas Corp Berhad(b) | | | 42,633 | |
| | 122,900 | | | Unisem M Berhad | | | 116,121 | |
| | 23,700 | | | United Malacca Berhad | | | 37,844 | |
| | 20,800 | | | United Plantations Berhad | | | 134,720 | |
| | 10,800 | | | United U-Li Corp Berhad | | | 10,970 | |
| | 202,900 | | | UOA Development Berhad | | | 122,214 | |
| | 63,100 | | | VS Industry Berhad | | | 45,907 | |
| | 123,137 | | | WCT Holdings Berhad(b) | | | 48,283 | |
| | 86,300 | | | Westports Holdings Berhad | | | 75,628 | |
| | 126,900 | | | Yinson Holdings Berhad | | | 118,702 | |
| | 43,014 | | | YNH Property Berhad(b) | | | 14,326 | |
| | 587,826 | | | YTL Corp. Berhad | | | 176,341 | |
| | 151,164 | | | YTL Power International Berhad | | | 46,419 | |
| | | | | | | | 11,298,392 | |
| Shares | | | | | Value | |
| MALTA — 0.0% | | | | |
| | 54,127 | | | Kindred Group Plc - SDR | | $ | 691,163 | |
| MEXICO — 0.2% | | | | |
| | 104,738 | | | Alpek SAB de CV | | | 109,864 | |
| | 82,188 | | | Alsea SAB de CV | | | 248,728 | |
| | 170,367 | | | Axtel SAB de CV - CPO Units(b) | | | 36,878 | |
| | 99,209 | | | Banregio Grupo Financiero SAB de CV | | | 529,170 | |
| | 51,537 | | | Bolsa Mexicana de Valores SAB de CV | | | 85,995 | |
| | 12,524 | | | Cia Minera Autlan SAB de CV - Series B | | | 11,759 | |
| | 17,900 | | | Concentradora Fibra Danhos SA de CV REIT | | | 30,073 | |
| | 183,251 | | | Consorcio ARA SAB de CV | | | 64,997 | |
| | 58,388 | | | Controladora Vuela Cia de Aviacion SAB de CV(b) | | | 59,662 | |
| | 25,361 | | | Corp. Actinver SAB de CV | | | 17,197 | |
| | 61,938 | | | Corp. Interamericana de Entretenimiento SAB de CV - Series B(b) | | | 57,910 | |
| | 27,300 | | | Corp. Moctezuma SAB de CV | | | 108,507 | |
| | 1,260 | | | Corporativo Fragua SAB de CV | | | 15,773 | |
| | 71,496 | | | Credito Real SAB de CV SOFOM ER | | | 114,861 | |
| | 24,124 | | | Elementia SAB de CV(b) | | | 31,458 | |
| | 182,900 | | | Fibra Uno Administracion SA de CV REIT | | | 286,966 | |
| | 129,006 | | | Genomma Lab Internacional SAB de CV - Class B(b) | | | 150,661 | |
| | 229,844 | | | Gentera SAB de CV | | | 232,580 | |
| | 15,205 | | | Gruma SAB de CV - Series B | | | 199,566 | |
| | 4,919 | | | Grupo Aeromexico SAB de CV(b) | | | 7,849 | |
| | 16,818 | | | Grupo Aeroportuario del Centro Norte SAB de CV | | | 84,960 | |
| | 169,244 | | | Grupo Aeroportuario del Pacifico SAB de CV - Series B | | | 1,609,216 | |
| | 63,812 | | | Grupo Aeroportuario del Sureste SAB de CV - Series B | | | 1,140,989 | |
| | 7,388 | | | Grupo Carso SAB de CV - Series A1 | | | 23,946 | |
| | 113,912 | | | Grupo Cementos de Chihuahua SAB de CV | | | 540,810 | |
| | 58,415 | | | Grupo Comercial Chedraui SA de CV | | | 115,326 | |
| | 9,143 | | | Grupo Elektra SAB de CV | | | 366,407 | |
| | 45,428 | | | Grupo Famsa SAB de CV - Class A(b) | | | 24,785 | |
| | 35,937 | | | Grupo Financiero Interacciones SA de CV | | | 163,417 | |
| | 29,254 | | | Grupo Gicsa SA de CV(b) | | | 17,700 | |
| | 92,311 | | | Grupo Herdez SAB de CV | | | 197,413 | |
| | 26,671 | | | Grupo Industrial Saltillo SAB de CV | | | 50,068 | |
| | 17,079 | | | Grupo KUO SAB de CV - Series B | | | 35,001 | |
| Old Westbury Funds, Inc. |
| Small & Mid Cap Strategies Fund |
| Portfolio of Investments - (Continued) | October 31, 2017 |
| |
| Shares | | | | | Value | |
| MEXICO (continued) | | | | |
| | 42,298 | | | Grupo Lala SAB de CV | | $ | 65,328 | |
| | 9,061 | | | Grupo Rotoplas SAB de CV | | | 14,056 | |
| | 19,200 | | | Grupo Sanborns SAB de CV | | | 21,101 | |
| | 15,920 | | | Grupo Simec SAB de CV - Series B(b) | | | 52,182 | |
| | 51,350 | | | Hoteles City Express SAB de CV(b) | | | 63,238 | |
| | 256,075 | | | Impulsora del Desarrollo y El Empleo en America Latina SAB de CV(b) | | | 466,022 | |
| | 33,147 | | | Industrias Bachoco SAB de CV - Series B | | | 163,247 | |
| | 140,613 | | | Industrias CH SAB de CV - Series B(b) | | | 560,347 | |
| | 6,209 | | | Industrias Penoles SAB de CV | | | 144,766 | |
| | 39,900 | | | Infraestructura Energetica Nova SAB de CV | | | 203,540 | |
| | 15,801 | | | Kimberly-Clark de Mexico SAB de CV - Class A | | | 27,182 | |
| | 166,313 | | | La Comer SAB de CV(b) | | | 161,353 | |
| | 72,900 | | | Macquarie Mexico Real Estate Management SA de CV REIT | | | 88,027 | |
| | 90 | | | Medica Sur SAB de CV - Series B | | | 184 | |
| | 44,125 | | | Megacable Holdings SAB de CV - CPO Shares | | | 174,827 | |
| | 153,670 | | | Mexichem SAB de CV | | | 395,802 | |
| | 62,689 | | | Minera Frisco SAB de CV(b) | | | 36,982 | |
| | 11,623 | | | Organizacion Cultiba SAB de CV | | | 9,639 | |
| | 124,599 | | | Organizacion Soriana SAB de CV - Series B(b) | | | 261,264 | |
| | 24,222 | | | Prologis Property Mexico SA de CV REIT | | | 47,189 | |
| | 30,304 | | | Promotora y Operadora de Infraestructura SAB de CV | | | 288,154 | |
| | 1,100 | | | Promotora y Operadora de Infraestructura SAB de CV - Series L | | | 8,227 | |
| | 19,043 | | | Qualitas Controladora SAB de CV - Class I | | | 31,537 | |
| | 13,174 | | | Rassini SAB de CV | | | 48,871 | |
| | 16,731 | | | Rassini SAB de CV - Series A | | | 31,330 | |
| | 202,323 | | | TV Azteca SAB de CV - CPO Shares | | | 36,620 | |
| | 37,764 | | | Unifin Financiera SAB de CV SOFOM ENR | | | 128,035 | |
| | 7,426 | | | Vitro SAB de CV - Series A | | | 27,540 | |
| | | | | | | | 10,327,082 | |
| MONACO — 0.0% | | | | |
| | 12,500 | | | Endeavour Mining Corp.(b) | | | 222,173 | |
| | 5,000 | | | Scorpio Tankers, Inc. | | | 17,799 | |
| | | | | | | | 239,972 | |
| NETHERLANDS — 0.7% | | | | |
| | 28,432 | | | Aalberts Industries NV | | | 1,402,424 | |
| | 9,307 | | | Accell Group NV | | | 284,258 | |
| Shares | | | | | Value | |
| NETHERLANDS (continued) | | | | |
| | 462,685 | | | Aegon NV | | $ | 2,731,441 | |
| | 6,845 | | | AMG Advanced Metallurgical Group NV | | | 327,826 | |
| | 4,136 | | | Amsterdam Commodities NV | | | 116,037 | |
| | 35,728 | | | Arcadis NV | | | 826,112 | |
| | 8,704 | | | ASM International NV | | | 583,187 | |
| | 6,555 | | | Atrium European Real Estate Ltd. | | | 30,695 | |
| | 6,009 | | | BE Semiconductor Industries NV | | | 472,122 | |
| | 3,301 | | | Beter Bed Holding NV | | | 67,560 | |
| | 14,804 | | | BinckBank NV | | | 75,444 | |
| | 162,690 | | | Boskalis Westminster | | | 5,817,938 | |
| | 3,196 | | | Brunel International NV | | | 54,335 | |
| | 9,766 | | | Corbion NV | | | 326,375 | |
| | 768 | | | Core Laboratories NV | | | 76,723 | |
| | 11,506 | | | Euronext NV | | | 683,675 | |
| | 14,579 | | | Fugro NV - CVA(b) | | | 187,910 | |
| | 8,519 | | | Gemalto NV | | | 337,196 | |
| | 11,509 | | | GrandVision NV | | | 287,296 | |
| | 10,014 | | | Heijmans NV - CVA(b) | | | 106,826 | |
| | 2,073 | | | Hunter Douglas NV | | | 167,848 | |
| | 3,058 | | | IMCD Group NV | | | 192,354 | |
| | 8,679 | | | KAS Bank NV - CVA | | | 100,693 | |
| | 3,442 | | | Kendrion NV | | | 150,634 | |
| | 40,176 | | | Koninklijke BAM Groep NV | | | 226,975 | |
| | 32,497 | | | Koninklijke Vopak NV | | | 1,407,227 | |
| | 669 | | | Nederland Apparatenfabriek | | | 31,175 | |
| | 3,676 | | | Nostrum Oil & Gas Plc(b) | | | 18,377 | |
| | 2,441 | | | NSI NV REIT | | | 92,567 | |
| | 15,773 | | | OCI NV(b) | | | 374,170 | |
| | 20,929 | | | Ordina NV | | | 36,203 | |
| | 1,805 | | | Philips Lighting NV | | | 68,386 | |
| | 28,293 | | | PostNL NV | | | 120,656 | |
| | 213,339 | | | QIAGEN NV | | | 7,225,365 | |
| | 28,961 | | | Randstad Holding NV | | | 1,781,894 | |
| | 537,344 | | | Refresco Gerber NV | | | 12,424,609 | |
| | 128,034 | | | SBM Offshore NV | | | 2,284,830 | |
| | 10,300 | | | Sligro Food Group NV | | | 463,301 | |
| | 86,230 | | | SNS REAAL NV(a)(b)(c) | | | 0 | |
| | 8,477 | | | TKH Group NV | | | 571,236 | |
| | 26,326 | | | TomTom NV(b) | | | 299,912 | |
| | 4,395 | | | Van Lanschot Kempen NV - CVA | | | 133,389 | |
| | 12,798 | | | Wessanen | | | 243,071 | |
| | | | | | | | 43,210,252 | |
| NEW ZEALAND — 0.6% | | | | |
| | 7,184 | | | a2 Milk Co. Ltd.(b) | | | 42,622 | |
| | 320,760 | | | Air New Zealand Ltd. | | | 724,336 | |
| | 3,211,087 | | | Auckland International Airport Ltd. | | | 13,689,446 | |
| | 65,726 | | | Chorus Ltd. | | | 180,580 | |
| | 105,881 | | | Contact Energy Ltd. | | | 416,612 | |
| | 19,426 | | | Ebos Group Ltd. | | | 233,960 | |
| | 23,408 | | | Freightways Ltd. | | | 122,698 | |
| Old Westbury Funds, Inc. |
| Small & Mid Cap Strategies Fund |
| Portfolio of Investments - (Continued) | October 31, 2017 |
| |
| Shares | | | | | Value | |
| NEW ZEALAND (continued) | | | | |
| | 34,123 | | | Genesis Energy Ltd. | | $ | 57,208 | |
| | 53,576 | | | Heartland Bank Ltd. | | | 69,658 | |
| | 36,913 | | | Infratil Ltd. | | | 81,209 | |
| | 7,542 | | | Kathmandu Holdings Ltd. | | | 12,386 | |
| | 76,737 | | | Kiwi Property Group Ltd. | | | 69,577 | |
| | 22,834 | | | Mainfreight Ltd. | | | 382,194 | |
| | 6,364,208 | | | Mercury Ltd.(a) | | | 14,328,015 | |
| | 28,706 | | | Metlifecare Ltd. | | | 113,539 | |
| | 19,783 | | | New Zealand Oil & Gas Ltd. | | | 9,815 | |
| | 13,133 | | | New Zealand Refining Co. Ltd. (The) | | | 22,647 | |
| | 56,805 | | | NZME Ltd. | | | 35,650 | |
| | 45,243 | | | NZX Ltd. | | | 36,532 | |
| | 73,491 | | | PGG Wrightson Ltd. | | | 28,162 | |
| | 80,140 | | | Pike River Coal Ltd.(a)(b)(c) | | | 0 | |
| | 226,520 | | | Port of Tauranga Ltd. | | | 709,934 | |
| | 23,490 | | | Restaurant Brands New Zealand Ltd. | | | 108,983 | |
| | 15,128 | | | Sanford Ltd. | | | 81,781 | |
| | 74,844 | | | Skellerup Holdings Ltd. | | | 91,676 | |
| | 127,402 | | | SKY Network Television Ltd. | | | 217,953 | |
| | 2,777,691 | | | SKYCITY Entertainment Group Ltd. | | | 7,393,997 | |
| | 55,636 | | | Summerset Group Holdings Ltd. | | | 185,409 | |
| | 29,035 | | | Tilt Renewables Ltd. | | | 38,744 | |
| | 43,782 | | | Tower Ltd.(b) | | | 24,268 | |
| | 82,337 | | | Trade Me Group Ltd. | | | 254,107 | |
| | 29,035 | | | TrustPower Ltd. | | | 115,635 | |
| | 25,065 | | | Vector Ltd. | | | 57,802 | |
| | 17,197 | | | Warehouse Group Ltd. (The) | | | 24,830 | |
| | 46,382 | | | Xero Ltd.(b) | | | 1,091,827 | |
| | | | | | | | 41,053,792 | |
| NORWAY — 0.2% | | | | |
| | 71,942 | | | ABG Sundal Collier Holding ASA | | | 49,852 | |
| | 1,087 | | | AF Gruppen ASA | | | 16,901 | |
| | 49,880 | | | Akastor ASA(b) | | | 114,807 | |
| | 9,669 | | | Aker ASA - Class A | | | 437,993 | |
| | 14,634 | | | Aker BP ASA | | | 336,467 | |
| | 57,652 | | | Aker Solutions ASA(b) | | | 316,352 | |
| | 18,643 | | | American Shipping Co. ASA | | | 52,268 | |
| | 14,276 | | | Archer Ltd.(b) | | | 17,024 | |
| | 18,135 | | | Atea ASA | | | 228,686 | |
| | 41,175 | | | Austevoll Seafood ASA | | �� | 412,103 | |
| | 17,720 | | | Avance Gas Holding Ltd.(b) | | | 42,738 | |
| | 12,020 | | | Bonheur ASA | | | 121,775 | |
| | 22,473 | | | Borregaard ASA | | | 216,669 | |
| | 107,939 | | | BW Offshore Ltd.(b) | | | 354,158 | |
| | 103,333 | | | DNO ASA(b) | | | 125,244 | |
| | 389,756 | | | DOF ASA(b) | | | 41,037 | |
| | 3,173 | | | Ekornes ASA | | | 44,479 | |
| | 9,266 | | | Entra ASA | | | 127,623 | |
| | 25,626 | | | Fred Olsen Energy ASA(b) | | | 70,591 | |
| | 35,356 | | | Frontline Ltd. | | | 216,430 | |
| Shares | | | | | Value | |
| NORWAY (continued) | | | | |
| | 17,070 | | | Grieg Seafood ASA | | $ | 162,069 | |
| | 14,061 | | | Hexagon Composites ASA(b) | | | 47,341 | |
| | 194,372 | | | Kongsberg Automotive ASA(b) | | | 228,687 | |
| | 5,903 | | | Kongsberg Gruppen ASA | | | 107,682 | |
| | 66,705 | | | Kvaerner ASA(b) | | | 127,399 | |
| | 83,110 | | | Leroy Seafood Group ASA | | | 499,189 | |
| | 87,300 | | | NEL ASA(b) | | | 29,820 | |
| | 16,893 | | | Nordic Semiconductor ASA(b) | | | 84,589 | |
| | 3,692 | | | Norwegian Air Shuttle ASA(b) | | | 104,414 | |
| | 15,648 | | | Ocean Yield ASA | | | 139,372 | |
| | 26,554 | | | Odfjell Drilling Ltd.(b) | | | 106,307 | |
| | 8,670 | | | Odfjell SE - Class A | | | 30,252 | |
| | 23,394 | | | Opera Software ASA | | | 67,020 | |
| | 190,145 | | | Petroleum Geo-Services ASA(b) | | | 311,244 | |
| | 12,370 | | | Protector Forsikring ASA | | | 134,786 | |
| | 10,518 | | | Salmar ASA | | | 313,814 | |
| | 13,890 | | | Scatec Solar ASA | | | 79,925 | |
| | 5,087 | | | Sevan Marine ASA(b) | | | 8,221 | |
| | 3,100 | | | Ship Finance International Ltd. | | | 46,190 | |
| | 7,106 | | | Skandiabanken ASA | | | 71,991 | |
| | 26,538 | | | SpareBank 1 SR-Bank ASA | | | 294,036 | |
| | 116,544 | | | Storebrand ASA | | | 998,072 | |
| | 67,097 | | | TGS Nopec Geophysical Co. ASA | | | 1,540,241 | |
| | 1,010,558 | | | Thin Film Electronics ASA(b) | | | 300,643 | |
| | 26,311 | | | Tomra Systems ASA | | | 367,220 | |
| | 14,551 | | | Veidekke ASA | | | 163,004 | |
| | 4,646 | | | Wilh Wilhelmsen Holding ASA | | | 135,944 | |
| | 7,396 | | | XXL ASA | | | 79,683 | |
| | | | | | | | 9,922,352 | |
| PANAMA — 0.0% | | | | |
| | 841 | | | Copa Holdings SA | | | 103,603 | |
| PERU — 0.0% | | | | |
| | 50,300 | | | Cia de Minas Buenaventura SAA - ADR | | | 693,637 | |
| | 18,932 | | | Hochschild Mining Plc | | | 55,418 | |
| | | | | | | | 749,055 | |
| PHILIPPINES — 0.1% | | | | |
| | 1,055,800 | | | Alliance Global Group, Inc.(b) | | | 327,221 | |
| | 190,966 | | | Belle Corp. | | | 14,057 | |
| | 300,300 | | | Bloomberry Resorts Corp.(b) | | | 54,912 | |
| | 86,020 | | | Cebu Air, Inc. | | | 181,621 | |
| | 104,400 | | | Century Pacific Food, Inc. | | | 30,739 | |
| | 133,952 | | | China Banking Corp. | | | 86,923 | |
| | 485,700 | | | Cosco Capital, Inc. | | | 80,158 | |
| | 130,900 | | | Del Monte Pacific Ltd. | | | 29,770 | |
| | 432,700 | | | DMCI Holdings, Inc. | | | 128,574 | |
| | 48,300 | | | East West Banking Corp. | | | 30,313 | |
| | 72,800 | | | EEI Corp.(b) | | | 17,373 | |
| | 165,200 | | | Emperador, Inc. | | | 23,039 | |
| | 374,754 | | | Energy Development Corp. | | | 41,885 | |
| | 2,062,375 | | | Filinvest Land, Inc. | | | 79,099 | |
| | 86,000 | | | First Gen Corp. | | | 29,286 | |
| | 123,070 | | | First Philippine Holdings Corp. | | | 152,213 | |
| Old Westbury Funds, Inc. |
| Small & Mid Cap Strategies Fund |
| Portfolio of Investments - (Continued) | October 31, 2017 |
| |
| Shares | | | | | Value | |
| PHILIPPINES (continued) | | | | |
| | 6,345 | | | GT Capital Holdings, Inc. | | $ | 145,029 | |
| | 173,000 | | | Integrated Micro-Electronics, Inc. | | | 59,314 | |
| | 56,320 | | | International Container Terminal Services, Inc. | | | 115,531 | |
| | 48,240 | | | Jollibee Foods Corp. | | | 232,673 | |
| | 1,274,700 | | | Lopez Holdings Corp. | | | 143,211 | |
| | 410,200 | | | LT Group, Inc. | | | 142,865 | |
| | 67,500 | | | Manila Water Co., Inc. | | | 40,533 | |
| | 166,300 | | | Megawide Construction Corp.(b) | | | 54,182 | |
| | 1,778,696 | | | Megaworld Corp. | | | 183,641 | |
| | 88,400 | | | Nickel Asia Corp. | | | 11,986 | |
| | 623,000 | | | Pepsi-Cola Products Philippines, Inc. | | | 34,755 | |
| | 864,600 | | | Petron Corp. | | | 163,123 | |
| | 124,300 | | | Philex Mining Corp. | | | 18,323 | |
| | 16,160 | | | Philippine National Bank(b) | | | 18,296 | |
| | 99,100 | | | Phoenix Petroleum Philippines, Inc. | | | 22,076 | |
| | 105,900 | | | Puregold Price Club, Inc. | | | 104,618 | |
| | 75,400 | | | Rizal Commercial Banking Corp. | | | 86,171 | |
| | 322,700 | | | Robinsons Land Corp. | | | 157,521 | |
| | 41,000 | | | Robinsons Retail Holdings, Inc. | | | 77,036 | |
| | 48,560 | | | San Miguel Corp. | | | 96,885 | |
| | 43,571 | | | Security Bank Corp. | | | 207,622 | |
| | 136,040 | | | Semirara Mining & Power Corp. | | | 111,994 | |
| | 149,000 | | | SSI Group, Inc.(b) | | | 11,198 | |
| | 398,000 | | | STI Education Systems Holdings, Inc. | | | 13,877 | |
| | 6 | | | Top Frontier Investment Holdings, Inc.(b) | | | 35 | |
| | 161,290 | | | Union Bank of Philippines, Inc. | | | 272,123 | |
| | 860,500 | | | Vista Land & Lifescapes, Inc. | | | 101,510 | |
| | | | | | | | 3,933,311 | |
| POLAND — 0.2% | | | | |
| | 1,147 | | | Agora SA(b) | | | 5,168 | |
| | 4,317 | | | Alior Bank SA(b) | | | 85,784 | |
| | 1,433 | | | Amica SA | | | 55,510 | |
| | 231 | | | AmRest Holdings SE(b) | | | 22,409 | |
| | 348 | | | Apator SA | | | 2,916 | |
| | 34,481 | | | Asseco Poland SA | | | 451,859 | |
| | 76,172 | | | Bank Millennium SA(b) | | | 166,995 | |
| | 27,216 | | | Boryszew SA(b) | | | 74,770 | |
| | 1,938 | | | Budimex SA | | | 99,297 | |
| | 2,732 | | | CCC SA | | | 204,865 | |
| | 10,845 | | | CD Projekt SA | | | 359,320 | |
| | 11,507 | | | Ciech SA(b) | | | 195,653 | |
| | 265 | | | ComArch SA | | | 11,692 | |
| | 10,857 | | | Cyfrowy Polsat SA | | | 75,642 | |
| | 990 | | | Dom Development SA | | | 22,844 | |
| | 2,172 | | | Emperia Holding SA(b) | | | 54,778 | |
| | 68,542 | | | Enea SA | | | 262,309 | |
| | 185,687 | | | Energa SA | | | 645,322 | |
| | 5,380 | | | Eurocash SA | | | 54,407 | |
| Shares | | | | | Value | |
| POLAND (continued) | | | | |
| | 1,397 | | | Fabryki Mebli Forte SA | | $ | 25,530 | |
| | 7,502 | | | Famur SA(b) | | | 11,851 | |
| | 162,514 | | | Getin Holding SA(b) | | | 71,882 | |
| | 67,759 | | | Getin Noble Bank SA(b) | | | 29,971 | |
| | 8,378 | | | Grupa Azoty SA | | | 168,023 | |
| | 119 | | | Grupa Azoty Zaklady Chemiczne Police SA | | | 683 | |
| | 1,899 | | | Grupa Kety SA | | | 205,815 | |
| | 68,000 | | | Grupa Lotos SA | | | 1,233,544 | |
| | 49,265 | | | Impexmetal SA(b) | | | 58,063 | |
| | 1,298 | | | Inter Cars SA | | | 102,700 | |
| | 7,681 | | | Jastrzebska Spolka Weglowa SA(b) | | | 206,588 | |
| | 46,335 | | | KGHM Polska Miedz SA | | | 1,565,101 | |
| | 2,355 | | | Lubelski Wegiel Bogdanka SA | | | 47,702 | |
| | 51,340 | | | Netia SA | | | 57,829 | |
| | 17,977 | | | Orange Polska SA(b) | | | 27,707 | |
| | 9,252 | | | Orbis SA | | | 222,407 | |
| | 1,145 | | | Pfleiderer Group SA | | | 12,583 | |
| | 200,124 | | | PGE Polska Grupa Energetyczna SA(b) | | | 717,487 | �� |
| | 3,502 | | | PKP Cargo SA(b) | | | 50,010 | |
| | 4,554 | | | Polnord SA(b) | | | 10,384 | |
| | 323,590 | | | Polskie Gornictwo Naftowe I Gazownictwo SA | | | 594,738 | |
| | 50,911 | | | Powszechny Zaklad Ubezpieczen SA | | | 657,097 | |
| | 36,927 | | | Stalexport Autostrady SA | | | 38,551 | |
| | 365 | | | Stalprodukt SA | | | 53,146 | |
| | 55,201 | | | Synthos SA | | | 74,765 | |
| | 979,021 | | | Tauron Polska Energia SA(b) | | | 946,759 | |
| | 6,571 | | | Trakcja SA | | | 13,936 | |
| | 14,504 | | | Vistula Group SA(b) | | | 13,548 | |
| | 4,785 | | | Warsaw Stock Exchange | | | 60,471 | |
| | 2,786 | | | Zespol Elektrowni Patnow Adamow Konin SA | | | 9,606 | |
| | | | | | | | 10,140,017 | |
| PORTUGAL — 0.0% | | | | |
| | 11,806 | | | Altri SGPS SA | | | 75,431 | |
| | 1,754,743 | | | Banco Comercial Portugues SA(b) | | | 524,289 | |
| | 1,231,589 | | | Banco Espirito Santo SA(a)(b)(c) | | | 0 | |
| | 8,821 | | | CTT-Correios de Portugal SA | | | 51,951 | |
| | 29,184 | | | Jeronimo Martins SGPS SA | | | 530,322 | |
| | 40,539 | | | Mota-Engil SGPS SA | | | 162,821 | |
| | 47,493 | | | Navigator Co. SA (The) | | | 242,256 | |
| | 36,299 | | | NOS SGPS SA | | | 217,503 | |
| | 15,219 | | | REN - Redes Energeticas Nacionais SGPS SA | | | 48,344 | |
| | 10,012 | | | Semapa - Sociedade de Investimento e Gestao | | | 200,186 | |
| | 22,814 | | | Sonae Capital SGPS SA | | | 22,642 | |
| | 241,425 | | | Sonae SGPS SA | | | 289,098 | |
| | | | | | | | 2,364,843 | |
| Old Westbury Funds, Inc. |
| Small & Mid Cap Strategies Fund |
| Portfolio of Investments - (Continued) | October 31, 2017 |
| |
| Shares | | | | | Value | |
| PUERTO RICO — 0.0% | | | | |
| | 86,700 | | | Evertec, Inc. | | $ | 1,300,500 | |
| ROMANIA — 0.0% | | | | |
| | 13,747 | | | NEPI Rockcastle Plc | | | 192,183 | |
| RUSSIA — 0.1% | | | | |
| | 460,735 | | | Gazprom PJSC - ADR | | | 1,978,626 | |
| | 42,236 | | | MegaFon PJSC - GDR | | | 441,366 | |
| | 1,224,652 | | | Surgutneftegas OJSC | | | 610,965 | |
| | 910,000 | | | United Co. RUSAL Plc | | | 586,728 | |
| | 35,600 | | | Yandex NV - Class A(b) | | | 1,204,348 | |
| | | | | | | | 4,822,033 | |
| SINGAPORE — 0.8% | | | | |
| | 106,800 | | | Accordia Golf Trust - Units | | | 58,763 | |
| | 6,935,700 | | | Ascendas Real Estate Investment Trust | | | 13,941,617 | |
| | 1,739,400 | | | Ascott Residence Trust REIT | | | 1,524,894 | |
| | 233,100 | | | ASL Marine Holdings Ltd.(b) | | | 20,179 | |
| | 7,400 | | | Bonvests Holdings Ltd. | | | 7,763 | |
| | 25,598 | | | Boustead Projects Ltd. | | | 16,338 | |
| | 48,229 | | | Boustead Singapore Ltd. | | | 31,844 | |
| | 16,000 | | | Breadtalk Group Ltd. | | | 18,487 | |
| | 40,000 | | | Bukit Sembawang Estates Ltd. | | | 186,340 | |
| | 24,746 | | | BW LPG Ltd.(b) | | | 92,919 | |
| | 8,774,400 | | | CapitaLand Mall Trust REIT | | | 13,002,926 | |
| | 42,000 | | | China Aviation Oil Singapore Corp. Ltd. | | | 54,537 | |
| | 116,500 | | | Chip Eng Seng Corp. Ltd. | | | 82,048 | |
| | 115,600 | | | COSCO Shipping International Singapore Co. Ltd.(b) | | | 24,594 | |
| | 88,000 | | | CW Group Holdings Ltd. | | | 15,905 | |
| | 65,300 | | | CWT Ltd. | | | 111,620 | |
| | 41,300 | | | Delfi Ltd. | | | 44,842 | |
| | 282,746 | | | Ezion Holdings Ltd.(a)(b)(c) | | | 40,863 | |
| | 130,121 | | | Far East Orchard Ltd. | | | 147,962 | |
| | 73,900 | | | First Resources Ltd. | | | 106,803 | |
| | 164,000 | | | Fragrance Group Ltd. | | | 20,453 | |
| | 15,000 | | | Frasers Centrepoint Ltd. | | | 22,889 | |
| | 59,100 | | | GL Ltd. | | | 40,105 | |
| | 594,900 | | | Golden Agri-Resources Ltd. | | | 172,391 | |
| | 58,000 | | | GP Industries Ltd. | | | 30,211 | |
| | 118,666 | | | Guocoland Ltd. | | | 208,064 | |
| | 32,000 | | | Hiap Hoe Ltd. | | | 20,541 | |
| | 66,600 | | | Ho Bee Land Ltd. | | | 123,614 | |
| | 285,340 | | | Hong Fok Corp. Ltd. | | | 186,305 | |
| | 91,800 | | | Hong Leong Asia Ltd. | | | 82,499 | |
| | 9,000 | | | Hour Glass Ltd. (The) | | | 4,490 | |
| | 862,700 | | | Hutchison Port Holdings Trust - Units | | | 370,961 | |
| | 29,000 | | | IGG, Inc. | | | 38,883 | |
| | 129,600 | | | Indofood Agri Resources Ltd. | | | 42,785 | |
| | 47,400 | | | Japfa Ltd. | | | 20,516 | |
| | 92,950 | | | Jurong Technologies Industrial Corp. Ltd.(a)(b)(c) | | | 0 | |
| | 81,178 | | | Keppel Infrastructure Trust - Units | | | 33,052 | |
| Shares | | | | | Value | |
| SINGAPORE (continued) | | | | |
| | 1,471 | | | Kulicke & Soffa Industries, Inc.(b) | | $ | 33,318 | |
| | 166,600 | | | Lian Beng Group Ltd. | | | 98,999 | |
| | 42,000 | | | Low Keng Huat Singapore Ltd. | | | 21,414 | |
| | 75,000 | | | Lum Chang Holdings Ltd. | | | 22,834 | |
| | 39,000 | | | M1 Ltd. | | | 51,500 | |
| | 209,700 | | | Midas Holdings Ltd.(b) | | | 32,307 | |
| | 214,300 | | | Olam International Ltd. | | | 369,456 | |
| | 34,400 | | | Oxley Holdings Ltd. | | | 18,297 | |
| | 26,250 | | | Pan-United Corp. Ltd. | | | 11,169 | |
| | 113,400 | | | Penguin International Ltd.(b) | | | 27,038 | |
| | 100,770 | | | QAF Ltd. | | | 91,300 | |
| | 66,275 | | | Raffles Medical Group Ltd. | | | 54,941 | |
| | 90,300 | | | RHT Health Trust - Units | | | 55,647 | |
| | 81,700 | | | Rotary Engineering Ltd. | | | 26,972 | |
| | 217,500 | | | Roxy-Pacific Holdings Ltd. | | | 90,951 | |
| | 4,320,000 | | | SATS Ltd. | | | 14,895,459 | |
| | 259,600 | | | Sembcorp Industries Ltd. | | | 628,479 | |
| | 97,000 | | | Sheng Siong Group Ltd. | | | 67,247 | |
| | 14,500 | | | SIA Engineering Co. Ltd. | | | 34,678 | |
| | 131,100 | | | SIIC Environment Holdings Ltd. | | | 50,974 | |
| | 552,500 | | | Sinarmas Land Ltd. | | | 172,264 | |
| | 108,200 | | | Singapore Airlines Ltd. | | | 815,211 | |
| | 106,200 | | | Singapore Post Ltd. | | | 100,115 | |
| | 174,000 | | | Singapore Reinsurance Corp. Ltd. | | | 39,572 | |
| | 440,400 | | | Stamford Land Corp. Ltd. | | | 166,390 | |
| | 36,600 | | | Sunningdale Tech Ltd. | | | 62,025 | |
| | 66,500 | | | Tiong Woon Corp Holding Ltd(b) | | | 13,904 | |
| | 378,314 | | | Tuan Sing Holdings Ltd. | | | 115,179 | |
| | 53,188 | | | UMS Holdings Ltd. | | | 41,166 | |
| | 220,554 | | | United Engineers Ltd. | | | 427,161 | |
| | 405,492 | | | United Industrial Corp. Ltd. | | | 978,702 | |
| | 158,057 | | | UOB-Kay Hian Holdings Ltd. | | | 157,118 | |
| | 87,611 | | | UOL Group Ltd. | | | 581,031 | |
| | 33,000 | | | Venture Corp. Ltd. | | | 471,844 | |
| | 62,946 | | | Vibrant Group Ltd. | | | 18,010 | |
| | 179,912 | | | Wheelock Properties (Singapore) Ltd. | | | 263,975 | |
| | 30,300 | | | Wing Tai Holdings Ltd. | | | 53,349 | |
| | 871 | | | XP Power Ltd. | | | 40,419 | |
| | 96,800 | | | Yongnam Holdings Ltd.(b) | | | 24,145 | |
| | | | | | | | 52,173,563 | |
| SOUTH AFRICA — 0.3% | | | | |
| | 9,257 | | | Adcock Ingram Holdings Ltd. | | | 38,485 | |
| | 67,486 | | | Advtech Ltd. | | | 84,627 | |
| | 30,266 | | | Aeci Ltd. | | | 226,244 | |
| | 9,268 | | | African Oxygen Ltd. | | | 16,060 | |
| | 42,506 | | | African Rainbow Minerals Ltd. | | | 372,968 | |
| | 10,747 | | | Afrimat Ltd. | | | 21,466 | |
| | 276,028 | | | Alexander Forbes Group Holdings Ltd. | | | 142,321 | |
| | 12,771 | | | Allied Electronics Corp. Ltd. - A Shares(b) | | | 11,110 | |
| Old Westbury Funds, Inc. |
| Small & Mid Cap Strategies Fund |
| Portfolio of Investments - (Continued) | October 31, 2017 |
| |
| Shares | | | | | Value | |
| SOUTH AFRICA (continued) | | | | |
| | 38,527 | | | Alviva Holdings Ltd. | | $ | 53,490 | |
| | 51,747 | | | Anglo American Platinum Ltd.(b) | | | 1,440,187 | |
| | 90,825 | | | AngloGold Ashanti Ltd. | | | 837,218 | |
| | 3,371 | | | Assore Ltd. | | | 73,727 | |
| | 3,359 | | | Astral Foods Ltd. | | | 46,080 | |
| | 44,855 | | | Attacq Ltd.(b) | | | 59,167 | |
| | 63,673 | | | Aveng Ltd.(b) | | | 11,349 | |
| | 61,658 | | | AVI Ltd. | | | 430,205 | |
| | 134,474 | | | Barloworld Ltd. | | | 1,268,010 | |
| | 40,840 | | | Bidvest Group Ltd. (The) | | | 495,380 | |
| | 174,597 | | | Blue Label Telecoms Ltd. | | | 213,017 | |
| | 1,957 | | | Cashbuild Ltd. | | | 50,383 | |
| | 15,038 | | | Caxton and CTP Publishers and Printers Ltd. | | | 13,933 | |
| | 5,038 | | | City Lodge Hotels Ltd. | | | 44,893 | |
| | 45,549 | | | Clicks Group Ltd. | | | 510,394 | |
| | 40,941 | | | Coronation Fund Managers Ltd. | | | 206,605 | |
| | 10,913 | | | Curro Holdings Ltd.(b) | | | 31,028 | |
| | 73,980 | | | DataTec Ltd. | | | 313,998 | |
| | 3,467 | | | Distell Group Ltd. | | | 31,853 | |
| | 38,509 | | | Exxaro Resources Ltd. | | | 391,552 | |
| | 5,854 | | | Foschini Group Ltd. (The) | | | 56,102 | |
| | 351,825 | | | Gold Fields Ltd. | | | 1,404,438 | |
| | 46,544 | | | Grand Parade Investments Ltd. | | | 9,876 | |
| | 194,690 | | | Grindrod Ltd.(b) | | | 214,398 | |
| | 3,258 | | | Holdsport Ltd. | | | 13,605 | |
| | 1,317 | | | Howden Africa Holdings Ltd.(b) | | | 3,167 | |
| | 8,133 | | | Hudaco Industries Ltd. | | | 72,444 | |
| | 74,268 | | | Hulamin Ltd. | | | 37,820 | |
| | 218,135 | | | Impala Platinum Holdings Ltd.(b) | | | 605,093 | |
| | 47,176 | | | Imperial Holdings Ltd. | | | 676,105 | |
| | 170,143 | | | Investec Plc | | | 1,164,899 | |
| | 1,143 | | | Invicta Holdings Ltd. | | | 4,429 | |
| | 7,257 | | | JSE Ltd. | | | 68,814 | |
| | 282,891 | | | KAP Industrial Holdings Ltd. | | | 170,070 | |
| | 35,575 | | | Kumba Iron Ore Ltd. | | | 684,389 | |
| | 4,835 | | | Lewis Group Ltd. | | | 9,308 | |
| | 29,431 | | | Liberty Holdings Ltd. | | | 231,139 | |
| | 39,290 | | | Life Healthcare Group Holdings Ltd. | | | 72,807 | |
| | 41,335 | | | Mediclinic International Plc | | | 319,511 | |
| | 560,963 | | | Merafe Resources Ltd. | | | 70,623 | |
| | 12,050 | | | Metrofile Holdings Ltd. | | | 3,750 | |
| | 60,572 | | | Mpact Ltd. | | | 110,701 | |
| | 42,743 | | | Mr Price Group Ltd. | | | 529,800 | |
| | 171,949 | | | Murray & Roberts Holdings Ltd. | | | 194,585 | |
| | 145,546 | | | Nampak Ltd.(b) | | | 191,471 | |
| | 1,304 | | | Net 1 UEPS Technologies, Inc.(b) | | | 11,748 | |
| | 34,968 | | | Northam Platinum Ltd.(b) | | | 130,165 | |
| | 6,339 | | | Oceana Group Ltd. | | | 40,440 | |
| | 4,750 | | | Omnia Holdings Ltd. | | | 48,969 | |
| | 145,014 | | | Peregrine Holdings Ltd. | | | 290,772 | |
| Shares | | | | | Value | |
| SOUTH AFRICA (continued) | | | | |
| | 4,372 | | | Pioneer Foods Group Ltd. | | $ | 36,797 | |
| | 437,098 | | | PPC Ltd.(b) | | | 227,843 | |
| | 2,961 | | | PSG Group Ltd. | | | 54,972 | |
| | 31,202 | | | Raubex Group Ltd. | | | 44,799 | |
| | 234,464 | | | Redefine Properties Ltd. REIT | | | 175,946 | |
| | 24,150 | | | Resilient REIT Ltd. | | | 240,565 | |
| | 45,825 | | | Reunert Ltd. | | | 225,386 | |
| | 8,824 | | | Royal Bafokeng Platinum Ltd.(b) | | | 20,346 | |
| | 2,420 | | | Santam Ltd. | | | 43,098 | |
| | 437,458 | | | Sappi Ltd. | | | 2,930,052 | |
| | 165,345 | | | Sibanye Gold Ltd. | | | 214,126 | |
| | 29,288 | | | Spar Group Ltd. (The) | | | 344,610 | |
| | 13,883 | | | Spur Corp. Ltd. | | | 26,404 | |
| | 17,155 | | | Stadio Holdings Ltd.(b) | | | 7,426 | |
| | 175,040 | | | Super Group Ltd.(b) | | | 493,968 | |
| | 33,617 | | | Telkom SA SOC Ltd. | | | 125,920 | |
| | 25,406 | | | Tongaat Hulett Ltd. | | | 207,435 | |
| | 31,655 | | | Transaction Capital Ltd. | | | 33,561 | |
| | 39,562 | | | Trencor Ltd. | | | 123,118 | |
| | 6,418 | | | Truworths International Ltd. | | | 34,208 | |
| | 11,813 | | | Wilson Bayly Holmes-Ovcon Ltd. | | | 126,579 | |
| | | | | | | | 20,614,347 | |
| SOUTH KOREA — 0.9% | | | | |
| | 4,875 | | | ABco Electronics Co. Ltd. | | | 32,156 | |
| | 15,397 | | | Ace Technologies Corp.(b) | | | 51,330 | |
| | 1,839 | | | Aekyung Petrochemical Co. Ltd. | | | 25,443 | |
| | 7,680 | | | AJ Rent A Car Co. Ltd.(b) | | | 88,772 | |
| | 2,287 | | | AK Holdings, Inc. | | | 137,381 | |
| | 12,123 | | | ALUKO Co. Ltd. | | | 41,443 | |
| | 1,630 | | | Amotech Co. Ltd.(b) | | | 55,141 | |
| | 832 | | | Asia Cement Co. Ltd. | | | 64,089 | |
| | 564 | | | ASIA Holdings Co. Ltd. | | | 57,893 | |
| | 612 | | | Asia Paper Manufacturing Co. Ltd. | | | 10,652 | |
| | 35,171 | | | Asiana Airlines, Inc.(b) | | | 145,192 | |
| | 6,791 | | | Austem Co. Ltd. | | | 31,277 | |
| | 2,350 | | | Autech Corp. | | | 19,633 | |
| | 2,934 | | | Baiksan Co. Ltd. | | | 20,165 | |
| | 735 | | | Binggrae Co. Ltd. | | | 39,822 | |
| | 93,019 | | | BNK Financial Group, Inc. | | | 825,286 | |
| | 1,467 | | | Boditech Med, Inc. | | | 22,456 | |
| | 1,549 | | | Bookook Securities Co. Ltd. | | | 38,022 | |
| | 1,205 | | | Boryung Pharmaceutical Co. Ltd. | | | 42,592 | |
| | 13,473 | | | Byucksan Corp. | | | 40,948 | |
| | 5,849 | | | Capro Corp.(b) | | | 43,071 | |
| | 430 | | | Caregen Co. Ltd. | | | 28,133 | |
| | 1,433 | | | Cell Biotech Co. Ltd. | | | 47,453 | |
| | 5,025 | | | Chabiotech Co. Ltd.(b) | | | 58,756 | |
| | 1,861 | | | Changhae Ethanol Co. Ltd. | | | 29,401 | |
| | 3,728 | | | Cheil Worldwide, Inc. | | | 69,213 | |
| | 1,609 | | | Chemtronics Co. Ltd.(b) | | | 9,364 | |
| Old Westbury Funds, Inc. |
| Small & Mid Cap Strategies Fund |
| Portfolio of Investments - (Continued) | October 31, 2017 |
| |
| Shares | | | | | Value | |
| SOUTH KOREA (continued) | | | | |
| | 2,370 | | | Chokwang Paint Ltd. | | $ | 22,318 | |
| | 628 | | | Chong Kun Dang Pharmaceutical Corp. | | | 63,061 | |
| | 1,209 | | | Chongkundang Holdings Corp. | | | 74,244 | |
| | 73 | | | Chosun Refractories Co. Ltd. | | | 5,662 | |
| | 1,068 | | | CJ CGV Co. Ltd. | | | 66,348 | |
| | 2,424 | | | CJ CheilJedang Corp. | | | 791,881 | |
| | 1,771 | | | CJ Corp. | | | 294,811 | |
| | 1,413 | | | CJ E&M Corp. | | | 106,573 | |
| | 1,668 | | | CJ Freshway Corp. | | | 58,436 | |
| | 333 | | | CJ Korea Express Corp.(b) | | | 46,665 | |
| | 1,557 | | | CJ O Shopping Co. Ltd. | | | 274,891 | |
| | 2,061 | | | CKD Bio Corp. | | | 40,103 | |
| | 1,487 | | | Com2uSCorp. | | | 177,057 | |
| | 524 | | | Cosmax, Inc. | | | 65,012 | |
| | 637 | | | Crown Confectionery Co. Ltd.(b) | | | 9,666 | |
| | 495 | | | Crown Haitai Holdings Co. Ltd. | | | 7,887 | |
| | 447 | | | Cuckoo Electronics Co. Ltd. | | | 60,047 | |
| | 2,180 | | | Dae Dong Industrial Co. Ltd. | | | 14,769 | |
| | 8,286 | | | Dae Hyun Co. Ltd. | | | 21,041 | |
| | 4,781 | | | Dae Won Chemical Co. Ltd.(b) | | | 10,028 | |
| | 18,236 | | | Dae Won Kang Up Co. Ltd. | | | 66,410 | |
| | 45,928 | | | Dae Young Packaging Co. Ltd.(b) | | | 35,870 | |
| | 12,386 | | | Daea TI Co. Ltd.(b) | | | 20,563 | |
| | 509 | | | Daechang Forging Co. Ltd. | | | 27,941 | |
| | 7,593 | | | Daehan Steel Co. Ltd. | | | 74,890 | |
| | 4,839 | | | Dae-Il Corp. | | | 40,816 | |
| | 3,101 | | | Daelim B&Co Co. Ltd. | | | 18,656 | |
| | 4,913 | | | Daelim Industrial Co. Ltd. | | | 365,729 | |
| | 3,143 | | | Daeryuk Can Co. Ltd. | | | 18,628 | |
| | 6,325 | | | Daesang Corp. | | | 134,364 | |
| | 8,133 | | | Daesang Holdings Co. Ltd. | | | 71,577 | |
| | 2,180 | | | Daesung Holdings Co. Ltd. | | | 16,462 | |
| | 1,090 | | | Daewon Pharmaceutical Co. Ltd. | | | 17,366 | |
| | 10,306 | | | Daewon San Up Co. Ltd. | | | 68,716 | |
| | 92,550 | | | Daewoo Engineering & Construction Co. Ltd.(b) | | | 607,170 | |
| | 912 | | | Daewoo Shipbuilding & Marine Engineering Co. Ltd.(b) | | | 14,937 | |
| | 7,695 | | | Daewoong Co. Ltd. | | | 106,803 | |
| | 513 | | | Daewoong Pharmaceutical Co. Ltd. | | | 51,971 | |
| | 902 | | | Daihan Pharmaceutical Co. Ltd. | | | 27,575 | |
| | 9,921 | | | Daishin Securities Co. Ltd. | | | 119,546 | |
| | 8,198 | | | Dayou Automotive Seat Technology Co. Ltd. | | | 8,378 | |
| | 1,831 | | | Deutsch Motors, Inc.(b) | | | 10,280 | |
| | 50,455 | | | DGB Financial Group, Inc. | | | 470,616 | |
| | 5,919 | | | Digital Power Communications Co. Ltd. | | | 21,503 | |
| | 887 | | | Dio Corp(b) | | | 26,839 | |
| | 1,795 | | | DNF Co. Ltd.(b) | | | 26,276 | |
| | 4,862 | | | Dong Ah Tire & Rubber Co. Ltd.(c) | | | 105,889 | |
| Shares | | | | | Value | |
| SOUTH KOREA (continued) | | | | |
| | 358 | | | Dong-A Socio Holdings Co. Ltd. | | $ | 38,984 | |
| | 585 | | | Dong-A ST Co. Ltd. | | | 46,681 | |
| | 4,103 | | | Dong-Ah Geological Engineering Co. Ltd. | | | 47,792 | |
| | 16,507 | | | DONGBU Co. Ltd.(b) | | | 11,566 | |
| | 2,480 | | | Dongbu HiTek Co. Ltd.(b) | | | 31,654 | |
| | 20,908 | | | Dongbu Insurance Co. Ltd. | | | 1,315,673 | |
| | 810 | | | Dong-IL Corp. | | | 40,198 | |
| | 3,239 | | | Dongjin Semichem Co. Ltd. | | | 59,556 | |
| | 665 | | | DongKook Pharmaceutical Co. Ltd. | | | 36,801 | |
| | 15,324 | | | Dongkuk Industries Co. Ltd. | | | 57,447 | |
| | 33,778 | | | Dongkuk Steel Mill Co. Ltd. | | | 327,122 | |
| | 2,706 | | | Dongsuh Cos., Inc. | | | 66,421 | |
| | 10,227 | | | DONGSUNG Corp. | | | 52,214 | |
| | 1,553 | | | Dongwha Enterprise Co. Ltd. | | | 49,278 | |
| | 17,479 | | | Dongwon Development Co. Ltd. | | | 88,460 | |
| | 287 | | | Dongwon F&B Co. Ltd. | | | 52,131 | |
| | 392 | | | Dongwon Industries Co. Ltd. | | | 99,894 | |
| | 221 | | | Dongyang E&P, Inc. | | | 2,387 | |
| | 2,644 | | | Doosan Corp. | | | 316,237 | |
| | 11,359 | | | Doosan Engine Co. Ltd.(b) | | | 42,786 | |
| | 23,714 | | | Doosan Heavy Industries & Construction Co. Ltd. | | | 370,416 | |
| | 41,564 | | | Doosan Infracore Co. Ltd.(b) | | | 343,538 | |
| | 1,300 | | | Doubleugames Co. Ltd. | | | 59,526 | |
| | 2,601 | | | DRB Holding Co. Ltd. | | | 19,687 | |
| | 2,814 | | | Duozone Bizon Co. Ltd. | | | 80,375 | |
| | 9,936 | | | DY Corp. | | | 67,668 | |
| | 2,154 | | | DY POWER Corp. | | | 45,758 | |
| | 382 | | | e Tec E&C Ltd. | | | 51,247 | |
| | 153 | | | E1 Corp. | | | 7,852 | |
| | 14,440 | | | Easy Bio, Inc. | | | 80,040 | |
| | 3,279 | | | Elentec Co. Ltd. | | | 12,527 | |
| | 6,808 | | | EM-Tech Co. Ltd. | | | 95,708 | |
| | 2,881 | | | ENF Technology Co. Ltd. | | | 70,074 | |
| | 15,659 | | | Eugene Corp. | | | 75,894 | |
| | 36,140 | | | Eugene Investment & Securities Co. Ltd.(b) | | | 95,806 | |
| | 3,297 | | | EVERDIGM Corp. | | | 30,458 | |
| | 1,101 | | | Exicon Co. Ltd. | | | 9,926 | |
| | 936 | | | F&F Co. Ltd. | | | 33,000 | |
| | 3,794 | | | Farmsco | | | 40,807 | |
| | 35,290 | | | Farmstory Co. Ltd.(b) | | | 40,476 | |
| | 519 | | | Fila Korea Ltd. | | | 31,362 | |
| | 7,435 | | | Foosung Co. Ltd.(b) | | | 59,262 | |
| | 452 | | | Gamevil, Inc.(b) | | | 25,538 | |
| | 520 | | | Gaon Cable Co. Ltd. | | | 11,000 | |
| | 404 | | | Geumhwa PSC Co. Ltd. | | | 14,424 | |
| | 696 | | | Golfzon Co. Ltd. | | | 28,794 | |
| | 4,062 | | | GOLFZONNEWDIN Co. Ltd. | | | 19,143 | |
| | 3,647 | | | Grand Korea Leisure Co. Ltd. | | | 91,147 | |
| | 5,299 | | | Green Cross Corp. | | | 997,982 | |
| | 3,228 | | | Green Cross Holdings Corp. | | | 109,055 | |
| Old Westbury Funds, Inc. |
| Small & Mid Cap Strategies Fund |
| Portfolio of Investments - (Continued) | October 31, 2017 |
| |
| Shares | | | | | Value | |
| SOUTH KOREA (continued) | | | | |
| | 38,056 | | | GS Engineering & Construction Corp.(b) | | $ | 883,167 | |
| | 17,664 | | | GS Global Corp.(b) | | | 49,191 | |
| | 25,901 | | | GS Holdings Corp. | | | 1,530,456 | |
| | 2,839 | | | GS Retail Co. Ltd. | | | 84,637 | |
| | 1,861 | | | G-SMATT GLOBAL Co. Ltd.(b) | | | 21,262 | |
| | 3,231 | | | Halla Holdings Corp. | | | 195,241 | |
| | 5,493 | | | Han Kuk Carbon Co. Ltd. | | | 28,731 | |
| | 27,554 | | | Hana Financial Group, Inc. | | | 1,179,287 | |
| | 3,827 | | | Hana Micron, Inc.(b) | | | 17,319 | |
| | 1,039 | | | Hana Tour Service, Inc. | | | 92,553 | |
| | 3,787 | | | Hancom, Inc. | | | 53,576 | |
| | 174 | | | Handok, Inc. | | | 3,805 | |
| | 7,271 | | | Handsome Co. Ltd. | | | 194,698 | |
| | 1,590 | | | Hanil Cement Co. Ltd. | | | 190,173 | |
| | 11,706 | | | Hanjin Heavy Industries & Construction Co. Ltd.(b) | | | 39,913 | |
| | 5,472 | | | Hanjin Kal Corp.(b) | | | 105,498 | |
| | 975 | | | Hanjin Transportation Co. Ltd. | | | 24,977 | |
| | 1,696 | | | Hankook Cosmetics Co. Ltd.(b) | | | 26,946 | |
| | 680 | | | Hankuk Paper Manufacturing Co. Ltd. | | | 16,054 | |
| | 841 | | | Hanmi Pharm Co. Ltd.(b) | | | 347,930 | |
| | 857 | | | Hanmi Science Co. Ltd.(b) | | | 70,221 | |
| | 3,807 | | | Hanmi Semiconductor Co. Ltd. | | | 34,150 | |
| | 2,383 | | | Hanmiglobal Co. Ltd. | | | 20,398 | |
| | 5,194 | | | Hanon Systems | | | 60,269 | |
| | 1,441 | | | Hans Biomed Corp.(b) | | | 21,351 | |
| | 7,442 | | | Hansae Yes24 Holdings Co. Ltd. | | | 67,090 | |
| | 143 | | | Hanshin Construction Co. Ltd. | | | 2,049 | |
| | 5,869 | | | Hanshin Machinery Co. | | | 20,011 | |
| | 966 | | | Hansol Chemical Co. Ltd. | | | 63,633 | |
| | 29,704 | | | Hansol HomeDeco Co. Ltd.(b) | | | 38,974 | |
| | 8,608 | | | Hansol Paper Co. Ltd. | | | 126,391 | |
| | 4,293 | | | Hansol Technics Co. Ltd.(b) | | | 67,632 | |
| | 662 | | | Hanssem Co. Ltd. | | | 100,746 | |
| | 39,670 | | | Hanwha Chemical Corp. | | | 1,078,191 | |
| | 25,115 | | | Hanwha Corp. | | | 1,000,924 | |
| | 195 | | | Hanwha Galleria Timeworld Co. Ltd.(b) | | | 6,266 | |
| | 28,083 | | | Hanwha General Insurance Co. Ltd.(a) | | | 204,541 | |
| | 28,818 | | | Hanwha Investment & Securities Co. Ltd.(b) | | | 74,338 | |
| | 5,184 | | | Hanwha Life Insurance Co. Ltd. | | | 36,647 | |
| | 2,501 | | | Hanwha Techwin Co. Ltd.(b) | | | 85,722 | |
| | 1,616 | | | Hanyang Securities Co. Ltd. | | | 11,683 | |
| | 11,947 | | | HB Technology Co. Ltd. | | | 45,640 | |
| | 2,857 | | | Heungkuk Fire & Marine Insurance Co., Ltd.(b) | | | 15,760 | |
| | 3,210 | | | Hite Jinro Co. Ltd. | | | 76,214 | |
| | 3,034 | | | HMC Investment Securities Co. Ltd. | | | 31,549 | |
| | 2,579 | | | Hotel Shilla Co. Ltd. | | | 180,243 | |
| | 5,644 | | | HS Industries Co. Ltd. | | | 53,904 | |
| | 2,585 | | | Huchems Fine Chemical Corp. | | | 54,337 | |
| Shares | | | | | Value | |
| SOUTH KOREA (continued) | | | | |
| | 861 | | | Humedix Co. Ltd. | | $ | 26,783 | |
| | 647 | | | Huons Co. Ltd.(b) | | | 38,750 | |
| | 2,671 | | | Huons Global Co. Ltd. | | | 101,085 | |
| | 3,840 | | | Huvis Corp. | | | 26,735 | |
| | 1,889 | | | Huvitz Co. Ltd. | | | 23,015 | |
| | 5,630 | | | Hwangkum Steel & Technology Co. Ltd. | | | 47,840 | |
| | 5,485 | | | Hwasung Industrial Co. Ltd. | | | 74,171 | |
| | 3,670 | | | Hy-Lok Corp. | | | 80,911 | |
| | 4,450 | | | Hyosung Corp. | | | 534,230 | |
| | 2,903 | | | Hyundai BNG Steel Co. Ltd. | | | 32,260 | |
| | 2,091 | | | Hyundai Construction Equipment Co. Ltd.(b) | | | 698,027 | |
| | 9,009 | | | Hyundai Department Store Co. Ltd. | | | 735,773 | |
| | 17,020 | | | Hyundai Development Co-Engineering & Construction | | | 609,186 | |
| | 1,913 | | | Hyundai Electric & Energy System Co. Ltd.(b) | | | 402,971 | |
| | 2,902 | | | Hyundai Elevator Co. Ltd. | | | 141,946 | |
| | 35,653 | | | Hyundai Engineering & Construction Co. Ltd. | | | 1,204,504 | |
| | 1,457 | | | Hyundai Glovis Co. Ltd. | | | 196,373 | |
| | 3,301 | | | Hyundai Greenfood Co. Ltd. | | | 47,142 | |
| | 3,594 | | | Hyundai Livart Furniture Co. Ltd. | | | 76,669 | |
| | 34,970 | | | Hyundai Marine & Fire Insurance Co. Ltd. | | | 1,415,530 | |
| | 1,752 | | | Hyundai Rotem Co. Ltd.(b) | | | 30,650 | |
| | 1,724 | | | ICD Co. Ltd. | | | 23,159 | |
| | 28,243 | | | IHQ, Inc.(b) | | | 47,897 | |
| | 687 | | | Il Dong Pharmaceutical Co. Ltd. | | | 13,920 | |
| | 2,212 | | | Iljin Electric Co. Ltd. | | | 9,082 | |
| | 7,945 | | | Iljin Holdings Co. Ltd. | | | 36,805 | |
| | 3,445 | | | Iljin Materials Co. Ltd. | | | 99,167 | |
| | 403 | | | Ilshin Spinning Co. Ltd. | | | 43,165 | |
| | 1,171 | | | InBody Co. Ltd. | | | 30,416 | |
| | 3,473 | | | Initech Co. Ltd.(b) | | | 19,003 | |
| | 1,372 | | | Innocean Worldwide Inc. | | | 94,051 | |
| | 2,072 | | | Innox Advanced Materials Co., Ltd.(b) | | | 135,193 | |
| | 4,028 | | | Insun ENT Co. Ltd.(b) | | | 24,376 | |
| | 1,393 | | | Interojo Co. Ltd. | | | 46,626 | |
| | 10,896 | | | Interpark Holdings Corp. | | | 40,701 | |
| | 2,599 | | | IS Dongseo Co. Ltd. | | | 80,149 | |
| | 1,378 | | | ISC Co. Ltd. | | | 26,075 | |
| | 5,011 | | | ISU Chemical Co. Ltd. | | | 76,707 | |
| | 5,556 | | | IsuPetasys Co. Ltd. | | | 21,944 | |
| | 1,973 | | | J.ESTINA Co. Ltd. | | | 11,746 | |
| | 1,265 | | | Jastech Ltd. | | | 21,001 | |
| | 52,431 | | | JB Financial Group Co. Ltd. | | | 275,645 | |
| | 6,109 | | | Jcontentree Corp.(b) | | | 22,629 | |
| | 861 | | | Jeju Air Co. Ltd. | | | 27,090 | |
| | 5,350 | | | Jusung Engineering Co. Ltd.(b) | | | 65,422 | |
| | 522 | | | JVM Co. Ltd. | | | 26,651 | |
| Old Westbury Funds, Inc. |
| Small & Mid Cap Strategies Fund |
| Portfolio of Investments - (Continued) | October 31, 2017 |
| |
| Shares | | | | | Value | |
| SOUTH KOREA (continued) | | | | |
| | 2,470 | | | JW Holdings Corp. | | $ | 17,748 | |
| | 1,234 | | | JW Pharmaceutical Corp. | | | 45,875 | |
| | 4,489 | | | JYP Entertainment Corp.(b) | | | 46,479 | |
| | 2,895 | | | Kaon Media Co. Ltd. | | | 24,987 | |
| | 20,670 | | | KB Financial Group Inc. | | | 1,077,456 | |
| | 3,881 | | | KC Tech Co. Ltd.(c) | | | 83,138 | |
| | 48,073 | | | KEC Corp.(b) | | | 56,854 | |
| | 1,953 | | | KEPCO Engineering & Construction Co., Inc. | | | 31,203 | |
| | 2,361 | | | KG Chemical Corp. | | | 34,350 | |
| | 7,458 | | | KG Eco Technology Service Co. Ltd. | | | 26,561 | |
| | 4,404 | | | Kginicis Co. Ltd. | | | 59,357 | |
| | 4,335 | | | KGMobilians Co. Ltd. | | | 26,737 | |
| | 848 | | | KISCO Corp. | | | 28,649 | |
| | 533 | | | KISCO Holdings Co. Ltd. | | | 38,012 | |
| | 680 | | | Kishin Corp. | | | 2,989 | |
| | 3,044 | | | KISWIRE Ltd. | | | 95,639 | |
| | 2,226 | | | KIWOOM Securities Co. Ltd. | | | 142,459 | |
| | 4,490 | | | KMH Co. Ltd.(b) | | | 37,472 | |
| | 18,872 | | | Kodaco Co. Ltd. | | | 51,629 | |
| | 1,319 | | | Koh Young Technology, Inc. | | | 90,417 | |
| | 1,469 | | | Kolmar BNH Co. Ltd. | | | 44,712 | |
| | 8,408 | | | Kolon Industries, Inc. | | | 568,113 | |
| | 1,741 | | | Kolon Plastic, Inc. | | | 11,624 | |
| | 5,221 | | | Korea Autoglass Corp. | | | 88,310 | |
| | 3,419 | | | Korea Circuit Co. Ltd. | | | 50,811 | |
| | 2,568 | | | Korea Electric Terminal Co. Ltd. | | | 160,450 | |
| | 4,846 | | | Korea Information & Communications Co. Ltd.(b) | | | 42,692 | |
| | 4,932 | | | Korea Investment Holdings Co. Ltd. | | | 278,659 | |
| | 1,117 | | | Korea Kolmar Co. Ltd. | | | 82,552 | |
| | 1,588 | | | Korea Kolmar Holdings Co. Ltd. | | | 63,925 | |
| | 5,252 | | | Korea Line Corp.(b) | | | 153,526 | |
| | 618 | | | Korea PetroChemical Ind Co. Ltd. | | | 137,903 | |
| | 1,632 | | | Korea United Pharm, Inc. | | | 35,179 | |
| | 17,345 | | | Korean Air Lines Co. Ltd.(b) | | | 489,998 | |
| | 42,800 | | | Korean Reinsurance Co. | | | 427,866 | |
| | 2,714 | | | Kortek Corp. | | | 35,126 | |
| | 1,183 | | | KPX Chemical Co. Ltd. | | | 79,511 | |
| | 2,793 | | | KSS LINE Ltd. | | | 24,257 | |
| | 5,046 | | | KT Skylife Co. Ltd. | | | 62,605 | |
| | 10,044 | | | Kt Submarine Co. Ltd. | | | 41,015 | |
| | 12,081 | | | KTB Investment & Securities Co. Ltd.(b) | | | 37,310 | |
| | 3,749 | | | KTCS Corp. | | | 8,048 | |
| | 4,664 | | | Ktis Corp. | | | 12,739 | |
| | 700 | | | Kukdo Chemical Co. Ltd. | | | 36,801 | |
| | 1,376 | | | Kumho Industrial Co. Ltd. | | | 11,864 | |
| | 3,137 | | | Kumho Petrochemical Co. Ltd. | | | 194,321 | |
| | 8,836 | | | Kwang Dong Pharmaceutical Co. Ltd. | | | 63,883 | |
| | 10,229 | | | Kwangju Bank | | | 107,736 | |
| Shares | | | | | Value | |
| SOUTH KOREA (continued) | | | | |
| | 1,092 | | | Kyeryong Construction Industrial Co. Ltd.(b) | | $ | 17,447 | |
| | 4,466 | | | Kyobo Securities Co. Ltd. | | | 36,275 | |
| | 1,118 | | | Kyongbo Pharmaceutical Co. Ltd. | | | 12,174 | |
| | 682 | | | Kyung Dong Navien Co. Ltd. | | | 24,623 | |
| | 2,747 | | | Kyungbang Ltd. | | | 35,675 | |
| | 1,746 | | | Kyungdong Pharm Co. Ltd. | | | 30,701 | |
| | 8,473 | | | Kyung-In Synthetic Corp. | | | 35,961 | |
| | 12,520 | | | LB Semicon, Inc.(b) | | | 28,608 | |
| | 7,239 | | | Leadcorp Inc (The) | | | 43,162 | |
| | 5,650 | | | Lee Ku Industrial Co. Ltd. | | | 11,624 | |
| | 1,206 | | | LEENO Industrial, Inc. | | | 55,114 | |
| | 9,257 | | | LF Corp. | | | 213,175 | |
| | 13,197 | | | LG Electronics, Inc. | | | 1,071,921 | |
| | 1,813 | | | LG Hausys Ltd. | | | 147,098 | |
| | 1,565 | | | LG Innotek Co. Ltd. | | | 240,264 | |
| | 10,592 | | | LG International Corp. | | | 274,644 | |
| | 1,098 | | | LIG Nex1 Co. Ltd. | | | 70,466 | |
| | 1,596 | | | LMS Co. Ltd./South Korea | | | 14,459 | |
| | 1,768 | | | Lock & Lock Co. Ltd. | | | 34,165 | |
| | 1,167 | | | Loen Entertainment, Inc. | | | 110,935 | |
| | 2,654 | | | LOTTE Fine Chemical Co. Ltd. | | | 95,348 | |
| | 3,512 | | | LOTTE Himart Co. Ltd. | | | 232,284 | |
| | 41,858 | | | Lotte Non-Life Insurance Co. Ltd. | | | 123,480 | |
| | 7,553 | | | LS Corp. | | | 532,590 | |
| | 4,601 | | | LS Industrial Systems Co. Ltd. | | | 245,994 | |
| | 7,860 | | | Lumens Co. Ltd.(b) | | | 25,362 | |
| | 14,408 | | | Macquarie Korea Infrastructure Fund | | | 109,569 | |
| | 867 | | | Macrogen, Inc.(b) | | | 21,049 | |
| | 564 | | | Maeil Dairies Co., Ltd.(b) | | | 35,239 | |
| | 762 | | | Mando Corp. | | | 222,067 | |
| | 1,128 | | | Mds Technology Co. Ltd. | | | 17,166 | |
| | 639 | | | Medy-Tox, Inc. | | | 241,546 | |
| | 16,916 | | | Meritz Financial Group, Inc. | | | 246,111 | |
| | 11,185 | | | Meritz Fire & Marine Insurance Co. Ltd. | | | 256,576 | |
| | 68,787 | | | Meritz Securities Co. Ltd. | | | 273,527 | |
| | 3,448 | | | META BIOMED Co. Ltd. | | | 10,587 | |
| | 7,104 | | | MiCo Ltd.(b) | | | 22,574 | |
| | 1,302 | | | Minwise Co. Ltd. | | | 28,124 | |
| | 35,221 | | | Mirae Asset Life Insurance Co. Ltd. | | | 184,224 | |
| | 7,937 | | | Mobase Co. Ltd. | | | 49,945 | |
| | 2,127 | | | Modetour Network, Inc. | | | 55,816 | |
| | 9,910 | | | Moorim P&P Co. Ltd. | | | 37,151 | |
| | 2,624 | | | Muhak Co. Ltd. | | | 42,510 | |
| | 2,496 | | | Namhae Chemical Corp. | | | 20,229 | |
| | 1,026 | | | Neopharm Co. Ltd. | | | 32,098 | |
| | 2,543 | | | NEPES Corp.(b) | | | 20,428 | |
| | 12,127 | | | Nexen Corp. | | | 88,218 | |
| | 12,832 | | | Nexen Tire Corp. | | | 147,178 | |
| | 35,520 | | | NH Investment & Securities Co. Ltd. | | | 445,447 | |
| Old Westbury Funds, Inc. |
| Small & Mid Cap Strategies Fund |
| Portfolio of Investments - (Continued) | October 31, 2017 |
| |
| Shares | | | | | Value | |
| SOUTH KOREA (continued) | | | | |
| | 3,304 | | | NHN KCP Corp.(b) | | $ | 51,904 | |
| | 3,584 | | | NICE Holdings Co. Ltd. | | | 50,864 | |
| | 5,313 | | | NICE Information Service Co. Ltd. | | | 40,546 | |
| | 3,498 | | | NICE Total Cash Management Co. Ltd. | | | 32,159 | |
| | 4,876 | | | NK Co. Ltd.(b) | | | 5,658 | |
| | 754 | | | Nong Shim Holdings Co. Ltd. | | | 77,059 | |
| | 1,577 | | | Nong Woo Bio Co. Ltd.(b) | | | 22,451 | |
| | 728 | | | NongShim Co. Ltd. | | | 225,804 | |
| | 454 | | | Noroo Holdings Co. Ltd. | | | 7,294 | |
| | 3,414 | | | Noroo Paint & Coatings Co. Ltd. | | | 27,608 | |
| | 2,740 | | | NPC | | | 14,747 | |
| | 6,272 | | | NS Shopping Co. Ltd. | | | 84,254 | |
| | 16,910 | | | OCI Co. Ltd. | | | 1,705,565 | |
| | 3,811 | | | OPTRON-TEC, Inc.(b) | | | 24,424 | |
| | 5,224 | | | Orion Corp./Republic Of Korea(b) | | | 494,260 | |
| | 2,075 | | | Osstem Implant Co. Ltd.(b) | | | 133,166 | |
| | 199 | | | Ottogi Corp. | | | 134,816 | |
| | 4,424 | | | Paik Kwang Industrial Co. Ltd.(b) | | | 10,741 | |
| | 35,393 | | | Pan Ocean Co. Ltd.(b) | | | 166,169 | |
| | 5,362 | | | Paradise Co. Ltd. | | | 96,199 | |
| | 4,829 | | | Partron Co. Ltd. | | | 37,672 | |
| | 15,667 | | | Paru Co. Ltd.(b) | | | 59,013 | |
| | 765 | | | Pharma Research Products Co. Ltd. | | | 30,522 | |
| | 8,309 | | | Poongsan Corp. | | | 363,776 | |
| | 898 | | | POSCO Coated & Color Steel Co. Ltd. | | | 22,443 | |
| | 8,282 | | | Posco Daewoo Corp. | | | 143,411 | |
| | 4,494 | | | Posco ICT Co. Ltd. | | | 28,199 | |
| | 15,195 | | | Power Logics Co. Ltd.(b) | | | 67,271 | |
| | 1,912 | | | Protec Co. Ltd. | | | 30,463 | |
| | 4,647 | | | PSK, Inc. | | | 93,118 | |
| | 180 | | | Pulmuone Co. Ltd. | | | 19,039 | |
| | 4,584 | | | Pyeong Hwa Automotive Co. Ltd. | | | 46,849 | |
| | 5,481 | | | S&S Tech Corp.(b) | | | 20,914 | |
| | 1,497 | | | S&T Motiv Co. Ltd. | | | 60,930 | |
| | 1,685 | | | S-1 Corp. | | | 137,766 | |
| | 854 | | | Sajo Industries Co. Ltd. | | | 55,721 | |
| | 1,443 | | | Sam Chun Dang Pharm Co. Ltd. | | | 16,808 | |
| | 422 | | | Sam Yung Trading Co. Ltd. | | | 6,724 | |
| | 163 | | | Samchully Co. Ltd. | | | 14,913 | |
| | 5,492 | | | Samick Musical Instruments Co. Ltd. | | | 9,583 | |
| | 1,305 | | | Samick THK Co. Ltd. | | | 20,967 | |
| | 6,581 | | | Samji Electronics Co. Ltd.(b) | | | 45,230 | |
| | 2,001 | | | Samjin Pharmaceutical Co. Ltd. | | | 59,118 | |
| | 577 | | | Samkwang Glass Co. Ltd. | | | 25,957 | |
| | 3,500 | | | Sammok S-Form Co. Ltd. | | | 40,769 | |
| | 6,651 | | | Samsung Card Co. Ltd. | | | 217,574 | |
| Shares | | | | | Value | |
| SOUTH KOREA (continued) | | | | |
| | 11,301 | | | Samsung Electro-Mechanics Co. Ltd. | | $ | 1,049,051 | |
| | 79,682 | | | Samsung Engineering Co. Ltd.(b) | | | 867,693 | |
| | 47,468 | | | Samsung Heavy Industries Co. Ltd.(b) | | | 499,953 | |
| | 6,903 | | | Samsung Pharmaceutical Co. Ltd.(b) | | | 21,565 | |
| | 4,416 | | | Samsung SDI Co. Ltd. | | | 811,975 | |
| | 6,252 | | | Samsung SDS Co. Ltd. | | | 1,155,143 | |
| | 10,934 | | | Samsung Securities Co. Ltd. | | | 347,436 | |
| | 11,879 | | | SAMT Co. Ltd. | | | 21,842 | |
| | 2,242 | | | Samwha Capacitor Co. Ltd. | | | 45,626 | |
| | 617 | | | Samyang Corp. | | | 53,420 | |
| | 426 | | | Samyang Foods Co. Ltd. | | | 23,080 | |
| | 2,726 | | | Sang-A Frontec Co. Ltd. | | | 33,699 | |
| | 10,570 | | | Savezone I&C Corp. | | | 48,588 | |
| | 5,185 | | | SBS Media Holdings Co. Ltd. | | | 14,046 | |
| | 6,080 | | | Seah Besteel Corp. | | | 172,303 | |
| | 485 | | | SeAH Holdings Corp. | | | 68,182 | |
| | 388 | | | SeAH Steel Corp. | | | 31,792 | |
| | 3,601 | | | Sebang Co. Ltd. | | | 43,713 | |
| | 3,398 | | | Sebang Global Battery Co. Ltd. | | | 102,666 | |
| | 1,617 | | | Sebo Manufacturing Engineer Corp. | | | 15,588 | |
| | 2,801 | | | Sekonix Co. Ltd. | | | 33,502 | |
| | 2,726 | | | Seobu T&D | | | 36,133 | |
| | 8,526 | | | Seoul Semiconductor Co. Ltd. | | | 208,898 | |
| | 3,508 | | | Seowonintech Co. Ltd. | | | 32,877 | |
| | 5,267 | | | Seoyon E-Hwa Co. Ltd. | | | 56,415 | |
| | 3,334 | | | SFA Engineering Corp. | | | 121,266 | |
| | 21,427 | | | SFA Semicon Co. Ltd.(b) | | | 48,004 | |
| | 8,409 | | | SH Energy & Chemical Co. Ltd. | | | 11,221 | |
| | 2,153 | | | Shinsegae Co. Ltd. | | | 440,074 | |
| | 802 | | | Shinsegae Information & Communication Co. Ltd. | | | 55,120 | |
| | 4,524 | | | Showbox Corp. | | | 22,290 | |
| | 36,517 | | | Signetics Corp.(b) | | | 46,284 | |
| | 3,938 | | | Silicon Works Co. Ltd. | | | 157,822 | |
| | 642 | | | SK Bioland Co. Ltd. | | | 11,203 | |
| | 5,896 | | | SK Chemicals Co. Ltd. | | | 388,909 | |
| | 1,727 | | | SK Gas Ltd. | | | 144,283 | |
| | 869 | | | SK Materials Co. Ltd. | | | 145,434 | |
| | 142,100 | | | SK Networks Co. Ltd. | | | 843,455 | |
| | 56,731 | | | SK Securities Co. Ltd.(b) | | | 63,043 | |
| | 4,247 | | | SKC Co. Ltd. | | | 150,683 | |
| | 1,591 | | | SKCKOLONPI, Inc. | | | 49,916 | |
| | 4,287 | | | SL Corp. | | | 87,818 | |
| | 1,105 | | | SM Entertainment Co.(b) | | | 32,794 | |
| | 3,546 | | | Songwon Industrial Co. Ltd. | | | 68,049 | |
| | 2,069 | | | Soulbrain Co. Ltd. | | | 127,056 | |
| | 15,386 | | | Ssangyong Cement Industrial Co. Ltd. | | | 222,478 | |
| | 790 | | | Suheung Co. Ltd. | | | 23,587 | |
| | 5,080 | | | Sung Kwang Bend Co. Ltd. | | | 45,026 | |
| Old Westbury Funds, Inc. |
| Small & Mid Cap Strategies Fund |
| Portfolio of Investments - (Continued) | October 31, 2017 |
| |
| Shares | | | | | Value | |
| SOUTH KOREA (continued) | | | | |
| | 11,506 | | | Sungchang Enterprise Holdings Ltd. | | $ | 28,191 | |
| | 3,961 | | | Sungdo Engineering & Construction Co. Ltd. | | | 23,370 | |
| | 7,382 | | | Sungshin Cement Co. Ltd.(b) | | | 35,317 | |
| | 20,469 | | | Sungwoo Hitech Co. Ltd. | | | 122,593 | |
| | 2,525 | | | Sunjin Co. Ltd. | | | 34,933 | |
| | 67 | | | Suprema, Inc.(b) | | | 1,462 | |
| | 2,233 | | | Systems Technology, Inc. | | | 36,375 | |
| | 6,520 | | | Tae Kyung Industrial Co. Ltd. | | | 30,146 | |
| | 210 | | | Taekwang Industrial Co. Ltd. | | | 213,871 | |
| | 21,432 | | | Taeyoung Engineering & Construction Co. Ltd.(b) | | | 164,133 | |
| | 8,575 | | | TBH Global Co. Ltd. (The)(b) | | | 67,201 | |
| | 2,118 | | | Techwing, Inc. | | | 31,571 | |
| | 1,053 | | | Tera Semicon Co. Ltd. | | | 27,727 | |
| | 1,108 | | | TES Co Ltd. | | | 34,169 | |
| | 8,316 | | | Texcell-Netcom Co. Ltd.(b) | | | 74,227 | |
| | 2,262 | | | Thinkware Systems Corp.(b) | | | 21,099 | |
| | 16,250 | | | TK Chemical Corp.(b) | | | 29,371 | |
| | 753 | | | Tokai Carbon Korea Co. Ltd. | | | 34,950 | |
| | 4,967 | | | Top Engineering Co. Ltd. | | | 30,901 | |
| | 1,904 | | | Toptec Co. Ltd. | | | 47,840 | |
| | 7,156 | | | Tovis Co. Ltd. | | | 51,737 | |
| | 1,613 | | | UIL Co. Ltd. | | | 10,611 | |
| | 3,120 | | | Unid Co. Ltd. | | | 128,799 | |
| | 4,676 | | | Union Semiconductor Equipment & Materials Co. Ltd. | | | 27,755 | |
| | 2,607 | | | UniTest, Inc. | | | 26,993 | |
| | 1,674 | | | Value Added Technologies Co. Ltd. | | | 43,555 | |
| | 1,227 | | | Viatron Technologies, Inc. | | | 22,178 | |
| | 4,146 | | | Vitzrocell Co. Ltd.(a)(b)(c) | | | 33,539 | |
| | 495 | | | Vp PLC | | | 5,259 | |
| | 1,916 | | | Webzen Inc(b) | | | 47,885 | |
| | 3,260 | | | Whanin Pharmaceutical Co. Ltd. | | | 60,524 | |
| | 4,480 | | | WiSoL Co. Ltd. | | | 54,583 | |
| | 8,940 | | | Wonik Holdings Corp.(b) | | | 60,246 | |
| | 1,674 | | | Wonik IPS Co. Ltd.(b) | | | 54,164 | |
| | 411 | | | Wonik Materials Co. Ltd.(b) | | | 25,313 | |
| | 2,740 | | | Wonik QnC Corp.(b) | | | 28,492 | |
| | 12,035 | | | Woongjin Co. Ltd.(b) | | | 24,868 | |
| | 62,406 | | | Woori Bank | | | 913,517 | |
| | 3,901 | | | Wooshin Systems Co. Ltd. | | | 30,084 | |
| | 4,055 | | | Y G-1 Co. Ltd. | | | 50,672 | |
| | 3,685 | | | Yearimdang Publishing Co. Ltd.(b) | | | 32,661 | |
| | 1,080 | | | YESCO Co. Ltd. | | | 36,631 | |
| | 2,162 | | | Youlchon Chemical Co. Ltd. | | | 32,130 | |
| | 49 | | | Young Poong Corp. | | | 48,679 | |
| | 11,398 | | | Youngone Corp. | | | 349,972 | |
| | 2,002 | | | Youngone Holdings Co. Ltd. | | | 100,069 | |
| | 16,555 | | | Yuanta Securities Korea Co. Ltd.(b) | | | 49,871 | |
| | 899 | | | Yuhan Corp. | | | 163,695 | |
| Shares | | | | | Value | |
| SOUTH KOREA (continued) | | | | |
| | 6,279 | | | Yungjin Pharmaceutical Co. Ltd.(b) | | $ | 49,824 | |
| | 2,552 | | | Zeus Co. Ltd. | | | 38,154 | |
| | | | | | | | 58,874,407 | |
| SPAIN — 0.4% | | | | |
| | 22,780 | | | Acciona SA | | | 1,886,923 | |
| | 56,641 | | | Acerinox SA | | | 813,842 | |
| | 54,887 | | | ACS Actividades de Construccion y Servicios SA | | | 2,164,523 | |
| | 17,364 | | | Almirall SA | | | 168,082 | |
| | 33,799 | | | Applus Services SA | | | 472,449 | |
| | 12,806 | | | Atresmedia Corp. de Medios de Comunicaion SA | | | 131,568 | |
| | 2,752 | | | Azkoyen SA | | | 25,709 | |
| | 1,029,597 | | | Banco de Sabadell SA | | | 2,061,641 | |
| | 59,752 | | | Banco Popular Espanol SA(b)(c) | | | 0 | |
| | 143,492 | | | Bankinter SA | | | 1,354,389 | |
| | 895 | | | Baron de Ley(b) | | | 116,765 | |
| | 16,407 | | | Bolsas y Mercados Espanoles SHMSF SA | | | 563,699 | |
| | 20,024 | | | Caja de Ahorros del Mediterraneo(a)(b)(c) | | | 0 | |
| | 35,477 | | | Cellnex Telecom SA | | | 880,850 | |
| | 6,043 | | | Cia de Distribucion Integral Logista Holdings SA | | | 141,593 | |
| | 15,715 | | | Cie Automotive SA | | | 467,159 | |
| | 4,520 | | | Construcciones y Auxiliar de Ferrocarriles SA | | | 186,122 | |
| | 80,465 | | | Deoleo SA(b) | | | 16,871 | |
| | 129,987 | | | Distribuidora Internacional de Alimentacion SA | | | 635,944 | |
| | 23,741 | | | Ebro Foods SA | | | 571,208 | |
| | 86,329 | | | EDP Renovaveis SA | | | 713,978 | |
| | 22,694 | | | eDreams ODIGEO SA(b) | | | 70,317 | |
| | 15,183 | | | Elecnor SA | | | 214,530 | |
| | 85,982 | | | Enagas SA | | | 2,476,860 | |
| | 67,086 | | | Ence Energia y Celulosa SA | | | 389,163 | |
| | 90,277 | | | Ercros SA | | | 292,237 | |
| | 32,853 | | | Euskaltel SA | | | 263,136 | |
| | 27,381 | | | Faes Farma SA | | | 92,814 | |
| | 9,353 | | | Fluidra SA | | | 94,785 | |
| | 8,488 | | | Fomento de Construcciones y Contratas SA(b) | | | 90,132 | |
| | 16,692 | | | Grupo Catalana Occidente SA | | | 702,500 | |
| | 47,660 | | | Grupo Ezentis SA(b) | | | 31,534 | |
| | 1,905 | | | Iberpapel Gestion SA | | | 59,426 | |
| | 25,809 | | | Indra Sistemas SA(b) | | | 370,985 | |
| | 25,895 | | | Inmobiliaria Colonial SA | | | 246,408 | |
| | 1,502 | | | Laboratorios Farmaceuticos Rovi SA | | | 28,186 | |
| | 138,741 | | | Liberbank SA(b) | | | 64,160 | |
| | 393,018 | | | Mapfre SA | | | 1,285,979 | |
| | 46,589 | | | Mediaset Espana Comunicacion SA | | | 506,440 | |
| | 20,767 | | | Melia Hotels International SA | | | 284,238 | |
| Old Westbury Funds, Inc. |
| Small & Mid Cap Strategies Fund |
| Portfolio of Investments - (Continued) | October 31, 2017 |
| |
| Shares | | | | | Value | |
| SPAIN (continued) | | | | |
| | 3,643 | | | Miquel y Costas & Miquel SA | | $ | 131,974 | |
| | 36,835 | | | NH Hotel Group SA | | | 232,986 | |
| | 44,830 | | | Obrascon Huarte Lain SA(b) | | | 251,806 | |
| | 24,898 | | | Papeles y Cartones de Europa SA | | | 258,702 | |
| | 9,982 | | | Pharma Mar SA(b) | | | 38,138 | |
| | 1,765 | | | Prim SA | | | 20,416 | |
| | 31,611 | | | Prosegur Cia de Seguridad SA | | | 241,184 | |
| | 28,335 | | | Red Electrica Corp. SA | | | 627,444 | |
| | 88,815 | | | Sacyr SA(b) | | | 228,121 | |
| | 12,063 | | | Saeta Yield SA | | | 134,741 | |
| | 2,458 | | | Siemens Gamesa Renewable Energy SA | | | 35,647 | |
| | 32,524 | | | Talgo SA | | | 159,498 | |
| | 861 | | | Tecnicas Reunidas SA | | | 27,711 | |
| | 30,529 | | | Tubacex SA(b) | | | 108,463 | |
| | 38,173 | | | Tubos Reunidos SA(b) | | | 39,797 | |
| | 4,430 | | | Vidrala SA | | | 401,212 | |
| | 8,488 | | | Viscofan SA | | | 513,939 | |
| | 34,839 | | | Vocento SA(b) | | | 60,467 | |
| | 39,000 | | | Zardoya Otis SA | | | 422,491 | |
| | | | | | | | 24,871,882 | |
| SWEDEN — 0.9% | | | | |
| | 222,625 | | | AAK AB(a) | | | 18,003,276 | |
| | 28,539 | | | Acando AB | | | 96,816 | |
| | 3,798 | | | Addlife AB | | | 74,856 | |
| | 5,641 | | | AddNode Group AB | | | 45,820 | |
| | 12,819 | | | AddTech AB - Class B | | | 284,045 | |
| | 697,344 | | | AF AB - B Shares(a) | | | 14,368,952 | |
| | 11,378 | | | Ahlstrom-Munksjo Oyj | | | 249,434 | |
| | 4,896 | | | Alimak Group AB | | | 87,725 | |
| | 3,189 | | | Atrium Ljungberg AB - Class B | | | 52,873 | |
| | 6,581 | | | Attendo AB | | | 77,392 | |
| | 2,983 | | | Avanza Bank Holding AB | | | 112,419 | |
| | 75,816 | | | Axactor AB(b) | | | 27,289 | |
| | 19,917 | | | Axfood AB | | | 360,196 | |
| | 4,430 | | | BE Group AB(b) | | | 28,046 | |
| | 5,500 | | | Beijer Alma AB | | | 177,384 | |
| | 3,886 | | | Beijer Ref AB | | | 135,542 | |
| | 7,695 | | | Bergman & Beving AB - Class B | | | 87,551 | |
| | 44,970 | | | Betsson AB | | | 352,921 | |
| | 35,606 | | | Bilia AB - A Shares | | | 318,987 | |
| | 78,125 | | | BillerudKorsnas AB | | | 1,344,754 | |
| | 2,871 | | | BioGaia AB - Class B | | | 104,426 | |
| | 8,156 | | | Biotage AB | | | 72,581 | |
| | 3,705 | | | Bjorn Borg AB | | | 14,782 | |
| | 1,799 | | | Bonava AB | | | 25,959 | |
| | 53,125 | | | Bonava AB - Class B | | | 773,556 | |
| | 13,752 | | | Bufab AB | | | 164,269 | |
| | 7,831 | | | Bulten AB | | | 111,081 | |
| | 33,716 | | | Byggmax Group AB | | | 229,562 | |
| | 21,585 | | | Castellum AB | | | 346,272 | |
| | 1,272 | | | Catena AB | | | 22,639 | |
| | 7,218 | | | Clas Ohlson AB - Class B | | | 124,803 | |
| Shares | | | | | Value | |
| SWEDEN (continued) | | | | |
| | 78,435 | | | Cloetta AB - B Shares | | $ | 265,146 | |
| | 5,320 | | | Collector AB(b) | | | 56,208 | |
| | 30,492 | | | Com Hem Holding AB | | | 457,836 | |
| | 4,799 | | | Coor Service Management Holding AB | | | 37,834 | |
| | 1,200 | | | Dedicare AB - Class B | | | 15,911 | |
| | 5,878 | | | Dios Fastigheter AB | | | 38,617 | |
| | 36,761 | | | Dometic Group AB | | | 319,674 | |
| | 13,750 | | | Doro AB | | | 79,659 | |
| | 15,850 | | | Duni AB | | | 236,189 | |
| | 8,279 | | | Dustin Group AB | | | 74,170 | |
| | 862 | | | Elanders AB - B Shares | | | 9,396 | |
| | 37,905 | | | Elekta AB - Class B | | | 364,486 | |
| | 4,800 | | | Eltel AB(b) | | | 13,646 | |
| | 2,635 | | | Enea AB | | | 26,203 | |
| | 1,232 | | | eWork Group AB | | | 14,054 | |
| | 12,359 | | | Fabege AB | | | 261,008 | |
| | 6,669 | | | Fagerhult AB | | | 84,641 | |
| | 8,150 | | | Fastighets AB Balder - Class B(b) | | | 212,228 | |
| | 999 | | | FastPartner AB | | | 16,229 | |
| | 42,592 | | | Getinge AB - B Shares | | | 838,444 | |
| | 42,380 | | | Granges AB | | | 439,157 | |
| | 27,379 | | | Gunnebo AB | | | 112,830 | |
| | 3,932 | | | Haldex AB(b) | | | 43,680 | |
| | 12,523 | | | Hemfosa Fastigheter AB | | | 152,131 | |
| | 49,658 | | | Hexpol AB | | | 502,414 | |
| | 5,834 | | | HIQ International AB | | | 41,813 | |
| | 16,146 | | | Holmen AB - Class B | | | 793,640 | |
| | 9,802 | | | Hufvudstaden AB - Class A | | | 161,344 | |
| | 19,749 | | | Indutrade AB | | | 547,768 | |
| | 16,846 | | | Intrum Justitia AB | | | 590,399 | |
| | 10,171 | | | Inwido AB | | | 112,078 | |
| | 4,575 | | | ITAB Shop Concept AB - Class B | | | 35,932 | |
| | 30,789 | | | JM AB | | | 812,419 | |
| | 43,237 | | | KappAhl AB | | | 315,046 | |
| | 8,338 | | | Karo Pharma AB | | | 39,540 | |
| | 33,241 | | | Klovern AB - B Shares | | | 44,749 | |
| | 6,404 | | | KNOW IT AB | | | 117,039 | |
| | 16,156 | | | Kungsleden AB | | | 115,308 | |
| | 8,118 | | | Lagercrantz Group AB - B Shares | | | 86,303 | |
| | 3,734 | | | Lifco AB - B Shares | | | 133,809 | |
| | 27,257 | | | Lindab International AB | | | 224,655 | |
| | 31,407 | | | Loomis AB - Class B | | | 1,260,159 | |
| | 11,667 | | | Mekonomen AB | | | 235,524 | |
| | 31,113 | | | Modern Times Group MTG AB - Class B | | | 1,187,041 | |
| | 7,695 | | | Momentum Group AB - Class B(b) | | | 94,675 | |
| | 8,390 | | | MQ Holding AB | | | 31,970 | |
| | 13,849 | | | Mycronic AB | | | 164,600 | |
| | 19,291 | | | NCC AB - Class B | | | 416,391 | |
| | 2,159 | | | Nederman Holding AB | | | 62,539 | |
| | 66,395 | | | Net Insight AB - Class B(b) | | | 41,637 | |
| Old Westbury Funds, Inc. |
| Small & Mid Cap Strategies Fund |
| Portfolio of Investments - (Continued) | October 31, 2017 |
| |
| Shares | | | | | Value | |
| SWEDEN (continued) | | | | |
| | 33,902 | | | NetEnt AB | | $ | 268,692 | |
| | 27,131 | | | New Wave Group AB - Class B | | | 179,865 | |
| | 41,644 | | | Nibe Industrier AB - Class B | | | 416,607 | |
| | 31,265 | | | Nobia AB | | | 256,569 | |
| | 32,613 | | | Nobina AB | | | 177,252 | |
| | 7,901 | | | Nolato AB - B Shares | | | 437,914 | |
| | 556 | | | OEM International AB - B Shares | | | 12,951 | |
| | 175,440 | | | Opus Group AB | | | 129,930 | |
| | 117,641 | | | Peab AB | | | 1,141,750 | |
| | 2,570 | | | Platzer Fastigheter Holding AB - Class B | | | 15,349 | |
| | 37,175 | | | Pricer AB - B Shares | | | 40,409 | |
| | 2,279 | | | Proact IT Group AB | | | 53,085 | |
| | 38,765 | | | Qliro Group AB(b) | | | 84,738 | |
| | 52,789 | | | Ratos AB - B Shares | | | 253,426 | |
| | 2,630 | | | Raysearch Laboratories AB(b) | | | 58,276 | |
| | 8,060 | | | Recipharm AB - B Shares | | | 98,684 | |
| | 22,978 | | | Rottneros AB | | | 20,586 | |
| | 8,304 | | | Saab AB - Class B | | | 424,343 | |
| | 166 | | | Sagax AB - Class B | | | 2,019 | |
| | 61,478 | | | SAS AB(b) | | | 190,199 | |
| | 23,896 | | | Scandi Standard AB | | | 169,123 | |
| | 8,472 | | | Scandic Hotels Group AB | | | 109,295 | |
| | 3,644 | | | Sectra AB - B Shares | | | 71,386 | |
| | 7,592 | | | Semcon AB | | | 45,344 | |
| | 10,844 | | | SkiStar AB | | | 237,044 | |
| | 31,885 | | | SSAB AB - A Shares(b) | | | 157,107 | |
| | 147,413 | | | SSAB AB - B Shares(b) | | | 594,130 | |
| | 69,161 | | | SSAB AB - Class A(b) | | | 339,541 | |
| | 176,772 | | | SSAB AB - Class B(b) | | | 712,650 | |
| | 13,247 | | | Sweco AB - Class B | | | 283,401 | |
| | 18,817 | | | Swedish Orphan Biovitrum AB(b) | | | 278,715 | |
| | 8,490 | | | Swedol AB - Class B | | | 34,988 | |
| | 3,229 | | | Systemair AB | | | 48,888 | |
| | 24,010 | | | Tele2 AB - B Shares | | | 305,443 | |
| | 3,843 | | | Thule Group AB | | | 85,980 | |
| | 4,188 | | | Tobii AB(b) | | | 21,511 | |
| | 866 | | | Troax Group AB | | | 29,275 | |
| | 9,116 | | | Victoria Park AB - B Shares | | | 33,647 | |
| | 2,479 | | | Vitrolife AB | | | 198,103 | |
| | 15,269 | | | Wallenstam AB | | | 142,628 | |
| | 6,462 | | | Wihlborgs Fastigheter AB | | | 153,452 | |
| | | | | | | | 58,928,672 | |
| SWITZERLAND — 1.2% | | | | |
| | 4,983 | | | Allreal Holding AG | | | 833,122 | |
| | 3,034 | | | ALSO Holding AG | | | 410,555 | |
| | 276 | | | APG SGA SA | | | 111,836 | |
| | 15,516 | | | Arbonia AG(b) | | | 271,392 | |
| | 31,625 | | | Aryzta AG | | | 1,003,923 | |
| | 11,073 | | | Ascom Holding AG | | | 253,614 | |
| | 827 | | | Autoneum Holding AG | | | 223,401 | |
| | 275 | | | Bachem Holding AG - Class B | | | 34,732 | |
| | 28,329 | | | Baloise Holding AG | | | 4,466,648 | |
| Shares | | | | | Value | |
| SWITZERLAND (continued) | | | | |
| | 640 | | | Bank Cler AG | | $ | 27,136 | |
| | 554 | | | Banque Cantonale de Geneve | | | 89,293 | |
| | 935 | | | Banque Cantonale Vaudoise | | | 672,443 | |
| | 424 | | | Barry Callebaut AG | | | 661,723 | |
| | 1,131 | | | Belimo Holding AG(a) | | | 4,849,815 | |
| | 715 | | | Bell Food Group AG | | | 308,712 | |
| | 2,721 | | | Bellevue Group AG | | | 63,276 | |
| | 1,224 | | | Berner Kantonalbank AG | | | 220,839 | |
| | 987 | | | BKW AG | | | 57,678 | |
| | 2,740 | | | Bobst Group SA | | | 292,772 | |
| | 1,166 | | | Bossard Holding AG | | | 275,474 | |
| | 2,875 | | | Bucher Industries AG | | | 1,125,332 | |
| | 14,425 | | | Burckhardt Compression Holding AG | | | 4,297,931 | |
| | 232 | | | Burkhalter Holding AG | | | 27,789 | |
| | 1,012 | | | Calida Holding AG | | | 37,532 | |
| | 111 | | | Carlo Gavazzi Holding AG | | | 37,022 | |
| | 12,616 | | | Cavotec SA | | | 39,483 | |
| | 5,780 | | | Cembra Money Bank AG | | | 517,949 | |
| | 178 | | | Cham Paper Holding AG | | | 72,215 | |
| | 446 | | | Cicor Technologies(b) | | | 22,978 | |
| | 539 | | | Cie Financiere Tradition SA | | | 51,353 | |
| | 133,112 | | | Clariant AG | | | 3,348,981 | |
| | 638 | | | Coltene Holding AG | | | 63,311 | |
| | 203 | | | Conzzeta AG | | | 199,409 | |
| | 25,226 | | | Daetwyler Holding AG | | | 4,232,779 | |
| | 3,583 | | | DKSH Holding AG | | | 300,424 | |
| | 821 | | | dormakaba Holding AG | | | 812,236 | |
| | 9,998 | | | Dufry AG(b) | | | 1,488,200 | |
| | 2,785 | | | EDAG Engineering Group AG | | | 43,617 | |
| | 38,356 | | | EFG International AG | | | 350,631 | |
| | 1,177 | | | Emmi AG | | | 734,998 | |
| | 2,219 | | | Energiedienst Holding AG | | | 57,496 | |
| | 721 | | | Feintool International Holding AG | | | 85,640 | |
| | 554 | | | Fenix Outdoor International AG | | | 66,110 | |
| | 46,077 | | | Ferrexpo Plc | | | 155,563 | |
| | 7,003 | | | Flughafen Zuerich AG | | | 1,523,231 | |
| | 291 | | | Forbo Holding AG | | | 439,862 | |
| | 61,396 | | | GAM Holding AG | | | 956,957 | |
| | 3,740 | | | Garmin Ltd. | | | 211,721 | |
| | 2,355 | | | Georg Fischer AG | | | 2,901,113 | |
| | 228 | | | Gurit Holding AG | | | 262,132 | |
| | 3,618 | | | Helvetia Holdings AG | | | 1,945,629 | |
| | 3,758 | | | Highlight Communications AG(b) | | | 22,128 | |
| | 289 | | | HOCHDORF Holding AG | | | 80,386 | |
| | 4,590 | | | Huber & Suhner AG | | | 248,444 | |
| | 12 | | | Hypothekarbank Lenzburg AG | | | 53,526 | |
| | 7,940 | | | Implenia AG | | | 501,796 | |
| | 338 | | | Inficon Holding AG | | | 209,884 | |
| | 136 | | | Interroll Holding AG | | | 194,393 | |
| | 104 | | | Intershop Holding AG | | | 51,080 | |
| | 100,579 | | | IWG Plc | | | 287,739 | |
| | 578 | | | Jungfraubahn Holding AG | | | 73,637 | |
| Old Westbury Funds, Inc. |
| Small & Mid Cap Strategies Fund |
| Portfolio of Investments - (Continued) | October 31, 2017 |
| |
| Shares | | | | | Value | |
| SWITZERLAND (continued) | | | | |
| | 1,015 | | | Kardex AG | | $ | 120,866 | |
| | 1,169 | | | Komax Holding AG | | | 334,536 | |
| | 19,796 | | | Kudelski SA | | | 243,072 | |
| | 60,115 | | | Landis+Gyr Group AG(b) | | | 4,097,449 | |
| | 144 | | | LEM Holding SA | | | 188,363 | |
| | 27,163 | | | Logitech International SA | | | 970,370 | |
| | 1,064 | | | Luzerner Kantonalbank AG | | | 479,128 | |
| | 725 | | | MCH Group AG | | | 49,234 | |
| | 74 | | | Metall Zug AG - Class B | | | 284,310 | |
| | 16,431 | | | Meyer Burger Technology AG(b) | | | 30,634 | |
| | 1,603 | | | Mobilezone Holding AG | | | 20,004 | |
| | 2,383 | | | Mobimo Holding AG | | | 601,931 | |
| | 111,727 | | | OC Oerlikon Corp AG | | | 1,791,843 | |
| | 5,837 | | | Oriflame Holding AG | | | 210,356 | |
| | 2,258 | | | Orior AG | | | 176,539 | |
| | 1,572 | | | Panalpina Welttransport Holding AG | | | 216,344 | |
| | 288 | | | Phoenix Mecano AG | | | 167,433 | |
| | 326 | | | Plazza AG | | | 75,712 | |
| | 2,374 | | | PSP Swiss Property AG | | | 208,928 | |
| | 1,363 | | | Rieter Holding AG | | | 318,737 | |
| | 154 | | | Romande Energie Holding SA | | | 174,584 | |
| | 95 | | | Schaffner Holding AG(b) | | | 30,186 | |
| | 272,660 | | | Schmolz & Bickenbach AG(b) | | | 251,438 | |
| | 262 | | | Schweiter Technologies AG | | | 321,443 | |
| | 3,690 | | | SFS Group AG | | | 437,185 | |
| | 1,808 | | | Siegfried Holding AG | | | 565,425 | |
| | 1,983 | | | Sonova Holding AG | | | 357,980 | |
| | 861 | | | St. Galler Kantonalbank AG | | | 388,794 | |
| | 39,008 | | | STMicroelectronics NV | | | 917,857 | |
| | 1,913 | | | Straumann Holding AG | | | 1,335,543 | |
| | 4,456 | | | Sulzer AG | | | 570,818 | |
| | 18,875 | | | Sunrise Communications Group AG | | | 1,570,315 | |
| | 8,494 | | | Swiss Life Holding AG | | | 2,952,658 | |
| | 2,320 | | | Swissquote Group Holding SA | | | 80,577 | |
| | 953 | | | Tamedia AG | | | 132,206 | |
| | 6,327 | | | Tecan Group AG | | | 1,338,142 | |
| | 22,864 | | | Temenos Group AG | | | 2,640,137 | |
| | 235 | | | Thurgauer Kantonalbank | | | 23,190 | |
| | 25,930 | | | Transocean Ltd.(b) | | | 272,265 | |
| | 45,534 | | | U-Blox AG | | | 8,936,558 | |
| | 6,050 | | | Valiant Holding AG | | | 622,799 | |
| | 1,862 | | | Valora Holding AG | | | 596,777 | |
| | 437 | | | Vaudoise Assurances Holding SA | | | 231,499 | |
| | 94 | | | Vetropack Holding AG | | | 178,926 | |
| | 8,356 | | | Vifor Pharma AG | | | 1,074,600 | |
| | 16,937 | | | Von Roll Holding AG(b) | | | 25,296 | |
| | 14,574 | | | Vontobel Holding AG | | | 906,447 | |
| | 60 | | | VZ Holding AG | | | 20,734 | |
| | 679 | | | Walter Meier AG | | | 27,973 | |
| | 14,014 | | | Weatherford International Plc(b) | | | 48,629 | |
| | 1,680 | | | Wizz Air Holdings Plc(b) | | | 73,075 | |
| Shares | | | | | Value | |
| SWITZERLAND (continued) | | | | |
| | 331 | | | Ypsomed Holding AG | | $ | 57,630 | |
| | 7,747 | | | Zehnder Group AG | | | 284,208 | |
| | 61 | | | Zug Estates Holding AG - B Shares | | | 107,368 | |
| | 34 | | | Zuger Kantonalbank AG | | | 180,624 | |
| | | | | | | | 81,580,696 | |
| TAIWAN — 1.2% | | | | |
| | 66,000 | | | AcBel Polytech, Inc. | | | 50,223 | |
| | 71,000 | | | Accton Technology Corp. | | | 228,823 | |
| | 1,857,878 | | | Acer, Inc. | | | 960,987 | |
| | 66,000 | | | Aces Electronic Co. Ltd. | | | 59,524 | |
| | 7,000 | | | Acter Co. Ltd. | | | 41,546 | |
| | 16,000 | | | Actron Technology Corp. | | | 58,887 | |
| | 3,000 | | | Addcn Technology Co. Ltd. | | | 27,156 | |
| | 9,998 | | | Adlink Technology, Inc. | | | 22,807 | |
| | 8,000 | | | Advanced Ceramic X Corp. | | | 87,800 | |
| | 50,000 | | | Advanced Connectek, Inc. | | | 15,252 | |
| | 48,000 | | | Advanced International Multitech Co. Ltd. | | | 59,524 | |
| | 26,000 | | | Advanced Optoelectronic Technology, Inc. | | | 30,345 | |
| | 65,373 | | | Advancetek Enterprise Co. Ltd. | | | 39,450 | |
| | 64,000 | | | AGV Products Corp.(b) | | | 15,979 | |
| | 17,916 | | | Airtac International Group | | | 290,189 | |
| | 9,000 | | | All Ring Tech Co. Ltd. | | | 22,381 | |
| | 26,850 | | | Alltek Technology Corp. | | | 18,785 | |
| | 11,000 | | | Alltop Technology Co. Ltd. | | | 31,148 | |
| | 85,000 | | | Alpha Networks, Inc. | | | 65,949 | |
| | 49,050 | | | Altek Corp. | | | 47,408 | |
| | 44,000 | | | Ambassador Hotel (The) | | | 33,555 | |
| | 18,000 | | | AMPOC Far-East Co. Ltd. | | | 15,756 | |
| | 28,000 | | | AmTRAN Technology Co. Ltd. | | | 14,344 | |
| | 20,000 | | | Apacer Technology, Inc. | | | 26,128 | |
| | 26,000 | | | APCB, Inc. | | | 25,690 | |
| | 14,000 | | | Apex Biotechnology Corp. | | | 15,319 | |
| | 79,161 | | | Apex International Co. Ltd. | | | 56,038 | |
| | 37,000 | | | Arcadyan Technology Corp. | | | 58,151 | |
| | 165,872 | | | Ardentec Corp. | | | 157,020 | |
| | 315,000 | | | Asia Cement Corp. | | | 280,956 | |
| | 193,000 | | | Asia Pacific Telecom Co. Ltd.(b) | | | 63,865 | |
| | 132,100 | | | Asia Vital Components Co. Ltd. | | | 125,269 | |
| | 4,208 | | | Asmedia Technology, Inc. | | | 47,020 | |
| | 4,000 | | | ASPEED Technology, Inc. | | | 92,442 | |
| | 19,000 | | | Aten International Co. Ltd. | | | 48,635 | |
| | 1,925,000 | | | AU Optronics Corp. | | | 788,267 | |
| | 44,800 | | | Audix Corp. | | | 66,325 | |
| | 24,291 | | | AVY Precision Technology, Inc. | | | 39,949 | |
| | 13,000 | | | Axiomtek Co. Ltd. | | | 22,242 | |
| | 100,278 | | | Bank of Kaohsiung Co. Ltd. | | | 30,722 | |
| | 49,000 | | | BenQ Materials Corp.(b) | | | 32,007 | |
| | 174,350 | | | BES Engineering Corp. | | | 39,946 | |
| | 11,000 | | | Bothhand Enterprise, Inc. | | | 24,947 | |
| | 13,000 | | | C Sun Manufacturing Ltd. | | | 12,371 | |
| | 9,000 | | | Capital Futures Corp. | | | 13,876 | |
| Old Westbury Funds, Inc. |
| Small & Mid Cap Strategies Fund |
| Portfolio of Investments - (Continued) | October 31, 2017 |
| |
| Shares | | | | | Value | |
| TAIWAN (continued) | | | | |
| | 316,781 | | | Capital Securities Corp. | | $ | 109,762 | |
| | 118,000 | | | Career Technology Manufacturing Co. Ltd. | | | 137,525 | |
| | 177,300 | | | Cathay Real Estate Development Co. Ltd. | | | 99,057 | |
| | 22,000 | | | Center Laboratories, Inc.(b) | | | 35,087 | |
| | 19,760 | | | Central Reinsurance Co. Ltd. | | | 10,286 | |
| | 180,000 | | | Chailease Holding Co. Ltd. | | | 464,331 | |
| | 26,000 | | | ChainQui Construction Development Co. Ltd. | | | 18,018 | |
| | 1,730 | | | Chang Wah Electromaterials, Inc. | | | 8,087 | |
| | 50,000 | | | Channel Well Technology Co. Ltd. | | | 56,699 | |
| | 12,000 | | | Chant Sincere Co. Ltd. | | | 13,230 | |
| | 30,185 | | | Charoen Pokphand Enterprise | | | 63,754 | |
| | 14,000 | | | CHC Healthcare Group | | | 17,315 | |
| | 13,000 | | | CHC Resources Corp. | | | 23,535 | |
| | 15,000 | | | Chen Full International Co. Ltd. | | | 24,047 | |
| | 22,000 | | | Chenbro Micom Co. Ltd. | | | 36,363 | |
| | 230,920 | | | Cheng Loong Corp. | | | 135,139 | |
| | 189,797 | | | Cheng Uei Precision Industry Co. Ltd. | | | 308,677 | |
| | 36,000 | | | Chenming Mold Industry Corp. | | | 23,038 | |
| | 13,000 | | | Chian Hsing Forging Industrial Co. Ltd. | | | 34,914 | |
| | 125,649 | | | Chicony Electronics Co. Ltd. | | | 314,544 | |
| | 30,150 | | | Chicony Power Technology Co. Ltd. | | | 65,679 | |
| | 32,251 | | | Chilisin Electronics Corp. | | | 110,143 | |
| | 76,000 | | | Chimei Materials Technology Corp.(b) | | | 34,649 | |
| | 1,283,744 | | | China Airlines Ltd.(b) | | | 523,551 | |
| | 209,000 | | | China Bills Finance Corp. | | | 104,987 | |
| | 64,000 | | | China Chemical & Pharmaceutical Co. Ltd. | | | 37,985 | |
| | 51,000 | | | China Electric Manufacturing Corp.(b) | | | 15,997 | |
| | 73,444 | | | China General Plastics Corp. | | | 68,794 | |
| | 277,374 | | | China Life Insurance Co. Ltd. | | | 262,112 | |
| | 106,077 | | | China Metal Products | | | 97,602 | |
| | 1,341,000 | | | China Petrochemical Development Corp.(b) | | | 598,035 | |
| | 12,114 | | | China Steel Chemical Corp. | | | 48,401 | |
| | 37,000 | | | China Steel Structure Co. Ltd. | | | 23,984 | |
| | 742,387 | | | China Synthetic Rubber Corp. | | | 1,033,845 | |
| | 31,360 | | | China Wire & Cable Co. Ltd. | | | 28,075 | |
| | 21,000 | | | Chinese Maritime Transport Ltd. | | | 19,705 | |
| | 85,883 | | | Chin-Poon Industrial Co. Ltd. | | | 179,116 | |
| | 284,000 | | | Chipbond Technology Corp. | | | 553,696 | |
| | 117,751 | | | Chipmos Technologies, Inc. | | | 117,323 | |
| | 16,000 | | | Chong Hong Construction Co. Ltd. | | | 39,099 | |
| | 33,876 | | | Chroma ATE, Inc. | | | 165,115 | |
| | 64,000 | | | Chun Yu Works & Co. Ltd. | | | 30,345 | |
| | 162,779 | | | Chun Yuan Steel | | | 60,989 | |
| Shares | | | | | Value | |
| TAIWAN (continued) | | | | |
| | 400,000 | | | Chung Hung Steel Corp.(b) | | $ | 153,186 | |
| | 138,779 | | | Chung Hwa Pulp Corp. | | | 49,236 | |
| | 56,125 | | | Chung-Hsin Electric & Machinery Manufacturing Corp. | | | 39,173 | |
| | 1,000 | | | Chunghwa Precision Test Tech Co. Ltd. | | | 36,307 | |
| | 14,000 | | | Chyang Sheng Dyeing & Finishing Co. Ltd. | | | 12,464 | |
| | 7,000 | | | Cleanaway Co. Ltd. | | | 40,269 | |
| | 113,348 | | | Clevo Co. | | | 116,507 | |
| | 533,000 | | | CMC Magnetics Corp.(b) | | | 78,997 | |
| | 30,034 | | | CoAsia Microelectronics Corp.(b) | | | 15,485 | |
| | 2,749,000 | | | Compal Electronics, Inc. | | | 2,023,502 | |
| | 1,451,000 | | | Compeq Manufacturing Co. Ltd. | | | 1,705,531 | |
| | 18,000 | | | Compucase Enterprise | | | 24,022 | |
| | 51,000 | | | Concord Securities Co. Ltd.(b) | | | 14,238 | |
| | 8,400 | | | Concraft Holding Co. Ltd. | | | 101,102 | |
| | 68,873 | | | Continental Holdings Corp. | | | 32,998 | |
| | 157,200 | | | Coretronic Corp. | | | 188,164 | |
| | 30,148 | | | Co-Tech Development Corp.(b) | | | 44,783 | |
| | 94,000 | | | CSBC Corp. Taiwan(b) | | | 40,206 | |
| | 1,324,000 | | | CTBC Financial Holding Co. Ltd. | | | 847,269 | |
| | 54,838 | | | CTCI Corp. | | | 85,004 | |
| | 7,590 | | | Cub Elecparts, Inc. | | | 74,869 | |
| | 18,000 | | | CviLux Corp. | | | 19,606 | |
| | 6,000 | | | Cyberpower Systems, Inc. | | | 22,878 | |
| | 36,000 | | | CyberTAN Technology, Inc. | | | 22,023 | |
| | 6,600 | | | Cypress Technology Co. Ltd. | | | 27,026 | |
| | 81,000 | | | DA CIN Construction Co. Ltd. | | | 48,209 | |
| | 76,321 | | | Da-Li Development Co. Ltd. | | | 84,774 | |
| | 95,000 | | | Danen Technology Corp.(b) | | | 24,097 | |
| | 98,000 | | | Darfon Electronics Corp. | | | 86,109 | |
| | 147,000 | | | Darwin Precisions Corp. | | | 159,139 | |
| | 29,111 | | | De Licacy Industrial Co. Ltd. | | | 24,710 | |
| | 66,201 | | | Delpha Construction Co. Ltd. | | | 29,962 | |
| | 24,000 | | | Depo Auto Parts Industrial Co. Ltd. | | | 64,139 | |
| | 198,904 | | | D-Link Corp. | | | 74,524 | |
| | 60,183 | | | Dynamic Electronics Co. Ltd.(b) | | | 23,347 | |
| | 39,000 | | | Dynapack International Technology Corp. | | | 66,208 | |
| | 118,000 | | | E Ink Holdings, Inc. | | | 164,718 | |
| | 31,620 | | | Eclat Textile Co. Ltd. | | | 377,958 | |
| | 3,000 | | | ECOVE Environment Corp. | | | 16,612 | |
| | 38,000 | | | Edison Opto Corp.(b) | | | 19,656 | |
| | 45,895 | | | Edom Technology Co. Ltd. | | | 23,891 | |
| | 13,520 | | | eGalax_eMPIA Technology, Inc. | | | 22,504 | |
| | 51,320 | | | Elan Microelectronics Corp. | | | 78,700 | |
| | 14,000 | | | E-LIFE MALL Corp. | | | 29,245 | |
| | 20,736 | | | Elite Advanced Laser Corp. | | | 84,224 | |
| | 18,967 | | | Elite Material Co. Ltd. | | | 75,467 | |
| Old Westbury Funds, Inc. | |
| Small & Mid Cap Strategies Fund | |
| Portfolio of Investments - (Continued) | October 31, 2017 |
| | |
| Shares | | | | | Value | |
| TAIWAN (continued) | | |
| | 37,000 | | | Elite Semiconductor Memory Technology, Inc. | | $ | 60,973 | |
| | 126,489 | | | Elitegroup Computer Systems Co. Ltd.(b) | | | 98,978 | |
| | 7,000 | | | eMemory Technology, Inc. | | | 85,761 | |
| | 57,011 | | | ENG Electric Co. Ltd. | | | 23,062 | |
| | 8,000 | | | Ennoconn Corp. | | | 113,662 | |
| | 133,000 | | | EnTie Commercial Bank Co. Ltd. | | | 55,785 | |
| | 28,000 | | | Epileds Technologies, Inc.(b) | | | 19,682 | |
| | 986,015 | | | Epistar Corp.(b) | | | 1,595,435 | |
| | 16,000 | | | Eson Precision Ind. Co., Ltd. | | | 28,382 | |
| | 142,033 | | | Eternal Materials Co. Ltd. | | | 143,401 | |
| | 28,000 | | | E-Ton Solar Tech Co. Ltd.(b) | | | 9,173 | |
| | 6,000 | | | Eurocharm Holdings Co. Ltd. | | | 18,601 | |
| | 7,728,074 | | | Eva Airways Corp. | | | 3,805,166 | |
| | 154,960 | | | Everest Textile Co. Ltd. | | | 75,786 | |
| | 246,000 | | | Evergreen International Storage & Transport Corp. | | | 114,193 | |
| | 1,592,138 | | | Evergreen Marine Corp. Taiwan Ltd.(b) | | | 952,870 | |
| | 129,342 | | | Everlight Chemical Industrial Corp. | | | 81,055 | |
| | 88,643 | | | Everlight Electronics Co. Ltd. | | | 135,347 | |
| | 403,062 | | | Far Eastern Department Stores Ltd. | | | 198,461 | |
| | 750,724 | | | Far Eastern International Bank | | | 232,987 | |
| | 39,478 | | | Faraday Technology Corp. | | | 60,671 | |
| | 78,000 | | | Farglory Land Development Co. Ltd. | | | 85,217 | |
| | 127,255 | | | Federal Corp. | | | 59,705 | |
| | 13,000 | | | Feedback Technology Corp. | | | 38,880 | |
| | 103,320 | | | Feng Hsin Steel Co. Ltd. | | | 178,483 | |
| | 49,720 | | | Feng TAY Enterprise Co. Ltd. | | | 224,205 | |
| | 1,635,000 | | | First Financial Holding Co. Ltd. | | | 1,054,419 | |
| | 72,120 | | | First Hotel | | | 37,185 | |
| | 61,000 | | | First Insurance Co. Ltd. (The) | | | 27,103 | |
| | 270,859 | | | First Steamship Co. Ltd.(b) | | | 71,757 | |
| | 52,049 | | | FLEXium Interconnect, Inc. | | | 199,329 | |
| | 9,955 | | | Flytech Technology Co. Ltd. | | | 28,024 | |
| | 37,000 | | | Focaltech Systems Co. Ltd. | | | 39,810 | |
| | 9,764 | | | Formosa International Hotels Corp. | | | 49,047 | |
| | 7,000 | | | Formosa Laboratories, Inc. | | | 19,102 | |
| | 31,203 | | | Formosa Oilseed Processing Co. Ltd. | | | 67,197 | |
| | 114,792 | | | Formosan Union Chemical | | | 70,224 | |
| | 33,000 | | | Fortune Electric Co. Ltd. | | | 21,063 | |
| | 58,210 | | | Founding Construction & Development Co. Ltd. | | | 30,013 | |
| | 316,000 | | | Foxconn Technology Co. Ltd. | | | 1,006,900 | |
| | 11,550 | | | Foxsemicon Integrated Technology, Inc. | | | 81,954 | |
| | 12,000 | | | Fulgent Sun International Holding Co. Ltd. | | | 30,359 | |
| | 169,000 | | | Fulltech Fiber Glass Corp. | | | 89,096 | |
| | 106,466 | | | Fwusow Industry Co. Ltd. | | | 61,953 | |
| Shares | | | | | Value | |
| TAIWAN (continued) | |
| | 40,000 | | | Gemtek Technology Corp. | | $ | 32,295 | |
| | 20,000 | | | General Interface Solution Holding Ltd. | | | 183,358 | |
| | 7,000 | | | Genius Electronic Optical Co. Ltd.(b) | | | 78,798 | |
| | 112,000 | | | Getac Technology Corp. | | | 156,342 | |
| | 21,000 | | | Giant Manufacturing Co. Ltd. | | | 107,926 | |
| | 122,000 | | | Giantplus Technology Co. Ltd. | | | 94,657 | |
| | 103,781 | | | Gigabyte Technology Co. Ltd. | | | 160,698 | |
| | 6,400 | | | Gigasolar Materials Corp. | | | 57,826 | |
| | 54,000 | | | Gigastorage Corp.(b) | | | 34,467 | |
| | 150,570 | | | Gintech Energy Corp.(b) | | | 94,357 | |
| | 167,000 | | | Global Brands Manufacture Ltd. | | | 76,967 | |
| | 8,000 | | | Global Mixed Mode Technology, Inc. | | | 18,409 | |
| | 7,000 | | | Global PMX Co. Ltd. | | | 41,082 | |
| | 6,000 | | | Global Unichip Corp. | | | 59,683 | |
| | 14,000 | | | Globalwafers Co. Ltd. | | | 161,773 | |
| | 76,650 | | | Globe Union Industrial Corp. | | | 51,211 | |
| | 170,880 | | | Gloria Material Technology Corp. | | | 112,751 | |
| | 13,000 | | | Glory Science Co. Ltd. | | | 27,026 | |
| | 181,770 | | | Gold Circuit Electronics Ltd.(b) | | | 62,078 | |
| | 187,852 | | | Goldsun Building Materials Co. Ltd.(b) | | | 56,182 | |
| | 12,485 | | | Gourmet Master Co. Ltd. | | | 143,232 | |
| | 42,000 | | | Grand Ocean Retail Group Ltd. | | | 31,194 | |
| | 376,000 | | | Grand Pacific Petrochemical | | | 284,872 | |
| | 4,000 | | | Grand Plastic Technology Corp. | | | 25,531 | |
| | 8,000 | | | Grape King Bio Ltd. | | | 46,022 | |
| | 59,000 | | | Great China Metal Industry | | | 49,885 | |
| | 40,000 | | | Great Taipei Gas Co. Ltd. | | | 34,284 | |
| | 216,946 | | | Great Wall Enterprise Co. Ltd. | | | 246,730 | |
| | 72,000 | | | Greatek Electonics, Inc. | | | 132,973 | |
| | 92,000 | | | Green Energy Technology, Inc.(b) | | | 59,026 | |
| | 141,000 | | | Hannstar Board Corp. | | | 85,321 | |
| | 3,217,000 | | | HannStar Display Corp. | | | 1,247,995 | |
| | 221,000 | | | HannsTouch Solution, Inc.(b) | | | 77,307 | |
| | 30,300 | | | Harvatek Corp.(b) | | | 16,929 | |
| | 89,000 | | | Hey Song Corp. | | | 91,775 | |
| | 66,666 | | | Highwealth Construction Corp. | | | 89,081 | |
| | 77,620 | | | Hitron Technology, Inc. | | | 56,363 | |
| | 23,026 | | | Hiwin Technologies Corp. | | | 230,569 | |
| | 273,531 | | | Ho Tung Chemical Corp.(b) | | | 82,623 | |
| | 87,000 | | | Hocheng Corp.(b) | | | 26,972 | |
| | 28,000 | | | Holtek Semiconductor, Inc. | | | 64,802 | |
| | 26,106 | | | Holy Stone Enterprise Co. Ltd. | | | 48,646 | |
| | 52,514 | | | Hong Pu Real Estate Development Co. Ltd. | | | 35,259 | |
| | 29,624 | | | Hota Industrial Manufacturing Co. Ltd. | | | 138,005 | |
| | 46,678 | | | Hsin Kuang Steel Co. Ltd. | | | 46,509 | |
| | 54,143 | | | Hsing TA Cement Co. | | | 23,159 | |
| | 338,000 | | | HTC Corp.(b) | | | 757,599 | |
| | 11,000 | | | Hu Lane Associate, Inc. | | | 62,733 | |
| Old Westbury Funds, Inc. | |
| Small & Mid Cap Strategies Fund | |
| Portfolio of Investments - (Continued) | October 31, 2017 |
| | |
| Shares | | | | | Value | |
| TAIWAN (continued) | | |
| | 62,479 | | | Huaku Development Co. Ltd. | | $ | 140,249 | |
| | 31,000 | | | Hung Ching Development & Construction Co. Ltd. | | | 20,609 | |
| | 74,000 | | | Hung Sheng Construction Ltd. | | | 58,519 | |
| | 42,830 | | | Hwa Fong Rubber Co. Ltd. | | | 16,260 | |
| | 30,110 | | | Ibase Technology, Inc. | | | 53,013 | |
| | 34,341 | | | Ichia Technologies, Inc.(b) | | | 18,674 | |
| | 9,436 | | | Innodisk Corp. | | | 34,885 | |
| | 2,164,000 | | | Innolux Corp. | | | 947,124 | |
| | 15,000 | | | Integrated Service Technology, Inc. | | | 56,699 | |
| | 4,000 | | | International Games System Co. Ltd. | | | 21,088 | |
| | 1,435,155 | | | Inventec Corp. | | | 1,113,501 | |
| | 12,000 | | | I-Sheng Electric Wire & Cable Co. Ltd. | | | 17,268 | |
| | 42,000 | | | ITEQ Corp. | | | 87,873 | |
| | 15,000 | | | Jarllytec Co. Ltd. | | | 27,006 | |
| | 10,000 | | | Jentech Precision Industrial Co. Ltd. | | | 25,630 | |
| | 10,500 | | | Jess-Link Products Co. Ltd. | | | 11,802 | |
| | 459,731 | | | Jih Sun Financial Holdings Co. Ltd. | | | 122,099 | |
| | 4,680 | | | Johnson Health Tech Co. Ltd. | | | 5,121 | |
| | 13,000 | | | Kaulin Manufacturing Co. Ltd. | | | 8,513 | |
| | 136,682 | | | Kenda Rubber Industrial Co. Ltd. | | | 181,279 | |
| | 38,000 | | | Kerry TJ Logistics Co. Ltd. | | | 46,052 | |
| | 109,000 | | | Kindom Construction Corp. | | | 69,572 | |
| | 36,720 | | | King Chou Marine Technology Co. Ltd. | | | 40,605 | |
| | 4,000 | | | King Slide Works Co. Ltd. | | | 53,515 | |
| | 526,184 | | | King Yuan Electronics Co. Ltd. | | | 557,422 | |
| | 5,000 | | | Kingpak Technology, Inc. | | | 44,762 | |
| | 374,185 | | | King’s Town Bank Co. Ltd. | | | 408,806 | |
| | 27,062 | | | King’s Town Construction Co. Ltd.(b) | | | 20,413 | |
| | 25,000 | | | Kinik Co. | | | 65,236 | |
| | 24,000 | | | Kinko Optical Co. Ltd. | | | 37,123 | |
| | 646,343 | | | Kinpo Electronics, Inc. | | | 222,881 | |
| | 277,000 | | | Kinsus Interconnect Technology Corp. | | | 698,022 | |
| | 5,000 | | | KMC Kuei Meng International, Inc. | | | 21,884 | |
| | 16,328 | | | KS Terminals, Inc. | | | 43,419 | |
| | 6,000 | | | Kung Long Batteries Industrial Co. Ltd. | | | 29,046 | |
| | 81,000 | | | Kung Sing Engineering Corp. | | | 30,886 | |
| | 31,000 | | | Kuo Toong International Co. Ltd.(b) | | | 18,656 | |
| | 104,982 | | | Kuoyang Construction Co. Ltd. | | | 42,467 | |
| | 74,799 | | | Kwong Fong Industries Corp. | | | 52,330 | |
| | 17,000 | | | Kwong Lung Enterprise Co. Ltd. | | | 24,153 | |
| | 39,000 | | | L&K Engineering Co. Ltd. | | | 48,815 | |
| | 8,000 | | | Land Mark Optoelectronics Corp. | | | 101,991 | |
| Shares | | | | | Value | |
| TAIWAN (continued) | | |
| | 14,000 | | | Lanner Electronics, Inc. | | $ | 19,868 | |
| | 17,000 | | | Laser Tek Taiwan Co. Ltd. | | | 17,671 | |
| | 1,218,000 | | | LCY Chemical Corp. | | | 1,663,874 | |
| | 94,714 | | | Lealea Enterprise Co. Ltd.(b) | | | 35,487 | |
| | 43,000 | | | LEE CHI Enterprises Co. Ltd. | | | 17,465 | |
| | 15,000 | | | Lelon Electronics Corp. | | | 25,664 | |
| | 62,275 | | | Leofoo Development Co. Ltd.(b) | | | 16,539 | |
| | 199,000 | | | Lextar Electronics Corp.(b) | | | 120,418 | |
| | 12,400 | | | Li Cheng Enterprise Co. Ltd. | | | 22,695 | |
| | 167,788 | | | Li Peng Enterprise Co. Ltd.(b) | | | 48,012 | |
| | 34,629 | | | Lian Hwa Food Corp. | | | 38,579 | |
| | 282,640 | | | Lien Hwa Industrial Corp. | | | 299,888 | |
| | 137,000 | | | Lingsen Precision Industries Ltd. | | | 73,135 | |
| | 75,882 | | | Lite-On Semiconductor Corp. | | | 95,357 | |
| | 18,000 | | | Lite-On Technology Corp. | | | 25,395 | |
| | 122,000 | | | Long Bon International Co. Ltd. | | | 56,835 | |
| | 267,746 | | | Long Chen Paper Co. Ltd. | | | 394,168 | |
| | 29,000 | | | Longwell Co. | | | 70,482 | |
| | 8,451 | | | Lotes Co. Ltd. | | | 52,119 | |
| | 69,000 | | | Lucky Cement Corp. | | | 19,927 | |
| | 12,545 | | | Lumax International Corp. Ltd. | | | 23,959 | |
| | 5,000 | | | Macauto Industrial Co. Ltd. | | | 25,780 | |
| | 10,500 | | | Macroblock Inc. | | | 23,674 | |
| | 90,274 | | | Macronix International(b) | | | 164,627 | |
| | 11,000 | | | Mag Layers Scientific-Technics Co. Ltd. | | | 22,248 | |
| | 30,213 | | | Makalot Industrial Co. Ltd. | | | 139,747 | |
| | 327,998 | | | Masterlink Securities Corp. | | | 91,789 | |
| | 26,095 | | | Meiloon Industrial Co. Ltd. | | | 28,596 | |
| | 178,740 | | | Mercuries & Associates Holding Ltd. | | | 144,606 | |
| | 305,517 | | | Mercuries Life Insurance Co. Ltd.(b) | | | 161,068 | |
| | 12,091 | | | Merry Electronics Co. Ltd. | | | 92,207 | |
| | 64,000 | | | Microbio Co. Ltd.(b) | | | 44,351 | |
| | 36,404 | | | Micro-Star International Co. Ltd. | | | 88,718 | |
| | 48,000 | | | MIN AIK Technology Co. Ltd.(c) | | | 44,722 | |
| | 34,036 | | | Mirle Automation Corp. | | | 51,913 | |
| | 4,000 | | | Nak Sealing Technologies Corp. | | | 11,061 | |
| | 34,000 | | | Namchow Chemical Industrial Co. Ltd. | | | 68,655 | |
| | 42,590 | | | Nan Kang Rubber Tire Co. Ltd. | | | 38,552 | |
| | 68,005 | | | Nantex Industry Co. Ltd. | | | 49,381 | |
| | 21,000 | | | National Petroleum Co. Ltd. | | | 27,121 | |
| | 114,428 | | | Neo Solar Power Corp.(b) | | | 58,050 | |
| | 11,000 | | | Nexcom International Co. Ltd. | | | 11,507 | |
| | 34,043 | | | Nichidenbo Corp. | | | 32,226 | |
| | 24,000 | | | Nien Made Enterprise Co. Ltd. | | | 249,872 | |
| | 955,000 | | | Novatek Microelectronics Corp. | | | 3,530,645 | |
| | 17,000 | | | Nuvoton Technology Corp. | | | 42,839 | |
| | 137,090 | | | OptoTech Corp. | | | 94,546 | |
| Old Westbury Funds, Inc. | |
| Small & Mid Cap Strategies Fund | |
| Portfolio of Investments - (Continued) | October 31, 2017 |
| | |
| Shares | | | | | Value | |
| TAIWAN (continued) | | |
| | 177,000 | | | Orient Semiconductor Electronics Ltd.(b) | | $ | 53,993 | |
| | 35,500 | | | Oriental Union Chemical Corp. | | | 30,545 | |
| | 19,440 | | | Paiho Shih Holdings Corp. | | | 42,929 | |
| | 156,453 | | | Pan Jit International, Inc. | | | 156,663 | |
| | 7,000 | | | Parade Technologies Ltd. | | | 113,845 | |
| | 4,242 | | | Paragon Technologies Co. Ltd. | | | 4,923 | |
| | 13,323 | | | PChome Online, Inc. | | | 77,086 | |
| | 2,000 | | | Pharmally International Holding Co. Ltd. | | | 30,936 | |
| | 103,616 | | | Phihong Technology Co. Ltd.(b) | | | 44,319 | |
| | 21,000 | | | Phison Electronics Corp. | | | 249,623 | |
| | 12,000 | | | Planet Technology Corp. | | | 22,441 | |
| | 24,000 | | | Plotech Co. Ltd. | | | 14,324 | |
| | 5,099 | | | Posiflex Technology, Inc. | | | 22,572 | |
| | 665,200 | | | Powertech Technology, Inc. | | | 2,079,887 | |
| | 9,242 | | | Poya International Co. Ltd. | | | 118,438 | |
| | 417,377 | | | President Securities Corp.(b) | | | 198,590 | |
| | 86,000 | | | Primax Electronics Ltd. | | | 222,988 | |
| | 277,370 | | | Prince Housing & Development Corp. | | | 102,084 | |
| | 4,000 | | | Pro Hawk Corp. | | | 18,966 | |
| | 121,000 | | | Prodisc Technology, Inc.(a)(b)(c) | | | 0 | |
| | 26,000 | | | Promate Electronic Co. Ltd. | | | 24,052 | |
| | 1,853,520 | | | Qisda Corp. | | | 1,352,060 | |
| | 118,000 | | | Quintain Steel Co. Ltd. | | | 35,604 | |
| | 208,008 | | | Radiant Opto-Electronics Corp. | | | 462,094 | |
| | 201,677 | | | Radium Life Tech Co. Ltd.(b) | | | 90,275 | |
| | 355,825 | | | Realtek Semiconductor Corp. | | | 1,339,085 | |
| | 45,771 | | | Rechi Precision Co. Ltd. | | | 47,047 | |
| | 182,616 | | | Rich Development Co. Ltd. | | | 56,372 | |
| | 446,597 | | | Ritek Corp.(b) | | | 74,187 | |
| | 128,400 | | | Ruentex Development Co. Ltd.(b) | | | 131,765 | |
| | 75,335 | | | Sampo Corp. | | | 34,721 | |
| | 37,113 | | | San Fang Chemical Industry Co. Ltd. | | | 43,439 | |
| | 17,600 | | | San Shing Fastech Corp. | | | 35,539 | |
| | 33,080 | | | Sanyang Motor Co. Ltd. | | | 23,911 | |
| | 7,000 | | | Scientech Corp. | | | 17,872 | |
| | 31,000 | | | SDI Corp. | | | 97,134 | |
| | 10,000 | | | Senao International Co. Ltd. | | | 17,175 | |
| | 53,000 | | | Sercomm Corp. | | | 151,481 | |
| | 49,674 | | | Sesoda Corp. | | | 48,258 | |
| | 16,800 | | | Sharehope Medicine Co. Ltd. | | | 20,945 | |
| | 19,000 | | | Sheng Yu Steel Co. Ltd. | | | 21,104 | |
| | 54,000 | | | Shieh Yih Machinery Industry Co. Ltd. | | | 22,918 | |
| | 87,000 | | | Shih Wei Navigation Co. Ltd.(b) | | | 25,299 | |
| | 4,221,606 | | | Shin Kong Financial Holding Co. Ltd. | | | 1,350,768 | |
| | 17,000 | | | Shin Zu Shing Co. Ltd. | | | 47,123 | |
| | 134,040 | | | Shining Building Business Co. Ltd.(b) | | | 46,444 | |
| | 116,000 | | | Shinkong Insurance Co. Ltd. | | | 101,540 | |
| Shares | | | | | Value | |
| TAIWAN (continued) | | |
| | 198,314 | | | Shinkong Synthetic Fibers Corp. | | $ | 63,914 | |
| | 33,000 | | | Shinkong Textile Co. Ltd. | | | 43,767 | |
| | 12,000 | | | Shiny Chemical Industrial Co. Ltd. | | | 31,512 | |
| | 164,000 | | | Sigurd Microelectronics Corp. | | | 142,469 | |
| | 88,200 | | | Simplo Technology Co. Ltd. | | | 507,392 | |
| | 28,364 | | | Sinbon Electronics Co. Ltd. | | | 81,162 | |
| | 36,170 | | | Sincere Navigation Corp. | | | 26,085 | |
| | 33,000 | | | Sinher Technology, Inc. | | | 54,490 | |
| | 6,487 | | | Sinmag Equipment Corp. | | | 32,909 | |
| | 10,961 | | | Sino-American Electronic Co. Ltd. | | | 3,907 | |
| | 49,000 | | | Sino-American Silicon Products, Inc. | | | 136,474 | |
| | 192,000 | | | Sinon Corp. | | | 112,999 | |
| | 15,146 | | | Sinphar Pharmaceutical Co. Ltd. | | | 10,998 | |
| | 24,217 | | | Sinyi Realty, Inc. | | | 28,144 | |
| | 15,000 | | | Sirtec International Co. Ltd. | | | 24,321 | |
| | 14,000 | | | Sitronix Technology Corp. | | | 39,643 | |
| | 36,000 | | | Siward Crystal Technology Co. Ltd. | | | 23,575 | |
| | 99,616 | | | Solar Applied Materials Technology Co.(b) | | | 47,233 | |
| | 57,013 | | | Solartech Energy Corp.(b) | | | 29,774 | |
| | 16,160 | | | Solteam Electronics Co. Ltd. | | | 21,781 | |
| | 15,000 | | | Sonix Technology Co. Ltd. | | | 18,427 | |
| | 117,000 | | | Southeast Cement Co. Ltd. | | | 56,639 | |
| | 11,361 | | | Sporton International, Inc. | | | 57,635 | |
| | 8,000 | | | St Shine Optical Co. Ltd. | | | 195,494 | |
| | 65,762 | | | Standard Foods Corp. | | | 162,881 | |
| | 26,400 | | | Stark Technology, Inc. | | | 29,893 | |
| | 27,000 | | | Sunko Ink Co. Ltd. | | | 11,549 | |
| | 11,000 | | | Sunny Friend Environmental Technology Co. Ltd. | | | 69,663 | |
| | 22,000 | | | Sunonwealth Electric Machine Industry Co. Ltd. | | | 49,019 | |
| | 48,000 | | | Sunspring Metal Corp. | | | 62,150 | |
| | 174,245 | | | Supreme Electronics Co. Ltd. | | | 187,478 | |
| | 36,000 | | | Swancor Holding Co. Ltd. | | | 90,240 | |
| | 79,969 | | | Sweeten Real Estate Development Co. Ltd. | | | 38,845 | |
| | 15,000 | | | Syncmold Enterprise Corp. | | | 34,765 | |
| | 211,550 | | | Synnex Technology International Corp. | | | 267,949 | |
| | 14,700 | | | Sysage Technology Co. Ltd. | | | 14,232 | |
| | 12,000 | | | Systex Corp. | | | 23,555 | |
| | 183,470 | | | TA Chen Stainless Pipe Co. Ltd. | | | 116,191 | |
| | 99,340 | | | Ta Ya Electric Wire & Cable(b) | | | 30,600 | |
| | 6,000 | | | Ta Yih Industrial Co. Ltd. | | | 16,234 | |
| | 46,262 | | | TA-I Technology Co. Ltd. | | | 37,734 | |
| | 775,880 | | | Taichung Commercial Bank Co. Ltd. | | | 248,512 | |
| | 10,500 | | | TaiDoc Technology Corp. | | | 30,359 | |
| | 47,580 | | | Taiflex Scientific Co. Ltd. | | | 76,356 | |
| | 16,000 | | | Taimide Tech, Inc. | | | 22,679 | |
| Old Westbury Funds, Inc. | |
| Small & Mid Cap Strategies Fund | |
| Portfolio of Investments - (Continued) | October 31, 2017 |
| | |
| Shares | | | | | Value | |
| TAIWAN (continued) | | |
| | 839,045 | | | Tainan Spinning Co. Ltd. | | $ | 376,964 | |
| | 2,473,000 | | | Taishin Financial Holding Co. Ltd. | | | 1,082,365 | |
| | 35,716 | | | Taisun Enterprise Co. Ltd.(b) | | | 21,968 | |
| | 29,000 | | | Taiwan Acceptance Corp. | | | 103,848 | |
| | 2,384,906 | | | Taiwan Business Bank | | | 658,707 | |
| | 616,000 | | | Taiwan Cement Corp. | | | 684,229 | |
| | 12,000 | | | Taiwan Chinsan Electronic Industrial Co. Ltd. | | | 22,162 | |
| | 61,088 | | | Taiwan Cogeneration Corp. | | | 47,802 | |
| | 6,000 | | | Taiwan FamilyMart Co. Ltd. | | | 36,605 | |
| | 91,000 | | | Taiwan Fertilizer Co. Ltd. | | | 118,881 | |
| | 54,320 | | | Taiwan Fire & Marine Insurance Co. Ltd. | | | 36,382 | |
| | 61,000 | | | Taiwan FU Hsing Industrial Co. Ltd. | | | 77,566 | |
| | 211,919 | | | Taiwan Glass Industrial Corp.(b) | | | 109,264 | |
| | 81,081 | | | Taiwan Hon Chuan Enterprise Co. Ltd. | | | 146,518 | |
| | 30,000 | | | Taiwan Hopax Chemicals Manufacturing Co. Ltd. | | | 18,999 | |
| | 214,701 | | | Taiwan Land Development Corp.(b) | | | 71,900 | |
| | 12,471 | | | Taiwan Line Tek Electronic | | | 14,328 | |
| | 49,544 | | | Taiwan Navigation Co. Ltd.(b) | | | 25,627 | |
| | 40,032 | | | Taiwan Paiho Ltd. | | | 165,254 | |
| | 128,000 | | | Taiwan PCB Techvest Co. Ltd. | | | 139,843 | |
| | 25,000 | | | Taiwan Prosperity Chemical Corp.(b) | | | 15,252 | |
| | 73,120 | | | Taiwan Pulp & Paper Corp.(b) | | | 46,186 | |
| | 39,000 | | | Taiwan Sakura Corp. | | | 50,432 | |
| | 28,408 | | | Taiwan Secom Co. Ltd. | | | 83,643 | |
| | 50,000 | | | Taiwan Semiconductor Co. Ltd. | | | 123,510 | |
| | 50,010 | | | Taiwan Shin Kong Security Co. Ltd. | | | 64,255 | |
| | 167,500 | | | Taiwan Styrene Monomer | | | 113,298 | |
| | 99,875 | | | Taiwan Surface Mounting Technology Corp. | | | 94,876 | |
| | 100,469 | | | Taiwan TEA Corp. | | | 53,467 | |
| | 28,000 | | | Taiwan Union Technology Corp. | | | 71,858 | |
| | 25,322 | | | Taiyen Biotech Co. Ltd. | | | 23,677 | |
| | 6,904 | | | TCI Co. Ltd. | | | 46,928 | |
| | 571,000 | | | Teco Electric and Machinery Co. Ltd. | | | 532,955 | |
| | 4,400 | | | Tehmag Foods Corp. | | | 32,607 | |
| | 18,000 | | | Test Research, Inc. | | | 25,067 | |
| | 81,000 | | | Test Rite International Co. Ltd. | | | 61,503 | |
| | 11,000 | | | Thinking Electronic Industrial Co. Ltd. | | | 33,446 | |
| | 25,525 | | | Thye Ming Industrial Co, Ltd. | | | 32,626 | |
| | 160,100 | | | Ton Yi Industrial Corp. | | | 72,460 | |
| | 8,000 | | | Tong Hsing Electronic Industries Ltd. | | | 34,218 | |
| | 141,834 | | | Tong Yang Industry Co. Ltd. | | | 295,806 | |
| Shares | | | | | Value | |
| TAIWAN (continued) | | |
| | 49,946 | | | Tong-Tai Machine & Tool Co. Ltd. | | $ | 33,866 | |
| | 9,000 | | | TOPBI International Holdings Ltd. | | | 32,079 | |
| | 19,662 | | | Topco Scientific Co. Ltd. | | | 49,547 | |
| | 5,000 | | | Topco Technologies Corp. | | | 11,224 | |
| | 37,049 | | | Topoint Technology Co. Ltd. | | | 26,411 | |
| | 17,000 | | | Toung Loong Textile Manufacturing Co. | | | 44,586 | |
| | 114,000 | | | TPK Holding Co. Ltd.(b) | | | 376,100 | |
| | 8,137 | | | Transcend Information, Inc. | | | 23,095 | |
| | 149,000 | | | Tripod Technology Corp. | | | 548,384 | |
| | 22,000 | | | Tsang Yow Industrial Co. Ltd. | | | 32,461 | |
| | 3,000 | | | TSC Auto ID Technology Co. Ltd. | | | 21,933 | |
| | 89,000 | | | Tsec Corp(b) | | | 33,936 | |
| | 61,942 | | | TSRC Corp. | | | 70,959 | |
| | 15,000 | | | Ttet Union Corp. | | | 44,762 | |
| | 23,000 | | | TTY Biopharm Co. Ltd. | | | 70,999 | |
| | 251,315 | | | Tung Ho Steel Enterprise Corp. | | | 202,072 | |
| | 7,000 | | | Tung Thih Electronic Co. Ltd. | | | 45,375 | |
| | 8,000 | | | TURVO International Co. Ltd. | | | 31,963 | |
| | 82,815 | | | TXC Corp. | | | 110,660 | |
| | 56,000 | | | TYC Brother Industrial Co. Ltd. | | | 64,059 | |
| | 88,303 | | | Tycoons Group Enterprise(b) | | | 17,772 | |
| | 94,458 | | | Tyntek Corp. | | | 43,534 | |
| | 38,000 | | | UDE Corp. | | | 75,850 | |
| | 44,000 | | | U-Ming Marine Transport Corp. | | | 52,229 | |
| | 1,653,000 | | | Unimicron Technology Corp. | | | 942,708 | |
| | 432,686 | | | Union Bank of Taiwan | | | 129,119 | |
| | 136,037 | | | Unitech Printed Circuit Board Corp.(b) | | | 64,276 | |
| | 2,057,000 | | | United Microelectronics Corp. | | | 1,057,163 | |
| | 11,920 | | | United Orthopedic Corp. | | | 26,994 | |
| | 60,000 | | | Univacco Technology, Inc. | | | 37,998 | |
| | 262,780 | | | Universal Cement Corp. | | | 203,449 | |
| | 9,000 | | | Universal Microwave Technology, Inc. | | | 23,187 | |
| | 152,000 | | | Unizyx Holding Corp. | | | 72,574 | |
| | 267,445 | | | UPC Technology Corp. | | | 148,534 | |
| | 377,743 | | | USI Corp. | | | 186,620 | |
| | 68,000 | | | Vanguard International Semiconductor Corp. | | | 128,968 | |
| | 39,800 | | | Ve Wong Corp. | | | 32,925 | |
| | 16,000 | | | Visual Photonics Epitaxy Co. Ltd. | | | 35,544 | |
| | 8,000 | | | Voltronic Power Technology Corp. | | | 150,666 | |
| | 136,287 | | | Wafer Works Corp.(b) | | | 169,910 | |
| | 54,000 | | | Wah Lee Industrial Corp. | | | 94,716 | |
| | 1,093,000 | | | Walsin Lihwa Corp. | | | 558,106 | |
| | 205,000 | | | Walton Advanced Engineering, Inc. | | | 108,755 | |
| | 148,300 | | | Wan Hai Lines Ltd. | | | 89,739 | |
| | 32,000 | | | Wei Chuan Foods Corp.(b) | | | 21,433 | |
| | 20,000 | | | Well Shin Technology Co. Ltd. | | | 41,446 | |
| | 42,460 | | | Win Semiconductors Corp. | | | 347,035 | |
| Old Westbury Funds, Inc. | |
| Small & Mid Cap Strategies Fund | |
| Portfolio of Investments - (Continued) | October 31, 2017 |
| | |
| Shares | | | | | Value | |
| TAIWAN (continued) | | | | |
| | 687,977 | | | Winbond Electronics Corp. | | $ | 595,375 | |
| | 51,000 | | | Winstek Semiconductor Co. Ltd. | | | 42,022 | |
| | 44,673 | | | Wintek Corp.(a)(b)(c) | | | 508 | |
| | 136,663 | | | Wisdom Marine Lines Co. Ltd. | | | 122,346 | |
| | 1,858,684 | | | Wistron Corp. | | | 1,549,956 | |
| | 62,643 | | | Wistron NeWeb Corp. | | | 179,665 | |
| | 11,000 | | | Wowprime Corp. | | | 55,256 | |
| | 329,865 | | | WPG Holdings Co. Ltd. | | | 451,713 | |
| | 106,126 | | | WT Microelectronics Co. Ltd. | | | 167,848 | |
| | 12,000 | | | XAC Automation Corp. | | | 19,556 | |
| | 17,204 | | | Xxentria Technology Materials Corp. | | | 36,508 | |
| | 191,144 | | | Yageo Corp. | | | 1,517,896 | |
| | 103,489 | | | YC Co. Ltd. | | | 47,182 | |
| | 77,084 | | | YC INOX Co. Ltd. | | | 65,814 | |
| | 27,000 | | | Yeong Guan Energy Technology Group Co. Ltd. | | | 62,309 | |
| | 12,000 | | | YFC-Boneagle Electric Co. Ltd. | | | 21,923 | |
| | 460,624 | | | YFY, Inc.(b) | | | 180,221 | |
| | 28,213 | | | Yi Jinn Industrial Co. Ltd. | | | 11,693 | |
| | 603,480 | | | Yieh Phui Enterprise Co. Ltd. | | | 230,111 | |
| | 13,000 | | | Yonyu Plastics Co. Ltd. | | | 14,009 | |
| | 56,110 | | | Youngtek Electronics Corp. | | | 104,743 | |
| | 313,000 | | | Yulon Motor Co. Ltd. | | | 261,530 | |
| | 14,000 | | | Yung Chi Paint & Varnish Manufacturing Co. Ltd. | | | 36,904 | |
| | 28,350 | | | YungShin Global Holding Corp. | | | 37,694 | |
| | 79,000 | | | Yungtay Engineering Co. Ltd. | | | 157,164 | |
| | 13,000 | | | Zeng Hsing Industrial Co. Ltd. | | | 54,311 | |
| | 27,000 | | | Zenitron Corp. | | | 16,741 | |
| | 34,000 | | | Zero One Technology Co. Ltd. | | | 22,490 | |
| | 95,000 | | | Zhen Ding Technology Holding Ltd. | | | 238,134 | |
| | 100,826 | | | Zig Sheng Industrial Co. Ltd. | | | 40,619 | |
| | 46,169 | | | Zinwell Corp. | | | 46,461 | |
| | 23,000 | | | Zippy Technology Corp. | | | 27,683 | |
| | | | | | | | 81,110,100 | |
| THAILAND — 0.2% | | | | |
| | 40,400 | | | Advanced Information Technology Public Co. Ltd. - FOR | | | 34,052 | |
| | 474,600 | | | AJ Advance Technology Public Co. Ltd. - FOR(b) | | | 8,000 | |
| | 27,700 | | | AJ Plast PCL | | | 11,590 | |
| | 47,800 | | | Amata Corp. Public Co. Ltd. - FOR | | | 30,936 | |
| | 663,900 | | | Ananda Development Public Co. Ltd. - FOR | | | 118,910 | |
| | 520,168 | | | AP Thailand Public Co. Ltd. - FOR | | | 139,359 | |
| | 237,900 | | | Asia Plus Group Holdings Securities Public Co. Ltd. - FOR | | | 29,505 | |
| Shares | | | | | Value | |
| THAILAND (continued) | | | | |
| | 255,300 | | | Bangchak Corp. Public Co. Ltd. - FOR | | $ | 320,854 | |
| | 20,425 | | | Bangkok Aviation Fuel Services Public Co. Ltd. - FOR | | | 29,820 | |
| | 146,700 | | | Bangkok Chain Hospital Public Co. Ltd. - FOR | | | 72,864 | |
| | 303,306 | | | Bangkok Expressway & Metro Public Co. Ltd. - FOR | | | 71,216 | |
| | 26,500 | | | Bangkok Insurance Public Co. Ltd. - FOR | | | 287,974 | |
| | 1,628,000 | | | Bangkok Land Public Co. Ltd. - FOR | | | 90,662 | |
| | 115,800 | | | Bangkok Ranch Public Co. Ltd. - FOR | | | 28,235 | |
| | 324,700 | | | Banpu Public Co. Ltd. - FOR | | | 171,049 | |
| | 123,600 | | | Beauty Community Public Co. Ltd. - FOR | | | 66,600 | |
| | 157,200 | | | BEC World Public Co. Ltd. - FOR | | | 82,338 | |
| | 228,300 | | | Better World Green Public Co. Ltd. - FOR | | | 12,095 | |
| | 87,500 | | | BJC Heavy Industries Public Co. Ltd. - FOR | | | 9,324 | |
| | 477,500 | | | BTS Group Holdings Public Co. Ltd. - FOR | | | 122,178 | |
| | 71,520 | | | Buriram Sugar Public Co. Ltd. - FOR - Class F | | | 21,960 | |
| | 691,508 | | | Cal-Comp Electronics Thailand Public Co. Ltd. - FOR | | | 72,440 | |
| | 52,100 | | | Central Plaza Hotel Public Co. Ltd. - FOR | | | 71,751 | |
| | 76,822 | | | CH Karnchang Public Co. Ltd. - FOR | | | 63,016 | |
| | 29,800 | | | Charoong Thai Wire & Cable Public Co. Ltd. - FOR | | | 9,060 | |
| | 601,400 | | | Chularat Hospital Public Co. Ltd. - FOR | | | 47,069 | |
| | 238,800 | | | CK Power Public Co. Ltd. - FOR | | | 31,198 | |
| | 70,900 | | | Com7 Public Co. Ltd. - FOR | | | 33,081 | |
| | 411,800 | | | Country Group Development Public Co. Ltd. - FOR(b) | | | 15,743 | |
| | 47,700 | | | Delta Electronics Thailand Public Co. Ltd. - FOR | | | 123,486 | |
| | 52,100 | | | Dhipaya Insurance Public Co. Ltd. - FOR | | | 78,025 | |
| | 376,500 | | | Dynasty Ceramic Public Co. Ltd. - FOR | | | 46,014 | |
| | 260,900 | | | Eastern Water Resources Development and Management Public Co. Ltd. - FOR | | | 96,601 | |
| | 3,700 | | | Electricity Generating Public Co. Ltd. - FOR | | | 25,617 | |
| | 148,000 | | | Energy Absolute Public Co. Ltd. | | | 192,685 | |
| | 404,800 | | | Energy Earth Public Co. Ltd. - FOR(a)(c) | | | 13,343 | |
| | 451,400 | | | Erawan Group Public Co. Ltd. (The) - FOR | | | 97,156 | |
| Old Westbury Funds, Inc. | |
| Small & Mid Cap Strategies Fund | |
| Portfolio of Investments - (Continued) | October 31, 2017 |
| | |
| Shares | | | | | Value | |
| THAILAND (continued) | | | | |
| | 497,300 | | | Esso Thailand Public Co. Ltd. - FOR(b) | | $ | 229,039 | |
| | 459 | | | Fabrinet(b) | | | 17,066 | |
| | 23,800 | | | Forth Smart Service Public Co. Ltd. - FOR | | | 15,045 | |
| | 116,400 | | | GFPT Public Co. Ltd. - FOR | | | 64,822 | |
| | 36,100 | | | Global Power Synergy Public Co. Ltd. - FOR | | | 66,288 | |
| | 79,600 | | | Golden Land Property Development Public Co. Ltd. - FOR | | | 23,003 | |
| | 333,800 | | | Grand Canal Land Public Co. Ltd. - FOR | | | 20,498 | |
| | 67,000 | | | Hana Microelectronics Public Co. Ltd. - FOR | | | 98,322 | |
| | 38,100 | | | ICC International Public Co. Ltd. - FOR | | | 43,295 | |
| | 10,808,300 | | | IRPC Public Co. Ltd. - FOR | | | 2,098,541 | |
| | 5,316,991 | | | Italian-Thai Development Public Co. Ltd. - FOR | | | 649,819 | |
| | 331,800 | | | Jasmine International Public Co. Ltd. - FOR | | | 75,908 | |
| | 56,466 | | | Jay Mart Public Co., Ltd. - FOR | | | 29,916 | |
| | 13,100 | | | KCE Electronics Public Co. Ltd. - FOR | | | 39,434 | |
| | 178,900 | | | KGI Securities Thailand Public Co. Ltd. - FOR | | | 24,126 | |
| | 450,966 | | | Khon Kaen Sugar Industry Public Co. Ltd. | | | 61,088 | |
| | 82,700 | | | Kiatnakin Bank Public Co. Ltd. - FOR | | | 188,577 | |
| | 7,700 | | | Krungthai Card Public Co. Ltd. - FOR | | | 31,871 | |
| | 59,000 | | | Land and Houses Public Co. Ltd. - FOR | | | 19,359 | |
| | 90,560 | | | Land and Houses Public Co. Ltd. - NVDR | | | 29,714 | |
| | 21,900 | | | Lanna Resources Public Co. Ltd. - FOR | | | 9,493 | |
| | 771,200 | | | LH Financial Group Public Co. Ltd. - FOR | | | 40,858 | |
| | 90,330 | | | Loxley Public Co. Ltd. - FOR | | | 8,701 | |
| | 51,900 | | | Major Cineplex Group Public Co. Ltd. - FOR | | | 50,775 | |
| | 16,400 | | | Malee Group Public Co. Ltd. - FOR | | | 21,475 | |
| | 30,600 | | | Maybank Kim Eng Securities Thailand Public Co. Ltd. - FOR | | | 20,357 | |
| | 353,700 | | | MBK Public Co. Ltd. - FOR | | | 250,209 | |
| | 89,400 | | | MCS Steel Public Co. Ltd. - FOR | | | 44,135 | |
| | 28,500 | | | Mega Lifesciences Public Co. Ltd. - FOR | | | 36,033 | |
| | 29,800 | | | MK Restaurants Group Public Co. Ltd. - FOR | | | 67,952 | |
| | 3,100 | | | Muang Thai Insurance Public Co. Ltd. - FOR | | | 12,831 | |
| Shares | | | | | Value | |
| THAILAND (continued) | | | | |
| | 72,700 | | | Muangthai Leasing Public Co. Ltd. - FOR | | $ | 85,896 | |
| | 102,600 | | | PCS Machine Group Holding Public Co. Ltd. - FOR | | | 20,539 | |
| | 105,900 | | | Polyplex Public Co. Ltd. - FOR | | | 44,630 | |
| | 72,650 | | | Precious Shipping Public Co. Ltd. - FOR(b) | | | 23,400 | |
| | 202,200 | | | Pruksa Real Estate Public Co. Ltd. - FOR | | | 153,689 | |
| | 89,000 | | | PTG Energy Public Co. Ltd. - FOR | | | 64,299 | |
| | 879,731 | | | Quality Houses Public Co. Ltd. - FOR | | | 77,857 | |
| | 156,700 | | | Ratchthani Leasing Public Co. Ltd. - FOR | | | 45,048 | |
| | 34,100 | | | Regional Container Lines Public Co. Ltd. - FOR(b) | | | 8,571 | |
| | 11,900 | | | Robinson Public Co. Ltd. - FOR | | | 26,598 | |
| | 496,100 | | | Rojana Industrial Park Public Co. Ltd. - FOR | | | 90,349 | |
| | 45,000 | | | Samart Corp. Public Co. Ltd. - FOR | | | 17,339 | |
| | 100,000 | | | Samart Telcoms Public Co. Ltd. - FOR | | | 46,057 | |
| | 2,354,500 | | | Sansiri Public Co. Ltd. - FOR | | | 165,850 | |
| | 26,700 | | | Sappe Public Co. Ltd. - FOR | | | 26,523 | |
| | 1,026,676 | | | SC Asset Corp. Public Co. Ltd. - FOR | | | 105,078 | |
| | 17,620 | | | Siam City Cement Public Co. Ltd. - FOR | | | 147,983 | |
| | 267,441 | | | Siam Future Development Public Co. Ltd. - FOR | | | 58,367 | |
| | 91,652 | | | Siam Global House Public Co. Ltd - FOR | | | 50,489 | |
| | 120,000 | | | Siamgas & Petrochemicals Public Co. Ltd. - FOR | | | 81,276 | |
| | 202,600 | | | Singha Estate Public Co. Ltd. - FOR(b) | | | 23,663 | |
| | 39,200 | | | Sino-Thai Engineering & Construction Public Co. Ltd. - FOR | | | 29,264 | |
| | 140,917 | | | Somboon Advance Technology Public Co. Ltd. - FOR | | | 86,960 | |
| | 153,600 | | | SPCG Public Co. Ltd. | | | 115,593 | |
| | 113,560 | | | Sri Trang Agro-Industry Public Co. Ltd. - FOR | | | 43,414 | |
| | 19,200 | | | Srisawad Corp. Public Co. Ltd. - FOR | | | 40,169 | |
| | 364,000 | | | Srithai Superware Public Co. Ltd. - FOR | | | 19,066 | |
| | 855,900 | | | Star Petroleum Refining Public Co. Ltd. - FOR | | | 448,304 | |
| | 247,900 | | | Supalai Public Co. Ltd. - FOR | | | 183,574 | |
| | 325,900 | | | SVI Public Co. Ltd. | | | 51,014 | |
| | 368,600 | | | Syntec Construction Public Co. Ltd. - FOR | | | 68,239 | |
| | 31,100 | | | Taokaenoi Food & Marketing Public Co. Ltd. - FOR | | | 24,107 | |
| Old Westbury Funds, Inc. | |
| Small & Mid Cap Strategies Fund | |
| Portfolio of Investments - (Continued) | October 31, 2017 |
| | |
| Shares | | | | | Value | |
| THAILAND (continued) | | | | |
| | 1,547,500 | | | Tata Steel Thailand Public Co. Ltd. - FOR(b) | | $ | 46,583 | |
| | 4,380 | | | Thai Agro Energy Public Co. Ltd. - FOR | | | 367 | |
| | 380,300 | | | Thai Airways International Public Co. Ltd. - FOR(b) | | | 212,931 | |
| | 15,000 | | | Thai Central Chemical Public Co. Ltd. - FOR | | | 23,254 | |
| | 82,500 | | | Thai Metal Trade Public Co. Ltd. - FOR | | | 40,480 | |
| | 11,900 | | | Thai Stanley Electric Public Co. Ltd. - FOR | | | 80,599 | |
| | 187,100 | | | Thai Union Group Public Co. Ltd. - FOR | | | 103,068 | |
| | 51,100 | | | Thai Vegetable Oil Public Co. Ltd. - FOR | | | 42,686 | |
| | 72,200 | | | Thai Wah Public Co. Ltd. - FOR | | | 20,756 | |
| | 116,500 | | | Thaicom Public Co. Ltd. - FOR | | | 48,396 | |
| | 202,200 | | | Thanacart Capital Public Co. Ltd. - FOR | | | 333,247 | |
| | 17,300 | | | Thitikorn Public Co. Ltd. - FOR | | | 9,061 | |
| | 121,084 | | | Thoresen Thai Agencies Public Co. Ltd. - FOR | | | 35,356 | |
| | 111,770 | | | Ticon Industrial Connection Public Co. Ltd. - FOR | | | 56,188 | |
| | 72,300 | | | Tipco Asphalt Public Co. Ltd. - FOR | | | 48,751 | |
| | 26,000 | | | Tisco Financial Group Public Co. Ltd. - FOR | | | 68,679 | |
| | 2,876,400 | | | TMB Bank Public Co. Ltd. - FOR | | | 223,393 | |
| | 14,700 | | | Total Access Communication Public Co. Ltd. - FOR(b) | | | 23,563 | |
| | 731,700 | | | TPI Polene Public Co. Ltd. - FOR | | | 49,338 | |
| | 105,400 | | | TTW Public Co. Ltd. - FOR | | | 34,583 | |
| | 118,800 | | | Unique Engineering & Construction Public Co. Ltd. - FOR | | | 63,298 | |
| | 449,400 | | | Univentures Public Co. Ltd. - FOR | | | 167,747 | |
| | 184,700 | | | Vanachai Group Public Co. Ltd. - FOR | | | 66,719 | |
| | 382,600 | | | VGI Global Media Public Co. Ltd. - FOR | | | 70,831 | |
| | 270,200 | | | Vibhavadi Medical Center Public Co. Ltd. - FOR | | | 22,612 | |
| | 139,700 | | | Vinythai Public Co. Ltd. - FOR | | | 87,050 | |
| | 596,100 | | | WHA Corp Public Co. Ltd. - FOR | | | 68,905 | |
| | 24,700 | | | Workpoint Entertainment Public Co. Ltd. - FOR | | | 72,866 | |
| | | | | | | | 11,758,868 | |
| TURKEY — 0.1% | | | | |
| | 9,076 | | | Adana Cimento Sanayii T.A.S. - Class A | | | 15,335 | |
| Shares | | | | | Value | |
| TURKEY (continued) | | | | |
| | 17,831 | | | AKIS Gayrimenkul Yatirimi AS REIT | | $ | 14,900 | |
| | 17,532 | | | Aksa Akrilik Kimya Sanayii AS | | | 61,697 | |
| | 26,465 | | | Aksa Enerji Uretim AS(b) | | | 23,929 | |
| | 29,600 | | | Aksigorta AS(b) | | | 24,423 | |
| | 29,721 | | | Alarko Holding AS | | | 58,446 | |
| | 92,924 | | | Albaraka Turk Katilim Bankasi AS | | | 31,844 | |
| | 1,359 | | | Alkim Alkali Kimya AS | | | 8,805 | |
| | 87,793 | | | Anadolu Cam Sanayii AS | | | 55,311 | |
| | 45,730 | | | Anadolu Efes Biracilik Ve Malt Sanayii AS | | | 264,721 | |
| | 9,733 | | | Anadolu Hayat Emeklilik AS | | | 17,318 | |
| | 12,296 | | | Aygaz AS | | | 52,217 | |
| | 7,874 | | | Bagfas Bandirma Gubre Fabrik AS(b) | | | 21,753 | |
| | 15,627 | | | Borusan Mannesmann Boru Sanayi ve Ticaret AS | | | 46,260 | |
| | 19,362 | | | Boyner Perakende Ve Tekstil Yatirimlari AS(b) | | | 43,180 | |
| | 12,202 | | | Brisa Bridgestone Sabanci Sanayi ve Ticaret AS(b) | | | 23,802 | |
| | 10,435 | | | Bursa Cimento Fabrikasi AS | | | 15,157 | |
| | 5,730 | | | Cimsa Cimento Sanayi VE Ticaret AS | | | 21,645 | |
| | 10,780 | | | Coca-Cola Icecek AS | | | 109,688 | |
| | 3,327,803 | | | Dogan Sirketler Grubu Holding AS(b) | | | 807,049 | |
| | 80,727 | | | Emlak Konut Gayrimenkul Yatirim Ortakligi AS REIT(b) | | | 56,179 | |
| | 15,003 | | | Ford Otomotiv Sanayi AS | | | 211,783 | |
| | 22,092 | | | Global Yatirim Holding AS(b) | | | 19,043 | |
| | 361 | | | Goltas Goller Bolgesi Cimento Sanayi ve Ticaret AS | | | 6,966 | |
| | 14,783 | | | Goodyear Lastikleri TAS | | | 16,873 | |
| | 184,835 | | | GSD Holding AS(b) | | | 38,004 | |
| | 16,968 | | | Gubre Fabrikalari TAS(b) | | | 21,112 | |
| | 294,548 | | | Ihlas Holding AS(b) | | | 47,363 | |
| | 19,196 | | | Is Gayrimenkul Yatirim Ortakligi AS REIT | | | 6,730 | |
| | 25,617 | | | Izmir Demir Celik Sanayi AS(b) | | | 22,284 | |
| | 147,575 | | | Kardemir Karabuk Demir Celik Sanayi ve Ticaret AS - Class A(b) | | | 98,032 | |
| | 14,106 | | | Kardemir Karabuk Demir Celik Sanayi ve Ticaret AS - Class B(b) | | | 11,081 | |
| | 390,783 | | | Kardemir Karabuk Demir Celik Sanayi ve Ticaret AS - Class D(b) | | | 249,290 | |
| | 30,773 | | | Karsan Otomotiv Sanayii Ve Ticaret AS(b) | | | 16,873 | |
| | 4,973 | | | Migros Ticaret AS(b) | | | 34,215 | |
| | 14,657 | | | Netas Telekomunikasyon AS(b) | | | 64,716 | |
| | 5,730 | | | Nuh Cimento Sanayi AS | | | 14,802 | |
| | 653,679 | | | Petkim Petrokimya Holding AS | | | 1,144,160 | |
| | 31,891 | | | Sarkuysan Elektrolitik Bakir Sanayi ve Ticaret AS | | | 24,632 | |
| Old Westbury Funds, Inc. | |
| Small & Mid Cap Strategies Fund | |
| Portfolio of Investments - (Continued) | October 31, 2017 |
| | |
| Shares | | | | | Value | |
| TURKEY (continued) | | | | |
| | 68,018 | | | Sekerbank TAS(b) | | $ | 27,433 | |
| | 55,241 | | | Selcuk Ecza Deposu Ticaret ve Sanayi AS | | | 53,588 | |
| | 53,498 | | | Soda Sanayii AS | | | 74,037 | |
| | 44,575 | | | TAV Havalimanlari Holding AS | | | 221,726 | |
| | 34,027 | | | Tekfen Holding AS | | | 114,902 | |
| | 89,608 | | | Trakya Cam Sanayii AS | | | 97,083 | |
| | 36,442 | | | Tupras Turkiye Petrol Rafinerileri AS | | | 1,311,261 | |
| | 456,707 | | | Turk Hava Yollari AO(b) | | | 1,249,652 | |
| | 102,718 | | | Turkiye Halk Bankasi AS | | | 299,472 | |
| | 357,721 | | | Turkiye Sinai Kalkinma Bankasi AS | | | 129,187 | |
| | 291,904 | | | Turkiye Sise ve Cam Fabrikalari AS | | | 342,417 | |
| | 474,882 | | | Turkiye Vakiflar Bankasi TAO - Class D | | | 792,398 | |
| | 11,630 | | | Ulker Biskuvi Sanayi AS | | | 62,050 | |
| | 39,024 | | | Vestel Elektonik Sanayi ve Ticaret AS(b) | | | 101,634 | |
| | 67,419 | | | Zorlu Enerji Elektrik Uretim AS(b) | | | 28,968 | |
| | | | | | | | 8,727,426 | |
| UNITED KINGDOM — 5.1% | | | | |
| | 1,160 | | | 4imprint Group PLC | | | 29,627 | |
| | 16,302 | | | A.G. Barr Plc | | | 135,213 | |
| | 383,638 | | | Abcam Plc | | | 5,069,791 | |
| | 18,704 | | | Acacia Mining Plc | | | 44,789 | |
| | 14,305 | | | Acal PLC | | | 60,227 | |
| | 96,900 | | | Adaptimmune Therapeutics Plc - ADR(b) | | | 760,665 | |
| | 25,242 | | | Admiral Group Plc | | | 645,022 | |
| | 129,757 | | | Afren Plc(a)(b)(c) | | | 0 | |
| | 12,891 | | | Aggreko Plc | | | 160,425 | |
| | 45,257 | | | Aldermore Group Plc(b) | | | 180,925 | |
| | 1,859 | | | Arrow Global Group Plc | | | 10,450 | |
| | 47,156 | | | Ashmore Group Plc | | | 241,063 | |
| | 13,140 | | | ASOS Plc(b) | | | 994,230 | |
| | 27,283 | | | Assura Plc REIT | | | 21,886 | |
| | 37,432 | | | Auto Trader Group Plc | | | 170,274 | |
| | 5,635 | | | Avon Rubber PLC | | | 73,269 | |
| | 94,106 | | | Babcock International Group PLC | | | 1,014,889 | |
| | 102,410 | | | Balfour Beatty PLC | | | 372,682 | |
| | 319,650 | | | Barratt Developments PLC | | | 2,778,624 | |
| | 237,739 | | | BBA Aviation Plc | | | 1,004,722 | |
| | 192,377 | | | Beazley Plc | | | 1,291,575 | |
| | 52,442 | | | Bellway PLC | | | 2,542,246 | |
| | 3,312 | | | Belmond Ltd. - Class A(b) | | | 43,553 | |
| | 37,557 | | | Berkeley Group Holdings Plc | | | 1,866,053 | |
| | 10,409 | | | Big Yellow Group PLC | | | 107,487 | |
| | 112,748 | | | Bodycote Plc | | | 1,403,117 | |
| | 33,993 | | | Booker Group Plc | | | 90,837 | |
| | 39,276 | | | Bovis Homes Group PLC | | | 613,451 | |
| | 5,261 | | | Braemar Shipping Services PLC | | | 21,539 | |
| | 42,050 | | | Brewin Dolphin Holdings PLC | | | 197,257 | |
| Shares | | | | | Value | |
| UNITED KINGDOM (continued) | | | | |
| | 19,353 | | | British Land Co. PLC (The) | | $ | 154,479 | |
| | 23,921 | | | Britvic Plc | | | 240,503 | |
| | 21,123 | | | BTG PLC | | | 211,530 | |
| | 55,211 | | | Burberry Group Plc | | | 1,394,702 | |
| | 14,681 | | | Cambian Group Plc | | | 37,827 | |
| | 24,814 | | | Capital & Counties Properties Plc | | | 87,632 | |
| | 44,553 | | | Capital & Regional PLC | | | 32,249 | |
| | 25,009 | | | Card Factory Plc | | | 104,264 | |
| | 1,647 | | | Cardtronics Plc - Class A(b) | | | 37,716 | |
| | 87,391 | | | Carillion PLC | | | 52,811 | |
| | 3,352 | | | Carpetright PLC | | | 7,390 | |
| | 52,706 | | | Chemring Group Plc | | | 120,752 | |
| | 48,977 | | | Chesnara Plc | | | 250,437 | |
| | 1,714,165 | | | Cineworld Group Plc | | | 15,128,400 | |
| | 19,803 | | | Circassia Pharmaceuticals Plc(b) | | | 21,962 | |
| | 2,013 | | | Clarkson PLC | | | 78,362 | |
| | 55,392 | | | Close Brothers Group PLC | | | 1,021,868 | |
| | 130,692 | | | Cobham Plc(b) | | | 241,273 | |
| | 55,701 | | | Communisis PLC | | | 39,949 | |
| | 26,022 | | | Computacenter Plc | | | 343,882 | |
| | 8,765 | | | Concentric AB | | | 147,102 | |
| | 11,234 | | | Connect Group Plc | | | 16,450 | |
| | 5,916 | | | Consort Medical PLC | | | 87,216 | |
| | 10,718 | | | Costain Group Plc | | | 61,495 | |
| | 11,142 | | | Cranswick PLC | | | 455,784 | |
| | 44,512 | | | Crest Nicholson Holdings Plc | | | 334,906 | |
| | 397,317 | | | Croda International Plc | | | 22,078,737 | |
| | 23,730 | | | Daily Mail & General Trust PLC | | | 218,570 | |
| | 34,422 | | | Dairy Crest Group PLC | | | 277,733 | |
| | 9,017 | | | De La Rue Plc | | | 83,831 | |
| | 198,560 | | | Debenhams Plc | | | 115,376 | |
| | 8,007 | | | Dechra Pharmaceuticals PLC | | | 218,644 | |
| | 4,685 | | | Derwent London PLC | | | 166,510 | |
| | 51,874 | | | Devro PLC | | | 167,762 | |
| | 7,996 | | | DFS Furniture Plc | | | 22,195 | |
| | 32,605 | | | Dialog Semiconductor Plc(b) | | | 1,619,844 | |
| | 4,728 | | | Dignity Plc | | | 152,152 | |
| | 784,625 | | | Diploma PLC(a) | | | 11,244,211 | |
| | 279,412 | | | Direct Line Insurance Group Plc | | | 1,379,377 | |
| | 81,959 | | | Domino’s Pizza Group Plc | | | 365,421 | |
| | 48,473 | | | Drax Group Plc | | | 178,845 | |
| | 153,705 | | | DS Smith PLC | | | 1,063,582 | |
| | 6,273 | | | Dunelm Group Plc | | | 60,986 | |
| | 21,230 | | | easyJet Plc | | | 377,551 | |
| | 192,576 | | | EI Group Plc(b) | | | 344,009 | |
| | 159,024 | | | Electrocomponents PLC | | | 1,466,832 | |
| | 1,160,834 | | | Elementis PLC | | | 4,383,211 | |
| | 161,056 | | | EnQuest Plc(b) | | | 55,081 | |
| | 9,265 | | | Ensco Plc - Class A | | | 49,938 | |
| | 1,190,431 | | | Equiniti Group Plc | | | 4,789,045 | |
| | 12,758 | | | Essentra Plc | | | 90,145 | |
| | 62,061 | | | Esure Group Plc | | | 221,314 | |
| Old Westbury Funds, Inc. | |
| Small & Mid Cap Strategies Fund | |
| Portfolio of Investments - (Continued) | October 31, 2017 |
| | |
| Shares | | | | | Value | |
| UNITED KINGDOM (continued) | | | | |
| | 8,122 | | | Euromoney Institutional Investor PLC | | $ | 124,700 | |
| | 19,818 | | | Evraz Plc | | | 75,937 | |
| | 50,183 | | | Fenner PLC | | | 229,777 | |
| | 2,100 | | | Ferroglobe Plc | | | 33,579 | |
| | 359,569 | | | Fiat Chrysler Automobiles NV | | | 6,215,642 | |
| | 6,971 | | | Fidessa Group PLC | | | 210,723 | |
| | 422,903 | | | Firstgroup PLC | | | 617,844 | |
| | 35,534 | | | Foxtons Group Plc | | | 37,401 | |
| | 3,059 | | | Fuller Smith & Turner Plc - Class A | | | 39,043 | |
| | 112,080 | | | G4S Plc | | | 418,292 | |
| | 18,966 | | | Galliford Try Plc | | | 307,313 | |
| | 5,545 | | | Games Workshop Group PLC | | | 167,176 | |
| | 26,321 | | | Gem Diamonds Ltd.(b) | | | 27,966 | |
| | 44,127 | | | Genus PLC | | | 1,377,852 | |
| | 580,156 | | | GKN Plc | | | 2,442,584 | |
| | 5,199 | | | Go-Ahead Group PLC | | | 122,219 | |
| | 26,527 | | | Gocompare.Com Group Plc | | | 35,848 | |
| | 764,195 | | | Greene King Plc | | | 5,490,942 | |
| | 30,359 | | | Greggs Plc | | | 513,691 | |
| | 18,043 | | | Gulf Keystone Petroleum Ltd.(b) | | | 24,982 | |
| | 85,828 | | | Halfords Group Plc | | | 376,744 | |
| | 660,324 | | | Halma PLC | | | 10,366,209 | |
| | 11,646 | | | Hammerson PLC | | | 81,050 | |
| | 67,725 | | | Hansteen Holdings Plc REIT | | | 123,230 | |
| | 41,002 | | | Hargreaves Lansdown Plc | | | 861,503 | |
| | 73,639 | | | Hays PLC | | | 182,305 | |
| | 11,940 | | | Headlam Group PLC | | | 93,562 | |
| | 26,404 | | | Helical Plc | | | 107,660 | |
| | 8,793 | | | Henry Boot PLC | | | 37,517 | |
| | 27,440 | | | Hill & Smith Holdings PLC | | | 481,794 | |
| | 632 | | | Hilton Food Group Plc | | | 7,487 | |
| | 5,026 | | | Hogg Robinson Group Plc | | | 5,006 | |
| | 100,738 | | | HomeServe Plc | | | 1,145,282 | |
| | 109,344 | | | Howden Joinery Group PLC | | | 595,566 | |
| | 28,336 | | | Hunting PLC | | | 197,016 | |
| | 14,815 | | | Imagination Technologies Group PLC | | | 35,516 | |
| | 22,425 | | | IMI Plc | | | 363,956 | |
| | 127,184 | | | Inchcape Plc | | | 1,320,100 | |
| | 25,333 | | | Indivior Plc(b) | | | 125,028 | |
| | 141,286 | | | Informa Plc | | | 1,307,908 | |
| | 57,563 | | | Inmarsat Plc | | | 474,767 | |
| | 32,301 | | | Intertek Group Plc | | | 2,327,347 | |
| | 21,818 | | | Intu Properties PLC | | | 62,591 | |
| | 44,620 | | | ITE Group PLC | | | 105,338 | |
| | 22,370 | | | J D Wetherspoon PLC | | | 369,897 | |
| | 343,043 | | | J Sainsbury Plc | | | 1,104,856 | |
| | 6,901 | | | Jackpotjoy Plc(b) | | | 74,791 | |
| | 11,666 | | | James Fisher & Sons PLC | | | 241,089 | |
| | 22,831 | | | Janus Henderson Group Plc | | | 793,377 | |
| | 25,740 | | | Jardine Lloyd Thompson Group PLC | | | 445,449 | |
| | 80,166 | | | JD Sports Fashion Plc | | | 380,744 | |
| Shares | | | | | Value | |
| UNITED KINGDOM (continued) | | | | |
| | 11,499 | | | John Laing Group Plc | | $ | 43,618 | |
| | 17,247 | | | John Menzies PLC | | | 160,346 | |
| | 151,724 | | | John Wood Group Plc | | | 1,433,754 | |
| | 25,658 | | | Johnson Matthey Plc | | | 1,152,162 | |
| | 38,882 | | | Jupiter Fund Management Plc | | | 307,005 | |
| | 8,237 | | | Just Eat Plc(b) | | | 85,331 | |
| | 56,252 | | | Just Group Plc | | | 115,204 | |
| | 55,928 | | | KAZ Minerals Plc(b) | | | 603,900 | |
| | 122,169 | | | KCOM Group PLC | | | 174,427 | |
| | 32,991 | | | Keller Group PLC | | | 410,345 | |
| | 12,170 | | | Kier Group PLC | | | 168,101 | |
| | 128,742 | | | Ladbrokes Coral Group Plc | | | 217,839 | |
| | 4,314,613 | | | Laird Plc(a) | | | 9,340,602 | |
| | 32,223 | | | Lancashire Holdings Ltd. | | | 321,618 | |
| | 26,949 | | | LivaNova Plc(b) | | | 1,991,531 | |
| | 20,610 | | | Londonmetric Property Plc REIT | | | 48,286 | |
| | 115,356 | | | Lookers Plc | | | 160,870 | |
| | 16,503 | | | Low & Bonar PLC | | | 15,124 | |
| | 11,902 | | | LSL Property Services Plc | | | 36,911 | |
| | 332,941 | | | Man Strategic Holdings Plc | | | 856,087 | |
| | 385,129 | | | Marks & Spencer Group Plc | | | 1,760,096 | |
| | 29,565 | | | Marshalls Plc | | | 187,184 | |
| | 249,397 | | | Marston’s Plc | | | 353,097 | |
| | 537,660 | | | Mcbride Plc(a)(b)(c) | | | 714 | |
| | 18,540 | | | McBride PLC | | | 52,941 | |
| | 13,685 | | | McColl’s Retail Group Plc | | | 51,937 | |
| | 18,776 | | | Mears Group PLC | | | 113,028 | |
| | 274,902 | | | Meggitt PLC | | | 1,893,093 | |
| | 619,773 | | | Melrose Industries Plc | | | 1,810,103 | |
| | 39,016 | | | Merlin Entertainments Plc | | | 196,290 | |
| | 2,769 | | | Michael Kors Holdings Ltd.(b) | | | 135,155 | |
| | 44,090 | | | Millennium & Copthorne Hotels PLC | | | 354,275 | |
| | 90,011 | | | Mitie Group PLC | | | 283,328 | |
| | 103,302 | | | Moneysupermarket.com Group Plc | | | 445,763 | |
| | 65,172 | | | Morgan Advanced Materials PLC | | | 271,792 | |
| | 12,987 | | | Morgan Sindall Group PLC | | | 249,070 | |
| | 19,828 | | | Mothercare PLC | | | 25,544 | |
| | 38,272 | | | N Brown Group Plc | | | 153,102 | |
| | 204,239 | | | National Express Group PLC | | | 996,877 | |
| | 3,594 | | | NCC Group Plc | | | 10,979 | |
| | 70,609 | | | NEX Group Plc | | | 595,028 | |
| | 17,895 | | | Noble Corp. Plc(b) | | | 74,443 | |
| | 63,435 | | | Northgate Plc | | | 377,444 | |
| | 401,218 | | | Ocado Group Plc(b) | | | 1,533,083 | |
| | 2,574 | | | OM Asset Management Plc | | | 39,331 | |
| | 29,443 | | | Onesavings Bank Plc | | | 158,765 | |
| | 70,583 | | | Ophir Energy Plc(b) | | | 61,168 | |
| | 6,094 | | | Oxford Instruments PLC | | | 76,931 | |
| | 22,060 | | | Pagegroup Plc | | | 137,031 | |
| | 5,282 | | | PayPoint Plc | | | 64,435 | |
| | 132,586 | | | Pearson PLC | | | 1,238,817 | |
| | 412,005 | | | Pendragon Plc | | | 138,169 | |
| Old Westbury Funds, Inc. | |
| Small & Mid Cap Strategies Fund | |
| Portfolio of Investments - (Continued) | October 31, 2017 |
| | |
| Shares | | | | | Value | |
| UNITED KINGDOM (continued) | | | | |
| | 20,546 | | | Pennon Group Plc | | $ | 216,667 | |
| | 46,429 | | | Persimmon PLC | | | 1,727,837 | |
| | 753,438 | | | Petropavlovsk Plc(b) | | | 80,154 | |
| | 19,177 | | | Pets at Home Group Plc | | | 44,852 | |
| | 36,290 | | | Photo-Me International PLC | | | 86,396 | |
| | 13,974 | | | Polypipe Group Plc | | | 76,558 | |
| | 1,385 | | | Porvair PLC | | | 8,646 | |
| | 296,794 | | | Premier Foods Plc(b) | | | 154,718 | |
| | 243,580 | | | Premier Oil Plc(b) | | | 219,986 | |
| | 53,646 | | | PZ Cussons Plc | | | 235,480 | |
| | 179,176 | | | QinetiQ Group Plc | | | 580,889 | |
| | 28,721 | | | Rank Group Plc | | | 90,748 | |
| | 97,202 | | | Redrow PLC | | | 840,430 | |
| | 128,562 | | | Renewi PLC | | | 177,237 | |
| | 23,226 | | | Renishaw PLC | | | 1,528,493 | |
| | 51,233 | | | Renold PLC | | | 29,770 | |
| | 195,018 | | | Rentokil Initial Plc | | | 869,763 | |
| | 29,192 | | | Restaurant Group Plc (The) | | | 117,748 | |
| | 7,870 | | | Ricardo PLC | | | 85,501 | |
| | 21,005 | | | Rightmove Plc | | | 1,158,870 | |
| | 17,462 | | | Robert Walters PLC | | | 144,139 | |
| | 150,939 | | | Rotork Plc | | | 526,632 | |
| | 36,853 | | | RPC Group PLC | | | 461,317 | |
| | 98,326 | | | RPS Group PLC | | | 384,264 | |
| | 223,118 | | | RSA Insurance Group Plc | | | 1,863,935 | |
| | 13,220 | | | Safestore Holdings Plc REIT | | | 78,169 | |
| | 51,636 | | | Saga Plc | | | 131,057 | |
| | 22,285 | | | Savills Plc | | | 276,147 | |
| | 21,495 | | | SDL PLC | | | 153,591 | |
| | 67,804 | | | Segro Plc REIT | | | 488,991 | |
| | 140,739 | | | Senior PLC | | | 538,895 | |
| | 73,665 | | | Severfield Plc | | | 63,839 | |
| | 13,492 | | | Severn Trent Plc | | | 378,277 | |
| | 16,397 | | | Shaftesbury PLC | | | 215,598 | |
| | 158,633 | | | SIG PLC | | | 363,436 | |
| | 133,882 | | | Smiths Group Plc | | | 2,793,468 | |
| | 192,123 | | | Spectris PLC | | | 6,532,279 | |
| | 126,321 | | | Speedy Hire PLC | | | 92,694 | |
| | 236,194 | | | Spirax-Sarco Engineering Plc | | | 17,724,039 | |
| | 129,217 | | | Spirent Communications PLC | | | 169,474 | |
| | 15,991 | | | Sportech Plc(b) | | | 22,300 | |
| | 63,174 | | | Sports Direct International Plc(b) | | | 331,757 | |
| | 18,929 | | | SSP Group Plc | | | 147,072 | |
| | 12,066 | | | St Ives PLC | | | 11,779 | |
| | 78,970 | | | St James’s Place PLC | | | 1,234,480 | |
| | 48,691 | | | St Modwen Properties PLC | | | 246,194 | |
| | 995 | | | Stallergenes Greer Plc(b) | | | 50,997 | |
| | 846,861 | | | STERIS Plc(a) | | | 79,037,537 | |
| | 24,157 | | | Sthree Plc | | | 113,898 | |
| | 7,112 | | | Stobart Group Ltd. | | | 26,722 | |
| | 10,189 | | | Stock Spirits Group Plc | | | 34,102 | |
| | 14,730 | | | Stolt-Nielsen Ltd. | | | 207,389 | |
| | 8,341 | | | SuperGroup Plc | | | 205,387 | |
| | 54,149 | | | Synthomer PLC | | | 352,253 | |
| | 90,072 | | | Talktalk Telecom Group Plc | | | 255,407 | |
| Shares | | | | | Value | |
| UNITED KINGDOM (continued) | | | | |
| | 93,409 | | | Tate & Lyle PLC | | $ | 802,052 | |
| | 679,854 | | | Taylor Wimpey PLC | | | 1,801,374 | |
| | 4,185 | | | Ted Baker PLC | | | 153,965 | |
| | 7,809 | | | Telecom Plus PLC | | | 126,532 | |
| | 117,616 | | | Thomas Cook Group Plc | | | 187,141 | |
| | 3,226 | | | Topps Tiles Plc | | | 2,989 | |
| | 103,584 | | | TP ICAP Plc | | | 749,093 | |
| | 154,509 | | | Travelport Worldwide Ltd. | | | 2,424,246 | |
| | 63,929 | | | Travis Perkins PLC | | | 1,290,586 | |
| | 16,317 | | | Trifast PLC | | | 47,731 | |
| | 107,872 | | | Trinity Mirror PLC | | | 121,063 | |
| | 52,377 | | | TT Electronics PLC | | | 155,128 | |
| | 194,449 | | | Tullow Oil PLC | | | 470,027 | |
| | 26,201 | | | U & I Group PLC | | | 64,204 | |
| | 61,174 | | | UBM Plc | | | 571,579 | |
| | 387,065 | | | Ultra Electronics Holdings Plc | | | 9,376,789 | |
| | 16,892 | | | UNITE Group PLC (The) | | | 157,718 | |
| | 15,981 | | | United Utilities Group Plc | | | 176,805 | |
| | 69,305 | | | Vectura Group Plc(b) | | | 92,047 | |
| | 155,304 | | | Vesuvius Plc | | | 1,212,845 | |
| | 468,829 | | | Victrex PLC | | | 14,931,693 | |
| | 28,483 | | | Virgin Money Holdings UK Plc | | | 110,387 | |
| | 11,826 | | | Vitec Group PLC (The) | | | 176,700 | |
| | 14,613 | | | Weir Group PLC (The) | | | 379,042 | |
| | 22,284 | | | WH Smith Plc | | | 605,838 | |
| | 244,679 | | | William Hill Plc | | | 839,720 | |
| | 15,003 | | | Wilmington PLC | | | 47,200 | |
| | 12,913 | | | Wincanton Plc | | | 42,876 | |
| | 734,715 | | | Wm Morrison Supermarkets PLC | | | 2,187,761 | |
| | 11,514 | | | Workspace Group Plc REIT | | | 135,336 | |
| | 25,204 | | | Worldpay Group Plc | | | 135,907 | |
| | 94,956 | | | Xaar PLC | | | 617,019 | |
| | | | | | | | 332,219,652 | |
| UNITED STATES — 53.4% | | | | |
| | 27,400 | | | 1st Source Corp. | | | 1,405,894 | |
| | 13,800 | | | A Schulman, Inc. | | | 542,340 | |
| | 1,373 | | | AAON, Inc. | | | 48,055 | |
| | 85,079 | | | Aaron’s, Inc. | | | 3,130,907 | |
| | 3,386 | | | Abercrombie & Fitch Co. | | | 45,474 | |
| | 732 | | | ABIOMED, Inc. | | | 141,217 | |
| | 983 | | | ABM Industries, Inc. | | | 41,257 | |
| | 2,279 | | | Acadia Healthcare Co. Inc.(b) | | | 71,469 | |
| | 6,908 | | | ACCO Brands Corp.(b) | | | 90,148 | |
| | 117,200 | | | Aceto Corp. | | | 1,180,204 | |
| | 3,182 | | | ACI Worldwide, Inc. | | | 76,623 | |
| | 4,700 | | | ACNB Corp. | | | 131,130 | |
| | 500,421 | | | Actuant Corp. - Class A | | | 12,760,736 | |
| | 964 | | | Acxiom Corp. | | | 24,254 | |
| | 12,200 | | | Addus HomeCare Corp. | | | 439,200 | |
| | 3,010 | | | Adient Plc | | | 253,924 | |
| | 1,660 | | | Adtalem Global Education, Inc. | | | 61,337 | |
| | 49,544 | | | Aduro Biotech, Inc.(b) | | | 393,875 | |
| | 755,687 | | | Advance Auto Parts, Inc. | | | 61,769,855 | |
| Old Westbury Funds, Inc. | |
| Small & Mid Cap Strategies Fund | |
| Portfolio of Investments - (Continued) | October 31, 2017 |
| | |
| Shares | | | | | Value | |
| UNITED STATES (continued) | | | | |
| | 56,700 | | | Advanced Disposal Services, Inc.(b) | | $ | 1,412,964 | |
| | 444 | | | Advanced Energy Industries, Inc. | | | 37,616 | |
| | 377 | | | AdvanSix, Inc.(b) | | | 17,444 | |
| | 246 | | | Advisory Board Co. (The)(b) | | | 13,266 | |
| | 5,633 | | | AECOM(b) | | | 197,493 | |
| | 16,547 | | | Aerovironment, Inc. | | | 846,545 | |
| | 3,005 | | | AES Corp/VA | | | 31,943 | |
| | 3,132 | | | Affiliated Managers Group, Inc. | | | 584,118 | |
| | 61,000 | | | AG Mortgage Investment Trust, Inc. | | | 1,147,410 | |
| | 2,939 | | | AGCO Corp. | | | 201,527 | |
| | 220,265 | | | AGNC Investment Corp. REIT | | | 4,433,934 | |
| | 8,516 | | | Air Lease Corp. | | | 370,020 | |
| | 2,413 | | | Air Transport Services Group, Inc.(b) | | | 58,395 | |
| | 1,706 | | | Akamai Technologies, Inc.(b) | | | 89,139 | |
| | 3,760 | | | Akorn, Inc. | | | 122,463 | |
| | 12,721 | | | Alamo Group, Inc. | | | 1,342,066 | |
| | 1,864 | | | Albany International Corp. | | | 112,492 | |
| | 4,900 | | | Albemarle Corp. | | | 690,361 | |
| | 823 | | | Alexander & Baldwin, Inc. | | | 37,233 | |
| | 3,708 | | | Alexander’s, Inc. | | | 1,523,988 | |
| | 644 | | | Alexandria Real Estate Equities, Inc. | | | 79,830 | |
| | 921 | | | Align Technology, Inc. | | | 220,101 | |
| | 105 | | | Alleghany Corp. | | | 59,453 | |
| | 42,988 | | | ALLETE, Inc. | | | 3,368,110 | |
| | 2,122 | | | Alliant Energy Corp. | | | 91,798 | |
| | 2,680 | | | Allison Transmission Holdings, Inc. | | | 113,873 | |
| | 9,428 | | | Allscripts Healthcare Solutions, Inc.(b) | | | 127,089 | |
| | 17,400 | | | Ally Financial, Inc. | | | 454,662 | |
| | 36,171 | | | Alnylam Pharmaceuticals, Inc.(b) | | | 4,407,075 | |
| | 34,600 | | | Alpha & Omega Semiconductor Ltd.(b) | | | 637,678 | |
| | 551 | | | Altra Industrial Motion Corp. | | | 26,393 | |
| | 10,230 | | | Ambarella, Inc.(b) | | | 577,381 | |
| | 1,438 | | | AMC Networks, Inc. - Class A(b) | | | 73,165 | |
| | 4,197 | | | Amdocs Ltd. | | | 273,225 | |
| | 464 | | | Amedisys, Inc. | | | 22,323 | |
| | 600 | | | AMERCO | | | 235,584 | |
| | 2,603 | | | American Axle & Manufacturing Holdings, Inc. | | | 46,307 | |
| | 1,233 | | | American Campus Communities, Inc. | | | 51,268 | |
| | 8,120 | | | American Eagle Outfitters, Inc. | | | 105,722 | |
| | 6,301 | | | American Equity Investment Life Holding Co. | | | 185,943 | |
| | 2,197 | | | American Financial Group, Inc. | | | 231,762 | |
| | 1,561 | | | American Homes 4 Rent - Class A REIT | | | 33,218 | |
| Shares | | | | | Value | |
| UNITED STATES (continued) | | | | |
| | 4,500 | | | American National Bankshares, Inc. | | $ | 176,175 | |
| | 461 | | | American National Insurance Co. | | | 56,118 | |
| | 33,994 | | | American Outdoor Brands Corp.(b) | | | 487,134 | |
| | 1,044 | | | American Public Education, Inc.(b) | | | 20,879 | |
| | 52,300 | | | American Software, Inc./GA | | | 649,043 | |
| | 26,100 | | | American States Water Co. | | | 1,402,875 | |
| | 200 | | | American Woodmark Corp. | | | 19,319 | |
| | 989 | | | Ameris Bancorp | | | 47,373 | |
| | 17,730 | | | AMERISAFE, Inc. | | | 1,147,131 | |
| | 1,991 | | | Amkor Technology, Inc. | | | 23,036 | |
| | 1,083 | | | AMN Healthcare Services, Inc. | | | 47,544 | |
| | 482,000 | | | Amplify Snack Brands, Inc.(b) | | | 3,079,980 | |
| | 22,200 | | | Analogic Corp. | | | 1,782,660 | |
| | 700 | | | Andersons, Inc. (The) | | | 26,215 | |
| | 63,200 | | | AngioDynamics, Inc.(b) | | | 1,072,504 | |
| | 992 | | | Anixter International, Inc. | | | 68,150 | |
| | 383,764 | | | Annaly Capital Management, Inc., REIT | | | 4,397,935 | |
| | 598,824 | | | ANSYS, Inc.(b) | | | 81,865,229 | |
| | 172,400 | | | Anworth Mortgage Asset Corp. | | | 963,716 | |
| | 1,597 | | | AO Smith Corp. | | | 94,542 | |
| | 1,789 | | | Apartment Investment & Management Co. - Class A REIT | | | 78,680 | |
| | 212,046 | | | Apollo Commercial Real Estate Finance, Inc., REIT | | | 3,831,671 | |
| | 13,700 | | | Appfolio, Inc. - Class A(b) | | | 628,830 | |
| | 1,163 | | | Apple Hospitality REIT, Inc. | | | 22,027 | |
| | 41,254 | | | Applied Industrial Technologies, Inc. | | | 2,625,817 | |
| | 1,238 | | | Aptargroup, Inc. | | | 107,793 | |
| | 1,333 | | | Aqua America, Inc. | | | 47,295 | |
| | 6,223 | | | Aramark | | | 271,883 | |
| | 1,344 | | | ArcBest Corp. | | | 43,814 | |
| | 3,279 | | | Arconic, Inc. | | | 82,368 | |
| | 3,700 | | | Ares Commercial Real Estate Corp. REIT | | | 48,026 | |
| | 18,119 | | | Argan, Inc. | | | 1,245,681 | |
| | 31,200 | | | Argonaut Gold, Inc.(b) | | | 56,349 | |
| | 448 | | | Arista Networks, Inc. | | | 89,551 | |
| | 1,290 | | | Armstrong World Industries, Inc.(b) | | | 65,919 | |
| | 6,443 | | | ARRIS International Plc(b) | | | 183,626 | |
| | 7,163 | | | Arrow Electronics, Inc. | | | 598,755 | |
| | 10,185 | | | Arrow Financial Corp. | | | 359,531 | |
| | 16,300 | | | Artesian Resources Corp. | | | 662,106 | |
| | 2,847 | | | Arthur J Gallagher & Co. | | | 180,301 | |
| | 854 | | | Artisan Partners Asset Management Inc. - Class A | | | 29,378 | |
| | 397 | | | Asbury Automotive Group, Inc. | | | 24,376 | |
| | 744 | | | Ashland Global Holdings, Inc. | | | 50,577 | |
| | 51,116 | | | Aspen Technology, Inc. | | | 3,298,004 | |
| | 5,003 | | | Associated Banc-Corp | | | 126,576 | |
| Old Westbury Funds, Inc. | |
| Small & Mid Cap Strategies Fund | |
| Portfolio of Investments - (Continued) | October 31, 2017 |
| | |
| Shares | | | | | Value | |
| UNITED STATES (continued) | | | | |
| | 28,013 | | | Assurant, Inc. | | $ | 2,819,508 | |
| | 415 | | | Astronics Corp. | | | 14,275 | |
| | 680 | | | athenahealth, Inc.(b) | | | 86,958 | |
| | 1,228 | | | Atlas Air Worldwide Holdings, Inc. | | | 75,338 | |
| | 872 | | | Atmos Energy Corp. | | | 76,073 | |
| | 350 | | | ATN International Inc. | | | 19,002 | |
| | 2,400 | | | Atrion Corp. | | | 1,578,360 | |
| | 5,067 | | | Autoliv, Inc. | | | 632,666 | |
| | 6,072 | | | AutoNation, Inc.(b) | | | 287,813 | |
| | 1,444 | | | Avery Dennison Corp. | | | 153,309 | |
| | 1,111 | | | Avis Budget Group, Inc. | | | 45,829 | |
| | 23,200 | | | Avista Corp. | | | 1,211,968 | |
| | 8,244 | | | Avnet, Inc. | | | 328,111 | |
| | 81,010 | | | AVX Corp. | | | 1,526,228 | |
| | 1,725,795 | | | Axalta Coating Systems Ltd.(b) | | | 57,382,684 | |
| | 776 | | | Axon Enterprise, Inc.(b) | | | 17,825 | |
| | 450,000 | | | B&G Foods, Inc. | | | 14,310,000 | |
| | 609 | | | Badger Meter, Inc. | | | 26,674 | |
| | 32,200 | | | Balchem Corp. | | | 2,714,138 | |
| | 22,500 | | | Baldwin & Lyons, Inc. | | | 516,375 | |
| | 28,672 | | | BancFirst Corp. | | | 1,566,925 | |
| | 6,227 | | | Bancorpsouth, Inc. | | | 196,773 | |
| | 484 | | | Bank of Hawaii Corp. | | | 39,499 | |
| | 2,100 | | | Bank of Marin Bancorp | | | 142,275 | |
| | 3,461 | | | Bank of the Ozarks | | | 161,352 | |
| | 27,100 | | | BankFinancial Corp. | | | 429,264 | |
| | 2,019 | | | Bankrate, Inc.(b) | | | 28,064 | |
| | 6,924 | | | Bankunited, Inc. | | | 241,301 | |
| | 1,199 | | | Banner Corp. | | | 68,727 | |
| | 1,719 | | | Barnes Group, Inc. | | | 111,890 | |
| | 472 | | | Barracuda Networks, Inc. | | | 11,002 | |
| | 6,100 | | | Barrett Business Services, Inc. | | | 370,819 | |
| | 6,400 | | | BCB Bancorp, Inc. | | | 89,920 | |
| | 1,801 | | | Beacon Roofing Supply, Inc. | | | 99,793 | |
| | 20,300 | | | Bel Fuse, Inc. | | | 656,705 | |
| | 2,524 | | | Belden, Inc. | | | 201,693 | |
| | 2,464 | | | Bemis Co., Inc. | | | 110,929 | |
| | 66,500 | | | Benchmark Electronics, Inc.(b) | | | 2,058,175 | |
| | 2,498 | | | Beneficial Bancorp, Inc. | | | 41,217 | |
| | 15,751 | | | Benefitfocus, Inc.(b) | | | 431,577 | |
| | 18,472 | | | Berkshire Hills Bancorp, Inc. | | | 707,478 | |
| | 2,087 | | | Berry Global Group, Inc.(b) | | | 124,072 | |
| | 4,800 | | | BG Staffing, Inc. | | | 81,024 | |
| | 6,886 | | | BGC Partners, Inc. - Class A | | | 104,461 | |
| | 46,176 | | | Big Lots, Inc. | | | 2,369,291 | |
| | 700 | | | Biglari Holdings, Inc.(b) | | | 250,208 | |
| | 433 | | | Bio-Rad Laboratories, Inc. - Class A | | | 95,169 | |
| | 396 | | | Bio-Techne Corp. | | | 51,884 | |
| | 9,469 | | | Bizlink Holding, Inc. | | | 94,817 | |
| | 38,238 | | | BJ’s Restaurants, Inc. | | | 1,212,145 | |
| | 650 | | | Black Hills Corp. | | | 42,419 | |
| | 2,167 | | | Black Knight, Inc.(b) | | | 98,273 | |
| | 402,451 | | | Blackbaud, Inc. | | | 40,768,286 | |
| Shares | | | | | Value | |
| UNITED STATES (continued) | | | |
| | 1,082 | | | Blackhawk Network Holdings, Inc. | | $ | 36,734 | |
| | 130,752 | | | Bloomin’ Brands, Inc. | | | 2,324,771 | |
| | 60,700 | | | Blucora, Inc. | | | 1,317,190 | |
| | 3,583 | | | Blue Buffalo Pet Products, Inc.(b) | | | 103,656 | |
| | 2,148 | | | BMC Stock Holdings, Inc.(b) | | | 46,075 | |
| | 33,182 | | | Bob Evans Farms, Inc./DE | | | 2,561,319 | |
| | 1,300 | | | Boise Cascade Co.(b) | | | 46,085 | |
| | 2,960 | | | BOK Financial Corp. | | | 255,951 | |
| | 2,676 | | | Booz Allen Hamilton Holding Corp. | | | 101,126 | |
| | 12,227 | | | BorgWarner, Inc. | | | 644,607 | |
| | 74,156 | | | Boston Beer Co., Inc. (The) - Class A(b) | | | 13,203,476 | |
| | 2,633 | | | Boston Private Financial Holdings, Inc. | | | 41,865 | |
| | 50,500 | | | Bottomline Technologies de, Inc.(b) | | | 1,644,280 | |
| | 229,951 | | | Brady Corp. - Class A | | | 8,749,636 | |
| | 1,157 | | | Bright Horizons Family Solutions, Inc.(b) | | | 99,849 | |
| | 177,493 | | | Brinker International, Inc. | | | 5,452,585 | |
| | 5,909 | | | Brink’s Co. (The) | | | 449,675 | |
| | 1,948 | | | Broadridge Financial Solutions, Inc. | | | 167,372 | |
| | 19,812 | | | Brookline Bancorp, Inc. | | | 305,105 | |
| | 57,800 | | | Brooks Automation, Inc. | | | 1,987,742 | |
| | 8,006 | | | Brown & Brown, Inc. | | | 399,019 | |
| | 1,773 | | | Bruker Corp. | | | 55,672 | |
| | 1,774 | | | Brunswick Corp. | | | 89,853 | |
| | 278,600 | | | Bryn Mawr Bank Corp.(a) | | | 12,216,610 | |
| | 5,300 | | | BSB Bancorp, Inc.(b) | | | 158,470 | |
| | 45,500 | | | Buffalo Wild Wings, Inc.(b) | | | 5,378,100 | |
| | 3,906 | | | Builders FirstSource, Inc.(b) | | | 70,386 | |
| | 3,000 | | | Bunge Ltd. | | | 206,340 | |
| | 472 | | | Burlington Stores, Inc.(b) | | | 44,316 | |
| | 1,941 | | | BWX Technologies, Inc. | | | 116,305 | |
| | 5,700 | | | C&F Financial Corp. | | | 330,600 | |
| | 138 | | | Cable One, Inc. | | | 97,954 | |
| | 1,875 | | | Cabot Corp. | | | 114,300 | |
| | 15,295 | | | Cabot Microelectronics Corp. | | | 1,478,568 | |
| | 2,395 | | | Cabot Oil & Gas Corp. | | | 66,342 | |
| | 917 | | | CACI International, Inc. - Class A(b) | | | 131,819 | |
| | 4,685 | | | Cadence Design Systems, Inc.(b) | | | 202,205 | |
| | 6,269 | | | Calatlantic Group, Inc. | | | 309,312 | |
| | 383 | | | Calavo Growers, Inc. | | | 28,227 | |
| | 2,219 | | | Caleres, Inc. | | | 60,645 | |
| | 579 | | | California Water Service Group | | | 24,317 | |
| | 1,938 | | | Callaway Golf Co. | | | 27,965 | |
| | 2,126 | | | Callon Petroleum Co.(b) | | | 23,577 | |
| | 23,692 | | | Calpine Corp.(b) | | | 353,958 | |
| | 35,200 | | | Cambium Learning Group, Inc.(b) | | | 215,424 | |
| | 771 | | | Cambrex Corp.(b) | | | 33,346 | |
| Old Westbury Funds, Inc. | |
| Small & Mid Cap Strategies Fund | |
| Portfolio of Investments - (Continued) | October 31, 2017 |
| | |
| Shares | | | | | Value | |
| UNITED STATES (continued) | | | |
| | 2,499 | | | Camden National Corp. | | $ | 107,882 | |
| | 983 | | | Camden Property Trust REIT | | | 89,689 | |
| | 113,420 | | | Cantel Medical Corp. | | | 11,124,234 | |
| | 17,900 | | | Capella Education Co. | | | 1,457,955 | |
| | 1,029 | | | Capital Bank Financial Corp. - Class A | | | 41,777 | |
| | 4,600 | | | Capital City Bank Group, Inc. | | | 113,436 | |
| | 4,000 | | | Capitol Federal Financial, Inc. | | | 55,160 | |
| | 433,818 | | | Capstead Mortgage Corp. REIT | | | 3,826,275 | |
| | 450,000 | | | Cardiovascular Systems, Inc.(a)(b) | | | 10,831,500 | |
| | 3,597 | | | Carlisle Cos., Inc. | | | 395,059 | |
| | 1,726 | | | Carpenter Technology Corp. | | | 85,938 | |
| | 400 | | | Carriage Services, Inc. | | | 10,359 | |
| | 36,200 | | | Carrols Restaurant Group, Inc.(b) | | | 407,250 | |
| | 1,819 | | | Cars.com, Inc. | | | 43,329 | |
| | 953 | | | Carter’s, Inc. | | | 92,184 | |
| | 65,700 | | | Casella Waste Systems, Inc. - Class A(b) | | | 1,212,822 | |
| | 731 | | | Casey’s General Stores, Inc. | | | 83,751 | |
| | 366,341 | | | Catalent, Inc.(b) | | | 15,602,463 | |
| | 75,700 | | | CatchMark Timber Trust, Inc. - Class A REIT | | | 968,960 | |
| | 5,246 | | | Cathay General Bancorp | | | 219,283 | |
| | 356 | | | Cavco Industries, Inc.(b) | | | 55,856 | |
| | 98,139 | | | CBIZ, Inc.(b) | | | 1,663,456 | |
| | 52,095 | | | CBOE Holdings, Inc. | | | 5,889,861 | |
| | 1,113 | | | CDK Global, Inc. | | | 70,742 | |
| | 2,624 | | | CDW Corp. | | | 183,680 | |
| | 786 | | | Centerstate Banks, Inc. | | | 20,939 | |
| | 67,349 | | | Central Garden & Pet Co. - Class A(b) | | | 2,485,852 | |
| | 10,400 | | | Central Garden & Pet Co. - Class A(b) | | | 397,072 | |
| | 47,900 | | | Central Pacific Financial Corp. | | | 1,490,648 | |
| | 22,000 | | | Central Valley Community Bancorp | | | 444,400 | |
| | 3,035 | | | Century Aluminum Co.(b) | | | 42,490 | |
| | 50,700 | | | Century Casinos, Inc.(b) | | | 418,275 | |
| | 11,717 | | | CEVA, Inc.(b) | | | 565,931 | |
| | 3,716 | | | CF Industries Holdings, Inc. | | | 141,134 | |
| | 1,340 | | | CH Robinson Worldwide, Inc. | | | 105,230 | |
| | 499 | | | Charles River Laboratories International, Inc.(b) | | | 58,029 | |
| | 670 | | | Chart Industries, Inc.(b) | | | 29,145 | |
| | 30,000 | | | Charter Financial Corp (MD) | | | 575,100 | |
| | 10,700 | | | Chase Corp. | | | 1,270,625 | |
| | 16,700 | | | Chatham Lodging Trust REIT | | | 363,225 | |
| | 121,515 | | | Cheesecake Factory, Inc. (The) | | | 5,436,581 | |
| | 38,764 | | | Chegg, Inc.(b) | | | 601,230 | |
| | 15,345 | | | Chemed Corp. | | | 3,428,533 | |
| | 2,348 | | | Chemical Financial Corp. | | | 123,716 | |
| | 1,814 | | | Chemours Co. (The) | | | 102,691 | |
| | 2,300 | | | Chemung Financial Corp. | | | 108,652 | |
| | 1,071 | | | Cheniere Energy, Inc.(b) | | | 50,059 | |
| Shares | | | | | Value | |
| UNITED STATES (continued) | | | |
| | 33,600 | | | Cherry Hill Mortgage Investment Corp. REIT | | $ | 611,856 | |
| | 41,000 | | | Chesapeake Lodging Trust REIT | | | 1,143,900 | |
| | 27,200 | | | Chesapeake Utilities Corp. | | | 2,190,960 | |
| | 594 | | | Children’s Place, Inc. (The) | | | 64,627 | |
| | 15,700 | | | Churchill Downs, Inc. | | | 3,274,235 | |
| | 13,300 | | | Chuy’s Holdings, Inc.(b) | | | 299,250 | |
| | 3,232 | | | Ciena Corp.(b) | | | 68,745 | |
| | 3,062 | | | Cinemark Holdings, Inc. | | | 111,273 | |
| | 49,872 | | | Cirrus Logic, Inc.(b) | | | 2,792,832 | |
| | 12,911 | | | CIT Group, Inc. | | | 601,911 | |
| | 800 | | | Citi Trends, Inc. | | | 17,407 | |
| | 7,200 | | | Citizens & Northern Corp. | | | 175,896 | |
| | 12,201 | | | City Holding Co. | | | 860,048 | |
| | 25,400 | | | Civitas Solutions, Inc.(b) | | | 473,710 | |
| | 3,354 | | | Clean Harbors, Inc.(b) | | | 179,473 | |
| | 636 | | | CoBiz Financial, Inc. | | | 13,000 | |
| | 7,551 | | | Coca-Cola Bottling Co. Consolidated | | | 1,703,204 | |
| | 89,759 | | | Codexis, Inc.(b) | | | 552,018 | |
| | 2,432 | | | Coeur Mining, Inc.(b) | | | 18,459 | |
| | 478 | | | Cogent Communications Group, Inc. | | | 25,764 | |
| | 617 | | | Cognex Corp. | | | 75,984 | |
| | 900 | | | Cohen & Steers, Inc. | | | 39,141 | |
| | 487 | | | Coherent, Inc.(b) | | | 127,940 | |
| | 4,065 | | | Colfax Corp.(b) | | | 169,551 | |
| | 16,800 | | | Collectors Universe, Inc. | | | 415,968 | |
| | 1,850 | | | Columbia Banking System, Inc. | | | 80,494 | |
| | 1,890 | | | Columbia Sportswear Co. | | | 117,898 | |
| | 600 | | | Comfort Systems USA, Inc. | | | 26,579 | |
| | 2,698 | | | Commerce Bancshares Inc/MO | | | 156,916 | |
| | 200 | | | Commerce Union Bancshares, Inc. | | | 4,831 | |
| | 6,116 | | | Commercial Metals Co. | | | 119,140 | |
| | 3,154 | | | CommScope Holding Co., Inc.(b) | | | 101,370 | |
| | 201,420 | | | Community Bank System, Inc. | | | 11,136,512 | |
| | 28,523 | | | Community Trust Bancorp, Inc. | | | 1,377,661 | |
| | 405,400 | | | CommVault Systems, Inc.(b) | | | 21,101,070 | |
| | 502 | | | Compass Minerals International, Inc. | | | 32,931 | |
| | 26,400 | | | Computer Programs & Systems, Inc. | | | 795,960 | |
| | 464,417 | | | CONMED Corp.(a) | | | 24,251,856 | |
| | 2,075 | | | Connectone Bancorp, Inc. | | | 55,714 | |
| | 12,332 | | | CONSOL Energy, Inc.(b) | | | 198,915 | |
| | 1,039 | | | Continental Building Products, Inc.(b) | | | 27,741 | |
| | 80,221 | | | Convergys Corp. | | | 2,064,086 | |
| | 319,220 | | | Cooper Cos., Inc. (The) | | | 76,695,797 | |
| | 3,536 | | | Cooper Tire & Rubber Co. | | | 115,981 | |
| | 21,894 | | | Cooper-Standard Holding Inc.(b) | | | 2,440,743 | |
| | 3,716 | | | Copart, Inc.(b) | | | 134,854 | |
| | 1,801,569 | | | CoreLogic, Inc.(a)(b) | | | 84,493,586 | |
| Old Westbury Funds, Inc. | |
| Small & Mid Cap Strategies Fund | |
| Portfolio of Investments - (Continued) | October 31, 2017 |
| | |
| Shares | | | | | Value | |
| UNITED STATES (continued) | | | |
| | 1,211 | | | Core-Mark Holding Co., Inc. | | $ | 41,247 | |
| | 209 | | | CoreSite Realty Corp., REIT | | | 23,147 | |
| | 14,217 | | | CorVel Corp.(b) | | | 853,020 | |
| | 414 | | | CoStar Group, Inc.(b) | | | 122,441 | |
| | 1,900 | | | County Bancorp, Inc. | | | 62,054 | |
| | 4,655 | | | Cousins Properties, Inc. REIT | | | 41,988 | |
| | 2,311 | | | Covanta Holding Corp. | | | 37,207 | |
| | 1,274 | | | Covenant Transportation Group, Inc. - Class A(b) | | | 37,838 | |
| | 17,300 | | | CRA International, Inc. | | | 731,098 | |
| | 44,924 | | | Cracker Barrel Old Country Store, Inc. | | | 7,013,984 | |
| | 661 | | | Crane Co. | | | 54,942 | |
| | 444 | | | Credit Acceptance Corp.(b) | | | 127,308 | |
| | 1,889 | | | Cree, Inc.(b) | | | 67,437 | |
| | 1,401 | | | Crocs, Inc.(b) | | | 14,290 | |
| | 2,266 | | | Crown Holdings, Inc.(b) | | | 136,345 | |
| | 31,810 | | | CSG Systems International, Inc. | | | 1,346,835 | |
| | 2,835 | | | CSRA, Inc. | | | 90,692 | |
| | 1,113 | | | CTS Corp. | | | 30,274 | |
| | 1,390 | | | CubeSmart REIT | | | 37,836 | |
| | 101 | | | Cubic Corp. | | | 5,510 | |
| | 528 | | | Cullen/Frost Bankers, Inc. | | | 52,008 | |
| | 23,600 | | | Culp, Inc. | | | 748,120 | |
| | 30,599 | | | Curtiss-Wright Corp. | | | 3,618,332 | |
| | 2,033 | | | Customers Bancorp, Inc.(b) | | | 55,582 | |
| | 25,200 | | | Cutera, Inc.(b) | | | 990,360 | |
| | 608,234 | | | CVB Financial Corp. | | | 14,512,463 | |
| | 6,688 | | | Cypress Semiconductor Corp. | | | 106,072 | |
| | 835 | | | Cyrusone, Inc. REIT | | | 51,261 | |
| | 4,205 | | | Dana, Inc. | | | 128,210 | |
| | 54,902 | | | Darden Restaurants, Inc. | | | 4,516,788 | |
| | 10,205 | | | Darling Ingredients, Inc.(b) | | | 186,241 | |
| | 11,724 | | | Dave & Buster’s Entertainment, Inc.(b) | | | 565,097 | |
| | 530 | | | Dct Industrial Trust, Inc. REIT | | | 30,751 | |
| | 696 | | | Deckers Outdoor Corp.(b) | | | 47,495 | |
| | 48,100 | | | Del Frisco’s Restaurant Group, Inc.(b) | | | 668,590 | |
| | 26,929 | | | Del Taco Restaurants, Inc.(b) | | | 341,729 | |
| | 1,705 | | | Delek US Holdings, Inc. | | | 44,415 | |
| | 730 | | | Deluxe Corp. | | | 50,845 | |
| | 120,900 | | | Denny’s Corp.(b) | | | 1,580,163 | |
| | 1,139,400 | | | DENTSPLY SIRONA, Inc. | | | 69,583,158 | |
| | 16,333 | | | DexCom, Inc.(b) | | | 734,495 | |
| | 2,056 | | | Diamond Offshore Drilling, Inc.(b) | | | 34,397 | |
| | 637 | | | Diamondback Energy, Inc.(b) | | | 68,261 | |
| | 1,807 | | | DiamondRock Hospitality Co. REIT | | | 19,624 | |
| | 23,439 | | | Digimarc Corp.(b) | | | 836,772 | |
| | 439 | | | Digital Realty Trust, Inc. REIT | | | 51,995 | |
| | 2,659 | | | Dime Community Bancshares, Inc. | | | 58,631 | |
| | 60,497 | | | Diodes, Inc.(b) | | | 2,077,467 | |
| Shares | | | | | Value | |
| UNITED STATES (continued) | | | |
| | 1,716 | | | Dolby Laboratories, Inc. - Class A | | $ | 99,425 | |
| | 462 | | | Domino’s Pizza, Inc. | | | 84,546 | |
| | 4,148 | | | Domtar Corp. | | | 196,283 | |
| | 2,273 | | | Donaldson Co., Inc. | | | 107,308 | |
| | 21,700 | | | Donegal Group, Inc. - Class A | | | 371,938 | |
| | 2,260 | | | Dorian LPG Ltd.(b) | | | 16,159 | |
| | 482 | | | Dorman Products, Inc.(b) | | | 33,311 | |
| | 400 | | | Douglas Dynamics, Inc. | | | 16,779 | |
| | 953 | | | Douglas Emmett, Inc. REIT | | | 37,920 | |
| | 995,500 | | | Dover Corp. | | | 95,060,295 | |
| | 857 | | | DST Systems, Inc. | | | 50,237 | |
| | 3,893 | | | DSW, Inc. - Class A | | | 74,551 | |
| | 2,900 | | | Ducommun, Inc.(b) | | | 95,613 | |
| | 3,199 | | | Duke Realty Corp. REIT | | | 91,108 | |
| | 794,152 | | | Dun & Bradstreet Corp. (The)(a) | | | 92,780,778 | |
| | 781 | | | Dunkin’ Brands Group Inc. | | | 46,134 | |
| | 1,026 | | | Dycom Industries, Inc.(b) | | | 90,114 | |
| | 4,573 | | | Dynegy, Inc.(b) | | | 56,934 | |
| | 114,600 | | | Dynex Capital, Inc. REIT | | | 802,200 | |
| | 7,817 | | | E*TRADE Financial Corp.(b) | | | 340,743 | |
| | 1,323 | | | Eagle Bancorp, Inc.(b) | | | 88,178 | |
| | 957 | | | Eagle Materials, Inc. | | | 101,030 | |
| | 4,118 | | | East West Bancorp, Inc. | | | 246,421 | |
| | 27,500 | | | Easterly Government Properties, Inc. REIT | | | 553,300 | |
| | 6,000 | | | Eastern Co. (The) | | | 173,400 | |
| | 12,595 | | | EastGroup Properties, Inc. REIT | | | 1,140,981 | |
| | 2,071 | | | Eaton Vance Corp. | | | 104,523 | |
| | 2,963 | | | EchoStar Corp. - Class A(b) | | | 165,780 | |
| | 1,730 | | | Edgewell Personal Care Co.(b) | | | 112,329 | |
| | 47,628 | | | El Paso Electric Co. | | | 2,738,610 | |
| | 365,000 | | | El Pollo Loco Holdings, Inc.(b) | | | 4,197,500 | |
| | 2,480 | | | Eldorado Resorts, Inc.(b) | | | 63,736 | |
| | 570 | | | Electronics For Imaging, Inc.(b) | | | 17,590 | |
| | 500,000 | | | Elf Beauty, Inc.(b) | | | 10,595,000 | |
| | 7,386 | | | Ellie Mae, Inc.(b) | | | 664,371 | |
| | 24,200 | | | Ellington Residential Mortgage REIT | | | 323,796 | |
| | 16,300 | | | EMC Insurance Group, Inc. | | | 480,198 | |
| | 39,244 | | | EMCOR Group, Inc. | | | 3,159,534 | |
| | 1,341 | | | Emergent BioSolutions, Inc.(b) | | | 54,968 | |
| | 1,923 | | | Empire State Realty Trust, Inc. - Class A REIT | | | 38,556 | |
| | 44,096 | | | Employers Holdings, Inc. | | | 2,103,379 | |
| | 602 | | | Encore Wire Corp. | | | 27,180 | |
| | 724 | | | Energen Corp.(b) | | | 37,431 | |
| | 1,315 | | | EnerSys, Inc. | | | 91,222 | |
| | 909 | | | Engility Holdings, Inc.(b) | | | 30,606 | |
| | 61,000 | | | Ennis, Inc. | | | 1,229,150 | |
| | 1,486 | | | Enova International, Inc.(b) | | | 22,067 | |
| | 143 | | | EnPro Industries, Inc. | | | 11,975 | |
| | 1,942 | | | Ensign Group, Inc. (The) | | | 44,821 | |
| | 10,500 | | | Entegra Financial Corp.(b) | | | 286,125 | |
| | 1,173 | | | Entegris, Inc. | | | 38,416 | |
| Old Westbury Funds, Inc. | |
| Small & Mid Cap Strategies Fund | |
| Portfolio of Investments - (Continued) | October 31, 2017 |
| | |
| Shares | | | | | Value | |
| UNITED STATES (continued) | | | |
| | 31,580 | | | Enterprise Financial Services Corp. | | $ | 1,376,888 | |
| | 3,000 | | | Entravision Communications Corp. - Class A | | | 15,599 | |
| | 31,903 | | | EPAM Systems, Inc.(b) | | | 2,907,958 | |
| | 11,778 | | | ePlus, Inc.(b) | | | 1,125,977 | |
| | 489 | | | EPR Properties REIT | | | 33,829 | |
| | 145,818 | | | Equity Commonwealth REIT(b) | | | 4,381,831 | |
| | 884 | | | Equity Lifestyle Properties, Inc. REIT | | | 78,216 | |
| | 420 | | | Erie Indemnity Co. - Class A | | | 50,736 | |
| | 2,500 | | | Escalade, Inc. | | | 30,875 | |
| | 600 | | | ESCO Technologies, Inc. | | | 34,770 | |
| | 12,600 | | | ESSA Bancorp, Inc. | | | 203,742 | |
| | 66,100 | | | Essent Group Ltd.(b) | | | 2,817,182 | |
| | 1,966 | | | Esterline Technologies Corp.(b) | | | 186,475 | |
| | 1,088 | | | Ethan Allen Interiors, Inc. | | | 32,368 | |
| | 1,005 | | | Euronet Worldwide, Inc.(b) | | | 97,123 | |
| | 3,000 | | | Evans Bancorp, Inc. | | | 130,650 | |
| | 628 | | | Evercore Partners, Inc. - Class A | | | 50,303 | |
| | 2,574 | | | EW Scripps Co. (The) - Class A(b) | | | 44,633 | |
| | 14,748 | | | Exact Sciences Corp.(b) | | | 810,993 | |
| | 31,438 | | | ExlService Holdings, Inc.(b) | | | 1,962,360 | |
| | 2,923 | | | Expeditors International of Washington Inc. | | | 170,645 | |
| | 375 | | | Exponent, Inc. | | | 27,694 | |
| | 5,737 | | | Extended Stay America Inc. - Units | | | 113,707 | |
| | 715 | | | Exterran Corp.(b) | | | 23,073 | |
| | 1,081 | | | Extra Space Storage, Inc. REIT | | | 88,199 | |
| | 1,061 | | | F5 Networks, Inc.(b) | | | 128,667 | |
| | 649 | | | Factset Research Systems, Inc. | | | 123,226 | |
| | 21,648 | | | Fair Isaac Corp. | | | 3,142,424 | |
| | 291 | | | Farmer Brothers Co.(b) | | | 9,879 | |
| | 700 | | | Farmers Capital Bank Corp. | | | 29,120 | |
| | 9,700 | | | Farmers National Banc Corp. | | | 140,650 | |
| | 12,740 | | | FARO Technologies, Inc.(b) | | | 659,932 | |
| | 638 | | | FBL Financial Group, Inc. - Class A | | | 49,349 | |
| | 1,206 | | | FCB Financial Holdings Inc. - Class A(b) | | | 56,320 | |
| | 365 | | | Federal Agricultural Mortgage Corp. - Class C | | | 27,098 | |
| | 288 | | | Federal Realty Investment Trust REIT | | | 34,710 | |
| | 1,300 | | | Federal Signal Corp. | | | 27,755 | |
| | 3,048 | | | Federated Investors, Inc. - Class B | | | 94,701 | |
| | 6,100 | | | Federated National Holding Co. | | | 93,574 | |
| | 1,775 | | | Ferro Corp.(b) | | | 42,281 | |
| | 35,031 | | | Fidelity Southern Corp. | | | 768,230 | |
| | 591,377 | | | Financial Engines, Inc.(a) | | | 21,348,710 | |
| | 29,100 | | | Financial Institutions, Inc. | | | 954,480 | |
| | 7,302 | | | First American Financial Corp. | | | 397,375 | |
| | 1,000 | | | First Bancorp | | | 36,700 | |
| Shares | | | | | Value | |
| UNITED STATES (continued) | | | |
| | 6,400 | | | First Bancshares, Inc. (The) | | $ | 204,160 | |
| | 61,263 | | | First Busey Corp. | | | 1,906,505 | |
| | 12,100 | | | First Business Financial Services, Inc. | | | 268,983 | |
| | 7,212 | | | First Citizens BancShares, Inc. - Class A | | | 2,920,860 | |
| | 6,224 | | | First Commonwealth Financial Corp. | | | 90,621 | |
| | 16,700 | | | First Community Bancshares, Inc. | | | 498,829 | |
| | 17,500 | | | First Defiance Financial Corp. | | | 948,500 | |
| | 2,240 | | | First Financial Bancorp | | | 61,152 | |
| | 190,548 | | | First Financial Bankshares, Inc. | | | 8,698,516 | |
| | 20,200 | | | First Financial Corp. | | | 959,500 | |
| | 6,970 | | | First Horizon National Corp. | | | 130,827 | |
| | 1,000 | | | First Internet Bancorp | | | 37,700 | |
| | 844 | | | First Interstate BancSystem, Inc. | | | 33,169 | |
| | 1,544 | | | First Merchants Corp. | | | 66,392 | |
| | 14,800 | | | First Mid-Illinois Bancshares, Inc. | | | 571,280 | |
| | 5,819 | | | First Midwest Bancorp, Inc. | | | 134,361 | |
| | 26,795 | | | First Solar, Inc.(b) | | | 1,468,902 | |
| | 1,654 | | | FirstCash, Inc. | | | 105,608 | |
| | 983 | | | Five Below, Inc.(b) | | | 54,311 | |
| | 493 | | | Five Prime Therapeutics, Inc.(b) | | | 22,116 | |
| | 3,323 | | | Flagstar Bancorp, Inc.(b) | | | 124,181 | |
| | 13,474 | | | Flex Ltd.(b) | | | 239,837 | |
| | 2,000 | | | Flexsteel Industries, Inc. | | | 100,540 | |
| | 684 | | | FLIR Systems, Inc. | | | 32,025 | |
| | 2,807 | | | Flowers Foods, Inc. | | | 53,417 | |
| | 933 | | | Flowserve Corp. | | | 41,117 | |
| | 2,021 | | | Fluor Corp. | | | 87,085 | |
| | 1,685 | | | Flushing Financial Corp. | | | 50,516 | |
| | 1,675 | | | FMC Corp. | | | 155,541 | |
| | 900 | | | FNB Bancorp/CA | | | 31,095 | |
| | 13,990 | | | FNB Corp/PA | | | 188,725 | |
| | 5,136 | | | FNF Group | | | 192,189 | |
| | 13,700 | | | Fogo De Chao, Inc.(b) | | | 151,385 | |
| | 1,804 | | | Forest City Realty Trust, Inc. - Class A REIT | | | 44,433 | |
| | 18,900 | | | Forrester Research, Inc. | | | 825,930 | |
| | 1,040 | | | Fortune Brands Home & Security Inc. | | | 68,702 | |
| | 35,646 | | | Forward Air Corp. | | | 2,047,506 | |
| | 21,368 | | | Foundation Medicine, Inc.(b) | | | 961,560 | |
| | 500 | | | Fox Factory Holding Corp.(b) | | | 21,275 | |
| | 696 | | | Franklin Electric Co., Inc. | | | 31,668 | |
| | 166,200 | | | Franklin Street Properties Corp. REIT | | | 1,662,000 | |
| | 47,057 | | | Fresh Del Monte Produce, Inc. | | | 2,094,507 | |
| | 46,715 | | | FTI Consulting, Inc.(b) | | | 1,997,066 | |
| | 5,761 | | | Fulton Financial Corp. | | | 104,850 | |
| | 3,498 | | | GameStop Corp. - Class A | | | 65,378 | |
| | 1,498 | | | Gaming and Leisure Properties Inc. REIT | | | 54,737 | |
| | 8,862 | | | Gannett Co., Inc. | | | 77,099 | |
| Old Westbury Funds, Inc. | |
| Small & Mid Cap Strategies Fund | |
| Portfolio of Investments - (Continued) | October 31, 2017 |
| | |
| Shares | | | | | Value | |
| UNITED STATES (continued) | | | |
| | 9,539 | | | Gap, Inc. (The) | | $ | 247,919 | |
| | 802 | | | Gartner, Inc.(b) | | | 100,499 | |
| | 981 | | | Generac Holdings, Inc.(b) | | | 51,100 | |
| | 623 | | | General Communication, Inc. - Class A(b) | | | 25,474 | |
| | 1,793 | | | Genesee & Wyoming, Inc. - Class A(b) | | | 128,702 | |
| | 3,855 | | | Genpact Ltd. | | | 117,385 | |
| | 6,891 | | | Gentex Corp. | | | 133,754 | |
| | 1,483 | | | Gentherm, Inc.(b) | | | 49,681 | |
| | 225,000 | | | German American Bancorp, Inc.(a) | | | 8,095,500 | |
| | 55,700 | | | Getty Realty Corp. REIT | | | 1,582,437 | |
| | 250,000 | | | Gigamon, Inc.(b) | | | 9,625,000 | |
| | 2,264 | | | G-III Apparel Group Ltd.(b) | | | 57,370 | |
| | 2,405 | | | Glacier Bancorp, Inc. | | | 91,294 | |
| | 52,400 | | | Gladstone Commercial Corp. REIT | | | 1,134,984 | |
| | 38,900 | | | Global Brass & Copper Holdings, Inc. | | | 1,361,500 | |
| | 1,400 | | | Global Net Lease, Inc. REIT | | | 30,240 | |
| | 29,504 | | | Globus Medical, Inc. - Class A(b) | | | 940,292 | |
| | 1,166 | | | GoDaddy, Inc. - Class A(b) | | | 54,452 | |
| | 1,800 | | | Golden Entertainment, Inc.(b) | | | 48,024 | |
| | 14,986 | | | Goodyear Tire & Rubber Co. (The) | | | 458,422 | |
| | 145,553 | | | Gorman-Rupp Co. (The)(a) | | | 4,654,785 | |
| | 20,500 | | | GP Strategies Corp.(b) | | | 595,525 | |
| | 998 | | | Graco, Inc. | | | 131,526 | |
| | 56 | | | Graham Holdings Co. - Class B | | | 31,161 | |
| | 1,466 | | | Gramercy Property Trust REIT | | | 43,540 | |
| | 683 | | | Grand Canyon Education, Inc.(b) | | | 61,135 | |
| | 1,488 | | | Granite Construction, Inc. | | | 94,771 | |
| | 7,838 | | | Graphic Packaging Holding Co. | | | 121,411 | |
| | 3,759 | | | Gray Television, Inc.(b) | | | 58,528 | |
| | 9,500 | | | Great Ajax Corp. REIT | | | 134,425 | |
| | 2,700 | | | Great Lakes Dredge & Dock Corp.(b) | | | 13,769 | |
| | 1,460 | | | Great Plains Energy, Inc. | | | 47,932 | |
| | 17,400 | | | Great Southern Bancorp, Inc. | | | 935,250 | |
| | 1,956 | | | Great Western Bancorp Inc. | | | 79,394 | |
| | 1,627 | | | Green Dot Corp. - Class A(b) | | | 92,121 | |
| | 928 | | | Green Plains Inc. | | | 17,075 | |
| | 358 | | | Greif, Inc. | | | 22,500 | |
| | 1,077 | | | Greif, Inc. - Class A | | | 59,806 | |
| | 500 | | | Griffon Corp. | | | 11,275 | |
| | 3,261 | | | Groupon, Inc.(b) | | | 15,555 | |
| | 37,485 | | | GrubHub, Inc.(b) | | | 2,287,335 | |
| | 500 | | | GTT Communications, Inc.(b) | | | 18,225 | |
| | 60,824 | | | Guess?, Inc. | | | 985,957 | |
| | 305,000 | | | Guidewire Software, Inc.(b) | | | 24,393,900 | |
| | 808 | | | H&E Equipment Services, Inc. | | | 26,616 | |
| | 27,782 | | | H&R Block, Inc. | | | 687,327 | |
| | 44,600 | | | Hackett Group, Inc. (The) | | | 688,624 | |
| | 59,238 | | | Haemonetics Corp.(b) | | | 2,817,359 | |
| Shares | | | | | Value | |
| UNITED STATES (continued) | | | |
| | 15,300 | | | Hallmark Financial Services, Inc.(b) | | $ | 177,327 | |
| | 23,420 | | | Halyard Health, Inc.(b) | | | 987,153 | |
| | 9,000 | | | Hamilton Beach Brands Holding Co.(a)(b) | | | 348,930 | |
| | 9,000 | | | Hamilton Beach Brands Holding Co. - Class A(b) | | | 348,930 | |
| | 2,798 | | | Hancock Holding Co. | | | 136,403 | |
| | 3,594,109 | | | Hanesbrands, Inc. | | | 80,867,453 | |
| | 16,908 | | | Hanmi Financial Corp. | | | 519,921 | |
| | 1,417 | | | Hanover Insurance Group, Inc. (The) | | | 139,404 | |
| | 2,907 | | | Harley-Davidson, Inc. | | | 137,617 | |
| | 2,000 | | | Harsco Corp.(b) | | | 42,500 | |
| | 26,900 | | | Haverty Furniture Cos., Inc. | | | 641,565 | |
| | 342 | | | Hawaiian Electric Industries, Inc. | | | 12,469 | |
| | 16,400 | | | Hawkins, Inc. | | | 624,840 | |
| | 452,674 | | | HB Fuller Co. | | | 25,743,570 | |
| | 243 | | | HCI Group, Inc. | | | 9,103 | |
| | 3,250 | | | HD Supply Holdings, Inc.(b) | | | 115,018 | |
| | 532 | | | Healthcare Realty Trust, Inc. REIT | | | 17,152 | |
| | 41,019 | | | Healthcare Services Group, Inc. | | | 2,169,495 | |
| | 838 | | | HealthEquity Inc.(b) | | | 42,084 | |
| | 62,677 | | | HealthSouth Corp. | | | 2,891,917 | |
| | 103,706 | | | Heartland Express, Inc. | | | 2,212,049 | |
| | 36,870 | | | Heartland Financial USA, Inc. | | | 1,815,848 | |
| | 15,475 | | | Hecla Mining Co. | | | 73,042 | |
| | 505 | | | Heico Corp. | | | 45,793 | |
| | 732 | | | Heico Corp. - Class A | | | 55,705 | |
| | 205,461 | | | Helen of Troy Ltd.(b) | | | 19,087,327 | |
| | 3,034 | | | Helix Energy Solutions Group, Inc.(b) | | | 20,692 | |
| | 1,471 | | | Herbalife Ltd.(b) | | | 106,824 | |
| | 400 | | | Herc Holdings, Inc.(b) | | | 19,383 | |
| | 40,000 | | | Heritage Commerce Corp. | | | 615,200 | |
| | 53,250 | | | Heritage Financial Corp. | | | 1,624,125 | |
| | 1,442 | | | Heritage Insurance Holdings, Inc. | | | 23,130 | |
| | 26,800 | | | Heritage-Crystal Clean, Inc.(b) | | | 523,940 | |
| | 55,405 | | | Herman Miller, Inc. | | | 1,861,608 | |
| | 69,000 | | | Hersha Hospitality Trust REIT | | | 1,220,610 | |
| | 3,675 | | | Hertz Global Holdings, Inc.(b) | | | 91,397 | |
| | 9,600 | | | Heska Corp.(b) | | | 936,000 | |
| | 1,811 | | | Hexcel Corp. | | | 109,910 | |
| | 11,100 | | | HFF, Inc. - Class A | | | 486,846 | |
| | 150,000 | | | Hibbett Sports, Inc.(b) | | | 1,920,000 | |
| | 1,228 | | | Highwoods Properties, Inc. REIT | | | 62,689 | |
| | 1,935 | | | Hillenbrand, Inc. | | | 76,529 | |
| | 1,731 | | | Hill-Rom Holdings, Inc. | | | 139,709 | |
| | 3,178 | | | Hilltop Holdings, Inc. | | | 74,874 | |
| | 1,720 | | | Hilton Grand Vacations, Inc.(b) | | | 70,451 | |
| | 2,400 | | | Hingham Institution For Savings | | | 467,280 | |
| | 3,268 | | | HMS Holdings Corp.(b) | | | 62,876 | |
| Old Westbury Funds, Inc. | |
| Small & Mid Cap Strategies Fund | |
| Portfolio of Investments - (Continued) | October 31, 2017 |
| | |
| Shares | | | | | Value | |
| UNITED STATES (continued) | | | |
| | 1,187 | | | HNI Corp. | | $ | 40,619 | |
| | 5,318 | | | HollyFrontier Corp. | | | 196,500 | |
| | 13,000 | | | Home Bancorp, Inc. | | | 556,920 | |
| | 8,395 | | | Home BancShares, Inc. | | | 188,720 | |
| | 46,214 | | | HomeStreet, Inc.(b) | | | 1,342,517 | |
| | 2,500 | | | Hooker Furniture Corp. | | | 118,500 | |
| | 3,506 | | | Hope Bancorp Inc. | | | 64,686 | |
| | 1,441 | | | Horace Mann Educators Corp. | | | 63,116 | |
| | 2,311 | | | Horizon Pharma Plc(b) | | | 31,337 | |
| | 1,087 | | | Hospitality Properties Trust REIT | | | 31,066 | |
| | 2,014 | | | Houghton Mifflin Harcourt Co.(b) | | | 19,939 | |
| | 500 | | | Howard Hughes Corp.( The)(b) | | | 63,815 | |
| | 60,067 | | | HRG Group, Inc.(b) | | | 974,287 | |
| | 1,122 | | | HSN, Inc. | | | 42,299 | |
| | 1,192 | | | Hub Group, Inc. - Class A(b) | | | 51,614 | |
| | 500 | | | Hubbell, Inc. | | | 62,910 | |
| | 932 | | | Hudson Pacific Properties Inc. REIT | | | 31,520 | |
| | 441 | | | Huntington Ingalls Industries, Inc. | | | 102,678 | |
| | 3,563 | | | Huntsman Corp. | | | 114,087 | |
| | 13,400 | | | Hurco Cos., Inc. | | | 599,650 | |
| | 700 | | | Hyatt Hotels Corp. - Class A(b) | | | 43,862 | |
| | 282 | | | Hyster-Yale Materials Handling, Inc. | | | 22,134 | |
| | 1,103 | | | IAC/InterActiveCorp.(b) | | | 142,342 | |
| | 1,380 | | | IBERIABANK Corp. | | | 101,775 | |
| | 26,500 | | | ICF International, Inc.(b) | | | 1,423,050 | |
| | 4,170 | | | Iconix Brand Group, Inc.(b) | | | 6,839 | |
| | 111,377 | | | ICU Medical, Inc.(b) | | | 21,284,145 | |
| | 31,628 | | | IDACORP, Inc. | | | 2,910,725 | |
| | 430,832 | | | IDEX Corp.(a) | | | 55,236,971 | |
| | 1,141 | | | II-VI, Inc.(b) | | | 51,573 | |
| | 2,275 | | | ILG Inc. | | | 67,499 | |
| | 1,814 | | | Impax Laboratories, Inc.(b) | | | 32,924 | |
| | 121,534 | | | INC Research Holdings, Inc. - Class A(b) | | | 6,945,668 | |
| | 190,587 | | | Independent Bank Corp.(a)(d) | | | 13,741,323 | |
| | 36,200 | | | Independent Bank Corp.(d) | | | 814,500 | |
| | 300 | | | Independent Bank Group, Inc. | | | 18,869 | |
| | 16,557 | | | Infinity Property & Casuality Corp. | | | 1,562,153 | |
| | 75,500 | | | InfraREIT, Inc.(b) | | | 1,691,200 | |
| | 766 | | | Ingevity Corp.(b) | | | 54,562 | |
| | 953 | | | Ingredion, Inc. | | | 119,459 | |
| | 31,010 | | | Innophos Holdings, Inc. | | | 1,517,319 | |
| | 205,162 | | | Innospec, Inc.(a) | | | 12,689,270 | |
| | 4,201 | | | Inogen, Inc.(b) | | | 415,605 | |
| | 1,845 | | | Inovalon Holdings, Inc.(b) | | | 30,904 | |
| | 18,000 | | | Insight Enterprises, Inc.(b) | | | 810,900 | |
| | 22,169 | | | Insperity, Inc. | | | 2,103,838 | |
| | 600 | | | Installed Building Products, Inc.(b) | | | 41,820 | |
| | 275,000 | | | Insulet Corp.(b) | | | 16,172,750 | |
| Shares | | | | | Value | |
| UNITED STATES (continued) | | | |
| | 9,904 | | | Integer Holdings Corp.(b) | | $ | 481,334 | |
| | 673,948 | | | Integra LifeScience Holdings Corp.(b) | | | 31,527,287 | |
| | 1,608 | | | Integrated Device Technology, Inc.(b) | | | 49,961 | |
| | 875 | | | Inter Parfums, Inc. | | | 40,513 | |
| | 337 | | | Interactive Brokers Group, Inc. - Class A | | | 18,205 | |
| | 448 | | | InterDigital, Inc. | | | 32,861 | |
| | 3,481 | | | International Bancshares Corp. | | | 141,329 | |
| | 351 | | | International Flavors & Fragrances, Inc. | | | 51,744 | |
| | 1,100 | | | International Game Technology Plc | | | 25,849 | |
| | 9,517 | | | Interpublic Group of Cos., Inc. (The) | | | 183,202 | |
| | 1,057 | | | INTL. FCStone, Inc.(b) | | | 43,876 | |
| | 1,504 | | | Intra-Cellular Therapies, Inc.(b) | | | 23,447 | |
| | 118,500 | | | Invesco Mortgage Capital, Inc. REIT | | | 2,040,570 | |
| | 500 | | | Investment Technology Group, Inc. | | | 11,735 | |
| | 10,281 | | | Investors Bancorp Inc. | | | 141,364 | |
| | 2,200 | | | Investors Title Co. | | | 417,340 | |
| | 10,192 | | | IPG Photonics Corp.(b) | | | 2,169,979 | |
| | 23,562 | | | iRobot Corp.(b) | | | 1,583,131 | |
| | 2,128 | | | Iron Mountain, Inc. REIT | | | 85,120 | |
| | 8,400 | | | Itron, Inc.(b) | | | 656,460 | |
| | 2,934 | | | ITT, Inc. | | | 136,842 | |
| | 58,814 | | | J & J Snack Foods Corp. | | | 7,832,260 | |
| | 25,800 | | | J Alexander’s Holdings, Inc.(b) | | | 270,900 | |
| | 49,122 | | | j2 Global, Inc. | | | 3,641,905 | |
| | 10,901 | | | Jabil, Inc. | | | 308,280 | |
| | 1,279 | | | Jack Henry & Associates, Inc. | | | 140,856 | |
| | 12,768 | | | Jack in the Box, Inc. | | | 1,321,616 | |
| | 3,843 | | | Jacobs Engineering Group, Inc. | | | 223,701 | |
| | 25,722 | | | JetBlue Airways Corp.(b) | | | 492,576 | |
| | 450,800 | | | JM Smucker Co. (The) | | | 47,807,340 | |
| | 16,000 | | | John B. Sanfilippo & Son, Inc. | | | 941,600 | |
| | 115,476 | | | John Bean Technologies Corp. | | | 12,344,384 | |
| | 481,625 | | | John Wiley & Sons, Inc. - Class A(a) | | | 26,320,806 | |
| | 943 | | | Jones Lang LaSalle, Inc. | | | 122,109 | |
| | 61,200 | | | K12, Inc.(b) | | | 992,664 | |
| | 6,400 | | | Kadant, Inc. | | | 727,040 | |
| | 56,392 | | | Kaman Corp. | | | 3,154,568 | |
| | 4,410 | | | Kansas City Southern | | | 459,610 | |
| | 6,205 | | | KapStone Paper and Packaging Corp. | | | 139,364 | |
| | 1,641,755 | | | KAR Auction Services, Inc.(a) | | | 77,704,264 | |
| | 1,629 | | | KB Home | | | 44,683 | |
| | 3,668 | | | KBR, Inc. | | | 72,003 | |
| | 2,513 | | | Kearny Financial Corp (MD) | | | 37,821 | |
| | 24,905 | | | Kelly Services, Inc. - Class A | | | 655,251 | |
| | 1,834 | | | Kemper Corp. | | | 117,559 | |
| | 3,461 | | | Kennedy-Wilson Holdings, Inc. | | | 67,316 | |
| | 1,846 | | | Keysight Technologies, Inc.(b) | | | 82,461 | |
| Old Westbury Funds, Inc. | |
| Small & Mid Cap Strategies Fund | |
| Portfolio of Investments - (Continued) | October 31, 2017 |
| | |
| Shares | | | | | Value | |
| UNITED STATES (continued) | | | |
| | 1,096 | | | Kilroy Realty Corp. REIT | | $ | 78,068 | |
| | 47,812 | | | Kimball Electronics, Inc.(b) | | | 1,051,864 | |
| | 24,200 | | | Kimball International, Inc. - Class B | | | 463,914 | |
| | 2,578 | | | Kindred Healthcare, Inc. | | | 15,597 | |
| | 23,200 | | | Kinsale Capital Group, Inc. | | | 1,006,416 | |
| | 3,570 | | | Kirby Corp.(b) | | | 252,935 | |
| | 831 | | | KLX, Inc.(b) | | | 45,589 | |
| | 12,600 | | | KMG Chemicals, Inc. | | | 694,638 | |
| | 4,795 | | | Knight-Swift Transportation Holdings, Inc.(b) | | | 198,753 | |
| | 1,725 | | | Knoll, Inc. | | | 36,605 | |
| | 14,163 | | | Kohl’s Corp. | | | 591,447 | |
| | 12,200 | | | Koppers Holdings, Inc.(b) | | | 592,310 | |
| | 1,405 | | | Korn/Ferry International | | | 58,771 | |
| | 3,217 | | | Kosmos Energy Ltd.(b) | | | 24,707 | |
| | 2,893 | | | Kraton Corp.(b) | | | 141,844 | |
| | 1,391 | | | Kronos Worldwide, Inc. | | | 36,597 | |
| | 5,633 | | | La Quinta Holdings, Inc.(b) | | | 99,253 | |
| | 673,400 | | | Laboratory Corp of America Holdings(b) | | | 103,508,314 | |
| | 1,668 | | | Lakeland Bancorp, Inc. | | | 34,277 | |
| | 905 | | | Lakeland Financial Corp. | | | 43,693 | |
| | 1,182 | | | Lamb Weston Holdings, Inc. | | | 60,270 | |
| | 20,189 | | | Lancaster Colony Corp. | | | 2,528,067 | |
| | 17,500 | | | Landec Corp.(b) | | | 231,875 | |
| | 930 | | | Landstar System, Inc. | | | 91,838 | |
| | 2,834 | | | Laredo Petroleum, Inc.(b) | | | 33,781 | |
| | 1,303 | | | LaSalle Hotel Properties REIT | | | 36,758 | |
| | 3,958 | | | La-Z-Boy, Inc. | | | 106,668 | |
| | 703 | | | LCI Industries | | | 87,031 | |
| | 5,200 | | | LCNB Corp. | | | 106,080 | |
| | 1,780 | | | Lear Corp. | | | 312,550 | |
| | 1,655 | | | LegacyTexas Financial Group, Inc. | | | 66,018 | |
| | 3,360 | | | Legg Mason, Inc. | | | 128,285 | |
| | 1,679 | | | Leggett & Platt, Inc. | | | 79,350 | |
| | 4,299 | | | Leidos Holdings, Inc. | | | 268,773 | |
| | 19,600 | | | LeMaitre Vascular, Inc. | | | 627,396 | |
| | 15,673 | | | Lendingtree, Inc.(b) | | | 4,201,148 | |
| | 4,752 | | | Lennar Corp. - Class A | | | 264,544 | |
| | 700 | | | Lennox International, Inc. | | | 133,791 | |
| | 10,985 | | | Leucadia National Corp. | | | 277,921 | |
| | 209,400 | | | Lexington Realty Trust REIT | | | 2,119,128 | |
| | 20,600 | | | LHC Group, Inc.(b) | | | 1,376,286 | |
| | 18,234 | | | Liberty Interactive Corp QVC Group - Class A(b) | | | 414,276 | |
| | 894 | | | Liberty Property Trust REIT | | | 38,335 | |
| | 12,000 | | | Liberty Tax, Inc. | | | 156,600 | |
| | 2,716 | | | Liberty Ventures - Series A(b) | | | 154,703 | |
| | 2,743 | | | LifePoint Health, Inc.(b) | | | 132,075 | |
| | 15,300 | | | Lifetime Brands, Inc. | | | 285,345 | |
| | 6,200 | | | Ligand Pharmaceuticals, Inc.(b) | | | 901,170 | |
| | 661 | | | Lincoln Electric Holdings, Inc. | | | 60,594 | |
| | 1,408 | | | Lions Gate Entertainment Corp. - Class A(b) | | | 40,860 | |
| Shares | | | | | Value | |
| UNITED STATES (continued) | | | |
| | 826 | | | Lions Gate Entertainment Corp. - Class B(b) | | $ | 22,847 | |
| | 664 | | | Lithia Motors, Inc. - Class A | | | 75,152 | |
| | 451 | | | Littelfuse, Inc. | | | 94,259 | |
| | 5,150 | | | Live Nation Entertainment, Inc.(b) | | | 225,467 | |
| | 10,860 | | | LKQ Corp.(b) | | | 409,313 | |
| | 220,617 | | | LogMein, Inc. | | | 26,705,688 | |
| | 4,954 | | | Louisiana-Pacific Corp.(b) | | | 134,650 | |
| | 2,252 | | | LPL Financial Holdings, Inc. | | | 111,722 | |
| | 811 | | | Lumentum Holdings, Inc.(b) | | | 51,215 | |
| | 66,100 | | | Luminex Corp. | | | 1,411,235 | |
| | 350,364 | | | Lydall, Inc.(a)(b) | | | 20,251,039 | |
| | 1,017 | | | M/I Homes, Inc.(b) | | | 33,968 | |
| | 1,169 | | | Macerich Co. REIT (The) | | | 63,827 | |
| | 2,083 | | | Macquarie Infrastructure Corp. | | | 144,873 | |
| | 528 | | | Madison Square Garden Co. (The) - Class A(b) | | | 117,580 | |
| | 24,565 | | | Magellan Health, Inc.(b) | | | 2,095,395 | |
| | 700 | | | MainSource Financial Group, Inc. | | | 26,383 | |
| | 3,987 | | | Mallinckrodt Plc(b) | | | 126,268 | |
| | 1,613 | | | Manhattan Associates, Inc.(b) | | | 67,520 | |
| | 3,739 | | | ManpowerGroup, Inc. | | | 460,944 | |
| | 42,213 | | | ManTech International Corp. - Class A | | | 1,959,105 | |
| | 1,526 | | | Marcus & Millichap, Inc.(b) | | | 43,369 | |
| | 24,163 | | | Marcus Corp. (The) | | | 656,025 | |
| | 800 | | | MarineMax, Inc.(b) | | | 14,839 | |
| | 14,400 | | | MarketAxess Holdings, Inc. | | | 2,505,600 | |
| | 9,400 | | | Marlin Business Services Corp. | | | 205,860 | |
| | 1,921 | | | Marriott Vacations Worldwide Corp. | | | 252,842 | |
| | 31,665 | | | Masimo Corp.(b) | | | 2,778,920 | |
| | 358 | | | Masonite International Corp.(b) | | | 24,022 | |
| | 1,602 | | | MasTec, Inc.(b) | | | 69,767 | |
| | 813 | | | Matador Resources Co.(b) | | | 21,585 | |
| | 1,614 | | | Materion Corp. | | | 82,879 | |
| | 1,201 | | | Matthews International Corp. - Class A | | | 75,483 | |
| | 40,621 | | | MAXIMUS, Inc. | | | 2,698,453 | |
| | 824 | | | Maxlinear, Inc.(b) | | | 20,163 | |
| | 3,000 | | | MB Financial, Inc. | | | 137,820 | |
| | 37,167 | | | McGrath RentCorp. | | | 1,661,365 | |
| | 2,232 | | | MDC Holdings, Inc. | | | 82,673 | |
| | 1,400 | | | MDU Resources Group, Inc. | | | 38,290 | |
| | 62,900 | | | MedEquities Realty Trust, Inc. REIT | | | 730,898 | |
| | 1,569 | | | Medical Properties Trust, Inc. REIT | | | 20,758 | |
| | 255,000 | | | Medidata Solutions, Inc.(b) | | | 19,183,650 | |
| | 24,800 | | | Medifast, Inc. | | | 1,547,520 | |
| | 1,009 | | | Mercantile Bank Corp. | | | 36,425 | |
| | 674 | | | Mercury General Corp. | | | 37,724 | |
| | 599 | | | Mercury Systems, Inc.(b) | | | 30,232 | |
| | 683 | | | Meredith Corp. | | | 36,199 | |
| | 1,100 | | | Meridian Bancorp, Inc. | | | 21,669 | |
| Old Westbury Funds, Inc. | |
| Small & Mid Cap Strategies Fund | |
| Portfolio of Investments - (Continued) | October 31, 2017 |
| | |
| Shares | | | | | Value | |
| UNITED STATES (continued) | | | |
| | 1,600 | | | Meridian Bioscience, Inc. | | $ | 23,919 | |
| | 32,205 | | | Merit Medical Systems, Inc.(b) | | | 1,225,400 | |
| | 2,878 | | | Meritage Homes Corp.(b) | | | 140,159 | |
| | 900 | | | Mesa Laboratories, Inc. | | | 143,505 | |
| | 13,366 | | | Meta Financial Group, Inc. | | | 1,166,184 | |
| | 949 | | | Methode Electronics, Inc. | | | 44,508 | |
| | 552,153 | | | MFA Financial, Inc. REIT | | | 4,549,741 | |
| | 40,100 | | | MGE Energy, Inc. | | | 2,648,605 | |
| | 400 | | | MGP Ingredients, Inc. | | | 27,183 | |
| | 1,949 | | | Michaels Cos. Inc (The)(b) | | | 37,850 | |
| | 1,450 | | | Microsemi Corp.(b) | | | 77,387 | |
| | 5,900 | | | MicroStrategy, Inc. - Class A(b) | | | 780,334 | |
| | 661 | | | Middleby Corp. (The)(b) | | | 76,610 | |
| | 30,700 | | | Middlesex Water Co. | | | 1,334,836 | |
| | 18,200 | | | MidWestOne Financial Group, Inc. | | | 640,822 | |
| | 660 | | | Milacron Holdings Corp.(b) | | | 11,847 | |
| | 23,500 | | | Miller Industries, Inc. | | | 663,875 | |
| | 19,050 | | | MINDBODY, Inc. - Class A(b) | | | 614,363 | |
| | 2,043 | | | Minerals Technologies, Inc. | | | 146,892 | |
| | 1,570 | | | Mistras Group, Inc.(b) | | | 32,986 | |
| | 7,398 | | | MKS Instruments, Inc. | | | 803,793 | |
| | 1,835 | | | Mobile Mini, Inc. | | | 60,739 | |
| | 3,452 | | | Modine Manufacturing Co.(b) | | | 72,665 | |
| | 300 | | | Moelis & Co. - Class A | | | 12,825 | |
| | 1,901 | | | Molina Healthcare, Inc.(b) | | | 128,945 | |
| | 99,100 | | | Monmouth Real Estate Investment Corp. REIT | | | 1,688,664 | |
| | 20,506 | | | Monolithic Power Systems, Inc. | | | 2,494,965 | |
| | 44,200 | | | Monotype Imaging Holdings, Inc. | | | 1,018,810 | |
| | 690 | | | Monro Muffler Brake, Inc. | | | 34,052 | |
| | 33,683 | | | Moog, Inc. - Class A(b) | | | 2,956,020 | |
| | 500 | | | Morningstar, Inc. | | | 42,605 | |
| | 973 | | | Mosaic Co. (The) | | | 21,737 | |
| | 1,469 | | | Motorcar Parts of America, Inc.(b) | | | 42,469 | |
| | 677 | | | Movie Gallery, Inc.(a)(b)(c) | | | 0 | |
| | 144,824 | | | MSA Safety, Inc. | | | 11,513,508 | |
| | 1,538 | | | MSCI, Inc. | | | 180,500 | |
| | 88,300 | | | MTGE Investment Corp. REIT | | | 1,598,230 | |
| | 14,042 | | | MTS Systems Corp. | | | 730,886 | |
| | 1,320 | | | Mueller Industries, Inc. | | | 45,870 | |
| | 3,489 | | | Mueller Water Products, Inc. - Class A | | | 41,659 | |
| | 42,810 | | | MuleSoft, Inc.(b) | | | 1,001,326 | |
| | 309 | | | Multi-Color Corp. | | | 25,554 | |
| | 5,737 | | | Murphy Oil Corp. | | | 153,465 | |
| | 1,265 | | | Murphy USA, Inc.(b) | | | 94,065 | |
| | 8,500 | | | MutualFirst Financial, Inc. | | | 328,950 | |
| | 4,977 | | | Myriad Genetics, Inc.(b) | | | 170,612 | |
| | 9,441 | | | Nabors Industries Ltd. | | | 53,153 | |
| | 5,200 | | | NACCO Industries, Inc. - Class A | | | 216,320 | |
| | 1,441,000 | | | Nasdaq, Inc.(a) | | | 104,688,650 | |
| | 7,200 | | | Nathan’s Famous Inc.(b) | | | 583,920 | |
| Shares | | | | | Value | |
| UNITED STATES (continued) | | | |
| | 501 | | | National Beverage Corp. | | $ | 49,048 | |
| | 12,000 | | | National Commerce Corp.(b) | | | 489,000 | |
| | 531 | | | National Fuel Gas Co. | | | 30,825 | |
| | 76,554 | | | National General Holdings Corp. | | | 1,544,860 | |
| | 31,700 | | | National Health Investors, Inc. REIT | | | 2,415,223 | |
| | 41,543 | | | National HealthCare Corp. | | | 2,658,752 | |
| | 18,025 | | | National Instruments Corp. | | | 811,125 | |
| | 13,983 | | | National Presto Industries, Inc. | | | 1,634,613 | |
| | 487 | | | National Retail Properties, Inc. REIT | | | 19,568 | |
| | 132 | | | National Western Life Group, Inc. | | | 47,201 | |
| | 400 | | | Natural Gas Services Group, Inc.(b) | | | 11,119 | |
| | 1,122 | | | Natus Medical, Inc.(b) | | | 47,573 | |
| | 39,300 | | | Navigant Consulting, Inc.(b) | | | 680,283 | |
| | 348,048 | | | Navigators Group, Inc. (The)(a) | | | 20,186,784 | |
| | 885 | | | NBT Bancorp, Inc. | | | 33,754 | |
| | 2,010 | | | NCI Building Systems Inc.(b) | | | 32,060 | |
| | 1,246 | | | NCR Corp. | | | 39,984 | |
| | 485 | | | Neenah Paper, Inc. | | | 42,098 | |
| | 1,119 | | | Nelnet, Inc. - Class A | | | 65,506 | |
| | 36,500 | | | Neogen Corp.(b) | | | 2,927,300 | |
| | 2,963 | | | NetApp, Inc. | | | 131,616 | |
| | 1,085 | | | NETGEAR, Inc.(b) | | | 50,615 | |
| | 1,916 | | | NetScout Systems, Inc.(b) | | | 54,414 | |
| | 1,058 | | | New Jersey Resources Corp. | | | 47,028 | |
| | 2,679 | | | New Media Investment Group, Inc. | | | 42,784 | |
| | 450,000 | | | New Relic, Inc.(b) | | | 23,098,500 | |
| | 31,115 | | | New York Community Bancorp, Inc. | | | 390,804 | |
| | 2,800 | | | New York Times Co. (The) - Class A | | | 53,480 | |
| | 1,818,900 | | | Newell Brands, Inc. | | | 74,174,742 | |
| | 207 | | | NewMarket Corp. | | | 82,881 | |
| | 12,255 | | | News Corp. - Class A | | | 167,403 | |
| | 5,413 | | | News Corp. - Class B | | | 75,241 | |
| | 8,400 | | | NexPoint Residential Trust, Inc., REIT | | | 199,500 | |
| | 1,404 | | | Nexstar Media Group Inc. - Class A | | | 89,575 | |
| | 6,267,181 | | | Nexteer Automotive Group Ltd. | | | 12,258,977 | |
| | 724,927 | | | NIC, Inc. | | | 12,323,759 | |
| | 4,400 | | | Nicolet Bankshares, Inc. | | | 250,536 | |
| | 3,595 | | | NiSource, Inc. | | | 94,800 | |
| | 1,777 | | | NN, Inc. | | | 52,510 | |
| | 933 | | | Nordson Corp. | | | 118,202 | |
| | 2,850 | | | Nordstrom, Inc. | | | 113,003 | |
| | 17,600 | | | Northeast Bancorp | | | 453,200 | |
| | 9,400 | | | Northrim Bancorp, Inc. | | | 305,500 | |
| | 124,325 | | | Northwest Bancshares, Inc. | | | 2,097,363 | |
| | 113,782 | | | Northwest Natural Gas Co. | | | 7,549,436 | |
| | 46,000 | | | NorthWestern Corp. | | | 2,726,880 | |
| Old Westbury Funds, Inc. | |
| Small & Mid Cap Strategies Fund | |
| Portfolio of Investments - (Continued) | October 31, 2017 |
| | |
| Shares | | | | | Value | |
| UNITED STATES (continued) | | | |
| | 2,400 | | | Norwegian Cruise Line Holdings Ltd.(b) | | $ | 133,800 | |
| | 7,450 | | | Norwood Financial Corp. | | | 222,532 | |
| | 25,400 | | | Novanta Inc.(b) | | | 1,201,420 | |
| | 4,737 | | | NRG Energy, Inc. | | | 118,425 | |
| | 10,500 | | | NRG Yield, Inc. - Class A | | | 192,675 | |
| | 797 | | | Nu Skin Enterprises, Inc. - Class A | | | 50,697 | |
| | 8,712 | | | Nuance Communications, Inc.(b) | | | 128,415 | |
| | 615 | | | NutriSystem, Inc. | | | 30,719 | |
| | 385,000 | | | NuVasive, Inc.(b) | | | 21,841,050 | |
| | 8,100 | | | NVE Corp. | | | 689,148 | |
| | 66 | | | NVR, Inc.(b) | | | 216,570 | |
| | 5,507 | | | Oceaneering International, Inc. | | | 111,352 | |
| | 7,800 | | | OceanFirst Financial Corp. | | | 216,450 | |
| | 17,599 | | | Office Depot, Inc. | | | 54,557 | |
| | 2,350 | | | OGE Energy Corp. | | | 86,574 | |
| | 270,000 | | | Okta, Inc.(b) | | | 7,808,400 | |
| | 1,548 | | | Old Dominion Freight Line, Inc. | | | 187,509 | |
| | 9,000 | | | Old Line Bancshares Inc. | | | 271,350 | |
| | 2,374 | | | Old National Bancorp | | | 43,207 | |
| | 17,455 | | | Old Republic International Corp. | | | 354,162 | |
| | 4,827 | | | Olin Corp. | | | 176,330 | |
| | 1,283 | | | Ollie’s Bargain Outlet Holdings, Inc.(b) | | | 57,286 | |
| | 1,233 | | | Omega Healthcare Investors, Inc. REIT | | | 35,584 | |
| | 38,099 | | | Omega Protein Corp. | | | 834,368 | |
| | 421,043 | | | Omnicell, Inc.(b) | | | 20,967,941 | |
| | 2,800 | | | On Assignment, Inc.(b) | | | 171,416 | |
| | 4,484 | | | ON Semiconductor Corp.(b) | | | 95,599 | |
| | 40,292 | | | ONE Gas, Inc. | | | 3,101,678 | |
| | 35,600 | | | One Liberty Properties, Inc. REIT | | | 862,588 | |
| | 955 | | | Opus Bank(b) | | | 24,735 | |
| | 8,032 | | | Orbital ATK, Inc. | | | 1,067,694 | |
| | 2,983 | | | Oritani Financial Corp. | | | 50,562 | |
| | 2,287 | | | Ormat Technologies, Inc. | | | 148,495 | |
| | 28,900 | | | Orthofix International NV(b) | | | 1,552,797 | |
| | 3,063 | | | Oshkosh Corp. | | | 280,448 | |
| | 554 | | | OSI Systems, Inc.(b) | | | 48,963 | |
| | 32,000 | | | Otter Tail Corp. | | | 1,470,400 | |
| | 65,200 | | | Owens & Minor, Inc. | | | 1,601,964 | |
| | 9,006 | | | Owens Corning, Inc. | | | 744,706 | |
| | 12,300 | | | Owens Realty Mortgage, Inc. REIT | | | 220,908 | |
| | 2,791 | | | Owens-Illinois, Inc.(b) | | | 66,677 | |
| | 23,984 | | | Oxford Industries, Inc. | | | 1,549,366 | |
| | 792 | | | Pacific Premier Bancorp, Inc.(b) | | | 31,997 | |
| | 25,253 | | | Pacira Pharmaceuticals, Inc./DE(b) | | | 809,359 | |
| | 1,770 | | | Packaging Corp. of America | | | 205,798 | |
| | 7,687 | | | PacWest Bancorp | | | 371,436 | |
| Shares | | | | | Value | |
| UNITED STATES (continued) | | | |
| | 31,200 | | | Papa John’s International, Inc. | | $ | 2,123,160 | |
| | 33,800 | | | Par Pacific Holdings, Inc.(b) | | | 709,462 | |
| | 1,400 | | | Paramount Group, Inc. REIT | | | 22,287 | |
| | 1,354 | | | Park Hotels & Resorts, Inc. REIT | | | 38,982 | |
| | 584 | | | Park National Corp. | | | 64,117 | |
| | 500 | | | Park-Ohio Holdings Corp. | | | 23,575 | |
| | 1,746 | | | Parsley Energy, Inc. - Class A(b) | | | 46,444 | |
| | 278 | | | Patrick Industries Inc(b) | | | 25,853 | |
| | 972 | | | Pattern Energy Group, Inc. | | | 22,424 | |
| | 1,925 | | | Patterson Cos., Inc. | | | 71,225 | |
| | 1,609 | | | Paycom Software, Inc.(b) | | | 132,260 | |
| | 26,570 | | | PC Connection, Inc. | | | 717,390 | |
| | 28,500 | | | Peapack Gladstone Financial Corp. | | | 988,665 | |
| | 686 | | | Pebblebrook Hotel Trust REIT | | | 24,463 | |
| | 740 | | | Pegasystems, Inc. | | | 43,142 | |
| | 2,100 | | | Penns Woods Bancorp Inc. | | | 101,682 | |
| | 105,500 | | | Pennymac Mortgage Investment Trust REIT | | | 1,694,330 | |
| | 5,119 | | | Penske Automotive Group, Inc. | | | 238,648 | |
| | 129,905 | | | Penumbra, Inc.(b) | | | 13,061,948 | |
| | 31,700 | | | Peoples Bancorp, Inc. | | | 1,049,904 | |
| | 4,200 | | | Peoples Financial Services Corp. | | | 190,428 | |
| | 9,949 | | | People’s United Financial, Inc. | | | 185,648 | |
| | 21,300 | | | People’s Utah Bancorp | | | 662,430 | |
| | 57,500 | | | Perficient, Inc.(b) | | | 1,118,375 | |
| | 62,074 | | | Performance Food Group Co.(b) | | | 1,756,694 | |
| | 3,136 | | | PerkinElmer, Inc. | | | 226,796 | |
| | 25,900 | | | Perry Ellis International, Inc.(b) | | | 603,211 | |
| | 900 | | | PGT Innovations, Inc.(b) | | | 12,689 | |
| | 1,914 | | | PH Glatfelter Co. | | | 40,117 | |
| | 1,854 | | | PharMerica Corp.(b) | | | 54,322 | |
| | 800 | | | PHH Corp.(b) | | | 10,567 | |
| | 36,000 | | | Phibro Animal Health Corp. - Class A | | | 1,355,400 | |
| | 3,640 | | | Photronics, Inc.(b) | | | 35,308 | |
| | 4,112 | | | Pilgrim’s Pride Corp.(b) | | | 130,679 | |
| | 1,476 | | | Pinnacle Financial Partners, Inc. | | | 97,711 | |
| | 2,235 | | | Pinnacle Foods, Inc. | | | 121,629 | |
| | 901 | | | Pinnacle West Capital Corp. | | | 79,027 | |
| | 5,485 | | | Pitney Bowes, Inc. | | | 75,364 | |
| | 28,300 | | | PJT Partners, Inc. - Class A | | | 1,092,380 | |
| | 1,867 | | | Planet Fitness Inc. - Class A(b) | | | 49,737 | |
| | 38,803 | | | Plantronics, Inc. | | | 1,760,104 | |
| | 23,053 | | | Platform Specialty Products Corp.(b) | | | 246,667 | |
| | 42,597 | | | Plexus Corp.(b) | | | 2,616,734 | |
| | 10,800 | | | PNM Resources, Inc. | | | 468,720 | |
| | 614 | | | Polaris Industries, Inc. | | | 72,716 | |
| | 2,203 | | | PolyOne Corp. | | | 101,492 | |
| | 419 | | | Pool Corp. | | | 50,607 | |
| | 62,617 | | | Portland General Electric Co. | | | 2,989,336 | |
| Old Westbury Funds, Inc. |
| Small & Mid Cap Strategies Fund |
| Portfolio of Investments - (Continued) | October 31, 2017 |
| |
| Shares | | | | | | Value | |
| UNITED STATES (continued) | | | | |
| | 3,700 | | | Post Holdings, Inc.(b) | | $ | 306,841 | |
| | 13,900 | | | Potbelly Corp.(b) | | | 167,495 | |
| | 9,700 | | | Potlatch Corp. REIT | | | 502,460 | |
| | 12,100 | | | Powell Industries, Inc. | | | 350,658 | |
| | 600 | | | Power Integrations, Inc. | | | 48,210 | |
| | 1,374 | | | PRA Health Sciences, Inc.(b) | | | 111,885 | |
| | 31,600 | | | Preferred Apartment Communities, Inc. - Class A REIT | | | 627,260 | |
| | 22,100 | | | Preferred Bank | | | 1,364,233 | |
| | 12,360 | | | Premier Financial Bancorp Inc. | | | 255,852 | |
| | 1,270 | | | Premier, Inc. - Class A(b) | | | 41,491 | |
| | 266,812 | | | Prestige Brands Holdings, Inc.(b) | | | 12,513,483 | |
| | 506 | | | PriceSmart, Inc. | | | 42,403 | |
| | 1,531 | | | Primerica, Inc. | | | 135,494 | |
| | 46,059 | | | Primoris Services Corp. | | | 1,302,088 | |
| | 1,773 | | | ProAssurance Corp. | | | 99,377 | |
| | 76,200 | | | Progress Software Corp. | | | 3,225,546 | |
| | 202,312 | | | Prosperity Bancshares, Inc. | | | 13,308,083 | |
| | 388 | | | Proto Labs, Inc.(b) | | | 33,853 | |
| | 9,700 | | | Provident Financial Holdings, Inc. | | | 187,501 | |
| | 59,764 | | | Provident Financial Services, Inc. | | | 1,625,581 | |
| | 20,800 | | | PS Business Parks, Inc. REIT | | | 2,752,464 | |
| | 26,542 | | | PulteGroup, Inc. | | | 802,365 | |
| | 375,000 | | | Pure Storage, Inc. - Class A(b) | | | 6,161,250 | |
| | 4,072 | | | PVH Corp. | | | 516,370 | |
| | 145,000 | | | Q2 Holdings, Inc.(b) | | | 6,169,750 | |
| | 23,700 | | | QAD Inc. | | | 876,900 | |
| | 25,600 | | | QCR Holdings, Inc. | | | 1,222,400 | |
| | 4,086 | | | Qorvo, Inc.(b) | | | 309,760 | |
| | 1,530 | | | Quad Graphics, Inc. | | | 34,869 | |
| | 351 | | | Quaker Chemical Corp. | | | 54,517 | |
| | 91,070 | | | Quality Systems, Inc.(b) | | | 1,281,355 | |
| | 525,984 | | | Qualys, Inc.(a)(b) | | | 27,824,554 | |
| | 4,601 | | | Quanta Services, Inc. | | | 173,596 | |
| | 43,162 | | | Quest Diagnostics, Inc. | | | 4,047,732 | |
| | 1,185 | | | Ralph Lauren Corp. | | | 105,975 | |
| | 3,485 | | | Rambus, Inc.(b) | | | 51,264 | |
| | 3,045 | | | Rayonier Advanced Materials, Inc. | | | 43,757 | |
| | 347 | | | RBC Bearings, Inc.(b) | | | 42,966 | |
| | 8,700 | | | RCI Hospitality Holdings, Inc. | | | 239,685 | |
| | 687 | | | Re Max Holdings, Inc. - Class A | | | 45,686 | |
| | 12,215 | | | Realogy Holdings Corp. | | | 394,911 | |
| | 6,210 | | | RealPage, Inc.(b) | | | 268,893 | |
| | 7,900 | | | Reata Pharmaceuticals, Inc. - Class A(b) | | | 239,212 | |
| | 725,433 | | | REC Silicon ASA(b) | | | 95,031 | |
| | 580 | | | Red Robin Gourmet Burgers, Inc.(b) | | | 39,672 | |
| | 2,255 | | | Regal-Beloit Corp. | | | 182,993 | |
| | 1,145 | | | Regency Centers Corp. REIT | | | 70,475 | |
| | 3,349 | | | Regis Corp.(b) | | | 50,001 | |
| Shares | | | | | | Value | |
| UNITED STATES (continued) | | | | |
| | 1,754 | | | Reinsurance Group of America, Inc. | | $ | 262,013 | |
| | 2,000 | | | Reis Inc. | | | 36,500 | |
| | 2,400 | | | Reliance Steel & Aluminum Co. | | | 184,416 | |
| | 41,396 | | | Renasant Corp. | | | 1,713,794 | |
| | 11,900 | | | Republic Bancorp, Inc. - Class A | | | 467,908 | |
| | 1,547 | | | ResMed, Inc. | | | 130,226 | |
| | 600 | | | Resources Connection, Inc. | | | 9,449 | |
| | 983 | | | Retail Opportunity Investments Corp. REIT | | | 17,674 | |
| | 3,777 | | | REX American Resources Corp.(b) | | | 333,056 | |
| | 3,895 | | | Rexnord Corp.(b) | | | 99,400 | |
| | 5,447 | | | Rice Energy, Inc.(b) | | | 154,422 | |
| | 49,400 | | | Riverview Bancorp, Inc. | | | 438,672 | |
| | 677 | | | RLI Corp. | | | 40,004 | |
| | 15,200 | | | RMR Group Inc. (The) - Class A | | | 797,240 | |
| | 2,089 | | | Robert Half International, Inc. | | | 108,148 | |
| | 40,448 | | | Rockwell Collins, Inc. | | | 5,484,749 | |
| | 498 | | | Rogers Corp.(b) | | | 75,736 | |
| | 1,480 | | | Rollins, Inc. | | | 64,987 | |
| | 8,980 | | | Rowan Cos Plc - Class A(b) | | | 128,683 | |
| | 1,166 | | | Royal Gold, Inc. | | | 98,072 | |
| | 2,026 | | | RPM International, Inc. | | | 108,047 | |
| | 4,010 | | | RPX Corp. | | | 52,210 | |
| | 926 | | | Rudolph Technologies, Inc.(b) | | | 25,697 | |
| | 37,362 | | | Rush Enterprises, Inc. - Class A(b) | | | 1,897,242 | |
| | 63,000 | | | Ruth’s Hospitality Group Inc. | | | 1,329,300 | |
| | 3,125 | | | Ryder System, Inc. | | | 253,375 | |
| | 42,701 | | | Ryman Hospitality Properties Inc. REIT | | | 2,823,817 | |
| | 2,261 | | | S&T Bancorp, Inc. | | | 92,452 | |
| | 911 | | | Sabra Health Care REIT, Inc. REIT | | | 18,147 | |
| | 1,798 | | | Sabre Corp. | | | 35,169 | |
| | 22,143 | | | Safety Insurance Group, Inc. | | | 1,820,155 | |
| | 4,800 | | | Saga Communications, Inc. - Class A | | | 210,000 | |
| | 3,655 | | | Saia, Inc.(b) | | | 236,844 | |
| | 11,694,600 | | | Samsonite International SA(a) | | | 48,793,708 | |
| | 58,930 | | | Sanderson Farms, Inc. | | | 8,814,160 | |
| | 12,454 | | | Sandy Spring Bancorp, Inc. | | | 503,266 | |
| | 63,424 | | | Sanmina Corp.(b) | | | 2,075,550 | |
| | 23,445 | | | Santander Consumer USA Holdings, Inc. | | | 390,125 | |
| | 49,900 | | | ScanSource, Inc.(b) | | | 2,143,205 | |
| | 788 | | | Schnitzer Steel Industries, Inc. - Class A | | | 23,207 | |
| | 1,097 | | | Schweitzer-Mauduit International, Inc. | | | 46,326 | |
| | 16,050 | | | Science Applications International Corp. | | | 1,177,107 | |
| | 974 | | | Scientific Games Corp. - Class A(b) | | | 46,362 | |
| | 570 | | | Scotts Miracle-Gro Co. (The) | | | 56,783 | |
| Old Westbury Funds, Inc. |
| Small & Mid Cap Strategies Fund |
| Portfolio of Investments - (Continued) | October 31, 2017 |
| |
| Shares | | | | | Value | |
| UNITED STATES (continued) | | | | |
| | 2,413 | | | Scripps Networks Interactive, Inc. - Class A | | $ | 200,955 | |
| | 153 | | | Seaboard Corp. | | | 673,218 | |
| | 633 | | | SEACOR Holdings, Inc.(b) | | | 29,878 | |
| | 3,132 | | | Sealed Air Corp. | | | 138,528 | |
| | 7,733 | | | Seattle Genetics, Inc.(b) | | | 474,110 | |
| | 1,826 | | | SEI Investments Co. | | | 117,795 | |
| | 32,000 | | | Select Income REIT | | | 773,120 | |
| | 8,962 | | | Select Medical Holdings Corp.(b) | | | 171,622 | |
| | 59,048 | | | Selective Insurance Group, Inc. | | | 3,519,261 | |
| | 1,190 | | | Semtech Corp.(b) | | | 48,850 | |
| | 2,045 | | | Senior Housing Properties Trust REIT | | | 37,628 | |
| | 4,271 | | | Sensata Technologies Holding NV(b) | | | 208,895 | |
| | 34,103 | | | Sensient Technologies Corp. | | | 2,593,533 | |
| | 1,918 | | | Service Corp. International | | | 68,012 | |
| | 2,340 | | | ServiceMaster Global Holdings, Inc.(b) | | | 110,237 | |
| | 1,179 | | | ServisFirst Bancshares, Inc. | | | 48,351 | |
| | 1,438 | | | Shenandoah Telecommunications Co. | | | 54,644 | |
| | 20,400 | | | Shore Bancshares, Inc. | | | 335,784 | |
| | 3,644 | | | Shutterfly, Inc.(b) | | | 155,599 | |
| | 13,000 | | | SI Financial Group, Inc. | | | 195,000 | |
| | 24,300 | | | Sierra Bancorp | | | 642,978 | |
| | 876 | | | Signature Bank(b) | | | 113,889 | |
| | 3,108 | | | Signet Jewelers Ltd. | | | 203,792 | |
| | 2,610 | | | Silgan Holdings, Inc. | | | 76,343 | |
| | 506 | | | Silicon Laboratories, Inc.(b) | | | 48,019 | |
| | 2,208 | | | Simmons First National Corp. - Class A | | | 127,402 | |
| | 285,000 | | | Simply Good Foods Co. (The)(b) | | | 3,283,200 | |
| | 1,434 | | | Simpson Manufacturing Co., Inc. | | | 79,931 | |
| | 31,500 | | | Simulations Plus, Inc. | | | 513,450 | |
| | 1,522 | | | Sinclair Broadcast Group, Inc. - Class A | | | 48,247 | |
| | 1,099,664 | | | SIX Flags Entertainment Corp. | | | 69,047,903 | |
| | 33,900 | | | SJW Corp. | | | 2,010,609 | |
| | 8,011 | | | Skechers U.S.A., Inc. - Class A(b) | | | 255,711 | |
| | 4,607 | | | SkyWest, Inc. | | | 216,990 | |
| | 982 | | | Sleep Number Corp.(b) | | | 31,915 | |
| | 8,075 | | | SLM Corp.(b) | | | 85,514 | |
| | 589,128 | | | Snap-on, Inc. | | | 92,952,616 | |
| | 811,000 | | | Snyder’s-Lance, Inc.(a) | | | 30,517,930 | |
| | 1,970 | | | Sonoco Products Co. | | | 102,026 | |
| | 679 | | | Sotheby’s(b) | | | 35,186 | |
| | 578 | | | South Jersey Industries, Inc. | | | 19,635 | |
| | 874 | | | South State Corp. | | | 78,704 | |
| | 4,200 | | | Southern First Bancshares, Inc.(b) | | | 161,910 | |
| | 12,600 | | | Southern Missouri Bancorp, Inc. | | | 465,318 | |
| Shares | | | | | Value | |
| UNITED STATES (continued) | | | | |
| | 300 | | | Southside Bancshares, Inc. | | $ | 10,623 | |
| | 97,194 | | | Southwest Gas Holdings, Inc. | | | 8,007,814 | |
| | 32,300 | | | SP Plus Corp.(b) | | | 1,251,625 | |
| | 26,100 | | | Spark Energy, Inc. Class A | | | 365,400 | |
| | 31,200 | | | SpartanNash Co. | | | 765,960 | |
| | 646,803 | | | Spectrum Brands Holdings, Inc.(a) | | | 71,096,586 | |
| | 545 | | | Speedway Motorsports, Inc. | | | 10,873 | |
| | 38,500 | | | Spire, Inc. | | | 3,039,575 | |
| | 3,042 | | | Spirit AeroSystems Holdings, Inc. - Class A | | | 243,664 | |
| | 10,801 | | | Splunk, Inc.(b) | | | 726,907 | |
| | 26,100 | | | Spok Holdings, Inc. | | | 442,395 | |
| | 4,171 | | | Sprouts Farmers Market, Inc.(b) | | | 77,122 | |
| | 787 | | | SPX Corp.(b) | | | 23,051 | |
| | 1,179 | | | SPX Flow, Inc.(b) | | | 48,610 | |
| | 2,400 | | | SRC Energy, Inc.(b) | | | 22,895 | |
| | 1,456 | | | SS&C Technologies Holdings, Inc. | | | 58,531 | |
| | 908 | | | St Joe Co. (The)(b) | | | 16,162 | |
| | 40,808 | | | STAAR Surgical Co.(b) | | | 540,706 | |
| | 8,399 | | | Stamps.com, Inc.(b) | | | 1,884,736 | |
| | 1,623 | | | Standard Motor Products, Inc. | | | 70,876 | |
| | 185,907 | | | Standex International Corp.(a) | | | 19,250,670 | |
| | 20,700 | | | StarTek, Inc.(b) | | | 247,158 | |
| | 941 | | | Starwood Waypoint Homes REIT | | | 34,168 | |
| | 5,300 | | | State Auto Financial Corp. | | | 135,892 | |
| | 1,458 | | | State Bank Financial Corp. | | | 42,151 | |
| | 2,402 | | | State National Cos., Inc. | | | 50,490 | |
| | 4,571 | | | Steel Dynamics, Inc. | | | 170,087 | |
| | 4,384 | | | Steelcase, Inc. - Class A | | | 63,787 | |
| | 26,546 | | | Stepan Co. | | | 2,119,964 | |
| | 505 | | | Stericycle, Inc.(b) | | | 35,779 | |
| | 6,121 | | | Sterling Bancorp | | | 153,331 | |
| | 4,607 | | | Steven Madden Ltd.(b) | | | 179,673 | |
| | 40,375 | | | Stewart Information Services Corp. | | | 1,531,828 | |
| | 2,205 | | | Stifel Financial Corp. | | | 116,931 | |
| | 199,542 | | | Stock Yards Bancorp, Inc.(a) | | | 7,532,711 | |
| | 22,300 | | | Stoneridge, Inc.(b) | | | 507,102 | |
| | 1,527 | | | STORE Capital Corp. REIT | | | 37,702 | |
| | 30,565 | | | Stratasys Ltd.(b) | | | 688,324 | |
| | 226 | | | Strayer Education, Inc. | | | 21,183 | |
| | 31,171 | | | Sturm Ruger & Co., Inc. | | | 1,544,523 | |
| | 1,944 | | | Summit Materials, Inc. - Class A(b) | | | 61,042 | |
| | 798 | | | Sun Communities, Inc. REIT | | | 72,027 | |
| | 1,971 | | | SunCoke Energy, Inc.(b) | | | 21,858 | |
| | 2,604 | | | Sunstone Hotel Investors, Inc. REIT | | | 42,497 | |
| | 41,753 | | | Super Micro Computer, Inc.(b) | | | 830,885 | |
| | 1,030 | | | Superior Industries International, Inc. | | | 16,017 | |
| | 9,400 | | | Superior Uniform Group, Inc. | | | 220,618 | |
| | 310,764 | | | Supernus Pharmaceuticals, Inc.(b) | | | 12,927,782 | |
| Old Westbury Funds, Inc. |
| Small & Mid Cap Strategies Fund |
| Portfolio of Investments - (Continued) | October 31, 2017 |
| |
| Shares | | | | | Value | |
| UNITED STATES (continued) | | | | |
| | 1,490 | | | SVB Financial Group(b) | | $ | 326,727 | |
| | 40,519 | | | Sykes Enterprises, Inc.(b) | | | 1,172,620 | |
| | 24,789 | | | SYNNEX Corp. | | | 3,343,540 | |
| | 600 | | | Synopsys, Inc.(b) | | | 51,912 | |
| | 3,657 | | | Synovus Financial Corp. | | | 171,330 | |
| | 10,425 | | | Tahoe Resources, Inc. | | | 50,020 | |
| | 1,477 | | | Take-Two Interactive Software, Inc.(b) | | | 163,430 | |
| | 2,182 | | | Tapestry, Inc. | | | 89,353 | |
| | 2,056 | | | Taylor Morrison Home Corp.(b) | | | 49,652 | |
| | 11,222 | | | TCF Financial Corp. | | | 204,465 | |
| | 30,149 | | | Tech Data Corp.(b) | | | 2,796,923 | |
| | 7,600 | | | TechTarget, Inc.(b) | | | 94,696 | |
| | 5,458 | | | TEGNA, Inc. | | | 66,751 | |
| | 102 | | | Tejon Ranch Co.(b) | | | 1,923 | |
| | 163,367 | | | Teladoc, Inc.(b) | | | 5,399,279 | |
| | 1,000 | | | Teledyne Technologies, Inc.(b) | | | 169,960 | |
| | 389 | | | Teleflex, Inc. | | | 92,185 | |
| | 5,182 | | | Telephone & Data Systems, Inc. | | | 151,055 | |
| | 31,200 | | | TeleTech Holdings, Inc. | | | 1,299,480 | |
| | 614 | | | Tempur Sealy International, Inc.(b) | | | 40,137 | |
| | 300 | | | Tennant Co. | | | 20,805 | |
| | 1,221 | | | Tenneco, Inc. | | | 70,952 | |
| | 2,726 | | | Teradata Corp.(b) | | | 91,185 | |
| | 1,528 | | | Teradyne, Inc. | | | 65,536 | |
| | 3,081 | | | Terex Corp. | | | 145,146 | |
| | 14,900 | | | Territorial Bancorp Inc. | | | 470,691 | |
| | 6,016 | | | Tesla Motors, Inc.(b) | | | 1,994,484 | |
| | 61,970 | | | Tetra Tech, Inc. | | | 3,052,023 | |
| | 1,481 | | | Texas Capital Bancshares, Inc.(b) | | | 127,440 | |
| | 130,863 | | | Texas Roadhouse, Inc. | | | 6,544,459 | |
| | 1,300 | | | TFS Financial Corp. | | | 20,045 | |
| | 600 | | | Thermon Group Holdings, Inc.(b) | | | 12,905 | |
| | 1,001 | | | Thor Industries, Inc. | | | 136,356 | |
| | 88,100 | | | Tier REIT, Inc. | | | 1,724,117 | |
| | 2,365 | | | Tiffany & Co. | | | 221,411 | |
| | 13,600 | | | Timberland Bancorp, Inc. | | | 412,216 | |
| | 2,104 | | | Timken Co. (The) | | | 99,204 | |
| | 754 | | | Tivity Health, Inc.(b) | | | 34,873 | |
| | 67,503 | | | TiVo Corp. | | | 1,225,179 | |
| | 5,434 | | | Toll Brothers, Inc. | | | 250,181 | |
| | 415 | | | Tompkins Financial Corp. | | | 36,155 | |
| | 13,390 | | | Tootsie Roll Industries, Inc. | | | 476,684 | |
| | 1,090 | | | Topbuild Corp.(b) | | | 71,929 | |
| | 3,226 | | | Torchmark Corp. | | | 271,403 | |
| | 1,753 | | | Toro Co. (The) | | | 110,176 | |
| | 4,337 | | | Total System Services, Inc. | | | 312,481 | |
| | 29,429 | | | TowneBank | | | 985,872 | |
| | 1,261 | | | TransUnion(b) | | | 66,190 | |
| | 315,400 | | | TreeHouse Foods, Inc.(b) | | | 20,936,252 | |
| | 587 | | | Trex Co., Inc.(b) | | | 64,247 | |
| | 10,791 | | | TRI Pointe Group, Inc.(b) | | | 190,893 | |
| Shares | | | | | Value | |
| UNITED STATES (continued) | | | | |
| | 2,390 | | | Tribune Media Co. | | $ | 97,823 | |
| | 35,490 | | | TriCo Bancshares | | | 1,469,996 | |
| | 550,000 | | | TriMas Corp.(a)(b) | | | 14,602,500 | |
| | 3,157 | | | Trimble, Inc.(b) | | | 129,058 | |
| | 1,596 | | | Trinet Group, Inc.(b) | | | 55,413 | |
| | 6,964 | | | Trinity Industries, Inc. | | | 226,469 | |
| | 1,148 | | | Trinseo SA | | | 81,508 | |
| | 1,448 | | | Triumph Group, Inc. | | | 44,960 | |
| | 27,439 | | | Trupanion, Inc.(b) | | | 772,682 | |
| | 148,150 | | | TrustCo Bank Corp. | | | 1,359,276 | |
| | 1,207 | | | Trustmark Corp. | | | 39,759 | |
| | 7,205 | | | TTM Technologies, Inc.(b) | | | 113,695 | |
| | 1,399 | | | Tupperware Brands Corp. | | | 82,191 | |
| | 14,800 | | | Turning Point Brands, Inc.(b) | | | 259,000 | |
| | 2,155 | | | Tutor Perini Corp.(b) | | | 60,771 | |
| | 525 | | | Tyler Technologies, Inc.(b) | | | 93,077 | |
| | 1,485 | | | Ubiquiti Networks, Inc.(b) | | | 92,337 | |
| | 2,356 | | | UDR, Inc. REIT | | | 91,389 | |
| | 12,800 | | | UFP Technologies, Inc.(b) | | | 394,880 | |
| | 1,399 | | | UGI Corp. | | | 66,956 | |
| | 411 | | | Ultimate Software Group, Inc.(The)(b) | | | 83,264 | |
| | 236,484 | | | UMB Financial Corp. | | | 17,388,669 | |
| | 57,900 | | | UMH Properties, Inc. REIT | | | 865,026 | |
| | 7,321 | | | Umpqua Holdings Corp. | | | 149,788 | |
| | 1,224 | | | Unifi, Inc.(b) | | | 46,573 | |
| | 354 | | | UniFirst Corp. | | | 55,755 | |
| | 1,779 | | | Union Bankshares Corp. | | | 61,393 | |
| | 900 | | | United Bankshares, Inc. | | | 32,355 | |
| | 2,535 | | | United Community Banks, Inc. | | | 69,510 | |
| | 37,944 | | | United Fire Group, Inc. | | | 1,748,839 | |
| | 1,860 | | | United Natural Foods, Inc.(b) | | | 72,112 | |
| | 798 | | | United Rentals, Inc.(b) | | | 112,901 | |
| | 1,723 | | | United States Cellular Corp.(b) | | | 63,045 | |
| | 1,377 | | | United States Steel Corp. | | | 34,866 | |
| | 612 | | | United Therapeutics Corp.(b) | | | 72,577 | |
| | 35,300 | | | Unitil Corp. | | | 1,835,600 | |
| | 2,759 | | | Univar, Inc.(b) | | | 82,080 | |
| | 34,735 | | | Universal Corp. | | | 1,992,052 | |
| | 1,389 | | | Universal Forest Products, Inc. | | | 156,818 | |
| | 9,500 | | | Universal Health Realty Income Trust | | | 695,495 | |
| | 211 | | | Universal Health Services, Inc. - Class B | | | 21,670 | |
| | 14,371 | | | Universal Insurance Holdings, Inc. | | | 342,748 | |
| | 405 | | | Univest Corp. of Pennsylvania | | | 11,867 | |
| | 6,879 | | | Unum Group | | | 357,983 | |
| | 11,300 | | | Upland Software, Inc.(b) | | | 248,261 | |
| | 5,190 | | | Urban Outfitters, Inc.(b) | | | 127,259 | |
| | 56,800 | | | Urstadt Biddle Properties, Inc. - Class A REIT | | | 1,234,264 | |
| | 364 | | | US Concrete, Inc.(b) | | | 28,465 | |
| | 13,600 | | | US Ecology, Inc. | | | 646,680 | |
| | 10,700 | | | US Physical Therapy, Inc. | | | 727,065 | |
| | 16,815 | | | USANA Health Sciences, Inc.(b) | | | 1,104,746 | |
| Old Westbury Funds, Inc. |
| Small & Mid Cap Strategies Fund |
| Portfolio of Investments - (Continued) | October 31, 2017 |
| |
| Shares | | | | | Value | |
| UNITED STATES (continued) | | | | |
| | 8,530 | | | USG Corp.(b) | | $ | 292,835 | |
| | 8,300 | | | Utah Medical Products Inc. | | | 625,820 | |
| | 487 | | | Vail Resorts, Inc. | | | 111,533 | |
| | 66,088 | | | Valeant Pharmaceuticals International, Inc.(b) | | | 771,991 | |
| | 8,739 | | | Valley National Bancorp | | | 100,499 | |
| | 291 | | | Valmont Industries, Inc. | | | 46,240 | |
| | 2,042 | | | Valvoline, Inc. | | | 49,049 | |
| | 1,489,500 | | | Vantiv, Inc. - Class A(b) | | | 104,265,000 | |
| | 22,438 | | | Varex Imaging Corp.(b) | | | 771,194 | |
| | 1,094 | | | Varian Medical Systems, Inc.(b) | | | 113,984 | |
| | 118,335 | | | Vector Group Ltd. | | | 2,459,001 | |
| | 732 | | | Vectren Corp. | | | 49,878 | |
| | 536 | | | Vectrus, Inc.(b) | | | 16,353 | |
| | 18,071 | | | Veeco Instruments, Inc.(b) | | | 326,182 | |
| | 1,828 | | | Veeva Systems, Inc. - Class A(b) | | | 111,398 | |
| | 7,844 | | | Vereit, Inc. REIT | | | 61,889 | |
| | 7,259 | | | VeriFone Systems, Inc.(b) | | | 138,502 | |
| | 60,956 | | | Verint Systems, Inc.(b) | | | 2,572,343 | |
| | 983 | | | VeriSign, Inc. | | | 105,692 | |
| | 35,918 | | | Viad Corp. | | | 2,085,040 | |
| | 1,213 | | | ViaSat, Inc.(b) | | | 78,966 | |
| | 12,000 | | | Village Super Market, Inc. - Class A | | | 287,880 | |
| | 490 | | | Virtus Investment Partners, Inc. | | | 57,036 | |
| | 330 | | | Virtusa Corp.(b) | | | 12,593 | |
| | 40,682 | | | Vishay Intertechnology, Inc. | | | 905,175 | |
| | 8,400 | | | Vishay Precision Group, Inc.(b) | | | 206,220 | |
| | 955 | | | Visteon Corp.(b) | | | 120,368 | |
| | 35,700 | | | Vocera Communications, Inc.(b) | | | 1,007,454 | |
| | 55,700 | | | Vonage Holdings Corp.(b) | | | 452,841 | |
| | 6,219 | | | Voya Financial, Inc. | | | 249,755 | |
| | 3,200 | | | VSE Corp. | | | 157,120 | |
| | 5,848 | | | VWR Corp.(b) | | | 193,569 | |
| | 3,334 | | | Wabash National Corp. | | | 75,015 | |
| | 895 | | | WABCO Holdings, Inc.(b) | | | 132,075 | |
| | 1,123,982 | | | Wabtec Corp.(a) | | | 85,984,623 | |
| | 5,214 | | | Waddell & Reed Financial, Inc. - Class A | | | 97,450 | |
| | 25,868 | | | Walker & Dunlop, Inc.(b) | | | 1,419,895 | |
| | 217,097 | | | Washington Trust Bancorp, Inc.(a) | | | 12,048,884 | |
| | 401,851 | | | Waters Corp.(b) | | | 78,782,889 | |
| | 49,200 | | | Waterstone Financial Inc. | | | 944,640 | |
| | 275 | | | Watsco, Inc. | | | 45,807 | |
| | 600 | | | Watts Water Technologies, Inc. - Class A | | | 40,440 | |
| | 33,178 | | | Wayfair, Inc. - Class A(b) | | | 2,319,142 | |
| | 372 | | | WD-40 Co. | | | 41,236 | |
| | 35,827 | | | Web.com Group, Inc.(b) | | | 863,431 | |
| | 2,743 | | | Webster Financial Corp. | | | 150,838 | |
| | 889 | | | Weingarten Realty Investors REIT | | | 27,070 | |
| | 1,100,600 | | | Welbilt, Inc.(b) | | | 24,279,236 | |
| Shares | | | | | Value | |
| UNITED STATES (continued) | | | | |
| | 841 | | | WellCare Health Plans, Inc.(b) | | $ | 166,299 | |
| | 2,902 | | | Wendy’s Co (The) | | | 44,139 | |
| | 5,508 | | | Werner Enterprises, Inc. | | | 196,360 | |
| | 1,572 | | | WesBanco, Inc. | | | 63,509 | |
| | 3,219 | | | WESCO International, Inc.(b) | | | 203,280 | |
| | 6,400 | | | West Bancorp, Inc. | | | 156,480 | |
| | 469 | | | West Pharmaceutical Services, Inc. | | | 47,557 | |
| | 3,142 | | | Western Alliance Bancorp(b) | | | 175,324 | |
| | 4,140 | | | Western Union Co. (The) | | | 82,220 | |
| | 3,397 | | | Westlake Chemical Corp. | | | 288,439 | |
| | 3,900 | | | Westwood Holdings Group, Inc. | | | 253,110 | |
| | 175,353 | | | WEX, Inc.(b) | | | 21,671,877 | |
| | 10,700 | | | Weyco Group, Inc. | | | 290,933 | |
| | 300 | | | White Mountains Insurance Group Ltd. | | | 266,745 | |
| | 2,316 | | | Williams-Sonoma, Inc. | | | 119,506 | |
| | 1,100 | | | Winmark Corp. | | | 143,825 | |
| | 1,190 | | | Winnebago Industries, Inc. | | | 58,489 | |
| | 7,544 | | | Wintrust Financial Corp. | | | 613,252 | |
| | 947,444 | | | Wolverine World Wide, Inc. | | | 25,865,221 | |
| | 276,270 | | | Woodward, Inc. | | | 21,363,959 | |
| | 408 | | | World Acceptance Corp.(b) | | | 35,700 | |
| | 1,662 | | | Worthington Industries, Inc. | | | 75,621 | |
| | 361 | | | WP Carey, Inc. REIT | | | 24,602 | |
| | 4,362 | | | WR Berkley Corp. | | | 299,146 | |
| | 1,138 | | | WR Grace & Co. | | | 87,046 | |
| | 1,000 | | | WSFS Financial Corp. | | | 49,700 | |
| | 4,417 | | | WW Grainger, Inc. | | | 873,241 | |
| | 996,731 | | | Wyndham Worldwide Corp. | | | 106,500,707 | |
| | 876 | | | Wynn Resorts Ltd. | | | 129,201 | |
| | 118,900 | | | Xenia Hotels & Resorts, Inc. REIT | | | 2,587,264 | |
| | 19,657 | | | Xerox Corp. | | | 595,804 | |
| | 48,300 | | | XO Group Inc.(b) | | | 964,068 | |
| | 6,475 | | | XPO Logistics, Inc.(b) | | | 449,041 | |
| | 3,364 | | | Xylem Inc. | | | 223,807 | |
| | 3,973 | | | Zayo Group Holdings, Inc.(b) | | | 143,266 | |
| | 1,004 | | | Zebra Technologies Corp. - Class A(b) | | | 116,454 | |
| | 13,421 | | | Zillow Group, Inc. - Class A(b) | | | 554,422 | |
| | 34,417 | | | Zillow Group, Inc. - Class C(b) | | | 1,420,734 | |
| | 13,017 | | | Zions Bancorporation | | | 604,770 | |
| | 23,592 | | | Zynga, Inc. - Class A(b) | | | 92,009 | |
| | | | | | | | 3,502,829,372 | |
Total Common Stocks
(Cost $4,406,488,739) | | | 5,946,173,034 | |
| Old Westbury Funds, Inc. | |
| Small & Mid Cap Strategies Fund | |
| Portfolio of Investments - (Continued) | October 31, 2017 |
| | |
| Shares | | | | | Value | |
| INVESTMENT COMPANY — 0.5% | | | | |
| | 30,936,229 | | | SEI Daily Income Trust Government II Fund, Class A 0.88%(e) | | $ | 30,936,229 | |
Total Investment Company
(Cost $30,936,229) | | 30,936,229 | |
| Shares | | | | | | Value | |
| EXCHANGE TRADED FUNDS — 3.1% | | | | |
| | 2,231,500 | | | SPDR S&P Oil & Gas Exploration & Production ETF | | $ | 76,495,820 | |
| | 2,178,600 | | | VanEck Vectors Gold Miners ETF | | | 48,974,928 | |
| | 1,565,365 | | | VanEck Vectors Junior Gold Miners ETF | | | 50,076,026 | |
| | 1,164,000 | | | VanEck Vectors Oil Services ETF | | | 28,215,360 | |
Total Exchange Traded Funds
(Cost $208,953,327) | | | 203,762,134 | |
| RIGHTS/WARRANTS — 0.0% | | | | |
| AUSTRALIA — 0.0% | | | | |
| | 8,641 | | | Westgold Resources Ltd. | | | 2,149 | |
| | 1,710 | | | Centrebet Litigation Rights(a)(b)(c) | | | 0 | |
| | 1,710 | | | Centrebet Litigation Units(a)(b)(c) | | | 0 | |
| | | | | | | | 2,149 | |
| AUSTRIA — 0.0% | | | | |
| | 9,812 | | | Intercell Contigent Value Rights AG(a)(b)(c) | | | 0 | |
| BRAZIL — 0.0% | | | | |
| | 22,087 | | | Helbor Empreendimentos SA(b) | | | 338 | |
| | 3,162 | | | Cia Energetica de Minas Gerais(b) | | | 1,169 | |
| | | | | | | | 1,507 | |
| CHILE — 0.0% | | | | |
| | 933,622 | | | Cia Sud Americana de Vapores SA(b) | | | 8,655 | |
| CHINA — 0.0% | | | | |
| | 18,134 | | | CTBH Financial Rights(b) | | | 0 | |
| FRANCE — 0.0% | | | | |
| | 34,332 | | | Etablissements Maurel et Prom Contingent Value Rights(a)(b)(c) | | | 1,600 | |
| INDIA — 0.0% | | | | |
| | 5,698 | | | HCL Info(a)(b) | | | 70 | |
| | 4,345 | | | Karur Vysya Bank(a)(b) | | | 3,414 | |
| | | | | | | | 3,484 | |
| MALAYSIA — 0.0% | | | | |
| | 49,750 | | | Malaysian Resources(a)(b) | | | 0 | |
| | 7,743 | | | Sunway Berhad | | | 1,171 | |
| | 103,900 | | | UMW Oil & Gas Corp. Berhad | | | 4,540 | |
| | | | | | | | 5,711 | |
| Old Westbury Funds, Inc. | |
| Small & Mid Cap Strategies Fund | |
| Portfolio of Investments - (Continued) | October 31, 2017 |
| | |
| Shares | | | | | | Value | |
| SOUTH KOREA — 0.0% | | | | |
| | 6,437 | | | Hanwha General Insurance(a)(b) | | $ | 5,459 | |
| | 594 | | | Hyundai Electric & Energy System Co. Ltd.(b) | | | 26,530 | |
| | | | | | | | 31,989 | |
| SPAIN — 0.0% | | | | |
| | 138,741 | | | Liberbank SA(b) | | | 49,938 | |
| | 24,898 | | | Papeles y Cartones de Europa SA(b) | | | 10,209 | |
| | | | | | | | 60,147 | |
| TAIWAN — 0.0% | | | | |
| | 14,468 | | | TA Chen Stainless(a)(b) | | | 528 | |
| | 8,340 | | | TSEC Corp.(a)(b) | | | 277 | |
| | 61,495 | | | Winbond Electronics Corp.(a)(b) | | | 8,360 | |
| | 5,984 | | | Wisdom Marine Rights(a)(b) | | | 694 | |
| | 14,124 | | | Yang Ming Marine Transport(a)(b) | | | 164 | |
| | | | | | | | 10,023 | |
| THAILAND — 0.0% | | | | |
| | 4,007 | | | Buriram Sugar Public Co. Ltd. Rights, Expire 12/31/19(b) | | | 0 | |
| | 61,975 | | | Supalai Public Co. Ltd. - FOR(a) | | | 38,431 | |
| | 7,158 | | | TPI Polene Public Co. Ltd. Rights(b)(c) | | | 0 | |
| | | | | | | | 38,431 | |
| UNITED STATES — 0.0% | | | | |
| | 9,600 | | | Ligand Pharmaceuticals Contingent Value Rights(b)(c) | | | 0 | |
Total Rights/Warrants
(Cost $93,858) | | | 163,696 | |
| | | | | | | | | |
Principal
Amount | | | | | | | |
| U.S. GOVERNMENT AGENCIES — 3.5% | | | | |
| Federal Home Loan Bank — 3.5% | | | | |
| $ | 8,000,000 | | | 0.50%, 11/01/2017(f) | | | 8,000,000 | |
| | 5,000,000 | | | 1.01%, 11/08/2017(f) | | | 4,999,020 | |
| | 72,000,000 | | | 1.01%, 11/10/2017(f) | | | 71,981,784 | |
| | 29,000,000 | | | 1.01%, 11/13/2017(f) | | | 28,990,227 | |
| | 20,000,000 | | | 1.02%, 11/17/2017(f) | | | 19,991,020 | |
| | 17,000,000 | | | 1.02%, 11/22/2017(f) | | | 16,989,987 | |
| | 26,000,000 | | | 1.02%, 12/04/2017(f) | | | 25,975,222 | |
| | 54,000,000 | | | 1.02%, 12/06/2017(f) | | | 53,945,406 | |
Total U.S. Government Agencies
(Cost $230,874,583) | | | 230,872,666 | |
| Old Westbury Funds, Inc. | |
| Small & Mid Cap Strategies Fund | |
| Portfolio of Investments - (Continued) | October 31, 2017 |
| | |
Principal
Amount | | | | Value | |
| U.S. GOVERNMENT SECURITIES — 0.5% | |
| U.S. Treasury Bills — 0.5% | | |
| $ | 30,000,000 | | | 0.88%, 11/02/2017(f) | | $ | 29,999,234 | |
Total U.S. Government Securities
(Cost $29,999,267) | | | 29,999,234 | |
| | | | | | | | | |
| | Shares | | | | | | Value | |
| CASH SWEEP — 1.5% | | | | |
| | 99,156,152 | | | Citibank - US Dollars on Deposit in Custody Account,0.10%(e) | | | 99,156,152 | |
Total Cash Sweep
(Cost $99,156,152) | | | 99,156,152 | |
TOTAL INVESTMENTS — 99.7%
(Cost $5,006,502,155) | | | 6,541,063,145 | |
| OTHER ASSETS IN EXCESS OF LIABILITIES — 0.3% | | | 21,318,125 | |
| NET ASSETS — 100.0% | | $ | 6,562,381,270 | |
| (a) | This security is considered either fully or partially illiquid. These securities, or portions thereof, have a value of $476,084,778 or 7.25% of net assets. |
| (b) | Non-income producing security. |
| (c) | Security is valued using significant unobservable inputs and is classified as Level 3 in the fair value hierarchy. The Aggregate value of the fair valued securities is $1,541,852 which is 0.02% of net assets and the cost is $9,019,653. |
| (d) | Securities incorporated in the same country but traded on different exchanges. |
| (e) | The rate shown represents the current yield as of October 31, 2017. |
| (f) | The rate represents the annualized yield at time of purchase. |
The following abbreviations are used in the report:
ADR — American Depositary Receipt
CPO — Certificate of Participation-Common
CVR — Contingent Value Rights
DVR — Differential Voting Rights
FOR — Foreign Ownership Restrictions
NVDR — Non Voting Depositary Receipt
NZD — New Zealand Dollar
REIT — Real Estate Investment Trust
SDR — Swedish Depositary Receipt
USD — U.S. Dollar
VVPR — Voter Verified Paper Record
Forward Foreign Currency Exchange Contracts Outstanding as of October 31, 2017:
| Currency Purchased | | Currency Sold | | Counterparty | | Settlement
Date | | Unrealized
Appreciation | |
| USD | | | 28,929,616 | | NZD | | | | 41,822,000 | | Citibank N.A. | | 01/31/18 | | $ | 354,673 | |
| | | | | | | | | | | | | | | | $ | 354,673 | |
| Old Westbury Funds, Inc. | |
| Small & Mid Cap Strategies Fund | |
| Portfolio of Investments - (Continued) | October 31, 2017 |
| | |
Portfolio Diversification by Sector (Unaudited)
| Sector | | Percentage
of Net Assets |
| Industrials | | | 20.9 | % |
| Consumer Discretionary | | | 14.7 | |
| Information Technology | | | 13.5 | |
| Health Care | | | 12.7 | |
| Consumer Staples | | | 6.6 | |
| Materials | | | 5.9 | |
| Banks | | | 4.4 | |
| Diversified Financials | | | 3.3 | |
| Real Estate | | | 2.8 | |
| Insurance | | | 2.3 | |
| Utilities | | | 2.0 | |
| Energy | | | 0.9 | |
| Telecommunication Services | | | 0.4 | |
| Financials | | | 0.2 | |
| Other* | | | 9.4 | |
| Total | | | 100.0 | % |
| * | Includes cash and equivalents, exchange traded funds, rights/warrants, U.S. government agencies, U.S government securitities, investment company, pending trades and Fund share transactions, interest and dividends receivable, prepaids and accrued expenses payable. |
The Board of Directors and Shareholders of Small & Mid Cap Strategies Fund, a fund comprised within the Old Westbury Funds, Inc.
We have audited the accompanying statements of assets and liabilities of Old Westbury Small & Mid Cap Strategies Fund (the “Fund”) (one of the funds comprising the Old Westbury Funds, Inc.), including the condensed portfolio of investments as of October 31, 2017, and the related statements of operations for the year then ended, the statements of changes in net assets for each of the two years in the period then ended (collectively, the “financial statements”), the financial highlights for each of the five years in the period then ended (the financial statements and financial highlights are included in Item 1 of this Form N-CSR) and the portfolio of investments as of October 31, 2017 (included in Item 6 of this Form N-CSR). These financial statements, financial highlights and portfolio of investments are the responsibility of the Fund’s management. Our responsibility is to express an opinion on these financial statements, financial highlights and portfolio of investments based on our audit.
We conducted our audit in accordance with the standards of the Public Company Accounting Oversight Board (United States). Those standards require that we plan and perform the audit to obtain reasonable assurance about whether the financial statements, financial highlights and portfolio of investments are free of material misstatement. An audit includes examining, on a test basis, evidence supporting the amounts and disclosures in the financial statements and portfolio of investments. An audit also includes assessing the accounting principles used and significant estimates made by management, and evaluating the overall financial statement presentation. Our procedures included confirmation of securities owned as of October 31, 2017, by correspondence with the custodians and brokers or by other appropriate auditing procedures where replies from brokers were not received. We believe that our audit provides a reasonable basis for our opinion.
In our opinion, the financial statements, financial highlights and portfolio of investments referred to above present fairly, in all material respects, the financial position of Old Westbury Small & Mid Cap Strategies Fund at October 31, 2017, the results of its operations for the year then ended, the changes in its net assets for each of the two years in the period then ended and the financial highlights for each of the five years in the period then ended, in conformity with U.S. generally accepted accounting principles.

New York, New York
December 28, 2017
Item 7. Disclosure of Proxy Voting Policies and Procedures for Closed-End Management Investment Companies.
Not applicable.
Item 8. Portfolio Managers of Closed-End Management Investment Companies.
Not applicable.
Item 9. Purchases of Equity Securities by Closed-End Management Investment Company and Affiliated Purchasers.
Not applicable.
Item 10. Submission of Matters to a Vote of Security Holders.
There have been no material changes to the procedures by which the shareholders may recommend nominees to the registrant’s board of directors, where those changes were implemented after the registrant last provided disclosure in response to the requirements of Item 407(c)(2)(iv) of Regulation S-K (17 CFR 229.407) (as required by Item 22(b)(15) of Schedule 14A (17 CFR 240.14a-101)), or this Item.
Item 11. Controls and Procedures.
| (a) | The registrant’s principal executive and principal financial officers, or persons performing similar functions, have concluded that the registrant’s disclosure controls and procedures (as defined in Rule 30a-3(c) under the Investment Company Act of 1940, as amended (the “1940 Act”) (17 CFR 270.30a-3(c))) are effective, as of a date within 90 days of the filing date of the report that includes the disclosure required by this paragraph, based on their evaluation of these controls and procedures required by Rule 30a-3(b) under the 1940 Act (17 CFR 270.30a-3(b)) and Rules 13a-15(b) or 15d-15(b) under the Securities Exchange Act of 1934, as amended (17 CFR 240.13a-15(b) or 240.15d-15(b)). |
| (b) | There were no changes in the registrant’s internal control over financial reporting (as defined in Rule 30a-3(d) under the 1940 Act (17 CFR 270.30a-3(d)) that occurred during the registrant’s second fiscal quarter of the period covered by this report that has materially affected, or is reasonably likely to materially affect, the registrant’s internal control over financial reporting. |
Item 12. Disclosure of Securities Lending Activities for Closed-End Management Investment Companies.
Item 13. Exhibits.
| | (a)(1) | Code of ethics, or any amendment thereto, that is the subject of disclosure required by Item 2 is attached hereto. |
| | (a)(2) | Certifications pursuant to Rule 30a-2(a) under the 1940 Act and Section 302 of the Sarbanes-Oxley Act of 2002 are attached hereto. |
| (b) | Certifications pursuant to Rule 30a-2(b) under the 1940 Act and Section 906 of the Sarbanes-Oxley Act of 2002 are attached hereto. |
SIGNATURES
Pursuant to the requirements of the Securities Exchange Act of 1934 and the Investment Company Act of 1940, the registrant has duly caused this report to be signed on its behalf by the undersigned, thereunto duly authorized.
| (Registrant) | Old Westbury Funds, Inc. | |
| | | |
| By (Signature and Title)* | /s/ David W. Rossmiller | |
| | David W. Rossmiller, President
(Principal Executive Officer) | |
Pursuant to the requirements of the Securities Exchange Act of 1934 and the Investment Company Act of 1940, this report has been signed below by the following persons on behalf of the registrant and in the capacities and on the dates indicated.
| By (Signature and Title)* | /s/ David W. Rossmiller | |
| | David W. Rossmiller, President
(Principal Executive Officer) | |
| By (Signature and Title)* | /s/ Matthew A. Rizzi | |
| | Matthew A. Rizzi, Treasurer
(Principal Financial Officer) | |
* Print the name and title of each signing officer under his or her signature.