UNITED STATES
SECURITIES AND EXCHANGE COMMISSION
Washington, D.C. 20549
FORM N-CSR
CERTIFIED SHAREHOLDER REPORT OF REGISTERED MANAGEMENT
INVESTMENT COMPANIES
Investment Company Act file number 811-07912
Old Westbury Funds, Inc.
(Exact name of registrant as specified in charter)
760 Moore Rd.
King of Prussia, PA 19406
(Address of principal executive offices) (Zip code)
Marianna DiBenedetto
BNY Mellon Investment Servicing (US) Inc.
760 Moore Rd.
King of Prussia, PA 19406
(Name and address of agent for service)
Registrant’s telephone number, including area code: 800-607-2200
Date of fiscal year end: October 31
Date of reporting period: October 31, 2020
Form N-CSR is to be used by management investment companies to file reports with the Commission not later than 10 days after the transmission to stockholders of any report that is required to be transmitted to stockholders under Rule 30e-1 under the Investment Company Act of 1940 (17 CFR 270.30e-1). The Commission may use the information provided on Form N-CSR in its regulatory, disclosure review, inspection, and policymaking roles.
A registrant is required to disclose the information specified by Form N-CSR, and the Commission will make this information public. A registrant is not required to respond to the collection of information contained in Form N-CSR unless the Form displays a currently valid Office of Management and Budget (“OMB”) control number. Please direct comments concerning the accuracy of the information collection burden estimate and any suggestions for reducing the burden to Secretary, Securities and Exchange Commission, 100 F Street, NE, Washington, DC 20549. The OMB has reviewed this collection of information under the clearance requirements of 44 U.S.C. § 3507.
Item 1. Reports to Stockholders.
The Report to Shareholders is attached herewith.
Old Westbury Funds, Inc.
Annual Report
October 31, 2020
BESSEMER INVESTMENT MANAGEMENT LLC
Investment Adviser
Old Westbury Funds, Inc.
| Old Westbury Funds, Inc. | |
| A Letter from the President (Unaudited) | |
| | October 31, 2020 |
| | |
Dear Shareholders:
Fiscal 2020 was marked by the outbreak of a global pandemic which upended financial markets around the world. Despite the tremendous uncertainty created by the virus, global equity markets still generated positive returns of about 5% for the fiscal year. U.S. investment-grade bonds slightly outperformed global equities, posting returns just over 5%. Overall, large-cap stocks outperformed small cap names, while U.S. stocks bested their non-U.S. developed-market counterparts.
The year began on a positive note, with global equities rallying nicely in November and December 2019. Economic data were strong, and progress was occurring on a U.S.-China trade deal. In January, news of the outbreak hit, and governments around the world worked to contain the spread, blocking travel and imposing quarantines. Investors sought to quantify the impact on growth as companies closed factories and supply chains were disrupted. By March, most of the world was sheltering in place, which led to a sharp drop in economic activity.
Global policymakers took swift and bold action, seeking to cushion the impact on citizens, financial markets, and the overall economy with aggressive monetary policy measures and expansive fiscal stimulus packages. In the U.S., the Federal Reserve introduced an unprecedented series of measures at record speed, including massive bond purchases, emergency facilities to bolster credit markets, actions with foreign central banks to ease the supply of dollars worldwide, and programs for lending directly to American businesses. Other world governments and central banks enacted similar measures. After improvement throughout the summer, a resurgence of the virus is occurring around the world as we write this. However, significant progress has been made toward developing both vaccines and treatments.
The Adviser, Bessemer Investment Management, LLC, maintained a modestly defensive stance, with U.S. election and virus-related uncertainty posing the threat of increased volatility. The uneven recovery, with some sectors benefiting from the virus while others are impaired, creates opportunity via active security selection across equity and bond markets – specifically, healthcare equities and higher-yielding credit.
The Old Westbury All Cap Core Fund significantly outperformed its primary benchmark due to its overweight position in the U.S. and stock selection within communication services, healthcare, and financials. The Old Westbury Large Cap Strategies Fund outperformed its benchmark as its stock selection in the communication services sector, underweight position to developed Europe, and stock selection in that region benefited relative performance. The Old Westbury Small & Mid Cap Strategies Fund experienced strong outperformance, benefiting from strong stock selection in the U.S. and specifically, the consumer discretionary sector. The Old Westbury All Cap ESG Fund underperformed, held back by negative stock selection in the technology, consumer discretionary, and communication services sectors; stock selection in the U.S., Japan, and emerging Asia Pacific also detracted from results.
The Old Westbury Fixed Income Fund was fairly even with the benchmark; the Fund maintains a portfolio duration slightly higher than the benchmark and an overweight position in credit-related assets, including investment-grade corporate bonds, high-quality asset-backed securities (ABS), collateralized loan obligations (CLOs), and taxable-municipal bonds. The Old Westbury Municipal Bond Fund was also even with the benchmark; duration, yield curve, and credit positioning were additive while bond selection detracted as several names have yet to recover to pre-COVID levels given ongoing macroeconomic headwinds. The Old Westbury California Municipal Bond Fund and the Old Westbury New York Municipal Bond Fund both slightly underperformed their benchmark; credit positioning posed a headwind as certain AA and A credit spreads* widened during the March / April volatility and have yet to fully recover.
At year-end, we remain committed to the Adviser’s longstanding investment approach, characterized by independent research, a global orientation, and long-term perspective. We believe these disciplines should continue to reap competitive long-term results for shareholders and position the Adviser to fulfill the central mandate of participating in strong market environments, while preserving capital during difficult times.
Sincerely,

David W. Rossmiller
President
Old Westbury Funds, Inc.
*Credit quality ratings are based on converting the available Moody’s and Standard & Poor’s ratings to a common numerical standard, and averaging that result. If neither of these agencies has assigned a rating, the Fund will determine the holding to be “Not Rated.” The ratings, expressed in Standard & Poor’s nomenclature, range from AAA (extremely strong capacity to meet its financial commitments; highest rating) to D (payment default on financial commitments). The ratings, expressed in Moody’s nomenclature, range from Aaa (highest) to C (lowest). The ratings represent the rating agencies’ opinions of the quality of the securities they rate, not of the Fund itself. Ratings are relative and subjective, and are not absolute standards of quality.
| Old Westbury Funds, Inc. | |
| All Cap Core Fund | |
| Investment Adviser’s Report (Unaudited) | |
| | |
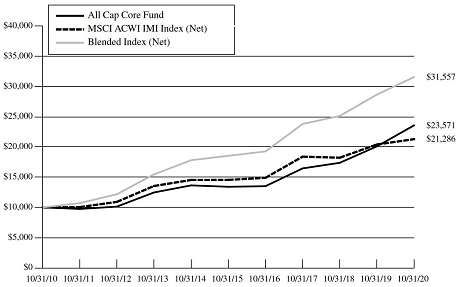
The return of the Old Westbury All Cap Core Fund (the “Fund”) for the fiscal year ended October 31, 2020 was 17.32%. In comparison, the return of its primary benchmark, the MSCI ACWI Investable Market Index (Net)a, was 4.32%. The Fund’s secondary benchmark, a blend of 90% MSCI USA Index (Gross) and 10% MSCI ACWI ex USA Index (Net)a, returned 10.11%.
The most significant positive contributors to the Fund’s relative performance during the year were an overweight position in the U.S. and stock selection within communication services, healthcare, and financials. Stocks in these sectors with the greatest relative contribution included Sea Ltd., Danaher, and BlackRock. Sea Ltd. appreciated significantly, driven by the company’s strong revenue growth in its gaming business and a successful foray into e-commerce. Danaher benefited from continued investment in life science and tools by the healthcare industry as well as a surge in demand for COVID-19 testing and prevention-related product. BlackRock benefited from strong fund flows and the market appreciation of assets under management. The Fund also benefited from an overweight position in the information technology sector (32.3% of the Fund during the fiscal year) as well as an underweight position in energy (-41.8% versus the benchmark).
The Fund’s results were modestly held back by an underweight to the materials sector which outperformed the benchmark as well as negative stock selection within the sector. Stocks within this sector with the highest negative relative contributions included Vulcan Materials and Aptargroup. The Fund was also held back by holding cash in a rising market.
At fiscal year-end, versus the primary benchmark, the Fund maintained overweight positions in the technology, communication services, consumer discretionary, and healthcare sectors and underweight positions in consumer staples, financials, materials, real estate, energy, and utilities. Relative to the primary benchmark, the Fund continued to be significantly overweight U.S. stocks (90%) versus non-U.S. stocks (9%); the remainder was cash.
a The Net version of each index reflects no deductions for fees, expenses or income taxes.
The performance data quoted represents past performance. Past performance does not guarantee future results and does not reflect the deduction of taxes that a shareholder may pay on Fund distributions or the redemption of Fund shares. Fund performance reflects fee waivers and/or expense reimbursements and reinvestments of distributions, if any. Without waivers/reimbursements, performance would have been lower. The investment return and principal value of an investment will fluctuate. Consequently, an investor’s shares, when redeemed, may be worth more or less than their original cost. Current performance may be lower or higher than the performance data quoted. To obtain performance information current to the most recent month end, please call 1-800-607-2200.
| Old Westbury Funds, Inc. | |
| All Cap Core Fund | |
| Investment Adviser’s Report (Unaudited) - (Continued) | |
| | |
PORTFOLIO DIVERSIFICATION BY SECTOR
| Sector: | | Percentage
of Net Assets |
| Banks | | | 0.7 | % |
| Communication Services | | | 13.6 | |
| Consumer Discretionary | | | 14.8 | |
| Consumer Staples | | | 2.0 | |
| Diversified Financials | | | 4.0 | |
| Energy | | | 0.4 | |
| Health Care | | | 14.0 | |
| Industrials | | | 10.0 | |
| Information Technology | | | 28.2 | |
| Insurance | | | 1.6 | |
| Materials | | | 1.7 | |
| Real Estate | | | 1.3 | |
| Utilities | | | 2.2 | |
| Other* | | | 5.5 | |
| | | | 100.0 | % |
| * | Includes cash and equivalents, exchange traded funds, investment company, pending trades and Fund share transactions, interest and dividends receivable, prepaids and accrued expenses payable. |
| Old Westbury Funds, Inc. | |
| All Cap Core Fund | |
| Investment Adviser’s Report (Unaudited) - (Continued) | |
| | |
Average Annual Total Returns
For the Period Ended October 31, 2020
| All Cap Core Fund | | | |
| One Year | | | 17.32 | % |
| Five Year | | | 11.94 | % |
| Ten Year | | | 8.95 | % |
| | | | | |
| MSCI ACWI IMI Index (Net) | | | | |
| One Year | | | 4.32 | % |
| Five Year | | | 7.91 | % |
| Ten Year | | | 7.85 | % |
| | | | | |
| Blended Index (Net) | | | | |
| One Year | | | 10.11 | % |
| Five Year | | | 11.24 | % |
| Ten Year | | | 12.18 | % |
On December 30, 2016, the Fund changed its name to All Cap Core Fund (formerly Large Cap Core Fund) as part of a series of changes to the overall investment focus and strategies of the Fund. Prior to November 16, 2011, the Fund was named the U.S. Large Cap Fund and operated under a different investment strategy. The performance information shown above may not be representative of performance the Fund will achieve under its current investment strategy. The index performance is not illustrative of the Fund’s performance and performance of the fund will differ; the use of the index performance is not intended to mask negative performance.
The performance data quoted represents past performance. Past performance does not guarantee future results and does not reflect the deduction of taxes that a shareholder may pay on Fund distributions or the redemption of Fund shares. Fund performance reflects fee waivers and/or expense reimbursements and reinvestments of distributions, if any. Without waivers/reimbursements, performance would have been lower. The investment return and principal value of an investment will fluctuate. Consequently, an investor’s shares, when redeemed, may be worth more or less than their original cost. Current performance may be lower or higher than the performance data quoted. To obtain performance information current to the most recent month end, please call 1-800-607-2200.
The expense ratio, prior to fee waivers and including acquired fund fees and expenses (if any), is stated in the prospectus dated February 28, 2020 as 0.99%. Additional information pertaining to the Fund’s expense ratio for the year ended October 31, 2020 can be found in the Financial Highlights.
| Old Westbury Funds, Inc. | |
| All Cap Core Fund | |
| Investment Adviser’s Report (Unaudited) - (Continued) | |
| | |
The chart shown on the previous page illustrates the total value of a $10,000 investment for 10 years, with distributions reinvested. The Fund compares its performance to a blended benchmark, as a secondary benchmark, consisting of a 90% weighting in the MSCI USA Index (Gross) and a 10% weighting in the MSCI ACWI ex USA Index (Net) (the “Blended Index”). The MSCI ACWI IMI (Net) and the Blended Index (Net) also include the reinvestment of distributions but do not include fees, expenses and income taxes associated with an investment in the Fund. The MSCI ACWI IMI (Net) and the Blended Index (Net) are unmanaged. Investments cannot be made directly in an index.
Investments made in foreign and emerging country securities may involve additional risks, such as political and social instability, less liquidity and currency exchange rate volatility.
| Old Westbury Funds, Inc. |
| All Cap ESG Fund |
| Investment Adviser’s Report (Unaudited) |
| |
The Old Westbury All Cap ESG Fund (the “Fund”) returned -2.48% for the fiscal year ended October 31, 2020. In comparison, the return of its benchmark, the MSCI All Country World Index (Net)a, was 4.89% for the year.
The Fund’s results were held back by negative stock selection in the technology, consumer discretionary, and communication services sectors. ESG criteria prevented the portfolio from holding top performing names (ex. Amazon, Tesla, Alibaba) in the last fiscal year. Furthermore, size of individual names constraint designed to limit single stock risk exposure detracted from relative performance in a more concentrated market environment. By region, stock selection in the U.S., Japan, and emerging Asia Pacific detracted from results. The overall overweight position to developed Europe and underweight position to emerging Asia Pacific also detracted.
The most significant positive contributors to the Fund’s relative performance for the year were stock selection in financials, an underweight position to the energy sector, and an overweight position to the technology sector. On a regional basis, stock selection in Asia Pacific ex-Japan and developed Europe helped.
At fiscal-year end, versus the benchmark, the Fund maintained the largest overweight positions in the healthcare, financials, and technology sectors and the largest underweight positions in the consumer discretionary, communication services, and utilities sectors. Relative to the benchmark, the Fund was overweight stocks in developed Europe, underweight emerging markets stocks, and close to neutral in the U.S., Japan, and other developed markets.
a The Net version of each index reflects no deductions for fees, expenses or income taxes.
| Old Westbury Funds, Inc. |
| All Cap ESG Fund |
| Investment Adviser’s Report (Unaudited) - (Continued) |
| |
PORTFOLIO DIVERSIFICATION BY SECTOR
| Sector: | | Percentage
of Net Assets |
| Banks | | | 2.0 | % |
| Communication Services | | | 7.7 | |
| Consumer Discretionary | | | 6.3 | |
| Consumer Staples | | | 7.8 | |
| Diversified Financials | | | 11.4 | |
| Energy | | | 1.7 | |
| Health Care | | | 17.5 | |
| Industrials | | | 10.6 | |
| Information Technology | | | 21.7 | |
| Insurance | | | 2.8 | |
| Materials | | | 4.3 | |
| Real Estate | | | 3.2 | |
| Utilities | | | 1.8 | |
| Other* | | | 1.2 | |
| | | | 100.0 | % |
| * | Includes cash and equivalents, investment company, pending trades and Fund share transactions, interest and dividends receivable, prepaids and accrued expenses payable. |
| Old Westbury Funds, Inc. |
| All Cap ESG Fund |
| Investment Adviser’s Report (Unaudited) - (Continued) |
| |

| Average Annual Total Returns | | | |
| For the Period Ended October 31, 2020 | | | |
| All Cap ESG Fund | | | | |
| One Year | | | -2.48 | % |
| Since Inception date of March 1, 2018 | | | 1.04 | % |
| | | | | |
| MSCI ACWI USD (Net) | | | | |
| One Year | | | 4.89 | % |
| Since Inception date of March 1, 2018 | | | 4.84 | % |
The performance data quoted represents past performance. Past performance does not guarantee future results and does not reflect the deduction of taxes that a shareholder may pay on Fund distributions or the redemption of Fund shares. Fund performance reflects fee waivers and/or expense reimbursements and reinvestments of distributions, if any. Without waivers/reimbursements, performance would have been lower. The investment return and principal value of an investment will fluctuate. Consequently, an investor’s shares, when redeemed, may be worth more or less than their original cost. Current performance may be lower or higher than the performance data quoted. To obtain performance information current to the most recent month end, please call 1-800-607-2200.
The Adviser has contractually committed through October 31, 2021, to waive its advisory fees to the extent necessary to maintain the net operating expense ratio of the Fund, excluding, Fund transaction costs, investment interest expense, dividend expenses associated with securities sold short and acquired fund fees and expenses (if any) at 1.00%, as disclosed in the Funds’ prospectus dated February 28, 2020. The expense ratio, prior to fee waivers and including acquired fund fees and expenses (if any), is stated in the prospectus dated February 28, 2020 as 1.43%. Additional information pertaining to the Fund’s expense ratio for the year ended October 31, 2020 can be found in the Financial Highlights.
The chart shown illustrates the total value of a $10,000 investment for 1 year and 8 months, with distributions reinvested. The MSCI ACWI USD Index (Net) also includes the reinvestment of distributions but not fees, expenses and income taxes associated with an investment in the Fund. The MSCI ACWI USD Index (Net) is unmanaged. Investments cannot be made directly in an index.
Investing in emerging and foreign markets may involve additional risks such as economic and political instability, market illiquidity, and currency volatility.
| Old Westbury Funds, Inc. | |
| Small & Mid Cap Strategies Fund | |
| Investment Adviser’s Report (Unaudited) | |
| | |
The return of the Old Westbury Small & Mid Cap Strategies Fund (the “Fund”) for the fiscal year ended October 31, 2020, was 5.91%. In comparison, the return of the MSCI All Country World Small Mid Cap Index (Net)a (the “Index”) was 0.61%.
The Fund benefitted from strong stock selection in the U.S. and specifically, the consumer discretionary sector. Individual stocks that contributed to performance included U.S. electric vehicle manufacturer Tesla (+516.1%), U.S. tele-healthcare provider Teladoc Health (+156.5%), and U.S. electronic design automation company Synopsys (+57.5%). Tesla’s share price movements have predominantly been driven by the company’s strong operational performance. Historically, the market had concerns about Tesla’s execution ability, doubting it could scale up production and become a mass-market auto manufacturer. Its progress this year, most noticeably opening a new plant in Shanghai within 10 months and completing approximately 500,000 vehicle deliveries, have largely allayed these concerns and this has driven the share price appreciation. Teladoc Health performed well as the pandemic-related quarantines drove doctors, hospitals, and patients to embrace the use of telemedicine. Synopsys is well positioned to participate in several secular trends (i.e. Internet of Things, 5G, autonomous), and constant improvement in the semiconductor chips. In addition, the company has a resilient business model, which has led to largely uninterrupted growth, all while improving margins and returns.
On the negative side, stock selection in the healthcare and technology sectors were drags to performance. Individual stocks detracted included Hong Kong luggage manufacturer Samsonite (-43.6%) and U.S. foodservice equipment manufacturer Welbilt (-67.9%). Samsonite and Welbilt were both victims of the COVID-19 pandemic. Samsonite faced challenges as a result of severe disruptions within the global travel industry, which resulted in extreme stress on the company’s financial profile and significant uncertainty over the company’s medium-term growth prospects. Welbilt struggled following the unprecedented shutdown of restaurants due to COVID-19, which had a material, short-term impact on demand for kitchen equipment.
At fiscal year-end, the Fund was overweight the healthcare, technology, and consumer discretionary sectors, and underweight real estate, financials, materials, utilities, energy, industrials, and communication services.
The Fund was regionally overweight the U.S. market. Conversely, the Fund was underweight developed Europe and Japan.
a The Net version of each index reflects no deductions for fees, expenses or income taxes.
| Old Westbury Funds, Inc. | |
| Small & Mid Cap Strategies Fund | |
| Investment Adviser’s Report (Unaudited) - (Continued) | |
| | |
PORTFOLIO DIVERSIFICATION BY COUNTRY
| | | Percentage |
| Country: | | of Net Assets |
| Argentina | | | 0.4 | % |
| Australia | | | 2.2 | |
| Austria | | | 0.0 | * |
| Belgium | | | 0.4 | |
| Bermuda | | | 0.4 | |
| Brazil | | | 0.3 | |
| Canada | | | 2.3 | |
| China | | | 3.7 | |
| Denmark | | | 1.4 | |
| Finland | | | 0.7 | |
| France | | | 0.6 | |
| Germany | | | 1.8 | |
| Greece | | | 0.1 | |
| Hong Kong | | | 0.5 | |
| Hungary | | | 0.0 | * |
| Iceland | | | 0.1 | |
| India | | | 0.4 | |
| Indonesia | | | 0.0 | * |
| Ireland | | | 0.1 | |
| Israel | | | 2.0 | |
| Italy | | | 0.7 | |
| Japan | | | 7.1 | |
| Jersey Channel Islands | | | 0.5 | |
| Malaysia | | | 0.0 | * |
| Netherlands | | | 1.0 | |
| New Zealand | | | 0.5 | |
| Norway | | | 0.1 | |
| Peru | | | 0.1 | |
| Philippines | | | 0.0 | * |
| Poland | | | 0.2 | |
| Portugal | | | 0.0 | * |
| Qatar | | | 0.0 | * |
| Russia | | | 0.5 | |
| Singapore | | | 0.2 | |
| South Africa | | | 0.0 | * |
| South Korea | | | 1.0 | |
| Spain | | | 0.4 | |
| Sweden | | | 1.6 | |
| Switzerland | | | 1.4 | |
| Taiwan | | | 1.3 | |
| Thailand | | | 0.2 | |
| Turkey | | | 0.3 | |
| United Arab Emirates | | | 0.0 | * |
| United Kingdom | | | 6.1 | |
| United States | | | 46.2 | |
| Vietnam | | | 0.0 | * |
| Other** | | | 13.2 | |
| | | | 100.0 | % |
| * | Represents less than 0.01% of net assets. |
| ** | Includes cash and equivalents, exchange traded funds, rights/warrants, investment company, pending trades and Fund share transactions, interest and dividends receivable, prepaids and accrued expenses payable. |
| Old Westbury Funds, Inc. | |
| Small & Mid Cap Strategies Fund | |
| Investment Adviser’s Report (Unaudited) - (Continued) | |
| | |

| Average Annual Total Returns | | |
| For the Period Ended October 31, 2020 | | |
| Small & Mid Cap Strategies Fund | | |
| One Year | | | 5.91 | % |
| Five Year | | | 6.90 | % |
| Ten Year | | | 7.73 | % |
| | | | | |
| MSCI ACWI SMID Cap Index (Net) | | | | |
| One Year | | | 0.61 | % |
| Five Year | | | 6.39 | % |
| Ten Year | | | 7.33 | % |
On December 30, 2016, the Fund changed its name to Small & Mid Cap Strategies Fund (formerly Small & Mid Cap Fund) as part of a series of changes to the overall investment focus and strategies of the Fund. The performance information shown above may not be representative of performance the Fund will achieve under its current investment strategy. The index performance is not illustrative of the Fund’s performance and performance of the fund will differ; the use of the index performance is not intended to mask negative performance.
The performance data quoted represents past performance. Past performance does not guarantee future results and does not reflect the deduction of taxes that a shareholder may pay on Fund distributions or the redemption of Fund shares. Fund performance reflects fee waivers and/or expense reimbursements and reinvestments of distributions, if any. Without waivers/reimbursements, performance would have been lower. The investment return and principal value of an investment will fluctuate. Consequently, an investor’s shares, when redeemed, may be worth more or less than their original cost. Current performance may be lower or higher than the performance data quoted. To obtain performance information current to the most recent month end, please call 1-800-607-2200.
The Adviser has contractually committed through October 31, 2021, to waive its advisory fees to the extent necessary to maintain the net operating expense ratio of the Fund, excluding Fund transaction costs, investment interest expense, dividend expenses associated with securities sold short and acquired fund fees and expenses (if any), at 1.11%, as disclosed in the Funds’ prospectus dated February 28, 2020. The expense ratio, prior to fee waivers and including acquired fund fees and expenses (if any), is stated in the prospectus as 1.17%. Additional information pertaining to the Fund’s expense ratio for the year ended October 31, 2020 can be found in the Financial Highlights.
The chart shown above illustrates the total value of a $10,000 investment for 10 years, with distributions reinvested. The MSCI ACWI SMID Cap Index (Net) also includes the reinvestment of distributions but not fees, expenses and income taxes associated with an investment in the Fund. The MSCI ACWI SMID Cap Index (Net) is unmanaged. Investments cannot be made directly in an index.
| Old Westbury Funds, Inc. | |
| Small & Mid Cap Strategies Fund | |
| Investment Adviser’s Report (Unaudited) - (Continued) | |
| | |
Investments made in small-capitalization and mid-capitalization companies are subject to greater volatility and less liquidity compared to investments made in larger and more established companies. Investments made in securities of companies in foreign and emerging countries may involve additional risks, such as political and social instability, less liquidity and currency exchange rate volatility.
| Old Westbury Funds, Inc. | |
| Large Cap Strategies Fund | |
| Investment Adviser’s Report (Unaudited) | |
| | |
The return of the Old Westbury Large Cap Strategies Fund (the “Fund”) for the fiscal year ended October 31, 2020, was 6.98%. In comparison, the return of the MSCI All Country World Large Cap Index (Net)a (“the Index”) was 5.67%.
The largest contributor to the Fund’s overall performance came from stock selection in the communication services sector. In addition, an underweight to developed Europe and stock selection in the region also benefited the Fund. Individual stocks that contributed included Singapore-based online gaming platform Sea Limited (+328.5%), Chinese internet company Tencent (+86.2%), Chinese online marketplace provider Alibaba (+72.5%), and Canadian e-commerce operator Shopify (+195.1%). All of these stocks are enablers of a more digital world, and have benefited as people around the globe have engaged in more activities from home amid the pandemic. Sea Ltd. delivered strong results across its core businesses in gaming and e-commerce, with COVID-19 further accelerating its traffic growth amid the lockdown. Tencent is the world’s largest social media operator, engaging over a billion monthly users and accounting for over 50 percent of all mobile-internet time spent in China. Meanwhile, Tencent’s cloud computing, fin-tech, and video game units have continued to generate strong growth, for the period. Alibaba is the world’s leading e-commerce business by gross merchandise volume, and has benefited broadly from the pandemic-induced spike in e-commerce adoption. Additionally, COVID-19 has accelerated online penetration and digitization of several strategic areas where Alibaba has the leading market share, including grocery delivery, cloud computing, and work collaboration. Shopify has become the operating system for small to medium enterprises seeking to do business on the internet, and is a key beneficiary of the generational shift from physical to digital commerce.
Stock selection in the U.S. and the consumer discretionary sector were the largest detractors overall. Individual stocks that detracted included U.S. aerospace and defense systems company Raytheon Technologies (-59.8%) and U.S. bank JPMorgan Chase (-21.5%). The COVID-19 pandemic negatively impacted Raytheon Technologies’ commercial aerospace business, as global air travel, related aftermarket parts and services, and plunging production rates at Boeing and Airbus drove revenues significantly lower. Further, fears of future defense spending reductions, principally driven by higher federal debt levels, also negatively impacted aerospace-defense sector sentiment and valuations. JP Morgan, like many U.S. and international banks, trailed the broader markets in fiscal 2020, reflecting the pandemic-driven broad-based global economic shutdown as unemployment surged, interest rates declined, and fears of loan losses grew. This drove a tightening of credit standards, and banks meaningfully boosted loss provisions, which negatively impacted earnings for the year.
At fiscal year-end, the Fund was overweight the consumer discretionary, healthcare, and technology sectors. The Fund was underweight financials, consumer staples, energy, financials, materials, real estate, and utilities.
On a regional basis, as of fiscal year-end, the Fund was overweight the U.S. and emerging markets, while being underweight developed Europe, Japan, and other developed markets.
a The Net version of each index reflects no deductions for fees, expenses or income taxes.
| Old Westbury Funds, Inc. | |
| Large Cap Strategies Fund | |
| Investment Adviser’s Report (Unaudited) - (Continued) | |
| | |
PORTFOLIO DIVERSIFICATION BY COUNTRY
| Country: | | Percentage
of Net Assets |
| Argentina | | | 0.4 | % |
| Australia | | | 0.4 | |
| Belgium | | | 0.2 | |
| Brazil | | | 0.6 | |
| Canada | | | 1.4 | |
| Chile | | | 0.0 | * |
| China | | | 8.5 | |
| Colombia | | | 0.0 | * |
| Czech Republic | | | 0.0 | * |
| Denmark | | | 0.1 | |
| Egypt | | | 0.0 | * |
| Finland | | | 0.1 | |
| France | | | 1.7 | |
| Georgia | | | 0.0 | * |
| Germany | | | 0.8 | |
| Hong Kong | | | 1.4 | |
| India | | | 3.0 | |
| Indonesia | | | 0.2 | |
| Ireland | | | 0.8 | |
| Isle of Man | | | 0.4 | |
| Israel | | | 0.1 | |
| Italy | | | 0.0 | * |
| Japan | | | 2.5 | |
| Kazakhstan | | | 0.0 | * |
| Kenya | | | 0.1 | |
| Luxembourg | | | 0.0 | * |
| Macau | | | 0.1 | |
| Malaysia | | | 0.1 | |
| Mexico | | | 0.2 | |
| Netherlands | | | 2.1 | |
| Norway | | | 0.0 | * |
| Panama | | | 0.0 | * |
| Peru | | | 0.0 | * |
| Poland | | | 0.1 | |
| Portugal | | | 0.0 | * |
| Puerto Rico | | | 0.0 | * |
| Qatar | | | 0.0 | * |
| Russia | | | 0.5 | |
| Singapore | | | 1.5 | |
| South Africa | | | 0.1 | |
| South Korea | | | 0.6 | |
| Spain | | | 0.0 | * |
| Sweden | | | 0.4 | |
| Switzerland | | | 2.1 | |
| Taiwan | | | 0.8 | |
| Thailand | | | 0.4 | |
| Turkey | | | 0.0 | * |
| United Arab Emirates | | | 0.0 | * |
| United Kingdom | | | 1.2 | |
| United States | | | 61.0 | |
| Old Westbury Funds, Inc. | |
| Large Cap Strategies Fund | |
| Investment Adviser’s Report (Unaudited) - (Continued) | |
| | |
| | | |
| Country: | | Percentage
of Net Assets |
| Vietnam | | | 0.0 | %* |
| Other** | | | 6.1 | |
| | | | 100.0 | % |
| | |
| * | Represents less than 0.01% of net assets. |
| ** | Includes cash and equivalents, exchange traded funds, investment company, pending trades and Fund share transactions, interest and dividends receivable, prepaids and accrued expenses payable. |
| Old Westbury Funds, Inc. | |
| Large Cap Strategies Fund | |
| Investment Adviser’s Report (Unaudited) - (Continued) | |
| | |

Average Annual Total Returns
For the Period Ended October 31, 2020
| Large Cap Strategies Fund | | | |
| One Year | | | 6.98 | % |
| Five Year | | | 7.30 | % |
| Ten Year | | | 7.01 | % |
| | | | | |
| MSCI ACWI Large Cap Index (Net) | | | | |
| One Year | | | 5.67 | % |
| Five Year | | | 8.46 | % |
| Ten Year | | | 8.03 | % |
On November 16, 2011, the Fund changed its name to Large Cap Strategies Fund (formerly Non-U.S. Large Cap Fund) as part of a series of changes to the overall investment focus and strategies of the Fund. The performance information shown above may not be representative of performance the Fund will achieve under its current investment strategy. The index performance is not illustrative of the Fund’s performance and performance of the fund will differ; the use of the index performance is not intended to mask negative performance.
The performance data quoted represents past performance. Past performance does not guarantee future results and does not reflect the deduction of taxes that a shareholder may pay on Fund distributions or the redemption of Fund shares. Fund performance reflects fee waivers and/or expense reimbursements and reinvestments of distributions, if any. Without waivers/reimbursements, performance would be lower. The investment return and principal value of an investment will fluctuate. Consequently, an investor’s shares, when redeemed, may be worth more or less than their original cost. Current performance may be lower or higher than the performance data quoted. To obtain performance information current to the most recent month end, please call 1-800-607-2200.
The Adviser has contractually committed through October 31, 2021, to waive its advisory fees to the extent necessary to maintain the net operating expense ratio of the Fund, excluding, Fund transaction costs, investment interest expense, dividend expenses associated with securities sold short and acquired fund fees and expenses (if any) at 1.15%, (current net operating expense is 1.10%). The expense ratio including acquired fund fees and expenses (if any), is stated in the prospectus dated February 28, 2020 as 1.12%. Additional information pertaining to the Fund’s expense ratio for the year ended October 31, 2020 can be found in the Financial Highlights.
The chart shown illustrates the total value of a $10,000 investment for 10 years, with distributions reinvested. The MSCI ACWI Large Cap Index (Net) also includes the reinvestment of distributions but not fees, expenses and income taxes associated with an investment in the Fund. The MSCI ACWI Large Cap Index (Net) is unmanaged. Investments cannot be made directly in an index.
Investments made in foreign and emerging country securities may involve additional risks, such as political and social instability, less liquidity and currency exchange rate volatility.
| Old Westbury Funds, Inc. |
| Credit Income Fund |
| Investment Adviser’s Report (Unaudited) |
| |
The Credit Income Fund was launched at the beginning of October 2020. Its investment approach provides the flexibility to invest across a wide variety of global credit instruments without constraints to particular benchmarks, asset classes, or sectors. The management of the Fund utilizes a combination of internally and externally managed strategies, and these are allocated in a complementary fashion in aiming to achieve the portfolio’s primary objective of income and secondary objective of capital appreciation.
At fiscal year-end, the Fund was allocated 15.6% to internally managed credit, 58.0% to externally managed credit, and 26.4% to government securities. The external-manager allocation included 1) Blackrock, which primarily invests in non-agency mortgage-backed securities, via both fixed and floating-rate securities, and 2) Muzinich, which mostly invests in U.S. high-yield bonds with credit ratings BB and lower. The internal-credit strategy employs quantitative tools and/or fundamental analysis in order to provide overall portfolio balance across actively and passively managed credit sectors, including asset-backed securities, preferred securities, and others.
| Old Westbury Funds, Inc. |
| Credit Income Fund |
| Investment Adviser’s Report (Unaudited) - (Continued) |
| |
PORTFOLIO DIVERSIFICATION BY SECTOR
| Sector: | | Percentage
of Net Assets |
| Asset-Backed Securities | | | 28.2 | % |
| Bank Loans | | | 0.1 | |
| Collateralized Mortgage Obligations | | | 16.8 | |
| Commercial Mortgage-Backed Securities | | | 2.4 | |
| Corporate Bonds | | | 7.8 | |
| U.S. Government Agencies and Securities | | | 17.2 | |
| Other* | | | 27.5 | |
| | | | 100.0 | % |
| * | Includes cash and equivalents, exchange traded funds, swap agreements, pending trades and Fund share transactions, interest and dividends receivable, prepaids and accrued expenses payable. |
| Old Westbury Funds, Inc. |
| Credit Income Fund |
| Investment Adviser’s Report (Unaudited) - (Continued) |
| |
| Average Annual Total Returns | | | |
| For the Period Ended October 31, 2020 | | | |
| Credit Income Fund | | | |
| Since Inception date of October 1, 2020 | | | -0.10 | % |
| | | | | |
| ICE Bank of America 1-10 Year U.S. Corporate Index | | | | |
| Since Inception date of October 1, 2020 | | | 0.06 | % |
The index performance is not illustrative of the Fund’s performance and performance of the fund will differ; the use of the index performance is not intended to mask negative performance.
The Fund has been in existence for less than one year; cumulative performance may not be indicative of the Fund’s long-term potential. The Fund returns will fluctuate over long and short-term periods.
The performance data quoted represents past performance. Past performance does not guarantee future results and does not reflect the deduction of taxes that a shareholder may pay on Fund distributions or the redemption of Fund shares. Fund performance reflects fee waivers and/or expense reimbursements and reinvestments of distributions, if any. Without waivers/reimbursements, performance would have been lower. The investment return and principal value of an investment will fluctuate. Consequently, an investor’s shares, when redeemed, may be worth more or less than their original cost. Current performance may be lower or higher than the performance data quoted. To obtain performance information current to the most recent month end, please call 1-800-607-2200.
The Adviser has contractually committed through October 31, 2021, to waive its advisory fees to the extent necessary to maintain the net operating expense ratio of the Fund, excluding Fund transaction costs, investment interest expense, dividend expenses associated with securities sold short and acquired fund fees and expenses (if any), at 0.85%, as disclosed in the Funds’ prospectus dated September 28, 2020. The expense ratio, prior to fee waivers and including acquired fund fees and expenses (if any), is stated in the prospectus as 0.95%. Additional information pertaining to the Fund’s expense ratio for the year ended October 31, 2020 can be found in the Financial Highlights.
Investments made in securities of companies in foreign and emerging countries may involve additional risks, such as political and social instability, less liquidity and currency exchange rate volatility. The Fund may invest in instruments that are volatile, speculative or otherwise risky. The Fund is non-diversified, meaning it may focus its assets in a smaller number of issuers and may be subject to more risk than a more diversified fund.
| Old Westbury Funds, Inc. | |
| Fixed Income Fund | |
| Investment Adviser’s Report (Unaudited) | |
| | |
The Old Westbury Fixed Income Fund (the “Fund”) returned 5.23% for the fiscal year ended October 31, 2020. In comparison, the return of the ICE Bank of America U.S. Corporate & Government 1-10 Year AAA-A US Corporate & Government Index (the “Index”) was 5.45%.
The Fund’s 2020 fiscal year began on a generally positive note in November 2019. Although economic data appeared to be slowing, progress on trade deals and recent interest rate cuts combined with supportive statements by the Federal Reserve buoyed market sentiment. As the calendar year turned however, news of the highly contagious virus that would define 2020 began to emerge. By the end of the first calendar quarter, it became clear that COVID-19, as the virus came to be known, would dominate every aspect of life during 2020. In March, broad stay-at-home orders were issued globally, shutting down significant parts of the economy and resulting in record-breaking job losses. Equities sold off sharply and liquidity dried up in fixed income markets. Governments around the world responded quickly and aggressively to this crisis. In the U.S., the Federal Reserve (Fed) lowered the Federal Funds rate to zero and began a very large-scale bond-buying program. In conjunction with the Treasury Department, the Fed introduced a number of lending programs intended in aiming to stabilize markets, provide liquidity and restore confidence. Congress passed the CARES Act which provided support to individuals and businesses financially impacted by COVID-19. On several measures, these actions were successful in supporting markets and the economy: equities have rebounded, credit is broadly available and as the initial wave of the virus subsided, many businesses were able to reopen and many unemployed workers were reemployed. Nonetheless, as the fiscal year came to a close, the virus continued to be both a health and economic threat to the U.S.
During the Fund’s fiscal year, Treasury yields declined across the yield curve, most significantly for shorter maturities where the Fed’s zero-rate policy and bond-buying program have the most impact. Longer-term rates have fluctuated within a relatively tight range throughout the year, drifting slightly higher as expectations for a vaccine that would end the health crisis gained traction, but remain near historic lows. Investment-grade corporate bonds underperformed Treasury securities during the fiscal year as a result of the sharp spread widening at the beginning of the pandemic. During the second half of the fiscal year, investment-grade bonds outperformed Treasury securities.
The Fund began the fiscal year with higher-than-benchmark duration (price sensitivity to interest rate moves), on the expectation that the economy would continue to slow and the Fed would take more aggressive action. Typically, as the economy weakens, the bond market rallies, with most benefit accruing to the intermediate part of the curve. Longer-dated securities may also benefit as yields respond to lower expected growth and inflation. The Fund was also underweight corporate bonds relative to the benchmark. Corporate spreads were near all-time lows at the beginning of the year. Given the team’s conviction that the economy would continue to weaken, investment grade bonds did not appear compelling. The Fund benefited from this positioning at the onset of the pandemic when Treasury yields declined and corporate spreads widened. The team maintained a long-duration bias during the second half of the year but shifted to target an overweight in corporate bonds to take advantage of wider credit spreads.
The outlook for the U.S. economy remains uncertain. Economic recovery is closely tied to the path of the pandemic. While there is encouraging news with respect to development of an effective vaccine, infection rates are increasing across the globe and the threat of the virus will remain a concern until a large portion of the population is vaccinated. Meanwhile, the recovery has been spotty. The goods-producing sector has rebounded from the worst of the crisis, but the services sector, which accounts for the greater part of the U.S. economy, has lagged. Inflation, both domestically and globally, remains muted. While the Federal Reserve has indicated its intention to support the economy through accommodative monetary policy, the prospect of divided government in the U.S. puts in question the extent of additional fiscal support.
The team’s current strategy is to maintain the portfolio duration slightly higher than the benchmark and an overweight position in credit-related assets, including investment-grade corporate bonds, high-quality asset-backed securities (ABS), collateralized loan obligations (CLOs), and taxable-municipal bonds. A small exposure will be maintained in U.S. Treasury Inflation-Protected Securities (TIPS), which helps protect against a possible increase in inflation. At fiscal year-end, credit represented approximately 35% of market value of the Fund, of which ABS and CLOs accounted for under 5%.
| Old Westbury Funds, Inc. | |
| Fixed Income Fund | |
| Investment Adviser’s Report (Unaudited) - (Continued) | |
| | |
PORTFOLIO DIVERSIFICATION BY SECTOR
| Sector: | | Percentage
of Net Assets |
| Asset-Backed Securities | | | 3.6 | % |
| Collateralized Mortgage Obligations | | | 0.0 | * |
| Corporate Bonds | | | 29.8 | |
| Municipal Bonds | | | 0.9 | |
| U.S. Government Agencies and Securities | | | 64.9 | |
| Other** | | | 0.8 | |
| | | | 100.0 | % |
| * | Represents less than 0.01% of net assets. |
| ** | Includes cash and equivalents, investment company, pending trades and Fund share transactions, interest and dividends receivable, prepaids and accrued expenses payable. |
| Old Westbury Funds, Inc. | |
| Fixed Income Fund | |
| Investment Adviser’s Report (Unaudited) - (Continued) | |
| | |

Average Annual Total Returns
For the Period Ended October 31, 2020
| Fixed Income Fund | | | | |
| One Year | | | 5.23 | % |
| Five Year | | | 2.77 | % |
| Ten Year | | | 2.08 | % |
| | | | | |
| ICE Bank of America 1-10 Year AAA-A U.S. Corporate & Government Index | | | | |
| One Year | | | 5.45 | % |
| Five Year | | | 3.05 | % |
| Ten Year | | | 2.60 | % |
The performance data quoted represents past performance. Past performance does not guarantee future results and does not reflect the deduction of taxes that a shareholder may pay on Fund distributions or the redemption of Fund shares. Fund performance reflects fee waivers and/or expense reimbursements and reinvestments of distributions, if any. Without waivers/reimbursements, performance would have been lower. The investment return and principal value of an investment will fluctuate. Consequently, an investor’s shares, when redeemed, may be worth more or less than their original cost. Current performance may be lower or higher than the performance data quoted. To obtain performance information current to the most recent month end, please call 1-800-607-2200.
The Adviser has contractually committed through October 31, 2021, to waive its advisory fees to the extent necessary to maintain the net operating expense ratio of the Fund, excluding Fund transaction costs, investment interest expense, dividend expenses associated with securities sold short and acquired fund fees and expenses (if any) at 0.57%. The expense ratio, prior to fee waivers and including acquired fund fees (if any), is stated in the prospectus dated February 28, 2020 as 0.70%. Additional information pertaining to the Fund’s expense ratio for the year ended October 31, 2020 can be found in the Financial Highlights.
The chart shown above illustrates the total value of a $10,000 investment for 10 years, with distributions reinvested. The ICE Bank of America 1-10 Year AAA-A U.S. Corporate & Government Index also includes the reinvestment of distributions but does not include fees, expenses and income taxes associated with an investment in the Fund. The ICE Bank of America 1-10 Year AAA-A U.S. Corporate & Government Index is unmanaged. Investments cannot be made directly in an index.
The Fund is subject to risks such as credit, prepayment and interest rate risk associated with the underlying bond holdings in the Fund. The value of the Fund can decline as interest rates rise and an investor can lose principal.
| Old Westbury Funds, Inc. | |
| Municipal Bond Fund | |
| Investment Adviser’s Report (Unaudited) | |
| | |
The return of the Old Westbury Municipal Bond Fund (the “Fund”) for the fiscal year ended October 31, 2020, was 3.38%. In comparison, the return of the primary benchmark, the ICE Bank of America 1-12 Year AAA-AA Municipal Securities Index (the “Index”), was 3.58%.
The municipal bond market’s momentum in 2019 continued in 2020 with one notable exception, the spike in volatility experienced in March / April. As in the prior year, the momentum in municipals was primarily attributable to several key tenets of the tax package that disproportionately affected the supply / demand backdrop for the asset class (the cap on the state/local tax deduction, the removal of the advanced refunding option, etc.). On the supply side of the equation, tax exempt supply was significantly lower than historical levels due to the removal of the advanced refunding option and a related shift to taxable muni issuance (given favorable economics of that transaction and a broader buyer base). The lower-supply tailwind was bolstered by continued strong demand from investors given an increasingly onerous tax regime on the state / local level. Despite the constructive backdrop, 2020 was not without trials for municipals; the asset class saw a significant sell-off in March given a funding squeeze for some levered mutual funds, and the onset of COVID-related shutdowns created significant investor trepidation in related sectors (airports, toll roads, hospitals, etc.). The swift and significant action taken by the Fed, in particular the Municipal Liquidity Facility, helped to assuage investor concerns, and the market normalized over the balance of the year.
Over the course of the year, the Fund was positioned with a long-duration posture relative to the benchmark in order to take advantage of the momentum within the asset class, which ultimately contributed to performance. Curve positioning was also additive as the curve flattened and the fund held an underweight front-end and overweight long-end stance. Credit positioning also worked well over the course of the year as the Fund’s credit barbell around AA insulated the Fund against volatility while managing to capture spread compression after the tumultuous March / April period. The most significant performance detractor was bond selection as several names have yet to recover to pre-COVID levels given ongoing macroeconomic headwinds.
| Old Westbury Funds, Inc. | |
| Municipal Bond Fund | |
| Investment Adviser’s Report (Unaudited) - (Continued) | |
| | |
PORTFOLIO DIVERSIFICATION BY STATE
| State: | | Percentage
of Net Assets |
| Alabama | | | 1.0 | % |
| Arizona | | | 1.7 | |
| Arkansas | | | 0.2 | |
| California | | | 3.2 | |
| Colorado | | | 1.4 | |
| Connecticut | | | 2.6 | |
| Delaware | | | 2.6 | |
| District of Columbia | | | 1.8 | |
| Florida | | | 2.0 | |
| Georgia | | | 4.4 | |
| Hawaii | | | 1.8 | |
| Idaho | | | 0.1 | |
| Illinois | | | 0.2 | |
| Indiana | | | 0.1 | |
| Iowa | | | 0.6 | |
| Kansas | | | 0.0 | * |
| Maine | | | 0.1 | |
| Maryland | | | 5.8 | |
| Massachusetts | | | 4.0 | |
| Michigan | | | 0.3 | |
| Minnesota | | | 1.1 | |
| Mississippi | | | 0.4 | |
| Missouri | | | 0.1 | |
| Montana | | | 0.1 | |
| New Hampshire | | | 0.2 | |
| New Jersey | | | 2.1 | |
| New York | | | 16.5 | |
| North Carolina | | | 2.4 | |
| Ohio | | | 3.4 | |
| Oklahoma | | | 1.0 | |
| Oregon | | | 1.1 | |
| Pennsylvania | | | 1.1 | |
| Rhode Island | | | 0.3 | |
| South Carolina | | | 0.6 | |
| South Dakota | | | 0.9 | |
| Tennessee | | | 0.3 | |
| Texas | | | 17.2 | |
| Utah | | | 0.5 | |
| Virginia | | | 4.9 | |
| Washington | | | 2.6 | |
| Wisconsin | | | 1.7 | |
| Other** | | | 7.6 | |
| | | | 100.0 | % |
| | |
| * | Represents less than 0.01% of net assets. |
| ** | Includes cash and equivalents, Corporate Bonds, U.S. Government Securities, investment company, pending trades and Fund share transactions, interest and dividends receivable, prepaids and accrued expenses payable. |
| Old Westbury Funds, Inc. | |
| Municipal Bond Fund | |
| Investment Adviser’s Report (Unaudited) - (Continued) | |
| | |

Average Annual Total Returns
For the Period Ended October 31, 2020
| Municipal Bond Fund | | | |
| One Year | | | 3.38 | % |
| Five Year | | | 2.26 | % |
| Ten Year | | | 1.95 | % |
| | | | | |
| ICE Bank of America 1-12 Year AAA-AA Municipal Securities Index | | | | |
| One Year | | | 3.58 | % |
| Five Year | | | 2.54 | % |
| Ten Year | | | 2.61 | % |
| | | | | |
| Lipper Short-Intermediate Municipal Debt Funds Index | | | | |
| One Year | | | 3.37 | % |
| Five Year | | | 2.21 | % |
| Ten Year | | | 2.10 | % |
The performance data quoted represents past performance. Past performance does not guarantee future results and does not reflect the deduction of taxes that a shareholder may pay on Fund distributions or the redemption of Fund shares. Fund performance reflects fee waivers and/or expense reimbursements and reinvestments of distributions, if any. Without waivers/reimbursements, performance would have been lower. The investment return and principal value of an investment will fluctuate. Consequently, an investor’s shares, when redeemed, may be worth more or less than their original cost. Current performance may be lower or higher than the performance data quoted. To obtain performance information current to the most recent month end, please call 1-800-607-2200.
The Adviser has contractually committed through October 31, 2021, to waive its advisory fees to the extent necessary to maintain the net operating expense ratio of the Fund, excluding Fund transaction costs, investment interest expense, dividend expenses associated with securities sold short and acquired fund fees and expenses (if any) at 0.57%. The expense ratio, prior to fee waivers and including acquired fund fees (if any), is stated in the prospectus dated February 28, 2020 as 0.68%. Additional information pertaining to the Fund’s expense ratio for the year ended October 31, 2020 can be found in the Financial Highlights.
The chart shown above illustrates the total value of a $10,000 investment for 10 years, with distributions reinvested. The ICE Bank of America 1-12 Year AAA-AA Municipal Securities Index and the Lipper Short-Intermediate Municipal Debt Funds Index also include the reinvestment of distributions but do not include fees, expenses and income taxes associated with an investment in the Fund. The ICE Bank of America 1-12 Year AAA-AA Municipal Securities Index and the Lipper Short-Intermediate Municipal Debt Funds Index are unmanaged. Investments cannot be made directly in an index.
| Old Westbury Funds, Inc. | |
| Municipal Bond Fund | |
| Investment Adviser’s Report (Unaudited) - (Continued) | |
| | |
Municipal securities held by the Fund may be adversely affected by local political and economic factors. Income from the Fund may be subject to federal alternative minimum tax, state and local taxes.
| Old Westbury Funds, Inc. | |
| California Municipal Bond Fund | |
| Investment Adviser’s Report (Unaudited) | |
| | |
The return of the Old Westbury California Municipal Bond Fund (the “Fund”) for the fiscal year ended October 31, 2020, was 3.30%. In comparison, the return of the primary benchmark, the ICE Bank of America 3-7 Year AAA-AA Municipal Securities Index (the “Index”), was 3.86%.
Over the course of the year, the Fund was positioned with a long-duration posture relative to the benchmark in order to take advantage of the momentum within the asset class, which ultimately contributed to performance. Curve positioning was also additive as the curve flattened and the fund held an underweight front-end and overweight long-end stance, though significant underweights in the belly of the curve dampened that somewhat. Credit positioning posed a headwind to performance over the year as certain AA and A credit spreads widened during the March / April volatility and have yet to fully recover. As a reminder, the Fund is compared to a national index of municipal securities, which can cause deviation over time based on the performance of California municipals relative to the rest of the market.
| Old Westbury Funds, Inc. | |
| California Municipal Bond Fund | |
| Investment Adviser’s Report (Unaudited) - (Continued) | |
| | |
PORTFOLIO DIVERSIFICATION BY STATE
| | | Percentage |
| State: | | of Net Assets |
| California | | | 88.2 | % |
| Other* | | | 11.8 | |
| | | | 100.0 | % |
| * | Includes cash and equivalents, Corporate Bonds, U.S. Government Securities, investment company, pending trades and Fund share transactions, interest and dividends receivable, prepaids and accrued expenses payable. |
| Old Westbury Funds, Inc. | |
| California Municipal Bond Fund | |
| Investment Adviser’s Report (Unaudited) - (Continued) | |
| | |

| Average Annual Total Returns | | | |
| For the Period Ended October 31, 2020 | | | |
| California Municipal Bond Fund | | | |
| One Year | | | 3.30 | % |
| Since Inception date of December 4, 2018 | | | 4.23 | % |
| | | | | |
| ICE Bank of America 3-7 Year AAA-AA Municipal Securities Index | | | | |
| One Year | | | 3.86 | % |
| Since Inception date of December 4, 2018 | | | 4.90 | % |
The performance data quoted represents past performance. Past performance does not guarantee future results and does not reflect the deduction of taxes that a shareholder may pay on Fund distributions or the redemption of Fund shares. Fund performance reflects fee waivers and/or expense reimbursements and reinvestments of distributions, if any. Without waivers/reimbursements, performance would have been lower. The investment return and principal value of an investment will fluctuate. Consequently, an investor’s shares, when redeemed, may be worth more or less than their original cost. Current performance may be lower or higher than the performance data quoted. To obtain performance information current to the most recent month end, please call 1-800-607-2200.
The Adviser has contractually committed through October 31, 2021, to waive its advisory fees to the extent necessary to maintain the net operating expense ratio of the Fund, excluding Fund transaction costs, investment interest expense, dividend expenses associated with securities sold short and acquired fund fees and expenses (if any) at 0.57%. The expense ratio, prior to fee waivers and including acquired fund fees (if any), is stated in the prospectus dated February 28, 2020 as 0.78%. Additional information pertaining to the Fund’s expense ratio for the year ended October 31, 2020 can be found in the Financial Highlights.
The chart shown illustrates the total value of a $10,000 investment for 1 Year and 11 Months, with distributions reinvested. The ICE Bank of America 3-7 Year AAA-AA Municipal Securities Index also includes the reinvestment of distributions but does not include fees, expenses and income taxes associated with an investment in the Fund. The ICE Bank of America 3-7 Year AAA-AA Municipal Securities Index is unmanaged. Investments cannot be made directly in an index.
Municipal securities held by the Fund may be adversely affected by local political and economic factors. Income from the Fund may be subject to federal alternative minimum tax, state and local taxes. The Fund is non-diversified, meaning it may focus its assets in a smaller number of issuers and may be subject to more risk than a more diversified fund.
| Old Westbury Funds, Inc. |
| New York Municipal Bond Fund |
| Investment Adviser’s Report (Unaudited) |
| |
The return of the Old Westbury New York Municipal Bond Fund (the “Fund”) for the fiscal year ended October 31, 2020, was 2.69%. In comparison, the return of the primary benchmark, the ICE Bank of America 3-7 Year AAA-AA Municipal Securities Index (the “Index”), was 3.86%.
Over the course of the year, the Fund was positioned with a long-duration posture relative to the benchmark in order to take advantage of the momentum within the asset class, which ultimately contributed to performance. Curve positioning was also additive as the curve flattened and the fund held an underweight front-end and overweight long-end stance, though significant underweights in the belly of the curve dampened that somewhat. Credit positioning posed a headwind to performance over the year as certain AA and A credit spreads widened during the March / April volatility and have yet to fully recover (NY was certainly hit disproportionately hard during the spike in COVID-19 over the winter/spring months). As a reminder, the Fund is compared to a national index of municipal securities, which can cause deviation over time based on the performance of New York municipals relative to the rest of the market.
| Old Westbury Funds, Inc. |
| New York Municipal Bond Fund |
| Investment Adviser’s Report (Unaudited) - (Continued) |
| |
PORTFOLIO DIVERSIFICATION BY STATE
| State: | | Percentage
of Net Assets |
| New York | | | 88.9 | % |
| Other* | | | 11.1 | |
| | | | 100.0 | % |
| * | Includes cash and equivalents, Corporate Bonds, U.S. Government Securities, investment company, pending trades and Fund share transactions, interest and dividends receivable, prepaids and accrued expenses payable. |
| Old Westbury Funds, Inc. |
| New York Municipal Bond Fund |
| Investment Adviser’s Report (Unaudited) - (Continued) |
| |

| Average Annual Total Returns | | | |
| For the Period Ended October 31, 2020 | | | |
| New York Municipal Bond Fund | | | |
| One Year | | | 2.69 | % |
| Since Inception date of December 4, 2018 | | | 4.21 | % |
| | | | | |
| ICE Bank of America 3-7 Year AAA-AA Municipal Securities Index | | | | |
| One Year | | | 3.86 | % |
| Since Inception date of December 4, 2018 | | | 4.90 | % |
The performance data quoted represents past performance. Past performance does not guarantee future results and does not reflect the deduction of taxes that a shareholder may pay on Fund distributions or the redemption of Fund shares. Fund performance reflects fee waivers and/or expense reimbursements and reinvestments of distributions, if any. Without waivers/reimbursements, performance would have been lower. The investment return and principal value of an investment will fluctuate. Consequently, an investor’s shares, when redeemed, may be worth more or less than their original cost. Current performance may be lower or higher than the performance data quoted. To obtain performance information current to the most recent month end, please call 1-800-607-2200.
The Adviser has contractually committed through October 31, 2021, to waive its advisory fees to the extent necessary to maintain the net operating expense ratio of the Fund, excluding Fund transaction costs, investment interest expense, dividend expenses associated with securities sold short and acquired fund fees and expenses (if any) at 0.57%. The expense ratio, prior to fee waivers and including acquired fund fees (if any), is stated in the prospectus dated February 28, 2020 as 0.78%. Additional information pertaining to the Fund’s expense ratio for the year ended October 31, 2020 can be found in the Financial Highlights.
The chart shown above illustrates the total value of a $10,000 investment for 1 Year and 11 Months, with distributions reinvested. The ICE Bank of America 3-7 Year AAA-AA Municipal Securities Index also includes the reinvestment of distributions but does not include fees, expenses and income taxes associated with an investment in the Fund. The ICE Bank of America 3-7 Year AAA-AA Municipal Securities Index is unmanaged. Investments cannot be made directly in an index.
Municipal securities held by the Fund may be adversely affected by local political and economic factors. Income from the Fund may be subject to federal alternative minimum tax, state and local taxes The Fund is non-diversified, meaning it may focus its assets in a smaller number of issuers and may be subject to more risk than a more diversified fund.
| Old Westbury Funds, Inc. | |
| Disclosure of Fund Expenses (Unaudited) | |
| | For the Period Ended October 31, 2020 |
| | |
As a shareholder of Old Westbury Funds, Inc., you incur ongoing costs, including management fees and other Fund expenses. This example is intended to help you understand your ongoing costs (in dollars) of investing in the Funds and to compare these costs with the ongoing costs of investing in other mutual funds.
The example is based on an investment of $1,000 invested at the beginning of the period and held for the entire period from May 1, 2020 through October 31, 2020.
Actual Expenses
The table below provides information about actual account values and actual expenses. You may use the information below, together with the amount you invested, to estimate the expenses that you paid over the period. Simply divide your account value by $1,000 (for example, an $8,600 account value divided by $1,000 = 8.6), then multiply the result by the number in the table under the heading entitled “Actual Expenses Paid During Period” to estimate the expenses you paid on your account during this period.
| | | | | | | Actual | | Actual |
| | | Actual | | Actual | | Expenses Paid | | Expense Ratio |
| | | Beginning | | ending | | During Period* | | During Period** |
| | | Account Value | | Account value | | 05/01/2020 | | 05/01/2020 |
| | | 05/01/2020 | | 10/31/2020 | | - 10/31/2020 | | - 10/31/2020 |
| All Cap Core Fund | | $ | 1,000.00 | | | $ | 1,174.60 | | | $ | 5.30 | | | | 0.97 | % |
| All Cap ESG Fund | | | 1,000.00 | | | | 1,073.70 | | | | 5.21 | | | | 1.00 | % |
| Small & Mid Cap Strategies Fund | | | 1,000.00 | | | | 1,177.80 | | | | 6.08 | | | | 1.11 | % |
| Large Cap Strategies Fund | | | 1,000.00 | | | | 1,152.60 | | | | 5.95 | | | | 1.10 | % |
| Credit Income Fund*** | | | 1,000.00 | | | | 999.00 | | | | 0.70 | | | | 0.85 | % |
| Fixed Income Fund | | | 1,000.00 | | | | 1,006.70 | | | | 2.88 | | | | 0.57 | % |
| Municipal Bond Fund | | | 1,000.00 | | | | 1,030.50 | | | | 2.91 | | | | 0.57 | % |
| California Municipal Bond Fund | | | 1,000.00 | | | | 1,028.80 | | | | 2.91 | | | | 0.57 | % |
| New York Municipal Bond Fund | | | 1,000.00 | | | | 1,033.90 | | | | 2.91 | | | | 0.57 | % |
| * | Expenses are equal to the average account value times the Fund’s annualized expense ratio multiplied by 184/366 to reflect the one-half year period. |
| ** | Expense ratios are annualized and reflect existing expense waivers/reimbursements. |
| *** | Expenses are equal to the average account value times the Fund’s annualized expense ratio multiplied by 30/366 to reflect the period of the Fund’s operations. |
| Old Westbury Funds, Inc. | |
| Disclosure of Fund Expenses (Unaudited) - (Continued) | |
| | For the Period Ended October 31, 2020 |
| | |
Hypothetical Example for Comparison Purposes
The table below provides information about hypothetical account values and hypothetical expenses based on each Fund’s actual expense ratio and an assumed rate of return of 5% per year before expenses, which is not the Fund’s actual return. The hypothetical account values and expenses may not be used to estimate the actual ending account balance or expenses you paid for the period. You may use this information to compare this 5% hypothetical example with the 5% hypothetical examples that appear in the shareholder reports of other funds.
| | | | | | | Hypothetical | | Hypothetical |
| | | Hypothetical | | Hypothetical | | Expenses Paid | | Expense Ratio |
| | | Beginning | | Ending | | During Period* | | During Period** |
| | | Account Value | | Account Value | | 05/01/2020 | | 05/01/2020 |
| | | 05/01/2020 | | 10/31/2020 | | - 10/31/2020 | | - 10/31/2020 |
| All Cap Core Fund | | $ | 1,000.00 | | | $ | 1,020.26 | | | $ | 4.93 | | | | 0.97 | % |
| All Cap ESG Fund | | | 1,000.00 | | | | 1,020.11 | | | | 5.08 | | | | 1.00 | % |
| Small & Mid Cap Strategies Fund | | | 1,000.00 | | | | 1,019.56 | | | | 5.63 | | | | 1.11 | % |
| Large Cap Strategies Fund | | | 1,000.00 | | | | 1,019.61 | | | | 5.58 | | | | 1.10 | % |
| Credit Income Fund*** | | | 1,000.00 | | | | 1,003.40 | | | | 0.70 | | | | 0.85 | % |
| Fixed Income Fund | | | 1,000.00 | | | | 1,022.27 | | | | 2.90 | | | | 0.57 | % |
| Municipal Bond Fund | | | 1,000.00 | | | | 1,022.27 | | | | 2.90 | | | | 0.57 | % |
| California Municipal Bond Fund | | | 1,000.00 | | | | 1,022.27 | | | | 2.90 | | | | 0.57 | % |
| New York Municipal Bond Fund | | | 1,000.00 | | | | 1,022.27 | | | | 2.90 | | | | 0.57 | % |
| * | Expenses are equal to the average account value times the Fund’s annualized expense ratio multiplied by 184/366 to reflect the one-half year period. |
| ** | Expense ratios are annualized and reflect existing expense waivers/reimbursements. |
| *** | Expenses are equal to the average account value times the Fund’s annualized expense ratio multiplied by 30/366 to reflect the period of the Fund’s operations. |
Please note that the expenses shown in the tables are meant to highlight your ongoing costs only and do not reflect any transactional costs, such as sales charges (loads), redemption fees, or exchange fees. Therefore, these tables are useful in comparing ongoing costs only, and will not help you determine the relative total costs of owning different funds. In addition, if these transactional costs were included, your costs would have been higher.
| Old Westbury Funds, Inc. | |
| All Cap Core Fund | |
| Portfolio of Investments | October 31, 2020 |
| Shares | | | | | Value | |
| COMMON STOCKS — 94.5% |
| Banks — 0.7% |
| | 207,856 | | | Bank of America Corp. | | $ | 4,926,187 | |
| | 265,812 | | | Citigroup, Inc. | | | 11,009,933 | |
| | | | | | | | 15,936,120 | |
| Communication Services — 13.6% |
| | 59,865 | | | Alphabet, Inc. - Class C(a) | | | 97,041,764 | |
| | 87,609 | | | Charter Communications, Inc. - Class A(a) | | | 52,900,067 | |
| | 297,229 | | | Facebook, Inc. - Class A(a) | | | 78,203,922 | |
| | 135,426 | | | Match Group, Inc.(a) | | | 15,815,048 | |
| | 158,620 | | | Sea Ltd. - ADR(a) | | | 25,014,374 | |
| | 539,039 | | | Tencent Holdings Ltd. - Class H | | | 41,092,815 | |
| | | | | | | | 310,067,990 | |
| Consumer Discretionary — 14.8% |
| | 126,590 | | | Advance Auto Parts, Inc. | | | 18,644,175 | |
| | 133,174 | | | Alibaba Group Holding Ltd. - ADR(a) | | | 40,576,786 | |
| | 30,809 | | | Amazon.com, Inc.(a) | | | 93,540,745 | |
| | 82,564 | | | Burlington Stores, Inc.(a) | | | 15,982,739 | |
| | 508,899 | | | Dollarama, Inc. | | | 17,524,796 | |
| | 254,450 | | | Hilton Worldwide Holdings, Inc. | | | 22,343,255 | |
| | 107,769 | | | Home Depot, Inc. (The) | | | 28,743,070 | |
| | 52,235 | | | LVMH Moet Hennessy Louis Vuitton SE | | | 24,474,035 | |
| | 410,112 | | | NIKE, Inc. - Class B | | | 49,246,249 | |
| | 214,055 | | | Ross Stores, Inc. | | | 18,231,064 | |
| | 183,680 | | | Wyndham Hotels & Resorts, Inc. | | | 8,542,957 | |
| | | | | | | | 337,849,871 | |
| Consumer Staples — 2.0% |
| | 299,865 | | | PepsiCo, Inc. | | | 39,969,006 | |
| | 300,200 | | | US Foods Holding Corp.(a) | | | 6,274,180 | |
| | | | | | | | 46,243,186 | |
| Diversified Financials — 4.0% |
| | 38,447 | | | BlackRock, Inc. | | | 23,037,827 | |
| | 619,085 | | | Blackstone Group, Inc. (The) - Class A | | | 31,214,266 | |
| | 146,774 | | | Nasdaq, Inc. | | | 17,758,186 | |
| | 59,222 | | | S&P Global, Inc. | | | 19,112,716 | |
| | | | | | | | 91,122,995 | |
| Energy — 0.4% |
| | 114,979 | | | Pioneer Natural Resources Co. | | | 9,147,729 | |
| Health Care — 14.0% |
| | 68,757 | | | Cooper Cos, Inc. (The) | | | 21,936,921 | |
| | 265,219 | | | Danaher Corp. | | | 60,878,369 | |
| | 274,371 | | | IQVIA Holdings, Inc.(a) | | | 42,250,390 | |
| | 89,294 | | | Laboratory Corp. of America Holdings(a) | | | 17,838,262 | |
| | 101,293 | | | STERIS Plc | | | 17,948,107 | |
| | 40,380 | | | Teleflex, Inc. | | | 12,850,127 | |
| | 128,829 | | | Thermo Fisher Scientific, Inc. | | | 60,951,577 | |
| | 139,698 | | | UnitedHealth Group, Inc. | | | 42,627,448 | |
| Shares | | | | | Value | |
| Health Care (continued) |
| | 19,384 | | | West Pharmaceutical Services, Inc. | | $ | 5,273,805 | |
| | 232,107 | | | Zoetis, Inc. | | | 36,800,565 | |
| | | | | | | | 319,355,571 | |
| Industrials — 10.0% |
| | 272,051 | | | A.O. Smith Corp. | | | 14,062,316 | |
| | 73,648 | | | Cintas Corp. | | | 23,165,978 | |
| | 146,224 | | | Dover Corp. | | | 16,188,459 | |
| | 105,523 | | | Equifax, Inc. | | | 14,414,442 | |
| | 385,144 | | | Fortive Corp. | | | 23,724,870 | |
| | 394,859 | | | IAA, Inc.(a) | | | 22,345,071 | |
| | 41,152 | | | IDEX Corp. | | | 7,011,889 | |
| | 45,115 | | | L3Harris Technologies, Inc. | | | 7,268,478 | |
| | 2,205,642 | | | Rentokil Initial Plc(a) | | | 15,030,026 | |
| | 190,756 | | | Safran SA(a) | | | 20,110,214 | |
| | 307,122 | | | Union Pacific Corp. | | | 54,418,947 | |
| | 58,344 | | | Verisk Analytics, Inc. | | | 10,383,482 | |
| | | | | | | | 228,124,172 | |
| Information Technology — 28.2% |
| | 44,250 | | | Adobe, Inc.(a) | | | 19,784,175 | |
| | 214,872 | | | Amphenol Corp. - Class A | | | 24,246,157 | |
| | 48,761 | | | ANSYS, Inc.(a) | | | 14,841,386 | |
| | 950,903 | | | Apple, Inc. | | | 103,515,301 | |
| | 113,839 | | | CDW Corp. | | | 13,956,661 | |
| | 122,575 | | | CMC Materials, Inc. | | | 17,428,939 | |
| | 351,668 | | | Fidelity National Information Services, Inc. | | | 43,814,316 | |
| | 706,801 | | | Microsoft Corp. | | | 143,105,998 | |
| | 61,640 | | | Nice Ltd. - ADR(a) | | | 14,069,946 | |
| | 23,673 | | | Paycom Software, Inc.(a) | | | 8,619,103 | |
| | 134,008 | | | salesforce.com, Inc.(a) | | | 31,126,038 | |
| | 52,049 | | | ServiceNow, Inc.(a) | | | 25,898,021 | |
| | 140,300 | | | SS&C Technologies Holdings, Inc. | | | 8,308,566 | |
| | 119,139 | | | Synopsys, Inc.(a) | | | 25,479,067 | |
| | 343,854 | | | Texas Instruments, Inc. | | | 49,717,850 | |
| | 468,513 | | | Visa, Inc. - Class A | | | 85,133,497 | |
| | 154,057 | | | Vontier Corp.(a) | | | 4,427,598 | |
| | 93,935 | | | WEX, Inc.(a) | | | 11,887,474 | |
| | | | | | | | 645,360,093 | |
| Insurance — 1.6% |
| | 95,445 | | | Aon Plc - Class A | | | 17,562,835 | |
| | 144,431 | | | Chubb Ltd. | | | 18,763,031 | |
| | | | | | | | 36,325,866 | |
| Materials — 1.7% |
| | 93,575 | | | Air Products & Chemicals, Inc. | | | 25,849,158 | |
| | 110,598 | | | AptarGroup, Inc. | | | 12,618,126 | |
| | | | | | | | 38,467,284 | |
| Real Estate — 1.3% |
| | 127,264 | | | American Tower Corp. REIT | | | 29,226,178 | |
| Old Westbury Funds, Inc. | |
| All Cap Core Fund | |
| Portfolio of Investments - (Continued) | October 31, 2020 |
| Shares | | | | | Value | |
| Utilities — 2.2% |
| | 344,400 | | | Ameren Corp. | | $ | 27,937,728 | |
| | 148,708 | | | American Water Works Co., Inc. | | | 22,382,041 | |
| | | | | | | | 50,319,769 | |
Total Common Stocks
(Cost $1,397,486,738) | | | 2,157,546,824 | |
| | | | | | | | | |
| EXCHANGE-TRADED FUNDS — 4.3% |
| | 722,000 | | | Energy Select Sector SPDR Fund | | | 20,735,840 | |
| | 2,613,000 | | | Financial Select Sector SPDR Fund | | | 62,346,180 | |
| | 150,420 | | | Health Care Select Sector SPDR Fund | | | 15,291,697 | |
| | | | | | | | | |
Total Exchange-Traded Funds
(Cost $99,647,676) | | | 98,373,717 | |
| | | | | | | | | |
| INVESTMENT COMPANY — 1.2% |
| | 27,631,247 | | | SEI Daily Income Trust Government II Fund - Class A, 0.01%(b) | | | 27,631,247 | |
| | | | | | | | | |
Total Investment Company
(Cost $27,631,247) | | | 27,631,247 | |
| | | | | |
TOTAL INVESTMENTS — 100.0%
(Cost $1,524,765,661) | | $ | 2,283,551,788 | |
| | | | |
| OTHER ASSETS IN EXCESS OF LIABILITIES — 0.0% | | | 353,886 | |
| NET ASSETS — 100.0% | | $ | 2,283,905,674 | |
| (a) | Non-income producing security. |
| (b) | The rate shown represents the current yield as of October 31, 2020. |
The following abbreviations are used in the report:
ADR — American Depositary Receipt
REIT — Real Estate Investment Trust
SPDR — Standard & Poor’s Depositary Receipt
| Old Westbury Funds, Inc. | |
| All Cap ESG Fund | |
| Portfolio of Investments | October 31, 2020 |
| Shares | | | | | Value | |
| COMMON STOCKS — 98.8% |
| Banks — 2.0% |
| | 557,980 | | | Bank of China Ltd. - H Shares | | $ | 176,337 | |
| | 2,908 | | | Bank of Montreal | | | 173,153 | |
| | 225,603 | | | China Minsheng Banking Corp. Ltd. - H Shares | | | 123,387 | |
| | 7,565 | | | Fifth Third Bancorp | | | 175,659 | |
| | 20,365 | | | SpareBank 1 SMN | | | 174,710 | |
| | | | | | | | 823,246 | |
| Communication Services — 7.7% |
| | 11,719 | | | AT&T, Inc. | | | 316,647 | |
| | 40,771 | | | China Mobile Ltd. | | | 247,966 | |
| | 3,672 | | | Cogeco Communications, Inc. | | | 255,770 | |
| | 9,800 | | | Comcast Corp. - Class A | | | 413,952 | |
| | 8,405 | | | JCDecaux SA(a) | | | 129,702 | |
| | 13,815 | | | NTT DOCOMO, Inc. | | | 512,908 | |
| | 517 | | | Swisscom AG | | | 262,912 | |
| | 3,167 | | | Tencent Holdings Ltd. - Class H | | | 241,431 | |
| | 7,297 | | | Verizon Communications, Inc. | | | 415,856 | |
| | 5,363 | | | Yandex NV - Class A(a) | | | 308,748 | |
| | | | | | | | 3,105,892 | |
| Consumer Discretionary — 6.3% |
| | 4,713 | | | Cheesecake Factory, Inc. (The) | | | 140,071 | |
| | 1,421 | | | Cracker Barrel Old Country Store, Inc. | | | 161,738 | |
| | 7,958 | | | Industria de Diseno Textil S.A. | | | 196,394 | |
| | 93,130 | | | Kingfisher Plc(a) | | | 346,387 | |
| | 28,882 | | | Mr. Price Group Ltd. | | | 218,065 | |
| | 3,781 | | | Starbucks Corp. | | | 328,796 | |
| | 64,326 | | | Super Retail Group Ltd. | | | 505,952 | |
| | 2,319 | | | Target Corp. | | | 352,998 | |
| | 124,282 | | | Xinyi Glass Holdings Ltd. | | | 272,210 | |
| | | | | | | | 2,522,611 | |
| Consumer Staples — 7.8% |
| | 38,350 | | | Arca Continental SAB de CV | | | 167,238 | |
| | 1,608 | | | Clorox Co. (The) | | | 333,258 | |
| | 13,335 | | | Coca-Cola European Partners Plc | | | 476,193 | |
| | 1,470 | | | Hershey Co. (The) | | | 202,066 | |
| | 3,375 | | | Kimberly-Clark Corp. | | | 447,491 | |
| | 4,886 | | | PepsiCo, Inc. | | | 651,255 | |
| | 2,680 | | | Reckitt Benckiser Group Plc | | | 236,093 | |
| | 9,874 | | | Seven & i Holdings Co. Ltd. | | | 299,818 | |
| | 11,713 | | | Tate & Lyle Plc | | | 90,317 | |
| | 3,815 | | | Unilever NV | | | 215,714 | |
| | | | | | | | 3,119,443 | |
| Diversified Financials — 11.4% |
| | 12,106 | | | 3i Group Plc | | | 150,717 | |
| | 765 | | | FactSet Research Systems, Inc. | | | 234,473 | |
| | 169,166 | | | GF Securities Co. Ltd. - Class H | | | 217,990 | |
| | 4,274 | | | Hong Kong Exchanges & Clearing Ltd. | | | 204,093 | |
| | 7,550 | | | IGM Financial, Inc. | | | 165,757 | |
| Shares | | | | | Value | |
| Diversified Financials (continued) |
| | 26,503 | | | Janus Henderson Group Plc | | $ | 644,023 | |
| | 88,749 | | | Jupiter Fund Management Plc | | | 266,971 | |
| | 11,992 | | | Lazard Ltd. - Class A | | | 403,771 | |
| | 985 | | | Moody’s Corp. | | | 258,956 | |
| | 4,849 | | | Morgan Stanley | | | 233,479 | |
| | 2,232 | | | Morningstar, Inc. | | | 424,928 | |
| | 745 | | | MSCI, Inc. | | | 260,631 | |
| | 2,826 | | | S&P Global, Inc. | | | 912,035 | |
| | 16,295 | | | UBS Group AG | | | 189,171 | |
| | | | | | | | 4,566,995 | |
| Energy — 1.7% |
| | 7,912 | | | Aker BP ASA | | | 122,907 | |
| | 27,682 | | | ARC Resources Ltd. | | | 136,301 | |
| | 19,486 | | | Eni SpA | | | 136,416 | |
| | 12,245 | | | Equinor ASA | | | 155,521 | |
| | 26,050 | | | MOL Hungarian Oil & Gas Plc(a) | | | 126,289 | |
| | | | | | | | 677,434 | |
| Health Care — 17.5% |
| | 3,197 | | | Abbott Laboratories | | | 336,037 | |
| | 4,399 | | | Agilent Technologies, Inc. | | | 449,094 | |
| | 1,557 | | | Amgen, Inc. | | | 337,776 | |
| | 951 | | | Anthem, Inc. | | | 259,433 | |
| | 43,598 | | | Astellas Pharma, Inc. | | | 597,575 | |
| | 1,543 | | | AstraZeneca Plc | | | 155,239 | |
| | 4,061 | | | Baxter International, Inc. | | | 315,012 | |
| | 1,566 | | | Biogen, Inc.(a) | | | 394,742 | |
| | 1,181 | | | CSL Ltd. | | | 238,710 | |
| | 3,226 | | | Danaher Corp. | | | 740,496 | |
| | 33,787 | | | Fleury SA | | | 161,811 | |
| | 49,805 | | | Hartalega Holdings Behrad | | | 215,762 | |
| | 3,200 | | | Medtronic Plc | | | 321,824 | |
| | 4,897 | | | Merck & Co., Inc. | | | 368,303 | |
| | 8,971 | | | Novo Nordisk A/S - B Shares | | | 576,196 | |
| | 12,656 | | | Pfizer, Inc. | | | 449,035 | |
| | 1,997 | | | Quest Diagnostics, Inc. | | | 243,913 | |
| | 787 | | | Roche Holding AG | | | 252,978 | |
| | 2,477 | | | Sanofi | | | 223,199 | |
| | 814 | | | Thermo Fisher Scientific, Inc. | | | 385,120 | |
| | | | | | | | 7,022,255 | |
| Industrials — 10.6% |
| | 4,930 | | | Allison Transmission Holdings, Inc. | | | 178,219 | |
| | 7,483 | | | Deutsche Post AG | | | 331,520 | |
| | 7,173 | | | Ebara Corp. | | | 197,935 | |
| | 1,120 | | | General Dynamics Corp. | | | 147,090 | |
| | 15,168 | | | Hino Motors Ltd. | | | 115,323 | |
| | 1,319 | | | Illinois Tool Works, Inc. | | | 258,366 | |
| | 13,420 | | | Kongsberg Gruppen ASA | | | 217,326 | |
| | 566 | | | Lockheed Martin Corp. | | | 198,174 | |
| | 2,291 | | | ManpowerGroup, Inc. | | | 155,490 | |
| | 1,464 | | | Norfolk Southern Corp. | | | 306,152 | |
| | 587 | | | Northrop Grumman Corp. | | | 170,124 | |
| Old Westbury Funds, Inc. | |
| All Cap ESG Fund | |
| Portfolio of Investments - (Continued) | October 31, 2020 |
| Shares | | | | | Value | |
| Industrials (continued) |
| | 2,540 | | | Regal Beloit Corp. | | $ | 250,571 | |
| | 82,253 | | | Royal Mail Plc | | | 241,889 | |
| | 17,668 | | | Sandvik AB(a) | | | 314,706 | |
| | 1,620 | | | Siemens AG | | | 189,993 | |
| | 818 | | | Siemens Energy AG(a) | | | 17,899 | |
| | 7,744 | | | Signify NV(a)(b) | | | 275,892 | |
| | 3,896 | | | Thomson Reuters Corp. | | | 302,895 | |
| | 5,407 | | | Toyota Tsusho Corp. | | | 149,720 | |
| | 2,392 | | | Waste Management, Inc. | | | 258,121 | |
| | | | | | | | 4,277,405 | |
| Information Technology — 21.7% |
| | 3,303 | | | Accenture Plc - Class A | | | 716,454 | |
| | 6,161 | | | Amdocs Ltd. | | | 347,357 | |
| | 4,747 | | | Apple, Inc. | | | 516,758 | |
| | 2,183 | | | Atos SE(a) | | | 148,986 | |
| | 1,402 | | | CACI International, Inc. - Class A(a) | | | 292,359 | |
| | 5,229 | | | Canon, Inc. | | | 89,926 | |
| | 5,614 | | | Cognizant Technology Solutions Corp. - Class A | | | 400,952 | |
| | 3,321 | | | Fujitsu Ltd. | | | 387,786 | |
| | 12,571 | | | Intel Corp. | | | 556,644 | |
| | 2,879 | | | International Business Machines Corp. | | | 321,469 | |
| | 1,239 | | | Intuit, Inc. | | | 389,888 | |
| | 1,460 | | | Jack Henry & Associates, Inc. | | | 216,445 | |
| | 16,750 | | | Juniper Networks, Inc. | | | 330,310 | |
| | 3,226 | | | Leidos Holdings, Inc. | | | 267,758 | |
| | 2,860 | | | Logitech International S.A. | | | 240,790 | |
| | 4,996 | | | Micron Technology, Inc.(a) | | | 251,499 | |
| | 4,579 | | | Microsoft Corp. | | | 927,110 | |
| | 2,219 | | | NXP Semiconductors NV | | | 299,831 | |
| | 5,871 | | | Oracle Corp. | | | 329,422 | |
| | 1,641 | | | SAP SE | | | 174,854 | |
| | 4,479 | | | Seagate Technology Plc | | | 214,186 | |
| | 2,423 | | | Synopsys, Inc.(a) | | | 518,183 | |
| | 3,042 | | | Texas Instruments, Inc. | | | 439,843 | |
| | 6,720 | | | TietoEVRY Oyj | | | 167,485 | |
| | 8,115 | | | Western Union Co. (The) | | | 157,756 | |
| | | | | | | | 8,704,051 | |
| Insurance — 2.8% |
| | 4,399 | | | MetLife, Inc. | | | 166,502 | |
| | 1,657 | | | Muenchener Rueckversicherungs-Gesellschaft AG | | | 387,507 | |
| | 3,648 | | | Principal Financial Group, Inc. | | | 143,075 | |
| | 4,727 | | | Prudential Financial, Inc. | | | 302,622 | |
| | 417 | | | Zurich Insurance Group AG | | | 138,250 | |
| | | | | | | | 1,137,956 | |
| Materials — 4.3% |
| | 9,059 | | | Anglo American Plc | | | 212,562 | |
| | 10,625 | | | Cabot Corp. | | | 403,856 | |
| | 4,472 | | | LyondellBasell Industries NV - Class A | | | 306,108 | |
| | 5,119 | | | Newmont Corp. | | | 321,678 | |
| Shares | | | | | Value | |
| Materials (continued) |
| | 1,986 | | | Packaging Corp. of America | | $ | 227,377 | |
| | 7,265 | | | Westrock Co. | | | 272,801 | |
| | | | | | | | 1,744,382 | |
| Real Estate — 3.2% |
| | 14,035 | | | Brandywine Realty Trust REIT | | | 122,947 | |
| | 82,790 | | | CapitaLand Ltd. | | | 155,767 | |
| | 8,982 | | | Castellum AB | | | 187,142 | |
| | 65,170 | | | China Overseas Land & Investment Ltd. | | | 163,083 | |
| | 50,535 | | | China Resources Land Ltd. | | | 205,660 | |
| | 1,195 | | | Gecina SA REIT | | | 148,361 | |
| | 112,469 | | | Swire Properties Ltd. | | | 301,029 | |
| | | | | | | | 1,283,989 | |
| Utilities — 1.8% |
| | 17,164 | | | Cia de Saneamento Basico do Estado de Sao Paulo | | | 127,280 | |
| | 19,195 | | | E.ON SE | | | 200,125 | |
| | 19,378 | | | Enagas SA | | | 418,195 | |
| | | | | | | | 745,600 | |
Total Common Stocks
(Cost $38,611,569) | | | 39,731,259 | |
| | | | | | | | | |
| INVESTMENT COMPANY — 1.0% | | | | |
| | 395,884 | | | SEI Daily Income Trust Government II Fund - Class A, 0.01%(c) | | | 395,884 | |
| | | | | | | | | |
Total Investment Company
(Cost $395,884) | | | 395,884 | |
| | | | | |
TOTAL INVESTMENTS — 99.8%
(Cost $39,007,453) | | $ | 40,127,143 | |
| | | | | |
| OTHER ASSETS IN EXCESS OF LIABILITIES — 0.2% | | | 64,448 | |
| NET ASSETS — 100.0% | | $ | 40,191,591 | |
| (a) | Non-income producing security. |
| (b) | Security exempt from registration under Rule 144A of the Securities Act of 1933, as amended. The security may be resold in transactions exempt from registration normally to qualified institutional buyers. The security has been determined to be liquid in accordance with procedures adopted by the Fund’s Board of Directors. |
| (c) | The rate shown represents the current yield as of October 31, 2020. |
The following abbreviations are used in the report:
REIT — Real Estate Investment Trust
| Old Westbury Funds, Inc. | |
| Small & Mid Cap Strategies Fund | |
| Portfolio of Investments | October 31, 2020 |
| | |
| Shares | | | | | Value | |
| COMMON STOCKS — 86.8% | | | | |
| ARGENTINA — 0.4% | | | | |
| | 24,149 | | | MercadoLibre, Inc.(a) | | $ | 29,318,093 | |
| | | | | | | | | |
| AUSTRALIA — 2.2% | | | | |
| | 455,515 | | | Accent Group Ltd. | | | 531,500 | |
| | 300,127 | | | Adairs Ltd. | | | 799,534 | |
| | 608,555 | | | Adelaide Brighton Ltd. | | | 1,210,540 | |
| | 67,116 | | | Altium Ltd. | | | 1,753,994 | |
| | 587,263 | | | Ansell Ltd. | | | 16,589,887 | |
| | 4,438,361 | | | Aurelia Metals Ltd. | | | 1,450,669 | |
| | 1,210,996 | | | Austal Ltd. | | | 2,306,773 | |
| | 501,262 | | | Australian Pharmaceutical Industries Ltd. | | | 385,808 | |
| | 31,724 | | | Baby Bunting Group Ltd. | | | 90,979 | |
| | 140,436 | | | Base Resources Ltd. | | | 23,197 | |
| | 746,989 | | | BlueScope Steel Ltd. | | | 7,697,345 | |
| | 1,404,692 | | | Boral Ltd. | | | 4,502,345 | |
| | 6,260 | | | Brickworks Ltd. | | | 76,167 | |
| | 1 | | | Castile Resources Ltd.(a) | | | 0 | |
| | 495,394 | | | Champion Iron Ltd.(a) | | | 1,169,992 | |
| | 125,430 | | | Class Ltd. | | | 195,725 | |
| | 37,558 | | | Clover Corp. Ltd. | | | 46,727 | |
| | 41,728 | | | Codan Ltd. | | | 346,101 | |
| | 180,582 | | | Computershare Ltd. | | | 1,542,210 | |
| | 1,832,840 | | | CSR Ltd. | | | 5,681,407 | |
| | 895,089 | | | Dacian Gold Ltd.(a) | | | 223,351 | |
| | 134,080 | | | Data#3 Ltd. | | | 587,144 | |
| | 2,034,205 | | | Deterra Royalties Ltd.(a) | | | 5,619,272 | |
| | 58,170 | | | Eagers Automotive Ltd. | | | 444,040 | |
| | 1,063,675 | | | Estia Health Ltd. | | | 994,382 | |
| | 281,214 | | | Hansen Technologies Ltd. | | | 778,800 | |
| | 982,030 | | | Harvey Norman Holdings Ltd. | | | 3,064,788 | |
| | 2,034,205 | | | Iluka Resources Ltd. | | | 7,363,677 | |
| | 494,636 | | | Imdex Ltd. | | | 418,953 | |
| | 1,801,117 | | | Independence Group NL | | | 5,621,053 | |
| | 44,455 | | | Infomedia Ltd. | | | 48,433 | |
| | 229,218 | | | Integrated Research Ltd. | | | 565,521 | |
| | 130,162 | | | JB Hi-Fi Ltd. | | | 4,339,404 | |
| | 67,922 | | | Johns Lyng Group Ltd. | | | 147,524 | |
| | 277,152 | | | Jupiter Mines Ltd. | | | 55,521 | |
| | 133,132 | | | Kogan.com Ltd. | | | 1,926,778 | |
| | 364,347 | | | MACA Ltd. | | | 211,282 | |
| | 888,753 | | | Macmahon Holdings Ltd. | | | 149,929 | |
| | 23,600 | | | Mastermyne Group Ltd. | | | 13,188 | |
| | 1,053,240 | | | Mayne Pharma Group Ltd.(a) | | | 222,096 | |
| | 50,823 | | | McMillan Shakespeare Ltd. | | | 333,657 | |
| | 570,199 | | | Mineral Resources Ltd. | | | 10,003,772 | |
| | 23,203 | | | MNF Group Ltd. | | | 73,392 | |
| | 2,265,708 | | | Mount Gibson Iron Ltd. | | | 1,082,943 | |
| | 442,310 | | | Navigator Global Investments Ltd. | | | 478,785 | |
| | 319,350 | | | Netwealth Group Ltd. | | | 3,878,854 | |
| | 16,484 | | | Nick Scali Ltd. | | | 96,169 | |
| | 227,702 | | | Nufarm Ltd.(a) | | | 550,577 | |
| Shares | | | | | Value | |
| AUSTRALIA (continued) | | | | |
| | 14,953 | | | Objective Corp. Ltd. | | $ | 136,741 | |
| | 28,928 | | | OFX Group Ltd. | | | 25,315 | |
| | 4,455,590 | | | Orora Ltd. | | | 8,080,118 | |
| | 1,195,009 | | | OZ Minerals Ltd. | | | 12,481,959 | |
| | 89,398 | | | People Infrastructure Ltd. | | | 209,250 | |
| | 2,661,523 | | | Perenti Global Ltd. | | | 1,954,966 | |
| | 117,732 | | | Perseus Mining Ltd.(a) | | | 100,546 | |
| | 101,435 | | | Praemium Ltd.(a) | | | 46,344 | |
| | 13,624 | | | Premier Investments Ltd. | | | 204,454 | |
| | 27,448 | | | Pro Medicus Ltd. | | | 624,906 | |
| | 7,456 | | | PWR HOLDINGS Ltd. | | | 23,793 | |
| | 492,007 | | | Redbubble Ltd.(a) | | | 1,493,990 | |
| | 227,682 | | | Regis Healthcare Ltd. | | | 164,839 | |
| | 931,756 | | | Regis Resources Ltd. | | | 2,717,960 | |
| | 22,840 | | | Reject Shop Ltd. (The)(a) | | | 99,857 | |
| | 317,565 | | | RPMGlobal Holdings Ltd.(a) | | | 241,073 | |
| | 845,706 | | | Sandfire Resources NL | | | 2,627,450 | |
| | 271,079 | | | SEEK Ltd.(b) | | | 4,098,539 | |
| | 1,572,046 | | | Sigma Healthcare Ltd.(a) | | | 585,644 | |
| | 2,425,338 | | | South32 Ltd. | | | 3,460,677 | |
| | 58,562 | | | Southern Cross Electrical Engineering Ltd. | | | 18,112 | |
| | 1,497,858 | | | Technology One Ltd. | | | 9,443,997 | |
| | 4,364 | | | Tiger Resources Ltd.(a) | | | 1 | |
| | 407,833 | | | Vita Group Ltd. | | | 283,799 | |
| | 237,652 | | | Vocus Group Ltd.(a) | | | 576,306 | |
| | 1,245,672 | | | Western Areas Ltd. | | | 1,685,494 | |
| | | | | | | | 147,080,315 | |
| AUSTRIA — 0.0% | | | | |
| | 15,073 | | | ANDRITZ AG | | | 507,682 | |
| | 1,515 | | | Fabasoft AG | | | 71,283 | |
| | 869 | | | Palfinger AG | | | 20,080 | |
| | 3,867 | | | Semperit AG Holding(a) | | | 99,081 | |
| | 14,896 | | | Strabag SE(a) | | | 431,979 | |
| | 10,825 | | | Telekom Austria AG | | | 72,870 | |
| | 595 | | | UBM Development AG | | | 18,641 | |
| | 11,200 | | | Vienna Insurance Group AG Wiener Versicherung Gruppe | | | 227,227 | |
| | 34,360 | | | Zumtobel Group AG | | | 192,083 | |
| | | | | | | | 1,640,926 | |
| BELGIUM — 0.4% | | | | |
| | 215,922 | | | AGFA-Gevaert NV(a) | | | 819,801 | |
| | 32,598 | | | Barco NV | | | 510,821 | |
| | 13,339 | | | Bekaert SA | | | 283,673 | |
| | 280,945 | | | bpost SA(a) | | | 2,488,367 | |
| | 12,200 | | | Deceuninck NV - VVPR Strip(a)(b) | | | 0 | |
| | 40,437 | | | D’ieteren SA | | | 2,027,431 | |
| | 33,267 | | | Econocom Group SA(a) | | | 73,149 | |
| | 5,307 | | | Etablissements Franz Colruyt NV | | | 314,107 | |
| | 19,889 | | | EVS Broadcast Equipment SA | | | 285,839 | |
| | 125,893 | | | Galapagos NV(a) | | | 14,867,347 | |
| Old Westbury Funds, Inc. | |
| Small & Mid Cap Strategies Fund | |
| Portfolio of Investments - (Continued) | October 31, 2020 |
| | |
| Shares | | | | | Value | |
| BELGIUM (continued) | | | | |
| | 7,282 | | | Intervest Offices & Warehouses NV REIT | | $ | 179,796 | |
| | 3,505 | | | Ion Beam Applications | | | 45,801 | |
| | 10,979 | | | Melexis NV | | | 834,968 | |
| | 78,715 | | | Orange Belgium SA | | | 1,310,954 | |
| | 14,890 | | | Proximus SADP | | | 289,518 | |
| | 780 | | | Sofina SA | | | 202,579 | |
| | 3,064 | | | Tessenderlo Group SA(a) | | | 104,200 | |
| | 10,715 | | | Warehouses De Pauw CVA REIT | | | 358,402 | |
| | | | | | | | 24,996,753 | |
| BERMUDA — 0.4% | | | | |
| | 385,000 | | | Argo Group International Holdings Ltd. | | | 13,736,800 | |
| | 42,110 | | | DHT Holdings, Inc. | | | 202,549 | |
| | 264,140 | | | James River Group Holdings Ltd. | | | 12,343,262 | |
| | 1,340,246 | | | Pacific Andes International Holdings Ltd.(a)(b) | | 4,737 | |
| | | | | | | | 26,287,348 | |
| BRAZIL — 0.3% | | | | |
| | 226,649 | | | Afya Ltd. - Class A(a) | | | 5,439,576 | |
| | 541,102 | | | Cia Energetica de Minas Gerais - ADR | | | 990,217 | |
| | 57,444 | | | EDP - Energias do Brasil SA | | | 170,291 | |
| | 221,685 | | | Embraer SA - ADR(a) | | | 913,342 | |
| | 210,300 | | | Notre Dame Intermedica Participacoes SA | | | 2,401,355 | |
| | 1,198,500 | | | Petrobras Distribuidora SA | | | 3,991,554 | |
| | 1,151,300 | | | Rumo SA(a) | | | 3,645,748 | |
| | | | | | | | 17,552,083 | |
| CANADA — 2.3% | | | | |
| | 76,215 | | | Absolute Software Corp. | | | 862,660 | |
| | 62,100 | | | AcuityAds Holdings, Inc.(a) | | | 210,216 | |
| | 77,400 | | | AGF Management Ltd. - Class B | | | 331,723 | |
| | 25,907 | | | AirBoss of America Corp. | | | 348,071 | |
| | 14,800 | | | Altius Minerals Corp. | | | 117,529 | |
| | 225,500 | | | Altus Group Ltd. | | | 9,226,154 | |
| | 1,900 | | | Andrew Peller Ltd. - Class A | | | 14,817 | |
| | 172,900 | | | Artis Real Estate Investment Trust REIT | | | 1,082,328 | |
| | 15,600 | | | Bird Construction, Inc. | | | 74,704 | |
| | 13,800 | | | Black Diamond Group Ltd.(a) | | | 17,712 | |
| | 72,000 | | | Boardwalk Real Estate Investment Trust REIT | | | 1,447,242 | |
| | 11,200 | | | Bridgemarq Real Estate Services | | | 117,775 | |
| | 20,100 | | | BRP, Inc. | | | 1,085,638 | |
| | 466,209 | | | CAE, Inc. | | | 7,967,859 | |
| | 7,178 | | | Canaccord Genuity Group, Inc. | | | 35,666 | |
| | 9,110 | | | Canadian Apartment Properties REIT | | | 292,863 | |
| | 13,800 | | | Canfor Corp.(a) | | | 167,386 | |
| | 9,200 | | | Canfor Pulp Products, Inc. | | | 31,074 | |
| | 99,392 | | | CanWel Building Materials Group Ltd. | | | 455,071 | |
| Shares | | | | | Value | |
| CANADA (continued) | | | | |
| | 69,800 | | | Cascades, Inc. | | $ | 742,899 | |
| | 334,828 | | | Celestica, Inc.(a) | | | 1,967,802 | |
| | 41,612 | | | Cogeco Communications, Inc. | | | 2,898,441 | |
| | 700 | | | Cogeco, Inc. | | | 41,864 | |
| | 116,600 | | | Descartes Systems Group, Inc. (The)(a) | | | 6,252,274 | |
| | 1,614,940 | | | Dollarama, Inc. | | | 55,613,186 | |
| | 14,000 | | | Dorel Industries, Inc. - Class B(a) | | | 151,212 | |
| | 14,531 | | | Dream Impact Trust - Units | | | 57,696 | |
| | 65,302 | | | DREAM Unlimited Corp. - Class A | | | 865,596 | |
| | 24,800 | | | Empire Co. Ltd. - Class A | | | 676,634 | |
| | 67,827 | | | Enerplus Corp. | | | 123,201 | |
| | 106,282 | | | Enghouse Systems Ltd. | | | 5,273,814 | |
| | 21,600 | | | ERO Copper Corp.(a) | | | 282,909 | |
| | 22,300 | | | Evertz Technologies Ltd. | | | 197,006 | |
| | 30,283 | | | Exco Technologies Ltd. | | | 161,382 | |
| | 45,125 | | | Finning International, Inc. | | | 686,206 | |
| | 608,900 | | | First Quantum Minerals Ltd. | | | 6,997,117 | |
| | 275,800 | | | H&R Real Estate Investment Trust REIT | | | 2,119,787 | |
| | 40,100 | | | Hardwoods Distribution, Inc. | | | 719,651 | |
| | 31,939 | | | High Liner Foods, Inc. | | | 203,290 | |
| | 1,173,774 | | | IAMGOLD Corp.(a) | | | 4,307,751 | |
| | 124,629 | | | Interfor Corp.(a) | | | 1,404,099 | |
| | 160,178 | | | Intertape Polymer Group, Inc. | | | 1,821,434 | |
| | 30,100 | | | Kinaxis, Inc.(a) | | | 4,594,865 | |
| | 900 | | | Lassonde Industries, Inc. - Class A | | | 102,680 | |
| | 17,318 | | | Leon’s Furniture Ltd. | | | 241,643 | |
| | 56,500 | | | Linamar Corp. | | | 1,846,863 | |
| | 96,972 | | | Medical Facilities Corp. | | | 365,383 | |
| | 6,841 | | | Metro, Inc. | | | 319,123 | |
| | 700 | | | Molson Coors Canada, Inc. | | | 24,626 | |
| | 1,100 | | | Morguard Corp. | | | 79,468 | |
| | 72,866 | | | Morguard North American Residential
Real Estate Investment Trust REIT | | | 755,295 | |
| | 10,000 | | | Morguard Real Estate Investment Trust REIT | | | 31,599 | |
| | 444,292 | | | Mullen Group Ltd. | | | 2,987,958 | |
| | 5,800 | | | Neo Performance Materials, Inc. | | | 50,673 | |
| | 48,550 | | | Nexus Real Estate Investment Trust REIT - Units | | | 58,670 | |
| | 6,300 | | | North West Co., Inc. (The) | | | 155,337 | |
| | 7,869 | | | Open Text Corp. | | | 289,115 | |
| | 26,000 | | | Pizza Pizza Royalty Corp. | | | 162,366 | |
| | 13,208 | | | Polaris Infrastructure, Inc. | | | 125,904 | |
| | 92,500 | | | Precision Drilling Corp.(a) | | | 64,569 | |
| | 53,600 | | | Quebecor, Inc. - Class B | | | 1,243,546 | |
| | 375,124 | | | Real Matters, Inc.(a) | | | 6,551,929 | |
| | 4,279 | | | Richards Packaging Income Fund - Units | | | 265,482 | |
| | 18,800 | | | Richelieu Hardware Ltd. | | | 505,454 | |
| | 175,000 | | | Ritchie Bros Auctioneers, Inc. | | | 10,610,250 | |
| | 91,300 | | | Roxgold, Inc.(a) | | | 118,554 | |
| Old Westbury Funds, Inc. | |
| Small & Mid Cap Strategies Fund | |
| Portfolio of Investments - (Continued) | October 31, 2020 |
| | |
| Shares | | | | | Value | |
| CANADA (continued) | | | | |
| | 31,300 | | | Russel Metals, Inc. | | $ | 416,535 | |
| | 15,600 | | | Stantec, Inc. | | | 447,989 | |
| | 36,100 | | | Stelco Holdings, Inc. | | | 394,518 | |
| | 34,000 | | | Stella-Jones, Inc. | | | 1,106,538 | |
| | 178,019 | | | Transcontinental, Inc. - Class A | | | 2,108,489 | |
| | 26,900 | | | Tricon Residential, Inc. | | | 220,886 | |
| | 19,236 | | | Uni-Select, Inc. | | | 87,929 | |
| | 29,500 | | | Wajax Corp. | | | 276,998 | |
| | 23,200 | | | West Fraser Timber Co. Ltd. | | | 1,075,980 | |
| | 136,000 | | | Western Forest Products, Inc. | | | 87,788 | |
| | 17,334 | | | Winpak Ltd. | | | 535,516 | |
| | | | | | | | 155,762,257 | |
| CHINA — 3.7% | | | | |
| | 11,228,000 | | | Agricultural Bank of China Ltd. - H Shares | | | 3,794,564 | |
| | 11,452,000 | | | Aluminum Corp. of China Ltd. - H Shares(a) | | 2,496,470 | |
| | 10,480,770 | | | Bank of China Ltd. - H Shares | | | 3,312,207 | |
| | 5,896,000 | | | Bank of Communications Co. Ltd. - H Shares | | | 2,897,615 | |
| | 290,195 | | | Baozun, Inc. - ADR(a) | | | 10,618,235 | |
| | 1,719,800 | | | Beibuwan Port Co. Ltd. | | | 2,568,226 | |
| | 4,297,800 | | | Beijing Yanjing Brewery Co. Ltd. | | | 5,583,684 | |
| | 1,751,000 | | | Better Life Commercial Chain Share Co. Ltd. | | | 2,946,900 | |
| | 70,000 | | | China Animal Healthcare Ltd.(a)(b) | | | 847 | |
| | 5,394,044 | | | China Construction Bank Corp. - H Shares | | | 3,722,430 | |
| | 6,820,000 | | | China Galaxy Securities Co. Ltd. - H Shares | | | 3,729,997 | |
| | 79,500 | | | China Huiyuan Juice Group Ltd.(a)(b) | | | 3,595 | |
| | 217,915 | | | China Lesso Group Holdings Ltd. | | | 351,925 | |
| | 4,603,800 | | | China Minsheng Banking Corp. Ltd. - H Shares | | | 2,517,912 | |
| | 3,213,000 | | | China Railway Construction Corp. Ltd. - H Shares | | | 2,171,702 | |
| | 5,998,000 | | | China Railway Group Ltd. - H Shares | | | 2,754,322 | |
| | 2,603,300 | | | China Railway Tielong Container Logistics Co. Ltd. | | | 1,939,904 | |
| | 7,152,000 | | | China Telecom Corp. Ltd. - H Shares | | | 2,251,000 | |
| | 2,911,295 | | | Chongqing Changan Automobile Co. Ltd.(a) | | | 7,182,103 | |
| | 496,000 | | | Chongqing Department Store Co. Ltd. | | | 2,673,894 | |
| | 6,384,000 | | | CSG Holding Co. Ltd. | | | 5,672,379 | |
| | 302,000 | | | CT Environmental Group Ltd.(a)(b) | | | 2,485 | |
| | 4,043,700 | | | Daqin Railway Co. Ltd. | | | 3,870,725 | |
| | 3,501,600 | | | Dongfang Electric Corp. Ltd. | | | 2,439,038 | |
| | 2,474,205 | | | FAW Jiefang Group Co. Ltd.(a) | | | 4,570,469 | |
| | 783,600 | | | Fujian Star-net Communication Co. Ltd. | | | 2,806,073 | |
| | 3,757,000 | | | Greentown China Holdings Ltd. | | | 6,077,108 | |
| | 147,065 | | | Guangdong Investment Ltd. | | | 217,776 | |
| Shares | | | | | Value | |
| CHINA (continued) | | | | |
| | 3,325,700 | | | Guangxi Liugong Machinery Co. Ltd. | | $ | 3,496,319 | |
| | 3,258,400 | | | Guangzhou R&F Properties Co. Ltd. - H Shares | | | 4,127,377 | |
| | 63,000 | | | Harmonicare Medical Holdings Ltd.(a)(b)(c) | | 16,578 | |
| | 68,000 | | | HOSA International Ltd.(a)(b) | | | 477 | |
| | 106,937 | | | I-Mab - ADR(a) | | | 4,402,596 | |
| | 6,511,000 | | | Industrial & Commercial Bank of China Ltd. - H Shares | | | 3,661,781 | |
| | 155,150 | | | JD.com, Inc. - ADR(a) | | | 12,647,828 | |
| | 3,541,938 | | | Jiangxi Copper Co. Ltd. - H Shares | | | 4,212,405 | |
| | 7,489,000 | | | Kingdee International Software Group Co. Ltd. | | | 19,658,323 | |
| | 2,293,400 | | | MLS Co. Ltd. | | | 4,161,132 | |
| | 291,869 | | | OneConnect Financial Technology Co. Ltd. - ADR(a) | | | 5,878,242 | |
| | 5,511,600 | | | ORG Technology Co. Ltd. | | | 4,633,844 | |
| | 9,445,715 | | | People’s Insurance Co. Group of China Ltd. (The) - H Shares | | | 2,802,340 | |
| | 67,000 | | | Real Gold Mining Ltd.(a)(b) | | | 2,273 | |
| | 12,066,000 | | | Shandong Nanshan Aluminum Co. Ltd. | | | 4,234,348 | |
| | 1,698,000 | | | Shenzhen Laibao Hi-tech Co. Ltd. | | | 3,068,163 | |
| | 5,233,500 | | | Sino-Ocean Group Holding Ltd. | | | 999,107 | |
| | 255,000 | | | Tenwow International Holdings Ltd.(a)(b) | | | 12,499 | |
| | 1,856,367 | | | Tongkun Group Co. Ltd. | | | 4,194,287 | |
| | 15,813,400 | | | Tongling Nonferrous Metals Group Co. Ltd. | | | 5,124,369 | |
| | 1,655,200 | | | UBS Beijing Hualian Hypermarket Co. Ltd. - A Shares(a) | | | 1,062,258 | |
| | 8,249,000 | | | UBS Beiqi Foton Motor Co. Ltd.(a) | | | 3,828,938 | |
| | 9,838,200 | | | UBS Rizhao Port Co. Ltd. - A Shares(a) | | | 3,993,916 | |
| | 2,440,400 | | | UBS Shandong Haihua Co. Ltd. - A Shares(a) | | 1,274,792 | |
| | 1,247,300 | | | UBS Triangle Tyre Co. Pnote(a) | | | 3,174,004 | |
| | 2,378,400 | | | UBS Xiamen King Long Motor Group Co. Ltd. - A Shares(a) | | | 2,367,673 | |
| | 3,635,300 | | | Wuxi Taiji Industry Co. Ltd. | | | 5,526,414 | |
| | 3,456,600 | | | Xiaomi Corp. - Class B(a)(c) | | | 9,809,120 | |
| | 1,799,374 | | | Xuji Electric Co. Ltd. | | | 3,786,063 | |
| | 104,500 | | | Youyuan International Holdings Ltd.(a)(b) | | | 658 | |
| | 4,859,600 | | | Yunnan Aluminium Co. Ltd.(a) | | | 3,984,082 | |
| | 2,740,300 | | | Yunnan Copper Co. Ltd.(a) | | | 5,070,196 | |
| | 284,646 | | | Zai Lab Ltd. - ADR(a) | | | 23,355,204 | |
| | 5,720,800 | | | Zoomlion Heavy Industry Science and Technology Co. Ltd. - H Shares | | | 5,040,060 | |
| | | | | | | | 248,781,251 | |
| DENMARK — 1.4% | | | | |
| | 31,872 | | | ALK-Abello A/S(a) | | | 10,630,648 | |
| Old Westbury Funds, Inc. | |
| Small & Mid Cap Strategies Fund | |
| Portfolio of Investments - (Continued) | October 31, 2020 |
| | |
| Shares | | | | | Value | |
| DENMARK (continued) | | | | |
| | 232,695 | | | Ambu A/S - Class B | | $ | 7,053,294 | |
| | 27,645 | | | Bang & Olufsen A/S(a) | | | 77,070 | |
| | 545 | | | Brodrene A&O Johansen A/S - Preference Shares | | | 48,259 | |
| | 33,502 | | | Carlsberg A/S - Class B | | | 4,240,162 | |
| | 65,795 | | | D/S Norden A/S | | | 931,547 | |
| | 64,077 | | | DSV PANALPINA A/S | | | 10,375,422 | |
| | 104,198 | | | FLSmidth & Co. A/S(a) | | | 2,657,929 | |
| | 75,828 | | | Genmab A/S(a) | | | 25,256,228 | |
| | 234,295 | | | GN Store Nord A/S | | | 16,850,033 | |
| | 22,477 | | | H+H International A/S - Class B(a) | | | 434,630 | |
| | 165,902 | | | Matas A/S(a) | | | 1,853,161 | |
| | 20,159 | | | Napatech A/S(a) | | | 23,228 | |
| | 16,317 | | | Nilfisk Holding A/S(a) | | | 223,874 | |
| | 4,279 | | | North Media AS | | | 42,978 | |
| | 4,888 | | | Per Aarsleff Holding A/S | | | 186,971 | |
| | 8,953 | | | Rockwool International A/S - B Shares | | | 3,498,841 | |
| | 574 | | | RTX A/S | | | 18,409 | |
| | 6,861 | | | Schouw & Co. A/S | | | 596,795 | |
| | 31,331 | | | SimCorp A/S | | | 3,735,016 | |
| | 67,873 | | | Spar Nord Bank A/S(a) | | | 584,014 | |
| | 30,532 | | | Vestas Wind Systems A/S | | | 5,211,266 | |
| | 8,340 | | | Vestjysk Bank A/S(a) | | | 3,601 | |
| | | | | | | | 94,533,376 | |
| FINLAND — 0.7% | | | | |
| | 2,247 | | | Aktia Bank Oyj(a) | | | 23,212 | |
| | 7,013 | | | Altia Oyj | | | 75,633 | |
| | 4,578 | | | Atria Oyj | | | 49,532 | |
| | 62,141 | | | BasWare Oyj(a) | | | 2,685,011 | |
| | 12,798 | | | Bittium Oyj(a) | | | 88,238 | |
| | 12,549 | | | Cargotec Oyj - B Shares | | | 430,854 | |
| | 36,495 | | | Caverion Oyj(a) | | | 239,296 | |
| | 2,662 | | | Elisa Oyj | | | 130,956 | |
| | 1,931 | | | eQ Oyj | | | 30,361 | |
| | 10,333 | | | Fiskars Oyj Abp | | | 155,002 | |
| | 16,592 | | | F-Secure Oyj(a) | | | 67,633 | |
| | 14,434 | | | Harvia Oyj | | | 289,981 | |
| | 48,645 | | | HKScan Oyj - A Shares(a) | | | 106,397 | |
| | 35,234 | | | Kamux Corp. | | | 380,806 | |
| | 45,208 | | | Kemira Oyj | | | 558,630 | |
| | 5,286 | | | Kojamo Oyj | | | 108,967 | |
| | 54,145 | | | Konecranes Oyj | | | 1,702,613 | |
| | 20,870 | | | Lassila & Tikanoja Oyj | | | 315,980 | |
| | 72,487 | | | Metsa Board Oyj | | | 608,258 | |
| | 696 | | | Olvi Oyj - A Shares | | | 36,396 | |
| | 56,281 | | | Oriola Oyj - Class B | | | 118,641 | |
| | 78,729 | | | Orion Oyj - Class B | | | 3,369,660 | |
| | 2,441,797 | | | Outotec Oyj | | | 17,190,947 | |
| | 23,612 | | | QT Group Oyj(a) | | | 1,141,234 | |
| | 19,754 | | | Raisio Oyj - V Shares | | | 70,170 | |
| | 1,052 | | | Remedy Entertainment Oyj | | | 42,882 | |
| | 46,834 | | | Revenio Group Oyj | | | 1,917,258 | |
| Shares | | | | | Value | |
| FINLAND (continued) | | | | |
| | 69,355 | | | Sanoma Oyj | | $ | 1,020,984 | |
| | 4,399 | | | Suominen Oyj | | | 24,797 | |
| | 18,150 | | | Tikkurila Oyj | | | 290,441 | |
| | 3,578 | | | Titanium Oyj | | | 46,255 | |
| | 100,278 | | | Tokmanni Group Corp. | | | 1,595,329 | |
| | 72,779 | | | Uponor Oyj | | | 1,357,884 | |
| | 187,722 | | | Vaisala Oyj - A Shares | | | 7,816,011 | |
| | 169,599 | | | Valmet Oyj | | | 4,045,267 | |
| | 7,589 | | | Verkkokauppa.com Oyj | | | 44,192 | |
| | 59,819 | | | YIT Oyj | | | 315,735 | |
| | | | | | | | 48,491,443 | |
| FRANCE — 0.6% | | | | |
| | 2,335 | | | AKWEL | | | 42,151 | |
| | 109,840 | | | Atos SE(a) | | | 7,496,388 | |
| | 2,144 | | | Bigben Interactive(a) | | | 35,158 | |
| | 369 | | | Boiron SA | | | 16,503 | |
| | 641 | | | Cegedim SA(a) | | | 16,648 | |
| | 402,461 | | | Cellectis SA(a) | | | 6,412,152 | |
| | 5,751 | | | Chargeurs SA | | | 111,721 | |
| | 7,085 | | | Coface SA(a) | | | 55,285 | |
| | 236,572 | | | Derichebourg SA | | | 693,766 | |
| | 6,116 | | | Ekinops SAS(a) | | | 41,812 | |
| | 3,886 | | | Eurobio Scientific SA(a) | | | 71,960 | |
| | 630 | | | Exel Industries - A Shares(a) | | | 28,689 | |
| | 6,465 | | | Fnac Darty SA(a) | | | 277,686 | |
| | 734 | | | FOCUS HOME INTERACTIVE SA(a) | | | 35,904 | |
| | 1,062 | | | Groupe Guillin | | | 25,356 | |
| | 5,483 | | | Guerbet | | | 185,187 | |
| | 658 | | | Infotel SA | | | 27,741 | |
| | 3,913 | | | Ipsen SA | | | 356,150 | |
| | 12,723 | | | IPSOS | | | 312,655 | |
| | 9,310 | | | Korian SA(a) | | | 262,180 | |
| | 320,412 | | | Lectra | | | 7,366,308 | |
| | 3,709 | | | LNA Sante SA | | | 191,361 | |
| | 10,806 | | | Mercialys SA REIT | | | 51,725 | |
| | 19,885 | | | Mersen SA(a) | | | 515,287 | |
| | 18,225 | | | Metropole Television SA(a) | | | 200,158 | |
| | 37,155 | | | Nexans SA(a) | | | 1,801,864 | |
| | 21,970 | | | Nexity SA | | | 616,653 | |
| | 34,891 | | | Quadient | | | 454,713 | |
| | 405,604 | | | Rexel SA(a) | | | 4,264,693 | |
| | 10,443 | | | Rothschild & Co.(a) | | | 268,789 | |
| | 865 | | | Seche Environnement SA | | | 34,907 | |
| | 4,871 | | | Societe BIC SA | | | 233,160 | |
| | 1,862 | | | Somfy SA | | | 259,361 | |
| | 6,666 | | | Sopra Steria Group(a) | | | 791,880 | |
| | 900 | | | Synergie SA(a) | | | 26,729 | |
| | 14,337 | | | Tarkett SA(a) | | | 173,654 | |
| | 166,446 | | | Television Francaise 1(a) | | | 977,007 | |
| | 5,012 | | | Trigano SA | | | 666,025 | |
| | 133,015 | | | Valneva SE(a) | | | 943,435 | |
| Old Westbury Funds, Inc. | |
| Small & Mid Cap Strategies Fund | |
| Portfolio of Investments - (Continued) | October 31, 2020 |
| | |
| Shares | | | | | Value | |
| FRANCE (continued) | | | | |
| | 7,245 | | | Virbac SA(a) | | $ | 1,685,885 | |
| | | | | | | | 38,028,686 | |
| GERMANY — 1.8% | | | | |
| | 65,518 | | | ADVA Optical Networking SE(a) | | | 502,852 | |
| | 1,049,990 | | | AIXTRON SE(a) | | | 11,830,012 | |
| | 487,919 | | | alstria office AG REIT | | | 6,211,004 | |
| | 3,856 | | | Atoss Software AG | | | 538,905 | |
| | 5,042 | | | Basler AG | | | 300,654 | |
| | 9,584 | | | Bauer AG(a) | | | 100,458 | |
| | 979 | | | Bertrandt AG | | | 33,579 | |
| | 32,547 | | | Carl Zeiss Meditec AG | | | 4,203,746 | |
| | 100,948 | | | CECONOMY AG(a) | | | 446,526 | |
| | 9,690 | | | CENTROTEC Sustainable AG(a) | | | 178,310 | |
| | 267 | | | Cewe Stiftung & Co. KGAA | | | 25,437 | |
| | 8,519 | | | CropEnergies AG | | | 115,686 | |
| | 110,304 | | | Deutsche EuroShop AG(a) | | | 1,392,562 | |
| | 153,543 | | | Deutz AG(a) | | | 788,253 | |
| | 18,591 | | | Draegerwerk AG & Co. KGaA - Preference Shares | | | 1,493,983 | |
| | 19,565 | | | Duerr AG | | | 561,910 | |
| | 5,730 | | | Elmos Semiconductor AG | | | 126,662 | |
| | 82,521 | | | Freenet AG | | | 1,461,318 | |
| | 34,319 | | | Gerresheimer AG | | | 3,449,367 | |
| | 32,763 | | | GFT Technologies SE | | | 351,429 | |
| | 178,250 | | | Hamburger Hafen und Logistik AG | | | 2,985,261 | |
| | 174,692 | | | HelloFresh SE(a) | | | 9,342,623 | |
| | 2,258 | | | Home24 SE(a) | | | 43,086 | |
| | 13,241 | | | Hornbach Baumarkt AG | | | 522,775 | |
| | 4,645 | | | Hornbach Holding AG & Co. KGaA | | | 447,389 | |
| | 11,411 | | | Hypoport SE(a) | | | 5,973,754 | |
| | 34,040 | | | Jungheinrich AG - Preference Shares | | | 1,236,910 | |
| | 20,999 | | | K+S AG | | | 140,673 | |
| | 58,934 | | | KION Group AG | | | 4,587,714 | |
| | 31,497 | | | Kloeckner & Co. SE(a) | | | 177,178 | |
| | 26,023 | | | Krones AG | | | 1,485,678 | |
| | 239 | | | KSB SE & Co. KGaA - Preference Shares | | | 49,546 | |
| | 694 | | | Leifheit AG | | | 27,319 | |
| | 648 | | | MBB SE | | | 53,885 | |
| | 2,685 | | | Mensch und Maschine Software SE | | | 159,481 | |
| | 312,205 | | | MorphoSys AG(a) | | | 31,837,543 | |
| | 8,031 | | | New Work SE | | | 2,090,456 | |
| | 3,883 | | | Norma Group SE | | | 120,475 | |
| | 99 | | | Paul Hartmann AG | | | 38,049 | |
| | 69,077 | | | ProSiebenSat.1 Media SE(a) | | | 770,713 | |
| | 53,442 | | | SAF-Holland SE(a) | | | 453,737 | |
| | 1,486 | | | Salzgitter AG(a) | | | 21,633 | |
| | 26,331 | | | Schaeffler AG - Preference Shares | | | 160,231 | |
| | 438,227 | | | Sirius Real Estate Ltd. | | | 417,278 | |
| | 35,891 | | | Software AG | | | 1,285,778 | |
| | 2,388 | | | STO SE & Co. KGaA - Preference Shares | | | 298,698 | |
| Shares | | | | | Value | |
| GERMANY (continued) | | | | |
| | 59,837 | | | Symrise AG | | $ | 7,376,572 | |
| | 470,413 | | | TAG Immobilien AG | | | 13,860,975 | |
| | 43,925 | | | Takkt AG(a) | | | 465,529 | |
| | 29,615 | | | Telefonica Deutschland Holding AG | | | 74,742 | |
| | 751 | | | Traffic Systems SE | | | 22,741 | |
| | 1,269 | | | Villeroy & Boch AG - Preference Shares | | | 18,326 | |
| | 7,765 | | | Wacker Chemie AG | | | 748,981 | |
| | 18,541 | | | Wacker Neuson SE(a) | | | 340,749 | |
| | 10,337 | | | Westwing Group AG(a) | | | 317,106 | |
| | 19,733 | | | Wuestenrot & Wuerttembergische AG | | | 328,642 | |
| | 6,272 | | | zooplus AG(a) | | | 1,008,043 | |
| | | | | | | | 123,402,922 | |
| GREECE — 0.1% | | | | |
| | 96 | | | Alapis Holding Industrial and Commercial SA of Pharmaceutical Chemical Products(a)(b) | | | 0 | |
| | 2,274,929 | | | Alpha Bank AE(a) | | | 1,147,228 | |
| | 3,407,374 | | | Eurobank Ergasias SA(a) | | | 1,129,799 | |
| | 939,392 | | | National Bank of Greece SA(a) | | | 980,933 | |
| | 367,190 | | | OPAP SA | | | 2,961,451 | |
| | 31,091 | | | TT Hellenic Postbank SA(a)(b) | | | 0 | |
| | | | | | | | 6,219,411 | |
| HONG KONG — 0.5% | | | | |
| | 210,000 | | | Analogue Holdings Ltd. | | | 30,610 | |
| | 367,795 | | | APT Satellite Holdings Ltd. | | | 90,614 | |
| | 504,000 | | | Bel Global Resources Holdings Ltd.(a)(b) | | | 0 | |
| | 289,000 | | | Brightoil Petroleum Holdings Ltd.(a)(b) | | | 10,486 | |
| | 332,173 | | | Build King Holdings Ltd. | | | 34,278 | |
| | 28,000 | | | Camsing International Holding Ltd.(a)(b) | | | 786 | |
| | 4,994,704 | | | Champion REIT | | | 2,416,013 | |
| | 56,000 | | | Cheuk Nang Holdings Ltd. | | | 20,948 | |
| | 525,600 | | | China Fiber Optic Network System Group Ltd.(a)(b) | | | 3,559 | |
| | 6,603,000 | | | China High Precision Automation Group Ltd.(a)(b) | | | 0 | |
| | 54,000 | | | China State Construction Development Holdings Ltd.(a) | | | 3,831 | |
| | 3,158,000 | | | China Unicom Hong Kong Ltd. | | | 1,938,998 | |
| | 752,412 | | | Chow Sang Sang Holdings International Ltd. | | | 822,048 | |
| | 2,657,000 | | | CITIC Telecom International Holdings Ltd. | | | 843,111 | |
| | 2,632,711 | | | COSCO SHIPPING Ports Ltd. | | | 1,538,366 | |
| | 3,897,454 | | | Cowell e Holdings, Inc. | | | 1,709,299 | |
| | 232,099 | | | Dah Sing Financial Holdings Ltd. | | | 577,216 | |
| Old Westbury Funds, Inc. | |
| Small & Mid Cap Strategies Fund | |
| Portfolio of Investments - (Continued) | October 31, 2020 |
| | |
| Shares | | | | | Value | |
| HONG KONG (continued) |
| | 244,000 | | | DBA Telecommunication Asia Holdings Ltd.(a)(b) | | $ | 11,979 | |
| | 2,900,000 | | | Emperor Watch & Jewellery Ltd.(a) | | | 34,041 | |
| | 256,000 | | | First Pacific Co. Ltd. | | | 79,252 | |
| | 722,000 | | | Giordano International Ltd. | | | 114,551 | |
| | 7,050,000 | | | G-Resources Group Ltd.(a) | | | 32,738 | |
| | 420,385 | | | HKR International Ltd. | | | 159,424 | |
| | 166,000 | | | Hsin Chong Group Holdings Ltd.(a)(b) | | | 1,405 | |
| | 220,000 | | | Hua Han Health Industry Holdings Ltd.(a)(b) | | | 2,821 | |
| | 480,000 | | | Hutchison Telecommunications Hong Kong Holdings Ltd. | | | 71,822 | |
| | 363,000 | | | Hysan Development Co. Ltd. | | | 1,154,202 | |
| | 504,000 | | | International Housewares Retail Co. Ltd. | | | 132,623 | |
| | 135,418 | | | IT Ltd.(a) | | | 18,690 | |
| | 246,000 | | | Jacobson Pharma Corp. Ltd. | | | 36,174 | |
| | 600,937 | | | Johnson Electric Holdings Ltd. | | | 1,241,794 | |
| | 100,500 | | | Kerry Properties Ltd. | | | 245,789 | |
| | 48,900 | | | Lai Sun Development Co. Ltd. | | | 42,261 | |
| | 16,000 | | | Lai Sun Garment International Ltd. | | | 14,447 | |
| | 59,774 | | | Liu Chong Hing Investment Ltd. | | | 47,958 | |
| | 136,000 | | | Luk Fook Holdings International Ltd. | | | 332,259 | |
| | 429,000 | | | Mingfa Group International Co. Ltd.(a)(b) | | | 3,116 | |
| | 114,000 | | | Modern Dental Group Ltd. | | | 19,263 | |
| | 3,507,000 | | | Nine Dragons Paper Holdings Ltd. | | | 4,659,413 | |
| | 44,788 | | | Oriental Watch Holdings | | | 14,039 | |
| | 2,063,274 | | | Perfect Shape Medical Ltd. | | | 739,878 | |
| | 5,997,000 | | | Poly Property Group Co. Ltd. | | | 1,725,032 | |
| | 935,000 | | | Polytec Asset Holdings Ltd. | | | 78,394 | |
| | 304,000 | | | Prosperity REIT | | | 86,269 | |
| | 313,560 | | | Sino Biopharmaceutical Ltd. | | | 316,290 | |
| | 200,000 | | | SOCAM Development Ltd.(a) | | | 31,474 | |
| | 476,230 | | | Stella International Holdings Ltd. | | | 487,134 | |
| | 3,590,000 | | | Sun Art Retail Group Ltd. | | | 3,880,581 | |
| | 161,156 | | | Sun Hung Kai & Co. Ltd. | | | 62,571 | |
| | 987,000 | | | Sunlight Real Estate Investment Trust REIT | | | 425,228 | |
| | 966,177 | | | Tai Hing Group Holdings Ltd. | | | 171,986 | |
| | 124,000 | | | Tang Palace China Holdings Ltd. | | | 11,196 | |
| | 1,118,564 | | | Texwinca Holdings Ltd. | | | 168,813 | |
| | 1,464,000 | | | Time Interconnect Technology Ltd. | | | 64,206 | |
| | 497,600 | | | Tsit Wing International Holdings Ltd. | | | 68,037 | |
| | 4,434,000 | | | United Laboratories International Holdings Ltd. (The) | | | 3,797,712 | |
| | 44,000 | | | Up Energy Development Group Ltd.(a)(b) | | | 137 | |
| | 1,101,300 | | | Valuetronics Holdings Ltd. | | | 451,501 | |
| | 545,841 | | | Vincent Medical Holdings Ltd. | | | 128,143 | |
| | 442,000 | | | VSTECS Holdings Ltd. | | | 276,517 | |
| | 34,166 | | | VTech Holdings Ltd. | | | 226,745 | |
| Shares | | | | | Value | |
| HONG KONG (continued) |
| | 186,000 | | | Wai Kee Holdings Ltd. | | $ | 88,771 | |
| | 24,209,667 | | | Wang On Group Ltd. | | | 159,264 | |
| | 8,676,000 | | | Wang On Properties Ltd. | | | 105,198 | |
| | 658,617 | | | Yue Yuen Industrial Holdings Ltd. | | | 1,072,138 | |
| | 241,010 | | | Yuexiu Transport Infrastructure Ltd. | | | 133,989 | |
| | | | | | | | 33,267,428 | |
| HUNGARY — 0.0% |
| | 13,099 | | | Richter Gedeon Nyrt | | | 267,196 | |
| ICELAND — 0.1% |
| | 852,806 | | | Ossur HF | | | 5,603,544 | |
| INDIA — 0.4% |
| | 2,190,500 | | | Bharat Heavy Electricals Ltd. | | | 827,636 | |
| | 56,756 | | | Chennai Super Kings Cricket Ltd.(a) (b) | | | 323 | |
| | 1,759,740 | | | DLF Ltd. | | | 3,758,956 | |
| | 2,015 | | | Dr Reddy’s Laboratories Ltd. | | | 132,923 | |
| | 770 | | | Greenlam Industries Ltd. | | | 8,036 | |
| | 2,835 | | | Hemisphere Properties India Ltd.(a) | | | 2,594 | |
| | 89,379 | | | IndiaMart InterMesh Ltd.(c) | | | 5,844,626 | |
| | 222,645 | | | Lupin Ltd. | | | 2,731,707 | |
| | 1,246,624 | | | State Bank of India(a) | | | 3,183,532 | |
| | 3,811,824 | | | Steel Authority of India Ltd.(a) | | | 1,766,841 | |
| | 2,952,481 | | | TV18 Broadcast Ltd.(a) | | | 1,145,415 | |
| | 125,990 | | | WNS Holdings Ltd. - ADR(a) | | | 7,262,064 | |
| | | | | | | | 26,664,653 | |
| INDONESIA — 0.0% |
| | 28,100 | | | Asahimas Flat Glass Tbk PT(a) | | | 4,592 | |
| | 9,876,000 | | | Bakrie Telecom Tbk PT(a)(b) | | | 6,331 | |
| | 2,616,900 | | | Hanson International Tbk PT(a)(b) | | | 3,355 | |
| | 22,129,300 | | | Perusahaan Gas Negara Tbk PT | | | 1,626,598 | |
| | 995,300 | | | Rimo International Lestari Tbk PT(a) (b) | | | 1,276 | |
| | 117,500 | | | Sinar Mas Agro Resources & Technology Tbk PT(a) | | | 24,103 | |
| | 1,313,000 | | | Trada Alam Minera Tbk PT(a)(b) | | | 1,683 | |
| | 4,875,000 | | | Truba Alam Manunggal Engineering PT(a)(b) | | | 0 | |
| | 539,500 | | | Tunas Ridean Tbk PT | | | 47,402 | |
| | | | | | | | 1,715,340 | |
| IRELAND — 0.1% |
| | 268,912 | | | Alkermes Plc(a) | | | 4,369,820 | |
| | 52,828 | | | COSMO Pharmaceuticals NV(a) | | | 4,269,104 | |
| | 2,679 | | | Grafton Group Plc - Units(a) | | | 23,340 | |
| | 270,870 | | | Greencore Group Plc | | | 317,401 | |
| | | | | | | | 8,979,665 | |
| ISRAEL — 2.0% |
| | 3,563 | | | Albaad Massuot Yitzhak Ltd.(a) | | | 78,955 | |
| | 22,841 | | | Ashtrom Properties Ltd. | | | 128,931 | |
| | 6,688 | | | Bayside Land Corp. | | | 46,827 | |
| Old Westbury Funds, Inc. | |
| Small & Mid Cap Strategies Fund | |
| Portfolio of Investments - (Continued) | October 31, 2020 |
| | |
| Shares | | | | | Value | |
| ISRAEL (continued) |
| | 2,733,624 | | | Bezeq The Israeli Telecommunication Corp. Ltd.(a) | | $ | 3,116,542 | |
| | 91,269 | | | Compugen Ltd.(a) | | | 1,176,457 | |
| | 141,895 | | | CyberArk Software Ltd.(a) | | | 14,068,889 | |
| | 8,444 | | | Delta Galil Industries Ltd. | | | 149,500 | |
| | 887 | | | Duniec Brothers Ltd. | | | 23,082 | |
| | 13,458 | | | Electra Consumer Products 1970 Ltd. | | | 370,800 | |
| | 4,084 | | | Hagag Group Real Estate Development(a) | | | 12,113 | |
| | 1,720,956 | | | Industrial Buildings Corp. Ltd. | | | 3,310,723 | |
| | 2,086,546 | | | Isramco Negev 2 LP | | | 377,309 | |
| | 38,365 | | | Kamada Ltd.(a) | | | 275,365 | |
| | 229,218 | | | Kornit Digital Ltd.(a) | | | 15,430,956 | |
| | 868,482 | | | Max Stock Ltd.(a) | | | 3,344,574 | |
| | 195,961 | | | Mizrahi Tefahot Bank Ltd. | | | 3,826,123 | |
| | 13,843 | | | Naphtha Israel Petroleum Corp. Ltd.(a) | | 53,959 | |
| | 1,016 | | | Neto ME Holdings Ltd. | | | 46,452 | |
| | 297,883 | | | Nice Ltd. - ADR(a) | | | 67,994,774 | |
| | 330 | | | Norstar Holdings, Inc. | | | 1,428 | |
| | 201,921 | | | Plus500 Ltd. | | | 3,859,754 | |
| | 389,765 | | | Radware Ltd.(a) | | | 8,769,712 | |
| | 40,320 | | | Rami Levy Chain Stores Hashikma Marketing 2006 Ltd. | | | 2,633,997 | |
| | 12,857 | | | SolarEdge Technologies, Inc.(a) | | | 3,313,120 | |
| | 44,502 | | | Summit Real Estate Holdings Ltd. | | | 389,713 | |
| | 5,402 | | | Tadiran Holdings Ltd. | | | 355,906 | |
| | | | | | | | 133,155,961 | |
| ITALY — 0.7% |
| | 1,156,955 | | | A2A SpA | | | 1,470,734 | |
| | 65,055 | | | ACEA SpA | | | 1,291,053 | |
| | 233,811 | | | Arnoldo Mondadori Editore SpA(a) | | | 301,172 | |
| | 22,967 | | | Avio SpA(a) | | | 325,796 | |
| | 356,806 | | | Azimut Holding SpA | | | 6,023,436 | |
| | 1,266 | | | B&C Speakers SpA(a) | | | 11,678 | |
| | 289,498 | | | Banca Generali SpA(a) | | | 8,226,770 | |
| | 863,000 | | | Banca Mediolanum SpA | | | 5,889,824 | |
| | 22,997 | | | BasicNet SpA | | | 77,136 | |
| | 21,873 | | | Biesse SpA(a) | | | 377,020 | |
| | 62,896 | | | Buzzi Unicem SpA | | | 1,360,648 | |
| | 43,975 | | | Cairo Communication SpA(a) | | | 51,830 | |
| | 18,956 | | | Cementir Holding NV | | | 120,761 | |
| | 75,558 | | | Cerved Group SpA(a) | | | 533,270 | |
| | 5,959 | | | CIR SpA-Compagnie Industriali(a) | | | 2,596 | |
| | 102,893 | | | Credito Emiliano SpA(a) | | | 404,439 | |
| | 13,708 | | | Danieli & C Officine Meccaniche SpA | | | 123,888 | |
| | 4,462 | | | Datalogic SpA | | | 51,395 | |
| | 618,571 | | | Davide Campari-Milano NV | | | 6,457,811 | |
| | 54,488 | | | De’ Longhi SpA(a) | | | 1,742,591 | |
| | 32,494 | | | DeA Capital SpA | | | 37,995 | |
| | 57,108 | | | Digital Bros SpA(a) | | | 1,113,388 | |
| | 724 | | | Digital Value SpA(a) | | | 26,139 | |
| Shares | | | | | Value | |
| ITALY (continued) |
| | 5,216 | | | El.En. SpA(a) | | $ | 114,085 | |
| | 46,369 | | | Elica SpA(a) | | | 137,709 | |
| | 56,697 | | | Esprinet SpA(a) | | | 481,373 | |
| | 5,477 | | | Fine Foods & Pharmaceuticals NTM | | | 61,874 | |
| | 94,858 | | | FNM SpA(a) | | | 50,819 | |
| | 6,046 | | | Gruppo MutuiOnline SpA | | | 152,447 | |
| | 630,138 | | | Hera SpA | | | 1,981,497 | |
| | 12,000 | | | Iervolino Entertainment SpA(a) | | | 39,412 | |
| | 54,202 | | | Immobiliare Grande Distribuzione SIIQ SpA REIT | | | 157,500 | |
| | 229,239 | | | Iren SpA | | | 520,882 | |
| | 5,614 | | | Italmobiliare SpA | | | 181,438 | |
| | 3,232 | | | La Doria SpA | | | 47,428 | |
| | 2,236 | | | Pharmanutra SpA | | | 69,531 | |
| | 76,341 | | | Reno de Medici SpA | | | 82,331 | |
| | 4,880 | | | Sanlorenzo SpA(a) | | | 86,389 | |
| | 14,629 | | | Sesa SpA(a) | | | 1,371,527 | |
| | 43,445 | | | Sogefi SpA(a) | | | 44,678 | |
| | 1,284 | | | Tinexta SpA(a) | | | 27,605 | |
| | 6,610 | | | Uni Land SpA(a)(b) | | | 0 | |
| | 1,886,352 | | | Unipol Gruppo SpA(a) | | | 6,872,004 | |
| | | | | | | | 48,501,899 | |
| JAPAN — 7.1% |
| | 121,800 | | | 77 Bank Ltd. (The) | | | 1,690,390 | |
| | 4,500 | | | A&A Material Corp. | | | 45,131 | |
| | 90,000 | | | A&D Co. Ltd. | | | 528,679 | |
| | 2,400 | | | Abist Co. Ltd. | | | 60,908 | |
| | 111,285 | | | Adastria Co. Ltd. | | | 1,919,678 | |
| | 6,800 | | | Advantage Risk Management Co. Ltd. | | | 42,608 | �� |
| | 121,800 | | | AEON Financial Service Co. Ltd. | | | 1,236,672 | |
| | 19,600 | | | Ahresty Corp.(a) | | | 56,163 | |
| | 6,600 | | | Aiphone Co. Ltd. | | | 92,039 | |
| | 11,000 | | | Aisan Industry Co. Ltd. | | | 46,650 | |
| | 4,200 | | | Akatsuki, Inc. | | | 185,940 | |
| | 5,400 | | | Akita Bank Ltd. (The) | | | 72,880 | |
| | 6,200 | | | All About, Inc. | | | 51,817 | |
| | 9,600 | | | Alpen Co. Ltd. | | | 185,132 | |
| | 98,892 | | | Altech Corp. | | | 1,817,357 | |
| | 8,900 | | | Anabuki Kosan, Inc. | | | 134,909 | |
| | 22,200 | | | Anest Iwata Corp. | | | 176,845 | |
| | 82,700 | | | AOI TYO Holdings, Inc. | | | 316,755 | |
| | 2,600 | | | Applied Co. Ltd. | | | 101,944 | |
| | 12,300 | | | Arata Corp. | | | 597,994 | |
| | 13,900 | | | Argo Graphics, Inc. | | | 428,172 | |
| | 97,200 | | | Asahi Co. Ltd. | | | 1,599,652 | |
| | 103,500 | | | Asahi Diamond Industrial Co. Ltd. | | | 472,544 | |
| | 699 | | | Asahi Kogyosha Co. Ltd. | | | 18,701 | |
| | 37,600 | | | Asahi Net, Inc. | | | 337,590 | |
| | 8,500 | | | ASAHI YUKIZAI CORP. | | | 109,604 | |
| | 70,100 | | | Asia Pile Holdings Corp. | | | 303,982 | |
| | 7,600 | | | ASKA Pharmaceutical Co. Ltd. | | | 95,095 | |
| | 22,600 | | | ASKUL Corp. | | | 861,302 | |
| Old Westbury Funds, Inc. | |
| Small & Mid Cap Strategies Fund | |
| Portfolio of Investments - (Continued) | October 31, 2020 |
| | |
| Shares | | | | | Value | |
| JAPAN (continued) |
| | 47,604 | | | Ateam, Inc. | | $ | 380,577 | |
| | 50,896 | | | Avant Corp. | | | 528,916 | |
| | 122,100 | | | Avex, Inc. | | | 1,174,409 | |
| | 421,600 | | | Azbil Corp. | | | 17,013,802 | |
| | 4,800 | | | Bando Chemical Industries Ltd. | | | 26,087 | |
| | 5,500 | | | Bank of Saga Ltd. (The) | | | 67,401 | |
| | 4,500 | | | BayCurrent Consulting, Inc. | | | 580,687 | |
| | 21,600 | | | Beenos, Inc. | | | 331,133 | |
| | 22,800 | | | BeNEXT Group, Inc. | | | 212,549 | |
| | 58,500 | | | BML, Inc. | | | 1,636,067 | |
| | 17,700 | | | Brother Industries Ltd. | | | 271,514 | |
| | 258,300 | | | Bunka Shutter Co. Ltd. | | | 2,023,077 | |
| | 2,200 | | | Business Brain Showa-Ota, Inc. | | | 34,042 | |
| | 624 | | | Business Engineering Corp. | | | 22,380 | |
| | 4,200 | | | CAC Holdings Corp. | | | 52,392 | |
| | 1,700 | | | Canare Electric Co. Ltd. | | | 27,572 | |
| | 229,800 | | | Capcom Co. Ltd. | | | 12,620,947 | |
| | 2,600 | | | Career Design Center Co. Ltd. | | | 24,238 | |
| | 196,100 | | | Chiba Kogyo Bank Ltd. (The) | | | 425,185 | |
| | 1,800 | | | Chino Corp. | | | 23,382 | |
| | 274,300 | | | Citizen Watch Co. Ltd. | | | 723,118 | |
| | 278,280 | | | CKD Corp. | | | 4,585,061 | |
| | 9,300 | | | CMK Corp. | | | 41,395 | |
| | 41,400 | | | COLOPL, Inc.(a) | | | 357,868 | |
| | 190,200 | | | Computer Engineering & Consulting Ltd. | | | 2,697,808 | |
| | 35,500 | | | CONEXIO Corp. | | | 424,189 | |
| | 68,400 | | | COOKPAD, Inc.(a) | | | 248,917 | |
| | 7,000 | | | Copro-Holdings Co. Ltd. | | | 196,036 | |
| | 3,400 | | | Core Corp. | | | 42,737 | |
| | 3,300 | | | Cosel Co. Ltd. | | | 31,363 | |
| | 4,729 | | | Cota Co. Ltd. | | | 59,217 | |
| | 17,400 | | | Creek & River Co. Ltd. | | | 166,031 | |
| | 6,900 | | | Creo Co. Ltd. | | | 82,646 | |
| | 29,000 | | | Cresco Ltd. | | | 332,948 | |
| | 5,200 | | | CTI Engineering Co. Ltd. | | | 94,518 | |
| | 25,600 | | | Cybernet Systems Co. Ltd. | | | 215,911 | |
| | 188,200 | | | Cybozu, Inc. | | | 5,428,760 | |
| | 12,900 | | | Daihen Corp. | | | 495,941 | |
| | 61,200 | | | Daiken Medical Co. Ltd. | | | 302,800 | |
| | 16,179 | | | Daikoku Denki Co. Ltd. | | | 140,627 | |
| | 28,000 | | | Daito Pharmaceutical Co. Ltd. | | | 1,067,100 | |
| | 38,500 | | | Daitron Co. Ltd. | | | 540,570 | |
| | 119 | | | Daiwa Office Investment Corp. REIT | | | 644,472 | |
| | 7,800 | | | Daiwabo Holdings Co. Ltd. | | | 508,104 | |
| | 302,911 | | | DCM Holdings Co. Ltd. | | | 3,743,893 | |
| | 31,200 | | | DeNA Co. Ltd. | | | 531,349 | |
| | 20,700 | | | Dexerials Corp. | | | 235,283 | |
| | 175,300 | | | Digital Garage, Inc. | | | 6,203,606 | |
| | 17,400 | | | Digital Holdings, Inc. | | | 214,560 | |
| | 180,200 | | | Dip Corp. | | | 3,440,659 | |
| | 1,700 | | | DMS, Inc. | | | 21,596 | |
| | 89,200 | | | Doshisha Co. Ltd. | | | 1,634,133 | |
| Shares | | | | | Value | |
| JAPAN (continued) |
| | 8,400 | | | Drecom Co. Ltd.(a) | | $ | 69,963 | |
| | 116,705 | | | Duskin Co. Ltd. | | | 2,967,369 | |
| | 22,600 | | | Dynam Japan Holdings Co. Ltd. | | | 23,147 | |
| | 1,000 | | | Earth Corp. | | | 63,231 | |
| | 2,900 | | | eBook Initiative Japan Co. Ltd.(a) | | | 77,974 | |
| | 172,800 | | | EDION Corp. | | | 1,695,072 | |
| | 14,600 | | | E-Guardian, Inc.(a) | | | 439,973 | |
| | 1,600 | | | Eizo Corp. | | | 60,289 | |
| | 4,600 | | | Elematec Corp. | | | 41,916 | |
| | 17,700 | | | Enigmo, Inc. | | | 238,378 | |
| | 76,700 | | | EPS Holdings, Inc. | | | 691,578 | |
| | 72,300 | | | eSOL Co. Ltd. | | | 880,486 | |
| | 5,000 | | | Exedy Corp. | | | 62,563 | |
| | 6,800 | | | Faith, Inc. | | | 57,676 | |
| | 309,100 | | | FAN Communications, Inc. | | | 1,378,764 | |
| | 23,800 | | | Fields Corp. | | | 73,654 | |
| | 14,871 | | | First Bank of Toyama Ltd. (The) | | | 39,772 | |
| | 121,500 | | | Foster Electric Co. Ltd. | | | 1,383,333 | |
| | 8,190 | | | FP Corp. | | | 325,816 | |
| | 4,100 | | | France Bed Holdings Co. Ltd. | | | 32,974 | |
| | 63,500 | | | Fuji Soft, Inc. | | | 3,384,402 | |
| | 152,400 | | | Fujikura Ltd. | | | 400,306 | |
| | 3,000 | | | Fujikyu Corp. | | | 26,993 | |
| | 1,900 | | | Fujimi, Inc. | | | 67,329 | |
| | 900 | | | Fujimori Kogyo Co. Ltd. | | | 36,664 | |
| | 30,300 | | | Fujisash Co. Ltd. | | | 23,442 | |
| | 493,900 | | | Fujitec Co. Ltd. | | | 10,704,036 | |
| | 147,457 | | | Fukui Computer Holdings, Inc. | | | 4,485,893 | |
| | 12,600 | | | Full Speed, Inc. | | | 60,175 | |
| | 102,200 | | | FULLCAST Holdings Co. Ltd. | | | 1,508,181 | |
| | 4,100 | | | Funai Electric Co. Ltd.(a) | | | 17,035 | |
| | 111,700 | | | Furuno Electric Co. Ltd. | | | 1,236,547 | |
| | 5,600 | | | Furusato Industries Ltd. | | | 70,659 | |
| | 64,883 | | | Furyu Corp. | | | 776,526 | |
| | 85,300 | | | Future Corp. | | | 1,456,769 | |
| | 68,500 | | | Gakken Holdings Co. Ltd. | | | 919,920 | |
| | 34,600 | | | Gakujo Co. Ltd. | | | 320,239 | |
| | 6,400 | | | Geo Holdings Corp. | | | 94,629 | |
| | 30,600 | | | Glory Ltd. | | | 641,257 | |
| | 35,276 | | | Goldcrest Co. Ltd. | | | 448,805 | |
| | 561,400 | | | Gree, Inc. | | | 2,922,422 | |
| | 34,800 | | | GS Yuasa Corp. | | | 602,298 | |
| | 3,800 | | | GSI Creos Corp. | | | 65,768 | |
| | 38,400 | | | Gumi, Inc. | | | 311,029 | |
| | 199,180 | | | GungHo Online Entertainment, Inc. | | | 4,914,102 | |
| | 31,500 | | | Gunma Bank Ltd. (The) | | | 99,288 | |
| | 28,600 | | | Gunze Ltd. | | | 1,047,624 | |
| | 377,400 | | | Gurunavi, Inc. | | | 2,220,530 | |
| | 7,800 | | | Hagihara Industries, Inc. | | | 110,710 | |
| | 28,100 | | | Hakuhodo DY Holdings, Inc. | | | 356,165 | |
| | 4,600 | | | Hamakyorex Co. Ltd. | | | 129,615 | |
| | 10,800 | | | Hanwa Co. Ltd. | | | 207,964 | |
| | 29,100 | | | Happinet Corp. | | | 387,185 | |
| Old Westbury Funds, Inc. | |
| Small & Mid Cap Strategies Fund | |
| Portfolio of Investments - (Continued) | October 31, 2020 |
| | |
| Shares | | | | | Value | |
| JAPAN (continued) |
| | 18,175 | | | Heiwa Corp. | | $ | 292,689 | |
| | 104,100 | | | Hennge KK(a) | | | 7,556,808 | |
| | 3,200 | | | HI-LEX Corp. | | | 33,713 | |
| | 14,900 | | | Hioki EE Corp. | | | 523,019 | |
| | 4,800 | | | Hirakawa Hewtech Corp. | | | 47,865 | |
| | 153,867 | | | Hirogin Holdings, Inc. | | | 831,833 | |
| | 9,800 | | | Hisamitsu Pharmaceutical Co., Inc. | | | 465,686 | |
| | 281,500 | | | Hitachi Zosen Corp. | | | 1,126,592 | |
| | 32,800 | | | Hochiki Corp. | | | 380,022 | |
| | 34,042 | | | Hokuetsu Industries Co. Ltd. | | | 328,080 | |
| | 238,500 | | | Hokuhoku Financial Group, Inc. | | | 2,246,153 | |
| | 6 | | | Honeys Holdings Co. Ltd. | | | 55 | |
| | 3,100 | | | Hosiden Corp. | | | 27,300 | |
| | 6,386 | | | Hosokawa Micron Corp. | | | 319,010 | |
| | 12,400 | | | ID Holdings Corp. | | | 158,709 | |
| | 34,000 | | | IMAGICA GROUP, Inc. | | | 122,432 | |
| | 2,300 | | | Inaba Seisakusho Co. Ltd. | | | 29,284 | |
| | 72,200 | | | Ines Corp. | | | 1,027,537 | |
| | 41,030 | | | Infocom Corp. | | | 1,485,302 | |
| | 1,867,000 | | | Infomart Corp. | | | 15,407,498 | |
| | 8,800 | | | Information Services International-Dentsu Ltd. | | | 552,233 | |
| | 61,800 | | | Intage Holdings, Inc. | | | 564,904 | |
| | 98,195 | | | Internet Initiative Japan, Inc. | | | 4,394,131 | |
| | 36,100 | | | I-O Data Device, Inc. | | | 346,880 | |
| | 22,600 | | | ISB Corp. | | | 569,668 | |
| | 1,900 | | | Iseki & Co. Ltd. | | | 24,300 | |
| | 13,200 | | | Isolite Insulating Products Co. Ltd. | | | 57,871 | |
| | 55,900 | | | Itoki Corp. | | | 181,537 | |
| | 62,300 | | | Iwaki & Co. Ltd. | | | 300,506 | |
| | 6,300 | | | Iwasaki Electric Co. Ltd. | | | 80,634 | |
| | 8,955 | | | Iwatani Corp. | | | 404,577 | |
| | 35,100 | | | JAC Recruitment Co. Ltd. | | | 419,074 | |
| | 7,300 | | | Jaccs Co. Ltd. | | | 126,553 | |
| | 90,100 | | | Japan Aviation Electronics Industry Ltd. | | | 1,229,790 | |
| | 130 | | | Japan Logistics Fund, Inc. REIT | | | 363,943 | |
| | 11,400 | | | Japan Pulp & Paper Co. Ltd. | | | 396,896 | |
| | 32 | | | Japan Real Estate Investment Corp. REIT | | | 156,493 | |
| | 24,200 | | | Japan System Techniques Co. Ltd. | | | 395,031 | |
| | 40,991 | | | JBCC Holdings, Inc. | | | 591,598 | |
| | 307,800 | | | Jeol Ltd. | | | 9,731,296 | |
| | 20,900 | | | JMS Co. Ltd. | | | 169,683 | |
| | 21,100 | | | Joshin Denki Co. Ltd. | | | 520,371 | |
| | 2,300 | | | Joyful Honda Co. Ltd. | | | 35,633 | |
| | 18,400 | | | JP-Holdings, Inc. | | | 52,373 | |
| | 134,900 | | | Juki Corp. | | | 566,942 | |
| | 43,300 | | | Juroku Bank Ltd. (The) | | | 789,529 | |
| | 58,400 | | | JVCKenwood Corp. | | | 78,651 | |
| | 57,500 | | | Kadokawa Corp. | | | 1,735,517 | |
| | 29,600 | | | Kaga Electronics Co. Ltd. | | | 568,279 | |
| | 121,610 | | | Kaken Pharmaceutical Co. Ltd. | | | 4,768,222 | |
| Shares | | | | | Value | |
| JAPAN (continued) |
| | 105,600 | | | Kanamoto Co. Ltd. | | $ | 2,166,568 | |
| | 33,210 | | | Kandenko Co. Ltd. | | | 248,373 | |
| | 28,100 | | | Kanematsu Corp. | | | 331,204 | |
| | 7,900 | | | Kato Sangyo Co. Ltd. | | | 261,459 | |
| | 22,100 | | | Kawai Musical Instruments Manufacturing Co. Ltd. | | | 516,325 | |
| | 181,400 | | | Keiyo Co. Ltd. | | | 1,370,528 | |
| | 190 | | | Kenedix Retail Corp. REIT | | | 361,507 | |
| | 1,800 | | | Kenko Mayonnaise Co. Ltd. | | | 30,225 | |
| | 2,002 | | | Kimura Unity Co. Ltd. | | | 19,619 | |
| | 4,900 | | | King Co. Ltd. | | | 25,180 | |
| | 31,700 | | | Kissei Pharmaceutical Co. Ltd. | | | 621,313 | |
| | 924 | | | Kita-Nippon Bank Ltd. (The) | | | 16,786 | |
| | 41,600 | | | Kito Corp. | | | 509,793 | |
| | 21,100 | | | Kitz Corp. | | | 113,667 | |
| | 1,600 | | | Koa Shoji Holdings Co. Ltd. | | | 40,086 | |
| | 227,200 | | | Kobe Bussan Co. Ltd. | | | 6,390,983 | |
| | 88,966 | | | Kohnan Shoji Co. Ltd. | | | 3,029,407 | |
| | 275,500 | | | Kojima Co. Ltd. | | | 1,813,071 | |
| | 3,700 | | | Kokusai Co. Ltd. | | | 28,520 | |
| | 12,187 | | | Komehyo Co. Ltd. | | | 83,113 | |
| | 67,600 | | | Komeri Co. Ltd. | | | 1,979,025 | |
| | 29,200 | | | Komori Corp. | | | 186,309 | |
| | 423,100 | | | Konica Minolta, Inc. | | | 1,066,893 | |
| | 276,215 | | | K’s Holdings Corp. | | | 3,519,469 | |
| | 24,100 | | | Kurabo Industries Ltd. | | | 431,611 | |
| | 1,200 | | | Kyodo Printing Co. Ltd. | | | 28,116 | |
| | 1,700 | | | Kyokuto Boeki Kaisha Ltd. | | | 21,596 | |
| | 53,800 | | | Kyokuto Kaihatsu Kogyo Co. Ltd. | | | 660,328 | |
| | 69,085 | | | KYORIN Holdings, Inc. | | | 1,246,493 | |
| | 9,000 | | | Kyoritsu Printing Co. Ltd. | | | 10,831 | |
| | 6,020 | | | Lawson, Inc. | | | 276,289 | |
| | 19,000 | | | LIFULL Co. Ltd.(a) | | | 70,959 | |
| | 11,530 | | | Lintec Corp. | | | 254,399 | |
| | 151,400 | | | M3, Inc. | | | 10,161,782 | |
| | 32,400 | | | Macnica Fuji Electronics Holdings, Inc. | | | 574,686 | |
| | 50,600 | | | Marubun Corp. | | | 233,438 | |
| | 7,810 | | | Maruichi Steel Tube Ltd. | | | 178,288 | |
| | 144,000 | | | Marvelous, Inc. | | | 1,072,831 | |
| | 54,300 | | | Max Co. Ltd. | | | 754,635 | |
| | 29,600 | | | Maxell Holdings Ltd.(a) | | | 308,171 | |
| | 325,600 | | | Mazda Motor Corp. | | | 1,698,052 | |
| | 16,700 | | | MCJ Co. Ltd. | | | 152,492 | |
| | 110,600 | | | Medipal Holdings Corp. | | | 1,967,020 | |
| | 106,700 | | | MedPeer, Inc.(a) | | | 5,187,478 | |
| | 42,200 | | | Megachips Corp. | | | 1,118,132 | |
| | 127,600 | | | Meidensha Corp. | | | 1,940,295 | |
| | 3,300 | | | Meiji Electric Industries Co. Ltd. | | | 41,670 | |
| | 53,200 | | | Meiko Network Japan Co. Ltd. | | | 305,902 | |
| | 67,100 | | | Meitec Corp. | | | 3,313,501 | |
| | 7,400 | | | Meiwa Estate Co. Ltd. | | | 31,029 | |
| | 10,900 | | | Melco Holdings, Inc. | | | 280,061 | |
| Old Westbury Funds, Inc. | |
| Small & Mid Cap Strategies Fund | |
| Portfolio of Investments - (Continued) | October 31, 2020 |
| | |
| Shares | | | | | Value | |
| JAPAN (continued) |
| | 4,100 | | | Members Co. Ltd. | | $ | 69,316 | |
| | 8,774 | | | METAWATER Co. Ltd. | | | 204,820 | |
| | 163,300 | | | Micronics Japan Co. Ltd. | | | 1,605,002 | |
| | 34,600 | | | Mimasu Semiconductor Industry Co. Ltd. | | | 808,694 | |
| | 5,725 | | | Mirait Holdings Corp. | | | 81,094 | |
| | 3,800 | | | Miroku Jyoho Service Co. Ltd. | | | 76,802 | |
| | 15,400 | | | Mito Securities Co. Ltd. | | | 31,772 | |
| | 7,900 | | | Mitsubishi Paper Mills Ltd. | | | 23,467 | |
| | 24,800 | | | Mitsubishi Research Institute, Inc. | | | 895,401 | |
| | 8,900 | | | Mitsuboshi Belting Ltd. | | | 138,479 | |
| | 112,600 | | | Mitsui Matsushima Holdings Co. Ltd. | | | 730,268 | |
| | 12,449 | | | Mitsui-Soko Holdings Co. Ltd. | | | 217,957 | |
| | 183,900 | | | Mixi, Inc. | | | 5,043,000 | |
| | 2,400 | | | Miyazaki Bank Ltd. (The) | | | 51,533 | |
| | 66,550 | | | Mizuno Corp. | | | 1,104,134 | |
| | 25,527 | | | Mochida Pharmaceutical Co. Ltd. | | | 926,526 | |
| | 313,500 | | | MonotaRO Co. Ltd. | | | 17,367,592 | |
| | 139 | | | Mori Trust Hotel, Inc. REIT | | | 142,990 | |
| | 201,785 | | | Morinaga & Co. Ltd. | | | 7,641,984 | |
| | 6 | | | Mory Industries, Inc. | | | 135 | |
| | 20,080 | | | Mugen Estate Co. Ltd. | | | 90,336 | |
| | 1,900 | | | Musashino Bank Ltd. (The) | | | 28,020 | |
| | 6,200 | | | Mynet, Inc.(a) | | | 65,852 | |
| | 6,500 | | | Nafco Co. Ltd. | | | 142,609 | |
| | 3,245 | | | Nagaileben Co. Ltd. | | | 81,020 | |
| | 30,300 | | | Nagano Keiki Co. Ltd. | | | 221,690 | |
| | 11,028 | | | Nagoya Railroad Co. Ltd. | | | 292,409 | |
| | 4,400 | | | Nakabayashi Co. Ltd. | | | 25,678 | |
| | 8,749 | | | Nakanishi, Inc. | | | 155,434 | |
| | 4,900 | | | NCS&A Co. Ltd. | | | 22,325 | |
| | 56,700 | | | NET One Systems Co. Ltd. | | | 1,689,708 | |
| | 1,030 | | | NH Foods Ltd. | | | 42,009 | |
| | 4,300 | | | Nichiban Co. Ltd. | | | 67,070 | |
| | 7,500 | | | Nichiha Corp. | | | 217,775 | |
| | 376,400 | | | Nichi-iko Pharmaceutical Co. Ltd. | | | 3,724,633 | |
| | 3,200 | | | Nihon Chouzai Co. Ltd. | | | 51,441 | |
| | 24,600 | | | Nihon Falcom Corp. | | | 302,874 | |
| | 12,535 | | | Nihon Kohden Corp. | | | 391,513 | |
| | 3,100 | | | Nihon Tokushu Toryo Co. Ltd. | | | 27,478 | |
| | 251,300 | | | Nihon Unisys Ltd. | | | 7,380,940 | |
| | 12,820 | | | Nippo Corp. | | | 328,168 | |
| | 6,673 | | | Nippon Air Conditioning Services Co. Ltd. | | | 46,401 | |
| | 2,300 | | | Nippon BS Broadcasting Corp. | | | 23,419 | |
| | 3,800 | | | Nippon Carbide Industries Co., Inc. | | | 43,337 | |
| | 7,000 | | | Nippon Chemi-Con Corp.(a) | | | 88,591 | |
| | 21,500 | | | Nippon Commercial Development Co. Ltd. | | | 346,440 | |
| | 8,460 | | | Nippon Flour Mills Co. Ltd. | | | 135,270 | |
| | 20,735 | | | Nippon Kayaku Co. Ltd. | | | 177,454 | |
| | 31,900 | | | Nippon Shinyaku Co. Ltd. | | | 2,266,928 | |
| | 4,400 | | | Nippon Soda Co. Ltd. | | | 114,943 | |
| Shares | | | | | Value | |
| JAPAN (continued) |
| | 15,100 | | | Nippon Steel Trading Corp. | | $ | 428,647 | |
| | 2,400 | | | Nippon Systemware Co. Ltd. | | | 46,925 | |
| | 8,700 | | | Nishimatsuya Chain Co. Ltd. | | | 140,437 | |
| | 228,100 | | | Nishi-Nippon Financial Holdings, Inc. | | | 1,533,812 | |
| | 11,073 | | | Nishi-Nippon Railroad Co. Ltd. | | | 291,275 | |
| | 18,300 | | | Nishio Rent All Co. Ltd. | | | 353,432 | |
| | 20,100 | | | Nissha Co. Ltd. | | | 235,183 | |
| | 3,600 | | | Nisshinbo Holdings, Inc. | | | 23,795 | |
| | 3,200 | | | Nitta Corp. | | | 67,182 | |
| | 94,600 | | | Nitto Kogyo Corp. | | | 1,740,289 | |
| | 13,600 | | | Nittoc Construction Co. Ltd. | | | 103,142 | |
| | 47,500 | | | Nojima Corp. | | | 1,327,069 | |
| | 30,900 | | | Nomura Co. Ltd. | | | 198,926 | |
| | 11,000 | | | Noritake Co. Ltd./Nagoya Japan | | | 322,031 | |
| | 29,500 | | | Noritz Corp. | | | 428,573 | |
| | 264,622 | | | NSD Co. Ltd. | | | 4,633,002 | |
| | 112,200 | | | OBIC Business Consultants Co. Ltd. | | | 6,065,734 | |
| | 49,600 | | | Obic Co Ltd. | | | 8,788,194 | |
| | 19,992 | | | Ohsho Food Service Corp. | | | 1,094,170 | |
| | 1,900 | | | Oiles Corp. | | | 26,405 | |
| | 80,315 | | | Okamura Corp. | | | 610,638 | |
| | 391,900 | | | Oki Electric Industry Co. Ltd. | | | 3,612,240 | |
| | 13,100 | | | Okinawa Cellular Telephone Co. | | | 522,398 | |
| | 65,900 | | | Okuwa Co. Ltd. | | | 878,709 | |
| | 5,000 | | | Onoken Co. Ltd. | | | 55,399 | |
| | 30,400 | | | Onward Holdings Co. Ltd. | | | 59,235 | |
| | 207,200 | | | Orient Corp. | | | 227,594 | |
| | 5,700 | | | Origin Co. Ltd. | | | 74,044 | |
| | 137,600 | | | Osaki Electric Co. Ltd. | | | 826,691 | |
| | 48,730 | | | Oyo Corp. | | | 556,675 | |
| | 20,700 | | | PAL GROUP Holdings Co. Ltd. | | | 238,842 | |
| | 16,905 | | | Pan Pacific International Holdings Corp. | | | 358,784 | |
| | 10,800 | | | PAPYLESS Co. Ltd. | | | 273,984 | |
| | 8,556 | | | Paramount Bed Holdings Co. Ltd. | | | 329,344 | |
| | 7,900 | | | Pasco Corp. | | | 94,171 | |
| | 59,600 | | | Pasona Group, Inc. | | | 910,836 | |
| | 52,900 | | | PC Depot Corp. | | | 320,851 | |
| | 3,600 | | | PCA Corp. | | | 161,612 | |
| | 28,600 | | | Pegasus Sewing Machine Manufacturing Co. Ltd. | | | 74,577 | |
| | 222,200 | | | PeptiDream, Inc.(a) | | | 10,240,365 | |
| | 62,000 | | | Poletowin Pitcrew Holdings, Inc. | | | 535,938 | |
| | 87,152 | | | Proto Corp. | | | 932,330 | |
| | 18,000 | | | Punch Industry Co. Ltd. | | | 75,133 | |
| | 4,500 | | | Quick Co. Ltd. | | | 43,584 | |
| | 318,100 | | | Raccoon Holdings, Inc. | | | 6,037,200 | |
| | 206,700 | | | Rakus Co. Ltd. | | | 4,080,891 | |
| | 12,900 | | | Ray Corp. | | | 37,581 | |
| | 240,390 | | | Relia, Inc. | | | 2,720,876 | |
| | 1,100 | | | Rhythm Watch Co. Ltd. | | | 6,504 | |
| | 72,600 | | | Riken Technos Corp. | | | 275,297 | |
| | 8,900 | | | Rion Co. Ltd. | | | 190,505 | |
| Old Westbury Funds, Inc. | |
| Small & Mid Cap Strategies Fund | |
| Portfolio of Investments - (Continued) | October 31, 2020 |
| | |
| Shares | | | | | Value | |
| JAPAN (continued) | | | | |
| | 63,500 | | | Rohm Co. Ltd. | | $ | 4,852,190 | |
| | 20,100 | | | Rohto Pharmaceutical Co. Ltd. | | | 625,875 | |
| | 57,900 | | | Roland DG Corp. | | | 706,226 | |
| | 3,600 | | | Ryoden Corp. | | | 52,541 | |
| | 15,700 | | | Ryosan Co. Ltd. | | | 288,972 | |
| | 24,600 | | | Sac’s Bar Holdings, Inc. | | | 126,883 | |
| | 86,800 | | | Sagami Rubber Industries Co. Ltd. | | | 979,138 | |
| | 100 | | | Saison Information Systems Co. Ltd. | | | 2,090 | |
| | 1,900 | | | Sakai Chemical Industry Co. Ltd. | | | 34,989 | |
| | 21,500 | | | Sangetsu Corp. | | | 308,243 | |
| | 53,500 | | | Sanken Electric Co. Ltd. | | | 1,699,102 | |
| | 62,468 | | | Sankyo Co. Ltd. | | | 1,585,940 | |
| | 15,200 | | | Sankyo Tateyama, Inc. | | | 134,005 | |
| | 4,400 | | | Sanyo Trading Co. Ltd. | | | 40,220 | |
| | 62,800 | | | Sato Holdings Corp. | | | 1,185,879 | |
| | 7,800 | | | Sawada Holdings Co. Ltd. | | | 68,169 | |
| | 88,227 | | | Sawai Pharmaceutical Co. Ltd. | | | 4,238,806 | |
| | 1,500 | | �� | Seika Corp. | | | 17,952 | |
| | 86,500 | | | Seikagaku Corp. | | | 791,509 | |
| | 151,700 | | | Seiko Holdings Corp. | | | 1,902,499 | |
| | 1,471 | | | Semba Corp. | | | 13,025 | |
| | 24,120 | | | Senko Group Holdings Co. Ltd. | | | 214,257 | |
| | 20,600 | | | Seria Co. Ltd. | | | 790,983 | |
| | 606,000 | | | SG Holdings Co. Ltd. | | | 14,557,429 | |
| | 600 | | | Shibaura Electronics Co. Ltd. | | | 13,210 | |
| | 20,900 | | | Shibaura Mechatronics Corp. | | | 598,683 | |
| | 91,800 | | | Shimadzu Corp. | | | 2,605,070 | |
| | 13,800 | | | Shimamura Co. Ltd. | | | 1,465,743 | |
| | 15,300 | | | Shindengen Electric Manufacturing Co. Ltd. | | | 290,378 | |
| | 30,900 | | | Shinmaywa Industries Ltd. | | | 238,476 | |
| | 31,800 | | | Shinoken Group Co. Ltd. | | | 313,459 | |
| | 97 | | | Shofu, Inc. | | | 1,380 | |
| | 6,200 | | | Sinfonia Technology Co. Ltd. | | | 67,096 | |
| | 50,000 | | | Sinko Industries Ltd. | | | 697,741 | |
| | 49,200 | | | SK-Electronics Co. Ltd.(a) | | | 521,630 | |
| | 256,900 | | | SKY Perfect JSAT Holdings, Inc. | | | 1,091,938 | |
| | 11,000 | | | Sodick Co. Ltd. | | | 81,007 | |
| | 89,113 | | | Soliton Systems KK | | | 1,604,451 | |
| | 12,060 | | | Sotetsu Holdings, Inc. | | | 296,158 | |
| | 13,200 | | | Sprix Ltd. | | | 111,581 | |
| | 6,300 | | | SRA Holdings | | | 136,657 | |
| | 11,600 | | | ST Corp. | | | 221,042 | |
| | 93,900 | | | St. Marc Holdings Co. Ltd. | | | 1,333,677 | |
| | 19,800 | | | Starts Corp, Inc. | | | 458,618 | |
| | 65 | | | Starts Proceed Investment Corp., REIT | | | 123,487 | |
| | 8,400 | | | St-Care Holding Corp. | | | 52,392 | |
| | 3,200 | | | Sumitomo Bakelite Co. Ltd. | | | 89,861 | |
| | 5,400 | | | Sumitomo Seika Chemicals Co. Ltd. | | | 171,240 | |
| | 18,900 | | | Sun-Wa Technos Corp. | | | 154,348 | |
| | 207,600 | | | Suruga Bank Ltd. | | | 672,204 | |
| | 109,550 | | | Suzuken Co. Ltd. | | | 3,939,594 | |
| Shares | | | | | Value | |
| JAPAN (continued) | | | | |
| | 800 | | | Systems Engineering Consultants Co. Ltd. | | $ | 22,924 | |
| | 253,100 | | | Systena Corp. | | | 4,585,995 | |
| | 3,600 | | | Taiho Kogyo Co. Ltd. | | | 18,087 | |
| | 34,800 | | | Taikisha Ltd. | | | 900,788 | |
| | 231,300 | | | Takara Leben Co. Ltd. | | | 642,899 | |
| | 18,500 | | | Takasago International Corp. | | | 360,299 | |
| | 126,000 | | | Tamron Co. Ltd. | | | 1,866,622 | |
| | 223,700 | | | Tanseisha Co. Ltd. | | | 1,504,225 | |
| | 16,800 | | | Tatsuta Electric Wire and Cable Co. Ltd. | | | 90,022 | |
| | 29,700 | | | TDC Soft, Inc. | | | 282,546 | |
| | 263,500 | | | TechMatrix Corp. | | | 5,622,609 | |
| | 400 | | | Techno Medica Co. Ltd. | | | 6,166 | |
| | 28,700 | | | Teikoku Electric Manufacturing Co. Ltd. | | | 277,693 | |
| | 63,300 | | | Temairazu, Inc. | | | 3,013,998 | |
| | 33,587 | | | T-Gaia Corp. | | | 612,743 | |
| | 293,100 | | | TIS, Inc. | | | 5,601,921 | |
| | 7,000 | | | TKC Corp. | | | 431,921 | |
| | 11,500 | | | Toa Corp. | | | 90,181 | |
| | 78,400 | | | TOC Co. Ltd. | | | 475,515 | |
| | 108,365 | | | Tochigi Bank Ltd. (The) | | | 186,310 | |
| | 5,585 | | | Toho Co. Ltd. | | | 220,317 | |
| | 6,394 | | | Toho Gas Co. Ltd. | | | 329,182 | |
| | 109,600 | | | Toho Holdings Co. Ltd. | | | 2,017,281 | |
| | 6,800 | | | Tokai Corp. | | | 132,174 | |
| | 7,700 | | | Tokyo Keiki, Inc. | | | 63,471 | |
| | 13,800 | | | Tokyo Seimitsu Co. Ltd. | | | 462,658 | |
| | 12,500 | | | Tokyo Tekko Co. Ltd. | | | 228,043 | |
| | 1,300 | | | Tomen Devices Corp. | | | 44,267 | |
| | 163,685 | | | TOMONY Holdings, Inc. | | | 490,922 | |
| | 232,590 | | | Tomy Co. Ltd. | | | 2,023,874 | |
| | 3,300 | | | Topy Industries Ltd.(a) | | | 34,325 | |
| | 41,200 | | | Tosei Corp. | | | 410,839 | |
| | 55,055 | | | Toshiba TEC Corp. | | | 2,192,840 | |
| | 7,900 | | | Tosho Co. Ltd. | | | 91,152 | |
| | 21,700 | | | Tow Co. Ltd. | | | 57,828 | |
| | 12,500 | | | Towa Bank Ltd. (The) | | | 81,905 | |
| | 150,200 | | | Towa Pharmaceutical Co. Ltd. | | | 2,767,427 | |
| | 6,600 | | | Toyo Denki Seizo KK | | | 69,407 | |
| | 18,700 | | | Toyo Machinery & Metal Co. Ltd. | | | 70,731 | |
| | 7,900 | | | TPR Co. Ltd. | | | 93,718 | |
| | 91,500 | | | Transcosmos, Inc. | | | 2,482,941 | |
| | 6,221 | | | Trend Micro, Inc. | | | 347,608 | |
| | 2,900 | | | Trinity Industrial Corp. | | | 18,780 | |
| | 16,900 | | | Tri-Stage, Inc. | | | 66,506 | |
| | 38,300 | | | Tsubakimoto Chain Co. | | | 846,518 | |
| | 2,900 | | | TV Asahi Holdings Corp. | | | 43,599 | |
| | 18,900 | | | ULS Group, Inc. | | | 684,187 | |
| | 5,900 | | | UNITED, Inc. | | | 80,643 | |
| | 4,600 | | | Valqua Ltd. | | | 76,670 | |
| | 3,400 | | | VINX Corp. | | | 38,970 | |
| Old Westbury Funds, Inc. | |
| Small & Mid Cap Strategies Fund | |
| Portfolio of Investments - (Continued) | October 31, 2020 |
| | |
| Shares | | | | | Value | |
| JAPAN (continued) | | | | |
| | 326,100 | | | Wacom Co. Ltd. | | $ | 2,130,497 | |
| | 22,800 | | | Warabeya Nichiyo Holdings Co. Ltd. | | | 324,921 | |
| | 8,400 | | | Waseda Academy Co. Ltd. | | | 77,585 | |
| | 8,200 | | | Watts Co. Ltd. | | | 61,875 | |
| | 1,600 | | | WDB Holdings Co. Ltd. | | | 46,230 | |
| | 6,900 | | | Weathernews, Inc. | | | 363,800 | |
| | 39,900 | | | Will Group, Inc. | | | 294,596 | |
| | 39,400 | | | World Holdings Co. Ltd. | | | 795,564 | |
| | 15,100 | | | Wowow, Inc. | | | 397,061 | |
| | 44,100 | | | Xebio Holdings Co. Ltd. | | | 286,011 | |
| | 69,500 | | | YAMABIKO Corp. | | | 866,302 | |
| | 254,800 | | | Yamada Denki Co. Ltd. | | | 1,236,338 | |
| | 38,900 | | | Yamaichi Electronics Co. Ltd. | | | 494,169 | |
| | 5,700 | | | YA-MAN Ltd. | | | 80,577 | |
| | 26,400 | | | Yamanashi Chuo Bank Ltd. (The) | | | 213,833 | |
| | 1,260 | | | Yaoko Co. Ltd. | | | 89,059 | |
| | 45,100 | | | Yurtec Corp. | | | 271,388 | |
| | 3,900 | | | Yushin Precision Equipment Co. Ltd. | | | 25,778 | |
| | 25,700 | | | Zenrin Co. Ltd. | | | 280,087 | |
| | 11,340 | | | Zensho Holdings Co. Ltd. | | | 263,530 | |
| | 85,000 | | | ZERIA Pharmaceutical Co. Ltd. | | | 1,503,606 | |
| | 38,200 | | | ZIGExN Co. Ltd. | | | 113,110 | |
| | 2,900 | | | Zuken, Inc. | | | 73,044 | |
| | | | | | | | 481,790,384 | |
| JERSEY CHANNEL ISLANDS — 0.5% | | | | |
| | 271,936 | | | Novocure Ltd.(a) | | | 33,203,386 | |
| MALAYSIA — 0.0% | | | | |
| | 282,260 | | | Kossan Rubber Industries | | | 509,495 | |
| | 12,700 | | | Shangri-La Hotels Malaysia Berhad | | | 12,165 | |
| | | | | | | | 521,660 | |
| NETHERLANDS — 1.0% | | | | |
| | 34,737 | | | Aalberts NV | | | 1,166,760 | |
| | 32,571 | | | Accell Group NV(a) | | | 878,165 | |
| | 3,019 | | | Amsterdam Commodities NV | | | 62,938 | |
| | 18,101 | | | Argenx SE(a) | | | 4,519,822 | |
| | 114,051 | | | ASM International NV | | | 16,311,406 | |
| | 310,134 | | | ASR Nederland NV | | | 9,427,224 | |
| | 114,064 | | | BE Semiconductor Industries NV | | | 4,608,365 | |
| | 20,503 | | | Boskalis Westminster(a) | | | 413,580 | |
| | 738 | | | Brack Capital Properties NV(a) | | | 55,890 | |
| | 11,679 | | | Brunel International NV(a) | | | 82,836 | |
| | 133,344 | | | Eurocommercial Properties NV REIT | | | 1,453,594 | |
| | 41,486 | | | ForFarmers NV | | | 243,032 | |
| | 80,741 | | | Fugro NV(a) | | | 305,989 | |
| | 187,057 | | | Heijmans NV(a) | | | 1,585,986 | |
| | 728 | | | Hunter Douglas NV(a) | | | 42,224 | |
| | 87,243 | | | IMCD NV | | | 10,105,853 | |
| | 1,494 | | | Kendrion NV(a) | | | 26,796 | |
| | 924,500 | | | Koninklijke BAM Groep NV(a) | | | 1,147,778 | |
| | 56,289 | | | Koninklijke DSM NV | | | 9,010,776 | |
| | 2,695 | | | Nederland Apparatenfabriek | | | 140,301 | |
| Shares | | | | | Value | |
| NETHERLANDS (continued) | | | | |
| | 3,476 | | | NSI NV REIT | | $ | 110,114 | |
| | 10,876 | | | Ordina NV(a) | | | 29,323 | |
| | 862,565 | | | PostNL NV(a) | | | 2,860,047 | |
| | 36,823 | | | TKH Group NV | | | 1,185,362 | |
| | 131,713 | | | TomTom NV(a) | | | 885,112 | |
| | 12,877 | | | Van Lanschot Kempen NV | | | 257,951 | |
| | 4,484 | | | Vastned Retail NV REIT | | | 118,546 | |
| | | | | | | | 67,035,770 | |
| NEW ZEALAND — 0.5% | | | | |
| | 207,409 | | | Argosy Property Ltd. REIT | | | 190,623 | |
| | 6,753 | | | CBL Corp. Ltd.(a)(b) | | | 2,654 | |
| | 54,083 | | | EBOS Group Ltd. | | | 920,813 | |
| | 717,451 | | | Fletcher Building Ltd.(a) | | | 1,951,623 | |
| | 35,054 | | | Fletcher Building Ltd.(a) | | | 95,029 | |
| | 152,998 | | | Kiwi Property Group Ltd. REIT | | | 124,430 | |
| | 38,075 | | | NZX Ltd. | | | 43,301 | |
| | 302,863 | | | Oceania Healthcare Ltd. | | | 270,342 | |
| | 32,923 | | | Plexure Group Ltd.(a) | | | 33,088 | |
| | 381,644 | | | Pushpay Holdings Ltd.(a) | | | 2,296,324 | |
| | 34,609 | | | Skellerup Holdings Ltd. | | | 70,481 | |
| | 460,774 | | | SKY NETWORK TELEVISION Ltd.(a) | | | 45,395 | |
| | 78,144 | | | Vista Group International Ltd.(a) | | | 78,020 | |
| | 365,983 | | | Xero Ltd.(a) | | | 28,335,977 | |
| | | | | | | | 34,458,100 | |
| NORWAY — 0.1% | | | | |
| | 10,775 | | | Atea ASA(a) | | | 124,605 | |
| | 11,763 | | | Austevoll Seafood ASA | | | 80,029 | |
| | 112,235 | | | B2Holding ASA(a) | | | 72,890 | |
| | 33,100 | | | Kitron ASA | | | 59,497 | |
| | 3,684 | | | Medistim ASA | | | 79,880 | |
| | 282,894 | | | Nordic Semiconductor ASA(a) | | | 2,975,133 | |
| | 46,133 | | | Norwegian Property ASA | | | 54,123 | |
| | 15,237 | | | Olav Thon Eiendomsselskap ASA(a) | | | 211,478 | |
| | 88,165 | | | PGS ASA(a) | | | 21,850 | |
| | 7,966 | | | Salmar ASA(a) | | | 402,612 | |
| | 1,758 | | | SpareBank 1 BV | | | 6,390 | |
| | 28,061 | | | SpareBank 1 SMN | | | 240,733 | |
| | 46 | | | Sparebanken More | | | 1,373 | |
| | 3,443 | | | Sparebanken Vest | | | 21,964 | |
| | 1 | | | TGS NOPEC Geophysical Co. ASA | | | 9 | |
| | 134,036 | | | Wallenius Wilhelmsen ASA(a) | | | 255,530 | |
| | | | | | | | 4,608,096 | |
| PERU — 0.1% | | | | |
| | 326,000 | | | Cia de Minas Buenaventura SAA - ADR | | | 4,000,020 | |
| PHILIPPINES — 0.0% | | | | |
| | 3,895 | | | Globe Telecom, Inc. | | | 163,075 | |
| POLAND — 0.2% | | | | |
| | 305,662 | | | KGHM Polska Miedz SA(a) | | | 9,122,913 | |
| Old Westbury Funds, Inc. | |
| Small & Mid Cap Strategies Fund | |
| Portfolio of Investments - (Continued) | October 31, 2020 |
| | |
| Shares | | | | | Value | |
| POLAND (continued) | | | | |
| | 1,110,477 | | | PGE Polska Grupa Energetyczna SA(a) | | $ | 1,265,157 | |
| | 3,097,256 | | | Tauron Polska Energia SA(a) | | | 1,357,485 | |
| | | | | | | | 11,745,555 | |
| PORTUGAL — 0.0% | | | | |
| | 56,280 | | | CTT-Correios de Portugal SA(a) | | | 137,647 | |
| | 12,196 | | | Semapa-Sociedade de Investimento e Gestao | | | 91,616 | |
| | | | | | | | 229,263 | |
| QATAR — 0.0% | | | | |
| | 28,625 | | | Qatar Electricity & Water Co. QSC | | | 131,293 | |
| | 118,295 | | | Qatar International Islamic Bank QSC | | | 269,697 | |
| | | | | | | | 400,990 | |
| RUSSIA — 0.5% | | | | |
| | 3,531,360 | | | Alrosa PJSC | | | 3,174,696 | |
| | 1,189,126,065 | | | Federal Grid Co. Unified Energy System PJSC | | | 2,842,452 | |
| | 4,480,742 | | | Gazprom PJSC | | | 8,742,223 | |
| | 1,373,778 | | | Gazprom PJSC - ADR | | | 5,261,570 | |
| | 112,793 | | | Magnit PJSC | | | 6,701,382 | |
| | 532,967 | | | Mobile TeleSystems PJSC | | | 2,086,416 | |
| | 157,401,550 | | | ROSSETI PJSC | | | 2,880,804 | |
| | 1,641,600 | | | Rostelecom PJSC | | | 1,916,763 | |
| | 461,432,194 | | | RusHydro PJSC | | | 4,193,584 | |
| | | | | | | | 37,799,890 | |
| SINGAPORE — 0.2% | | | | |
| | 912,242 | | | Asian Pay Television Trust - Units | | | 78,806 | |
| | 21,700 | | | Best World International Ltd.(b) | | | 4,016 | |
| | 458,500 | | | China Aviation Oil Singapore Corp. Ltd. | | | 308,811 | |
| | 874,508 | | | China Sunsine Chemical Holdings Ltd. | | | 252,887 | |
| | 1,608,200 | | | CSE Global Ltd. | | | 512,147 | |
| | 88,000 | | | CW Group Holdings Ltd.(a)(b) | | | 491 | |
| | 47,900 | | | Delfi Ltd. | | | 22,443 | |
| | 584,900 | | | Ezion Holdings Ltd.(a)(b) | | | 3,468 | |
| | 238,500 | | | Food Empire Holdings Ltd. | | | 101,270 | |
| | 646,400 | | | Frencken Group Ltd. | | | 447,196 | |
| | 157,500 | | | Hanwell Holdings Ltd. | | | 32,862 | |
| | 60,700 | | | Haw Par Corp. Ltd. | | | 416,828 | |
| | 1,844,600 | | | Hi-P International Ltd. | | | 1,634,003 | |
| | 34 | | | Ho Bee Land Ltd. | | | 58 | |
| | 62,320 | | | Hong Fok Corp. Ltd. | | | 29,199 | |
| | 62,459 | | | Hong Leong Asia Ltd. | | | 21,491 | |
| | 76,000 | | | Hyflux Ltd.(a) | | | 145 | |
| | 200,700 | | | Hyphens Pharma International Ltd. | | | 55,834 | |
| | 400,600 | | | Midas Holdings Ltd.(a)(b) | | | 10,558 | |
| | 240,100 | | | Olam International Ltd. | | | 224,992 | |
| | 68,690 | | | OM Holdings Ltd. | | | 15,209 | |
| | 362,934 | | | Penguin International Ltd. | | | 108,937 | |
| | 142,000 | | | Raffles Medical Group Ltd. | | | 80,047 | |
| Shares | | | | | Value | |
| SINGAPORE (continued) | | | | |
| | 304,400 | | | RHT Health Trust - Units REIT(a)(b) | | $ | 4,234 | |
| | 2,200 | | | Riverstone Holdings Ltd./Singapore | | | 6,120 | |
| | 95,700 | | | Sasseur Real Estate Investment Trust REIT | | | 52,546 | |
| | 574,495 | | | Sheng Siong Group Ltd. | | | 702,373 | |
| | 160,700 | | | Singapore Medical Group Ltd. | | | 29,412 | |
| | 140,300 | | | Singapore Post Ltd. | | | 68,304 | |
| | 509,200 | | | Starhill Global REIT | | | 154,704 | |
| | 75,200 | | | Sunningdale Tech Ltd. | | | 85,333 | |
| | 101,106 | | | XP Power Ltd. | | | 5,239,331 | |
| | 1,118,600 | | | Yanlord Land Group Ltd. | | | 859,863 | |
| | | | | | | | 11,563,918 | |
| SOUTH AFRICA — 0.0% | | | | |
| | 826,049 | | | Sappi Ltd.(a) | | | 1,176,608 | |
| SOUTH KOREA — 1.0% | | | | |
| | 23,169 | | | Green Cross Corp. | | | 6,125,584 | |
| | 161,394 | | | GS Engineering & Construction Corp. | | | 3,797,673 | |
| | 45,478 | | | Hyundai Department Store Co. Ltd. | | | 2,372,696 | |
| | 137,051 | | | Hyundai Engineering & Construction Co. Ltd. | | | 3,701,959 | |
| | 102,010 | | | KB Financial Group, Inc. | | | 3,605,007 | |
| | 94,348 | | | Kia Motors Corp. | | | 4,198,972 | |
| | 148,364 | | | Korea Electric Power Corp.(a) | | | 2,608,497 | |
| | 48,029 | | | Korea Shipbuilding & Offshore Engineering Co. Ltd.(a) | | | 3,318,475 | |
| | 37,221 | | | Kumho Petrochemical Co. Ltd. | | | 4,362,733 | |
| | 334,179 | | | LG Display Co. Ltd.(a) | | | 4,137,847 | |
| | 64,849 | | | LG Electronics, Inc. | | | 4,800,666 | |
| | 17,209 | | | Lotte Chemical Corp. | | | 3,533,707 | |
| | 56,652 | | | OCI Co. Ltd.(a) | | | 3,085,480 | |
| | 3,543 | | | S-1 Corp. | | | 254,789 | |
| | 107,201 | | | Samsung Electronics Co Ltd. | | | 5,347,296 | |
| | 401,995 | | | Samsung Engineering Co. Ltd.(a) | | | 4,162,723 | |
| | 582,404 | | | Samsung Heavy Industries Co. Ltd.(a) | | | 2,591,998 | |
| | 32,924 | | | Samsung SDS Co. Ltd. | | | 4,889,128 | |
| | 572,093 | | | SK Networks Co. Ltd. | | | 2,286,456 | |
| | 3,045 | | | Yuyang DNU Co. Ltd.(a)(b) | | | 2,455 | |
| | | | | | | | 69,184,141 | |
| SPAIN — 0.4% | | | | |
| | 1,237,337 | | | Almirall SA | | | 13,236,132 | |
| | 109,596 | | | Applus Services SA(a) | | | 858,383 | |
| | 53,843 | | | Atresmedia Corp. de Medios de Comunicacion SA | | | 141,093 | |
| | 32,327 | | | Cia de Distribucion Integral Logista Holdings SA | | | 545,165 | |
| | 65,319 | | | Faes Farma SA | | | 246,098 | |
| | 8,622 | | | Laboratorios Farmaceuticos Rovi SA(a) | | | 307,272 | |
| | 320,579 | | | Mediaset Espana Comunicacion SA(a) | | | 1,071,546 | |
| | 59,316 | | | Pharma Mar SA | | | 7,951,355 | |
| | 73,584 | | | Prosegur Cia de Seguridad SA | | | 168,313 | |
| Old Westbury Funds, Inc. | |
| Small & Mid Cap Strategies Fund | |
| Portfolio of Investments - (Continued) | October 31, 2020 |
| | |
| Shares | | | | | Value | |
| SPAIN (continued) | | | | |
| | 18,730 | | | Red Electrica Corp. S.A. | | $ | 329,934 | |
| | | | | | | | 24,855,291 | |
| SWEDEN — 1.6% | | | | |
| | 359,863 | | | AAK AB(a) | | | 7,012,524 | |
| | 3,907 | | | AddLife AB(a) | | | 58,756 | |
| | 6,972 | | | AddNode Group AB(a) | | | 172,372 | |
| | 5,639 | | | Akelius Residential Property AB | | | 10,206 | |
| | 37,127 | | | Arise AB(a) | | | 143,945 | |
| | 700,018 | | | Arjo AB - B Shares | | | 4,975,741 | |
| | 39,746 | | | Atrium Ljungberg AB - B Shares | | | 642,304 | |
| | 180,074 | | | Avanza Bank Holding AB | | | 3,419,997 | |
| | 18,396 | | | Axfood AB | | | 427,939 | |
| | 2,217 | | | Beijer Electronics Group AB(a) | | | 8,745 | |
| | 1,616 | | | Bergman & Beving AB | | | 14,528 | |
| | 182,854 | | | Betsson AB | | | 1,395,283 | |
| | 117,359 | | | BHG Group AB(a) | | | 1,833,240 | |
| | 426,113 | | | Bilia AB - A Shares(a) | | | 5,693,702 | |
| | 10,672 | | | BioGaia AB - B Shares | | | 507,911 | |
| | 87,039 | | | Bonava AB - B Shares(a) | | | 680,298 | |
| | 248,760 | | | Bredband2 i Skandinavien AB | | | 45,847 | |
| | 8,004 | | | Bufab AB(a) | | | 119,812 | |
| | 3,823 | | | Bulten AB(a) | | | 32,093 | |
| | 201,334 | | | Byggmax Group AB(a) | | | 996,896 | |
| | 181,483 | | | Cantargia AB(a) | | | 1,119,686 | |
| | 18,146 | | | Castellum AB | | | 378,076 | |
| | 92,015 | | | Cibus Nordic Real Estate AB | | | 1,598,660 | |
| | 196,467 | | | Clas Ohlson AB - B Shares(a) | | | 1,744,234 | |
| | 758,125 | | | Cloetta AB - B Shares(a) | | | 1,784,044 | |
| | 32,420 | | | Contextvision AB(a) | | | 59,090 | |
| | 8,322 | | | Corem Property Group AB - B Shares | | | 16,133 | |
| | 4,088 | | | Corem Property Group AB - Preference Shares | | | 143,335 | |
| | 438,608 | | | Dios Fastigheter AB | | | 3,073,273 | |
| | 7,721 | | | Doro AB(a) | | | 36,096 | |
| | 1,605 | | | Elanders AB - B Shares(a) | | | 14,556 | |
| | 715,735 | | | Elekta AB - B Shares | | | 8,389,279 | |
| | 1,975 | | | Ferronordic AB(a) | | | 32,849 | |
| | 197,408 | | | Fortnox AB | | | 6,167,336 | |
| | 32,154 | | | G5 Entertainment AB | | | 1,436,711 | |
| | 579,275 | | | Getinge AB - B Shares | | | 11,349,973 | |
| | 20,214 | | | GHP Specialty Care AB(a) | | | 45,024 | |
| | 90,316 | | | Haldex AB(a) | | | 368,941 | |
| | 6,147 | | | HEXATRONIC GROUP AB(a) | | | 39,514 | |
| | 40,801 | | | Humana AB(a) | | | 243,016 | |
| | 11,009 | | | Indutrade AB(a) | | | 558,467 | |
| | 120,422 | | | Instalco AB | | | 2,666,000 | |
| | 440 | | | Internationella Engelska Skolan i Sverige Holding II AB | | | 3,827 | |
| | 178,191 | | | Inwido AB(a) | | | 1,889,364 | |
| | 11,149 | | | KNOW IT AB(a) | | | 304,460 | |
| | 87,921 | | | Kungsleden AB | | | 746,969 | |
| | 1,362 | | | Lime Technologies AB | | | 46,454 | |
| | | | | | | | | |
| Shares | | | | | Value | |
| SWEDEN (continued) | | | | |
| | 317,746 | | | Lindab International AB | | $ | 4,913,451 | |
| | 14,341 | | | Mekonomen AB(a) | | | 139,407 | |
| | 113,136 | | | MIPS AB | | | 4,872,080 | |
| | 10,584 | | | Modern Times Group MTG AB - B Shares(a) | 141,185 | |
| | 2,899 | | | Momentum Group AB - Class B(a) | | | 39,942 | |
| | 130,279 | | | NCC AB - B Shares(a) | | | 2,078,982 | |
| | 1,604 | | | Nederman Holding AB(a) | | | 21,631 | |
| | 145,193 | | | New Wave Group AB - B Shares(a) | | | 655,118 | |
| | 269,968 | | | Nobia AB(a) | | | 1,629,201 | |
| | 72,281 | | | Nolato AB - B Shares(a) | | | 6,010,961 | |
| | 18,625 | | | NP3 Fastigheter AB | | | 217,261 | |
| | 83,304 | | | Nyfosa AB(a) | | | 689,956 | |
| | 192,146 | | | Oncopeptides AB(a)(c) | | | 3,383,673 | |
| | 124,147 | | | Orexo AB(a) | | | 675,955 | |
| | 49,870 | | | Paradox Interactive AB | | | 1,541,204 | |
| | 5,047 | | | Platzer Fastigheter Holding AB - Class B | | | 48,380 | |
| | 250,378 | | | Pricer AB - B Shares | | | 749,862 | |
| | 7,176 | | | Proact IT Group AB(a) | | | 170,965 | |
| | 968,511 | | | Ratos AB - B Shares | | | 3,535,157 | |
| | 76,901 | | | RaySearch Laboratories AB(a) | | | 651,615 | |
| | 167,521 | | | Recipharm AB - B Shares(a) | | | 2,699,644 | |
| | 167,629 | | | Rottneros AB | | | 150,516 | |
| | 64,590 | | | Scandi Standard AB(a) | | | 437,694 | |
| | 8,435 | | | Sectra AB - B Shares | | | 514,722 | |
| | 6,540 | | | Semcon AB(a) | | | 47,185 | |
| | 19,971 | | | SkiStar AB | | | 223,985 | |
| | 10,709 | | | Systemair AB(a) | | | 300,869 | |
| | 22,961 | | | Tethys Oil AB | | | 95,989 | |
| | 41,788 | | | Trelleborg AB - B Shares(a) | | | 694,557 | |
| | 12,645 | | | Vitrolife AB(a) | | | 308,082 | |
| | 7,563 | | | Volati AB(a) | | | 57,880 | |
| | | | | | | | 110,144,615 | |
| SWITZERLAND — 1.4% | | | | |
| | 198,735 | | | Alcon, Inc.(a) | | | 11,291,885 | |
| | 6,783 | | | Allreal Holding AG | | | 1,436,565 | |
| | 7,361 | | | ALSO Holding AG | | | 1,721,942 | |
| | 24,279 | | | Arbonia AG(a) | | | 269,546 | |
| | 86,835 | | | Ascom Holding AG(a) | | | 1,039,804 | |
| | 1,184 | | | Bachem Holding AG | | | 478,403 | |
| | 57,398 | | | Baloise Holding AG | | | 7,843,361 | |
| | 2,300 | | | Banque Cantonale Vaudoise | | | 222,738 | |
| | 29,937 | | | Basilea Pharmaceutica AG(a) | | | 1,453,509 | |
| | 947 | | | Belimo Holding AG | | | 7,043,503 | |
| | 143 | | | Bell Food Group AG | | | 36,259 | |
| | 1,350 | | | BKW AG | | | 134,271 | |
| | 740 | | | Bobst Group SA | | | 35,590 | |
| | 5,017 | | | Bucher Industries AG | | | 1,931,404 | |
| | 11,008 | | | Burckhardt Compression Holding AG | | | 2,755,151 | |
| | 606 | | | Burkhalter Holding AG | | | 38,926 | |
| | 2,304 | | | Comet Holding AG | | | 323,633 | |
| Old Westbury Funds, Inc. | |
| Small & Mid Cap Strategies Fund | |
| Portfolio of Investments - (Continued) | October 31, 2020 |
| | |
| Shares | | | | | Value | |
| SWITZERLAND (continued) | | | | |
| | 7,892 | | | dormakaba Holding AG | | $ | 3,625,182 | |
| | 1,106,226 | | | Ferrexpo Plc | | | 2,730,095 | |
| | 335 | | | Forbo Holding AG | | | 512,209 | |
| | 2,690 | | | Galenica AG(c) | | | 169,858 | |
| | 219 | | | Georg Fischer AG | | | 220,923 | |
| | 19,066 | | | Huber + Suhner AG | | | 1,374,407 | |
| | 58,239 | | | Implenia AG | | | 1,166,749 | |
| | 9,340 | | | Ina Invest Holding AG(a) | | | 173,569 | |
| | 1,339 | | | Investis Holding SA | | | 128,504 | |
| | 705 | | | Lastminute.com NV(a) | | | 12,033 | |
| | 42 | | | LEM Holding SA | | | 76,126 | |
| | 41,591 | | | Logitech International S.A. | | | 3,501,636 | |
| | 8,582 | | | Lonza Group AG | | | 5,196,277 | |
| | 92 | | | Metall Zug AG | | | 113,878 | |
| | 478 | | | Orell Fuessli AG | | | 47,333 | |
| | 833 | | | Peach Property Group AG(a) | | | 37,882 | |
| | 135 | | | Phoenix Mecano AG | | | 61,320 | |
| | 16,555 | | | PSP Swiss Property AG | | | 2,002,235 | |
| | 410,663 | | | Quotient Ltd.(a) | | | 1,938,329 | |
| | 213 | | | Schweiter Technologies AG | | | 290,365 | |
| | 10,343 | | | SFS Group AG | | | 964,422 | |
| | 12,262 | | | Siegfried Holding AG | | | 7,762,791 | |
| | 1,587 | | | Sulzer AG | | | 115,959 | |
| | 3,905 | | | Sunrise Communications Group AG(c) | | | 469,733 | |
| | 2,367 | | | Swissquote Group Holding SA | | | 188,699 | |
| | 207 | | | Tamedia AG | | | 14,493 | |
| | 24,201 | | | Tecan Group AG | | | 11,480,926 | |
| | 86,248 | | | Temenos AG | | | 9,259,232 | |
| | 24,490 | | | u-blox Holding AG | | | 1,230,710 | |
| | 15,662 | | | Vontobel Holding AG | | | 958,218 | |
| | 5,645 | | | VZ Holding AG | | | 473,418 | |
| | 920 | | | V-ZUG Holding AG(a) | | | 69,932 | |
| | 7,699 | | | Ypsomed Holding AG | | | 957,180 | |
| | 14,789 | | | Zehnder Group AG | | | 707,233 | |
| | | | | | | | 96,088,346 | |
| TAIWAN — 1.3% | | | | |
| | 6,172,000 | | | Acer, Inc. | | | 5,146,300 | |
| | 11,720,000 | | | AU Optronics Corp.(a) | | | 4,732,498 | |
| | 1,668,559 | | | Cheng Shin Rubber Industry Co. Ltd. | | | 2,105,860 | |
| | 6,497,650 | | | China Petrochemical Development Corp. | | | 1,942,242 | |
| | 4,939,000 | | | Compal Electronics, Inc. | | | 3,211,684 | |
| | 9,574,240 | | | Evergreen Marine Corp. Taiwan Ltd.(a) | | | 6,326,258 | |
| | 1,067,000 | | | Everlight Electronics Co. Ltd. | | | 1,413,788 | |
| | 866,200 | | | Gigabyte Technology Co. Ltd. | | | 2,174,320 | |
| | 10,345,000 | | | HannStar Display Corp.(a) | | | 3,309,272 | |
| | 1,227,000 | | | HTC Corp.(a) | | | 1,231,139 | |
| | 13,550,000 | | | Innolux Corp. | | | 4,694,548 | |
| | 2,741,431 | | | International CSRC Investment Holdings Co. | | | 1,878,513 | |
| Shares | | | | | Value | |
| TAIWAN (continued) | | | | |
| | 4,243,000 | | | Inventec Corp. | | $ | 3,352,450 | |
| | 1,189,000 | | | Kinsus Interconnect Technology Corp. | | | 2,872,372 | |
| | 161,000 | | | MediaTek, Inc. | | | 3,816,246 | |
| | 6,590 | | | momo.com, Inc. | | | 157,588 | |
| | 1,363,000 | | | Pegatron Corp. | | | 2,930,568 | |
| | 91,790 | | | Powertech Technology, Inc. | | | 270,844 | |
| | 6,722,000 | | | Qisda Corp. | | | 4,394,616 | |
| | 93,105 | | | Radiant Opto-Electronics Corp. | | | 366,190 | |
| | 68,180 | | | SCI Pharmtech, Inc. | | | 277,692 | |
| | 16,877,894 | | | Shin Kong Financial Holding Co. Ltd. | | | 4,696,909 | |
| | 10,961 | | | Sino-American Electronic Co. Ltd.(a)(b) | | | 0 | |
| | 512,018 | | | Taichung Commercial Bank Co. Ltd. | | | 194,221 | |
| | 47,895 | | | TaiDoc Technology Corp. | | | 387,634 | |
| | 1,856,000 | | | Unimicron Technology Corp. | | | 4,425,305 | |
| | 19,028,646 | | | United Microelectronics Corp. | | | 20,423,355 | |
| | 44,673 | | | Wintek Corp.(a)(b) | | | 536 | |
| | 4,812,696 | | | Wistron Corp. | | | 4,795,282 | |
| | | | | | | | 91,528,230 | |
| THAILAND — 0.2% | | | | |
| | 92,771 | | | Fabrinet(a) | | | 5,568,115 | |
| | 27,214,907 | | | IRPC Public Co. Ltd. - FOR | | | 1,763,828 | |
| | 5,002,000 | | | Italian-Thai Development Public Co. Ltd. - FOR(a) | | | 142,834 | |
| | 3,299,558 | | | PTT Global Chemical Public Co. Ltd. - FOR | | | 4,234,614 | |
| | 3,229,183 | | | Thai Oil Public Co. Ltd. - FOR | | | 3,548,553 | |
| | | | | | | | 15,257,944 | |
| TURKEY — 0.3% | | | | |
| | 1,536,106 | | | Arcelik AS(a) | | | 4,927,565 | |
| | 6,634,452 | | | Dogan Sirketler Grubu Holding AS | | | 1,923,947 | |
| | 16,225,567 | | | Emlak Konut Gayrimenkul Yatirim Ortakligi AS REIT | | | 3,330,506 | |
| | 6,292,629 | | | Petkim Petrokimya Holding AS(a) | | | 3,086,426 | |
| | 244,987 | | | Tupras Turkiye Petrol Rafinerileri AS(a) | | | 2,185,426 | |
| | 1,709,828 | | | Turkcell Iletisim Hizmetleri AS | | | 2,979,114 | |
| | 426,738 | | | Turkiye Sise ve Cam Fabrikalari AS | | | 312,179 | |
| | | | | | | | 18,745,163 | |
| UNITED ARAB EMIRATES — 0.0% | | | | |
| | 833 | | | NMC Health Plc(a) | | | 228 | |
| UNITED KINGDOM — 6.1% | | | | |
| | 35,366 | | | 4imprint Group Plc(a) | | | 948,408 | |
| | 244,722 | | | AA Plc(a) | | | 72,126 | |
| | 12,026 | | | accesso Technology Group Plc(a) | | | 42,844 | |
| | 944,998 | | | Adaptimmune Therapeutics Plc - ADR(a) | | | 4,261,941 | |
| | 8,010 | | | AG Barr Plc(a) | | | 48,928 | |
| | 227,306 | | | Aggreko Plc | | | 1,299,817 | |
| | 449 | | | Aptitude Software Group Plc | | | 2,792 | |
| Old Westbury Funds, Inc. | |
| Small & Mid Cap Strategies Fund | |
| Portfolio of Investments - (Continued) | October 31, 2020 |
| Shares | | | | Value |
| UNITED KINGDOM (continued) | | |
| | 10,408 | | | Argentex Group Plc | | $ | 14,697 | |
| | 304,460 | | | ASOS Plc(a) | | | 17,386,445 | |
| | 111,439 | | | AVEVA Group Plc | | | 6,193,462 | |
| | 1,682,735 | | | B&M European Value Retail SA | | | 10,568,596 | |
| | 1,222,898 | | | Balfour Beatty Plc(a) | | | 3,384,001 | |
| | 27,727 | | | Bloomsbury Publishing Plc | | | 91,777 | |
| | 2,390,529 | | | boohoo Group Plc(a) | | | 8,411,293 | |
| | 579,669 | | | Britvic Plc | | | 5,542,113 | |
| | 461,919 | | | Capita Plc(a) | | | 147,749 | |
| | 28,780 | | | Central Asia Metals Plc | | | 62,787 | |
| | 2,442,884 | | | Centrica Plc(a) | | | 1,176,661 | |
| | 90,110 | | | Chemring Group Plc | | | 304,102 | |
| | 14,041 | | | Chesnara Plc | | | 47,658 | |
| | 1,200 | | | Clarkson Plc | | | 31,248 | |
| | 48,237 | | | Clinigen Group Plc | | | 376,197 | |
| | 4,767 | | | Clipper Logistics Plc | | | 26,864 | |
| | 85,351 | | | CLS Holdings Plc | | | 219,155 | |
| | 1,957,345 | | | Codemasters Group Holdings Plc(a) | | | 10,523,360 | |
| | 63,918 | | | Computacenter Plc | | | 1,883,010 | |
| | 57,927 | | | Concentric AB(a) | | | 959,548 | |
| | 4,609,989 | | | ConvaTec Group Plc(c) | | | 10,791,877 | |
| | 1,512 | | | CRANEWARE Plc | | | 30,459 | |
| | 14,020 | | | CVS Group Plc | | | 224,313 | |
| | 3,562 | | | Daily Mail & General Trust Plc - Class A | | | 31,195 | |
| | 154,908 | | | Dart Group Plc | | | 1,706,818 | |
| | 2,438 | | | Devro Plc | | | 4,769 | |
| | 323,331 | | | Dialog Semiconductor Plc(a) | | | 12,343,839 | |
| | 22,569 | | | Dignity Plc(a) | | | 153,501 | |
| | 1,368,684 | | | Dixons Carphone Plc | | | 1,703,098 | |
| | 2,427,734 | | | Drax Group Plc | | | 9,303,326 | |
| | 28,901 | | | Dunelm Group Plc | | | 487,861 | |
| | 1,071,972 | | | Electrocomponents Plc | | | 9,436,520 | |
| | 229,501 | | | Elementis Plc(a) | | | 221,206 | |
| | 79,118 | | | EMIS Group Plc | | | 1,020,877 | |
| | 1,306 | | | Epwin Group Plc(a) | | | 1,095 | |
| | 15,595 | | | Ergomed Plc(a) | | | 148,697 | |
| | 122,438 | | | FDM Group Holdings Plc | | | 1,586,190 | |
| | 156,805 | | | Fevertree Drinks Plc | | | 4,093,303 | |
| | 14,028 | | | Frontier Developments Plc(a) | | | 474,324 | |
| | 1,912 | | | Games Workshop Group Plc | | | 256,865 | |
| | 10,948 | | | Gamma Communications Plc | | | 236,859 | |
| | 6,409 | | | Gateley Holdings Plc(a) | | | 10,171 | |
| | 19,555 | | | GB Group Plc(a) | | | 225,216 | |
| | 235,343 | | | Genus Plc | | | 12,506,503 | |
| | 113,814 | | | Go-Ahead Group Plc (The) | | | 862,562 | |
| | 143,212 | | | Greggs Plc(a) | | | 2,387,794 | |
| | 495,269 | | | Gulf Keystone Petroleum Ltd. | | | 449,136 | |
| | 275,323 | | | Halfords Group Plc | | | 857,821 | |
| | 902,783 | | | Hays Plc(a) | | | 1,249,090 | |
| | 67,140 | | | Headlam Group Plc | | | 231,367 | |
| | 361,328 | | | HomeServe Plc | | | 5,172,528 | |
| | 41,216 | | | Horizon Discovery Group Plc(a) | | | 47,415 | |
| Shares | | | | Value |
| UNITED KINGDOM (continued) | | |
| | 1,118,129 | | | Howden Joinery Group Plc(a) | | $ | 9,224,311 | |
| | 94,451 | | | Hummingbird Resources Plc(a) | | | 41,236 | |
| | 33,579 | | | Hunting Plc | | | 60,685 | |
| | 28,495 | | | IG Group Holdings Plc | | | 280,926 | |
| | 251,866 | | | IMI Plc | | | 3,373,875 | |
| | 53,989 | | | Impact Healthcare Plc REIT | | | 69,244 | |
| | 528,376 | | | Inchcape Plc(a) | | | 3,393,818 | |
| | 243,011 | | | Indivior Plc(a) | | | 347,249 | |
| | 582,131 | | | IntegraFin Holdings Plc | | | 3,668,956 | |
| | 367,674 | | | International Personal Finance Plc(a) | | | 273,410 | |
| | 2,539 | | | iomart Group Plc | | | 10,328 | |
| | 914,543 | | | JD Sports Fashion Plc | | | 8,781,698 | |
| | 135,753 | | | John Wood Group Plc(a) | | | 373,017 | |
| | 148,109 | | | Johnson Service Group Plc(a) | | | 167,508 | |
| | 4,044 | | | Judges Scientific Plc | | | 282,907 | |
| | 934,341 | | | Just Group Plc(a) | | | 509,597 | |
| | 125,910 | | | Kainos Group Plc | | | 2,012,864 | |
| | 21,666 | | | Keller Group Plc | | | 142,588 | |
| | 360,123 | | | Lookers Plc(b) | | | 97,974 | |
| | 34,675 | | | LoopUp Group Plc(a) | | | 96,582 | |
| | 102,044 | | | M&G Plc | | | 193,869 | |
| | 672,893 | | | Marks & Spencer Group Plc | | | 777,065 | |
| | 901,985 | | | Marston’s Plc | | | 564,632 | |
| | 221,243 | | | McBride Plc(a)(b) | | | 287 | |
| | 20,113 | | | McBride Plc | | | 15,999 | |
| | 950,169 | | | Micro Focus International Plc(a) | | | 2,657,617 | |
| | 36,674 | | | Mitie Group Plc | | | 13,398 | |
| | 471,738 | | | Moneysupermarket.com Group Plc | | | 1,486,289 | |
| | 22,720 | | | Morgan Advanced Materials Plc(a) | | | 73,585 | |
| | 14,312 | | | Morgan Sindall Group Plc(a) | | | 204,696 | |
| | 33,415 | | | N Brown Group Plc | | | 24,761 | |
| | 115,107 | | | NCC Group Plc | | | 272,296 | |
| | 40,043 | | | NewRiver Plc REIT | | | 32,941 | |
| | 283,426 | | | Ninety One Plc(a) | | | 756,390 | |
| | 484 | | | Norcros Plc | | | 1,091 | |
| | 3,144,199 | | | Ocado Group Plc(a) | | | 92,708,860 | |
| | 149,683 | | | Orchard Therapeutics plc - ADR(a) | | | 604,719 | |
| | 320,831 | | | Oxford Biomedica Plc(a) | | | 3,341,730 | |
| | 33,991 | | | Oxford Instruments Plc(a) | | | 698,403 | |
| | 96,831 | | | Oxford Metrics Plc | | | 92,829 | |
| | 47,725 | | | Pagegroup Plc(a) | | | 221,097 | |
| | 5,827 | | | Patisserie Holdings Plc(a)(b) | | | 0 | |
| | 114,778 | | | PayPoint Plc | | | 749,425 | |
| | 468,448 | | | Pets at Home Group Plc | | | 2,340,116 | |
| | 36,579 | | | Photo-Me International Plc(a) | | | 23,220 | |
| | 40,982 | | | Polar Capital Holdings Plc | | | 271,833 | |
| | 164,245 | | | Rank Group Plc | | | 191,502 | |
| | 22,103 | | | Rathbone Brothers Plc | | | 415,201 | |
| | 81,123 | | | Reach Plc | | | 110,350 | |
| | 47,634 | | | Redrow Plc(a) | | | 256,467 | |
| | 137,598 | | | Renishaw Plc(a) | | | 9,973,582 | |
| | 6,884,706 | | | Rentokil Initial Plc(a) | | | 46,914,825 | |
| | 1,472,551 | | | Rightmove Plc(a) | | | 11,789,565 | |
| Old Westbury Funds, Inc. | |
| Small & Mid Cap Strategies Fund | |
| Portfolio of Investments - (Continued) | October 31, 2020 |
| Shares | | | | Value |
| UNITED KINGDOM (continued) | | | | |
| | 12,337 | | | RM Plc(a) | | $ | 27,530 | |
| | 14,847 | | | Robert Walters Plc | | | 76,937 | |
| | 3,512,425 | | | Rotork Plc | | | 12,786,519 | |
| | 1,111,283 | | | Royal Mail Plc | | | 3,268,056 | |
| | 140,011 | | | RPS Group Plc(a) | | | 91,962 | |
| | 81,405 | | | Safestore Holdings Plc REIT | | | 847,376 | |
| | 18,534 | | | SDI Group PLC(a) | | | 17,288 | |
| | 185,138 | | | Senior Plc(a) | | | 131,436 | |
| | 480,768 | | | Serco Group Plc(a) | | | 805,951 | |
| | 63,577 | | | Softcat Plc | | | 926,598 | |
| | 47,327 | | | Speedy Hire Plc | | | 32,496 | |
| | 567,901 | | | Spirent Communications Plc | | | 2,129,905 | |
| | 188,222 | | | Sports Direct International Plc(a) | | | 913,922 | |
| | 840,910 | | | SSP Group Plc | | | 2,033,915 | |
| | 265,294 | | | St. James’s Place Plc | | | 3,090,457 | |
| | 881,091 | | | Stagecoach Group Plc | | | 434,210 | |
| | 109,870 | | | SThree Plc | | | 350,149 | |
| | 25,810 | | | Sumo Group Plc(a) | | | 83,258 | |
| | 672,885 | | | Tate & Lyle Plc | | | 5,188,511 | |
| | 9,007 | | | Team17 Group Plc(a) | | | 82,847 | |
| | 116,147 | | | Telit Communications Plc(a) | | | 201,327 | |
| | 735,120 | | | TP ICAP Plc | | | 1,817,086 | |
| | 885,998 | | | Trainline Plc(a)(c) | | | 3,156,490 | |
| | 29,200 | | | Travis Perkins Plc(a) | | | 401,552 | |
| | 12,733 | | | Tyman Plc(a) | | | 44,043 | |
| | 45,570 | | | Ultra Electronics Holdings Plc | | | 1,109,880 | |
| | 941,496 | | | Vectura Group Plc(a) | | | 1,256,304 | |
| | 60,862 | | | Vertu Motors Plc | | | 23,181 | |
| | 41,686 | | | Vesuvius Plc | | | 215,586 | |
| | 185,045 | | | Victrex Plc | | | 4,422,957 | |
| | 346,488 | | | Vistry Group plc(a) | | | 2,446,379 | |
| | 394 | | | Vitec Group Plc (The)(a) | | | 3,644 | |
| | 9,775 | | | Volution Group Plc | | | 24,567 | |
| | 92,541 | | | Watkin Jones Plc | | | 160,409 | |
| | 370,851 | | | YouGov Plc | | | 4,660,260 | |
| | | | | | | | 416,534,575 | |
| UNITED STATES — 46.2% | | | | |
| | 852,825 | | | A.O. Smith Corp. | | | 44,082,524 | |
| | 18,509 | | | Acceleron Pharma, Inc.(a) | | | 1,935,671 | |
| | 405,992 | | | Advance Auto Parts, Inc. | | | 59,794,502 | |
| | 159,744 | | | AeroVironment, Inc.(a) | | | 12,198,052 | |
| | 52,272 | | | Agios Pharmaceuticals, Inc.(a) | | | 2,094,539 | |
| | 60,000 | | | Albany International Corp. - Class A | | | 3,056,400 | |
| | 388,716 | | | Alnylam Pharmaceuticals, Inc.(a) | | | 47,800,407 | |
| | 485,000 | | | Altra Industrial Motion Corp. | | | 20,738,600 | |
| | 87,999 | | | Ambarella, Inc.(a) | | | 4,810,905 | |
| | 170,102 | | | ANSYS, Inc.(a) | | | 51,773,946 | |
| | 306,699 | | | Appian Corp.(a) | | | 19,414,047 | |
| | 45,676 | | | Aprea Therapeutics, Inc.(a) | | | 996,194 | |
| | 346,282 | | | AptarGroup, Inc. | | | 39,507,313 | |
| | 435,000 | | | AtriCure, Inc.(a) | | | 15,033,600 | |
| | 479 | | | Atrion Corp. | | | 287,951 | |
| Shares | | | | Value |
| UNITED STATES (continued) | | | | |
| | 632,900 | | | Avanos Medical, Inc.(a) | | $ | 22,373,015 | |
| | 254,575 | | | Axogen, Inc.(a) | | | 3,210,191 | |
| | 134,283 | | | Axon Enterprise, Inc.(a) | | | 13,280,589 | |
| | 487,675 | | | B&G Foods, Inc. | | | 12,952,648 | |
| | 560,000 | | | Barnes Group, Inc. | | | 20,552,000 | |
| | 207,681 | | | Benefitfocus, Inc.(a) | | | 2,132,884 | |
| | 155,000 | | | Blackbaud, Inc. | | | 7,647,700 | |
| | 313,887 | | | Blackline, Inc.(a) | | | 30,660,482 | |
| | 20,550 | | | Bloomin’ Brands, Inc. | | | 287,289 | |
| | 4,440 | | | Brinker International, Inc. | | | 193,318 | |
| | 200,000 | | | Bryn Mawr Bank Corp. | | | 5,372,000 | |
| | 262,890 | | | Burlington Stores, Inc.(a) | | | 50,890,246 | |
| | 6,850 | | | Cabot Oil & Gas Corp. | | | 121,861 | |
| | 352,745 | | | Cantel Medical Corp. | | | 16,875,321 | |
| | 620,000 | | | Cardiovascular Systems, Inc.(a) | | | 22,103,000 | |
| | 215,000 | | | Catalent, Inc.(a) | | | 18,870,550 | |
| | 356,590 | | | CDW Corp. | | | 43,717,934 | |
| | 105,521 | | | CEVA, Inc.(a) | | | 4,254,607 | |
| | 55,000 | | | Chase Corp. | | | 5,233,800 | |
| | 13,802 | | | Cheesecake Factory, Inc. (The) | | | 410,195 | |
| | 522,676 | | | Chegg, Inc.(a) | | | 38,385,325 | |
| | 146,063 | | | Chinook Therapeutics, Inc.(a) | | | 1,803,878 | |
| | 2,455 | | | Citrix Systems, Inc. | | | 278,078 | |
| | 1,061,321 | | | Cloudera, Inc.(a) | | | 10,316,040 | |
| | 397,170 | | | CMC Materials, Inc. | | | 56,473,602 | |
| | 1,154,617 | | | Codexis, Inc.(a) | | | 15,367,952 | |
| | 3,765 | | | Cogent Communications Holdings, Inc. | | | 210,087 | |
| | 210,000 | | | Community Bank System, Inc. | | | 12,177,900 | |
| | 345,000 | | | CONMED Corp. | | | 26,899,650 | |
| | 222,814 | | | Cooper Cos, Inc. (The) | | | 71,088,807 | |
| | 3,183 | | | Cracker Barrel Old Country Store, Inc. | | | 362,289 | |
| | 221,380 | | | Cree, Inc.(a) | | | 14,079,768 | |
| | 85,000 | | | CSW Industrials, Inc. | | | 7,270,050 | |
| | 525,000 | | | CVB Financial Corp. | | | 9,187,500 | |
| | 21,889 | | | DexCom, Inc.(a) | | | 6,995,287 | |
| | 194,873 | | | Digimarc Corp.(a) | | | 6,175,525 | |
| | 2,045 | | | Digital Realty Trust, Inc. REIT | | | 295,094 | |
| | 940 | | | Domino’s Pizza, Inc. | | | 355,621 | |
| | 473,690 | | | Dover Corp. | | | 52,442,220 | |
| | 750,000 | | | elf Beauty, Inc.(a) | | | 15,202,500 | |
| | 140,000 | | | Envestnet, Inc.(a) | | | 10,743,600 | |
| | 159,750 | | | Envista Holdings Corp.(a) | | | 4,220,595 | |
| | 334,948 | | | Equifax, Inc. | | | 45,753,897 | |
| | 9,295 | | | Equity Commonwealth REIT | | | 245,574 | |
| | 131,031 | | | Everbridge, Inc.(a) | | | 13,717,635 | |
| | 185,122 | | | EverQuote, Inc. - Class A(a) | | | 6,199,736 | |
| | 795,000 | | | Evoqua Water Technologies Corp.(a) | | | 18,229,350 | |
| | 232,110 | | | Exact Sciences Corp.(a) | | | 28,742,181 | |
| | 3,402 | | | Exponent, Inc. | | | 236,745 | |
| | 1,804 | | | Extra Space Storage, Inc. REIT | | | 209,174 | |
| | 108,967 | | | FARO Technologies, Inc.(a) | | | 6,564,172 | |
| | 116,500 | | | First Solar, Inc.(a) | | | 10,140,743 | |
| Old Westbury Funds, Inc. | |
| Small & Mid Cap Strategies Fund | |
| Portfolio of Investments - (Continued) | October 31, 2020 |
| Shares | | | | Value |
| UNITED STATES (continued) | | | | |
| | 389,809 | | | Flexion Therapeutics, Inc.(a) | | $ | 4,673,810 | |
| | 652,408 | | | Freeport-McMoRan, Inc. | | | 11,312,755 | |
| | 50,000 | | | Freshpet, Inc.(a) | | | 5,725,000 | |
| | 1,957 | | | FTI Consulting, Inc.(a) | | | 192,686 | |
| | 75,000 | | | Generac Holdings, Inc.(a) | | | 15,761,250 | |
| | 250,000 | | | German American Bancorp, Inc. | | | 7,542,500 | |
| | 132,501 | | | Glaukos Corp.(a) | | | 7,409,456 | |
| | 56,233 | | | Global Blood Therapeutics, Inc.(a) | | | 2,973,601 | |
| | 220,000 | | | Globus Medical, Inc. - Class A(a) | | | 11,466,400 | |
| | 18,801 | | | H&R Block, Inc. | | | 324,505 | |
| | 8,070 | | | Hawaiian Electric Industries, Inc. | | | 266,633 | |
| | 195,000 | | | HB Fuller Co. | | | 8,823,750 | |
| | 167,604 | | | Heron Therapeutics, Inc.(a) | | | 2,733,621 | |
| | 2,025,000 | | | Hostess Brands, Inc.(a) | | | 25,596,000 | |
| | 1,266,060 | | | IAA, Inc.(a) | | | 71,646,335 | |
| | 132,695 | | | IDEX Corp. | | | 22,609,901 | |
| | 260,000 | | | Independent Bank Corp. | | | 14,895,400 | |
| | 222,667 | | | Ingersoll Rand, Inc.(a) | | | 7,779,985 | |
| | 160,000 | | | Innospec, Inc. | | | 10,582,400 | |
| | 172,338 | | | Insmed, Inc.(a) | | | 5,676,814 | |
| | 205,671 | | | Inspire Medical Systems, Inc.(a) | | | 24,563,288 | |
| | 575,000 | | | Integra LifeScience Holdings Corp.(a) | | | 25,357,500 | |
| | 294,285 | | | Intersect ENT, Inc.(a) | | | 4,561,418 | |
| | 70,887 | | | IPG Photonics Corp.(a) | | | 13,182,147 | |
| | 141,141 | | | iRobot Corp.(a) | | | 11,232,001 | |
| | 90,000 | | | J&J Snack Foods Corp. | | | 12,201,300 | |
| | 2,065 | | | Jack Henry & Associates, Inc. | | | 306,136 | |
| | 5,086 | | | Jack in the Box, Inc. | | | 407,185 | |
| | 340,000 | | | John Bean Technologies Corp. | | | 28,549,800 | |
| | 430,115 | | | John Wiley & Sons, Inc. - Class A | | | 13,316,360 | |
| | 10,287 | | | Juniper Networks, Inc. | | | 202,860 | |
| | 19,406 | | | KKR Real Estate Finance Trust, Inc. REIT | | | 324,274 | |
| | 140,590 | | | L3Harris Technologies, Inc. | | | 22,650,455 | |
| | 279,440 | | | Laboratory Corp. of America Holdings(a) | | | 55,823,729 | |
| | 200,000 | | | Lancaster Colony Corp. | | | 33,228,000 | |
| | 134,240 | | | LendingTree, Inc.(a) | | | 43,438,722 | |
| | 2,683 | | | Life Storage, Inc. REIT | | | 306,264 | |
| | 235,350 | | | LivePerson, Inc.(a) | | | 12,581,811 | |
| | 199,587 | | | LiveRamp Holdings, Inc.(a) | | | 13,190,705 | |
| | 26,402 | | | Madrigal Pharmaceuticals, Inc.(a) | | | 3,359,655 | |
| | 113,141 | | | MarketAxess Holdings, Inc. | | | 60,966,028 | |
| | 40,000 | | | Masimo Corp.(a) | | | 8,952,800 | |
| | 436,286 | | | Match Group, Inc.(a) | | | 50,949,479 | |
| | 365,481 | | | MaxCyte, Inc.(a) | | | 1,931,808 | |
| | 825,000 | | | Medallia, Inc.(a) | | | 23,471,250 | |
| | 266,410 | | | MGP Ingredients, Inc. | | | 11,194,548 | |
| | 238,792 | | | Model N, Inc.(a) | | | 8,412,642 | |
| | 195,000 | | | MSA Safety, Inc. | | | 25,724,400 | |
| | 470,505 | | | Nasdaq, Inc. | | | 56,926,400 | |
| | 5,669 | | | National Health Investors, Inc. REIT | | | 317,747 | |
| | 3,593 | | | National HealthCare Corp. | | | 227,437 | |
| Shares | | | | Value |
| UNITED STATES (continued) | | |
| | 100,353 | | | National Instruments Corp. | | $ | 3,139,042 | |
| | 350,000 | | | National Vision Holdings, Inc.(a) | | | 14,115,500 | |
| | 6,417 | | | Nelnet, Inc. - Class A | | | 391,694 | |
| | 442,270 | | | New Relic, Inc.(a) | | | 26,828,098 | |
| | 125,000 | | | Omnicell, Inc.(a) | | | 10,818,750 | |
| | 269,284 | | | Pacira BioSciences, Inc.(a) | | | 14,083,553 | |
| | 115,000 | | | Palomar Holdings, Inc.(a) | | | 10,254,550 | |
| | 76,047 | | | Paycom Software, Inc.(a) | | | 27,687,952 | |
| | 85,000 | | | Penumbra, Inc.(a) | | | 22,187,550 | |
| | 800,000 | | | Pluralsight, Inc.(a) | | | 12,560,000 | |
| | 505,000 | | | Prestige Consumer Healthcare, Inc.(a) | | | 16,680,150 | |
| | 225,000 | | | Prosperity Bancshares, Inc. | | | 12,399,750 | |
| | 46,162 | | | Protara Therapeutics, Inc.(a) | | | 828,146 | |
| | 1,950,000 | | | Pure Storage, Inc. - Class A(a) | | | 31,395,000 | |
| | 3,304,860 | | | PureTech Health Plc(a) | | | 11,110,392 | |
| | 506,756 | | | Q2 Holdings, Inc.(a) | | | 46,236,417 | |
| | 3,023 | | | Quest Diagnostics, Inc. | | | 369,229 | |
| | 60,450 | | | RBC Bearings, Inc.(a) | | | 7,196,573 | |
| | 95,047 | | | Rubius Therapeutics, Inc.(a) | | | 402,049 | |
| | 565,000 | | | SailPoint Technologies Holding, Inc.(a) | | | 23,453,150 | |
| | 791,540 | | | Sally Beauty Holdings, Inc.(a) | | | 6,625,190 | |
| | 48,648 | | | Seagen, Inc.(a) | | | 8,114,486 | |
| | 250,000 | | | Selective Insurance Group, Inc. | | | 13,015,000 | |
| | 440,000 | | | Sensient Technologies Corp. | | | 28,789,200 | |
| | 75,000 | | | Shake Shack, Inc. - Class A(a) | | | 5,064,000 | |
| | 3,115 | | | Shenandoah Telecommunications Co. | | | 135,876 | |
| | 83,304 | | | Shockwave Medical, Inc.(a) | | | 5,691,329 | |
| | 1,080,000 | | | Simply Good Foods Co. (The)(a) | | | 20,304,000 | |
| | 8,065 | | | Simulations Plus, Inc. | | | 522,773 | |
| | 4,177 | | | Southwest Gas Holdings, Inc. | | | 274,512 | |
| | 94,163 | | | Splunk, Inc.(a) | | | 18,648,041 | |
| | 4,175 | | | Sprouts Farmers Market, Inc.(a) | | | 79,534 | |
| | 451,910 | | | SS&C Technologies Holdings, Inc. | | | 26,762,110 | |
| | 439,832 | | | STAAR Surgical Co.(a) | | | 31,887,820 | |
| | 130,000 | | | Standex International Corp. | | | 8,071,700 | |
| | 315,795 | | | STERIS Plc | | | 55,955,716 | |
| | 165,000 | | | Stock Yards Bancorp, Inc. | | | 6,306,300 | |
| | 247,050 | | | Stratasys Ltd.(a) | | | 3,157,299 | |
| | 377,895 | | | Synopsys, Inc.(a) | | | 80,816,625 | |
| | 119,491 | | | Tabula Rasa HealthCare, Inc.(a) | | | 4,127,219 | |
| | 250,000 | | | Tactile Systems Technology, Inc.(a) | | | 9,145,000 | |
| | 228,510 | | | Teladoc Health, Inc.(a) | | | 44,893,075 | |
| | 154,958 | | | Teleflex, Inc. | | | 49,312,284 | |
| | 650,000 | | | Tenable Holdings, Inc.(a) | | | 22,171,500 | |
| | 168,866 | | | Tesla, Inc.(a) | | | 65,526,763 | |
| | 403,100 | | | TreeHouse Foods, Inc.(a) | | | 15,656,404 | |
| | 657,875 | | | TriMas Corp.(a) | | | 16,006,099 | |
| | 234,121 | | | Trupanion, Inc.(a) | | | 16,749,016 | |
| | 297,100 | | | UMB Financial Corp. | | | 18,084,477 | |
| | 895 | | | UniFirst Corp. | | | 146,610 | |
| | 667,183 | | | Upwork, Inc.(a) | | | 12,309,526 | |
| | 71,858 | | | UroGen Pharma Ltd.(a) | | | 1,618,242 | |
| Old Westbury Funds, Inc. | |
| Small & Mid Cap Strategies Fund | |
| Portfolio of Investments - (Continued) | October 31, 2020 |
| Shares | | | | Value |
| UNITED STATES (continued) | |
| | 962,900 | | | US Foods Holding Corp.(a) | | $ | 20,124,610 | |
| | 170,705 | | | Utz Brands, Inc. | | | 2,895,157 | |
| | 100,000 | | | Vapotherm, Inc.(a) | | | 2,995,000 | |
| | 345,580 | | | Veeco Instruments, Inc.(a) | | | 4,399,233 | |
| | 188,815 | | | Verisk Analytics, Inc. | | | 33,603,406 | |
| | 1,543,928 | | | ViewRay, Inc.(a) | | | 4,585,466 | |
| | 150,000 | | | Washington Trust Bancorp, Inc. | | | 5,065,500 | |
| | 121,237 | | | Wayfair, Inc. - Class A(a) | | | 30,070,413 | |
| | 1,800 | | | WD-40 Co. | | | 438,084 | |
| | 6,175 | | | Weis Markets, Inc. | | | 280,407 | |
| | 1,322,745 | | | Welbilt, Inc.(a) | | | 8,042,290 | |
| | 61,945 | | | West Pharmaceutical Services, Inc. | | | 16,853,376 | |
| | 295,170 | | | WEX, Inc.(a) | | | 37,353,763 | |
| | 25,000 | | | Wingstop, Inc. | | | 2,908,250 | |
| | 711,945 | | | Wolverine World Wide, Inc. | | | 18,987,573 | |
| | 215,000 | | | Workiva, Inc.(a) | | | 11,891,650 | |
| | 669,760 | | | Wyndham Hotels & Resorts, Inc. | | | 31,150,538 | |
| | 2,669,956 | | | Yext, Inc.(a) | | | 44,267,870 | |
| | 2,485 | | | York Water Co. (The) | | | 104,991 | |
| | 111,597 | | | Zillow Group, Inc. - Class A(a) | | | 9,968,960 | |
| | 444,250 | | | Zillow Group, Inc. - Class C(a) | | | 39,369,435 | |
| | 46,075 | | | Zscaler, Inc.(a) | | | 6,254,681 | |
| | 250,131 | | | Zuora, Inc. - Class A(a) | | | 2,406,260 | |
| | | | | | | | 3,123,007,991 | |
| VIETNAM — 0.0% | | | | |
| | 794,673 | | | PetroVietnam Drilling & Well Services JSC(a) | | | 371,927 | |
| | 563,790 | | | Vietnam National Petroleum Group | | | 1,191,662 | |
| | | | | | | | 1,563,589 | |
Total Common Stocks
(Cost $4,941,549,048) | | | 5,875,857,378 | |
| | | | | | | | | |
| RIGHTS/WARRANTS — 0.0% | | | | |
| AUSTRALIA — 0.0% | | | | |
| | 1,710 | | | Centrebet Litigation Rights, 12/01/49(a)(b) | | | 0 | |
| | 1,710 | | | Centrebet Litigation Units Rights, Expire 12/01/49(a)(b) | | | 0 | |
| | | | | | | | 0 | |
| AUSTRIA — 0.0% | | | | |
| | 9,812 | | | Intercell Contigent Value Rights AG, Expire 05/22/29(a)(b) | | | 0 | |
| HONG KONG — 0.0% | | | | |
| | 600 | | | Legend Holdings Corp. Rights, Expire 12/31/20(a)(b) | | | 0 | |
| SINGAPORE — 0.0% | | | | |
| | 169,647 | | | Ezion Holdings Ltd. Warrants, Expire 04/16/23(a) | | 0 | |
| Shares | | | | Value |
| UNITED STATES — 0.0% | | |
| | 9,600 | | | Ligand Pharmaceuticals Contingent Value Rights(a)(b) | | $ | 0 | |
Total Rights/Warrants
(Cost $0) | | | 0 | |
| | | | | | | | | |
| EXCHANGE-TRADED FUNDS — 10.6% | | | | |
| | 657,300 | | | iShares Core S&P Small-Cap ETF | | | 47,338,746 | |
| | 454,850 | | | iShares MSCI China ETF | | | 35,350,942 | |
| | 747,000 | | | iShares MSCI Emerging Markets ETF | | | 33,398,370 | |
| | 872,000 | | | iShares MSCI Japan ETF | | | 50,785,280 | |
| | 671,900 | | | iShares MSCI Taiwan ETF | | | 30,343,004 | |
| | 49,805 | | | iShares Russell 2000 ETF | | | 7,624,647 | |
| | 501,800 | | | iShares Russell Mid-Cap Growth ETF | | | 86,851,544 | |
| | 1,135,825 | | | Vanguard Mid-Cap ETF | | | 200,064,216 | |
| | 974,500 | | | Vanguard Small-Cap Growth ETF | | | 211,252,110 | |
| | 429,000 | | | Xtrackers Harvest CSI 300 China A-Shares ETF | | | 15,362,490 | |
| | | | | | | | | |
Total Exchange-Traded Funds
(Cost $576,270,957) | | | 718,371,349 | |
| | | | | | | | | |
| INVESTMENT COMPANY — 0.3% | | | | |
| | 20,792,269 | | | SEI Daily Income Trust Government II Fund - Class A, 0.01%(d) | | | 20,792,269 | |
Total Investment Company
(Cost $20,792,269) | | | 20,792,269 | |
| | | | | | | | | |
| CASH SWEEP — 1.3% | | | | |
| | 84,916,412 | | | Citibank - US Dollars on Deposit in Custody Account, 0.01%(a)(d) | | | 84,916,412 | |
Total Cash Sweep
(Cost $84,916,412) | | | 84,916,412 | |
TOTAL INVESTMENTS — 99.0%
(Cost $5,623,528,686) | | $ | 6,699,937,408 | |
| OTHER ASSETS IN EXCESS OF LIABILITIES — 1.0% | | | 65,305,167 | |
| NET ASSETS — 100.0% | | $ | 6,765,242,575 | |
| (a) | Non-income producing security. |
| (b) | Security is valued using significant unobservable inputs and is classified as Level 3 in the fair value hierarchy. The aggregate value of fair valued securities is $4,316,618 which is 0.06% of net assets and the cost is $6,781,075. |
| (c) | Security exempt from registration under Rule 144A of the Securities Act of 1933, as amended. The security may be resold in transactions exempt from registration normally to qualified institutional buyers. The security has been determined to be liquid in accordance with procedures adopted by the Fund’s Board of Directors. |
| Old Westbury Funds, Inc. | |
| Small & Mid Cap Strategies Fund | |
| Portfolio of Investments - (Continued) | October 31, 2020 |
| (d) | The rate shown represents the current yield as of October 31, 2020. |
The following abbreviations are used in the report:
ADR — American Depositary Receipt
CVR — Contingent Value Right
ETF — Exchange -Traded Fund
FOR — Foreign Ownership Restrictions
MSCI — Morgan Stanley Capital International Index
REIT — Real Estate Investment Trust
VVPR — Voter Verified Paper Record
| Old Westbury Funds, Inc. | |
| Large Cap Strategies Fund | |
| Portfolio of Investments | October 31, 2020 |
| | |
| Shares | | | | | Value | |
| COMMON STOCKS — 93.8% | | | | |
| ARGENTINA — 0.4% | | | | |
| | 80,627 | | | Globant SA(a) | | $ | 14,562,043 | |
| | 43,525 | | | MercadoLibre, Inc.(a) | | | 52,841,526 | |
| | | | | | | | 67,403,569 | |
| AUSTRALIA — 0.4% | | | | |
| | 370,953 | | | Atlassian Corp. Plc - Class A(a) | | | 71,082,014 | |
| | 18,681 | | | Australia & New Zealand Banking Group Ltd. | | | 246,991 | |
| | 21,623 | | | BHP Group Ltd. | | | 513,415 | |
| | 29,775 | | | BlueScope Steel Ltd. | | | 306,816 | |
| | 1,594 | | | Cochlear Ltd. | | | 237,731 | |
| | 10,205 | | | Commonwealth Bank of Australia | | | 495,086 | |
| | 26,739 | | | Computershare Ltd. | | | 228,357 | |
| | 3,024 | | | CSL Ltd. | | | 611,228 | |
| | 3,081 | | | Macquarie Group Ltd. | | | 274,494 | |
| | 112,907 | | | Oil Search Ltd. | | | 203,961 | |
| | 72,114 | | | Santos Ltd. | | | 239,758 | |
| | 14,676 | | | Woodside Petroleum Ltd. | | | 180,732 | |
| | 8,272 | | | Woolworths Group Ltd. | | | 221,876 | |
| | | | | | | | 74,842,459 | |
| BELGIUM — 0.2% | | | | |
| | 3,319 | | | Etablissements Franz Colruyt NV | | | 196,443 | |
| | 284,210 | | | Galapagos NV - ADR(a) | | | 33,104,781 | |
| | 8,528 | | | Proximus SADP | | | 165,816 | |
| | 2,123 | | | UCB S.A. | | | 209,424 | |
| | | | | | | | 33,676,464 | |
| BRAZIL — 0.6% | | | | |
| | 88,713 | | | Ambev S.A. | | | 188,930 | |
| | 926,520 | | | Ambev SA - ADR | | | 1,982,753 | |
| | 863,804 | | | B3 SA - Brasil Bolsa Balcao | | | 7,649,053 | |
| | 2,614,467 | | | Banco Bradesco SA - ADR | | | 9,150,634 | |
| | 757,051 | | | Cia Brasileira de Distribuicao - ADR | | | 8,145,869 | |
| | 2,120,854 | | | Itau Unibanco Holding SA - ADR | | | 8,674,293 | |
| | 1,950,635 | | | Localiza Rent a Car SA | | | 20,652,162 | |
| | 614,800 | | | Lojas Renner SA | | | 4,014,771 | |
| | 414,006 | | | Pagseguro Digital Ltd. - Class A(a) | | | 15,156,760 | |
| | 62,266 | | | Petroleo Brasileiro S.A. | | | 206,289 | |
| | 1,927,685 | | | Raia Drogasil S.A. | | | 8,109,920 | |
| | 1,074,100 | | | Ultrapar Participacoes SA | | | 3,064,338 | |
| | 2,407 | | | Ultrapar Participacoes SA - ADR | | | 6,836 | |
| | 551,071 | | | WEG S.A. | | | 7,289,413 | |
| | 215,199 | | | XP, Inc. - Class A(a) | | | 8,625,176 | |
| | | | | | | | 102,917,197 | |
| CANADA — 1.4% | | | | |
| | 3,460,472 | | | Alimentation Couche-Tard, Inc. - Class B | | | 106,569,966 | |
| | 5,119 | | | Bank of Nova Scotia (The) | | | 212,667 | |
| | 93,926 | | | Barrick Gold Corp. | | | 2,511,179 | |
| | 300,240 | | | BCE, Inc. | | | 12,065,488 | |
| | 2,498 | | | Canadian National Railway Co. | | | 248,150 | |
| Shares | | | | | Value | |
| CANADA (continued) | | | | |
| | 15,195 | | | Canadian Natural Resources Ltd. | | $ | 241,788 | |
| | 1,651 | | | Canadian Pacific Railway Ltd. | | | 493,379 | |
| | 204 | | | Constellation Software, Inc. | | | 214,150 | |
| | 6,378 | | | Dollarama, Inc. | | | 219,637 | |
| | 49,850 | | | Enbridge, Inc. | | | 1,373,560 | |
| | 26,895 | | | Intact Financial Corp. | | | 2,778,121 | |
| | 188,590 | | | Loblaw Cos. Ltd. | | | 9,387,742 | |
| | 6,821 | | | Metro, Inc. | | | 318,191 | |
| | 4,648 | | | Rogers Communications, Inc. - Class B | | | 188,809 | |
| | 5,472 | | | Royal Bank of Canada | | | 382,625 | |
| | 102,680 | | | Shopify, Inc. - Class A(a) | | | 95,023,152 | |
| | 4,392 | | | TC Energy Corp. | | | 172,871 | |
| | 40,445 | | | Thomson Reuters Corp. | | | 3,144,407 | |
| | 379 | | | TOPICUS.COM, Inc.(a)(b) | | | 0 | |
| | 228,220 | | | Toronto-Dominion Bank (The) | | | 10,068,882 | |
| | 5,724 | | | Wheaton Precious Metals Corp. | | | 262,678 | |
| | | | | | | | 245,877,442 | |
| CHILE — 0.0% | | | | |
| | 20,132 | | | Antofagasta Plc | | | 268,505 | |
| | 133,555 | | | Banco Santander Chile - ADR | | | 1,853,743 | |
| | | | | | | | 2,122,248 | |
| CHINA — 8.5% | | | | |
| | 97,384 | | | 51job, Inc. - ADR(a) | | | 6,826,618 | |
| | 569,664 | | | Agricultural Bank of China Ltd. - H Shares | | | 192,521 | |
| | 410,000 | | | Airtac International Group | | | 11,008,443 | |
| | 747,416 | | | Alibaba Group Holding Ltd.(a) | | | 28,267,317 | |
| | 1,531,056 | | | Alibaba Group Holding Ltd. - ADR(a) | | | 466,497,453 | |
| | 13,510,295 | | | ANTA Sports Products Ltd. | | | 148,652,456 | |
| | 41,100 | | | Autohome, Inc. - ADR | | | 3,927,105 | |
| | 54,815 | | | Baidu, Inc. - ADR(a) | | | 7,293,136 | |
| | 24,700,207 | | | Bank of China Ltd. - H Shares | | | 7,805,934 | |
| | 39,295 | | | BeiGene Ltd. - ADR(a) | | | 11,651,753 | |
| | 12,152,163 | | | China Construction Bank Corp. - H Shares | | | 8,386,207 | |
| | 128,202 | | | China International Capital Corp. Ltd. - H Shares(a)(c) | | | 298,325 | |
| | 96,910 | | | China Life Insurance Co. Ltd. - H Shares | | | 210,508 | |
| | 55,693 | | | China Merchants Bank Co. Ltd. - H Shares | | | 289,510 | |
| | 391,636 | | | China Petroleum & Chemical Corp. - H Shares | | | 152,057 | |
| | 176,136 | | | China Railway Construction Corp. Ltd. - H Shares | | | 119,052 | |
| | 106,258 | | | China Shenhua Energy Co Ltd. - H Shares | | | 183,664 | |
| | 101,676 | | | CITIC Securities Co. Ltd. - H Shares | | | 219,287 | |
| | 180,941 | | | CNOOC Ltd. | | | 164,311 | |
| | 26,524 | | | CNOOC Ltd. - ADR | | | 2,443,391 | |
| Old Westbury Funds, Inc. | |
| Large Cap Strategies Fund | |
| Portfolio of Investments - (Continued) | October 31, 2020 |
| | |
| Shares | | | | | Value | |
| CHINA (continued) | | | | |
| | 9,668,698 | | | CSPC Pharmaceutical Group Ltd. | | $ | 10,189,392 | |
| | 985,058 | | | ENN Energy Holdings Ltd. | | | 12,445,847 | |
| | 628,048 | | | Foshan Haitian Flavouring & Food Co. Ltd. - Class A | | | 15,024,870 | |
| | 158,013 | | | Fosun International Ltd. | | | 190,370 | |
| | 471,500 | | | Fuyao Glass Industry Group Co. Ltd. - H Shares(c) | | | 1,997,907 | |
| | 1,282,353 | | | Fuyao Glass Industry Group Co., Ltd. - Class A | | | 7,177,324 | |
| | 1,132,143 | | | Guangdong Investment Ltd. | | | 1,676,492 | |
| | 211,357 | | | Haitong Securities Co. Ltd. – H Shares(a) | | | 178,301 | |
| | 1,869,767 | | | Hangzhou Hikvision Digital Technology Co., Ltd. - Class A | | | 12,536,872 | |
| | 501,986 | | | Hangzhou Tigermed Consulting Co. Ltd. - H Shares(a)(c) | | | 8,061,562 | |
| | 16,257,415 | | | Industrial & Commercial Bank of China Ltd. - H Shares | | | 9,143,158 | |
| | 337,378 | | | Jiangsu Hengrui Medicine Co. Ltd. - Class A | | | 4,475,903 | |
| | 139,789 | | | Jiangsu Yanghe Brewery Joint-Stock Co., Ltd. - Class A | | | 3,508,268 | |
| | 1,537,329 | | | Midea Group Co., Ltd. - Class A | | | 17,876,906 | |
| | 59,716 | | | New China Life Insurance Co. Ltd. - H Shares | | | 237,632 | |
| | 881,645 | | | New Oriental Education & Technology Group, Inc. - ADR(a) | | | 141,398,225 | |
| | 204,755 | | | PICC Property & Casualty Co Ltd. - H Shares | | | 138,396 | |
| | 1,407,500 | | | Ping An Insurance Group Co. of China Ltd. | | | 14,442,648 | |
| | 20,119 | | | Poly Property Services Co. Ltd. | | | 144,680 | |
| | 504,289 | | | S.f. Holding Co., Ltd. - Class A | | | 6,235,413 | |
| | 629,458 | | | Shenzhou International Group Holdings Ltd. | | | 10,871,903 | |
| | 66,000 | | | Silergy Corp. | | | 4,061,041 | |
| | 1,324,043 | | | Sunny Optical Technology Group Co. Ltd. | | | 21,895,171 | |
| | 5,822,144 | | | Tencent Holdings Ltd. - Class H | | | 443,842,258 | |
| | 576,781 | | | Trip.com Group Ltd. - ADR(a) | | | 16,588,222 | |
| | 954,000 | | | Wuxi Biologics Cayman, Inc.(a)(c) | | | 26,654,163 | |
| | 4,376 | | | Yum China Holdings, Inc. | | | 232,934 | |
| | 68,802 | | | ZTO Express Cayman, Inc. - ADR | | | 1,993,882 | |
| | | | | | | | 1,497,808,788 | |
| COLOMBIA — 0.0% | | | | |
| | 208,043 | | | Bancolombia SA - ADR | | | 5,303,016 | |
| CZECH REPUBLIC — 0.0% | | | | |
| | 209,673 | | | Komercni Banka AS(a) | | | 4,247,894 | |
| DENMARK — 0.1% | | | | |
| | 1,614 | | | Carlsberg A/S - Class B | | | 204,275 | |
| | 2,280 | | | Chr Hansen Holding A/S | | | 229,641 | |
| Shares | | | | | Value | |
| DENMARK (continued) | | | | |
| | 19,837 | | | Coloplast A/S - Class B | | $ | 2,894,862 | |
| | 2,740 | | | DSV PANALPINA A/S | | | 443,664 | |
| | 4,463 | | | GN Store Nord A/S | | | 320,970 | |
| | 9,396 | | | Novo Nordisk A/S - B Shares | | | 603,493 | |
| | 61,796 | | | Novozymes A/S - B Shares | | | 3,713,367 | |
| | 38,130 | | | Pandora A/S | | | 3,019,619 | |
| | 15,365 | | | SimCorp A/S | | | 1,831,685 | |
| | | | | | | | 13,261,576 | |
| EGYPT — 0.0% | | | | |
| | 1,494,527 | | | Commercial International Bank Egypt SAE - GDR | | | 5,776,347 | |
| FINLAND — 0.1% | | | | |
| | 45,434 | | | Elisa Oyj | | | 2,235,110 | |
| | 123,790 | | | Kesko Oyj - Class B | | | 3,180,424 | |
| | 3,427 | | | Kone Oyj - Class B | | | 272,761 | |
| | 79,420 | | | Neste Oyj | | | 4,132,730 | |
| | 7,350 | | | UPM-Kymmene Oyj | | | 207,669 | |
| | | | | | | | 10,028,694 | |
| FRANCE — 1.7% | | | | |
| | 2,343 | | | Air Liquide S.A. | | | 342,460 | |
| | 1,200,825 | | | Airbus SE(a) | | | 87,534,371 | |
| | 2,873 | | | Atos SE(a) | | | 196,077 | |
| | 8,552 | | | BNP Paribas S.A.(a) | | | 297,357 | |
| | 2,625 | | | Capgemini SE | | | 303,090 | |
| | 4,916 | | | Edenred | | | 229,245 | |
| | 312 | | | Hermes International | | | 290,332 | |
| | 12,195 | | | Iliad SA | | | 2,357,675 | |
| | 310,830 | | | L’Oreal S.A. | | | 100,529,321 | |
| | 1,702 | | | LVMH Moet Hennessy Louis Vuitton SE | | | 797,450 | |
| | 4,226 | | | Sanofi | | | 380,799 | |
| | 945 | | | Sartorius Stedim Biotech | | | 358,352 | |
| | 848,037 | | | Schneider Electric SE | | | 102,914,475 | |
| | 916 | | | Teleperformance | | | 274,919 | |
| | 11,914 | | | TOTAL SE | | | 358,268 | |
| | | | | | | | 297,164,191 | |
| GEORGIA — 0.0% | | | | |
| | 115,923 | | | Bank of Georgia Group Plc(a) | | | 1,347,104 | |
| GERMANY — 0.8% | | | | |
| | 5,078 | | | BASF SE | | | 278,375 | |
| | 1,360 | | | Bechtle AG | | | 233,311 | |
| | 1,295 | | | Deutsche Boerse AG | | | 190,563 | |
| | 222,322 | | | Deutsche Post AG | | | 9,849,561 | |
| | 14,459 | | | Deutsche Telekom AG | | | 220,094 | |
| | 8,271 | | | Evonik Industries AG | | | 199,110 | |
| | 2,789 | | | Fresenius Medical Care AG & Co KGaA | | | 213,017 | |
| | 6,593 | | | Fresenius SE & Co KGaA | | | 244,484 | |
| | 7,175 | | | RWE AG | | | 265,648 | |
| | 2,328 | | | Siemens AG | | | 273,028 | |
| Old Westbury Funds, Inc. | |
| Large Cap Strategies Fund | |
| Portfolio of Investments - (Continued) | October 31, 2020 |
| | |
| Shares | | | | | Value | |
| GERMANY (continued) | | | | |
| | 540,900 | | | Telefonica Deutschland Holding AG | | $ | 1,365,117 | |
| | 4,982 | | | Vonovia SE | | | 318,080 | |
| | 1,277,494 | | | Zalando SE(a)(c) | | | 119,294,072 | |
| | | | | | | | 132,944,460 | |
| HONG KONG — 1.4% | | | | |
| | 16,418,782 | | | AIA Group Ltd. | | | 154,710,355 | |
| | 528,209 | | | ASM Pacific Technology Ltd. | | | 5,314,454 | |
| | 3,554,969 | | | BOC Hong Kong Holdings Ltd. | | | 9,858,992 | |
| | 52,978 | | | China Mengniu Dairy Co. Ltd. | | | 249,087 | |
| | 47,298 | | | China Mobile Ltd. | | | 287,662 | |
| | 58,030 | | | China Overseas Land & Investment Ltd. | | | 145,215 | |
| | 41,259 | | | China Resources Beer Holdings Co. Ltd. | | | 255,723 | |
| | 46,999 | | | China Resources Land Ltd. | | | 191,270 | |
| | 90,353 | | | CLP Holdings Ltd. | | | 830,979 | |
| | 30,759 | | | Galaxy Entertainment Group Ltd. | | | 202,745 | |
| | 91,684 | | | Hang Lung Properties Ltd. | | | 222,572 | |
| | 11,051 | | | Hang Seng Bank Ltd. | | | 169,917 | |
| | 5,352,351 | | | Hong Kong & China Gas Co. Ltd. | | | 7,691,092 | |
| | 218,419 | | | Hong Kong Exchanges & Clearing Ltd. | | | 10,430,018 | |
| | 275,346 | | | Hutchison China MediTech Ltd. - ADR(a) | | | 8,106,186 | |
| | 1,947,748 | | | MTR Corp. Ltd. | | | 9,635,103 | |
| | 10,292,656 | | | Sino Biopharmaceutical Ltd. | | | 10,382,273 | |
| | 32,706 | | | Sun Hung Kai Properties Ltd. | | | 418,291 | |
| | 1,341,257 | | | Techtronic Industries Co. Ltd. | | | 17,889,194 | |
| | | | | | | | 236,991,128 | |
| INDIA — 3.0% | | | | |
| | 868,905 | | | Apollo Hospitals Enterprise Ltd. | | | 24,850,396 | |
| | 1,690,638 | | | Asian Paints Ltd. | | | 50,451,654 | |
| | 454,868 | | | Bajaj Finance Ltd. | | | 20,310,471 | |
| | 2,374,989 | | | Bandhan Bank Ltd.(a)(c) | | | 9,276,262 | |
| | 321,111 | | | Britannia Industries Ltd. | | | 15,049,742 | |
| | 9,012,173 | | | HDFC Bank Ltd.(a) | | | 143,930,876 | |
| | 169,723 | | | HDFC Bank Ltd. - ADR(a) | | | 9,748,889 | |
| | 2,729,598 | | | Housing Development Finance Corp. Ltd. | | | 70,850,025 | |
| | 1,779,738 | | | ICICI Prudential Life Insurance Co. Ltd.(c) | | | 9,686,703 | |
| | 640,030 | | | Jubilant Foodworks Ltd. | | | 18,782,245 | |
| | 591,309 | | | Kotak Mahindra Bank Ltd.(a) | | | 12,346,814 | |
| | 106,121 | | | Maruti Suzuki India Ltd. | | | 9,974,006 | |
| | 2,217,750 | | | Reliance Industries Ltd. | | | 61,483,215 | |
| | 580,875 | | | Tata Consultancy Services Ltd. | | | 20,887,828 | |
| | 3,546,404 | | | Titan Co. Ltd. | | | 55,786,803 | |
| | | | | | | | 533,415,929 | |
| INDONESIA — 0.2% | | | | |
| | 13,231,049 | | | Astra International Tbk PT | | | 4,907,927 | |
| | 11,250,884 | | | Bank Central Asia Tbk PT | | | 22,270,981 | |
| Shares | | | | | Value | |
| INDONESIA (continued) | | | | |
| | 43,600,930 | | | Bank Rakyat Indonesia Persero Tbk PT | | $ | 10,017,034 | |
| | | | | | | | 37,195,942 | |
| IRELAND — 0.8% | | | | |
| | 57,962 | | | Accenture Plc - Class A | | | 12,572,537 | |
| | 565,334 | | | Aptiv Plc | | | 54,549,078 | |
| | 34,150 | | | Cimpress PLC(a) | | | 2,506,610 | |
| | 6,625 | | | Experian Plc | | | 241,775 | |
| | 1,753 | | | Jazz Pharmaceuticals Plc(a) | | | 252,607 | |
| | 713,884 | | | Medtronic Plc | | | 71,795,314 | |
| | | | | | | | 141,917,921 | |
| ISLE OF MAN — 0.4% | | | | |
| | 5,340,902 | | | GVC Holdings Plc(a) | | | 66,852,954 | |
| ISRAEL — 0.1% | | | | |
| | 1,700,210 | | | Bank Leumi Le-Israel BM | | | 8,047,476 | |
| | 1,842 | | | Check Point Software Technologies Ltd.(a) | | | 209,178 | |
| | 1,395 | | | Nice Ltd.(a) | | | 319,063 | |
| | | | | | | | 8,575,717 | |
| ITALY — 0.0% | | | | |
| | 1,251 | | | DiaSorin SpA | | | 274,639 | |
| | 20,791 | | | FinecoBank Banca Fineco SpA(a) | | | 284,516 | |
| | 11,746 | | | Prysmian SpA | | | 319,290 | |
| | | | | | | | 878,445 | |
| JAPAN — 2.5% | | | | |
| | 9,594 | | | Aeon Co. Ltd. | | | 244,077 | |
| | 211,465 | | | Ajinomoto Co., Inc. | | | 4,236,571 | |
| | 5,876 | | | Asahi Group Holdings Ltd. | | | 180,891 | |
| | 11,847 | | | Astellas Pharma, Inc. | | | 162,381 | |
| | 53,856 | | | Bandai Namco Holdings, Inc. | | | 4,000,041 | |
| | 49,970 | | | Benesse Holdings, Inc. | | | 1,173,659 | |
| | 67,417 | | | Central Japan Railway Co. | | | 8,103,949 | |
| | 7,180 | | | Chugai Pharmaceutical Co Ltd. | | | 275,761 | |
| | 14,094 | | | Chugoku Electric Power Co. Inc. (The) | | | 177,025 | |
| | 1,559 | | | Daikin Industries Ltd. | | | 290,074 | |
| | 7,875 | | | Daiwa House Industry Co. Ltd. | | | 205,760 | |
| | 120 | | | Daiwa House REIT Investment Corp. REIT | | | 277,263 | |
| | 800 | | | Disco Corp. | | | 214,184 | |
| | 2,628 | | | East Japan Railway Co. | | | 136,979 | |
| | 340,900 | | | ENEOS Holdings, Inc. | | | 1,141,597 | |
| | 8,449 | | | Fuji Electric Co. Ltd. | | | 254,208 | |
| | 112,455 | | | FUJIFILM Holdings Corp. | | | 5,712,170 | |
| | 1,940 | | | Fujitsu Ltd. | | | 226,529 | |
| | 4,576 | | | Hamamatsu Photonics KK | | | 229,029 | |
| | 6,693 | | | Hitachi Ltd. | | | 223,878 | |
| | 2,714 | | | Hoya Corp. | | | 305,890 | |
| | 131,876 | | | ITOCHU Corp. | | | 3,149,052 | |
| | 475 | | | Japan Real Estate Investment Corp. REIT | | | 2,322,938 | |
| Old Westbury Funds, Inc. | |
| Large Cap Strategies Fund | |
| Portfolio of Investments - (Continued) | October 31, 2020 |
| | |
| Shares | | | | | Value | |
| JAPAN (continued) | | | | |
| | 10,695 | | | Japan Tobacco, Inc. | | $ | 201,243 | |
| | 3,698 | | | Kao Corp. | | | 262,087 | |
| | 98,031 | | | KDDI Corp. | | | 2,614,753 | |
| | 489,913 | | | Keyence Corp. | | | 221,103,102 | |
| | 98,046 | | | Kyowa Kirin Co. Ltd. | | | 2,425,514 | |
| | 49,382 | | | Lawson, Inc. | | | 2,266,398 | |
| | 5,248 | | | M3, Inc. | | | 352,239 | |
| | 9,769 | | | Mitsubishi Corp. | | | 216,990 | |
| | 16,140 | | | Mitsubishi Electric Corp. | | | 206,577 | |
| | 12,213 | | | Mitsubishi Estate Co. Ltd. | | | 181,279 | |
| | 572,276 | | | Mitsui & Co. Ltd. | | | 8,909,784 | |
| | 11,528 | | | Mitsui Fudosan Co. Ltd. | | | 195,391 | |
| | 43,255 | | | MS&AD Insurance Group Holdings, Inc. | | | 1,175,212 | |
| | 4,303 | | | Murata Manufacturing Co Ltd. | | | 298,676 | |
| | 7,341 | | | Nabtesco Corp. | | | 272,759 | |
| | 51,862 | | | Nagoya Railroad Co. Ltd. | | | 1,375,127 | |
| | 7,527 | | | Nichirei Corp. | | | 188,939 | |
| | 5,487 | | | Nihon Kohden Corp. | | | 171,379 | |
| | 1,198,400 | | | Nihon M&A Center, Inc. | | | 69,938,622 | |
| | 57 | | | Nippon Building Fund, Inc. REIT | | | 287,464 | |
| | 144 | | | Nippon Prologis REIT, Inc. REIT | | | 473,146 | |
| | 220,482 | | | Nippon Telegraph & Telephone Corp. | | | 4,624,657 | |
| | 71,790 | | | Nissan Chemical Corp. | | | 3,785,098 | |
| | 50,717 | | | Nomura Holdings, Inc. | | | 225,016 | |
| | 8,212 | | | Nomura Research Institute Ltd. | | | 242,764 | |
| | 75,140 | | | NTT DOCOMO, Inc. | | | 2,789,715 | |
| | 1,250 | | | Obic Co Ltd. | | | 221,477 | |
| | 12,097 | | | Olympus Corp. | | | 229,819 | |
| | 3,562 | | | Omron Corp. | | | 255,170 | |
| | 11,664 | | | Osaka Gas Co. Ltd. | | | 220,813 | |
| | 4,966 | | | Otsuka Holdings Co. Ltd. | | | 182,854 | |
| | 26,607 | | | Panasonic Corp. | | | 244,151 | |
| | 590,400 | | | PeptiDream, Inc.(a) | | | 27,209,322 | |
| | 13,090 | | | Recruit Holdings Co. Ltd. | | | 496,368 | |
| | 23,552 | | | Sawai Pharmaceutical Co. Ltd. | | | 1,131,540 | |
| | 111,060 | | | Sega Sammy Holdings, Inc. | | | 1,385,399 | |
| | 635,460 | | | Sekisui Chemical Co. Ltd. | | | 9,832,802 | |
| | 155,945 | | | Sekisui House Ltd. | | | 2,571,651 | |
| | 5,679 | | | Seven & i Holdings Co. Ltd. | | | 172,439 | |
| | 7,402 | | | Shimadzu Corp. | | | 210,051 | |
| | 1,743 | | | Shin-Etsu Chemical Co Ltd. | | | 231,246 | |
| | 543 | | | SMC Corp. | | | 286,813 | |
| | 14,944 | | | SoftBank Corp. | | | 173,070 | |
| | 6,898 | | | Sony Corp. | | | 571,501 | |
| | 7,785 | | | Sumitomo Mitsui Financial Group, Inc. | | | 214,228 | |
| | 7,675 | | | Sumitomo Realty & Development Co. Ltd. | | | 204,310 | |
| | 5,361 | | | Suntory Beverage & Food Ltd. | | | 184,341 | |
| | 266,750 | | | Terumo Corp. | | | 9,776,205 | |
| | 252,318 | | | Tobu Railway Co. Ltd. | | | 7,121,636 | |
| | 3,775 | | | Toho Gas Co. Ltd. | | | 194,348 | |
| Shares | | | | | Value | |
| JAPAN (continued) | | | | |
| | 4,237 | | | Tokio Marine Holdings, Inc. | | $ | 188,549 | |
| | 1,249 | | | Tokyo Electron Ltd. | | | 332,844 | |
| | 10,446 | | | Tokyo Gas Co. Ltd. | | | 236,019 | |
| | 4,747 | | | Toyo Suisan Kaisha Ltd. | | | 235,774 | |
| | 155,505 | | | Toyota Motor Corp. | | | 10,104,594 | |
| | 50,560 | | | Trend Micro, Inc. | | | 2,825,121 | |
| | 5,136 | | | Unicharm Corp. | | | 237,435 | |
| | 231,395 | | | West Japan Railway Co. | | | 9,857,412 | |
| | 4,756 | | | Yamaha Corp. | | | 223,502 | |
| | | | | | | | 445,590,641 | |
| KAZAKHSTAN — 0.0% | | | | |
| | 111,768 | | | Kaspi.KZ JSC - GDR(a)(c) | | | 4,800,435 | |
| | 52,125 | | | Kaspi.KZ JSC - GDR(a) | | | 2,238,769 | |
| | | | | | | | 7,039,204 | |
| KENYA — 0.1% | | | | |
| | 1,013,379 | | | East African Breweries Ltd. | | | 1,399,450 | |
| | 32,047,920 | | | Safaricom Plc | | | 9,087,117 | |
| | | | | | | | 10,486,567 | |
| LUXEMBOURG — 0.0% | | | | |
| | 388,541 | | | Tenaris SA - ADR | | | 3,714,452 | |
| MACAU — 0.1% | | | | |
| | 3,448,200 | | | Sands China Ltd. | | | 12,075,928 | |
| MALAYSIA — 0.1% | | | | |
| | 2,540,547 | | | Public Bank Berhad | | | 9,220,565 | |
| | 67,333 | | | Tenaga Nasional Bhd | | | 154,599 | |
| | | | | | | | 9,375,164 | |
| MEXICO — 0.2% | | | | |
| | 350,579 | | | America Movil SAB de CV- Series L | | | 213,043 | |
| | 167,344 | | | Fomento Economico Mexicano SAB de CV - ADR | | | 8,998,087 | |
| | 56,040 | | | Grupo Aeroportuario del Sureste SAB de CV - ADR(a) | | | 6,464,214 | |
| | 74,793 | | | Grupo Financiero Banorte SAB de CV- Series O(a) | | | 333,565 | |
| | 105,603 | | | Grupo Mexico SAB de CV- Series B | | | 301,104 | |
| | 9,561,823 | | | Wal-Mart de Mexico SAB de CV | | | 23,152,310 | |
| | | | | | | | 39,462,323 | |
| NETHERLANDS — 2.1% | | | | |
| | 61,777 | | | Adyen NV(a)(c) | | | 104,145,217 | |
| | 377,444 | | | ASML Holding NV | | | 137,151,658 | |
| | 309,876 | | | ASML Holding NV | | | 111,930,310 | |
| | 2,469 | | | IMCD NV | | | 285,998 | |
| | 71,333 | | | ING Groep NV(a) | | | 486,752 | |
| | 9,088 | | | Koninklijke Ahold Delhaize NV | | | 249,684 | |
| | 2,354 | | | NXP Semiconductors NV | | | 318,072 | |
| | 192,338 | | | Prosus NV | | | 19,215,208 | |
| | 16,984 | | | Royal Dutch Shell Plc - A Shares | | | 212,415 | |
| | 17,758 | | | Royal Dutch Shell Plc - B Shares | | | 213,722 | |
| Old Westbury Funds, Inc. | |
| Large Cap Strategies Fund | |
| Portfolio of Investments - (Continued) | October 31, 2020 |
| | |
| Shares | | | | | Value | |
| NETHERLANDS (continued) | | | | |
| | 36,534 | | | Wolters Kluwer NV | | $ | 2,960,572 | |
| | | | | | | | 377,169,608 | |
| NORWAY — 0.0% | | | | |
| | 14,286 | | | Aker BP ASA | | | 221,922 | |
| | 12,713 | | | Telenor ASA | | | 196,022 | |
| | | | | | | | 417,944 | |
| PANAMA — 0.0% | | | | |
| | 126,548 | | | Copa Holdings SA - Class A | | | 6,236,285 | |
| PERU — 0.0% | | | | |
| | 56,862 | | | Credicorp. Ltd. | | | 6,520,934 | |
| POLAND — 0.1% | | | | |
| | 294,899 | | | Allegro.eu SA(a)(c) | | | 5,993,186 | |
| | 42,148 | | | CD Projekt SA(a) | | | 3,571,070 | |
| | 37,406 | | | Powszechna Kasa Oszczednosci Bank Polski S.A.(a) | | | 179,111 | |
| | 26,616 | | | Powszechny Zaklad Ubezpieczen S.A.(a) | | | 145,230 | |
| | | | | | | | 9,888,597 | |
| PORTUGAL — 0.0% | | | | |
| | 11,394 | | | Jeronimo Martins SGPS S.A. | | | 181,002 | |
| PUERTO RICO — 0.0% | | | | |
| | 54,610 | | | EVERTEC, Inc. | | | 1,817,421 | |
| QATAR — 0.0% | | | | |
| | 52,333 | | | Qatar National Bank QPSC | | | 254,407 | |
| RUSSIA — 0.5% | | | | |
| | 267,110 | | | LUKOIL PJSC - ADR | | | 13,646,650 | |
| | 120,246 | | | Novatek PJSC - GDR | | | 14,489,643 | |
| | 1,116,353 | | | Sberbank of Russia PJSC - ADR | | | 11,275,165 | |
| | 410,109 | | | Sberbank of Russia PJSC - ADR | | | 4,146,202 | |
| | 839,519 | | | Yandex NV - Class A(a) | | | 48,331,109 | |
| | | | | | | | 91,888,769 | |
| SINGAPORE — 1.5% | | | | |
| | 93,557 | | | CapitaLand Ltd. | | | 176,025 | |
| | 6,924,785 | | | CapitaLand Mall Trust REIT | | | 8,770,364 | |
| | 1,509,540 | | | Oversea-Chinese Banking Corp. Ltd. | | | 9,305,119 | |
| | 1,398,613 | | | Sea Ltd. - ADR(a) | | | 220,561,270 | |
| | 1,421,963 | | | Singapore Exchange Ltd. | | | 9,015,117 | |
| | 660,549 | | | United Overseas Bank Ltd. | | | 9,183,224 | |
| | | | | | | | 257,011,119 | |
| SOUTH AFRICA — 0.1% | | | | |
| | 44,287 | | | Absa Group Ltd. | | | 236,569 | |
| | 1,015,789 | | | Discovery Ltd. | | | 6,678,819 | |
| | 915,206 | | | Standard Bank Group Ltd. | | | 5,965,183 | |
| | 30,577 | | | Vodacom Group Ltd. | | | 230,224 | |
| | | | | | | | 13,110,795 | |
| Shares | | | | | Value | |
| SOUTH KOREA — 0.5% | | | | |
| | 45,231 | | | Amorepacific Corp. | | $ | 6,298,139 | |
| | 111,135 | | | Coway Co. Ltd. | | | 6,797,188 | |
| | 1,594 | | | Hyundai Mobis Co. Ltd. | | | 316,777 | |
| | 8,849 | | | KB Financial Group, Inc. | | | 312,721 | |
| | 9,574 | | | Kia Motors Corp. | | | 426,092 | |
| | 708 | | | Korea Zinc Co. Ltd. | | | 238,662 | |
| | 19,197 | | | LG Household & Health Care Ltd. | | | 25,377,192 | |
| | 1,599 | | | NAVER Corp. | | | 408,663 | |
| | 2,271 | | | POSCO | | | 416,293 | |
| | 29,345 | | | Samsung Electronics Co Ltd. | | | 1,463,759 | |
| | 30,887 | | | Samsung Electronics Co. Ltd. - GDR | | | 38,516,880 | |
| | 388,660 | | | Shinhan Financial Group Co. Ltd. | | | 10,395,551 | |
| | | | | | | | 90,967,917 | |
| SPAIN — 0.0% | | | | |
| | 4,545 | | | Amadeus IT Group S.A. | | | 216,973 | |
| | 41,183 | | | Iberdrola S.A. | | | 485,632 | |
| | 7,079 | | | Industria de Diseno Textil S.A. | | | 174,701 | |
| | 163,768 | | | Red Electrica Corp. S.A. | | | 2,884,818 | |
| | | | | | | | 3,762,124 | |
| SWEDEN — 0.4% | | | | |
| | 1,520,197 | | | Atlas Copco AB - A Shares | | | 67,122,786 | |
| | 6,444 | | | Essity AB - Class B | | | 186,765 | |
| | 8,303 | | | Hexagon AB - B Shares(a) | | | 606,881 | |
| | 16,148 | | | Sandvik AB(a) | | | 287,631 | |
| | 290,535 | | | Svenska Handelsbanken AB - Class A(a) | | | 2,354,736 | |
| | 3,262 | | | Swedish Match AB | | | 245,831 | |
| | 14,554 | | | Tele2 AB - B Shares | | | 172,635 | |
| | 721,915 | | | Telia Co. AB | | | 2,768,109 | |
| | | | | | | | 73,745,374 | |
| SWITZERLAND — 2.1% | | | | |
| | 105 | | | Chocoladefabriken Lindt & Spruengli AG | | | 9,080,648 | |
| | 627,621 | | | Coca-Cola HBC AG - CDI | | | 14,269,657 | |
| | 23,999 | | | Credit Suisse Group AG | | | 225,713 | |
| | 20,245 | | | Geberit AG | | | 11,525,045 | |
| | 281 | | | Georg Fischer AG | | | 283,467 | |
| | 59 | | | Givaudan S.A. | | | 240,388 | |
| | 5,685 | | | Logitech International S.A. | | | 478,632 | |
| | 165,899 | | | Lonza Group AG | | | 100,449,452 | |
| | 100,416 | | | Nestle S.A. | | | 11,290,572 | |
| | 8,854 | | | Novartis AG | | | 690,302 | |
| | 77,125 | | | PSP Swiss Property AG | | | 9,327,840 | |
| | 252,998 | | | Roche Holding AG | | | 81,325,220 | |
| | 41,060 | | | Schindler Holding AG | | | 10,500,649 | |
| | 3,885 | | | SGS SA | | | 9,706,674 | |
| | 1,442 | | | Sika AG | | | 354,937 | |
| | 1,092 | | | Sonova Holding AG(a) | | | 259,022 | |
| | 8,464 | | | STMicroelectronics NV | | | 257,775 | |
| | 2,408 | | | Sunrise Communications Group AG(c) | | | 289,659 | |
| Old Westbury Funds, Inc. | |
| Large Cap Strategies Fund | |
| Portfolio of Investments - (Continued) | October 31, 2020 |
| | |
| Shares | | | | | Value | |
| SWITZERLAND (continued) |
| | 89,785 | | | Swiss Prime Site AG | | $ | 7,549,401 | |
| | 8,925 | | | Swisscom AG | | | 4,538,663 | |
| | 951,717 | | | TE Connectivity Ltd. | | | 92,202,343 | |
| | 20,519 | | | UBS Group AG | | | 238,208 | |
| | 665 | | | Zurich Insurance Group AG | | | 220,470 | |
| | | | | | | | 365,304,737 | |
| TAIWAN — 0.8% |
| | 1,234,627 | | | Chunghwa Telecom Co. Ltd. | | | 4,618,494 | |
| | 4,262,125 | | | CTBC Financial Holding Co. Ltd. | | | 2,689,578 | |
| | 43,974 | | | Delta Electronics, Inc. | | | 292,099 | |
| | 804,541 | | | Eclat Textile Co. Ltd. | | | 10,646,207 | |
| | 2,132,300 | | | First Financial Holding Co. Ltd. | | | 1,494,664 | |
| | 81,821 | | | Formosa Chemicals & Fibre Corp. | | | 196,804 | |
| | 4,475,484 | | | Hon Hai Precision Industry Co. Ltd. | | | 12,126,139 | |
| | 90,000 | | | Largan Precision Co. Ltd. | | | 9,518,066 | |
| | 15,925 | | | MediaTek, Inc. | | | 377,476 | |
| | 2,809,617 | | | Mega Financial Holding Co. Ltd. | | | 2,706,136 | |
| | 90,343 | | | Pegatron Corp. | | | 194,245 | |
| | 25,338 | | | Realtek Semiconductor Corp. | | | 314,915 | |
| | 2,520,273 | | | Taiwan Cement Corp. | | | 3,572,887 | |
| | 3,475,506 | | | Taiwan Semiconductor Manufacturing Co. Ltd. | | | 52,490,730 | |
| | 453,997 | | | Taiwan Semiconductor Manufacturing Co. Ltd. - ADR | | | 38,076,728 | |
| | 87,130 | | | Uni-President Enterprises Corp. | | | 186,728 | |
| | 329,155 | | | United Integrated Services Co. Ltd. | | | 2,284,240 | |
| | | | | | | | 141,786,136 | |
| THAILAND — 0.4% |
| | 14,146,600 | | | Airports of Thailand Public Co. Ltd. - FOR | | | 23,488,780 | |
| | 27,006,800 | | | CP ALL Public Co. Ltd. - FOR(a) | | | 46,574,653 | |
| | 3,060,200 | | | Siam Commercial Bank Public Co. Ltd. (The) - FOR | | | 6,382,065 | |
| | | | | | | | 76,445,498 | |
| TURKEY — 0.0% |
| | 13,489 | | | BIM Birlesik Magazalar AS | | | 107,532 | |
| | 91,377 | | | Eregli Demir ve Celik Fabrikalari TAS | | | 103,923 | |
| | 100,730 | | | Tupras Turkiye Petrol Rafinerileri AS(a) | | | 898,570 | |
| | | | | | | | 1,110,025 | |
| UNITED ARAB EMIRATES — 0.0% |
| | 1,097,449 | | | Network International Holdings Plc(a)(c) | | | 3,161,973 | |
| UNITED KINGDOM — 1.2% |
| | 12,864 | | | Anglo American Plc | | | 301,843 | |
| | 8,916 | | | Ashtead Group Plc | | | 323,420 | |
| | 5,890 | | | AstraZeneca Plc | | | 592,586 | |
| | 32,438 | | | Barratt Developments Plc(a) | | | 202,764 | |
| | 104,826 | | | BP Plc | | | 266,988 | |
| | 10,897 | | | British American Tobacco Plc | | | 345,587 | |
| Shares | | | | | Value | |
| UNITED KINGDOM (continued) |
| | 53,599 | | | Coca-Cola European Partners Plc | | $ | 1,914,020 | |
| | 3,410 | | | Croda International Plc | | | 266,562 | |
| | 9,830 | | | Diageo Plc | | | 318,243 | |
| | 19,022 | | | GlaxoSmithKline Plc | | | 318,339 | |
| | 10,281 | | | Hargreaves Lansdown Plc | | | 180,141 | |
| | 221,217 | | | ITV Plc(a) | | | 206,744 | |
| | 31,248 | | | JD Sports Fashion Plc | | | 300,052 | |
| | 76,705 | | | Legal & General Group Plc | | | 183,639 | |
| | 393,000 | | | Linde Plc | | | 86,593,620 | |
| | 1,134,375 | | | London Stock Exchange Group Plc | | | 121,652,497 | |
| | 120,728 | | | M&G Plc | | | 229,366 | |
| | 11,744 | | | Mondi Plc | | | 222,587 | |
| | 3,553 | | | Next Plc | | | 268,811 | |
| | 14,782 | | | RELX Plc | | | 292,519 | |
| | 8,050 | | | Rio Tinto Plc | | | 454,383 | |
| | 2,201 | | | Spirax-Sarco Engineering Plc | | | 321,639 | |
| | 115,549 | | | Taylor Wimpey Plc(a) | | | 158,377 | |
| | 13,255 | | | Unilever NV | | | 749,485 | |
| | | | | | | | 216,664,212 | |
| UNITED STATES — 61.0% |
| | 2,435 | | | 3M Co. | | | 389,503 | |
| | 5,845 | | | A.O. Smith Corp. | | | 302,128 | |
| | 395,000 | | | Abbott Laboratories | | | 41,518,450 | |
| | 1,247,595 | | | AbbVie, Inc. | | | 106,170,335 | |
| | 186,377 | | | ABIOMED, Inc.(a) | | | 46,944,639 | |
| | 7,605 | | | ACI Worldwide, Inc.(a) | | | 221,838 | |
| | 453,066 | | | Activision Blizzard, Inc. | | | 34,310,688 | |
| | 2,476 | | | Adobe, Inc.(a) | | | 1,107,020 | |
| | 724,869 | | | Agilent Technologies, Inc. | | | 74,001,876 | |
| | 192,670 | | | AGNC Investment Corp. REIT | | | 2,691,600 | |
| | 3,185 | | | Agree Realty Corp. REIT | | | 197,693 | |
| | 428,576 | | | Air Products & Chemicals, Inc. | | | 118,389,834 | |
| | 3,194 | | | Albemarle Corp. | | | 297,713 | |
| | 1,907 | | | Alexion Pharmaceuticals, Inc.(a) | | | 219,572 | |
| | 178,888 | | | Align Technology, Inc.(a) | | | 76,220,599 | |
| | 5,259 | | | Alliance Data Systems Corp. | | | 271,049 | |
| | 101,820 | | | Allstate Corp. (The) | | | 9,036,525 | |
| | 12,924 | | | Ally Financial, Inc. | | | 344,812 | |
| | 33,274 | | | Alphabet, Inc. - Class A(a) | | | 53,774,444 | |
| | 287,327 | | | Alphabet, Inc. - Class C(a) | | | 465,759,940 | |
| | 215,771 | | | Amazon.com, Inc.(a) | | | 655,113,122 | |
| | 4,507 | | | American Express Co. | | | 411,219 | |
| | 169,276 | | | American Tower Corp. REIT | | | 38,874,233 | |
| | 1,782 | | | Ameriprise Financial, Inc. | | | 286,599 | |
| | 2,182 | | | AmerisourceBergen Corp. | | | 209,625 | |
| | 1,526,537 | | | AMETEK, Inc. | | | 149,905,933 | |
| | 335,298 | | | Amgen, Inc. | | | 72,739,548 | |
| | 107,555 | | | Amphenol Corp. - Class A | | | 12,136,506 | |
| | 1,910 | | | Analog Devices, Inc. | | | 226,392 | |
| | 407,780 | | | Annaly Capital Management, Inc. REIT | | | 2,891,160 | |
| | 994 | | | ANSYS, Inc.(a) | | | 302,544 | |
| Old Westbury Funds, Inc. | |
| Large Cap Strategies Fund | |
| Portfolio of Investments - (Continued) | October 31, 2020 |
| | |
| Shares | | | | | Value | |
| UNITED STATES (continued) |
| | 214,764 | | | Anthem, Inc. | | $ | 58,587,619 | |
| | 1,037 | | | Aon Plc - Class A | | | 190,818 | |
| | 5,781,912 | | | Apple, Inc. | | | 629,418,940 | |
| | 6,034 | | | Applied Materials, Inc. | | | 357,394 | |
| | 95,815 | | | AptarGroup, Inc. | | | 10,931,533 | |
| | 5,065 | | | ASGN, Inc.(a) | | | 337,734 | |
| | 2,880 | | | Aspen Technology, Inc.(a) | | | 316,253 | |
| | 14,298 | | | Assurant, Inc. | | | 1,778,242 | |
| | 31,103 | | | AT&T, Inc. | | | 840,403 | |
| | 1,941 | | | Autodesk, Inc.(a) | | | 457,183 | |
| | 234,207 | | | Automatic Data Processing, Inc. | | | 36,995,338 | |
| | 199 | | | AutoZone, Inc.(a) | | | 224,667 | |
| | 1,793 | | | Avery Dennison Corp. | | | 248,133 | |
| | 9,529,453 | | | Bank of America Corp. | | | 225,848,036 | |
| | 169,525 | | | Bank of Hawaii Corp. | | | 10,279,996 | |
| | 10,722 | | | Bank OZK | | | 265,691 | |
| | 4,029 | | | Baxter International, Inc. | | | 312,530 | |
| | 5,320 | | | Berkshire Hathaway, Inc. - Class B(a) | | | 1,074,108 | |
| | 903 | | | Biogen, Inc.(a) | | | 227,619 | |
| | 458 | | | Bio-Rad Laboratories, Inc. - Class A(a) | | | 268,580 | |
| | 1,008 | | | Bio-Techne Corp. | | | 254,429 | |
| | 3,816 | | | Blackbaud, Inc. | | | 188,281 | |
| | 3,395,200 | | | Blackstone Group, Inc. (The) - Class A | | | 171,185,984 | |
| | 398,494 | | | Bluebird Bio, Inc.(a) | | | 20,606,125 | |
| | 268 | | | Booking Holdings, Inc.(a) | | | 434,830 | |
| | 7,312 | | | BorgWarner, Inc. | | | 255,774 | |
| | 2,911,010 | | | Boston Scientific Corp.(a) | | | 99,760,313 | |
| | 12,950 | | | Boyd Gaming Corp. | | | 410,774 | |
| | 1,869,577 | | | Bristol-Myers Squibb Co. | | | 109,276,776 | |
| | 93,853 | | | Broadcom, Inc. | | | 32,813,824 | |
| | 1,882 | | | Broadridge Financial Solutions, Inc. | | | 258,963 | |
| | 3,101 | | | Brown-Forman Corp. - Class B | | | 216,171 | |
| | 115 | | | Cable One, Inc. | | | 199,164 | |
| | 9,440 | | | Cabot Oil & Gas Corp. | | | 167,938 | |
| | 699,404 | | | Cadence Design Systems, Inc.(a) | | | 76,493,815 | |
| | 3,702 | | | California Water Service Group | | | 164,998 | |
| | 3,853 | | | Cardinal Health, Inc. | | | 176,429 | |
| | 33,230 | | | Casey’s General Stores, Inc. | | | 5,601,581 | |
| | 2,777 | | | Caterpillar, Inc. | | | 436,128 | |
| | 5,536 | | | CDK Global, Inc. | | | 238,602 | |
| | 4,157 | | | Cerner Corp. | | | 291,364 | |
| | 38,660 | | | CH Robinson Worldwide, Inc. | | | 3,418,704 | |
| | 7,509 | | | Charles Schwab Corp. (The) | | | 308,695 | |
| | 728 | | | Charter Communications, Inc. - Class A(a) | | | 439,581 | |
| | 439 | | | Chemed Corp. | | | 209,982 | |
| | 2,462,345 | | | Chevron Corp. | | | 171,132,978 | |
| | 2,691 | | | Church & Dwight Co., Inc. | | | 237,857 | |
| | 19,268 | | | Cigna Corp. | | | 3,217,178 | |
| | 14,768 | | | Cinemark Holdings, Inc. | | | 120,950 | |
| | 22,407 | | | Cisco Systems, Inc. | | | 804,411 | |
| | 15,029 | | | Citigroup, Inc. | | | 622,501 | |
| | 14,433 | | | Citizens Financial Group, Inc. | | | 393,299 | |
| Shares | | | | | Value | |
| UNITED STATES (continued) |
| | 2,166 | | | Citrix Systems, Inc. | | $ | 245,343 | |
| | 10,824 | | | Clorox Co. (The) | | | 2,243,274 | |
| | 1,476,275 | | | Coca-Cola Co. (The) | | | 70,949,777 | |
| | 36,880 | | | Cogent Communications Holdings, Inc. | | | 2,057,904 | |
| | 4,924 | | | Cognizant Technology Solutions Corp. - Class A | | | 351,672 | |
| | 8,519 | | | Colfax Corp.(a) | | | 231,632 | |
| | 4,577 | | | Colgate-Palmolive Co. | | | 361,080 | |
| | 20,947 | | | Comcast Corp. - Class A | | | 884,801 | |
| | 7,959 | | | Comerica, Inc. | | | 362,214 | |
| | 4,877 | | | CommVault Systems, Inc.(a) | | | 193,080 | |
| | 5,627 | | | ConocoPhillips | | | 161,045 | |
| | 5,372 | | | CoreLogic, Inc. | | | 413,268 | |
| | 347,907 | | | Costco Wholesale Corp. | | | 124,418,501 | |
| | 1,952 | | | Crown Castle International Corp. REIT | | | 304,902 | |
| | 6,238 | | | CSX Corp. | | | 492,428 | |
| | 1,315 | | | Cummins, Inc. | | | 289,155 | |
| | 5,855 | | | CVS Health Corp. | | | 328,407 | |
| | 613,273 | | | Danaher Corp. | | | 140,770,684 | |
| | 248,915 | | | Deere & Co. | | | 56,232,388 | |
| | 188,101 | | | DexCom, Inc.(a) | | | 60,113,318 | |
| | 2,483 | | | Digital Realty Trust, Inc. REIT | | | 358,297 | |
| | 1,086 | | | Dollar General Corp. | | | 226,659 | |
| | 545 | | | Domino’s Pizza, Inc. | | | 206,184 | |
| | 8,903 | | | Domtar Corp. | | | 212,604 | |
| | 109,905 | | | Dover Corp. | | | 12,167,583 | |
| | 12,132 | | | East West Bancorp, Inc. | | | 442,575 | |
| | 538,832 | | | Eaton Corp. Plc | | | 55,925,373 | |
| | 9,060 | | | eBay, Inc. | | | 431,528 | |
| | 1,416 | | | Ecolab, Inc. | | | 259,963 | |
| | 847,121 | | | Edwards Lifesciences Corp.(a) | | | 60,730,104 | |
| | 2,237 | | | Electronic Arts, Inc.(a) | | | 268,060 | |
| | 69,282 | | | Eli Lilly & Co. | | | 9,038,530 | |
| | 2,733 | | | Encompass Health Corp. | | | 167,560 | |
| | 3,727 | | | Entegris, Inc. | | | 278,668 | |
| | 3,426 | | | Envestnet, Inc.(a) | | | 262,911 | |
| | 4,777 | | | EOG Resources, Inc. | | | 163,564 | |
| | 93,544 | | | EPAM Systems, Inc.(a) | | | 28,900,419 | |
| | 76,626 | | | Equity Commonwealth REIT | | | 2,024,459 | |
| | 3,112 | | | Equity LifeStyle Properties, Inc. REIT | | | 184,199 | |
| | 2,247 | | | Euronet Worldwide, Inc.(a) | | | 199,623 | |
| | 46,985 | | | Evergy, Inc. | | | 2,593,572 | |
| | 34,500 | | | Exponent, Inc. | | | 2,400,855 | |
| | 2,110 | | | Extra Space Storage, Inc. REIT | | | 244,655 | |
| | 12,212 | | | Exxon Mobil Corp. | | | 398,355 | |
| | 1,426,605 | | | Facebook, Inc. - Class A(a) | | | 375,354,042 | |
| | 1,228 | | | Fair Isaac Corp.(a) | | | 480,701 | |
| | 5,484 | | | Fastenal Co. | | | 237,073 | |
| | 12,011 | | | Fifth Third Bancorp | | | 278,895 | |
| | 1,246,875 | | | Fiserv, Inc.(a) | | | 119,039,156 | |
| | 1,556 | | | FleetCor Technologies, Inc.(a) | | | 343,736 | |
| Old Westbury Funds, Inc. | |
| Large Cap Strategies Fund | |
| Portfolio of Investments - (Continued) | October 31, 2020 |
| | |
| Shares | | | | | Value | |
| UNITED STATES (continued) |
| | 24,444 | | | Flex Ltd.(a) | | $ | 345,883 | |
| | 5,736 | | | FLIR Systems, Inc. | | | 198,982 | |
| | 1,763 | | | Fortinet, Inc.(a) | | | 194,582 | |
| | 24,240 | | | FTI Consulting, Inc.(a) | | | 2,386,670 | |
| | 2,404 | | | General Dynamics Corp. | | | 315,717 | |
| | 5,006 | | | General Mills, Inc. | | | 295,955 | |
| | 665,271 | | | Genuine Parts Co. | | | 60,160,457 | |
| | 5,894 | | | Gilead Sciences, Inc. | | | 342,736 | |
| | 126,445 | | | Globe Life, Inc. | | | 10,253,425 | |
| | 2,408 | | | Goldman Sachs Group, Inc. (The) | | | 455,208 | |
| | 4,192 | | | Graco, Inc. | | | 259,485 | |
| | 2,225 | | | Guidewire Software, Inc.(a) | | | 213,845 | |
| | 26,953 | | | Halliburton Co. | | | 325,053 | |
| | 263,050 | | | Hawaiian Electric Industries, Inc. | | | 8,691,172 | |
| | 1,709 | | | HCA Healthcare, Inc. | | | 211,813 | |
| | 11,695 | | | Helen of Troy Ltd.(a) | | | 2,217,372 | |
| | 11,317 | | | Helmerich & Payne, Inc. | | | 168,284 | |
| | 295,376 | | | Hershey Co. (The) | | | 40,602,385 | |
| | 258,970 | | | Highwoods Properties, Inc. REIT | | | 7,709,537 | |
| | 508,877 | | | Home Depot, Inc. (The) | | | 135,722,585 | |
| | 395,523 | | | Honeywell International, Inc. | | | 65,241,519 | |
| | 897,900 | | | Horizon Therapeutics Plc(a) | | | 67,279,647 | |
| | 4,290 | | | Hormel Foods Corp. | | | 208,880 | |
| | 16,850 | | | HP, Inc. | | | 302,626 | |
| | 728 | | | Humana, Inc. | | | 290,676 | |
| | 68,660 | | | IDEX Corp. | | | 11,698,977 | |
| | 741 | | | IDEXX Laboratories, Inc.(a) | | | 314,792 | |
| | 521,395 | | | Illinois Tool Works, Inc. | | | 102,130,853 | |
| | 185,888 | | | Illumina, Inc.(a) | | | 54,409,418 | |
| | 4,022 | | | Integra LifeScience Holdings Corp.(a) | | | 177,370 | |
| | 20,276 | | | Intel Corp. | | | 897,821 | |
| | 2,185 | | | Intercontinental Exchange, Inc. | | | 206,264 | |
| | 4,213 | | | InterDigital, Inc. | | | 235,844 | |
| | 661,275 | | | International Business Machines Corp. | | | 73,837,967 | |
| | 2,250 | | | Intuit, Inc. | | | 708,030 | |
| | 85,688 | | | Intuitive Surgical, Inc.(a) | | | 57,160,751 | |
| | 237,578 | | | iRhythm Technologies, Inc.(a) | | | 50,235,868 | |
| | 61,609 | | | Jack Henry & Associates, Inc. | | | 9,133,534 | |
| | 10,750 | | | Johnson & Johnson | | | 1,473,933 | |
| | 6,678 | | | Johnson Controls International plc | | | 281,878 | |
| | 1,828 | | | Jones Lang LaSalle, Inc. | | | 206,308 | |
| | 3,082,790 | | | JPMorgan Chase & Co. | | | 302,236,732 | |
| | 633,053 | | | Kansas City Southern | | | 111,505,955 | |
| | 850,585 | | | Kellogg Co. | | | 53,493,291 | |
| | 8,899 | | | Kennametal, Inc. | | | 275,869 | |
| | 967,015 | | | Keysight Technologies, Inc.(a) | | | 101,410,863 | |
| | 331,945 | | | Kimberly-Clark Corp. | | | 44,012,588 | |
| | 13,196 | | | Kinder Morgan, Inc. | | | 157,032 | |
| | 516,336 | | | KLA Corp. | | | 101,811,132 | |
| | 6,188 | | | Kroger Co. (The) | | | 199,315 | |
| | 1,566 | | | L3Harris Technologies, Inc. | | | 252,298 | |
| | 1,056 | | | Lam Research Corp. | | | 361,236 | |
| | 1,375 | | | Lancaster Colony Corp. | | | 228,443 | |
| Shares | | | | | Value | |
| UNITED STATES (continued) |
| | 2,035 | | | Leidos Holdings, Inc. | | $ | 168,905 | |
| | 4,605 | | | Lennar Corp. - Class A | | | 323,409 | |
| | 1,490 | | | LHC Group, Inc.(a) | | | 322,659 | |
| | 7,843 | | | Liberty Media Corp-Liberty Formula One - Class C(a) | | | 283,368 | |
| | 34,690 | | | Life Storage, Inc. REIT | | | 3,959,864 | |
| | 6,662 | | | Lincoln National Corp. | | | 233,836 | |
| | 242,553 | | | Lockheed Martin Corp. | | | 84,925,082 | |
| | 267,270 | | | Loews Corp. | | | 9,268,924 | |
| | 789,667 | | | Lowe’s Cos, Inc. | | | 124,846,353 | |
| | 3,615 | | | LPL Financial Holdings, Inc. | | | 288,947 | |
| | 3,371 | | | Manhattan Associates, Inc.(a) | | | 288,221 | |
| | 2,492 | | | Marriott Vacations Worldwide Corp. | | | 240,727 | |
| | 7,546 | | | Marvell Technology Group Ltd. | | | 283,050 | |
| | 4,908 | | | Masco Corp. | | | 263,069 | |
| | 977 | | | Masimo Corp.(a) | | | 218,672 | |
| | 552,203 | | | Mastercard, Inc. - Class A | | | 159,387,874 | |
| | 3,931 | | | Maxim Integrated Products, Inc. | | | 273,794 | |
| | 494,349 | | | McDonald’s Corp. | | | 105,296,337 | |
| | 1,393 | | | McKesson Corp. | | | 205,454 | |
| | 1,028,740 | | | Merck & Co., Inc. | | | 77,371,535 | |
| | 336 | | | Mettler-Toledo International, Inc.(a) | | | 335,298 | |
| | 2,699 | | | Microchip Technology, Inc. | | | 283,611 | |
| | 5,097 | | | Micron Technology, Inc.(a) | | | 256,583 | |
| | 3,067,097 | | | Microsoft Corp. | | | 620,995,130 | |
| | 2,427 | | | Mohawk Industries, Inc.(a) | | | 250,442 | |
| | 1,157 | | | Molina Healthcare, Inc.(a) | | | 215,746 | |
| | 8,907 | | | Mondelez International, Inc. - Class A | | | 473,140 | |
| | 1,056 | | | Monolithic Power Systems, Inc. | | | 337,498 | |
| | 3,536 | | | Monster Beverage Corp.(a) | | | 270,752 | |
| | 2,765 | | | Moody’s Corp. | | | 726,919 | |
| | 12,167 | | | Morgan Stanley | | | 585,841 | |
| | 488,696 | | | Motorola Solutions, Inc. | | | 77,243,290 | |
| | 903 | | | MSCI, Inc. | | | 315,906 | |
| | 12,364 | | | Mylan NV(a) | | | 179,773 | |
| | 80,270 | | | National Instruments Corp. | | | 2,510,846 | |
| | 56,385 | | | National Retail Properties, Inc. REIT | | | 1,804,884 | |
| | 26,425 | | | Navient Corp. | | | 211,664 | |
| | 10,245 | | | NCR Corp.(a) | | | 208,178 | |
| | 4,662 | | | NetApp, Inc. | | | 204,615 | |
| | 176,593 | | | Netflix, Inc.(a) | | | 84,012,354 | |
| | 8,425 | | | NewMarket Corp. | | | 3,013,538 | |
| | 63,254 | | | Newmont Corp. | | | 3,974,881 | |
| | 4,359 | | | NextEra Energy Partners LP | | | 273,745 | |
| | 3,196,400 | | | NextEra Energy, Inc. | | | 234,008,444 | |
| | 861,091 | | | NIKE, Inc. - Class B | | | 103,399,807 | |
| | 2,618 | | | Norfolk Southern Corp. | | | 547,476 | |
| | 147,982 | | | Northrop Grumman Corp. | | | 42,888,143 | |
| | 9,728 | | | NortonLifeLock, Inc. | | | 200,105 | |
| | 2,448 | | | Novanta Inc.(a) | | | 266,147 | |
| | 336,750 | | | Nuance Communications, Inc.(a) | | | 10,745,693 | |
| | 290,798 | | | NVIDIA Corp. | | | 145,794,485 | |
| | 281,380 | | | OGE Energy Corp. | | | 8,658,063 | |
| Old Westbury Funds, Inc. | |
| Large Cap Strategies Fund | |
| Portfolio of Investments - (Continued) | October 31, 2020 |
| | |
| Shares | | | | | Value | |
| UNITED STATES (continued) |
| | 228,458 | | | Okta, Inc.(a) | | $ | 47,937,342 | |
| | 14,221 | | | ON Semiconductor Corp.(a) | | | 356,805 | |
| | 12,332 | | | Oracle Corp. | | | 691,949 | |
| | 533 | | | O’Reilly Automotive, Inc.(a) | | | 232,708 | |
| | 2,908 | | | PACCAR, Inc. | | | 248,285 | |
| | 54,850 | | | Parker-Hannifin Corp. | | | 11,428,546 | |
| | 152,646 | | | Paychex, Inc. | | | 12,555,134 | |
| | 14,088 | | | Penn National Gaming, Inc.(a) | | | 760,470 | |
| | 952,907 | | | PepsiCo, Inc. | | | 127,012,974 | |
| | 21,837 | | | Pfizer, Inc. | | | 774,777 | |
| | 7,218 | | | Philip Morris International, Inc. | | | 512,622 | |
| | 3,340 | | | Phillips 66 | | | 155,844 | |
| | 716,405 | | | Pinnacle West Capital Corp. | | | 58,437,156 | |
| | 2,563 | | | Pioneer Natural Resources Co. | | | 203,912 | |
| | 6,745 | | | Pool Corp. | | | 2,359,603 | |
| | 267,490 | | | Portland General Electric Co. | | | 10,512,357 | |
| | 2,196 | | | PRA Health Sciences, Inc.(a) | | | 213,978 | |
| | 5,957 | | | Premier, Inc. - Class A | | | 194,973 | |
| | 1,756,078 | | | Procter & Gamble Co. (The) | | | 240,758,294 | |
| | 5,189 | | | Progress Software Corp. | | | 188,724 | |
| | 2,945 | | | Prologis, Inc. REIT | | | 292,144 | |
| | 703,595 | | | Prudential Financial, Inc. | | | 45,044,152 | |
| | 3,344 | | | PTC, Inc.(a) | | | 280,495 | |
| | 367,200 | | | Public Storage REIT | | | 84,114,504 | |
| | 4,357 | | | PVH Corp. | | | 253,970 | |
| | 4,953 | | | QUALCOMM, Inc. | | | 611,002 | |
| | 601,708 | | | Quest Diagnostics, Inc. | | | 73,492,615 | |
| | 4,975 | | | Raytheon Technologies Corp. | | | 270,242 | |
| | 3,263 | | | RealPage, Inc.(a) | | | 181,716 | |
| | 107,261 | | | Regeneron Pharmaceuticals, Inc.(a) | | | 58,302,789 | |
| | 37,339 | | | Republic Services, Inc. | | | 3,292,180 | |
| | 1,271 | | | ResMed, Inc. | | | 243,956 | |
| | 5,031 | | | Rollins, Inc. | | | 291,043 | |
| | 898 | | | Roper Technologies, Inc. | | | 333,463 | |
| | 1,733,885 | | | Ross Stores, Inc. | | | 147,674,985 | |
| | 2,480 | | | Saia, Inc.(a) | | | 366,197 | |
| | 412,320 | | | salesforce.com, Inc.(a) | | | 95,769,566 | |
| | 631 | | | SBA Communications Corp. REIT | | | 183,223 | |
| | 12,848 | | | Schlumberger NV | | | 191,949 | |
| | 2,430 | | | Science Applications International Corp. | | | 185,579 | |
| | 3,815 | | | Seagate Technology Plc | | | 182,433 | |
| | 32,990 | | | Service Corp. International | | | 1,527,767 | |
| | 34,040 | | | Shenandoah Telecommunications Co. | | | 1,484,825 | |
| | 151,306 | | | Sherwin-Williams Co. (The) | | | 104,095,502 | |
| | 12,535 | | | Six Flags Entertainment Corp. | | | 271,007 | |
| | 2,059 | | | Skyworks Solutions, Inc. | | | 290,916 | |
| | 123,053 | | | Snowflake, Inc. - Class A(a) | | | 30,765,711 | |
| | 212,330 | | | Sonoco Products Co. | | | 10,380,814 | |
| | 5,135 | | | Spectrum Brands Holdings, Inc. | | | 292,027 | |
| | 5,205 | | | SS&C Technologies Holdings, Inc. | | | 308,240 | |
| | 523,488 | | | Starbucks Corp. | | | 45,522,516 | |
| | 6,127 | | | State Street Corp. | | | 360,880 | |
| Shares | | | | | Value | |
| UNITED STATES (continued) |
| | 4,010 | | | Stericycle, Inc.(a) | | $ | 249,823 | |
| | 1,131 | | | SVB Financial Group(a) | | | 328,782 | |
| | 12,665 | | | Synchrony Financial | | | 316,878 | |
| | 1,870 | | | Synopsys, Inc.(a) | | | 399,918 | |
| | 1,579 | | | Take-Two Interactive Software, Inc.(a) | | | 244,619 | |
| | 2,559 | | | Target Corp. | | | 389,531 | |
| | 3,032 | | | Teradyne, Inc. | | | 266,361 | |
| | 777,692 | | | Texas Instruments, Inc. | | | 112,446,486 | |
| | 43,255 | | | Texas Roadhouse, Inc. | | | 3,029,148 | |
| | 7,207 | | | Textron, Inc. | | | 258,011 | |
| | 349,452 | | | Thermo Fisher Scientific, Inc. | | | 165,332,730 | |
| | 5,512 | | | Timken Co. (The) | | | 329,066 | |
| | 2,127 | | | Tractor Supply Co. | | | 283,338 | |
| | 7,551 | | | Trimble, Inc.(a) | | | 363,430 | |
| | 4,231 | | | TriNet Group, Inc.(a) | | | 291,601 | |
| | 2,359,158 | | | Truist Financial Corp. | | | 99,367,735 | |
| | 653 | | | Tyler Technologies, Inc.(a) | | | 251,000 | |
| | 3,165 | | | Tyson Foods, Inc. - Class A | | | 181,133 | |
| | 1,423,931 | | | Uber Technologies, Inc.(a) | | | 47,573,535 | |
| | 5,131 | | | UFP Industries, Inc. | | | 256,088 | |
| | 923 | | | Ulta Beauty, Inc.(a) | | | 190,849 | |
| | 426,152 | | | Union Pacific Corp. | | | 75,509,873 | |
| | 1,884 | | | United Rentals, Inc.(a) | | | 335,898 | |
| | 1,900 | | | United Therapeutics Corp.(a) | | | 255,037 | |
| | 521,065 | | | UnitedHealth Group, Inc. | | | 158,997,774 | |
| | 1,206 | | | Vail Resorts, Inc. | | | 279,840 | |
| | 3,890 | | | Valero Energy Corp. | | | 150,193 | |
| | 945 | | | VeriSign, Inc.(a) | | | 180,212 | |
| | 1,289 | | | Verisk Analytics, Inc. | | | 229,403 | |
| | 2,678,974 | | | Verizon Communications, Inc. | | | 152,674,728 | |
| | 1,129,035 | | | Visa, Inc. - Class A | | | 205,156,950 | |
| | 11,252 | | | Vistra Corp. | | | 195,447 | |
| | 1,448 | | | VMware, Inc. - Class A(a) | | | 186,401 | |
| | 4,419 | | | Walgreens Boots Alliance, Inc. | | | 150,423 | |
| | 803,533 | | | Walmart, Inc. | | | 111,490,204 | |
| | 305,502 | | | Waste Management, Inc. | | | 32,966,721 | |
| | 982 | | | Waters Corp.(a) | | | 218,809 | |
| | 15,935 | | | WD-40 Co. | | | 3,878,260 | |
| | 18,018 | | | Wells Fargo & Co. | | | 386,486 | |
| | 8,163 | | | WESCO International, Inc.(a) | | | 336,642 | |
| | 1,156 | | | West Pharmaceutical Services, Inc. | | | 314,513 | |
| | 6,401 | | | Westrock Co. | | | 240,358 | |
| | 3,744 | | | WEX, Inc.(a) | | | 473,803 | |
| | 9,863 | | | Weyerhaeuser Co. REIT | | | 269,161 | |
| | 454,213 | | | Workday, Inc. - Class A(a) | | | 95,439,236 | |
| | 4,976 | | | WR Grace & Co. | | | 216,406 | |
| | 701 | | | WW Grainger, Inc. | | | 245,364 | |
| | 32,349 | | | Yum! Brands, Inc. | | | 3,019,132 | |
| | 956 | | | Zebra Technologies Corp. - Class A(a) | | | 271,160 | |
| | 125,813 | | | Zoom Video Communications, Inc. - Class A(a) | | | 57,988,470 | |
| | | | | | | | 10,733,684,891 | |
| Old Westbury Funds, Inc. | |
| Large Cap Strategies Fund | |
| Portfolio of Investments - (Continued) | October 31, 2020 |
| | |
| Shares | | | | | Value | |
| VIETNAM — 0.0% |
| | 4,398,890 | | | Vincom Retail JSC(a) | | $ | 4,800,687 | |
Total Common Stocks
(Cost $12,198,864,576) | | | 16,524,224,219 | |
| | | | | | | | | |
| MASTER LIMITED PARTNERSHIPS — 0.0% |
| UNITED STATES — 0.0% |
| | 35,975 | | | Magellan Midstream Partners LP | | | 1,278,551 | |
Total Master Limited Partnerships
(Cost $1,132,519) | | | 1,278,551 | |
| | | | | | | | | |
| PREFERRED STOCKS — 0.1% |
| SOUTH KOREA — 0.1% |
| | 7,697 | | | Samsung Electronics Co Ltd. - Preference Shares | | | 339,843 | |
| | 5,320 | | | Samsung Electronics Co. Ltd. - GDR | | | 5,979,680 | |
| | 3,475 | | | Samsung Electronics Co. Ltd. - GDR | | | 3,835,760 | |
Total Preferred Stocks
(Cost $6,768,691) | | | 10,155,283 | |
| | | | | | | | | |
| EXCHANGE-TRADED FUNDS — 4.0% |
| | 2,486,050 | | | Health Care Select Sector SPDR Fund | | | 252,731,843 | |
| | 1,385,700 | | | iShares China Large-Cap ETF | | | 61,109,370 | |
| | 1,265,229 | | | iShares MSCI ACWI ETF | | | 98,864,994 | |
| | 1,240,895 | | | iShares MSCI China ETF | | | 96,442,360 | |
| | 2,183,469 | | | iShares MSCI Emerging Markets ETF | | | 97,622,899 | |
| | 950,000 | | | Materials Select Sector SPDR Fund | | | 60,021,000 | |
| | 1,204,020 | | | Xtrackers Harvest CSI 300 China A-Shares ETF | | | 43,115,956 | |
Total Exchange-Traded Funds
(Cost $630,153,331) | | | 709,908,422 | |
| | | | | | | | | |
| INVESTMENT COMPANY — 2.0% |
| | 346,150,292 | | | Federated Government Obligations Fund, 0.01%(d) | | | 346,150,292 | |
Total Investment Company
(Cost $346,150,292) | | | 346,150,292 | |
TOTAL INVESTMENTS — 99.9%
(Cost $13,183,069,409) | | $ | 17,591,716,767 | |
| OTHER ASSETS IN EXCESS OF LIABILITIES — 0.1% | | | 17,816,431 | |
| NET ASSETS — 100.0% | | $ | 17,609,533,198 | |
| (a) | Non-income producing security. |
| (b) | Security is valued using significant unobservable inputs and is classified as Level 3 in the fair value hierarchy. The aggregate value of fair valued securities is $0 which is 0.0% of net assets and the cost is $0. |
| (c) | Security exempt from registration under Rule 144A of the Securities Act of 1933, as amended. The security may be resold in transactions exempt from registration normally to qualified institutional buyers. The security has been determined to be liquid in accordance with procedures adopted by the Fund’s Board of Directors. |
| (d) | The rate shown represents the current yield as of October 31, 2020. |
The following abbreviations are used in the report:
ACWI — All Country World Index
ADR — American Depositary Receipt
CDI — Chess Depositary Interests
ETF — Exchange -Traded Fund
FOR — Foreign Ownership Restrictions
GDR — Global Depositary Receipt
MSCI — Morgan Stanley Capital International Index
REIT — Real Estate Investment Trust
SPDR — Standard & Poor’s Depositary Receipt
| Old Westbury Funds, Inc. | |
| Credit Income Fund | |
| Portfolio of Investments | October 31, 2020 |
| | |
| Shares | | | | | Value | |
| EXCHANGE-TRADED FUNDS — 13.8% |
| UNITED STATES — 13.8% |
| | 612,390 | | | iShares JP Morgan USD Emerging Markets Bond ETF | | $ | 67,375,148 | |
| | 3,712,427 | | | iShares Preferred & Income Securities ETF | | | 134,464,106 | |
| | 966,235 | | | SPDR Bloomberg Barclays Convertible Securities ETF | | | 66,583,254 | |
| | | | | | | | | |
Total Exchange-Traded Funds
(Cost $271,710,174) | | | 268,422,508 | |
| | | | | | | | | |
Principal
Amount | | | | | | | |
| BANK LOANS — 0.1% |
| UNITED STATES — 0.1% |
| $ | 2,800,000 | | | Caliber Home Loans, Inc.,
(LIBOR + 3.250%),
3.31%, 04/24/21(a)(b) | | | 2,786,000 | |
Total Bank Loans
(Cost $2,788,095) | | | 2,786,000 | |
| | | | | | | | | |
| CORPORATE BONDS — 7.8% |
| CANADA — 0.4% |
| | 1,500,000 | | | 1011778 BC ULC/New Red Finance, Inc.,
5.00%, 10/15/25(c) | | | 1,538,100 | |
| | 500,000 | | | 1011778 BC ULC/New Red Finance, Inc.,
4.00%, 10/15/30(c) | | | 496,875 | |
| | 350,000 | | | ATS Automation Tooling Systems, Inc.,
6.50%, 06/15/23(c) | | | 354,375 | |
| | 500,000 | | | Bombardier, Inc.,
6.00%, 10/15/22(c) | | | 444,375 | |
| | 250,000 | | | Brookfield Residential Properties Inc/Brookfield Residential US Corp.,
6.25%, 09/15/27(c) | | | 256,175 | |
| | 350,000 | | | Cenovus Energy, Inc.,
5.38%, 07/15/25 | | | 369,028 | |
| | 75,000 | | | Fairstone Financial, Inc.,
7.88%, 07/15/24(c) | | | 76,875 | |
| | 250,000 | | | Garda World Security Corp.,
4.63%, 02/15/27(c) | | | 243,750 | |
| | 325,000 | | | Garda World Security Corp.,
9.50%, 11/01/27(c) | | | 346,938 | |
| | 250,000 | | | GFL Environmental, Inc.,
3.75%, 08/01/25(c) | | | 250,000 | |
| | 350,000 | | | goeasy Ltd.,
5.38%, 12/01/24(c) | | | 353,500 | |
Principal
Amount | | | | | Value | |
| CANADA (continued) |
| $ | 500,000 | | | Hudbay Minerals, Inc.,
6.13%, 04/01/29(c) | | $ | 511,250 | |
| | 250,000 | | | Mattamy Group Corp.,
5.25%, 12/15/27(c) | | | 264,375 | |
| | 350,000 | | | MEG Energy Corp.,
7.00%, 03/31/24(c) | | | 332,500 | |
| | 250,000 | | | Mercer International, Inc.,
7.38%, 01/15/25 | | | 254,220 | |
| | 500,000 | | | NOVA Chemicals Corp.,
4.88%, 06/01/24(c) | | | 494,600 | |
| | 500,000 | | | NOVA Chemicals Corp.,
5.25%, 06/01/27(c) | | | 488,250 | |
| | 500,000 | | | Telesat Canada/Telesat LLC,
4.88%, 06/01/27(c) | | | 508,750 | |
| | 650,000 | | | Telesat Canada/Telesat LLC,
6.50%, 10/15/27(c) | | | 646,750 | |
| | | | | | | | 8,230,686 | |
| CAYMAN ISLANDS — 0.2% |
| | 4,463,911 | | | Ambac LSNI LLC,
(3 mo. LIBOR US + 5.000%),
6.00%, 02/12/23(b)(c) | | | 4,441,592 | |
| CURAÇAO — 0.0% |
| | 500,000 | | | Teva Pharmaceutical Finance Co. BV,
2.95%, 12/18/22 | | | 479,600 | |
| FRANCE — 0.1% |
| | 500,000 | | | Constellium SE,
5.75%, 05/15/24(c) | | | 506,355 | |
| | 500,000 | | | Constellium SE,
6.63%, 03/01/25(c) | | | 507,500 | |
| | | | | | | | 1,013,855 | |
| IRELAND — 0.1% |
| | 225,000 | | | Ardagh Packaging Finance PLC/Ardagh Holdings USA, Inc.,
4.13%, 08/15/26(c) | | | 229,500 | |
| | 750,000 | | | Ardagh Packaging Finance PLC/Ardagh Holdings USA, Inc.,
5.25%, 08/15/27(c) | | | 769,875 | |
| | 250,000 | | | LCPR Senior Secured Financing DAC,
6.75%, 10/15/27(c) | | | 265,625 | |
| | | | | | | | 1,265,000 | |
| LUXEMBOURG — 0.2% |
| | 1,650,000 | | | Altice Financing SA,
5.00%, 01/15/28(c) | | | 1,600,500 | |
| | 1,000,000 | | | Altice France Holding SA,
6.00%, 02/15/28(c) | | | 962,500 | |
| Old Westbury Funds, Inc. | |
| Credit Income Fund | |
| Portfolio of Investments - (Continued) | October 31, 2020 |
| | |
Principal
Amount | | | | | Value | |
| LUXEMBOURG (continued) |
| $ | 500,000 | | | ARD Finance SA, PIK,
6.50%, 06/30/27(c) | | $ | 508,125 | |
| | 250,000 | | | Consolidated Energy Finance SA,
6.88%, 06/15/25(c) | | | 232,500 | |
| | 750,000 | | | Dana Financing Luxembourg Sarl,
5.75%, 04/15/25(c) | | | 776,250 | |
| | 500,000 | | | Venator Finance Sarl/Venator Materials LLC,
9.50%, 07/01/25(c) | | | 529,865 | |
| | | | | | | | 4,609,740 | |
| NETHERLANDS — 0.2% |
| | 1,000,000 | | | Alcoa Nederland Holding BV,
5.50%, 12/15/27(c) | | | 1,052,500 | |
| | 875,000 | | | Teva Pharmaceutical Finance Netherlands III BV,
3.15%, 10/01/26 | | | 770,000 | |
| | 1,000,000 | | | UPC Holding BV,
5.50%, 01/15/28(c) | | | 1,032,500 | |
| | | | | | | | 2,855,000 | |
| UNITED KINGDOM — 0.1% |
| | 750,000 | | | Jaguar Land Rover Automotive Plc,
7.75%, 10/15/25(c) | | | 748,125 | |
| UNITED STATES — 6.5% |
| | 250,000 | | | Abercrombie & Fitch Management Co.,
8.75%, 07/15/25(c) | | | 267,187 | |
| | 1,000,000 | | | Adient Global Holdings Ltd.,
4.88%, 08/15/26(c) | | | 957,380 | |
| | 375,000 | | | Advantage Sales & Marketing, Inc.,
6.50%, 11/15/28(c) | | | 366,094 | |
| | 500,000 | | | Allegheny Technologies, Inc.,
7.88%, 08/15/23 | | | 504,725 | |
| | 750,000 | | | Alliance Data Systems Corp.,
4.75%, 12/15/24(c) | | | 695,625 | |
| | 250,000 | | | Alliance Data Systems Corp.,
7.00%, 01/15/26(c) | | | 250,700 | |
| | 381,965 | | | Ambac Assurance Corp.,
5.10%, 06/07/69(c) | | | 521,382 | |
| | 500,000 | | | American Airlines, Inc.,
11.75%, 07/15/25(c) | | | 486,250 | |
| | 1,000,000 | | | American Axle & Manufacturing, Inc.,
6.25%, 04/01/25 | | | 1,013,440 | |
| | 450,000 | | | AMN Healthcare, Inc.,
4.00%, 04/15/29(c) | | | 448,312 | |
| | 500,000 | | | Amsted Industries, Inc.,
4.63%, 05/15/30(c) | | | 513,750 | |
Principal
Amount | | | | | Value | |
| UNITED STATES (continued) |
| $ | 250,000 | | | Antero Resources Corp.,
5.38%, 11/01/21 | | $ | 250,500 | |
| | 1,000,000 | | | Apache Corp.,
4.88%, 11/15/27 | | | 938,500 | |
| | 525,000 | | | Aramark Services, Inc.,
6.38%, 05/01/25(c) | | | 550,662 | |
| | 500,000 | | | Aramark Services, Inc.,
5.00%, 02/01/28(c) | | | 504,430 | |
| | 500,000 | | | Archrock Partners LP/Archrock Partners Finance Corp.,
6.25%, 04/01/28(c) | | | 482,500 | |
| | 1,625,000 | | | Bausch Health Cos, Inc.,
6.13%, 04/15/25(c) | | | 1,668,469 | |
| | 500,000 | | | Bausch Health Cos, Inc.,
9.00%, 12/15/25(c) | | | 546,350 | |
| | 600,000 | | | Bausch Health Cos, Inc.,
7.00%, 01/15/28(c) | | | 634,500 | |
| | 500,000 | | | Bausch Health Cos, Inc.,
5.00%, 01/30/28(c) | | | 494,190 | |
| | 275,000 | | | Bausch Health Cos, Inc.,
6.25%, 02/15/29(c) | | | 283,404 | |
| | 400,000 | | | Bausch Health Cos, Inc.,
5.25%, 01/30/30(c) | | | 395,020 | |
| | 500,000 | | | BCD Acquisition, Inc.,
9.63%, 09/15/23(c) | | | 500,625 | |
| | 300,000 | | | Beacon Roofing Supply, Inc.,
4.88%, 11/01/25(c) | | | 294,300 | |
| | 750,000 | | | Big River Steel LLC/BRS Finance Corp.,
6.63%, 01/31/29(c) | | | 772,500 | |
| | 350,000 | | | Blue Racer Midstream LLC/Blue Racer Finance Corp.,
6.63%, 07/15/26(c) | | | 314,125 | |
| | 700,000 | | | Buckeye Partners LP,
3.95%, 12/01/26 | | | 649,250 | |
| | 750,000 | | | Burlington Coat Factory Warehouse Corp.,
6.25%, 04/15/25(c) | | | 786,094 | |
| | 575,000 | | | Cable One, Inc.,
4.00%, 11/15/30(c) | | | 583,625 | |
| | 325,000 | | | Cablevision Lightpath LLC,
3.88%, 09/15/27(c) | | | 322,563 | |
| | 500,000 | | | Cablevision Lightpath LLC,
5.63%, 09/15/28(c) | | | 505,000 | |
| | 500,000 | | | Caesars Resort Collection LLC/CRC Finco, Inc.,
5.75%, 07/01/25(c) | | | 512,815 | |
| Old Westbury Funds, Inc. | |
| Credit Income Fund | |
| Portfolio of Investments - (Continued) | October 31, 2020 |
| | |
Principal
Amount | | | | | Value | |
| UNITED STATES (continued) |
| $ | 500,000 | | | Calpine Corp.,
4.63%, 02/01/29(c) | | $ | 504,855 | |
| | 475,000 | | | Calpine Corp.,
5.00%, 02/01/31(c) | | | 484,951 | |
| | 1,000,000 | | | Carnival Corp.,
10.50%, 02/01/26(c) | | | 1,082,500 | |
| | 750,000 | | | CCO Holdings LLC/CCO Holdings Capital Corp.,
5.75%, 02/15/26(c) | | | 777,495 | |
| | 1,750,000 | | | CCO Holdings LLC/CCO Holdings Capital Corp.,
4.25%, 02/01/31(c) | | | 1,793,382 | |
| | 1,000,000 | | | CCO Holdings LLC/CCO Holdings Capital Corp.,
4.50%, 05/01/32(c) | | | 1,033,750 | |
| | 2,000,000 | | | Centene Corp.,
3.00%, 10/15/30 | | | 2,076,906 | |
| | 250,000 | | | Century Communities, Inc.,
6.75%, 06/01/27 | | | 266,250 | |
| | 1,000,000 | | | CenturyLink, Inc.,
5.63%, 04/01/25 | | | 1,050,000 | |
| | 1,000,000 | | | CenturyLink, Inc.,
5.13%, 12/15/26(c) | | | 1,022,500 | |
| | 250,000 | | | Chemours Co. (The),
7.00%, 05/15/25 | | | 251,875 | |
| | 750,000 | | | CITGO Petroleum Corp.,
6.25%, 08/15/22(c) | | | 721,875 | |
| | 350,000 | | | Clarios Global LP/Clarios US Finance Co.,
8.50%, 05/15/27(c) | | | 365,103 | |
| | 350,000 | | | Cleveland-Cliffs, Inc.,
6.75%, 03/15/26(c) | | | 367,500 | |
| | 350,000 | | | Cleveland-Cliffs, Inc.,
5.88%, 06/01/27 | | | 340,301 | |
| | 1,500,000 | | | Colt Merger Sub, Inc.,
6.25%, 07/01/25(c) | | | 1,536,552 | |
| | 234,000 | | | CommScope Technologies LLC,
6.00%, 06/15/25(c) | | | 231,983 | |
| | 500,000 | | | CommScope, Inc.,
6.00%, 03/01/26(c) | | | 518,750 | |
| | 250,000 | | | Consolidated Communications, Inc.,
6.50%, 10/01/28(c) | | | 256,875 | |
| | 500,000 | | | Cornerstone Building Brands, Inc.,
6.13%, 01/15/29(c) | | | 510,775 | |
| | 358,000 | | | Covanta Holding Corp.,
5.88%, 07/01/25 | | | 370,158 | |
| | 325,000 | | | Covanta Holding Corp.,
5.00%, 09/01/30 | | | 330,688 | |
Principal
Amount | | | | | Value | |
| UNITED STATES (continued) |
| $ | 700,000 | | | CrownRock LP/CrownRock Finance, Inc.,
5.63%, 10/15/25(c) | | $ | 688,366 | |
| | 1,250,000 | | | CSC Holdings LLC,
7.50%, 04/01/28(c) | | | 1,368,581 | |
| | 975,000 | | | CSC Holdings LLC,
5.75%, 01/15/30(c) | | | 1,042,319 | |
| | 1,000,000 | | | CSC Holdings LLC,
4.63%, 12/01/30(c) | | | 999,980 | |
| | 500,000 | | | CVR Partners LP/CVR Nitrogen Finance Corp.,
9.25%, 06/15/23(c) | | | 458,750 | |
| | 800,000 | | | Dana, Inc.,
5.50%, 12/15/24 | | | 812,000 | |
| | 225,000 | | | DaVita, Inc.,
4.63%, 06/01/30(c) | | | 228,858 | |
| | 625,000 | | | DCP Midstream Operating LP,
3.88%, 03/15/23 | | | 621,875 | |
| | 750,000 | | | DCP Midstream Operating LP,
5.13%, 05/15/29 | | | 746,025 | |
| | 1,000,000 | | | Delta Air Lines Inc/SkyMiles IP Ltd.,
4.75%, 10/20/28(c) | | | 1,022,212 | |
| | 250,000 | | | Delta Air Lines, Inc.,
3.40%, 04/19/21 | | | 250,563 | |
| | 1,000,000 | | | Delta Air Lines, Inc.,
7.38%, 01/15/26 | | | 1,035,000 | |
| | 500,000 | | | Diamond Sports Group LLC/Diamond Sports Finance Co.,
5.38%, 08/15/26(c) | | | 292,187 | |
| | 500,000 | | | DISH DBS Corp.,
5.00%, 03/15/23 | | | 503,760 | |
| | 1,000,000 | | | DISH DBS Corp.,
7.38%, 07/01/28 | | | 1,007,500 | |
| | 500,000 | | | Energizer Holdings, Inc.,
4.38%, 03/31/29(c) | | | 504,750 | |
| | 250,000 | | | Enviva Partners LP/Enviva Partners Finance Corp.,
6.50%, 01/15/26(c) | | | 263,750 | |
| | 50,000 | | | EQM Midstream Partners LP,
6.50%, 07/01/27(c) | | | 52,440 | |
| | 375,000 | | | EQT Corp.,
5.00%, 01/15/29 | | | 375,000 | |
| | 1,000,000 | | | Ford Motor Co.,
8.50%, 04/21/23 | | | 1,103,750 | |
| | 1,000,000 | | | Ford Motor Co.,
9.00%, 04/22/25 | | | 1,178,395 | |
| | 500,000 | | | Ford Motor Co.,
4.75%, 01/15/43 | | | 461,850 | |
| Old Westbury Funds, Inc. | |
| Credit Income Fund | |
| Portfolio of Investments - (Continued) | October 31, 2020 |
| | |
Principal
Amount | | | | | Value | |
| UNITED STATES (continued) |
| $ | 2,500,000 | | | Ford Motor Credit Co. LLC,
4.06%, 11/01/24 | | $ | 2,507,000 | |
| | 1,000,000 | | | Ford Motor Credit Co. LLC,
4.27%, 01/09/27 | | | 998,750 | |
| | 250,000 | | | Forterra Finance LLC/FRTA Finance Corp.,
6.50%, 07/15/25(c) | | | 264,063 | |
| | 400,000 | | | Gap, Inc. (The),
8.63%, 05/15/25(c) | | | 439,000 | |
| | 400,000 | | | Gap, Inc. (The),
8.88%, 05/15/27(c) | | | 457,380 | |
| | 500,000 | | | GCI LLC,
4.75%, 10/15/28(c) | | | 516,100 | |
| | 750,000 | | | Gray Television, Inc.,
7.00%, 05/15/27(c) | | | 809,062 | |
| | 500,000 | | | Gray Television, Inc.,
4.75%, 10/15/30(c) | | | 492,500 | |
| | 500,000 | | | Greif, Inc.,
6.50%, 03/01/27(c) | | | 524,375 | |
| | 250,000 | | | Greystar Real Estate Partners LLC,
5.75%, 12/01/25(c) | | | 253,125 | |
| | 500,000 | | | Griffon Corp.,
5.75%, 03/01/28 | | | 521,250 | |
| | 250,000 | | | H&E Equipment Services, Inc.,
5.63%, 09/01/25 | | | 259,375 | |
| | 500,000 | | | Hanesbrands, Inc.,
5.38%, 05/15/25(c) | | | 526,250 | |
| | 775,000 | | | Harvest Midstream I LP,
7.50%, 09/01/28(c) | | | 769,188 | |
| | 250,000 | | | HAT Holdings I LLC/HAT Holdings II LLC REIT,
6.00%, 04/15/25(c) | | | 265,313 | |
| | 775,000 | | | HAT Holdings I LLC/HAT Holdings II LLC REIT,
3.75%, 09/15/30(c) | | | 774,031 | |
| | 1,100,000 | | | Herbalife Nutrition Ltd/HLF Financing, Inc.,
7.88%, 09/01/25(c) | | | 1,160,500 | |
| | 500,000 | | | Herc Holdings, Inc.,
5.50%, 07/15/27(c) | | | 513,812 | |
| | 500,000 | | | Hilton Domestic Operating Co., Inc.,
4.25%, 09/01/24 | | | 497,250 | |
| | 300,000 | | | Howard Hughes Corp. (The),
5.38%, 08/01/28(c) | | | 303,000 | |
| | 1,000,000 | | | Howmet Aerospace, Inc.,
6.88%, 05/01/25 | | | 1,112,500 | |
| | 1,000,000 | | | Hughes Satellite Systems Corp.,
6.63%, 08/01/26 | | | 1,083,125 | |
Principal
Amount | | | | | Value | |
| UNITED STATES (continued) |
| $ | 1,000,000 | | | Icahn Enterprises LP/Icahn Enterprises Finance Corp.,
6.38%, 12/15/25 | | $ | 1,025,010 | |
| | 350,000 | | | iHeartCommunications, Inc.,
8.38%, 05/01/27 | | | 339,574 | |
| | 300,000 | | | Ingevity Corp.,
3.88%, 11/01/28(c) | | | 304,560 | |
| | 975,000 | | | IRB Holding Corp.,
7.00%, 06/15/25(c) | | | 1,039,092 | |
| | 500,000 | | | IRB Holding Corp.,
6.75%, 02/15/26(c) | | | 501,250 | |
| | 1,000,000 | | | Iron Mountain, Inc. REIT,
4.50%, 02/15/31(c) | | | 995,570 | |
| | 500,000 | | | J2 Global, Inc.,
4.63%, 10/15/30(c) | | | 505,175 | |
| | 300,000 | | | Koppers, Inc.,
6.00%, 02/15/25(c) | | | 306,750 | |
| | 1,750,000 | | | Kraft Heinz Foods Co.,
3.75%, 04/01/30(c) | | | 1,838,725 | |
| | 500,000 | | | Kraft Heinz Foods Co.,
4.38%, 06/01/46 | | | 513,245 | |
| | 300,000 | | | Kraton Polymers LLC/Kraton Polymers Capital Corp.,
7.00%, 04/15/25(c) | | | 309,375 | |
| | 1,000,000 | | | L Brands, Inc.,
6.63%, 10/01/30(c) | | | 1,050,000 | |
| | 350,000 | | | Ladder Capital Finance Holdings LLLP/Ladder Capital Finance Corp. REIT,
4.25%, 02/01/27(c) | | | 302,313 | |
| | 250,000 | | | Legacy LifePoint Health LLC,
6.75%, 04/15/25(c) | | | 264,375 | |
| | 250,000 | | | Legacy LifePoint Health LLC,
4.38%, 02/15/27(c) | | | 247,427 | |
| | 250,000 | | | Levi Strauss & Co.,
5.00%, 05/01/25 | | | 256,250 | |
| | 700,000 | | | Logan Merger Sub, Inc.,
5.50%, 09/01/27(c) | | | 709,625 | |
| | 500,000 | | | Macy’s Retail Holdings LLC,
3.45%, 01/15/21 | | | 496,250 | |
| | 1,000,000 | | | Macy’s, Inc.,
8.38%, 06/15/25(c) | | | 1,044,100 | |
| | 250,000 | | | Manitowoc Co., Inc. (The),
9.00%, 04/01/26(c) | | | 256,615 | |
| | 375,000 | | | MasTec, Inc.,
4.50%, 08/15/28(c) | | | 385,313 | |
| Old Westbury Funds, Inc. | |
| Credit Income Fund | |
| Portfolio of Investments - (Continued) | October 31, 2020 |
| | |
Principal
Amount | | | | | Value | |
| UNITED STATES (continued) |
| $ | 750,000 | | | Mauser Packaging Solutions Holding Co.,
7.25%, 04/15/25(c) | | $ | 723,525 | |
| | 600,000 | | | Meritor, Inc.,
6.25%, 06/01/25(c) | | | 627,000 | |
| | 1,000,000 | | | MGM Resorts International,
6.75%, 05/01/25 | | | 1,051,900 | |
| | 750,000 | | | Midcontinent Communications/Midcontinent Finance Corp.,
5.38%, 08/15/27(c) | | | 780,844 | |
| | 2,000,000 | | | Mileage Plus Holdings LLC/Mileage Plus Intellectual Property Assets Ltd.,
6.50%, 06/20/27(c) | | | 2,082,500 | |
| | 300,000 | | | Molina Healthcare, Inc.,
5.38%, 11/15/22 | | | 311,743 | |
| | 625,000 | | | MPH Acquisition Holdings LLC,
5.75%, 11/01/28(c) | | | 614,062 | |
| | 450,000 | | | Murphy Oil Corp.,
6.38%, 12/01/42 | | | 335,250 | |
| | 350,000 | | | Nationstar Mortgage Holdings, Inc.,
5.50%, 08/15/28(c) | | | 349,125 | |
| | 1,000,000 | | | Navient Corp.,
6.50%, 06/15/22 | | | 1,020,000 | |
| | 250,000 | | | Navistar International Corp.,
6.63%, 11/01/25(c) | | | 258,488 | |
| | 1,000,000 | | | Netflix, Inc.,
4.88%, 06/15/30(c) | | | 1,141,250 | |
| | 725,000 | | | Nexstar Broadcasting, Inc.,
5.63%, 07/15/27(c) | | | 755,813 | |
| | 350,000 | | | Nexstar Broadcasting, Inc.,
4.75%, 11/01/28(c) | | | 353,903 | |
| | 1,000,000 | | | Novelis Corp.,
5.88%, 09/30/26(c) | | | 1,031,880 | |
| | 1,000,000 | | | Novelis Corp.,
4.75%, 01/30/30(c) | | | 1,014,115 | |
| | 750,000 | | | Occidental Petroleum Corp.,
2.70%, 08/15/22 | | | 693,562 | |
| | 150,000 | | | Occidental Petroleum Corp.,
2.70%, 02/15/23 | | | 134,250 | |
| | 175,000 | | | Occidental Petroleum Corp.,
3.50%, 08/15/29 | | | 126,255 | |
| | 250,000 | | | Occidental Petroleum Corp.,
6.63%, 09/01/30 | | | 219,075 | |
| | 500,000 | | | Occidental Petroleum Corp.,
4.30%, 08/15/39 | | | 340,000 | |
| | 500,000 | | | Occidental Petroleum Corp.,
4.40%, 04/15/46 | | | 336,110 | |
Principal
Amount | | | | | Value | |
| UNITED STATES (continued) |
| $ | 500,000 | | | OneMain Finance Corp.,
6.13%, 03/15/24 | | $ | 525,601 | |
| | 1,000,000 | | | OneMain Finance Corp.,
5.38%, 11/15/29 | | | 1,027,540 | |
| | 500,000 | | | Ortho-Clinical Diagnostics Inc/Ortho-Clinical Diagnostics SA,
7.38%, 06/01/25(c) | | | 527,500 | |
| | 250,000 | | | Outfront Media Capital LLC/Outfront Media Capital Corp.,
6.25%, 06/15/25(c) | | | 255,156 | |
| | 500,000 | | | Park Intermediate Holdings LLC/PK Domestic Property LLC/PK Finance Co.-Issuer REIT,
5.88%, 10/01/28(c) | | | 490,000 | |
| | 300,000 | | | Pattern Energy Operations LP/Pattern Energy Operations, Inc.,
4.50%, 08/15/28(c) | | | 312,789 | |
| | 500,000 | | | Performance Food Group, Inc.,
5.50%, 06/01/24(c) | | | 502,500 | |
| | 1,000,000 | | | Post Holdings, Inc.,
5.75%, 03/01/27(c) | | | 1,047,710 | |
| | 1,025,000 | | | Post Holdings, Inc.,
4.63%, 04/15/30(c) | | | 1,053,187 | |
| | 500,000 | | | PowerTeam Services LLC,
9.03%, 12/04/25(c) | | | 529,375 | |
| | 350,000 | | | Prime Healthcare Services, Inc.,
7.25%, 11/01/25(c) | | | 352,730 | |
| | 125,000 | | | Providence Service Corp. (The),
5.88%, 11/15/25(c) | | | 127,187 | |
| | 250,000 | | | Radiate Holdco LLC/Radiate Finance, Inc.,
4.50%, 09/15/26(c) | | | 250,688 | |
| | 500,000 | | | Radiate Holdco LLC/Radiate Finance, Inc.,
6.50%, 09/15/28(c) | | | 515,625 | |
| | 990,000 | | | Rockies Express Pipeline LLC,
3.60%, 05/15/25(c) | | | 987,525 | |
| | 675,000 | | | Rockies Express Pipeline LLC,
4.95%, 07/15/29(c) | | | 657,450 | |
| | 1,550,000 | | | Rockies Express Pipeline LLC,
4.80%, 05/15/30(c) | | | 1,457,388 | |
| | 1,000,000 | | | Royal Caribbean Cruises Ltd.,
9.13%, 06/15/23(c) | | | 1,041,250 | |
| | 650,000 | | | Sabre GLBL, Inc.,
5.25%, 11/15/23(c) | | | 637,000 | |
| | 475,000 | | | Sabre GLBL, Inc.,
7.38%, 09/01/25(c) | | | 484,500 | |
| Old Westbury Funds, Inc. | |
| Credit Income Fund | |
| Portfolio of Investments - (Continued) | October 31, 2020 |
| | |
Principal
Amount | | | | | Value | |
| UNITED STATES (continued) | | | | |
| $ | 300,000 | | | Scientific Games International, Inc.,
5.00%, 10/15/25(c) | | $ | 301,125 | |
| | 250,000 | | | Select Medical Corp.,
6.25%, 08/15/26(c) | | | 263,750 | |
| | 1,000,000 | | | Service Properties Trust REIT,
4.50%, 06/15/23 | | | 962,500 | |
| | 400,000 | | | Shea Homes LP/Shea Homes Funding Corp.,
4.75%, 02/15/28(c) | | | 404,000 | |
| | 250,000 | | | Simmons Foods, Inc.,
5.75%, 11/01/24(c) | | | 247,187 | |
| | 250,000 | | | Sinclair Television Group, Inc.,
5.50%, 03/01/30(c) | | | 235,025 | |
| | 1,859,000 | | | Southern Star Central Corp.,
5.13%, 07/15/22(c) | | | 1,863,260 | |
| | 600,000 | | | Southwestern Energy Co.,
6.45%, 01/23/25 | | | 601,125 | |
| | 500,000 | | | Spectrum Brands, Inc.,
5.50%, 07/15/30(c) | | | 535,000 | |
| | 500,000 | | | Springleaf Finance Corp.,
7.13%, 03/15/26 | | | 554,430 | |
| | 1,500,000 | | | Sprint Capital Corp.,
6.88%, 11/15/28 | | | 1,897,500 | |
| | 450,000 | | | SRM Escrow Issuer LLC,
6.00%, 11/01/28(c) | | | 450,000 | |
| | 150,000 | | | Standard Industries, Inc.,
4.38%, 07/15/30(c) | | | 154,500 | |
| | 400,000 | | | Starwood Property Trust, Inc. REIT,
5.50%, 11/01/23(c) | | | 396,416 | |
| | 500,000 | | | Sunoco LP/Sunoco Finance Corp.,
5.88%, 03/15/28 | | | 518,750 | |
| | 500,000 | | | Talen Energy Supply LLC,
6.63%, 01/15/28(c) | | | 477,500 | |
| | 500,000 | | | Targa Resources Partners LP/Targa
Resources Partners Finance Corp.,
4.25%, 11/15/23 | | | 499,947 | |
| | 1,000,000 | | | TEGNA, Inc.,
4.63%, 03/15/28(c) | | | 986,080 | |
| | 1,000,000 | | | TEGNA, Inc.,
5.00%, 09/15/29 | | | 1,012,500 | |
| | 225,000 | | | Tenet Healthcare Corp.,
4.63%, 07/15/24 | | | 228,803 | |
| | 500,000 | | | Tenet Healthcare Corp.,
7.50%, 04/01/25(c) | | | 538,605 | |
| | 750,000 | | | Tenet Healthcare Corp.,
5.13%, 05/01/25 | | | 742,275 | |
| | 500,000 | | | Tenet Healthcare Corp.,
6.13%, 10/01/28(c) | | | 485,000 | |
Principal
Amount | | | | | Value | |
| UNITED STATES (continued) | | | | |
| $ | 1,000,000 | | | TransDigm, Inc.,
8.00%, 12/15/25(c) | | $ | 1,082,800 | |
| | 250,000 | | | Tronox, Inc.,
6.50%, 05/01/25(c) | | | 263,750 | |
| | 500,000 | | | United Airlines Holdings, Inc.,
4.25%, 10/01/22 | | | 454,650 | |
| | 600,000 | | | United Natural Foods, Inc.,
6.75%, 10/15/28(c) | | | 607,500 | |
| | 1,000,000 | | | United Rentals North America, Inc.,
5.25%, 01/15/30 | | | 1,083,750 | |
| | 750,000 | | | Uniti Group LP/Uniti Fiber Holdings Inc/CSL Capital LLC REIT,
7.88%, 02/15/25(c) | | | 795,725 | |
| | 250,000 | | | Uniti Group LP/Uniti Group Finance Inc/CSL Capital LLC REIT,
6.00%, 04/15/23(c) | | | 253,281 | |
| | 250,000 | | | Verscend Escrow Corp.,
9.75%, 08/15/26(c) | | | 268,750 | |
| | 300,000 | | | Waste Pro USA, Inc.,
5.50%, 02/15/26(c) | | | 303,000 | |
| | 750,000 | | | WESCO Distribution, Inc.,
7.25%, 06/15/28(c) | | | 821,250 | |
| | 500,000 | | | Western Midstream Operating LP,
4.65%, 07/01/26 | | | 480,000 | |
| | 375,000 | | | Western Midstream Operating LP,
5.50%, 08/15/48 | | | 301,875 | |
| | 500,000 | | | Williams Scotsman International, Inc.,
4.63%, 08/15/28(c) | | | 503,125 | |
| | 350,000 | | | WPX Energy, Inc.,
4.50%, 01/15/30 | | | 336,000 | |
| | 300,000 | | | Wyndham Destinations, Inc.,
4.25%, 03/01/22 | | | 300,750 | |
| | 350,000 | | | Wynn Las Vegas LLC/Wynn Las Vegas
Capital Corp.,
5.50%, 03/01/25(c) | | | 335,125 | |
| | 500,000 | | | Zayo Group Holdings, Inc.,
4.00%, 03/01/27(c) | | | 490,747 | |
| | | | | | | | 126,785,452 | |
Total Corporate Bonds
(Cost $151,712,682) | | | 150,429,050 | |
| Old Westbury Funds, Inc. | |
| Credit Income Fund | |
| Portfolio of Investments - (Continued) | October 31, 2020 |
| | |
Principal
Amount | | | | | Value | |
| ASSET-BACKED SECURITIES — 28.2% | | | | |
| CANADA — 0.1% | | | | |
| Other Asset-Backed Securities — 0.1% | | | | |
| $ | 300,000 | | | Golden Credit Card Trust, Series 2017-4A, Class A,
(1 mo. LIBOR US + 0.520%),
0.67%, 07/15/24(b)(c) | | $ | 301,097 | |
| | 1,000,000 | | | Master Credit Card Trust II, Series 2020-1A, Class A,
1.99%, 09/21/24(c) | | | 1,036,468 | |
| | | | | | | | 1,337,565 | |
| CAYMAN ISLANDS — 2.8% | | | | |
| Collateralized Loan Obligations — 2.7% | | | | |
| | 1,000,000 | | | ALM Loan Funding Ltd., Series 2013-7RA, Class DR,
(3 mo. LIBOR US + 7.140%),
7.38%, 10/15/28(b)(c) | | | 908,352 | |
| | 2,000,000 | | | ALM Loan Funding Ltd., Series 2015-16A, Class DR2,
(3 mo. LIBOR US + 5.100%),
5.34%, 07/15/27(b)(c) | | | 1,798,301 | |
| | 1,000,000 | | | Apidos CLO XV, Series 2013-15A, Class ERR,
(3 mo. LIBOR US + 5.700%),
5.92%, 04/20/31(b)(c) | | | 850,539 | |
| | 5,000,000 | | | Atrium VIII, Series 8A, Class SUB,
0.00%, 10/23/24(c)(d) | | | 211,318 | |
| | 2,000,000 | | | Atrium XII, Series 12A, Class ER,
(3 mo. LIBOR US + 5.250%),
5.47%, 04/22/27(b)(c) | | | 1,677,780 | |
| | 12,131,250 | | | Atrium XIII, Series 13A, Class SUB,
0.00%, 11/21/47(c)(d) | | | 7,228,121 | |
| | 1,500,000 | | | BlueMountain CLO Ltd., Series 2015-1A, Class D,
(3 mo. LIBOR US + 5.450%),
5.67%, 04/13/27(b)(c) | | | 1,378,763 | |
| | 1,000,000 | | | Carlyle Global Market Strategies CLO Ltd., Series 2015-2A, Class DR,
(3 mo. LIBOR US + 4.350%),
4.57%, 04/27/27(b)(c) | | | 811,639 | |
| | 788,998 | | | Carlyle Global Market Strategies CLO Ltd., Series 2015-4A, Class SBB1,
(3 mo. LIBOR US + 8.500%),
8.72%, 07/20/32(b)(c) | | | 650,641 | |
| | 17,550,000 | | | CBAM Ltd., Series 2019-10A, Class SUB,
0.00%, 04/20/32(c)(d) | | | 8,294,335 | |
| | 9,915,625 | | | Cedar Funding VII CLO Ltd., Series 2018-7A, Class SUB,
0.00%, 01/20/31(c)(d) | | | 5,226,306 | |
Principal
Amount | | | | | Value | |
| CAYMAN ISLANDS (continued) | | | | |
| Collateralized Loan Obligations (continued) | | | | |
| $ | 2,000,000 | | | Madison Park Funding XVI Ltd., Series 2015-16A, Class D,
(3 mo. LIBOR US + 5.500%),
5.72%, 04/20/26(b)(c) | | $ | 1,817,384 | |
| | 1,250,000 | | | Neuberger Berman CLO XX Ltd., Series 2015-20A, Class ER,
(3 mo. LIBOR US + 5.000%),
5.24%, 01/15/28(b)(c) | | | 1,128,168 | |
| | 5,000,000 | | | Romark CLO II Ltd., Series 2018-2A, Class SUB,
0.00%, 07/25/31(c)(d) | | | 2,408,401 | |
| | 5,000,000 | | | Romark CLO Ltd., Series 2017-1A, Class SUB,
0.00%, 10/23/30(c)(d) | | | 2,326,002 | |
| | 7,500,000 | | | Romark WM-R Ltd., Series 2018-1A, Class F,
(3 mo. LIBOR US + 8.100%),
8.32%, 04/20/31(b)(c) | | | 5,104,391 | |
| | 1,000,000 | | | Venture XXIV CLO Ltd., Series 2016-24A, Class AR,
(3 mo. LIBOR US + 1.180%),
1.40%, 10/20/28(b)(c) | | | 990,013 | |
| | 1,000,000 | | | Westcott Park CLO Ltd., Series 2016-1A, Class DR,
(3 mo. LIBOR US + 3.250%),
3.47%, 07/20/28(b)(c) | | | 967,499 | |
| | 4,500,000 | | | York CLO-3 Ltd., Series 2016-1A, Class ER,
(3 mo. LIBOR US + 6.400%),
6.62%, 10/20/29(b)(c) | | | 4,020,366 | |
| | 4,000,000 | | | York CLO-3 Ltd., Series 2016-1A, Class SUB,
0.00%, 10/20/29(c)(d) | | | 1,708,118 | |
| | 6,375,000 | | | York CLO-5 Ltd., Series 2018-1A, Class SUB,
0.00%, 10/22/31(c)(d) | | | 3,581,784 | |
| | | | | | | | 53,088,221 | |
| | | | | | | | | |
| Other Asset-Backed Securities — 0.1% | | | | |
| | 1,000,000 | | | Atlas Senior Loan Fund Ltd., Series 2017-8A, Class A,
(3 mo. LIBOR US + 1.300%),
1.53%, 01/16/30(b)(c) | | | 992,827 | |
| | | | | | | | 54,081,048 | |
| Old Westbury Funds, Inc. | |
| Credit Income Fund | |
| Portfolio of Investments - (Continued) | October 31, 2020 |
| | |
Principal
Amount | | | | | Value | |
| UNITED STATES — 25.3% | | | | |
| Other Asset-Backed Securities — 25.3% | | | | |
| $ | 4,057,123 | | | Ajax Mortgage Loan Trust, Series 2017-D, Class A,
3.75%, 12/25/57(c) | | $ | 4,089,713 | |
| | 1,381,041 | | | Ajax Mortgage Loan Trust, Series 2017-D, Class B,
0.00%, 12/25/57(a)(c)(d) | | | 811,223 | |
| | 2,289,613 | | | Ajax Mortgage Loan Trust, Series 2018-A, Class A,
3.85%, 04/25/58(c) | | | 2,284,074 | |
| | 764,504 | | | Ajax Mortgage Loan Trust, Series 2018-A, Class B,
0.00%, 04/25/58(c) | | | 387,547 | |
| | 1,318,196 | | | Ajax Mortgage Loan Trust, Series 2018-B, Class A,
3.75%, 02/26/57(a)(c) | | | 1,316,615 | |
| | 936,380 | | | Ajax Mortgage Loan Trust, Series 2018-B, Class B,
0.00%, 02/26/57(c) | | | 277,002 | |
| | 6,558,133 | | | Ajax Mortgage Loan Trust, Series 2018-D, Class A,
3.75%, 08/25/58(c)(d) | | | 6,676,284 | |
| | 1,824,312 | | | Ajax Mortgage Loan Trust, Series 2018-D, Class B,
0.00%, 08/25/58(a)(c)(d) | | | 921,278 | |
| | 1,312,500 | | | Ajax Mortgage Loan Trust, Series 2018-E, Class B,
5.25%, 06/25/58(a)(c)(d) | | | 1,320,244 | |
| | 3,256,857 | | | Ajax Mortgage Loan Trust, Series 2018-E, Class C,
0.00%, 06/25/58(c)(d) | | | 2,520,087 | |
| | 1,498,613 | | | Ajax Mortgage Loan Trust, Series 2018-F, Class B,
5.25%, 11/25/58(a)(c)(d) | | | 1,485,425 | |
| | 3,515,346 | | | Ajax Mortgage Loan Trust, Series 2018-F, Class C,
0.00%, 11/25/58(c) | | | 2,271,726 | |
| | 14,911,465 | | | Ajax Mortgage Loan Trust, Series 2018-G, Class A,
4.38%, 06/25/57(c)(d) | | | 15,319,744 | |
| | 2,100,000 | | | Ajax Mortgage Loan Trust, Series 2018-G, Class B,
5.25%, 06/25/57(a)(c)(d) | | | 1,585,500 | |
| | 5,362,641 | | | Ajax Mortgage Loan Trust, Series 2018-G, Class C,
0.00%, 06/25/57(a)(c) | | | 5,273,085 | |
| | 16,135,983 | | | Ajax Mortgage Loan Trust, Series 2019-A, Class A,
3.75%, 08/25/57(c)(d) | | | 16,408,970 | |
Principal
Amount | | | | | Value | |
| UNITED STATES (continued) | | | | |
| Other Asset-Backed Securities (continued) | | | |
| $ | 2,450,000 | | | Ajax Mortgage Loan Trust, Series 2019-A, Class B,
5.25%, 08/25/57(c)(d) | | $ | 2,082,655 | |
| | 6,127,642 | | | Ajax Mortgage Loan Trust, Series 2019-A, Class C,
0.00%, 08/25/57(a)(c) | | | 5,076,138 | |
| | 8,531,682 | | | Ajax Mortgage Loan Trust, Series 2019-B, Class A,
3.75%, 01/25/59(c)(d) | | | 8,675,482 | |
| | 2,100,000 | | | Ajax Mortgage Loan Trust, Series 2019-B, Class B,
5.25%, 01/25/59(a)(c)(d) | | | 1,585,500 | |
| | 5,374,749 | | | Ajax Mortgage Loan Trust, Series 2019-B, Class C,
0.00%, 01/25/59(a)(c) | | | 4,613,147 | |
| | 9,430,947 | | | Ajax Mortgage Loan Trust, Series 2019-E, Class A, STEP,
3.00%, 09/25/59(c) | | | 9,389,661 | |
| | 3,512,199 | | | Ajax Mortgage Loan Trust, Series 2019-E, Class B, STEP,
4.88%, 09/25/59(c) | | | 2,878,927 | |
| | 8,049,293 | | | Ajax Mortgage Loan Trust, Series 2019-E, Class C,
0.00%, 09/25/59(c) | | | 4,419,477 | |
| | 14,099,595 | | | Ajax Mortgage Loan Trust, Series 2019-G, Class A, STEP,
3.00%, 09/25/59(c) | | | 14,032,586 | |
| | 2,927,374 | | | Ajax Mortgage Loan Trust, Series 2019-G, Class B, STEP,
4.25%, 09/25/59(c) | | | 2,478,018 | |
| | 7,494,458 | | | Ajax Mortgage Loan Trust, Series 2019-G, Class C,
0.00%, 09/25/59(c) | | | 5,843,020 | |
| | 27,937,528 | | | Ajax Mortgage Loan Trust, Series 2020-A, Class A, STEP,
2.38%, 12/25/59(c) | | | 27,860,658 | |
| | 4,328,402 | | | Ajax Mortgage Loan Trust, Series 2020-A, Class B, STEP,
3.50%, 12/25/59(c) | | �� | 4,309,606 | |
| | 10,463,111 | | | Ajax Mortgage Loan Trust, Series 2020-A, Class C,
0.00%, 12/25/59(a)(c) | | | 6,557,232 | |
| | 500,000 | | | American Credit Acceptance Receivables Trust, Series 2020-4, Class B,
0.85%, 12/13/24(c) | | | 500,227 | |
| Old Westbury Funds, Inc. | |
| Credit Income Fund | |
| Portfolio of Investments - (Continued) | October 31, 2020 |
| | |
Principal
Amount | | | | | Value | |
| UNITED STATES (continued) | | | | |
| Other Asset-Backed Securities (continued) | | | | |
| $ | 1,000,000 | | | American Express Credit Account Master Trust, Series 2017-5, Class A,
(1 mo. LIBOR US + 0.380%),
0.53%, 02/18/25(b) | | $ | 1,003,463 | |
| | 1,000,000 | | | American Express Credit Account Master Trust, Series 2018-5, Class A,
(1 mo. LIBOR US + 0.340%),
0.49%, 12/15/25(b) | | | 1,001,501 | |
| | 4,250,000 | | | Ameriquest Mortgage Securities, Inc. Asset-Backed Pass-Through Certificates, Series 2005-R3, Class M7,
(1 mo. LIBOR US + 1.980%),
2.13%, 05/25/35(b) | | | 4,137,383 | |
| | 6,000,000 | | | AMSR Trust, Series 2020-SFR2, Class F,
2.69%, 11/17/37(c) | | | 5,694,541 | |
| | 10,357,027 | | | Argent Mortgage Loan Trust, Series 2005-W1, Class A2,
(1 mo. LIBOR US + 0.480%),
0.63%, 05/25/35(b) | | | 9,366,436 | |
| | 4,662,515 | | | Argent Securities, Inc. Asset-Backed Pass-Through Certificates, Series 2005-W5, Class M1,
(1 mo. LIBOR US + 0.460%),
0.61%, 01/25/36(b) | | | 4,471,477 | |
| | 6,017,085 | | | Asset Backed Securities Corp. Home Equity Loan Trust, Series 2006-HE1, Class M2,
(1 mo. LIBOR US + 0.420%),
0.57%, 01/25/36(b) | | | 5,239,973 | |
| | 5,740,000 | | | BankAmerica Manufactured Housing Contract Trust, Series 1997-2, Class B1,
7.07%, 02/10/22(d) | | | 3,303,763 | |
| | 5,000,000 | | | BankAmerica Manufactured Housing Contract Trust, Series 1998-2, Class B1,
7.46%, 12/10/25(d) | | | 2,323,904 | |
| | 7,843,368 | | | Bayview Commercial Asset Trust, Series 2007-4A, Class A1,
(1 mo. LIBOR US + 0.450%),
0.60%, 09/25/37(b)(c) | | | 7,268,128 | |
| | 8,931,969 | | | Bayview Financial Revolving Asset Trust, Series 2004-B, Class A1,
(1 mo. LIBOR US + 1.000%),
1.15%, 05/28/39(b)(c) | | | 8,354,340 | |
Principal
Amount | | | | | Value | |
| UNITED STATES (continued) | | | | |
| Other Asset-Backed Securities (continued) | | | | |
| $ | 426,644 | | | Bayview Financial Revolving Asset Trust, Series 2004-B, Class A2,
(1 mo. LIBOR US + 1.300%),
1.45%, 05/28/39(b)(c) | | $ | 382,879 | |
| | 1,836,675 | | | Bayview Financial Revolving Asset Trust, Series 2005-E, Class A1,
(1 mo. LIBOR US + 1.000%),
1.15%, 12/28/40(b)(c) | | | 1,625,934 | |
| | 3,857,432 | | | Bayview Financial Revolving Asset Trust, Series 2005-E, Class A2A,
(1 mo. LIBOR US + 0.930%),
1.08%, 12/28/40(b)(c) | | | 3,701,650 | |
| | 250,000 | | | BCC Funding XVII LLC, Series 2020- 1, Class A2,
0.91%, 08/20/25(c) | | | 249,960 | |
| | 1,808,820 | | | Bear Stearns Asset Backed Securities I Trust, Series 2006-HE1, Class 1M4,
(1 mo. LIBOR US + 0.680%),
0.83%, 12/25/35(b) | | | 2,344,223 | |
| | 3,453,857 | | | Bear Stearns Asset Backed Securities I Trust, Series 2007-HE1, Class 21A2,
(1 mo. LIBOR US + 0.160%),
0.31%, 01/25/37(b) | | | 3,353,933 | |
| | 4,882,859 | | | Bear Stearns Asset-Backed Securities Trust, Series 2006-HE10, Class 22A,
(1 mo. LIBOR US + 0.140%),
0.29%, 12/25/36(b) | | | 5,183,610 | |
| | 500,000 | | | CarMax Auto Owner Trust, Series 2020-4, Class B,
0.85%, 06/15/26 | | | 499,009 | |
| | 4,884,740 | | | Carrington Mortgage Loan Trust, Series 2007-FRE1, Class A4,
(1 mo. LIBOR US + 0.420%),
0.57%, 02/25/37(b) | | | 3,892,181 | |
| | 6,465,711 | | | Carrington Mortgage Loan Trust, Series 2007-FRE1, Class M1,
(1 mo. LIBOR US + 0.500%),
0.65%, 02/25/37(b) | | | 4,761,286 | |
| | 7,512,596 | | | Cascade MH Asset Trust, Series 2019- MH1, Class A,
4.00%, 11/25/44(c)(d) | | | 7,727,737 | |
| | 2,334,715 | | | Conseco Finance Corp., Series 1997-7, Class M1,
7.03%, 07/15/28(d) | | | 1,945,975 | |
| Old Westbury Funds, Inc. | |
| Credit Income Fund | |
| Portfolio of Investments - (Continued) | October 31, 2020 |
| | |
Principal
Amount | | | | | Value | |
| UNITED STATES (continued) | | | | |
| Other Asset-Backed Securities (continued) | | | | |
| $ | 2,438,793 | | | Conseco Finance Corp., Series 1998-2, Class M1,
6.94%, 12/01/28(d) | | $ | 2,393,378 | |
| | 2,464,002 | | | Conseco Finance Corp., Series 1999-5, Class A5,
7.86%, 03/01/30(d) | | | 1,486,578 | |
| | 2,779,785 | | | Conseco Finance Corp., Series 1999-5, Class A6,
7.50%, 03/01/30(d) | | | 1,615,272 | |
| | 11,192,746 | | | Conseco Finance Securitizations Corp., Series 2000-1, Class A5,
8.06%, 09/01/29(d) | | | 3,945,519 | |
| | 2,654,784 | | | Countrywide Asset-Backed Certificates, Series 2005-17, Class 1AF4, STEP,
6.05%, 05/25/36 | | | 2,700,275 | |
| | 635,089 | | | Countrywide Asset-Backed Certificates, Series 2006-11, Class 3AV2,
(1 mo. LIBOR US + 0.160%),
0.31%, 09/25/46(b) | | | 620,629 | |
| | 5,282,081 | | | Countrywide Asset-Backed Certificates, Series 2006-12, Class 1A,
(1 mo. LIBOR US + 0.130%),
0.28%, 12/25/36(b) | | | 4,929,832 | |
| | 5,558,423 | | | Countrywide Asset-Backed Certificates, Series 2006-22, Class M1,
(1 mo. LIBOR US + 0.230%),
0.38%, 05/25/47(b) | | | 3,810,392 | |
| | 5,603,826 | | | Countrywide Asset-Backed Certificates, Series 2006-26, Class M1,
(1 mo. LIBOR US + 0.250%),
0.40%, 06/25/37(b) | | | 4,501,536 | |
| | 2,058,972 | | | Countrywide Revolving Home Equity Loan Resecuritization Trust, Series 2006-C, Class 2A,
(1 mo. LIBOR US + 0.180%),
0.33%, 05/15/36(b) | | | 1,984,583 | |
| | 1,136,195 | | | Countrywide Revolving Home Equity Loan Resecuritization Trust, Series 2006-RES, Class 4Q1B,
(1 mo. LIBOR US + 0.300%),
0.45%, 12/15/33(b)(c) | | | 1,075,336 | |
Principal
Amount | | | | | Value | |
| UNITED STATES (continued) | | | | |
| Other Asset-Backed Securities (continued) | | | | |
| $ | 865,267 | | | Countrywide Revolving Home Equity Loan Resecuritization Trust, Series 2006-RES, Class 4T1B,
(1 mo. LIBOR US + 0.240%),
0.39%, 02/15/30(b)(c) | | $ | 763,890 | |
| | 585,778 | | | Countrywide Revolving Home Equity Loan Resecuritization Trust, Series 2006-RES, Class 5B1B,
(1 mo. LIBOR US + 0.190%),
0.34%, 05/15/35(b)(c) | | | 524,705 | |
| | 10,235,244 | | | Credit Suisse Mortgage Capital Certificates, Series 2019-JR1, Class B3,
16.20%, 09/27/66(a)(c) | | | 6,550,556 | |
| | 3,833,423 | | | Credit Suisse Mortgage Capital Certificates, Series 2019-JR1, Class PT2,
0.00%, 03/25/59(a)(c) | | | 1,571,703 | |
| | 2,810,737 | | | Credit-Based Asset Servicing and Securitization LLC, Series 2007- CB6, Class A4,
(1 mo. LIBOR US + 0.340%),
0.49%, 07/25/37(b)(c) | | | 2,254,848 | |
| | 8,807,991 | | | CWABS Asset-Backed Certificates Trust, Series 2006-18, Class M1,
(1 mo. LIBOR US + 0.300%),
0.45%, 03/25/37(b) | | | 7,014,661 | |
| | 1,000,000 | | | DT Auto Owner Trust, Series 2019-1A, Class C,
3.61%, 11/15/24(c) | | | 1,023,473 | |
| | 1,000,000 | | | Enterprise Fleet Financing LLC, Series 2020-2, Class A3,
0.65%, 07/20/26(c) | | | 998,134 | |
| | 4,887,668 | | | First Frankin Mortgage Loan Trust, Series 2006-FF4, Class M1,
(1 mo. LIBOR US + 0.360%),
0.69%, 03/25/36(b) | | | 3,930,406 | |
| | 2,205,260 | | | First Franklin Mortgage Loan Trust, Series 2003-FF4, Class M1,
(1 mo. LIBOR US + 1.800%),
1.95%, 10/25/33(b) | | | 2,213,581 | |
| | 9,125,243 | | | First Franklin Mortgage Loan Trust, Series 2006-FF8, Class M1,
(1 mo. LIBOR US + 0.250%),
0.40%, 07/25/36(b) | | | 6,443,118 | |
| | 4,121,735 | | | First Franklin Mortgage Loan Trust, Series 2006-FFH1, Class M2,
(1 mo. LIBOR US + 0.400%),
0.55%, 01/25/36(b) | | | 3,017,268 | |
| Old Westbury Funds, Inc. | |
| Credit Income Fund | |
| Portfolio of Investments - (Continued) | October 31, 2020 |
Principal
Amount | | | | | Value | |
| UNITED STATES (continued) |
| Other Asset-Backed Securities (continued) |
| $ | 4,339,774 | | | First Franklin Mortgage Loan Trust, Series 2007-FF2, Class A2C,
(1 mo. LIBOR US + 0.150%),
0.30%, 03/25/37(b) | | $ | 2,692,170 | |
| | 500,000 | | | Flagship Credit Auto Trust, Series 2020-4, Class B,
1.00%, 10/15/25(c) | | | 499,806 | |
| | 1,000,000 | | | Ford Credit Auto Owner Trust, Series 2020-2, Class A,
1.06%, 04/15/33(c) | | | 1,001,448 | |
| | 1,500,000 | | | Fremont Home Loan Trust, Series 2005-D, Class M1,
(1 mo. LIBOR US + 0.410%),
0.56%, 11/25/35(b) | | | 1,369,289 | |
| | 1,000,000 | | | GM Financial Consumer Automobile Receivables Trust, Series 2020-4, Class A3,
0.38%, 08/18/25 | | | 1,000,038 | |
| | 830,975 | | | GMACM Home Equity Loan Trust, Series 2005-HE3, Class A3,
(1 mo. LIBOR US + 0.500%),
0.65%, 02/25/36(b) | | | 806,737 | |
| | 377,275 | | | GMACM Home Equity Loan Trust, Series 2006-HE1, Class A,
(1 mo. LIBOR US + 0.315%),
0.46%, 11/25/36(b) | | | 373,233 | |
| | 500,000 | | | GMF Floorplan Owner Revolving Trust, Series 2020-2, Class B,
0.96%, 10/15/25(c) | | | 499,807 | |
| | 6,381,857 | | | Greenpoint Manufactured Housing, Series 2000-3, Class IA,
8.45%, 06/20/31(d) | | | 5,139,815 | |
| | 2,463,906 | | | GSAA Home Equity Trust, Series 2005-14, Class 1A2,
(1 mo. LIBOR US + 0.350%),
0.50%, 12/25/35(b) | | | 1,009,161 | |
| | 10,111,696 | | | GSAA Home Equity Trust, Series 2006-5, Class 1A1,
(1 mo. LIBOR US + 0.180%),
0.33%, 03/25/36(b) | | | 4,442,526 | |
| | 457,953 | | | GSAA Trust, Series 2006-7, Class AF2,
5.99%, 03/25/46(d) | | | 277,080 | |
| | 3,566,000 | | | GSAMP Trust, Series 2007-HS1, Class M5,
(1 mo. LIBOR US + 2.250%),
2.40%, 02/25/47(b) | | | 3,626,132 | |
Principal
Amount | | | | | Value | |
| UNITED STATES (continued) |
| Other Asset-Backed Securities (continued) |
| $ | 4,375,000 | | | Home Equity Asset Trust, Series 2007-1, Class 2A3,
(1 mo. LIBOR US + 0.150%),
0.30%, 05/25/37(b) | | $ | 3,736,700 | |
| | 5,266,105 | | | HSI Asset Loan Obligation Trust, Series 2007-WF1, Class A3, STEP,
4.83%, 12/25/36 | | | 2,571,867 | |
| | 1,000,000 | | | Hyundai Auto Lease Securitization Trust, Series 2020-B, Class B,
0.81%, 10/15/24(c) | | | 1,001,299 | |
| | 1,143,368 | | | Irwin Home Equity Loan Trust, Series 2006-3, Class 2A3, STEP,
6.53%, 09/25/37(c) | | | 1,139,432 | |
| | 5,247,138 | | | Legacy Mortgage Asset Trust, Series 2019-SL1, Class A,
4.00%, 12/28/54(c)(d) | | | 5,296,472 | |
| | 1,922,886 | | | Legacy Mortgage Asset Trust, Series 2019-SL2, Class B,
0.00%, 02/25/59(a)(c) | | | 321,891 | |
| | 1,900,000 | | | Legacy Mortgage Asset Trust, Series 2019-SL2, Class M,
4.25%, 02/25/59(a)(c)(d) | | | 1,814,500 | |
| | 3,478,770 | | | Lehman ABS Manufactured Housing Contract Trust, Series 2001-B, Class M1,
6.63%, 04/15/40(d) | | | 3,696,056 | |
| | 309,723 | | | Lehman ABS Mortgage Loan Trust, Series 2007-1, Class 2A1,
(1 mo. LIBOR US + 0.090%),
0.24%, 06/25/37(b)(c) | | | 239,685 | |
| | 6,373,909 | | | Lehman ABS Mortgage Loan Trust, Series 2007-1, Class 2A2,
(1 mo. LIBOR US + 0.200%),
0.35%, 06/25/37(b)(c) | | | 5,002,462 | |
| | 1,073,790 | | | Long Beach Mortgage Loan Trust, Series 2006-10, Class 2A2,
(1 mo. LIBOR US + 0.110%),
0.26%, 11/25/36(b) | | | 412,644 | |
| | 5,782,040 | | | Long Beach Mortgage Loan Trust, Series 2006-9, Class 2A3,
(1 mo. LIBOR US + 0.160%),
0.31%, 10/25/36(b) | | | 2,377,488 | |
| | 2,638,951 | | | Madison Avenue Manufactured Housing Contract Trust, Series 2002-A, Class B2,
(1 mo. LIBOR US + 3.250%),
3.40%, 03/25/32(b) | | | 2,641,238 | |
| Old Westbury Funds, Inc. | |
| Credit Income Fund | |
| Portfolio of Investments - (Continued) | October 31, 2020 |
Principal
Amount | | | | | Value | |
| UNITED STATES (continued) |
| Other Asset-Backed Securities (continued) |
| $ | 4,105,373 | | | MASTR Second Lien Trust, Series 2006-1, Class A,
(1 mo. LIBOR US + 0.320%),
0.47%, 03/25/36(b) | | $ | 565,072 | |
| | 350,754 | | | MCM Trust, Series 2018-NPL1, Class A,
4.00%, 05/28/58(c) | | | 352,732 | |
| | 1,586,756 | | | MCM Trust, Series 2018-NPL1, Class B,
0.00%, 05/28/58(c) | | | 1,102,697 | |
| | 1,000,000 | | | Mercedes-Benz Auto Lease Trust, Series 2020-A, Class A4,
1.88%, 09/15/25 | | | 1,023,196 | |
| | 2,729,435 | | | MERIT Securities Corp., Series 13, Class M2, STEP,
7.33%, 12/28/33 | | | 2,429,954 | |
| | 10,506,108 | | | Merrill Lynch Mortgage Investors Trust, Series 2006-RM5, Class A2D,
(1 mo. LIBOR US + 0.250%),
0.40%, 10/25/37(b) | | | 4,533,337 | |
| | 1,236,278 | | | Morgan Stanley ABS Capital I, Inc. Trust, Series 2006-HE4, Class A4,
(1 mo. LIBOR US + 0.480%),
0.63%, 06/25/36(b) | | | 826,331 | |
| | 7,013,271 | | | Morgan Stanley ABS Capital I, Inc. Trust, Series 2007-NC1, Class A1,
(1 mo. LIBOR US + 0.130%),
0.28%, 11/25/36(b) | | | 3,891,262 | |
| | 3,958,365 | | | Morgan Stanley ABS Capital I, Inc. Trust, Series 2007-SEA1, Class 2A1,
(1 mo. LIBOR US + 1.900%),
2.05%, 02/25/47(b)(c) | | | 3,821,735 | |
| | 3,554,193 | | | Morgan Stanley Capital I, Inc. Trust, Series 2006-NC2, Class M1,
(1 mo. LIBOR US + 0.360%),
0.51%, 02/25/36(b) | | | 3,308,053 | |
| | 4,693,107 | | | Morgan Stanley Mortgage Loan Trust, Series 2006-12XS, Class A4, STEP,
6.01%, 10/25/36 | | | 1,677,039 | |
| | 1,235,668 | | | Morgan Stanley Mortgage Loan Trust, Series 2006-4SL, Class A1,
(1 mo. LIBOR US + 0.300%),
0.45%, 03/25/36(b) | | | 1,224,171 | |
Principal
Amount | | | | | Value | |
| UNITED STATES (continued) |
| Other Asset-Backed Securities (continued) |
| $ | 5,000,000 | | | Nationstar HECM Loan Trust, Series 2019-2A, Class M4,
5.68%, 11/25/29(a)(c)(d) | | $ | 4,952,300 | |
| | 8,000,000 | | | Nationstar Home Equity Loan Trust, Series 2007-A, Class M3,
(1 mo. LIBOR US + 0.300%),
0.45%, 03/25/37(b) | | | 6,503,506 | |
| | 5,683,775 | | | New Century Home Equity Loan Trust, Series 2005-C, Class M2,
(1 mo. LIBOR US + 0.450%),
0.60%, 12/25/35(b) | | | 4,627,874 | |
| | 1,888,168 | | | Nomura Asset Acceptance Corp. Alternative Loan Trust, Series 2006-S5, Class A1,
(1 mo. LIBOR US + 0.400%),
0.55%, 10/25/36(b)(c) | | | 1,831,314 | |
| | 1,880,313 | | | Oakwood Mortgage Investors, Inc., Series 1999-C, Class A2,
7.48%, 08/15/27 | | | 1,778,066 | |
| | 10,092,784 | | | Oakwood Mortgage Investors, Inc., Series 2000-D, Class A4,
7.40%, 07/15/30(d) | | | 3,765,510 | |
| | 8,572,117 | | | Oakwood Mortgage Investors, Inc., Series 2001-C, Class A2,
5.92%, 06/15/31(d) | | | 1,660,765 | |
| | 5,947,218 | | | Oakwood Mortgage Investors, Inc., Series 2001-C, Class A3,
6.61%, 06/15/31(d) | | | 1,286,509 | |
| | 6,795,981 | | | Oakwood Mortgage Investors, Inc., Series 2001-C, Class A4,
7.41%, 06/15/31(d) | | | 1,646,928 | |
| | 705,357 | | | Oakwood Mortgage Investors, Inc., Series 2001-D, Class A3,
5.90%, 09/15/22(d) | | | 524,397 | |
| | 744,767 | | | Oakwood Mortgage Investors, Inc., Series 2002-B, Class A4,
7.09%, 06/15/32(d) | | | 783,719 | |
| | 4,000,000 | | | OneMain Financial Issuance Trust, Series 2015-3A, Class D,
6.94%, 11/20/28(c) | | | 4,009,556 | |
| | 2,955,985 | | | Popular ABS Mortgage Pass-Through Trust, Series 2005-3, Class M2, STEP,
3.91%, 07/25/35 | | | 2,452,008 | |
| | 1,000,000 | | | Progress Residential Trust, Series 2019-SFR3, Class F,
3.87%, 09/17/36(c) | | | 1,012,600 | |
| Old Westbury Funds, Inc. | |
| Credit Income Fund | |
| Portfolio of Investments - (Continued) | October 31, 2020 |
Principal
Amount | | | | | Value | |
| UNITED STATES (continued) |
| Other Asset-Backed Securities (continued) |
| $ | 3,000,000 | | | Progress Residential Trust, Series 2019-SFR4, Class F,
3.68%, 10/17/36(c) | | $ | 3,049,999 | |
| | 5,000,000 | | | PRPM LLC, Series 2020-4, Class A1,
2.61%, 10/25/25(a)(c) | | | 4,999,912 | |
| | 3,825,000 | | | Residential Asset Securities Corp., Series 2005-KS10, Class M4,
(1 mo. LIBOR US + 0.580%),
0.73%, 11/25/35(b) | | | 2,929,934 | |
| | 2,000,000 | | | Residential Asset Securities Corp., Series 2006-KS4, Class M2,
(1 mo. LIBOR US + 0.290%),
0.44%, 06/25/36(b) | | | 1,871,210 | |
| | 1,422,356 | | | SACO I Trust, Series 2006-7, Class A1,
(1 mo. LIBOR US + 0.260%),
0.41%, 07/25/36(b) | | | 1,399,513 | |
| | 500,000 | | | Santander Retail Auto Lease Trust, Series 2020-B, Class A4,
0.65%, 12/20/24(c) | | | 499,677 | |
| | 4,167,784 | | | Saxon Asset Securities Trust, Series 2006-2, Class M3,
(1 mo. LIBOR US + 0.320%),
0.47%, 09/25/36(b) | | | 3,274,047 | |
| | 8,477,089 | | | Saxon Asset Securities Trust, Series 2007-1, Class M1,
(1 mo. LIBOR US + 0.290%),
0.44%, 01/25/47(b) | | | 7,048,005 | |
| | 2,999,183 | | | Securitized Asset Backed Receivables LLC Trust, Series 2007-BR1, Class A2B,
(1 mo. LIBOR US + 0.270%),
0.42%, 02/25/37(b) | | | 2,218,721 | |
| | 11,510,750 | | | Soundview Home Loan Trust, Series 2006-OPT5, Class M1,
(1 mo. LIBOR US + 0.250%),
0.40%, 07/25/36(b) | | | 9,698,937 | |
| | 4,073,324 | | | Structured Asset Investment Loan Trust, Series 2005-9, Class M2,
(1 mo. LIBOR US + 0.450%),
0.60%, 11/25/35(b) | | | 2,765,375 | |
| | 4,363,389 | | | Structured Asset Investment Loan Trust, Series 2005-HE1, Class M3,
(1 mo. LIBOR US + 0.500%),
0.65%, 07/25/35(b) | | | 3,596,398 | |
Principal
Amount | | | | | Value | |
| UNITED STATES (continued) |
| Other Asset-Backed Securities (continued) |
| $ | 2,008,383 | | | Structured Asset Securities Corp. Mortgage Loan Trust, Series 2007-WF1, Class M1,
(1 mo. LIBOR US + 0.440%),
0.59%, 02/25/37(b) | | $ | 5,597,092 | |
| | 1,000,000 | | | Tesla Auto Lease Trust, Series 2019-B, Class A3,
2.16%, 10/20/22(c) | | | 1,023,388 | |
| | 1,000,000 | | | Toyota Auto Receivables 2020-D Owner Trust, Series 2020-D, Class A3,
0.35%, 01/15/25 | | | 1,001,400 | |
| | 1,000,000 | | | Tricon American Homes Trust, Series 2020-SFR2, Class A,
1.48%, 11/17/39(c) | | | 999,976 | |
| | 1,000,000 | | | Verizon Owner Trust, Series 2020-C, Class B,
0.67%, 04/21/25 | | | 999,414 | |
| | 1,000,000 | | | VERIZON OWNER TRUST, Series 2020-A, Class B,
1.98%, 07/22/24 | | | 1,031,333 | |
| | 1,000,000 | | | World Omni Automobile Lease Securitization Trust, Series 2020-B, Class B,
0.70%, 02/17/26 | | | 999,733 | |
| | 1,000,000 | | | World Omni Select Auto Trust, Series 2019-A, Class A3,
2.00%, 08/15/24 | | | 1,017,830 | |
| | 9,413,317 | | | Yale Mortgage Loan Trust, Series 2007-1, Class A,
(1 mo. LIBOR US + 0.400%),
0.55%, 06/25/37(b)(c) | | | 3,864,009 | |
| | | | | | | | 490,919,320 | |
Total Asset-Backed Securities
(Cost $545,634,023) | | | 546,337,933 | |
| | | | | | | | | |
| NON-AGENCY MORTGAGE-BACKED SECURITIES — 18.7% |
| COLLATERALIZED MORTGAGE OBLIGATIONS — 16.3% |
| | 589,088 | | | Adjustable Rate Mortgage Trust, Series 2005-3, Class 2A1,
3.76%, 07/25/35(d) | | | 573,065 | |
| | 1,958,864 | | | Adjustable Rate Mortgage Trust, Series 2007-1, Class 4A1,
4.63%, 03/25/37(d) | | | 1,606,579 | |
| Old Westbury Funds, Inc. | |
| Credit Income Fund | |
| Portfolio of Investments - (Continued) | October 31, 2020 |
Principal
Amount | | | | | Value | |
| COLLATERALIZED MORTGAGE OBLIGATIONS (continued) |
| $ | 1,794,579 | | | American Home Mortgage Assets Trust, Series 2006-2, Class 1A1,
(12 mo. Federal Reserve Cumulative Average US + 0.960%),
1.84%, 09/25/46(b) | | $ | 1,814,909 | |
| | 1,476,755 | | | American Home Mortgage Assets Trust, Series 2007-3, Class 22A1, STEP,
6.25%, 06/25/37 | | | 1,353,279 | |
| | 12,798,976 | | | APS Resecuritization Trust, Series 2016-1, Class 1MZ,
4.15%, 07/31/57(c)(d) | | | 4,517,782 | |
| | 3,356,175 | | | Ari Investments LLC,
4.61%, 01/06/25(a) | | | 3,289,052 | |
| | 3,136,896 | | | Ari Investments LLC,
4.55%, 01/30/25(a) | | | 3,074,158 | |
| | 1,820,849 | | | Banc of America Alternative Loan Trust, Series 2006-9, Class A2,
(1 mo. LIBOR US + 0.400%),
0.55%, 01/25/37(b) | | | 1,343,326 | |
| | 289,761 | | | Banc of America Funding Corp., Series 2005-F, Class 6A1,
3.16%, 09/20/35(d) | | | 280,252 | |
| | 545,740 | | | Banc of America Funding Corp., Series 2006-A, Class 3A2,
3.34%, 02/20/36(d) | | | 515,631 | |
| | 517,981 | | | Banc of America Funding Corp., Series 2006-E, Class 2A1,
3.41%, 06/20/36(d) | | | 487,033 | |
| | 1,697,012 | | | Banc of America Funding Corp., Series 2007-1, Class TA5, STEP,
6.09%, 01/25/37 | | | 1,730,383 | |
| | 3,290,514 | | | Banc of America Funding Corp., Series 2015-R3, Class 1A2,
0.59%, 03/27/36(c)(d) | | | 2,497,324 | |
| | 514,355 | | | Banc of America Mortgage Securities, Inc., Series 2005-I, Class 2A5,
2.92%, 10/25/35(d) | | | 512,909 | |
| | 3,774,265 | | | BCAP LLC Trust, Series 2012-RR3, Class 1A5,
6.36%, 12/26/37(c)(d) | | | 3,251,816 | |
| | 1,132,474 | | | Bear Stearns Adjustable Rate Mortgage Trust, Series 2005-12, Class 23A1,
3.19%, 02/25/36(d) | | | 1,127,160 | |
| | 221,882 | | | Bear Stearns Adjustable Rate Mortgage Trust, Series 2005-6, Class 5A1,
3.57%, 08/25/35(d) | | | 208,290 | |
Principal
Amount | | | | | Value | |
| COLLATERALIZED MORTGAGE OBLIGATIONS (continued) |
| $ | 411,975 | | | Bear Stearns Adjustable Rate Mortgage Trust, Series 2007-3, Class 1A1,
3.87%, 05/25/47(d) | | $ | 398,648 | |
| | 1,640,139 | | | Bear Stearns ALT-A Trust, Series 2006-2, Class 11A1,
(1 mo. LIBOR US + 0.440%),
0.59%, 04/25/36(b) | | | 1,977,875 | |
| | 3,464,521 | | | Bear Stearns ALT-A Trust, Series 2006-6, Class 1A1,
(1 mo. LIBOR US + 0.320%),
0.47%, 11/25/36(b) | | | 2,969,986 | |
| | 2,945,581 | | | Bear Stearns Asset-Backed Securities Trust, Series 2006-AC2, Class 22A1,
(1 mo. LIBOR US + 0.350%),
0.50%, 03/25/36(b) | | | 340,911 | |
| | 2,945,581 | | | Bear Stearns Asset-Backed Securities Trust, Series 2006-AC2, Class 22A3,
(1 mo. LIBOR US + 0.350%),
0.50%, 03/25/36(b) | | | 340,911 | |
| | 1,531,335 | | | Bear Stearns Mortgage Funding Trust, Series 2006-SL1, Class A1,
(1 mo. LIBOR US + 0.280%),
0.43%, 08/25/36(b) | | | 1,503,726 | |
| | 1,102,932 | | | Bear Stearns Mortgage Funding Trust, Series 2006-SL4, Class A,
(1 mo. LIBOR US + 0.300%),
0.45%, 11/25/36(b) | | | 1,054,736 | |
| | 1,533,685 | | | Chase Mortgage Finance Corp., Series 2016-SH1, Class M4,
3.75%, 04/25/45(c)(d) | | | 1,527,877 | |
| | 4,408,266 | | | Chase Mortgage Finance Trust, Series 2007-S6, Class 1A1,
6.00%, 12/25/37 | | | 2,941,171 | |
| | 12,690,937 | | | ChaseFlex Trust, Series 2007-1, Class 2A7,
6.00%, 02/25/37 | | | 7,803,282 | |
| | 2,849,520 | | | Citicorp Mortgage Securities Trust, Series 2007-9, Class 1A1,
6.25%, 12/25/37 | | | 2,555,616 | |
| | 3,327,911 | | | Citicorp Mortgage Securities Trust, Series 2008-2, Class 1A1,
6.50%, 06/25/38 | | | 2,912,998 | |
| | 171,538 | | | Citigroup Mortgage Loan Trust, Series 2006-AR3, Class 1A2A,
3.93%, 06/25/36(d) | | | 161,185 | |
| | 3,615,236 | | | Citigroup Mortgage Loan Trust, Series 2007-9, Class 1A1,
5.75%, 04/25/47(c) | | | 3,085,595 | |
| Old Westbury Funds, Inc. | |
| Credit Income Fund | |
| Portfolio of Investments - (Continued) | October 31, 2020 |
Principal
Amount | | | | | Value | |
| COLLATERALIZED MORTGAGE OBLIGATIONS (continued) |
| $ | 240,537 | | | Citigroup Mortgage Loan Trust, Inc., Series 2005-2, Class 1A1,
3.74%, 05/25/35(d) | | $ | 242,133 | |
| | 461,994 | | | Countrywide Alternative Loan Trust, Series 2004-36CB, Class 1A1,
6.00%, 02/25/35 | | | 427,551 | |
| | 927,337 | | | Countrywide Alternative Loan Trust, Series 2005-31, Class 2A1,
(1 mo. LIBOR US + 0.300%),
0.45%, 08/25/35(b) | | | 868,574 | |
| | 7,087,024 | | | Countrywide Alternative Loan Trust, Series 2005-53T2, Class 2A7,
(1 mo. LIBOR US x (1) + 5.500%),
5.35%, 11/25/35(b) | | | 1,536,519 | |
| | 402,345 | | | Countrywide Alternative Loan Trust, Series 2005-63, Class 5A1,
3.77%, 12/25/35(d) | | | 383,853 | |
| | 87,738 | | | Countrywide Alternative Loan Trust, Series 2005-69, Class A1,
(12 mo. Federal Reserve Cumulative Average US + 1.000%),
1.88%, 12/25/35(b) | | | 83,186 | |
| | 1,405,243 | | | Countrywide Alternative Loan Trust, Series 2005-9CB, Class 1A3,
(1 mo. LIBOR US + 0.450%),
0.60%, 05/25/35(b) | | | 1,244,328 | |
| | 844,634 | | | Countrywide Alternative Loan Trust, Series 2005-J14, Class A3,
5.50%, 12/25/35 | | | 683,300 | |
| | 3,117,040 | | | Countrywide Alternative Loan Trust, Series 2006-12CB, Class A10,
(1 mo. LIBOR US + 0.350%),
0.50%, 05/25/36(b) | | | 1,245,028 | |
| | 1,954,309 | | | Countrywide Alternative Loan Trust, Series 2006-15CB, Class A1,
6.50%, 06/25/36 | | | 1,475,026 | |
| | 3,851,393 | | | Countrywide Alternative Loan Trust, Series 2006-20CB, Class A9,
6.00%, 07/25/36 | | | 2,593,990 | |
| | 1,297,249 | | | Countrywide Alternative Loan Trust, Series 2006-24CB, Class A13,
(1 mo. LIBOR US + 0.350%),
0.50%, 08/25/36(b) | | | 598,084 | |
| | 1,297,249 | | | Countrywide Alternative Loan Trust, Series 2006-24CB, Class A14,
(1 mo. LIBOR US x (1) + 7.150%),
7.00%, 08/25/36(b) | | | 364,341 | |
Principal
Amount | | | | | Value | |
| COLLATERALIZED MORTGAGE OBLIGATIONS (continued) |
| $ | 1,337,281 | | | Countrywide Alternative Loan Trust, Series 2006-24CB, Class A15,
5.75%, 08/25/36 | | $ | 1,072,317 | |
| | 1,344,952 | | | Countrywide Alternative Loan Trust, Series 2006-2CB, Class A4,
(1 mo. LIBOR US + 0.400%),
0.55%, 03/25/36(b) | | | 560,099 | |
| | 3,777,860 | | | Countrywide Alternative Loan Trust, Series 2006-2CB, Class A6,
5.50%, 03/25/36 | | | 2,515,799 | |
| | 1,457,232 | | | Countrywide Alternative Loan Trust, Series 2006-41CB, Class 1A10,
6.00%, 01/25/37 | | | 1,166,802 | |
| | 1,055,140 | | | Countrywide Alternative Loan Trust, Series 2006-41CB, Class 1A4,
5.75%, 01/25/37 | | | 825,811 | |
| | 1,243,936 | | | Countrywide Alternative Loan Trust, Series 2006-45T1, Class 2A2,
6.00%, 02/25/37 | | | 917,252 | |
| | 2,844,358 | | | Countrywide Alternative Loan Trust, Series 2006-45T1, Class 2A5,
6.00%, 02/25/37 | | | 2,097,369 | |
| | 5,422,006 | | | Countrywide Alternative Loan Trust, Series 2006-45T1, Class 2A7,
(1 mo. LIBOR US + 0.340%),
0.49%, 02/25/37(b) | | | 2,327,583 | |
| | 2,711,003 | | | Countrywide Alternative Loan Trust, Series 2006-45T1, Class 2A8,
(1 mo. LIBOR US x (1) + 6.600%),
6.45%, 02/25/37(b) | | | 682,038 | |
| | 173,505 | | | Countrywide Alternative Loan Trust, Series 2006-6CB, Class 1A10,
5.50%, 05/25/36 | | | 170,150 | |
| | 492,251 | | | Countrywide Alternative Loan Trust, Series 2006-6CB, Class 1A2,
(1 mo. LIBOR US + 0.400%),
0.55%, 05/25/36(b) | | | 398,175 | |
| | 3,142,023 | | | Countrywide Alternative Loan Trust, Series 2006-7CB, Class 2A1,
6.50%, 05/25/36 | | | 2,105,287 | |
| | 2,674,754 | | | Countrywide Alternative Loan Trust, Series 2006-J7, Class 2A1, (Cost of Funds for the 11th District of San Francisco + 1.500%),
2.03%, 11/20/46(b) | | | 1,925,186 | |
| Old Westbury Funds, Inc. | |
| Credit Income Fund | |
| Portfolio of Investments - (Continued) | October 31, 2020 |
| | |
Principal
Amount | | | | | Value | |
| COLLATERALIZED MORTGAGE OBLIGATIONS (continued) | |
| $ | 5,337,132 | | | Countrywide Alternative Loan Trust, Series 2006-OA14, Class 1A1,
(12 mo. Federal Reserve Cumulative Average US + 1.730%),
2.61%, 11/25/46(b) | | $ | 4,432,448 | |
| | 2,743,377 | | | Countrywide Alternative Loan Trust, Series 2006-OA14, Class 2A1,
(1 mo. LIBOR US + 0.190%),
0.34%, 11/25/46(b) | | | 2,411,990 | |
| | 4,061,646 | | | Countrywide Alternative Loan Trust, Series 2006-OA21, Class A1,
(1 mo. LIBOR US + 0.190%),
0.34%, 03/20/47(b) | | | 3,342,862 | |
| | 914,207 | | | Countrywide Alternative Loan Trust, Series 2006-OA3, Class 2A1,
(1 mo. LIBOR US + 0.210%),
0.36%, 05/25/36(b) | | | 802,761 | |
| | 3,225,406 | | | Countrywide Alternative Loan Trust, Series 2006-OC3, Class 1A1,
(1 mo. LIBOR US + 0.180%),
0.33%, 04/25/46(b) | | | 2,857,856 | |
| | 2,208,577 | | | Countrywide Alternative Loan Trust, Series 2007-12T1, Class A22,
5.75%, 06/25/37 | | | 1,562,109 | |
| | 2,224,576 | | | Countrywide Alternative Loan Trust, Series 2007-12T1, Class A5,
6.00%, 06/25/37 | | | 1,616,864 | |
| | 1,090,795 | | | Countrywide Alternative Loan Trust, Series 2007-19, Class 1A34,
6.00%, 08/25/37 | | | 800,265 | |
| | 4,724,101 | | | Countrywide Alternative Loan Trust, Series 2007-22, Class 2A16,
6.50%, 09/25/37 | | | 2,756,737 | |
| | 4,254,033 | | | Countrywide Alternative Loan Trust, Series 2007-25, Class 1A3,
6.50%, 11/25/37 | | | 2,964,055 | |
| | 1,030,256 | | | Countrywide Alternative Loan Trust, Series 2007-9T1, Class 1A8,
6.00%, 05/25/37 | | | 676,154 | |
| | 452,826 | | | Countrywide Alternative Loan Trust, Series 2007-J1, Class 3A4, STEP,
4.23%, 11/25/36 | | | 547,763 | |
| | 9,519,117 | | | Countrywide Alternative Loan Trust, Series 2007-OA2, Class 1A1,
(12 mo. Federal Reserve Cumulative Average US + 0.840%),
1.72%, 03/25/47(b) | | | 8,017,736 | |
Principal
Amount | | | | | Value | |
| COLLATERALIZED MORTGAGE OBLIGATIONS (continued) | |
| $ | 198,992 | | | Countrywide Alternative Loan Trust, Series 2007-OA3, Class 1A2,
(1 mo. LIBOR US + 0.180%),
0.33%, 04/25/47(b) | | $ | 38,800 | |
| | 1,793,606 | | | Countrywide Alternative Loan Trust, Series 2007-OH2, Class A2A,
(1 mo. LIBOR US + 0.240%),
0.39%, 08/25/47(b) | | | 1,624,475 | |
| | 1,684,575 | | | Countrywide Alternative Loan Trust, Series 2008-1R, Class 2A3,
6.00%, 08/25/37 | | | 1,305,712 | |
| | 1,384,961 | | | Countrywide Alternative Resecuritization, Series 2006- 22R, Class 2A1,
6.25%, 05/25/36 | | | 1,116,276 | |
| | 1,279,875 | | | Countrywide Home Loan Mortgage Pass-Through Trust, Series 2005- 31, Class 2A3,
3.27%, 01/25/36(d) | | | 1,148,512 | |
| | 2,029,557 | | | Countrywide Home Loan Mortgage Pass-Through Trust, Series 2005- J2, Class 2A4,
(1 mo. LIBOR US + 1.400%),
1.55%, 08/25/35(b) | | | 1,650,265 | |
| | 368,863 | | | Countrywide Home Loan Mortgage Pass-Through Trust, Series 2005- J3, Class 2A4,
4.50%, 09/25/35 | | | 360,356 | |
| | 11,023,064 | | | Countrywide Home Loan Mortgage Pass-Through Trust, Series 2006- OA4, Class A1,
(12 mo. Federal Reserve Cumulative Average US + 0.960%),
1.84%, 04/25/46(b) | | | 4,647,836 | |
| | 2,868,021 | | | Countrywide Home Loan Mortgage Pass-Through Trust, Series 2006- OA5, Class 3A1,
(1 mo. LIBOR US + 0.200%),
0.35%, 04/25/46(b) | | | 2,619,276 | |
| | 745,504 | | | Countrywide Home Loan Mortgage Pass-Through Trust, Series 2006- R2, Class AF1,
(1 mo. LIBOR US + 0.420%),
0.57%, 07/25/36(b)(c) | | | 671,127 | |
| | 2,066,722 | | | Countrywide Home Loan Mortgage Pass-Through Trust, Series 2007- 21, Class 1A1,
6.25%, 02/25/38 | | | 1,639,841 | |
| Old Westbury Funds, Inc. | |
| Credit Income Fund | |
| Portfolio of Investments - (Continued) | October 31, 2020 |
| | |
Principal
Amount | | | | | Value | |
| COLLATERALIZED MORTGAGE OBLIGATIONS (continued) | |
| $ | 2,854,868 | | | Countrywide Home Loan Mortgage Pass-Through Trust, Series 2007- HYB1, Class 3A1,
3.35%, 03/25/37(d) | | $ | 2,606,314 | |
| | 13,256 | | | Credit Suisse Mortgage Capital Certificates, Series 2006-8, Class 1A1,
4.50%, 10/25/21 | | | 12,262 | |
| | 2,394,581 | | | Credit Suisse Mortgage Capital Certificates, Series 2006-9, Class 3A1,
6.00%, 11/25/36 | | | 2,227,793 | |
| | 2,830,764 | | | Credit Suisse Mortgage Capital Certificates, Series 2007-3, Class 1A1A,
5.84%, 04/25/37(d) | | | 1,204,607 | |
| | 7,025,598 | | | Credit Suisse Mortgage Capital Certificates, Series 2009-12R, Class 3A1,
6.50%, 10/27/37(c) | | | 3,720,319 | |
| | 4,043,921 | | | Credit Suisse Mortgage Capital Certificates, Series 2014-2R, Class 17A3,
4.01%, 04/27/37(c)(d) | | | 3,422,522 | |
| | 7,000,000 | | | Credit Suisse Mortgage Capital Certificates, Series 2015-4R, Class 1A4,
(1 mo. LIBOR US + 0.150%),
0.30%, 10/27/36(b)(c) | | | 5,172,048 | |
| | 8,753,452 | | | Credit Suisse Mortgage Trust Mortgage-Backed Trust, Series 2017-2, Class CERT,
0.00%, 02/01/47(a)(c) | | | 8,053,175 | |
| | 6,438,525 | | | CSFB Mortgage-Backed Pass-Through Certificates, Series 2005-10, Class 10A1,
(1 mo. LIBOR US + 1.350%),
1.50%, 11/25/35(b) | | | 1,227,390 | |
| | 554,400 | | | GMACM Mortgage Loan Trust, Series 2005-AR6, Class 2A1,
3.59%, 11/19/35(d) | | | 524,364 | |
| | 4,026,325 | | | GSMPS Mortgage Loan Trust, Series 2005-RP1, Class 1AF,
(1 mo. LIBOR US + 0.350%),
0.50%, 01/25/35(b)(c) | | | 3,571,857 | |
| | 1,488,518 | | | GSMPS Mortgage Loan Trust, Series 2006-RP1, Class 1AF1,
(1 mo. LIBOR US + 0.350%),
0.50%, 01/25/36(b)(c) | | | 1,204,396 | |
Principal
Amount | | | | | Value | |
| COLLATERALIZED MORTGAGE OBLIGATIONS (continued) | |
| $ | 408,480 | | | GSR Mortgage Loan Trust, Series 2005-AR1, Class 2A1,
3.25%, 01/25/35(d) | | $ | 405,144 | |
| | 31,380 | | | GSR Mortgage Loan Trust, Series 2006-4F, Class 1A1,
5.00%, 05/25/36 | | | 136,625 | |
| | 3,030,895 | | | GSR Mortgage Loan Trust, Series 2006-7F, Class 4A2,
6.50%, 08/25/36 | | | 1,683,687 | |
| | 96,634 | | | GSR Mortgage Loan Trust, Series 2006-9F, Class 9A1,
6.00%, 08/25/21 | | | 105,005 | |
| | 400,918 | | | GSR Mortgage Loan Trust, Series 2006-AR1, Class 3A1,
3.74%, 01/25/36(d) | | | 395,867 | |
| | 655,347 | | | GSR Mortgage Loan Trust, Series 2007-4F, Class 3A1,
6.00%, 07/25/37 | | | 577,999 | |
| | 12,061,250 | | | GSR Mortgage Loan Trust, Series 2007-OA2, Class 2A1,
2.52%, 06/25/47(d) | | | 9,277,432 | |
| | 2,520,755 | | | HarborView Mortgage Loan Trust, Series 2007-4, Class 2A2, (1 mo. LIBOR US + 0.250%),
0.40%, 07/19/47(b) | | | 2,186,167 | |
| | 5,000,000 | | | Headlands Residential LLC, Series 2019-RPL1, Class NOTE, STEP,
3.97%, 06/25/24(c) | | | 5,022,193 | |
| | 576,261 | | | HomeBanc Mortgage Trust, Series 2006-1, Class 2A1,
3.28%, 04/25/37(d) | | | 523,426 | |
| | 24,807,162 | | | IndyMac IMSC Mortgage Loan Trust, Series 2007-HOA1, Class AXPP,
2.72%, 07/25/47(d) | | | 1,459,490 | |
| | 2,430,856 | | | IndyMac INDX Mortgage Loan Trust, Series 2007-FLX3, Class A2,
(1 mo. LIBOR US + 0.270%),
0.42%, 06/25/37(b) | | | 2,329,163 | |
| | 1,660,538 | | | JP Morgan Mortgage Trust, Series 2007-A5, Class 2A1,
1.84%, 10/25/37(d) | | | 1,229,680 | |
| | 58,563 | | | JP Morgan Mortgage Trust, Series 2007-S2, Class 2A3,
5.50%, 06/25/37 | | | 66,837 | |
| | 7,123,289 | | | JP Morgan Mortgage Trust, Series 2007-S3, Class 1A10,
6.25%, 08/25/37 | | | 3,640,371 | |
| Old Westbury Funds, Inc. | |
| Credit Income Fund | |
| Portfolio of Investments - (Continued) | October 31, 2020 |
| | |
Principal
Amount | | | | | Value | |
| COLLATERALIZED MORTGAGE OBLIGATIONS (continued) | |
| $ | 2,941,337 | | | Lehman XS Trust, Series 2007-20N, Class A1,
(1 mo. LIBOR US + 1.150%),
1.30%, 12/25/37(b) | | $ | 2,747,668 | |
| | 5,368,351 | | | MASTR Asset Securitization Trust, Series 2007-1, Class 1A4,
6.50%, 11/25/37 | | | 2,871,555 | |
| | 3,201,333 | | | MASTR Reperforming Loan Trust, Series 2005-2, Class 1A3,
7.50%, 05/25/35(c) | | | 3,052,139 | |
| | 1,613,350 | | | MASTR Resecuritization Trust, Series 2008-3, Class A1,
0.58%, 08/25/37(c)(d) | | | 856,611 | |
| | 7,320,537 | | | MCM Capital LLC Trust, Series 2018- NPL2, Class B,
0.00%, 10/25/28(c) | | | 3,262,701 | |
| | 4,735,680 | | | MCM Trust, Series 2018-NPL2, Class A, STEP,
4.00%, 10/25/28(a)(c) | | | 4,747,520 | |
| | 3,217,936 | | | Merrill Lynch Alternative Note Asset Trust, Series 2007-OAR2, Class A2,
(1 mo. LIBOR US + 0.210%),
0.36%, 04/25/37(b) | | | 3,008,793 | |
| | 1,287,319 | | | Merrill Lynch Mortgage Investors Trust, Series 2006-A3, Class 3A1,
3.76%, 05/25/36(d) | | | 1,140,691 | |
| | 583,093 | | | Merrill Lynch Mortgage Investors Trust, Series 2006-AF2, Class AF1,
6.25%, 10/25/36 | | | 392,399 | |
| | 5,046,400 | | | Morgan Stanley Re-REMIC Trust, Series 2010-R5, Class 7B, STEP,
0.58%, 05/26/37(c) | | | 4,889,665 | |
| | 1,166,619 | | | Morgan Stanley Resecuritization Trust, Series 2015-R6, Class 3A,
(1 mo. LIBOR US + 0.160%),
0.31%, 07/26/45(b)(c) | | | 1,123,135 | |
| | 5,000,000 | | | NYMT LOAN TRUST, Series 2020- SP2, Class A1,
2.94%, 10/25/60(c)(d) | | | 4,997,515 | |
| | 4,071,913 | | | Prime Mortgage Trust, Series 2006- DR1, Class 2A1,
5.50%, 05/25/35(c) | | | 3,374,207 | |
| | 1,825,393 | | | Prime Mortgage Trust, Series 2006- DR1, Class 2A2,
6.00%, 05/25/35(c) | | | 1,494,959 | |
| | 5,000,000 | | | PRPM LLC, Series 2020-5, Class A1,
3.10%, 11/25/25(a)(c) | | | 4,999,911 | |
Principal
Amount | | | | | Value | |
| COLLATERALIZED MORTGAGE OBLIGATIONS (continued) | |
| $ | 721,759 | | | Residential Accredit Loans, Inc., Series 2006-QS15, Class A1,
6.50%, 10/25/36 | | $ | 710,878 | |
| | 4,477,420 | | | Residential Accredit Loans, Inc., Series 2007-QS1, Class 1A5,
(1 mo. LIBOR US + 0.550%),
0.70%, 01/25/37(b) | | | 3,175,285 | |
| | 118,525 | | | Residential Funding Mortgage Securities I, Series 2006-S11, Class A2,
6.00%, 11/25/36 | | | 115,244 | |
| | 8,660,596 | | | Residential Funding Mortgage Securities I, Series 2006-SA2, Class 2A1,
4.76%, 08/25/36(d) | | | 7,238,858 | |
| | 1,935,000 | | | RMF Buyout Issuance Trust, Series 2020-1, Class M5,
6.00%, 02/25/30(a)(c)(d) | | | 1,887,786 | |
| | 10,931,248 | | | Seasoned Credit Risk Transfer Trust, Series 2017-3, Class B,
0.00%, 07/25/56(c)(e) | | | 1,203,184 | |
| | 18,896,612 | | | Seasoned Credit Risk Transfer Trust, Series 2017-3, Class BIO,
0.91%, 07/25/56(c)(d) | | | 2,644,931 | |
| | 4,803,405 | | | Seasoned Credit Risk Transfer Trust, Series 2018-2, Class BX,
1.65%, 11/25/57(d) | | | 2,237,999 | |
| | 9,029,312 | | | Seasoned Credit Risk Transfer Trust, Series 2018-3, Class BX,
0.83%, 08/25/57(c)(d) | | | 2,998,545 | |
| | 1,575,507 | | | Structured Adjustable Rate Mortgage Loan Trust, Series 2005-11, Class 1A1,
3.29%, 05/25/35(d) | | | 1,289,595 | |
| | 2,714,553 | | | Structured Adjustable Rate Mortgage Loan Trust, Series 2006-3, Class 4A,
3.53%, 04/25/36(d) | | | 2,143,827 | |
| | 3,884,983 | | | Structured Asset Mortgage Investments II Trust, Series 2006-AR5, Class 4A1,
(1 mo. LIBOR US + 0.220%),
0.37%, 05/25/46(b) | | | 1,990,639 | |
| | 1,758,882 | | | Structured Asset Mortgage Investments II Trust, Series 2007-AR4, Class GA4B,
(1 mo. LIBOR US + 0.180%),
0.33%, 09/25/47(b) | | | 1,730,017 | |
| Old Westbury Funds, Inc. | |
| Credit Income Fund | |
| Portfolio of Investments - (Continued) | October 31, 2020 |
| | |
Principal
Amount | | | | | Value | |
| COLLATERALIZED MORTGAGE OBLIGATIONS (continued) | |
| $ | 3,310,696 | | | Structured Asset Securities Corp., Series 2005-RF3, Class 1A,
(1 mo. LIBOR US + 0.350%),
0.50%, 06/25/35(b)(c) | | $ | 2,861,994 | |
| | 11,123,749 | | | Structured Asset Securities Corp. Mortgage Loan Trust, Series 2006-RF3, Class 1A2,
6.00%, 10/25/36(c) | | | 7,662,441 | |
| | 798,137 | | | Suntrust Adjustable Rate Mortgage Loan Trust, Series 2007-2, Class 3A3,
3.86%, 04/25/37(d) | | | 642,360 | |
| | 285,710 | | | Suntrust Adjustable Rate Mortgage Loan Trust, Series 2007-2, Class 4A1,
3.86%, 04/25/37(d) | | | 215,453 | |
| | 672,111 | | | Thornburg Mortgage Securities Trust, Series 2007-3, Class 4A1,
(12 mo. LIBOR US + 1.250%),
1.59%, 06/25/47(b) | | | 620,943 | |
| | 29,782,114 | | | Voyager OPTONE Delaware Trust, Series 2009-1, Class SAA7,
3.95%, 02/25/38(c)(d) | | | 10,168,218 | |
| | 216,935 | | | Voyager STICS Delaware Trust, Series 2009-1, Class CAA1,
(1 mo. LIBOR US + 0.320%),
0.47%, 04/26/37(b)(c) | | | 216,161 | |
| | 1,085,912 | | | WaMu Mortgage Pass-Through Certificates Trust, Series 2007- HY7, Class 2A2,
3.07%, 07/25/37(d) | | | 1,037,505 | |
| | 8,508,637 | | | WaMu Mortgage Pass-Through Certificates Trust, Series 2007- OA4, Class 2A, (Cost of Funds for the 11th District of San Francisco + 1.250%),
1.78%, 05/25/47(b) | | | 7,646,691 | |
| | 1,037,651 | | | Washington Mutual Mortgage Pass- Through Certificates Trust, Series 2005-10, Class 2A6,
5.50%, 11/25/35 | | | 977,823 | |
| | 5,589,852 | | | Washington Mutual Mortgage Pass- Through Certificates Trust, Series 2006-1, Class 4CB,
6.50%, 02/25/36 | | | 4,806,852 | |
| | 4,298,741 | | | Washington Mutual Mortgage Pass- Through Certificates Trust, Series 2006-5, Class 3A3, STEP,
6.22%, 07/25/36 | | | 1,587,806 | |
Principal
Amount | | | | | Value | |
| COLLATERALIZED MORTGAGE OBLIGATIONS (continued) | |
| $ | 1,549,991 | | | Washington Mutual Mortgage Pass- Through Certificates Trust, Series 2006-AR6, Class 2A,
(12 mo. Federal Reserve Cumulative Average US + 0.960%),
1.84%, 08/25/46(b) | | $ | 1,027,378 | |
| | 999,942 | | | Wells Fargo Alternative Loan Trust, Series 2007-PA1, Class A1,
(1 mo. LIBOR US + 0.320%),
0.47%, 03/25/37(b) | | | 842,694 | |
| | 8,354,066 | | | Wells Fargo Alternative Loan Trust, Series 2007-PA1, Class A2,
(1 mo. LIBOR US x (1) + 6.680%),
6.53%, 03/25/37(b) | | | 1,570,081 | |
| | 1,770,294 | | | Wells Fargo Alternative Loan Trust, Series 2007-PA1, Class A8,
(1 mo. LIBOR US + 0.540%),
0.69%, 03/25/37(b) | | | 1,507,789 | |
| | 1,591,710 | | | Wells Fargo Alternative Loan Trust, Series 2007-PA1, Class A9,
(1 mo. LIBOR US + 0.490%),
0.64%, 03/25/37(b) | | | 1,355,584 | |
| | 2,170,822 | | | Wells Fargo Mortgage Backed Securities Trust, Series 2008-AR1, Class A2,
3.86%, 03/25/38(d) | | | 1,540,536 | |
| | | | | | | | 316,480,021 | |
| COMMERCIAL MORTGAGE-BACKED SECURITIES — 2.4% | |
| | 1,227,197 | | | Bayview Commercial Asset Trust, Series 2005-4A, Class M2,
(1 mo. LIBOR US + 0.470%),
0.62%, 01/25/36(b)(c) | | | 1,147,089 | |
| | 1,046,908 | | | Bayview Commercial Asset Trust, Series 2005-4A, Class M3,
(1 mo. LIBOR US + 0.500%),
0.65%, 01/25/36(b)(c) | | | 973,014 | |
| | 1,587,099 | | | Bayview Commercial Asset Trust, Series 2006-2A, Class B1,
(1 mo. LIBOR US + 0.870%),
1.02%, 07/25/36(b)(c) | | | 1,423,100 | |
| | 7,628,500 | | | Bayview Commercial Asset Trust, Series 2007-5A, Class A4,
(1 mo. LIBOR US + 1.500%),
1.65%, 10/25/37(b)(c) | | | 5,113,534 | |
| Old Westbury Funds, Inc. | |
| Credit Income Fund | |
| Portfolio of Investments - (Continued) | October 31, 2020 |
| | |
Principal
Amount | | | | | Value | |
| COMMERCIAL MORTGAGE-BACKED SECURITIES (continued) | |
| $ | 10,127,000 | | | Bayview Commercial Asset Trust, Series 2007-6A, Class A4A,
(1 mo. LIBOR US + 1.500%),
1.65%, 12/25/37(b)(c) | | $ | 9,601,697 | |
| | 4,746,489 | | | BX Commercial Mortgage Trust, Series 2019-XL, Class J,
(1 mo. LIBOR US + 2.650%),
2.80%, 10/15/36(b)(c) | | | 4,580,093 | |
| | 1,825,439 | | | CBA Commercial Small Balance Commercial Mortgage, Series 2007-1A, Class A, STEP,
5.76%, 07/25/39(c) | | | 1,378,253 | |
| | 2,399,123 | | | Velocity Commercial Capital Loan Trust, Series 2014-1, Class M7,
7.98%, 09/25/44(c)(d) | | | 2,013,431 | |
| | 3,881,000 | | | Velocity Commercial Capital Loan Trust, Series 2016-1, Class M5,
8.65%, 04/25/46(c)(d) | | | 3,980,885 | |
| | 3,055,000 | | | Velocity Commercial Capital Loan Trust, Series 2017-1, Class M6,
7.95%, 05/25/47(c)(d) | | | 2,300,986 | |
| | 3,495,273 | | | Velocity Commercial Capital Loan Trust, Series 2018-2, Class M4,
5.32%, 10/26/48(c)(d) | | | 3,442,778 | |
| | 980,459 | | | Velocity Commercial Capital Loan Trust, Series 2018-2, Class M5,
6.36%, 10/26/48(c)(d) | | | 965,555 | |
| | 1,889,129 | | | Velocity Commercial Capital Loan Trust, Series 2019-1, Class M2,
4.01%, 03/25/49(c)(d) | | | 1,887,622 | |
| | 2,784,134 | | | Velocity Commercial Capital Loan Trust, Series 2019-1, Class M3,
4.12%, 03/25/49(c)(d) | | | 2,728,260 | |
| | 3,059,893 | | | Velocity Commercial Capital Loan Trust, Series 2019-1, Class M4,
4.61%, 03/25/49(c)(d) | | | 2,954,965 | |
| | 1,590,845 | | | Velocity Commercial Capital Loan Trust, Series 2019-1, Class M5,
5.70%, 03/25/49(c)(d) | | | 1,511,066 | |
| | | | | | | | 46,002,328 | |
Total Non-Agency Mortgage-Backed Securities
(Cost $361,292,024) | | | 362,482,349 | |
Principal
Amount | | | | | Value | |
| U.S. GOVERNMENT SPONSORED AGENCY MORTGAGE-BACKED SECURITIES — 0.5% | | | | |
| COLLATERALIZED MORTGAGE OBLIGATIONS — 0.5% | |
| $ | 5,000,000 | | | Freddie Mac STACR REMIC Trust, Series 2020-DNA5, Class B1, (SOFR 30A + 4.800%),
4.89%, 10/25/50(b)(c) | | $ | 5,018,777 | |
| | 1,365,348 | | | Freddie Mac Structured Agency Credit Risk Debt Notes, Series 2017- DNA1, Class B2,
(1 mo. LIBOR US + 10.000%),
10.15%, 07/25/29(b) | | | 1,230,206 | |
| | 3,000,000 | | | Freddie Mac Structured Agency Credit Risk Debt Notes, Series 2018- DNA1, Class B1,
(1 mo. LIBOR US + 3.150%),
3.30%, 07/25/30(b) | | | 2,692,595 | |
| | 1,417,407 | | | Freddie Mac Structured Agency Credit Risk Debt Notes, Series 2018- SPI2, Class M2,
3.81%, 05/25/48(c)(d) | | | 1,408,800 | |
Total U.S. Government Sponsored Agency Mortgage-Backed Securities
(Cost $10,310,981) | | | 10,350,378 | |
| | | | | | | | | |
| U.S. GOVERNMENT SECURITIES — 17.2% | |
| U.S. Treasury Bonds — 17.2% | | | | |
| | 25,565,000 | | | 3.63%, 08/15/43 | | | 36,277,334 | |
| | 23,700,000 | | | 3.63%, 02/15/44 | | | 33,716,027 | |
| | 25,010,000 | | | 3.13%, 08/15/44 | | | 33,125,550 | |
| | 25,100,000 | | | 3.00%, 02/15/47 | | | 32,924,141 | |
| | 25,900,000 | | | 2.75%, 08/15/47 | | | 32,586,449 | |
| | 25,860,000 | | | 3.00%, 08/15/48 | | | 34,124,088 | |
| | 22,900,000 | | | 3.38%, 11/15/48 | | | 32,280,055 | |
| | 26,450,000 | | | 3.00%, 02/15/49 | | | 34,984,258 | |
| | 25,375,000 | | | 2.88%, 05/15/49 | | | 32,843,774 | |
| | 34,950,000 | | | 1.25%, 05/15/50 | | | 31,749,891 | |
| | | | | | | | | |
Total U.S. Government Securities
(Cost $342,575,396) | | | 334,611,567 | |
| Old Westbury Funds, Inc. | |
| Credit Income Fund | |
| Portfolio of Investments - (Continued) | October 31, 2020 |
| | |
| Shares | | | | | Value | |
| CASH SWEEP — 14.3% | | | | |
| UNITED STATES — 14.3% | | | | |
| | 276,369,511 | | | Citibank - US Dollars on Deposit in Custody Account, 0.01%(f) | | $ | 276,369,511 | |
Total Cash Sweep
(Cost $276,369,511) | | | 276,369,511 | |
TOTAL INVESTMENTS — 100.6%
(Cost $1,962,392,886) | | $ | 1,951,789,296 | |
| LIABILITIES IN EXCESS OF OTHER ASSETS — (0.6)% | | | (12,590,349 | ) |
| NET ASSETS — 100.0% | | $ | 1,939,198,947 | |
| (a) | Security is valued using significant unobservable inputs and is classified as Level 3 in the fair value hierarchy. The aggregate value of fair valued securities is $79,593,851 which is 4.10% of net assets and the cost is $79,367,398. |
| (b) | Floating rate security. Rate shown is the rate in effect as of October 31, 2020. |
| (c) | Security exempt from registration under Rule 144A of the Securities Act of 1933, as amended. The security may be resold in transactions exempt from registration normally to qualified institutional buyers. The aggregate value is $577,595,239, which is 29.79% of net assets. These securities have been determined to be liquid in accordance with procedures adopted by the Fund’s Board of Directors except those also included in footnote (c) below. |
| (d) | Variable or floating rate security, which interest rate adjusts periodically based on changes in current interest rates and prepayments on the underlying pool of assets. Rate shown is the rate in effect as of October 31, 2020. |
| (e) | Zero coupon bond. The rate represents the yield at time of purchase. |
| (f) | The rate shown represents the current yield as of October 31, 2020. |
| Reference Entity | | Counterparty | | Payment/
Expiration Date | | Notional
Amount
(000) | | Value | | | Upfront
Premium
Paid
(Received) | | | Unrealized
Appreciation
(Depreciation) | |
| Total Return Swaps | | | | | | | | | | | | | | | | | | |
| Total return swap with Barclays Bank PLC receiving total return of the Barclays US Mortgage Backed Securities Index over the initial level of 2,317.85 and paying a (3 mo. LIBOR USD + 0.65%) 0.884%, with quarterly payments until expiration date | | Barclays Bank Plc | | 11/02/2021 | | 100,000 | | $ | (132,046 | ) | | $ | – | | | $ | (132,046 | ) |
| Total return swap with Barclays Bank PLC receiving total return of the Barclays US Mortgage Backed Securities Index over the initial level of 2,317.97 and paying a (3 mo. LIBOR USD + 0.65%) 0.884%, with quarterly payments until expiration date | | Barclays Bank Plc | | 12/02/2021 | | 80,000 | | | (103,890 | ) | | | (9,288 | ) | | | (94,602 | ) |
| Total Total Return Swaps | | | | | | | | | | | | | | | | $ | (226,648 | ) |
The following abbreviations are used in the report:
CLO — Collateralized Loan Obligation
CTFS — Certificates
CVR — Contingent Value Right
ETF — Exchange -Traded Fund
LIBOR — London Interbank Offered Rate
PIK — Payment In Kind
REIT — Real Estate Investment Trust
SOFR — Secured Overnight Financing Rate
SPDR — Standard & Poor’s Depositary Receipt
STEP — Step Coupon Bond
USD — U.S. Dollar
| Old Westbury Funds, Inc. | |
| Fixed Income Fund | |
| Portfolio of Investments | October 31, 2020 |
Principal
Amount | | | | | Value | |
| MUNICIPAL BONDS — 0.9% | | | |
| California — 0.3% | | | | |
| $ | 4,500,000 | | | University of California University & College Improvements Revenue Bonds, Series BG,
1.61%, 05/15/30 | | $ | 4,404,420 | |
| | | | | | | | | |
| Michigan — 0.1% | | | | |
| | 2,500,000 | | | University of Michigan University & College Improvements Revenue Bonds, Series B,
1.00%, 04/01/25 | | | 2,502,175 | |
| | | | | | | | | |
| Oregon — 0.2% | | | | |
| | 3,500,000 | | | State of Oregon Department of Transportation Advance Refunding Revenue Bonds, Series B,
1.08%, 11/15/27 | | | 3,445,575 | |
| | | | | | | | | |
| Pennsylvania — 0.3% | | | | |
| | 5,000,000 | | | Pennsylvania State University, Refunding Revenue Bonds, Series D,
1.65%, 09/01/25 | | | 5,166,550 | |
Total Municipal Bonds
(Cost $15,500,000) | | | 15,518,720 | |
| | | | | | | | | |
| CORPORATE BONDS — 29.8% | | | | |
| Banks — 4.3% | | | | |
| | 1,750,000 | | | Banco Santander Chile,
2.50%, 12/15/20(a) | | | 1,748,250 | |
| | 2,800,000 | | | Banco Santander SA,
3.85%, 04/12/23 | | | 2,992,996 | |
| | 6,000,000 | | | Bank of America Corp.,
(3 mo. LIBOR US + 0.810%),
3.37%, 01/23/26(b) | | | 6,545,733 | |
| | 2,000,000 | | | Bank of Montreal, Series D,
3.10%, 04/13/21 | | | 2,025,867 | |
| | 3,675,000 | | | Bank of New York Mellon Corp. (The) MTN,
1.60%, 04/24/25 | | | 3,803,478 | |
| | 5,000,000 | | | BNP Paribas SA,
2.95%, 05/23/22(a) | | | 5,186,175 | |
| | 5,560,000 | | | Canadian Imperial Bank of Commerce, 3.10%, 04/02/24 | | | 5,996,892 | |
| | 5,785,000 | | | Citigroup, Inc.,
(3 mo. LIBOR US + 1.390%),
3.67%, 07/24/28(b) | | | 6,480,216 | |
Principal
Amount | | | | | Value | |
| Banks (continued) | | | | |
| $ | 5,065,000 | | | Credit Suisse AG/New York NY,
2.10%, 11/12/21 | | $ | 5,154,113 | |
| | 5,885,000 | | | JPMorgan Chase & Co.,
(3 mo. LIBOR US + 1.260%),
4.20%, 07/23/29(b) | | | 6,925,526 | |
| | 5,000,000 | | | Mizuho Financial Group, Inc.,
(3 mo. LIBOR US + 1.000%),
3.92%, 09/11/24(b) | | | 5,425,865 | |
| | 4,400,000 | | | Morgan Stanley, Series F,
3.88%, 04/29/24 | | | 4,862,592 | |
| | 4,500,000 | | | Royal Bank of Canada,
3.35%, 10/22/21(a) | | | 4,635,135 | |
| | 2,200,000 | | | Sumitomo Mitsui Financial Group, Inc.,
2.72%, 09/27/29 | | | 2,337,032 | |
| | 2,000,000 | | | Svenska Handelsbanken AB,
1.88%, 09/07/21 | | | 2,026,391 | |
| | 6,000,000 | | | Truist Bank,
1.25%, 03/09/23 | | | 6,111,572 | |
| | | | | | | | 72,257,833 | |
| Communication Services — 1.8% | | | | |
| | 5,000,000 | | | Alphabet, Inc.,
1.10%, 08/15/30 | | | 4,885,035 | |
| | 5,000,000 | | | Amazon.com, Inc.,
1.20%, 06/03/27 | | | 5,051,852 | |
| | 5,720,000 | | | Comcast Corp.,
4.15%, 10/15/28 | | | 6,802,569 | |
| | 900,000 | | | Discovery Communications LLC,
2.95%, 03/20/23 | | | 947,725 | |
| | 5,910,000 | | | Omnicom Group, Inc.,
2.45%, 04/30/30 | | | 6,046,412 | |
| | 6,000,000 | | | T-Mobile USA, Inc.,
2.25%, 11/15/31(a) | | | 5,926,380 | |
| | | | | | | | 29,659,973 | |
| Consumer Discretionary — 4.6% | | | | |
| | 5,000,000 | | | American Honda Finance Corp. MTN,
0.88%, 07/07/23 | | | 5,041,278 | |
| | 2,500,000 | | | Brown University in Providence in the State of Rhode Island and Providence Plant, Series A,
1.91%, 09/01/30 | | | 2,546,727 | |
| | 2,000,000 | | | Costco Wholesale Corp.,
1.38%, 06/20/27 | | | 2,037,960 | |
| | 8,000,000 | | | DR Horton, Inc.,
1.40%, 10/15/27 | | | 7,886,903 | |
| Old Westbury Funds, Inc. | |
| Fixed Income Fund | |
| Portfolio of Investments - (Continued) | October 31, 2020 |
Principal
Amount | | | | | Value | |
| Consumer Discretionary (continued) | | | | |
| $ | 5,000,000 | | | Equifax, Inc.,
2.60%, 12/01/24 | | $ | 5,320,505 | |
| | 6,000,000 | | | Estee Lauder Cos., Inc. (The),
2.60%, 04/15/30 | | | 6,523,451 | |
| | 2,300,000 | | | General Motors Financial Co., Inc.,
1.70%, 08/18/23 | | | 2,319,688 | |
| | 5,210,000 | | | Hasbro, Inc.,
3.50%, 09/15/27 | | | 5,489,876 | |
| | 6,145,000 | | | Kimberly-Clark Corp.,
1.05%, 09/15/27 | | | 6,159,325 | |
| | 5,000,000 | | | Lowe’s Cos, Inc.,
2.50%, 04/15/26 | | | 5,398,720 | |
| | 4,205,000 | | | McDonald’s Corp. MTN,
3.30%, 07/01/25 | | | 4,650,833 | |
| | 1,450,000 | | | NIKE, Inc.,
2.40%, 03/27/25 | | | 1,557,160 | |
| | 3,060,000 | | | PayPal Holdings, Inc.,
1.65%, 06/01/25 | | | 3,161,625 | |
| | 5,000,000 | | | Ross Stores, Inc.,
0.88%, 04/15/26 | | | 4,957,248 | |
| | 3,535,000 | | | Southwest Airlines Co.,
5.25%, 05/04/25 | | | 3,920,431 | |
| | 1,000,000 | | | Starbucks Corp.,
1.30%, 05/07/22 | | | 1,014,369 | |
| | 4,985,000 | | | Verisk Analytics, Inc.,
4.00%, 06/15/25 | | | 5,614,524 | |
| | 2,500,000 | | | VF Corp.,
2.05%, 04/23/22 | | | 2,557,983 | |
| | | | | | | | 76,158,606 | |
| Consumer Staples — 3.3% | | | | |
| | 5,000,000 | | | Anheuser-Busch Cos LLC/Anheuser-Busch InBev Worldwide, Inc.,
3.65%, 02/01/26 | | | 5,616,117 | |
| | 5,000,000 | | | Bunge Ltd. Finance Corp.,
1.63%, 08/17/25 | | | 5,030,031 | |
| | 5,940,000 | | | Coca-Cola Co. (The),
3.38%, 03/25/27 | | | 6,781,551 | |
| | 4,125,000 | | | Conagra Brands, Inc.,
1.38%, 11/01/27 | | | 4,090,499 | |
| | 5,640,000 | | | Constellation Brands, Inc.,
2.65%, 11/07/22 | | | 5,866,801 | |
| | 5,000,000 | | | Diageo Capital PLC,
2.63%, 04/29/23 | | | 5,239,862 | |
| | 4,950,000 | | | General Mills, Inc.,
4.00%, 04/17/25 | | | 5,587,104 | |
| | 3,100,000 | | | Hershey Co. (The),
1.70%, 06/01/30 | | | 3,170,179 | |
Principal
Amount | | | | | Value | |
| Consumer Staples (continued) | | | | |
| $ | 1,166,000 | | | Kroger Co. (The),
2.80%, 08/01/22 | | $ | 1,209,619 | |
| | 2,000,000 | | | Mars, Inc.,
0.88%, 07/16/26(a) | | | 1,993,036 | |
| | 5,000,000 | | | Mondelez International Holdings Netherlands BV,
2.13%, 09/19/22(a) | | | 5,151,463 | |
| | 6,000,000 | | | Tyson Foods, Inc.,
2.25%, 08/23/21 | | | 6,078,713 | |
| | | | | | | | 55,814,975 | |
| Diversified Financials — 2.8% | | | | |
| | 3,950,000 | | | AerCap Ireland Capital DAC/AerCap Global Aviation Trust,
4.50%, 05/15/21 | | | 4,020,303 | |
| | 1,760,000 | | | American Express Co.,
3.70%, 08/03/23 | | | 1,910,702 | |
| | 2,000,000 | | | American Tower Corp. REIT,
2.40%, 03/15/25 | | | 2,116,367 | |
| | 1,645,000 | | | American Tower Corp. REIT,
1.88%, 10/15/30 | | | 1,622,319 | |
| | 5,000,000 | | | Andrew W Mellon Foundation (The), Series 2020,
0.95%, 08/01/27 | | | 4,871,711 | |
| | 6,000,000 | | | Fidelity National Financial, Inc.,
2.45%, 03/15/31 | | | 5,895,085 | |
| | 3,070,000 | | | Goldman Sachs Group, Inc. (The),
(3 mo. LIBOR US + 0.780%),
0.99%, 10/31/22(c) | | | 3,082,233 | |
| | 3,065,000 | | | Goldman Sachs Group, Inc. (The),
(3 mo. LIBOR US + 1.000%),
1.21%, 07/24/23(c) | | | 3,090,842 | |
| | 5,000,000 | | | Kimco Realty Corp. REIT,
1.90%, 03/01/28 | | | 4,925,055 | |
| | 3,500,000 | | | Magna International, Inc.,
3.63%, 06/15/24 | | | 3,829,589 | |
| | 1,500,000 | | | Magna International, Inc.,
2.45%, 06/15/30 | | | 1,575,024 | |
| | 2,470,000 | | | National Rural Utilities Cooperative Finance Corp. MTN,
2.90%, 03/15/21 | | | 2,494,255 | |
| | 5,000,000 | | | New York Life Global Funding,
1.10%, 05/05/23(a) | | | 5,079,289 | |
| | 2,350,000 | | | Visa, Inc.,
1.90%, 04/15/27 | | | 2,474,582 | |
| | | | | | | | 46,987,356 | |
| Old Westbury Funds, Inc. | |
| Fixed Income Fund | |
| Portfolio of Investments - (Continued) | October 31, 2020 |
Principal
Amount | | | | | Value | |
| Energy — 1.4% | | | | |
| $ | 2,840,000 | | | Energy Transfer Operating LP,
5.88%, 01/15/24 | | $ | 3,107,383 | |
| | 5,000,000 | | | Phillips 66,
2.15%, 12/15/30 | | | 4,694,860 | |
| | 5,170,000 | | | Sabine Pass Liquefaction LLC,
5.88%, 06/30/26 | | | 6,074,726 | |
| | 3,430,000 | | | Valero Energy Corp.,
1.20%, 03/15/24 | | | 3,360,010 | |
| | 5,000,000 | | | Williams Cos., Inc. (The),
3.35%, 08/15/22 | | | 5,172,297 | |
| | 1,560,000 | | | Williams Cos., Inc. (The),
4.50%, 11/15/23 | | | 1,706,156 | |
| | | | | | | | 24,115,432 | |
| Health Care — 3.6% |
| | 4,000,000 | | | AbbVie, Inc.,
2.60%, 11/21/24(a) | | | 4,254,180 | |
| | 5,000,000 | | | Anthem, Inc.,
3.65%, 12/01/27 | | | 5,653,086 | |
| | 6,000,000 | | | Baxter International, Inc.,
1.73%, 04/01/31(a) | | | 5,988,539 | |
| | 3,000,000 | | | Bristol-Myers Squibb Co.,
2.90%, 07/26/24 | | | 3,237,464 | |
| | 5,000,000 | | | Cigna Corp.,
3.75%, 07/15/23 | | | 5,409,227 | |
| | 5,000,000 | | | HCA, Inc.,
5.00%, 03/15/24 | | | 5,594,304 | |
| | 3,000,000 | | | Johnson & Johnson,
1.30%, 09/01/30 | | | 2,989,970 | |
| | 5,000,000 | | | Kaiser Foundation Hospitals,
3.15%, 05/01/27 | | | 5,511,884 | |
| | 5,000,000 | | | Laboratory Corp. of America Holdings,
3.20%, 02/01/22 | | | 5,168,185 | |
| | 6,320,000 | | | Merck & Co., Inc.,
1.45%, 06/24/30 | | | 6,327,653 | |
| | 5,000,000 | | | Stryker Corp.,
1.15%, 06/15/25 | | | 5,052,950 | |
| | 2,500,000 | | | Takeda Pharmaceutical Co. Ltd.,
5.00%, 11/26/28 | | | 3,083,025 | |
| | 2,500,000 | | | Takeda Pharmaceutical Co. Ltd.,
2.05%, 03/31/30 | | | 2,516,247 | |
| | | | | | | | 60,786,714 | |
| Industrials — 2.3% | | | | |
| | 5,000,000 | | | Burlington Northern Santa Fe LLC,
3.25%, 06/15/27 | | | 5,633,702 | |
| | 3,875,000 | | | General Dynamics Corp.,
3.63%, 04/01/30 | | | 4,600,513 | |
Principal
Amount | | | | | Value | |
| Industrials (continued) | | | |
| $ | 5,150,000 | | | Honeywell International, Inc.,
1.35%, 06/01/25 | | $ | 5,287,339 | |
| | 6,206,000 | | | Jabil, Inc.,
4.70%, 09/15/22 | | | 6,636,902 | |
| | 6,185,000 | | | Northrop Grumman Corp.,
2.55%, 10/15/22 | | | 6,430,661 | |
| | 2,000,000 | | | Otis Worldwide Corp.,
(3 mo. LIBOR US + 0.450%),
0.68%, 04/05/23(c) | | | 2,000,501 | |
| | 2,522,000 | | | Precision Castparts Corp.,
3.25%, 06/15/25 | | | 2,786,416 | |
| | 4,525,000 | | | Roper Technologies, Inc.,
1.40%, 09/15/27 | | | 4,527,408 | |
| | | | | | | | 37,903,442 | |
| Information Technology — 2.2% | | | | |
| | 5,000,000 | | | Analog Devices, Inc.,
3.90%, 12/15/25 | | | 5,699,373 | |
| | 3,000,000 | | | Broadcom Corp/Broadcom Cayman Finance Ltd.,
3.63%, 01/15/24 | | | 3,222,802 | |
| | 3,000,000 | | | Broadcom, Inc.,
3.15%, 11/15/25 | | | 3,233,340 | |
| | 3,090,000 | | | Hewlett Packard Enterprise Co.,
2.25%, 04/01/23 | | | 3,197,545 | |
| | 5,200,000 | | | International Business Machines Corp.,
3.50%, 05/15/29 | | | 5,944,670 | |
| | 5,071,000 | | | Microsoft Corp.,
2.40%, 08/08/26 | | | 5,502,252 | |
| | 5,000,000 | | | Oracle Corp.,
2.50%, 05/15/22 | | | 5,147,208 | |
| | 4,000,000 | | | QUALCOMM, Inc.,
2.15%, 05/20/30 | | | 4,151,180 | |
| | | | | | | | 36,098,370 | |
| Insurance — 0.3% | | | | |
| | 5,000,000 | | | Metropolitan Life Global Funding I,
2.40%, 01/08/21(a) | | | 5,019,750 | |
| Materials — 1.4% | | | | |
| | 5,000,000 | | | Air Products and Chemicals, Inc.,
1.50%, 10/15/25 | | | 5,182,398 | |
| | 4,730,000 | | | DuPont de Nemours, Inc.,
4.49%, 11/15/25 | | | 5,460,056 | |
| | 1,799,000 | | | Ecolab, Inc.,
3.25%, 12/01/27 | | | 2,021,702 | |
| | 5,000,000 | | | Nucor Corp.,
2.00%, 06/01/25 | | | 5,227,024 | |
| Old Westbury Funds, Inc. | |
| Fixed Income Fund | |
| Portfolio of Investments - (Continued) | October 31, 2020 |
Principal
Amount | | | | | Value | |
| Materials (continued) | | | |
| $ | 5,000,000 | | | Nutrition & Biosciences, Inc.,
1.83%, 10/15/27(a) | | $ | 5,012,471 | |
| | | | | | | | 22,903,651 | |
| Utilities — 1.8% | | | | |
| | 2,390,000 | | | Berkshire Hathaway Energy Co.,
2.38%, 01/15/21 | | | 2,399,944 | |
| | 1,500,000 | | | Duke Energy Corp.,
3.55%, 09/15/21 | | | 1,529,981 | |
| | 5,000,000 | | | Eversource Energy, Series N,
3.80%, 12/01/23 | | | 5,474,010 | |
| | 4,180,000 | | | Florida Power & Light Co.,
2.75%, 06/01/23 | | | 4,386,193 | |
| | 5,000,000 | | | Public Service Co. of Colorado, Series 35,
1.90%, 01/15/31 | | | 5,180,020 | |
| | 5,000,000 | | | Southern Co. Gas Capital Corp.,
2.45%, 10/01/23 | | | 5,246,977 | |
| | 5,000,000 | | | Xcel Energy, Inc.,
3.30%, 06/01/25 | | | 5,495,568 | |
| | | | | | | | 29,712,693 | |
Total Corporate Bonds
(Cost $483,918,658) | | | 497,418,795 | |
| | | | | | | | | |
| ASSET-BACKED SECURITIES — 3.6% | | | | |
| CANADA — 0.2% | | | | |
| Other Asset-Backed Securities — 0.2% | | | | |
| | 514,133 | | | Canadian Pacer Auto Receivables Trust, Series 2018-1A, Class A3,
3.00%, 11/19/21(a) | | | 515,731 | |
| | 3,000,000 | | | Evergreen Credit Card Trust, Series 2018-1, Class A,
2.95%, 03/15/23(a) | | | 3,029,187 | |
| | | | | | | | 3,544,918 | |
| CAYMAN ISLANDS — 1.2% | | | | |
| Collateralized Loan Obligations — 1.1% | | | | |
| | 2,938,243 | | | Apex Credit CLO Ltd., Series 2017- 1A, Class A1,
(3 mo. LIBOR US + 1.470%),
1.68%, 04/24/29(a)(c) | | | 2,916,843 | |
| | 4,000,000 | | | Crestline Denali CLO XV Ltd., Series 2017-1A, Class A,
(3 mo. LIBOR US + 1.300%),
1.52%, 04/20/30(a)(c) | | | 3,961,202 | |
| | 1,985,393 | | | Mercer Field II CLO Ltd., Series 2017-1A, Class A1,
(3 mo. LIBOR US + 1.330%),
1.57%, 04/15/29(a)(c) | | | 1,974,469 | |
Principal
Amount | | | | | Value | |
| CAYMAN ISLANDS (continued) | | | |
| Collateralized Loan Obligations (continued) | | | | |
| $ | 5,000,000 | | | THL Credit Wind River CLO Ltd., Series 2017-2A, Class A,
(3 mo. LIBOR US + 1.230%),
1.45%, 07/20/30(a)(c) | | $ | 4,945,973 | |
| | 2,500,000 | | | Venture XXIV CLO Ltd., Series 2016- 24A, Class AR,
(3 mo. LIBOR US + 1.180%),
1.40%, 10/20/28(a)(c) | | | 2,475,034 | |
| | 2,036,601 | | | Z Capital Credit Partners CLO Ltd., Series 2015-1A, Class A1R,
(3 mo. LIBOR US + 0.950%),
1.18%, 07/16/27(a)(c) | | | 2,020,187 | |
| | | | | | | | 18,293,708 | |
| | | | | | | | | |
| Other Asset-Backed Securities — 0.1% | | | | |
| | 1,240,000 | | | Atlas Senior Loan Fund Ltd., Series 2017-8A, Class A,
(3 mo. LIBOR US + 1.300%),
1.53%, 01/16/30(a)(c) | | | 1,231,105 | |
| | | | | | | | 19,524,813 | |
| UNITED STATES — 2.2% | | | | |
| Other Asset-Backed Securities — 2.2% | | | | |
| | 82,663 | | | CarMax Auto Owner Trust, Series 2017-2, Class A3,
1.93%, 03/15/22 | | | 82,789 | |
| | 963,331 | | | Chesapeake Funding II LLC, Series 2017-4A, Class A1,
2.12%, 11/15/29(a) | | | 970,009 | |
| | 4,000,000 | | | DT Auto Owner Trust, Series 2019- 1A, Class C,
3.61%, 11/15/24(a) | | | 4,093,891 | |
| | 937,358 | | | Enterprise Fleet Financing LLC, Series 2017-2, Class A3,
2.22%, 01/20/23(a) | | | 942,515 | |
| | 2,500,000 | | | Enterprise Fleet Financing LLC, Series 2020-2, Class A2,
0.61%, 07/20/26(a) | | | 2,499,568 | |
| | 4,000,000 | | | Ford Credit Auto Owner Trust, Series 2020-2, Class A,
1.06%, 04/15/33(a) | | | 4,005,793 | |
| | 1,383,948 | | | GM Financial Consumer Automobile, Series 2017-1A, Class A4,
2.06%, 05/16/23(a) | | | 1,386,972 | |
| | 432,379 | | | GM Financial Consumer Automobile Receivables Trust, Series 2018-1, Class A3,
2.32%, 07/18/22 | | | 435,031 | |
| Old Westbury Funds, Inc. | |
| Fixed Income Fund | |
| Portfolio of Investments - (Continued) | October 31, 2020 |
Principal
Amount | | | | | Value | |
| UNITED STATES (continued) | | | |
| Other Asset-Backed Securities (continued) | | | | |
| $ | 1,250,000 | | | Hyundai Auto Lease Securitization Trust, Series 2020-B, Class B,
0.81%, 10/15/24(a) | | $ | 1,251,623 | |
| | 2,873,691 | | | Sofi Professional Loan Program Trust, Series 2018-B, Class A2FX,
3.34%, 08/25/47(a) | | | 2,951,639 | |
| | 794,278 | | | Toyota Auto Receivables Owner Trust, Series 2017-A, Class A4,
2.10%, 09/15/22 | | | 796,609 | |
| | 2,500,000 | | | Toyota Auto Receivables Owner Trust, Series 2020-C, Class A3,
0.44%, 10/15/24 | | | 2,505,474 | |
| | 92,363 | | | Verizon Owner Trust, Series 2017-3A, Class A1A,
2.06%, 04/20/22(a) | | | 92,458 | |
| | 5,000,000 | | | Verizon Owner Trust, Series 2020-B, Class A,
0.47%, 02/20/25 | | | 5,005,443 | |
| | 2,500,000 | | | Verizon Owner Trust, Series 2020-C, Class B,
0.67%, 04/21/25 | | | 2,498,536 | |
| | 717,745 | | | Volkswagen Auto Loan Enhanced Trust, Series 2018-1, Class A3,
3.02%, 11/21/22 | | | 727,460 | |
| | 148,281 | | | Wheels SPV 2 LLC, Series 2018-1A, Class A2,
3.06%, 04/20/27(a) | | | 149,042 | |
| | 1,574,973 | | | World Omni Auto Receivables Trust, Series 2018-A, Class A3,
2.50%, 04/17/23 | | | 1,594,776 | |
| | 2,150,000 | | | World Omni Auto Receivables Trust, Series 2019-A, Class A3,
3.04%, 05/15/24 | | | 2,196,864 | |
| | 3,500,000 | | | World Omni Auto Receivables Trust, Series 2020-C, Class A3,
0.48%, 11/17/25 | | | 3,505,084 | |
| | | | | | | | 37,691,576 | |
Total Asset-Backed Securities
(Cost $60,672,943) | | | 60,761,307 | |
Principal
Amount | | | | | Value | |
| U.S. GOVERNMENT SPONSORED AGENCY MORTGAGE-BACKED SECURITIES — 0.0% | |
| COLLATERALIZED MORTGAGE OBLIGATIONS — 0.0% | |
| $ | 774,377 | | | JP Morgan Tax-Emept Pass-Through Trust, Series 2012-AMT1, Class A,
3.00%, 01/27/38(a) | | $ | 767,396 | |
Total U.S. Government Sponsored Agency Mortgage-Backed Securities
(Cost $787,001) | | | 767,396 | |
| | | | | | | | | |
| U.S. GOVERNMENT AGENCIES — 0.1% | | | | |
| Overseas Private Investment Corp. — 0.1% | | | | |
| | 1,119,310 | | | 5.14%, 12/15/23 | | | 1,206,909 | |
| Small Business Administration — 0.0% | | | | |
| | 141,178 | | | 4.08%, 03/10/21 | | | 142,488 | �� |
Total U.S. Government Agencies
(Cost $1,260,491) | | | 1,349,397 | |
| | | | | | | | | |
| U.S. GOVERNMENT SECURITIES — 64.8% | |
| U.S. Treasury Bonds — 1.2% | | | | |
| | 13,726,000 | | | 3.50%, 02/15/39 | | | 18,781,564 | |
| U.S. Treasury Inflation Indexed Bonds — 2.2% | |
| | 35,133,983 | | | 0.63%, 01/15/24(d) | | | 37,119,877 | |
| U.S. Treasury Notes — 61.4% | | | | |
| | 7,678,000 | | | 1.88%, 12/15/20 | | | 7,693,548 | |
| | 26,092,000 | | | 2.63%, 05/15/21 | | | 26,442,611 | |
| | 44,366,000 | | | 1.88%, 11/30/21 | | | 45,192,663 | |
| | 66,986,000 | | | 1.88%, 01/31/22 | | | 68,430,386 | |
| | 143,332,000 | | | 2.75%, 07/31/23 | | | 153,365,240 | |
| | 29,019,000 | | | 1.25%, 07/31/23 | | | 29,860,098 | |
| | 70,055,000 | | | 2.25%, 01/31/24 | | | 74,652,360 | |
| | 140,865,000 | | | 2.38%, 08/15/24 | | | 152,040,657 | |
| | 33,257,000 | | | 2.00%, 02/15/25 | | | 35,636,954 | |
| | 4,790,000 | | | 2.00%, 08/15/25 | | | 5,159,915 | |
| | 58,018,000 | | | 2.25%, 11/15/25 | | | 63,393,730 | |
| | 61,852,000 | | | 1.63%, 02/15/26 | | | 65,727,414 | |
| | 112,024,000 | | | 2.00%, 11/15/26 | | | 121,869,859 | |
| | 22,353,000 | | | 0.50%, 04/30/27 | | | 22,241,235 | |
| | 70,370,000 | | | 2.38%, 05/15/27 | | | 78,498,285 | |
| | 5,034,000 | | | 2.25%, 11/15/27 | | | 5,595,802 | |
| | 65,016,000 | | | 1.50%, 02/15/30 | | | 69,018,548 | |
| | | | | | | | 1,024,819,305 | |
Total U.S. Government Securities
(Cost $1,042,060,782) | | | 1,080,720,746 | |
| Old Westbury Funds, Inc. | |
| Fixed Income Fund | |
| Portfolio of Investments - (Continued) | October 31, 2020 |
| Shares | | | | | Value | |
| INVESTMENT COMPANY — 0.8% | | | | |
| | 12,732,841 | | | SEI Daily Income Trust Government II Fund - Class A, 0.01%(e) | | $ | 12,732,841 | |
Total Investment Company
(Cost $12,732,841) | | | 12,732,841 | |
TOTAL INVESTMENTS — 100.0%
(Cost $1,616,932,716) | | $ | 1,669,269,202 | |
| LIABILITIES IN EXCESS OF OTHER ASSETS — 0.0% | | | (183,392 | ) |
| NET ASSETS — 100.0% | | $ | 1,669,085,810 | |
| (a) | Security exempt from registration under Rule 144A of the Securities Act of 1933, as amended. The security may be resold in transactions exempt from registration normally to qualified institutional buyers. |
| | The security has been determined to be liquid in accordance with procedures adopted by the Fund’s Board of Directors. |
| (b) | Variable rate security. Security may be issued at a fixed coupon rate, which converts to a variable rate at a specified date. Rate shown is the rate in effect as of October 31, 2020. |
| (c) | Floating rate security. Rate shown is the rate in effect as of October 31, 2020. |
| (d) | Inflation protected security. Principal amount reflects original security face amount. |
| (e) | The rate shown represents the current yield as of October 31, 2020. |
The following abbreviations are used in the report:
CLO — Collateralized Loan Obligation
LIBOR — London Interbank Offered Rate
MTN — Medium Term Note
REIT — Real Estate Investment Trust
| Old Westbury Funds, Inc. | |
| Municipal Bond Fund | |
| Portfolio of Investments | October 31, 2020 |
Principal
Amount | | | | | Value | |
| MUNICIPAL BONDS — 92.4% | | | | |
| Alabama — 1.0% | | | | |
| $ | 2,000,000 | | | Alabama Federal Aid Highway Finance Authority Highway Improvements Revenue Bonds, Series A,
5.00%, 09/01/22 | | $ | 2,173,900 | |
| | 1,750,000 | | | Alabama Federal Aid Highway Finance Authority Public Improvement Revenue Bonds,
5.00%, 09/01/21 | | | 1,818,985 | |
| | 1,500,000 | | | Alabama Public School & College Authority Advance Refunding Revenue Bonds, Series B,
5.00%, 05/01/24 | | | 1,743,390 | |
| | 1,250,000 | | | Auburn University,
0.92%, 06/01/25 | | | 1,246,100 | |
| | 1,250,000 | | | Auburn University,
1.20%, 06/01/26 | | | 1,248,850 | |
| | 1,250,000 | | | Auburn University,
1.30%, 06/01/27 | | | 1,241,138 | |
| | 1,000,000 | | | Auburn University,
1.50%, 06/01/28 | | | 995,190 | |
| | 1,100,000 | | | Auburn University,
1.60%, 06/01/29 | | | 1,092,146 | |
| | 1,000,000 | | | Auburn University,
1.70%, 06/01/30 | | | 991,590 | |
| | 3,030,000 | | | City of Huntsville School Capital Improvements Warrants Refunding GO,
5.00%, 09/01/22 | | | 3,289,368 | |
| | 3,660,000 | | | City of Huntsville School Capital Improvements Warrants Refunding GO,
5.00%, 09/01/26 | | | 4,285,457 | |
| | 1,500,000 | | | City of Huntsville Warrants Refunding GO, Series A,
5.00%, 08/01/26 | | | 1,751,670 | |
| | 15,625,000 | | | Water Works Board of the City of Birmingham Water Utility Improvements Revenue Bonds, Series B,
5.00%, 01/01/45(a) | | | 18,645,156 | |
| | | | | | | | 40,522,940 | |
| Arizona — 1.7% | | | | |
| | 875,000 | | | Arizona Department of Transportation State Highway Fund Refunding Revenue Bonds,
5.00%, 07/01/25 | | | 1,022,525 | |
Principal
Amount | | | | | Value | |
| Arizona (continued) | | | | |
| $ | 1,300,000 | | | Arizona Department of Transportation State Highway Fund Refunding Revenue Bonds, Series A,
5.00%, 07/01/29(a) | | $ | 1,401,166 | |
| | 2,390,000 | | | Arizona School Facilities Board Advance Refunding COP, Series A,
5.00%, 09/01/23 | | | 2,702,875 | |
| | 150,000 | | | Arizona State Board of Regents Advance Refunding COP, Series A,
5.00%, 06/01/22 | | | 160,397 | |
| | 1,715,000 | | | Arizona State Board of Regents Advance Refunding COP, Series A,
5.00%, 06/01/24 | | | 1,962,766 | |
| | 1,250,000 | | | Arizona Water Infrastructure Finance Authority Refunding Revenue Bonds, Series A,
5.00%, 10/01/26 | | | 1,469,400 | |
| | 5,000,000 | | | City of Phoenix Advance Refunding GO,
5.00%, 07/01/25 | | | 6,085,300 | |
| | 8,950,000 | | | Salt River Project Agricultural Improvement & Power District,
5.00%, 01/01/30 | | | 11,499,228 | |
| | 5,000,000 | | | Salt River Project Agricultural Improvement & Power District Advance Refunding Revenue Bonds,
5.00%, 01/01/21 | | | 5,038,550 | |
| | 5,000,000 | | | Salt River Project Agricultural Improvement & Power District Advance Refunding Revenue Bonds,
5.00%, 01/01/22 | | | 5,277,600 | |
| | 8,850,000 | | | Salt River Project Agricultural Improvement & Power District Electric Light & Power Improvements Revenue Bonds, Series A,
5.00%, 01/01/22 | | | 9,341,352 | |
| | 6,470,000 | | | Salt River Project Agricultural Improvement & Power District Electric Light & Power Improvements Revenue Bonds, Series A,
5.00%, 01/01/23 | | | 7,132,075 | |
| Old Westbury Funds, Inc. | |
| Municipal Bond Fund | |
| Portfolio of Investments - (Continued) | October 31, 2020 |
Principal
Amount | | | | | Value | |
| Arizona (continued) | | | | |
| $ | 7,970,000 | | | Salt River Project Agricultural Improvement & Power District Electric Light & Power Improvements Revenue Bonds, Series A,
5.00%, 01/01/27 | | $ | 10,118,154 | |
| | 6,965,000 | | | Salt River Project Agricultural Improvement & Power District Electric Light & Power Improvements Revenue Bonds, Series A,
5.00%, 01/01/28 | | | 9,047,535 | |
| | | | | | | | 72,258,923 | |
| Arkansas — 0.2% | | | | |
| | 7,250,000 | | | State of Arkansas Public Improvements GO,
5.00%, 10/01/26 | | | 8,483,587 | |
| California — 3.2% | | | | |
| | 200,000 | | | California Municipal Finance Authority Channing House Project Advance Refunding Revenue Bonds (State Appropriation),
5.00%, 05/15/25 | | | 237,826 | |
| | 1,500,000 | | | County of San Bernardino CA Arrow Head Project Current Refunding COP, Series A,
5.00%, 10/01/23 | | | 1,693,695 | |
| | 5,000,000 | | | Los Angeles Department of Water & Power Power System Revenue Current Refunding Revenue Bonds, Series B,
5.00%, 01/01/22 | | | 5,254,900 | |
| | 5,000,000 | | | Los Angeles Department of Water & Power Power System Revenue Current Refunding Revenue Bonds, Series B,
5.00%, 07/01/24 | | | 5,856,950 | |
| | 3,500,000 | | | Sacramento Municipal Utility District Refunding Revenue Bonds, Sub-Series B,
5.00%, 08/15/49(b) | | | 4,126,605 | |
| | 6,850,000 | | | San Bernardino Community College District Advance Refunding GO,
1.61%, 08/01/27 | | | 7,008,372 | |
| | 800,000 | | | San Diego Regional Building Authority Advance Refunding Revenue Bonds, Series A,
5.00%, 10/15/24 | | | 935,600 | |
Principal
Amount | | | | | Value | |
| California (continued) | | | | |
| $ | 1,000,000 | | | San Francisco Bay Area Rapid Transit District Transit Improvements GO,
5.00%, 08/01/24 | | $ | 1,175,600 | |
| | 10,000,000 | | | San Francisco City & County Airport Comm-San Francisco International Airport Current Refunding Revenue Bonds, Series 2020,
5.00%, 05/01/37 | | | 12,287,000 | |
| | 5,000,000 | | | San Francisco City & County Airport Comm-San Francisco International Airport Current Refunding Revenue Bonds, Series H,
5.00%, 05/01/21 | | | 5,108,200 | |
| | 3,250,000 | | | State of California Current Refunding GO,
5.00%, 08/01/26 | | | 4,065,848 | |
| | 2,000,000 | | | State of California Current Refunding GO,
5.00%, 04/01/27 | | | 2,546,340 | |
| | 6,735,000 | | | State of California Department of Water Resources Advance Refunding Revenue Bonds,
1.79%, 12/01/35 | | | 6,433,407 | |
| | 1,620,000 | | | State of California Department of Water Resources Advance Refunding Revenue Bonds,
5.00%, 12/01/22 | | | 1,779,424 | |
| | 2,865,000 | | | State of California Department of Water Resources Advance Refunding Revenue Bonds, Series AX,
5.00%, 12/01/21 | | | 3,012,347 | |
| | 7,000,000 | | | State of California Public Improvements GO,
5.00%, 09/01/22 | | | 7,601,930 | |
| | 3,000,000 | | | State of California Public Improvements GO,
5.00%, 03/01/26 | | | 3,583,350 | |
| | 5,715,000 | | | State of California Public Improvements GO,
5.00%, 10/01/27 | | | 7,022,078 | |
| | 750,000 | | | State of California Refunding GO,
5.00%, 04/01/24 | | | 868,305 | |
| | 8,000,000 | | | State of California Refunding GO,
5.00%, 10/01/25 | | | 9,431,440 | |
| Old Westbury Funds, Inc. | |
| Municipal Bond Fund | |
| Portfolio of Investments - (Continued) | October 31, 2020 |
Principal
Amount | | | | | Value | |
| California (continued) | | | | |
| $ | 7,230,000 | | | State of California School Improvements GO,
5.00%, 11/01/28 | | $ | 9,273,776 | |
| | 14,000,000 | | | State of California Water Utility Improvements GO,
5.00%, 11/01/29 | | | 18,744,460 | |
| | 6,360,000 | | | University of California (College and University Revenue LOC) Refunding Revenue Bonds, Series AJ,
4.60%, 05/15/31 | | | 7,552,754 | |
| | 1,235,000 | | | Western Municipal Water District Facilities Authority Water Utility Improvements Revenue Bonds, Series A,
5.00%, 10/01/37 | | | 1,639,339 | |
| | 1,215,000 | | | Western Municipal Water District Facilities Authority Water Utility Improvements Revenue Bonds, Series A,
5.00%, 10/01/38 | | | 1,601,929 | |
| | 1,335,000 | | | Western Municipal Water District Facilities Authority Water Utility Improvements Revenue Bonds, Series A,
5.00%, 10/01/39 | | | 1,754,230 | |
| | 1,100,000 | | | Western Municipal Water District Facilities Authority Water Utility Improvements Revenue Bonds, Series A,
5.00%, 10/01/40 | | | 1,437,172 | |
| | | | | | | | 132,032,877 | |
| Colorado — 1.4% | | | | |
| | 800,000 | | | City & County of Broomfield Advance Refunding COP,
5.00%, 12/01/21 | | | 840,248 | |
| | 10,000,000 | | | City & County of Denver CO Airport System Revenue,
5.00%, 12/01/32 | | | 12,195,200 | |
| | 8,000,000 | | | City & County of Denver CO Airport System Revenue Refunding Revenue Bonds, Series A1,
5.00%, 11/15/22 | | | 8,742,800 | |
| | 2,175,000 | | | City & County of Denver CO Airport System Revenue Refunding Revenue Bonds, Series A1,
5.00%, 11/15/32 | | | 2,803,031 | |
Principal
Amount | | | | | Value | |
| Colorado (continued) | | | | |
| $ | 5,000,000 | | | City & County of Denver CO Airport System Revenue Refunding Revenue Bonds, Series A2,
5.00%, 11/15/23 | | $ | 5,675,500 | |
| | 2,300,000 | | | City & County of Denver CO Airport System Revenue Refunding Revenue Bonds, Series A2,
5.00%, 11/15/25 | | | 2,791,740 | |
| | 4,000,000 | | | City & County of Denver Co. Airport System Refunding Revenue Bonds, Series D,
5.00%, 11/15/31(b) | | | 4,371,400 | |
| | 2,060,000 | | | Colorado Higher Education Refunding COP, Series A,
5.00%, 11/01/24 | | | 2,424,558 | |
| | 2,000,000 | | | Denver City & County School District No 1 Refunding GO (State Aid Intercept Program),
5.00%, 12/01/24 | | | 2,374,180 | |
| | 100,000 | | | Denver City & County School District No 1 Refunding GO, Series C (State Aid Withholding),
5.00%, 12/01/23 | | | 114,232 | |
| | 1,180,000 | | | Jefferson County School District GO, Series R-1, (State Aid Withholding),
5.00%, 12/15/22 | | | 1,298,024 | |
| | 10,000,000 | | | University of Colorado Hospital Authority Revenue Current Refunding Revenue Bonds, Series C,
5.00%, 11/15/47(b) | | | 11,529,400 | |
| | 890,000 | | | Weld County School District No RE-2 Eaton Schools Improvements GO, (State Aid Intercept Program),
5.00%, 12/01/23 | | | 1,016,665 | |
| | 1,630,000 | | | Western State Colorado University Refunding Revenue Bonds (State Aid Intercept Program),
5.00%, 05/15/26 | | | 1,970,539 | |
| | | | | | | | 58,147,517 | |
| Connecticut — 2.6% | | | | |
| | 9,000,000 | | | Connecticut State Health & Educational Facilities Authority Refunding Revenue Bonds, Series A,
1.45%, 07/01/42(b)(c) | | | 9,162,450 | |
| Old Westbury Funds, Inc. | |
| Municipal Bond Fund | |
| Portfolio of Investments - (Continued) | October 31, 2020 |
Principal
Amount | | | | | Value | |
| Connecticut (continued) | | | | |
| $ | 10,000,000 | | | Connecticut State Health & Educational Facilities Authority University & College Improvements Revenue Bonds, Series A-4,
2.00%, 07/01/49(b) | | $ | 10,206,700 | |
| | 8,880,000 | | | Connecticut State Health & Educational Facilities Authority University & College Improvements Revenue Bonds, Series C-1,
5.00%, 07/01/40(b) | | | 11,492,496 | |
| | 12,885,000 | | | Connecticut State Health & Educational Facilities Authority University & College Improvements Revenue Bonds, Series S,
5.00%, 07/01/27 | | | 16,531,068 | |
| | 1,000,000 | | | Hartford County Metropolitan District Refunding Notes GO,
5.00%, 03/01/25 | | | 1,136,480 | |
| | 325,000 | | | Hartford County Metropolitan District Refunding Notes GO, Series C, (AGM),
5.00%, 11/01/23 | | | 367,945 | |
| | 5,860,000 | | | Hartford County Metropolitan District Refunding Notes GO, Series C, (AGM),
5.00%, 11/01/25 | | | 7,086,381 | |
| | 2,350,000 | | | State of Connecticut Clean Water Fund - State Revolving Fund Refunding Revenue Bonds, Series A,
5.00%, 03/01/29 | | | 2,808,086 | |
| | 1,380,000 | | | State of Connecticut Clean Water Fund - State Revolving Fund Refunding Revenue Bonds, Series A,
5.00%, 05/01/31 | | | 1,725,041 | |
| | 1,000,000 | | | State of Connecticut Refunding GO, Series B,
5.00%, 04/15/21 | | | 1,021,160 | |
| | 32,445,000 | | | State of Connecticut Refunding GO, Series C,
5.00%, 06/01/23 | | | 34,810,241 | |
| | 3,100,000 | | | State of Connecticut Special Tax Revenue Public Improvements Revenue Bonds, Series A,
5.00%, 08/01/22 | | | 3,352,743 | |
Principal
Amount | | | | | Value | |
| Connecticut (continued) | | | | |
| $ | 1,250,000 | | | State of Connecticut Special Tax Revenue Transportation Infrastructure Advance Refunding Revenue Bonds,
5.00%, 08/01/22 | | $ | 1,351,913 | |
| | 1,900,000 | | | State of Connecticut Transportation Infrastructure Refunding Revenue Bonds,
5.00%, 09/01/24 | | | 2,221,860 | |
| | 5,000,000 | | | State of Connecticut Transportation Infrastructure Revenue Bonds, Series A,
5.00%, 09/01/27 | | | 5,803,600 | |
| | 825,000 | | | Town of New Canaan CT Refunding GO, Series C,
5.00%, 04/01/25 | | | 997,136 | |
| | | | | | | | 110,075,300 | |
| Delaware — 2.6% | | | | |
| | 10,000,000 | | | Delaware State Health Facilities Authority Current Refundin Revenue Bonds,
5.00%, 10/01/45 | | | 12,257,800 | |
| | 2,415,000 | | | Delaware Transportation Authority Current Refunding Revenue Bonds,
5.00%, 09/01/28 | | | 3,127,667 | |
| | 1,165,000 | | | Delaware Transportation Authority Current Refunding Revenue Bonds,
5.00%, 09/01/29 | | | 1,531,008 | |
| | 1,250,000 | | | Delaware Transportation Authority Current Refunding Revenue Bonds,
5.00%, 09/01/30 | | | 1,668,763 | |
| | 1,250,000 | | | Delaware Transportation Authority Current Refunding Revenue Bonds,
5.00%, 09/01/31 | | | 1,657,825 | |
| | 5,000,000 | | | Delaware Transportation Authority Current Refunding Revenue Bonds,
5.00%, 07/01/32 | | | 6,699,600 | |
| | 1,500,000 | | | Delaware Transportation Authority Current Refunding Revenue Bonds,
5.00%, 09/01/32 | | | 1,975,140 | |
| | 3,400,000 | | | Delaware Transportation Authority Current Refunding Revenue Bonds,
5.00%, 07/01/33 | | | 4,528,902 | |
| Old Westbury Funds, Inc. | |
| Municipal Bond Fund | |
| Portfolio of Investments - (Continued) | October 31, 2020 |
Principal
Amount | | | | | Value | |
| Delaware (continued) | | | | |
| $ | 1,250,000 | | | Delaware Transportation Authority Current Refunding Revenue Bonds,
5.00%, 09/01/33 | | $ | 1,635,362 | |
| | 1,875,000 | | | Delaware Transportation Authority Current Refunding Revenue Bonds,
5.00%, 09/01/34 | | | 2,445,562 | |
| | 1,000,000 | | | Delaware Transportation Authority Current Refunding Revenue Bonds,
5.00%, 09/01/35 | | | 1,298,820 | |
| | 3,825,000 | | | Delaware Transportation Authority Public Improvements Revenue Bonds,
5.00%, 07/01/26 | | | 4,784,654 | |
| | 5,010,000 | | | State of Delaware Advance Refunding GO, Series A,
5.00%, 01/01/28 | | | 6,528,331 | |
| | 720,000 | | | State of Delaware Current Refunding GO, Series A,
5.00%, 10/01/26 | | | 908,366 | |
| | 7,705,000 | | | State of Delaware Current Refunding GO, Series A,
5.00%, 10/01/27 | | | 9,984,447 | |
| | 10,800,000 | | | State of Delaware Public Facilities GO,
5.00%, 02/01/25 | | | 12,943,152 | |
| | 9,650,000 | | | State of Delaware Public Facilities GO,
5.00%, 02/01/26 | | | 11,957,991 | |
| | 15,000,000 | | | State of Delaware Public Facilities GO,
5.00%, 02/01/28 | | | 19,585,050 | |
| | 2,885,000 | | | State of Delaware Public Improvements GO,
5.00%, 03/01/24 | | | 3,338,580 | |
| | | | | | | | 108,857,020 | |
| District of Columbia — 1.8% | | | | |
| | 8,000,000 | | | District of Columbia,
5.00%, 10/01/21 | | | 8,347,840 | |
| | 3,000,000 | | | District of Columbia,
5.00%, 05/01/37 | | | 3,915,330 | |
| | 1,000,000 | | | District of Columbia Public Improvements GO, Series A,
5.00%, 06/01/25 | | | 1,209,900 | |
| | 3,000,000 | | | District of Columbia Public Improvements GO, Series A,
5.00%, 10/15/27 | | | 3,879,510 | |
Principal
Amount | | | | | Value | |
| District of Columbia (continued) | | | | |
| $ | 4,145,000 | | | District of Columbia Public Improvements Revenue Bonds, Series A,
5.00%, 03/01/25 | | $ | 4,974,705 | |
| | 8,800,000 | | | District of Columbia Public Improvements Revenue Bonds, Series A,
5.00%, 03/01/26 | | | 10,914,552 | |
| | 3,500,000 | | | District of Columbia Public Improvements Revenue Bonds, Series B,
5.00%, 10/01/27 | | | 4,524,450 | |
| | 1,000,000 | | | District of Columbia Refunding Revenue Bonds, Series A,
5.00%, 12/01/20 | | | 1,003,720 | |
| | 11,735,000 | | | District of Columbia Refunding Revenue Bonds, Series C,
5.00%, 10/01/23 | | | 13,341,756 | |
| | 9,340,000 | | | District of Columbia Transit Improvements Revenue Bonds, Series A,
5.00%, 03/01/26 | | | 11,584,308 | |
| | 10,000,000 | | | District of Columbia Water & Sewer Authority Revenue Bonds, Series B,
5.00%, 10/01/52 | | | 11,958,300 | |
| | | | | | | | 75,654,371 | |
| Florida — 2.0% | | | | |
| | 2,000,000 | | | City of Tampa FL Water & Wastewater System Revenue,
5.00%, 10/01/37 | | | 2,652,640 | |
| | 3,970,000 | | | County of Palm Beach Advance Refunding Revenue Bonds,
5.00%, 11/01/26 | | | 4,670,864 | |
| | 4,620,000 | | | Florida Department of Management Services Current Refunding Revenue Bonds, Series A,
5.00%, 09/01/28 | | | 5,888,744 | |
| | 1,065,000 | | | Peace River Manasota Regional Water Supply Authority Refunding Revenue Bonds,
4.00%, 10/01/22 | | | 1,139,188 | |
| | 1,255,000 | | | Peace River Manasota Regional Water Supply Authority Refunding Revenue Bonds,
4.00%, 10/01/24 | | | 1,430,374 | |
| | 1,000,000 | | | Peace River Manasota Regional Water Supply Authority Refunding Revenue Bonds,
5.00%, 10/01/25 | | | 1,219,640 | |
| Old Westbury Funds, Inc. | |
| Municipal Bond Fund | |
| Portfolio of Investments - (Continued) | October 31, 2020 |
Principal
Amount | | | | | Value | |
| Florida (continued) | | | | |
| $ | 3,990,000 | | | State of Florida Advance Refunding GO, Series B,
5.00%, 06/01/27 | | $ | 4,987,540 | |
| | 20,005,000 | | | State of Florida Current Refunding GO,
5.00%, 07/01/24 | | | 23,433,657 | |
| | 3,475,000 | | | State of Florida Current Refunding GO, Series A,
5.00%, 06/01/24 | | | 4,057,375 | |
| | 2,845,000 | | | State of Florida Current Refunding GO, Series C,
5.00%, 06/01/25 | | | 3,440,715 | |
| | 2,565,000 | | | State of Florida Current Refunding GO, Series D,
5.00%, 06/01/23 | | | 2,876,314 | |
| | 1,750,000 | | | State of Florida Current Refunding GO, Series F,
5.00%, 06/01/28 | | | 2,178,785 | |
| | 2,380,000 | | | State of Florida Department of Transportation Turnpike System Revenue,
5.00%, 07/01/22 | | | 2,566,021 | |
| | 2,465,000 | | | State of Florida Department of Transportation Turnpike System Revenue,
5.00%, 07/01/22 | | | 2,657,664 | |
| | 1,100,000 | | | State of Florida Economic Defeasance GO, Series D,
5.00%, 06/01/28 | | | 1,369,522 | |
| | 9,800,000 | | | State of Florida Refunding GO,
5.00%, 07/01/24 | | | 10,570,868 | |
| | 5,350,000 | | | State of Florida Refunding GO, Series C,
5.00%, 06/01/23 | | | 5,999,330 | |
| | 3,895,000 | | | State of Florida Refunding GO, Series C,
5.00%, 06/01/24 | | | 4,369,878 | |
| | | | | | | | 85,509,119 | |
| Georgia — 4.4% | | | | |
| | 1,295,000 | | | Americus-Sumter Payroll Development Authority Current Refunding Revenue Bonds,
5.00%, 06/01/32 | | | 1,562,288 | |
| | 500,000 | | | Barnesville-Lamar County Industrial Development Authority Current Refunding Revenue Bonds,
5.00%, 06/01/26 | | | 596,685 | |
Principal
Amount | | | | | Value | |
| Georgia (continued) | | | | |
| $ | 1,010,000 | | | Barnesville-Lamar County Industrial Development Authority Current Refunding Revenue Bonds,
5.00%, 06/01/33 | | $ | 1,214,091 | |
| | 1,185,000 | | | Brookhaven Development Authority Children’s Healthcare of Atlan Revenue Bonds,
5.00%, 07/01/21 | | | 1,221,593 | |
| | 1,950,000 | | | Brookhaven Development Authority Children’s Healthcare of Atlan Revenue Bonds,
5.00%, 07/01/23 | | | 2,183,181 | |
| | 18,000,000 | | | Brookhaven Development Authority Children’s Healthcare of Atlan Revenue Bonds, Series A,
4.00%, 07/01/49 | | | 20,331,720 | |
| | 750,000 | | | Cherokee County Board of Education Advance Refunding GO, (State Aid Withholding),
5.00%, 02/01/23 | | | 829,867 | |
| | 2,000,000 | | | City of Atlanta GA Department of Aviation Current Refunding Revenue Bonds, Series A,
5.00%, 07/01/24 | | | 2,325,280 | |
| | 3,000,000 | | | City of Atlanta GA Department of Aviation Current Refunding Revenue Bonds, Series A,
5.00%, 07/01/25 | | | 3,607,950 | |
| | 2,225,000 | | | City of Atlanta GA Department of Aviation Current Refunding Revenue Bonds, Series A,
5.00%, 07/01/26 | | | 2,749,588 | |
| | 9,445,000 | | | City of Atlanta GA Department of Aviation Current Refunding Revenue Bonds, Series A,
5.00%, 07/01/27 | | | 11,962,659 | |
| | 3,000,000 | | | City of Atlanta GA Department of Aviation Current Refunding Revenue Bonds, Series A,
5.00%, 07/01/28 | | | 3,877,500 | |
| | 1,400,000 | | | City of Atlanta GA Department of Aviation Current Refunding Revenue Bonds, Series B,
5.00%, 07/01/24 | | | 1,614,452 | |
| | 2,000,000 | | | City of Atlanta GA Department of Aviation Current Refunding Revenue Bonds, Series B,
5.00%, 07/01/25 | | | 2,379,900 | |
| Old Westbury Funds, Inc. | |
| Municipal Bond Fund | |
| Portfolio of Investments - (Continued) | October 31, 2020 |
Principal
Amount | | | | | Value | |
| Georgia (continued) | | | | |
| $ | 2,000,000 | | | City of Atlanta GA Department of Aviation Current Refunding Revenue Bonds, Series B,
5.00%, 07/01/26 | | $ | 2,436,800 | |
| | 3,000,000 | | | City of Atlanta GA Department of Aviation Current Refunding Revenue Bonds, Series B,
5.00%, 07/01/27 | | | 3,725,070 | |
| | 3,000,000 | | | City of Atlanta GA Department of Aviation Current Refunding Revenue Bonds, Series B,
5.00%, 07/01/28 | | | 3,786,690 | |
| | 260,000 | | | Cobb County Development Authority Advance Refunding Revenue Bonds,
5.00%, 07/15/21 | | | 268,200 | |
| | 2,710,000 | | | Cobb County Development Authority Advance Refunding Revenue Bonds,
5.00%, 07/15/23 | | | 2,990,919 | |
| | 2,100,000 | | | Cobb County Development Authority Advance Refunding Revenue Bonds,
5.00%, 07/15/24 | | | 2,391,921 | |
| | 200,000 | | | Cobb County Kennestone Hospital Authority,
5.00%, 04/01/25 | | | 236,700 | |
| | 3,375,000 | | | County of Cobb GA Water & Sewerage Current Refunding Revenue Bonds,
5.00%, 07/01/27 | | | 4,350,375 | |
| | 10,000,000 | | | County of Forsyth Public Improvements GO,
5.00%, 09/01/25 | | | 12,247,900 | |
| | 3,250,000 | | | Gainesville & Hall County Hospital Authority,
5.00%, 02/15/21 | | | 3,289,260 | |
| | 5,310,000 | | | Gainesville & Hall County Hospital Authority,
5.00%, 02/15/22 | | | 5,599,714 | |
| | 4,250,000 | | | Gainesville & Hall County Hospital Authority,
5.00%, 02/15/23 | | | 4,660,167 | |
| | 6,010,000 | | | Gainesville & Hall County Hospital Authority,
5.00%, 02/15/25 | | | 7,072,147 | |
| | 3,000,000 | | | Gainesville & Hall County Hospital Authority,
5.00%, 02/15/26 | | | 3,632,160 | |
Principal
Amount | | | | | Value | |
| Georgia (continued) | | | | |
| $ | 3,120,000 | | | Gainesville & Hall County Hospital Authority,
5.00%, 02/15/27 | | $ | 3,861,031 | |
| | 2,165,000 | | | Gainesville & Hall County Hospital Authority,
5.00%, 02/15/28 | | | 2,734,417 | |
| | 1,555,000 | | | Gainesville & Hall County Hospital Authority,
5.00%, 02/15/29 | | | 1,997,351 | |
| | 2,000,000 | | | Georgia State Road & Tollway Authority Refunding Revenue Bonds, Series B,
5.00%, 06/01/21 | | | 2,055,520 | |
| | 3,935,000 | | | Lowndes County Board of Education School Improvements GO (State Aid Withholding),
5.00%, 02/01/22 | | | 4,167,598 | |
| | 1,975,000 | | | Lowndes County Board of Education School Improvements GO (State Aid Withholding),
5.00%, 02/01/23 | | | 2,185,318 | |
| | 1,555,000 | | | South Regional Joint Development Authority Advance Refunding Revenue Bonds,
5.00%, 08/01/26 | | | 1,881,659 | |
| | 1,100,000 | | | South Regional Joint Development Authority Advance Refunding Revenue Bonds,
5.00%, 08/01/26 | | | 1,331,077 | |
| | 3,265,000 | | | State of Georgia Advance Refunding GO, Series C-1,
5.00%, 01/01/24 | | | 3,754,260 | |
| | 11,295,000 | | | State of Georgia Advance Refunding GO, Series E,
5.00%, 12/01/26 | | | 14,329,402 | |
| | 1,950,000 | | | State of Georgia Public Improvements GO, Series A-2,
5.00%, 02/01/25 | | | 2,248,272 | |
| | 4,750,000 | | | State of Georgia School Improvements GO, Series A,
5.00%, 07/01/30 | | | 6,343,245 | |
| | 2,500,000 | | | State of Georgia School Improvements GO, Series A (Tranche 1),
5.00%, 07/01/26 | | | 3,136,750 | |
| | 2,230,000 | | | State of Georgia School Improvements GO, Series A-1,
5.00%, 02/01/25 | | | 2,669,377 | |
| Old Westbury Funds, Inc. | |
| Municipal Bond Fund | |
| Portfolio of Investments - (Continued) | October 31, 2020 |
Principal
Amount | | | | | Value | |
| Georgia (continued) | | | | |
| $ | 18,020,000 | | | State of Georgia University and College Improvements GO, Series A-1,
5.00%, 02/01/24 | | $ | 20,789,854 | |
| | | | | | | | 186,629,908 | |
| Hawaii — 1.8% | | | | |
| | 10,000,000 | | | City & County of Honolulu HI Refunding GO,
5.00%, 09/01/25 | | | 12,215,600 | |
| | 4,940,000 | | | City & County of Honolulu HI Transit Improvements GO,
5.00%, 09/01/29(b) | | | 5,484,092 | |
| | 3,000,000 | | | City & County of Honolulu Public Improvements Refunding GO, Series D,
5.00%, 08/01/23 | | | 3,386,550 | |
| | 2,500,000 | | | State of Hawaii Airports System Revenue,
5.00%, 07/01/35 | | | 2,970,025 | |
| | 10,000,000 | | | State of Hawaii Airports System Revenue Airport & Marina Impt. Revenue Bonds, Series A,
5.00%, 07/01/31 | | | 12,627,400 | |
| | 10,000,000 | | | State of Hawaii Airports System Revenue Airport & Marina Impt. Revenue Bonds, Series A,
5.00%, 07/01/32 | | | 12,500,700 | |
| | 5,865,000 | | | State of Hawaii Airports System Revenue Airport & Marina Impt. Revenue Bonds, Series A,
5.00%, 07/01/33 | | | 7,271,720 | |
| | 2,000,000 | | | State of Hawaii Airports System Revenue Current Refunding Revenue Bonds, Series E,
1.71%, 07/01/26 | | | 2,003,280 | |
| | 2,250,000 | | | State of Hawaii Airports System Revenue Current Refunding Revenue Bonds, Series E,
1.81%, 07/01/27 | | | 2,250,720 | |
| | 1,000,000 | | | State of Hawaii Department of Budget & Finance Queens Health System Refunding Revenue Bonds, Series A,
5.00%, 07/01/21 | | | 1,028,840 | |
| | 1,300,000 | | | State of Hawaii Public Facilities GO, Series FW,
5.00%, 01/01/30 | | | 1,696,331 | |
| | 5,420,000 | | | State of Hawaii Public Improvements GO, Series EH,
5.00%, 08/01/33(a) | | | 6,095,007 | |
Principal
Amount | | | | | Value | |
| Hawaii (continued) | | | | |
| $ | 2,515,000 | | | State of Hawaii Public Improvements GO, Series FK,
5.00%, 05/01/29 | | $ | 3,156,451 | |
| | 1,570,000 | | | University of Hawaii Advance Refunding Revenue Bonds, Series F,
5.00%, 10/01/21 | | | 1,635,312 | |
| | 1,180,000 | | | University of Hawaii Advance Refunding Revenue Bonds, Series F,
5.00%, 10/01/22 | | | 1,281,574 | |
| | | | | | | | 75,603,602 | |
| Idaho — 0.1% | | | | |
| | 900,000 | | | Canyon County School District No 131 Nampa Advance Refunding GO, (School Board GTY),
5.00%, 09/15/25 | | | 1,083,969 | |
| | 1,500,000 | | | Idaho Board Bank Authority Refunding Revenue Bonds, Series D,
5.00%, 09/15/23 | | | 1,630,680 | |
| | 740,000 | | | Madison County School District No 321 Rexburg School Improvements GO, (School Board GTY), Series B,
5.00%, 09/15/28 | | | 946,327 | |
| | | | | | | | 3,660,976 | |
| Illinois — 0.2% | | | | |
| | 1,220,000 | | | Illinois State Toll Highway Authority Current Refunding Revenue Bonds, Series A,
5.00%, 01/01/21 | | | 1,229,028 | |
| | 3,250,000 | | | Metropolitan Water Reclamation District of Greater Chicago Current Refunding GO, Series A,
5.00%, 12/01/24 | | | 3,807,603 | |
| | 2,000,000 | | | Metropolitan Water Reclamation District of Greater Chicago Refunding GO, Series D,
5.00%, 12/01/22 | | | 2,181,940 | |
| | | | | | | | 7,218,571 | |
| Indiana — 0.1% | | | | |
| | 235,000 | | | Columbus Multi-High School Building Corp. Refunding Revenue Bonds (State Aid Intercept Program),
5.00%, 07/15/22 | | | 253,170 | |
| Old Westbury Funds, Inc. | |
| Municipal Bond Fund | |
| Portfolio of Investments - (Continued) | October 31, 2020 |
Principal
Amount | | | | | Value | |
| Indiana (continued) | | | |
| $ | 1,330,000 | | | GCS School Building Corp. One, First Mortgage Refunding Revenue Bonds (State Aid Intercept Program),
5.00%, 01/15/22 | | $ | 1,402,006 | |
| | 250,000 | | | GCS School Building Corp. One, First Mortgage Refunding Revenue Bonds (State Aid Intercept Program),
5.00%, 07/15/22 | | | 269,108 | |
| | 2,000,000 | | | Indiana Finance Authority University Health Obligated Group Revenue Bonds,
1.65%, 12/01/42(b) | | | 2,028,220 | |
| | | | | | | | 3,952,504 | |
| Iowa — 0.6% | | | | |
| | 5,675,000 | | | County of Polk Current Refunding GO, Series C,
5.00%, 06/01/21 | | | 5,831,517 | |
| | 4,000,000 | | | County of Polk Current Refunding GO, Series C,
5.00%, 06/01/26 | | | 4,990,040 | |
| | 6,110,000 | | | Iowa Finance Authority Advance Refunding Revenue Bonds,
5.00%, 08/01/21 | | | 6,327,088 | |
| | 4,000,000 | | | Iowa Finance Authority Green Bond, Series A,
5.00%, 08/01/35 | | | 5,344,880 | |
| | 3,000,000 | | | State of Iowa Advance Refunding Revenue Bonds, Series A,
5.00%, 06/01/28 | | | 3,696,930 | |
| | | | | | | | 26,190,455 | |
| Kansas — 0.0% | | | | |
| | 1,260,000 | | | Sedgwick County Public Building Commission Technical Education Complex Refunding Revenue Bonds, Series 2,
5.00%, 08/01/23 | | | 1,423,094 | |
| Maine — 0.1% | | | | |
| | 725,000 | | | Maine Governmental Facilities Authority Facilities Improvements Revenue Bonds, Series A,
5.00%, 10/01/23 | | | 821,548 | |
| | 165,000 | | | Maine Health & Higher Educational Facilities Authority Refunding Revenue Bonds, Series A,
5.00%, 07/01/21 | | | 169,950 | |
Principal
Amount | | | | | Value | |
| Maine (continued) | | | |
| $ | 5,000 | | | Maine Health & Higher Educational Facilities Authority Refunding Revenue Bonds, Series A,
5.00%, 07/01/21 | | $ | 5,156 | |
| | 1,100,000 | | | Maine Municipal Bond Bank Highway Improvements Revenue Bonds, Series A,
5.00%, 09/01/28 | | | 1,421,937 | |
| | 600,000 | | | Maine Municipal Bond Bank Miscellaneous Purpose Revenue Bonds, Series B,
5.00%, 11/01/23 | | | 683,904 | |
| | | | | | | | 3,102,495 | |
| Maryland — 5.8% | | | | |
| | 5,735,000 | | | County of Anne Arundel School Improvements GO,
5.00%, 04/01/27 | | | 6,864,049 | |
| | 2,410,000 | | | County of Anne Arundel School Improvements GO,
5.00%, 10/01/27 | | | 3,117,311 | |
| | 2,810,000 | | | County of Anne Arundel School Improvements GO,
5.00%, 04/01/28 | | | 3,352,780 | |
| | 3,575,000 | | | County of Baltimore Refunding GO,
5.00%, 03/01/27 | | | 4,556,802 | |
| | 1,200,000 | | | County of Baltimore Refunding GO, (Special Assessment),
5.00%, 02/01/29 | | | 1,464,420 | |
| | 2,730,000 | | | County of Baltimore Refunding Notes GO,
5.00%, 03/01/23 | | | 3,030,764 | |
| | 3,835,000 | | | County of Baltimore Refunding Public Notes GO,
5.00%, 03/01/23 | | | 4,257,502 | |
| | 8,165,000 | | | County of Baltimore Refunding Public Notes GO,
5.00%, 03/01/24 | | | 9,442,741 | |
| | 2,860,000 | | | County of Charles Public School Improvements GO,
5.00%, 10/01/21 | | | 2,983,552 | |
| | 3,910,000 | | | County of Frederick MD Public Improvements GO, Series A,
5.00%, 08/01/27 | | | 5,039,052 | |
| | 1,500,000 | | | County of Frederick Refunding GO, Series A,
5.00%, 02/01/25 | | | 1,796,955 | |
| Old Westbury Funds, Inc. | |
| Municipal Bond Fund | |
| Portfolio of Investments - (Continued) | October 31, 2020 |
Principal
Amount | | | | | Value | |
| Maryland (continued) | | | |
| $ | 3,220,000 | | | County of Howard MD Advance Refunding Public Improvements GO, Series B,
5.00%, 02/15/29 | | $ | 4,058,971 | |
| | 1,750,000 | | | County of Howard MD Advance Refunding Public Improvements GO, Series C,
1.45%, 08/15/24 | | | 1,800,313 | |
| | 1,010,000 | | | County of Howard MD Advance Refunding Public Improvements GO, Series C,
1.55%, 08/15/25 | | | 1,042,663 | |
| | 4,500,000 | | | County of Montgomery Advance Refunding GO, Series B,
5.00%, 06/01/23 | | | 5,049,855 | |
| | 6,650,000 | | | County of Montgomery Advance Refunding GO, Series C,
5.00%, 10/01/22 | | | 7,254,551 | |
| | 19,000,000 | | | County of Montgomery Advance Refunding GO, Series C,
5.00%, 10/01/26 | | | 23,958,240 | |
| | 2,000,000 | | | County of Montgomery Public Improvements GO, Series A,
5.00%, 12/01/27 | | | 2,355,740 | |
| | 1,200,000 | | | County of Montgomery Refunding GO, Series A,
5.00%, 11/01/23 | | | 1,370,124 | |
| | 3,185,000 | | | County of Prince George’s Public School Improvement GO, Series A,
5.00%, 09/15/25 | | | 3,901,084 | |
| | 3,180,000 | | | County of Prince George’s Public School Improvement GO, Series A,
5.00%, 09/15/26 | | | 4,005,178 | |
| | 3,110,000 | | | County of Prince George’s Public School Improvements GO, Series A,
5.00%, 07/01/24 | | | 3,646,755 | |
| | 9,355,000 | | | County of Prince George’s Public School Improvements GO, Series A,
5.00%, 07/01/25 | | | 11,375,867 | |
| | 5,530,000 | | | Maryland State Transportation Authority,
5.00%, 07/01/36 | | | 7,262,383 | |
| | 7,585,000 | | | State of Maryland Advance Refunding GO, Series B,
5.00%, 08/01/24 | | | 8,910,706 | |
Principal
Amount | | | | | Value | |
| Maryland (continued) | | | |
| $ | 9,255,000 | | | State of Maryland Advance Refunding GO, Series B,
5.00%, 08/01/25 | | $ | 11,277,680 | |
| | 6,000,000 | | | State of Maryland Department of Transportation Transit Improvements Revenue Bonds,
5.00%, 02/01/25 | | | 6,627,120 | |
| | 10,000,000 | | | State of Maryland Department of Transportation Transit Improvements Revenue Bonds,
5.00%, 11/01/26 | | | 11,770,300 | |
| | 2,750,000 | | | State of Maryland Public Facilities GO, Series 1,
5.00%, 03/15/32 | | | 3,598,128 | |
| | 8,035,000 | | | State of Maryland Public Improvements GO, Series A,
5.00%, 08/01/24(a) | | | 9,071,113 | |
| | 3,000,000 | | | State of Maryland Public Improvements GO, Series A,
5.00%, 03/15/25 | | | 3,604,080 | |
| | 8,145,000 | | | State of Maryland Public Improvements GO, Series A,
5.00%, 03/15/27 | | | 10,392,694 | |
| | 5,000,000 | | | State of Maryland Public Improvements GO, Series A,
5.00%, 03/15/28 | �� | | 6,341,700 | |
| | 4,350,000 | | | State of Maryland Refunding GO, Series 2-C,
5.00%, 08/01/23 | | | 4,914,369 | |
| | 6,700,000 | | | State of Maryland School Improvements GO,
5.00%, 06/01/23 | | | 7,516,864 | |
| | 20,000,000 | | | State of Maryland School Improvements GO, Series A,
5.00%, 03/15/23 | | | 22,240,000 | |
| | 7,500,000 | | | Washington Suburban Sanitary Commission Water & Sewer System Improvements GO,
5.00%, 06/01/22 | | | 8,063,100 | |
| | 5,000,000 | | | Washington Suburban Sanitary Commission Water & Sewer System Improvements GO, 2nd Series,
5.00%, 06/01/25 | | | 6,062,200 | |
| | | | | | | | 243,377,706 | |
| Massachusetts — 4.0% | | | | |
| | 840,000 | | | Commonwealth of Massachusetts Advance Refunding GO, Series A,
5.00%, 07/01/26 | | | 1,051,277 | |
| Old Westbury Funds, Inc. | |
| Municipal Bond Fund | |
| Portfolio of Investments - (Continued) | October 31, 2020 |
Principal
Amount | | | | | Value | |
| Massachusetts (continued) | | | |
| $ | 6,430,000 | | | Commonwealth of Massachusetts Advance Refunding GO, Series B,
5.00%, 07/01/27 | | $ | 8,244,674 | |
| | 13,025,000 | | | Commonwealth of Massachusetts Advance Refunding GO, Series B,
5.00%, 07/01/31 | | | 15,936,869 | |
| | 9,330,000 | | | Commonwealth of Massachusetts Advance Refunding GO, Series C,
5.00%, 10/01/26 | | | 11,752,348 | |
| | 4,000,000 | | | Commonwealth of Massachusetts Current Refunding GO, Series C,
5.00%, 05/01/27 | | | 5,106,760 | |
| | 2,900,000 | | | Commonwealth of Massachusetts Highway Improvements Revenue Bonds, Series B,
5.00%, 06/15/22 | | | 3,122,111 | |
| | 2,000,000 | | | Commonwealth of Massachusetts Public Improvements GO, Series C,
5.00%, 07/01/32 | | | 2,386,280 | |
| | 1,125,000 | | | Commonwealth of Massachusetts Public Improvements GO, Series D,
5.00%, 02/01/33 | | | 1,387,575 | |
| | 8,000,000 | | | Commonwealth of Massachusetts Refunding GO, Series C, (AGM),
5.25%, 11/01/26 | | | 10,216,080 | |
| | 7,000,000 | | | Commonwealth of Massachusetts Transit Improvements GO, Series F,
5.00%, 05/01/28 | | | 9,134,160 | |
| | 4,500,000 | | | Commonwealth of Massachusetts Transportation Fund Advance Refunding Revenue Bonds, Series A,
5.00%, 06/01/27 | | | 5,580,990 | |
| | 1,000,000 | | | Massachusetts Bay Transportation Authority Advance Refunding Revenue Bonds, Senior Series B,
5.00%, 07/01/33 | | | 1,179,370 | |
| | 2,720,000 | | | Massachusetts Bay Transportation Authority Refunding Revenue Bonds, Series A,
5.25%, 07/01/31 | | | 3,843,877 | |
| | 3,325,000 | | | Massachusetts Clean Water Trust (The),
5.00%, 08/01/31 | | | 4,526,389 | |
Principal
Amount | | | | | Value | |
| Massachusetts (continued) | | | |
| $ | 5,000,000 | | | Massachusetts Clean Water Trust Advance Green Revenue Bond, Series 2020,
5.00%, 02/01/36 | | $ | 5,879,050 | |
| | 5,500,000 | | | Massachusetts Clean Water Trust Advance Green Revenue Bond, Sub Series 2017A,
5.00%, 02/01/33 | | | 6,028,330 | |
| | 8,500,000 | | | Massachusetts Clean Water Trust Advance Refunding Revenue Bonds, Series 2017,
5.00%, 08/01/21 | | | 8,800,730 | |
| | 4,050,000 | | | Massachusetts Development Finance Agency,
5.00%, 10/15/26 | | | 5,128,191 | |
| | 12,785,000 | | | Massachusetts Development Finance Agency,
5.00%, 10/15/27 | | | 16,603,624 | |
| | 5,000,000 | | | Massachusetts Development Finance Agency Advance Refunding Revenue Bonds, Series A,
5.00%, 07/15/33 | | | 6,152,300 | |
| | 10,000,000 | | | Massachusetts Development Finance Agency Miscellaneous Purpose Revenue Bonds, Series A,
5.25%, 04/01/37(a) | | | 10,208,700 | |
| | 3,500,000 | | | Massachusetts School Building Authority Refunding Revenue Bonds, Senior Series A,
5.00%, 08/15/23 | | | 3,794,700 | |
| | 500,000 | | | Massachusetts Water Resources Authority Refunding Revenue Bonds, Series A,
5.00%, 08/01/22 | | | 541,495 | |
| | 8,535,000 | | | Massachusetts Water Resources Authority Refunding Revenue Bonds, Series B, (AGM),
5.25%, 08/01/26 | | | 10,836,804 | |
| | 2,700,000 | | | Massachusetts Water Resources Authority Refunding Revenue Bonds, Series C,
5.00%, 08/01/22 | | | 2,924,073 | |
| | 5,875,000 | | | Pioneer Valley Transit Authority,
2.00%, 07/16/21 | | | 5,927,405 | |
| | | | | | | | 166,294,162 | |
| Michigan — 0.3% | | | | |
| | 200,000 | | | Caledonia Community Schools Refunding GO, (Q-SBLF),
5.00%, 05/01/23 | | | 222,964 | |
| Old Westbury Funds, Inc. | |
| Municipal Bond Fund | |
| Portfolio of Investments - (Continued) | October 31, 2020 |
Principal
Amount | | | | | Value | |
| Michigan (continued) | | | | |
| $ | 1,000,000 | | | Michigan State Building Authority Current Refunding Revenue Bonds, (Facilities Program),
5.00%, 10/15/21 | | $ | 1,045,140 | |
| | 1,000,000 | | | Michigan State Building Authority Current Refunding Revenue Bonds, (Facilities Program),
5.00%, 10/15/23 | | | 1,135,880 | |
| | 1,000,000 | | | Michigan State Building Authority Current Refunding Revenue Bonds, (Facilities Program),
5.00%, 04/15/24 | | | 1,157,250 | |
| | 1,000,000 | | | Michigan State University Refunding Revenue Bonds, Series A,
5.00%, 08/15/31 | | | 1,177,850 | |
| | 2,250,000 | | | University of Michigan,
1.37%, 04/01/27 | | | 2,243,632 | |
| | 1,000,000 | | | University of Michigan Advance Refunding Revenue Bonds, Series A,
5.00%, 04/01/22 | | | 1,066,570 | |
| | 3,000,000 | | | University of Michigan University & College Improvements Revenue Bonds, Series A,
5.00%, 04/01/26 | | | 3,738,540 | |
| | 1,500,000 | | | University of Michigan University & College Improvements Revenue Bonds, Series B,
1.00%, 04/01/25 | | | 1,501,305 | |
| | 290,000 | | | Wayne-Westland Community Schools Improvements GO, (Q-SBLF),
5.00%, 11/01/22 | | | 316,048 | |
| | | | | | | | 13,605,179 | |
| Minnesota — 1.1% | | | | |
| | 1,515,000 | | | Cambridge-Isanti Independent School District No 911 School Building Refunding GO, Series D, (School District Credit Program),
5.00%, 02/01/24 | | | 1,740,962 | |
| | 1,000,000 | | | City of Rochester Advance Refunding GO, Series B,
5.00%, 12/01/24 | | | 1,187,540 | |
| | 2,090,000 | | | Minneapolis Special School District No 1,
5.00%, 02/01/28 | | | 2,713,426 | |
| | 1,815,000 | | | Minnesota Public Facilities Authority Advance Refunding Revenue Bonds, Series B,
5.00%, 03/01/27 | | | 2,242,505 | |
Principal
Amount | | | | | Value | |
| Minnesota (continued) | | | | |
| $ | 2,535,000 | | | Robbinsdale Independent School District No 281 Current Refunding GO, Series A, (School District Credit Program),
5.00%, 02/01/23 | | $ | 2,799,527 | |
| | 2,805,000 | | | Robbinsdale Independent School District No 281 Current Refunding GO, Series A, (School District Credit Program),
5.00%, 02/01/24 | | | 3,226,311 | |
| | 2,200,000 | | | Sartell-St Stephen Independent School District No 748 GO (School District Credit Program), Series A,
5.00%, 02/01/25 | | | 2,628,318 | |
| | 2,335,000 | | | State of Minnesota,
5.00%, 08/01/23 | | | 2,637,242 | |
| | 2,870,000 | | | State of Minnesota Highway Improvements GO, Series B,
5.00%, 10/01/23 | | | 3,263,879 | |
| | 785,000 | | | State of Minnesota Public Improvements COP,
5.00%, 06/01/23 | | | 879,192 | |
| | 1,395,000 | | | State of Minnesota Public Improvements COP,
5.00%, 06/01/24 | | | 1,622,274 | |
| | 2,740,000 | | | State of Minnesota Public Improvements COP,
5.00%, 06/01/25 | | | 3,181,085 | |
| | 2,910,000 | | | State of Minnesota Public Improvements COP,
5.00%, 06/01/26 | | | 3,372,836 | |
| | 1,000,000 | | | State of Minnesota Refunding Revenue Bonds, Series B,
5.00%, 03/01/21 | | | 1,015,620 | |
| | 3,915,000 | | | State of Minnesota School Improvements GO, Series A,
5.00%, 08/01/28 | | | 4,900,327 | |
| | 5,170,000 | | | Virginia Independent School District No 706 School Improvement GO, Series A, (School District Credit Program),
5.00%, 02/01/25 | | | 6,169,361 | |
| | 1,000,000 | | | Waconia Independent School District No 110 Refunding GO, Series A, (School District Credit Program),
5.00%, 02/01/24 | | | 1,149,150 | |
| | | | | | | | 44,729,555 | |
| Old Westbury Funds, Inc. | |
| Municipal Bond Fund | |
| Portfolio of Investments - (Continued) | October 31, 2020 |
Principal
Amount | | | | | Value | |
| Mississippi — 0.4% | | | | |
| $ | 570,000 | | | Mississippi Development Bank DeSoto County Highway Project Advance Refunding Revenue Bonds, Series S, (State Aid Intercept Program),
5.00%, 01/01/23 | | $ | 625,073 | |
| | 2,310,000 | | | Mississippi Development Bank Harrison County Highway Refunding Revenue Bonds, Series A,
5.00%, 01/01/25 | | | 2,729,427 | |
| | 310,000 | | | Mississippi State University Educational Building Corp. Campus Improvements Project Revenue Bonds,
5.00%, 11/01/22 | | | 337,584 | |
| | 10,000,000 | | | State of Mississippi Public Improvements GO, Series B,
5.00%, 12/01/31(a) | | | 11,442,100 | |
| | | | | | | | 15,134,184 | |
| Missouri — 0.1% | | | | |
| | 905,000 | | | Missouri State Environmental Improvement & Energy Resources Authority Advance Refunding Revenue Bonds, Series B,
5.00%, 01/01/25 | | | 1,075,484 | |
| | 2,000,000 | | | Missouri State Health & Educational Facilities Authority Columbia Arena Project Refunding Revenue Bonds,
5.00%, 10/01/21 | | | 2,080,400 | |
| | 500,000 | | | North Kansas City School District No 74 School Improvements Refunding GO, (State Aid Direct Deposit),
5.00%, 03/01/24 | | | 576,985 | |
| | 1,800,000 | | | North Kansas City School District No 74 School Improvements Refunding GO, (State Aid Direct Deposit),
5.00%, 03/01/25 | | | 2,076,858 | |
| | | | | | | | 5,809,727 | |
| Montana — 0.1% | | | | |
| | 1,000,000 | | | State of Montana Public Facilities GO, Series G,
5.00%, 08/01/27 | | | 1,288,000 | |
Principal
Amount | | | | | Value | |
| Montana (continued) | | | | |
| $ | 1,500,000 | | | State of Montana Public Facilities GO, Series G,
5.00%, 08/01/28 | | $ | 1,978,620 | |
| | | | | | | | 3,266,620 | |
| New Hampshire — 0.2% | | | | |
| | 3,990,000 | | | State of New Hampshire Public Improvements GO, Series B,
5.00%, 12/01/21 | | | 4,195,206 | |
| | 3,990,000 | | | State of New Hampshire Public Improvements GO, Series B,
5.00%, 12/01/22 | | | 4,380,900 | |
| | | | | | | | 8,576,106 | |
| New Jersey — 2.1% | | | | |
| | 1,060,000 | | | County of Ocean Current Refunding GO, Series B,
4.00%, 08/01/24 | | | 1,208,813 | |
| | 1,230,000 | | | County of Ocean Current Refunding GO, Series B,
5.00%, 08/01/28 | | | 1,628,987 | |
| | 1,825,000 | | | County of Ocean Public Improvements GO, Series A,
5.00%, 08/01/24 | | | 2,149,211 | |
| | 1,255,000 | | | County of Ocean Public Improvements GO, Series A,
5.00%, 08/01/25 | | | 1,533,924 | |
| | 1,340,000 | | | County of Ocean Public Improvements GO, Series A,
5.00%, 08/01/27 | | | 1,732,057 | |
| | 1,900,000 | | | County of Ocean Public Improvements GO, Series A,
5.00%, 08/01/28 | | | 2,516,322 | |
| | 1,575,000 | | | County of Ocean Public Improvements GO, Series A,
5.00%, 08/01/29 | | | 2,125,856 | |
| | 1,000,000 | | | County of Ocean Public Improvements GO, Series A,
5.00%, 08/01/30 | | | 1,376,960 | |
| | 1,000,000 | | | Monmouth County Improvement Authority Cash Flow Management Revenue Bonds (County GTY), Series B,
5.00%, 12/01/23 | | | 1,144,310 | |
| | 1,000,000 | | | Monmouth County Improvement Authority Cash Flow Management Revenue Bonds (County GTY), Series B,
5.00%, 12/01/24 | | | 1,189,780 | |
| Old Westbury Funds, Inc. | |
| Municipal Bond Fund | |
| Portfolio of Investments - (Continued) | October 31, 2020 |
Principal
Amount | | | | | Value | |
| New Jersey (continued) | | | | |
| $ | 200,000 | | | Monmouth County Improvement Authority Refunding Revenue Bonds (County GTY, Municipal Government GTY),
5.00%, 12/01/22 | | $ | 219,550 | |
| | 700,000 | | | New Jersey Economic Development Authority,
5.00%, 03/01/21 | | | 710,955 | |
| | 1,800,000 | | | New Jersey Economic Development Authority,
5.00%, 03/01/21 | | | 1,824,732 | |
| | 2,000,000 | | | New Jersey Economic Development Authority Advance Refunding Revenue Bonds, Series B (State Appropriation),
5.00%, 11/01/21 | | | 2,082,420 | |
| | 3,295,000 | | | New Jersey Economic Development Authority Refunding Revenue Bonds, Series GG,
5.00%, 09/01/21 | | | 3,339,845 | |
| | 1,500,000 | | | New Jersey Health Care Facilities Financing Authority Revenue Bonds,
5.00%, 07/01/23 | | | 1,667,955 | |
| | 990,000 | | | New Jersey Health Care Facilities Financing Authority RWJ Barnabas Health System Obligated Group Refunding Revenue Bonds,
5.00%, 07/01/21 | | | 1,019,631 | |
| | 1,000,000 | | | New Jersey Health Care Facilities Financing Authority RWJ Barnabas Health System Obligated Group Refunding Revenue Bonds,
5.00%, 07/01/23 | | | 1,116,190 | |
| | 1,855,000 | | | New Jersey Transit Corp. Refunding Revenue Bonds, Series A,
5.00%, 09/15/21 | | | 1,923,450 | |
| | 8,500,000 | | | New Jersey Transportation Trust Fund Authority Current Refunding Revenue Bonds,
5.00%, 06/15/23 | | | 9,296,705 | |
| | 5,000,000 | | | New Jersey Transportation Trust Fund Authority Refunding Revenue Bonds (NATL-RE),
5.25%, 12/15/21 | | | 5,243,950 | |
Principal
Amount | | | | | Value | |
| New Jersey (continued) | | | | |
| $ | 3,860,000 | | | New Jersey Transportation Trust Fund Authority Refunding Revenue Bonds, Series A,
5.50%, 12/15/21 | | $ | 4,059,022 | |
| | 2,000,000 | | | New Jersey Transportation Trust Fund Authority Refunding Revenue Bonds, Series A,
5.25%, 12/15/21 | | | 2,097,580 | |
| | 7,000,000 | | | New Jersey Transportation Trust Fund Authority Refunding Revenue Bonds, Series B (NATL-RE),
5.50%, 12/15/21 | | | 7,360,920 | |
| | 1,500,000 | | | New Jersey Transportation Trust Fund Authority Transit Improvements Refunding Revenue Bonds, Series A,
5.25%, 12/15/22 | | | 1,635,075 | |
| | 650,000 | | | New Jersey Transportation Trust Fund Authority Transit Improvements Revenue Bonds,
5.00%, 06/15/21 | | | 664,631 | |
| | 440,000 | | | New Jersey Transportation Trust Fund Authority Transit Improvements Revenue Bonds, Series AA,
5.00%, 06/15/21 | | | 451,370 | |
| | 2,775,000 | | | New Jersey Turnpike Authority,
5.00%, 01/01/27 | | | 3,439,363 | |
| | 2,145,000 | | | New Jersey Turnpike Authority,
5.00%, 01/01/29 | | | 2,451,821 | |
| | 1,000,000 | | | New Jersey Turnpike Authority Advance Refunding Revenue Bonds, Series B,
5.00%, 01/01/27 | | | 1,239,410 | |
| | 2,380,000 | | | New Jersey Turnpike Authority Current Refunding Revenue Bonds, Series C,
5.00%, 01/01/25 | | | 2,805,687 | |
| | 2,000,000 | | | New Jersey Turnpike Authority Highway Improvements Revenue Bonds Series A,
5.00%, 01/01/29 | | | 2,433,880 | |
| | 3,250,000 | | | New Jersey Turnpike Authority Highway Improvements Revenue Bonds, Series E,
5.00%, 01/01/32 | | | 3,745,852 | |
| | 3,000,000 | | | New Jersey Turnpike Authority Highway Improvements Revenue Bonds, Series E,
5.00%, 01/01/33 | | | 3,445,860 | |
| Old Westbury Funds, Inc. | |
| Municipal Bond Fund | |
| Portfolio of Investments - (Continued) | October 31, 2020 |
Principal
Amount | | | | | Value | |
| New Jersey (continued) | | | | |
| $ | 4,000,000 | | | New Jersey Turnpike Authority Highway Improvements Revenue Bonds, Series A,
5.00%, 01/01/34 | | $ | 4,749,920 | |
| | 2,000,000 | | | Rutgers The State University of New Jersey Advance Refunding Revenue Bonds, Series S,
1.66%, 05/01/28 | | | 1,947,260 | |
| | 2,500,000 | | | Rutgers The State University of New Jersey Advance Refunding Revenue Bonds, Series S,
2.18%, 05/01/35 | | | 2,364,900 | |
| | | | | | | | 89,944,154 | |
| New York — 16.5% | | | | |
| | 10,025,000 | | | City of New York Advance Refunding GO, Series C,
5.00%, 08/01/21 | | | 10,371,965 | |
| | 30,000,000 | | | City of New York Advance Refunding GO, Series C,
5.00%, 08/01/22 | | | 32,369,100 | |
| | 15,000,000 | | | City of New York Current Refunding GO, Series E,
5.00%, 08/01/23 | | | 16,818,600 | |
| | 9,400,000 | | | City of New York Current Refunding GO, Series E,
5.00%, 08/01/24 | | | 10,935,866 | |
| | 8,000,000 | | | City of New York GO, Sub-Series B-3,
0.36%, 10/01/46(b) | | | 8,000,000 | |
| | 1,135,000 | | | City of New York Public Improvements GO, Series I, Subseries I-A,
5.00%, 04/01/27(c) | | | 1,412,757 | |
| | 1,400,000 | | | City of New York Public Improvements GO, Series I, Subseries I-A,
5.00%, 04/01/28(c) | | | 1,772,694 | |
| | 2,000,000 | | | City of New York Public Improvements GO, Series I, Subseries I-A,
5.00%, 04/01/29(c) | | | 2,572,680 | |
| | 2,910,000 | | | City of New York Public Improvements GO, Sub-Series D-1,
5.00%, 08/01/22 | | | 3,139,803 | |
| | 32,750,000 | | | City of New York Public Improvements GO, Sub-Series D-3,
5.00%, 08/01/38(b)(c) | | | 36,373,460 | |
Principal
Amount | | | | | Value | |
| New York (continued) | | | | |
| $ | 1,500,000 | | | City of New York Public Improvements GO, Subseries F-1,
5.00%, 04/01/43 | | $ | 1,774,350 | |
| | 650,000 | | | City of New York Refunding GO, Series C,
5.00%, 08/01/22 | | | 701,331 | |
| | 8,170,000 | | | City of New York Refunding GO, Series D,
5.00%, 08/01/22 | | | 8,815,185 | |
| | 3,575,000 | | | City of New York Refunding GO, Series F,
5.00%, 08/01/29 | | | 3,760,757 | |
| | 2,500,000 | | | City of New York Refunding GO, Series G,
5.00%, 08/01/21 | | | 2,586,525 | |
| | 18,500,000 | | | City of New York Refunding GO, Series G,
5.00%, 08/01/22 | | | 19,960,945 | |
| | 5,000,000 | | | City of New York Refunding GO, Series I,
5.00%, 08/01/25 | | | 5,566,950 | |
| | 9,450,000 | | | City of New York Refunding GO, Series J, Subseries J11,
5.00%, 08/01/25(c) | | | 11,357,104 | |
| | 5,000,000 | | | Erie County Industrial Development Agency Refunding Revenue Bonds, Series B, (State Aid Withholding),
5.00%, 05/01/23 | | | 5,117,300 | |
| | 2,055,000 | | | Metropolitan Transportation Authority Advance Refunding Revenue Bonds, Series A,
5.25%, 11/15/31 | | | 2,446,067 | |
| | 240,000 | | | Metropolitan Transportation Authority Current Refunding Revenue Bonds, Series D,
5.00%, 11/15/28 | | | 257,712 | |
| | 1,020,000 | | | Metropolitan Transportation Authority Current Refunding Revenue Bonds, Series D,
5.00%, 11/15/29 | | | 1,094,154 | |
| | 3,020,000 | | | Metropolitan Transportation Authority Current Refunding Revenue Bonds, Series F,
5.00%, 11/15/30 | | | 3,098,248 | |
| | 20,000,000 | | | Metropolitan Transportation Authority Refunding Revenue Bonds, Series A-2,
5.00%, 11/15/48(b) | | | 20,753,600 | |
| Old Westbury Funds, Inc. | |
| Municipal Bond Fund | |
| Portfolio of Investments - (Continued) | October 31, 2020 |
Principal
Amount | | | | | Value | |
| New York (continued) | | | | |
| $ | 940,000 | | | Metropolitan Transportation Authority Refunding Revenue Bonds, Series C-1,
5.00%, 11/15/27 | | $ | 1,023,256 | |
| | 24,820,000 | | | Metropolitan Transportation Authority Refunding Revenue Bonds, Series D-1,
5.00%, 09/01/22 | | | 25,238,713 | |
| | 1,925,000 | | | Metropolitan Transportation Authority Refunding Revenue Bonds, Series F,
5.00%, 11/15/21 | | | 1,955,762 | |
| | 1,910,000 | | | Metropolitan Transportation Authority Transit Improvements Revenue Bonds, Series C,
5.00%, 11/15/21 | | | 1,940,522 | |
| | 11,475,000 | | | New York City Housing Development Corp. Multi-Family Housing Revenue Bonds, Series G,
2.00%, 11/01/57(b) | | | 11,480,393 | |
| | 2,500,000 | | | New York City Transitional Finance Authority Building Aid Revenue Public Improvements Revenue Bonds, Series S-1, (State Aid Withholding),
5.00%, 07/15/24 | | | 2,920,900 | |
| | 7,500,000 | | | New York City Transitional Finance Authority Building Aid Revenue Refunding Revenue Bonds, Sub-Series S-3, (State Aid Withholding),
5.00%, 07/15/28 | | | 9,685,200 | |
| | 1,670,000 | | | New York City Transitional Finance Authority Building Aid Revenue School Improvements Revenue Bonds, Series S1, (State Aid Withholding),
5.00%, 07/15/24 | | | 1,951,161 | |
| | 3,270,000 | | | New York City Transitional Finance Authority Building Aid Revenue School Improvements Revenue Bonds, Series S1, (State Aid Withholding),
5.00%, 07/15/28 | | | 4,222,747 | |
| | 2,750,000 | | | New York City Transitional Finance Authority Building Aid Revenue School Improvements Revenue Bonds, Series S1, (State Aid Withholding),
5.00%, 07/15/29 | | | 3,604,838 | |
Principal
Amount | | | | | Value | |
| New York (continued) | | | | |
| $ | 2,285,000 | | | New York City Transitional Finance Authority Building Aid Revenue School Improvements Revenue Bonds, Series S1, (State Aid Withholding),
5.00%, 07/15/30 | | $ | 3,039,507 | |
| | 975,000 | | | New York City Transitional Finance Authority Building Aid School Improvements Revenue Bonds, Series S-1A, (State Aid Withholding),
5.00%, 07/15/21 | | | 1,006,941 | |
| | 1,350,000 | | | New York City Transitional Finance Authority Future Tax Secured Advanced Refunding Revenue Bonds, Series C,
5.00%, 11/01/23 | | | 1,536,178 | |
| | 15,920,000 | | | New York City Transitional Finance Authority Future Tax Secured Refunding Revenue Bonds, Sub-Series B,
5.00%, 11/01/21 | | | 16,662,350 | |
| | 2,425,000 | | | New York City Transitional Finance Authority Future Tax Secured Refunding Revenue Bonds, Sub-Series G,
5.00%, 11/01/21 | | | 2,538,078 | |
| | 1,535,000 | | | New York City Transitional Finance Authority Future Tax Secured Refunding Revenue Bonds, Sub-Series H,
5.00%, 11/01/21 | | | 1,606,577 | |
| | 4,000,000 | | | New York City Transitional Finance Authority Future Tax Secured Revenue Current Refunding Revenue Bonds,
5.00%, 11/01/21 | | | 4,186,520 | |
| | 9,500,000 | | | New York City Transitional Finance Authority Future Tax Secured Revenue Current Refunding Revenue Bonds,
5.00%, 11/01/22 | | | 10,385,210 | |
| | 3,000,000 | | | New York City Transitional Finance Authority Future Tax Secured Revenue Public Improvement Revenue Bonds, Series C-1,
5.00%, 05/01/22 | | | 3,209,610 | |
| Old Westbury Funds, Inc. | |
| Municipal Bond Fund | |
| Portfolio of Investments - (Continued) | October 31, 2020 |
Principal
Amount | | | | | Value | |
| New York (continued) | | | | |
| $ | 2,210,000 | | | New York City Transitional Finance Authority Future Tax Secured Revenue Public Improvements Revenue Bonds,
5.00%, 02/01/29 | | $ | 2,518,074 | |
| | 9,000,000 | | | New York City Transitional Finance Authority Future Tax Secured Revenue Public Improvements Revenue Bonds,
5.00%, 02/01/31 | | | 11,111,130 | |
| | 9,500,000 | | | New York City Transitional Finance Authority Future Tax Secured Revenue Public Improvements Revenue Bonds,
5.00%, 05/01/34 | | | 12,294,900 | |
| | 600,000 | | | New York City Transitional Finance Authority Refunding Revenue Bonds, Sub-Series G,
5.00%, 11/01/20 | | | 600,000 | |
| | 3,545,000 | | | New York City Water & Sewer System Current Refunding Revenue,
5.00%, 06/15/24 | | | 4,137,015 | |
| | 2,350,000 | | | New York City Water & Sewer System Water Utility Improvements Revenue Bonds, Series AA-2,
5.00%, 06/15/30 | | | 3,173,416 | |
| | 6,200,000 | | | New York City Water & Sewer System Water Utility Improvements Revenue Bonds, Series BB-2,
5.00%, 06/15/25 | | | 7,097,450 | |
| | 1,000,000 | | | New York City Water & Sewer System Water Utility Improvements Revenue Bonds, Series DD-2,
5.00%, 06/15/24 | | | 1,099,350 | |
| | 5,000,000 | | | New York Municipal Bond Bank Agency Refunding Revenue Bonds, (State Aid Withholding),
5.00%, 12/01/21 | | | 5,257,700 | |
| | 9,100,000 | | | New York State Dormitory Authority Advance Refunding Revenue Bonds, Series A,
5.00%, 03/15/23 | | | 10,087,259 | |
| | 7,790,000 | | | New York State Dormitory Authority Advance Refunding Revenue Bonds, Series E,
5.00%, 03/15/22 | | | 8,286,768 | |
| | 14,000,000 | | | New York State Dormitory Authority Advance Refunding Revenue Bonds, Series E,
5.00%, 03/15/24 | | | 16,134,720 | |
Principal
Amount | | | | | Value | |
| New York (continued) | | | | |
| $ | 2,000,000 | | | New York State Dormitory Authority Advance Refunding Revenue Bonds, Series E,
5.00%, 03/15/31 | | $ | 2,377,160 | |
| | 5,000,000 | | | New York State Dormitory Authority Current Refunding Revenue Bonds, Series 1 (State Aid Withholding),
5.00%, 01/15/30 | | | 6,151,950 | |
| | 8,770,000 | | | New York State Dormitory Authority Public Improvement Revenue Bonds, Series A-Group A,
5.00%, 03/15/22 | | | 9,329,263 | |
| | 5,000,000 | | | New York State Dormitory Authority Public Improvements Revenue Bonds, Series B,
5.00%, 02/15/28 | | | 5,869,800 | |
| | 15,000,000 | | | New York State Dormitory Authority Refunding Revenue Bonds, Series A,
5.00%, 12/15/20 | | | 15,082,500 | |
| | 4,160,000 | | | New York State Dormitory Authority Refunding Revenue Bonds, Series A,
5.00%, 02/15/26 | | | 4,764,198 | |
| | 6,600,000 | | | New York State Dormitory Authority School Improvement Refunding Revenue Bonds, Series E,
5.00%, 03/15/30 | | | 8,441,730 | |
| | 1,000,000 | | | New York State Dormitory Authority School Improvement Revenue Bonds, Series A,
5.00%, 02/15/27 | | | 1,234,300 | |
| | 6,290,000 | | | New York State Dormitory Authority School Improvement Revenue Bonds, Series A,
5.00%, 03/15/27 | | | 7,893,636 | |
| | 4,185,000 | | | New York State Dormitory Authority School Improvement Revenue Bonds, Series A,
5.00%, 03/15/28 | | | 5,326,542 | |
| | 1,045,000 | | | New York State Dormitory Authority School Improvement Revenue Bonds, Series A,
5.00%, 03/15/21 | | | 1,063,016 | |
| | 5,200,000 | | | New York State Dormitory Authority School Improvement Revenue Bonds, Series A,
5.00%, 03/15/25 | | | 5,966,376 | |
| Old Westbury Funds, Inc. | |
| Municipal Bond Fund | |
| Portfolio of Investments - (Continued) | October 31, 2020 |
Principal
Amount | | | | | Value | |
| New York (continued) | | | | |
| $ | 12,000,000 | | | New York State Dormitory Authority School Improvement Revenue Bonds, Series A-Group 2,
5.00%, 03/15/29 | | $ | 15,266,880 | |
| | 22,680,000 | | | New York State Dormitory Authority School Improvement Revenue Bonds, Series C,
5.00%, 03/15/27 | | | 28,462,266 | |
| | 13,375,000 | | | New York State Dormitory Authority School Improvement Revenue Bonds, Series D,
5.00%, 02/15/25 | | | 15,870,909 | |
| | 6,325,000 | | | New York State Dormitory Authority School Improvements Revenue Bonds, Series C,
5.00%, 03/15/30 | | | 7,982,909 | |
| | 7,305,000 | | | New York State Dormitory Authority University & College Improvements Revenue Bonds, Series A,
5.00%, 03/15/22 | | | 7,770,840 | |
| | 1,500,000 | | | New York State Dormitory Authority University & College Improvements Revenue Bonds, Series A,
5.00%, 07/01/32 | | | 1,880,670 | |
| | 3,000,000 | | | New York State Environmental Facilities Corp Refunding Revenue Bonds,
5.00%, 06/15/29 | | | 3,478,650 | |
| | 2,000,000 | | | New York State Urban Development Corp Advance Refunding Revenue Bonds, Series A,
5.00%, 03/15/24 | | | 2,304,960 | |
| | 2,105,000 | | | New York State Urban Development Corp Advance Refunding Revenue Bonds, Series A,
5.00%, 03/15/27 | | | 2,567,321 | |
| | 5,875,000 | | | New York State Urban Development Corp Personal Income Tax Advance Refunding Revenue, Series A,
5.00%, 03/15/25 | | | 7,002,295 | |
| | 5,605,000 | | | New York State Urban Development Corp Personal Income Tax Economic Improvements Revenue Bonds, Series C,
5.00%, 03/15/22 | | | 5,962,431 | |
Principal
Amount | | | | | Value | |
| New York (continued) | | | | |
| $ | 6,000,000 | | | New York State Urban Development Corp. Civic Convention Center Revenue Bonds,
1.83%, 03/15/29 | | $ | 5,948,220 | |
| | 1,000,000 | | | New York State Urban Development Corp. Economic Improvements Revenue Bonds,
5.00%, 03/15/27 | | | 1,254,950 | |
| | 4,000,000 | | | New York State Urban Development Corp. Economic Improvements Revenue Bonds,
5.00%, 03/15/28 | | | 5,110,560 | |
| | 5,000,000 | | | New York State Urban Development Corp. Economic Improvements Revenue Bonds,
5.00%, 03/15/29 | | | 6,497,950 | |
| | 5,000,000 | | | New York State Urban Development Corp. Economic Improvements Revenue Bonds,
5.00%, 03/15/31 | | | 6,587,450 | |
| | 13,350,000 | | | New York State Urban Development Corp. Economic Improvements Revenue Bonds,
5.00%, 03/15/32 | | | 17,439,372 | |
| | 1,500,000 | | | New York State Urban Development Corp. Personal Income Tax Economic Improvements Revenue Bonds,
5.00%, 03/15/30 | | | 1,978,755 | |
| | 4,705,000 | | | New York State Urban Development Corp. Public Improvement Revenue Bonds, Series A-1,
5.00%, 03/15/22 | | | 5,005,038 | |
| | 2,810,000 | | | Port Authority of New York & New Jersey,
5.00%, 07/15/21 | | | 2,896,407 | |
| | 2,270,000 | | | Port Authority of New York & New Jersey,
5.00%, 07/15/22 | | | 2,438,661 | |
| | 2,800,000 | | | Port Authority of New York & New Jersey,
5.00%, 07/15/23 | | | 3,128,412 | |
| | 1,000,000 | | | Port Authority of New York & New Jersey,
5.00%, 07/15/24 | | | 1,153,560 | |
| | 3,195,000 | | | Port Authority of New York & New Jersey,
5.00%, 07/15/25 | | | 3,799,973 | |
| Old Westbury Funds, Inc. | |
| Municipal Bond Fund | |
| Portfolio of Investments - (Continued) | October 31, 2020 |
Principal
Amount | | | | | Value | |
| New York (continued) | | | | |
| $ | 3,885,000 | | | Port Authority of New York & New Jersey,
5.00%, 07/15/26 | | $ | 4,727,851 | |
| | 4,255,000 | | | Port Authority of New York & New Jersey,
5.00%, 07/15/27 | | | 5,263,052 | |
| | 3,340,000 | | | Port Authority of New York & New Jersey,
5.00%, 07/15/28 | | | 4,174,432 | |
| | 4,750,000 | | | Port Authority of New York & New Jersey,
5.00%, 07/15/29 | | | 6,018,108 | |
| | 5,020,000 | | | Port Authority of New York & New Jersey,
5.00%, 07/15/30 | | | 6,449,596 | |
| | 16,725,000 | | | Port Authority of New York & New Jersey Cash Flow Management Revenue Bonds, Series AAA,
1.09%, 07/01/23 | | | 16,914,661 | |
| | 4,215,000 | | | Port Authority of New York & New Jersey Refunding Revenue Bonds, Series 179,
5.00%, 12/01/27 | | | 4,747,017 | |
| | 5,880,000 | | | Port Authority of New York & New Jersey Refunding Revenue Bonds, Series 179,
5.00%, 12/01/28 | | | 6,599,242 | |
| | 1,025,000 | | | Triborough Bridge & Tunnel Authority Highway Improvements Revenue Bonds, Series A,
5.00%, 11/15/27 | | | 1,282,582 | |
| | 1,600,000 | | | Utility Debt Securitization Authority Restructuring Refunding Revenue Bonds,
5.00%, 12/15/24 | | | 1,759,312 | |
| | | | | | | | 694,275,161 | |
| North Carolina — 2.4% | | | | |
| | 1,880,000 | | | City of Charlotte Current Refunding GO, Series A,
5.00%, 06/01/27 | | | 2,419,372 | |
| | 3,000,000 | | | County of Union University & College Improvements GO, Series C,
5.00%, 09/01/25 | | | 3,672,750 | |
| | 3,325,000 | | | County of Wake Advance Refunding Revenue, Series A,
5.00%, 12/01/26 | | | 4,202,334 | |
| | 1,150,000 | | | County of Wake Advance Refunding Revenue, Series A,
5.00%, 12/01/29 | | | 1,424,447 | |
Principal
Amount | | | | | Value | |
| North Carolina (continued) | | | | |
| $ | 7,225,000 | | | County of Wake Refunding Public Notes GO, Series A,
5.00%, 03/01/26 | | $ | 8,982,698 | |
| | 675,000 | | | Dare County Refunding Revenue Bonds, Series D,
5.00%, 06/01/21 | | | 693,421 | |
| | 1,000,000 | | | Durham Capital Financing Corp Advance Refunding Revenue Bonds,
5.00%, 12/01/25 | | | 1,231,560 | |
| | 2,000,000 | | | North Carolina Eastern Municipal Power Agency Improvements Revenue Bonds, Series A,
5.00%, 01/01/22 | | | 2,109,100 | |
| | 2,000,000 | | | North Carolina Eastern Municipal Power Agency Improvements Revenue Bonds, Series A,
5.00%, 01/01/23(a) | | | 2,155,640 | |
| | 1,000,000 | | | North Carolina State University at Raleigh,
5.00%, 10/01/34 | | | 1,323,830 | |
| | 325,000 | | | North Carolina State University At Raleigh Refunding Revenue Bonds, Series A,
5.00%, 10/01/21 | | | 338,949 | |
| | 3,250,000 | | | State of North Carolina Advance Refunding Revenue Bonds,
5.00%, 03/01/22 | | | 3,451,338 | |
| | 13,000,000 | | | State of North Carolina Advance Refunding Revenue Bonds, Series B,
5.00%, 05/01/23 | | | 14,520,220 | |
| | 2,010,000 | | | State of North Carolina Advance Refunding Revenue Bonds, Series B,
5.00%, 05/01/24 | | | 2,335,379 | |
| | 5,000,000 | | | State of North Carolina Highway Improvements Revenue Bonds,
5.00%, 03/01/29 | | | 6,602,650 | |
| | 6,675,000 | | | State of North Carolina Highway Improvements Revenue Bonds,
5.00%, 03/01/30 | | | 8,735,372 | |
| | 1,500,000 | | | State of North Carolina Highway Improvements Revenue Bonds, Series A,
5.00%, 05/01/22 | | | 1,605,975 | |
| | 8,750,000 | | | State of North Carolina Highway Improvements Revenue Bonds, Series B,
5.00%, 05/01/29 | | | 11,600,225 | |
| Old Westbury Funds, Inc. | |
| Municipal Bond Fund | |
| Portfolio of Investments - (Continued) | October 31, 2020 |
Principal
Amount | | | | | Value | |
| North Carolina (continued) | | | | |
| $ | 5,580,000 | | | State of North Carolina Highway Improvements Revenue Bonds, Series B,
5.00%, 05/01/32 | | $ | 7,397,462 | |
| | 8,025,000 | | | State of North Carolina Public Improvements GO, Series A,
5.00%, 06/01/26 | | | 10,051,473 | |
| | 5,270,000 | | | State of North Carolina Public Improvements GO, Series A,
5.00%, 06/01/27 | | | 6,781,963 | |
| | | | | | | | 101,636,158 | |
| Ohio — 3.4% | | | | |
| | 750,000 | | | Akron Bath Copley Joint Township Hospital District Current Refunding Revenue Bonds,
4.00%, 11/15/35 | | | 838,057 | |
| | 1,000,000 | | | Akron Bath Copley Joint Township Hospital District Current Refunding Revenue Bonds,
4.00%, 11/15/36 | | | 1,112,270 | |
| | 1,175,000 | | | Central Ohio Solid Waste Authority Advance Refunding GO,
5.00%, 12/01/23 | | | 1,344,177 | |
| | 1,000,000 | | | Central Ohio Solid Waste Authority Advance Refunding GO,
5.00%, 12/01/24 | | | 1,189,330 | |
| | 1,285,000 | | | Central Ohio Solid Waste Authority Advance Refunding GO,
5.00%, 12/01/25 | | | 1,582,555 | |
| | 3,500,000 | | | City of Columbus GO, Series A,
4.00%, 08/15/25 | | | 4,103,015 | |
| | 3,730,000 | | | City of Columbus Refunding GO, Series 1,
5.00%, 07/01/21 | | | 3,847,719 | |
| | 2,000,000 | | | City of Columbus Refunding GO, Series 5,
5.00%, 08/15/23 | | | 2,263,720 | |
| | 1,100,000 | | | County of Cuyahoga Refunding Revenue Bonds,
5.00%, 12/01/22 | | | 1,207,283 | |
| | 1,000,000 | | | County of Hamilton Sewer System Refunding Revenue Bonds, Series A,
5.00%, 12/01/26 | | | 1,178,190 | |
| | 1,515,000 | | | County of Hamilton Sewer System Refunding Revenue Bonds, Series A,
5.00%, 12/01/27 | | | 1,783,609 | |
Principal
Amount | | | | | Value | |
| Ohio (continued) | | | | |
| $ | 1,000,000 | | | Greater Cleveland Regional Transit Authority Capital Improvements Advance Refunding Revenue Bonds,
5.00%, 12/01/23 | | $ | 1,140,670 | |
| | 3,000,000 | | | Ohio Water Development Authority Revenue Bonds,
5.00%, 06/01/26 | | | 3,746,280 | |
| | 2,350,000 | | | Ohio Water Development Authority Water Pollution Control Loan Fund Pollution Control Revenue Bonds, Series B,
5.00%, 06/01/21 | | | 2,414,954 | |
| | 875,000 | | | Ohio Water Development Authority Water Pollution Control Loan Fund Pollution Control Revenue Bonds, Series B,
5.00%, 06/01/22 | | | 940,546 | |
| | 3,375,000 | | | Ohio Water Development Authority Water Pollution Control Loan Fund Pollution Control Revenue Bonds, Series B,
5.00%, 06/01/23 | | | 3,785,535 | |
| | 3,300,000 | | | Ohio Water Development Authority Water Pollution Control Loan Fund Pollution Control Revenue Bonds, Series B,
5.00%, 06/01/24 | | | 3,854,334 | |
| | 1,410,000 | | | Ohio Water Development Authority Water Pollution Control Loan Fund Pollution Control Revenue Bonds, Series B,
5.00%, 06/01/25 | | | 1,707,383 | |
| | 1,450,000 | | | Ohio Water Development Authority Water Pollution Control Loan Fund Pollution Control Revenue Bonds, Series B,
5.00%, 06/01/26 | | | 1,810,702 | |
| | 2,000,000 | | | Ohio Water Development Authority Water Pollution Control Loan Fund Pollution Control Revenue Bonds, Series B,
5.00%, 06/01/27 | | | 2,564,860 | |
| | 10,000,000 | | | Ohio Water Development Authority Water Pollution Control Loan Fund, Revenue Bond, Series A,
5.00%, 12/01/24 | | | 11,906,700 | |
| Old Westbury Funds, Inc. | |
| Municipal Bond Fund | |
| Portfolio of Investments - (Continued) | October 31, 2020 |
Principal
Amount | | | | | Value | |
| Ohio (continued) | | | | |
| $ | 10,285,000 | | | Ohio Water Development Authority Water Utility Improvements Revenue Bonds,
5.00%, 06/01/28 | | $ | 13,412,360 | |
| | 3,045,000 | | | Revere Local School District School Improvements GO, Series A,
5.00%, 12/01/42(a) | | | 3,272,614 | |
| | 2,350,000 | | | Revere Local School District School Improvements GO, Series A,
5.00%, 12/01/45(a) | | | 2,525,662 | |
| | 320,000 | | | RiverSouth Authority Area Redevelopment Refunding Revenue Bonds,
5.00%, 06/01/24 | | | 357,606 | |
| | 1,075,000 | | | State of North Carolina Highway capital Improvements GO, Series Q,
5.00%, 05/01/21 | | | 1,100,488 | |
| | 16,790,000 | | | State of Ohio Advance Refunding GO, Series A,
5.00%, 12/15/24 | | | 19,997,226 | |
| | 2,500,000 | | | State of Ohio Advance Refunding GO, Series A,
5.00%, 09/01/27 | | | 3,221,100 | |
| | 1,400,000 | | | State of Ohio Advance Refunding GO, Series C,
5.00%, 08/01/27 | | | 1,799,994 | |
| | 4,790,000 | | | State of Ohio Advance Refunding GO, Series U,
5.00%, 05/01/27 | | | 6,118,890 | |
| | 1,000,000 | | | State of Ohio Advance Refunding Revenue Bonds,
5.00%, 10/01/21 | | | 1,042,640 | |
| | 1,445,000 | | | State of Ohio Department of Administration Telecommunications Improvements COP,
5.00%, 09/01/24 | | | 1,696,401 | |
| | 300,000 | | | State of Ohio Department of Administration Telecommunications Improvements COP,
5.00%, 09/01/24 | | | 352,194 | |
| | 210,000 | | | State of Ohio Highway Improvements Revenue Bonds,
5.00%, 12/15/24 | | | 249,260 | |
| | 2,000,000 | | | State of Ohio Highway Improvements Revenue Bonds, Series 2016-1,
5.00%, 12/15/20 | | | 2,010,940 | |
Principal
Amount | | | | | Value | |
| Ohio (continued) | | | | |
| $ | 2,000,000 | | | State of Ohio Mental Health Facility Improvements Revenue Bonds,
5.00%, 06/01/25 | | $ | 2,412,720 | |
| | 1,415,000 | | | State of Ohio Public Improvements Revenue Bonds, Series A,
5.00%, 02/01/24 | | | 1,624,561 | |
| | 970,000 | | | State of Ohio Recreation Facilities Improvements Revenue Bonds,
5.00%, 04/01/21 | | | 988,673 | |
| | 775,000 | | | State of Ohio Recreation Facilities Improvements Revenue Bonds,
5.00%, 04/01/25 | | | 928,024 | |
| | 5,000,000 | | | State of Ohio School Improvements GO, Series B,
5.00%, 06/15/23 | | | 5,617,300 | |
| | 2,200,000 | | | State of Ohio University and College Improvements GO, Series A,
5.00%, 05/01/28(a) | | | 2,356,134 | |
| | 7,505,000 | | | State of Ohio University and College Improvements GO, Series A,
5.00%, 05/01/27 | | | 9,587,112 | |
| | 5,445,000 | | | State of Ohio University and College Improvements GO, Series A,
5.00%, 05/01/28 | | | 6,547,014 | |
| | 1,000,000 | | | University of Cincinnati Advance Refunding Revenue, Series A,
5.00%, 06/01/26 | | | 1,231,400 | |
| | | | | | | | 142,772,202 | |
| Oklahoma — 1.0% | | | | |
| | 675,000 | | | City of Oklahoma City Current Refunding GO,
5.00%, 03/01/24 | | | 781,123 | |
| | 3,650,000 | | | City of Oklahoma City Public Improvements GO,
5.00%, 03/01/26 | | | 4,531,402 | |
| | 1,445,000 | | | Oklahoma Capitol Improvement Authority Highway Improvements Revenue Bonds, Series B,
5.00%, 07/01/28 | | | 1,876,361 | |
| | 1,670,000 | | | Oklahoma Capitol Improvement Authority Highway Improvements Revenue Bonds, Series B,
5.00%, 07/01/29 | | | 2,203,615 | |
| Old Westbury Funds, Inc. | |
| Municipal Bond Fund | |
| Portfolio of Investments - (Continued) | October 31, 2020 |
Principal
Amount | | | | | Value | |
| Oklahoma (continued) | | | | |
| $ | 1,000,000 | | | Oklahoma Capitol Improvement Authority Highway Improvements Revenue Bonds, Series B,
5.00%, 07/01/33 | | $ | 1,308,500 | |
| | 1,000,000 | | | Oklahoma Capitol Improvement Authority Highway Improvements Revenue Bonds, Series B,
5.00%, 07/01/34 | | | 1,301,920 | |
| | 2,000,000 | | | Oklahoma Capitol Improvement Authority Highway Improvements Revenue Bonds, Series B,
5.00%, 07/01/35 | | | 2,589,780 | |
| | 1,500,000 | | | Oklahoma Turnpike Authority Refunding Revenue Bonds, Series A,
5.00%, 01/01/24 | | | 1,719,135 | |
| | 1,000,000 | | | Oklahoma Turnpike Authority Refunding Revenue Bonds, Series A,
5.00%, 01/01/25 | | | 1,188,840 | |
| | 2,000,000 | | | Oklahoma Turnpike Authority Refunding Revenue Bonds, Series A,
5.00%, 01/01/26 | | | 2,457,500 | |
| | 2,000,000 | | | Oklahoma Turnpike Authority Refunding Revenue Bonds, Series A,
5.00%, 01/01/27 | | | 2,521,080 | |
| | 2,000,000 | | | Oklahoma Turnpike Authority Refunding Revenue Bonds, Series A,
5.00%, 01/01/28 | | | 2,581,860 | |
| | 2,315,000 | | | Oklahoma Turnpike Authority Refunding Revenue Bonds, Series A,
5.00%, 01/01/29 | | | 3,044,943 | |
| | 2,000,000 | | | Oklahoma Turnpike Authority Refunding Revenue Bonds, Series D,
4.00%, 01/01/21 | | | 2,012,040 | |
| | 5,000,000 | | | Oklahoma Turnpike Authority Refunding Revenue Bonds, Series D,
5.00%, 01/01/26 | | | 6,143,750 | |
Principal
Amount | | | | | Value | |
| Oklahoma (continued) | | | | |
| $ | 2,985,000 | | | Oklahoma Turnpike Authority Refunding Revenue Bonds, Series D,
5.00%, 01/01/28 | | $ | 3,853,426 | |
| | 1,575,000 | | | Tulsa Metropolitan Utility Authority Refunding Revenue Bonds, Series A,
5.00%, 04/01/27 | | | 2,005,243 | |
| | | | | | | | 42,120,518 | |
| Oregon — 1.1% | | | | |
| | 1,040,000 | | | Clatsop County School District No 30 Warrenton-Hammond School Improvements GO, Series B, (School Board GTY),
5.00%, 06/15/27 | | | 1,327,321 | |
| | 1,600,000 | | | Medford Hospital Facilities Authority,
5.00%, 08/15/38 | | | 2,018,048 | |
| | 5,000,000 | | | State of Oregon Advance Refunding GO, Series I,
5.00%, 08/01/28 | | | 6,413,500 | |
| | 3,290,000 | | | State of Oregon Advance Refunding GO, Series M,
5.00%, 11/01/23 | | | 3,756,423 | |
| | 10,350,000 | | | State of Oregon Facilities Improvements GO, Series A,
5.00%, 05/01/25 | | | 12,516,669 | |
| | 4,940,000 | | | State of Oregon Facilities Improvements GO, Series A,
5.00%, 05/01/27 | | | 6,335,847 | |
| | 4,140,000 | | | State of Oregon Refunding GO, Series G,
5.00%, 11/01/30(a) | | | 4,720,966 | |
| | 4,700,000 | | | State of Oregon School Improvements GO,
5.00%, 06/01/28 | | | 6,003,686 | |
| | 2,000,000 | | | Washington County School District No 1 West Union School Improvements GO, (School Board GTY),
5.00%, 06/15/28 | | | 2,545,340 | |
| | | | | | | | 45,637,800 | |
| Pennsylvania — 1.1% | | | | |
| | 15,000,000 | | | Commonwealth of Pennsylvania Advance Refunding GO,
5.00%, 07/15/26 | | | 18,629,550 | |
| | 9,775,000 | | | Commonwealth of Pennsylvania Current Refunding GO, 1St Series,
5.00%, 07/01/21 | | | 10,078,807 | |
| Old Westbury Funds, Inc. | |
| Municipal Bond Fund | |
| Portfolio of Investments - (Continued) | October 31, 2020 |
Principal
Amount | | | | | Value | |
| Pennsylvania (continued) | | | | |
| $ | 5,000,000 | | | Commonwealth of Pennsylvania Public Facilities GO, Series 1,
5.00%, 03/01/22 | | $ | 5,311,850 | |
| | 1,000,000 | | | Lancaster County Hospital Authority Advance Refunding Revenue Bonds,
5.00%, 08/15/26 | | | 1,240,040 | |
| | 4,120,000 | | | Pennsylvania Intergovernmental Cooperation Authority Special Tax Revenue Refunding Bonds,
5.00%, 06/15/21 | | | 4,237,914 | |
| | 2,755,000 | | | Pennsylvania Intergovernmental Cooperation Authority Special Tax Revenue Refunding Bonds,
5.00%, 06/15/22 | | | 2,960,854 | |
| | 3,500,000 | | | Pennsylvania Intergovernmental Cooperation Authority Special Tax Revenue Refunding Bonds,
5.00%, 06/15/23 | | | 3,934,070 | |
| | | | | | | | 46,393,085 | |
| Rhode Island — 0.3% | | | | |
| | 6,950,000 | | | Rhode Island Commerce Corp Grant Anticipation Current Refunding Revenue,
5.00%, 06/15/23 | | | 7,749,945 | |
| | 3,000,000 | | | Rhode Island Convention Center Authority Refunding Revenue Bonds, Series A,
5.00%, 05/15/22 | | | 3,184,980 | |
| | 550,000 | | | State of Rhode Island School for the Deaf Project Advance Refunding COP, Series D,
5.00%, 04/01/24 | | | 632,704 | |
| | 960,000 | | | State of Rhode Island University & College Improvements COP, Series A,
5.00%, 06/01/24 | | | 1,111,200 | |
| | 1,010,000 | | | State of Rhode Island University & College Improvements COP, Series A,
5.00%, 06/01/25 | | | 1,209,283 | |
| | | | | | | | 13,888,112 | |
| South Carolina — 0.6% | | | | |
| | 3,600,000 | | | Beaufort County School District School Improvements Refunding GO, Series A (South Carolina School District),
5.00%, 03/01/22 | | | 3,828,024 | |
Principal
Amount | | | | | Value | |
| South Carolina (continued) | | | | |
| $ | 4,010,000 | | | Darlington County School District School Improvement GO (South Carolina School District),
5.00%, 03/01/27 | | $ | 5,094,144 | |
| | 3,000,000 | | | Darlington County School District School Improvement GO (South Carolina School District),
5.00%, 03/01/28 | | | 3,824,070 | |
| | 2,350,000 | | | Lexington County School District No 2 School Improvements GO (South Carolina School District),
5.00%, 03/01/26 | | | 2,907,702 | |
| | 1,500,000 | | | State of South Carolina Advance Refunding GO, Series B (State Aid Withholding),
5.00%, 04/01/26 | | | 1,869,270 | |
| | 1,485,000 | | | State of South Carolina University & College Improvements GO, Series B (State Aid Withholding),
5.00%, 04/01/22 | | | 1,584,732 | |
| | 4,680,000 | | | State of South Carolina University & College Improvements Refunding GO, Series A (State Aid Withholding),
5.00%, 04/01/22 | | | 4,994,309 | |
| | | | | | | | 24,102,251 | |
| South Dakota — 0.9% | | | |
| | 2,125,000 | | | South Dakota Conservancy District,
5.00%, 08/01/29 | | | 2,855,490 | |
| | 1,950,000 | | | South Dakota Conservancy District,
5.00%, 08/01/31 | | | 2,650,265 | |
| | 1,500,000 | | | South Dakota Conservancy District,
5.00%, 08/01/33 | | | 2,010,915 | |
| | 1,020,000 | | | South Dakota Conservancy District,
5.00%, 08/01/35 | | | 1,357,457 | |
| | 1,400,000 | | | South Dakota Conservancy District,
5.00%, 08/01/36 | | | 1,856,316 | |
| | 1,850,000 | | | South Dakota Conservancy District,
5.00%, 08/01/37 | | | 2,441,722 | |
| | 4,910,000 | | | South Dakota Conservancy District,
5.00%, 08/01/38 | | | 6,437,305 | |
| | 5,155,000 | | | South Dakota Conservancy District,
5.00%, 08/01/39 | | | 6,735,987 | |
| | 1,950,000 | | | South Dakota Conservancy District,
5.00%, 08/01/40 | | | 2,543,872 | |
| | 3,820,000 | | | South Dakota Conservancy District,
5.00%, 08/01/41 | | | 4,964,510 | |
| Old Westbury Funds, Inc. | |
| Municipal Bond Fund | |
| Portfolio of Investments - (Continued) | October 31, 2020 |
Principal
Amount | | | | | Value | |
| South Dakota (continued) | | | | |
| $ | 1,000,000 | | | South Dakota Conservancy District,
5.00%, 08/01/42 | | $ | 1,295,260 | |
| | 2,455,000 | | | South Dakota Conservancy District Water Utility Improvements Revenue Bonds,
5.00%, 08/01/29 | | | 2,861,106 | |
| | | | | | | | 38,010,205 | |
| Tennessee — 0.3% | | | | |
| | 1,000,000 | | | County of Montgomery Advance Refunding School Improvements GO,
5.00%, 04/01/26 | | | 1,240,120 | |
| | 5,105,000 | | | County of Shelby Refunding GO,
5.00%, 04/01/22 | | | 5,447,852 | |
| | 400,000 | | | Metropolitan Government of Nashville & Davidson County Electric System Revenue, Series A,
5.00%, 05/15/23 | | | 447,500 | |
| | 1,005,000 | | | State of Tennessee Refunding GO, Series A,
5.00%, 09/01/23 | | | 1,139,619 | |
| | 2,000,000 | | | State of Tennessee Refunding Notes GO, Series A,
5.00%, 08/01/21 | | | 2,071,060 | |
| | 2,335,000 | | | State of Tennessee Refunding Notes GO, Series A,
5.00%, 08/01/27 | | | 2,924,541 | |
| | 900,000 | | | Tennessee State School Bond Authority Refunding Revenue Bonds (State Aid Intercept Program),
5.00%, 11/01/25 | | | 1,064,763 | |
| | | | | | | | 14,335,455 | |
| Texas — 17.2% | | | | |
| | 2,250,000 | | | Alief Independent School District School Improvements GO, (PSF-GTD),
5.00%, 02/15/28 | | | 2,831,805 | |
| | 1,000,000 | | | Allen Independent School District Current Refunding GO, Series A (PSF-GTD),
5.00%, 02/15/22 | | | 1,061,090 | |
| | 860,000 | | | Alvin Independent School District Improvements Refunding GO, Series A, (PSF-GTD),
5.00%, 02/15/25 | | | 1,024,810 | |
| | 1,720,000 | | | Alvin Independent School District Improvements Refunding GO, Series A, (PSF-GTD),
5.00%, 02/15/26 | | | 2,112,366 | |
Principal
Amount | | | | | Value | |
| Texas (continued) | | | | |
| $ | 485,000 | | | Aransas Pass Independent School District Improvements GO, (PSF-GTD),
5.00%, 02/15/23 | | $ | 535,775 | |
| | 1,315,000 | | | Austin Community College District Refunding GO,
5.00%, 08/01/27 | | | 1,639,213 | |
| | 2,525,000 | | | Austin Independent School District Refunding GO, (PSF-GTD),
5.00%, 08/01/27 | | | 3,165,365 | |
| | 1,000,000 | | | Austin Independent School District Refunding GO, Series B, (PSF-GTD),
5.00%, 08/01/21 | | | 1,035,380 | |
| | 3,000,000 | | | Austin Independent School District School Improvements GO, (PSF-GTD),
5.00%, 08/01/28 | | | 3,941,430 | |
| | 7,475,000 | | | Austin Independent School District School Improvements GO, (PSF-GTD),
5.00%, 08/01/29 | | | 9,992,655 | |
| | 895,000 | | | Barbers Hill Independent School District School Improvements GO, (PSF-GTD),
5.00%, 02/15/27 | | | 1,133,688 | |
| | 5,310,000 | | | Beaumont Independent School District Refunding GO, (PSF-GTD),
5.00%, 02/15/26 | | | 6,552,487 | |
| | 2,050,000 | | | Beaumont Independent School District Refunding GO, (PSF-GTD),
5.00%, 02/15/28 | | | 2,584,394 | |
| | 1,075,000 | | | Bonham Independent School District Improvements GO, (PSF-GTD),
5.00%, 08/01/27 | | | 1,329,087 | |
| | 540,000 | | | Bridgeport Independent School District,
5.00%, 08/15/26 | | | 677,619 | |
| | 1,605,000 | | | Brock Independent School District Refunding GO, (PSF-GTD),
5.00%, 08/15/25 | | | 1,932,998 | |
| | 5,000,000 | | | Burleson Independent School District School Improvement GO, (PSF-GTD),
2.50%, 02/01/47(b) | | | 5,185,900 | |
| | 1,000,000 | | | Burleson Independent School District Refunding GO, (PSF-GTD),
5.00%, 08/01/25 | | | 1,211,190 | |
| Old Westbury Funds, Inc. | |
| Municipal Bond Fund | |
| Portfolio of Investments - (Continued) | October 31, 2020 |
Principal
Amount | | | | | Value | |
| Texas (continued) | | | | |
| $ | 1,420,000 | | | Burleson Independent School District Refunding GO, Series B, (PSF-GTD),
5.50%, 08/01/27 | | $ | 1,859,348 | |
| | 1,120,000 | | | Channelview Independent School District Improvements GO, (PSF-GTD),
5.00%, 08/15/30 | | | 1,462,294 | |
| | 1,700,000 | | | City of Austin Public Improvements GO,
5.00%, 11/01/22 | | | 1,860,548 | |
| | 3,000,000 | | | City of Austin TX Electric Utility Revenue Refunding Revenue Bonds, Series A,
5.00%, 11/15/28 | | | 3,950,370 | |
| | 810,000 | | | City of Austin TX Water & Wastewater System Revenue,
5.00%, 11/15/21 | | | 849,771 | |
| | 190,000 | | | City of Austin TX Water & Wastewater System Revenue,
5.00%, 11/15/21 | | | 199,145 | |
| | 5,000,000 | | | City of Austin Water & Wastewater System Advance Refunding Revenue Bonds,
5.00%, 11/15/29 | | | 6,240,800 | |
| | 2,360,000 | | | City of Bryan Waterworks & Sewer Current Refunding Revenue,
4.00%, 07/01/21 | | | 2,418,103 | |
| | 2,450,000 | | | City of Bryan Waterworks & Sewer Current Refunding Revenue,
4.00%, 07/01/22 | | | 2,589,552 | |
| | 4,020,000 | | | City of College Station Improvements Advance Refunding GO,
5.00%, 02/15/25 | | | 4,809,287 | |
| | 935,000 | | | City of Conroe Public Improvements GO,
5.00%, 03/01/25 | | | 1,075,933 | |
| | 1,715,000 | | | City of Dallas TX Waterworks & Sewer System Revenue,
5.00%, 10/01/28 | | | 2,256,683 | |
| | 2,000,000 | | | City of Dallas TX Waterworks & Sewer System Revenue,
5.00%, 10/01/32 | | | 2,695,840 | |
| | 2,075,000 | | | City of Denton Public Improvements GO,
5.00%, 02/15/23 | | | 2,296,755 | |
| | 1,715,000 | | | City of Denton Public Improvements GO,
5.00%, 02/15/24 | | | 1,978,047 | |
Principal
Amount | | | | | Value | |
| Texas (continued) | | | | |
| $ | 1,290,000 | | | City of Denton Public Improvements GO,
5.00%, 02/15/28 | | $ | 1,582,766 | |
| | 830,000 | | | City of El Paso Municipal Drainage Utility System Sewer Improvement Revenue Bonds,
5.00%, 03/01/24 | | | 955,405 | |
| | 350,000 | | | City of El Paso Water & Sewer Refunding Revenue Bonds,
5.00%, 03/01/25 | | | 403,890 | |
| | 1,250,000 | | | City of El Paso Water & Sewer Refunding Revenue Bonds,
5.00%, 03/01/26 | | | 1,441,562 | |
| | 5,145,000 | | | City of Fort Worth Water & Sewer System Improvements Revenue,
5.00%, 02/15/25 | | | 6,162,475 | |
| | 7,500,000 | | | City of Houston TX Airport System Revenue Refunding Revenue Bonds, Sub-Series A,
4.00%, 07/01/47 | | | 8,223,900 | |
| | 1,000,000 | | | City of Houston TX Airport System Revenue Refunding Revenue Bonds, Sub-Series B,
5.00%, 07/01/26 | | | 1,227,670 | |
| | 2,460,000 | | | City of Houston TX Airport System Revenue Refunding Revenue Bonds, Sub-Series B,
5.00%, 07/01/27 | | | 3,077,780 | |
| | 1,500,000 | | | City of Houston TX Airport System Revenue Refunding Revenue Bonds, Sub-Series B,
5.00%, 07/01/28 | | | 1,908,345 | |
| | 1,000,000 | | | City of Houston TX Airport System Revenue Refunding Revenue Bonds, Sub-Series C,
0.88%, 07/01/22 | | | 999,760 | |
| | 5,500,000 | | | City of Houston TX Airport System Revenue Refunding Revenue Bonds, Sub-Series C,
1.05%, 07/01/23 | | | 5,501,265 | |
| | 2,040,000 | | | City of McKinney Waterworks & Sewer System Revenue Sewer Improvements,
5.00%, 03/15/25 | | | 2,448,816 | |
| | 2,360,000 | | | City of McKinney Waterworks & Sewer System Revenue Sewer Improvements,
5.00%, 03/15/26 | | | 2,928,784 | |
| Old Westbury Funds, Inc. | |
| Municipal Bond Fund | |
| Portfolio of Investments - (Continued) | October 31, 2020 |
Principal
Amount | | | | | Value | |
| Texas (continued) | | | | |
| $ | 930,000 | | | City of Pflugerville Advance Refunding GO,
5.00%, 08/01/26 | | $ | 1,158,696 | |
| | 1,815,000 | | | City of Plano Advance Refunding GO,
5.00%, 09/01/23 | | | 2,054,798 | |
| | 2,820,000 | | | City of Plano Recreation Facilities Improvements GO,
5.00%, 09/01/30 | | | 3,615,381 | |
| | 1,180,000 | | | City of Plano Waterworks & Sewer System Water Utility Improvement Revenue Bonds,
5.00%, 05/01/26 | | | 1,463,011 | |
| | 1,205,000 | | | City of Round Rock TX Utility System Revenue Advance Refunding,
5.00%, 08/01/25 | | | 1,461,376 | |
| | 875,000 | | | Clear Creek Independent School District Improvements GO, (PSF-GTD),
5.00%, 02/15/24 | | | 1,009,514 | |
| | 1,000,000 | | | Clear Creek Independent School District Improvements GO, (PSF-GTD),
5.00%, 02/15/25 | | | 1,198,700 | |
| | 1,505,000 | | | Clint Independent School District Advance Refunding GO, (PSF-GTD),
5.00%, 08/15/25 | | | 1,828,425 | |
| | 1,195,000 | | | Connally Independent School District Refunding GO, (PSF-GTD),
5.00%, 08/15/25 | | | 1,449,272 | |
| | 900,000 | | | Conroe Independent School District School Improvements GO, (PSF-GTD),
5.00%, 02/15/21 | | | 912,123 | |
| | 460,000 | | | Conroe Independent School District School Improvements GO, (PSF-GTD),
5.00%, 02/15/22 | | | 488,037 | |
| | 1,500,000 | | | Conroe Independent School District Current Refunding GO, Series A, (PSF-GTD),
5.00%, 02/15/24 | | | 1,723,680 | |
| | 2,000,000 | | | Conroe Independent School District Current Refunding GO, Series A, (PSF-GTD),
5.00%, 02/15/25 | | | 2,386,100 | |
| | 5,000,000 | | | Conroe Independent School District Current Refunding GO, Series A, (PSF-GTD),
5.00%, 02/15/27 | | | 6,322,900 | |
Principal
Amount | | | | | Value | |
| Texas (continued) | | | | |
| $ | 19,000,000 | | | Conroe Independent School District Current Refunding GO, Series A, (PSF-GTD),
5.00%, 02/15/28 | | $ | 24,626,470 | |
| | 20,000,000 | | | Conroe Independent School District Current Refunding GO, Series A, (PSF-GTD),
5.00%, 02/15/29 | | | 26,479,800 | |
| | 1,400,000 | | | Coppell Independent School District School Improvements GO, (PSF-GTD),
5.00%, 08/15/32 | | | 1,788,892 | |
| | 2,130,000 | | | County of Bexar Advance Refunding GO,
5.00%, 06/15/26 | | | 2,583,860 | |
| | 7,500,000 | | | County of Bexar Advance Refunding GO,
5.00%, 06/15/29 | | | 9,295,275 | |
| | 2,910,000 | | | County of Bexar Refunding GO,
5.00%, 06/15/22 | | | 3,133,866 | |
| | 675,000 | | | County of Collin Advance Refunding GO,
5.00%, 02/15/24 | | | 777,573 | |
| | 2,800,000 | | | County of Dallas Public Improvements GO,
5.00%, 08/15/28 | | | 3,509,968 | |
| | 1,500,000 | | | County of Denton Advance Refunding GO,
5.00%, 07/15/24 | | | 1,758,540 | |
| | 1,590,000 | | | County of Harris Advance Refunding Revenue, Series A,
5.00%, 08/15/25 | | | 1,926,635 | |
| | 4,075,000 | | | County of Harris Current Refunding GO, Series A,
5.00%, 10/01/26 | | | 5,119,504 | |
| | 4,100,000 | | | County of Harris Current Refunding GO, Series A,
5.00%, 10/01/27 | | | 5,280,882 | |
| | 1,485,000 | | | County of Harris Current Refunding GO, Series A,
5.00%, 10/01/24 | | | 1,756,443 | |
| | 1,850,000 | | | County of Williamson Limited Tax Advance Refunding GO,
5.00%, 02/15/24 | | | 2,133,753 | |
| | 1,000,000 | | | County of Williamson Limited Tax Refunding GO,
5.00%, 02/15/21 | | | 1,013,530 | |
| Old Westbury Funds, Inc. | |
| Municipal Bond Fund | |
| Portfolio of Investments - (Continued) | October 31, 2020 |
Principal
Amount | | | | | Value | |
| Texas (continued) | | | |
| $ | 360,000 | | | Crystal City Independent School District Advance Refunding GO, (PSF-GTD),
5.00%, 02/15/26 | | $ | 428,652 | |
| | 1,500,000 | | | Cuero Independent School District Advance Refunding GO, (PSF-GTD),
5.00%, 08/15/30 | | | 1,890,825 | |
| | 1,500,000 | | | Dallas Area Rapid Transit Advance Refunding Revenue Bonds,
1.15%, 12/01/26 | | | 1,497,705 | |
| | 750,000 | | | Dallas Area Rapid Transit Refunding Revenue Bonds, Series A,
5.00%, 12/01/25 | | | 887,978 | |
| | 1,120,000 | | | Dayton Independent School District School Improvements GO, (PSF-GTD),
5.00%, 02/15/22 | | | 1,188,421 | |
| | 7,715,000 | | | Denton Independent School District Advance Refunding GO, (PSF-GTD),
5.00%, 08/15/26 | | | 9,189,877 | |
| | 6,000,000 | | | Denton Independent School District Advance Refunding GO, (PSF-GTD),
5.00%, 08/15/29 | | | 7,344,240 | |
| | 1,085,000 | | | Denver City Independent School District School Building GO, Series A, (PSF-GTD),
5.00%, 02/15/25 | | | 1,293,949 | |
| | 2,665,000 | | | Eagle Mountain & Saginaw Independent School District Refunding GO, (PSF-GTD),
5.00%, 08/15/25 | | | 3,243,332 | |
| | 1,835,000 | | | Eagle Mountain & Saginaw Independent School District Refunding GO, (PSF-GTD),
5.00%, 08/15/27 | | | 2,258,977 | |
| | 10,000,000 | | | Eagle Mountain & Saginaw Independent School District School Improvements GO, (PSF-GTD), Series 2011,
2.00%, 08/01/50(b)(c) | | | 10,509,200 | |
| | 3,000,000 | | | Edinburg Consolidated Independent School District Advance Refunding GO, (PSF-GTD),
5.00%, 02/15/25 | | | 3,580,560 | |
| | 1,500,000 | | | El Paso Independent School District Refunding GO (PSF-GTD),
5.00%, 08/15/25 | | | 1,768,560 | |
Principal
Amount | | | | | Value | |
| Texas (continued) | | | |
| $ | 1,925,000 | | | Fort Bend Independent School District Refunding Notes GO, Series A, (PSF-GTD),
1.95%, 08/01/49(b) | | $ | 1,978,168 | |
| | 885,000 | | | Frenship Independent School District Refunding GO (PSF-GTD),
5.00%, 02/15/26(a) | | | 1,021,113 | |
| | 4,890,000 | | | Frisco Independent School District Advance Refunding GO, (PSF-GTD),
5.00%, 08/15/26 | | | 6,037,047 | |
| | 1,285,000 | | | Goose Creek Consolidated Independent School District Advance Refunding GO, (PSF-GTD), Series A,
5.00%, 02/15/25 | | | 1,537,914 | |
| | 1,095,000 | | | Graham Independent School District Refunding GO, Series B (PSF-GTD),
5.00%, 02/15/21 | | | 1,109,782 | |
| | 8,500,000 | | | Grand Parkway Transportation Corp Highway Improvements Revenue Bonds, Sub-Tier Series B,
5.00%, 10/01/52(b) | | | 9,497,900 | |
| | 8,000,000 | | | Grand Parkway Transportation Corp. Highway Improvements Revenue Bonds, Series A,
5.50%, 04/01/53(a) | | | 9,197,280 | |
| | 2,865,000 | | | Harris County Flood Control District Advance Refunding,
5.00%, 10/01/28 | | | 3,663,304 | |
| | 5,000,000 | | | Harris County Flood Control District Refunding Revenue Bonds, Series A,
5.00%, 10/01/23 | | | 5,686,200 | |
| | 5,030,000 | | | Harris County Metropolitan Authority Transit Improvements Revenue Bonds, Series B,
5.00%, 11/01/23(a) | | | 5,268,170 | |
| | 2,040,000 | | | Hays Consolidated Independent School District Advance Refunding GO, (PSF-GTD),
5.00%, 02/15/27 | | | 2,564,035 | |
| | 2,730,000 | | | Hays Consolidated Independent School District Advance Refunding GO, (PSF-GTD),
5.00%, 08/15/27 | | | 3,380,068 | |
| | 4,000,000 | | | Houston Independent School District Improvements GO, (PSF-GTD),
5.00%, 02/15/28 | | | 5,039,920 | |
| Old Westbury Funds, Inc. | |
| Municipal Bond Fund | |
| Portfolio of Investments - (Continued) | October 31, 2020 |
Principal
Amount | | | | | Value | |
| Texas (continued) | | | |
| $ | 175,000 | | | Hutto Independent School District Advance Refunding GO, (PSF-GTD), Series A,
5.00%, 08/01/25 | | $ | 208,175 | |
| | 2,455,000 | | | Irving Independent School District Advance Refunding GO, (PSF-GTD),
5.00%, 02/15/24 | | | 2,834,175 | |
| | 585,000 | | | Kaufman Independent School District School Building Refunding GO, (PSF-GTD),
5.00%, 02/15/24 | | | 672,235 | |
| | 500,000 | | | Kaufman Independent School District School Building Refunding GO, (PSF-GTD),
5.00%, 02/15/25 | | | 595,585 | |
| �� | 750,000 | | | Klein Independent School District School Improvements GO, (PSF-GTD),
5.00%, 08/01/23 | | | 846,862 | |
| | 13,725,000 | | | Lone Star College System Advance Refunding GO,
5.00%, 02/15/29 | | | 16,744,088 | |
| | 4,455,000 | | | Lone Star College System Advance Refunding GO, Series B,
5.00%, 02/15/23 | | | 4,934,358 | |
| | 1,835,000 | | | Longview Independent School District Advance Refunding GO, (PSF-GTD),
5.00%, 02/15/21 | | | 1,859,772 | |
| | 1,860,000 | | | Longview Independent School District Advance Refunding GO, (PSF-GTD),
5.00%, 02/15/23 | | | 2,058,778 | |
| | 560,000 | | | Longview Independent School District Advance Refunding GO, (PSF-GTD),
5.00%, 02/15/24 | | | 645,098 | |
| | 225,000 | | | Longview Independent School District Advance Refunding GO, (PSF-GTD),
5.00%, 02/15/26 | | | 277,515 | |
| | 2,670,000 | | | Magnolia Independent School District School Improvement Advance Refunding GO, (PSF-GTD),
5.00%, 08/15/25 | | | 3,246,586 | |
| | 300,000 | | | Manor Independent School District Advance Refunding GO, (PSF-GTD),
5.00%, 08/01/26 | | | 374,349 | |
Principal
Amount | | | | | Value | |
| Texas (continued) | | | | |
| $ | 3,410,000 | | | Manor Independent School District Advance Refunding GO, (PSF-GTD),
5.00%, 08/01/24 | | $ | 3,992,087 | |
| | 1,005,000 | | | Mesquite Independent School District Advance Refunding GO, (PSF-GTD), Series A,
5.00%, 08/15/23 | | | 1,136,313 | |
| | 1,060,000 | | | Mesquite Independent School District Advance Refunding GO, (PSF-GTD), Series A,
5.00%, 08/15/24 | | | 1,245,394 | |
| | 1,110,000 | | | Mesquite Independent School District Advance Refunding GO, (PSF-GTD), Series A,
5.00%, 08/15/25 | | | 1,354,422 | |
| | 1,435,000 | | | Mesquite Independent School District Advance Refunding GO, (PSF-GTD), Series B,
5.00%, 08/15/23 | | | 1,622,497 | |
| | 1,650,000 | | | Mesquite Independent School District Advance Refunding GO, (PSF-GTD), Series B,
5.00%, 08/15/25 | | | 2,013,330 | |
| | 585,000 | | | Mesquite Independent School District Advance Refunding GO, (PSF-GTD), Series B,
5.00%, 08/15/26 | | | 733,707 | |
| | 580,000 | | | Mesquite Independent School District Current Refunding GO, Series A (PSF-GTD),
5.00%, 08/15/24 | | | 681,442 | |
| | 1,170,000 | | | Mesquite Independent School District Current Refunding GO, Series A (PSF-GTD),
5.00%, 08/15/25 | | | 1,427,634 | |
| | 1,000,000 | | | Mesquite Independent School District Improvements GO, Series C, (PSF-GTD),
5.00%, 08/15/21 | | | 1,037,310 | |
| | 595,000 | | | Mesquite Independent School District Improvements GO, Series C, (PSF-GTD),
5.00%, 08/15/26 | | | 746,249 | |
| | 1,585,000 | | | Mesquite Independent School District School Improvements GO, Series B (PSF-GTD),
5.00%, 08/15/26 | | | 1,987,907 | |
| Old Westbury Funds, Inc. | |
| Municipal Bond Fund | |
| Portfolio of Investments - (Continued) | October 31, 2020 |
Principal
Amount | | | | | Value | |
| Texas (continued) | | | |
| $ | 3,000,000 | | | Midlothian Independent School District Refunding GO, Series C (PSF-GTD),
2.00%, 08/01/51(b)(c) | | $ | 3,158,460 | |
| | 1,000,000 | | | New Caney Independent School District Advance Refunding GO, (PSF-GTD),
5.00%, 02/15/27 | | | 1,264,580 | |
| | 250,000 | | | Northside Independent School District School Improvements GO, (PSF-GTD),
5.00%, 08/15/26 | | | 312,743 | |
| | 3,000,000 | | | Northwest Independent School District Refunding GO, (PSF-GTD), Series B,
5.00%, 02/15/23 | | | 3,319,890 | |
| | 2,525,000 | | | Northwest Independent School District Refunding GO, (PSF-GTD), Series B,
5.00%, 02/15/25 | | | 3,019,572 | |
| | 1,145,000 | | | Palestine Independent School District Advance Refunding GO, (PSF-GTD),
5.00%, 02/15/23 | | | 1,264,870 | |
| | 1,220,000 | | | Palestine Independent School District Advance Refunding GO, (PSF-GTD),
5.00%, 02/15/28 | | | 1,487,656 | |
| | 250,000 | | | Pasadena Independent School District Advance Refunding GO, (PSF-GTD),
5.00%, 02/15/22 | | | 265,273 | |
| | 4,420,000 | | | Pasadena Independent School District School Improvement Refunding GO, (PSF-GTD),
5.00%, 02/15/25(a) | | | 4,895,548 | |
| | 24,150,000 | | | Permanent University Fund - Texas A&M University System Refunding Revenue Bonds,
5.50%, 07/01/28 | | | 29,245,167 | |
| | 750,000 | | | Pharr San Juan Alamo Independent School District Advance Refunding GO, (PSF-GTD),
5.00%, 02/01/27 | | | 890,438 | |
| | 1,525,000 | | | Plano Independent School District School Improvement GO, (PSF-GTD),
5.00%, 02/15/23 | | | 1,688,343 | |
Principal
Amount | | | | | Value | |
| Texas (continued) | | | | |
| $ | 5,000,000 | | | Plano Independent School District School Improvement GO, (PSF-GTD),
5.00%, 02/15/26 | | $ | 6,178,750 | |
| | 1,050,000 | | | Point Isabel Independent School District,
5.00%, 02/01/25 | | | 1,252,965 | |
| | 1,995,000 | | | Port Arthur Independent School District Advance Refunding GO, (PSF-GTD), Series B,
5.00%, 02/15/25 | | | 2,379,197 | |
| | 1,000,000 | | | Prosper Independent School District School Building School Improvement GO, (PSF-GTD),
5.00%, 02/15/25 | | | 1,194,930 | |
| | 10,000,000 | | | Prosper Independent School District School Improvement GO, (PSF-GTD), Series B,
2.00%, 02/15/50(b) | | | 10,362,300 | |
| | 925,000 | | | Roma Independent School District Refunding GO, (PSF-GTD),
5.00%, 08/15/22 | | | 1,003,301 | |
| | 1,020,000 | | | Roma Independent School District Refunding GO, (PSF-GTD),
5.00%, 08/15/23 | | | 1,150,846 | |
| | 1,075,000 | | | Roma Independent School District Refunding GO, (PSF-GTD),
5.00%, 08/15/24 | | | 1,260,352 | |
| | 1,000,000 | | | Roma Independent School District Refunding GO, (PSF-GTD),
5.00%, 08/15/25 | | | 1,213,310 | |
| | 1,330,000 | | | San Antonio Independent School District School Improvements GO, (PSF-GTD),
5.00%, 08/15/23 | | | 1,502,993 | |
| | 1,185,000 | | | San Antonio Water System,
5.00%, 05/15/36 | | | 1,550,087 | |
| | 1,150,000 | | | San Antonio Water System,
4.00%, 05/15/37 | | | 1,389,051 | |
| | 2,600,000 | | | San Antonio Water System,
5.00%, 05/15/39 | | | 3,373,058 | |
| | 5,000,000 | | | San Antonio Water System,
5.00%, 05/15/41 | | | 6,442,950 | |
| | 7,000,000 | | | San Antonio Water System Water Utility Improvements Revenue Bonds, Series A,
2.63%, 05/01/49(b) | | | 7,450,240 | |
| Old Westbury Funds, Inc. | |
| Municipal Bond Fund | |
| Portfolio of Investments - (Continued) | October 31, 2020 |
Principal
Amount | | | | | Value | |
| Texas (continued) | | | |
| $ | 205,000 | | | San Elizario Independent School District School Improvements GO, (PSF-GTD),
5.00%, 05/01/25 | | $ | 247,099 | |
| | 1,195,000 | | | Southside Independent School District School Improvement GO, (PSF-GTD),
5.00%, 08/15/29 | | | 1,508,831 | |
| | 5,000,000 | | | Spring Branch Independent School District School Improvement GO, (PSF-GTD),
1.55%, 06/15/41(b)(c) | | | 5,014,650 | |
| | 450,000 | | | Spring Independent School District Advance Refunding GO (PSF-GTD),
5.00%, 08/15/27 | | | 557,442 | |
| | 1,000,000 | | | Spring Independent School District Advance Refunding GO, (PSF-GTD),
5.00%, 08/15/26 | | | 1,253,560 | |
| | 2,160,000 | | | Spring Independent School District Advance Refunding GO, (PSF-GTD),
5.00%, 08/15/22 | | | 2,342,844 | |
| | 7,180,000 | | | Spring Independent School District Advance Refunding GO, Series A,
5.00%, 08/15/28 | | | 8,866,797 | |
| | 40,000,000 | | | State of Texas Cash Flow Management Revenue Notes,
4.00%, 08/26/21 | | | 41,226,400 | |
| | 3,720,000 | | | State of Texas Highway Improvements Revenue Bonds GO,
5.00%, 04/01/44(a) | | | 4,300,543 | |
| | 5,000,000 | | | State of Texas Public Finance Authority Advance Refunding GO,
5.00%, 10/01/26 | | | 6,298,150 | |
| | 5,000,000 | | | State of Texas Public Finance Authority Advance Refunding GO,
2.18%, 10/01/27 | | | 5,361,950 | |
| | 2,000,000 | | | State of Texas Public Finance Authority Advance Refunding GO,
2.53%, 10/01/31 | | | 2,170,160 | |
| | 2,720,000 | | | State of Texas Public Finance Authority Advance Refunding GO,
2.65%, 10/01/32 | | | 2,954,518 | |
| | 2,500,000 | | | State of Texas Refunding Public Notes GO, Series A,
5.00%, 10/01/21 | | | 2,608,475 | |
| | 4,150,000 | | | State of Texas Student Loans GO,
4.00%, 08/01/31 | | | 5,158,574 | |
Principal
Amount | | | | | Value | |
| Texas (continued) | | | |
| $ | 4,275,000 | | | State of Texas Student Loans GO,
4.00%, 08/01/32 | | $ | 5,285,439 | |
| | 3,200,000 | | | State of Texas Transportation Commission Advance Refunding GO, Series F,
5.00%, 10/01/25 | | | 3,920,288 | |
| | 5,000,000 | | | State of Texas Transportation Commission Advance Refunding GO, Series F,
5.00%, 10/01/28 | | | 6,095,450 | |
| | 1,840,000 | | | State of Texas Transportation Commission Advance Refunding GO, Series F,
5.00%, 10/01/30 | | | 2,337,996 | |
| | 6,500,000 | | | State of Texas Transportation Commission Highway Improvement GO,
5.00%, 04/01/25 | | | 7,824,440 | |
| | 9,320,000 | | | State of Texas Transportation Commission Highway Improvement GO,
5.00%, 04/01/27 | | | 11,501,812 | |
| | 12,005,000 | | | State of Texas Transportation Commission Highway Improvement GO,
5.00%, 04/01/30(a) | | | 12,809,455 | |
| | 3,500,000 | | | State of Texas Transportation Commission Refunding GO, Series A,
5.00%, 10/01/22 | | | 3,817,450 | |
| | 2,500,000 | | | State of Texas Water Financial Assistance Refunding GO, Series 2019 C,
5.00%, 08/01/22 | | | 2,707,025 | |
| | 1,030,000 | | | State of Texas Water Utility Improvement Refunding GO, Series B1,
5.00%, 08/01/26 | | | 1,291,877 | |
| | 1,000,000 | | | State of Texas, Water Financial Assistance Refunding GO, Subseries 2018 B-2,
5.00%, 08/01/28 | | | 1,173,150 | |
| | 3,500,000 | | | State of Texas, Water Financial Assistance Refunding GO, Subseries 2018 B-3,
5.00%, 08/01/27 | | | 4,505,305 | |
| | 1,000,000 | | | Sulphur Springs Independent School District Advance Refunding GO, (PSF-GTD),
5.00%, 08/15/26 | | | 1,250,320 | |
| Old Westbury Funds, Inc. | |
| Municipal Bond Fund | |
| Portfolio of Investments - (Continued) | October 31, 2020 |
Principal
Amount | | | | | Value | |
| Texas (continued) | | | |
| $ | 5,325,000 | | | Tarrant County Cultural Education Facilities Finance Corp. Refunding Revenue Bonds,
5.00%, 11/15/40(a) | | $ | 5,333,414 | |
| | 3,000,000 | | | Tarrant County Cultural Education Facilities Finance Corp. Revenue Bonds,
5.00%, 12/01/32 | | | 3,867,840 | |
| | 1,000,000 | | | Temple Independent School District Advance Refunding GO, (PSF-GTD),
5.00%, 02/01/27 | | | 1,264,030 | |
| | 1,250,000 | | | Texas A&M University,
0.59%, 05/15/24 | | | 1,252,113 | |
| | 1,770,000 | | | Texas A&M University,
1.38%, 05/15/28 | | | 1,771,097 | |
| | 1,000,000 | | | Texas A&M University,
1.56%, 05/15/30 | | | 1,000,700 | |
| | 2,000,000 | | | Texas Tech University System,
1.34%, 02/15/27 | | | 1,999,260 | |
| | 2,000,000 | | | Texas Tech University System,
1.75%, 02/15/30 | | | 1,977,980 | |
| | 1,000,000 | | | Texas Transportation Commission,
1.12%, 10/01/27 | | | 1,012,780 | |
| | 3,000,000 | | | Texas Transportation Commission,
1.53%, 10/01/29 | | | 3,031,290 | |
| | 1,000,000 | | | Texas Transportation Commission State Highway Fund First Tier Advance Refunding Revenue Bonds,
5.00%, 10/01/22 | | | 1,090,910 | |
| | 5,785,000 | | | Texas Transportation Commission State Highway Fund First Tier Advance Refunding Revenue Bonds,
5.00%, 10/01/24 | | | 6,834,977 | |
| | 3,225,000 | | | Texas Transportation Commission State Highway Fund First Tier Advance Refunding Revenue Bonds, Series A,
5.00%, 04/01/21 | | | 3,288,307 | |
| | 4,250,000 | | | Texas Transportation Commission State Highway Fund Highway Improvements Revenue Bonds Series A,
5.00%, 10/01/26 | | | 5,344,970 | |
Principal
Amount | | | | | Value | |
| Texas (continued) | | | |
| $ | 2,080,000 | | | Texas Water Development Board Water Utility Improvements Revenue Bonds,
5.00%, 08/01/31 | | $ | 2,747,846 | |
| | 1,250,000 | | | Texas Water Development Board Water Utility Improvements Revenue Bonds, Series A,
5.00%, 10/15/23 | | | 1,424,212 | |
| | 1,000,000 | | | Trinity River Authority Central Regional Wastewater System Advance Refunding Revenue Bonds,
5.00%, 08/01/24 | | | 1,170,700 | |
| | 1,420,000 | | | Trinity River Authority Central Regional Wastewater System Revenue Current Refunding Revenue Bonds,
5.00%, 08/01/29 | | | 1,887,066 | |
| | 2,000,000 | | | Trinity River Authority Central Regional Wastewater System Revenue Current Refunding Revenue Bonds,
5.00%, 08/01/30 | | | 2,703,020 | |
| | 500,000 | | | United Independent School District GO, (PSF-GTD),
5.00%, 08/15/22 | | | 542,325 | |
| | 1,680,000 | | | United Independent School District GO, (PSF-GTD),
5.00%, 08/15/23 | | | 1,897,006 | |
| | 935,000 | | | United Independent School District GO, (PSF-GTD),
5.00%, 08/15/24 | | | 1,098,531 | |
| | 2,085,000 | | | United Independent School District GO, (PSF-GTD),
5.00%, 08/15/25 | | | 2,534,151 | |
| | 1,635,000 | | | United Independent School District GO, (PSF-GTD),
5.00%, 08/15/26 | | | 2,041,118 | |
| | 1,000,000 | | | United Independent School District GO, (PSF-GTD),
5.00%, 08/15/27 | | | 1,277,820 | |
| | 420,000 | | | University of North Texas Prerefunded Refunding Revenue,
5.00%, 04/15/21 | | | 428,929 | |
| | 1,065,000 | | | University of Texas System Refunding Revenue Bonds, Series A,
5.00%, 08/15/29 | | | 1,242,940 | |
| Old Westbury Funds, Inc. | |
| Municipal Bond Fund | |
| Portfolio of Investments - (Continued) | October 31, 2020 |
Principal
Amount | | | | | Value | |
| Texas (continued) | | | |
| $ | 2,000,000 | | | University of Texas System University and College Improvements Revenue, Series D,
5.00%, 08/15/23 | | $ | 2,264,920 | |
| | 7,000,000 | | | University of Texas System/The Advance Refunding Revenue Bonds, Series C,
5.00%, 08/15/26 | | | 8,774,920 | |
| | 3,000,000 | | | University of Texas System/The Advance Refunding Revenue Bonds, Series C,
5.00%, 08/15/21 | | | 3,112,650 | |
| | 325,000 | | | Waco Independent School District Advance Refunding GO, (PSF-GTD),
5.00%, 08/15/27 | | | 405,307 | |
| | 640,000 | | | Wall Independent School District School Improvements GO, (PSF-GTD),
5.00%, 02/15/27 | | | 760,550 | |
| | 1,210,000 | | | Wichita Falls Independent School District School Improvements GO (PSF-GTD),
5.00%, 02/01/23 | | | 1,336,263 | |
| | | | | | | | 723,575,007 | |
| Utah — 0.5% | | | | |
| | 610,000 | | | City of Salt Lake City Ut Public Utilities Revenue Bonds,
5.00%, 02/01/29 | | | 813,331 | |
| | 600,000 | | | City of Salt Lake City Ut Public Utilities Revenue Bonds,
5.00%, 02/01/30 | | | 793,776 | |
| | 4,135,000 | | | Granite School District Board of Education School Improvements GO, (School Board GTY),
5.00%, 06/01/30 | | | 5,629,017 | |
| | 840,000 | | | Salt Lake County Municipal Building Authority Public Facilities Revenue Bonds,
5.00%, 01/15/31 | | | 1,069,589 | |
| | 10,000,000 | | | State of Utah Highway Improvements Revenue Bonds GO,
5.00%, 07/01/26 | | | 12,553,400 | |
| | | | | | | | 20,859,113 | |
| Virginia — 4.9% | | | | |
| | 2,000,000 | | | City of Richmond Public Utility Revenue, Advance Refunding Revenue Bonds, Series B,
2.35%, 01/15/27 | | | 2,141,140 | |
Principal
Amount | | | | | Value | |
| Virginia (continued) | | | |
| $ | 2,250,000 | | | City of Richmond Public Utility Revenue, Advance Refunding Revenue Bonds, Series B,
2.45%, 01/15/28 | | $ | 2,404,980 | |
| | 2,955,000 | | | City of Richmond Public Utility Revenue, Sewer Improvement Revenue Bonds, Series A,
5.00%, 01/15/34 | | | 3,916,616 | |
| | 2,300,000 | | | City of Richmond Public Utility Revenue, Sewer Improvement Revenue Bonds, Series A,
5.00%, 01/15/35 | | | 3,039,749 | |
| | 4,110,000 | | | City of Suffolk Public Improvements GO,
5.00%, 02/01/26(a) | | | 4,157,964 | |
| | 1,600,000 | | | City of Virginia Beach Current Refunding GO, Series B, (State Aid Withholding),
5.00%, 07/15/26 | | | 2,002,416 | |
| | 5,175,000 | | | City of Virginia Beach Public Improvements GO, Series A, (State Aid Withholding),
5.00%, 07/15/26 | | | 6,476,564 | |
| | 7,430,000 | | | Commonwealth of Virginia Advance Refunding GO, Series B (State Aid Withholding),
5.00%, 06/01/28 | | | 8,978,263 | |
| | 3,815,000 | | | Commonwealth of Virginia University and College Improvements GO, Series A,
5.00%, 06/01/22 | | | 4,101,430 | |
| | 3,865,000 | | | Commonwealth of Virginia University and College Improvements GO, Series A,
5.00%, 06/01/27 | | | 4,843,425 | |
| | 7,000,000 | | | Country of Fairfax Public Improvements GO, Series A, (State Aid Withholding),
5.00%, 10/01/22 | | | 7,633,500 | |
| | 5,000,000 | | | Country of Fairfax School Improvements GO, Series A, (State Aid Withholding),
5.00%, 10/01/27 | | | 6,381,500 | |
| | 2,000,000 | | | Country of Fairfax School Improvements GO, Series A, (State Aid Withholding),
5.00%, 10/01/28 | | | 2,535,180 | |
| Old Westbury Funds, Inc. | |
| Municipal Bond Fund | |
| Portfolio of Investments - (Continued) | October 31, 2020 |
Principal
Amount | | | | | Value | |
| Virginia (continued) | | | | |
| $ | 7,965,000 | | | Country of Fairfax School Improvements GO, Series A, (State Aid Withholding),
5.00%, 10/01/29 | | $ | 10,084,009 | |
| | 2,660,000 | | | County of Arlington Public Improvements GO,
5.00%, 08/15/31 | | | 3,476,567 | |
| | 3,270,000 | | | County of Chesterfield School Improvements GO, Series A, (State Aid Withholding),
5.00%, 01/01/27 | | | 4,155,908 | |
| | 2,715,000 | | | County of Fairfax,
5.00%, 10/01/25 | | | 3,336,545 | |
| | 2,160,000 | | | County of Fairfax Sewer Improvement Revenue Bonds,
5.00%, 07/15/22(a) | | | 2,232,641 | |
| | 7,530,000 | | | County of Loudoun Public Facilities GO, Series A, (State Aid Withholding),
5.00%, 12/01/26 | | | 9,547,739 | |
| | 1,170,000 | | | Prince William County Industrial Development Authority Public Improvements Refunding Revenue Bonds, Series A,
5.00%, 10/01/24 | | | 1,380,354 | |
| | 1,635,000 | | | Virginia College Building Authority,
5.00%, 09/01/21 | | | 1,640,853 | |
| | 10,000,000 | | | Virginia College Building Authority Advance Refunding Revenue Bonds,
5.00%, 02/01/27 | | | 12,661,300 | |
| | 1,000,000 | | | Virginia College Building Authority Advance Refunding Revenue, Series A,
5.00%, 09/01/28 | | | 1,247,190 | |
| | 5,285,000 | | | Virginia College Building Authority University & College Improvements Revenue Bonds, Series B,
5.00%, 02/01/24 | | | 6,093,658 | |
| | 2,800,000 | | | Virginia College Building Authority University & College Improvements Revenue Bonds, Series B,
5.00%, 02/01/25 | | | 3,354,316 | |
| | 500,000 | | | Virginia College Building Authority, University and College Improvements Revenue, Series A,
5.00%, 02/01/27(a) | | | 575,990 | |
Principal
Amount | | | | | Value | |
| Virginia (continued) | | | | |
| $ | 6,000,000 | | | Virginia Commonwealth Transportation Board Advance Refunding Revenue Bonds,
5.00%, 09/15/29 | | $ | 7,630,860 | |
| | 2,600,000 | | | Virginia Commonwealth Transportation Board Advance Refunding Revenue Bonds, Series A,
5.00%, 05/15/23 | | | 2,906,644 | |
| | 5,375,000 | | | Virginia Commonwealth Transportation Board Advance Refunding Revenue Bonds, Series A,
5.00%, 05/15/28 | | | 6,934,825 | |
| | 465,000 | | | Virginia Commonwealth Transportation Board Transit Improvements Revenue Bonds,
5.00%, 03/15/21 | | | 473,086 | |
| | 2,510,000 | | | Virginia Commonwealth Transportation Board Transit Improvements Revenue Bonds,
5.00%, 03/15/23 | | | 2,786,702 | |
| | 815,000 | | | Virginia Commonwealth Transportation Board Transit Improvements Revenue Bonds,
5.00%, 03/15/25 | | | 976,753 | |
| | 1,345,000 | | | Virginia Commonwealth Transportation Board Transit Improvements Revenue Bonds,
5.00%, 03/15/26 | | | 1,664,330 | |
| | 1,230,000 | | | Virginia Commonwealth Transportation Board Transit Improvements Revenue Bonds,
5.00%, 03/15/27 | | | 1,562,383 | |
| | 2,915,000 | | | Virginia Commonwealth Transportation Board Transit Improvements Revenue Bonds,
5.00%, 03/15/28 | | | 3,795,126 | |
| | 2,175,000 | | | Virginia Commonwealth Transportation Board Transit Improvements Revenue Bonds,
5.00%, 03/15/29 | | | 2,886,595 | |
| | 1,250,000 | | | Virginia Commonwealth Transportation Board Transit Improvements Revenue Bonds,
5.00%, 03/15/30 | | | 1,691,688 | |
| | 3,935,000 | | | Virginia Commonwealth Transportation Board Transit Improvements Revenue Bonds,
5.00%, 03/15/32 | | | 5,276,166 | |
| Old Westbury Funds, Inc. | |
| Municipal Bond Fund | |
| Portfolio of Investments - (Continued) | October 31, 2020 |
Principal
Amount | | | | | Value | |
| Virginia (continued) | | | | |
| $ | 4,160,000 | | | Virginia Commonwealth Transportation Board Transit Improvements Revenue Bonds,
5.00%, 03/15/33 | | $ | 5,541,203 | |
| | 5,000,000 | | | Virginia Commonwealth Transportation Board Transit Improvements Revenue Bonds,
5.00%, 03/15/23(a) | | | 5,324,550 | |
| | 5,000,000 | | | Virginia Commonwealth Transportation Board Transit Improvements Revenue Bonds,
5.00%, 05/15/27 | | | 6,165,500 | |
| | 6,145,000 | | | Virginia Public Building Authority Advance Refunding Revenue Bonds, Series B,
5.00%, 08/01/26 | | | 7,715,293 | |
| | 2,465,000 | | | Virginia Public Building Authority Revenue Bonds, Series A,
5.00%, 08/01/21 | | | 2,552,582 | |
| | 500,000 | | | Virginia Public School Authority Advance Refunding Revenue Bonds,
5.00%, 02/01/26 | | | 616,655 | |
| | 2,450,000 | | | Virginia Public School Authority Advance Refunding Revenue Bonds, (State Aid Withholding),
5.00%, 08/01/24 | | | 2,870,224 | |
| | 5,000,000 | | | Virginia Public School Authority Refunding Revenue Bonds, Series A, (State Aid Withholding),
5.00%, 08/01/25 | | | 6,071,700 | |
| | 2,790,000 | | | Virginia Public School Authority School Improvement Revenue Bonds, Series A,
5.00%, 10/01/23 | | | 3,174,629 | |
| | 2,750,000 | | | Virginia Public School Authority School Improvement Revenue Bonds, Series A,
5.00%, 10/01/26 | | | 3,476,798 | |
| | 1,500,000 | | | Virginia Resources Authority Advance Refunding Revenue,
5.00%, 11/01/26 | | | 1,893,435 | |
| | 30,000 | | | Virginia Resources Authority Refunding Revenue Bonds,
5.00%, 11/01/25(a) | | | 35,502 | |
| | 1,120,000 | | | Virginia Resources Authority Refunding Revenue Bonds,
5.00%, 11/01/25 | | | 1,329,944 | |
| | | | | | | | 203,752,970 | |
Principal
Amount | | | | | Value | |
| Washington — 2.6% | | | | |
| $ | 1,025,000 | | | Benton County School District No 17 Kennewick School Improvements GO, (School Board GTY),
5.00%, 12/01/21 | | $ | 1,077,716 | |
| | 1,050,000 | | | Chelan County School District No 228 Cascade School Improvements GO, (School Board GTY),
5.00%, 12/01/26 | | | 1,304,005 | |
| | 2,100,000 | | | City of Seattle Public Improvements GO, Series A,
5.00%, 11/01/24 | | | 2,491,797 | |
| | 1,600,000 | | | Clark County Public Utility District No 1 Refunding Revenue Bonds,
5.00%, 01/01/27 | | | 1,955,936 | |
| | 825,000 | | | Clark County School District No 117 Camas School Improvements GO, (School Board GTY),
5.00%, 12/01/24 | | | 983,045 | |
| | 1,000,000 | | | County of King WA Sewer Advance Refunding Revenue Bonds,
5.00%, 07/01/30 | | | 1,260,400 | |
| | 7,000,000 | | | County of King WA Sewer Revenue Sewer Improvement Revenue Bonds, Series B,
5.00%, 07/01/29 | | | 9,112,460 | |
| | 10,000,000 | | | Energy Northwest Advance Refunding Revenue Bonds,
5.00%, 07/01/27 | | | 12,439,300 | |
| | 3,000,000 | | | Energy Northwest Advance Refunding Revenue Bonds, Series A,
5.00%, 07/01/27 | | | 3,617,160 | |
| | 3,900,000 | | | Energy Northwest Refunding Revenue Bonds, Series A,
5.00%, 07/01/28 | | | 4,185,090 | |
| | 1,035,000 | | | King County Refunding GO,
5.00%, 07/01/25 | | | 1,233,347 | |
| | 5,395,000 | | | King County Refunding GO,
5.00%, 07/01/26 | | | 6,406,401 | |
| | 9,000,000 | | | King County School District No 411 Issaquah School Improvement GO, (School Board GTY),
5.00%, 12/01/32 | | | 11,308,050 | |
| | 3,000,000 | | | King County School District No 411 Issaquah School Improvement GO, (School Board GTY),
5.00%, 12/01/33 | | | 3,754,860 | |
| Old Westbury Funds, Inc. | |
| Municipal Bond Fund | |
| Portfolio of Investments - (Continued) | October 31, 2020 |
Principal
Amount | | | | | Value | |
| Washington (continued) | | | | |
| $ | 1,180,000 | | | Nooksack Valley School District No 506 School Improvements GO, (School Board GTY),
5.00%, 12/01/24 | | $ | 1,399,716 | |
| | 2,995,000 | | | Pierce County School District No 10 Tacoma Current Refunding GO, (School Board GTY),
5.00%, 12/01/26 | | | 3,668,216 | |
| | 1,000,000 | | | Pierce County School District No 402 Franklin Pierce School Improvements GO, (School Board GTY),
5.00%, 12/01/30 | | | 1,265,750 | |
| | 750,000 | | | Port of Seattle Inter Lien Refunding Revenue Bonds,
5.00%, 02/01/27 | | | 893,655 | |
| | 5,000,000 | | | Port of Seattle Refunding GO,
5.00%, 06/01/24 | | | 5,836,000 | |
| | 1,120,000 | | | Skagit County Consolidated School District No 320 Mount Vernon School Improvements Refunding GO, (School Board GTY),
5.00%, 12/01/23 | | | 1,278,659 | |
| | 750,000 | | | Snohomish County Public Utility District No 1 Current Refunding Revenue Bonds, Series A,
5.00%, 12/01/23 | | | 857,490 | |
| | 750,000 | | | Snohomish County Public Utility District No 1 Current Refunding Revenue Bonds, Series A,
5.00%, 12/01/24 | | | 890,993 | |
| | 5,000,000 | | | Snohomish County School District No 201 Refunding GO (School Board GTY),
5.00%, 12/01/25 | | | 5,820,400 | |
| | 360,000 | | | Spokane County School District No 354 Mead School Improvement GO, (School Board GTY),
5.00%, 12/01/22 | | | 394,877 | |
| | 3,195,000 | | | State of Washington Public Improvements GO, Series B,
5.00%, 08/01/27 | | | 4,011,450 | |
| | 5,475,000 | | | State of Washington Public Improvements GO, Series C,
5.00%, 02/01/30 | | | 6,502,767 | |
| | 800,000 | | | State of Washington Refunding GO, Series R-2012C,
5.00%, 07/01/23 | | | 862,784 | |
Principal
Amount | | | | | Value | |
| Washington (continued) | | | | |
| $ | 2,315,000 | | | State of Washington School Improvements GO, Series C,
5.00%, 02/01/27 | | $ | 2,934,332 | |
| | 3,100,000 | | | State of Washington Senior 520 Corridor Program Highway Improvements Revenue Bonds, Series C,
5.00%, 06/01/29 | | | 3,863,406 | |
| | 4,435,000 | | | Yakima County School District No 7 Yakima Advance Refunding GO, (School Board GTY),
5.00%, 12/01/24 | | | 5,260,797 | |
| | | | | | | | 106,870,859 | |
| Wisconsin — 1.7% | | | | |
| | 9,140,000 | | | State of Wisconsin Advance Refunding GO, Series 3,
5.00%, 11/01/28 | | | 11,576,998 | |
| | 4,700,000 | | | State of Wisconsin Clean Water Fund Leveraged Loan Portfolio Advance Refunding Revenue Bonds,
5.00%, 06/01/29(a) | | | 5,476,346 | |
| | 1,000,000 | | | State of Wisconsin Clean Water Fund Leveraged Loan Portfolio Advance Refunding Revenue Bonds, Series 1,
5.00%, 06/01/23 | | | 1,120,050 | |
| | 1,000,000 | | | State of Wisconsin Clean Water Fund Leveraged Loan Portfolio Refunding Revenue Bonds, Series 1,
5.00%, 06/01/26(a) | | | 1,120,050 | |
| | 14,000,000 | | | State of Wisconsin Current Refunding Revenue Bonds, Series A,
5.00%, 05/01/29 | | | 17,630,900 | |
| | 10,465,000 | | | State of Wisconsin Environmental Improvement Fund Revenue, Green Bond, Series A,
5.00%, 06/01/35 | | | 13,584,931 | |
| | 1,200,000 | | | State of Wisconsin General Fund Advance Refunding Revenue Bonds, Series B,
5.00%, 05/01/27 | | | 1,483,404 | |
| | 3,205,000 | | | State of Wisconsin Public Improvements GO, Series B,
5.00%, 05/01/30(a) | | | 3,432,459 | |
| | 1,900,000 | | | State of Wisconsin Refunding Bonds GO, Series 3,
5.00%, 11/01/25 | | | 2,079,930 | |
| Old Westbury Funds, Inc. | |
| Municipal Bond Fund | |
| Portfolio of Investments - (Continued) | October 31, 2020 |
Principal
Amount | | | | | Value | |
| Wisconsin (continued) | | | | |
| $ | 1,000,000 | | | State of Wisconsin Refunding GO, Series 1,
5.00%, 05/01/24 | | $ | 1,118,270 | |
| | 2,770,000 | | | State of Wisconsin Refunding GO, Series 2,
5.00%, 11/01/26 | | | 3,489,092 | |
| | 860,000 | | | State of Wisconsin Refunding Notes GO, Series A,
5.00%, 05/01/28 | | | 1,028,964 | |
| | 5,000,000 | | | Wisconsin Department of Transportation,
1.01%, 07/01/26 | | | 5,019,700 | |
| | 2,250,000 | | | Wisconsin Health & Educational Facilities Authority Refunding Revenue Bonds, Series A,
5.13%, 04/15/31(a) | | | 2,507,760 | |
| | | | | | | | 70,668,854 | |
Total Municipal Bonds
(Cost $3,748,331,128) | | | 3,878,958,402 | |
| | | | | | | | | |
| CORPORATE BONDS — 2.3% | | | | |
| United States — 2.3% | | | | |
| | 4,500,000 | | | Andrew W Mellon Foundation (The), Series 2020,
0.95%, 08/01/27 | | | 4,384,540 | |
| | 5,000,000 | | | Ascension Health, Series B,
2.53%, 11/15/29 | | | 5,299,116 | |
| | 3,000,000 | | | BayCare Health System, Inc., Series 2020,
2.61%, 11/15/22 | | | 3,130,706 | |
| | 2,000,000 | | | BayCare Health System, Inc., Series 2020,
2.70%, 11/15/23 | | | 2,109,360 | |
| | 1,750,000 | | | Bon Secours Mercy Health, Inc.,
1.35%, 06/01/25 | | | 1,756,474 | |
| | 8,000,000 | | | Brown University in Providence in the State of Rhode Island and Providence Plant, Series A,
1.91%, 09/01/30 | | | 8,149,526 | |
| | 12,000,000 | | | Children’s Hospital, Series 2020,
2.93%, 07/15/50 | | | 11,134,407 | |
| | 7,500,000 | | | John D and Catherine T MacArthur Foundation,
1.30%, 12/01/30 | | | 7,353,593 | |
| | 5,000,000 | | | Leland Stanford Junior University (The),
1.29%, 06/01/27 | | | 5,049,406 | |
| | 3,000,000 | | | Orlando Health Obligated Group,
2.89%, 10/01/35 | | | 2,958,056 | |
Principal
Amount | | | | | Value | |
| United States (continued) | | | | |
| $ | 5,750,000 | | | PeaceHealth Obligated Group, Series 2020,
1.38%, 11/15/25 | | $ | 5,816,144 | |
| | 1,000,000 | | | Smithsonian Institution,
1.77%, 09/01/28 | | | 994,493 | |
| | 4,530,000 | | | Smithsonian Institution,
2.65%, 09/01/39 | | | 4,502,964 | |
| | 5,000,000 | | | Stanford Health Care, Series 2020,
3.31%, 08/15/30 | | | 5,600,748 | |
| | 16,000,000 | | | Yale University, Series 2020,
0.87%, 04/15/25 | | | 16,135,830 | |
| | 12,550,000 | | | Yale University, Series 2020,
1.48%, 04/15/30 | | | 12,585,830 | |
| | | | | | | | | |
Total Corporate Bonds
(Cost $97,260,288) | | | 96,961,193 | |
| | | | | | | | | |
| U.S. GOVERNMENT SECURITIES — 4.3% | | | | |
| U.S. Treasury Notes — 4.3% | | | | |
| | 100,000,000 | | | 1.50%, 03/31/23 | | | 103,195,312 | |
| | 46,000,000 | | | 2.25%, 01/31/24 | | | 49,018,750 | |
| | 27,340,000 | | | 2.00%, 02/15/25 | | | 29,296,519 | |
| | | | | | | | | |
Total U.S. Government Securities
(Cost $174,628,632) | | | 181,510,581 | |
| | | | | | | | | |
| Shares | | | | | | | |
| INVESTMENT COMPANY — 2.0% | | | | |
| | 85,431,086 | | | SEI Daily Income Trust Government II Fund - Class A, 0.01%(d) | | | 85,431,086 | |
Total Investment Company
(Cost $85,431,086) | | | 85,431,086 | |
TOTAL INVESTMENTS — 101.0%
(Cost $4,105,651,134) | | $ | 4,242,861,262 | |
| LIABILITIES IN EXCESS OF OTHER ASSETS — (1.0)% | | | (41,222,086 | ) |
| NET ASSETS — 100.0% | | $ | 4,201,639,176 | |
| (a) | These securities are pre-refunded; the date shown represents the pre-refunded date. Bonds which are pre-refunded are collateralized by U.S. Government securities which are held in escrow and are used to pay principal and interest on the municipal issue and to retire the bonds in full at the earliest refunding date. |
| (b) | Variable or floating rate security, which interest rate adjusts periodically based on changes in current interest rates and prepayments on the underlying pool of assets. Rate shown is the rate in effect as of October 31, 2020. |
| Old Westbury Funds, Inc. | |
| Municipal Bond Fund | |
| Portfolio of Investments - (Continued) | October 31, 2020 |
| (c) | These securities are subject to remarketing prior to its stated maturity, and is subject to mandatory redemption at the stated maturity date. |
| (d) | The rate shown represents the current yield as of October 31, 2020. |
The following abbreviations are used in the report:
AGM — Assured Guaranty Municipal Corp.
COP — Certificates of Participation
GO — General Obligation
GTY — Guaranty
NATL-RE — Insured by National Public Finance Guarantee Corp.
PSF-GTD — Permanent School Fund Guarantee
Q-SBLF — Qualified-School Board Loan Fund
| Old Westbury Funds, Inc. | |
| California Municipal Bond Fund | |
| Portfolio of Investments | October 31, 2020 |
Principal
Amount | | | | | Value | |
| MUNICIPAL BONDS — 88.2% | | | |
| California — 88.2% | | | |
| $ | 1,000,000 | | | Abag Finance Authority for Nonprofit Corps Odd fellows Home CA Refunding Revenue Bonds, Series A,
5.00%, 04/01/23 | | $ | 1,102,860 | |
| | 175,000 | | | Alameda County Joint Powers Authority Refunding Revenue Bonds,
5.00%, 12/01/20 | | | 175,655 | |
| | 635,000 | | | Anaheim Housing & Public Improvements Authority Pre-refunding Revenue Bonds,
5.00%, 10/01/41(a) | | | 662,254 | |
| | 250,000 | | | Bay Area Toll Authority Pre-refunded Highway Improvements Revenue Bonds, Subseries S-4,
5.00%, 04/01/38(a) | | | 278,655 | |
| | 6,000,000 | | | Bay Area Toll Authority Pre-refunded Highway Improvements Revenue Bonds, Subseries S-4,
5.00%, 04/01/43(a) | | | 6,687,720 | |
| | 24,695,000 | | | Bay Area Toll Authority Pre-refunded Highway Improvements Revenue Bonds, Subseries S-4,
5.25%, 04/01/48(a) | | | 27,673,958 | |
| | 100,000 | | | Bay Area Toll Authority San Francisco Bay Area Subordinate Transportation Advance Refunding Revenue Bonds,
5.00%, 04/01/22 | | | 106,687 | |
| | 125,000 | | | Bay Area Toll Authority San Francisco Bay Area Subordinate Transportation Advance Refunding Revenue Bonds,
5.00%, 04/01/23 | | | 139,101 | |
| | 6,000,000 | | | Bay Area Toll Authority San Francisco Bay Area Subordinate Transportation Advance Refunding Revenue Bonds,
2.00%, 04/01/53(b) | | | 6,211,260 | |
| | 150,000 | | | Cabrillo Community College District Refunding GO,
5.00%, 08/01/23(a) | | | 162,504 | |
| | 100,000 | | | Cabrillo Community College District Refunding GO,
5.00%, 08/01/24(a) | | | 108,336 | |
| | 930,000 | | | Cabrillo Community College District Refunding GO,
5.00%, 08/01/27(a) | | | 1,007,525 | |
Principal
Amount | | | | | Value | |
| California (continued) | | | |
| $ | 500,000 | | | California Educational Facilities Authority Advance Refunding Revenue Bonds,
5.00%, 01/01/27 | | $ | 610,380 | |
| | 1,550,000 | | | California Educational Facilities Authority Refunding Revenue Bonds,
5.00%, 10/01/23 | | | 1,761,482 | |
| | 275,000 | | | California Health Facilities Financing Authority Current Refunding Revenue Bonds,
5.00%, 11/15/22 | | | 300,649 | |
| | 1,000,000 | | | California Health Facilities Financing Authority Current Refunding Revenue Bonds,
5.00%, 11/01/23 | | | 1,132,140 | |
| | 100,000 | | | California Health Facilities Financing Authority Current Refunding Revenue Bonds,
5.00%, 11/15/25 | | | 122,436 | |
| | 1,565,000 | | | California Infrastructure & Economic Development Bank Current Refunding Revenue Bond, Series A-1,
5.00%, 04/01/33 | | | 2,220,031 | |
| | 125,000 | | | California Infrastructure & Economic Development Bank University & College Improvements Revenue Bonds,
5.00%, 05/15/23 | | | 139,170 | |
| | 5,725,000 | | | California Infrastructure & Economic Development Bank Water Utility Improvements Green Bond,
5.00%, 10/01/35 | | | 7,304,241 | |
| | 150,000 | | | California Infrastructure & Economic Development Bank Water Utility Improvements Green Bond,
5.00%, 10/01/22 | | | 163,636 | |
| | 250,000 | | | California Infrastructure & Economic Development Bank Water Utility Improvements Green Bond,
5.00%, 10/01/23 | | | 284,310 | |
| | 100,000 | | | California Infrastructure & Economic Development Bank Water Utility Improvements Green Bond,
5.00%, 10/01/23 | | | 113,724 | |
| | 150,000 | | | California Infrastructure & Economic Development Bank Water Utility Improvements Green Bond,
5.00%, 10/01/26 | | | 189,543 | |
| Old Westbury Funds, Inc. | |
| California Municipal Bond Fund | |
| Portfolio of Investments - (Continued) | October 31, 2020 |
Principal
Amount | | | | | Value | |
| California (continued) | | | |
| $ | 100,000 | | | California Municipal Finance Authority Advance Refunding Anaheim Water System Project Revenue Bonds,{br}Series A,
5.00%, 10/01/24 | | $ | 118,622 | |
| | 100,000 | | | California Municipal Finance Authority Advance Refunding Revenue Bonds,
5.00%, 08/15/23 | | | 113,036 | |
| | 405,000 | | | California Municipal Finance Authority Pre-refunding Revenue Bonds,
6.35%, 12/01/31(a) | | | 406,940 | |
| | 415,000 | | | California Municipal Finance Authority Pre-refunding Revenue Bonds,
6.80%, 12/01/36(a) | | | 417,129 | |
| | 160,000 | | | California Municipal Finance Authority Retirement Facilities California Armenian Home Project Revenue Bonds,
5.00%, 05/15/22 | | | 170,499 | |
| | 100,000 | | | California Municipal Finance Authority Retirement Facilities Revenue Bonds,
5.00%, 04/01/23 | | | 110,337 | |
| | 125,000 | | | California Municipal Finance Authority Retirement Facilities Revenue Bonds,
5.00%, 04/01/24 | | | 143,065 | |
| | 645,000 | | | California Municipal Finance Authority Retirement Facilities Town and Country Manor Revenue Bonds,
4.00%, 07/01/23 | | | 701,508 | |
| | 670,000 | | | California Municipal Finance Authority Retirement Facilities Town and Country Manor Revenue Bonds,
4.00%, 07/01/24 | | | 749,516 | |
| | 4,770,000 | | | California State Current Refunding GO,
5.00%, 08/01/27 | | | 5,658,794 | |
| | 250,000 | | | California State Public Works Board Correctional Facilities Improvements Revenue Bonds, Series C,
5.00%, 11/01/23 | | | 284,235 | |
Principal
Amount | | | | | Value | |
| California (continued) | | | |
| $ | 460,000 | | | California State Public Works Board Correctional Facilities Improvements Revenue Bonds, Series C,
5.00%, 11/01/24 | | $ | 543,209 | |
| | 100,000 | | | California State Public Works Board Correctional Facilities Improvements, Series A,
5.00%, 11/01/25 | | | 122,249 | |
| | 150,000 | | | California State Public Works Board Public Improvements Revenue Bonds, Series G,
5.00%, 11/01/22 | | | 164,261 | |
| | 325,000 | | | California State Public Works Board Refunding Revenue Bonds, Series F,
5.00%, 05/01/26 | | | 389,493 | |
| | 100,000 | | | California State Public Works Board, Advance Refunding Revenue Bonds,
5.00%, 11/01/26 | | | 125,624 | |
| | 250,000 | | | California State University & College Improvements Current Refunding Revenue Bonds, Series A,
5.00%, 11/01/23 | | | 285,203 | |
| | 1,785,000 | | | California State University & College Improvements Revenue Bonds, Series A,
5.00%, 11/01/24 | | | 2,116,475 | |
| | 1,000,000 | | | California State University Current Refunding Revenue Bonds, Series A,
5.00%, 11/01/24(a) | | | 1,094,020 | |
| | 250,000 | | | California State University Current Refunding Revenue Bonds, Series A,
5.00%, 11/01/25 | | | 296,425 | |
| | 120,000 | | | California State University Current Refunding Revenue Bonds, Series C,
5.00%, 11/01/21 | | | 125,744 | |
| | 150,000 | | | California Statewide Communities Development Authority,
5.00%, 08/15/23 | | | 169,107 | |
| | 150,000 | | | California Statewide Communities Development Authority Advance Refunding Revenue Bonds,
5.00%, 08/15/25 | | | 182,156 | |
| Old Westbury Funds, Inc. | |
| California Municipal Bond Fund | |
| Portfolio of Investments - (Continued) | October 31, 2020 |
Principal
Amount | | | | | Value | |
| California (continued) | | | |
| $ | 745,000 | | | California Statewide Communities Development Authority Current Refunding Revenue Bonds,
4.00%, 11/15/25 | | $ | 863,068 | |
| | 100,000 | | | California Statewide Communities Development Authority Nursing Homes Retirement Facilities Revenue Bonds,
5.00%, 07/01/28 | | | 127,810 | |
| | 5,000,000 | | | Carlsbad Unified School District School Improvements GO, Series B,
6.00%, 05/01/34 | | | 5,947,600 | |
| | 885,000 | | | Chabot-Las Positas Community College District Refunding GO,
5.00%, 08/01/25 | | | 997,731 | |
| | 325,000 | | | City & County of San Francisco CA Public Improvements GO, Series B,
5.00%, 06/15/22 | | | 350,165 | |
| | 100,000 | | | City & County of San Francisco CA Refunding COP,
5.00%, 04/01/21 | | | 101,879 | |
| | 150,000 | | | City & County of San Francisco CA Refunding COP,
5.00%, 04/01/23 | | | 166,690 | |
| | 2,500,000 | | | City & County of San Francisco CA Refunding Public Improvements COP,
5.00%, 04/01/23 | | | 2,771,775 | |
| | 100,000 | | | City of Los Angeles CA Wastewater System Revenue Advance Refunding Revenue Bonds, Subseries A,
5.00%, 06/01/24 | | | 116,681 | |
| | 2,550,000 | | | City of Los Angeles CA Wastewater System Revenue Refunding Revenue Bonds, Subseries A,
5.00%, 06/01/25 | | | 2,855,974 | |
| | 1,800,000 | | | City of Los Angeles CA Wastewater System Revenue Refunding Revenue Bonds, Subseries A,
5.00%, 06/01/27 | | | 2,012,022 | |
| | 7,500,000 | | | City of Los Angeles Department of Airports Current Refunding Revenue Bonds,
5.00%, 05/15/40 | | | 9,321,750 | |
Principal
Amount | | | | | Value | |
| California (continued) | | | |
| $ | 850,000 | | | City of Los Angeles Department of Airports Current Refunding Revenue Bonds, Series B,
5.00%, 05/15/31 | | $ | 1,116,373 | |
| | 3,645,000 | | | City of Los Angeles Department of Airports Current Refunding Revenue Bonds, Series C,
5.00%, 05/15/23 | | | 4,054,297 | |
| | 1,500,000 | | | City of Los Angeles Department of Airports Current Refunding Revenue Bonds, Series C,
5.00%, 05/15/24 | | | 1,731,120 | |
| | 200,000 | | | City of Los Angeles Department of Airports Port Airport & Marina Improvements Refunding Revenue Bonds,
5.00%, 05/15/24 | | | 230,816 | |
| | 100,000 | | | City of Los Angeles Department of Airports Port Airport & Marina Improvements Refunding Revenue Bonds,
5.00%, 05/15/25 | | | 119,258 | |
| | 275,000 | | | City of Palo Alto CA Parking Facility Improvement COP, Series A,
5.00%, 11/01/23 | | | 313,987 | |
| | 150,000 | | | City of Palo Alto CA Parking Facility Improvement COP, Series A,
5.00%, 11/01/24 | | | 178,052 | |
| | 200,000 | | | City of Palo Alto CA Parking Facility Improvement COP, Series A,
5.00%, 11/01/25 | | | 246,054 | |
| | 100,000 | | | City of Roseville CA Water Utility Revenue Advance Refunding COP,
5.00%, 12/01/23 | | | 114,564 | |
| | 150,000 | | | City of Sacramento CA Wastewater Revenue Sewer Improvement Revenue Bonds,
5.00%, 09/01/25 | | | 184,041 | |
| | 165,000 | | | City of Sacramento CA Wastewater Revenue Sewer Improvement Revenue Bonds,
5.00%, 09/01/26 | | | 208,481 | |
| | 100,000 | | | City of San Francisco CA Public Utilities Commission Water Revenue Advance Refunding Green Bond, Series D,
5.00%, 11/01/26 | | | 126,701 | |
| Old Westbury Funds, Inc. | |
| California Municipal Bond Fund | |
| Portfolio of Investments - (Continued) | October 31, 2020 |
Principal
Amount | | | | | Value | |
| California (continued) | | | |
| $ | 1,900,000 | | | City of San Francisco CA Public Utilities Commission Water Revenue Advance Refunding Revenue Bonds,
5.00%, 11/01/28 | | $ | 2,283,591 | |
| | 550,000 | | | Contra Costa Community College District University & College Improvements GO, Series B2,
5.00%, 08/01/27 | | | 712,607 | |
| | 330,000 | | | Contra Costa Transportation Authority Advance Refunding Revenue Bonds, Series A,
4.00%, 03/01/23 | | | 357,816 | |
| | 275,000 | | | Contra Costa Water District Refunding Revenue Bonds, Series T,
5.00%, 10/01/25 | | | 325,974 | |
| | 425,000 | | | County of Marin CA Advance Refunding Public Improvements,
5.00%, 11/01/26 | | | 522,627 | |
| | 225,000 | | | County of Sacramento CA Airport System Revenue Current Refunding Revenue Bonds, Subseries D,
5.00%, 07/01/23 | | | 250,256 | |
| | 225,000 | | | County of Sacramento CA Airport System Revenue Current Refunding Revenue Bonds, Subseries D,
5.00%, 07/01/26 | | | 273,310 | |
| | 100,000 | | | County of San Diego CA Refunding COP, Series A,
5.00%, 10/15/25 | | | 118,455 | |
| | 100,000 | | | Cucamonga Valley Water District Financing Authority Current Refunding Revenue Bonds,
5.00%, 09/01/24 | | | 118,235 | |
| | 1,445,000 | | | Desert Community College District Refunding GO,
5.00%, 08/01/26 | | | 1,821,740 | |
| | 200,000 | | | East Bay Municipal Utility District Wastewater System Revenue Advance Refunding Revenue Bonds, Series A,
5.00%, 06/01/22 | | | 215,082 | |
| | 300,000 | | | East Bay Municipal Utility District Wastewater System Revenue Advance Refunding Revenue Bonds, Series A,
5.00%, 06/01/23 | | | 336,657 | |
Principal
Amount | | | | | Value | |
| California (continued) | | | |
| $ | 225,000 | | | East Bay Municipal Utility District Wastewater System Revenue Current Refunding Revenue Bonds, Series A,
5.00%, 06/01/24 | | $ | 263,059 | |
| | 150,000 | | | East Bay Municipal Utility District Wastewater System Revenue Current Refunding Revenue Bonds, Series A,
5.00%, 06/01/25 | | | 182,247 | |
| | 1,500,000 | | | Eastern Municipal Water District Financing Authority Current Refunding Revenue Bonds, Series A,
5.00%, 07/01/36 | | | 2,001,735 | |
| | 1,000,000 | | | Eastern Municipal Water District Financing Authority Current Refunding Revenue Bonds, Series A,
5.00%, 07/01/37 | | | 1,329,360 | |
| | 805,000 | | | Garden Grove Unified School District School Improvements GO, Series C,
5.00%, 08/01/30(a) | | | 909,747 | |
| | 275,000 | | | Gilroy School Facilities Financing Authority Refunding Revenue Bonds, Series A,
4.00%, 08/01/42(a) | | | 303,267 | |
| | 2,000,000 | | | Los Angeles Community College District/CA Advance Refunding GO,
1.17%, 08/01/26 | | | 1,998,540 | |
| | 200,000 | | | Los Angeles Community College District/CA Refunding GO, Series A,
5.00%, 08/01/25 | | | 234,956 | |
| | 1,100,000 | | | Los Angeles Community College District/CA Refunding GO, Series A,
5.00%, 08/01/29 | | | 1,284,195 | |
| | 1,000,000 | | | Los Angeles Community College District/CA University & College Improvements GO, Series 2008-F,
5.00%, 08/01/24 | | | 1,129,150 | |
| | 850,000 | | | Los Angeles County Metropolitan Transportation Authority Transit Improvements Revenue Bonds, Senior Series B,
5.00%, 07/01/25 | | | 955,502 | |
| Old Westbury Funds, Inc. | |
| California Municipal Bond Fund | |
| Portfolio of Investments - (Continued) | October 31, 2020 |
Principal
Amount | | | | | Value | |
| California (continued) | | | |
| $ | 3,000,000 | | | Los Angeles County Metropolitan Transportation Authority Advance Refunding Revenue Bonds, Series B,
5.00%, 07/01/23 | | $ | 3,374,910 | |
| | 100,000 | | | Los Angeles County Metropolitan Transportation Authority Current Refunding Revenue Bonds, Series A,
5.00%, 07/01/23 | | | 112,497 | |
| | 125,000 | | | Los Angeles County Metropolitan Transportation Authority Current Refunding Revenue Bonds, Series A,
5.00%, 07/01/24 | | | 146,424 | |
| | 120,000 | | | Los Angeles County Metropolitan Transportation Authority Current Refunding Revenue Bonds, Series A,
5.00%, 07/01/25 | | | 140,471 | |
| | 250,000 | | | Los Angeles County Metropolitan Transportation Authority Green Bond, Series A,
5.00%, 07/01/22 | | | 269,497 | |
| | 800,000 | | | Los Angeles County Metropolitan Transportation Authority Green Bond, Series A,
5.00%, 07/01/23 | | | 899,976 | |
| | 125,000 | | | Los Angeles County Metropolitan Transportation Authority Refunding Revenue Bonds,
5.00%, 07/01/21 | | | 128,894 | |
| | 275,000 | | | Los Angeles County Metropolitan Transportation Authority, Refunding Revenue Bonds,
5.00%, 07/01/24 | | | 322,132 | |
| | 1,125,000 | | | Los Angeles Department of Water & Power Current Refunding Revenue Bonds, Series B,
5.00%, 07/01/39 | | | 1,470,049 | |
| | 2,065,000 | | | Los Angeles Department of Water & Power Power System Revenue Current Refunding Revenue Bonds, Series A,
5.00%, 07/01/23 | | | 2,274,432 | |
| | 250,000 | | | Los Angeles Department of Water & Power Power System Revenue Current Refunding Revenue Bonds, Series A,
5.00%, 07/01/23 | | | 281,243 | |
Principal
Amount | | | | | Value | |
| California (continued) | | | |
| $ | 150,000 | | | Los Angeles Department of Water & Power Power System Revenue Current Refunding Revenue Bonds, Series B,
5.00%, 01/01/22 | | $ | 157,647 | |
| | 450,000 | | | Los Angeles Department of Water & Power Power System Revenue Current Refunding Revenue Bonds, Series B,
5.00%, 01/01/23 | | | 494,087 | |
| | 600,000 | | | Los Angeles Department of Water & Power Power System Revenue Current Refunding Revenue Bonds, Series B,
5.00%, 01/01/24 | | | 686,784 | |
| | 5,000,000 | | | Los Angeles Department of Water & Power Power System Revenue Current Refunding Revenue Bonds, Series B,
5.00%, 07/01/24 | | | 5,856,950 | |
| | 330,000 | | | Los Angeles Department of Water & Power Power System Revenue Electric Light & Power Improvements, Series D,
5.00%, 07/01/21 | | | 340,326 | |
| | 1,425,000 | | | Los Angeles Department of Water & Power Power System Revenue Electric Light & Power Improvements, Series D,
5.00%, 07/01/22 | | | 1,536,634 | |
| | 100,000 | | | Los Angeles Department of Water & Power Power System Revenue Electricity Light & Power Improvements Revenue Bonds, Series C,
5.00%, 07/01/22 | | | 107,834 | |
| | 195,000 | | | Los Angeles Department of Water & Power Power System Revenue Unrefunded Revenue Bonds, Series A,
5.00%, 07/01/22 | | | 201,088 | |
| | 200,000 | | | Los Angeles Department of Water Current Refunding Revenue Bonds, Series A,
5.00%, 07/01/27 | | | 253,952 | |
| | 200,000 | | | Los Angeles Department of Water Water Utility Improvements Current Refunding Revenue Bonds, Series B,
5.00%, 07/01/28 | | | 265,076 | |
| Old Westbury Funds, Inc. | |
| California Municipal Bond Fund | |
| Portfolio of Investments - (Continued) | October 31, 2020 |
Principal
Amount | | | | | Value | |
| California (continued) | | | | |
| $ | 1,800,000 | | | Los Rios Community College District Refunding GO,
5.00%, 08/01/27 | | $ | 1,944,990 | |
| | 175,000 | | | Marin Community College District Advance Refunding GO,
5.00%, 08/01/23 | | | 197,858 | |
| | 275,000 | | | Mount San Antonio Community College District University & College Improvements GO, Series 2018-A,
5.00%, 08/01/27 | | | 356,304 | |
| | 1,100,000 | | | Mount San Jacinto Community College District University & College Improvements GO, Series 2014-A,
5.00%, 08/01/28 | | | 1,325,995 | |
| | 2,000,000 | | | Municipal Improvement Corp. of Los Angeles Refunding Revenue Bonds, Series A,
5.00%, 11/01/24 | | | 2,314,680 | |
| | 325,000 | | | Nevada County Finance Authority Revenue Bonds,
4.00%, 10/01/22 | | | 348,481 | |
| | 450,000 | | | Northern California Power Agency Hydroelectric Project Current Refunding Revenue Bonds, Series A,
5.00%, 07/01/22 | | | 485,721 | |
| | 125,000 | | | Northern California Power Agency Hydroelectric Project Current Refunding Revenue Bonds, Series A,
5.00%, 07/01/24 | | | 146,824 | |
| | 210,000 | | | Northern California Transmission Agency California-Oregon Project Advance Refunding Revenue Bonds,
5.00%, 05/01/26 | | | 257,811 | |
| | 160,000 | | | Ohlone Community College District Advance Refunding GO,
5.00%, 08/01/24 | | | 188,555 | |
| | 100,000 | | | Orange County Sanitation District Advance Refunding Revenue Bonds,
5.00%, 02/01/26 | | | 124,270 | |
| | 3,000,000 | | | Orange County Sanitation District Advance Refunding Revenue Bonds, Series A,
5.00%, 02/01/34 | | | 3,496,260 | |
Principal
Amount | | | | | Value | |
| California (continued) | | | | |
| $ | 150,000 | | | Orange County Sanitation District Current Refunding Revenue Bonds, Series A,
5.00%, 02/01/27 | | $ | 191,609 | |
| | 100,000 | | | Orange County Water District Advance Refunding Revenue Bonds, Series A,
5.00%, 08/15/27 | | | 127,972 | |
| | 475,000 | | | Orange County Water District Repayment Of Bank Loan Revenue Bonds, Series C,
5.00%, 08/15/25 | | | 582,383 | |
| | 100,000 | | | Palomar Community College District University & College Improvements GO, Series 2006-D,
5.00%, 08/01/22 | | | 108,336 | |
| | 200,000 | | | Placer County Water Agency Current Refunding COP,
5.00%, 07/01/22 | | | 215,528 | |
| | 150,000 | | | Regents of the University of California Medical Center Pooled Revenue Advance Refunding Revenue Bonds, Series L,
5.00%, 05/15/23 | | | 167,166 | |
| | 1,145,000 | | | Regents of the University of California Medical Center Pooled Revenue Current Refunding Revenue Bonds, Series L,
5.00%, 05/15/24 | | | 1,324,914 | |
| | 1,320,000 | | | Regents of the University of California Medical Center Pooled Revenue Pre-refunded Revenue Bonds, Series J,
5.00%, 05/15/24(a) | | | 1,473,608 | |
| | 6,150,000 | | | Regents of the University of California Medical Center Pooled Revenue Pre-refunded Revenue Bonds, Series J,
5.25%, 05/15/27(a) | | | 6,904,359 | |
| | 1,100,000 | | | Rio Hondo Community College District/CA Current Refunding GO, Series B,
5.00%, 08/01/24 | | | 1,296,317 | |
| | 675,000 | | | Rio Hondo Community College District/CA Current Refunding GO, Series B,
5.00%, 08/01/25 | | | 825,734 | |
| Old Westbury Funds, Inc. | |
| California Municipal Bond Fund | |
| Portfolio of Investments - (Continued) | October 31, 2020 |
Principal
Amount | | | | | Value | |
| California (continued) | | | | |
| $ | 870,000 | | | Riverside County Transportation Commission Pre-refunding Refunding Notes Highway Improvements, Series A,
5.25%, 06/01/24(a) | | $ | 982,187 | |
| | 200,000 | | | Sacramento County Sanitation Districts Financing Authority Current Refunding Revenue Bonds,
5.00%, 08/01/25 | | | 244,662 | |
| | 3,000,000 | | | Sacramento Municipal Utility District Refunding Revenue Bonds, Series A,
5.00%, 08/15/49(b) | | | 3,320,700 | |
| | 5,250,000 | | | Sacramento Municipal Utility District Refunding Revenue Bonds, Sub- Series B,
5.00%, 08/15/49(b) | | | 6,189,907 | |
| | 275,000 | | | Saddleback Valley Unified School District Refunding GO,
5.00%, 08/01/24 | | | 310,921 | |
| | 5,000,000 | | | San Bernardino Community College District Advance Refunding GO,
1.61%, 08/01/27 | | | 5,115,600 | |
| | 1,000,000 | | | San Diego Community College District Advance Refunding GO,
5.00%, 08/01/28 | | | 1,254,250 | |
| | 1,030,000 | | | San Diego Community College District Pre-refunded University & College Improvements GO,
5.00%, 08/01/24(a) | | | 1,067,070 | |
| | 100,000 | | | San Diego County Regional Transportation Commission Sales & Use Tax Refunding Revenue Bonds, Series A,
5.00%, 04/01/25 | | | 116,033 | |
| | 7,800,000 | | | San Diego County Water Authority Advance Refunding Revenue Bonds, Series A,
1.33%, 05/01/28 | | | 7,776,054 | |
| | 120,000 | | | San Diego County Water Authority Financing Corp. Advance Refunding Revenue Bonds,
5.00%, 05/01/22 | | | 128,572 | |
| | 150,000 | | | San Diego County Water Authority Financing Corp. Advance Refunding Revenue Bonds,
5.00%, 05/01/23 | | | 167,822 | |
Principal
Amount | | | | | Value | |
| California (continued) | | | | |
| $ | 300,000 | | | San Diego Public Facilities Financing Authority Advance Refunding Revenue Bonds, Series B,
5.00%, 08/01/25 | | $ | 365,091 | |
| | 1,115,000 | | | San Diego Public Facilities Financing Authority Advance Refunding Revenue Bonds, Series B,
5.00%, 08/01/28 | | | 1,389,903 | |
| | 300,000 | | | San Diego Public Facilities Financing Authority Refunding Revenue Bonds, Series A,
5.00%, 08/01/23 | | | 338,832 | |
| | 1,000,000 | | | San Diego Public Facilities Financing Authority Refunding Revenue Bonds, Subseries A,
5.00%, 08/01/31(a) | | | 1,082,440 | |
| | 175,000 | | | San Diego Regional Building Authority Advance Refunding Revenue Bonds, Series A,
5.00%, 10/15/22 | | | 189,870 | |
| | 100,000 | | | San Diego Regional Building Authority County Operation Centre Current Advance Revenue Bonds, Series A,
5.00%, 10/15/23 | | | 112,769 | |
| | 1,460,000 | | | San Francisco Bay Area Rapid Transit District Sales Tax Revenue Current Refunding Revenue Bonds, Series A,
5.00%, 07/01/28 | | | 1,749,912 | |
| | 1,500,000 | | | San Francisco Bay Area Rapid Transit District Transit Improvements GO,
5.00%, 08/01/24 | | | 1,763,400 | |
| | 2,500,000 | | | San Francisco Bay Area Rapid Transit District Transit Improvements GO, Series C-1,
5.00%, 08/01/24 | | | 2,939,000 | |
| | 1,045,000 | | | San Francisco Bay Area Rapid Transit District Transit Improvements GO, Series C-1,
5.00%, 08/01/25 | | | 1,276,697 | |
| | 1,500,000 | | | San Francisco Bay Area Rapid Transit District Transit Improvements GO, Series C-1,
5.00%, 08/01/28 | | | 1,994,550 | |
| | 1,100,000 | | | San Francisco Bay Area Rapid Transit District Transit Improvements GO, Series C-1,
5.00%, 08/01/29 | | | 1,493,558 | |
| Old Westbury Funds, Inc. | |
| California Municipal Bond Fund | |
| Portfolio of Investments - (Continued) | October 31, 2020 |
Principal
Amount | | | | | Value | |
| California (continued) | | | | |
| $ | 500,000 | | | San Francisco City & County Airport Comm-San Francisco International Airport Advance Refunding Current Revenue Bonds, Series A,
5.00%, 05/01/23 | | $ | 554,635 | |
| | 3,810,000 | | | San Francisco City & County Airport Comm-San Francisco International Airport Advance Refunding Current Revenue Bonds, Series A,
5.00%, 05/01/26 | | | 4,661,344 | |
| | 2,400,000 | | | San Francisco City & County Airport Comm-San Francisco International Airport Current Refunding Revenue Bonds,
5.00%, 05/01/24 | | | 2,763,144 | |
| | 3,000,000 | | | San Francisco City & County Airport Comm-San Francisco International Airport Current Refunding Revenue Bonds, Series H,
5.00%, 05/01/29 | | | 3,801,060 | |
| | 3,000,000 | | | San Francisco City & County Airport Comm-San Francisco International Airport Current Refunding Revenue Bonds, Series H,
5.00%, 05/01/21 | | | 3,064,920 | |
| | 1,095,000 | | | San Francisco City & County Airport Comm-San Francisco International Airport Refunding Revenue Bonds, Series D,
5.00%, 05/01/26 | | | 1,119,243 | |
| | 1,025,000 | | | San Francisco City & County Airport Comm-San Francisco International Airport Revenue Bonds, Series E,
5.00%, 05/01/40 | | | 1,227,806 | |
| | 8,000,000 | | | San Francisco City & County Public Utilities Commission Wastewater Revenue Green Bond, Series C,
2.13%, 10/01/48(b) | | | 8,275,840 | |
| | 200,000 | | | San Francisco Municipal Transportation Agency Transit Improvements Revenue Bonds,
5.00%, 03/01/23 | | | 221,342 | |
Principal
Amount | | | | | Value | |
| California (continued) | | | | |
| $ | 175,000 | | | San Francisco Municipal Transportation Agency Transit Improvements Revenue Bonds,
5.00%, 03/01/26 | | $ | 214,566 | |
| | 100,000 | | | San Francisco Municipal Transportation Agency Transit Improvements Revenue Bonds,
5.00%, 03/01/27 | | | 125,694 | |
| | 1,290,000 | | | San Francisco Municipal Transportation Agency Transit Improvements Revenue Bonds,
5.00%, 03/01/28 | | | 1,418,781 | |
| | 1,165,000 | | | San Joaquin County Transportation Authority Refunding Revenue Bonds, Series A,
5.50%, 03/01/41(a) | | | 1,185,294 | |
| | 830,000 | | | San Jose Evergreen Community College District Advance Refunding GO,
5.00%, 09/01/24 | | | 981,002 | |
| | 785,000 | | | San Mateo County Community College District Refunding GO,
5.00%, 09/01/24 | | | 853,334 | |
| | 100,000 | | | San Mateo Joint Powers Financing Authority Advance Refunding Revenue Bonds, Series A,
5.00%, 07/15/24 | | | 116,953 | |
| | 100,000 | | | San Mateo Joint Powers Financing Authority Public Improvements Capital Project Revenue Bonds, Series A,
5.00%, 07/15/25 | | | 121,196 | |
| | 1,000,000 | | | San Mateo Union High School District Refunding GO,
5.00%, 09/01/27(a) | | | 1,179,580 | |
| | 275,000 | | | San Mateo Union High School District Refunding GO, Series C,
5.00%, 09/01/24 | | | 325,377 | |
| | 125,000 | | | San Rafael Joint Powers Financing Authority Green Bonds Public Facilities,
5.00%, 06/01/23 | | | 139,759 | |
| | 1,000,000 | | | San Ramon Valley Unified School District/CA School Improvements GO,
5.00%, 08/01/24 | | | 1,174,370 | |
| | 750,000 | | | San Ramon Valley Unified School District/CA School Improvements GO,
5.00%, 08/01/25 | | | 913,515 | |
| Old Westbury Funds, Inc. | |
| California Municipal Bond Fund | |
| Portfolio of Investments - (Continued) | October 31, 2020 |
Principal
Amount | | | | | Value | |
| California (continued) | | | | |
| $ | 100,000 | | | Santa Clara County Financing Authority Public Facilities Revenue Bonds, Series A,
5.00%, 04/01/22 | | $ | 106,745 | |
| | 125,000 | | | Santa Clara County Financing Authority Public Facilities Revenue Bonds, Series A,
5.00%, 04/01/26 | | | 155,015 | |
| | 300,000 | | | Santa Clara County Financing Authority Public Facilities Revenue Bonds, Series A,
5.00%, 04/01/27 | | | 381,951 | |
| | 250,000 | | | Santa Clara Unified School District Advance Refunding GO,
5.00%, 07/01/22 | | | 269,845 | |
| | 350,000 | | | Santa Clara Unified School District Advance Refunding GO,
5.00%, 07/01/23 | | | 394,040 | |
| | 100,000 | | | Santa Clara Unified School District Advance Refunding GO,
5.00%, 07/01/25 | | | 117,179 | |
| | 245,000 | | | Santa Clara Unified School District School Improvements GO,
5.00%, 07/01/27 | | | 307,713 | |
| | 175,000 | | | Santa Clara Valley Water District Current Refunding COP, Series A,
5.00%, 02/01/23 | | | 193,846 | |
| | 1,540,000 | | | Santa Clarita Community College District Refunding GO,
5.00%, 08/01/24 | | | 1,741,155 | |
| | 100,000 | | | Santa Clarita Community College District University & College Improvements GO,
5.00%, 08/01/26 | | | 126,072 | |
| | 150,000 | | | Santa Monica Public Financing Authority Current Refunding Revenue Bonds,
5.00%, 07/01/25 | | | 182,949 | |
| | 100,000 | | | Southern California Public Power Authority Advance Refunding Revenue Bonds, Series C,
5.00%, 07/01/25 | | | 119,158 | |
| | 225,000 | | | Southern California Public Power Authority Electricity Light & Power Improvements Mead- Pheonix Project Revenue Bonds,
5.00%, 07/01/26 | | | 277,893 | |
Principal
Amount | | | | | Value | |
| California (continued) | | | | |
| $ | 100,000 | | | State of California (Other Revenue LOC) Advance Refunding GO,
5.00%, 09/01/22 | | $ | 108,599 | |
| | 125,000 | | | State of California Advance Refunding GO,
5.00%, 11/01/23 | | | 142,480 | |
| | 325,000 | | | State of California Advance Refunding GO,
5.00%, 09/01/25 | | | 396,308 | |
| | 1,155,000 | | | State of California Advance Refunding GO,
5.00%, 08/01/26 | | | 1,444,940 | |
| | 200,000 | | | State of California Advance Refunding GO,
5.00%, 09/01/26 | | | 250,738 | |
| | 1,345,000 | | | State of California Advance Refunding GO, Series B,
5.00%, 09/01/23 | | | 1,522,701 | |
| | 3,310,000 | | | State of California Current Refunding GO,
5.00%, 08/01/24 | | | 3,881,769 | |
| | 2,000,000 | | | State of California Current Refunding GO,
5.00%, 10/01/25 | | | 2,445,800 | |
| | 2,355,000 | | | State of California Current Refunding GO,
5.00%, 08/01/26 | | | 2,946,176 | |
| | 125,000 | | | State of California Current Refunding GO,
5.00%, 02/01/22 | | | 132,340 | |
| | 1,000,000 | | | State of California Current Refunding GO,
5.00%, 10/01/25 | | | 1,178,930 | |
| | 6,065,000 | | | State of California Current Refunding GO,
5.00%, 10/01/26 | | | 7,124,374 | |
| | 5,000,000 | | | State of California Department of Water Resources Advance Refunding Revenue Bonds,
1.79%, 12/01/35 | | | 4,776,100 | |
| | 200,000 | | | State of California Department of Water Resources Advance Refunding Revenue Bonds, Series AX,
5.00%, 12/01/21 | | | 210,286 | |
| | 1,000,000 | | | State of California Department of Water Resources Advance Refunding Revenue Bonds, Series AX,
5.00%, 12/01/25 | | | 1,235,530 | |
| Old Westbury Funds, Inc. | |
| California Municipal Bond Fund | |
| Portfolio of Investments - (Continued) | October 31, 2020 |
Principal
Amount | | | | | Value | |
| California (continued) | | | | |
| $ | 150,000 | | | State of California Department of Water Resources Central Valley Project Current Refunding Revenue Bonds,
5.00%, 12/01/22 | | $ | 164,762 | |
| | 100,000 | | | State of California Department of Water Resources Central Valley Project Current Refunding Revenue Bonds,
5.00%, 12/01/24 | | | 119,157 | |
| | 1,300,000 | | | State of California Department of Water Resources Power Supply Revenue Advance Refunding Revenue Bonds, Series O,
5.00%, 05/01/22 | | | 1,393,067 | |
| | 100,000 | | | State of California Department of Water Resources Power Supply Revenue Refunding Revenue Bonds, Series N,
5.00%, 05/01/21 | | | 102,406 | |
| | 80,000 | | | State of California Department of Water Resources Pre-refunded Water Utility Improvements Refunding Revenue Bonds, Series AQ,
4.00%, 12/01/30(a) | | | 87,747 | |
| | 300,000 | | | State of California Department of Water Resources Refunding Revenue Bonds, Series AS,
5.00%, 12/01/25 | | | 357,471 | |
| | 125,000 | | | State of California Department of Water Resources Refunding Revenue Bonds, Series AV,
5.00%, 12/01/27 | | | 156,879 | |
| | 1,000,000 | | | State of California Multi Utility Improvements GO,
5.00%, 10/01/25 | | | 1,222,900 | |
| | 1,500,000 | | | State of California Refunding GO,
5.00%, 04/01/24 | | | 1,736,610 | |
| | 5,740,000 | | | State of California Water Utility Improvements GO,
5.00%, 11/01/29 | | | 7,685,229 | |
| | 550,000 | | | Turlock Irrigation District Revenue Bonds,
5.00%, 01/01/25 | | | 655,369 | |
| | 3,000,000 | | | University of California (College and University Revenue LOC) Refunding Revenue Bonds, Series AJ,
4.60%, 05/15/31 | | | 3,562,620 | |
Principal
Amount | | | | | Value | |
| California (continued) | | | | |
| $ | 13,915,000 | | | University of California (College and University Revenue LOC) Refunding Revenue Bonds, Series AK,
5.00%, 05/15/48(b) | | $ | 15,556,135 | |
| | 1,955,000 | | | University of California Advance Refunding Revenue Bonds, Series AY,
5.00%, 05/15/24 | | | 2,274,897 | |
| | 995,000 | | | University of California Current Pre-refunded Refunding Revenue Bonds, Series AF,
5.00%, 05/15/24(a) | | | 1,112,131 | |
| | 1,270,000 | | | University of California Current Pre-refunded Refunding Revenue Bonds, Series AF,
5.00%, 05/15/26(a) | | | 1,419,504 | |
| | 3,235,000 | | | University of California Current Pre-refunded Refunding Revenue Bonds, Series AF,
5.00%, 05/15/30(a) | | | 3,615,824 | |
| | 1,000,000 | | | University of California Current Revenue Bonds, Series I,
5.00%, 05/15/23 | | | 1,116,590 | |
| | 1,575,000 | | | University of California Pre-refunded Limited Project Current Refunding Revenue Bonds, Series G,
5.00%, 05/15/30(a) | | | 1,689,424 | |
| | 200,000 | | | University of California University & College Improvements Refunding Revenue Bonds, Series BB,
5.00%, 05/15/25 | | | 241,702 | |
| | 100,000 | | | University of California University & College Improvements Revenue Bonds, Series AM,
5.00%, 05/15/26 | | | 116,171 | |
| | 2,500,000 | | | University of California University & College Improvements Revenue Bonds, Series BE,
5.00%, 05/15/33 | | | 3,348,450 | |
| | 7,500,000 | | | University of California University & College Improvements Revenue Bonds, Series BG,
1.61%, 05/15/30 | | | 7,340,700 | |
| | 130,000 | | | University of California Unrefunded Limited Project Current Refunding Revenue Bonds, Series G,
5.00%, 05/15/23 | | | 139,236 | |
| Old Westbury Funds, Inc. | |
| California Municipal Bond Fund | |
| Portfolio of Investments - (Continued) | October 31, 2020 |
Principal
Amount | | | | | Value | |
| California (continued) | | | | |
| $ | 550,000 | | | Upper Santa Clara Valley Joint Powers Authority Water Utility Improvements Revenue Bonds, Series A,
5.00%, 08/01/40 | | $ | 694,820 | |
| | 1,000,000 | | | Upper Santa Clara Valley Joint Powers Authority Water Utility Improvements Revenue Bonds, Series A,
4.00%, 08/01/45 | | | 1,115,950 | |
| | 125,000 | | | Ventura County Community College District Advance Refunding GO,
5.00%, 08/01/24 | | | 147,309 | |
| | 1,645,000 | | | Ventura County Public Financing Authority Advance Refunding Revenue Bonds,
1.32%, 11/01/25 | | | 1,671,007 | |
| | 2,295,000 | | | Ventura County Public Financing Authority Advance Refunding Revenue Bonds,
1.54%, 11/01/26 | | | 2,321,232 | |
| | 2,000,000 | | | Ventura County Public Financing Authority Advance Refunding Revenue Bonds,
1.74%, 11/01/27 | | | 2,022,380 | |
| | 3,970,000 | | | Ventura County Public Financing Authority Advance Refunding Revenue Bonds,
1.96%, 11/01/28 | | | 4,017,759 | |
| | 425,000 | | | Ventura County Public Financing Authority Advance Refunding Revenue Bonds,
5.00%, 11/01/24 | | | 504,853 | |
| | 460,000 | | | Ventura County Public Financing Authority Advance Refunding Revenue Bonds,
5.00%, 11/01/26 | | | 582,204 | |
| | 100,000 | | | Walnut Energy Center Authority Current Refunding Revenue Bonds,
5.00%, 01/01/23 | | | 110,279 | |
| | 250,000 | | | West Valley-Mission Community College District Current Refunding GO, Series A,
5.00%, 08/01/27 | | | 324,297 | |
| | 1,100,000 | | | Western Municipal Water District Facilities Authority Water Utility Improvements Revenue Bonds, Series A,
5.00%, 10/01/36 | | | 1,465,541 | |
Principal
Amount | | | | | Value | |
| California (continued) | | | | |
| $ | 1,000,000 | | | Western Municipal Water District Facilities Authority Water Utility Improvements Revenue Bonds, Series A,
5.00%, 10/01/37 | | $ | 1,327,400 | |
| | 1,000,000 | | | Western Municipal Water District Facilities Authority Water Utility Improvements Revenue Bonds, Series A,
5.00%, 10/01/38 | | | 1,318,460 | |
| | 1,300,000 | | | Western Municipal Water District Facilities Authority Water Utility Improvements Revenue Bonds, Series A,
5.00%, 10/01/39 | | | 1,708,239 | |
| | 1,100,000 | | | Western Municipal Water District Facilities Authority Water Utility Improvements Revenue Bonds, Series A,
5.00%, 10/01/40 | | | 1,437,172 | |
| | 100,000 | | | William S Hart Union High School District Advance Refunding GO,
5.00%, 08/01/24 | | | 117,560 | |
| | 125,000 | | | Yosemite Community College District Current Refunding GO,
5.00%, 08/01/25 | | | 151,399 | |
| | | | | | | | | |
Total Municipal Bonds
(Cost $343,400,543) | | | 353,289,508 | |
| | | | | | | | | |
| CORPORATE BONDS — 0.6% | | | | |
| United States — 0.6% | | | | |
| | 2,000,000 | | | Stanford Health Care, Series 2020,
3.31%, 08/15/30 | | | 2,240,299 | |
Total Corporate Bonds
(Cost $2,000,000) | | | 2,240,299 | |
| | | | | | | | | |
| U.S. GOVERNMENT SECURITIES — 8.2% | | | | |
| U.S. Treasury Notes — 8.2% | | | | |
| | 30,770,000 | | | 2.00%, 02/15/25 | | | 32,971,978 | |
Total U.S. Government Securities
(Cost $31,272,020) | | | 32,971,978 | |
| Old Westbury Funds, Inc. | |
| California Municipal Bond Fund | |
| Portfolio of Investments - (Continued) | October 31, 2020 |
| Shares | | | | | Value | |
| INVESTMENT COMPANY — 2.4% | | | | |
| | 9,527,349 | | | SEI Daily Income Trust Government II Fund - Class A, 0.01%(c) | | $ | 9,527,349 | |
Total Investment Company
(Cost $9,527,349) | | | 9,527,349 | |
TOTAL INVESTMENTS — 99.4%
(Cost $386,199,912) | | $ | 398,029,134 | |
| OTHER ASSETS IN EXCESS OF LIABILITIES — 0.6% | | | 2,338,324 | |
| NET ASSETS — 100.0% | | $ | 400,367,458 | |
| (a) | These securities are pre-refunded; the date shown represents the pre-refunded date. Bonds which are pre-refunded are collateralized by U.S. Government securities which are held in escrow and are used to pay principal and interest on the municipal issue and to retire the bonds in full at the earliest refunding date. |
| (b) | Variable or floating rate security, which interest rate adjusts periodically based on changes in current interest rates and prepayments on the underlying pool of assets. Rate shown is the rate in effect as of October 31, 2020. |
| (c) | The rate shown represents the current yield as of October 31, 2020. |
The following abbreviations are used in the report:
COP — Certificates of Participation
GO — General Obligation
| Old Westbury Funds, Inc. | |
| New York Municipal Bond Fund | |
| Portfolio of Investments | October 31, 2020 |
Principal
Amount | | | | | Value | |
| MUNICIPAL BONDS — 88.9% | | | | |
| New York — 88.9% | | | | |
| $ | 2,000,000 | | | Battery Park City Authority Current Refunding Revenue Bonds, Series A,
5.00%, 11/01/25 | | | 2,283,540 | |
| | 100,000 | | | Build NYC Resource Corp. Refunding Revenue Bonds, Series A,
5.00%, 06/01/24 | | | 117,032 | |
| | 1,110,000 | | | City of New York Public Improvements GO, Series 2018-1,
5.00%, 08/01/25 | | | 1,334,009 | |
| | 225,000 | | | City of New York Advance Refunding GO, Series 2015-A,
5.00%, 08/01/24 | | | 261,763 | |
| | 2,520,000 | | | City of New York Advance Refunding GO, Series A,
5.00%, 08/01/26 | | | 3,102,876 | |
| | 150,000 | | | City of New York Advance Refunding GO, Series C,
5.00%, 08/01/22 | | | 161,846 | |
| | 350,000 | | | City of New York Advance Refunding GO, Series C,
5.00%, 08/01/22 | | | 377,639 | |
| | 200,000 | | | City of New York Advance Refunding GO, Series C,
5.00%, 08/01/23 | | | 224,248 | |
| | 875,000 | | | City of New York Advance Refunding GO, Series C,
5.00%, 08/01/23 | | | 981,085 | |
| | 1,515,000 | | | City of New York Advance Refunding GO, Series C,
5.00%, 08/01/27 | | | 1,772,232 | |
| | 100,000 | | | City of New York Advance Refunding GO, Series C,
5.00%, 08/01/28 | | | 122,923 | |
| | 125,000 | | | City of New York Advance Refunding GO, Series D,
5.00%, 08/01/24 | | | 145,424 | |
| | 100,000 | | | City of New York Advance Refunding GO, Series E,
5.00%, 08/01/24 | | | 116,339 | |
| | 4,500,000 | | | City of New York Current Refunding GO, Series 2019-A,
5.00%, 08/01/25 | | | 5,408,145 | |
| | 1,250,000 | | | City of New York Current Refunding GO, Series C-1,
5.00%, 08/01/25 | | | 1,502,262 | |
Principal
Amount | | | | | Value | |
| New York (continued) | | | | |
| $ | 24,000,000 | | | City of New York Current Refunding GO, Series C-1,
5.00%, 08/01/26 | | | 29,551,200 | |
| | 4,250,000 | | | City of New York Current Refunding GO, Series E,
5.00%, 08/01/24 | | | 4,944,408 | |
| | 225,000 | | | City of New York Public Improvements GO, Series 1,
5.00%, 08/01/21 | | | 232,787 | |
| | 255,000 | | | City of New York Public Improvements GO, Series 1,
5.00%, 08/01/23 | | | 285,916 | |
| | 1,000,000 | | | City of New York Public Improvements GO, Sub-Series D-3,
5.00%, 08/01/38(a)(b) | | | 1,110,640 | |
| | 1,500,000 | | | City of New York Public Improvements GO, Subseries F-1,
5.00%, 04/01/43 | | | 1,774,350 | |
| | 200,000 | | | City of New York Public Improvements GO, Sub-Series F-1,
5.00%, 04/01/23 | | | 221,334 | |
| | 100,000 | | | City of New York Public Improvements GO, Sub-Series F-1,
5.00%, 03/01/24 | | | 109,788 | |
| | 4,775,000 | | | City of New York Public Improvements GO, Sub-Series F-1,
5.00%, 03/01/28 | | | 5,231,872 | |
| | 100,000 | | | City of New York Public Improvements GO, Sub-Series F-3,
5.00%, 12/01/23(b) | | | 113,572 | |
| | 200,000 | | | City of New York Public Improvements GO, Sub-Series F-3,
5.00%, 12/01/25(b) | | | 242,828 | |
| | 1,500,000 | | | City of New York Public Improvements GO, Sub-Series H-A,
5.00%, 01/01/25(b) | | | 1,768,290 | |
| | 1,325,000 | | | City of New York Public Improvements GO, Sub-Series I-1,
5.00%, 03/01/25 | | | 1,504,908 | |
| Old Westbury Funds, Inc. | |
| New York Municipal Bond Fund | |
| Portfolio of Investments - (Continued) | October 31, 2020 |
Principal
Amount | | | | | Value | |
| New York (continued) | | | | |
| $ | 3,000,000 | | | City of New York Public Improvements GO, Sub-Series I-1,
5.00%, 03/01/26 | | | 3,406,260 | |
| | 275,000 | | | City of New York Refunding Cash Flow Management GO Notes, Series 1,
5.00%, 08/01/22(b) | | | 296,717 | |
| | 300,000 | | | City of New York Refunding GO, Series B,
5.00%, 08/01/25 | | | 360,543 | |
| | 400,000 | | | City of New York Refunding GO, Series C,
5.00%, 08/01/27 | | | 481,580 | |
| | 200,000 | | | City of New York Refunding GO, Series D,
5.00%, 08/01/22 | | | 215,794 | |
| | 100,000 | | | City of New York Refunding GO, Series F,
5.00%, 08/01/29 | | | 105,196 | |
| | 10,410,000 | | | City of New York Refunding GO, Series F,
5.00%, 08/01/30 | | | 10,949,550 | |
| | 1,035,000 | | | City of New York Refunding GO, Series H,
5.00%, 08/01/22 | | | 1,116,734 | |
| | 500,000 | | | City of New York Refunding GO, Series J,
5.00%, 08/01/25 | | | 556,695 | |
| | 150,000 | | | City of New York Refunding GO, Series J,
5.00%, 08/01/22 | | | 161,845 | |
| | 325,000 | | | City of New York Refunding GO, Series J,
5.00%, 08/01/24 | | | 378,102 | |
| | 100,000 | | | City of New York Refunding GO, Sub-Series H-3,
5.00%, 08/01/23(b) | | | 112,124 | |
| | 350,000 | | | County of Westchester NY Recreation Facilities Improvements GO, Series A,
5.00%, 07/01/21 | | | 361,046 | |
| | 350,000 | | | County of Westchester NY Recreation Facilities Improvements GO, Series A,
5.00%, 07/01/22 | | | 377,664 | |
| | 100,000 | | | County of Westchester NY Recreation Facilities Improvements GO, Series A,
5.00%, 07/01/23 | | | 112,554 | |
Principal
Amount | | | | | Value | |
| New York (continued) | | | | |
| $ | 110,000 | | | County of Westchester NY Sewer Improvements GO, Series C,
5.00%, 07/01/22 | | | 118,694 | |
| | 375,000 | | | Erie County Fiscal Stability Authority Advance Refunding Revenue Bonds,
5.00%, 09/01/22 | | | 407,749 | |
| | 150,000 | | | Erie County Fiscal Stability Authority Public Improvements Revenue Bonds, Series A,
5.00%, 03/15/22 | | | 159,779 | |
| | 300,000 | | | Erie County Industrial Development Agency (The) City School District of the City of Buffalo Project Advance Refunding Revenue Bonds, (State Aid Withholding),
5.00%, 05/01/23 | | | 333,810 | |
| | 125,000 | | | Erie County Industrial Development Agency (The) City School District of the City of Buffalo Project Advance Refunding Revenue Bonds, (State Aid Withholding),
5.00%, 05/01/24 | | | 144,620 | |
| | 100,000 | | | Erie County Industrial Development Agency (The) Refunding Revenue Bonds, (State Aid Withholding),
5.00%, 05/01/21 | | | 102,341 | |
| | 100,000 | | | Erie County Industrial Development Agency (The) School Improvements City School District of the City of Buffalo Project Revenue Bonds, (State Aid Withholding),
5.00%, 05/01/22 | | | 102,341 | |
| | 1,200,000 | | | Long Island Power Authority Electric Light & Power Improvements Revenue Bonds,
5.00%, 09/01/35 | | | 1,503,312 | |
| | 500,000 | | | Long Island Power Authority Electric System General Revenue Bonds,
5.00%, 09/01/25 | | | 610,245 | |
| | 4,000,000 | | | Long Island Power Authority Refunding Revenue Bonds, Series B,
5.00%, 09/01/25 | | | 4,309,920 | |
| | 2,000,000 | | | Metropolitan Transportation Authority Advance Refunding Revenue Bonds, Series A,
5.00%, 11/15/26 | | | 2,402,780 | |
| Old Westbury Funds, Inc. | |
| New York Municipal Bond Fund | |
| Portfolio of Investments - (Continued) | October 31, 2020 |
Principal
Amount | | | | | Value | |
| New York (continued) | | | | |
| $ | 900,000 | | | Metropolitan Transportation Authority Advance Refunding Revenue Bonds, Series B,
5.00%, 11/15/25 | | | 962,226 | |
| | 125,000 | | | Metropolitan Transportation Authority Advance Refunding Revenue Bonds, Series D,
5.00%, 11/15/24 | | | 132,139 | |
| | 100,000 | | | Metropolitan Transportation Authority Advance Refunding Revenue Bonds, Series F,
5.00%, 11/15/23 | | | 104,427 | |
| | 700,000 | | | Metropolitan Transportation Authority Current Refunding Revenue Bonds, Series D,
5.00%, 11/15/23 | | | 721,119 | |
| | 2,225,000 | | | Metropolitan Transportation Authority Current Refunding Revenue Bonds, Series D,
5.00%, 11/15/28 | | | 2,284,341 | |
| | 205,000 | | | Metropolitan Transportation Authority Current Refunding Revenue Bonds, Series F,
5.00%, 11/15/25 | | | 211,023 | |
| | 1,500,000 | | | Metropolitan Transportation Authority Current Refunding Revenue Bonds, Series F,
5.00%, 11/15/30 | | | 1,538,865 | |
| | 370,000 | | | Metropolitan Transportation Authority Green Bond Refunding Revenue Bonds,
5.00%, 11/15/26 | | | 399,715 | |
| | 1,500,000 | | | Metropolitan Transportation Authority Green Bond Refunding Revenue Bonds,
5.00%, 11/15/48(a) | | | 1,567,275 | |
| | 150,000 | | | Metropolitan Transportation Authority Green Bond Refunding Revenue Bonds, Series A2,
5.00%, 11/15/25 | | | 160,371 | |
| | 2,570,000 | | | Metropolitan Transportation Authority Green Bond Revenue Bonds,
5.00%, 11/15/23 | | | 2,859,896 | |
| | 250,000 | | | Metropolitan Transportation Authority Green Bond Revenue Bonds,
5.00%, 11/15/27 | | | 305,775 | |
| | 250,000 | | | Metropolitan Transportation Authority Green Bond Revenue Bonds, Series C-1,
5.00%, 11/15/23 | | | 261,068 | |
Principal
Amount | | | | | Value | |
| New York (continued) | | | | |
| $ | 375,000 | | | Metropolitan Transportation Authority Green Bond Revenue Bonds, Sub-Series B-2,
5.00%, 11/15/26 | | | 450,521 | |
| | 150,000 | | | Metropolitan Transportation Authority Prerefunded Transit Improvements Revenue Bonds, Series C,
5.00%, 11/15/25(c) | | | 177,977 | |
| | 1,600,000 | | | Metropolitan Transportation Authority Refunding Revenue Bonds, Series A,
5.00%, 11/15/25 | | | 1,717,072 | |
| | 2,500,000 | | | Metropolitan Transportation Authority Refunding Revenue Bonds, Series A,
5.00%, 11/15/29 | | | 2,659,850 | |
| | 525,000 | | | Metropolitan Transportation Authority Refunding Revenue Bonds, Series A-2,
5.00%, 11/15/48(a) | | | 544,782 | |
| | 2,500,000 | | | Metropolitan Transportation Authority Refunding Revenue Bonds, Series B-1,
5.00%, 11/15/29(b) | | | 2,734,850 | |
| | 100,000 | | | Metropolitan Transportation Authority Refunding Revenue Bonds, Series D-1,
5.00%, 11/01/23(b) | | | 102,963 | |
| | 8,000,000 | | | Metropolitan Transportation Authority Refunding Revenue Bonds, Series D-1,
5.00%, 11/01/27(b) | | | 8,219,920 | |
| | 150,000 | | | Metropolitan Transportation Authority Transit Improvements Revenue Bonds, Series B,
5.00%, 11/15/20 | | | 150,146 | |
| | 100,000 | | | Metropolitan Transportation Authority Transit Improvements Revenue Bonds, Series C,
5.00%, 11/15/22 | | | 103,059 | |
| | 150,000 | | | Metropolitan Transportation Authority Transit Improvements Revenue Bonds, Sub-Series A-1,
5.00%, 11/15/25 | | | 159,420 | |
| | 375,000 | | | Metropolitan Transportation Authority Transportation Green Bond Advance Refunding Revenue Bonds,
5.00%, 11/15/22 | | | 386,471 | |
| Old Westbury Funds, Inc. | |
| New York Municipal Bond Fund | |
| Portfolio of Investments - (Continued) | October 31, 2020 |
Principal
Amount | | | | | Value | |
| New York (continued) | | | | |
| $ | 600,000 | | | Metropolitan Transportation Authority Transportation Green Bond Advance Refunding Revenue Bonds,
5.00%, 11/15/23 | | | 626,562 | |
| | 100,000 | | | Metropolitan Transportation Authority Transportation Green Bond Advance Refunding Revenue Bonds,
5.00%, 11/15/26 | | | 108,031 | |
| | 100,000 | | | Monroe County Industrial Development Agency School Improvements Revenue Bonds, (State Aid Withholding),
5.00%, 05/01/24 | | | 115,507 | |
| | 300,000 | | | Nassau County Sewer & Storm Water Finance Authority Refunding Revenue Bonds, Series A,
5.00%, 10/01/24 | | | 355,095 | |
| | 2,500,000 | | | New York City Housing Development Corp. Multi-Family Housing Revenue Bonds,
1.75%, 05/01/59(a) | | | 2,527,525 | |
| | 3,000,000 | | | New York City Housing Development Corp. Multi-Family Housing Revenue Bonds, Series L,
2.75%, 05/01/50(a) | | | 3,124,800 | |
| | 250,000 | | | New York City Transitional Finance Authority Building Aid Revenue Advance Refunding Revenue Bonds, Series S-1, (State Aid Withholding),
5.00%, 07/15/23 | | | 281,410 | |
| | 100,000 | | | New York City Transitional Finance Authority Building Aid Revenue Advance Refunding Revenue Bonds, Series S-1, (State Aid Withholding),
5.00%, 07/15/25 | | | 120,793 | |
| | 1,035,000 | | | New York City Transitional Finance Authority Building Aid Revenue Advance Refunding Revenue Bonds, Series S-1, (State Aid Withholding),
5.00%, 07/15/26 | | | 1,283,928 | |
Principal
Amount | | | | | Value | |
| New York (continued) | | | | |
| $ | 300,000 | | | New York City Transitional Finance Authority Building Aid Revenue Public Improvements Revenue Bonds, Series S, (State Aid Withholding),
5.00%, 07/15/23 | | | 337,692 | |
| | 100,000 | | | New York City Transitional Finance Authority Building Aid Revenue Public Improvements Revenue Bonds, Series S, (State Aid Withholding),
5.00%, 07/15/24 | | | 116,836 | |
| | 150,000 | | | New York City Transitional Finance Authority Building Aid Revenue Public Improvements Revenue Bonds, Series S-1, (State Aid Withholding),
5.00%, 07/15/25 | | | 178,641 | |
| | 125,000 | | | New York City Transitional Finance Authority Building Aid Revenue Public Improvements Revenue Bonds, Series S-1, (State Aid Withholding),
5.00%, 07/15/26 | | | 152,463 | |
| | 8,000,000 | | | New York City Transitional Finance Authority Building Aid Revenue Public Improvements Revenue Bonds, Series S-1, (State Aid Withholding),
5.00%, 07/15/28 | | | 8,604,000 | |
| | 1,075,000 | | | New York City Transitional Finance Authority Building Aid Revenue Refunding Revenue Bonds, Sub-Series S-2A, (State Aid Withholding),
5.00%, 07/15/25 | | | 1,298,525 | |
| | 125,000 | | | New York City Transitional Finance Authority Building Aid Revenue Refunding Revenue Bonds, Sub-Series S-3A, (State Aid Withholding),
5.00%, 07/15/23 | | | 140,705 | |
| | 250,000 | | | New York City Transitional Finance Authority Building Aid Revenue Refunding Revenue Bonds, Sub-Series S-3A, (State Aid Withholding),
5.00%, 07/15/24 | | | 292,090 | |
| Old Westbury Funds, Inc. | |
| New York Municipal Bond Fund | |
| Portfolio of Investments - (Continued) | October 31, 2020 |
Principal
Amount | | | | | Value | |
| New York (continued) | | | | |
| $ | 100,000 | | | New York City Transitional Finance Authority Building Aid Revenue Refunding Revenue Bonds, Sub-Series S-4A, (State Aid Withholding),
5.00%, 07/15/23 | | | 112,564 | |
| | 525,000 | | | New York City Transitional Finance Authority Building Aid Revenue Refunding Revenue Bonds, Sub-Series S-4A, (State Aid Withholding),
5.00%, 07/15/24 | | | 613,389 | |
| | 2,000,000 | | | New York City Transitional Finance Authority Building Aid Revenue Refunding Revenue Bonds, Sub-Series S-4A, (State Aid Withholding),
5.00%, 07/15/25 | | | 2,415,860 | |
| | 150,000 | | | New York City Transitional Finance Authority Building Aid Revenue Refunding Revenue Bonds, Sub-Series S-4A, (State Aid Withholding),
5.00%, 07/15/27 | | | 190,211 | |
| | 2,000,000 | | | New York City Transitional Finance Authority Building Aid Revenue School Improvements Revenue Bonds, Series S1, (State Aid Withholding),
5.00%, 07/15/30 | | | 2,660,400 | |
| | 1,000,000 | | | New York City Transitional Finance Authority Building Aid Revenue School Improvements Revenue Bonds, Series- S1, (State Aid Withholding),
5.00%, 07/15/22 | | | 1,079,280 | |
| | 330,000 | | | New York City Transitional Finance Authority Building Aid Revenue Unrefunded Advance Refunding Revenue Bonds, Series S-1, (State Aid Withholding),
5.00%, 07/15/22 | | | 356,162 | |
| | 475,000 | | | New York City Transitional Finance Authority Future Tax Secured Advance Refunding Revenue Bonds, Series C,
5.00%, 11/01/23 | | | 540,507 | |
Principal
Amount | | | | | Value | |
| New York (continued) | | | | |
| $ | 250,000 | | | New York City Transitional Finance Authority Future Tax Secured Advance Refunding Revenue Bonds, Series C,
5.00%, 11/01/24 | | | 295,005 | |
| | 100,000 | | | New York City Transitional Finance Authority Future Tax Secured Public Improvements Revenue Bonds,
5.00%, 08/01/23 | | | 112,650 | |
| | 4,375,000 | | | New York City Transitional Finance Authority Future Tax Secured Public Improvements Revenue Bonds,
5.00%, 08/01/24 | | | 5,114,681 | |
| | 3,000,000 | | | New York City Transitional Finance Authority Future Tax Secured Public Improvements Revenue Bonds,
5.00%, 02/01/30 | | | 3,722,040 | |
| | 225,000 | | | New York City Transitional Finance Authority Future Tax Secured Public Improvements Revenue Bonds, Sub-Series B-1,
5.00%, 08/01/26 | | | 278,609 | |
| | 150,000 | | | New York City Transitional Finance Authority Future Tax Secured Public Improvements Revenue Bonds, Sub-Series F-1,
5.00%, 05/01/23 | | | 167,262 | |
| | 200,000 | | | New York City Transitional Finance Authority Future Tax Secured Public Improvements Revenue Bonds, Sub-Series FI,
5.00%, 08/01/25 | | | 233,652 | |
| | 190,000 | | | New York City Transitional Finance Authority Future Tax Secured Public Improvements Revenue Bonds, Sub-Series FI,
5.00%, 08/01/29 | | | 220,430 | |
| | 2,650,000 | | | New York City Transitional Finance Authority Future Tax Secured Public Improvements Revenue Bonds, Sub-Series I,
5.00%, 05/01/26 | | | 2,950,748 | |
| | 100,000 | | | New York City Transitional Finance Authority Future Tax Secured Public Improvements Unrefunded Revenue Bonds,
5.00%, 11/01/25 | | | 115,734 | |
| Old Westbury Funds, Inc. | |
| New York Municipal Bond Fund | |
| Portfolio of Investments - (Continued) | October 31, 2020 |
Principal
Amount | | | | | Value | |
| New York (continued) | | | | |
| $ | 150,000 | | | New York City Transitional Finance Authority Future Tax Secured Refunding Revenue Bonds, Sub- Series B,
5.00%, 11/01/21 | | | 156,995 | |
| | 5,000,000 | | | New York City Transitional Finance Authority Future Tax Secured Refunding Revenue Bonds, Sub-Series C,
5.00%, 11/01/23 | | | 5,689,550 | |
| | 200,000 | | | New York City Transitional Finance Authority Future Tax Secured Revenue Public Improvements Revenue Bonds,
5.00%, 08/01/28 | | | 239,430 | |
| | 5,000,000 | | | New York City Transitional Finance Authority Future Tax Secured Revenue Public Improvements Revenue Bonds,
5.00%, 05/01/34 | | | 6,471,000 | |
| | 4,575,000 | | | New York City Transitional Finance Authority Future Tax Secured Revenue Public Improvements Revenue Bonds, Sub-Series B-1,
5.00%, 11/01/23 | | | 5,205,938 | |
| | 670,000 | | | New York City Transitional Finance Authority Future Tax Secured Revenue Refunding Revenue Bonds, Subseries C,
5.00%, 11/01/27 | | | 771,130 | |
| | 600,000 | | | New York City Transitional Finance Authority Public Improvements Revenue Bonds, Series C-1,
5.00%, 05/01/23 | | | 669,048 | |
| | 300,000 | | | New York City Transitional Finance Authority Public Improvements Revenue Bonds, Series C-1,
5.00%, 05/01/24 | | | 347,427 | |
| | 350,000 | | | New York City Transitional Finance Authority Public Improvements Revenue Bonds, Sub-Series B-1,
5.00%, 08/01/23 | | | 394,275 | |
| | 200,000 | | | New York City Water & Sewer System Current Refunding Revenue,
5.00%, 06/15/24 | | | 233,400 | |
| | 1,825,000 | | | New York City Water & Sewer System Current Refunding Revenue Bonds, Series AA,
5.00%, 06/15/26 | | | 2,272,125 | |
Principal
Amount | | | | | Value | |
| New York (continued) | | | | |
| $ | 2,000,000 | | | New York City Water & Sewer System Current Refunding Revenue Bonds, Series CC,
5.00%, 06/15/25 | | | 2,419,000 | |
| | 7,500,000 | | | New York City Water & Sewer System Refunding Revenue Bonds,
5.00%, 06/15/28 | | | 8,949,750 | |
| | 2,000,000 | | | New York City Water & Sewer System Refunding Revenue Bonds, Series DD-2,
5.00%, 06/15/25 | | | 2,289,500 | |
| | 150,000 | | | New York City Water & Sewer System Refunding Revenue Bonds, Series FF,
5.00%, 06/15/25 | | | 181,425 | |
| | 125,000 | | | New York City Water & Sewer System Refunding Revenue Bonds, Series GG,
5.00%, 06/15/25 | | | 151,188 | |
| | 2,000,000 | | | New York City Water & Sewer System Refunding Revenue Bonds, Series GG,
5.00%, 06/15/27 | | | 2,388,620 | |
| | 1,040,000 | | | New York City Water & Sewer System Refunding Revenue Bonds, Series HH,
5.00%, 06/15/31 | | | 1,069,630 | |
| | 450,000 | | | New York City Water & Sewer System Refunding Revenue Bonds, Sub-Series BB-2,
5.00%, 06/15/29 | | | 567,018 | |
| | 4,750,000 | | | New York City Water & Sewer System Water Utility Improvements Revenue Bonds, Series BB-2,
5.00%, 06/15/25 | | | 5,437,563 | |
| | 3,900,000 | | | New York City Water & Sewer System Water Utility Improvements Revenue Bonds, Series GG-2,
5.00%, 06/15/26 | | | 4,592,367 | |
| | 1,500,000 | | | New York City Water & Sewer System Water Utility Improvements Revenue Bonds, Subseries FF-1,
5.00%, 06/15/49 | | | 1,838,805 | |
| | 6,170,000 | | | New York State Dormitory Authority Advance Refunding Revenue Bonds,
5.00%, 02/15/25 | | | 7,321,384 | |
| Old Westbury Funds, Inc. | |
| New York Municipal Bond Fund | |
| Portfolio of Investments - (Continued) | October 31, 2020 |
Principal
Amount | | | | | Value | |
| New York (continued) | | | | |
| $ | 360,000 | | | New York State Dormitory Authority Advance Refunding Revenue Bonds,
5.00%, 02/15/28 | | | 450,331 | |
| | 390,000 | | | New York State Dormitory Authority Advance Refunding Revenue Bonds,
5.00%, 07/01/23 | | | 433,996 | |
| | 255,000 | | | New York State Dormitory Authority Advance Refunding Revenue Bonds, Series A,
5.00%, 03/15/22 | | | 271,261 | |
| | 150,000 | | | New York State Dormitory Authority Advance Refunding Revenue Bonds, Series A,
5.00%, 07/01/22 | | | 161,751 | |
| | 500,000 | | | New York State Dormitory Authority Advance Refunding Revenue Bonds, Series A,
5.00%, 07/01/24 | | | 586,295 | |
| | 1,000,000 | | | New York State Dormitory Authority Advance Refunding Revenue Bonds, Series A,
5.00%, 07/01/26 | | | 1,253,430 | |
| | 100,000 | | | New York State Dormitory Authority Advance Refunding Revenue Bonds, Series D,
5.00%, 02/15/24 | | | 114,880 | |
| | 600,000 | | | New York State Dormitory Authority Advance Refunding Revenue Bonds, Series D,
5.00%, 02/15/28 | | | 736,014 | |
| | 525,000 | | | New York State Dormitory Authority Advance Refunding Revenue Bonds, Series E,
5.00%, 03/15/24 | | | 605,052 | |
| | 1,600,000 | | | New York State Dormitory Authority Advance Refunding Revenue Bonds, Series E,
5.00%, 03/15/25 | | | 1,903,952 | |
| | 5,000,000 | | | New York State Dormitory Authority Current Refunding Revenue Bonds, Series A,
5.00%, 07/01/50 | | | 6,340,400 | |
| | 1,575,000 | | | New York State Dormitory Authority Current Refunding Revenue Bonds, Series A-2,
5.00%, 07/01/30 | | | 2,151,088 | |
Principal
Amount | | | | | Value | |
| New York (continued) | | | | |
| $ | 650,000 | | | New York State Dormitory Authority Green Bond Revenue Bonds,
5.00%, 07/01/24 | | | 762,184 | |
| | 100,000 | | | New York State Dormitory Authority Master BOCES Program Advance Refunding Revenue Bonds, (State Appropriation),
5.00%, 08/15/27 | | | 124,197 | |
| | 3,765,000 | | | New York State Dormitory Authority Public Improvement Revenue Bonds, Series E,
5.00%, 02/15/26 | | | 4,449,590 | |
| | 1,455,000 | | | New York State Dormitory Authority Public Improvement Revenue Bonds, Series E,
5.00%, 02/15/30 | | | 1,698,756 | |
| | 125,000 | | | New York State Dormitory Authority Public Improvements Revenue Bonds, Series 2015B-A,
5.00%, 03/15/24 | | | 144,060 | |
| | 150,000 | | | New York State Dormitory Authority Public Improvements Revenue Bonds, Series 2015B-B,
5.00%, 03/15/26 | | | 182,186 | |
| | 10,335,000 | | | New York State Dormitory Authority Public Improvements Revenue Bonds, Series 2015B-B,
5.00%, 03/15/29 | | | 12,365,517 | |
| | 2,000,000 | | | New York State Dormitory Authority Public Improvements Revenue Bonds, Series A,
5.00%, 03/15/24 | | | 2,304,960 | |
| | 100,000 | | | New York State Dormitory Authority Public Improvements Revenue Bonds, Series A,
5.00%, 03/15/26 | | | 122,712 | |
| | 230,000 | | | New York State Dormitory Authority Public Improvements Revenue Bonds, Series A,
5.00%, 03/15/27 | | | 286,069 | |
| | 350,000 | | | New York State Dormitory Authority Public Improvements Revenue Bonds, Series B,
5.00%, 02/15/25 | | | 415,314 | |
| | 500,000 | | | New York State Dormitory Authority Public Improvements Revenue Bonds, Series B,
5.00%, 02/15/30 | | | 583,765 | |
| Old Westbury Funds, Inc. | |
| New York Municipal Bond Fund | |
| Portfolio of Investments - (Continued) | October 31, 2020 |
Principal
Amount | | | | | Value | |
| New York (continued) | | | | |
| $ | 100,000 | | | New York State Dormitory Authority Public Improvements Revenue Bonds, Series B,
5.00%, 02/15/26 | | | 122,157 | |
| | 125,000 | | | New York State Dormitory Authority Public Improvements Revenue Bonds, Series B,
5.00%, 02/15/27 | | | 155,851 | |
| | 5,000,000 | | | New York State Dormitory Authority Public Improvements Revenue Bonds, Series B,
5.00%, 02/15/28 | | | 5,869,800 | |
| | 100,000 | | | New York State Dormitory Authority Refunding Revenue Bonds, Series 1, (State Aid Withholding),
5.00%, 01/15/23 | | | 109,119 | |
| | 200,000 | | | New York State Dormitory Authority Refunding Revenue Bonds, Series 1, (State Aid Withholding),
5.00%, 01/15/25 | | | 233,542 | |
| | 3,275,000 | | | New York State Dormitory Authority Refunding Revenue Bonds, Series 1, (State Aid Withholding),
5.00%, 01/15/27 | | | 4,016,427 | |
| | 1,925,000 | | | New York State Dormitory Authority Refunding Revenue Bonds, Series A,
5.00%, 02/15/25 | | | 2,207,301 | |
| | 3,000,000 | | | New York State Dormitory Authority Refunding Revenue Bonds, Series A,
5.00%, 07/01/24 | | | 3,342,840 | |
| | 1,600,000 | | | New York State Dormitory Authority Refunding Revenue Bonds, Series A,
5.00%, 07/01/26(c) | | | 1,801,904 | |
| | 5,500,000 | | | New York State Dormitory Authority Refunding Revenue Bonds, Series A,
5.00%, 07/01/29 | | | 6,452,105 | |
| | 125,000 | | | New York State Dormitory Authority Refunding Revenue Bonds, Series A,
5.00%, 12/15/22 | | | 137,140 | |
| | 150,000 | | | New York State Dormitory Authority Refunding Revenue Bonds, Series A,
5.00%, 12/15/24 | | | 164,433 | |
Principal
Amount | | | | | Value | |
| New York (continued) | | | | |
| $ | 1,025,000 | | | New York State Dormitory Authority Refunding Revenue Bonds, Series A,
5.00%, 02/15/26 | | | 1,173,871 | |
| | 4,765,000 | | | New York State Dormitory Authority Refunding Revenue Bonds, Series A,
5.00%, 12/15/29 | | | 5,190,657 | |
| | 350,000 | | | New York State Dormitory Authority Refunding Revenue Bonds, Series C,
5.00%, 03/15/25 | | | 402,594 | |
| | 400,000 | | | New York State Dormitory Authority Refunding Revenue Bonds, Series E,
5.00%, 02/15/24 | | | 459,520 | |
| | 350,000 | | | New York State Dormitory Authority School Improvements Bidding Group 1 Revenue Bonds, Series C,
5.00%, 03/15/23 | | | 387,972 | |
| | 625,000 | | | New York State Dormitory Authority School Improvements Bidding Group 2 Unrefunded Refunding Revenue Bonds,
5.00%, 03/15/24 | | | 720,300 | |
| | 125,000 | | | New York State Dormitory Authority School Improvements Group 1 Revenue Bonds, Series A,
5.00%, 03/15/24 | | | 144,060 | |
| | 125,000 | | | New York State Dormitory Authority School Improvements Group 1 Revenue Bonds, Series A,
5.00%, 03/15/27 | | | 156,869 | |
| | 8,050,000 | | | New York State Dormitory Authority School Improvements Group 1 Revenue Bonds, Series A,
5.00%, 03/15/27 | | | 10,057,107 | |
| | 100,000 | | | New York State Dormitory Authority School Improvements Group 1 Revenue Bonds, Series E,
5.00%, 03/15/23 | | | 110,849 | |
| | 2,500,000 | | | New York State Dormitory Authority School Improvements Income Tax Revenue Bonds, Series A,
5.00%, 02/15/28 | | | 3,066,725 | |
| | 5,420,000 | | | New York State Dormitory Authority School Improvements Revenue Bonds, Series A,
5.00%, 03/15/23 | | | 6,006,661 | |
| Old Westbury Funds, Inc. | |
| New York Municipal Bond Fund | |
| Portfolio of Investments - (Continued) | October 31, 2020 |
Principal
Amount | | | | | Value | |
| New York (continued) | | | | |
| $ | 1,305,000 | | | New York State Dormitory Authority School Improvements Revenue Bonds, Series A,
5.00%, 03/15/24 | | | 1,503,986 | |
| | 425,000 | | | New York State Dormitory Authority School Improvements Revenue Bonds, Series A,
5.00%, 02/15/26 | | | 519,167 | |
| | 355,000 | | | New York State Dormitory Authority Third Generation Resolution State Universal Refunding Revenue Bonds,
5.00%, 05/15/24 | | | 378,018 | |
| | 150,000 | | | New York State Dormitory Authority University and College Improvements Revenue Bonds, Series A,
5.00%, 07/01/22 | | | 161,829 | |
| | 140,000 | | | New York State Dormitory Authority University and College Improvements Revenue Bonds, Series A,
5.00%, 07/01/24 | | | 163,159 | |
| | 100,000 | | | New York State Dormitory Authority University and College Improvements Revenue Bonds, Series A,
5.00%, 07/01/25 | | | 120,521 | |
| | 2,525,000 | | | New York State Dormitory Authority University and College Improvements Revenue Bonds, Series A,
5.00%, 07/01/25 | | | 3,043,155 | |
| | 1,025,000 | | | New York State Dormitory Authority University and College Improvements Revenue Bonds, Series A,
5.00%, 03/15/26 | | | 1,172,364 | |
| | 1,750,000 | | | New York State Dormitory Authority University and College Improvements Revenue Bonds, Series A,
5.00%, 07/01/26 | | | 2,169,178 | |
| | 200,000 | | | New York State Dormitory Authority University of New York Dormitory Facilities Student Housing Revenue Bonds, Series A,
5.00%, 07/01/22 | | | 215,668 | |
Principal
Amount | | | | | Value | |
| New York (continued) | | | | |
| $ | 145,000 | | | New York State Dormitory Authority Unrefunded Refunding Revenue Bonds,
5.00%, 07/01/21 | | | 145,310 | |
| | 150,000 | | | New York State Dormitory Authority Unrefunded Refunding Revenue Bonds,
5.00%, 08/15/23 | | | 150,321 | |
| | 100,000 | | | New York State Environmental Facilities Corp. Green Bond Revenue Bonds,
5.00%, 03/15/23 | | | 111,099 | |
| | 100,000 | | | New York State Environmental Facilities Corp. Green Bond Revenue Bonds, Series C,
5.00%, 02/15/27 | | | 127,093 | |
| | 175,000 | | | New York State Environmental Facilities Corp. Refunding Revenue Bonds,
5.00%, 06/15/22 | | | 188,491 | |
| | 100,000 | | | New York State Environmental Facilities Corp. Refunding Revenue Bonds,
5.00%, 06/15/22 | | | 107,709 | |
| | 475,000 | | | New York State Environmental Facilities Corp. Refunding Revenue Bonds,
5.00%, 06/15/27 | | | 531,520 | |
| | 6,250,000 | | | New York State Environmental Facilities Corp. Refunding Revenue Bonds,
5.00%, 06/15/28 | | | 7,249,625 | |
| | 100,000 | | | New York State Environmental Facilities Corp. Refunding Revenue Bonds, Series A,
5.00%, 06/15/22 | | | 107,709 | |
| | 275,000 | | | New York State Environmental Facilities Corp. Refunding Revenue Bonds, Series A,
5.00%, 06/15/24 | | | 321,250 | |
| | 125,000 | | | New York State Environmental Facilities Corp. Refunding Revenue Bonds, Sub-Series A,
5.00%, 06/15/21 | | | 128,695 | |
| | 1,485,000 | | | New York State Environmental Facilities Corp. Refunding Revenue Bonds, Sub-Series A,
5.00%, 06/15/24 | | | 1,597,949 | |
| Old Westbury Funds, Inc. | |
| New York Municipal Bond Fund | |
| Portfolio of Investments - (Continued) | October 31, 2020 |
Principal
Amount | | | | | Value | |
| New York (continued) | | | | |
| $ | 1,000,000 | | | New York State Environmental Facilities Corp. Water Utility Improvements Revenue Bonds,
5.00%, 06/15/36 | | | 1,292,050 | |
| | 3,000,000 | | | New York State Environmental Facilities Corp. Water Utility Improvements Revenue Bonds,
5.00%, 06/15/23 | | | 3,367,860 | |
| | 550,000 | | | New York State Environmental Facilities Corp. Water Utility Improvements Revenue Bonds,
5.00%, 06/15/24 | | | 642,499 | |
| | 4,240,000 | | | New York State Environmental Facilities Corp. Water Utility Improvements Revenue Bonds,
5.00%, 06/15/27 | | | 5,436,613 | |
| | 985,000 | | | New York State Environmental Facilities Corp. Water Utility Improvements Revenue Bonds,
5.00%, 06/15/24 | | | 1,150,657 | |
| | 100,000 | | | New York State Environmental Facilities Corp. Water Utility Improvements Revenue Bonds, Subordinated SRF Bonds,
5.00%, 06/15/23 | | | 112,262 | |
| | 605,000 | | | New York State Environmental Facilities Corp. Water Utility Improvements Revenue Bonds, Subordinated SRF Bonds,
5.00%, 06/15/24 | | | 706,749 | |
| | 100,000 | | | New York State Thruway Authority Advance Refunding Revenue Bonds, Series A,
5.00%, 03/15/22 | | | 106,377 | |
| | 375,000 | | | New York State Thruway Authority Current Refunding Revenue Bonds, Series L,
5.00%, 01/01/26 | | | 453,750 | |
| | 150,000 | | | New York State Thruway Authority Highway & Bridge Trust Fund Refunding Revenue Bonds, Series A,
5.00%, 04/01/23 | | | 160,035 | |
| | 895,000 | | | New York State Thruway Authority Refunding Revenue Bonds, Series I,
5.00%, 01/01/28(c) | | | 944,690 | |
Principal
Amount | | | | | Value | |
| New York (continued) | | | | |
| $ | 2,000,000 | | | New York State Thruway Authority Refunding Revenue Bonds, Series J,
5.00%, 01/01/27 | | | 2,261,080 | |
| | 375,000 | | | New York State Thruway Authority Refunding Revenue Bonds, Series K,
5.00%, 01/01/24 | | | 425,464 | |
| | 300,000 | | | New York State Thruway Authority Refunding Revenue Bonds, Series K,
5.00%, 01/01/26 | | | 352,980 | |
| | 250,000 | | | New York State Thruway Authority Refunding Revenue Bonds, Series L,
5.00%, 01/01/23 | | | 273,872 | |
| | 125,000 | | | New York State Thruway Authority Refunding Revenue Bonds, Series L,
5.00%, 01/01/24 | | | 141,821 | |
| | 200,000 | | | New York State Thruway Authority Refunding Revenue Bonds, Series L,
5.00%, 01/01/25 | | | 234,870 | |
| | 100,000 | | | New York State Thruway Authority Refunding Revenue Bonds, Series L,
5.00%, 01/01/27 | | | 123,738 | |
| | 300,000 | | | New York State Urban Development Corp Advance Refunding Revenue Bonds, Series A,
5.00%, 03/15/24 | | | 345,744 | |
| | 1,925,000 | | | New York State Urban Development Corp Advance Refunding Revenue Bonds, Series A,
5.00%, 03/15/27 | | | 2,347,788 | |
| | 5,000,000 | | | New York State Urban Development Corp. Civic Convention Center Revenue Bonds,
1.83%, 03/15/29 | | | 4,956,850 | |
| | 1,675,000 | | | New York State Urban Development Corp. Civic Convention Center Revenue Bonds, Series A,
5.00%, 03/15/29 | | | 2,176,813 | |
| | 1,000,000 | | | New York State Urban Development Corp. Civic Convention Center Revenue Bonds, Series A,
5.00%, 03/15/35 | | | 1,282,700 | |
| Old Westbury Funds, Inc. | |
| New York Municipal Bond Fund | |
| Portfolio of Investments - (Continued) | October 31, 2020 |
Principal
Amount | | | | | Value | |
| New York (continued) | | | | |
| $ | 1,000,000 | | | New York State Urban Development Corp. Economic Improvements Revenue Bonds,
5.00%, 03/15/27 | | | 1,254,950 | |
| | 4,000,000 | | | New York State Urban Development Corp. Economic Improvements Revenue Bonds,
5.00%, 03/15/28 | | | 5,110,560 | |
| | 5,000,000 | | | New York State Urban Development Corp. Economic Improvements Revenue Bonds,
5.00%, 03/15/29 | | | 6,497,950 | |
| | 4,500,000 | | | New York State Urban Development Corp. Economic Improvements Revenue Bonds,
5.00%, 03/15/31 | | | 5,928,705 | |
| | 4,500,000 | | | New York State Urban Development Corp. Economic Improvements Revenue Bonds,
5.00%, 03/15/32 | | | 5,878,440 | |
| | 425,000 | | | New York State Urban Development Corp. Personal Income Tax Advance Refunding Revenue Bonds, Series A,
5.00%, 03/15/22 | | | 452,102 | |
| | 100,000 | | | New York State Urban Development Corp. Personal Income Tax Advance Refunding Revenue Bonds, Series A,
5.00%, 03/15/23 | | | 110,849 | |
| | 1,050,000 | | | New York State Urban Development Corp. Personal Income Tax Advance Refunding Revenue Bonds, Series A,
5.00%, 03/15/26 | | | 1,289,096 | |
| | 1,920,000 | | | New York State Urban Development Corp. Personal Income Tax Advance Refunding Revenue Bonds, Series A,
5.00%, 03/15/28 | | | 2,340,557 | |
| | 200,000 | | | New York State Urban Development Corp. Personal Income Tax Economic Improvements Revenue Bonds, Series C,
5.00%, 03/15/23 | | | 221,698 | |
| | 225,000 | | | New York State Urban Development Corp. Personal Income Tax Refunding Revenue Bonds, Series A,
5.00%, 03/15/24 | | | 259,308 | |
Principal
Amount | | | | | Value | |
| New York (continued) | | | | |
| $ | 150,000 | | | New York State Urban Development Corp. State Personal Income Tax Advance Refunding Revenue Bonds,
5.00%, 03/15/22 | | | 159,565 | |
| | 100,000 | | | New York State Urban Development Corp. State Personal Income Tax Advance Refunding Revenue Bonds,
5.00%, 03/15/26 | | | 122,771 | |
| | 100,000 | | | New York State Urban Development Corp. State Personal Income Tax Advance Refunding Revenue Bonds,
5.00%, 03/15/27 | | | 125,495 | |
| | 200,000 | | | New York State Urban Development Corp. State Personal Income Tax Advance Refunding Revenue Bonds,
5.00%, 03/15/24 | | | 230,496 | |
| | 15,000,000 | | | New York State Urban Development Corp. State Personal Income Tax Advance Refunding Revenue Bonds,
5.00%, 03/15/26 | | | 17,178,150 | |
| | 150,000 | | | New York State Urban Development Corp. State Personal Income Tax Public Improvements Revenue Bonds, Series A,
5.00%, 03/15/23 | | | 152,614 | |
| | 400,000 | | | New York State Urban Development Corp. State Personal Income Tax Public Improvements Revenue Bonds, Series A,
4.00%, 03/15/24 | | | 405,160 | |
| | 175,000 | | | New York State Urban Development Corp. State Personal Income Tax Public Improvements Revenue Bonds, Series E,
5.00%, 03/15/23 | | | 193,986 | |
| | 5,000,000 | | | New York State Urban Development Corp. State Personal Income Tax Public Improvements Revenue Bonds, Series E,
5.00%, 03/15/26 | | | 5,531,100 | |
| | 3,000,000 | | | New York State Urban Development Corp. State Personal Income Tax Public Improvements Revenue Bonds, Series E,
5.00%, 03/15/28 | | | 3,314,910 | |
| Old Westbury Funds, Inc. | |
| New York Municipal Bond Fund | |
| Portfolio of Investments - (Continued) | October 31, 2020 |
Principal
Amount | | | | | Value | |
| New York (continued) | | | | |
| $ | 2,000,000 | | | New York State Urban Development Corp. State Personal Income Tax Public Improvements Revenue Bonds, Series E,
5.00%, 03/15/29 | | | 2,209,440 | |
| | 1,190,000 | | | Port Authority of New York & New Jersey Consolidated Revenue Bonds,
5.00%, 09/01/25 | | | 1,432,748 | |
| | 2,085,000 | | | Port Authority of New York & New Jersey Consolidated Revenue Bonds, Series 189,
5.00%, 05/01/26 | | | 2,471,184 | |
| | 10,000,000 | | | Port Authority of New York & New Jersey Cash Flow Management Revenue Bonds, Series AAA,
1.09%, 07/01/23 | | | 10,113,400 | |
| | 175,000 | | | Port Authority of New York & New Jersey Consolidated Revenue Bonds,
5.00%, 12/15/26 | | | 200,951 | |
| | 2,250,000 | | | Port Authority of New York & New Jersey Consolidated Revenue Bonds,
5.00%, 09/01/34 | | | 2,552,265 | |
| | 100,000 | | | Port Authority of New York & New Jersey Consolidated Revenue Bonds, Series 175,
5.00%, 12/01/22 | | | 109,443 | |
| | 150,000 | | | Port Authority of New York & New Jersey Consolidated Revenue Bonds, Series 189,
5.00%, 05/01/24 | | | 172,922 | |
| | 125,000 | | | Port Authority of New York & New Jersey Consolidated Revenue Bonds, Series 205,
5.00%, 11/15/22 | | | 136,552 | |
| | 2,885,000 | | | Port Authority of New York & New Jersey Refunding Revenue Bonds, Series 179,
5.00%, 12/01/25 | | | 3,259,502 | |
| | 800,000 | | | Port Authority of New York & New Jersey Refunding Revenue Bonds, Series 179,
5.00%, 12/01/27 | | | 900,976 | |
| | 5,000,000 | | | Port Authority of New York & New Jersey Refunding Revenue Bonds, Series 179,
5.00%, 12/01/28 | | | 5,611,600 | |
Principal
Amount | | | | | Value | |
| New York (continued) | | | | |
| $ | 300,000 | | | Port Authority of New York & New Jersey Revenue Bonds, Two Hundred Ninth Series,
5.00%, 07/15/22 | | | 323,196 | |
| | 100,000 | | | Port Authority of New York & New Jersey Revenue Bonds, Two Hundred Ninth Series,
5.00%, 07/15/23 | | | 112,073 | |
| | 325,000 | | | Port Authority of New York & New Jersey Revenue Bonds, Two Hundred Ninth Series,
5.00%, 07/15/24 | | | 377,491 | |
| | 125,000 | | | Sales Tax Asset Receivable Corp. Refunding Revenue Bonds, Series A,
5.00%, 10/15/23 | | | 142,421 | |
| | 475,000 | | | Sales Tax Asset Receivable Corp. Refunding Revenue Bonds, Series A,
5.00%, 10/15/24 | | | 563,074 | |
| | 5,150,000 | | | Sales Tax Asset Receivable Corp. Refunding Revenue Bonds, Series A,
5.00%, 10/15/30 | | | 6,031,731 | |
| | 8,195,000 | | | State of New York Current Refunding GO, Series B,
2.55%, 02/15/29 | | | 8,624,992 | |
| | 425,000 | | | State of New York Green GO, Series A,
5.00%, 02/15/22 | | | 451,019 | |
| | 100,000 | | | State of New York Green GO, Series A,
5.00%, 02/15/26 | | | 123,870 | |
| | 250,000 | | | State of New York Public Improvements GO, Series A,
5.00%, 03/01/24 | | | 277,483 | |
| | 1,000,000 | | | Syracuse Industrial Development Agency School Improvements Revenue Bonds, Series A, (State Aid Withholding),
4.00%, 05/01/33 | | | 1,169,960 | |
| | 1,915,000 | | | Syracuse Industrial Development Agency School Improvements Revenue Bonds, Series A, (State Aid Withholding),
4.00%, 05/01/34 | | | 2,230,343 | |
| | 1,000,000 | | | Syracuse Industrial Development Agency School Improvements Revenue Bonds, Series A, (State Aid Withholding),
4.00%, 05/01/35 | | | 1,159,770 | |
| Old Westbury Funds, Inc. | |
| New York Municipal Bond Fund | |
| Portfolio of Investments - (Continued) | October 31, 2020 |
Principal
Amount | | | | | Value | |
| New York (continued) | | | | |
| $ | 1,000,000 | | | Syracuse Industrial Development Agency School Improvements Revenue Bonds, Series A, (State Aid Withholding),
4.00%, 05/01/36 | | | 1,154,010 | |
| | 400,000 | | | Syracuse Industrial Development Agency Syracuse City School Improvements Revenue Bonds, Series A, (State Aid Withholding),
4.00%, 05/01/22 | | | 422,236 | |
| | 150,000 | | | Syracuse Industrial Development Agency Syracuse City School Improvements Revenue Bonds, Series A, (State Aid Withholding),
5.00%, 05/01/23 | | | 153,519 | |
| | 500,000 | | | Syracuse Industrial Development Agency Syracuse City School Improvements Revenue Bonds, Series A, (State Aid Withholding),
5.00%, 05/01/26 | | | 617,175 | |
| | 375,000 | | | Triborough Bridge & Tunnel Authority Advance Refunding Revenue Bonds, Series A,
5.00%, 11/15/24 | | | 439,665 | |
| | 3,715,000 | | | Triborough Bridge & Tunnel Authority Current Refunding Revenue Bonds, Sub-Series A,
5.00%, 11/15/25 | | | 4,107,341 | |
| | 475,000 | | | Triborough Bridge & Tunnel Authority Current Refunding Revenue Bonds, Sub-Series A,
5.00%, 11/15/26 | | | 524,405 | |
| | 1,050,000 | | | Triborough Bridge & Tunnel Authority Current Refunding Revenue Bonds, Sub-Series A,
5.00%, 11/15/27 | | | 1,158,927 | |
| | 1,575,000 | | | Triborough Bridge & Tunnel Authority Current Refunding Revenue Bonds, Sub-Series A,
5.00%, 11/15/29 | | | 1,737,556 | |
| | 100,000 | | | Triborough Bridge & Tunnel Authority Highway Improvements Revenue Bonds, Series A,
5.00%, 11/15/25 | | | 120,829 | |
| | 265,000 | | | Triborough Bridge & Tunnel Authority Highway Improvements Revenue Bonds, Series B,
5.00%, 11/15/23 | | | 300,030 | |
Principal
Amount | | | | | Value | |
| New York (continued) | | | | |
| $ | 435,000 | | | Triborough Bridge & Tunnel Authority Highway Improvements Revenue Bonds, Series B,
5.00%, 11/15/27 | | | 520,138 | |
| | 6,340,000 | | | Triborough Bridge & Tunnel Authority Highway Improvements Revenue Bonds, Series C,
5.00%, 11/15/29 | | | 7,023,072 | |
| | 1,500,000 | | | Triborough Bridge & Tunnel Authority Highway Improvements Revenue Bonds, Series C,
5.00%, 11/15/30 | | | 1,661,205 | |
| | 250,000 | | | Triborough Bridge & Tunnel Authority MTA Bridges & Tunnels Advance Refunding Revenue Bonds,
5.00%, 11/15/23 | | | 283,047 | |
| | 125,000 | | | Triborough Bridge & Tunnel Authority Prerefunded Highway Improvements Revenue Bonds, Series A,
5.00%, 11/15/25(c) | | | 151,496 | |
| | 250,000 | | | Triborough Bridge & Tunnel Authority Prerefunded Highway Improvements Revenue Bonds, Series C,
5.00%, 11/15/27(c) | | | 280,037 | |
| | 150,000 | | | Triborough Bridge & Tunnel Authority Refunding Revenue Bonds, Series B,
5.00%, 11/15/24 | | | 175,866 | |
| | 150,000 | | | Triborough Bridge & Tunnel Authority Refunding Revenue Bonds, Series B,
5.00%, 11/15/20 | | | 150,235 | |
| | 1,000,000 | | | Triborough Bridge & Tunnel Authority Refunding Revenue Bonds, Series B,
5.00%, 11/15/22 | | | 1,089,850 | |
| | 100,000 | | | Triborough Bridge & Tunnel Authority Refunding Revenue Bonds, Series B,
5.00%, 11/15/24 | | | 108,968 | |
| | 100,000 | | | Utility Debt Securitization Authority Refunding Revenue Bonds,
5.00%, 12/15/26 | | | 118,650 | |
| | 1,750,000 | | | Utility Debt Securitization Authority Refunding Revenue Bonds,
5.00%, 06/15/25 | | | 1,963,605 | |
| Old Westbury Funds, Inc. | |
| New York Municipal Bond Fund | |
| Portfolio of Investments - (Continued) | October 31, 2020 |
Principal
Amount | | | | | Value | |
| New York (continued) | | | | |
| $ | 1,500,000 | | | Utility Debt Securitization Authority Refunding Revenue Bonds, Series A,
5.00%, 06/15/26 | | | 1,746,960 | |
| | 1,080,000 | | | Utility Debt Securitization Authority Refunding Revenue Bonds, Series E,
5.00%, 12/15/28 | | | 1,231,621 | |
| | 8,720,000 | | | Utility Debt Securitization Authority Refunding Revenue Bonds, Series E,
5.00%, 12/15/29 | | | 9,941,323 | |
| | 2,750,000 | | | Utility Debt Securitization Authority Refunding Revenue Bonds, Series E,
5.00%, 12/15/30 | | | 3,134,230 | |
| | 5,290,000 | | | Utility Debt Securitization Authority Refunding Revenue Bonds, Series TE,
5.00%, 12/15/31 | | | 6,025,627 | |
| | | | | | | | | |
Total Municipal Bonds
(Cost $504,639,367) | | $ | 517,914,010 | |
| | | | | | | | | |
| CORPORATE BONDS — 1.8% | | | | |
| United States — 1.8% | | | | |
| | 4,500,000 | | | Andrew W Mellon Foundation (The), Series 2020,
0.95%, 08/01/27 | | | 4,384,539 | |
| | 6,000,000 | | | New York and Presbyterian Hospital (The),
1.65%, 08/01/30 | | | 5,952,736 | |
| | | | | | | | | |
Total Corporate Bonds
(Cost $10,500,000) | | | 10,337,275 | |
| | | | | | | | | |
| U.S. GOVERNMENT SECURITIES — 3.9% | | | | |
| U.S. Treasury Notes — 3.9% | | | | |
| | 14,500,000 | | | 1.63%, 02/15/26 | | | 15,408,516 | |
| | 7,000,000 | | | 2.00%, 02/15/25 | | | 7,500,937 | |
| | | | | | | | | |
Total U.S. Government Securities
(Cost $21,655,164) | | | 22,909,453 | |
| Shares | | | | | Value | |
| INVESTMENT COMPANY — 4.7% | | | | |
| | 27,397,460 | | | SEI Daily Income Trust Government II Fund - Class A, 0.01%(d) | | $ | 27,397,460 | |
Total Investment Company
(Cost $27,397,460) | | | 27,397,460 | |
TOTAL INVESTMENTS — 99.3%
(Cost $564,191,991) | | $ | 578,558,198 | |
| OTHER ASSETS IN EXCESS OF LIABILITIES — 0.7% | | | 3,942,109 | |
| NET ASSETS — 100.0% | | $ | 582,500,307 | |
| (a) | Variable or floating rate security, which interest rate adjusts periodically based on changes in current interest rates and prepayments on the underlying pool of assets. Rate shown is the rate in effect as of October 31, 2020. |
| (b) | These securities are subject to remarketing prior to its stated maturity, and is subject to mandatory redemption at the stated maturity date. |
| (c) | These securities are pre-refunded; the date shown represents the pre-refunded date. Bonds which are pre-refunded are collateralized by U.S. Government securities which are held in escrow and are used to pay principal and interest on the municipal issue and to retire the bonds in full at the earliest refunding date. |
| (d) | The rate shown represents the current yield as of October 31, 2020. |
The following abbreviation is used in the report:
GO — General Obligation
| Old Westbury Funds, Inc. | |
| Statements of Assets and Liabilities | |
| | October 31, 2020 |
| | | ALL CAP CORE
FUND | | ALL CAP
ESG
FUND | | SMALL & MID CAP
STRATEGIES
FUND | | LARGE CAP
STRATEGIES
FUND | |
| ASSETS: | | | | | | | | | | | | | | | | | | | | | |
| Investments, at fair value - unaffiliated | | | $ | 2,283,551,788 | | | | $ | 40,127,143 | | | | $ | 6,699,937,408 | | | | $ | 17,591,716,767 | | |
| Foreign currency, at value (Cost $0, $0, $1,475,417 and $0 respectively) | | | | — | | | | | — | | | | | 1,467,686 | | | | | — | | |
| Cash | | | | 1 | | | | | 1 | | | | | 57,168,273 | | | | | 2,433,752 | | |
| Dividends and interest receivable | | | | 947,478 | | | | | 106,747 | | | | | 6,108,653 | | | | | 21,911,148 | | |
| Receivable for Fund shares sold | | | | 336,754 | | | | | — | | | | | 977,450 | | | | | 4,259,538 | | |
| Receivable for investments sold | | | | 2,314,918 | | | | | — | | | | | 15,469,613 | | | | | 10,725,426 | | |
| Prepaid expenses | | | | 20,795 | | | | | 13,210 | | | | | 36,007 | | | | | 72,097 | | |
| Total Assets | | | | 2,287,171,734 | | | | | 40,247,101 | | | | | 6,781,165,090 | | | | | 17,631,118,728 | | |
| LIABILITIES: | | | | | | | | | | | | | | | | | | | | | |
| Payable for Fund shares redeemed | | | | 1,192,760 | | | | | — | | | | | 1,612,047 | | | | | 2,107,703 | | |
| Payable for investments purchased | | | | — | | | | | — | | | | | 7,548,716 | | | | | 1,709,082 | | |
| Accrued expenses and other payables: | | | | | | | | | | | | | | | | | | | | | |
| Investment advisory | | | | 1,377,578 | | | | | 20,413 | | | | | 4,718,773 | | | | | 12,537,734 | | |
| Administration | | | | 123,688 | | | | | 6,303 | | | | | 357,615 | | | | | 914,465 | | |
| Shareholder servicing fee | | | | 404,324 | | | | | 7,197 | | | | | 1,200,337 | | | | | 3,094,730 | | |
| Custody | | | | 33,537 | | | | | 1,003 | | | | | 48,196 | | | | | 370,281 | | |
| Directors | | | | 16,169 | | | | | 291 | | | | | 47,714 | | | | | 121,978 | | |
| Legal and Audit | | | | 65,703 | | | | | 14,407 | | | | | 203,788 | | | | | 424,351 | | |
| Other | | | | 52,301 | | | | | 5,896 | | | | | 185,329 | | | | | 305,206 | | |
| Total Liabilities | | | | 3,266,060 | | | | | 55,510 | | | | | 15,922,515 | | | | | 21,585,530 | | |
| NET ASSETS | | | $ | 2,283,905,674 | | | | $ | 40,191,591 | | | | $ | 6,765,242,575 | | | | $ | 17,609,533,198 | | |
| NET ASSETS consist of: | | | | | | | | | | | | | | | | | | | | | |
| Capital paid-in | | | $ | 1,451,572,291 | | | | $ | 40,132,982 | | | | $ | 5,458,025,652 | | | | $ | 12,979,607,379 | | |
| Total accumulated earnings | | | | 832,333,383 | | | | | 58,609 | | | | | 1,307,216,923 | | | | | 4,629,925,819 | | |
| NET ASSETS | | | $ | 2,283,905,674 | | | | $ | 40,191,591 | | | | $ | 6,765,242,575 | | | | $ | 17,609,533,198 | | |
| Net Asset Value, maximum offering price and redemption price per share | | | $ | 20.18 | | | | $ | 9.91 | | | | $ | 15.57 | | | | $ | 15.26 | | |
| Number of shares authorized | | | | 2,500,000,000 | | | | | 3,500,000,000 | | | | | 3,500,000,000 | | | | | 3,000,000,000 | | |
| SHARES OF CAPITAL STOCK OUTSTANDING | | | | 113,192,342 | | | | | 4,055,570 | | | | | 434,506,769 | | | | | 1,154,310,520 | | |
| INVESTMENTS, AT COST | | | $ | 1,524,765,661 | | | | $ | 39,007,453 | | | | $ | 5,623,528,686 | | | | $ | 13,183,069,409 | | |
See Notes to Financial Statements.
| Old Westbury Funds, Inc. | |
| Statements of Assets and Liabilities - (Continued) | |
| | October 31, 2020 |
| | | CREDIT
INCOME
FUND | |
| ASSETS: | | | | | |
| Investments, at fair value - unaffiliated | | $ | 1,951,789,296 | | |
| Cash | | | 48,063 | | |
| Due from broker for collateral | | | 320,000 | | |
| Interest receivable | | | 6,757,996 | | |
| Receivable for Fund shares sold | | | 4,339,058 | | |
| Receivable for investments sold | | | 580,674 | | |
| Prepaid expenses | | | 18,698 | | |
| Total Assets | | | 1,963,853,785 | | |
| LIABILITIES: | | | | | |
| Payable for Fund shares redeemed | | | 626,071 | | |
| Payable for investments purchased | | | 22,549,813 | | |
| Unrealized depreciation on swap contracts (Premium received $9,288) | | | 226,648 | | |
| Accrued expenses and other payables: | | | | | |
| Investment advisory | | | 716,437 | | |
| Administration | | | 68,406 | | |
| Shareholder servicing fee | | | 295,154 | | |
| Custody | | | 17,124 | | |
| Directors | | | 3,690 | | |
| Legal and Audit | | | 53,970 | | |
| Other | | | 97,525 | | |
| Total Liabilities | | | 24,654,838 | | |
| NET ASSETS | | $ | 1,939,198,947 | | |
| NET ASSETS consist of: | | | | | |
| Capital paid-in | | $ | 1,941,990,653 | | |
| Total accumulated loss | | | (2,791,706 | ) | |
| NET ASSETS | | $ | 1,939,198,947 | | |
| Net Asset Value, maximum offering price and redemption price per share | | $ | 9.99 | | |
| Number of shares authorized | | | 3,500,000,000 | | |
| SHARES OF CAPITAL STOCK OUTSTANDING | | | 194,209,757 | | |
| INVESTMENTS, AT COST | | $ | 1,962,392,886 | | |
See Notes to Financial Statements.
| Old Westbury Funds, Inc. | |
| Statements of Assets and Liabilities - (Continued) | |
| | October 31, 2020 |
| | | FIXED
INCOME
FUND | | MUNICIPAL
BOND
FUND | | CALIFORNIA
MUNICIPAL
BOND
FUND | | NEW YORK
MUNICIPAL
BOND
FUND |
| ASSETS: | | | | | | | | | | | | | | | | |
| Investments, at fair value - unaffiliated | | $ | 1,669,269,202 | | | $ | 4,242,861,262 | | | $ | 398,029,134 | | | $ | 578,558,198 | |
| Cash | | | 8,076 | | | | — | | | | — | | | | 1 | |
| Dividends and interest receivable | | | 9,749,109 | | | | 40,751,903 | | | | 4,126,197 | | | | 6,554,227 | |
| Receivable for Fund shares sold | | | 185,161 | | | | 5,357,816 | | | | 409,000 | | | | — | |
| Receivable for investments sold | | | — | | | | 19,178,962 | | | | — | | | | — | |
| Prepaid expenses | | | 18,475 | | | | 26,671 | | | | 14,374 | | | | 14,962 | |
| Total Assets | | | 1,679,230,023 | | | | 4,308,176,614 | | | | 402,578,705 | | | | 585,127,388 | |
| LIABILITIES: | | | | | | | | | | | | | | | | |
| Payable for Fund shares redeemed | | | 737,936 | | | | 3,127,682 | | | | 1,100 | | | | 2,319,922 | |
| Payable for investments purchased | | | 8,510,023 | | | | 101,182,877 | | | | 2,000,000 | | | | — | |
| Accrued expenses and other payables: | | | | | | | | | | | | | | | | |
| Investment advisory | | | 404,413 | | | | 1,012,655 | | | | 87,190 | | | | 132,996 | |
| Administration | | | 85,782 | | | | 209,663 | | | | 23,882 | | | | 32,708 | |
| Shareholder servicing fee | | | 283,527 | | | | 714,059 | | | | 68,212 | | | | 99,263 | |
| Custody | | | 21,265 | | | | 53,554 | | | | 5,116 | | | | 7,445 | |
| Directors | | | 11,656 | | | | 29,216 | | | | 2,820 | | | | 4,066 | |
| Legal and Audit | | | 52,099 | | | | 102,519 | | | | 18,019 | | | | 21,962 | |
| Other | | | 37,512 | | | | 105,213 | | | | 4,908 | | | | 8,719 | |
| Total Liabilities | | | 10,144,213 | | | | 106,537,438 | | | | 2,211,247 | | | | 2,627,081 | |
| NET ASSETS | | $ | 1,669,085,810 | | | $ | 4,201,639,176 | | | $ | 400,367,458 | | | $ | 582,500,307 | |
| NET ASSETS consist of: | | | | | | | | | | | | | | | | |
| Capital paid-in | | $ | 1,586,635,664 | | | $ | 4,038,573,581 | | | $ | 385,305,944 | | | $ | 563,696,039 | |
| Total accumulated earnings | | | 82,450,146 | | | | 163,065,595 | | | | 15,061,514 | | | | 18,804,268 | |
| NET ASSETS | | $ | 1,669,085,810 | | | $ | 4,201,639,176 | | | $ | 400,367,458 | | | $ | 582,500,307 | |
| Net Asset Value, maximum offering price and redemption price per share | | $ | 11.82 | | | $ | 12.52 | | | $ | 10.57 | | | $ | 10.55 | |
| Number of shares authorized | | | 2,000,000,000 | | | | 2,000,000,000 | | | | 2,000,000,000 | | | | 2,000,000,000 | |
| SHARES OF CAPITAL STOCK OUTSTANDING | | | 141,209,856 | | | | 335,597,071 | | | | 37,870,951 | | | | 55,199,361 | |
| INVESTMENTS, AT COST | | $ | 1,616,932,716 | | | $ | 4,105,651,134 | | | $ | 386,199,912 | | | $ | 564,191,991 | |
See Notes to Financial Statements.
| Old Westbury Funds, Inc. | |
| Statements of Operations | |
| | For the Year Ended October 31, 2020 |
| | | ALL CAP CORE
FUND | | ALL CAP
ESG
FUND | | SMALL & MID CAP
STRATEGIES
FUND | | LARGE CAP
STRATEGIES
FUND | |
| INVESTMENT INCOME: | | | | | | | | | | | | | | | | | | | | | |
| Interest | | | $ | — | | | | $ | — | | | | $ | 415,687 | | | | $ | 2,268,510 | | |
| Dividends | | | | 21,753,762 | | | | | 1,034,851 | | | | | 85,849,251 | | | | | 273,532,514 | | |
| Foreign tax withheld | | | | (30,613 | ) | | | | (55,207 | ) | | | | (4,392,348 | ) | | | | (9,301,698 | ) | |
| Total investment income | | | | 21,723,149 | | | | | 979,644 | | | | | 81,872,590 | | | | | 266,499,326 | | |
| EXPENSES: | | | | | | | | | | | | | | | | | | | | | |
| Investment advisory fees | | | | 13,931,002 | | | | | 291,407 | | | | | 54,233,033 | | | | | 136,374,141 | | |
| Shareholder servicing fees | | | | 4,055,693 | | | | | 77,708 | | | | | 12,760,714 | | | | | 33,624,785 | | |
| Administration and Accounting fees | | | | 933,926 | | | | | 42,236 | | | | | 2,884,303 | | | | | 7,558,116 | | |
| Custodian fees | | | | 353,182 | | | | | 13,448 | | | | | 1,825,611 | | | | | 4,613,444 | | |
| Directors fees and expenses | | | | 60,636 | | | | | 1,139 | | | | | 186,506 | | | | | 490,023 | | |
| Insurance premiums | | | | 19,194 | | | | | 13,430 | | | | | 33,834 | | | | | 69,168 | | |
| Legal and Audit fees | | | | 101,957 | | | | | 13,155 | | | | | 323,692 | | | | | 717,837 | | |
| Printing and postage fees | | | | 22,613 | | | | | 10,239 | | | | | 50,489 | | | | | 117,085 | | |
| Registration fees | | | | 39,684 | | | | | 23,412 | | | | | 56,011 | | | | | 52,349 | | |
| Transfer agent fees | | | | 200,630 | | | | | 15,635 | | | | | 603,049 | | | | | 1,566,340 | | |
| Miscellaneous expenses | | | | 21,869 | | | | | 18,906 | | | | | 430,322 | | | | | 104,913 | | |
| Total expenses | | | | 19,740,386 | | | | | 520,715 | | | | | 73,387,564 | | | | | 185,288,201 | | |
| Expenses waived by Advisor | | | | — | | | | | (132,173 | ) | | | | (2,565,603 | ) | | | | — | | |
| Net expenses | | | | 19,740,386 | | | | | 388,542 | | | | | 70,821,961 | | | | | 185,288,201 | | |
| NET INVESTMENT INCOME | | | | 1,982,763 | | | | | 591,102 | | | | | 11,050,629 | | | | | 81,211,125 | | |
| | | | | | | | | | | | | | | | | | | | | | |
| NET REALIZED AND CHANGE IN UNREALIZED GAIN/(LOSS) ON INVESTMENTS, FOREIGN CURRENCY TRANSACTIONS, NET OF FOREIGN TAXES: | | | | | | | | | | | | | | | | | | | | | |
| Net realized gain/(loss) on: | | | | | | | | | | | | | | | | | | | | | |
| Investments | | | | 80,158,705 | | | | | (153,862 | ) | | | | 264,200,433 | | | | | 211,195,804 | | |
| Forward foreign currency exchange contracts | | | | — | | | | | — | | | | | (69,310 | ) | | | | (360,514 | ) | |
| Foreign currency transactions | | | | (12,768 | ) | | | | (5,695 | ) | | | | (1,127,656 | ) | | | | (5,069,649 | ) | |
| Foreign capital gains tax | | | | — | | | | | — | | | | | (9 | ) | | | | (996,804 | ) | |
| Net change in unrealized appreciation/ (depreciation) on: | | | | | | | | | | | | | | | | | | | | | |
| Investments | | | | 299,945,664 | | | | | (965,505 | ) | | | | 180,521,457 | | | | | 830,230,387 | | |
| Foreign currency transactions | | | | (110 | ) | | | | 583 | | | | | 68,397 | | | | | 727,492 | | |
| Foreign deferred taxes on unrealized appreciation | | | | — | | | | | — | | | | | — | | | | | 2,601,509 | | |
| Net realized and change in unrealized gain/ (loss) on investments, foreign currency transactions, net of foreign taxes | | | | 380,091,491 | | | | | (1,124,479 | ) | | | | 443,593,312 | | | | | 1,038,328,225 | | |
| NET INCREASE/(DECREASE) IN NET ASSETS RESULTING FROM OPERATIONS | | | $ | 382,074,254 | | | | $ | (533,377 | ) | | | $ | 454,643,941 | | | | $ | 1,119,539,350 | | |
See Notes to Financial Statements.
| Old Westbury Funds, Inc. | |
| Statements of Operations - (Continued) | |
| | For the Year Ended October 31, 2020 |
| | | CREDIT
INCOME
FUND(a) | |
| INVESTMENT INCOME: | | | | | |
| Interest | | $ | 9,228,426 | | |
| Dividends | | | 34 | | |
| Total investment income | | | 9,228,460 | | |
| EXPENSES: | | | | | |
| Investment advisory fees | | | 873,150 | | |
| Shareholder servicing fees | | | 295,154 | | |
| Administration and Accounting fees | | | 68,405 | | |
| Custodian fees | | | 18,450 | | |
| Directors fees and expenses | | | 3,690 | | |
| Insurance premiums | | | 540 | | |
| Legal and Audit fees | | | 53,970 | | |
| Printing and postage fees | | | 3,420 | | |
| Registration fees | | | 73,758 | | |
| Transfer agent fees | | | 12,090 | | |
| Miscellaneous expenses | | | 8,490 | | |
| Total expenses | | | 1,411,117 | | |
| Expenses waived by Advisor | | | (156,712 | ) | |
| Net expenses | | | 1,254,405 | | |
| NET INVESTMENT INCOME | | | 7,974,055 | | |
| | | | | | |
| NET REALIZED AND CHANGE IN UNREALIZED GAIN/(LOSS) ON INVESTMENTS, FUTURES CONTRACTS, SWAP AGREEMENTS: | | | | | |
| Net realized gain/(loss) on: | | | | | |
| Investments | | | 22,894 | | |
| Futures contracts | | | 41,583 | | |
| Net change in unrealized (depreciation) on: | | | | | |
| Investments | | | (10,603,590 | ) | |
| Swap agreements | | | (226,648 | ) | |
| Net realized and change in unrealized gain/(loss) on investments, futures contracts, swap agreements | | | (10,765,761 | ) | |
| NET DECREASE IN NET ASSETS RESULTING FROM OPERATIONS | | $ | (2,791,706 | ) | |
| (a) | For the period from October 1, 2020 (commencement of operations) to October 31, 2020. |
See Notes to Financial Statements.
| Old Westbury Funds, Inc. | |
| Statements of Operations - (Continued) | |
| | For the Year Ended October 31, 2020 |
| | | FIXED
INCOME
FUND | | | MUNICIPAL
BOND
FUND | | CALIFORNIA
MUNICIPAL
BOND
FUND | | NEW YORK
MUNICIPAL
BOND
FUND |
| INVESTMENT INCOME: | | | | | | | | | | | | | | | | |
| Interest | | $ | 30,923,070 | | | $ | 69,560,453 | | | $ | 6,288,033 | | | $ | 9,222,052 | |
| Dividends | | | 74,078 | | | | 406,067 | | | | 30,665 | | | | 86,658 | |
| Total investment income | | | 30,997,148 | | | | 69,966,520 | | | | 6,318,698 | | | | 9,308,710 | |
| EXPENSES: | | | | | | | | | | | | | | | | |
| Investment advisory fees | | | 6,273,587 | | | | 14,511,363 | | | | 1,668,270 | | | | 2,445,880 | |
| Shareholder servicing fees | | | 3,156,336 | | | | 7,863,636 | | | | 741,453 | | | | 1,097,940 | |
| Administration and Accounting fees | | | 719,963 | | | | 1,756,400 | | | | 188,256 | | | | 266,747 | |
| Custodian fees | | | 236,725 | | | | 589,773 | | | | 55,609 | | | | 82,345 | |
| Directors fees and expenses | | | 46,855 | | | | 116,839 | | | | 11,119 | | | | 16,405 | |
| Insurance premiums | | | 18,343 | | | | 25,636 | | | | 14,430 | | | | 14,960 | |
| Legal and Audit fees | | | 73,148 | | | | 155,495 | | | | 22,684 | | | | 28,590 | |
| Printing and postage fees | | | 19,526 | | | | 36,396 | | | | 12,464 | | | | 13,678 | |
| Registration fees | | | 33,442 | | | | 61,885 | | | | 30,099 | | | | 29,378 | |
| Transfer agent fees | | | 158,886 | | | | 377,282 | | | | 46,467 | | | | 62,917 | |
| Miscellaneous expenses | | | 35,841 | | | | 117,208 | | | | 42,550 | | | | 48,367 | |
| Total expenses | | | 10,772,652 | | | | 25,611,913 | | | | 2,833,401 | | | | 4,107,207 | |
| Expenses waived by Advisor | | | (1,777,096 | ) | | | (3,200,551 | ) | | | (720,259 | ) | | | (978,078 | ) |
| Net expenses | | | 8,995,556 | | | | 22,411,362 | | | | 2,113,142 | | | | 3,129,129 | |
| NET INVESTMENT INCOME | | | 22,001,592 | | | | 47,555,158 | | | | 4,205,556 | | | | 6,179,581 | |
| | | | | | | | | | | | | | | | | |
| NET REALIZED AND CHANGE IN UNREALIZED GAIN/(LOSS) ON INVESTMENTS: | | | | | | | | | | | | | | | | |
| Net realized gain/(loss) on: | | | | | | | | | | | | | | | | |
| Investments | | | 42,920,519 | | | | 29,034,242 | | | | 2,818,592 | | | | 3,909,922 | |
| Net change in unrealized appreciation on: | | | | | | | | | | | | | | | | |
| Investments | | | 13,941,459 | | | | 49,604,957 | | | | 4,938,511 | | | | 3,998,762 | |
| Net realized and change in unrealized gain/ (loss) on investments | | | 56,861,978 | | | | 78,639,199 | | | | 7,757,103 | | | | 7,908,684 | |
| NET INCREASE IN NET ASSETS RESULTING FROM OPERATIONS | | $ | 78,863,570 | | | $ | 126,194,357 | | | $ | 11,962,659 | | | $ | 14,088,265 | |
See Notes to Financial Statements.
| Old Westbury Funds, Inc. | |
| Statements of Changes in Net Assets | |
| | |
| | | ALL CAP CORE FUND | |
| | | FOR THE YEAR
ENDED
OCTOBER 31, 2020 | | FOR THE YEAR
ENDED
OCTOBER 31, 2019 | |
| | | | | | | | | | | | |
| FROM OPERATIONS: | | | | | | | | | | | |
| Net investment income | | $ | | 1,982,763 | | | $ | | 9,407,157 | | |
| Net realized gain/(loss) on investments, foreign capital gains tax, foreign currency transactions | | | | 80,145,937 | | | | | 162,599,776 | | |
| Net change in unrealized appreciation/(depreciation) on investments, foreign currency transactions, net of foreign deferred taxes | | | | 299,945,554 | | | | | 105,646,605 | | |
| Net increase/(decrease) in net assets resulting from operations | | | | 382,074,254 | | | | | 277,653,538 | | |
| | | | | | | | | | | | |
| DISTRIBUTIONS TO SHAREHOLDERS FROM: | | | | | | | | | | | |
| Net investment income and net realized gains | | | | (158,030,798 | ) | | | | (81,538,163 | ) | |
| Total distributions to shareholders | | | | (158,030,798 | ) | | | | (81,538,163 | ) | |
| | | | | | | | | | | | |
| CAPITAL STOCK TRANSACTIONS (DOLLARS): | | | | | | | | | | | |
| Proceeds from sale of capital stock | | | | 486,652,689 | | | | | 259,037,010 | | |
| Reinvestment of distributions | | | | 102,617,948 | | | | | 51,355,652 | | |
| Value of capital stock redeemed | | | | (295,695,429 | ) | | | | (579,883,757 | ) | |
| Net increase/(decrease) in net assets resulting from capital stock transactions | | | | 293,575,208 | | | | | (269,491,095 | ) | |
| Net increase/(decrease) in net assets | | | | 517,618,664 | | | | | (73,375,720 | ) | |
| | | | | | | | | | | | |
| NET ASSETS: | | | | | | | | | | | |
| Beginning of year | | | | 1,766,287,010 | | | | | 1,839,662,730 | | |
| End of year | | $ | | 2,283,905,674 | | | $ | | 1,766,287,010 | | |
| | | | | | | | | | | | |
| CAPITAL SHARE TRANSACTIONS: | | | | | | | | | | | |
| Shares sold | | | | 29,839,413 | | | | | 15,277,193 | | |
| Shares issued as reinvestment of distributions | | | | 5,768,294 | | | | | 3,227,885 | | |
| Shares redeemed | | | | (16,180,914 | ) | | | | (32,475,341 | ) | |
| Net increase/(decrease) in shares outstanding | | | | 19,426,793 | | | | | (13,970,263 | ) | |
See Notes to Financial Statements.
| Old Westbury Funds, Inc. | |
| Statements of Changes in Net Assets - (Continued) | |
| | |
| ALL CAP ESG FUND | | SMALL & MID CAP STRATEGIES FUND | | LARGE CAP STRATEGIES FUND |
FOR THE YEAR
ENDED
OCTOBER 31, 2020 | | FOR THE YEAR
ENDED
OCTOBER 31, 2019 | | FOR THE YEAR
ENDED
OCTOBER 31, 2020 | | FOR THE YEAR
ENDED
OCTOBER 31, 2019 | | FOR THE YEAR
ENDED
OCTOBER 31, 2020 | | FOR THE YEAR
ENDED
OCTOBER 31, 2019 |
| | | | | | | | | | | | | | | | | | | | | | | | | | | | | |
| $ | | 591,102 | | | $ | | 796,599 | | | $ | | 11,050,629 | | | $ | | 34,440,518 | | | $ | | 81,211,125 | | | $ | | 151,940,694 | |
| | | | | | | | | | | | | | | | | | | | | | | | | | | | | |
| | | (159,557 | ) | | | | (730,555 | ) | | | | 263,003,458 | | | | | 283,364,055 | | | | | 204,768,837 | | | | | 740,802,959 | |
| | | | | | | | | | | | | | | | | | | | | | | | | | | | | |
| | | (964,922 | ) | | | | 3,086,993 | | | | | 180,589,854 | | | | | 131,693,194 | | | | | 833,559,388 | | | | | 1,086,161,287 | |
| | | (533,377 | ) | | | | 3,153,037 | | | | | 454,643,941 | | | | | 449,497,767 | | | | | 1,119,539,350 | | | | | 1,978,904,940 | |
| | | | | | | | | | | | | | | | | | | | | | | | | | | | | |
| | | (871,187 | ) | | | | (426,110 | ) | | | | (294,105,663 | ) | | | | (584,296,570 | ) | | | | (841,174,746 | ) | | | | (684,286,172 | ) |
| | | (871,187 | ) | | | | (426,110 | ) | | | | (294,105,663 | ) | | | | (584,296,570 | ) | | | | (841,174,746 | ) | | | | (684,286,172 | ) |
| | | | | | | | | | | | | | | | | | | | | | | | | | | | | |
| | | 7,027,796 | | | | | 5,732,538 | | | | | 1,067,779,413 | | | | | 1,632,309,102 | | | | | 1,940,470,637 | | | | | 1,890,886,896 | |
| | | 123,814 | | | | | 405,455 | | | | | 158,298,276 | | | | | 314,559,459 | | | | | 449,497,820 | | | | | 343,901,108 | |
| | | (4,130,224 | ) | | | | (292,723 | ) | | | | (899,814,445 | ) | | | | (1,756,120,763 | ) | | | | (2,060,679,178 | ) | | | | (3,026,676,067 | ) |
| | | 3,021,386 | | | | | 5,845,270 | | | | | 326,263,244 | | | | | 190,747,798 | | | | | 329,289,279 | | | | | (791,888,063 | ) |
| | | 1,616,822 | | | | | 8,572,197 | | | | | 486,801,522 | | | | | 55,948,995 | | | | | 607,653,883 | | | | | 502,730,705 | |
| | | | | | | | | | | | | | | | | | | | | | | | | | | | | |
| | | 38,574,769 | | | | | 30,002,572 | | | | | 6,278,441,053 | | | | | 6,222,492,058 | | | | | 17,001,879,315 | | | | | 16,499,148,610 | |
| $ | | 40,191,591 | | | $ | | 38,574,769 | | | $ | | 6,765,242,575 | | | $ | | 6,278,441,053 | | | $ | | 17,609,533,198 | | | $ | | 17,001,879,315 | |
| | | | | | | | | | | | | | | | | | | | | | | | | | | | | |
| | | 735,697 | | | | | 582,983 | | | | | 80,097,942 | | | | | 113,658,909 | | | | | 139,256,546 | | | | | 137,451,075 | |
| | | 11,860 | | | | | 43,785 | | | | | 10,245,843 | | | | | 24,346,707 | | | | | 30,745,405 | | | | | 26,211,975 | |
| | | (404,695 | ) | | | | (30,343 | ) | | | | (63,865,971 | ) | | | | (122,559,353 | ) | | | | (149,768,926 | ) | | | | (219,307,552 | ) |
| | | 342,862 | | | | | 596,425 | | | | | 26,477,814 | | | | | 15,446,263 | | | | | 20,233,025 | | | | | (55,644,502 | ) |
See Notes to Financial Statements.
| Old Westbury Funds, Inc. | |
| Statements of Changes in Net Assets - (Continued) | |
| | |
| | | CREDIT INCOME
FUND | | FIXED INCOME FUND |
| | | FOR THE PERIOD
ENDED
OCTOBER 31,
2020(a) | | FOR THE YEAR
ENDED
OCTOBER 31, 2020 | | FOR THE YEAR
ENDED
OCTOBER 31, 2019 |
| | | | | | | | | | | | | | | | |
| FROM OPERATIONS: | | | | | | | | | | | | | | | |
| Net investment income | | $ | | 7,974,055 | | | $ | | 22,001,592 | | | $ | | 22,816,474 | |
| Net realized gain on investments, futures contracts | | | | 64,477 | | | | | 42,920,519 | | | | | 11,941,711 | |
| Net change in unrealized appreciation/(depreciation) on investments, swap agreements | | | | (10,830,238 | ) | | | | 13,941,459 | | | | | 58,914,175 | |
| Net increase/(decrease) in net assets resulting from operations | | | | (2,791,706 | ) | | | | 78,863,570 | | | | | 93,672,360 | |
| | | | | | | | | | | | | | | | |
| DISTRIBUTIONS TO SHAREHOLDERS FROM: | | | | | | | | | | | | | | | |
| Net investment income and net realized gains | | | | — | | | | | (27,441,587 | ) | | | | (22,911,587 | ) |
| Total distributions to shareholders | | | | — | | | | | (27,441,587 | ) | | | | (22,911,587 | ) |
| | | | | | | | | | | | | | | | |
| CAPITAL STOCK TRANSACTIONS (DOLLARS): | | | | | | | | | | | | | | | |
| Proceeds from sale of capital stock | | | | 1,950,834,733 | | | | | 388,948,214 | | | | | 674,032,961 | |
| Reinvestment of distributions | | | | — | | | | | 16,254,462 | | | | | 13,001,267 | |
| Value of capital stock redeemed | | | | (8,844,080 | ) | | | | (280,356,378 | ) | | | | (130,007,266 | ) |
| Net increase in net assets resulting from capital stock transactions | | | | 1,941,990,653 | | | | | 124,846,298 | | | | | 557,026,962 | |
| Net increase in net assets | | | | 1,939,198,947 | | | | | 176,268,281 | | | | | 627,787,735 | |
| | | | | | | | | | | | | | | | |
| NET ASSETS: | | | | | | | | | | | | | | | |
| Beginning of period | | | | — | | | | | 1,492,817,529 | | | | | 865,029,794 | |
| End of period | | $ | | 1,939,198,947 | | | $ | | 1,669,085,810 | | | $ | | 1,492,817,529 | |
| | | | | | | | | | | | | | | | |
| CAPITAL SHARE TRANSACTIONS: | | | | | | | | | | | | | | | |
| Shares sold | | | | 195,093,897 | | | | | 33,141,790 | | | | | 60,698,953 | |
| Shares issued as reinvestment of distributions | | | | — | | | | | 1,391,381 | | | | | 1,167,782 | |
| Shares redeemed | | | | (884,140 | ) | | | | (23,950,896 | ) | | | | (11,723,314 | ) |
| Net increase in shares outstanding | | | | 194,209,757 | | | | | 10,582,275 | | | | | 50,143,421 | |
| (a) | For the period from October 1, 2020 (commencement of operations) to October 31, 2020. |
| (b) | For the period from December 4, 2018 (commencement of operations) to October 31, 2019. |
See Notes to Financial Statements.
| Old Westbury Funds, Inc. | |
| Statements of Changes in Net Assets - (Continued) | |
| | |
| MUNICIPAL BOND FUND | | CALIFORNIA MUNICIPAL BOND FUND | | NEW YORK MUNICIPAL BOND FUND |
FOR THE YEAR
ENDED
OCTOBER 31, 2020 | | FOR THE YEAR
ENDED
OCTOBER 31, 2019 | | FOR THE YEAR
ENDED
OCTOBER 31, 2020 | | FOR THE PERIOD
ENDED
OCTOBER 31,
2019(b) | | FOR THE YEAR
ENDED
OCTOBER 31, 2020 | | FOR THE PERIOD
ENDED
OCTOBER 31,
2019(b) |
| | | | | | | | | | | | | | | | | | | | | | | | | | | | | |
| $ | | 47,555,158 | | | $ | | 41,870,405 | | | $ | | 4,205,556 | | | $ | | 3,228,311 | | | $ | | 6,179,581 | | | $ | | 4,793,578 | |
| | | 29,034,242 | | | | | 531,984 | | | | | 2,818,592 | | | | | 725,434 | | | | | 3,909,922 | | | | | 1,413,792 | |
| | | | | | | | | | | | | | | | | | | | | | | | | | | | | |
| | | 49,604,957 | | | | | 132,116,431 | | | | | 4,938,511 | | | | | 6,890,711 | | | | | 3,998,762 | | | | | 10,367,445 | |
| | | 126,194,357 | | | | | 174,518,820 | | | | | 11,962,659 | | | | | 10,844,456 | | | | | 14,088,265 | | | | | 16,574,815 | |
| | | | | | | | | | | | | | | | | | | | | | | | | | | | | |
| | | (47,868,985 | ) | | | | (40,647,762 | ) | | | | (4,840,879 | ) | | | | (2,904,722 | ) | | | | (7,571,015 | ) | | | | (4,287,797 | ) |
| | | (47,868,985 | ) | | | | (40,647,762 | ) | | | | (4,840,879 | ) | | | | (2,904,722 | ) | | | | (7,571,015 | ) | | | | (4,287,797 | ) |
| | | | | | | | | | | | | | | | | | | | | | | | | | | | | |
| | | 969,547,176 | | | | | 1,876,838,241 | | | | | 120,629,965 | | | | | 356,911,421 | | | | | 171,679,217 | | | | | 512,094,535 | |
| | | 12,512,019 | | | | | 9,958,370 | | | | | 2,055,461 | | | | | 1,163,975 | | | | | 2,870,995 | | | | | 1,339,904 | |
| | | (517,589,369 | ) | | | | (659,355,899 | ) | | | | (69,000,182 | ) | | | | (26,454,696 | ) | | | | (97,419,168 | ) | | | | (26,869,444 | ) |
| | | 464,469,826 | | | | | 1,227,440,712 | | | | | 53,685,244 | | | | | 331,620,700 | | | | | 77,131,044 | | | | | 486,564,995 | |
| | | 542,795,198 | | | | | 1,361,311,770 | | | | | 60,807,024 | | | | | 339,560,434 | | | | | 83,648,294 | | | | | 498,852,013 | |
| | | | | | | | | | | | | | | | | | | | | | | | | | | | | |
| | | 3,658,843,978 | | | | | 2,297,532,208 | | | | | 339,560,434 | | | | | — | | | | | 498,852,013 | | | | | — | |
| $ | | 4,201,639,176 | | | $ | | 3,658,843,978 | | | $ | | 400,367,458 | | | $ | | 339,560,434 | | | $ | | 582,500,307 | | | $ | | 498,852,013 | |
| | | | | | | | | | | | | | | | | | | | | | | | | | | | | |
| | | 77,962,776 | | | | | 155,628,423 | | | | | 11,522,959 | | | | | 35,217,298 | | | | | 16,381,052 | | | | | 50,359,804 | |
| | | 1,010,713 | | | | | 825,924 | | | | | 197,029 | | | | | 113,101 | | | | | 274,948 | | | | | 129,655 | |
| | | (41,902,780 | ) | | | | (55,558,285 | ) | | | | (6,593,752 | ) | | | | (2,585,684 | ) | | | | (9,346,387 | ) | | | | (2,599,711 | ) |
| | | 37,070,709 | | | | | 100,896,062 | | | | | 5,126,236 | | | | | 32,744,715 | | | | | 7,309,613 | | | | | 47,889,748 | |
See Notes to Financial Statements.
| Old Westbury Funds, Inc. | |
| All Cap Core Fund | |
| Financial Highlights | |
| | |
For a Share Outstanding Throughout Each Year.
| | | YEAR ENDED OCTOBER 31, | |
| | | 2020 | | | 2019 | | | 2018 | | | 2017 | | | 2016 | |
| Net asset value, beginning of year | | $ | 18.84 | | | $ | 17.08 | | | $ | 16.50 | | | $ | 13.69 | | | $ | 13.92 | |
| Investment operations: | | | | | | | | | | | | | | | | | | | | |
| Net investment income | | | 0.02 | (a) | | | 0.09 | (a) | | | 0.07 | (a) | | | 0.10 | (a) | | | 0.14 | (a) |
| Net realized and unrealized gains/(losses) | | | 3.02 | | | | 2.44 | | | | 0.84 | | | | 2.86 | | | | (0.05 | ) |
| Total from investment operations | | | 3.04 | | | | 2.53 | | | | 0.91 | | | | 2.96 | | | | 0.09 | |
| Distributions: | | | | | | | | | | | | | | | | | | | | |
| Net investment income | | | (0.08 | ) | | | (0.08 | ) | | | (0.09 | ) | | | (0.15 | ) | | | (0.16 | ) |
| Net realized gains | | | (1.62 | ) | | | (0.69 | ) | | | (0.24 | ) | | | — | | | | (0.16 | ) |
| Total distributions | | | (1.70 | ) | | | (0.77 | ) | | | (0.33 | ) | | | (0.15 | ) | | | (0.32 | ) |
| Net asset value, end of year | | $ | 20.18 | | | $ | 18.84 | | | $ | 17.08 | | | $ | 16.50 | | | $ | 13.69 | |
| Total return | | | 17.3 | % | | | 15.7 | % | | | 5.6 | % | | | 21.8 | % | | | 0.7 | % |
| Annualized ratios/supplemental data: | | | | | | | | | | | | | | | | | | | | |
| Net assets at end of year (000’s) | | $ | 2,283,906 | | | $ | 1,766,287 | | | $ | 1,839,663 | | | $ | 1,772,368 | | | $ | 1,246,197 | |
| Ratio of expenses to average net assets before expense waivers | | | 0.97 | %(b) | | | 0.98 | %(b) | | | 0.98 | %(b) | | | 0.99 | %(b) | | | 1.00 | %(b) |
| Ratio of expenses to average net assets after expense waivers | | | 0.97 | % | | | 0.98 | % | | | 0.98 | % | | | 0.99 | % | | | 1.00 | % |
| Ratio of net investment income to average net assets | | | 0.10 | % | | | 0.51 | % | | | 0.42 | % | | | 0.67 | % | | | 1.07 | % |
| Portfolio turnover rate | | | 43 | % | | | 31 | % | | | 38 | % | | | 57 | % | | | 34 | % |
| (a) | Calculated based on the average shares method for the year. |
| (b) | There were no voluntary fee reductions during the year. |
See Notes to Financial Statements.
| Old Westbury Funds, Inc. | |
| All Cap ESG Fund | |
| Financial Highlights | |
| | |
For a Share Outstanding Throughout Each Period.
| | | | | | | | | PERIOD | |
| | | | | | | | | FROM | |
| | | | | | | | | MARCH 1, | |
| | | | | | | | | 2018(a) TO | |
| | | YEAR ENDED OCTOBER 31, | | | OCTOBER | |
| | | 2020 | | | 2019 | | | 31, 2018 | |
| Net asset value, beginning of period | | $ | 10.39 | | | $ | 9.63 | | | $ | 10.00 | |
| Investment operations: | | | | | | | | | | | | |
| Net investment income | | | 0.15 | (b) | | | 0.23 | (b) | | | 0.15 | (c) |
| Net realized and unrealized gains/(losses) | | | (0.40 | ) | | | 0.67 | | | | (0.52 | ) |
| Total from investment operations | | | (0.25 | ) | | | 0.90 | | | | 0.37 | |
| Distributions: | | | | | | | | | | | | |
| Net investment income | | | (0.23 | ) | | | (0.14 | ) | | | — | |
| Total distributions | | | (0.23 | ) | | | (0.14 | ) | | | — | |
| Net asset value, end of period | | $ | 9.91 | | | $ | 10.39 | | | $ | 9.63 | |
| Total return | | | (2.5 | )% | | | 9.5 | % | | | (3.7 | )%(d) |
| Annualized ratios/supplemental data: | | | | | | | | | | | | |
| Net assets at end of period (000’s) | | $ | 40,192 | | | $ | 38,575 | | | $ | 30,003 | |
| Ratio of expenses to average net assets before expense waivers | | | 1.34 | % | | | 1.50 | % | | | 1.64 | %(e) |
| Ratio of expenses to average net assets after expense waivers | | | 1.00 | % | | | 1.00 | % | | | 1.00 | %(e) |
| Ratio of net investment income to average net assets | | | 1.52 | % | | | 2.32 | % | | | 2.30 | %(e) |
| Portfolio turnover rate | | | 40 | % | | | 57 | % | | | 33 | %(d) |
| (a) | Commencement of Investment Operations. |
| (b) | Calculated based on the average shares method for the year. |
| (c) | Calculated based on the average shares method for the period. |
| (d) | Not Annualized. |
| (e) | Annualized. |
See Notes to Financial Statements.
| Old Westbury Funds, Inc. | |
| Small & Mid Cap Strategies Fund | |
| Financial Highlights | |
| | |
For a Share Outstanding Throughout Each Year.
| | | YEAR ENDED OCTOBER 31, | |
| | | 2020 | | | 2019 | | | 2018 | | | 2017 | | | 2016 | |
| Net asset value, beginning of year | | $ | 15.39 | | | $ | 15.85 | | | $ | 17.49 | | | $ | 15.81 | | | $ | 15.86 | |
| Investment operations: | | | | | | | | | | | | | | | | | | | | |
| Net investment income | | | 0.03 | (a) | | | 0.09 | (a) | | | 0.08 | (a) | | | 0.10 | (a) | | | 0.09 | (a) |
| Net realized and unrealized gains/(losses) | | | 0.88 | | | | 1.10 | | | | (0.47 | ) | | | 2.54 | | | | 0.66 | |
| Total from investment operations | | | 0.91 | | | | 1.19 | | | | 0.39 | | | | 2.64 | | | | 0.75 | |
| Distributions: | | | | | | | | | | | | | | | | | | | | |
| Net investment income | | | (0.09 | ) | | | (0.09 | ) | | | (0.11 | ) | | | (0.09 | ) | | | (0.12 | ) |
| Net realized gains | | | (0.64 | ) | | | (1.56 | ) | | | (1.14 | ) | | | (0.87 | ) | | | (0.68 | ) |
| Total distributions | | | (0.73 | ) | | | (1.65 | ) | | | (1.25 | ) | | | (0.96 | ) | | | (0.80 | ) |
| Net asset value, end of year | | $ | 15.57 | | | $ | 15.39 | | | $ | 15.85 | | | $ | 17.49 | | | $ | 15.81 | |
| Total return | | | 5.9 | % | | | 9.4 | % | | | (2.6 | )% | | | 17.6 | % | | | 5.1 | % |
| Annualized ratios/supplemental data: | | | | | | | | | | | | | | | | | | | | |
| Net assets at end of year (000’s) | | $ | 6,765,243 | | | $ | 6,278,441 | | | $ | 6,222,492 | | | $ | 6,562,381 | | | $ | 5,471,624 | |
| Ratio of expenses to average net assets before expense waivers | | | 1.15 | %(b) | | | 1.15 | %(b) | | | 1.15 | %(b) | | | 1.15 | %(b) | | | 1.16 | %(b) |
| Ratio of expenses to average net assets after expense waivers | | | 1.11 | % | | | 1.11 | % | | | 1.11 | % | | | 1.11 | % | | | 1.11 | % |
| Ratio of net investment income to average net assets | | | 0.17 | % | | | 0.58 | % | | | 0.48 | % | | | 0.59 | % | | | 0.61 | % |
| Portfolio turnover rate | | | 65 | % | | | 52 | % | | | 62 | % | | | 45 | % | | | 48 | % |
| (a) | Calculated based on the average shares method for the year. |
| (b) | When counterparties post cash collateral with respect to various derivative transactions, the Fund may invest the collateral and receive interest income on the investment and pays interest expense on the collateral to the counterparty. The interest income is included in investment income on the Statements of Operations, and the interest expense is included in the Fund’s overall expenses on the Statements of Operations and expense ratio. |
See Notes to Financial Statements.
| Old Westbury Funds, Inc. | |
| Large Cap Strategies Fund | |
| Financial Highlights | |
| | |
For a Share Outstanding Throughout Each Year.
| | | YEAR ENDED OCTOBER 31, | |
| | | 2020 | | | 2019 | | | 2018 | | | 2017 | | | 2016 | |
| Net asset value, beginning of year | | $ | 14.99 | | | $ | 13.87 | | | $ | 14.85 | | | $ | 12.95 | | | $ | 13.01 | |
| Investment operations: | | | | | | | | | | | | | | | | | | | | |
| Net investment income | | | 0.07 | (a) | | | 0.13 | (a) | | | 0.13 | (a) | | | 0.11 | (a) | | | 0.08 | (a) |
| Net realized and unrealized gains/ (losses) | | | 0.94 | | | | 1.58 | | | | (0.26 | ) | | | 2.02 | | | | 0.16 | |
| Total from investment operations | | | 1.01 | | | | 1.71 | | | | (0.13 | ) | | | 2.13 | | | | 0.24 | |
| Distributions: | | | | | | | | | | | | | | | | | | | | |
| Net investment income | | | (0.12 | ) | | | (0.14 | ) | | | (0.10 | ) | | | (0.10 | ) | | | (0.10 | ) |
| Net realized gains | | | (0.62 | ) | | | (0.45 | ) | | | (0.75 | ) | | | (0.13 | ) | | | (0.20 | ) |
| Total distributions | | | (0.74 | ) | | | (0.59 | ) | | | (0.85 | ) | | | (0.23 | ) | | | (0.30 | ) |
| Net asset value, end of year | | $ | 15.26 | | | $ | 14.99 | | | $ | 13.87 | | | $ | 14.85 | | | $ | 12.95 | |
| Total return | | | 7.0 | % | | | 12.9 | % | | | (1.1 | )% | | | 16.7 | % | | | 1.9 | % |
| Annualized ratios/supplemental data: | | | | | | | | | | | | | | | | | | | | |
| Net assets at end of year (000’s) | | $ | 17,609,533 | | | $ | 17,001,879 | | | $ | 16,499,149 | | | $ | 17,243,479 | | | $ | 14,595,891 | |
| Ratio of expenses to average net assets before expense waivers | | | 1.10 | %(b)(c) | | | 1.10 | %(b)(c) | | | 1.11 | %(b)(c) | | | 1.11 | %(b)(c) | | | 1.11 | %(b)(c) |
| Ratio of expenses to average net assets after expense waivers | | | 1.10 | % | | | 1.10 | % | | | 1.11 | % | | | 1.11 | % | | | 1.11 | % |
| Ratio of net investment income to average net assets | | | 0.48 | % | | | 0.93 | % | | | 0.86 | % | | | 0.77 | % | | | 0.67 | % |
| Portfolio turnover rate | | | 76 | % | | | 73 | % | | | 38 | % | | | 61 | % | | | 50 | % |
| (a) | Calculated based on the average shares method for the year. |
| (b) | There were no voluntary fee reductions during the year. |
| (c) | When counterparties post cash collateral with respect to various derivative transactions, the Fund may invest the collateral and receive interest income on the investment and pays interest expense on the collateral to the counterparty. The interest income is included in investment income on the Statements of Operations, and the interest expense is included in the Fund’s overall expenses on the Statements of Operations and expense ratio. |
See Notes to Financial Statements.
| Old Westbury Funds, Inc. | |
| Credit Income Fund | |
| Financial Highlights | |
| | |
For a Share Outstanding Throughout the Period.
| | | PERIOD
FROM
OCTOBER 1,
2020(a) TO
OCTOBER
31, 2020 | |
| Net asset value, beginning of period | | $ | 10.00 | |
| Investment operations: | | | | |
| Net investment income | | | 0.05 | (b) |
| Net realized and unrealized losses | | | (0.06 | ) |
| Total from investment operations | | | (0.01 | ) |
| Distributions: | | | | |
| Net asset value, end of period | | $ | 9.99 | |
| Total return | | | (0.1 | )%(c) |
| Annualized ratios/supplemental data: | | | | |
| Net assets at end of period (000’s) | | $ | 1,939,199 | |
| Ratio of expenses to average net assets before expense waivers | | | 0.94 | %(d)(e) |
| Ratio of expenses to average net assets after expense waivers | | | 0.85 | %(d) |
| Ratio of net investment income to average net assets | | | 5.33 | %(d) |
| Portfolio turnover rate | | | 1 | %(c) |
| (a) | Commencement of Investment Operations. |
| (b) | Calculated based on the average shares method for the period. |
| (c) | Not Annualized. |
| (d) | Annualized. |
| (e) | When counterparties post cash collateral with respect to various derivative transactions, the Fund may invest the collateral and receive interest income on the investment and pays interest expense on the collateral to the counterparty. The interest income is included in investment income on the Statements of Operations, and the interest expense is included in the Fund’s overall expenses on the Statements of Operations and expense ratio. |
See Notes to Financial Statements.
| Old Westbury Funds, Inc. | |
| Fixed Income Fund | |
| Financial Highlights | |
| | |
For a Share Outstanding Throughout Each Year.
| | | YEAR ENDED OCTOBER 31, | |
| | | 2020 | | | 2019 | | | 2018 | | | 2017 | | | 2016 | |
| Net asset value, beginning of year | | $ | 11.43 | | | $ | 10.75 | | | $ | 11.11 | | | $ | 11.28 | | | $ | 11.19 | |
| Investment operations: | | | | | | | | | | | | | | | | | | | | |
| Net investment income | | | 0.16 | (a) | | | 0.21 | (a) | | | 0.19 | (a) | | | 0.14 | (a) | | | 0.12 | (a) |
| Net realized and unrealized gains/(losses) | | | 0.43 | | | | 0.69 | | | | (0.35 | ) | | | (0.15 | ) | | | 0.11 | |
| Total from investment operations | | | 0.59 | | | | 0.90 | | | | (0.16 | ) | | | (0.01 | ) | | | 0.23 | |
| Distributions: | | | | | | | | | | | | | | | | | | | | |
| Net investment income | | | (0.20 | ) | | | (0.22 | ) | | | (0.20 | ) | | | (0.16 | ) | | | (0.14 | ) |
| Total distributions | | | (0.20 | ) | | | (0.22 | ) | | | (0.20 | ) | | | (0.16 | ) | | | (0.14 | ) |
| Net asset value, end of year | | $ | 11.82 | | | $ | 11.43 | | | $ | 10.75 | | | $ | 11.11 | | | $ | 11.28 | |
| Total return | | | 5.2 | % | | | 8.4 | % | | | (1.5 | )% | | | (1.0 | )% | | | 2.1 | % |
| Annualized ratios/supplemental data: | | | | | | | | | | | | | | | | | | | | |
| Net assets at end of year (000’s) | | $ | 1,669,086 | | | $ | 1,492,818 | | | $ | 865,030 | | | $ | 825,545 | | | $ | 785,417 | |
| Ratio of expenses to average net assets before expense waivers | | | 0.68 | % | | | 0.70 | % | | | 0.72 | % | | | 0.72 | % | | | 0.74 | % |
| Ratio of expenses to average net assets after expense waivers | | | 0.57 | % | | | 0.57 | % | | | 0.62 | % | | | 0.62 | % | | | 0.64 | % |
| Ratio of net investment income to average net assets | | | 1.39 | % | | | 1.93 | % | | | 1.70 | % | | | 1.28 | % | | | 1.07 | % |
| Portfolio turnover rate | | | 87 | % | | | 34 | % | | | 49 | % | | | 70 | % | | | 68 | % |
| (a) | Calculated based on the average shares method for the year. |
See Notes to Financial Statements.
| Old Westbury Funds, Inc. | |
| Municipal Bond Fund | |
| Financial Highlights | |
| | |
For a Share Outstanding Throughout Each Year.
| | | YEAR ENDED OCTOBER 31, | |
| | | 2020 | | | 2019 | | | 2018 | | | 2017 | | | 2016 | |
| Net asset value, beginning of year | | $ | 12.26 | | | $ | 11.63 | | | $ | 11.95 | | | $ | 12.09 | | | $ | 12.00 | |
| Investment operations: | | | | | | | | | | | | | | | | | | | | |
| Net investment income | | | 0.15 | (a) | | | 0.18 | (a) | | | 0.17 | (a) | | | 0.14 | (a) | | | 0.14 | (a) |
| Net realized and unrealized gains/(losses) | | | 0.26 | | | | 0.62 | | | | (0.33 | ) | | | (0.08 | ) | | | 0.10 | |
| Total from investment operations | | | 0.41 | | | | 0.80 | | | | (0.16 | ) | | | 0.06 | | | | 0.24 | |
| Distributions: | | | | | | | | | | | | | | | | | | | | |
| Net investment income | | | (0.15 | ) | | | (0.17 | ) | | | (0.16 | ) | | | (0.14 | ) | | | (0.14 | ) |
| Net realized gains | | | — | | | | — | | | | — | | | | (0.06 | ) | | | (0.01 | ) |
| Total distributions | | | (0.15 | ) | | | (0.17 | ) | | | (0.16 | ) | | | (0.20 | ) | | | (0.15 | ) |
| Net asset value, end of year | | $ | 12.52 | | | $ | 12.26 | | | $ | 11.63 | | | $ | 11.95 | | | $ | 12.09 | |
| Total return | | | 3.4 | % | | | 6.9 | % | | | (1.4 | )% | | | 0.5 | % | | | 2.1 | % |
| Annualized ratios/supplemental data: | | | | | | | | | | | | | | | | | | | | |
| Net assets at end of year (000’s) | | $ | 4,201,639 | | | $ | 3,658,844 | | | $ | 2,297,532 | | | $ | 2,235,503 | | | $ | 2,055,136 | |
| Ratio of expenses to average net assets before expense waivers | | | 0.65 | % | | | 0.66 | % | | | 0.67 | % | | | 0.67 | % | | | 0.69 | % |
| Ratio of expenses to average net assets after expense waivers | | | 0.57 | % | | | 0.57 | % | | | 0.57 | % | | | 0.57 | % | | | 0.59 | % |
| Ratio of net investment income to average net assets | | | 1.21 | % | | | 1.46 | % | | | 1.41 | % | | | 1.17 | % | | | 1.17 | % |
| Portfolio turnover rate | | | 40 | % | | | 26 | % | | | 51 | % | | | 31 | % | | | 44 | % |
| (a) | Calculated based on the average shares method for the year. |
See Notes to Financial Statements.
| Old Westbury Funds, Inc. | |
| California Municipal Bond Fund | |
| Financial Highlights | |
| | |
For a Share Outstanding Throughout Each Period.
| | | FOR THE
YEAR
ENDED
OCTOBER
31, 2020 | | | PERIOD
FROM
DECEMBER
4, 2018(a) TO
OCTOBER
31, 2019 | |
| Net asset value, beginning of period | | $ | 10.37 | | | $ | 10.00 | |
| Investment operations: | | | | | | | | |
| Net investment income | | | 0.12 | (b) | | | 0.12 | (c) |
| Net realized and unrealized gain | | | 0.22 | | | | 0.36 | |
| Total from investment operations | | | 0.34 | | | | 0.48 | |
| Distributions: | | | | | | | | |
| Net investment income | | | (0.12 | ) | | | (0.11 | ) |
| Net realized gains | | | (0.02 | ) | | | — | |
| Total distributions | | | (0.14 | ) | | | (0.11 | ) |
| Net asset value, end of period | | $ | 10.57 | | | $ | 10.37 | |
| Total return | | | 3.3 | % | | | 4.8 | %(d) |
| Annualized ratios/supplemental data: | | | | | | | | |
| Net assets at end of period (000’s) | | $ | 400,367 | | | $ | 339,560 | |
| Ratio of expenses to average net assets before expense waivers | | | 0.76 | % | | | 0.78 | %(e) |
| Ratio of expenses to average net assets after expense waivers | | | 0.57 | % | | | 0.57 | %(e) |
| Ratio of net investment income to average net assets | | | 1.13 | % | | | 1.32 | %(e) |
| Portfolio turnover rate | | | 26 | % | | | 41 | %(d) |
| (a) | Commencement of Investment Operations. |
| (b) | Calculated based on the average shares method for the year. |
| (c) | Calculated based on the average shares method for the period. |
| (d) | Not Annualized. |
| (e) | Annualized. |
See Notes to Financial Statements.
| Old Westbury Funds, Inc. | |
| New York Municipal Bond Fund | |
| Financial Highlights | |
| | |
For a Share Outstanding Throughout Each Period.
| | | FOR THE
YEAR
ENDED
OCTOBER
31, 2020 | | | PERIOD
FROM
DECEMBER
4, 2018(a) TO
OCTOBER
31, 2019 | |
| Net asset value, beginning of period | | $ | 10.42 | | | $ | 10.00 | |
| Investment operations: | | | | | | | | |
| Net investment income | | | 0.12 | (b) | | | 0.13 | (c) |
| Net realized and unrealized gain | | | 0.16 | | | | 0.40 | |
| Total from investment operations | | | 0.28 | | | | 0.53 | |
| Distributions: | | | | | | | | |
| Net investment income | | | (0.12 | ) | | | (0.11 | ) |
| Net realized gains | | | (0.03 | ) | | | — | |
| Total distributions | | | (0.15 | ) | | | (0.11 | ) |
| Net asset value, end of period | | $ | 10.55 | | | $ | 10.42 | |
| Total return | | | 2.7 | % | | | 5.4 | %(d) |
| Annualized ratios/supplemental data: | | | | | | | | |
| Net assets at end of period (000’s) | | $ | 582,500 | | | $ | 498,852 | |
| Ratio of expenses to average net assets before expense waivers | | | 0.75 | % | | | 0.77 | %(e) |
| Ratio of expenses to average net assets after expense waivers | | | 0.57 | % | | | 0.57 | %(e) |
| Ratio of net investment income to average net assets | | | 1.13 | % | | | 1.42 | %(e) |
| Portfolio turnover rate | | | 37 | % | | | 29 | %(d) |
| (a) | Commencement of Investment Operations. |
| (b) | Calculated based on the average shares method for the year. |
| (c) | Calculated based on the average shares method for the period. |
| (d) | Not Annualized. |
| (e) | Annualized. |
See Notes to Financial Statements.
| Old Westbury Funds, Inc. | |
| Notes to Financial Statements | |
| | October 31, 2020 |
Old Westbury Funds, Inc. (the “Corporation”) was organized as a Maryland corporation on August 26, 1993 and commenced operations on October 22, 1993. The Corporation is an open-end management investment company registered under the Investment Company Act of 1940, as amended (the “1940 Act”). The Corporation’s Board of Directors (the “Board”) are permitted to create an unlimited number of series, each with one or more separate classes of shares. As of October 31, 2020, the Corporation consisted of nine separate investment portfolios (each series individually referred to as a “Fund” and collectively as the “Funds”) shown below:
| Fund Name | | Investment Objective |
| Old Westbury All Cap Core Fund (“All Cap Core Fund”) | | Long-term capital appreciation. |
| Old Westbury All Cap ESG Fund (“All Cap ESG Fund”) | | Long-term capital appreciation. |
| Old Westbury Small & Mid Cap Strategies Fund (“Small & Mid Cap Strategies Fund”) | | Long-term capital appreciation. |
| Old Westbury Large Cap Strategies Fund (“Large Cap Strategies Fund”) | | Long-term capital appreciation. |
| Old Westbury Credit Income Fund (“Credit Income Fund”)* | | Income and capital appreciation. |
| Old Westbury Fixed Income Fund (“Fixed Income Fund”) | | Total return (consisting of current income and capital appreciation). |
| Old Westbury Municipal Bond Fund (“Municipal Bond Fund”) | | Total return (consisting of current income that is exempt from regular federal income tax and capital appreciation). |
| Old Westbury California Municipal Bond Fund (“California Municipal Bond Fund”) | | Total return (consisting of current income that is exempt from regular federal and California income tax and capital appreciation). |
| Old Westbury New York Municipal Bond Fund (“New York Municipal Bond Fund”) | | Total return (consisting of current income that is exempt from regular federal and New York income tax and capital appreciation). |
| | |
| * | Credit Income Fund commenced operations on October 1, 2020. |
The Corporation has authorized a total of 27.5 billion shares of common stock (par value $0.001 per share).
Under the Corporation’s organizational documents, its Officers and Directors are indemnified against certain liabilities arising out of the performance of their duties for the Corporation. In addition, in the normal course of business, the Corporation enters into contracts with vendors and others that provide for general indemnifications. The Corporation’s maximum exposure under these arrangements is unknown as this would involve future claims that may be made against the Corporation. However, based on experience, the Corporation expects the risk of loss to be remote.
| 2. | Significant Accounting Policies: |
The following is a summary of the significant accounting policies followed by the Corporation in the preparation of its financial statements. The policies are in conformity with accounting principles generally accepted in the U.S. (“GAAP”). The preparation of financial statements in accordance with GAAP requires management to make estimates and assumptions that affect the reported amounts of assets and liabilities at the date of the financial statements and the reported amounts of income and expenses for the period. Actual results could differ from those estimates.
The Financial Accounting Standards Board (“FASB”) Accounting Standards Codification is the exclusive reference of authoritative GAAP recognized by the FASB to be applied by nongovernmental entities. Rules and interpretive releases of the Securities and Exchange Commission (“SEC”) under authority of federal laws are also sources of authoritative GAAP for SEC registrants such as the Corporation.
The Corporation qualifies as an investment company and follows accounting and reporting guidance as defined by the FASB in ASC 946, Financial Services - Investment Companies.
A. Valuation of Investments. Readily marketable equity securities listed on an exchange are valued, except as indicated below, at the last sale price reflected at the close of the regular trading session of the exchange on the business day as of which such value is being determined, and securities listed on NASDAQ are valued at the NASDAQ Official Closing Price (“NOCP”) and, if no NOCP is available, then at
| Old Westbury Funds, Inc. | |
| Notes to Financial Statements - (Continued) | |
| | October 31, 2020 |
the last reported sales price. If there has been no sale on such day, the securities are valued at the mean of the closing bid and asked prices on such day. If no bid or asked prices are quoted on such day, then the securities are valued using a broker-dealer quote or an approved pricing service. Equity securities traded on more than one national securities exchange are valued at the last sale price on the business day as of which such value is being determined as reflected on the tape at the close of the exchange representing the principal market for such securities.
Readily marketable equity securities traded in the over-the-counter market (“OTC”), including listed securities whose primary market is believed by BIM, or a sub-adviser, as applicable, to be over-the-counter, are valued at the mean of the latest bid and asked prices using a broker-dealer or an approved pricing service.
Shares of open-end investment companies are valued at the latest net asset value (“NAV”) reported by the investment company. Shares of investment companies that are traded intra-day on an exchange, such as exchange traded funds and closed-end funds, will be valued at the last sale price as reflected at the close of the regular trading session of such exchange.
Debt instruments are valued on the basis of prices obtained from a broker-dealer or an approved pricing service.
Foreign securities generally are valued in their national currency at the latest available quoted sale price as of the close of trading on the foreign exchange or other principal market on which the security is traded. In the absence of current trade activity, the securities will be valued at the mean of the latest bid/ask quotations. As described below, this value is then converted into its U.S. dollar equivalent using the daily rate of exchange at the time of a Fund’s NAV calculation (normally 4:00 p.m. Eastern Time).
Forward currency contracts are valued at the mean between the bid and the asked prices. Quotations are available for regularly scheduled settlement dates such as on a 1-,2-,3-,4-,5-,6-,9-, and 12-month basis. Over-the-counter derivatives, such as swaps and non-exchange traded options and futures are valued on the basis of counterparty valuation quotations or dealer quotations, subject to review by BIM, or a sub-adviser with BIM’s oversight where appropriate. An approved pricing service may also be used to price these instruments. Exchange-traded swaps, options and futures contracts and options thereon are valued at their last sale or settlement price as of the close of such exchanges or, if no sales are reported, at the mean between the last reported bid and asked prices. Repurchase agreements are valued at the original cost. Contracts for long puts and calls are valued at the bid price and short puts and calls are valued at the offering price of a broker-dealer or an exchange. Generally, options, rights/warrants and other “when-issued” securities follow the same pricing methods as equity securities.
Securities and other investments for which market quotations are not readily available are valued under the general supervision and responsibility of the Board and pursuant to policies and procedures established by the Board, which are designed to reflect, in good faith, the fair value of such investments. A market quotation is considered not readily available if, among other circumstances, the most recent reported price is deemed unreliable. For example, securities that may be subject to fair valuation include, but are not limited to: (1) securities in which trading has been halted pending further news; (2) illiquid securities in which there is no trading market and no broker coverage; (3) stale priced securities; (4) securities that may have defaulted or de-listed from an exchange and are no longer trading; (5) any other security for which the Funds’ Pricing Committee, with input from the Adviser or sub-advisers, as applicable, believes that the last trading price does not represent a reliable current price; or (6) other investments, including derivatives for which readily available market quotations are not generally available. In addition, a Fund may fair value securities that trade on a foreign exchange because a significant event has occurred after the foreign exchange closes but before the time as of which a Fund’s share price is calculated. Foreign exchanges typically close before the time as of which Fund share prices are calculated, and may be closed altogether on some days a Fund is open. Such significant events affecting a foreign security may include, but are not limited to: (1) those relating to a single issuer; (2) governmental actions that affect securities in one sector or country; (3) natural disasters or armed conflicts affecting a country or region; or (4) significant market fluctuations. There is no single standard for determining the fair value of a security or investment, but, rather, several factors are considered, including an evaluation of the forces that influence the market in which the security or investment is purchased or sold, in determining whether a market price is readily available and, if not, the security’s or other investment’s fair value.
In light of the judgment involved in fair value decisions, there can be no assurances that a fair value assigned to a particular security reflects a price for which a security has traded or will trade. Accordingly, when a Fund uses fair value to price securities, it may value those securities higher or lower than another fund that uses market quotations to price the same securities.
In the event of a change in the S&P 500 Index that is greater than predetermined levels approved by the Board, the Funds will utilize an approved pricing service that has been designated to determine fair value to price securities traded on any overseas exchange. Pricing service vendors base their valuations on a number of factors, including, but not limited to, actual transaction data, benchmark yields, market bids, market offers, quotations from dealers, credit risk spreads, interest rate spreads, proprietary pricing models, cash flows, prepayment information, default rates, delinquency and loss assumptions, collateral characteristics, credit enhancements, specific deal information and other relationships observed in markets of comparable securities. In addition, foreign securities held by a Fund may trade on weekends or other days when the Fund does not calculate NAV. As a result, the market value of these investments may change on days when shares of the Fund cannot be bought or sold. Such fair valuations are categorized as Level 2 in the fair value hierarchy. Foreign securities that are valued based on market
| Old Westbury Funds, Inc. | |
| Notes to Financial Statements - (Continued) | |
| | October 31, 2020 |
quotations are categorized as Level 1 in the fair value hierarchy. The All Cap Core Fund, All Cap ESG Fund, Small & Mid Cap Strategies Fund and Large Cap Strategies Fund utilized a systematic fair valuation model provided by an independent third-party vendor to fair value certain securities 94 days during the year ended October 31, 2020. The Credit Income Fund utilized a systematic fair valuation model provided by an independent third-party vendor to fair value certain securities 4 days during the period from October 1, 2020 (commencement of operations) to October 31, 2020. As a result on days when the index change exceeds predetermined levels, certain securities held by the Funds were transferred from Level 1 into Level 2. On any subsequent day when such index level is not exceeded, certain securities held by the Funds were transferred from Level 2 back into Level 1. As of October 31, 2020, foreign securities were not fair valued as the change in the S&P 500 Index did not exceed the Funds’ predetermined Level.
The fair value of investments is determined in accordance with the valuation policies and procedures approved by the Board. The Funds’ Pricing Committee established by the Board (the “Pricing Committee”) reviews pricing methodologies on at least a quarterly basis. The Pricing Committee is responsible for (i) establishing valuation processes and (ii) determining the fair value of the Funds’ holdings for which price quotations are not readily available, unreliable or for which an approved valuation method is deemed not to represent fair value. These investments are either categorized as Level 2 or 3 depending on the observability of the inputs used. The Pricing Committee may consider one or more factors in determining an investment’s fair value. The factors to be taken into account, to the extent relevant, typically include, but are not limited to: fundamental analytical data relating to the investment, the nature and duration of any restrictions on disposition of the investments, an evaluation of the forces that influence the market in which the investments are purchased or sold, the type of investment, financial statements and company filings, lack of marketability, the cost at date of purchase, good faith recommendation of BIM or a sub-adviser, as applicable, and any other relevant matters. When the fair valuation of investments use significant unobservable inputs, such investments will be categorized as Level 3 in the fair value hierarchy.
The significant unobservable inputs used in fair value measurement of the Funds’ Level 3 investments may include, where applicable: (i) an estimation of a normalized earnings level or projected cash flows for the company; (ii) the discounts applied to the last available price of the investment or a selection of comparable investments due to the lack of marketability of the investment; (iii) values or bid offers by dealers or other third parties; and (iv) the value associated with the latest round of financing. Significant changes in any of those inputs in isolation may result in a significantly lower or higher fair value measurement. Generally, a change in the assumptions used for the normalized earnings level will be accompanied by a directionally similar change in the discounts applied to the list of comparable investments.
The Funds’ Pricing Committee employs various methods for calibrating the valuation approach related to investments categorized within Level 3 in the fair value hierarchy. These methods may include regular due diligence of the Funds’ pricing vendors including back testing of trigger related fair value prices, a regular review of key inputs and assumptions, reviews of missing and stale prices and price variance analysis, including investigation of unusual or unexpected pricing changes and reviews of any market related activities. Additionally, the pricing of all fair value holdings is subsequently reviewed and approved by the Funds’ Board.
B. Security Transactions and Related Investment Income. Security transactions are accounted for no later than the first NAV calculation on the first business day following the trade date. However, for financial reporting purposes, portfolio securities transactions are reported on trade date. Realized gains and losses on security transactions are determined using the identified cost method for maximum tax benefit to shareholders. Dividend income and other distributions from portfolio securities are recorded on the ex-dividend date, except for certain dividends from foreign securities where the ex-dividend dates may have passed are recorded as soon as the Funds are informed of the dividends. Upon notification from issuers, some of the dividend income received from a real estate investment trust may be re-designated as a reduction of cost of the related investment and/or realized gain. Dividend income is recorded net of foreign taxes withheld where recovery of such taxes is not assured. Interest income is recognized on an accrual basis and includes where applicable, the amortization of premiums and accretion of discounts.
C. Payment-In-Kind Securities. The Funds may invest in payment-in-kind securities (“PIKs”). PIKs give the issuer the option at each interest payment date of making interest payments in either cash or additional debt securities. Those additional debt securities usually have the same terms, including maturity dates and interest rates, and associated risks as the original bonds. The daily market quotations of the original bonds may include the accrued interest (referred to as a dirty price) and require a pro-rata adjustment from the unrealized appreciation or depreciation on investments to interest receivable on the Statements of Assets and Liabilities.
For the year ended October 31, 2020, there were no in-kind payments received by the Funds with respect to PIK securities.
D. Foreign Currency Transactions. The books and records of the Funds are maintained in U.S. dollars. Investments and other assets and liabilities of the Funds denominated in a foreign currency, if any, are translated into U.S. dollars at current exchange rates as of the date of the Statements of Assets and Liabilities. Purchases and sales of securities, income receipts and expense payments are translated into U.S. dollars at the exchange rate on the dates of the transactions.
| Old Westbury Funds, Inc. | |
| Notes to Financial Statements - (Continued) | |
| | October 31, 2020 |
The Funds do not isolate the portion of operations resulting from changes in foreign exchange rates on investments from fluctuations arising from changes in market prices of securities held. Such fluctuations are included with the net realized and change in unrealized gain/(loss) on investments, futures contracts, swap agreements and foreign currency transactions in the Statements of Operations.
Foreign security and currency transactions may involve certain risks not typically associated with those of U.S. companies, including the level of governmental supervision and regulation of foreign securities markets and the possibility of political and economic instability.
E. Securities Sold. The Funds may sell securities short. A short sale is a transaction in which a Fund sells securities it does not own, but has borrowed, in anticipation of a decline in the market price of the securities. A Fund is obligated to replace the borrowed securities at their market price at the time of settlement. A Fund’s obligation to replace the securities borrowed in connection with a short sale will be fully secured by collateral deposited with the broker to the extent required under applicable law and rules. Short sales by a Fund involve certain risks and special considerations.
The Funds may not always be able to close out a short position on favorable terms. Short sales involve the risk that a Fund will incur a loss by subsequently buying a security at a higher price than the price at which it sold the security short. The amount of such loss is theoretically unlimited (since it is limited only by the increase in value of the security sold short by a Fund). In contrast, the risk of loss from a long position is limited to a Fund’s investment in the long position, since its value cannot fall below zero. Short selling is a form of leverage which may lead to higher volatility of a Fund’s NAV or greater losses for a Fund. To mitigate leverage risk, a Fund will always hold liquid assets (including its long positions) at least equal to its short position exposure, marked-to-market daily. The Funds had no short sales outstanding at October 31, 2020.
F. Inflation-Protected Securities. The Funds may invest in inflation-protected securities, which unlike traditional debt securities that make fixed or variable principal and interest payments, are structured to provide protection against the negative effects of inflation. The value of the debt securities’ principal is adjusted to track changes in an official inflation measure. For example, the U.S. Treasury currently uses the Consumer Price Index for Urban Consumers as a measure of inflation for Treasury Inflation-Protected Securities (“TIPS”). Other inflation-protected securities may not carry a similar guarantee by their issuer. A Fund may buy TIPS that are designed to provide an investment vehicle that is not vulnerable to inflation. The interest rate paid by TIPS is fixed. The principal value rises or falls semi-annually based on the changes in the published Consumer Price Index. If inflation occurs, the principal and interest payments on TIPS are adjusted to protect investors from inflationary loss. If deflation occurs, the principal and interest payments will be adjusted downward, although the principal will not fall below its face amount at maturity.
G. When-Issued and Delayed Delivery Securities. The Funds may purchase or sell securities that they are entitled to receive on a when-issued basis. The Funds may also purchase or sell securities on a delayed delivery basis. When-issued and delayed delivery securities involve risk that the security a Fund buys will lose value prior to its delivery. There is also a risk that the security will not be issued or that the other party to the transaction will not meet its obligation. If this occurs, a Fund loses both the investment opportunity for the assets it set aside to pay for the security and any gain in the security’s price.
H. Loan Participations and Assignments. The Credit Income Fund and Fixed Income Fund may invest in fixed or floating rate loans to U.S. companies, foreign entities, and U.S. subsidiaries of foreign entities made by one or more financial institutions. The rate of interest on a fixed-rate loan is generally a set amount. The rate of interest payable on floating rate loans is the sum of a base lending rate plus a specified spread. Base lending rates are generally the London InterBank Offered Rate, the Certificate of Deposit Rate of a designated U.S. bank, the prime rate of a designated U.S. bank, the Federal Funds rate, or another base lending rate used by commercial lenders. The applicable spread may be fixed at time of issuance or may adjust upward or downward to reflect changes in credit quality of the borrower. A Fund may invest in loans that are investment grade, below investment grade (“junk”), or not rated by any nationally recognized statistical ratings organization. Loans that are rated lower than investment grade typically entail default and other risks greater than those associated with higher- rated loans. Generally, the lower the rating category, the riskier the investment. Typically, a Fund’s investments in loans are expected to take the form of loan participations and assignments of portions of loans from third parties.
Currently, the Credit Income Fund intends to invest in loans that are below investment grade and, to a lesser extent, unrated loans. The Credit Income Fund’s investments in loans are expected in most instances to be in the form of assignments. Generally, when a Fund purchases an assignment of a loan from a lender, it will step into the position of the lender and acquire direct rights against the borrower on the loan. Because assignments are arranged through private negotiations between potential assignees and potential assignors, however, the rights and obligations acquired by a Fund as the purchaser of an assignment may differ from, and be more limited than, those held by the assigning lender. The assignability of certain obligations may be restricted by the governing documentation as to the nature of the assignee such that the only way in which a Fund may acquire an interest in a loan is by purchasing a participation of interest and not an assignment. A Fund may have difficulty disposing of assignments and participation interests given these limitations and other factors.
I. Credit Enhancements. Certain obligations held by the Funds have credit enhancement or liquidity features that may, under certain circumstances, provide for repayment of principal and interest on the obligation upon demand date, interest rate reset date or final maturity.
| Old Westbury Funds, Inc. | |
| Notes to Financial Statements - (Continued) | |
| | October 31, 2020 |
These enhancements may include: letters of credit; liquidity guarantees; and third party insurance (i.e., AMBAC and FGIC). The value of the obligations may be affected by changes in credit worthiness of the entities that provide any supporting letters of credit or other credit enhancements. The value of the obligations also will be affected by the exhaustion, termination or expiration of any credit enhancement.
J. Restricted and Illiquid Securities. The Funds may purchase securities which are subject to legal or contractual delays, restrictions, and costs on resale. Because of time limitations, the Funds might not be able to dispose of these securities at reasonable prices or at times advantageous to the Funds. Each Fund limits its illiquid investments to not more than 15% of its net assets. Illiquid investments, in general, are those that, because of the absence of a readily available market or due to legal or contractual restrictions on resale, may not reasonably be expected to be sold or disposed of in current market conditions in seven calendar days or less without the sale or disposition significantly changing the market value of the investment.
K. Distributions to Shareholders. Distributions from net investment income, if any, generally are declared and paid quarterly for the Credit Income Fund, Fixed Income Fund, Municipal Bond Fund, California Municipal Bond Fund and New York Municipal Bond Fund and at least annually for the All Cap Core Fund, All Cap ESG Fund, Small & Mid Cap Strategies Fund and Large Cap Strategies Fund. Distributable net realized capital gains, if any, are declared and distributed at least annually. The amount and timing of dividends and distributions are determined in accordance with federal income tax regulations, which may differ from U.S. GAAP.
L. Expenses. Expenses that are directly related to one of the Funds are charged directly to that Fund on an accrual basis. Other operating expenses of the Corporation are prorated to each Fund on an accrual basis utilizing relative net assets or another reasonable basis.
M. Recent Accounting Standards. In March 2017, the FASB issued Accounting Standards Update 2017-08 “Receivables- Nonre-fundable Fees and Other Costs (Subtopic 310-20): Premium Amortization on Purchased Callable Debt Securities” which amends the amortization period for certain purchased callable debt securities. Under the new guidance, the premium amortization of purchased callable debt securities that have explicit, non-contingent call features and are callable at fixed prices will be amortized to the earliest call date. The guidance will be applied on a modified retrospective basis and is effective for fiscal years beginning after December 15, 2019, and interim periods within fiscal years beginning after December 15, 2020. Management believes this guidance will have an immaterial impact on the Funds.
In August 2018, the FASB issued Accounting Standards Update 2018-13 “Fair Value Measurement (Topic 820): Disclosure Framework-Changes to the Disclosure Requirements for Fair Value Measurement” which modifies disclosure requirements for fair value measurements. The guidance is effective for fiscal years beginning after December 15, 2019 and for interim periods within those fiscal years. Management is currently evaluating the impact of this guidance on the Funds.
A. Market and Credit Risk.
In the normal course of business, the Funds invest in securities and enter into transactions where risks exist due to fluctuations in the market (market risk) or failure of the issuer of a security to meet all its obligations (credit risk). The value of securities held by a Fund may decline in response to certain events, including those directly involving the issuers whose securities are owned by the Fund; changes or perceived changes in economic conditions; overall market changes; local, regional or global political, social or economic events or instability, pandemics and epidemics and other conditions; and currency and interest rate and price fluctuations. Exposure to foreign markets through issuers or currencies can involve additional risks relating to market, economic, political, regulatory, geopolitical, or other conditions. In addition, the securities of foreign companies also may be subject to the imposition of economic sanctions or other government restrictions. The risks of foreign investments are increased in emerging markets which may experience hyperinflation and have far lower trading volumes and less liquidity than developed markets. Changes in foreign currency exchange rates can affect the value of a Fund’s portfolio. Depositary receipts are generally subject to the same risks as the foreign securities that they evidence or into which they may be converted. Similar to credit risk, a Fund may be exposed to counterparty risk, or the risk that an entity with which a Fund has unsettled or open transactions may default. Financial assets, which potentially expose a Fund to credit and counterparty risks, consist principally of investments, receivables for securities sold and cash due from brokers. The Funds’ Adviser and sub-advisers, as applicable, review the creditworthiness of counterparties that they believe entail material credit risk in relation to the investment policies of a Fund. The extent of a Fund’s exposure to credit and counterparty risks with respect to these financial assets is generally represented by their values recorded in the Fund’s Statements of Assets and Liabilities.
A recent outbreak of a respiratory disease caused by a novel coronavirus (“COVID-19”) has spread globally in a short period of time. In an organized attempt to contain and mitigate the effects of COVID-19, governments and businesses world-wide have taken aggressive measures, including businesses canceling dividends to preserve cash, governments closing borders, restricting international and domestic travel, and the imposition of prolonged quarantines of large populations. COVID-19 has resulted in the disruption of and delays in the delivery of health care services and processes, the cancellation of organized events and educational institutions, the disruption of production and supply chains, a decline in consumer demand for certain goods and services, and general concern and uncertainty, all of which have contributed to increased
| Old Westbury Funds, Inc. | |
| Notes to Financial Statements - (Continued) | |
| | October 31, 2020 |
volatility in global markets. The effects of COVID-19 have affected and are likely to continue to affect certain sectors and industries more dramatically than others, and the effects borne by some will negatively affect the value of the issuers in those sectors and industries, which may adversely affect the value of a Fund’s investments in those sectors or industries. COVID-19, and other epidemics and pandemics that may arise in the future, could adversely affect the economies of many nations, the global economy, individual companies and capital markets in ways that cannot be foreseen at the present time. In addition, the impact of infectious diseases in developing or emerging market countries may be greater due to limited health care resources. Political, economic and social stresses caused by COVID-19 also may exacerbate other pre-existing political, social and economic risks in certain countries. The duration of COVID-19 and its effects cannot be determined at this time, but the effects could be present for an extended period of time. It is impossible to predict the effects on the Funds of these or similar events and market conditions in the future. However, it is possible that these or similar events and market conditions could have a significant and adverse effect on the NAV and/or risk profile of a Fund.
In March 2020, the Board of Governors of the Federal Reserve System (the “Fed”) reduced the federal funds rate to at or near zero percent in an effort to stimulate the economy following market turmoil due to the COVID-19 pandemic. It is uncertain for how long the Fed will continue to keep rates near zero. If the Fed raises interest rates, there is a risk that interest rates across the U. S. financial markets will raise suddenly and significantly, thereby exposing fixed income and related markets to heightened volatility and reduced liquidity. Such market events may cause a Fund to experience losses and/or high redemption requests, which may result in increased transactions costs and lower a Fund’s performance.
B. Concentration Risk.
California Municipal Bond Fund and New York Municipal Fund invest a substantial amount of their assets in issuers located in a single state. This may subject each Fund to the risk that economic, political or social issues impacting a particular state could have an adverse and disproportionate impact on the income from, or the value or liquidity of, each Fund’s respective portfolios. Investment percentages in specific states or U.S. territories are presented in the Portfolios of Investments.
C. LIBOR Risk.
Many financial instruments, financings or other transactions to which a Fund may be a party use or may use a floating rate based on the London Interbank Offered Rate (“LIBOR”). In July 2017, the Financial Conduct Authority, the United Kingdom’s financial regulatory body, announced that after 2021 it will cease its active encouragement of banks to provide the quotations needed to sustain LIBOR. The future publication and utilization of LIBOR, and the nature of any replacement rate, is uncertain. Therefore, the potential effect of a transition away from LIBOR on as Fund or the financial instruments in which a Fund invests cannot yet be determined.
| 4. | Fair Value Measurements: |
The inputs and valuation techniques used to measure fair value of the Funds’ investments are summarized into three levels as described in the hierarchy below:
• Level 1 - quoted prices generally in active markets for identical securities.
• Level 2 - other significant observable inputs (including quoted prices for similar securities, interest rates, prepayment speeds, credit ratings, etc.).
• Level 3 - significant unobservable inputs (including the Funds’ own assumptions in determining the fair value of investments).
The inputs or methodology used for valuing securities are not necessarily an indication of the risk associated with investing in those securities.
The summary of inputs used to value the Funds’ investments as of October 31, 2020 is as follows:
| | | | Level 1
Quoted Prices | | | Level 2
Significant
Observable
Inputs | | | Level 3
Significant
Unobservable
Inputs(a) | | | Total | |
| All Cap Core Fund | | | | | | | | | | | | | | | | | |
| Equity Securities | | | $ | 2,157,546,824(b) | | | $ | — | | | $ | — | | | $ | 2,157,546,824 | |
| Exchange-Traded Funds | | | | 98,373,717 | | | | — | | | | — | | | | 98,373,717 | |
| Investment Company | | | | 27,631,247 | | | | — | | | | — | | | | 27,631,247 | |
| Total | | | $ | 2,283,551,788 | | | $ | — | | | $ | — | | | $ | 2,283,551,788 | |
| Old Westbury Funds, Inc. | |
| Notes to Financial Statements - (Continued) | |
| | October 31, 2020 |
| | | | Level 1
Quoted Prices | | | Level 2
Significant
Observable
Inputs | | | Level 3
Significant
Unobservable
Inputs(a) | | | Total |
| All Cap ESG Fund | | | | | | | | | | | | | | | | | |
| Equity Securities | | | $ | 39,731,259(b) | | | $ | — | | | $ | — | | | $ | 39,731,259 | |
| Investment Company | | | | 395,884 | | | | — | | | | — | | | | 395,884 | |
| Total | | | $ | 40,127,143 | | | $ | — | | | $ | — | | | $ | 40,127,143 | |
| | | | | | | | | | | | | | | | | | |
| Small & Mid Cap Strategies Fund | | | | | | | | | | | | | | | | | |
| Equity Securities | | | | | | | | | | | | | | | | | |
| Argentina | | | $ | 29,318,093 | | | $ | — | | | $ | — | | | $ | 29,318,093 | |
| Australia | | | | 142,981,775 | | | | 1 | | | | 4,098,539 | | | | 147,080,315 | |
| Austria | | | | 1,640,926 | | | | — | | | | — | | | | 1,640,926 | |
| Belgium | | | | 24,996,753 | | | | — | | | | — | | | | 24,996,753 | |
| Bermuda | | | | 26,282,611 | | | | — | | | | 4,737 | | | | 26,287,348 | |
| Brazil | | | | 17,552,083 | | | | — | | | | — | | | | 17,552,083 | |
| Canada | | | | 155,762,257 | | | | — | | | | — | | | | 155,762,257 | |
| China | | | | 233,040,258 | | | | 15,701,581 | | | | 39,412 | | | | 248,781,251 | |
| Denmark | | | | 94,533,376 | | | | — | | | | — | | | | 94,533,376 | |
| Finland | | | | 48,491,443 | | | | — | | | | — | | | | 48,491,443 | |
| France | | | | 38,028,686 | | | | — | | | | — | | | | 38,028,686 | |
| Germany | | | | 123,402,922 | | | | — | | | | — | | | | 123,402,922 | |
| Greece | | | | 6,219,411 | | | | — | | | | — | | | | 6,219,411 | |
| Hong Kong | | | | 33,233,139 | | | | — | | | | 34,289 | | | | 33,267,428 | |
| Hungary | | | | 267,196 | | | | — | | | | — | | | | 267,196 | |
| Iceland | | | | 5,603,544 | | | | — | | | | — | | | | 5,603,544 | |
| India | | | | 26,664,330 | | | | — | | | | 323 | | | | 26,664,653 | |
| Indonesia | | | | 1,702,695 | | | | — | | | | 12,645 | | | | 1,715,340 | |
| Ireland | | | | 8,979,665 | | | | — | | | | — | | | | 8,979,665 | |
| Israel | | | | 133,155,961 | | | | — | | | | — | | | | 133,155,961 | |
| Italy | | | | 48,501,899 | | | | — | | | | — | | | | 48,501,899 | |
| Japan | | | | 481,790,384 | | | | — | | | | — | | | | 481,790,384 | |
| Jersey Channel Islands | | | | 33,203,386 | | | | — | | | | — | | | | 33,203,386 | |
| Malaysia | | | | 521,660 | | | | — | | | | — | | | | 521,660 | |
| Netherlands | | | | 67,035,770 | | | | — | | | | — | | | | 67,035,770 | |
| New Zealand | | | | 34,455,446 | | | | — | | | | 2,654 | | | | 34,458,100 | |
| Norway | | | | 4,608,096 | | | | — | | | | — | | | | 4,608,096 | |
| Peru | | | | 4,000,020 | | | | — | | | | — | | | | 4,000,020 | |
| Philippines | | | | — | | | | 163,075 | | | | — | | | | 163,075 | |
| Poland | | | | 11,745,555 | | | | — | | | | — | | | | 11,745,555 | |
| Portugal | | | | 229,263 | | | | — | | | | — | | | | 229,263 | |
| Qatar | | | | 400,990 | | | | — | | | | — | | | | 400,990 | |
| Russia | | | | 37,799,890 | | | | — | | | | — | | | | 37,799,890 | |
| Singapore | | | | 11,541,006 | | | | 145 | | | | 22,767 | | | | 11,563,918 | |
| South Africa | | | | 1,176,608 | | | | — | | | | — | | | | 1,176,608 | |
| South Korea | | | | 69,181,686 | | | | — | | | | 2,455 | | | | 69,184,141 | |
| Spain | | | | 24,855,291 | | | | — | | | | — | | | | 24,855,291 | |
| Sweden | | | | 110,144,615 | | | | — | | | | — | | | | 110,144,615 | |
| Switzerland | | | | 96,088,346 | | | | — | | | | — | | | | 96,088,346 | |
| Taiwan | | | | 91,527,694 | | | | — | | | | 536 | | | | 91,528,230 | |
| Thailand | | | | 5,568,115 | | | | 9,689,829 | | | | — | | | | 15,257,944 | |
| Turkey | | | | 18,745,163 | | | | — | | | | — | | | | 18,745,163 | |
| United Arab Emirates | | | | — | | | | 228 | | | | — | | | | 228 | |
| United Kingdom | | | | 416,436,314 | | | | — | | | | 98,261 | | | | 416,534,575 | |
| United States | | | | 3,123,007,991 | | | | — | | | | — | | | | 3,123,007,991 | |
| Old Westbury Funds, Inc. | |
| Notes to Financial Statements - (Continued) | |
| | October 31, 2020 |
| | | | Level 1
Quoted Prices | | | Level 2
Significant
Observable
Inputs | | | Level 3
Significant
Unobservable
Inputs(a) | | | Total | |
| Vietnam | | | $ | 1,563,589 | | | $ | — | | | $ | — | | | $ | 1,563,589 | |
| Total Equity Securities | | | $ | 5,845,985,901 | | | $ | 25,554,859 | | | $ | 4,316,618 | | | $ | 5,875,857,378 | |
| Rights/Warrants | | | | | | | | | | | | | | | | | |
| Australia | | | | — | | | | — | | | | — | | | | — | |
| Austria | | | | — | | | | — | | | | — | | | | — | |
| Hong Kong | | | | — | | | | — | | | | — | | | | — | |
| Singapore | | | | — | | | | — | | | | — | | | | — | |
| United States | | | | — | | | | — | | | | — | | | | — | |
| Total Rights/Warrants | | | $ | — | | | $ | — | | | $ | — | | | $ | — | |
| Exchange-Traded Funds | | | | 718,371,349 | | | | — | | | | — | | | | 718,371,349 | |
| Investment Company | | | | 20,792,269 | | | | — | | | | — | | | | 20,792,269 | |
| Cash Sweep | | | | 84,916,412 | | | | — | | | | — | | | | 84,916,412 | |
| Total | | | $ | 6,670,065,931 | | | $ | 25,554,859 | | | $ | 4,316,618 | | | $ | 6,699,937,408 | |
| | | | | | | | | | | | | | | | | | |
| Large Cap Strategies Fund | | | | | | | | | | | | | | | | | |
| Equity Securities | | | $ | 16,447,778,721(b) | | | $ | 76,445,498(b)(c) | | | $ | — | | | $ | 16,524,224,219 | |
| Master Limited Partnerships | | | | 1,278,551(b) | | | | — | | | | — | | | | 1,278,551 | |
| Preferred Stocks | | | | 10,155,283(b) | | | | — | | | | — | | | | 10,155,283 | |
| Exchange-Traded Funds | | | | 709,908,422 | | | | — | | | | — | | | | 709,908,422 | |
| Investment Company | | | | 346,150,292 | | | | — | | | | — | | | | 346,150,292 | |
| Total | | | $ | 17,515,271,269 | | | $ | 76,445,498 | | | $ | — | | | $ | 17,591,716,767 | |
| | | | | | | | | | | | | | | | | | |
| Credit Income Fund | | | | | | | | | | | | | | | | | |
| Exchange-Traded Funds | | | $ | 268,422,508 | | | $ | — | | | $ | — | | | $ | 268,422,508 | |
| Bank Loans | | | | — | | | | — | | | | 2,786,000(b) | | | | 2,786,000 | |
| Corporate Bonds | | | | — | | | | 150,429,050(b) | | | | — | | | | 150,429,050 | |
| Asset-Backed Securities | | | | — | | | | 495,581,684(b) | | | | 50,756,249(b) | | | | 546,337,933 | |
| Non-Agency Mortgage-Backed Securities | | | | — | | | | 336,430,747(b) | | | | 26,051,602(b) | | | | 362,482,349 | |
| U.S. Government Sponsored Agency Mortgage- Backed Securities | | | | — | | | | 10,350,378(b) | | | | — | | | | 10,350,378 | |
| U.S. Government Securities | | | | — | | | | 334,611,567 | | | | — | | | | 334,611,567 | |
| Cash Sweep | | | | 276,369,511 | | | | — | | | | — | | | | 276,369,511 | |
| | | | | | | | | | | | | | | | | | |
| Other financial instruments - Liabilities Equity contracts | | | | — | | | | (226,648)(b) | | | | — | | | | (226,648) | |
| Total | | | $ | 544,792,019 | | | $ | 1,327,176,778 | | | $ | 79,593,851 | | | $ | 1,951,562,648 | |
| | | | | | | | | | | | | | | | | | |
| Fixed Income Fund | | | | | | | | | | | | | | | | | |
| Municipal Bonds | | | $ | — | | | $ | 15,518,720(b) | | | $ | — | | | $ | 15,518,720 | |
| Corporate Bonds | | | | — | | | | 497,418,795(b) | | | | — | | | | 497,418,795 | |
| Asset-Backed Securities | | | | — | | | | 60,761,307(b) | | | | — | | | | 60,761,307 | |
| U.S. Government Sponsored Agency Mortgage-Backed Securities | | | | — | | | | 767,396(b) | | | | — | | | | 767,396 | |
| U.S. Government Agencies | | | | — | | | | 1,349,397 | | | | — | | | | 1,349,397 | |
| U.S. Government Securities | | | | — | | | | 1,080,720,746 | | | | — | | | | 1,080,720,746 | |
| Investment Company | | | | 12,732,841 | | | | — | | | | — | | | | 12,732,841 | |
| Total | | | $ | 12,732,841 | | | $ | 1,656,536,361 | | | $ | — | | | $ | 1,669,269,202 | |
| | | | | | | | | | | | | | | | | | |
| Municipal Bond Fund | | | | | | | | | | | | | | | | | |
| Municipal Bonds | | | $ | — | | | $ | 3,878,958,402(b) | | | $ | — | | | $ | 3,878,958,402 | |
| Corporate Bonds | | | | — | | | | 96,961,193(b) | | | | — | | | | 96,961,193 | |
| U.S. Government Securities | | | | — | | | | 181,510,581 | | | | — | | | | 181,510,581 | |
| Old Westbury Funds, Inc. | |
| Notes to Financial Statements - (Continued) | |
| | October 31, 2020 |
| | | | Level 1
Quoted Prices | | | Level 2
Significant
Observable
Inputs | | | Level 3
Significant
Unobservable
Inputs(a) | | | Total | |
| Investment Company | | | | 85,431,086 | | | | — | | | | — | | | | 85,431,086 | |
| Total | | | $ | 85,431,086 | | | $ | 4,157,430,176 | | | $ | — | | | $ | 4,242,861,262 | |
| | | | | | | | | | | | | | | | | | |
| California Municipal Bond Fund | | | | | | | | | | | | | | | | | |
| Municipal Bonds | | | $ | — | | | $ | 353,289,508(b) | | | $ | — | | | $ | 353,289,508 | |
| Corporate Bonds | | | | — | | | | 2,240,299(b) | | | | — | | | | 2,240,299 | |
| U.S. Government Securities | | | | — | | | | 32,971,978 | | | | — | | | | 32,971,978 | |
| Investment Company | | | | 9,527,349 | | | | — | | | | — | | | | 9,527,349 | |
| Total | | | $ | 9,527,349 | | | $ | 388,501,785 | | | $ | — | | | $ | 398,029,134 | |
| | | | | | | | | | | | | | | | | | |
| New York Municipal Bond Fund | | | | | | | | | | | | | | | | | |
| Municipal Bonds | | | $ | — | | | $ | 517,914,010(b) | | | $ | — | | | $ | 517,914,010 | |
| Corporate Bonds | | | | — | | | | 10,337,275(b) | | | | — | | | | 10,337,275 | |
| U.S. Government Securities | | | | — | | | | 22,909,453 | | | | — | | | | 22,909,453 | |
| Investment Company | | | | 27,397,460 | | | | — | | | | — | | | | 27,397,460 | |
| Total | | | $ | 27,397,460 | | | $ | 551,160,738 | | | $ | — | | | $ | 578,558,198 | |
| (a) | The Small & Mid Cap Strategies Fund and Large Cap Strategies Fund held certain investments categorized as Level 3 that had a combined fair value less than 1% of NAV for the respective Fund for the year ended October 31, 2020. For the Small & Mid Cap Strategies Fund there were transfers into Level 3 in the amount of $8,406,029. For the Small & Mid Cap Strategies Fund there were transfers out of level 3 in the amount of $2,594. In addition, with the exception of the Credit Income Fund, there were no significant purchases and sales during the period. As of October 31, 2020, the fair value of Level 3 assets as a percentage of NAV was 0.01%, 0.00% and 4.10% for the Small & Mid Cap Strategies Fund, the Large Cap Strategies Fund and the Credit Income Fund, respectively. The Funds’ instrument types classified as Level 3 investments are valued using recent transaction price or broker quotes. |
| (b) | The classification of the Fund’s investments into major categories or countries is disclosed in the respective Fund’s Portfolio of Investments and in footnote 5 for derivatives. |
| (c) | Represents securities as disclosed in the Thailand section of the Fund’s Portfolio of Investments. |
During the year ended October 31, 2020, the funds recognized no transfers to/from Level 1 or Level 2. The Fund’s policy is to recognize transfers to /from Level 1, Level 2 and Level 3 at the end of the year utilizing fair value at the beginning of the year.
The following is a rollforward of Level 3 investments:
| | Credit Income Fund |
| Balance as of 10/01/20 (value) | | $ | — | |
| Net accrued discounts (premiums) | | | 3,998 | |
| Realized gain (loss) | | | 17,182 | |
| Unrealized gain (loss) | | | 226,455 | |
| Purchases | | | 79,888,560 | |
| Sales (paydowns) | | | (542,344 | ) |
| Balance as of 10/31/20 (value) | | $ | 79,593,851 | |
| Net change in unrealized appreciation (depreciation) on investments still held at October 31, 2020 | | $ | 226,455 | |
| 5. | Derivative Instruments: |
The Funds engage in various portfolio investment strategies utilizing derivatives both to increase the return of the Funds and/or to economically hedge, or protect, their exposure to, for example, interest rate movements, movements in the securities or commodities markets and currency value fluctuations. Derivatives are subject to a number of risks, including changes in the market price of the underlying securities, credit risk with respect to the counterparty to the derivative instruments and the risk of loss due to changes in interest rates. The use of certain derivatives may also have a leveraging effect, which may increase the Fund’s sensitivity to adverse market movements and may exaggerate a loss. Losses may arise if the value of the contract decreases due to, among other potentially adverse events, an unfavorable change in the price
| Old Westbury Funds, Inc. | |
| Notes to Financial Statements - (Continued) | |
| | October 31, 2020 |
of the underlying security or commodity or if the counterparty does not perform under the contract. The use of derivatives can lead to losses because of relatively small adverse movements in the price or value of the underlying security, asset, index or reference rate, which may be magnified by or potentially unlimited as a result of certain features of the derivatives.
The primary difference in risks associated with over-the-counter contracts and exchange-traded contracts is credit and liquidity risks. Over-the-counter contracts, as bilateral arrangements, contain credit risk from various counterparties for any unrealized gains for the duration of the contract. The credit risk related to exchange-traded contracts is minimal because the exchanges are viewed as presenting lower credit risk than bilateral counterparties. The Funds may mitigate counterparty risk on derivatives through master netting agreements included within an International Swaps and Derivatives Association, Inc. (“ISDA”) Master Agreement between a Fund and each of its counterparties. The ISDA Master Agreement allows each Fund to offset with its counterparty certain derivative financial instruments’ payables and/or receivables with collateral held with each counterparty. The amount of collateral moved to/from applicable counterparties is based upon minimum transfer amounts of up to $250,000. To the extent amounts due to the Funds from their counterparties are not fully collateralized contractually or otherwise, the Funds bear the risk of loss from counterparty non-performance.
The Funds’ maximum risk of loss from counterparty credit risk on over-the-counter derivatives is generally the aggregate net unrealized gain in excess of any collateral pledged by the counterparty to the Funds. For over-the-counter purchased options, the Funds bear the risk of loss in the amount of the premiums paid and positive change in market value of the options should the counterparty not perform under the contracts. Written options by the Funds do not give rise to counterparty credit risk, as written options obligate the Funds to perform and not the counterparty. Certain ISDA Master Agreements allow counterparties to over-the-counter derivatives to terminate or require full collateralization of derivative contracts prior to maturity in the event a Fund’s net assets decline by a stated percentage or a Fund fails to meet the terms of its ISDA Master Agreements, which would cause the Funds to post additional collateral or accelerate payment of any net liability owed to the counterparty. There were no trigger events during the year ended October 31, 2020.
Cash collateral that has been pledged to cover obligations of a Fund and cash collateral received from the counterparty, if any, is reported separately on the Statements of Assets and Liabilities as due from brokers for collateral and payable to brokers for collateral, respectively. Non-cash collateral pledged by the Fund, if any, is noted in the Portfolio of Investments.
When counterparties post cash collateral with respect to various derivative transactions, a Fund may invest the collateral and receives interest income on the investment and pays interest expense on the collateral to the counterparty. The interest income is included in investment income on the Statements of Operations, and the interest expense is included in a Fund’s overall expenses on the Statements of Operations and expense ratio in the Financial Highlights.
As of October 31, 2020, the Funds had transactions subject to enforceable master netting arrangements (“MNA”). For reporting purposes, the Funds do not offset derivative assets and derivative liabilities that are subject to netting arrangements or another similar arrangement in the Statements of Assets and Liabilities. A reconciliation of the gross amounts on the Statements of Assets and Liabilities to the net amounts by counterparty, including any collateral exposure, is included in the following tables:
| Credit Income Fund | | | | | | | | | | | | | | | |
| | | Gross | | | | | | | | | | | | | |
| | | Amounts of | | | | | | | | | | | | | |
| | | Liabilities | | | | | | | | | | | | | |
| | | Presented | | | | | | | | | | | | | |
| | | in the | | | | | | | | | | | | Net | |
| | | Statement | | | Derivatives | | | Non-cash | | | Cash | | | Amount of | |
| | | of Assets and | | | Available | | | Collateral | | | Collateral | | | Derivative | |
| Counterparty | | Liabilities | | | for Offset (a) | | | Pledged (b) | | | Pledged (b) | | | Liabilities(c) | |
| Barclays Bank Plc | | $ | 226,648 | | | $ | — | | | $ | — | | | $ | (226,648 | ) | | $ | — | |
| (a) | The amount of derivatives available for offset is limited to the amount of assets and/or liabilities that are subject to a MNA or another similar arrangement. |
| (b) | Excess of collateral received from/payable to the individual counterparty is not shown for financial reporting purposes. |
| (c) | Net amount represents the net amount receivable from/payable to counterparty in the event of default. |
| Old Westbury Funds, Inc. | |
| Notes to Financial Statements - (Continued) | |
| | October 31, 2020 |
The Funds may be subject to, among other risks, interest rate risk, equity price risk, commodity risk and foreign currency exchange risk in the normal course of pursuing their investment objectives by investing in various derivative financial instruments, as described below.
For open derivative instruments, please see the respective Fund’s Portfolio of Investments or details below:
| | | Fair Values of Derivative Instruments as of October 31, 2020 | |
| | | Derivative Assets | | | Derivative Liabilities | |
| | | | | | | |
| | | Statements of Assets | | | | | Statements of Assets | | | |
| | | and Liabilities | | | | | and Liabilities | | | |
| Credit Income Fund | | Location | | Value | | | Location | | Value | |
| Equity Risk | | Unrealized appreciation on swap agreements | | $ | — | | | Unrealized depreciation on swap agreements | | $ | 226,648 | |
| | | The Effect of Derivative Instruments on the Statements of Operations | |
| | | For the Period Ended October 31, 2020 | |
| | | Net Realized Gain/(Loss) from Derivatives Recognized in Income | |
| | | |
| | | Purchased Options | | | Written | | | | | | | | | Foreign | | | | |
| | | and Structured | | | Options and | | | | | | | | | Currency | | | | |
| | | Options | | | Structured | | | Futures | | | Swap | | | Exchange | | | | |
| Credit Income Fund | | (Investments) | | | Options | | | Contracts | | | Agreements | | | Contracts | | | Total | |
| Interest Risk | | $ | — | | | $ | — | | | $ | 41,583 | | | $ | — | | | $ | — | | | $ | 41,583 | |
| | | | | | | | | | | | | | | | | | | | | | | | | |
| | | Purchased Options | | | Written | | | | | | | | | Foreign | | | | |
| | | and Structured | | | Options and | | | | | | | | | Currency | | | | |
| | | Options | | | Structured | | | Futures | | | Swap | | | Exchange | | | | |
| Small & Mid Cap Strategies Fund | | (Investments) | | | Options | | | Contracts | | | Agreements | | | Contracts | | | Total | |
| Foreign Currency Exchange Risk | | $ | — | | | $ | — | | | $ | — | | | $ | — | | | $ | (69,310) | | | $ | (69,310) | |
| | | | | | | | | | | | | | | | | | | | | | | | | |
| | | Purchased Options | | | Written | | | | | | | | | Foreign | | | | |
| | | and Structured | | | Options and | | | | | | | | | Currency | | | | |
| | | Options | | | Structured | | | Futures | | | Swap | | | Exchange | | | | |
| Large Cap Strategies Fund | | (Investments) | | | Options | | | Contracts | | | Agreements | | | Contracts | | | Total | |
| Foreign Currency Exchange Risk | | $ | — | | | $ | — | | | $ | — | | | $ | — | | | $ | (360,514) | | | $ | (360,514) | |
| | | | | | | | | | | | | | | | | | | | | | | | | |
| | | Net Change in Unrealized Appreciation/(Depreciation) | |
| | | on Derivatives Recognized in Income | |
| | | |
| | | Purchased Options | | | Written | | | | | | | | | Foreign | | | | |
| | | and Structured | | | Options and | | | | | | | | | Currency | | | | |
| | | Options | | | Structured | | | Futures | | | Swap | | | Exchange | | | | |
| Credit Income Fund | | (Investments) | | | Options | | | Contracts | | | Agreements | | | Contracts | | | Total | |
| Equity Risk | | $ | — | | | $ | — | | | $ | — | | | $ | (226,648) | | | $ | — | | | $ | (226,648) | |
| Old Westbury Funds, Inc. | |
| Notes to Financial Statements - (Continued) | |
| | October 31, 2020 |
For the year ended October 31, 2020, the quarterly average volume of derivative activities were as follows:
| | | Small & Mid Cap Strategies Fund |
| Forward Currency Contracts Sold (U.S. Dollar Amounts) | | $18,750,000 |
| | | Large Cap Strategies Fund |
| Forward Currency Contracts Sold (U.S. Dollar Amounts) | | $52,500,000 |
| | | Credit Income Fund |
| Equity Swaps (Notional Amount in U.S. Dollars) | | $180,000,000 |
A. Futures Contracts. The Funds may purchase and write (sell) futures contracts and options on futures contracts to gain exposure to, or hedge against, changes in the value of equity securities (equity risk), interest rates (interest rate risk) or commodity risk.
Futures contracts are agreements pursuant to which two parties agree to take or make delivery of an amount of cash equal to the difference between the value of the contract at the close of the last trading day and the price at which the contract was originally written. Upon entering into a futures contract, the Funds are required to pledge to a futures commission merchant an amount of cash, U.S. government securities, or other assets, equal to a certain percentage of the contract amount. This is known as the initial margin deposit. Subsequent payments, known as variation margin, are made or received by the Funds each day, depending on the daily fluctuations in fair value of the underlying instrument. The Funds recognize an unrealized gain or loss equal to the variation margin. These futures contracts permit the Funds to meet their objectives at a lower cost than investing directly in the underlying instruments or commodities, while permitting the equivalent of an investment in a portfolio of the underlying instruments or commodities. A potential risk to the Funds is that the change in value of the underlying securities or commodities may not correlate to the change in value of the contracts. Listed futures contracts involve minimal counterparty risk since futures contracts are guaranteed against default by the exchange on which they trade and exchanges are viewed as presenting lower credit risk than bilateral counterparties.
B. Forward Foreign Currency Exchange Contracts. The Funds (except Municipal Bond Fund, California Municipal Bond and New York Municipal Bond) may enter into forward foreign currency contracts (“Forward”) to hedge their exposure to changes in foreign currency exchange rates on foreign portfolio holdings (foreign currency exchange risk). In addition, certain Funds may use a Forward to provide exposure to the foreign currency market. A Forward is an agreement between two parties to purchase or sell a foreign currency at a future date at a negotiated forward rate. A Forward is marked-to-market daily and the change in market value is recorded by the Funds as unrealized appreciation or depreciation until the contract settlement date. The market value of the Forward is determined using the forward rate for the remainder of the outstanding period of the contract, through the delivery date. When a Forward is closed or settled, the Funds record a realized gain or loss equal to the fluctuation in rates during the period a Forward was open. Risks may arise upon entering into these contracts from, for example, the potential inability of the counterparties to meet the terms of their contracts, or if the foreign currency rates change unfavorably.
In the event of default by the counterparty to the transaction, the Funds’ maximum amount of loss, as either the buyer or seller, is the unrealized gain on the contract.
The Funds may be required to pledge to the broker an amount of cash, U.S. government securities or other assets, equal to a certain percentage of the contract amount.
C. Swap Agreements. The Funds may enter into swap agreements, which are agreements involving two parties to exchange the return generated by a security, currency, commodity, interest rate, index, or other measures for the return generated by another instrument, for example, the agreement to pay interest in exchange for a market-linked return based on a notional amount. The Funds entered into total return, interest rate and other swap agreements. Interest rate swap agreements generally involve the agreement by the Funds to pay a counterparty a fixed or floating rate on a fixed notional amount and to receive a fixed or floating rate on a fixed notional amount, but may also involve the agreement to pay or receive payments derived from changes in interest rates. Periodic payments are generally made during the life of the swap agreement according to the terms and conditions of the agreement and at termination or maturity. Total return swap agreements involve the commitments to pay or receive an amount generally determined by reference to a security, index or other measure in exchange for a specific market linked return, based on notional amounts. To the extent that the total return of the security, index or other measure underlying the transaction exceeds or falls short of the offsetting interest rate-based obligation, the Funds receive or make a payment to the counterparty. Payments received or made by a Fund at the expiration or other termination of the swap agreements are recorded in the Statements of Operations as realized gains or losses, respectively. Swap agreements are marked-to-market daily based on counterparty valuation quotations, and changes in value, including the periodic amounts of interest to be paid or received on swaps, are recorded as unrealized appreciation/(depreciation). Risks may exceed amounts recognized on the Statements of Assets and Liabilities. These risks include changes in the returns of the underlying instruments, failure of the counterparties to perform under the contracts’ terms and the possible lack of liquidity with respect to
| Old Westbury Funds, Inc. | |
| Notes to Financial Statements - (Continued) | |
| | October 31, 2020 |
the swap agreements. Details of swap agreements open at period end are included in the Portfolios of Investments under the caption “Swap Agreements”.
D. Options. The Funds may purchase and write (sell) put and call options on equity securities and stock index futures in order to gain exposure to or to protect against changes in the market.
Options on swaps (swaptions) are similar to options on securities except that instead of selling or purchasing the right to buy or sell a security, the writer or purchaser of the swaption is granting or buying the right to enter into a previously agreed upon swap agreement at any time before the expiration of the option.
A call option gives the purchaser of the option the right (but not the obligation) to buy, and obligates the seller to sell (when the option is exercised), the underlying instrument at the exercise price at any time or at a specified time during the option period. A put option gives the holder the right to sell and obligates the writer to buy the underlying instrument at the exercise price at any time or at a specified time during the option period. When a Fund purchases (writes) an option, an amount equal to the premium paid (received) by a Fund is reflected as an asset (liability). The amount of the asset (liability) is subsequently marked-to-market to reflect the current market value of the option purchased (written). When an instrument is purchased or sold through an exercise of an option, the related premium paid (or received) is added to (or deducted from) the basis of the instrument acquired or deducted from (or added to) the proceeds of the instrument sold. When an option expires (or a Fund enters into a closing transaction), a Fund realizes a gain or loss on the option to the extent of the premiums received or paid (or gain or loss to the extent the cost of the closing transaction exceeds the premium received or paid). When a Fund writes a call option, such option is “covered,” meaning that a Fund holds the underlying instrument subject to being called by the option counterparty, or cash in an amount sufficient to cover the obligation. When a Fund writes a put option, such option is covered by cash in an amount sufficient to cover the obligation.
In purchasing and writing options, a Fund bears certain risks, including the market risk of an unfavorable change in the price of the underlying instrument or the risk that a Fund may not be able to enter into a closing transaction due to an illiquid market. Exercise of a written option could result in a Fund purchasing or selling a security at a price different from the current market value.
A Fund may execute transactions in both listed and over-the-counter options. Listed options involve minimal counterparty risk since listed options are guaranteed against default by the exchange on which they trade and exchanges are viewed as presenting lower credit risk than bilateral counterparties. Transactions in certain over-the-counter options may expose a Fund to the risk of default by the counterparty to the transaction. In the event of default by the counterparty to the over-the-counter option transaction, a Fund’s maximum amount of loss is the premium paid and unrealized gain (as purchaser) or the unrealized gain of the contract less the premium received (as writer).
The Credit Income Fund may invest in structured options to increase or decrease its exposure to an underlying index or group of securities (equity risk) or to increase or decrease its exposure to changes in foreign currency exchange rates (foreign currency exchange risk). These structured options may consist of single or multiple OTC options which are priced as a single security. Structured options may only be exercised at the expiration date, but may be transferred/sold prior to the expiration date. The value of a structured option may either increase or decrease with the underlying index or group of securities, depending on the combination of options used. Structured options are issued in units where-by each unit represents a structure based on a specific index with an initial reference strike price. Generally, the basis of the contracts is the premium received or paid which is recorded as an asset on the Statements of Assets and Liabilities. The amount of the asset is subsequently market-to-market to reflect the current market value of the structured option. When a structured option is transferred/sold or exercised, the Fund will record a realized gain or loss equal to the difference between the proceeds from (or cost of) the closing transaction and the Fund’s basis in the contract, if any. One type of structure involves the combination of selling a put while buying a call on a specific index. This option would rise in value as the underlying index increases and fall in value as the underlying index decreases. Alternatively, another structure involves the sale of a call and the purchase of a put. This option structure would rise in value as the underlying index decreases and fall in value as the underlying index increases. Upon the exercise of the structured option, the Fund will receive a payment from, or be required to remit a payment to the counterparty, depending on the value of the underlying index at exercise.
| Old Westbury Funds, Inc. | |
| Notes to Financial Statements - (Continued) | |
| | October 31, 2020 |
| 6. | Investment Advisory Fee, Administration Fee and Other Transactions: |
A. Investment Advisory Fees. The Funds’ investment adviser is BIM, a wholly-owned subsidiary of Bessemer Trust Company, N.A. (“Bessemer”). Bessemer is a subsidiary of The Bessemer Group, Incorporated (“BGI”). The investment advisory fee paid to BIM for advisory services is computed daily and paid monthly in accordance with the following schedule:
| | | | | | Next $500 million | | | | | | | |
| | | First $500 million of | | | to $1 billion of | | | Average net assets | | | Blended | |
| | | average net assets | | | average net assets | | | exceeding $1 billion | | | Advisory Rate | |
| All Cap Core Fund | | | 0.75 | % | | | 0.70 | % | | | 0.65 | % | | | 0.69 | % |
| All Cap ESG Fund | | | 0.75 | % | | | 0.70 | % | | | 0.65 | % | | | 0.75 | % |
| Credit Income Fund | | | 0.65 | % | | | 0.60 | % | | | 0.55 | % | | | 0.59 | % |
| Fixed Income Fund | | | 0.45 | % | | | 0.40 | % | | | 0.35 | % | | | 0.40 | % |
| Municipal Bond Fund | | | 0.45 | % | | | 0.40 | % | | | 0.35 | % | | | 0.37 | % |
| California Municipal Bond Fund | | | 0.45 | % | | | 0.40 | % | | | 0.35 | % | | | 0.45 | % |
| New York Municipal Bond Fund | | | 0.45 | % | | | 0.40 | % | | | 0.35 | % | | | 0.45 | % |
| | | | | | | | | | | | | | | | |
| | | | | | | | | | | | | | | | Average net assets |
| Small & Mid Cap Strategies Fund | | | | | | | | | | | | | | | 0.85 | % |
| | | | | | | | | | | | | | | | | |
| | | | | Next $1.25 billion | | Average net assets | | |
| | | First $1.25 billion of | | to $2.5 billion of | | exceeding $2.5 | | Blended |
| | | average net assets | | average net assets | | billion | | Advisory Rate |
| Large Cap Strategies Fund | | | 0.90 | % | | | 0.85 | % | | | 0.80 | % | | | 0.81 | % |
BIM has retained Acadian Asset Management, LLC (“Acadian”), Artisan Partners (“Artisan”), Baillie Gifford Overseas Limited (“Baillie Gifford”), Champlain Investment Partners, LLC (“Champlain”), and Polunin Capital Partners Limited (“Polunin”) as sub-advisers to each manage segments of the Small & Mid Cap Strategies Fund. Acadian, Artisan, Baillie Gifford, Champlain, and Polunin are paid for their services directly by BIM.
BIM has retained Harding Loevner LP (“Harding Loevner”) and Sands Capital Management, LLC (“Sands”) as sub-advisers to manage a segment of the Large Cap Strategies Fund. Harding Loevner and Sands are paid for their services directly by BIM.
BIM has retained BlackRock Financial Management, Inc. (“BlackRock”) and Muzinich & Co., Inc. (“Muzinich”) as sub-advisers to each manage a segment of the Credit Income Fund. BlackRock and Muzinich are paid for their services directly by BIM.
B. Administration, Fund Accounting, Transfer Agent and Underwriting Fees. The Corporation, on behalf of each Fund, has entered into an administrative oversight, supervision and coordination services agreement (the “Administrative Agreement”) with Bessemer, pursuant to which Bessemer and Bessemer Trust Company (“BTCO”), an affiliate of BIM, provide certain non- advisory services to the Funds, such as the maintenance of records, the provision of supervisory personnel and the monitoring of the other non-advisory service providers. Under the Administrative Agreement, each Fund pays an annual fee of 0.03% of its average daily net assets for such services. BNY Mellon Investment Servicing (US) Inc. (“BNY Mellon”) acts as administrator, fund accounting agent and transfer agent for the Funds pursuant to an Administration and Accounting Services Agreement and a Transfer Agency Services Agreement, respectively. Certain Officers of the Funds are also employees of BNY Mellon.
The Corporation entered into an Underwriting Agreement with Foreside Funds Distributors LLC for the limited purpose of acting as statutory underwriter to facilitate the registration and distribution of shares of the Funds.
C. Distribution and Shareholder Servicing Fees. The Funds have adopted a shareholder servicing plan (the “Shareholder Servicing Plan”) with Bessemer, pursuant to which Bessemer serves as a shareholder servicing agent and provides certain shareholder support services. Bessemer may engage shareholder sub-servicing agents, such as broker/dealers, banks, trust companies, investment advisers, and other financial institutions and intermediaries to provide certain shareholder support services and is solely responsible for paying each such shareholder sub-servicing agent from the fee it receives from each of the Funds. Each Fund pays for shareholder support services an annual fee of 0.20% of its average daily net assets. The shareholder servicing fee commitment arrangements may be changed or terminated at any time with the approval of the Board. Bessemer, however, does not have the ability to recapture fees currently being waived at a later date.
| Old Westbury Funds, Inc. | |
| Notes to Financial Statements - (Continued) | |
| | October 31, 2020 |
D. Custody Fees. The All Cap Core Fund, All Cap ESG Fund, Large Cap Strategies Fund, Fixed Income Fund, Municipal Bond Fund, California Municipal Bond Fund, and New York Municipal Bond Fund have each retained BTCO, a wholly-owned subsidiary of BGI, to serve as their custodian, and the Small & Mid Cap Strategies Fund has retained BTCO to serve as their co-custodian. Pursuant to the Funds’ Custody Agreements, BTCO is responsible for maintaining the custody of these Funds’ securities and cash. BTCO serves as custodian for the Small & Mid Cap Strategies Fund only with respect to equity securities of U.S. companies (other than exchange-traded funds) and securities in the form of depositary receipts directly managed by BIM, income, other payments and distributions issued with respect to such securities, proceeds of the sale of such securities, and cash, cash equivalents and money market instruments received and held by BTCO from time to time on behalf of the Small & Mid Cap Strategies Fund. For providing these services, BTCO receives a fee calculated and paid monthly at the annual rate of 0.065% of the average daily net assets of the non-U.S. investments for All Cap Core Fund, All Cap ESG Fund and Large Cap Strategies Fund and 0.015% of the average daily net assets of each of the Fixed Income Fund, Municipal Bond Fund, California Municipal Bond Fund, and New York Municipal Bond Fund or portion thereof for the Small & Mid Cap Strategies Fund and U.S. investments for All Cap Core Fund, All Cap ESG Fund and Large Cap Strategies Fund. The Credit Income Fund has retained Citibank, N.A. (“Citibank”) to serve as its custodian and the Small & Mid Cap Strategies Fund has retained Citibank to serve as its co-custodian. Citibank is responsible for maintaining the custody of these Funds’ securities and cash and assets of the Small & Mid Cap Strategies Fund managed by the sub-advisers. For providing these services, Citibank receives a fee from each Fund calculated daily and paid monthly based on safekeeping and transaction fees that vary by country.
E. Fee Waivers. BIM may voluntarily waive a portion of its advisory fee to limit the Funds’ total expenses. BIM may terminate this voluntary waiver at any time. BIM, however, does not have the ability to recapture fees currently being waived at a later date. BIM has contractually committed through October 31, 2021 to waive its advisory fees to the extent necessary to maintain the net operating expense ratios, excluding fund transaction costs, investment interest expense, dividend expenses associated with securities sold short and acquired fund fees and expenses, if any, of the Small & Mid Cap Strategies Fund at 1.11%, the Large Cap Strategies Fund at 1.15%, the Credit Income Fund at 0.85%, the Fixed Income Fund at 0.57%, the Municipal Bond Fund at 0.57%, the California Municipal Bond Fund at 0.57%, the New York Municipal Bond Fund at 0.57% and the All Cap ESG Fund at 1.00%. Any waiver amounts are disclosed in the Statements of Operations. For the year ended October 31, 2020, BIM waived $132,173 for the All Cap ESG Fund, $2,565,603 for the Small & Mid Cap Strategies Fund, $156,712 for the Credit Income Fund, $1,777,096 for the Fixed Income Fund, $3,200,551 for the Municipal Bond Fund, $720,259 for the California Municipal Bond Fund and $978,078 for the New York Municipal Bond Fund. The contractual advisory fee waivers and the shareholder servicing fee waivers may be changed or terminated at any time with the approval of the Board.
Effective November 1, 2020, BIM has contractually committed through October 31, 2024 to waive its advisory fees to the extent necessary to maintain the net operating expense ratios, excluding fund transaction costs, investment interest expense, dividend expenses associated with securities sold short and acquired fund fees and expenses, if any, of the Small & Mid Cap Strategies Fund at 1.10% and the Large Cap Strategies Fund at 1.10%.
F. Board of Directors’ Fees. Effective February 1, 2020, each Director who is not an “interested person” of the Corporation (as that term is defined under the 1940 Act) (each, an “Independent Director”) receives from the Funds a total annual retainer of $240,000, plus $30,000 for serving as Board’s Chairperson and $15,000 as the Audit Committee Chairperson. Prior to that, the total annual retainer was $235,000, plus $30,000 for serving as the Board’s Chairperson and $15,000 as the Audit Committee Chairperson.
Each Independent Director is reimbursed for all out-of-pocket expense relating to attendance at meetings of the board and any Board committee. Directors who are not independent Directors, officers or employees of BIM and BNY Mellon do not receive compensation from the Funds. Fees paid are allocated to the Funds on a pro rata basis based on net assets.
G. Other Transactions. From time to time, the Funds may sell or purchase investments from affiliated funds. The prices of these transactions are based on valuations obtained in accordance with the valuation procedures followed by the Funds, as described in Note 2, applied on a consistent basis. For the year ended October 31, 2020, an affiliated fund sold investments, at fair value, in the amount of $124,150,217 to the Large Cap Strategies Fund.
In October 2020, in connection with its launch, shareholders contributed a basket of securities and cash totaling $1,321,251,911 to the Credit Income Fund as subscriptions in-kind.
| Old Westbury Funds, Inc. | |
| Notes to Financial Statements - (Continued) | |
| | October 31, 2020 |
| | |
| 7. | Securities Transactions: |
Investment transactions for the year ended October 31, 2020, excluding short-term debt investments and U.S. Government securities, were as follows:
| | | Purchases | | Sales |
| All Cap Core Fund | | $ | 1,022,824,230 | | | $ | 854,707,349 | |
| All Cap ESG Fund | | | 18,103,650 | | | | 15,536,176 | |
| Small & Mid Cap Strategies Fund | | | 4,161,035,072 | | | | 3,993,742,070 | |
| Large Cap Strategies Fund | | | 12,412,995,430 | | | | 12,817,186,255 | |
| Credit Income Fund | | | 469,731,962 | | | | 8,810,989 | |
| Fixed Income Fund | | | 451,340,332 | | | | 191,636,830 | |
| Municipal Bond Fund | | | 1,674,753,601 | | | | 1,238,586,559 | |
| California Municipal Bond Fund | | | 106,013,832 | | | | 82,675,269 | |
| New York Municipal Bond Fund | | | 188,947,411 | | | | 128,192,780 | |
Purchase and sales of U.S. Government Securities, excluding those with maturity of one year or less during the year ended October 31, 2020 were as follows:
| | | Purchases | | Sales |
| Credit Income Fund | | $ | 342,518,352 | | | $ | 9,318 | |
| Fixed Income Fund | | | 1,002,194,510 | | | | 1,154,537,835 | |
| Municipal Bond Fund | | | 395,527,184 | | | | 296,027,618 | |
| California Municipal Bond Fund | | | 40,708,591 | | | | 9,956,418 | |
| New York Municipal Bond Fund | | | 89,494,627 | | | | 68,950,856 | |
It is the policy of each Fund to qualify as a regulated investment company by complying with the provisions available to certain investment companies as defined in Subchapter M of the Internal Revenue Code of 1986, as amended (the “Code”), and to make distributions from net investment income and net realized capital gains sufficient to relieve it from all, or substantially all, federal income taxes. Federal income tax regulations differ from accounting principles generally accepted in the U.S.; therefore, distributions determined in accordance with tax regulations may differ in amount or character from net investment income and realized gains for financial reporting purposes. Financial reporting records are adjusted for permanent book/tax differences to reflect tax character within the components of net assets in the Statements of Assets and Liabilities. These permanent differences primarily arise from utilization of earnings and profits on shareholder redemptions. Financial records are not adjusted for temporary differences. Temporary differences primarily arise from the tax treatment of wash sales, passive foreign investment companies, and index options.
As of October 31, 2020, the tax cost of investments and the breakdown of unrealized appreciation (depreciation) for each Fund were as follows:
| | | Cost of
Investments
Federal
Income Tax
Purposes | | Gross
Unrealized
Appreciation
on Investments | | Gross
Unrealized
Depreciation
on Investments | | Net
Unrealized
Appreciation
(Depreciation)
on Investments |
| All Cap Core Fund | | $ | 1,529,241,882 | | | $ | 782,571,615 | | | $ | (28,261,709 | ) | | $ | 754,309,906 | |
| All Cap ESG Fund | | | 39,219,983 | | | | 5,034,756 | | | | (4,127,596 | ) | | | 907,160 | |
| Small & Mid Cap Strategies Fund | | | 5,648,944,493 | | | | 1,470,219,342 | | | | (419,226,427 | ) | | | 1,050,992,915 | |
| Large Cap Strategies Fund | | | 13,222,630,628 | | | | 4,781,051,138 | | | | (411,964,999 | ) | | | 4,369,086,139 | |
| Credit Income Fund | | | 1,962,420,579 | | | | 9,433,671 | | | | (20,064,954 | ) | | | (10,631,283 | ) |
| Fixed Income Fund | | | 1,623,245,523 | | | | 55,882,210 | | | | (9,858,530 | ) | | | 46,023,680 | |
| Municipal Bond Fund | | | 4,105,690,576 | | | | 146,197,327 | | | | (9,026,641 | ) | | | 137,170,686 | |
| California Municipal Bond Fund | | | 386,200,514 | | | | 12,575,230 | | | | (746,610 | ) | | | 11,828,620 | |
| New York Municipal Bond Fund | | | 564,191,991 | | | | 15,727,456 | | | | (1,361,249 | ) | | | 14,366,207 | |
| Old Westbury Funds, Inc. |
| Notes to Financial Statements - (Continued) |
| October 31, 2020 |
| |
Permanent differences as of October 31, 2020, were as follows:
| | | Total Distributable
Earnings
/(Accumulated Loss) | | Increase/
(Decrease)
Paid-in-Capital |
| All Cap Core Fund | | | $(5,789,213 | ) | | | $5,789,213 | |
| Small & Mid Cap Strategies Fund | | | (6,750,537 | ) | | | 6,750,537 | |
| Large Cap Strategies Fund | | | (26,520,650 | ) | | | 26,520,650 | |
The Funds may be subject to taxes imposed by other countries in which they invest. Such taxes are generally based on income earned as well as capital gains and in certain situations, unrealized gains. These taxes are accrued and applied to net investment income, net realized gains and unrealized gains, if applicable, as such income and/or gains are earned.
The tax character of distributions from the Funds during the year ended October 31, 2020 was as follows:
| | | All Cap Core
Fund | | All Cap ESG
Fund | | Small & Mid Cap
Strategies Fund | | Large Cap
Strategies Fund | | Fixed Income
Fund |
| Distributions paid from: | | | | | | | | | | | | | | | | | | | | |
| Ordinary income | | $ | 11,301,833 | | | $ | 871,187 | | | $ | 33,645,169 | | | $ | 134,614,727 | | | $ | 27,441,587 | |
| Net Long Term Capital Gains | | | 146,728,965 | | | | — | | | | 260,460,494 | | | | 706,560,019 | | | | — | |
| Total Taxable Distributions | | | 158,030,798 | | | | 871,187 | | | | 294,105,663 | | | | 841,174,746 | | | | 27,441,587 | |
| Tax Exempt Distributions | | | — | | | | — | | | | — | | | | — | | | | — | |
| Total Distributions Paid | | $ | 158,030,798 | | | $ | 871,187 | | | $ | 294,105,663 | | | $ | 841,174,746 | | | $ | 27,441,587 | |
| | | Municipal Bond
Fund | | California
Municipal Bond
Fund | | New York
Municipal Bond
Fund |
| Distributions paid from: | | | | | | | | | | | | |
| Ordinary income | | $ | 4,568,157 | | | $ | 1,330,187 | | | $ | 1,973,466 | |
| Net Long Term Capital Gains | | | — | | | | — | | | | — | |
| Total Taxable Distributions | | | 4,568,157 | | | | 1,330,187 | | | | 1,973,466 | |
| Tax Exempt Distributions | | | 43,300,828 | | | | 3,510,692 | | | | 5,597,549 | |
| Total Distributions Paid | | $ | 47,868,985 | | | $ | 4,840,879 | | | $ | 7,571,015 | |
The tax character of distributions from the Funds during the year ended October 31, 2019 was as follows:
| | | All Cap Core
Fund | | Large Cap
Strategies Fund | | Fixed Income
Fund | | Municipal Bond Fund |
| Distributions paid from: | | | | | | | | | | | | | | | | |
| Ordinary income | | $ | 8,735,740 | | | $ | 160,749,063 | | | $ | 22,911,587 | | | $ | 3,303,305 | |
| Net Long Term Capital Gains | | | 72,802,423 | | | | 523,537,109 | | | | — | | | | — | |
| Total Taxable Distributions | | | 81,538,163 | | | | 684,286,172 | | | | 22,911,587 | | | | 3,303,305 | |
| Tax Exempt Distributions | | | — | | | | — | | | | — | | | | 37,344,457 | |
| Total Distributions Paid | | $ | 81,538,163 | | | $ | 684,286,172 | | | $ | 22,911,587 | | | $ | 40,647,762 | |
The difference in classification between the amounts reflected above and the Statements of Changes in Net Assets is primarily due to short-term capital gain distributions.
As of and during the year ended October 31, 2020, the Funds did not have any liabilities for any uncertain tax positions. The Funds recognize interest and penalties, if any, related to unrecognized tax positions as income tax expense in the Statements of Operations. During the year, the Funds did not incur any interest or penalties. The statute of limitation on each Fund’s U.S. federal income tax returns remains open for each of the four years ended October 31, 2020. The statutes of limitations on each Fund’s state and local tax returns may remain open for an additional year depending upon the jurisdiction.
| Old Westbury Funds, Inc. |
| Notes to Financial Statements - (Continued) |
| October 31, 2020 |
| |
As of October 31, 2020, the components of accumulated earnings/(deficits) on a tax basis were as follows:
| | | All Cap Core
Fund | | All Cap ESG
Fund | | Small & Mid
Cap Strategies
Fund | | Large Cap
Strategies Fund | | Credit Income
Fund |
| Undistributed Tax Exempt Income | | $ | — | | | $ | — | | | $ | — | | | $ | — | | | $ | — | |
| Undistributed ordinary income | | | 2,986,325 | | | | 497,007 | | | | 11,766,210 | | | | 49,514,102 | | | | 8,326,419 | |
| Undistributed long-term capital gains | | | 75,037,207 | | | | — | | | | 244,390,071 | | | | 211,114,814 | | | | — | |
| Accumulated Earnings | | | 78,023,532 | | | | 497,007 | | | | 256,156,281 | | | | 260,628,916 | | | | 8,326,419 | |
| Capital Loss Carryforwards | | | — | | | | (1,347,322 | ) | | | — | | | | — | | | | (486,835 | ) |
| Unrealized Appreciation/(Depreciation) | | | 754,309,851 | | | | 908,924 | | | | 1,051,060,642 | | | | 4,369,296,903 | | | | (10,631,290 | ) |
| Total Accumulated Earnings/(Deficits) | | $ | 832,333,383 | | | $ | 58,609 | | | $ | 1,307,216,923 | | | $ | 4,629,925,819 | | | $ | (2,791,706 | ) |
| | | Fixed Income
Fund | | Municipal Bond
Fund | | California
Municipal Bond
Fund | | New York
Municipal Bond
Fund |
| Undistributed Tax Exempt Income | | $ | — | | | $ | 3,957,774 | | | $ | 413,864 | | | $ | 528,530 | |
| Undistributed ordinary income | | | 7,802,953 | | | | 4,351,820 | | | | 611,594 | | | | 1,936,180 | |
| Undistributed long-term capital gains | | | 28,623,513 | | | | 17,585,315 | | | | 2,207,436 | | | | 1,973,351 | |
| Accumulated Earnings | | | 36,426,466 | | | | 25,894,909 | | | | 3,232,894 | | | | 4,438,061 | |
| Unrealized Appreciation/(Depreciation) | | | 46,023,680 | | | | 137,170,686 | | | | 11,828,620 | | | | 14,366,207 | |
| Total Accumulated Earnings/(Deficits) | | $ | 82,450,146 | | | $ | 163,065,595 | | | $ | 15,061,514 | | | $ | 18,804,268 | |
As of October 31, 2020, the All Cap ESG Fund had a short-term capital loss carryforward of $1,102,747 and a long-term capital loss carryforward of $244,575, the Credit Income Fund had a short-term capital loss carryforward of $486,835, the Fixed Income Fund utilized $8,050,021 capital loss carryforward and the Municipal Bond Fund utilized $7,097,107 capital loss carryforward available to offset future realized capital gains in accordance with the Regulated Investment Company Modernization Act of 2010. This capital loss carryforward is not subject to expiration and must first be utilized to offset future realized gains of the same character.
The capital loss carryforward will reduce the applicable Fund’s taxable income arising from future net realized gains on investments, if any, to the extent permitted by the Code, and thus will reduce the amount of the distributions to shareholders which would otherwise be necessary to relieve the Funds of any liability for federal tax.
Under current tax law, ordinary losses incurred after December 31 of a Fund’s fiscal year may be deferred and treated as occurring on the first business day of the following fiscal year for tax purposes. The Funds had no late year loss deferrals in the current year.
The Credit Income Fund may invest in floating rate loan interests. In connection with these investments, the Credit Income Fund may also enter into bridge loan commitments (“commitments”). Bridge loan commitments may obligate the Credit Income Fund to furnish temporary financing to a borrower until permanent financing can be arranged.
As of October 31, 2020, the Credit Income Fund had no outstanding bridge loan commitments. In connection with these commitments, the Credit Income Fund would earn a commitment fee, typically set as a percentage of the commitment amount. Such fee income, which would be included in interest income in the Statements of Operations, is recognized ratably over the commitment period.
Management has evaluated the impact of all subsequent events on the Funds and has determined that there were no subsequent events requiring recognition or disclosure in the financial statements.
| Old Westbury Funds, Inc. |
| Notes to Financial Statements - (Continued) |
| October 31, 2020 |
| |
| 11. | Additional Tax Information (Unaudited) |
Qualified Dividend Income (Unaudited)
The Funds designate a portion of the income dividends distributed during the fiscal year ended October 31, 2020, as Qualified Dividend Income (“QDI”) as defined in the Code as follows:
| All Cap Core Fund | | | 100.00 | % |
| All Cap ESG Fund | | | 100.00 | % |
| Small & Mid Cap Strategies Fund | | | 100.00 | % |
| Large Cap Strategies Fund | | | 100.00 | % |
Qualified Interest Income (Unaudited)
The Funds designate a portion of the income dividends distributed during the fiscal year ended October 31, 2020, as Qualified Interest Income as defined in the Code as follows:
| All Cap Core Fund | | | 3.90 | % |
| All Cap ESG Fund | | | 0.67 | % |
| Small & Mid Cap Strategies Fund | | | 3.18 | % |
| Large Cap Strategies Fund | | | 2.33 | % |
| Fixed Income Fund | | | 98.70 | % |
| Municipal Bond Fund | | | 8.36 | % |
| California Municipal Bond Fund | | | 13.07 | % |
| New York Municipal Bond Fund | | | 8.35 | % |
Qualified Short Term Gain (Unaudited)
The Funds designate a portion of the income dividends distributed during the fiscal year ended October 31, 2020, as Qualified Short-Term Gain as defined in the Code as follows:
| All Cap Core Fund | | | 100.00 | % |
| California Municipal Bond Fund | | | 100.00 | % |
| New York Municipal Bond Fund | | | 100.00 | % |
Dividends Received Deduction (Unaudited)
For the fiscal year ended October 31, 2020, the following percentage of income dividends paid by the Funds qualifies for the Dividends Received Deduction available to corporations:
| All Cap Core Fund | | | 100.00 | % |
| All Cap ESG Fund | | | 35.81 | % |
| Small & Mid Cap Strategies Fund | | | 81.54 | % |
| Large Cap Strategies Fund | | | 100.00 | % |
| California Municipal Bond Fund | | | 0.29 | % |
Long Term Capital Gain Dividends (Unaudited)
The Funds designate Long-Term Capital Gain dividends pursuant to Section 852(b)(3) of the Code for the fiscal year ended October 31, 2020 as follows:
| All Cap Core Fund | | $ | 146,728,965 | |
| Small & Mid Cap Strategies Fund | | | 266,756,940 | |
| Large Cap Strategies Fund | | | 706,560,019 | |
| Old Westbury Funds, Inc. |
| Notes to Financial Statements - (Continued) |
| October 31, 2020 |
| |
U.S. Government Income (Unaudited)
The percentages of the ordinary income dividends paid by the Funds during the fiscal year ended October 31, 2020 which were derived from U.S. Treasury securities were as follows:
| Small & Mid Cap Strategies Fund | | | 1.81 | % |
| Large Cap Strategies Fund | | | 0.89 | % |
| Fixed Income Fund | | | 52.10 | % |
| Municipal Bond Fund | | | 4.00 | % |
| California Municipal Bond Fund | | | 4.18 | % |
| New York Municipal Bond Fund | | | 1.27 | % |
Tax Exempt Distributions (Unaudited)
The distributions designated as tax exempt dividends paid for the fiscal year ended October 31, 2020 were as follows:
| Municipal Bond Fund | | $ | 3,957,774 | |
| California Municipal Bond Fund | | | 413,864 | |
| New York Municipal Bond Fund | | | 528,530 | |
| Old Westbury Funds, Inc. | |
| Report of Independent Registered Public Accounting Firm | |
| | October 31, 2020 |
To the Shareholders and the Board of Directors of Old Westbury Funds, Inc.
Opinion on the Financial Statements
We have audited the accompanying statements of assets and liabilities of Old Westbury Funds, Inc. (the “Corporation”) (comprising All Cap Core Fund, All Cap ESG Fund, Small & Mid Cap Strategies Fund, Large Cap Strategies Fund, Credit Income Fund, Fixed Income Fund, Municipal Bond Fund, California Municipal Bond Fund and New York Municipal Bond Fund (collectively referred to as the “Funds”)), including the portfolios of investments, as of October 31, 2020, and the related statements of operations, and changes in net assets, and the financial highlights for each of the periods indicated in the table below and the related notes (collectively referred to as the “financial statements”). In our opinion, the financial statements present fairly, in all material respects, the financial position of each of the Funds comprising the Corporation at October 31, 2020, the results of their operations, changes in net assets and financial highlights for each of the periods indicated in the table below, in conformity with U.S. generally accepted accounting principles.
Funds comprising
the Corporation | | Statement of
operations | | Statement of changes
in net assets | | Financial
highlights |
All Cap Core Fund
Small & Mid Cap Strategies Fund
Large Cap Strategies Fund
Fixed Income Fund
Municipal Bond Fund | | For the year ended October 31, 2020 | | For each of the two years in the period ended October 31, 2020 | | For each of the five years in the period ended October 31, 2020 |
| All Cap ESG Fund | | For the year ended October 31, 2020 | | For each of the two years in the period ended October 31, 2020 | | For each of the two years in the period ended October 31, 2020 and the period from March 1, 2018 (commencement of operations) through October 31, 2018 |
| Credit Income Fund | | For the period from October 1, 2020 (commencement of operations) through October 31, 2020 |
California Municipal Bond Fund
New York Municipal Bond Fund | | For the year ended October 31, 2020 | | For the year ended October 31, 2020 and the period from December 4, 2018 (commencement of operations) through October 31, 2019 |
Basis for Opinion
These financial statements are the responsibility of the Corporation’s management. Our responsibility is to express an opinion on each of the Funds’ financial statements based on our audits. We are a public accounting firm registered with the Public Company Accounting Oversight Board (United States) (“PCAOB”) and are required to be independent with respect to the Corporation in accordance with the U.S. federal securities laws and the applicable rules and regulations of the Securities and Exchange Commission and the PCAOB.
We conducted our audits in accordance with the standards of the PCAOB. Those standards require that we plan and perform the audit to obtain reasonable assurance about whether the financial statements are free of material misstatement, whether due to error or fraud. The Corporation is not required to have, nor were we engaged to perform, an audit of the Corporation’s internal control over financial reporting. As part of our audits we are required to obtain an understanding of internal control over financial reporting but not for the purpose of expressing an opinion on the effectiveness of the Corporation’s internal control over financial reporting. Accordingly, we express no such opinion.
Our audits included performing procedures to assess the risks of material misstatement of the financial statements, whether due to error or fraud, and performing procedures that respond to those risks. Such procedures included examining, on a test basis, evidence regarding the amounts and disclosures in the financial statements. Our procedures included confirmation of securities owned as of October 31, 2020, by correspondence with the custodians and brokers or by other appropriate auditing procedures where replies from brokers were not received. Our audits also included evaluating the accounting principles used and significant estimates made by management, as well as evaluating the overall presentation of the financial statements. We believe that our audits provide a reasonable basis for our opinion.
We have served as the Corporation’s auditor since 2006.

New York, New York
December 28, 2020
| Old Westbury Funds, Inc. | |
| Directors and Officers of Old Westbury Funds, Inc. (Unaudited) | |
| | October 31, 2020 |
Independent and Interested Directors. The following table sets forth certain information with respect to the Directors of the Corporation, each of which, under current Board policy, may serve until the end of the calendar year during which he or she reaches the applicable mandatory retirement age established by the Board.
| Name, Address, and Age | | Position(s)
Held with the
Corporation | | Term of Office
and Length
of Time
Served as a
Director of the
Corporation | | Principal Occupation(s)
During Past 5 Years | | Number of
Portfolios
in Fund
Complex Overseen
by Director | | Other
Director-
ships1 Held
by Director
During
Past 5 Years |
| | | | | | | | | | | |
| Interested Director | | | | | | | | | | |
| | | | | | | | | | | |
George H. Wilcox2
630 Fifth Avenue
New York, NY 10111
Age: 55 | | Director | | Indefinite
term;
2 Years | | President of Bessemer (2013- Present). | | 9 | | 0 |
| | | | | | | | | |
| Independent Directors | | | | | | | | |
| | | | | | | | | | | |
Alexander Ellis III
630 Fifth Avenue
New York, NY 10111
Age: 71 | | Chairman & Director | | Indefinite
term;
8 Years | | General Partner, Rockport Capital Partners (2000-Present). | | 9 | | 13 |
| |
Patricia L. Francy
630 Fifth Avenue
New York, NY 10111
Age: 75 | | Director | | Indefinite
term;
16 Years | | Director, corporate, and foundation boards. | | 9 | | 14 |
| |
J. David Officer
630 Fifth Avenue
New York, NY 10111
Age: 72 | | Director | | Indefinite
term;
8 Years | | Independent Director. | | 9 | | 25 |
| |
R. Keith Walton
630 Fifth Avenue
New York, NY 10111
Age: 56 | | Director | | Indefinite
term;
4 Years | | Senior Adviser & Venture Partner, Plexo LLC (March 2018-Present); Senior Adviser, Vatic Labs LLC (May 2018- Present); Executive Vice President and Chief Legal Officer, Zero Mass Water LLC (July 2017-Present); and Vice President, Strategy, Arizona State University (2013-July 2017). | | 9 | | 66 |
| | | | | | | | | | | |
| 1 | Directorships held during the last five years in (1) any other investment companies registered under the 1940 Act, (2) any company with a class of securities registered pursuant to Section 12 of Exchange Act or (3) any company subject to the requirements of Section 15(d) of the Exchange Act. |
| 2 | Directors who are or may be deemed “interested persons” (as defined under the 1940 Act) of the Corporation, BIM (as defined below) or Bessemer (as defined below) are referred to as Interested Directors. Mr. Wilcox is deemed an Interested Director by virtue of his position as President of Bessemer Trust Company, N.A. Mr. Wilcox also serves as Director of Bessemer Trust Company (Cayman) Ltd. and Bessemer Investor Services. |
| 3 | Mr. Ellis has served as Director of Clean Diesel Technologies Inc. |
| 4 | Ms. Francy has served as Director of Siebert Financial Corp. |
| 5 | Mr. Officer serves, or has served, as Director of the following entities: DBX ETF Trust (40); and Ilex Partners (Asia) LLC. |
| 6 | Mr. Walton serves as Director of the following entities: Blue Crest Capital Management, LLC Funds, Global Infrastructure Partners, Systematica Investments Limited, Zweig Fund Inc., Zweig Total Return Fund Inc. and Virtus Closed-End Funds. |
| Old Westbury Funds, Inc. |
| Directors and Officers of Old Westbury Funds, Inc. (Unaudited) - (Continued) |
| October 31, 2020 |
Officers. The table below sets forth certain information with respect to the Officers of the Corporation:
| Name, Address, and Age | | Position(s)
Held with the
Corporation | | Term of Office and
Length of Time
Served as a Director
of the Corporation | | Principal Occupation(s) During Past 5 Years |
| | | | | | | |
David W. Rossmiller
630 Fifth Avenue
New York, NY 10111
Age: 62 | | President & Chief Executive Officer | | Indefinite;
8 Years | | Managing Director and Head of Fixed Income, Bessemer Trust Company, N.A. (Since 2010). |
| |
Matthew A. Rizzi
630 Fifth Avenue
New York, NY 10111
Age: 47 | | Vice President & Treasurer | | Indefinite;
6 Years | | Principal and Head of Fund Accounting, The Bessemer Group, Incorporated (Since 2018); Principal and Head of Trust Accounting and Fees, The Bessemer Group, Incorporated (2015-2017); Senior Vice President and Head of Trust Accounting, The Bessemer Group, Incorporated (2007-2014). |
| |
Nicola R. Knight
630 Fifth Avenue
New York, NY 10111
Age: 57 | | Chief Legal Officer; Assistant Secretary | | Indefinite;
Since July
21, 2020;
11 Years | | Principal and Associate General Counsel of Bessemer Trust Company, N.A. (Since 2007). |
| |
| |
Sean Gray
630 Fifth Avenue
New York, NY 1011
Age: 55 | | Chief Compliance Officer; | | Indefinite;
Since August 1,
2020 | | Managing Director and Chief Compliance and Compliance Officer of Bessemer Trust Company, N.A. (Since 2015). |
| |
Hardik B. Patel
630 Fifth Avenue
New York, NY 10111
Age: 38 | | Vice President & Assistant Treasurer | | Indefinite; Since
October 27, 2020 | | Vice President and Accounting Manager, The Bessemer Group, Incorporated (since 2017); Associate Vice President and Accounting Manager, The Bessemer Group, Incorporated (2015-2017). |
| |
David Schwart
801 Brickell Avenue
Suite 2250
Miami, FL 33131
Age: 50 | | Vice President & Anti-Money Laundering Compliance Officer | | Indefinite;
5 Years | | Senior Vice President and Senior Bank Compliance Manager, Bessemer Trust Company, N.A. (Since 2019); Vice President And Associate Director of Bank Compliance, Bessemer Trust Company, N.A (2013-2019). |
| |
Marianna DiBenedetto
760 Moore Road
King of Prussia, PA
19406
Age: 55 | | Vice President & Assistant Treasurer | | Indefinite;
2 Years | | Vice President and Group Manager of Fund Accounting and Administration Client Services, The Bank of New York Mellon (“BNY Mellon”) (Since 2010). |
| |
Jack Jafolla
760 Moore Road
King of Prussia, PA
19406
Age: 50 | | Assistant Treasurer | | Indefinite;
13 Years | | Vice President and Lead Manager of NAV Operations, BNY Mellon (Since 2008). |
| Old Westbury Funds, Inc. |
| Directors and Officers of Old Westbury Funds, Inc. (Unaudited) - (Continued) |
| October 31, 2020 |
| Name, Address, and Age | | Position(s)
Held with the
Corporation | | Term of Office and
Length of Time
Served as a Director
of the Corporation | | Principal Occupation(s) During Past 5 Years |
| |
Lisa M. King
301 Bellevue Parkway
Wilmington, DE
19809
Age: 52 | | Secretary | | Indefinite;
3 Years | | Vice President and Group Manager, BNY Mellon (Since 2017); Vice President and Counsel BNY Mellon (2016-2017); Counsel, Stradley, Ronon, Stevens & Young LLP (2007-2016). |
| |
William H. Wallace, III
301 Bellevue Parkway
Wilmington, DE
19809
Age: 50 | | Assistant Secretary | | Indefinite;
3 Years | | Secretary of the Corporation (2015-2016); Vice President and Manager, BNY Mellon (Since 2010). |
The Statement of Additional Information (“SAI”) includes additional information about the Corporation’s Directors and Officers and is available upon request, without charge. To obtain a copy of the SAI, please call (800) 607-2200.
| Old Westbury Funds, Inc. | |
| Additional Information (Unaudited) | |
| | October 31, 2020 |
Information on Proxy Voting:
The Funds’ proxy voting guidelines, used to determine how to vote proxies relating to portfolio securities and information regarding how the Funds voted proxies relating to portfolio securities during the most recent 12-month period ended June 30 is available (i) without charge, upon request, by calling (800) 607-2200; and (ii) on the U.S. Securities and Exchange Commission’s (“SEC”) website at http://www.sec.gov.
Information on Form N-PORT
Each Fund files a complete schedule of its fund holdings for the first and third quarters of its fiscal year with the SEC on Form N-PORT. The Funds’ Forms N-PORT is available on the SEC’s website at http:www.sec.gov. Portfolio holdings information may be obtained upon request and without charge by calling (800) 607-2200.
| Old Westbury Funds, Inc. | |
| Liquidity Risk Management Program (Unaudited) | |
| | October 31, 2020 |
The Corporation has adopted a Liquidity Risk Management Program (the “Program”), on behalf of each of its Funds under Rule 22e-4 under the 1940 Act (the “Liquidity Rule”). The Program became effective on June 1, 2019. The Program seeks to assess, manage and review each Fund’s Liquidity Risk. “Liquidity Risk” is defined as the risk that a fund could not meet requests to redeem shares issued by the fund without significant dilution of remaining investors’ interests in the fund. Among other things, the Liquidity Rule requires that a written report be provided to the Board on an annual basis that addresses the operation of the Program and assesses the adequacy and effectiveness of its implementation, including the operation of any Highly Liquidity Investment Minimum (“HLIM”) established for a Fund and any material changes to the Program.
The Board has appointed the Adviser’s Liquidity Risk Committee to be the program administrator for the Program (the “Program Administrator”). On July 21, 2020, the Board of Directors reviewed the Program Administrator’s initial written report (the “Report”) concerning the operation of the Program for the period from June 1, 2019 through April 30, 2020 (the “Program Reporting Period”). The Report addressed the operation of the Program and assessed its adequacy and effectiveness of implementation, including, where applicable, the operation of a Fund’s HLIM. There were no material changes to the Program during the Program Reporting Period.
The Report summarized the operation of the Program and the information and factors considered by the Program Administrator in assessing whether the Program has been adequately and effectively implemented with respect to each Fund. Such information and factors included, among other things: (1) the liquidity risk framework used to assess, manage, and periodically review each Fund’s Liquidity Risk and the results of this assessment; (2) historical data with respect to purchase and redemption requests compared to average cash levels; and (3) whether a Fund invested primarily in “Highly Liquid Investments” (as defined under the Liquidity Rule), whether an HLIM should be established for a Fund (and, for Funds that have adopted an HLIM, whether the HLIM continues to be appropriate or whether a Fund has invested below its HLIM) and the procedures for monitoring for this limit.
Based on this review, the Report concluded that: (1) the Program continues to be reasonably designed to effectively assess and manage each Fund’s Liquidity Risk; and (2) the Program has been adequately and effectively implemented with respect to each Fund during the Program Reporting Period.
| Old Westbury Funds, Inc. | |
| Renewal of Investment Advisory Agreement and Sub-Advisory Agreements (Unaudited) | |
| | |
At a meeting held on July 21, 2020, the Board of Directors (the “Board” or the “Directors”) of Old Westbury Funds, Inc. (the “Corporation”), including the Directors who are not “interested persons” (as defined under the Investment Company Act of 1940 (the “1940 Act”)) of any party to the agreements defined below (“Independent Directors”), unanimously approved the continuation of the following investment advisory and sub-advisory agreements (collectively, the “Agreements”): (1) an investment advisory agreement between Bessemer Investment Management LLC (“BIM” or the “Adviser”) and the Corporation on behalf of Old Westbury All Cap Core Fund (“All Cap Core Fund”), Old Westbury Large Cap Strategies Fund (“Large Cap Strategies Fund”), Old Westbury All Cap ESG Fund (“All Cap ESG Fund”), Old Westbury Small & Mid Cap Strategies Fund (“Small & Mid Cap Strategies Fund”), Old Westbury Multi-Asset Opportunities Fund (“Multi-Asset Opportunities Fund”), Old Westbury Fixed Income Fund (“Fixed Income Fund”), Old Westbury Municipal Bond Fund (“Municipal Bond Fund”), Old Westbury California Municipal Bond Fund (“California Municipal Bond Fund”), and Old Westbury New York Municipal Bond Fund (“New York Municipal Bond Fund”) (each, a “Fund” and, collectively, the “Funds”), (2) a sub-advisory agreement among BIM, Champlain Investment Partners, LLC (“Champlain”) and the Corporation on behalf of the Small & Mid Cap Strategies Fund, (3) a sub-advisory agreement among BIM, BlackRock Financial Management, Inc. (“BlackRock”) and the Corporation on behalf of the Multi-Asset Opportunities Fund, (4) a sub-advisory agreement among BIM, Sands Capital Management, LLC (“Sands”) and the Corporation on behalf of the Large Cap Strategies Fund, (5) a sub-advisory agreement among BIM, Muzinich & Co, Inc. (“Muzinich”) and the Corporation on behalf of the Multi-Asset Opportunities Fund, (6) a sub-advisory agreement among BIM, Harding Loevner LP (“Harding Loevner”) and the Corporation on behalf of the Large Cap Strategies Fund, (7) a sub-advisory agreement among BIM, Baillie Gifford Overseas Limited (“Baillie Gifford”) and the Corporation on behalf of the Small & Mid Cap Strategies Fund, (8) a sub-advisory agreement among BIM, Polunin Capital Partners Limited (“Polunin”) and the Corporation on behalf of the Small & Mid Cap Strategies Fund, and (9) a sub-advisory agreement among BIM, Acadian Asset Management LLC (“Acadian”) and the Corporation on behalf of the Small & Mid Cap Strategies Fund (Polunin, Champlain, BlackRock, Sands, Muzinich, Harding Loevner, Baillie Gifford and Acadian together, the “Sub-Advisers”). At both the meeting of the Board held on July 21, 2020 and the meeting of the Board held on April 21, 2020, the Board had requested and received substantial information regarding the Adviser, each of the Sub-Advisers, and the Agreements, as well as related matters pertaining to the fee rates charged and services provided by affiliated service providers (“15(c) Materials”). The Independent Directors also met in person with Counsel to the Independent Directors on April 14, 2020 and June 25, 2020, during which time they conducted an in-depth review of all 15(c) materials and requested certain supplemental information from the Adviser, which was provided to the Directors. The Directors reviewed and discussed the 15(c) Materials and other information provided by the Adviser and the Sub-Advisers in reports and presentations throughout the year. Throughout this process, the Directors met on a number of occasions telephonically with Counsel to the Independent Directors to review the materials provided by the Adviser and each of the Sub-Advisers. At the July 21, 2020 meeting and at the April 14, April 21, and June 25, 2020 meetings, the Directors reviewed these materials in detail, requested, received and reviewed certain supplemental material from the Adviser.
The Directors reviewed detailed due diligence questionnaires from BIM and each of the Sub-Advisers, as well as substantial information concerning, among other things, each Fund’s performance, comparative fee and expense information as well as information regarding BIM and each of the Sub-Advisers relating to their respective organizations, compliance and regulatory processes and programs and financial conditions. The Directors also discussed and considered economies of scale and how the Adviser shared those economies with the Funds’ shareholders. The Board received and discussed information concerning BIM’s and each Sub-Adviser’s performance, the use of affiliated brokers to execute transactions, the use of soft dollars, best execution, portfolio manager compensation, and whether there are any other direct or indirect benefits received by the Adviser or the Sub-Advisers in managing the Funds. In addition, the Adviser supplied the Directors with additional information concerning its estimated profitability from managing the Funds. Moreover, the Board had received and considered materials and presentations throughout the course of the year relating to the investment management, performance and operation of the Funds.
The Directors determined that they had received adequate information to make a reasonable determination with respect to the approval of the Advisory Agreement and Sub-Advisory Agreements. The Board considered information about BIM and the Sub-Advisers, the performance of the Funds and certain additional factors described above and below that it deemed relevant. The following summary details the materials and factors that the Board considered, among others, and the conclusions they reached, in approving the continuance of the Agreements.
(1) The nature, extent and quality of services to be provided by Adviser and Sub-Advisers.
The Board considered the scope and quality of services provided by the Adviser and Sub-Advisers, particularly the qualifications, capabilities and experience of the investment, operational, compliance, legal and other personnel who are responsible for providing services to the Funds. The Board also considered the fact that the Adviser and Sub-Advisers pay the costs of all investment and management facilities necessary for the efficient conduct of their respective services. The Board further considered the role and efforts of the Adviser in providing oversight of the various Sub-Advisers for the Funds, including in overseeing the service of, and in monitoring the performance of, each Sub-Adviser, as well as determining the appropriate allocation of assets to Sub-Advisers. The Board also considered the Adviser’s role in making recommendations to the Board regarding retaining or replacing Sub-Advisers where appropriate and in conducting the necessary searches and due diligence of prospective new sub-advisers. In this regard, the Board noted the information that it had received regarding the Adviser’s on-going due diligence with respect to each Sub-Adviser, including the Adviser’s review of, among other things, each Sub-Adviser’s investment process, compliance
| Old Westbury Funds, Inc. | |
| Renewal of Investment Advisory Agreement and Sub-Advisory Agreements (Unaudited) - (Continued) | |
| | |
program and performance. The Board also took into account the various reports it received throughout the year regarding the activities and operation of various oversight and operations groups within the Adviser and its affiliates, such as External Managers Solutions Group, Internal Audit, Cybersecurity and Business Continuity, and Investment Risk Management. The Board also considered the role of the Pricing Committee in the valuation of the Funds’ portfolio instruments, including its role in determining fair values for securities pursuant to the Corporation’s Valuation Policies, as well as its role in selecting and monitoring pricing service providers and, foreign fair value service providers.
In addition, the Board considered that the Adviser manages the overall investment program of the Funds and that the Adviser keeps the Board informed of important developments affecting the Funds, both in connection with the Board’s annual review of the Investment Advisory Agreement and Sub-Advisory Agreements and at each Board meeting. The Board also noted that it received in-person reports from each Sub-Adviser on a rotating schedule. The Board evaluated these factors based on its direct experience with the Adviser, and in consultation with Counsel to the Corporation and Counsel to the Independent Directors, as well as Counsel to the Independent Directors alone. The Board also considered the Adviser’s effectiveness in ensuring that the Funds are in compliance with their respective investment policies and restrictions and the requirements of the 1940 Act and related securities regulations. The Board further noted the Adviser’s and its affiliates’ efforts to oversee the Funds’ other service providers, including those providing administrative, accounting and custodial services.
Based on these factors, as well as other factors discussed herein, the Board concluded that the nature, quality and extent of services provided by the Adviser and Sub-Advisers have been and continue to be satisfactory.
(2) The performance of the Funds and the Adviser and Sub-Advisers.
The Board’s analysis of the Funds’ performance included the discussion and review of the performance data of each of the Funds against securities benchmarks as well as against a competitive group of similar funds, based on, in part, information provided by an independent, third-party mutual fund data provider. The Board considered that for some Funds, like the Multi-Asset Opportunities Fund, the investment strategy employed by the Fund was distinct from any securities benchmark and was different than that employed by other funds, making performance comparisons against benchmarks and industry peers less meaningful. The Board also considered recent changes made with respect to the investments and focus of the Multi-Asset Opportunities Fund and took into account the performance of the Fund since those changes were implemented. The Board reviewed comparative performance over long-, intermediate- and short-term periods. In reviewing performance, the Board generally placed greater emphasis on longer-term performance than on shorter-term performance, taking into account that over short periods of time underperformance may be transitory. The Board also considered the performance of the Funds in the context of whether the Funds were meeting the expectations of Bessemer clients invested in the Funds. In this regard, the Board considered that the Fixed Income Fund, Municipal Bond Fund, New York Municipal Bond Fund and California Municipal Bond Fund were designed as conservative investment products and that clients were most interested in capital preservation when investing in those particular Funds. As a result, the Board determined that the Fixed Income Fund, Municipal Bond Fund, New York Municipal Bond Fund and California Municipal Bond Fund appeared to be meeting their investment objectives even though some Funds may have underperformed their competitive peer groups during certain periods.
The Board considered the performance of the Adviser and each of the Sub-Advisers both against comparative benchmarks as well as against similarly managed accounts, if applicable, managed by the Adviser and Sub-Advisers. When reviewing performance against similarly managed accounts, the Board considered, among other things, differences in the nature of such accounts from a regulatory and tax perspective and differences in the investment mandate from that of the Funds. In evaluating the Funds’ performance, the Board also considered the principal role of the Funds as part of the asset allocation strategy for client accounts maintained by Bessemer and its affiliates. The Board took into account that the Adviser had proposed changes in the Sub-Advisers for certain Funds at its July 21 meeting in an effort to improve performance.
(3) The cost of the advisory and sub-advisory services and the profits to the Adviser and its affiliates from the relationship with the Funds.
In connection with the Board’s consideration of the level of the advisory and sub-advisory fees, the Board considered a number of factors. The Board’s analysis of each Fund’s advisory fees and expenses included a discussion and review of data concerning the current fee and expense ratios of each Fund compared to a peer group of similar funds and noted that each Fund’s advisory fee and expenses were generally in line with those of their representative group. The Board also noted the applicable advisory fee breakpoints as well as the Adviser’s contractual commitment to waive advisory fees for certain of the Funds. Additionally, the Board considered the Adviser’s profitability. With respect to the Sub-Advisory Agreements with the Sub-Advisers, the Board noted that the Sub-Advisers’ fees were paid entirely by the Adviser so that no additional expenses would be borne by shareholders for the engagement of the Sub-Advisers. The Board noted that Sub-Advisory fee levels were arrived at pursuant to an arms-length negotiation between the Adviser and each Sub-Adviser. The Board also considered fee data from the Sub-Advisers with respect to similarly managed accounts and considered the relevance of differences in the services provided to separate accounts as they relate to differences in the fees charged in connection with the Funds. The Board also took into account the significant costs and risks assumed by the Adviser in connection with launching and maintaining the Funds, including entrepreneurial risks.
| Old Westbury Funds, Inc. | |
| Renewal of Investment Advisory Agreement and Sub-Advisory Agreements (Unaudited) - (Continued) | |
| | |
Based on this analysis as well as other factors described herein, including the fact that the Funds are intended principally to satisfy asset allocation requirements of client accounts maintained by Bessemer and its affiliates, the Board concluded that the advisory fee schedule for each Fund was fair and reasonable in light of the quality of services provided by the Adviser and Sub-Advisers.
(4) The extent to which economies of scale will be realized as the Funds grow and whether fee levels reflect those economies of scale.
The Board considered the information provided by the Adviser relating to economies of scale. In this regard, the Board noted the current advisory fee breakpoint levels at $500 million and $1 billion with respect to All Cap Core Fund, All Cap ESG Fund, Fixed Income Fund, California Municipal Bond Fund, New York Municipal Bond Fund, and Municipal Bond Fund, and at $1.25 billion and $2.5 billion for the Multi-Asset Opportunities Fund and Large Cap Strategies Fund. The Board also considered the experience of the Adviser in managing the Funds, as well as the Adviser’s profitability analysis. The Board also noted other areas where each Fund may share in economies of scale, including through potential lower fees charged by third-party service providers based on the combined size of the Funds.
(5) Ancillary benefits and other factors.
In addition to the above factors, the Board also discussed other benefits received by the Adviser, the Sub-Advisers and their affiliates from the management of the Funds (such as soft-dollar credits), including the ability to market their advisory services for similar products in the future. In addition, the Board discussed the compensation payable by the Funds to affiliates of the Adviser for other services including administrative services, shareholder servicing and custody. The Board considered comparative information relating to the fees charged for these services and reviewed reports from the Adviser and its affiliates regarding their capabilities and experience in providing these services. The Board also discussed the use of the Funds as asset allocation investment vehicles for clients of Bessemer and its affiliates, with the resulting expectation that the asset sizes of the Funds would grow as Bessemer’s client base grows. The Board concluded that advisory and sub-advisory fees were reasonable in light of these fall-out benefits.
Conclusion
The Board, including all of the Independent Directors, concluded that the fees payable under the Investment Advisory Agreement and Sub-Advisory Agreements were fair and reasonable with respect to the services that the Adviser and each Sub-Adviser provide, in light of the factors described above that the Board deemed relevant. The Board based its decision on an evaluation of all these factors as a whole and did not consider any one factor as all-important or controlling. The Independent Directors were also assisted by the advice of Counsel to the Independent Directors, as well as Counsel to the Corporation, in making this determination.
| Old Westbury Funds, Inc. | |
| Approval of New Sub-Advisory Agreement with Artisan Partners Limited Partnership (Unaudited) | |
| | |
At a meeting held on July 21, 2020, the Board of Directors, including the Independent Directors, unanimously approved a new Sub-Advisory Agreement among BIM, Artisan Partners Limited Partnership (“Artisan”), and the Corporation on behalf of the Old Westbury Small & Mid Cap Strategies Fund (the “Fund”) (the “Sub-Advisory Agreement”). The Board noted that the fees payable to Artisan under the Sub-Advisory Agreement would be paid by the Adviser from the advisory fees that it receives from the Fund.
In approving the Sub-Advisory Agreement with Artisan, the Board considered the overall fairness of the Sub-Advisory Agreement and whether the agreement was in the best interests of the Fund. The Board noted that it had received and reviewed substantial information regarding Artisan, and the services to be provided by Artisan to the Fund under the Sub-Advisory Agreement. This information, which included a detailed due diligence questionnaire from Artisan, as well as information concerning their organization, compliance program and financial condition, formed, in part, the primary (but not exclusive) basis for the Board’s determinations. The Board also noted that the Independent Directors had met in executive session with their Counsel and Counsel to the Corporation and had met with the Adviser to discuss the Adviser’s recommendation regarding Artisan Partners’ appointment. During the executive session, the Independent Directors reviewed their legal responsibilities in approving the Sub-Advisory Agreement and discussed materials and other information provided to them. The Board concluded that they had received adequate information to make a reasonable determination with respect to the approval of the Sub-Advisory Agreement.
The Board’s conclusions are based on the comprehensive consideration of all information presented to it and are not the result of any single controlling factor.
The following summary details the factors considered by the Board and the conclusions that formed the basis for the Board’s approval of the proposed Sub-Advisory Agreement.
(1) The nature, extent and quality of services to be provided by Artisan.
The Board considered the scope and quality of services to be provided by Artisan, including the fact that Artisan pays the costs of all investment and management facilities necessary for the efficient conduct of its services. The Board also considered, among other things, the qualifications and experience of the individual portfolio manager responsible for managing Artisan’s portion of the Fund, as well as the compliance, operational and trading capabilities of Artisan.
Based on these considerations, as well as those discussed below, the Board concluded that the nature, extent and quality of services to be provided by Artisan were satisfactory.
(2) The performance of Artisan.
The Board considered the performance data provided by Artisan with respect to other accounts and determined that Artisan had demonstrated an ability to appropriately manage assets in the style expected to be used by Artisan in connection with the Fund.
(3) The cost of the advisory services and comparative fee rates.
As previously discussed, the Board noted that Artisan’s fee would be paid entirely by the Adviser. The Directors reviewed the level of the proposed fee against benchmarks and peer comparisons. Based on these considerations, as well as other factors described herein, the Board, including all of the Independent Directors, concluded that Artisan’s sub-advisory fee was fair and reasonable in light of the quality of services to be provided by Artisan.
(4) The extent to which economies of scale will be realized as the Fund grows and whether fee levels reflect those economies of scale.
The Board discussed whether any economies of scale would be realized with respect to the management of the Fund and whether the Fund would benefit from any such economies of scale. The Board noted in this regard that the Adviser would bear Artisan’s sub-advisory fee and that the sub-advisory fee includes breakpoints under certain circumstances. The Directors undertook to continue to monitor the appropriateness of the sub-advisory fee, taking into account the potential impact of economies of scale, as the mandate grew.
(5) Ancillary benefits and other factors.
In addition to the above factors, the Board also discussed whether there were other benefits received by the Adviser, Artisan, or their affiliates, from Artisan’s relationship with the Fund. The Board concluded that any such fall-out benefits resulting from the proposed engagement of Artisan were such that it did not affect the Board’s conclusion that the proposed sub-advisory fee was reasonable.
| Old Westbury Funds, Inc. | |
| Approval of New Sub-Advisory Agreement with Artisan Partners Limited Partnership (Unaudited) - (Continued) | |
| | |
Conclusion
The Board, including all of the Independent Directors, concluded that the fee to be paid to Artisan under the Sub-Advisory Agreement was fair and reasonable with respect to the services that Artisan would provide, in light of the factors described above that the Board deemed relevant. The Board based its decision on an evaluation of all these factors as a whole and did not consider any one factor as all-important or controlling.
| Old Westbury Funds, Inc. | |
| Approval of Amendment to Investment Advisory Agreement and Sub-Advisory Agreements for Old Westbury Credit Income Fund (Unaudited) | |
| | |
At a meeting held on July 31, 2020, the Board of Directors, including the Independent Directors, unanimously approved, on behalf of Old Westbury Credit Income Fund (“New Fund”), an Amendment (the “Amendment”) to the Investment Advisory Agreement between BIM and the Corporation, a Sub-Advisory Agreement among BIM, BlackRock Financial Management, Inc. (“BlackRock”) and the Corporation, and a Sub-Advisory Agreement among BIM, Muzinich & Co., Inc. (“Muzinich”) and the Corporation (collectively, “Sub-Advisory Agreements”).
The Directors determined that they had received adequate information to make a reasonable determination with respect to the approval of the Amendment and Sub-Advisory Agreements. The Board considered information about BIM, BlackRock and Muzinich, the 15(c) materials and other information provided by BIM, BlackRock and Muzinich in reports and presentations throughout the year, and supplemental information provided with respect to the New Fund. The Board’s conclusions are based on the comprehensive consideration of all information presented to it and are not the result of any single controlling factor.
The following summary details certain of the materials and factors that the Board considered, among others, and the conclusions they reached, in approving the Amendment and Sub-Advisory Agreements on behalf of the New Fund.
(1) The nature, extent and quality of services provided by the Adviser and Sub-Advisers.
The Board considered the nature, extent and quality of services to be provided to the New Fund under the Amendment to the Investment Advisory Agreement and the Sub-Advisory Agreements. The Board took into account information provided by the Adviser both at the July 31, 2020 meeting and at previous meetings regarding the design, investment objective and strategies and fees and expenses of the New Fund. The Board also took into account the detailed information that it had reviewed earlier in the year as it relates to the Adviser, Blackrock and Muzinich regarding these matters in connection with its annual review of the Investment Advisory Agreement and Sub-Advisory Agreements for the existing funds in the Corporation. The Board considered the experience and skills of the investment personnel, the resources made available to such personnel and the organizational depth of the Adviser, BlackRock and Muzinich.
The Directors noted that, in addition to managing the overall investment program of the New Fund, the Adviser will provide day-to-day portfolio management. The Directors also considered that the Adviser and its affiliates will provide, at their expense, personnel responsible for supervising the provision of compliance, administrative services, accounting and related services, including valuation of the New Fund’s portfolio of investments, yield calculations, reports and filings with regulatory authorities and services related to such functions. The Directors evaluated these factors based on their direct experience with the Adviser and the Sub-Advisers, and in consultation with Counsel to the Corporation and Counsel to the Independent Directors. In addition, the Board focused on the Adviser’s long-standing relationship with the Corporation. The Board also discussed the Adviser’s effectiveness in ensuring that the Corporation’s portfolios are in compliance with their investment policies and restrictions and the requirements of the 1940 Act and related securities regulations. The Board further discussed the benefits of engaging the Adviser to extend such compliance services to the New Fund.
The Board considered the scope and quality of services to be provided by BlackRock and Muzinich including the fact that each firm pays the costs of all investment and management facilities necessary for the efficient conduct of its services. The Board also considered, among other things, the qualifications and experience of the individual portfolio managers responsible for managing BlackRock’s and Muzinich’s portions of the New Fund, as well as the compliance, operational and trading capabilities of BlackRock and Muzinich. The Board considered that Blackrock and Muzinich served as sub-advisers to other funds in the Corporation and took into account their history in managing those portfolios as well as their compliance, operational and trading capabilities.
Based on these factors, as well as those discussed below, the Directors concluded that they were satisfied with the nature, quality and extent of services anticipated to be provided by the Adviser, BlackRock and Muzinich.
(2) The performance of the New Fund and the Adviser and Sub-Advisers.
The Board noted that since the New Fund had not commenced operations, there was no performance information for it to consider at this time but that the Board would monitor the New Fund’s performance going forward. The Board considered the Adviser’s expertise and ability to manage an investment strategy similar to that of the New Fund and it considered BlackRock’s and Muzinich’s historical performance for similarly managed sleeves of another series of the Corporation. The Board determined that the Adviser, BlackRock and Muzinich had demonstrated an ability to appropriately manage assets in the styles expected to be used in connection with the New Fund.
(3) The cost of the advisory services and the profits to the Adviser and its affiliates from the relationship with the New Fund.
The Board considered New Fund’s proposed advisory fees, operating expenses and estimated total expense ratio, and compared them to fees and expenses of the peer group presented. The Board considered that the New Fund’s proposed advisory fee was equal to or less than the medi-
| Old Westbury Funds, Inc. | |
| Approval of Amendment to Investment Advisory Agreement and Sub-Advisory Agreements for Old Westbury Credit Income Fund (Unaudited) - (Continued) | |
| | |
an for its peer group. The Board also considered that the Adviser provided not only supervisory services, but also direct day-to-day investment management over the New Fund’s assets and a tax management overlay. The Board also considered that the New Fund’s total anticipated expenses were below the peer group median. The Board also noted the advisory fee breakpoints as well as the Adviser’s contractual commitment to waive its advisory fee to the extent necessary to ensure that the net annual fund operating expense ratio (excluding Fund transaction costs, investment interest expense, dividend expenses associated with securities sold short, and acquired fund fees and expenses) do not exceed 0.85%. The Board noted that BlackRock’s sub-advisory fee and Muzinich’s sub-advisory fee would be paid entirely by the Adviser. Additionally, the Board considered the Adviser’s anticipated profitability from its relationship to the New Fund. Based on this analysis as well as other factors, including the fact that the New Fund is intended principally to satisfy asset allocation requirements of client accounts of Bessemer and its affiliates, the Board, including all of the Independent Directors, concluded that the New Fund’s advisory fee schedule and sub-advisory fees were fair and reasonable in light of the quality of services to be provided by the Adviser, BlackRock and Muzinich.
(4) The extent to which economies of scale will be realized as the New Fund grows and whether fee levels reflect those economies of scale.
The Board considered whether economies of scale would be realized with respect to the management of the New Fund and whether the New Fund would benefit from any such economies of scale. In this regard, the Directors noted the advisory fee breakpoint levels with respect to the New Fund. The Directors also noted that the Adviser would bear BlackRock’s and Muzinich’s sub-advisory fees and that the sub-advisory fees included breakpoints. As the New Fund had not yet commenced investment operations, the Directors concluded that it was not possible to determine whether economies of scale were currently in existence. The Directors determined to continue to monitor this in the future.
(5) Ancillary benefits and other factors.
In addition to the above factors, the Directors also discussed other benefits received by the Adviser from the management of the New Fund. The Board discussed the compensation to be paid by the New Fund to affiliates of the Adviser for other services including administrative services, shareholder servicing and custody. The Board considered comparative information relating to the fees charged for these services and reviewed reports from the Adviser and its affiliates regarding their capabilities and experience in providing these services. The Board also discussed the use of the New Fund as asset allocation investment vehicles for clients of Bessemer and its affiliated banks and trust companies, with the resulting expectation that the asset size of the New Fund would grow as Bessemer’s client base grows. The Board also discussed whether there were other benefits received by the Adviser, BlackRock, Muzinich or their affiliates, from BlackRock’s and Muzinich’s relationship with the New Fund, including potential future increases in profitability to the Adviser resulting from the BlackRock and Muzinich sub-advisory fee schedules. The Board determined to monitor these matters and concluded that the proposed advisory fee was reasonable in light of these fall-out benefits and other factors.
Conclusion:
Based on all of the information considered and the conclusions reached, the Board determined that the terms of the Amendment and Sub-Advisory Agreements for the New Fund were fair and reasonable and that the Amendment and Sub-Advisory Agreements were in the best interests of the New Fund. The Board based its decision on an evaluation of all these factors as a whole and did not consider any one factor as all-important or controlling. The Independent Directors were also assisted by the advice of Independent Counsel in making this determination.
Approval of Amendment to Sub-Advisory Agreement with Harding Loevner LP
At a meeting held on October 27, 2020, the Board of Directors, including the Independent Directors, unanimously approved an Amendment (the “Amendment”) to the Sub-Advisory Agreement among BIM, Harding Loevner LP (“Harding Loevner”) and the Corporation to reflect a reduction to the first tier of Harding Loevner’s sub-advisory fee schedule from 0.97% to 0.87%, on behalf of the Old Westbury Large Cap Strategies Fund, effective as of October 1, 2020. The Board noted that the fees payable to Harding Loevner under the Sub-Advisory Agreement are paid by BIM and that the Amendment did not modify any other terms or conditions of the Sub-Advisory Agreement, the annual continuation of which the Board had considered and approved at its meeting held on July 21, 2020.
Investment Adviser:
Bessemer Investment Management LLC
630 Fifth Avenue
New York, NY 10111
(212) 708-9100
Distributor:
Foreside Funds Distributors LLC
400 Berwyn Park
899 Cassatt Road
Berwyn, PA 19312
Custodians:
Bessemer Trust Company
100 Woodbridge Center Drive
Woodbridge, NJ 07095
Citibank, N.A.
388 Greenwich Street
New York, NY 10013
Administrator:
BNY Mellon Investment Servicing (US) Inc.
760 Moore Road
King of Prussia, PA 19406
Transfer Agent:
BNY Mellon Investment Servicing (US) Inc.
760 Moore Road
King of Prussia, PA 19406
Independent Registered Public Accounting Firm:
Ernst & Young LLP
5 Times Square
New York, NY 10036
Mutual funds are not bank deposits or obligations, are not guaranteed by any bank, and are not insured or guaranteed by the U.S. government, the Federal Deposit Insurance Corporation, the Federal Reserve Board, or any other government agency. Investment in mutual funds involves investment risks, including possible loss of principal.
This report is authorized for distribution to prospective investors only when preceded or accompanied by the Funds’ prospectus which contains facts concerning the Funds’ objectives and policies, management fees, expenses and other information.
The information in this report is based on data obtained from recognized services and sources and is believed to be reliable. Any opinions, projections, or recommendations in this report are subject to change without notice and are not intended as individual investment advice. Furthermore, Bessemer Investment Management LLC and its affiliates, as agents for their clients, and any of its officers or employees may have a beneficial interest or position in any of the securities mentioned, which may be contrary to any opinion or projection expressed in this report.
October 31, 2020
Cusip 680414307
Cusip 680414604
Cusip 680414109
Cusip 680414406
Cusip 680414505
Cusip 680414851
Cusip 680414885
Cusip 680414869
Cusip 680414877
(OWF_A21-AR2020)
(12/20)
Item 1. Reports to Stockholders (cont.).
Item 2. Code of Ethics.
| (a) | The registrant, as of the end of the period covered by this report, has adopted a code of ethics that applies to the registrant’s principal executive officer, principal financial officer, principal accounting officer or controller, or persons performing similar functions, regardless of whether these individuals are employed by the registrant or a third party. |
The Code of Ethics for Principal Executive and Principal Financial Officers is attached as an Exhibit under Item 13(a)(1).
| (c) | There have been no amendments, during the period covered by this report, to a provision of the code of ethics that applies to the registrant’s principal executive officer, principal financial officer, principal accounting officer or controller, or persons performing similar functions, regardless of whether these individuals are employed by the registrant or a third party, and that relates to any element of the code of ethics description. |
| (d) | The registrant, during the period covered by this report, has not granted any waivers, including an implicit waiver, from a provision of the code of ethics to the registrant’s principal executive officer, principal financial officer, principal accounting officer or controller, or persons performing similar functions, regardless of whether these individuals are employed by the registrant or a third party, that relates to one or more of the items set forth in paragraph (b) of this item’s instructions. |
Item 3. Audit Committee Financial Expert.
The registrant’s board of directors has determined that the registrant has four audit committee financial experts serving on its audit committee and those persons (Patricia L. Francy, Alexander Ellis III, J. David Officer and R. Keith Walton) are “independent” for purposes of this Item 3 of Form N-CSR.
Item 4. Principal Accountant Fees and Services.
Audit Fees
| (a) | The aggregate fees billed for each of the last two fiscal years for professional services rendered by the principal accountant for the audit of the registrant’s annual financial statements or services that are normally provided by the accountant in connection with statutory and regulatory filings or engagements for those fiscal years were $704,463 in 2020 and $771,900 in 2019. |
Audit-Related Fees
| (b) | The aggregate fees billed in each of the last two fiscal years for assurance and related services by the principal accountant that are reasonably related to the performance of the audit of the registrant’s financial statements and are not reported under paragraph (a) of this Item were $9,000 in 2020 and $8,700 in 2019. Fees for both 2020 and 2019 relate to the review of financial statement data incorporated in the Funds’ periodic N-1A filings. |
Tax Fees
| (c) | The aggregate fees billed in each of the last two fiscal years for professional services rendered by the principal accountant for tax compliance, tax advice, and tax planning were $267,766 in 2020 and $262,809 in 2019. Fees for both 2020 and 2019 relate to the review of federal income and excise tax returns, review of capital gains distribution calculations and certain global tax compliance services. |
All Other Fees
| (d) | The aggregate fees billed in each of the last two fiscal years for products and services provided by the principal accountant, other than the services reported in paragraphs (a) through (c) of this Item were $45,400 in 2020 and $60,500 in 2019. Fees for 2020 relate to the review of holdings for the Funds’ affiliated custodian under Rule 17f-2. Fees for 2019 relate to the review of holdings for the Funds’ affiliated custodian under Rule 17f-2 and regulatory reporting for OWF Multi-Asset Opportunities Fund, Ltd. |
| (e)(1) | Disclose the audit committee’s pre-approval policies and procedures described in paragraph (c)(7) of Rule 2-01 of Regulation S-X. |
Before an auditor is engaged by the Funds to render audit services, the Audit Committee reviews and approves the engagement, including all related fees. The Audit Committee also reviews and approves in advance, unless excepted under Rule 2-01(c)(7) of Regulation S-X, any proposal that the Funds employ their auditor to render “permissible non-audit services” to the Funds, including all related fees. In addition, the Audit Committee reviews and approves in advance, unless excepted under Rule 2-01(c)(7) of Regulation S-X, any proposal that the Adviser, and any entity controlling, controlled by, or under common control with the Adviser that provides ongoing services to the Funds, employ the Funds’ Auditor to render non-audit services, if such engagement would relate directly to the operations and financial reporting of the Funds. As a part of its review, the Audit Committee considers whether the provision of such services does not impact the Auditor’s independence.
| (e)(2) | The percentage of services described in each of paragraphs (b) through (d) of this Item that were approved by the audit committee pursuant to paragraph (c)(7)(i)(C) of Rule 2-01 of Regulation S-X are as follows: |
| (f) | The percentage of hours expended on the principal accountant’s engagement to audit the registrant’s financial statements for the most recent fiscal year that were attributed to work performed by persons other than the principal accountant’s full-time, permanent employees was less than fifty percent. |
| (g) | The aggregate non-audit fees billed by the registrant’s accountant for services rendered to the registrant, and rendered to the registrant’s investment adviser (not including any sub-adviser whose role is primarily portfolio management and is subcontracted with or overseen by another investment adviser), and any entity controlling, controlled by, or under common control with the adviser that provides ongoing services to the registrant for each of the last two fiscal years of the registrant were $360,175 in 2020 and $463,318 in 2019. |
| (h) | The registrant’s audit committee of the board of directors has considered whether the provision of non-audit services that were rendered to the registrant’s investment adviser (not including any sub-adviser whose role is primarily portfolio management and is subcontracted with or overseen by another investment adviser), and any entity controlling, controlled by, or under common control with the investment adviser that provides ongoing services to the registrant that were not pre-approved pursuant to paragraph (c)(7)(ii) of Rule 2-01 of Regulation S-X is compatible with maintaining the principal accountant’s independence. |
Item 5. Audit Committee of Listed Registrants.
Not applicable.
Item 6. Investments.
| (a) | The Schedule of Investments in securities of unaffiliated issuers as of the close of the reporting period is included as part of the report to shareholders filed under Item 1 of this form. |
| Item 7. | Disclosure of Proxy Voting Policies and Procedures for Closed-End Management Investment Companies. |
Not applicable.
Item 8. Portfolio Managers of Closed-End Management Investment Companies.
Not applicable.
| Item 9. | Purchases of Equity Securities by Closed-End Management Investment Company and Affiliated Purchasers. |
Not applicable.
Item 10. Submission of Matters to a Vote of Security Holders.
There have been no material changes to the procedures by which the shareholders may recommend nominees to the registrant’s board of directors, where those changes were implemented after the registrant last provided disclosure in response to the requirements of Item 407(c)(2)(iv) of Regulation S-K (17 CFR 229.407) (as required by Item 22(b)(15) of Schedule 14A (17 CFR 240.14a-101)), or this Item.
Item 11. Controls and Procedures.
| (a) | The registrant’s principal executive and principal financial officers, or persons performing similar functions, have concluded that the registrant’s disclosure controls and procedures (as defined in Rule 30a-3(c) under the Investment Company Act of 1940, as amended (the “1940 Act”) (17 CFR 270.30a-3(c))) are effective, as of a date within 90 days of the filing date of the report that includes the disclosure required by this paragraph, based on their evaluation of these controls and procedures required by Rule 30a-3(b) under the 1940 Act (17 CFR 270.30a-3(b)) and Rules 13a-15(b) or 15d-15(b) under the Securities Exchange Act of 1934, as amended (17 CFR 240.13a-15(b) or 240.15d-15(b)). |
| (b) | There were no changes in the registrant’s internal control over financial reporting (as defined in Rule 30a-3(d) under the 1940 Act (17 CFR 270.30a-3(d)) that occurred during the period covered by this report that has materially affected, or is reasonably likely to materially affect, the registrant’s internal control over financial reporting. |
Item 12. Disclosure of Securities Lending Activities for Closed-End Management Investment Companies.
Not applicable.
Item 13. Exhibits.
SIGNATURES
Pursuant to the requirements of the Securities Exchange Act of 1934 and the Investment Company Act of 1940, the registrant has duly caused this report to be signed on its behalf by the undersigned, thereunto duly authorized.
| (Registrant) | | Old Westbury Funds, Inc. | |
| By (Signature and Title)* | /s/ David W. Rossmiller | |
| | David W. Rossmiller, President and Chief Executive Officer | |
| | (Principal Executive Officer) | |
Pursuant to the requirements of the Securities Exchange Act of 1934 and the Investment Company Act of 1940, this report has been signed below by the following persons on behalf of the registrant and in the capacities and on the dates indicated.
| By (Signature and Title)* | /s/ David W. Rossmiller | |
| | David W. Rossmiller, President and Chief Executive Officer | |
| | (Principal Executive Officer) | |
| By (Signature and Title)* | /s/ Matthew A. Rizzi | |
| | Matthew A. Rizzi, Treasurer | |
| | (Principal Financial Officer) | |
* Print the name and title of each signing officer under his or her signature.