UNITED STATES
SECURITIES AND EXCHANGE COMMISSION
Washington, D.C. 20549
FORM N-CSR
CERTIFIED SHAREHOLDER REPORT OF REGISTERED MANAGEMENT
INVESTMENT COMPANIES
| | Investment Company Act file number | 811-07912 | |
| | Old Westbury Funds, Inc. | |
| (Exact name of registrant as specified in charter) |
| | 103 Bellevue Parkway
Wilmington, DE 19809 | |
| (Address of principal executive offices) (Zip code) |
| | Marianna DiBenedetto
BNY Mellon Investment Servicing (US) Inc.
103 Bellevue Parkway
Wilmington, DE 19809 | |
| (Name and address of agent for service) |
Registrant’s telephone number, including area code: 800-607-2200
Date of fiscal year end: October 31
Date of reporting period: October 31, 2021
Form N-CSR is to be used by management investment companies to file reports with the Commission not later than 10 days after the transmission to stockholders of any report that is required to be transmitted to stockholders under Rule 30e-1 under the Investment Company Act of 1940 (17 CFR 270.30e-1). The Commission may use the information provided on Form N-CSR in its regulatory, disclosure review, inspection, and policymaking roles.
A registrant is required to disclose the information specified by Form N-CSR, and the Commission will make this information public. A registrant is not required to respond to the collection of information contained in Form N-CSR unless the Form displays a currently valid Office of Management and Budget (“OMB”) control number. Please direct comments concerning the accuracy of the information collection burden estimate and any suggestions for reducing the burden to Secretary, Securities and Exchange Commission, 100 F Street, NE, Washington, DC 20549. The OMB has reviewed this collection of information under the clearance requirements of 44 U.S.C. § 3507.
Item 1. Reports to Stockholders.
The Report to Shareholders is attached herewith.
Old Westbury Funds, Inc.
Annual Report
October 31, 2021
BESSEMER INVESTMENT MANAGEMENT LLC
Investment Adviser
Old Westbury Funds, Inc.
| Old Westbury Funds, Inc. | |
| A Letter from the President (Unaudited) | |
| | October 31, 2021 |
| | |
Dear Shareholders:
During 2021, the U.S. Federal Reserve (the “Fed”) maintained its exceptional level of accommodation, supporting recovery from the COVID-19 recession that disrupted the global economy and labor markets. The Fed continued to buy $120 billion in government-backed bonds each month — $80 billion in Treasury debt and $40 billion in mortgage-backed securities – until November, when a “taper” (reduction of bond purchases) of $15 billion-per-month began. The Fed justified this by citing significant progress toward realizing its targets for employment and inflation. Separate from the Fed’s decision to taper its bond purchases, current economic conditions are likely to support the Fed’s policy rates remaining at its lower bound until at least mid-2022.
While Fed Chairman Powell, who was recently reappointed for another four years, mentioned following the November Federal Open Market Committee (FOMC) meeting, “There is still a lot of ground to cover to reach maximum employment,” progress on inflation has certainly been achieved. Inflation has risen quickly this year, with headline consumer price index (CPI), a price index that measures a weighted average of a basket of consumer goods and services, rising at its fastest annual pace since 1990 (6.2% in November). Price pressures were more persistent than expected by the Fed, due in part to rebounding demand along with supply-chain bottlenecks. Economic growth expectations are expected to remain above historical averages over the coming year, and real gross domestic product (GDP), a monetary measure of the market value of all final goods and services, is running at its strongest rate in nearly two decades. In conjunction with this impressive economic growth, S&P 500 companies are expected to deliver the highest net margins to date in 2021 and 2022.
Throughout the year, global supply-chain disruptions have affected nearly every sector, as businesses faced a myriad of factors including a tight labor market and ongoing COVID-19 outbreaks. Several firms have also pointed to elevated inflation levels translating into higher input costs. Generally, firms have been successful in pushing through higher costs and maintaining solid profit margins, but some have experienced margin pressure. Importantly, earnings commentary in the most recent quarter has highlighted impressive consumer strength, with some companies even having trouble meeting high consumer demand. This strength largely has been attributed to solid consumer balance sheets as many consumers remain flush with cash from fiscal stimulus and excess savings accumulated during the pandemic. Looking ahead, while it seems unlikely that supply-chain constraints will be resolved before 2022, we are starting to see signs that pressures may be easing, including easing in raw-material costs, normalization in shipping costs, and resumption of factory production.
U.S. and global labor markets were undergoing seismic changes even before the COVID-19 pandemic began. The growth of gig economy opportunities, proliferation of technology-enabled mobile workforces, surge in retirements, and curtailment of immigration were some of the factors driving the changing landscape and causing the tight labor market that materialized in 2021. That said, in November, the number of Americans filing new unemployment claims fell to pre-pandemic levels as the labor market recovery continued, and a persistent shortage of workers remains an obstacle to faster job growth. Overall, the economy is regaining momentum, now that the summertime Delta-variant scare has passed.
Outside the U.S., the situation remains mixed, with most lower-income countries maintaining low vaccination rates and, as a result, are struggling to successfully reopen their economies. Additionally, some European countries with high vaccination rates have reimposed selected restrictions, mainly on unvaccinated individuals, after cases started rising materially late in the fall. Due to waning vaccine immunity, some countries like the U.S. and Israel have approved vaccine boosters. Additionally, drug companies like Merck and Pfizer have identified new treatments for individuals most at risk for contracting severe infections. Looking ahead, we remain optimistic that the environment will continue to improve, as vaccine supply increases and more treatment options become available.
Over the course of the year, the Adviser, Bessemer Investment Management, LLC, maintained its modestly optimistic outlook, believing the market backdrop remains supportive of growth-oriented assets. The Old Westbury All Cap Core Fund and Old Westbury Credit Income Fund produced notable results. The Old Westbury All Cap Core Fund outperformed its primary benchmark due to its underweight position in Emerging Asia Pacific, an overweight position in the U.S., and stock selection within financials, healthcare, and communication services. The Old Westbury Credit Income Fund outperformed its benchmark primarily due to the continued re-opening of the economy as risk-oriented assets performed well; major contributors to the Fund’s results were high-yield bonds, preferred securities, convertible bonds and non-agency mortgage-backed securities. Detailed explanations of positioning and outcomes appear in later sections of this report, to be read at your leisure.
At the end of this eventful year, we remain committed to the Adviser’s longstanding investment approach, characterized by independent research, a global orientation, and a long-term focus. We believe these disciplines will continue to result in competitive long-term results for our shareholders and position the Adviser to fulfill the fundamental mandate of participating in strong market environments, while preserving capital during difficult times.
| Old Westbury Funds, Inc. | |
| A Letter from the President (Unaudited) - (Continued) | |
| | October 31, 2021 |
| | |
Sincerely,

David W. Rossmiller
President
Old Westbury Funds, Inc.
| Old Westbury Funds, Inc. | |
| All Cap Core Fund | |
| Investment Adviser’s Report (Unaudited) | |
| | |
The return of the Old Westbury All Cap Core Fund (the “Fund”) for the fiscal year ended October 31, 2021 was 39.8%. In comparison, the return of its primary benchmark, the MSCI ACWI Investable Market Index (Net)a, was 38.2%. The Fund’s secondary benchmark, a blend of 90% MSCI USA Index (Gross) and 10% MSCI ACWI ex USA Index (Net)a, returned 42.0%.
The most significant positive contributors to the Fund’s relative performance during the year were an underweight position in Emerging Asia Pacific, an overweight position in the U.S., and stock selection within financials, healthcare, and communication services. Stocks in these sectors with the greatest relative contribution included Blackstone, IQVIA, and Alphabet. Blackstone appreciated significantly, driven by the company’s growth in assets managed, improved operating leverage, and the market’s recognition of the durability of growth within its higher quality fee-related earnings. IQVIA benefited from an acceleration in clinical trial activity, new business wins, and a growing appreciation for the technological and data advantage it offers. Alphabet benefited from a continued increase in demand for digital advertising with growth rates sustaining at high levels, as well as greater business transparency and shareholder-friendly actions. The Fund also benefited from an underweight position in the consumer staples sector (2.3% of the Fund during the fiscal year) as well as an underweight position in utilities (1.5% of the Fund during the fiscal year).
The Fund’s results were held back by stock selection within the information technology sector and an underweight to the financials sector which outperformed the benchmark. Stocks within information technology with the highest negative relative contributions included Visa and PayPal. The Fund was also held back by holding cash in a rising market.
At fiscal year-end, versus the primary benchmark, the Fund maintained overweight positions in the technology, communication services, consumer discretionary, and healthcare sectors and underweight positions in consumer staples, materials, energy, real estate, and utilities. Relative to the primary benchmark, the Fund continued to be significantly overweight U.S. stocks (91%) versus non-U.S. stocks (6%).
| a | The Net version of each index reflects no deductions for fees, expenses or income taxes. |
The performance data quoted represents past performance. Past performance does not guarantee future results and does not reflect the deduction of taxes that a shareholder may pay on Fund distributions or the redemption of Fund shares. Fund performance reflects fee waivers and/or expense reimbursements and reinvestments of distributions, if any. Without waivers/reimbursements, performance would have been lower. The investment return and principal value of an investment will fluctuate. Consequently, an investor’s shares, when redeemed, may be worth more or less than their original cost. Current performance may be lower or higher than the performance data quoted. To obtain performance information current to the most recent month end, please call 1-800-607-2200.
| Old Westbury Funds, Inc. | |
| All Cap Core Fund | |
| Investment Adviser’s Report (Unaudited) - (Continued) | |
| | |
PORTFOLIO DIVERSIFICATION BY SECTOR
| Sector: | | Percentage
of Net Assets |
| Banks | | | 5.0 | % |
| Communication Services | | | 11.2 | |
| Consumer Discretionary | | | 14.1 | |
| Consumer Staples | | | 2.3 | |
| Diversified Financials | | | 7.2 | |
| Energy | | | 2.2 | |
| Exchange-Traded Funds | | | 0.4 | |
| Health Care | | | 12.8 | |
| Industrials | | | 10.2 | |
| Information Technology | | | 25.6 | |
| Insurance | | | 1.3 | |
| Materials | | | 1.8 | |
| Real Estate | | | 2.2 | |
| Utilities | | | 1.4 | |
| Other* | | | 2.3 | |
| | | | 100.0 | % |
| * | Includes cash and equivalents, investment company, pending trades and Fund share transactions, interest and dividends receivable, prepaids and accrued expenses payable. |
| Old Westbury Funds, Inc. | |
| All Cap Core Fund | |
| Investment Adviser’s Report (Unaudited) - (Continued) | |
| | |

| Average Annual Total Returns | | |
| For the Year Ended October 31, 2021 | | |
| All Cap Core Fund | | |
| One Year | | | 39.77 | % |
| Five Year | | | 19.52 | % |
| Ten Year | | | 12.96 | % |
| | | | | |
| MSCI ACWI IMI Index (Net) | | | | |
| One Year | | | 38.18 | % |
| Five Year | | | 14.59 | % |
| Ten Year | | | 11.34 | % |
| | | | | |
| Blended Index (Net) | | | | |
| One Year | | | 41.96 | % |
| Five Year | | | 18.39 | % |
| Ten Year | | | 15.41 | % |
On December 30, 2016, the Fund changed its name to All Cap Core Fund (formerly Large Cap Core Fund) as part of a series of changes to the overall investment focus and strategies of the Fund. Prior to November 16, 2011, the Fund was named the U.S. Large Cap Fund and operated under a different investment strategy. The performance information shown above may not be representative of performance the Fund will achieve under its current investment strategy. The index performance is not illustrative of the Fund’s performance and performance of the fund will differ; the use of the index performance is not intended to mask negative performance.
The performance data quoted represents past performance. Past performance does not guarantee future results and does not reflect the deduction of taxes that a shareholder may pay on Fund distributions or the redemption of Fund shares. Fund performance reflects fee waivers and/or expense reimbursements and reinvestments of distributions, if any. Without waivers/reimbursements, performance would have been lower. The investment return and principal value of an investment will fluctuate. Consequently, an investor’s shares, when redeemed, may be worth more or less than their original cost. Current performance may be lower or higher than the performance data quoted. To obtain performance information current to the most recent month end, please call 1-800-607-2200.
The expense ratio, prior to fee waivers and including acquired fund fees and expenses (if any), is stated in the prospectus dated March 1, 2021 as 0.98%. Additional information pertaining to the Fund’s expense ratio for the year ended October 31, 2021 can be found in the Financial Highlights.
| Old Westbury Funds, Inc. | |
| All Cap Core Fund | |
| Investment Adviser’s Report (Unaudited) - (Continued) | |
| | |
The chart shown on the previous page illustrates the total value of a $10,000 investment for 10 years, with distributions reinvested. The Fund compares its performance to a blended benchmark, as a secondary benchmark, consisting of a 90% weighting in the MSCI USA Index (Gross) and a 10% weighting in the MSCI ACWI ex USA Index (Net) (the“Blended Index”). The MSCI ACWI IMI (Net) and the Blended Index (Net) also include the reinvestment of distributions but do not include fees, expenses and income taxes associated with an investment in the Fund. The MSCI ACWI IMI (Net) and the Blended Index (Net) are unmanaged. Investments cannot be made directly in an index.
Investments made in foreign and emerging country securities may involve additional risks, such as political and social instability, less liquidity and currency exchange rate volatility.
| Old Westbury Funds, Inc. | |
| Small & Mid Cap Strategies Fund | |
| Investment Adviser’s Report (Unaudited) | |
| | |
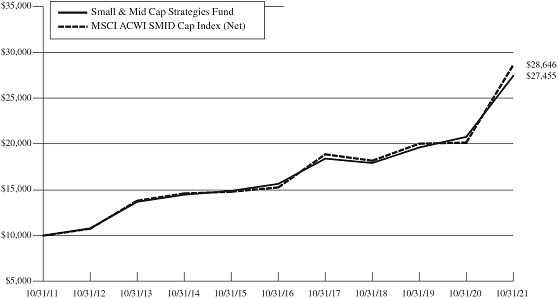
The return of the Old Westbury Small & Mid Cap Strategies Fund (the “Fund”) for the fiscal year ended October 31, 2021, was 32.1%. In comparison, the return of the MSCI All Country World Small Mid Cap Index (Net)a (the “Index”) was 42.1%.
The Fund benefited from stock selection in the healthcare sector and an underweight position to the utilities sector. An underweight position to Japan also contributed to performance. Individual stocks that contributed to performance included U.S. electric vehicle manufacturer Tesla (+187.1%), U.S. information solutions provider Equifax (+104.6%), U.S. exchange company Nasdaq (+75.8%), and U.S. electronic design automation company Synopsys (+55.8%). Tesla appreciated on the basis of encouraging financial results, and recently announced it had delivered a record number of vehicles for the prior quarter. Tesla’s latest results reported a significant increase in revenue, but more notable was its margin performance. This was driven by declining unit costs, prompted by efficiencies derived from scaled-up production and a higher Model Y mix. Equifax showed impressive results in driving revenue and profit growth. Following the 2017 data breach, the business is taking advantage of its new IT infrastructure to better position the company for growth. In addition, Equifax has a unique data asset in Verification/Work Number, which is one of the largest and highest margin businesses at the company. Nasdaq has increased the growth of its non-transactional businesses and educated investors that it is more than just an exchange. Synopsys benefited from the industry trend of more powerful and specific chips.
On the negative side, stock selection in the technology and financials sectors were detractors to performance. In addition, stock selection in the U.S. hurt performance. Individual stocks that detractors included U.S. online loan marketplace operator LendingTree (-50.1%), German antibodies developer MorphoSys (-53.8%), and U.S. electronic trading platform operator MarketAxess (-23.8%). LendingTree has been in a challenging environment due to its exposure to the U.S. economy and the associated cyclicality. MorphoSys declined due to soft sales for Monjuvi (a treatment for relapse and refractory large B-cell lymphoma) and news of the company’s recent acquisition of Constellation Pharmaceuticals. MarketAxess’s recent share price weakness followed a period of very strong share price performance.
At fiscal year-end, the Fund was overweight the healthcare, technology, and consumer staples sectors. The Fund was underweight the real estate, financials, and utilities sectors. On a regional basis, as of fiscal year-end, the Fund was overweight the U.S. and other developed markets, while being underweight emerging markets and Japan.
| a | The Net version of each index reflects no deductions for fees, expenses or income taxes. |
| Old Westbury Funds, Inc. | |
| Small & Mid Cap Strategies Fund | |
| Investment Adviser’s Report (Unaudited) - (Continued) | |
| | |
PORTFOLIO DIVERSIFICATION BY COUNTRY
| Country: | | Percentage
of Net Assets |
| Argentina | | | 0.4 | % |
| Australia | | | 1.5 | |
| Austria | | | 0.1 | |
| Belgium | | | 0.2 | |
| Bermuda | | | 0.4 | |
| Brazil | | | 0.3 | |
| Canada | | | 2.8 | |
| China | | | 3.1 | |
| Costa Rica | | | 0.0 | * |
| Denmark | | | 1.5 | |
| Finland | | | 0.7 | |
| France | | | 0.8 | |
| Germany | | | 1.5 | |
| Greece | | | 0.1 | |
| Hong Kong | | | 0.5 | |
| Iceland | | | 0.1 | |
| India | | | 0.8 | |
| Indonesia | | | 0.0 | * |
| Ireland | | | 0.2 | |
| Israel | | | 2.9 | |
| Italy | | | 0.5 | |
| Japan | | | 6.1 | |
| Jersey Channel Islands | | | 0.3 | |
| Netherlands | | | 1.4 | |
| New Zealand | | | 0.5 | |
| Norway | | | 0.1 | |
| Peru | | | 0.1 | |
| Poland | | | 0.2 | |
| Portugal | | | 0.0 | * |
| Russia | | | 0.8 | |
| Singapore | | | 0.1 | |
| South Africa | | | 0.2 | |
| South Korea | | | 0.9 | |
| Spain | | | 0.3 | |
| Sweden | | | 1.6 | |
| Switzerland | | | 2.4 | |
| Taiwan | | | 0.8 | |
| Thailand | | | 0.5 | |
| Turkey | | | 0.5 | |
| United Kingdom | | | 6.1 | |
| United States | | | 43.4 | |
| Vietnam | | | 0.0 | * |
| Other** | | | 15.3 | |
| | | | 100.0 | % |
| * | Represents less than 0.01% of net assets. |
| ** | Includes cash and equivalents, exchange-traded funds, rights/warrants, investment company, pending trades and Fund share transactions, interest and dividends receivable, prepaids and accrued expenses payable. |
| Old Westbury Funds, Inc. | |
| Small & Mid Cap Strategies Fund | |
| Investment Adviser’s Report (Unaudited) - (Continued) | |
| | |
| Average Annual Total Returns | | |
| For the Year Ended October 31, 2021 | | |
| Small & Mid Cap Strategies Fund | | |
| One Year | | | 32.12 | % |
| Five Year | | | 11.90 | % |
| Ten Year | | | 10.63 | % |
| | | | | |
| MSCI ACWI SMID Cap Index (Net) | | | | |
| One Year | | | 42.10 | % |
| Five Year | | | 13.42 | % |
| Ten Year | | | 11.10 | % |
On December 30, 2016, the Fund changed its name to Small & Mid Cap Strategies Fund (formerly Small & Mid Cap Fund) as part of a series of changes to the overall investment focus and strategies of the Fund. The performance information shown above may not be representative of performance the Fund will achieve under its current investment strategy. The index performance is not illustrative of the Fund’s performance and performance of the fund will differ; the use of the index performance is not intended to mask negative performance.
The performance data quoted represents past performance. Past performance does not guarantee future results and does not reflect the deduction of taxes that a shareholder may pay on Fund distributions or the redemption of Fund shares. Fund performance reflects fee waivers and/or expense reimbursements and reinvestments of distributions, if any. Without waivers/reimbursements, performance would have been lower. The investment return and principal value of an investment will fluctuate. Consequently, an investor’s shares, when redeemed, may be worth more or less than their original cost. Current performance may be lower or higher than the performance data quoted. To obtain performance information current to the most recent month end, please call 1-800-607-2200.
The Adviser has contractually committed through October 31, 2024, to waive its advisory fees to the extent necessary to maintain the net operating expense ratio of the Fund, excluding Fund transaction costs, investment interest expense, dividend expenses associated with securities sold short and acquired fund fees and expenses (if any), at 1.10%, as disclosed in the Funds’ prospectus dated March 1, 2021. The expense ratio, prior to fee waivers and including acquired fund fees and expenses (if any), is stated in the prospectus as 1.17%. Additional information pertaining to the Fund’s expense ratio for the year ended October 31, 2021 can be found in the Financial Highlights.
The chart shown above illustrates the total value of a $10,000 investment for 10 years, with distributions reinvested. The MSCI ACWI SMID Cap Index (Net) also includes the reinvestment of distributions but not fees, expenses and income taxes associated with an investment in the Fund. The MSCI ACWI SMID Cap Index (Net) is unmanaged. Investments cannot be made directly in an index.
| Old Westbury Funds, Inc. | |
| Small & Mid Cap Strategies Fund | |
| Investment Adviser’s Report (Unaudited) - (Continued) | |
| | |
Investments made in small-capitalization and mid-capitalization companies are subject to greater volatility and less liquidity compared to investments made in larger and more established companies. Investments made in securities of companies in foreign and emerging countries may involve additional risks, such as political and social instability, less liquidity and currency exchange rate volatility.
| Old Westbury Funds, Inc. | |
| Large Cap Strategies Fund | |
| Investment Adviser’s Report (Unaudited) | |
| | |
The return of the Old Westbury Large Cap Strategies Fund (the “Fund”) for the fiscal year ended October 31, 2021, was 33.6%. In comparison, the return of the MSCI All Country World Large Cap Index (Net)a (“the Index”) was 36.8%.
The largest contributors to the Fund’s overall performance came from stock selection in the technology and financials sectors. In addition, stock selection in Asia Pacific ex-Japan and an underweight position to the U.S. benefited the Fund. Individual stocks that contributed included U.S. investment management company Blackstone (+187.5%), Singapore-based online gaming platform Sea Limited (+117.9%), U.S. bank and financial holding company Bank of America (+105.8%), and Dutch semiconductor equipment developer ASML (+124.6%). Blackstone is the world’s largest and most diverse alternative asset manager, with over $730 billion in assets under management. Blackstone appreciated significantly, driven by the company’s growth in assets managed, improved operating leverage, and the market’s recognition of the durability of growth within its higher quality fee-related earnings. Sea Limited produced strong business results, as the business has executed on its opportunities in gaming, ecommerce, and digital financial services. Bank of America outperformed the broader markets in 2021, reflecting the strength in consumer spending and confidence, which led to a rebound in global economic growth after the COVID-19 pandemic. The company also benefitted from a rising interest rate environment and reserve releases after setting aside significant loss provisions in 2020, which positively impacting earnings during the year. ASML benefits from several secular industry drivers, such as 5G, Artificial Technology, Internet of Things, and cloud technology, driving demand for higher performance computing chips. Large global semiconductor foundries have been increasing their capital expenditures throughout 2021, which had a significantly positive impact on the company’s earnings for the year.
Stock selection in the consumer discretionary sector was the largest detractor overall. An overweight position to Emerging Asia Pacific and stock selection in the region also detracted from performance. Individual stocks that detracted included Chinese online marketplace provider Alibaba (-45.9%), Chinese private educational services provider New Oriental Education & Technology (-87.2%), and U.S. cardiac monitor developer iRhythm Technologies (-66.8%). Alibaba and New Oriental Education & Technology traded lower due to Chinese regulatory pressures. Chinese regulators effectively ended the for-profit after-school tutoring industry and the Fund exited its position in New Oriental Education & Technology. iRhythm Technologies shares sold off after a regional Medicare payer announced a significant cut to its reimbursement rate.
At fiscal year-end, the Fund was overweight the communication services, technology, and consumer discretionary sectors. The Fund was underweight the consumer staples, financials, utilities, and real estate sectors.
On a regional basis, as of fiscal year-end, the Fund was overweight the U.S., while being underweight developed Europe, Japan, and other developed markets.
| a | The Net version of each index reflects no deductions for fees, expenses or income taxes. |
| Old Westbury Funds, Inc. | |
| Large Cap Strategies Fund | |
| Investment Adviser’s Report (Unaudited) - (Continued) | |
| | |
PORTFOLIO DIVERSIFICATION BY COUNTRY
| Country: | | Percentage
of Net Assets |
| Argentina | | | 0.7 | % |
| Australia | | | 0.7 | |
| Belgium | | | 0.0 | * |
| Brazil | | | 0.3 | |
| Canada | | | 0.6 | |
| Chile | | | 0.0 | * |
| China | | | 5.9 | |
| Cyprus | | | 0.1 | |
| Denmark | | | 0.0 | * |
| Finland | | | 0.0 | * |
| France | | | 1.1 | |
| Germany | | | 1.7 | |
| Hong Kong | | | 0.6 | |
| India | | | 3.5 | |
| Indonesia | | | 0.1 | |
| Ireland | | | 1.4 | |
| Israel | | | 0.0 | * |
| Italy | | | 0.0 | * |
| Japan | | | 2.2 | |
| Kazakhstan | | | 0.2 | |
| Malaysia | | | 0.0 | * |
| Mexico | | | 0.0 | * |
| Netherlands | | | 2.4 | |
| Norway | | | 0.0 | * |
| Poland | | | 0.0 | * |
| Portugal | | | 0.0 | * |
| Qatar | | | 0.0 | * |
| Russia | | | 0.3 | |
| Singapore | | | 1.5 | |
| South Africa | | | 0.0 | * |
| South Korea | | | 0.7 | |
| Spain | | | 0.0 | * |
| Sweden | | | 0.5 | |
| Switzerland | | | 0.6 | |
| Taiwan | | | 1.2 | |
| Thailand | | | 0.3 | |
| Turkey | | | 0.0 | * |
| United Kingdom | | | 1.9 | |
| United States | | | 60.9 | |
| Uruguay | | | 0.1 | |
| Vietnam | | | 0.0 | * |
| Other** | | | 10.5 | |
| | | | 100.0 | % |
| * | Represents less than 0.01% of net assets. |
| ** | Includes cash and equivalents, exchange-traded funds, investment company, pending trades and Fund share transactions, interest and dividends receivable, prepaids and accrued expenses payable. |
| Old Westbury Funds, Inc. | |
| Large Cap Strategies Fund | |
| Investment Adviser’s Report (Unaudited) - (Continued) | |
| | |

Average Annual Total Returns
For the Year Ended October 31, 2021 | | | |
| Large Cap Strategies Fund | | | |
| One Year | | | 33.64 | % |
| Five Year | | | 13.27 | % |
| Ten Year | | | 11.21 | % |
| | | | | |
| MSCI ACWI Large Cap Index (Net) | | | | |
| One Year | | | 36.84 | % |
| Five Year | | | 15.03 | % |
| Ten Year | | | 11.43 | % |
On November 16, 2011, the Fund changed its name to Large Cap Strategies Fund (formerly Non-U.S. Large Cap Fund) as part of a series of changes to the overall investment focus and strategies of the Fund. The performance information shown above may not be representative of performance the Fund will achieve under its current investment strategy. The index performance is not illustrative of the Fund’s performance and performance of the fund will differ; the use of the index performance is not intended to mask negative performance.
The performance data quoted represents past performance. Past performance does not guarantee future results and does not reflect the deduction of taxes that a shareholder may pay on Fund distributions or the redemption of Fund shares. Fund performance reflects fee waivers and/or expense reimbursements and reinvestments of distributions, if any. Without waivers/reimbursements, performance would be lower. The investment return and principal value of an investment will fluctuate. Consequently, an investor’s shares, when redeemed, may be worth more or less than their original cost. Current performance may be lower or higher than the performance data quoted. To obtain performance information current to the most recent month end, please call 1-800-607-2200.
The Adviser has contractually committed through October 31, 2024, to waive its advisory fees to the extent necessary to maintain the net operating expense ratio of the Fund, excluding, Fund transaction costs, investment interest expense, dividend expenses associated with securities sold short and acquired fund fees and expenses (if any) at 1.10%, (current net operating expense is 1.09%). The expense ratio including acquired fund fees and expenses (if any), is stated in the prospectus dated March 1, 2021 as 1.12%. Additional information pertaining to the Fund’s expense ratio for the year ended October 31, 2021 can be found in the Financial Highlights.
The chart shown above illustrates the total value of a $10,000 investment for 10 years, with distributions reinvested. The MSCI ACWI Large Cap Index (Net) also includes the reinvestment of distributions but not fees, expenses and income taxes associated with an investment in the Fund. The MSCI ACWI Large Cap Index (Net) is unmanaged. Investments cannot be made directly in an index.
| Old Westbury Funds, Inc. | |
| Large Cap Strategies Fund | |
| Investment Adviser’s Report (Unaudited) - (Continued) | |
| | |
Investments made in foreign and emerging country securities may involve additional risks, such as political and social instability, less liquidity and currency exchange rate volatility.
| Old Westbury Funds, Inc. |
| Credit Income Fund |
| Investment Adviser’s Report (Unaudited) |
| |
The Old Westbury Credit Income Fund (the “Fund”) returned 5.9% for the fiscal year ended October 31, 2021. In comparison, the return of the ICE Bank of America Merrill Lynch 1-10 Year U.S. Corporate Index (the “Index”) was 1.0%.
The Fund’s investment approach provides flexibility to invest across a wide variety of global credit instruments without constraints to benchmarks, asset classes, or sectors. The management of the Fund utilizes a combination of internally and externally managed strategies, and these are allocated in a complementary fashion in aiming to achieve the portfolio’s objectives of income and capital appreciation.
At fiscal year end, the Fund was allocated 20.3% to Bessemer Investment Management LLC (“Bessemer”) managed credit, 46.5% to externally managed credit (37% BlackRock Inc.; 9.5% Muzinich Co. Inc.) and 33.2% to Bessemer managed government securities.
The Fund benefitted from continued re-opening of the economy as risk-oriented assets performed well. The spread component of the assets is what added value as a more normal functioning economy helped heal the credit markets. The major contributors to the Fund were high-yield bonds, preferred securities, convertible bonds and non-agency mortgage-backed securities. The Fund’s major detractor was treasury securities as the Federal Reserve has hinted to reducing extra accommodative policy and yields normalized to higher levels due to the easing pandemic concerns.
PORTFOLIO DIVERSIFICATION BY SECTOR
| Sector: | | Percentage
of Net Assets |
| Asset-Backed Securities | | | 19.3 | % |
| Bank Loans | | | 0.1 | |
| Corporate Bonds | | | 9.7 | |
| Exchange-Traded Funds | | | 18.1 | |
| Non-Agency Mortgage-Backed Securities | | | 16.1 | |
| Preferred Stocks | | | 0.2 | |
| U.S. Government Agencies and Securities | | | 23.1 | |
| Other* | | | 13.4 | |
| | | | 100.0 | % |
| * | Includes cash and equivalents, swap agreements, pending trades and Fund share transactions, interest and dividends receivable, prepaids and accrued expenses payable. |
| Old Westbury Funds, Inc. |
| Credit Income Fund |
| Investment Adviser’s Report (Unaudited) - (Continued) |
| |

Average Annual Total Returns
For the Period Ended October 31, 2021 | | | |
| Credit Income Fund | | | | |
| One Year | | | 5.90 | % |
| Since Inception date of October 1, 2020 | | | 5.34 | % |
| | | | | |
| ICE Bank of America 1-10 Year U.S. Corporate Index | | | | |
| One Year | | | 1.01 | % |
| Since Inception date of October 1, 2020 | | | 0.98 | % |
The performance data quoted represents past performance. Past performance does not guarantee future results and does not reflect the deduction of taxes that a shareholder may pay on Fund distributions or the redemption of Fund shares. Fund performance reflects fee waivers and/or expense reimbursements and reinvestments of distributions, if any. Without waivers/reimbursements, performance would have been lower. The investment return and principal value of an investment will fluctuate. Consequently, an investor’s shares, when redeemed, may be worth more or less than their original cost. Current performance may be lower or higher than the performance data quoted. To obtain performance information current to the most recent month end, please call 1-800-607-2200.
The Adviser has contractually committed through October 31, 2024, to waive its advisory fees to the extent necessary to maintain the net operating expense ratio of the Fund, excluding Fund transaction costs, investment interest expense, dividend expenses associated with securities sold short and acquired fund fees and expenses (if any), at 0.85%, as disclosed in the Funds’ prospectus dated March 1, 2021. The expense ratio, prior to fee waivers and including acquired fund fees and expenses (if any), is stated in the prospectus as 0.93%. Additional information pertaining to the Fund’s expense ratio for the year ended October 31, 2021 can be found in the Financial Highlights.
The chart shown above illustrates the total value of a $10,000 investment for 1 Year and 1 Month, with distributions reinvested. The ICE Bank of America 1-10 Year U.S. Corporate Index also includes the reinvestment of distributions but does not include fees, expenses and income taxes associated with an investment in the Fund. The ICE Bank of America 1-10 Year U.S. Corporate Index is unmanaged. Investments cannot be made directly in an index.
Investments made in securities of companies in foreign and emerging countries may involve additional risks, such as political and social instability, less liquidity and currency exchange rate volatility. The Fund may invest in instruments that are volatile, speculative or otherwise risky. The Fund is non-diversified, meaning it may focus its assets in a smaller number of issuers and may be subject to more risk than a more diversified fund.
| Old Westbury Funds, Inc. | |
| Fixed Income Fund | |
| Investment Adviser’s Report (Unaudited) | |
| | |
The Old Westbury Fixed Income Fund (the “Fund”) returned (-1.2%) for the fiscal year ended October 31, 2021. In comparison, the return of the ICE Bank of America Merrill Lynch U.S. Corporate & Government 1-10 Year AAA-A U.S. Corporate & Government Index (the “Index”) was (-1.1%).
The Fund’s 2021 fiscal year began with a cautious tone. Economic data showed that the initial stages of the economic recovery were stronger than expected, however, the outlook for continued progress remained uncertain. COVID-case counts were spiking, resulting in new activity restrictions in Europe and concerns that there could be new lockdowns in the U.S. as well. Congress was negotiating another fiscal stimulus package, but its outcome was still unknown. On the positive side, news that an effective COVID vaccine would soon be available provided hope that the impact of the virus could be contained. As the first few months of the fiscal year progressed, caution turned to optimism. A new round of fiscal stimulus was delivered in December with expectations for more stimulus to follow, COVID cases began to decline, and an aggressive vaccine rollout was implemented. At the same time, the Federal Reserve continued its massive bond-buying program and remained committed to it zero interest rate policy. By the end of the first calendar quarter of 2021, the market had recalibrated growth and inflation expectations higher for the year. However, it soon became clear that, although the recovery continued to progress, significant challenges remained. Over the last few months of the fiscal year, the global economy experienced wide-spread shortages of goods and supply-chain bottlenecks, while workers exhibited a reluctance to fully engage in the labor market. The combination has resulted in decades-high inflation levels and concern that inflation could become entrenched at a higher-than-expected level. As the fiscal year closed, the Federal Reserve had just indicated that it would soon begin tapering its bond-buying program, and market participants began to price in future rate hikes.
During the Fund’s fiscal year, Treasury yields of maturities beyond one year increased across curve, most significantly for intermediate maturities where the impact of potential future rate hikes is felt most acutely. Longer-term rates fluctuated throughout the year in response to changes in market expectations for growth and inflation, rising during the first quarter on higher growth expectations, drifting lower during the summer with the increase in COVID cases and rising again towards the end of the year as inflation concerns took hold. Investment-grade corporate bonds outperformed Treasury securities during the fiscal year as spreads tightened. Most of the spread tightening occurred during the first half of the year.
The Fund maintained a slightly higher-than-benchmark duration (price sensitivity to interest rate moves) throughout the fiscal year. The Adviser’s expectations were that economy would continue to recover but more slowly than the market-expected pace and that inflation would return to levels in-line with those experienced pre-COVID, allowing the Federal Reserve to maintain an accommodative monetary policy throughout the year. This positioning detracted from performance, particularly during the first half of the fiscal year, as rates rose and the yield curve steepened in response to a more optimistic outlook. A portion of this underperformance was retraced during the second half of the year when the curve flattened with the weaker growth outlook. The Fund also maintained an overweight position in investment-grade bonds, including an out-of-benchmark allocation to BBB-rated corporate bonds. A stable rate environment in an improving economy is supportive of credit fundamentals and the Fund benefited from both the spread-tightening earlier in the year and the overall higher yield provided by corporate bonds. The overweight position contributed to the Fund’s overall performance during the fiscal year.
The Adviser’s current strategy is to maintain the Fund duration slightly higher than the benchmark with an overweight position in credit-related assets, including investment-grade corporate bonds, high-quality asset-backed securities (ABS), collateralized loan obligations (CLOs) and taxable-municipal bonds. A small exposure will be maintained in U.S. Treasury Inflation-Protected Securities (TIPS), which helps protect against a possible increase in inflation. At fiscal year-end, credit represented approximately 43% of market value of the Fund, of which ABS and CLOs account for 6.5%.
| Old Westbury Funds, Inc. | |
| Fixed Income Fund | |
| Investment Adviser’s Report (Unaudited) - (Continued) | |
| | |
PORTFOLIO DIVERSIFICATION BY SECTOR
| Sector: | | Percentage
of Net Assets |
| Asset-Backed Securities | | | 6.5 | % |
| Corporate Bonds | | | 35.4 | |
| Municipal Bonds | | | 0.7 | |
| Non-Agency Mortgage-Backed Securities | | | 0.1 | |
| U.S. Government Agencies and Securities | | | 55.8 | |
| Other* | | | 1.5 | |
| | | | 100.0 | % |
| * | Includes cash and equivalents, investment company, pending trades and Fund share transactions, interest and dividends receivable, prepaids and accrued expenses payable. |
| Old Westbury Funds, Inc. | |
| Fixed Income Fund | |
| Investment Adviser’s Report (Unaudited) - (Continued) | |
| | |

Average Annual Total Returns
For the Year Ended October 31, 2021 | | | |
| Fixed Income Fund | | | | |
| One Year | | | -1.23 | % |
| Five Year | | | 2.10 | % |
| Ten Year | | | 1.76 | % |
| | | | | |
| ICE Bank of America 1-10 Year AAA-A U.S. Corporate & Government Index | | | | |
| One Year | | | -1.13 | % |
| Five Year | | | 2.27 | % |
| Ten Year | | | 2.16 | % |
The performance data quoted represents past performance. Past performance does not guarantee future results and does not reflect the deduction of taxes that a shareholder may pay on Fund distributions or the redemption of Fund shares. Fund performance reflects fee waivers and/or expense reimbursements and reinvestments of distributions, if any. Without waivers/reimbursements, performance would have been lower. The investment return and principal value of an investment will fluctuate. Consequently, an investor’s shares, when redeemed, may be worth more or less than their original cost. Current performance may be lower or higher than the performance data quoted. To obtain performance information current to the most recent month end, please call 1-800-607-2200.
The Adviser has contractually committed through October 31, 2024, to waive its advisory fees to the extent necessary to maintain the net operating expense ratio of the Fund, excluding Fund transaction costs, investment interest expense, dividend expenses associated with securities sold short and acquired fund fees and expenses (if any) at 0.57%. The expense ratio, prior to fee waivers and including acquired fund fees (if any), is stated in the prospectus dated March 1, 2021 as 0.68%. Additional information pertaining to the Fund’s expense ratio for the year ended October 31, 2021 can be found in the Financial Highlights.
The chart shown above illustrates the total value of a $10,000 investment for 10 years, with distributions reinvested. The ICE Bank of America 1-10 Year AAA-A U.S. Corporate & Government Index also includes the reinvestment of distributions but does not include fees, expenses and income taxes associated with an investment in the Fund. The ICE Bank of America 1-10 Year AAA-A U.S. Corporate & Government Index is unmanaged. Investments cannot be made directly in an index.
The Fund is subject to risks such as credit, prepayment and interest rate risk associated with the underlying bond holdings in the Fund. The value of the Fund can decline as interest rates rise and an investor can lose principal.
| Old Westbury Funds, Inc. |
| Municipal Bond Fund |
| Investment Adviser’s Report (Unaudited) |
| |
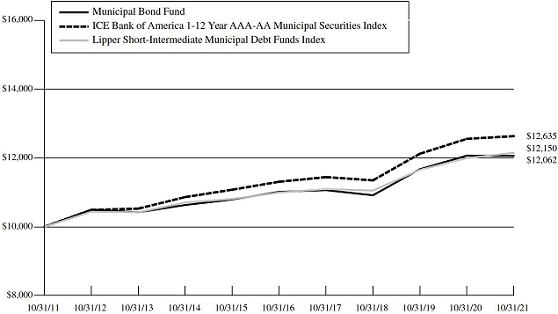
The return of the Old Westbury Municipal Bond Fund (the “Fund”) for the fiscal year ended October 31, 2021, was (-0.05%). In comparison, the return of the primary benchmark, the ICE Bank of America Merrill Lynch 1-12 Year AAA-AA Municipal Securities Index (the “Index”), was 0.63%.
Fiscal 2021 proved to be a financial market rollercoaster much akin to that experienced in 2020, though notably with very different catalysts. As the fiscal year commenced, the economy had just experienced sequential GDP declines of (-5.1%) and (-31.2%) in the first and second quarters, and rebounded with a solid +33.8% pace in the third quarter of 2020. The ensuing three figures would average a respectable +5.8% before slowing to +2.1% in the third quarter of 2021, a notably faster aggregate pace than the average +2.6% quarterly pace experienced since the early 1990s. Arguably, much of this growth was driven by the unprecedented amount of fiscal support released by the Federal Government to help bolster the economy, totaling roughly $870 billion and spread over three distinct packages (the CARES Act totaling $292 billion, the Consolidated Appropriations Act totaling $164 billion, and finally the American Rescue Plan totaling $411 billion). Concurrent to this catalyst for consumer spending, the global economy encountered a supply headwind; with factories shuttered around the world, production was very quickly overwhelmed by demand, a formidable imbalance exacerbated by the six day blockage of the Suez Canal when the Ever Given ran aground.
Given the magnitude of the supply/demand imbalance in the economy, investors found themselves faced with a concern not encountered in decades; inflation. As the calendar year commenced, inflationary fears became a focal point for investors and fluctuated between hyperinflation, stagflation, and all scenarios in-between. The economic data reinforced these fears to a certain extent; Core PCE, the Federal Reserve’s (the “Fed”) preferred inflation measure, rose from the long run average of 1.9% to 2.7%/6.1%/4.5% in the first/second/third quarters of 2021, respectively. Adding further fuel to the fire, the Fed announced its Flexible Average Inflation Targeting (FAIT) framework during the third quarter of the year, and speculation about changes to the composition of the Fed began to mount (specifically, rumors that President Biden would replace Chair Powell with a more dovish option). As if that wasn’t enough, two Federal Reserve members resigned in September amid scrutiny of their trading activity, the Fed formally announced that it will begin the tapering of purchases in November ($10 billion of Treasuries and $5 billion of mortgages per month beginning in December), and investor concern shifted towards the timing and pace of potential rate hikes.
Fixed income markets responded to these developments as one would expect; rates backed up across the board, with the 10-year U.S. Treasury rising from roughly 85 bps to 155 bps and the ten year muni rising from 92 bps to 120 bps. The more muted response in municipals was driven by the low-supply/high-demand imbalance that the asset class has enjoyed since the passage of the tax cut package several years ago. Notably, demand for municipals (as measured by investor inflows) came in at the second fastest pace in the past 15 years, with year-to-date inflows of roughly $81 billion second only to the calendar year 2019 inflow of $92 billion. The lower-beta response of municipals drove valuations to the rich side of neutral, though notably those valuations are well off the extremes exhibited in late 2019/early 2020, and liquidity remained robust throughout most of the year. Primary market subscriptions remained elevated throughout the year, particularly for lower-rated credits, and dealers observed a wide breadth of buying interest from both retail and institutional investors. Notably, municipal credit generally improved to very robust levels, a recovery driven by the influx of Federal stimulus as well as a recovery in tax collections that proved to be much more rapid than anticipated.
Over the course of the year, the Fund was positioned with a long-duration posture relative to the benchmark given the solid technical and fundamental backdrop for municipals via a curve flattener posture. This ultimately proved to be disadvantageous, however, as the market took on a very inflationary/reflationary bias and rates backed up, particularly in the months of February and September. The most significant performance detractor was the portfolio’s duration, a relative long driven by an overweight posture in longer dated maturities. Notably, longer dated maturities beyond seven years impacted the Fund most acutely given higher interest rate sensitivity and tighter valuations. Helping to offset this negative effect, the Fund captured positive roll-down effect (positive across the maturity spectrum given the steepness of the municipal curve) and credit allocation remained strong. In particular, the credit barbell (overweight AAA and A, financed by an underweight in AA) performed particularly well; the AAA market beta helped to buffer some of the market volatility, and single A positions outperformed given a continued reach for yield in the muni market.
| Old Westbury Funds, Inc. |
| Municipal Bond Fund |
| Investment Adviser’s Report (Unaudited) - (Continued) |
| |
PORTFOLIO DIVERSIFICATION BY STATE
| State: | | Percentage
of Net Assets |
| Alabama | | | 0.7 | % |
| Arizona | | | 1.0 | |
| Arkansas | | | 0.2 | |
| California | | | 5.7 | |
| Colorado | | | 1.3 | |
| Connecticut | | | 2.9 | |
| Delaware | | | 2.1 | |
| District of Columbia | | | 1.6 | |
| Florida | | | 1.8 | |
| Georgia | | | 4.2 | |
| Hawaii | | | 4.1 | |
| Idaho | | | 0.1 | |
| Illinois | | | 0.2 | |
| Indiana | | | 0.3 | |
| Iowa | | | 0.9 | |
| Kansas | | | 0.0 | * |
| Maine | | | 0.2 | |
| Maryland | | | 4.0 | |
| Massachusetts | | | 3.4 | |
| Michigan | | | 0.2 | |
| Minnesota | | | 1.5 | |
| Mississippi | | | 0.3 | |
| Missouri | | | 0.0 | * |
| Montana | | | 0.0 | * |
| New Hampshire | | | 0.2 | |
| New Jersey | | | 3.9 | |
| New Mexico | | | 0.0 | * |
| New York | | | 14.0 | |
| North Carolina | | | 2.2 | |
| Ohio | | | 3.4 | |
| Oklahoma | | | 0.7 | |
| Oregon | | | 0.8 | |
| Pennsylvania | | | 2.4 | |
| Rhode Island | | | 0.3 | |
| South Carolina | | | 0.6 | |
| South Dakota | | | 0.5 | |
| Tennessee | | | 0.9 | |
| Texas | | | 12.2 | |
| Utah | | | 0.9 | |
| Virginia | | | 3.6 | |
| Washington | | | 5.9 | |
| West Virginia | | | 0.0 | * |
| Wisconsin | | | 1.1 | |
| Other** | | | 9.7 | |
| | | | 100.0 | % |
| * | Represents less than 0.01% of net assets. |
| ** | Includes cash and equivalents, Corporate Bonds, U.S. Government Securities, investment company, pending trades and Fund share transactions, interest and dividends receivable, prepaids and accrued expenses payable. |
| Old Westbury Funds, Inc. |
| Municipal Bond Fund |
| Investment Adviser’s Report (Unaudited) - (Continued) |
| |
Average Annual Total Returns
For the Year Ended October 31, 2021
| Municipal Bond Fund | | | |
| One Year | | | -0.05 | % |
| Five Year | | | 1.83 | % |
| Ten Year | | | 1.89 | % |
| | | | | |
| ICE Bank of America 1-12 Year AAA-AA Municipal Securities Index | | | | |
| One Year | | | 0.63 | % |
| Five Year | | | 2.24 | % |
| Ten Year | | | 2.37 | % |
| | | | | |
| Lipper Short-Intermediate Municipal Debt Funds Index | | | | |
| One Year | | | 1.27 | % |
| Five Year | | | 2.02 | % |
| Ten Year | | | 1.97 | % |
The performance data quoted represents past performance. Past performance does not guarantee future results and does not reflect the deduction of taxes that a shareholder may pay on Fund distributions or the redemption of Fund shares. Fund performance reflects fee waivers and/or expense reimbursements and reinvestments of distributions, if any. Without waivers/reimbursements, performance would have been lower. The investment return and principal value of an investment will fluctuate. Consequently, an investor’s shares, when redeemed, may be worth more or less than their original cost. Current performance may be lower or higher than the performance data quoted. To obtain performance information current to the most recent month end, please call 1-800-607-2200.
The Adviser has contractually committed through October 31, 2024, to waive its advisory fees to the extent necessary to maintain the net operating expense ratio of the Fund, excluding Fund transaction costs, investment interest expense, dividend expenses associated with securities sold short and acquired fund fees and expenses (if any) at 0.57%. The expense ratio, prior to fee waivers and including acquired fund fees (if any), is stated in the prospectus dated March 1, 2021 as 0.65%. Additional information pertaining to the Fund’s expense ratio for the year ended October 31, 2021 can be found in the Financial Highlights.
The chart shown above illustrates the total value of a $10,000 investment for 10 years, with distributions reinvested. The ICE Bank of America 1-12 Year AAA-AA Municipal Securities Index and the Lipper Short-Intermediate Municipal Debt Funds Index also include the reinvestment of distributions but do not include fees, expenses and income taxes associated with an investment in the Fund. The ICE Bank
| Old Westbury Funds, Inc. |
| Municipal Bond Fund |
| Investment Adviser’s Report (Unaudited) - (Continued) |
| |
of America 1-12 Year AAA-AA Municipal Securities Index and the Lipper Short-Intermediate Municipal Debt Funds Index are unmanaged. Investments cannot be made directly in an index.
Municipal securities held by the Fund may be adversely affected by local political and economic factors. Income from the Fund may be subject to federal alternative minimum tax, state and local taxes.
| Old Westbury Funds, Inc. |
| California Municipal Bond Fund |
| Investment Adviser’s Report (Unaudited) |
| |
The return of the Old Westbury California Municipal Bond Fund (the “Fund”) was (-0.05%) for the fiscal year ended Octover 31, 2021. In comparison, the return of the Fund’s benchmark, the ICE Bank of America Merrill Lynch 3-7 Year AAA-AA Municipal Securities Index (the “Index”), was 0.33%.
Fiscal 2021 proved to be a financial market rollercoaster much akin to that experienced in 2020, though notably with very different catalysts. As the fiscal year commenced, the economy had just experienced sequential GDP declines of (-5.1%) and (-31.2%) in the first and second quarters, and rebounded with a solid +33.8%. The ensuing three paces would average a respectable +5.8% before slowing to +2.1% in the third quarter of 2021, a notably faster aggregate pace than the average +2.6% quarterly pace experienced since the early 1990s. Arguably, much of this growth was driven by the unprecedented amount of fiscal support released by the Federal Government to help bolster the economy, totaling roughly $870 billion and spread over three distinct packages (the CARES Act totaling $292 billion, the Consolidated Appropriations Act totaling $164 billion, and finally the American Rescue Plan totaling $411 billion). Concurrent to this catalyst for consumer spending, the global economy encountered a supply headwind; with factories shuttered around the world, production was very quickly overwhelmed by demand, a formidable imbalance exacerbated by the six day blockage of the Suez Canal when the Ever Given ran aground.
Given the magnitude of the supply/demand imbalance in the economy, investors found themselves faced with a concern not encountered in decades; inflation. As the calendar year commenced, inflationary fears became a focal point for investors and fluctuated between hyperinflation, stagflation, and all scenarios in-between. The economic data reinforced these fears to a certain extent; Core PCE, the Federal Reserve’s preferred inflation measure, rose from the long run average of 1.9% to 2.7%/6.1%/4.5% in the first/second/third quarters of 2021, respectively. Adding further fuel to the fire, the Fed announced its Flexible Average Inflation Targeting (FAIT) framework during the third quarter of the year, and speculation about changes to the composition of the Fed began to mount (specifically, rumors that President Biden would replace Chair Powell with a more dovish option). As if that wasn’t enough, two Federal Reserve members resigned in September amid scrutiny of their trading activity, the Fed formally announced that it will begin the tapering of purchases in November ($10 billion of Treasuries and $5 billion of mortgages per month beginning in December), and investor concern shifted towards the timing and pace of potential rate hikes.
Fixed income markets responded to these developments as one would expect; rates backed up across the board, with the 10-year U.S. Treasury rising from roughly 85 bps to 155 bps and the ten year muni rising from 92 bps to 120 bps. The more muted response in municipals was driven by the low-supply/high-demand imbalance that the asset class has enjoyed since the passage of the tax cut package several years ago. Notably, demand for municipals (as measured by investor inflows) came in at the second fastest pace in the past 15 years, with year-to-date inflows of roughly $81 billion second only to the calendar year 2019 inflow of $92 billion. The lower-beta response of municipals drove valuations to the rich side of neutral, though notably those valuations are well off the extremes exhibited in late 2019/early 2020, and liquidity remained robust throughout most of the year. Primary market subscriptions remained elevated throughout the year, particularly for lower-rated credits, and dealers observed a wide breadth of buying interest from both retail and institutional investors. Notably, municipal credit generally improved to very robust levels, a recovery driven by the influx of Federal stimulus as well as a recovery in tax collections that proved to be much more rapid than anticipated.
Over the course of the year, the Fund was positioned with a long-duration posture relative to the benchmark given the solid technical and fundamental backdrop for municipals via a curve flattener posture. This ultimately proved to be disadvantageous, however, as the market took on a very inflationary/reflationary bias and rates backed up, particularly in the months of February and September. The most significant performance detractor was the portfolio’s duration, a relative long driven by an overweight posture in longer dated maturities. Notably, longer dated maturities beyond seven years impacted the Fund most acutely given higher interest rate sensitivity and tighter valuations. Helping to offset this negative effect, the Fund captured positive roll-down effect (positive across the maturity spectrum given the steepness of the municipal curve) and credit allocation remained strong. In particular, AA-rated California credits performed relatively well as the possibility of higher taxes catalyzed investor demand, though notably California municipals slightly underperformed the broader universe given particularly tight valuations.
| Old Westbury Funds, Inc. |
| California Municipal Bond Fund |
| Investment Adviser’s Report (Unaudited) - (Continued) |
| |
PORTFOLIO DIVERSIFICATION BY STATE
| State: | | Percentage
of Net Assets |
| California | | | 93.4 | % |
| Other* | | | 6.6 | |
| | | | 100.0 | % |
| * | Includes cash and equivalents, Corporate Bonds, investment company, pending trades and Fund share transactions, interest and dividends receivable, prepaids and accrued expenses payable. |
| Old Westbury Funds, Inc. |
| California Municipal Bond Fund |
| Investment Adviser’s Report (Unaudited) - (Continued) |
| |

Average Annual Total Returns
For the Period Ended October 31, 2021
| California Municipal Bond Fund | | | |
| One Year | | | -0.05 | % |
| Since Inception date of December 4, 2018 | | | 2.74 | % |
| | | | | |
| ICE Bank of America 3-7 Year AAA-AA Municipal Securities Index | | | | |
| One Year | | | 0.33 | % |
| Since Inception date of December 4, 2018 | | | 3.31 | % |
The performance data quoted represents past performance. Past performance does not guarantee future results and does not reflect the deduction of taxes that a shareholder may pay on Fund distributions or the redemption of Fund shares. Fund performance reflects fee waivers and/or expense reimbursements and reinvestments of distributions, if any. Without waivers/reimbursements, performance would have been lower. The investment return and principal value of an investment will fluctuate. Consequently, an investor’s shares, when redeemed, may be worth more or less than their original cost. Current performance may be lower or higher than the performance data quoted. To obtain performance information current to the most recent month end, please call 1-800-607-2200.
The Adviser has contractually committed through October 31, 2024, to waive its advisory fees to the extent necessary to maintain the net operating expense ratio of the Fund, excluding Fund transaction costs, investment interest expense, dividend expenses associated with securities sold short and acquired fund fees and expenses (if any) at 0.57%. The expense ratio, prior to fee waivers and including acquired fund fees (if any), is stated in the prospectus dated March 1, 2021 as 0.77%. Additional information pertaining to the Fund’s expense ratio for the year ended October 31, 2021 can be found in the Financial Highlights.
The chart shown above illustrates the total value of a $10,000 investment for 2 Years and 11 Months, with distributions reinvested. The ICE Bank of America 3-7 Year AAA-AA Municipal Securities Index also includes the reinvestment of distributions but does not include fees, expenses and income taxes associated with an investment in the Fund. The ICE Bank of America 3-7 Year AAA-AA Municipal Securities Index is unmanaged. Investments cannot be made directly in an index.
Municipal securities held by the Fund may be adversely affected by local political and economic factors. Income from the Fund may be subject to federal alternative minimum tax, state and local taxes. The Fund is non-diversified, meaning it may focus its assets in a smaller number of issuers and may be subject to more risk than a more diversified fund.
| Old Westbury Funds, Inc. |
| New York Municipal Bond Fund |
| Investment Adviser’s Report (Unaudited) |
| |
The return of the Old Westbury New York Municipal Bond Fund (the “Fund”) was 0.55% for the fiscal year ended October 31, 2021. In comparison, the return of the Fund’s benchmark, the ICE Bank of America Merrill Lynch 3-7 Year AAA-AA Municipal Securities Index (the “Index”), was 0.33%.
Fiscal 2021 proved to be a financial market rollercoaster much akin to that experienced in 2020, though notably with very different catalysts. As the fiscal year commenced, the economy had just experienced sequential GDP declines of (-5.1%) and (-31.2%) in the first and second quarters, and rebounded with a solid +33.8%. The following three paces would average a respectable +5.8% before slowing to +2.1% in the third quarter of 2021, a notably faster aggregate pace than the average +2.6% quarterly pace experienced since the early 1990s. Argu-ably, much of this growth was driven by the unprecedented amount of fiscal support released by the Federal Government to help bolster the economy, totaling roughly $870 billion and spread over three distinct packages (the CARES Act totaling $292 billion, the Consolidated Appropriations Act totaling $164 billion, and finally the American Rescue Plan totaling $411 billion). Concurrent to this catalyst for consumer spending, the global economy encountered a supply headwind; with factories shuttered around the world, production was very quickly overwhelmed by demand, a formidable imbalance exacerbated by the six day blockage of the Suez Canal when the Ever Given ran aground.
Given the magnitude of the supply/demand imbalance in the economy, investors found themselves faced with a concern not encountered in decades; inflation. As the calendar year commenced, inflationary fears became a focal point for investors and fluctuated between hyperinflation, stagflation, and all scenarios in-between. The economic data reinforced these fears to a certain extent; Core PCE, the Federal Reserve’s preferred inflation measure, rose from the long run average of 1.9% to 2.7%/6.1%/4.5% in the first/second/third quarters of 2021, respectively. Adding further fuel to the fire, the Fed announced its Flexible Average Inflation Targeting (FAIT) framework during the third quarter of the year, and speculation about changes to the composition of the Fed began to mount (specifically, rumors that President Biden would replace Chair Powell with a more dovish option). As if that wasn’t enough, two Federal Reserve members resigned in September amid scrutiny of their trading activity, the Fed formally announced that it will begin the tapering of purchases in November ($10 billion of Treasuries and $5 billion of mortgages per month beginning in December), and investor concern shifted towards the timing and pace of potential rate hikes.
Fixed income markets responded to these developments as one would expect; rates backed up across the board, with the 10-year U.S. Treasury rising from roughly 85 bps to 155 bps and the ten year muni rising from 92 bps to 120 bps. The more muted response in municipals was driven by the low-supply/high-demand imbalance that the asset class has enjoyed since the passage of the tax cut package several years ago. Notably, demand for municipals (as measured by investor inflows) came in at the second fastest pace in the past 15 years, with year-to-date inflows of roughly $81 billion second only to the calendar year 2019 inflow of $92 billion. The lower-beta response of municipals drove valuations to the rich side of neutral, though notably those valuations are well off the extremes exhibited in late 2019/early 2020, and liquidity remained robust throughout most of the year. Primary market subscriptions remained elevated throughout the year, particularly for lower-rated credits, and dealers observed a wide breadth of buying interest from both retail and institutional investors. Notably, municipal credit generally improved to very robust levels, a recovery driven by the influx of Federal stimulus as well as a recovery in tax collections that proved to be much more rapid than anticipated.
Over the course of the year, the Fund was positioned with a long-duration posture relative to the benchmark given the solid technical and fundamental backdrop for municipals via a curve flattener posture. This ultimately proved to be disadvantageous, however, as the market took on a very inflationary/reflationary bias and rates backed up, particularly in the months of February and September. Credit positioning helped to offset this given strong relative performance from lower rated credits in revenue sectors, as was roll-down effect given overweight positioning in the belly of the curve.
| Old Westbury Funds, Inc. |
| New York Municipal Bond Fund |
| Investment Adviser’s Report (Unaudited) - (Continued) |
| |
PORTFOLIO DIVERSIFICATION BY STATE
| State: | | Percentage
of Net Assets |
| New York | | | 92.1 | % |
| Other* | | | 7.9 | |
| | | | 100.0 | % |
| * | Includes cash and equivalents, Corporate Bonds, investment company, pending trades and Fund share transactions, interest and dividends receivable, prepaids and accrued expenses payable. |
| Old Westbury Funds, Inc. |
| New York Municipal Bond Fund |
| Investment Adviser’s Report (Unaudited) - (Continued) |
| |

Average Annual Total Returns
For the Period Ended October 31, 2021
| New York Municipal Bond Fund | | | | |
| One Year | | | 0.55 | % |
| Since Inception date of December 4, 2018 | | | 2.94 | % |
| | | | | |
| ICE Bank of America 3-7 Year AAA-AA Municipal Securities Index | | | | |
| One Year | | | 0.33 | % |
| Since Inception date of December 4, 2018 | | | 3.31 | % |
The performance data quoted represents past performance. Past performance does not guarantee future results and does not reflect the deduction of taxes that a shareholder may pay on Fund distributions or the redemption of Fund shares. Fund performance reflects fee waivers and/or expense reimbursements and reinvestments of distributions, if any. Without waivers/reimbursements, performance would have been lower. The investment return and principal value of an investment will fluctuate. Consequently, an investor’s shares, when redeemed, may be worth more or less than their original cost. Current performance may be lower or higher than the performance data quoted. To obtain performance information current to the most recent month end, please call 1-800-607-2200.
The Adviser has contractually committed through October 31, 2024, to waive its advisory fees to the extent necessary to maintain the net operating expense ratio of the Fund, excluding Fund transaction costs, investment interest expense, dividend expenses associated with securities sold short and acquired fund fees and expenses (if any) at 0.57%. The expense ratio, prior to fee waivers and including acquired fund fees (if any), is stated in the prospectus dated March 1, 2021 as 0.76%. Additional information pertaining to the Fund’s expense ratio for the year ended October 31, 2021 can be found in the Financial Highlights.
The chart shown above illustrates the total value of a $10,000 investment for 2 Years and 11 Months, with distributions reinvested. The ICE Bank of America 3-7 Year AAA-AA Municipal Securities Index also includes the reinvestment of distributions but does not include fees, expenses and income taxes associated with an investment in the Fund. The ICE Bank of America 3-7 Year AAA-AA Municipal Securities Index is unmanaged. Investments cannot be made directly in an index.
Municipal securities held by the Fund may be adversely affected by local political and economic factors. Income from the Fund may be subject to federal alternative minimum tax, state and local taxes The Fund is non-diversified, meaning it may focus its assets in a smaller number of issuers and may be subject to more risk than a more diversified fund.
| Old Westbury Funds, Inc. |
| Disclosure of Fund Expenses (Unaudited) |
| | For the Period Ended October 31, 2021 |
| | |
As a shareholder of Old Westbury Funds, Inc., you incur ongoing costs, including management fees and other Fund expenses. This example is intended to help you understand your ongoing costs (in dollars) of investing in the Funds and to compare these costs with the ongoing costs of investing in other mutual funds.
The example is based on an investment of $1,000 invested at the beginning of the period and held for the entire period from May 1, 2021 through October 31, 2021.
Actual Expenses
The table below provides information about actual account values and actual expenses. You may use the information below, together with the amount you invested, to estimate the expenses that you paid over the period. Simply divide your account value by $1,000 (for example, an $8,600 account value divided by $1,000 = 8.6), then multiply the result by the number in the table under the heading entitled “Actual Expenses Paid During Period” to estimate the expenses you paid on your account during this period.
| | | Actual
Beginning
Account Value
05/01/2021 | | Actual
Ending
Account Value
10/31/2021 | | Actual
Expenses Paid
During Period*
05/01/2021
- 10/31/2021 | | Actual
Expense Ratio
During Period**
05/01/2021
- 10/31/2021 |
| All Cap Core Fund | | $ | 1,000.00 | | | $ | 1,118.69 | | | $ | 5.07 | | | | 0.95 | % |
| Small & Mid Cap Strategies Fund | | | 1,000.00 | | | | 1,008.69 | | | | 5.57 | | | | 1.10 | % |
| Large Cap Strategies Fund | | | 1,000.00 | | | | 1,086.24 | | | | 5.73 | | | | 1.09 | % |
| Credit Income Fund | | | 1,000.00 | | | | 1,036.90 | | | | 4.36 | | | | 0.85 | % |
| Fixed Income Fund | | | 1,000.00 | | | | 998.48 | | | | 2.87 | | | | 0.57 | % |
| Municipal Bond Fund | | | 1,000.00 | | | | 994.74 | | | | 2.87 | | | | 0.57 | % |
| California Municipal Bond Fund | | | 1,000.00 | | | | 995.35 | | | | 2.87 | | | | 0.57 | % |
| New York Municipal Bond Fund | | | 1,000.00 | | | | 996.46 | | | | 2.87 | | | | 0.57 | % |
| * | Expenses are equal to the average account value times each Fund’s annualized expense ratio multiplied by 184/365 to reflect the one-half year period. |
| ** | Expense ratios are annualized and reflect existing expense waivers/reimbursements. |
| Old Westbury Funds, Inc. |
| Disclosure of Fund Expenses (Unaudited) - (Continued) |
| | For the Period Ended October 31, 2021 |
| | |
Hypothetical Example for Comparison Purposes
The table below provides information about hypothetical account values and hypothetical expenses based on each Fund’s actual expense ratio and an assumed rate of return of 5% per year before expenses, which is not the Fund’s actual return. The hypothetical account values and expenses may not be used to estimate the actual ending account balance or expenses you paid for the period. You may use this information to compare this 5% hypothetical example with the 5% hypothetical examples that appear in the shareholder reports of other funds.
| | | Hypothetical
Beginning
Account Value
05/01/2021 | | Hypothetical
Ending
Account Value
10/31/2021 | | Hypothetical
Expenses Paid
During Period*
05/01/2021
- 10/31/2021 | | Hypothetical
Expense Ratio
During Period**
05/01/2021
- 10/31/2021 |
| All Cap Core Fund | | $ | 1,000.00 | | | $ | 1,020.42 | | | $ | 4.84 | | | | 0.95 | % |
| Small & Mid Cap Strategies Fund | | | 1,000.00 | | | | 1,019.66 | | | | 5.60 | | | | 1.10 | % |
| Large Cap Strategies Fund | | | 1,000.00 | | | | 1,019.71 | | | | 5.55 | | | | 1.09 | % |
| Credit Income Fund | | | 1,000.00 | | | | 1,020.92 | | | | 4.33 | | | | 0.85 | % |
| Fixed Income Fund | | | 1,000.00 | | | | 1,022.33 | | | | 2.91 | | | | 0.57 | % |
| Municipal Bond Fund | | | 1,000.00 | | | | 1,022.33 | | | | 2.91 | | | | 0.57 | % |
| California Municipal Bond Fund | | | 1,000.00 | | | | 1,022.33 | | | | 2.91 | | | | 0.57 | % |
| New York Municipal Bond Fund | | | 1,000.00 | | | | 1,022.33 | | | | 2.91 | | | | 0.57 | % |
| * | Expenses are equal to the average account value times each Fund’s annualized expense ratio multiplied by 184/365 to reflect the one-half year period. |
| ** | Expense ratios are annualized and reflect existing expense waivers/reimbursements. |
Please note that the expenses shown in the tables are meant to highlight your ongoing costs only and do not reflect any transactional costs, such as sales charges (loads), redemption fees, or exchange fees. Therefore, these tables are useful in comparing ongoing costs only, and will not help you determine the relative total costs of owning different funds. In addition, if these transactional costs were included, your costs would have been higher.
| Old Westbury Funds, Inc. | |
| All Cap Core Fund | |
| Portfolio of Investments | October 31, 2021 |
| Shares | | | | | Value | |
| COMMON STOCKS — 97.3% | | | | |
| Banks — 5.0% | | | | |
| | 1,934,093 | | | Bank of America Corp. | | $ | 92,410,963 | |
| | 560,551 | | | Citigroup, Inc. | | | 38,767,707 | |
| | 314,112 | | | JPMorgan Chase & Co. | | | 53,364,488 | |
| | | | | | | | 184,543,158 | |
| Communication Services — 11.2% | | | | |
| | 62,679 | | | Alphabet, Inc. - Class C(a) | | | 185,868,933 | |
| | 80,727 | | | Charter Communications, Inc. - Class A(a) | | | 54,481,845 | |
| | 190,160 | | | Match Group, Inc.(a) | | | 28,672,325 | |
| | 336,472 | | | Meta Platforms, Inc. - Class A(a) | | | 108,872,245 | |
| | 92,752 | | | Sea Ltd. - ADR(a) | | | 31,866,805 | |
| | | | | | | | 409,762,153 | |
| Consumer Discretionary — 14.1% | | | | |
| | 128,889 | | | Advance Auto Parts, Inc. | | | 29,067,047 | |
| | 34,783 | | | Amazon.com, Inc.(a) | | | 117,303,233 | |
| | 248,209 | | | Aptiv Plc(a) | | | 42,912,854 | |
| | 68,790 | | | Burlington Stores, Inc.(a) | | | 19,005,989 | |
| | 685,518 | | | Dollarama, Inc. | | | 30,985,679 | |
| | 34,561 | | | Domino’s Pizza, Inc. | | | 16,899,292 | |
| | 71,660 | | | Expedia Group, Inc.(a) | | | 11,781,621 | |
| | 328,966 | | | Hilton Worldwide Holdings, Inc.(a) | | | 47,354,656 | |
| | 64,755 | | | Home Depot, Inc. (The) | | | 24,072,024 | |
| | 58,724 | | | LVMH Moet Hennessy Louis Vuitton SE | | | 45,971,684 | |
| | 464,469 | | | NIKE, Inc. - Class B | | | 77,701,019 | |
| | 317,168 | | | Ross Stores, Inc. | | | 35,903,418 | |
| | 203,518 | | | Wyndham Hotels & Resorts, Inc. | | | 17,191,165 | |
| | | | | | | | 516,149,681 | |
| Consumer Staples — 2.3% | | | | |
| | 339,180 | | | PepsiCo, Inc. | | | 54,811,488 | |
| | 865,318 | | | US Foods Holding Corp.(a) | | | 30,000,575 | |
| | | | | | | | 84,812,063 | |
| Diversified Financials — 7.2% | | | | |
| | 701,085 | | | Blackstone, Inc. | | | 97,044,186 | |
| | 799,875 | | | Charles Schwab Corp. (The) | | | 65,613,746 | |
| | 58,194 | | | MSCI, Inc. | | | 38,692,027 | |
| | 136,479 | | | Nasdaq, Inc. | | | 28,642,848 | |
| | 66,979 | | | S&P Global, Inc. | | | 31,758,762 | |
| | | | | | | | 261,751,569 | |
| Energy — 2.2% | | | | |
| | 738,768 | | | ConocoPhillips | | | 55,030,829 | |
| | 130,193 | | | Pioneer Natural Resources Co. | | | 24,343,487 | |
| | | | | | | | 79,374,316 | |
| Health Care — 12.8% | | | | |
| | 225,317 | | | Catalent, Inc.(a) | | | 31,062,202 | |
| | 74,272 | | | Cooper Cos, Inc. (The) | | | 30,965,482 | |
| | 190,353 | | | Danaher Corp. | | | 59,346,355 | |
| | 337,825 | | | IQVIA Holdings, Inc.(a) | | | 88,314,212 | |
| Shares | | | | | Value | |
| Health Care (continued) | | | | |
| | 59,336 | | | Laboratory Corp. of America Holdings(a) | | $ | 17,030,619 | |
| | 114,948 | | | STERIS Plc | | | 26,867,946 | |
| | 60,312 | | | Teleflex, Inc. | | | 21,527,765 | |
| | 97,204 | | | Thermo Fisher Scientific, Inc. | | | 61,536,936 | |
| | 157,830 | | | UnitedHealth Group, Inc. | | | 72,675,980 | |
| | 262,472 | | | Zoetis, Inc. | | | 56,746,446 | |
| | | | | | | | 466,073,943 | |
| Industrials — 10.2% | | | | |
| | 215,709 | | | A.O. Smith Corp. | | | 15,761,857 | |
| | 91,320 | | | Carlisle Cos, Inc. | | | 20,357,055 | |
| | 83,360 | | | Cintas Corp. | | | 36,103,216 | |
| | 139,042 | | | Dover Corp. | | | 23,509,221 | |
| | 317,066 | | | Eaton Corp. Plc | | | 52,239,794 | |
| | 112,131 | | | Equifax, Inc. | | | 31,108,503 | |
| | 58,732 | | | HEICO Corp. | | | 8,186,654 | |
| | 366,452 | | | IAA, Inc.(a) | | | 21,858,862 | |
| | 127,960 | | | Lincoln Electric Holdings, Inc. | | | 18,221,504 | |
| | 70,496 | | | Northrop Grumman Corp. | | | 25,182,581 | |
| | 1,481,331 | | | Rentokil Initial Plc | | | 11,928,489 | |
| | 259,880 | | | Safran SA | | | 34,860,885 | |
| | 300,613 | | | Union Pacific Corp. | | | 72,567,978 | |
| | | | | | | | 371,886,599 | |
| Information Technology — 25.6% | | | | |
| | 79,928 | | | Adobe, Inc.(a) | | | 51,981,974 | |
| | 486,823 | | | Amphenol Corp. - Class A | | | 37,373,402 | |
| | 48,295 | | | ANSYS, Inc.(a) | | | 18,331,816 | |
| | 1,076,111 | | | Apple, Inc. | | | 161,201,428 | |
| | 67,315 | | | ASML Holding NV | | | 54,510,206 | |
| | 101,116 | | | Aspen Technology, Inc.(a) | | | 15,843,866 | |
| | 135,072 | | | CDW Corp. | | | 25,211,189 | |
| | 713,567 | | | Microsoft Corp. | | | 236,633,089 | |
| | 86,948 | | | Nice Ltd. - ADR(a) | | | 24,608,023 | |
| | 46,165 | | | Paycom Software, Inc.(a) | | | 25,291,495 | |
| | 52,297 | | | ServiceNow, Inc.(a) | | | 36,490,755 | |
| | 261,416 | | | SS&C Technologies Holdings, Inc. | | | 20,774,729 | |
| | 84,463 | | | Synopsys, Inc.(a) | | | 28,141,382 | |
| | 389,366 | | | Texas Instruments, Inc. | | | 72,998,338 | |
| | 530,796 | | | Visa, Inc. - A Shares | | | 112,406,669 | |
| | 78,043 | | | WEX, Inc.(a) | | | 11,683,037 | |
| | | | | | | | 933,481,398 | |
| Insurance — 1.3% | | | | |
| | 143,583 | | | Aon Plc - Class A | | | 45,935,073 | |
| | | | | | | | | |
| Materials — 1.8% | | | | |
| | 103,218 | | | Air Products and Chemicals, Inc. | | | 30,945,789 | |
| | 175,529 | | | Vulcan Materials Co. | | | 33,371,573 | |
| | | | | | | | 64,317,362 | |
| Real Estate — 2.2% | | | | |
| | 195,027 | | | American Tower Corp. REIT | | | 54,991,763 | |
| Old Westbury Funds, Inc. | |
| All Cap Core Fund | |
| Portfolio of Investments - (Continued) | October 31, 2021 |
| Shares | | | | | Value | |
| Real Estate (continued) | | | | |
| | 93,453 | | | Jones Lang LaSalle, Inc.(a) | | $ | 24,132,368 | |
| | | | | | | | 79,124,131 | |
| Utilities — 1.4% | | | | |
| | 316,607 | | | Ameren Corp. | | | 26,686,804 | |
| | 137,446 | | | American Water Works Co., Inc. | | | 23,940,344 | |
| | | | | | | | 50,627,148 | |
Total Common Stocks
(Cost $1,884,454,140) | | | 3,547,838,594 | |
| | | | | | | | | |
| EXCHANGE-TRADED FUNDS — 0.4% | | | | |
| | 31,000 | | | SPDR S&P MidCap 400 ETF Trust | | | 15,783,340 | |
| | | | | | | | | |
Total Exchange-Traded Funds
(Cost $15,108,427) | | | 15,783,340 | |
| | | | | | | | | |
| INVESTMENT COMPANY — 2.3% | | | | |
| | 84,879,834 | | | SEI Daily Income Trust Government II Fund - Class A, 0.01%(b) | | | 84,879,834 | |
| | | | | |
Total Investment Company
(Cost $84,879,834) | | | 84,879,834 | |
| | | | | |
TOTAL INVESTMENTS — 100.0%
(Cost $1,984,442,401) | | $ | 3,648,501,768 | |
| OTHER ASSETS IN EXCESS OF LIABILITIES — 0.0% | | | 180,900 | |
| NET ASSETS — 100.0% | | $ | 3,648,682,668 | |
| (a) | Non-income producing security. |
| (b) | The rate shown represents the current yield as of October 31, 2021. |
The following abbreviations are used in the report:
ADR — American Depositary Receipt
ETF — Exchange-Traded Fund
REIT — Real Estate Investment Trust
SPDR — Standard & Poor’s Depositary Receipt
| Old Westbury Funds, Inc. | |
| Small & Mid Cap Strategies Fund | |
| Portfolio of Investments | October 31, 2021 |
| | |
| Shares | | | | | Value | |
| COMMON STOCKS — 84.7% | | | | |
| ARGENTINA — 0.4% | | | | |
| | 24,149 | | | MercadoLibre, Inc.(a) | | $ | 35,765,152 | |
| AUSTRALIA — 1.5% | | | | |
| | 1,066,907 | | | Adbri Ltd. | | | 2,391,691 | |
| | 626,517 | | | Aeris Resources Ltd.(a) | | | 75,408 | |
| | 4,267 | | | Altium Ltd. | | | 117,866 | |
| | 420,121 | | | Ardent Leisure Group Ltd.(a) | | | 472,474 | |
| | 62,971 | | | Atomos Ltd.(a) | | | 66,318 | |
| | 82,024 | | | Australian Clinical Labs Ltd.(a) | | | 270,257 | |
| | 140,436 | | | Base Resources Ltd. | | | 32,221 | |
| | 746,989 | | | BlueScope Steel Ltd. | | | 11,586,841 | |
| | 133,008 | | | Calix Ltd.(a) | | | 517,286 | |
| | 11,072 | | | Cardno Ltd. | | | 12,618 | |
| | 1 | | | Castile Resources Ltd.(a) | | | 0 | |
| | 2,182,394 | | | Champion Iron Ltd.(a) | | | 7,223,506 | |
| | 61,163 | | | Clinuvel Pharmaceuticals Ltd. | | | 1,776,441 | |
| | 6,292 | | | Cogstate Ltd.(a) | | | 11,265 | |
| | 199,504 | | | Cokal Ltd.(a) | | | 24,763 | |
| | 1,832,840 | | | CSR Ltd. | | | 8,176,011 | |
| | 6,637 | | | Data#3 Ltd. | | | 28,309 | |
| | 5,053 | | | DDH1 Ltd. | | | 4,561 | |
| | 15,835 | | | DGL Group Ltd.(a) | | | 35,736 | |
| | 61,947 | | | Eclipx Group Ltd.(a) | | | 116,499 | |
| | 14,106 | | | Enero Group Ltd. | | | 42,021 | |
| | 926,872 | | | Estia Health Ltd. | | | 1,464,203 | |
| | 8,358 | | | Euroz Ltd. | | | 10,248 | |
| | 459,637 | | | Hansen Technologies Ltd. | | | 2,185,215 | |
| | 1,585,425 | | | Healius Ltd. | | | 5,748,505 | |
| | 681,771 | | | IGO Ltd. | | | 4,943,992 | |
| | 1,730,427 | | | Iluka Resources Ltd. | | | 12,236,109 | |
| | 397,331 | | | Imdex Ltd. | | | 857,821 | |
| | 159,854 | | | Incitec Pivot Ltd. | | | 359,548 | |
| | 71,119 | | | IVE Group Ltd. | | | 95,496 | |
| | 811,814 | | | Karoon Energy Ltd.(a) | | | 1,111,450 | |
| | 364,347 | | | MACA Ltd. | | | 209,671 | |
| | 1,033,952 | | | Macmahon Holdings Ltd. | | | 159,447 | |
| | 23,600 | | | Mastermyne Group Ltd. | | | 17,043 | |
| | 749,872 | | | Mayne Pharma Group Ltd.(a) | | | 191,791 | |
| | 112,692 | | | McMillan Shakespeare Ltd. | | | 1,160,536 | |
| | 107,242 | | | Medusa Mining Ltd. | | | 62,118 | |
| | 520,030 | | | Mineral Resources Ltd. | | | 15,096,121 | |
| | 242,442 | | | Monash IVF Group Ltd. | | | 171,434 | |
| | 352,823 | | | Myer Holdings Ltd.(a) | | | 143,322 | |
| | 183,806 | | | Navigator Global Investments Ltd. | | | 259,944 | |
| | 2,933,810 | | | New Hope Corp. Ltd. | | | 4,435,987 | |
| | 84,662 | | | Nick Scali Ltd. | | | 921,551 | |
| | 964,902 | | | Nufarm Ltd.(a) | | | 3,157,437 | |
| | 17,007 | | | Objective Corp. Ltd. | | | 267,384 | |
| | 4,455,590 | | | Orora Ltd. | | | 11,060,668 | |
| | 899,439 | | | OZ Minerals Ltd. | | | 17,003,033 | |
| | 83,935 | | | Pact Group Holdings Ltd. | | | 195,734 | |
| | 87,736 | | | People Infrastructure Ltd. | | | 291,717 | |
| Shares | | | | | Value | |
| AUSTRALIA (continued) | | | | |
| | 9,386 | | | ReadyTech Holdings Ltd.(a) | | $ | 26,689 | |
| | 43,545 | | | Regis Healthcare Ltd. | | | 64,367 | |
| | 14,254 | | | Ridley Corp. Ltd. | | | 14,207 | |
| | 93,934 | | | RPMGlobal Holdings Ltd.(a) | | | 137,791 | |
| | 956,482 | | | Sandfire Resources Ltd. | | | 4,000,496 | |
| | 271,079 | | | SEEK Ltd. | | | 6,668,157 | |
| | 2,028,425 | | | Seven West Media Ltd.(a) | | | 694,277 | |
| | 37,539 | | | SG Fleet Group Ltd. | | | 71,726 | |
| | 703,578 | | | Sigma Healthcare Ltd. | | | 301,682 | |
| | 33,228 | | | SmartGroup Corp. Ltd. | | | 200,466 | |
| | 2,425,338 | | | South32 Ltd. | | | 6,513,324 | |
| | 12,440 | | | Sunland Group Ltd. | | | 25,173 | |
| | 428,507 | | | Technology One Ltd. | | | 3,935,825 | |
| | 448,369 | | | Telix Pharmaceuticals Ltd.(a) | | | 2,033,832 | |
| | 39,775 | | | ThinkSmart Ltd. | | | 54,434 | |
| | 7,365 | | | Tuas Ltd.(a) | | | 7,756 | |
| | 44,772 | | | Virtus Health Ltd. | | | 186,923 | |
| | 4,028,261 | | | Whitehaven Coal Ltd.(a) | | | 7,908,977 | |
| | 970 | | | Zimplats Holdings Ltd. | | | 16,783 | |
| | | | | | | | 149,662,502 | |
| AUSTRIA — 0.1% | | | | |
| | 50,721 | | | ANDRITZ AG | | | 2,871,868 | |
| | 19,850 | | | EVN AG | | | 559,897 | |
| | 7,921 | | | Palfinger AG | | | 349,785 | |
| | 7,264 | | | POLYTEC Holding AG | | | 71,040 | |
| | 3,902 | | | Porr Ag(a) | | | 55,933 | |
| | 590 | | | Rosenbauer International AG | | | 32,192 | |
| | 13,404 | | | S IMMO AG | | | 317,648 | |
| | 27,107 | | | Schoeller-Bleckmann Oilfield Equipment AG(a) | | | 1,104,583 | |
| | 18,592 | | | Semperit AG Holding | | | 626,502 | |
| | 10,527 | | | UNIQA Insurance Group AG | | | 97,962 | |
| | 28,029 | | | Zumtobel Group AG | | | 288,374 | |
| | | | | | | | 6,375,784 | |
| BELGIUM — 0.2% | | | | |
| | 3,907 | | | Ackermans & van Haaren NV | | | 671,602 | |
| | 82,251 | | | AGFA-Gevaert NV(a) | | | 357,509 | |
| | 53,556 | | | Bekaert SA | | | 2,345,179 | |
| | 375,756 | | | bpost SA(a) | | | 3,214,367 | |
| | 4,644 | | | Cie d’Entreprises CFE | | | 475,109 | |
| | 10,734 | | | Deceuninck NV | | | 45,787 | |
| | 196,752 | | | Econocom Group SA | | | 831,313 | |
| | 18,393 | | | EVS Broadcast Equipment SA | | | 431,625 | |
| | 140,385 | | | Galapagos NV(a) | | | 7,433,467 | |
| | 11,070 | | | Ion Beam Applications | | | 217,548 | |
| | 55,348 | | | Melexis NV | | | 6,372,636 | |
| | 25,321 | | | Recticel SA | | | 468,337 | |
| | 652 | | | Sipef NV | | | 43,866 | |
| | 7,341 | | | Warehouses De Pauw CVA REIT | | | 334,356 | |
| | | | | | | | 23,242,701 | |
| Old Westbury Funds, Inc. | |
| Small & Mid Cap Strategies Fund | |
| Portfolio of Investments - (Continued) | October 31, 2021 |
| | |
| Shares | | | | | Value | |
| BERMUDA — 0.4% | | | | |
| | 425,000 | | | Argo Group International Holdings Ltd. | | $ | 23,417,500 | |
| | 382,255 | | | James River Group Holdings Ltd. | | | 12,213,047 | |
| | | | | | | | 35,630,547 | |
| BRAZIL — 0.3% | | | | |
| | 326,780 | | | Afya Ltd. - Class A(a) | | | 5,702,311 | |
| | 1,665,988 | | | Cia Energetica de Minas Gerais - ADR | | | 3,748,473 | |
| | 221,685 | | | Embraer SA - ADR(a) | | | 3,442,768 | |
| | 397,700 | | | Notre Dame Intermedica Participacoes SA | | | 4,529,600 | |
| | 1,658,800 | | | Rumo SA(a) | | | 4,655,621 | |
| | 2,547,500 | | | Vibra Energia SA | | | 9,474,472 | |
| | | | | | | | 31,553,245 | |
| CANADA — 2.8% | | | | |
| | 40,500 | | | Absolute Software Corp. | | | 454,872 | |
| | 6,900 | | | AcuityAds Holdings, Inc.(a) | | | 43,989 | |
| | 331,746 | | | Advantage Energy Ltd.(a) | | | 1,879,072 | |
| | 14,146 | | | Alaris Equity Partners Income - Units | | | 211,916 | |
| | 2,300 | | | Algoma Central Corp. | | | 32,002 | |
| | 5,600 | | | Allied Properties Real Estate Investment Trust REIT | | | 193,529 | |
| | 422,000 | | | Altus Group Ltd. | | | 22,133,177 | |
| | 34,200 | | | Birchcliff Energy Ltd. | | | 183,767 | |
| | 22,180 | | | Bird Construction, Inc. | | | 180,652 | |
| | 26,300 | | | Black Diamond Group Ltd.(a) | | | 96,266 | |
| | 14,553 | | | Boardwalk Real Estate Investment Trust REIT | | | 627,816 | |
| | 9,134 | | | Bridgemarq Real Estate Services | | | 126,205 | |
| | 6,500 | | | BRP, Inc. | | | 571,534 | |
| | 817,429 | | | CAE, Inc.(a) | | | 24,788,389 | |
| | 313,824 | | | Canfor Corp.(a) | | | 6,501,654 | |
| | 9,200 | | | Canfor Pulp Products, Inc.(a) | | | 49,955 | |
| | 973,033 | | | Capstone Mining Corp.(a) | | | 4,080,512 | |
| | 41,947 | | | Cardinal Energy Ltd.(a) | | | 158,284 | |
| | 173,457 | | | Celestica, Inc.(a) | | | 1,709,903 | |
| | 178,194 | | | CES Energy Solutions Corp. | | | 277,888 | |
| | 700 | | | Cogeco, Inc. | | | 46,595 | |
| | 168,100 | | | Descartes Systems Group, Inc. (The)(a) | | | 13,728,076 | |
| | 1,896,320 | | | Dollarama, Inc. | | | 85,714,400 | |
| | 56,640 | | | Doman Building Materials Group Ltd. | | | 310,293 | |
| | 14,531 | | | Dream Impact Trust - Units | | | 75,849 | |
| | 4,316 | | | DREAM Unlimited Corp. - Class A | | | 107,761 | |
| | 41,042 | | | Ensign Energy Services, Inc.(a) | | | 67,652 | |
| | 71,013 | | | ERO Copper Corp.(a) | | | 1,324,895 | |
| | 19,400 | | | Evertz Technologies Ltd. | | | 222,122 | |
| | 30,283 | | | Exco Technologies Ltd. | | | 238,819 | |
| | 54,507 | | | Finning International, Inc. | | | 1,613,717 | |
| | 6,700 | | | Firm Capital Property Trust REIT | | | 40,440 | |
| | 4,900 | | | Frontera Energy Corp.(a) | | | 34,881 | |
| | 184,422 | | | H&R Real Estate Investment Trust REIT | | | 2,534,759 | |
| | 52,462 | | | Hardwoods Distribution, Inc. | | | 1,754,527 | |
| Shares | | | | | Value | |
| CANADA (continued) | | | | |
| | 14,739 | | | High Liner Foods, Inc. | | $ | 156,608 | |
| | 1,173,774 | | | IAMGOLD Corp.(a) | | | 3,251,354 | |
| | 282,329 | | | Interfor Corp. | | | 6,465,097 | |
| | 246,413 | | | Intertape Polymer Group, Inc. | | | 5,598,847 | |
| | 42,105 | | | Kelt Exploration Ltd.(a) | | | 170,107 | |
| | 102,100 | | | Kinaxis, Inc.(a) | | | 15,846,290 | |
| | 15,218 | | | Leon’s Furniture Ltd. | | | 309,869 | |
| | 93,087 | | | Linamar Corp. | | | 5,119,935 | |
| | 96,972 | | | Medical Facilities Corp. | | | 723,999 | |
| | 15,500 | | | MEG Energy Corp.(a) | | | 138,894 | |
| | 1,887 | | | Morguard Corp. | | | 208,201 | |
| | 72,866 | | | Morguard North American Residential Real Estate Investment Trust REIT | | | 1,084,512 | |
| | 435,892 | | | Mullen Group Ltd. | | | 4,508,256 | |
| | 7,600 | | | Neo Performance Materials, Inc. | | | 117,169 | |
| | 4,132 | | | Nexus Real Estate Investment Trust - Units | | | 44,305 | |
| | 194,037 | | | NuVista Energy Ltd.(a) | | | 961,092 | |
| | 20,200 | | | Obsidian Energy Ltd.(a) | | | 78,345 | |
| | 7,506 | | | Pason Systems, Inc. | | | 55,798 | |
| | 184,653 | | | Peyto Exploration & Development Corp. | | | 1,456,216 | |
| | 24,952 | | | Precision Drilling Corp.(a) | | | 1,104,654 | |
| | 299,700 | | | Real Matters, Inc.(a) | | | 2,191,568 | |
| | 2,700 | | | Richelieu Hardware Ltd. | | | 95,316 | |
| | 475,000 | | | Ritchie Bros Auctioneers, Inc. | | | 32,466,250 | |
| | 42,436 | | | Russel Metals, Inc. | | | 1,118,848 | |
| | 49,225 | | | ShawCor Ltd.(a) | | | 211,998 | |
| | 282,834 | | | Stelco Holdings, Inc. | | | 9,820,117 | |
| | 100,448 | | | TECSYS, Inc. | | | 4,544,347 | |
| | 39,100 | | | Tidewater Midstream and Infrastructure Ltd. | | | 47,074 | |
| | 239 | | | Uni-Select, Inc.(a) | | | 3,439 | |
| | 44,177 | | | Wajax Corp. | | | 882,041 | |
| | 15,970 | | | West Fraser Timber Co. Ltd. | | | 1,278,658 | |
| | 512,884 | | | Western Forest Products, Inc. | | | 886,855 | |
| | | | | | | | 273,062,227 | |
| CHINA — 3.1% | | | | |
| | 4,754,716 | | | 3SBio, Inc.(a)(b) | | | 4,351,080 | |
| | 13,276,000 | | | Agricultural Bank of China Ltd. - H Shares | | | 4,521,740 | |
| | 179,432 | | | Alibaba Group Holding Ltd. - ADR(a) | | | 29,595,514 | |
| | 11,452,000 | | | Aluminum Corp. of China Ltd. - H Shares(a) | | | 6,844,265 | |
| | 2,818,500 | | | Bank of Changsha Co. Ltd. - A Shares | | | 3,540,912 | |
| | 3,062,400 | | | Bank of Chengdu Co. Ltd. - A Shares | | | 6,098,371 | |
| | 10,480,770 | | | Bank of China Ltd. - H Shares | | | 3,704,404 | |
| | 5,896,000 | | | Bank of Communications Co. Ltd. - H Shares | | | 3,508,577 | |
| | 290,195 | | | Baozun, Inc. - ADR(a) | | | 5,020,373 | |
| | 2,400,400 | | | Beibuwan Port Co. Ltd. - A Shares | | | 2,790,880 | |
| Old Westbury Funds, Inc. | |
| Small & Mid Cap Strategies Fund | |
| Portfolio of Investments - (Continued) | October 31, 2021 |
| | |
| Shares | | | | | Value | |
| CHINA (continued) | | | | |
| | 4,297,800 | | | Beijing Yanjing Brewery Co. Ltd. - A Shares | | $ | 4,446,937 | |
| | 8,249,000 | | | Beiqi Foton Motor Co. Ltd. - A Shares(a) | | | 4,524,552 | |
| | 1,751,000 | | | Better Life Commercial Chain Share Co. Ltd. - A Shares | | | 1,836,355 | |
| | 6,487,044 | | | China Construction Bank Corp. - H Shares | | | 4,410,573 | |
| | 6,820,000 | | | China Galaxy Securities Co. Ltd. - H Shares | | | 3,804,229 | |
| | 2,603,300 | | | China Railway Tielong Container Logistics Co. Ltd. - A Shares | | | 1,917,642 | |
| | 772,400 | | | Chongqing Department Store Co. Ltd. - A Shares | | | 2,773,704 | |
| | 5,092,800 | | | CSG Holding Co. Ltd. - A Shares | | | 7,184,992 | |
| | 4,043,700 | | | Daqin Railway Co. Ltd. - A Shares | | | 4,007,319 | |
| | 5,171,600 | | | Dongfang Electric Corp. Ltd. - H Shares | | | 8,268,711 | |
| | 4,004,000 | | | Dongfeng Motor Group Co. Ltd. - H Shares | | | 3,741,287 | |
| | 2,474,205 | | | FAW Jiefang Group Co. Ltd. | | | 4,019,644 | |
| | 1,194,480 | | | Fujian Star-net Communication Co. Ltd. - A Shares | | | 4,084,346 | |
| | 3,757,000 | | | Greentown China Holdings Ltd. | | | 5,195,723 | |
| | 3,325,700 | | | Guangxi Liugong Machinery Co. Ltd. - A Shares | | | 3,856,320 | |
| | 3,258,400 | | | Guangzhou R&F Properties Co. Ltd. - H Shares | | | 2,043,698 | |
| | 69,056 | | | I-Mab - ADR(a) | | | 4,266,970 | |
| | 9,504,000 | | | Industrial & Commercial Bank of China Ltd. - H Shares | | | 5,203,655 | |
| | 3,394,600 | | | IRICO Display Devices Co. Ltd. - A Shares(a) | | | 3,660,204 | |
| | 2,368,938 | | | Jiangxi Copper Co. Ltd. - H Shares | | | 4,146,897 | |
| | 2,895,483 | | | Jilin Sino-Microelectronics Co. Ltd. - A Shares | | | 4,072,219 | |
| | 7,489,000 | | | Kingdee International Software Group Co. Ltd.(a) | | | 24,737,138 | |
| | 2,293,400 | | | MLS Co. Ltd. - A Shares | | | 4,985,769 | |
| | 429,518 | | | OneConnect Financial Technology Co. Ltd. - ADR(a) | | | 1,361,572 | |
| | 5,511,600 | | | ORG Technology Co. Ltd. - A Shares | | | 5,754,466 | |
| | 9,838,200 | | | Rizhao Port Co. Ltd. - A Shares | | | 4,027,956 | |
| | 2,440,400 | | | Shandong Haihua Co. Ltd. - A Shares | | | 3,085,156 | |
| | 12,066,000 | | | Shandong Nanshan Aluminum Co. Ltd. - A Shares | | | 8,134,826 | |
| | 1,437,405 | | | Shanghai Kehua Bio-Engineering Co. Ltd. - A Shares | | | 3,088,974 | |
| | 1,675,731 | | | Shenzhen Hepalink Pharmaceutical Group Co. Ltd. - A Shares | | | 4,016,953 | |
| | 1,698,000 | | | Shenzhen Laibao Hi-tech Co. Ltd. - A Shares | | | 2,734,756 | |
| Shares | | | | | Value | |
| CHINA (continued) | | | | |
| | 5,233,500 | | | Sino-Ocean Group Holding Ltd. | | $ | 1,136,767 | |
| | 3,324,900 | | | Tianjin Port Co. Ltd. - A Shares | | | 2,104,269 | |
| | 1,856,367 | | | Tongkun Group Co. Ltd. - A Shares | | | 5,776,838 | |
| | 15,813,400 | | | Tongling Nonferrous Metals Group Co. Ltd. - A Shares | | | 9,106,528 | |
| | 1,544,000 | | | Triangle Tyre Co. Ltd. - A Shares | | | 3,059,385 | |
| | 3,635,300 | | | Wuxi Taiji Industry Co. Ltd. - A Shares | | | 4,538,700 | |
| | 2,378,400 | | | Xiamen King Long Motor Group Co. Ltd. - A Shares | | | 2,137,078 | |
| | 1,799,374 | | | Xuji Electric Co. Ltd. - A Shares | | | 5,565,783 | |
| | 2,429,800 | | | Yunnan Aluminium Co. Ltd. - A Shares(a) | | | 4,508,723 | |
| | 2,740,300 | | | Yunnan Copper Co. Ltd. - A Shares | | | 5,662,227 | |
| | 323,308 | | | Zai Lab Ltd. - ADR(a) | | | 33,753,355 | |
| | 5,720,800 | | | Zoomlion Heavy Industry Science and Technology Co. Ltd. - H Shares | | | 4,132,240 | |
| | | | | | | | 300,851,552 | |
| COSTA RICA — 0.0% | | | | |
| | 52,364 | | | Establishment Labs Holdings, Inc.(a) | | | 4,269,761 | |
| DENMARK — 1.5% | | | | |
| | 36,538 | | | ALK-Abello A/S(a) | | | 15,830,294 | |
| | 438,460 | | | Ambu A/S - Class B | | | 12,489,467 | |
| | 1,452 | | | Brodrene A&O Johansen A/S - Preference Shares | | | 249,333 | |
| | 48,276 | | | Carlsberg AS - Class B | | | 7,963,477 | |
| | 13,512 | | | Chemometec A/S | | | 2,040,973 | |
| | 30,074 | | | Columbus A/S | | | 44,118 | |
| | 133,040 | | | D/S Norden A/S | | | 3,210,740 | |
| | 69,350 | | | Dfds A/S(a) | | | 3,588,741 | |
| | 66,915 | | | DSV A/S | | | 15,551,108 | |
| | 95,277 | | | Genmab A/S(a) | | | 42,700,679 | |
| | 202,784 | | | GN Store Nord AS | | | 12,305,696 | |
| | 454,595 | | | H Lundbeck A/S | | | 12,638,236 | |
| | 17,109 | | | H+H International A/S - Class B(a) | | | 675,320 | |
| | 188,145 | | | Matas A/S | | | 3,681,034 | |
| | 22,271 | | | Nilfisk Holding A/S(a) | | | 773,515 | |
| | 6,153 | | | North Media A/S | | | 115,698 | |
| | 353 | | | Solar A/S - Class B | | | 41,142 | |
| | 60,546 | | | Spar Nord Bank A/S | | | 779,994 | |
| | 300,123 | | | Vestas Wind Systems A/S | | | 12,979,679 | |
| | | | | | | | 147,659,244 | |
| FINLAND — 0.7% | | | | |
| | 10,650 | | | Aktia Bank Oyj | | | 152,415 | |
| | 2,578 | | | Aspo Oyj | | | 36,239 | |
| | 4,578 | | | Atria Oyj | | | 59,061 | |
| | 112,401 | | | BasWare Oyj(a) | | | 4,151,441 | |
| | 33,927 | | | Caverion Oyj | | | 268,066 | |
| | 1,816 | | | Consti Oyj | | | 28,445 | |
| | 4,481 | | | eQ Oyj | | | 134,681 | |
| | 13,388 | | | Fiskars Oyj Abp | | | 328,876 | |
| Old Westbury Funds, Inc. | |
| Small & Mid Cap Strategies Fund | |
| Portfolio of Investments - (Continued) | October 31, 2021 |
| | |
| Shares | | | | | Value | |
| FINLAND (continued) | | | | |
| | 16,592 | | | F-Secure Oyj | | $ | 93,504 | |
| | 30,895 | | | Harvia Oyj | | | 1,900,018 | |
| | 642 | | | Marimekko Oyj | | | 61,227 | |
| | 3,220,006 | | | Metso Outotec Oyj | | | 32,309,798 | |
| | 7,742 | | | Oma Saastopankki Oyj | | | 164,675 | |
| | 42,588 | | | Orion Oyj - Class B | | | 1,842,744 | |
| | 12,025 | | | Pihlajalinna Oyj | | | 163,197 | |
| | 1,114 | | | Ponsse Oyj | | | 57,564 | |
| | 48,994 | | | QT Group Oyj(a) | | | 7,906,534 | |
| | 71,828 | | | Revenio Group Oyj | | | 4,745,346 | |
| | 28,653 | | | Sievi Capital Oyj | | | 69,227 | |
| | 10,692 | | | Solteq Oyj | | | 56,238 | |
| | 3,578 | | | Titanium Oyj | | | 64,111 | |
| | 118,332 | | | Tokmanni Group Corp. | | | 2,692,062 | |
| | 77,674 | | | Uponor Oyj | | | 1,889,206 | |
| | 112,846 | | | Vaisala Oyj - Class A | | | 6,000,699 | |
| | 123,312 | | | Valmet Oyj | | | 5,003,458 | |
| | 8,970 | | | Verkkokauppa.com Oyj | | | 73,518 | |
| | 2,653 | | | Vincit Oyj | | | 26,375 | |
| | | | | | | | 70,278,725 | |
| FRANCE — 0.8% | | | | |
| | 3,602 | | | AKWEL | | | 91,814 | |
| | 1,668 | | | Altarea SCA REIT | | | 356,719 | |
| | 3,048 | | | Alten SA | | | 490,470 | |
| | 24,339 | | | Artefact SA(a) | | | 219,460 | |
| | 2,904 | | | Aubay | | | 179,937 | |
| | 1,888 | | | Axway Software SA | | | 59,365 | |
| | 1,683 | | | Beneteau SA(a) | | | 25,642 | |
| | 369 | | | Boiron SA | | | 17,852 | |
| | 641 | | | Cegedim SA(a) | | | 19,192 | |
| | 389,059 | | | Cellectis SA(a) | | | 4,238,915 | |
| | 40,041 | | | Coface SA(a) | | | 571,649 | |
| | 237,413 | | | Derichebourg SA(a) | | | 2,697,838 | |
| | 8,263 | | | Eramet SA(a) | | | 690,612 | |
| | 432 | | | Esker SA | | | 147,570 | |
| | 17,401 | | | Etablissements Maurel et Prom SA(a) | | | 50,088 | |
| | 3,886 | | | Eurobio Scientific SA(a) | | | 80,231 | |
| | 222,990 | | | Gaztransport Et Technigaz SA | | | 18,405,238 | |
| | 3,114 | | | Groupe Guillin | | | 96,834 | |
| | 6,868 | | | Groupe LDLC | | | 436,667 | |
| | 5,483 | | | Guerbet | | | 242,125 | |
| | 3,358 | | | Haulotte Group SA(a) | | | 19,409 | |
| | 658 | | | Infotel SA | | | 37,994 | |
| | 3,913 | | | Ipsen SA | | | 404,394 | |
| | 1,099 | | | Jacquet Metals SACA | | | 26,806 | |
| | 9,151 | | | Lagardere SA(a) | | | 241,614 | |
| | 447,759 | | | Lectra | | | 18,737,460 | |
| | 1,707 | | | LNA Sante SA | | | 98,171 | |
| | 9,223 | | | Manitou BF SA | | | 313,990 | |
| | 185,086 | | | Mercialys SA REIT | | | 2,005,870 | |
| | 14,250 | | | Mersen SA | | | 534,549 | |
| | 1,232 | | | Neurones | | | 50,701 | |
| Shares | | | | | Value | |
| FRANCE (continued) | | | | |
| | 2,057 | | | Nexans SA | | $ | 206,044 | |
| | 125,471 | | | Nexity SA | | | 5,726,356 | |
| | 26,648 | | | Quadient SA | | | 636,433 | |
| | 24,092 | | | ReWorld Media SA(a) | | | 184,091 | |
| | 464,168 | | | Rexel SA | | | 9,207,682 | |
| | 416 | | | Seche Environnement SA | | | 32,893 | |
| | 16,813 | | | Societe BIC SA | | | 976,650 | |
| | 1,113 | | | Societe pour l’Informatique Industrielle | | | 50,693 | |
| | 1,386 | | | Somfy SA | | | 272,377 | |
| | 286 | | | Stef SA | | | 35,773 | |
| | 900 | | | Synergie SE | | | 41,564 | |
| | 112,884 | | | Technip Energies NV(a) | | | 1,738,831 | |
| | 208,902 | | | Television Francaise 1 | | | 2,236,204 | |
| | 4,034 | | | Thermador Groupe | | | 458,869 | |
| | 5,595 | | | Virbac SA | | | 2,829,671 | |
| | 3,077 | | | Wavestone | | | 169,314 | |
| | | | | | | | 76,392,621 | |
| GERMANY — 1.5% | | | | |
| | 367 | | | ABO Wind AG | | | 26,643 | |
| | 1,552 | | | Adesso SE | | | 345,546 | |
| | 65,518 | | | ADVA Optical Networking SE(a) | | | 867,967 | |
| | 733,097 | | | AIXTRON SE | | | 17,415,306 | |
| | 450,005 | | | alstria office REIT-AG REIT | | | 8,406,525 | |
| | 8,498 | | | Amadeus Fire AG | | | 1,962,773 | |
| | 8,594 | | | Atoss Software AG | | | 1,943,220 | |
| | 4,334 | | | Basler AG | | | 800,615 | |
| | 1,566 | | | BayWa AG | | | 66,257 | |
| | 24,172 | | | Carl Zeiss Meditec AG | | | 4,860,656 | |
| | 1,567 | | | Datagroup SE(a) | | | 137,308 | |
| | 58,705 | | | Dermapharm Holding SE | | | 5,904,079 | |
| | 188,916 | | | Deutsche EuroShop AG | | | 3,837,058 | |
| | 170,975 | | | Deutz AG(a) | | | 1,434,918 | |
| | 18,591 | | | Draegerwerk AG & Co. KGaA - Preference Shares | | | 1,463,550 | |
| | 21,421 | | | Eckert & Ziegler Strahlen- und Medizintechnik AG | | | 3,206,767 | |
| | 1,752 | | | Elmos Semiconductor AG | | | 81,519 | |
| | 137 | | | Envitec Biogas AG | | | 6,430 | |
| | 31,823 | | | Ernst Russ AG(a) | | | 156,714 | |
| | 184,973 | | | EuroEyes International Eye Clinic Ltd. | | | 236,313 | |
| | 21,274 | | | GFT Technologies SE | | | 1,003,384 | |
| | 462 | | | GK Software SE(a) | | | 84,116 | |
| | 119,262 | | | Hamborner REIT AG | | | 1,337,447 | |
| | 348,371 | | | Hamburger Hafen und Logistik AG | | | 7,808,680 | |
| | 520,453 | | | Heidelberger Druckmaschinen AG(a) | | | 1,341,665 | |
| | 4,723 | | | Hornbach Holding AG & Co. KGaA | | | 596,755 | |
| | 2,517 | | | IVU Traffic Technologies AG | | | 58,775 | |
| | 2,011 | | | JDC Group AG(a) | | | 57,420 | |
| | 93,305 | | | Jungheinrich AG - Preference Shares | | | 4,726,451 | |
| | 143,887 | | | K+S AG(a) | | | 2,477,536 | |
| | 84,930 | | | KION Group AG | | | 9,268,105 | |
| Old Westbury Funds, Inc. | |
| Small & Mid Cap Strategies Fund | |
| Portfolio of Investments - (Continued) | October 31, 2021 |
| | |
| Shares | | | | | Value | |
| GERMANY (continued) | | | | |
| | 291,837 | | | Kloeckner & Co. SE(a) | | $ | 3,926,912 | |
| | 7,512 | | | Koenig & Bauer AG(a) | | | 264,858 | |
| | 43,662 | | | Krones AG | | | 4,504,740 | |
| | 239 | | | KSB SE & Co. KGaA - Preference Shares | | | 99,462 | |
| | 547 | | | KUKA AG | | | 45,401 | |
| | 2,073 | | | Mensch und Maschine Software SE | | | 148,097 | |
| | 312,328 | | | MorphoSys AG(a) | | | 14,712,835 | |
| | 3,326 | | | New Work SE | | | 811,265 | |
| | 604 | | | OEKOWORLD AG - Preference Shares | | | 66,611 | |
| | 99 | | | Paul Hartmann AG | | | 41,200 | |
| | 1,687 | | | Pfeiffer Vacuum Technology AG | | | 421,237 | |
| | 2,188 | | | PSI Software AG | | | 105,473 | |
| | 158,268 | | | SAF-Holland SE(a) | | | 2,195,494 | |
| | 181,123 | | | Salzgitter AG(a) | | | 6,662,414 | |
| | 90,925 | | | Schaeffler AG - Preference Shares | | | 721,050 | |
| | 694 | | | Secunet Security Networks AG | | | 364,228 | |
| | 138,742 | | | SGL Carbon SE(a) | | | 1,324,786 | |
| | 9,447 | | | Software AG | | | 388,341 | |
| | 2,475 | | | Steico SE | | | 323,877 | |
| | 1,836 | | | STO SE & Co. KGaA - Preference Shares | | | 413,022 | |
| | 2,064 | | | STRATEC SE | | | 329,266 | |
| | 50,092 | | | SUESS MicroTec SE(a) | | | 1,314,474 | |
| | 98,486 | | | Symrise AG | | | 13,610,745 | |
| | 3,601 | | | Technotrans SE | | | 106,358 | |
| | 12,336 | | | VIB Vermoegen AG | | | 581,112 | |
| | 1,269 | | | Villeroy & Boch AG - Preference Shares | | | 35,207 | |
| | 48,988 | | | Wacker Chemie AG | | | 8,831,468 | |
| | 78,520 | | | Wacker Neuson SE | | | 2,574,212 | |
| | 4,714 | | | Washtec AG | | | 306,255 | |
| | 17,289 | | | Wuestenrot & Wuerttembergische AG | | | 360,149 | |
| | | | | | | | 147,511,047 | |
| GREECE — 0.1% | | | | |
| | 4,107,680 | | | Alpha Services and Holdings SA(a) | | | 5,216,203 | |
| | 4,072,764 | | | Eurobank Ergasias Services and Holdings SA(a) | | | 4,253,311 | |
| | 1,284,524 | | | National Bank of Greece SA(a) | | | 4,038,955 | |
| | | | | | | | 13,508,469 | |
| HONG KONG — 0.5% | | | | |
| | 330,000 | | | Analogue Holdings Ltd. | | | 75,496 | |
| | 534,900 | | | ASM Pacific Technology Ltd. | | | 5,778,336 | |
| | 114,414 | | | Build King Holdings Ltd. | | | 14,558 | |
| | 263,479 | | | Champion REIT | | | 138,504 | |
| | 893,301 | | | Chow Sang Sang Holdings International Ltd. | | | 1,269,830 | |
| | 2,632,710 | | | COSCO SHIPPING Ports Ltd. | | | 2,192,656 | |
| | 2,900,000 | | | Emperor Watch & Jewellery Ltd. | | | 67,464 | |
| Shares | | | | | Value | |
| HONG KONG (continued) | | | | |
| | 349,000 | | | Far East Consortium International Ltd. | | $ | 115,279 | |
| | 114,495 | | | FSE Lifestyle Services Ltd. | | | 98,006 | |
| | 1,130,000 | | | Giordano International Ltd. | | | 220,757 | |
| | 10,000 | | | Great Eagle Holdings Ltd. | | | 27,569 | |
| | 117,500 | | | G-Resources Group Ltd.(a) | | | 44,399 | |
| | 487,000 | | | Guotai Junan International Holdings Ltd. | | | 70,729 | |
| | 420,385 | | | HKR International Ltd. | | | 168,575 | |
| | 350,700 | | | Hutchison Port Holdings Trust - Units | | | 75,401 | |
| | 128,000 | | | Hysan Development Co. Ltd. | | | 445,010 | |
| | 504,000 | | | International Housewares Retail Co. Ltd. | | | 175,547 | |
| | 3,604,000 | | | IRC Ltd.(a) | | | 114,876 | |
| | 205,918 | | | Jacobson Pharma Corp. Ltd. | | | 15,350 | |
| | 20,242 | | | Jinhui Shipping & Transportation Ltd. | | | 29,352 | |
| | 1,136,437 | | | Johnson Electric Holdings Ltd. | | | 2,523,955 | |
| | 107,031 | | | Kerry Logistics Network Ltd. | | | 259,994 | |
| | 1,544,500 | | | Kerry Properties Ltd. | | | 4,357,275 | |
| | 122,000 | | | LH GROUP Ltd. | | | 15,367 | |
| | 278,374 | | | Luk Fook Holdings International Ltd. | | | 760,291 | |
| | 202,057 | | | Modern Dental Group Ltd. | | | 172,179 | |
| | 3,507,000 | | | Nine Dragons Paper Holdings Ltd. | | | 4,408,259 | |
| | 44,788 | | | Oriental Watch Holdings | | | 23,889 | |
| | 9,000,825 | | | Pacific Basin Shipping Ltd. | | | 4,164,639 | |
| | 780,562 | | | PC Partner Group Ltd. | | | 991,190 | |
| | 2,582,000 | | | Poly Property Group Co. Ltd. | | | 637,162 | |
| | 1,172,000 | | | Prosperity REIT | | | 459,431 | |
| | 272,000 | | | Prosperous Industrial Holdings Ltd. | | | 48,943 | |
| | 372,000 | | | Singamas Container Holdings Ltd. | | | 43,987 | |
| | 2,153,000 | | | SITC International Holdings Co. Ltd. | | | 7,291,504 | |
| | 200,000 | | | SOCAM Development Ltd.(a) | | | 37,787 | |
| | 2,826,000 | | | Solomon Systech International Ltd. | | | 276,044 | |
| | 38,000 | | | Stella International Holdings Ltd. | | | 45,275 | |
| | 3,590,000 | | | Sun Art Retail Group Ltd. | | | 2,113,258 | |
| | 117,198 | | | Sun Hung Kai & Co. Ltd. | | | 61,005 | |
| | 1,156,177 | | | Tai Hing Group Holdings Ltd. | | | 227,357 | |
| | 1,397 | | | Tang Palace China Holdings Ltd. | | | 129 | |
| | 851,500 | | | Texhong Textile Group Ltd. | | | 1,273,885 | |
| | 1,118,564 | | | Texwinca Holdings Ltd. | | | 228,586 | |
| | 1,464,000 | | | Time Interconnect Technology Ltd. | | | 88,436 | |
| | 497,600 | | | Tsit Wing International Holdings Ltd. | | | 63,315 | |
| | 6,838,000 | | | United Laboratories International Holdings Ltd. (The) | | | 4,332,799 | |
| | 1,006,600 | | | Valuetronics Holdings Ltd. | | | 432,946 | |
| | 1,178,000 | | | VSTECS Holdings Ltd. | | | 1,115,849 | |
| | 59,000 | | | VTech Holdings Ltd. | | | 453,846 | |
| | 135,331 | | | Wai Kee Holdings Ltd. | | | 65,748 | |
| | | | | | | | 48,112,024 | |
| ICELAND — 0.1% | | | | |
| | 1,224,790 | | | Ossur HF(a) | | | 7,974,934 | |
| Old Westbury Funds, Inc. | |
| Small & Mid Cap Strategies Fund | |
| Portfolio of Investments - (Continued) | October 31, 2021 |
| | |
| Shares | | | | | Value | |
| INDIA — 0.8% | | | | |
| | 6,013,944 | | | Bank of Baroda(a) | | $ | 7,830,526 | |
| | 2,190,500 | | | Bharat Heavy Electricals Ltd.(a) | | | 1,996,516 | |
| | 132,746 | | | IndiaMart InterMesh Ltd.(b) | | | 12,668,983 | |
| | 5,705,879 | | | Indian Oil Corp. Ltd. | | | 9,749,667 | |
| | 400,191 | | | Lupin Ltd. | | | 4,932,293 | |
| | 5,143,880 | | | Steel Authority of India Ltd. | | | 7,906,660 | |
| | 60,693 | | | Sun TV Network Ltd. | | | 454,704 | |
| | 5,047,781 | | | TV18 Broadcast Ltd.(a) | | | 2,800,905 | |
| | 234,461 | | | WNS Holdings Ltd. - ADR(a) | | | 20,822,481 | |
| | 1,044,380 | | | Zee Entertainment Enterprises Ltd. | | | 4,197,395 | |
| | | | | | | | 73,360,130 | |
| INDONESIA — 0.0% | | | | |
| | 22,129,300 | | | Perusahaan Gas Negara Tbk PT(a) | | | 2,358,584 | |
| IRELAND — 0.2% | | | | |
| | 390,746 | | | Alkermes Plc(a) | | | 11,835,696 | |
| | 52,828 | | | COSMO Pharmaceuticals NV(a) | | | 4,021,529 | |
| | 124,792 | | | Grafton Group Plc - Units | | | 2,290,215 | |
| | | | | | | | 18,147,440 | |
| ISRAEL — 2.9% | | | | |
| | 18,785 | | | Airport City Ltd.(a) | | | 357,849 | |
| | 27,267 | | | Alony Hetz Properties & Investments Ltd. | | | 444,548 | |
| | 161,848 | | | Bezeq The Israeli Telecommunication Corp. Ltd.(a) | | 202,595 | |
| | 1,057 | | | Blue Square Real Estate Ltd. | | | 81,504 | |
| | 158,371 | | | Compugen Ltd.(a) | | | 1,027,828 | |
| | 277,444 | | | CyberArk Software Ltd.(a) | | | 49,970,439 | |
| | 5,435 | | | Danel Adir Yeoshua Ltd. | | | 1,147,338 | |
| | 43,216 | | | Delek Automotive Systems Ltd. | | | 564,996 | |
| | 12,662 | | | Delta Galil Industries Ltd. | | | 647,835 | |
| | 715 | | | Duniec Brothers Ltd. | | | 39,700 | |
| | 10,272 | | | Electra Consumer Products 1970 Ltd. | | | 481,082 | |
| | 9,607 | | | FIBI Holdings Ltd. | | | 422,005 | |
| | 8,790 | | | First International Bank of Israel Ltd. (The) | | | 351,672 | |
| | 2,901 | | | Formula Systems 1985 Ltd. | | | 310,970 | |
| | 1,219 | | | Fox Wizel Ltd. | | | 167,767 | |
| | 10,947 | | | Gav-Yam Lands Corp. Ltd. | | | 130,146 | |
| | 1,576 | | | Israel Corp. Ltd. (The)(a) | | | 579,828 | |
| | 6,900,100 | | | Isramco Negev 2 LP | | | 1,870,933 | |
| | 236,596 | | | JFrog Ltd.(a) | | | 7,734,323 | |
| | 312,151 | | | Kornit Digital Ltd.(a) | | | 52,216,619 | |
| | 1,232,057 | | | Max Stock Ltd. | | | 5,018,792 | |
| | 5,284 | | | Melisron Ltd.(a) | | | 446,352 | |
| | 7,233 | | | Naphtha Israel Petroleum Corp. Ltd.(a) | | | 44,778 | |
| | 1,016 | | | Neto ME Holdings Ltd. | | | 50,056 | |
| | 447,076 | | | Nice Ltd. - ADR(a) | | | 126,531,450 | |
| | 330 | | | Norstar Holdings, Inc. | | | 2,837 | |
| | 478,267 | | | Oil Refineries Ltd.(a) | | | 129,378 | |
| | 68,459 | | | Phoenix Holdings Ltd. (The) | | | 862,566 | |
| Shares | | | | | Value | |
| ISRAEL (continued) | | | | |
| | 206,747 | | | Plus500 Ltd. | | $ | 3,724,953 | |
| | 700,981 | | | Radware Ltd.(a) | | | 24,835,757 | |
| | 58,124 | | | Rami Levy Chain Stores Hashikma Marketing 2006 Ltd. | | | 4,371,676 | |
| | 117,400 | | | Ratio Oil Exploration 1992 LP(a) | | | 56,653 | |
| | 742,780 | | | Sarine Technologies Ltd. | | | 382,819 | |
| | 3,532 | | | Scope Metals Group Ltd. | | | 159,391 | |
| | 7,226 | | | Tadiran Group Ltd. | | | 940,829 | |
| | 7,517 | | | YH Dimri Construction & Development Ltd. | | | 538,770 | |
| | | | | | | | 286,847,034 | |
| ITALY — 0.5% | | | | |
| | 64,676 | | | Aeffe SpA(a) | | | 187,661 | |
| | 801 | | | Alkemy SpA(a) | | | 17,917 | |
| | 16,534 | | | Aquafil SpA(a) | | | 148,510 | |
| | 140,236 | | | Arnoldo Mondadori Editore SpA(a) | | | 324,226 | |
| | 274,489 | | | Azimut Holding SpA | | | 7,897,828 | |
| | 100,044 | | | Banca IFIS SpA | | | 1,849,257 | |
| | 133,952 | | | Banca Mediolanum SpA | | | 1,348,111 | |
| | 68,270 | | | Banca Popolare di Sondrio SCPA | | | 296,424 | |
| | 396,834 | | | Banco BPM SpA | | | 1,232,176 | |
| | 97,891 | | | Biesse SpA(a) | | | 3,025,952 | |
| | 319,730 | | | Cairo Communication SpA | | | 669,729 | |
| | 14,298 | | | Credito Emiliano SpA | | | 108,427 | |
| | 41,355 | | | Danieli & C Officine Meccaniche SpA | | | 893,023 | |
| | 30,300 | | | Datalogic SpA | | | 550,271 | |
| | 891,642 | | | Davide Campari-Milano NV | | | 12,657,464 | |
| | 58,173 | | | Digital Bros SpA | | | 2,812,311 | |
| | 4,948 | | | Digital Value SpA(a) | | | 520,510 | |
| | 4,312 | | | Digital360 SpA(a) | | | 24,525 | |
| | 9,952 | | | El.En. SpA | | | 199,028 | |
| | 24,978 | | | Elica SpA(a) | | | 103,660 | |
| | 23,216 | | | Exprivia SpA(a) | | | 50,992 | |
| | 8,226 | | | Fine Foods & Pharmaceuticals NTM | | | 169,740 | |
| | 13,310 | | | Gefran SpA | | | 173,866 | |
| | 4,369 | | | GPI SpA | | | 62,880 | |
| | 11,139 | | | Gruppo MutuiOnline SpA | | | 544,040 | |
| | 207,517 | | | Immobiliare Grande Distribuzione SIIQ SpA REIT(a) | | | 909,182 | |
| | 6,503 | | | Interpump Group SpA | | | 479,239 | |
| | 5,820 | | | Italian Wine Brands SpA | | | 286,609 | |
| | 46 | | | Italmobiliare SpA | | | 1,614 | |
| | 173,385 | | | Leonardo SpA(a) | | | 1,270,345 | |
| | 1,467 | | | MARR SpA | | | 34,528 | |
| | 933,189 | | | Mediaset NV | | | 2,619,245 | |
| | 9,447 | | | Prima Industrie SpA(a) | | | 208,368 | |
| | 1,769 | | | Reply SpA | | | 342,940 | |
| | 148,724 | | | Rizzoli Corriere Della Sera Mediagroup SpA | | | 122,239 | |
| | 2,056 | | | Sabaf SpA | | | 66,073 | |
| | 10,622 | | | Sanlorenzo SpA | | | 445,729 | |
| | 23,783 | | | Seco SpA(a) | | | 219,395 | |
| Old Westbury Funds, Inc. | |
| Small & Mid Cap Strategies Fund | |
| Portfolio of Investments - (Continued) | October 31, 2021 |
| | |
| Shares | | | | | Value | |
| ITALY (continued) | | | | |
| | 2,524 | | | Sesa SpA | | $ | 494,849 | |
| | 6,963 | | | SIT SpA | | | 92,164 | |
| | 104,789 | | | Sogefi SpA(a) | | | 165,956 | |
| | 37,784 | | | Tinexta SpA | | | 1,672,879 | |
| | 203,454 | | | Unipol Gruppo SpA | | | 1,168,908 | |
| | | | | | | | 46,468,790 | |
| JAPAN — 6.1% | | | | |
| | 40,900 | | | 77 Bank Ltd. (The) | | | 416,984 | |
| | 4,500 | | | A&A Material Corp. | | | 38,100 | |
| | 70,900 | | | A&D Co. Ltd. | | | 628,909 | |
| | 4,900 | | | Abist Co. Ltd. | | | 123,387 | |
| | 2,600 | | | Achilles Corp. | | | 29,907 | |
| | 22,800 | | | Advanced Media, Inc.(a) | | | 154,434 | |
| | 92,300 | | | AEON Financial Service Co. Ltd. | | | 1,167,770 | |
| | 9,300 | | | Ai Holdings Corp. | | | 175,025 | |
| | 4,700 | | | Aichi Steel Corp. | | | 109,320 | |
| | 9,400 | | | Aida Engineering Ltd. | | | 85,031 | |
| | 6,600 | | | Aiphone Co. Ltd. | | | 136,488 | |
| | 32,800 | | | Aisan Industry Co. Ltd. | | | 240,586 | |
| | 51,900 | | | Akatsuki, Inc. | | | 1,411,625 | |
| | 106,492 | | | Altech Corp. | | | 1,911,670 | |
| | 46,700 | | | Anest Iwata Corp. | | | 371,224 | |
| | 2,900 | | | AOI Electronics Co. Ltd. | | | 62,542 | |
| | 2,300 | | | Arakawa Chemical Industries Ltd. | | | 24,983 | |
| | 4,100 | | | Arata Corp. | | | 144,791 | |
| | 11,900 | | | Arealink Co. Ltd. | | | 161,625 | |
| | 8,300 | | | Argo Graphics, Inc. | | | 230,121 | |
| | 20,400 | | | Artiza Networks, Inc. | | | 220,869 | |
| | 85,300 | | | Asahi Co. Ltd. | | | 989,398 | |
| | 174,500 | | | Asahi Diamond Industrial Co. Ltd. | | | 1,070,195 | |
| | 22,500 | | | Asahi Net, Inc. | | | 141,939 | |
| | 6,200 | | | ASAHI YUKIZAI CORP. | | | 74,743 | |
| | 50,000 | | | Asia Pile Holdings Corp. | | | 203,115 | |
| | 7,600 | | | ASKA Pharmaceutical Holdings Co. Ltd. | | | 65,681 | |
| | 28,200 | | | Astena Holdings Co. Ltd. | | | 139,546 | |
| | 48,504 | | | Ateam, Inc. | | | 702,186 | |
| | 63,696 | | | Avant Corp. | | | 887,469 | |
| | 660,600 | | | Azbil Corp. | | | 28,110,638 | |
| | 35,200 | | | Bando Chemical Industries Ltd. | | | 271,779 | |
| | 391,500 | | | BASE, Inc.(a) | | | 3,194,516 | |
| | 10,300 | | | BayCurrent Consulting, Inc. | | | 4,238,386 | |
| | 74,400 | | | BML, Inc. | | | 2,607,835 | |
| | 258,300 | | | Bunka Shutter Co. Ltd. | | | 2,511,045 | |
| | 1,700 | | | Canare Electric Co. Ltd. | | | 25,506 | |
| | 415,900 | | | Capcom Co. Ltd. | | | 11,166,080 | |
| | 943,900 | | | Carenet, Inc. | | | 10,343,769 | |
| | 3,000 | | | Carlit Holdings Co. Ltd. | | | 19,978 | |
| | 3,000 | | | Central Glass Co. Ltd. | | | 55,644 | |
| | 170,300 | | | Chiba Kogyo Bank Ltd. (The) | | | 403,431 | |
| | 1,800 | | | Chino Corp. | | | 22,173 | |
| | 1,138,780 | | | CKD Corp. | | | 22,470,860 | |
| Shares | | | | | Value | |
| JAPAN (continued) | | | | |
| | 5,200 | | | Cleanup Corp. | | $ | 25,321 | |
| | 95,000 | | | COLOPL, Inc.(a) | | | 685,150 | |
| | 212,400 | | | Computer Engineering & Consulting Ltd. | | | 2,521,406 | |
| | 49,900 | | | CONEXIO Corp. | | | 637,459 | |
| | 2,300 | | | Copro-Holdings Co. Ltd. | | | 24,720 | |
| | 1,800 | | | Core Corp. | | | 25,269 | |
| | 21,000 | | | Cosel Co. Ltd. | | | 170,616 | |
| | 15,500 | | | Cosmo Energy Holdings Co. Ltd. | | | 317,276 | |
| | 13,200 | | | Creek & River Co. Ltd. | | | 228,039 | |
| | 2,900 | | | Creo Co. Ltd. | | | 25,393 | |
| | 52,100 | | | Cresco Ltd. | | | 951,262 | |
| | 3,500 | | | CTI Engineering Co. Ltd. | | | 83,865 | |
| | 19,200 | | | CTS Co. Ltd. | | | 133,924 | |
| | 31,500 | | | Cybernet Systems Co. Ltd. | | | 175,499 | |
| | 4,300 | | | Dai Nippon Toryo Co. Ltd. | | | 32,672 | |
| | 9,700 | | | Daihatsu Diesel Manufacturing Co. Ltd. | | | 50,213 | |
| | 16,400 | | | Daihen Corp. | | | 682,764 | |
| | 2,300 | | | Daiichi Jitsugyo Co. Ltd. | | | 106,751 | |
| | 6,000 | | | Daiken Corp. | | | 130,818 | |
| | 61,200 | | | Daiken Medical Co. Ltd. | | | 309,289 | |
| | 13,679 | | | Daikoku Denki Co. Ltd. | | | 145,341 | |
| | 248,649 | | | Daikokutenbussan Co. Ltd. | | | 14,136,833 | |
| | 20,900 | | | Daito Pharmaceutical Co. Ltd. | | | 586,795 | |
| | 38,500 | | | Daitron Co. Ltd. | | | 764,764 | |
| | 3,600 | | | Daiwa Industries Ltd. | | | 39,893 | |
| | 70,251 | | | DCM Holdings Co. Ltd. | | | 683,557 | |
| | 28,900 | | | Dear Life Co. Ltd. | | | 145,039 | |
| | 10,500 | | | Dexerials Corp. | | | 211,704 | |
| | 2,400 | | | Digital Hearts Holdings Co. Ltd. | | | 38,093 | |
| | 40,100 | | | Digital Holdings, Inc. | | | 613,242 | |
| | 118,305 | | | Dip Corp. | | | 4,245,382 | |
| | 1,700 | | | DMS, Inc. | | | 22,605 | |
| | 117,700 | | | Doshisha Co. Ltd. | | | 1,840,240 | |
| | 69,500 | | | Drecom Co. Ltd.(a) | | | 314,038 | |
| | 58,000 | | | Duskin Co. Ltd. | | | 1,393,323 | |
| | 10,000 | | | E-Guardian, Inc. | | | 273,744 | |
| | 40,500 | | | Eiken Chemical Co. Ltd. | | | 678,701 | |
| | 6,200 | | | Eizo Corp. | | | 236,631 | |
| | 4,600 | | | Elematec Corp. | | | 45,808 | |
| | 192,650 | | | en Japan, Inc. | | | 7,623,176 | |
| | 19,500 | | | Enigmo, Inc. | | | 184,435 | |
| | 22,400 | | | Exedy Corp. | | | 332,733 | |
| | 8,500 | | | FALCO HOLDINGS Co. Ltd. | | | 126,558 | |
| | 341,500 | | | FAN Communications, Inc. | | | 1,351,318 | |
| | 1,900 | | | FCC Co. Ltd. | | | 26,256 | |
| | 103,400 | | | Ferrotec Holdings Corp. | | | 3,447,423 | |
| | 44,500 | | | Fields Corp. | | | 202,637 | |
| | 14,871 | | | First Bank of Toyama Ltd. (The) | | | 37,447 | |
| | 3,000 | | | Forum Engineering, Inc. | | | 24,979 | |
| | 120,100 | | | Foster Electric Co. Ltd. | | | 853,529 | |
| | 107,000 | | | Freee KK(a) | | | 7,641,851 | |
| Old Westbury Funds, Inc. | |
| Small & Mid Cap Strategies Fund | |
| Portfolio of Investments - (Continued) | October 31, 2021 |
| | |
| Shares | | | | | Value | |
| JAPAN (continued) | | | | |
| | 15,800 | | | Fudo Tetra Corp. | | $ | 251,053 | |
| | 4,800 | | | Fuji Corp. Ltd. | | | 28,975 | |
| | 23,400 | | | Fuji Pharma Co. Ltd. | | | 225,428 | |
| | 40,500 | | | Fuji Soft, Inc. | | | 2,053,871 | |
| | 348,000 | | | Fujikura Ltd.(a) | | | 1,868,620 | |
| | 30,300 | | | Fujisash Co. Ltd. | | | 20,470 | |
| | 836,700 | | | Fujitec Co. Ltd. | | | 18,932,655 | |
| | 73,853 | | | Fukui Computer Holdings, Inc. | | | 2,656,699 | |
| | 1,000 | | | Fukushima Galilei Co. Ltd. | | | 39,658 | |
| | 12,600 | | | Full Speed, Inc. | | | 41,788 | |
| | 128,600 | | | FULLCAST Holdings Co. Ltd. | | | 2,991,170 | |
| | 1,400 | | | Funai Soken Holdings, Inc. | | | 38,754 | |
| | 111,700 | | | Furuno Electric Co. Ltd. | | | 1,189,768 | |
| | 83,783 | | | Furyu Corp. | | | 1,212,915 | |
| | 72,200 | | | Future Corp. | | | 2,106,295 | |
| | 30,200 | | | Gakujo Co. Ltd. | | | 314,785 | |
| | 12,200 | | | Gecoss Corp. | | | 92,055 | |
| | 18,000 | | | GLOBERIDE, Inc. | | | 649,879 | |
| | 48,600 | | | Glory Ltd. | | | 1,042,997 | |
| | 22,100 | | | GMO Financial Gate, Inc. | | | 5,718,175 | |
| | 2,700 | | | GMO Pepabo, Inc. | | | 64,411 | |
| | 64,776 | | | Goldcrest Co. Ltd. | | | 925,818 | |
| | 21,400 | | | Grandy House Corp. | | | 91,064 | |
| | 505,300 | | | Gree, Inc. | | | 4,247,224 | |
| | 17,400 | | | GSI Creos Corp. | | | 150,528 | |
| | 353,580 | | | GungHo Online Entertainment, Inc. | | | 6,620,221 | |
| | 23,900 | | | Gunosy, Inc.(a) | | | 137,141 | |
| | 23,200 | | | Gunze Ltd. | | | 892,582 | |
| | 86,500 | | | H.U. Group Holdings, Inc. | | | 2,128,822 | |
| | 34,200 | | | Hanwa Co. Ltd. | | | 1,021,724 | |
| | 29,100 | | | Happinet Corp. | | | 382,723 | |
| | 3,100 | | | Heiwa Real Estate Co. Ltd. | | | 97,644 | |
| | 163,700 | | | Hennge KK(a) | | | 8,057,530 | |
| | 2,600 | | | HI-LEX Corp. | | | 41,427 | |
| | 3,600 | | | Himaraya Co. Ltd. | | | 33,292 | |
| | 16,000 | | | Hioki EE Corp. | | | 1,113,227 | |
| | 29,100 | | | Hito Communications Holdings, Inc. | | | 560,426 | |
| | 32,800 | | | Hochiki Corp. | | | 360,016 | |
| | 111,600 | | | Hokuhoku Financial Group, Inc. | | | 798,996 | |
| | 7,200 | | | Hoosiers Holdings | | | 44,283 | |
| | 18,700 | | | Hosiden Corp. | | | 196,393 | |
| | 81 | | | Ichigo Hotel REIT Investment Corp. | | | 69,292 | |
| | 2,200 | | | ID Holdings Corp. | | | 18,125 | |
| | 22,100 | | | Idec Corp. | | | 466,335 | |
| | 34,000 | | | IMAGICA GROUP, Inc.(a) | | | 173,020 | |
| | 44,600 | | | Ines Corp. | | | 649,972 | |
| | 30,700 | | | Infocom Corp. | | | 587,738 | |
| | 1,867,000 | | | Infomart Corp. | | | 18,182,672 | |
| | 50,500 | | | Intage Holdings, Inc. | | | 850,713 | |
| | 165,000 | | | Internet Initiative Japan, Inc. | | | 5,740,075 | |
| | 37,000 | | | I-O Data Device, Inc. | | | 294,442 | |
| | 2,000 | | | I-PEX, Inc. | | | 35,973 | |
| | 17,300 | | | ISB Corp. | | | 188,217 | |
| Shares | | | | | Value | |
| JAPAN (continued) | | | | |
| | 14,200 | | | Iseki & Co. Ltd.(a) | | $ | 204,575 | |
| | 4,100 | | | Isolite Insulating Products Co. Ltd. | | | 31,800 | |
| | 57,000 | | | Itfor, Inc. | | | 443,597 | |
| | 71,800 | | | Itoki Corp. | | | 228,047 | |
| | 2,500 | | | Iwaki Co. Ltd. | | | 22,000 | |
| | 6,300 | | | Iwasaki Electric Co. Ltd. | | | 115,525 | |
| | 90,100 | | | JAC Recruitment Co. Ltd. | | | 1,764,450 | |
| | 70,300 | | | Japan Aviation Electronics Industry Ltd. | | | 1,161,438 | |
| | 14,400 | | | Japan Lifeline Co. Ltd. | | | 154,771 | |
| | 1,200 | | | Japan Living Warranty, Inc. | | | 35,850 | |
| | 18,200 | | | Japan Petroleum Exploration Co. Ltd. | | | 331,664 | |
| | 11,400 | | | Japan Pulp & Paper Co. Ltd. | | | 384,084 | |
| | 24,200 | | | Japan System Techniques Co. Ltd. | | | 471,791 | |
| | 42,091 | | | JBCC Holdings, Inc. | | | 641,475 | |
| | 212,600 | | | Jeol Ltd. | | | 16,041,764 | |
| | 23,100 | | | Joshin Denki Co. Ltd. | | | 479,531 | |
| | 134,900 | | | Juki Corp. | | | 1,003,687 | |
| | 58,400 | | | JVCKenwood Corp. | | | 100,429 | |
| | 7,800 | | | Kaga Electronics Co. Ltd. | | | 213,863 | |
| | 43,200 | | | Kaken Pharmaceutical Co. Ltd. | | | 1,701,847 | |
| | 129,800 | | | Kanamoto Co. Ltd. | | | 2,771,952 | |
| | 7,100 | | | Kaneka Corp. | | | 271,915 | |
| | 14,600 | | | Kanematsu Corp. | | | 169,090 | |
| | 2,100 | | | Kanematsu Electronics Ltd. | | | 68,449 | |
| | 22,100 | | | Kawai Musical Instruments Manufacturing Co. Ltd. | | | 680,597 | |
| | 2,000 | | | Keihanshin Building Co. Ltd. | | | 24,900 | |
| | 45,300 | | | Kimoto Co. Ltd. | | | 92,210 | |
| | 45,300 | | | Kissei Pharmaceutical Co. Ltd. | | | 905,006 | |
| | 65,800 | | | Kito Corp. | | | 908,124 | |
| | 33,700 | | | Kitz Corp. | | | 224,716 | |
| | 230,800 | | | Kobe Bussan Co. Ltd. | | | 7,927,896 | |
| | 235,700 | | | Kojima Co. Ltd. | | | 1,209,778 | |
| | 8,387 | | | Komehyo Holdings Co. Ltd. | | | 136,650 | |
| | 87,500 | | | Komeri Co. Ltd. | | | 2,019,083 | |
| | 41,500 | | | Komori Corp. | | | 270,173 | |
| | 424,200 | | | Konica Minolta, Inc. | | | 2,091,690 | |
| | 1,700 | | | Konoshima Chemical Co. Ltd. | | | 43,583 | |
| | 31,000 | | | Kurabo Industries Ltd. | | | 514,876 | |
| | 3,900 | | | Kuriyama Holdings Corp. | | | 33,979 | |
| | 62,200 | | | Kyokuto Kaihatsu Kogyo Co. Ltd. | | | 848,070 | |
| | 11,600 | | | Kyokuto Securities Co. Ltd. | | | 77,452 | |
| | 9,000 | | | Kyoritsu Printing Co. Ltd. | | | 13,345 | |
| | 151,400 | | | M3, Inc. | | | 8,910,649 | |
| | 13,100 | | | Macnica Fuji Electronics Holdings, Inc. | | | 306,998 | |
| | 2,500 | | | Maezawa Kyuso Industries Co. Ltd. | | | 23,251 | |
| | 5,200 | | | Makino Milling Machine Co. Ltd. | | | 186,830 | |
| | 15,500 | | | Marubun Corp. | | | 108,660 | |
| | 5,400 | | | Marusan Securities Co. Ltd. | | | 28,380 | |
| | 227,600 | | | Marvelous, Inc. | | | 1,441,783 | |
| | 54,300 | | | Max Co. Ltd. | | | 862,321 | |
| Old Westbury Funds, Inc. | |
| Small & Mid Cap Strategies Fund | |
| Portfolio of Investments - (Continued) | October 31, 2021 |
| | |
| Shares | | | | | Value | |
| JAPAN (continued) | | | | |
| | 38,000 | | | Maxell Ltd. | | $ | 455,767 | |
| | 448,700 | | | Mazda Motor Corp.(a) | | | 4,011,628 | |
| | 72,400 | | | Megachips Corp. | | | 2,280,465 | |
| | 96,300 | | | Meidensha Corp. | | | 2,020,209 | |
| | 2,700 | | | Meiho Facility Works Ltd. | | | 21,605 | |
| | 3,300 | | | Meiji Electric Industries Co. Ltd. | | | 38,740 | |
| | 57,800 | | | Meiko Network Japan Co. Ltd. | | | 288,049 | |
| | 66,500 | | | Meitec Corp. | | | 3,979,206 | |
| | 16,200 | | | Melco Holdings, Inc. | | | 667,331 | |
| | 242,700 | | | Micronics Japan Co. Ltd. | | | 3,200,510 | |
| | 4,600 | | | Mimaki Engineering Co. Ltd. | | | 37,454 | |
| | 15,300 | | | Mimasu Semiconductor Industry Co. Ltd. | | | 334,123 | |
| | 43,200 | | | Mito Securities Co. Ltd. | | | 111,814 | |
| | 9,800 | | | Mitsubishi Paper Mills Ltd.(a) | | | 30,868 | |
| | 2,000 | | | Mitsubishi Pencil Co. Ltd. | | | 23,935 | |
| | 25,700 | | | Mitsubishi Research Institute, Inc. | | | 956,069 | |
| | 34,600 | | | Mitsuboshi Belting Ltd. | | | 612,615 | |
| | 112,600 | | | Mitsui Matsushima Holdings Co. Ltd. | | | 1,459,181 | |
| | 3,100 | | | Mitsui-Soko Holdings Co. Ltd. | | | 62,041 | |
| | 164,600 | | | Mixi, Inc. | | | 3,762,079 | |
| | 72,150 | | | Mizuno Corp. | | | 1,672,475 | |
| | 18,400 | | | Mochida Pharmaceutical Co. Ltd. | | | 534,363 | |
| | 161,600 | | | Money Forward, Inc.(a) | | | 10,945,839 | |
| | 627,000 | | | MonotaRO Co. Ltd. | | | 14,193,113 | |
| | 2,900 | | | MORESCO Corp. | | | 30,482 | |
| | 206,746 | | | Morinaga Milk Industry Co. Ltd. | | | 12,117,247 | |
| | 3,800 | | | Mory Industries, Inc. | | | 90,153 | |
| | 46,580 | | | Mugen Estate Co. Ltd. | | | 200,256 | |
| | 8,200 | | | Nachi-Fujikoshi Corp. | | | 309,726 | |
| | 1,500 | | | Nafco Co. Ltd. | | | 22,663 | |
| | 31,600 | | | Nagano Keiki Co. Ltd. | | | 362,925 | |
| | 4,300 | | | Naigai Trans Line Ltd. | | | 82,850 | |
| | 4,400 | | | Nakabayashi Co. Ltd. | | | 22,082 | |
| | 3,900 | | | Nakamoto Packs Co. Ltd. | | | 59,608 | |
| | 4,300 | | | Nakanishi, Inc. | | | 99,601 | |
| | 13,600 | | | Nakayama Steel Works Ltd. | | | 51,548 | |
| | 2,500 | | | Narumiya International Co. Ltd. | | | 25,005 | |
| | 4,900 | | | NCS&A Co. Ltd. | | | 21,711 | |
| | 3,000 | | | Nicca Chemical Co. Ltd. | | | 24,979 | |
| | 1,400 | | | Nice Corp. | | | 23,265 | |
| | 15,900 | | | Nichiban Co. Ltd. | | | 257,943 | |
| | 4,500 | | | Nichiha Corp. | | | 129,107 | |
| | 23,200 | | | Nihon Falcom Corp. | | | 276,833 | |
| | 2,900 | | | Nihon Kohden Corp. | | | 92,235 | |
| | 223,900 | | | Nihon Unisys Ltd. | | | 6,266,646 | |
| | 12,300 | | | Nikon Corp. | | | 134,790 | |
| | 2,200 | | | Nippon Carbide Industries Co., Inc. | | | 26,637 | |
| | 78,600 | | | Nippon Commercial Development Co. Ltd. | | | 1,191,672 | |
| | 3,600 | | | Nippon Light Metal Holdings Co. Ltd. | | | 59,603 | |
| | 96,800 | | | Nippon Sheet Glass Co. Ltd.(a) | | | 539,311 | |
| Shares | | | | | Value | |
| JAPAN (continued) | | | | |
| | 13,200 | | | Nippon Steel Trading Corp. | | $ | 595,288 | |
| | 2,061 | | | Nippon Systemware Co. Ltd. | | | 45,026 | |
| | 9,600 | | | Nippon Thompson Co. Ltd. | | | 49,274 | |
| | 116,500 | | | Nishi-Nippon Financial Holdings, Inc. | | | 679,732 | |
| | 16,500 | | | Nishio Rent All Co. Ltd. | | | 406,655 | |
| | 5,400 | | | Nissei ASB Machine Co. Ltd. | | | 175,539 | |
| | 3,200 | | | Nissei Plastic Industrial Co. Ltd. | | | 30,519 | |
| | 53,200 | | | Nissha Co. Ltd. | | | 866,790 | |
| | 117,600 | | | Nisshinbo Holdings, Inc. | | | 905,925 | |
| | 33,400 | | | Nissin Electric Co. Ltd. | | | 412,024 | |
| | 27,000 | | | Nisso Corp. | | | 170,090 | |
| | 3,400 | | | Nissui Pharmaceutical Co. Ltd. | | | 28,996 | |
| | 13,500 | | | Nitta Corp. | | | 308,673 | |
| | 122,500 | | | Nitto Kogyo Corp. | | | 1,816,407 | |
| | 26,200 | | | Nitto Seiko Co. Ltd. | | | 150,568 | |
| | 20,500 | | | Nojima Corp. | | | 448,401 | |
| | 14,000 | | | Nomura Real Estate Holdings, Inc. | | | 340,127 | |
| | 9,300 | | | Noritake Co. Ltd. | | | 405,128 | |
| | 29,500 | | | Noritz Corp. | | | 472,104 | |
| | 207,722 | | | NSD Co. Ltd. | | | 3,945,761 | |
| | 110,500 | | | NTN Corp.(a) | | | 238,500 | |
| | 1,000 | | | OBIC Business Consultants Co. Ltd. | | | 49,221 | |
| | 42,300 | | | Obic Co. Ltd. | | | 7,790,103 | |
| | 93,400 | | | Okamura Corp. | | | 1,227,578 | |
| | 376,300 | | | Oki Electric Industry Co. Ltd. | | | 3,086,997 | |
| | 1,600 | | | Okura Industrial Co. Ltd. | | | 29,508 | |
| | 16,800 | | | Optex Group Co. Ltd. | | | 213,141 | |
| | 2,900 | | | Oricon, Inc. | | | 25,521 | |
| | 2,854 | | | Origin Co. Ltd. | | | 32,177 | |
| | 162,000 | | | Osaki Electric Co. Ltd. | | | 797,385 | |
| | 42,030 | | | Oyo Corp. | | | 642,758 | |
| | 10,900 | | | PAPYLESS Co. Ltd. | | | 131,594 | |
| | 17,200 | | | Paramount Bed Holdings Co. Ltd. | | | 320,383 | |
| | 4,800 | | | Pasco Corp. | | | 63,803 | |
| | 67,200 | | | Pasona Group, Inc. | | | 1,871,989 | |
| | 40,600 | | | Pegasus Sewing Machine Manufacturing Co. Ltd. | | | 163,148 | |
| | 222,200 | | | PeptiDream, Inc.(a) | | | 5,367,112 | |
| | 4,800 | | | Pilot Corp. | | | 175,617 | |
| | 83,500 | | | Plus Alpha Consulting Co. Ltd. | | | 2,197,850 | |
| | 58,300 | | | Poletowin Pitcrew Holdings, Inc. | | | 524,304 | |
| | 700 | | | Pronexus, Inc. | | | 6,510 | |
| | 87,152 | | | Proto Corp. | | | 1,075,875 | |
| | 18,000 | | | Punch Industry Co. Ltd. | | | 91,757 | |
| | 4,500 | | | Quick Co. Ltd. | | | 56,657 | |
| | 596,000 | | | Raccoon Holdings, Inc. | | | 8,314,455 | |
| | 246,090 | | | Relia, Inc. | | | 2,517,578 | |
| | 1,100 | | | Rhythm Co. Ltd. | | | 13,463 | |
| | 11,900 | | | Riken Corp. | | | 280,233 | |
| | 80,400 | | | Riken Technos Corp. | | | 385,864 | |
| | 7,600 | | | Rion Co. Ltd. | | | 165,036 | |
| | 121,400 | | | Rohm Co. Ltd. | | | 11,056,214 | |
| | 204,400 | | | Roland Corp. | | | 8,357,131 | |
| Old Westbury Funds, Inc. | |
| Small & Mid Cap Strategies Fund | |
| Portfolio of Investments - (Continued) | October 31, 2021 |
| | |
| Shares | | | | | Value | |
| JAPAN (continued) | | | | |
| | 57,900 | | | Roland DG Corp. | | $ | 1,516,906 | |
| | 6,700 | | | Ryobi Ltd. | | | 70,072 | |
| | 100 | | | Saison Information Systems Co. Ltd. | | | 1,704 | |
| | 11,700 | | | Sakai Chemical Industry Co. Ltd. | | | 217,524 | |
| | 1,100 | | | Sakai Heavy Industries Ltd. | | | 24,225 | |
| | 13,600 | | | Sangetsu Corp. | | | 186,743 | |
| | 55,200 | | | Sanken Electric Co. Ltd. | | | 2,891,371 | |
| | 15,200 | | | Sankyo Tateyama, Inc. | | | 98,955 | |
| | 11,300 | | | Sansha Electric Manufacturing Co. Ltd. | | | 107,770 | |
| | 67,600 | | | Sanwa Holdings Corp. | | | 785,281 | |
| | 600 | | | Sanyo Denki Co. Ltd. | | | 34,323 | |
| | 9,200 | | | Sanyo Special Steel Co. Ltd. | | | 151,188 | |
| | 13,000 | | | Sanyo Trading Co. Ltd. | | | 124,440 | |
| | 56,400 | | | Sato Holdings Corp. | | | 1,295,505 | |
| | 2,800 | | | Sato Shoji Corp. | | | 29,308 | |
| | 36,940 | | | Sawai Group Holdings Co. Ltd. | | | 1,627,013 | |
| | 87,500 | | | SCREEN Holdings Co. Ltd. | | | 8,114,718 | |
| | 7,200 | | | Seed Co. Ltd. | | | 38,977 | |
| | 106,000 | | | Seikagaku Corp. | | | 933,749 | |
| | 78,500 | | | Seiko Holdings Corp. | | | 1,653,683 | |
| | 2,500 | | | Sekisui Jushi Corp. | | | 46,436 | |
| | 17,100 | | | Sekisui Kasei Co. Ltd. | | | 85,219 | |
| | 900 | | | Semba Corp. | | | 6,262 | |
| | 1,223,000 | | | SG Holdings Co. Ltd. | | | 30,581,707 | |
| | 6,300 | | | Shibaura Electronics Co. Ltd. | | | 363,159 | |
| | 20,900 | | | Shibaura Mechatronics Corp. | | | 1,340,461 | |
| | 20,400 | | | Shidax Corp.(a) | | | 78,575 | |
| | 700 | | | Shinagawa Refractories Co. Ltd. | | | 23,861 | |
| | 50,500 | | | Shindengen Electric Manufacturing Co. Ltd.(a) | | | 1,790,042 | |
| | 6,900 | | | Shinmaywa Industries Ltd. | | | 56,302 | |
| | 4,200 | | | Shinnihon Corp. | | | 30,696 | |
| | 82,300 | | | Shinoken Group Co. Ltd. | | | 813,071 | |
| | 1,997 | | | Shofu, Inc. | | | 41,263 | |
| | 3,400 | | | Sigma Koki Co. Ltd. | | | 53,070 | |
| | 7,100 | | | SIGMAXYZ Holdings, Inc. | | | 170,687 | |
| | 62,900 | | | Sinfonia Technology Co. Ltd. | | | 722,957 | |
| | 46,200 | | | Sinko Industries Ltd. | | | 835,025 | |
| | 49,200 | | | SK-Electronics Co. Ltd. | | | 396,276 | |
| | 1,300 | | | SMK Corp. | | | 26,565 | |
| | 92,900 | | | Sodick Co. Ltd. | | | 713,205 | |
| | 1,900 | | | Softcreate Holdings Corp. | | | 65,681 | |
| | 1,900 | | | Soken Chemical & Engineering Co. Ltd. | | | 29,506 | |
| | 115,413 | | | Soliton Systems KK | | | 1,437,916 | |
| | 11,200 | | | Sprix Ltd. | | | 114,874 | |
| | 9,600 | | | ST Corp. | | | 136,114 | |
| | 4,100 | | | Star Mica Holdings Co. Ltd. | | | 54,175 | |
| | 102,300 | | | Star Micronics Co. Ltd. | | | 1,338,270 | |
| | 54,600 | | | Starts Corp., Inc. | | | 1,309,250 | |
| | 10,200 | | | Studio Alice Co. Ltd. | | | 192,679 | |
| | 3,200 | | | Sumitomo Bakelite Co. Ltd. | | | 143,470 | |
| Shares | | | | | Value | |
| JAPAN (continued) | | | | |
| | 20,900 | | | Sumitomo Mitsui Construction Co. Ltd. | | $ | 88,569 | |
| | 21,600 | | | Sumitomo Riko Co. Ltd. | | | 140,241 | |
| | 47,200 | | | Sumitomo Rubber Industries Ltd. | | | 580,190 | |
| | 3,000 | | | Sumitomo Seika Chemicals Co. Ltd. | | | 85,413 | |
| | 37,700 | | | Sun Frontier Fudousan Co. Ltd. | | | 351,944 | |
| | 18,700 | | | Sun-Wa Technos Corp. | | | 252,177 | |
| | 3,200 | | | Takaoka Toko Co. Ltd. | | | 41,328 | |
| | 513,000 | | | Takara Leben Co. Ltd. | | | 1,395,306 | |
| | 4,300 | | | Takara Standard Co. Ltd. | | | 56,969 | |
| | 16,800 | | | Takasago International Corp. | | | 436,454 | |
| | 4,800 | | | Takeuchi Manufacturing Co. Ltd. | | | 123,185 | |
| | 124,400 | | | Tamron Co. Ltd. | | | 2,917,492 | |
| | 114,100 | | | Tanseisha Co. Ltd. | | | 931,020 | |
| | 27,600 | | | Tatsuta Electric Wire and Cable Co. Ltd. | | | 123,985 | |
| | 20,100 | | | TDC Soft, Inc. | | | 230,319 | |
| | 59,400 | | | TechMatrix Corp. | | | 938,100 | |
| | 1,200 | | | Techno Medica Co. Ltd. | | | 16,604 | |
| | 24,500 | | | Teikoku Electric Manufacturing Co. Ltd. | | | 311,046 | |
| | 91,300 | | | Temairazu, Inc. | | | 4,437,833 | |
| | 19,187 | | | T-Gaia Corp. | | | 341,402 | |
| | 11,500 | | | Toa Corp. | | | 82,233 | |
| | 400 | | | TOA ROAD Corp. | | | 17,758 | |
| | 85,800 | | | TOC Co. Ltd. | | | 479,531 | |
| | 88,265 | | | Tochigi Bank Ltd. (The) | | | 137,073 | |
| | 109,600 | | | Toho Holdings Co. Ltd. | | | 1,766,486 | |
| | 6,800 | | | Tokai Corp. | | | 130,601 | |
| | 22,100 | | | Tokai Rika Co. Ltd. | | | 308,304 | |
| | 25,500 | | | Tokyo Keiki, Inc. | | | 224,181 | |
| | 91,900 | | | Tokyo Seimitsu Co. Ltd. | | | 3,729,217 | |
| | 38,000 | | | Tokyo Tekko Co. Ltd. | | | 496,776 | |
| | 58,085 | | | TOMONY Holdings, Inc. | | | 154,927 | |
| | 276,090 | | | Tomy Co. Ltd. | | | 2,616,163 | |
| | 30,700 | | | Topcon Corp. | | | 546,795 | |
| | 5,600 | | | Toppan Forms Co. Ltd. | | | 53,654 | |
| | 5,200 | | | Topy Industries Ltd. | | | 54,429 | |
| | 3,100 | | | Torishima Pump Manufacturing Co. Ltd. | | | 23,935 | |
| | 90,300 | | | Tosei Corp. | | | 865,169 | |
| | 566,739 | | | Toshiba Corp. | | | 24,414,902 | |
| | 39,855 | | | Toshiba TEC Corp. | | | 1,563,078 | |
| | 43,800 | | | Towa Corp. | | | 949,208 | |
| | 142,500 | | | Towa Pharmaceutical Co. Ltd. | | | 3,657,052 | |
| | 6,600 | | | Toyo Denki Seizo KK | | | 62,135 | |
| | 18,700 | | | Toyo Machinery & Metal Co. Ltd. | | | 88,270 | |
| | 2,300 | | | Toyo Tanso Co. Ltd. | | | 62,457 | |
| | 13,600 | | | TPR Co. Ltd. | | | 172,543 | |
| | 115,400 | | | Transcosmos, Inc. | | | 3,467,822 | |
| | 2,900 | | | Trinity Industrial Corp. | | | 21,297 | |
| | 60,600 | | | Tsubakimoto Chain Co. | | | 1,783,839 | |
| | 37,700 | | | Tsukuba Bank Ltd. | | | 56,562 | |
| Old Westbury Funds, Inc. | |
| Small & Mid Cap Strategies Fund | |
| Portfolio of Investments - (Continued) | October 31, 2021 |
| | |
| Shares | | | | | Value | |
| JAPAN (continued) | | | | |
| | 6,700 | | | TV Asahi Holdings Corp. | | $ | 101,345 | |
| | 237,800 | | | Ubicom Holdings, Inc. | | | 6,019,329 | |
| | 9,800 | | | Uchida Yoko Co. Ltd. | | | 412,722 | |
| | 6,400 | | | ULS Group, Inc. | | | 314,455 | |
| | 27,700 | | | Ulvac, Inc. | | | 1,545,707 | |
| | 3,300 | | | Union Tool Co. | | | 111,182 | |
| | 23,200 | | | UNITED, Inc. | | | 345,430 | |
| | 17,500 | | | Unitika Ltd.(a) | | | 55,736 | |
| | 12,600 | | | V Technology Co. Ltd. | | | 473,709 | |
| | 3,900 | | | Valqua Ltd. | | | 78,565 | |
| | 600 | | | Visional, Inc.(a) | | | 46,642 | |
| | 59,100 | | | VT Holdings Co. Ltd. | | | 263,416 | |
| | 566,300 | | | Wacom Co. Ltd. | | | 3,646,977 | |
| | 800 | | | WDB coco Co. Ltd. | | | 33,060 | |
| | 17,400 | | | WDB Holdings Co. Ltd. | | | 548,068 | |
| | 3,600 | | | Welbe, Inc. | | | 50,758 | |
| | 48,300 | | | Will Group, Inc. | | | 544,554 | |
| | 83,700 | | | World Holdings Co. Ltd. | | | 2,087,818 | |
| | 21,700 | | | Xebio Holdings Co. Ltd. | | | 201,245 | |
| | 126,300 | | | YAMABIKO Corp. | | | 1,372,983 | |
| | 2,200 | | | YAMADA Consulting Group Co. Ltd. | | | 22,372 | |
| | 69,900 | | | Yamaichi Electronics Co. Ltd. | | | 1,069,582 | |
| | 35,600 | | | Yamanashi Chuo Bank Ltd. (The) | | | 256,126 | |
| | 17,800 | | | Yonex Co. Ltd. | | | 116,819 | |
| | 13,500 | | | Yushin Precision Equipment Co. Ltd. | | | 90,967 | |
| | 30,600 | | | Zenrin Co. Ltd. | | | 281,367 | |
| | 30,400 | | | ZERIA Pharmaceutical Co. Ltd. | | | 542,519 | |
| | 99,500 | | | ZIGExN Co. Ltd. | | | 352,691 | |
| | 900 | | | Zuken, Inc. | | | 34,587 | |
| | | | | | | | 597,997,534 | |
| JERSEY CHANNEL ISLANDS — 0.3% | | | | |
| | 314,553 | | | Novocure Ltd.(a) | | | 32,263,701 | |
| NETHERLANDS — 1.4% | | | | |
| | 76,667 | | | Aalberts NV | | | 4,240,804 | |
| | 5,765 | | | Accell Group NV(a) | | | 237,584 | |
| | 25,108 | | | Arcadis NV | | | 1,224,849 | |
| | 22,258 | | | Argenx SE(a) | | | 6,661,561 | |
| | 45,943 | | | ASM International NV | | | 20,787,296 | |
| | 127,464 | | | ASR Nederland NV | | | 5,961,716 | |
| | 196,187 | | | BE Semiconductor Industries NV | | | 17,907,510 | |
| | 140,733 | | | Boskalis Westminster | | | 4,197,334 | |
| | 35,527 | | | Brunel International NV | | | 487,902 | |
| | 223,433 | | | Eurocommercial Properties NV | | | 5,214,846 | |
| | 187,057 | | | Heijmans NV | | | 2,603,504 | |
| | 105,771 | | | IMCD NV | | | 23,482,199 | |
| | 3,966 | | | Kendrion NV | | | 91,694 | |
| | 1,876,501 | | | Koninklijke BAM Groep NV(a) | | | 5,444,780 | |
| | 81,289 | | | Koninklijke DSM NV | | | 17,765,044 | |
| | 1,880 | | | Nedap NV | | | 131,483 | |
| | 1,938 | | | NSI NV REIT | | | 77,739 | |
| | 162,187 | | | OCI NV(a) | | | 4,593,460 | |
| | 862,565 | | | PostNL NV | | | 3,742,211 | |
| Shares | | | | | Value | |
| NETHERLANDS (continued) | | | | |
| | 77,070 | | | TKH Group NV | | $ | 4,388,717 | |
| | 32,767 | | | Van Lanschot Kempen NV | | | 909,088 | |
| | 32,929 | | | Vastned Retail NV REIT | | | 938,325 | |
| | 2,107 | | | Wereldhave NV REIT | | | 32,663 | |
| | | | | | | | 131,122,309 | |
| NEW ZEALAND — 0.5% | | | | |
| | 1,249,566 | | | Fletcher Building Ltd. | | | 6,344,906 | |
| | 563,889 | | | Fletcher Building Ltd. | | | 2,897,274 | |
| | 75,764 | | | Skellerup Holdings Ltd. | | | 338,242 | |
| | 145,311 | | | SKY Network Television Ltd.(a) | | | 197,847 | |
| | 3,190 | | | Tourism Holdings Ltd.(a) | | | 6,286 | |
| | 19,825 | | | Warehouse Group Ltd. (The) | | | 57,253 | |
| | 365,983 | | | Xero Ltd.(a) | | | 41,161,704 | |
| | | | | | | | 51,003,512 | |
| NORWAY — 0.1% | | | | |
| | 65,917 | | | 2020 Bulkers Ltd. | | | 889,515 | |
| | 504,491 | | | ABG Sundal Collier Holding ASA | | | 555,974 | |
| | 8,478 | | | American Shipping Co. ASA | | | 31,311 | |
| | 206 | | | Atea ASA | | | 3,853 | |
| | 350,506 | | | B2Holding ASA(a) | | | 383,785 | |
| | 87,795 | | | Belships ASA | | | 146,535 | |
| | 236,694 | | | DNO ASA(a) | | | 344,622 | |
| | 6,111 | | | Elektro Importoren AS | | | 54,904 | |
| | 95,522 | | | FLEX LNG Ltd. | | | 1,929,006 | |
| | 1,727 | | | Medistim ASA | | | 77,683 | |
| | 239,883 | | | MPC Container Ships AS(a) | | | 566,776 | |
| | 16,133 | | | OKEA ASA(a) | | | 51,562 | |
| | 14,768 | | | Olav Thon Eiendomsselskap ASA | | | 323,753 | |
| | 16,612 | | | Pareto Bank ASA | | | 121,131 | |
| | 46 | | | Sparebanken More | | | 2,358 | |
| | 1 | | | TGS ASA | | | 9 | |
| | 34,685 | | | Veidekke ASA | | | 499,260 | |
| | 400,150 | | | Wallenius Wilhelmsen ASA(a) | | | 1,823,622 | |
| | | | | | | | 7,805,659 | |
| PERU — 0.1% | | | | |
| | 645,000 | | | Cia de Minas Buenaventura SAA - ADR(a) | | | 5,082,600 | |
| POLAND — 0.2% | | | | |
| | 256,165 | | | Grupa Lotos SA(a) | | | 3,979,574 | |
| | 1,750,123 | | | PGE Polska Grupa Energetyczna SA(a) | | | 4,302,434 | |
| | 369,073 | | | Polski Koncern Naftowy ORLEN SA | | | 7,961,205 | |
| | 3,097,256 | | | Tauron Polska Energia SA(a) | | | 2,550,997 | |
| | | | | | | | 18,794,210 | |
| PORTUGAL — 0.0% | | | | |
| | 241,645 | | | CTT-Correios de Portugal SA | | | 1,329,666 | |
| RUSSIA — 0.8% | | | | |
| | 3,531,360 | | | Alrosa PJSC | | | 6,222,187 | |
| | 1,189,126,065 | | | Federal Grid Co. Unified Energy System PJSC | | | 3,109,616 | |
| Old Westbury Funds, Inc. | |
| Small & Mid Cap Strategies Fund | |
| Portfolio of Investments - (Continued) | October 31, 2021 |
| | |
| Shares | | | | | Value | |
| RUSSIA (continued) | | | | |
| | 4,480,742 | | | Gazprom PJSC | | $ | 22,116,307 | |
| | 1,373,778 | | | Gazprom PJSC - ADR | | | 13,471,267 | |
| | 112,793 | | | Magnit PJSC | | | 10,288,548 | |
| | 243,969 | | | Mail.Ru Group Ltd. - GDR(a) | | | 5,014,445 | |
| | 532,967 | | | Mobile TeleSystems PJSC | | | 2,330,779 | |
| | 190,648,655 | | | ROSSETI PJSC | | | 3,744,267 | |
| | 1,641,600 | | | Rostelecom PJSC | | | 2,158,468 | |
| | 461,432,194 | | | RusHydro PJSC | | | 5,292,013 | |
| | 10,568,881 | | | Surgutneftegas PJSC | | | 5,084,869 | |
| | | | | | | | 78,832,766 | |
| SINGAPORE — 0.1% | | | | |
| | 123,700 | | | APAC Realty Ltd. | | | 73,844 | |
| | 8,959 | | | Asian Pay Television Trust - Units | | | 897 | |
| | 68,080 | | | China Sunsine Chemical Holdings Ltd. | | | 25,748 | |
| | 1,608,200 | | | CSE Global Ltd. | | | 614,181 | |
| | 161,700 | | | Food Empire Holdings Ltd. | | | 98,327 | |
| | 722,000 | | | Geo Energy Resources Ltd. | | | 182,039 | |
| | 91,500 | | | Hanwell Holdings Ltd. | | | 27,820 | |
| | 34 | | | Ho Bee Land Ltd. | | | 71 | |
| | 17,703 | | | Hong Leong Asia Ltd. | | | 11,027 | |
| | 36,156 | | | Hyphens Pharma International Ltd. | | | 7,910 | |
| | 13,200 | | | iFAST Corp. Ltd. | | | 84,672 | |
| | 325,500 | | | InnoTek Ltd. | | | 185,862 | |
| | 94,300 | | | ISDN Holdings Ltd. | | | 43,356 | |
| | 219,700 | | | Kimly Ltd. | | | 61,910 | |
| | 219,700 | | | LHN Ltd. | | | 56,208 | |
| | 68,690 | | | OM Holdings Ltd.(a) | | | 55,806 | |
| | 135,200 | | | Oxley Holdings Ltd. | | | 20,052 | |
| | 345,300 | | | Propnex Ltd. | | | 489,079 | |
| | 73,920 | | | Q&M Dental Group Singapore Ltd. | | | 30,971 | |
| | 1,467,200 | | | Raffles Medical Group Ltd. | | | 1,490,592 | |
| | 741,500 | | | Rex International Holding Ltd.(a) | | | 186,956 | |
| | 304,400 | | | RHT Health Trust REIT(a)(c) | | | 4,289 | |
| | 3,202,400 | | | Riverstone Holdings Ltd. | | | 2,042,317 | |
| | 71,800 | | | Sabana Industrial Real Estate Investment Trust REIT | | | 23,161 | |
| | 587,300 | | | Singapore Medical Group Ltd. | | | 137,189 | |
| | 467,900 | | | Starhill Global REIT | | | 223,801 | |
| | 1,203,000 | | | UMS Holdings Ltd. | | | 1,177,575 | |
| | 18,500 | | | Wing Tai Holdings Ltd. | | | 26,615 | |
| | 1,118,600 | | | Yanlord Land Group Ltd. | | | 929,056 | |
| | | | | | | | 8,311,331 | |
| SOUTH AFRICA — 0.2% | | | | |
| | 579,261 | | | Remgro Ltd. | | | 5,105,460 | |
| | 2,043,616 | | | Sappi Ltd.(a) | | | 6,238,548 | |
| | 527,065 | | | Shoprite Holdings Ltd. | | | 6,262,326 | |
| | | | | | | | 17,606,334 | |
| SOUTH KOREA — 0.9% | | | | |
| | 12,060 | | | Green Cross Corp. | | | 2,832,972 | |
| | 161,394 | | | GS Engineering & Construction Corp. | | | 5,711,045 | |
| Shares | | | | | Value | |
| SOUTH KOREA (continued) | | |
| | 124,679 | | | Hankook Tire & Technology Co. Ltd. | | $ | 4,411,858 | |
| | 70,221 | | | Hyundai Department Store Co. Ltd. | | | 4,975,653 | |
| | 137,051 | | | Hyundai Engineering & Construction Co. Ltd. | | | 5,899,333 | |
| | 102,010 | | | KB Financial Group, Inc. | | | 4,940,966 | |
| | 94,348 | | | Kia Corp. | | | 6,870,921 | |
| | 62,952 | | | Korea Shipbuilding & Offshore Engineering Co. Ltd.(a) | | | 5,548,805 | |
| | 51,649 | | | LG Electronics, Inc. | | | 5,326,006 | |
| | 17,209 | | | Lotte Chemical Corp. | | | 3,306,166 | |
| | 56,652 | | | OCI Co. Ltd.(a) | | | 6,278,237 | |
| | 401,995 | | | Samsung Engineering Co. Ltd.(a) | | | 8,531,493 | |
| | 1,163,031 | | | Samsung Heavy Industries Co. Ltd.(a) | | | 6,349,868 | |
| | 82,412 | | | Samsung Life Insurance Co. Ltd. | | | 4,746,333 | |
| | 32,924 | | | Samsung SDS Co. Ltd. | | | 4,310,789 | |
| | 157,641 | | | Shinhan Financial Group Co. Ltd. | | | 5,160,043 | |
| | 572,093 | | | SK Networks Co. Ltd. | | | 2,491,937 | |
| | | | | | | | 87,692,425 | |
| SPAIN — 0.3% | | | | |
| | 24,097 | | | Acerinox SA | | | 335,249 | |
| | 1,403,423 | | | Almirall SA | | | 20,847,287 | |
| | 282,284 | | | Atresmedia Corp. de Medios de Comunicacion SA(a) | | 1,152,563 | |
| | 181 | | | Corp. Financiera Alba SA | | | 10,305 | |
| | 39,971 | | | Ercros SA(a) | | | 161,723 | |
| | 65,319 | | | Faes Farma SA | | | 266,395 | |
| | 41,091 | | | Laboratorios Farmaceuticos Rovi SA | | | 2,878,572 | |
| | 320,579 | | | Mediaset Espana Comunicacion SA(a) | | | 1,667,652 | |
| | | | | | | | 27,319,746 | |
| SWEDEN — 1.6% | | | | |
| | 645,025 | | | AAK AB | | | 14,097,717 | |
| | 32,400 | | | Annehem Fastigheter AB - Class B(a) | | | 139,213 | |
| | 756,313 | | | Arjo AB - Class B | | | 10,303,752 | |
| | 3,004 | | | Atrium Ljungberg AB - Class B | | | 68,979 | |
| | 136,418 | | | Avanza Bank Holding AB | | | 5,415,102 | |
| | 15,625 | | | Beijer Alma AB | | | 392,080 | |
| | 1,616 | | | Bergman & Beving AB | | | 29,166 | |
| | 182,854 | | | Betsson AB - Class B | | | 1,273,250 | |
| | 387,030 | | | Bilia AB - Class A | | | 6,872,622 | |
| | 18,066 | | | BioGaia AB - Class B | | | 1,110,718 | |
| | 63,242 | | | Biotage AB | | | 2,044,245 | |
| | 685 | | | BTS Group AB - Class B | | | 33,420 | |
| | 28,490 | | | Bufab AB | | | 1,214,176 | |
| | 201,650 | | | Byggmax Group AB | | | 1,725,812 | |
| | 52,210 | | | Catella AB | | | 233,449 | |
| | 8,135 | | | Cellavision AB | | | 369,997 | |
| | 6,424 | | | C-RAD AB - Class B(a) | | | 43,834 | |
| | 392,143 | | | Dios Fastigheter AB | | | 4,563,891 | |
| | 7,721 | | | Doro AB(a) | | | 60,236 | |
| | 2,249 | | | Elanders AB - Class B | | | 38,758 | |
| | 495,536 | | | Elekta AB - Class B | | | 5,753,941 | |
| | 40,648 | | | Fagerhult AB | | | 326,112 | |
| Old Westbury Funds, Inc. | |
| Small & Mid Cap Strategies Fund | |
| Portfolio of Investments - (Continued) | October 31, 2021 |
| | |
| Shares | | | | | Value | |
| SWEDEN (continued) | | | | |
| | 9,719 | | | Ferronordic AB | | $ | 332,718 | |
| | 650 | | | Fortinova Fastigheter AB | | | 4,163 | |
| | 322,026 | | | Fortnox AB | | | 22,798,301 | |
| | 4,320 | | | GARO AB | | | 108,654 | |
| | 495,267 | | | Getinge AB - Class B | | | 22,162,448 | |
| | 20,214 | | | GHP Specialty Care AB | | | 60,374 | |
| | 49,425 | | | Haldex AB(a) | | | 295,238 | |
| | 26,231 | | | Hanza Holding AB | | | 102,932 | |
| | 29,850 | | | HMS Networks AB | | | 1,703,132 | |
| | 53,047 | | | Humana AB(a) | | | 442,882 | |
| | 77,837 | | | Instalco AB | | | 4,123,875 | |
| | 171,934 | | | Inwido AB | | | 3,153,191 | |
| | 7,753 | | | Lagercrantz Group AB - Class B | | | 103,819 | |
| | 5,473 | | | Lifco AB - Class B | | | 159,385 | |
| | 281,334 | | | Lindab International AB | | | 9,218,373 | |
| | 27,490 | | | Medicover AB - Class B | | | 829,053 | |
| | 133,292 | | | Mekonomen AB(a) | | | 2,747,169 | |
| | 4,383 | | | Micro Systemation AB - Class B | | | 22,022 | |
| | 51 | | | Momentum Group AB - Class B | | | 1,309 | |
| | 176,851 | | | Net Insight AB - Class B(a) | | | 66,721 | |
| | 145,193 | | | New Wave Group AB - Class B(a) | | | 2,461,586 | |
| | 1,314 | | | Nilorngruppen AB - Class B | | | 12,684 | |
| | 260,298 | | | Nobia AB | | | 1,601,857 | |
| | 495,609 | | | Nolato AB - Class B | | | 6,544,255 | |
| | 6,181 | | | Nordic Waterproofing Holding AB | | | 183,530 | |
| | 27,773 | | | NP3 Fastigheter AB | | | 986,349 | |
| | 1,644 | | | OEM International AB - Class B | | | 36,946 | |
| | 21,528 | | | Proact IT Group AB | | | 216,834 | |
| | 778 | | | Probi AB | | | 34,742 | |
| | 11,639 | | | QleanAir AB | | | 87,550 | |
| | 953,575 | | | Ratos AB - Class B | | | 5,482,945 | |
| | 144,420 | | | Sectra AB - Class B | | | 3,524,736 | |
| | 9,984 | | | SkiStar AB(a) | | | 208,097 | |
| | 24,081 | | | Softronic AB - Class B | | | 70,241 | |
| | 3,574 | | | Studsvik AB | | | 35,790 | |
| | 33,487 | | | Svedbergs i Dalstorp AB - Class B | | | 230,837 | |
| | 73,808 | | | SwedenCare AB | | | 1,216,096 | |
| | 46,256 | | | Systemair AB | | | 445,971 | |
| | 59,684 | | | Tethys Oil AB | | | 434,356 | |
| | 15,913 | | | Troax Group AB | | | 652,233 | |
| | 1,497 | | | VBG Group AB - Class B | | | 28,849 | |
| | 59,080 | | | Vitrolife AB | | | 3,845,566 | |
| | 26,897 | | | Volati AB | | | 601,330 | |
| | | | | | | | 153,489,609 | |
| SWITZERLAND — 2.4% | | | | |
| | 372,085 | | | Alcon, Inc. | | | 30,746,998 | |
| | 10,788 | | | ALSO Holding AG | | | 3,193,041 | |
| | 117,666 | | | Arbonia AG | | | 2,554,828 | |
| | 101,147 | | | Ascom Holding AG(a) | | | 1,570,894 | |
| | 2,358 | | | Bachem Holding AG - Class B | | | 1,895,465 | |
| | 87,858 | | | Baloise Holding AG | | | 14,009,685 | |
| | 5,160 | | | Barry Callebaut AG | | | 11,936,304 | |
| Shares | | | | | Value | |
| SWITZERLAND (continued) | | | | |
| | 29,311 | | | Belimo Holding AG | | $ | 17,030,856 | |
| | 2,908 | | | Bellevue Group AG | | | 130,536 | |
| | 13,973 | | | Bobst Group SA(a) | | | 1,138,473 | |
| | 9,363 | | | Bossard Holding AG - Class A | | | 3,435,963 | |
| | 15,081 | | | Bucher Industries AG | | | 7,603,090 | |
| | 17,298 | | | Burckhardt Compression Holding AG | | | 7,273,624 | |
| | 606 | | | Burkhalter Holding AG | | | 43,815 | |
| | 1,678 | | | Calida Holding AG | | | 88,885 | |
| | 1,562 | | | Coltene Holding AG | | | 197,212 | |
| | 56,397 | | | Comet Holding AG | | | 20,942,529 | |
| | 10,008 | | | dormakaba Holding AG | | | 7,416,370 | |
| | 15,136 | | | EFG International AG | | | 106,296 | |
| | 266 | | | Energiedienst Holding AG | | | 13,451 | |
| | 1,573 | | | Feintool International Holding AG(a) | | | 92,944 | |
| | 1,106,226 | | | Ferrexpo Plc | | | 4,723,448 | |
| | 7,640 | | | Georg Fischer AG | | | 11,556,793 | |
| | 1,410,311 | | | Glencore Plc | | | 7,049,621 | |
| | 572 | | | Hiag Immobilien Holding AG | | | 60,599 | |
| | 31,457 | | | Huber + Suhner AG | | | 2,796,636 | |
| | 52 | | | Ina Invest Holding AG(a) | | | 1,051 | |
| | 2,792 | | | Inficon Holding AG | | | 3,573,858 | |
| | 168 | | | Interroll Holding AG | | | 815,596 | |
| | 1,339 | | | Investis Holding SA | | | 149,168 | |
| | 59 | | | Kardex Holding AG | | | 18,172 | |
| | 11,005 | | | Komax Holding AG(a) | | | 2,802,934 | |
| | 8,388 | | | Kudelski SA | | | 33,393 | |
| | 20 | | | LEM Holding SA | | | 48,493 | |
| | 9,072 | | | Leonteq AG | | | 600,440 | |
| | 92 | | | Metall Zug AG - Class B | | | 207,995 | |
| | 16,551 | | | Mobilezone Holding AG | | | 222,343 | |
| | 1,498 | | | Mobimo Holding AG | | | 504,732 | |
| | 15,330 | | | OC Oerlikon Corp. AG | | | 155,627 | |
| | 19 | | | Orell Fuessli AG | | | 1,942 | |
| | 135 | | | Phoenix Mecano AG | | | 65,686 | |
| | 51,393 | | | PSP Swiss Property AG | | | 6,421,318 | |
| | 348,937 | | | Quotient Ltd.(a) | | | 882,811 | |
| | 7,575 | | | Rieter Holding AG(a) | | | 1,571,920 | |
| | 409 | | | Schweiter Technologies AG | | | 586,966 | |
| | 29,401 | | | SFS Group AG | | | 3,956,098 | |
| | 15,131 | | | Siegfried Holding AG | | | 14,534,419 | |
| | 2,367 | | | Swissquote Group Holding SA | | | 479,294 | |
| | 39,412 | | | Tecan Group AG | | | 24,105,199 | |
| | 86,248 | | | Temenos AG | | | 13,173,638 | |
| | 10,644 | | | Vontobel Holding AG | | | 984,651 | |
| | 1,976 | | | V-ZUG Holding AG(a) | | | 277,538 | |
| | 16,997 | | | Zehnder Group AG | | | 1,828,533 | |
| | | | | | | | 235,612,171 | |
| TAIWAN — 0.8% | | | | |
| | 6,172,000 | | | Acer, Inc. | | | 5,770,610 | |
| | 1,831,000 | | | ASE Technology Holding Co. Ltd. | | | 6,571,149 | |
| | 6,150,100 | | | AU Optronics Corp. | | | 4,246,253 | |
| | 2,226,018 | | | Cheng Shin Rubber Industry Co. Ltd. | | | 2,729,641 | |
| Old Westbury Funds, Inc. | |
| Small & Mid Cap Strategies Fund | |
| Portfolio of Investments - (Continued) | October 31, 2021 |
| | |
| Shares | | | | | Value | |
| TAIWAN (continued) | | | | |
| | 7,721,432 | | | China Petrochemical Development Corp.(a) | | $ | 3,359,740 | |
| | 1,645,000 | | | ENNOSTAR, Inc.(a) | | | 4,318,284 | |
| | 1,067,000 | | | Everlight Electronics Co. Ltd. | | | 1,899,293 | |
| | 1,644,000 | | | Hon Hai Precision Industry Co. Ltd. | | | 6,325,692 | |
| | 2,247,000 | | | HTC Corp.(a) | | | 5,300,653 | |
| | 8,110,500 | | | Innolux Corp. | | | 4,870,645 | |
| | 2,741,431 | | | International CSRC Investment Holdings Co. | | | 2,365,979 | |
| | 4,243,000 | | | Inventec Corp. | | | 4,050,979 | |
| | 1,363,000 | | | Pegatron Corp. | | | 3,332,938 | |
| | 303,000 | | | Phison Electronics Corp. | | | 4,254,868 | |
| | 6,722,000 | | | Qisda Corp. | | | 7,493,464 | |
| | 5,777,000 | | | Winbond Electronics Corp. | | | 5,463,621 | |
| | 4,812,696 | | | Wistron Corp. | | | 5,053,517 | |
| | | | | | | | 77,407,326 | |
| THAILAND — 0.5% | | | | |
| | 11,652,166 | | | Banpu Public Co. Ltd. - FOR | | | 4,003,155 | |
| | 176,442 | | | Fabrinet(a) | | | 16,938,432 | |
| | 43,105,207 | | | IRPC Public Co. Ltd. - FOR | | | 5,585,848 | |
| | 5,002,000 | | | Italian-Thai Development Public Co. Ltd. - FOR(a) | | 352,737 | |
| | 3,299,558 | | | PTT Global Chemical Public Co. Ltd. - FOR | | | 6,239,652 | |
| | 396,032 | | | Siam Cement Public Co. Ltd. (The) - FOR | | | 4,714,311 | |
| | 3,229,183 | | | Thai Oil Public Co. Ltd. - FOR | | | 5,425,358 | |
| | | | | | | | 43,259,493 | |
| TURKEY — 0.5% | | | | |
| | 1,843,327 | | | Arcelik AS | | | 6,457,588 | |
| | 6,634,452 | | | Dogan Sirketler Grubu Holding AS | | | 1,835,619 | |
| | 18,659,402 | | | Emlak Konut Gayrimenkul Yatirim Ortakligi AS REIT | | | 3,823,489 | |
| | 4,729,940 | | | Eregli Demir ve Celik Fabrikalari TAS | | | 9,687,177 | |
| | 7,551,154 | | | Petkim Petrokimya Holding AS(a) | | | 5,128,879 | |
| | 3,078,894 | | | Turkcell Iletisim Hizmetleri AS | | | 4,896,639 | |
| | 8,814,293 | | | Turkiye Is Bankasi AS - Class C | | | 5,161,688 | |
| | 589,180 | | | Turkiye Petrol Rafinerileri AS(a) | | | 8,567,440 | |
| | 19,202,250 | | | Yapi ve Kredi Bankasi AS | | | 5,452,688 | |
| | | | | | | | 51,011,207 | |
| UNITED KINGDOM — 6.1% | | | | |
| | 4,205 | | | 4imprint Group Plc | | | 164,586 | |
| | 3,659 | | | accesso Technology Group Plc(a) | | | 44,367 | |
| | 2,089,252 | | | Adaptimmune Therapeutics Plc - ADR(a) | | | 10,592,508 | |
| | 42,832 | | | Advanced Medical Solutions Group Plc | | | 190,508 | |
| | 70,342 | | | Alliance Pharma Plc | | | 98,962 | |
| | 2,184,420 | | | Alphawave IP Group Plc(a) | | | 5,961,039 | |
| | 2,756 | | | Aptitude Software Group Plc | | | 23,875 | |
| | 408,574 | | | ASOS Plc(a) | | | 13,878,201 | |
| Shares | | | | | Value | |
| UNITED KINGDOM (continued) | | | | |
| | 200,483 | | | AVEVA Group Plc | | $ | 9,762,121 | |
| | 1,420,934 | | | B&M European Value Retail SA | | | 12,313,329 | |
| | 1,763,414 | | | Balfour Beatty Plc | | | 6,129,833 | |
| | 19,959 | | | Belvoir Group Plc | | | 71,975 | |
| | 27,727 | | | Bloomsbury Publishing Plc | | | 137,364 | |
| | 5,522,351 | | | boohoo Group Plc(a) | | | 13,735,962 | |
| | 5,000 | | | Braemar Shipping Services Plc | | | 17,175 | |
| | 134,494 | | | Brewin Dolphin Holdings Plc | | | 692,993 | |
| | 27,923 | | | Brickability Group Plc | | | 40,316 | |
| | 902,440 | | | Britvic Plc | | | 10,967,104 | |
| | 119,918 | | | Bytes Technology Group Plc(a) | | | 876,368 | |
| | 14,468 | | | Central Asia Metals Plc | | | 48,609 | |
| | 1,508,173 | | | Centrica Plc(a) | | | 1,245,011 | |
| | 380,893 | | | Ceres Power Holdings Plc(a) | | | 6,489,825 | |
| | 10,247 | | | Cerillion Plc | | | 111,487 | |
| | 359,900 | | | Chemring Group Plc | | | 1,440,683 | |
| | 4,567 | | | Clarkson Plc | | | 250,007 | |
| | 63,918 | | | Computacenter Plc | | | 2,353,077 | |
| | 40,496 | | | Concentric AB | | | 1,190,643 | |
| | 8,906,881 | | | ConvaTec Group Plc(b) | | | 26,061,177 | |
| | 7,431 | | | Craneware Plc | | | 231,869 | |
| | 146,084 | | | Crest Nicholson Holdings plc | | | 711,727 | |
| | 166,601 | | | CVS Group Plc(a) | | | 5,688,645 | |
| | 30,892 | | | Daily Mail & General Trust Plc - Class A | | | 439,683 | |
| | 15,024 | | | Dechra Pharmaceuticals Plc | | | 1,052,728 | |
| | 10,545 | | | Devro Plc | | | 31,100 | |
| | 45,700 | | | DFS Furniture Plc(a) | | | 170,742 | |
| | 43,810 | | | Dignity Plc(a) | | | 424,490 | |
| | 87,434 | | | dotdigital group plc | | | 287,777 | |
| | 1,931,507 | | | Drax Group Plc | | | 14,023,046 | |
| | 2,500 | | | Eco Animal Health Group Plc | | | 9,152 | |
| | 107,607 | | | EKF Diagnostics Holdings Plc | | | 119,285 | |
| | 1,683,858 | | | Electrocomponents Plc | | | 25,924,993 | |
| | 610,966 | | | Elementis Plc(a) | | | 1,166,412 | |
| | 79,118 | | | EMIS Group Plc | | | 1,459,573 | |
| | 1,306 | | | Epwin Group Plc | | | 1,993 | |
| | 341,992 | | | Ergomed Plc(a) | | | 6,716,276 | |
| | 135,738 | | | FDM Group Holdings Plc | | | 2,232,886 | |
| | 248,897 | | | Fevertree Drinks Plc | | | 7,728,849 | |
| | 19,537 | | | Focusrite Plc | | | 362,291 | |
| | 274,139 | | | Frasers Group Plc(a) | | | 2,414,238 | |
| | 11,561 | | | Galliford Try Holdings Plc | | | 31,644 | |
| | 8,895 | | | Gattaca Plc(a) | | | 26,051 | |
| | 235,343 | | | Genus Plc | | | 17,810,950 | |
| | 111,075 | | | Go-Ahead Group Plc (The)(a) | | | 1,193,292 | |
| | 172,353 | | | Greggs Plc | | | 7,205,941 | |
| | 644,285 | | | Gulf Keystone Petroleum Ltd. | | | 1,752,892 | |
| | 530,375 | | | Halfords Group Plc | | | 1,933,650 | |
| | 5,585 | | | Hargreaves Services Plc | | | 32,102 | |
| | 73,434 | | | Headlam Group Plc | | | 457,266 | |
| | 2,622 | | | Hill & Smith Holdings Plc | | | 65,810 | |
| | 726,325 | | | HomeServe Plc | | | 8,498,803 | |
| Old Westbury Funds, Inc. | |
| Small & Mid Cap Strategies Fund | |
| Portfolio of Investments - (Continued) | October 31, 2021 |
| | |
| Shares | | | | | Value | |
| UNITED KINGDOM (continued) | | | | |
| | 1,973,365 | | | Howden Joinery Group Plc | | $ | 24,840,566 | |
| | 238,107 | | | Hunting Plc | | | 552,009 | |
| | 409,611 | | | IMI Plc | | | 9,159,765 | |
| | 100,750 | | | Impact Healthcare Plc REIT | | | 162,976 | |
| | 10,195 | | | Impax Asset Management Group Plc | | | 152,918 | |
| | 289,233 | | | Inchcape Plc | | | 3,269,554 | |
| | 201,995 | | | Indivior Plc(a) | | | 672,303 | |
| | 1,241,097 | | | ITM Power Plc(a) | | | 8,305,681 | |
| | 873 | | | James Halstead Plc | | | 6,643 | |
| | 813,046 | | | JD Sports Fashion Plc | | | 12,106,112 | |
| | 1,666,602 | | | JET2 Plc(a) | | | 27,814,699 | |
| | 31,821 | | | Joules Group Plc(a) | | | 87,097 | |
| | 1,087,108 | | | Just Group Plc(a) | | | 1,367,253 | |
| | 308,965 | | | Kainos Group Plc | | | 8,372,114 | |
| | 69,678 | | | Keller Group Plc | | | 874,431 | |
| | 85,517 | | | Kin & Carta Plc(a) | | | 312,482 | |
| | 13,357 | | | Liontrust Asset Management Plc | | | 398,498 | |
| | 360,123 | | | Lookers Plc(a) | | | 315,422 | |
| | 33,599 | | | M&C Saatchi Plc(a) | | | 74,491 | |
| | 28,648 | | | Macfarlane Group Plc | | | 51,458 | |
| | 2,501,114 | | | Man Group Plc | | | 7,965,087 | |
| | 919,112 | | | Micro Focus International Plc | | | 4,486,754 | |
| | 24,897 | | | Morgan Advanced Materials Plc | | | 117,892 | |
| | 21,090 | | | Morgan Sindall Group Plc | | | 656,627 | |
| | 32,539 | | | Next Fifteen Communications Group Plc | | | 549,961 | |
| | 307,405 | | | Ninety One Plc | | | 1,097,183 | |
| | 484 | | | Norcros Plc | | | 2,206 | |
| | 8,750 | | | Numis Corp. Plc | | | 40,355 | |
| | 3,144,199 | | | Ocado Group Plc(a) | | | 77,582,974 | |
| | 510,237 | | | Orchard Therapeutics plc - ADR(a) | | | 979,655 | |
| | 510,331 | | | Oxford Biomedica Plc(a) | | | 10,629,853 | |
| | 48,846 | | | Oxford Instruments Plc | | | 1,540,851 | |
| | 96,831 | | | Oxford Metrics Plc | | | 160,347 | |
| | 812,375 | | | Oxford Nanopore Technologies Plc(a) | | | 6,209,268 | |
| | 47,725 | | | Pagegroup Plc | | | 433,685 | |
| | 5,827 | | | Patisserie Holdings Plc(a)(c) | | | 0 | |
| | 45,186 | | | PayPoint Plc | | | 426,691 | |
| | 63,657 | | | Pharos Energy Plc(a) | | | 17,467 | |
| | 17,255 | | | Phoenix Spree Deutschland Ltd. | | | 94,693 | |
| | 150,806 | | | Polar Capital Holdings Plc | | | 1,713,000 | |
| | 36,420 | | | Rathbone Brothers Plc | | | 982,896 | |
| | 7,691 | | | Renew Holdings Plc | | | 80,310 | |
| | 137,598 | | | Renishaw Plc | | | 9,462,565 | |
| | 4,160,856 | | | Rentokil Initial Plc | | | 33,505,493 | |
| | 609,230 | | | Rightmove Plc | | | 5,764,628 | |
| | 12,337 | | | RM Plc | | | 35,118 | |
| | 805 | | | Robert Walters Plc | | | 9,364 | |
| | 5,217,980 | | | Rotork Plc | | | 25,293,658 | |
| | 2,364,062 | | | Royal Mail Plc | | | 13,604,592 | |
| | 111,903 | | | RPS Group Plc | | | 193,575 | |
| | 307,077 | | | Safestore Holdings Plc REIT | | | 5,051,408 | |
| | 53,484 | | | Sanderson Design Group Plc | | | 129,190 | |
| Shares | | | | | Value | |
| UNITED KINGDOM (continued) | | | | |
| | 59,554 | | | Savills Plc | | $ | 1,155,707 | |
| | 153,639 | | | Senior Plc(a) | | | 336,841 | |
| | 134,385 | | | Serica Energy Plc | | | 378,860 | |
| | 1,272,810 | | | SIG Plc(a) | | | 904,919 | |
| | 16,957 | | | Softcat Plc | | | 450,902 | |
| | 150,092 | | | Speedy Hire Plc | | | 131,051 | |
| | 514,796 | | | Spirent Communications Plc | | | 2,029,029 | |
| | 26,063 | | | Springfield Properties Plc | | | 53,324 | |
| | 823,428 | | | St. James’s Place Plc | | | 17,799,423 | |
| | 109,870 | | | SThree Plc | | | 885,636 | |
| | 9,253 | | | Stolt-Nielsen Ltd. | | | 142,389 | |
| | 2,130,648 | | | Trainline Plc(a)(b) | | | 9,237,566 | |
| | 172,326 | | | Travis Perkins Plc | | | 3,638,961 | |
| | 51,428 | | | Tyman Plc | | | 262,876 | |
| | 1,163 | | | UP Global Sourcing Holdings Plc | | | 2,626 | |
| | 60,862 | | | Vertu Motors Plc(a) | | | 51,142 | |
| | 191,004 | | | Victrex Plc | | | 5,980,798 | |
| | 4,337 | | | Vitec Group Plc (The) | | | 85,470 | |
| | 152,630 | | | Volution Group Plc | | | 1,031,876 | |
| | 111,284 | | | Wincanton Plc | | | 577,208 | |
| | 536,125 | | | YouGov Plc | | | 9,685,023 | |
| | | | | | | | 597,630,706 | |
| UNITED STATES — 43.4% | | | | |
| | 580,755 | | | A.O. Smith Corp. | | | 42,435,768 | |
| | 356,807 | | | Advance Auto Parts, Inc. | | | 80,467,115 | |
| | 159,744 | | | AeroVironment, Inc.(a) | | | 14,234,788 | |
| | 243,923 | | | Agilysys, Inc.(a) | | | 11,640,006 | |
| | 105,000 | | | Albany International Corp. - Class A | | | 8,468,250 | |
| | 409,101 | | | Alnylam Pharmaceuticals, Inc.(a) | | | 65,276,156 | |
| | 510,000 | | | Altra Industrial Motion Corp. | | | 26,596,500 | |
| | 87,999 | | | Ambarella, Inc.(a) | | | 16,352,854 | |
| | 135,659 | | | ANSYS, Inc.(a) | | | 51,493,443 | |
| | 306,699 | | | Appian Corp.(a) | | | 30,488,948 | |
| | 40,000 | | | Asana, Inc. - Class A(a) | | | 5,432,000 | |
| | 278,050 | | | Aspen Technology, Inc.(a) | | | 43,567,654 | |
| | 240,000 | | | AtriCure, Inc.(a) | | | 18,014,400 | |
| | 145,000 | | | Avanos Medical, Inc.(a) | | | 4,573,300 | |
| | 254,575 | | | Axogen, Inc.(a) | | | 3,866,994 | |
| | 145,712 | | | Axon Enterprise, Inc.(a) | | | 26,222,332 | |
| | 65,000 | | | Axonics, Inc.(a) | | | 4,767,750 | |
| | 400,000 | | | Barnes Group, Inc. | | | 16,776,000 | |
| | 207,681 | | | Benefitfocus, Inc.(a) | | | 2,276,184 | |
| | 489,003 | | | BioCryst Pharmaceuticals, Inc.(a) | | | 7,300,815 | |
| | 335,000 | | | Blackbaud, Inc.(a) | | | 23,788,350 | |
| | 427,574 | | | Blackline, Inc.(a) | | | 54,246,313 | |
| | 498,310 | | | BRP Group, Inc. - Class A(a) | | | 18,188,315 | |
| | 200,000 | | | Bryn Mawr Bank Corp. | | | 9,268,000 | |
| | 189,669 | | | Burlington Stores, Inc.(a) | | | 52,403,648 | |
| | 526,860 | | | Cardiovascular Systems, Inc.(a) | | | 18,482,249 | |
| | 161,839 | | | Cardlytics, Inc.(a) | | | 12,730,256 | |
| | 252,600 | | | Carlisle Cos, Inc. | | | 56,309,592 | |
| | 373,440 | | | CDW Corp. | | | 69,702,576 | |
| Old Westbury Funds, Inc. | |
| Small & Mid Cap Strategies Fund | |
| Portfolio of Investments - (Continued) | October 31, 2021 |
| | |
| Shares | | | | | Value | |
| UNITED STATES (continued) | | | | |
| | 325,000 | | | Central Garden & Pet Co. - Class A(a) | | $ | 15,015,000 | |
| | 119,275 | | | Cerence, Inc.(a) | | | 12,539,381 | |
| | 105,521 | | | CEVA, Inc.(a) | | | 4,812,813 | |
| | 65,000 | | | Chase Corp. | | | 6,240,000 | |
| | 522,676 | | | Chegg, Inc.(a) | | | 31,067,861 | |
| | 146,063 | | | Chinook Therapeutics, Inc.(a) | | | 1,568,717 | |
| | 1,241,194 | | | Codexis, Inc.(a) | | | 43,156,315 | |
| | 195,000 | | | Community Bank System, Inc. | | | 13,975,650 | |
| | 295,000 | | | CONMED Corp. | | | 43,152,600 | |
| | 205,436 | | | Cooper Cos, Inc. (The) | | | 85,650,377 | |
| | 140,000 | | | CSW Industrials, Inc. | | | 19,406,800 | |
| | 600,745 | | | CVB Financial Corp. | | | 12,026,915 | |
| | 194,873 | | | Digimarc Corp.(a) | | | 9,846,933 | |
| | 96,280 | | | Domino’s Pizza, Inc. | | | 47,078,032 | |
| | 384,510 | | | Dover Corp. | | | 65,012,951 | |
| | 690,000 | | | elf Beauty, Inc.(a) | | | 22,293,900 | |
| | 210,000 | | | Envestnet, Inc.(a) | | | 17,535,000 | |
| | 159,750 | | | Envista Holdings Corp.(a) | | | 6,246,225 | |
| | 310,150 | | | Equifax, Inc. | | | 86,044,915 | |
| | 115,000 | | | ESCO Technologies, Inc. | | | 9,724,400 | |
| | 140,876 | | | Everbridge, Inc.(a) | | | 22,442,956 | |
| | 185,122 | | | EverQuote, Inc. - Class A(a) | | | 2,552,832 | |
| | 1,075,000 | | | Evoqua Water Technologies Corp.(a) | | | 44,967,250 | |
| | 240,582 | | | Exact Sciences Corp.(a) | | | 22,908,218 | |
| | 196,400 | | | Expedia Group, Inc.(a) | | | 32,290,124 | |
| | 275,000 | | | German American Bancorp, Inc. | | | 10,840,500 | |
| | 84,660 | | | Gibraltar Industries, Inc.(a) | | | 5,516,446 | |
| | 274,730 | | | Glaukos Corp.(a) | | | 12,557,908 | |
| | 325,000 | | | Globus Medical, Inc. - Class A(a) | | | 25,080,250 | |
| | 160,745 | | | HEICO Corp. | | | 22,406,246 | |
| | 105,000 | | | Honest Co., Inc. (The)(a) | | | 960,750 | |
| | 2,165,000 | | | Hostess Brands, Inc.(a) | | | 40,940,150 | |
| | 1,013,580 | | | IAA, Inc.(a) | | | 60,460,047 | |
| | 300,000 | | | Independent Bank Corp. | | | 25,350,000 | |
| | 321,197 | | | Ingersoll Rand, Inc.(a) | | | 17,267,551 | |
| | 160,000 | | | Innospec, Inc. | | | 14,497,600 | |
| | 159,754 | | | Inspire Medical Systems, Inc.(a) | | | 43,066,483 | |
| | 582,050 | | | Integra LifeSciences Holdings Corp.(a) | | | 38,683,043 | |
| | 106,263 | | | Intersect ENT, Inc.(a) | | | 2,865,913 | |
| | 76,268 | | | IPG Photonics Corp.(a) | | | 12,127,375 | |
| | 141,141 | | | iRobot Corp.(a) | | | 11,773,982 | |
| | 120,000 | | | J & J Snack Foods Corp. | | | 17,706,000 | |
| | 345,000 | | | John Bean Technologies Corp. | | | 50,973,750 | |
| | 475,000 | | | John Wiley & Sons, Inc. - Class A | | | 25,730,750 | |
| | 260,440 | | | Jones Lang LaSalle, Inc.(a) | | | 67,253,421 | |
| | 164,123 | | | Laboratory Corp. of America Holdings(a) | | | 47,106,583 | |
| | 210,000 | | | Lancaster Colony Corp. | | | 35,700,000 | |
| | 366,900 | | | Lantheus Holdings, Inc.(a) | | | 8,581,791 | |
| | 190,467 | | | Legend Biotech Corp. - ADR(a) | | | 9,999,517 | |
| | 134,240 | | | LendingTree, Inc.(a) | | | 21,664,994 | |
| | 354,100 | | | Lincoln Electric Holdings, Inc. | | | 50,423,840 | |
| | 252,660 | | | LivePerson, Inc.(a) | | | 13,014,517 | |
| Shares | | | | | Value | |
| UNITED STATES (continued) | | | | |
| | 217,246 | | | LiveRamp Holdings, Inc.(a) | | $ | 11,624,833 | |
| | 38,074 | | | Madrigal Pharmaceuticals, Inc.(a) | | | 2,960,253 | |
| | 113,141 | | | MarketAxess Holdings, Inc. | | | 46,237,332 | |
| | 35,000 | | | Masimo Corp.(a) | | | 9,923,900 | |
| | 525,946 | | | Match Group, Inc.(a) | | | 79,302,138 | |
| | 495,440 | | | MaxCyte, Inc.(a) | | | 5,125,940 | |
| | 290,000 | | | MGP Ingredients, Inc. | | | 18,620,900 | |
| | 562,101 | | | Model N, Inc.(a) | | | 18,217,693 | |
| | 33,545 | | | Montrose Environmental Group, Inc.(a) | | | 2,299,510 | |
| | 275,000 | | | MSA Safety, Inc. | | | 42,083,250 | |
| | 343,759 | | | Myriad Genetics, Inc.(a) | | | 10,577,464 | |
| | 376,365 | | | Nasdaq, Inc. | | | 78,987,723 | |
| | 205,000 | | | National Vision Holdings, Inc.(a) | | | 12,636,200 | |
| | 64,017 | | | Nevro Corp.(a) | | | 7,281,294 | |
| | 570,000 | | | New Relic, Inc.(a) | | | 46,261,200 | |
| | 95,000 | | | Omnicell, Inc.(a) | | | 16,924,250 | |
| | 370,000 | | | Outset Medical, Inc.(a) | | | 19,709,900 | |
| | 285,647 | | | Pacira BioSciences, Inc.(a) | | | 14,933,625 | |
| | 165,000 | | | Palomar Holdings, Inc.(a) | | | 15,089,250 | |
| | 127,873 | | | Paycom Software, Inc.(a) | | | 70,055,223 | |
| | 85,000 | | | Penumbra, Inc.(a) | | | 23,506,750 | |
| | 215,000 | | | Prestige Consumer Healthcare, Inc.(a) | | | 12,897,850 | |
| | 225,000 | | | Prosperity Bancshares, Inc. | | | 16,944,750 | |
| | 305,000 | | | Pulmonx Corp.(a) | | | 11,873,650 | |
| | 1,880,000 | | | Pure Storage, Inc. - Class A(a) | | | 50,496,800 | |
| | 3,304,860 | | | PureTech Health Plc(a) | | | 16,010,946 | |
| | 499,947 | | | Q2 Holdings, Inc.(a) | | | 39,225,842 | |
| | 115,000 | | | Qualys, Inc.(a) | | | 14,315,200 | |
| | 27,264 | | | Reata Pharmaceuticals, Inc. - Class A(a) | | | 2,617,617 | |
| | 95,047 | | | Rubius Therapeutics, Inc.(a) | | | 1,350,618 | |
| | 605,000 | | | SailPoint Technologies Holding, Inc.(a) | | | 29,027,900 | |
| | 885,000 | | | Sally Beauty Holdings, Inc.(a) | | | 13,505,100 | |
| | 300,000 | | | Selective Insurance Group, Inc. | | | 23,511,000 | |
| | 270,000 | | | Sensient Technologies Corp. | | | 25,812,000 | |
| | 135,000 | | | Shake Shack, Inc. - Class A(a) | | | 9,337,950 | |
| | 83,304 | | | Shockwave Medical, Inc.(a) | | | 17,802,065 | |
| | 237,705 | | | SI-BONE, Inc.(a) | | | 5,360,248 | |
| | 1,070,000 | | | Simply Good Foods Co. (The)(a) | | | 42,425,500 | |
| | 94,163 | | | Splunk, Inc.(a) | | | 15,519,946 | |
| | 122,128 | | | Sprout Social, Inc. - Class A(a) | | | 15,593,303 | |
| | 733,245 | | | SS&C Technologies Holdings, Inc. | | | 58,270,980 | |
| | 382,425 | | | STAAR Surgical Co.(a) | | | 45,302,065 | |
| | 130,000 | | | Standex International Corp. | | | 14,465,100 | |
| | 431,275 | | | STERIS Plc | | | 100,806,218 | |
| | 179,785 | | | Stock Yards Bancorp, Inc. | | | 11,011,831 | |
| | 247,050 | | | Stratasys Ltd.(a) | | | 7,791,957 | |
| | 777,655 | | | Sumo Logic, Inc.(a) | | | 13,430,102 | |
| | 233,622 | | | Synopsys, Inc.(a) | | | 77,838,178 | |
| | 119,491 | | | Tabula Rasa HealthCare, Inc.(a) | | | 3,244,181 | |
| | 314,005 | | | Tactile Systems Technology, Inc.(a) | | | 10,830,032 | |
| Old Westbury Funds, Inc. | |
| Small & Mid Cap Strategies Fund | |
| Portfolio of Investments - (Continued) | October 31, 2021 |
| | |
| Shares | | | | | Value | |
| UNITED STATES (continued) | | | | |
| | 275,378 | | | Teladoc Health, Inc.(a) | | $ | 41,193,795 | |
| | 170,413 | | | Teleflex, Inc. | | | 60,827,216 | |
| | 625,000 | | | Tenable Holdings, Inc.(a) | | | 33,281,250 | |
| | 79,136 | | | Tesla, Inc.(a) | | | 88,157,504 | |
| | 65,000 | | | Transcat, Inc.(a) | | | 4,867,200 | |
| | 665,770 | | | TriMas Corp.(a) | | | 22,203,429 | |
| | 234,121 | | | Trupanion, Inc.(a) | | | 23,973,990 | |
| | 275,000 | | | UMB Financial Corp. | | | 27,175,500 | |
| | 889,986 | | | Upwork, Inc.(a) | | | 41,936,140 | |
| | 2,393,730 | | | US Foods Holding Corp.(a) | | | 82,990,619 | |
| | 993,085 | | | Utz Brands, Inc. | | | 15,482,195 | |
| | 300,000 | | | Vapotherm, Inc.(a) | | | 6,861,000 | |
| | 281,659 | | | Varex Imaging Corp.(a) | | | 7,562,544 | |
| | 345,580 | | | Veeco Instruments, Inc.(a) | | | 8,394,138 | |
| | 310,000 | | | Veracyte, Inc.(a) | | | 14,842,800 | |
| | 367,510 | | | Verastem, Inc.(a) | | | 955,526 | |
| | 3,096,024 | | | ViewRay, Inc.(a) | | | 22,631,935 | |
| | 150,000 | | | Washington Trust Bancorp, Inc. | | | 8,199,000 | |
| | 88,181 | | | Wayfair, Inc. - Class A(a) | | | 21,965,887 | |
| | 102,275 | | | WEX, Inc.(a) | | | 15,310,567 | |
| | 155,000 | | | Wingstop, Inc. | | | 26,732,850 | |
| | 257,754 | | | Wolfspeed, Inc.(a) | | | 30,958,833 | |
| | 775,000 | | | Wolverine World Wide, Inc. | | | 25,706,750 | |
| | 195,000 | | | Workiva, Inc.(a) | | | 29,162,250 | |
| | 557,180 | | | Wyndham Hotels & Resorts, Inc. | | | 47,064,995 | |
| | 997,185 | | | Yext, Inc.(a) | | | 12,554,559 | |
| | 140,000 | | | Zevia PBC - Class A(a) | | | 1,566,600 | |
| | 111,597 | | | Zillow Group, Inc. - Class A(a) | | | 11,798,035 | |
| | 488,082 | | | Zillow Group, Inc. - Class C(a) | | | 50,579,938 | |
| | 424,017 | | | Zogenix, Inc.(a) | | | 6,500,181 | |
| | 649,312 | | | Zuora, Inc. - Class A(a) | | | 14,193,960 | |
| | | | | | | | 4,230,084,871 | |
| VIETNAM — 0.0% | | | | |
| | 794,673 | | | PetroVietnam Drilling & Well Services JSC(a) | | | 979,741 | |
| | 563,790 | | | Vietnam National Petroleum Group | | | 1,340,617 | |
| | | | | | | | 2,320,358 | |
Total Common Stocks
(Cost $5,896,323,763) | | | 8,255,010,047 | |
| | | | | |
| RIGHTS/WARRANTS — 0.0% | | | | |
| THAILAND — 0.0% | | | | |
| | 2,510,366 | | | Banpu Public Co. Ltd. Warrants, Expire 09/30/22(a) | | 389,614 | |
| | 2,510,366 | | | Banpu Public Co. Ltd. Warrants, Expire 09/30/23(a) | | 255,708 | |
| | | | | | | | 645,322 | |
| Shares | | | | | Value | |
| UNITED STATES — 0.0% | | | | |
| | 146,063 | | | Aduro Biotech CVR Rights, Expire 12/31/21(a)(c) | $ | 0 | |
| | | | | | | | |
Total Rights/Warrants
(Cost $0) | | | 645,322 | |
| | | | | | | | | |
| EXCHANGE-TRADED FUNDS — 11.9% | | | | |
| | 1,383,000 | | | Consumer Staples Select Sector SPDR Fund | | | 98,538,750 | |
| | 560,000 | | | Invesco KBW Bank ETF | | | 39,995,200 | |
| | 456,925 | | | iShares Core S&P Small-Cap ETF | | | 51,659,941 | |
| | 49,805 | | | iShares Russell 2000 ETF | | | 11,358,030 | |
| | 213,600 | | | iShares Russell Mid-Cap Growth ETF | | | 25,646,952 | |
| | 853,900 | | | SPDR S&P Bank ETF | | | 47,254,826 | |
| | 128,000 | | | SPDR S&P MidCap 400 ETF Trust | | | 65,169,920 | |
| | 514,500 | | | SPDR S&P Oil & Gas Exploration & Production ETF | | | 54,722,220 | |
| | 1,447,020 | | | SPDR S&P Regional Banking ETF | | | 102,608,188 | |
| | 2,000,000 | | | VanEck Gold Miners ETF | | | 63,420,000 | |
| | 2,822,645 | | | VanEck Junior Gold Miners ETF | | | 122,135,849 | |
| | 238,000 | | | Vanguard Consumer Staples ETF | | | 44,191,840 | |
| | 640,000 | | | Vanguard Energy ETF | | | 51,980,800 | |
| | 379,300 | | | Vanguard Financials ETF | | | 37,797,245 | |
| | 201,830 | | | Vanguard Mid-Cap ETF | | | 50,933,819 | |
| | 974,500 | | | Vanguard Small-Cap Growth ETF | | | 288,062,200 | |
| | | | | | | | | |
Total Exchange-Traded Funds
(Cost $915,411,506) | | | 1,155,475,780 | |
| | | | | | | | | |
| INVESTMENT COMPANY — 0.2% | | | | |
| | 17,388,439 | | | SEI Daily Income Trust Government II Fund - Class A, 0.01%(d) | | | 17,388,439 | |
| | | | | |
Total Investment Company
(Cost $17,388,439) | | | 17,388,439 | |
| | | | | |
| CASH SWEEP — 3.1% | | | | |
| | 305,673,113 | | | Citibank - US Dollars on Deposit in Custody Account, 0.03%(d) | | | 305,673,113 | |
| | | | | | | | | |
Total Cash Sweep
(Cost $305,673,113) | | | 305,673,113 | |
| | | | | |
TOTAL INVESTMENTS — 99.9%
(Cost $7,134,796,821) | | $ | 9,734,192,701 | |
| OTHER ASSETS IN EXCESS OF LIABILITIES — 0.1% | | | 12,646,655 | |
| NET ASSETS — 100.0% | | $ | 9,746,839,356 | |
| Old Westbury Funds, Inc. | |
| Small & Mid Cap Strategies Fund | |
| Portfolio of Investments - (Continued) | October 31, 2021 |
| | |
| (a) | Non-income producing security. |
| (b) | Security exempt from registration under Rule 144A of the Securities Act of 1933, as amended. The security may be resold in transactions exempt from registration normally to qualified institutional buyers. The security has been determined to be liquid in accordance with procedures adopted by the Fund’s Board of Directors. |
| (c) | Security is valued using significant unobservable inputs and is classified as Level 3 in the fair value hierarchy. The aggregate value of fair valued securities is $4,289 which is 0.00% of net assets and the cost is $203,236. |
| (d) | The rate shown represents the current yield as of October 31, 2021. |
The following abbreviations are used in the report:
ADR — American Depositary Receipt
CVR — Contingent Value Right
ETF — Exchange-Traded Fund
FOR — Foreign Ownership Restrictions
GDR — Global Depositary Receipt
REIT — Real Estate Investment Trust
SPDR — Standard & Poor’s Depositary Receipt
| Old Westbury Funds, Inc. | |
| Large Cap Strategies Fund | |
| Portfolio of Investments | October 31, 2021 |
| | |
| Shares | | | | | Value | |
| COMMON STOCKS — 89.5% |
| ARGENTINA — 0.7% |
| | 124,592 | | | MercadoLibre, Inc.(a) | | $ | 184,523,244 | |
| AUSTRALIA — 0.7% |
| | 405,359 | | | Atlassian Corp. Plc - Class A(a) | | | 185,707,119 | |
| | 18,781 | | | Australia & New Zealand Banking Group Ltd. | | | 397,562 | |
| | 21,723 | | | BHP Group Ltd. | | | 597,758 | |
| | 29,875 | | | BlueScope Steel Ltd. | | | 463,403 | |
| | 10,305 | | | Commonwealth Bank of Australia | | | 811,473 | |
| | 26,839 | | | Computershare Ltd. | | | 378,758 | |
| | 3,074 | | | CSL Ltd. | | | 694,858 | |
| | 3,131 | | | Macquarie Group Ltd.(b) | | | 465,948 | |
| | 72,214 | | | Santos Ltd. | | | 379,174 | |
| | 14,776 | | | Woodside Petroleum Ltd. | | | 258,541 | |
| | 8,322 | | | Woolworths Group Ltd. | | | 238,389 | |
| | | | | | | | 190,392,983 | |
| BELGIUM — 0.0% |
| | 3,369 | | | Etablissements Franz Colruyt NV | | | 165,285 | |
| | 8,578 | | | Proximus SADP | | | 161,485 | |
| | 2,173 | | | UCB SA | | | 258,986 | |
| | | | | | | | 585,756 | |
| BRAZIL — 0.3% |
| | 88,713 | | | Ambev SA | | | 267,689 | |
| | 76,650 | | | B3 SA - Brasil Bolsa Balcao | | | 162,160 | |
| | 1,334,200 | | | Localiza Rent a Car SA | | | 10,671,142 | |
| | 537,647 | | | Pagseguro Digital Ltd. - Class A(a) | | | 19,462,821 | |
| | 62,266 | | | Petroleo Brasileiro SA | | | 306,266 | |
| | 2,488,285 | | | Raia Drogasil SA | | | 10,316,785 | |
| | 53,222 | | | WEG SA | | | 348,068 | |
| | 740,961 | | | XP, Inc. - Class A(a) | | | 24,310,930 | |
| | | | | | | | 65,845,861 | |
| CANADA — 0.6% |
| | 9,217 | | | Alimentation Couche-Tard, Inc. - Class B | | | 345,712 | |
| | 5,169 | | | Bank of Nova Scotia (The) | | | 338,892 | |
| | 9,436 | | | Barrick Gold Corp. | | | 173,151 | |
| | 2,548 | | | Canadian National Railway Co. | | | 338,635 | |
| | 15,295 | | | Canadian Natural Resources Ltd. | | | 650,062 | |
| | 8,355 | | | Canadian Pacific Railway Ltd. | | | 646,675 | |
| | 214 | | | Constellation Software, Inc. | | | 376,089 | |
| | 6,378 | | | Dollarama, Inc. | | | 288,288 | |
| | 8,230 | | | Enbridge, Inc. | | | 344,734 | |
| | 117,665 | | | GoGold Resources, Inc.(a) | | | 327,059 | |
| | 42,580 | | | Kinross Gold Corp. | | | 255,975 | |
| | 6,971 | | | Metro, Inc. | | | 350,747 | |
| | 4,698 | | | Rogers Communications, Inc. - Class B | | | 218,501 | |
| | 5,522 | | | Royal Bank of Canada | | | 574,777 | |
| | 105,965 | | | Shopify, Inc. - Class A(a) | | | 155,422,045 | |
| | 4,442 | | | TC Energy Corp. | | | 240,297 | |
| Shares | | | | | Value | |
| CANADA (continued) |
| | 4,970 | | | Toronto-Dominion Bank (The) | | $ | 360,783 | |
| | 5,774 | | | Wheaton Precious Metals Corp. | | | 233,088 | |
| | | | | | | | 161,485,510 | |
| CHILE — 0.0% |
| | 20,232 | | | Antofagasta Plc | | | 394,700 | |
| CHINA — 5.9% |
| | 574,500 | | | AAC Technologies Holdings, Inc. | | | 2,506,815 | |
| | 569,964 | | | Agricultural Bank of China Ltd. - H Shares | | | 194,127 | |
| | 2,413,412 | | | Alibaba Group Holding Ltd.(a) | | | 50,560,524 | |
| | 295,476 | | | Alibaba Group Holding Ltd. - ADR(a) | | | 48,735,811 | |
| | 11,044,878 | | | ANTA Sports Products Ltd. | | | 172,618,362 | |
| | 179,387 | | | Asymchem Laboratories Tianjin Co. Ltd. - A Shares | | | 11,148,190 | |
| | 509,680 | | | Bank of China Ltd. - H Shares | | | 180,145 | |
| | 36,796 | | | BeiGene Ltd. - ADR(a) | | | 13,162,665 | |
| | 289,800 | | | Beijing United Information Technology Co. Ltd. - A Shares | | | 5,074,491 | |
| | 665,587 | | | Berry Genomics Co. Ltd. - A Shares(a) | | | 2,016,191 | |
| | 242,965 | | | BGI Genomics Co. Ltd. - A Shares | | | 3,379,248 | |
| | 139,895 | | | Bilibili, Inc. - ADR(a) | | | 10,254,303 | |
| | 264,557 | | | Burning Rock Biotech Ltd. - ADR(a) | | | 3,727,608 | |
| | 448,058 | | | China Construction Bank Corp. - H Shares | | | 304,637 | |
| | 128,302 | | | China International Capital Corp. Ltd. - H Shares(c) | | | 319,250 | |
| | 97,010 | | | China Life Insurance Co. Ltd. - H Shares | | | 169,071 | |
| | 2,677,793 | | | China Merchants Bank Co. Ltd. - H Shares | | | 22,560,161 | |
| | 16,269,000 | | | China Molybdenum Co. Ltd. - H Shares | | | 10,099,514 | |
| | 391,836 | | | China Petroleum & Chemical Corp. - H Shares | | | 192,380 | |
| | 106,358 | | | China Shenhua Energy Co. Ltd. - H Shares | | | 229,106 | |
| | 101,776 | | | CITIC Securities Co. Ltd. - H Shares | | | 259,264 | |
| | 332,686 | | | Contemporary Amperex Technology Co. Ltd. - A Shares | | | 33,188,383 | |
| | 2,550,000 | | | Country Garden Services Holdings Co. Ltd. | | | 19,828,417 | |
| | 422,300 | | | ENN Energy Holdings Ltd. | | | 7,311,074 | |
| | 2,406,721 | | | Estun Automation Co. Ltd. - A Shares | | | 9,934,652 | |
| | 1,493,718 | | | Foshan Haitian Flavouring & Food Co. Ltd. - A Shares | | | 27,279,093 | |
| | 158,113 | | | Fosun International Ltd. | | | 185,944 | |
| | 1,142,800 | | | Fuyao Glass Industry Group Co. Ltd. - H Shares(c) | | | 6,594,913 | |
| | 635,600 | | | Glodon Co. Ltd. - A Shares | | | 7,390,940 | |
| | 599,255 | | | Guangzhou Kingmed Diagnostics Group Co. Ltd. - A Shares | | | 10,707,312 | |
| Old Westbury Funds, Inc. | |
| Large Cap Strategies Fund | |
| Portfolio of Investments - (Continued) | October 31, 2021 |
| | |
| Shares | | | | | Value | |
| CHINA (continued) |
| | 1,866,800 | | | Haier Smart Home Co. Ltd. - H Shares | | $ | 6,982,055 | |
| | 211,457 | | | Haitong Securities Co. Ltd. - H Shares | | | 188,342 | |
| | 898,835 | | | Hangzhou Robam Appliances Co. Ltd. - A Shares | | | 4,394,825 | |
| | 330,612 | | | Hangzhou Tigermed Consulting Co. Ltd. - A Shares | | | 8,792,035 | |
| | 1,082,686 | | | Hangzhou Tigermed Consulting Co. Ltd. - H Shares(c) | | | 21,109,629 | |
| | 2,086,816 | | | Huayu Automotive Systems Co. Ltd. - A Shares | | | 8,708,569 | |
| | 370,445 | | | Industrial & Commercial Bank of China Ltd. - H Shares | | | 202,827 | |
| | 605,858 | | | JD Health International, Inc.(a)(c) | | | 5,365,159 | |
| | 724,650 | | | JD.com, Inc. - A Shares(a) | | | 28,909,628 | |
| | 272,967 | | | Kanzhun Ltd. - ADR(a) | | | 9,581,142 | |
| | 124,114 | | | KE Holdings, Inc. - ADR(a) | | | 2,261,357 | |
| | 3,025,000 | | | Kingdee International Software Group Co. Ltd.(a) | | | 9,991,967 | |
| | 1,192,000 | | | Kingsoft Corp. Ltd. | | | 5,124,658 | |
| | 332,900 | | | Kuaishou Technology(a)(c) | | | 4,428,398 | |
| | 80,427 | | | Kweichow Moutai Co. Ltd. - A Shares | | | 22,920,437 | |
| | 1,885,500 | | | Li Ning Co. Ltd. | | | 20,962,117 | |
| | 531,500 | | | LONGi Green Energy Technology Co. Ltd. - A Shares | | | 8,103,163 | |
| | 510,759 | | | Lufax Holding Ltd. - ADR(a) | | | 3,222,889 | |
| | 229,524 | | | Luzhou Laojiao Co. Ltd. - A Shares | | | 8,201,060 | |
| | 1,423,000 | | | Medlive Technology Co. Ltd.(a)(c) | | | 7,398,027 | |
| | 922,400 | | | Meituan - B Shares(a)(c) | | | 31,961,833 | |
| | 1,023,211 | | | Midea Group Co. Ltd. - A Shares | | | 10,981,596 | |
| | 1,246,000 | | | Minth Group Ltd. | | | 4,980,477 | |
| | 103,340 | | | NetEase, Inc. - ADR | | | 10,084,951 | |
| | 59,816 | | | New China Life Insurance Co. Ltd. - H Shares | | | 173,363 | |
| | 286,134 | | | NIO, Inc. - ADR(a) | | | 11,276,541 | |
| | 204,855 | | | PICC Property & Casualty Co. Ltd. - H Shares | | | 191,677 | |
| | 75,546 | | | Pinduoduo, Inc. - ADR(a) | | | 6,717,550 | |
| | 4,209,305 | | | Ping An Bank Co. Ltd. - A Shares | | | 12,809,914 | |
| | 319,300 | | | Ping An Healthcare and Technology Co. Ltd.(a)(c) | | | 1,553,307 | |
| | 2,795,500 | | | Ping An Insurance Group Co. of China Ltd. - H Shares | | | 20,084,628 | |
| | 851,600 | | | Pop Mart International Group Ltd.(c) | | | 5,029,371 | |
| | 235,696 | | | Proya Cosmetics Co. Ltd. - A Shares | | | 7,393,490 | |
| | 223,500 | | | SG Micro Corp. - A Shares | | | 11,301,179 | |
| | 467,593 | | | Shandong Sinocera Functional Material Co. Ltd. - A Shares | | | 3,121,835 | |
| | 1,240,252 | | | Shenzhen Inovance Technology Co. Ltd. - A Shares | | | 12,625,789 | |
| | 1,551,637 | | | Shenzhen Megmeet Electrical Co. Ltd. - A Shares | | | 7,417,172 | |
| Shares | | | | | Value | |
| CHINA (continued) |
| | 602,300 | | | Shenzhou International Group Holdings Ltd. | | $ | 12,989,646 | |
| | 845,617 | | | Sinocare, Inc. - A Shares | | | 3,097,334 | |
| | 327,100 | | | Sunny Optical Technology Group Co. Ltd. | | | 8,837,018 | |
| | 6,712,540 | | | Tencent Holdings Ltd. | | | 414,977,410 | |
| | 384,819 | | | Tencent Music Entertainment Group - ADR(a) | | | 3,024,677 | |
| | 212,772 | | | Topchoice Medical Corp. - A Shares(a) | | | 7,918,287 | |
| | 2,918,000 | | | Weichai Power Co. Ltd. - H Shares | | | 5,243,061 | |
| | 539,500 | | | WuXi AppTec Co. Ltd. - H Shares(c) | | | 11,531,245 | |
| | 12,527,548 | | | Wuxi Biologics Cayman, Inc.(a)(c) | | | 190,638,350 | |
| | 442,839 | | | Yatsen Holding Ltd. - ADR(a) | | | 1,239,949 | |
| | 374,484 | | | Yifeng Pharmacy Chain Co. Ltd. - A Shares | | | 2,790,666 | |
| | 1,439,840 | | | Yonyou Network Technology Co. Ltd. - A Shares | | | 7,145,664 | |
| | 4,426 | | | Yum China Holdings, Inc. | | | 252,636 | |
| | 141,400 | | | Yunnan Energy New Material Co. Ltd. - A Shares | | | 6,437,935 | |
| | 79,400 | | | Zai Lab Ltd. - ADR(a) | | | 8,289,360 | |
| | 2,819,868 | | | Zhejiang Sanhua Intelligent Controls Co. Ltd. - A Shares | | | 10,438,658 | |
| | | | | | | | 1,519,517,444 | |
| CYPRUS — 0.1% |
| | 300,294 | | | TCS Group Holding Plc - GDR | | | 30,750,106 | |
| DENMARK — 0.0% |
| | 1,639 | | | Carlsberg AS - Class B | | | 270,365 | |
| | 2,330 | | | Chr Hansen Holding A/S | | | 185,386 | |
| | 1,502 | | | Coloplast A/S - Class B | | | 244,848 | |
| | 2,840 | | | DSV A/S | | | 660,019 | |
| | 4,513 | | | GN Store Nord AS | | | 273,866 | |
| | 9,596 | | | Novo Nordisk A/S - Class B | | | 1,050,266 | |
| | 4,181 | | | Novozymes A/S - Class B | | | 307,451 | |
| | | | | | | | 2,992,201 | |
| FINLAND — 0.0% |
| | 3,384 | | | Elisa Oyj | | | 204,123 | |
| | 13,020 | | | Kesko Oyj - Class B | | | 422,786 | |
| | 3,477 | | | Kone Oyj - Class B | | | 236,985 | |
| | 7,400 | | | UPM-Kymmene Oyj | | | 261,080 | |
| | | | | | | | 1,124,974 | |
| FRANCE — 1.1% |
| | 2,393 | | | Air Liquide SA | | | 399,012 | |
| | 1,297,717 | | | Airbus SE(a) | | | 165,917,790 | |
| | 2,923 | | | Atos SE | | | 151,987 | |
| | 8,602 | | | BNP Paribas SA | | | 575,752 | |
| | 2,675 | | | Capgemini SE | | | 622,480 | |
| | 4,966 | | | Edenred | | | 268,492 | |
| | 322 | | | Hermes International | | | 510,144 | |
| | 1,348 | | | L’Oreal SA | | | 615,446 | |
| Old Westbury Funds, Inc. | |
| Large Cap Strategies Fund | |
| Portfolio of Investments - (Continued) | October 31, 2021 |
| | |
| Shares | | | | | Value | |
| FRANCE (continued) |
| | 1,727 | | | LVMH Moet Hennessy Louis Vuitton SE | | $ | 1,351,970 | |
| | 4,276 | | | Sanofi | | | 427,228 | |
| | 970 | | | Sartorius Stedim Biotech | | | 533,973 | |
| | 675,737 | | | Schneider Electric SE | | | 116,313,529 | |
| | 941 | | | Teleperformance | | | 392,803 | |
| | 12,014 | | | TotalEnergies SE | | | 602,331 | |
| | | | | | | | 288,682,937 | |
| GERMANY — 1.7% |
| | 347,133 | | | adidas AG | | | 113,684,253 | |
| | 5,078 | | | BASF SE | | | 365,594 | |
| | 1,320 | | | Deutsche Boerse AG | | | 219,122 | |
| | 6,906 | | | Deutsche Post AG | | | 427,268 | |
| | 27,659 | | | Deutsche Telekom AG | | | 514,075 | |
| | 8,321 | | | Evonik Industries AG | | | 269,527 | |
| | 2,839 | | | Fresenius Medical Care AG & Co KGaA | | | 188,577 | |
| | 6,643 | | | Fresenius SE & Co KGaA | | | 301,528 | |
| | 7,225 | | | RWE AG | | | 277,874 | |
| | 1,105,481 | | | Siemens AG | | | 179,268,867 | |
| | 5,032 | | | Vonovia SE | | | 305,159 | |
| | 1,395,982 | | | Zalando SE(a)(c) | | | 131,650,149 | |
| | | | | | | | 427,471,993 | |
| HONG KONG — 0.6% |
| | 10,927,695 | | | AIA Group Ltd. | | | 123,385,130 | |
| | 63,099 | | | BOC Hong Kong Holdings Ltd. | | | 200,314 | |
| | 53,378 | | | China Mengniu Dairy Co. Ltd. | | | 339,937 | |
| | 58,130 | | | China Overseas Land & Investment Ltd. | | | 128,207 | |
| | 41,359 | | | China Resources Beer Holdings Co. Ltd. | | | 342,864 | |
| | 47,099 | | | China Resources Land Ltd. | | | 183,420 | |
| | 91,053 | | | CLP Holdings Ltd. | | | 891,162 | |
| | 3,774,000 | | | Geely Automobile Holdings Ltd. | | | 13,120,841 | |
| | 103,863 | | | Guangdong Investment Ltd. | | | 130,822 | |
| | 11,151 | | | Hang Seng Bank Ltd. | | | 212,113 | |
| | 14,987 | | | Hong Kong Exchanges & Clearing Ltd. | | | 906,867 | |
| | 418,257 | | | Hutchmed China Ltd. - ADR(a) | | | 12,305,121 | |
| | 32,806 | | | Sun Hung Kai Properties Ltd. | | | 436,401 | |
| | 27,057 | | | Techtronic Industries Co. Ltd. | | | 556,754 | |
| | | | | | | | 153,139,953 | |
| INDIA — 3.5% |
| | 978,195 | | | Apollo Hospitals Enterprise Ltd. | | | 55,676,368 | |
| | 1,919,124 | | | Asian Paints Ltd. | | | 79,452,150 | |
| | 522,805 | | | Bajaj Finance Ltd. | | | 51,666,626 | |
| | 3,084,267 | | | Bandhan Bank Ltd.(c) | | | 12,004,469 | |
| | 622,973 | | | Britannia Industries Ltd. | | | 30,580,326 | |
| | 10,003,149 | | | HDFC Bank Ltd. | | | 211,447,918 | |
| | 7,540 | | | Hero MotoCorp Ltd. | | | 267,551 | |
| Shares | | | | | Value | |
| INDIA (continued) |
| | 2,192,088 | | | Housing Development Finance Corp. Ltd. | | $ | 83,276,290 | |
| | 3,761,045 | | | ICICI Prudential Life Insurance Co. Ltd.(c) | | | 31,060,248 | |
| | 730,029 | | | Jubilant Foodworks Ltd. | | | 35,967,562 | |
| | 5,336,341 | | | Reliance Industries Ltd. | | | 180,743,442 | |
| | 27,555 | | | Tata Consumer Products Ltd. | | | 297,882 | |
| | 3,891,533 | | | Titan Co. Ltd. | | | 123,871,643 | |
| | | | | | | | 896,312,475 | |
| INDONESIA — 0.1% |
| | 45,058,810 | | | Bank Central Asia Tbk PT | | | 23,773,750 | |
| | 1,066,862 | | | Bank Rakyat Indonesia Persero Tbk PT | | | 320,040 | |
| | | | | | | | 24,093,790 | |
| IRELAND — 1.4% |
| | 2,717 | | | Accenture Plc - Class A | | | 974,832 | |
| | 1,588,040 | | | Aptiv Plc(a) | | | 274,556,236 | |
| | 6,725 | | | Experian Plc | | | 308,041 | |
| | 905 | | | ICON Plc(a) | | | 259,527 | |
| | 1,778 | | | Jazz Pharmaceuticals Plc(a) | | | 236,545 | |
| | 789,505 | | | Medtronic Plc | | | 94,630,069 | |
| | | | | | | | 370,965,250 | |
| ISRAEL — 0.0% |
| | 1,867 | | | Check Point Software Technologies Ltd.(a) | | | 223,293 | |
| | 1,420 | | | Nice Ltd.(a) | | | 399,477 | |
| | | | | | | | 622,770 | |
| ITALY — 0.0% |
| | 1,276 | | | DiaSorin SpA | | | 288,153 | |
| | 20,891 | | | FinecoBank Banca Fineco SpA(a) | | | 398,837 | |
| | 11,946 | | | Prysmian SpA | | | 451,573 | |
| | | | | | | | 1,138,563 | |
| JAPAN — 2.2% |
| | 9,594 | | | Aeon Co. Ltd. | | | 220,374 | |
| | 5,876 | | | Asahi Group Holdings Ltd. | | | 265,870 | |
| | 11,847 | | | Astellas Pharma, Inc. | | | 199,260 | |
| | 3,761 | | | Bandai Namco Holdings, Inc. | | | 286,658 | |
| | 7,180 | | | Chugai Pharmaceutical Co. Ltd. | | | 267,545 | |
| | 1,559 | | | Daikin Industries Ltd. | | | 340,456 | |
| | 7,875 | | | Daiwa House Industry Co. Ltd. | | | 259,172 | |
| | 130 | | | Daiwa House REIT Investment Corp. | | | 372,977 | |
| | 800 | | | Disco Corp. | | | 214,784 | |
| | 13,699 | | | Fuji Electric Co. Ltd. | | | 667,071 | |
| | 3,290 | | | Fujitsu Ltd. | | | 566,495 | |
| | 4,576 | | | Hamamatsu Photonics KK | | | 270,605 | |
| | 6,693 | | | Hitachi Ltd. | | | 384,873 | |
| | 2,714 | | | Hoya Corp. | | | 398,260 | |
| | 9,886 | | | ITOCHU Corp. | | | 281,206 | |
| Old Westbury Funds, Inc. | |
| Large Cap Strategies Fund | |
| Portfolio of Investments - (Continued) | October 31, 2021 |
| | |
| Shares | | | | | Value | |
| JAPAN (continued) |
| | 75 | | | Japan Real Estate Investment Corp. REIT | | $ | 459,311 | |
| | 10,695 | | | Japan Tobacco, Inc. | | | 209,771 | |
| | 3,698 | | | Kao Corp. | | | 208,658 | |
| | 8,141 | | | KDDI Corp. | | | 251,998 | |
| | 237,574 | | | Keyence Corp. | | | 142,804,955 | |
| | 8,646 | | | Kyowa Kirin Co. Ltd. | | | 283,712 | |
| | 3,562 | | | Lawson, Inc. | | | 172,201 | |
| | 5,298 | | | M3, Inc. | | | 311,814 | |
| | 9,769 | | | Mitsubishi Corp. | | | 309,591 | |
| | 16,140 | | | Mitsubishi Electric Corp. | | | 215,955 | |
| | 12,213 | | | Mitsubishi Estate Co. Ltd. | | | 185,164 | |
| | 14,123 | | | Mitsui & Co. Ltd. | | | 321,183 | |
| | 11,528 | | | Mitsui Fudosan Co. Ltd. | | | 262,825 | |
| | 4,303 | | | Murata Manufacturing Co. Ltd. | | | 326,684 | |
| | 7,341 | | | Nabtesco Corp. | | | 237,669 | |
| | 7,527 | | | Nichirei Corp. | | | 183,593 | |
| | 5,487 | | | Nihon Kohden Corp. | | | 174,515 | |
| | 2,619,100 | | | Nihon M&A Center Holdings, Inc. | | | 80,083,909 | |
| | 62 | | | Nippon Building Fund, Inc. REIT | | | 402,544 | |
| | 144 | | | Nippon Prologis, Inc. REIT | | | 480,737 | |
| | 9,341 | | | Nippon Telegraph & Telephone Corp. | | | 261,278 | |
| | 50,817 | | | Nomura Holdings, Inc. | | | 245,224 | |
| | 8,212 | | | Nomura Research Institute Ltd. | | | 327,111 | |
| | 1,250 | | | Obic Co. Ltd. | | | 230,204 | |
| | 3,662 | | | Omron Corp. | | | 349,252 | |
| | 11,664 | | | Osaka Gas Co. Ltd. | | | 187,893 | |
| | 4,966 | | | Otsuka Holdings Co. Ltd. | | | 195,808 | |
| | 26,607 | | | Panasonic Corp. | | | 325,073 | |
| | 13,090 | | | Recruit Holdings Co. Ltd. | | | 869,642 | |
| | 5,679 | | | Seven & i Holdings Co. Ltd. | | | 238,271 | |
| | 7,452 | | | Shimadzu Corp. | | | 301,741 | |
| | 1,743 | | | Shin-Etsu Chemical Co. Ltd. | | | 309,756 | |
| | 543 | | | SMC Corp. | | | 323,680 | |
| | 14,944 | | | SoftBank Corp. | | | 203,821 | |
| | 1,611,599 | | | Sony Group Corp. | | | 185,798,735 | |
| | 7,785 | | | Sumitomo Mitsui Financial Group, Inc. | | | 254,161 | |
| | 7,675 | | | Sumitomo Realty & Development Co. Ltd. | | | 276,765 | |
| | 5,361 | | | Suntory Beverage & Food Ltd. | | | 207,667 | |
| | 6,620 | | | Terumo Corp. | | | 291,460 | |
| | 4,237 | | | Tokio Marine Holdings, Inc. | | | 222,975 | |
| | 307,625 | | | Tokyo Electron Ltd. | | | 142,645,152 | |
| | 10,446 | | | Tokyo Gas Co. Ltd. | | | 181,379 | |
| | 4,747 | | | Toyo Suisan Kaisha Ltd. | | | 204,499 | |
| | 42,525 | | | Toyota Motor Corp. | | | 748,642 | |
| | 5,136 | | | Unicharm Corp. | | | 206,927 | |
| | 4,756 | | | Yamaha Corp. | | | 299,610 | |
| | | | | | | | 568,589,121 | |
| KAZAKHSTAN — 0.2% |
| | 257,893 | | | Kaspi.KZ JSC - GDR | | | 37,394,485 | |
| Shares | | | | | Value | |
| MALAYSIA — 0.0% |
| | 344,835 | | | Public Bank Berhad | | $ | 347,250 | |
| | 67,933 | | | Tenaga Nasional Berhad | | | 158,472 | |
| | | | | | | | 505,722 | |
| MEXICO — 0.0% |
| | 353,479 | | | America Movil SAB de CV - Series L | | | 314,711 | |
| | 75,493 | | | Grupo Financiero Banorte SAB de CV - Series O | | | 477,203 | |
| | 106,503 | | | Grupo Mexico SAB de CV - Series B | | | 466,714 | |
| | 82,378 | | | Wal-Mart de Mexico SAB de CV | | | 287,010 | |
| | | | | | | | 1,545,638 | |
| NETHERLANDS — 2.4% |
| | 63,216 | | | Adyen NV(a)(c) | | | 190,769,325 | |
| | 270,567 | | | ASML Holding NV | | | 219,938,503 | |
| | 243,651 | | | ASML Holding NV | | | 197,303,220 | |
| | 2,519 | | | IMCD NV | | | 559,243 | |
| | 71,433 | | | ING Groep NV | | | 1,083,404 | |
| | 9,188 | | | Koninklijke Ahold Delhaize NV | | | 298,778 | |
| | 2,404 | | | NXP Semiconductors NV | | | 482,867 | |
| | 17,084 | | | Royal Dutch Shell Plc - Class A | | | 393,023 | |
| | 17,858 | | | Royal Dutch Shell Plc - Class B | | | 411,807 | |
| | 2,754 | | | Wolters Kluwer NV | | | 288,564 | |
| | | | | | | | 611,528,734 | |
| NORWAY — 0.0% |
| | 14,386 | | | Aker BP ASA | | | 551,572 | |
| | 12,813 | | | Telenor ASA | | | 202,253 | |
| | | | | | | | 753,825 | |
| POLAND — 0.0% |
| | 37,606 | | | Powszechna Kasa Oszczednosci Bank Polski SA(a) | | | 459,983 | |
| | 26,916 | | | Powszechny Zaklad Ubezpieczen SA | | | 269,184 | |
| | | | | | | | 729,167 | |
| PORTUGAL — 0.0% |
| | 11,494 | | | Jeronimo Martins SGPS SA | | | 260,426 | |
| QATAR — 0.0% |
| | 52,733 | | | Qatar National Bank QPSC | | | 296,904 | |
| RUSSIA — 0.3% |
| | 771,107 | | | Yandex NV - Class A(a) | | | 63,878,504 | |
| SINGAPORE — 1.5% |
| | 1,089,129 | | | Sea Ltd. - ADR(a) | | | 374,192,051 | |
| SOUTH AFRICA — 0.0% |
| | 44,587 | | | Absa Group Ltd. | | | 408,653 | |
| | 35,902 | | | Standard Bank Group Ltd. | | | 318,312 | |
| | 33,477 | | | Vodacom Group Ltd. | | | 297,140 | |
| | | | | | | | 1,024,105 | |
| SOUTH KOREA — 0.7% |
| | 1,619 | | | Hyundai Mobis Co. Ltd. | | | 349,140 | |
| | 8,899 | | | KB Financial Group, Inc. | | | 431,033 | |
| Old Westbury Funds, Inc. | |
| Large Cap Strategies Fund | |
| Portfolio of Investments - (Continued) | October 31, 2021 |
| | |
| Shares | | | | | Value | |
| SOUTH KOREA (continued) |
| | 13,024 | | | Kia Corp. | | $ | 948,477 | |
| | 733 | | | Korea Zinc Co. Ltd. | | | 336,846 | |
| | 239 | | | LG Household & Health Care Ltd. | | | 239,501 | |
| | 509,856 | | | NAVER Corp. | | | 177,580,242 | |
| | 2,371 | | | POSCO | | | 600,587 | |
| | 29,445 | | | Samsung Electronics Co. Ltd. | | | 1,758,813 | |
| | 7,747 | | | Samsung Electronics Co. Ltd. - Preference Shares | | | 424,293 | |
| | | | | | | | 182,668,932 | |
| SPAIN — 0.0% |
| | 42,312 | | | Iberdrola SA | | | 499,643 | |
| | 7,129 | | | Industria de Diseno Textil SA | | | 257,453 | |
| | 13,908 | | | Red Electrica Corp. SA | | | 289,558 | |
| | | | | | | | 1,046,654 | |
| SWEDEN — 0.5% |
| | 8,676 | | | Atlas Copco AB - Class A | | | 557,454 | |
| | 6,494 | | | Essity AB - Class B | | | 210,064 | |
| | 800,023 | | | Evolution AB(c) | | | 129,412,197 | |
| | 58,621 | | | Hexagon AB - Class B | | | 941,977 | |
| | 16,248 | | | Sandvik AB | | | 411,498 | |
| | 33,020 | | | Swedish Match AB | | | 290,598 | |
| | 14,654 | | | Tele2 AB - Class B | | | 206,722 | |
| | | | | | | | 132,030,510 | |
| SWITZERLAND — 0.6% |
| | 281 | | | Georg Fischer AG | | | 425,060 | |
| | 64 | | | Givaudan SA | | | 301,197 | |
| | 5,785 | | | Logitech International SA | | | 481,578 | |
| | 719 | | | Lonza Group AG | | | 589,429 | |
| | 12,201 | | | Nestle SA | | | 1,610,010 | |
| | 8,954 | | | Novartis AG | | | 739,712 | |
| | 2,638 | | | Roche Holding AG | | | 1,020,078 | |
| | 1,467 | | | Sika AG | | | 496,691 | |
| | 1,117 | | | Sonova Holding AG | | | 461,513 | |
| | 8,514 | | | STMicroelectronics NV | | | 402,693 | |
| | 654 | | | Swisscom AG | | | 356,000 | |
| | 1,052,941 | | | TE Connectivity Ltd. | | | 153,729,386 | |
| | 20,619 | | | UBS Group AG | | | 374,840 | |
| | 665 | | | Zurich Insurance Group AG | | | 294,805 | |
| | | | | | | | 161,282,992 | |
| TAIWAN — 1.2% |
| | 386,190 | | | Chunghwa Telecom Co. Ltd. | | | 1,534,567 | |
| | 44,074 | | | Delta Electronics, Inc. | | | 388,303 | |
| | 81,921 | | | Formosa Chemicals & Fibre Corp. | | | 237,145 | |
| | 140,564 | | | Hon Hai Precision Industry Co. Ltd. | | | 540,854 | |
| | 16,025 | | | MediaTek, Inc. | | | 526,128 | |
| | 202,532 | | | Mega Financial Holding Co. Ltd. | | | 243,255 | |
| | 90,443 | | | Pegatron Corp. | | | 221,160 | |
| | 25,438 | | | Realtek Semiconductor Corp. | | | 456,463 | |
| | 147,021 | | | Taiwan Cement Corp. | | | 255,093 | |
| Shares | | | | | Value | |
| TAIWAN (continued) |
| | 10,935,701 | | | Taiwan Semiconductor Manufacturing Co. Ltd. | | $ | 232,017,678 | |
| | 693,862 | | | Taiwan Semiconductor Manufacturing Co. Ltd. - ADR | | | 78,892,109 | |
| | 87,230 | | | Uni-President Enterprises Corp. | | | 208,912 | |
| | | | | | | | 315,521,667 | |
| THAILAND — 0.3% |
| | 41,523,900 | | | CP ALL Public Co. Ltd. - FOR | | | 80,088,287 | |
| TURKEY — 0.0% |
| | 13,589 | | | BIM Birlesik Magazalar AS | | | 87,847 | |
| | 91,777 | | | Eregli Demir ve Celik Fabrikalari TAS | | | 187,964 | |
| | | | | | | | 275,811 | |
| UNITED KINGDOM — 1.9% |
| | 12,964 | | | Anglo American Plc | | | 493,668 | |
| | 8,966 | | | Ashtead Group Plc | | | 751,441 | |
| | 5,940 | | | AstraZeneca Plc | | | 739,268 | |
| | 4,051 | | | AstraZeneca Plc - ADR | | | 252,701 | |
| | 32,538 | | | Barratt Developments Plc | | | 295,233 | |
| | 104,926 | | | BP Plc | | | 502,875 | |
| | 10,997 | | | British American Tobacco Plc | | | 383,247 | |
| | 3,510 | | | Croda International Plc | | | 454,326 | |
| | 9,930 | | | Diageo Plc | | | 493,578 | |
| | 5,852,009 | | | Entain Plc(a) | | | 164,019,546 | |
| | 19,222 | | | GlaxoSmithKline Plc | | | 396,856 | |
| | 10,381 | | | Hargreaves Lansdown Plc | | | 218,360 | |
| | 221,317 | | | ITV Plc(a) | | | 326,054 | |
| | 31,348 | | | JD Sports Fashion Plc | | | 466,766 | |
| | 76,805 | | | Legal & General Group Plc | | | 303,667 | |
| | 522,087 | | | Linde Plc | | | 166,650,170 | |
| | 1,399,903 | | | London Stock Exchange Group Plc | | | 136,024,445 | |
| | 120,828 | | | M&G Plc | | | 330,388 | |
| | 11,844 | | | Mondi Plc | | | 295,816 | |
| | 3,603 | | | Next Plc | | | 392,794 | |
| | 14,882 | | | RELX Plc | | | 461,103 | |
| | 11,000 | | | Rio Tinto Plc | | | 686,540 | |
| | 2,251 | | | Spirax-Sarco Engineering Plc | | | 480,729 | |
| | 13,255 | | | Unilever Plc | | | 709,598 | |
| | 200 | | | Unilever Plc | | | 10,708 | |
| | | | | | | | 476,139,877 | |
| UNITED STATES — 60.9% |
| | 2,485 | | | 3M Co. | | | 444,020 | |
| | 5,895 | | | A.O. Smith Corp. | | | 430,748 | |
| | 437,159 | | | Abbott Laboratories | | | 56,345,424 | |
| | 1,529,014 | | | AbbVie, Inc. | | | 175,332,035 | |
| | 7,655 | | | ACI Worldwide, Inc.(a) | | | 234,855 | |
| | 4,021 | | | Activision Blizzard, Inc. | | | 314,402 | |
| | 2,526 | | | Adobe, Inc.(a) | | | 1,642,809 | |
| | 802,017 | | | Agilent Technologies, Inc. | | | 126,309,657 | |
| | 4,970 | | | Agilysys, Inc.(a) | | | 237,168 | |
| | 3,235 | | | Agree Realty Corp. REIT | | | 229,879 | |
| Old Westbury Funds, Inc. | |
| Large Cap Strategies Fund | |
| Portfolio of Investments - (Continued) | October 31, 2021 |
| | |
| Shares | | | | | Value | |
| UNITED STATES (continued) |
| | 474,233 | | | Air Products and Chemicals, Inc. | | $ | 142,179,796 | |
| | 3,244 | | | Albemarle Corp. | | | 812,525 | |
| | 195,409 | | | Align Technology, Inc.(a) | | | 122,007,517 | |
| | 5,309 | | | Alliance Data Systems Corp. | | | 452,592 | |
| | 13,024 | | | Ally Financial, Inc. | | | 621,766 | |
| | 36,264 | | | Alphabet, Inc. - Class A(a) | | | 107,374,803 | |
| | 277,827 | | | Alphabet, Inc. - Class C(a) | | | 823,870,964 | |
| | 215,325 | | | Amazon.com, Inc.(a) | | | 726,168,490 | |
| | 4,557 | | | American Express Co. | | | 791,915 | |
| | 391,212 | | | American Tower Corp. REIT | | | 110,310,048 | |
| | 1,807 | | | Ameriprise Financial, Inc. | | | 545,949 | |
| | 2,232 | | | AmerisourceBergen Corp. | | | 272,349 | |
| | 1,659,498 | | | AMETEK, Inc. | | | 219,717,535 | |
| | 238,006 | | | Amgen, Inc. | | | 49,260,102 | |
| | 1,935 | | | Analog Devices, Inc. | | | 335,703 | |
| | 1,019 | | | ANSYS, Inc.(a) | | | 386,792 | |
| | 328,943 | | | Anthem, Inc. | | | 143,132,968 | |
| | 1,062 | | | Aon Plc - Class A | | | 339,755 | |
| | 6,491,611 | | | Apple, Inc. | | | 972,443,328 | |
| | 6,134 | | | Applied Materials, Inc. | | | 838,211 | |
| | 5,115 | | | ASGN, Inc.(a) | | | 612,061 | |
| | 31,203 | | | AT&T, Inc. | | | 788,188 | |
| | 1,966 | | | Autodesk, Inc.(a) | | | 624,421 | |
| | 403,475 | | | Automatic Data Processing, Inc. | | | 90,576,103 | |
| | 209 | | | AutoZone, Inc.(a) | | | 373,032 | |
| | 4,500,491 | | | Avantor, Inc.(a) | | | 181,729,827 | |
| | 1,818 | | | Avery Dennison Corp. | | | 395,815 | |
| | 11,543,276 | | | Bank of America Corp. | | | 551,537,727 | |
| | 10,822 | | | Bank OZK | | | 483,419 | |
| | 4,079 | | | Baxter International, Inc. | | | 322,078 | |
| | 5,370 | | | Berkshire Hathaway, Inc. - Class B(a) | | | 1,541,244 | |
| | 928 | | | Biogen, Inc.(a) | | | 247,479 | |
| | 498 | | | Bio-Rad Laboratories, Inc. - Class A(a) | | | 395,751 | |
| | 1,033 | | | Bio-Techne Corp. | | | 540,930 | |
| | 3,866 | | | Blackbaud, Inc.(a) | | | 274,525 | |
| | 3,698,418 | | | Blackstone, Inc. | | | 511,935,020 | |
| | 278 | | | Booking Holdings, Inc.(a) | | | 672,977 | |
| | 7,362 | | | BorgWarner, Inc. | | | 331,805 | |
| | 13,050 | | | Boyd Gaming Corp.(a) | | | 832,329 | |
| | 10,337 | | | Bristol-Myers Squibb Co. | | | 603,681 | |
| | 182,627 | | | Broadcom, Inc. | | | 97,097,297 | |
| | 1,907 | | | Broadridge Financial Solutions, Inc. | | | 340,228 | |
| | 3,151 | | | Brown-Forman Corp. - Class B | | | 213,921 | |
| | 125 | | | Cable One, Inc. | | | 213,901 | |
| | 755,686 | | | Cadence Design Systems, Inc.(a) | | | 130,816,803 | |
| | 3,752 | | | California Water Service Group | | | 228,422 | |
| | 3,903 | | | Cardinal Health, Inc. | | | 186,602 | |
| | 2,827 | | | Caterpillar, Inc. | | | 576,736 | |
| | 5,536 | | | CDK Global, Inc. | | | 240,927 | |
| | 4,257 | | | Cerner Corp. | | | 316,253 | |
| | 7,559 | | | Charles Schwab Corp. (The) | | | 620,065 | |
| | 778 | | | Charter Communications, Inc. - Class A(a) | | | 525,064 | |
| Shares | | | | | Value | |
| UNITED STATES (continued) |
| | 449 | | | Chemed Corp. | | $ | 216,530 | |
| | 3,380,689 | | | Chevron Corp. | | | 387,055,084 | |
| | 91,223 | | | Chipotle Mexican Grill, Inc.(a) | | | 162,288,454 | |
| | 2,741 | | | Church & Dwight Co., Inc. | | | 239,454 | |
| | 2,053 | | | Cigna Corp. | | | 438,541 | |
| | 22,707 | | | Cisco Systems, Inc. | | | 1,270,911 | |
| | 15,129 | | | Citigroup, Inc. | | | 1,046,322 | |
| | 14,533 | | | Citizens Financial Group, Inc. | | | 688,574 | |
| | 2,166 | | | Citrix Systems, Inc. | | | 205,185 | |
| | 1,415 | | | Clorox Co. (The) | | | 230,659 | |
| | 653,342 | | | Cloudflare, Inc. - Class A(a) | | | 127,218,754 | |
| | 2,189,391 | | | Coca-Cola Co. (The) | | | 123,415,971 | |
| | 4,974 | | | Cognizant Technology Solutions Corp. - Class A | | | 388,420 | |
| | 8,569 | | | Colfax Corp.(a) | | | 442,332 | |
| | 4,627 | | | Colgate-Palmolive Co. | | | 352,531 | |
| | 3,653,311 | | | Comcast Corp. - Class A | | | 187,889,785 | |
| | 8,009 | | | Comerica, Inc. | | | 681,486 | |
| | 4,927 | | | CommVault Systems, Inc.(a) | | | 303,010 | |
| | 5,677 | | | ConocoPhillips | | | 422,880 | |
| | 3,054,833 | | | Corteva, Inc. | | | 131,816,044 | |
| | 377,846 | | | Costco Wholesale Corp. | | | 185,726,423 | |
| | 9,490 | | | Coterra Energy, Inc. | | | 202,327 | |
| | 1,977 | | | Crown Castle International Corp. REIT | | | 356,453 | |
| | 18,914 | | | CSX Corp. | | | 684,119 | |
| | 1,340 | | | Cummins, Inc. | | | 321,386 | |
| | 5,905 | | | CVS Health Corp. | | | 527,198 | |
| | 552,085 | | | Danaher Corp. | | | 172,123,540 | |
| | 275,488 | | | Deere & Co. | | | 94,302,297 | |
| | 255,521 | | | DexCom, Inc.(a) | | | 159,243,242 | |
| | 2,583 | | | Digital Realty Trust, Inc. REIT | | | 407,623 | |
| | 1,111 | | | Dollar General Corp. | | | 246,109 | |
| | 570 | | | Domino’s Pizza, Inc. | | | 278,713 | |
| | 565,638 | | | DoorDash, Inc. - Class A(a) | | | 110,186,282 | |
| | 12,132 | | | East West Bancorp, Inc. | | | 964,251 | |
| | 596,129 | | | Eaton Corp. Plc | | | 98,218,214 | |
| | 12,360 | | | eBay, Inc. | | | 948,259 | |
| | 1,441 | | | Ecolab, Inc. | | | 320,219 | |
| | 1,160,910 | | | Edwards Lifesciences Corp.(a) | | | 139,100,236 | |
| | 2,287 | | | Electronic Arts, Inc. | | | 320,752 | |
| | 4,069 | | | Eli Lilly & Co. | | | 1,036,618 | |
| | 2,783 | | | Encompass Health Corp. | | | 176,887 | |
| | 3,777 | | | Entegris, Inc. | | | 531,726 | |
| | 3,476 | | | Envestnet, Inc.(a) | | | 290,246 | |
| | 4,827 | | | EOG Resources, Inc. | | | 446,304 | |
| | 9,238 | | | Equity Commonwealth REIT(a) | | | 239,541 | |
| | 3,162 | | | Equity LifeStyle Properties, Inc. REIT | | | 267,221 | |
| | 2,297 | | | Euronet Worldwide, Inc.(a) | | | 257,700 | |
| | 2,160 | | | Extra Space Storage, Inc. REIT | | | 426,319 | |
| | 12,312 | | | Exxon Mobil Corp. | | | 793,755 | |
| | 1,253 | | | Fair Isaac Corp.(a) | | | 498,945 | |
| | 5,534 | | | Fastenal Co. | | | 315,881 | |
| Old Westbury Funds, Inc. | |
| Large Cap Strategies Fund | |
| Portfolio of Investments - (Continued) | October 31, 2021 |
| | |
| Shares | | | | | Value | |
| UNITED STATES (continued) |
| | 12,111 | | | Fifth Third BanCorp | | $ | 527,192 | |
| | 1,581 | | | FleetCor Technologies, Inc.(a) | | | 391,155 | |
| | 25,044 | | | Flex Ltd.(a) | | | 423,244 | |
| | 515,153 | | | Fortinet, Inc.(a) | | | 173,266,560 | |
| | 1,428,400 | | | Freeport-McMoRan, Inc. | | | 53,879,248 | |
| | 2,454 | | | General Dynamics Corp. | | | 497,548 | |
| | 1,581,955 | | | General Electric Co. | | | 165,899,621 | |
| | 5,106 | | | General Mills, Inc. | | | 315,551 | |
| | 736,274 | | | Genuine Parts Co. | | | 96,532,884 | |
| | 5,944 | | | Gilead Sciences, Inc. | | | 385,647 | |
| | 2,458 | | | Goldman Sachs Group, Inc. (The) | | | 1,016,014 | |
| | 4,292 | | | Graco, Inc. | | | 322,673 | |
| | 2,275 | | | Guidewire Software, Inc.(a) | | | 286,036 | |
| | 1,734 | | | HCA Healthcare, Inc. | | | 434,298 | |
| | 297,317 | | | Hershey Co. (The) | | | 52,134,536 | |
| | 271,616 | | | Home Depot, Inc. (The) | | | 100,970,532 | |
| | 685,954 | | | Honeywell International, Inc. | | | 149,963,263 | |
| | 4,340 | | | Hormel Foods Corp. | | | 183,669 | |
| | 17,050 | | | HP, Inc. | | | 517,126 | |
| | 753 | | | Humana, Inc. | | | 348,759 | |
| | 766 | | | IDEXX Laboratories, Inc.(a) | | | 510,263 | |
| | 577,043 | | | Illinois Tool Works, Inc. | | | 131,490,788 | |
| | 963 | | | Illumina, Inc.(a) | | | 399,703 | |
| | 4,122 | | | Integra LifeSciences Holdings Corp.(a) | | | 273,948 | |
| | 20,376 | | | Intel Corp. | | | 998,424 | |
| | 4,263 | | | InterDigital, Inc. | | | 285,408 | |
| | 6,440 | | | International Business Machines Corp. | | | 805,644 | |
| | 234,225 | | | Intuit, Inc. | | | 146,622,508 | |
| | 284,532 | | | Intuitive Surgical, Inc.(a) | | | 102,753,041 | |
| | 1,181 | | | Jack Henry & Associates, Inc. | | | 196,613 | |
| | 2,545 | | | Jack in the Box, Inc. | | | 251,828 | |
| | 10,850 | | | Johnson & Johnson | | | 1,767,248 | |
| | 6,728 | | | Johnson Controls International plc | | | 493,633 | |
| | 1,853 | | | Jones Lang LaSalle, Inc.(a) | | | 478,500 | |
| | 3,347,562 | | | JPMorgan Chase & Co. | | | 568,717,308 | |
| | 8,949 | | | Kennametal, Inc. | | | 355,723 | |
| | 854,842 | | | Keysight Technologies, Inc.(a) | | | 153,888,657 | |
| | 2,345 | | | Kimberly-Clark Corp. | | | 303,654 | |
| | 13,196 | | | Kinder Morgan, Inc. | | | 221,033 | |
| | 571,442 | | | KLA Corp. | | | 213,010,720 | |
| | 6,238 | | | Kroger Co. (The) | | | 249,645 | |
| | 1,591 | | | L3Harris Technologies, Inc. | | | 366,789 | |
| | 187,268 | | | Lam Research Corp. | | | 105,538,627 | |
| | 1,400 | | | Lancaster Colony Corp. | | | 238,000 | |
| | 2,085 | | | Leidos Holdings, Inc. | | | 208,458 | |
| | 4,655 | | | Lennar Corp. - Class A | | | 465,174 | |
| | 1,540 | | | LHC Group, Inc.(a) | | | 207,269 | |
| | 7,893 | | | Liberty Media Corp-Liberty Formula One - Class C(a) | | | 440,429 | |
| | 6,712 | | | Lincoln National Corp. | | | 484,271 | |
| | 132,192 | | | Lockheed Martin Corp. | | | 43,930,045 | |
| | 830,112 | | | Lowe’s Cos, Inc. | | | 194,096,788 | |
| | 3,421 | | | Manhattan Associates, Inc.(a) | | | 621,048 | |
| Shares | | | | | Value | |
| UNITED STATES (continued) |
| | 2,542 | | | Marriott Vacations Worldwide Corp. | | $ | 399,653 | |
| | 7,596 | | | Marvell Technology, Inc. | | | 520,326 | |
| | 5,058 | | | Masco Corp. | | | 331,552 | |
| | 1,002 | | | Masimo Corp.(a) | | | 284,107 | |
| | 452,998 | | | Mastercard, Inc. - Class A | | | 151,989,889 | |
| | 296,009 | | | McDonald’s Corp. | | | 72,685,010 | |
| | 1,418 | | | McKesson Corp. | | | 294,774 | |
| | 1,366,518 | | | Merck & Co., Inc. | | | 120,321,910 | |
| | 1,338,604 | | | Meta Platforms, Inc. - Class A(a) | | | 433,132,096 | |
| | 346 | | | Mettler-Toledo International, Inc.(a) | | | 512,384 | |
| | 5,498 | | | Microchip Technology, Inc. | | | 407,347 | |
| | 5,147 | | | Micron Technology, Inc. | | | 355,658 | |
| | 3,107,622 | | | Microsoft Corp. | | | 1,030,549,608 | |
| | 810 | | | Moderna, Inc.(a) | | | 279,620 | |
| | 2,477 | | | Mohawk Industries, Inc.(a) | | | 438,949 | |
| | 1,232 | | | Molina Healthcare, Inc.(a) | | | 364,327 | |
| | 9,007 | | | Mondelez International, Inc. - Class A | | | 547,085 | |
| | 1,081 | | | Monolithic Power Systems, Inc. | | | 568,022 | |
| | 3,586 | | | Monster Beverage Corp.(a) | | | 304,810 | |
| | 2,815 | | | Moody’s Corp. | | | 1,137,682 | |
| | 12,267 | | | Morgan Stanley | | | 1,260,802 | |
| | 523,961 | | | Motorola Solutions, Inc. | | | 130,251,465 | |
| | 928 | | | MSCI, Inc. | | | 617,009 | |
| | 26,825 | | | Navient Corp. | | | 528,452 | |
| | 10,345 | | | NCR Corp.(a) | | | 409,041 | |
| | 4,712 | | | NetApp, Inc. | | | 420,782 | |
| | 227,625 | | | Netflix, Inc.(a) | | | 157,131,814 | |
| | 6,876 | | | Newmont Corp. | | | 371,304 | |
| | 4,409 | | | NextEra Energy Partners LP | | | 380,497 | |
| | 2,958,334 | | | NextEra Energy, Inc. | | | 252,434,640 | |
| | 940,568 | | | NIKE, Inc. - Class B | | | 157,347,621 | |
| | 2,668 | | | Norfolk Southern Corp. | | | 781,857 | |
| | 364,466 | | | Northrop Grumman Corp. | | | 130,194,545 | |
| | 9,778 | | | NortonLifeLock, Inc. | | | 248,850 | |
| | 2,498 | | | Novanta, Inc.(a) | | | 431,055 | |
| | 628,886 | | | NVIDIA Corp. | | | 160,787,284 | |
| | 346,028 | | | Okta, Inc.(a) | | | 85,531,201 | |
| | 14,521 | | | ON Semiconductor Corp.(a) | | | 698,024 | |
| | 12,432 | | | Oracle Corp. | | | 1,192,726 | |
| | 558 | | | O’Reilly Automotive, Inc.(a) | | | 347,255 | |
| | 2,958 | | | PACCAR, Inc. | | | 265,096 | |
| | 3,006 | | | Paychex, Inc. | | | 370,580 | |
| | 990 | | | PayPal Holdings, Inc.(a) | | | 230,264 | |
| | 618,563 | | | PepsiCo, Inc. | | | 99,959,781 | |
| | 22,037 | | | Pfizer, Inc. | | | 963,898 | |
| | 7,268 | | | Philip Morris International, Inc. | | | 687,117 | |
| | 3,390 | | | Phillips 66 | | | 253,504 | |
| | 2,613 | | | Pioneer Natural Resources Co. | | | 488,579 | |
| | 6,007 | | | Premier, Inc. - Class A | | | 233,973 | |
| | 456,739 | | | Procter & Gamble Co. (The) | | | 65,309,110 | |
| | 5,239 | | | Progress Software Corp. | | | 269,337 | |
| | 2,995 | | | Prologis, Inc. REIT | | | 434,155 | |
| | 1,110,595 | | | Prudential Financial, Inc. | | | 122,220,980 | |
| Old Westbury Funds, Inc. | |
| Large Cap Strategies Fund | |
| Portfolio of Investments - (Continued) | October 31, 2021 |
| | |
| Shares | | | | | Value | |
| UNITED STATES (continued) |
| | 3,394 | | | PTC, Inc.(a) | | $ | 432,226 | |
| | 1,555 | | | Public Storage REIT | | | 516,540 | |
| | 4,457 | | | PVH Corp.(a) | | | 487,284 | |
| | 5,003 | | | QUALCOMM, Inc. | | | 665,599 | |
| | 586,054 | | | Quest Diagnostics, Inc. | | | 86,021,006 | |
| | 5,025 | | | Raytheon Technologies Corp. | | | 446,521 | |
| | 501 | | | Regeneron Pharmaceuticals, Inc.(a) | | | 320,610 | |
| | 1,296 | | | ResMed, Inc. | | | 340,731 | |
| | 7,696 | | | Rollins, Inc. | | | 271,130 | |
| | 923 | | | Roper Technologies, Inc. | | | 450,304 | |
| | 782,343 | | | Ross Stores, Inc. | | | 88,561,228 | |
| | 2,530 | | | Saia, Inc.(a) | | | 790,979 | |
| | 12,948 | | | Schlumberger NV | | | 417,702 | |
| | 2,480 | | | Science Applications International Corp. | | | 222,654 | |
| | 3,915 | | | Seagate Technology Holdings Plc | | | 348,709 | |
| | 1,183 | | | Sherwin-Williams Co. (The) | | | 374,550 | |
| | 753,675 | | | Simon Property Group, Inc. REIT | | | 110,473,681 | |
| | 12,635 | | | Six Flags Entertainment Corp.(a) | | | 519,678 | |
| | 3,359 | | | Skyworks Solutions, Inc. | | | 561,390 | |
| | 342,178 | | | Snowflake, Inc. - Class A(a) | | | 121,076,264 | |
| | 5,185 | | | Spectrum Brands Holdings, Inc. | | | 486,094 | |
| | 223,293 | | | Square, Inc. - Class A(a) | | | 56,828,068 | |
| | 5,255 | | | SS&C Technologies Holdings, Inc. | | | 417,615 | |
| | 578,961 | | | Starbucks Corp. | | | 61,410,393 | |
| | 6,177 | | | State Street Corp. | | | 608,743 | |
| | 4,060 | | | Stericycle, Inc.(a) | | | 271,695 | |
| | 1,156 | | | SVB Financial Group(a) | | | 829,314 | |
| | 12,765 | | | Synchrony Financial | | | 592,934 | |
| | 1,895 | | | Synopsys, Inc.(a) | | | 631,376 | |
| | 1,604 | | | Take-Two Interactive Software, Inc.(a) | | | 290,324 | |
| | 2,609 | | | Target Corp. | | | 677,349 | |
| | 421 | | | Teledyne Technologies, Inc.(a) | | | 189,122 | |
| | 3,082 | | | Teradyne, Inc. | | | 426,056 | |
| | 708,049 | | | Texas Instruments, Inc. | | | 132,745,027 | |
| | 7,257 | | | Textron, Inc. | | | 535,929 | |
| | 280,305 | | | Thermo Fisher Scientific, Inc. | | | 177,452,686 | |
| | 5,612 | | | Timken Co. (The) | | | 398,171 | |
| | 2,177 | | | Tractor Supply Co. | | | 472,779 | |
| | 7,601 | | | Trimble, Inc.(a) | | | 664,099 | |
| | 4,331 | | | TriNet Group, Inc.(a) | | | 438,514 | |
| | 2,610,924 | | | Truist Financial Corp. | | | 165,715,346 | |
| | 263,877 | | | Twilio, Inc. - Class A(a) | | | 76,883,203 | |
| | 678 | | | Tyler Technologies, Inc.(a) | | | 368,303 | |
| | 3,215 | | | Tyson Foods, Inc. - Class A | | | 257,104 | |
| | 5,181 | | | UFP Industries, Inc. | | | 423,961 | |
| | 948 | | | Ulta Beauty, Inc.(a) | | | 348,257 | |
| | 724,057 | | | Union Pacific Corp. | | | 174,787,360 | |
| | 415,274 | | | United Rentals, Inc.(a) | | | 157,434,526 | |
| | 1,925 | | | United Therapeutics Corp.(a) | | | 367,213 | |
| | 673,018 | | | UnitedHealth Group, Inc. | | | 309,904,598 | |
| | 1,231 | | | Vail Resorts, Inc. | | | 424,338 | |
| | 3,940 | | | Valero Energy Corp. | | | 304,680 | |
| Shares | | | | | Value | |
| UNITED STATES (continued) |
| | 970 | | | VeriSign, Inc.(a) | | $ | 215,990 | |
| | 1,314 | | | Verisk Analytics, Inc. | | | 276,295 | |
| | 2,746,347 | | | Verizon Communications, Inc. | | | 145,528,928 | |
| | 15,173 | | | Viatris, Inc. | | | 202,560 | |
| | 1,523,844 | | | Visa, Inc. - Class A | | | 322,704,444 | |
| | 11,352 | | | Vistra Corp. | | | 222,386 | |
| | 1,473 | | | VMware, Inc. - Class A(a) | | | 223,454 | |
| | 19,390 | | | Vonage Holdings Corp.(a) | | | 312,567 | |
| | 4,469 | | | Walgreens Boots Alliance, Inc. | | | 210,132 | |
| | 1,397,198 | | | Walmart, Inc. | | | 208,769,325 | |
| | 583,317 | | | Waste Management, Inc. | | | 93,464,883 | |
| | 1,007 | | | Waters Corp.(a) | | | 370,123 | |
| | 1,175 | | | WD-40 Co. | | | 266,725 | |
| | 18,118 | | | Wells Fargo & Co. | | | 926,917 | |
| | 3,190 | | | Welltower, Inc. REIT | | | 256,476 | |
| | 8,213 | | | WESCO International, Inc.(a) | | | 1,064,076 | |
| | 1,181 | | | West Pharmaceutical Services, Inc. | | | 507,688 | |
| | 6,451 | | | Westrock Co. | | | 310,293 | |
| | 3,794 | | | WEX, Inc.(a) | | | 567,962 | |
| | 9,913 | | | Weyerhaeuser Co. REIT | | | 354,092 | |
| | 726 | | | WW Grainger, Inc. | | | 336,218 | |
| | 2,424 | | | Yum! Brands, Inc. | | | 302,855 | |
| | 981 | | | Zebra Technologies Corp. - Class A(a) | | | 523,805 | |
| | 200,300 | | | Zoetis, Inc. | | | 43,304,860 | |
| | | | | | | | 15,671,499,616 | |
| URUGUAY — 0.1% |
| | 104,705 | | | Globant SA(a) | | | 33,420,789 | |
| VIETNAM — 0.0% |
| | 335,600 | | | Vincom Retail JSC(a) | | | 460,221 | |
| | | | | | | | | |
Total Common Stocks
(Cost $14,441,140,992) | | | 23,035,174,548 | |
| | | | | | | | | |
| EXCHANGE-TRADED FUNDS — 8.7% |
| | 2,383,650 | | | Consumer Staples Select Sector SPDR Fund | | | 169,835,063 | |
| | 2,444,400 | | | Energy Select Sector SPDR Fund | | | 140,479,668 | |
| | 3,737,000 | | | Financial Select Sector SPDR Fund | | | 150,451,620 | |
| | 1,226,910 | | | Health Care Select Sector SPDR Fund | | | 164,185,096 | |
| | 1,449,429 | | | iShares MSCI ACWI ETF | | | 152,639,368 | |
| | 2,350,695 | | | iShares MSCI Emerging Markets ETF | | | 119,697,389 | |
| | 6,587,856 | | | iShares MSCI Europe Financials ETF | | | 138,674,369 | |
| | 1,514,000 | | | iShares MSCI Japan ETF | | | 103,557,600 | |
| | 1,372,885 | | | Materials Select Sector SPDR Fund | | | 116,859,971 | |
| | 1,350,000 | | | SPDR S&P Metals & Mining ETF | | | 58,887,000 | |
| | 1,477,755 | | | SPDR S&P Oil & Gas Exploration & Production ETF | | | 157,174,022 | |
| | 8,644,585 | | | VanEck Gold Miners ETF | | | 274,119,790 | |
| | 635,150 | | | Vanguard Consumer Staples ETF | | | 117,934,652 | |
| | 1,333,480 | | | Vanguard Financials ETF | | | 132,881,282 | |
| | 451,000 | | | Vanguard Health Care ETF | | | 116,560,950 | |
| Old Westbury Funds, Inc. | |
| Large Cap Strategies Fund | |
| Portfolio of Investments - (Continued) | October 31, 2021 |
| | |
| Shares | | | | | Value | |
| | 294,500 | | | Vanguard S&P 500 ETF | | $ | 124,326,120 | |
| | | | | | | | | |
Total Exchange-Traded Funds
(Cost $1,892,408,948) | | | 2,238,263,960 | |
| | | | | |
| INVESTMENT COMPANY — 2.0% |
| | 506,048,905 | | | Federated Hermes Government Obligations Fund, 0.03%(d) | | | 506,048,905 | |
| | | | | | | | | |
Total Investment Company
(Cost $506,048,905) | | | 506,048,905 | |
| | | | | |
| CASH SWEEP — 0.0% |
| | 6,737,107 | | | Citibank - US Dollars on Deposit in Custody Account, 0.03%(d) | | | 6,737,107 | |
| | | | | | | | | |
Total Cash Sweep
(Cost $6,737,107) | | | 6,737,107 | |
| | | | | |
TOTAL INVESTMENTS — 100.2%
(Cost $16,846,335,952) | | $ | 25,786,224,520 | |
| LIABILITIES IN EXCESS OF OTHER ASSETS — (0.2)% | | | (43,737,882 | ) |
| NET ASSETS — 100.0% | | $ | 25,742,486,638 | |
| (a) | Non-income producing security. |
| (b) | Security is valued using significant unobservable inputs and is classified as Level 3 in the fair value hierarchy. The aggregate value of fair valued securities is $465,948 which is 0.00% of net assets and the cost is $274,288. |
| (c) | Security exempt from registration under Rule 144A of the Securities Act of 1933, as amended. The security may be resold in transactions exempt from registration normally to qualified institutional buyers. The security has been determined to be liquid in accordance with procedures adopted by the Fund’s Board of Directors. |
| (d) | The rate shown represents the current yield as of October 31, 2021. |
The following abbreviations are used in the report:
ACWI — All Country World Index
ADR — American Depositary Receipt
ETF — Exchange-Traded Fund
FOR — Foreign Ownership Restrictions
GDR — Global Depositary Receipt
MSCI — Morgan Stanley Capital International Index
REIT — Real Estate Investment Trust
SPDR — Standard & Poor’s Depositary Receipt
| Old Westbury Funds, Inc. | |
| Credit Income Fund | |
| Portfolio of Investments | October 31, 2021 |
| | |
| Shares | | | | | Value | |
| PREFERRED STOCKS — 0.2% | | | |
| UNITED STATES — 0.2% | | | |
| | 27,600 | | | MetLife, Inc., Series F, 4.75% | | $ | 740,784 | |
| | 38,900 | | | Morgan Stanley, Series K, 5.85% | | | 1,145,994 | |
| | 31,500 | | | Public Storage, Series O, 3.90% | | | 806,400 | |
| | 28,500 | | | US Bancorp, Series L, 3.75% | | | 690,555 | |
| | 122,100 | | | Wells Fargo & Co., Series Z, 4.75% | | | 3,162,390 | |
| | | | | | | | | |
Total Preferred Stocks
(Cost $6,547,571) | | 6,546,123 | |
| | | | | | | | | |
| EXCHANGE-TRADED FUNDS — 18.1% | | | |
| UNITED STATES — 18.1% | | | |
| | 12,956,804 | | | Invesco Preferred ETF | | | 195,388,604 | |
| | 1,166,665 | | | iShares JP Morgan USD Emerging Markets Bond ETF | | | 128,204,817 | |
| | 1,769,837 | | | iShares Preferred & Income Securities ETF | | | 69,678,483 | |
| | 1,591,740 | | | SPDR Bloomberg Barclays Convertible Securities ETF | | | 140,041,285 | |
| | | | | | | | | |
Total Exchange-Traded Funds
(Cost $509,507,432) | | 533,313,189 | |
| | | | | | | | | |
Principal
Amount | | | | | | | |
| BANK LOANS — 0.1% | | | |
| UNITED STATES — 0.1% | | | |
| $ | 4,393,750 | | | Caliber Home Loans, Inc., (1 mo. LIBOR USD + 2.875%),
3.15%, 07/15/24(a) | | | 4,382,766 | |
Total Bank Loans
(Cost $4,393,750) | | 4,382,766 | |
| CORPORATE BONDS — 9.7% | | | |
| CANADA — 0.4% | | | |
| | 1,000,000 | | | 1011778 BC ULC/New Red Finance, Inc.,
3.88%, 01/15/28(b) | | | 997,580 | |
| | 500,000 | | | Bombardier, Inc.,
7.50%, 12/01/24(b) | | | 520,625 | |
| | 1,250,000 | | | Brookfield Residential Properties, Inc./Brookfield Residential US LLC,
6.25%, 09/15/27(b) | | | 1,301,562 | |
| | 1,125,000 | | | First Quantum Minerals Ltd.,
6.50%, 03/01/24(b) | | | 1,141,875 | |
| | 1,000,000 | | | First Quantum Minerals Ltd.,
6.88%, 03/01/26(b) | | | 1,041,250 | |
| | 1,325,000 | | | GFL Environmental, Inc.,
3.75%, 08/01/25(b) | | | 1,363,359 | |
Principal
Amount | | | | | | Value | |
| CANADA (continued) | | | |
| $ | 1,100,000 | | | goeasy Ltd.,
5.38%, 12/01/24(b) | | $ | 1,128,875 | |
| | 600,000 | | | Kronos Acquisition Holdings, Inc./Kik Custom Products, Inc.,
7.00%, 12/31/27(b) | | | 580,236 | |
| | 500,000 | | | MEG Energy Corp.,
7.13%, 02/01/27(b) | | | 525,000 | |
| | 350,000 | | | MEG Energy Corp.,
5.88%, 02/01/29(b) | | | 360,063 | |
| | 600,000 | | | Methanex Corp.,
5.25%, 12/15/29 | | | 636,000 | |
| | 500,000 | | | NOVA Chemicals Corp.,
4.88%, 06/01/24(b) | | | 520,375 | |
| | 500,000 | | | NOVA Chemicals Corp.,
5.25%, 06/01/27(b) | | | 526,235 | |
| | 500,000 | | | Telesat Canada/Telesat LLC,
4.88%, 06/01/27(b) | | | 446,740 | |
| | | | | | | | 11,089,775 | |
| CAYMAN ISLANDS — 0.0% | | |
| | 762,952 | | | Spirit Loyalty Cayman Ltd./Spirit IP Cayman Ltd.,
8.00%, 09/20/25(b) | | | 854,001 | |
| FRANCE — 0.0% | | |
| | 550,000 | | | Iliad Holding SASU,
6.50%, 10/15/26(b) | | | 566,610 | |
| GERMANY — 0.0% | | | |
| | 500,000 | | | Deutsche Bank AG, (5 yr. Swap Semi 30/360 USD + 2.248%),
4.30%, 05/24/28(c) | | | 518,041 | |
| IRELAND — 0.1% | | | |
| | 925,000 | | | Castlelake Aviation Finance DAC,
5.00%, 04/15/27(b) | | | 922,401 | |
| | 1,225,000 | | | LCPR Senior Secured Financing DAC,
6.75%, 10/15/27(b) | | | 1,286,250 | |
| | | | | | | | 2,208,651 | |
| ITALY — 0.1% | | | |
| | 1,500,000 | | | Intesa Sanpaolo SpA,
5.71%, 01/15/26(b) | | | 1,667,739 | |
| | 1,525,000 | | | UniCredit SpA, (USD Swap Rate 11:00 am NY 1 + 3.703%),
5.86%, 06/19/32(b)(c) | | | 1,683,679 | |
| | | | | | | | 3,351,418 | |
| Old Westbury Funds, Inc. | |
| Credit Income Fund | |
| Portfolio of Investments - (Continued) | October 31, 2021 |
| | |
Principal
Amount | | | | | | Value | |
| LUXEMBOURG — 0.2% | | | |
| $ | 525,000 | | | Allied Universal Holdco LLC/Allied Universal Finance Corp./Atlas Luxco 4 Sarl,
4.63%, 06/01/28(b) | | $ | 520,758 | |
| | 1,650,000 | | | Altice Financing SA,
5.00%, 01/15/28(b) | | | 1,589,973 | |
| | 1,000,000 | | | Altice France Holding SA,
6.00%, 02/15/28(b) | | | 950,000 | |
| | 900,000 | | | Consolidated Energy Finance SA,
5.63%, 10/15/28(b) | | | 895,590 | |
| | 925,000 | | | JBS Finance Luxembourg Sarl,
3.63%, 01/15/32(b) | | | 913,289 | |
| | 600,000 | | | Telecom Italia Capital SA,
6.38%, 11/15/33 | | | 688,326 | |
| | 500,000 | | | Telecom Italia Capital SA,
7.20%, 07/18/36 | | | 608,600 | |
| | 500,000 | | | Venator Finance Sarl/Venator Materials LLC,
9.50%, 07/01/25(b) | | | 548,750 | |
| | | | | | | | 6,715,286 | |
| NETHERLANDS — 0.1% | | | |
| | 1,000,000 | | | Alcoa Nederland Holding BV,
5.50%, 12/15/27(b) | | | 1,075,000 | |
| | 1,075,000 | | | Teva Pharmaceutical Finance Netherlands III BV,
3.15%, 10/01/26 | | | 1,013,188 | |
| | 1,000,000 | | | UPC Holding BV,
5.50%, 01/15/28(b) | | | 1,035,000 | |
| | | | | | | | 3,123,188 | |
| UNITED KINGDOM — 0.1% | | | |
| | 200,000 | | | INEOS Quattro Finance 2 Plc,
3.38%, 01/15/26(b) | | | 198,750 | |
| | 1,400,000 | | | Jaguar Land Rover Automotive Plc,
7.75%, 10/15/25(b) | | | 1,508,500 | |
| | 1,050,000 | | | Jaguar Land Rover Automotive Plc,
5.50%, 07/15/29(b) | | | 1,011,927 | |
| | | | | | | | 2,719,177 | |
| UNITED STATES — 8.7% | | | |
| | 1,000,000 | | | Abercrombie & Fitch Management Co.,
8.75%, 07/15/25(b) | | | 1,075,000 | |
| | 350,000 | | | AdaptHealth LLC,
5.13%, 03/01/30(b) | | | 351,750 | |
| | 1,000,000 | | | Adient Global Holdings Ltd.,
4.88%, 08/15/26(b) | | | 1,018,085 | |
| | 375,000 | | | Advantage Sales & Marketing, Inc.,
6.50%, 11/15/28(b) | | | 390,000 | |
Principal
Amount | | | | | | Value | |
| UNITED STATES (continued) | | |
| $ | 750,000 | | | Albertsons Cos., Inc./Safeway, Inc./New Albertsons LP/Albertsons LLC,
7.50%, 03/15/26(b) | | $ | 808,125 | |
| | 500,000 | | | Albertsons Cos., Inc./Safeway, Inc./New Albertsons LP/Albertsons LLC,
5.88%, 02/15/28(b) | | | 531,250 | |
| | 750,000 | | | Alliance Data Systems Corp.,
4.75%, 12/15/24(b) | | | 767,245 | |
| | 1,850,000 | | | Alliance Data Systems Corp.,
7.00%, 01/15/26(b) | | | 1,970,250 | |
| | 1,200,000 | | | Allison Transmission, Inc.,
5.88%, 06/01/29(b) | | | 1,291,500 | |
| | 381,965 | | | Ambac Assurance Corp.,
5.10%(b)(d) | | | 536,176 | |
| | 350,000 | | | Ambience Merger Sub, Inc.,
7.13%, 07/15/29(b) | | | 337,267 | |
| | 1,025,000 | | | American Airlines, Inc.,
11.75%, 07/15/25(b) | | | 1,269,719 | |
| | 250,000 | | | American Airlines, Inc./AAdvantage Loyalty IP Ltd.,
5.50%, 04/20/26(b) | | | 262,182 | |
| | 1,350,000 | | | American Airlines, Inc./AAdvantage Loyalty IP Ltd.,
5.75%, 04/20/29(b) | | | 1,452,938 | |
| | 525,000 | | | American Axle & Manufacturing, Inc.,
6.25%, 03/15/26 | | | 539,438 | |
| | 825,000 | | | AMN Healthcare, Inc.,
4.63%, 10/01/27(b) | | | 847,704 | |
| | 550,000 | | | Antero Midstream Partners LP/Antero Midstream Finance Corp.,
5.75%, 03/01/27(b) | | | 567,875 | |
| | 575,000 | | | Antero Midstream Partners LP/Antero Midstream Finance Corp.,
5.38%, 06/15/29(b) | | | 599,438 | |
| | 520,000 | | | Antero Resources Corp.,
8.38%, 07/15/26(b) | | | 585,000 | |
| | 325,000 | | | Antero Resources Corp.,
7.63%, 02/01/29(b) | | | 359,775 | |
| | 375,000 | | | Antero Resources Corp.,
5.38%, 03/01/30(b) | | | 396,938 | |
| | 1,175,000 | | | Aramark Services, Inc.,
6.38%, 05/01/25(b) | | | 1,236,558 | |
| | 975,000 | | | Archrock Partners LP/Archrock Partners Finance Corp.,
6.25%, 04/01/28(b) | | | 1,009,125 | |
| | 650,000 | | | Artera Services LLC,
9.03%, 12/04/25(b) | | | 693,875 | |
| Old Westbury Funds, Inc. | |
| Credit Income Fund | |
| Portfolio of Investments - (Continued) | October 31, 2021 |
| | |
Principal
Amount | | | | | | Value | |
| UNITED STATES (continued) | | | |
| $ | 1,075,000 | | | Ascent Resources Utica Holdings LLC/ARU Finance Corp.,
8.25%, 12/31/28(b) | | $ | 1,169,063 | |
| | 1,100,000 | | | Ball Corp.,
3.13%, 09/15/31 | | | 1,069,750 | |
| | 3,930,000 | | | Bank of America Corp., Series FF, (3 mo. LIBOR USD + 2.931%),
5.88%(c)(d) | | | 4,399,517 | |
| | 630,000 | | | Bank of New York Mellon Corp. (The), Series F, (3 mo. LIBOR USD + 3.131%),
4.63%(c)(d) | | | 676,463 | |
| | 1,000,000 | | | Bath & Body Works, Inc.,
6.63%, 10/01/30(b) | | | 1,119,700 | |
| | 750,000 | | | Bath & Body Works, Inc.,
6.75%, 07/01/36 | | | 900,304 | |
| | 1,325,000 | | | Bausch Health Cos, Inc.,
6.13%, 04/15/25(b) | | | 1,349,539 | |
| | 600,000 | | | Bausch Health Cos, Inc.,
7.00%, 01/15/28(b) | | | 607,581 | |
| | 500,000 | | | Bausch Health Cos, Inc.,
5.00%, 01/30/28(b) | | | 461,510 | |
| | 275,000 | | | Bausch Health Cos, Inc.,
6.25%, 02/15/29(b) | | | 266,406 | |
| | 1,000,000 | | | Berry Global, Inc.,
5.63%, 07/15/27(b) | | | 1,047,360 | |
| | 600,000 | | | Big River Steel LLC/BRS Finance Corp.,
6.63%, 01/31/29(b) | | | 651,750 | |
| | 1,500,000 | | | Blackstone Mortgage Trust, Inc. REIT,
3.75%, 01/15/27(b) | | | 1,492,275 | |
| | 475,000 | | | Bloomin’ Brands, Inc./OSI Restaurant Partners LLC,
5.13%, 04/15/29(b) | | | 469,514 | |
| | 250,000 | | | Blue Racer Midstream LLC/Blue Racer Finance Corp.,
7.63%, 12/15/25(b) | | | 268,750 | |
| | 1,000,000 | | | Boeing Co. (The),
5.04%, 05/01/27 | | | 1,136,484 | |
| | 1,000,000 | | | Boyd Gaming Corp.,
8.63%, 06/01/25(b) | | | 1,080,720 | |
| | 1,050,000 | | | Brink’s Co. (The),
5.50%, 07/15/25(b) | | | 1,100,505 | |
| | 700,000 | | | Buckeye Partners LP,
3.95%, 12/01/26 | | | 717,619 | |
| | 625,000 | | | Buckeye Partners LP,
4.50%, 03/01/28(b) | | | 617,187 | |
Principal
Amount | | | | | | Value | |
| UNITED STATES (continued) | | | |
| $ | 300,000 | | | Burford Capital Global Finance LLC,
6.25%, 04/15/28(b) | | $ | 318,000 | |
| | 325,000 | | | Cablevision Lightpath LLC,
3.88%, 09/15/27(b) | | | 316,453 | |
| | 700,000 | | | Cablevision Lightpath LLC,
5.63%, 09/15/28(b) | | | 691,922 | |
| | 1,500,000 | | | Caesars Entertainment, Inc.,
6.25%, 07/01/25(b) | | | 1,577,775 | |
| | 826,000 | | | Caesars Entertainment, Inc.,
8.13%, 07/01/27(b) | | | 925,161 | |
| | 500,000 | | | Caesars Resort Collection LLC/CRC Finco, Inc.,
5.75%, 07/01/25(b) | | | 525,375 | |
| | 1,350,000 | | | Carnival Corp.,
10.50%, 02/01/26(b) | | | 1,568,700 | |
| | 1,100,000 | | | Carnival Corp.,
5.75%, 03/01/27(b) | | | 1,119,580 | |
| | 450,000 | | | Carnival Corp.,
6.00%, 05/01/29(b) | | | 450,900 | |
| | 1,250,000 | | | CCO Holdings LLC/CCO Holdings Capital Corp.,
4.50%, 08/15/30(b) | | | 1,271,875 | |
| | 1,925,000 | | | CCO Holdings LLC/CCO Holdings Capital Corp.,
4.25%, 02/01/31(b) | | | 1,916,337 | |
| | 1,000,000 | | | Centene Corp.,
3.00%, 10/15/30 | | | 1,016,380 | |
| | 250,000 | | | Century Communities, Inc.,
6.75%, 06/01/27 | | | 265,450 | |
| | 1,670,000 | | | Charles Schwab Corp. (The), Series H,
(10 yr. US Treasury Yield Curve Rate T Note Constant Maturity + 3.079%),
4.00%(c)(d) | | | 1,695,050 | |
| | 200,000 | | | Cheniere Energy Partners LP,
3.25%, 01/31/32(b) | | | 198,240 | |
| | 1,175,000 | | | Chesapeake Energy Corp.,
5.88%, 02/01/29(b) | | | 1,248,438 | |
| | 875,000 | | | CHS/Community Health Systems, Inc.,
6.00%, 01/15/29(b) | | | 922,031 | |
| | 650,000 | | | Churchill Downs, Inc.,
4.75%, 01/15/28(b) | | | 671,938 | |
| | 500,000 | | | CITGO Petroleum Corp.,
7.00%, 06/15/25(b) | | | 515,300 | |
| | 350,000 | | | Clarios Global LP/Clarios US Finance Co.,
8.50%, 05/15/27(b) | | | 371,795 | |
| Old Westbury Funds, Inc. | |
| Credit Income Fund | |
| Portfolio of Investments - (Continued) | October 31, 2021 |
| | |
Principal
Amount | | | | | | Value | |
| UNITED STATES (continued) | | | |
| $ | 450,000 | | | Clarivate Science Holdings Corp.,
4.88%, 07/01/29(b) | | $ | 448,065 | |
| | 1,500,000 | | | Cleveland-Cliffs, Inc.,
6.75%, 03/15/26(b) | | | 1,597,500 | |
| | 234,000 | | | CommScope Technologies LLC,
6.00%, 06/15/25(b) | | | 231,620 | |
| | 500,000 | | | CommScope, Inc.,
6.00%, 03/01/26(b) | | | 515,000 | |
| | 775,000 | | | CommScope, Inc.,
4.75%, 09/01/29(b) | | | 760,430 | |
| | 650,000 | | | Comstock Resources, Inc.,
5.88%, 01/15/30(b) | | | 675,870 | |
| | 250,000 | | | Consolidated Communications, Inc.,
6.50%, 10/01/28(b) | | | 266,223 | |
| | 500,000 | | | Cornerstone Building Brands, Inc.,
6.13%, 01/15/29(b) | | | 518,750 | |
| | 700,000 | | | CrownRock LP/CrownRock Finance, Inc.,
5.63%, 10/15/25(b) | | | 715,750 | |
| | 1,250,000 | | | CSC Holdings LLC,
7.50%, 04/01/28(b) | | | 1,331,250 | |
| | 650,000 | | | CSC Holdings LLC,
6.50%, 02/01/29(b) | | | 697,125 | |
| | 1,000,000 | | | CSC Holdings LLC,
4.50%, 11/15/31(b) | | | 968,900 | |
| | 130,000 | | | CVR Partners LP/CVR Nitrogen Finance Corp.,
9.25%, 06/15/23(b) | | | 130,260 | |
| | 400,000 | | | CVR Partners LP/CVR Nitrogen Finance Corp.,
6.13%, 06/15/28(b) | | | 414,000 | |
| | 1,000,000 | | | Dana, Inc.,
4.25%, 09/01/30 | | | 1,011,951 | |
| | 1,600,000 | | | Delta Air Lines, Inc.,
7.38%, 01/15/26 | | | 1,882,003 | |
| | 650,000 | | | DIRECTV Holdings LLC/DIRECTV Financing Co., Inc.,
5.88%, 08/15/27(b) | | | 673,822 | |
| | 1,000,000 | | | DISH DBS Corp.,
5.00%, 03/15/23 | | | 1,035,000 | |
| | 1,575,000 | | | DISH DBS Corp.,
7.38%, 07/01/28 | | | 1,655,719 | |
| | 750,000 | | | DISH DBS Corp.,
5.13%, 06/01/29 | | | 721,875 | |
| | 375,000 | | | Dornoch Debt Merger Sub, Inc.,
6.63%, 10/15/29(b) | | | 369,844 | |
| | 275,000 | | | DT Midstream, Inc.,
4.13%, 06/15/29(b) | | | 276,966 | |
Principal
Amount | | | | | | Value | |
| UNITED STATES (continued) | | | |
| $ | 900,000 | | | DT Midstream, Inc.,
4.38%, 06/15/31(b) | | $ | 911,844 | |
| | 575,000 | | | Dycom Industries, Inc.,
4.50%, 04/15/29(b) | | | 583,625 | |
| | 550,000 | | | Embarq Corp.,
8.00%, 06/01/36 | | | 607,750 | |
| | 250,000 | | | Enviva Partners LP/Enviva Partners Finance Corp.,
6.50%, 01/15/26(b) | | | 258,565 | |
| | 525,000 | | | EPR Properties REIT,
5.25%, 07/15/23 | | | 558,735 | |
| | 1,050,000 | | | EQM Midstream Partners LP,
6.50%, 07/01/27(b) | | | 1,168,125 | |
| | 475,000 | | | EQM Midstream Partners LP,
4.75%, 01/15/31(b) | | | 491,779 | |
| | 925,000 | | | EQM Midstream Partners LP,
6.50%, 07/15/48 | | | 1,100,213 | |
| | 375,000 | | | EQT Corp.,
5.00%, 01/15/29 | | | 416,604 | |
| | 500,000 | | | Ford Motor Co.,
8.50%, 04/21/23 | | | 548,250 | |
| | 1,000,000 | | | Ford Motor Co.,
9.00%, 04/22/25 | | | 1,202,500 | |
| | 425,000 | | | Ford Motor Co.,
6.63%, 10/01/28 | | | 509,830 | |
| | 1,100,000 | | | Ford Motor Co.,
4.75%, 01/15/43 | | | 1,200,111 | |
| | 575,000 | | | Ford Motor Co.,
5.29%, 12/08/46 | | | 661,250 | |
| | 2,100,000 | | | Ford Motor Credit Co. LLC,
4.06%, 11/01/24 | | | 2,202,270 | |
| | 1,000,000 | | | Ford Motor Credit Co. LLC,
4.27%, 01/09/27 | | | 1,061,290 | |
| | 500,000 | | | Ford Motor Credit Co. LLC,
4.00%, 11/13/30 | | | 521,875 | |
| | 250,000 | | | Forterra Finance LLC/FRTA Finance Corp.,
6.50%, 07/15/25(b) | | | 266,437 | |
| | 1,000,000 | | | FXI Holdings, Inc.,
7.88%, 11/01/24(b) | | | 1,018,750 | |
| | 725,000 | | | Gap, Inc. (The),
3.88%, 10/01/31(b) | | | 710,500 | |
| | 500,000 | | | GCI LLC,
4.75%, 10/15/28(b) | | | 517,500 | |
| | 625,000 | | | Genesis Energy LP/Genesis Energy Finance Corp.,
6.50%, 10/01/25 | | | 621,419 | |
| Old Westbury Funds, Inc. | |
| Credit Income Fund | |
| Portfolio of Investments - (Continued) | October 31, 2021 |
| | |
Principal
Amount | | | | | | Value | |
| UNITED STATES (continued) | | | |
| $ | 350,000 | | | Genesis Energy LP/Genesis Energy Finance Corp.,
8.00%, 01/15/27 | | $ | 351,645 | |
| | 925,000 | | | Genesis Energy LP/Genesis Energy Finance Corp.,
7.75%, 02/01/28 | | | 913,660 | |
| | 722,000 | | | Global Infrastructure Solutions, Inc.,
5.63%, 06/01/29(b) | | | 740,050 | |
| | 675,000 | | | Go Daddy Operating Co. LLC/GD Finance Co., Inc.,
3.50%, 03/01/29(b) | | | 653,062 | |
| | 975,000 | | | GPD Cos, Inc.,
10.13%, 04/01/26(b) | | | 1,043,250 | |
| | 750,000 | | | Gray Television, Inc.,
7.00%, 05/15/27(b) | | | 802,500 | |
| | 975,000 | | | Gray Television, Inc.,
4.75%, 10/15/30(b) | | | 961,723 | |
| | 500,000 | | | Greif, Inc.,
6.50%, 03/01/27(b) | | | 520,000 | |
| | 250,000 | | | Greystar Real Estate Partners LLC,
5.75%, 12/01/25(b) | | | 254,062 | |
| | 750,000 | | | Griffon Corp.,
5.75%, 03/01/28 | | | 783,750 | |
| | 1,000,000 | | | Gulfport Energy Operating Corp.,
8.00%, 05/17/26(b) | | | 1,107,500 | |
| | 1,250,000 | | | H&E Equipment Services, Inc.,
3.88%, 12/15/28(b) | | | 1,245,313 | |
| | 500,000 | | | Hanesbrands, Inc.,
5.38%, 05/15/25(b) | | | 520,000 | |
| | 1,075,000 | | | Harvest Midstream I LP,
7.50%, 09/01/28(b) | | | 1,128,750 | |
| | 250,000 | | | HAT Holdings I LLC/HAT Holdings II LLC REIT,
6.00%, 04/15/25(b) | | | 260,362 | |
| | 775,000 | | | HAT Holdings I LLC/HAT Holdings II LLC REIT,
3.38%, 06/15/26(b) | | | 768,219 | |
| | 525,000 | | | Hawaiian Brand Intellectual Property Ltd./HawaiianMiles Loyalty Ltd.,
5.75%, 01/20/26(b) | | | 550,594 | |
| | 1,400,000 | | | Herbalife Nutrition Ltd./HLF Financing, Inc.,
7.88%, 09/01/25(b) | | | 1,503,194 | |
| | 1,000,000 | | | Herc Holdings, Inc.,
5.50%, 07/15/27(b) | | | 1,042,500 | |
| | 600,000 | | | Hilcorp Energy I LP/Hilcorp Finance Co.,
6.00%, 02/01/31(b) | | | 615,824 | |
Principal
Amount | | | | | | Value | |
| UNITED STATES (continued) | | | |
| $ | 1,175,000 | | | Hilton Domestic Operating Co., Inc.,
5.75%, 05/01/28(b) | | $ | 1,261,656 | |
| | 300,000 | | | Hilton Grand Vacations Borrower Escrow LLC/Hilton Grand Vacations Borrower Esc,
5.00%, 06/01/29(b) | | | 305,925 | |
| | 450,000 | | | Hilton Grand Vacations Borrower Escrow LLC/Hilton Grand Vacations Borrower Esc,
4.88%, 07/01/31(b) | | | 447,696 | |
| | 1,150,000 | | | HLF Financing Sarl LLC/Herbalife International, Inc.,
4.88%, 06/01/29(b) | | | 1,158,314 | |
| | 500,000 | | | Home Point Capital, Inc.,
5.00%, 02/01/26(b) | | | 449,195 | |
| | 1,200,000 | | | Hughes Satellite Systems Corp.,
6.63%, 08/01/26 | | | 1,360,440 | |
| | 1,000,000 | | | Icahn Enterprises LP/Icahn Enterprises Finance Corp.,
6.38%, 12/15/25 | | | 1,020,000 | |
| | 1,350,000 | | | Icahn Enterprises LP/Icahn Enterprises Finance Corp.,
4.38%, 02/01/29 | | | 1,350,000 | |
| | 350,000 | | | iHeartCommunications, Inc.,
8.38%, 05/01/27 | | | 372,750 | |
| | 1,000,000 | | | International Game Technology Plc,
6.50%, 02/15/25(b) | | | 1,110,000 | |
| | 975,000 | | | IRB Holding Corp.,
7.00%, 06/15/25(b) | | | 1,029,844 | |
| | 500,000 | | | IRB Holding Corp.,
6.75%, 02/15/26(b) | | | 511,250 | |
| | 650,000 | | | Iron Mountain, Inc. REIT,
4.50%, 02/15/31(b) | | | 656,500 | |
| | 4,810,000 | | | JPMorgan Chase & Co., Series HH,
(SOFR RATE + 3.125%),
4.60%(c)(d) | | | 4,919,989 | |
| | 1,250,000 | | | Kaiser Aluminum Corp.,
4.50%, 06/01/31(b) | | | 1,225,125 | |
| | 1,075,000 | | | Kennedy-Wilson, Inc.,
4.75%, 02/01/30 | | | 1,081,719 | |
| | 300,000 | | | Koppers, Inc.,
6.00%, 02/15/25(b) | | | 307,179 | |
| | 1,750,000 | | | Kraft Heinz Foods Co.,
3.75%, 04/01/30 | | | 1,903,120 | |
| | 1,075,000 | | | Kraft Heinz Foods Co.,
5.00%, 06/04/42 | | | 1,328,873 | |
| | 1,125,000 | | | Kraft Heinz Foods Co.,
4.38%, 06/01/46 | | | 1,306,333 | |
| Old Westbury Funds, Inc. | |
| Credit Income Fund | |
| Portfolio of Investments - (Continued) | October 31, 2021 |
| | |
Principal
Amount | | | | | | Value | |
| UNITED STATES (continued) | | | |
| $ | 175,000 | | | Kraton Polymers LLC/Kraton Polymers Capital Corp.,
4.25%, 12/15/25(b) | | $ | 180,906 | |
| | 534,000 | | | LABL, Inc.,
10.50%, 07/15/27(b) | | | 564,705 | |
| | 400,000 | | | Ladder Capital Finance Holdings LLLP/Ladder Capital Finance Corp. REIT,
4.75%, 06/15/29(b) | | | 403,000 | |
| | 550,000 | | | LBM Acquisition LLC,
6.25%, 01/15/29(b) | | | 534,105 | |
| | 925,000 | | | LCM Investments Holdings II LLC,
4.88%, 05/01/29(b) | | | 949,808 | |
| | 250,000 | | | Legacy LifePoint Health LLC,
6.75%, 04/15/25(b) | | | 261,875 | |
| | 250,000 | | | Legacy LifePoint Health LLC,
4.38%, 02/15/27(b) | | | 247,500 | |
| | 650,000 | | | Level 3 Financing, Inc.,
4.25%, 07/01/28(b) | | | 642,687 | |
| | 700,000 | | | Level 3 Financing, Inc.,
3.75%, 07/15/29(b) | | | 661,500 | |
| | 550,000 | | | Live Nation Entertainment, Inc.,
4.88%, 11/01/24(b) | | | 556,188 | |
| | 600,000 | | | Live Nation Entertainment, Inc.,
5.63%, 03/15/26(b) | | | 620,250 | |
| | 1,000,000 | | | LogMeIn, Inc.,
5.50%, 09/01/27(b) | | | 1,000,890 | |
| | 425,000 | | | LSB Industries, Inc.,
6.25%, 10/15/28(b) | | | 429,139 | |
| | 875,000 | | | LSF9 Atlantis Holdings LLC/Victra Finance Corp.,
7.75%, 02/15/26(b) | | | 886,865 | |
| | 1,000,000 | | | Lumen Technologies, Inc.,
5.63%, 04/01/25 | | | 1,073,750 | |
| | 1,000,000 | | | Lumen Technologies, Inc.,
5.13%, 12/15/26(b) | | | 1,023,230 | |
| | 575,000 | | | Lumen Technologies, Inc.,
5.38%, 06/15/29(b) | | | 577,156 | |
| | 450,000 | | | Macy’s Retail Holdings LLC,
2.88%, 02/15/23 | | | 454,500 | |
| | 550,000 | | | Manitowoc Co., Inc. (The),
9.00%, 04/01/26(b) | | | 585,623 | |
| | 750,000 | | | Masonite International Corp.,
5.38%, 02/01/28(b) | | | 787,500 | |
| | 625,000 | | | Match Group Holdings II LLC,
5.00%, 12/15/27(b) | | | 651,563 | |
Principal
Amount | | | | | | Value | |
| UNITED STATES (continued) | | | |
| $ | 1,100,000 | | | Mauser Packaging Solutions Holding Co.,
5.50%, 04/15/24(b) | | $ | 1,103,575 | |
| | 1,000,000 | | | Meritage Homes Corp.,
3.88%, 04/15/29(b) | | | 1,036,250 | |
| | 600,000 | | | Meritor, Inc.,
6.25%, 06/01/25(b) | | | 627,750 | |
| | 525,000 | | | Michaels Cos., Inc. (The),
7.88%, 05/01/29(b) | | | 530,250 | |
| | 825,000 | | | Midcap Financial Issuer Trust,
6.50%, 05/01/28(b) | | | 855,938 | |
| | 500,000 | | | Midcap Financial Issuer Trust,
5.63%, 01/15/30(b) | | | 491,875 | |
| | 750,000 | | | Midcontinent Communications/Midcontinent Finance Corp.,
5.38%, 08/15/27(b) | | | 778,125 | |
| | 2,000,000 | | | Mileage Plus Holdings LLC/Mileage Plus Intellectual Property Assets Ltd.,
6.50%, 06/20/27(b) | | | 2,176,720 | |
| | 1,050,000 | | | Millennium Escrow Corp.,
6.63%, 08/01/26(b) | | | 1,067,104 | |
| | 325,000 | | | ModivCare Escrow Issuer, Inc.,
5.00%, 10/01/29(b) | | | 330,580 | |
| | 1,150,000 | | | ModivCare, Inc.,
5.88%, 11/15/25(b) | | | 1,207,500 | |
| | 800,000 | | | Mozart Debt Merger Sub, Inc.,
3.88%, 04/01/29(b) | | | 796,576 | |
| | 975,000 | | | MPH Acquisition Holdings LLC,
5.75%, 11/01/28(b) | | | 886,031 | |
| | 825,000 | | | Murphy Oil Corp.,
6.38%, 07/15/28 | | | 871,452 | |
| | 1,650,000 | | | Nationstar Mortgage Holdings, Inc.,
5.50%, 08/15/28(b) | | | 1,687,125 | |
| | 1,000,000 | | | Navient Corp.,
6.50%, 06/15/22 | | | 1,028,750 | |
| | 1,075,000 | | | Navient Corp.,
5.50%, 01/25/23 | | | 1,123,977 | |
| | 500,000 | | | Netflix, Inc.,
5.38%, 11/15/29(b) | | | 603,090 | |
| | 1,000,000 | | | Netflix, Inc.,
4.88%, 06/15/30(b) | | | 1,175,190 | |
| | 825,000 | | | New Enterprise Stone & Lime Co., Inc.,
5.25%, 07/15/28(b) | | | 832,326 | |
| | 1,000,000 | | | Newell Brands, Inc.,
4.70%, 04/01/26 | | | 1,095,138 | |
| Old Westbury Funds, Inc. | |
| Credit Income Fund | |
| Portfolio of Investments - (Continued) | October 31, 2021 |
| | |
Principal
Amount | | | | | | Value | |
| UNITED STATES (continued) | | | |
| $ | 725,000 | | | Nexstar Media, Inc.,
5.63%, 07/15/27(b) | | $ | 764,875 | |
| | 550,000 | | | Nexstar Media, Inc.,
4.75%, 11/01/28(b) | | | 561,907 | |
| | 1,100,000 | | | Northern Oil and Gas, Inc.,
8.13%, 03/01/28(b) | | | 1,182,500 | |
| | 1,000,000 | | | Novelis Corp.,
4.75%, 01/30/30(b) | | | 1,040,000 | |
| | 525,000 | | | Occidental Petroleum Corp.,
5.88%, 09/01/25 | | | 582,750 | |
| | 750,000 | | | Occidental Petroleum Corp.,
5.50%, 12/01/25 | | | 824,925 | |
| | 1,225,000 | | | Occidental Petroleum Corp.,
6.63%, 09/01/30 | | | 1,498,971 | |
| | 1,000,000 | | | Occidental Petroleum Corp.,
4.30%, 08/15/39 | | | 1,005,000 | |
| | 575,000 | | | Occidental Petroleum Corp.,
6.20%, 03/15/40 | | | 696,650 | |
| | 500,000 | | | Occidental Petroleum Corp.,
4.40%, 04/15/46 | | | 505,883 | |
| | 500,000 | | | OneMain Finance Corp.,
6.13%, 03/15/24 | | | 531,875 | |
| | 500,000 | | | OneMain Finance Corp.,
7.13%, 03/15/26 | | | 567,500 | |
| | 600,000 | | | OneMain Finance Corp.,
5.38%, 11/15/29 | | | 640,500 | |
| | 1,000,000 | | | Open Text Holdings, Inc.,
4.13%, 02/15/30(b) | | | 1,016,600 | |
| | 1,675,000 | | | Organon & Co./Organon Foreign Debt Co-Issuer BV,
4.13%, 04/30/28(b) | | | 1,698,031 | |
| | 425,000 | | | Organon & Co./Organon Foreign Debt Co-Issuer BV,
5.13%, 04/30/31(b) | | | 438,358 | |
| | 300,000 | | | Ortho-Clinical Diagnostics, Inc./ Ortho-Clinical Diagnostics SA,
7.38%, 06/01/25(b) | | | 314,940 | |
| | 250,000 | | | Outfront Media Capital LLC/Outfront Media Capital Corp.,
6.25%, 06/15/25(b) | | | 261,562 | |
| | 600,000 | | | Patrick Industries, Inc.,
4.75%, 05/01/29(b) | | | 595,500 | |
| | 875,000 | | | PBF Holding Co. LLC/PBF Finance Corp.,
9.25%, 05/15/25(b) | | | 853,125 | |
| | 525,000 | | | PetSmart, Inc./PetSmart Finance Corp.,
7.75%, 02/15/29(b) | | | 567,378 | |
Principal
Amount | | | | | | Value | |
| UNITED STATES (continued) | | | |
| $ | 700,000 | | | PGT Innovations, Inc.,
4.38%, 10/01/29(b) | | $ | 696,500 | |
| | 625,000 | | | Pilgrim’s Pride Corp.,
4.25%, 04/15/31(b) | | | 659,375 | |
| | 1,000,000 | | | Post Holdings, Inc.,
5.75%, 03/01/27(b) | | | 1,037,500 | |
| | 550,000 | | | PRA Group, Inc.,
5.00%, 10/01/29(b) | | | 543,504 | |
| | 725,000 | | | Premier Entertainment Sub LLC/Premier Entertainment Finance Corp.,
5.63%, 09/01/29(b) | | | 737,687 | |
| | 1,650,000 | | | Prime Healthcare Services, Inc.,
7.25%, 11/01/25(b) | | | 1,757,250 | |
| | 975,000 | | | Primo Water Holdings, Inc.,
4.38%, 04/30/29(b) | | | 966,295 | |
| | 250,000 | | | Radiate Holdco LLC/Radiate Finance, Inc.,
4.50%, 09/15/26(b) | | | 254,010 | |
| | 700,000 | | | Radiate Holdco LLC/Radiate Finance, Inc.,
6.50%, 09/15/28(b) | | | 700,000 | |
| | 453,000 | | | Rayonier AM Products, Inc.,
7.63%, 01/15/26(b) | | | 468,289 | |
| | 250,000 | | | Rent-A-Center, Inc.,
6.38%, 02/15/29(b) | | | 261,250 | |
| | 596,000 | | | Rite Aid Corp.,
7.50%, 07/01/25(b) | | | 597,490 | |
| | 575,000 | | | ROBLOX Corp.,
3.88%, 05/01/30(b) | | | 572,844 | |
| | 675,000 | | | Rockies Express Pipeline LLC,
4.95%, 07/15/29(b) | | | 722,250 | |
| | 1,000,000 | | | Rockies Express Pipeline LLC,
4.80%, 05/15/30(b) | | | 1,065,000 | |
| | 1,500,000 | | | Royal Caribbean Cruises Ltd.,
9.13%, 06/15/23(b) | | | 1,628,670 | |
| | 1,050,000 | | | Royal Caribbean Cruises Ltd.,
5.50%, 08/31/26(b) | | | 1,069,687 | |
| | 675,000 | | | Royal Caribbean Cruises Ltd.,
5.50%, 04/01/28(b) | | | 686,813 | |
| | 275,000 | | | RP Escrow Issuer LLC,
5.25%, 12/15/25(b) | | | 275,000 | |
| | 975,000 | | | Sabre GLBL, Inc.,
7.38%, 09/01/25(b) | | | 1,035,938 | |
| | 500,000 | | | SCE Recovery Funding LLC, Series A-1,
0.86%, 11/15/31 | | | 479,568 | |
| Old Westbury Funds, Inc. | |
| Credit Income Fund | |
| Portfolio of Investments - (Continued) | October 31, 2021 |
| | |
Principal
Amount | | | | | | Value | |
| UNITED STATES (continued) | | | |
| $ | 500,000 | | | Scientific Games International, Inc.,
5.00%, 10/15/25(b) | | $ | 514,770 | |
| | 675,000 | | | SCIL IV LLC/SCIL USA Holdings LLC,
5.38%, 11/01/26(b) | | | 680,785 | |
| | 550,000 | | | Scotts Miracle-Gro Co. (The),
4.38%, 02/01/32(b) | | | 552,780 | |
| | 650,000 | | | Scripps Escrow, Inc.,
5.88%, 07/15/27(b) | | | 659,750 | |
| | 2,350,000 | | | Select Medical Corp.,
6.25%, 08/15/26(b) | | | 2,458,021 | |
| | 1,000,000 | | | Service Properties Trust REIT,
4.35%, 10/01/24 | | | 1,007,750 | |
| | 1,325,000 | | | Service Properties Trust REIT,
5.50%, 12/15/27 | | | 1,386,084 | |
| | 400,000 | | | Shea Homes LP/Shea Homes Funding Corp.,
4.75%, 02/15/28(b) | | | 403,000 | |
| | 850,000 | | | Sinclair Television Group, Inc.,
5.50%, 03/01/30(b) | | | 811,750 | |
| | 1,025,000 | | | Sirius XM Radio, Inc.,
3.13%, 09/01/26(b) | | | 1,026,281 | |
| | 1,300,000 | | | Sirius XM Radio, Inc.,
4.00%, 07/15/28(b) | | | 1,308,059 | |
| | 4,765,000 | | | Sitka Holdings LLC, (3 mo. LIBOR USD + 4.500%,
5.25%, 07/06/26(b)(e) | | | 4,847,183 | |
| | 580,000 | | | Six Flags Entertainment Corp.,
4.88%, 07/31/24(b) | | | 584,350 | |
| | 457,000 | | | Southwestern Energy Co.,
6.45%, 01/23/25 | | | 498,130 | |
| | 875,000 | | | Southwestern Energy Co.,
5.38%, 03/15/30 | | | 923,107 | |
| | 500,000 | | | Spectrum Brands, Inc.,
5.50%, 07/15/30(b) | | | 540,000 | |
| | 1,300,000 | | | Spirit AeroSystems, Inc.,
7.50%, 04/15/25(b) | | | 1,372,475 | |
| | 1,500,000 | | | Sprint Capital Corp.,
6.88%, 11/15/28 | | | 1,899,210 | |
| | 1,500,000 | | | SRM Escrow Issuer LLC,
6.00%, 11/01/28(b) | | | 1,560,000 | |
| | 400,000 | | | Starwood Property Trust, Inc. REIT,
5.50%, 11/01/23(b) | | | 420,000 | |
| | 300,000 | | | Starwood Property Trust, Inc. REIT,
3.63%, 07/15/26(b) | | | 300,000 | |
| | 325,000 | | | Summer BC Bidco B LLC,
5.50%, 10/31/26(b) | | | 330,688 | |
Principal
Amount | | | | | | Value | |
| UNITED STATES (continued) | | | |
| $ | 175,000 | | | SunCoke Energy, Inc.,
4.88%, 06/30/29(b) | | $ | 173,687 | |
| | 500,000 | | | Talen Energy Supply LLC,
6.63%, 01/15/28(b) | | | 472,500 | |
| | 1,225,000 | | | Tallgrass Energy Partners LP/Tallgrass Energy Finance Corp.,
6.00%, 12/31/30(b) | | | 1,225,270 | |
| | 1,000,000 | | | TEGNA, Inc.,
4.63%, 03/15/28 | | | 1,008,750 | |
| | 1,500,000 | | | TEGNA, Inc.,
5.00%, 09/15/29 | | | 1,518,638 | |
| | 650,000 | | | Tempur Sealy International, Inc.,
3.88%, 10/15/31(b) | | | 644,117 | |
| | 500,000 | | | Tenet Healthcare Corp.,
6.13%, 10/01/28(b) | | | 524,975 | |
| | 675,000 | | | Tenneco, Inc.,
7.88%, 01/15/29(b) | | | 738,281 | |
| | 625,000 | | | Tenneco, Inc.,
5.13%, 04/15/29(b) | | | 619,531 | |
| | 375,000 | | | Thor Industries, Inc.,
4.00%, 10/15/29(b) | | | 371,362 | |
| | 1,000,000 | | | T-Mobile USA, Inc.,
3.50%, 04/15/31 | | | 1,035,000 | |
| | 300,000 | | | TMS International Corp.,
6.25%, 04/15/29(b) | | | 309,750 | |
| | 750,000 | | | Toll Brothers Finance Corp.,
4.35%, 02/15/28 | | | 818,437 | |
| | 1,550,000 | | | TransDigm, Inc.,
8.00%, 12/15/25(b) | | | 1,648,813 | |
| | 650,000 | | | TransDigm, Inc.,
6.25%, 03/15/26(b) | | | 679,250 | |
| | 875,000 | | | Travel + Leisure Co.,
4.25%, 03/01/22 | | | 876,925 | |
| | 1,000,000 | | | Travel + Leisure Co.,
4.63%, 03/01/30(b) | | | 1,037,620 | |
| | 1,075,000 | | | Tronox, Inc.,
6.50%, 05/01/25(b) | | | 1,130,094 | |
| | 1,650,000 | | | Truist Financial Corp., Series N,
(5 yr. US Treasury Yield Curve Rate T Note Constant Maturity + 3.003%),
4.80%(c)(d) | | | 1,709,813 | |
| | 1,500,000 | | | Uber Technologies, Inc.,
8.00%, 11/01/26(b) | | | 1,596,600 | |
| | 1,700,000 | | | Uber Technologies, Inc.,
7.50%, 09/15/27(b) | | | 1,859,545 | |
| | 1,000,000 | | | United Airlines Holdings, Inc.,
4.25%, 10/01/22 | | | 1,019,500 | |
| Old Westbury Funds, Inc. | |
| Credit Income Fund | |
| Portfolio of Investments - (Continued) | October 31, 2021 |
| | |
Principal
Amount | | | | | | Value | |
| UNITED STATES (continued) | | | |
| $ | 275,000 | | | United Airlines, Inc.,
4.38%, 04/15/26(b) | | $ | 284,479 | |
| | 275,000 | | | United Airlines, Inc.,
4.63%, 04/15/29(b) | | | 283,520 | |
| | 500,000 | | | United Rentals North America, Inc.,
3.88%, 02/15/31 | | | 503,700 | |
| | 575,000 | | | United Rentals North America, Inc.,
3.75%, 01/15/32 | | | 573,620 | |
| | 375,000 | | | United States Steel Corp.,
6.88%, 03/01/29 | | | 401,250 | |
| | 1,500,000 | | | Uniti Group LP/Uniti Fiber Holdings, Inc./CSL Capital LLC REIT,
7.88%, 02/15/25(b) | | | 1,577,550 | |
| | 950,000 | | | US Foods, Inc.,
6.25%, 04/15/25(b) | | | 992,750 | |
| | 825,000 | | | USA Compression Partners LP/USA Compression Finance Corp.,
6.88%, 09/01/27 | | | 856,969 | |
| | 925,000 | | | Vector Group Ltd.,
5.75%, 02/01/29(b) | | | 920,375 | |
| | 75,000 | | | Venture Global Calcasieu Pass LLC,
3.88%, 08/15/29(b) | | | 76,440 | |
| | 1,600,000 | | | Veritas US, Inc./Veritas Bermuda Ltd.,
7.50%, 09/01/25(b) | | | 1,658,000 | |
| | 250,000 | | | Verscend Escrow Corp.,
9.75%, 08/15/26(b) | | | 264,828 | |
| | 500,000 | | | Viking Cruises Ltd.,
5.88%, 09/15/27(b) | | | 483,125 | |
| | 800,000 | | | Wabash National Corp.,
4.50%, 10/15/28(b) | | | 777,784 | |
| | 1,225,000 | | | WASH Multifamily Acquisition, Inc.,
5.75%, 04/15/26(b) | | | 1,266,344 | |
| | 750,000 | | | WESCO Distribution, Inc.,
7.25%, 06/15/28(b) | | | 827,183 | |
| | 162,000 | | | Western Midstream Operating LP,
4.65%, 07/01/26 | | | 174,960 | |
| | 375,000 | | | Western Midstream Operating LP,
5.50%, 08/15/48 | | | 447,667 | |
| | 1,075,000 | | | Wynn Las Vegas LLC/Wynn Las Vegas Capital Corp.,
5.50%, 03/01/25(b) | | | 1,092,469 | |
| | 1,250,000 | | | Wynn Resorts Finance LLC/Wynn Resorts Capital Corp.,
7.75%, 04/15/25(b) | | | 1,315,375 | |
Principal
Amount | | | | | | Value | |
| UNITED STATES (continued) | | | |
| $ | 575,000 | | | ZoomInfo Technologies LLC/ZoomInfo Finance Corp.,
3.88%, 02/01/29(b) | | $ | 571,406 | |
| | | | | | | | 256,209,158 | |
| | | | | | | | | |
Total Corporate Bonds
(Cost $283,781,226) | | 287,355,305 | |
| | | | | | | | | |
| ASSET-BACKED SECURITIES — 19.3% | | | |
| CANADA — 0.0% | | | | |
| Other Asset-Backed Securities — 0.0% | | | |
| | 300,000 | | | Golden Credit Card Trust, Series 2017-4A, Class A, (1 mo. LIBOR USD + 0.520%),
0.61%, 07/15/24(b)(e) | | | 301,182 | |
| | 1,000,000 | | | Master Credit Card Trust II, Series 2020-1A, Class A,
1.99%, 09/21/24(b) | | | 1,020,737 | |
| | | | | | | | 1,321,919 | |
| CAYMAN ISLANDS — 1.8% | | | |
| Collateralized Loan Obligations — 1.8% | | | |
| | 1,000,000 | | | Apidos CLO XV, Series 2013-15A, Class ERR, (3 mo. LIBOR USD + 5.700%),
5.83%, 04/20/31(b)(e) | | | 949,778 | |
| | 5,000,000 | | | Atrium VIII, Series 8A, Class SUB,
1.25%, 10/23/24(b)(f)(g)(h) | | | 243,457 | |
| | 2,000,000 | | | Atrium XII, Series 12A, Class ER, (3 mo. LIBOR USD + 5.250%),
5.38%, 04/22/27(b)(e)(h) | | | 1,967,088 | |
| | 12,131,250 | | | Atrium XIII, Series 13A, Class SUB,
2.83%, 11/21/47(b)(f)(g)(h) | | | 8,520,397 | |
| | 457,228 | | | BlueMountain CLO Ltd., Series 2015- 2A, Class A1R, (3 mo. LIBOR USD + 0.930%),
1.05%, 07/18/27(b)(e) | | | 457,228 | |
| | 400,336 | | | Carlyle Global Market Strategies CLO Ltd., Series 2015-4A, Class SBB1, (3 mo. LIBOR USD + 8.500%),
8.63%, 07/20/32(b)(e)(h) | | | 394,210 | |
| | 17,550,000 | | | CBAM Ltd., Series 2019-10A, Class SUB,
3.62%, 04/20/32(b)(f)(g)(h) | | | 11,590,013 | |
| | 9,915,625 | | | Cedar Funding VII CLO Ltd., Series 2018-7A, Class SUB,
3.74%, 01/20/31(b)(f)(g)(h) | | | 6,463,869 | |
| Old Westbury Funds, Inc. | |
| Credit Income Fund | |
| Portfolio of Investments - (Continued) | October 31, 2021 |
| | |
Principal
Amount | | | | | | Value | |
| CAYMAN ISLANDS (continued) | | | |
| Collateralized Loan Obligations (continued) | | | |
| $ | 1,000,000 | | | Flatiron CLO 17 Ltd., Series 2017-1A, Class BR, (3 mo. LIBOR USD + 1.450%),
1.57%, 05/15/30(b)(e) | | $ | 999,997 | |
| | 4,500,000 | | | Generate CLO-3 Ltd., Series 3A, Class ER, (3 mo. LIBOR USD + 6.400%),
6.53%, 10/20/29(b)(e) | | | 4,500,631 | |
| | 4,000,000 | | | Generate CLO-3 Ltd., Series 3A, Class SUB,
6.71%, 10/20/29(b)(f)(g)(h) | | | 2,200,726 | |
| | 500,000 | | | GoldentTree Loan Management US CLO 1 Ltd., Series 2021-10A, Class B, (3 mo. LIBOR USD + 1.600%),
1.73%, 07/20/34(b)(e) | | | 499,188 | |
| | 1,000,000 | | | Gulf Stream Meridian 3 Ltd., Series 2021-IIIA, Class A2, (3 mo. LIBOR USD + 1.750%),
1.87%, 04/15/34(b)(e) | | | 999,996 | |
| | 500,000 | | | LCM XXIV Ltd., Series 24A, Class BR, (3 mo. LIBOR USD + 1.400%),
1.53%, 03/20/30(b)(e) | | | 496,510 | |
| | 1,000,000 | | | Regatta XXI Funding Ltd., Series 2021-3A, Class B, (3 mo. LIBOR USD + 1.700%),
1.83%, 10/20/34(b)(e) | | | 998,276 | |
| | 5,000,000 | | | Romark CLO II Ltd., Series 2018-2A, Class SUB,
5.26%, 07/25/31(b)(f)(g) | | | 2,850,730 | |
| | 5,000,000 | | | Romark CLO Ltd., Series 2017-1A, Class SUB,
5.70%, 10/23/30(b)(f)(g) | | | 2,840,965 | |
| | 7,500,000 | | | Romark WM-R Ltd., Series 2018-1A, Class F, (3 mo. LIBOR USD + 8.100%),
8.23%, 04/20/31(b)(e) | | | 6,452,224 | |
| | | | | | | | 53,425,283 | |
| UNITED STATES — 17.5% | | | |
| Other Asset-Backed Securities — 17.5% | | | |
| | 4,492,027 | | | 510 Loan Acquisition Trust, Series 2020-1, Class A, STEP,
5.11%, 09/25/60(b) | | | 4,535,615 | |
Principal
Amount | | | | | | Value | |
| UNITED STATES (continued) | | | |
| Other Asset-Backed Securities (continued) | | | |
| $ | 218,484 | | | Aegis Asset-Backed Securities Corp. Mortgage Pass-Through Certificates, Series 2003-3, Class M1, (1 mo. LIBOR USD + 1.050%),
1.14%, 01/25/34(e) | | $ | 218,320 | |
| | 111,431 | | | Ajax Mortgage Loan Trust, Series 2017-D, Class B,
2.35%, 12/25/57(a)(b)(f)(g) | | | 89,390 | |
| | 33,194 | | | Ajax Mortgage Loan Trust, Series 2018-A, Class B,
2.90%, 04/25/58(b)(g) | | | 30,233 | |
| | 119,326 | | | Ajax Mortgage Loan Trust, Series 2018-B, Class B,
1.98%, 02/26/57(b)(g) | | | 58,151 | |
| | 5,529,404 | | | Ajax Mortgage Loan Trust, Series 2018-D, Class A,
3.75%, 08/25/58(b)(f) | | | 5,533,177 | |
| | 1,820,383 | | | Ajax Mortgage Loan Trust, Series 2018-D, Class B,
2.93%, 08/25/58(a)(b)(f)(g) | | | 1,295,748 | |
| | 140,112 | | | Ajax Mortgage Loan Trust, Series 2018-E, Class C,
1.15%, 06/25/58(b)(f)(g) | | | 135,993 | |
| | 215,833 | | | Ajax Mortgage Loan Trust, Series 2018-F, Class C,
1.99%, 11/25/58(a)(b)(g) | | | 141,111 | |
| | 10,619,895 | | | Ajax Mortgage Loan Trust, Series 2018-G, Class A,
4.38%, 06/25/57(b)(f) | | | 10,663,948 | |
| | 2,100,000 | | | Ajax Mortgage Loan Trust, Series 2018-G, Class B,
5.25%, 06/25/57(a)(b)(f) | | | 1,585,500 | |
| | 5,362,641 | | | Ajax Mortgage Loan Trust, Series 2018-G, Class C,
0.05%, 06/25/57(b)(g) | | | 5,321,932 | |
| | 10,623,662 | | | Ajax Mortgage Loan Trust, Series 2019-A, Class A,
3.75%, 08/25/57(b)(f) | | | 10,739,844 | |
| | 2,450,000 | | | Ajax Mortgage Loan Trust, Series 2019-A, Class B,
5.25%, 08/25/57(b)(f) | | | 2,319,082 | |
| | 6,120,402 | | | Ajax Mortgage Loan Trust, Series 2019-A, Class C,
0.79%, 08/25/57(a)(b)(g) | | | 5,067,693 | |
| | 6,125,922 | | | Ajax Mortgage Loan Trust, Series 2019-B, Class A,
3.75%, 01/25/59(b)(f) | | | 6,192,090 | |
| Old Westbury Funds, Inc. | |
| Credit Income Fund | |
| Portfolio of Investments - (Continued) | October 31, 2021 |
| | |
Principal
Amount | | | | | | Value | |
| UNITED STATES (continued) | | | |
| Other Asset-Backed Securities (continued) | | | |
| $ | 2,100,000 | | | Ajax Mortgage Loan Trust, Series 2019-B, Class B,
5.25%, 01/25/59(a)(b)(f) | | $ | 1,585,500 | |
| | 5,351,208 | | | Ajax Mortgage Loan Trust, Series 2019-B, Class C,
0.61%, 01/25/59(b)(g) | | | 4,692,208 | |
| | 6,299,227 | | | Ajax Mortgage Loan Trust, Series 2019-E, Class A, STEP,
3.00%, 09/25/59(b) | | | 6,316,276 | |
| | 3,512,199 | | | Ajax Mortgage Loan Trust, Series 2019-E, Class B, STEP,
4.88%, 09/25/59(b) | | | 3,189,905 | |
| | 7,623,843 | | | Ajax Mortgage Loan Trust, Series 2019-E, Class C,
2.64%, 09/25/59(b)(g) | | | 6,874,896 | |
| | 11,697,852 | | | Ajax Mortgage Loan Trust, Series 2019-G, Class A, STEP,
3.00%, 09/25/59(b)(g) | | | 11,738,366 | |
| | 2,927,374 | | | Ajax Mortgage Loan Trust, Series 2019-G, Class B, STEP,
4.25%, 09/25/59(b) | | | 2,855,987 | |
| | 7,464,195 | | | Ajax Mortgage Loan Trust, Series 2019-G, Class C,
1.05%, 09/25/59(b)(g) | | | 6,922,462 | |
| | 23,783,753 | | | Ajax Mortgage Loan Trust, Series 2020-A, Class A, STEP,
2.38%, 12/25/59(b) | | | 23,718,036 | |
| | 4,328,402 | | | Ajax Mortgage Loan Trust, Series 2020-A, Class B, STEP,
3.50%, 12/25/59(b) | | | 4,316,158 | |
| | 10,387,904 | | | Ajax Mortgage Loan Trust, Series 2020-A, Class C,
1.92%, 12/25/59(a)(b)(g) | | | 6,513,216 | |
| | 14,323,996 | | | Ajax Mortgage Loan Trust, Series 2021-D, Class A, STEP,
2.00%, 03/25/60(b) | | | 14,178,301 | |
| | 2,042,300 | | | Ajax Mortgage Loan Trust, Series 2021-D, Class B,
4.00%, 03/25/60(a)(b)(f) | | | 2,024,532 | |
| | 3,051,274 | | | Ajax Mortgage Loan Trust, Series 2021-D, Class C,
0.66%, 03/25/60(a)(b)(f)(g) | | | 2,364,738 | |
| | 4,041,340 | | | Ajax Mortgage Loan Trust, Series 2021-E, Class B2,
3.77%, 12/25/60(b)(f) | | | 3,892,481 | |
| | 1,080,800 | | | Ajax Mortgage Loan Trust, Series 2021-F, Class B, STEP,
3.75%, 06/25/61(b) | | | 1,073,571 | |
Principal
Amount | | | | | | Value | |
| UNITED STATES (continued) | | | |
| Other Asset-Backed Securities (continued) | | | |
| $ | 2,017,749 | | | Ajax Mortgage Loan Trust, Series 2021-F, Class C,
0.55%, 06/25/61(b)(g) | | $ | 1,818,045 | |
| | 500,000 | | | American Credit Acceptance Receivables Trust, Series 2020-4, Class B,
0.85%, 12/13/24(b) | | | 500,812 | |
| | 1,000,000 | | | American Express Credit Account Master Trust, Series 2017-5, Class A, (1 mo. LIBOR USD + 0.380%),
0.47%, 02/18/25(e) | | | 1,002,373 | |
| | 1,000,000 | | | American Express Credit Account Master Trust, Series 2018-5, Class A, (1 mo. LIBOR USD + 0.340%),
0.43%, 12/15/25(e) | | | 1,003,353 | |
| | 5,000,000 | | | Ameriquest Mortgage Securities, Inc. Asset-Backed Pass-Through Certificates, Series 2005-R3, Class M7, (1 mo. LIBOR USD + 1.980%),
2.07%, 05/25/35(e) | | | 5,115,049 | |
| | 6,000,000 | | | AMSR Trust, Series 2020-SFR5, Class F,
2.69%, 11/17/37(b) | | | 5,860,935 | |
| | 8,853,642 | | | Argent Mortgage Loan Trust, Series 2005-W1, Class A2, (1 mo. LIBOR USD + 0.480%),
0.57%, 05/25/35(e) | | | 8,312,036 | |
| | 4,662,515 | | | Argent Securities, Inc. Asset-Backed Pass-Through Certificates, Series 2005-W5, Class M1, (1 mo. LIBOR USD + 0.690%),
0.78%, 01/25/36(e) | | | 5,139,993 | |
| | 6,021,472 | | | Asset Backed Securities Corp. Home Equity Loan Trust, Series 2006- HE1, Class M2, (1 mo. LIBOR USD + 0.630%),
0.72%, 01/25/36(e) | | | 5,896,384 | |
| | 5,740,000 | | | BankAmerica Manufactured Housing Contract Trust, Series 1997-2, Class B1,
7.07%, 02/10/22(f) | | | 2,563,773 | |
| | 5,000,000 | | | BankAmerica Manufactured Housing Contract Trust, Series 1998-2, Class B1,
7.41%, 12/10/25(f) | | | 1,840,319 | |
| Old Westbury Funds, Inc. | |
| Credit Income Fund | |
| Portfolio of Investments - (Continued) | October 31, 2021 |
| | |
Principal
Amount | | | | | | Value | |
| UNITED STATES (continued) | | | |
| Other Asset-Backed Securities (continued) | | | |
| $ | 7,565,648 | | | Bayview Commercial Asset Trust, Series 2007-4A, Class A1, (1 mo. LIBOR USD + 0.450%),
0.54%, 09/25/37(b)(e) | | $ | 7,281,600 | |
| | 7,530,892 | | | Bayview Financial Revolving Asset Trust, Series 2004-B, Class A1, (1 mo. LIBOR USD + 1.000%),
1.09%, 05/28/39(b)(e) | | | 7,145,258 | |
| | 1,662,864 | | | Bayview Financial Revolving Asset Trust, Series 2004-B, Class A2, (1 mo. LIBOR USD + 1.300%),
1.39%, 05/28/39(b)(e) | | | 1,342,597 | |
| | 1,407,759 | | | Bayview Financial Revolving Asset Trust, Series 2005-E, Class A1, (1 mo. LIBOR USD + 1.000%),
1.09%, 12/28/40(b)(e) | | | 1,323,712 | |
| | 2,956,611 | | | Bayview Financial Revolving Asset Trust, Series 2005-E, Class A2A, (1 mo. LIBOR USD + 0.930%),
1.02%, 12/28/40(b)(e) | | | 2,913,716 | |
| | 210,574 | | | BCC Funding XVII LLC, Series 2020- 1, Class A2,
0.91%, 08/20/25(b) | | | 211,038 | |
| | 908,185 | | | Bear Stearns Asset Backed Securities I Trust, Series 2005-TC1, Class M4, (1 mo. LIBOR USD + 1.800%),
1.89%, 05/25/35(e) | | | 913,079 | |
| | 1,809,327 | | | Bear Stearns Asset Backed Securities I Trust, Series 2006-HE1, Class 1M4, (1 mo. LIBOR USD + 1.020%),
1.11%, 12/25/35(e) | | | 2,644,325 | |
| | 3,864,400 | | | Bear Stearns Asset Backed Securities I Trust, Series 2006-HE10, Class 22A, (1 mo. LIBOR USD + 0.140%),
0.23%, 12/25/36(e) | | | 4,904,735 | |
| | 2,609,542 | | | Bear Stearns Asset Backed Securities I Trust, Series 2007-HE1, Class 21A2, (1 mo. LIBOR USD + 0.160%),
0.25%, 01/25/37(e) | | | 2,576,904 | |
| | 500,000 | | | BMW Vehicle Lease Trust, Series 2021-1, Class A4,
0.37%, 07/25/24 | | | 498,110 | |
| | 500,000 | | | Capital One Prime Auto Receivables Trust, Series 2021-1, Class A3,
0.77%, 09/15/26 | | | 498,550 | |
Principal
Amount | | | | | | Value | |
| UNITED STATES (continued) | | | |
| Other Asset-Backed Securities (continued) | | | |
| $ | 500,000 | | | CarMax Auto Owner Trust, Series 2020-4, Class B,
0.85%, 06/15/26 | | $ | 497,486 | |
| | 1,000,000 | | | CarMax Auto Owner Trust, Series 2021-1, Class B,
0.74%, 10/15/26 | | | 983,637 | |
| | 4,884,740 | | | Carrington Mortgage Loan Trust, Series 2007-FRE1, Class A4, (1 mo. LIBOR USD + 0.420%),
0.51%, 12/26/36(e) | | | 4,428,278 | |
| | 6,740,542 | | | Carrington Mortgage Loan Trust, Series 2007-FRE1, Class M1, (1 mo. LIBOR USD + 0.500%),
0.59%, 02/25/37(e) | | | 6,427,573 | |
| | 6,674,297 | | | Cascade MH Asset Trust, Series 2019- MH1, Class A,
4.00%, 11/25/44(b)(f) | | | 6,896,376 | |
| | 3,471,236 | | | Citigroup Mortgage Loan Trust, Series 2007-AHL2, Class A3B, (1 mo. LIBOR USD + 0.200%),
0.29%, 05/25/37(e) | | | 2,893,897 | |
| | 93,275 | | | Citigroup Mortgage Loan Trust, Series 2007-AHL2, Class A3C, (1 mo. LIBOR USD + 0.270%),
0.36%, 05/25/37(e) | | | 78,377 | |
| | 4,224,278 | | | Citigroup Mortgage Loan Trust, Series 2007-AHL3, Class A3B, (1 mo. LIBOR USD + 0.170%),
0.26%, 07/25/45(e) | | | 3,643,976 | |
| | 500,000 | | | CNH Equipment Trust, Series 2021- C, Class A4,
1.16%, 10/16/28 | | | 499,309 | |
| | 1,832,809 | | | Conseco Finance Corp., Series 1997-7, Class M1,
7.03%, 07/15/28(f) | | | 1,852,592 | |
| | 1,907,079 | | | Conseco Finance Corp., Series 1998-2, Class M1,
6.94%, 12/01/28(f) | | | 1,938,650 | |
| | 2,305,457 | | | Conseco Finance Corp., Series 1999-5, Class A5,
7.86%, 03/01/30(f) | | | 1,290,032 | |
| | 2,600,921 | | | Conseco Finance Corp., Series 1999-5, Class A6,
7.50%, 03/01/30(f) | | | 1,398,807 | |
| | 11,184,069 | | | Conseco Finance Securitizations Corp., Series 2000-1, Class A5,
8.06%, 09/01/29(f) | | | 3,315,925 | |
| Old Westbury Funds, Inc. | |
| Credit Income Fund | |
| Portfolio of Investments - (Continued) | October 31, 2021 |
| | |
Principal
Amount | | | | | | Value | |
| UNITED STATES (continued) | | | |
| Other Asset-Backed Securities (continued) | | | |
| $ | 2,605,856 | | | Countrywide Asset-Backed Certificates, Series 2005-17, Class 1AF4, STEP,
6.05%, 05/25/36 | | $ | 2,596,588 | |
| | 295,157 | | | Countrywide Asset-Backed Certificates, Series 2006-11, Class 3AV2, (1 mo. LIBOR USD + 0.160%),
0.25%, 09/25/46(e) | | | 292,592 | |
| | 4,483,804 | | | Countrywide Asset-Backed Certificates, Series 2006-12, Class 1A, (1 mo. LIBOR USD + 0.260%),
0.35%, 12/25/36(e) | | | 4,480,418 | |
| | 8,945,032 | | | Countrywide Asset-Backed Certificates, Series 2006-18, Class M1, (1 mo. LIBOR USD + 0.300%),
0.39%, 03/25/37(e) | | | 9,308,402 | |
| | 5,671,328 | | | Countrywide Asset-Backed Certificates, Series 2006-22, Class M1, (1 mo. LIBOR USD + 0.230%),
0.32%, 05/25/47(e) | | | 4,951,454 | |
| | 5,718,283 | | | Countrywide Asset-Backed Certificates, Series 2006-26, Class M1, (1 mo. LIBOR USD + 0.250%),
0.34%, 06/25/37(e) | | | 5,967,467 | |
| | 1,439,323 | | | Countrywide Revolving Home Equity Loan Resecuritization Trust, Series 2006-C, Class 2A, (1 mo. LIBOR USD + 0.180%),
0.27%, 05/15/36(e) | | | 1,408,808 | |
| | 790,432 | | | Countrywide Revolving Home Equity Loan Resecuritization Trust, Series 2006-RES, Class 4Q1B, (1 mo. LIBOR USD + 0.300%),
0.39%, 12/15/33(b)(e) | | | 719,609 | |
| | 644,199 | | | Countrywide Revolving Home Equity Loan Resecuritization Trust, Series 2006-RES, Class 4T1B, (1 mo. LIBOR USD + 0.240%),
0.33%, 02/15/30(b)(e) | | | 589,829 | |
| | 398,751 | | | Countrywide Revolving Home Equity Loan Resecuritization Trust, Series 2006-RES, Class 5B1B, (1 mo. LIBOR USD + 0.190%),
0.28%, 05/15/35(b)(e) | | | 390,540 | |
Principal
Amount | | | | | | Value | |
| UNITED STATES (continued) | | | |
| Other Asset-Backed Securities (continued) | | | |
| $ | 500,000 | | | Credit Acceptance Auto Loan Trust, Series 2021-2A, Class A,
0.96%, 02/15/30(b) | | $ | 498,739 | |
| | 2,244,775 | | | Credit Suisse Mortgage Capital Certificates, Series 2021-JR1, Class A2,
3.50%, 09/27/66(b)(f) | | | 2,134,285 | |
| | 3,895,940 | | | Credit Suisse Mortgage Capital Certificates, Series 2021-JR1, Class B2,
30.67%, 09/27/66(a)(b)(f) | | | 3,384,598 | |
| | 3,699,404 | | | Credit Suisse Mortgage Capital Certificates, Series 2021-JR1, Class PT2,
2.68%, 07/26/60(a)(b)(f)(g) | | | 1,304,040 | |
| | 2,432,688 | | | Credit-Based Asset Servicing and Securitization LLC, Series 2007- CB6, Class A4, (1 mo. LIBOR USD + 0.340%),
0.43%, 07/25/37(b)(e) | | | 2,000,529 | |
| | 1,000,000 | | | Discover Card Execution Note Trust, Series 2017-A7, Class A7, (1 mo. LIBOR USD + 0.360%),
0.45%, 04/15/25(e) | | | 1,002,975 | |
| | 500,000 | | | Drive Auto Receivables Trust, Series 2021-1, Class A3,
0.44%, 11/15/24 | | | 500,279 | |
| | 302,152 | | | DT Auto Owner Trust, Series 2019- 1A, Class C,
3.61%, 11/15/24(b) | | | 303,408 | |
| | 1,000,000 | | | DT Auto Owner Trust, Series 2021- 1A, Class B,
0.62%, 09/15/25(b) | | | 999,438 | |
| | 1,000,000 | | | Enterprise Fleet Financing LLC, Series 2020-2, Class A3,
0.65%, 07/20/26(b) | | | 990,406 | |
| | 500,000 | | | Enterprise Fleet Financing LLC, Series 2021-3, Class A2,
0.77%, 08/20/27(b) | | | 499,516 | |
| | 4,888,215 | | | First Frankin Mortgage Loan Trust, Series 2006-FF4, Class M1, (1 mo. LIBOR USD + 0.540%),
0.63%, 03/25/36(e) | | | 4,510,992 | |
| | 1,990,933 | | | First Franklin Mortgage Loan Trust, Series 2003-FF4, Class M1, (1 mo. LIBOR USD + 1.800%),
1.88%, 10/25/33(e) | | | 2,006,222 | |
| Old Westbury Funds, Inc. | |
| Credit Income Fund | |
| Portfolio of Investments - (Continued) | October 31, 2021 |
Principal
Amount | | | | | Value | |
| UNITED STATES (continued) | | | | |
| Other Asset-Backed Securities (continued) | | | | |
| $ | 9,141,360 | | | First Franklin Mortgage Loan Trust, Series 2006-FF8, Class M1, (1 mo. LIBOR USD + 0.375%),
0.46%, 07/25/36(e) | | $ | 9,440,621 | |
| | 4,310,792 | | | First Franklin Mortgage Loan Trust, Series 2006-FFH1, Class M2, (1 mo. LIBOR USD + 0.600%),
0.69%, 01/25/36(e) | | | 3,999,212 | |
| | 3,955,388 | | | First Franklin Mortgage Loan Trust, Series 2007-FF2, Class A2C, (1 mo. LIBOR USD + 0.150%),
0.24%, 03/25/37(e) | | | 2,444,575 | |
| | 500,000 | | | Flagship Credit Auto Trust, Series 2020-4, Class B,
1.00%, 10/15/25(b) | | | 501,580 | |
| | 1,000,000 | | | Ford Credit Auto Owner Trust, Series 2020-2, Class A,
1.06%, 04/15/33(b) | | | 987,939 | |
| | 1,300,000 | | | Ford Credit Auto Owner Trust, Series 2020-C, Class B,
0.79%, 08/15/26 | | | 1,284,053 | |
| | 1,000,000 | | | Ford Credit Floorplan Master Owner Trust, Series 2020-2, Class A,
1.06%, 09/15/27 | | | 988,305 | |
| | 1,500,000 | | | Fremont Home Loan Trust, Series 2005-D, Class M1, (1 mo. LIBOR USD + 0.615%),
0.70%, 11/25/35(e) | | | 1,452,146 | |
| | 1,500,000 | | | FRTKL, Series 2021-SFR1, Class F,
3.17%, 09/17/38(b) | | | 1,476,201 | |
| | 1,000,000 | | | GM Financial Consumer Automobile Receivables Trust, Series 2020-4, Class A3,
0.38%, 08/18/25 | | | 998,424 | |
| | 1,050,000 | | | GM Financial Consumer Automobile Receivables Trust, Series 2021-1, Class B,
0.75%, 05/17/27 | | | 1,036,836 | |
| | 598,166 | | | GMACM Home Equity Loan Trust, Series 2005-HE3, Class A3, (1 mo. LIBOR USD + 0.500%),
0.59%, 02/25/36(e) | | | 592,145 | |
| | 130,757 | | | GMACM Home Equity Loan Trust, Series 2006-HE1, Class A, (1 mo. LIBOR USD + 0.315%),
0.40%, 11/25/36(e) | | | 311,243 | |
| | 500,000 | | | GMF Floorplan Owner Revolving Trust, Series 2020-2, Class B,
0.96%, 10/15/25(b) | | | 499,314 | |
Principal
Amount | | | | | Value | |
| UNITED STATES (continued) | | | | |
| Other Asset-Backed Securities (continued) | | | | |
| $ | 500,000 | | | GreatAmerica Leasing Receivables Funding LLC, Series 2021-1, Class B,
0.72%, 12/15/26(b) | | $ | 491,607 | |
| | 5,782,048 | | | Greenpoint Manufactured Housing, Series 2000-3, Class IA,
8.45%, 06/20/31(f) | | | 4,171,846 | |
| | 2,463,906 | | | GSAA Home Equity Trust, Series 2005-14, Class 1A2, (1 mo. LIBOR USD + 0.700%),
0.79%, 12/25/35(e) | | | 1,093,355 | |
| | 9,308,009 | | | GSAA Home Equity Trust, Series 2006-5, Class 1A1, (1 mo. LIBOR USD + 0.360%),
0.45%, 03/25/36(e) | | | 4,043,059 | |
| | 399,037 | | | GSAA Trust, Series 2006-7, Class AF2,
5.99%, 03/25/46(f) | | | 220,572 | |
| | 3,566,000 | | | GSAMP Trust, Series 2007-HS1, Class M5, (1 mo. LIBOR USD + 3.375%),
3.46%, 02/25/47(e) | | | 3,781,399 | |
| | 3,954,185 | | | Home Equity Asset Trust, Series 2007- 1, Class 2A3, (1 mo. LIBOR USD + 0.300%),
0.39%, 05/25/37(e) | | | 3,606,607 | |
| | 3,000,000 | | | Home Partners of America Trust, Series 2021-2, Class F,
3.80%, 12/17/26(b) | | | 2,999,890 | |
| | 375,000 | | | HPEFS Equipment Trust, Series 2021- 2A, Class B,
0.61%, 09/20/28(b) | | | 372,304 | |
| | 4,877,547 | | | HSI Asset Loan Obligation Trust, Series 2007-WF1, Class A3, STEP,
4.76%, 12/25/36 | | | 2,221,130 | |
| | 1,000,000 | | | Hyundai Auto Lease Securitization Trust, Series 2020-B, Class B,
0.81%, 10/15/24(b) | | | 1,002,138 | |
| | 768,776 | | | Irwin Home Equity Loan Trust, Series 2006-3, Class 2A3, STEP,
6.53%, 09/25/37(b) | | | 764,667 | |
| | 500,000 | | | John Deere Owner Trust, Series 2021- A, Class A3,
0.36%, 09/15/25 | | | 497,316 | |
| | 118,480 | | | JP Morgan Mortgage Acquisition Trust, Series 2006-WF1, Class A4, STEP,
6.63%, 07/25/36 | | | 48,442 | |
| Old Westbury Funds, Inc. | |
| Credit Income Fund | |
| Portfolio of Investments - (Continued) | October 31, 2021 |
Principal
Amount | | | | | Value | |
| UNITED STATES (continued) | | | | |
| Other Asset-Backed Securities (continued) | | | | |
| $ | 240,702 | | | JP Morgan Mortgage Acquisition Trust, Series 2006-WMC2, Class A3, (1 mo. LIBOR USD + 0.180%),
0.27%, 07/25/36(e) | | $ | 137,712 | |
| | 1,250,000 | | | Kubota Credit Owner Trust, Series 2021-1A, Class A3,
0.62%, 08/15/25(b) | | | 1,243,347 | |
| | 1,686,381 | | | Legacy Mortgage Asset Trust, Series 2019-SL2, Class B,
0.27%, 02/25/59(a)(b)(g) | | | 252,957 | |
| | 1,900,000 | | | Legacy Mortgage Asset Trust, Series 2019-SL2, Class M,
4.25%, 02/25/59(b)(f) | | | 1,941,323 | |
| | 2,654,978 | | | Lehman ABS Manufactured Housing Contract Trust, Series 2001-B, Class M1,
6.63%, 04/15/40(f) | | | 2,815,880 | |
| | 276,136 | | | Lehman ABS Mortgage Loan Trust, Series 2007-1, Class 2A1, (1 mo. LIBOR USD + 0.090%),
0.18%, 06/25/37(b)(e) | | | 226,568 | |
| | 5,682,717 | | | Lehman ABS Mortgage Loan Trust, Series 2007-1, Class 2A2, (1 mo. LIBOR USD + 0.200%),
0.29%, 06/25/37(b)(e) | | | 4,723,801 | |
| | 1,008,945 | | | Long Beach Mortgage Loan Trust, Series 2006-10, Class 2A2, (1 mo. LIBOR USD + 0.110%),
0.20%, 11/25/36(e) | | | 429,279 | |
| | 5,309,782 | | | Long Beach Mortgage Loan Trust, Series 2006-9, Class 2A3, (1 mo. LIBOR USD + 0.160%),
0.25%, 10/25/36(e) | | | 2,201,712 | |
| | 1,729,919 | | | Madison Avenue Manufactured Housing Contract Trust, Series 2002-A, Class B2, (1 mo. LIBOR USD + 3.250%),
3.34%, 03/25/32(e) | | | 1,738,123 | |
| | 3,940,453 | | | MASTR Second Lien Trust, Series 2006-1, Class A, (1 mo. LIBOR USD + 0.320%),
0.41%, 03/25/36(e) | | | 440,758 | |
| | 1,000,000 | | | Mercedes-Benz Auto Lease Trust, Series 2020-A, Class A4,
1.88%, 09/15/25 | | | 1,010,020 | |
| | 2,306,738 | | | MERIT Securities Corp., Series 13, Class M2, STEP,
7.88%, 12/28/33 | | | 1,911,295 | |
Principal
Amount | | | | | Value | |
| UNITED STATES (continued) | | | | |
| Other Asset-Backed Securities (continued) | | | | |
| $ | 10,348,143 | | | Merrill Lynch Mortgage Investors Trust, Series 2006-RM5, Class A2D, (1 mo. LIBOR USD + 0.500%),
0.59%, 10/25/37(e) | | $ | 4,545,117 | |
| | 1,089,382 | | | Morgan Stanley ABS Capital I, Inc. Trust, Series 2006-HE4, Class A4, (1 mo. LIBOR USD + 0.480%),
0.57%, 06/25/36(e) | | | 727,122 | |
| | 6,515,736 | | | Morgan Stanley ABS Capital I, Inc. Trust, Series 2007-NC1, Class A1, (1 mo. LIBOR USD + 0.130%),
0.22%, 11/25/36(e) | | | 3,587,184 | |
| | 3,346,689 | | | Morgan Stanley ABS Capital I, Inc. Trust, Series 2007-SEA1, Class 2A1, (1 mo. LIBOR USD + 1.900%),
1.99%, 02/25/47(b)(e) | | | 3,269,499 | |
| | 3,565,680 | | | Morgan Stanley Capital I, Inc. Trust, Series 2006-NC2, Class M1, (1 mo. LIBOR USD + 0.540%),
0.63%, 02/25/36(e) | | | 3,790,066 | |
| | 4,424,923 | | | Morgan Stanley Mortgage Loan Trust, Series 2006-12XS, Class A4, STEP,
6.51%, 10/25/36 | | | 1,492,716 | |
| | 495,845 | | | Morgan Stanley Mortgage Loan Trust, Series 2006-4SL, Class A1, (1 mo. LIBOR USD + 0.300%),
0.39%, 03/25/36(e) | | | 489,862 | |
| | 8,000,000 | | | Nationstar Home Equity Loan Trust, Series 2007-A, Class M3, (1 mo. LIBOR USD + 0.300%),
0.39%, 03/25/37(e) | | | 7,476,239 | |
| | 754,064 | | | Navient Private Education Refi Loan Trust, Series 2020-GA, Class A,
1.17%, 09/16/69(b) | | | 753,914 | |
| | 610,360 | | | Navient Private Education Refi Loan Trust, Series 2020-HA, Class A,
1.31%, 01/15/69(b) | | | 612,040 | |
| | 5,690,116 | | | New Century Home Equity Loan Trust, Series 2005-C, Class M2, (1 mo. LIBOR USD + 0.675%),
0.76%, 12/25/35(e) | | | 5,451,378 | |
| Old Westbury Funds, Inc. | |
| Credit Income Fund | |
| Portfolio of Investments - (Continued) | October 31, 2021 |
Principal
Amount | | | | | Value | |
| UNITED STATES (continued) | | | | |
| Other Asset-Backed Securities (continued) | | | | |
| $ | 857,364 | | | Nomura Asset Acceptance Corp. Alternative Loan Trust, Series 2006-S5, Class A1, (1 mo. LIBOR USD + 0.400%),
0.49%, 10/25/36(b)(e) | | $ | 1,057,978 | |
| | 1,566,648 | | | Oakwood Mortgage Investors, Inc., Series 1999-C, Class A2,
7.48%, 08/15/27 | | | 1,461,975 | |
| | 9,913,794 | | | Oakwood Mortgage Investors, Inc., Series 2000-D, Class A4,
7.40%, 07/15/30(f) | | | 3,584,730 | |
| | 8,572,117 | | | Oakwood Mortgage Investors, Inc., Series 2001-C, Class A2,
5.92%, 06/15/31(f) | | | 1,404,439 | |
| | 5,947,218 | | | Oakwood Mortgage Investors, Inc., Series 2001-C, Class A3,
6.61%, 06/15/31(f) | | | 1,087,949 | |
| | 6,795,981 | | | Oakwood Mortgage Investors, Inc., Series 2001-C, Class A4,
7.41%, 06/15/31(f) | | | 1,392,741 | |
| | 629,176 | | | Oakwood Mortgage Investors, Inc., Series 2001-D, Class A3,
5.90%, 09/15/22(f) | | | 435,866 | |
| | 454,420 | | | Oakwood Mortgage Investors, Inc., Series 2002-B, Class A4,
7.09%, 06/15/32(f) | | | 472,517 | |
| | 4,000,000 | | | OneMain Financial Issuance Trust, Series 2015-3A, Class D,
6.94%, 11/20/28(b) | | | 4,011,914 | |
| | 1,000,000 | | | PFS Financing Corp., Series 2020-A, Class A,
1.27%, 06/15/25(b) | | | 1,008,055 | |
| | 2,955,985 | | | Popular ABS Mortgage Pass-Through Trust, Series 2005-3, Class M2, STEP,
3.70%, 07/25/35 | | | 2,790,137 | |
| | 1,000,000 | | | Progress Residential Trust, Series 2019- SFR3, Class F,
3.87%, 09/17/36(b) | | | 1,006,784 | |
| | 3,000,000 | | | Progress Residential Trust, Series 2019- SFR4, Class F,
3.68%, 10/17/36(b) | | | 3,033,245 | |
| | 750,000 | | | Progress Residential Trust, Series 2020- SFR1, Class G,
4.03%, 04/17/37(b) | | | 752,079 | |
| | 3,500,000 | | | Progress Residential Trust, Series 2021- SFR8, Class F,
3.18%, 10/17/38(b) | | | 3,446,965 | |
Principal
Amount | | | | | Value | |
| UNITED STATES (continued) | | | | |
| Other Asset-Backed Securities (continued) | | | | |
| $ | 2,400,000 | | | Progress Residential Trust, Series 2021- SFR9, Class F,
4.05%, 11/17/40(b) | | $ | 2,380,897 | |
| | 4,327,916 | | | PRPM LLC, Series 2020-4, Class A1, STEP,
2.95%, 10/25/25(b) | | | 4,332,257 | |
| | 3,825,000 | | | Residential Asset Securities Corp. Trust, Series 2005-KS10, Class M4, (1 mo. LIBOR USD + 0.870%),
0.96%, 11/25/35(e) | | | 3,356,995 | |
| | 2,000,000 | | | Residential Asset Securities Corp. Trust, Series 2006-KS4, Class M2, (1 mo. LIBOR USD + 0.290%),
0.52%, 06/25/36(e) | | | 1,948,025 | |
| | 333,250 | | | SACO I Trust, Series 2006-7, Class A1, (1 mo. LIBOR USD + 0.260%),
0.35%, 07/25/36(e) | | | 342,775 | |
| | 1,000,000 | | | Santander Drive Auto Receivables Trust, Series 2020-4, Class B,
0.73%, 03/17/25 | | | 1,001,927 | |
| | 500,000 | | | Santander Retail Auto Lease Trust, Series 2020-B, Class A4,
0.65%, 12/20/24(b) | | | 498,728 | |
| | 4,179,436 | | | Saxon Asset Securities Trust, Series 2006-2, Class M3, (1 mo. LIBOR USD + 0.320%),
0.41%, 09/25/36(e) | | | 4,218,721 | |
| | 8,480,772 | | | Saxon Asset Securities Trust, Series 2007-1, Class M1, (1 mo. LIBOR USD + 0.290%),
0.38%, 01/25/47(e) | | | 9,188,573 | |
| | 2,740,908 | | | Securitized Asset Backed Receivables LLC Trust, Series 2007-BR1, Class A2B, (1 mo. LIBOR USD + 0.270%),
0.36%, 02/25/37(e) | | | 2,130,278 | |
| | 1,000,000 | | | SLM Student Loan Trust, Series 2003- 10A, Class A4, (3 mo. LIBOR USD + 0.670%),
0.79%, 12/17/68(b)(e) | | | 1,001,843 | |
| | 11,572,290 | | | Soundview Home Loan Trust, Series 2006-OPT5, Class M1, (1 mo. LIBOR USD + 0.250%),
0.34%, 07/25/36(e) | | | 12,163,434 | |
| Old Westbury Funds, Inc. | |
| Credit Income Fund | |
| Portfolio of Investments - (Continued) | October 31, 2021 |
Principal
Amount | | | | | Value | |
| UNITED STATES (continued) | | | | |
| Other Asset-Backed Securities (continued) | | | | |
| $ | 4,124,459 | | | Structured Asset Investment Loan Trust, Series 2005-9, Class M2, (1 mo. LIBOR USD + 0.675%),
0.76%, 11/25/35(e) | | $ | 4,369,229 | |
| | 4,363,389 | | | Structured Asset Investment Loan Trust, Series 2005-HE1, Class M3, (1 mo. LIBOR USD + 0.750%),
0.84%, 07/25/35(e) | | | 4,125,424 | |
| | 2,064,400 | | | Structured Asset Securities Corp. Mortgage Loan Trust, Series 2007-WF1, Class M1, (1 mo. LIBOR USD + 0.660%),
0.75%, 02/25/37(e) | | | 6,866,831 | |
| | 1,000,000 | | | Tesla Auto Lease Trust, Series 2019-A, Class A3,
2.16%, 10/20/22(b) | | | 1,007,105 | |
| | 1,000,000 | | | Toyota Auto Receivables Owner Trust, Series 2020-D, Class A3,
0.35%, 01/15/25 | | | 998,634 | |
| | 1,700,000 | | | Tricon American Homes Trust, Series 2017-SFR2, Class F,
5.10%, 01/17/36(b) | | | 1,742,522 | |
| | 1,520,000 | | | Tricon American Homes Trust, Series 2020-SFR1, Class F,
4.88%, 07/17/38(b) | | | 1,582,958 | |
| | 995,196 | | | Tricon American Homes Trust, Series 2020-SFR2, Class A,
1.48%, 11/17/39(b) | | | 966,594 | |
| | 1,000,000 | | | Verizon Owner Trust, Series 2020-A, Class B,
1.98%, 07/22/24 | | | 1,018,364 | |
| | 1,000,000 | | | Verizon Owner Trust, Series 2020-C, Class B,
0.67%, 04/21/25 | | | 995,824 | |
| | 1,000,000 | | | World Omni Automobile Lease Securitization Trust, Series 2020-B, Class B,
0.70%, 02/17/26 | | | 998,415 | |
| | 662,890 | | | World Omni Select Auto Trust, Series 2019-A, Class A3,
2.00%, 08/15/24 | | | 666,203 | |
Principal
Amount | | | | | Value | |
| UNITED STATES (continued) | | | | |
| Other Asset-Backed Securities (continued) | | | | |
| $ | 8,903,823 | | | Yale Mortgage Loan Trust, Series 2007- 1, Class A, (1 mo. LIBOR USD + 0.400%),
0.49%, 06/25/37(b)(e) | | $ | 3,843,033 | |
| | | | | | | | 515,765,006 | |
Total Asset-Backed Securities
(Cost $547,916,793) | | | 570,512,208 | |
| | | | | | | | | |
| NON-AGENCY MORTGAGE-BACKED SECURITIES — 16.1% | |
| COLLATERALIZED MORTGAGE OBLIGATIONS — 13.9% | |
| | 3,800,000 | | | 1Texas Capital Bank CLN,
0.00%, 02/01/26(g) | | | 3,812,469 | |
| | 365,053 | | | Adjustable Rate Mortgage Trust, Series 2005-3, Class 2A1,
2.91%, 07/25/35(f) | | | 373,783 | |
| | 1,672,084 | | | Adjustable Rate Mortgage Trust, Series 2007-1, Class 4A1,
4.31%, 03/25/37(f) | | | 1,350,787 | |
| | 1,230,360 | | | Ajax Mortgage Loan Trust, Series 2021-C, Class B, STEP,
3.72%, 01/25/61(b) | | | 1,227,264 | |
| | 3,154,362 | | | Ajax Mortgage Loan Trust, Series 2021-C, Class C,
1.51%, 01/25/61(b) | | | 2,574,791 | |
| | 1,522,737 | | | American Home Mortgage Assets Trust, Series 2006-2, Class 1A1, (12 mo. Federal Reserve Cumulative Average USD + 0.960%),
1.05%, 09/25/46(e) | | | 1,526,051 | |
| | 1,137,866 | | | American Home Mortgage Assets Trust, Series 2007-3, Class 22A1, STEP,
6.75%, 06/25/37 | | | 1,102,704 | |
| | 3,324,000 | | | Angel Oak Mortgage Trust, Series 2020-R1, Class B2,
4.61%, 04/25/53(b)(f) | | | 3,362,836 | |
| | 1,000,000 | | | Angel Oak Mortgage Trust I LLC, Series 2019-2, Class B1,
5.02%, 03/25/49(b)(f) | | | 1,001,403 | |
| | 13,306,096 | | | APS Resecuritization Trust, Series 2016-1, Class 1MZ,
3.63%, 07/31/57(b)(f) | | | 5,178,520 | |
| | 2,965,490 | | | ARI Investments LLC,
4.61%, 01/08/25(a) | | | 2,950,662 | |
| | 2,989,534 | | | ARI Investments LLC,
4.55%, 01/06/25(a) | | | 2,959,639 | |
| Old Westbury Funds, Inc. | |
| Credit Income Fund | |
| Portfolio of Investments - (Continued) | October 31, 2021 |
Principal
Amount | | | | | Value | |
| COLLATERALIZED MORTGAGE OBLIGATIONS (continued) | |
| $ | 1,461,366 | | | Banc of America Alternative Loan Trust, Series 2006-9, Class A2, (1 mo. LIBOR USD + 0.400%),
0.49%, 01/25/37(e) | | $ | 1,134,293 | |
| | 196,949 | | | Banc of America Funding Corp. Trust, Series 2005-F, Class 6A1,
3.20%, 09/20/35(f) | | | 204,483 | |
| | 439,693 | | | Banc of America Funding Corp. Trust, Series 2006-A, Class 3A2,
2.76%, 02/20/36(f) | | | 433,183 | |
| | 411,282 | | | Banc of America Funding Corp. Trust, Series 2006-E, Class 2A1,
2.66%, 06/20/36(f) | | | 395,908 | |
| | 1,357,255 | | | Banc of America Funding Corp. Trust, Series 2007-1, Class TA5, STEP,
6.59%, 01/25/37 | | | 1,374,230 | |
| | 3,308,403 | | | Banc of America Funding Corp. Trust, Series 2015-R3, Class 1A2,
0.49%, 03/27/36(b)(f) | | | 3,095,204 | |
| | 399,149 | | | Banc of America Mortgage Trust, Series 2005-I, Class 2A5,
2.71%, 10/25/35(f) | | | 408,084 | |
| | 2,544,199 | | | BCAP LLC Trust, Series 2012-RR3, Class 1A5,
6.25%, 12/26/37(b)(f) | | | 2,232,038 | |
| | 836,670 | | | Bear Stearns Adjustable Rate Mortgage Trust, Series 2005-12, Class 23A1,
3.11%, 02/25/36(f) | | | 833,950 | |
| | 55,406 | | | Bear Stearns Adjustable Rate Mortgage Trust, Series 2005-6, Class 5A1,
3.53%, 08/25/35(f) | | | 51,419 | |
| | 298,463 | | | Bear Stearns Adjustable Rate Mortgage Trust, Series 2007-3, Class 1A1,
3.14%, 05/25/47(f) | | | 297,681 | |
| | 1,221,148 | | | Bear Stearns ALT-A Trust, Series 2006- 2, Class 11A1, (1 mo. LIBOR USD + 0.440%),
0.53%, 04/25/36(e) | | | 1,569,219 | |
| | 3,047,843 | | | Bear Stearns ALT-A Trust, Series 2006- 6, Class 1A1, (1 mo. LIBOR USD + 0.320%),
0.41%, 11/25/36(e) | | | 2,806,359 | |
| | 2,945,517 | | | Bear Stearns Asset Backed Securities I Trust, Series 2006-AC2, Class 22A1, (1 mo. LIBOR USD + 0.350%),
0.44%, 03/25/36(e) | | | 352,332 | |
Principal
Amount | | | | | Value | |
| COLLATERALIZED MORTGAGE OBLIGATIONS (continued) | |
| $ | 2,945,517 | | | Bear Stearns Asset Backed Securities I Trust, Series 2006-AC2, Class 22A3, (1 mo. LIBOR USD + 0.350%),
0.44%, 03/25/36(e) | | $ | 352,331 | |
| | 1,157,913 | | | Bear Stearns Mortgage Funding Trust, Series 2006-SL1, Class A1, (1 mo. LIBOR USD + 0.280%),
0.37%, 08/25/36(e) | | | 1,143,577 | |
| | 530,872 | | | Bear Stearns Mortgage Funding Trust, Series 2006-SL4, Class A, (1 mo. LIBOR USD + 0.300%),
0.39%, 11/25/36(e) | | | 526,351 | |
| | 3,100,000 | | | CFMT LLC, Series 2021-HB7, Class M3,
3.85%, 10/27/31(b)(f) | | | 3,099,991 | |
| | 1,533,685 | | | Chase Mortgage Finance Corp., Series 2016-SH1, Class M4,
3.75%, 04/25/45(b)(f) | | | 1,535,994 | |
| | 3,837,011 | | | Chase Mortgage Finance Trust, Series 2007-S6, Class 1A1,
6.00%, 12/25/37 | | | 2,341,616 | |
| | 11,617,864 | | | ChaseFlex Trust, Series 2007-1, Class 2A7,
6.00%, 02/25/37 | | | 6,603,417 | |
| | 2,359,481 | | | Citicorp Mortgage Securities Trust, Series 2007-9, Class 1A1,
6.25%, 12/25/37 | | | 2,128,706 | |
| | 2,712,530 | | | Citicorp Mortgage Securities Trust, Series 2008-2, Class 1A1,
6.50%, 06/25/38 | | | 2,419,971 | |
| | 118,766 | | | Citigroup Mortgage Loan Trust, Series 2006-AR3, Class 1A2A,
3.20%, 06/25/36(f) | | | 115,784 | |
| | 3,113,843 | | | Citigroup Mortgage Loan Trust, Series 2007-9, Class 1A1,
5.75%, 04/25/47(b) | | | 2,169,382 | |
| | 187,237 | | | Citigroup Mortgage Loan Trust, Inc., Series 2005-2, Class 1A1,
2.89%, 05/25/35(f) | | | 190,853 | |
| | 381,188 | | | Countrywide Alternative Loan Trust, Series 2004-36CB, Class 1A1,
6.00%, 02/25/35 | | | 352,951 | |
| | 829,301 | | | Countrywide Alternative Loan Trust, Series 2005-31, Class 2A1, (1 mo. LIBOR USD + 0.600%),
0.69%, 08/25/35(e) | | | 799,713 | |
| Old Westbury Funds, Inc. | |
| Credit Income Fund | |
| Portfolio of Investments - (Continued) | October 31, 2021 |
Principal
Amount | | | | | Value | |
| COLLATERALIZED MORTGAGE OBLIGATIONS (continued) | |
| $ | 3,370,920 | | | Countrywide Alternative Loan Trust, Series 2005-53T2, Class 2A6, (1 mo. LIBOR USD + 0.500%),
0.59%, 11/25/35(e) | | $ | 1,830,046 | |
| | 6,269,218 | | | Countrywide Alternative Loan Trust, Series 2005-53T2, Class 2A7, (1 mo. LIBOR USD + 5.500%),
5.41%, 11/25/35(e) | | | 1,176,172 | |
| | 230,704 | | | Countrywide Alternative Loan Trust, Series 2005-63, Class 5A1,
3.35%, 12/25/35(f) | | | 226,226 | |
| | 70,626 | | | Countrywide Alternative Loan Trust, Series 2005-69, Class A1, (12 mo. Federal Reserve Cumulative Average USD + 1.000%),
1.09%, 12/25/35(e) | | | 69,221 | |
| | 1,070,767 | | | Countrywide Alternative Loan Trust, Series 2005-9CB, Class 1A3, (1 mo. LIBOR USD + 0.450%),
0.54%, 05/25/35(e) | | | 992,023 | |
| | 650,292 | | | Countrywide Alternative Loan Trust, Series 2005-J14, Class A3,
5.50%, 12/25/35 | | | 534,427 | |
| | 2,733,768 | | | Countrywide Alternative Loan Trust, Series 2006-12CB, Class A10, (1 mo. LIBOR USD + 0.350%),
0.44%, 05/25/36(e) | | | 1,317,663 | |
| | 1,733,986 | | | Countrywide Alternative Loan Trust, Series 2006-15CB, Class A1,
6.50%, 06/25/36 | | | 1,261,652 | |
| | 3,360,696 | | | Countrywide Alternative Loan Trust, Series 2006-20CB, Class A9,
6.00%, 07/25/36 | | | 2,175,580 | |
| | 1,119,658 | | | Countrywide Alternative Loan Trust, Series 2006-24CB, Class A13, (1 mo. LIBOR USD + 0.350%),
0.44%, 08/25/36(e) | | | 556,502 | |
| | 1,119,658 | | | Countrywide Alternative Loan Trust, Series 2006-24CB, Class A14, (1 mo. LIBOR USD + 7.150%),
7.06%, 08/25/36(e) | | | 395,899 | |
| | 1,154,210 | | | Countrywide Alternative Loan Trust, Series 2006-24CB, Class A15,
5.75%, 08/25/36 | | | 880,356 | |
| | 1,169,979 | | | Countrywide Alternative Loan Trust, Series 2006-2CB, Class A4, (1 mo. LIBOR USD + 0.400%),
0.49%, 03/25/36(e) | | | 415,078 | |
Principal
Amount | | | | | Value | |
| COLLATERALIZED MORTGAGE OBLIGATIONS (continued) | |
| $ | 2,079,721 | | | Countrywide Alternative Loan Trust, Series 2006-2CB, Class A5, (1 mo. LIBOR USD + 7.100%),
7.01%, 03/25/36(e) | | $ | 507,771 | |
| | 3,286,375 | | | Countrywide Alternative Loan Trust, Series 2006-2CB, Class A6,
5.50%, 03/25/36 | | | 2,036,690 | |
| | 1,255,731 | | | Countrywide Alternative Loan Trust, Series 2006-41CB, Class 1A10,
6.00%, 01/25/37 | | | 961,980 | |
| | 909,198 | | | Countrywide Alternative Loan Trust, Series 2006-41CB, Class 1A4,
5.75%, 01/25/37 | | | 682,058 | |
| | 1,120,746 | | | Countrywide Alternative Loan Trust, Series 2006-45T1, Class 2A2,
6.00%, 02/25/37 | | | 853,818 | |
| | 2,562,674 | | | Countrywide Alternative Loan Trust, Series 2006-45T1, Class 2A5,
6.00%, 02/25/37 | | | 1,952,323 | |
| | 4,885,051 | | | Countrywide Alternative Loan Trust, Series 2006-45T1, Class 2A7, (1 mo. LIBOR USD + 0.340%),
0.43%, 02/25/37(e) | | | 2,324,236 | |
| | 2,442,525 | | | Countrywide Alternative Loan Trust, Series 2006-45T1, Class 2A8, (1 mo. LIBOR USD + 6.600%),
6.51%, 02/25/37(e) | | | 776,576 | |
| | 137,606 | | | Countrywide Alternative Loan Trust, Series 2006-6CB, Class 1A10,
5.50%, 05/25/36 | | | 133,314 | |
| | 390,402 | | | Countrywide Alternative Loan Trust, Series 2006-6CB, Class 1A2, (1 mo. LIBOR USD + 0.400%),
0.49%, 05/25/36(e) | | | 314,787 | |
| | 3,077,026 | | | Countrywide Alternative Loan Trust, Series 2006-7CB, Class 2A1,
6.50%, 05/25/36 | | | 2,230,728 | |
| | 2,161,739 | | | Countrywide Alternative Loan Trust, Series 2006-J7, Class 2A1, (Cost of Funds for the 11th District of San Francisco + 1.500%),
1.74%, 11/20/46(e) | | | 1,652,376 | |
| | 4,167,207 | | | Countrywide Alternative Loan Trust, Series 2006-OA14, Class 1A1, (12 mo. Federal Reserve Cumulative Average USD + 1.730%),
1.82%, 11/25/46(e) | | | 3,629,453 | |
| Old Westbury Funds, Inc. | |
| Credit Income Fund | |
| Portfolio of Investments - (Continued) | October 31, 2021 |
Principal
Amount | | | | | Value | |
| COLLATERALIZED MORTGAGE OBLIGATIONS (continued) | |
| $ | 1,971,363 | | | Countrywide Alternative Loan Trust, Series 2006-OA14, Class 2A1, (1 mo. LIBOR USD + 0.380%),
0.47%, 11/25/46(e) | | $ | 1,778,533 | |
| | 3,354,298 | | | Countrywide Alternative Loan Trust, Series 2006-OA21, Class A1, (1 mo. LIBOR USD + 0.190%),
0.28%, 03/20/47(e) | | | 2,900,693 | |
| | 701,800 | | | Countrywide Alternative Loan Trust, Series 2006-OA3, Class 2A1, (1 mo. LIBOR USD + 0.420%),
0.51%, 05/25/36(e) | | | 647,851 | |
| | 2,607,625 | | | Countrywide Alternative Loan Trust, Series 2006-OC3, Class 1A1, (1 mo. LIBOR USD + 0.360%),
0.45%, 04/25/46(e) | | | 2,579,168 | |
| | 1,985,658 | | | Countrywide Alternative Loan Trust, Series 2007-12T1, Class A22,
5.75%, 06/25/37 | | | 1,342,144 | |
| | 2,000,043 | | | Countrywide Alternative Loan Trust, Series 2007-12T1, Class A5,
6.00%, 06/25/37 | | | 1,391,313 | |
| | 964,879 | | | Countrywide Alternative Loan Trust, Series 2007-19, Class 1A34,
6.00%, 08/25/37 | | | 684,550 | |
| | 4,313,927 | | | Countrywide Alternative Loan Trust, Series 2007-22, Class 2A16,
6.50%, 09/25/37 | | | 2,450,378 | |
| | 3,711,941 | | | Countrywide Alternative Loan Trust, Series 2007-25, Class 1A3,
6.50%, 11/25/37 | | | 2,461,397 | |
| | 885,179 | | | Countrywide Alternative Loan Trust, Series 2007-9T1, Class 1A8,
6.00%, 05/25/37 | | | 579,537 | |
| | 222,096 | | | Countrywide Alternative Loan Trust, Series 2007-J1, Class 3A4, STEP,
4.08%, 11/25/36 | | | 333,371 | |
| | 7,473,564 | | | Countrywide Alternative Loan Trust, Series 2007-OA2, Class 1A1, (12 mo. Federal Reserve Cumulative Average USD + 0.840%),
0.93%, 03/25/47(e) | | | 6,798,091 | |
| | 194,747 | | | Countrywide Alternative Loan Trust, Series 2007-OA3, Class 1A2, (1 mo. LIBOR USD + 0.180%),
0.45%, 04/25/47(e) | | | 42,428 | |
Principal
Amount | | | | | Value | |
| COLLATERALIZED MORTGAGE OBLIGATIONS (continued) | |
| $ | 1,502,066 | | | Countrywide Alternative Loan Trust, Series 2007-OH2, Class A2A, (1 mo. LIBOR USD + 0.480%),
0.57%, 08/25/47(e) | | $ | 1,466,730 | |
| | 1,247,851 | | | Countrywide Alternative Resecuritization Loan Trust, Series 2006-22R, Class 2A1,
6.25%, 05/25/36 | | | 987,560 | |
| | 1,490,116 | | | Countrywide Alternative Resecuritization Loan Trust, Series 2008-1R, Class 2A3,
6.00%, 08/25/37 | | | 1,057,187 | |
| | 1,056,741 | | | Countrywide Home Loan Mortgage Pass-Through Trust, Series 2005- 31, Class 2A3,
2.54%, 01/25/36(f) | | | 984,562 | |
| | 1,934,730 | | | Countrywide Home Loan Mortgage Pass-Through Trust, Series 2005- J2, Class 2A4, (1 mo. LIBOR USD + 1.400%),
1.49%, 08/25/35(e) | | | 1,606,815 | |
| | 220,626 | | | Countrywide Home Loan Mortgage Pass-Through Trust, Series 2005- J3, Class 2A4,
4.50%, 09/25/35 | | | 217,516 | |
| | 10,262,058 | | | Countrywide Home Loan Mortgage Pass-Through Trust, Series 2006- OA4, Class A1, (12 mo. Federal Reserve Cumulative Average USD + 0.960%),
1.05%, 04/25/46(e) | | | 4,036,942 | |
| | 2,620,861 | | | Countrywide Home Loan Mortgage Pass-Through Trust, Series 2006- OA5, Class 3A1, (1 mo. LIBOR USD + 0.400%),
0.49%, 04/25/46(e) | | | 2,477,880 | |
| | 1,513,634 | | | Countrywide Home Loan Mortgage Pass-Through Trust, Series 2007- 21, Class 1A1,
6.25%, 02/25/38 | | | 1,050,644 | |
| | 2,087,504 | | | Countrywide Home Loan Mortgage Pass-Through Trust, Series 2007- HYB1, Class 3A1,
2.99%, 03/25/37(f) | | | 1,984,706 | |
| | 1,740,848 | | | Credit Suisse Mortgage Capital Certificates Trust, Series 2006-9, Class 3A1,
6.00%, 11/25/36 | | | 1,623,726 | |
| Old Westbury Funds, Inc. | |
| Credit Income Fund | |
| Portfolio of Investments - (Continued) | October 31, 2021 |
Principal
Amount | | | | | Value | |
| COLLATERALIZED MORTGAGE OBLIGATIONS (continued) | |
| $ | 2,657,937 | | | Credit Suisse Mortgage Capital Certificates Trust, Series 2007-3, Class 1A1A,
5.84%, 04/25/37(f) | | $ | 959,627 | |
| | 7,024,727 | | | Credit Suisse Mortgage Capital Certificates Trust, Series 2009- 12R, Class 3A1,
6.50%, 10/27/37(b) | | | 3,838,037 | |
| | 3,661,155 | | | Credit Suisse Mortgage Capital Certificates Trust, Series 2014-2R, Class 17A3,
2.67%, 04/27/37(b)(f) | | | 3,224,621 | |
| | 6,325,523 | | | Credit Suisse Mortgage Capital Certificates Trust, Series 2015-4R, Class 1A4, (1 mo. LIBOR USD + 0.150%),
0.24%, 10/27/36(b)(e) | | | 5,271,063 | |
| | 6,288,065 | | | Credit Suisse Mortgage Capital Certificates Trust, Series 2017-2, Class CERT,
0.45%, 02/01/47(a)(b)(g) | | | 5,674,978 | |
| | 2,400,000 | | | Credit Suisse Mortgage Capital Certificates Trust, Series 2020- SPT1, Class B2,
3.39%, 04/25/65(b)(f) | | | 2,410,214 | |
| | 3,289,850 | | | Credit Suisse Mortgage Capital Certificates Trust, Series 2021- NQM2, Class B1,
3.44%, 02/25/66(b)(f) | | | 3,307,446 | |
| | 6,267,249 | | | CSFB Mortgage-Backed Pass-Through Certificates, Series 2005-10, Class 10A1, (1 mo. LIBOR USD + 1.350%),
1.44%, 11/25/35(e) | | | 1,166,851 | |
| | 1,626,000 | | | Deephaven Residential Mortgage Trust, Series 2021-1, Class B1,
3.10%, 05/25/65(b)(f) | | | 1,610,705 | |
| | 100,000 | | | GCAT Trust, Series 2019-NQM2, Class B1,
4.01%, 09/25/59(b)(f) | | | 101,112 | |
| | 2,000,000 | | | GCAT Trust, Series 2020-NQM2, Class B1,
4.85%, 04/25/65(b)(f) | | | 2,053,064 | |
| | 438,016 | | | GMACM Mortgage Loan Trust, Series 2005-AR6, Class 2A1,
3.09%, 11/19/35(f) | | | 433,850 | |
| | 3,553,739 | | | GSMPS Mortgage Loan Trust, Series 2005-RP1, Class 1AF, (1 mo. LIBOR USD + 0.350%),
0.44%, 01/25/35(b)(e) | | | 3,308,955 | |
Principal
Amount | | | | | Value | |
| COLLATERALIZED MORTGAGE OBLIGATIONS (continued) | |
| $ | 4,609,964 | | | GSMPS Mortgage Loan Trust, Series 2005-RP3, Class 1AF, (1 mo. LIBOR USD + 0.350%),
0.44%, 09/25/35(b)(e) | | $ | 3,977,745 | |
| | 1,339,497 | | | GSMPS Mortgage Loan Trust, Series 2006-RP1, Class 1AF1, (1 mo. LIBOR USD + 0.350%),
0.44%, 01/25/36(b)(e) | | | 1,122,228 | |
| | 273,147 | | | GSR Mortgage Loan Trust, Series 2005-AR1, Class 2A1,
2.61%, 01/25/35(f) | | | 279,274 | |
| | 2,696,655 | | | GSR Mortgage Loan Trust, Series 2006-7F, Class 4A2,
6.50%, 08/25/36 | | | 1,323,789 | |
| | 45,690 | | | GSR Mortgage Loan Trust, Series 2006-9F, Class 9A1,
6.00%, 10/01/36 | | | 43,500 | |
| | 203,744 | | | GSR Mortgage Loan Trust, Series 2006-AR1, Class 3A1,
2.85%, 01/25/36(f) | | | 215,373 | |
| | 535,064 | | | GSR Mortgage Loan Trust, Series 2007-4F, Class 3A1,
6.00%, 07/25/37 | | | 457,902 | |
| | 10,157,695 | | | GSR Mortgage Loan Trust, Series 2007-OA2, Class 2A1,
2.26%, 06/25/47(f) | | | 8,070,051 | |
| | 1,959,135 | | | HarborView Mortgage Loan Trust, Series 2007-4, Class 2A2, (1 mo. LIBOR USD + 0.250%),
0.33%, 07/19/47(e) | | | 1,819,122 | |
| | 385,838 | | | HomeBanc Mortgage Trust, Series 2006-1, Class 2A1,
2.40%, 04/25/37(f) | | | 360,879 | |
| | 3,690,000 | | | Homeward Opportunities Fund I Trust, Series 2020-2, Class B1,
5.45%, 05/25/65(b)(f) | | | 3,826,751 | |
| | 20,031,742 | | | IndyMac IMSC Mortgage Loan Trust, Series 2007-HOA1, Class AXPP,
2.28%, 07/25/47(f) | | | 688,607 | |
| | 1,878,003 | | | IndyMac INDX Mortgage Loan Trust, Series 2007-FLX3, Class A2, (1 mo. LIBOR USD + 0.270%),
0.36%, 06/25/37(e) | | | 2,479,544 | |
| | 3,617,502 | | | IndyMac INDX Mortgage Loan Trust, Series 2007-FLX5, Class 2A2, (1 mo. LIBOR USD + 0.240%),
0.33%, 08/25/37(e) | | | 3,403,467 | |
| | 1,163,081 | | | JP Morgan Mortgage Trust, Series 2007-A5, Class 2A1,
1.62%, 10/25/37(f) | | | 870,207 | |
| Old Westbury Funds, Inc. | |
| Credit Income Fund | |
| Portfolio of Investments - (Continued) | October 31, 2021 |
Principal
Amount | | | | | Value | |
| COLLATERALIZED MORTGAGE OBLIGATIONS (continued) | |
| $ | 44,087 | | | JP Morgan Mortgage Trust, Series 2007-S2, Class 2A3,
5.50%, 06/25/37 | | $ | 59,365 | |
| | 6,402,279 | | | JP Morgan Mortgage Trust, Series 2007-S3, Class 1A10,
6.25%, 08/25/37 | | | 2,996,971 | |
| | 84,534 | | | JP Morgan Mortgage Trust, Series 2017-5, Class A1B,
3.10%, 10/26/48(b)(f) | | | 87,313 | |
| | 113,391,200 | | | JP Morgan Mortgage Trust, Series 2021-INV5, Class A2X,
0.50%, 12/25/51(b)(f) | | | 1,808,590 | |
| | 6,670,015 | | | JP Morgan Mortgage Trust, Series 2021-INV5, Class A5X,
0.50%, 12/25/51(b)(f) | | | 103,719 | |
| | 120,061,216 | | | JP Morgan Mortgage Trust, Series 2021-INV5, Class AX1,
0.19%, 12/25/51(b)(f) | | | 686,150 | |
| | 6,167,618 | | | JP Morgan Mortgage Trust, Series 2021-INV5, Class B1,
3.19%, 12/25/51(b)(f) | | | 6,178,028 | |
| | 1,810,124 | | | JP Morgan Mortgage Trust, Series 2021-INV5, Class B2,
3.19%, 12/25/51(b)(f) | | | 1,786,050 | |
| | 2,011,122 | | | JP Morgan Mortgage Trust, Series 2021-INV5, Class B3,
3.19%, 12/25/51(b)(f) | | | 1,904,531 | |
| | 1,340,811 | | | JP Morgan Mortgage Trust, Series 2021-INV5, Class B4,
3.19%, 12/25/51(b)(f) | | | 1,066,713 | |
| | 469,312 | | | JP Morgan Mortgage Trust, Series 2021-INV5, Class B5,
3.19%, 12/25/51(b)(f) | | | 340,099 | |
| | 1,608,964 | | | JP Morgan Mortgage Trust, Series 2021-INV5, Class B6,
3.19%, 12/25/51(b)(f) | | | 659,275 | |
| | 37,000,000 | | | JP Morgan Mortgage Trust, Series 2021-INV7, Class A2X,
0.50%, 02/25/52(b)(f) | | | 726,126 | |
| | 23,618,234 | | | JP Morgan Mortgage Trust, Series 2021-INV7, Class A3X,
0.50%, 02/25/52(b)(f) | | | 283,419 | |
| | 7,872,776 | | | JP Morgan Mortgage Trust, Series 2021-INV7, Class A4X,
0.50%, 02/25/52(b)(f) | | | 334,593 | |
| | 4,028,950 | | | JP Morgan Mortgage Trust, Series 2021-INV7, Class A5X,
0.50%, 02/25/52(b)(f) | | | 76,550 | |
Principal
Amount | | | | | Value | |
| COLLATERALIZED MORTGAGE OBLIGATIONS (continued) | |
| $ | 72,520,067 | | | JP Morgan Mortgage Trust, Series 2021-INV7, Class AX1,
0.27%, 02/25/52(b)(f) | | $ | 637,430 | |
| | 3,948,390 | | | JP Morgan Mortgage Trust, Series 2021-INV7, Class B1,
3.27%, 02/25/52(b)(f) | | | 4,068,791 | |
| | 926,630 | | | JP Morgan Mortgage Trust, Series 2021-INV7, Class B2,
3.27%, 02/25/52(b)(f) | | | 940,316 | |
| | 1,289,150 | | | JP Morgan Mortgage Trust, Series 2021-INV7, Class B3,
3.27%, 02/25/52(b)(f) | | | 1,259,294 | |
| | 684,950 | | | JP Morgan Mortgage Trust, Series 2021-INV7, Class B4,
3.27%, 02/25/52(b)(f) | | | 620,915 | |
| | 281,960 | | | JP Morgan Mortgage Trust, Series 2021-INV7, Class B5,
3.27%, 02/25/52(b)(f) | | | 229,197 | |
| | 926,814 | | | JP Morgan Mortgage Trust, Series 2021-INV7, Class B6,
3.27%, 02/25/52(b)(f) | | | 451,041 | |
| | 2,165,686 | | | Lehman XS Trust, Series 2007-20N, Class A1, (1 mo. LIBOR USD + 1.150%),
1.24%, 12/25/37(e) | | | 2,286,388 | |
| | 8,570,000 | | | Loan Revolving Advance Investment Trust, Series 2021-1, Class A1X, (1 mo. LIBOR USD + 2.750%),
2.84%, 12/31/22(a)(b)(e) | | | 8,570,000 | |
| | 11,430,000 | | | Loan Revolving Advance Investment Trust, Series 2021-2, Class A1X, (1 mo. LIBOR USD + 2.750%),
2.84%, 06/30/23(a)(b)(e) | | | 11,430,000 | |
| | 4,617,425 | | | MASTR Asset Securitization Trust, Series 2007-1, Class 1A4,
6.50%, 11/25/37 | | | 1,656,176 | |
| | 2,709,740 | | | MASTR Reperforming Loan Trust, Series 2005-2, Class 1A3,
7.50%, 05/25/35(b) | | | 2,561,670 | |
| | 1,302,962 | | | MASTR Resecuritization Trust, Series 2008-3, Class A1,
0.52%, 08/25/37(b)(f) | | | 698,909 | |
| | 1,762,241 | | | MCM Trust, Series 2021-VFN1,
3.00%, 08/25/31(a) | | | 1,762,241 | |
| | 1,356,782 | | | MCM Trust, Series 2021-VFN1, Class CERT,
3.00%(a)(d) | | | 484,792 | |
| Old Westbury Funds, Inc. | |
| Credit Income Fund | |
| Portfolio of Investments - (Continued) | October 31, 2021 |
Principal
Amount | | | | | Value | |
| COLLATERALIZED MORTGAGE OBLIGATIONS (continued) | |
| $ | 2,500,000 | | | Mello Warehouse Securitization Trust, Series 2020-2, Class F, (1 mo. LIBOR USD + 3.250%),
3.34%, 11/25/53(b)(e) | | $ | 2,487,431 | |
| | 4,875,000 | | | Mello Warehouse Securitization Trust, Series 2021-1, Class F, (1 mo. LIBOR USD + 2.750%),
2.84%, 02/25/55(b)(e) | | | 4,815,603 | |
| | 2,294,076 | | | Merrill Lynch Alternative Note Asset Trust, Series 2007-OAR2, Class A2, (1 mo. LIBOR USD + 0.420%),
0.51%, 04/25/37(e) | | | 2,277,603 | |
| | 869,230 | | | Merrill Lynch Mortgage Investors Trust, Series 2006-A3, Class 3A1,
2.63%, 05/25/36(f) | | | 740,746 | |
| | 459,833 | | | Merrill Lynch Mortgage Investors Trust, Series 2006-AF2, Class AF1,
6.25%, 10/25/36 | | | 288,059 | |
| | 3,757,238 | | | Morgan Stanley Re-REMIC Trust, Series 2010-R5, Class 7B, STEP,
0.93%, 05/26/37(b) | | | 3,793,417 | |
| | 3,057,707 | | | Morgan Stanley Resecuritization Trust, Series 2013-R7, Class 1B, (1 mo. LIBOR USD + 0.160%),
0.41%, 12/26/46(b)(e) | | | 3,034,244 | |
| | 435,205 | | | Morgan Stanley Resecuritization Trust, Series 2015-R6, Class 3A, (1 mo. LIBOR USD + 0.160%),
0.41%, 07/26/45(b)(e) | | | 430,394 | |
| | 915,480 | | | MortgageIT Trust, Series 2004-1, Class B1, (1 mo. LIBOR USD + 1.800%),
1.89%, 11/25/34(e) | | | 889,047 | |
| | 1,389,000 | | | New Residential Mortgage Loan Trust, Series 2020-NQM1, Class B2,
4.52%, 01/26/60(b)(f) | | | 1,388,475 | |
| | 4,016,253 | | | NYMT Loan Trust, Series 2020-SP2, Class A1,
2.94%, 10/25/60(b)(f) | | | 4,014,217 | |
| | 3,334,007 | | | Prime Mortgage Trust, Series 2006- DR1, Class 2A1,
5.50%, 05/25/35(b) | | | 3,211,179 | |
| | 1,570,747 | | | Prime Mortgage Trust, Series 2006- DR1, Class 2A2,
6.00%, 05/25/35(b) | | | 1,507,681 | |
Principal
Amount | | | | | Value | |
| COLLATERALIZED MORTGAGE OBLIGATIONS (continued) | |
| $ | 3,000,000 | | | Provident Funding Mortgage Warehouse Securitization Trust, Series 2021-1, Class G, (1 mo. LIBOR USD + 5.500%),
5.59%, 02/25/55(a)(b)(e) | | $ | 3,000,000 | |
| | 4,166,087 | | | PRPM LLC, Series 2020-5, Class A1, STEP,
3.10%, 11/25/25(b) | | | 4,168,083 | |
| | 610,771 | | | Reperforming Loan REMIC Trust, Series 2006-R2, Class AF1, (1 mo. LIBOR USD + 0.420%),
0.51%, 07/25/36(b)(e) | | | 575,781 | |
| | 765,066 | | | Residential Accredit Loans, Inc., Series 2006-QO5, Class 2A1, (1 mo. LIBOR USD + 0.380%),
0.47%, 05/25/46(e) | | | 728,439 | |
| | 564,836 | | | Residential Accredit Loans, Inc., Series 2006-QS15, Class A1,
6.50%, 10/25/36 | | | 563,018 | |
| | 3,722,983 | | | Residential Accredit Loans, Inc., Series 2007-QS1, Class 1A5, (1 mo. LIBOR USD + 0.550%),
0.64%, 01/25/37(e) | | | 2,768,318 | |
| | 637,046 | | | Residential Asset Securitization Trust, Series 2006-A7CB, Class 2A5, (1 mo. LIBOR USD + 0.250%),
0.34%, 07/25/36(e) | | | 52,876 | |
| | 2,584,074 | | | Residential Funding Mortgage Securities I, Inc. Trust, Series 2005-SA4, Class 2A1,
3.11%, 09/25/35(f) | | | 2,014,668 | |
| | 7,010,468 | | | Residential Funding Mortgage Securities I, Inc. Trust, Series 2006-SA2, Class 2A1,
4.41%, 08/25/36(f) | | | 5,669,854 | |
| | 92,109 | | | Residential Funding Mortgage Securities I, Inc. Trust, Series 2006-SA3, Class 2A1,
4.46%, 09/25/36(f) | | | 68,968 | |
| | 2,150,000 | | | Residential Mortgage Loan Trust, Series 2020-1, Class B2,
4.67%, 02/25/24(b)(f) | | | 2,217,237 | |
| | 3,750,000 | | | Residential Mortgage Loan Trust, Series 2020-2, Class B2,
5.40%, 05/25/60(b)(f) | | | 3,710,146 | |
| | 2,814,000 | | | Residential Mortgage Loan Trust, Series 2021-1R, Class B1,
3.42%, 01/25/65(b)(f) | | | 2,783,556 | |
| Old Westbury Funds, Inc. | |
| Credit Income Fund | |
| Portfolio of Investments - (Continued) | October 31, 2021 |
Principal
Amount | | | | | Value | |
| COLLATERALIZED MORTGAGE OBLIGATIONS (continued) | |
| $ | 1,935,000 | | | RMF Buyout Issuance Trust, Series 2020-1, Class M5,
6.00%, 02/25/30(a)(b)(f) | | $ | 1,895,913 | |
| | 10,787,832 | | | Seasoned Credit Risk Transfer Trust, Series 2017-3, Class B,
3.03%, 07/25/56(b)(g) | | | 3,672,992 | |
| | 18,753,197 | | | Seasoned Credit Risk Transfer Trust, Series 2017-3, Class BIO,
1.46%, 07/25/56(b)(f) | | | 1,875,355 | |
| | 4,763,029 | | | Seasoned Credit Risk Transfer Trust, Series 2018-2, Class BX,
1.01%, 11/25/57(f) | | | 2,100,667 | |
| | 2,645,285 | | | Seasoned Credit Risk Transfer Trust, Series 2018-3, Class BX,
2.38%, 08/25/57(b)(f)(g) | | | 1,104,147 | |
| | 4,500,055 | | | Seasoned Loans Structured Transaction Trust, Series 2020-3, Class M1,
4.75%, 04/26/60(b)(f) | | | 4,620,639 | |
| | 100,000 | | | SG Residential Mortgage Trust, Series 2019-3, Class B1,
4.08%, 09/25/59(b)(f) | | | 99,538 | |
| | 175,000 | | | SG Residential Mortgage Trust, Series 2020-2, Class B1,
4.25%, 05/25/65(b)(f) | | | 176,180 | |
| | 257,000 | | | SG Residential Mortgage Trust, Series 2020-2, Class M1,
3.19%, 05/25/65(b)(f) | | | 259,048 | |
| | 2,425,000 | | | Spruce Hill Mortgage Loan Trust, Series 2020-SH1, Class B2,
4.68%, 01/28/50(b)(f) | | | 2,466,829 | |
| | 3,000,000 | | | Station Place Securitization Trust, Series 2021-WL1, Class F, (1 mo. LIBOR USD + 2.500%),
2.59%, 01/26/54(b)(e) | | | 2,998,802 | |
| | 1,306,597 | | | Structured Adjustable Rate Mortgage Loan Trust, Series 2005-11, Class 1A1,
2.88%, 05/25/35(f) | | | 1,100,547 | |
| | 2,012,228 | | | Structured Adjustable Rate Mortgage Loan Trust, Series 2006-3, Class 4A,
3.00%, 04/25/36(f) | | | 1,488,636 | |
| | 3,489,276 | | | Structured Asset Mortgage Investments II Trust, Series 2006-AR5, Class 4A1, (1 mo. LIBOR USD + 0.440%),
0.53%, 05/25/46(e) | | | 1,741,456 | |
Principal
Amount | | | | | Value | |
| COLLATERALIZED MORTGAGE OBLIGATIONS (continued) | |
| $ | 1,446,954 | | | Structured Asset Mortgage Investments II Trust, Series 2007-AR4, Class GA4B, (1 mo. LIBOR USD + 0.180%),
0.27%, 09/25/47(e) | | $ | 1,488,147 | |
| | 2,960,295 | | | Structured Asset Securities Corp., Series 2005-RF3, Class 1A, (1 mo. LIBOR USD + 0.350%),
0.44%, 06/25/35(b)(e) | | | 2,683,390 | |
| | 13,286,701 | | | Structured Asset Securities Corp. Mortgage Loan Trust, Series 2006-RF3, Class 1A2,
6.00%, 10/25/36(b) | | | 9,882,095 | |
| | 496,694 | | | Suntrust Adjustable Rate Mortgage Loan Trust, Series 2007-2, Class 3A3,
2.25%, 04/25/37(f) | | | 329,738 | |
| | 229,125 | | | Suntrust Adjustable Rate Mortgage Loan Trust, Series 2007-2, Class 4A1,
2.47%, 04/25/37(f) | | | 163,818 | |
| | 204,010 | | | Thornburg Mortgage Securities Trust, Series 2007-3, Class 4A1, (12 mo. LIBOR USD + 1.250%),
1.55%, 06/25/47(e) | | | 194,467 | |
| | 4,138,321 | | | TVC Holdings Plc, Series 2021-1, Class A,
2.38%, 03/25/23(a) | | | 4,138,321 | |
| | 1,034,580 | | | TVC Holdings Plc, Series 2021-1, Class CERT,
0.00%(a)(d)(g) | | | 1,299,433 | |
| | 3,162,000 | | | Verus Securitization Trust, Series 2021- 1, Class B1,
2.98%, 01/25/66(b)(f) | | | 3,142,712 | |
| | 3,300,000 | | | Vista Point Securitization Trust, Series 2020-2, Class B2,
5.16%, 04/25/65(b)(f) | | | 3,352,587 | |
| | 27,967,067 | | | Voyager OPTONE Delaware Trust, Series 2009-1, Class SAA7,
5.68%, 02/25/38(b)(f) | | | 8,687,357 | |
| | 896,888 | | | WaMu Mortgage Pass-Through Certificates Trust, Series 2007- HY7, Class 2A2,
2.92%, 07/25/37(f) | | | 907,309 | |
| Old Westbury Funds, Inc. | |
| Credit Income Fund | |
| Portfolio of Investments - (Continued) | October 31, 2021 |
Principal
Amount | | | | | Value | |
| COLLATERALIZED MORTGAGE OBLIGATIONS (continued) | |
| $ | 6,634,695 | | | WaMu Mortgage Pass-Through Certificates Trust, Series 2007- OA4, Class 2A, (Cost of Funds for the 11th District of San Francisco + 1.250%),
1.49%, 05/25/47(e) | | $ | 6,656,143 | |
| | 1,329,781 | | | Washington Mutual Mortgage Pass-Through Certificates Trust, Series 2005-10, Class 1CB,
6.50%, 11/25/35 | | | 897,090 | |
| | 851,731 | | | Washington Mutual Mortgage Pass-Through Certificates Trust, Series 2005-10, Class 2A6,
5.50%, 11/25/35 | | | 867,830 | |
| | 4,607,371 | | | Washington Mutual Mortgage Pass-Through Certificates Trust, Series 2006-1, Class 4CB,
6.50%, 02/25/36 | | | 4,101,020 | |
| | 4,013,207 | | | Washington Mutual Mortgage Pass-Through Certificates Trust, Series 2006-5, Class 3A3, STEP,
6.72%, 07/25/36 | | | 1,385,582 | |
| | 1,328,458 | | | Washington Mutual Mortgage Pass-Through Certificates Trust, Series 2006-AR6, Class 2A, (12 mo. Federal Reserve Cumulative Average USD + 0.960%),
1.05%, 08/25/46(e) | | | 879,457 | |
| | 708,754 | | | Wells Fargo Alternative Loan Trust, Series 2007-PA1, Class A1, (1 mo. LIBOR USD + 0.320%),
0.41%, 03/25/37(e) | | | 611,744 | |
| | 5,921,324 | | | Wells Fargo Alternative Loan Trust, Series 2007-PA1, Class A2, (1 mo. LIBOR USD + 6.680%),
6.59%, 03/25/37(e) | | | 944,958 | |
| | 1,254,777 | | | Wells Fargo Alternative Loan Trust, Series 2007-PA1, Class A8, (1 mo. LIBOR USD + 0.540%),
0.63%, 03/25/37(e) | | | 1,093,953 | |
| | 1,128,197 | | | Wells Fargo Alternative Loan Trust, Series 2007-PA1, Class A9, (1 mo. LIBOR USD + 0.490%),
0.58%, 03/25/37(e) | | | 981,368 | |
| | 1,616,228 | | | Wells Fargo Mortgage Backed Securities Trust, Series 2008-AR1, Class A2,
2.85%, 03/25/38(f) | | | 1,453,266 | |
Principal
Amount | | | | | Value | |
| COLLATERALIZED MORTGAGE OBLIGATIONS (continued) | |
| $ | 13,610,000 | | | Western Alliance CLN,
5.63%, 12/28/24 | | $ | 13,598,735 | |
| | | | | | | | 409,354,529 | |
| COMMERCIAL MORTGAGE-BACKED SECURITIES — 2.2% | |
| | 1,044,879 | | | Bayview Commercial Asset Trust, Series 2005-4A, Class M2, (1 mo. LIBOR USD + 0.705%),
0.79%, 01/25/36(b)(e) | | | 1,009,718 | |
| | 891,375 | | | Bayview Commercial Asset Trust, Series 2005-4A, Class M3, (1 mo. LIBOR USD + 0.750%),
0.84%, 01/25/36(b)(e) | | | 861,865 | |
| | 1,309,647 | | | Bayview Commercial Asset Trust, Series 2006-2A, Class B1, (1 mo. LIBOR USD + 1.305%),
1.39%, 07/25/36(b)(e) | | | 1,235,903 | |
| | 7,462,303 | | | Bayview Commercial Asset Trust, Series 2007-5A, Class A4, (1 mo. LIBOR USD + 1.500%),
1.59%, 10/25/37(b)(e) | | | 5,613,567 | |
| | 10,127,000 | | | Bayview Commercial Asset Trust, Series 2007-6A, Class A4A, (1 mo. LIBOR USD + 1.500%),
1.59%, 12/25/37(b)(e) | | | 9,969,785 | |
| | 4,250,000 | | | BX Commercial Mortgage Trust, Series 2019-XL, Class J, (1 mo. LIBOR USD + 2.650%),
2.74%, 10/15/36(b)(e) | | | 4,239,421 | |
| | 1,382,512 | | | CBA Commercial Small Balance Commercial Mortgage, Series 2007-1A, Class A, STEP,
6.26%, 07/25/39(b) | | | 1,052,460 | |
| | 3,000,000 | | | Lehman Brothers Small Balance Commercial Mortgage Trust, Series 2007-2A, Class M2, (1 mo. LIBOR USD + 0.600%),
0.69%, 06/25/37(b)(e) | | | 2,545,078 | |
| | 3,600,000 | | | Lehman Brothers Small Balance Commercial Mortgage Trust, Series 2007-3A, Class M2, (1 mo. LIBOR USD + 2.000%),
2.09%, 10/25/37(b)(e) | | | 2,896,628 | |
| | 2,387,596 | | | Velocity Commercial Capital Loan Trust, Series 2014-1, Class M7,
8.07%, 09/25/44(b)(f) | | | 2,230,964 | |
| | 3,881,000 | | | Velocity Commercial Capital Loan Trust, Series 2016-1, Class M5,
8.63%, 04/25/46(b)(f) | | | 3,950,815 | |
| Old Westbury Funds, Inc. | |
| Credit Income Fund | |
| Portfolio of Investments - (Continued) | October 31, 2021 |
Principal
Amount | | | | | Value | |
| COMMERCIAL MORTGAGE-BACKED SECURITIES (continued) | |
| $ | 3,055,000 | | | Velocity Commercial Capital Loan Trust, Series 2017-1, Class M6,
7.95%, 05/25/47(b)(f) | | $ | 3,082,880 | |
| | 2,770,716 | | | Velocity Commercial Capital Loan Trust, Series 2018-2, Class M4,
5.32%, 10/26/48(b)(f) | | | 2,829,582 | |
| | 980,459 | | | Velocity Commercial Capital Loan Trust, Series 2018-2, Class M5,
6.36%, 10/26/48(b)(f) | | | 1,005,583 | |
| | 1,842,153 | | | Velocity Commercial Capital Loan Trust, Series 2019-1, Class M2,
4.01%, 03/25/49(b)(f) | | | 1,871,518 | |
| | 2,246,506 | | | Velocity Commercial Capital Loan Trust, Series 2019-1, Class M3,
4.12%, 03/25/49(b)(f) | | | 2,267,898 | |
| | 2,640,788 | | | Velocity Commercial Capital Loan Trust, Series 2019-1, Class M4,
4.61%, 03/25/49(b)(f) | | | 2,664,300 | |
| | 1,590,845 | | | Velocity Commercial Capital Loan Trust, Series 2019-1, Class M5,
5.70%, 03/25/49(b)(f) | | | 1,611,334 | |
| | 498,304 | | | Velocity Commercial Capital Loan Trust, Series 2019-2, Class M5,
4.93%, 07/25/49(b)(f) | | | 502,846 | |
| | 2,030,134 | | | Velocity Commercial Capital Loan Trust, Series 2021-1, Class M5,
3.97%, 05/25/51(b)(f) | | | 1,996,571 | |
| | 1,241,259 | | | Velocity Commercial Capital Loan Trust, Series 2021-2, Class M5,
3.83%, 08/25/51(b)(f) | | | 1,221,164 | |
| | 1,241,259 | | | Velocity Commercial Capital Loan Trust, Series 2021-2, Class M6,
4.77%, 08/25/51(b)(f) | | | 1,222,707 | |
| | 3,395,972 | | | Velocity Commercial Capital Loan Trust, Series 2021-2, Class M7,
6.54%, 08/25/51(a)(b) | | | 3,345,033 | |
| | 5,000,000 | | | Velocity Commercial Capital Loan Trust, Series 2021-3, Class M5,
4.33%, 10/25/51(b)(f) | | | 4,957,261 | |
| | | | | | | | 64,184,881 | |
Total Non-Agency Mortgage-Backed Securities
(Cost $472,857,261) | | | 473,539,410 | |
Principal
Amount | | | | | Value | |
| U.S. GOVERNMENT SPONSORED AGENCY MORTGAGE-BACKED SECURITIES — 1.6% | |
| COLLATERALIZED MORTGAGE OBLIGATIONS — 1.6% | |
| $ | 2,740,286 | | | Connecticut Avenue Securities Trust, Series 2021-R01, Class 1B2, (SOFR 30A + 6.000%),
6.05%, 10/25/41(b)(e) | | $ | 2,728,311 | |
| | 5,000,000 | | | Freddie Mac STACR REMIC Trust, Series 2020-DNA5, Class B1, (SOFR 30A + 4.800%),
4.85%, 10/25/50(b)(e) | | | 5,289,676 | |
| | 3,000,000 | | | Freddie Mac STACR REMIC Trust, Series 2020-DNA6, Class B1, (SOFR 30A + 3.000%),
3.05%, 12/25/50(b)(e) | | | 3,038,279 | |
| | 2,000,000 | | | Freddie Mac STACR REMIC Trust, Series 2020-DNA6, Class B2, (SOFR 30A + 5.650%),
5.70%, 12/25/50(b)(e) | | | 2,154,479 | |
| | 3,076,000 | | | Freddie Mac STACR REMIC Trust, Series 2021-DNA1, Class B1, (SOFR 30A + 2.650%),
2.70%, 01/25/51(b)(e) | | | 3,090,023 | |
| | 4,000,000 | | | Freddie Mac STACR REMIC Trust, Series 2021-DNA1, Class B2, (SOFR 30A + 4.750%),
4.80%, 01/25/51(b)(e) | | | 4,146,542 | |
| | 4,000,000 | | | Freddie Mac STACR REMIC Trust, Series 2021-DNA5, Class B2, (SOFR 30A + 5.500%),
5.55%, 01/25/34(b)(e) | | | 4,194,780 | |
| | 1,375,566 | | | Freddie Mac STACR REMIC Trust, Series 2021-HQA1, Class B1, (SOFR 30A + 3.000%),
3.05%, 08/25/33(b)(e) | | | 1,384,162 | |
| | 2,856,608 | | | Freddie Mac STACR REMIC Trust, Series 2021-HQA1, Class B2, (SOFR 30A + 5.000%),
5.05%, 08/25/33(b)(e) | | | 2,945,447 | |
| | 3,357,143 | | | Freddie Mac STACR REMIC Trust, Series 2021-HQA3, Class B1, (SOFR 30A + 3.350%),
3.40%, 09/25/41(b)(e) | | | 3,325,063 | |
| | 1,361,989 | | | Freddie Mac Structured Agency Credit Risk Debt Notes, Series 2017- DNA1, Class B2, (1 mo. LIBOR USD + 10.000%),
10.09%, 07/25/29(e) | | | 1,463,824 | |
| Old Westbury Funds, Inc. | |
| Credit Income Fund | |
| Portfolio of Investments - (Continued) | October 31, 2021 |
Principal
Amount | | | | | Value | |
| COLLATERALIZED MORTGAGE OBLIGATIONS (continued) | |
| $ | 3,000,000 | | | Freddie Mac Structured Agency Credit Risk Debt Notes, Series 2018- DNA1, Class B1, (1 mo. LIBOR USD + 3.150%),
3.24%, 07/25/30(e) | | $ | 3,044,950 | |
| | 167,989 | | | Freddie Mac Structured Agency Credit Risk Debt Notes, Series 2018- SPI2, Class M2,
3.81%, 05/25/48(b)(f) | | | 167,947 | |
| | 4,000,000 | | | Freddie Mac Structured Agency Credit Risk Debt Notes, Series 2020- HQA5, Class B1, (SOFR 30A + 4.000%),
4.05%, 11/25/50(b)(e) | | | 4,192,300 | |
| | 2,000,000 | | | Freddie Mac Structured Agency Credit Risk Debt Notes, Series 2021- DNA2, Class B1, (SOFR 30A + 3.400%),
3.45%, 08/25/33(b)(e) | | | 2,051,721 | |
| | 3,000,000 | | | Freddie Mac Structured Agency Credit Risk Debt Notes, Series 2021- DNA2, Class B2, (SOFR 30A + 6.000%),
6.05%, 08/25/33(b)(e) | | | 3,330,029 | |
| | | | | | | | | |
Total U.S. Government Sponsored Agency Mortgage-Backed Securities
(Cost $44,512,190) | | | 46,547,533 | |
| | | | | | | | | |
| U.S. GOVERNMENT SECURITIES — 21.5% | | | | |
| U.S. Treasury Bonds — 21.5% | | | | |
| | 41,315,000 | | | 3.63%, 08/15/43 | | | 53,265,687 | |
| | 38,170,000 | | | 3.63%, 02/15/44 | | | 49,431,641 | |
| | 48,055,000 | | | 3.38%, 05/15/44 | | | 60,181,379 | |
| | 42,650,000 | | | 3.13%, 08/15/44 | | | 51,483,215 | |
| | 42,050,000 | | | 3.00%, 02/15/47 | | | 50,957,701 | |
| | 47,000,000 | | | 2.75%, 08/15/47 | | | 54,600,781 | |
| | 42,100,000 | | | 3.00%, 08/15/48 | | | 51,345,555 | |
| | 41,800,000 | | | 3.38%, 11/15/48 | | | 54,516,344 | |
| | 47,000,000 | | | 3.00%, 02/15/49 | | | 57,527,266 | |
| | 42,290,000 | | | 2.88%, 05/15/49 | | | 50,718,265 | |
| | 59,560,000 | | | 1.25%, 05/15/50 | | | 50,270,036 | |
| | 53,100,000 | | | 1.63%, 11/15/50 | | | 49,175,578 | |
| | | | | | | | | |
Total U.S. Government Securities
(Cost $665,874,665) | | | 633,473,448 | |
| Shares | | | | | Value | |
| CASH SWEEP — 13.4% | | | | |
| UNITED STATES — 13.4% | | | | |
| | 395,197,227 | | | Citibank - US Dollars on Deposit in Custody Account, 0.03%(i) | | $ | 395,197,227 | |
Total Cash Sweep
(Cost $395,197,227) | | | 395,197,227 | |
TOTAL INVESTMENTS — 100.0%
(Cost $2,930,588,115) | | $ | 2,950,867,209 | |
| LIABILITIES IN EXCESS OF OTHER ASSETS — 0.0% | | | (291,297) | |
| NET ASSETS — 100.0% | | $ | 2,950,575,912 | |
| (a) | Security is valued using significant unobservable inputs and is classified as Level 3 in the fair value hierarchy. The aggregate value of fair valued securities is $77,502,801 which is 2.63% of net assets and the cost is $77,644,081. |
| (b) | Security exempt from registration under Rule 144A of the Securities Act of 1933, as amended. The security may be resold in transactions exempt from registration normally to qualified institutional buyers. The aggregate value is $828,229,215, which is 28.07% of net assets. These securities have been determined to be liquid in accordance with procedures adopted by the Fund’s Board of Directors except as indicated in (h). |
| (c) | Variable rate security. Security may be issued at a fixed coupon rate, which converts to a variable rate at a specified date. Rate shown is the rate in effect as of October 31, 2021. |
| (d) | Perpetual security with no stated maturity date. |
| (e) | Floating rate security. Rate shown is the rate in effect as of October 31, 2021. |
| (f) | Variable or floating rate security, which interest rate adjusts periodically based on changes in current interest rates and prepayments on the underlying pool of assets. Rate shown is the rate in effect as of October 31, 2021. |
| (g) | Zero coupon bond. The rate represents the yield at time of purchase. These securities have been determined to be illiquid in accordance with procedures adopted by the Fund’s Board of Directors. |
| (i) | The rate shown represents the current yield as of October 31, 2021. |
| Old Westbury Funds, Inc. | |
| Credit Income Fund | |
| Portfolio of Investments - (Continued) | October 31, 2021 |
| Reference Entity | | Counterparty | | Payment/
Expiration Date | | Notional
Amount
(000) | | | Value | | | Upfront
Premium
Paid
(Received) | | | Unrealized
Appreciation
(Depreciation) | |
| Total Return Swaps | | | | | | | | | | | | | | | | | | | | |
| Total Return Swap receiving total return of the Barclays US Mortgage Backed Securities Index over the initial level of 2,317.85 and paying a (3 mo. LIBOR USD + 0.650%) 0.776%, with quarterly payments until expiration date | | Barclays Bank Plc | | 11/02/2021 | | | 80,000 | | | $ | (699,328) | | | $ | – | | | $ | (699,328) | |
| Total Return Swap receiving total return of the Barclays US Mortgage Backed Securities Index over the initial level of 2,317.97 and paying a (3 mo. LIBOR USD + 0.650%) 0.769%, with quarterly payments until expiration date | | Barclays Bank Plc | | 12/02/2021 | | | 100,000 | | | | (811,514) | | | | (62,775) | | | | (748,739) | |
| Total Return Swap receiving total return of the Barclays US Mortgage Backed Securities Index over the initial level of 2,321.93 and paying a (3 mo. LIBOR USD + 0.650%) 0.776%, with quarterly payments until expiration date | | Barclays Bank Plc | | 01/31/2022 | | | 120,000 | | | | (1,258,413) | | | | (397,233) | | | | (861,180) | |
| Total Return Swap receiving total return of the Barclays US Mortgage Backed Securities Index over the initial level of 2,310.26 and paying a (3 mo. LIBOR USD + 0.650%) 0.764%, with quarterly payments until expiration date | | Barclays Bank Plc | | 09/13/2022 | | | 40,000 | | | | (182,338) | | | | – | | | | (182,338) | |
| Total Total Return Swaps | | | | | | | | | | | | | | | | | | $ | (2,491,585) | |
The following abbreviations are used in the report:
CLO — Collateralized Loan Obligation
CVR — Contingent Value Right
ETF — Exchange-Traded Fund
LIBOR — London Interbank Offered Rate
REIT — Real Estate Investment Trust
SOFR — Secured Overnight Financing Rate
SOFR 30A — Secured Overnight Financing Rate 30 Day Average USD
SPDR — Standard & Poor’s Depositary Receipt
STEP — Step Coupon Bond
USD — U.S. Dollar
| Old Westbury Funds, Inc. | |
| Fixed Income Fund | |
| Portfolio of Investments | October 31, 2021 |
Principal
Amount | | | | | Value | |
| MUNICIPAL BONDS — 0.7% | |
| California — 0.3% | | | |
| $ | 4,500,000 | | | University of California University & College Improvements Revenue Bonds, Series BG,
1.61%, 05/15/30 | | $ | 4,366,238 | |
| New Jersey — 0.1% | | | | |
| | 1,750,000 | | | New Jersey Turnpike Authority Advance Refunding Revenue Bonds, Series B,
1.48%, 01/01/28 | | | 1,727,604 | |
| Pennsylvania — 0.3% | | | | |
| | 5,000,000 | | | Pennsylvania State University Refunding Revenue Bonds, Series D,
1.65%, 09/01/25 | | | 5,094,015 | |
Total Municipal Bonds
(Cost $11,250,000) | | | 11,187,857 | |
| | | | | | | | | |
| CORPORATE BONDS — 35.4% | | | | |
| Banks — 6.9% | | | | |
| | 1,500,000 | | | ANZ New Zealand Int’l Ltd.,
1.25%, 06/22/26(a) | | | 1,476,039 | |
| | 4,000,000 | | | Banco Santander SA, (1 yr. US Treasury Yield Curve Rate T Note Constant Maturity + 0.450%),
0.70%, 06/30/24(b) | | | 3,988,042 | |
| | 6,425,000 | | | Bank of America Corp., (3 mo. LIBOR US + 0.810%),
3.37%, 01/23/26(b) | | | 6,817,675 | |
| | 5,470,000 | | | Bank of America Corp., (SOFR RATE + 0.960%),
1.73%, 07/22/27(b) | | | 5,435,599 | |
| | 3,675,000 | | | Bank of New York Mellon Corp. (The) MTN,
1.60%, 04/24/25 | | | 3,728,526 | |
| | 6,140,000 | | | Barclays Plc, (1 yr. US Treasury Yield Curve Rate T Note Constant Maturity + 1.200%),
2.67%, 03/10/32(b) | | | 6,118,147 | |
| | 5,000,000 | | | BNP Paribas SA, (SOFR RATE + 1.004%),
1.32%, 01/13/27(a)(b) | | | 4,887,907 | |
| | 5,000,000 | | | BPCE SA,
1.00%, 01/20/26(a) | | | 4,870,343 | |
Principal
Amount | | | | | Value | |
| Banks (continued) | | | |
| $ | 5,560,000 | | | Canadian Imperial Bank of Commerce,
3.10%, 04/02/24 | | $ | 5,849,274 | |
| | 6,295,000 | | | Citigroup, Inc., (3 mo. LIBOR US + 1.390%),
3.67%, 07/24/28(b) | | | 6,812,381 | |
| | 4,000,000 | | | Credit Suisse AG,
1.25%, 08/07/26 | | | 3,915,940 | |
| | 2,000,000 | | | Danske Bank A/S, (1 yr. US Treasury Yield Curve Rate T Note Constant Maturity + 0.550%),
0.98%, 09/10/25(a)(b) | | | 1,984,639 | |
| | 4,570,000 | | | HSBC Holdings Plc, (SOFR RATE + 1.285%),
2.21%, 08/17/29(b) | | | 4,484,623 | |
| | 2,000,000 | | | Huntington Bancshares, Inc., (5 yr. US Treasury Yield Curve Rate T Note Constant Maturity + 1.170%),
2.49%, 08/15/36(a)(b) | | | 1,955,081 | |
| | 7,136,000 | | | JPMorgan Chase & Co., (SOFRRATE + 1.015%),
2.07%, 06/01/29(b) | | | 7,069,797 | |
| | 3,369,000 | | | JPMorgan Chase & Co., (3 mo. LIBOR US + 1.260%),
4.20%, 07/23/29(b) | | | 3,780,048 | |
| | 4,000,000 | | | Macquarie Group Ltd., (SOFR RATE + 0.694%),
1.20%, 10/14/25(a)(b) | | | 3,975,972 | |
| | 5,000,000 | | | Mitsubishi UFJ Financial Group, Inc., (1 yr. US Treasury Yield Curve Rate T Note Constant Maturity + 0.750%),
1.54%, 07/20/27(b) | | | 4,938,433 | |
| | 5,000,000 | | | Mizuho Financial Group, Inc., (3 mo. LIBOR USD + 1.000%),
3.92%, 09/11/24(b) | | | 5,280,873 | |
| | 2,500,000 | | | Mizuho Financial Group, Inc.,
2.56%, 09/13/31 | | | 2,449,358 | |
| | 2,875,000 | | | Morgan Stanley, (SOFRRATE + 0.879%),
1.59%, 05/04/27(b) | | | 2,848,616 | |
| | 2,555,000 | | | Morgan Stanley GMTN, (SOFRRATE + 0.858%),
1.51%, 07/20/27(b) | | | 2,516,097 | |
| | 2,000,000 | | | NatWest Markets Plc,
1.60%, 09/29/26(a) | | | 1,973,995 | |
| Old Westbury Funds, Inc. | |
| Fixed Income Fund | |
| Portfolio of Investments - (Continued) | October 31, 2021 |
Principal
Amount | | | | | Value | |
| Banks (continued) | | | |
| $ | 5,000,000 | | | Standard Chartered Plc, (1 yr. US Treasury Yield Curve Rate T Note Constant Maturity + 1.200%),
2.68%, 06/29/32(a)(b) | | $ | 4,897,463 | |
| | 6,000,000 | | | Truist Bank,Series, BKNT,
1.25%, 03/09/23 | | | 6,059,414 | |
| | | | | | | | 108,114,282 | |
| Communication Services — 1.7% | | | | |
| | 7,325,000 | | | Amazon.com, Inc.,
1.65%, 05/12/28 | | | 7,301,762 | |
| | 5,720,000 | | | Comcast Corp.,
4.15%, 10/15/28 | | | 6,529,764 | |
| | 5,000,000 | | | E*TRADE Financial Corp.,
4.50%, 06/20/28 | | | 5,694,817 | |
| | 6,176,000 | | | Omnicom Group, Inc.,
2.45%, 04/30/30 | | | 6,215,521 | |
| | | | | | | | 25,741,864 | |
| Consumer Discretionary — 5.6% | | | | |
| | 5,500,000 | | | American Honda Finance Corp. MTN,
0.88%, 07/07/23 | | | 5,529,079 | |
| | 2,500,000 | | | Brown University in Providence in the State of Rhode Island and Providence Plant, Series A,
1.91%, 09/01/30 | | | 2,496,561 | |
| | 8,500,000 | | | DR Horton, Inc.,
1.40%, 10/15/27 | | | 8,259,638 | |
| | 5,465,000 | | | Equifax, Inc.,
2.60%, 12/01/24 | | | 5,689,747 | |
| | 6,250,000 | | | Estee Lauder Cos., Inc. (The),
2.60%, 04/15/30 | | | 6,530,592 | |
| | 2,300,000 | | | General Motors Financial Co., Inc.,
1.70%, 08/18/23 | | | 2,331,486 | |
| | 2,616,000 | | | General Motors Financial Co., Inc.,
4.35%, 04/09/25 | | | 2,846,847 | |
| | 5,210,000 | | | Hasbro, Inc.,
3.50%, 09/15/27 | | | 5,609,221 | |
| | 6,145,000 | | | Kimberly-Clark Corp.,
1.05%, 09/15/27 | | | 5,960,653 | |
| | 5,000,000 | | | Lowe’s Cos, Inc.,
2.50%, 04/15/26 | | | 5,227,429 | |
| | 4,205,000 | | | McDonald’s Corp. MTN,
3.30%, 07/01/25 | | | 4,490,234 | |
| | 5,105,000 | | | Moody’s Corp.,
3.75%, 03/24/25 | | | 5,499,032 | |
Principal
Amount | | | | | Value | |
| Consumer Discretionary (continued) | | |
| $ | 3,060,000 | | | PayPal Holdings, Inc.,
1.65%, 06/01/25 | | $ | 3,104,046 | |
| | 5,500,000 | | | Ross Stores, Inc.,
0.88%, 04/15/26 | | | 5,357,519 | |
| | 3,535,000 | | | Southwest Airlines Co.,
5.25%, 05/04/25 | | | 3,963,528 | |
| | 3,693,000 | | | Southwest Airlines Co.,
5.13%, 06/15/27 | | | 4,261,887 | |
| | 1,000,000 | | | Starbucks Corp.,
1.30%, 05/07/22 | | | 1,004,687 | |
| | 4,985,000 | | | Verisk Analytics, Inc.,
4.00%, 06/15/25 | | | 5,433,667 | |
| | 2,680,000 | | | VF Corp.,
2.05%, 04/23/22 | | | 2,700,242 | |
| | 1,830,000 | | | Walmart, Inc.,
1.80%, 09/22/31 | | | 1,804,529 | |
| | | | | | | | 88,100,624 | |
| Consumer Staples — 1.8% | | | | |
| | 5,000,000 | | | Bunge Ltd. Finance Corp.,
1.63%, 08/17/25 | | | 5,018,524 | |
| | 5,000,000 | | | Conagra Brands, Inc.,
4.60%, 11/01/25 | | | 5,570,495 | |
| | 4,125,000 | | | Conagra Brands, Inc.,
1.38%, 11/01/27 | | | 3,974,520 | |
| | 1,965,000 | | | Constellation Brands, Inc.,
3.15%, 08/01/29 | | | 2,089,648 | |
| | 5,000,000 | | | Diageo Capital Plc,
2.63%, 04/29/23 | | | 5,129,633 | |
| | 4,950,000 | | | General Mills, Inc.,
4.00%, 04/17/25 | | | 5,381,465 | |
| | 1,426,000 | | | Kroger Co. (The),
2.80%, 08/01/22 | | | 1,448,967 | |
| | | | | | | | 28,613,252 | |
| Diversified Financials — 4.4% | | | | |
| | 2,950,000 | | | Ally Financial, Inc.,
2.20%, 11/02/28 | | | 2,913,576 | |
| | 1,760,000 | | | American Express Co.,
3.70%, 08/03/23 | | | 1,849,762 | |
| | 2,000,000 | | | American Tower Corp.,
2.40%, 03/15/25 | | | 2,060,398 | |
| | 5,000,000 | | | Andrew W Mellon Foundation (The), Series 2020,
0.95%, 08/01/27 | | | 4,874,047 | |
| | 5,000,000 | | | Athene Global Funding,
1.73%, 10/02/26(a) | | | 4,945,223 | |
| | 5,000,000 | | | Blackstone Holdings Finance Co. LLC,
2.00%, 01/30/32(a) | | | 4,808,567 | |
| Old Westbury Funds, Inc. | |
| Fixed Income Fund | |
| Portfolio of Investments - (Continued) | October 31, 2021 |
Principal
Amount | | | | | Value | |
| Diversified Financials (continued) | | |
| $ | 5,000,000 | | | Capital One Financial Corp., (SOFRRATE + 1.337%),
2.36%, 07/29/32(b) | | $ | 4,829,931 | |
| | 2,570,000 | | | Charles Schwab Corp. (The),
2.00%, 03/20/28 | | | 2,593,913 | |
| | 6,000,000 | | | Fidelity National Financial, Inc.,
2.45%, 03/15/31 | | | 5,952,346 | |
| | 3,270,000 | | | Goldman Sachs Group, Inc. (The), (3 mo. LIBOR USD + 1.000%),
1.12%, 07/24/23(c) | | | 3,286,045 | |
| | 5,220,000 | | | Invitation Homes Operating Partnership LP REIT,
2.00%, 08/15/31 | | | 4,956,282 | |
| | 5,000,000 | | | Kimco Realty Corp. REIT,
1.90%, 03/01/28 | | | 4,927,789 | |
| | 3,500,000 | | | Magna International, Inc.,
3.63%, 06/15/24 | | | 3,732,595 | |
| | 1,500,000 | | | Magna International, Inc.,
2.45%, 06/15/30 | | | 1,525,556 | |
| | 1,800,000 | | | Mastercard, Inc.,
3.50%, 02/26/28 | | | 1,991,577 | |
| | 5,000,000 | | | New York Life Global Funding,
1.10%, 05/05/23(a) | | | 5,047,618 | |
| | 6,070,000 | | | Public Storage REIT,
1.85%, 05/01/28 | | | 6,065,223 | |
| | 2,525,000 | | | Visa, Inc.,
1.90%, 04/15/27 | | | 2,576,843 | |
| | | | | | | | 68,937,291 | |
| Energy — 2.9% | | | | |
| | 6,235,000 | | | BP Capital Markets America, Inc.,
3.94%, 09/21/28 | | | 6,984,671 | |
| | 6,253,000 | | | Chevron USA, Inc.,
0.69%, 08/12/25 | | | 6,151,627 | |
| | 1,500,000 | | | Enbridge, Inc.,
1.60%, 10/04/26 | | | 1,489,398 | |
| | 5,567,000 | | | Energy Transfer LP,
4.95%, 06/15/28 | | | 6,360,025 | |
| | 8,525,000 | | | Pioneer Natural Resources Co.,
1.13%, 01/15/26 | | | 8,343,689 | |
| | 5,370,000 | | | Sabine Pass Liquefaction LLC,
5.88%, 06/30/26 | | | 6,233,341 | |
| | 3,555,000 | | | Valero Energy Corp.,
1.20%, 03/15/24 | | | 3,547,666 | |
| | 5,000,000 | | | Williams Cos., Inc. (The),
3.35%, 08/15/22 | | | 5,074,442 | |
Principal
Amount | | | | | Value | |
| Energy (continued) | | |
| $ | 1,560,000 | | | Williams Cos., Inc. (The),
4.50%, 11/15/23 | | $ | 1,658,290 | |
| | | | | | | | 45,843,149 | |
| Health Care — 2.6% | | | | |
| | 4,000,000 | | | AbbVie, Inc.,
2.60%, 11/21/24 | | | 4,165,549 | |
| | 5,000,000 | | | Anthem, Inc.,
3.65%, 12/01/27 | | | 5,489,356 | |
| | 3,000,000 | | | Bristol-Myers Squibb Co.,
2.90%, 07/26/24 | | | 3,157,563 | |
| | 2,714,000 | | | Cigna Corp.,
3.75%, 07/15/23 | | | 2,849,584 | |
| | 5,000,000 | | | HCA, Inc.,
5.00%, 03/15/24 | | | 5,441,494 | |
| | 5,000,000 | | | Kaiser Foundation Hospitals,
3.15%, 05/01/27 | | | 5,367,802 | |
| | 6,320,000 | | | Merck & Co., Inc.,
1.45%, 06/24/30 | | | 6,076,195 | |
| | 5,000,000 | | | Stryker Corp.,
1.15%, 06/15/25 | | | 4,989,032 | |
| | 2,550,000 | | | Thermo Fisher Scientific, Inc.,
1.22%, 10/18/24 | | | 2,552,689 | |
| | | | | | | | 40,089,264 | |
| Industrials — 1.7% | | | | |
| | 4,175,000 | | | General Dynamics Corp.,
3.63%, 04/01/30 | | | 4,674,166 | |
| | 6,206,000 | | | Jabil, Inc.,
4.70%, 09/15/22 | | | 6,420,709 | |
| | 2,522,000 | | | Precision Castparts Corp.,
3.25%, 06/15/25 | | | 2,700,514 | |
| | 6,889,000 | | | Union Pacific Corp.,
3.95%, 09/10/28 | | | 7,774,941 | |
| | 5,000,000 | | | Waste Management, Inc.,
1.15%, 03/15/28 | | | 4,774,855 | |
| | | | | | | | 26,345,185 | |
| Information Technology — 2.2% | | | | |
| | 4,165,000 | | | Adobe, Inc.,
3.25%, 02/01/25 | | | 4,434,013 | |
| | 3,275,000 | | | Broadcom, Inc.,
4.70%, 04/15/25 | | | 3,616,237 | |
| | 3,000,000 | | | Broadcom, Inc.,
3.15%, 11/15/25 | | | 3,167,080 | |
| | 4,871,000 | | | Hewlett Packard Enterprise Co.,
4.90%, 10/15/25 | | | 5,458,233 | |
| | 8,000,000 | | | NVIDIA Corp.,
2.00%, 06/15/31 | | | 7,842,240 | |
| Old Westbury Funds, Inc. | |
| Fixed Income Fund | |
| Portfolio of Investments - (Continued) | October 31, 2021 |
Principal
Amount | | | | | Value | |
| Information Technology (continued) | | |
| $ | 5,475,000 | | | Oracle Corp.,
2.50%, 05/15/22 | | $ | 5,518,707 | |
| | 4,670,000 | | | Roper Technologies, Inc.,
2.95%, 09/15/29 | | | 4,906,642 | |
| | | | | | | | 34,943,152 | |
| Materials — 2.4% | | | | |
| | 5,200,000 | | | Air Products and Chemicals, Inc.,
1.50%, 10/15/25 | | | 5,256,371 | |
| | 4,730,000 | | | DuPont de Nemours, Inc.,
4.49%, 11/15/25 | | | 5,262,999 | |
| | 10,000,000 | | | Georgia-Pacific LLC,
1.75%, 09/30/25(a) | | | 10,143,392 | |
| | 7,000,000 | | | International Flavors & Fragrances, Inc.,
1.83%, 10/15/27(a) | | | 6,908,922 | |
| | 5,250,000 | | | Nucor Corp.,
2.00%, 06/01/25 | | | 5,359,789 | |
| | 3,996,000 | | | Sherwin-Williams Co. (The),
3.45%, 08/01/25 | | | 4,290,103 | |
| | 1,000,000 | | | Westlake Chemical Corp.,
0.88%, 08/15/24 | | | 999,967 | |
| | | | | | | | 38,221,543 | |
| Telecommunication Services — 0.9% | | | | |
| | 6,000,000 | | | T-Mobile USA, Inc.,
3.88%, 04/15/30 | | | 6,563,678 | |
| | 7,935,000 | | | Verizon Communications, Inc.,
1.75%, 01/20/31 | | | 7,497,156 | |
| | | | | | | | 14,060,834 | |
| Utilities — 2.3% | | | | |
| | 5,000,000 | | | Dominion Energy, Inc., Series B,
3.60%, 03/15/27 | | | 5,454,588 | |
| | 2,000,000 | | | Enel Finance International NV,
2.25%, 07/12/31(a) | | | 1,959,135 | |
| | 5,000,000 | | | Eversource Energy, Series N,
3.80%, 12/01/23 | | | 5,294,956 | |
| | 4,180,000 | | | Florida Power & Light Co.,
2.75%, 06/01/23 | | | 4,284,662 | |
| | 5,000,000 | | | Public Service Co. of Colorado, Series 35,
1.90%, 01/15/31 | | | 4,885,938 | |
| | 4,500,000 | | | SCE Recovery Funding LLC, Series A-1,
0.86%, 11/15/31 | | | 4,316,115 | |
| | 5,000,000 | | | Southern Co. Gas Capital Corp.,
2.45%, 10/01/23 | | | 5,142,590 | |
Principal
Amount | | | | | Value | |
| Utilities (continued) | | |
| $ | 5,000,000 | | | Xcel Energy, Inc.,
3.30%, 06/01/25 | | $ | 5,312,759 | |
| | | | | | | | 36,650,743 | |
Total Corporate Bonds
(Cost $554,273,501) | | | 555,661,183 | |
| | | | | | | | | |
| ASSET-BACKED SECURITIES — 6.5% | | | | |
| CAYMAN ISLANDS — 2.8% | | | | |
| Collateralized Loan Obligations — 2.8% | | | | |
| | 3,500,000 | | | AGL CLO 10 Ltd., Series 2021-10A, Class B, (3 mo. LIBOR USD + 1.500%),
1.62%, 04/15/34(a)(c) | | | 3,489,638 | |
| | 5,000,000 | | | Aimco CLO 14 Ltd., Series 2021-14A, Class A, (3 mo. LIBOR USD + 0.990%),
1.12%, 04/20/34(a)(c) | | | 4,996,328 | |
| | 1,828,910 | | | BlueMountain CLO Ltd., Series 2015- 2A, Class A1R, (3 mo. LIBOR USD + 0.930%),
1.05%, 07/18/27(a)(c) | | | 1,828,911 | |
| | 1,500,000 | | | Flatiron CLO 17 Ltd., Series 2017-1A, Class BR, (3 mo. LIBOR USD + 1.450%),
1.57%, 05/15/30(a)(c) | | | 1,499,996 | |
| | 5,750,000 | | | GoldentTree Loan Management US CLO 1 Ltd., Series 2021-10A, Class B, (3 mo. LIBOR USD + 1.600%),
1.73%, 07/20/34(a)(c) | | | 5,740,663 | |
| | 4,700,000 | | | Gulf Stream Meridian 3 Ltd., Series 2021-IIIA, Class A2, (3 mo. LIBOR USD + 1.750%),
1.87%, 04/15/34(a)(c) | | | 4,699,983 | |
| | 5,000,000 | | | KAYNE CLO I Ltd., Series 2018-1A, Class BR, (3 mo. LIBOR USD + 1.400%),
1.52%, 07/15/31(a)(c) | | | 4,987,658 | |
| | 1,500,000 | | | LCM XXIV Ltd., Series 24A, Class BR, (3 mo. LIBOR USD + 1.400%),
1.53%, 03/20/30(a)(c) | | | 1,489,530 | |
| | 1,125,323 | | | Mercer Field II CLO Ltd., Series 2017-1A, Class A1, (3 mo. LIBOR USD + 1.330%),
1.45%, 04/15/29(a)(c) | | | 1,126,041 | |
| Old Westbury Funds, Inc. | |
| Fixed Income Fund | |
| Portfolio of Investments - (Continued) | October 31, 2021 |
Principal
Amount | | | | | Value | |
| CAYMAN ISLANDS (continued) | | | |
| Collateralized Loan Obligations (continued) | | | |
| $ | 1,750,000 | | | OCP CLO Ltd., Series 2019-17A, Class BR, (3 mo. LIBOR USD + 1.600%),
1.73%, 07/20/32(a)(c) | | $ | 1,739,529 | |
| | 4,500,000 | | | Octagon 55 Ltd., Series 2021-1A, Class B, (3 mo. LIBOR USD + 1.650%),
1.76%, 07/20/34(a)(c) | | | 4,492,360 | |
| | 4,000,000 | | | Palmer Square Loan Funding Ltd., Series 2021-3A, Class A2, (3 mo. LIBOR USD + 1.400%),
1.57%, 07/20/29(a)(c) | | | 3,989,827 | |
| | 3,000,000 | | | Regatta XXI Funding Ltd., Series 2021-3A, Class B, (3 mo. LIBOR USD + 1.700%),
1.83%, 10/20/34(a)(c) | | | 2,994,827 | |
| | 150,188 | | | Z Capital Credit Partners CLO Ltd., Series 2015-1A, Class A1R, (3 mo. LIBOR USD + 0.950%),
1.07%, 07/16/27(a)(c) | | | 150,185 | |
| | | | | | | | 43,225,476 | |
| UNITED STATES — 3.7% | | | | |
| Other Asset-Backed Securities — 3.7% | | | | |
| | 2,100,000 | | | BMW Vehicle Lease Trust, Series 2021-1, Class A4,
0.37%, 07/25/24 | | | 2,092,064 | |
| | 2,750,000 | | | Capital One Prime Auto Receivables Trust, Series 2021-1, Class A3,
0.77%, 09/15/26 | | | 2,742,027 | |
| | 1,500,000 | | | CarMax Auto Owner Trust, Series 2021-1, Class B,
0.74%, 10/15/26 | | | 1,475,455 | |
| | 350,000 | | | CarMax Auto Owner Trust, Series 2021-2, Class A3,
0.52%, 02/17/26 | | | 349,497 | |
| | 1,500,000 | | | CNH Equipment Trust, Series 2021- C, Class A4,
1.16%, 10/16/28 | | | 1,497,928 | |
| | 2,000,000 | | | Credit Acceptance Auto Loan Trust, Series 2021-2A, Class A,
0.96%, 02/15/30(a) | | | 1,994,954 | |
| | 3,000,000 | | | Drive Auto Receivables Trust, Series 2021-1, Class A3,
0.44%, 11/15/24 | | | 3,001,674 | |
| | 1,208,608 | | | DT Auto Owner Trust, Series 2019- 1A, Class C,
3.61%, 11/15/24(a) | | | 1,213,633 | |
Principal
Amount | | | | | Value | |
| UNITED STATES (continued) | | | |
| Other Asset-Backed Securities (continued) | | | �� | |
| $ | 2,114,477 | | | Enterprise Fleet Financing LLC, Series 2020-2, Class A2,
0.61%, 07/20/26(a) | | $ | 2,114,655 | |
| | 1,750,000 | | | Enterprise Fleet Financing LLC, Series 2021-3, Class A2,
0.77%, 08/20/27(a) | | | 1,748,306 | |
| | 4,000,000 | | | Ford Credit Auto Owner Trust, Series 2020-2, Class A,
1.06%, 04/15/33(a) | | | 3,951,756 | |
| | 32,759 | | | GM Financial Consumer Automobile Receivables Trust, Series 2018-3, Class A3,
3.02%, 05/16/23 | | | 32,939 | |
| | 1,000,000 | | | HPEFS Equipment Trust, Series 2021- 2A, Class B,
0.61%, 09/20/28(a) | | | 992,809 | |
| | 1,250,000 | | | Hyundai Auto Lease Securitization Trust, Series 2020-B, Class B,
0.81%, 10/15/24(a) | | | 1,252,672 | |
| | 2,202,505 | | | Navient Private Education Refi Loan Trust, Series 2021-BA, Class A,
0.94%, 07/15/69(a) | | | 2,186,075 | |
| | 3,530,881 | | | Navient Private Education Refi Loan Trust, Series 2021-CA, Class A,
1.06%, 10/15/69(a) | | | 3,516,400 | |
| | 5,000,000 | | | PFS Financing Corp., Series 2020-A, Class A,
1.27%, 06/15/25(a) | | | 5,040,275 | |
| | 2,000,000 | | | PFS Financing Corp., Series 2021-A, Class A,
0.71%, 04/15/26(a) | | | 1,982,629 | |
| | 1,750,000 | | | Santander Drive Auto Receivables Trust, Series 2020-4, Class B,
0.73%, 03/17/25 | | | 1,753,372 | |
| | 1,506,801 | | | Sofi Professional Loan Program Trust, Series 2018-B, Class A2FX,
3.34%, 08/25/47(a) | | | 1,541,461 | |
| | 907,104 | | | Sofi Professional Loan Program Trust, Series 2021-A, Class AFX,
1.03%, 08/17/43(a) | | | 900,441 | |
| | 2,000,000 | | | Tesla Auto Lease Trust, Series 2021-B, Class A3,
0.60%, 09/22/25(a) | | | 1,982,638 | |
| | 2,500,000 | | | Toyota Auto Receivables Owner Trust, Series 2020-C, Class A3,
0.44%, 10/15/24 | | | 2,500,957 | |
| | 5,500,000 | | | Verizon Owner Trust, Series 2020-B, Class A,
0.47%, 02/20/25 | | | 5,499,153 | |
| Old Westbury Funds, Inc. | |
| Fixed Income Fund | |
| Portfolio of Investments - (Continued) | October 31, 2021 |
Principal
Amount | | | | | Value | |
| UNITED STATES (continued) | | | |
| Other Asset-Backed Securities (continued) | | | | |
| $ | 2,500,000 | | | Verizon Owner Trust, Series 2020-C, Class B,
0.67%, 04/21/25 | | $ | 2,489,559 | |
| | 51,598 | | | Volkswagen Auto Loan Enhanced Trust, Series 2018-1, Class A3,
3.02%, 11/21/22 | | | 51,704 | |
| | 232,966 | | | World Omni Auto Receivables Trust, Series 2018-A, Class A3,
2.50%, 04/17/23 | | | 233,489 | |
| | 844,692 | | | World Omni Auto Receivables Trust, Series 2019-A, Class A3,
3.04%, 05/15/24 | | | 853,894 | |
| | 3,500,000 | | | World Omni Auto Receivables Trust, Series 2020-C, Class A3,
0.48%, 11/17/25 | | | 3,495,380 | |
| | | | | | | | 58,487,796 | |
Total Asset-Backed Securities
(Cost $101,920,239) | | | 101,713,272 | |
| | | | | | | | | |
| NON-AGENCY MORTGAGE-BACKED SECURITIES — 0.1% | |
| COLLATERALIZED MORTGAGE OBLIGATIONS — 0.1% | |
| | 639,407 | | | JP Morgan Tax-Exempt Pass-Through Trust, Series 2012-AMT1, Class A,
3.00%, 01/27/38(a) | | | 611,642 | |
Total Non-Agency Mortgage-Backed Securities
(Cost $648,854) | | | 611,642 | |
| | | | | | | | | |
| U.S. GOVERNMENT AGENCIES — 0.0% | | | | |
| U.S. International Development Finance Corp. — 0.0% | |
| | 182,928 | | | 5.14%, 12/15/23 | | | 192,344 | |
Total U.S. Government Agencies
(Cost $182,928) | | | 192,344 | |
| | | | | | | | | |
| U.S. GOVERNMENT SECURITIES — 55.8% | | | | |
| U.S. Treasury Bonds — 2.0% | | | | |
| | 833,000 | | | 1.38%, 11/15/40 | | | 749,342 | |
| | 31,000,000 | | | 1.88%, 02/15/41 | | | 30,384,844 | |
| | | | | | | | 31,134,186 | |
| U.S. Treasury Inflation Indexed Bonds — 2.6% | | |
| | 38,655,347 | | | 0.63%, 01/15/24(d) | | | 41,381,606 | |
| U.S. Treasury Notes — 51.2% | | | | |
| | 160,000 | | | 1.88%, 01/31/22 | | | 160,713 | |
| | 1,000,000 | | | 1.63%, 12/15/22 | | | 1,015,977 | |
Principal
Amount | | | | | Value | |
| U.S. Treasury Notes (continued) | | | |
| $ | 80,000,000 | | | 0.13%, 06/30/23 | | $ | 79,640,625 | |
| | 53,595,000 | | | 2.75%, 07/31/23 | | | 55,749,268 | |
| | 85,966,000 | | | 2.25%, 01/31/24 | | | 89,162,861 | |
| | 100,000,000 | | | 0.25%, 06/15/24 | | | 98,847,656 | |
| | 74,871,000 | | | 2.38%, 08/15/24 | | | 78,289,914 | |
| | 1,234,000 | | | 2.25%, 11/15/24 | | | 1,288,518 | |
| | 24,486,000 | | | 2.00%, 02/15/25 | | | 25,403,269 | |
| | 50,139,000 | | | 2.00%, 08/15/25 | | | 52,046,632 | |
| | 56,783,000 | | | 2.25%, 11/15/25 | | | 59,522,336 | |
| | 59,079,000 | | | 1.63%, 02/15/26 | | | 60,405,970 | |
| | 36,058,000 | | | 2.00%, 11/15/26 | | | 37,476,375 | |
| | 12,353,000 | | | 0.50%, 04/30/27 | | | 11,841,509 | |
| | 48,258,000 | | | 2.38%, 05/15/27 | | | 51,093,157 | |
| | 20,000,000 | | | 1.00%, 07/31/28 | | | 19,430,469 | |
| | 3,249,000 | | | 2.63%, 02/15/29 | | | 3,511,458 | |
| | 35,999,000 | | | 1.50%, 02/15/30 | | | 36,053,842 | |
| | 41,833,000 | | | 1.63%, 05/15/31 | | | 42,146,747 | |
| | | | | | | | 803,087,296 | |
Total U.S. Government Securities
(Cost $868,656,141) | | | 875,603,088 | |
| | | | | | | | | |
| Shares | | | | | | | |
| INVESTMENT COMPANY — 1.2% | | | | |
| | 18,309,659 | | | SEI Daily Income Trust Government II Fund - Class A, 0.01%(e) | | | 18,309,659 | |
Total Investment Company
(Cost $18,309,659) | | | 18,309,659 | |
TOTAL INVESTMENTS — 99.7%
(Cost $1,555,241,322) | | $ | 1,563,279,045 | |
| OTHER ASSETS IN EXCESS OF LIABILITIES — 0.3% | | | 5,412,302 | |
| NET ASSETS — 100.0% | | $ | 1,568,691,347 | |
| (a) | Security exempt from registration under Rule 144A of the Securities Act of 1933, as amended. The security may be resold in transactions exempt from registration normally to qualified institutional buyers. |
| | The security has been determined to be liquid in accordance with procedures adopted by the Fund’s Board of Directors. |
| (b) | Variable rate security. Security may be issued at a fixed coupon rate, which converts to a variable rate at a specified date. Rate shown is the rate in effect as of October 31, 2021. |
| (c) | Floating rate security. Rate shown is the rate in effect as of October 31, 2021. |
| (d) | Inflation protected security. Principal amount reflects original security face amount. |
| (e) | The rate shown represents the current yield as of October 31, 2021. |
| Old Westbury Funds, Inc. | |
| Fixed Income Fund | |
| Portfolio of Investments - (Continued) | October 31, 2021 |
The following abbreviations are used in the report:
CLO — Collateralized Loan Obligation
GMTN — Global Medium Term Note
LIBOR — London Interbank Offered Rate
MTN — Medium Term Note
REIT — Real Estate Investment Trust
SOFR — Secured Overnight Financing Rate
| Old Westbury Funds, Inc. | |
| Municipal Bond Fund | |
| Portfolio of Investments | October 31, 2021 |
| | |
Principal
Amount | | | | | Value | |
| MUNICIPAL BONDS — 90.3% | | |
| Alabama — 0.7% | | | | |
| $ | 2,000,000 | | | Alabama Federal Aid Highway Finance Authority Highway Improvements Revenue Bonds, Series A,
5.00%, 09/01/22 | | $ | 2,079,879 | |
| | 1,500,000 | | | Alabama Public School & College Authority Advance Refunding Revenue Bonds, Series B,
5.00%, 05/01/24 | | | 1,674,769 | |
| | 3,030,000 | | | City of Huntsville School Capital Improvements Warrants Refunding GO,
5.00%, 09/01/22 | | | 3,151,017 | |
| | 3,660,000 | | | City of Huntsville School Capital Improvements Warrants Refunding GO,
5.00%, 09/01/26 | | | 4,135,119 | |
| | 1,500,000 | | | City of Huntsville Warrants Refunding GO, Series A,
5.00%, 08/01/26 | | | 1,689,368 | |
| | 13,000,000 | | | Water Works Board of the City of Birmingham Water Utility Improvements Revenue Bonds, Series B,
5.00%, 01/01/45(a) | | | 14,883,660 | |
| | | | | | | | 27,613,812 | |
| Arizona — 1.0% | | | | |
| | 875,000 | | | Arizona Department of Transportation State Highway Fund Refunding Revenue Bonds,
5.00%, 07/01/25 | | | 982,080 | |
| | 1,300,000 | | | Arizona Department of Transportation State Highway Fund Refunding Revenue Bonds, Series A,
5.00%, 07/01/29(a) | | | 1,341,357 | |
| | 2,390,000 | | | Arizona School Facilities Board Advance Refunding COP, Series A,
5.00%, 09/01/23 | | | 2,595,617 | |
| | 1,715,000 | | | Arizona State Board of Regents Advance Refunding COP, Series A,
5.00%, 06/01/24 | | | 1,916,366 | |
| | 1,250,000 | | | Arizona Water Infrastructure Finance Authority Refunding Revenue Bonds, Series A,
5.00%, 10/01/26 | | | 1,415,540 | |
Principal
Amount | | | | | Value | |
| Arizona (continued) | | | | |
| $ | 5,000,000 | | | Salt River Project Agricultural Improvement & Power District Advance Refunding Revenue Bonds,
5.00%, 01/01/22 | | $ | 5,039,764 | |
| | 8,950,000 | | | Salt River Project Agricultural Improvement & Power District Advance Refunding Revenue Bonds,
5.00%, 01/01/30 | | | 11,080,293 | |
| | 8,850,000 | | | Salt River Project Agricultural Improvement & Power District Electric Light & Power Improvements Revenue Bonds, Series A,
5.00%, 01/01/22 | | | 8,920,381 | |
| | 6,470,000 | | | Salt River Project Agricultural Improvement & Power District Electric Light & Power Improvements Revenue Bonds, Series A,
5.00%, 01/01/23 | | | 6,830,560 | |
| | | | | | | | 40,121,958 | |
| Arkansas — 0.2% | | | | |
| | 7,250,000 | | | State of Arkansas Public Improvements GO,
5.00%, 10/01/26 | | | 8,184,540 | |
| | 735,000 | | | University of Arkansas Refunding Revenue Bonds,
5.00%, 03/01/26 | | | 839,975 | |
| | | | | | | | 9,024,515 | |
| California — 5.7% | | | | |
| | 100,000 | | | California Health Facilities Financing Authority Current Refunding Revenue Bonds, (California Mortgage Insurance),
5.00%, 07/01/23 | | | 107,637 | |
| | 200,000 | | | California Municipal Finance Authority Advance Refunding Revenue Bonds, (California Mortgage Insurance),
5.00%, 02/01/25 | | | 229,014 | |
| | 200,000 | | | California Municipal Finance Authority Channing House Project Advance Refunding Revenue Bonds, (California Mortgage Insurance),
5.00%, 05/15/25 | | | 231,215 | |
| Old Westbury Funds, Inc. | |
| Municipal Bond Fund | |
| Portfolio of Investments - (Continued) | October 31, 2021 |
| | |
Principal
Amount | | | | | Value | |
| California (continued) | | | | |
| $ | 1,410,000 | | | City of Los Angeles Department of Airports Airport & Marina Improvements Refunding Revenue Bonds, Series A,
5.00%, 05/15/29 | | $ | 1,776,928 | |
| | 1,160,000 | | | City of Los Angeles Department of Airports Airport & Marina Improvements Refunding Revenue Bonds, Series A,
5.00%, 05/15/30 | | | 1,481,636 | |
| | 1,360,000 | | | City of Los Angeles Department of Airports Airport & Marina Improvements Refunding Revenue Bonds, Series A,
5.00%, 05/15/31 | | | 1,760,950 | |
| | 1,805,000 | | | City of Los Angeles Department of Airports Airport & Marina Improvements Refunding Revenue Bonds, Series A,
5.00%, 05/15/33 | | | 2,317,951 | |
| | 5,235,000 | | | City of Los Angeles Department of Airports Airport & Marina Improvements Revenue Bonds, Series D,
5.00%, 05/15/27 | | | 6,346,450 | |
| | 5,000,000 | | | City of Los Angeles Department of Airports Airport & Marina Improvements Revenue Bonds, Series D,
5.00%, 05/15/28 | | | 6,184,645 | |
| | 8,250,000 | | | City of Los Angeles Department of Airports Airport & Marina Improvements Revenue Bonds, Series D,
5.00%, 05/15/30 | | | 10,537,496 | |
| | 10,000,000 | | | City of Los Angeles Department of Airports Airport & Marina Improvements Revenue Bonds, Series D,
5.00%, 05/15/31 | | | 12,948,164 | |
| | 7,000,000 | | | City of Los Angeles Department of Airports Airport & Marina Improvements Revenue Bonds, Series D,
5.00%, 05/15/32 | | | 9,115,219 | |
| | 1,500,000 | | | County of San Bernardino CA Arrow Head Project Current Refunding COP, Series A,
5.00%, 10/01/23 | | | 1,633,878 | |
Principal
Amount | | | | | Value | |
| California (continued) | | | | |
| $ | 4,150,000 | | | Los Angeles County Metropolitan Transportation Authority Transit Improvements Revenue Bonds, Series A,
5.00%, 06/01/32 | | $ | 5,590,112 | |
| | 5,000,000 | | | Los Angeles Department of Water & Power Power System Revenue Current Refunding Revenue Bonds, Series B,
5.00%, 01/01/22 | | | 5,019,586 | |
| | 5,000,000 | | | Los Angeles Department of Water & Power Power System Revenue Current Refunding Revenue Bonds, Series B,
5.00%, 07/01/24 | �� | | 5,616,151 | |
| | 3,500,000 | | | Sacramento Municipal Utility District Refunding Revenue Bonds, Sub- Series B,
5.00%, 08/15/49(b) | | | 4,032,426 | |
| | 6,850,000 | | | San Bernardino Community College District Advance Refunding GO,
1.61%, 08/01/27 | | | 6,867,444 | |
| | 3,800,000 | | | San Diego County Water Authority Refunding Revenue Bonds, Sub- Series S1,
5.00%, 05/01/28 | | | 4,785,584 | |
| | 800,000 | | | San Diego Regional Building Authority Advance Refunding Revenue Bonds, Series A,
5.00%, 10/15/24 | | | 909,277 | |
| | 2,500,000 | | | San Francisco Bay Area Rapid Transit District Transit Improvements GO, Series B-1,
5.00%, 08/01/24 | | | 2,818,551 | |
| | 10,000,000 | | | San Francisco City & County Airport Comm-San Francisco International Airport Current Refunding Revenue Bonds, Series 2020,
5.00%, 05/01/37 | | | 12,439,732 | |
| | 2,340,000 | | | San Francisco City & County Airport Comm-San Francisco International Airport Current Refunding Revenue Bonds, Series A,
5.00%, 05/01/31 | | | 3,023,036 | |
| Old Westbury Funds, Inc. | |
| Municipal Bond Fund | |
| Portfolio of Investments - (Continued) | October 31, 2021 |
| | |
Principal
Amount | | | | | Value | |
| California (continued) | | | | |
| $ | 13,000,000 | | | San Francisco City & County Airport Comm-San Francisco International Airport Current Refunding Revenue Bonds, Series A,
5.00%, 05/01/32 | | $ | 16,722,800 | |
| | 1,860,000 | | | San Francisco City & County Airport Comm-San Francisco International Airport Current Refunding Revenue Bonds, Series A,
5.00%, 05/01/34 | | | 2,380,630 | |
| | 1,000,000 | | | San Francisco City & County Airport Comm-San Francisco International Airport Current Refunding Revenue Bonds, Series B,
5.00%, 05/01/31 | | | 1,317,598 | |
| | 4,380,000 | | | State of California Advance Refunding GO,
5.00%, 08/01/25 | | | 5,105,046 | |
| | 6,095,000 | | | State of California Advance Refunding GO,
5.00%, 09/01/25 | | | 7,122,736 | |
| | 4,475,000 | | | State of California Advance Refunding GO,
5.00%, 11/01/25 | | | 5,256,863 | |
| | 4,530,000 | | | State of California Advance Refunding GO, Group B,
5.00%, 09/01/25 | | | 5,293,846 | |
| | 2,000,000 | | | State of California Current Refunding GO,
5.00%, 10/01/25 | | | 2,343,356 | |
| | 9,635,000 | | | State of California Current Refunding GO,
5.00%, 12/01/28 | | | 12,277,907 | |
| | 750,000 | | | State of California Current Refunding GO,
5.00%, 04/01/24 | | | 834,438 | |
| | 2,630,000 | | | State of California Current Refunding GO,
5.00%, 10/01/25 | | | 3,081,513 | |
| | 3,250,000 | | | State of California Current Refunding GO,
5.00%, 08/01/26 | | | 3,905,881 | |
| | 2,000,000 | | | State of California Current Refunding GO,
5.00%, 04/01/27 | | | 2,448,530 | |
Principal
Amount | | | | | Value | |
| California (continued) | | | | |
| $ | 8,695,000 | | | State of California Current Refunding GO, (AGM),
5.25%, 08/01/32 | | $ | 11,907,420 | |
| | 1,620,000 | | | State of California Department of Water Resources Advance Refunding Revenue Bonds, Series AX,
5.00%, 12/01/22 | | | 1,704,298 | |
| | 6,210,000 | | | State of California GO,
5.00%, 10/01/23 | | | 6,769,265 | |
| | 3,735,000 | | | State of California GO,
5.00%, 10/01/24 | | | 4,236,631 | |
| | 7,000,000 | | | State of California Public Improvements GO,
5.00%, 09/01/22 | | | 7,280,178 | |
| | 3,000,000 | | | State of California Public Improvements GO,
5.00%, 03/01/26 | | | 3,439,468 | |
| | 5,715,000 | | | State of California Public Improvements GO,
5.00%, 10/01/27 | | | 6,811,873 | |
| | 8,000,000 | | | State of California Refunding GO,
5.00%, 10/01/25 | | | 9,064,450 | |
| | 7,230,000 | | | State of California School Improvements GO,
5.00%, 11/01/28 | | | 9,028,544 | |
| | 6,360,000 | | | University of California Refunding Revenue Bonds, Series AJ,
4.60%, 05/15/31 | | | 7,411,564 | |
| | | | | | | | 241,517,917 | |
| Colorado — 1.3% | | | | |
| | 5,850,000 | | | City & County of Denver CO Airport System Revenue Airport & Marina Improvements Refunding Revenue Bonds, Series A,
5.00%, 12/01/28 | | | 7,269,164 | |
| | 8,000,000 | | | City & County of Denver CO Airport System Revenue Refunding Revenue Bonds, Series A1,
5.00%, 11/15/22 | | | 8,398,589 | |
| | 2,175,000 | | | City & County of Denver CO Airport System Revenue Refunding Revenue Bonds, Series A1,
5.00%, 11/15/32 | | | 2,797,377 | |
| | 5,000,000 | | | City & County of Denver CO Airport System Revenue Refunding Revenue Bonds, Series A2,
5.00%, 11/15/23 | | | 5,470,360 | |
| Old Westbury Funds, Inc. | |
| Municipal Bond Fund | |
| Portfolio of Investments - (Continued) | October 31, 2021 |
| | |
Principal
Amount | | | | | Value | |
| Colorado (continued) | | | | |
| $ | 3,300,000 | | | City & County of Denver CO Airport System Revenue Refunding Revenue Bonds, Series A2,
5.00%, 11/15/25 | | $ | 3,875,521 | |
| | 10,000,000 | | | City & County of Denver CO Airport System Revenue, Series A,
5.00%, 12/01/32 | | | 12,283,043 | |
| | 4,000,000 | | | City & County of Denver Co. Airport System Refunding Revenue Bonds, Series D,
5.00%, 11/15/31(b) | | | 4,191,577 | |
| | 2,060,000 | | | Colorado Higher Education Refunding COP, Series A,
5.00%, 11/01/24 | | | 2,328,806 | |
| | 2,000,000 | | | Denver City & County School District No 1 Refunding GO, (State Aid Withholding),
5.00%, 12/01/24 | | | 2,280,456 | |
| | 4,275,000 | | | Regional Transportation District Sales Tax Revenue Advance Refunding Revenue Bonds,
1.18%, 11/01/27 | | | 4,165,281 | |
| | 890,000 | | | Weld County School District No RE-2 Eaton Schools Improvements GO, (State Aid Withholding),
5.00%, 12/01/23 | | | 976,443 | |
| | | | | | | | 54,036,617 | |
| Connecticut — 2.9% | | | | |
| | 9,000,000 | | | Connecticut State Health & Educational Facilities Authority Refunding Revenue Bonds, Series A,
1.45%, 07/01/42(b)(c) | | | 9,074,714 | |
| | 1,000,000 | | | Connecticut State Health & Educational Facilities Authority Revenue Bonds, Series A,
5.00%, 07/01/31 | | | 1,319,726 | |
| | 6,500,000 | | | Connecticut State Health & Educational Facilities Authority University & College Improvements Revenue Bonds,
4.00%, 07/01/31 | | | 8,053,386 | |
| | 8,880,000 | | | Connecticut State Health & Educational Facilities Authority University & College Improvements Revenue Bonds, Series C-1,
5.00%, 07/01/40(b) | | | 11,010,792 | |
Principal
Amount | | | | | Value | |
| Connecticut (continued) | | | | |
| $ | 11,200,000 | | | Connecticut State Health & Educational Facilities Authority University & College Improvements Revenue Bonds, Series S,
5.00%, 07/01/27 | | $ | 13,811,330 | |
| | 1,000,000 | | | Hartford County Metropolitan District Refunding Notes GO,
5.00%, 03/01/25 | | | 1,105,694 | |
| | 325,000 | | | Hartford County Metropolitan District Refunding Notes GO, Series C, (AGM),
5.00%, 11/01/23 | | | 355,635 | |
| | 5,860,000 | | | Hartford County Metropolitan District Refunding Notes GO, Series C, (AGM),
5.00%, 11/01/25 | | | 6,888,933 | |
| | 2,350,000 | | | State of Connecticut Clean Water Fund - State Revolving Fund Refunding Revenue Bonds, Series A,
5.00%, 03/01/29 | | | 2,693,409 | |
| | 5,000,000 | | | State of Connecticut Current Refunding GO, Series C,
5.00%, 07/15/22 | | | 5,170,271 | |
| | 8,650,000 | | | State of Connecticut Current Refunding GO, Series C,
5.00%, 07/15/24 | | | 9,725,468 | |
| | 1,675,000 | | | State of Connecticut GO, Series A,
5.00%, 04/15/28 | | | 2,096,414 | |
| | 20,000,000 | | | State of Connecticut Refunding GO, Series C,
5.00%, 06/01/23 | | | 20,551,446 | |
| | 1,245,000 | | | State of Connecticut Special Tax Revenue Highway Improvements Revenue Bonds, Series A,
5.00%, 05/01/26 | | | 1,485,280 | |
| | 1,700,000 | | | State of Connecticut Special Tax Revenue Highway Improvements Revenue Bonds, Series A,
5.00%, 05/01/27 | | | 2,083,588 | |
| | 1,715,000 | | | State of Connecticut Special Tax Revenue Highway Improvements Revenue Bonds, Series A,
5.00%, 05/01/28 | | | 2,148,783 | |
| | 2,200,000 | | | State of Connecticut Special Tax Revenue Highway Improvements Revenue Bonds, Series A,
5.00%, 05/01/29 | | | 2,804,779 | |
| Old Westbury Funds, Inc. | |
| Municipal Bond Fund | |
| Portfolio of Investments - (Continued) | October 31, 2021 |
| | |
Principal
Amount | | | | | Value | |
| Connecticut (continued) | | | | |
| $ | 1,700,000 | | | State of Connecticut Special Tax Revenue Highway Improvements Revenue Bonds, Series A,
5.00%, 05/01/29 | | $ | 2,174,345 | |
| | 1,500,000 | | | State of Connecticut Special Tax Revenue Highway Improvements Revenue Bonds, Series A,
5.00%, 05/01/30 | | | 1,949,364 | |
| | 2,000,000 | | | State of Connecticut Special Tax Revenue Highway Improvements Revenue Bonds, Series A,
5.00%, 05/01/31 | | | 2,647,713 | |
| | 2,000,000 | | | State of Connecticut Special Tax Revenue Public Improvements Revenue Bonds, Series A,
5.00%, 08/01/30 | | | 2,315,717 | |
| | 3,100,000 | | | State of Connecticut Special Tax Revenue Public Improvements Revenue Bonds, Series A,
5.00%, 08/01/22 | | | 3,212,199 | |
| | 1,250,000 | | | State of Connecticut Special Tax Revenue Transportation Infrastructure Advance Refunding Revenue Bonds,
5.00%, 08/01/22 | | | 1,295,241 | |
| | 1,900,000 | | | State of Connecticut Transportation Infrastructure Refunding Revenue Bonds,
5.00%, 09/01/24 | | | 2,146,647 | |
| | 5,000,000 | | | State of Connecticut Transportation Infrastructure Revenue Bonds, Series A,
5.00%, 09/01/27 | | | 5,639,991 | |
| | | | | | | | 121,760,865 | |
| Delaware — 2.1% | | | | |
| | 10,000,000 | | | Delaware State Health Facilities Authority Current Refundin Revenue Bonds,
5.00%, 10/01/45 | | | 12,411,542 | |
| | 2,415,000 | | | Delaware Transportation Authority Current Refunding Revenue Bonds,
5.00%, 09/01/28 | | | 3,031,062 | |
| | 1,165,000 | | | Delaware Transportation Authority Current Refunding Revenue Bonds,
5.00%, 09/01/29 | | | 1,491,783 | |
Principal
Amount | | | | | Value | |
| Delaware (continued) | | | | |
| $ | 1,250,000 | | | Delaware Transportation Authority Current Refunding Revenue Bonds,
5.00%, 09/01/30 | | $ | 1,630,768 | |
| | 2,750,000 | | | Delaware Transportation Authority Current Refunding Revenue Bonds,
5.00%, 09/01/31 | | | 3,571,671 | |
| | 5,000,000 | | | Delaware Transportation Authority Current Refunding Revenue Bonds,
5.00%, 07/01/32 | | | 6,504,007 | |
| | 1,500,000 | | | Delaware Transportation Authority Current Refunding Revenue Bonds,
5.00%, 09/01/32 | | | 1,942,585 | |
| | 1,000,000 | | | Delaware Transportation Authority Current Refunding Revenue Bonds,
5.00%, 09/01/35 | | | 1,284,839 | |
| | 5,825,000 | | | Delaware Transportation Authority Public Improvements Revenue Bonds,
5.00%, 07/01/26 | | | 6,989,493 | |
| | 10,000,000 | | | State of Delaware Current Refunding GO,
5.00%, 02/01/28 | | | 12,509,475 | |
| | 7,705,000 | | | State of Delaware Current Refunding GO, Series A,
5.00%, 10/01/27 | | | 9,563,923 | |
| | 10,800,000 | | | State of Delaware Public Facilities GO,
5.00%, 02/01/25 | | | 12,404,508 | |
| | 9,650,000 | | | State of Delaware Public Facilities GO,
5.00%, 02/01/26 | | | 11,447,468 | |
| | 2,885,000 | | | State of Delaware Public Improvements GO,
5.00%, 03/01/24 | | | 3,201,338 | |
| | | | | | | | 87,984,462 | |
| District of Columbia — 1.6% | | | | |
| | 1,000,000 | | | District of Columbia Public Improvements GO, Series A,
5.00%, 06/01/25 | | | 1,161,615 | |
| | 4,145,000 | | | District of Columbia Public Improvements Revenue Bonds, Series A,
5.00%, 03/01/25 | | | 4,774,494 | |
| Old Westbury Funds, Inc. | |
| Municipal Bond Fund | |
| Portfolio of Investments - (Continued) | October 31, 2021 |
| | |
Principal
Amount | | | | | Value | |
| District of Columbia (continued) | | | | |
| $ | 8,800,000 | | | District of Columbia Public Improvements Revenue Bonds, Series A,
5.00%, 03/01/26 | | $ | 10,470,433 | |
| | 3,500,000 | | | District of Columbia Public Improvements Revenue Bonds, Series B,
5.00%, 10/01/27 | | | 4,344,417 | |
| | 11,735,000 | | | District of Columbia Refunding Revenue Bonds, Series C,
5.00%, 10/01/23 | | | 12,789,472 | |
| | 10,000,000 | | | District of Columbia Water & Sewer Authority Revenue Bonds, Series B,
5.00%, 10/01/52 | | | 11,835,113 | |
| | 5,000,000 | | | Metropolitan Washington Airports Authority Aviation Revenue Airport & Marina Improvements Revenue Bonds, Series A,
5.00%, 10/01/26 | | | 5,957,813 | |
| | 9,000,000 | | | Metropolitan Washington Airports Authority Aviation Revenue Airport & Marina Improvements Revenue Bonds, Series A,
5.00%, 10/01/27 | | | 10,950,666 | |
| | 5,000,000 | | | Metropolitan Washington Airports Authority Aviation Revenue Airport & Marina Improvements Revenue Bonds, Series A,
5.00%, 10/01/28 | | | 6,200,499 | |
| | | | | | | | 68,484,522 | |
| Florida — 1.8% | | | | |
| | 740,000 | | | County of Hillsborough Refunding GO,
5.00%, 07/01/25 | | | 862,251 | |
| | 5,000,000 | | | Orange County Health Facilities Authority Current Refunding Revenue Bonds,
5.00%, 11/15/52(b) | | | 6,047,290 | |
| | 1,065,000 | | | Peace River Manasota Regional Water Supply Authority Refunding Revenue Bonds,
4.00%, 10/01/22 | | | 1,101,661 | |
| | 1,000,000 | | | Peace River Manasota Regional Water Supply Authority Refunding Revenue Bonds,
5.00%, 10/01/25 | | | 1,168,289 | |
| | 10,000,000 | | | State of Florida Current Refunding GO, Series A,
5.00%, 07/01/29 | | | 12,866,348 | |
Principal
Amount | | | | | Value | |
| Florida (continued) | | | | |
| $ | 10,000,000 | | | State of Florida Current Refunding GO, Series A,
5.00%, 07/01/30 | | $ | 13,073,992 | |
| | 5,000,000 | | | State of Florida Current Refunding GO, Series A,
5.00%, 07/01/24 | | | 5,616,151 | |
| | 3,475,000 | | | State of Florida Current Refunding GO, Series A,
5.00%, 06/01/24 | | | 3,890,655 | |
| | 10,000,000 | | | State of Florida Current Refunding GO, Series B,
5.00%, 06/01/28 | | | 12,590,095 | |
| | 2,565,000 | | | State of Florida Current Refunding GO, Series D,
5.00%, 06/01/23 | | | 2,756,892 | |
| | 1,750,000 | | | State of Florida Current Refunding GO, Series F,
5.00%, 06/01/28 | | | 2,093,797 | |
| | 2,380,000 | | | State of Florida Department of Transportation Turnpike System Advance Refunding Revenue Bonds, Series A,
5.00%, 07/01/22 | | | 2,456,431 | |
| | 2,465,000 | | | State of Florida Department of Transportation Turnpike System Refunding Revenue Bonds, Series C,
5.00%, 07/01/22 | | | 2,544,160 | |
| | 5,350,000 | | | State of Florida Refunding GO, Series C,
5.00%, 06/01/23 | | | 5,750,243 | |
| | 3,895,000 | | | State of Florida Refunding GO, Series C,
5.00%, 06/01/24 | | | 4,188,971 | |
| | | | | | | | 77,007,226 | |
| Georgia — 4.2% | | | | |
| | 800,000 | | | Brookhaven Development Authority Revenue Bonds, Series A,
5.00%, 07/01/22 | | | 825,636 | |
| | 1,950,000 | | | Brookhaven Development Authority Revenue Bonds, Series A,
5.00%, 07/01/23 | | | 2,104,370 | |
| | 21,000,000 | | | Brookhaven Development Authority Revenue Bonds, Series A,
4.00%, 07/01/49 | | | 24,033,385 | |
| | 750,000 | | | Cherokee County Board of Education Advance Refunding GO, (State Aid Withholding),
5.00%, 02/01/23 | | | 794,725 | |
| Old Westbury Funds, Inc. | |
| Municipal Bond Fund | |
| Portfolio of Investments - (Continued) | October 31, 2021 |
| | |
Principal
Amount | | | | | Value | |
| Georgia (continued) | | | | |
| $ | 2,000,000 | | | City of Atlanta GA Department of Aviation Current Refunding Revenue Bonds, Series A,
5.00%, 07/01/24 | | $ | 2,244,186 | |
| | 5,000,000 | | | City of Atlanta GA Department of Aviation Current Refunding Revenue Bonds, Series A,
5.00%, 07/01/25 | | | 5,804,212 | |
| | 4,225,000 | | | City of Atlanta GA Department of Aviation Current Refunding Revenue Bonds, Series A,
5.00%, 07/01/26 | | | 5,056,720 | |
| | 11,445,000 | | | City of Atlanta GA Department of Aviation Current Refunding Revenue Bonds, Series A,
5.00%, 07/01/27 | | | 14,056,438 | |
| | 5,000,000 | | | City of Atlanta GA Department of Aviation Current Refunding Revenue Bonds, Series A,
5.00%, 07/01/28 | | | 6,285,355 | |
| | 1,400,000 | | | City of Atlanta GA Department of Aviation Current Refunding Revenue Bonds, Series B,
5.00%, 07/01/24 | | | 1,563,789 | |
| | 2,000,000 | | | City of Atlanta GA Department of Aviation Current Refunding Revenue Bonds, Series B,
5.00%, 07/01/25 | | | 2,306,710 | |
| | 2,000,000 | | | City of Atlanta GA Department of Aviation Current Refunding Revenue Bonds, Series B,
5.00%, 07/01/26 | | | 2,368,442 | |
| | 3,000,000 | | | City of Atlanta GA Department of Aviation Current Refunding Revenue Bonds, Series B,
5.00%, 07/01/27 | | | 3,636,431 | |
| | 3,000,000 | | | City of Atlanta GA Department of Aviation Current Refunding Revenue Bonds, Series B,
5.00%, 07/01/28 | | | 3,705,832 | |
| | 265,000 | | | City of Atlanta GA Department of Aviation Refunding Revenue Bonds, Series A,
5.00%, 07/01/22 | | | 273,528 | |
| | 1,500,000 | | | City of Atlanta GA Department of Aviation Refunding Revenue Bonds, Series B,
5.00%, 07/01/22 | | | 1,548,273 | |
Principal
Amount | | | | | Value | |
| Georgia (continued) | | | | |
| $ | 240,000 | | | City of Atlanta GA Department of Aviation Refunding Revenue Bonds, Series B,
5.00%, 07/01/23 | | $ | 258,957 | |
| | 820,000 | | | City of Atlanta GA Department of Aviation Refunding Revenue Bonds, Series B,
5.00%, 07/01/25 | | | 951,891 | |
| | 750,000 | | | City of Atlanta GA Department of Aviation Refunding Revenue Bonds, Series B,
5.00%, 07/01/26 | | | 897,643 | |
| | 1,000,000 | | | City of Atlanta GA Department of Aviation Refunding Revenue Bonds, Series B,
5.00%, 07/01/29 | | | 1,281,557 | |
| | 1,000,000 | | | City of Atlanta GA Department of Aviation Refunding Revenue Bonds, Series B,
5.00%, 07/01/30 | | | 1,305,488 | |
| | 1,350,000 | | | City of Atlanta GA Department of Aviation Refunding Revenue Bonds, Series C,
5.00%, 07/01/22 | | | 1,392,800 | |
| | 1,140,000 | | | City of Atlanta GA Department of Aviation Refunding Revenue Bonds, Series C,
5.00%, 07/01/23 | | | 1,228,854 | |
| | 1,230,000 | | | City of Atlanta GA Department of Aviation Refunding Revenue Bonds, Series C,
5.00%, 07/01/24 | | | 1,373,901 | |
| | 920,000 | | | City of Atlanta GA Department of Aviation Refunding Revenue Bonds, Series C,
5.00%, 07/01/25 | | | 1,061,087 | |
| | 1,250,000 | | | City of Atlanta GA Department of Aviation Refunding Revenue Bonds, Series C,
5.00%, 07/01/29 | | | 1,566,524 | |
| | 1,315,000 | | | City of Atlanta GA Department of Aviation Refunding Revenue Bonds, Series C,
5.00%, 07/01/30 | | | 1,675,855 | |
| | 1,725,000 | | | City of Atlanta GA Department of Aviation Refunding Revenue Bonds, Series C,
5.00%, 07/01/31 | | | 2,236,831 | |
| Old Westbury Funds, Inc. | |
| Municipal Bond Fund | |
| Portfolio of Investments - (Continued) | October 31, 2021 |
| | |
Principal
Amount | | | | | Value | |
| Georgia (continued) | | | | |
| $ | 1,400,000 | | | City of Atlanta GA Department of Aviation Refunding Revenue Bonds, Series C,
5.00%, 07/01/33 | | $ | 1,805,127 | |
| | 810,000 | | | Development Authority of Bulloch County Current Refunding Revenue Bonds,
5.00%, 08/01/22 | | | 838,256 | |
| | 6,010,000 | | | Gainesville & Hall County Hospital Authority Current Refunding Revenue Bonds,
5.00%, 02/15/25 | | | 6,886,445 | |
| | 3,000,000 | | | Gainesville & Hall County Hospital Authority Current Refunding Revenue Bonds,
5.00%, 02/15/26 | | | 3,539,256 | |
| | 1,000,000 | | | Gainesville & Hall County Hospital Authority Revenue Bonds, Series A,
5.00%, 02/15/24 | | | 1,104,748 | |
| | 1,000,000 | | | Gainesville & Hall County Hospital Authority Revenue Bonds, Series A,
5.00%, 02/15/30 | | | 1,284,329 | |
| | 1,750,000 | | | Georgia State Road & Tollway Authority Highway Improvements Revenue Bonds,
5.00%, 06/01/28 | | | 2,200,723 | |
| | 3,190,000 | | | Georgia State Road & Tollway Authority Highway Improvements Revenue Bonds,
5.00%, 06/01/29 | | | 4,094,870 | |
| | 3,800,000 | | | Georgia State Road & Tollway Authority Highway Improvements Revenue Bonds,
5.00%, 06/01/29 | | | 4,855,663 | |
| | 3,000,000 | | | Georgia State Road & Tollway Authority Highway Improvements Revenue Bonds,
5.00%, 06/01/30 | | | 3,901,924 | |
| | 3,935,000 | | | Lowndes County Board of Education School Improvements GO, (State Aid Withholding),
5.00%, 02/01/22 | | | 3,982,077 | |
| | 1,975,000 | | | Lowndes County Board of Education School Improvements GO, (State Aid Withholding),
5.00%, 02/01/23 | | | 2,092,776 | |
Principal
Amount | | | | | Value | |
| Georgia (continued) | | | | |
| $ | 1,555,000 | | | South Regional Joint Development Authority Advance Refunding Revenue Bonds, Series A,
5.00%, 08/01/26 | | $ | 1,852,751 | |
| | 1,100,000 | | | South Regional Joint Development Authority Advance Refunding Revenue Bonds, Series B,
5.00%, 08/01/26 | | | 1,310,628 | |
| | 3,265,000 | | | State of Georgia Advance Refunding GO, Series C-1,
5.00%, 01/01/24 | | | 3,596,424 | |
| | 1,950,000 | | | State of Georgia Public Improvements GO, Series A-2,
5.00%, 02/01/25 | | | 2,152,267 | |
| | 13,475,000 | | | State of Georgia School Improvements GO, Series A,
5.00%, 07/01/31 | | | 18,172,793 | |
| | 2,230,000 | | | State of Georgia School Improvements GO, Series A-1,
5.00%, 02/01/25 | | | 2,561,301 | |
| | 18,020,000 | | | State of Georgia University and College Improvements GO, Series A-1,
5.00%, 02/01/24 | | | 19,915,965 | |
| | | | | | | | 177,987,743 | |
| Hawaii — 4.1% | | | | |
| | 12,715,000 | | | City & County of Honolulu GO, Series E,
5.00%, 03/01/30 | | | 16,506,838 | |
| | 13,705,000 | | | City & County of Honolulu GO, Series E,
5.00%, 03/01/31 | | | 18,096,679 | |
| | 10,000,000 | | | City & County of Honolulu HI Refunding GO, Series A,
5.00%, 09/01/25 | | | 11,690,346 | |
| | 4,940,000 | | | City & County of Honolulu HI Transit Improvements GO, Series E,
5.00%, 09/01/29(b) | | | 5,298,141 | |
| | 3,000,000 | | | City & County of Honolulu Public Improvements Refunding GO, Series D,
5.00%, 08/01/23 | | | 3,250,127 | |
| | 12,260,000 | | | State of Hawaii Airports System Revenue Airport & Marina Improvements Revenue Bonds, Series A,
5.00%, 07/01/31 | | | 15,491,233 | |
| Old Westbury Funds, Inc. | |
| Municipal Bond Fund | |
| Portfolio of Investments - (Continued) | October 31, 2021 |
| | |
Principal
Amount | | | | | Value | |
| Hawaii (continued) | | | | |
| $ | 11,965,000 | | | State of Hawaii Airports System Revenue Airport & Marina Improvements Revenue Bonds, Series A,
5.00%, 07/01/32 | | $ | 15,116,670 | |
| | 5,865,000 | | | State of Hawaii Airports System Revenue Airport & Marina Improvements Revenue Bonds, Series A,
5.00%, 07/01/33 | | | 7,367,203 | |
| | 2,500,000 | | | State of Hawaii Airports System Revenue Airport & Marina Improvements Revenue Bonds, Series A,
5.00%, 07/01/35 | | | 3,032,594 | |
| | 2,000,000 | | | State of Hawaii Airports System Revenue Current Refunding Revenue Bonds, Series E,
1.71%, 07/01/26 | | | 2,001,005 | |
| | 2,250,000 | | | State of Hawaii Airports System Revenue Current Refunding Revenue Bonds, Series E,
1.81%, 07/01/27 | | | 2,239,831 | |
| | 10,000,000 | | | State of Hawaii Airports System Revenue Refunding Revenue Bonds, Series D,
5.00%, 07/01/33 | | | 12,717,597 | |
| | 1,500,000 | | | State of Hawaii Harbor System Revenue Airport & Marina Improvements Revenue Bonds, Series A,
5.00%, 07/01/26 | | | 1,780,103 | |
| | 4,165,000 | | | State of Hawaii Harbor System Revenue Airport & Marina Improvements Revenue Bonds, Series A,
5.00%, 07/01/27 | | | 5,053,677 | |
| | 7,330,000 | | | State of Hawaii Harbor System Revenue Airport & Marina Improvements Revenue Bonds, Series A,
5.00%, 07/01/28 | | | 9,091,568 | |
| | 3,915,000 | | | State of Hawaii Harbor System Revenue Airport & Marina Improvements Revenue Bonds, Series A,
5.00%, 07/01/29 | | | 4,951,684 | |
Principal
Amount | | | | | Value | |
| Hawaii (continued) | | | | |
| $ | 3,750,000 | | | State of Hawaii Harbor System Revenue Airport & Marina Improvements Revenue Bonds, Series A,
5.00%, 07/01/30 | | $ | 4,810,509 | |
| | 10,420,000 | | | State of Hawaii Harbor System Revenue Airport & Marina Improvements Revenue Bonds, Series A,
4.00%, 07/01/31 | | | 12,349,108 | |
| | 11,920,000 | | | State of Hawaii Harbor System Revenue Airport & Marina Improvements Revenue Bonds, Series A,
4.00%, 07/01/32 | | | 14,082,952 | |
| | 5,420,000 | | | State of Hawaii Public Improvements GO, Series EH,
5.00%, 08/01/33(a) | | | 5,863,934 | |
| | 2,515,000 | | | State of Hawaii Public Improvements GO, Series FK,
5.00%, 05/01/29 | | | 3,062,194 | |
| | 1,180,000 | | | University of Hawaii Advance Refunding Revenue Bonds, Series F,
5.00%, 10/01/22 | | | 1,231,943 | |
| | | | | | | | 175,085,936 | |
| Idaho — 0.1% | | | | |
| | 500,000 | | | Canyon County School District No 131 Nampa Advance Refunding GO, (School Board GTY),
5.00%, 09/15/24 | | | 565,733 | |
| | 900,000 | | | Canyon County School District No 131 Nampa Advance Refunding GO, (School Board GTY),
5.00%, 09/15/25 | | | 1,051,520 | |
| | 810,000 | | | Idaho Bond Bank Authority Current Refunding Revenue Bonds, Series D,
5.00%, 09/15/23 | | | 843,280 | |
| | 690,000 | | | Idaho Bond Bank Authority Current Refunding Revenue Bonds, Series D,
5.00%, 09/15/23(a) | | | 718,427 | |
| | | | | | | | 3,178,960 | |
| Illinois — 0.2% | | | | |
| | 250,000 | | | Glenview Park District Recreation Facilities Improvements GO,
5.00%, 12/01/25 | | | 291,262 | |
| Old Westbury Funds, Inc. | |
| Municipal Bond Fund | |
| Portfolio of Investments - (Continued) | October 31, 2021 |
| | |
Principal
Amount | | | | | Value | |
| Illinois (continued) | | | | |
| $ | 300,000 | | | Glenview Park District Recreation Facilities Improvements GO,
5.00%, 12/01/26 | | $ | 359,129 | |
| | 500,000 | | | Illinois State Toll Highway Authority Refunding Revenue Bonds, Series D,
5.00%, 01/01/24 | | | 549,381 | |
| | 3,250,000 | | | Metropolitan Water Reclamation District of Greater Chicago Current Refunding GO, Series A,
5.00%, 12/01/24 | | | 3,702,518 | |
| | 2,000,000 | | | Metropolitan Water Reclamation District of Greater Chicago Refunding GO, Series D,
5.00%, 12/01/22 | | | 2,102,055 | |
| | 850,000 | | | Peoria Metropolitan Airport Authority Advance Refunding GO, Series D,
5.00%, 12/01/24 | | | 969,194 | |
| | | | | | | | 7,973,539 | |
| Indiana — 0.3% | | | | |
| | 355,000 | | | Center Grove 2000 Building Corp. Current Refunding Revenue Bonds, (State Aid Intercept Program),
5.00%, 01/10/24 | | | 390,033 | |
| | 235,000 | | | Columbus Multi-High School Building Corp. Refunding Revenue Bonds, (State Aid Intercept Program),
5.00%, 07/15/22 | | | 242,799 | |
| | 1,330,000 | | | GCS School Building Corp. One, First Mortgage Refunding Revenue Bonds, (State Aid Intercept Program),
5.00%, 01/15/22 | | | 1,342,751 | |
| | 250,000 | | | GCS School Building Corp. One, First Mortgage Refunding Revenue Bonds, (State Aid Intercept Program),
5.00%, 07/15/22 | | | 258,242 | |
| | 7,025,000 | | | Indiana Finance Authority Health Care Facilities Revenue Bonds,
0.70%, 12/01/46(b) | | | 6,994,867 | |
| | 2,000,000 | | | Indiana Finance Authority University Health Obligated Group Revenue Bonds,
1.65%, 12/01/42(a)(b) | | | 2,004,668 | |
| | | | | | | | 11,233,360 | |
Principal
Amount | | | | | Value | |
| Iowa — 0.9% | | | |
| $ | 1,750,000 | | | Iowa Finance Authority Green Purpose Revenue Bonds, Series A,
5.00%, 08/01/27 | | $ | 2,162,413 | |
| | 1,425,000 | | | Iowa Finance Authority Green Purpose Revenue Bonds, Series A,
5.00%, 08/01/28 | | | 1,804,308 | |
| | 1,000,000 | | | Iowa Finance Authority Green Purpose Revenue Bonds, Series A,
5.00%, 08/01/29 | | | 1,293,912 | |
| | 1,210,000 | | | Iowa Finance Authority Green Purpose Revenue Bonds, Series A,
5.00%, 08/01/30 | | | 1,597,312 | |
| | 1,250,000 | | | Iowa Finance Authority Green Purpose Revenue Bonds, Series A,
5.00%, 08/01/31 | | | 1,680,545 | |
| | 2,360,000 | | | Iowa Finance Authority Green Purpose Revenue Bonds, Series A,
5.00%, 08/01/32 | | | 3,152,354 | |
| | 3,000,000 | | | State of Iowa Advance Refunding Revenue Bonds, Series A,
5.00%, 06/01/28 | | | 3,565,171 | |
| | 3,920,000 | | | State of Iowa Board of Regents Current Refunding Revenue Bonds,
5.00%, 09/01/24 | | | 4,430,059 | |
| | 4,325,000 | | | State of Iowa Board of Regents Current Refunding Revenue Bonds,
5.00%, 09/01/26 | | | 5,198,932 | |
| | 4,535,000 | | | State of Iowa Board of Regents Current Refunding Revenue Bonds,
5.00%, 09/01/27 | | | 5,585,933 | |
| | 4,785,000 | | | State of Iowa Board of Regents Current Refunding Revenue Bonds,
5.00%, 09/01/28 | | | 6,030,762 | |
| | | | | | | | 36,501,701 | |
| Kansas — 0.0% | | | | |
| | 1,260,000 | | | Sedgwick County Public Building Commission Technical Education Complex Refunding Revenue Bonds, Series 2,
5.00%, 08/01/23 | | | 1,364,128 | |
| Maine — 0.2% | | | | |
| | 725,000 | | | Maine Governmental Facilities Authority Facilities Improvements Revenue Bonds, Series A,
5.00%, 10/01/23 | | | 789,708 | |
| | 2,835,000 | | | State of Maine Highway Improvements GO, Series B,
5.00%, 06/01/28 | | | 3,571,354 | |
| Old Westbury Funds, Inc. | |
| Municipal Bond Fund | |
| Portfolio of Investments - (Continued) | October 31, 2021 |
| | |
Principal
Amount | | | | | Value | |
| Maine (continued) | | | | |
| $ | 3,400,000 | | | State of Maine Highway Improvements GO, Series B,
5.00%, 06/01/29 | | $ | 4,378,716 | |
| | | | | | | | 8,739,778 | |
| Maryland — 4.0% | | | | |
| | 5,735,000 | | | County of Anne Arundel School Improvements GO,
5.00%, 04/01/27 | | | 6,596,208 | |
| | 2,810,000 | | | County of Anne Arundel School Improvements GO,
5.00%, 04/01/28 | | | 3,223,699 | |
| | 1,200,000 | | | County of Baltimore 78th Issue Refunding GO,
5.00%, 02/01/29 | | | 1,412,208 | |
| | 3,835,000 | | | County of Baltimore 81st Issue Refunding GO,
5.00%, 03/01/23 | | | 4,080,227 | |
| | 2,730,000 | | | County of Baltimore Refunding GO,
5.00%, 03/01/23 | | | 2,904,569 | |
| | 2,000,000 | | | County of Baltimore Refunding GO,
5.00%, 03/01/27 | | | 2,444,486 | |
| | 340,000 | | | County of Frederick Crossover Pre-refunded Refunding GO, Series A,
5.00%, 02/01/25(a) | | | 389,063 | |
| | 1,160,000 | | | County of Frederick Crossover Refunding GO, Series A,
5.00%, 02/01/25 | | | 1,331,930 | |
| | 4,500,000 | | | County of Montgomery Advance Refunding GO, Series B,
5.00%, 06/01/23 | | | 4,838,888 | |
| | 2,000,000 | | | County of Montgomery Public Improvements GO, Series A,
5.00%, 12/01/27 | | | 2,272,424 | |
| | 10,000,000 | | | County of Montgomery Refunding GO, Series A,
5.00%, 08/01/27 | | | 12,350,311 | |
| | 10,000,000 | | | County of Montgomery Refunding GO, Series A,
5.00%, 08/01/28 | | | 12,639,395 | |
| | 10,000,000 | | | County of Montgomery Refunding GO, Series A,
5.00%, 08/01/31 | | | 13,400,928 | |
| | 3,500,000 | | | County of Montgomery Refunding GO, Series A,
5.00%, 11/01/23 | | | 3,830,654 | |
Principal
Amount | | | | | Value | |
| Maryland (continued) | | | | |
| $ | 3,185,000 | | | County of Prince George’s Public School Improvement GO, Series A,
5.00%, 09/15/25 | | $ | 3,733,235 | |
| | 3,110,000 | | | County of Prince George’s Public School Improvements GO, Series A,
5.00%, 07/01/24 | | | 3,495,901 | |
| | 1,000,000 | | | Maryland State Transportation Authority Highway Improvements Revenue Bonds, Series A,
5.00%, 07/01/23 | | | 1,078,815 | |
| | 945,000 | | | Maryland State Transportation Authority Highway Improvements Revenue Bonds, Series A,
5.00%, 07/01/24 | | | 1,061,721 | |
| | 2,750,000 | | | Maryland State Transportation Authority Highway Improvements Revenue Bonds, Series A,
5.00%, 07/01/29 | | | 3,542,915 | |
| | 1,000,000 | | | Maryland State Transportation Authority Highway Improvements Revenue Bonds, Series A,
5.00%, 07/01/30 | | | 1,311,232 | |
| | 9,255,000 | | | State of Maryland Advance Refunding GO, Series B,
5.00%, 08/01/25 | | | 10,802,061 | |
| | 6,000,000 | | | State of Maryland Department of Transportation Transit Improvements Revenue Bonds,
5.00%, 02/01/25 | | | 6,357,801 | |
| | 10,000,000 | | | State of Maryland Department of Transportation Transit Improvements Revenue Bonds,
5.00%, 11/01/26 | | | 11,354,056 | |
| | 8,035,000 | | | State of Maryland Public Improvements GO, Series A,
5.00%, 08/01/24(a) | | | 8,700,495 | |
| | 1,000,000 | | | State of Maryland Public Improvements GO, Series A,
5.00%, 03/15/25 | | | 1,152,665 | |
| | 7,015,000 | | | State of Maryland Refunding GO, Series 2-C,
5.00%, 08/01/23 | | | 7,597,303 | |
| Old Westbury Funds, Inc. | |
| Municipal Bond Fund | |
| Portfolio of Investments - (Continued) | October 31, 2021 |
| | |
Principal
Amount | | | | | Value | |
| Maryland (continued) | | | | |
| $ | 7,700,000 | | | State of Maryland School Improvements GO, 1st Series,
5.00%, 06/01/23 | | $ | 8,279,875 | |
| | 20,000,000 | | | State of Maryland School Improvements GO, Series A,
5.00%, 03/15/23 | | | 21,309,670 | |
| | 1,675,000 | | | University System of Maryland Current Refunding Revenue Bonds, Series A,
5.00%, 04/01/24 | | | 1,862,288 | |
| | 5,000,000 | | | Washington Suburban Sanitary Commission Water & Sewer System Improvements GO, 2nd Series, (County GTY),
5.00%, 06/01/25 | | | 5,806,136 | |
| | | | | | | | 169,161,159 | |
| Massachusetts — 3.4% | | | | |
| | 13,025,000 | | | Commonwealth of Massachusetts Advance Refunding GO, Series B,
5.00%, 07/01/31 | | | 15,495,801 | |
| | 9,330,000 | | | Commonwealth of Massachusetts Advance Refunding GO, Series C,
5.00%, 10/01/26 | | | 11,266,711 | |
| | 835,000 | | | Commonwealth of Massachusetts Advance Refunding GO, Series E,
5.00%, 11/01/23 | | | 913,709 | |
| | 15,000,000 | | | Commonwealth of Massachusetts Current Refunding GO, Series
A, 5.00%, 09/01/27 | | | 18,543,330 | |
| | 3,900,000 | | | Commonwealth of Massachusetts Highway Improvements Revenue Bonds, Series B,
5.00%, 06/15/22 | | | 4,017,152 | |
| | 2,000,000 | | | Commonwealth of Massachusetts Public Improvements GO, Series C,
5.00%, 07/01/32 | | | 2,307,784 | |
| | 8,000,000 | | | Commonwealth of Massachusetts Refunding GO, Series C, (AGM),
5.25%, 11/01/26 | | | 9,781,423 | |
| | 5,000,000 | | | Commonwealth of Massachusetts Transportation Fund Advance Refunding Revenue Bonds, Series A,
5.00%, 06/01/27 | | | 5,950,082 | |
Principal
Amount | | | | | Value | |
| Massachusetts (continued) | | | | |
| $ | 1,000,000 | | | Massachusetts Bay Transportation Authority Sales Tax Revenue Advance Refunding Revenue Bonds, Senior Series B,
5.00%, 07/01/33 | | $ | 1,151,168 | |
| | 2,000,000 | | | Massachusetts Bay Transportation Authority Sales Tax Revenue Transit Improvements Revenue Bonds, Series A-1,
5.00%, 07/01/24 | | | 2,245,891 | |
| | 1,500,000 | | | Massachusetts Bay Transportation Authority Sales Tax Revenue Transit Improvements Revenue Bonds, Series A-1,
5.00%, 07/01/25 | | | 1,743,045 | |
| | 1,000,000 | | | Massachusetts Bay Transportation Authority Sales Tax Revenue Transit Improvements Revenue Bonds, Series A-1,
5.00%, 07/01/26 | | | 1,198,384 | |
| | 1,000,000 | | | Massachusetts Bay Transportation Authority Sales Tax Revenue Transit Improvements Revenue Bonds, Series A-1,
5.00%, 07/01/28 | | | 1,260,747 | |
| | 7,280,000 | | | Massachusetts Clean Water Trust Advance Green Revenue Bond, Series 2020,
5.00%, 02/01/36 | | | 8,277,172 | |
| | 8,000,000 | | | Massachusetts Clean Water Trust Advance Green Revenue Bond, Sub Series 2017A,
5.00%, 02/01/33 | | | 8,452,189 | |
| | 2,265,000 | | | Massachusetts Clean Water Trust Revenue Bond, Series 23B,
5.00%, 02/01/29 | | | 2,902,183 | |
| | 2,380,000 | | | Massachusetts Clean Water Trust Revenue Bond, Series 23B,
5.00%, 02/01/30 | | | 3,113,036 | |
| | 5,035,000 | | | Massachusetts Clean Water Trust Revenue Bond, Series 23B,
5.00%, 02/01/32 | | | 6,678,939 | |
| | 5,000,000 | | | Massachusetts Development Finance Agency Advance Refunding Revenue Bonds, Series A,
5.00%, 07/15/33 | | | 5,953,132 | |
| | 10,000,000 | | | Massachusetts Development Finance Agency Advance Refunding Revenue Bonds, Series A,
5.00%, 10/15/27 | | | 12,450,306 | |
| Old Westbury Funds, Inc. | |
| Municipal Bond Fund | |
| Portfolio of Investments - (Continued) | October 31, 2021 |
| | |
Principal
Amount | | | | | Value | |
| Massachusetts (continued) | | | | |
| $ | 4,050,000 | | | Massachusetts Development Finance Agency Current Refunding Revenue Bonds, Series A,
5.00%, 10/15/26 | | $ | 4,911,447 | |
| | 3,500,000 | | | Massachusetts Development Finance Agency University & College Improvements Revenue Bonds,
0.45%, 07/01/41(b) | | | 3,477,386 | |
| | 5,450,000 | | | Massachusetts Housing Finance Agency STATE MF HSG Revenue Bonds, Series B-2,
0.90%, 06/01/26 | | | 5,447,345 | |
| | 3,500,000 | | | Massachusetts School Building Authority Refunding Revenue Bonds, Senior Series A,
5.00%, 08/15/23 | | | 3,631,908 | |
| | 500,000 | | | Massachusetts Water Resources Authority Refunding Revenue Bonds, Series A,
5.00%, 08/01/22 | | | 518,019 | |
| | 3,050,000 | | | Massachusetts Water Resources Authority Refunding Revenue Bonds, Series C,
5.00%, 08/01/22 | | | 3,159,919 | |
| | | | | | | | 144,848,208 | |
| Michigan — 0.2% | | | | |
| | 225,000 | | | Allegan Public School District Current Refunding GO, (Q-SBLF),
5.00%, 05/01/25 | | | 259,790 | |
| | 950,000 | | | L’Anse Creuse Public Schools Current Refunding GO, (Q-SBLF),
5.00%, 05/01/23 | | | 1,015,939 | |
| | 1,000,000 | | | Michigan State Building Authority Current Refunding Revenue Bonds, (Facilities Program),
5.00%, 04/15/24 | | | 1,114,027 | |
| | 1,000,000 | | | Michigan State University Refunding Revenue Bonds, Series A,
5.00%, 08/15/31 | | | 1,151,058 | |
| | 1,000,000 | | | University of Michigan Advance Refunding Revenue Bonds, Series A,
5.00%, 04/01/22 | | | 1,020,078 | |
| | 3,000,000 | | | University of Michigan University & College Improvements Revenue Bonds, Series A,
5.00%, 04/01/26 | | | 3,574,341 | |
Principal
Amount | | | | | Value | |
| Michigan (continued) | | | | |
| $ | 290,000 | | | Wayne-Westland Community Schools Improvements GO, (Q-SBLF),
5.00%, 11/01/22 | | $ | 303,707 | |
| | | | | | | | 8,438,940 | |
| Minnesota — 1.5% | | | | |
| | 600,000 | | | Cambridge-Isanti Independent School District No 911 Crossover Refunding GO, Series D, (School District Credit Program),
5.00%, 02/01/25 | | | 686,205 | |
| | 1,515,000 | | | Cambridge-Isanti Independent School District No 911 School Building Refunding GO, Series D, (School District Credit Program),
5.00%, 02/01/24 | | | 1,670,793 | |
| | 2,000,000 | | | City of Rochester Advance Refunding GO, Series B,
5.00%, 12/01/24 | | | 2,282,443 | |
| | 10,000,000 | | | Metropolitan Council Transit Improvements GO, Series B,
5.00%, 12/01/23 | | | 10,980,070 | |
| | 1,815,000 | | | Minnesota Public Facilities Authority Advance Refunding Revenue Bonds, Series B,
5.00%, 03/01/27 | | | 2,151,817 | |
| | 2,535,000 | | | Robbinsdale Independent School District No 281 Current Refunding GO, Series A, (School District Credit Program),
5.00%, 02/01/23 | | | 2,685,842 | |
| | 2,805,000 | | | Robbinsdale Independent School District No 281 Current Refunding GO, Series A, (School District Credit Program),
5.00%, 02/01/24 | | | 3,094,783 | |
| | 2,200,000 | | | Sartell-St Stephen Independent School District No 748 GO, Series A, (School District Credit Program),
5.00%, 02/01/25 | | | 2,519,921 | |
| | 1,500,000 | | | State of Minnesota Advance Refunding GO, Series D,
5.00%, 08/01/25 | | | 1,750,130 | |
| | 2,335,000 | | | State of Minnesota Advance Refunding GO, Series D,
5.00%, 08/01/23 | | | 2,530,541 | |
| | 2,870,000 | | | State of Minnesota Highway Improvements GO, Series B,
5.00%, 10/01/23 | | | 3,132,524 | |
| Old Westbury Funds, Inc. | |
| Municipal Bond Fund | |
| Portfolio of Investments - (Continued) | October 31, 2021 |
| | |
Principal
Amount | | | | | Value | |
| Minnesota (continued) | | | | |
| $ | 1,395,000 | | | State of Minnesota Public Improvements COP,
5.00%, 06/01/24 | | $ | 1,561,860 | |
| | 2,910,000 | | | State of Minnesota Public Improvements COP,
5.00%, 06/01/26 | | | 3,241,312 | |
| | 10,000,000 | | | State of Minnesota School Improvements GO, Series A,
5.00%, 09/01/29 | | | 12,943,286 | |
| | 8,260,000 | | | State of Minnesota School Improvements GO, Series A,
5.00%, 09/01/30 | | | 10,905,103 | |
| | 1,000,000 | | | Waconia Independent School District No 110 Refunding GO, Series A, (School District Credit Program),
5.00%, 02/01/24 | | | 1,103,310 | |
| | | | | | | | 63,239,940 | |
| Mississippi — 0.3% | | | | |
| | 2,310,000 | | | Mississippi Development Bank Harrison County Highway Refunding Revenue Bonds, Series A,
5.00%, 01/01/25 | | | 2,635,287 | |
| | 10,000,000 | | | State of Mississippi Public Improvements GO, Series B,
5.00%, 12/01/31(a) | | | 10,980,069 | |
| | | | | | | | 13,615,356 | |
| Missouri — 0.0% | | | | |
| | 905,000 | | | Missouri State Environmental Improvement & Energy Resources Authority Advance Refunding Revenue Bonds, Series B,
5.00%, 01/01/25 | | | 1,033,668 | |
| | 500,000 | | | North Kansas City School District No 74 School Improvements Refunding GO, (State Aid Direct Deposit),
5.00%, 03/01/24 | | | 554,330 | |
| | | | | | | | 1,587,998 | |
| Montana — 0.0% | | | | |
| | 1,000,000 | | | State of Montana Public Facilities GO, Series G,
5.00%, 08/01/27 | | | 1,234,398 | |
| | | | | | | | | |
| New Hampshire — 0.2% | | | | |
| | 3,990,000 | | | State of New Hampshire Public Improvements GO, Series B,
5.00%, 12/01/21 | | | 4,005,608 | |
Principal
Amount | | | | | Value | |
| New Hampshire (continued) | | | | |
| $ | 3,990,000 | | | State of New Hampshire Public Improvements GO, Series B,
5.00%, 12/01/22 | | $ | 4,197,176 | |
| | | | | | | | 8,202,784 | |
| New Jersey — 3.9% | | | | |
| | 1,060,000 | | | County of Ocean Current Refunding GO, Series B,
4.00%, 08/01/24 | | | 1,166,105 | |
| | 1,825,000 | | | County of Ocean Public Improvements GO, Series A,
5.00%, 08/01/24 | | | 2,057,542 | |
| | 1,255,000 | | | County of Ocean Public Improvements GO, Series A,
5.00%, 08/01/25 | | | 1,465,805 | |
| | 1,340,000 | | | County of Ocean Public Improvements GO, Series A,
5.00%, 08/01/27 | | | 1,656,640 | |
| | 1,000,000 | | | Monmouth County Improvement Authority Cash Flow Management Revenue Bonds, Series B, (County GTY),
5.00%, 12/01/23 | | | 1,097,567 | |
| | 1,000,000 | | | Monmouth County Improvement Authority Cash Flow Management Revenue Bonds, Series B, (County GTY),
5.00%, 12/01/24 | | | 1,140,890 | |
| | 200,000 | | | Monmouth County Improvement Authority Refunding Revenue Bonds (County GTY, Municipal Government GTY),
5.00%, 12/01/22 | | | 210,318 | |
| | 5,000,000 | | | New Jersey Economic Development Authority Advance Refunding Revenue Bonds, Series B,
5.00%, 11/01/21 | | | 5,000,000 | |
| | 5,095,000 | | | New Jersey Educational Facilities Authority Current Refunding Revenue Bonds, Series C,
5.00%, 03/01/31 | | | 6,806,772 | |
| | 4,920,000 | | | New Jersey Educational Facilities Authority University & College Improvements Revenue Bonds, Series A,
5.00%, 09/01/22 | | | 5,111,023 | |
| | 12,500,000 | | | New Jersey Health Care Facilities Financing Authority Revenue Bonds,
5.00%, 07/01/24 | | | 14,040,376 | |
| Old Westbury Funds, Inc. | |
| Municipal Bond Fund | |
| Portfolio of Investments - (Continued) | October 31, 2021 |
| | |
Principal
Amount | | | | | Value | |
| New Jersey (continued) | | | | |
| $ | 7,500,000 | | | New Jersey Health Care Facilities Financing Authority Revenue Bonds,
5.00%, 07/01/25 | | $ | 8,724,142 | |
| | 1,675,000 | | | New Jersey Health Care Facilities Financing Authority Revenue Bonds,
5.00%, 07/01/26 | | | 2,009,000 | |
| | 1,000,000 | | | New Jersey Health Care Facilities Financing Authority Revenue Bonds,
5.00%, 07/01/26 | | | 1,199,913 | |
| | 1,000,000 | | | New Jersey Health Care Facilities Financing Authority Revenue Bonds,
5.00%, 07/01/27 | | | 1,231,907 | |
| | 1,055,000 | | | New Jersey Health Care Facilities Financing Authority Revenue Bonds,
5.00%, 07/01/29 | | | 1,356,505 | |
| | 1,000,000 | | | New Jersey Health Care Facilities Financing Authority Revenue Bonds,
5.00%, 07/01/30 | | | 1,309,314 | |
| | 1,500,000 | | | New Jersey Health Care Facilities Financing Authority Revenue Bonds,
5.00%, 07/01/30 | | | 1,959,664 | |
| | 1,040,000 | | | New Jersey Health Care Facilities Financing Authority Revenue Bonds,
5.00%, 07/01/31 | | | 1,382,450 | |
| | 1,500,000 | | | New Jersey Health Care Facilities Financing Authority Revenue Bonds,
5.00%, 07/01/23 | | | 1,616,129 | |
| | 1,000,000 | | | New Jersey Health Care Facilities Financing Authority RWJ Barnabas Health System Obligated Group Refunding Revenue Bonds,
5.00%, 07/01/23 | | | 1,078,989 | |
| | 4,455,000 | | | New Jersey Infrastructure Bank Green Purpose Revenue Bonds,
5.00%, 09/01/26 | | | 5,378,750 | |
| | 10,300,000 | | | New Jersey Transportation Trust Fund Authority Current Refunding Revenue Bonds, Series A,
5.00%, 06/15/23 | | | 11,062,760 | |
Principal
Amount | | | | | Value | |
| New Jersey (continued) | | | | |
| $ | 5,000,000 | | | New Jersey Transportation Trust Fund Authority Refunding Revenue Bonds, (NATL-RE),
5.25%, 12/15/21 | | $ | 5,029,871 | |
| | 2,000,000 | | | New Jersey Transportation Trust Fund Authority Refunding Revenue Bonds, Series A,
5.25%, 12/15/21 | | | 2,011,948 | |
| | 3,860,000 | | | New Jersey Transportation Trust Fund Authority Refunding Revenue Bonds, Series A,
5.50%, 12/15/21 | | | 3,884,211 | |
| | 7,750,000 | | | New Jersey Transportation Trust Fund Authority Refunding Revenue Bonds, Series B, (NATL-RE),
5.50%, 12/15/21 | | | 7,798,611 | |
| | 100,000 | | | New Jersey Transportation Trust Fund Authority Refunding Revenue Bonds, Series D,
5.00%, 12/15/23 | | | 109,695 | |
| | 1,770,000 | | | New Jersey Transportation Trust Fund Authority Transit Improvements Refunding Revenue Bonds, Series A,
5.25%, 12/15/22 | | | 1,867,210 | |
| | 9,000,000 | | | New Jersey Turnpike Authority Advance Refunding Revenue Bonds, Series B,
1.28%, 01/01/27 | | | 8,890,826 | |
| | 5,500,000 | | | New Jersey Turnpike Authority Advance Refunding Revenue Bonds, Series B,
1.81%, 01/01/30 | | | 5,400,446 | |
| | 3,500,000 | | | New Jersey Turnpike Authority Advance Refunding Revenue Bonds, Series B,
1.86%, 01/01/31 | | | 3,409,615 | |
| | 1,000,000 | | | New Jersey Turnpike Authority Advance Refunding Revenue Bonds, Series B,
5.00%, 01/01/27 | | | 1,210,149 | |
| | 2,380,000 | | | New Jersey Turnpike Authority Current Refunding Revenue Bonds, Series C,
5.00%, 01/01/25 | | | 2,712,723 | |
| | 2,775,000 | | | New Jersey Turnpike Authority Highway Improvements Revenue Bonds Series A,
5.00%, 01/01/27 | | | 3,358,163 | |
| Old Westbury Funds, Inc. | |
| Municipal Bond Fund | |
| Portfolio of Investments - (Continued) | October 31, 2021 |
| | |
Principal
Amount | | | | | Value | |
| New Jersey (continued) | | | | |
| $ | 2,145,000 | | | New Jersey Turnpike Authority Highway Improvements Revenue Bonds Series A,
5.00%, 01/01/29 | | $ | 2,392,316 | |
| | 2,500,000 | | | New Jersey Turnpike Authority Highway Improvements Revenue Bonds Series A,
5.00%, 01/01/29 | | | 3,008,953 | |
| | 3,250,000 | | | New Jersey Turnpike Authority Highway Improvements Revenue Bonds, Series E,
5.00%, 01/01/32 | | | 3,688,966 | |
| | 3,000,000 | | | New Jersey Turnpike Authority Highway Improvements Revenue Bonds, Series E,
5.00%, 01/01/33 | | | 3,404,188 | |
| | 4,000,000 | | | New Jersey Turnpike Authority Highway Improvements Revenue Bonds,Series A,
5.00%, 01/01/34 | | | 4,789,896 | |
| | 2,000,000 | | | Rutgers The State University of New Jersey Advance Refunding Revenue Bonds, Series S,
1.66%, 05/01/28 | | | 1,989,016 | |
| | 20,000,000 | | | State of New Jersey COVID-19 GO, Series A,
5.00%, 06/01/24 | | | 22,277,056 | |
| | | | | | | | 165,296,420 | |
| New Mexico — 0.0% | | | | |
| | 500,000 | | | Albuquerque Municipal School District No 12 School Improvements GO, Series 2017, (State Aid Withholding),
5.00%, 08/01/24 | | | 562,976 | |
| | 1,000,000 | | | Hobbs School District No 16 School Improvements GO, Series A, (State Aid Withholding),
5.00%, 09/15/28 | | | 1,124,731 | |
| | | | | | | | 1,687,707 | |
| New York — 14.0% | | | | |
| | 10,000 | | | City of New York Advance Refunding GO, Series C,
5.00%, 08/01/26 | | | 11,997 | |
| | 30,000,000 | | | City of New York Advance Refunding GO, Series C,
5.00%, 08/01/22 | | | 31,083,480 | |
| | 15,000,000 | | | City of New York Current Refunding GO, Series E,
5.00%, 08/01/23 | | | 16,245,125 | |
Principal
Amount | | | | | Value | |
| New York (continued) | | | | |
| $ | 9,400,000 | | | City of New York Current Refunding GO, Series E,
5.00%, 08/01/24 | | $ | 10,575,670 | |
| | 8,000,000 | | | City of New York GO, Sub-Series B-3,
0.12%, 10/01/46(b) | | | 8,000,000 | |
| | 1,400,000 | | | City of New York Public Improvements GO, Series I, Subseries I-A,
5.00%, 04/01/28(c) | | | 1,748,658 | |
| | 2,000,000 | | | City of New York Public Improvements GO, Series I, Subseries I-A,
5.00%, 04/01/29(c) | | | 2,550,464 | |
| | 2,910,000 | | | City of New York Public Improvements GO, Sub-Series D-1,
5.00%, 08/01/22 | | | 3,015,098 | |
| | 32,750,000 | | | City of New York Public Improvements GO, Sub-Series D-3,
5.00%, 08/01/38(b)(c) | | | 35,197,460 | |
| | 2,135,000 | | | City of New York Public Improvements GO, Sub-Series F-1,
5.00%, 03/01/24 | | | 2,268,561 | |
| | 650,000 | | | City of New York Refunding GO, Series C,
5.00%, 08/01/22 | | | 673,475 | |
| | 3,575,000 | | | City of New York Refunding GO, Series F,
5.00%, 08/01/29 | | | 3,617,679 | |
| | 18,500,000 | | | City of New York Refunding GO, Series G,
5.00%, 08/01/22 | | | 19,168,146 | |
| | 5,000,000 | | | City of New York Refunding GO, Series I,
5.00%, 08/01/25 | | | 5,405,865 | |
| | 9,450,000 | | | City of New York Refunding GO, Series J, Sub-Series J11,
5.00%, 08/01/25(c) | | | 11,002,818 | |
| | 4,000,000 | | | Long Island Power Authority Revenue Bonds, Series A,
5.00%, 09/01/30 | | | 5,230,103 | |
| | 4,000,000 | | | Long Island Power Authority Revenue Bonds, Series A,
5.00%, 09/01/31 | | | 5,312,864 | |
| | 2,055,000 | | | Metropolitan Transportation Authority Advance Refunding Revenue Bonds, Series A,
5.25%, 11/15/31 | | | 2,478,176 | |
| Old Westbury Funds, Inc. | |
| Municipal Bond Fund | |
| Portfolio of Investments - (Continued) | October 31, 2021 |
| | |
Principal
Amount | | | | | Value | |
| New York (continued) | | | | |
| $ | 240,000 | | | Metropolitan Transportation Authority Current Refunding Revenue Bonds, Series D,
5.00%, 11/15/28 | | $ | 283,803 | |
| | 1,020,000 | | | Metropolitan Transportation Authority Current Refunding Revenue Bonds, Series D,
5.00%, 11/15/29 | | | 1,199,958 | |
| | 3,020,000 | | | Metropolitan Transportation Authority Current Refunding Revenue Bonds, Series F,
5.00%, 11/15/30 | | | 3,152,592 | |
| | 24,820,000 | | | Metropolitan Transportation Authority Refunding Revenue Bonds, Series D-1,
5.00%, 09/01/22 | | | 25,782,798 | |
| | 1,925,000 | | | Metropolitan Transportation Authority Refunding Revenue Bonds, Series F,
5.00%, 11/15/21 | | | 1,928,329 | |
| | 1,910,000 | | | Metropolitan Transportation Authority Transit Improvements Revenue Bonds, Series C,
5.00%, 11/15/21 | | | 1,913,259 | |
| | 2,045,000 | | | New York City Transitional Finance Authority Building Aid Pre-refunded Revenue Bonds, Series S, (State Aid Withholding),
5.00%, 07/15/24(a) | | | 2,296,948 | |
| | 455,000 | | | New York City Transitional Finance Authority Building Aid Revenue Bonds, Series S-1, (State Aid Withholding),
5.00%, 07/15/24 | | | 511,753 | |
| | 700,000 | | | New York City Transitional Finance Authority Building Aid Revenue Public Improvements Revenue Bonds, Series S, (State Aid Withholding),
5.00%, 07/15/26 | | | 800,820 | |
| | 1,850,000 | | | New York City Transitional Finance Authority Building Aid Revenue Refunding Revenue Bonds, Sub-Series S-4A, (State Aid Withholding),
5.00%, 07/15/25 | | | 2,153,646 | |
Principal
Amount | | | | | Value | |
| New York (continued) | | | | |
| $ | 1,670,000 | | | New York City Transitional Finance Authority Building Aid Revenue School Improvements Revenue Bonds, Series S1, (State Aid Withholding),
5.00%, 07/15/24 | | $ | 1,878,301 | |
| | 3,270,000 | | | New York City Transitional Finance Authority Building Aid Revenue School Improvements Revenue Bonds, Series S1, (State Aid Withholding),
5.00%, 07/15/28 | | | 4,110,534 | |
| | 2,750,000 | | | New York City Transitional Finance Authority Building Aid Revenue School Improvements Revenue Bonds, Series S1, (State Aid Withholding),
5.00%, 07/15/29 | | | 3,528,035 | |
| | 1,350,000 | | | New York City Transitional Finance Authority Future Tax Secured Advanced Refunding Revenue Bonds, Series C,
5.00%, 11/01/23 | | | 1,476,684 | |
| | 10,000,000 | | | New York City Transitional Finance Authority Future Tax Secured Refunding Revenue Bonds, Sub- Series B,
5.00%, 11/01/21 | | | 10,000,000 | |
| | 2,425,000 | | | New York City Transitional Finance Authority Future Tax Secured Refunding Revenue Bonds, Sub- Series G,
5.00%, 11/01/21 | | | 2,425,000 | |
| | 1,535,000 | | | New York City Transitional Finance Authority Future Tax Secured Refunding Revenue Bonds, Sub- Series H,
5.00%, 11/01/21 | | | 1,535,000 | |
| | 4,000,000 | | | New York City Transitional Finance Authority Future Tax Secured Revenue Current Refunding Revenue Bonds,
5.00%, 11/01/21 | | | 4,000,000 | |
| | 9,500,000 | | | New York City Transitional Finance Authority Future Tax Secured Revenue Current Refunding Revenue Bonds,
5.00%, 11/01/22 | | | 9,955,880 | |
| Old Westbury Funds, Inc. | |
| Municipal Bond Fund | |
| Portfolio of Investments - (Continued) | October 31, 2021 |
| | |
Principal
Amount | | | | | Value | |
| New York (continued) | | | | |
| $ | 4,210,000 | | | New York City Transitional Finance Authority Future Tax Secured Revenue Public Improvements Revenue Bonds,
5.00%, 02/01/29 | | $ | 4,640,930 | |
| | 9,000,000 | | | New York City Transitional Finance Authority Future Tax Secured Revenue Public Improvements Revenue Bonds,
5.00%, 02/01/31 | | | 10,855,578 | |
| | 1,000,000 | | | New York City Transitional Finance Authority Future Tax Secured Revenue Public Improvements Revenue Bonds, Series C1,
5.00%, 11/01/30 | | | 1,272,677 | |
| | 10,500,000 | | | New York City Transitional Finance Authority Future Tax Secured Revenue Refunding Revenue Bonds, Series A-1,
5.00%, 11/01/33 | | | 13,884,807 | |
| | 3,545,000 | | | New York City Water & Sewer System Current Refunding Revenue Bonds, Series AA,
5.00%, 06/15/24 | | | 3,974,001 | |
| | 1,000,000 | | | New York City Water & Sewer System Current Refunding Revenue Bonds, Series DD,
5.00%, 06/15/29 | | | 1,286,312 | |
| | 500,000 | | | New York City Water & Sewer System Current Refunding Revenue Bonds, Series EE,
5.00%, 06/15/29 | | | 587,168 | |
| | 1,000,000 | | | New York City Water & Sewer System Refunding Revenue Bonds, Series DD-2,
5.00%, 06/15/25 | | | 1,098,626 | |
| | 2,350,000 | | | New York City Water & Sewer System Water Utility Improvements Revenue Bonds, Series AA-2,
5.00%, 06/15/30 | | | 3,080,991 | |
| | 6,200,000 | | | New York City Water & Sewer System Water Utility Improvements Revenue Bonds, Series BB-2,
5.00%, 06/15/25 | | | 6,811,479 | |
| | 1,000,000 | | | New York City Water & Sewer System Water Utility Improvements Revenue Bonds, Series DD-2,
5.00%, 06/15/24 | | | 1,053,639 | |
Principal
Amount | | | | | Value | |
| New York (continued) | | | | |
| $ | 5,000,000 | | | New York Municipal Bond Bank Agency Refunding Revenue Bonds, (State Aid Withholding),
5.00%, 12/01/21 | | $ | 5,019,642 | |
| | 150,000 | | | New York State Dormitory Authority Advance Refunding Revenue Bonds,
5.00%, 08/15/23 | | | 160,984 | |
| | 9,100,000 | | | New York State Dormitory Authority Advance Refunding Revenue Bonds, Series A,
5.00%, 03/15/23 | | | 9,690,700 | |
| | 7,790,000 | | | New York State Dormitory Authority Advance Refunding Revenue Bonds, Series E,
5.00%, 03/15/22 | | | 7,929,381 | |
| | 2,000,000 | | | New York State Dormitory Authority Advance Refunding Revenue Bonds, Series E,
5.00%, 03/15/31 | | | 2,320,035 | |
| | 8,770,000 | | | New York State Dormitory Authority Public Improvement Revenue Bonds, Series A-Group A,
5.00%, 03/15/22 | | | 8,926,915 | |
| | 5,000,000 | | | New York State Dormitory Authority Public Improvements Revenue Bonds, Series B,
5.00%, 02/15/28 | | | 5,706,263 | |
| | 4,660,000 | | | New York State Dormitory Authority Refunding Revenue Bonds, Series A,
5.00%, 02/15/26 | | | 5,143,617 | |
| | 6,600,000 | | | New York State Dormitory Authority School Improvement Refunding Revenue Bonds, Series E,
5.00%, 03/15/30 | | | 8,284,843 | |
| | 12,000,000 | | | New York State Dormitory Authority School Improvement Revenue Bonds, Group 2, Series A,
5.00%, 03/15/29 | | | 14,933,322 | |
| | 1,000,000 | | | New York State Dormitory Authority School Improvement Revenue Bonds, Series A,
5.00%, 02/15/27 | | | 1,204,201 | |
| | 6,290,000 | | | New York State Dormitory Authority School Improvement Revenue Bonds, Series A,
5.00%, 03/15/27 | | | 7,686,778 | |
| Old Westbury Funds, Inc. | |
| Municipal Bond Fund | |
| Portfolio of Investments - (Continued) | October 31, 2021 |
| | |
Principal
Amount | | | | | Value | |
| New York (continued) | | | | |
| $ | 5,200,000 | | | New York State Dormitory Authority School Improvement Revenue Bonds, Series A,
5.00%, 03/15/25 | | $ | 5,771,302 | |
| | 22,680,000 | | | New York State Dormitory Authority School Improvement Revenue Bonds, Series C,
5.00%, 03/15/27 | | | 27,716,396 | |
| | 13,375,000 | | | New York State Dormitory Authority School Improvement Revenue Bonds, Series D,
5.00%, 02/15/25 | | | 15,338,358 | |
| | 6,325,000 | | | New York State Dormitory Authority School Improvements Revenue Bonds, Series C,
5.00%, 03/15/30 | | | 7,826,274 | |
| | 7,305,000 | | | New York State Dormitory Authority University & College Improvements Revenue Bonds, Series A,
5.00%, 03/15/22 | | | 7,435,703 | |
| | 1,750,000 | | | New York State Dormitory Authority University and College Improvements Revenue Bonds, Series A,
5.00%, 03/15/26 | | | 1,939,625 | |
| | 7,500,000 | | | New York State Environmental Facilities Corp. Current Refunding Revenue Bonds,
5.00%, 06/15/29 | | | 9,653,672 | |
| | 2,250,000 | | | New York State Environmental Facilities Corp. Current Refunding Revenue Bonds,
5.00%, 06/15/30 | | | 2,952,037 | |
| | 5,000,000 | | | New York State Environmental Facilities Corp. Current Refunding Revenue Bondss,
5.00%, 06/15/29 | | | 5,599,495 | |
| | 10,000,000 | | | New York State Thruway Authority Refunding Revenue Bonds, Series O,
5.00%, 01/01/33 | | | 13,094,188 | |
| | 2,000,000 | | | New York State Urban Development Corp. Advance Refunding Revenue Bonds, Series A,
5.00%, 03/15/24 | | | 2,220,428 | |
| | 2,105,000 | | | New York State Urban Development Corp. Advance Refunding Revenue Bonds, Series A,
5.00%, 03/15/27 | | | 2,486,579 | |
Principal
Amount | | | | | Value | |
| New York (continued) | | | | |
| $ | 1,000,000 | | | New York State Urban Development Corp. Current Refunding Revenue Bonds, Series A,
5.00%, 03/15/28 | | $ | 1,165,429 | |
| | 4,000,000 | | | New York State Urban Development Corp. Economic Improvements Revenue Bonds,
5.00%, 03/15/28 | | | 5,000,537 | |
| | 5,000,000 | | | New York State Urban Development Corp. Economic Improvements Revenue Bonds,
5.00%, 03/15/29 | | | 6,392,659 | |
| | 5,000,000 | | | New York State Urban Development Corp. Economic Improvements Revenue Bonds,
5.00%, 03/15/31 | | | 6,482,962 | |
| | 10,000,000 | | | New York State Urban Development Corp. Economic Improvements Revenue Bonds,
5.00%, 03/15/32 | | | 12,911,306 | |
| | 5,875,000 | | | New York State Urban Development Corp. Personal Income Tax Advance Refunding Revenue, Series A,
5.00%, 03/15/25 | | | 6,764,760 | |
| | 5,605,000 | | | New York State Urban Development Corp. Personal Income Tax Economic Improvements Revenue Bonds, Series C,
5.00%, 03/15/22 | | | 5,705,286 | |
| | 4,705,000 | | | New York State Urban Development Corp. Public Improvement Revenue Bonds, Series A-1,
5.00%, 03/15/22 | | | 4,789,183 | |
| | 10,000,000 | | | New York State Urban Development Corp. Transit Improvements Refunding Revenue Bonds, Series A,
5.00%, 03/15/30 | | | 13,023,160 | |
| | 3,500,000 | | | Port Authority of New York & New Jersey Current Refunding Revenue Bonds, Series 223,
5.00%, 07/15/30 | | | 4,472,994 | |
| | 8,000,000 | | | Port Authority of New York & New Jersey Current Refunding Revenue Bonds, Series 223,
5.00%, 07/15/32 | | | 10,313,653 | |
| Old Westbury Funds, Inc. | |
| Municipal Bond Fund | |
| Portfolio of Investments - (Continued) | October 31, 2021 |
| | |
Principal
Amount | | | | | Value | |
| New York (continued) | | | | |
| $ | 5,715,000 | | | Port Authority of New York & New Jersey Refunding Revenue Bonds, Series 179,
5.00%, 12/01/27 | | $ | 6,265,060 | |
| | 5,880,000 | | | Port Authority of New York & New Jersey Refunding Revenue Bonds, Series 179,
5.00%, 12/01/28 | | | 6,440,779 | |
| | 3,270,000 | | | Port Authority of New York & New Jersey Refunding Revenue Bonds, Series 221,
5.00%, 07/15/22 | | | 3,378,045 | |
| | 3,800,000 | | | Port Authority of New York & New Jersey Refunding Revenue Bonds, Series 221,
5.00%, 07/15/23 | | | 4,097,458 | |
| | 1,000,000 | | | Port Authority of New York & New Jersey Refunding Revenue Bonds, Series 221,
5.00%, 07/15/24 | | | 1,119,150 | |
| | 4,195,000 | | | Port Authority of New York & New Jersey Refunding Revenue Bonds, Series 221,
5.00%, 07/15/25 | | | 4,850,631 | |
| | 4,885,000 | | | Port Authority of New York & New Jersey Refunding Revenue Bonds, Series 221,
5.00%, 07/15/26 | | | 5,803,301 | |
| | 5,255,000 | | | Port Authority of New York & New Jersey Refunding Revenue Bonds, Series 221,
5.00%, 07/15/27 | | | 6,381,616 | |
| | 5,750,000 | | | Port Authority of New York & New Jersey Refunding Revenue Bonds, Series 221,
5.00%, 07/15/29 | | | 7,253,584 | |
| | 1,600,000 | | | Utility Debt Securitization Authority Restructuring Refunding Revenue Bonds,
5.00%, 12/15/24 | | | 1,684,894 | |
| | | | | | | | 594,402,372 | |
| North Carolina — 2.2% | | | | |
| | 1,260,000 | | | City of Durham NC Water & Sewer Utility System Revenue Refunding Revenue Bonds,
5.00%, 08/01/26 | | | 1,516,899 | |
| | 1,680,000 | | | City of Durham NC Water & Sewer Utility System Revenue Refunding Revenue Bonds,
5.00%, 08/01/27 | | | 2,073,789 | |
Principal
Amount | | | | | Value | |
| North Carolina (continued) | | | | |
| $ | 1,300,000 | | | City of Durham NC Water & Sewer Utility System Revenue Refunding Revenue Bonds,
5.00%, 08/01/28 | | $ | 1,644,092 | |
| | 750,000 | | | City of Winston-Salem Current Refunding Revenue Bonds, Series C,
5.00%, 06/01/26 | | | 839,297 | |
| | 1,000,000 | | | Durham Capital Financing Corp. Advance Refunding Revenue Bonds,
5.00%, 12/01/25 | | | 1,178,261 | |
| | 2,000,000 | | | North Carolina Eastern Municipal Power Agency Improvements Revenue Bonds, Series A,
5.00%, 01/01/22 | | | 2,015,956 | |
| | 2,000,000 | | | North Carolina Eastern Municipal Power Agency Improvements Revenue Bonds, Series A,
5.00%, 01/01/23(a) | | | 2,064,309 | |
| | 3,250,000 | | | State of North Carolina Advance Refunding Revenue Bonds,
5.00%, 03/01/22 | | | 3,301,941 | |
| | 13,000,000 | | | State of North Carolina Advance Refunding Revenue Bonds, Series B,
5.00%, 05/01/23 | | | 13,930,778 | |
| | 1,000,000 | | | State of North Carolina Advance Refunding Revenue Bonds, Series B,
5.00%, 05/01/24 | | | 1,116,778 | |
| | 8,950,000 | | | State of North Carolina GO, Series B,
5.00%, 06/01/30 | | | 11,476,136 | |
| | 1,500,000 | | | State of North Carolina Highway Improvements Revenue Bonds, Series A,
5.00%, 05/01/22 | | | 1,536,222 | |
| | 8,750,000 | | | State of North Carolina Highway Improvements Revenue Bonds, Series B,
5.00%, 05/01/29 | | | 11,213,215 | |
| | 2,000,000 | | | State of North Carolina Highway Improvements Revenue Bonds, Series B,
5.00%, 05/01/32 | | | 2,595,545 | |
| | 2,650,000 | | | State of North Carolina Revenue Bonds,
5.00%, 03/01/23 | | | 2,818,350 | |
| Old Westbury Funds, Inc. | |
| Municipal Bond Fund | |
| Portfolio of Investments - (Continued) | October 31, 2021 |
| | |
Principal
Amount | | | | | Value | |
| North Carolina (continued) | | | | |
| $ | 3,250,000 | | | State of North Carolina Revenue Bonds,
5.00%, 03/01/24 | | $ | 3,604,751 | |
| | 3,250,000 | | | State of North Carolina Revenue Bonds,
5.00%, 03/01/25 | | | 3,741,235 | |
| | 2,555,000 | | | State of North Carolina Revenue Bonds,
5.00%, 03/01/26 | | | 3,031,550 | |
| | 2,750,000 | | | State of North Carolina Revenue Bonds,
5.00%, 03/01/28 | | | 3,429,957 | |
| | 2,125,000 | | | State of North Carolina Revenue Bonds,
5.00%, 03/01/29 | | | 2,705,278 | |
| | 3,500,000 | | | State of North Carolina Revenue Bonds,
5.00%, 03/01/30 | | | 4,537,337 | |
| | 2,100,000 | | | State of North Carolina Revenue Bonds,
5.00%, 03/01/31 | | | 2,762,161 | |
| | 4,000,000 | | | State of North Carolina Revenue Bonds,
5.00%, 03/01/32 | | | 5,241,901 | |
| | 1,500,000 | | | State of North Carolina Revenue Bonds,
5.00%, 03/01/33 | | | 1,960,722 | |
| | 385,000 | | | Town of Garner Public Improvements GO,
5.00%, 08/01/24 | | | 434,170 | |
| | 1,175,000 | | | University of North Carolina at Chapel Hill Current Refunding Revenue Bonds, Series B,
5.00%, 12/01/29 | | | 1,528,445 | |
| | | | | | | | 92,299,075 | |
| Ohio — 3.4% | | | | |
| | 1,000,000 | | | Central Ohio Solid Waste Authority Advance Refunding GO,
5.00%, 12/01/24 | | | 1,141,222 | |
| | 2,225,000 | | | City of Columbus Advance Refunding GO, Series 2017-1,
5.00%, 04/01/24 | | | 2,476,642 | |
| | 2,000,000 | | | City of Columbus Refunding GO, Series 5,
5.00%, 08/15/23 | | | 2,169,593 | |
| | 1,100,000 | | | County of Cuyahoga Refunding Revenue Bonds,
5.00%, 12/01/22 | | | 1,156,870 | |
Principal
Amount | | | | | Value | |
| Ohio (continued) | | | | |
| $ | 1,000,000 | | | County of Hamilton Sewer System Refunding Revenue Bonds, Series A,
5.00%, 12/01/26 | | $ | 1,136,596 | |
| | 1,515,000 | | | County of Hamilton Sewer System Refunding Revenue Bonds, Series A,
5.00%, 12/01/27 | | | 1,720,944 | |
| | 1,350,000 | | | County of Montgomery Current Refunding Revenue Bonds,
5.00%, 08/01/30 | | | 1,757,316 | |
| | 600,000 | | | Greater Cleveland Regional Transit Authority Advance Refunding Revenue Bonds,
5.00%, 12/01/25 | | | 705,628 | |
| | 545,000 | | | Greater Cleveland Regional Transit Authority Advance Refunding Revenue Bonds,
5.00%, 12/01/26 | | | 659,940 | |
| | 1,000,000 | | | Greater Cleveland Regional Transit Authority Capital Improvements Advance Refunding Revenue Bonds,
5.00%, 12/01/23 | | | 1,096,029 | |
| | 1,030,000 | | | Hamilton City School District Advance Refunding GO, (School District Credit Program),
5.00%, 12/01/22 | | | 1,081,867 | |
| | 1,000,000 | | | Ohio State University Revenue Bonds, Series A,
5.00%, 12/01/28 | | | 1,272,734 | |
| | 2,000,000 | | | Ohio State University Revenue Bonds, Series A,
5.00%, 12/01/29 | | | 2,594,438 | |
| | 2,500,000 | | | Ohio State University Revenue Bonds, Series A,
5.00%, 12/01/30 | | | 3,304,320 | |
| | 2,000,000 | | | Ohio State University Revenue Bonds, Series A,
5.00%, 12/01/31 | | | 2,698,364 | |
| | 1,500,000 | | | Ohio State University Revenue Bonds, Series A,
5.00%, 12/01/32 | | | 2,009,503 | |
| | 4,300,000 | | | Ohio State University Revenue Bonds, Series A,
5.00%, 12/01/33 | | | 5,747,458 | |
| | 3,000,000 | | | Ohio Water Development Authority Revenue Bonds,
5.00%, 06/01/26 | | | 3,589,367 | |
| Old Westbury Funds, Inc. | |
| Municipal Bond Fund | |
| Portfolio of Investments - (Continued) | October 31, 2021 |
| | |
Principal
Amount | | | | | Value | |
| Ohio (continued) | | | | |
| $ | 3,375,000 | | | Ohio Water Development Authority Water Pollution Control Loan Fund Pollution Control Revenue Bonds, Series B,
5.00%, 06/01/23 | | $ | 3,629,166 | |
| | 3,300,000 | | | Ohio Water Development Authority Water Pollution Control Loan Fund Pollution Control Revenue Bonds, Series B,
5.00%, 06/01/24 | | | 3,690,186 | |
| | 1,410,000 | | | Ohio Water Development Authority Water Pollution Control Loan Fund Pollution Control Revenue Bonds, Series B,
5.00%, 06/01/25 | | | 1,633,510 | |
| | 1,450,000 | | | Ohio Water Development Authority Water Pollution Control Loan Fund Pollution Control Revenue Bonds, Series B,
5.00%, 06/01/26 | | | 1,734,861 | |
| | 2,000,000 | | | Ohio Water Development Authority Water Pollution Control Loan Fund Pollution Control Revenue Bonds, Series B,
5.00%, 06/01/27 | | | 2,455,100 | |
| | 10,000,000 | | | Ohio Water Development Authority Water Pollution Control Loan Fund Revenue Bond, Series 2015-A,
5.00%, 12/01/24 | | | 11,392,362 | |
| | 10,285,000 | | | Ohio Water Development Authority Water Utility Improvements Revenue Bonds,
5.00%, 06/01/28 | | | 12,893,733 | |
| | 3,045,000 | | | Revere Local School District School Improvements GO, Series A,
5.00%, 12/01/42(a) | | | 3,130,214 | |
| | 2,350,000 | | | Revere Local School District School Improvements GO, Series A,
5.00%, 12/01/45(a) | | | 2,415,764 | |
| | 320,000 | | | RiverSouth Authority Area Redevelopment Refunding Revenue Bonds, Series A,
5.00%, 06/01/24 | | | 343,464 | |
| | 16,790,000 | | | State of Ohio Advance Refunding GO, Series A,
5.00%, 12/15/24 | | | 19,170,265 | |
| | 4,000,000 | | | State of Ohio Current Refunding GO, Series C,
5.00%, 03/15/28 | | | 4,995,859 | |
Principal
Amount | | | | | Value | |
| Ohio (continued) | | | | |
| $ | 2,250,000 | | | State of Ohio Current Refunding GO, Series C,
5.00%, 03/15/30 | | $ | 2,923,530 | |
| | 2,400,000 | | | State of Ohio Current Refunding GO, Series C,
5.00%, 03/15/31 | | | 3,179,731 | |
| | 2,500,000 | | | State of Ohio Current Refunding GO, Series C,
5.00%, 03/15/32 | | | 3,380,004 | |
| | 1,445,000 | | | State of Ohio Department of Administration Telecommunications Improvements COP,
5.00%, 09/01/24 | | | 1,630,394 | |
| | 1,690,000 | | | State of Ohio Department of Administration Telecommunications Improvements COP,
5.00%, 09/01/24 | | | 1,906,828 | |
| | 2,000,000 | | | State of Ohio Highway Improvements Revenue Bonds, Series 1-A,
5.00%, 12/15/29 | | | 2,594,662 | |
| | 1,000,000 | | | State of Ohio Highway Improvements Revenue Bonds, Series 1-A,
5.00%, 12/15/30 | | | 1,320,788 | |
| | 2,000,000 | | | State of Ohio Mental Health Facility Improvements Revenue Bonds, Series A,
5.00%, 06/01/25 | | | 2,315,490 | |
| | 2,185,000 | | | State of Ohio Public Facilities Revenue Bonds, Series A,
5.00%, 02/01/26 | | | 2,582,900 | |
| | 2,400,000 | | | State of Ohio Public Facilities Revenue Bonds, Series A,
5.00%, 02/01/29 | | | 3,040,587 | |
| | 1,415,000 | | | State of Ohio Public Improvements Revenue Bonds, Series A,
5.00%, 02/01/24 | | | 1,561,183 | |
| | 5,000,000 | | | State of Ohio School Improvements GO, Series B,
5.00%, 06/15/23 | | | 5,380,436 | |
| | 2,200,000 | | | State of Ohio University and College Improvements GO, Series A,
5.00%, 05/01/28(a) | | | 2,252,789 | |
| | 5,445,000 | | | State of Ohio University and College Improvements GO, Series A,
5.00%, 05/01/28 | | | 6,282,816 | |
| | | | | | | | 144,155,453 | |
| Old Westbury Funds, Inc. | |
| Municipal Bond Fund | |
| Portfolio of Investments - (Continued) | October 31, 2021 |
| | |
Principal
Amount | | | | | Value | |
| Oklahoma — 0.7% | | | | |
| $ | 3,650,000 | | | City of Oklahoma City Public Improvements GO,
5.00%, 03/01/26 | | $ | 4,337,675 | |
| | 2,350,000 | | | Oklahoma Turnpike Authority Pre-refunded Highway Improvements Revenue Bonds, Series C,
5.00%, 01/01/31(a) | | | 2,369,078 | |
| | 1,500,000 | | | Oklahoma Turnpike Authority Refunding Revenue Bonds, Series A,
5.00%, 01/01/24 | | | 1,652,262 | |
| | 1,000,000 | | | Oklahoma Turnpike Authority Refunding Revenue Bonds, Series A,
5.00%, 01/01/25 | | | 1,144,556 | |
| | 2,000,000 | | | Oklahoma Turnpike Authority Refunding Revenue Bonds, Series A,
5.00%, 01/01/26 | | | 2,364,510 | |
| | 2,000,000 | | | Oklahoma Turnpike Authority Refunding Revenue Bonds, Series A,
5.00%, 01/01/27 | | | 2,433,864 | |
| | 2,000,000 | | | Oklahoma Turnpike Authority Refunding Revenue Bonds, Series A,
5.00%, 01/01/28 | | | 2,493,951 | |
| | 2,315,000 | | | Oklahoma Turnpike Authority Refunding Revenue Bonds, Series A,
5.00%, 01/01/29 | | | 2,951,682 | |
| | 5,000,000 | | | Oklahoma Turnpike Authority Refunding Revenue Bonds, Series D,
5.00%, 01/01/26 | | | 5,911,274 | |
| | 2,985,000 | | | Oklahoma Turnpike Authority Refunding Revenue Bonds, Series D,
5.00%, 01/01/28 | | | 3,722,222 | |
| | | | | | | | 29,381,074 | |
| Oregon — 0.8% | | | | |
| | 8,035,000 | | | City of Portland Sewer System Revenue Sewer Improvements Revenue Bonds, Series A,
5.00%, 03/01/30 | | | 10,468,162 | |
| | 3,290,000 | | | State of Oregon Advance Refunding GO, Series M,
5.00%, 11/01/23 | | | 3,598,041 | |
Principal
Amount | | | | | Value | |
| Oregon (continued) | | | | |
| $ | 10,350,000 | | | State of Oregon Facilities Improvements GO, Series A,
5.00%, 05/01/25 | | $ | 11,969,856 | |
| | 4,900,000 | | | State of Oregon Public Facilities GO,
5.00%, 05/01/29 | | | 6,271,284 | |
| | | | | | | | 32,307,343 | |
| Pennsylvania — 2.4% | | | | |
| | 15,000,000 | | | Commonwealth of Pennsylvania Advance Refunding GO,
5.00%, 07/15/26 | | | 18,011,416 | |
| | 5,000,000 | | | Commonwealth of Pennsylvania Public Facilities GO, Series 1,
5.00%, 03/01/22 | | | 5,080,080 | |
| | 8,245,000 | | | General Authority of Southcentral Pennsylvania Pre-refunded Refunding Revenue Bonds,
5.00%, 06/01/44(a) | | | 9,235,749 | |
| | 1,000,000 | | | Lancaster County Hospital Authority Advance Refunding Revenue Bonds,
5.00%, 08/15/26 | | | 1,200,539 | |
| | 1,500,000 | | | Pennsylvania Higher Educational Facilities Authority Advance Refunding Revenue Bonds, Series C,
5.00%, 08/15/25 | | | 1,749,223 | |
| | 2,755,000 | | | Pennsylvania Intergovernmental Cooperation Authority Special Tax Revenue Refunding Bonds,
5.00%, 06/15/22 | | | 2,837,231 | |
| | 3,500,000 | | | Pennsylvania Intergovernmental Cooperation Authority Special Tax Revenue Refunding Bonds,
5.00%, 06/15/23 | | | 3,769,275 | |
| | 1,700,000 | | | Philadelphia Authority for Industrial Development Refunding Revenue Bonds,
5.00%, 07/01/25 | | | 1,974,105 | |
| | 7,000,000 | | | Philadelphia Authority for Industrial Development Refunding Revenue Bonds,
5.00%, 07/01/26 | | | 8,370,881 | |
| | 5,890,000 | | | Philadelphia Authority for Industrial Development Refunding Revenue Bonds,
5.00%, 07/01/27 | | | 7,222,970 | |
| Old Westbury Funds, Inc. | |
| Municipal Bond Fund | |
| Portfolio of Investments - (Continued) | October 31, 2021 |
| | |
Principal
Amount | | | | | Value | |
| Pennsylvania (continued) | | | | |
| $ | 6,275,000 | | | Philadelphia Authority for Industrial Development Refunding Revenue Bonds,
5.00%, 07/01/28 | | $ | 7,869,725 | |
| | 8,500,000 | | | Philadelphia Authority for Industrial Development Refunding Revenue Bonds,
5.00%, 07/01/29 | | | 10,871,724 | |
| | 6,500,000 | | | Philadelphia Authority for Industrial Development Refunding Revenue Bonds,
5.00%, 07/01/30 | | | 8,460,882 | |
| | 6,000,000 | | | Philadelphia Authority for Industrial Development Refunding Revenue Bonds,
5.00%, 07/01/31 | | | 7,950,141 | |
| | 6,000,000 | | | Philadelphia Authority for Industrial Development Refunding Revenue Bonds,
5.00%, 07/01/32 | | | 8,093,873 | |
| | | | | | | | 102,697,814 | |
| Rhode Island — 0.3% | | | | |
| | 6,950,000 | | | Rhode Island Commerce Corp. Grant Anticipation Current Refunding Revenue,
5.00%, 06/15/23 | | | 7,477,627 | |
| | 1,045,000 | | | State of Rhode Island Advance Refunding COP, Series D,
5.00%, 04/01/25 | | | 1,200,211 | |
| | 550,000 | | | State of Rhode Island School for the Deaf Project Advance Refunding COP, Series D,
5.00%, 04/01/24 | | | 609,667 | |
| | 960,000 | | | State of Rhode Island University & College Improvements COP, Series A,
5.00%, 06/01/24 | | | 1,070,875 | |
| | 1,010,000 | | | State of Rhode Island University & College Improvements COP, Series A,
5.00%, 06/01/25 | | | 1,166,207 | |
| | | | | | | | 11,524,587 | |
| South Carolina — 0.6% | | | | |
| | 3,600,000 | | | Beaufort County School District School Improvements Refunding GO, Series A, (South Carolina School District Enhancement),
5.00%, 03/01/22 | | | 3,657,657 | |
Principal
Amount | | | | | Value | |
| South Carolina (continued) | | | | |
| $ | 9,360,000 | | | County of Charleston Highway Improvements GO, Series A,
5.00%, 11/01/30 | | $ | 12,415,012 | |
| | 4,010,000 | | | Darlington County School District School Improvement GO, (South Carolina School District Enhancement),
5.00%, 03/01/27 | | | 4,898,844 | |
| | 2,350,000 | | | Lexington County School District No 2 School Improvements GO, (South Carolina School District Enhancement),
5.00%, 03/01/26 | | | 2,790,531 | |
| | 1,485,000 | | | State of South Carolina University & College Improvements GO, Series B, (State Aid Withholding),
5.00%, 04/01/22 | | | 1,515,005 | |
| | | | | | | | 25,277,049 | |
| South Dakota — 0.5% | | | | |
| | 2,125,000 | | | South Dakota Conservancy District Water Utility Improvements Revenue Bonds,
5.00%, 08/01/29 | | | 2,745,904 | |
| | 1,950,000 | | | South Dakota Conservancy District Water Utility Improvements Revenue Bonds,
5.00%, 08/01/31 | | | 2,548,867 | |
| | 1,500,000 | | | South Dakota Conservancy District Water Utility Improvements Revenue Bonds,
5.00%, 08/01/33 | | | 1,950,739 | |
| | 4,910,000 | | | South Dakota Conservancy District Water Utility Improvements Revenue Bonds,
5.00%, 08/01/38 | | | 6,263,340 | |
| | 5,155,000 | | | South Dakota Conservancy District Water Utility Improvements Revenue Bonds,
5.00%, 08/01/39 | | | 6,560,824 | |
| | 2,455,000 | | | South Dakota Conservancy District Water Utility Improvements Revenue Bonds, Series B,
5.00%, 08/01/29 | | | 2,755,580 | |
| | | | | | | | 22,825,254 | |
| Tennessee — 0.9% | | | | |
| | 500,000 | | | City of Clarksville TN Water Sewer & Gas Revenue Repayment of Bank Loan Refunding Revenue Bonds,
5.00%, 02/01/25 | | | 573,758 | |
| Old Westbury Funds, Inc. | |
| Municipal Bond Fund | |
| Portfolio of Investments - (Continued) | October 31, 2021 |
| | |
Principal
Amount | | | | | Value | |
| Tennessee (continued) | | | | |
| $ | 2,000,000 | | | City of Clarksville TN Water Sewer & Gas Revenue Water Utility Improvements Revenue Bonds, Series A,
5.00%, 02/01/29 | | $ | 2,548,181 | |
| | 1,000,000 | | | City of Clarksville TN Water Sewer & Gas Revenue Water Utility Improvements Revenue Bonds, Series A,
5.00%, 02/01/30 | | | 1,299,757 | |
| | 1,125,000 | | | City of Clarksville TN Water Sewer & Gas Revenue Water Utility Improvements Revenue Bonds, Series A,
5.00%, 02/01/31 | | | 1,491,026 | |
| | 1,000,000 | | | County of Montgomery Advance Refunding School Improvements GO,
5.00%, 04/01/26 | | | 1,190,484 | |
| | 5,105,000 | | | County of Shelby Refunding GO, Series B,
5.00%, 04/01/22 | | | 5,207,714 | |
| | 400,000 | | | Metropolitan Government of Nashville & Davidson County Electric System Revenue Bonds, Series A,
5.00%, 05/15/23 | | | 429,427 | |
| | 3,880,000 | | | Metropolitan Government of Nashville & Davidson County TN Water & Sewer Revenue Refunding Revenue Bonds, Series A,
5.00%, 07/01/24 | | | 4,358,133 | |
| | 2,070,000 | | | Metropolitan Government of Nashville & Davidson County TN Water & Sewer Revenue Refunding Revenue Bonds, Series A,
5.00%, 07/01/25 | | | 2,408,684 | |
| | 1,470,000 | | | Metropolitan Government of Nashville & Davidson County TN Water & Sewer Revenue Refunding Revenue Bonds, Series A,
5.00%, 07/01/26 | | | 1,764,622 | |
| | 2,175,000 | | | Metropolitan Government of Nashville & Davidson County TN Water & Sewer Revenue Refunding Revenue Bonds, Series A,
5.00%, 07/01/27 | | | 2,679,397 | |
Principal
Amount | | | | | Value | |
| Tennessee (continued) | | | | |
| $ | 2,150,000 | | | Metropolitan Government of Nashville & Davidson County TN Water & Sewer Revenue Refunding Revenue Bonds, Series A,
5.00%, 07/01/28 | | $ | 2,710,606 | |
| | 3,115,000 | | | Metropolitan Government of Nashville & Davidson County TN Water & Sewer Revenue Refunding Revenue Bonds, Series A,
5.00%, 07/01/29 | | | 4,002,586 | |
| | 1,600,000 | | | Metropolitan Government of Nashville & Davidson County TN Water & Sewer Revenue Refunding Revenue Bonds, Series A,
5.00%, 07/01/31 | | | 2,131,971 | |
| | 1,900,000 | | | Metropolitan Government of Nashville & Davidson County TN Water & Sewer Revenue Refunding Revenue Bonds, Series A,
5.00%, 07/01/32 | | | 2,521,250 | |
| | 1,005,000 | | | State of Tennessee Refunding GO, Series A,
5.00%, 09/01/23 | | | 1,092,470 | |
| | 2,165,000 | | | Tennessee State School Bond Authority Pre-refunded Advance Refunding Revenue Bonds, Series B, (State Aid Intercept Program),
5.00%, 11/01/30(a) | | | 2,543,264 | |
| | 900,000 | | | Tennessee State School Bond Authority Refunding Revenue Bonds, (State Aid Intercept Program),
5.00%, 11/01/25 | | | 1,021,472 | |
| | | | | | | | 39,974,802 | |
| Texas — 12.2% | | | | |
| | 1,000,000 | | | Allen Independent School District Current Refunding GO, Series A, (PSF-GTD),
5.00%, 02/15/22 | | | 1,013,868 | |
| | 860,000 | | | Alvin Independent School District Improvements Refunding GO, Series A, (PSF-GTD),
5.00%, 02/15/25 | | | 986,934 | |
| | 1,720,000 | | | Alvin Independent School District Improvements Refunding GO, Series A, (PSF-GTD),
5.00%, 02/15/26 | | | 2,036,371 | |
| | 485,000 | | | Aransas Pass Independent School District Improvements GO, (PSF-GTD),
5.00%, 02/15/23 | | | 513,763 | |
| Old Westbury Funds, Inc. | |
| Municipal Bond Fund | |
| Portfolio of Investments - (Continued) | October 31, 2021 |
| | |
Principal
Amount | | | | | Value | |
| Texas (continued) | | | | |
| $ | 410,000 | | | Aransas Pass Independent School District School Improvements GO, (PSF-GTD),
5.00%, 02/15/22 | | $ | 415,662 | |
| | 1,315,000 | | | Austin Community College District Refunding GO,
5.00%, 08/01/27 | | | 1,578,333 | |
| | 280,000 | | | Austin Independent School District Advance Refunding GO, Series B, (PSF-GTD),
5.00%, 08/01/23 | | | 303,242 | |
| | 5,000,000 | | | Austin Independent School District School Improvements GO, (PSF-GTD),
5.00%, 08/01/31 | | | 6,695,049 | |
| | 1,075,000 | | | Bonham Independent School District Improvements GO, (PSF-GTD),
5.00%, 08/01/27 | | | 1,289,159 | |
| | 1,605,000 | | | Brock Independent School District Refunding GO, (PSF-GTD),
5.00%, 08/15/25 | | | 1,854,665 | |
| | 750,000 | | | City of Austin Public Improvements GO,
5.00%, 09/01/25 | | | 849,864 | |
| | 1,465,000 | | | City of Austin Public Improvements GO,
5.00%, 09/01/26 | | | 1,659,178 | |
| | 1,700,000 | | | City of Austin Public Improvements GO,
5.00%, 11/01/22 | | | 1,781,228 | |
| | 290,000 | | | City of Austin TX Airport System Revenue Airport & Marina Improvements Revenue Bonds, Series A,
5.00%, 11/15/28 | | | 348,012 | |
| | 3,000,000 | | | City of Austin TX Electric Utility Revenue Refunding Revenue Bonds, Series A,
5.00%, 11/15/28 | | | 3,802,777 | |
| | 810,000 | | | City of Austin TX Water & Wastewater System Advance Refunding Revenue Bonds, Series A,
5.00%, 11/15/21 | | | 811,417 | |
| | 4,000,000 | | | City of Austin TX Water & Wastewater System Revenue Current Refunding Revenue Bonds,
5.00%, 11/15/26 | | | 4,834,951 | |
Principal
Amount | | | | | Value | |
| Texas (continued) | | | | |
| $ | 1,000,000 | | | City of Austin TX Water & Wastewater System Revenue Current Refunding Revenue Bonds,
5.00%, 11/15/30 | | $ | 1,315,003 | |
| | 1,000,000 | | | City of Austin TX Water & Wastewater System Revenue Current Refunding Revenue Bonds,
5.00%, 11/15/33 | | | 1,329,656 | |
| | 1,250,000 | | | City of Austin TX Water & Wastewater System Revenue Current Refunding Revenue Bonds,
5.00%, 11/15/34 | | | 1,655,436 | |
| | 1,500,000 | | | City of Austin TX Water & Wastewater System Revenue Current Refunding Revenue Bonds,
5.00%, 11/15/35 | | | 1,980,190 | |
| | 1,250,000 | | | City of Austin TX Water & Wastewater System Revenue Current Refunding Revenue Bonds,
4.00%, 11/15/36 | | | 1,522,902 | |
| | 1,750,000 | | | City of Austin TX Water & Wastewater System Revenue Current Refunding Revenue Bonds,
5.00%, 11/15/37 | | | 2,295,529 | |
| | 1,750,000 | | | City of Austin TX Water & Wastewater System Revenue Current Refunding Revenue Bonds,
4.00%, 11/15/38 | | | 2,120,386 | |
| | 2,350,000 | | | City of Austin TX Water & Wastewater System Revenue Current Refunding Revenue Bonds,
5.00%, 11/15/39 | | | 3,069,849 | |
| | 1,500,000 | | | City of Austin TX Water & Wastewater System Revenue Current Refunding Revenue Bonds,
4.00%, 11/15/40 | | | 1,808,645 | |
| | 1,000,000 | | | City of Austin TX Water & Wastewater System Revenue Current Refunding Revenue Bonds,
4.00%, 11/15/41 | | | 1,200,316 | |
| Old Westbury Funds, Inc. | |
| Municipal Bond Fund | |
| Portfolio of Investments - (Continued) | October 31, 2021 |
| | |
Principal
Amount | | | | | Value | |
| Texas (continued) | | | | |
| $ | 5,000,000 | | | City of Austin Water & Wastewater System Advance Refunding Revenue Bonds,
5.00%, 11/15/29 | | $ | 6,030,794 | |
| | 4,020,000 | | | City of College Station Improvements Advance Refunding GO,
5.00%, 02/15/25 | | | 4,613,344 | |
| | 935,000 | | | City of Conroe Public Improvements GO,
5.00%, 03/01/25 | | | 1,036,365 | |
| | 1,715,000 | | | City of Dallas TX Waterworks & Sewer System Revenue Current Refunding Revenue Bonds, Series C,
5.00%, 10/01/28 | | | 2,170,746 | |
| | 3,545,000 | | | City of Dallas TX Waterworks & Sewer System Revenue Refunding Revenue Bonds, Series C,
5.00%, 10/01/31 | | | 4,766,532 | |
| | 3,725,000 | | | City of Dallas TX Waterworks & Sewer System Revenue Refunding Revenue Bonds, Series C,
5.00%, 10/01/32 | | | 4,976,904 | |
| | 2,075,000 | | | City of Denton Public Improvements GO,
5.00%, 02/15/23 | | | 2,201,390 | |
| | 1,715,000 | | | City of Denton Public Improvements GO,
5.00%, 02/15/24 | | | 1,898,384 | |
| | 1,290,000 | | | City of Denton Public Improvements GO,
5.00%, 02/15/28 | | | 1,521,880 | |
| | 830,000 | | | City of El Paso Municipal Drainage Utility System Sewer Improvement Revenue Bonds,
5.00%, 03/01/24 | | | 918,136 | |
| | 350,000 | | | City of El Paso Water & Sewer Refunding Revenue Bonds,
5.00%, 03/01/25 | | | 387,684 | |
| | 1,250,000 | | | City of El Paso Water & Sewer Refunding Revenue Bonds,
5.00%, 03/01/26(a) | | | 1,386,443 | |
| | 5,145,000 | | | City of Fort Worth Water & Sewer System Improvements Refunding Revenue Bonds,
5.00%, 02/15/25 | | | 5,909,853 | |
| | 1,000,000 | | | City of Houston TX Airport System Revenue Refunding Revenue Bonds, Sub-Series A,
5.00%, 07/01/24 | | | 1,116,992 | |
Principal
Amount | | | | | Value | |
| Texas (continued) | | | | |
| $ | 1,250,000 | | | City of Houston TX Airport System Revenue Refunding Revenue Bonds, Sub-Series A,
5.00%, 07/01/26 | | $ | 1,480,276 | |
| | 1,000,000 | | | City of Houston TX Airport System Revenue Refunding Revenue Bonds, Sub-Series A,
5.00%, 07/01/27 | | | 1,212,144 | |
| | 1,000,000 | | | City of Houston TX Airport System Revenue Refunding Revenue Bonds, Sub-Series A,
5.00%, 07/01/29 | | | 1,252,397 | |
| | 1,200,000 | | | City of Houston TX Airport System Revenue Refunding Revenue Bonds, Sub-Series A,
5.00%, 07/01/31 | | | 1,549,860 | |
| | 1,000,000 | | | City of Houston TX Airport System Revenue Refunding Revenue Bonds, Sub-Series A,
5.00%, 07/01/32 | | | 1,289,321 | |
| | 1,000,000 | | | City of Houston TX Airport System Revenue Refunding Revenue Bonds, Sub-Series A,
5.00%, 07/01/33 | | | 1,283,224 | |
| | 1,000,000 | | | City of Houston TX Airport System Revenue Refunding Revenue Bonds, Sub-Series B,
5.00%, 07/01/26 | | | 1,195,332 | |
| | 2,460,000 | | | City of Houston TX Airport System Revenue Refunding Revenue Bonds, Sub-Series B,
5.00%, 07/01/27 | | | 3,010,629 | |
| | 3,000,000 | | | City of Houston TX Airport System Revenue Refunding Revenue Bonds, Sub-Series B,
5.00%, 07/01/28 | | | 3,740,536 | |
| | 1,000,000 | | | City of Houston TX Airport System Revenue Refunding Revenue Bonds, Sub-Series C,
0.88%, 07/01/22 | | | 1,005,002 | |
| | 5,500,000 | | | City of Houston TX Airport System Revenue Refunding Revenue Bonds, Sub-Series C,
1.05%, 07/01/23 | | | 5,541,396 | |
| | 2,040,000 | | | City of McKinney Waterworks & Sewer System Revenue Sewer Improvements Refunding Revenue Bonds,
5.00%, 03/15/25 | | | 2,348,470 | |
| Old Westbury Funds, Inc. | |
| Municipal Bond Fund | |
| Portfolio of Investments - (Continued) | October 31, 2021 |
Principal
Amount | | | | | Value | |
| Texas (continued) | | | |
| $ | 2,360,000 | | | City of McKinney Waterworks & Sewer System Revenue Sewer Improvements Refunding Revenue Bonds,
5.00%, 03/15/26 | | $ | 2,803,473 | |
| | 1,815,000 | | | City of Plano Advance Refunding GO,
5.00%, 09/01/23 | | | 1,973,318 | |
| | 1,180,000 | | | City of Plano Waterworks & Sewer System Water Utility Improvement Revenue Bonds,
5.00%, 05/01/26 | | | 1,406,578 | |
| | 1,205,000 | | | City of Round Rock TX Utility System Revenue Advance Refunding Revenue Bonds,
5.00%, 08/01/25 | | | 1,400,079 | |
| | 875,000 | | | Clear Creek Independent School District Improvements GO, (PSF-GTD),
5.00%, 02/15/24 | | | 968,351 | |
| | 1,000,000 | | | Clear Creek Independent School District Improvements GO, (PSF-GTD),
5.00%, 02/15/25 | | | 1,149,014 | |
| | 1,195,000 | | | Connally Independent School District Refunding GO, (PSF-GTD),
5.00%, 08/15/25 | | | 1,388,662 | |
| | 460,000 | | | Conroe Independent School District School Improvements GO, (PSF-GTD),
5.00%, 02/15/22 | | | 466,379 | |
| | 1,500,000 | | | Conroe Independent School District Current Refunding GO, Series A, (PSF-GTD),
5.00%, 02/15/24 | | | 1,660,030 | |
| | 2,000,000 | | | Conroe Independent School District Current Refunding GO, Series A, (PSF-GTD),
5.00%, 02/15/25 | | | 2,297,319 | |
| | 10,000,000 | | | Conroe Independent School District Current Refunding GO, Series A, (PSF-GTD),
5.00%, 02/15/28 | | | 12,486,566 | |
| | 670,000 | | | Corsicana Independent School District Current Refunding GO, (PSF-GTD),
5.00%, 02/15/22 | | | 679,214 | |
| | 2,130,000 | | | County of Bexar Advance Refunding GO,
5.00%, 06/15/26 | | | 2,476,546 | |
Principal
Amount | | | | | Value | |
| Texas (continued) | | | |
| $ | 7,500,000 | | | County of Bexar Advance Refunding GO,
5.00%, 06/15/29 | | $ | 8,957,158 | |
| | 2,910,000 | | | County of Bexar Refunding GO,
5.00%, 06/15/22 | | | 2,997,228 | |
| | 3,000,000 | | | County of Bexar Tax Public Improvements GO, Series B,
5.00%, 06/15/43(a) | | | 3,230,962 | |
| | 650,000 | | | County of Collin Advance Refunding GO,
5.00%, 02/15/25 | | | 745,939 | |
| | 675,000 | | | County of Collin Advance Refunding GO,
5.00%, 02/15/24 | | | 746,686 | |
| | 1,500,000 | | | County of Denton Advance Refunding GO,
5.00%, 07/15/24 | | | 1,686,065 | |
| | 475,000 | | | County of El Paso Advance Refunding GO,
5.00%, 02/15/23 | | | 502,916 | |
| | 2,000,000 | | | County of Harris Current Refunding GO, Series A,
5.00%, 10/01/26 | | | 2,417,311 | |
| | 1,485,000 | | | County of Harris Current Refunding GO, Series A,
5.00%, 10/01/24 | | | 1,683,516 | |
| | 1,850,000 | | | County of Williamson Limited Tax Advance Refunding GO,
5.00%, 02/15/24 | | | 2,047,820 | |
| | 1,000,000 | | | County of Williamson Public Improvements GO,
5.00%, 02/15/25 | | | 1,149,014 | |
| | 360,000 | | | Crystal City Independent School District Advance Refunding GO, (PSF-GTD),
5.00%, 02/15/26 | | | 411,611 | |
| | 750,000 | | | Dallas Area Rapid Transit Refunding Revenue Bonds, Series A,
5.00%, 12/01/25 | | | 855,171 | |
| | 1,120,000 | | | Dayton Independent School District School Improvements GO, (PSF-GTD),
5.00%, 02/15/22 | | | 1,135,598 | |
| | 7,715,000 | | | Denton Independent School District Advance Refunding GO, (PSF-GTD),
5.00%, 08/15/26 | | | 8,842,811 | |
| Old Westbury Funds, Inc. | |
| Municipal Bond Fund | |
| Portfolio of Investments - (Continued) | October 31, 2021 |
Principal
Amount | | | | | Value | |
| Texas (continued) | | | |
| $ | 2,500,000 | | | Denton Independent School District Advance Refunding GO, (PSF-GTD),
5.00%, 08/15/29 | | $ | 2,945,902 | |
| | 1,085,000 | | | Denver City Independent School District School Building GO, Series A, (PSF-GTD),
5.00%, 02/15/25 | | | 1,241,313 | |
| | 100,000 | | | Denver City Independent School District School Improvements GO, Series A, (PSF-GTD),
5.00%, 02/15/26 | | | 117,975 | |
| | 25,000 | | | Dilley Independent School District School Improvements GO, (PSF-GTD),
5.00%, 08/15/25 | | | 29,123 | |
| | 180,000 | | | Dilley Independent School District School Improvements GO, (PSF-GTD),
5.00%, 08/15/25 | | | 209,542 | |
| | 2,780,000 | | | Eagle Mountain & Saginaw Independent School District Current Refunding GO, (PSF-GTD),
5.00%, 08/15/24 | | | 3,135,585 | |
| | 1,835,000 | | | Eagle Mountain & Saginaw Independent School District Refunding GO, (PSF-GTD),
5.00%, 08/15/27 | | | 2,165,697 | |
| | 750,000 | | | Eagle Mountain & Saginaw Independent School District School Improvements GO, (PSF-GTD),
5.00%, 08/15/23 | | | 813,175 | |
| | 3,000,000 | | | Edinburg Consolidated Independent School District Advance Refunding GO, (PSF-GTD),
5.00%, 02/15/25 | | | 3,434,318 | |
| | 1,500,000 | | | El Paso Independent School District Refunding GO, (PSF-GTD),
5.00%, 08/15/25 | | | 1,694,995 | |
| | 5,000,000 | | | Fort Worth Independent School District School Improvements GO, Series A, (PSF-GTD),
5.00%, 02/15/28 | | | 6,225,990 | |
| | 1,395,000 | | | Frenship Independent School District Refunding GO, (PSF-GTD),
5.00%, 02/15/26(a) | | | 1,542,952 | |
Principal
Amount | | | | | Value | |
| Texas (continued) | | | |
| $ | 1,285,000 | | | Goose Creek Consolidated Independent School District Current Refunding GO, Series A, (PSF-GTD),
5.00%, 02/15/25 | | $ | 1,474,663 | |
| | 8,000,000 | | | Grand Parkway Transportation Corp. Highway Improvements Revenue Bonds, Series A,
5.50%, 04/01/53(a) | | | 8,791,900 | |
| | 1,990,000 | | | Harlandale Independent School District Current Refunding GO, Series A, (PSF-GTD),
5.00%, 02/15/24 | | | 2,196,042 | |
| | 350,000 | | | Harlandale Independent School District Current Refunding GO, Series A, (PSF-GTD),
5.00%, 02/15/25 | | | 400,547 | |
| | 325,000 | | | Harlingen Consolidated Independent School District Current Refunding GO, (PSF-GTD),
5.00%, 08/15/22 | | | 337,054 | |
| | 1,000,000 | | | Harris County Flood Control District Refunding GO, Series A,
5.00%, 10/01/29 | | | 1,289,439 | |
| | 1,500,000 | | | Harris County Flood Control District Refunding GO, Series A,
5.00%, 10/01/31 | | | 1,960,305 | |
| | 5,000,000 | | | Harris County Flood Control District Refunding Revenue Bonds, Series A,
5.00%, 10/01/23 | | | 5,451,302 | |
| | 1,970,000 | | | Harris County Toll Road Authority Bridges Revenue Bonds,
5.00%, 08/15/28 | | | 2,486,274 | |
| | 2,000,000 | | | Harris County Toll Road Authority Bridges Revenue Bonds,
5.00%, 08/15/29 | | | 2,575,999 | |
| | 2,150,000 | | | Harris County Toll Road Authority Bridges Revenue Bonds,
5.00%, 08/15/30 | | | 2,823,496 | |
| | 1,500,000 | | | Harris County Toll Road Authority Bridges Revenue Bonds,
5.00%, 08/15/31 | | | 1,962,291 | |
| | 1,000,000 | | | Harris County Toll Road Authority Bridges Revenue Bonds,
5.00%, 08/15/32 | | | 1,301,482 | |
| | 2,455,000 | | | Irving Independent School District Advance Refunding GO, (PSF-GTD),
5.00%, 02/15/24 | | | 2,715,130 | |
| Old Westbury Funds, Inc. | |
| Municipal Bond Fund | |
| Portfolio of Investments - (Continued) | October 31, 2021 |
Principal
Amount | | | | | Value | |
| Texas (continued) | | | |
| $ | 585,000 | | | Kaufman Independent School District School Building Refunding GO, (PSF-GTD),
5.00%, 02/15/24 | | $ | 645,429 | |
| | 500,000 | | | Kaufman Independent School District School Building Refunding GO, (PSF-GTD),
5.00%, 02/15/25 | | | 571,506 | |
| | 750,000 | | | Klein Independent School District School Improvements GO, (PSF-GTD),
5.00%, 08/01/23 | | | 811,705 | |
| | 5,625,000 | | | Lamar Consolidated Independent School District Current Refunding GO, Series A, (PSF-GTD),
5.00%, 02/15/33 | | | 7,360,365 | |
| | 4,500,000 | | | Lamar Consolidated Independent School District Current Refunding GO, Series A, (PSF-GTD),
4.00%, 02/15/34 | | | 5,453,393 | |
| | 10,000,000 | | | Lone Star College System Advance Refunding GO,
5.00%, 02/15/29 | | | 11,737,379 | |
| | 1,860,000 | | | Longview Independent School District Advance Refunding GO, (PSF-GTD),
5.00%, 02/15/23 | | | 1,973,045 | |
| | 225,000 | | | Longview Independent School District Advance Refunding GO, (PSF-GTD),
5.00%, 02/15/26 | | | 265,444 | |
| | 1,050,000 | | | Longview Independent School District Current Refunding GO, (PSF-GTD),
5.00%, 02/15/23 | | | 1,113,816 | |
| | 2,670,000 | | | Magnolia Independent School District School Improvement Advance Refunding GO, (PSF-GTD),
5.00%, 08/15/25 | | | 3,109,245 | |
| | 3,410,000 | | | Manor Independent School District Advance Refunding GO, (PSF-GTD),
5.00%, 08/01/24 | | | 3,831,497 | |
| | 2,755,000 | | | Manor Independent School District Advance Refunding GO, Series B, (PSF-GTD),
5.00%, 08/01/30 | | | 3,469,867 | |
Principal
Amount | | | | | Value | |
| Texas (continued) | | | |
| $ | 5,675,000 | | | Manor Independent School District Advance Refunding GO, Series B, (PSF-GTD),
5.00%, 08/01/31 | | $ | 7,242,605 | |
| | 1,005,000 | | | Mesquite Independent School District Advance Refunding GO, Series A, (PSF-GTD),
5.00%, 08/15/23 | | | 1,089,654 | |
| | 1,060,000 | | | Mesquite Independent School District Advance Refunding GO, Series A, (PSF-GTD),
5.00%, 08/15/24 | | | 1,195,583 | |
| | 1,435,000 | | | Mesquite Independent School District Advance Refunding GO, Series B, (PSF-GTD),
5.00%, 08/15/23 | | | 1,555,874 | |
| | 1,650,000 | | | Mesquite Independent School District Advance Refunding GO, Series B, (PSF-GTD),
5.00%, 08/15/25 | | | 1,924,821 | |
| | 585,000 | | | Mesquite Independent School District Advance Refunding GO, Series B, (PSF-GTD),
5.00%, 08/15/26 | | | 702,621 | |
| | 580,000 | | | Mesquite Independent School District Current Refunding GO, Series A, (PSF-GTD),
5.00%, 08/15/24 | | | 654,187 | |
| | 1,170,000 | | | Mesquite Independent School District Current Refunding GO, Series A, (PSF-GTD),
5.00%, 08/15/25 | | | 1,364,873 | |
| | 500,000 | | | Mesquite Independent School District School Improvements GO, Series C, (PSF-GTD),
5.00%, 08/15/22 | | | 519,031 | |
| | 5,030,000 | | | Metropolitan Transit Authority of Harris County Sales Tax Revenue Bonds, Series B,
5.00%, 11/01/23(a) | | | 5,030,000 | |
| | 1,765,000 | | | North Texas Municipal Water District Water System Revenue Current Refunding Revenue Bonds,
5.00%, 09/01/26 | | | 2,120,715 | |
| | 2,000,000 | | | North Texas Municipal Water District Water System Revenue Current Refunding Revenue Bonds,
5.00%, 09/01/27 | | | 2,462,199 | |
| Old Westbury Funds, Inc. | |
| Municipal Bond Fund | |
| Portfolio of Investments - (Continued) | October 31, 2021 |
Principal
Amount | | | | | Value | |
| Texas (continued) | | | |
| $ | 545,000 | | | Northside Independent School District School Improvements GO, (PSF-GTD),
5.00%, 08/15/25 | | $ | 636,669 | |
| | 3,000,000 | | | Northwest Independent School District Refunding GO, Series B, (PSF-GTD),
5.00%, 02/15/23 | | | 3,185,547 | |
| | 2,525,000 | | | Northwest Independent School District Refunding GO, Series B, (PSF-GTD),
5.00%, 02/15/25 | | | 2,890,551 | |
| | 500,000 | | | Palestine Independent School District Advance Refunding GO, (PSF-GTD),
5.00%, 02/15/25 | | | 571,682 | |
| | 1,145,000 | | | Palestine Independent School District Advance Refunding GO, (PSF-GTD),
5.00%, 02/15/23 | | | 1,212,905 | |
| | 1,220,000 | | | Palestine Independent School District Advance Refunding GO, (PSF-GTD),
5.00%, 02/15/28 | | | 1,432,523 | |
| | 1,000,000 | | | Pecos Barstow Toyah Independent School District Advance Refunding GO, (PSF-GTD),
5.00%, 02/15/23 | | | 1,060,714 | |
| | 21,665,000 | | | Permanent University Fund - Texas A&M University System Refunding Revenue Bonds,
5.50%, 07/01/28 | | | 25,506,716 | |
| | 650,000 | | | Petersburg Independent School District School Improvements GO, (PSF-GTD),
5.00%, 02/15/26 | | | 768,651 | |
| | 1,525,000 | | | Plano Independent School District School Improvement GO, (PSF-GTD),
5.00%, 02/15/23 | | | 1,618,911 | |
| | 1,050,000 | | | Point Isabel Independent School District Current Refunding GO, (PSF-GTD),
5.00%, 02/01/25 | | | 1,202,323 | |
| | 1,995,000 | | | Port Arthur Independent School District Advance Refunding GO, Series B, (PSF-GTD),
5.00%, 02/15/25 | | | 2,288,752 | |
Principal
Amount | | | | | Value | |
| Texas (continued) | | | |
| $ | 1,000,000 | | | Prosper Independent School District School Building School Improvement GO, (PSF-GTD),
5.00%, 02/15/25 | | $ | 1,147,952 | |
| | 925,000 | | | Roma Independent School District Current Refunding GO, (PSF-GTD),
5.00%, 08/15/22 | | | 959,382 | |
| | 1,020,000 | | | Roma Independent School District Current Refunding GO, (PSF-GTD),
5.00%, 08/15/23 | | | 1,104,195 | |
| | 1,075,000 | | | Roma Independent School District Current Refunding GO, (PSF-GTD),
5.00%, 08/15/24 | | | 1,209,623 | |
| | 1,000,000 | | | Roma Independent School District Current Refunding GO, (PSF-GTD),
5.00%, 08/15/25 | | | 1,162,469 | |
| | 1,330,000 | | | San Antonio Independent School District School Improvements GO, (PSF-GTD),
5.00%, 08/15/23 | | | 1,442,779 | |
| | 205,000 | | | San Elizario Independent School District School Improvements GO, (PSF-GTD),
5.00%, 05/01/25 | | | 236,775 | |
| | 1,000,000 | | | Socorro Independent School District Current Refunding GO, Series B, (PSF-GTD),
5.00%, 08/15/25 | | | 1,144,068 | |
| | 2,160,000 | | | Spring Independent School District Advance Refunding GO, (PSF-GTD),
5.00%, 08/15/22 | | | 2,241,162 | |
| | 7,180,000 | | | Spring Independent School District Advance Refunding GO, Series A,
5.00%, 08/15/28 | | | 8,593,669 | |
| | 2,500,000 | | | State of Texas Current Refunding GO, Series B,
5.00%, 08/01/24 | | | 2,817,082 | |
| | 5,000,000 | | | State of Texas Current Refunding GO, Series B,
5.00%, 08/01/25 | | | 5,831,736 | |
| | 2,300,000 | | | State of Texas Highway Improvements GO,
5.00%, 04/01/27 | | | 2,734,794 | |
| Old Westbury Funds, Inc. | |
| Municipal Bond Fund | |
| Portfolio of Investments - (Continued) | October 31, 2021 |
Principal
Amount | | | | | Value | |
| Texas (continued) | | | |
| $ | 3,720,000 | | | State of Texas Highway Improvements Revenue Bonds GO,
5.00%, 04/01/44(a) | | $ | 4,130,227 | |
| | 5,000,000 | | | State of Texas Public Finance Authority Advance Refunding GO,
5.00%, 10/01/26 | | | 6,040,586 | |
| | 5,000,000 | | | State of Texas Public Finance Authority Advance Refunding GO,
2.18%, 10/01/27 | | | 5,198,611 | |
| | 3,200,000 | | | State of Texas Transportation Commission Advance Refunding GO, Series A,
5.00%, 10/01/25 | | | 3,752,087 | |
| | 5,000,000 | | | State of Texas Transportation Commission Advance Refunding GO, Series A,
5.00%, 10/01/28 | | | 5,845,676 | |
| | 6,500,000 | | | State of Texas Transportation Commission Highway Improvement GO,
5.00%, 04/01/25 | | | 7,498,860 | |
| | 3,500,000 | | | State of Texas Transportation Commission Refunding GO, Series A,
5.00%, 10/01/22 | | | 3,654,400 | |
| | 1,000,000 | | | State of Texas, Water Financial Assistance Refunding GO, Subseries B-2,
5.00%, 08/01/28 | | | 1,123,021 | |
| | 1,000,000 | | | Sulphur Springs Independent School District Advance Refunding GO, (PSF- GTD),
5.00%, 08/15/26 | | | 1,199,495 | |
| | 1,000,000 | | | Temple Independent School District Advance Refunding GO, (PSF- GTD),
5.00%, 02/01/27 | | | 1,214,998 | |
| | 1,250,000 | | | Texas A&M University University & College Improvements Revenue Bonds, Series A,
0.59%, 05/15/24 | | | 1,240,954 | |
| | 1,000,000 | | | Texas State University System University & College Improvements Revenue Bonds, Series A,
5.00%, 03/15/24 | | | 1,109,614 | |
Principal
Amount | | | | | Value | |
| Texas (continued) | | | |
| $ | 1,000,000 | | | Texas Transportation Commission State Highway Fund First Tier Advance Refunding Revenue Bonds,
5.00%, 10/01/22 | | $ | 1,044,020 | |
| | 5,785,000 | | | Texas Transportation Commission State Highway Fund First Tier Advance Refunding Revenue Bonds,
5.00%, 10/01/24 | | | 6,558,343 | |
| | 4,250,000 | | | Texas Transportation Commission State Highway Fund Highway Improvements Revenue Bonds Series A,
5.00%, 10/01/26 | | | 5,134,498 | |
| | 5,000,000 | | | Texas Water Development Board Water Utility Improvements Revenue Bonds,
5.00%, 08/01/24 | | | 5,634,353 | |
| | 6,665,000 | | | Texas Water Development Board Water Utility Improvements Revenue Bonds,
5.00%, 08/01/25 | | | 7,782,891 | |
| | 5,000,000 | | | Texas Water Development Board Water Utility Improvements Revenue Bonds,
5.00%, 08/01/26 | | | 6,020,864 | |
| | 1,500,000 | | | Texas Water Development Board Water Utility Improvements Revenue Bonds,
5.00%, 08/01/27 | | | 1,853,163 | |
| | 4,050,000 | | | Texas Water Development Board Water Utility Improvements Revenue Bonds,
5.00%, 08/01/29 | | | 5,215,182 | |
| | 4,985,000 | | | Texas Water Development Board Water Utility Improvements Revenue Bonds,
5.00%, 08/01/30 | | | 6,536,146 | |
| | 2,500,000 | | | Texas Water Development Board Water Utility Improvements Revenue Bonds,
5.00%, 08/01/31 | | | 3,338,968 | |
| | 5,000,000 | | | Texas Water Development Board Water Utility Improvements Revenue Bonds,
5.00%, 08/01/32 | | | 6,656,284 | |
| Old Westbury Funds, Inc. | |
| Municipal Bond Fund | |
| Portfolio of Investments - (Continued) | October 31, 2021 |
Principal
Amount | | | | | Value | |
| Texas (continued) | | | |
| $ | 6,000,000 | | | Texas Water Development Board Water Utility Improvements Revenue Bonds,
5.00%, 08/01/33 | | $ | 7,975,526 | |
| | 1,250,000 | | | Texas Water Development Board Water Utility Improvements Revenue Bonds, Series A,
5.00%, 10/15/23 | | | 1,365,293 | |
| | 1,000,000 | | | Trinity River Authority Central Regional Wastewater System Advance Refunding Revenue Bonds,
5.00%, 08/01/24 | | | 1,126,245 | |
| | 2,000,000 | | | Trinity River Authority Central Regional Wastewater System Revenue Current Refunding Revenue Bonds,
5.00%, 08/01/30 | | | 2,601,514 | |
| | 500,000 | | | United Independent School District GO, (PSF-GTD),
5.00%, 08/15/22 | | | 519,031 | |
| | 1,680,000 | | | United Independent School District GO, (PSF-GTD),
5.00%, 08/15/23 | | | 1,821,196 | |
| | 935,000 | | | United Independent School District GO, (PSF-GTD),
5.00%, 08/15/24 | | | 1,054,594 | |
| | 2,085,000 | | | United Independent School District GO, (PSF-GTD),
5.00%, 08/15/25 | | | 2,433,129 | |
| | 500,000 | | | University of North Texas System University & College Improvements Revenue Bonds, Series A,
5.00%, 04/15/22 | | | 510,884 | |
| | 7,000,000 | | | University of Texas System Advance Refunding Revenue Bonds, Series C,
5.00%, 08/15/26 | | | 8,425,738 | |
| | 1,065,000 | | | University of Texas System Refunding Revenue Bonds, Series A,
5.00%, 08/15/29 | | | 1,198,370 | |
| | 4,000,000 | | | University of Texas System University and College Improvements Revenue, Series D,
5.00%, 08/15/23 | | | 4,340,690 | |
| | 640,000 | | | Valley View Independent School District/Hidalgo County Current Refunding GO, (PSF-GTD),
5.00%, 02/15/26 | | | 755,041 | |
Principal
Amount | | | | | Value | |
| Texas (continued) | | | |
| $ | 640,000 | | | Wall Independent School District School Improvements GO, (PSF-GTD),
5.00%, 02/15/27 | | $ | 731,077 | |
| | 315,000 | | | Wichita Falls Independent School District School Improvements GO, Series A, (PSF-GTD),
5.00%, 02/01/24 | | | 347,842 | |
| | 1,210,000 | | | Wichita Falls Independent School District School Improvements GO, Series A, (PSF-GTD),
5.00%, 02/01/23 | | | 1,281,371 | |
| | 430,000 | | | Wildorado Independent School District School Improvements GO, (PSF-GTD),
5.00%, 02/15/25 | | | 491,041 | |
| | 450,000 | | | Wildorado Independent School District School Improvements GO, (PSF-GTD),
5.00%, 02/15/26 | | | 514,197 | |
| | | | | | | | 515,286,749 | |
| Utah — 0.9% | | | | |
| | 1,255,000 | | | City of Salt Lake City UT Airport Revenue Airport & Marina Improvements Revenue Bonds, Series A,
5.00%, 07/01/25 | | | 1,446,968 | |
| | 1,635,000 | | | City of Salt Lake City UT Airport Revenue Airport & Marina Improvements Revenue Bonds, Series A,
5.00%, 07/01/26 | | | 1,936,201 | |
| | 2,250,000 | | | City of Salt Lake City UT Airport Revenue Airport & Marina Improvements Revenue Bonds, Series A,
5.00%, 07/01/27 | | | 2,727,323 | |
| | 2,500,000 | | | City of Salt Lake City UT Airport Revenue Airport & Marina Improvements Revenue Bonds, Series A,
5.00%, 07/01/28 | | | 3,081,013 | |
| | 3,365,000 | | | City of Salt Lake City UT Airport Revenue Airport & Marina Improvements Revenue Bonds, Series A,
5.00%, 07/01/29 | | | 4,203,269 | |
| Old Westbury Funds, Inc. | |
| Municipal Bond Fund | |
| Portfolio of Investments - (Continued) | October 31, 2021 |
Principal
Amount | | | | | Value | |
| Utah (continued) | | | |
| $ | 4,920,000 | | | City of Salt Lake City UT Airport Revenue Airport & Marina Improvements Revenue Bonds, Series A,
5.00%, 07/01/30 | | $ | 6,247,332 | |
| | 6,390,000 | | | City of Salt Lake City UT Airport Revenue Airport & Marina Improvements Revenue Bonds, Series A,
5.00%, 07/01/32 | | | 8,219,078 | |
| | 10,000,000 | | | State of Utah Highway Improvements Revenue Bonds GO,
5.00%, 07/01/26 | | | 12,019,554 | |
| | 200,000 | | | Washington County School District Board of Education/St George School Improvements Refunding GO, (School Board GTY),
5.00%, 03/01/22 | | | 203,210 | |
| | | | | | | | 40,083,948 | |
| Virginia — 3.6% | | | | |
| | 555,000 | | | City of Alexandria Advance Refunding GO, Series C, (State Aid Withholding),
5.00%, 07/01/22 | | | 572,785 | |
| | 7,800,000 | | | City of Harrisonburg GO, Series A, (State Aid Withholding),
5.00%, 07/15/27 | | | 9,622,752 | |
| | 6,665,000 | | | City of Harrisonburg GO, Series A, (State Aid Withholding),
5.00%, 07/15/28 | | | 8,420,303 | |
| | 7,615,000 | | | City of Harrisonburg GO, Series A, (State Aid Withholding),
5.00%, 07/15/29 | | | 9,831,173 | |
| | 3,045,000 | | | City of Newport News Public Improvements GO, Series A, (State Aid Withholding),
5.00%, 02/01/27 | | | 3,694,428 | |
| | 1,530,000 | | | City of Newport News Public Improvements GO, Series A, (State Aid Withholding),
5.00%, 02/01/29 | | | 1,944,468 | |
| | 2,975,000 | | | City of Newport News Water Revenue Water Utility Improvements Revenue Bonds,
5.00%, 07/15/30 | | | 3,900,866 | |
| | 7,430,000 | | | Commonwealth of Virginia Advance Refunding GO, Series B, (State Aid Withholding),
5.00%, 06/01/28 | | | 8,627,918 | |
Principal
Amount | | | | | Value | |
| Virginia (continued) | | | |
| $ | 2,275,000 | | | Commonwealth of Virginia Pre-refunded GO, Series A,
5.00%, 06/01/22(a) | | $ | 2,337,608 | |
| | 2,715,000 | | | County of Fairfax School Improvements GO, Series A, (State Aid Withholding),
5.00%, 10/01/25 | | | 3,183,411 | |
| | 5,000,000 | | | County of Fairfax School Improvements GO, Series A, (State Aid Withholding),
5.00%, 10/01/27 | | | 6,109,510 | |
| | 7,965,000 | | | County of Fairfax School Improvements GO, Series A, (State Aid Withholding),
5.00%, 10/01/29 | | | 9,714,429 | |
| | 7,530,000 | | | County of Loudoun Public Facilities GO, Series A, (State Aid Withholding),
5.00%, 12/01/26 | | | 9,155,826 | |
| | 21,235,000 | | | Hampton Roads Transportation Accountability Commission Revenue Bonds, Series A,
5.00%, 07/01/26 | | | 25,393,665 | |
| | 1,170,000 | | | Prince William County Industrial Development Authority Public Improvements Refunding Revenue Bonds, Series A,
5.00%, 10/01/24 | | | 1,324,946 | |
| | 5,375,000 | | | Virginia Commonwealth Transportation Board Advance Refunding Revenue Bonds, Series A,
5.00%, 05/15/28 | | | 6,685,531 | |
| | 2,510,000 | | | Virginia Commonwealth Transportation Board Transit Improvements Revenue Bonds,
5.00%, 03/15/23 | | | 2,674,722 | |
| | 815,000 | | | Virginia Commonwealth Transportation Board Transit Improvements Revenue Bonds,
5.00%, 03/15/25 | | | 938,237 | |
| | 1,345,000 | | | Virginia Commonwealth Transportation Board Transit Improvements Revenue Bonds,
5.00%, 03/15/26 | | | 1,597,102 | |
| | 2,175,000 | | | Virginia Commonwealth Transportation Board Transit Improvements Revenue Bonds,
5.00%, 03/15/29 | | | 2,772,864 | |
| Old Westbury Funds, Inc. | |
| Municipal Bond Fund | |
| Portfolio of Investments - (Continued) | October 31, 2021 |
Principal
Amount | | | | | Value | |
| Virginia (continued) | | | |
| $ | 1,250,000 | | | Virginia Commonwealth Transportation Board Transit Improvements Revenue Bonds,
5.00%, 03/15/30 | | $ | 1,625,132 | |
| | 3,935,000 | | | Virginia Commonwealth Transportation Board Transit Improvements Revenue Bonds,
5.00%, 03/15/32 | | | 5,172,304 | |
| | 4,160,000 | | | Virginia Commonwealth Transportation Board Transit Improvements Revenue Bonds,
5.00%, 03/15/33 | | | 5,426,474 | |
| | 5,000,000 | | | Virginia Commonwealth Transportation Board Transit Improvements Revenue Bonds,
5.00%, 05/15/27 | | | 5,961,963 | |
| | 4,450,000 | | | Virginia Public School Authority Advance Refunding Revenue Bonds,
5.00%, 08/01/24 | | | 5,013,098 | |
| | 870,000 | | | Virginia Public School Authority Advance Refunding Revenue Bonds, Series A,
5.00%, 08/01/25 | | | 1,014,369 | |
| | 2,790,000 | | | Virginia Public School Authority School Improvement Revenue Bonds, Series A, (State Aid Withholding),
5.00%, 10/01/23 | | | 3,041,264 | |
| | 920,000 | | | Virginia Public School Authority School Improvements Revenue Bonds, Series A, (State Aid Withholding),
5.00%, 10/01/25 | | | 1,076,773 | |
| | 2,000,000 | | | Virginia Resources Authority Advance Refunding Revenue,
5.00%, 11/01/26 | | | 2,419,754 | |
| | 750,000 | | | Virginia Resources Authority Refunding Revenue Bonds,
5.00%, 11/01/23 | | | 820,380 | |
| | 395,000 | | | Virginia Resources Authority Refunding Revenue Bonds,
5.00%, 11/01/25(a) | | | 449,214 | |
| | 755,000 | | | Virginia Resources Authority Refunding Revenue Bonds,
5.00%, 11/01/25 | | | 859,571 | |
| | | | | | | | 151,382,840 | |
Principal
Amount | | | | | Value | |
| Washington — 5.9% | | | |
| $ | 1,025,000 | | | Benton County School District No 17 Kennewick School Improvements GO, (School Board GTY),
5.00%, 12/01/21 | | $ | 1,028,959 | |
| | 3,000,000 | | | Central Puget Sound Regional Transit Authority Current Refunding Revenue Bonds, Series S-1,
5.00%, 11/01/23 | | | 3,282,001 | |
| | 5,000,000 | | | Central Puget Sound Regional Transit Authority Current Refunding Revenue Bonds, Series S-1,
5.00%, 11/01/24 | | | 5,683,218 | |
| | 5,000,000 | | | Central Puget Sound Regional Transit Authority Current Refunding Revenue Bonds, Series S-1,
5.00%, 11/01/25 | | | 5,878,888 | |
| | 5,000,000 | | | Central Puget Sound Regional Transit Authority Current Refunding Revenue Bonds, Series S-1,
5.00%, 11/01/26 | | | 6,056,441 | |
| | 4,000,000 | | | Central Puget Sound Regional Transit Authority Current Refunding Revenue Bonds, Series S-1,
5.00%, 11/01/29 | | | 5,168,667 | |
| | 5,000,000 | | | Central Puget Sound Regional Transit Authority Current Refunding Revenue Bonds, Series S-1,
5.00%, 11/01/30 | | | 6,586,054 | |
| | 5,000,000 | | | Central Puget Sound Regional Transit Authority Current Refunding Revenue Bonds, Series S-1,
5.00%, 11/01/31 | | | 6,722,096 | |
| | 10,000,000 | | | Central Puget Sound Regional Transit Authority Current Refunding Revenue Bonds, Series S-1,
5.00%, 11/01/32 | | | 13,404,380 | |
| | 10,000,000 | | | Central Puget Sound Regional Transit Authority Current Refunding Revenue Bonds, Series S-1,
5.00%, 11/01/33 | | | 13,375,292 | |
| | 100,000 | | | Central Puget Sound Regional Transit Authority Green Purpose Revenue Bonds, Series S-1,
5.00%, 11/01/26 | | | 121,152 | |
| | 1,050,000 | | | Chelan County School District No 228 Cascade School Improvements GO, (School Board GTY),
5.00%, 12/01/26 | | | 1,253,131 | |
| Old Westbury Funds, Inc. | |
| Municipal Bond Fund | |
| Portfolio of Investments - (Continued) | October 31, 2021 |
Principal
Amount | | | | | Value | |
| Washington (continued) | | | |
| $ | 11,320,000 | | | City of Seattle WA Drainage & Wastewater Revenue Sewer Improvements Revenue Bonds,
5.00%, 09/01/30 | | $ | 14,889,501 | |
| | 11,620,000 | | | City of Seattle WA Drainage & Wastewater Revenue Sewer Improvements Revenue Bonds,
5.00%, 09/01/31 | | | 15,597,984 | |
| | 1,600,000 | | | Clark County Public Utility District No 1 Refunding Revenue Bonds,
5.00%, 01/01/27 | | | 1,880,044 | |
| | 825,000 | | | Clark County School District No 117 Camas School Improvements GO, (School Board GTY),
5.00%, 12/01/24 | | | 942,054 | |
| | 1,035,000 | | | County of King Refunding GO,
5.00%, 07/01/25 | | | 1,184,225 | |
| | 5,395,000 | | | County of King Refunding GO,
5.00%, 07/01/26 | | | 6,163,867 | |
| | 9,000,000 | | | County of King School District No 411 Issaquah School Improvement GO, (School Board GTY),
5.00%, 12/01/32 | | | 11,071,347 | |
| | 10,000,000 | | | County of King Sewer Improvements GO, Series A,
5.00%, 01/01/30 | | | 12,985,043 | |
| | 5,000,000 | | | County of King Sewer Improvements GO, Series A,
5.00%, 01/01/31 | | | 6,610,139 | |
| | 8,000,000 | | | County of King WA Sewer Revenue Sewer Improvement Revenue Bonds, Series B,
5.00%, 07/01/29 | | | 9,998,758 | |
| | 10,000,000 | | | Energy Northwest Advance Refunding Revenue Bonds, Series A,
5.00%, 07/01/27 | | | 11,943,170 | |
| | 3,000,000 | | | Energy Northwest Advance Refunding Revenue Bonds, Series A,
5.00%, 07/01/27 | | | 3,476,599 | |
| | 2,250,000 | | | Energy Northwest Current Refunding Revenue Bonds, Series A,
5.00%, 07/01/26 | | | 2,698,657 | |
| | 3,900,000 | | | Energy Northwest Refunding Revenue Bonds, Series A,
5.00%, 07/01/28 | | | 4,020,717 | |
Principal
Amount | | | | | Value | |
| Washington (continued) | | | |
| $ | 565,000 | | | Jefferson County School District No 50 Port Townsend School Improvements GO, (School Board GTY),
5.00%, 12/01/23 | | $ | 618,637 | |
| | 250,000 | | | Jefferson County School District No 50 Port Townsend School Improvements GO, (School Board GTY),
5.00%, 12/01/25 | | | 293,459 | |
| | 5,000,000 | | | Port of Seattle Airport & Marina Improvements Refunding Revenue Bonds, Series C,
5.00%, 08/01/27 | | | 6,077,903 | |
| | 5,000,000 | | | Port of Seattle Airport & Marina Improvements Refunding Revenue Bonds, Series C,
5.00%, 08/01/29 | | | 6,312,422 | |
| | 5,000,000 | | | Port of Seattle Airport & Marina Improvements Refunding Revenue Bonds, Series C,
5.00%, 08/01/30 | | | 6,399,355 | |
| | 5,000,000 | | | Port of Seattle Airport & Marina Improvements Refunding Revenue Bonds, Series C,
5.00%, 08/01/31 | | | 6,513,949 | |
| | 5,000,000 | | | Port of Seattle Airport & Marina Improvements Refunding Revenue Bonds, Series C,
5.00%, 08/01/32 | | | 6,466,871 | |
| | 6,885,000 | | | Port of Seattle Current Refunding Revenue Bonds,
5.00%, 09/01/25 | | | 7,991,872 | |
| | 4,390,000 | | | Port of Seattle Current Refunding Revenue Bonds,
5.00%, 09/01/26 | | | 5,233,302 | |
| | 750,000 | | | Port of Seattle Inter Lien Refunding Revenue Bonds,
5.00%, 02/01/27 | | | 881,750 | |
| | 5,000,000 | | | Port of Seattle Refunding GO,
5.00%, 06/01/24 | | | 5,596,689 | |
| | 1,120,000 | | | Skagit County Consolidated School District No 320 Mount Vernon School Improvements Refunding GO, (School Board GTY),
5.00%, 12/01/23 | | | 1,228,783 | |
| | 750,000 | | | Snohomish County Public Utility District No 1 Current Refunding Revenue Bonds, Series A,
5.00%, 12/01/23 | | | 822,845 | |
| Old Westbury Funds, Inc. | |
| Municipal Bond Fund | |
| Portfolio of Investments - (Continued) | October 31, 2021 |
Principal
Amount | | | | | Value | |
| Washington (continued) | | | |
| $ | 750,000 | | | Snohomish County Public Utility District No 1 Current Refunding Revenue Bonds, Series A,
5.00%, 12/01/24 | | $ | 855,171 | |
| | 5,000,000 | | | Snohomish County School District No 201 Refunding GO, (School Board GTY),
5.00%, 12/01/25 | | | 5,585,699 | |
| | 775,000 | | | Spokane & Whitman Counties School District No 360 Cheney Advance Refunding GO, (School Board GTY),
5.00%, 12/01/23 | | | 850,444 | |
| | 1,000,000 | | | State of Washington Advance Refunding COP, (State Aid Intercept Program),
5.00%, 07/01/24 | | | 1,121,241 | |
| | 5,475,000 | | | State of Washington Public Improvements GO, Series C,
5.00%, 02/01/30 | | | 6,242,576 | |
| | 2,760,000 | | | State of Washington Public Improvements GO, Series D,
5.00%, 02/01/24 | | | 3,048,419 | |
| | 800,000 | | | State of Washington Refunding GO, Series R-2012C,
5.00%, 07/01/23 | | | 825,297 | |
| | 4,435,000 | | | Yakima County School District No 7 Yakima Advance Refunding GO, (School Board GTY),
5.00%, 12/01/24 | | | 5,053,979 | |
| | | | | | | | 250,043,047 | |
| West Virginia — 0.0% | | | | |
| | 1,650,000 | | | West Virginia Parkways Authority Highway Improvements Revenue Bonds,
5.00%, 06/01/26 | | | 1,967,561 | |
| Wisconsin — 1.1% | | | | |
| | 1,000,000 | | | State of Wisconsin Advance Refunding Revenue Bonds, Series B,
5.00%, 05/01/28 | | | 1,189,080 | |
| | 4,700,000 | | | State of Wisconsin Clean Water Fund Leveraged Loan Portfolio Advance Refunding Revenue Bonds,
5.00%, 06/01/29(a) | | | 5,258,304 | |
Principal
Amount | | | | | Value | |
| Wisconsin (continued) | | | |
| $ | 1,000,000 | | | State of Wisconsin Clean Water Fund Leveraged Loan Portfolio Advance Refunding Revenue Bonds, Series
1, 5.00%, 06/01/23 | | $ | 1,074,431 | |
| | 1,000,000 | | | State of Wisconsin Clean Water Fund Leveraged Loan Portfolio Refunding Revenue Bonds, Series
1, 5.00%, 06/01/26(a) | | | 1,074,316 | |
| | 14,000,000 | | | State of Wisconsin Current Refunding Revenue Bonds, Series A,
5.00%, 05/01/29 | | | 17,046,008 | |
| | 1,200,000 | | | State of Wisconsin General Fund Advance Refunding Revenue Bonds, Series B,
5.00%, 05/01/27 | | | 1,431,595 | |
| | 3,205,000 | | | State of Wisconsin Public Improvements GO, Series B,
5.00%, 05/01/30(a) | | | 3,282,214 | |
| | 1,900,000 | | | State of Wisconsin Refunding Bonds GO, Series 3,
5.00%, 11/01/25(a) | | | 1,991,588 | |
| | 1,000,000 | | | State of Wisconsin Refunding GO, Series 1,
5.00%, 05/01/24 | | | 1,071,285 | |
| | 860,000 | | | State of Wisconsin Refunding Notes GO, Series A,
5.00%, 05/01/28 | | | 991,680 | |
| | 6,000,000 | | | Wisconsin Department of Transportation Advance Refunding Revenue Bonds, Series 1,
1.01%, 07/01/26 | | | 5,903,352 | |
| | 1,600,000 | | | Wisconsin Department of Transportation Pre-refunded Current Refunding Revenue Bonds, Series 1,
5.00%, 07/01/29(a) | | | 1,651,163 | |
| | 2,250,000 | | | Wisconsin Health & Educational Facilities Authority Refunding Revenue Bonds, Series A,
5.13%, 04/15/31(a) | | | 2,407,188 | |
| | | | | | | | 44,372,204 | |
Total Municipal Bonds
(Cost $3,772,468,392) | | | 3,824,911,121 | |
| Old Westbury Funds, Inc. | |
| Municipal Bond Fund | |
| Portfolio of Investments - (Continued) | October 31, 2021 |
Principal
Amount | | | | | Value | |
| CORPORATE BONDS — 1.5% | | | |
| United States — 1.5% | | | | |
| $ | 1,675,000 | | | Andrew W Mellon Foundation (The), Series 2020,
0.95%, 08/01/27 | | $ | 1,632,806 | |
| | 3,000,000 | | | BayCare Health System, Inc., Series 2020,
2.61%, 11/15/22 | | | 3,062,226 | |
| | 5,000,000 | | | Baylor Scott & White Holdings, Series 2021,
0.83%, 11/15/25 | | | 4,845,942 | |
| | 1,750,000 | | | Bon Secours Mercy Health, Inc.,
1.35%, 06/01/25 | | | 1,750,623 | |
| | 8,000,000 | | | Brown University in Providence in the State of Rhode Island and Providence Plant, Series A,
1.91%, 09/01/30 | | | 7,988,995 | |
| | 5,000,000 | | | Leland Stanford Junior University,
1.29%, 06/01/27 | | | 4,955,121 | |
| | 5,750,000 | | | PeaceHealth Obligated Group, Series 2020,
1.38%, 11/15/25 | | | 5,760,590 | |
| | 10,000,000 | | | Seattle Children’s Hospital, Series 2021,
1.21%, 10/01/27 | | | 9,666,258 | |
| | 10,000,000 | | | Yale University, Series 2020,
0.87%, 04/15/25 | | | 9,950,968 | |
| | 12,550,000 | | | Yale University, Series 2020,
1.48%, 04/15/30 | | | 12,329,801 | |
Total Corporate Bonds
(Cost $62,766,359) | | | 61,943,330 | |
| | | | | | | | | |
| U.S. GOVERNMENT SECURITIES — 2.0% | | | | |
| U.S. Treasury Bills — 1.2% | | | | |
| | 50,000,000 | | | 0.05%, 03/31/22(d)(e) | | | 49,986,979 | |
| U.S. Treasury Bonds — 0.8% | | | | |
| | 25,000,000 | | | 4.50%, 02/15/36 | | | 34,355,469 | |
Total U.S. Government Securities
(Cost $84,183,166) | | | 84,342,448 | |
| | | | | | | |
| Shares | | | | | Value | |
| INVESTMENT COMPANY — 9.5% | | | |
| | 402,891,766 | | | SEI Daily Income Trust Government II Fund - Class A, 0.01%(f) | | $ | 402,891,766 | |
Total Investment Company
(Cost $402,891,766) | | | 402,891,766 | |
TOTAL INVESTMENTS — 103.3%
(Cost $4,322,309,683) | | $ | 4,374,088,665 | |
| LIABILITIES IN EXCESS OF OTHER ASSETS — (3.3)% | | | (139,841,978) | |
| NET ASSETS — 100.0% | | $ | 4,234,246,687 | |
| (a) | These securities are pre-refunded; the date shown represents the pre-refunded date. Bonds which are pre-refunded are collateralized by U.S. Government securities which are held in escrow and are used to pay principal and interest on the municipal issue and to retire the bonds in full at the earliest refunding date. |
| (b) | Variable or floating rate security, which interest rate adjusts periodically based on changes in current interest rates and prepayments on the underlying pool of assets. Rate shown is the rate in effect as of October 31, 2021. |
| (c) | These securities are subject to remarketing prior to its stated maturity, and is subject to mandatory redemption at the stated maturity date. |
| (d) | Zero coupon bond. The rate represents the yield at time of purchase. |
| (e) | The rate represents the annualized yield at time of purchase. |
| (f) | The rate shown represents the current yield as of October 31, 2021. |
The following abbreviations are used in the report:
AGM — Assured Guaranty Municipal Corp.
COP — Certificates of Participation
GO — General Obligation
GTY — Guaranty
NATL-RE — Insured by National Public Finance Guarantee Corp.
PSF-GTD — Permanent School Fund Guarantee
Q-SBLF — Qualified-School Board Loan Fund
| Old Westbury Funds, Inc. | |
| California Municipal Bond Fund | |
| Portfolio of Investments | October 31, 2021 |
| | |
Principal
Amount | | | | | Value | |
| MUNICIPAL BONDS — 93.4% | | | | |
| California — 93.4% | | | | |
| $ | 1,000,000 | | | Abag Finance Authority for Nonprofit Corps Odd fellows Home Refunding Revenue Bonds, Series A, (California Mortgage Insurance),
5.00%, 04/01/23 | | $ | 1,064,613 | |
| | 250,000 | | | Bay Area Toll Authority Pre-refunded Highway Improvements Revenue Bonds, Sub-Series S-4,
5.00%, 04/01/38(a) | | | 266,964 | |
| | 6,000,000 | | | Bay Area Toll Authority Pre-refunded Highway Improvements Revenue Bonds, Sub-Series S-4,
5.00%, 04/01/43(a) | | | 6,407,131 | |
| | 20,000,000 | | | Bay Area Toll Authority Pre-refunded Highway Improvements Revenue Bonds, Sub-Series S-4,
5.25%, 04/01/48(a) | | | 21,427,666 | |
| | 100,000 | | | Bay Area Toll Authority San Francisco Bay Area Subordinate Transportation Advance Refunding Revenue Bonds,
5.00%, 04/01/22 | | | 102,012 | |
| | 125,000 | | | Bay Area Toll Authority San Francisco Bay Area Subordinate Transportation Advance Refunding Revenue Bonds,
5.00%, 04/01/23 | | | 133,353 | |
| | 150,000 | | | Cabrillo Community College District Refunding GO,
5.00%, 08/01/23(a) | | | 155,417 | |
| | 100,000 | | | Cabrillo Community College District Refunding GO,
5.00%, 08/01/24(a) | | | 103,612 | |
| | 930,000 | | | Cabrillo Community College District Refunding GO,
5.00%, 08/01/27(a) | | | 963,588 | |
| | 500,000 | | | California Educational Facilities Authority Advance Refunding Revenue Bonds, Series A,
5.00%, 01/01/27 | | | 587,739 | |
| | 1,550,000 | | | California Educational Facilities Authority Refunding Revenue Bonds, Series A,
5.00%, 10/01/23 | | | 1,690,279 | |
| | 500,000 | | | California Health Facilities Financing Authority Current Refunding Revenue Bonds,
5.00%, 11/01/31 | | | 676,757 | |
Principal
Amount | | | | | Value | |
| California (continued) | | | | |
| $ | 275,000 | | | California Health Facilities Financing Authority Current Refunding Revenue Bonds,
5.00%, 11/15/22 | | $ | 288,790 | |
| | 1,000,000 | | | California Health Facilities Financing Authority Current Refunding Revenue Bonds,
5.00%, 11/01/23 | | | 1,094,051 | |
| | 100,000 | | | California Health Facilities Financing Authority Current Refunding Revenue Bonds,
5.00%, 11/15/25 | | | 117,922 | |
| | 1,565,000 | | | California Infrastructure & Economic Development Bank Current Refunding Revenue Bond, Series A-1,
5.00%, 04/01/33 | | | 2,179,804 | |
| | 5,725,000 | | | California Infrastructure & Economic Development Bank Revenue Bond,
5.00%, 10/01/35 | | | 7,076,298 | |
| | 100,000 | | | California Infrastructure & Economic Development Bank Revenue Bond,
5.00%, 10/01/23 | | | 109,107 | |
| | 250,000 | �� | | California Infrastructure & Economic Development Bank Revenue Bond,
5.00%, 10/01/23 | | | 272,767 | |
| | 125,000 | | | California Infrastructure & Economic Development Bank University & College Improvements Revenue Bonds,
5.00%, 05/15/23 | | | 134,055 | |
| | 100,000 | | | California Municipal Finance Authority Advance Refunding Anaheim Water System Project Revenue Bonds, Series A,
5.00%, 10/01/24 | | | 113,650 | |
| | 160,000 | | | California Municipal Finance Authority Retirement Facilities California Armenian Home Project Revenue Bonds, (California Mortgage Insurance),
5.00%, 05/15/22 | | | 164,164 | |
| | 100,000 | | | California Municipal Finance Authority Retirement Facilities Revenue Bonds, (California Mortgage Insurance),
5.00%, 04/01/23 | | | 106,786 | |
| Old Westbury Funds, Inc. | |
| California Municipal Bond Fund | |
| Portfolio of Investments - (Continued) | October 31, 2021 |
| | |
Principal
Amount | | | | | Value | |
| California (continued) | | | | |
| $ | 125,000 | | | California Municipal Finance Authority Retirement Facilities Revenue Bonds, (California Mortgage Insurance),
5.00%, 04/01/24 | | $ | 138,817 | |
| | 670,000 | | | California Municipal Finance Authority Retirement Facilities Town and Country Manor Revenue Bonds, (California Mortgage Insurance),
4.00%, 07/01/24 | | | 733,502 | |
| | 4,770,000 | | | California State Current Refunding GO,
5.00%, 08/01/27 | | | 5,470,312 | |
| | 250,000 | | | California State Public Works Board Correctional Facilities Improvements Revenue Bonds, Series C,
5.00%, 11/01/23 | | | 273,302 | |
| | 460,000 | | | California State Public Works Board Correctional Facilities Improvements Revenue Bonds, Series C,
5.00%, 11/01/24 | | | 522,972 | |
| | 100,000 | | | California State Public Works Board Correctional Facilities Improvements Revenue Bonds, Series C,
5.00%, 11/01/25 | | | 117,515 | |
| | 325,000 | | | California State Public Works Board Current Refunding Revenue Bonds, Series F,
5.00%, 05/01/26 | | | 374,396 | |
| | 150,000 | | | California State Public Works Board Public Improvements Current Refunding Revenue Bonds, Series G,
5.00%, 11/01/22 | | | 157,214 | |
| | 250,000 | | | California State University & College Improvements Current Refunding Revenue Bonds, Series A,
5.00%, 11/01/23 | | | 273,618 | |
| | 1,785,000 | | | California State University & College Improvements Revenue Bonds, Series A,
5.00%, 11/01/24 | | | 2,032,806 | |
| | 1,000,000 | | | California State University Current Refunding Revenue Bonds, Series A,
5.00%, 11/01/24(a) | | | 1,048,091 | |
Principal
Amount | | | | | Value | |
| California (continued) | | | | |
| $ | 120,000 | | | California State University Current Refunding Revenue Bonds, Series C,
5.00%, 11/01/21 | | $ | 120,000 | |
| | 20,000 | | | California State University Pre-refunded Refunding Revenue Bonds,
5.00%, 11/01/25(a) | | | 22,739 | |
| | 230,000 | | | California State University Unfunded Revenue Bonds,
5.00%, 11/01/25(a) | | | 262,078 | |
| | 150,000 | | | California Statewide Communities Development Authority Advance Refunding Revenue Bonds, (California Mortgage Insurance),
5.00%, 08/15/25 | | | 174,554 | |
| | 745,000 | | | California Statewide Communities Development Authority Current Refunding Revenue Bonds, (California Mortgage Insurance),
4.00%, 11/15/25 | | | 844,001 | |
| | 100,000 | | | California Statewide Communities Development Authority Nursing Homes Retirement Facilities Revenue Bonds, (California Mortgage Insurance),
5.00%, 07/01/28 | | | 125,122 | |
| | 5,000,000 | | | Carlsbad Unified School District School Improvements GO, Series B,
6.00%, 05/01/34 | | | 5,693,376 | |
| | 885,000 | | | Chabot-Las Positas Community College District Refunding GO,
5.00%, 08/01/25(a) | | | 957,975 | |
| | 325,000 | | | City & County of San Francisco Public Improvements GO, Series B,
5.00%, 06/15/22 | | | 334,742 | |
| | 4,335,000 | | | City & County of San Francisco Public Improvements GO, Series R1,
5.00%, 06/15/29 | | | 5,646,181 | |
| | 150,000 | | | City & County of San Francisco Refunding Notes COP,
5.00%, 04/01/23 | | | 160,090 | |
| | 2,500,000 | | | City & County of San Francisco Refunding Notes COP,
5.00%, 04/01/23 | | | 2,667,792 | |
| Old Westbury Funds, Inc. | |
| California Municipal Bond Fund | |
| Portfolio of Investments - (Continued) | October 31, 2021 |
| | |
Principal
Amount | | | | | Value | |
| California (continued) | | | | |
| $ | 1,000,000 | | | City of Los Angeles Department of Airports Airport & Marina Improvements Refunding Revenue Bonds, Series A,
5.00%, 05/15/30 | | $ | 1,277,272 | |
| | 1,000,000 | | | City of Los Angeles Department of Airports Airport & Marina Improvements Refunding Revenue Bonds, Series A,
5.00%, 05/15/31 | | | 1,294,816 | |
| | 1,000,000 | | | City of Los Angeles Department of Airports Airport & Marina Improvements Refunding Revenue Bonds, Series A,
5.00%, 05/15/32 | | | 1,288,310 | |
| | 1,000,000 | | | City of Los Angeles Department of Airports Airport & Marina Improvements Refunding Revenue Bonds, Series A,
5.00%, 05/15/33 | | | 1,284,183 | |
| | 1,000,000 | | | City of Los Angeles Department of Airports Airport & Marina Improvements Refunding Revenue Bonds, Series A,
5.00%, 05/15/34 | | | 1,280,793 | |
| | 1,000,000 | | | City of Los Angeles Department of Airports Airport & Marina Improvements Revenue Bonds, Series A,
5.00%, 05/15/46 | | | 1,241,244 | |
| | 4,000,000 | | | City of Los Angeles Department of Airports Current Refunding Revenue Bonds,
5.00%, 05/15/34 | | | 5,127,719 | |
| | 7,500,000 | | | City of Los Angeles Department of Airports Current Refunding Revenue Bonds,
5.00%, 05/15/40 | | | 9,488,865 | |
| | 3,645,000 | | | City of Los Angeles Department of Airports Current Refunding Revenue Bonds, Series C,
5.00%, 05/15/23 | | | 3,911,396 | |
| | 1,500,000 | | | City of Los Angeles Department of Airports Current Refunding Revenue Bonds, Series C,
5.00%, 05/15/24 | | | 1,675,701 | |
Principal
Amount | | | | | Value | |
| California (continued) | | | | |
| $ | 200,000 | | | City of Los Angeles Department of Airports Port Airport & Marina Improvements Refunding Revenue Bonds,
5.00%, 05/15/24 | | $ | 223,427 | |
| | 100,000 | | | City of Los Angeles Department of Airports Port Airport & Marina Improvements Refunding Revenue Bonds,
5.00%, 05/15/25 | | | 115,798 | |
| | 100,000 | | | City of Los Angeles Wastewater System Revenue Advance Refunding Revenue Bonds, Sub-Series A,
5.00%, 06/01/24 | | | 112,044 | |
| | 2,550,000 | | | City of Los Angeles Wastewater System Revenue Refunding Revenue Bonds, Sub-Series A,
5.00%, 06/01/25 | | | 2,741,614 | |
| | 1,800,000 | | | City of Los Angeles Wastewater System Revenue Refunding Revenue Bonds, Sub-Series A,
5.00%, 06/01/27 | | | 1,935,257 | |
| | 275,000 | | | City of Palo Alto Parking Facility Improvements COP, Series A,
5.00%, 11/01/23 | | | 300,980 | |
| | 150,000 | | | City of Palo Alto Parking Facility Improvements COP, Series A,
5.00%, 11/01/24 | | | 170,824 | |
| | 200,000 | | | City of Palo Alto Parking Facility Improvements COP, Series A,
5.00%, 11/01/25 | | | 235,639 | |
| | 100,000 | | | City of Roseville Water Utility Revenue Advance Refunding COP,
5.00%, 12/01/23 | | | 109,823 | |
| | 150,000 | | | City of Sacramento Wastewater Revenue Sewer Improvements Revenue Bonds,
5.00%, 09/01/25 | | | 175,979 | |
| | 1,900,000 | | | City of San Francisco Public Utilities Commission Water Revenue Advance Refunding Revenue Bonds,
5.00%, 11/01/28 | | | 2,192,351 | |
| | 1,600,000 | | | Contra Costa County Public Financing Authority Current Refunding Revenue Bonds, Series B,
5.00%, 06/01/25 | | | 1,852,392 | |
| Old Westbury Funds, Inc. | |
| California Municipal Bond Fund | |
| Portfolio of Investments - (Continued) | October 31, 2021 |
| | |
Principal
Amount | | | | | Value | |
| California (continued) | | | | |
| $ | 3,625,000 | | | Contra Costa Transportation Authority Current Refunding Revenue Bonds, Series A,
5.00%, 03/01/31 | | $ | 4,877,041 | |
| | 275,000 | | | Contra Costa Water District Refunding Revenue Bonds, Series T,
5.00%, 10/01/25 | | | 312,364 | |
| | 425,000 | | | County of Marin Advance Refunding COP,
5.00%, 11/01/26 | | | 499,809 | |
| | 225,000 | | | County of Sacramento Airport System Revenue Current Refunding Revenue Bonds, Sub-Series D,
5.00%, 07/01/23 | | | 242,694 | |
| | 225,000 | | | County of Sacramento Airport System Revenue Current Refunding Revenue Bonds, Sub-Series D,
5.00%, 07/01/26 | | | 269,293 | |
| | 100,000 | | | County of San Diego Refunding COP, Series A,
5.00%, 10/15/25 | | | 113,565 | |
| | 100,000 | | | Cucamonga Valley Water District Financing Authority Current Refunding Revenue Bonds,
5.00%, 09/01/24 | | | 113,012 | |
| | 1,445,000 | | | Desert Community College District Refunding GO,
5.00%, 08/01/26 | | | 1,744,889 | |
| | 200,000 | | | East Bay Municipal Utility District Wastewater System Revenue Advance Refunding Revenue Bonds, Series A,
5.00%, 06/01/22 | | | 205,597 | |
| | 300,000 | | | East Bay Municipal Utility District Wastewater System Revenue Advance Refunding Revenue Bonds, Series A,
5.00%, 06/01/23 | | | 322,543 | |
| | 225,000 | | | East Bay Municipal Utility District Wastewater System Revenue Current Refunding Revenue Bonds, Series A,
5.00%, 06/01/24 | | | 252,223 | |
| | 150,000 | | | East Bay Municipal Utility District Wastewater System Revenue Current Refunding Revenue Bonds, Series A,
5.00%, 06/01/25 | | | 174,417 | |
Principal
Amount | | | | | Value | |
| California (continued) | | | | |
| $ | 1,500,000 | | | Eastern Municipal Water District Financing Authority Current Refunding Revenue Bonds, Series A,
5.00%, 07/01/36 | | $ | 1,951,334 | |
| | 1,000,000 | | | Eastern Municipal Water District Financing Authority Current Refunding Revenue Bonds, Series A,
5.00%, 07/01/37 | | | 1,297,483 | |
| | 805,000 | | | Garden Grove Unified School District School Improvements GO, Series C,
5.00%, 08/01/30(a) | | | 872,118 | |
| | 2,000,000 | | | Los Angeles Community College District Advance Refunding GO,
1.17%, 08/01/26 | | | 1,996,590 | |
| | 200,000 | | | Los Angeles Community College District Refunding GO, Series A,
5.00%, 08/01/25(a) | | | 225,308 | |
| | 1,100,000 | | | Los Angeles Community College District Refunding GO, Series A,
5.00%, 08/01/29(a) | | | 1,239,193 | |
| | 1,000,000 | | | Los Angeles Community College District University & College Improvements GO, Series 2008-F,
5.00%, 08/01/24(a) | | | 1,083,376 | |
| | 850,000 | | | Los Angeles County Metropolitan Transportation Authority Transit Improvements Revenue Bonds, Senior Series B,
5.00%, 07/01/25 | | | 916,992 | |
| | 125,000 | | | Los Angeles County Metropolitan Transportation Authority Current Refunding Revenue Bonds, Series A,
5.00%, 07/01/24 | | | 140,582 | |
| | 120,000 | | | Los Angeles County Metropolitan Transportation Authority Current Refunding Revenue Bonds, Series A,
5.00%, 07/01/25 | | | 134,958 | |
| | 5,000,000 | | | Los Angeles County Metropolitan Transportation Authority Transit Improvements Revenue Bonds, Series A,
5.00%, 06/01/28 | | | 6,324,219 | |
| Old Westbury Funds, Inc. | |
| California Municipal Bond Fund | |
| Portfolio of Investments - (Continued) | October 31, 2021 |
| | |
Principal
Amount | | | | | Value | |
| California (continued) | | | | |
| $ | 4,000,000 | | | Los Angeles County Metropolitan Transportation Authority Transit Improvements Revenue Bonds, Series A,
5.00%, 06/01/29 | | $ | 5,171,672 | |
| | 4,950,000 | | | Los Angeles County Metropolitan Transportation Authority Transit Improvements Revenue Bonds, Series A,
5.00%, 06/01/30 | | | 6,522,866 | |
| | 5,000,000 | | | Los Angeles County Metropolitan Transportation Authority Transit Improvements Revenue Bonds, Series A,
5.00%, 06/01/31 | | | 6,715,266 | |
| | 4,000,000 | | | Los Angeles County Metropolitan Transportation Authority Transit Improvements Revenue Bonds, Series A,
5.00%, 06/01/32 | | | 5,388,060 | |
| | 275,000 | | | Los Angeles County Metropolitan Transportation Authority, Refunding Revenue Bonds,
5.00%, 07/01/24 | | | 309,280 | |
| | 1,125,000 | | | Los Angeles Department of Water & Power Current Refunding Revenue Bonds, Series B,
5.00%, 07/01/39 | | | 1,444,789 | |
| | 1,425,000 | | | Los Angeles Department of Water & Power Power System Electricity Light & Power Improvements Revenue Bonds, Series D,
5.00%, 07/01/22 | | | 1,470,762 | |
| | 2,065,000 | | | Los Angeles Department of Water & Power Power System Revenue Current Refunding Revenue Bonds, Series A,
5.00%, 07/01/23 | | | 2,179,663 | |
| | 250,000 | | | Los Angeles Department of Water & Power Power System Revenue Current Refunding Revenue Bonds, Series A,
5.00%, 07/01/23 | | | 269,835 | |
| | 150,000 | | | Los Angeles Department of Water & Power Power System Revenue Current Refunding Revenue Bonds, Series B,
5.00%, 01/01/22 | | | 150,588 | |
Principal
Amount | | | | | Value | |
| California (continued) | | | | |
| $ | 450,000 | | | Los Angeles Department of Water & Power Power System Revenue Current Refunding Revenue Bonds, Series B,
5.00%, 01/01/23 | | $ | 473,385 | |
| | 600,000 | | | Los Angeles Department of Water & Power Power System Revenue Current Refunding Revenue Bonds, Series B,
5.00%, 01/01/24 | | | 658,672 | |
| | 5,000,000 | | | Los Angeles Department of Water & Power Power System Revenue Current Refunding Revenue Bonds, Series B,
5.00%, 07/01/24 | | | 5,616,150 | |
| | 100,000 | | | Los Angeles Department of Water & Power Power System Revenue Electricity Light & Power Improvements Revenue Bonds, Series C,
5.00%, 07/01/22 | | | 103,211 | |
| | 1,800,000 | | | Los Rios Community College District Refunding GO,
5.00%, 08/01/27 | | | 1,863,069 | |
| | 175,000 | | | Marin Community College District Advance Refunding GO,
5.00%, 08/01/23 | | | 189,591 | |
| | 1,100,000 | | | Mount San Jacinto Community College District University & College Improvements GO, Series 2014-A,
5.00%, 08/01/28 | | | 1,280,751 | |
| | 2,000,000 | | | Municipal Improvement Corp. of Los Angeles Refunding Revenue Bonds, Series A,
5.00%, 11/01/24(a) | | | 2,232,493 | |
| | 450,000 | | | Northern California Power Agency Hydroelectric Project Current Refunding Revenue Bonds, Series A,
5.00%, 07/01/22 | | | 464,420 | |
| | 125,000 | | | Northern California Power Agency Hydroelectric Project Current Refunding Revenue Bonds, Series A,
5.00%, 07/01/24 | | | 140,475 | |
| Old Westbury Funds, Inc. | |
| California Municipal Bond Fund | |
| Portfolio of Investments - (Continued) | October 31, 2021 |
| | |
Principal
Amount | | | | | Value | |
| California (continued) | | | | |
| $ | 210,000 | | | Northern California Transmission Agency California-Oregon Project Advance Refunding Revenue Bonds,
5.00%, 05/01/26 | | $ | 249,707 | |
| | 160,000 | | | Ohlone Community College District Advance Refunding GO,
5.00%, 08/01/24 | | | 180,670 | |
| | 100,000 | | | Orange County Sanitation District Advance Refunding Revenue Bonds, Series A,
5.00%, 02/01/26 | | | 118,905 | |
| | 3,000,000 | | | Orange County Sanitation District Advance Refunding Revenue Bonds, Series A,
5.00%, 02/01/34 | | | 3,370,818 | |
| | 475,000 | | | Orange County Water District Repayment Of Bank Loan Revenue Bonds, Series C,
5.00%, 08/15/25 | | | 556,066 | |
| | 200,000 | | | Placer County Water Agency Current Refunding COP,
5.00%, 07/01/22 | | | 206,436 | |
| | 150,000 | | | Regents of the University of California Medical Center Pooled Revenue Current Refunding Revenue Bonds, Series L,
5.00%, 05/15/23 | | | 160,987 | |
| | 1,145,000 | | | Regents of the University of California Medical Center Pooled Revenue Current Refunding Revenue Bonds, Series L,
5.00%, 05/15/24 | | | 1,277,882 | |
| | 1,320,000 | | | Regents of the University of California Medical Center Pooled Revenue Pre-refunded Revenue Bonds, Series J,
5.00%, 05/15/24(a) | | | 1,416,111 | |
| | 6,150,000 | | | Regents of the University of California Medical Center Pooled Revenue Pre-refunded Revenue Bonds, Series J,
5.25%, 05/15/27(a) | | | 6,621,348 | |
| | 1,100,000 | | | Rio Hondo Community College District Current Refunding GO, Series B,
5.00%, 08/01/24 | | | 1,242,105 | |
Principal
Amount | | | | | Value | |
| California (continued) | | | | |
| $ | 675,000 | | | Rio Hondo Community College District Current Refunding GO, Series B,
5.00%, 08/01/25 | | $ | 789,755 | |
| | 870,000 | | | Riverside County Transportation Commission Pre-refunding Refunding Revenue Bond, Series A,
5.25%, 06/01/24(a) | | | 939,237 | |
| | 200,000 | | | Sacramento County Sanitation Districts Financing Authority Current Refunding Revenue Bonds,
5.00%, 08/01/25 | | | 233,839 | |
| | 3,000,000 | | | Sacramento Municipal Utility District Refunding Revenue Bonds, Sub-Series A,
5.00%, 08/15/49(b) | | | 3,200,871 | |
| | 5,250,000 | | | Sacramento Municipal Utility District Refunding Revenue Bonds, Sub- Series B,
5.00%, 08/15/49(b) | | | 6,048,639 | |
| | 275,000 | | | Saddleback Valley Unified School District Refunding GO,
5.00%, 08/01/24 | | | 297,827 | |
| | 5,000,000 | | | San Bernardino Community College District Advance Refunding GO,
1.61%, 08/01/27 | | | 5,012,732 | |
| | 1,000,000 | | | San Diego Community College District Advance Refunding GO,
5.00%, 08/01/28 | | | 1,203,368 | |
| | 100,000 | | | San Diego County Regional Transportation Commission Sales & Use Tax Refunding Revenue Bonds, Series A,
5.00%, 04/01/25(a) | | | 111,348 | |
| | 120,000 | | | San Diego County Water Authority Advance Refunding Revenue Bonds,
5.00%, 05/01/22 | | | 122,898 | |
| | 7,800,000 | | | San Diego County Water Authority Advance Refunding Revenue Bonds, Series A,
1.33%, 05/01/28 | | | 7,650,706 | |
| | 3,800,000 | | | San Diego County Water Authority Refunding Revenue Bonds, Sub- Series S1,
5.00%, 05/01/28 | | | 4,785,584 | |
| Old Westbury Funds, Inc. | |
| California Municipal Bond Fund | |
| Portfolio of Investments - (Continued) | October 31, 2021 |
| | |
Principal
Amount | | | | | Value | |
| California (continued) | | | | |
| $ | 300,000 | | | San Diego Public Facilities Financing Authority Advance Refunding Revenue Bonds, Series B,
5.00%, 08/01/25 | | $ | 349,782 | |
| | 1,115,000 | | | San Diego Public Facilities Financing Authority Advance Refunding Revenue Bonds, Series B,
5.00%, 08/01/28 | | | 1,340,018 | |
| | 300,000 | | | San Diego Public Facilities Financing Authority Refunding Revenue Bonds, Series A,
5.00%, 08/01/23 | | | 324,902 | |
| | 1,000,000 | | | San Diego Public Facilities Financing Authority Refunding Revenue Bonds, Sub-Series A,
5.00%, 08/01/31(a) | | | 1,035,962 | |
| | 175,000 | | | San Diego Regional Building Authority Advance Refunding Revenue Bonds, Series A,
5.00%, 10/15/22 | | | 183,062 | |
| | 100,000 | | | San Diego Regional Building Authority County Operation Centre Current Advance Revenue Bonds, Series A,
5.00%, 10/15/23 | | | 109,244 | |
| | 1,460,000 | | | San Francisco Bay Area Rapid Transit District Sales Tax Revenue Current Refunding Revenue Bonds, Series A,
5.00%, 07/01/28 | | | 1,693,098 | |
| | 1,500,000 | | | San Francisco Bay Area Rapid Transit District Transit Improvements GO, Series B-1,
5.00%, 08/01/24 | | | 1,691,131 | |
| | 2,500,000 | | | San Francisco Bay Area Rapid Transit District Transit Improvements GO, Series C-1,
5.00%, 08/01/24 | | | 2,818,551 | |
| | 500,000 | | | San Francisco City & County Airport Comm-San Francisco International Airport Advance Refunding Current Revenue Bonds, Series A,
5.00%, 05/01/23 | | | 535,486 | |
| | 3,810,000 | | | San Francisco City & County Airport Comm-San Francisco International Airport Advance Refunding Current Revenue Bonds, Series A,
5.00%, 05/01/26 | | | 4,537,848 | |
Principal
Amount | | | | | Value | |
| California (continued) | | | | |
| $ | 3,000,000 | | | San Francisco City & County Airport Comm-San Francisco International Airport Current Refunding Revenue Bonds, Series H,
5.00%, 05/01/29 | | $ | 3,770,773 | |
| | 1,025,000 | | | San Francisco City & County Airport Comm-San Francisco International Airport Port Airport & Marina Improvements Revenue Bonds, Series E,
5.00%, 05/01/40 | | | 1,252,729 | |
| | 3,450,000 | | | San Francisco Municipal Transportation Agency Advance Refunding Revenue Bonds, Series A,
1.69%, 03/01/30 | | | 3,385,887 | |
| | 200,000 | | | San Francisco Municipal Transportation Agency Transit Improvements Revenue Bonds,
5.00%, 03/01/23 | | | 212,567 | |
| | 175,000 | | | San Francisco Municipal Transportation Agency Transit Improvements Revenue Bonds,
5.00%, 03/01/26 | | | 207,640 | |
| | 830,000 | | | San Jose Evergreen Community College District Advance Refunding GO,
5.00%, 09/01/24 | | | 939,508 | |
| | 785,000 | | | San Mateo County Community College District Refunding GO,
5.00%, 09/01/24(a) | | | 816,487 | |
| | 100,000 | | | San Mateo Joint Powers Financing Authority Advance Refunding Revenue Bonds, Series A,
5.00%, 07/15/24 | | | 112,693 | |
| | 100,000 | | | San Mateo Joint Powers Financing Authority Public Improvements Capital Project Revenue Bonds, Series A,
5.00%, 07/15/25 | | | 116,789 | |
| | 1,000,000 | | | San Mateo Union High School District Refunding GO,
5.00%, 09/01/27(a) | | | 1,132,575 | |
| | 275,000 | | | San Mateo Union High School District Refunding GO, Series C,
5.00%, 09/01/24 | | | 310,949 | |
| Old Westbury Funds, Inc. | |
| California Municipal Bond Fund | |
| Portfolio of Investments - (Continued) | October 31, 2021 |
| | |
Principal
Amount | | | | | Value | |
| California (continued) | | | | |
| $ | 125,000 | | | San Rafael Joint Powers Financing Authority Green Bonds Public Facilities Revenue Bonds,
5.00%, 06/01/23 | | $ | 134,104 | |
| | 1,000,000 | | | San Ramon Valley Unified School District School Improvements GO,
5.00%, 08/01/24 | | | 1,126,833 | |
| | 125,000 | | | Santa Clara County Financing Authority Public Facilities Revenue Bonds, Series A,
5.00%, 04/01/26 | | | 149,051 | |
| | 250,000 | | | Santa Clara Unified School District Advance Refunding GO,
5.00%, 07/01/22 | | | 258,011 | |
| | 350,000 | | | Santa Clara Unified School District Advance Refunding GO,
5.00%, 07/01/23 | | | 377,585 | |
| | 100,000 | | | Santa Clara Unified School District Advance Refunding GO,
5.00%, 07/01/25 | | | 112,351 | |
| | 245,000 | | | Santa Clara Unified School District School Improvements GO,
5.00%, 07/01/27 | | | 294,730 | |
| | 1,540,000 | | | Santa Clarita Community College District Refunding GO,
5.00%, 08/01/24(a) | | | 1,668,399 | |
| | 100,000 | | | Santa Clarita Community College District University & College Improvements GO,
5.00%, 08/01/26 | | | 120,754 | |
| | 150,000 | | | Santa Monica Public Financing Authority Current Refunding Revenue Bonds,
5.00%, 07/01/25 | | | 174,721 | |
| | 100,000 | | | Southern California Public Power Authority Advance Refunding Revenue Bonds, Series C,
5.00%, 07/01/25 | | | 114,490 | |
| | 225,000 | | | Southern California Public Power Authority Electricity Light & Power Improvements Revenue Bonds,
5.00%, 07/01/26 | | | 265,193 | |
| | 100,000 | | | State of California (Other Revenue LOC) Advance Refunding GO,
5.00%, 09/01/22 | | | 104,003 | |
| | 125,000 | | | State of California Advance Refunding GO,
5.00%, 11/01/23 | | | 136,730 | |
Principal
Amount | | | | | Value | |
| California (continued) | | | | |
| $ | 1,155,000 | | | State of California Advance Refunding GO,
5.00%, 08/01/26 | | $ | 1,388,090 | |
| | 325,000 | | | State of California Advance Refunding GO, Group B,
5.00%, 09/01/25 | | | 379,801 | |
| | 1,500,000 | | | State of California Current Refunding GO,
5.00%, 04/01/24 | | | 1,668,876 | |
| | 3,310,000 | | | State of California Current Refunding GO,
5.00%, 08/01/24 | | | 3,730,788 | |
| | 200,000 | | | State of California Department of Water Resources Advance Refunding Revenue Bonds, Series AX,
5.00%, 12/01/21 | | | 200,789 | |
| | 150,000 | | | State of California Department of Water Resources Central Valley Project Current Refunding Revenue Bonds,
5.00%, 12/01/22 | | | 157,805 | |
| | 100,000 | | | State of California Department of Water Resources Central Valley Project Current Refunding Revenue Bonds,
5.00%, 12/01/24 | | | 114,321 | |
| | 1,300,000 | | | State of California Department of Water Resources Power Supply Revenue Advance Refunding Revenue Bonds, Series O,
5.00%, 05/01/22 | | | 1,331,452 | |
| | 300,000 | | | State of California Department of Water Resources Refunding Revenue Bonds, Series AS,
5.00%, 12/01/25 | | | 342,665 | |
| | 125,000 | | | State of California Department of Water Resources Refunding Revenue Bonds, Series AV,
5.00%, 12/01/27 | | | 149,557 | |
| | 1,000,000 | | | State of California Multi Utility Improvements GO,
5.00%, 10/01/25 | | | 1,171,678 | |
| | 125,000 | | | State of California Refunding GO,
5.00%, 02/01/22 | | | 126,499 | |
| | 1,000,000 | | | State of California Refunding GO,
5.00%, 10/01/25 | | | 1,133,056 | |
| | 6,065,000 | | | State of California Refunding GO,
5.00%, 10/01/26 | | | 6,871,986 | |
| Old Westbury Funds, Inc. | |
| California Municipal Bond Fund | |
| Portfolio of Investments - (Continued) | October 31, 2021 |
| | |
Principal
Amount | | | | | Value | |
| California (continued) | | | | |
| $ | 5,740,000 | | | State of California Water Utility Improvements GO,
5.00%, 11/01/29 | | $ | 7,433,383 | |
| | 550,000 | | | Turlock Irrigation District Revenue Bonds,
5.00%, 01/01/25 | | | 628,383 | |
| | 1,955,000 | | | University of California Advance Refunding Revenue Bonds, Series AY,
5.00%, 05/15/24 | | | 2,187,167 | |
| | 995,000 | | | University of California Current Pre-refunded Refunding Revenue Bonds, Series AF,
5.00%, 05/15/24(a) | | | 1,066,648 | |
| | 1,270,000 | | | University of California Current Pre-refunded Refunding Revenue Bonds, Series AF,
5.00%, 05/15/26(a) | | | 1,361,451 | |
| | 3,235,000 | | | University of California Current Pre-refunded Refunding Revenue Bonds, Series AF,
5.00%, 05/15/30(a) | | | 3,467,947 | |
| | 1,575,000 | | | University of California Pre-refunded Limited Project Current Refunding Revenue Bonds, Series G,
5.00%, 05/15/30(a) | | | 1,615,650 | |
| | 11,000,000 | | | University of California Refunding Revenue Bonds, Series AK,
5.00%, 05/15/48(b) | | | 11,798,635 | |
| | 130,000 | | | University of California University & College Improvements Refunding Revenue Bonds,
5.00%, 05/15/23 | | | 133,391 | |
| | 200,000 | | | University of California University & College Improvements Refunding Revenue Bonds, Series BB,
5.00%, 05/15/25 | | | 231,902 | |
| | 100,000 | | | University of California University & College Improvements Revenue Bonds, Series AM,
5.00%, 05/15/26 | | | 111,767 | |
| | 2,500,000 | | | University of California University & College Improvements Revenue Bonds, Series BE,
5.00%, 05/15/33 | | | 3,251,832 | |
Principal
Amount | | | | | Value | |
| California (continued) | | | | |
| $ | 550,000 | | | Upper Santa Clara Valley Joint Powers Authority Water Utility Improvements Revenue Bonds, Series A,
5.00%, 08/01/40 | | $ | 680,367 | |
| | 125,000 | | | Ventura County Community College District Advance Refunding GO,
5.00%, 08/01/24 | | | 141,148 | |
| | 425,000 | | | Ventura County Public Financing Authority Advance Refunding Revenue Bonds,
5.00%, 11/01/24 | | | 483,865 | |
| | 1,645,000 | | | Ventura County Public Financing Authority Advance Refunding Revenue Bonds, Series A,
1.32%, 11/01/25 | | | 1,642,109 | |
| | 2,295,000 | | | Ventura County Public Financing Authority Advance Refunding Revenue Bonds, Series A,
1.54%, 11/01/26 | | | 2,287,632 | |
| | 2,000,000 | | | Ventura County Public Financing Authority Advance Refunding Revenue Bonds, Series A,
1.74%, 11/01/27 | | | 1,994,456 | |
| | 3,970,000 | | | Ventura County Public Financing Authority Advance Refunding Revenue Bonds, Series A,
1.96%, 11/01/28 | | | 3,977,736 | |
| | 100,000 | | | Walnut Energy Center Authority Current Refunding Revenue Bonds,
5.00%, 01/01/23 | | | 105,561 | |
| | 1,100,000 | | | Western Municipal Water District Facilities Authority Water Utility Improvements Revenue Bonds, Series A,
5.00%, 10/01/36 | | | 1,442,149 | |
| | 1,000,000 | | | Western Municipal Water District Facilities Authority Water Utility Improvements Revenue Bonds, Series A,
5.00%, 10/01/37 | | | 1,305,570 | |
| | 100,000 | | | William S Hart Union High School District Advance Refunding GO,
5.00%, 08/01/24 | | | 112,713 | |
| Old Westbury Funds, Inc. | |
| California Municipal Bond Fund | |
| Portfolio of Investments - (Continued) | October 31, 2021 |
| | |
Principal
Amount | | | | | Value | |
| California (continued) | | | | |
| $ | 125,000 | | | Yosemite Community College District Current Refunding GO,
5.00%, 08/01/25 | | $ | 145,845 | |
Total Municipal Bonds
(Cost $318,734,794) | | | 323,465,890 | |
| | | | | | | | | |
| CORPORATE BONDS — 0.6% | | | | |
| United States — 0.6% | | | | |
| | 2,000,000 | | | Stanford Health Care, Series 2020,
3.31%, 08/15/30 | | | 2,171,032 | |
Total Corporate Bonds
(Cost $2,000,000) | | | 2,171,032 | |
| | | | | | | | | |
| Shares | | | | | | | |
| INVESTMENT COMPANY — 4.8% | | | | |
| | 16,446,457 | | | SEI Daily Income Trust Government II Fund - Class A, 0.01%(c) | | | 16,446,457 | |
Total Investment Company
(Cost $16,446,457) | | | 16,446,457 | |
TOTAL INVESTMENTS — 98.8%
(Cost $337,181,251) | | $ | 342,083,379 | |
| OTHER ASSETS IN EXCESS OF LIABILITIES — 1.2% | | | 4,071,564 | |
| NET ASSETS — 100.0% | | $ | 346,154,943 | |
| (a) | These securities are pre-refunded; the date shown represents the pre-refunded date. Bonds which are pre-refunded are collateralized by U.S. Government securities which are held in escrow and are used to pay principal and interest on the municipal issue and to retire the bonds in full at the earliest refunding date. |
| (b) | Variable or floating rate security, which interest rate adjusts periodically based on changes in current interest rates and prepayments on the underlying pool of assets. Rate shown is the rate in effect as of October 31, 2021. |
| (c) | The rate shown represents the current yield as of October 31, 2021. |
The following abbreviations are used in the report:
COP — Certificates of Participation
GO — General Obligation
| Old Westbury Funds, Inc. | |
| New York Municipal Bond Fund | |
| Portfolio of Investments | October 31, 2021 |
Principal
Amount | | | | | Value | |
| MUNICIPAL BONDS — 92.1% | | | | |
| New York — 92.1% | | | | |
| $ | 2,000,000 | | | Battery Park City Authority Current Refunding Revenue Bonds, Series A,
5.00%, 11/01/25 | | $ | 2,188,945 | |
| | 100,000 | | | Build NYC Resource Corp. Refunding Revenue Bonds, Series A,
5.00%, 06/01/24 | | | 112,154 | |
| | 1,110,000 | | | City of New York Public Improvements GO, Series 2018-1,
5.00%, 08/01/25 | | | 1,292,395 | |
| | 225,000 | | | City of New York Advance Refunding GO, Series 2015-A,
5.00%, 08/01/24 | | | 253,141 | |
| | 2,520,000 | | | City of New York Advance Refunding GO, Series A,
5.00%, 08/01/26 | | | 3,023,333 | |
| | 510,000 | | | City of New York Advance Refunding GO, Series C,
5.00%, 08/01/27 | | | 617,611 | |
| | 150,000 | | | City of New York Advance Refunding GO, Series C,
5.00%, 08/01/22 | | | 155,417 | |
| | 350,000 | | | City of New York Advance Refunding GO, Series C,
5.00%, 08/01/22 | | | 362,641 | |
| | 200,000 | | | City of New York Advance Refunding GO, Series C,
5.00%, 08/01/23 | | | 216,602 | |
| | 875,000 | | | City of New York Advance Refunding GO, Series C,
5.00%, 08/01/23 | | | 947,632 | |
| | 1,515,000 | | | City of New York Advance Refunding GO, Series C,
5.00%, 08/01/27 | | | 1,730,030 | |
| | 1,190,000 | | | City of New York Advance Refunding GO, Series D,
5.00%, 08/01/33 | | | 1,456,018 | |
| | 125,000 | | | City of New York Advance Refunding GO, Series D,
5.00%, 08/01/24 | | | 140,634 | |
| | 100,000 | | | City of New York Advance Refunding GO, Series E,
5.00%, 08/01/24 | | | 112,507 | |
| | 1,250,000 | | | City of New York Current Refunding GO, Series C-1,
5.00%, 08/01/25 | | | 1,455,399 | |
Principal
Amount | | | | | Value | |
| New York (continued) | | | | |
| $ | 24,000,000 | | | City of New York Current Refunding GO, Series C-1,
5.00%, 08/01/26 | | $ | 28,793,645 | |
| | 5,750,000 | | | City of New York Current Refunding GO, Series E,
5.00%, 08/01/24 | | | 6,469,160 | |
| | 10,000,000 | | | City of New York GO, Series A-1,
5.00%, 08/01/32 | | | 13,122,411 | |
| | 255,000 | | | City of New York Public Improvements GO, Series 2018-1,
5.00%, 08/01/23 | | | 276,167 | |
| | 1,650,000 | | | City of New York Public Improvements GO, Sub-Series D-3,
5.00%, 08/01/38(a)(b) | | | 1,773,307 | |
| | 200,000 | | | City of New York Public Improvements GO, Sub-Series F-1,
5.00%, 04/01/23 | | | 213,512 | |
| | 100,000 | | | City of New York Public Improvements GO, Sub-Series F-1,
5.00%, 03/01/24 | | | 106,256 | |
| | 100,000 | | | City of New York Public Improvements GO, Sub-Series F-3,
5.00%, 12/01/23(b) | | | 109,735 | |
| | 200,000 | | | City of New York Public Improvements GO, Sub-Series F-3,
5.00%, 12/01/25(b) | | | 235,386 | |
| | 1,500,000 | | | City of New York Public Improvements GO, Sub-Series H-A,
5.00%, 01/01/25(b) | | | 1,713,262 | |
| | 2,025,000 | | | City of New York Public Improvements GO, Sub-Series I-1,
5.00%, 03/01/25 | | | 2,243,531 | |
| | 3,000,000 | | | City of New York Public Improvements GO, Sub-Series I-1,
5.00%, 03/01/26 | | | 3,320,044 | |
| | 155,000 | | | City of New York Refunding GO, Series B,
5.00%, 08/01/25 | | | 160,491 | |
| | 400,000 | | | City of New York Refunding GO, Series C,
5.00%, 08/01/27 | | | 470,634 | |
| Old Westbury Funds, Inc. | |
| New York Municipal Bond Fund | |
| Portfolio of Investments - (Continued) | October 31, 2021 |
| | |
Principal
Amount | | | | | Value | |
| New York (continued) | | | | |
| $ | 100,000 | | | City of New York Refunding GO, Series F,
5.00%, 08/01/29 | | $ | 101,194 | |
| | 9,000,000 | | | City of New York Refunding GO, Series F,
5.00%, 08/01/30 | | | 9,106,989 | |
| | 500,000 | | | City of New York Refunding GO, Series J,
5.00%, 08/01/25 | | | 540,587 | |
| | 325,000 | | | City of New York Refunding GO, Series J,
5.00%, 08/01/24 | | | 365,648 | |
| | 400,000 | | | City of New York Refunding GO, Series J, Sub-Series J11,
5.00%, 08/01/25(b) | | | 465,728 | |
| | 100,000 | | | City of New York Refunding GO, Sub-Series H-3,
5.00%, 08/01/23(b) | | | 108,301 | |
| | 2,125,000 | | | County of Nassau Public Improvements GO, Series A,
5.00%, 04/01/22 | | | 2,167,575 | |
| | 2,230,000 | | | County of Nassau Public Improvements GO, Series A,
5.00%, 04/01/23 | | | 2,380,658 | |
| | 350,000 | | | County of Westchester NY Recreation Facilities Improvements GO, Series A,
5.00%, 07/01/22 | | | 361,240 | |
| | 100,000 | | | County of Westchester NY Recreation Facilities Improvements GO, Series A,
5.00%, 07/01/23 | | | 107,934 | |
| | 110,000 | | | County of Westchester NY Sewer Improvements GO, Series C,
5.00%, 07/01/22 | | | 113,533 | |
| | 150,000 | | | Erie County Fiscal Stability Authority Public Improvements Revenue Bonds, Series A,
5.00%, 03/15/22 | | | 152,695 | |
| | 300,000 | | | Erie County Industrial Development Agency City School District of the City of Buffalo Project Advance Refunding Revenue Bonds, (State Aid Withholding),
5.00%, 05/01/23 | | | 321,386 | |
Principal
Amount | | | | | Value | |
| New York (continued) | | | | |
| $ | 125,000 | | | Erie County Industrial Development Agency City School District of the City of Buffalo Project Advance Refunding Revenue Bonds, (State Aid Withholding),
5.00%, 05/01/24 | | $ | 139,365 | |
| | 1,025,000 | | | Erie County Industrial Development Agency Current Refunding Revenue Bonds, (State Aid Withholding),
5.00%, 05/01/29 | | | 1,315,249 | |
| | 1,500,000 | | | Erie County Industrial Development Agency Current Refunding Revenue Bonds, (State Aid Withholding),
5.00%, 05/01/31 | | | 1,999,963 | |
| | 1,200,000 | | | Long Island Power Authority Electric Light & Power Improvements Revenue Bonds,
5.00%, 09/01/35 | | | 1,505,526 | |
| | 1,420,000 | | | Long Island Power Authority Electric Light & Power Improvements Revenue Bonds, Series A,
5.00%, 09/01/34 | | | 1,840,990 | |
| | 500,000 | | | Long Island Power Authority Electric System General Revenue Bonds,
5.00%, 09/01/25 | | | 585,348 | |
| | 4,000,000 | | | Long Island Power Authority Refunding Revenue Bonds, Series B,
5.00%, 09/01/25 | | | 4,157,359 | |
| | 1,600,000 | | | Long Island Power Authority Revenue Bonds, Series A,
5.00%, 09/01/24 | | | 1,810,614 | |
| | 1,500,000 | | | Long Island Power Authority Revenue Bonds, Series A,
5.00%, 09/01/25 | | | 1,756,045 | |
| | 1,025,000 | | | Long Island Power Authority Revenue Bonds, Series A,
5.00%, 09/01/26 | | | 1,235,364 | |
| | 1,000,000 | | | Long Island Power Authority Revenue Bonds, Series A,
5.00%, 09/01/30 | | | 1,307,526 | |
| | 1,000,000 | | | Long Island Power Authority Revenue Bonds, Series A,
5.00%, 09/01/31 | | | 1,328,216 | |
| | 2,000,000 | | | Metropolitan Transportation Authority Advance Refunding Revenue Bonds, Series A,
5.00%, 11/15/26 | | | 2,417,096 | |
| Old Westbury Funds, Inc. | |
| New York Municipal Bond Fund | |
| Portfolio of Investments - (Continued) | October 31, 2021 |
| | |
Principal
Amount | | | | | Value | |
| New York (continued) | | | | |
| $ | 900,000 | | | Metropolitan Transportation Authority Advance Refunding Revenue Bonds, Series B,
5.00%, 11/15/25 | | $ | 1,047,101 | |
| | 125,000 | | | Metropolitan Transportation Authority Advance Refunding Revenue Bonds, Series D,
5.00%, 11/15/24 | | | 141,250 | |
| | 100,000 | | | Metropolitan Transportation Authority Advance Refunding Revenue Bonds, Series F,
5.00%, 11/15/23 | | | 109,136 | |
| | 450,000 | | | Metropolitan Transportation Authority Current Refunding Revenue Bonds, Series A2,
5.00%, 11/15/27 | | | 534,699 | |
| | 700,000 | | | Metropolitan Transportation Authority Current Refunding Revenue Bonds, Series D,
5.00%, 11/15/23 | | | 733,881 | |
| | 2,225,000 | | | Metropolitan Transportation Authority Current Refunding Revenue Bonds, Series D,
5.00%, 11/15/28 | | | 2,325,323 | |
| | 400,000 | | | Metropolitan Transportation Authority Current Refunding Revenue Bonds, Series F,
5.00%, 11/15/24 | | | 418,932 | |
| | 205,000 | | | Metropolitan Transportation Authority Current Refunding Revenue Bonds, Series F,
5.00%, 11/15/25 | | | 214,593 | |
| | 1,500,000 | | | Metropolitan Transportation Authority Current Refunding Revenue Bonds, Series F,
5.00%, 11/15/30 | | | 1,565,857 | |
| | 150,000 | | | Metropolitan Transportation Authority Green Bond Refunding Revenue Bonds, Series A2,
5.00%, 11/15/25 | | | 174,526 | |
| | 370,000 | | | Metropolitan Transportation Authority Green Bond Refunding Revenue Bonds, Series A2,
5.00%, 11/15/26 | | | 441,369 | |
| | 1,500,000 | | | Metropolitan Transportation Authority Green Bond Refunding Revenue Bonds, Sub-Series A1,
5.00%, 11/15/48(a) | | | 1,688,111 | |
Principal
Amount | | | | | Value | |
| New York (continued) | | | | |
| $ | 2,570,000 | | | Metropolitan Transportation Authority Green Bond Revenue Bonds, Series B-2,
5.00%, 11/15/23 | | $ | 2,816,841 | |
| | 250,000 | | | Metropolitan Transportation Authority Green Bond Revenue Bonds, Series B-2,
5.00%, 11/15/27 | | | 309,752 | |
| | 250,000 | | | Metropolitan Transportation Authority Green Bond Revenue Bonds, Series C-1,
5.00%, 11/15/23 | | | 272,837 | |
| | 375,000 | | | Metropolitan Transportation Authority Green Bond Revenue Bonds, Sub-Series B-2,
5.00%, 11/15/26 | | | 453,594 | |
| | 150,000 | | | Metropolitan Transportation Authority Pre-refunded Transit Improvements Revenue Bonds, Series C,
5.00%, 11/15/25(c) | | | 171,147 | |
| | 1,600,000 | | | Metropolitan Transportation Authority Refunding Revenue Bonds, Series A,
5.00%, 11/15/25 | | | 1,676,360 | |
| | 2,500,000 | | | Metropolitan Transportation Authority Refunding Revenue Bonds, Series A,
5.00%, 11/15/29 | | | 2,617,171 | |
| | 2,500,000 | | | Metropolitan Transportation Authority Refunding Revenue Bonds, Series B-1,
5.00%, 11/15/29(b) | | | 2,714,553 | |
| | 100,000 | | | Metropolitan Transportation Authority Refunding Revenue Bonds, Series D-1,
5.00%, 11/01/23(b) | | | 104,660 | |
| | 8,000,000 | | | Metropolitan Transportation Authority Refunding Revenue Bonds, Series D-1,
5.00%, 11/01/27(b) | | | 8,351,458 | |
| | 100,000 | | | Metropolitan Transportation Authority Transit Improvements Revenue Bonds, Series C,
5.00%, 11/15/22 | | | 104,769 | |
| | 2,000,000 | | | Metropolitan Transportation Authority Transit Improvements Revenue Bonds, Sub-Series A-1,
5.00%, 11/15/33 | | | 2,245,676 | |
| Old Westbury Funds, Inc. | |
| New York Municipal Bond Fund | |
| Portfolio of Investments - (Continued) | October 31, 2021 |
| | |
Principal
Amount | | | | | Value | |
| New York (continued) | | | | |
| $ | 150,000 | | | Metropolitan Transportation Authority Transit Improvements Revenue Bonds, Sub-Series A-1,
5.00%, 11/15/25 | | $ | 171,403 | |
| | 375,000 | | | Metropolitan Transportation Authority Transportation Green Bond Advance Refunding Revenue Bonds, Series B,
5.00%, 11/15/22 | | | 392,884 | |
| | 600,000 | | | Metropolitan Transportation Authority Transportation Green Bond Advance Refunding Revenue Bonds, Series B,
5.00%, 11/15/23 | | | 654,809 | |
| | 100,000 | | | Metropolitan Transportation Authority Transportation Green Bond Advance Refunding Revenue Bonds, Series B,
5.00%, 11/15/26 | | | 119,289 | |
| | 100,000 | | | Monroe County Industrial Development Agency School Improvements Revenue Bonds, (State Aid Withholding),
5.00%, 05/01/24 | | | 111,333 | |
| | 6,000,000 | | | Nassau County Interim Finance Authority Current Refunding Revenue Bonds, Series A,
5.00%, 11/15/31 | | | 8,002,435 | |
| | 6,250,000 | | | Nassau County Interim Finance Authority Current Refunding Revenue Bonds, Series A,
5.00%, 11/15/34 | | | 8,243,179 | |
| | 5,500,000 | | | Nassau County Interim Finance Authority Current Refunding Revenue Bonds, Series A,
5.00%, 11/15/35 | | | 7,237,463 | |
| | 5,000,000 | | | Nassau County Interim Finance Authority Current Refunding Revenue Bonds, Series B,
0.83%, 11/15/26 | | | 4,889,021 | |
| | 6,280,000 | | | Nassau County Interim Finance Authority Current Refunding Revenue Bonds, Series B,
1.46%, 11/15/29 | | | 6,078,750 | |
| | 300,000 | | | Nassau County Sewer & Storm Water Finance Authority Refunding Revenue Bonds, Series A,
5.00%, 10/01/24 | | | 340,573 | |
Principal
Amount | | | | | Value | |
| New York (continued) | | | | |
| $ | 115,000 | | | New York City Transitional Finance Authority Building Aid Advance pre-refunded Revenue Bonds, (State Aid Withholding),
5.00%, 07/15/23(c) | | $ | 124,131 | |
| | 135,000 | | | New York City Transitional Finance Authority Building Aid Advance Refunding Revenue Bonds, (State Aid Withholding),
5.00%, 07/15/23 | | | 145,881 | |
| | 1,225,000 | | | New York City Transitional Finance Authority Building Aid Pre-refunded Revenue Bonds, Series S, (State Aid Withholding),
5.00%, 07/15/24(c) | | | 1,375,922 | |
| | 500,000 | | | New York City Transitional Finance Authority Building Aid Revenue Advance Refunding Revenue Bonds, Series S-1, (State Aid Withholding),
5.00%, 07/15/29 | | | 613,206 | |
| | 100,000 | | | New York City Transitional Finance Authority Building Aid Revenue Advance Refunding Revenue Bonds, Series S-1, (State Aid Withholding),
5.00%, 07/15/25 | | | 116,654 | |
| | 1,035,000 | | | New York City Transitional Finance Authority Building Aid Revenue Advance Refunding Revenue Bonds, Series S-1, (State Aid Withholding),
5.00%, 07/15/26 | | | 1,242,011 | |
| | 275,000 | | | New York City Transitional Finance Authority Building Aid Revenue Bonds, Series S-1, (State Aid Withholding),
5.00%, 07/15/24 | | | 309,301 | |
| | 3,000,000 | | | New York City Transitional Finance Authority Building Aid Revenue Current Refunding Revenue Bonds, Series S-1, (State Aid Withholding),
5.00%, 07/15/31 | | | 3,985,138 | |
| | 4,000,000 | | | New York City Transitional Finance Authority Building Aid Revenue Current Refunding Revenue Bonds, Series S-1, (State Aid Withholding),
5.00%, 07/15/32 | | | 5,278,135 | |
| Old Westbury Funds, Inc. | |
| New York Municipal Bond Fund | |
| Portfolio of Investments - (Continued) | October 31, 2021 |
| | |
Principal
Amount | | | | | Value | |
| New York (continued) | | | | |
| $ | 700,000 | | | New York City Transitional Finance Authority Building Aid Revenue Public Improvements Revenue Bonds, Series S, (State Aid Withholding),
5.00%, 07/15/26 | | $ | 800,820 | |
| | 300,000 | | | New York City Transitional Finance Authority Building Aid Revenue Public Improvements Revenue Bonds, Series S, (State Aid Withholding),
5.00%, 07/15/23 | | | 324,180 | |
| | 100,000 | | | New York City Transitional Finance Authority Building Aid Revenue Public Improvements Revenue Bonds, Series S, (State Aid Withholding),
5.00%, 07/15/24 | | | 112,473 | |
| | 150,000 | | | New York City Transitional Finance Authority Building Aid Revenue Public Improvements Revenue Bonds, Series S-1, (State Aid Withholding),
5.00%, 07/15/25 | | | 171,759 | |
| | 125,000 | | | New York City Transitional Finance Authority Building Aid Revenue Public Improvements Revenue Bonds, Series S-1, (State Aid Withholding),
5.00%, 07/15/26 | | | 147,504 | |
| | 4,000,000 | | | New York City Transitional Finance Authority Building Aid Revenue Public Improvements Revenue Bonds, Series S-1, (State Aid Withholding),
5.00%, 07/15/28 | | | 4,133,901 | |
| | 125,000 | | | New York City Transitional Finance Authority Building Aid Revenue Refunding Revenue Bonds, Sub-Series S-3A, (State Aid Withholding),
5.00%, 07/15/23 | | | 135,075 | |
| | 250,000 | | | New York City Transitional Finance Authority Building Aid Revenue Refunding Revenue Bonds, Sub-Series S-3A, (State Aid Withholding),
5.00%, 07/15/24 | | | 281,183 | |
Principal
Amount | | | | | Value | |
| New York (continued) | | | | |
| $ | 100,000 | | | New York City Transitional Finance Authority Building Aid Revenue Refunding Revenue Bonds, Sub-Series S-4A, (State Aid Withholding),
5.00%, 07/15/23 | | $ | 108,101 | |
| | 525,000 | | | New York City Transitional Finance Authority Building Aid Revenue Refunding Revenue Bonds, Sub-Series S-4A, (State Aid Withholding),
5.00%, 07/15/24 | | | 590,484 | |
| | 2,000,000 | | | New York City Transitional Finance Authority Building Aid Revenue Refunding Revenue Bonds, Sub-Series S-4A, (State Aid Withholding),
5.00%, 07/15/25 | | | 2,328,266 | |
| | 2,000,000 | | | New York City Transitional Finance Authority Building Aid Revenue School Improvements Revenue Bonds, Series S1, (State Aid Withholding),
5.00%, 07/15/30 | | | 2,607,817 | |
| | 1,000,000 | | | New York City Transitional Finance Authority Building Aid Revenue School Improvements Revenue Bonds, Series- S1, (State Aid Withholding),
5.00%, 07/15/22 | | | 1,033,765 | |
| | 475,000 | | | New York City Transitional Finance Authority Future Tax Secured Advance Refunding Revenue Bonds, Series C,
5.00%, 11/01/23 | | | 519,574 | |
| | 250,000 | | | New York City Transitional Finance Authority Future Tax Secured Advance Refunding Revenue Bonds, Series C,
5.00%, 11/01/24 | | | 284,385 | |
| | 4,375,000 | | | New York City Transitional Finance Authority Future Tax Secured Public Improvements Revenue Bonds,
5.00%, 08/01/24 | | | 4,929,892 | |
| | 100,000 | | | New York City Transitional Finance Authority Future Tax Secured Public Improvements Revenue Bonds, Sub-Series A1,
5.00%, 08/01/23 | | | 108,301 | |
| Old Westbury Funds, Inc. | |
| New York Municipal Bond Fund | |
| Portfolio of Investments - (Continued) | October 31, 2021 |
| | |
Principal
Amount | | | | | Value | |
| New York (continued) | | | | |
| $ | 3,000,000 | | | New York City Transitional Finance Authority Future Tax Secured Public Improvements Revenue Bonds, Sub-Series A-E1,
5.00%, 02/01/30 | | $ | 3,629,763 | |
| | 150,000 | | | New York City Transitional Finance Authority Future Tax Secured Public Improvements Revenue Bonds, Sub-Series F-1,
5.00%, 05/01/23 | | | 160,716 | |
| | 200,000 | | | New York City Transitional Finance Authority Future Tax Secured Public Improvements Revenue Bonds, Sub-Series FI,
5.00%, 08/01/25 | | | 225,190 | |
| | 190,000 | | | New York City Transitional Finance Authority Future Tax Secured Public Improvements Revenue Bonds, Sub-Series FI,
5.00%, 08/01/29 | | | 213,485 | |
| | 2,000,000 | | | New York City Transitional Finance Authority Future Tax Secured Public Improvements Revenue Bonds, Sub-Series I,
5.00%, 05/01/26 | | | 2,139,444 | |
| | 100,000 | | | New York City Transitional Finance Authority Future Tax Secured Public Improvements Unrefunded Revenue Bonds, Series B1,
5.00%, 11/01/25 | | | 111,518 | |
| | 275,000 | | | New York City Transitional Finance Authority Future Tax Secured Revenue Advance Refunding Revenue Bonds, Series C,
5.00%, 11/01/28 | | | 336,163 | |
| | 1,075,000 | | | New York City Transitional Finance Authority Future Tax Secured Revenue Public Improvement Revenue Bonds, Series C-1,
5.00%, 05/01/22 | | | 1,100,849 | |
| | 200,000 | | | New York City Transitional Finance Authority Future Tax Secured Revenue Public Improvements Revenue Bonds, Series A1,
5.00%, 08/01/28 | | | 232,055 | |
| | 650,000 | | | New York City Transitional Finance Authority Future Tax Secured Revenue Public Improvements Revenue Bonds, Series C1,
5.00%, 11/01/30 | | | 827,240 | |
Principal
Amount | | | | | Value | |
| New York (continued) | | | | |
| $ | 375,000 | | | New York City Transitional Finance Authority Future Tax Secured Revenue Public Improvements Revenue Bonds, Series C1,
5.00%, 11/01/31 | | $ | 476,233 | |
| | 515,000 | | | New York City Transitional Finance Authority Future Tax Secured Revenue Public Improvements Revenue Bonds, Series D1,
5.00%, 02/01/27 | | | 567,960 | |
| | 5,000,000 | | | New York City Transitional Finance Authority Future Tax Secured Revenue Public Improvements Revenue Bonds, Series S,
5.00%, 05/01/34 | | | 6,451,677 | |
| | 3,000,000 | | | New York City Transitional Finance Authority Future Tax Secured Revenue Public Improvements Revenue Bonds, Sub-Series B-1,
5.00%, 11/01/23 | | | 3,281,521 | |
| | 1,100,000 | | | New York City Transitional Finance Authority Future Tax Secured Revenue Refunding Revenue Bonds, Series A,
5.00%, 11/01/23 | | | 1,100,000 | |
| | 670,000 | | | New York City Transitional Finance Authority Future Tax Secured Revenue Refunding Revenue Bonds, Sub-Series C,
5.00%, 11/01/27 | | | 746,106 | |
| | 600,000 | | | New York City Transitional Finance Authority Public Improvements Revenue Bonds, Series C-1,
5.00%, 05/01/23 | | | 642,865 | |
| | 300,000 | | | New York City Transitional Finance Authority Public Improvements Revenue Bonds, Series C-1,
5.00%, 05/01/24 | | | 334,794 | |
| | 350,000 | | | New York City Transitional Finance Authority Public Improvements Revenue Bonds, Sub-Series B-1,
5.00%, 08/01/23 | | | 379,053 | |
| | 200,000 | | | New York City Water & Sewer System Current Refunding Revenue Bonds, Series AA,
5.00%, 06/15/24 | | | 224,203 | |
| | 1,825,000 | | | New York City Water & Sewer System Current Refunding Revenue Bonds, Series AA,
5.00%, 06/15/26 | | | 2,186,934 | |
| Old Westbury Funds, Inc. | |
| New York Municipal Bond Fund | |
| Portfolio of Investments - (Continued) | October 31, 2021 |
| | |
Principal
Amount | | | | | Value | |
| New York (continued) | | | | |
| $ | 2,750,000 | | | New York City Water & Sewer System Current Refunding Revenue Bonds, Series CC,
5.00%, 06/15/25 | | $ | 3,194,187 | |
| | 250,000 | | | New York City Water & Sewer System Current Refunding Revenue Bonds, Series EE,
5.00%, 06/15/29 | | | 293,584 | |
| | 2,000,000 | | | New York City Water & Sewer System Refunding Revenue Bonds, Series DD-2,
5.00%, 06/15/25 | | | 2,197,251 | |
| | 150,000 | | | New York City Water & Sewer System Refunding Revenue Bonds, Series FF,
5.00%, 06/15/25 | | | 174,228 | |
| | 125,000 | | | New York City Water & Sewer System Refunding Revenue Bonds, Series GG,
5.00%, 06/15/25 | | | 145,190 | |
| | 2,000,000 | | | New York City Water & Sewer System Refunding Revenue Bonds, Series GG,
5.00%, 06/15/27 | | | 2,320,697 | |
| | 7,500,000 | | | New York City Water & Sewer System Refunding Revenue Bonds, Series HH,
5.00%, 06/15/28 | | | 8,679,189 | |
| | 450,000 | | | New York City Water & Sewer System Refunding Revenue Bonds, Sub- Series BB-2,
5.00%, 06/15/29 | | | 548,779 | |
| | 4,750,000 | | | New York City Water & Sewer System Water Utility Improvements Revenue Bonds, Series BB-2,
5.00%, 06/15/25 | | | 5,218,472 | |
| | 1,500,000 | | | New York City Water & Sewer System Water Utility Improvements Revenue Bonds, Sub-Series FF-1,
5.00%, 06/15/49 | | | 1,849,846 | |
| | 4,285,000 | | | New York State Dormitory Authority Advance Pre-refunded Revenue Bonds, Series A,
5.00%, 02/15/25(c) | | | 4,919,767 | |
| | 1,885,000 | | | New York State Dormitory Authority Advance Refunding Revenue Bonds, Series A,
5.00%, 02/15/25 | | | 2,161,705 | |
Principal
Amount | | | | | Value | |
| New York (continued) | | | | |
| $ | 375,000 | | | New York State Dormitory Authority Advance Refunding Revenue Bonds, Series A,
5.00%, 02/15/27 | | $ | 455,775 | |
| | 150,000 | | | New York State Dormitory Authority Advance Refunding Revenue Bonds, Series A,
5.00%, 07/01/22 | | | 154,782 | |
| | 500,000 | | | New York State Dormitory Authority Advance Refunding Revenue Bonds, Series A,
5.00%, 03/15/23 | | | 532,456 | |
| | 500,000 | | | New York State Dormitory Authority Advance Refunding Revenue Bonds, Series A,
5.00%, 07/01/24 | | | 562,042 | |
| | 1,000,000 | | | New York State Dormitory Authority Advance Refunding Revenue Bonds, Series A,
5.00%, 07/01/26 | | | 1,201,955 | |
| | 390,000 | | | New York State Dormitory Authority Advance Refunding Revenue Bonds, Series B,
5.00%, 07/01/23 | | | 420,533 | |
| | 1,400,000 | | | New York State Dormitory Authority Advance Refunding Revenue Bonds, Series D,
5.00%, 02/15/24 | | | 1,550,521 | |
| | 200,000 | | | New York State Dormitory Authority Advance Refunding Revenue Bonds, Series D,
5.00%, 02/15/28 | | | 240,108 | |
| | 1,525,000 | | | New York State Dormitory Authority Advance Refunding Revenue Bonds, Series E,
5.00%, 03/15/24 | | | 1,694,613 | |
| | 1,600,000 | | | New York State Dormitory Authority Advance Refunding Revenue Bonds, Series E,
5.00%, 03/15/25 | | | 1,845,808 | |
| | 750,000 | | | New York State Dormitory Authority Current Refunding Revenue Bonds, Series 1, (State Aid Withholding),
5.00%, 01/15/28 | | | 923,902 | |
| | 1,000,000 | | | New York State Dormitory Authority Current Refunding Revenue Bonds, Series A,
5.00%, 07/01/32 | | | 1,329,103 | |
| Old Westbury Funds, Inc. | |
| New York Municipal Bond Fund | |
| Portfolio of Investments - (Continued) | October 31, 2021 |
| | |
Principal
Amount | | | | | Value | |
| New York (continued) | | | | |
| $ | 3,500,000 | | | New York State Dormitory Authority Current Refunding Revenue Bonds, Series A,
5.00%, 07/01/35 | | $ | 4,600,048 | |
| | 5,000,000 | | | New York State Dormitory Authority Current Refunding Revenue Bonds, Series A,
5.00%, 07/01/50 | | | 6,259,301 | |
| | 1,575,000 | | | New York State Dormitory Authority Current Refunding Revenue Bonds, Series A-2,
5.00%, 07/01/30 | | | 2,078,850 | |
| | 650,000 | | | New York State Dormitory Authority Green Bond Revenue Bonds,
5.00%, 07/01/24 | | | 730,655 | |
| | 3,765,000 | | | New York State Dormitory Authority Public Improvement Revenue Bonds, Series E,
5.00%, 02/15/26 | | | 4,315,384 | |
| | 1,455,000 | | | New York State Dormitory Authority Public Improvement Revenue Bonds, Series E,
5.00%, 02/15/30 | | | 1,657,969 | |
| | 125,000 | | | New York State Dormitory Authority Public Improvements Revenue Bonds, Series 2015B-A,
5.00%, 03/15/24 | | | 138,620 | |
| | 150,000 | | | New York State Dormitory Authority Public Improvements Revenue Bonds, Series 2015B-B,
5.00%, 03/15/26 | | | 175,379 | |
| | 10,335,000 | | | New York State Dormitory Authority Public Improvements Revenue Bonds, Series 2015B-B, 5.00%, 03/15/29 | | | 12,049,022 | |
| | 2,000,000 | | | New York State Dormitory Authority Public Improvements Revenue Bonds, Series A,
5.00%, 03/15/24 | | | 2,217,913 | |
| | 100,000 | | | New York State Dormitory Authority Public Improvements Revenue Bonds, Series A,
5.00%, 03/15/26 | | | 119,055 | |
| | 230,000 | | | New York State Dormitory Authority Public Improvements Revenue Bonds, Series A,
5.00%, 03/15/27 | | | 277,387 | |
Principal
Amount | | | | | Value | |
| New York (continued) | | | | |
| $ | 350,000 | | | New York State Dormitory Authority Public Improvements Revenue Bonds, Series B,
5.00%, 02/15/25 | | $ | 402,617 | |
| | 500,000 | | | New York State Dormitory Authority Public Improvements Revenue Bonds, Series B,
5.00%, 02/15/30 | | | 569,749 | |
| | 100,000 | | | New York State Dormitory Authority Public Improvements Revenue Bonds, Series B,
5.00%, 02/15/26 | | | 118,235 | |
| | 125,000 | | | New York State Dormitory Authority Public Improvements Revenue Bonds, Series B,
5.00%, 02/15/27 | | | 151,925 | |
| | 5,000,000 | | | New York State Dormitory Authority Public Improvements Revenue Bonds, Series B,
5.00%, 02/15/28 | | | 5,706,263 | |
| | 100,000 | | | New York State Dormitory Authority Refunding Revenue Bonds, Series 1, (State Aid Withholding),
5.00%, 01/15/23 | | | 105,443 | |
| | 200,000 | | | New York State Dormitory Authority Refunding Revenue Bonds, Series 1, (State Aid Withholding),
5.00%, 01/15/25 | | | 227,844 | |
| | 3,275,000 | | | New York State Dormitory Authority Refunding Revenue Bonds, Series 1, (State Aid Withholding),
5.00%, 01/15/27 | | | 3,946,717 | |
| | 20,000 | | | New York State Dormitory Authority Refunding Revenue Bonds, Series A,
5.00%, 12/15/22 | | | 21,070 | |
| | 1,925,000 | | | New York State Dormitory Authority Refunding Revenue Bonds, Series A,
5.00%, 02/15/25 | | | 2,127,573 | |
| | 3,000,000 | | | New York State Dormitory Authority Refunding Revenue Bonds, Series A,
5.00%, 07/01/24 | | | 3,228,174 | |
| | 1,600,000 | | | New York State Dormitory Authority Refunding Revenue Bonds, Series A,
5.00%, 07/01/26(c) | | | 1,726,662 | |
| Old Westbury Funds, Inc. | |
| New York Municipal Bond Fund | |
| Portfolio of Investments - (Continued) | October 31, 2021 |
| | |
Principal
Amount | | | | | Value | |
| New York (continued) | | | | |
| $ | 6,500,000 | | | New York State Dormitory Authority Refunding Revenue Bonds, Series A,
5.00%, 07/01/29 | | $ | 7,498,757 | |
| | 150,000 | | | New York State Dormitory Authority Refunding Revenue Bonds, Series A,
5.00%, 12/15/24 | | | 157,976 | |
| | 2,025,000 | | | New York State Dormitory Authority Refunding Revenue Bonds, Series A,
5.00%, 02/15/26 | | | 2,235,156 | |
| | 4,765,000 | | | New York State Dormitory Authority Refunding Revenue Bonds, Series A,
5.00%, 12/15/29 | | | 5,017,271 | |
| | 1,000,000 | | | New York State Dormitory Authority Refunding Revenue Bonds, Series B, (AMBAC),
5.50%, 03/15/22 | | | 1,019,738 | |
| | 350,000 | | | New York State Dormitory Authority Refunding Revenue Bonds, Series C,
5.00%, 03/15/25 | | | 388,101 | |
| | 500,000 | | | New York State Dormitory Authority Refunding Revenue Bonds, Series E,
5.00%, 02/15/23 | | | 530,522 | |
| | 400,000 | | | New York State Dormitory Authority Refunding Revenue Bonds, Series E,
5.00%, 02/15/24 | | | 442,618 | |
| | 625,000 | | | New York State Dormitory Authority School Improvements Bidding Group 2 Revenue Bonds,
5.00%, 03/15/24 | | | 693,098 | |
| | 125,000 | | | New York State Dormitory Authority School Improvements Group 1 Revenue Bonds, Series A,
5.00%, 03/15/24 | | | 138,620 | |
| | 8,050,000 | | | New York State Dormitory Authority School Improvements Group 1 Revenue Bonds, Series A,
5.00%, 03/15/27 | | | 9,804,448 | |
| | 125,000 | | | New York State Dormitory Authority School Improvements Group 1 Revenue Bonds, Series A,
5.00%, 03/15/27 | | | 152,758 | |
Principal
Amount | | | | | Value | |
| New York (continued) | | | | |
| $ | 100,000 | | | New York State Dormitory Authority School Improvements Group 1 Revenue Bonds, Series E,
5.00%, 03/15/23 | | $ | 106,491 | |
| | 2,500,000 | | | New York State Dormitory Authority School Improvements Income Tax Revenue Bonds, Series A,
5.00%, 02/15/28 | | | 3,001,347 | |
| | 425,000 | | | New York State Dormitory Authority School Improvements Revenue Bonds, Series A,
5.00%, 02/15/26 | | | 502,500 | |
| | 355,000 | | | New York State Dormitory Authority Third Generation Resolution State Universal Refunding Revenue Bonds,
5.00%, 05/15/24 | | | 364,140 | |
| | 1,000,000 | | | New York State Dormitory Authority University and College Improvements Revenue Bonds, Series A,
5.00%, 03/15/24 | | | 1,108,957 | |
| | 140,000 | | | New York State Dormitory Authority University and College Improvements Revenue Bonds, Series A,
5.00%, 07/01/24 | | | 157,292 | |
| | 2,525,000 | | | New York State Dormitory Authority University and College Improvements Revenue Bonds, Series A,
5.00%, 07/01/25 | | | 2,939,131 | |
| | 100,000 | | | New York State Dormitory Authority University and College Improvements Revenue Bonds, Series A,
5.00%, 07/01/25 | | | 116,401 | |
| | 1,025,000 | | | New York State Dormitory Authority University and College Improvements Revenue Bonds, Series A,
5.00%, 03/15/26 | | | 1,136,066 | |
| | 1,750,000 | | | New York State Dormitory Authority University and College Improvements Revenue Bonds, Series A,
5.00%, 07/01/26 | | | 2,101,634 | |
| Old Westbury Funds, Inc. | |
| New York Municipal Bond Fund | |
| Portfolio of Investments - (Continued) | October 31, 2021 |
| | |
Principal
Amount | | | | | Value | |
| New York (continued) | | | | |
| $ | 200,000 | | | New York State Dormitory Authority University of New York Dormitory Facilities Student Housing Revenue Bonds, Series A,
5.00%, 07/01/22 | | $ | 206,376 | |
| | 2,500,000 | | | New York State Environmental Facilities Corp. Current Refunding Revenue Bonds,
5.00%, 06/15/28 | | | 3,150,357 | |
| | 3,660,000 | | | New York State Environmental Facilities Corp. Current Refunding Revenue Bonds,
5.00%, 06/15/29 | | | 4,710,992 | |
| | 2,250,000 | | | New York State Environmental Facilities Corp. Current Refunding Revenue Bonds,
5.00%, 06/15/30 | | | 2,952,037 | |
| | 2,250,000 | | | New York State Environmental Facilities Corp. Current Refunding Revenue Bonds,
5.00%, 06/15/31 | | | 3,009,797 | |
| | 200,000 | | | New York State Environmental Facilities Corp. Current Refunding Revenue Bonds, Series A,
5.00%, 06/15/23 | | | 205,918 | |
| | 100,000 | | | New York State Environmental Facilities Corp. Green Bond Revenue Bonds, Series C,
5.00%, 02/15/27 | | | 122,020 | |
| | 100,000 | | | New York State Environmental Facilities Corp. Green Bond Revenue Bonds, Series D,
5.00%, 03/15/23 | | | 106,563 | |
| | 6,250,000 | | | New York State Environmental Facilities Corp. Refunding Revenue Bonds,
5.00%, 06/15/28 | | | 6,999,368 | |
| | 475,000 | | | New York State Environmental Facilities Corp. Refunding Revenue Bonds, Series A,
5.00%, 06/15/27 | | | 511,303 | |
| | 275,000 | | | New York State Environmental Facilities Corp. Refunding Revenue Bonds, Series A,
5.00%, 06/15/24 | | | 308,510 | |
Principal
Amount | | | | | Value | |
| New York (continued) | | | | |
| $ | 2,530,000 | | | New York State Environmental Facilities Corp. Refunding Revenue Bonds, Series B,
4.00%, 06/15/37 | | $ | 2,981,794 | |
| | 1,485,000 | | | New York State Environmental Facilities Corp. Refunding Revenue Bonds, Sub-Series A,
5.00%, 06/15/24 | | | 1,529,324 | |
| | 1,000,000 | | | New York State Environmental Facilities Corp. Water Utility Improvements Revenue Bonds,
5.00%, 06/15/34 | | | 1,281,089 | |
| | 1,000,000 | | | New York State Environmental Facilities Corp. Water Utility Improvements Revenue Bonds,
5.00%, 06/15/36 | | | 1,275,556 | |
| | 100,000 | | | New York State Environmental Facilities Corp. Water Utility Improvements Revenue Bonds,
5.00%, 06/15/23 | | | 107,728 | |
| | 605,000 | | | New York State Environmental Facilities Corp. Water Utility Improvements Revenue Bonds,
5.00%, 06/15/24 | | | 678,722 | |
| | 985,000 | | | New York State Environmental Facilities Corp. Water Utility Improvements Revenue Bonds,
5.00%, 06/15/24 | | | 1,105,027 | |
| | 4,240,000 | | | New York State Environmental Facilities Corp. Water Utility Improvements Revenue Bonds, Series B,
5.00%, 06/15/27 | | | 5,217,492 | |
| | 3,000,000 | | | New York State Environmental Facilities Corp. Water Utility Improvements Revenue Bonds, Series E,
5.00%, 06/15/23 | | | 3,231,826 | |
| | 550,000 | | | New York State Environmental Facilities Corp. Water Utility Improvements Revenue Bonds, Series E,
5.00%, 06/15/24 | | | 617,020 | |
| | 100,000 | | | New York State Thruway Authority Advance Refunding Revenue Bonds, Series A,
5.00%, 03/15/22 | | | 101,789 | |
| Old Westbury Funds, Inc. | |
| New York Municipal Bond Fund | |
| Portfolio of Investments - (Continued) | October 31, 2021 |
| | |
Principal
Amount | | | | | Value | |
| New York (continued) | | | | |
| $ | 375,000 | | | New York State Thruway Authority Current Refunding Revenue Bonds, Series L,
5.00%, 01/01/26 | | $ | 441,988 | |
| | 150,000 | | | New York State Thruway Authority Highway & Bridge Trust Fund Refunding Revenue Bonds, Series A,
5.00%, 04/01/23 | | | 152,944 | |
| | 10,000,000 | | | New York State Thruway Authority Refunding Revenue Bonds, Series B,
4.00%, 01/01/38 | | | 11,589,901 | |
| | 2,000,000 | | | New York State Thruway Authority Refunding Revenue Bonds, Series J,
5.00%, 01/01/27 | | | 2,196,611 | |
| | 1,000,000 | | | New York State Thruway Authority Refunding Revenue Bonds, Series K,
5.00%, 01/01/25 | | | 1,142,175 | |
| | 375,000 | | | New York State Thruway Authority Refunding Revenue Bonds, Series K,
5.00%, 01/01/24 | | | 412,636 | |
| | 300,000 | | | New York State Thruway Authority Refunding Revenue Bonds, Series K,
5.00%, 01/01/26 | | | 342,652 | |
| | 250,000 | | | New York State Thruway Authority Refunding Revenue Bonds, Series L,
5.00%, 01/01/23 | | | 263,751 | |
| | 125,000 | | | New York State Thruway Authority Refunding Revenue Bonds, Series L,
5.00%, 01/01/24 | | | 137,545 | |
| | 200,000 | | | New York State Thruway Authority Refunding Revenue Bonds, Series L,
5.00%, 01/01/25 | | | 228,435 | |
| | 100,000 | | | New York State Thruway Authority Refunding Revenue Bonds, Series L,
5.00%, 01/01/27 | | | 121,184 | |
| | 2,405,000 | | | New York State Thruway Authority Refunding Revenue Bonds, Series O,
5.00%, 01/01/33 | | | 3,149,152 | |
Principal
Amount | | | | | Value | |
| New York (continued) | | | | |
| $ | 1,500,000 | | | New York State Urban Development Corp. Advance Refunding Revenue Bonds, Series A,
5.00%, 03/15/29 | | $ | 1,819,408 | |
| | 300,000 | | | New York State Urban Development Corp. Advance Refunding Revenue Bonds, Series A,
5.00%, 03/15/24 | | | 333,064 | |
| | 1,925,000 | | | New York State Urban Development Corp. Advance Refunding Revenue Bonds, Series A,
5.00%, 03/15/27 | | | 2,273,950 | |
| | 540,000 | | | New York State Urban Development Corp. Civic Convention Center Revenue Bonds,
1.83%, 03/15/29 | | | 534,768 | |
| | 1,675,000 | | | New York State Urban Development Corp. Civic Convention Center Revenue Bonds, Series A,
5.00%, 03/15/29 | | | 2,141,541 | |
| | 1,000,000 | | | New York State Urban Development Corp. Civic Convention Center Revenue Bonds, Series A,
5.00%, 03/15/35 | | | 1,281,081 | |
| | 1,000,000 | | | New York State Urban Development Corp. Correctional Facilities Improvements Revenue Bonds, Series A-2, (NATL-RE),
5.50%, 03/15/23 | | | 1,071,743 | |
| | 6,000,000 | | | New York State Urban Development Corp. Economic Improvements Revenue Bonds,
5.00%, 03/15/33 | | | 7,722,435 | |
| | 1,000,000 | | | New York State Urban Development Corp. Economic Improvements Revenue Bonds,
5.00%, 03/15/27 | | | 1,220,296 | |
| | 5,000,000 | | | New York State Urban Development Corp. Economic Improvements Revenue Bonds,
5.00%, 03/15/29 | | | 6,392,659 | |
| | 500,000 | | | New York State Urban Development Corp. Economic Improvements Revenue Bonds,
5.00%, 03/15/32 | | | 645,565 | |
| | 425,000 | | | New York State Urban Development Corp. Personal Income Tax Advance Refunding Revenue Bonds, Series A,
5.00%, 03/15/22 | | | 432,604 | |
| Old Westbury Funds, Inc. | |
| New York Municipal Bond Fund | |
| Portfolio of Investments - (Continued) | October 31, 2021 |
| | |
Principal
Amount | | | | | Value | |
| New York (continued) | | | | |
| $ | 100,000 | | | New York State Urban Development Corp. Personal Income Tax Advance Refunding Revenue Bonds, Series A,
5.00%, 03/15/23 | | $ | 106,491 | |
| | 3,225,000 | | | New York State Urban Development Corp. Personal Income Tax Advance Refunding Revenue Bonds, Series A,
5.00%, 03/15/26 | | | 3,828,780 | |
| | 2,750,000 | | | New York State Urban Development Corp. Personal Income Tax Advance Refunding Revenue Bonds, Series A,
5.00%, 03/15/28 | | | 3,245,901 | |
| | 1,000,000 | | | New York State Urban Development Corp. Personal Income Tax Advance Refunding Revenue, Series A,
5.00%, 03/15/25 | | | 1,151,449 | |
| | 200,000 | | | New York State Urban Development Corp. Personal Income Tax Economic Improvements Revenue Bonds, Series C,
5.00%, 03/15/23 | | | 212,982 | |
| | 225,000 | | | New York State Urban Development Corp. Personal Income Tax Refunding Revenue Bonds, Series A,
5.00%, 03/15/24 | | | 249,798 | |
| | 10,000,000 | | | New York State Urban Development Corp. State Personal Income Tax Advance Refunding Revenue Bonds,
5.00%, 03/15/26 | | | 11,071,020 | |
| | 150,000 | | | New York State Urban Development Corp. State Personal Income Tax Advance Refunding Revenue Bonds, Series A,
5.00%, 03/15/22 | | | 152,684 | |
| | 100,000 | | | New York State Urban Development Corp. State Personal Income Tax Advance Refunding Revenue Bonds, Series A,
5.00%, 03/15/26 | | | 118,722 | |
| | 100,000 | | | New York State Urban Development Corp. State Personal Income Tax Advance Refunding Revenue Bonds, Series A,
5.00%, 03/15/27 | | | 122,030 | |
Principal
Amount | | | | | Value | |
| New York (continued) | | | | |
| $ | 200,000 | | | New York State Urban Development Corp. State Personal Income Tax Advance Refunding Revenue Bonds, Series A,
5.00%, 03/15/24 | | $ | 222,043 | |
| | 175,000 | | | New York State Urban Development Corp. State Personal Income Tax Public Improvements Revenue Bonds, Series E,
5.00%, 03/15/23 | | | 186,360 | |
| | 2,000,000 | | | New York State Urban Development Corp. State Personal Income Tax Public Improvements Revenue Bonds, Series E,
5.00%, 03/15/29 | | | 2,128,397 | |
| | 2,085,000 | | | Port Authority of New York & New Jersey Consolidated Revenue Bonds, Series 189,
5.00%, 05/01/26 | | | 2,409,745 | |
| | 500,000 | | | Port Authority of New York & New Jersey Airport & Marina Improvements Revenue Bonds, Series 194,
5.00%, 10/15/33 | | | 582,489 | |
| | 11,500,000 | | | Port Authority of New York & New Jersey Cash Flow Management Revenue Bonds, Series AAA,
1.09%, 07/01/23 | | | 11,606,029 | |
| | 150,000 | | | Port Authority of New York & New Jersey Consolidated Revenue Bonds, Series 189,
5.00%, 05/01/24 | | | 167,397 | |
| | 175,000 | | | Port Authority of New York & New Jersey Consolidated Revenue Bonds, Series 83,
5.00%, 12/15/26 | | | 196,178 | |
| | 2,250,000 | | | Port Authority of New York & New Jersey Consolidated Revenue Bonds, Series 84,
5.00%, 09/01/34 | | | 2,531,204 | |
| | 1,400,000 | | | Port Authority of New York & New Jersey Refunding Revenue Bonds, Series 179,
5.00%, 12/01/27 | | | 1,534,748 | |
| | 5,000,000 | | | Port Authority of New York & New Jersey Refunding Revenue Bonds, Series 179,
5.00%, 12/01/28 | | | 5,476,853 | |
| Old Westbury Funds, Inc. | |
| New York Municipal Bond Fund | |
| Portfolio of Investments - (Continued) | October 31, 2021 |
| | |
Principal
Amount | | | | | Value | |
| New York (continued) | | | | |
| $ | 100,000 | | | Port Authority of New York & New Jersey Revenue Bonds, Series 209,
5.00%, 07/15/23 | | $ | 108,078 | |
| | 325,000 | | | Port Authority of New York & New Jersey Revenue Bonds, Series 209,
5.00%, 07/15/24 | | | 365,502 | |
| | 125,000 | | | Sales Tax Asset Receivable Corp. Refunding Revenue Bonds, Series A,
5.00%, 10/15/23 | | | 136,563 | |
| | 475,000 | | | Sales Tax Asset Receivable Corp. Refunding Revenue Bonds, Series A,
5.00%, 10/15/24 | | | 539,944 | |
| | 5,150,000 | | | Sales Tax Asset Receivable Corp. Refunding Revenue Bonds, Series A,
5.00%, 10/15/30(c) | | | 5,854,128 | |
| | 8,195,000 | | | State of New York Current Refunding GO, Series B,
2.55%, 02/15/29 | | | 8,633,591 | |
| | 425,000 | | | State of New York Green GO, Series A,
5.00%, 02/15/22 | | | 430,906 | |
| | 100,000 | | | State of New York Green GO, Series A,
5.00%, 02/15/26 | | | 118,954 | |
| | 250,000 | | | State of New York Public Improvements GO, Series A,
5.00%, 03/01/24(c) | | | 265,917 | |
| | 1,100,000 | | | Syracuse Industrial Development Agency Current Refunding Revenue Bonds, Series A, (State Aid Withholding),
5.00%, 05/01/22 | | | 1,126,506 | |
| | 1,415,000 | | | Syracuse Industrial Development Agency Current Refunding Revenue Bonds, Series A, (State Aid Withholding),
5.00%, 05/01/23 | | | 1,514,983 | |
| | 1,000,000 | | | Syracuse Industrial Development Agency School Improvements Revenue Bonds, Series A, (State Aid Withholding),
4.00%, 05/01/33 | | | 1,167,695 | |
| | 1,915,000 | | | Syracuse Industrial Development Agency School Improvements Revenue Bonds, Series A, (State Aid Withholding),
4.00%, 05/01/34 | | | 2,229,260 | |
Principal
Amount | | | | | Value | |
| New York (continued) | | | | |
| $ | 1,000,000 | | | Syracuse Industrial Development Agency School Improvements Revenue Bonds, Series A, (State Aid Withholding),
4.00%, 05/01/35 | | $ | 1,161,490 | |
| | 1,000,000 | | | Syracuse Industrial Development Agency School Improvements Revenue Bonds, Series A, (State Aid Withholding),
4.00%, 05/01/36 | | | 1,157,298 | |
| | 500,000 | | | Syracuse Industrial Development Agency Syracuse City School Improvements Revenue Bonds, Series A, (State Aid Withholding),
5.00%, 05/01/26 | | | 596,008 | |
| | 375,000 | | | Triborough Bridge & Tunnel Authority Advance Refunding Revenue Bonds, Series A,
5.00%, 11/15/24 | | | 426,671 | |
| | 900,000 | | | Triborough Bridge & Tunnel Authority Advance Refunding Revenue Bonds, Series B,
5.00%, 11/15/27 | | | 1,100,967 | |
| | 450,000 | | | Triborough Bridge & Tunnel Authority Advance Refunding Revenue Bonds, Series B,
5.00%, 11/15/29 | | | 547,104 | |
| | 500,000 | | | Triborough Bridge & Tunnel Authority Advance Refunding Revenue Bonds, Series C-1,
5.00%, 11/15/25 | | | 587,419 | |
| | 4,315,000 | | | Triborough Bridge & Tunnel Authority Current Refunding Revenue Bonds, Sub-Series A,
5.00%, 11/15/25 | | | 4,619,284 | |
| | 475,000 | | | Triborough Bridge & Tunnel Authority Current Refunding Revenue Bonds, Sub-Series A,
5.00%, 11/15/26 | | | 508,496 | |
| | 1,050,000 | | | Triborough Bridge & Tunnel Authority Current Refunding Revenue Bonds, Sub-Series A,
5.00%, 11/15/27 | | | 1,124,044 | |
| | 1,575,000 | | | Triborough Bridge & Tunnel Authority Current Refunding Revenue Bonds, Sub-Series A,
5.00%, 11/15/29 | | | 1,685,309 | |
| Old Westbury Funds, Inc. | |
| New York Municipal Bond Fund | |
| Portfolio of Investments - (Continued) | October 31, 2021 |
| | |
Principal
Amount | | | | | Value | |
| New York (continued) | | | | |
| $ | 3,000,000 | | | Triborough Bridge & Tunnel Authority Highway Improvements Revenue Bonds, Series A,
5.00%, 11/01/25 | | $ | 3,525,456 | |
| | 100,000 | | | Triborough Bridge & Tunnel Authority Highway Improvements Revenue Bonds, Series A,
5.00%, 11/15/25 | | | 117,484 | |
| | 265,000 | | | Triborough Bridge & Tunnel Authority Highway Improvements Revenue Bonds, Series B,
5.00%, 11/15/23 | | | 290,271 | |
| | 435,000 | | | Triborough Bridge & Tunnel Authority Highway Improvements Revenue Bonds, Series B,
5.00%, 11/15/27 | | | 510,484 | |
| | 6,340,000 | | | Triborough Bridge & Tunnel Authority Highway Improvements Revenue Bonds, Series C,
5.00%, 11/15/29 | | | 6,778,964 | |
| | 1,500,000 | | | Triborough Bridge & Tunnel Authority Highway Improvements Revenue Bonds, Series C,
5.00%, 11/15/30 | | | 1,603,856 | |
| | 250,000 | | | Triborough Bridge & Tunnel Authority MTA Bridges & Tunnels Advance Refunding Revenue Bonds,
5.00%, 11/15/23 | | | 273,840 | |
| | 125,000 | | | Triborough Bridge & Tunnel Authority Pre-refunded Highway Improvements Revenue Bonds, Series A,
5.00%, 11/15/25(c) | | | 145,018 | |
| | 250,000 | | | Triborough Bridge & Tunnel Authority Pre-refunded Highway Improvements Revenue Bonds, Series C,
5.00%, 11/15/27(c) | | | 268,323 | |
| | 150,000 | | | Triborough Bridge & Tunnel Authority Refunding Revenue Bonds, Series B,
5.00%, 11/15/24 | | | 170,668 | |
| | 100,000 | | | Triborough Bridge & Tunnel Authority Refunding Revenue Bonds, Series B,
5.00%, 11/15/24 | | | 104,886 | |
| | 100,000 | | | Utility Debt Securitization Authority Refunding Revenue Bonds,
5.00%, 12/15/26 | | | 114,277 | |
Principal
Amount | | | | | Value | |
| New York (continued) | | | | |
| $ | 1,750,000 | | | Utility Debt Securitization Authority Refunding Revenue Bonds,
5.00%, 06/15/25 | | $ | 1,882,559 | |
| | 1,500,000 | | | Utility Debt Securitization Authority Refunding Revenue Bonds, Series A,
5.00%, 06/15/26 | | | 1,682,362 | |
| | 5,290,000 | | | Utility Debt Securitization Authority Refunding Revenue Bonds, Series TE,
5.00%, 12/15/31 | | | 5,802,258 | |
| | 1,080,000 | | | Utility Debt Securitization Authority Refunding Revenue Bonds, Series TE,
5.00%, 12/15/28 | | | 1,185,307 | |
| | 8,720,000 | | | Utility Debt Securitization Authority Refunding Revenue Bonds, Series TE,
5.00%, 12/15/29 | | | 9,568,303 | |
| | 2,750,000 | | | Utility Debt Securitization Authority Refunding Revenue Bonds, Series TE,
5.00%, 12/15/30 | | | 3,016,911 | |
| | | | | | | | | |
Total Municipal Bonds
(Cost $566,885,867) | | | 577,401,202 | |
| | | | | |
| CORPORATE BONDS — 0.8% | | | | |
| United States — 0.8% | | | | |
| | 5,000,000 | | | Andrew W Mellon Foundation (The), Series 2020,
0.95%, 08/01/27 | | | 4,874,047 | |
| | | | | | | | | |
Total Corporate Bonds
(Cost $5,000,000) | | | 4,874,047 | |
| | | | | | | | | |
| Shares | | | | | | | |
| INVESTMENT COMPANY — 6.0% | | | | |
| | 37,412,126 | | | SEI Daily Income Trust Government II Fund - Class A, 0.01%(d) | | | 37,412,126 | |
| | | | | | | | | |
Total Investment Company
(Cost $37,412,126) | | | 37,412,126 | |
| | | | | |
TOTAL INVESTMENTS — 98.9%
(Cost $609,297,993) | | $ | 619,687,375 | |
| OTHER ASSETS IN EXCESS OF LIABILITIES — 1.1% | | | 6,856,741 | |
| NET ASSETS — 100.0% | | $ | 626,544,116 | |
| Old Westbury Funds, Inc. | |
| New York Municipal Bond Fund | |
| Portfolio of Investments - (Continued) | October 31, 2021 |
| | |
| (a) | Variable or floating rate security, which interest rate adjusts periodically based on changes in current interest rates and prepayments on the underlying pool of assets. Rate shown is the rate in effect as of October 31, 2021. |
| (b) | These securities are subject to remarketing prior to its stated maturity, and is subject to mandatory redemption at the stated maturity date. |
| (c) | These securities are pre-refunded; the date shown represents the pre-refunded date. Bonds which are pre-refunded are collateralized by U.S. Government securities which are held in escrow and are used to pay principal and interest on the municipal issue and to retire the bonds in full at the earliest refunding date. |
| (d) | The rate shown represents the current yield as of October 31, 2021. |
The following abbreviations are used in the report:
AMBAC — Insured by AMBAC Financial Group
GO — General Obligation
NATL-RE — Insured by National Public Finance Guarantee Corp.
| Old Westbury Funds, Inc. | |
| Statements of Assets and Liabilities | |
| | October 31, 2021 |
| | | ALL CAP CORE
FUND | | SMALL & MID CAP
STRATEGIES
FUND | | LARGE CAP
STRATEGIES
FUND | | CREDIT
INCOME
FUND |
| ASSETS: | | | | | | | | | | | | | | | | |
| Investments, at fair value - unaffiliated | | $ | 3,648,501,768 | | | $ | 9,734,192,701 | | | $ | 25,786,224,520 | | | $ | 2,950,867,209 | |
| Foreign currency, at value (Cost $0, $2,018,737, $0 and $0 respectively) | | | — | | | | 2,008,793 | | | | — | | | | — | |
| Cash | | | 4 | | | | — | | | | 9,890,342 | | | | — | |
| Due from broker for collateral | | | — | | | | — | | | | — | | | | 2,890,000 | |
| Dividends and interest receivable | | | 2,630,199 | | | | 7,470,828 | | | | 24,546,613 | | | | 11,361,529 | |
| Receivable for Fund shares sold | | | 1,088,488 | | | | 1,351,579 | | | | 3,183,302 | | | | 1,646,618 | |
| Receivable for investments sold | | | — | | | | 19,593,146 | | | | 111,721,541 | | | | 192,298 | |
| Prepaid expenses | | | 24,104 | | | | 39,446 | | | | 78,508 | | | | 22,655 | |
| Total Assets | | | 3,652,244,563 | | | | 9,764,656,493 | | | | 25,935,644,826 | | | | 2,966,980,309 | |
| LIABILITIES: | | | | | | | | | | | | | | | | |
| Payable for Fund shares redeemed | | | 576,449 | | | | 2,728,383 | | | | 6,692,982 | | | | 404,390 | |
| Payable for investments purchased | | | 15 | | | | 4,890,419 | | | | 124,986,662 | | | | 11,150,894 | |
| Unrealized depreciation on swap contracts (Premiums received $0, $0, $0 and $460,008 respectively) | | | — | | | | — | | | | — | | | | 2,491,585 | |
| Deferred foreign capital gains tax liability (Note 8) | | | — | | | | 807,977 | | | | 37,345,093 | | | | — | |
| Accrued expenses and other payables: | | | | | | | | | | | | | | | | |
| Investment advisory | | | 2,014,627 | | | | 6,628,705 | | | | 17,169,033 | | | | 1,358,175 | |
| Administration and accounting - unaffiliated | | | 88,553 | | | | 308,943 | | | | 603,834 | | | | 109,003 | |
| Administration and accounting - affiliated | | | 90,043 | | | | 243,649 | | | | 637,867 | | | | 74,211 | |
| Shareholder servicing fee | | | 600,286 | | | | 1,624,331 | | | | 4,252,447 | | | | 494,738 | |
| Custody - unaffiliated | | | — | | | | 159,490 | | | | 28,067 | | | | 5,867 | |
| Custody - affiliated | | | 52,547 | | | | 18,756 | | | | 458,684 | | | | — | |
| Directors | | | 16,510 | | | | 48,941 | | | | 126,123 | | | | 12,062 | |
| Legal and Audit | | | 72,645 | | | | 222,176 | | | | 506,109 | | | | 227,025 | |
| Other | | | 50,220 | | | | 135,367 | | | | 351,287 | | | | 76,447 | |
| Total Liabilities | | | 3,561,895 | | | | 17,817,137 | | | | 193,158,188 | | | | 16,404,397 | |
| NET ASSETS | | $ | 3,648,682,668 | | | $ | 9,746,839,356 | | | $ | 25,742,486,638 | | | $ | 2,950,575,912 | |
| NET ASSETS consist of: | | | | | | | | | | | | | | | | |
| Capital paid-in | | $ | 1,786,425,776 | | | $ | 6,526,067,660 | | | $ | 15,286,826,169 | | | $ | 2,916,293,425 | |
| Total accumulated earnings | | | 1,862,256,892 | | | | 3,220,771,696 | | | | 10,455,660,469 | | | | 34,282,487 | |
| NET ASSETS | | $ | 3,648,682,668 | | | $ | 9,746,839,356 | | | $ | 25,742,486,638 | | | $ | 2,950,575,912 | |
| Net Asset Value, maximum offering price and redemption price per share | | $ | 27.31 | | | $ | 19.92 | | | $ | 20.11 | | | $ | 10.15 | |
| Number of shares authorized | | | 2,500,000,000 | | | | 3,500,000,000 | | | | 3,000,000,000 | | | | 3,500,000,000 | |
| SHARES OF CAPITAL STOCK OUTSTANDING | | | 133,596,308 | | | | 489,183,840 | | | | 1,280,067,412 | | | | 290,679,086 | |
| INVESTMENTS, AT COST | | $ | 1,984,442,401 | | | $ | 7,134,796,821 | | | $ | 16,846,335,952 | | | $ | 2,930,588,115 | |
See Notes to Financial Statements.
| Old Westbury Funds, Inc. | |
| Statements of Assets and Liabilities - (Continued) | |
| | October 31, 2021 |
| | | FIXED
INCOME
FUND | | MUNICIPAL
BOND
FUND | | CALIFORNIA
MUNICIPAL
BOND
FUND | | NEW YORK
MUNICIPAL
BOND
FUND |
| ASSETS: | | | | | | | | | | | | | | | | |
| Investments, at fair value - unaffiliated | | $ | 1,563,279,045 | | | $ | 4,374,088,665 | | | $ | 342,083,379 | | | $ | 619,687,375 | |
| Cash | | | — | | | | — | | | | 1 | | | | 1 | |
| Dividends and interest receivable | | | 7,619,911 | | | | 41,604,108 | | | | 4,238,034 | | | | 7,196,576 | |
| Receivable for Fund shares sold | | | 263,129 | | | | 4,741,457 | | | | 7,200 | | | | — | |
| Receivable for investments sold | | | 3,070,155 | | | | — | | | | — | | | | — | |
| Prepaid expenses | | | 19,238 | | | | 26,052 | | | | 17,213 | | | | 16,774 | |
| Total Assets | | | 1,574,251,478 | | | | 4,420,460,282 | | | | 346,345,827 | | | | 626,900,726 | |
| LIABILITIES: | | | | | | | | | | | | | | | | |
| Payable for Fund shares redeemed | | | 67,953 | | | | 523,910 | | | | — | | | | 29,500 | |
| Payable for investments purchased | | | 4,659,618 | | | | 183,462,199 | | | | — | | | | — | |
| Accrued expenses and other payables: | | | | | | | | | | | | | | | | |
| Investment advisory | | | 385,849 | | | | 1,040,672 | | | | 75,573 | | | | 142,991 | |
| Administration and accounting - unaffiliated | | | 47,054 | | | | 130,899 | | | | 21,251 | | | | 29,524 | |
| Administration and accounting - affiliated | | | 40,068 | | | | 107,540 | | | | 8,886 | | | | 15,823 | |
| Shareholder servicing fee | | | 267,123 | | | | 716,932 | | | | 59,239 | | | | 105,486 | |
| Custody - affiliated | | | 20,035 | | | | 53,769 | | | | 4,443 | | | | 7,912 | |
| Directors | | | 11,588 | | | | 29,129 | | | | 2,816 | | | | 4,081 | |
| Legal and Audit | | | 39,884 | | | | 90,432 | | | | 18,676 | | | | 21,093 | |
| Other | | | 20,959 | | | | 58,113 | | | | — | | | | 200 | |
| Total Liabilities | | | 5,560,131 | | | | 186,213,595 | | | | 190,884 | | | | 356,610 | |
| NET ASSETS | | $ | 1,568,691,347 | | | $ | 4,234,246,687 | | | $ | 346,154,943 | | | $ | 626,544,116 | |
| NET ASSETS consist of: | | | | | | | | | | | | | | | | |
| Capital paid-in | | $ | 1,567,689,511 | | | $ | 4,130,944,136 | | | $ | 337,960,539 | | | $ | 613,094,231 | |
| Total accumulated earnings | | | 1,001,836 | | | | 103,302,551 | | | | 8,194,404 | | | | 13,449,885 | |
| NET ASSETS | | $ | 1,568,691,347 | | | $ | 4,234,246,687 | | | $ | 346,154,943 | | | $ | 626,544,116 | |
| Net Asset Value, maximum offering price and redemption price per share | | $ | 11.25 | | | $ | 12.33 | | | $ | 10.38 | | | $ | 10.43 | |
| Number of shares authorized | | | 2,000,000,000 | | | | 2,000,000,000 | | | | 2,000,000,000 | | | | 2,000,000,000 | |
| SHARES OF CAPITAL STOCK OUTSTANDING | | | 139,488,958 | | | | 343,473,285 | | | | 33,340,862 | | | | 60,067,153 | |
| INVESTMENTS, AT COST | | $ | 1,555,241,322 | | | $ | 4,322,309,683 | | | $ | 337,181,251 | | | $ | 609,297,993 | |
See Notes to Financial Statements.
| Old Westbury Funds, Inc. | |
| Statements of Operations | |
| | For the Year Ended October 31, 2021 |
| | | ALL CAP CORE
FUND | | SMALL & MID
CAP
STRATEGIES
FUND | | LARGE CAP
STRATEGIES
FUND | | CREDIT
INCOME
FUND |
| INVESTMENT INCOME: | | | | | | | | | | | | | | | | |
| Interest | | $ | 2,446 | | | $ | — | | | $ | 192,445 | | | $ | 113,463,292 | |
| Dividends - unaffiliated | | | 25,365,703 | | | | 95,156,119 | | | | 263,563,764 | | | | 16,597,899 | |
| Foreign tax withheld | | | (124,518 | ) | | | (6,624,284 | ) | | | (5,598,623 | ) | | | — | |
| Total investment income | | | 25,243,631 | | | | 88,531,835 | | | | 258,157,586 | | | | 130,061,191 | |
| EXPENSES: | | | | | | | | | | | | | | | | |
| Investment advisory fees | | | 19,873,840 | | | | 75,399,102 | | | | 182,173,117 | | | | 14,835,361 | |
| Shareholder servicing fees | | | 5,884,259 | | | | 17,740,965 | | | | 45,074,529 | | | | 5,121,949 | |
| Administration and accounting fees - unaffiliated | | | 452,206 | | | | 1,497,249 | | | | 3,302,390 | | | | 496,658 | |
| Administration and accounting fees - affiliated | | | 882,639 | | | | 2,661,145 | | | | 6,761,179 | | | | 768,292 | |
| Custodian fees - unaffiliated | | | — | | | | 1,878,574 | | | | 81,271 | | | | 81,483 | |
| Custodian fees - affiliated | | | 525,117 | | | | 232,415 | | | | 5,532,691 | | | | — | |
| Directors fees and expenses | | | 67,017 | | | | 204,594 | | | | 518,529 | | | | 64,805 | |
| Insurance premiums | | | 21,770 | | | | 37,603 | | | | 75,274 | | | | 19,614 | |
| Legal and Audit fees | | | 97,799 | | | | 312,851 | | | | 735,676 | | | | 439,801 | |
| Printing and postage fees | | | 22,279 | | | | 48,557 | | | | 110,362 | | | | 20,826 | |
| Registration fees | | | 36,090 | | | | 90,658 | | | | 216,602 | | | | 35,039 | |
| Transfer agent fees | | | 287,332 | | | | 838,642 | | | | 2,109,291 | | | | 252,469 | |
| Miscellaneous expenses | | | 17,418 | | | | 49,621 | | | | 73,007 | | | | 16,806 | |
| Total expenses | | | 28,167,766 | | | | 100,991,976 | | | | 246,763,918 | | | | 22,153,103 | |
| Expenses waived by Advisor | | | — | | | | (3,417,187 | ) | | | — | | | | (384,818 | ) |
| Net expenses | | | 28,167,766 | | | | 97,574,789 | | | | 246,763,918 | | | | 21,768,285 | |
| NET INVESTMENT INCOME/(LOSS) | | | (2,924,135 | ) | | | (9,042,954 | ) | | | 11,393,668 | | | | 108,292,906 | |
| NET REALIZED AND CHANGE IN UNREALIZED GAIN/(LOSS) ON INVESTMENTS, FUTURES CONTRACTS, SWAP AGREEMENTS, FOREIGN CURRENCY TRANSACTIONS, AND FOREIGN CAPITAL GAINS TAXES: | | | | | | | | | | | | | | | | |
| Net realized gain/(loss) on: | | | | | | | | | | | | | | | | |
| Investments | | | 220,381,046 | | | | 675,821,438 | | | | 1,642,059,283 | | | | 6,403,344 | |
| Futures contracts | | | — | | | | — | | | | — | | | | (18,120 | ) |
| Swap agreements | | | — | | | | — | | | | — | | | | (2,252,755 | ) |
| Foreign currency transactions | | | (125,601 | ) | | | (1,251,276 | ) | | | (2,574,673 | ) | | | — | |
| Foreign capital gains tax | | | — | | | | (117,711 | ) | | | (3,308,637 | ) | | | — | |
| Net change in unrealized appreciation/(depreciation) on: | | | | | | | | | | | | | | | | |
| Investments | | | 905,273,240 | | | | 1,522,987,158 | | | | 4,531,241,210 | | | | 30,882,691 | |
| Swap agreements | | | — | | | | — | | | | — | | | | (2,264,937 | ) |
| Foreign currency transactions | | | (597 | ) | | | (139,208 | ) | | | (90,578 | ) | | | — | |
| Deferred foreign capital gains taxed on unrealized appreciation/(depreciation) | | | — | | | | (807,977 | ) | | | (37,345,093 | ) | | | — | |
| Net realized and change in unrealized gain/(loss) on investments, futures contracts, swap agreements, foreign currency transactions, and foreign capital gains taxes | | | 1,125,528,088 | | | | 2,196,492,424 | | | | 6,129,981,512 | | | | 32,750,223 | |
| NET INCREASE IN NET ASSETS RESULTING FROM OPERATIONS | | $ | 1,122,603,953 | | | $ | 2,187,449,470 | | | $ | 6,141,375,180 | | | $ | 141,043,129 | |
See Notes to Financial Statements.
| Old Westbury Funds, Inc. | |
| Statements of Operations - (Continued) | |
| | For the Year Ended October 31, 2021 |
| | | FIXED
INCOME
FUND | | MUNICIPAL
BOND
FUND | | CALIFORNIA
MUNICIPAL
BOND
FUND | | NEW YORK
MUNICIPAL
BOND
FUND |
| INVESTMENT INCOME: | | | | | | | | | | | | | | | | |
| Interest | | $ | 24,774,957 | | | $ | 62,438,417 | | | $ | 5,952,650 | | | $ | 9,358,801 | |
| Dividends - unaffiliated | | | 1,562 | | | | 15,434 | | | | 1,038 | | | | 1,947 | |
| Total investment income | | | 24,776,519 | | | | 62,453,851 | | | | 5,953,688 | | | | 9,360,748 | |
| EXPENSES: | | | | | | | | | | | | | | | | |
| Investment advisory fees | | | 6,370,599 | | | | 15,282,427 | | | | 1,675,723 | | | | 2,617,786 | |
| Shareholder servicing fees | | | 3,211,771 | | | | 8,304,244 | | | | 744,765 | | | | 1,183,893 | |
| Administration and accounting fees - unaffiliated | | | 269,666 | | | | 696,504 | | | | 106,549 | | | | 142,963 | |
| Administration and accounting fees - affiliated | | | 481,766 | | | | 1,245,637 | | | | 111,715 | | | | 177,584 | |
| Custodian fees - affiliated | | | 240,883 | | | | 622,818 | | | | 55,857 | | | | 88,792 | |
| Directors fees and expenses | | | 39,310 | | | | 100,633 | | | | 9,220 | | | | 14,250 | |
| Insurance premiums | | | 19,253 | | | | 27,725 | | | | 15,026 | | | | 15,642 | |
| Legal and Audit fees | | | 55,778 | | | | 130,768 | | | | 25,326 | | | | 27,204 | |
| Printing and postage fees | | | 17,317 | | | | 28,738 | | | | 11,718 | | | | 12,638 | |
| Registration fees | | | 27,669 | | | | 46,629 | | | | 26,788 | | | | 24,566 | |
| Transfer agent fees | | | 162,483 | | | | 399,441 | | | | 46,787 | | | | 67,163 | |
| Miscellaneous expenses | | | 13,410 | | | | 18,336 | | | | 10,504 | | | | 11,091 | |
| Total expenses | | | 10,909,905 | | | | 26,903,900 | | | | 2,839,978 | | | | 4,383,572 | |
| Expenses waived by Advisor | | | (1,756,358 | ) | | | (3,237,188 | ) | | | (717,605 | ) | | | (1,009,694 | ) |
| Net expenses | | | 9,153,547 | | | | 23,666,712 | | | | 2,122,373 | | | | 3,373,878 | |
| NET INVESTMENT INCOME | | | 15,622,972 | | | | 38,787,139 | | | | 3,831,315 | | | | 5,986,870 | |
| NET REALIZED AND CHANGE IN UNREALIZED GAIN/(LOSS) ON INVESTMENTS: | | | | | | | | | | | | | | | | |
| Net realized gain on: | | | | | | | | | | | | | | | | |
| Investments | | | 7,726,587 | | | | 48,932,448 | | | | 3,021,716 | | | | 2,550,678 | |
| Net change in unrealized depreciation on: | | | | | | | | | | | | | | | | |
| Investments | | | (44,298,763 | ) | | | (85,431,146 | ) | | | (6,927,094 | ) | | | (3,976,825 | ) |
| Net realized and change in unrealized gain/(loss) on investments | | | (36,572,176 | ) | | | (36,498,698 | ) | | | (3,905,378 | ) | | | (1,426,147 | ) |
| NET INCREASE/(DECREASE) IN NET ASSETS RESULTING FROM OPERATIONS | | $ | (20,949,204 | ) | | $ | 2,288,441 | | | $ | (74,063 | ) | | $ | 4,560,723 | |
See Notes to Financial Statements.
| Old Westbury Funds, Inc. | |
| Statements of Changes in Net Assets | |
| | |
| | | ALL CAP CORE FUND |
| | | FOR THE YEAR
ENDED
OCTOBER 31, 2021 | | FOR THE YEAR
ENDED
OCTOBER 31, 2020 |
| FROM OPERATIONS: | | | | | | | | |
| Net investment income/(loss) | | $ | (2,924,135 | ) | | $ | 1,982,763 | |
| Net realized gain on investments, futures contracts, swap agreements, foreign currency transactions, and foreign capital gains tax | | | 220,255,445 | | | | 80,145,937 | |
| Net change in unrealized appreciation/(depreciation) on investments, swap agreements, foreign currency transactions, net of foreign deferred taxes | | | 905,272,643 | | | | 299,945,554 | |
| Net increase/(decrease) in net assets resulting from operations | | | 1,122,603,953 | | | | 382,074,254 | |
| | | | | | | | | |
| DISTRIBUTIONS TO SHAREHOLDERS FROM: | | | | | | | | |
| Net investment income and net realized gains | | | (79,249,855 | ) | | | (158,030,798 | ) |
| Total distributions to shareholders | | | (79,249,855 | ) | | | (158,030,798 | ) |
| | | | | | | | | |
| CAPITAL STOCK TRANSACTIONS (DOLLARS): | | | | | | | | |
| Proceeds from sale of capital stock | | | 568,233,362 | | | | 486,652,689 | |
| Reinvestment of distributions | | | 53,810,174 | | | | 102,617,948 | |
| Value of capital stock redeemed | | | (300,620,640 | ) | | | (295,695,429 | ) |
| Net increase in net assets resulting from capital stock transactions | | | 321,422,896 | | | | 293,575,208 | |
| Net increase in net assets | | | 1,364,776,994 | | | | 517,618,664 | |
| | | | | | | | | |
| NET ASSETS: | | | | | | | | |
| Beginning of year | | | 2,283,905,674 | | | | 1,766,287,010 | |
| End of year | | $ | 3,648,682,668 | | | $ | 2,283,905,674 | |
| | | | | | | | | |
| CAPITAL SHARE TRANSACTIONS: | | | | | | | | |
| Shares sold | | | 30,516,643 | | | | 29,839,413 | |
| Shares issued as reinvestment of distributions | | | 2,518,024 | | | | 5,768,294 | |
| Shares redeemed | | | (12,630,701 | ) | | | (16,180,914 | ) |
| Net increase in shares outstanding | | | 20,403,966 | | | | 19,426,793 | |
| (a) | For the period from October 1, 2020 (commencement of operations) to October 31, 2020. |
See Notes to Financial Statements.
| Old Westbury Funds, Inc. | |
| Statements of Changes in Net Assets - (Continued) | |
| | |
| SMALL & MID CAP STRATEGIES FUND | | LARGE CAP STRATEGIES FUND | | CREDIT INCOME FUND |
FOR THE YEAR
ENDED
OCTOBER 31, 2021 | | FOR THE YEAR
ENDED
OCTOBER 31, 2020 | | FOR THE YEAR
ENDED
OCTOBER 31, 2021 | | FOR THE YEAR
ENDED
OCTOBER 31, 2020 | | FOR THE YEAR
ENDED
OCTOBER 31, 2021 | | FOR THE PERIOD
ENDED
OCTOBER 31,
2020(a) |
| | | | | | | | | | | | | | | | | | | | | | | |
| $ | (9,042,954 | ) | | $ | 11,050,629 | | | $ | 11,393,668 | | | $ | 81,211,125 | | | $ | 108,292,906 | | | $ | 7,974,055 | |
| | | | | | | | | | | | | | | | | | | | | | | |
| | 674,452,451 | | | | 263,003,458 | | | | 1,636,175,973 | | | | 204,768,837 | | | | 4,132,469 | | | | 64,477 | |
| | | | | | | | | | | | | | | | | | | | | | | |
| | 1,522,039,973 | | | | 180,589,854 | | | | 4,493,805,539 | | | | 833,559,388 | | | | 28,617,754 | | | | (10,830,238 | ) |
| | 2,187,449,470 | | | | 454,643,941 | | | | 6,141,375,180 | | | | 1,119,539,350 | | | | 141,043,129 | | | | (2,791,706 | ) |
| | | | | | | | | | | | | | | | | | | | | | | |
| | (256,159,437 | ) | | | (294,105,663 | ) | | | (272,974,801 | ) | | | (841,174,746 | ) | | | (103,968,936 | ) | | | — | |
| | (256,159,437 | ) | | | (294,105,663 | ) | | | (272,974,801 | ) | | | (841,174,746 | ) | | | (103,968,936 | ) | | | — | |
| | | | | | | | | | | | | | | | | | | | | | | |
| | 1,469,920,430 | | | | 1,067,779,413 | | | | 3,340,285,718 | | | | 1,940,470,637 | | | | 1,083,765,608 | | | | 1,950,834,733 | |
| | 149,738,738 | | | | 158,298,276 | | | | 150,793,033 | | | | 449,497,820 | | | | 39,200,662 | | | | — | |
| | (569,352,420 | ) | | | (899,814,445 | ) | | | (1,226,525,690 | ) | | | (2,060,679,178 | ) | | | (148,663,498 | ) | | | (8,844,080 | ) |
| | 1,050,306,748 | | | | 326,263,244 | | | | 2,264,553,061 | | | | 329,289,279 | | | | 974,302,772 | | | | 1,941,990,653 | |
| | 2,981,596,781 | | | | 486,801,522 | | | | 8,132,953,440 | | | | 607,653,883 | | | | 1,011,376,965 | | | | 1,939,198,947 | |
| | | | | | | | | | | | | | | | | | | | | | | |
| | 6,765,242,575 | | | | 6,278,441,053 | | | | 17,609,533,198 | | | | 17,001,879,315 | | | | 1,939,198,947 | | | | — | |
| $ | 9,746,839,356 | | | $ | 6,765,242,575 | | | $ | 25,742,486,638 | | | $ | 17,609,533,198 | | | $ | 2,950,575,912 | | | $ | 1,939,198,947 | |
| | | | | | | | | | | | | | | | | | | | | | | |
| | 76,480,118 | | | | 80,097,942 | | | | 184,198,653 | | | | 139,256,546 | | | | 107,298,194 | | | | 195,093,897 | |
| | 8,231,926 | | | | 10,245,843 | | | | 8,975,776 | | | | 30,745,405 | | | | 3,903,038 | | | | — | |
| | (30,034,973 | ) | | | (63,865,971 | ) | | | (67,417,537 | ) | | | (149,768,926 | ) | | | (14,731,903 | ) | | | (884,140 | ) |
| | 54,677,071 | | | | 26,477,814 | | | | 125,756,892 | | | | 20,233,025 | | | | 96,469,329 | | | | 194,209,757 | |
See Notes to Financial Statements.
| Old Westbury Funds, Inc. | |
| Statements of Changes in Net Assets - (Continued) | |
| | |
| | | FIXED INCOME FUND |
| | | FOR THE YEAR
ENDED
OCTOBER 31, 2021 | | FOR THE YEAR
ENDED
OCTOBER 31, 2020 |
| FROM OPERATIONS: | | | | | | | | |
| Net investment income | | $ | 15,622,972 | | | $ | 22,001,592 | |
| Net realized gain on investments | | | 7,726,587 | | | | 42,920,519 | |
| Net change in unrealized appreciation/(depreciation) on investments | | | (44,298,763 | ) | | | 13,941,459 | |
| Net increase/(decrease) in net assets resulting from operations | | | (20,949,204 | ) | | | 78,863,570 | |
| | | | | | | | | |
| DISTRIBUTIONS TO SHAREHOLDERS FROM: | | | | | | | | |
| Net investment income and net realized gains | | | (60,499,108 | ) | | | (27,441,587 | ) |
| Total distributions to shareholders | | | (60,499,108 | ) | | | (27,441,587 | ) |
| | | | | | | | | |
| CAPITAL STOCK TRANSACTIONS (DOLLARS): | | | | | | | | |
| Proceeds from sale of capital stock | | | 284,962,485 | | | | 388,948,214 | |
| Reinvestment of distributions | | | 40,178,581 | | | | 16,254,462 | |
| Value of capital stock redeemed | | | (344,087,217 | ) | | | (280,356,378 | ) |
| Net increase/(decrease) in net assets resulting from capital stock transactions | | | (18,946,151 | ) | | | 124,846,298 | |
| Net increase/(decrease) in net assets | | | (100,394,463 | ) | | | 176,268,281 | |
| | | | | | | | | |
| NET ASSETS: | | | | | | | | |
| Beginning of year | | | 1,669,085,810 | | | | 1,492,817,529 | |
| End of year | | $ | 1,568,691,347 | | | $ | 1,669,085,810 | |
| | | | | | | | | |
| CAPITAL SHARE TRANSACTIONS: | | | | | | | | |
| Shares sold | | | 24,942,340 | | | | 33,141,790 | |
| Shares issued as reinvestment of distributions | | | 3,490,875 | | | | 1,391,381 | |
| Shares redeemed | | | (30,154,113 | ) | | | (23,950,896 | ) |
| Net increase/(decrease) in shares outstanding | | | (1,720,898 | ) | | | 10,582,275 | |
See Notes to Financial Statements.
| Old Westbury Funds, Inc. | |
| Statements of Changes in Net Assets - (Continued) | |
| | |
| MUNICIPAL BOND FUND | | CALIFORNIA MUNICIPAL BOND FUND | | NEW YORK MUNICIPAL BOND FUND |
FOR THE YEAR
ENDED
OCTOBER 31, 2021 | | FOR THE YEAR
ENDED
OCTOBER 31, 2020 | | FOR THE YEAR
ENDED
OCTOBER 31, 2021 | | FOR THE YEAR
ENDED
OCTOBER 31, 2020 | | FOR THE YEAR
ENDED
OCTOBER 31, 2021 | | FOR THE YEAR
ENDED
OCTOBER 31, 2020 |
| | | | | | | | | | | | | | | | | | | | | | | |
| $ | 38,787,139 | | | $ | 47,555,158 | | | $ | 3,831,315 | | | $ | 4,205,556 | | | $ | 5,986,870 | | | $ | 6,179,581 | |
| | 48,932,448 | | | | 29,034,242 | | | | 3,021,716 | | | | 2,818,592 | | | | 2,550,678 | | | | 3,909,922 | |
| | (85,431,146 | ) | | | 49,604,957 | | | | (6,927,094 | ) | | | 4,938,511 | | | | (3,976,825 | ) | | | 3,998,762 | |
| | 2,288,441 | | | | 126,194,357 | | | | (74,063 | ) | | | 11,962,659 | | | | 4,560,723 | | | | 14,088,265 | |
| | | | | | | | | | | | | | | | | | | | | | | |
| | (62,051,485 | ) | | | (47,868,985 | ) | | | (6,793,047 | ) | | | (4,840,879 | ) | | | (9,915,106 | ) | | | (7,571,015 | ) |
| | (62,051,485 | ) | | | (47,868,985 | ) | | | (6,793,047 | ) | | | (4,840,879 | ) | | | (9,915,106 | ) | | | (7,571,015 | ) |
| | | | | | | | | | | | | | | | | | | | | | | |
| | 973,951,398 | | | | 969,547,176 | | | | 65,517,376 | | | | 120,629,965 | | | | 179,396,663 | | | | 171,679,217 | |
| | 22,329,496 | | | | 12,512,019 | | | | 3,422,001 | | | | 2,055,461 | | | | 4,321,762 | | | | 2,870,995 | |
| | (903,910,339 | ) | | | (517,589,369 | ) | | | (116,284,782 | ) | | | (69,000,182 | ) | | | (134,320,233 | ) | | | (97,419,168 | ) |
| | 92,370,555 | | | | 464,469,826 | | | | (47,345,405 | ) | | | 53,685,244 | | | | 49,398,192 | | | | 77,131,044 | |
| | 32,607,511 | | | | 542,795,198 | | | | (54,212,515 | ) | | | 60,807,024 | | | | 44,043,809 | | | | 83,648,294 | |
| | | | | | | | | | | | | | | | | | | | | | | |
| | 4,201,639,176 | | | | 3,658,843,978 | | | | 400,367,458 | | | | 339,560,434 | | | | 582,500,307 | | | | 498,852,013 | |
| $ | 4,234,246,687 | | | $ | 4,201,639,176 | | | $ | 346,154,943 | | | $ | 400,367,458 | | | $ | 626,544,116 | | | $ | 582,500,307 | |
| | | | | | | | | | | | | | | | | | | | | | | |
| | 78,706,808 | | | | 77,962,776 | | | | 6,238,869 | | | | 11,522,959 | | | | 17,211,966 | | | | 16,381,052 | |
| | 1,784,997 | | | | 1,010,713 | | | | 324,974 | | | | 197,029 | | | | 409,495 | | | | 274,948 | |
| | (72,615,591 | ) | | | (41,902,780 | ) | | | (11,093,932 | ) | | | (6,593,752 | ) | | | (12,753,669 | ) | | | (9,346,387 | ) |
| | 7,876,214 | | | | 37,070,709 | | | | (4,530,089 | ) | | | 5,126,236 | | | | 4,867,792 | | | | 7,309,613 | |
See Notes to Financial Statements.
| Old Westbury Funds, Inc. | |
| All Cap Core Fund | |
| Financial Highlights | |
| | |
For a Share Outstanding Throughout Each Year.
| | | YEAR ENDED OCTOBER 31, | |
| | | 2021 | | | 2020 | | | 2019 | | | 2018 | | | 2017 | |
| Net asset value, beginning of year | | $ | 20.18 | | | $ | 18.84 | | | $ | 17.08 | | | $ | 16.50 | | | $ | 13.69 | |
| Investment operations: | | | | | | | | | | | | | | | | | | | | |
| Net investment income/(loss) | | | (0.02 | )(a) | | | 0.02 | (a) | | | 0.09 | (a) | | | 0.07 | (a) | | | 0.10 | (a) |
| Net realized and unrealized gain | | | 7.85 | | | | 3.02 | | | | 2.44 | | | | 0.84 | | | | 2.86 | |
| Total from investment operations | | | 7.83 | | | | 3.04 | | | | 2.53 | | | | 0.91 | | | | 2.96 | |
| Distributions: | | | | | | | | | | | | | | | | | | | | |
| Net investment income | | | (0.01 | ) | | | (0.08 | ) | | | (0.08 | ) | | | (0.09 | ) | | | (0.15 | ) |
| Net realized gains | | | (0.69 | ) | | | (1.62 | ) | | | (0.69 | ) | | | (0.24 | ) | | | — | |
| Total distributions | | | (0.70 | ) | | | (1.70 | ) | | | (0.77 | ) | | | (0.33 | ) | | | (0.15 | ) |
| Net asset value, end of year | | $ | 27.31 | | | $ | 20.18 | | | $ | 18.84 | | | $ | 17.08 | | | $ | 16.50 | |
| Total return | | | 39.8 | % | | | 17.3 | % | | | 15.7 | % | | | 5.6 | % | | | 21.8 | % |
| Annualized ratios/supplemental data: | | | | | | | | | | | | | | | | | | | | |
| Net assets at end of year (000’s) | | $ | 3,648,683 | | | $ | 2,283,906 | | | $ | 1,766,287 | | | $ | 1,839,663 | | | $ | 1,772,368 | |
| Ratio of expenses to average net assets before expense waivers | | | 0.96 | %(b) | | | 0.97 | %(b) | | | 0.98 | %(b) | | | 0.98 | %(b) | | | 0.99 | %(b) |
| Ratio of expenses to average net assets after expense waivers | | | 0.96 | % | | | 0.97 | % | | | 0.98 | % | | | 0.98 | % | | | 0.99 | % |
| Ratio of net investment income/(loss) to average net assets | | | (0.10 | )% | | | 0.10 | % | | | 0.51 | % | | | 0.42 | % | | | 0.67 | % |
| Portfolio turnover rate | | | 30 | % | | | 43 | % | | | 31 | % | | | 38 | % | | | 57 | % |
| (a) | Calculated based on the average shares method for the year. |
| (b) | There were no voluntary fee reductions during the year. |
See Notes to Financial Statements.
| Old Westbury Funds, Inc. | |
| Small & Mid Cap Strategies Fund | |
| Financial Highlights | |
| | |
For a Share Outstanding Throughout Each Year.
| | | YEAR ENDED OCTOBER 31, | |
| | | 2021 | | | 2020 | | | 2019 | | | 2018 | | | 2017 | |
| Net asset value, beginning of year | | $ | 15.57 | | | $ | 15.39 | | | $ | 15.85 | | | $ | 17.49 | | | $ | 15.81 | |
| Investment operations: | | | | | | | | | | | | | | | | | | | | |
| Net investment income/(loss) | | | (0.02 | )(a) | | | 0.03 | (a) | | | 0.09 | (a) | | | 0.08 | (a) | | | 0.10 | (a) |
| Net realized and unrealized gain/(loss) | | | 4.97 | | | | 0.88 | | | | 1.10 | | | | (0.47 | ) | | | 2.54 | |
| Total from investment operations | | | 4.95 | | | | 0.91 | | | | 1.19 | | | | 0.39 | | | | 2.64 | |
| Distributions: | | | | | | | | | | | | | | | | | | | | |
| Net investment income | | | (0.03 | ) | | | (0.09 | ) | | | (0.09 | ) | | | (0.11 | ) | | | (0.09 | ) |
| Net realized gains | | | (0.57 | ) | | | (0.64 | ) | | | (1.56 | ) | | | (1.14 | ) | | | (0.87 | ) |
| Total distributions | | | (0.60 | ) | | | (0.73 | ) | | | (1.65 | ) | | | (1.25 | ) | | | (0.96 | ) |
| Net asset value, end of year | | $ | 19.92 | | | $ | 15.57 | | | $ | 15.39 | | | $ | 15.85 | | | $ | 17.49 | |
| Total return | | | 32.1 | % | | | 5.9 | % | | | 9.4 | % | | | (2.6 | )% | | | 17.6 | % |
| Annualized ratios/supplemental data: | | | | | | | | | | | | | | | | | | | | |
| Net assets at end of year (000’s) | | $ | 9,746,839 | | | $ | 6,765,243 | | | $ | 6,278,441 | | | $ | 6,222,492 | | | $ | 6,562,381 | |
| Ratio of expenses to average net assets before expense waivers | | | 1.14 | %(b) | | | 1.15 | %(b) | | | 1.15 | %(b) | | | 1.15 | %(b) | | | 1.15 | %(b) |
| Ratio of expenses to average net assets after expense waivers | | | 1.10 | % | | | 1.11 | % | | | 1.11 | % | | | 1.11 | % | | | 1.11 | % |
| Ratio of net investment income/(loss) to average net assets | | | (0.10 | )% | | | 0.17 | % | | | 0.58 | % | | | 0.48 | % | | | 0.59 | % |
| Portfolio turnover rate | | | 46 | % | | | 65 | % | | | 52 | % | | | 62 | % | | | 45 | % |
| (a) | Calculated based on the average shares method for the year. |
| (b) | When counterparties post cash collateral with respect to various derivative transactions, the Fund may invest the collateral and receive interest income on the investment and pays interest expense on the collateral to the counterparty. The interest income is included in investment income on the Statements of Operations, and the interest expense is included in the Fund’s overall expenses on the Statements of Operations and expense ratio. |
See Notes to Financial Statements.
| Old Westbury Funds, Inc. | |
| Large Cap Strategies Fund | |
| Financial Highlights | |
| | |
For a Share Outstanding Throughout Each Year.
| | | YEAR ENDED OCTOBER 31, | |
| | | 2021 | | | 2020 | | | 2019 | | | 2018 | | | 2017 | |
| Net asset value, beginning of year | | $ | 15.26 | | | $ | 14.99 | | | $ | 13.87 | | | $ | 14.85 | | | $ | 12.95 | |
| Investment operations: | | | | | | | | | | | | | | | | | | | | |
| Net investment income | | | 0.01 | (a) | | | 0.07 | (a) | | | 0.13 | (a) | | | 0.13 | (a) | | | 0.11 | (a) |
| Net realized and unrealized gain/(loss) | | | 5.08 | | | | 0.94 | | | | 1.58 | | | | (0.26 | ) | | | 2.02 | |
| Total from investment operations | | | 5.09 | | | | 1.01 | | | | 1.71 | | | | (0.13 | ) | | | 2.13 | |
| Distributions: | | | | | | | | | | | | | | | | | | | |
| Net investment income | | | (0.05 | ) | | | (0.12 | ) | | | (0.14 | ) | | | (0.10 | ) | | | (0.10 | ) |
| Net realized gains | | | (0.19 | ) | | | (0.62 | ) | | | (0.45 | ) | | | (0.75 | ) | | | (0.13 | ) |
| Total distributions | | | (0.24 | ) | | | (0.74 | ) | | | (0.59 | ) | | | (0.85 | ) | | | (0.23 | ) |
| Net asset value, end of year | | $ | 20.11 | | | $ | 15.26 | | | $ | 14.99 | | | $ | 13.87 | | | $ | 14.85 | |
| Total return | | | 33.6 | % | | | 7.0 | % | | | 12.9 | % | | | (1.1 | )% | | | 16.7 | % |
| Annualized ratios/supplemental data: | | | | | | | | | | | | | | | | | | | | |
| Net assets at end of year (000’s) | | $ | 25,742,487 | | | $ | 17,609,533 | | | $ | 17,001,879 | | | $ | 16,499,149 | | | $ | 17,243,479 | |
| Ratio of expenses to average net assets before expense waivers | | | 1.09 | %(b)(c) | | | 1.10 | %(b)(c) | | | 1.10 | %(b)(c) | | | 1.11 | %(b)(c) | | | 1.11 | %(b)(c) |
| Ratio of expenses to average net assets after expense waivers | | | 1.09 | % | | | 1.10 | % | | | 1.10 | % | | | 1.11 | % | | | 1.11 | % |
| Ratio of net investment income to average net assets | | | 0.05 | % | | | 0.48 | % | | | 0.93 | % | | | 0.86 | % | | | 0.77 | % |
| Portfolio turnover rate | | | 43 | % | | | 76 | % | | | 73 | % | | | 38 | % | | | 61 | % |
| (a) | Calculated based on the average shares method for the year. |
| (b) | There were no voluntary fee reductions during the year. |
| (c) | When counterparties post cash collateral with respect to various derivative transactions, the Fund may invest the collateral and receive interest income on the investment and pays interest expense on the collateral to the counterparty. The interest income is included in investment income on the Statements of Operations, and the interest expense is included in the Fund’s overall expenses on the Statements of Operations and expense ratio. |
See Notes to Financial Statements.
| Old Westbury Funds, Inc. | |
| Credit Income Fund | |
| Financial Highlights | |
| | |
For a Share Outstanding Throughout the Period.
| | | YEAR
ENDED
OCTOBER
31, 2021 | | | PERIOD
FROM
OCTOBER 1,
2020(a) TO
OCTOBER
31, 2020 | |
| Net asset value, beginning of period | | $ | 9.99 | | | $ | 10.00 | |
| Investment operations: | | | | | | | | |
| Net investment income | | | 0.43 | (b) | | | 0.05 | (b) |
| Net realized and unrealized gain/(loss) | | | 0.15 | | | | (0.06 | ) |
| Total from investment operations | | | 0.58 | | | | (0.01 | ) |
| Distributions: | | | | | | | | |
| Net investment income | | | (0.42 | ) | | | — | |
| Total distributions | | | (0.42 | ) | | | — | |
| Net asset value, end of period | | $ | 10.15 | | | $ | 9.99 | |
| Total return | | | 5.9 | % | | | (0.1 | )%(c) |
| Annualized ratios/supplemental data: | | | | | | | | |
| Net assets at end of period (000’s) | | $ | 2,950,576 | | | $ | 1,939,199 | |
| Ratio of expenses to average net assets before expense waivers | | | 0.87 | %(d) | | | 0.94 | %(d)(e) |
| Ratio of expenses to average net assets after expense waivers | | | 0.85 | % | | | 0.85 | %(e) |
| Ratio of net investment income to average net assets | | | 4.23 | % | | | 5.33 | %(e) |
| Portfolio turnover rate | | | 24 | % | | | 1 | %(c) |
| (a) | Commencement of Investment Operations. |
| (b) | Calculated based on the average shares method for the period. |
| (c) | Not Annualized. |
| (d) | When counterparties post cash collateral with respect to various derivative transactions, the Fund may invest the collateral and receive interest income on the investment and pays interest expense on the collateral to the counterparty. The interest income is included in investment income on the Statements of Operations, and the interest expense is included in the Fund’s overall expenses on the Statements of Operations and expense ratio. |
| (e) | Annualized. |
See Notes to Financial Statements.
| Old Westbury Funds, Inc. | |
| Fixed Income Fund | |
| Financial Highlights | |
| | |
For a Share Outstanding Throughout Each Year.
| | | YEAR ENDED OCTOBER 31, | |
| | | 2021 | | | 2020 | | | 2019 | | | 2018 | | | 2017 | |
| Net asset value, beginning of year | | $ | 11.82 | | | $ | 11.43 | | | $ | 10.75 | | | $ | 11.11 | | | $ | 11.28 | |
| Investment operations: | | | | | | | | | | | | | | | | | | | | |
| Net investment income | | | 0.11 | (a) | | | 0.16 | (a) | | | 0.21 | (a) | | | 0.19 | (a) | | | 0.14 | (a) |
| Net realized and unrealized gain/(loss) | | | (0.25 | ) | | | 0.43 | | | | 0.69 | | | | (0.35 | ) | | | (0.15 | ) |
| Total from investment operations | | | (0.14 | ) | | | 0.59 | | | | 0.90 | | | | (0.16 | ) | | | (0.01 | ) |
| Distributions: | | | | | | | | | | | | | | | | | | | | |
| Net investment income | | | (0.19 | ) | | | (0.20 | ) | | | (0.22 | ) | | | (0.20 | ) | | | (0.16 | ) |
| Net realized gains | | | (0.24 | ) | | | — | | | | — | | | | — | | | | — | |
| Total distributions | | | (0.43 | ) | | | (0.20 | ) | | | (0.22 | ) | | | (0.20 | ) | | | (0.16 | ) |
| Net asset value, end of year | | $ | 11.25 | | | $ | 11.82 | | | $ | 11.43 | | | $ | 10.75 | | | $ | 11.11 | |
| Total return | | | (1.2 | )% | | | 5.2 | % | | | 8.4 | % | | | (1.5 | )% | | | (1.0 | )% |
| Annualized ratios/supplemental data: | | | | | | | | | | | | | | | | | | | | |
| Net assets at end of year (000’s) | | $ | 1,568,691 | | | $ | 1,669,086 | | | $ | 1,492,818 | | | $ | 865,030 | | | $ | 825,545 | |
| Ratio of expenses to average net assets before expense waivers | | | 0.68 | % | | | 0.68 | % | | | 0.70 | % | | | 0.72 | % | | | 0.72 | % |
| Ratio of expenses to average net assets after expense waivers | | | 0.57 | % | | | 0.57 | % | | | 0.57 | % | | | 0.62 | % | | | 0.62 | % |
| Ratio of net investment income to average net assets | | | 0.97 | % | | | 1.39 | % | | | 1.93 | % | | | 1.70 | % | | | 1.28 | % |
| Portfolio turnover rate | | | 58 | % | | | 87 | % | | | 34 | % | | | 49 | % | | | 70 | % |
| (a) | Calculated based on the average shares method for the year. |
See Notes to Financial Statements.
| Old Westbury Funds, Inc. | |
| Municipal Bond Fund | |
| Financial Highlights | |
| | |
For a Share Outstanding Throughout Each Year.
| | | YEAR ENDED OCTOBER 31, | |
| | | 2021 | | | 2020 | | | 2019 | | | 2018 | | | 2017 | |
| Net asset value, beginning of year | | $ | 12.52 | | | $ | 12.26 | | | $ | 11.63 | | | $ | 11.95 | | | $ | 12.09 | |
| Investment operations: | | | | | | | | | | | | | | | | | | | | |
| Net investment income | | | 0.12 | (a) | | | 0.15 | (a) | | | 0.18 | (a) | | | 0.17 | (a) | | | 0.14 | (a) |
| Net realized and unrealized gain/(loss) | | | (0.12 | ) | | | 0.26 | | | | 0.62 | | | | (0.33 | ) | | | (0.08 | ) |
| Total from investment operations | | | 0.00 | | | | 0.41 | | | | 0.80 | | | | (0.16 | ) | | | 0.06 | |
| Distributions: | | | | | | | | | | | | | | | | | | | | |
| Net investment income | | | (0.12 | ) | | | (0.15 | ) | | | (0.17 | ) | | | (0.16 | ) | | | (0.14 | ) |
| Net realized gains | | | (0.07 | ) | | | — | | | | — | | | | — | | | | (0.06 | ) |
| Total distributions | | | (0.19 | ) | | | (0.15 | ) | | | (0.17 | ) | | | (0.16 | ) | | | (0.20 | ) |
| Net asset value, end of year | | $ | 12.33 | | | $ | 12.52 | | | $ | 12.26 | | | $ | 11.63 | | | $ | 11.95 | |
| Total return | | | (0.1 | )% | | | 3.4 | % | | | 6.9 | % | | | (1.4 | )% | | | 0.5 | % |
| Annualized ratios/supplemental data: | | | | | | | | | | | | | | | | | | | | |
| Net assets at end of year (000’s) | | $ | 4,234,247 | | | $ | 4,201,639 | | | $ | 3,658,844 | | | $ | 2,297,532 | | | $ | 2,235,503 | |
| Ratio of expenses to average net assets before expense waivers | | | 0.65 | % | | | 0.65 | % | | | 0.66 | % | | | 0.67 | % | | | 0.67 | % |
| Ratio of expenses to average net assets after expense waivers | | | 0.57 | % | | | 0.57 | % | | | 0.57 | % | | | 0.57 | % | | | 0.57 | % |
| Ratio of net investment income to average net assets | | | 0.93 | % | | | 1.21 | % | | | 1.46 | % | | | 1.41 | % | | | 1.17 | % |
| Portfolio turnover rate | | | 58 | % | | | 40 | % | | | 26 | % | | | 51 | % | | | 31 | % |
| (a) | Calculated based on the average shares method for the year. |
See Notes to Financial Statements.
| Old Westbury Funds, Inc. | |
| California Municipal Bond Fund | |
| Financial Highlights | |
| | |
For a Share Outstanding Throughout Each Period.
| | | YEAR ENDED OCTOBER 31, | | | PERIOD
FROM
DECEMBER
4, 2018(a) TO
OCTOBER | |
| | | 2021 | | | 2020 | | | 31, 2019 | |
| Net asset value, beginning of period | | $ | 10.57 | | | $ | 10.37 | | | $ | 10.00 | |
| Investment operations: | | | | | | | | | | | | |
| Net investment income | | | 0.11 | (b) | | | 0.12 | (b) | | | 0.12 | (b) |
| Net realized and unrealized gain/(loss) | | | (0.11 | ) | | | 0.22 | | | | 0.36 | |
| Total from investment operations | | | 0.00 | | | | 0.34 | | | | 0.48 | |
| Distributions: | | | | | | | | | | | | |
| Net investment income | | | (0.11 | ) | | | (0.12 | ) | | | (0.11 | ) |
| Net realized gains | | | (0.08 | ) | | | (0.02 | ) | | | — | |
| Total distributions | | | (0.19 | ) | | | (0.14 | ) | | | (0.11 | ) |
| Net asset value, end of period | | $ | 10.38 | | | $ | 10.57 | | | $ | 10.37 | |
| Total return | | | (0.1 | )% | | | 3.3 | % | | | 4.8 | %(c) |
| Annualized ratios/supplemental data: | | | | | | | | | | | | |
| Net assets at end of period (000’s) | | $ | 346,155 | | | $ | 400,367 | | | $ | 339,560 | |
| Ratio of expenses to average net assets before expense waivers | | | 0.76 | % | | | 0.76 | % | | | 0.78 | %(d) |
| Ratio of expenses to average net assets after expense waivers | | | 0.57 | % | | | 0.57 | % | | | 0.57 | %(d) |
| Ratio of net investment income to average net assets | | | 1.03 | % | | | 1.13 | % | | | 1.32 | %(d) |
| Portfolio turnover rate | | | 25 | % | | | 26 | % | | | 41 | %(c) |
| (a) | Commencement of Investment Operations. |
| (b) | Calculated based on the average shares method for the period. |
| (c) | Not Annualized. |
| (d) | Annualized. |
See Notes to Financial Statements.
| Old Westbury Funds, Inc. | |
| New York Municipal Bond Fund | |
| Financial Highlights | |
| | |
For a Share Outstanding Throughout Each Period.
| | | YEAR ENDED OCTOBER 31, | | | PERIOD
FROM
DECEMBER
4, 2018(a) TO
OCTOBER | |
| | | 2021 | | | 2020 | | | 31, 2019 | |
| Net asset value, beginning of period | | $ | 10.55 | | | $ | 10.42 | | | $ | 10.00 | |
| Investment operations: | | | | | | | | | | | | |
| Net investment income | | | 0.11 | (b) | | | 0.12 | (b) | | | 0.13 | (b) |
| Net realized and unrealized gain/(loss) | | | (0.05 | ) | | | 0.16 | | | | 0.40 | |
| Total from investment operations | | | 0.06 | | | | 0.28 | | | | 0.53 | |
| Distributions: | | | | | | | | | | | | |
| Net investment income | | | (0.11 | ) | | | (0.12 | ) | | | (0.11 | ) |
| Net realized gains | | | (0.07 | ) | | | (0.03 | ) | | | — | |
| Total distributions | | | (0.18 | ) | | | (0.15 | ) | | | (0.11 | ) |
| Net asset value, end of period | | $ | 10.43 | | | $ | 10.55 | | | $ | 10.42 | |
| Total return | | | 0.6 | % | | | 2.7 | % | | | 5.4 | %(c) |
| Annualized ratios/supplemental data: | | | | | | | | | | | | |
| Net assets at end of period (000’s) | | $ | 626,544 | | | $ | 582,500 | | | $ | 498,852 | |
| Ratio of expenses to average net assets before expense waivers | | | 0.74 | % | | | 0.75 | % | | | 0.77 | %(d) |
| Ratio of expenses to average net assets after expense waivers | | | 0.57 | % | | | 0.57 | % | | | 0.57 | %(d) |
| Ratio of net investment income to average net assets | | | 1.01 | % | | | 1.13 | % | | | 1.42 | %(d) |
| Portfolio turnover rate | | | 23 | % | | | 37 | % | | | 29 | %(c) |
| (a) | Commencement of Investment Operations. |
| (b) | Calculated based on the average shares method for the period. |
| (c) | Not Annualized. |
| (d) | Annualized. |
See Notes to Financial Statements.
| Old Westbury Funds, Inc. | |
| Notes to Financial Statements | |
| | October 31, 2021 |
Old Westbury Funds, Inc. (the “Corporation”) was organized as a Maryland corporation on August 26, 1993 and commenced operations on October 22, 1993. The Corporation is an open-end management investment company registered under the Investment Company Act of 1940, as amended (the “1940 Act”). The Corporation’s Board of Directors (the “Board”) are permitted to create an unlimited number of series, each with one or more separate classes of shares. As of October 31, 2021, the Corporation consisted of eight separate investment portfolios (each series individually referred to as a “Fund” and collectively as the “Funds”) shown below:
| Fund Name | | Investment Objective |
| Old Westbury All Cap Core Fund (“All Cap Core Fund”) | | Long-term capital appreciation. |
| Old Westbury Small & Mid Cap Strategies Fund (“Small & Mid Cap Strategies Fund”) | | Long-term capital appreciation. |
| Old Westbury Large Cap Strategies Fund (“Large Cap Strategies Fund”) | | Long-term capital appreciation. |
| Old Westbury Credit Income Fund (“Credit Income Fund”) | | Income and capital appreciation. |
| Old Westbury Fixed Income Fund (“Fixed Income Fund”) | | Total return (consisting of current income and capital appreciation). |
| Old Westbury Municipal Bond Fund (“Municipal Bond Fund”) | | Total return (consisting of current income that is exempt from regular federal income tax and capital appreciation). |
| Old Westbury California Municipal Bond Fund (“California Municipal Bond Fund”) | | Total return (consisting of current income that is exempt from regular federal and California income tax and capital appreciation). |
| Old Westbury New York Municipal Bond Fund (“New York Municipal Bond Fund”) | | Total return (consisting of current income that is exempt from regular federal and New York income tax and capital appreciation). |
The Corporation has authorized a total of 20.5 billion shares of common stock (par value $0.001 per share).
Under the Corporation’s organizational documents, its Officers and Directors are indemnified against certain liabilities arising out of the performance of their duties for the Corporation. In addition, in the normal course of business, the Corporation enters into contracts with vendors and others that provide for general indemnifications. The Corporation’s maximum exposure under these arrangements is unknown as this would involve future claims that may be made against the Corporation. However, based on experience, the Corporation expects the risk of loss to be remote.
| 2. | Significant Accounting Policies: |
The following is a summary of the significant accounting policies followed by the Corporation in the preparation of its financial statements. The policies are in conformity with accounting principles generally accepted in the U.S. (“GAAP”). The preparation of financial statements in accordance with GAAP requires management to make estimates and assumptions that affect the reported amounts of assets and liabilities at the date of the financial statements and the reported amounts of income and expenses for the period. Actual results could differ from those estimates.
The Financial Accounting Standards Board (“FASB”) Accounting Standards Codification is the exclusive reference of authoritative GAAP recognized by the FASB to be applied by nongovernmental entities. Rules and interpretive releases of the Securities and Exchange Commission (“SEC”) under authority of federal laws are also sources of authoritative GAAP for SEC registrants such as the Corporation.
The Corporation qualifies as an investment company and follows accounting and reporting guidance as defined by the FASB in ASC 946, Financial Services - Investment Companies.
A. Valuation of Investments. Readily marketable equity securities listed on an exchange are valued, except as indicated below, at the last sale price reflected at the close of the regular trading session of the exchange on the business day as of which such value is being determined, and securities listed on NASDAQ are valued at the NASDAQ Official Closing Price (“NOCP”) and, if no NOCP is available, then at the last reported sales price. If there has been no sale on such day, the securities are valued at the mean of the closing bid and asked prices on such day. If no bid or asked prices are quoted on such day, then the securities are valued using a broker-dealer quote or an approved pricing service.
| Old Westbury Funds, Inc. | |
| Notes to Financial Statements - (Continued) | |
| | October 31, 2021 |
Equity securities traded on more than one national securities exchange are valued at the last sale price on the business day as of which such value is being determined as reflected on the tape at the close of the exchange representing the principal market for such securities.
Readily marketable equity securities traded in the over-the-counter market (“OTC”), including listed securities whose primary market is believed by Bessemer Investment Management LLC (“BIM”), or a sub-adviser, as applicable, to be over-the-counter, are valued at the mean of the latest bid and asked prices using a broker-dealer or an approved pricing service.
Shares of open-end investment companies are valued at the latest net asset value (“NAV”) reported by the investment company. Shares of investment companies that are traded intra-day on an exchange, such as exchange traded funds and closed-end funds, will be valued at the last sale price as reflected at the close of the regular trading session of such exchange.
Debt instruments are valued on the basis of prices obtained from a broker-dealer or an approved pricing service.
Foreign securities generally are valued in their national currency at the latest available quoted sale price as of the close of trading on the foreign exchange or other principal market on which the security is traded. In the absence of current trade activity, the securities will be valued at the mean of the latest bid/ask quotations. As described below, this value is then converted into its U.S. dollar equivalent using the daily rate of exchange at the time of a Fund’s NAV calculation (normally 4:00 p.m. Eastern Time).
Forward currency contracts are valued at the mean between the bid and the asked prices. Quotations are available for regularly scheduled settlement dates such as on a 1-,2-,3-,4-,5-,6-,9-, and 12-month basis. Over-the-counter derivatives, such as swaps and non-exchange traded options and futures are valued on the basis of counterparty valuation quotations or dealer quotations, subject to review by BIM, or a sub-adviser with BIM’s oversight where appropriate. An approved pricing service may also be used to price these instruments. Exchange-traded swaps, options and futures contracts and options thereon are valued at their last sale or settlement price as of the close of such exchanges or, if no sales are reported, at the mean between the last reported bid and asked prices. Repurchase agreements are valued at the original cost. Contracts for long puts and calls are valued at the bid price and short puts and calls are valued at the offering price of a broker-dealer or an exchange. Generally, options, rights/warrants and other “when-issued” securities follow the same pricing methods as equity securities.
Securities and other investments for which market quotations are not readily available are valued under the general supervision and responsibility of the Board and pursuant to policies and procedures established by the Board, which are designed to reflect, in good faith, the fair value of such investments. A market quotation is considered not readily available if, among other circumstances, the most recent reported price is deemed unreliable. For example, securities that may be subject to fair valuation include, but are not limited to: (1) securities in which trading has been halted pending further news; (2) illiquid securities in which there is no trading market and no broker coverage; (3) stale priced securities; (4) securities that may have defaulted or de-listed from an exchange and are no longer trading; (5) any other security for which the Funds’ Pricing Committee, with input from the Adviser or sub-advisers, as applicable, believes that the last trading price does not represent a reliable current price; or (6) other investments, including derivatives for which readily available market quotations are not generally available. In addition, a Fund may fair value securities that trade on a foreign exchange because a significant event has occurred after the foreign exchange closes but before the time as of which a Fund’s share price is calculated. Foreign exchanges typically close before the time as of which Fund share prices are calculated, and may be closed altogether on some days a Fund is open. Such significant events affecting a foreign security may include, but are not limited to: (1) those relating to a single issuer; (2) governmental actions that affect securities in one sector or country; (3) natural disasters or armed conflicts affecting a country or region; or (4) significant market fluctuations. There is no single standard for determining the fair value of a security or investment, but, rather, several factors are considered, including an evaluation of the forces that influence the market in which the security or investment is purchased or sold, in determining whether a market price is readily available and, if not, the security’s or other investment’s fair value.
In light of the judgment involved in fair value decisions, there can be no assurances that a fair value assigned to a particular security reflects a price for which a security has traded or will trade. Accordingly, when a Fund uses fair value to price securities, it may value those securities higher or lower than another fund that uses market quotations to price the same securities.
In the event of a change in the S&P 500 Index that is greater than predetermined levels approved by the Board, the Funds will utilize an approved pricing service that has been designated to determine fair value to price securities traded on any overseas exchange. Pricing service vendors base their valuations on a number of factors, including, but not limited to, actual transaction data, benchmark yields, market bids, market offers, quotations from dealers, credit risk spreads, interest rate spreads, proprietary pricing models, cash flows, prepayment information, default rates, delinquency and loss assumptions, collateral characteristics, credit enhancements, specific deal information and other relationships observed in markets of comparable securities. In addition, foreign securities held by a Fund may trade on weekends or other days when the Fund does not calculate NAV. As a result, the market value of these investments may change on days when shares of the Fund cannot be bought or sold. Such fair valuations are categorized as Level 2 in the fair value hierarchy. Foreign securities that are valued based on market quotations are categorized as Level 1 in the fair value hierarchy. The All Cap Core Fund, Small & Mid Cap Strategies Fund, Large Cap Strategies Fund and Credit Income Fund utilized a systematic fair valuation model provided by an independent third-party vendor to fair
| Old Westbury Funds, Inc. | |
| Notes to Financial Statements - (Continued) | |
| | October 31, 2021 |
value certain securities 54 days during the year ended October 31, 2021. As a result on days when the index change exceeds predetermined levels, certain securities held by the Funds were transferred from Level 1 into Level 2. On any subsequent day when such index level is not exceeded, certain securities held by the Funds were transferred from Level 2 back into Level 1. As of October 31, 2021, foreign securities were not fair valued as the change in the S&P 500 Index did not exceed the Funds’ predetermined Level.
The fair value of investments is determined in accordance with the valuation policies and procedures approved by the Board. The Funds’ Pricing Committee established by the Board (the “Pricing Committee”) reviews pricing methodologies on at least a quarterly basis. The Pricing Committee is responsible for (i) establishing valuation processes and (ii) determining the fair value of the Funds’ holdings for which price quotations are not readily available, unreliable or for which an approved valuation method is deemed not to represent fair value. These investments are either categorized as Level 2 or 3 depending on the observability of the inputs used. The Pricing Committee may consider one or more factors in determining an investment’s fair value. The factors to be taken into account, to the extent relevant, typically include, but are not limited to: fundamental analytical data relating to the investment, the nature and duration of any restrictions on disposition of the investments, an evaluation of the forces that influence the market in which the investments are purchased or sold, the type of investment, financial statements and company filings, lack of marketability, the cost at date of purchase, good faith recommendation of BIM or a sub-adviser, as applicable, and any other relevant matters. When the fair valuation of investments use significant unobservable inputs, such investments will be categorized as Level 3 in the fair value hierarchy.
The significant unobservable inputs used in fair value measurement of the Funds’ Level 3 investments may include, where applicable: (i) an estimation of a normalized earnings level or projected cash flows for the company; (ii) the discounts applied to the last available price of the investment or a selection of comparable investments due to the lack of marketability of the investment; (iii) values or bid offers by dealers or other third parties; and (iv) the value associated with the latest round of financing. Significant changes in any of those inputs in isolation may result in a significantly lower or higher fair value measurement. Generally, a change in the assumptions used for the normalized earnings level will be accompanied by a directionally similar change in the discounts applied to the list of comparable investments.
The Funds’ Pricing Committee employs various methods for calibrating the valuation approach related to investments categorized within Level 3 in the fair value hierarchy. These methods may include regular due diligence of the Funds’ pricing vendors including back testing of trigger related fair value prices, a regular review of key inputs and assumptions, reviews of missing and stale prices and price variance analysis, including investigation of unusual or unexpected pricing changes and reviews of any market related activities. Additionally, the pricing of all fair value holdings is subsequently reviewed and approved by the Funds’ Board.
B. Security Transactions and Related Investment Income. Security transactions are accounted for no later than the first NAV calculation on the first business day following the trade date. However, for financial reporting purposes, portfolio securities transactions are reported on trade date. Realized gains and losses on security transactions are determined using the identified cost method for maximum tax benefit to shareholders. Dividend income and other distributions from portfolio securities are recorded on the ex-dividend date, except for certain dividends from foreign securities where the ex-dividend dates may have passed are recorded as soon as the Funds are informed of the dividends. Upon notification from issuers, some of the dividend income received from a real estate investment trust may be re-designated as a reduction of cost of the related investment and/or realized gain. Dividend income is recorded net of foreign taxes withheld where recovery of such taxes is not assured. Interest income is recognized on an accrual basis and includes where applicable, the amortization of premiums and accretion of discounts.
C. Payment-In-Kind Securities. The Funds may invest in payment-in-kind securities (“PIKs”). PIKs give the issuer the option at each interest payment date of making interest payments in either cash or additional debt securities. Those additional debt securities usually have the same terms, including maturity dates and interest rates, and associated risks as the original bonds. The daily market quotations of the original bonds may include the accrued interest (referred to as a dirty price) and require a pro-rata adjustment from the unrealized appreciation or depreciation on investments to interest receivable on the Statements of Assets and Liabilities.
For the year ended October 31, 2021, there were no in-kind payments received by the Funds with respect to PIK securities.
D. Foreign Currency Transactions. The books and records of the Funds are maintained in U.S. dollars. Investments and other assets and liabilities of the Funds denominated in a foreign currency, if any, are translated into U.S. dollars at current exchange rates as of the date of the Statements of Assets and Liabilities. Purchases and sales of securities, income receipts and expense payments are translated into U.S. dollars at the exchange rate on the dates of the transactions.
The Funds do not isolate the portion of operations resulting from changes in foreign exchange rates on investments from fluctuations arising from changes in market prices of securities held. Such fluctuations are included with the net realized and change in unrealized gain/(loss) on investments, futures contracts, swap agreements and foreign currency transactions in the Statements of Operations.
| Old Westbury Funds, Inc. | |
| Notes to Financial Statements - (Continued) | |
| | October 31, 2021 |
Foreign security and currency transactions may involve certain risks not typically associated with those of U.S. companies, including the level of governmental supervision and regulation of foreign securities markets and the possibility of political and economic instability.
E. Securities Sold. The Funds may sell securities short. A short sale is a transaction in which a Fund sells securities it does not own, but has borrowed, in anticipation of a decline in the market price of the securities. A Fund is obligated to replace the borrowed securities at their market price at the time of settlement. A Fund’s obligation to replace the securities borrowed in connection with a short sale will be fully secured by collateral deposited with the broker to the extent required under applicable law and rules. Short sales by a Fund involve certain risks and special considerations.
The Funds may not always be able to close out a short position on favorable terms. Short sales involve the risk that a Fund will incur a loss by subsequently buying a security at a higher price than the price at which it sold the security short. The amount of such loss is theoretically unlimited (since it is limited only by the increase in value of the security sold short by a Fund). In contrast, the risk of loss from a long position is limited to a Fund’s investment in the long position, since its value cannot fall below zero. Short selling is a form of leverage which may lead to higher volatility of a Fund’s NAV or greater losses for a Fund. To mitigate leverage risk, a Fund will always hold liquid assets (including its long positions) at least equal to its short position exposure, marked-to-market daily. The Funds had no short sales outstanding at October 31, 2021.
F. Inflation-Protected Securities. The Funds may invest in inflation-protected securities, which unlike traditional debt securities that make fixed or variable principal and interest payments, are structured to provide protection against the negative effects of inflation. The value of the debt securities’ principal is adjusted to track changes in an official inflation measure. For example, the U.S. Treasury currently uses the Consumer Price Index for Urban Consumers as a measure of inflation for Treasury Inflation-Protected Securities (“TIPS”). Other inflation-protected securities may not carry a similar guarantee by their issuer. A Fund may buy TIPS that are designed to provide an investment vehicle that is not vulnerable to inflation. The interest rate paid by TIPS is fixed. The principal value rises or falls semi-annually based on the changes in the published Consumer Price Index. If inflation occurs, the principal and interest payments on TIPS are adjusted to protect investors from inflationary loss. If deflation occurs, the principal and interest payments will be adjusted downward, although the principal will not fall below its face amount at maturity.
G. When-Issued and Delayed Delivery Securities. The Funds may purchase or sell securities that they are entitled to receive on a when-issued basis. The Funds may also purchase or sell securities on a delayed delivery basis. When-issued and delayed delivery securities involve risk that the security a Fund buys will lose value prior to its delivery. There is also a risk that the security will not be issued or that the other party to the transaction will not meet its obligation. If this occurs, a Fund loses both the investment opportunity for the assets it set aside to pay for the security and any gain in the security’s price.
H. Loan Participations and Assignments. The Credit Income Fund and Fixed Income Fund may invest in fixed or floating rate loans to U.S. companies, foreign entities, and U.S. subsidiaries of foreign entities made by one or more financial institutions. The rate of interest on a fixed-rate loan is generally a set amount. The rate of interest payable on floating rate loans is the sum of a base lending rate plus a specified spread. Base lending rates are generally the London InterBank Offered Rate, the Certificate of Deposit Rate of a designated U.S. bank, the prime rate of a designated U.S. bank, the Federal Funds rate, or another base lending rate used by commercial lenders. The applicable spread may be fixed at time of issuance or may adjust upward or downward to reflect changes in credit quality of the borrower. A Fund may invest in loans that are investment grade, below investment grade (“junk”), or not rated by any nationally recognized statistical ratings organization. Loans that are rated lower than investment grade typically entail default and other risks greater than those associated with higher-rated loans. Generally, the lower the rating category, the riskier the investment. Typically, a Fund’s investments in loans are expected to take the form of loan participations and assignments of portions of loans from third parties.
Currently, the Credit Income Fund intends to invest in loans that are below investment grade and, to a lesser extent, unrated loans. The Credit Income Fund’s investments in loans are expected in most instances to be in the form of assignments. Generally, when a Fund purchases an assignment of a loan from a lender, it will step into the position of the lender and acquire direct rights against the borrower on the loan. Because assignments are arranged through private negotiations between potential assignees and potential assignors, however, the rights and obligations acquired by a Fund as the purchaser of an assignment may differ from, and be more limited than, those held by the assigning lender. The assignability of certain obligations may be restricted by the governing documentation as to the nature of the assignee such that the only way in which a Fund may acquire an interest in a loan is by purchasing a participation of interest and not an assignment. A Fund may have difficulty disposing of assignments and participation interests given these limitations and other factors.
I. Credit Enhancements. Certain obligations held by the Funds have credit enhancement or liquidity features that may, under certain circumstances, provide for repayment of principal and interest on the obligation upon demand date, interest rate reset date or final maturity. These enhancements may include: letters of credit; liquidity guarantees; and third party insurance. The value of the obligations may be affected by changes in credit worthiness of the entities that provide any supporting letters of credit or other credit enhancements. The value of the obligations also will be affected by the exhaustion, termination or expiration of any credit enhancement.
| Old Westbury Funds, Inc. | |
| Notes to Financial Statements - (Continued) | |
| | October 31, 2021 |
J. Restricted and Illiquid Securities. The Funds may purchase securities which are subject to legal or contractual delays, restrictions, and costs on resale. Because of time limitations, the Funds might not be able to dispose of these securities at reasonable prices or at times advantageous to the Funds. Each Fund limits its illiquid investments to not more than 15% of its net assets. Illiquid investments, in general, are those that, because of the absence of a readily available market or due to legal or contractual restrictions on resale, may not reasonably be expected to be sold or disposed of in current market conditions in seven calendar days or less without the sale or disposition significantly changing the market value of the investment.
K. Distributions to Shareholders. Distributions from net investment income, if any, generally are declared and paid quarterly for the Credit Income Fund, Fixed Income Fund, Municipal Bond Fund, California Municipal Bond Fund and New York Municipal Bond Fund and at least annually for the All Cap Core Fund, Small & Mid Cap Strategies Fund and Large Cap Strategies Fund. Distributable net realized capital gains, if any, are declared and distributed at least annually. The amount and timing of dividends and distributions are determined in accordance with federal income tax regulations, which may differ from U.S. GAAP.
L. Expenses. Expenses that are directly related to one of the Funds are charged directly to that Fund on an accrual basis. Other operating expenses of the Corporation are prorated to each Fund on an accrual basis utilizing relative net assets or another reasonable basis.
A. Market and Credit Risk.
In the normal course of business, the Funds invest in securities and enter into transactions where risks exist due to fluctuations in the market (market risk) or failure of the issuer of a security to meet all its obligations (credit risk). The value of securities held by a Fund may decline in response to certain events, including those directly involving the issuers whose securities are owned by the Fund; changes or perceived changes in economic conditions; overall market changes; local, regional or global political, social or economic events or instability, pandemics and epidemics and other conditions; and currency and interest rate and price fluctuations. Exposure to foreign markets through issuers or currencies can involve additional risks relating to market, economic, political, regulatory, geopolitical, or other conditions. In addition, the securities of foreign companies also may be subject to the imposition of economic sanctions or other government restrictions. The risks of foreign investments are increased in emerging markets which may experience hyperinflation and have far lower trading volumes and less liquidity than developed markets. Changes in foreign currency exchange rates can affect the value of a Fund’s portfolio. Depositary receipts are generally subject to the same risks as the foreign securities that they evidence or into which they may be converted. Similar to credit risk, a Fund may be exposed to counterparty risk, or the risk that an entity with which a Fund has unsettled or open transactions may default. Financial assets, which potentially expose a Fund to credit and counterparty risks, consist principally of investments, receivables for securities sold and cash due from brokers. The Funds’ Adviser and sub-advisers, as applicable, review the creditworthiness of counterparties that they believe entail material credit risk in relation to the investment policies of a Fund. The extent of a Fund’s exposure to credit and counterparty risks with respect to these financial assets is generally represented by their values recorded in the Fund’s Statements of Assets and Liabilities.
In an organized attempt to contain and mitigate the effects of the COVID-19 pandemic, governments and businesses world-wide have taken aggressive measures, including businesses canceling dividends to preserve cash, governments closing borders, restricting international and domestic travel, and the imposition of prolonged quarantines of large populations. COVID-19 has resulted in the disruption of and delays in the delivery of health care services and processes, the cancellation of organized events and educational institutions, the disruption of production and supply chains, a decline in consumer demand for certain goods and services, and general concern and uncertainty, all of which have contributed to increased volatility in global markets. The effects of COVID-19 have affected and are likely to continue to affect certain sectors and industries more dramatically than others, and the effects borne by some will negatively affect the value of the issuers in those sectors and industries, which may adversely affect the value of a Fund’s investments in those sectors or industries. COVID-19, and other epidemics and pandemics that may arise in the future, could adversely affect the economies of many nations, the global economy, individual companies and capital markets in ways that cannot be foreseen at the present time. In addition, the impact of infectious diseases in developing or emerging market countries may be greater due to limited health care resources. Political, economic and social stresses caused by COVID-19 also may exacerbate other pre-existing political, social and economic risks in certain countries. The duration of COVID-19 and its effects cannot be determined at this time, but the effects could be present for an extended period of time. It is impossible to predict the effects on the Funds of these or similar events and market conditions in the future. However, it is possible that these or similar events and market conditions could have a significant and adverse effect on the NAV and/or risk profile of a Fund.
In March 2020, the Board of Governors of the Federal Reserve System (the “Fed”) reduced the federal funds rate to at or near zero percent in an effort to stimulate the economy following market turmoil due to the COVID-19 pandemic. It is uncertain for how long the Fed will continue to keep rates near zero. If the Fed raises interest rates, there is a risk that interest rates across the U. S. financial markets will raise suddenly and significantly, thereby exposing fixed income and related markets to heightened volatility and reduced liquidity. Such market events may cause a Fund to experience losses and/or high redemption requests, which may result in increased transactions costs and lower a Fund’s performance.
| Old Westbury Funds, Inc. | |
| Notes to Financial Statements - (Continued) | |
| | October 31, 2021 |
B. Concentration Risk.
California Municipal Bond Fund and New York Municipal Fund invest a substantial amount of their assets in issuers located in a single state. This may subject each Fund to the risk that economic, political or social issues impacting a particular state could have an adverse and disproportionate impact on the income from, or the value or liquidity of, each Fund’s respective portfolios. Investment percentages in specific states or U.S. territories are presented in the Portfolios of Investments.
C. LIBOR Risk.
Many financial instruments, financings or other transactions to which a Fund may be a party use or may use a floating rate based on the London Interbank Offered Rate (“LIBOR”). On March 5, 2021, the United Kingdom’s Financial Conduct Authority and ICE Benchmark Authority formally announced the dates after which the LIBORs will cease publication. Certain LIBORs (e.g., all euro and Swiss franc LIBOR settings, the Spot Next/Overnight, 1 week, 2 month and 12 month Japanese yen and Great British pound LIBOR settings, and the 1 week and 2 months U.S. dollar LIBOR settings) will cease publication after December 31, 2021. However, the publication of certain other LIBORs (e.g., the overnight, 1 month, 3 month, 6 month, and 12 months U.S. dollar LIBOR settings) will continue through at least June 30, 2023. The future publication and strike utilization of LIBOR, and the nature of any replacement rate, is uncertain. Therefore, the potential effect of a transition away from LIBOR on a Fund or the financial instruments in which a Fund invests cannot yet be determined.
In March 2020, the FASB issued guidance providing optional temporary financial reporting relief from the effect of certain types of contract modifications due to the planned discontinuation of the LIBOR or other interbank-offered based reference rates as of the end of December 2021. Management continues to evaluate the impact of the guidance and may apply other elections, as applicable, as the expected market transition to alternative reference rates evolves.
D. Shareholder Concentration Risk.
As of October 31, 2021, the following Funds had omnibus accounts which each owned more than 5% of a Fund’s outstanding shares as shown below:
| | | | # of Omnibus Accounts | | | % of Fund |
| All Cap Core Fund | | | | 1 | | | | 99.06 | % |
| Small & Mid Cap Strategies Fund | | | | 1 | | | | 98.09 | % |
| Large Cap Strategies Fund | | | | 1 | | | | 98.42 | % |
| Credit Income Fund | | | | 1 | | | | 99.02 | % |
| Fixed Income Fund | | | | 1 | | | | 99.66 | % |
| Municipal Bond Fund | | | | 1 | | | | 98.97 | % |
| California Municipal Bond Fund | | | | 1 | | | | 99.20 | % |
| New York Municipal Bond Fund | | | | 1 | | | | 99.92 | % |
| 4. | Fair Value Measurements: |
The inputs and valuation techniques used to measure fair value of the Funds’ investments are summarized into three levels as described in the hierarchy below:
• Level 1 - quoted prices generally in active markets for identical securities.
• Level 2 - other significant observable inputs (including quoted prices for similar securities, interest rates, prepayment speeds, credit ratings, etc.).
• Level 3 - significant unobservable inputs (including the Funds’ own assumptions in determining the fair value of investments).
The inputs or methodology used for valuing securities are not necessarily an indication of the risk associated with investing in those securities.
| Old Westbury Funds, Inc. | |
| Notes to Financial Statements - (Continued) | |
| | October 31, 2021 |
The summary of inputs used to value the Funds’ investments as of October 31, 2021 is as follows:
| | | | Level 1
Quoted Prices | | | Level 2
Significant
Observable
Inputs | | | Level 3
Significant
Unobservable
Inputs(a) | | | Total | |
| All Cap Core Fund | | | | | | | | | | | | | | | | | |
| Equity Securities | | | $ | 3,547,838,594(b) | | | $ | — | | | $ | — | | | $ | 3,547,838,594 | |
| Exchange-Traded Funds | | | | 15,783,340 | | | | — | | | | — | | | | 15,783,340 | |
| Investment Company | | | | 84,879,834 | | | | — | | | | — | | | | 84,879,834 | |
| Total | | | $ | 3,648,501,768 | | | $ | — | | | $ | — | | | $ | 3,648,501,768 | |
| | | | | | | | | | | | | | | | | | |
| Small & Mid Cap Strategies Fund | | | | | | | | | | | | | | | | | |
| Equity Securities | | | | | | | | | | | | | | | | | |
| Argentina | | | $ | 35,765,152 | | | $ | — | | | $ | — | | | $ | 35,765,152 | |
| Australia | | | | 149,662,502 | | | | — | | | | — | | | | 149,662,502 | |
| Austria | | | | 6,375,784 | | | | — | | | | — | | | | 6,375,784 | |
| Belgium | | | | 23,242,701 | | | | — | | | | — | | | | 23,242,701 | |
| Bermuda | | | | 35,630,547 | | | | — | | | | — | | | | 35,630,547 | |
| Brazil | | | | 31,553,245 | | | | — | | | | — | | | | 31,553,245 | |
| Canada | | | | 273,062,227 | | | | — | | | | — | | | | 273,062,227 | |
| China | | | | 274,180,733 | | | | 26,670,819 | | | | — | | | | 300,851,552 | |
| Costa Rica | | | | 4,269,761 | | | | — | | | | — | | | | 4,269,761 | |
| Denmark | | | | 147,659,244 | | | | — | | | | — | | | | 147,659,244 | |
| Finland | | | | 70,278,725 | | | | — | | | | — | | | | 70,278,725 | |
| France | | | | 76,392,621 | | | | — | | | | — | | | | 76,392,621 | |
| Germany | | | | 147,511,047 | | | | — | | | | — | | | | 147,511,047 | |
| Greece | | | | 13,508,469 | | | | — | | | | — | | | | 13,508,469 | |
| Hong Kong | | | | 48,112,024 | | | | — | | | | — | | | | 48,112,024 | |
| Iceland | | | | 7,974,934 | | | | — | | | | — | | | | 7,974,934 | |
| India | | | | 73,360,130 | | | | — | | | | — | | | | 73,360,130 | |
| Indonesia | | | | 2,358,584 | | | | — | | | | — | | | | 2,358,584 | |
| Ireland | | | | 18,147,440 | | | | — | | | | — | | | | 18,147,440 | |
| Israel | | | | 286,847,034 | | | | — | | | | — | | | | 286,847,034 | |
| Italy | | | | 46,468,790 | | | | — | | | | — | | | | 46,468,790 | |
| Japan | | | | 597,997,534 | | | | — | | | | — | | | | 597,997,534 | |
| Jersey Channel Islands | | | | 32,263,701 | | | | — | | | | — | | | | 32,263,701 | |
| Netherlands | | | | 131,122,309 | | | | — | | | | — | | | | 131,122,309 | |
| New Zealand | | | | 51,003,512 | | | | — | | | | — | | | | 51,003,512 | |
| Norway | | | | 7,805,659 | | | | — | | | | — | | | | 7,805,659 | |
| Peru | | | | 5,082,600 | | | | — | | | | — | | | | 5,082,600 | |
| Poland | | | | 18,794,210 | | | | — | | | | — | | | | 18,794,210 | |
| Portugal | | | | 1,329,666 | | | | — | | | | — | | | | 1,329,666 | |
| Russia | | | | 78,832,766 | | | | — | | | | — | | | | 78,832,766 | |
| Singapore | | | | 8,307,042 | | | | — | | | | 4,289 | | | | 8,311,331 | |
| South Africa | | | | 17,606,334 | | | | — | | | | — | | | | 17,606,334 | |
| South Korea | | | | 87,692,425 | | | | — | | | | — | | | | 87,692,425 | |
| Spain | | | | 27,319,746 | | | | — | | | | — | | | | 27,319,746 | |
| Sweden | | | | 153,489,609 | | | | — | | | | — | | | | 153,489,609 | |
| Switzerland | | | | 235,612,171 | | | | — | | | | — | | | | 235,612,171 | |
| Taiwan | | | | 77,407,326 | | | | — | | | | — | | | | 77,407,326 | |
| Thailand | | | | 16,938,432 | | | | 26,321,061 | | | | — | | | | 43,259,493 | |
| Turkey | | | | 51,011,207 | | | | — | | | | — | | | | 51,011,207 | |
| United Kingdom | | | | 597,630,706 | | | | — | | | | 0 | | | | 597,630,706 | |
| United States | | | | 4,230,084,871 | | | | — | | | | — | | | | 4,230,084,871 | |
| Vietnam | | | | 2,320,358 | | | | — | | | | — | | | | 2,320,358 | |
| Total Equity Securities | | | $ | 8,202,013,878 | | | $ | 52,991,880 | | | $ | 4,289 | | | $ | 8,255,010,047 | |
| Old Westbury Funds, Inc. | |
| Notes to Financial Statements - (Continued) | |
| | October 31, 2021 |
| | | | Level 1
Quoted Prices | | | Level 2
Significant
Observable
Inputs | | | Level 3
Significant
Unobservable
Inputs(a) | | | Total | |
| Rights/Warrants | | | | | | | | | | | | | | | | | |
| Thailand | | | $ | 645,322 | | | $ | — | | | $ | — | | | $ | 645,322 | |
| United States | | | | — | | | | — | | | | 0 | | | | 0 | |
| Total Rights/Warrants | | | $ | 645,322 | | | $ | — | | | $ | 0 | | | $ | 645,322 | |
| Exchange-Traded Funds | | | | 1,155,475,780 | | | | — | | | | — | | | | 1,155,475,780 | |
| Investment Company | | | | 17,388,439 | | | | — | | | | — | | | | 17,388,439 | |
| Cash Sweep | | | | 305,673,113 | | | | — | | | | — | | | | 305,673,113 | |
| Total | | | $ | 9,681,196,532 | | | $ | 52,991,880 | | | $ | 4,289 | | | $ | 9,734,192,701 | |
| | | | | | | | | | | | | | | | | | |
| Large Cap Strategies Fund | | | | | | | | | | | | | | | | | |
| Equity Securities | | | $ | 22,954,620,313(b) | | | $ | 80,088,287(b)(c) | | | $ | 465,948(b) | | | $ | 23,035,174,548 | |
| Exchange-Traded Funds | | | | 2,238,263,960 | | | | — | | | | — | | | | 2,238,263,960 | |
| Investment Company | | | | 506,048,905 | | | | — | | | | — | | | | 506,048,905 | |
| Cash Sweep | | | | 6,737,107 | | | | — | | | | — | | | | 6,737,107 | |
| Total | | | $ | 25,705,670,285 | | | $ | 80,088,287 | | | $ | 465,948 | | | $ | 25,786,224,520 | |
| | | | | | | | | | | | | | | | | | |
| Credit Income Fund | | | | | | | | | | | | | | | | | |
| Preferred Stocks | | | $ | 6,546,123(b) | | | $ | — | | | $ | — | | | $ | 6,546,123 | |
| Exchange-Traded Funds | | | | 533,313,189 | | | | — | | | | — | | | | 533,313,189 | |
| Bank Loans | | | | — | | | | — | | | | 4,382,766(b) | | | | 4,382,766 | |
| Corporate Bonds | | | | — | | | | 287,355,305(b) | | | | — | | | | 287,355,305 | |
| Asset-Backed Securities | | | | — | | | | 544,903,185(b) | | | | 25,609,023(b) | | | | 570,512,208 | |
| Non-Agency Mortgage-Backed Securities | | | | — | | | | 426,028,398(b) | | | | 47,511,012(b) | | | | 473,539,410 | |
| U.S. Government Sponsored Agency Mortgage-Backed Securities | | | | — | | | | 46,547,533(b) | | | | — | | | | 46,547,533 | |
| U.S. Government Securities | | | | — | | | | 633,473,448 | | | | — | | | | 633,473,448 | |
| Cash Sweep | | | | 395,197,227 | | | | — | | | | — | | | | 395,197,227 | |
| | | | | | | | | | | | | | | | | | |
| Other financial instruments - Liabilities Interest Rate Risk | | | | — | | | | (2,491,585)(b) | | | | — | | | | (2,491,585) | |
| Total | | | $ | 935,056,539 | | | $ | 1,935,816,284 | | | $ | 77,502,801 | | | $ | 2,948,375,624 | |
| | | | | | | | | | | | | | | | | | |
| Fixed Income Fund | | | | | | | | | | | | | | | | | |
| Municipal Bonds | | | $ | — | | | $ | 11,187,857(b) | | | $ | — | | | $ | 11,187,857 | |
| Corporate Bonds | | | | — | | | | 555,661,183(b) | | | | — | | | | 555,661,183 | |
| Asset-Backed Securities | | | | — | | | | 101,713,272(b) | | | | — | | | | 101,713,272 | |
| Non-Agency Mortgage-Backed Securities | | | | — | | | | 611,642(b) | | | | — | | | | 611,642 | |
| U.S. Government Agencies | | | | — | | | | 192,344 | | | | — | | | | 192,344 | |
| U.S. Government Securities | | | | — | | | | 875,603,088 | | | | — | | | | 875,603,088 | |
| Investment Company | | | | 18,309,659 | | | | — | | | | — | | | | 18,309,659 | |
| Total | | | $ | 18,309,659 | | | $ | 1,544,969,386 | | | $ | — | | | $ | 1,563,279,045 | |
| | | | | | | | | | | | | | | | | | |
| Municipal Bond Fund | | | | | | | | | | | | | | | | | |
| Municipal Bonds | | | $ | — | | | $ | 3,824,911,121(b) | | | $ | — | | | $ | 3,824,911,121 | |
| Corporate Bonds | | | | — | | | | 61,943,330(b) | | | | — | | | | 61,943,330 | |
| U.S. Government Securities | | | | — | | | | 84,342,448 | | | | — | | | | 84,342,448 | |
| Investment Company | | | | 402,891,766 | | | | — | | | | — | | | | 402,891,766 | |
| Total | | | $ | 402,891,766 | | | $ | 3,971,196,899 | | | $ | — | | | $ | 4,374,088,665 | |
| | | | | | | | | | | | | | | | | | |
| California Municipal Bond Fund | | | | | | | | | | | | | | | | | |
| Municipal Bonds | | | $ | — | | | $ | 323,465,890(b) | | | $ | — | | | $ | 323,465,890 | |
| Corporate Bonds | | | | — | | | | 2,171,032(b) | | | | — | | | | 2,171,032 | |
| Old Westbury Funds, Inc. | |
| Notes to Financial Statements - (Continued) | |
| | October 31, 2021 |
| | | | Level 1
Quoted Prices | | | Level 2
Significant
Observable
Inputs | | | Level 3
Significant
Unobservable
Inputs(a) | | | Total | |
| Investment Company | | | $ | 16,446,457 | | | $ | — | | | $ | — | | | $ | 16,446,457 | |
| Total | | | $ | 16,446,457 | | | $ | 325,636,922 | | | $ | — | | | $ | 342,083,379 | |
| | | | | | | | | | | | | | | | | | |
| New York Municipal Bond Fund | | | | | | | | | | | | | | | | | |
| Municipal Bonds | | | $ | — | | | $ | 577,401,202(b) | | | $ | — | | | $ | 577,401,202 | |
| Corporate Bonds | | | | — | | | | 4,874,047(b) | | | | — | | | | 4,874,047 | |
| Investment Company | | | | 37,412,126 | | | | — | | | | — | | | | 37,412,126 | |
| Total | | | $ | 37,412,126 | | | $ | 582,275,249 | | | $ | — | | | $ | 619,687,375 | |
| (a) | The Small & Mid Cap Strategies Fund and the Large Cap Strategies Fund held certain investments categorized as Level 3 that had a combined fair value less than 1% of NAV for the respective Fund for the year ended October 31, 2021. For the Small & Mid Cap Strategies Fund there were transfers out of Level 3 in the amount of $4,196,513. For the Large Cap Strategies Fund there were transfers into Level 3 in the amount of $274,494. In addition, with the exception of the Credit Income Fund, there were no significant purchases and sales during the period. As of October 31, 2021, the fair value of Level 3 assets as a percentage of NAV was 0.00%, 0.00% and 2.63% for the Small & Mid Cap Strategies Fund, the Large Cap Strategies Fund and the Credit Income Fund, respectively. The Funds’ instrument types classified as Level 3 investments are valued using recent transaction price or broker quotes. |
| (b) | The classification of the Fund’s investments into major categories or countries is disclosed in the respective Fund’s Portfolio of Investments and in Note 5 for derivatives. |
| (c) | Represents securities as disclosed in the Thailand section of the Fund’s Portfolio of Investments. |
During the year ended October 31, 2021, the Funds recognized no material transfers to/from Level 1 or Level 2. The Fund’s policy is to recognize transfers to/from Level 1, Level 2 and Level 3 at the end of the year utilizing fair value at the beginning of the year.
The following is a rollforward of Level 3 investments:
| | | Credit Income
Fund |
| Balance as of 10/31/2020 (value) | | $ | 79,593,851 | |
| Net accrued discounts (premiums) | | | (188,833 | ) |
| Realized gain | | | 3,646,107 | |
| Unrealized gain | | | 178,635 | |
| Purchases | | | 46,205,618 | |
| Sales (paydowns) | | | (32,503,748 | ) |
| Transfer in | | | 2,271,726 | |
| Transfer out | | | (21,700,555 | ) |
| Balance as of 10/31/2021 (value) | | $ | 77,502,801 | |
| Net change in unrealized appreciation on investments still held at October 31, 2021 | | $ | 2,027,973 | |
| 5. | Derivative Instruments: |
The Funds engage in various portfolio investment strategies utilizing derivatives both to increase the return of the Funds and/or to economically hedge, or protect, their exposure to, for example, interest rate movements, movements in the securities or commodities markets and currency value fluctuations. Derivatives are subject to a number of risks, including changes in the market price of the underlying securities, credit risk with respect to the counterparty to the derivative instruments and the risk of loss due to changes in interest rates. The use of certain derivatives may also have a leveraging effect, which may increase the Fund’s sensitivity to adverse market movements and may exaggerate a loss. Losses may arise if the value of the contract decreases due to, among other potentially adverse events, an unfavorable change in the price of the underlying security or commodity or if the counterparty does not perform under the contract. The use of derivatives can lead to losses because of relatively small adverse movements in the price or value of the underlying security, asset, index or reference rate, which may be magnified by or potentially unlimited as a result of certain features of the derivatives.
The primary difference in risks associated with over-the-counter contracts and exchange-traded contracts is credit and liquidity risks. Over-the-counter contracts, as bilateral arrangements, contain credit risk from various counterparties for any unrealized gains for the duration of the contract. The credit risk related to exchange-traded contracts is minimal because the exchanges are viewed as presenting lower credit risk
| Old Westbury Funds, Inc. | |
| Notes to Financial Statements - (Continued) | |
| | October 31, 2021 |
than bilateral counterparties. The Funds may mitigate counterparty risk on derivatives through master netting agreements included within an International Swaps and Derivatives Association, Inc. (“ISDA”) Master Agreement between a Fund and each of its counterparties. The ISDA Master Agreement allows each Fund to offset with its counterparty certain derivative financial instruments’ payables and/or receivables with collateral held with each counterparty. The amount of collateral moved to/from applicable counterparties is based upon minimum transfer amounts of up to $250,000. To the extent amounts due to the Funds from their counterparties are not fully collateralized contractually or otherwise, the Funds bear the risk of loss from counterparty non-performance.
The Funds’ maximum risk of loss from counterparty credit risk on over-the-counter derivatives is generally the aggregate net unrealized gain in excess of any collateral pledged by the counterparty to the Funds. For over-the-counter purchased options, the Funds bear the risk of loss in the amount of the premiums paid and positive change in market value of the options should the counterparty not perform under the contracts. Written options by the Funds do not give rise to counterparty credit risk, as written options obligate the Funds to perform and not the counterparty. Certain ISDA Master Agreements allow counterparties to over-the-counter derivatives to terminate or require full collateralization of derivative contracts prior to maturity in the event a Fund’s net assets decline by a stated percentage or a Fund fails to meet the terms of its ISDA Master Agreements, which would cause the Funds to post additional collateral or accelerate payment of any net liability owed to the counterparty. There were no trigger events during the year ended October 31, 2021.
Cash collateral that has been pledged to cover obligations of a Fund and cash collateral received from the counterparty, if any, is reported separately on the Statements of Assets and Liabilities as due from brokers for collateral and payable to brokers for collateral, respectively. Non-cash collateral pledged by the Fund, if any, is noted in the Portfolio of Investments.
When counterparties post cash collateral with respect to various derivative transactions, a Fund may invest the collateral and receives interest income on the investment and pays interest expense on the collateral to the counterparty. The interest income is included in investment income on the Statements of Operations, and the interest expense is included in a Fund’s overall expenses on the Statements of Operations and expense ratio in the Financial Highlights.
As of October 31, 2021, the Funds had transactions subject to enforceable master netting arrangements (“MNA”). For reporting purposes, the Funds do not offset derivative assets and derivative liabilities that are subject to netting arrangements or another similar arrangement in the Statements of Assets and Liabilities. A reconciliation of the gross amounts on the Statements of Assets and Liabilities to the net amounts by counterparty, including any collateral exposure, is included in the following tables:
| Credit Income Fund | | | | | | | | | | | | | | | |
| Counterparty | | Gross
Amounts of
Liabilities
Presented
in the
Statement
of Assets and
Liabilities | | Derivatives
Available
for Offset (a) | | Non-cash
Collateral
Pledged (b) | | Cash
Collateral
Pledged (b) | | Net
Amount of
Derivative
Liabilities (c) |
| | | | | | | | | | | |
| Barclays Bank Plc | | $ | 2,491,585 | | | $ | — | | $ | — | | $ | (2,491,585 | ) | | $ | — |
| | | | | | | | | | | | | | | | | | | | | |
| (a) | The amount of derivatives available for offset is limited to the amount of assets and/or liabilities that are subject to a MNA or another similar arrangement. |
| (b) | Excess of collateral received from/payable to the individual counterparty is not shown for financial reporting purposes. |
| (c) | Net amount represents the net amount receivable from/payable to counterparty in the event of default. |
| Old Westbury Funds, Inc. | |
| Notes to Financial Statements - (Continued) | |
| | October 31, 2021 |
The Funds may be subject to, among other risks, interest rate risk, equity price risk, commodity risk and foreign currency exchange risk in the normal course of pursuing their investment objectives by investing in various derivative financial instruments, as described below.
For open derivative instruments, please see the respective Fund’s Portfolio of Investments or details below:
| | | Fair Values of Derivative Instruments as of October 31, 2021 |
| | | Derivative Assets | | Derivative Liabilities | |
| | | | | | |
| Credit Income Fund | | Statements of Assets
and Liabilities
Location | | Value | | | Statements of Assets
and Liabilities
Location | | Value | |
| Interest Rate Risk | | Unrealized appreciation on swap agreements | | $ | — | | | Unrealized depreciation on swap agreements | | $ | 2,491,585 | |
| | | | |
| | | The Effect of Derivative Instruments on the Statements of Operations
For the Year Ended October 31, 2021
Net Realized Gain/(Loss) from Derivatives Recognized in Income | |
| | | | |
| Credit Income Fund | | Purchased
Options
and
Structured
Options
(Investments) | | | Written
Options
and
Structured
Options | | | Futures
Contracts | | | Swap
Agreements | | | Foreign
Currency
Exchange
Contracts | | | Total | |
| Interest Rate Risk | | $ | — | | | $ | — | | | $ | (18,120) | | | $ | (2,252,755) | | | $ | — | | | $ | (2,270,875) | |
| | | | |
| | | Net Change in Unrealized Appreciation/(Depreciation)
on Derivatives Recognized in Income | |
| | | | |
| Credit Income Fund | | Purchased
Options
and
Structured
Options
(Investments) | | | Written
Options
and
Structured
Options | | | Futures
Contracts | | | Swap
Agreements | | | Foreign Currency
Exchange
Contracts | | | Total | |
| Interest Rate Risk | | $ | — | | | $ | — | | | $ | — | | | $ | (2,264,937) | | | $ | — | | | $ | (2,264,937) | |
For the year ended October 31, 2021, the quarterly average volume of derivative activities were as follows:
| | | Credit Income Fund | |
| Total Return Swaps (Notional Amount in U.S. Dollars) | | $ | 315,000,000 | |
A. Futures Contracts. The Funds may purchase and write (sell) futures contracts and options on futures contracts to gain exposure to, or hedge against, changes in the value of equity securities (equity risk), interest rates (interest rate risk) or commodity risk.
Futures contracts are agreements pursuant to which two parties agree to take or make delivery of an amount of cash equal to the difference between the value of the contract at the close of the last trading day and the price at which the contract was originally written. Upon entering into a futures contract, the Funds are required to pledge to a futures commission merchant an amount of cash, U.S. government securities, or other assets, equal to a certain percentage of the contract amount. This is known as the initial margin deposit. Subsequent payments, known as variation margin, are made or received by the Funds each day, depending on the daily fluctuations in fair value of the underlying instrument.
| Old Westbury Funds, Inc. | |
| Notes to Financial Statements - (Continued) | |
| | October 31, 2021 |
The Funds recognize an unrealized gain or loss equal to the variation margin. These futures contracts permit the Funds to meet their objectives at a lower cost than investing directly in the underlying instruments or commodities, while permitting the equivalent of an investment in a portfolio of the underlying instruments or commodities. A potential risk to the Funds is that the change in value of the underlying securities or commodities may not correlate to the change in value of the contracts. Listed futures contracts involve minimal counterparty risk since futures contracts are guaranteed against default by the exchange on which they trade and exchanges are viewed as presenting lower credit risk than bilateral counterparties.
B. Forward Foreign Currency Exchange Contracts. The Funds (except Municipal Bond Fund, California Municipal Bond and New York Municipal Bond) may enter into forward foreign currency contracts (“Forward”) to hedge their exposure to changes in foreign currency exchange rates on foreign portfolio holdings (foreign currency exchange risk). In addition, certain Funds may use a Forward to provide exposure to the foreign currency market. A Forward is an agreement between two parties to purchase or sell a foreign currency at a future date at a negotiated forward rate. A Forward is marked-to-market daily and the change in market value is recorded by the Funds as unrealized appreciation or depreciation until the contract settlement date. The market value of the Forward is determined using the forward rate for the remainder of the outstanding period of the contract, through the delivery date. When a Forward is closed or settled, the Funds record a realized gain or loss equal to the fluctuation in rates during the period a Forward was open. Risks may arise upon entering into these contracts from, for example, the potential inability of the counterparties to meet the terms of their contracts, or if the foreign currency rates change unfavorably.
In the event of default by the counterparty to the transaction, the Funds’ maximum amount of loss, as either the buyer or seller, is the unrealized gain on the contract.
The Funds may be required to pledge to the broker an amount of cash, U.S. government securities or other assets, equal to a certain percentage of the contract amount.
C. Swap Agreements. The Funds may enter into swap agreements, which are agreements involving two parties to exchange the return generated by a security, currency, commodity, interest rate, index, or other measures for the return generated by another instrument, for example, the agreement to pay interest in exchange for a market-linked return based on a notional amount. The Funds entered into total return, interest rate and other swap agreements. Interest rate swap agreements generally involve the agreement by the Funds to pay a counterparty a fixed or floating rate on a fixed notional amount and to receive a fixed or floating rate on a fixed notional amount, but may also involve the agreement to pay or receive payments derived from changes in interest rates. Periodic payments are generally made during the life of the swap agreement according to the terms and conditions of the agreement and at termination or maturity. Total return swap agreements involve the commitments to pay or receive an amount generally determined by reference to a security, index or other measure in exchange for a specific market linked return, based on notional amounts. To the extent that the total return of the security, index or other measure underlying the transaction exceeds or falls short of the offsetting interest rate-based obligation, the Funds receive or make a payment to the counterparty. Payments received or made by a Fund at the expiration or other termination of the swap agreements are recorded in the Statements of Operations as realized gains or losses, respectively. Swap agreements are marked-to-market daily based on counterparty valuation quotations, and changes in value, including the periodic amounts of interest to be paid or received on swaps, are recorded as unrealized appreciation/(depreciation). Risks may exceed amounts recognized on the Statements of Assets and Liabilities. These risks include changes in the returns of the underlying instruments, failure of the counterparties to perform under the contracts’ terms and the possible lack of liquidity with respect to the swap agreements. Details of swap agreements open at period end are included in the Portfolios of Investments under the caption “Swap Agreements”.
D. Options. The Funds may purchase and write (sell) put and call options on equity securities and stock index futures in order to gain exposure to or to protect against changes in the market.
Options on swaps (swaptions) are similar to options on securities except that instead of selling or purchasing the right to buy or sell a security, the writer or purchaser of the swaption is granting or buying the right to enter into a previously agreed upon swap agreement at any time before the expiration of the option.
A call option gives the purchaser of the option the right (but not the obligation) to buy, and obligates the seller to sell (when the option is exercised), the underlying instrument at the exercise price at any time or at a specified time during the option period. A put option gives the holder the right to sell and obligates the writer to buy the underlying instrument at the exercise price at any time or at a specified time during the option period. When a Fund purchases (writes) an option, an amount equal to the premium paid (received) by a Fund is reflected as an asset (liability). The amount of the asset (liability) is subsequently marked-to-market to reflect the current market value of the option purchased (written). When an instrument is purchased or sold through an exercise of an option, the related premium paid (or received) is added to (or deducted from) the basis of the instrument acquired or deducted from (or added to) the proceeds of the instrument sold. When an option expires (or a Fund enters into a closing transaction), a Fund realizes a gain or loss on the option to the extent of the premiums received or paid (or gain or loss to the extent the cost of the closing transaction exceeds the premium received or paid). When a Fund writes a call option, such option is “covered,” meaning that a Fund holds the underlying instrument subject to being called by the option counterparty, or cash
| Old Westbury Funds, Inc. | |
| Notes to Financial Statements - (Continued) | |
| | October 31, 2021 |
in an amount sufficient to cover the obligation. When a Fund writes a put option, such option is covered by cash in an amount sufficient to cover the obligation.
In purchasing and writing options, a Fund bears certain risks, including the market risk of an unfavorable change in the price of the underlying instrument or the risk that a Fund may not be able to enter into a closing transaction due to an illiquid market. Exercise of a written option could result in a Fund purchasing or selling a security at a price different from the current market value.
A Fund may execute transactions in both listed and over-the-counter options. Listed options involve minimal counterparty risk since listed options are guaranteed against default by the exchange on which they trade and exchanges are viewed as presenting lower credit risk than bilateral counterparties. Transactions in certain over-the-counter options may expose a Fund to the risk of default by the counterparty to the transaction. In the event of default by the counterparty to the over-the-counter option transaction, a Fund’s maximum amount of loss is the premium paid and unrealized gain (as purchaser) or the unrealized gain of the contract less the premium received (as writer).
The Credit Income Fund may invest in structured options to increase or decrease its exposure to an underlying index or group of securities (equity risk) or to increase or decrease its exposure to changes in foreign currency exchange rates (foreign currency exchange risk). These structured options may consist of single or multiple OTC options which are priced as a single security. Structured options may only be exercised at the expiration date, but may be transferred/sold prior to the expiration date. The value of a structured option may either increase or decrease with the underlying index or group of securities, depending on the combination of options used. Structured options are issued in units whereby each unit represents a structure based on a specific index with an initial reference strike price. Generally, the basis of the contracts is the premium received or paid which is recorded as an asset on the Statements of Assets and Liabilities. The amount of the asset is subsequently market-to-market to reflect the current market value of the structured option. When a structured option is transferred/sold or exercised, the Fund will record a realized gain or loss equal to the difference between the proceeds from (or cost of) the closing transaction and the Fund’s basis in the contract, if any. One type of structure involves the combination of selling a put while buying a call on a specific index. This option would rise in value as the underlying index increases and fall in value as the underlying index decreases. Alternatively, another structure involves the sale of a call and the purchase of a put. This option structure would rise in value as the underlying index decreases and fall in value as the underlying index increases. Upon the exercise of the structured option, the Fund will receive a payment from, or be required to remit a payment to the counterparty, depending on the value of the underlying index at exercise.
| 6. | Investment Advisory Fee, Administration Fee and Other Transactions: |
A. Investment Advisory Fees. The Funds’ investment adviser is BIM, a wholly-owned subsidiary of Bessemer Trust Company, N.A. (“Bessemer”). Bessemer is a subsidiary of The Bessemer Group, Incorporated (“BGI”). The investment advisory fee paid to BIM for advisory services is computed daily and paid monthly in accordance with the following schedule:
| | | First $500 million of
average net assets | | Next $500 million
to $1 billion of
average net assets | | Average net assets
exceeding $1 billion | | Blended
Advisory Rate |
| All Cap Core Fund | | | 0.75 | % | | | 0.70 | % | | | 0.65 | % | | | 0.68 | % |
| Credit Income Fund | | | 0.65 | % | | | 0.60 | % | | | 0.55 | % | | | 0.58 | % |
| Fixed Income Fund | | | 0.45 | % | | | 0.40 | % | | | 0.35 | % | | | 0.40 | % |
| Municipal Bond Fund | | | 0.45 | % | | | 0.40 | % | | | 0.35 | % | | | 0.37 | % |
| California Municipal Bond Fund | | | 0.45 | % | | | 0.40 | % | | | 0.35 | % | | | 0.45 | % |
| New York Municipal Bond Fund | | | 0.45 | % | | | 0.40 | % | | | 0.35 | % | | | 0.44 | % |
| | | | | | | | | | | | | | | | | |
| | | Average net assets |
| Small & Mid Cap Strategies Fund | | | 0.85 | % |
| | | | | |
| | | First $1.25 billion of
average net assets | | Next $1.25 billion
to $2.5 billion of
average net assets | | Average net assets
exceeding $2.5
billion | | Blended
Advisory Rate |
| Large Cap Strategies Fund | | | 0.90 | % | | | 0.85 | % | | | 0.80 | % | | | 0.81 | % |
BIM has retained Acadian Asset Management, LLC (“Acadian”), Artisan Partners Limited Partnership (“Artisan”), Baillie Gifford Overseas Limited (“Baillie Gifford”), Champlain Investment Partners, LLC (“Champlain”), and Polunin Capital Partners Limited (“Polunin”) as sub-advisers to each manage segments of the Small & Mid Cap Strategies Fund. Acadian, Artisan, Baillie Gifford, Champlain, and Polunin are paid for their services directly by BIM.
| Old Westbury Funds, Inc. | |
| Notes to Financial Statements - (Continued) | |
| | October 31, 2021 |
BIM has retained Baillie Gifford and Sands Capital Management, LLC (“Sands”) as sub-advisers to each manage a segment of the Large Cap Strategies Fund. Baillie Gifford and Sands are paid for their services directly by BIM. Harding Loevner LP (“Harding Loevner”) previously served as sub-adviser to the fund and was terminated effective June 30, 2021, and Baillie Gifford was added as sub-adviser to Large Cap Strategies Fund, effective June 24, 2021.
BIM has retained BlackRock Financial Management, Inc. (“BlackRock”) and Muzinich & Co., Inc. (“Muzinich”) as sub-advisers to each manage a segment of the Credit Income Fund. BlackRock and Muzinich are paid for their services directly by BIM.
B. Administration, Fund Accounting, Transfer Agent and Underwriting Fees. The Corporation, on behalf of each Fund, has entered into an administrative oversight, supervision and coordination services agreement (the “Administrative Agreement”) with Bessemer, pursuant to which Bessemer and Bessemer Trust Company (“BTCO”), an affiliate of BIM, provide certain non- advisory services to the Funds, such as the maintenance of records, the provision of supervisory personnel and the monitoring of the other non-advisory service providers. Under the Administrative Agreement, each Fund pays an annual fee of 0.03% of its average daily net assets for such services. The Bank of New York Mellon (“BNY Mellon”) and BNY Mellon Investment Servicing (US) Inc. act as administrator and fund accounting agent and transfer agent, respectively, for the Funds pursuant to an Administration and Accounting Services Agreement and a Transfer Agency Services Agreement, respectively. Certain Officers of the Funds are also employees of BNY Mellon.
The Corporation entered into an Underwriting Agreement with Foreside Funds Distributors LLC for the limited purpose of acting as statutory underwriter to facilitate the registration and distribution of shares of the Funds.
C. Distribution and Shareholder Servicing Fees. The Funds have adopted a shareholder servicing plan (the “Shareholder Servicing Plan”) with Bessemer, pursuant to which Bessemer serves as a shareholder servicing agent and provides certain shareholder support services. Bessemer may engage shareholder sub-servicing agents, such as broker/dealers, banks, trust companies, investment advisers, and other financial institutions and intermediaries to provide certain shareholder support services and is solely responsible for paying each such shareholder sub-servicing agent from the fee it receives from each of the Funds. Each Fund pays for shareholder support services an annual fee of 0.20% of its average daily net assets. The shareholder servicing fee commitment arrangements may be changed or terminated at any time with the approval of the Board. Bessemer, however, does not have the ability to recapture fees currently being waived at a later date.
D. Custody Fees. The All Cap Core Fund, Fixed Income Fund, Municipal Bond Fund, California Municipal Bond Fund, and New York Municipal Bond Fund have each retained BTCO, a wholly-owned subsidiary of BGI, to serve as their custodian, and the Small & Mid Cap Strategies Fund and the Large Cap Strategies Fund each has retained BTCO to serve as their co-custodian. Pursuant to the Funds’ Custody Agreements, BTCO is responsible for maintaining the custody of these Funds’ securities and cash. BTCO serves as custodian for the Small & Mid Cap Strategies Fund only with respect to equity securities of U.S. companies (other than exchange-traded funds) and securities in the form of depositary receipts directly managed by BIM, income, other payments and distributions issued with respect to such securities, proceeds of the sale of such securities, and cash, cash equivalents and money market instruments received and held by BTCO from time to time on behalf of the Small & Mid Cap Strategies Fund. BTCO also serves as custodian for the Large Cap Strategies Fund except for assets managed by Baillie Gifford. For providing these services, BTCO receives a fee calculated and paid monthly at the annual rate of 0.065% of the average daily net assets of the non-U.S. investments for All Cap Core Fund and Large Cap Strategies Fund and 0.015% of the average daily net assets of each of the Fixed Income Fund, Municipal Bond Fund, California Municipal Bond Fund, and New York Municipal Bond Fund or portion thereof for the Small & Mid Cap Strategies Fund and U.S. investments for All Cap Core Fund and Large Cap Strategies Fund. The Credit Income Fund has retained Citibank, N.A. (“Citibank”) to serve as its custodian and the Small & Mid Cap Strategies Fund and Large Cap Strategies Fund have retained Citibank to serve as its co-custodian. Citibank is responsible for maintaining the custody of these Funds’ securities and cash, assets of the Small & Mid Cap Strategies Fund managed by the sub-advisers, and assets of the Large Cap Strategies Fund managed by Baillie Gifford. For providing these services, Citibank receives a fee from each Fund calculated daily and paid monthly based on safekeeping and transaction fees that vary by country.
E. Fee Waivers. BIM may voluntarily waive a portion of its advisory fee to limit the Funds’ total expenses. BIM may terminate this voluntary waiver at any time. BIM, however, does not have the ability to recapture fees currently being waived at a later date. BIM has contractually committed through October 31, 2024 to waive its advisory fees to the extent necessary to maintain the net operating expense ratios, excluding fund transaction costs, investment interest expense, dividend expenses associated with securities sold short and acquired fund fees and expenses, if any, of the Large Cap Strategies Fund at 1.10%, the Small & Mid Cap Strategies Fund at 1.10%, the Credit Income Fund at 0.85%, the Fixed Income Fund at 0.57%, the Municipal Bond Fund at 0.57%, the California Municipal Bond Fund at 0.57% and the New York Municipal Bond Fund at 0.57%. Any waiver amounts are disclosed in the Statements of Operations. For the year ended October 31, 2021, BIM waived $3,417,187 for the Small & Mid Cap Strategies Fund, $384,818 for the Credit Income Fund, $1,756,358 for the Fixed Income Fund, $3,237,188 for the Municipal Bond Fund, $717,605 for the California Municipal Bond Fund and $1,009,694 for the New York Municipal Bond Fund. The contractual advisory fee waivers and the shareholder servicing fee waivers may be changed or terminated at any time with the approval of the Board.
| Old Westbury Funds, Inc. | |
| Notes to Financial Statements - (Continued) | |
| | October 31, 2021 |
F. Board of Directors’ Fees. Effective February 1, 2020, each Director who is not an “interested person” of the Corporation (as that term is defined under the 1940 Act) (each, an “Independent Director”) receives from the Funds a total annual retainer of $240,000, plus $30,000 for serving as Board’s Chairperson and $15,000 as the Audit Committee Chairperson.
Each Independent Director is reimbursed for all out-of-pocket expense relating to attendance at meetings of the board and any Board committee. Directors who are not independent Directors, officers or employees of BIM and BNY Mellon do not receive compensation from the Funds. Fees paid are allocated to the Funds on a pro rata basis based on net assets.
G. Other Transactions. From time to time, the Funds may sell or purchase investments from affiliated funds. The prices of these transactions are based on valuations obtained in accordance with the valuation procedures followed by the Funds, as described in Note 2, applied on a consistent basis. For the year ended October 31, 2021, there were no affiliated transactions except for as described in Note 10.
| 7. | Securities Transactions: |
Investment transactions for the year ended October 31, 2021, excluding short-term debt investments and U.S. Government securities, were as follows:
| | | Purchases | | | Sales | |
| All Cap Core Fund | | $ | 871,940,373 | | | $ | 941,496,852 | |
| Small & Mid Cap Strategies Fund | | | 4,539,825,402 | | | | 3,920,132,977 | |
| Large Cap Strategies Fund | | | 11,342,863,726 | | | | 9,480,879,206 | |
| Credit Income Fund | | | 979,695,929 | | | | 528,918,571 | |
| Fixed Income Fund | | | 390,025,675 | | | | 301,306,756 | |
| Municipal Bond Fund | | | 2,078,812,020 | | | | 2,205,826,677 | |
| California Municipal Bond Fund | | | 84,442,311 | | | | 99,510,651 | |
| New York Municipal Bond Fund | | | 127,769,709 | | | | 119,586,663 | |
Purchase and sales of U.S. Government Securities, excluding those with maturity of one year or less during the year ended October 31, 2021 were as follows:
| | | Purchases | | | Sales | |
| Credit Income Fund | | $ | 359,591,813 | | | $ | 1,396,780 | |
| Fixed Income Fund | | | 522,390,930 | | | | 705,081,946 | |
| Municipal Bond Fund | | | 225,412,109 | | | | 378,692,151 | |
| California Municipal Bond Fund | | | 4,832,031 | | | | 37,593,421 | |
| New York Municipal Bond Fund | | | 4,832,031 | | | | 27,479,473 | |
It is the policy of each Fund to qualify as a regulated investment company by complying with the provisions available to certain investment companies as defined in Subchapter M of the Internal Revenue Code of 1986, as amended (the “Code”), and to make distributions from net investment income and net realized capital gains sufficient to relieve it from all, or substantially all, federal income taxes. Federal income tax regulations differ from accounting principles generally accepted in the U.S.; therefore, distributions determined in accordance with tax regulations may differ in amount or character from net investment income and realized gains for financial reporting purposes. Financial reporting records are adjusted for permanent book/tax differences to reflect tax character within the components of net assets in the Statements of Assets and Liabilities. These permanent differences primarily arise from utilization of earnings and profits on shareholder redemptions. Financial records are not adjusted for temporary differences. Temporary differences primarily arise from the tax treatment of wash sales, passive foreign investment companies, and index options.
| Old Westbury Funds, Inc. | |
| Notes to Financial Statements - (Continued) | |
| | October 31, 2021 |
As of October 31, 2021, the tax cost of investments and the breakdown of unrealized appreciation (depreciation) for each Fund were as follows:
| | | Cost of
Investments
Federal
Income Tax
Purposes | | Gross
Unrealized
Appreciation
on Investments | | Gross
Unrealized
Depreciation
on Investments | | Net
Unrealized
Appreciation
(Depreciation)
on Investments |
| All Cap Core Fund | | $ | 1,988,123,872 | | | $ | 1,666,218,048 | | | $ | (5,840,152 | ) | | $ | 1,660,377,896 | |
| Small & Mid Cap Strategies Fund | | | 7,170,561,042 | | | | 2,892,305,408 | | | | (328,673,749 | ) | | | 2,563,631,659 | |
| Large Cap Strategies Fund | | | 16,876,125,261 | | | | 9,190,406,033 | | | | (280,306,774 | ) | | | 8,910,099,259 | |
| Credit Income Fund | | | 2,925,141,189 | | | | 98,563,801 | | | | (72,837,781 | ) | | | 25,726,020 | |
| Fixed Income Fund | | | 1,567,781,079 | | | | 21,729,941 | | | | (26,231,975 | ) | | | (4,502,034) | |
| Municipal Bond Fund | | | 4,322,349,125 | | | | 70,433,312 | | | | (18,693,772 | ) | | | 51,739,540 | |
| California Municipal Bond Fund | | | 337,181,251 | | | | 6,925,037 | | | | (2,022,909 | ) | | | 4,902,128 | |
| New York Municipal Bond Fund | | | 609,297,993 | | | | 13,200,680 | | | | (2,811,298 | ) | | | 10,389,382 | |
Permanent differences as of October 31, 2021, were as follows:
| | | Total Distributable
Earnings
/(Accumulated Loss) | | Increase/
(Decrease)
Paid-in-Capital |
| All Cap Core Fund | | | $(13,430,589) | | | | $13,430,589 | |
| Small & Mid Cap Strategies Fund | | | (17,735,260) | | | | 17,735,260 | |
| Large Cap Strategies Fund | | | (42,665,729) | | | | 42,665,729 | |
| Fixed Income Fund | | | 2 | | | | (2) | |
The Funds may be subject to taxes imposed by other countries in which they invest. Such taxes are generally based on income earned as well as capital gains and in certain situations, unrealized gains. These taxes are accrued and applied to net investment income, net realized gains and unrealized gains, if applicable, as such income and/or gains are earned.
The tax character of distributions from the Funds during the year ended October 31, 2021 was as follows:
| | | All Cap Core
Fund | | Small & Mid Cap
Strategies Fund | | Large Cap
Strategies Fund | | Credit Income
Fund |
| Distributions paid from: | | | | | | | | | | | | | | | | |
| Ordinary income | | $ | 4,211,963 | | | $ | 11,767,194 | | | $ | 56,977,378 | | | $ | 103,968,936 | |
| Net Long Term Capital Gains | | | 75,037,892 | | | | 244,392,243 | | | | 215,997,423 | | | | — | |
| Total Taxable Distributions | | | 79,249,855 | | | | 256,159,437 | | | | 272,974,801 | | | | 103,968,936 | |
| Tax Exempt Distributions | | | — | | | | — | | | | — | | | | — | |
| Total Distributions Paid | | $ | 79,249,855 | | | $ | 256,159,437 | | | $ | 272,974,801 | | | $ | 103,968,936 | |
| | | | | | | | | | | | | | | | | |
| | | Fixed Income
Fund | | Municipal Bond
Fund | | California
Municipal Bond
Fund | | New York
Municipal Bond
Fund |
| Distributions paid from: | | | | | | | | | | | | | | | | |
| Ordinary income | | $ | 31,873,485 | | | $ | 7,449,778 | | | $ | 1,277,911 | | | $ | 2,468,325 | |
| Net Long Term Capital Gains | | | 28,625,623 | | | | 17,587,348 | | | | 2,207,796 | | | | 1,974,234 | |
| Total Taxable Distributions | | | 60,499,108 | | | | 25,037,126 | | | | 3,485,707 | | | | 4,442,559 | |
| Tax Exempt Distributions | | | — | | | | 37,014,359 | | | | 3,307,340 | | | | 5,472,547 | |
| Total Distributions Paid | | $ | 60,499,108 | | | $ | 62,051,485 | | | $ | 6,793,047 | | | $ | 9,915,106 | |
| Old Westbury Funds, Inc. | |
| Notes to Financial Statements - (Continued) | |
| | October 31, 2021 |
The tax character of distributions from the Funds during the year ended October 31, 2020 was as follows:
| | | All Cap Core
Fund | | Small & Mid Cap
Strategies Fund | | Large Cap
Strategies Fund | | Fixed Income
Fund |
| Distributions paid from: | | | | | | | | | | | | | | | | |
| Ordinary income | | $ | 11,301,833 | | | $ | 33,645,169 | | | $ | 134,614,727 | | | $ | 27,441,587 | |
| Net Long Term Capital Gains | | | 146,728,965 | | | | 260,460,494 | | | | 706,560,019 | | | | — | |
| Total Taxable Distributions | | | 158,030,798 | | | | 294,105,663 | | | | 841,174,746 | | | | 27,441,587 | |
| Tax Exempt Distributions | | | — | | | | — | | | | — | | | | — | |
| Total Distributions Paid | | $ | 158,030,798 | | | $ | 294,105,663 | | | $ | 841,174,746 | | | $ | 27,441,587 | |
| | | | | | | | | | | | | | | | | |
| | | Municipal Bond
Fund | | California
Municipal Bond
Fund | | New York
Municipal Bond
Fund |
| Distributions paid from: | | | | | | | | | | | | |
| Ordinary income | | $ | 4,568,157 | | | $ | 1,330,187 | | | $ | 1,973,466 | |
| Net Long Term Capital Gains | | | — | | | | — | | | | — | |
| Total Taxable Distributions | | | 4,568,157 | | | | 1,330,187 | | | | 1,973,466 | |
| Tax Exempt Distributions | | | 43,300,828 | | | | 3,510,692 | | | | 5,597,549 | |
| Total Distributions Paid | | $ | 47,868,985 | | | $ | 4,840,879 | | | $ | 7,571,015 | |
The difference in classification between the amounts reflected above and the Statements of Changes in Net Assets is primarily due to short-term capital gain distributions.
As of and during the year ended October 31, 2021, the Funds did not have any liabilities for any uncertain tax positions. The Funds recognize interest and penalties, if any, related to unrecognized tax positions as income tax expense in the Statements of Operations. During the year, the Funds did not incur any interest or penalties. The statute of limitation on each Fund’s U.S. federal income tax returns remains open for each of the four years ended October 31, 2021. The statutes of limitations on each Fund’s state and local tax returns may remain open for an additional year depending upon the jurisdiction.
As of October 31, 2021, the components of accumulated earnings/(deficits) on a tax basis were as follows:
| | | All Cap Core
Fund | | Small & Mid Cap
Strategies Fund | | Large Cap
Strategies Fund | | Credit Income
Fund |
| Undistributed Tax Exempt Income | | $ | — | | | $ | — | | | $ | — | | | $ | — | |
| Undistributed ordinary income | | | — | | | | 152,425,521 | | | | 113,091,890 | | | | 8,905,432 | |
| Undistributed long-term capital gains | | | 204,877,634 | | | | 505,593,974 | | | | 1,469,694,227 | | | | — | |
| Accumulated Earnings | | | 204,877,634 | | | | 658,019,495 | | | | 1,582,786,117 | | | | 8,905,432 | |
| Deferred Qualified Late-Year Losses | | | (2,997,986 | ) | | | — | | | | — | | | | — | |
| Capital Loss Carryforwards | | | — | | | | — | | | | — | | | | (348,965 | ) |
| Unrealized Appreciation/(Depreciation) | | | 1,660,377,244 | | | | 2,562,752,201 | | | | 8,872,874,352 | | | | 25,726,020 | |
| Total Accumulated Earnings/(Deficits) | | $ | 1,862,256,892 | | | $ | 3,220,771,696 | | | $ | 10,455,660,469 | | | $ | 34,282,487 | |
| | | | | | | | | | | | | | | | | |
| | | Fixed Income
Fund | | Municipal Bond
Fund | | California
Municipal Bond
Fund | | New York
Municipal Bond
Fund |
| Undistributed Tax Exempt Income | | $ | — | | | $ | 2,632,596 | | | $ | 271,522 | | | $ | 510,708 | |
| Undistributed ordinary income | | | 2,043,013 | | | | — | | | | — | | | | — | |
| Undistributed long-term capital gains | | | 3,460,857 | | | | 48,930,415 | | | | 3,020,754 | | | | 2,549,795 | |
| Accumulated Earnings | | | 5,503,870 | | | | 51,563,011 | | | | 3,292,276 | | | | 3,060,503 | |
| Unrealized Appreciation/(Depreciation) | | | (4,502,034 | ) | | | 51,739,540 | | | | 4,902,128 | | | | 10,389,382 | |
| Total Accumulated Earnings/(Deficits) | | $ | 1,001,836 | | | $ | 103,302,551 | | | $ | 8,194,404 | | | $ | 13,449,885 | |
As of October 31, 2021, the Credit Income Fund utilized $137,877 capital loss carryforward and had a short-term capital loss carryforward of $348,965 available to offset future realized capital gains in accordance with the Regulated Investment Company Modernization Act of 2010. This capital loss carryforward is not subject to expiration and must first be utilized to offset future realized gains of the same character.
| Old Westbury Funds, Inc. | |
| Notes to Financial Statements - (Continued) | |
| | October 31, 2021 |
The capital loss carryforward will reduce the applicable Fund’s taxable income arising from future net realized gains on investments, if any, to the extent permitted by the Code, and thus will reduce the amount of the distributions to shareholders which would otherwise be necessary to relieve the Funds of any liability for federal tax.
Under current tax law, ordinary losses incurred after December 31 of a Fund’s fiscal year may be deferred and treated as occurring on the first business day of the following fiscal year for tax purposes. The Funds had no late year loss deferrals in the current year.
The Credit Income Fund may invest in floating rate loan interests. In connection with these investments, the Credit Income Fund may also enter into bridge loan commitments (“commitments”). Bridge loan commitments may obligate the Credit Income Fund to furnish temporary financing to a borrower until permanent financing can be arranged.
As of October 31, 2021, the Credit Income Fund had no outstanding bridge loan commitments. In connection with these commitments, the Credit Income Fund would earn a commitment fee, typically set as a percentage of the commitment amount. Such fee income, which would be included in interest income in the Statements of Operations, is recognized ratably over the commitment period.
| 10. | Acquisition of Net Assets |
As of close of business on June 25, 2021, pursuant to an Agreement and Plan of Asset Acquisition previously approved by the Board of Directors, certain assets of the Bessemer Trust Company, N.A. Common Trust Fund A (All Cap Core Fund), Bessemer Trust Company All Cap Core Fund A, Bessemer Trust Company Tax-Exempt Securities Special Fund B, Bessemer Trust Company General Municipal Bond Fund C, and Bessemer Trust Company Taxable Fixed Income Fund D (each, a “Selling Fund” and collectively, the “Selling Funds”) were sold to All Cap Core Fund, New York Municipal Bond Fund, Municipal Bond Fund, and Fixed Income Fund (each, a “Purchasing Fund” and collectively, the “Purchasing Funds”) in exchange for shares of the Purchasing Fund (the “Transaction”). The Transaction was a tax-free event for federal income tax purposes. Information with respect to the assets and other relevant data on the effective date of the Transaction are included below:
| Purchasing Fund | | All Cap Core Fund | | New York Municipal
Bond Fund | | Municipal Bond
Fund | | Fixed Income Fund |
| Net assets immediately prior to Transaction | | $2,938,407,680 | | $550,973,814 | | $3,884,104,972 | | $1,528,418,384 |
| Net assets immediately after Transaction | | $3,370,412,202 | | $611,858,981 | | $4,128,555,350 | | $1,574,202,795 |
| Fund shares issued in exchange for Selling Funds | | 17,221,627 | | 5,790,701 | | 19,669,959 | | 4,041,703 |
| | | | | | | | | |
Management has evaluated the impact of all subsequent events on the Funds and has determined that there were no subsequent events requiring recognition or disclosure in the financial statements.
| 12. | Additional Tax Information (Unaudited) |
Qualified Dividend Income (Unaudited)
The Funds designate a portion of the income dividends distributed during the fiscal year ended October 31, 2021, as Qualified Dividend Income (“QDI”) as defined in the Code as follows:
| All Cap Core Fund | 100.00% |
| Small & Mid Cap Strategies Fund | 84.50% |
| Large Cap Strategies Fund | 100.00% |
| Credit Income Fund | 0.19% |
| Old Westbury Funds, Inc. | |
| Notes to Financial Statements - (Continued) | |
| | October 31, 2021 |
Qualified Interest Income (Unaudited)
The Funds designate a portion of the income dividends distributed during the fiscal year ended October 31, 2021, as Qualified Interest Income as defined in the Code as follows:
| Small & Mid Cap Strategies Fund | 0.91% |
| Large Cap Strategies Fund | 0.77% |
| Credit Income Fund | 71.42% |
| Fixed Income Fund | 94.97% |
| Municipal Bond Fund | 6.34% |
| California Municipal Bond Fund | 14.40% |
| New York Municipal Bond Fund | 7.38% |
Qualified Short Term Gain (Unaudited)
The Funds designate a portion of the income dividends distributed during the fiscal year ended October 31, 2021, as Qualified Short-Term Gain as defined in the Code as follows:
| All Cap Core Fund | 100.00% |
| Small & Mid Cap Strategies Fund | 100.00% |
| Large Cap Strategies Fund | 100.00% |
| Fixed Income Fund | 100.00% |
| Municipal Bond Fund | 100.00% |
| California Municipal Bond Fund | 100.00% |
| New York Municipal Bond Fund | 100.00% |
Dividends Received Deduction (Unaudited)
For the fiscal year ended October 31, 2021, the following percentage of income dividends paid by the Funds qualifies for the Dividends Received Deduction available to corporations:
| All Cap Core Fund | 100.00% |
| Small & Mid Cap Strategies Fund | 75.81% |
| Large Cap Strategies Fund | 100.00% |
| Credit Income Fund | 0.15% |
Long Term Capital Gain Dividends (Unaudited)
The Funds designate Long-Term Capital Gain dividends pursuant to Section 852(b)(3) of the Code for the fiscal year ended October 31, 2021 as follows:
| All Cap Core Fund | $75,037,892 |
| Small & Mid Cap Strategies Fund | 257,680,197 |
| Large Cap Strategies Fund | 215,997,423 |
| Fixed Income Fund | 28,625,623 |
| Municipal Bond Fund | 17,587,348 |
| California Municipal Bond Fund | 2,207,796 |
| New York Municipal Bond Fund | 1,974,234 |
| Old Westbury Funds, Inc. | |
| Notes to Financial Statements - (Continued) | |
| | October 31, 2021 |
U.S. Government Income (Unaudited)
The percentages of the ordinary income dividends paid by the Funds during the fiscal year ended October 31, 2021 which were derived from U.S. Treasury securities were as follows:
| Small & Mid Cap Strategies Fund | 0.22% |
| Large Cap Strategies Fund | 0.24% |
| Credit Income Fund | 7.15% |
| Fixed Income Fund | 43.85% |
| Municipal Bond Fund | 3.04% |
| California Municipal Bond Fund | 4.09% |
| New York Municipal Bond Fund | 2.63% |
Tax Exempt Distributions (Unaudited)
The distributions designated as tax exempt dividends paid for the fiscal year ended October 31, 2021 were as follows:
| Municipal Bond Fund | | $ | 37,014,359 | |
| California Municipal Bond Fund | | | 3,307,340 | |
| New York Municipal Bond Fund | | | 5,472,547 | |
| Old Westbury Funds, Inc. | |
| Report of Independent Registered Public Accounting Firm | |
| | October 31, 2021 |
To the Shareholders and the Board of Directors of Old Westbury Funds, Inc.
Opinion on the Financial Statements
We have audited the accompanying statements of assets and liabilities of Old Westbury Funds, Inc. (the “Corporation”) (comprising All Cap Core Fund, Small & Mid Cap Strategies Fund, Large Cap Strategies Fund, Credit Income Fund, Fixed Income Fund, Municipal Bond Fund, California Municipal Bond Fund and New York Municipal Bond Fund (collectively referred to as the “Funds”)), including the portfolios of investments, as of October 31, 2021, and the related statements of operations, and changes in net assets, and the financial highlights for each of the periods indicated in the table below and the related notes (collectively referred to as the “financial statements”). In our opinion, the financial statements present fairly, in all material respects, the financial position of each of the Funds comprising the Corporation at October 31, 2021, the results of their operations, changes in net assets and financial highlights for each of the periods indicated in the table below, in conformity with U.S. generally accepted accounting principles.
Funds comprising
the Corporation | | Statement of
operations | | Statement of changes
in net assets | | Financial
highlights |
All Cap Core Fund
Small & Mid Cap Strategies Fund
Large Cap Strategies Fund
Fixed Income Fund
Municipal Bond Fund | | For the year ended October 31, 2021 | | For each of the two years in the period ended October 31, 2021 | | For each of the five years in the period ended October 31, 2021 |
| Credit Income Fund | | For the year ended October 31, 2021 | | For the year ended October 31, 2021 and the period from October 1, 2020 (commencement of operations) through October 31, 2020 |
California Municipal Bond Fund
New York Municipal Bond Fund | | For the year ended October 31, 2021 | | For each of the two years in the period ended October 31, 2021 | | For each of the two years in the period ended October 31, 2021 and the period from December 4, 2018 (commencement of operations) through October 31, 2019 |
Basis for Opinion
These financial statements are the responsibility of the Corporation’s management. Our responsibility is to express an opinion on each of the Funds’ financial statements based on our audits. We are a public accounting firm registered with the Public Company Accounting Oversight Board (United States) (“PCAOB”) and are required to be independent with respect to the Corporation in accordance with the U.S. federal securities laws and the applicable rules and regulations of the Securities and Exchange Commission and the PCAOB.
We conducted our audits in accordance with the standards of the PCAOB. Those standards require that we plan and perform the audit to obtain reasonable assurance about whether the financial statements are free of material misstatement, whether due to error or fraud. The Corporation is not required to have, nor were we engaged to perform, an audit of the Corporation’s internal control over financial reporting. As part of our audits we are required to obtain an understanding of internal control over financial reporting but not for the purpose of expressing an opinion on the effectiveness of the Corporation’s internal control over financial reporting. Accordingly, we express no such opinion.
Our audits included performing procedures to assess the risks of material misstatement of the financial statements, whether due to error or fraud, and performing procedures that respond to those risks. Such procedures included examining, on a test basis, evidence regarding the amounts and disclosures in the financial statements. Our procedures included confirmation of securities owned as of October 31, 2021, by correspondence with the custodians and brokers or by other appropriate auditing procedures where replies from brokers were not received. Our audits also included evaluating the accounting principles used and significant estimates made by management, as well as evaluating the overall presentation of the financial statements. We believe that our audits provide a reasonable basis for our opinion.
We have served as the Corporation’s auditor since 2006.

New York, New York
December 23, 2021
| Old Westbury Funds, Inc. | |
| Directors and Officers of Old Westbury Funds, Inc. (Unaudited) | |
| | October 31, 2021 |
Independent and Interested Directors. The following table sets forth certain information with respect to the Directors of the Corporation, each of which, under current Board policy, may serve until the end of the calendar year during which he or she reaches the applicable mandatory retirement age established by the Board.
| Name, Address, and Age | | Position(s)
Held with the
Corporation | | Term of
Office and
Length of
Time Served
as a Director
of the
Corporation | | Principal Occupation(s)
During Past 5 Years | | Number of
Portfolios
in Fund
Complex
Overseen by
Director | | Other
Director-
ships1
Held by
Director
During
Past 5
Years |
| | | | | | | | | | | |
| Interested Director | | | | | | | | | | |
| | | | | | | | | | | |
George H. Wilcox2
1271 Avenue of the
Americas
New York, NY 10020
Age: 56 | | Director | | Indefinite term; 3 Years | | President of Bessemer (2013- Present). | | 8 | | 0 |
| | | | | | | | | | | |
| Independent Directors | | | | | | | | | | |
| | | | | | | | | | | |
Alexander Ellis III
1271 Avenue of the
Americas
New York, NY 10020
Age: 72 | | Chairman & Director | | Indefinite term; 9 Years | | General Partner, Rockport Capital Partners (2000-Present); Partner, New Energy Development Co. (2020-Present); Partner, Abnaki Group, LLC (2017-Present). | | 8 | | 13 |
| | | | | | | | | | | |
Patricia L. Francy
1271 Avenue of the
Americas
New York, NY 10020
Age: 76 | | Director | | Indefinite term; 17 Years | | Director, corporate, and foundation boards. | | 8 | | 14 |
| | | | | | | | | | | |
J. David Officer
1271 Avenue of the
Americas
New York, NY 10020
Age: 73 | | Director | | Indefinite term; 9 Years | | Independent Director. | | 8 | | 25 |
| | | | | | | | | | | |
R. Keith Walton
1271 Avenue of the
Americas
New York, NY 10020
Age: 57 | | Director | | Indefinite term; 5 Years | | Managing Director, Lafayette Square Holding (October 2020-Present); Senior Adviser & Venture Partner, Plexo LLC (March 2017-October 2020); Senior Adviser, Vatic Labs LLC (May 2018-July 2019); Executive Vice President and Chief Legal Officer, Zero Mass Water LLC (July 2017-July 2018); and Vice President, Strategy, Arizona State University (2013-July 2017). | | 8 | | 66 |
| Old Westbury Funds, Inc. | |
| Directors and Officers of Old Westbury Funds, Inc. (Unaudited) - (Continued) |
| | October 31, 2021 |
| 1 | Directorships held during the last five years in (1) any other investment companies registered under the 1940 Act, (2) any company with a class of securities registered pursuant to Section 12 of Exchange Act or (3) any company subject to the requirements of Section 15(d) of the Exchange Act. |
| 2 | Directors who are or may be deemed “interested persons” (as defined under the 1940 Act) of the Corporation, BIM (as defined below) or Bessemer (as defined below) are referred to as Interested Directors. Mr. Wilcox is deemed an Interested Director by virtue of his position as President of Bessemer Trust Company, N.A. Mr. Wilcox also serves as Director of Bessemer Trust Company (Cayman) Ltd. and Bessemer Investor Services. |
| 3 | Mr. Ellis has served as Director of Clean Diesel Technologies Inc. |
| 4 | Ms. Francy has served as Director of Siebert Financial Corp. |
| 5 | Mr. Officer serves, or has served, as Director of the following entities: DWS Trackers (formerly DBX ETF Trust) (40); and Ilex Partners (Asia) LLC. |
| 6 | Mr. Walton serves, or has served, as Director of the following entities: Blue Crest Capital Management, LLC Funds; Global Infrastructure Partners; Systematica Investments Limited; Zweig Fund Inc.; Zweig Total Return Fund Inc.; and Virtus Closed-End Funds. |
| Old Westbury Funds, Inc. | |
| Directors and Officers of Old Westbury Funds, Inc. (Unaudited) - (Continued) |
| | October 31, 2021 |
Officers. The table below sets forth certain information with respect to the Officers of the Corporation:
| Name, Address, and Age | | Position(s)
Held with the
Corporation | | Term of Office;
Term Served in
Office | | Principal Occupation(s) During Past 5 Years |
| | | | | | | |
David W. Rossmiller
1271 Avenue of the
Americas
New York, NY 10020
Age: 63 | | President & Chief
Executive Officer | | Indefinite;
9 Years | | Managing Director and Head of Fixed Income, Bessemer Trust Company, N.A. (Since 2010). |
| | | | | | | |
Nicola R. Knight
1271 Avenue of the
Americas
New York, NY 10020
Age: 58 | | Chief Legal Officer;
Assistant Secretary | | Indefinite;
Chief Legal
Officer 1
Year; Assistant
Secretary 12
Years | | Principal and Associate General Counsel of Bessemer Trust Company, N.A. (Since 2007). |
| | | | | | | |
Matthew A. Rizzi
1271 Avenue of the
Americas
New York, NY 10020
Age: 48 | | Vice President & Treasurer | | Indefinite;
7 Years | | Principal and Head of Fund Accounting, Bessemer Trust Company, N.A. (Since 2018); Principal and Head of Trust Accounting and Fees, Bessemer Trust Company, N.A. (2015-2017). |
| | | | | | | |
Ritu Gupta
1271 Avenue of the
Americas
New York, NY 10020
Age: 41 | | Chief Compliance Officer; | | Indefinite;
Since April 21,
2021 | | Principal and Director of Investment Management Compliance, Bessemer Trust Company, N.A. (Since March 2021); Vice President, Brown Brothers Harriman & Co. (2005-2021). |
| | | | | | | |
Hardik B. Patel
1271 Avenue of the
Americas
New York, NY 10020
Age: 39 | | Vice President &
Assistant Treasurer | | Indefinite;
1 Year | | Senior Vice President and Accounting Manager, Bessemer Trust Company, N.A. (Since 2021); Vice President and Accounting Manager, Bessemer Trust Company, N.A. (2017-2020); Associate Vice President and Accounting Manager, Bessemer Trust Company, N.A. (2015-2017). |
| | | | | | | |
David Schwart
801 Brickell Avenue
Suite 2000
Miami, FL 33131-2900
Age: 51 | | Vice President & Anti-
Money Laundering
Compliance Officer | | Indefinite;
6 Years | | Senior Vice President and Senior Bank Compliance Manager, Bessemer Trust Company, N.A. (Since 2019); Vice President and Associate Director of Bank Compliance, Bessemer Trust Company, N.A. (2013-2019). |
| Old Westbury Funds, Inc. | |
| Directors and Officers of Old Westbury Funds, Inc. (Unaudited) - (Continued) |
| | October 31, 2021 |
| Name, Address, and Age | | Position(s)
Held with the
Corporation | | Term of Office;
Term Served in
Office | | Principal Occupation(s) During Past 5 Years |
| | | | | | | |
Marianna DiBenedetto
103 Bellevue Parkway
Wilmington, DE
19809
Age: 55 | | Vice President & Assistant
Treasurer | | Indefinite;
3 Years | | Vice President and Group Manager of Fund Accounting and Administration Client Services, The Bank of New York Mellon (“BNY Mellon”) (Since 2010). |
| | | | | | | |
Jack Jafolla
103 Bellevue Parkway
Wilmington, DE
19809
Age: 51 | | Assistant Treasurer | | Indefinite;
14 Years | | Vice President and Lead Manager of NAV Operations, BNY Mellon (Since 2008). |
| | | | | | | |
Lisa M. King
103 Bellevue Parkway
Wilmington, DE
19809
Age: 53 | | Secretary | | Indefinite;
4 Years | | Vice President and Group Manager, BNY Mellon Regulatory Administration (Since 2017); Vice President and Counsel, BNY Mellon (2016-2017); Counsel, Stradley, Ronon, Stevens & Young LLP (2007-2016). |
| | | | | | | |
William H. Wallace, III
103 Bellevue Parkway
Wilmington, DE
19809
Age: 51 | | Assistant Secretary | | Indefinite;
4 Years | | Secretary of the Corporation (2015-2016); Vice President and Manager, BNY Mellon Regulatory Administration (Since 2010). |
The Statement of Additional Information (“SAI”) includes additional information about the Corporation’s Directors and Officers and is available upon request, without charge. To obtain a copy of the SAI, please call (800) 607-2200.
| Old Westbury Funds, Inc. | |
| Additional Information (Unaudited) |
| | October 31, 2021 |
Information on Proxy Voting:
The Funds’ proxy voting guidelines, used to determine how to vote proxies relating to portfolio securities and information regarding how the Funds voted proxies relating to portfolio securities during the most recent 12-month period ended June 30 is available (i) without charge, upon request, by calling (800) 607-2200; and (ii) on the U.S. Securities and Exchange Commission’s (“SEC”) website at http://www.sec.gov.
Information on Form N-PORT
Each Fund files a complete schedule of its fund holdings for the first and third quarters of its fiscal year with the SEC on Form N-PORT. The Funds’ Forms N-PORT is available on the SEC’s website at http://www.sec.gov. Portfolio holdings information may be obtained upon request and without charge by calling (800) 607-2200.
| Old Westbury Funds, Inc. | |
| Liquidity Risk Management Program (Unaudited) |
| | October 31, 2021 |
The Corporation has adopted a Liquidity Risk Management Program (the “Program”), on behalf of each of its Funds under Rule 22e-4 under the 1940 Act (the “Liquidity Rule”). The Program became effective on June 1, 2019. The Program seeks to assess, manage and review each Fund’s Liquidity Risk. “Liquidity Risk” is defined as the risk that a fund could not meet requests to redeem shares issued by the fund without significant dilution of remaining investors’ interests in the fund. Among other things, the Liquidity Rule requires that a written report be provided to the Board on an annual basis that addresses the operation of the Program and assesses the adequacy and effectiveness of its implementation, including the operation of any Highly Liquidity Investment Minimum (“HLIM”) established for a Fund and any material changes to the Program.
The Board has appointed the Adviser’s Liquidity Risk Committee to be the program administrator for the Program (the “Program Administrator”). On July 21, 2021, the Board of Directors reviewed the annual report (the “Report”) concerning the operation of the Program based on a Fund-by-Fund analysis as of April 30, 2021. The Report addressed the operation of the Program and assessed its adequacy and effectiveness of implementation, including, where applicable, the operation of a Fund’s HLIM. There were no material changes to the Program during the Program Reporting Period.
The Report summarized the operation of the Program and the information and factors considered by the Program Administrator in assessing whether the Program has been adequately and effectively implemented with respect to each Fund. Such information and factors included, among other things: (1) the liquidity risk framework used to assess, manage, and periodically review each Fund’s Liquidity Risk and the results of this assessment; (2) historical data with respect to purchase and redemption requests compared to average cash levels; and (3) whether a Fund invested primarily in “Highly Liquid Investments” (as defined under the Liquidity Rule), whether an HLIM should be established for a Fund (and, for Funds that have adopted an HLIM, whether the HLIM continues to be appropriate or whether a Fund has invested below its HLIM) and the procedures for monitoring for this limit.
Based on this review, the Report concluded that: (1) the Program continues to be reasonably designed to effectively assess and manage each Fund’s Liquidity Risk; and (2) the Program has been adequately and effectively implemented with respect to each Fund during the Program Reporting Period.
| Old Westbury Funds, Inc. | |
| Renewal of Investment Advisory Agreement and Sub-Advisory Agreements (Unaudited) |
| | October 31, 2021 |
At a meeting held on July 21, 2021, the Board of Directors (the “Board” or the “Directors”) of Old Westbury Funds, Inc. (the “Corporation”), including the Directors who are not “interested persons” (as defined under the Investment Company Act of 1940 (the “1940 Act”)) of any party to the agreements defined below (“Independent Directors”), unanimously approved the continuation of the following investment advisory and sub-advisory agreements (collectively, the “Agreements”): (1) an investment advisory agreement between Bessemer Investment Management LLC (“BIM” or the “Adviser”) and the Corporation on behalf of Old Westbury All Cap Core Fund (“All Cap Core Fund”), Old Westbury Large Cap Strategies Fund (“Large Cap Strategies Fund”), Old Westbury Small & Mid Cap Strategies Fund (“Small & Mid Cap Strategies Fund”), Old Westbury Credit Income Fund (“Credit Income Fund”), Old Westbury Fixed Income Fund (“Fixed Income Fund”), Old Westbury Municipal Bond Fund (“Municipal Bond Fund”), Old Westbury California Municipal Bond Fund (“California Municipal Bond Fund”), and Old Westbury New York Municipal Bond Fund (“New York Municipal Bond Fund”) (each, a “Fund” and, collectively, the “Funds”), (2) a sub-advisory agreement among BIM, Artisan Partners Limited Partnership (“Artisan”) and the Corporation on behalf of the Small & Mid Cap Strategies Fund, (3) a sub-advisory agreement among BIM, Champlain Investment Partners, LLC (“Champlain”) and the Corporation on behalf of the Small & Mid Cap Strategies Fund, (4) a sub-advisory agreement among BIM, BlackRock Financial Management, Inc. (“BlackRock”) and the Corporation on behalf of the Credit Income Fund, (5) a sub-advisory agreement among BIM, Sands Capital Management, LLC (“Sands”) and the Corporation on behalf of the Large Cap Strategies Fund, (6) a sub-advisory agreement among BIM, Muzinich & Co, Inc. (“Muzinich”) and the Corporation on behalf of the Credit Income Fund, (7) a sub-advisory agreement among BIM, Baillie Gifford Overseas Limited (“Baillie Gifford”) and the Corporation on behalf of the Small & Mid Cap Strategies Fund, (8) a sub-advisory agreement among BIM, Polunin Capital Partners Limited (“Polunin”) and the Corporation on behalf of the Small & Mid Cap Strategies Fund, and (9) a sub-advisory agreement among BIM, Acadian Asset Management LLC (“Acadian”) and the Corporation on behalf of the Small & Mid Cap Strategies Fund (Polunin, Artisan, Champlain, BlackRock, Sands, Muzinich, Baillie Gifford and Acadian together, the “Sub-Advisers”). At both the meeting of the Board held on July 21, 2021 and the meeting of the Board held on April 21, 2021, the Board had requested and received substantial information regarding the Adviser, each of the Sub-Advisers, and the Agreements, as well as related matters pertaining to the fee rates charged and services provided by affiliated service providers. The Independent Directors also met in person with Counsel to the Independent Directors on May 24, 2021, during which time they conducted a review of substantial information from the Adviser and Sub-Advisers.
The Directors reviewed detailed due diligence questionnaires from BIM and each of the Sub-Advisers, as well as substantial information concerning, among other things, each Fund’s performance, comparative fee and expense information as well as information regarding BIM and each of the Sub-Advisers relating to their respective organizations, compliance and regulatory processes and programs and financial conditions. The Directors also discussed and considered economies of scale and how the Adviser shared those economies with the Funds’ shareholders. The Board received and discussed information concerning BIM’s and each Sub-Adviser’s performance, the use of affiliated brokers to execute transactions, the use of soft dollars, best execution, portfolio manager compensation, and whether there are any other direct or indirect benefits received by the Adviser or the Sub-Advisers in managing the Funds. In addition, the Adviser supplied the Directors with additional information concerning its estimated profitability from managing the Funds. Moreover, the Board had received and considered materials and presentations throughout the course of the year relating to the investment management, performance and operation of the Funds.
The Directors determined that they had received adequate information to make a reasonable determination with respect to the approval of the Agreements. The Board considered information about BIM and the Sub-Advisers, the performance of the Funds and certain additional factors described above and below that it deemed relevant. The following summary details the materials and factors that the Board considered, among others, and the conclusions they reached, in approving the continuance of the Agreements.
(1) The nature, extent and quality of services provided by the Adviser and Sub-Advisers.
The Board considered the scope and quality of services provided by the Adviser and Sub-Advisers, particularly the qualifications, capabilities and experience of the investment, operational, compliance, legal and other personnel who are responsible for providing services to the Funds. The Board also considered the fact that the Adviser and Sub-Advisers pay the costs of all investment and management facilities necessary for the efficient conduct of their respective services. The Board further considered the role and efforts of the Adviser in providing oversight of the various Sub-Advisers for the Funds, including in overseeing the service of, and in monitoring the performance of, each Sub-Adviser, as well as determining the appropriate allocation of assets to Sub-Advisers. The Board also considered the Adviser’s role in making recommendations to the Board regarding retaining or replacing Sub-Advisers where appropriate and in conducting the necessary searches and due diligence of prospective new sub-advisers. In this regard, the Board noted the information that it had received regarding the Adviser’s on-going due diligence with respect to each Sub-Adviser, including the Adviser’s review of, among other things, each Sub-Adviser’s investment process, compliance program and performance. The Board also took into account the various reports it received throughout the year regarding the activities and operation of various oversight and operations groups within the Adviser and its affiliates, such as External Managers Solutions Group, Internal Audit, Cybersecurity and Business Continuity, and Investment Risk Management. The Board also considered the role of the Pricing Committee in the valuation of the Funds’ portfolio instruments, including its role in determining fair values for securities pursuant to the Corporation’s Valuation Policies, as well as its role in selecting and monitoring pricing service providers and, foreign fair value service providers.
| Old Westbury Funds, Inc. | |
| Renewal of Investment Advisory Agreement and Sub-Advisory Agreements (Unaudited) - |
| (Continued) | October 31, 2021 |
In addition, the Board considered that the Adviser manages the overall investment program of the Funds and that the Adviser keeps the Board informed of important developments affecting the Funds, both in connection with the Board’s annual review of the Investment Advisory Agreement and Sub-Advisory Agreements and at each Board meeting. The Board also noted that it received in-person reports from each Sub-Adviser on a rotating schedule. The Board evaluated these factors based on its direct experience with the Adviser, and in consultation with Counsel to the Corporation and Counsel to the Independent Directors, as well as Counsel to the Independent Directors alone. The Board also considered the Adviser’s effectiveness in ensuring that the Funds are in compliance with their respective investment policies and restrictions and the requirements of the 1940 Act and related securities regulations. The Board further noted the Adviser’s and its affiliates’ efforts to oversee the Funds’ other service providers, including those providing administrative, accounting and custodial services.
Based on these factors, as well as other factors discussed herein, the Board concluded that the nature, quality and extent of services provided by the Adviser and Sub-Advisers have been and continue to be satisfactory.
(2) The performance of the Funds and the Adviser and Sub-Advisers.
The Board’s analysis of the Funds’ performance included the discussion and review of the performance data of each of the Funds against securities benchmarks as well as against a competitive group of similar funds, based on, in part, information provided by an independent, third-party mutual fund data provider. The Board considered that for some Funds the investment strategy employed by the Fund was distinct from any securities benchmark and was different than that employed by other funds, making performance comparisons against benchmarks and industry peers less meaningful. The Board reviewed comparative performance over long-, intermediate- and short-term periods. In reviewing performance, the Board generally placed greater emphasis on longer-term performance than on shorter-term performance, taking into account that over short periods of time underperformance may be transitory. The Board also considered the performance of the Funds in the context of whether the Funds were meeting the expectations of Bessemer clients invested in the Funds. In this regard, the Board considered that the Fixed Income Fund, Municipal Bond Fund, New York Municipal Bond Fund and California Municipal Bond Fund were designed as conservative investment products and that clients were most interested in capital preservation when investing in those particular Funds. As a result, the Board determined that the Fixed Income Fund, Municipal Bond Fund, New York Municipal Bond Fund and California Municipal Bond Fund appeared to be meeting their investment objectives even though some Funds may have underperformed their competitive peer groups during certain periods.
The Board considered the performance of the Adviser and each of the Sub-Advisers both against comparative benchmarks as well as against similarly managed accounts, if applicable, managed by the Adviser and Sub-Advisers. When reviewing performance against similarly managed accounts, the Board considered, among other things, differences in the nature of such accounts from a regulatory and tax perspective and differences in the investment mandate from that of the Funds. In evaluating the Funds’ performance, the Board also considered the principal role of the Funds as part of the asset allocation strategy for client accounts maintained by Bessemer and its affiliates.
(3) The cost of the advisory and sub-advisory services and the profits to the Adviser and its affiliates from the relationship with the Funds.
In connection with the Board’s consideration of the level of the advisory and sub-advisory fees, the Board considered a number of factors. The Board’s analysis of each Fund’s advisory fees and expenses included a discussion and review of data concerning the current fee and expense ratios of each Fund compared to a peer group of similar funds and noted that each Fund’s advisory fee and expenses were generally in line with those of their representative group. The Board also noted the applicable advisory fee breakpoints as well as the Adviser’s contractual commitment to waive advisory fees for certain of the Funds. Additionally, the Board considered the Adviser’s profitability. With respect to the Sub-Advisory Agreements with the Sub-Advisers, the Board noted that the Sub-Advisers’ fees were paid entirely by the Adviser so that no additional expenses would be borne by shareholders for the engagement of the Sub-Advisers. The Board noted that Sub-Advisory fee levels were arrived at pursuant to an arms-length negotiation between the Adviser and each Sub-Adviser. The Board also considered fee data from the Sub-Advisers with respect to similarly managed accounts and considered the relevance of differences in the services provided to separate accounts as they relate to differences in the fees charged in connection with the Funds. The Board also took into account the significant costs and risks assumed by the Adviser in connection with launching and maintaining the Funds, including entrepreneurial risks.
Based on this analysis as well as other factors described herein, including the fact that the Funds are intended principally to satisfy asset allocation requirements of client accounts maintained by Bessemer and its affiliates, the Board concluded that the advisory fee schedule for each Fund was fair and reasonable in light of the quality of services provided by the Adviser and Sub-Advisers.
(4) The extent to which economies of scale will be realized as the Funds grow and whether fee levels reflect those economies of scale.
The Board considered the information provided by the Adviser relating to economies of scale. In this regard, the Board noted the current advisory fee breakpoint levels at $500 million and $1 billion with respect to All Cap Core Fund, Fixed Income Fund, California Municipal Bond
| Old Westbury Funds, Inc. | |
| Renewal of Investment Advisory Agreement and Sub-Advisory Agreements (Unaudited) - |
| (Continued) | October 31, 2021 |
Fund, New York Municipal Bond Fund, Municipal Bond Fund and Credit Income Fund, and at $1.25 billion and $2.5 billion for the Large Cap Strategies Fund. The Board also considered the experience of the Adviser in managing the Funds, as well as the Adviser’s profitability analysis. The Board also noted other areas where each Fund may share in economies of scale, including through potential lower fees charged by third-party service providers based on the combined size of the Funds.
(5) Ancillary benefits and other factors.
In addition to the above factors, the Board also discussed other benefits received by the Adviser, the Sub-Advisers and their affiliates from the management of the Funds (such as soft-dollar credits), including the ability to market their advisory services for similar products in the future. In addition, the Board discussed the compensation payable by the Funds to affiliates of the Adviser for other services including administrative services, shareholder servicing and custody. The Board considered comparative information relating to the fees charged for these services and reviewed reports from the Adviser and its affiliates regarding their capabilities and experience in providing these services. The Board also discussed the use of the Funds as asset allocation investment vehicles for clients of Bessemer and its affiliates, with the resulting expectation that the asset sizes of the Funds would grow as Bessemer’s client base grows. The Board concluded that advisory and sub-advisory fees were reasonable in light of these fall-out benefits.
Conclusion
The Board, including all of the Independent Directors, concluded that the fees payable under the Investment Advisory Agreement and Sub-Advisory Agreements were fair and reasonable with respect to the services that the Adviser and each Sub-Adviser provide, in light of the factors described above that the Board deemed relevant. The Board based its decision on an evaluation of all these factors as a whole and did not consider any one factor as all-important or controlling. The Independent Directors were also assisted by the advice of Counsel to the Independent Directors, as well as Counsel to the Corporation, in making this determination.
| Old Westbury Funds, Inc. | |
| Approval of New Sub-Advisory Agreement with Baillie Gifford Overseas Limited (Unaudited) |
| | October 31, 2021 |
At a special meeting held on June 7, 2021, the Board of Directors, including the Independent Directors, unanimously approved a new Sub-Advisory Agreement among BIM, Baillie Gifford Overseas Limited (“Baillie Gifford”), and the Corporation on behalf of the Old West-bury Large Cap Strategies Fund (the “Fund”) (the “Sub-Advisory Agreement”). The Board noted that the fees payable to Baillie Gifford under the Sub-Advisory Agreement would be paid by the Adviser from the advisory fees that it receives from the Fund.
In approving the Sub-Advisory Agreement with Baillie Gifford, the Board considered the overall fairness of the Sub-Advisory Agreement and whether the agreement was in the best interests of the Fund. The Board noted that it had received and reviewed substantial information regarding Baillie Gifford, and the services to be provided by Baillie Gifford to the Fund under the Sub-Advisory Agreement. This information, which included a detailed due diligence questionnaire from Baillie Gifford, as well as information concerning their organization, compliance program and financial condition, formed, in part, the primary (but not exclusive) basis for the Board’s determinations. The Board considered information about BIM and Baillie Gifford, the materials presented in advance of the Meeting, and in conjunction with the Board’s meeting on April 21, 2021, and other information provided by BIM and Baillie Gifford in reports and presentations throughout the year. The Board also noted that the Independent Directors had met in executive session with their Counsel and Counsel to the Corporation and had met with the Adviser to discuss the Adviser’s recommendation regarding Baillie Gifford’s appointment. During the executive session, the Independent Directors reviewed their legal responsibilities in approving the Sub-Advisory Agreement and discussed materials and other information provided to them. The Board concluded that they had received adequate information to make a reasonable determination with respect to the approval of the Sub-Advisory Agreement.
The Board’s conclusions are based on the comprehensive consideration of all information presented to it and are not the result of any single controlling factor.
The following summary details certain of the materials and factors that the Board considered, among others, and the conclusions they reached, in approving the Sub-Advisory Agreement.
(1) The nature, extent and quality of services to be provided by Baillie Gifford.
The Board considered the scope and quality of services to be provided by Baillie Gifford, including the fact that Baillie Gifford pays the costs of all investment and management facilities necessary for the efficient conduct of its services. The Board also considered, among other things, the qualifications and experience of the individual portfolio managers responsible for managing Baillie Gifford’s portion of the Fund. The Board considered that Baillie Gifford serves as sub-adviser to another fund in the Corporation and took into account its history in managing that portfolio as well as its compliance, operational and trading capabilities. The Board also took into account the detailed information that it had reviewed earlier as it relates to Baillie Gifford in connection with its annual review of the Sub-Advisory Agreements for the existing funds in the Corporation. The Board considered the experience and skills of the investment personnel, the resources made available to such personnel and the organizational depth of Baillie Gifford.
Based on these considerations, as well as those discussed below, the Board concluded that the nature, extent and quality of services to be provided by Baillie Gifford were satisfactory.
(2) The performance of Baillie Gifford.
The Board considered the performance data provided by Baillie Gifford with respect to other accounts and determined that Baillie Gifford had demonstrated an ability to appropriately manage assets in the style expected to be used by Baillie Gifford in connection with the Fund.
(3) The cost of the advisory services and comparative fee rates.
The Directors noted that the fee payable to Baillie Gifford under the Sub-Advisory Agreement would be paid entirely by the Adviser. The Directors reviewed the level of the proposed fee against benchmarks and peer comparisons. Based on these considerations, as well as other factors described herein, the Board, including all of the Independent Directors, concluded that Baillie Gifford’s sub-advisory fee was fair and reasonable in light of the quality of services to be provided by Baillie Gifford.
(4) The extent to which economies of scale will be realized as the Fund grows and whether fee levels reflect those economies of scale.
The Board discussed whether any economies of scale would be realized with respect to the management of the Fund and whether the Fund would benefit from any such economies of scale. The Board noted in this regard that BIM would bear Baillie Gifford’s sub-advisory fee and that the sub-advisory fee included breakpoints. The Directors undertook to continue to monitor the appropriateness of the sub-advisory fee, taking into account the potential impact of economies of scale, as the mandate grew.
| Old Westbury Funds, Inc. | |
| Approval of New Sub-Advisory Agreement with Baillie Gifford Overseas Limited (Unaudited) - (Continued) |
| | October 31, 2021 |
(5) Ancillary benefits and other factors.
In addition to the above factors, the Board also discussed whether there were other benefits received by the Adviser, Baillie Gifford, or their affiliates, from Baillie Gifford’s relationship with the Fund. The Board determined to monitor these matters and concluded that the proposed sub-advisory fee was reasonable in light of these fall-out benefits and other factors.
Conclusion
The Board, including all of the Independent Directors, concluded that the fee to be paid to Baillie Gifford under the Sub-Advisory Agreement was fair and reasonable with respect to the services that Baillie Gifford would provide, in light of the factors described above that the Board deemed relevant. The Board based its decision on an evaluation of all these factors as a whole and did not consider any one factor as all-important or controlling. The Independent Directors were also assisted by the advice of Counsel to the Independent Directors, as well as Counsel to the Corporation, in making this determination.
Investment Adviser:
Bessemer Investment Management LLC
1271 Avenue of the Americas
New York, NY 10020
(212) 708-9100
Distributor:
Foreside Funds Distributors LLC
400 Berwyn Park
899 Cassatt Road
Berwyn, PA 19312
Custodians:
Bessemer Trust Company
100 Woodbridge Center Drive
Woodbridge, NJ 07095
Citibank, N.A.
388 Greenwich Street
New York, NY 10013
Administrator:
BNY Mellon Investment Servicing (US) Inc.
103 Bellevue Parkway
Wilmington, DE 19809
Transfer Agent:
BNY Mellon Investment Servicing (US) Inc.
103 Bellevue Parkway
Wilmington, DE 19809
Independent Registered Public
Accounting Firm:
Ernst & Young LLP
One Manhattan West
New York, NY 10001
Mutual funds are not bank deposits or obligations, are not guaranteed by any bank, and are not insured or guaranteed by the U.S. government, the Federal Deposit Insurance Corporation, the Federal Reserve Board, or any other government agency. Investment in mutual funds involves investment risks, including possible loss of principal.
This report is authorized for distribution to prospective investors only when preceded or accompanied by the Funds’ prospectus which contains facts concerning the Funds’ objectives and policies, management fees, expenses and other information.
The information in this report is based on data obtained from recognized services and sources and is believed to be reliable. Any opinions, projections, or recommendations in this report are subject to change without notice and are not intended as individual investment advice. Furthermore, Bessemer Investment Management LLC and its affiliates, as agents for their clients, and any of its officers or employees may have a beneficial interest or position in any of the securities mentioned, which may be contrary to any opinion or projection expressed in this report.
October 31, 2021
Cusip 680414307
Cusip 680414604
Cusip 680414109
Cusip 680414851
Cusip 680414406
Cusip 680414505
Cusip 680414877
Cusip 680414869
(OWF_A21-AR2021)
(10/21)
Item 1. Reports to Stockholders (cont.).
Item 2. Code of Ethics.
| (a) | The registrant, as of the end of the period covered by this report, has adopted a code of ethics that applies to the registrant’s principal executive officer, principal financial officer, principal accounting officer or controller, or persons performing similar functions, regardless of whether these individuals are employed by the registrant or a third party. |
The Code of Ethics for Principal Executive and Principal Financial Officers is attached as an Exhibit under Item 13(a)(1).
| (c) | There have been no amendments, during the period covered by this report, to a provision of the code of ethics that applies to the registrant’s principal executive officer, principal financial officer, principal accounting officer or controller, or persons performing similar functions, regardless of whether these individuals are employed by the registrant or a third party, and that relates to any element of the code of ethics description. |
| (d) | The registrant, during the period covered by this report, has not granted any waivers, including an implicit waiver, from a provision of the code of ethics to the registrant’s principal executive officer, principal financial officer, principal accounting officer or controller, or persons performing similar functions, regardless of whether these individuals are employed by the registrant or a third party, that relates to one or more of the items set forth in paragraph (b) of this item’s instructions. |
Item 3. Audit Committee Financial Expert.
The registrant’s board of directors has determined that the registrant has four audit committee financial experts serving on its audit committee and those persons (Patricia L. Francy, Alexander Ellis III, J. David Officer and R. Keith Walton) are “independent” for purposes of this Item 3 of Form N-CSR.
Item 4. Principal Accountant Fees and Services.
Audit Fees
| (a) | The aggregate fees billed for each of the last two fiscal years for professional services rendered by the principal accountant for the audit of the registrant’s annual financial statements or services that are normally provided by the accountant in connection with statutory and regulatory filings or engagements for those fiscal years were $642,455 in 2021 and $704,463 in 2020. |
Audit-Related Fees
| (b) | The aggregate fees billed in each of the last two fiscal years for assurance and related services by the principal accountant that are reasonably related to the performance of the audit of the registrant’s financial statements and are not reported under paragraph (a) of this Item were $9,300 in 2021 and $9,000 in 2020. Fees for both 2021 and 2020 relate to the review of financial statement data incorporated in the Funds’ periodic N-1A filings. |
Tax Fees
| (c) | The aggregate fees billed in each of the last two fiscal years for professional services rendered by the principal accountant for tax compliance, tax advice, and tax planning were $307,523 in 2021 and $267,766 in 2020. Fees for both 2021 and 2020 relate to the review of federal income and excise tax returns, review of capital gains distribution calculations and certain global tax compliance services. |
All Other Fees
| (d) | The aggregate fees billed in each of the last two fiscal years for products and services provided by the principal accountant, other than the services reported in paragraphs (a) through (c) of this Item were $46,400 in 2021 and $45,400 in 2020. Fees for both 2021 and 2020 relate to the review of holdings for the Funds’ affiliated custodian under Rule 17f-2. |
| (e)(1) | Disclose the audit committee’s pre-approval policies and procedures described in paragraph (c)(7) of Rule 2-01 of Regulation S-X. |
Before an auditor is engaged by the Funds to render audit services, the Audit Committee reviews and approves the engagement, including all related fees. The Audit Committee also reviews and approves in advance, unless excepted under Rule 2-01(c)(7) of Regulation S-X, any proposal that the Funds employ their auditor to render “permissible non-audit services” to the Funds, including all related fees. In addition, the Audit Committee reviews and approves in advance, unless excepted under Rule 2-01(c)(7) of Regulation S-X, any proposal that the Adviser, and any entity controlling, controlled by, or under common control with the Adviser that provides ongoing services to the Funds, employ the Funds’ Auditor to render non-audit services, if such engagement would relate directly to the operations and financial reporting of the Funds. As a part of its review, the Audit Committee considers whether the provision of such services does not impact the Auditor’s independence.
| (e)(2) | The percentage of services described in each of paragraphs (b) through (d) of this Item that were approved by the audit committee pursuant to paragraph (c)(7)(i)(C) of Rule 2-01 of Regulation S-X are as follows: |
(b) 0%
(c) 0%
(d) 0%
| (f) | The percentage of hours expended on the principal accountant’s engagement to audit the registrant’s financial statements for the most recent fiscal year that were attributed to work performed by persons other than the principal accountant’s full-time, permanent employees was less than fifty percent. |
| (g) | The aggregate non-audit fees billed by the registrant’s accountant for services rendered to the registrant, and rendered to the registrant’s investment adviser (not including any sub-adviser whose role is primarily portfolio management and is subcontracted with or overseen by another investment adviser), and any entity controlling, controlled by, or under common control with the adviser that provides ongoing services to the registrant for each of the last two fiscal years of the registrant were $380,953 in 2021 and $360,175 in 2020. |
| (h) | The registrant’s audit committee of the board of directors has considered whether the provision of non-audit services that were rendered to the registrant’s investment adviser (not including any sub-adviser whose role is primarily portfolio management and is subcontracted with or overseen by another investment adviser), and any entity controlling, controlled by, or under common control with the investment adviser that provides ongoing services to the registrant that were not pre-approved pursuant to paragraph (c)(7)(ii) of Rule 2-01 of Regulation S-X is compatible with maintaining the principal accountant’s independence. |
Item 5. Audit Committee of Listed Registrants.
Not applicable.
Item 6. Investments.
| (a) | The Schedule of Investments in securities of unaffiliated issuers as of the close of the reporting period is included as part of the report to shareholders filed under Item 1 of this form. |
Item 7. Disclosure of Proxy Voting Policies and Procedures for Closed-End Management Investment Companies.
Not applicable.
Item 8. Portfolio Managers of Closed-End Management Investment Companies.
Not applicable.
Item 9. Purchases of Equity Securities by Closed-End Management Investment Company and Affiliated Purchasers.
Not applicable.
Item 10. Submission of Matters to a Vote of Security Holders.
There have been no material changes to the procedures by which the shareholders may recommend nominees to the registrant’s board of directors, where those changes were implemented after the registrant last provided disclosure in response to the requirements of Item 407(c)(2)(iv) of Regulation S-K (17 CFR 229.407) (as required by Item 22(b)(15) of Schedule 14A (17 CFR 240.14a-101)), or this Item.
Item 11. Controls and Procedures.
| (a) | The registrant’s principal executive and principal financial officers, or persons performing similar functions, have concluded that the registrant’s disclosure controls and procedures (as defined in Rule 30a-3(c) under the Investment Company Act of 1940, as amended (the “1940 Act”) (17 CFR 270.30a-3(c))) are effective, as of a date within 90 days of the filing date of the report that includes the disclosure required by this paragraph, based on their evaluation of these controls and procedures required by Rule 30a-3(b) under the 1940 Act (17 CFR 270.30a-3(b)) and Rules 13a-15(b) or 15d-15(b) under the Securities Exchange Act of 1934, as amended (17 CFR 240.13a-15(b) or 240.15d-15(b)). |
| (b) | There were no changes in the registrant’s internal control over financial reporting (as defined in Rule 30a-3(d) under the 1940 Act (17 CFR 270.30a-3(d)) that occurred during the period covered by this report that has materially affected, or is reasonably likely to materially affect, the registrant’s internal control over financial reporting. |
Item 12. Disclosure of Securities Lending Activities for Closed-End Management Investment Companies.
Not applicable.
Item 13. Exhibits.
SIGNATURES
Pursuant to the requirements of the Securities Exchange Act of 1934 and the Investment Company Act of 1940, the registrant has duly caused this report to be signed on its behalf by the undersigned, thereunto duly authorized.
| (Registrant) | | Old Westbury Funds, Inc. | |
| By (Signature and Title)* | /s/ David W. Rossmiller | |
| | David W. Rossmiller, President and Chief Executive Officer
(Principal Executive Officer) | |
Date 1/5/2022
Pursuant to the requirements of the Securities Exchange Act of 1934 and the Investment Company Act of 1940, this report has been signed below by the following persons on behalf of the registrant and in the capacities and on the dates indicated.
| By (Signature and Title)* | /s/ David W. Rossmiller | |
| | David W. Rossmiller, President and Chief Executive Officer
(Principal Executive Officer) | |
Date 1/5/2022
| By (Signature and Title)* | /s/ Matthew A. Rizzi | |
| | Matthew A. Rizzi, Treasurer
(Principal Financial Officer) | |
Date 1/5/2022
| * | Print the name and title of each signing officer under his or her signature. |