UNITED STATES
SECURITIES AND EXCHANGE COMMISSION
Washington, D.C. 20549
FORM N-CSR
CERTIFIED SHAREHOLDER REPORT OF REGISTERED MANAGEMENT INVESTMENT COMPANIES
Investment Company Act file number 811-07912
Old Westbury Funds, Inc.
(Exact name of registrant as specified in charter)
760 Moore Rd.
King of Prussia, PA 19406
(Address of principal executive offices) (Zip code)
Andrew J. McNally
BNY Mellon Investment Servicing (US) Inc.
760 Moore Rd.
King of Prussia, PA 19406
(Name and address of agent for service)
Registrant's telephone number, including area code: 800-607-2200
Date of fiscal year end: October 31
Date of reporting period: October 31, 2016
Form N-CSR is to be used by management investment companies to file reports with the Commission not later than 10 days after the transmission to stockholders of any report that is required to be transmitted to stockholders under Rule 30e-1 under the Investment Company Act of 1940 (17 CFR 270.30e-1). The Commission may use the information provided on Form N-CSR in its regulatory, disclosure review, inspection, and policymaking roles.
A registrant is required to disclose the information specified by Form N-CSR, and the Commission will make this information public. A registrant is not required to respond to the collection of information contained in Form N-CSR unless the Form displays a currently valid Office of Management and Budget ("OMB") control number. Please direct comments concerning the accuracy of the information collection burden estimate and any suggestions for reducing the burden to Secretary, Securities and Exchange Commission, 100 F Street, NE, Washington, DC 20549. The OMB has reviewed this collection of information under the clearance requirements of 44 U.S.C. § 3507.
Item 1. Reports to Stockholders.
The Report to Shareholders is attached herewith.
Old Westbury Funds, Inc.
Annual Report
October 31, 2016
BESSEMER INVESTMENT MANAGEMENT LLC
Investment Adviser
Old Westbury Funds, Inc.
This Page Intentionally Left Blank
| Old Westbury Funds, Inc. |
| A Letter From the President (Unaudited) |
| |
| |
Dear Shareholders:
The fiscal year ended October 31, 2016 was marked by two pronounced rotations within financial markets away from risk assets. The first came at the turn of the calendar year. Global equities sold off as oil prices declined precipitously and investors worried about economic growth in China and the future path of its currency, the renminbi. Another concern feeding into the sell-off was the impact that negative European and Japanese interest rates may have on banks and the effectiveness of monetary policy. Equities recovered as oil prices stabilized, only to be whipsawed once again in June after the U.K.’s surprise referendum mandate to leave the European Union (called “Brexit”). Again, recovery was relatively quick, as central banks pledged to maintain liquidity, valuations became more attractive, and investors questioned whether the U.K. would in fact ultimately leave the European Union.
After the Brexit vote in June, equity markets enjoyed a respite from volatility until uncertainty escalated over the outcome of the U.S. presidential and congressional elections. For the fiscal year, global equities posted gains of about 2%. The U.S. outperformed other developed markets and emerging markets, while small-cap stocks generally outperformed large-cap names. By sector, the global leaders were materials, information technology, and utilities, while financials, consumer discretionary, and healthcare lagged.
Global central banks were more active earlier in the fiscal year. The Fed delivered one rate increase in December 2015 – its first in nine years, but kept its policy intact thereafter in the face of heightened uncertainty over Brexit and the U.S. elections. Other notable actions included the Bank of Japan’s implementation of negative interest rates and expanded asset purchases as well as the European Central Bank’s reduction of its deposit-facility rate further below zero. Later in the year, the Bank of England announced monetary stimulus measures and reduced interest rates in the wake of the Brexit vote, while the Bank of Japan announced new fiscal stimulus and yield-curve targeting measures that aim to keep its 10-year government bond yield near 0%.
During the year, bonds slightly outperformed global equities, benefitting from the intra-year rotations out of risk assets. For most of the year, bond yields declined across the globe, with certain global non-U.S. 10-year bond yields entering negative territory. During the summer, the 10-year U.S. Treasury yield fell to a record low of 1.32% as lackluster economic growth and low inflation pushed yields downward. The U.S. yield curve flattened, with short-term rates rising and long-term rates declining. Global bond yields moved higher later in the year, driven by a view that central banks may dial back their accommodative policies. In the U.S., inflation began to tick higher, and economic prospects began to improve as markets began to expect some form of stimulative fiscal spending from the new U.S. administration.
The oil-price slump early in the year was driven by fears of a slowdown in China, and reports of a supply build-up. U.S. drillers idled rigs, which helped prices to stabilize. Later in the year, OPEC members appeared to reach an agreement to cut production by up to one million barrels per day, though details have yet to be finalized. The drop in oil prices had a negative impact on the energy sector — both in equities and high yield bonds.
Global economic growth continued to be muted. In the U.S., growth was lackluster through the first three quarters of the fiscal year, with growth rates under 1.5%. However, the economy accelerated in the calendar third quarter, rising around 3% with employment and consumer spending holding up relatively well. Europe and Japan remained mired in low inflation, and extraordinarily easy monetary policy has reduced the urgency for policymakers to tackle structural reforms. To date, Europe has weathered the immediate aftermath of Brexit surprisingly well; a bright spot is an acceleration in European loan growth.
In this environment, our portfolio results varied. On a total-return basis, the Small & Mid Cap Fund posted solid outperformance due to strong stock selection. The Old Westbury Large Cap Core Fund underperformed as a result of sector allocation and stock selection within the technology sector, and the Old Westbury Large Cap Strategies Fund slightly underperformed. Elevated cash holdings early in the year detracted slightly from the performance of each of the equity funds. The Old Westbury Strategic Opportunities Fund’s return was short of its primary and secondary benchmarks. Most components outperformed, but de-risking measures taken early in the year detracted. The Old Westbury Fixed Income Fund underperformed, mainly due to its conservative underweight position in interest-rate exposure. The Old Westbury Municipal Bond Fund’s return was essentially in-line with its benchmark.
During the fiscal year, the adviser, Bessemer Investment Management, LLC (the “Adviser” or “BIM”), made several key changes. It added Bessemer-managed quantitative low-volatility equity sleeves to the Old Westbury Large Cap Strategies and Small & Mid Cap Funds. BIM also added an external manager with a low-volatility U.S. small-cap strategy to the Old Westbury Small & Mid Cap Fund. In the Old Westbury Strategic Opportunities Fund, positions were eliminated in master limited partnerships (MLPs) and global government bonds.
| Old Westbury Funds, Inc. |
| A Letter From the President (Unaudited) - (Continued) |
| |
| |
At year-end, we remain committed to the Adviser’s longstanding investment approach, characterized by independent research, a global orientation, and long-term perspective. We believe these disciplines will continue to reap competitive long-term results for shareholders and position the Adviser to fulfill the central mandate of participating in strong market environments while preserving capital during difficult ones.
Sincerely,

David W. Rossmiller
President
Old Westbury Funds, Inc.
| Old Westbury Funds, Inc. |
| Large Cap Core Fund |
| Investment Adviser’s Report (Unaudited) |
| |
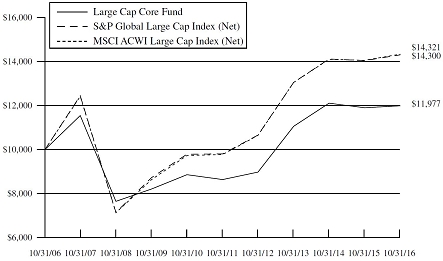
The return of the Old Westbury Large Cap Core Fund (the “Fund”) for the fiscal year ended October 31, 2016 was 0.73%. In comparison, the return of the MSCI ACWI Large Cap Index (Net) was 2.01%. The MSCI All Country World Large Cap Index (Net)is comprised of large-capitalization stocks in 23 developed and 23 emerging market countries. With close to 1,200 constituents, the index covers approximately 70% of the free float-adjusted market capitalization in each country. Net means that the return calculation for the index reflects the reinvestment of dividends after the deduction of withholding taxes, using a tax rate applicable to non-resident institutional investors who do not benefit from double taxation treaties.
The most significant positive contributors to the Fund’s relative performance during the year were an overweight position in the utilities sector (4.7% of the Fund as of October 31, 2016) and an underweight position in consumer staples (6.7%). Stock selection overall was a positive contributor. By sector, healthcare and financials stock selection contributed positively. Stocks that contributed the most included American Water Works Company, Broadcom Limited, and Raytheon. American Water Works shares appreciated as the market rewarded a higher valuation to its steady and growing earnings power. Broadcom benefited from its continued strategy of consolidating the semiconductor industry via acquisition. Raytheon’s shares outperformed as the market came to appreciate the improving outlook for defense spending and the durable nature of the company’s long-term prospects.
The Fund’s results were held back by an overweight position in the consumer discretionary sector (23.8%), an underweight position in materials (1.3%), and an allocation to cash (4.8%). Stock selection within the information technology sector also detracted from returns. Stocks with the highest negative contributions included Nokia Oyi, Nike, and ConocoPhillips. Nokia shares have fallen as the outlook networking equipment sales has declined due to a slowdown in customer spending on wireless networks. Nike shares have pulled back after having a strong run in the previous year, as the market worried that growth and market-share gains were slowing. Oil and gas company ConocoPhillips saw its share price fall with the price of crude oil.
At fiscal year-end, the Fund maintained overweight positions in consumer discretionary and utilities; these overweights were largely the result of Comcast, Aramark, Dollar General, PVH Corp., and Lowe’s. The Fund maintained underweight positions in consumer staples, telecoms, financials, materials, and energy, due to a general caution over commodity prices and the high valuations among consumer staples. The Fund continues to be overweight U.S. stocks (66.6%) versus non-U.S. stocks (28.4%); the remainder was cash. Within non-U.S. stocks, the Fund is underweight Europe, Japan, and emerging markets.
The performance data quoted represents past performance. Past performance does not guarantee future results and does not reflect the deduction of taxes that a shareholder may pay on Fund distributions or the redemption of Fund shares. Fund performance reflects fee waivers and/or expense reimbursements and reinvestments of distributions, if any. Without waivers/ reimbursements, performance would have been lower. The investment return and principal value of an investment will fluctuate. Consequently, an investor’s shares, when redeemed, may be worth more or less than their original cost. Current performance may be lower or higher than the performance data quoted. To obtain performance information current to the most recent month end, please call 1-800-607-2200.
| Old Westbury Funds, Inc. | |
| Large Cap Core Fund | |
| Investment Adviser’s Report (Unaudited) - (Continued) | |
| | |
PORTFOLIO DIVERSIFICATION BY SECTOR*
| Sector: | | | | |
| Banks | | | 9.6 | % |
| Consumer Discretionary | | | 23.8 | |
| Consumer Staples | | | 6.7 | |
| Diversified Financials | | | 5.1 | |
| Energy | | | 4.9 | |
| Health Care | | | 11.2 | |
| Industrials | | | 7.1 | |
| Information Technology | | | 16.1 | |
| Insurance | | | 2.5 | |
| Materials | | | 1.3 | |
| Real Estate | | | 1.0 | |
| Telecommunication Services | | | 1.1 | |
| Utilities | | | 4.7 | |
| Other** | | | 4.9 | |
| | | | 100.0 | % |
| * | Stated as a percentage of net assets. |
| ** | Includes cash and equivalents, investment company, pending trades and Fund share transactions, interest and dividends receivable, prepaids and accrued expenses payable. |
| Old Westbury Funds, Inc. | |
| Large Cap Core Fund | |
| Investment Adviser’s Report (Unaudited) - (Continued) | |
| | |
Average Annual Total Returns
For the Period Ended October 31, 2016
| Large Cap Core Fund | | | | |
| One Year | | | 0.73 | % |
| Five Year | | | 6.76 | % |
| Ten Year | | | 1.82 | % |
| | | | | |
| MSCI ACWI Large Cap Index (Net) | | | | |
| One Year | | | 2.01 | % |
| Five Year | | | 7.95 | % |
| Ten Year | | | 3.66 | % |
| | | | | |
| S&P Global LargeCap Index (Net) | | | | |
| One Year | | | 1.96 | % |
| Five Year | | | 7.84 | % |
| Ten Year | | | 3.64 | % |
On November 16, 2011, the Fund changed its name to Large Cap Core Fund (formerly U.S. Large Cap Fund) as part of a series of changes to the overall investment focus and strategies of the Fund. Prior to October 2, 2008, the Fund was named the Large Cap Equity Fund and operated under a different investment strategy. Prior to February 16, 2004, the Fund was named the Core Equities Fund and operated under a different investment strategy. The performance information shown above may not be representative of performance the Fund will achieve under its current investment strategy.
The performance data quoted represents past performance. Past performance does not guarantee future results and does not reflect the deduction of taxes that a shareholder may pay on Fund distributions or the redemption of Fund shares. Fund performance reflects fee waivers and/or expense reimbursements and reinvestments of distributions, if any. Without waivers/reimbursements, performance would have been lower. The investment return and principal value of an investment will fluctuate. Consequently, an investor’s shares, when redeemed, may be worth more or less than their original cost. Current performance may be lower or higher than the performance data quoted. To obtain performance information current to the most recent month end, please call 1-800-607-2200.
The Adviser has contractually committed through October 31, 2017, to waive its advisory fees to the extent necessary to maintain the net operating expense ratio of the Fund, excluding Fund transaction costs, investment interest expense, dividend expenses associated with securities sold short and acquired fund fees and expenses (if any), at 1.00%, as disclosed in the Funds’ prospectus dated March 1, 2016. The Board has approved, the termination of this fee waiver agreement (subject to shareholder approval, which was given at a shareholder meeting held on December 22, 2016, of a proposed fee change in connection with a modification of the Fund’s investment strategy). The expense ratio, prior to fee waivers and including acquired fund fees and expenses (if any), is stated in the prospectus as 1.01%. Additional information pertaining to the Fund’s expense ratio for the year ended October 31, 2016 can be found in the Financial Highlights.
| Old Westbury Funds, Inc. | |
| Large Cap Core Fund | |
| Investment Adviser’s Report (Unaudited) - (Concluded) | |
| | |
The chart shown on the previous page illustrates the total value of a $10,000 investment for 10 years, with distributions reinvested. On January 1, 2016, the Fund changed its primary benchmark from the S&P Global LargeCap Index (Net) to the MSCI ACWI Large Cap Index (Net) to more closely reflect the Fund’s current investment strategy. The S&P Global LargeCap Index (Net) and MSCI ACWI Large Cap Index (Net) also include the reinvestment of distributions but not fees and expenses associated with an investment in the Fund. The S&P Global LargeCap Index (Net) and the MSCI ACWI Large Cap Index (Net) are unmanaged. Investments cannot be made directly in an index. The Board has approved a change in the Fund’s primary benchmark to MSCI ACWI Investible Market Index (Net) in conjunction with a modification of the Fund’s investment strategy, all of which will become effective on or about December 30, 2016.
Investments made in foreign and emerging country securities may involve additional risks, such as political and social instability, less liquidity and currency exchange rate volatility.
| Old Westbury Funds, Inc. |
| Large Cap Strategies Fund |
| Investment Adviser’s Report (Unaudited) |
| |
The return of the Old Westbury Large Cap Strategies Fund (the “Fund”) for the fiscal year ended October 31, 2016, was 1.93%. In comparison, the return of the MSCI ACWI Large Cap Index (Net) (“the Index”) was 2.01%. The Index is comprised of large-capitalization stocks in 23 developed and 23 emerging market countries. With close to 1,200 constituents, the index covers approximately 70% of the free float-adjusted market capitalization in each country. Net means that the return calculation for the index reflects the reinvestment of dividends after the deduction of withholding taxes, using a tax rate applicable to non-resident institutional investors who do not benefit from double taxation treaties.
During the fiscal year, each of the Fund’s main components outperformed the Index, while holdings of cash, exchange-traded funds, and currency hedges detracted from performance.
Stocks that contributed the most to relative performance were Hewlett Packard Enterprise (1.24%), Texas Instruments (1.90%), and Tencent Holdings (1.21%). Hewlett Packard Enterprise posted resilient earnings and announced two well-received divestitures. U.S. semiconductor company Texas Instruments continued to benefit from the stable growth of its analog business. Tencent Holdings, the largest internet company in Asia, saw significant appreciation as it found new ways to monetize its dominant position in Chinese social media.
Stocks that detracted from relative performance were Gilead Sciences (0.90%), Apple (1.19%), and Regeneron Pharmaceuticals (0.33%). Gilead and Regeneron, two biotechnology firms, suffered from a broad sell-off across the health care sector caused by worries around the sustainability of high drug prices in the U.S. under a new president. An underweight position in Apple detracted from performance as excitement around a new product launch supported the shares.
At fiscal year-end, the Fund was overweight the following sectors: consumer discretionary (14.7% versus the Index’s 11.4%), consumer staples (14.1% versus 11.1%), industrials (9.7% versus 9.1%), and information technology (22.4% versus 16.8%).The Fund was underweight the following sectors: energy (2.6% versus the Index’s 7.4%), financials (14.9% versus 21.0%), materials (1.4% versus 4.1%), telecommunications (1.7% versus 4.1%), and utilities (0.4% versus 2.9%). The health care sector weighting was relatively neutral (11.7% versus the Index’s 12.1%).
The Fund held a significant overweight to the U.S. (+5.5% as of 10/31/16), given the country’s improving economy and strengthening currency, combined with U.S. companies’ greater focus on economic value creation than companies in other global regions. At fiscal year-end, the Fund was underweight developed Europe and Japan, and slightly overweight emerging markets.
| Old Westbury Funds, Inc. | |
| Large Cap Strategies Fund | |
| Investment Adviser’s Report (Unaudited) - (Continued) | |
| | |
PORTFOLIO DIVERSIFICATION BY COUNTRY*
| Country: | | | | |
| Argentina | | | 0.0 | %*** |
| Belgium | | | 0.2 | |
| Bermuda | | | 0.4 | |
| Brazil | | | 1.6 | |
| Canada | | | 1.8 | |
| Chile | | | 0.0 | *** |
| China | | | 4.2 | |
| Columbia | | | 0.0 | *** |
| Czech Republic | | | 0.1 | |
| Egypt | | | 0.0 | *** |
| Finland | | | 2.2 | |
| France | | | 1.4 | |
| Germany | | | 0.8 | |
| Guernsey | | | 0.1 | |
| Hong Kong | | | 2.0 | |
| Hungary | | | 0.1 | |
| India | | | 2.3 | |
| Indonesia | | | 0.2 | |
| Japan | | | 5.9 | |
| Kenya | | | 0.0 | *** |
| Luxembourg | | | 0.1 | |
| Mexico | | | 0.3 | |
| Netherlands | | | 3.1 | |
| Peru | | | 0.0 | *** |
| Philippines | | | 0.0 | *** |
| Poland | | | 0.1 | |
| Russia | | | 0.3 | |
| Singapore | | | 0.7 | |
| South Africa | | | 0.8 | |
| South Korea | | | 0.9 | |
| Sweden | | | 1.8 | |
| Switzerland | | | 1.5 | |
| Taiwan | | | 0.8 | |
| Thailand | | | 0.7 | |
| Turkey | | | 0.0 | *** |
| United Arab Emirates | | | 0.1 | |
| United Kingdom | | | 2.6 | |
| United States | | | 56.7 | |
| Other** | | | 6.2 | |
| | | | 100.0 | % |
| * | Stated as a percentage of net assets. |
| ** | Includes cash and equivalents, participation notes, exchange traded funds, U.S. government agencies, investment company, pending trades and Fund share transactions, interest and dividends receivable, prepaids and accrued expenses payable. |
| *** | Represents less than 0.1% of net assets. |
| Old Westbury Funds, Inc. | |
| Large Cap Strategies Fund | |
| Investment Adviser’s Report (Unaudited) - (Continued) | |
| | |

| Average Annual Total Returns | | | | |
| For the Period Ended October 31, 2016 | | | | |
| | | | | |
| Large Cap Strategies Fund | | | | |
| One Year | | | 1.93 | % |
| Five Year | | | 9.18 | % |
| Ten Year | | | 2.78 | % |
| | | | | |
| MSCI ACWI Large Cap Index (Net) | | | | |
| One Year | | | 2.01 | % |
| Five Year | | | 7.95 | % |
| Ten Year | | | 3.66 | % |
| | | | | |
| S&P Global LargeCap Index (Net) | | | | |
| One Year | | | 1.96 | % |
| Five Year | | | 7.84 | % |
| Ten Year | | | 3.64 | % |
On November 16, 2011, the Fund changed its name to Large Cap Strategies Fund (formerly Non-U.S. Large Cap Fund) as part of a series of changes to the overall investment focus and strategies of the Fund. Prior to July 28, 2008, the Fund was named the International Fund and operated under a different investment strategy. The prior performance shown represents performance of the Fund’s prior strategy to invest in a diversified portfolio of foreign companies located outside of the U.S., at least 85% of which were listed on recognized foreign securities exchanges. The performance information shown above may not be representative of performance the Fund will achieve under its current investment strategy.
The performance data quoted represents past performance. Past performance does not guarantee future results and does not reflect the deduction of taxes that a shareholder may pay on Fund distributions or the redemption of Fund shares. Fund performance reflects fee waivers and/or expense reimbursements and reinvestments of distributions, if any. Without waivers/reimbursements, performance would be lower. The investment return and principal value of an investment will fluctuate. Consequently, an investor’s shares, when redeemed, may be worth more or less than their original cost. Current performance may be lower or higher than the performance data quoted. To obtain performance information current to the most recent month end, please call 1-800-607-2200.
| Old Westbury Funds, Inc. | |
| Large Cap Strategies Fund | |
| Investment Adviser’s Report (Unaudited) - (Concluded) | |
| | |
The Adviser has contractually committed through October 31, 2017, to waive its advisory fees to the extent necessary to maintain the net operating expense ratio of the Fund, excluding, Fund transaction costs, investment interest expense, dividend expenses associated with securities sold short and acquired fund fees and expenses (if any) at 1.15% (current net operating expense is 1.11%), as disclosed in the Funds’ prospectus dated March 1, 2016. The Board has approved the termination of this fee waiver agreement. The expense ratio, prior to fee waivers and including acquired fund fees and expenses (if any), is stated in the prospectus as 1.15%. Additional information pertaining to the Fund’s expense ratio for the year ended October 31, 2016 can be found in the Financial Highlights.
The chart shown on the previous page illustrates the total value of a $10,000 investment for 10 years, with distributions reinvested. On January 1, 2016, the Fund changed its primary benchmark from the S&P Global LargeCap Index (Net) to the MSCI ACWI Large Cap Index (Net) to more closely reflect the Fund’s current investment strategy. The S&P Global LargeCap Index (Net) and MSCI ACWI Large Cap Index (Net) also include the reinvestment of distributions but not fees and expenses associated with an investment in the Fund. The S&P Global LargeCap Index (Net) and the MSCI ACWI Large Cap Index (Net) are unmanaged. Investments cannot be made directly in an index.
Investments made in foreign and emerging country securities may involve additional risks, such as political and social instability, less liquidity and currency exchange rate volatility.
| Old Westbury Funds, Inc. | |
| Small & Mid Cap Fund | |
| Investment Adviser’s Report (Unaudited) | |
| | |
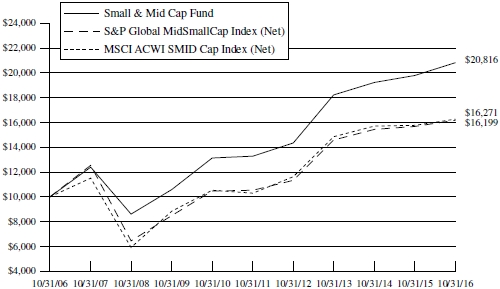
The return of the Old Westbury Small & Mid Cap Fund (the “Fund”) for the fiscal year ended October 31, 2016, was 5.13%. In comparison, the return of the MSCI All Country World Small Mid Cap Index (Net) (the “Index”) was 3.17%. The Index is comprised of mid- and small-cap stocks in 23 developed and 23 emerging market countries. With around 7,500 constituents, the index covers approximately 28% of the free float-adjusted market capitalization in each country. Net means that the return calculation for the index reflects the reinvestment of dividends after the deduction of withholding taxes, using a tax rate applicable to non-resident institutional investors who do not benefit from double taxation treaties.
Relative to the Index, strong outperformance came from the Bessemer Investment Management LLC’s mid-cap segment (18.18%) of the Fund as of October 31, 2016), non-U.S. developed-market small-cap stocks managed by London-based Mondrian Investment Partners (10.1%), and small- and mid-cap stocks managed by Vermont-based Champlain Investment Partners LLC (16.4%). Global small-cap stocks managed by Texas-based Dimensional Fund Advisors LP (15.5%) slightly outperformed. Small-cap stocks in emerging markets managed by Mondrian (13.7%) modestly underperformed. Elevated cash holdings early in 2016 also detracted from performance.
The Fund benefited from excellent stock selection in the healthcare and consumer staples sectors. In healthcare, strong performers included C.R. Bard (1.82%), a medical technologies company that benefitted from a sustained and meaningful increase in organic growth partially attributable to a successful launch of a drug-coated balloon for treatment of vascular diseases. Cooper Companies (1.71%), a medical devices company, performed well thanks to the continued patient trade-up to higher-priced daily contact lenses. In the consumer staples sector, Spectrum Brands (2.13%), a diversified consumer products company, benefitted from increased confidence in the sustainability of organic revenue growth and robust free cash flow generation. Ingredion (0.25%), a global ingredients company, benefitted from lower input costs, higher capacity utilization, and the success of many new value-added and higher-margin products. J.M. Smucker (1.26%), a food products company, benefitted from a significant rebound in branded coffee profitability and better synergies and cash-flow generation from a recent acquisition. From a sector-allocation perspective, the Fund benefited from an overweight position in consumer staples and an underweight position in financials.
Sectors that detracted from performance included materials and utilities; the Fund was underweight both of these sectors. Stocks that were challenged included auto parts retailer Advance Auto Parts (1.16%), which faced significant integration challenges from a recent acquisition that negatively impacted sales and profits. Wyndham Worldwide (1.97%), a global hospitality company that specializes in vacation ownership, managed home rentals, and hotel management, struggled to contain an increase in vacation ownership defaults, which modestly weighed on revenue and profit growth. Tupperware Brands, a relationship-based seller of consumer products, disappointed investors with continued sales growth challenges in both developed and emerging markets.
At fiscal year-end, the Fund was overweight the consumer staples, healthcare, and industrials sectors. The Fund was underweight energy, financials, materials, and utilities.
The Fund was regionally overweight the U.S. market (63.3%) thanks to the country’s low interest rates, reasonable valuations, and promising earnings outlook. Conversely, the Fund was underweight developed Europe (11.4%), Japan (6.2%), and emerging markets (7.9%).
| Old Westbury Funds, Inc. | |
| Small & Mid Cap Fund | |
| Investment Adviser’s Report (Unaudited) - (Continued) | |
| | |
PORTFOLIO DIVERSIFICATION BY COUNTRY*
| Country: | | | | |
| Australia | | | 1.7 | % |
| Austria | | | 0.2 | |
| Belgium | | | 0.2 | |
| Bermuda | | | 1.2 | |
| Brazil | | | 0.3 | |
| Cambodia | | | 0.0 | *** |
| Canada | | | 2.3 | |
| Cayman Islands | | | 0.0 | *** |
| Chile | | | 0.1 | |
| China | | | 1.2 | |
| Curacao | | | 0.1 | |
| Denmark | | | 0.5 | |
| Faeroe Islands | | | 0.0 | *** |
| Finland | | | 0.4 | |
| France | | | 1.4 | |
| Germany | | | 1.6 | |
| Gibraltar | | | 0.0 | *** |
| Greece | | | 0.0 | *** |
| Guernsey | | | 0.0 | *** |
| Hong Kong | | | 1.1 | |
| Hungary | | | 0.0 | *** |
| India | | | 1.3 | |
| Indonesia | | | 0.5 | |
| Ireland | | | 0.3 | |
| Isle of Man | | | 0.0 | *** |
| Israel | | | 1.5 | |
| Italy | | | 0.3 | |
| Japan | | | 6.1 | |
| Jersey Channel Islands | | | 0.1 | |
| Luxembourg | | | 0.2 | |
| Malaysia | | | 0.4 | |
| Malta | | | 0.0 | *** |
| Martinique | | | 0.0 | *** |
| Mexico | | | 0.4 | |
| Monaco | | | 0.0 | *** |
| Netherlands | | | 0.5 | |
| New Zealand | | | 0.7 | |
| Norway | | | 0.1 | |
| Peru | | | 0.1 | |
| Philippines | | | 0.2 | |
| Poland | | | 0.1 | |
| Portugal | | | 0.0 | *** |
| Puerto Rico | | | 0.0 | *** |
| Romania | | | 0.0 | *** |
| Singapore | | | 1.0 | |
| South Africa | | | 0.4 | |
| South Korea | | | 1.0 | |
| Spain | | | 0.3 | |
| Sweden | | | 0.8 | |
| Switzerland | | | 1.5 | |
| Taiwan | | | 0.8 | |
| Thailand | | | 0.3 | |
| Turkey | | | 0.0 | *** |
| Ukraine | | | 0.0 | *** |
| United Arab Emirates | | | 0.0 | *** |
| United Kingdom | | | 3.6 | |
| United States | | | 59.0 | |
| Other** | | | 6.2 | |
| | | | 100.0 | % |
| * | Stated as a percentage of net assets. |
| ** | Includes cash and equivalents, exchange traded funds, rights/warrants, U.S. Government agencies, investment companies, pending trades and Fund share transactions, interest and dividends receivable, prepaids and accrued expenses payable. |
| *** | Represents less than 0.1% of net assets. |
| Old Westbury Funds, Inc. | |
| Small & Mid Cap Fund | |
| Investment Adviser’s Report (Unaudited) - (Continued) | |
| | |
| Average Annual Total Returns | | | | |
| For the Period Ended October 31, 2016 | | | | |
| | | | | |
| Small & Mid Cap Fund | | | | |
| One Year | | | 5.13 | % |
| Five Year | | | 9.37 | % |
| Ten Year | | | 7.61 | % |
| | | | | |
| MSCI ACWI SMID Cap Index (Net) | | | | |
| One Year | | | 3.17 | % |
| Five Year | | | 8.82 | % |
| Ten Year | | | 4.99 | % |
| | | | | |
| S&P Global MidSmallCap Index (Net) | | | | |
| One Year | | | 3.30 | % |
| Five Year | | | 8.94 | % |
| Ten Year | | | 4.94 | % |
Prior to October 2, 2008, the Fund was named Global Small Cap Fund and operated under a different investment strategy. The prior performance shown represents performance of the Fund’s prior strategy to invest at least 80% of its net assets plus any borrowings for investment purposes in securities of small-capitalization companies. Effective January 1, 2014, the Board approved changes to the Fund’s name (formerly Global Small & Mid Cap Fund), and investment strategies. The performance information shown above may not be representative of performance the Fund will achieve under its current investment strategy.
The performance data quoted represents past performance. Past performance does not guarantee future results and does not reflect the deduction of taxes that a shareholder may pay on Fund distributions or the redemption of Fund shares. Fund performance reflects fee waivers and/or expense reimbursements and reinvestments of distributions, if any. Without waivers/reimbursements, performance would be lower. The investment return and principal value of an investment will fluctuate. Consequently, an investor’s shares, when redeemed, may be worth more or less than their original cost. Current performance may be lower or higher than the performance data quoted. To obtain performance information current to the most recent month end, please call 1-800-607-2200.
| Old Westbury Funds, Inc. | |
| Small & Mid Cap Fund | |
| Investment Adviser’s Report (Unaudited) - (Concluded) | |
| | |
The Adviser has contractually committed through October 31, 2017, to waive its advisory fees to the extent necessary to maintain the net operating expense ratio of the Fund, excluding Fund transaction costs, investment interest expense, dividend expenses associated with securities sold short and acquired fund fees and expenses (if any), at 1.11%, as disclosed in the Funds’ prospectus dated March 1, 2016. The expense ratio, prior to fee waivers and including acquired fund fees and expenses (if any), is stated in the prospectus as 1.18%. Additional information pertaining to the Fund’s expense ratio for the year ended October 31, 2016 can be found in the Financial Highlights.
The chart shown on the previous page illustrates the total value of a $10,000 investment from the Fund’s inception, with distributions reinvested. On January 1, 2016, the Fund changed its primary benchmark from the S&P Global MidSmallCap Index (Net) to the MSCI ACWI SMID Cap Index (Net) to more closely reflect the Fund’s current investment strategy. The S&P Global MidSmallCap Index (Net) and the MSCI ACWI SMID Cap Index (Net) also include the reinvestment of distributions but not fees and expenses associated with an investment in the Fund. The S&P Global MidSmallCap Index (Net) and the MSCI ACWI SMID Cap Index (Net) are unmanaged. Investments cannot be made directly in an index.
Investments made in small-capitalization and mid-capitalization companies are subject to greater volatility and less liquidity compared to investments made in larger and more established companies. Investments made in securities of companies in foreign and emerging countries may involve additional risks, such as political and social instability, less liquidity and currency exchange rate volatility.
| Old Westbury Funds, Inc. | |
| Strategic Opportunities Fund | |
| Investment Adviser’s Report (Unaudited) | |
| | |
The return of the Old Westbury Strategic Opportunities Fund (the “Fund”) for the fiscal year ended October 31, 2016, was 0.17%. In comparison, the return of the Fund’s primary benchmark, the MSCI All Country World Investable Market Index (IMI) (Net), was 2.34%. The MSCI All Country World IMI (Net) is comprised of large-, mid- and small-capitalization stocks in 23 developed market and 23 emerging market countries. With around 8,600 constituents, the index covers approximately 99% of the global investable equity opportunity set. Net means that the return calculation for the index reflects the reinvestment of dividends after the deduction of withholding taxes, using a tax rate applicable to non-resident institutional investors who do not benefit from double taxation treaties. The return for the Fund’s secondary benchmark, the BofA Merrill Lynch 1-10 Year AAA-A U.S. Corporate & Government Index (40%) and the MSCI All Country World (IMI) (Net) (60%), was 2.65%. The BofA Merrill Lynch 1-10 Year AAA-A U.S. Corporate & Government Index tracks the performance of U.S. dollar denominated investment grade debt publicly issued in the U.S. market, including U.S. Treasury, U.S. agency, foreign government, supranational and corporate securities, with a remaining term to final maturity less than 10 years and rated AAA through A3, inclusive.
During the fiscal year, segments of the Fund that outperformed the primary benchmark included Bessemer Investment Management LLC’s (“Bessemer”) quantitative equities (8% of the Fund as of October 31, 2016), global high yield (4%, managed by sub-advisor Muzinich & Co., Inc.), non-agency mortgage-backed securities (16%, managed by sub-advisor BlackRock Financial Management, Inc.), collateralized loan obligations (5%, managed by Bessemer and BlackRock), closed-end funds (7%, managed by Bessemer), and convertible bonds (5%, managed by Bessemer). Non-agency mortgage-backed securities were boosted by an improving housing market. In quantitative equities, results were driven by strong stock selection in Japan, overweight positions in consumer staples and utilities, and outperformance in the volatile January-February 2016 period. Global high yield benefitted from a narrowing of credit spreads due to the oil rally that began earlier in the year. Also, the Fund’s derivative strategies (41%) contributed positive absolute return as many of the seasoned options positions, primarily sold puts, earned option premium throughout the year.
Earlier in the calendar year, de-risking measures undertaken by the Fund detracted from performance. Despite the U.S. dollar overweight, exposure to other currencies was a detractor in absolute terms. Other segments of the Fund that underperformed included Bessemer’s commodity alpha (1%), global government bonds (now exited, previously managed by sub-advisor Franklin Advisers, Inc.) and master limited partnerships, or MLPs (now exited, previously managed by sub-advisor TPH Asset Management LLC). Commodity alpha’s results were hurt by a soybean swap trade in the second quarter. Global government bonds fell as bond yields dropped in line with negative interest rates becoming a global theme. The volatility in the energy sector negatively impacted MLPs.
The Fund’s primary benchmark consists of global equities, and the Fund’s secondary benchmark consists of equities and U.S. Treasuries. Relative to the benchmarks, therefore, at year-end, the Fund was overweight convertible bonds, collateralized loan obligations, non-agency mortgage-backed securities, global high yield, and closed-end credit funds. The investment team views each of these asset classes as having a better risk-adjusted return profile than U.S. Treasuries. The Fund has limited interest rate risk — despite U.S. Treasuries comprising 40% of the secondary benchmark — as this asset class does not currently fit the Fund’s criteria established for all investments: equity-like returns, facing a market dislocation, and upside potential greater than downside risk (positive asymmetry).
At year-end, based on notional exposures for derivatives and underlying regional exposures with exchange traded funds, the Fund had 75.2% of its assets in the U.S., 13.8% in developed Europe, 5.1% in Japan, 5.4% in emerging markets, and 0.5% in other developed markets. The Fund maintains significant exposure to the U.S. dollar, representing 77.8% of the Fund compared to 53.7% for the primary benchmark and 72.2% for the secondary benchmark.
| Old Westbury Funds, Inc. | |
| Strategic Opportunities Fund | |
| Investment Adviser’s Report (Unaudited) - (Continued) | |
| | |
PORTFOLIO DIVERSIFICATION BY COUNTRY*
| Country: | | | | |
| Belgium | | | 0.1 | |
| Bermuda | | | 0.5 | |
| Bulgaria | | | 0.0 | *** |
| Canada | | | 0.1 | |
| Cayman Islands | | | 4.8 | |
| China | | | 0.3 | |
| Cyprus | | | 0.0 | *** |
| Czech Republic | | | 0.0 | *** |
| Dominican Republic | | | 0.0 | *** |
| Finland | | | 0.0 | *** |
| France | | | 0.1 | |
| Germany | | | 0.1 | |
| Hong Kong | | | 0.4 | |
| Hungary | | | 0.0 | *** |
| Indonesia | | | 0.0 | *** |
| Ireland | | | 0.3 | |
| Italy | | | 0.1 | |
| Japan | | | 1.0 | |
| Jersey Channel Islands | | | 0.1 | |
| Luxembourg | | | 0.4 | |
| Malaysia | | | 0.1 | |
| Mexico | | | 0.0 | *** |
| Morocco and Antilles | | | 0.1 | |
| Netherlands | | | 0.3 | |
| New Zealand | | | 0.0 | *** |
| Norway | | | 0.0 | *** |
| Pakistan | | | 0.1 | |
| Peru | | | 0.0 | *** |
| Poland | | | 0.0 | *** |
| Qatar | | | 0.0 | *** |
| Singapore | | | 0.1 | |
| South Africa | | | 0.0 | *** |
| South Korea | | | 0.1 | |
| Spain | | | 0.0 | *** |
| Sweden | | | 0.1 | |
| Switzerland | | | 0.2 | |
| Taiwan | | | 0.1 | |
| Thailand | | | 0.0 | *** |
| Turkey | | | 0.1 | |
| United Arab Emirates | | | 0.1 | |
| United Kingdom | | | 0.4 | |
| United States | | | 71.8 | |
| Other** | | | 18.1 | |
| | | | 100.0 | % |
| * | Value of Investments in Portfolio as a percentage of net assets. |
| ** | Includes cash and equivalents, closed-end funds, exchange traded funds, purchased or written options, futures, swap agreements, pending trades and Fund share transactions, interest and dividends receivable, prepaids and accrued expenses payable. |
| *** | Represents less than 0.1% of net assets. |
| Old Westbury Funds, Inc. | |
| Strategic Opportunities Fund | |
| Investment Adviser’s Report (Unaudited) - (Continued) | |
| | |

Average Annual Total Returns
For the Period Ended October 31, 2016
| Strategic Opportunities Fund | | | | |
| One Year | | | 0.17 | % |
| Five Year | | | 5.61 | % |
| Since Inception (November 28, 2007) | | | 1.61 | % |
| | | | | |
| S&P Global Broad Market Index (Net) | | | | |
| One Year | | | 2.36 | % |
| Five Year | | | 8.18 | % |
| November 28, 2007 to October 31, 2016 | | | 2.71 | % |
| | | | | |
| Prior Blended Index (Net) | | | | |
| One Year | | | 2.67 | % |
| Five Year | | | 5.86 | % |
| November 28, 2007 to October 31, 2016 | | | 3.41 | % |
| | | | | |
| MSCI ACWI Investable Market Index (IMI) (Net) | | | | |
| One Year | | | 2.34 | % |
| Five Year | | | 8.19 | % |
| November 28, 2007 to October 31, 2016 | | | 2.74 | % |
| | | | | |
| Blended Index (Net) | | | | |
| One Year | | | 2.65 | % |
| Five Year | | | 5.86 | % |
| November 28, 2007 to October 31, 2016 | | | 3.41 | % |
Effective January 1, 2014, the Board approved changes to the Fund’s name (formerly Global Opportunities Fund), investment strategies and primary benchmark. The performance information shown above may not be representative of performance the Fund will achieve under its current investment strategy.
| Old Westbury Funds, Inc. | |
| Strategic Opportunities Fund | |
| Investment Adviser’s Report (Unaudited) - (Concluded) | |
| | |
The performance data quoted represents past performance. Past performance does not guarantee future results and does not reflect the deduction of taxes that a shareholder may pay on Fund distributions or the redemption of Fund shares. Fund performance reflects fee waivers and/or expense reimbursements and reinvestments of distributions, if any. Without waivers/reimbursements, performance would be lower. The investment return and principal value of an investment will fluctuate. Consequently, an investor’s shares, when redeemed, may be worth more or less than their original cost. Current performance may be lower or higher than the performance data quoted. To obtain performance information current to the most recent month end, please call 1-800-607-2200.
The Adviser has contractually committed through October 31, 2017, to waive its advisory fees to the extent necessary to maintain the net operating expense ratio of the Fund, excluding Fund transaction costs, investment interest expense, dividend expenses associated with securities sold short and acquired fund fees and expenses (if any), at 1.20%, as disclosed in the Funds’ prospectus dated March 1, 2016. The expense ratio, prior to fee waivers and including acquired fund fees and expenses (if any), is stated in the prospectus as 1.45%. Additional information pertaining to the Fund’s expense ratio for the year ended October 31, 2016 can be found in the Financial Highlights.
The chart shown on the previous page illustrates the total value of a $10,000 investment from the Fund’s inception, with distributions reinvested. On January 1, 2016, the Fund changed its primary benchmark from the S&P Global Broad Market Index (Net) to the MSCI All Country World Investable Market Index (ACWI IMI) (Net) to more closely reflect the Fund’s current investment strategy. In addition, effective January 1, 2016, the Fund also compares its performance to a blended benchmark, as a secondary benchmark, consisting of a 60% weighting in the MSCI All Country World Investable Market Index (ACWI IMI) (Net) and a 40% weighting in the Bank of America Merrill Lynch 1-10 Year AAA-A US Corporate & Government Index (the “Blended Index”). The Fund previously compared its performance to a blended benchmark, as a secondary benchmark, consisting of a 60% weighting in the S&P Global Broad Market Index (Net) and a 40% weighting in the Bank of America Merrill Lynch 1-10 Year AAA-A US Corporate & Government Index (the “Prior Blended Index”). The ACWI IMI (Net), the Blended Index (Net), the S&P Global Broad Market Index (Net) and the Prior Blended Index (Net) also include the reinvestment of distributions but do not include fees and expenses associated with an investment in the Fund. The ACWI IMI (Net), the Blended Index (Net), the S&P Global Broad Market Index (Net) and the Prior Blended Index (Net) are unmanaged. Investments cannot be made directly in an index.
Investments made in securities of companies in foreign and emerging countries may involve additional risks, such as political and social instability, less liquidity and currency exchange rate volatility. The Fund may invest in instruments that are volatile, speculative or otherwise risky. The Fund is non-diversified, meaning it may focus its assets in a smaller number of issuers and may be subject to more risk than a more diversified fund.
| Old Westbury Funds, Inc. | |
| Fixed Income Fund | |
| Investment Adviser’s Report (Unaudited) | |
| | |
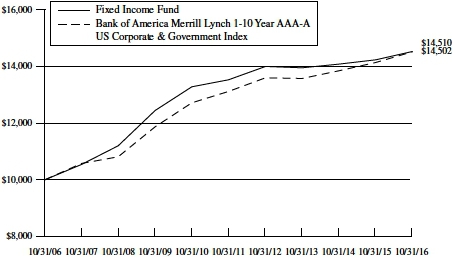
The Old Westbury Fixed Income Fund (the “Fund”) returned 2.08% for the fiscal year ended October 31, 2016. In comparison, the return of the Bank of America Merrill Lynch U.S. Corporate & Government 1-10 Year AAA-A US Corporate & Government Index (the “Index”) was 2.69%.
Short-term interest rates rose slightly during the fiscal year, while longer-term rates dipped in a flattening of the yield curve. Weaker-than-expected growth and inflation prospects in the U.S. economy during the end of 2015 and the first quarter of 2016 pushed yields lower in a move that ran until midyear. As economic prospects improved, other risks kept yields low and prevented the Fed from raising its policy rates further. These risks included Brexit in June, and the U.S. election in November. Finally, as the election approached, long-term yields began to rise, anticipating stimulative fiscal spending from whichever candidate might win the presidency. During the year, credit spreads contracted, and corporate bonds outperformed treasuries and U.S. agency bonds.
The Fund maintained a barbell structure throughout the year, meaning it was underweight bonds with intermediate maturities, and overweight bonds with shorter- and longer-term maturities. A barbell positioning is typically advantageous in a rising-rate environment. For the year, this structure had a slightly negative influence on performance. The Fund also had a lower duration (price sensitivity to interest-rate moves) than the benchmark, and since yields fell sharply in the first quarter, this was a drag on performance. The market does not believe the Fed will raise rates as quickly as its statements have suggested, and long-term yields have been slow to react.
Corporate credit significantly outperformed treasuries and agencies, so the Fund’s large portfolio overweight in corporate bonds, as well as the addition of even more corporate exposure toward year-end, had a positive effect on relative performance. Corporate bonds have benefitted from a slowdown in the pace of new issuance, continued strong investor demand, and a decline in global interest rates.
Further improving U.S. economic strength and a slowly moving Fed are expected as 2017 approaches, and these factors, combined with weak non-U.S. growth, low inflation, and strong demand for bonds will likely keep yields from breaking out significantly to the upside. That said, if the new U.S. administration implements strong fiscal spending measures, yields could rise further.
At fiscal year-end, the Fund maintained its barbell positioning. Credit represented approximately 42% of the market value of the Fund, including an allocation to high-quality asset-backed securities and collateralized loan obligations. Credit exposure is limited to investment-grade securities, with an emphasis on liquid, shorter-duration bonds. In the coming months, the team will closely watch developments in the U.S. and global economy that may drive changes in interest rates and the yield curve.
| Old Westbury Funds, Inc. | |
| Fixed Income Fund | |
| Investment Adviser’s Report (Unaudited) - (Continued) | |
| | |
PORTFOLIO ASSET ALLOCATION*
| U.S. Government Agencies and Securities | | | 55.3 | % |
| Corporate Bonds | | | 34.7 | |
| Municipal Bonds | | | 1.7 | |
| Government Bonds | | | 0.2 | |
| Asset Backed Securities | | | 7.4 | |
| Collateralized Mortgage Obligations | | | 0.2 | |
| Other** | | | 0.5 | |
| | | | 100.0 | % |
| * | Stated as a percentage of net assets. |
| ** | Includes cash and equivalents, investment company, pending trades and Fund share transactions, interest and dividends receivable, prepaids and accrued expenses payable. |
| Old Westbury Funds, Inc. | |
| Fixed Income Fund | |
| Investment Adviser’s Report (Unaudited) - (Continued) | |
| | |
Average Annual Total Returns
For the Period Ended October 31, 2016
| Fixed Income Fund | | | | |
| One Year | | | 2.08 | % |
| Five Year | | | 1.43 | % |
| Ten Year | | | 3.79 | % |
| | | | | |
| Bank of America Merrill Lynch 1-10 Year AAA-A US Corporate & Government Index | | | | |
| One Year | | | 2.69 | % |
| Five Year | | | 2.04 | % |
| Ten Year | | | 3.79 | % |
The performance data quoted represents past performance. Past performance does not guarantee future results and does not reflect the deduction of taxes that a shareholder may pay on Fund distributions or the redemption of Fund shares. Fund performance reflects fee waivers and/or expense reimbursement and reinvestments of distributions, if any. Without waivers/reimbursements, performance would have been lower. The investment return and principal value of an investment will fluctuate. Consequently, an investor’s shares, when redeemed, may be worth more or less than their original cost. Current performance may be lower or higher than the performance data quoted. To obtain performance information current to the most recent month end, please call 1-800-607-2200.
The Adviser has contractually committed through October 31, 2017, to waive its advisory fees to the extent necessary to maintain the net operating expense ratio of the Fund, excluding Fund transaction costs, investment interest expense, dividend expenses associated with securities sold short and acquired fund fees and expenses (if any) at 0.70% (current net operating expense ratio is 0.64%), as disclosed in the Funds’ prospectus dated March 1, 2016. The expense ratio, prior to fee waivers and including acquired fund fees (if any), is stated in the prospectus as 0.74%. Additional information pertaining to the Fund’s expense ratio for the year ended October 31, 2016 can be found in the Financial Highlights.
| Old Westbury Funds, Inc. | |
| Fixed Income Fund | |
| Investment Adviser’s Report (Unaudited) - (Concluded) | |
| | |
The chart shown on the previous page illustrates the total value of a $10,000 investment for 10 years, with distributions reinvested. The Bank of America Merrill Lynch 1-10 Year AAA-A US Corporate & Government Index also includes the reinvestment of distributions but does not include fees and expenses associated with an investment in the Fund. The Bank of America Merrill Lynch 1-10 Year AAA-A US Corporate & Government Index is unmanaged. Investments cannot be made directly in an index.
The Fund is subject to risks such as credit, prepayment and interest rate risk associated with the underlying bond holdings in the Fund. The value of the Fund can decline as interest rates rise and an investor can lose principal.
| Old Westbury Funds, Inc. |
| Municipal Bond Fund |
| Investment Adviser’s Report (Unaudited) |
| |
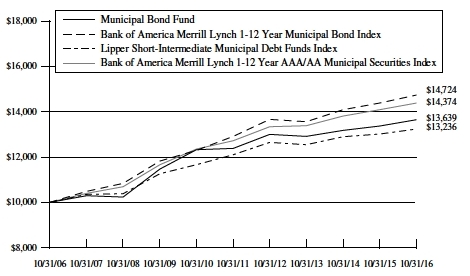
The return of the Old Westbury Municipal Bond Fund (the “Fund”) for the fiscal year ended October 31, 2016, was 2.05%. In comparison, the return of the Bank of America Merrill Lynch 1-12 Year AAA-AA Municipal Securities Index (the “Index”) was 2.09%, and the return of the Fund’s other index, the Lipper Short-Intermediate Municipal Debt Funds Index, was 1.72%.
Throughout the year, the Fund used a barbell maturity structure with a lower concentration in the three- to six-year maturity range. This proved beneficial as the yield curve flattened through October of this year. The Fund maintains this type of structure given the view that the yield curve will flatten further as the Federal Reserve (the “Fed”) increases the federal funds rate. The Fund’s duration is slightly lower than the Index in anticipation of some pressure on interest rates to rise.
While rates ranged widely over the course of the year, the general path of long-maturity municipal yields was lower. The Fund was positioned for an increase in short-term yields, given the expectation that the Fed would move rates higher; the Fed only moved once, in December 2015. This positioning resulted in a slight drag on performance.
Municipal credit spreads were virtually unchanged for the year. The Fund has a greater weighting in A-rated bonds and benefits when the difference between lower- and higher-quality securities narrows. The Fund’s advisor expects that the yield spread between higher- and A-rated municipal bonds will remain somewhat constant.
| Old Westbury Funds, Inc. |
| Municipal Bond Fund |
| Investment Adviser’s Report (Unaudited) - (Continued) |
| |
PORTFOLIO DIVERSIFICATION BY STATE*
| States: | | | |
| Alabama | | 1.0 | % |
| Arizona | | 0.8 | |
| Arkansas | | 0.1 | |
| California | | 6.0 | |
| Colorado | | 1.4 | |
| Connecticut | | 3.8 | |
| District of Columbia | | 1.1 | |
| Florida | | 1.8 | |
| Georgia | | 4.2 | |
| Hawaii | | 0.4 | |
| Idaho | | 0.6 | |
| Illinois | | 1.1 | |
| Indiana | | 1.9 | |
| Iowa | | 0.2 | |
| Kansas | | 0.2 | |
| Kentucky | | 0.5 | |
| Louisiana | | 0.1 | |
| Maine | | 0.2 | |
| Maryland | | 1.2 | |
| Massachusetts | | 9.3 | |
| Michigan | | 0.8 | |
| Minnesota | | 1.4 | |
| Mississippi | | 0.2 | |
| Missouri | | 0.9 | |
| Montana | | 0.1 | |
| Nevada | | 0.1 | |
| New Hampshire | | 0.4 | |
| New Jersey | | 2.7 | |
| New Mexico | | 0.5 | |
| New York | | 21.5 | |
| North Carolina | | 1.9 | |
| Ohio | | 2.6 | |
| Oklahoma | | 0.2 | |
| Oregon | | 0.6 | |
| Pennsylvania | | 1.9 | |
| Rhode Island | | 0.6 | |
| South Carolina | | 2.6 | |
| Tennessee | | 0.4 | |
| Texas | | 14.3 | |
| Utah | | 1.9 | |
| Virginia | | 3.6 | |
| Washington | | 2.5 | |
| West Virginia | | 0.0 | *** |
| Other** | | 2.4 | |
| | | 100.0 | % |
| * | Stated as a percentage of net assets. |
| ** | Includes cash and equivalents, investment company, pending trades and Fund share transactions, interest and dividends receivable, prepaids and accrued expenses payable. |
| *** | Represents less than 0.1% of net assets. |
| Old Westbury Funds, Inc. |
| Municipal Bond Fund |
| Investment Adviser’s Report (Unaudited) - (Continued) |
| |
Average Annual Total Returns
For the Period Ended October 31, 2016
| Municipal Bond Fund | | | | |
| One Year | | | 2.05 | % |
| Five Year | | | 1.95 | % |
| Ten Year | | | 3.15 | % |
| | | | | |
Bank of America Merrill Lynch
1-12 Year AAA-AA Municipal
Securities Index | | | | |
| One Year | | | 2.09 | % |
| Five Year | | | 2.49 | % |
| Ten Year | | | 3.69 | % |
| | | | | |
Bank of America Merrill Lynch
1-12 Year Municipal Bond Index | | | | |
| One Year | | | 2.49 | % |
| Five Year | | | 2.83 | % |
| Ten Year | | | 3.95 | % |
| | | | | |
|
Lipper Short-Intermediate
Municipal Debt Funds Index | | | | |
| One Year | | | 1.72 | % |
| Five Year | | | 1.92 | % |
| Ten Year | | | 2.84 | % |
The performance data quoted represents past performance. Past performance does not guarantee future results and does not reflect the deduction of taxes that a shareholder may pay on Fund distributions or the redemption of Fund shares. Fund performance reflects fee waivers and/or expense reimbursements and reinvestment of distributions, if any. Without waivers/reimbursements performance would have been lower. The investment return and principal value of an investment will fluctuate. Consequently, an investor’s shares, when redeemed, may be worth more or less than their original cost. Current performance may be lower or higher than the performance data quoted. To obtain performance information current to the most recent month end, please call 1-800-607-2200.
| Old Westbury Funds, Inc. |
| Municipal Bond Fund |
| Investment Adviser’s Report (Unaudited) - (Concluded) |
| |
The Adviser has contractually committed through October 31, 2017, to waive its advisory fees to the extent necessary to maintain the net operating expense ratio of the Fund, excluding Fund transaction costs, investment interest expense, dividend expenses associated with securities sold short and acquired fund fees and expenses (if any) at 0.70% (current net operating expense ratio is 0.59%), as disclosed in the Fund’s prospectus dated March 1, 2016. The expense ratio, prior to fee waivers and including acquired fund fees (if any), is stated in the prospectus as 0.70%. Additional information pertaining to the Fund’s expense ratio for the year ended October 31, 2016 can be found in the Financial Highlights.
The chart shown on the previous page illustrates the total value of a $10,000 investment for 10 years, with distributions reinvested. On January 1, 2016, the Fund changed its primary benchmark from the Bank of America Merrill Lynch 1-12 Year Municipal Bond Index to the Bank of America Merrill Lynch 1-12 Year AAA-AA Municipal Securities Index to more closely reflect the Fund’s current investment strategy. The Fund also compares its performance to the Lipper Short-Intermediate Municipal Debt Funds Index. The Bank of America Merrill Lynch 1-12 Year AAA-AA Municipal Securities Index, Bank of America Merrill Lynch 1-12 Year Municipal Bond Index and Lipper Short-Intermediate Municipal Debt Funds Index also include the reinvestment of distributions but do not include fees and expenses associated with an investment in the Fund. The Bank of America Merrill Lynch 1-12 Year AAA-AA Municipal Securities Index, Bank of America Merrill Lynch 1-12 Year Municipal Bond Index and the Lipper Short-Intermediate Municipal Debt Funds Index are unmanaged. Investments cannot be made directly in an index.
Municipal securities held by the Fund may be adversely affected by local political and economic factors. Income from the Fund may be subject to federal alternative minimum tax, state and local taxes.
| Old Westbury Funds, Inc. |
| Disclosure of Fund Expenses (Unaudited) |
| For the Period Ended October 31, 2016 |
| |
As a shareholder of Old Westbury Funds, Inc., you incur ongoing costs, including management fees and other Fund expenses. This example is intended to help you understand your ongoing costs (in dollars) of investing in the Funds and to compare these costs with the ongoing costs of investing in other mutual funds.
The example is based on an investment of $1,000 invested at the beginning of the period and held for the entire period from May 1, 2016 through October 31, 2016.
Actual Expenses
The table below provides information about actual account values and actual expenses. You may use the information below, together with the amount you invested, to estimate the expenses that you paid over the period. Simply divide your account value by $1,000 (for example, an $8,600 account value divided by $1,000 = 8.6), then multiply the result by the number in the table under the heading entitled “Actual Expenses Paid During Period” to estimate the expenses you paid on your account during this period.
| | | Actual
Beginning
Account Value
5/1/16 | | Actual
Ending
Account Value
10/31/16 | | Actual
Expenses Paid
During Period*
5/1/16-10/31/16 | | Actual
Expense Ratio
During Period
5/1/16-10/31/16** |
| Large Cap Core Fund | | | $1,000.00 | | | | $1,021.60 | | | | $5.05 | | | | 1.00 | % |
| Large Cap Strategies Fund | | | 1,000.00 | | | | 1,031.10 | | | | 5.69 | | | | 1.12 | % |
| Small & Mid Cap Fund | | | 1,000.00 | | | | 1,044.30 | | | | 5.67 | | | | 1.11 | % |
| Strategic Opportunities Fund | | | 1,000.00 | | | | 1,032.00 | | | | 6.10 | | | | 1.20 | % |
| Fixed Income Fund | | | 1,000.00 | | | | 1,004.00 | | | | 3.16 | | | | 0.63 | % |
| Municipal Bond Fund | | | 1,000.00 | | | | 1,000.30 | | | | 2.90 | | | | 0.58 | % |
| * | Expenses are equal to the average account value times the Fund’s annualized expense ratio multiplied by 183/366 to reflect the one-half year period. |
| ** | Expense ratios are annualized and reflect existing expense waivers/reimbursements. |
| Old Westbury Funds, Inc. |
| Disclosure of Fund Expenses (Unaudited) - (Continued) |
| For the Period Ended October 31, 2016 |
| |
Hypothetical Example for Comparison Purposes
The table below provides information about hypothetical account values and hypothetical expenses based on each Fund’s actual expense ratio and an assumed rate of return of 5% per year before expenses, which is not the Fund’s actual return. The hypothetical account values and expenses may not be used to estimate the actual ending account balance or expenses you paid for the period. You may use this information to compare this 5% hypothetical example with the 5% hypothetical examples that appear in the shareholder reports of other funds.
| | | Hypothetical
Beginning
Account Value
5/1/16 | | Hypothetical
Ending
Account Value
10/31/16 | | Hypothetical
Expenses Paid
During Period*
5/1/16-10/31/16 | | Hypothetical
Expense Ratio
During Period
5/1/16-10/31/16** |
| Large Cap Core Fund | | | $1,000.00 | | | | $1,020.00 | | | | $5.05 | | | | 1.00 | % |
| Large Cap Strategies Fund | | | 1,000.00 | | | | 1,019.40 | | | | 5.65 | | | | 1.12 | % |
| Small & Mid Cap Fund | | | 1,000.00 | | | | 1,019.45 | | | | 5.60 | | | | 1.11 | % |
| Strategic Opportunities Fund | | | 1,000.00 | | | | 1,019.00 | | | | 6.06 | | | | 1.20 | % |
| Fixed Income Fund | | | 1,000.00 | | | | 1,021.85 | | | | 3.18 | | | | 0.63 | % |
| Municipal Bond Fund | | | 1,000.00 | | | | 1,022.10 | | | | 2.93 | | | | 0.58 | % |
| * | Expenses are equal to the average account value times the Fund’s annualized expense ratio multiplied by 183/366 to reflect the one-half year period. |
| ** | Expense ratios are annualized and reflect existing expense waivers/reimbursements. |
Please note that the expenses shown in the tables are meant to highlight your ongoing costs only and do not reflect any transactional costs, such as sales charges (loads), redemption fees, or exchange fees. Therefore, these tables are useful in comparing ongoing costs only, and will not help you determine the relative total costs of owning different funds. In addition, if these transactional costs were included, your costs would have been higher.
| Old Westbury Funds, Inc. | |
| Large Cap Core Fund | |
| Portfolio of Investments | October 31, 2016 |
| | |
| Shares | | | | | Value | |
| COMMON STOCKS — 95.1% | | | | |
| Banks — 9.6% | | | | |
| | 485,020 | | | BNP Paribas SA - ADR | | $ | 14,075,280 | |
| | 401,070 | | | Citigroup, Inc. | | | 19,712,591 | |
| | 363,160 | | | DBS Group Holdings Ltd. - ADR | | | 15,681,249 | |
| | 169,175 | | | HSBC Holdings Plc - ADR | | | 6,366,055 | |
| | 1,607,445 | | | KeyCorp | | | 22,697,123 | |
| | 696,970 | | | Morgan Stanley | | | 23,397,283 | |
| | 969,100 | | | Nordea Bank AB | | | 10,187,613 | |
| | 1,919,810 | | | Siam Commercial Bank Public Co. Ltd.(b)(c) | | | 7,871,783 | |
| | | | | | | | 119,988,977 | |
| Consumer Discretionary — 23.8% | | | | |
| | 200,880 | | | Accor SA | | | 7,626,582 | |
| | 28,171 | | | Amazon.com, Inc.(b) | | | 22,250,019 | |
| | 721,200 | | | Aramark | | | 26,850,276 | |
| | 388,240 | | | CBS Corp. - Class B | | | 21,982,149 | |
| | 484,405 | | | Comcast Corp. - Class A | | | 29,945,917 | |
| | 322,290 | | | Dollar General Corp. | | | 22,267,016 | |
| | 2,451,450 | | | Kingfisher Plc | | | 10,841,121 | |
| | 326,910 | | | Lowe’s Cos, Inc. | | | 21,788,552 | |
| | 116,920 | | | Mohawk Industries, Inc.(b) | | | 21,548,356 | |
| | 277,520 | | | Nielsen Holdings Plc | | | 12,493,950 | |
| | 343,460 | | | NIKE, Inc. - Class B | | | 17,234,823 | |
| | 1,422,780 | | | Nissan Motor Co. Ltd. | | | 14,496,428 | |
| | 272,875 | | | Pandora A/S - ADR | | | 8,827,506 | |
| | 243,225 | | | PVH Corp. | | | 26,020,211 | |
| | 245,495 | | | Royal Caribbean Cruises Ltd. | | | 18,871,201 | |
| | 334,860 | | | Tata Motors Ltd. - ADR | | | 13,196,833 | |
| | | | | | | | 296,240,940 | |
| Consumer Staples — 6.7% | | | | |
| | 240,000 | | | Coca-Cola European Partners Plc | | | 9,254,075 | |
| | 322,310 | | | CVS Health Corp. | | | 27,106,271 | |
| | 240,860 | | | PepsiCo, Inc. | | | 25,820,192 | |
| | 325,440 | | | Unilever NV | | | 13,639,935 | |
| | 326,055 | | | Wilmar International Ltd. - ADR | | | 7,669,792 | |
| | | | | | | | 83,490,265 | |
| Diversified Financials — 5.1% | | | | |
| | 588,010 | | | Discover Financial Services | | | 33,122,603 | |
| | 860,210 | | | ING Groep NV | | | 11,326,877 | |
| | 578,550 | | | Mediobanca SpA | | | 4,239,335 | |
| | 915,170 | | | ORIX Corp. | | | 14,534,334 | |
| | | | | | | | 63,223,149 | |
| Energy — 4.9% | | | | |
| | 140,805 | | | China Petroleum & Chemical Corp. - ADR | | | 10,197,098 | |
| | 720,705 | | | ConocoPhillips | | | 31,314,632 | |
| | 372,190 | | | Encana Corp. | | | 3,549,027 | |
| | 1,072,340 | | | ENI SpA | | | 15,550,372 | |
| | | | | | | | 60,611,129 | |
| Shares | | | | | Value | |
| Health Care — 11.2% | | | | |
| | 148,615 | | | Aetna, Inc. | | $ | 15,953,820 | |
| | 197,415 | | | AstraZeneca Plc | | | 11,086,303 | |
| | 405,660 | | | DENTSPLY Sirona, Inc. | | | 23,353,846 | |
| | 143,210 | | | Otsuka Holdings Co. Ltd. | | | 6,277,643 | |
| | 589,890 | | | Pfizer, Inc. | | | 18,705,412 | |
| | 236,400 | | | Shionogi & Co. Ltd. | | | 11,672,349 | |
| | 159,260 | | | Shire Plc | | | 9,064,479 | |
| | 204,905 | | | Thermo Fisher Scientific, Inc. | | | 30,127,182 | |
| | 122,915 | | | Zimmer Holdings, Inc. | | | 12,955,241 | |
| | | | | | | | 139,196,275 | |
| Industrials — 7.1% | | | | |
| | 275,500 | | | J.B. Hunt Transport Services, Inc. | | | 22,483,555 | |
| | 664,600 | | | Obayashi Corp. | | | 6,419,756 | |
| | 250,885 | | | Raytheon Co. | | | 34,273,400 | |
| | 148,460 | | | Union Pacific Corp. | | | 13,091,203 | |
| | 262,480 | | | Xylem, Inc. | | | 12,685,658 | |
| | | | | | | | 88,953,572 | |
| Information Technology — 16.1% | | | | |
| | 139,000 | | | Alibaba Group Holding Ltd. - ADR(b) | | | 14,134,910 | |
| | 52,900 | | | Alphabet, Inc. - Class C(b) | | | 41,502,166 | |
| | 449,870 | | | Apple, Inc. | | | 51,078,240 | |
| | 126,440 | | | Atos SE | | | 13,133,271 | |
| | 113,345 | | | Broadcom Ltd. | | | 19,300,387 | |
| | 373,800 | | | CDW Corp. | | | 16,787,358 | |
| | 2,212,160 | | | Nokia Oyj | | | 9,878,771 | |
| | 198,840 | | | NXP Semiconductors NV(b) | | | 19,884,000 | |
| | 564,000 | | | Sabre Corp. | | | 14,568,120 | |
| | | | | | | | 200,267,223 | |
| Insurance — 2.5% | | | | |
| | 176,555 | | | American International Group, Inc. | | | 10,893,444 | |
| | 113,085 | | | CHUBB Ltd. | | | 14,361,795 | |
| | 972,349 | | | RSA Insurance Group Plc - ADR | | | 6,508,904 | |
| | | | | | | | 31,764,143 | |
| Materials — 1.3% | | | | |
| | 386,690 | | | Rio Tinto Ltd. | | | 15,937,301 | |
| Real Estate — 1.0% | | | | |
| | 809,910 | | | Wharf Holdings Ltd. - ADR | | | 12,096,006 | |
| Telecommunication Services — 1.1% | | | | |
| | 281,015 | | | China Telecom Corp. Ltd. - ADR | | | 14,486,323 | |
| Utilities — 4.7% | | | | |
| | 154,740 | | | American Water Works Co., Inc. | | | 11,456,950 | |
| | 302,905 | | | Edison International | | | 22,257,459 | |
| | 407,310 | | | Electric Power Development Co. Ltd. | | | 9,504,029 | |
| Old Westbury Funds, Inc. | |
| Large Cap Core Fund | |
| Portfolio of Investments - (Continued) | October 31, 2016 |
| | |
| Shares | | | | | Value | |
| Utilities (continued) | | | | |
| | 549,460 | | | Enagas SA | | $ | 15,772,961 | |
| | | | | | | | 58,991,399 | |
Total Common Stocks
(Cost $1,081,748,771) | | | 1,185,246,702 | |
| | | | | | | | | |
| INVESTMENT COMPANY — 4.8% | | | | |
| | 60,170,000 | | | SEI Daily Income Trust Government II Fund, Class A, 0.01%,(d) | | | 60,170,000 | |
Total Investment Company
(Cost $60,170,000) | | | 60,170,000 | |
TOTAL INVESTMENTS — 99.9%
(Cost $1,141,918,771)(a) | | | 1,245,416,702 | |
| OTHER ASSETS IN EXCESS OF LIABILITIES — 0.1% | | | 780,305 | |
| NET ASSETS — 100.0% | | $ | 1,246,197,007 | |
| (a) | Cost for federal income tax purposes is $1,145,177,115 and net unrealized appreciation of investments is as follows: |
| Unrealized appreciation | | $ | 185,879,755 | |
| Unrealized depreciation | | | (85,640,168 | ) |
| Net unrealized appreciation | | $ | 100,239,587 | |
| (b) | Non-income producing security. |
| (c) | This security is considered either fully or partially illiquid. These securities or portions thereof have a value of $7,785,194 or 0.62% of net assets. |
| (d) | Rate shown represents current yield at October 31, 2016. |
ADR-American Depositary Receipt
| Old Westbury Funds, Inc. | |
| Large Cap Strategies Fund | |
| Portfolio of Investments | October 31, 2016 |
| | |
| Shares | | | | | Value | |
| COMMON STOCKS — 93.6% | | | | |
| ARGENTINA — 0.0% | | | | |
| | 36,000 | | | MercadoLibre, Inc. | | $ | 6,048,360 | |
| BELGIUM — 0.2% | | | | |
| | 387,000 | | | UCB SA | | | 26,207,838 | |
| BERMUDA — 0.4% | | | | |
| | 99,976 | | | RenaissanceRe Holdings Ltd. | | | 12,426,017 | |
| | 784,117 | | | Validus Holdings Ltd. | | | 40,068,379 | |
| | | | | | | | 52,494,396 | |
| BRAZIL — 1.6% | | | | |
| | 28,950,000 | | | Ambev SA(e) | | | 170,779,605 | |
| | 1,563,900 | | | Ambev SA - ADR | | | 9,227,010 | |
| | 1,170,952 | | | Banco Bradesco SA - ADR | | | 12,189,610 | |
| | 1,150,600 | | | BM&FBovespa SA - Bolsa de Valores Mercadorias e Futuros | | | 6,758,694 | |
| | 331,800 | | | Cia Brasileira de Distribuicao - ADR | | | 6,320,790 | |
| | 715,368 | | | Cielo SA | | | 7,272,460 | |
| | 1,231,662 | | | Itau Unibanco Holding SA - ADR | | | 14,693,731 | |
| | | | | | | | 227,241,900 | |
| CANADA — 1.8% | | | | |
| | 1,557,000 | | | Canadian Pacific Railway Ltd. | | | 222,574,502 | |
| | 394,979 | | | Peyto Exploration & Development Corp.(e) | | | 10,147,600 | |
| | 360,609 | | | Waste Connections, Inc. | | | 27,121,403 | |
| | | | | | | | 259,843,505 | |
| CHILE — 0.0% | | | | |
| | 341,100 | | | Banco Santander Chile - ADR | | | 7,794,135 | |
| CHINA — 4.2% | | | | |
| | 289,500 | | | 51Job, Inc. - ADR(b) | | | 9,843,000 | |
| | 1,515,000 | | | AAC Technologies Holdings, Inc. | | | 14,455,454 | |
| | 895,000 | | | Alibaba Group Holding Ltd. - ADR(b) | | | 91,012,550 | |
| | 352,700 | | | Baidu, Inc. - ADR(b) | | | 62,378,522 | |
| | 15,369,500 | | | China Shenhua Energy Co. Ltd. - H Shares | | | 31,985,318 | |
| | 122,362 | | | CNOOC Ltd. - ADR | | | 15,353,984 | |
| | 253,800 | | | Ctrip.com International Ltd. - ADR(b) | | | 11,205,270 | |
| | 1,854,000 | | | ENN Energy Holdings Ltd. | | | 8,725,493 | |
| | 273,100 | | | JD.Com, Inc. -ADR(b) | | | 7,086,945 | |
| | 3,404,000 | | | Jiangsu Expressway Co. Ltd. - H Shares | | | 4,634,905 | |
| | 1,239,000 | | | Shenzhou International Group Holdings Ltd. | | | 8,219,475 | |
| | 35,300,000 | | | Sinopharm Group Co. Ltd. - H Shares(e) | | | 171,822,114 | |
| | 6,683,000 | | | Tencent Holdings Ltd. | | | 177,338,989 | |
| | | | | | | | 614,062,019 | |
| Shares | | | | | Value | |
| COLUMBIA — 0.0% | | | | |
| | 208,300 | | | Bancolombia SA - ADR | | $ | 7,973,724 | |
| CZECH REPUBLIC — 0.1% | | | | |
| | 254,740 | | | Komercni Banka AS | | | 9,331,018 | |
| EGYPT — 0.0% | | | | |
| | 666,500 | | | Commercial International Bank Egypt SAE - GDR | | | 2,945,929 | |
| FINLAND — 2.2% | | | | |
| | 1,650,000 | | | Kone Oyj - Class B(e) | | | 75,947,637 | |
| | 5,320,000 | | | Sampo Oyj - A Shares(e) | | | 243,939,184 | |
| | | | | | | | 319,886,821 | |
| FRANCE — 1.4% | | | | |
| | 1,125,000 | | | L’Oreal SA(e) | | | 201,362,589 | |
| GERMANY — 0.8% | | | | |
| | 1,372,000 | | | Bayerische Motoren Werke AG | | | 119,540,743 | |
| GUERNSEY — 0.1% | | | | |
| | 304,290 | | | Amdocs Ltd. | | | 17,785,751 | |
| HONG KONG — 2.0% | | | | |
| | 3,224,000 | | | AIA Group Ltd. | | | 20,348,628 | |
| | 707,709 | | | ASM Pacific Technology Ltd. | | | 6,830,208 | |
| | 3,178,570 | | | China Merchants Holdings International Co. Ltd. | | | 8,237,876 | |
| | 1,582,781 | | | China Mobile Ltd. | | | 18,132,833 | |
| | 238,700 | | | China Mobile Ltd. - ADR | | | 13,708,541 | |
| | 13,244,000 | | | China Unicom Hong Kong Ltd. | | | 15,522,814 | |
| | 214,419 | | | Hong Kong Exchanges and Clearing Ltd. | | | 5,678,728 | |
| | 2,875,718 | | | Jardine Matheson Holdings Ltd.(e) | | | 175,159,983 | |
| | 3,844,400 | | | Sands China Ltd. | | | 16,729,761 | |
| | 8,173,162 | | | Sino Biopharmaceutical Ltd. | | | 5,722,388 | |
| | 2,605,500 | | | Yue Yuen Industrial Holdings Ltd. | | | 9,927,410 | |
| | | | | | | | 295,999,170 | |
| HUNGARY — 0.1% | | | | |
| | 501,217 | | | Richter Gedeon | | | 10,772,899 | |
| INDIA — 2.3% | | | | |
| | 1,734,071 | | | Ambuja Cements Ltd. | | | 6,236,647 | |
| | 2,329,000 | | | Asian Paints Ltd.(e) | | | 37,513,895 | |
| | 1,942,300 | | | Axis Bank Ltd. | | | 14,183,401 | |
| | 1,249,421 | | | Bharti Airtel Ltd.(b) | | | 5,962,140 | |
| | 1,155,700 | | | Bharti Infratel Ltd. | | | 6,013,277 | |
| | 1,367,134 | | | Dabur India Ltd. | | | 5,978,326 | |
| | 113,233 | | | Eicher Motors Ltd.(e) | | | 40,719,476 | |
| | 4,581,700 | | | Housing Development Finance Corp. | | | 94,499,513 | |
| | 842,800 | | | Maruti Suzuki India Ltd. | | | 74,405,385 | |
| | 4,573,000 | | | Motherson Sumi Systems Ltd. | | | 22,715,560 | |
| | 4,846,000 | | | Titan Co. Ltd.(e) | | | 27,735,897 | |
| | | | | | | | 335,963,517 | |
| INDONESIA — 0.2% | | | | |
| | 16,775,000 | | | Astra International Tbk PT | | | 10,574,370 | |
| Old Westbury Funds, Inc. | |
| Large Cap Strategies Fund | |
| Portfolio of Investments - (Continued) | October 31, 2016 |
| | |
| Shares | | | | | Value | |
| INDONESIA (continued) | | | | |
| | 13,671,262 | | | Bank Rakyat Indonesia Persero Tbk PT | | $ | 12,782,756 | |
| | | | | | | | 23,357,126 | |
| JAPAN — 5.9% | | | | |
| | 647,800 | | | Adastria Co. Ltd. | | | 16,999,577 | |
| | 819,300 | | | Ajinomoto Co, Inc. | | | 18,253,976 | |
| | 436,000 | | | Bandai Namco Holdings, Inc. | | | 13,096,214 | |
| | 216,100 | | | Daiichikosho Co. Ltd. | | | 9,406,851 | |
| | 100,000 | | | Fast Retailing Co. Ltd. | | | 33,813,293 | |
| | 444,400 | | | Fujifilm Holdings Corp. | | | 16,844,569 | |
| | 1,200,000 | | | Hoshizaki Electric Co. Ltd.(e) | | | 108,477,162 | |
| | 1,055,500 | | | Kyowa Hakko Kirin Co. Ltd. | | | 16,154,072 | |
| | 121,100 | | | Lawson, Inc. | | | 9,215,009 | |
| | 691,900 | | | Megmilk Snow Brand Co. Ltd. | | | 24,114,566 | |
| | 522,100 | | | Mitsubishi Tanabe Pharma Corp. | | | 10,186,103 | |
| | 1,854,000 | | | Morinaga Milk Industry Co. Ltd. | | | 14,956,460 | |
| | 1,083,000 | | | Nichirei Corp. | | | 23,741,938 | |
| | 599,238 | | | Nikon Corp. | | | 9,068,282 | |
| | 766,600 | | | Nippon Telegraph & Telephone Corp. | | | 34,064,613 | |
| | 469,100 | | | Nissin Foods Holdings Co. Ltd. | | | 27,196,796 | |
| | 5,830,000 | | | Nomura Research Institute Ltd.(e) | | | 202,635,167 | |
| | 489,000 | | | NTT Data Corp. | | | 25,273,005 | |
| | 1,708,069 | | | Ono Pharmaceutical Co. Ltd. | | | 43,438,734 | |
| | 4,057,000 | | | Osaka Gas Co. Ltd. | | | 16,894,173 | |
| | 681,400 | | | Otsuka Holdings Co. Ltd. | | | 29,869,322 | |
| | 287,300 | | | Park24 Co. Ltd. | | | 8,889,945 | |
| | 355,500 | | | Sawai Pharmaceutical Co. Ltd. | | | 23,017,498 | |
| | 250,200 | | | Secom Co. Ltd. | | | 18,091,605 | |
| | 201,800 | | | Sohgo Security Services Co. Ltd. | | | 9,217,336 | |
| | 2,370,000 | | | Sumitomo Osaka Cement Co. Ltd. | | | 9,830,743 | |
| | 484,000 | | | Terumo Corp. | | | 18,760,942 | |
| | 1,069,000 | | | Toho Gas Co. Ltd. | | | 9,918,347 | |
| | 2,138,000 | | | Toray Industries, Inc. | | | 19,954,938 | |
| | 595,800 | | | Toyo Suisan Kaisha Ltd. | | | 24,174,015 | |
| | 850,500 | | | Zensho Holdings Co. Ltd. | | | 15,911,900 | |
| | | | | | | | 861,467,151 | |
| KENYA — 0.0% | | | | |
| | 1,119,379 | | | East African Breweries Ltd. | | | 3,039,337 | |
| | 18,283,520 | | | Safaricom Ltd. | | | 3,570,368 | |
| | | | | | | | 6,609,705 | |
| LUXEMBOURG — 0.1% | | | | |
| | 337,200 | | | Tenaris SA - ADR | | | 9,509,040 | |
| MEXICO — 0.3% | | | | |
| | 51,200 | | | Fomento Economico Mexicano SAB de CV - ADR | | | 4,898,304 | |
| | 66,100 | | | Grupo Aeroportuario del Sureste SAB de CV - ADR | | | 10,509,900 | |
| | 2,495,100 | | | Grupo Financiero Banorte SAB
de CV - Series O | | | 14,718,991 | |
| Shares | | | | | Value | |
| MEXICO (continued) | | | | |
| | 509,300 | | | Grupo Televisa SAB - ADR | | $ | 12,493,129 | |
| | | | | | | | 42,620,324 | |
| NETHERLANDS — 3.1% | | | | |
| | 683,000 | | | ASML Holding NV | | | 72,138,460 | |
| | 453,140 | | | Core Laboratories NV | | | 43,940,986 | |
| | 782,843 | | | LyondellBasell Industries NV | | | 62,275,161 | |
| | 758,969 | | | Nostrum Oil & Gas Plc(b) | | | 3,260,726 | |
| | 16,515,211 | | | RELX NV(e) | | | 278,743,476 | |
| | | | | | | | 460,358,809 | |
| PERU — 0.0% | | | | |
| | 52,100 | | | CrediCorp Ltd. | | | 7,746,228 | |
| PHILIPPINES — 0.0% | | | | |
| | 1,140,100 | | | Universal Robina Corp. | | | 4,285,161 | |
| POLAND — 0.1% |
| | 316,786 | | | Bank Pekao SA | | | 9,774,280 | |
| RUSSIA — 0.3% |
| | 333,800 | | | Lukoil PJSC - ADR | | | 16,226,018 | |
| | 2,352,800 | | | Sberbank of Russia - ADR | | | 22,351,600 | |
| | | | | | | | 38,577,618 | |
| SINGAPORE — 0.7% | | | | |
| | 3,224,444 | | | Jardine Cycle & Carriage Ltd.(e) | | | 97,851,591 | |
| SOUTH AFRICA — 0.8% | | | | |
| | 428,631 | | | AngloGold Ashanti Ltd.(b) | | | 5,742,630 | |
| | 486,700 | | | Aspen Pharmacare Holdings Ltd. | | | 10,602,272 | |
| | 826,380 | | | Discovery Ltd. | | | 7,062,113 | |
| | 1,514,848 | | | Gold Fields Ltd. | | | 6,157,695 | |
| | 318,859 | | | Massmart Holdings Ltd. | | | 2,763,464 | |
| | 401,300 | | | Naspers Ltd. - Class N | | | 67,258,579 | |
| | 276,400 | | | Sasol Ltd. | | | 7,675,141 | |
| | 558,100 | | | Standard Bank Group Ltd. | | | 5,921,334 | |
| | | | | | | | 113,183,228 | |
| SOUTH KOREA — 0.9% | | | | |
| | 12,515 | | | AMOREPACIFIC Corp. | | | 3,926,489 | |
| | 242,673 | | | Hankook Tire Co. Ltd. | | | 11,706,838 | |
| | 3,783 | | | Hanssem Co. Ltd. | | | 586,832 | |
| | 54,958 | | | Hyundai Mobis | | | 13,160,142 | |
| | 315,671 | | | Korea Electric Power Corp. | | | 13,586,888 | |
| | 952,587 | | | LG Display Co. Ltd. | | | 22,727,223 | |
| | 11,100 | | | LG Household & Health Care Ltd. | | | 7,954,555 | |
| | 12,366 | | | NAVER Corp. | | | 9,261,667 | |
| | 92,684 | | | S-1 Corp. | | | 7,492,480 | |
| | 50,200 | | | Samsung Electronics Co. Ltd. - GDR | | | 35,952,718 | |
| | | | | | | | 126,355,832 | |
| SWEDEN — 1.8% | | | | |
| | 2,500,000 | | | Atlas Copco AB - A Shares | | | 73,349,092 | |
| Old Westbury Funds, Inc. | |
| Large Cap Strategies Fund | |
| Portfolio of Investments - (Continued) | October 31, 2016 |
| | |
| Shares | | | | | Value | |
| SWEDEN (continued) | | | | |
| | 14,300,000 | | | Svenska Handelsbanken AB - A Shares(e) | | $ | 195,054,334 | |
| | | | | | | | 268,403,426 | |
| SWITZERLAND — 1.5% | | | | |
| | 251,985 | | | Allied World Assurance Co. Holdings AG | | | 10,830,315 | |
| | 434,100 | | | Coca-Cola HBC AG - CDI | | | 9,383,474 | |
| | 2,693,000 | | | Nestle SA | | | 195,263,251 | |
| | | | | | | | 215,477,040 | |
| TAIWAN — 0.8% | | | | |
| | 1,160,000 | | | Advantech Co. Ltd. | | | 9,446,883 | |
| | 454,150 | | | Airtac International Group | | | 3,619,384 | |
| | 310,930 | | | Eclat Textile Co. Ltd. | | | 3,537,158 | |
| | 489,776 | | | Hiwin Technologies Corp. | | | 2,165,056 | |
| | 1,837,275 | | | Hon Hai Precision Industry Co., Ltd. | | | 4,966,159 | |
| | 3,970,000 | | | Kinsus Interconnect Technology Corp. | | | 9,170,974 | |
| | 143,000 | | | Largan Precision Co. Ltd. | | | 16,924,820 | |
| | 5,834,000 | | | Taiwan Semiconductor Manufacturing Co. Ltd. | | | 34,847,786 | |
| | 13,774,000 | | | Uni-President Enterprises Corp. | | | 26,668,507 | |
| | | | | | | | 111,346,727 | |
| THAILAND — 0.7% | | | | |
| | 2,786,000 | | | Airports of Thailand Public Co. Ltd. | | | 30,329,766 | |
| | 36,923,000 | | | CP ALL Public Co. Ltd. | | | 64,092,357 | |
| | 2,811,600 | | | Siam Commercial Bank Public Co. Ltd.(b) | | | 11,528,383 | |
| | | | | | | | 105,950,506 | |
| TURKEY — 0.0% | | | | |
| | 603,367 | | | Arcelik AS | | | 3,985,722 | |
| | 774,500 | | | Turkiye Garanti Bankasi AS | | | 2,105,048 | |
| | | | | | | | 6,090,770 | |
| UNITED ARAB EMIRATES — 0.1% | | | | |
| | 312,200 | | | DP World Ltd. | | | 5,603,990 | |
| | 1,999,000 | | | Emaar Properties PJSC | | | 3,793,417 | |
| | 339,800 | | | MHP SA - GDR | | | 3,211,110 | |
| | | | | | | | 12,608,517 | |
| UNITED KINGDOM — 2.6% | | | | |
| | 890,768 | | | ASOS Plc(b)(e) | | | 57,317,307 | |
| | 278,302 | | | BGEO Group Plc | | | 10,069,408 | |
| | 1,399,501 | | | Reckitt Benckiser Group Plc | | | 125,271,414 | |
| | 4,637,000 | | | Rolls-Royce Holdings Plc | | | 41,234,042 | |
| | 213,302,000 | | | Rolls-Royce Holdings Plc - C shares | | | 261,083 | |
| | 3,270,000 | | | Whitbread Plc(e) | | | 144,690,243 | |
| | | | | | | | 378,843,497 | |
| UNITED STATES — 56.5% | | | | |
| | 1,557,381 | | | AGNC Investment Corp. REIT | | | 31,241,063 | |
| Shares | | | | | Value | |
| UNITED STATES (continued) | | | | |
| | 661,200 | | | Allergan Plc(b) | | $ | 138,151,128 | |
| | 55,000 | | | Alphabet, Inc. - Class A(b) | | | 44,544,500 | |
| | 325,000 | | | Alphabet, Inc. - Class C(b) | | | 254,975,500 | |
| | 306,700 | | | Amazon.com, Inc.(b) | | | 242,237,794 | |
| | 113,875 | | | Amsurg Corp.(b) | | | 6,804,031 | |
| | 1,172,400 | | | Anadarko Petroleum Corp. | | | 69,687,456 | |
| | 2,902,584 | | | Annaly Capital Management, Inc., REIT | | | 30,070,770 | |
| | 1,524,709 | | | Apple, Inc. | | | 173,115,460 | |
| | 2,655,000 | | | Automatic Data Processing, Inc. | | | 231,144,300 | |
| | 123,690 | | | AutoZone, Inc.(b) | | | 91,797,770 | |
| | 2,338,557 | | | Bank of New York Mellon Corp. (The) | | | 101,189,361 | |
| | 1,085,162 | | | Baxter International, Inc. | | | 51,642,860 | |
| | 1,158,000 | | | Becton Dickinson and Co. | | | 194,439,780 | |
| | 1,610,169 | | | Berkshire Hathaway, Inc. - Class B(b) | | | 232,347,387 | |
| | 223,557 | | | Big Lots, Inc. | | | 9,702,374 | |
| | 169,000 | | | Biogen Idec, Inc.(b) | | | 47,350,420 | |
| | 509,000 | | | BioMarin Pharmaceutical, Inc.(b) | | | 40,984,680 | |
| | 2,745,000 | | | Bristol-Myers Squibb Co. | | | 139,747,950 | |
| | 107,762 | | | Cardinal Health, Inc. | | | 7,402,172 | |
| | 483,000 | | | Cerner Corp.(b) | | | 28,294,140 | |
| | 2,110,000 | | | Charles Schwab Corp. (The) | | | 66,887,000 | |
| | 234,797 | | | Cheesecake Factory, Inc. (The) | | | 12,488,852 | |
| | 74,000 | | | Chipotle Mexican Grill, Inc.(b) | | | 26,696,240 | |
| | 392,791 | | | Clorox Co. (The) | | | 47,142,776 | |
| | 1,902,800 | | | Cognizant Technology Solutions Corp. - Class A(b) | | | 97,708,780 | |
| | 2,244,400 | | | Colgate-Palmolive Co. | | | 160,160,384 | |
| | 1,138,454 | | | Comcast Corp. - Class A | | | 70,379,226 | |
| | 4,785,450 | | | Corning, Inc. | | | 108,677,570 | |
| | 1,315,000 | | | Costco Wholesale Corp. | | | 194,449,050 | |
| | 66,854 | | | Cracker Barrel Old Country Store, Inc. | | | 9,225,852 | |
| | 862,748 | | | Darden Restaurants, Inc. | | | 55,897,443 | |
| | 532,000 | | | Edwards Lifesciences Corp.(b) | | | 50,657,040 | |
| | 305,765 | | | Equity Commonwealth REIT(b) | | | 9,237,161 | |
| | 876,000 | | | Facebook, Inc. - Class A(b) | | | 114,747,240 | |
| | 275,780 | | | FLIR Systems, Inc. | | | 9,078,678 | |
| | 1,426,250 | | | Fluor Corp. | | | 74,150,738 | |
| | 275,609 | | | FTI Consulting, Inc.(b) | | | 10,737,727 | |
| | 3,059,650 | | | Gap, Inc. (The) | | | 84,415,744 | |
| | 1,779,200 | | | Gilead Sciences, Inc. | | | 131,002,496 | |
| | 324,102 | | | Hancock Holding Co. | | | 10,873,622 | |
| | 8,058,900 | | | Hewlett Packard Enterprise Co. | | | 181,083,483 | |
| | 320,000 | | | Illumina, Inc.(b) | | | 43,564,800 | |
| | 337,219 | | | International Business Machines Corp. | | | 51,827,188 | |
| | 153,512 | | | Jack Henry & Associates, Inc. | | | 12,437,542 | |
| | 438,205 | | | Johnson & Johnson | | | 50,827,398 | |
| | 1,884,298 | | | JPMorgan Chase & Co. | | | 130,506,479 | |
| | 434,000 | | | Kansas City Southern | | | 38,087,840 | |
| | 2,519,600 | | | Kraft Heinz Co. (The) | | | 224,118,420 | |
| | 856,000 | | | Las Vegas Sands Corp. | | | 49,545,280 | |
| Old Westbury Funds, Inc. | |
| Large Cap Strategies Fund | |
| Portfolio of Investments - (Continued) | October 31, 2016 |
| | |
| Shares | | | | | Value | |
| UNITED STATES (continued) | | | | |
| | 760,024 | | | Lockheed Martin Corp. | | $ | 187,254,713 | |
| | 130,280 | | | Magellan Health, Inc.(b) | | | 6,702,906 | |
| | 214,000 | | | Markel Corp.(b)(e) | | | 187,770,020 | |
| | 2,316,500 | | | Mastercard, Inc. - Class A | | | 247,911,830 | |
| | 3,410,700 | | | Mattel, Inc. | | | 107,539,371 | |
| | 429,994 | | | McDonald’s Corp. | | | 48,404,425 | |
| | 579,000 | | | Medidata Solutions, Inc.(b)(e) | | | 27,786,210 | |
| | 361,700 | | | Medtronic Plc | | | 29,666,634 | |
| | 1,174,800 | | | Merck & Co., Inc. | | | 68,984,256 | |
| | 566,000 | | | Monsanto Co. | | | 57,035,820 | |
| | 107,541 | | | Morningstar, Inc. | | | 7,595,621 | |
| | 890,000 | | | NIKE, Inc. - Class B | | | 44,660,200 | |
| | 619,742 | | | NiSource, Inc. | | | 14,415,199 | |
| | 983,220 | | | Occidental Petroleum Corp. | | | 71,686,570 | |
| | 2,786,320 | | | Oracle Corp. | | | 107,050,414 | |
| | 84,948 | | | Panera Bread Co. - Class A(b) | | | 16,204,680 | |
| | 1,424,752 | | | People’s United Financial, Inc. | | | 23,137,972 | |
| | 1,391,500 | | | PepsiCo, Inc. | | | 149,168,800 | |
| | 1,487,000 | | | Philip Morris International, Inc. | | | 143,406,280 | |
| | 1,192,183 | | | PNC Financial Services Group, Inc. (The) | | | 113,972,695 | |
| | 143,300 | | | Priceline Group, Inc. (The)(b) | | | 211,257,159 | |
| | 124,571 | | | Procter & Gamble Co. (The) | | | 10,812,763 | |
| | 1,448,000 | | | QUALCOMM, Inc. | | | 99,506,560 | |
| | 1,869,526 | | | Quest Diagnostics, Inc. | | | 152,254,197 | |
| | 1,870,100 | | | Range Resources Corp. | | | 63,190,679 | |
| | 267,473 | | | Raytheon Co. | | | 36,539,487 | |
| | 138,000 | | | Regeneron Pharmaceuticals, Inc.(b) | | | 47,612,760 | |
| | 771,360 | | | Republic Services, Inc. | | | 40,596,677 | |
| | 186,707 | | | Sanderson Farms, Inc. | | | 16,799,896 | |
| | 291,176 | | | Sykes Enterprises, Inc.(b) | | | 7,786,046 | |
| | 1,513,500 | | | Synchrony Financial | | | 43,270,965 | |
| | 3,912,700 | | | Texas Instruments, Inc. | | | 277,214,795 | |
| | 679,955 | | | TJX Cos., Inc. | | | 50,146,681 | |
| | 376,936 | | | Tyson Foods, Inc. - Class A | | | 26,705,916 | |
| | 288,000 | | | Under Armour, Inc. - Class A(b) | | | 8,956,800 | |
| | 290,044 | | | Under Armour, Inc. - Class C(b) | | | 7,500,538 | |
| | 571,100 | | | UnitedHealth Group, Inc. | | | 80,713,563 | |
| | 5,491,000 | | | US Bancorp | | | 245,777,160 | |
| | 3,212,789 | | | Verizon Communications, Inc. | | | 154,535,151 | |
| | 1,246,000 | | | Visa, Inc. - Class A | | | 102,807,460 | |
| | 1,200,000 | | | Wabtec Corp. | | | 92,772,000 | |
| | 388,200 | | | Walgreens Boots Alliance, Inc. | | | 32,115,786 | |
| | 728,537 | | | Wal-Mart Stores, Inc. | | | 51,012,161 | |
| | 730,000 | | | Walt Disney Co. (The) | | | 67,663,700 | |
| | 799,327 | | | Waste Management, Inc. | | | 52,483,811 | |
| | 3,974,000 | | | Wells Fargo & Co. | | | 182,843,740 | |
| | 1,810,000 | | | Whole Foods Market, Inc. | | | 51,204,900 | |
| | 847,000 | | | Workday, Inc. - Class A(b) | | | 73,417,960 | |
| | | | | | | | 8,241,336,872 | |
Total Common Stocks
(Cost $11,781,930,111) | | | 13,657,007,762 | |
| Shares | | | | | Value | |
| MASTER LIMITED PARTNERSHIPS — 0.2% | | | | |
| UNITED STATES — 0.2% | | | | |
| | 185,853 | | | AmeriGas Partners LP(e) | | $ | 8,874,481 | |
| | 558,595 | | | Spectra Energy Partners LP(e) | | | 23,818,491 | |
| | | | | | | | 32,692,972 | |
Total Master Limited Partnerships
(Cost $35,627,020) | | | 32,692,972 | |
| PREFERRED STOCKS — 0.1% | | | | |
| SOUTH KOREA — 0.1% | | | | |
| | 11,100 | | | Samsung Electronics Co. Ltd. - GDR, 6.74% | | | 6,387,896 | |
Total Preferred Stocks
(Cost $5,313,420) | | | 6,387,896 | |
| | | | | |
| PARTICIPATION NOTES — 0.0% | | | | |
| UNITED KINGDOM — 0.0% | | | | |
| | 140,320 | | | HSBC Bank Plc (Qatar National Bank), 3.50 QAR, due 9/9/19(f) | | | 6,219,221 | |
Total Participation Notes
(Cost $6,046,417) | | | 6,219,221 | |
| | | | | |
| Principal | | | | | | |
| Amount | | | | | | |
| U.S. GOVERNMENT AGENCIES — 2.5% | | | | |
| Federal Home Loan Bank — 2.5% | | | | |
| $ | 20,000,000 | | | 0.28%, 11/04/16(c) | | | 19,999,660 | |
| | 17,000,000 | | | 0.33%, 11/09/16(c) | | | 16,999,252 | |
| | 53,000,000 | | | 0.27%, 11/14/16(c) | | | 52,996,184 | |
| | 13,900,000 | | | 0.28%, 11/14/16(c) | | | 13,898,999 | |
| | 61,100,000 | | | 0.28%, 11/18/16(c) | | | 61,094,257 | |
| | 15,400,000 | | | 0.27%, 11/23/16(c) | | | 15,398,121 | |
| | 11,400,000 | | | 0.25%, 11/28/16(c) | | | 11,398,290 | |
| | 77,000,000 | | | 0.29%, 12/09/16(c) | | | 76,982,906 | |
| | 83,000,000 | | | 0.27%, 12/16/16(c) | | | 82,978,171 | |
| | 13,200,000 | | | 0.26%, 12/19/16(c) | | | 13,196,304 | |
Total U.S. Government Agencies
(Cost $364,923,539) | | | 364,942,144 | |
| Old Westbury Funds, Inc. | |
| Large Cap Strategies Fund | |
| Portfolio of Investments - (Continued) | October 31, 2016 |
| | |
| Shares | | | | | Value | |
| EXCHANGE TRADED FUNDS — 2.1% | | | | |
| | 3,000,000 | | | iShares MSCI Emerging Markets Index Fund | | $ | 111,420,000 | |
| | 930,000 | | | iShares S&P 500 Index Fund | | | 198,731,700 | |
Total Exchange Traded Funds
(Cost $303,874,965) | | | 310,151,700 | |
| INVESTMENT COMPANY — 1.7% | | | | |
| | 248,076,200 | | | Federated Government Obligations Fund, 0.01%(d) | | | 248,076,200 | |
Total Investment Company
(Cost $248,076,200) | | | 248,076,200 | |
| | | | | | | | | |
TOTAL INVESTMENTS — 100.2%
(Cost $12,745,791,672)(a) | | | 14,625,477,895 | |
| LIABILITIES IN EXCESS OF OTHER ASSETS — (0.2)% | | | (29,586,643 | ) |
| NET ASSETS — 100.0% | | $ | 14,595,891,252 | |
| (a) | Cost for federal income tax purposes is $12,761,212,227 and net unrealized appreciation of investments is as follows: |
| Unrealized appreciation | | $ | 2,233,687,862 | |
| Unrealized depreciation | | | (369,422,194 | ) |
| Net unrealized appreciation | | $ | 1,864,265,668 | |
| (b) | Non-income producing security. |
| (c) | The rate represents the annualized yield at time of purchase. |
| (d) | Rate shown represents current yield at October 31, 2016. |
| (e) | This security is considered either fully or partially illiquid. These securities, or portions thereof, have a value of $1,392,645,589 or 9.54% of net assets. |
| (f) | Security exempt from registration under Rule 144A of the Securities Act of 1933, as amended. The security may be resold in transactions exempt from registration normally to qualified institutional buyers. The security has been determined to be liquid in accordance with procedures adopted by the Fund’s Board of Directors. The aggregate value of these securities is $6,219,221 which is 0.04% of net assets. |
ADR-American Depositary Receipt
CDI-Chess Depositary Interests
GDR-Global Depositary Receipt
QAR-Qatari Rial
REIT-Real Estate Investment Trust
Portfolio diversification by Sector (Unaudited)
| | | Percentage |
| Sector | | of Net Assets |
| Banks | | | 6.9 | % |
| Consumer Discretionary | | | 14.7 | |
| Consumer Staples | | | 14.1 | |
| Diversified Financials | | | 4.4 | |
| Energy | | | 2.6 | |
| Health Care | | | 11.7 | |
| Industrials | | | 9.7 | |
| Information Technology | | | 22.3 | |
| Insurance | | | 3.6 | |
| Materials | | | 1.4 | |
| Real Estate | | | 0.3 | |
| Telecommunication Services | | | 1.7 | |
| Utilities | | | 0.4 | |
| Other* | | | 6.2 | |
| | | | 100.0 | % |
| * | Includes cash and equivalents, participation notes, exchange traded funds, U.S. government agencies, investment company, pending trades and Fund share transactions, interest and dividends receivable, prepaid and accrued expenses payable. |
| Old Westbury Funds, Inc. | |
| Small & Mid Cap Fund | |
| Condensed Portfolio of Investments | |
| | October 31, 2016 |
| Shares | | | | | Percentage of
Net Assets (%) | | | Value | |
| COMMON STOCKS — 93.8% |
| AUSTRALIA — 1.7% |
| | 38,835,919 | | | Other Securities | | | 1.7 | | | $ | 93,849,550 | |
| AUSTRIA — 0.2% |
| | 274,366 | | | Other Securities | | | 0.2 | | | | 8,138,608 | |
| BELGIUM — 0.2% |
| | 340,148 | | | Other Securities | | | 0.2 | | | | 10,251,445 | |
| BERMUDA — 1.2% |
| | 321,498 | | | Argo Group International Holdings Ltd.(b) | | | 0.3 | | | | 17,875,289 | |
| | 325,000 | | | Endurance Specialty Holdings Ltd. | | | 0.5 | | | | 29,883,750 | |
| | 644,797 | | | Other Securities | | | 0.4 | | | | 20,211,386 | |
| | | | | | | | | | | | 67,970,425 | |
| BRAZIL — 0.3% |
| | 2,807,276 | | | Other Securities | | | 0.3 | | | | 16,849,099 | |
| CAMBODIA — 0.0% |
| | 166,000 | | | Other Securities | | | 0.0 | | | | 102,525 | |
| CANADA — 2.3% |
| | 1,433,521 | | | CAE, Inc. | | | 0.4 | | | | 20,135,343 | |
| | 8,991,889 | | | Other Securities | | | 1.9 | | | | 107,207,509 | |
| | | | | | | | | | | | 127,342,852 | |
| CAYMAN ISLANDS — 0.0% |
| | 36,700 | | | Other Securities | | | 0.0 | | | | 2,214,845 | |
| CHILE — 0.1% |
| | 30,020,572 | | | Other Securities | | | 0.1 | | | | 2,626,716 | |
| CHINA — 1.2% |
| | 118,597,066 | | | Other Securities | | | 1.2 | | | | 64,369,399 | |
| CURACAO — 0.1% |
| | 71,060 | | | Other Securities | | | 0.1 | | | | 2,511,971 | |
| DENMARK — 0.5% |
| | 876,504 | | | Other Securities | | | 0.5 | | | | 29,343,812 | |
| FAEROE ISLANDS — 0.0% |
| | 7,482 | | | Other Securities | | | 0.0 | | | | 313,865 | |
| FINLAND — 0.4% |
| | 1,396,365 | | | Other Securities | | | 0.4 | | | | 20,208,442 | |
| FRANCE — 1.4% |
| | 1,967,593 | | | Other Securities | | | 1.4 | | | | 77,892,731 | |
| GERMANY — 1.6% |
| | 152,665 | | | MTU Aero Engines AG | | | 0.3 | | | | 15,934,341 | |
| | 1,825,948 | | | Other Securities | | | 1.3 | | | | 72,141,854 | |
| | | | | | | | | | | | 88,076,195 | |
| GIBRALTAR — 0.0% |
| | 23,380 | | | Other Securities | | | 0.0 | | | | 62,242 | |
| GREECE — 0.0% |
| | 351,663 | | | Other Securities | | | 0.0 | | | | 619,723 | |
| Shares | | | | | Percentage of
Net Assets (%) | | | Value | |
| GUERNSEY — 0.0% |
| | 5,739 | | | Other Securities | | | 0.0 | | | $ | 2,740 | |
| HONG KONG — 1.1% |
| | 152,550,097 | | | Other Securities | | | 1.1 | | | | 62,425,471 | |
| HUNGARY — 0.0% |
| | 34,386 | | | Other Securities | | | 0.0 | | | | 63,002 | |
| INDIA — 1.3% |
| | 14,591,400 | | | Other Securities | | | 1.3 | | | | 69,594,797 | |
| INDONESIA — 0.5% |
| | 286,712,466 | | | Other Securities | | | 0.5 | | | | 25,580,518 | |
| IRELAND — 0.3% |
| | 1,478,698 | | | Other Securities | | | 0.3 | | | | 17,158,885 | |
| ISLE OF MAN — 0.0% |
| | 19,921 | | | Other Securities | | | 0.0 | | | | 169,830 | |
| ISRAEL — 1.5% |
| | 850,833 | | | Check Point Software Technologies Ltd.(c) | | | 1.3 | | | | 71,946,438 | |
| | 4,044,148 | | | Other Securities | | | 0.2 | | | | 12,135,828 | |
| | | | | | | | | | | | 84,082,266 | |
| ITALY — 0.3% |
| | 4,006,881 | | | Other Securities | | | 0.3 | | | | 15,582,407 | |
| JAPAN — 6.1% |
| | 333,300 | | | Nifco, Inc. | | | 0.3 | | | | 19,228,235 | |
| | 30,670,127 | | | Other Securities | | | 5.8 | | | | 314,740,216 | |
| | | | | | | | | | | | 333,968,451 | |
| JERSEY CHANNEL ISLANDS — 0.1% |
| | 1,135,429 | | | Other Securities | | | 0.1 | | | | 4,455,681 | |
| LUXEMBOURG — 0.2% |
| | 379,267 | | | Other Securities | | | 0.2 | | | | 10,427,502 | |
| MALAYSIA — 0.4% |
| | 34,247,043 | | | Other Securities | | | 0.4 | | | | 21,158,349 | |
| MALTA — 0.0% |
| | 34,973 | | | Other Securities | | | 0.0 | | | | 308,603 | |
| MARTINIQUE — 0.0% |
| | 100,000 | | | Other Securities | | | 0.0 | | | | 165,559 | |
| MEXICO — 0.4% |
| | 13,947,615 | | | Other Securities | | | 0.4 | | | | 21,770,190 | |
| MONACO — 0.0% |
| | 12,500 | | | Other Securities | | | 0.0 | | | | 244,166 | |
| NETHERLANDS — 0.5% |
| | 1,372,140 | | | Other Securities | | | 0.5 | | | | 24,512,061 | |
| NEW ZEALAND — 0.7% |
| | 3,211,087 | | | Auckland International Airport Ltd.(b) | 0.3 | | | | 15,132,234 | |
| | 9,655,172 | | | Other Securities | | | 0.4 | | | | 22,868,366 | |
| | | | | | | | | | | | 38,000,600 | |
| Old Westbury Funds, Inc. | |
| Small & Mid Cap Fund | |
| Condensed Portfolio of Investments - (Continued) | |
| | October 31, 2016 |
| Shares | | | | | Percentage of
Net Assets (%) | | | Value | |
| NORWAY — 0.1% |
| | 1,113,126 | | | Other Securities | | | 0.1 | | | $ | 5,149,119 | |
| PERU — 0.1% |
| | 3,212,966 | | | Other Securities | | | 0.1 | | | | 3,714,119 | |
| PHILIPPINES — 0.2% |
| | 45,589,090 | | | Other Securities | | | 0.2 | | | | 12,078,087 | |
| POLAND — 0.1% |
| | 729,772 | | | Other Securities | | | 0.1 | | | | 2,811,131 | |
| PORTUGAL — 0.0% |
| | 1,635,349 | | | Other Securities | | | 0.0 | | | | 1,717,457 | |
| PUERTO RICO — 0.0% |
| | 74,300 | | | Other Securities | | | 0.0 | | | | 1,125,645 | |
| ROMANIA — 0.0% |
| | 3,619 | | | Other Securities | | | 0.0 | | | | 44,624 | |
| SINGAPORE — 1.0% |
| | 4,320,000 | | | SATS Ltd. | | | 0.3 | | | | 15,028,787 | |
| | 30,364,360 | | | Other Securities | | | 0.7 | | | | 41,975,247 | |
| | | | | | | | | | | | 57,004,034 | |
| SOUTH AFRICA — 0.4% |
| | 5,365,619 | | | Other Securities | | | 0.4 | | | | 23,777,049 | |
| SOUTH KOREA — 1.0% |
| | 2,866,352 | | | Other Securities | | | 1.0 | | | | 52,468,259 | |
| SPAIN — 0.3% |
| | 2,347,389 | | | Other Securities | | | 0.3 | | | | 15,364,598 | |
| SWEDEN — 0.8% |
| | 3,359,819 | | | Other Securities | | | 0.8 | | | | 43,700,884 | |
| SWITZERLAND — 1.5% |
| | 615,000 | | | Allied World Assurance Co. Holdings AG | | | 0.5 | | | | 26,432,700 | |
| | 1,062,997 | | | Other Securities | | | 1.0 | | | | 55,665,522 | |
| | | | | | | | | | | | 82,098,222 | |
| TAIWAN — 0.8% |
| | 48,935,030 | | | Other Securities | | | 0.8 | | | | 45,836,320 | |
| THAILAND — 0.3% |
| | 42,251,956 | | | Other Securities | | | 0.3 | | | | 15,015,827 | |
| TURKEY — 0.0% |
| | 1,458,590 | | | Other Securities | | | 0.0 | | | | 2,279,377 | |
| UKRAINE — 0.0% |
| | 11,788 | | | Other Securities | | | 0.0 | | | | 188,872 | |
| UNITED ARAB EMIRATES — 0.0% |
| | 64,871 | | | Other Securities | | | 0.0 | | | | 58,361 | |
| UNITED KINGDOM — 3.6% |
| | 400,493 | | | Croda International Plc | | | 0.3 | | | | 17,147,386 | |
| | 28,373,403 | | | Other Securities | | | 3.3 | | | | 180,819,577 | |
| | | | | | | | | | | | 197,966,963 | |
| UNITED STATES — 59.0% |
| | 452,587 | | | Advance Auto Parts, Inc. | | | 1.2 | | | | 63,398,387 | |
| Shares | | | | | Percentage of
Net Assets (%) | | | Value | |
| UNITED STATES (continued) |
| | 768,000 | | | ANSYS, Inc.(c) | | | 1.3 | | | $ | 70,156,800 | |
| | 343,900 | | | Blackbaud, Inc. | | | 0.4 | | | | 21,115,460 | |
| | 495,000 | | | Cepheid, Inc.(c) | | | 0.5 | | | | 26,185,500 | |
| | 325,000 | | | CLARCOR, Inc.(b) | | | 0.4 | | | | 20,218,250 | |
| | 385,000 | | | CONMED Corp.(b) | | | 0.3 | | | | 15,400,000 | |
| | 533,000 | | | Cooper Cos., Inc. (The) | | | 1.7 | | | | 93,829,320 | |
| | 2,730,400 | | | CoreLogic, Inc.(b)(c) | | | 2.1 | | | | 116,205,824 | |
| | 460,000 | | | CR Bard, Inc. | | | 1.8 | | | | 99,672,800 | |
| | 860,759 | | | Dun & Bradstreet Corp. (The)(b) | | | 2.0 | | | | 107,465,761 | |
| | 3,110,000 | | | Hanesbrands, Inc. | | | 1.5 | | | | 79,927,000 | |
| | 136,300 | | | ICU Medical, Inc.(c) | | | 0.3 | | | | 18,986,590 | |
| | 595,000 | | | IDEX Corp. | | | 0.9 | | | | 51,431,800 | |
| | 336,200 | | | Integra LifeScience Holdings Corp.(c) | | | 0.5 | | | | 26,731,262 | |
| | 524,800 | | | JM Smucker Co. (The) | | | 1.3 | | | | 68,911,488 | |
| | 430,000 | | | John Wiley & Sons, Inc. - Class A(b) | | | 0.4 | | | | 22,188,000 | |
| | 2,500,000 | | | KAR Auction Services, Inc.(b) | | | 1.9 | | | | 106,450,000 | |
| | 830,000 | | | Laboratory Corp of America Holdings(c) | | | 1.9 | | | | 104,032,200 | |
| | 225,000 | | | LogMein, Inc. | | | 0.4 | | | | 21,375,000 | |
| | 1,441,000 | | | Nasdaq, Inc. | | | 1.7 | | | | 92,180,770 | |
| | 2,243,900 | | | Newell Brands, Inc. | | | 2.0 | | | | 107,752,078 | |
| | 13,004,296 | | | Nexteer Automotive Group Ltd. | | | 0.3 | | | | 17,136,619 | |
| | 713,272 | | | NIC, Inc.(b) | | | 0.3 | | | | 16,369,592 | |
| | 317,500 | | | NuVasive, Inc.(c) | | | 0.3 | | | | 18,964,275 | |
| | 1,825,000 | | | Patterson Cos., Inc.(b) | | | 1.4 | | | | 77,945,750 | |
| | 500,000 | | | Qualys, Inc.(b)(c) | | | 0.3 | | | | 18,625,000 | |
| | 538,593 | | | Rockwell Collins, Inc. | | | 0.8 | | | | 45,414,162 | |
| | 11,694,600 | | | Samsonite International SA(b) | | | 0.7 | | | | 36,792,779 | |
| | 594,000 | | | Snap-on, Inc. | | | 1.7 | | | | 91,535,400 | |
| | 600,000 | | | Snyder’s-Lance, Inc. | | | 0.4 | | | | 21,342,000 | |
| | 860,000 | | | Spectrum Brands Holdings, Inc.(b) | | | 2.1 | | | | 116,306,400 | |
| | 265,000 | | | TreeHouse Foods, Inc.(c) | | | 0.4 | | | | 23,182,200 | |
| | 250,000 | | | UMB Financial Corp. | | | 0.3 | | | | 15,512,500 | |
| | 815,000 | | | Universal Health Services, Inc., Series B | | | 1.8 | | | | 98,378,650 | |
| | 1,350,000 | | | Vantiv, Inc. - Class A(c) | | | 1.4 | | | | 78,786,000 | |
| | 795,000 | | | Wabtec Corp. | | | 1.1 | | | | 61,461,450 | |
| | 502,351 | | | Waters Corp.(c) | | | 1.3 | | | | 69,897,118 | |
| | 200,000 | | | WEX, Inc.(c) | | | 0.4 | | | | 21,820,000 | |
| | 1,035,000 | | | Wolverine World Wide, Inc. | | | 0.4 | | | | 22,097,250 | |
| | 1,633,500 | | | Wyndham Worldwide Corp. | | | 2.0 | | | | 107,549,640 | |
| | 27,307,518 | | | Other Securities | | | 17.1 | | | | 935,626,493 | |
| | | | | | | | | | | | 3,228,357,568 | |
Total Common Stocks
(Cost $4,109,361,311) | | | | | | 5,133,172,039 | |
| Old Westbury Funds, Inc. | |
| Small & Mid Cap Fund | |
| Condensed Portfolio of Investments - (Continued) | |
| | October 31, 2016 |
| Shares | | | | | Percentage of
Net Assets (%) | | | Value | |
| INVESTMENT COMPANY — 1.1% |
| | 62,714,100 | | | SEI Daily Income Trust Government II Fund, Class A 0.01%(d) | | | 1.1 | | | | 62,714,100 | |
Total Investment Company
(Cost $62,714,100) | | | | | | 62,714,100 | |
| EXCHANGE TRADED FUNDS — 3.5% |
| | 100,861 | | | iShares MSCI Japan Small Cap Index Fund(b) | | | 0.1 | | | | 6,569,077 | |
| | 175,300 | | | iShares S&P Small Cap 600 Value Index Fund | | | 0.4 | | | $ | 21,060,542 | |
| | 180,000 | | | SPDR S&P Emerging Markets Small Cap Index Fund(b) | | | 0.1 | | | | 7,740,000 | |
| | 860,000 | | | SPDR S&P Oil & Gas Exploration & Production Index Fund | | | 0.6 | | | | 30,401,000 | |
| | 868,200 | | | SPDR S&P Regional Banking Index Fund | | | 0.7 | | | | 38,018,478 | |
| | 229,300 | | | Vanguard Mid-Cap Value ETF | | | 0.4 | | | | 20,937,383 | |
| | 495,750 | | | Vanguard Small-Cap ETF | | | 1.1 | | | | 58,111,815 | |
| | 185,000 | | | WisdomTree Emerging Markets SmallCap Dividend Fund | | | 0.1 | | | | 7,594,250 | |
Total Exchange Traded Funds
(Cost $163,250,010) | | | | | | 190,432,545 | |
| RIGHTS/WARRANTS — 0.0% |
| | 1,113,591 | | | Other Rights/Warrants | | | 0.0 | | | | 209,988 | |
Total Rights/Warrants
(Cost $103,022) | | | | | | 209,988 | |
| | | | | | | | |
| U.S. GOVERNMENT AGENCIES — 0.6% |
| Federal Home Loan Bank — 0.6% |
| $ | 8,600,000 | | | 0.25%, 11/28/2016(e) | | | 0.2 | | | | 8,598,710 | |
| | 9,800,000 | | | 0.26%, 12/19/2016(e) | | | 0.2 | | | | 9,797,256 | |
| | 11,600,000 | | | 0.27%, 11/23/2016(e) | | | 0.2 | | | | 11,598,585 | |
Total U.S. Government Agencies
(Cost $29,993,190) | | | | | | 29,994,551 | |
| Shares | | | | | | | | | Value | |
| CASH SWEEP — 1.0% |
| | 54,342,747 | | | Citibank - US Dollars on Deposit in Custody Account, 0.02%(d) | 1.0 | | | $ | 54,342,747 | |
Total Cash Sweep
(Cost $54,342,747) | | 54,342,747 | |
TOTAL INVESTMENTS — 100.0%
(Cost $4,419,764,380)(a) | $ | 5,470,865,970 | |
| OTHER ASSETS IN EXCESS OF LIABILITIES — 0.0% | | 757,555 | |
| NET ASSETS — 100.0% | $ | 5,471,623,525 | |
| (a) | Cost for federal income tax purposes is $4,431,768,641 and net unrealized appreciation of investments is as follows: |
| | Unrealized appreciation | | $ | 1,182,602,979 | |
| | Unrealized depreciation | | | (143,505,650 | ) |
| | Net unrealized appreciation | | $ | 1,039,097,329 | |
| (b) | This security is considered either fully or partially illiquid. These securities, or portions thereof, have a value of $489,280,110 or 8.94% of net assets. |
| (c) | Non-income producing security. |
| (d) | The rate shown is the current yield as of October 31, 2016. |
| (e) | The rate represents the annualized yield at time of purchase. |
This Condensed Portfolio of Investments does not reflect the complete portfolio holdings of the Fund. It includes the Fund’s 50 largest holdings and each investment of any issuer that exceeds 1% of the Fund’s net assets. “Other Securities” represent all issues not required to be disclosed under the rules adopted by the U.S. Securities and Exchange Commission (“SEC”). The complete Portfolio of Investments is available (i) without charge, upon request, by calling (800) 607-2200; and (ii) on the SEC’s website at http://www.sec.gov.
Level 3 common stocks and rights with a value of $888,822 (cost of $8,412,587) or 0.02% of net assets were fair valued by the Board of Directors.
| Old Westbury Funds, Inc. | |
| Small & Mid Cap Fund | |
| Condensed Portfolio of Investments - (Continued) | |
| | October 31, 2016 |
Portfolio diversification by Sector (Unaudited)
| Sector | | Percentage
of Net Assets |
| Industrials | | | 20.5 | % |
| Health Care | | | 16.5 | |
| Consumer Discretionary | | | 15.2 | |
| Information Technology | | | 12.7 | |
| Consumer Staples | | | 8.5 | |
| Materials | | | 5.0 | |
| Diversified Financials | | | 3.4 | |
| Banks | | | 3.3 | |
| Insurance | | | 2.7 | |
| Real Estate | | | 2.6 | |
| Utilities | | | 2.0 | |
| Energy | | | 1.0 | |
| Telecommunication Services | | | 0.4 | |
| Other* | | | 6.2 | |
| Total | | | 100.0 | % |
| * | Includes cash and equivalents, exchange traded funds, rights/warrants, U.S. government agencies, investment companies, pending trades and Fund share transactions, interest and dividends receivable, prepaids and accrued expenses payable. |
| Old Westbury Funds, Inc. | |
| Strategic Opportunities Fund | |
| Consolidated Portfolio of Investments | |
| | October 31, 2016 |
| Shares | | | | | Value | |
| COMMON STOCKS — 8.2% | | | |
| BELGIUM — 0.1% | | | |
| | 55,888 | | | Groupe Bruxelles Lambert SA | | $ | 4,807,491 | |
| BERMUDA — 0.4% | | | |
| | 24,440 | | | Everest Re Group Ltd. | | | 4,974,029 | |
| | 84,242 | | | RenaissanceRe Holdings Ltd. | | | 10,470,438 | |
| | 113,109 | | | Validus Holdings Ltd. | | | 5,779,870 | |
| | | | | | | | 21,224,337 | |
| CANADA — 0.1% | | | |
| | 45,000 | | | Potash Corp of Saskatchewan, Inc. | | | 732,600 | |
| | 104,779 | | | Toronto-Dominion Bank (The) | | | 4,754,231 | |
| | 15,832 | | | Waste Connections, Inc. | | | 1,188,138 | |
| | | | | | | | 6,674,969 | |
| CHINA — 0.3% |
| | 11,207,000 | | | Bank of China Ltd. - H Shares | | | 5,028,703 | |
| | 6,751,000 | | | China Construction Bank Corp. - H Shares | | | 4,944,289 | |
| | 2,608,500 | | | China Shenhua Energy Co. Ltd. - H Shares | | | 5,428,524 | |
| | 8,124,000 | | | Industrial & Commercial Bank of China Ltd. - H Shares | | | 4,891,862 | |
| | | | | | | | 20,293,378 | |
| HONG KONG — 0.4% | | |
| | 4,772,000 | | | Anxin-China Holdings Ltd.(b)(c)(d) | | | 44,425 | |
| | 268,000 | | | Cheung Kong Infrastructure Holdings Ltd. | | | 2,196,027 | |
| | 2,236,000 | | | China Lumena New Materials Corp.(b)(c)(d) | | | 0 | |
| | 257,800 | | | Hang Seng Bank Ltd. | | | 4,657,024 | |
| | 2,401,000 | | | Hong Kong & China Gas Co Ltd. | | | 4,705,688 | |
| | 801,000 | | | Link REIT (The) | | | 5,711,432 | |
| | 1,031,500 | | | Yue Yuen Industrial Holdings Ltd. | | | 3,930,195 | |
| | | | | | | | 21,244,791 | |
| JAPAN — 1.0% |
| | 96,200 | | | Ajinomoto Co, Inc. | | | 2,143,333 | |
| | 57,000 | | | Daiichikosho Co. Ltd. | | | 2,481,215 | |
| | 470,000 | | | Fukuyama Transporting Co. Ltd. | | | 2,680,080 | |
| | 35,007 | | | Hisamitsu Pharmaceutical Co., Inc. | | | 1,872,693 | |
| | 33,900 | | | Kobayashi Pharmaceutical Co. Ltd. | | | 1,774,683 | |
| | 204,000 | | | Lion Corp. | | | 3,343,912 | |
| | 59,200 | | | Miura Co. Ltd. | | | 1,023,454 | |
| | 48,000 | | | Mochida Pharmaceutical Co. Ltd. | | | 3,766,950 | |
| | 89,600 | | | Nikon Corp. | | | 1,355,919 | |
| | 56,100 | | | Nissin Foods Holdings Co. Ltd. | | | 3,252,484 | |
| | 45,000 | | | NTT Data Corp. | | | 2,325,737 | |
| | 117,600 | | | Okamura Corp. | | | 1,156,151 | |
| Shares | | | | | Value | |
| JAPAN (continued) | | |
| | 412,000 | | | Osaka Gas Co. Ltd. | | $ | 1,715,652 | |
| | 170,200 | | | Otsuka Holdings Co. Ltd. | | | 7,460,755 | |
| | 57,600 | | | Park24 Co. Ltd. | | | 1,782,321 | |
| | 66,700 | | | Rohto Pharmaceutical Co. Ltd. | | | 1,172,831 | |
| | 43,100 | | | Sankyo Co. Ltd. | | | 1,520,645 | |
| | 57,533 | | | Sawai Pharmaceutical Co. Ltd. | | | 3,725,079 | |
| | 721,300 | | | Sumitomo Osaka Cement Co. Ltd. | | | 2,991,947 | |
| | 53,200 | | | Toyo Suisan Kaisha Ltd. | | | 2,158,539 | |
| | 79,428 | | | West Japan Railway Co. | | | 4,901,860 | |
| | 214,400 | | | Yokogawa Electric Corp. | | | 3,019,632 | |
| | | | | | | | 57,625,872 | |
| MALAYSIA — 0.1% | | |
| | 1,347,800 | | | Hong Leong Bank Berhad | | | 4,279,546 | |
| MOROCCO AND ANTILLES — 0.1% | | |
| | 102,692 | | | Attijariwafa Bank | | | 4,240,943 | |
| PAKISTAN — 0.1% | | |
| | 723,500 | | | Engro Corp. Ltd. | | | 1,927,078 | |
| | 1,019,500 | | | Hub Power Co. Ltd. (The) | | | 1,038,275 | |
| | 435,600 | | | Lucky Cement Ltd. | | | 2,791,124 | |
| | | | | | | | 5,756,477 | |
| QATAR — 0.0% | | |
| | 68,503 | | | Ooredoo QSC | | | 1,824,715 | |
| SINGAPORE — 0.1% | | |
| | 3,394,200 | | | Mapletree Industrial Trust, REIT | | | 4,196,244 | |
| | 673,000 | | | Oversea-Chinese Banking Corp. Ltd. | | | 4,102,095 | |
| | | | | | | | 8,298,339 | |
| SOUTH AFRICA — 0.0% | | |
| | 72,975 | | | AngloGold Ashanti Ltd.(d) | | | 977,690 | |
| | 249,439 | | | Gold Fields Ltd. | | | 1,013,943 | |
| | | | | | | | 1,991,633 | |
| SOUTH KOREA — 0.1% | | |
| | 49,572 | | | Dongbu Insurance Co. Ltd. | | | 3,080,244 | |
| | 30,745 | | | Green Cross Holdings Corp. | | | 596,495 | |
| | 66,162 | | | LG Display Co. Ltd. | | | 1,578,521 | |
| | 205,334 | | | LG Uplus Corp. | | | 2,117,493 | |
| | 12,320 | | | S-1 Corp. | | | 995,936 | |
| | | | | | | | 8,368,689 | |
| SWITZERLAND — 0.2% | | |
| | 108,550 | | | Allied World Assurance Co. Holdings AG | | | 4,665,479 | |
| | 56,651 | | | Nestle SA | | | 4,107,634 | |
| | | | | | | | 8,773,113 | |
| TAIWAN — 0.1% | | |
| | 982,000 | | | Formosa Petrochemical Corp. | | | 3,282,928 | |
| | 694,880 | | | Foxconn Technology Co. Ltd. | | | 2,016,985 | |
| Old Westbury Funds, Inc. | |
| Strategic Opportunities Fund | |
| Consolidated Portfolio of Investments - (Continued) | |
| | October 31, 2016 |
| Shares | | | | | Value | |
| TAIWAN (continued) | | |
| | 772,000 | | | Siliconware Precision Industries Co. Ltd. | | $ | 1,168,122 | |
| | | | | | | | 6,468,035 | |
| THAILAND — 0.0% | | |
| | 1,411,692 | | | Bangkok Expressway & Metro Public Co. Ltd. - FOR(b) | | | 300,510 | |
| UNITED ARAB EMIRATES — 0.1% | | |
| | 7,438,996 | | | Dana Gas PJSC(d) | | | 1,073,434 | |
| | 961,939 | | | Emirates Telecommunications Group Co PJSC | | | 4,936,781 | |
| | | | | | | | 6,010,215 | |
| UNITED KINGDOM — 0.1% | | |
| | 35,000 | | | BP Plc - ADR | | | 1,244,250 | |
| | 327,925 | | | Cineworld Group Plc | | | 2,169,469 | |
| | 303,670 | | | National Grid Plc | | | 3,958,537 | |
| | | | | | | | 7,372,256 | |
| UNITED STATES — 4.9% | | |
| | 25,066 | | | 3M Co. | | | 4,143,410 | |
| | 52,210 | | | Aaron’s, Inc.(d) | | | 1,290,109 | |
| | 98,546 | | | AGNC Investment Corp. REIT | | | 1,976,833 | |
| | 63,036 | | | Altria Group, Inc. | | | 4,167,940 | |
| | 61,938 | | | American Electric Power Co., Inc. | | | 4,016,060 | |
| | 52,170 | | | American Water Works Co., Inc. | | | 3,862,667 | |
| | 35,311 | | | Amgen, Inc. | | | 4,984,501 | |
| | 21,000 | | | Anadarko Petroleum Corp. | | | 1,248,240 | |
| | 223,311 | | | Annaly Capital Management, Inc., REIT | | | 2,313,502 | |
| | 10,637 | | | Anthem, Inc. | | | 1,296,225 | |
| | 200,000 | | | Apollo Commercial Real Estate Finance, Inc., REIT | | | 3,384,000 | |
| | 442,833 | | | Apollo Investment Corp. | | | 2,617,143 | |
| | 55,919 | | | AptarGroup, Inc. | | | 3,994,853 | |
| | 92,472 | | | Arthur J Gallagher & Co. | | | 4,459,925 | |
| | 102,922 | | | AT&T, Inc. | | | 3,786,500 | |
| | 93,886 | | | Baxter International, Inc. | | | 4,468,035 | |
| | 405,373 | | | Capitol Federal Financial, Inc. | | | 5,946,822 | |
| | 14,724 | | | Cardinal Health, Inc. | | | 1,011,392 | |
| | 47,715 | | | Cheesecake Factory, Inc. (The) | | | 2,537,961 | |
| | 85,914 | | | Church & Dwight Co., Inc. | | | 4,146,210 | |
| | 193,000 | | | Cisco Systems, Inc. | | | 5,921,240 | |
| | 76,683 | | | Clorox Co. (The) | | | 9,203,494 | |
| | 22,330 | | | Consolidated Edison, Inc. | | | 1,687,032 | |
| | 22,397 | | | Cracker Barrel Old Country Store, Inc. | | | 3,090,786 | |
| | 138,060 | | | Darden Restaurants, Inc. | | | 8,944,907 | |
| | 70,031 | | | DENTSPLY Sirona, Inc. | | | 4,031,685 | |
| | 28,469 | | | Dollar Tree, Inc.(d) | | | 2,150,833 | |
| | 45,107 | | | Dr Pepper Snapple Group, Inc. | | | 3,959,944 | |
| | 43,912 | | | DTE Energy Co. | | | 4,215,991 | |
| | 37,295 | | | Ecolab, Inc. | | | 4,257,970 | |
| | 86,351 | | | Emerson Electric Co. | | | 4,376,269 | |
| Shares | | | | | Value | |
| UNITED STATES (continued) |
| | 74,678 | | | FLIR Systems, Inc. | | $ | 2,458,400 | |
| | 37,808 | | | FTI Consulting, Inc.(d) | | | 1,473,000 | |
| | 1,725,000 | | | General Motors Co., Escrow Shares(b)(c)(d) | | | 258,750 | |
| | 85,000 | | | Gilead Sciences, Inc. | | | 6,258,550 | |
| | 38,000 | | | Hess Corp. | | | 1,822,860 | |
| | 54,683 | | | IDEX Corp. | | | 4,726,799 | |
| | 60,000 | | | Intel Corp. | | | 2,092,200 | |
| | 25,972 | | | International Business Machines Corp. | | | 3,991,637 | |
| | 34,694 | | | International Flavors & Fragrances, Inc. | | | 4,537,281 | |
| | 35,887 | | | Johnson & Johnson | | | 4,162,533 | |
| | 115,000 | | | Juniper Networks, Inc. | | | 3,029,100 | |
| | 10,000 | | | Lear Corp. | | | 1,227,800 | |
| | 7,198 | | | Lockheed Martin Corp. | | | 1,773,443 | |
| | 24,500 | | | ManpowerGroup, Inc. | | | 1,881,600 | |
| | 80,000 | | | Marathon Oil Corp. | | | 1,054,400 | |
| | 65,327 | | | Marsh & McLennan Cos., Inc. | | | 4,141,079 | |
| | 40,909 | | | McCormick & Co., Inc. - Non Voting Shares | | | 3,921,946 | |
| | 29,443 | | | McDonald’s Corp. | | | 3,314,399 | |
| | 38,500 | | | Microsoft Corp. | | | 2,306,920 | |
| | 18,500 | | | Monsanto Co. | | | 1,864,245 | |
| | 33,620 | | | NextEra Energy, Inc. | | | 4,303,360 | |
| | 133,938 | | | NIC, Inc. | | | 3,073,877 | |
| | 146,693 | | | NiSource, Inc. | | | 3,412,079 | |
| | 24,000 | | | Noble Energy, Inc. | | | 827,280 | |
| | 79,979 | | | Northwest Bancshares, Inc. | | | 1,258,869 | |
| | 54,492 | | | Omnicom Group, Inc. | | | 4,349,551 | |
| | 89,500 | | | Oracle Corp. | | | 3,438,590 | |
| | 66,833 | | | Packaging Corp. of America | | | 5,513,723 | |
| | 8,032 | | | Panera Bread Co. - Class A(d) | | | 1,532,184 | |
| | 306,200 | | | People’s United Financial, Inc. | | | 4,972,688 | |
| | 53,288 | | | Pinnacle West Capital Corp. | | | 4,056,815 | |
| | 30,879 | | | ProAssurance Corp. | | | 1,645,851 | |
| | 25,331 | | | Quest Diagnostics, Inc. | | | 2,062,957 | |
| | 11,629 | | | Raytheon Co. | | | 1,588,638 | |
| | 84,959 | | | Republic Services, Inc. | | | 4,471,392 | |
| | 46,878 | | | Sanderson Farms, Inc. | | | 4,218,082 | |
| | 38,471 | | | Sempra Energy | | | 4,120,244 | |
| | 88,741 | | | Sonoco Products Co. | | | 4,462,784 | |
| | 138,796 | | | South Jersey Industries, Inc. | | | 4,115,301 | |
| | 58,662 | | | Sykes Enterprises, Inc.(d) | | | 1,568,622 | |
| | 107,419 | | | Tanger Factory Outlet Centers, Inc. REIT | | | 3,738,181 | |
| | 16,581 | | | Target Corp. | | | 1,139,612 | |
| | 29,894 | | | Thermo Fisher Scientific, Inc. | | | 4,395,315 | |
| | 15,108 | | | TJX Cos., Inc. | | | 1,114,215 | |
| | 36,941 | | | Travelers Cos., Inc. (The) | | | 3,996,277 | |
| | 21,597 | | | Tyson Foods, Inc. - Class A | | | 1,530,142 | |
| | 97,358 | | | UGI Corp. | | | 4,506,702 | |
| | 40,848 | | | United Parcel Service, Inc. - Class B | | | 4,401,780 | |
| | 82,962 | | | Vectren Corp. | | | 4,173,818 | |
| | 93,007 | | | Verizon Communications, Inc. | | | 4,473,637 | |
| Old Westbury Funds, Inc. | |
| Strategic Opportunities Fund | |
| Consolidated Portfolio of Investments - (Continued) | |
| | October 31, 2016 |
| Shares | | | | | Value | |
| UNITED STATES (continued) | | |
| | 112,393 | | | Wal-Mart Stores, Inc. | | $ | 7,869,758 | |
| | 65,759 | | | Waste Management, Inc. | | | 4,317,736 | |
| | 90,000 | | | Wells Fargo & Co. | | | 4,140,900 | |
| | | | | | | | 288,580,381 | |
Total Common Stocks
(Cost $446,662,220) | | 484,135,690 | |
| | | | |
| CLOSED-END FUNDS — 6.5% |
| UNITED STATES — 6.5% | | | | |
| | 444,779 | | | AllianceBernstein Global High Income Fund, Inc.(b) | | | 5,541,946 | |
| | 396,882 | | | Apollo Tactical Income Fund, Inc.(b) | | | 6,036,575 | |
| | 560,715 | | | Ares Dynamic Credit Allocation Fund, Inc.(b) | | | 8,242,511 | |
| | 107,008 | | | Avenue Income Credit Strategies Fund | | | 1,348,301 | |
| | 474,122 | | | Barings Global Short Duration High Yield Fund(b) | | | 8,790,222 | |
| | 100,709 | | | Barings Participation Investors(b) | | | 1,510,635 | |
| | 190,472 | | | Blackrock Corp. High Yield Fund, Inc. | | | 2,003,765 | |
| | 496,490 | | | BlackRock Credit Allocation Income Trust(b) | | | 6,389,826 | |
| | 924,286 | | | BlackRock Debt Strategies Fund, Inc.(b) | | | 3,345,915 | |
| | 231,570 | | | BlackRock Defined Opportunity Credit Trust(b) | | | 3,114,617 | |
| | 755,000 | | | BlackRock Income Trust, Inc.(b) | | | 4,771,600 | |
| | 655,000 | | | Blackrock Limited Duration Income Trust(b) | | | 9,897,050 | |
| | 1,041,497 | | | Blackrock Multi-Sector Income Trust(b) | | | 17,455,490 | |
| | 1,177,931 | | | Blackstone/GSO Strategic Credit Fund(b) | | | 17,350,924 | |
| | 617,043 | | | Brookfield Mortgage Opportunity Income Fund, Inc.(b) | | | 8,842,226 | |
| | 65,444 | | | Brookfield Total Return Fund, Inc.(b) | | | 1,413,590 | |
| | 716,685 | | | Cohen & Steers Limited Duration Preferred and Income Fund, Inc.(b) | | | 17,673,452 | |
| | 294,540 | | | Cohen & Steers Quality Income Realty Fund, Inc. | | | 3,552,152 | |
| | 187,446 | | | Cohen & Steers REIT and Preferred Income Fund, Inc. | | | 3,518,361 | |
| | 898,904 | | | Doubleline Income Solutions Fund(b) | | | 16,854,451 | |
| | 132,505 | | | Dreyfus Strategic Municipals, Inc. | | | 1,164,719 | |
| | 75,000 | | | Eaton Vance Municipal Income Trust | | | 996,000 | |
| Shares | | | | | Value | |
| UNITED STATES (continued) |
| | 320,000 | | | First Trust High Income Long/Short Fund(b) | | $ | 4,966,400 | |
| | 585,921 | | | First Trust Intermediate Duration Preferred & Income Fund(b) | | | 13,276,970 | |
| | 93,441 | | | Guggenheim Credit Allocation Fund(b) | | | 2,024,866 | |
| | 233,003 | | | Guggenheim Strategic Opportunities Fund(b) | | | 4,592,489 | |
| | 138,807 | | | Invesco Advantage Municipal Income Trust II | | | 1,624,042 | |
| | 1,710,632 | | | Invesco Dynamic Credit Opportunities Fund(b) | | | 19,980,182 | |
| | 3,540,873 | | | Invesco Senior Income Trust(b) | | | 15,544,432 | |
| | 150,000 | | | Kayne Anderson MLP Investment Co. | | | 2,827,500 | |
| | 252,134 | | | KKR Income Opportunities Fund(b) | | | 3,953,461 | |
| | 227,191 | | | Legg Mason BW Global Income Opportunities Fund, Inc.(b) | | | 2,939,852 | |
| | 115,282 | | | New America High Income Fund | | | 1,039,844 | |
| | 397,525 | | | NexPoint Credit Strategies Fund(b) | | | 8,491,134 | |
| | 125,000 | | | Nuveen Credit Strategies Income Fund | | | 1,052,500 | |
| | 8,500 | | | Nuveen Enhanced AMT-Free Municipal Credit Opportunities Fund | | | 127,925 | |
| | 205,544 | | | Nuveen Mortgage Opportunity Term Fund(b) | | | 4,900,169 | |
| | 284,115 | | | Nuveen Preferred & Income Term Fund(b) | | | 6,827,283 | |
| | 1,396,864 | | | Nuveen Preferred Securities Income Fund(b) | | | 13,004,804 | |
| | 344,144 | | | PIMCO Corporate & Income Strategy Fund(b) | | | 5,096,773 | |
| | 1,212,314 | | | PIMCO Dynamic Credit Income Fund(b) | | | 24,634,220 | |
| | 655,795 | | | PIMCO Dynamic Income Fund(b) | | | 18,886,897 | |
| | 909,213 | | | PIMCO Income Strategy Fund II(b) | | | 8,555,694 | |
| | 636,717 | | | Pioneer Floating Rate Trust(b) | | | 7,519,628 | |
| | 81,385 | | | Pioneer Municipal High Income Advantage Trust | | | 1,037,659 | |
| | 985,103 | | | Prudential Global Short Duration High Yield Fund, Inc.(b) | | | 14,500,716 | |
| | 860,446 | | | Prudential Short Duration High Yield Fund, Inc.(b) | | | 13,190,637 | |
| | 179,716 | | | Stone Harbor Emerging Markets Income Fund(b) | | | 2,717,306 | |
| | 2,302,620 | | | Voya Prime Rate Trust(b) | | | 12,226,912 | |
| | 1,375,505 | | | Wells Fargo Advantage Income Opportunities Fund(b) | | | 11,237,876 | |
| | 988,407 | | | Western Asset High Income Fund II, Inc.(b) | | | 6,988,037 | |
| Old Westbury Funds, Inc. | |
| Strategic Opportunities Fund | |
| Consolidated Portfolio of Investments - (Continued) | |
| | October 31, 2016 |
| Shares | | | | | Value | |
| UNITED STATES (continued) |
| | 27,383 | | | Western Asset Variable Rate Strategic Fund,
Inc.(b) | | $ | 434,021 | |
Total Closed-End Funds
(Cost $397,564,835) | | | 384,014,557 | |
| EXCHANGE TRADED FUNDS — 8.5% |
| UNITED STATES — 8.5% |
| | 385,892 | | | iShares Europe ETF | | | 14,714,062 | |
| | 1,461,135 | | | iShares MSCI EAFE ETF | | | 84,482,826 | |
| | 670,000 | | | iShares MSCI Emerging Markets Index Fund | | | 24,883,800 | |
| | 230,000 | | | iShares MSCI Eurozone ETF | | | 7,852,200 | |
| | 880,000 | | | iShares MSCI Germany ETF | | | 22,800,800 | |
| | 4,675,000 | | | iShares MSCI Japan Index Fund | | | 59,045,250 | |
| | 1,200,000 | | | iShares MSCI Singapore ETF(b) | | | 12,420,000 | |
| | 20,000 | | | iShares Nasdaq Biotechnology ETF | | | 5,133,600 | |
| | 392,000 | | | iShares US Preferred Stock ETF | | | 15,268,400 | |
| | 900,000 | | | Powershares Preferred Portfolio | | | 13,482,000 | |
| | 25,000 | | | ProShares Short VIX Short-Term Futures ETF | | | 1,795,500 | |
| | 65,000 | | | ProShares UltraShort Yen(d) | | | 4,217,200 | |
| | 69,573 | | | Real Estate Select Sector SPDR Fund | | | 2,153,284 | |
| | 291,000 | | | SPDR Dow Jones Industrial Average ETF Trust | | | 52,720,470 | |
| | 202,500 | | | SPDR S&P Dividend ETF | | | 16,489,575 | |
| | 340,000 | | | SPDR S&P500 ETF Trust | | | 72,267,000 | |
| | 483,000 | | | Vanguard FTSE Europe ETF | | | 22,705,830 | |
| | 370,000 | | | WisdomTree Europe Hedged Equity Fund | | | 20,098,400 | |
| | 323,500 | | | WisdomTree Europe SmallCap Dividend Fund | | | 17,261,960 | |
| | 771,000 | | | WisdomTree Japan Hedged Equity Fund | | | 34,810,650 | |
Total Exchange Traded Funds
(Cost $496,006,304) | | | 504,602,807 | |
| PREFERRED STOCKS — 0.2% |
| UNITED STATES — 0.2% |
| | 8,000 | | | Allergan Plc, 5.50% | | | 6,152,000 | |
| | 104,500 | | | New York Community Capital Trust V, 6.00%(b) | | | 5,197,830 | |
Total Preferred Stocks
(Cost $12,143,694) | | | 11,349,830 | |
| | | | | | | | | |
| Contracts | | | | | | | |
| CALL OPTIONS PURCHASED — 0.0% |
| | 200 | | | London Metal Exchange Nickel Futures, Strike $9,500.00, Expires 12/07/16 | | | 1,232,520 | |
Total Call Options Purchased
(Cost $1,034,701) | | | 1,232,520 | |
| Contracts | | | | | Value | |
| PUT OPTIONS PURCHASED — 0.0% |
| | 11,000 | | | Energy Select Sector SPDR (ETF), Strike $63.00, Expires 12/16/16 | | $ | 759,000 | |
| | 100 | | | London Metal Exchange Zinc Futures, Strike $2,000.00, Expires 12/06/16 | | | 1,250 | |
| | 500 | | | S&P 500 Index, Strike $2,125, Expires 11/04/16 | | | 555,000 | |
| | 100 | | | S&P 500 Index, Strike $2,130, Expires 11/04/16 | | | 129,000 | |
Total Put Options Purchased
(Cost $4,061,619) | | | 1,444,250 | |
| |
Principal
Amount | | | | | Value | |
| BANK LOANS — 0.3% |
| UNITED STATES — 0.3% |
| $ | 15,400,000 | | | Lone Star LPST Future Funding Term Loan,
4.36%, 10/09/18 | | | 15,400,000 | |
Total Bank Loans
(Cost $15,400,000) | | | 15,400,000 | |
| CORPORATE BONDS — 8.2% |
| BERMUDA — 0.1% |
| | 7,000,000 | | | Celestial Nutrifoods Ltd., Cnv.,
16.00%, 06/12/16(b)(c)(d)(e)(f) | | | 1,006,289 | |
| | 1,540,000 | | | Digicel Ltd.,
6.75%, 03/01/23(g) | | | 1,381,688 | |
| | 950,000 | | | Tengizchevroil Finance Co International Ltd,
4.00%, 08/15/26(g) | | | 915,874 | |
| | | | | | | | 3,303,851 | |
| BULGARIA — 0.0% |
| | 1,500,000 | (h) | | Bulgarian Telecommunications Co. EAD,
6.63%, 11/15/18(g) | | | 1,672,511 | |
| CANADA — 0.0% |
| | 500,000 | | | Quebecor Media, Inc.,
5.75%, 01/15/23 | | | 522,500 | |
| | 1,350,000 | (h) | | Valeant Pharmaceuticals International, Inc.,
4.50%, 05/15/23(g) | | | 1,130,743 | |
| | | | | | | | 1,653,243 | |
| CAYMAN ISLANDS — 0.1% |
| | 1,150,000 | | | Jafz Sukuk Ltd.,
7.00%, 06/19/19(g) | | | 1,279,375 | |
| | 401,000 | | | Petrobras Global Finance BV,
7.88%, 03/15/19 | | | 431,075 | |
| | 325,000 | | | Petrobras Global Finance BV,
5.75%, 01/20/20 | | | 335,400 | |
| Old Westbury Funds, Inc. | |
| Strategic Opportunities Fund | |
| Consolidated Portfolio of Investments - (Continued) | |
| | October 31, 2016 |
Principal
Amount | | | | | Value | |
| CAYMAN ISLANDS (continued) |
| $ | 2,000,000 | | | Petrobras Global Finance BV,
5.38%, 01/27/21 | | $ | 1,980,400 | |
| | 850,000 | | | Suzano Trading Ltd.,
5.88%, 01/23/21(g) | | | 877,625 | |
| | 330,000 | | | TAM Capital 3, Inc.,
8.38%, 06/03/21(g) | | | 337,095 | |
| | 1,750,000 | | | Vale Overseas Ltd.,
5.88%, 06/10/21 | | | 1,865,938 | |
| | | | | | | | 7,106,908 | |
| CYPRUS — 0.0% |
| | 400,000 | (i) | | Aroundtown Property Holdings Plc,
1.50%, 05/03/22(g) | | | 438,059 | |
| CZECH REPUBLIC — 0.0% |
| | 725,000 | (h) | | EP Energy AS,
4.38%, 05/01/18(g) | | | 837,280 | |
| DOMINICAN REPUBLIC — 0.0% |
| | 800,000 | | | Aeropuertos Dominicanos Siglo XXI SA,
9.80%, 11/13/19(j) | | | 845,600 | |
| FINLAND — 0.0% |
| | 800,000 | (i) | | SATO Oyj,
2.38%, 03/24/21(g) | | | 925,098 | |
| FRANCE — 0.1% |
| | 600,000 | (i) | | Areva SA,
3.25%, 09/04/20(g) | | | 635,613 | |
| | 200,000 | (i) | | Areva SA,
3.50%, 03/22/21 | | | 211,867 | |
| | 725,000 | (i) | | BUT SAS,
7.38%, 09/15/19(g) | | | 825,718 | |
| | 1,300,000 | (i) | | Casino Guichard Perrachon SA,
3.25%, 03/07/24(g) | | | 1,546,834 | |
| | 1,100,000 | (i) | | Numericable-SFR SAS,
5.38%, 05/15/22(g) | | | 1,259,201 | |
| | 1,125,000 | (i) | | Numericable-SFR SAS,
5.63%, 05/15/24(g) | | | 1,295,179 | |
| | 275,000 | (i) | | Solvay Finance SA,
5.43%, 11/29/49(g)(k) | | | 325,340 | |
| | 275,000 | (i) | | Solvay Finance SA,
5.87%, 12/29/49(g)(k) | | | 331,164 | |
| | 650,000 | | | SPCM SA,
6.00%, 01/15/22(g) | | | 672,625 | |
| | | | | | | | 7,103,541 | |
| GERMANY — 0.1% |
| | 1,010,000 | (i) | | IHO Verwaltungs GmbH, 3.25% Cash or 4.00% payment-in-kind interest,
09/15/23(g)(l) | | | 1,125,499 | |
| | 975,000 | (i) | | IHO Verwaltungs GmbH, 3.75% cash or 4.50% payment-in-kind interest,
09/15/26(g)(l) | | | 1,057,019 | |
Principal
Amount | | | | | Value | |
| GERMANY (continued) |
| $ | 1,425,000 | (i) | | Rapid Holding GmbH,
6.63%, 11/15/20(g) | | $ | 1,631,410 | |
| | 1,800,000 | (m) | | RWE AG,
7.00%, 03/29/49(g)(k) | | | 2,310,814 | |
| | 1,000,000 | (i) | | Safari Holding Verwaltungs GmbH,
8.25%, 02/15/21(g) | | | 1,155,387 | |
| | 475,000 | (i) | | Unitymedia Hessen GmbH & Co. KG/Unitymedia NRW GmbH,
4.63%, 02/15/26(g) | | | 554,086 | |
| | | | | | | | 7,834,215 | |
| HONG KONG — 0.0% |
| | 9,700,000 | | | China Milk Products Group Ltd., Cnv.,
13.00%, 01/05/12(b)(c)(d)(e)(f) | | | 1,133,154 | |
| HUNGARY — 0.0% |
| | 775,000 | (i) | | MOL Hungarian Oil & Gas Plc,
2.63%, 04/28/23(g) | | | 880,537 | |
| INDONESIA — 0.0% |
| | 800,000 | | | Perusahaan Listrik Negara PT,
5.50%, 11/22/21(g) | | | 886,000 | |
| IRELAND — 0.3% |
| | 525,000 | (h) | | Ardagh Packaging Finance Plc/Ardagh Holdings USA, Inc.,
6.75%, 05/15/24(g) | | | 613,782 | |
| | 925,000 | | | GTLK Europe Ltd.,
5.95%, 07/19/21(g) | | | 952,554 | |
| | 7,000,000 | | | Jazz Investments I Ltd., Cnv.,
1.88%, 08/15/21(b) | | | 6,938,750 | |
| | 650,000 | | | MMC Norilsk Nickel OJSC via MMC Finance Ltd.,
4.38%, 04/30/18(g) | | | 663,780 | |
| | 975,000 | | | Novolipetsk Steel via Steel Funding Ltd.,
4.50%, 06/15/23(g) | | | 973,781 | |
| | 1,725,000 | | | Phosagro OAO via Phosagro Bond Funding Ltd.,
4.20%, 02/13/18(g) | | | 1,752,945 | |
| | 975,000 | (n) | | Russian Railways via RZD Capital Plc,
2.18%, 02/26/18 | | | 996,736 | |
| | 650,000 | | | Russian Railways via RZD Capital Plc,
5.70%, 04/05/22(g) | | | 692,996 | |
| | 450,000 | | | Smurfit Kappa Acquisitions,
4.88%, 09/15/18(j) | | | 464,625 | |
| | 1,000,000 | | | Vimpel Communications Via VIP Finance Ireland Ltd. OJSC,
9.13%, 04/30/18(g) | | | 1,085,752 | |
| | 275,000 | (m) | | Virgin Media Receivables Financing Notes I DAC,
5.50%, 09/15/24(g) | | | 330,194 | |
| | | | | | | | 15,465,895 | |
| Old Westbury Funds, Inc. | |
| Strategic Opportunities Fund | |
Consolidated Portfolio of Investments - (Continued) | |
| | October 31, 2016 |
Principal
Amount | | | | | Value | |
| ITALY — 0.1% | | | | |
| $ | 1,975,000 | (m) | | Enel SpA,
7.75%, 09/10/75(g)(k) | | $ | 2,681,534 | |
| | 1,375,000 | (i) | | Telecom Italia SpA Milano,
3.00%, 09/30/25(g) | | | 1,508,722 | |
| | | | | | | | 4,190,256 | |
| JAPAN — 0.0% |
| | 650,000 | (h) | | SoftBank Group Corp.,
4.75%, 07/30/25(g) | | | 785,466 | |
| | 125,000 | (h) | | SoftBank Group Corp.,
5.25%, 07/30/27(g) | | | 154,114 | |
| | | | | | | | 939,580 | |
| JERSEY CHANNEL ISLANDS — 0.1% | | | | |
| | 1,600,000 | (h) | | Adient Global Holdings Ltd.,
3.50%, 08/15/24(g) | | | 1,745,220 | |
| | 525,000 | (i) | | Kennedy Wilson Europe Real Estate Plc,
3.95%, 06/30/22(g) | | | 647,011 | |
| | 700,000 | (h) | | Lincoln Finance Ltd.,
6.88%, 04/15/21(g) | | | 834,821 | |
| | 1,150,000 | (h) | | Mercury Bondco Plc, 8.25% cash or 9.00% payment-in-kind interest,
05/30/21(g)(l) | | | 1,325,539 | |
| | | | | | | | 4,552,591 | |
| LUXEMBOURG — 0.4% | | | | |
| | 375,000 | (i) | | Altice Financing SA,
5.25%, 02/15/23(g) | | | 429,668 | |
| | 1,000,000 | | | Altice Finco SA,
8.13%, 01/15/24(j) | | | 1,025,000 | |
| | 775,000 | (i) | | Cirsa Funding Luxembourg SA,
5.88%, 05/15/23(g) | | | 886,918 | |
| | 650,000 | (i) | | Dakar Finance SA, 9.00% cash or 9.25% payment-in-kind interest,
11/15/20(g)(l) | | | 724,244 | |
| | 1,200,000 | (i) | | Garfunkelux Holdco 3 SA,
7.50%, 08/01/22(g) | | | 1,329,162 | |
| | 125,000 | (m) | | Garfunkelux Holdco 3 SA,
8.50%, 11/01/22(g) | | | 151,088 | |
| | 1,200,000 | | | Gazprom OAO Via Gaz Capital SA,
8.15%, 04/11/18(g) | | | 1,290,000 | |
| | 1,300,000 | (n) | | Gazprom OAO Via Gaz Capital SA,
3.38%, 11/30/18(g) | | | 1,362,993 | |
| | 800,000 | | | Gazprom OAO Via Gaz Capital SA,
6.51%, 03/07/22(g) | | | 876,642 | |
| | 400,000 | (m) | | Glencore Finance Europe SA,
6.50%, 02/27/19 | | | 538,276 | |
| | 975,000 | (i) | | Glencore Finance Europe SA,
2.75%, 04/01/21(g) | | | 1,132,389 | |
| | 600,000 | (i) | | Grand City Properties SA,
3.75%, 02/18/49(k) | | | 669,884 | |
| | 2,200,000 | (i) | | Greif Nevada Holdings, Inc. SCS,
7.38%, 07/15/21(g) | | | 2,922,224 | |
Principal
Amount | | | | | Value | |
| LUXEMBOURG (continued) | | | | |
| $ | 650,000 | (i) | | Hanesbrands Finance Luxembourg SCA,
3.50%, 06/15/24(g) | | $ | 747,719 | |
| | 800,000 | (i) | | INEOS Group Holdings SA,
5.38%, 08/01/24(g) | | | 874,084 | |
| | 1,450,000 | (i) | | Intralot Capital Luxembourg SA,
6.00%, 05/15/21(g) | | | 1,583,786 | |
| | 1,675,000 | (n) | | Matterhorn Telecom SA,
3.63%, 05/01/22(g) | | | 1,686,002 | |
| | 975,000 | | | Minerva Luxembourg SA,
6.50%, 09/20/26(g) | | | 954,915 | |
| | 2,085,000 | | | Severstal OAO Via Steel Capital SA,
4.45%, 03/19/18(g) | | | 2,128,777 | |
| | 900,000 | (i) | | Telecom Italia Finance SA,
7.75%, 01/24/33 | | | 1,295,937 | |
| | 900,000 | | | Ultrapar International SA,
5.25%, 10/06/26(g) | | | 913,410 | |
| | | | | | | | 23,523,118 | |
| MEXICO — 0.0% | | | | |
| | 625,000 | | | Grupo Posadas SAB de CV,
7.88%, 06/30/22(g) | | | 647,188 | |
| NETHERLANDS — 0.3% | | | | |
| | 950,000 | (i) | | Constellium NV,
4.63%, 05/15/21(g) | | | 943,795 | |
| | 950,000 | | | Embraer Netherlands Finance BV,
5.05%, 06/15/25 | | | 952,375 | |
| | 375,000 | (m) | | Koninklijke KPN NV,
6.88%, 03/14/73(g)(k) | | | 498,086 | |
| | 600,000 | | | Majapahit Holding BV,
7.75%, 01/20/20(g) | | | 687,000 | |
| | 700,000 | (i) | | NE Property Cooperatief UA,
3.75%, 02/26/21(g) | | | 814,729 | |
| | 1,450,000 | | | Petrobras Global Finance BV,
4.88%, 03/17/20 | | | 1,460,513 | |
| | 800,000 | | | Petrobras Global Finance BV,
8.75%, 05/23/26 | | | 901,200 | |
| | 400,000 | (i) | | Repsol International Finance BV,
3.88%, 12/29/49(g)(k) | | | 426,320 | |
| | 750,000 | (i) | | Saipem Finance International BV,
3.75%, 09/08/23(g) | | | 852,791 | |
| | 525,000 | (i) | | Samvardhana Motherson Automotive Systems Group BV,
4.13%, 07/15/21(g) | | | 589,951 | |
| | 4,000,000 | (i) | | Sonae Investments BV, Cnv.,
1.63%, 06/11/19(b)(g) | | | 4,144,025 | |
| | 1,000,000 | (i) | | Telefonica Europe BV,
7.63%, 09/18/21(g)(k) | | | 1,263,712 | |
| | 600,000 | (i) | | Telefonica Europe BV,
5.88%, 03/31/49(g)(k) | | | 704,759 | |
| | 500,000 | (m) | | Telefonica Europe BV,
6.75%, 11/26/49(g)(k) | | | 651,215 | |
| | 864,000 | (i) | | United Group BV,
7.88%, 11/15/20(g) | | | 988,770 | |
| Old Westbury Funds, Inc. | |
| Strategic Opportunities Fund | |
Consolidated Portfolio of Investments - (Continued) | |
| | October 31, 2016 |
Principal
Amount | | | | | Value | |
| NETHERLANDS (continued) | | | | |
| $ | 600,000 | (i) | | Vonovia Finance BV,
4.00%, 12/29/49(g)(k) | | $ | 689,741 | |
| | 1,350,000 | (i) | | Ziggo Secured Finance BV,
4.25%, 01/15/27(g) | | | 1,475,416 | |
| | | | | | | | 18,044,398 | |
| NORWAY — 0.0% | | | | |
| | 575,000 | (i) | | Lock AS,
7.00%, 08/15/21(g) | | | 656,199 | |
| | 975,000 | (i) | | Silk Bidco AS,
7.50%, 02/01/22(g) | | | 1,122,971 | |
| | | | | | | | 1,779,170 | |
| PERU — 0.0% | | | | |
| | 800,000 | | | InRetail Consumer,
5.25%, 10/10/21(g) | | | 826,800 | |
| POLAND — 0.0% | | | | |
| | 450,000 | (i) | | Play Finance 1 SA,
6.50%, 08/01/19(g) | | | 511,279 | |
| | 1,075,000 | (i) | | Play Finance 2 SA,
5.25%, 02/01/19(g) | | | 1,209,589 | |
| | | | | | | | 1,720,868 | |
| SPAIN — 0.0% | | | | |
| | 400,000 | (i) | | Ence Energia y Celulosa SA,
5.38%, 11/01/22(g) | | | 460,961 | |
| | 875,000 | (i) | | Naviera Armas SA,
6.50%, 07/31/23(g)(k) | | | 962,053 | |
| | | | | | | | 1,423,014 | |
| SWEDEN — 0.1% | | | | |
| | 1,125,000 | (h) | | Akelius Residential Property AB,
3.38%, 09/23/20(g) | | | 1,323,510 | |
| | 560,000 | (h) | | TVN Finance Corp III AB,
7.38%, 12/15/20(g) | | | 641,484 | |
| | 750,000 | (h) | | Volvo Treasury AB,
4.85%, 03/10/78(g)(k) | | | 864,482 | |
| | | | | | | | 2,829,476 | |
| TURKEY — 0.1% | | | | |
| | 850,000 | | | Tupras Turkiye Petrol Rafinerileri AS,
4.13%, 05/02/18(g) | | | 855,313 | |
| | 1,100,000 | | | Turk Telekomunikasyon AS,
4.88%, 06/19/24(g) | | | 1,084,138 | |
| | 1,300,000 | | | Turkiye Sise ve Cam Fabrikalari AS,
4.25%, 05/09/20(g) | | | 1,290,250 | |
| | | | | | | | 3,229,701 | |
| UNITED KINGDOM — 0.3% | | | | |
| | 125,000 | (h) | | Anglo American Capital Plc,
2.50%, 04/29/21(g) | | | 139,973 | |
| | 825,000 | (i) | | Arqiva Broadcast Finance Plc,
9.50%, 03/31/20(g) | | | 1,088,064 | |
Principal
Amount | | | | | Value | |
| UNITED KINGDOM (continued) | | | | |
| $ | 825,000 | (i) | | Bakkavor Finance 2 Plc,
8.75%, 06/15/20(g) | | $ | 1,075,441 | |
| | 350,000 | (i) | | Co-operative Group Holdings 2011 Ltd., STEP,
6.90%, 07/08/20(g) | | | 486,236 | |
| | 400,000 | (i) | | Infinis Plc,
7.00%, 02/15/19(g) | | | 499,394 | |
| | 1,675,000 | (h) | | Inovyn Finance Plc,
6.25%, 05/15/21(g) | | | 1,924,719 | |
| | 1,600,000 | (h) | | International Game Technology Plc,
4.75%, 02/15/23(g) | | | 1,903,507 | |
| | 170,000 | (i) | | Iron Mountain Europe Plc, REIT,
6.13%, 09/15/22(g) | | | 215,884 | |
| | 1,375,000 | | | Jaguar Land Rover Automotive Plc,
3.50%, 03/15/20(j) | | | 1,400,369 | |
| | 1,050,000 | (i) | | Jerrold Finco Plc,
6.25%, 09/15/21(g) | | | 1,272,353 | |
| | 1,050,000 | | | OAS Finance Ltd.,
8.00%, 07/02/21(d)(f)(j) | | | 39,375 | |
| | 850,000 | (i) | | Southern Water Greensands Financing Plc,
8.50%, 04/15/19(g) | | | 1,182,598 | |
| | 1,250,000 | (h) | | TA Manufacturing Ltd.,
3.63%, 04/15/23(g) | | | 1,350,959 | |
| | 450,000 | (h) | | Titan Global Finance Plc,
3.50%, 06/17/21(g) | | | 510,044 | |
| | 1,075,000 | (i) | | Virgin Media Finance Plc,
7.00%, 04/15/23(g) | | | 1,390,477 | |
| | 1,150,000 | (i) | | Virgin Media Finance Plc,
6.38%, 10/15/24(g) | | | 1,453,353 | |
| | | | | | | | 15,932,746 | |
| UNITED STATES — 6.1% | | | | |
| | 1,000,000 | | | Aceto Corp,
2.00%, 11/01/20(b)(j) | | | 906,875 | |
| | 10,000,000 | | | Akamai Technologies, Inc., Cnv.,
0.50%, 02/15/19(e) | | | 10,512,500 | |
| | 525,000 | | | Albertsons Cos. LLC/Safeway, Inc./New Albertson’s, Inc./Albertson’s LLC,
5.75%, 03/15/25(j) | | | 518,275 | |
| | 5,000,000 | | | Allscripts Healthcare Solutions, Inc., Cnv.,
1.25%, 07/01/20 | | | 4,940,625 | |
| | 12,000,000 | | | Apollo Commercial Real Estate Finance, Inc., Cnv.,
5.50%, 03/15/19 | | | 12,555,000 | |
| | 1,125,000 | | | Belo Corp.,
7.75%, 06/01/27 | | | 1,220,625 | |
| | 5,500,000 | | | Blackhawk Network Holdings, Inc., Cnv.,
1.50%, 01/15/22(j) | | | 5,537,813 | |
| | 4,000,000 | | | BlackRock Kelso Capital Corp., Cnv.,
5.50%, 02/15/18 | | | 4,087,500 | |
| Old Westbury Funds, Inc. | |
| Strategic Opportunities Fund | |
Consolidated Portfolio of Investments - (Continued) | |
| | October 31, 2016 |
Principal
Amount | | | | | Value | |
| UNITED STATES (continued) | | | | |
| $ | 5,000,000 | | | Blackstone Mortgage Trust, Inc., Cnv.,
5.25%, 12/01/18 | | $ | 5,575,000 | |
| | 5,000,000 | | | Bottomline Technologies, Inc., Cnv.,
1.50%, 12/01/17 | | | 5,071,875 | |
| | 18,000,000 | | | Brocade Communications Systems, Inc.,
1.38%, 01/01/20(j) | | | 17,842,500 | |
| | 6,000,000 | | | CalAmp Corp., Cnv.,
1.63%, 05/15/20 | | | 5,628,750 | |
| | 1,000,000 | | | Cemex Finance LLC,
9.38%, 10/12/22(j) | | | 1,098,750 | |
| | 750,000 | | | Centene Corp.,
5.63%, 02/15/21 | | | 786,763 | |
| | 1,200,000 | | | Cequel Communications Holdings I LLC/Cequel Capital Corp.,
6.38%, 09/15/20(j) | | | 1,236,000 | |
| | 1,200,000 | | | Cheniere Corpus Christi Holdings LLC,
7.00%, 06/30/24(j) | | | 1,272,000 | |
| | 6,000,000 | | | Ciena Corp. Cnv., 0.88%, 06/15/17 | | | 5,966,250 | |
| | 8,000,000 | | | Colony Capital, Inc., Cnv.,
3.88%, 01/15/21 | | | 7,815,000 | |
| | 1,500,000 | | | CSC Holdings LLC,
6.75%, 11/15/21 | | | 1,578,750 | |
| | 7,000,000 | | | CSG Systems International, Inc., Cnv.,
4.25%, 03/15/36(j) | | | 7,393,750 | |
| | 4,000,000 | | | Cypress Semiconductor Corp.,
4.50%, 01/15/22(j) | | | 4,197,500 | |
| | 1,500,000 | | | Dollar Tree, Inc.,
5.75%, 03/01/23 | | | 1,597,500 | |
| | 2,356,000 | | | Echo Global Logistics, Inc.,
2.50%, 05/01/20 | | | 2,152,795 | |
| | 3,000,000 | | | Envestnet, Inc., Cnv.,
1.75%, 12/15/19 | | | 2,838,750 | |
| | 6,000,000 | | | Extra Space Storage LP, Cnv.,
3.13%, 10/01/35(j) | | | 6,386,250 | |
| | 1,000,000 | | | Freeport-McMoRan, Inc.,
2.30%, 11/14/17 | | | 990,000 | |
| | 600,000 | | | GEO Group, Inc. (The),
6.00%, 04/15/26 | | | 517,500 | |
| | 6,000,000 | | | Goldman Sachs Group, Inc. (The), Series M,
5.38%, 12/29/49(k) | | | 6,030,000 | |
| | 4,800,000 | | | Hologic, Inc., Cnv., STEP,
3.20%, 12/15/43 | | | 5,793,000 | |
| | 625,000 | | | Hughes Satellite Systems Corp.,
5.25%, 08/01/26(j) | | | 615,625 | |
| | 550,000 | | | Hughes Satellite Systems Corp.,
6.63%, 08/01/26(j) | | | 544,500 | |
| | 5,500,000 | | | Huron Consulting Group Inc,
1.25%, 10/01/19(b) | | | 5,383,125 | |
Principal
Amount | | | | | Value | |
| UNITED STATES (continued) | | | | |
| $ | 6,000,000 | | | Illumina, Inc., Cnv.,
0.40%, 06/15/19(e) | | $ | 5,835,000 | |
| | 3,000,000 | | | Illumina, Inc., Cnv.,
0.50%, 06/15/21 | | | 2,998,125 | |
| | 850,000 | (h) | | IMS Health, Inc.,
3.50%, 10/15/24(g) | | | 956,359 | |
| | 3,000,000 | | | Infinera Corp., Cnv.,
1.75%, 06/01/18 | | | 2,966,250 | |
| | 6,000,000 | | | Integrated Device Technology, Inc., Cnv.,
0.88%, 11/15/22(b)(j) | | | 5,808,750 | |
| | 7,000,000 | | | JDS Uniphase Corp., Cnv.,
0.63%, 08/15/33 | | | 6,956,250 | |
| | 3,000,000 | | | Knowles Corp,
3.25%, 11/01/21(j) | | | 3,279,375 | |
| | 21,339,801 | | | Liberty Interactive LLC, Cnv.,
3.75%, 02/15/30(b) | | | 12,830,556 | |
| | 5,000,000 | | | Live Nation Entertainment, Inc., Cnv.,
2.50%, 05/15/19 | | | 5,425,000 | |
| | 900,000 | | | MPH Acquisition Holdings LLC,
7.13%, 06/01/24(j) | | | 962,910 | |
| | 1,150,000 | (h) | | MPT Operating Partnership LP/MPT Finance Corp., REIT,
5.75%, 10/01/20 | | | 1,318,470 | |
| | 850,000 | (h) | | MPT Operating Partnership LP/MPT Finance Corp., REIT,
4.00%, 08/19/22 | | | 1,002,430 | |
| | 7,000,000 | | | Nuance Communications, Inc.,
1.50%, 11/01/35 | | | 6,575,625 | |
| | 10,600,000 | | | Nuance Communications, Inc., Cnv.,
2.75%, 11/01/31 | | | 10,626,500 | |
| | 7,000,000 | | | Nuance Communications, Inc., Cnv.,
1.00%, 12/15/35(j) | | | 6,068,125 | |
| | 15,000,000 | | | ON Semiconductor Corp., Cnv.,
1.00%, 12/01/20 | | | 14,971,875 | |
| | 2,000,000 | | | Priceline Group, Inc. (The), Cnv.,
0.90%, 09/15/21(b) | | | 2,138,750 | |
| | 8,000,000 | | | Redwood Trust, Inc., Cnv., REIT,
4.63%, 04/15/18 | | | 8,020,000 | |
| | 6,000,000 | | | Restoration Hardware Holdings, Inc., Cnv.,
2.90%, 06/15/19(e)(j) | | | 5,055,000 | |
| | 900,000 | | | Revlon Consumer Products Corp.,
6.25%, 08/01/24(j) | | | 927,000 | |
| | 1,500,000 | | | Sabine Pass Liquefaction LLC,
5.63%, 02/01/21 | | | 1,578,750 | |
| | 1,250,000 | | | Sabine Pass Liquefaction LLC,
5.63%, 04/15/23 | | | 1,328,125 | |
| | 2,170,000 | | | Sabine Pass Liquefaction LLC,
5.88%, 06/30/26(j) | | | 2,338,609 | |
| | 800,000 | | | Sabine Pass Liquefaction LLC,
5.00%, 03/15/27(j) | | | 814,000 | |
| | 3,395,000 | | | Southern Star Central Corp.,
5.13%, 07/15/22(j) | | | 3,454,413 | |
| Old Westbury Funds, Inc. | |
| Strategic Opportunities Fund | |
Consolidated Portfolio of Investments - (Continued) | |
| | October 31, 2016 |
Principal
Amount | | | | | Value | |
| UNITED STATES (continued) | | | | |
| $ | 725,000 | | | Sprint Communications, Inc.,
7.00%, 08/15/20 | | $ | 754,000 | |
| | 2,850,000 | | | Sprint Spectrum Co. LLC/Sprint Spectrum Co. II LLC/Sprint Spectrum Co. III LLC,
3.36%, 09/20/21(j) | | | 2,874,225 | |
| | 2,475,000 | | | Standard Industries, Inc.,
5.50%, 02/15/23(j) | | | 2,574,000 | |
| | 14,000,000 | | | Starwood Property Trust, Inc., Cnv.,
3.75%, 10/15/17 | | | 14,358,750 | |
| | 1,750,000 | | | T-Mobile USA, Inc.,
6.84%, 04/28/23. | | | 1,869,000 | |
| | 19,000,000 | | | Twitter, Inc., Cnv.,
0.25%, 09/15/19 | | | 17,765,000 | |
| | 12,500,000 | | | Vector Group Ltd., Cnv.,
1.75%, 04/15/20(k) | | | 13,945,313 | |
| | 8,000,000 | | | VEREIT, Inc., Cnv., REIT,
3.00%, 08/01/18 | | | 7,995,000 | |
| | 9,000,000 | | | Verint Systems, Inc., Cnv.,
1.50%, 06/01/21 | | | 8,482,500 | |
| | 42,119,000 | | | Washington Mutual Bank,
4.30%, 12/31/49(d)(e)(f) | | | 9,002,936 | |
| | 3,000,000 | | | Washington Mutual Bank,
5.60%, 12/31/49(d)(f) | | | 641,250 | |
| | 29,287,000 | | | Washington Mutual Bank,
6.00%, 12/31/49(d)(e)(f) | | | 6,260,096 | |
| | 9,840,000 | | | Washington Mutual Bank,
6.00%, 12/31/49(d)(e)(f) | | | 2,103,300 | |
| | 8,200,000 | | | Washington Mutual Bank,
6.00%, 12/31/49(d)(e)(f) | | | 1,752,750 | |
| | 8,000,000 | | | Web.com Group, Inc., Cnv.,
1.00%, 08/15/18 | | | 7,585,000 | |
| | 4,000,000 | | | WebMD Health Corp., Cnv.,
2.63%, 06/15/23(j) | | | 3,860,000 | |
| | 3,000,000 | | | Wright Medical Group, Inc., Cnv.,
2.00%, 02/15/20 | | | 3,069,375 | |
| | 800,000 | (h) | | XPO Logistics, Inc.,
5.75%, 06/15/21(g) | | | 914,831 | |
| | 150,000 | | | XPO Logistics, Inc.,
6.13%, 09/01/23(j) | | | 154,313 | |
| | | | | | | | 358,789,032 | |
Total Corporate Bonds
(Cost $499,489,873) | | | 488,513,830 | |
| ASSET-BACKED SECURITIES — 11.6% | | | | |
| CAYMAN ISLANDS — 4.7% | | | | |
| | 11,750,000 | | | Adams Mill CLO Ltd., Series 2014-1A, Class F, 6.57%, 07/15/26(b)(j)(k) | | | 7,307,280 | |
| | 7,500,000 | | | Adams Mill CLO Ltd., Series 2014-1A, Class SUB, 11.13%, 07/15/26(b)(e)(j) | | | 2,647,164 | |
| | 3,000,000 | | | ALM Loan Funding Ltd., Series 2012-6A, Class DR, 6.30%, 07/15/26(j)(k) | | | 2,798,331 | |
Principal
Amount | | | | | Value | |
| CAYMAN ISLANDS (continued) | | | | |
| $ | 1,100,000 | | | ALM Loan Funding Ltd., Series 2013-7R2A, Class C, 4.30%, 04/24/24(j)(k) | | $ | 1,090,388 | |
| | 1,000,000 | | | ALM Loan Funding Ltd., Series 2013-7R2A, Class D, 5.90%, 04/24/24(j)(k) | | | 966,917 | |
| | 1,200,000 | | | ALM Loan Funding Ltd., Series 2015-12A, Class D, 6.40%, 04/16/27(j)(k) | | | 1,093,264 | |
| | 2,000,000 | | | ALM Loan Funding Ltd., Series 2015-16A, Class D, 6.20%, 07/15/27(j)(k) | | | 1,809,254 | |
| | 1,100,000 | | | ALM Loan Funding Ltd., Series 2015-17A, Class C1, 5.00%, 01/15/28(j)(k) | | | 1,088,910 | |
| | 1,000,000 | | | ALM XVIII Ltd., Series 2016-18A, Class D, 8.30%, 07/15/27(j)(k) | | | 1,000,000 | |
| | 1,250,000 | | | American Money Management Corp. CLO IX Ltd., Series 2011-9A, Class DR, 6.50%, 01/15/22(j)(k) | | | 1,249,206 | |
| | 2,250,000 | | | American Money Management Corp. CLO IX Ltd., Series 2011-9A, Class ER, 8.50%, 01/15/22(j)(k) | | | 2,254,823 | |
| | 2,000,000 | | | American Money Management Corp. CLO Ltd., Series 2015-17A, Class E, 7.57%, 11/15/27(j)(k) | | | 1,868,863 | |
| | 1,000,000 | | | American Money Management Corp. CLO Ltd., Series 2016-18A, Class D, 5.67%, 05/26/28(j)(k) | | | 998,540 | |
| | 1,000,000 | | | Anchorage Capital CLO Ltd., Series 2012-1A, Class DR, 8.12%, 01/13/27(j)(k) | | | 962,900 | |
| | 3,000,000 | | | Anchorage Capital CLO Ltd., Series 2015-6A, Class E1, 5.80%, 04/15/27(j)(k) | | | 2,543,761 | |
| | 2,500,000 | | | Anchorage Capital CLO Ltd., Series 2015-6A, Class F, 6.80%, 04/15/27(j)(k) | | | 1,998,459 | |
| | 500,000 | | | Annisa CLO, Ltd. Series 2016-2A, Class E, 8.00%, 07/20/28(j)(k) | | | 478,041 | |
| | 1,000,000 | | | Apartment Investment and Management Co. CLO., Series 2015-AA, Class E, 8.70%, 01/15/28(k) | | | 988,402 | |
| | 3,500,000 | | | Apidos CLO XIX, Series 2014-19A, Class E, 6.30%, 10/17/26(j)(k) | | | 3,093,598 | |
| | 1,000,000 | | | Apidos CLO XV, Series 2013-15A, Class D, 5.60%, 10/20/25(j)(k) | | | 890,647 | |
| | 5,000,000 | | | Apidos CLO XVIII, Series 2014-18A, Class D, 6.10%, 07/22/26(j)(k) | | | 4,440,056 | |
| | 2,500,000 | | | Apidos CLO XX, Series 2015-20A, Class D, 6.50%, 01/16/27(j)(k) | | | 2,225,232 | |
| | 1,000,000 | | | Ares XXVII CLO Ltd., Series 2013-2A, Class D, 4.49%, 07/28/25(j)(k) | | | 993,790 | |
| Old Westbury Funds, Inc. | |
| Strategic Opportunities Fund | |
Consolidated Portfolio of Investments - (Continued) | |
| | October 31, 2016 |
Principal
Amount | | | | | Value | |
| CAYMAN ISLANDS (continued) | | | | |
| $ | 4,250,000 | | | Ares XXXIII CLO Ltd., Series 2015-1A, Class D, 7.07%, 12/05/25(j)(k) | | $ | 3,976,398 | |
| | 3,500,000 | | | Ares XXXIX CLO Ltd., Series 2016-39A, Class E, 8.10%, 07/18/28(j)(k) | | | 3,451,811 | |
| | 3,000,000 | | | Ares XXXVII CLO Ltd., Series 2015- 4A, Class D1, 7.70%, 10/15/26(j)(k) | | | 2,882,374 | |
| | 3,000,000 | | | Ares XXXVII CLO Ltd., Series 2015-4A, Class D2, 7.90%, 10/15/26(j)(k) | | | 2,890,544 | |
| | 650,000 | | | Atlas Senior Loan Fund Ltd., Series 2012-1A, Class B2L, 7.10%, 08/15/24(j)(k) | | | 649,983 | |
| | 5,000,000 | | | Atrium CDO Corp., Series 81, Class SUB, 1.00%, 10/23/22(e) | | | 3,232,073 | |
| | 1,000,000 | | | Atrium VIII, Series 8A, Class DR, 4.86%, 10/23/24(j)(k) | | | 1,000,000 | |
| | 1,750,000 | | | Atrium VIII, Series 8A, Class ER, 8.11%, 10/23/24(j)(k) | | | 1,750,000 | |
| | 5,000,000 | | | Atrium XI, Series 11A, Class E, 6.00%, 10/23/25(j)(k) | | | 4,456,209 | |
| | 2,000,000 | | | Atrium XII, Series 12A, Class E, 6.80%, 10/22/26(j)(k) | | | 1,830,821 | |
| | 2,500,000 | | | Babson CLO Ltd., Series 16-1A, Class E, 7.40%, 04/23/27(j)(k) | | | 2,352,310 | |
| | 750,000 | | | Babson CLO Ltd., Series 2015-2A, Class E, 6.40%, 07/20/27(j)(k) | | | 660,728 | |
| | 1,000,000 | | | Babson CLO Ltd., Series 2016-2A,Class E, 7.63%, 07/20/28(j)(k) | | | 956,272 | |
| | 2,000,000 | | | Battalion CLO IX Ltd., Series 2015-9A, Class D, 4.80%, 07/15/28(j)(k) | | | 1,844,950 | |
| | 500,000 | | | Battalion CLO VIII Ltd., Series 2015-8A, Class D, 6.30%, 04/18/27(j)(k) | | | 447,594 | |
| | 1,250,000 | | | Benefit Street Partners CLO VI Ltd., Series 2015-VIA, Class D, 6.40%, 04/18/27(j)(k) | | | 1,103,087 | |
| | 2,250,000 | | | Benefit Street Partners CLO VIII Ltd., Series 2015-8A, Class C, 4.80%, 01/20/28(j)(k) | | | 2,208,551 | |
| | 1,250,000 | | | Benefit Street Partners CLO VIII Ltd., Series 2015-8A, Class D, 6.40%, 01/20/28(j)(k) | | | 1,075,730 | |
| | 1,000,000 | | | Birchwood Park CLO Ltd., Series 2014-1A, Class D1, 4.30%, 07/15/26(j)(k) | | | 952,807 | |
| | 1,000,000 | | | BlueMountain CLO Ltd. Series 2016-2A, Class D., 7.70%, 08/20/28(j)(k) | | | 982,743 | |
| | 650,000 | | | BlueMountain CLO Ltd., Series 2011-1A, Class E, 6.57%, 08/16/22(j)(k) | | | 650,742 | |
Principal
Amount | | | | | Value | |
| CAYMAN ISLANDS (continued) | | | | |
| $ | 2,500,000 | | | BlueMountain CLO Ltd., Series 2012-1A, Class D, 5.20%, 07/20/23(j)(k) | | $ | 2,534,944 | |
| | 1,250,000 | | | BlueMountain CLO Ltd., Series 2014-4A, Class E, 6.13%, 11/30/26(j)(k) | | | 1,131,944 | |
| | 1,000,000 | | | BlueMountain CLO Ltd., Series 2015-1A, Class C, 4.60%, 04/13/27(j)(k) | | | 979,577 | |
| | 1,500,000 | | | BlueMountain CLO Ltd., Series 2015-1A, Class D, 6.30%, 04/13/27(j)(k) | | | 1,435,710 | |
| | 500,000 | | | BlueMountain CLO Ltd., Series 2015-2A, Class E, 6.20%, 07/18/27(j)(k) | | | 433,927 | |
| | 1,000,000 | | | BlueMountain CLO Ltd., Series 2015-4A, Class D2, 4.90%, 01/20/27(j)(k) | | | 984,031 | |
| | 1,000,000 | | | BlueMountain CLO Ltd., Series 2015-4A, Class E, 7.40%, 01/20/27(j)(k) | | | 970,153 | |
| | 1,000,000 | | | Burnham Park CLO Ltd., Series 2016-1A, Class E, 7.71%, 10/20/29(j)(k) | | | 957,750 | |
| | 2,000,000 | | | Canyon Capital CLO Ltd., Series 2012-1A, Class DR, 4.97%, 01/15/26(j)(k) | | | 2,000,240 | |
| | 1,000,000 | | | Canyon Capital CLO., Series 2016-1A, Class E, 8.40%, 04/15/28(j)(k) | | | 976,286 | |
| | 1,000,000 | | | Canyon Capital CLO., Series 2016-2A, Series E, 7.60%, 10/15/28(j)(k) | | | 943,192 | |
| | 2,500,000 | | | Carlyle Global Market Strategies CLO 2015-3 Ltd., Series 2015-3A, Class D, 6.60%, 07/28/28(j)(k) | | | 2,266,027 | |
| | 1,500,000 | | | Carlyle Global Market Strategies CLO Ltd., Series 2015-1A, Class E1, 6.20%, 04/20/27(j)(k) | | | 1,349,295 | |
| | 2,351,647 | | | Carlyle Global Market Strategies CLO Ltd., Series 2015-4A, Class SBB1, 9.38%, 10/20/27(j) | | | 2,287,917 | |
| | 750,000 | | | Carlyle Global Market Strategies CLO Ltd., Series 2016-1A, Class D, 8.50%, 04/20/27(j)(k) | | | 749,006 | |
| | 1,000,000 | | | Carlyle Global Market Strategies CLO, Series 2015-2A, Class D, 6.20%, 04/27/27(j)(k) | | | 906,231 | |
| | 1,000,000 | | | Carlyle Global Market Strategies CLO., Series 2016-3A, Class D, 7.79%, 10/20/29(j)(k) | | | 978,803 | |
| | 1,500,000 | | | CIFC Funding Ltd., Series 2012-2A, Class B2R, 6.59%, 12/05/24(j)(k) | | | 1,470,387 | |
| | 2,500,000 | | | CIFC Funding Ltd., Series 2014-2A, Class B1L, 4.33%, 05/24/26(j)(k) | | | 2,392,314 | |
| Old Westbury Funds, Inc. | |
| Strategic Opportunities Fund | |
Consolidated Portfolio of Investments - (Continued) | |
| | October 31, 2016 |
Principal
Amount | | | | | Value | |
| CAYMAN ISLANDS (continued) | | | | |
| $ | 1,000,000 | | | Cole Park CLO Ltd., Series 2015-1A, Class E, 7.00%, 10/20/28(j)(k) | | $ | 935,029 | |
| | 1,000,000 | | | Cumberland Park CLO Ltd., Series 2015-2A, Class E, 5.90%, 07/20/26(j)(k) | | | 870,213 | |
| | 1,000,000 | | | Dryden Senior Loan Fund, Series 2014-34A, Class D, 4.50%, 10/15/26(j)(k) | | | 961,133 | |
| | 1,000,000 | | | Dryden Senior Loan Fund, Series 2014-36A, Class E, 5.99%, 11/09/25(j)(k) | | | 887,875 | |
| | 1,000,000 | | | Dryden Senior Loan Fund, Series 2016-43A, Class E, 7.90%, 07/20/29(j)(k) | | | 990,000 | |
| | 1,500,000 | | | Galaxy XXI CLO Ltd., Series 2015-21A, Class E2, 7.38%, 01/20/28(j)(k) | | | 1,439,838 | |
| | 2,000,000 | | | Goldentree Loan Opportunities XI Ltd., Series 2015-11A, Class E, 6.40%, 04/18/27(j)(k) | | | 1,822,639 | |
| | 3,000,000 | | | Gramercy Park CLO Ltd., Series 2012-1AR, Class DR, 6.40%, 07/17/23(j)(k) | | | 2,965,043 | |
| | 1,000,000 | | | Highbridge Loan Management Ltd., Series 2015-6A, Class E1, 6.23%, 05/05/27(j)(k) | | | 896,454 | |
| | 1,000,000 | | | Highbridge Loan Management Ltd., Series 2015-7A, Class D, 4.57%, 11/15/26(j)(k) | | | 932,185 | |
| | 500,000 | | | Highbridge Loan Management Ltd., Series 2016-8A, Class D, 5.70%, 04/20/27(j)(k) | | | 481,975 | |
| | 962,500 | | | Highbridge Loan Management Ltd., Series 5A-2015, Class E, 6.10%, 01/29/26(j)(k) | | | 865,516 | |
| | 1,000,000 | | | Highbridge Loan Management Ltd., Series 8A-2016, Class E, 8.80%, 04/20/27(k) | | | 998,393 | |
| | 1,000,000 | | | Highbridge Loan Management Ltd., Series 9A-2016, Class D2, 7.08%, 07/19/27(j)(k) | | | 902,181 | |
| | 21,500,000 | | | Jackson Mill CLO Ltd., Series 2015-1A, Class E, 5.88%, 04/15/27(b)(j)(k) | | | 18,134,635 | |
| | 20,000,000 | | | Jackson Mill CLO Ltd., Series 2015-1A, Class SUB, 1.00%, 04/15/27(b)(e)(j) | | | 15,066,080 | |
| | 8,000,000 | | | Jefferson Mill CLO Ltd., Series 2015-1A, Class F, 7.38%, 07/20/27(b)(j)(k) | | | 4,934,892 | |
| | 8,000,000 | | | Jefferson Mill CLO Ltd., Series 2015-1A, Class SUB, 6.70%, 07/20/27(b)(e)(j) | | | 4,647,320 | |
| | 1,000,000 | | | LCM Ltd. Partnership XIII LP, Series 13A, Class D, 4.70%, 01/19/23(j)(k) | | | 995,374 | |
Principal
Amount | | | | | Value | |
| CAYMAN ISLANDS (continued) | | | | |
| $ | 1,000,000 | | | LCM Ltd. Partnership XVII LP, Series -17A, Class D, 4.40%, 10/15/26(j)(k) | | $ | 977,425 | |
| | 1,500,000 | | | LCM Ltd. Partnership XVIII LP, Series -18A, Class D, 4.70%, 04/20/27(j)(k) | | | 1,470,578 | |
| | 500,000 | | | LCM Ltd. Partnership XVIII LP, Series 18A, Class E, 4.60%, 04/20/27(j)(k) | | | 324,198 | |
| | 1,000,000 | | | LCM Ltd. Partnership XVIII LP, Series 18A, Class E, 6.20%, 04/20/27(j)(k) | | | 895,535 | |
| | 1,350,000 | | | LCM Ltd. Partnership XXI LP, Series -21A, Class D, 6.00%, 04/20/28(j)(k) | | | 1,370,263 | |
| | 1,100,000 | | | LCM XVI LP, Series 16A, Class E, 5.48%, 07/15/26(j)(k) | | | 951,661 | |
| | 1,000,000 | | | LCM XXI LP, Series -21A, Class E, 8.50%, 04/20/28(j)(k) | | | 999,930 | |
| | 1,000,000 | | | Madison Park Funding Ltd., Series 2012-9A, Class E, 6.07%, 08/15/22(j)(k) | | | 966,687 | |
| | 1,000,000 | | | Madison Park Funding XIX Ltd., Series 2015-19A, Class D, 7.30%, 01/22/28(j)(k) | | | 952,653 | |
| | 1,000,000 | | | Madison Park Funding XX Ltd., Series 2016-20A, Class E, 8.30%, 04/27/27(j)(k) | | | 1,009,686 | |
| | 1,000,000 | | | Neuberger Berman CLO Ltd., Series 2015-20A, Class D, 4.80%, 01/15/28(j)(k) | | | 968,519 | |
| | 3,250,000 | | | Neuberger Berman CLO Ltd., Series 2015-20A, Class E, 7.30%, 01/15/28(j)(k) | | | 3,019,913 | |
| | 1,250,000 | | | Neuberger Berman CLO XII Ltd., Series 2012-12AR, Class ER, 7.10%, 07/25/23(j)(k) | | | 1,252,267 | |
| | 2,050,000 | | | Neuberger Berman CLO XIII Ltd., Series 2012-13A, Class D, 5.40%, 01/23/24(j)(k) | | | 2,050,629 | |
| | 625,000 | | | Neuberger Berman CLO XVII Ltd., Series 2014-17A, Class D, 4.32%, 08/04/25(j)(k) | | | 599,804 | |
| | 1,000,000 | | | Neuberger Berman CLO XVIII Ltd., Series 2014-18A, Class C, 4.57%, 11/14/25(j)(k) | | | 968,685 | |
| | 750,000 | | | Neuberger Berman CLO XXI Ltd., Series 2016-21A, Class D, 5.80%, 04/20/27(j)(k) | | | 751,028 | |
| | 2,000,000 | | | Neuberger Berman CLO XXI Ltd., Series 2016-21A, Class E, 7.90%, 04/20/27(j)(k) | | | 1,980,569 | |
| | 1,000,000 | | | Neuberger Berman CLO XXII Ltd., Series 2016-22A, Class E, 7.69%, 10/17/27(j)(k) | | | 944,100 | |
| Old Westbury Funds, Inc. | |
| Strategic Opportunities Fund | |
Consolidated Portfolio of Investments - (Continued) | |
| | October 31, 2016 |
Principal
Amount | | | | | Value | |
| CAYMAN ISLANDS (continued) | | | | |
| $ | 1,000,000 | | | Oak Hill Credit Partners XII Ltd., Series 2015-12A, Class D1, 5.10%, 01/23/27(j)(k) | | $ | 976,660 | |
| | 1,000,000 | | | OCP CLO Ltd.,Series 2015-8A,Class C,, 4.50%, 04/17/27(j)(k) | | | 919,402 | |
| | 1,000,000 | | | Octagon Investment Partners 26 Ltd., Series 2016-1A, Class D, 5.80%, 04/15/27(j)(k) | | | 1,001,354 | |
| | 2,000,000 | | | Octagon Investment Partners 26 Ltd., Series 2016-1A, Class E, 8.70%, 04/15/27(j)(k) | | | 1,999,828 | |
| | 2,500,000 | | | Octagon Investment Partners 27 Ltd., Series 2016-1A, Class E, 7.76%, 07/15/27(j)(k) | | | 2,449,906 | |
| | 1,000,000 | | | Octagon Investment Partners XII Ltd., Series 2012-1AR, Class ER, 6.28%, 05/05/23(j)(k) | | | 978,884 | |
| | 1,100,000 | | | Octagon Investment Partners XXI Ltd., Series 2014-1A, Class C, 4.47%, 11/14/26(j)(k) | | | 1,069,106 | |
| | 1,000,000 | | | Octagon Investment Partners XXI Ltd., Series 2014-1A, Class D, 7.42%, 11/14/26(j)(k) | | | 930,685 | |
| | 1,250,000 | | | Octagon Investment Partners XXII Ltd., Series 2014-1A, Class E1, 6.10%, 11/25/25(j)(k) | | | 1,086,712 | |
| | 1,500,000 | | | Octagon Loan Funding Ltd., Series 2014-1A, Class E, 6.00%, 11/18/26(j)(k) | | | 1,301,489 | |
| | 1,375,000 | | | OHA Credit Partners XI Ltd., Series 2015-11A, Class E, 7.60%, 10/20/28(j)(k) | | | 1,302,056 | |
| | 2,250,000 | | | OZLM Funding II Ltd., Series 2012-2A, Class DR, 8.17%, 10/30/27(j)(k) | | | 2,165,850 | |
| | 2,750,000 | | | OZLM Funding III Ltd., Series 2013-3A, Class D, 5.90%, 01/22/25(j)(k) | | | 2,602,882 | |
| | 1,750,000 | | | OZLM Funding IV Ltd., Series 2013-4A, Class D, 5.50%, 07/22/25(j)(k) | | | 1,530,673 | |
| | 1,750,000 | | | OZLM Funding Ltd., Series 2012-1A, Class DR, 7.60%, 07/22/27(j)(k) | | | 1,704,161 | |
| | 1,500,000 | | | OZLM VII Ltd., Series 2014-7A, Class D,
5.90%, 07/17/26(j)(k) | | | 1,342,545 | |
| | 1,000,000 | | | OZLM XI Ltd., Series 2015-11A, Class C2, 4.51%, 01/30/27(j)(k) | | | 957,594 | |
| | 1,250,000 | | | OZLM XIII Ltd., Series 2015-13A, Class D, 6.21%, 07/30/27(j)(k) | | | 1,087,951 | |
| | 1,200,000 | | | OZLM XIV Ltd., Series 2015-14A, Class C, 5.20%, 01/15/29(j)(k) | | | 1,200,658 | |
| | 1,500,000 | | | OZLM XIV Ltd., Series 2015-14A, Class D, 7.20%, 01/15/29(j)(k) | | | 1,392,802 | |
| | 1,000,000 | | | Race Point V CLO, Ltd., Series 2011-5A, Class ER,, 6.85%, 12/15/22(j)(k) | | | 1,000,118 | |
Principal
Amount | | | | | Value | |
| CAYMAN ISLANDS (continued) | | | | |
| $ | 2,000,000 | | | Regatta III Funding Ltd., Series 2014-1A, Class C, 4.30%, 04/15/26(j)(k) | | $ | 1,887,992 | |
| | 1,650,000 | | | Sound Point CLO III Ltd., Series 2013-2A, Class E, 5.50%, 07/15/25(j)(k) | | | 1,462,242 | |
| | 1,000,000 | | | Sound Point CLO IX Ltd., Series 2015-2A, Class E, 6.40%, 07/20/27(j)(k) | | | 890,390 | |
| | 5,000,000 | | | Sound Point CLO X Ltd., Series 2015-3A, Class E, 7.60%, 01/20/28(j)(k) | | | 4,713,379 | |
| | 2,000,000 | | | Sound Point CLO XII Ltd., Series 2016-2A,Class E, 7.30%, 10/20/28(j)(k) | | | 1,850,066 | |
| | 1,750,000 | | | Sound Point CLO XIV Ltd., Series 2016-3A, Class E, 7.53%, 01/23/29(j)(k) | | | 1,606,675 | |
| | 1,000,000 | | | Stewart Park CLO Ltd., Series 2015-1A, Class E, 6.30%, 04/15/26(j)(k) | | | 895,347 | |
| | 1,500,000 | | | Symphony CLO XV Ltd., Series 2014-15A, Class E, 5.90%, 10/17/26(j)(k) | | | 1,324,838 | |
| | 1,000,000 | | | Symphony CLO XVI Ltd., Series 2015-16A, Class E, 6.13%, 07/15/28(j)(k) | | | 900,045 | |
| | 5,000,000 | | | TICP CLO I Ltd., Series 2015-1A, Class D, 4.43%, 07/20/27(j)(k) | | | 4,587,979 | |
| | 1,250,000 | | | Vibrant CLO IV Ltd., Series 2016-4A, Class D, 5.13%, 07/20/28(k) | | | 1,219,870 | |
| | 1,000,000 | | | Voya CLO Ltd., Series 2012-2AR, Class ER, 6.90%, 10/15/22(j)(k) | | | 991,859 | |
| | 1,000,000 | | | Voya CLO Ltd., Series 2014-1A, Class C, 4.30%, 04/18/26(j)(k) | | | 951,610 | |
| | 3,750,000 | | | Voya CLO Ltd., Series 2015-1A, Class E, 7.40%, 04/18/27(j)(k) | | | 3,015,154 | |
| | 1,250,000 | | | Voya CLO Ltd., Series 2015-2A, Class D, 4.30%, 07/23/27(j)(k) | | | 1,187,888 | |
| | 1,500,000 | | | Voya CLO Ltd., Series 2016-2A, Class D, 7.63%, 07/19/28(j)(k) | | | 1,438,502 | |
| | 1,000,000 | | | Voya CLO Ltd., Series 2016-3A, Class D, 7.71%, 10/18/27(j)(k) | | | 947,600 | |
| | 11,250,000 | | | Washington Mill CLO Ltd., Series 2014-1A, Class F, 6.38%, 04/20/26(b)(j)(k) | | | 7,385,963 | |
| | 17,600,000 | | | Washington Mill CLO Ltd., Series 2014-1A, Class SUB, 11.00%, 04/20/26(b)(e)(j) | | | 6,755,161 | |
| | 4,250,000 | | | Webster Park CLO Ltd., Series 2015-1A, Class C, 4.90%, 01/20/27(j)(k) | | | 4,178,281 | |
| | 2,650,000 | | | Webster Park CLO Ltd., Series 2015-1A, Class D, 7.00%, 01/20/27(j)(k) | | | 2,449,574 | |
| Old Westbury Funds, Inc. | |
| Strategic Opportunities Fund | |
Consolidated Portfolio of Investments - (Continued) | |
| | October 31, 2016 |
Principal
Amount | | | | | Value | |
| CAYMAN ISLANDS (continued) | | | | |
| $ | 1,000,000 | | | Westcott Park CLO Ltd., Series 2016-1A, Class D, 5.05%, 07/20/28(j)(k) | | $ | 998,844 | |
| | 1,000,000 | | | Westcott Park CLO Ltd., Series 2016-1A, Class E, 7.90%, 07/20/28(j)(k) | | | 937,038 | |
| | 3,500,000 | | | York CLO Ltd., Series 2016-1A, Class E, 6.60%, 07/15/28(j)(k) | | | 3,131,967 | |
| | 1,000,000 | | | York CLO-2 Ltd., Series 2015-1A, Class E, 7.10%, 10/22/27(j)(k) | | | 926,241 | |
| | | | | | | | 277,708,013 | |
| UNITED STATES — 6.9% | | | | |
| | 15,864,791 | | | Argent Mortgage Loan Trust, Series 2005-W1, Class A2, 0.80%, 05/25/35(k) | | | 13,466,828 | |
| | 1,000,000 | | | Atlas Senior Loan Fund II Ltd., Series 2012-2A, Class DR, 4.73%, 01/30/24(j)(k) | | | 995,825 | |
| | 5,000,000 | | | BankAmerica Manufactured Housing Contract Trust, Series 1998-2, Class B1, 7.93%, 12/10/25(k) | | | 4,868,146 | |
| | 9,616,820 | | | Bayview Financial Revolving Asset Trust, Series 2004-B, Class A1, 1.52%, 05/28/39(j)(k) | | | 7,098,373 | |
| | 1,500,000 | | | Bayview Opportunity Master Fund IVb Trust 2016-RN4, Series 2016-RN4, Class A1, 3.60%, 10/28/31(j) | | | 1,497,750 | |
| | 3,664,651 | | | Bayview Opportunity Master Fund Trust, Series 2016-RPL3, Class A1, 3.47%, 07/28/31(j) | | | 3,670,944 | |
| | 4,211,732 | | | Bayview Opportunity Master Fund Trust, Series 2016-RPL3, Class A1, 1.45%, 12/28/40(j)(k) | | | 3,442,701 | |
| | 3,169,240 | | | Bear Stearns Asset Backed Securities I Trust, Series 2006-EC2, Class M2, 0.95%, 02/25/36(k) | | | 2,790,052 | |
| | 7,987,970 | | | Bear Stearns Asset Backed Securities I Trust, Series 2006-HE10, Class 22A, 0.67%, 12/25/36(k) | | | 6,736,335 | |
| | 3,432,635 | | | Bear Stearns Asset-Backed Securities Trust, Series 2006-AC2, Class 22A1, 0.88%, 03/25/36(k) | | | 1,189,327 | |
| | 3,432,635 | | | Bear Stearns Asset-Backed Securities Trust, Series 2006-AC2, Class 22A3, 0.88%, 03/25/36(k) | | | 1,189,327 | |
| | 13,894,520 | | | Bear Stearns Asset-Backed Securities Trust, Series 2006-AQ1, Class 2A2, 0.73%, 10/25/36(k) | | | 11,728,441 | |
| | 8,000,000 | | | Bear Stearns Second Lien Trust, Series 2007-SV1A, Class M1, 1.73%, 12/25/36(j)(k) | | | 7,598,139 | |
Principal
Amount | | | | | Value | |
| UNITED STATES (continued) | | | | |
| $ | 3,802,559 | | | Bombardier Capital Mortgage Securitization Pass-Through Certificates, Series 2000-A, Class A2, 7.58%, 06/15/30(k) | | $ | 1,712,841 | |
| | 3,564,899 | | | Bombardier Capital Mortgage Securitization Pass-Through Certificates, Series 2000-A, Class A3, 7.83%, 06/15/30(k) | | | 1,756,812 | |
| | 6,036,563 | | | Bombardier Capital Mortgage Securitization Pass-Through Certificates, Series 2000-A, Class A4, 8.29%, 06/15/30(k) | | | 3,039,064 | |
| | 750,000 | | | BSP Mortgage Securities Corp. Ltd., Series 2016-9A, Class E, 7.60%, 07/20/28(j)(k) | | | 680,919 | |
| | 3,676,456 | | | Carrington Mortgage Loan Trust Series, Series 2006-NC2, Class A3, 0.68%, 06/25/36(k) | | | 3,372,792 | |
| | 8,203,000 | | | Carrington Mortgage Loan Trust, Series 2006-FRE1, Class A3, 0.68%, 07/25/36(k) | | | 7,003,475 | |
| | 11,505,013 | | | Carrington Mortgage Loan Trust, Series 2006-FRE2, Class A3, 0.69%, 10/25/36(k) | | | 6,008,762 | |
| | 3,079,001 | | | Carrington Mortgage Loan Trust, Series 2007-FRE1, Class A2, 0.73%, 02/25/37(k) | | | 2,922,190 | |
| | 4,884,740 | | | Carrington Mortgage Loan Trust, Series 2007-FRE1, Class A4, 0.95%, 02/25/37(k) | | | 3,338,289 | |
| | 8,250,000 | | | Carrington Mortgage Loan Trust, Series 2007-RFC1, Class A3, 0.67%, 12/25/36(k) | | | 5,277,998 | |
| | 12,415,000 | | | Carrington Mortgage Loan Trust, Series 2007-RFC1, Class A4, 0.75%, 12/25/36(k) | | | 7,215,607 | |
| | 14,560,762 | | | Conseco Finance Securitizations Corp., Series 2000-4, Class A5, 7.97%, 05/01/32 | | | 8,481,123 | |
| | 4,300,000 | | | Conseco Financial Corp., Series 1997-7, Class M1, 7.03%, 07/15/28 | | | 4,145,171 | |
| | 2,905,302 | | | Conseco Financial Corp., Series 1998-2, Class M1, 6.94%, 12/01/28(k) | | | 2,596,759 | |
| | 4,647,479 | | | Conseco Financial Corp., Series 1999-5, Class A5, 7.86%, 03/01/30(k) | | | 3,962,731 | |
| | 3,578,404 | | | Conseco Financial Corp., Series 1999-5, Class A6, 7.50%, 03/01/30(k) | | | 2,811,982 | |
| | 1,468,309 | | | Countrywide Asset-Backed Certificates, Series 2006-11, Class 3AV2, 0.68%, 09/25/46(k) | | | 1,355,431 | |
| | 1,865,012 | | | Countrywide Asset-Backed Certificates, Series 2006-S3, Class A3, STEP, 6.29%, 06/25/21 | | | 1,996,306 | |
| Old Westbury Funds, Inc. | |
| Strategic Opportunities Fund | |
| Consolidated Portfolio of Investments - (Continued) | |
| | October 31, 2016 |
| Principal | | | | | | |
| Amount | | | | | Value | |
| UNITED STATES (continued) | | | | |
| $ | 17,150,349 | | | Countrywide Asset-Backed Certificates, Series 2007-S3, Class A3, 0.91%, 05/25/37(k) | | $ | 14,079,739 | |
| | 4,156,878 | | | Countrywide Home Equity Loan Trust, Series 2006-S5, Class A4, 5.84%, 06/25/35 | | | 4,151,090 | |
| | 5,284,167 | | | Countrywide Home Equity Loan Trust, Series 2006-S5, Class A5, 6.16%, 06/25/35 | | | 4,951,950 | |
| | 2,827,140 | | | Countrywide Revolving Home Equity Loan Resecuritization Trust, Series 2006-RES, Class 4Q1B, 0.82%, 12/15/33(j)(k) | | | 2,395,238 | |
| | 2,526,907 | | | Countrywide Revolving Home Equity Loan Resecuritization Trust, Series 2006-RES, Class 4T1B, 0.76%, 02/15/30(j)(k) | | | 2,043,004 | |
| | 2,392,375 | | | Countrywide Revolving Home Equity Loan Resecuritization Trust, Series 2006-RES, Class 5B1B, 0.71%, 05/15/35(j)(k) | | | 2,020,958 | |
| | 2,998,654 | | | Credit-Based Asset Servicing & Securitization LLC Trust, Series 2006-CB9, Class A3, 0.68%, 11/25/36(k) | | | 1,886,008 | |
| | 5,722,902 | | | First Franklin Mortgage Loan Trust Asset Backed Certificates, Series 2007-FF2, Class A2C, 0.67%, 03/25/37(k) | | | 3,364,488 | |
| | 3,924,776 | | | GMAC Mortgage Home Equity Loan Trust, Series 2005-HE3, Class A3, 0.76%, 02/25/36(k) | | | 3,813,077 | |
| | 3,307,719 | | | GMAC Mortgage Home Equity Loan Trust, Series 2006-HE1, Class A, 0.73%, 11/25/36(k) | | | 3,098,300 | |
| | 3,603,507 | | | Greenpoint Manufactured Housing, Series 1999-1, Class A5, 6.77%, 08/15/29(k) | | | 3,532,504 | |
| | 3,352,279 | | | Greenpoint Manufactured Housing, Series 2000-1, Class A4, 8.14%, 03/20/30(k) | | | 3,551,197 | |
| | 8,847,445 | | | Greenpoint Manufactured Housing, Series 2000-3, Class IA, 8.45%, 06/20/31(k) | | | 8,693,844 | |
| | 716,998 | | | GSAA Trust, Series 2006-7, Class AF2, 5.99%, 03/25/46(k) | | | 497,718 | |
| | 7,071,948 | | | GSAMP Trust, Series 2006-FM2, Class A2B, 0.65%, 09/25/36(k) | | | 2,947,461 | |
| | 4,000,000 | | | Invitation Homes Trust, Series 2015-SFR3, Class E, 4.28%, 08/17/32(j)(k) | | | 4,005,000 | |
| | 820,185 | | | Irwin Home Equity Loan Trust, Series 2006-2, Class 2A2, STEP, 6.24%, 02/25/36(j) | | | 844,246 | |
| Principal | | | | | | |
| Amount | | | | | Value | |
| UNITED STATES (continued) | | | | |
| $ | 4,000,000 | | | J.P. Morgan Mortgage Acquisition Corp., Series 2006-CW1,Class M1, 0.80%, 05/25/36(k) | | $ | 3,007,676 | |
| | 8,866,714 | | | Lehman ABS Mortgage Loan Trust,Series 2007-1,Class 2A2, 0.73%, 06/25/37(j)(k) | | | 5,485,658 | |
| | 10,378,865 | | | Long Beach Mortgage Loan Trust, Series 2006-1, Class 1A, 0.75%, 02/25/36(k) | | | 9,099,872 | |
| | 1,412,202 | | | Long Beach Mortgage Loan Trust, Series 2006-10, Class 2A2, 0.64%, 11/25/36(k) | | | 540,778 | |
| | 19,479,506 | | | Long Beach Mortgage Loan Trust, Series 2006-10, Class 2A3, 0.69%, 11/25/36(k) | | | 7,551,583 | |
| | 3,828,751 | | | Long Beach Mortgage Loan Trust, Series 2006-10, Class 2A4, 0.75%, 11/25/36(k) | | | 1,505,774 | |
| | 4,369,843 | | | Long Beach Mortgage Loan Trust, Series 2006-2, Class 2A3, 0.72%, 03/25/46(k) | | | 2,187,737 | |
| | 26,691,396 | | | Long Beach Mortgage Loan Trust, Series 2006-5, Class 2A4, 0.77%, 06/25/36(k) | | | 14,239,296 | |
| | 7,259,871 | | | Long Beach Mortgage Loan Trust, Series 2006-9, Class 2A3, 0.69%, 10/25/36(k) | | | 3,361,386 | |
| | 4,000,000 | | | Madison Avenue Manufactured Housing Contract Trust, Series 2002-A, Class B2, 3.78%, 03/25/32(k) | | | 4,042,000 | |
| | 4,924,608 | | | Mastr Second Lien Trust, Series 2006-1, Class A, 0.85%, 03/25/36(k) | | | 1,224,693 | |
| | 1,000,000 | | | Mill Creek CLO Ltd., Series 2016-1A, Class E, 8.60%, 04/20/28(j)(k) | | | 1,001,117 | |
| | 1,770,815 | | | Morgan Stanley ABS Capital I, Series 2006-HE4, Class A4, 0.77%, 06/25/36(k) | | | 1,157,878 | |
| | 9,399,978 | | | Morgan Stanley ABS Capital I, Series 2007-NC3, Class A2B, 0.67%, 05/25/37(k) | | | 6,626,940 | |
| | 5,988,858 | | | Morgan Stanley Mortgage Loan Trust, Series 2006-12XS, Class A4, STEP, 6.01%, 10/25/36 | | | 2,923,121 | |
| | 3,483,365 | | | Oakwood Mortgage Investors, Inc., Series 1999-C, Class A2, 7.48%, 08/15/27 | | | 3,458,950 | |
| | 11,335,367 | | | Oakwood Mortgage Investors, Inc., Series 2000-D, Class A4, 7.40%, 07/15/30(k) | | | 7,269,503 | |
| | 8,860,252 | | | Oakwood Mortgage Investors, Inc., Series 2001-C, Class A2, 5.92%, 06/15/31(k) | | | 3,342,155 | |
| Old Westbury Funds, Inc. | |
| Strategic Opportunities Fund | |
| Consolidated Portfolio of Investments - (Continued) | |
| | October 31, 2016 |
| Principal | | | | | | |
| Amount | | | | | Value | |
| UNITED STATES (continued) | | | | |
| $ | 6,147,123 | | | Oakwood Mortgage Investors, Inc., Series 2001-C, Class A3, 6.61%, 06/15/31(k) | | $ | 2,571,205 | |
| | 7,024,415 | | | Oakwood Mortgage Investors, Inc., Series 2001-C, Class A4, 7.41%, 06/15/31(k) | | | 3,270,551 | |
| | 1,072,360 | | | Oakwood Mortgage Investors, Inc., Series 2001-D, Class A3, 5.90%, 09/15/22(k) | | | 898,609 | |
| | 1,887,478 | | | Oakwood Mortgage Investors, Inc., Series 2002-B, Class A4, 7.09%, 06/15/32(k) | | | 2,014,409 | |
| | 2,000,000 | | | OneMain Financial Issuance Trust, Series 2014-2A, Class C, 4.33%, 09/18/24(j) | | | 1,992,719 | |
| | 4,000,000 | | | OneMain Financial Issuance Trust, Series 2014-2A, Class D, 5.31%, 09/18/24(j) | | | 4,004,213 | |
| | 15,000,000 | | | OneMain Financial Issuance Trust, Series 2015-1A, Class C, 5.12%, 03/18/26(j) | | | 15,160,134 | |
| | 3,000,000 | | | OneMain Financial Issuance Trust, Series 2015-1A, Class D, 6.63%, 03/18/26(b)(j) | | | 3,100,649 | |
| | 10,000,000 | | | OneMain Financial Issuance Trust, Series 2015-2A, Class D, 5.64%, 07/18/25(b)(j) | | | 10,031,873 | |
| | 4,000,000 | | | OneMain Financial Issuance Trust, Series 2015-3A, Class D, 6.94%, 11/20/28(j) | | | 3,974,080 | |
| | 9,086,810 | | | Pretium Mortgage Credit Partners LLC, Series 2016-NPL3, Class A1, STEP, 4.38%, 05/27/31(j) | | | 9,174,460 | |
| | 6,000,000 | | | Progress Residential Trust, Series 2015-SFR1, Class E, 4.53%, 02/17/32(j)(k) | | | 6,027,836 | |
| | 3,918,256 | | | Residential Asset Securities Corp. Trust, Series 2002-KS4, Class AIIA, 1.02%, 07/25/32(k) | | | 3,439,193 | |
| | 18,480,000 | | | Santander Drive Auto Receivables Trust, Series 2012-AA, 0.00%, 12/16/19(b)(j) | | | 7,761,600 | |
| | 20,980,000 | | | Santander Drive Auto Receivables Trust, Series 2014-S5, 0.00%, 12/16/19(b)(j) | | | 9,713,740 | |
| | 20,980,000 | | | Santander Drive Auto Receivables Trust, Series 2014-S6, 0.00%, 12/16/19(b)(j) | | | 10,825,680 | |
| | 2,000,000 | | | Silver Bay Realty Trust, Series 2014-1, Class E, 3.78%, 09/17/31(j)(k) | | | 2,000,340 | |
| | 681,166 | | | U.S. Residential Opportunity II Trust, Series 2016-1II, Class A, 3.47%, 07/27/36(j) | | | 679,299 | |
| Principal | | | | | | |
| Amount | | | | | Value | |
| UNITED STATES (continued) | | | | |
| $ | 3,902,292 | | | U.S. Residential Opportunity III Trust, Series 2016-1III, Class A, 3.47%, 07/27/36(j) | | $ | 3,905,568 | |
| | 7,104,981 | | | U.S. Residential Opportunity IV Trust, Series 2016-1IV, Class A, 3.47%, 07/27/36(j) | | | 7,105,691 | |
| | 1,000,000 | | | US Residential Opportunity Fund II Trust 2016-3, Series 2016-3II, Class A, 3.60%, 10/27/36(j) | | | 1,000,000 | |
| | 2,000,000 | | | US Residential Opportunity Fund III Trust 2016-3, Series 2016- 3III, Class A, 3.60%, 10/27/36(j) | | | 2,000,000 | |
| | 1,500,000 | | | US Residential Opportunity Fund IV Trust 2016-3, Series 2016-3IV, Class A, 3.60%, 10/27/36(j) | | | 1,500,000 | |
| | 9,028,958 | | | Vericrest Opportunity Loan Trust XLVI LLC, Series 2016-NPL6, Class A1, STEP, 3.84%, 06/25/46(j) | | | 9,074,266 | |
| | 4,447,884 | | | Vericrest Opportunity Loan Trust XLVII LLC, Series 2016-NPL7, Class A1, STEP, 3.75%, 06/25/46(j) | | | 4,460,656 | |
| | 4,806,398 | | | Vericrest Opportunity Loan Trust XLVIII LLC, Series 2016-NPL8, Class A1,STEP, 3.50%, 07/25/46(j) | | | 4,804,842 | |
| | 1,381,533 | | | Wachovia Amortization Controlled Heloc NIM Trust, Series 2006-N1, Class N1, 5.68%, 08/12/47(j) | | | 1,417,405 | |
| | | | | | | | 409,761,397 | |
Total Asset-Backed Securities
(Cost $708,596,467) | | | 687,469,410 | |
NON-AGENCY MORTGAGE-BACKED
SECURITIES — 8.5% | |
| COLLATERALIZED MORTGAGE OBLIGATIONS — 7.6% | |
| | 1,982,874 | | | Adjustable Rate Mortgage Trust, Series 2005-3, Class 2A1, 3.06%, 07/25/35(k) | | | 1,801,441 | |
| | 2,966,614 | | | Adjustable Rate Mortgage Trust, Series 2007-1, Class 4A1, 4.16%, 03/25/37(k) | | | 2,287,283 | |
| | 6,711,775 | | | Ajax Mortgage Loan Trust, Series 2016-A, Class A, STEP, 4.25%, 08/25/64(j) | | | 6,697,034 | |
| | 3,225,775 | | | American Home Mortgage Assets Trust, Series 2006-2, Class 1A1, 1.47%, 09/25/46(k) | | | 2,324,607 | |
| | 3,139,375 | | | American Home Mortgage Assets Trust, Series 2007-3, Class 22A1, STEP, 6.25%, 06/25/37 | | | 2,439,120 | |
| | 2,251,226 | | | American Home Mortgage Investment Trust, Series 2005-2, Class 5A4D, STEP, 5.33%, 09/25/35 | | | 1,914,885 | |
| Old Westbury Funds, Inc. | |
| Strategic Opportunities Fund | |
| Consolidated Portfolio of Investments - (Continued) | |
| | October 31, 2016 |
| Principal | | | | | | |
| Amount | | | | | Value | |
COLLATERALIZED MORTGAGE OBLIGATIONS
(continued) | |
| $ | 33 | | | Banc of America Alternative Loan Trust, Series 2005-9, Class 2CB1, 6.00%, 10/25/35 | | $ | 32 | |
| | 574,276 | | | Banc of America Funding Corp., Series 2005-F, Class 6A1, 3.20%, 09/20/35(k) | | | 551,240 | |
| | 1,313,200 | | | Banc of America Funding Corp., Series 2006-A, Class 3A2, 3.07%, 02/20/36(k) | | | 1,046,725 | |
| | 1,260,894 | | | Banc of America Funding Corp., Series 2006-E, Class 2A1, 3.30%, 06/20/36(k) | | | 1,037,643 | |
| | 3,339,067 | | | Banc of America Funding Corp., Series 2007-1, Class TA5, STEP, 6.09%, 01/25/37 | | | 2,833,814 | |
| | 1,473,925 | | | Banc of America Mortgage Securities, Inc., Series 2005-I, Class 2A5, 3.40%, 10/25/35(k) | | | 1,310,668 | |
| | 5,587,498 | | | BCAP LLC Trust, Series 2010-RR11, Class 4A1, 2.88%, 03/27/47(j)(k) | | | 5,482,174 | |
| | 6,250,000 | | | BCAP LLC Trust, Series 2012-RR4, Class 8A4, 0.74%, 06/26/47(j)(k) | | | 5,726,615 | |
| | 3,467,608 | | | Bear Stearns Adjustable Rate Mortgage Trust, Series 2005-12, Class 23A1, 2.97%, 02/25/36(k) | | | 2,902,857 | |
| | 1,078,648 | | | Bear Stearns Adjustable Rate Mortgage Trust, Series 2005-6, Class 5A1, 3.02%, 08/25/35(k) | | | 951,284 | |
| | 1,070,384 | | | Bear Stearns Adjustable Rate Mortgage Trust, Series 2007-3, Class 1A1, 3.17%, 05/25/47(k) | | | 964,572 | |
| | 3,307,762 | | | Bear Stearns Alt-A Trust, Series 2006-2, Class 11A1, 0.97%, 04/25/36(k) | | | 2,655,066 | |
| | 7,030,834 | | | Bear Stearns ALT-A Trust, Series 2006-6, Class 1A1, 0.85%, 11/25/36(k) | | | 6,546,444 | |
| | 3,092,491 | | | Bear Stearns Mortgage Funding Trust, Series 2006-SL4, Class A, 0.82%, 11/25/36(k) | | | 7,024,359 | |
| | 3,078,576 | | | Chase Mortgage Trust, Series 2016-1, Class M4, 3.75%, 04/25/45(j)(k) | | | 2,931,671 | |
| | 612,541 | | | Citigroup Mortgage Loan Trust, Inc., Series 2005-2, Class 1A1, 3.00%, 05/25/35(k) | | | 595,861 | |
| | 552,587 | | | Citigroup Mortgage Loan Trust, Inc., Series 2006-AR3, Class 1A2A, 3.20%, 06/25/36(k) | | | 526,430 | |
| | 6,015,796 | | | Citigroup Mortgage Loan Trust, Inc., Series 2007-9, Class 1A1, 5.75%, 04/25/47(j) | | | 4,680,500 | |
| | 842,407 | | | Countrywide Alternative Loan Trust, Series 2004-36CB, Class 1A1, 6.00%, 02/25/35 | | | 774,657 | |
| Principal | | | | | | |
| Amount | | | | | Value | |
COLLATERALIZED MORTGAGE OBLIGATIONS
(continued) | |
| $ | 1,983,104 | | | Countrywide Alternative Loan Trust, Series 2005-31, Class 2A1, 0.83%, 08/25/35(k) | | $ | 1,628,060 | |
| | 3,867,574 | | | Countrywide Alternative Loan Trust, Series 2005-36, Class 2A1A, 0.84%, 08/25/35(k) | | | 2,842,535 | |
| | 5,524,952 | | | Countrywide Alternative Loan Trust, Series 2005-38, Class A3, 0.88%, 09/25/35(k) | | | 4,746,303 | |
| | 2,623,735 | | | Countrywide Alternative Loan Trust, Series 2005-63, Class 5A1, 2.74%, 12/25/35(k) | | | 2,064,603 | |
| | 191,453 | | | Countrywide Alternative Loan Trust, Series 2005-69, Class A1, 1.51%, 12/25/35(k) | | | 167,215 | |
| | 2,931,978 | | | Countrywide Alternative Loan Trust, Series 2005-9CB, Class 1A3, 0.98%, 05/25/35(k) | | | 2,380,942 | |
| | 1,561,431 | | | Countrywide Alternative Loan Trust, Series 2005-J14, Class A3, 5.50%, 12/25/35 | | | 1,323,178 | |
| | 5,232,641 | | | Countrywide Alternative Loan Trust, Series 2006-12CB, Class A10, 0.88%, 05/25/36(k) | | | 2,686,718 | |
| | 3,065,648 | | | Countrywide Alternative Loan Trust, Series 2006-15CB, Class A1, 6.50%, 06/25/36 | | | 2,220,925 | |
| | 6,117,343 | | | Countrywide Alternative Loan Trust, Series 2006-20CB, Class A9, 6.00%, 07/25/36 | | | 4,471,210 | |
| | 2,892,968 | | | Countrywide Alternative Loan Trust, Series 2006-22R, Class 2A1, 6.25%, 05/25/36 | | | 2,032,031 | |
| | 2,214,038 | | | Countrywide Alternative Loan Trust, Series 2006-24CB, Class A13, 0.88%, 06/25/36(k) | | | 1,349,764 | |
| | 2,214,038 | | | Countrywide Alternative Loan Trust, Series 2006-24CB, Class A14, 6.60%, 06/25/36(k) | | | 647,419 | |
| | 2,282,362 | | | Countrywide Alternative Loan Trust, Series 2006-24CB, Class A15, 5.75%, 06/25/36 | | | 1,962,805 | |
| | 2,336,046 | | | Countrywide Alternative Loan Trust, Series 2006-2CB, Class A4, 0.93%, 03/25/36(k) | | | 1,184,746 | |
| | 6,561,765 | | | Countrywide Alternative Loan Trust, Series 2006-2CB, Class A6, 5.50%, 03/25/36 | | | 5,142,480 | |
| | 2,528,024 | | | Countrywide Alternative Loan Trust, Series 2006-41CB, Class 1A10, 6.00%, 01/25/37 | | | 2,105,948 | |
| | 1,830,586 | | | Countrywide Alternative Loan Trust, Series 2006-41CB, Class 1A4, 5.75%, 01/25/37 | | | 1,490,884 | |
| Old Westbury Funds, Inc. | |
| Strategic Opportunities Fund | |
| Consolidated Portfolio of Investments - (Continued) | |
| | October 31, 2016 |
| Principal | | | | | | |
| Amount | | | | | Value | |
COLLATERALIZED MORTGAGE OBLIGATIONS
(continued) | |
| $ | 2,286,079 | | | Countrywide Alternative Loan Trust, Series 2006-45T1, Class 2A2, 6.00%, 02/25/37 | | $ | 1,806,166 | |
| | 5,227,302 | | | Countrywide Alternative Loan Trust, Series 2006-45T1, Class 2A5, 6.00%, 02/25/37 | | | 4,129,942 | |
| | 357,198 | | | Countrywide Alternative Loan Trust, Series 2006-6CB, Class 1A10, 5.50%, 05/25/36 | | | 332,572 | |
| | 1,013,403 | | | Countrywide Alternative Loan Trust, Series 2006-6CB, Class 1A2, 0.93%, 05/25/36(k) | | | 752,279 | |
| | 5,685,012 | | | Countrywide Alternative Loan Trust, Series 2006-7CB, Class 2A1, 6.50%, 05/25/36 | | | 4,021,313 | |
| | 4,461,137 | | | Countrywide Alternative Loan Trust, Series 2006-J7, Class 2A1, 2.19%, 11/20/36(k) | | | 2,641,812 | |
| | 9,604,041 | | | Countrywide Alternative Loan Trust, Series 2006-OA14, Class 1A1, 2.24%, 11/25/46(k) | | | 7,755,575 | |
| | 5,665,544 | | | Countrywide Alternative Loan Trust, Series 2006-OA14, Class 2A1, 0.72%, 11/25/46(k) | | | 4,613,094 | |
| | 6,715,420 | | | Countrywide Alternative Loan Trust, Series 2006-OA14, Class 3A1, 1.36%, 11/25/46(k) | | | 5,549,166 | |
| | 4,704,566 | | | Countrywide Alternative Loan Trust, Series 2006-OA18, Class A1, 0.65%, 12/25/46(k) | | | 4,074,654 | |
| | 6,884,398 | | | Countrywide Alternative Loan Trust, Series 2006-OA21, Class A1, 0.72%, 03/20/47(k) | | | 4,759,707 | |
| | 2,998,708 | | | Countrywide Alternative Loan Trust, Series 2006-OA22, Class A1, 0.69%, 02/25/47(k) | | | 2,509,769 | |
| | 1,726,314 | | | Countrywide Alternative Loan Trust, Series 2006-OA3, Class 2A1, 0.74%, 05/25/36(k) | | | 1,281,397 | |
| | 8,539,550 | | | Countrywide Alternative Loan Trust, Series 2006-OA6, Class 1A1A, 0.74%, 07/25/46(k) | | | 6,238,456 | |
| | 14,595,667 | | | Countrywide Alternative Loan Trust, Series 2006-OA8, Class 1A1, 0.72%, 07/25/46(k) | | | 11,925,691 | |
| | 8,851,127 | | | Countrywide Alternative Loan Trust, Series 2006-OC1, Class 1A1, 0.76%, 03/25/36(k) | | | 7,334,575 | |
| | 6,490,586 | | | Countrywide Alternative Loan Trust, Series 2006-OC3, Class 1A1, 0.71%, 04/25/46(k) | | | 4,435,472 | |
| | 3,392,643 | | | Countrywide Alternative Loan Trust, Series 2007-12T1, Class A22, 5.75%, 06/25/37 | | | 2,540,799 | |
| Principal | | | | | | |
| Amount | | | | | Value | |
COLLATERALIZED MORTGAGE OBLIGATIONS
(continued) | |
| $ | 3,417,220 | | | Countrywide Alternative Loan Trust, Series 2007-12T1, Class A5, 6.00%, 06/25/37 | | $ | 2,614,763 | |
| | 1,773,193 | | | Countrywide Alternative Loan Trust, Series 2007-19, Class 1A34, 6.00%, 08/25/37 | | | 1,399,604 | |
| | 6,452,916 | | | Countrywide Alternative Loan Trust, Series 2007-22, Class 2A16, 6.50%, 09/25/37 | | | 4,658,354 | |
| | 6,356,588 | | | Countrywide Alternative Loan Trust, Series 2007-25, Class 1A3, 6.50%, 11/25/37 | | | 4,985,242 | |
| | 1,716,698 | | | Countrywide Alternative Loan Trust, Series 2007-9T1, Class 1A8, 6.00%, 05/25/37 | | | 1,250,044 | |
| | 4,999,028 | | | Countrywide Alternative Loan Trust, Series 2007-HY5R, Class 2A1B, 2.88%, 03/25/47(k) | | | 4,717,865 | |
| | 2,270,828 | | | Countrywide Alternative Loan Trust, Series 2007-J1, Class 3A4, STEP, 5.11%, 11/25/36 | | | 1,786,098 | |
| | 17,970,086 | | | Countrywide Alternative Loan Trust, Series 2007-OA2, Class 1A1, 1.35%, 03/25/47(k) | | | 14,108,521 | |
| | 4,592,055 | | | Countrywide Alternative Loan Trust, Series 2007-OA2, Class 2A1, 0.66%, 03/25/47(k) | | | 3,314,673 | |
| | 2,738,438 | | | Countrywide Alternative Loan Trust, Series 2008-1R, Class 2A3, 6.00%, 08/25/37 | | | 2,219,489 | |
| | 3,869,968 | | | Countrywide Home Loan Mortgage Pass-Through Trust, Series 2005-31, Class 2A3, 2.61%, 01/25/36(k) | | | 3,369,287 | |
| | 1,001,549 | | | Countrywide Home Loan Mortgage Pass-Through Trust, Series 2005-J3, Class 2A4, 4.50%, 09/25/35 | | | 941,236 | |
| | 2,709,436 | | | Countrywide Home Loan Mortgage Pass-Through Trust, Series 2006-HYB1, Class 2A1, 2.72%, 03/20/36(k) | | | 2,425,422 | |
| | 16,059,431 | | | Countrywide Home Loan Mortgage Pass-Through Trust, Series 2006-OA4, Class A1, 1.47%, 04/25/46(k) | | | 8,730,948 | |
| | 5,097,536 | | | Countrywide Home Loan Mortgage Pass-Through Trust, Series 2006-OA5, Class 3A1, 0.73%, 04/25/46(k) | | | 4,485,010 | |
| | 1,688,682 | | | Countrywide Home Loan Mortgage Pass-Through Trust, Series 2006-R2, Class AF1, 0.95%, 07/25/36(j)(k) | | | 1,523,529 | |
| Old Westbury Funds, Inc. | |
| Strategic Opportunities Fund | |
| Consolidated Portfolio of Investments - (Continued) | |
| | October 31, 2016 |
| Principal | | | | | | |
| Amount | | | | | Value | |
COLLATERALIZED MORTGAGE OBLIGATIONS
(continued) | |
| $ | 3,907,453 | | | Countrywide Home Loan Mortgage Pass-Through Trust, Series 2007-21, Class 1A1, 6.25%, 02/25/38 | | $ | 3,289,167 | |
| | 289,188 | | | Credit Suisse Mortgage Capital Certificates, Series 2006-8, Class 1A1, 4.50%, 10/25/21 | | | 266,357 | |
| | 3,920,666 | | | Credit Suisse Mortgage Capital Certificates, Series 2006-9, Class 3A1, 6.00%, 11/25/36 | | | 3,611,576 | |
| | 674,047 | | | Credit Suisse Mortgage Capital Certificates, Series 2010-20R, Class 9A1, 2.95%, 01/27/36(j)(k) | | | 670,588 | |
| | 2,281,428 | | | Credit Suisse Mortgage Capital Certificates, Series 2011-5R, Class 2A1, 2.93%, 08/27/46(j)(k) | | | 2,236,798 | |
| | 3,552,059 | | | Credit Suisse Mortgage Trust Mortgage-Backed Trust, Series 2007-3, Class 1A1A, 5.84%, 04/25/37(k) | | | 1,799,911 | |
| | 4,437,615 | | | Credit Suisse Mortgage Trust, Series 2014-2R, Class 17A3, 12.40%, 04/27/37(j)(k) | | | 3,390,138 | |
| | 7,000,000 | | | Credit Suisse Mortgage Trust, Series 2015-4R, Class 1A4, 0.67%, 10/27/36(j)(k) | | | 2,931,950 | |
| | 12,047,482 | | | Credit Suisse Mortgage Trust, Series 2015-6R, Class 5A1, 0.70%, 03/27/36(j)(k) | | | 5,808,657 | |
| | 6,157,187 | | | Credit Suisse Mortgage Trust, Series 2015-6R, Class 5A1, 0.70%, 03/27/36(j)(k) | | | 5,798,161 | |
| | 3,531,694 | | | Deephaven Residential Mortgage Trust, Series 2016-1A, Class A1, 4.00%, 07/25/46(j) | | | 3,541,505 | |
| | 1,797,542 | | | Deutsche Alt-A Securities Mortgage Loan Trust, Series 2007-1, Class 1A3B, 0.67%, 08/25/37(k) | | | 1,606,018 | |
| | 3,196,574 | | | Deutsche Alt-A Securities Mortgage Loan Trust, Series 2007-OA2, Class A1, 1.28%, 04/25/47(k) | | | 2,716,866 | |
| | 3,338,144 | | | Deutsche Alt-A Securities Mortgage Loan Trust, Series 2007-OA4, Class 1A1B, 0.66%, 08/25/47(k) | | | 2,664,301 | |
| | 1,835,000 | | | Fannie Mae Connecticut Avenue Securities, Series 2014-C03, Class 1M2, 3.53%, 07/25/24(k) | | | 1,837,559 | |
| | 3,223,880 | | | Fannie Mae Connecticut Avenue Securities, Series 2016-C02, Class 1M2, 6.53%, 09/25/28(k) | | | 3,527,505 | |
| | 1,142,941 | | | GMAC Mortgage Corp. Loan Trust, Series 2005-AR6, Class 2A1, 3.50%, 11/19/35(k) | | | 1,053,849 | |
| Principal | | | | | | |
| Amount | | | | | Value | |
COLLATERALIZED MORTGAGE OBLIGATIONS
(continued) | |
| $ | 6,357,103 | | | GSMPS Mortgage Loan Trust, Series 2005-RP1, Class 1AF, 0.88%, 01/25/35(j)(k) | | $ | 5,476,869 | |
| | 2,319,050 | | | GSMPS Mortgage Loan Trust, Series 2006-RP1, Class 1AF1, 0.88%, 01/25/36(j)(k) | | | 1,939,295 | |
| | 972,086 | | | GSR Mortgage Loan Trust, Series 2005-AR1, Class 2A1, 3.20%, 01/25/35(k) | | | 978,641 | |
| | 1,627,695 | | | GSR Mortgage Loan Trust, Series 2005-AR3, Class 5A1, 3.10%, 05/25/35(k) | | | 1,557,160 | |
| | 365,339 | | | GSR Mortgage Loan Trust, Series 2006-4F, Class 1A1, 5.00%, 05/25/36 | | | 340,740 | |
| | 843,676 | | | GSR Mortgage Loan Trust, Series 2006-9F, Class 9A1, 6.00%, 08/25/21 | | | 810,657 | |
| | 1,391,801 | | | GSR Mortgage Loan Trust, Series 2006-AR1, Class 3A1, 3.13%, 01/25/36(k) | | | 1,254,372 | |
| | 1,657,535 | | | GSR Mortgage Loan Trust, Series 2007-4F, Class 3A1, 6.00%, 07/25/37 | | | 1,495,764 | |
| | 1,965,162 | | | Homebanc Mortgage Trust, Series 2006-1, Class 2A1, 2.67%, 04/25/37(k) | | | 1,548,982 | |
| | 57,466,254 | | | IndyMac IMSC Mortgage Loan Trust, Series 2007-HOA1, Class AXPP, 8.23%, 07/25/47 | | | 4,937,073 | |
| | 6,438,197 | | | IndyMac INDX Mortgage Loan Trust, Series 2006-AR33, Class 2A21, 3.24%, 01/25/37(k) | | | 5,347,764 | |
| | 4,691,909 | | | JPMorgan Alternative Loan Trust, Series 2007-A1, Class 1A3A, 0.68%, 03/25/37(k) | | | 4,495,135 | |
| | 4,959,433 | | | JPMorgan Mortgage Trust, Series 2007-A5, Class 2A1, 1.48%, 10/25/37(k) | | | 3,909,937 | |
| | 434,059 | | | JPMorgan Mortgage Trust, Series 2007-S2, Class 2A3, 5.50%, 06/25/37 | | | 420,982 | |
| | 4,034,818 | | | JPMorgan Resecuritization Trust, Series 2015-3, Class 2A1, 4.30%, 11/26/36(j)(k) | | | 3,955,009 | |
| | 5,360,150 | | | Lehman XS Trust, Series 2007-20N, Class A1, 1.67%, 12/25/37(k) | | | 4,058,360 | |
| | 3,785,162 | | | LSTAR Securities Investment Trust, Series 2015-2, Class A, 2.52%, 01/01/20(j)(k) | | | 3,754,501 | |
| | 18,405,814 | | | LSTAR Securities Investment Trust, Series 2016-2, Class A, 2.52%, 03/01/21(j)(k) | | | 18,074,509 | |
| Old Westbury Funds, Inc. | |
| Strategic Opportunities Fund | |
| Consolidated Portfolio of Investments - (Continued) | |
| | October 31, 2016 |
| Principal | | | | | | |
| Amount | | | | | Value | |
COLLATERALIZED MORTGAGE OBLIGATIONS
(continued) | |
| $ | 2,963,069 | | | LSTAR Securities Investment Trust, Series 2016-3, Class A, 2.53%, 09/01/21(j)(k) | | $ | 2,919,549 | |
| | 3,325,787 | | | Mastr Resecuritization Trust, Series 2008-3, Class A1, 0.96%, 08/25/37(j)(k) | | | 2,353,759 | |
| | 3,380,282 | | | Merrill Lynch Mortgage Investors Trust, Series 2006-A3, Class 3A1, 3.00%, 05/25/36(k) | | | 2,777,461 | |
| | 1,100,934 | | | Merrill Lynch Mortgage Investors, Inc., Series 2006-AF2, Class AF1, 6.25%, 10/25/36 | | | 916,560 | |
| | 11,134,901 | | | Morgan Stanley Re-REMIC Trust, Series 2010-R5, Class 7B, 0.88%, 05/26/37(j)(k) | | | 9,019,665 | |
| | 6,629,489 | | | Morgan Stanley Resecuritization Trust, Series 2015-R6, Class 3A, 0.68%, 07/26/45(k) | | | 5,984,443 | |
| | 6,222,965 | | | Prime Mortgage Trust, Series 2006-DR1, Class 2A1, 5.50%, 05/25/35(j) | | | 5,779,047 | |
| | 2,710,773 | | | Prime Mortgage Trust, Series 2006-DR1, Class 2A2, 6.00%, 05/25/35(j) | | | 2,560,662 | |
| | 1,517,718 | | | Residential Accredit Loans, Inc., Series 2006-QS15, Class A1, 6.50%, 10/25/36 | | | 1,296,295 | |
| | 261,054 | | | Residential Funding Mortgage Securities I, Series 2006-S11, Class A2, 6.00%, 11/25/36 | | | 243,261 | |
| | 6,414,708 | | | Residential Funding Mortgage Securities I, Series 2006-SA2, Class 2A1, 4.02%, 08/25/36(k) | | | 5,474,971 | |
| | 3,183,160 | | | Structured Adjustable Rate Mortgage Loan Trust, Series 2005-11, Class 1A1, 2.90%, 05/25/35(k) | | | 2,610,543 | |
| | 3,604,465 | | | Structured Asset Mortgage Investments II Trust, Series 2007-AR4, Class GA4B, 0.71%, 09/25/47(k) | | | 3,075,596 | |
| | 5,136,271 | | | Structured Asset Mortgage Investments, Inc., Series 2006-AR5, Class 4A1, 0.75%, 05/25/46(k) | | | 2,758,407 | |
| | 5,579,006 | | | Structured Asset Securities Corp, Series 2005-RF3, Class 1A, 0.88%, 06/25/35(j)(k) | | | 4,714,364 | |
| | 2,674,035 | | | Suntrust Adjustable Rate Mortgage Loan Trust, Series 2007-2, Class 3A3, 3.04%, 04/25/37(k) | | | 2,257,944 | |
| | 1,054,801 | | | Suntrust Adjustable Rate Mortgage Loan Trust, Series 2007-2, Class 4A1, 3.17%, 04/25/37(k) | | | 831,473 | |
| | 3,479,690 | | | Thornburg Mortgage Securities Trust, Series 2007-3, Class 4A1, 5.75%, 06/25/47(k) | | | 3,269,735 | |
| Principal | | | | | | |
| Amount | | | | | Value | |
COLLATERALIZED MORTGAGE OBLIGATIONS
(continued) | |
| $ | 5,000,000 | | | VOLT LI LLC, Series 2016-NP11, Class A1, 3.50%, 10/25/46(j) | | $ | 5,000,000 | |
| | 174,879 | | | WaMu Mortgage Pass-Through Certificates Trust, Series 2005-AR16, Class 1A1, 2.60%, 12/25/35(k) | | | 163,684 | |
| | 3,329,450 | | | WaMu Mortgage Pass-Through Certificates Trust, Series 2006-AR13, Class 2A, 2.19%, 10/25/46(k) | | | 2,992,001 | |
| | 7,602,999 | | | WaMu Mortgage Pass-Through Certificates Trust, Series 2006-AR19, Class 2A, 1.94%, 01/25/47(k) | | | 7,078,451 | |
| | 5,508,307 | | | WaMu Mortgage Pass-Through Certificates Trust, Series 2006-AR3, Class A1A, 1.51%, 02/25/46(k) | | | 5,042,040 | |
| | 2,120,486 | | | WaMu Mortgage Pass-Through Certificates Trust, Series 2007-HY7, Class 2A2, 2.58%, 07/25/37(k) | | | 1,722,485 | |
| | 4,751,505 | | | WaMu Mortgage Pass-Through Certificates Trust, Series 2007-OA4, Class 1A, 1.28%, 05/25/47(k) | | | 4,162,484 | |
| | 2,022,977 | | | Washington Mutual Alternative Mortgage Pass-Through Certificates, Series 2005-10, Class 2A6, 5.50%, 11/25/35 | | | 1,847,983 | |
| | 5,362,725 | | | Washington Mutual Alternative Mortgage Pass-Through Certificates, Series 2006-5, Class 3A3, STEP, 6.22%, 07/25/36 | | | 2,397,640 | |
| | 2,386,635 | | | Washington Mutual Mortgage Pass-Through Certificates, Series 2006-AR6, Class 2A, 1.47%, 08/25/46(k) | | | 1,588,928 | |
| | 225,962 | | | Wells Fargo Mortgage Backed Securities Trust, Series 2006-AR10, Class 3A1, 2.99%, 07/25/36(k) | | | 222,266 | |
| | 884,094 | | | Wells Fargo Mortgage Backed Securities Trust, Series 2006-AR8, Class 2A3, 3.00%, 04/25/36(k) | | | 857,924 | |
| | | | | | | | 448,713,549 | |
COMMERCIAL MORTGAGE-BACKED
SECURITIES — 0.9% | |
| | 9,739,139 | | | Bayview Commercial Asset Trust, Series 2007-4A, Class A1, 0.97%, 09/25/37(j)(k) | | | 8,178,247 | |
| | 6,549,002 | | | CDGJ Commercial Mortgage Trust, Series 2014-BXCH, Class EPA, 4.77%, 12/15/27(j)(k) | | | 6,490,071 | |
| | 890,000 | | | CFCRE Commercial Mortgage Trust, Series 2016-C3, Class D, 3.05%, 01/10/48(j)(k) | | | 599,626 | |
| Old Westbury Funds, Inc. | |
| Strategic Opportunities Fund | |
| Consolidated Portfolio of Investments - (Continued) | |
| | October 31, 2016 |
| Principal | | | | | | |
| Amount | | | | | Value | |
COMMERCIAL MORTGAGE-BACKED SECURITIES
(continued) | | | | |
| $ | 940,000 | | | Citigroup Commercial Mortgage Trust, Series 2015-P1, Class D, 3.23%, 09/15/48(j) | | $ | 725,568 | |
| | 2,000,000 | | | Commercial Mortgage Trust, Series 2014-PAT, Class E, 3.68%, 08/13/27(j)(k) | | | 1,978,000 | |
| | 4,482,000 | | | Commercial Mortgage Trust, Series 2014-PAT, Class F, 2.97%, 08/13/27(j)(k) | | | 4,170,053 | |
| | 1,180,000 | | | Commercial Mortgage Trust, Series 2015-CR25, Class D, 3.80%, 08/10/48(k) | | | 886,862 | |
| | 15,000,000 | | | GAHR Commercial Mortgage Trust, Series 2015-NRF, Class FFX, 3.40%, 12/15/34(j)(k) | | | 14,327,282 | |
| | 10,000,000 | | | GAHR Commercial Mortgage Trust, Series 2015-NRF, Class GFX, 3.40%, 12/15/34(j)(k) | | | 9,207,743 | |
| | 3,000,000 | | | GS Mortgage Securities Trust, Series 2014-GSFL, Class D, 4.42%, 07/15/31(j)(k) | | | 3,003,898 | |
| | 700,000 | | | GS Mortgage Securities Trust, Series 2014-GSFL, Class E, 6.47%, 07/15/31(j)(k) | | | 693,227 | |
| | 3,881,000 | | | Velocity Commercial Capital Loan Trust, Series 2016-1, Class M5, 7.77%, 04/25/46(j)(k) | | | 3,803,385 | |
| | 2,000,000 | | | Wells Fargo Commercial Mortgage Trust, Series 2015-NXS3, Class D, 3.15%, 09/15/57(j) | | | 1,326,359 | |
| | | | | | | | | |
| | | | | | | | 55,390,321 | |
Total Non-Agency Mortgage-Backed Securities
(Cost $490,773,803) | | | 504,103,870 | |
| U.S. GOVERNMENT AGENCIES — 42.1% | | | | |
| Federal Home Loan Bank — 42.1% | | | | |
| | 66,500,000 | | | 0.25%, 11/01/16(o) | | | 66,500,000 | |
| | 48,000,000 | | | 0.04%, 11/01/16(o) | | | 48,000,000 | |
| | 88,000,000 | | | 0.26%, 11/03/16(o) | | | 87,999,032 | |
| | 50,000,000 | | | 0.27%, 11/03/16(o) | | | 49,999,450 | |
| | 17,000,000 | | | 0.29%, 11/03/16(o) | | | 16,999,813 | |
| | 37,000,000 | | | 0.29%, 11/04/16(o) | | | 36,999,371 | |
| | 24,000,000 | | | 0.24%, 11/08/16(o) | | | 23,999,064 | |
| | 50,000,000 | | | 0.24%, 11/10/16(o) | | | 49,997,500 | |
| | 76,000,000 | | | 0.23%, 11/14/16(o) | | | 75,994,528 | |
| | 14,300,000 | | | 0.27%, 11/14/16(o) | | | 14,298,970 | |
| | 7,000,000 | | | 0.22%, 11/14/16(o) | | | 6,999,496 | |
| | 95,000,000 | | | 0.27%, 11/15/16(o) | | | 94,992,590 | |
| | 65,000,000 | | | 0.26%, 11/15/16(o) | | | 64,994,507 | |
| | 124,000,000 | | | 0.26%, 11/16/16(o) | | | 123,989,708 | |
| | 113,000,000 | | | 0.29%, 11/16/16(o) | | | 112,990,621 | |
| | 50,000,000 | | | 0.27%, 11/17/16(o) | | | 49,995,550 | |
| Principal | | | | | | |
| Amount | | | | | Value | |
| Federal Home Loan Bank (continued) | | | | |
| $ | 50,000,000 | | | 0.28%, 11/17/16(o) | | $ | 49,995,550 | |
| | 26,800,000 | | | 0.24%, 11/17/16(o) | | | 26,797,615 | |
| | 13,000,000 | | | 0.26%, 11/17/16(o) | | | 12,998,527 | |
| | 5,000,000 | | | 0.27%, 11/17/16(o) | | | 4,999,555 | |
| | 214,415,000 | | | 0.00%, 11/18/16(o) | | | 214,388,710 | |
| | 39,500,000 | | | 0.26%, 11/18/16(o) | | | 39,495,508 | |
| | 24,000,000 | | | 0.26%, 11/18/16(o) | | | 23,997,744 | |
| | 125,000,000 | | | 0.27%, 11/21/16(o) | | | 124,986,125 | |
| | 45,000,000 | | | 0.26%, 11/21/16(o) | | | 44,995,005 | |
| | 10,000,000 | | | 0.25%, 11/21/16(o) | | | 9,998,611 | |
| | 100,000,000 | | | 0.27%, 12/05/16(o) | | | 99,980,200 | |
| | 100,000,000 | | | 0.29%, 12/05/16(o) | | | 99,980,200 | |
| | 6,185,000 | | | 0.32%, 12/05/16(o) | | | 6,183,775 | |
| | 100,000,000 | | | 0.27%, 12/06/16(o) | | | 99,979,600 | |
| | 10,000,000 | | | 0.29%, 12/06/16(o) | | | 9,997,960 | |
| | 25,000,000 | | | 0.30%, 12/07/16(o) | | | 24,994,750 | |
| | 135,585,000 | | | 0.00%, 01/05/17(o) | | | 135,506,632 | |
| | 14,415,000 | | | 0.31%, 01/05/17(o) | | | 14,406,668 | |
| | 21,000,000 | | | 0.28%, 01/09/17(o) | | | 20,987,127 | |
| | 65,000,000 | | | 0.32%, 10/02/17(o) | | | 64,999,610 | |
| | 21,500,000 | | | 0.15%, 10/03/17(o) | | | 21,499,764 | |
| | 65,000,000 | | | 0.26%, 10/04/17(o) | | | 64,998,894 | |
| | 19,000,000 | | | 0.30%, 10/04/17(o) | | | 18,999,677 | |
| | 100,000,000 | | | 0.30%, 10/09/17(o) | | | 99,995,600 | |
| | 50,000,000 | | | 0.29%, 10/09/17(o) | | | 49,997,800 | |
| | 100,000,000 | | | 0.30%, 10/14/17(o) | | | 99,992,800 | |
| | 8,000,000 | | | 0.25%, 10/15/17(o) | | | 7,999,376 | |
| | 11,400,000 | | | 0.28%, 10/16/17(o) | | | 11,399,054 | |
| | 70,000,000 | | | 0.29%, 12/07/17(o) | | | 69,985,300 | |
Total U.S. Government Agencies
(Cost $2,499,232,681) | | | 2,499,287,937 | |
| U.S. GOVERNMENT SECURITIES — 2.8% | | | | |
| U.S. Treasury Bills — 2.8% | | | | |
| | 127,000,000 | | | 0.23%, 11/17/16(o) | | | 126,989,967 | |
| | 42,500,000 | | | 0.29%, 01/12/17(o) | | | 42,477,603 | |
Total U.S. Government Securities
(Cost $169,462,276) | | | 169,467,570 | |
| | | | | |
| Shares | | | | | | | |
| CASH SWEEP — 2.9% | | | | |
| UNITED STATES — 2.9% | | | | |
| | 171,982,106 | | | Citibank - US Dollars on Deposit in Custody Account, 0.02%(p) | | | 171,982,106 | |
Total Cash Sweep
(Cost $171,982,106) | | | 171,982,106 | |
| Old Westbury Funds, Inc. | |
| Strategic Opportunities Fund | |
| Consolidated Portfolio of Investments - (Continued) | |
| | October 31, 2016 |
| | | | | | Value | |
TOTAL INVESTMENTS — 99.8%
(Cost $5,912,410,579)(a) | | $ | 5,923,004,377 | |
| OTHER ASSETS IN EXCESS OF LIABILITIES — 0.2% | | | 11,048,813 | |
| NET ASSETS — 100.0% | | $ | 5,934,053,190 | |
| | | | | | | | | |
| Shares | | | | | | | |
| SECURITIES SOLD SHORT — (0.3)% | | | | |
| | (14,400 | ) | | Continental Resources, Inc. | | $ | (704,304 | ) |
| | (150,000 | ) | | Denbury Resources, Inc. | | | (358,500 | ) |
| | (85,000 | ) | | Freeport-McMoRan Copper & Gold, Inc. | | | (950,300 | ) |
| | (56,500 | ) | | Murphy Oil Corp. | | | (1,461,655 | ) |
| | (100,000 | ) | | Oasis Petroleum, Inc. | | | (1,049,000 | ) |
| | (30,000 | ) | | SM Energy Co. | | | (1,008,900 | ) |
| | (55,000 | ) | | Southwestern Energy Co. | | | (571,450 | ) |
| | (260,000 | ) | | Utilities Select Sector SPDR Fund | | | (12,851,800 | ) |
Total Securities Sold Short
(Proceeds received $(17,084,707)) | | $ | (18,955,909 | ) |
| | | | | | | | | |
| Contracts | | | | | | | |
| PUT OPTIONS WRITTEN — 0.0% | | | | |
| | (500 | ) | | S&P 500 Index, Strike $2,060, Expires 11/04/16 | | | (62,500 | ) |
| | (100 | ) | | S&P 500 Index, Strike $2,065, Expires 11/04/16 | | | (15,000 | ) |
| | (11,000 | ) | | Energy Select Sector SPDR (ETF), Strike $60.00, Expires 12/16/16 | | | (385,000 | ) |
Total Put Options Written
(Premiums received $(2,311,191)) | | | (462,500 | ) |
| | | | | | | | | |
| Contracts/ | | | | | | | |
| Notional | | | | | | | |
| Amount ($) | | | | | | Value | |
| STRUCTURED OPTIONS — 1.8% | | | | |
| | 41,470 | | | Apple, Inc., One purchased call strike 120.57, One written call strike 156.74, One written put strike 120.57 with a barrier level strike of 102.48, Expires 01/20/17, Broker Bank of America N.A. | | | (71,303 | ) |
| | 11,809 | | | DAXK Index, One purchased call strike 4,488.00, One written call strike 4,667.52, One written put strike 3,814.80 (4,456 contracts), Expires 03/16/17, Broker UBS AG(q) | | | 1,709,517 | |
| | | | | | | | | |
| Contracts/ | | | | | | |
| Notional | | | | | | |
| Amount ($) | | | | | Value | |
| | 3,904 | | | DAXK Index, One purchased call strike 5,122.64, One written put strike 5,122.64 with a barrier level strike of 4,564.27, Expires 11/17/16, Broker JPMorgan Chase Bank N.A. | | $ | 447,840 | |
| | 1,186,441 | | | Energy Select Sector SPDR Fund, One purchased call strike 59.00, One written call strike 61.36, One written put strike 53.10 (338,983 contracts), Expires 12/30/16, Broker Credit Suisse International(q) | | | 2,479,342 | |
| | 1,064,506 | | | Energy Select Sector SPDR Fund, One purchased call strike 62.94, One written call strike 65.4576, One written put strike 56.646 ( 317,763 contracts), Expires 01/20/17, Broker Goldman Sachs International(q) | | | 1,886,069 | |
| $ | 10,000,000 | | | Euro STOXX 50 Index, One purchased call strike 2,595.70, Expires 01/19/18, Broker Citibank N.A. | | | 1,954,630 | |
| | 5,505 | | | Euro STOXX 50 Index, One purchased call strike 2,725,10, Expires 12/21/18, One written put strike 2,725.10 with a barrier level strike of 2,125.58, Expires 12/16/16, Broker Goldman Sachs International | | | 2,379,874 | |
| $ | 7,875,000 | | | Euro STOXX 50 Index, One purchased call strike 2,797.2047, Expires 12/21/18, One written put strike 2,797.2047 with a barrier level strike of 2,041.959 ($7,500,000 notional amount), Expires 12/16/16, Broker JPMorgan Chase Bank N.A.(r) | | | 1,087,743 | |
| | 5,339 | | | Euro STOXX 50 Index, One purchased call strike 2,810.00, Expires 06/15/18, Broker Goldman Sachs International | | | 1,898,548 | |
| | 20,727 | | | Euro STOXX 50 Index, One purchased call strike 2,894.72, One written call strike 3,010.51, One written put strike 2,405.51 (10,364 contracts), One purchased put strike 2,894.72 with a barrier level strike of 2,605.25 (10,364 contracts), Expires 02/16/17, Broker Credit Suisse International(q) | | | 1,680,178 | |
| Old Westbury Funds, Inc. | |
| Strategic Opportunities Fund | |
| Consolidated Portfolio of Investments - (Continued) | |
| | October 31, 2016 |
| Contracts/ | | | | | | |
| Notional | | | | | | |
| Amount ($) | | | | | Value | |
| | 20,638 | | | Euro STOXX 50 Index, One purchased call strike 2,907.21, One written call strike 3,023.50, One written put strike 2,442.06 (10,319 contracts), One purchased put strike 2,907.21 with a barrier level strike of 2,616.49 (10,319 contracts), Expires 02/16/17, Broker Credit Suisse International(q) | | $ | 1,651,384 | |
| | 10,194 | | | Euro STOXX 50 Index, One purchased call strike 2,943.00, One written call strike 3,060.72, One purchased put strike 2,943.00 with a barrier level strike of 2,678.13 (5,097 contracts), One written put strike 2,462.9967 (5,097 contracts), Expires 02/16/17, Broker JPMorgan Chase Bank N.A.(q) | | | 639,930 | |
| | 10,073 | | | Euro STOXX 50 Index, One purchased call strike 2,978.40, One written call strike 3,097.54, One written put strike 2,431.86 (5,036 contracts), Expires 01/19/17, Broker Citibank N.A.(q) | | | 661,560 | |
| | 11,500 | | | Euro STOXX 50 Index, One purchased call strike 3,004.34, One written call strike 3,154.557, One purchased put strike 2,944.2532 (3,329 contracts), One purchased put strike 2,944.2532 with a barrier level strike of 2,613.776 (3,329 contracts), One written put strike 3,004.34 with a barrier level strike of 2,613.776 (6,657 contracts), Expires 12/15/16, Broker JPMorgan Chase Bank N.A.(q) | | | 971,488 | |
| | 13,263 | | | Euro STOXX 50 Index, One purchased call strike 3,016.00, One written call strike 3,136.64, One written put strike 2,563.30 (6,631 contracts), One purchased put strike 3,016.00 with a barrier level strike of 2,714.40 (6,631 contracts), Expires 01/19/17, Broker UBS AG(q) | | | 985,834 | |
| Contracts/ | | | | | | |
| Notional | | | | | | |
| Amount ($) | | | | | Value | |
| | 3,295 | | | Euro STOXX 50 Index, One purchased call strike 3,065.1884, One written put strike 3,034.84 with a barrier level strike of 2,053.9797, Expires 06/15/17, Broker BNP Paribas SA | | $ | 135,241 | |
| | 3,251 | | | Euro STOXX 50 Index, One purchased call strike 3,075.57, One written put strike 3,075.57 with a barrier level strike of 2,251.9324, Expires 05/18/17, Broker BNP Paribas SA. | | | 45,299 | |
| | 14,621 | | | Euro STOXX 50 Index, One purchased call strike 3,077.68, One written call strike 3,200.7872, One purchased put strike 3,016.1264 (4,874 contracts), One written put strike 3,077.68 with a barrier level strike of 2,152.5294 (9,748 contracts), Expires 12/16/16, Broker BNP Paribas SA(q) | | | 977,711 | |
| | 4,869 | | | Euro STOXX 50 Index, One purchased call strike 3,080.5032, One written call strike 2,306.9278 on S&P 500 Index (7,152 contracts), One written put strike 2,097.2071 on S&P 500 Index with a barrier level strike of 1,721.8071 (7,152 contracts), Expires 06/15/17, Broker Goldman Sachs International(q) | | | 87,761 | |
| | 27,951 | | | Euro STOXX 50 Index, One purchased call strike 3,087.54, One written call strike 3,241.92, One written put strike 3,087.54 with a barrier level strike of 2,778.79 (6,478 contracts), Expires 12/15/16, Broker Credit Suisse International(q) | | | 1,173,301 | |
| | 24,624 | | | S&P 500 Index, One purchased call strike 1,845.775, One purchased put strike 1,809.225, One written put strike 1,827.50 with a barrier level strike of 1,388.90 (49,248 contracts), Expires 02/16/17, Broker BNP Paribas SA(q) | | | 7,076,672 | |
| Old Westbury Funds, Inc. | |
| Strategic Opportunities Fund | |
| Consolidated Portfolio of Investments - (Continued) | |
| | October 31, 2016 |
Contracts/
Notional
Amount ($) | | | | | Value | |
| | 14,226 | | | Euro STOXX 50 Index, One purchased call strike 3,163.15, One written call strike 3,289.676, One purchased put strike 3,099.887 (4,742 contracts), One written put strike 3,163.15 with a barrier level strike of 2,246.47 (9,484 contracts), Expires 01/19/17, Broker BNP Paribas SA(q) | | $ | 817,330 | |
| | 24,018 | | | Euro STOXX 50 Index, One purchased call strike 3,394.61, One written call strike 3,529.05, One written put strike 3,361.00 with a barrier level strike of 2,688.80 (5,951 contracts) Expires 02/16/17, Broker JPMorgan Chase Bank N.A.(q) | | | (523,181 | ) |
| | 5,823 | | | Euro STOXX 50 Index, One purchased call strike 3,434.45, One written call strike 2,284.733 on S&P 500 Index (9,629 contracts), One written put strike 2,077.03 on S&P 500 Index with a barrier level strike of 1,729.13 (9,629 contracts) Expires 11/17/16, Broker JPMorgan Chase Bank N.A.(q) | | | (12,920 | ) |
| | 330,472 | | | Euro STOXX Banks Index, One purchased call strike 131.63, One written call strike 138.2115, One purchased put strike 128.9974 (75,971 contracts), One purchased put strike 128.9974 with a barrier level strike of 114.518 (75,971 contracts), One written put strike 131.63 with a barrier level strike of 114.518 (151,941 contracts), Expires 11/17/16, Broker JPMorgan Chase Bank N.A.(q) | | | (2,033,678 | ) |
| | 130,762 | | | Euro STOXX Banks Index, One purchased call strike 93.6054, One purchased put strike 90.8523, One written put strike 91.77 with a barrier level strike of 66.6709 (261,523 contracts), Expires 06/30/17, Broker BNP Paribas SA(q) | | | 1,453,872 | |
Contracts/
Notional
Amount ($) | | | | | Value | |
| | 2,312 | | | FTSE 100 Index, One purchased call strike 6,487.90, One purchased put strike 6,358.1420, One written put strike 6,487.90 with a barrier level strike of 5,053.425(4,624 contracts), Expires 06/15/17, Broker BNP Paribas SA(q) | | $ | 1,041,466 | |
| | 1,681 | | | FTSE 100 Index, One purchased call strike 5,950.01, One purchased put strike 5,831.01, One written put strike 5,950.01 with a barrier level strike of 5,051.56 (3,361 contracts), Expires 12/15/16, Broker Credit Suisse International(q) | | | 1,663,759 | |
| | 3,267 | | | FTSE 100 Index, One purchased call strike 6,122.48, One written put strike 6,122.48 with a barrier level strike of 4,916.35, Expires 11/17/16, Broker Credit Suisse International | | | 2,669,933 | |
| | 1,543 | | | FTSE 100 Index, One purchased call strike 6,547.83, One purchased put strike 6,353.34, One written put strike 6,483.00 with a barrier level strike of 4,860.95 (3,084.99 contracts), Expires 07/13/17, Broker UBS AG(q) | | | 674,744 | |
| | 1,758 | | | FTSE 100 Index, One purchased call strike 8,531.00, One purchased put strike 8,360.38, One written put strike 8,531.00 with a barrier level strike of 7,268.41 (3,517 contracts), Expires 02/28/17, Broker UBS AG(q) | | | 445,043 | |
| | 1,976 | | | FTSE 100 Index, One purchased call strike 9,159.13, One written call strike 55.2994 on Utilities SPDR ETF (397,834 contracts), One written put strike 2,117.55 on S&P 500 Index with a barrier level strike of 1,736.39 (9,445 contracts), Expires 06/15/17, Broker Credit Suisse International(q) | | | (465,745 | ) |
| | 606 | | | FTSE MIB Index, One purchased call strike 16,656.54, One purchased put strike 16,326.70, One written put strike 16,491.62 with a barrier level strike of 16,491.62 (1,213 contracts), Expires 10/19/17, Broker Citibank N.A.(q) | | | 410,237 | |
| Old Westbury Funds, Inc. | |
| Strategic Opportunities Fund | |
| Consolidated Portfolio of Investments - (Continued) | |
| | October 31, 2016 |
Contracts/
Notional
Amount ($) | | | | | Value | |
| | 2,606 | | | FTSE MIB Index, One purchased call strike 17,130.50, One written call strike 17,978.54, One written put strike 16,960.89 with a barrier level strike of 14,416.76 (590 contracts), Expires 10/19/17, Broker Credit Suisse International(q) | | $ | 61,662 | |
| | 3,436 | | | FTSE MIB Index, One purchased call strike 17,461.47, One written call strike 18,159.93, One written put strike 14,842.25 (1,145 contracts), Expires 02/16/17, Broker Credit Suisse International(q) | | | 944,802 | |
| | 398,359 | | | HP, Inc., One purchased call strike 12.175, One written put strike 12.5515 with a barrier level strike of 10.9424, Expires 04/17/17, Broker JPMorgan Chase Bank N.A. | | | 862,945 | |
| | 3,195 | | | IBEX 35 Index, One purchased call strike 10,202.31, One written call strike 10,610.40, One written put strike 9,284.10 (980 contracts), Expires 12/15/16, Broker Credit Suisse International(q) | | | (329,785 | ) |
| | 2,903 | | | IBEX 35 Index, One purchased call strike 8,697.30, One written call strike 9,386.20, One written put strike 8,051.46, Expires 12/30/16, UBS AG | | | 988,198 | |
| | 3,697 | | | IBEX 35 Index, One purchased call strike 9,467.6932, One written call strike 9,846.4009, One purchased put strike 9,278.3393 (1,056 contracts), One written put strike 9,467.6932 with a barrier level strike 7,067.633 (2,112 contracts), Expires 01/19/17, Broker JPMorgan Chase Bank N.A.(q) | | | 517,464 | |
Contracts/
Notional
Amount ($) | | | | | Value | |
| | 10,558 | | | IBEX 35 Index, One purchased call strike 9,944.62, One written call strike 10,342.4048, One purchased put strike 9,745.7276 (2,011 contracts), One purchased put strike 9,745.7276 with a barrier level strike 9,149.05 (2,011 contracts), One written put strike 9,944.62 with a barrier level level strike 9,149.05 (4,022 contracts), Expires 11/17/16, Broker JPMorgan Chase Bank N.A.(q) | | $ | (42,835 | ) |
| | 1,375,087 | | | iShares China Large-Cap ETF, One purchased call strike 32.7252, One written call strike 34.0342, One written put strike 29.4527 (458,362 contracts), Expires 02/28/17, Broker Goldman Sachs International(q) | | | 1,221,581 | |
| | 2,308,841 | | | iShares China Large-Cap ETF, One purchased call strike 37.508, One written call strike 38.6332, One written put strike 37.508 with a barrier level strike of 33.007 (266,610 contracts), Expires 11/18/16, Broker Goldman Sachs International(q) | | | 638,017 | |
| | 300,707 | | | iShares China Large-Cap ETF, One purchased call strike 33.255, One purchased put strike 32.5899, One written put strike 33.255 with a barrier level strike of 25.4434 (601,413 contracts), Expires 02/17/17, Broker BNP Paribas SA(q) | | | 1,132,859 | |
| | 1,673,390 | | | iShares China Large-Cap ETF, One purchased call strike 33.465, One written call strike 34.8036, One written put strike 30.45315 (597,639 contracts), Expires 11/18/16, Broker BNP Paribas SA(q) | | | 2,042,029 | |
| | 1,314,965 | | | iShares China Large-Cap ETF, One purchased call strike 33.65, One written call strike 35.00, One written put strike 29.95 (445,751 contracts), Expires 01/20/17, Broker Bank of America N.A.(q) | | | 1,195,961 | |
| Old Westbury Funds, Inc. | |
| Strategic Opportunities Fund | |
| Consolidated Portfolio of Investments - (Continued) | |
| | October 31, 2016 |
Contracts/
Notional
Amount ($) | | | | | Value | |
| | 1,273,565 | | | iShares China Large-Cap ETF, One purchased call strike 33.7635, One written call strike 35.114, One written put strike 30.7248 (444,267 contracts), Expires 12/16/16, Broker Goldman Sachs International(q) | | $ | 1,363,481 | |
| | 303,575 | | | iShares iBoxx $ High Yield Corporate Bond ETF, One purchased call strike 79.0579, with a barrier level strike of 90.5872, One purchased put strike 82.352 with a barrier level strike of 61.764, one written put strike 82.352 with a barrier level strike of 73.8697, Expires 04/13/17, Broker Goldman Sachs International | | | 1,234,669 | |
| | 241,721 | | | iShares iBoxx $ High Yield Corporate Bond ETF, One purchased call strike 80.2578 with a barrier level strike of 89.3592, One purchased put strike 82.74 with a barrier level strike of 62.055, One written put strike 82.74 with a barrier level strike of 73.0181, Expires 05/19/17, Broker JPMorgan Chase Bank N.A. | | | 445,700 | |
| | 239,120 | | | iShares iBoxx $ High Yield Corporate Bond ETF, One purchased call strike 81.9672 with a barrier level strike of 91.1676, One purchased put strike 83.64 with a barrier level strike of 62.73, One written put strike 83.64 with a barrier level strike of 74.9414, Expires 06/16/17, Broker JPMorgan Chase Bank N.A. | | | 444,540 | |
| | 291,804 | | | iShares iBoxx $ High Yield Corporate Bond ETF, One purchased call strike 83.10 with a barrier level strike of 94.24, One purchased put strike 85.67 with a barrier level strike of 64.26, One written put strike 85.67 with a barrier level strike of 77.11, Expires 12/16/16, Broker Bank of America N.A. | | | 1,069,841 | |
| | 435,444 | | | iShares MSCI EAFE Index Fund, One purchased call strike 57.99, One written put strike 55.12, Expires 11/8/16, UBS AG | | | 142,754 | |
Contracts/
Notional
Amount ($) | | | | | Value | |
| | 517,509 | | | iShares MSCI EAFE Index Fund, One purchased call strike 58.5497, One written put strike 55.6512, Expires 11/07/16, Broker BNP Paribas SA | | $ | 36,066 | |
| | 511,059 | | | iShares MSCI EAFE Index Fund, One purchased call strike 59.2886, One written put strike 55.76652, Expires 11/17/16, Broker BNP Paribas SA | | | (39,832 | ) |
| | 244,763 | | | iShares MSCI EAFE Index Fund, One purchased call strike 61.8966, One purchased call strike 61.8966 with a barrier level strike of 70.4764, One purchased put strike 60.671 with a barrier level strike of 52.0912, One written put strike 61.2838 with a barrier level strike of 51.4784, Expires 12/16/16, Broker Goldman Sachs International | | | (126,812 | ) |
| | 243,273 | | | iShares MSCI EAFE Index Fund, One purchased call strike 62.2756, One written call strike 62.2756 with a barrier level strike of 70.291, One purchased put strike 61.0424 with a barrier level strike of 49.327, One written put strike 61.659 with a barrier level strike of 53.952, Expires 01/20/17, Broker JPMorgan Chase Bank N.A. | | | 153,585 | |
| | 584,812 | | | iShares MSCI Emerging Markets ETF, One purchased call strike 34.199, One written put strike 34.199 with a barrier level strike of 26.9728, Expires 01/20/17, Broker BNP Paribas SA | | | 1,693,372 | |
| | 1,719,346 | | | iShares MSCI Emerging Markets ETF, One purchased call strike 34.897, One written call strike 36.2929, One purchased put strike 34.1991 (429,836 contracts), One written put strike 34.897 with a barrier level strike of 28.807 (859,673 contracts), Expires 01/20/17, Broker JPMorgan Chase Bank N.A.(q) | | | 1,603,200 | |
| Old Westbury Funds, Inc. | |
| Strategic Opportunities Fund | |
| Consolidated Portfolio of Investments - (Continued) | |
| | October 31, 2016 |
Contracts/
Notional
Amount ($) | | | | | Value | |
| | 1,883,875 | | | iShares MSCI Emerging Markets ETF, One purchased call strike 35.565, One written call strike 36.632, One written put strike 35.565 with a barrier level strike of 31.6529 (281,175 contracts), Expires 12/16/16, Broker Goldman Sachs International(q) | | $ | 1,329,656 | |
| | 135,469 | | | iShares NASDAQ Biotechnology Index, One purchased call strike 272.19, One written call strike 298.87, One written put strike 266.85 with a barrier level strike of 242.83 (56,211 contracts), Expires 10/20/17, Broker Barclays Bank Plc(q) | | | (613,586 | ) |
| | 171,356 | | | iShares NASDAQ Biotechnology Index, One purchased call strike 275.30, One written call strike 307.37, One written put strike 267.28 with a barrier level strike of 240.55 (74,828 contracts), Expires 10/17/17, Broker Barclays Bank Plc(q) | | | (727,574 | ) |
| | 120,352 | | | MSCI Singapore Free Index, One purchased call strike 340.2515, One written call strike 357.2641, One written put strike 340.2515 with a barrier level strike of 313.0314 (44,085 contracts), Expires 11/30/16, Broker BNP Paribas SA(q) | | | (945,515 | ) |
| | 3,695 | | | Nikkei 225 Index, One purchased call strike 16,237.99, One written Call strike 16,887.5096,One written put strike 14,029.6234 (1,848 contracts), One purchased put strike 16,237.99 with a barrier level strike of 14,614.191 (1,848 contracts), Expires 12/15/16, Broker Goldman Sachs International(q) | | | 2,029,259 | |
| | 14,844 | | | OMX Stockholm 30 Index, One purchased call strike 1,360.8033, One purchased put strike 1,320.3834, One written put strike 1,347.3300 with a barrier level strike of 1,022.8929 (29,688 contracts), Expires 05/18/17, Broker JPMorgan Chase Bank N.A.(q) | | | 1,435,680 | |
Contracts/
Notional
Amount ($) | | | | | Value | |
| | 14,761 | | | OMX Stockholm 30 Index, One purchased call strike 1,368.4692, One purchased put strike 1,327.8216, One written put strike 1,354.9200 with a barrier level strike of 1,038.5462 (29,522 contracts) Expires 06/15/17, Broker JPMorgan Chase Bank N.A.(q) | | $ | 1,261,540 | |
| | 816,327 | | | PowerShares DB US Dollar Bullish ETF, One purchased put strike 24.50, One written put strike 81.81 on iShares iBoxx $ High Yield Corporate Bond ETF with a barrier level strike of 70.85 (244,469 contracts), Expires 12/30/16, Broker UBS AG(q) | | | 4,010 | |
| | 20,814 | | | Russell 2000 Index, One purchased call strike 1,057.00, One written call strike 1,109.85, One purchased put strike 1,035.86 (9,461 contracts), One written put strike 1,057.00 with a barrier level strike of 724.05 (18,921 contracts), Expires 01/19/17, Broker UBS AG(q) | | | 987,852 | |
| | 36,000 | | | Russell 2000 Index, One purchased call strike 1,111.1032, One written call strike 1,155.5473, One purchased put strike 1,111.1032 with a barrier level strike of 888.8826 (13,500 contracts), One written put strike 1,111.1032 with a barrier level strike of 795.5499 (13,500 contracts), Expires 12/30/16, Broker Goldman Sachs International(q) | | | 1,316,286 | |
| | 17,512 | | | Russell 2000 Index, One purchased call strike 1,142.07, One written call strike 1,210.5942, One purchased put strike 1,119.2286 (8,756 contracts), One written put strike 1,142.07 with a barrier level strike of 788.83, Expires 02/16/17, Broker BNP Paribas SA(q) | | | 804,703 | |
| Old Westbury Funds, Inc. | |
| Strategic Opportunities Fund | |
| Consolidated Portfolio of Investments - (Continued) | |
| | October 31, 2016 |
Contracts/
Notional
Amount ($) | | | | | Value | |
| | 26,034 | | | Russell 2000 Index, One purchased call strike 1,152.354, One written call strike 1,198.448, One purchased put strike 1,152.354 with a barrier level strike of 921.883 (8,678 contracts), One written put strike 1,152.354 with a barrier level strike of 830.847 (8,678 contracts), Expires 12/30/16, Broker BNP Paribas SA(q) | | $ | 849,660 | |
| | 25,828 | | | Russell 2000 Index, One purchased call strike 1,161.5407, One written call strike 1,231.2331, One purchased put strike 1,138.3099 (12,914 contracts), One written put strike 1,161.5407 with a barrier level strike of 831.0823, Expires 01/19/17, Broker Goldman Sachs International(q) | | | 1,135,346 | |
| | 17,191 | | | Russell 2000 Index, One purchased call strike 1,163.41, One written call strike 1,233.2146, One purchased put strike 1,140.1418 (8,595 contracts), One written put strike 1,163.41 with a barrier level strike of 944.69, Expires 01/19/17, Broker BNP Paribas SA(q) | | | 665,034 | |
| | 15,930 | | | S&P 500 Index, One purchased call strike 1,883.20, One written call strike 1,958.528, One purchased put strike 1,845.536 with a barrier level strike of 1,421.816 (5,310 contracts), One written put strike 1,883.20 with a barrier level strike of 1,421.816 (5,310 contracts), Expires 01/19/17, Broker BNP Paribas SA(q) | | | 1,030,959 | |
| | 15,784 | | | S&P 500 Index, One purchased call strike 1,900.63, One written call strike 1,976.65, One written put strike 1,680.15 (7,892 contracts), One purchased put strike 1,900.63 with a barrier level strike of 1,615.53 (7,892 contracts), Expires 01/19/17, Broker Bank of America N.A.(q) | | | 1,070,100 | |
Contracts/
Notional
Amount ($) | | | | | Value | |
| | 25,215 | | | S&P 500 Index, One purchased call strike 1,982.94, One written call strike 2,062.2576, One purchased put strike 1,963.1106 (10,086 contracts), One written put strike 1,982.94 with a barrier level strike of 1,504.06 (20,172 contracts), Expires 03/16/17, Broker BNP Paribas SA(q) | | $ | 1,356,643 | |
| | 7,042 | | | S&P 500 Index, One purchased call strike 2,151.41, One purchased put strike 2,023.60, One written put strike 2,151.41 with a barrier level strike of 1,541.56 (14,084 contracts), Expires 01/19/17, Broker Bank of America N.A.(q) | | | 323,541 | |
| | 15,990 | | | S&P 500 Index, One purchased call strike 1,876.15, One written call strike 1,951.196, One written put strike 1,651.012 (7,995 contracts), Expires 02/16/17, Broker JPMorgan Chase Bank N.A.(q) | | | 1,010,925 | |
| | 10,598 | | | S&P 500 Index, One purchased call strike 1,887.14, One written call strike 1,962.63, One purchased put strike 1,887.14 with a barrier level strike of 1,698.42 (5,299 contracts), One written put strike 1,715.41 (5,299 contracts), Expires 12/30/16, Broker Citibank N.A.(q) | | | 727,750 | |
| | 21,117 | | | S&P 500 Index, One purchased call strike 1,894.225, One written call strike 1,969.994, One purchased put strike 1,894.225 with a barrier level strike of 1,704.80 (10,558 contracts), One written put strike 1,682.0718 (10,558 contracts), Expires 02/16/17, Broker JPMorgan Chase Bank N.A.(q) | | | 1,367,560 | |
| | 14,711 | | | S&P 500 Index, One purchased call strike 1,903.32, One written call strike 1,979.45, One purchased put strike 1,865.25 (5,254 contracts), One written put strike 1,903.32 with a barrier level strike of 1,414.17 (10,508 contracts), Expires 01/19/17, Broker UBS AG(q) | | | 1,026,922 | |
| Old Westbury Funds, Inc. | |
| Strategic Opportunities Fund | |
| Consolidated Portfolio of Investments - (Continued) | |
| | October 31, 2016 |
Contracts/
Notional
Amount ($) | | | | | Value | |
| | 14,439 | | | S&P 500 Index, One purchased call strike 1,904.63, One purchased put strike 1,866.54 (5,250 contracts), One written call strike 1,980.82, One written put strike 1,904.63 with a barrier level strike of 1,366.57 (10,501 contracts), Expires 02/16/17, Broker UBS AG(q) | | $ | 1,002,819 | |
| | 5,286 | | | S&P 500 Index, One purchased call strike 1,910.67, One purchased put strike 1,853.92, One written put strike 1,891.75 with a barrier level strike of 1,453.81 (10,572 contracts), Expires 01/19/17, Broker Credit Suisse International(q) | | | 1,198,008 | |
| | 26,034 | | | S&P 500 Index, One purchased call strike 1,920.55, One written call strike 1,997.372, One written put strike 1,630.739 (13,017 contracts), Expires 03/16/17, Broker Goldman Sachs International(q) | | | 1,524,091 | |
| | 19,521 | | | S&P 500 Index, One purchased call strike 1,921.05, One purchased put strike 1,901.84 (7,808 contracts), One written call strike 1,997.89, One written put strike 1,921.05 with a barrier level strike of 1,315.92 (15,616 contracts), Expires 03/16/17, Broker UBS AG(q) | | | 1,383,905 | |
| | 31,217 | | | S&P 500 Index, One purchased call strike 1,922.00, One written call strike 1,998.88, One purchased put strike 1,883.56 (10,406 contracts), One written put strike 1,922.00 with a barrier level strike of 1,441.50 (20,812 contracts), Expires 12/30/16, Broker UBS AG(q) | | | 2,180,664 | |
| | 77,817 | | | S&P 500 Index, One purchased call strike 1,927.60, One written call strike 2,004.70, One purchased put strike 1,908.32 (25,939 contracts), One written put strike 1,927.60 with a barrier level strike of 1,515.09 (51,878 contracts), Expires 12/30/16, Broker UBS AG(q) | | | 5,438,727 | |
Contracts/
Notional
Amount ($) | | | | | Value | |
| | 20,666 | | | S&P 500 Index, One purchased call strike 1,935.50, One written call strike 2,012.92, One purchased put strike 1,935.50 with a barrier level strike of 1,741.95 (10,333 contracts), One written put strike 1,766.14 (10,333 contracts), Expires 01/19/17, Broker Citibank N.A.(q) | | $ | 1,352,460 | |
| | 12,869 | | | S&P 500 Index, One purchased call strike 1,942.62, One purchased put strike 1,903.77, One written call strike 2,020.32, One written put strike 1,942.62 with a barrier level strike of 1,683.28 (25,738 contracts), Expires 02/28/17, Broker UBS AG(q) | | | 1,509,396 | |
| | 5,174 | | | S&P 500 Index, One purchased call strike 1,952.23, One purchased put strike 1,894.24, One written put strike 1,932.90 with a barrier level strike of 1,454.51 (10,347 contracts), Expires 01/19/17, Broker UBS AG(q) | | | 1,024,161 | |
| | 12,595 | | | S&P 500 Index, One purchased call strike 1,984.95, One written call strike 2,064.35, One purchased put strike 1,965.10 (5,038 contracts), One written put strike 1,984.95 with a barrier level strike of 1,496.65 (10,076 contracts), Expires 03/16/17, Broker UBS AG(q) | | | 781,607 | |
| | 20,074 | | | S&P 500 Index, One purchased call strike 1,992.68, One written call strike 2,072.39, One purchased put strike 1,952.83 (7,528 contracts), One written put strike 1,992.68 with a barrier level strike of 1,522.41 (15,055 contracts), Expires 12/30/16, Broker Citibank N.A.(q) | | | 1,302,210 | |
| | 22,533 | | | S&P 500 Index, One purchased call strike 1,997.0343, One written call strike 2,076.9157, One purchased put strike 1,957.0936 (7,511 contracts), One written put strike 1,997.0343 with a barrier level strike of 1,531.7253 (15,022 contracts), Expires 02/16/17, Broker Goldman Sachs International(q) | | | 1,344,467 | |
| Old Westbury Funds, Inc. | |
| Strategic Opportunities Fund | |
| Consolidated Portfolio of Investments - (Continued) | |
| | October 31, 2016 |
Contracts/
Notional
Amount ($) | | | | | Value | |
| | 5,054 | | | S&P 500 Index, One purchased call strike 1,998.49, One purchased put strike 1,939.13, One written put strike 1,978.70 with a barrier level strike of 1,691.79 (10,108 contracts), Expires 12/15/16, Broker Credit Suisse International(q) | | $ | 699,895 | |
| | 14,957 | | | S&P 500 Index, One purchased call strike 2,005.80, One written call strike 2,086.03, One purchased put strike 1,965.68 (4,986 contracts), One written put strike 2,005.80 with a barrier level strike of 1,534.44 (9,971 contracts), Expires 01/31/17, Broker Credit Suisse International(q) | | | 925,409 | |
| | 14,849 | | | S&P 500 Index, One purchased call strike 2,020.28, One written call strike 2,101.09, One purchased put strike 1,979.87 (4,950 contracts), One written put strike 2,020.28 with a barrier level strike of 1,543.49 (9,900 contracts), Expires 01/19/17, Broker Credit Suisse International(q) | | | 923,488 | |
| | 12,276 | | | S&P 500 Index, One purchased call strike 2,036.54, One written call strike 2,118.00, One purchased put strike 1,995.81 (4,910 contracts), One written put strike 2,036.54 with a barrier level strike of 1,520.277 (9,821 contracts), Expires 01/19/17, Broker Citibank N.A.(q) | | | 728,910 | |
| | 14,678 | | | S&P 500 Index, One purchased call strike 2,043.83, One written call strike 2,125.5832, One purchased put strike 2,002.9534 (4,893 contracts), One written put strike 2,043.83 with a barrier level strike of 1,563.53 (9,786 contracts), Expires 02/16/17, Broker JPMorgan Chase Bank N.A.(q) | | | 801,010 | |
Contracts/
Notional
Amount ($) | | | | | Value | |
| | 7,331 | | | S&P 500 Index, One purchased call strike 2,046.0802, One written call strike 2,127.9234, One purchased put strike 2,005.1586 (2,444 contracts), One written put strike 2,046.0802 with a barrier level strike of 1,555.021 (4,887 contracts), Expires 02/16/17, Broker Goldman Sachs International(q) | | $ | 409,911 | |
| | 22,726 | | | S&P 500 Index, One purchased call strike 2,048.36, One written call strike 2,130.29, One purchased put strike 2,027.88 (9,763 contracts), One written put strike 2,048.36 with a barrier level strike of 1,556.75 (19,528 contracts), Expires 04/13/17, Broker UBS AG(q) | | | 1,096,632 | |
| | 29,259 | | | S&P 500 Index, One purchased call strike 2,050.62, One written call strike 2,132.64, One purchased put strike 2,009.61 (9,753 contracts), One written put strike 2,050.62 with a barrier level strike of 1,611.79 (19,506 contracts), Expires 01/19/17, Broker Credit Suisse International(q) | | | 1,668,986 | |
| | 14,196 | | | S&P 500 Index, One purchased call strike 2,113.31, One written call strike 2,197.8424, One purchased put strike 2,071.0438 (4,732 contracts), One written put strike 2,113.31 with a barrier level strike of 1,669.51 (9,464 contracts), Expires 01/19/17, Broker JPMorgan Chase Bank N.A.(q) | | | 622,140 | |
| | 18,993 | | | S&P 500 Index, One purchased call strike 2,148.12, One written put strike 1,895.40, Expires 12/15/16, Broker Citibank N.A. | | | 397,000 | |
| | 16,452 | | | S&P 500 Index, One purchased call strike 2,148.735, One written put strike 2,042.362, Expires 11/30/16, Broker Goldman Sachs International | | | 91,192 | |
| | 11,729 | | | S&P 500 Index, One purchased call strike 2,152.82, One written put strike 2,046.24, Expires 11/08/16, Broker BNP Paribas SA | | | 41,199 | |
| Old Westbury Funds, Inc. | |
| Strategic Opportunities Fund | |
| Consolidated Portfolio of Investments - (Continued) | |
| | October 31, 2016 |
Contracts/
Notional
Amount ($) | | | | | Value | |
| | 14,019 | | | S&P 500 Index, One purchased call strike 2,161.34, One written put strike 2,054.34, Expires 11/07/16, Broker BNP Paribas SA | | $ | 5,280 | |
| | 7,005 | | | S&P 500 Index, One purchased call strike 2,162.75, One purchased put strike 2,119.93, One written call strike 2,141.34 with a barrier level strike of 1,724.85 (14,010 contracts), Expires 11/16/17, Broker Bank of America N.A.(q) | | | (117,110 | ) |
| | 27,989 | | | S&P 500 Index, One purchased call strike 2,165.14, One written put strike 2,057.96, Expires 11/17/16, Broker Credit Suisse International | | | (89,937 | ) |
| | 28,117 | | | S&P 500 Index, One purchased call strike 2,176.61, One written put strike 1,920.54, Expires 12/30/16, Broker Credit Suisse International | | | 265,362 | |
| | 9,282 | | | S&P 500 Index, One purchased call strike 2,197.787, One written put strike 1,939.224, Expires 12/30/16, Citibank N.A. | | | (11,521 | ) |
| | 18,301 | | | S&P 500 Index, One purchased call strike 2,229.42, One written put strike 2,163.85, with a barrier level strike of 2,185.71, Expires 08/17/17, Broker Credit Suisse International | | | (685,109 | ) |
| | 22,390 | | | S&P 500 Index, One purchased call strike 2,250.99, One written put strike 2,143.80 with a barrier level strike of 1,972.30, Expires 01/19/17, Broker Credit Suisse International | | | (99,360 | ) |
| | 186,632 | | | S&P 500 Index, One purchased call strike price 2,250.43, One written put strike 2,036.10, (23,303 contracts), Expires 11/17/16, Broker Barclays Bank Plc(q) | | | (212,294 | ) |
| | 7,817 | | | S&P 500 Index, One purchased put strike 2,014.95 with a barrier level strike of 1,343.30, One written put strike 46.49 on Utilities Sector SPDR Fund with a barrier level strike of 31.38 (322,650 contracts), Expires 12/30/16, Broker UBS AG(q) | | | 170,273 | |
Contracts/
Notional
Amount ($) | | | | | Value | |
| | 10,289 | | | S&P 500 Index, One purchased put strike 2,021.50 with a barrier level strike 1,360.625, One written put strike 46.7161 on Utilities Sector SPDR Fund with a barrier level strike of 31.6502 (428,118 contracts), Expires 12/30/16, Broker JPMorgan Chase Bank N.A.(q) | | $ | 185,424 | |
| | 10,279 | | | S&P 500 Index, One purchased put strike 2,093.49 with a barrier level strike of 1,361.93, One written put strike 43.41 on Utilities Select Sector SPDR Fund with a barrier level strike of 34.73 (460,713 contracts), Expires 12/15/16, Broker Bank of America N.A.(q) | | | 331,880 | |
| | 5,968 | | | S&P 500 Index, One purchased put strike 2,136.3186 with a barrier level strike of 1,466.101, One written put strike 47.00 on Utilities Select Sector SPDR Fund with a barrier level strike of 34.6625 (265,957 contracts), Expires 02/16/17, Broker JPMorgan Chase Bank N.A.(q) | | | 295,500 | |
| | 1,904,762 | | | Select Sector Financial SPDR Fund, One purchased call strike 21.00, One written call strike 21.84, One written put strike 18.38 (952,381 contracts), One purchased put strike 21.00 with a barrier level strike of 18.90 (952,381 contracts), Expires 12/30/16, Broker Credit Suisse International(q) | | | 1,487,577 | |
| | 251,693 | | | SPDR Dow Jones Industrial Average ETF Trust, One purchased call strike 158.924, One written call strike 165.281, One written put strike 131.589 (125,847 contracts), Expires 03/16/17, Broker Citibank N.A.(q) | | | 1,323,480 | |
| Old Westbury Funds, Inc. | |
| Strategic Opportunities Fund | |
| Consolidated Portfolio of Investments - (Continued) | |
| | October 31, 2016 |
| Contracts/ | | | | | | |
| Notional | | | | | | |
| Amount ($) | | | | | Value | |
| | 249,763 | | | SPDR Dow Jones Industrial Average ETF Trust, One purchased call strike 160.152 (249,763 contracts), One written call strike 166.5581(249,763 contracts),One written put strike 138.9319 (124,881 contracts), One purchased put strike 160.152 with a barrier level strike of 144.1368 (124,881 contracts), Expires 03/16/17, Broker Goldman Sachs International(q) | | $ | 1,341,763 | |
| | 236,499 | | | SPDR Dow Jones Industrial Average ETF Trust, One purchased call strike 169.134, One written call strike 175.8994, One purchased put strike 165.7513 (88,687 contracts), One written put strike 169.134 with a barrier level strike of 131.4509 (177,374 contracts), Expires 12/30/16, Broker Goldman Sachs International(q) | | | 1,256,412 | |
| | 87,499 | | | SPDR Dow Jones Industrial Average ETF Trust, One purchased call strike 173.1443, One purchased put strike 168.0014, One written put strike 171.43 with a barrier level strike of 146.95 (174,999 contracts), Expires 01/19/17, Broker BNP Paribas SA(q) | | | 832,049 | |
| | 85,885 | | | SPDR Dow Jones Industrial Average ETF Trust, One purchased call strike 176.3994, One purchased put strike 171.1598, One written put strike 174.6529 with a barrier level strike of 134.832 (171,769 contracts), Expires 01/31/17, Broker JPMorgan Chase Bank N.A.(q) | | | 690,420 | |
| | 165,237 | | | SPDR Dow Jones Industrial Average ETF Trust, One purchased call strike 183.373, One written put strike 174.2951, Expires 11/18/16, Broker Goldman Sachs International | | | 41,813 | |
| | 84,803 | | | SPDR Dow Jones Industrial Average ETF Trust, One purchased call strike 185.724, One written put strike 168.036, Expires 11/18/16, Broker BNP Paribas SA | | | 27,201 | |
| Contracts/ | | | | | | |
| Notional | | | | | | |
| Amount ($) | | | | | Value | |
| | 398,443 | | | SPDR Dow Jones Industrial Average ETF Trust, One purchased call strike 187.1035, One written put strike 169.2841 (168,356 contracts), Expires 12/16/16, Broker Goldman Sachs International(q) | | $ | 87,188 | |
| | 214,777 | | | SPDR Dow Jones Industrial Average ETF Trust, One purchased call strike 188.1019, One written put strike 176.9275, Expires 11/17/16, Broker Goldman Sachs International | | | (264,329 | ) |
| | 109,750 | | | SPDR Dow Jones Industrial Average ETF Trust, One written put strike 164.0088, One purchased call strike 185.8766, Expires 12/30/16, Broker Goldman Sachs International | | | 53,119 | |
| | 84,731 | | | SPDR Gold Shares, One written call strike 118.02, with a barrier level strike of 171.129, One written put strike 118.02 with a barrier level strike of 94.416, One purchased put strike 1,919.051 on S&P 500 Index (10,196 contracts), One written put strike 1,727.1459 on S&P 500 Index (10,196 contracts), One purchase call strike 1,919.051 on S&P 500 Index with a barrier level strike of 2,206.9087 (5,211 contracts), Expires 12/15/16, Broker JPMorgan Chase Bank N.A.(q) | | | 495,238 | |
| | 234,894 | | | SPDR Gold Shares, One purchased call strike 128.9942, One written call strike 143.043, One written put strike 121.7271, Expires 01/19/17, Broker Goldman Sachs International | | | (482,781 | ) |
| | 357,173 | | | SPDR Gold Shares, One purchased call strike 127.25, One written call strike 138.59, One written put strike 120.35, Expires 12/15/16, Broker Bank of America N.A. | | | (348,887 | ) |
| | 115,884 | | | SPDR Gold Shares, One purchased call strike 130.73, Expires 02/17/17, Broker UBS AG | | | (403,889 | ) |
| Old Westbury Funds, Inc. | |
| Strategic Opportunities Fund | |
| Consolidated Portfolio of Investments - (Continued) | |
| | October 31, 2016 |
| Contracts/ | | | | | | |
| Notional | | | | | | |
| Amount ($) | | | | | Value | |
| | 351,153 | | | SPDR S&P 500 ETF Trust, One purchased call strike 220.6401, One written put strike 199.6268 (142,766 contracts), Expires 12/16/16, Broker Goldman Sachs International(q) | | $ | (32,477 | ) |
| | 348,755 | | | SPDR S&P 500 ETF Trust, One purchased call strike 221.29, One written put strike 200.21 (142,349 contracts), Expires 12/16/16, Broker Bank of America N.A.(q) | | | (81,784 | ) |
| | 115,644 | | | SPDR S&P 500 ETF Trust, One purchased call strike 216.1800, One written put strike 45.5712 (526,648 contracts) on Utilities SPDR ETF, One written call strike 49.3688 (526,648 contracts) on Utilities SPDR ETF Expires 11/18/16, Broker JPMorgan Chase Bank N.A.(q) | | | (280,550 | ) |
| | 833,004 | | | SPDR S&P Regional Banking ETF, One purchased call strike 36.9746, One written call strike 38.4536, One written put strike 33.2771 (270,456 contracts), Expires 12/30/16, Broker BNP Paribas SA(q) | | | 1,118,125 | |
| | 1,252 | | | Swiss Market Index, One purchased call strike 7,987.08, One purchased put strike 7,749.84, One written put strike 7,908.00, with a barrier level strike of 6,073.34 (2,504.04 contracts), Expires 07/13/17, Broker UBS AG(q) | | | 74,863 | |
| | 2,501 | | | Swiss Market Index, One purchased call strike 8,075.3631, One purchased put strike 7,835.5008, One written put strike 7,995.4090 with a barrier level strike of 6,228.42 (5,003 contracts), Expires 10/19/17, Broker JPMorgan Chase Bank N.A.(q) | | | (352,560 | ) |
| | 1,247 | | | Swiss Market Index, One purchased call strike 8,098.84, One purchased put strike 7,858.28, One written put strike 8,018.66, with a barrier level strike of 6,194.41 (2,494 contracts), Expires 07/13/17, Broker JPMorgan Chase Bank N.A.(q) | | | (3,740 | ) |
| Contracts/ | | | | | | |
| Notional | | | | | | |
| Amount ($) | | | | | Value | |
| | 1,232 | | | Swiss Market Index, One purchased call strike 8,196.15, One purchased put strike 7,952.70, One written put strike 8,115.00 with a barrier level strike of 6,255.85 (2,464.57 contracts), Expires 08/17/17, Broker UBS AG(q) | | $ | (135,340 | ) |
| | 3,702 | | | Taiwan Stock Exchange Weighted Index, One purchased call strike 8,105.00, One written call strike 8,429.20, One purchased put strike 8,105.00 with a barrier level strike of 6,808.20 (1,234 contracts), One written put strike 8,105.00 with a barrier level strike of 6,078.75 (1,234 contracts), Expires 12/21/16, Broker Goldman Sachs International(q) | | | 1,160,979 | |
| | 195,752 | | | Teradata Corp., One purchased call strike 25.5425, One written call strike 33.2053, One written put strike 25.5425 with a barrier level strike of 19.2718, Expires 01/20/17, Broker JPMorgan Chase Bank N.A. | | | 407,685 | |
| | 41,564 | | | Tokyo Stock Exchange Tokyo Price Index , One purchased call strike 1,299.2, One written call strike 1,351.168, One written put strike 1,169.28 (15,394 contracts), Expires 12/30/16, Broker Goldman Sachs International(q) | | | 1,676,069 | |
| | 3,201,191 | | | Tokyo Stock Exchange Tokyo Price Index, One purchased call strike 1,338.75, One written call strike 1,392.3017, One written put strike 1,245.0391 (1,200,447 contracts), Expires 03/10/17, Broker Goldman Sachs International(q) | | | 790,998 | |
| $ | 10,000,000 | | | USD/BRL foreign exchange rate, One purchased call strike 3.14, One written put strike 3.6308, Expires 03/31/17, Broker Goldman Sachs International | | | 19,434 | |
| $ | 100,000 | | | USD/BRL foreign exchange rate, One purchased call strike 3.16, One purchased put strike 3.1900, One written put strike 3.4600, Expires 04/13/17, Broker Goldman Sachs International | | | 8,015 | |
| Old Westbury Funds, Inc. | |
| Strategic Opportunities Fund | |
| Consolidated Portfolio of Investments - (Continued) | |
| | October 31, 2016 |
| Contracts/ | | | | | | |
| Notional | | | | | | |
| Amount ($) | | | | | Value | |
| $ | 10,000,000 | | | USD/BRL foreign exchange rate, One purchased call strike 3.2150, One written put strike 3.4370, Expires 12/30/16, Broker Bank of America N.A. | | $ | 95,187 | |
| $ | 15,000,000 | | | USD/BRL foreign exchange rate, One purchased put strike 3.140, One purchased call strike 3.170, One written call strike 3.4770, Expires 03/31/17, Broker JPMorgan Chase Bank N.A. | | | (91,710 | ) |
| $ | 10,000,000 | | | USD/BRL foreign exchange rate, One purchased put strike 3.21, One written call strike 3.6355, Expires 02/24/17, Broker Goldman Sachs International | | | 150,986 | |
| $ | 10,000,000 | | | USD/BRL foreign exchange rate, One purchased put strike 3.23, One written call strike 3.5698, Expires 01/31/17, Broker Goldman Sachs International | | | 191,345 | |
| $ | 100,000,000 | | | USD/CNY (Offshore) foreign exchange rate, One purchased call strike 6.70, One written call strike 7.10, Expires 03/10/17, Broker Bank of America N.A. | | | 2,303,935 | |
| $ | 100,000,000 | | | USD/CNY (Offshore) foreign exchange rate, One purchased call strike 7.00, One written call strike 7.40, Expires 02/03/17, Broker JPMorgan Chase Bank N.A. | | | 332,600 | |
| $ | 35,000,000 | | | USD/MXN foreign exchange rate, One purchased put strike 16.45, One written call strike 18.361, Expires 12/15/16, Broker Bank of America N.A. | | | (1,633,123 | ) |
| $ | 15,000,000 | | | USD/MXN foreign exchange rate, One purchased put strike 16.65, One written call strike 17.87, Expires 01/30/17, Broker Bank of America N.A. | | | (1,086,619 | ) |
| $ | 15,000,000 | | | USD/MXN foreign exchange rate, One purchased put strike 17.15, One written call strike 19.1102, Expires 04/17/17, Broker Goldman Sachs International | | | (593,329 | ) |
| $ | 10,000,000 | | | USD/MXN foreign exchange rate, One purchased put strike 17.20, One written call strike 18.9201, Expires 05/02/17, Broker Goldman Sachs International | | | (452,945 | ) |
| Contracts/ | | | | | | |
| Notional | | | | | | |
| Amount ($) | | | | | Value | |
| $ | 10,000,000 | | | USD/MXN foreign exchange rate, One purchased put strike 17.30, One written call strike 19.2902, Expires 05/19/17, Broker Goldman Sachs International | | $ | (382,529 | ) |
| $ | 15,000,000 | | | USD/MXN foreign exchange rate, One purchased put strike 19.45, One written call strike 21.915, Expires 10/23/17, Broker JPMorgan Chase Bank N.A. | | | 304,725 | |
| $ | 10,000,000 | | | USD/MXN foreign exchange rate, One written call strike 21.5100, One purchased put strike 18.7500, Expires 10/19/17, Broker JPMorgan Chase Bank N.A. | | | (6,906 | ) |
| | 1,517,953 | | | WisdomTree Japan Hedged Equity Fund, One purchased call strike 51.8989, One written call strike 53.9543, One written put strike 51.385 with a barrier level strike of 47.7881 (291,914 contracts), Expires 11/18/16, Broker Goldman Sachs International(q) | | | (967,835 | ) |
| | 948,890 | | | WisdomTree Japan Hedged Equity Fund, One purchased call strike 54.8219, One written call strike 56.9718, One written put strike 53.747 with a barrier level strike of 49.4472 (186,057 contracts), Expires 12/15/16, Broker Goldman Sachs International(q) | | | (1,096,975 | ) |
Total Structured Options
(Premiums received $5,722,394) | | $ | 106,759,265 | |
| Old Westbury Funds, Inc. | |
| Strategic Opportunities Fund | |
| Consolidated Portfolio of Investments - (Continued) | |
| | October 31, 2016 |
FUTURES CONTRACTS: SHORT POSITION
| Contracts | | | | | Unrealized
Appreciation/
(Depreciation) | |
| | 30 | | | Intercontinental Exchange Coffee, December 2016 | | $ | (133,650 | ) |
| | 150 | | | London Metal Exchange Aluminum, December 2016 | | | (598,125 | ) |
| | 100 | | | London Metal Exchange Copper, December 2016 | | | 321,250 | |
| | 198 | | | London Metal Exchange Nickel, December 2016 | | | (1,489,182 | ) |
| | 40 | | | London Metal Exchange Zinc, December 2016 | | | (138,430 | ) |
| | 134 | | | Intercontinental Exchange Frozen Concentrated Orange Juice, January 2017 | | | (60,127 | ) |
| | 25 | | | Intercontinental Exchange Cotton No.2, March 2017 | | | (21,310 | ) |
| | | | | Net unrealized depreciation | | $ | (2,119,574 | ) |
FUTURES CONTRACTS: LONG POSITION
| Contracts | | | | | Unrealized
Appreciation/
(Depreciation) | |
| | 25 | | | COMEX Gold, December 2016, | | $ | (220,090 | ) |
| | 100 | | | London Metal Exchange Copper, December 2016 | | | (222,500 | ) |
| | 198 | | | London Metal Exchange Nickel, December 2016 | | | 2,042,635 | |
| | 120 | | | Minneapolis Grain Exchange Red Spring Wheat, December 2016 | | | 61,475 | |
| | 100 | | | Chicago Board of Trade Hard Red Winter Wheat, July 2017 | | | (132,513 | ) |
| | 2,500 | | | Chicago Board of Trade, 5 Year U.S. Treasury Note, December 2016 | | | (1,494,841 | ) |
| | 725 | | | Chicago Board of Exchange Volatility Index, December 2016 | | | (281,045 | ) |
| | | | | Net unrealized depreciation | | $ | (246,879 | ) |
| | | Unrealized
Appreciation/
(Depreciation) | |
| SWAP AGREEMENTS (PURCHASED) | | | | |
| Commodity Index Swap Agreement with Cargill, Inc. based on a basket of commodity Indexes, paying a fixed amount and paying the closing settlement price if over the target value of the basket and receiving the closing settlement price if under the target value of the basket on a monthly basis until the termination date, expiring 12/31/16 (Underlying notional amount $2,816,703)(s) | | $ | (151,106 | ) |
| | | Unrealized
Appreciation/
(Depreciation) | |
| Commodity Index Swap Agreement with Cargill, Inc. based on a basket of commodity Indexes, paying a fixed amount and paying the closing settlement price if over the target value of the basket and receiving the closing settlement price if under the target value of the basket on the termination date, expiring 12/31/16 (Underlying notional amount $537,874)(t) | | $ | 531,030 | |
| Commodity Index Swap Agreement with Cargill, Inc. based on the Baltic Capesize Freight Index (“BCI”) receiving a fixed amount per day and paying the arithmetic average of the rates for BCI Routes published by the Baltic Exchange, expiring 01/31/18 (Underlying notional amount $281,250) | | | (13,950 | ) |
| Commodity Index Swap Agreement with Cargill, Inc. based on the Baltic Capesize Freight Index (“BCI”) receiving a fixed amount per day and paying the arithmetic average of the rates for BCI Routes published by the Baltic Exchange, expiring 02/28/18 (Underlying notional amount $281,250) | | | (13,950 | ) |
| Commodity Index Swap Agreement with Cargill, Inc. based on the Baltic Capesize Freight Index (“BCI”) receiving a fixed amount per day and paying the arithmetic average of the rates for BCI Routes published by the Baltic Exchange, expiring 03/31/18 (Underlying notional amount $281,250) | | | (13,950 | ) |
| Commodity Index Swap Agreement with Cargill, Inc. based on the Baltic Capesize Freight Index (“BCI”) receiving a fixed amount per day and paying the arithmetic average of the rates for BCI Routes published by the Baltic Exchange, expiring 04/30/18 (Underlying notional amount $281,250) | | | (13,950 | ) |
| Old Westbury Funds, Inc. | |
| Strategic Opportunities Fund | |
| Consolidated Portfolio of Investments - (Continued) | |
| | October 31, 2016 |
| | | Unrealized
Appreciation/
(Depreciation) | |
| Commodity Index Swap Agreement with Cargill, Inc. based on the Baltic Capesize Freight Index (“BCI”) receiving a fixed amount per day and paying the arithmetic average of the rates for BCI Routes published by the Baltic Exchange, expiring 05/31/18 (Underlying notional amount $281,250) | | $ | (13,950 | ) |
| Commodity Index Swap Agreement with Cargill, Inc. based on the Baltic Capesize Freight Index (“BCI”) receiving a fixed amount per day and paying the arithmetic average of the rates for BCI Routes published by the Baltic Exchange, expiring 06/30/18 (Underlying notional amount $281,250) | | | (13,950 | ) |
| Commodity Index Swap Agreement with Cargill, Inc. based on the Baltic Capesize Freight Index (“BCI”) receiving a fixed amount per day and paying the arithmetic average of the rates for BCI Routes published by the Baltic Exchange, expiring 07/31/18 (Underlying notional amount $281,250) | | | (13,950 | ) |
| Commodity Index Swap Agreement with Cargill, Inc. based on the Baltic Capesize Freight Index (“BCI”) receiving a fixed amount per day and paying the arithmetic average of the rates for BCI Routes published by the Baltic Exchange, expiring 08/31/18 (Underlying notional amount $281,250) | | | (13,950 | ) |
| Commodity Index Swap Agreement with Cargill, Inc. based on the Baltic Capesize Freight Index (“BCI”) receiving a fixed amount per day and paying the arithmetic average of the rates for BCI Routes published by the Baltic Exchange, expiring 09/30/18 (Underlying notional amount $281,250) | | | (13,950 | ) |
| Commodity Index Swap Agreement with Cargill, Inc. based on the Baltic Capesize Freight Index (“BCI”) receiving a fixed amount per day and paying the arithmetic average of the rates for BCI Routes published by the Baltic Exchange, expiring 10/31/18 (Underlying notional amount $281,250) | | | (13,950 | ) |
| | | Unrealized
Appreciation/
(Depreciation) | |
| Commodity Index Swap Agreement with Cargill, Inc. based on the Baltic Capesize Freight Index (“BCI”) receiving a fixed amount per day and paying the arithmetic average of the rates for BCI Routes published by the Baltic Exchange, expiring 11/30/16 (Underlying notional amount $261,000) | | $ | 39,000 | |
| Commodity Index Swap Agreement with Cargill, Inc. based on the Baltic Capesize Freight Index (“BCI”) receiving a fixed amount per day and paying the arithmetic average of the rates for BCI Routes published by the Baltic Exchange, expiring 11/30/18 (Underlying notional amount $281,250) | | | (13,950 | ) |
| Commodity Index Swap Agreement with Cargill, Inc. based on the Baltic Capesize Freight Index (“BCI”) receiving a fixed amount per day and paying the arithmetic average of the rates for BCI Routes published by the Baltic Exchange, expiring 12/31/16 (Underlying notional amount $261,000) | | | 6,000 | |
| Commodity Index Swap Agreement with Cargill, Inc. based on the Baltic Capesize Freight Index (“BCI”) receiving a fixed amount per day and paying the arithmetic average of the rates for BCI Routes published by the Baltic Exchange, expiring 12/31/18 (Underlying notional amount $281,250) | | | (13,950 | ) |
| Commodity Index Swap Agreement with Cargill, Inc. based on the Singapore Exchange (“SGX”) Steel Index, paying a fixed amount per metric ton and receiving the closing settlement price of SGX April 2017 Iron Ore on the termination date, expiring 04/30/17 (Underlying notional amount $116,250) | | | 25,375 | |
| Commodity Index Swap Agreement with Cargill, Inc. based on the Singapore Exchange (“SGX”) Steel Index, paying a fixed amount per metric ton and receiving the closing settlement price of SGX August 2017 Iron Ore on the termination date, expiring 08/31/17 (Underlying notional amount $116,250) | | | 16,875 | |
| Old Westbury Funds, Inc. | |
| Strategic Opportunities Fund | |
| Consolidated Portfolio of Investments - (Continued) | |
| | October 31, 2016 |
| | | Unrealized
Appreciation/
(Depreciation) | |
| Commodity Index Swap Agreement with Cargill, Inc. based on the Singapore Exchange (“SGX”) Steel Index, paying a fixed amount per metric ton and receiving the closing settlement price of SGX December 2017 Iron Ore on the termination date, expiring 12/31/17 (Underlying notional amount $116,250) | | $ | 10,150 | |
| Commodity Index Swap Agreement with Cargill, Inc. based on the Singapore Exchange (“SGX”) Steel Index, paying a fixed amount per metric ton and receiving the closing settlement price of SGX February 2017 Iron Ore on the termination date, expiring 02/28/17 (Underlying notional amount $116,250) | | | 32,100 | |
| Commodity Index Swap Agreement with Cargill, Inc. based on the Singapore Exchange (“SGX”) Steel Index, paying a fixed amount per metric ton and receiving the closing settlement price of SGX January 2017 Iron Ore on the termination date, expiring 01/31/17 (Underlying notional amount $116,250) | | | 35,050 | |
| Commodity Index Swap Agreement with Cargill, Inc. based on the Singapore Exchange (“SGX”) Steel Index, paying a fixed amount per metric ton and receiving the closing settlement price of SGX July 2017 Iron Ore on the termination date, expiring 07/31/17 (Underlying notional amount $116,250) | | | 18,125 | |
| Commodity Index Swap Agreement with Cargill, Inc. based on the Singapore Exchange (“SGX”) Steel Index, paying a fixed amount per metric ton and receiving the closing settlement price of SGX June 2017 Iron Ore on the termination date, expiring 06/30/17 (Underlying notional amount $116,250) | | | 21,700 | |
| Commodity Index Swap Agreement with Cargill, Inc. based on the Singapore Exchange (“SGX”) Steel Index, paying a fixed amount per metric ton and receiving the closing settlement price of SGX March 2017 Iron Ore on the termination date, expiring 03/31/17 (Underlying notional amount $116,250) | | | 29,275 | |
| | | Unrealized
Appreciation/
(Depreciation) | |
| Commodity Index Swap Agreement with Cargill, Inc. based on the Singapore Exchange (“SGX”) Steel Index, paying a fixed amount per metric ton and receiving the closing settlement price of SGX May 2017 Iron Ore on the termination date, expiring 05/31/17 (Underlying notional amount $116,250) | | $ | 23,550 | |
| Commodity Index Swap Agreement with Cargill, Inc. based on the Singapore Exchange (“SGX”) Steel Index, paying a fixed amount per metric ton and receiving the closing settlement price of SGX November 2017 Iron Ore on the termination date, expiring 11/30/17 (Underlying notional amount $116,250) | | | 11,225 | |
| Commodity Index Swap Agreement with Cargill, Inc. based on the Singapore Exchange (“SGX”) Steel Index, paying a fixed amount per metric ton and receiving the closing settlement price of SGX October 2017 Iron Ore on the termination date, expiring 10/31/17 (Underlying notional amount $116,250) | | | 12,350 | |
| Commodity Index Swap Agreement with Cargill, Inc. based on the Singapore Exchange (“SGX”) Steel Index, paying a fixed amount per metric ton and receiving the closing settlement price of SGX September 2017 Iron Ore on the termination date, expiring 09/30/17 (Underlying notional amount $116,250) | | | 15,625 | |
| Commodity Index Swap Agreement with Macquarie Bank Ltd. based on the Macquarie Commodity Spread 201E Index, paying a fixed amount when Soybean Index lower than initial index level of 106.0047 and receiving an amount when Soybean Index greater than initial index level of 106.0047, expiring 12/07/16 (Underlying notional amount $6,360,282) | | | 14,892 | |
| Old Westbury Funds, Inc. | |
| Strategic Opportunities Fund | |
| Consolidated Portfolio of Investments - (Continued) | |
| | October 31, 2016 |
| | | Unrealized
Appreciation/
(Depreciation) | |
| Commodity Index Swap Agreement with Macquarie Bank Ltd. based on the Macquarie Commodity Spread 203E Index, paying a fixed amount when Soybean Index lower than initial index level of 165.3420 and receiving an amount when Soybean Index greater than initial index level of 165.3420, expiring 12/06/17 (Underlying notional amount $496,026) | | $ | (33,083 | ) |
| Conditional Variance Swap with BNP Paribas SA receiving variance of the Hang Seng China Enterprises (“HSCEI”) Index over the volatility strike price of 23.70 with a knockout level of 130% of initial index level and the S&P 500 Index over the volatility strike price of 19.70 and paying variance of the HSCEI Index under the volatility strike price of 23.70 with a knockout level of 130% of initial index level and the S&P 500 Index under the volatility strike price of 19.70, expiring 12/28/18 (Underlying vega amount $500,000) | | | 837,092 | |
| Conditional Variance Swap with BNP Paribas SA receiving variance of the Nikkei 225 Index over the volatility strike price of 20.60 with a knockout level of 120% of initial index level and the S&P 500 Index over the volatility strike price of 23.00 and paying variance of the Nikkei 225 Index under the volatility strike price of 20.60 with a knockout level of 120% of initial index level and the S&P 500 Index under the volatility strike price of 23.00, expiring 12/21/18 (Underlying vega amount $200,000) | | | 531,408 | |
| Equity swap with Goldman Sachs International, receiving total return of the Goldman Sachs Volatility Carry U.S. Series 30 Index over the initial equity level of 130.7558 and paying a variable payment based on 3-month LIBOR, expiring 10/05/17 (Underlying notional amount $100,000,000) | | | 881,616 | |
| | | $ | 2,740,849 | |
| | | Unrealized
Appreciation/
(Depreciation) | |
| SWAP AGREEMENTS (WRITTEN) | | | | |
| Commodity Index Swap Agreement with Cargill, Inc. based on the Baltic Capesize Freight Index (“BCI”) receiving a fixed amount per day and paying the arithmetic average of the rates for BCI Routes published by the Baltic Exchange, expiring 01/31/18 (Underlying notional amount $86,500) | | $ | (2,600 | ) |
| Commodity Index Swap Agreement with Cargill, Inc. based on the Baltic Capesize Freight Index (“BCI”) receiving a fixed amount per day and paying the arithmetic average of the rates for BCI Routes published by the Baltic Exchange, expiring 02/28/18 (Underlying notional amount $86,500) | | | (2,600 | ) |
| Commodity Index Swap Agreement with Cargill, Inc. based on the Baltic Capesize Freight Index (“BCI”) receiving a fixed amount per day and paying the arithmetic average of the rates for BCI Routes published by the Baltic Exchange, expiring 03/31/18 (Underlying notional amount $86,500) | | | (2,600 | ) |
| Commodity Index Swap Agreement with Cargill, Inc. based on the Baltic Capesize Freight Index (“BCI”) receiving a fixed amount per day and paying the arithmetic average of the rates for BCI Routes published by the Baltic Exchange, expiring 04/30/18 (Underlying notional amount $86,500) | | | (2,600 | ) |
| Commodity Index Swap Agreement with Cargill, Inc. based on the Baltic Capesize Freight Index (“BCI”) receiving a fixed amount per day and paying the arithmetic average of the rates for BCI Routes published by the Baltic Exchange, expiring 05/31/18 (Underlying notional amount $86,500) | | | (2,600 | ) |
| Old Westbury Funds, Inc. | |
| Strategic Opportunities Fund | |
| Consolidated Portfolio of Investments - (Continued) | |
| | October 31, 2016 |
| | | Unrealized
Appreciation/
(Depreciation) | |
| Commodity Index Swap Agreement with Cargill, Inc. based on the Baltic Capesize Freight Index (“BCI”) receiving a fixed amount per day and paying the arithmetic average of the rates for BCI Routes published by the Baltic Exchange, expiring 06/30/18 (Underlying notional amount $86,500) | | $ | (2,600 | ) |
| Commodity Index Swap Agreement with Cargill, Inc. based on the Baltic Capesize Freight Index (“BCI”) receiving a fixed amount per day and paying the arithmetic average of the rates for BCI Routes published by the Baltic Exchange, expiring 08/31/18 (Underlying notional amount $86,500) | | | (2,600 | ) |
| Commodity Index Swap Agreement with Cargill, Inc. based on the Baltic Capesize Freight Index (“BCI”) receiving a fixed amount per day and paying the arithmetic average of the rates for BCI Routes published by the Baltic Exchange, expiring 09/30/18 (Underlying notional amount $86,500) | | | (2,600 | ) |
| Commodity Index Swap Agreement with Cargill, Inc. based on the Baltic Capesize Freight Index (“BCI”) receiving a fixed amount per day and paying the arithmetic average of the rates for BCI Routes published by the Baltic Exchange, expiring 10/31/18 (Underlying notional amount $86,500) | | | (2,600 | ) |
| Commodity Index Swap Agreement with Cargill, Inc. based on the Baltic Capesize Freight Index (“BCI”) receiving a fixed amount per day and paying the arithmetic average of the rates for BCI Routes published by the Baltic Exchange, expiring 11/30/18 (Underlying notional amount $86,500) | | | (2,600 | ) |
| Commodity Index Swap Agreement with Cargill, Inc. based on the Baltic Capesize Freight Index (“BCI”) receiving a fixed amount per day and paying the arithmetic average of the rates for BCI Routes published by the Baltic Exchange, expiring 12/31/18 (Underlying notional amount $86,500) | | | (2,600 | ) |
| | | Unrealized
Appreciation/
(Depreciation) | |
| Commodity Index Swap Agreement with Cargill, Inc. based on the Baltic Capesize Freight Index (“BCI”) receiving a fixed amount per day and paying the arithmetic average of the rates for BCI Routes published by the Baltic Exchange, expiring 11/30/16 (Underlying notional amount $209,500) | | $ | (90,500 | ) |
| Commodity Index Swap Agreement with Cargill, Inc. based on the Baltic Capesize Freight Index (“BCI”) receiving a fixed amount per day and paying the arithmetic average of the rates for BCI Routes published by the Baltic Exchange, expiring 12/30/16 (Underlying notional amount $209,500) | | | (57,500 | ) |
| Commodity Index Swap Agreement with Cargill, Inc. based on the Baltic Capesize Freight Index (“BCI”) receiving a fixed amount per day and paying the arithmetic average of the rates for BCI Routes expiring 07/31/18 (Underlying notional amount $86,500) | | | (2,600 | ) |
| Commodity Index Swap Agreement with Cargill, Inc. based on the Intercontinental Exchange, Inc. (“ICE”) Cocoa-London Index, receiving a fixed amount per metric ton and paying the closing settlement price of ICE December 2016 Cocoa-London Futures contracts on the termination date, expiring 12/09/16 (Underlying notional amount $2,320,344) | | | 96,072 | |
| Commodity Index Swap Agreement with Cargill, Inc. based on the Intercontinental Exchange, Inc. (“ICE”) Cocoa-London Index, receiving a fixed amount per metric ton and paying the closing settlement price of ICE March 2017 Cocoa-London Futures contracts on the termination date, expiring 12/13/16 (Underlying notional amount $68,850) | | | (13,674 | ) |
| Old Westbury Funds, Inc. | |
| Strategic Opportunities Fund | |
| Consolidated Portfolio of Investments - (Continued) | |
| | October 31, 2016 |
| | | Unrealized
Appreciation
(Depreciation) | |
| Commodity Index Swap Agreement with Cargill, Inc. based on the Kansas City Board of Trade (“KCBT”) and Chicago Board of Trade (“CBOT”) Wheat Index, receiving a fixed amount per bushel and paying the closing settlement price of KCBT July 2017 minus CBOT July 2017 Wheat Futures contracts on the termination date, expiring 07/28/17 (Underlying notional amount $1,117,186) | | $ | 775,936 | |
| Commodity Index Swap Agreement with Cargill, Inc. based on the Kansas City Board of Trade (“KCBT”) and Chicago Board of Trade (“CBOT”) Wheat Index, receiving a fixed amount per bushel and paying the closing settlement price of KCBT July 2017 minus CBOT July 2017 Wheat Futures contracts on the termination date, expiring 06/28/17 (Underlying notional amount $569,749) | | | 316,437 | |
| Equity swap with Barclays Capital, Inc. receiving total return of the Shiller Barclays CAPE US Core Sector Index over the initial equity level of 550.0789 and paying a variable payment based on 1-month LIBOR, expiring 08/31/17 (Underlying notional amount $30,000,000) | | | (923,868 | ) |
| Variance swap with Bank of America N.A. paying variance of the Merrill Lynch Core Portfolio Gross Index over the target volatility of 44.89 and receiving variance of the Merrill Lynch Core Portfolio Gross Index under the target volatility of 44.89, expiring 03/24/17 (Underlying vega amount $1,000,000) | | | 990,953 | |
| Variance swap with Bank of America N.A. paying variance of the Merrill Lynch Core Portfolio Gross Index over the target volatility of 44.89 and receiving variance of the Merrill Lynch Core Portfolio Gross Index under the target volatility of 44.89, expiring 11/17/17 (Underlying vega amount $1,000,000) | | | 398,959 | |
| | | Unrealized | |
| | | Appreciation/ | |
| | | (Depreciation) | |
| Variance swap with Bank of America N.A. paying variance of the Merrill Lynch Core Portfolio Gross Index over the target volatility of 44.89 and receiving variance of the Merrill Lynch Core Portfolio Gross Index under the target volatility of 44.89, expiring 10/05/17 (Underlying vega amount $1,000,000) | | $ | 443,595 | |
| Variance swap with Bank of America N.A. paying variance of the Merrill Lynch Core Portfolio Gross Index over the target volatility of 45.5625 and receiving variance of the Merrill Lynch Core Portfolio Gross Index under the target volatility of 45.5625, expiring 07/25/17 (Underlying vega amount $500,000) | | | 428,491 | |
| Variance swap with Goldman Sachs International paying variance of the Goldman Sachs Momentum Builder Multi Asset 5 Index over the target volatility of 6.15 and receiving variance of the Goldman Sachs Momentum Builder Multi Asset 5 Index under the target volatility of 6.15, expiring 05/29/18 (Underlying vega amount $1,000,000) | | | (252,888 | ) |
| Variance swap with Goldman Sachs International paying variance of the Goldman Sachs Momentum Builder Multi Asset 5 Index over the target volatility of 6.15 and receiving variance of the Goldman Sachs Momentum Builder Multi Asset 5 Index under the target volatility of 6.15, expiring 05/29/18 (Underlying vega amount $1,000,000) | | | (258,950 | ) |
| Variance swap with Goldman Sachs International paying variance of the Goldman Sachs Momentum Builder Multi Asset 5 Index over the target volatility of 6.25 and receiving variance of the Goldman Sachs Momentum Builder Multi Asset 5 Index under the target volatility of 6.25, expiring 10/09/17 (Underlying vega amount $2,000,000) | | | 684,610 | |
| Old Westbury Funds, Inc. | |
| Strategic Opportunities Fund | |
| Consolidated Portfolio of Investments - (Continued) | |
| | October 31, 2016 |
| | | Unrealized | |
| | | Appreciation/ | |
| | | (Depreciation) | |
| Variance swap with Goldman Sachs International paying variance of the Goldman Sachs Momentum Builder Multi Asset 5 Index over the target volatility of 6.25 and receiving variance of the Goldman Sachs Momentum Builder Multi Asset 5 Index under the target volatility of 6.25, expiring 11/06/17 (Underlying vega amount $2,000,000) | | $ | 463,504 | |
| Variance swap with JPMorgan Chase Bank N.A. paying variance of the S&P 500 Index over the target volatility of 33.05 and receiving variance of the S&P 500 Index under the target volatility of 33.05, expiring 12/20/19 (Underlying vega amount $500,000) | | | 5,625,267 | |
| Volatility swap with JPMorgan Chase Bank N.A. paying an amount if the volatility of USD/MXN foreign exchange rate is over 16.00% and receiving an amount if the volatility of USD/MXN foreign exchange rate is under 16.00%, expiring 09/27/17 (Underlying vega amount $75,000) | | | 83,550 | |
| Volatility swap with JPMorgan Chase Bank N.A. paying an amount if the volatility of USD/MXN foreign exchange rate is over 16.50% and receiving an amount if the volatility of USD/MXN foreign exchange rate is under 16.50%, expiring 09/27/17 (Underlying vega amount $75,000) | | | 65,175 | |
| | | $ | 8,743,969 | |
| (a) | Cost for federal income tax purposes is $5,928,817,161 and net unrealized appreciation of investments is as follows: |
| Unrealized appreciation | | $ | 130,868,616 | |
| Unrealized depreciation | | | (134,773,970 | ) |
| Net unrealized appreciation | | $ | (3,905,354 | ) |
| (b) | This security is considered either fully or partially illiquid. These securities, or portions thereof, have a value of $361,176,023 or 6.09% of net assets. Included in this amount are securities which are also exempt from registration under Rule 144A of the Securities Act of 1933, as amended (see (j) below) that amount to $115,027,662 or 1.94% of net assets. |
| (c) | Level 3 fair valued security under procedures established by the Fund’s Board of Directors. The aggregate value of fair valued securities is $2,442,618, which is 0.04% of net assets. |
| (d) | Non-income producing security. |
| (e) | Zero coupon bond. The rate represents the yield at time of purchase. |
| (f) | Issuer filed for bankruptcy and/or is in default of interest payments. |
| (g) | Security offered and sold outside of the United States, and thus is exempt from registration under Regulation S of the Securities Act of 1933. These securities have been deemed liquid under guidelines approved by the Fund’s Board of Directors except those also included in footnote (b) above. |
| (h) | Principal amount denoted in Euros. |
| (i) | Investment in non-U.S. Dollars. Principal amount reflects local currency. |
| (j) | Security exempt from registration under Rule 144A of the Securities Act of 1933, as amended. The security may be resold in transactions exempt from registration normally to qualified institutional buyers. The aggregate value is $694,729,733, which is 11.71% of net assets. These securities have been determined to be liquid in accordance with procedures adopted by the Fund’s Board of Directors except those also included in footnote (b) above. |
| (k) | Variable rate security. Rate shown is the rate as of October 31, 2016. |
| (l) | Payment-in-kind (“PIK”) security. Income may be paid in additional securities or cash at the discretion of the issuer. |
| (m) | Principal amount denoted in British Pounds. |
| (n) | Principal amount denoted in Swiss Francs. |
| (o) | The rate represents the annualized yield at time of purchase. |
| (p) | The rate shown is the current yield as of October 31, 2016. |
| (q) | Number of contracts are shown parenthetically for any leg of Structured Option which has a different number of contracts than the amount shown under contracts column. |
| (r) | Notional Amount is shown parenthetically for any leg of Structured Option which has a different notional amount than the amount shown under Notional Amount column. |
| (s) | The following table represents the individual long and short positions and related values underlying the basket swap with Cargill, Inc., as of October 31, 2016, expiration date December 31, 2016: |
| | | Unrealized |
| | | Appreciation/ |
| Reference Entity — Long | | (Depreciation) |
| Chicago Board of Trade Lean Hogs, December 2016 | | $ | (1,076 | ) |
| Chicago Board of Trade Wheat, March 2017 | | 2,461 | |
| COMEX Gold, December 2016 | | | (26,619 | ) |
| Intercontinental Exchange Brent Crude Oil, January 2017 | | (31,377 | ) |
| Intercontinental Exchange Cocoa, March 2017 | | (15,863 | ) |
| Intercontinental Exchange Cotton #2, March 2017 | | | 2,153 | |
| Intercontinental Exchange Coffee, December 2016 | | | 64,330 | |
| Intercontinental Exchange Corn, September 2016 | | | (1,820 | ) |
| Intercontinental Exchange Sugar #11, March 2017 | | | (48,808 | ) |
| London Metal Exchange Copper, March 2017 | | | 15,253 | |
| London Metal Exchange Lead, November 2016 | | | (54,730 | ) |
| Old Westbury Funds, Inc. | |
| Strategic Opportunities Fund | |
| Consolidated Portfolio of Investments - (Continued) | |
| | October 31, 2016 |
| | | Unrealized |
| | | Appreciation/ |
| Reference Entity — Long (Continued) | | (Depreciation) |
| London Metal Exchange Lead, December 2016 | | $ | 2,948 | |
| London Metal Exchange Tin, November 2016 | | | 20,764 | |
| London Metal Exchange Tin, December 2016 | | | 8,254 | |
| London Metal Exchange Zinc, November 2016 | | | (19,175 | ) |
| New York Mercantile Exchange Palladium, March 2017 | | | (10,254 | ) |
| New York Mercantile Exchange Gasoline RBOB, November 2016 | | 22,730 | |
| New York Mercantile Exchange Gasoline RBOB, December 2016 | | (55,857 | ) |
| New York Mercantile Exchange Heating Oil, December 2016 | | | (18,109 | ) |
| New York Mercantile Exchange Natural Gas, November 2016 | | | (9,228 | ) |
| New York Mercantile Exchange Natural Gas, December 2016 | | | (2,584 | ) |
| | | $ | (156,607 | ) |
| | | | | |
| | | Unrealized |
| | | Appreciation/ |
| Reference Entity — Short | | (Depreciation) |
| Chicago Board of Trade Lean Hogs, February 2017 | | $ | (20,641 | ) |
| Chicago Board of Trade Live Cattle, December 2016 | | | (19,318 | ) |
| Chicago Board of Trade Live Cattle, February 2017 | | | 1,928 | |
| Chicago Board of Trade Soybean Oil, January 2017 | | | 19,048 | |
| Chicago Board of Trade Soybean Meal, December 2016 | | | (32,310 | ) |
| Chicago Board of Trade Soybean Meal, January 2017 | | | (7,783 | ) |
| Chicago Board of Trade Wheat, December 2016 | | | (19,457 | ) |
| COMEX Copper, December 2016 | | | 22,161 | |
| COMEX Nickel, November 2016 | | | 9,967 | |
| COMEX Silver, December 2016 | | | 38,427 | |
| COMEX Silver, March 2017 | | | (2,892 | ) |
| Intercontinental Exchange Corn, December 2016 | | | (19,739 | ) |
| Intercontinental Exchange Cotton # 2, December 2016 | | | (2,615 | ) |
| London Metal Exchange Aluminum, November 2016 | | | (737 | ) |
| London Metal Exchange Aluminum, December 2016 | | | (36,375 | ) |
| London Metal Exchange Palladium, December 2016 | | | 46,706 | |
| New York Mercantile Exchange Platinum, January 2017 | | | 29,131 | |
| | | $ | 5,501 | |
| (t) | The following table represents the individual long and short positions and related values underlying the basket swap with Cargill, Inc., as of October 31, 2016, expiration date December 31, 2016: |
| | |
| | | Unrealized |
| | | Appreciation/ |
| Reference Entity — Long | | (Depreciation) |
| Chicago Board of Trade Corn #2, December 2016 | | $ | 197,594 | |
| Chicago Board of Trade Hard Red Winter Wheat, July 2017 | | | 7,698 | |
| Chicago Board of Trade Soybean, November 2016 | | | (85,196 | ) |
| Chicago Board of Trade Wheat, December 2016 | | | 58,508 | |
| Chicago Board of Trade Wheat, July 2017 | | | 57,482 | |
| Chicago Mercantile Exchange Lean Hogs, December 2016 | | | 467,820 | |
| Intercontinental Exchange Cotton #2, March 2017 | | | (22,993 | ) |
| New York Mercantile Exchange Natural Gas, October 2017 | | | (36,829 | ) |
| New York Mercantile Exchange Natural Gas, January 2018 | | | 126,871 | |
| | | $ | 770,955 | |
| | | | | |
| | | Unrealized |
| | | Appreciation/ |
| Reference Entity — Short | | (Depreciation) |
| Chicago Board of Trade Soybean, November 2016 | | $ | (186,241 | ) |
| Chicago Board of Trade Soybean, January 2017 | | | (32,395 | ) |
| Chicago Board of Trade Wheat, December 2016 | | | 1,540 | |
| Chicago Mercantile Exchange Lean Hog, December 2016 | | | 10,675 | |
| New York Mercantile Exchange Natural Gas, October 2017 | | | 10,470 | |
| New York Mercantile Exchange Natural Gas, January 2018 | | | (43,974 | ) |
| | | $ | (239,925 | ) |
ADR — American Depositary Receipt
BRL — Brazilian Real
CLO — Collateralized Loan Obligation
CNY — Chinese Yuan
Cnv. — Convertible
ETF — Exchange Traded Fund
FOR — Foreign Ownership Restrictions
LIBOR — London Interbank Offered Rate
MXN — Mexican Peso
REIT — Real Estate Investment Trust
STEP — Step Coupon Bond
| Old Westbury Funds, Inc. | |
| Strategic Opportunities Fund | |
| Consolidated Portfolio of Investments - (Continued) | |
| | October 31, 2016 |
Portfolio diversification by Sector (Unaudited)
| | | Percentage |
| Sector | | of Net Assets |
| Asset-Backed Securities | | | 11.6 | % |
| Banks | | | 0.8 | % |
| Collateralized Mortgage Obligations | | | 7.6 | % |
| Commercial Mortgage-Backed Securities | | | 0.9 | % |
| Consumer Discretionary | | | 1.9 | % |
| Consumer Staples | | | 1.0 | % |
| Diversified Financials | | | 1.4 | % |
| Energy | | | 0.7 | % |
| Health Care | | | 1.5 | % |
| Industrials | | | 1.4 | % |
| Information Technology | | | 3.0 | % |
| Insurance | | | 0.7 | % |
| Materials | | | 0.8 | % |
| Real Estate | | | 1.5 | % |
| Telecommunication Services | | | 1.0 | % |
| U.S. Government Agencies and Securities | | | 45.0 | % |
| Utilities | | | 1.1 | % |
| Other* | | | 18.1 | % |
| | | | 100.0 | % |
| * | Includes cash and equivalents, closed-end funds, exchange traded funds, purchased or written options, structured options, futures, swap agreements, pending trades and Fund share transactions, interest and dividends receivable, prepaids and accrued expenses payable. |
| Old Westbury Funds, Inc. | |
| Fixed Income Fund | |
| Portfolio of Investments | October 31, 2016 |
| | |
| Principal | | | | | | |
| Amount | | | | | Value | |
| CORPORATE BONDS — 34.7% | | | | |
| Banks — 6.9% | | | | |
| $ | 4,960,000 | | | Bank of America Corp.,
3.50%, 04/19/26 | | $ | 5,091,049 | |
| | 3,800,000 | | | Bank of America NA,
1.25%, 02/14/17 | | | 3,802,075 | |
| | 2,650,000 | | | Bank of Montreal,
1.35%, 08/28/18 | | | 2,645,532 | |
| | 3,000,000 | | | Capital One NA,
1.65%, 02/05/18 | | | 3,002,478 | |
| | 2,000,000 | | | Capital One NA,
1.85%, 09/13/19 | | | 1,997,910 | |
| | 5,000,000 | | | Commonwealth Bank of Australia,
1.13%, 03/13/17 | | | 5,002,955 | |
| | 2,000,000 | | | Commonwealth Bank of Australia,
2.25%, 03/16/17(b) | | | 2,008,822 | |
| | 2,770,000 | | | Cooperatieve Rabobank UA,
4.38%, 08/04/25 | | | 2,917,392 | |
| | 2,750,000 | | | Cooperatieve Rabobank UA,
3.75%, 07/21/26 | | | 2,762,097 | |
| | 2,500,000 | | | International Bank For Reconstruction & Development,
1.38%, 04/10/18 | | | 2,513,963 | |
| | 6,125,000 | | | KFW,
1.25%, 02/15/17 | | | 6,132,571 | |
| | 2,260,000 | | | Sumitomo Mitsui Banking Corp.,
1.95%, 07/23/18 | | | 2,274,365 | |
| | 5,000,000 | | | Sumitomo Mitsui Trust Bank Ltd,
2.05%, 10/18/19(b) | | | 5,014,485 | |
| | 1,375,000 | | | Svenska Handelsbanken AB,
1.50%, 09/06/19 | | | 1,366,357 | |
| | 8,000,000 | | | Westpac Banking Corp.,
1.55%, 05/25/18 | | | 8,008,960 | |
| | | | | | | | 54,541,011 | |
| Consumer Discretionary — 3.6% | | | | |
| | 3,435,000 | | | Carnival Corp,
1.88%, 12/15/17 | | | 3,457,015 | |
| | 6,000,000 | | | Daimler Finance North America LLC,
2.00%, 08/03/18(b) | | | 6,040,368 | |
| | 7,700,000 | | | Ford Motor Credit Co. LLC,
3.00%, 06/12/17 | | | 7,774,505 | |
| | 2,215,000 | | | Time Warner, Inc.,
2.10%, 06/01/19 | | | 2,231,929 | |
| | 3,200,000 | | | TJX Cos., Inc. (The),
2.25%, 09/15/26 | | | 3,077,658 | |
| | 1,775,000 | | | Toyota Motor Credit Corp. MTN,
1.13%, 05/16/17 | | | 1,776,447 | |
| | 2,000,000 | | | Under Armour, Inc.,
3.25%, 06/15/26 | | | 1,971,892 | |
| Principal | | | | | | |
| Amount | | | | | Value | |
| Consumer Discretionary (continued) | | | | |
| $ | 1,820,000 | | | Whirlpool Corp.,
1.65%, 11/01/17 | | $ | 1,824,921 | |
| | | | | | | | 28,154,735 | |
| Consumer Staples — 2.0% | | | | |
| | 3,000,000 | | | Anheuser-Busch Inbev Finance, Inc.,
1.90%, 02/01/19 | | | 3,023,322 | |
| | 3,000,000 | | | Anheuser-Busch Inbev Finance, Inc.,
3.65%, 02/01/26 | | | 3,156,786 | |
| | 4,000,000 | | | Coca-Cola Co. (The),
1.15%, 04/01/18 | | | 4,005,240 | |
| | 3,000,000 | | | McDonald’s Corp. MTN,
2.10%, 12/07/18 | | | 3,037,017 | |
| | 2,077,000 | | | Sysco Corp,
1.90%, 04/01/19 | | | 2,089,319 | |
| | | | | | | | 15,311,684 | |
| Diversified Financials — 3.0% | | | | |
| | 1,400,000 | | | General Electric Capital Corp. MTN,
2.30%, 04/27/17 | | | 1,409,103 | |
| | 2,930,000 | | | Goldman Sachs Group, Inc. (The),
5.95%, 01/18/18 | | | 3,082,758 | |
| | 6,010,000 | | | Goldman Sachs Group, Inc. (The),
2.63%, 01/31/19 | | | 6,123,968 | |
| | 3,800,000 | | | JPMorgan Chase & Co.,
1.52%, 01/28/19(c) | | | 3,804,499 | |
| | 2,202,000 | | | JPMorgan Chase & Co.,
1.84%, 01/23/20(c) | | | 2,223,289 | |
| | 3,000,000 | | | Morgan Stanley,
2.45%, 02/01/19 | | | 3,046,200 | |
| | 3,900,000 | | | Toronto-Dominion Bank (The),
1.29%, 07/02/19(c) | | | 3,890,995 | |
| | | | | | | | 23,580,812 | |
| Energy — 4.6% | | | | |
| | 3,000,000 | | | Cameron International Corp.,
1.15%, 12/15/16 | | | 3,000,525 | |
| | 3,315,000 | | | ConocoPhillips Co.,
4.95%, 03/15/26 | | | 3,718,734 | |
| | 3,000,000 | | | Energy Transfer Partners LP,
4.15%, 10/01/20 | | | 3,140,139 | |
| | 3,000,000 | | | Energy Transfer Partners LP,
4.05%, 03/15/25 | | | 2,963,256 | |
| | 5,310,000 | | | Enterprise Products Operating LLC,
1.65%, 05/07/18 | | | 5,307,770 | |
| | 1,000,000 | | | Enterprise Products Operating LLC,
3.95%, 02/15/27 | | | 1,039,028 | |
| Old Westbury Funds, Inc. | |
| Fixed Income Fund | |
| Portfolio of Investments - (Continued) | October 31, 2016 |
| | |
| Principal | | | | | | |
| Amount | | | | | Value | |
| Energy (continued) | | | | |
| $ | 2,605,000 | | | Kinder Morgan Energy Partners LP,
5.95%, 02/15/18 | | $ | 2,738,808 | |
| | 1,000,000 | | | Schlumberger Investment SA,
1.25%, 08/01/17(b) | | | 999,910 | |
| | 6,000,000 | | | Shell International Finance BV,
1.25%, 11/10/17 | | | 6,008,760 | |
| | 3,750,000 | | | Sunoco Logistics Partners Operations LP,
3.90%, 07/15/26 | | | 3,799,016 | |
| | 2,120,000 | | | Tennessee Gas Pipeline Co. LLC,
7.50%, 04/01/17 | | | 2,169,207 | |
| | 1,000,000 | | | TransCanada Pipelines Ltd.,
1.88%, 01/12/18 | | | 1,004,118 | |
| | | | | | | | 35,889,271 | |
| Health Care — 4.3% | | | | |
| | 6,000,000 | | | AbbVie, Inc.,
1.75%, 11/06/17 | | | 6,021,420 | |
| | 4,390,000 | | | Aetna, Inc.,
1.90%, 06/07/19 | | | 4,425,186 | |
| | 4,000,000 | | | Amgen, Inc.,
2.20%, 05/22/19 | | | 4,060,188 | |
| | 2,000,000 | | | Johnson & Johnson,
1.13%, 11/21/17 | | | 2,003,560 | |
| | 2,255,000 | | | McKesson Corp.,
2.28%, 03/15/19 | | | 2,286,020 | |
| | 5,955,000 | | | Shire Acquisitions Investments Ireland DAC,
1.90%, 09/23/19 | | | 5,943,834 | |
| | 5,000,000 | | | Takeda Pharmaceutical Co. Ltd.,
1.63%, 03/17/17(b) | | | 5,007,980 | |
| | 3,950,000 | | | UnitedHealth Group, Inc.,
1.40%, 12/15/17 | | | 3,957,150 | |
| | | | | | | | 33,705,338 | |
| Industrials — 3.1% | | | | |
| | 6,115,000 | | | Caterpillar Financial Services Corp.,
1.35%, 05/18/19 | | | 6,095,071 | |
| | 5,400,000 | | | Eaton Corp.,
5.60%, 05/15/18 | | | 5,734,098 | |
| | 1,525,000 | | | Ecolab, Inc.,
2.00%, 01/14/19 | | | 1,542,533 | |
| | 116,386 | | | Federal Express Corp. 2012 Pass Through Trust,
2.63%, 01/15/18(b) | | | 116,612 | |
| | 1,700,000 | | | Honeywell International Inc,
1.40%, 10/30/19 | | | 1,697,996 | |
| | 1,000,000 | | | International Paper Co.,
3.00%, 02/15/27 | | | 986,351 | |
| | 2,000,000 | | | Penske Truck Leasing Co. LP / PTL Finance Corp.,
3.40%, 11/15/26(b) | | | 1,997,762 | |
| Principal | | | | | | |
| Amount | | | | | Value | |
| Industrials (continued) | | | | |
| $ | 6,460,000 | | | Precision Castparts Corp.,
1.25%, 01/15/18 | | $ | 6,463,320 | |
| | | | | | | | 24,633,743 | |
| Information Technology — 3.0% | | | | |
| | 6,500,000 | | | Apple, Inc.,
1.13%, 05/03/18(c) | | | 6,514,846 | |
| | 2,000,000 | | | Broadridge Financial Solutions Inc.,
3.40%, 06/27/26 | | | 2,029,798 | |
| | 2,000,000 | | | Cisco Systems, Inc.,
1.60%, 02/28/19 | | | 2,013,186 | |
| | 2,020,000 | | | Cisco Systems, Inc.,
1.40%, 09/20/19 | | | 2,021,024 | |
| | 3,000,000 | | | Diamond 1 Finance Corp. / Diamond 2 Finance Corp.,
3.48%, 06/01/19(b) | | | 3,077,997 | |
| | 3,000,000 | | | Microsoft Corp.,
1.30%, 11/03/18 | | | 3,011,307 | |
| | 2,750,000 | | | Oracle Corp.,
5.75%, 04/15/18 | | | 2,930,499 | |
| | 2,190,000 | | | Oracle Corp.,
2.25%, 10/08/19 | | | 2,238,789 | |
| | | | | | | | 23,837,446 | |
| Insurance — 1.4% | | | | |
| | 3,040,000 | | | Berkshire Hathaway, Inc.,
3.13%, 03/15/26 | | | 3,154,939 | |
| | 5,000,000 | | | New York Life Global Funding,
1.65%, 05/15/17(b) | | | 5,018,290 | |
| | 3,000,000 | | | New York Life Global Funding,
1.45%, 12/15/17(b) | | | 3,009,363 | |
| | | | | | | | 11,182,592 | |
| Materials — 0.3% |
| | 2,270,000 | | | BHP Billiton Finance USA Ltd.,
2.05%, 09/30/18 | | | 2,297,074 | |
| Real Estate — 0.4% | | | | |
| | 3,000,000 | | | American Tower Corp. REIT,,
2.80%, 06/01/20 | | | 3,063,363 | |
| Telecommunication Services — 0.5% | | | | |
| | 4,000,000 | | | Verizon Communications Inc,
1.38%, 08/15/19 | | | 3,965,992 | |
| Utilities — 1.6% | | | | |
| | 3,000,000 | | | Berkshire Hathaway Energy Co,
2.00%, 11/15/18 | | | 3,028,011 | |
| | 3,690,000 | | | Duke Energy Corp.,
1.63%, 08/15/17 | | | 3,700,188 | |
| | 3,000,000 | | | National Rural Utilities Cooperative Finance Corp. MTN,
3.25%, 11/01/25 | | | 3,167,415 | |
| Old Westbury Funds, Inc. | |
| Fixed Income Fund | |
| Portfolio of Investments - (Continued) | October 31, 2016 |
| | |
| Principal | | | | | | |
| Amount | | | | | Value | |
| Utilities (continued) | | | | |
| $ | 2,310,000 | | | NextEra Energy Capital Holdings, Inc.,
2.30%, 04/01/19 | | $ | 2,342,188 | |
| | | | | | | | 12,237,802 | |
Total Corporate Bonds
(Cost $271,488,018) | | | 272,400,863 | |
| ASSET-BACKED SECURITIES — 7.4% | | | | |
| CAYMAN ISLANDS — 4.2% | | | | |
| | 8,500,000 | | | Anchorage Capital CLO Ltd., Series 2013-1A, Class 1A, 2.07%, 07/13/25(b)(c) | | | 8,458,775 | |
| | 4,000,000 | | | Cavalry CLO II Ltd., 2.23%, 01/17/24(b)(c) | | | 3,995,354 | |
| | 3,555,000 | | | CIFC Funding Ltd., Series 2013-IA, Class A1, 2.03%, 04/16/25(b)(c) | | | 3,544,039 | |
| | 6,000,000 | | | OCP CLO Ltd., Series 2013-4A, Class A1A, 2.28%, 10/24/25(b)(c) | | | 5,988,360 | |
| | 5,000,000 | | | Saratoga Investment Corp. CLO Ltd. Series 2013-1A, Class A1, 2.18%, 10/20/23(b)(c) | | | 4,994,200 | |
| | 2,000,000 | | | Securitized Term Auto Receivables Trust 2016-1,
1.52%, 03/25/20(b) | | | 2,000,000 | |
| | 4,000,000 | | | York CLO 1 Ltd. Series 2014-1A, Class A,
2.43%, 01/22/27(b)(c) | | | 3,994,995 | |
| | | | | | | | 32,975,723 | |
| UNITED STATES — 3.2% | | | | |
| | 998,963 | | | Ally Auto Receivables Trust Series 2014-1, Class A3, 0.97%, 10/15/18 | | | 999,231 | |
| | 836,124 | | | AmeriCredit Automobile Receivables Trust Series 2014-2, Class A3, 0.94%, 02/08/19 | | | 835,803 | |
| | 2,975,000 | | | Chase Issuance Trust, Series 2012-A4, Class A4,
1.58%, 08/16/21 | | | 2,991,216 | |
| | 2,975,000 | | | CNH Equipment Trust 2015-A, Class A4, 1.85%, 04/15/21 | | | 3,005,381 | |
| | 2,000,000 | | | Enterprise Fleet Financing LLC Series 2016-2, Class A2, 1.74%, 02/22/22(b) | | | 2,003,448 | |
| | 1,033,687 | | | Fifth Third Auto Trust Series 2014-2, Class A3,
0.89%, 11/15/18 | | | 1,033,580 | |
| | 4,000,000 | | | Ford Credit Floorplan Master Owner Trust Series 2015-1, Class A1, 1.42%, 01/15/20 | | | 4,008,681 | |
| Principal | | | | | | |
| Amount | | | | | Value | |
| UNITED STATES (continued) | | | | |
| $ | 5,000,000 | | | Hertz Vehicle Financing LLC Series 2016-3,
2.27%, 07/25/20(b) | | $ | 4,994,388 | |
| | 979,183 | | | Mercedes-Benz Auto Receivables Trust Series 2014-1, Class A3, 0.87%, 10/15/18 | | | 979,496 | |
| | 2,000,000 | | | Toyota Auto Receivables Owner Trust Series 2014-B, Class A4, 1.31%, 09/16/19 | | | 2,004,700 | |
| | 1,000,000 | | | World Omni Automobile Lease Securitization Trust Series 2016-A, Class A3, 1.45%, 08/15/19 | | | 1,002,666 | |
| | 1,502,214 | | | World Omni Automobile Lease Securitization Trust, Series 2014-A, Class A3, 1.16%, 09/15/17 | | | 1,502,442 | |
| | | | | | | | 25,361,032 | |
Total Asset-Backed Securities (Cost $58,279,210) | | | 58,336,755 | |
| MUNICIPAL BONDS — 1.7% | | | | |
| California — 0.5% | | | | |
| | 3,850,000 | | | Southern California Public Power Authority Refunding Revenue Bonds, Series B (AGM)
6.93%, 05/15/17 | | | 3,970,659 | |
| Georgia — 0.4% | | | | |
| | 3,085,000 | | | State of Georgia Taxable School Improvement GO, Series C-3
2.59%, 10/01/17 | | | 3,124,426 | |
| Illinois — 0.3% | | | | |
| | 2,600,000 | | | State of Illinois Public Improvements Revenue Bonds
1.56%, 06/15/17 | | | 2,610,582 | |
| New Jersey — 0.2% | | | | |
| | 1,500,000 | | | County of Monmouth Build America Bonds GO
3.75%, 11/01/16 | | | 1,500,000 | |
| New York — 0.3% | | | | |
| | 2,520,000 | | | Metropolitan Transportation Authority Highway Toll Build America Revenue Bonds
4.28%, 11/15/16 | | | 2,522,873 | |
Total Municipal Bonds
(Cost $13,660,068) | | | 13,728,540 | |
| Old Westbury Funds, Inc. | |
| Fixed Income Fund | |
| Portfolio of Investments - (Continued) | October 31, 2016 |
| | |
| Principal | | | | | | |
| Amount | | | | | Value | |
| COLLATERALIZED MORTGAGE OBLIGATIONS — 0.2% | | | | |
| $ | 1,748,009 | | | JPMorgan Tax Exempt Pass Through Trust, Series 2012-AMT1, Class A, 3.00%, 01/27/38(b) | | $ | 1,753,358 | |
Total Collateralized Mortgage Obligations
(Cost $1,786,443) | | | 1,753,358 | |
| U.S. GOVERNMENT AGENCIES — 6.5% | | | | |
| Fannie Mae — 2.5% | | | | |
| | 6,720,000 | | | 0.88%, 12/20/17 | | | 6,729,710 | |
| | 7,802,000 | | | 1.88%, 02/19/19 | | | 7,957,931 | |
| | 5,000,000 | | | 1.00%, 02/26/19 | | | 5,001,945 | |
| | | | | | | | 19,689,586 | |
| Federal Home Loan Bank — 2.9% | | | | |
| | 5,200,000 | | | 0.63%, 10/26/17 | | | 5,195,752 | |
| | 5,000,000 | | | 0.88%, 10/01/18 | | | 4,997,650 | |
| | 12,485,000 | | | 1.13%, 06/21/19 | | | 12,517,299 | |
| | | | | | | | 22,710,701 | |
| Overseas Private Investment Corp. — 0.6% | | | | |
| | 4,113,331 | | | 5.14%, 12/15/23 | | | 4,467,756 | |
| | | | | | | | 4,467,756 | |
| Private Export Funding Corp. — 0.1% | | | | |
| | 500,000 | | | 2.25%, 12/15/17 | | | 507,548 | |
| | | | | | | | 507,548 | |
| Small Business Administration — 0.3% | | | | |
| | 438,209 | | | 4.73%, 02/10/19 | | | 460,927 | |
| | 419,986 | | | 4.11%, 03/10/20 | | | 439,905 | |
| | 1,513,650 | | | 4.08%, 03/10/21 | | | 1,601,520 | |
| | | | | | | | 2,502,352 | |
| Tennessee Valley Authority — 0.1% | | | | |
| | 725,000 | | | 6.25%, 12/15/17 | | | 768,855 | |
| | | | | | | | 768,855 | |
Total U.S. Government Agencies
(Cost $50,165,019) | | | 50,646,798 | |
| U.S. GOVERNMENT SECURITIES — 48.8% | | | | |
| U.S. Treasury Notes — 48.8% | | | | |
| | 5,115,000 | | | 0.88%, 11/30/17 | | | 5,122,192 | |
| | 17,480,000 | | | 0.75%, 04/30/18 | | | 17,467,030 | |
| | 16,182,000 | | | 0.88%, 05/31/18 | | | 16,197,810 | |
| | 500,000 | | | 0.75%, 09/30/18 | | | 498,925 | |
| | 4,300,000 | | | 0.88%, 10/15/18 | | | 4,299,665 | |
| | 8,686,000 | | | 0.88%, 04/15/19 | | | 8,672,085 | |
| | 22,616,000 | | | 0.88%, 05/15/19 | | | 22,575,359 | |
| Principal | | | | | | |
| Amount | | | | | Value | |
| U.S. Treasury Notes (continued) | | | | |
| $ | 21,660,000 | | | 0.88%, 09/15/19 | | $ | 21,584,688 | |
| | 52,901,000 | | | 1.88%, 11/30/21 | | | 54,196,651 | |
| | 26,540,000 | | | 0.63%, 01/15/24(d) | | | 28,618,582 | |
| | 78,115,000 | | | 2.38%, 08/15/24 | | | 81,993,254 | |
| | 85,590,000 | | | 2.00%, 02/15/25 | | | 87,228,278 | |
| | 33,495,000 | | | 2.25%, 11/15/25 | | | 34,737,966 | |
Total U.S. Government Securities
(Cost $378,984,620) | | | 383,192,485 | |
| GOVERNMENT BONDS — 0.2% | | | | |
| SOUTH KOREA — 0.2% | | | | |
| | 1,400,000 | | | Export-Import Bank of Korea,
4.00%, 01/11/17 | | | 1,407,000 | |
Total Government Bonds
(Cost $1,399,886) | | | 1,407,000 | |
| | | | | |
| Shares | | | | | | Value | |
| INVESTMENT COMPANY — 0.6% | | | | |
| | 4,537,200 | | | SEI Daily Income Trust Government II Fund, Class A, 0.01%(e) | | | 4,537,200 | |
Total Investment Company
(Cost $4,537,200) | | | 4,537,200 | |
TOTAL INVESTMENTS — 100.1%
(Cost $780,300,464)(a) | | $ | 786,002,999 | |
| LIABILITIES IN EXCESS OF OTHER ASSETS — (0.1)% | | | (586,456 | ) |
| NET ASSETS — 100.0% | | $ | 785,416,543 | |
| Old Westbury Funds, Inc. | |
| Fixed Income Fund | |
| Portfolio of Investments - (Continued) | October 31, 2016 |
| | |
| (a) | Cost for federal income tax purposes is $782,936,133 and net unrealized appreciation of investments is as follows: |
| | |
| Unrealized appreciation | | $ | 7,585,132 | |
| Unrealized depreciation | | | (4,518,266 | ) |
| Net unrealized appreciation | | $ | 3,066,866 | |
| (b) | Security exempt from registration under Rule 144A of the Securities Act of 1933, as amended. The security may be resold in transactions exempt from registration normally to qualified institutional buyers. The security has been determined to be liquid in accordance with procedures adopted by the Fund’s Board of Directors. The aggregate value of these securities is $74,018,506 which is 9.42% of net assets. |
| (c) | Variable rate security. Rate shown is the rate as of October 31, 2016. |
| (d) | Inflation protected security. Principal amount reflects original security face amount. |
| (e) | Rate shown represents current yield at October 31, 2016. |
AGM — Assured Guaranty Municipal Corp.
CLO — Collateralized Loan Obligation
GO — General Obligations
MTN — Medium Term Note
REIT — Real Estate Investment Trust
| Old Westbury Funds, Inc. | |
| Municipal Bond Fund | |
| Portfolio of Investments | October 31, 2016 |
| | |
| Principal | | | | | | |
| Amount | | | | | Value | |
| MUNICIPAL BONDS — 97.6% | | | | |
| Alabama — 1.0% | | | | |
| $ | 5,000,000 | | | Alabama Federal Aid Highway Finance Authority Revenue Bonds,
5.00%, 09/01/20 | | $ | 5,678,500 | |
| | 3,030,000 | | | City of Huntsville School Capital Improvements Warrants Refunding GO,
5.00%, 09/01/22 | | | 3,642,121 | |
| | 2,990,000 | | | City of Huntsville School Capital Improvements Warrants Refunding GO,
5.00%, 09/01/24 | | | 3,722,640 | |
| | 3,660,000 | | | City of Huntsville School Capital Improvements Warrants Refunding GO,
5.00%, 09/01/26 | | | 4,532,581 | |
| | 1,500,000 | | | City of Huntsville Warrants Refunding GO, Series A,
5.00%, 08/01/26 | | | 1,854,045 | |
| | | | | | | | 19,429,887 | |
| Arizona — 0.8% | | | | |
| | 875,000 | | | Arizona Department of Transportation State Highway Fund Refunding Revenue Bonds,
5.00%, 07/01/25 | | | 1,095,841 | |
| | 2,000,000 | | | Arizona Department of Transportation State Highway Fund Refunding Revenue Bonds, Sub-series A,
5.00%, 07/01/21 | | | 2,341,500 | |
| | 2,500,000 | | | Arizona School Facilities Board Advance Refunding COP, Series A,
5.00%, 09/01/23 | | | 3,045,850 | |
| | 1,000,000 | | | Arizona State Board of Regents Advance Refunding COP, Series A,
5.00%, 06/01/22 | | | 1,190,140 | |
| | 1,715,000 | | | Arizona State Board of Regents Advance Refunding COP, Series A,
5.00%, 06/01/24 | | | 2,110,290 | |
| | 350,000 | | | Arizona State Board of Regents Revenue Bonds, Series 2008-C, OID,
5.88%, 07/01/24 | | | 378,763 | |
| | 2,010,000 | | | Arizona State Board of Regents Revenue Bonds, Series C,
5.00%, 07/01/17 | | | 2,066,622 | |
| | 500,000 | | | City of Tempe Advance Refunding Revenue,
5.00%, 07/01/26 | | | 633,179 | |
| Principal | | | | | | |
| Amount | | | | | Value | |
| Arizona (continued) | | | | |
| $ | 200,000 | | | Maricopa County Community College District GO, Series C,
5.00%, 07/01/20 | | $ | 221,287 | |
| | 2,875,000 | | | Phoenix Civic Improvement Corp. Refunding Revenue Bonds,
5.00%, 07/01/20 | | | 3,271,779 | |
| | | | | | | | 16,355,251 | |
| Arkansas — 0.1% | | | | |
| | 2,160,000 | | | Pulaski County Special School District School Improvements GO, (State Aid Withholding),
3.00%, 02/01/17 | | | 2,171,297 | |
| California — 6.0% | | | | |
| | 6,250,000 | | | California State Current Refunding GO - Group C,
5.00%, 08/01/27 | | | 7,641,813 | |
| | 2,000,000 | | | California State Public Works Board Correctional Facilities Improvements Revenue Bonds, Series D,
5.00%, 09/01/24 | | | 2,460,360 | |
| | 10,000,000 | | | City of Los Angeles Cash Flow Management GO Notes, Series A,
2.00%, 03/30/17 | | | 10,060,600 | |
| | 1,150,000 | | | City of Roseville Water Utility Advance Revenue Refunding COP,
5.00%, 12/01/22 | | | 1,398,619 | |
| | 22,000,000 | | | County of Los Angeles Public Improvements GO,
3.00%, 06/30/17 | | | 22,351,340 | |
| | 9,250,000 | | | Los Angeles Community College District Refunding GO, Series A,
5.00%, 08/01/23 | | | 11,385,825 | |
| | 995,000 | | | Los Angeles Department of Water Utility Improvements Refunding Revenue Bonds, Series A,
5.00%, 07/01/26 | | | 1,264,705 | |
| | 1,035,000 | | | Los Rios Community College District 2002 Election GO, Series D,
5.25%, 08/01/23 | | | 1,155,567 | |
| | 2,500,000 | | | Sacramento Municipal Utility District Refunding Revenue - Series D,
5.00%, 08/15/27 | | | 3,249,525 | |
| | 1,000,000 | | | San Diego Regional Building Authority Advance Refunding Revenue Bonds, Series A,
5.00%, 10/15/24 | | | 1,257,960 | |
| Old Westbury Funds, Inc. | |
| Municipal Bond Fund | |
| Portfolio of Investments - (Continued) | October 31, 2016 |
| | |
| Principal | | | | | | |
| Amount | | | | | Value | |
| California (continued) | | | | |
| $ | 1,300,000 | | | San Mateo County Transportation Authority Advance Refunding Revenue Bonds, Series A,
5.00%, 06/01/23 | | $ | 1,600,443 | |
| | 10,000,000 | | | State of California Refunding GO,
5.00%, 09/01/22 | | | 12,026,400 | |
| | 750,000 | | | State of California Refunding GO,
5.00%, 03/01/23 | | | 909,398 | |
| | 8,000,000 | | | State of California Refunding GO,
5.00%, 03/01/24 | | | 9,854,880 | |
| | 8,000,000 | | | State of California Refunding GO,
5.00%, 10/01/25 | | | 9,966,480 | |
| | 18,720,000 | | | State of California Refunding GO,
5.00%, 09/01/27 | | | 23,460,840 | |
| | 3,000,000 | | | University of California Refunding Revenue Bonds, Series I,
5.00%, 05/15/23 | | | 3,680,430 | |
| | | | | | | | 123,725,185 | |
| Colorado — 1.4% | | | | |
| | 500,000 | | | Adams & Weld Counties School District No 27J Brighton Co. Refunding GO, Series A, (State Aid Withholding),
5.00%, 12/01/19 | | | 559,009 | |
| | 3,935,000 | | | Colorado Higher Education Refunding COP, Series A,
5.00%, 11/01/24 | | | 4,878,613 | |
| | 2,000,000 | | | Denver City & County School District No 1 Refunding GO (State Aid Intercept Program), 5.00%, 12/01/24 | | | 2,499,580 | |
| | 9,490,000 | | | Denver City & County School District No 1 Refunding GO (State Aid Intercept Program),
5.00%, 12/01/25 | | | 11,986,439 | |
| | 100,000 | | | Denver City & County School District No 1 Refunding GO, Series C (State Aid Withholding),
5.00%, 12/01/23 | | | 123,417 | |
| | 2,000,000 | | | El Paso County School District No 38 Lewis-Palmer Refunding GO (State Aid Withholding),
4.00%, 12/01/17 | | | 2,068,320 | |
| | 1,180,000 | | | Jefferson County School District GO, Series R-1, (State Aid Withholding),
5.00%, 12/15/22 | | | 1,425,865 | |
| Principal | | | | | | |
| Amount | | | | | Value | |
| Colorado (continued) | | | |
| $ | 1,600,000 | | | University of Colorado Refunding Revenue Bonds, Series A (NATL-RE),
4.50%, 06/01/21 | | $ | 1,633,296 | |
| | 2,280,000 | | | Western State Colorado University Refunding Revenue Bonds (State Aid Intercept Program),
5.00%, 05/15/26 | | | 2,828,522 | |
| | | | | | | | 28,003,061 | |
| Connecticut — 3.8% | | |
| | 7,000,000 | | | State of Connecticut Advance Refunding GO, Series B,
5.00%, 05/15/24 | | | 8,412,950 | |
| | 8,000,000 | | | State of Connecticut Advance Refunding GO, Series B,
5.00%, 05/15/25 | | | 9,699,360 | |
| | 6,000,000 | | | State of Connecticut Public Improvements GO, Series F,
5.00%, 11/15/26 | | | 7,314,540 | |
| | 3,100,000 | | | State of Connecticut Special Tax Revenue Public Improvements Revenue Bonds, Series A,
5.00%, 08/01/22 | | | 3,685,559 | |
| | 1,250,000 | | | State of Connecticut Special Tax Revenue Transportation Infrastructure Advance Refunding Revenue Bonds,
5.00%, 08/01/22 | | | 1,486,113 | |
| | 8,000,000 | | | State of Connecticut Special Tax Transportation Infrastructure Refunding Revenue Bonds,
5.00%, 09/01/25 | | | 9,821,840 | |
| | 2,000,000 | | | State of Connecticut Transportation Infrastructure Refunding Revenue Bonds,
5.00%, 09/01/24 | | | 2,447,300 | |
| | 8,000,000 | | | State of Connecticut Transportation Infrastructure Revenue Bonds, Series A,
5.00%, 10/01/19 | | | 8,881,680 | |
| | 5,000,000 | | | State of Connecticut Transportation Infrastructure Revenue Bonds, Series A,
5.00%, 09/01/27 | | | 6,077,700 | |
| | 10,000,000 | | | State of Connecticut Water & Sewer System Improvements GO, Series E,
5.00%, 10/15/23 | | | 11,973,300 | |
| | 3,900,000 | | | Town of Ledyard Cash Flow Management GO Notes,
2.00%, 05/24/17 | | | 3,928,782 | |
| Old Westbury Funds, Inc. | |
| Municipal Bond Fund | |
| Portfolio of Investments - (Continued) | October 31, 2016 |
| | |
Principal
Amount | | | | | Value | |
| Connecticut (continued) | | | |
| $ | 5,000,000 | | | Town of Redding School Improvement Refunding GO,
2.00%, 03/15/17 | | $ | 5,022,650 | |
| | | | | | | | 78,751,774 | |
| District Of Columbia — 1.1% | | | |
| | 5,000,000 | | | District of Columbia Public Improvement Revenue Bonds, Series C,
5.00%, 12/01/19 | | | 5,598,200 | |
| | 1,000,000 | | | District of Columbia Refunding Revenue Bonds, Series A,
5.00%, 12/01/20 | | | 1,153,360 | |
| | 15,000,000 | | | Washington Metropolitan Area Transit Authority Revenue, Series A,
4.00%, 07/01/17 | | | 15,322,800 | |
| | | | | | | | 22,074,360 | |
| Florida — 1.8% | | | |
| | 4,790,000 | | | County of Miami-Dade Public Improvements GO,
5.00%, 07/01/24 | | | 5,913,111 | |
| | 1,000,000 | | | County of Sarasota Refunding Revenue Bonds,
5.00%, 10/01/24 | | | 1,238,280 | |
| | 5,000,000 | | | Florida State Board of Education Lottery Refunding Revenue Bonds, Series A,
5.00%, 07/01/17 | | | 5,141,200 | |
| | 8,575,000 | | | Florida State Board of Education Lottery Revenue Bonds, Series A, OID,
5.50%, 07/01/27 | | | 9,305,247 | |
| | 500,000 | | | Florida Water Pollution Control Financing Corp. Water Polution Control Revenue Bonds, Series A,
4.00%, 01/15/17 | | | 503,379 | |
| | 1,065,000 | | | Hillsborough County Community Investment Tax Revenue Bonds, (AMBAC),
5.00%, 11/01/16 | | | 1,065,000 | |
| | 1,200,000 | | | Lee County School Board Refunding COP,
5.00%, 08/01/25 | | | 1,463,796 | |
| | 4,000,000 | | | Miami-Dade County Refunding GO, Series B,
5.00%, 07/01/24 | | | 4,937,880 | |
| | 2,000,000 | | | Miami-Dade County Water & Sewer Refunding Revenue Bonds, (XLCA),
5.00%, 10/01/19 | | | 2,077,020 | |
Principal
Amount | | | | | Value | |
| Florida (continued) | | | |
| $ | 2,000,000 | | | Orlando Utilities Commission Refunding Revenue Bonds, Series A,
5.00%, 10/01/20 | | $ | 2,290,340 | |
| | 500,000 | | | Palm Beach County Revenue Bonds, Series 2, OID,
5.25%, 11/01/25 | | | 542,895 | |
| | 1,975,000 | | | State of Florida Refunding GO, Series A,
4.00%, 01/01/17 | | | 1,985,902 | |
| | | | | | | | 36,464,050 | |
| Georgia — 4.2% | | | | |
| | 2,000,000 | | | Cherokee County Board of Education Advance Refunding GO,
5.00%, 08/01/23 | | | 2,447,380 | |
| | 750,000 | | | Cherokee County Board of Education Advance Refunding GO, (State Aid Withholding),
5.00%, 02/01/23 | | | 907,890 | |
| | 2,710,000 | | | Cobb County Development Authority Advance Refunding Revenue Bonds,
5.00%, 07/15/23 | | | 3,228,586 | |
| | 2,100,000 | | | Cobb County Development Authority Advance Refunding Revenue Bonds,
5.00%, 07/15/24 | | | 2,532,495 | |
| | 15,000,000 | | | County of Fulton Cash Flow Management GO Notes,
1.00%, 12/30/16 | | | 15,009,300 | |
| | 375,000 | | | Fulton County Development Authority Georgia Tech Facilities Refunding Revenue Bonds, Series A,
5.00%, 05/01/23 | | | 452,579 | |
| | 1,000,000 | | | Fulton County Water & Sewer Refunding Revenue Bonds,
5.00%, 01/01/18 | | | 1,048,190 | |
| | 1,040,000 | | | Georgia State Road & Tollway Authority Federal Highway Grant Anticipation Refunding Revenue Bonds, Series A,
5.00%, 06/01/17 | | | 1,065,428 | |
| | 1,250,000 | | | Georgia State Road & Tollway Authority Federal Highway Grant Anticipation Revenue Bonds, Series A,
5.00%, 06/01/18 | | | 1,328,275 | |
| | 5,000,000 | | | Georgia State Road & Tollway Authority Highway Improvement Revenue Bonds, Series A,
5.00%, 06/01/20 | | | 5,483,500 | |
| Old Westbury Funds, Inc. | |
| Municipal Bond Fund | |
| Portfolio of Investments - (Continued) | October 31, 2016 |
| | |
| Principal | | | | | | |
| Amount | | | | | Value | |
| Georgia (continued) | | | |
| $ | 2,025,000 | | | Georgia State Road & Tollway Authority Refunding Revenue Bonds, Series B, (State GTY),
5.00%, 10/01/19 | | $ | 2,258,665 | |
| | 630,000 | | | Gwinnett County Development Authority Refunding COP, Gwinnett Development Schools Project, (NATL-RE),
5.25%, 01/01/17 | | | 634,593 | |
| | 3,000,000 | | | Private Colleges & Universities Authority Refunding Revenue Bonds, Series B-2,
0.52%, 09/01/35(b) | | | 3,000,000 | |
| | 1,095,000 | | | South Regional Joint Development Authority Advance Refunding Revenue Bonds,
5.00%, 08/01/25 | | | 1,328,104 | |
| | 1,555,000 | | | South Regional Joint Development Authority Advance Refunding Revenue Bonds,
5.00%, 08/01/26 | | | 1,903,320 | |
| | 1,100,000 | | | South Regional Joint Development Authority Advance Refunding Revenue Bonds,
5.00%, 08/01/26 | | | 1,345,333 | |
| | 1,925,000 | | | State of Georgia Refunding GO, Series E-2,
4.00%, 09/01/18 | | | 2,035,091 | |
| | 2,860,000 | | | State of Georgia Refunding GO, Series E-2,
4.00%, 09/01/19 | | | 3,102,785 | |
| | 1,500,000 | | | State of Georgia School Improvement GO, Series B,
5.00%, 01/01/18 | | | 1,573,185 | |
| | 28,020,000 | | | State of Georgia University and College Improvements GO, Series A-1,
5.00%, 02/01/24 | | | 34,901,992 | |
| | | | | | | | 85,586,691 | |
| Hawaii — 0.4% | | | |
| | 1,000,000 | | | State of Hawaii Department of Budget & Finance Queens Health System Refunding Revenue Bonds, Series A,
5.00%, 07/01/21 | | | 1,161,380 | |
| | 400,000 | | | State of Hawaii Refunding GO, Series DY,
5.00%, 02/01/18 | | | 420,551 | |
| | 5,000,000 | | | State of Hawaii Refunding GO, Series EP,
5.00%, 08/01/25 | | | 6,229,400 | |
| | | | | | | | 7,811,331 | |
Principal
Amount | | | | | Value | |
| Idaho — 0.6% | | | |
| $ | 1,000,000 | | | Canyon County School District No 131 Nampa Advance Refunding GO, (School Board GTY),
5.00%, 09/15/25 | | $ | 1,257,410 | |
| | 1,500,000 | | | Idaho Board Bank Authority Refunding Revenue Bonds, Series D,
5.00%, 09/15/23 | | | 1,802,160 | |
| | 10,000,000 | | | State of Idaho Cash Flow Management GO Notes,
2.00%, 06/30/17 | | | 10,088,300 | |
| | | | | | | | 13,147,870 | |
| Illinois — 1.1% | | | |
| | 1,250,000 | | | Chicago Park District Alternative Revenue Source Refunding GO,
4.00%, 01/01/17 | | | 1,255,538 | |
| | 900,000 | | | Chicago Transit Authority Federal Transit Revenue Bonds, (AMBAC),
5.00%, 06/01/21 | | | 903,033 | |
| | 1,345,000 | | | City of Champaign Parking Facilities Improvements GO, Series 2008,
5.00%, 12/15/17 | | | 1,351,886 | |
| | 2,215,000 | | | Cook County Community College District No 508 University & College Improvements GO,
5.00%, 12/01/21 | | | 2,513,671 | |
| | 2,575,000 | | | Cook County Community College District No. 524 Moraine Valley GO, Series B, (NATL-RE),
5.00%, 12/01/25 | | | 2,685,699 | |
| | 3,000,000 | | | Illinois State Toll Highway Authority Refunding Revenue Bonds, Series B,
5.00%, 12/01/17 | | | 3,131,280 | |
| | 3,250,000 | | | Metropolitan Water Reclamation District of Greater Chicago Current Refunding GO, Series A,
5.00%, 12/01/24 | | | 3,976,603 | |
| | 2,000,000 | | | Metropolitan Water Reclamation District of Greater Chicago Refunding GO, Series D,
5.00%, 12/01/22 | | | 2,377,000 | |
| | 3,500,000 | | | State of Illinois Public Improvement Refunding Revenue Bonds,
5.00%, 06/15/18 | | | 3,716,930 | |
| Old Westbury Funds, Inc. | |
| Municipal Bond Fund | |
| Portfolio of Investments - (Continued) | October 31, 2016 |
| | |
| Principal | | | | | | |
| Amount | | | | | Value | |
| Illinois (continued) | | | |
| $ | 780,000 | | | University of Illinois College Improvement Refunding Revenue Bonds, Series A,
5.00%, 04/01/21 | | $ | 889,645 | |
| | | | | | | | 22,801,285 | |
| Indiana — 1.9% | | | |
| | 650,000 | | | Avon Community School Building Corp., First Mortgage Refunding and Improvement Revenue Bonds, (AMBAC, State Aid Withholding),
5.00%, 01/15/17 | | | 655,688 | |
| | 500,000 | | | Center Grove School Building Corp. First Mortgage Refunding Revenue Bonds, Series A (State Aid Intercept Program),
5.00%, 07/15/20 | | | 564,675 | |
| | 650,000 | | | Decatur Township Marion County Multi-School Building Corp., First Mortgage Revenue Bonds, Series B, (AGM, State Aid Withholding),
5.00%, 07/15/18 | | | 655,636 | |
| | 1,330,000 | | | GCS School Building Corp. One, First Mortgage Refunding Revenue Bonds (State Aid Intercept Program),
5.00%, 01/15/22 | | | 1,573,696 | |
| | 250,000 | | | GCS School Building Corp. One, First Mortgage Refunding Revenue Bonds (State Aid Intercept Program),
5.00%, 07/15/22 | | | 299,439 | |
| | 8,835,000 | | | Indiana Finance Authority Refunding Revenue Bonds, Series C,
5.00%, 06/01/27 | | | 11,224,691 | |
| | 5,000,000 | | | Indiana Finance Authority Southern Industrial Gas & Electric Refunding Revenue Bonds, Series E,
1.95%, 05/01/37(b) | | | 5,034,250 | |
| | 15,000,000 | | | Indiana Health & Educational Facilities Financing Authority Refunding Revenue Notes,
5.00%, 11/15/39(c) | | | 15,022,050 | |
| | 1,160,000 | | | Indianapolis Local Public Improvements Bond Bank Revenue Bonds, Series B-1,
5.00%, 01/15/17 | | | 1,170,080 | |
| | 500,000 | | | Ivy Tech Community College University & College Improvements Revenue Bonds, Series R-1,
5.00%, 07/01/19 | | | 549,195 | |
Principal
Amount | | | | | Value | |
| Indiana (continued) | | | | |
| $ | 570,000 | | | Portage Township Multi-School Building Corp., First Mortgage Refunding Revenue Bonds, (NATL-RE, School Board Resolution Funding),
5.00%, 07/15/17 | | $ | 587,163 | |
| | 1,000,000 | | | Warsaw Multi-School Building Corp. Revenue Bonds, Series B (State Aid Withholding),
5.75%, 07/15/26 | | | 1,055,760 | |
| | | | | | | | 38,392,323 | |
| Iowa — 0.2% | | | |
| | 1,800,000 | | | Iowa Finance Authority Water Utilities Improvements Revenue Bonds,
5.00%, 08/01/20 | | | 2,054,664 | |
| | 1,500,000 | | | State of Iowa Special Obligation Revenue Bonds,
5.00%, 06/15/26 | | | 1,890,375 | |
| | | | | | | | 3,945,039 | |
| Kansas — 0.2% | | | |
| | 1,260,000 | | | Sedgwick County Public Building Commission Technical Education Complex Refunding Revenue Bonds, Series 2,
5.00%, 08/01/23 | | | 1,536,431 | |
| | 2,170,000 | | | Topeka Public Building Commission KBI Forensic Laboratory Project Revenue Bonds,
5.00%, 12/01/17 | | | 2,265,675 | |
| | | | | | | | 3,802,106 | |
| Kentucky — 0.5% | | | | |
| | 3,500,000 | | | Kentucky Asset Liability Commission Federal Highway Trust First Series Revenue Bonds,
5.00%, 09/01/17 | | | 3,618,335 | |
| | 5,000,000 | | | Kentucky Turnpike Authority Advance Refunding Revenue Bonds, Series A,
5.00%, 07/01/24 | | | 6,084,200 | |
| | | | | | | | 9,702,535 | |
| Louisiana — 0.1% | | | | |
| | 375,000 | | | Consolidated Government of The City of Baton Rouge & Parish of East Baton Rouge Advance Refunding Revenue Bonds, Series A-1,
5.00%, 08/01/26 | | | 472,631 | |
| Old Westbury Funds, Inc. | |
| Municipal Bond Fund | |
| Portfolio of Investments - (Continued) | October 31, 2016 |
| | |
Principal
Amount | | | | | Value | |
| Louisiana (continued) | | | |
| $ | 2,000,000 | | | State of Louisiana Interstate 49 South Project Revenue Bonds,
5.00%, 09/01/22 | | $ | 2,347,700 | |
| | | | | | | | 2,820,331 | |
| Maine — 0.2% | | | | |
| | 2,250,000 | | | Maine Governmental Facilities Authority Refunding Revenue Bonds, Series A,
5.00%, 10/01/19 | | | 2,489,085 | |
| | 670,000 | | | Maine Health & Higher Educational Facilities Authority Refunding Revenue Bonds, Series A,
5.00%, 07/01/17 | | | 688,418 | |
| | 30,000 | | | Maine Health & Higher Educational Facilities Authority Refunding Revenue Bonds, Series A,
5.00%, 07/01/17(c) | | | 30,835 | |
| | 165,000 | | | Maine Health & Higher Educational Facilities Authority Refunding Revenue Bonds, Series A,
5.00%, 07/01/21 | | | 191,385 | |
| | 5,000 | | | Maine Health & Higher Educational Facilities Authority Refunding Revenue Bonds, Series A,
5.00%, 07/01/21(c) | | | 5,846 | |
| | | | | | | | 3,405,569 | |
| Maryland — 1.2% | | | | |
| | 1,200,000 | | | County of Baltimore Refunding GO, (Special Assessment), 5.00%, 02/01/29 | | | 1,504,740 | |
| | 4,110,000 | | | County of Prince George’s Public School Improvements GO, Series A,
5.00%, 07/01/24 | | | 5,143,953 | |
| | 9,355,000 | | | County of Prince George’s Public School Improvements GO, Series A,
5.00%, 07/01/25 | | | 11,874,395 | |
| | 1,000,000 | | | Maryland State Department of Transportation Highway Improvement Revenue Bonds,
5.00%, 10/01/20 | | | 1,146,410 | |
| | 1,300,000 | | | State of Maryland Public Improvements GO, Series A,
5.00%, 08/01/17 | | | 1,341,613 | |
| | 1,000,000 | | | State of Maryland Public Improvements GO, Series A,
5.00%, 08/01/17 | | | 1,032,010 | |
Principal
Amount | | | | | Value | |
| Maryland (continued) | | | |
| $ | 2,000,000 | | | State of Maryland School Improvements GO, Series B,
5.00%, 08/01/17 | | $ | 2,064,020 | |
| | | | | | | | 24,107,141 | |
| Massachusetts — 9.3% | | | |
| | 7,900,000 | | | Cape Cod Regional Transit Authority Cash Flow Management Revenue Notes,
2.00%, 07/28/17 | | | 7,968,493 | |
| | 3,607,450 | | | City of Lawrence Cash Flow Management GO Notes, (State Aid Withholding),
2.00%, 03/01/17 | | | 3,622,493 | |
| | 10,000,000 | | | City of Lawrence Cash Flow Management GO Notes, Series A, (State Aid Withholding),
2.00%, 09/01/17 | | | 10,099,100 | |
| | 15,818,882 | | | City of New Bedford Refunding GO Notes,
2.00%, 05/03/17 | | | 15,913,004 | |
| | 7,000,000 | | | Commonwealth of Massachusetts Advance Refunding GO, Series A,
5.00%, 07/01/25 | | | 8,808,030 | |
| | 5,705,000 | | | Commonwealth of Massachusetts Advance Refunding GO, Series B,
5.00%, 07/01/27 | | | 7,340,738 | |
| | 4,450,000 | | | Commonwealth of Massachusetts Highway Improvements Revenue Bonds, Series B,
4.00%, 06/15/17 | | | 4,540,736 | |
| | 4,000,000 | | | Commonwealth of Massachusetts Highway Improvements Revenue Bonds, Series B,
5.00%, 06/15/22 | | | 4,806,280 | |
| | 9,000,000 | | | Commonwealth of Massachusetts Public Improvements GO, Series A,
5.00%, 05/01/19 | | | 9,889,380 | |
| | 9,650,000 | | | Commonwealth of Massachusetts Public Improvements GO, Series C,
5.00%, 07/01/22 | | | 11,574,982 | |
| | 3,275,000 | | | Commonwealth of Massachusetts Refunding GO, Series C,
0.62%, 01/01/21(b) | | | 3,275,000 | |
| | 2,000,000 | | | Commonwealth of Massachusetts Refunding GO, Series C (AMBAC),
5.50%, 12/01/24 | | | 2,578,300 | |
| Old Westbury Funds, Inc. | |
| Municipal Bond Fund | |
| Portfolio of Investments - (Continued) | October 31, 2016 |
| | |
| Principal | | | | | | |
| Amount | | | | | Value | |
| Massachusetts (continued) | | | | |
| $ | 7,470,000 | | | Commonwealth of Massachusetts Transportation Fund Advance Refunding Revenue Bonds, Series A,
5.00%, 06/01/27 | | $ | 9,451,567 | |
| | 7,500,000 | | | Greater Attleboro-Taunton Regional Transit Authority Cash Flow Management Revenue Notes,
2.00%, 08/25/17 | | | 7,563,000 | |
| | 5,300,000 | | | Lowell Regional Transit Authority Cash Flow Management Revenue Notes,
2.00%, 08/11/17 | | | 5,342,771 | |
| | 3,000,000 | | | Massachusetts Bay Transportation Authority Refunding Revenue Bonds, Series A-2,
0.64%, 07/01/26(b) | | | 3,000,000 | |
| | 7,780,000 | | | Massachusetts State Water Pollution Abatement Trust Refunding Revenue Bonds, Sub-Series 16-B,
5.00%, 08/01/20 | | | 8,899,153 | |
| | 500,000 | | | Massachusetts Water Resources Authority Refunding Revenue Bonds, Series A,
5.00%, 08/01/22 | | | 601,149 | |
| | 5,000,000 | | | Merrimack Valley Regional Transit Authority Cash Flow Management Revenue Notes,
2.00%, 06/30/17 | | | 5,037,450 | |
| | 3,000,000 | | | Metrowest Regional Transit Authority Cash Flow Management Revenue Notes,
2.00%, 09/22/17 | | | 3,030,210 | |
| | 19,000,000 | | | Montachusett Regional Transit Authority Cash Flow Management Revenue Notes,
2.00%, 08/04/17 | | | 19,153,900 | |
| | 4,000,000 | | | Southeastern Regional Transit Authority Cash Flow Management Revenue Notes,
2.00%, 08/25/17 | | | 4,034,160 | |
| | 6,000,000 | | | Town of Arlington Cash Flow Management GO Notes, Series A,
2.00%, 11/10/16 | | | 6,001,980 | |
| | 3,685,000 | | | Town of Canton Public Improvements GO,
2.00%, 03/24/17 | | | 3,704,309 | |
| | 4,780,000 | | | Town of Easton Cash Flow Management Refunding GO Notes,
2.00%, 08/18/17 | | | 4,822,255 | |
Principal
Amount | | | | | Value | |
| Massachusetts (continued) | | | |
| $ | 10,379,952 | | | Town of Marblehead Refunding GO Notes,
2.00%, 08/04/17 | | $ | 10,474,306 | |
| | 1,430,000 | | | Town of Northborough Cash Flow Management GO Notes,
2.00%, 06/16/17 | | | 1,440,525 | |
| | 7,500,000 | | | Worcester Regional Transit Authority Cash Flow Management Revenue Notes,
2.00%, 06/30/17 | | | 7,557,150 | |
| | | | | | | | 190,530,421 | |
| Michigan — 0.8% | | | |
| | 200,000 | | | Caledonia Community Schools Refunding GO, (Q-SBLF),
5.00%, 05/01/23 | | | 238,655 | |
| | 635,000 | | | Dexter Community Schools Refunding GO (Q-SBLF),
4.00%, 05/01/18 | | | 663,867 | |
| | 1,225,000 | | | Grand Valley State University & College Advance Refunding Revenue Bonds, Series A,
5.00%, 12/01/25 | | | 1,497,930 | |
| | 1,000,000 | | | Grand Valley State University & College Improvements Revenue Bonds, Series A,
5.00%, 12/01/23 | | | 1,200,710 | |
| | 400,000 | | | Hudsonville Public Schools Improvements GO, (Q-SBLF),
5.00%, 05/01/18 | | | 423,983 | |
| | 250,000 | | | Hudsonville Public Schools Improvements GO, (Q-SBLF),
5.00%, 05/01/19 | | | 273,083 | |
| | 1,295,000 | | | Lake Shore Public Schools Refunding GO, (Q-SBLF),
3.00%, 11/01/16 | | | 1,295,000 | |
| | 1,375,000 | | | Northville Public Schools Refunding GO, (Q-SBLF),
5.00%, 05/01/18 | | | 1,453,636 | |
| | 5,000,000 | | | State of Michigan Trunk Line Refunding Revenue Bonds,
5.00%, 11/15/16 | | | 5,007,300 | |
| | 4,530,000 | | | University of Michigan Refunding Revenue Bonds, Series C,
4.00%, 04/01/19 | | | 4,857,428 | |
| | | | | | | | 16,911,592 | |
| Minnesota — 1.4% | | | |
| | 1,515,000 | | | Cambridge Independent School District No 911 School Building Refunding GO, Series D, (School District Credit Program),
5.00%, 02/01/24 | | | 1,862,496 | |
| Old Westbury Funds, Inc. | |
| Municipal Bond Fund | |
| Portfolio of Investments - (Continued) | October 31, 2016 |
| | |
Principal
Amount | | | | | Value | |
| Minnesota (continued) | | | | |
| $ | 3,875,000 | | | County of Hennepin Public Improvements GO, Series C,
0.60%, 12/01/33(b) | | $ | 3,875,000 | |
| | 910,000 | | | Rockford Independent School District No. 883 Refunding GO (School District Credit Program),
5.00%, 02/01/17 | | | 919,391 | |
| | 2,200,000 | | | Sartell-St Stephen Independent School District No 748 GO (School District Credit Program), Series A,
5.00%, 02/01/25 | | | 2,742,828 | |
| | 5,425,000 | | | St. Paul Port Authority Anderson Office Building Refunding Revenue Bonds, Series 3,
5.00%, 12/01/19 | | | 6,059,996 | |
| | 750,000 | | | St. Paul Port Authority Anderson Office Building Refunding Revenue Bonds, Series 3,
5.00%, 12/01/21 | | | 885,518 | |
| | 1,000,000 | | | State of Minnesota Public Improvements COP,
5.00%, 06/01/23 | | | 1,209,380 | |
| | 1,395,000 | | | State of Minnesota Public Improvements COP,
5.00%, 06/01/24 | | | 1,713,200 | |
| | 2,740,000 | | | State of Minnesota Public Improvements COP,
5.00%, 06/01/25 | | | 3,330,333 | |
| | 2,910,000 | | | State of Minnesota Public Improvements COP,
5.00%, 06/01/26 | | | 3,516,415 | |
| | 1,000,000 | | | State of Minnesota Refunding Revenue Bonds, Series B,
5.00%, 03/01/21 | | | 1,161,150 | |
| | 1,000,000 | | | Waconia Independent School District No 110 Refunding GO, Series A, (School District Credit Program),
5.00%, 02/01/24 | | | 1,229,370 | |
| | | | | | | | 28,505,077 | |
| Mississippi — 0.2% | | | |
| | 650,000 | | | Delta State University Educational Building Corp., Facilities Refunding Revenue,
5.00%, 12/01/23 | | | 789,081 | |
| | 1,810,000 | | | Mississippi Development Bank Department of Corrections Refunding Revenue Bonds, Series D,
5.00%, 08/01/18 | | | 1,935,524 | |
Principal
Amount | | | | | Value | |
| Mississippi (continued) | | | |
| $ | 570,000 | | | Mississippi Development Bank DeSoto County Highway Project Advance Refunding Revenue Bonds, Series S, (State Aid Intercept Program),
5.00%, 01/01/23 | | $ | 681,783 | |
| | 310,000 | | | Mississippi State University Educational Building Corp. Campus Improvements Project Revenue Bonds,
5.00%, 11/01/22 | | | 369,821 | |
| | 830,000 | | | University of Mississippi Educational Building Corp. Facilities Financing Project Advance Refunding Revenue Bonds, Series A,
5.00%, 10/01/25 | | | 1,033,068 | |
| | | | | | | | 4,809,277 | |
| Missouri — 0.9% | | | |
| | 570,000 | | | County of Jackson Refunding Revenue Bonds,
4.00%, 12/01/21 | | | 640,007 | |
| | 300,000 | | | County of Jackson Refunding Revenue Bonds,
4.00%, 12/01/22 | | | 340,421 | |
| | 2,300,000 | | | County of Jackson Sports Complex Project Refunding Revenue Bonds, (State Appropriation, City Appropriation),
5.00%, 12/01/26 | | | 2,793,166 | |
| | 4,000,000 | | | Hazelwood School District Refunding GO, (State Aid Direct Deposit),
5.00%, 03/01/25 | | | 4,952,360 | |
| | 915,000 | | | Missouri State Environmental Improvement & Energy Resources Authority Advance Refunding Revenue Bonds, Series B,
5.00%, 01/01/25 | | | 1,149,716 | |
| | 2,225,000 | | | Missouri State Health & Educational Facilities Authority Columbia Arena Project Refunding Revenue Bonds,
5.00%, 10/01/19 | | | 2,472,242 | |
| | 2,000,000 | | | Missouri State Health & Educational Facilities Authority Columbia Arena Project Refunding Revenue Bonds,
5.00%, 10/01/21 | | | 2,344,700 | |
| Old Westbury Funds, Inc. | |
| Municipal Bond Fund | |
| Portfolio of Investments - (Continued) | October 31, 2016 |
| | |
| Principal | | | | | |
| Amount | | | | | Value | |
| Missouri (continued) | | | | |
| $ | 300,000 | | | North Kansas City School District No 74 School Improvements Refunding GO, (State Aid Direct Deposit),
4.00%, 03/01/17 | | $ | 303,293 | |
| | 850,000 | | | North Kansas City School District No 74 School Improvements Refunding GO, (State Aid Direct Deposit),
5.00%, 03/01/24 | | | 1,053,040 | |
| | 1,800,000 | | | North Kansas City School District No 74 School Improvements Refunding GO, (State Aid Direct Deposit),
5.00%, 03/01/25 | | | 2,195,100 | |
| | | | | | | | 18,244,045 | |
| Montana — 0.1% | | | | |
| | 2,625,000 | | | Montana Department of Transportation Advance Refunding Revenue Bonds,
4.00%, 06/01/17 | | | 2,672,381 | |
| | | | | | | | | |
| Nevada — 0.1% | | | | |
| | 2,605,000 | | | Clark County Water Reclamation District GO, Series A,
5.25%, 07/01/20 | | | 2,892,071 | |
| New Hampshire — 0.4% | | | | |
| | 6,375,000 | | | County of Merrimack Cash Flow Management GO,
1.75%, 12/29/16 | | | 6,384,435 | |
| | 2,250,000 | | | State of New Hampshire Highway Improvements Revenue Bonds,
5.00%, 09/01/19 | | | 2,477,070 | |
| | | | | | | | 8,861,505 | |
| New Jersey — 2.7% | | | | |
| | 240,000 | | | Bergen County Improvement Authority Refunding Revenue Bonds, Series A (County GTY),
4.00%, 12/15/16 | | | 240,947 | |
| | 200,000 | | | Bergen County Improvement Authority Refunding Revenue Bonds, Series A (County GTY),
4.00%, 12/15/17 | | | 207,143 | |
| | 1,150,000 | | | Burlington County Bridge Commission Governmental Leasing Refunding Revenue Notes, Series A,
2.00%, 04/26/17 | | | 1,157,372 | |
| | 2,000,000 | | | Garden State Preservation Trust Refunding Revenue Bonds, Series A,
5.00%, 11/01/17 | | | 2,080,180 | |
| Principal | | | | | |
| Amount | | | | | Value | |
| New Jersey (continued) | | | | |
| $ | 200,000 | | | Monmouth County Improvement Authority Refunding Revenue Bonds (County GTY, Municipal Government GTY),
5.00%, 12/01/22 | | $ | 242,195 | |
| | 795,000 | | | New Jersey Economic Development Authority School Facilities Construction Refunding Revenue Bonds,
5.00%, 12/15/16(c) | | | 799,023 | |
| | 560,000 | | | New Jersey Economic Development Authority School Facilities Construction Refunding Revenue Bonds,
5.00%, 12/15/16 | | | 562,743 | |
| | 1,090,000 | | | New Jersey Economic Development Authority School Facilities Construction Refunding Revenue Bonds,
5.00%, 03/01/18(c) | | | 1,148,991 | |
| | 410,000 | | | New Jersey Economic Development Authority School Facilities Construction Refunding Revenue Bonds,
5.00%, 03/01/18 | | | 427,405 | |
| | 11,690,000 | | | New Jersey Economic Development Authority School Facility Construction Refunding Revenue Bonds, Series EE,
5.00%, 09/01/17 | | | 12,090,149 | |
| | 40,000 | | | New Jersey Sports & Exposition Authority Refunding Revenue Bonds, Series B (State Appropriation),
5.00%, 09/01/18(c) | | | 42,936 | |
| | 1,300,000 | | | New Jersey State Turnpike Authority Refunding Revenue Bonds, Series B,
5.00%, 01/01/20 | | | 1,452,763 | |
| | 9,220,000 | | | New Jersey State Turnpike Authority Refunding Revenue Bonds, Series C,
5.00%, 01/01/25 | | | 11,347,607 | |
| | 2,000,000 | | | New Jersey Transportation Trust Fund Authority Refunding Revenue Bonds, Series A,
5.25%, 12/15/21 | | | 2,260,520 | |
| | 1,500,000 | | | New Jersey Transportation Trust Fund Authority Transit Improvements Refunding Revenue Bonds, Series A,
5.25%, 12/15/22 | | | 1,715,205 | |
| Old Westbury Funds, Inc. | |
| Municipal Bond Fund | |
| Portfolio of Investments - (Continued) | October 31, 2016 |
| | |
| Principal | | | | | |
| Amount | | | | | Value | |
| New Jersey (continued) | | | |
| $ | 1,575,000 | | | New Jersey Transportation Trust Fund Authority Transit Improvements Revenue Bonds,
5.00%, 06/15/24 | | $ | 1,784,570 | |
| | 500,000 | | | New Jersey Transportation Trust Fund Authority Transit Improvements Revenue Bonds, Series B,
5.00%, 06/15/19 | | | 536,719 | |
| | 825,000 | | | New Jersey Transportation Trust Fund Authority Transportation Systems Refunding Revenue Bonds, Series B, (NATL-RE),
5.50%, 12/15/16 | | | 829,521 | |
| | 4,320,000 | | | Township of Mendham GO Refunding Notes,
2.00%, 05/18/17 | | | 4,348,555 | |
| | 11,814,691 | | | Township of Wayne GO Refunding Notes,
2.00%, 07/14/17 | | | 11,918,424 | |
| | | | | | | | 55,192,968 | |
| New Mexico — 0.5% | | | |
| | 250,000 | | | Gadsden Independent School District No 16 Refunding GO, Series B (State Aid Withholding),
4.00%, 08/15/17 | | | 255,973 | |
| | 6,210,000 | | | State of New Mexico, University and College Improvements GO,
5.00%, 03/01/17 | | | 6,298,679 | |
| | 3,000,000 | | | University of New Mexico/The Refunding Revenue Bonds, Series C,
0.65%, 06/01/30(b) | | | 3,000,000 | |
| | | | | | | | 9,554,652 | |
| New York — 21.5% | | | |
| | 5,500,000 | | | City of New York Advance Refunding GO, Series 2015-A,
5.00%, 08/01/24 | | | 6,771,270 | |
| | 10,000,000 | | | City of New York Advance Refunding GO, Series A,
5.00%, 08/01/25 | | | 12,327,700 | |
| | 5,000,000 | | | City of New York Public Improvements GO, Series C, Sub-Series C-A,
5.00%, 08/01/17(d) | | | 5,160,050 | |
| | 3,300,000 | | | City of New York Public Improvements GO, Sub-Series B-3 (TD Bank N.A.),
0.52%, 09/01/27(b) | | | 3,300,000 | |
| Principal | | | | | |
| Amount | | | | | Value | |
| New York (continued) | | | |
| $ | 3,330,000 | | | City of New York Public Improvements GO, Sub-Series D-1,
5.00%, 08/01/22 | | $ | 3,977,219 | |
| | 8,240,000 | | | City of New York Refunding Bonds GO, Series C, 5.00%, 08/01/25 | | | 10,258,800 | |
| | 5,000,000 | | | City of New York Refunding GO, Series B,
5.00%, 08/01/17 | | | 5,160,050 | |
| | 1,855,000 | | | City of New York Refunding GO, Series C,
5.00%, 08/01/20 | | | 2,111,584 | |
| | 650,000 | | | City of New York Refunding GO, Series C,
5.00%, 08/01/22 | | | 776,333 | |
| | 8,170,000 | | | City of New York Refunding GO, Series D,
5.00%, 08/01/22 | | | 9,757,921 | |
| | 4,000,000 | | | City of New York Refunding GO, Series E,
5.00%, 08/01/17 | | | 4,128,040 | |
| | 10,000,000 | | | City of New York Refunding GO, Series G,
5.00%, 08/01/17 | | | 10,320,100 | |
| | 2,500,000 | | | City of New York Refunding GO, Series G,
5.00%, 08/01/21 | | | 2,919,200 | |
| | 18,500,000 | | | City of New York Refunding GO, Series G,
5.00%, 08/01/22 | | | 22,095,660 | |
| | 4,500,000 | | | County of Rockland Cash Flow Management Refunding GO,
2.00%, 03/16/17 | | | 4,519,170 | |
| | 505,000 | | | County of Rockland Refunding GO (BAM), 2.00%, 02/15/17 | | | 506,404 | |
| | 2,799,000 | | | County of Tompkins Public Improvements GO Notes,
2.00%, 07/07/17 | | | 2,822,875 | |
| | 2,000,000 | | | Erie County Industrial Development Agency Refunding Revenue Bonds, Series B, (State Aid Withholding),
5.00%, 05/01/18 | | | 2,123,620 | |
| | 5,000,000 | | | Erie County Industrial Development Agency Refunding Revenue Bonds, Series B, (State Aid Withholding),
5.00%, 05/01/23 | | | 5,807,500 | |
| | 5,000,000 | | | Metropolitan Transportation Authority Advance Refunding Revenue Bonds, Series C-2B,
5.00%, 11/15/34(b) | | | 5,585,800 | |
| Old Westbury Funds, Inc. | |
| Municipal Bond Fund | |
| Portfolio of Investments - (Continued) | October 31, 2016 |
| | |
| Principal | | | | | |
| Amount | | | | | Value | |
| New York (continued) | | |
| $ | 650,000 | | | Metropolitan Transportation Authority Cash Flow Management Revenue Notes, Series A-2C,
2.00%, 02/01/17 | | $ | 652,061 | |
| | 1,925,000 | | | Metropolitan Transportation Authority Refunding Revenue Bonds, Series F,
5.00%, 11/15/21 | | | 2,255,542 | |
| | 8,500,000 | | | Metropolitan Transportation Authority Refunding Revenue, Series B, OID, (BHAC, AGM),
4.50%, 11/15/36(c) | | | 8,511,135 | |
| | 1,910,000 | | | Metropolitan Transportation Authority Transit Improvements Revenue Bonds, Series C,
5.00%, 11/15/21 | | | 2,237,966 | |
| | 9,000,000 | | | Middle Country Central School District At Centereach Cash Flow Management GO Notes, (State Aid Withholding),
2.00%, 06/27/17 | | | 9,066,690 | |
| | 2,500,000 | | | New York City Municipal Water Finance Authority Fiscal 2009 Revenue Bonds, Series A,
5.50%, 06/15/21 | | | 2,688,750 | |
| | 1,250,000 | | | New York City Municipal Water Finance Authority Fiscal 2014 Refunding Revenue Bonds, Series CC-2,
5.00%, 06/15/18 | | | 1,256,450 | |
| | 2,500,000 | | | New York City Transitional Finance Authority Building Aid Revenue Public Improvements Revenue Bonds, Series S-1, (State Aid Withholding),
5.00%, 07/15/24 | | | 3,084,875 | |
| | 11,030,000 | | | New York City Transitional Finance Authority Building Aid Revenue Public Improvements Revenue Bonds, Series S-1, (State Aid Withholding),
5.00%, 07/15/25 | | | 13,779,779 | |
| | 1,350,000 | | | New York City Transitional Finance Authority Future Tax Secured Advanced Refunding Revenue Bonds, Series C,
5.00%, 11/01/23 | | | 1,657,598 | |
| | 1,605,000 | | | New York City Transitional Finance Authority Future Tax Secured Public Improvements Revenue Bonds,
5.00%, 05/01/22 | | | 1,764,858 | |
| Principal | | | | | |
| Amount | | | | | Value | |
| New York (continued) | | | |
| $ | 595,000 | | | New York City Transitional Finance Authority Future Tax Secured Public Improvements Revenue Bonds,
5.00%, 05/01/22(c) | | $ | 653,643 | |
| | 1,230,000 | | | New York City Transitional Finance Authority Future Tax Secured Refunding Revenue Bonds, Series B,
5.00%, 11/01/17(c) | | | 1,282,447 | |
| | 770,000 | | | New York City Transitional Finance Authority Future Tax Secured Refunding Revenue Bonds, Series B,
5.00%, 11/01/17 | | | 802,594 | |
| | 15,920,000 | | | New York City Transitional Finance Authority Future Tax Secured Refunding Revenue Bonds, Sub-Series B,
5.00%, 11/01/21 | | | 18,776,366 | |
| | 3,025,000 | | | New York City Transitional Finance Authority Future Tax Secured Refunding Revenue Bonds, Sub-Series G,
5.00%, 11/01/18 | | | 3,268,966 | |
| | 1,045,000 | | | New York City Transitional Finance Authority Future Tax Secured Refunding Revenue Bonds, Sub-Series G,
5.00%, 11/01/19 | | | 1,166,690 | |
| | 2,425,000 | | | New York City Transitional Finance Authority Future Tax Secured Refunding Revenue Bonds, Sub-Series G,
5.00%, 11/01/21 | | | 2,860,094 | |
| | 935,000 | | | New York City Transitional Finance Authority Future Tax Secured Refunding Revenue Bonds, Sub-Series H,
5.00%, 11/01/18 | | | 1,010,408 | |
| | 1,535,000 | | | New York City Transitional Finance Authority Future Tax Secured Refunding Revenue Bonds, Sub-Series H,
5.00%, 11/01/21 | | | 1,810,410 | |
| | 1,725,000 | | | New York City Transitional Finance Authority Future Tax Secured Refunding Revenue Notes,
5.00%, 02/01/18 | | | 1,814,510 | |
| | 225,000 | | | New York City Transitional Finance Authority Future Tax Secured Refunding Revenue Notes,
5.00%, 02/01/18(c) | | | 236,531 | |
| Old Westbury Funds, Inc. | |
| Municipal Bond Fund | |
| Portfolio of Investments - (Continued) | October 31, 2016 |
| | |
| Principal | | | | | |
| Amount | | | | | Value | |
| New York (continued) | | | |
| $ | 4,700,000 | | | New York City Transitional Finance Authority Future Tax Secured Revenue Bonds,
5.00%, 02/01/17 | | $ | 4,750,290 | |
| | 515,000 | | | New York City Transitional Finance Authority Future Tax Secured Revenue Bonds, Sub-Series, F-1,
5.00%, 02/01/19 | | | 560,722 | |
| | 600,000 | | | New York City Transitional Finance Authority Refunding Revenue Bonds, Sub-Series G, 5.00%, 11/01/20 | | | 689,675 | |
| | 1,235,000 | | | New York City Transitional Finance Authority School Improvement Revenue Bonds, Sub-Series S-1A, (State Aid Withholding),
5.00%, 07/15/21 | | | 1,443,270 | |
| | 4,875,000 | | | New York City Water & Sewer System Refunding Revenue Bonds, Series F-2,
0.65%, 06/15/33(b) | | | 4,875,000 | |
| | 3,000,000 | | | New York Local Government Assistance Corp. Refunding Revenue Bonds, Sub-Lien Series
B-3V,
0.65%, 04/01/24(b) | | | 3,000,000 | |
| | 700,000 | | | New York Local Government Assistance Corp. Refunding Revenue Bonds, Sub-Series
A-5-6, 5.00%, 04/01/17(d) | | | 712,537 | |
| | 5,100,000 | | | New York Municipal Bond Bank Agency Refunding Revenue Bonds, (State Aid Withholding),
4.00%, 12/01/17 | | | 5,277,582 | |
| | 10,000,000 | | | New York Municipal Bond Bank Agency Refunding Revenue Bonds, (State Aid Withholding),
5.00%, 12/01/21 | | | 11,780,000 | |
| | 9,100,000 | | | New York State Dormitory Authority Advance Refunding Revenue Bonds, Series A,
5.00%, 03/15/23 | | | 11,088,623 | |
| | 7,790,000 | | | New York State Dormitory Authority Advance Refunding Revenue Bonds, Series E,
5.00%, 03/15/22 | | | 9,243,770 | |
| | 14,000,000 | | | New York State Dormitory Authority Advance Refunding Revenue Bonds, Series E,
5.00%, 03/15/24 | | | 17,207,680 | |
| Principal | | | | |
| Amount | | | | Value |
| New York (continued) | | | |
| $ | 900,000 | | | New York State Dormitory Authority Economic Development & Housing Revenue Bonds, Series A, 4.00%, 12/15/16 | | $ | 903,663 | |
| | 15,000 | | | New York State Dormitory Authority Mental Health Services Facility Refunding Revenue Bonds, (State Appropriation),
5.00%, 08/15/18(c) | | | 16,085 | |
| | 1,770,000 | | | New York State Dormitory Authority Mental Health Services Facility Refunding Revenue Bonds, Series A, (State Appropriation),
4.50%, 08/15/17 | | | 1,822,427 | |
| | 1,000,000 | | | New York State Dormitory Authority NYU Hospital Center Advance Refunding Revenue,
5.00%, 07/01/25 | | | 1,239,260 | |
| | 2,110,000 | | | New York State Dormitory Authority Refunding Revenue Bonds,
5.00%, 08/15/18 | | | 2,264,621 | |
| | 15,000,000 | | | New York State Dormitory Authority Refunding Revenue Bonds, Series A,
5.00%, 12/15/20 | | | 17,295,600 | |
| | 4,160,000 | | | New York State Dormitory Authority Refunding Revenue Bonds, Series A,
5.00%, 02/15/26 | | | 5,099,786 | |
| | 765,000 | | | New York State Dormitory Authority Refunding Revenue Bonds, Series A (NATL-IBC),
5.88%, 05/15/17 | | | 786,206 | |
| | 4,500,000 | | | New York State Dormitory Authority Refunding Revenue Bonds, Series E,
5.00%, 02/15/23 | | | 5,437,935 | |
| | 1,045,000 | | | New York State Dormitory Authority School Improvement Revenue Bonds, Series A,
5.00%, 03/15/21 | | | 1,211,500 | |
| | 7,700,000 | | | New York State Dormitory Authority School Improvement Revenue Bonds, Series A,
5.00%, 03/15/25 | | | 9,476,236 | |
| | 2,750,000 | | | New York State Dormitory Authority School Improvement Revenue Bonds, Series A,
5.00%, 02/15/27 | | | 3,449,133 | |
| Old Westbury Funds, Inc. | |
| Municipal Bond Fund | |
| Portfolio of Investments - (Continued) | October 31, 2016 |
| | |
| Principal | | | | | | |
| Amount | | | | | Value | |
| New York (continued) | | | | |
| $ | 3,770,000 | | | New York State Dormitory Authority School Improvement Revenue Bonds, Series C,
5.00%, 03/15/17(c) | | $ | 3,829,378 | |
| | 230,000 | | | New York State Dormitory Authority School Improvement Revenue Bonds, Series C,
5.00%, 03/15/17 | | | 233,682 | |
| | 2,850,000 | | | New York State Dormitory Authority School Improvement Revenue Bonds, Series G,
5.00%, 03/15/17 | | | 2,895,401 | |
| | 3,750,000 | | | New York State Environmental Facilities Corp Water Utility Improvements Refunding Revenue,
5.00%, 06/15/25 | | | 4,744,800 | |
| | 3,800,000 | | | New York State Thruway Authority Highway & Bridge Trust Fund Highway Improvements Refunding Revenue Bonds, Series B,
5.00%, 04/01/20 | | | 4,094,500 | |
| | 3,200,000 | | | New York State Thruway Authority Highway & Bridge Trust Fund Highway Improvements Refunding Revenue Bonds, Series B,
5.00%, 04/01/20(c) | | | 3,447,392 | |
| | 2,510,000 | | | New York State Thruway Authority Highway & Bridge Trust Fund Highway Improvements Refunding Revenue Bonds, Series B,
5.00%, 04/01/21(c) | | | 2,704,048 | |
| | 2,490,000 | | | New York State Thruway Authority Highway & Bridge Trust Fund Highway Improvements Refunding Revenue Bonds, Series B,
5.00%, 04/01/21 | | | 2,682,502 | |
| | 1,420,000 | | | New York State Thruway Authority Highway Improvement Revenue Bonds, Series A,
5.00%, 03/15/17 | | | 1,442,621 | |
| | 1,430,000 | | | New York State Thruway Authority Highway Improvement Revenue Bonds, Series A,
5.00%, 03/15/20 | | | 1,611,782 | |
| Principal | | | | | | |
| Amount | | | | | Value | |
| New York (continued) | | | | |
| $ | 5,000,000 | | | New York State Thruway Authority Highway Improvement Revenue Bonds, Series A,
5.00%, 03/15/21 | | $ | 5,471,500 | |
| | 1,900,000 | | | New York State Thruway Authority Highway Improvement Revenue Bonds, Series B,
5.00%, 04/01/21 | | | 2,084,414 | |
| | 400,000 | | | New York State Thruway Authority Refunding Revenue Bonds, Series A,
5.00%, 03/15/17 | | | 406,371 | |
| | 8,000,000 | | | New York State Thruway Authority Refunding Revenue Bonds, Series A,
5.00%, 03/15/21 | | | 9,187,680 | |
| | 2,000,000 | | | New York State Urban Development Corp Advance Refunding Revenue Bonds, Series A,
5.00%, 03/15/24 | | | 2,458,240 | |
| | 6,720,000 | | | New York State Urban Development Corp Personal Income Tax Advance Refunding Revenue, Series A,
5.00%, 03/15/25 | | | 8,365,459 | |
| | 1,000,000 | | | New York State Urban Development Corp. Economic Improvements Revenue Bonds, Series A1,
4.00%, 12/15/16 | | | 1,004,070 | |
| | 4,705,000 | | | New York State Urban Development Corp. Public Improvement Revenue Bonds, Series A-1,
5.00%, 03/15/22 | | | 5,583,047 | |
| | 3,550,000 | | | Port Authority of New York & New Jersey Refunding Revenue Bonds, Series 189,
5.00%, 05/01/23 | | | 4,343,212 | |
| | 7,800,000 | | | Rockville Centre Union Free School District Cash Flow Management GO Notes (State Aid Withholding),
2.00%, 06/23/17 | | | 7,856,784 | |
| | 14,390,000 | | | Sales Tax Asset Receivable Corp. Fiscal 2015 Refunding Revenue Bonds, Series A,
5.00%, 10/15/26 | | | 17,931,379 | |
| | 4,015,000 | | | Town of North Hempstead Cash Flow Management Refunding GO, Series B,
2.00%, 04/04/17 | | | 4,038,729 | |
| Old Westbury Funds, Inc. | |
| Municipal Bond Fund | |
| Portfolio of Investments - (Continued) | October 31, 2016 |
| | |
| Principal | | | | | | |
| Amount | | | | | Value | |
| New York (continued) | | | | |
| $ | 4,700,000 | | | Triborough Bridge & Tunnel Authority Advance Refunding Revenue Bonds, Series A,
5.00%, 11/15/25 | | $ | 5,917,488 | |
| | 3,000,000 | | | Triborough Bridge & Tunnel Authority Refunding Revenue Bonds, Series B,
0.52%, 01/01/32(b)(d) | | | 3,000,000 | |
| | 5,390,000 | | | Triborough Bridge & Tunnel Authority Toll Road Refunding Revenue Bonds, Series B,
5.00%, 11/15/23 | | | 6,624,580 | |
| | 1,600,000 | | | Utility Debt Securitization Authority Restructuring Refunding Revenue Bonds,
5.00%, 12/15/24 | | | 1,945,936 | |
| | 1,000,000 | | | Utility Debt Securitization Authority Restructuring Refunding Revenue Bonds, Series TE,
5.00%, 12/15/18 | | | 1,005,340 | |
| | 6,500,000 | | | Wappingers Central School District GO Refunding Notes, Series A (State Aid Withholding),
1.50%, 12/15/16 | | | 6,506,240 | |
| | | | | | | | 442,115,835 | |
| North Carolina — 1.9% | | | | |
| | 680,000 | | | Appalachian State University Refunding Revenue Bonds,
5.00%, 05/01/20 | | | 766,673 | |
| | 905,000 | | | Buncombe County Refunding Revenue Bonds,
5.00%, 06/01/21 | | | 1,054,216 | |
| | 1,355,000 | | | Cabarrus County School Improvement COP,
5.00%, 01/01/21 | | | 1,472,099 | |
| | 1,005,000 | | | City of Charlotte Equipment Acquisition Refunding COP,
5.00%, 12/01/16 | | | 1,008,427 | |
| | 880,000 | | | City of Charlotte NC Storm Water Current Refunding Revenue,
5.00%, 12/01/22 | | | 1,066,806 | |
| | 3,000,000 | | | City of Charlotte Water & Sewer System Revenue Bonds, Series B,
0.58%, 07/01/36(b) | | | 3,000,000 | |
| | 3,015,000 | | | County of Mecklenburg Refunding GO, Series A,
5.00%, 12/01/22 | | | 3,670,763 | |
| | 3,325,000 | | | County of Wake Advance Refunding Revenue, Series A,
5.00%, 12/01/26 | | | 4,248,752 | |
| Principal | | | | | | |
| Amount | | | | | Value | |
| North Carolina (continued) | | | | |
| $ | 2,840,000 | | | County of Wake School Improvements GO, Series A,
5.00%, 04/01/17 | | $ | 2,890,864 | |
| | 615,000 | | | Dare County Refunding Revenue Bonds, Series D,
4.00%, 06/01/17 | | | 626,679 | |
| | 675,000 | | | Dare County Refunding Revenue Bonds, Series D,
4.00%, 06/01/18 | | | 708,035 | |
| | 675,000 | | | Dare County Refunding Revenue Bonds, Series D,
5.00%, 06/01/21 | | | 783,027 | |
| | 1,000,000 | | | Durham Capital Financing Corp Advance Refunding Revenue Bonds,
5.00%, 12/01/25 | | | 1,256,400 | |
| | 325,000 | | | North Carolina State University At Raleigh Refunding Revenue Bonds, Series A,
5.00%, 10/01/21 | | | 381,690 | |
| | 2,000,000 | | | Orange County Public Facilities Co. Refunding Revenue Bonds,
5.00%, 10/01/21 | | | 2,346,780 | |
| | 10,000,000 | | | State of North Carolina Refunding Revenue Bonds, Series B,
5.00%, 06/01/24 | | | 12,393,000 | |
| | 1,595,000 | | | Town of Cary Public Improvements GO,
5.00%, 03/01/17 | | | 1,617,872 | |
| | | | | | | | 39,292,083 | |
| Ohio — 2.6% | | | | |
| | 5,800,000 | | | City of Columbus Cash Flow Management GO Notes,
1.75%, 08/04/17 | | | 5,844,834 | |
| | 2,500,000 | | | City of Columbus GO, Series A,
5.00%, 02/15/22 | | | 2,982,050 | |
| | 3,500,000 | | | City of Columbus GO, Series A,
4.00%, 08/15/25 | | | 4,129,125 | |
| | 2,000,000 | | | City of Columbus Refunding GO, Series 5,
5.00%, 08/15/23 | | | 2,464,340 | |
| | 1,100,000 | | | County of Cuyahoga Refunding Revenue Bonds,
5.00%, 12/01/22 | | | 1,334,949 | |
| | 1,000,000 | | | County of Hamilton Sewer System Refunding Revenue Bonds, Series A,
5.00%, 12/01/26 | | | 1,228,590 | |
| | 1,665,000 | | | County of Hamilton Sewer System Refunding Revenue Bonds, Series A,
5.00%, 12/01/27 | | | 2,040,025 | |
| Old Westbury Funds, Inc. | |
| Municipal Bond Fund | |
| Portfolio of Investments - (Continued) | October 31, 2016 |
| | |
| Principal | | | | | | |
| Amount | | | | | Value | |
| Ohio (continued) | | | | |
| $ | 1,000,000 | | | Greater Cleveland Regional Transit Authority Capital Improvements Advance Refunding Revenue Bonds,
5.00%, 12/01/23 | | $ | 1,228,900 | |
| | 2,365,000 | | | Ohio State Building Authority Facilities Administration Building Project Refunding Revenue Bonds, Series B, (NATL-RE, FGIC),
5.00%, 10/01/18 | | | 2,547,838 | |
| | 5,000,000 | | | Ohio State Water Development Authority Refunding Revenue Bonds, Series B,
5.00%, 06/01/22 | | | 5,989,250 | |
| | 3,000,000 | | | Ohio Water Development Authority Revenue Bonds,
5.00%, 06/01/26 | | | 3,828,930 | |
| | 320,000 | | | RiverSouth Authority Area Redevelopment Refunding Revenue Bonds,
5.00%, 06/01/24 | | | 387,002 | |
| | 1,000,000 | | | State of Ohio Capital Facilities Lease Appropriation Refunding Revenue Bonds,
5.00%, 10/01/17 | | | 1,039,070 | |
| | 210,000 | | | State of Ohio Highway Improvements Revenue Bonds,
5.00%, 12/15/24 | | | 260,711 | |
| | 6,630,000 | | | State of Ohio Highway Improvements Revenue Bonds, Series 2016-1,
4.00%, 12/15/17 | | | 6,869,144 | |
| | 2,000,000 | | | State of Ohio Highway Improvements Revenue Bonds, Series 2016-1,
5.00%, 12/15/20 | | | 2,301,740 | |
| | 2,000,000 | | | State of Ohio Mental Health Facility Improvements Revenue,
5.00%, 06/01/25 | | | 2,485,000 | |
| | 2,465,000 | | | State of Ohio Public Improvements Revenue Bonds, Series A,
5.00%, 02/01/24 | | | 3,009,666 | |
| | 2,000,000 | | | University of Cincinnati Advance Refunding Revenue, Series A,
5.00%, 06/01/26 | | | 2,524,560 | |
| | 1,730,000 | | | University of Cincinnati College & University Refunding Revenue Bonds, Series A, (State Appropriation),
5.00%, 06/01/17 | | | 1,773,008 | |
| | | | | | | | 54,268,732 | |
| Principal | | | | | | |
| Amount | | | | | Value | |
| Oklahoma — 0.2% | | | | |
| $ | 1,795,000 | | | University of Oklahoma Refunding Revenue Bonds, Series A,
3.00%, 07/01/17 | | $ | 1,820,740 | |
| | 2,500,000 | | | University of Oklahoma Refunding Revenue Bonds, Series A,
5.00%, 07/01/25 | | | 3,091,400 | |
| | | | | | | | 4,912,140 | |
| Oregon — 0.6% | | | | |
| | 1,300,000 | | | City of Portland Water System Refunding Revenue Bonds, Series A,
5.00%, 05/01/17 | | | 1,327,872 | |
| | 400,000 | | | Clackamas County School District No 86 Canby Refunding Revenue Bonds GO, Series A, (School Board GTY),
3.00%, 06/15/17 | | | 405,523 | |
| | 815,000 | | | Lane County School District No 19 Springfield School Improvements GO, Series B, (AGM, School Board GTY),
5.00%, 06/15/17 | | | 835,750 | |
| | 5,500,000 | | | State of Oregon Cash Flow Management GO Notes, Series A,
2.00%, 06/30/17 | | | 5,548,950 | |
| | 1,755,000 | | | Washington & Multnomah Counties School District No 48J Beaverton Refunding GO, Series B, (School Board GTY),
4.00%, 06/15/19 | | | 1,890,153 | |
| | 2,200,000 | | | Yamhill Clackamas & Washington Counties School District No 29J Newberg Refunding GO (NATL-RE, School Board GTY),
5.50%, 06/15/17 | | | 2,262,766 | |
| | | | | | | | 12,271,014 | |
| Pennsylvania — 1.9% | | | | |
| | 20,065,000 | | | Commonwealth of Pennsylvania Public Improvements GO, Series 2,
5.00%, 09/15/17 | | | 20,803,593 | |
| | 10,000,000 | | | Commonwealth of Pennsylvania Public Improvements GO, Series 2,
5.00%, 09/15/20 | | | 11,334,100 | |
| | 1,000,000 | | | Lancaster County Hospital Authority Advance Refunding Revenue Bonds,
5.00%, 08/15/26 | | | 1,253,220 | |
| Old Westbury Funds, Inc. | |
| Municipal Bond Fund | |
| Portfolio of Investments - (Continued) | October 31, 2016 |
| | |
| Principal | | | | | | |
| Amount | | | | | Value | |
| Pennsylvania (continued) | | | | |
| $ | 3,000,000 | | | Pennsylvania State University Advance Refunding Revenue, Series B,
5.00%, 09/01/26 | | $ | 3,811,560 | |
| | 1,240,000 | | | Pennsylvania State University, University and College Improvements Revenue, Series A,
5.00%, 09/01/26 | | | 1,575,445 | |
| | | | | | | | 38,777,918 | |
| Rhode Island — 0.6% | | | | |
| | 6,950,000 | | | Rhode Island Commerce Corp Grant Anticipation Current Refunding Revenue,
5.00%, 06/15/23 | | | 8,336,108 | |
| | 3,000,000 | | | Rhode Island Convention Center Authority Refunding Revenue Bonds, Series A,
5.00%, 05/15/22 | | | 3,534,570 | |
| | 705,000 | | | Rhode Island Health & Educational Building Corp. Town of East Greenwich Revenue Bonds, Series A, (Municipal Government GTY),
4.00%, 05/15/18 | | | 737,987 | |
| | | | | | | | 12,608,665 | |
| South Carolina — 2.6% | | | | |
| | 1,865,000 | | | City of Charleston Waterworks & Sewer System Advance Refunding Revenue Bonds,
5.00%, 01/01/24 | | | 2,312,320 | |
| | 4,530,000 | | | County of Charleston Refunding GO, Series A,
5.00%, 11/01/21 | | | 5,364,471 | |
| | 880,000 | | | Lexington County School District No 2 Refunding GO (South Carolina School District),
4.00%, 03/01/17 | | | 889,627 | |
| | 2,090,000 | | | Lexington County School District No 2 Refunding GO (South Carolina School District),
5.00%, 03/01/18 | | | 2,204,532 | |
| | 1,635,000 | | | Lexington County School District No 2 Refunding GO (South Carolina School District),
5.00%, 03/01/20 | | | 1,839,915 | |
| | 4,060,000 | | | Lexington County School District No 2 School Improvements GO (South Carolina School District),
5.00%, 03/01/26 | | | 5,123,192 | |
| Principal | | | | | | |
| Amount | | | | | Value | |
| South Carolina (continued) | | | | |
| $ | 5,000,000 | | | Richland County School District No 1 School Improvements GO Notes (South Carolina School District),
2.00%, 03/01/17 | | $ | 5,021,050 | |
| | 10,000,000 | | | South Carolina Association of Governmental Organizations Cash Flow Management Certificate of Participation, (South Carolina School District),
2.00%, 04/14/17 | | | 10,057,500 | |
| | 16,420,000 | | | South Carolina Association of Governmental Organizations Cash Flow Management Certificate of Participation, (South Carolina School District) Series A,
3.00%, 03/01/17 | | | 16,543,807 | |
| | 330,000 | | | State of South Carolina University & College Improvements GO, Series B,
5.00%, 03/01/19 | | | 361,013 | |
| | 680,000 | | | State of South Carolina University & College Improvements GO, Series E (State Aid Withholding),
5.00%, 03/01/19 | | | 743,906 | |
| | 3,500,000 | | | Town of Lexington Waterworks & Sewer System Refunding Revenue Notes,
2.50%, 12/01/16 | | | 3,505,565 | |
| | | | | | | | 53,966,898 | |
| Tennessee — 0.4% | | | | |
| | 5,000,000 | | | Metropolitan Government of Nashville & Davidson County Advance Refunding GO,
5.00%, 01/01/25 | | | 6,247,950 | |
| | 900,000 | | | Tennessee State School Bond Authority Refunding Revenue Bonds (State Aid Intercept Program),
5.00%, 11/01/25 | | | 1,120,365 | |
| | | | | | | | 7,368,315 | |
| Texas — 14.3% | | | | |
| | 4,220,000 | | | Alamo Community College District Refunding GO,
4.00%, 02/15/17 | | | 4,261,483 | |
| | 3,630,000 | | | Alief Independent School District School Improvements Refunding GO, (PSF-GTD),
5.00%, 02/15/25 | | | 4,507,480 | |
| Old Westbury Funds, Inc. | |
| Municipal Bond Fund | |
| Portfolio of Investments - (Continued) | October 31, 2016 |
| | |
| Principal | | | | | | |
| Amount | | | | | Value | |
| Texas (continued) | | | | |
| $ | 860,000 | | | Alvin Independent School District Improvements Refunding GO, Series A, (PSF-GTD),
5.00%, 02/15/25 | | $ | 1,067,888 | |
| | 1,720,000 | | | Alvin Independent School District Improvements Refunding GO, Series A, (PSF-GTD),
5.00%, 02/15/26 | | | 2,156,811 | |
| | 1,100,000 | | | Amarillo College District Refunding GO,
4.00%, 02/15/20 | | | 1,196,624 | |
| | 485,000 | | | Aransas Pass Independent School District Improvements GO, (PSF-GTD),
5.00%, 02/15/23 | | | 586,414 | |
| | 4,340,000 | | | Austin Community College District Refunding GO,
5.00%, 08/01/27 | | | 5,409,072 | |
| | 1,000,000 | | | Austin Independent School District Refunding GO, Series B, (PSF-GTD),
5.00%, 08/01/21 | | | 1,170,690 | |
| | 400,000 | | | Beaumont Independent School District Improvements GO, (PSF-GTD),
4.00%, 02/15/18 | | | 415,991 | |
| | 5,310,000 | | | Beaumont Independent School District Refunding GO, (PSF-GTD),
5.00%, 02/15/26 | | | 6,699,574 | |
| | 1,075,000 | | | Bonham Independent School District Improvements GO, (PSF-GTD),
5.00%, 08/01/27 | | | 1,346,233 | |
| | 1,605,000 | | | Brock Independent School District Refunding GO, (PSF-GTD),
5.00%, 08/15/25 | | | 2,014,564 | |
| | 1,000,000 | | | Burleson Independent School District Refunding GO, (PSF-GTD),
5.00%, 08/01/25 | | | 1,254,140 | |
| | 1,000,000 | | | City of Austin Water & Wastewater System Advance Refunding Revenue Bonds, Series A,
5.00%, 11/15/21 | | | 1,181,310 | |
| | 2,535,000 | | | City of Cedar Park Public Improvements Refunding GO,
5.00%, 02/15/20 | | | 2,838,947 | |
| | 4,020,000 | | | City of College Station Improvements Advance Refunding GO,
5.00%, 02/15/25 | | | 5,005,704 | |
| Principal | | | | | | |
| Amount | | | | | Value | |
| Texas (continued) | | | | |
| $ | 935,000 | | | City of Conroe Public Improvements GO,
5.00%, 03/01/25 | | $ | 1,143,112 | |
| | 2,075,000 | | | City of Denton Public Improvements GO,
5.00%, 02/15/23 | | | 2,514,423 | |
| | 1,715,000 | | | City of Denton Public Improvements GO,
5.00%, 02/15/24 | | | 2,109,038 | |
| | 1,290,000 | | | City of Denton Public Improvements GO,
5.00%, 02/15/28 | | | 1,591,757 | |
| | 830,000 | | | City of El Paso Municipal Drainage Utility System Sewer Improvement Revenue Bonds,
5.00%, 03/01/24 | | | 1,018,584 | |
| | 350,000 | | | City of El Paso Water & Sewer Refunding Revenue Bonds,
5.00%, 03/01/25 | | | 427,363 | |
| | 1,250,000 | | | City of El Paso Water & Sewer Refunding Revenue Bonds,
5.00%, 03/01/26 | | | 1,514,825 | |
| | 6,635,000 | | | City of Fort Worth General Purpose Refunding GO,
5.00%, 03/01/17 | | | 6,729,482 | |
| | 5,145,000 | | | City of Fort Worth Water & Sewer System Improvements Revenue,
5.00%, 02/15/25 | | | 6,406,554 | |
| | 300,000 | | | City of League Waterworks & Sewer GO, Series A,
5.00%, 02/15/22 | | | 353,303 | |
| | 1,325,000 | | | City of Lubbock Prerefunded Public Improvements GO,
5.25%, 02/15/20(c) | | | 1,451,471 | |
| | 450,000 | | | City of Lubbock Unrefunded Public Improvements GO,
5.25%, 02/15/20 | | | 494,618 | |
| | 2,240,000 | | | City of McKinney Waterworks & Sewer System Revenue Sewer Improvements,
5.00%, 03/15/25 | | | 2,778,675 | |
| | 2,360,000 | | | City of McKinney Waterworks & Sewer System Revenue Sewer Improvements,
5.00%, 03/15/26 | | | 2,952,808 | |
| | 2,440,000 | | | City of Plano Advance Refunding GO,
5.00%, 09/01/23 | | | 2,986,877 | |
| | 1,180,000 | | | City of Plano Waterworks & Sewer System Water Utility Improvement Revenue Bonds,
5.00%, 05/01/26 | | | 1,488,228 | |
| Old Westbury Funds, Inc. | |
| Municipal Bond Fund | |
| Portfolio of Investments - (Continued) | October 31, 2016 |
| | |
| Principal | | | | | | |
| Amount | | | | | Value | |
| Texas (continued) | | | | |
| $ | 2,850,000 | | | City Public Service Board of San Antonio Electric & Gas Refunding Revenue,
5.00%, 02/01/26 | | $ | 3,601,232 | |
| | 1,430,000 | | | Clear Creek Independent School District GO, (PSF-GTD), Series B,
3.00%, 02/15/35(b) | | | 1,452,952 | |
| | 1,505,000 | | | Clint Independent School District Advance Refunding GO, (PSF-GTD),
5.00%, 08/15/25 | | | 1,889,046 | |
| | 1,195,000 | | | Connally Independent School District Refunding GO, (PSF-GTD),
5.00%, 08/15/25 | | | 1,493,344 | |
| | 2,130,000 | | | County of Bexar Advance Refunding GO,
5.00%,06/15/26 | | | 2,648,676 | |
| | 4,410,000 | | | County of Bexar Refunding GO,
5.00%, 06/15/22 | | | 5,272,508 | |
| | 675,000 | | | County of Collin Advance Refunding GO,
5.00%, 02/15/24 | | | 833,740 | |
| | 3,440,000 | | | County of Dallas Public Improvements GO,
5.00%, 08/15/26 | | | 4,377,297 | |
| | 1,500,000 | | | County of Denton Advance Refunding GO,
5.00%, 07/15/24 | | | 1,865,595 | |
| | 1,590,000 | | | County of Harris Advance Refunding Revenue, Series A,
5.00%, 08/15/25 | | | 1,994,273 | |
| | 1,000,000 | | | County of Williamson Limited Tax Refunding GO,
5.00%, 02/15/21 | | | 1,159,990 | |
| | 360,000 | | | Crystal City Independent School District Advance Refunding GO, (PSF-GTD),
5.00%, 02/15/26 | | | 442,055 | |
| | 1,095,000 | | | Cypress-Fairbanks Independent School District Refunding GO, Series A, (PSF-GTD),
4.00%, 02/15/17 | | | 1,105,326 | |
| | 4,000,000 | | | Cypress-Fairbanks Independent School District School Improvements GO, Series B-2 (PSF-GTD),
3.00%, 02/15/40(b) | | | 4,064,440 | |
| | 2,000,000 | | | Dallas Area Rapid Transit Refunding Revenue Bonds, Series A,
5.00%, 12/01/25 | | | 2,479,120 | |
| Principal | | | | | | |
| Amount | | | | | Value | |
| Texas (continued) | | | | |
| $ | 4,450,000 | | | Dallas Independent School District School Improvement School Building GO, (PSF-GTD), Series B-1,
3.00%, 02/15/36(b) | | $ | 4,478,614 | |
| | 1,120,000 | | | Dayton Independent School District School Improvements GO, (PSF-GTD),
5.00%, 02/15/22 | | | 1,319,002 | |
| | 245,000 | | | Deer Park Independent School District Limited Tax GO, (AGM),
5.00%, 02/15/17 | | | 248,031 | |
| | 1,085,000 | | | Denver City Independent School District School Building GO, Series A, (PSF-GTD),
5.00%, 02/15/25 | | | 1,344,456 | |
| | 2,665,000 | | | Eagle Mountain & Saginaw Independent School District Refunding GO, (PSF-GTD),
5.00%, 08/15/25 | | | 3,345,055 | |
| | 2,335,000 | | | Eagle Mountain & Saginaw Independent School District Refunding GO, (PSF-GTD),
5.00%, 08/15/27 | | | 2,907,822 | |
| | 3,000,000 | | | Edinburg Consolidated Independent School District Advance Refunding GO, (PSF-GTD),
5.00%, 02/15/25 | | | 3,714,780 | |
| | 1,500,000 | | | El Paso Independent School District Refunding GO (PSF-GTD),
5.00%, 08/15/25 | | | 1,839,780 | |
| | 520,000 | | | Forsan Independent School District Refunding GO (PSF-GTD),
4.00%, 02/15/17 | | | 524,904 | |
| | 6,000,000 | | | Fort Bend Independent School District Refunding GO, (PSF-GTD), Series A,
5.00%, 08/15/25 | | | 7,388,460 | |
| | 2,000,000 | | | Fort Worth Independent School District School Building GO, (PSF-GTD),
5.00%, 02/15/22 | | | 2,371,000 | |
| | 885,000 | | | Frenship Independent School District Refunding GO (PSF-GTD),
5.00%, 02/15/26 | | | 1,073,443 | |
| | 250,000 | | | Frisco Independent School District School Building GO, Series A, (PSF-GTD),
6.13%, 08/15/21 | | | 273,428 | |
| Old Westbury Funds, Inc. | |
| Municipal Bond Fund | |
| Portfolio of Investments - (Continued) | October 31, 2016 |
| | |
Principal
Amount | | | | | Value | |
| Texas (continued) | | | | |
| $ | 2,500,000 | | | Frisco Independent School District School Improvements GO, Series A, (PSF-GTD),
5.00%, 08/15/25 | | $ | 3,147,175 | |
| | 1,385,000 | | | Goose Creek Consolidated Independent School District Advance Refunding GO, (PSF-GTD), Series A,
5.00%, 02/15/25 | | | 1,733,078 | |
| | 13,000,000 | | | Goose Creek Consolidated Independent School District School Improvements GO, Series B, (PSF-GTD),
3.00%, 02/15/35(b) | | | 13,208,650 | |
| | 1,000,000 | | | Harris County Refunding GO, Series C, (AGM),
5.25%, 08/15/19 | | | 1,116,060 | |
| | 2,730,000 | | | Hays Consolidated Independent School District Advance Refunding GO, (PSF-GTD),
5.00%, 08/15/27 | | | 3,443,322 | |
| | 2,030,000 | | | Houston Community College System University & College Improvements Revenue Bonds (AGM),
5.25%, 04/15/21 | | | 2,153,871 | |
| | 960,000 | | | Houston Community College System University & College Improvements Revenue Bonds (AGM),
5.25%, 04/15/21(c) | | | 1,020,739 | |
| | 3,750,000 | | | Houston Independent School District School Improvement Refunding GO, (PSF-GTD), Series A,
5.00%, 02/15/25 | | | 4,685,888 | |
| | 6,000,000 | | | Houston Independent School District School Improvements GO, Series 2014A-1A, (PSF-GTD),
2.00%, 06/01/39(b)(d) | | | 6,037,260 | |
| | 2,455,000 | | | Irving Independent School District Advance Refunding GO, (PSF-GTD),
5.00%, 02/15/24 | | | 3,019,061 | |
| | 585,000 | | | Kaufman Independent School District School Building Refunding GO, (PSF-GTD),
5.00%, 02/15/24 | | | 720,311 | |
| | 500,000 | | | Kaufman Independent School District School Building Refunding GO, (PSF-GTD),
5.00%, 02/15/25 | | | 623,909 | |
| | 5,000,000 | | | Klein Independent School District Advance Refunding GO, (PSF-GTD), Series A,
5.00%, 08/01/26 | | | 6,225,000 | |
Principal
Amount | | | | | Value | |
| Texas (continued) | | | | |
| $ | 1,860,000 | | | Longview Independent School District Advance Refunding GO, (PSF-GTD),
5.00%, 02/15/23 | | $ | 2,248,926 | |
| | 1,760,000 | | | Longview Independent School District Advance Refunding GO, (PSF-GTD),
5.00%, 02/15/24 | | | 2,165,733 | |
| | 1,335,000 | | | Longview Independent School District Advance Refunding GO, (PSF-GTD),
5.00%, 02/15/26 | | | 1,684,356 | |
| | 2,670,000 | | | Magnolia Independent School District School Improvement Advance Refunding GO, (PSF-GTD),
5.00%, 08/15/25 | | | 3,351,331 | |
| | 3,410,000 | | | Manor Independent School District Advance Refunding GO, (PSF-GTD),
5.00%, 08/01/24 | | | 4,226,013 | |
| | 1,085,000 | | | Mercedes Independent School District Advance Refunding GO, (PSF-GTD),
5.00%, 08/15/22 | | | 1,296,586 | |
| | 1,005,000 | | | Mesquite Independent School District Advance Refunding GO, (PSF-GTD), Series A,
5.00%, 08/15/23 | | | 1,223,799 | |
| | 1,060,000 | | | Mesquite Independent School District Advance Refunding GO, (PSF-GTD), Series A,
5.00%, 08/15/24 | | | 1,309,630 | |
| | 1,110,000 | | | Mesquite Independent School District Advance Refunding GO, (PSF-GTD), Series A,
5.00%, 08/15/25 | | | 1,386,101 | |
| | 1,435,000 | | | Mesquite Independent School District Advance Refunding GO, (PSF-GTD), Series B,
5.00%, 08/15/23 | | | 1,747,414 | |
| | 1,650,000 | | | Mesquite Independent School District Advance Refunding GO, (PSF-GTD), Series B,
5.00%, 08/15/25 | | | 2,060,421 | |
| | 585,000 | | | Mesquite Independent School District Advance Refunding GO, (PSF-GTD), Series B,
5.00%, 08/15/26 | | | 739,633 | |
| | 1,405,000 | | | Mission Consolidated Independent School District Refunding Revenue Bonds, (PSF-GTD),
3.25%, 02/15/17 | | | 1,415,271 | |
| Old Westbury Funds, Inc. | |
| Municipal Bond Fund | |
| Portfolio of Investments - (Continued) | October 31, 2016 |
| | |
Principal
Amount | | | | | Value | |
| Texas (continued) | | | | |
| $ | 1,505,000 | | | Northside Independent School District School Improvements GO, (PSF-GTD),
5.00%, 08/15/26 | | $ | 1,908,927 | |
| | 1,145,000 | | | Palestine Independent School District Advance Refunding GO, (PSF-GTD),
5.00%, 02/15/23 | | | 1,380,607 | |
| | 250,000 | | | Pasadena Independent School District Advance Refunding GO, (PSF-GTD),
5.00%, 02/15/22 | | | 296,095 | |
| | 1,105,000 | | | Pasadena Independent School District GO, (PSF-GTD),
5.00%, 02/15/17 | | | 1,118,536 | |
| | 750,000 | | | Pharr San Juan Alamo Independent School District Advance Refunding GO, (PSF-GTD),
5.00%, 02/01/27 | | | 919,568 | |
| | 1,525,000 | | | Plano Independent School District School Improvement GO, (PSF-GTD),
5.00%, 02/15/23 | | | 1,845,921 | |
| | 2,595,000 | | | Port Arthur Independent School District Advance Refunding GO, (PSF-GTD), Series B,
5.00%, 02/15/25 | | | 3,224,521 | |
| | 1,000,000 | | | Prosper Independent School District School Building School Improvement GO, (PSF-GTD),
5.00%, 02/15/25 | | | 1,237,400 | |
| | 265,000 | | | Red Oak Independent School District School Improvements GO (PSF-GTD),
5.00%, 08/15/18(c) | | | 273,713 | |
| | 260,000 | | | Red Oak Independent School District School Improvements GO (PSF-GTD),
5.00%, 08/15/18 | | | 268,757 | |
| | 925,000 | | | Roma Independent School District Refunding GO, (PSF-GTD),
5.00%, 08/15/22 | | | 1,101,990 | |
| | 1,020,000 | | | Roma Independent School District Refunding GO, (PSF-GTD),
5.00%, 08/15/23 | | | 1,237,678 | |
| | 1,075,000 | | | Roma Independent School District Refunding GO, (PSF-GTD),
5.00%, 08/15/24 | | | 1,326,400 | |
| | 1,000,000 | | | Roma Independent School District Refunding GO, (PSF-GTD),
5.00%, 08/15/25 | | | 1,247,830 | |
Principal
Amount | | | | | Value | |
| Texas (continued) | | | | |
| $ | 705,000 | | | San Elizario Independent School District School Improvements GO, (PSF-GTD),
5.00%, 05/01/25 | | $ | 881,335 | |
| | 145,000 | | | Seagraves Independent School District School Building GO, (PSF-GTD),
4.00%, 02/15/19 | | | 153,878 | |
| | 1,450,000 | | | Spring Independent School District Advance Refunding GO (PSF-GTD),
5.00%, 08/15/27 | | | 1,824,463 | |
| | 1,000,000 | | | Spring Independent School District Advance Refunding GO, (PSF- GTD),
5.00%, 08/15/26 | | | 1,269,410 | |
| | 2,695,000 | | | State of Texas Public Finance Authority Refunding GO,
5.00%, 10/01/20 | | | 3,090,680 | |
| | 6,500,000 | | | State of Texas Transportation Commission Highway Improvement GO,
5.00%, 04/01/25 | | | 8,151,260 | |
| | 1,390,000 | | | Texas State University Systems University and College Improvement Revenue Bonds,
5.00%, 03/15/17 | | | 1,412,143 | |
| | 6,950,000 | | | Texas Transportation Commission State Highway Fund First Tier Advance Refunding Revenue Bonds,
5.00%, 10/01/20 | | | 7,970,399 | |
| | 5,785,000 | | | Texas Transportation Commission State Highway Fund First Tier Advance Refunding Revenue Bonds,
5.00%, 10/01/24 | | | 7,216,672 | |
| | 1,070,000 | | | Texas Transportation Commission State Highway Fund Highway Improvements First Tier Revenue Bonds,
5.00%, 04/01/17 | | | 1,088,800 | |
| | 4,850,000 | | | Tyler Independent School District Advance Refunding GO, (PSF-GTD),
5.00%, 02/15/23 | | | 5,851,234 | |
| | 500,000 | | | United Independent School District GO, (PSF-GTD),
5.00%, 08/15/22 | | | 601,499 | |
| | 1,680,000 | | | United Independent School District GO, (PSF-GTD),
5.00%, 08/15/23 | | | 2,059,075 | |
| | 1,235,000 | | | United Independent School District GO, (PSF-GTD),
5.00%, 08/15/24 | | | 1,537,019 | |
| Old Westbury Funds, Inc. | |
| Municipal Bond Fund | |
| Portfolio of Investments - (Continued) | October 31, 2016 |
| | |
Principal
Amount | | | | | Value | |
| Texas (continued) | | | | |
| $ | 2,085,000 | | | United Independent School District GO, (PSF-GTD),
5.00%, 08/15/25 | | $ | 2,626,683 | |
| | 220,000 | | | University of North Texas Prerefunded Refunding Revenue,
5.00%, 04/15/20 | | | 248,728 | |
| | 420,000 | | | University of North Texas Prerefunded Refunding Revenue,
5.00%, 04/15/21(c) | | | 488,359 | |
| | 1,480,000 | | | University of North Texas Unrefunded Refunding Revenue,
5.00%, 04/15/20(c) | | | 1,669,499 | |
| | 2,810,000 | | | University of North Texas Unrefunded Refunding Revenue,
5.00%, 04/15/21(c) | | | 3,256,790 | |
| | 2,075,000 | | | University of Texas Financing Systems Refunding Revenue Bonds, Series A,
5.00%, 08/15/17 | | | 2,144,886 | |
| | 2,000,000 | | | University of Texas System University and College Improvements Revenue, Series D,
5.00%, 08/15/23 | | | 2,452,720 | |
| | 145,000 | | | Victoria Utility System, Water & Wastewater Authority Refunding Revenue Bonds, (AMBAC),
5.00%, 12/01/17 | | | 151,538 | |
| | 1,940,000 | | | Waco Independent School District Advance Refunding GO, (PSF- GTD),
5.00%, 08/15/27 | | | 2,460,677 | |
| | 640,000 | | | Wall Independent School District School Improvements GO, (PSF-GTD),
5.00%, 02/15/27 | | | 778,246 | |
| | 1,370,000 | | | Wichita Falls Independent School District Advance Refunding GO, (PSF-GTD),
5.00%, 02/01/25 | | | 1,710,418 | |
| | 1,210,000 | | | Wichita Falls Independent School District School Improvements GO (PSF-GTD),
5.00%, 02/01/23 | | | 1,460,712 | |
| | | | | | | | 294,517,016 | |
| Utah — 1.9% | | | | |
| | 1,975,000 | | | Alpine School District School Building GO, (School Board GTY),
5.00%, 03/15/21 | | | 2,198,274 | |
Principal
Amount | | | | | Value | |
| Utah (continued) | | | | |
| $ | 23,100,000 | | | County of Salt Lake Cash Flow Management GO Notes,
2.00%, 12/29/16 | | $ | 23,150,820 | |
| | 13,000,000 | | | Salt Lake City Corp Cash Flow Management GO Notes,
2.00%, 06/30/17 | | | 13,109,590 | |
| | 1,085,000 | | | Uintah County School District Refunding GO, (School Board GTY),
5.00%, 02/01/24 | | | 1,339,704 | |
| | | | | | | | 39,798,388 | |
| Virginia — 3.6% | | | | |
| | 155,000 | | | City of Norfolk Water Refunding Revenue Bonds,
5.00%, 11/01/22 | | | 183,779 | |
| | 5,000,000 | | | County of Arlington Refunding GO, Series B,
5.00%, 08/15/25 | | | 6,368,900 | |
| | 600,000 | | | County of Prince William Facilities Refunding COP,
4.00%, 10/01/17 | | | 617,333 | |
| | 1,350,000 | | | Fairfax County Economic Development Authority Community Services Facilities Project Revenue Bonds, Series A,
4.50%, 03/01/20 | | | 1,497,218 | |
| | 3,000,000 | | | Hampton Roads Sanitation District Refunding Revenue Bonds, Series B,
0.62%, 08/01/46(b) | | | 3,000,000 | |
| | 1,170,000 | | | Prince William County Industrial Development Authority Public Improvements Refunding Revenue Bonds, Series A,
5.00%, 10/01/24 | | | 1,455,632 | |
| | 1,000,000 | | | Virginia College Building Authority Advance Refunding Revenue, Series A,
5.00%, 09/01/28 | | | 1,252,240 | |
| | 2,000,000 | | | Virginia College Building Authority Public Higher Education Refunding Revenue Bonds, Series B (State Aid Intercept Program),
5.00%, 09/01/21 | | | 2,290,740 | |
| | 6,450,000 | | | Virginia Commonwealth Transportation Board Current Refunding Revenue,
5.00%, 05/15/17 | | | 6,598,802 | |
| | 5,000,000 | | | Virginia Commonwealth Transportation Board Transit Improvements Revenue Bonds,
5.00%, 03/15/23 | | | 5,933,100 | |
| Old Westbury Funds, Inc. | |
| Municipal Bond Fund | |
| Portfolio of Investments - (Continued) | October 31, 2016 |
| | |
Principal
Amount | | | | | Value | |
| Virginia (continued) | | | | |
| $ | 2,465,000 | | | Virginia Public Building Authority Revenue Bonds, Series A,
5.00%, 08/01/21 | | $ | 2,889,473 | |
| | 1,250,000 | | | Virginia Public Building Authority Revenue Bonds, Series B (State Appropriation),
5.00%, 08/01/21 | | | 1,385,363 | |
| | 5,000,000 | | | Virginia Public School Authority Advance Refunding Revenue Bonds,
5.00%, 02/01/24 | | | 6,159,250 | |
| | 2,450,000 | | | Virginia Public School Authority Advance Refunding Revenue Bonds, (State Aid Withholding),
5.00%, 08/01/24 | | | 3,052,406 | |
| | 5,000,000 | | | Virginia Public School Authority Refunding Revenue Bonds, Series A, (State Aid Withholding),
5.00%, 08/01/25 | | | 6,312,150 | |
| | 8,010,000 | | | Virginia Public School Authority School Improvements Revenue Bonds, Series II,
5.00%, 04/15/17 | | | 8,166,275 | |
| | 1,500,000 | | | Virginia Resources Authority Advance Refunding Revenue,
5.00%, 11/01/26 | | | 1,929,345 | |
| | 1,150,000 | | | Virginia Resources Authority Refunding Revenue Bonds,
5.00%, 11/01/25 | | | 1,433,533 | |
| | 10,000,000 | | | Virginia Resources Authority Refunding Revenue Bonds, Series B,
5.00%, 10/01/25 | | | 12,441,300 | |
| | | | | | | | 72,966,839 | |
| Washington — 2.5% | | | | |
| | 1,025,000 | | | Benton County School District No 17 Kennewick School Improvements GO, (School Board GTY),
5.00%, 12/01/21 | | | 1,208,004 | |
| | 430,000 | | | Benton County School District No 17 Kennewick School Improvements GO, (School Board GTY),
5.00%, 12/01/23 | | | 526,491 | |
| | 100,000 | | | CDP-King County III Lease King Street Center Project Refunding Revenue Bonds, (NATL-RE),
5.00%, 06/01/17 | | | 102,363 | |
Principal
Amount | | | | | Value | |
| Washington (continued) | | | | |
| $ | 1,050,000 | | | Chelan County School District No 228 Cascade School Improvements GO, (School Board GTY),
5.00%, 12/01/26 | | $ | 1,310,862 | |
| | 1,600,000 | | | Clark County Public Utility District No 1 Refunding Revenue Bonds,
5.00%, 01/01/27 | | | 1,971,312 | |
| | 2,525,000 | | | Clark County School District No 117 Camas Refunding GO, (School Board GTY),
5.00%, 12/01/17 | | | 2,639,963 | |
| | 1,390,000 | | | Clark County School District No 117 Camas School Improvements GO, (School Board GTY),
5.00%, 12/01/24 | | | 1,738,404 | |
| | 5,500,000 | | | Energy Northwest Refunding Revenue Bonds,
5.00%, 07/01/25 | | | 6,895,460 | |
| | 800,000 | | | Island County School District No 201 Oak Harbor School Improvements GO, (School Board GTY),
5.00%, 12/01/16 | | | 802,728 | |
| | 680,000 | | | King County Public Transportation Sales Tax Refunding GO,
4.00%, 12/01/18 | | | 723,289 | |
| | 1,035,000 | | | King County Refunding GO,
5.00%, 07/01/25 | | | 1,286,195 | |
| | 1,500,000 | | | King County School District No. 414 Lake Washington GO, (School Board GTY),
5.00%, 12/01/20 | | | 1,627,605 | |
| | 1,000,000 | | | King County Sewer Improvements GO, Series B,
0.57%, 01/01/40(b) | | | 1,000,000 | |
| | 1,180,000 | | | Nooksack Valley School District No 506 School Improvements GO, (School Board GTY),
5.00%, 12/01/24 | | | 1,451,719 | |
| | 750,000 | | | Port of Seattle Inter Lien Refunding Revenue Bonds,
5.00%, 02/01/27 | | | 930,443 | |
| | 1,320,000 | | | Skagit County Consolidated School District No 320 Mount Vernon School Improvements Refunding GO, (School Board GTY),
5.00%, 12/01/23 | | | 1,626,134 | |
| | 5,000,000 | | | Snohomish County School District No 201 Refunding GO (School Board GTY),
5.00%, 12/01/25 | | | 6,156,450 | |
| Old Westbury Funds, Inc. | |
| Municipal Bond Fund | |
| Portfolio of Investments - (Continued) | October 31, 2016 |
| | |
Principal
Amount | | | | | Value | |
| Washington (continued) | | | | |
| $ | 1,315,000 | | | Spokane County School District No 363 West Valley Refunding GO, (School Board GTY),
5.00%, 12/01/18 | | $ | 1,420,621 | |
| | 5,000,000 | | | State of Washington Advance Refunding GO, Series B,
5.00%, 07/01/26 | | | 6,259,300 | |
| | 1,000,000 | | | State of Washington Public Improvements Advance Refunding COP, (State Higher Education Intercept Program),
3.00%, 07/01/17 | | | 1,014,670 | |
| | 800,000 | | | State of Washington Refunding GO, Series R-2012C,
5.00%, 07/01/23 | | | 960,552 | |
| | 3,250,000 | | | State of Washington Senior 520 Corridor Program Highway Improvements Revenue Bonds,
5.00%, 09/01/19 | | | 3,594,240 | |
| | 325,000 | | | Washington Health Care Facilities Authority Advance Refunding Revenue Bonds, Series B,
5.00%, 08/15/24 | | | 399,679 | |
| | 4,435,000 | | | Yakima County School District No 7 Yakima Advance Refunding GO, (School Board GTY),
5.00%, 12/01/24 | | | 5,523,881 | |
| | | | | | | | 51,170,365 | |
| West Virginia — 0.0% | | | | |
| | 125,000 | | | West Virginia University Revenue Bonds, Series A, (NATL-RE),
5.50%, 04/01/17 | | | 127,463 | |
Total Municipal Bonds
(Cost $1,979,470,384) | | | 2,004,832,746 | |
| Shares | | | | | Value | |
| INVESTMENT COMPANY — 2.4% | | | | |
| | 50,327,400 | | | SEI Daily Income Trust Government II Fund, Class A,
0.01%(e) | | $ | 50,327,400 | |
Total Investment Company
(Cost $50,327,400) | | | 50,327,400 | |
| | | | | |
TOTAL INVESTMENTS — 100.0%
(Cost $2,029,797,784)(a) | | $ | 2,055,160,146 | |
| LIABILITIES IN EXCESS OF OTHER ASSETS — 0.0% | | | (24,476 | ) |
| NET ASSETS — 100.0% | | $ | 2,055,135,670 | |
| (a) | Cost for federal income tax purposes is $2,029,837,226 and net unrealized appreciation of investments is as follows: | |
| | Unrealized appreciation | | $ | 31,522,220 | |
| | Unrealized depreciation | | | (6,199,300 | ) |
| | Net unrealized appreciation | | $ | 25,322,920 | |
| (b) | Variable rate security. Rate shown is the rate as of October 31, 2016. | |
| (c) | These securities are pre-refunded; the date shown represents the pre-refunded date. Bonds which are pre-refunded are collateralized by U.S. Government securities which are held in escrow and are used to pay principal and interest on the municipal issue and to retire the bonds in full at the earliest refunding date. | |
| (d) | The security is subject to remarketing prior to its stated maturity, and is subject to mandatory redemption at the stated maturity date. | |
| (e) | Rate shown represents current yield at October 31, 2016. | |
| | | |
AGM — Assured Guaranty Municipal Corp.
AMBAC — Insured by AMBAC Indemnity Corp.
BAM — Build America Mutual Assurance Co.
BHAC — Berkshire Hathaway Assurance Corp.
COP — Certificates of Participation
FGIC — Insured by Financial Guaranty Insurance Corp.
GO — General Obligations
GTY — Guaranty
NATL-RE — Insured by National Public Finance Guarantee Corp.
NATL-IBC — Insured by National Public Finance Guarantee Corp.
OID — Original Issue Discount
PSF-GTD — Permanent School Fund Guarantee
Q–SBLF — Qualified-School Bond Loan Fund
XLCA — XL Capital Insurance | |
| Old Westbury Funds, Inc. | |
| Statements of Assets and Liabilities | |
| | October 31, 2016 |
| | |
| | | LARGE CAP CORE
FUND | | LARGE CAP
STRATEGIES
FUND | | SMALL & MID CAP
FUND |
| ASSETS: | | | | | | | | | | | | | | | |
| Investments, at fair value | | | $ | 1,245,416,702 | | | | $ | 14,625,477,895 | | | | $ | 5,470,865,970 | |
| Foreign currency, at value (Cost $0, $1,818,978 and $8,547,987, respectively) | | | | — | | | | | 1,820,586 | | | | | 8,569,509 | |
| Cash | | | | 189 | | | | | 316 | | | | | 6,942,035 | |
| Due from brokers for collateral | | | | — | | | | | 5,190,000 | | | | | — | |
| Dividends and interest receivable | | | | 1,789,568 | | | | | 20,174,616 | | | | | 5,767,450 | |
| Receivable for Fund shares sold | | | | 305,869 | | | | | 1,314,943 | | | | | 4,046,079 | |
| Receivable for investments sold | | | | — | | | | | 13,004,503 | | | | | 14,105,338 | |
| Unrealized appreciation on forward foreign currency exchange contracts | | | | — | | | | | 7,438,173 | | | | | 74,658 | |
| Prepaid expenses | | | | 35,547 | | | | | 97,861 | | | | | 58,219 | |
| Total Assets | | | | 1,247,547,875 | | | | | 14,674,518,893 | | | | | 5,510,429,258 | |
| LIABILITIES: | | | | | | | | | | | | | | | |
| Payable to brokers for collateral | | | | — | | | | | 7,220,000 | | | | | — | |
| Payable for Fund shares redeemed | | | | 356,161 | | | | | 14,011,793 | | | | | 9,073,836 | |
| Payable for investments purchased | | | | — | | | | | 40,793,010 | | | | | 24,083,035 | |
| Deferred tax liability (Note 9) | | | | — | | | | | 3,253,874 | | | | | 460,230 | |
| Accrued expenses and other payables: | | | | | | | | | | | | | | | |
| Investment advisory | | | | 658,124 | | | | | 9,503,642 | | | | | 3,514,054 | |
| Administration | | | | 65,628 | | | | | 725,759 | | | | | 276,118 | |
| Shareholder servicing fee | | | | 199,566 | | | | | 2,338,769 | | | | | 880,671 | |
| Custody | | | | 26,035 | | | | | 394,627 | | | | | 176,134 | |
| Legal and Audit | | | | 23,658 | | | | | 188,676 | | | | | 107,950 | |
| Other | | | | 21,696 | | | | | 197,491 | | | | | 233,705 | |
| Total Liabilities | | | | 1,350,868 | | | | | 78,627,641 | | | | | 38,805,733 | |
| NET ASSETS | | | $ | 1,246,197,007 | | | | $ | 14,595,891,252 | | | | $ | 5,471,623,525 | |
| NET ASSETS consist of: | | | | | | | | | | | | | | | |
| Capital paid-in | | | $ | 1,156,576,501 | | | | $ | 12,491,267,864 | | | | $ | 4,109,704,355 | |
| Accumulated undistributed net investment income | | | | 9,635,381 | | | | | 88,579,044 | | | | | 17,748,968 | |
| Accumulated undistributed net realized gain/(loss) on investments and foreign currency transactions | | | | (23,480,137 | ) | | | | 132,750,759 | | | | | 293,585,521 | |
| Net unrealized appreciation on investments and foreign currency transactions | | | | 103,465,262 | | | | | 1,883,293,585 | | | | | 1,050,584,681 | |
| NET ASSETS | | | $ | 1,246,197,007 | | | | $ | 14,595,891,252 | | | | $ | 5,471,623,525 | |
| Net Asset Value, maximum offering price and redemption price per share | | | $ | 13.69 | | | | $ | 12.95 | | | | $ | 15.81 | |
| Number of shares authorized | | | | 2,500,000,000 | | | | | 3,000,000,000 | | | | | 3,500,000,000 | |
| SHARES OF CAPITAL STOCK OUTSTANDING | | | | 91,008,066 | | | | | 1,126,733,221 | | | | | 346,052,477 | |
| INVESTMENTS, AT COST | | | $ | 1,141,918,771 | | | | $ | 12,745,791,672 | | | | $ | 4,419,764,380 | |
See Notes to Financial Statements.
| Old Westbury Funds, Inc. | |
| Statements of Assets and Liabilities - (Continued) | |
| | October 31, 2016 |
| | |
| | | STRATEGIC
OPPORTUNITIES
FUNDa |
| ASSETS: | | | | | |
| Investments, at fair value | | | $ | 5,923,004,377 | |
| Cash | | | | 96,161 | |
| Segregated cash for futures contracts (Note 6) | | | | 5,934,812 | |
| Segregated cash for options written | | | | 26,428,463 | |
| Due from brokers for collateral | | | | 7,890,000 | |
| Due from broker for securities sold short | | | | 8,519,773 | |
| Structured option contracts, at value (premium received $4,812,347) | | | | 122,605,670 | |
| Dividends and interest receivable | | | | 9,448,681 | |
| Receivable for Fund shares sold | | | | 830,112 | |
| Receivable for investments sold | | | | 63,419,696 | |
| Unrealized appreciation on swap contracts | | | | 13,464,987 | |
| Unrealized appreciation on forward foreign currency exchange contracts | | | | 4,431,594 | |
| Variation margin | | | | 295,087 | |
| Prepaid expenses | | | | 69,306 | |
| Total Assets | | | | 6,186,438,719 | |
| LIABILITIES: | | | | | |
| Foreign currency, at value (Cost $246,771) | | | | 247,813 | |
| Payable to brokers for collateral | | | | 94,672,000 | |
| Securities sold short, at value (premium received $17,084,707) | | | | 18,955,909 | |
| Written option contracts, at value (premium received $2,311,191) | | | | 462,500 | |
| Structured option contracts, at value (premium received $910,047) | | | | 15,846,405 | |
| Payable for Fund shares redeemed | | | | 6,847,509 | |
| Payable for investments purchased | | | | 94,770,674 | |
| Unrealized depreciation on swap contracts | | | | 1,980,169 | |
| Unrealized depreciation on forward foreign currency exchange contracts | | | | 12,666,197 | |
| Deferred tax liability (Note 9) | | | | 4,779 | |
| Accrued expenses and other payables: | | | | | |
| Investment advisory | | | | 4,120,303 | |
| Administration | | | | 303,447 | |
| Shareholder servicing fee | | | | 943,330 | |
| Custody | | | | 32,513 | |
| Legal and Audit | | | | 330,077 | |
| Other | | | | 201,904 | |
| Total Liabilities | | | | 252,385,529 | |
| NET ASSETS | | | $ | 5,934,053,190 | |
| NET ASSETS consist of: | | | | | |
| Capital paid-in | | | $ | 5,911,402,327 | |
| Accumulated undistributed net investment income | | | | 85,974,455 | |
| Accumulated undistributed net realized loss on investments, securities sold short, futures contracts, swap contracts, written options and foreign currency transactions | | | | (177,943,908 | ) |
| Net unrealized appreciation on investments, securities sold short, futures contracts, swap agreements, written options and foreign currency transactions | | | | 114,620,316 | |
| NET ASSETS | | | $ | 5,934,053,190 | |
| Net Asset Value, maximum offering price and redemption price per share | | | $ | 7.41 | |
| Number of shares authorized | | | | 3,500,000,000 | |
| SHARES OF CAPITAL STOCK OUTSTANDING | | | | 800,476,399 | |
| INVESTMENTS, AT COST | | | $ | 5,912,410,579 | |
| a | Consolidated Statement of Assets and Liabilities. |
See Notes to Financial Statements.
| Old Westbury Funds, Inc. | |
| Statements of Assets and Liabilities - (Continued) | |
| | October 31, 2016 |
| | |
| | | FIXED
INCOME
FUND | | MUNICIPAL
BOND
FUND |
| ASSETS: | | | | | | | | | | |
| Investments, at fair value | | | $ | 786,002,999 | | | | $ | 2,055,160,146 | |
| Cash | | | | 52 | | | | | 22 | |
| Dividends and interest receivable | | | | 3,838,953 | | | | | 20,705,300 | |
| Receivable for Fund shares sold | | | | 170,055 | | | | | 488,530 | |
| Receivable for investments sold | | | | 1,959,020 | | | | | 2,466,329 | |
| Prepaid expenses | | | | 35,876 | | | | | 42,157 | |
| Total Assets | | | | 792,006,955 | | | | | 2,078,862,484 | |
| LIABILITIES: | | | | | | | | | | |
| Payable for Fund shares redeemed | | | | 410,045 | | | | | 5,990,027 | |
| Payable for investments purchased | | | | 5,755,273 | | | | | 16,702,090 | |
| Accrued expenses and other payables: | | | | | | | | | | |
| Investment advisory | | | | 267,824 | | | | | 631,430 | |
| Administration | | | | 41,346 | | | | | 102,103 | |
| Shareholder servicing fee | | | | 62,004 | | | | | 163,430 | |
| Custody | | | | 9,301 | | | | | 24,514 | |
| Legal and Audit | | | | 22,270 | | | | | 40,294 | |
| Other | | | | 22,349 | | | | | 72,926 | |
| Total Liabilities | | | | 6,590,412 | | | | | 23,726,814 | |
| NET ASSETS | | | $ | 785,416,543 | | | | $ | 2,055,135,670 | |
| NET ASSETS consist of: | | | | | | | | | | |
| Capital paid-in | | | $ | 785,706,468 | | | | $ | 2,018,664,021 | |
| Accumulated undistributed (distributions in excess of) net investment income | | | | 770,831 | | | | | 1,776,685 | |
| Accumulated undistributed net realized gain/(loss) on investments | | | | (6,763,291 | ) | | | | 9,332,602 | |
| Net unrealized appreciation on investments | | | | 5,702,535 | | | | | 25,362,362 | |
| NET ASSETS | | | $ | 785,416,543 | | | | $ | 2,055,135,670 | |
| Net Asset Value, maximum offering price and redemption price per share | | | $ | 11.28 | | | | $ | 12.09 | |
| Number of shares authorized | | | | 2,000,000,000 | | | | | 2,000,000,000 | |
| SHARES OF CAPITAL STOCK OUTSTANDING | | | | 69,650,878 | | | | | 170,018,932 | |
| INVESTMENTS, AT COST | | | $ | 780,300,464 | | | | $ | 2,029,797,784 | |
See Notes to Financial Statements.
| Old Westbury Funds, Inc. | |
| Statements of Operations | |
| | For the Year Ended October 31, 2016 |
| | |
| | | LARGE CAP CORE
FUND | | LARGE CAP
STRATEGIES
FUND | | SMALL & MID CAP
FUND |
| INVESTMENT INCOME: | | | | | | | | | | | | | | | |
| Interest | | | $ | 14,214 | | | | $ | 642,832 | | | | $ | 399,463 | |
| Dividends | | | | 25,332,466 | | | | | 261,664,175 | | | | | 95,486,324 | |
| Foreign tax withheld | | | | (1,248,478 | ) | | | | (13,240,480 | ) | | | | (4,585,939 | ) |
| Total investment income | | | | 24,098,202 | | | | | 249,066,527 | | | | | 91,299,848 | |
| EXPENSES: | | | | | | | | | | | | | | | |
| Investment advisory fees | | | | 7,731,832 | | | | | 113,735,206 | | | | | 45,024,450 | |
| Shareholder servicing fees | | | | 2,327,277 | | | | | 27,965,052 | | | | | 10,593,988 | |
| Administration and Accounting fees | | | | 550,432 | | | | | 6,338,972 | | | | | 2,416,889 | |
| Custodian fees | | | | 674,656 | | | | | 4,737,396 | | | | | 1,567,129 | |
| Directors fees and expenses | | | | 35,433 | | | | | 419,869 | | | | | 165,947 | |
| Insurance premiums | | | | 25,264 | | | | | 77,882 | | | | | 43,020 | |
| Interest expense | | | | — | | | | | — | | | | | 6,510 | |
| Legal and Audit fees | | | | 78,977 | | | | | 778,556 | | | | | 345,449 | |
| Printing and postage fees | | | | 10,147 | | | | | 126,929 | | | | | 52,114 | |
| Registration fees | | | | 37,712 | | | | | 95,925 | | | | | 38,098 | |
| Transfer agent fees | | | | 133,369 | | | | | 1,461,011 | | | | | 561,903 | |
| Miscellaneous expenses | | | | 19,753 | | | | | 85,922 | | | | | 395,964 | |
| Total expenses | | | | 11,624,852 | | | | | 155,822,720 | | | | | 61,211,461 | |
| Expenses waived by Adviser (Note 7) | | | | — | | | | | — | | | | | (2,408,316 | ) |
| Net expenses | | | | 11,624,852 | | | | | 155,822,720 | | | | | 58,803,145 | |
| NET INVESTMENT INCOME | | | | 12,473,350 | | | | | 93,243,807 | | | | | 32,496,703 | |
| NET REALIZED AND CHANGE IN UNREALIZED GAIN/(LOSS) ON INVESTMENTS, FOREIGN CURRENCY TRANSACTIONS, NET OF FOREIGN TAXES: | | | | | | | | | | | | | | | |
| Net realized gains/(loss) on: | | | | | | | | | | | | | | | |
| Investments | | | | (23,423,138 | ) | | | | 232,114,784 | | | | | 329,352,819 | |
| Foreign currency transactions | | | | 30,892 | | | | | (61,705,570 | ) | | | | (699,586 | ) |
| Net change in unrealized appreciation/(depreciation) on: | | | | | | | | | | | | | | | |
| Investments | | | | 26,412,335 | | | | | 56,443,001 | | | | | (65,888,231 | ) |
| Foreign currency transactions | | | | (31,549 | ) | | | | (8,702,465 | ) | | | | (5,348,164 | ) |
| Foreign deferred taxes on unrealized appreciation | | | | — | | | | | (3,097,777 | ) | | | | (325,234 | ) |
| Net realized and change in unrealized gain/(loss) on investments, foreign currency transactions, net of foreign taxes | | | | 2,988,540 | | | | | 215,051,973 | | | | | 257,091,604 | |
| NET INCREASE IN NET ASSETS RESULTING FROM OPERATIONS | | | $ | 15,461,890 | | | | $ | 308,295,780 | | | | $ | 289,588,307 | |
See Notes to Financial Statements.
| Old Westbury Funds, Inc. | |
| Statements of Operations - (Continued) | |
| | For the Year Ended October 31, 2016 |
| | |
| | | STRATEGIC
OPPORTUNITIES
FUNDa |
| INVESTMENT INCOME: | | | | | |
| Interest | | | $ | 117,387,010 | |
| Dividends | | | | 66,347,213 | |
| Foreign tax withheld | | | | (867,478 | ) |
| Total investment income | | | | 182,866,745 | |
| EXPENSES: | | | | | |
| Investment advisory fees | | | | 65,600,718 | |
| Shareholder servicing fees | | | | 12,745,144 | |
| Administration and Accounting fees | | | | 2,954,633 | |
| Custodian fees | | | | 520,259 | |
| Directors fees and expenses | | | | 195,662 | |
| Insurance premiums | | | | 49,854 | |
| Interest expense | | | | 44,017 | |
| Legal and Audit fees | | | | 725,661 | |
| Printing and postage fees | | | | 63,395 | |
| Registration fees | | | | 69,595 | |
| Transfer agent fees | | | | 673,575 | |
| Miscellaneous expenses | | | | 421,543 | |
| Total expenses | | | | 84,064,056 | |
| Expenses waived by Adviser (Note 7) | | | | (7,549,178 | ) |
| Net expenses | | | | 76,514,878 | |
| NET INVESTMENT INCOME | | | | 106,351,867 | |
| NET REALIZED AND CHANGE IN UNREALIZED GAIN/(LOSS) ON INVESTMENTS, SECURITIES SOLD SHORT, FUTURES CONTRACTS, SWAP AGREEMENTS, WRITTEN OPTIONS, FOREIGN CURRENCY TRANSACTIONS, NET OF FOREIGN TAXES: | | | | | |
| Net realized gain/(loss) on: | | | | | |
| Investments | | | | (199,391,026 | ) |
| Futures contracts | | | | (47,622,043 | ) |
| Swap agreements | | | | (14,912,109 | ) |
| Written options and structured options | | | | 127,970,350 | |
| Foreign currency transactions | | | | (40,586,755 | ) |
| Net change in unrealized appreciation/(depreciation) on: | | | | | |
| Investments | | | | 57,503,666 | |
| Securities sold short | | | | (1,871,202 | ) |
| Futures contracts | | | | (2,378,811 | ) |
| Swap agreements | | | | 16,739,280 | |
| Written options and structured options | | | | 11,729,439 | |
| Foreign currency transactions | | | | (3,955,783 | ) |
| Foreign deferred taxes on unrealized appreciation | | | | 81,542 | |
| Net realized and change in unrealized gain/(loss) on investments, securities sold short, futures contracts, swap agreements, written options, foreign currency transactions, net of foreign taxes | | | | (96,693,452 | ) |
| NET INCREASE IN NET ASSETS RESULTING FROM OPERATIONS | | | $ | 9,658,415 | |
| a | Consolidated Statement of Operations. |
See Notes to Financial Statements.
| Old Westbury Funds, Inc. | |
| Statements of Operations - (Continued) | |
| | For the Year Ended October 31, 2016 |
| | |
| | | FIXED
INCOME
FUND | | MUNICIPAL
BOND
FUND |
| INVESTMENT INCOME: | | | | | | | | | | |
| Interest | | | $ | 11,363,038 | | | | $ | 30,039,866 | |
| Dividends | | | | 5,369 | | | | | 86,007 | |
| Total investment income | | | | 11,368,407 | | | | | 30,125,873 | |
| EXPENSES: | | | | | | | | | | |
| Investment advisory fees | | | | 2,915,164 | | | | | 6,758,557 | |
| Shareholder servicing fees | | | | 1,332,582 | | | | | 3,433,461 | |
| Administration and Accounting fees | | | | 320,415 | | | | | 786,142 | |
| Custodian fees | | | | 99,944 | | | | | 257,510 | |
| Directors fees and expenses | | | | 20,635 | | | | | 52,635 | |
| Insurance premiums | | | | 22,935 | | | | | 26,297 | |
| Legal and Audit fees | | | | 47,890 | | | | | 104,286 | |
| Printing and postage fees | | | | 2,901 | | | | | 14,218 | |
| Registration fees | | | | 35,973 | | | | | 80,120 | |
| Transfer agent fees | | | | 81,431 | | | | | 189,192 | |
| Miscellaneous expenses | | | | 18,797 | | | | | 66,498 | |
| Total expenses | | | | 4,898,667 | | | | | 11,768,916 | |
| Expenses waived by Shareholder Servicing Agent (Note 7) | | | | (666,291 | ) | | | | (1,716,731 | ) |
| Net expenses | | | | 4,232,376 | | | | | 10,052,185 | |
| NET INVESTMENT INCOME | | | | 7,136,031 | | | | | 20,073,688 | |
| NET REALIZED AND CHANGE IN UNREALIZED GAIN/(LOSS) ON INVESTMENTS | | | | | | | | | | |
| Net realized gain/(loss) on: | | | | | | | | | | |
| Investments | | | | 2,141,711 | | | | | 9,373,093 | |
| Net change in unrealized appreciation/(depreciation) on: | | | | | | | | | | |
| Investments | | | | 2,875,205 | | | | | (747,741 | ) |
| Net realized and change in unrealized gain/(loss) on investments | | | | 5,016,916 | | | | | 8,625,352 | |
| NET INCREASE IN NET ASSETS RESULTING FROM OPERATIONS | | | $ | 12,152,947 | | | | $ | 28,699,040 | |
See Notes to Financial Statements.
| Old Westbury Funds, Inc. | |
| Statements of Changes in Net Assets | |
| | |
| | |
| | | LARGE CAP CORE FUND |
| | | FOR THE YEAR
ENDED
OCTOBER 31,
2016 | | FOR THE YEAR
ENDED
OCTOBER 31,
2015 |
| | | | | |
| FROM OPERATIONS: | | | | | | | | | | |
| Net investment income | | | $ | 12,473,350 | | | | $ | 11,616,965 | |
| Net realized gain/(loss) on investments and foreign currency transactions | | | | (23,392,246 | ) | | | | 12,939,455 | |
| Net change in unrealized appreciation/(depreciation) on investments, foreign currency transactions, net of foreign deferred taxes | | | | 26,380,786 | | | | | (47,525,792 | ) |
| Net increase/(decrease) in net assets resulting from operations | | | | 15,461,890 | | | | | (22,969,372 | ) |
| DISTRIBUTIONS TO SHAREHOLDERS FROM: | | | | | | | | | | |
| Net investment income | | | | (12,767,618 | ) | | | | (13,732,039 | ) |
| Capital gains | | | | (13,076,789 | ) | | | | (44,983,869 | ) |
| Net decrease in net assets from distributions | | | | (25,844,407 | ) | | | | (58,715,908 | ) |
| CAPITAL STOCK TRANSACTIONS (DOLLARS): | | | | | | | | | | |
| Proceeds from sale of capital stock | | | | 268,944,429 | | | | | 270,970,429 | |
| Reinvestment of distributions | | | | 13,209,958 | | | | | 28,093,739 | |
| Value of capital stock redeemed | | | | (171,467,228 | ) | | | | (100,859,768 | ) |
| Net increase/(decrease) in net assets resulting from capital stock transactions | | | | 110,687,159 | | | | | 198,204,400 | |
| Net increase/(decrease) in net assets | | | | 100,304,642 | | | | | 116,519,120 | |
| NET ASSETS: | | | | | | | | | | |
| Beginning of year | | | | 1,145,892,365 | | | | | 1,029,373,245 | |
| End of year | | | $ | 1,246,197,007 | | | | $ | 1,145,892,365 | |
| Undistributed net investment income | | | $ | 9,635,381 | | | | $ | 9,899,378 | |
| CAPITAL SHARE TRANSACTIONS: | | | | | | | | | | |
| Shares sold | | | | 20,570,567 | | | | | 18,673,538 | |
| Shares issued as reinvestment of distributions | | | | 1,012,257 | | | | | 2,032,832 | |
| Shares redeemed | | | | (12,921,809 | ) | | | | (6,977,713 | ) |
| Net increase/(decrease) in shares outstanding | | | | 8,661,015 | | | | | 13,728,657 | |
See Notes to Financial Statements.
| Old Westbury Funds, Inc. | |
| Statements of Changes in Net Assets - (Continued) |
| | |
| | |
| LARGE CAP STRATEGIES FUND | | SMALL & MID CAP FUND |
FOR THE YEAR
ENDED
OCTOBER 31,
2016 | | FOR THE YEAR
ENDED
OCTOBER 31,
2015 | | FOR THE YEAR
ENDED
OCTOBER 31,
2016 | | FOR THE YEAR
ENDED
OCTOBER 31,
2015 |
| | | |
| | $ | 93,243,807 | | | | $ | 120,773,254 | | | | $ | 32,496,703 | | | | $ | 31,818,245 | |
| | | 170,409,214 | | | | | 185,132,408 | | | | | 328,653,233 | | | | | 587,562,084 | |
| | | | | | | | | | | | | | | | | | | |
| | | 44,642,759 | | | | | (71,168,287 | ) | | | | (71,561,629 | ) | | | | (459,499,891 | ) |
| | | 308,295,780 | | | | | 234,737,375 | | | | | 289,588,307 | | | | | 159,880,438 | |
| | | | | | | | | | | | | | | | | | | |
| | | (109,206,576 | ) | | | | (92,723,523 | ) | | | | (41,515,802 | ) | | | | (48,279,762 | ) |
| | | (212,416,103 | ) | | | | (324,269,763 | ) | | | | (228,201,193 | ) | | | | (558,353,084 | ) |
| | | | | | | | | | | | | | | | | | | |
| | | (321,622,679 | ) | | | | (416,993,286 | ) | | | | (269,716,995 | ) | | | | (606,632,846 | ) |
| | | | | | | | | | | | | | | | | | | |
| | | 1,921,668,809 | | | | | 2,504,726,596 | | | | | 775,408,537 | | | | | 580,123,538 | |
| | | 166,548,307 | | | | | 187,760,218 | | | | | 159,969,805 | | | | | 324,318,415 | |
| | | (1,620,400,131 | ) | | | | (993,415,783 | ) | | | | (933,234,823 | ) | | | | (1,393,863,779 | ) |
| | | | | | | | | | | | | | | | | | | |
| | | 467,816,985 | | | | | 1,699,071,031 | | | | | 2,143,519 | | | | | (489,421,826 | ) |
| | | 454,490,086 | | | | | 1,516,815,120 | | | | | 22,014,831 | | | | | (936,174,234 | ) |
| | | | | | | | | | | | | | | | | | | |
| | | 14,141,401,166 | | | | | 12,624,586,046 | | | | | 5,449,608,694 | | | | | 6,385,782,928 | |
| | $ | 14,595,891,252 | | | | $ | 14,141,401,166 | | | | $ | 5,471,623,525 | | | | $ | 5,449,608,694 | |
| | $ | 88,579,044 | | | | $ | 92,767,985 | | | | $ | 17,748,968 | | | | $ | 22,476,044 | |
| | | | | | | | | | | | | | | | | | | |
| | | 155,007,934 | | | | | 191,745,138 | | | | | 53,021,050 | | | | | 35,407,151 | |
| | | 13,388,128 | | | | | 15,032,844 | | | | | 10,860,136 | | | | | 19,926,717 | |
| | | (128,899,429 | ) | | | | (75,657,222 | ) | | | | (61,440,681 | ) | | | | (85,305,805 | ) |
| | | 39,496,633 | | | | | 131,120,760 | | | | | 2,440,505 | | | | | (29,971,937 | ) |
See Notes to Financial Statements.
| Old Westbury Funds, Inc. | |
| Statements of Changes in Net Assets - (Continued) |
| | |
| | |
| | | STRATEGIC OPPORTUNITIES
FUND |
| | | FOR THE YEAR
ENDED
OCTOBER 31,
2016a | | FOR THE YEAR
ENDED
OCTOBER 31,
2015a |
| FROM OPERATIONS: | | | | | | | | | | |
| Net investment income | | | $ | 106,351,867 | | | | $ | 75,866,802 | |
| Net realized gain/(loss) on investments, securities sold short, swap agreements, futures contracts, written options, foreign capital gains tax and foreign currency transactions | | | | (174,541,583 | ) | | | | 161,840,922 | |
| Net change in unrealized appreciation/(depreciation) on investments, securities sold short, futures contracts, written options, swap agreements, foreign currency transactions, net of foreign deferred taxes | | | | 77,848,131 | | | | | (215,432,223 | ) |
| Net increase in net assets resulting from operations | | | | 9,658,415 | | | | | 22,275,501 | |
| DISTRIBUTIONS TO SHAREHOLDERS FROM: | | | | | | | | | | |
| Net investment income | | | | (105,784,964 | ) | | | | (117,060,603 | ) |
| Capital gains | | | | (128,054,530 | ) | | | | (301,239,367 | ) |
| Net decrease in net assets from distributions | | | | (233,839,494 | ) | | | | (418,299,970 | ) |
| CAPITAL STOCK TRANSACTIONS (DOLLARS): | | | | | | | | | | |
| Proceeds from sale of capital stock | | | | 1,138,862,753 | | | | | 2,310,376,160 | |
| Reinvestment of distributions | | | | 112,339,997 | | | | | 145,499,270 | |
| Value of capital stock redeemed | | | | (2,188,724,376 | ) | | | | (562,647,104 | ) |
| Net increase/(decrease) in net assets resulting from capital stock transactions | | | | (937,521,626 | ) | | | | 1,893,228,326 | |
| Net increase/(decrease) in net assets | | | | (1,161,702,705 | ) | | | | 1,497,203,857 | |
| NET ASSETS: | | | | | | | | | | |
| Beginning of year | | | | 7,095,755,895 | | | | | 5,598,552,038 | |
| End of year | | | $ | 5,934,053,190 | | | | $ | 7,095,755,895 | |
| Undistributed (distributions in excess of) net investment income | | | $ | 85,974,455 | | | | $ | 76,306,686 | |
| CAPITAL SHARE TRANSACTIONS: | | | | | | | | | | |
| Shares sold | | | | 161,379,147 | | | | | 297,763,432 | |
| Shares issued as reinvestment of distributions | | | | 15,410,151 | | | | | 19,094,392 | |
| Shares redeemed | | | | (303,283,841 | ) | | | | (72,368,368 | ) |
| Net increase/(decrease) in shares outstanding | | | | (126,494,543 | ) | | | | 244,489,456 | |
| a | Consolidated Statement of Changes in Net Assets. |
See Notes to Financial Statements.
| Old Westbury Funds, Inc. | |
| Statements of Changes in Net Assets - (Continued) |
| | |
| | |
| FIXED INCOME FUND | | MUNICIPAL BOND FUND |
FOR THE YEAR
ENDED
OCTOBER 31,
2016 | | FOR THE YEAR
ENDED
OCTOBER 31,
2015 | | FOR THE YEAR
ENDED
OCTOBER 31,
2016 | | FOR THE YEAR
ENDED
OCTOBER 31,
2015 |
| | | | | | | | | | | | | | | | | | | |
| | $ | 7,136,031 | | | | $ | 6,022,443 | | | | $ | 20,073,688 | | | | $ | 16,921,764 | |
| | | | | | | | | | | | | | | | | | | |
| | | 2,141,711 | | | | | 1,337,614 | | | | | 9,373,093 | | | | | 1,455,987 | |
| | | | | | | | | | | | | | | | | | | |
| | | 2,875,205 | | | | | (1,044,658 | ) | | | | (747,741 | ) | | | | 1,812,451 | |
| | | 12,152,947 | | | | | 6,315,399 | | | | | 28,699,040 | | | | | 20,190,202 | |
| | | | | | | | | | | | | | | | | | | |
| | | (8,506,761 | ) | | | | (7,734,614 | ) | | | | (19,986,880 | ) | | | | (16,554,029 | ) |
| | | — | | | | | — | | | | | (1,416,604 | ) | | | | (5,448,869 | ) |
| | | (8,506,761 | ) | | | | (7,734,614 | ) | | | | (21,403,484 | ) | | | | (22,002,898 | ) |
| | | | | | | | | | | | | | | | | | | |
| | | 298,387,151 | | | | | 153,102,338 | | | | | 846,467,718 | | | | | 356,508,102 | |
| | | 4,352,215 | | | | | 3,117,561 | | | | | 5,542,028 | | | | | 5,275,133 | |
| | | (104,173,333 | ) | | | | (135,312,765 | ) | | | | (179,212,789 | ) | | | | (311,036,793 | ) |
| | | 198,566,033 | | | | | 20,907,134 | | | | | 672,796,957 | | | | | 50,746,442 | |
| | | 202,212,219 | | | | | 19,487,919 | | | | | 680,092,513 | | | | | 48,933,746 | |
| | | | | | | | | | | | | | | | | | | |
| | | 583,204,324 | | | | | 563,716,405 | | | | | 1,375,043,157 | | | | | 1,326,109,411 | |
| | $ | 785,416,543 | | | | $ | 583,204,324 | | | | $ | 2,055,135,670 | | | | $ | 1,375,043,157 | |
| | $ | 770,831 | | | | $ | 663,511 | | | | $ | 1,776,685 | | | | $ | 1,689,877 | |
| | | | | | | | | | | | | | | | | | | |
| | | 26,401,431 | | | | | 13,624,788 | | | | | 69,733,995 | | | | | 29,807,851 | |
| | | 386,760 | | | | | 278,937 | | | | | 459,206 | | | | | 442,391 | |
| | | (9,241,847 | ) | | | | (12,034,135 | ) | | | | (14,782,785 | ) | | | | (25,955,796 | ) |
| | | 17,546,344 | | | | | 1,869,590 | | | | | 55,410,416 | | | | | 4,294,446 | |
See Notes to Financial Statements.
| Old Westbury Funds, Inc. |
| Large Cap Core Fund |
| Financial Highlights |
| |
For a Share Outstanding Throughout Each Period.
| | | YEAR ENDED OCTOBER 31, | |
| | | 2016 | | | 2015 | | | 2014 | | | 2013 | | | 2012 | |
| Net asset value, beginning of year | | $ | 13.92 | | | $ | 15.00 | | | $ | 13.92 | | | $ | 11.53 | | | $ | 11.13 | |
| | | | | | | | | | | | | | | | | | | | | |
| Investment operations: | | | | | | | | | | | | | | | | | | | | |
| Net investment income | | | 0.14 | a | | | 0.15 | a | | | 0.21 | a | | | 0.24 | a | | | 0.19 | a |
| Net realized and unrealized gains/(losses) on investments | | | (0.05 | ) | | | (0.41 | ) | | | 1.08 | | | | 2.38 | | | | 0.25 | |
| Total from investment operations | | | 0.09 | | | | (0.26 | ) | | | 1.29 | | | | 2.62 | | | | 0.44 | |
| | | | | | | | | | | | | | | | | | | | | |
| Distributions: | | | | | | | | | | | | | | | | | | | | |
| Net investment income | | | (0.16 | ) | | | (0.19 | ) | | | (0.21 | ) | | | (0.23 | ) | | | (0.04 | ) |
| Net realized gains | | | (0.16 | ) | | | (0.63 | ) | | | — | | | | — | | | | — | |
| Total distributions | | | (0.32 | ) | | | (0.82 | ) | | | (0.21 | ) | | | (0.23 | ) | | | (0.04 | ) |
| Net asset value, end of year | | $ | 13.69 | | | $ | 13.92 | | | $ | 15.00 | | | $ | 13.92 | | | $ | 11.53 | |
| Total return | | | 0.7 | % | | | (1.7 | )% | | | 9.4 | % | | | 23.1 | % | | | 3.9 | % |
| | | | | | | | | | | | | | | | | | | | | |
| Annualized ratios/supplemental data: | | | | | | | | | | | | | | | | | | | | |
| Net assets at end of year (000’s) | | $ | 1,246,197 | | | $ | 1,145,892 | | | $ | 1,029,373 | | | $ | 835,858 | | | $ | 569,710 | |
| Ratio of expenses to average net assets before expense waivers | | | 1.00 | %b | | | 1.01 | % | | | 1.04 | % | | | 1.06 | % | | | 1.07 | % |
| Ratio of expenses to average net assets after expense waivers | | | 1.00 | % | | | 1.00 | % | | | 1.00 | % | | | 1.00 | % | | | 1.00 | % |
| Ratio of net investment income to average net assets | | | 1.07 | % | | | 1.02 | % | | | 1.46 | % | | | 1.91 | % | | | 1.69 | % |
| Portfolio turnover rate | | | 34 | % | | | 43 | % | | | 43 | % | | | 63 | % | | | 86 | % |
| a | Calculated using the average shares method for the period. |
| b | There were no voluntary fee reductions during the period. |
See Notes to Financial Statements.
| Old Westbury Funds, Inc. |
| Large Cap Strategies Fund |
| Financial Highlights |
| |
For a Share Outstanding Throughout Each Period.
| | | YEAR ENDED OCTOBER 31, | |
| | | 2016 | | | 2015 | | | 2014 | | | 2013 | | | 2012 | |
| Net asset value, beginning of year | | $ | 13.01 | | | $ | 13.20 | | | $ | 12.09 | | | $ | 9.69 | | | $ | 9.12 | |
| | | | | | | | | | | | | | | | | | | | | |
| Investment operations: | | | | | | | | | | | | | | | | | | | | |
| Net investment income | | | 0.08 | a | | | 0.12 | a | | | 0.10 | a | | | 0.11 | a | | | 0.09 | a |
| Net realized and unrealized gains on investments and foreign currency transactions | | | 0.16 | | | | 0.13 | | | | 1.09 | | | | 2.36 | | | | 0.63 | |
| Total from investment operations | | | 0.24 | | | | 0.25 | | | | 1.19 | | | | 2.47 | | | | 0.72 | |
| | | | | | | | | | | | | | | | | | | | | |
| Distributions: | | | | | | | | | | | | | | | | | | | | |
| Net investment income | | | (0.10 | ) | | | (0.10 | ) | | | (0.08 | ) | | | (0.07 | ) | | | (0.15 | ) |
| Net realized gains | | | (0.20 | ) | | | (0.34 | ) | | | — | | | | — | | | | — | |
| Total distributions | | | (0.30 | ) | | | (0.44 | ) | | | (0.08 | ) | | | (0.07 | ) | | | (0.15 | ) |
| Net asset value, end of year | | $ | 12.95 | | | $ | 13.01 | | | $ | 13.20 | | | $ | 12.09 | | | $ | 9.69 | |
| Total return | | | 1.9 | % | | | 2.0 | % | | | 9.9 | % | | | 25.7 | % | | | 8.0 | % |
| | | | | | | | | | | | | | | | | | | | | |
| Annualized ratios/supplemental data: | | | | | | | | | | | | | | | | | | | | |
| Net assets at end of year (000’s) | | $ | 14,595,891 | | | $ | 14,141,401 | | | $ | 12,624,586 | | | $ | 9,564,418 | | | $ | 4,145,804 | |
| Ratio of expenses to average net assets before expense waivers | | | 1.11 | %b | | | 1.11 | %b | | | 1.12 | %b | | | 1.15 | %b | | | 1.18 | % |
| Ratio of expenses to average net assets after expense waivers | | | 1.11 | % | | | 1.11 | % | | | 1.12 | % | | | 1.15 | % | | | 1.15 | % |
| Ratio of net investment income to average net assets | | | 0.67 | % | | | 0.88 | % | | | 0.82 | % | | | 1.00 | % | | | 0.93 | % |
| Portfolio turnover rate | | | 50 | % | | | 61 | % | | | 51 | % | | | 42 | % | | | 55 | % |
| a | Calculated using the average shares method for the period. |
| b | There were no voluntary fee reductions during the period. |
See Notes to Financial Statements.
| Old Westbury Funds, Inc. |
| Small & Mid Cap Fund |
| Financial Highlights |
| |
For a Share Outstanding Throughout Each Period.
| | | YEAR ENDED OCTOBER 31, | |
| | | 2016 | | | 2015 | | | 2014 | | | 2013 | | | 2012 | |
| Net asset value, beginning of year | | $ | 15.86 | | | $ | 17.09 | | | $ | 17.30 | | | $ | 14.64 | | | $ | 14.34 | |
| | | | | | | | | | | | | | | | | | | | | |
| Investment operations: | | | | | | | | | | | | | | | | | | | | |
| Net investment income | | | 0.09 | a | | | 0.09 | a | | | 0.12 | a | | | 0.12 | a | | | 0.11 | a |
| Net realized and unrealized gains on investments, foreign currency transactions and deferred taxes | | | 0.66 | | | | 0.40 | | | | 0.83 | | | | 3.61 | | | | 0.95 | |
| Total from investment operations | | | 0.75 | | | | 0.49 | | | | 0.95 | | | | 3.73 | | | | 1.06 | |
| | | | | | | | | | | | | | | | | | | | | |
| Distributions: | | | | | | | | | | | | | | | | | | | | |
| Net investment income | | | (0.12 | ) | | | (0.13 | ) | | | (0.13 | ) | | | (0.16 | ) | | | (0.10 | ) |
| Net realized gains | | | (0.68 | ) | | | (1.59 | ) | | | (1.03 | ) | | | (0.91 | ) | | | (0.66 | ) |
| Total distributions | | | (0.80 | ) | | | (1.72 | ) | | | (1.16 | ) | | | (1.07 | ) | | | (0.76 | ) |
| Net asset value, end of year | | $ | 15.81 | | | $ | 15.86 | | | $ | 17.09 | | | $ | 17.30 | | | $ | 14.64 | |
| Total return | | | 5.1 | % | | | 2.9 | % | | | 5.7 | % | | | 26.8 | % | | | 8.0 | % |
| | | | | | | | | | | | | | | | | | | | | |
| Annualized ratios/supplemental data: | | | | | | | | | | | | | | | | | | | | |
| Net assets at end of year (000’s) | | $ | 5,471,624 | | | $ | 5,449,609 | | | $ | 6,385,783 | | | $ | 6,624,651 | | | $ | 4,876,907 | |
| Ratio of expenses to average net assets before expense waivers | | | 1.16 | %b | | | 1.16 | %b | | | 1.15 | %b | | | 1.16 | %b | | | 1.17 | %b |
| Ratio of expenses to average net assets after expense waivers | | | 1.11 | % | | | 1.11 | % | | | 1.11 | % | | | 1.11 | % | | | 1.11 | % |
| Ratio of net investment income to average net assets | | | 0.61 | % | | | 0.56 | % | | | 0.67 | % | | | 0.73 | % | | | 0.78 | % |
| Portfolio turnover rate | | | 48 | % | | | 50 | % | | | 38 | % | | | 31 | % | | | 28 | % |
| a | Calculated using the average shares method for the period. |
| b | When counterparties post cash collateral with respect to various derivative transactions, the Fund may invest the collateral and receive interest income on the investment and pays interest expense on the collateral to the counterparty. The interest income is included in investment income on the Statements of Operations, and the interest expense is included in the Fund’s overall expenses on the Statement of Operations and expense ratio. |
See Notes to Financial Statements.
| Old Westbury Funds, Inc. |
| Strategic Opportunities Fund |
| Financial Highlights |
| |
For a Share Outstanding Throughout Each Period.
| | | YEAR ENDED OCTOBER 31, | |
| | | 2016a | | | 2015a | | | 2014 | | | 2013 | | | 2012 | |
| Net asset value, beginning of year | | $ | 7.65 | | | $ | 8.20 | | | $ | 8.24 | | | $ | 7.51 | | | $ | 7.23 | |
| | | | | | | | | | | | | | | | | | | | | |
| Investment operations: | | | | | | | | | | | | | | | | | | | | |
| Net investment income | | | 0.12 | b | | | 0.09 | b | | | 0.09 | b | | | 0.15 | b | | | 0.22 | b |
| Net realized and unrealized gains/(losses) on investments, securities sold short, futures contracts, swap agreements, written options, foreign currency transactions and deferred taxes | | | (0.10 | ) | | | (0.02 | ) | | | 0.36 | | | | 0.76 | | | | 0.41 | |
| Total from investment operations | | | 0.02 | | | | 0.07 | | | | 0.45 | | | | 0.91 | | | | 0.63 | |
| | | | | | | | | | | | | | | | | | | | | |
| Distributions: | | | | | | | | | | | | | | | | | | | | |
| Net investment income | | | (0.12 | ) | | | (0.17 | ) | | | (0.27 | ) | | | (0.18 | ) | | | (0.35 | ) |
| Net realized gains | | | (0.14 | ) | | | (0.45 | ) | | | (0.22 | ) | | | — | | | | — | |
| Total distributions | | | (0.26 | ) | | | (0.62 | ) | | | (0.49 | ) | | | (0.18 | ) | | | (0.35 | ) |
| Net asset value, end of year | | $ | 7.41 | | | $ | 7.65 | | | $ | 8.20 | | | $ | 8.24 | | | $ | 7.51 | |
| Total return | | | 0.2 | % | | | 0.9 | % | | | 5.9 | % | | | 12.3 | % | | | 9.4 | % |
| | | | | | | | | | | | | | | | | | | | | |
| Annualized ratios/supplemental data: | | | | | | | | | | | | | | | | | | | | |
| Net assets at end of period (000’s) | | $ | 5,934,053 | | | $ | 7,095,756 | | | $ | 5,598,552 | | | $ | 5,737,691 | | | $ | 7,023,142 | |
| Ratio of expenses to average net assets before expense waivers | | | 1.32 | %c | | | 1.32 | %c | | | 1.32 | %c | | | 1.32 | %c | | | 1.35 | %c |
| Ratio of expenses to average net assets after expense waivers | | | 1.20 | % | | | 1.20 | % | | | 1.20 | % | | | 1.20 | % | | | 1.20 | % |
| Ratio of net investment income to average net assets | | | 1.67 | % | | | 1.16 | % | | | 1.14 | % | | | 1.97 | % | | | 3.09 | % |
| Portfolio turnover rate | | | 114 | % | | | 70 | % | | | 82 | % | | | 61 | % | | | 122 | % |
| a | Consolidated Financial Highlights. |
| b | Calculated using the average shares method for the period. |
| c | When counterparties post cash collateral with respect to various derivative transactions, the Fund may invest the collateral and receive interest income on the investment and pays interest expense on the collateral to the counterparty. The interest income is included in investment income on the Statements of Operations, and the interest expense is included in the Fund’s overall expenses on the Statement of Operations and expense ratio. |
See Notes to Financial Statements.
| Old Westbury Funds, Inc. |
| Fixed Income Fund |
| Financial Highlights |
| |
For a Share Outstanding Throughout Each Period.
| | | YEAR ENDED OCTOBER 31, | |
| | | 2016 | | | 2015 | | | 2014 | | | 2013 | | | 2012 | |
| Net asset value, beginning of year | | $ | 11.19 | | | $ | 11.22 | | | $ | 11.34 | | | $ | 11.66 | | | $ | 11.80 | |
| | | | | | | | | | | | | | | | | | | | | |
| Investment operations: | | | | | | | | | | | | | | | | | | | | |
| Net investment income | | | 0.12 | a | | | 0.12 | a | | | 0.11 | a | | | 0.14 | a | | | 0.20 | a |
| Net realized and unrealized gains/(losses) on investments | | | 0.11 | | | | — | b | | | (0.01 | ) | | | (0.18 | ) | | | 0.20 | |
| Total from investment operations | | | 0.23 | | | | 0.12 | | | | 0.10 | | | | (0.04 | ) | | | 0.40 | |
| | | | | | | | | | | | | | | | | | | | | |
| Distributions: | | | | | | | | | | | | | | | | | | | | |
| Net investment income | | | (0.14 | ) | | | (0.15 | ) | | | (0.20 | ) | | | (0.22 | ) | | | (0.28 | ) |
| Net realized gains | | | — | | | | — | | | | (0.02 | ) | | | (0.06 | ) | | | (0.26 | ) |
| Total distributions | | | (0.14 | ) | | | (0.15 | ) | | | (0.22 | ) | | | (0.28 | ) | | | (0.54 | ) |
| Net asset value, end of year | | $ | 11.28 | | | $ | 11.19 | | | $ | 11.22 | | | $ | 11.34 | | | $ | 11.66 | |
| Total return | | | 2.1 | % | | | 1.1 | % | | | 0.9 | % | | | (0.3 | )% | | | 3.5 | % |
| | | | | | | | | | | | | | | | | | | | | |
| Annualized ratios/supplemental data: | | | | | | | | | | | | | | | | | | | | |
| Net assets at end of year (000’s) | | $ | 785,417 | | | $ | 583,204 | | | $ | 563,716 | | | $ | 533,444 | | | $ | 491,311 | |
| Ratio of expenses to average net assets before expense waivers | | | 0.74 | % | | | 0.74 | % | | | 0.75 | % | | | 0.75 | % | | | 0.76 | % |
| Ratio of expenses to average net assets after expense waivers | | | 0.64 | % | | | 0.64 | % | | | 0.65 | % | | | 0.65 | % | | | 0.66 | % |
| Ratio of net investment income to average net assets | | | 1.07 | % | | | 1.03 | % | | | 0.94 | % | | | 1.26 | % | | | 1.69 | % |
| Portfolio turnover rate | | | 68 | % | | | 67 | % | | | 65 | % | | | 78 | % | | | 64 | % |
| a | Calculated using the average shares method for the period. |
| b | Amount is less than $0.005 per share. |
See Notes to Financial Statements.
| Old Westbury Funds, Inc. |
| Municipal Bond Fund |
| Financial Highlights |
| |
For a Share Outstanding Throughout Each Period.
| | | YEAR ENDED OCTOBER 31, | |
| | | 2016 | | | 2015 | | | 2014 | | | 2013 | | | 2012 | |
| Net asset value, beginning of year | | $ | 12.00 | | | $ | 12.02 | | | $ | 11.96 | | | $ | 12.33 | | | $ | 11.96 | |
| | | | | | | | | | | | | | | | | | | | | |
| Investment operations: | | | | | | | | | | | | | | | | | | | | |
| Net investment income | | | 0.14 | a | | | 0.15 | a | | | 0.14 | a | | | 0.17 | a | | | 0.19 | a |
| Net realized and unrealized gains/(losses) on investments | | | 0.10 | | | | 0.03 | | | | 0.10 | | | | (0.25 | ) | | | 0.40 | |
| Total from investment operations | | | 0.24 | | | | 0.18 | | | | 0.24 | | | | (0.08 | ) | | | 0.59 | |
| | | | | | | | | | | | | | | | | | | | | |
| Distributions: | | | | | | | | | | | | | | | | | | | | |
| Net investment income | | | (0.14 | ) | | | (0.15 | ) | | | (0.15 | ) | | | (0.17 | ) | | | (0.19 | ) |
| Net realized gains | | | (0.01 | ) | | | (0.05 | ) | | | (0.03 | ) | | | (0.12 | ) | | | (0.03 | ) |
| Total distributions | | | (0.15 | ) | | | (0.20 | ) | | | (0.18 | ) | | | (0.29 | ) | | | (0.22 | ) |
| Net asset value, end of year | | $ | 12.09 | | | $ | 12.00 | | | $ | 12.02 | | | $ | 11.96 | | | $ | 12.33 | |
| Total return | | | 2.1 | % | | | 1.5 | % | | | 2.0 | % | | | (0.7 | )% | | | 5.0 | % |
| | | | | | | | | | | | | | | | | | | | | |
| Annualized ratios/supplemental data: | | | | | | | | | | | | | | | | | | | | |
| Net assets at end of year (000’s) | | $ | 2,055,136 | | | $ | 1,375,043 | | | $ | 1,326,109 | | | $ | 1,244,693 | | | $ | 1,098,750 | |
| Ratio of expenses to average net assets before expense waivers | | | 0.69 | % | | | 0.70 | % | | | 0.70 | % | | | 0.71 | % | | | 0.73 | % |
| Ratio of expenses to average net assets after expense waivers | | | 0.59 | % | | | 0.60 | % | | | 0.60 | % | | | 0.61 | % | | | 0.63 | % |
| Ratio of net investment income to average net assets | | | 1.17 | % | | | 1.28 | % | | | 1.20 | % | | | 1.38 | % | | | 1.55 | % |
| Portfolio turnover rate | | | 44 | % | | | 31 | % | | | 55 | % | | | 51 | % | | | 34 | % |
| a | Calculated using the average shares method for the period. |
See Notes to Financial Statements.
| Old Westbury Funds, Inc. | |
| Notes To Financial Statements | |
| | October 31, 2016 |
| | |
Old Westbury Funds, Inc. (the “Corporation”) was organized as a Maryland corporation on August 26, 1993 and commenced operations on October 22, 1993. The Corporation is an open-end management investment company registered under the Investment Company Act of 1940, as amended (the “1940 Act”). The Corporation’s Board of Directors (the “Board”) are permitted to create an unlimited number of series, each with one or more separate classes of shares. At October 31, 2016, the Corporation consisted of six separate investment portfolios (each series individually referred to as a “Fund” and collectively as the “Funds”) shown below:
| Fund Name | | Investment Objective |
| Old Westbury Large Cap Core Fund (“Large Cap Core Fund”) | | Long-term capital appreciation. |
| Old Westbury Large Cap Strategies Fund (“Large Cap Strategies Fund”) | | Long-term capital appreciation. |
| Old Westbury Small & Mid Cap Fund (“Small & Mid Cap Fund”) | | Long-term capital appreciation. |
| Old Westbury Strategic Opportunities Fund (“Strategic Opportunities Fund”) | | Long-term capital appreciation. |
| Old Westbury Fixed Income Fund (“Fixed Income Fund”) | | Total return (consisting of current income and capital appreciation). |
| Old Westbury Municipal Bond Fund (“Municipal Bond Fund”) | | Total return (consisting of current income that is exempt from regular federal income tax and capital appreciation). |
The Corporation has authorized a total of 20 billion shares of common stock (par value $0.001 per share).
Under the Corporation’s organizational documents, its Officers and Directors are indemnified against certain liabilities arising out of the performance of their duties for the Corporation. In addition, in the normal course of business, the Corporation enters into contracts with vendors and others that provide for general indemnifications. The Corporation’s maximum exposure under these arrangements is unknown as this would involve future claims that may be made against the Corporation. However, based on experience, the Corporation expects the risk of loss to be remote.
| 2. | Basis for Consolidation for the Strategic Opportunities Fund: |
The consolidated financial statements of the Strategic Opportunities Fund include the financial results of its wholly-owned subsidiary (organized under the laws of the Cayman Islands), OWF Strategic Opportunities Fund, Ltd. (the “Subsidiary”). All material intercompany accounts and transactions have been eliminated. The Subsidiary commenced operations on May 1, 2015. The Strategic Opportunities Fund commenced reporting on a consolidated basis as of such commencement date. The Subsidiary is a commodity pool, as defined in the regulations of the Commodity Futures Trade Commission (the “CFTC”), and is operated by Bessemer Investment Management LLC (“BIM” or the “Adviser”), a commodity pool operator registered with the CFTC effective January 1, 2013. The Strategic Opportunities Fund seeks to gain exposure to commodities through direct investments in commodities-related instruments, derivatives and other investments and through investments in the Subsidiary. The Subsidiary has the same investment goal as the Strategic Opportunities Fund. The Subsidiary pursues its investment goal by investing in commodities-related instruments, derivatives and other investments. The Subsidiary (unlike the Strategic Opportunities Fund) may invest without limitation in these instruments. However, the Subsidiary is otherwise subject to the same fundamental, non-fundamental and certain other investment restrictions as the Strategic Opportunities Fund. The portion of the Strategic Opportunities Fund’s or Subsidiary’s assets exposed to any particular commodity, derivative or other investment will vary based on market conditions, but from time to time, some exposure could be substantial. To the extent of the Strategic Opportunities Fund’s investment through the Subsidiary, it will be subject to the risks associated with the derivatives and other instruments in which the Subsidiary invests. As of October 31, 2016, the Subsidiary represented $74,267,084 or 1.25% of the Strategic Opportunities Fund’s net assets.
| 3. | Significant Accounting Policies: |
The following is a summary of the significant accounting policies followed by the Corporation in the preparation of its financial statements. The policies are in conformity with accounting principles generally accepted in the U.S. (“GAAP”). The preparation of financial statements in accordance with GAAP requires management to make estimates and assumptions that affect the reported amounts of assets and liabilities at the date of the financial statements and the reported amounts of income and expenses for the period. Actual results could differ from those estimates.
| Old Westbury Funds, Inc. | |
| Notes To Financial Statements - (Continued) | |
| | October 31, 2016 |
| | |
The Financial Accounting Standards Board (“FASB”) Accounting Standards Codification is the exclusive reference of authoritative GAAP recognized by the FASB to be applied by nongovernmental entities. Rules and interpretive releases of the Securities and Exchange Commission (“SEC”) under authority of federal laws are also sources of authoritative GAAP for SEC registrants such as the Corporation.
In August 2014, FASB issued Accounting Standards Update (“ASU”) No. 2014-15, “Presentation of Financial Statements – Going Concern (Subtopic 205-40): Disclosure of Uncertainties about an Entity’s Ability to Continue as a Going Concern.” Under GAAP, a reporting entity’s continued existence is the basis for preparing financial statements as a going concern (commonly referred to as the going concern basis of accounting) unless and until the entity’s liquidation becomes imminent. This ASU provides guidance in GAAP about management’s responsibility to evaluate whether there is substantial doubt about an entity’s ability to continue as a going concern and to provide related disclosures in the entity’s financial statements. The ASU becomes effective for all entities for the annual period ending after December 15, 2016, and for annual periods and interim periods thereafter. Management is evaluating the impact of this guidance on the Funds’ financial statement disclosures.
A. Valuation of Investments. Readily marketable equity securities listed on an exchange are valued, except as indicated below, at the last sale price reflected at the close of the regular trading session of the exchange on the business day as of which such value is being determined, and securities listed on NASDAQ are valued at the NASDAQ Official Closing Price (“NOCP”) and, if no NOCP is available, then at the last reported sales price. If there has been no sale on such day, the securities are valued at the mean of the closing bid and asked prices on such day. If no bid or asked prices are quoted on such day, then the securities are valued using a broker-dealer quote or an approved pricing service. Equity securities traded on more than one national securities exchange are valued at the last sale price on the business day as of which such value is being determined as reflected on the tape at the close of the exchange representing the principal market for such securities.
Readily marketable equity securities traded in the over-the-counter market (“OTC”), including listed securities whose primary market is believed by BIM, or a sub-adviser, as applicable, to be over-the-counter, are valued at the mean of the latest bid and asked prices using a broker-dealer or an approved pricing service.
Shares of open-end investment companies are valued at the latest net asset value (“NAV”) reported by the investment company. Shares of investment companies that are traded intra-day on an exchange (e.g., exchange traded funds) will be valued at the last sale price as reflected at the close of the regular trading session of such exchange.
Debt instruments are valued on the basis of prices obtained from a broker-dealer or an approved pricing service.
Foreign securities generally are valued in their national currency at the latest available quoted sale price as of the close of trading on the foreign exchange or other principal market on which the security is traded. In the absence of current trade activity, the securities will be valued at the mean of the latest bid/ask quotations. As described below, this value is then converted into its U.S. dollar equivalent using the daily rate of exchange at the time of a Fund’s NAV calculation (normally 4:00 p.m. Eastern Time).
Forward currency contracts are valued at the mean between the bid and the asked prices. Quotations are available for regularly scheduled settlement dates such as on a 1-,2-,3-,4-,5-,6-,9-, and 12-month basis. Over-the-counter derivatives, such as swaps and non-exchange traded options and futures are valued on the basis of counterparty valuation quotations or dealer quotations, subject to review by BIM, or a sub-adviser with BIM’s oversight where appropriate. An approved pricing service may also be used to price these instruments. Exchange-traded swaps, options and futures contracts and options thereon are valued at their last sale or settlement price as of the close of such exchanges or, if no sales are reported, at the mean between the last reported bid and asked prices. Repurchase agreements are valued at the original cost. Contracts for long puts and calls are valued at the bid price and short puts and calls are valued at the offering price of a broker-dealer or an exchange. Generally, options, rights/warrants and other “when-issued” securities follow the same pricing methods as equity securities.
Securities and other investments for which market quotations are not readily available are valued under the general supervision and responsibility of the Board and pursuant to policies and procedures established by the Board, which are designed to reflect, in good faith, the fair value of such investments. A market quotation is considered not readily available if, among other circumstances, the most recent reported price is deemed unreliable. For example, securities that may be subject to fair valuation include, but are not limited to: (1) securities in which trading has been halted pending further news; (2) illiquid securities in which there is no trading market and no broker coverage; (3) stale priced securities; (4) securities that may have defaulted or de-listed from an exchange and are no longer trading; (5) any other security for which the Funds’ Pricing Committee, with input from the Adviser or sub-advisers, as applicable, believes that the last trading price does not represent a reliable current price; or (6) other investments, including derivatives for which readily available market quotations are not generally available.
| Old Westbury Funds, Inc. | |
| Notes To Financial Statements - (Continued) | |
| | October 31, 2016 |
| | |
In addition, a Fund may fair value securities that trade on a foreign exchange because a significant event has occurred after the foreign exchange closes but before the time as of which a Fund’s share price is calculated. Foreign exchanges typically close before the time as of which Fund share prices are calculated, and may be closed altogether on some days a Fund is open. Such significant events affecting a foreign security may include, but are not limited to: (1) those relating to a single issuer; (2) governmental actions that affect securities in one sector or country; (3) natural disasters or armed conflicts affecting a country or region; or (4) significant market fluctuations. There is no single standard for determining the fair value of a security or investment, but, rather, several factors are considered, including an evaluation of the forces that influence the market in which the security or investment is purchased or sold, in determining whether a market price is readily available and, if not, the security’s or other investment’s fair value.
In light of the judgment involved in fair value decisions, there can be no assurances that a fair value assigned to a particular security reflects a price for which a security has traded or will trade. Accordingly, when a Fund uses fair value to price securities, it may value those securities higher or lower than another fund that uses market quotations to price the same securities.
In the event of a change in the S&P 500 Index that is greater than predetermined levels approved by the Board, the Funds will utilize an approved pricing service that has been designated to determine fair value to price securities traded on any overseas exchange. Pricing Service Vendors base their valuations on a number of factors, including, but not limited to, actual transaction data, benchmark yields, market bids, market offers, quotations from dealers, credit risk spreads, interest rate spreads, proprietary pricing models, cash flows, prepayment information, default rates, delinquency and loss assumptions, collateral characteristics, credit enhancements, specific deal information and other relationships observed in markets of comparable securities. In addition, foreign securities held by a Fund may trade on weekends or other days when the Fund does not calculate NAV. As a result, the market value of these investments may change on days when shares of the Fund cannot be bought or sold. Such fair valuations are categorized as Level 2 in the fair value hierarchy. Foreign securities that are valued based on market quotations are categorized as Level 1 in the fair value hierarchy. The Large Cap Core Fund, Large Cap Strategies Fund, Small & Mid Cap Fund and the Strategic Opportunities Fund utilized a systematic fair valuation model provided by an independent third-party vendor to fair value certain securities 35 days during the year ended October 31, 2016. As a result on days when the index change exceeds predetermined levels, certain securities held by the Funds were transferred from Level 1 into Level 2. On any subsequent day when such index level is not exceeded, certain securities held by the Funds were transferred from Level 2 back into Level 1. As of October 31, 2016, foreign securities were not fair valued as the change in the S&P 500 Index did not exceed the Funds’ predetermined level. There were no other transfers between Level 1 and Level 2 during the year ended October 31, 2016.
The fair value of investments is determined in accordance with the valuation policies and procedures approved by the Board. The Funds’ Pricing Committee established by the Board (the “Pricing Committee”) reviews pricing methodologies on at least a quarterly basis. The Pricing Committee is responsible for (i) establishing valuation processes and (ii) determining the fair value of the Funds’ holdings for which price quotations are not readily available, unreliable or for which an approved valuation method is deemed not to represent fair value. These investments are either categorized as Level 2 or 3 depending on the observability of the inputs used. The Pricing Committee may consider one or more factors in determining an investment’s fair value. The factors to be taken into account, to the extent relevant, typically include, but are not limited to: fundamental analytical data relating to the investment, the nature and duration of any restrictions on disposition of the investments, an evaluation of the forces that influence the market in which the investments are purchased or sold, the type of investment, financial statements and company filings, lack of marketability, the cost at date of purchase, good faith recommendation of BIM or a sub-adviser, as applicable, and any other relevant matters. When the fair valuation of investments use significant unobservable inputs, such investments will be categorized as Level 3 in the fair value hierarchy.
The significant unobservable inputs used in fair value measurement of the Funds’ Level 3 investments may include, where applicable: (i) an estimation of a normalized earnings level or projected cash flows for the company; (ii) the discounts applied to the last available price of the investment or a selection of comparable investments due to the lack of marketability of the investment; (iii) values or bid offers by dealers or other third parties; and (iv) the value associated with the latest round of financing. Significant changes in any of those inputs in isolation may result in a significantly lower or higher fair value measurement. Generally, a change in the assumptions used for the normalized earnings level will be accompanied by a directionally similar change in the discounts applied to the list of comparable investments.
| Old Westbury Funds, Inc. | |
| Notes To Financial Statements - (Continued) | |
| | October 31, 2016 |
| | |
The Funds’ Pricing Committee employs various methods for calibrating the valuation approach related to investments categorized within Level 3 in the fair value hierarchy. These methods may include regular due diligence of the Funds’ pricing vendors including back testing of trigger related fair value prices, a regular review of key inputs and assumptions, reviews of missing and stale prices and price variance analysis, including investigation of unusual or unexpected pricing changes and reviews of any market related activities. Additionally, the pricing of all fair value holdings is subsequently reviewed and approved by the Funds’ Board.
B. Security Transactions and Related Investment Income. Security transactions are accounted for no later than the first NAV calculation on the first business day following the trade date. However, for financial reporting purposes, portfolio securities transactions are reported on trade date. Realized gains and losses on security transactions are determined using the identified cost method for maximum tax benefit to shareholders. Dividend income and other distributions from portfolio securities are recorded on the ex-dividend date, except for certain dividends from foreign securities where the ex-dividend dates may have passed are recorded as soon as the Funds are informed of the dividends. Upon notification from issuers, some of the dividend income received from a real estate investment trust may be redesignated as a reduction of cost of the related investment and/or realized gain. Dividend income is recorded net of foreign taxes withheld where recovery of such taxes is not assured. Interest income is recognized on an accrual basis and includes where applicable, the amortization of premiums and accretion of discounts.
C. Payment-In-Kind Securities. The Funds may invest in payment-in-kind securities (“PIKs”). PIKs give the issuer the option at each interest payment date of making interest payments in either cash or additional debt securities. Those additional debt securities usually have the same terms, including maturity dates and interest rates, and associated risks as the original bonds. The daily market quotations of the original bonds may include the accrued interest (referred to as a dirty price) and require a pro-rata adjustment from the unrealized appreciation or depreciation on investments to interest receivable on the Statements of Assets and Liabilities.
For the year ended October 31, 2016, there were no in-kind payments received by the Funds with respect to PIK securities.
D. Foreign Currency Transactions. The books and records of the Funds are maintained in U.S. dollars. Investments and other assets and liabilities of the Funds denominated in a foreign currency, if any, are translated into U.S. dollars at current exchange rates as of the date of the Statements of Assets and Liabilities. Purchases and sales of securities, income receipts and expense payments are translated into U.S. dollars at the exchange rate on the dates of the transactions.
The Funds do not isolate the portion of operations resulting from changes in foreign exchange rates on investments from fluctuations arising from changes in market prices of securities held. Such fluctuations are included with the net realized and change in unrealized gain/(loss) on investments, securities sold short, futures contracts, swap agreements, written options and foreign currency transactions in the Statements of Operations.
Foreign security and currency transactions may involve certain risks not typically associated with those of U.S. companies, including the level of governmental supervision and regulation of foreign securities markets and the possibility of political and economic instability.
E. Securities Sold Short. The Funds may sell securities short. A short sale is a transaction in which a Fund sells securities it does not own, but has borrowed, in anticipation of a decline in the market price of the securities. A Fund is obligated to replace the borrowed securities at their market price at the time of settlement. A Fund’s obligation to replace the securities borrowed in connection with a short sale will be fully secured by collateral deposited with the broker. Short sales by a Fund involve certain risks and special considerations.
The Funds may not always be able to close out a short position on favorable terms. Short sales involve the risk that a Fund will incur a loss by subsequently buying a security at a higher price than the price at which it sold the security short. The amount of such loss is theoretically unlimited (since it is limited only by the increase in value of the security sold short by a Fund). In contrast, the risk of loss from a long position is limited to a Fund’s investment in the long position, since its value cannot fall below zero. Short selling is a form of leverage which may lead to higher volatility of a Fund’s NAV or greater losses for a Fund. To mitigate leverage risk, a Fund will always hold liquid assets (including its long positions) at least equal to its short position exposure, marked-to-market daily.
F. Collectibles. The Strategic Opportunities Fund may invest in collectibles, which are rare objects collected by investors. They can include stamps, coins, books, oriental rugs, antiques, sports and other memorabilia, photographs, art and wine. Collectibles are generally expected to rise in value during inflationary periods when investors are trying to move to assets viewed as
| Old Westbury Funds, Inc. | |
| Notes To Financial Statements - (Continued) | |
| | October 31, 2016 |
| | |
an inflation hedge. Generally, collectibles can be expected to drop in value during periods of low inflation. Collectible trading for profit is subject to certain risks and other considerations, including that collectibles: (i) have limited buying and selling markets; (ii) are often bought and sold at auction and subject to buyer and/or seller premiums; (iii) experience periods of high and low demand; (iv) must be insured, physically held and properly maintained; (v) may need to have their authenticity and provenance verified from time to time; and (vi) may not have representative market valuations available. The Strategic Opportunities Fund does not currently intend to invest more than 5% of its total assets in collectibles. As of October 31, 2016, the Strategic Opportunities Fund held no collectibles.
G. Commodities. In order to gain exposure to the commodities markets, the Strategic Opportunities Fund, directly or through its Subsidiary, may invest in commodities-related instruments, derivatives and other investments. Commodities are assets that have tangible properties, such as oil, agriculture products and precious metals. The value of commodities may be affected by, among other things, changes in overall market movements, commodity index volatility, changes in interest rates, or factors affecting a particular industry or commodity, such as drought, floods, weather, livestock disease, embargoes, tariffs and international economic, political and regulatory developments. These factors may have a larger impact on commodity prices and commodity-linked instruments than on traditional securities. Certain commodities are also subject to limited pricing flexibility because of supply and demand factors. Others are subject to broad price fluctuations as a result of the volatility of the prices for certain raw materials and the instability of supplies of other materials. These additional variables may create additional risks which subject the Strategic Opportunities Fund and its Subsidiary’s investments to greater volatility than investments in traditional securities.
H. Inflation-Protected Securities. The Funds may invest in inflation-protected securities, which unlike traditional debt securities that make fixed or variable principal and interest payments, are structured to provide protection against the negative effects of inflation. The value of the debt securities’ principal is adjusted to track changes in an official inflation measure. For example, the U.S. Treasury currently uses the Consumer Price Index for Urban Consumers as a measure of inflation for Treasury Inflation-Protected Securities (“TIPS”). Other inflation-protected securities may not carry a similar guarantee by their issuer. A Fund may buy TIPS that are designed to provide an investment vehicle that is not vulnerable to inflation. The interest rate paid by TIPS is fixed. The principal value rises or falls semi-annually based on the changes in the published Consumer Price Index. If inflation occurs, the principal and interest payments on TIPS are adjusted to protect investors from inflationary loss. If deflation occurs, the principal and interest payments will be adjusted downward, although the principal will not fall below its face amount at maturity.
I. When-Issued and Delayed Delivery Securities. The Funds may purchase or sell securities that they are entitled to receive on a when-issued basis. The Funds may also purchase or sell securities on a delayed delivery basis. When-issued and delayed delivery securities involve risk that the security a Fund buys will lose value prior to its delivery. There is also a risk that the security will not be issued or that the other party to the transaction will not meet its obligation. If this occurs, a Fund loses both the investment opportunity for the assets it set aside to pay for the security and any gain in the security’s price.
J. Loan Participations and Assignments. The Strategic Opportunities Fund and Fixed Income Fund may invest in fixed or floating rate loans to U.S. companies, foreign entities, and U.S. subsidiaries of foreign entities made by one or more financial institutions. The rate of interest on a fixed-rate loan is generally a set amount. The rate of interest payable on floating rate loans is the sum of a base lending rate plus a specified spread. Base lending rates are generally the London InterBank Offered Rate, the Certificate of Deposit Rate of a designated U.S. bank, the prime rate of a designated U.S. bank, the Federal Funds rate, or another base lending rate used by commercial lenders. The applicable spread may be fixed at time of issuance or may adjust upward or downward to reflect changes in credit quality of the borrower. A Fund may invest in loans that are investment grade, below investment grade (“junk”), or not rated by any nationally recognized statistical ratings organization. Loans that are rated lower than investment grade typically entail default and other risks greater than those associated with higher-rated loans. Generally, the lower the rating category, the riskier the investment. Typically, a Fund���s investments in loans are expected to take the form of loan participations and assignments of portions of loans from third parties.
Currently, the Strategic Opportunities Fund intends to invest in loans that are below investment grade and, to a lesser extent, unrated loans. The Strategic Opportunities Fund’s investments in loans are expected in most instances to be in the form of assignments. Generally, when a Fund purchases an assignment of a loan from a lender, it will step into the position of the lender and acquire direct rights against the borrower on the loan. Because assignments are arranged through private negotiations between potential assignees and potential assignors, however, the rights and obligations acquired by a Fund as the purchaser of an assignment may differ from, and be more limited than, those held by the assigning lender. The assignability of certain obligations may be restricted by the governing documentation as to the nature of the assignee such that the only way
| Old Westbury Funds, Inc. | |
| Notes To Financial Statements - (Continued) | |
| | October 31, 2016 |
| | |
in which a Fund may acquire an interest in a loan is by purchasing a participation of interest and not an assignment. A Fund may have difficulty disposing of assignments and participation interests given these limitations and other factors.
K. Credit Enhancements. Certain obligations held by the Funds have credit enhancement or liquidity features that may, under certain circumstances, provide for repayment of principal and interest on the obligation upon demand date, interest rate reset date or final maturity. These enhancements may include: letters of credit; liquidity guarantees; and third party insurance (i.e., AMBAC and FGIC). The value of the obligations may be affected by changes in credit worthiness of the entities that provide any supporting letters of credit or other credit enhancements. The value of the obligations also will be affected by the exhaustion, termination or expiration of any credit enhancement.
L. Restricted and Illiquid Securities. The Funds may purchase securities which are subject to legal or contractual delays, restrictions, and costs on resale. Because of time limitations, the Funds might not be able to dispose of these securities at reasonable prices or at times advantageous to the Funds. Each Fund intends to limit the purchase of securities which have not been determined by BIM to be liquid, together with other securities considered to be illiquid, including repurchase agreements providing for settlement in more than seven days after notice, to not more than 15% of its net assets.
M. Distributions to Shareholders. Distributions from net investment income, if any, generally are declared and paid quarterly for the Fixed Income Fund and Municipal Bond Fund and at least annually for the Large Cap Core Fund, Large Cap Strategies Fund, Small & Mid Cap Fund and Strategic Opportunities Fund. Distributable net realized capital gains, if any, are declared and distributed at least annually. The amount and timing of dividends and distributions are determined in accordance with federal income tax regulations, which may differ from U.S. GAAP.
N. Expenses. Expenses that are directly related to one of the Funds are charged directly to that Fund on an accrual basis. Other operating expenses of the Corporation are prorated to each Fund on an accrual basis utilizing relative net assets or another reasonable basis.
| 4. | Market and Credit Risk: |
In the normal course of business, the Funds invest in securities and enter into transactions where risks exist due to fluctuations in the market (market risk) or failure of the issuer of a security to meet all its obligations (credit risk). The value of securities held by a Fund may decline in response to certain events, including those directly involving the issuers whose securities are owned by the Fund; changes or perceived changes in economic conditions; overall market changes; local, regional or global political, social or economic events or instability; and currency and interest rate and price fluctuations. Since 2008, the U.S. government has implemented various measures designed to stabilize the U.S. economy and support U.S. economic recovery, including by keeping the federal funds rate at or near zero percent and purchasing large quantities of securities issued or guaranteed by the U.S. government or its agencies and instrumentalities on the open market (“quantitative easing”). The Board of Governors of the Federal Reserve System has recently ended this quantitative easing and, to the extent it raises the federal funds rate, there is a risk that interest rates across the U.S. financial markets will rise suddenly and significantly, thereby exposing fixed income and related markets to heightened volatility and reduced liquidity. Such market events may cause a Fund to experience losses and/or high redemption requests, which may result in increased transactions costs and lower a Fund’s performance. Exposure to foreign markets through issuers or currencies can involve additional risks relating to market, economic, political, regulatory, geopolitical, or other conditions. In addition, the securities of foreign companies also may be subject to the imposition of economic sanctions or other government restrictions. The risks of foreign investments are increased in emerging markets which may experience hyperinflation and have far lower trading volumes and less liquidity than developed markets. Changes in foreign currency exchange rates can affect the value of a Fund’s portfolio. Depositary receipts are generally subject to the same risks as the foreign securities that they evidence or into which they may be converted. Similar to credit risk, a Fund may be exposed to counterparty risk, or the risk that an entity with which the Fund has unsettled or open transactions may default. Financial assets, which potentially expose a Fund to credit and counterparty risks, consist principally of investments, receivables for securities sold and cash due from brokers. The Funds’ Adviser and sub-advisers, as applicable, review the creditworthiness of counterparties that they believe entail material credit risk in relation to the investment policies of a Fund. The extent of a Fund’s exposure to credit and counterparty risks with respect to these financial assets is generally represented by their values recorded in the Fund’s Statements of Assets and Liabilities.
| 5. | Fair Value Measurements: |
The inputs and valuation techniques used to measure fair value of the Funds’ investments are summarized into three levels as described in the hierarchy below:
| Old Westbury Funds, Inc. | |
| Notes To Financial Statements - (Continued) | |
| | October 31, 2016 |
| | |
• Level 1 - quoted prices in active markets for identical securities.
• Level 2 - other significant observable inputs (including quoted prices for similar securities, interest rates, prepayment speeds, credit ratings, etc.).
• Level 3 - significant unobservable inputs (including the Funds’ own assumptions in determining the fair value of investments).
The inputs or methodology used for valuing securities are not necessarily an indication of the risk associated with investing in those securities.
The summary of inputs used to value the Funds’ investments as of October 31, 2016 is as follows:
| | | Level 1
Quoted Prices | | | Level 2
Significant
Observable
Inputs | | | Level 3
Significant
Unobservable
Inputs(d) | | | Total | |
| Large Cap Core Fund | | | | | | | | | | | | | | | | |
| Equity Securities(b) | | $ | 1,177,374,919(a | ) | | $ | 7,871,783 | | | $ | — | | | $ | 1,185,246,702 | |
| Investment Company | | | 60,170,000 | | | | — | | | | — | | | | 60,170,000 | |
| Total | | $ | 1,237,544,919 | | | $ | 7,871,783 | | | $ | — | | | $ | 1,245,416,702 | |
| Large Cap Strategies Fund | | | | | | | | | | | | | | | | |
| Equity Securities(b) | | $ | 13,551,057,256(a | ) | | $ | 105,950,506(e | ) | | $ | — | | | $ | 13,657,007,762 | |
| Participation Notes | | | 6,219,221 | | | | — | | | | — | | | | 6,219,221 | |
| Master Limited Partnerships | | | 32,692,972(a | ) | | | — | | | | — | | | | 32,692,972 | |
| Preferred Stocks | | | 6,387,896 | | | | — | | | | — | | | | 6,387,896 | |
| Exchange Traded Funds | | | 310,151,700(a | ) | | | — | | | | — | | | | 310,151,700 | |
| U.S. Government Agencies | | | — | | | | 364,942,144 | | | | — | | | | 364,942,144 | |
| Investment Company | | | 248,076,200 | | | | — | | | | — | | | | 248,076,200 | |
| Other Financial Instruments - Liabilities* | | | | | | | | | | | | | | | | |
| Foreign currency exchange contracts | | | — | | | | 7,438,173 | | | | — | | | | 7,438,173 | |
| Total | | $ | 14,154,585,245 | | | $ | 478,330,823 | | | $ | — | | | $ | 14,632,916,068 | |
| Small & Mid Cap Fund | | | | | | | | | | | | | | | | |
| Equity Securities(b) | | | | | | | | | | | | | | | | |
| Australia | | $ | 93,775,033 | | | $ | 74,517 | | | $ | — | | | $ | 93,849,550 | |
| Austria | | | 8,138,608 | | | | — | | | | — | | | | 8,138,608 | |
| Belgium | | | 10,251,445 | | | | — | | | | — | | | | 10,251,445 | |
| Bermuda | | | 67,970,425 | | | | — | | | | — | | | | 67,970,425 | |
| Brazil | | | 16,807,545 | | | | — | | | | 41,554 | | | | 16,849,099 | |
| Cambodia | | | 102,525 | | | | — | | | | — | | | | 102,525 | |
| Canada | | | 127,334,442 | | | | 7 | | | | — | | | | 127,334,449 | |
| Cayman Islands | | | 2,214,845 | | | | — | | | | — | | | | 2,214,845 | |
| Chile | | | 2,626,716 | | | | — | | | | — | | | | 2,626,716 | |
| China | | | 64,041,101 | | | | — | | | | 328,298 | | | | 64,369,399 | |
| Curacao | | | 2,511,971 | | | | — | | | | — | | | | 2,511,971 | |
| Denmark | | | 29,343,812 | | | | — | | | | — | | | | 29,343,812 | |
| Faeroe Islands | | | 313,865 | | | | — | | | | — | | | | 313,865 | |
| Finland | | | 20,207,420 | | | | — | | | | 1,022 | | | | 20,208,442 | |
| France | | | 77,892,731 | | | | — | | | | — | | | | 77,892,731 | |
| Germany | | | 88,076,195 | | | | — | | | | — | | | | 88,076,195 | |
| Gibraltar | | | 62,242 | | | | — | | | | — | | | | 62,242 | |
| Greece | | | 619,723 | | | | — | | | | — | | | | 619,723 | |
| Guernsey | | | 2,740 | | | | — | | | | — | | | | 2,740 | |
| Hong Kong | | | 62,069,148 | | | | — | | | | 356,323 | | | | 62,425,471 | |
| Hungary | | | 63,002 | | | | — | | | | — | | | | 63,002 | |
| Old Westbury Funds, Inc. | |
| Notes To Financial Statements - (Continued) | |
| | October 31, 2016 |
| | |
| | | Level 1
Quoted Prices | | Level 2
Significant
Observable
Inputs | | Level 3
Significant
Unobservable
Inputs(d) | | Total |
| India | | | $ | 69,574,952 | | | | $ | — | | | | $ | 19,845 | | | | $ | 69,594,797 | |
| Indonesia | | | | 25,538,937 | | | | | — | | | | | 41,581 | | | | | 25,580,518 | |
| Ireland | | | | 17,158,885 | | | | | — | | | | | — | | | | | 17,158,885 | |
| Isle of Man | | | | 169,830 | | | | | — | | | | | — | | | | | 169,830 | |
| Israel | | | | 84,082,266 | | | | | — | | | | | — | | | | | 84,082,266 | |
| Italy | | | | 15,582,407 | | | | | — | | | | | — | | | | | 15,582,407 | |
| Japan | | | | 333,968,451 | | | | | — | | | | | — | | | | | 333,968,451 | |
| Jersey Channel Islands | | | | 4,455,681 | | | | | — | | | | | — | | | | | 4,455,681 | |
| Luxembourg | | | | 10,427,502 | | | | | — | | | | | — | | | | | 10,427,502 | |
| Malaysia | | | | 21,151,519 | | | | | — | | | | | 6,830 | | | | | 21,158,349 | |
| Malta | | | | 308,603 | | | | | — | | | | | — | | | | | 308,603 | |
| Martinique | | | | 165,559 | | | | | — | | | | | — | | | | | 165,559 | |
| Mexico | | | | 21,684,315 | | | | | 85,875 | | | | | — | | | | | 21,770,190 | |
| Monaco | | | | 244,166 | | | | | — | | | | | — | | | | | 244,166 | |
| Netherlands | | | | 24,512,061 | | | | | — | | | | | — | | | | | 24,512,061 | |
| New Zealand | | | | 38,000,600 | | | | | — | | | | | — | | | | | 38,000,600 | |
| Norway | | | | 5,149,119 | | | | | — | | | | | — | | | | | 5,149,119 | |
| Peru | | | | 3,714,119 | | | | | — | | | | | — | | | | | 3,714,119 | |
| Philippines | | | | 12,078,087 | | | | | — | | | | | — | | | | | 12,078,087 | |
| Poland | | | | 2,811,131 | | | | | — | | | | | — | | | | | 2,811,131 | |
| Portugal | | | | 1,717,457 | | | | | — | | | | | — | | | | | 1,717,457 | |
| Puerto Rico | | | | 1,125,645 | | | | | — | | | | | — | | | | | 1,125,645 | |
| Romania | | | | 44,624 | | | | | — | | | | | — | | | | | 44,624 | |
| Singapore | | | | 56,946,862 | | | | | — | | | | | 57,172 | | | | | 57,004,034 | |
| South Africa | | | | 23,777,008 | | | | | 41 | | | | | — | | | | | 23,777,049 | |
| South Korea | | | | 52,432,548 | | | | | — | | | | | 35,711 | | | | | 52,468,259 | |
| Spain | | | | 15,364,598 | | | | | — | | | | | — | | | | | 15,364,598 | |
| Sweden | | | | 43,338,881 | | | | | — | | | | | — | | | | | 43,338,881 | |
| Switzerland | | | | 82,098,222 | | | | | — | | | | | — | | | | | 82,098,222 | |
| Taiwan | | | | 45,835,834 | | | | | — | | | | | 486 | | | | | 45,836,320 | |
| Thailand | | | | 1,469,248 | | | | | 13,546,579 | | | | | — | | | | | 15,015,827 | |
| Turkey | | | | 2,279,377 | | | | | — | | | | | — | | | | | 2,279,377 | |
| Ukraine | | | | 188,872 | | | | | — | | | | | — | | | | | 188,872 | |
| United Arab Emirates | | | | 58,361 | | | | | — | | | | | — | | | | | 58,361 | |
| United Kingdom | | | | 197,966,963 | | | | | — | | | | | — | | | | | 197,966,963 | |
| United States | | | | 3,228,357,568 | | | | | 370,406 | | | | | — | | | | | 3,228,727,974 | |
| Total Equities | | | $ | 5,118,205,792 | | | | $ | 14,077,425 | | | | $ | 888,822 | | | | $ | 5,133,172,039 | |
| Exchange Traded Funds | | | | 190,432,545 | | | | | — | | | | | — | | | | | 190,432,545 | |
| Investment Company | | | | 62,714,100 | | | | | — | | | | | — | | | | | 62,714,100 | |
| Rights/Warrants | | | | | | | | | | | | | | | | | | | | |
| Hong Kong | | | | 960 | | | | | — | | | | | — | | | | | 960 | |
| India | | | | — | | | | | 8,811 | | | | | — | | | | | 8,811 | |
| Malaysia | | | | 62,301 | | | | | — | | | | | — | | | | | 62,301 | |
| Norway | | | | — | | | | | 549 | | | | | — | | | | | 549 | |
| Singapore | | | | 4,284 | | | | | 56 | | | | | — | | | | | 4,340 | |
| South Korea | | | | — | | | | | 28,649 | | | | | — | | | | | 28,649 | |
| Spain | | | | 4,545 | | | | | — | | | | | — | | | | | 4,545 | |
| Sweden | | | | — | | | | | 3,331 | | | | | — | | | | | 3,331 | |
| United Kingdom | | | | 96,502 | | | | | — | | | | | — | | | | | 96,502 | |
| Total Rights/Warrants | | | $ | 168,592 | | | | $ | 41,396 | | | | $ | — | | | | $ | 209,988 | |
| Old Westbury Funds, Inc. | |
| Notes To Financial Statements - (Continued) | |
| | October 31, 2016 |
| | |
| | | Level 1
Quoted Prices | | Level 2
Significant
Observable
Inputs | | Level 3
Significant
Unobservable
Inputs(d) | | Total |
| | | | | | | | | | | | | | | | | | | | | |
| U.S. Government Agencies | | | $ | — | | | | $ | 29,994,551 | | | | $ | — | | | | $ | 29,994,551 | |
| Cash Sweep | | | | 54,342,747 | | | | | — | | | | | — | | | | | 54,342,747 | |
| | | | | | | | | | | | | | | | | | | | | |
| Other financial instruments - Assets* | | | | | | | | | | | | | | | | | | | | |
| Foreign currency exchange contracts | | | | — | | | | | 74,658 | | | | | — | | | | | 74,658 | |
| Total | | | $ | 5,425,863,776 | | | | $ | 44,188,030 | | | | $ | 888,822 | | | | $ | 5,470,940,628 | |
| | | | | | | | | | | | | | | | | | | | | |
| Strategic Opportunities Fund | | | | | | | | | | | | | | | | | | | | |
| Equity Securities(b) | | | | | | | | | | | | | | | | | | | | |
| Belgium | | | $ | 4,807,491 | | | | $ | — | | | | $ | — | | | | $ | 4,807,491 | |
| Bermuda | | | | 21,224,337 | | | | | — | | | | | — | | | | | 21,224,337 | |
| Canada | | | | 6,674,969 | | | | | — | | | | | — | | | | | 6,674,969 | |
| China | | | | 20,293,378 | | | | | — | | | | | — | | | | | 20,293,378 | |
| Hong Kong | | | | 21,200,366 | | | | | — | | | | | 44,425 | | | | | 21,244,791 | |
| Japan | | | | 57,625,872 | | | | | — | | | | | — | | | | | 57,625,872 | |
| Malaysia | | | | 4,279,546 | | | | | — | | | | | — | | | | | 4,279,546 | |
| Morocco and Antilles | | | | 4,240,943 | | | | | — | | | | | — | | | | | 4,240,943 | |
| Pakistan | | | | 5,756,477 | | | | | — | | | | | — | | | | | 5,756,477 | |
| Qatar | | | | 1,824,715 | | | | | — | | | | | — | | | | | 1,824,715 | |
| Singapore | | | | 8,298,339 | | | | | — | | | | | — | | | | | 8,298,339 | |
| South Africa | | | | 1,991,633 | | | | | — | | | | | — | | | | | 1,991,633 | |
| South Korea | | | | 8,368,689 | | | | | — | | | | | — | | | | | 8,368,689 | |
| Switzerland | | | | 8,773,113 | | | | | — | | | | | — | | | | | 8,773,113 | |
| Taiwan | | | | 6,468,035 | | | | | — | | | | | — | | | | | 6,468,035 | |
| Thailand | | | | — | | | | | 300,510 | | | | | — | | | | | 300,510 | |
| United Arab Emirates | | | | 6,010,215 | | | | | — | | | | | — | | | | | 6,010,215 | |
| United Kingdom | | | | 7,372,256 | | | | | — | | | | | — | | | | | 7,372,256 | |
| United States | | | | 288,321,631 | | | | | — | | | | | 258,750 | | | | | 288,580,381 | |
| Total Equities | | | $ | 483,532,005 | | | | $ | 300,510 | | | | $ | 303,175 | | | | $ | 484,135,690 | |
| Closed-End Funds | | | | 384,014,557(a | ) | | | | — | | | | | — | | | | | 384,014,557 | |
| Exchange Traded Funds | | | | 504,602,807(a | ) | | | | — | | | | | — | | | | | 504,602,807 | |
| Preferred Stocks | | | | 11,349,830(a | ) | | | | — | | | | | — | | | | | 11,349,830 | |
| Bank Loans | | | | — | | | | | 15,400,000(a | ) | | | | — | | | | | 15,400,000 | |
| Corporate Bonds | | | | — | | | | | 486,374,387(a | ) | | | | 2,139,443(c | ) | | | | 488,513,830 | |
| Asset-Backed Securities | | | | — | | | | | 687,469,410(a | ) | | | | — | | | | | 687,469,410 | |
| Non-Agency Mortgage-Backed Securities | | | | — | | | | | 504,103,870(a | ) | | | | — | | | | | 504,103,870 | |
| U.S. Government Agencies | | | | — | | | | | 2,499,287,937 | | | | | — | | | | | 2,499,287,937 | |
| U.S. Government Securities | | | | — | | | | | 169,467,570 | | | | | — | | | | | 169,467,570 | |
| Cash Sweep | | | | 171,982,106 | | | | | — | | | | | — | | | | | 171,982,106 | |
| Securities Sold Short | | | | (18,955,909 | ) | | | | — | | | | | — | | | | | (18,955,909 | ) |
| Other financial instruments - Assets* | | | | | | | | | | | | | | | | | | | | |
| Commodity contracts | | | | 3,659,130 | | | | | 2,030,767 | | | | | — | | | | | 5,689,897 | |
| Equity contracts | | | | 1,443,000 | | | | | 130,484,938 | | | | | — | | | | | 131,927,938 | |
| Foreign currency exchange contracts | | | | — | | | | | 7,986,546 | | | | | — | | | | | 7,986,546 | |
| | | | | | | | | | | | | | | | | | | | | |
| Other financial instruments - Liabilities* | | | | | | | | | | | | | | | | | | | | |
| Commodity contracts | | | | (3,015,927 | ) | | | | (544,463 | ) | | | | — | | | | | (3,560,390 | ) |
| Equity contracts | | | | (743,545 | ) | | | | (13,034,950 | ) | | | | — | | | | | (13,778,495 | ) |
| Old Westbury Funds, Inc. | |
| Notes To Financial Statements - (Continued) | |
| | October 31, 2016 |
| | |
| | | Level 1
Quoted Prices | | Level 2
Significant
Observable
Inputs | | Level 3
Significant
Unobservable
Inputs(d) | | Total |
| Interest rate contracts | | | $ | (1,494,841 | ) | | | $ | — | | | | $ | — | | | | $ | (1,494,841 | ) |
| Foreign currency exchange contracts | | | | — | | | | | (16,913,358 | ) | | | | — | | | | | (16,913,358 | ) |
| Total | | | $ | 1,536,373,213 | | | | $ | 4,472,413,164 | | | | $ | 2,442,618 | | | | $ | 6,011,228,995 | |
| Fixed Income Fund | | | | | | | | | | | | | | | | | | | | |
| Corporate Bonds | | | $ | — | | | | $ | 272,400,863(a | ) | | | $ | — | | | | $ | 272,400,863 | |
| Asset-Backed Securities | | | | — | | | | | 58,336,755(a | ) | | | | — | | | | | 58,336,755 | |
| Municipal Bonds | | | | — | | | | | 13,728,540(a | ) | | | | — | | | | | 13,728,540 | |
| Collateralized Mortgage Obligations | | | | — | | | | | 1,753,358(a | ) | | | | — | | | | | 1,753,358 | |
| U.S. Government Agencies | | | | — | | | | | 50,646,798 | | | | | — | | | | | 50,646,798 | |
| U.S. Government Securities | | | | — | | | | | 383,192,485 | | | | | — | | | | | 383,192,485 | |
| Government Bonds | | | | — | | | | | 1,407,000(a | ) | | | | — | | | | | 1,407,000 | |
| Investment Company | | | | 4,537,200 | | | | | — | | | | | — | | | | | 4,537,200 | |
| Total | | | $ | 4,537,200 | | | | $ | 781,465,799 | | | | $ | — | | | | $ | 786,002,999 | |
| Municipal Bond Fund | | | | | | | | | | | | | | | | | | | | |
| Municipal Bonds | | | $ | — | | | | $ | 2,004,832,746(a | ) | | | $ | — | | | | $ | 2,004,832,746 | |
| Investment Company | | | | 50,327,400 | | | | | — | | | | | — | | | | | 50,327,400 | |
| Total | | | $ | 50,327,400 | | | | $ | 2,004,832,746 | | | | $ | — | | | | $ | 2,055,160,146 | |
| (a) | The breakdown of the Fund’s investments into major categories or countries is disclosed in the respective Fund’s Portfolio of Investments and in footnote 6 for derivatives. |
| (b) | At October 31, 2016, the change in the S&P 500 Index did not exceed the Funds’ predetermined level (see footnote 3.A) and no transfers between levels occurred for the Funds for this reason. Certain Investments for reasons other than exceeding the predetermined level for the Small & Mid Cap Fund were transferred from Level 2 into Level 1 in the amount of $2,973,582, and from Level 1 into Level 2 in the amount of $168,665. |
| (c) | Represents securities as disclosed in the Bermuda, Hong Kong and the United States sections of the Fund’s Portfolio of Investments. |
| (d) | The Small & Mid Cap Fund and Strategic Opportunities Fund held certain investments categorized as Level 3 that had a combined fair value less than 1% of NAV for the respective Fund for the period ended October 31, 2016. There were transfers into Level 3 of $422,411 and out of Level 3 in the amount of $1,419,549 for the Small & Mid Cap Fund. In addition, there were no significant purchases and sales during the period. As of October 31, 2016, the percentage of NAV was 0.02% and 0.04% for the Small & Mid Cap Fund and Strategic Opportunities Fund, respectively. The Funds’ instrument types classified as Level 3 investments have no significant unobservable inputs to disclose, as their Level 3 assets and liabilities are generally valued using last trade price or broker quote. |
| (e) | Represents securities as disclosed in the Thailand section of the Fund’s Portfolio of Investments. |
* Other financial instruments are exchange traded options and futures (Level 1), over-the-counter options (Level 2), forwards (Level 2) and swaps (Level 2). Futures, forwards and swaps are valued at the unrealized appreciation/(depreciation) on the instrument and options are shown at market value.
The Funds’ policy is to recognize transfers in and transfers out as of the beginning of the period.
| 6. | Derivative Instruments: |
The Funds engage in various portfolio investment strategies utilizing derivatives both to increase the return of the Funds and/or to economically hedge, or protect, their exposure to, for example, interest rate movements, movements in the securities or commodities markets and currency value fluctuations. Derivatives are subject to a number of risks, including changes in the market price of the underlying securities, credit risk with respect to the counterparty to the derivative instruments and the risk of loss due to changes in interest rates. The use of certain derivatives may also have a leveraging effect, which may increase
| Old Westbury Funds, Inc. | |
| Notes To Financial Statements - (Continued) | |
| | October 31, 2016 |
| | |
the Fund’s sensitivity to adverse market movements and may exaggerate a loss. Losses may arise if the value of the contract decreases due to, among other potentially adverse events, an unfavorable change in the price of the underlying security or commodity or if the counterparty does not perform under the contract. The use of derivatives can lead to losses because of relatively small adverse movements in the price or value of the underlying security, asset, index or reference rate, which may be magnified by or potentially unlimited as a result of certain features of the derivatives.
The primary difference in risks associated with over-the-counter contracts and exchange-traded contracts is credit and liquidity risks. Over-the-counter contracts, as bilateral arrangements, contain credit risk from various counterparties for any unrealized gains for the duration of the contract. The credit risk related to exchange-traded contracts is minimal because the exchanges ensure that their contracts are always honored. The Funds may mitigate counterparty risk on derivatives through master netting agreements included within an International Swaps and Derivatives Association, Inc. (“ISDA”) Master Agreement between a Fund and each of its counterparties. The ISDA Master Agreement allows each Fund to offset with its counterparty certain derivative financial instruments’ payables and/or receivables with collateral held with each counterparty. The amount of collateral moved to/from applicable counterparties is based upon minimum transfer amounts of up to $250,000. To the extent amounts due to the Funds from their counterparties are not fully collateralized contractually or otherwise, the Funds bear the risk of loss from counterparty non-performance.
The Funds’ maximum risk of loss from counterparty credit risk on over-the-counter derivatives is generally the aggregate net unrealized gain in excess of any collateral pledged by the counterparty to the Funds. For over-the-counter purchased options, the Funds bear the risk of loss in the amount of the premiums paid and positive change in market value of the options should the counterparty not perform under the contracts. Written options by the Funds do not give rise to counterparty credit risk, as written options obligate the Funds to perform and not the counterparty. Certain ISDA Master Agreements allow counterparties to over-the-counter derivatives to terminate or require full collateralization of derivative contracts prior to maturity in the event a Fund’s net assets decline by a stated percentage or a Fund fails to meet the terms of its ISDA Master Agreements, which would cause the Funds to post additional collateral or accelerate payment of any net liability owed to the counterparty. There were no trigger events during the year ended October 31, 2016.
Cash collateral that has been pledged to cover obligations of a Fund and cash collateral received from the counterparty, if any, is reported separately on the Statements of Assets and Liabilities as due from brokers for collateral and payable to brokers for collateral, respectively. Non-cash collateral pledged by the Fund, if any, is noted in the Portfolio of Investments.
When counterparties post cash collateral with respect to various derivative transactions, a Fund may invest the collateral and receives interest income on the investment and pays interest expense on the collateral to the counterparty. The interest income is included in investment income on the Statements of Operations, and the interest expense is included in a Fund’s overall expenses on the Statements of Operations and expense ratio in the Financial Highlights.
| Old Westbury Funds, Inc. | |
| Notes To Financial Statements - (Continued) | |
| | October 31, 2016 |
| | |
As of October 31, 2016, the Funds had transactions subject to enforceable master netting arrangements (“MNA”). For reporting purposes, the Funds do not offset derivative assets and derivative liabilities that are subject to netting arrangements in the Statements of Assets and Liabilities. A reconciliation of the gross amounts on the Statements of Assets and Liabilities to the net amounts by counterparty, including any collateral exposure, is included in the following tables:
Large Cap Strategies Fund
| Counterparty | Gross Amounts of
Assets
Presented
in the Statement
of Assets and
Liabilities (a) | | Derivatives
Available for
Offset (b) | | Non-Cash
Collateral
Received (c) | | Cash
Collateral
Received (c) | | Net
Amount of
Derivative
Assets (e) | |
| | | | | | | | | | | | | | | | | | | | | | | | | | | |
| Bank of New York Mellon Corp. | | | $ | 7,438,173 | | | | | $— | | | | | $— | | | | | $(7,220,000 | ) | | | | $218,173 | | |
| Total | | | $ | 7,438,173 | | | | | | | | | | | | | | | | | | | | | | |
| | | | | | | | | | | | | | | | | | | | | | | | | | | |
| Small & Mid Cap Fund | | | | | | | | | | | |
| Counterparty | Gross Amounts of
Assets
Presented
in the Statement
of Assets and
Liabilities | | Derivatives
Available for
Offset (b) | | Non-Cash
Collateral
Received (c) | | Cash
Collateral Received (c) | | Net
Amount of
Derivative
Assets (e) | |
| | | | | | | | | | | | | | | | | | | | | | | | | | | |
| Citibank N.A. | | | $ | 74,658 | | | | | $— | | | | | $— | | | | | $— | | | | | $74,658 | | |
| Total | | | $ | 74,658 | | | | | | | | | | | | | | | | | | | | | | |
| Strategic Opportunities Fund | | | | | | | | | | | |
| | | | | | | | | | | | | | | | | | | | | | | | | | | |
| Counterparty | Gross Amounts of
Assets
Presented
in the Statement
of Assets and
Liabilities | | Derivatives
Available for
Offset (b) | | Non-Cash
Collateral
Received (c) | | Cash
Collateral
Received (c) | | Net
Amount of
Derivative
Assets (e) | |
| | | | | | | | | | | | | | | | | | | | | | | | | | | |
| Barclays Bank Plc | | | $ | 649,795 | | | | $ | (649,795 | ) | | | $ | — | | | | $ | — | | | | $ | — | | |
| Bank of America N.A. | | | | 8,652,443 | | | | | (3,338,826 | ) | | | | — | | | | | (5,260,000 | ) | | | | 53,617 | | |
| BNP Paribas Group | | | | 24,551,270 | | | | | (985,347 | ) | | | | — | | | | | (23,565,923 | ) | | | | — | | |
| Citibank N.A. | | | | 9,632,852 | | | | | (2,362,396 | ) | | | | (7,270,456 | ) | | | | — | | | | | — | | |
| Cargill Inc. | | | | 2,015,875 | | | | | (511,380 | ) | | | | — | | | | | (930,000 | ) | | | | 574,495 | | |
| Credit Suisse International | | | | 19,493,086 | | | | | (1,669,936 | ) | | | | — | | | | | (17,823,150 | ) | | | | — | | |
| Goldman Sachs International | | | | 28,698,059 | | | | | (4,911,850 | ) | | | | — | | | | | (20,860,000 | ) | | | | 2,926,209 | | |
| JPMorgan Chase Bank, N.A. | | | | 25,014,785 | | | | | (7,661,465 | ) | | | | — | | | | | (14,980,000 | ) | | | | 2,373,320 | | |
| Macquarie Bank Limited | | | | 14,892 | | | | | (14,892 | ) | | | | — | | | | | — | | | | | — | | |
| UBS AG | | | | 21,779,194 | | | | | (960,131 | ) | | | | (10,156,678 | ) | | | | (10,202,000 | ) | | | | 460,385 | | |
| Derivatives not subject to a MNA or similar agreement (a) | | | | 2,971,857 | | | | | — | | | | | — | | | | | — | | | | | 2,971,857 | | |
| Total | | | $ | 143,474,108 | | | | | | | | | | | | | | | | | | | | | | |
| Old Westbury Funds, Inc. | |
| Notes To Financial Statements - (Continued) | |
| | October 31, 2016 |
| | |
| Strategic Opportunities Fund |
| Counterparty | Gross Amounts
of Liabilities
Presented
in the Statement
of Assets and
Liabilities | | Derivatives
Available for
Offset (b) | | Non-Cash
Collateral
Pledged (c) | | Cash
Collateral
Pledged (c) | | Net
Amount of
Derivative
Liabilities (d) | |
| | | | | | | | | | | | | | | | | | | | | | | | | | | |
| Barclays Bank Plc | | | $ | 4,833,750 | | | | $ | (649,795 | ) | | | | $— | | | | | $(3,410,000 | ) | | | | $773,955 | | |
| Bank of America N.A. | | | | 3,338,826 | | | | | (3,338,826 | ) | | | | — | | | | | — | | | | | — | | |
| Bank of New York Mellon Corp. | | | | 3,224,607 | | | | | — | | | | | — | | | | | (3,224,607 | ) | | | | — | | |
| BNP Paribas Group | | | | 985,347 | | | | | (985,347 | ) | | | | — | | | | | — | | | | | — | | |
| Citibank N.A. | | | | 2,362,396 | | | | | (2,362,396 | ) | | | | — | | | | | — | | | | | — | | |
| Cargill Inc. | | | | 511,380 | | | | | (511,380 | ) | | | | — | | | | | — | | | | | — | | |
| Credit Suisse International | | | | 1,669,936 | | | | | (1,669,936 | ) | | | | — | | | | | — | | | | | — | | |
| Goldman Sachs Group, Inc. | | | | 4,911,850 | | | | | (4,911,850 | ) | | | | — | | | | | — | | | | | — | | |
| JPMorgan Chase Bank, N.A. | | | | 7,661,465 | | | | | (7,661,465 | ) | | | | — | | | | | — | | | | | — | | |
| Macquarie Bank Limited | | | | 33,083 | | | | | (14,892 | ) | | | | — | | | | | — | | | | | 18,191 | | |
| UBS AG | | | | 960,131 | | | | | (960,131 | ) | | | | — | | | | | — | | | | | — | | |
| Derivatives not subject to a MNA or similar agreement (a) | | | | 462,500 | | | | | — | | | | | — | | | | | — | | | | | 462,500 | | |
| Total | | | $ | 30,955,271 | | | | | | | | | | | | | | | | | | | | | | |
| (a) | Includes derivatives (futures, exchange traded options and certain forward foreign currency exchange contracts) which are not subject to a MNA, or another similar arrangement. |
| | |
| (b) | The amount of derivatives available for offset is limited to the amount of assets and/or liabilities that are subject to a MNA. |
| | |
| (c) | Excess of collateral received from/payable to the individual counterparty is not shown for financial reporting purposes. |
| | |
| (d) | Represents the net amount payable to counterparty in the event of default. |
| | |
| (e) | Represents the net amount receivable from counterparty in the event of default. |
The Funds are subject to, among other risks, interest rate risk, equity price risk, commodity risk and foreign currency exchange risk in the normal course of pursuing their investment objectives by investing in various derivative financial instruments, as described below.
| Old Westbury Funds, Inc. | |
| Notes To Financial Statements - (Continued) | |
| | October 31, 2016 |
| | |
For open derivative instruments, please see the respective Fund’s Portfolio of Investments or details below:
| | | Fair Values of Derivative Instruments as of October 31, 2016 |
| | | Derivative Assets | | | Derivative Liabilities | |
| Large Cap Strategies Fund | | Statements of Assets
and Liabilities
Location | | Value | | | Statements of Assets
and Liabilities
Location | | Value | |
| Foreign Currency Exchange Risk | | Unrealized appreciation on forward foreign currency exchange contracts | | $ | 7,438,173 | | | Unrealized depreciation on forward foreign currency exchange contracts | | $ | — | |
| Total | | | | $ | 7,438,173 | | | | | $ | — | |
| | | | | | | | | | | | | |
| Small & Mid Cap Fund | | Statements of Assets
and Liabilities
Location | | Value | | | Statements of Assets
and Liabilities
Location | | Value | |
| Foreign Currency Exchange Risk | | Unrealized appreciation on forward foreign currency exchange contracts | | $ | 74,658 | | | Unrealized depreciation on forward foreign currency exchange contracts | | $ | — | |
| Total | | | | $ | 74,658 | | | | | $ | — | |
| | | | | | | | | | | | | |
| Strategic Opportunities Fund | | Statements of Assets
and Liabilities
Location | | Value | | | Statements of Assets
and Liabilities
Location | | Value | |
| Commodity risk | | Investments, at value (purchased options) | | $ | 1,233,770 | | | | | | | |
| | | Unrealized appreciation on swap contracts | | | 2,030,767 | | | Unrealized depreciation on swap contracts | | $ | 544,463 | |
| | | Variation margin | | | 295,087 | | | | | | | |
| Equity Risk | | Unrealized appreciation on swap contracts | | | 11,285,495 | | | Unrealized depreciation on swap contracts | | | 1,435,706 | |
| | | Structured option contracts, at value | | | 119,199,443 | | | Structured option contracts, at value | | | 11,599,244 | |
| | | Investments, at value (purchased options) | | | 1,443,000 | | | Written option contracts, at value | | | 462,500 | |
| Foreign Currency Exchange Risk | | Unrealized appreciation on swap contracts | | | 148,725 | | | | | | | |
| | | Structured option contracts, at value | | | 3,406,227 | | | Structured option contracts, at value | | | 4,247,161 | |
| | | Unrealized appreciation on forward foreign currency exchange contracts | | | 4,431,594 | | | Unrealized depreciation on forward foreign currency exchange contracts | | | 12,666,197 | |
| Total | | | | $ | 143,474,108 | | | | | $ | 30,955,271 | |
| | | The Effect of Derivative Instruments on the Statements of Operations | | |
| | | Year Ended October 31, 2016 | | |
| | | Net Realized Gain/(Loss) from Derivatives Recognized in Income | | |
| Large Cap Strategies Fund | | Written Options and Structured Options | | Futures Contracts | | Swap Agreements | | Foreign Currency
Exchange Contracts(a) | | Total | | |
| Foreign Currency Exchange Risk | | | $— | | | | $— | | | | $— | | | | $ | (55,666,282 | ) | | $ | (55,666,282 | ) | |
| Total | | | $— | | | | $— | | | | $— | | | | $ | (55,666,282 | ) | | $ | (55,666,282 | ) | |
| | | | | | | | | | | | | |
| Small & Mid Cap Fund | | Written Options and Structured Options | | Futures Contracts | | Swap Agreements | | Foreign Currency
Exchange Contracts(a) | | Total | | |
| Foreign Currency Exchange Risk | | | $— | | | | $— | | | | $— | | | | $ | (434,188 | ) | | $ | (434,188 | ) | |
| Total | | | $— | | | | $— | | | | $— | | | | $ | (434,188 | ) | | $ | (434,188 | ) | |
| Old Westbury Funds, Inc. | |
| Notes To Financial Statements - (Continued) | |
| | October 31, 2016 |
| | |
| | | The Effect of Derivative Instruments on the Statements of Operations | | |
| | | Year Ended October 31, 2016 | | |
| | | Net Realized Gain/(Loss) from Derivatives Recognized in Income | | |
| Strategic Opportunities Fund | | Written Options and Structured Options | | Futures Contracts | | Swap Agreements | | Foreign Currency
Exchange Contracts(a) | | | Total | | |
| Commodity Risk | | | $ | (3,801,661 | ) | | | $ | (432,064 | ) | | | $ | (7,415,412 | ) | | | $ | — | | | | $ | (11,649,137 | ) | |
| Interest Rate Risk | | | — | | | | 781,920 | | | | (6,971,856 | ) | | | — | | | | (6,189,936 | ) | |
| Equity Risk | | | (49,196,283 | ) | | | (47,971,899 | ) | | | (524,841 | ) | | | — | | | | (97,693,023 | ) | |
| Foreign Currency Exchange Risk | | | | 10,345,095 | | | | | — | | | | | — | | | | | 5,610,426 | | | | | 15,955,521 | | |
| Total | | | $ | (42,652,849 | ) | | | $ | (47,622,043 | ) | | | $ | (14,912,109 | ) | | | $ | 5,610,426 | | | | $ | (99,576,575 | ) | |
| | | | | | | | | | | | | | | | | | | | | | | | | | | |
(a) Included in net realized gain/(loss) on foreign currency transactions on the Statements of Operation. |
| | | | |
| | | Net Change in Unrealized Appreciation/(Depreciation) | | |
| | | on Derivatives Recognized in Income | | |
| Large Cap Strategies Fund | | Written Options and Structured Options | | Futures Contracts | | Swap Agreements | | Foreign Currency
Exchange Contracts(b) | | | Total | | |
| Foreign Currency Exchange Risk | | | $ | — | | | | $ | — | | | | $ | — | | | | $ | (8,462,238 | ) | | | $ | (8,462,238 | ) | |
| Total | | | $ | — | | | | $ | — | | | | $ | — | | | | $ | (8,462,238 | ) | | | $ | (8,462,238 | ) | |
| | | | | | | | | | | | |
| Small & Mid Cap Fund | | Written Options and Structured Options | | Futures Contracts | | Swap Agreements | | Foreign Currency
Exchange Contracts(b) | | | Total | | |
| Foreign Currency Exchange Risk | | | $ | — | | | | $ | — | | | | $ | — | | | | $ | (5,255,709 | ) | | | $ | (5,255,709 | ) | |
| Total | | | $ | — | | | | $ | — | | | | $ | — | | | | $ | (5,255,709 | ) | | | $ | (5,255,709 | ) | |
| | | | | | | | | | | | |
| Strategic Opportunities Fund | | Written Options and Structured Options | | Futures Contracts | | Swap Agreements | | Foreign Currency
Exchange Contracts(b) | | | Total | | |
| Commodity Risk | | | $ | 1,200,396 | | | | $ | (602,925 | ) | | | $ | 5,411,968 | | | | $ | — | | | | $ | 6,009,439 | | |
| Interest Rate Risk | | | — | | | | (1,494,841 | ) | | | 4,670,135 | | | | — | | | | 3,175,294 | | |
| Equity Risk | | | 26,440,410 | | | | (281,045 | ) | | | 6,508,452 | | | | — | | | | 32,667,817 | | |
| Foreign Currency Exchange Risk | | | | (19,254,178 | ) | | | | — | | | | | 148,725 | | | | | (6,139,140 | ) | | | | (25,244,593 | ) | |
| Total | | | $ | 8,386,628 | | | | $ | (2,378,811 | ) | | | $ | 16,739,280 | | | | $ | (6,139,140 | ) | | | $ | 16,607,957 | | |
(b) Included in net change in unrealized appreciation/(depreciation) on foreign currency transactions on the Statements of Operation.
For the year ended October 31, 2016, the quarterly average volume of derivative activities were as follows:
| | | Large Cap Strategies Fund | | | Small & Mid Cap Fund | | | Strategic Opportunities Fund | |
| Structured Options (Notional Amounts) | | | $— | | | | $— | | | $ | 4,241,413,764 | |
| Purchased Options (Cost $) | | | — | | | | — | | | | 10,574,107 | |
| Written Options (Premium Received $) | | | — | | | | — | | | | 5,267,769 | |
| Futures Long Position (Notional Amounts) | | | — | | | | — | | | | 118,064,023 | |
| Futures Short Position (Notional Amounts) | | | — | | | | — | | | | 148,666,529 | |
| Forward Currency Contracts Purchased (U.S. Dollar Amounts) | | | — | | | | — | | | | 466,719,099 | |
| Forward Currency Contracts Sold (U.S. Dollar Amounts) | | | 699,079,798 | | | | 257,039,385 | | | | 815,618,745 | |
| Currency Swaps (Notional Amount in U.S. Dollars) | | | — | | | | — | | | | 37,500 | |
| Equity Swaps (Notional Amount in U.S. Dollars) | | | — | | | | — | | | | 44,200,000 | |
| Interest Rate Swaps (Notional Amount in U.S. Dollars) | | | — | | | | — | | | | 18,787,500 | |
| Index Swaps as buyer (Notional Amount in U.S. Dollars) | | | — | | | | — | | | | 11,979,634 | |
| Index Swaps as writer (Notional Amount in U.S. Dollars) | | | — | | | | — | | | | 4,442,893 | |
A. Futures Contracts. The Funds purchased or sold futures contracts and options on futures contracts to gain exposure to, or hedge against, changes in the value of equity securities (equity risk), interest rates (interest rate risk) or commodity risk.
Futures contracts are agreements pursuant to which two parties agree to take or make delivery of an amount of cash equal to the difference between the value of the contract at the close of the last trading day and the price at which the contract was
| Old Westbury Funds, Inc. | |
| Notes To Financial Statements - (Continued) | |
| | October 31, 2016 |
| | |
originally written. Upon entering into a futures contract, the Funds are required to pledge to a futures commission merchant an amount of cash, U.S. government securities, or other assets, equal to a certain percentage of the contract amount. This is known as the initial margin deposit. Subsequent payments, known as variation margin, are made or received by the Funds each day, depending on the daily fluctuations in fair value of the underlying instrument. The Funds recognize an unrealized gain or loss equal to the variation margin. These futures contracts permit the Funds to meet their objectives at a lower cost than investing directly in the underlying instruments or commodities, while permitting the equivalent of an investment in a portfolio of the underlying instruments or commodities. A potential risk to the Funds is that the change in value of the underlying securities or commodities may not correlate to the change in value of the contracts. Listed futures contracts involve minimal counterparty risk since futures contracts are guaranteed against default by the exchange on which they trade.
B. Forward Foreign Currency Exchange Contracts. The Funds (except Municipal Bond Fund) may enter into forward foreign currency contracts (“Forward”) to hedge their exposure to changes in foreign currency exchange rates on foreign portfolio holdings (foreign currency exchange risk). In addition, certain Funds may use a Forward to provide exposure to the foreign currency market. A Forward is an agreement between two parties to purchase or sell a foreign currency at a future date at a negotiated forward rate. A Forward is marked-to-market daily and the change in market value is recorded by the Funds as unrealized appreciation or depreciation until the contract settlement date. The market value of the Forward is determined using the forward rate for the remainder of the outstanding period of the contract, through the delivery date. When a Forward is closed or settled, the Funds record a realized gain or loss equal to the fluctuation in rates during the period a Forward was open. Risks may arise upon entering into these contracts from, for example, the potential inability of the counterparties to meet the terms of their contracts, or if the foreign currency rates change unfavorably.
In the event of default by the counterparty to the transaction, the Funds’ maximum amount of loss, as either the buyer or seller, is the unrealized gain on the contract.
The Funds may be required to pledge to the broker an amount of cash, U.S. government securities or other assets, equal to a certain percentage of the contract amount.
As of October 31, 2016, the Large Cap Strategies Fund had the following open Forwards:
| Currency Purchased | | Currency Sold | | Counterparty | | Settlement
Date | | Unrealized
Appreciation/
(Depreciation) |
| U.S. Dollar | | 213,563,625 | | Japanese Yen | | 21,583,765,000 | | Bank of New York Mellon Corp. | | 12/09/16 | | | $ | 7,438,173 | |
| | | | | | | | | | | | | | $ | 7,438,173 | |
As of October 31, 2016, the Small & Mid Cap Fund had the following open Forwards:
| Currency Purchased | | Currency Sold | | Counterparty | | Settlement
Date | | Unrealized
Appreciation/
(Depreciation) |
| U.S. Dollar | | 26,455,245 | | New Zealand Dollar | | 37,005,000 | | Citibank, N.A. | | 01/25/17 | | | $ | 74,658 | |
| | | | | | | | | | | | | | $ | 74,658 | |
As of October 31, 2016, the Strategic Opportunities Fund had the following open Forwards:
| Currency Purchased | | Currency Sold | | Counterparty | | Settlement
Date | | Unrealized
Appreciation/
(Depreciation) |
| United Kingdom Pound | | 40,459,125 | | U.S. Dollar | | 52,621,862 | | Bank of New York Mellon Corp. | | 11/30/16 | | | $ | (3,071,483 | ) |
| Swedish Krona | | 164,370,000 | | U.S. Dollar | | 18,439,624 | | Bank of New York Mellon Corp. | | 01/31/17 | | | | (153,124 | ) |
| Argentine Peso | | 77,250,000 | | U.S. Dollar | | 5,000,000 | | Barclays Bank Plc | | 11/14/16 | | | | 51,488 | |
| Brazil Real | | 32,489,000 | | U.S. Dollar | | 10,000,000 | | Barclays Bank Plc | | 11/30/16 | | | | 76,952 | |
| Old Westbury Funds, Inc. | |
| Notes To Financial Statements - (Continued) | |
| | October 31, 2016 |
| | |
| Currency Purchased | | Currency Sold | | Counterparty | | Settlement
Date | | Unrealized
Appreciation/
(Depreciation) | |
| Brazil Real | | 16,220,000 | | U.S. Dollar | | 5,000,000 | | Barclays Bank Plc | | 11/30/16 | | $ | | 30,877 | |
| Canadian Dollar | | 5,601,100 | | U.S. Dollar | | 4,231,074 | | Barclays Bank Plc | | 11/30/16 | | | | (54,406 | ) |
| Chilean Unidad de Fomento | | 9,874,500,000 | | U.S. Dollar | | 15,000,000 | | Barclays Bank Plc | | 11/30/16 | | | | 84,324 | |
| Indonesian Rupiah | | 300,000,000,000 | | U.S. Dollar | | 22,886,787 | | Barclays Bank Plc | | 11/30/16 | | | | 48,993 | |
| Indonesian Rupiah | | 97,500,000,000 | | U.S. Dollar | | 7,500,000 | | Barclays Bank Plc | | 11/30/16 | | | | (45,871 | ) |
| Malaysian Ringgit | | 102,575,000 | | U.S. Dollar | | 25,000,000 | | Barclays Bank Plc | | 11/30/16 | | | | (591,474 | ) |
| Russian Ruble | | 318,750,000 | | U.S. Dollar | | 5,000,000 | | Barclays Bank Plc | | 11/30/16 | | | | (10,039 | ) |
| Russian Ruble | | 125,380,000 | | U.S. Dollar | | 2,000,000 | | Barclays Bank Plc | | 11/30/16 | | | | (37,204 | ) |
| Swiss Franc | | 19,118,190 | | U.S. Dollar | | 19,758,851 | | Barclays Bank Plc | | 11/30/16 | | | | (409,044 | ) |
| U.S. Dollar | | 24,266,619 | | Malaysian Ringgit | | 102,575,000 | | Barclays Bank Plc | | 11/30/16 | | | | (141,907 | ) |
| United Kingdom Pound | | 2,058,133 | | U.S. Dollar | | 2,500,000 | | Barclays Bank Plc | | 11/30/16 | | | | 20,600 | |
| United Kingdom Pound | | 2,462,894 | | U.S. Dollar | | 3,000,000 | | Barclays Bank Plc | | 11/30/16 | | | | 16,312 | |
| United Kingdom Pound | | 820,223 | | U.S. Dollar | | 1,000,000 | | Barclays Bank Plc | | 11/30/16 | | | | 4,529 | |
| United Kingdom Pound | | 2,042,595 | | U.S. Dollar | | 2,500,000 | | Barclays Bank Plc | | 11/30/16 | | | | 1,571 | |
| United Kingdom Pound | | 1,633,923 | | U.S. Dollar | | 2,000,000 | | Barclays Bank Plc | | 11/30/16 | | | | 1,069 | |
| United Kingdom Pound | | 2,038,438 | | U.S. Dollar | | 2,500,000 | | Barclays Bank Plc | | 11/30/16 | | | | (3,520 | ) |
| United Kingdom Pound | | 2,838,881 | | U.S. Dollar | | 3,500,000 | | Barclays Bank Plc | | 11/30/16 | | | | (23,216 | ) |
| United Kingdom Pound | | 3,950,758 | | U.S. Dollar | | 5,000,000 | | Barclays Bank Plc | | 11/30/16 | | | | (161,498 | ) |
| United Kingdom Pound | | 3,825,438 | | U.S. Dollar | | 4,986,603 | | Barclays Bank Plc | | 11/30/16 | | | | (301,581 | ) |
| Russian Ruble | | 63,850,000 | | U.S. Dollar | | 1,000,000 | | Barclays Bank Plc | | 12/29/16 | | | | (9,637 | ) |
| Russian Ruble | | 63,620,000 | | U.S. Dollar | | 1,000,000 | | Barclays Bank Plc | | 12/29/16 | | | | (13,204 | ) |
| Russian Ruble | | 63,540,000 | | U.S. Dollar | | 1,000,000 | | Barclays Bank Plc | | 12/29/16 | | | | (14,445 | ) |
| Russian Ruble | | 319,800,000 | | U.S. Dollar | | 5,000,000 | | Barclays Bank Plc | | 12/29/16 | | | | (39,653 | ) |
| Russian Ruble | | 316,700,000 | | U.S. Dollar | | 5,000,000 | | Barclays Bank Plc | | 12/29/16 | | | | (87,737 | ) |
| Russian Ruble | | 315,600,000 | | U.S. Dollar | | 5,000,000 | | Barclays Bank Plc | | 12/29/16 | | | | (104,799 | ) |
| Indonesian Rupiah | | 99,300,000,000 | | U.S. Dollar | | 7,500,000 | | Barclays Bank Plc | | 12/30/16 | | | | 54,778 | |
| Indian Rupee | | 338,950,000 | | U.S. Dollar | | 5,000,000 | | Barclays Bank Plc | | 01/17/17 | | | | 27,067 | |
| Brazil Real | | 18,812,500 | | U.S. Dollar | | 5,859,679 | | Barclays Bank Plc | | 01/31/17 | | | | (136,914 | ) |
| Chilean Unidad de Fomento | | 3,985,200,000 | | U.S. Dollar | | 6,000,000 | | Barclays Bank Plc | | 01/31/17 | | | | 57,707 | |
| Swiss Franc | | 20,000,000 | | U.S. Dollar | | 20,151,316 | | Barclays Bank Plc | | 01/31/17 | | | | 173,528 | |
| U.S. Dollar | | 5,887,428 | | Chilean Unidad de Fomento | | 3,985,200,000 | | Barclays Bank Plc | | 01/31/17 | | | | (170,279 | ) |
| Japanese Yen | | 3,192,143,525 | | U.S. Dollar | | 31,904,775 | | Citibank, N.A. | | 11/30/16 | | | | (1,435,941 | ) |
| Old Westbury Funds, Inc. | |
| Notes To Financial Statements - (Continued) | |
| | October 31, 2016 |
| | |
| Currency Purchased | | Currency Sold | | Counterparty | | Settlement
Date | | Unrealized
Appreciation/
(Depreciation) | |
| Swedish Krona | | 51,135,054 | | U.S. Dollar | | 6,000,000 | | Citibank, N.A. | | 11/30/16 | | $ | | (330,963 | ) |
| U.S. Dollar | | 7,000,000 | | Japanese Yen | | 710,735,200 | | Citibank, N.A. | | 11/30/16 | | | | 216,072 | |
| U.S. Dollar | | 5,844,262 | | Swedish Krona | | 51,135,054 | | Citibank, N.A. | | 11/30/16 | | | | 175,225 | |
| United Kingdom Pound | | 822,073 | | U.S. Dollar | | 1,000,000 | | Citibank, N.A. | | 11/30/16 | | | | 6,795 | |
| Canadian Dollar | | 18,704,400 | | U.S. Dollar | | 14,221,013 | | Citibank, N.A. | | 12/29/16 | | | | (269,249 | ) |
| Hong Kong Dollar | | 465,744,000 | | U.S. Dollar | | 59,750,603 | | Citibank, N.A. | | 06/12/17 | | | | 376,523 | |
| U.S. Dollar | | 59,812,404 | | Hong Kong Dollar | | 465,744,000 | | Citibank, N.A. | | 06/12/17 | | | | (314,722 | ) |
| U.S. Dollar | | 158,574,288 | | Mexican Peso | | 8,000,000 | | JPMorgan Chase Bank N.A. | | 12/01/09 | | | | 334,106 | |
| Argentine Peso | | 76,950,000 | | U.S. Dollar | | 5,000,000 | | JPMorgan Chase Bank N.A. | | 11/15/16 | | | | 28,582 | |
| Argentine Peso | | 31,020,000 | | U.S. Dollar | | 2,000,000 | | JPMorgan Chase Bank N.A. | | 11/18/16 | | | | 23,149 | |
| Argentine Peso | | 46,275,000 | | U.S. Dollar | | 3,000,000 | | JPMorgan Chase Bank N.A. | | 11/18/16 | | | | 18,093 | |
| Argentine Peso | | 30,840,000 | | U.S. Dollar | | 2,000,000 | | JPMorgan Chase Bank N.A. | | 11/18/16 | | | | 11,410 | |
| Argentine Peso | | 23,167,500 | | U.S. Dollar | | 1,500,000 | | JPMorgan Chase Bank N.A. | | 11/25/16 | | | | 4,135 | |
| Argentine Peso | | 15,370,000 | | U.S. Dollar | | 1,000,000 | | JPMorgan Chase Bank N.A. | | 11/25/16 | | | | (2,113 | ) |
| Argentine Peso | | 15,300,000 | | U.S. Dollar | | 1,000,000 | | JPMorgan Chase Bank N.A. | | 11/25/16 | | | | (6,657 | ) |
| Australian Dollar | | 8,034,484 | | U.S. Dollar | | 6,000,000 | | JPMorgan Chase Bank N.A. | | 11/30/16 | | | | 107,064 | |
| Australian Dollar | | 6,559,364 | | U.S. Dollar | | 5,000,000 | | JPMorgan Chase Bank N.A. | | 11/30/16 | | | | (14,185 | ) |
| Australian Dollar | | 6,517,571 | | U.S. Dollar | | 5,000,000 | | JPMorgan Chase Bank N.A. | | 11/30/16 | | | | (45,952 | ) |
| Brazil Real | | 16,222,500 | | U.S. Dollar | | 5,000,000 | | JPMorgan Chase Bank N.A. | | 11/30/16 | | | | 31,652 | |
| Euro | | 4,574,411 | | U.S. Dollar | | 5,000,000 | | JPMorgan Chase Bank N.A. | | 11/30/16 | | | | 27,571 | |
| Euro | | 6,645,920 | | U.S. Dollar | | 7,500,000 | | JPMorgan Chase Bank N.A. | | 11/30/16 | | | | (195,708 | ) |
| Euro | | 27,321,310 | | U.S. Dollar | | 30,727,540 | | JPMorgan Chase Bank N.A. | | 11/30/16 | | | | (699,669 | ) |
| Euro | | 35,000,000 | | U.S. Dollar | | 39,359,320 | | JPMorgan Chase Bank N.A. | | 11/30/16 | | | | (892,075 | ) |
| Euro | | 71,402,457 | | U.S. Dollar | | 80,288,644 | | JPMorgan Chase Bank N.A. | | 11/30/16 | | | | (1,812,763 | ) |
| U.S. Dollar | | 5,038,826 | | Brazil Real | | 16,222,500 | | JPMorgan Chase Bank N.A. | | 11/30/16 | | | | 7,174 | |
| U.S. Dollar | | 17,623,936 | | Euro | | 15,626,162 | | JPMorgan Chase Bank N.A. | | 11/30/16 | | | | 449,781 | |
| U.S. Dollar | | 7,474,507 | | Euro | | 6,645,920 | | JPMorgan Chase Bank N.A. | | 11/30/16 | | | | 170,215 | |
| U.S. Dollar | | 7,500,000 | | Euro | | 6,834,068 | | JPMorgan Chase Bank N.A. | | 11/30/16 | | | | (11,078 | ) |
| United Kingdom Pound | | 15,000,000 | | U.S. Dollar | | 18,194,145 | | JPMorgan Chase Bank N.A. | | 11/30/16 | | | | 176,388 | |
| United Kingdom Pound | | 1,639,606 | | U.S. Dollar | | 2,000,000 | | JPMorgan Chase Bank N.A. | | 11/30/16 | | | | 8,029 | |
| United Kingdom Pound | | 1,638,495 | | U.S. Dollar | | 2,000,000 | | JPMorgan Chase Bank N.A. | | 11/30/16 | | | | 6,669 | |
| United Kingdom Pound | | 2,030,889 | | U.S. Dollar | | 2,500,000 | | JPMorgan Chase Bank N.A. | | 11/30/16 | | | | (12,766 | ) |
| Indonesian Rupiah | | 65,840,000,000 | | U.S. Dollar | | 5,000,000 | | JPMorgan Chase Bank N.A. | | 12/28/16 | | | | 10,756 | |
| Mexican Peso | | 266,257,080 | | U.S. Dollar | | 13,771,220 | | JPMorgan Chase Bank N.A. | | 12/29/16 | | | | 223,741 | |
| Mexican Peso | | 98,699,420 | | U.S. Dollar | | 5,000,000 | | JPMorgan Chase Bank N.A. | | 12/29/16 | | | | 187,823 | |
| Old Westbury Funds, Inc. | |
| Notes To Financial Statements - (Continued) | |
| | October 31, 2016 |
| | |
| Currency Purchased | | Currency Sold | | Counterparty | | Settlement
Date | | Unrealized
Appreciation/
(Depreciation) | |
| Mexican Peso | | 123,618,153 | | U.S. Dollar | | 6,598,633 | | JPMorgan Chase Bank N.A. | | 12/29/16 | | $ | | (101,036 | ) |
| Australian Dollar | | 16,581,515 | | U.S. Dollar | | 12,614,238 | | JPMorgan Chase Bank N.A. | | 01/31/17 | | | | (29,155 | ) |
| Indian Rupee | | 338,950,000 | | U.S. Dollar | | 5,000,000 | | JPMorgan Chase Bank N.A. | | 01/31/17 | | | | 17,492 | |
| Indian Rupee | | 338,325,000 | | U.S. Dollar | | 5,000,000 | | JPMorgan Chase Bank N.A. | | 01/31/17 | | | | 8,240 | |
| Indian Rupee | | 338,250,000 | | U.S. Dollar | | 5,000,000 | | JPMorgan Chase Bank N.A. | | 01/31/17 | | | | 7,130 | |
| Indian Rupee | | 338,100,000 | | U.S. Dollar | | 5,000,000 | | JPMorgan Chase Bank N.A. | | 01/31/17 | | | | 4,910 | |
| Indonesian Rupiah | | 39,987,000,000 | | U.S. Dollar | | 3,034,574 | | JPMorgan Chase Bank N.A. | | 01/31/17 | | | | (5,053 | ) |
| U.S. Dollar | | 34,564,209 | | Mexican Peso | | 647,148,941 | | JPMorgan Chase Bank N.A. | | 01/31/17 | | | | 676,514 | |
| Indonesian Rupiah | | 137,950,000,000 | | U.S. Dollar | | 10,293,240 | | JPMorgan Chase Bank N.A. | | 02/28/17 | | | | 118,262 | |
| Hong Kong Dollar | | 465,744,000 | | U.S. Dollar | | 60,000,000 | | JPMorgan Chase Bank N.A. | | 06/12/17 | | | | 127,126 | |
| U.S. Dollar | | 59,641,952 | | Hong Kong Dollar | | 465,744,000 | | JPMorgan Chase Bank N.A. | | 06/12/17 | | | | (485,175 | ) |
| Indonesian Rupiah | | 103,305,000,000 | | U.S. Dollar | | 7,500,000 | | JPMorgan Chase Bank N.A. | | 08/31/17 | | | | 69,899 | |
| United Kingdom Pound | | 820,219 | | U.S. Dollar | | 1,000,000 | | UBS AG | | 11/30/16 | | | | 4,524 | |
| United Kingdom Pound | | 8,069,475 | | U.S. Dollar | | 10,000,000 | | UBS AG | | 11/30/16 | | | | (117,296 | ) |
| United Kingdom Pound | | 3,834,723 | | U.S. Dollar | | 5,000,000 | | UBS AG | | 11/30/16 | | | | (303,606 | ) |
| United Kingdom Pound | | 10,500,000 | | U.S. Dollar | | 12,733,340 | | UBS AG | | 01/31/17 | | | | 146,749 | |
| | | | | | | | | | | | | $ | | (8,234,603 | ) |
C. Swap Agreements. The Funds entered into swap agreements, which are agreements involving two parties to exchange the return generated by a security, currency, commodity, interest rate, index, or other measures for the return generated by another instrument, for example, the agreement to pay interest in exchange for a market-linked return based on a notional amount. The Funds entered into total return, interest rate and other swap agreements. Interest rate swap agreements generally involve the agreement by the Funds to pay a counterparty a fixed or floating rate on a fixed notional amount and to receive a fixed or floating rate on a fixed notional amount, but may also involve the agreement to pay or receive payments derived from changes in interest rates. Periodic payments are generally made during the life of the swap agreement according to the terms and conditions of the agreement and at termination or maturity. Total return swap agreements involve the commitments to pay or receive an amount generally determined by reference to a security, index or other measure in exchange for a specific market linked return, based on notional amounts. To the extent that the total return of the security, index or other measure underlying the transaction exceeds or falls short of the offsetting interest rate-based obligation, the Funds receive or make a payment to the counterparty. Payments received or made by a Fund at the expiration or other termination of the swap agreements are recorded in the Statements of Operations as realized gains or losses, respectively. Swap agreements are marked-to-market daily based on dealer-supplied valuations, and changes in value, including the periodic amounts of interest to be paid or received on swaps, are recorded as unrealized appreciation/(depreciation). Risks may exceed amounts recognized on the Statements of Assets and Liabilities. These risks include changes in the returns of the underlying instruments, failure of the counterparties to perform under the contracts’ terms and the possible lack of liquidity with respect to the swap agreements. Details of swap agreements open at period end are included in the Portfolios of Investments under the caption “Swap Agreements”.
| Old Westbury Funds, Inc. | |
| Notes To Financial Statements - (Continued) | |
| | October 31, 2016 |
| | |
D. Options. The Funds purchased and wrote (sold) put and call options on equity securities and stock index futures in order to gain exposure to or to protect against changes in the market.
Options on swaps (swaptions) are similar to options on securities except that instead of selling or purchasing the right to buy or sell a security, the writer or purchaser of the swaption is granting or buying the right to enter into a previously agreed upon swap agreement at any time before the expiration of the option.
A call option gives the purchaser of the option the right (but not the obligation) to buy, and obligates the seller to sell (when the option is exercised), the underlying instrument at the exercise price at any time or at a specified time during the option period. A put option gives the holder the right to sell and obligates the writer to buy the underlying instrument at the exercise price at any time or at a specified time during the option period. When a Fund purchases (writes) an option, an amount equal to the premium paid (received) by a Fund is reflected as an asset (liability). The amount of the asset (liability) is subsequently marked-to-market to reflect the current market value of the option purchased (written). When an instrument is purchased or sold through an exercise of an option, the related premium paid (or received) is added to (or deducted from) the basis of the instrument acquired or deducted from (or added to) the proceeds of the instrument sold. When an option expires (or a Fund enters into a closing transaction), a Fund realizes a gain or loss on the option to the extent of the premiums received or paid (or gain or loss to the extent the cost of the closing transaction exceeds the premium received or paid). When a Fund writes a call option, such option is “covered,” meaning that a Fund holds the underlying instrument subject to being called by the option counterparty, or cash in an amount sufficient to cover the obligation. When a Fund writes a put option, such option is covered by cash in an amount sufficient to cover the obligation.
In purchasing and writing options, a Fund bears certain risks, including the market risk of an unfavorable change in the price of the underlying instrument or the risk that a Fund may not be able to enter into a closing transaction due to an illiquid market. Exercise of a written option could result in a Fund purchasing or selling a security at a price different from the current market value.
A Fund may execute transactions in both listed and over-the-counter options. Listed options involve minimal counterparty risk since listed options are guaranteed against default by the exchange on which they trade. Transactions in certain over-the-counter options may expose a Fund to the risk of default by the counterparty to the transaction. In the event of default by the counterparty to the over-the-counter option transaction, a Fund’s maximum amount of loss is the premium paid and unrealized gain (as purchaser) or the unrealized gain of the contract less the premium received (as writer).
A summary of the Strategic Opportunities Fund’s written option transactions for the year ended October 31, 2016 is as follows:
| | | Number of
Options
Contracts | | Premiums
Received |
| Contracts outstanding at October 31, 2015 | | | | 5,516 | | | | $ | 3,623,270 | |
| Options written | | | | 146,420 | | | | | 34,384,443 | |
| Options terminated in closing purchase transactions | | | | (94,783 | ) | | | | (18,338,063 | ) |
| Options exercised | | | | (1 | ) | | | | (711 | ) |
| Options expired | | | | (45,552 | ) | | | | (17,357,748 | ) |
| Contracts outstanding at October 31, 2016 | | | | 11,600 | | | | $ | 2,311,191 | |
The Strategic Opportunities Fund invests in structured options to increase or decrease its exposure to an underlying index or group of securities (equity risk) or to increase or decrease its exposure to changes in foreign currency exchange rates (foreign currency exchange risk). These structured options may consist of single or multiple OTC options which are priced as a single security. Structured options may only be exercised at the expiration date, but may be transferred/sold prior to the expiration date. The value of a structured option may either increase or decrease with the underlying index or group of securities, depending on the combination of options used. Structured options are issued in units whereby each unit represents a structure based on a specific index with an initial reference strike price. Generally, the basis of the contracts is the premium received or paid which is recorded as an asset on the Statements of Assets and Liabilities. The amount of the asset is subsequently market-to-market to reflect the current market value of the structured option. When a structured option is transferred/sold or exercised, the Fund will record a realized gain or loss equal to the difference between the proceeds from (or cost of) the closing transaction and the Fund’s basis in the contract, if any. One type of structure involves the combination of selling a put while buying a call on a specific index. This option would rise in value as the underlying index increases and fall in value as the
| Old Westbury Funds, Inc. | |
| Notes To Financial Statements - (Continued) | |
| | October 31, 2016 |
| | |
underlying index decreases. Alternatively, another structure involves the sale of a call and the purchase of a put. This option structure would rise in value as the underlying index decreases and fall in value as the underlying index increases. Upon the exercise of the structured option, the Fund will receive a payment from, or be required to remit a payment to the counterparty, depending on the value of the underlying index at exercise.
| 7. | Investment Advisory Fee,Administration Fee and Other Transactions: |
A. Investment Advisory Fees. The Funds’ investment adviser is BIM, a wholly-owned subsidiary of Bessemer Trust Company, N.A. (“Bessemer”). Bessemer is a subsidiary of The Bessemer Group, Incorporated (“BGI”). The investment advisory fee paid to BIM for advisory services is computed daily and paid monthly in accordance with the following schedule:
| | | First $500 million of
average net assets | | Next $500 million
to $1 billion of
average net assets | | Average net assets
exceeding $1 billion | | Blended
Advisory Rate |
| Large Cap Core Fund | | | 0.70 | % | | | 0.65 | % | | | 0.60 | % | | | 0.66 | % |
| Fixed Income Fund | | | 0.45 | % | | | 0.40 | % | | | 0.35 | % | | | 0.44 | % |
| Municipal Bond Fund | | | 0.45 | % | | | 0.40 | % | | | 0.35 | % | | | 0.39 | % |
| | | Average net assets |
| Small & Mid Cap Fund | | | 0.85 | % |
| | | First $1.25 billion of
average net assets | | Next $1.25 billion
to $2.5 billion of
average net assets | | Average net assets
exceeding $2.5 billion | | Blended
Advisory Rate |
| Large Cap Strategies Fund | | | 0.90 | % | | | 0.85 | % | | | 0.80 | % | | | 0.81 | % |
| Strategic Opportunities Fund | | | 1.10 | % | | | 1.05 | % | | | 1.00 | % | | | 1.03 | % |
BIM has retained Harding Loevner LP (“Harding Loevner”) and Sands Capital Management, LLC (“Sands”) as sub-advisers to manage a segment of the Large Cap Strategies Fund. Harding Loevner and Sands are paid for their services directly by BIM.
BIM has retained Dimensional Fund Advisors LP (“Dimensional”), Champlain Investment Partners, LLC (“Champlain”), Martingale Asset Management, L.P. (“Martingale”) (effective July 28, 2016) and Mondrian Investment Partners Limited (“Mondrian”) as sub-advisers to each manage segments of the Small & Mid Cap Fund. Dimensional, Champlain, Martingale and Mondrian are paid for their services directly by BIM.
BIM has retained Franklin Advisers, Inc. (“Franklin”), BlackRock Financial Management, Inc. (“BlackRock”), Muzinich & Co., Inc. (“Muzinich”) and TPH Asset Management LLC (“TPH”) as sub-advisers to each manage a segment of the Strategic Opportunities Fund. Franklin, BlackRock, Muzinich and TPH are paid for their services directly by BIM. TPH (effective September 1, 2016) and Franklin (effective October 15, 2016) no longer act as a sub-adviser of the Fund.
B. Administration, Fund Accounting, Transfer Agent and Underwriting Fees. The Corporation, on behalf of each Fund, has entered into an administrative oversight, supervision and coordination services agreement (the “Administrative Agreement”) with Bessemer, pursuant to which Bessemer and Bessemer Trust Company (“BTCO”), an affiliate of BIM, provide certain non-advisory services to the Funds, such as the maintenance of records, the provision of supervisory personnel and the monitoring of the other non-advisory service providers. Under the Administrative Agreement, each Fund pays an annual fee of 0.03% of its average daily net assets for such services. BNY Mellon Investment Servicing (US) Inc. (“BNY Mellon”) acts as administrator, fund accounting agent and transfer agent for the Funds pursuant to an Administration and Accounting Services Agreement and a Transfer Agency Services Agreement, respectively. Certain Officers of the Funds are also employees of BNY Mellon.
The Corporation entered into an Underwriting Agreement with Foreside Funds Distributors LLC for the limited purpose of acting as statutory underwriter to facilitate the registration and distribution of shares of the Funds.
C. Distribution and Shareholder Servicing Fees. The Funds have adopted a shareholder servicing plan (the “Shareholder Servicing Plan”) with Bessemer, pursuant to which Bessemer serves as a shareholder servicing agent and provides certain shareholder support services. Bessemer may engage shareholder sub-servicing agents, such as broker/dealers, banks, trust companies, investment advisers, and other financial institutions and intermediaries to provide certain shareholder support services and is solely responsible for paying each such shareholder sub-servicing agent from the fee it receives from each of the Funds. Each Fund pays for shareholder support services an annual fee of 0.20% of its average daily net assets; however, with
| Old Westbury Funds, Inc. | |
| Notes To Financial Statements - (Continued) | |
| | October 31, 2016 |
| | |
respect to the Fixed Income Fund and the Municipal Bond Fund, Bessemer has contractually committed to waive its shareholder servicing fee to the extent necessary to maintain a maximum shareholder servicing fee at 0.10% through October 31, 2017. The shareholder servicing fee commitment arrangements may be changed or terminated at any time with the approval of the Board. Bessemer, however, does not have the ability to recapture fees currently being waived at a later date. For the year ended October 31, 2016, Bessemer waived shareholder servicing fees in the amount of $666,291 with respect to the Fixed Income Fund and $1,716,731 with respect to the Municipal Bond Fund.
D. Custody Fees. The Large Cap Core Fund, Large Cap Strategies Fund, Fixed Income Fund and Municipal Bond Fund have each retained BTCO, a wholly-owned subsidiary of BGI, to serve as their custodian, and the Small & Mid Cap Fund has retained BTCO to serve as their co-custodian. Pursuant to the Funds’ Custody Agreements, BTCO is responsible for maintaining the custody of these Funds’ securities and cash. BTCO serves as custodian for the Small & Mid Cap Fund only with respect to equity securities of U.S. companies (other than exchange-traded funds) and securities in the form of depositary receipts directly managed by BIM, income, other payments and distributions issued with respect to such securities, proceeds of the sale of such securities, and cash, cash equivalents and money market instruments received and held by BTCO from time to time on behalf of the Small & Mid Cap Fund. For providing these services, BTCO receives a fee calculated and paid monthly at the annual rate of 0.075% of the average daily net assets of the non-U.S. investments for Large Cap Core Fund and Large Cap Strategies Fund and 0.015% of the average daily net assets of each of the Fixed Income Fund and Municipal Bond Fund or portion thereof for the Small & Mid Cap Fund and U.S. investments for Large Cap Core Fund and Large Cap Strategies Fund. The Strategic Opportunities Fund and the Subsidiary have retained Citibank, N.A. (“Citibank”) to serve as their custodian and the Small & Mid Cap Fund has retained Citibank to serve as its co-custodian. Citibank is responsible for maintaining the custody of these Funds’ securities and cash and assets of the Small & Mid Cap Fund managed by the sub-advisers. For providing these services, Citibank receives a fee from each Fund calculated daily and paid monthly based on safekeeping and transaction fees that vary by country.
E. Fee Waivers. BIM may voluntarily waive a portion of its advisory fee to limit the Funds’ total expenses. BIM may terminate this voluntary waiver at any time. BIM, however, does not have the ability to recapture fees currently being waived at a later date. BIM has contractually committed through October 31, 2017 to waive its advisory fees to the extent necessary to maintain the net operating expense ratios, excluding fund transaction costs, investment interest expense, dividend expenses associated with securities sold short and acquired fund fees and expenses, if any, of the Large Cap Core Fund at 1.00%, Large Cap Strategies Fund at 1.15%, the Small & Mid Cap Fund at 1.11%, the Strategic Opportunities Fund at 1.20%, the Fixed Income Fund at 0.70% and the Municipal Bond Fund at 0.70%. Any waiver amounts are disclosed in the Statements of Operations. For the year ended October 31, 2016, BIM waived $2,408,316 for the Small & Mid Cap Fund and $7,549,178 for the Strategic Opportunities Fund. The Fixed Income Fund and Municipal Bond Fund had shareholder servicing fee waivers of $666,291 and $1,716,731, respectively. The contractual advisory fee waivers and the shareholder servicing fee waivers may be changed or terminated at any time with the approval of the Board.
F. Board of Directors’ Fees. Each Director who is not an “interested person” of the Corporation (as that term is defined under the 1940 Act) (each, an “Independent Director”) receives from the Funds a total annual retainer of $120,000 (plus $50,000 for serving as the Board’s Chairperson, $20,000 as the Audit Committee Chairperson, $10,000 as the Pricing Committee Liaison and $10,000 each as the Nominating Committee Chairperson and the Governance Committee Chairperson) and receives for attendance at Board and committee meetings the following:
| | | Noticed to be
In-Person
(whether participating
by phone or in-person) | | | Noticed to be
telephonic | |
| Regular Board Meeting | | $ | 9,000 | | | $ | 4,500 | |
| Special Board Meeting | | | 6,000 | | | | 3,000 | |
| Audit Committee Meeting | | | 5,000 | | | | 2,500 | |
| Nominating Committee Meeting | | | 5,000 | | | | 2,500 | |
| Governance Committee Meeting | | | 5,000 | | | | 2,500 | |
Each Independent Director is reimbursed for all out-of-pocket expenses relating to attendance at meetings of the Board and any Board committee. Directors who are not Independent Directors, officers or employees of BIM and BNY Mellon do not receive compensation from the Funds. Fees paid are allocated to the Funds on a pro rata basis based on net assets.
| Old Westbury Funds, Inc. | |
| Notes To Financial Statements - (Continued) | |
| | October 31, 2016 |
| | |
| 8. | Securities Transactions: |
Investment transactions for the year ended October 31, 2016, excluding short-term debt investments and U.S. Government securities, were as follows:
| | | Purchases | | | Sales | |
| Large Cap Core Fund | | $ | 470,562,865 | | | $ | 373,044,182 | |
| Large Cap Strategies Fund | | | 7,196,614,738 | | | | 6,753,591,297 | |
| Small & Mid Cap Fund | | | 2,434,116,550 | | | | 2,697,120,974 | |
| Strategic Opportunities Fund (Consolidated) | | | 3,517,888,503 | | | | 4,020,104,214 | |
| Fixed Income Fund | | | 265,777,389 | | | | 201,827,293 | |
| Municipal Bond Fund | | | 939,784,823 | | | | 412,371,471 | |
Purchase and sales of U.S. Government Securities, excluding those with maturity of one year or less during the year ended October 31, 2016 were as follows:
| | | Purchases | | | Sales | |
| Fixed Income Fund | | $ | 404,670,987 | | | $ | 248,628,177 | |
| Municipal Bond Fund | | | 313,636,289 | | | | 331,215,012 | |
It is the policy of each Fund to qualify as a regulated investment company by complying with the provisions available to certain investment companies as defined in Subchapter M of the Internal Revenue Code of 1986, as amended (the “Code”), and to make distributions from net investment income and net realized capital gains sufficient to relieve it from all, or substantially all, federal income taxes. Federal income tax regulations differ from accounting principles generally accepted in the U.S.; therefore, distributions determined in accordance with tax regulations may differ in amount or character from net investment income and realized gains for financial reporting purposes. Financial reporting records are adjusted for permanent book/tax differences to reflect tax character within the components of net assets in the Statements of Assets and Liabilities. These permanent differences primarily arise from paydowns, real estate investment trusts, passive foreign investment companies, partnerships, utilization of earnings and profits on shareholder redemptions and the tax treatment of foreign currency gains/losses. Financial records are not adjusted for temporary differences. Temporary differences primarily arise from the tax treatment of wash sales, passive foreign investment companies, and index options.
Permanent differences as of October 31, 2016, were as follows:
| | | Increase/(Decrease)
Undistributed
Net Investment Income | | Increase/(Decrease)
Net Realized Gains | | Net Unrealized
Appreciation
(Depreciation) | | Increase/
(Decrease)
Paid-in-Capital |
| Large Cap Core Fund | | $ | 30,271 | | | $ | (30,271 | ) | | | $— | | | $ | — | |
| Large Cap Strategies Fund | | | 11,773,828 | | | | (11,773,828 | ) | | | — | | | | — | |
| Small & Mid Cap Fund | | | 4,292,023 | | | | (28,803,326 | ) | | | — | | | | 24,511,303 | |
| Strategic Opportunities Fund | | | 9,100,866 | | | | 3,084,466 | | | | — | | | | (12,185,332 | ) |
| Fixed Income Fund | | | 1,478,050 | | | | (1,478,050 | ) | | | — | | | | — | |
By investing in the Subsidiary, the Strategic Opportunities Fund will gain exposure to commodities and commodity-linked instruments within the limits of Subchapter M of the Code.
The Funds may also be subject to capital gains tax in India on gains realized upon the sale of Indian securities. The Funds may accrue a deferred tax liability for unrealized gains on India, Indonesia and Pakistan securities based on existing tax rates and holding periods of the securities. As of October 31, 2016, the Large Cap Strategies Fund, the Small & Mid Cap Fund and the Strategic Opportunities Fund recorded liabilities of $3,253,874, $460,230 and $4,779, respectively, in the Statements of Assets and Liabilities as an estimate for potential future India, Indonesia and Pakistan capital gain taxes.
| Old Westbury Funds, Inc. | |
| Notes To Financial Statements - (Continued) | |
| | October 31, 2016 |
| | |
The tax character of distributions from the Funds during the year ended October 31, 2016 was as follows (amounts in thousands):
| | | Large Cap
Core Fund | | Large Cap Strategies
Fund | | Small & Mid Cap
Fund | | Strategic
Opportunities
Fund | | Fixed
Income
Fund | | Municipal
Bond
Fund | |
| Distributions paid from: | | | | | | | | | | | | | | | | | | | | | | | | | | | | | | | |
| Ordinary Income | | | $ | 12,768 | | | | $ | 109,207 | | | | $ | 43,722 | | | | $ | 106,192 | | | | $ | 8,507 | | | | $ | 1,369 | | |
| Net Long Term Capital Gains | | | | 13,076 | | | | | 212,416 | | | | | 250,506 | | | | | 127,647 | | | | | — | | | | | 1,053 | | |
| Total Taxable Distributions | | | | 25,844 | | | | | 321,623 | | | | | 294,228 | | | | | 233,839 | | | | | 8,507 | | | | | 2,422 | | |
| Tax Exempt Distributions | | | | — | | | | | — | | | | | — | | | | | — | | | | | — | | | | | 18,981 | | |
| Total Distributions Paid | | | $ | 25,844 | | | | $ | 321,623 | | | | $ | 294,228 | | | | $ | 233,839 | | | | $ | 8,507 | | | | $ | 21,403 | | |
The tax character of distributions from the Funds during the year ended October 31, 2015 was as follows (amounts in thousands):
| | | Large Cap
Core Fund | | Large Cap
Strategies Fund | | Small & Mid Cap
Fund | | Strategic
Opportunities
Fund | | Fixed
Income
Fund | | Municipal
Bond
Fund | |
| Distributions paid from: | | | | | | | | | | | | | | | | | | | | | | | | | | | | | | | |
| Ordinary Income | | | $ | 13,732 | | | | $ | 92,723 | | | | $ | 48,279 | | | | $ | 219,097 | | | | $ | 7,735 | | | | $ | 201 | | |
| Net Long Term Capital Gains | | | | 44,984 | | | | | 324,270 | | | | | 558,353 | | | | | 199,203 | | | | | — | | | | | 5,449 | | |
| Total Taxable Distributions | | | | 58,716 | | | | | 416,993 | | | | | 606,632 | | | | | 418,300 | | | | | 418,300 | | | | | 5,650 | | |
| Tax Exempt Distributions | | | | — | | | | | — | | | | | — | | | | | — | | | | | — | | | | | 16,353 | | |
| Total Distributions Paid | | | $ | 58,716 | | | | $ | 416,993 | | | | $ | 606,632 | | | | $ | 418,300 | | | | $ | 418,300 | | | | $ | 22,003 | | |
The difference in classification between the amounts reflected above and the Statements of Changes in Net Assets is primarily due to short-term capital gain distributions.
As of and during the year ended October 31, 2016, the Funds did not have any liabilities for any uncertain tax positions. The Funds recognize interest and penalties, if any, related to unrecognized tax positions as income tax expense in the Statements of Operations. During the year, the Funds did not incur any interest or penalties. The statute of limitation on each Fund’s U.S. federal income tax returns remains open for each of the four years ended October 31, 2016. The statutes of limitations on each Fund’s state and local tax returns may remain open for an additional year depending upon the jurisdiction.
At October 31, 2016, the components of accumulated earnings/(deficits) on a tax basis were as follows:
| | | Large Cap Core
Fund | | Large Cap Strategies
Fund | | Small & Mid Cap
Fund | | Strategic
Opportunities
Fund | | Fixed
Income
Fund | | Municipal
Bond
Fund | |
| Undistributed Tax Exempt Income | | | $ | — | | | | $ | — | | | | $ | — | | | | $ | — | | | | $ | — | | | | $ | 1,776,684 | | |
| Undistributed Ordinary Income | | | | 12,470,318 | | | | | 92,586,803 | | | | | 25,130,992 | | | | | 85,043,614 | | | | | 770,831 | | | | | 6,686,676 | | |
| Undistributed Long-Term Capital Gains | | | | — | | | | | 151,601,728 | | | | | 298,282,299 | | | | | — | | | | | — | | | | | 2,685,368 | | |
| Accumulated Earnings | | | | 12,470,318 | | | | | 244,188,531 | | | | | 323,413,291 | | | | | 85,043,614 | | | | | 770,831 | | | | | 11,148,728 | | |
| Other Accumulated Earnings | | | | — | | | | | — | | | | | — | | | | | — | | | | | — | | | | | — | | |
| Deferred Qualified Late-Year Losses | | | | — | | | | | — | | | | | — | | | | | — | | | | | — | | | | | — | | |
| Capital Loss Carryforwards | | | | (23,056,130 | ) | | | | — | | | | | — | | | | | (178,594,106 | ) | | | | (4,127,622 | ) | | | | — | | |
| Unrealized Appreciation/(Depreciation) | | | | 100,206,318 | | | | | 1,860,434,857 | | | | | 1,038,505,879 | | | | | 116,233,073 | | | | | 3,066,866 | | | | | 25,322,920 | | |
| Other Temporary Differences | | | | — | | | | | — | | | | | — | | | | | (31,720 | ) | | | | — | | | | | — | | |
| Total Accumulated Earnings/(Deficits) | | | $ | 89,620,506 | | | | $ | 2,104,623,388 | | | | $ | 1,361,919,170 | | | | $ | 22,650,861 | | | | $ | (289,925 | ) | | | $ | 36,471,648 | | |
The Fixed Income Fund utilized capital loss carryforwards in the current year of $485,385.
As of October 31, 2016, the Large Cap Core Fund had a short-term capital loss carryforward of $14,442,362 and a long-term capital loss carryforward of $8,613,768 ,the Fixed Income Fund had a long-term capital loss carryforward of $4,127,622 and the Strategic Opportunities Fund had a short-term capital loss carryforward of $122,896,935 and a long-term capital loss carryforward of $55,697,171 available to offset future realized capital gains in accordance with the Regulated Investment Company
| Old Westbury Funds, Inc. | |
| Notes To Financial Statements - (Continued) | |
| | October 31, 2016 |
| | |
Modernization Act of 2010. This capital loss carryforward is not subject to expiration and must first be utilized to offset future realized gains of the same character.
The capital loss carryforward will reduce the applicable Fund’s taxable income arising from future net realized gains on investments, if any, to the extent permitted by the Code, and thus will reduce the amount of the distributions to shareholders which would otherwise be necessary to relieve the Funds of any liability for federal tax.
Under current tax law, ordinary losses incurred after December 31 of a Fund’s fiscal year may be deferred and treated as occurring on the first business day of the following fiscal year for tax purposes.
The Strategic Opportunities Fund may invest in floating rate loan interests. In connection with these investments, the Strategic Opportunities Fund may also enter into bridge loan commitments (“commitments”). Bridge loan commitments may obligate the Strategic Opportunities Fund to furnish temporary financing to a borrower until permanent financing can be arranged. As of October 31, 2016, the Strategic Opportunities Fund had no outstanding bridge loan commitments. In connection with these commitments, the Strategic Opportunities Fund would earn a commitment fee, typically set as a percentage of the commitment amount. Such fee income, which would be included in interest income in the Statements of Operations, is recognized ratably over the commitment period.
Management has evaluated the impact of all subsequent events on the Funds and has determined that there were no subsequent events requiring recognition or disclosure in the financial statements except for the following:
Old Westbury Large Cap Core Fund. At a special meeting of the Board of the Corporation held on October 25, 2016, the Board approved: 1) a change in the investment strategy and an expanded investment mandate for Old Westbury Large Cap Core Fund, 2) a change in the Fund’s name to Old Westbury All Cap Core Fund, 3) a change in the Fund’s primary benchmark from the MCSI ACWI Large Cap Index (Net) to the MSCI ACWI Investable Market Index (Net) to more closely reflect the modified investment strategy, 4) subject to shareholder approval (which was given at a shareholder meeting held on December 22, 2016), an increase in the investment advisory fee rate payable by the Fund to BIM by approximately 0.05%, 5) the termination of a fee waiver agreement, which would maintain the net operating expense ratio of the Fund at 1.00% or below through October 31, 2017, and 6) selected portfolio management changes. All changes will become effective on or about December 30, 2016.
Old Westbury Small & Mid Cap Fund. At a special meeting of the Board of the Corporation held on October 25, 2016, the Board approved changing the name of the Old Westbury Small & Mid Cap Fund to Old Westbury Small & Mid Cap Strategies Fund. This change will become effective on or about December 30, 2016.
| 12. | Additional Tax Information (Unaudited) |
Qualified Dividend Income (Unaudited)
The Funds designate a portion of the income dividends distributed during the fiscal year ended October 31, 2016, as Qualified Dividend Income (“QDI”) as defined in the Code as follows:
| Large Cap Core Fund | | 100.00 | % |
| Large Cap Strategies Fund | | 100.00 | % |
| Small & Mid Cap Fund | | 100.00 | % |
| Strategic Opportunities Fund | | 20.16 | % |
| Old Westbury Funds, Inc. | |
| Notes To Financial Statements - (Continued) | |
| | October 31, 2016 |
| | |
Qualified Interest Income (Unaudited)
The Funds designate a portion of the income dividends distributed during the fiscal year ended October 31, 2016, as Qualified Interest Income as defined in the Code as follows:
| Large Cap Core Fund | | 0.06 | % |
| Large Cap Strategies Fund | | 0.06 | % |
| Small & Mid Cap Fund | | 0.08 | % |
| Strategic Opportunities Fund | | 53.43 | % |
| Fixed Income Fund | | 91.58 | % |
| Municipal Bond Fund | | 4.76 | % |
Qualified Short Term Gain (Unaudited)
The Funds designate a portion of the income dividends distributed during the fiscal year ended October 31, 2016, as Qualified Short-Term Gain as defined in the Code as follows:
| Municipal Bond Fund | | 0.14 | % |
Dividends Received Deduction (Unaudited)
For the fiscal year ended October 31, 2016, the following percentage of income dividends paid by the Funds qualifies for the Dividends Received Deduction available to corporations:
| Large Cap Core Fund | | 53.38 | % |
| Large Cap Strategies Fund | | 95.78 | % |
| Small & Mid Cap Fund | | 61.19 | % |
| Strategic Opportunities Fund | | 6.28 | % |
Long Term Capital Gain Dividends (Unaudited)
The Funds designate Long-Term Capital Gain dividends pursuant to Section 852(b)(3) of the Code for the fiscal year ended October 31, 2016 as follows:
| Large Cap Core Fund | $ | 13,076,169 | |
| Large Cap Strategies Fund | | 212,416,103 | |
| Small & Mid Cap Fund | | 250,505,661 | |
| Strategic Opportunities Fund | | — | |
| Municipal Bond Fund | | 1,053,071 | |
U.S. Government Income (Unaudited)
The percentages of the ordinary income dividends paid by the Funds during the fiscal year ended October 31, 2016 which were derived from U.S. Treasury securities were as follows:
| Large Cap Core Fund | | 0.02 | % |
| Large Cap Strategies Fund | | 0.05 | % |
| Small & Mid Cap Fund | | 0.07 | % |
| Strategic Opportunities Fund | | 1.46 | % |
| Fixed Income Fund | | 34.55 | % |
| Municipal Bond Fund | | 11.77 | % |
Tax Exempt Distributions (Unaudited)
The Municipal Bond Fund designates $18,980,850 as tax exempt dividends paid for the fiscal year ended October 31, 2016.
| Report of Independent Registered Public Accounting Firm | |
| | |
| | |
| | |
To the Board of Directors and Shareholders of
Old Westbury Funds, Inc.
We have audited the accompanying statements of assets and liabilities of Old Westbury Funds, Inc. (comprising, respectively, Large Cap Core Fund, Large Cap Strategies Fund, Small & Mid Cap Fund, Strategic Opportunities Fund (consolidated), Fixed Income Fund and Municipal Bond Fund (collectively, the “Funds”)), including the portfolios of investments of Large Cap Core Fund, Large Cap Strategies Fund, Strategic Opportunities Fund (consolidated), Fixed Income Fund and Municipal Bond Fund and the condensed portfolio of investments of Small & Mid Cap Fund, as of October 31, 2016, and the related statements of operations for the year then ended, the statements of changes in net assets for each of the two years in the period then ended and the financial highlights for each of the five years in the period then ended. These financial statements and financial highlights are the responsibility of the Funds’ management. Our responsibility is to express an opinion on these financial statements and financial highlights based on our audits.
We conducted our audits in accordance with the standards of the Public Company Accounting Oversight Board (United States). Those standards require that we plan and perform the audit to obtain reasonable assurance about whether the financial statements and financial highlights are free of material misstatement. We were not engaged to perform an audit of the Funds’ internal control over financial reporting. Our audits included consideration of internal control over financial reporting as a basis for designing audit procedures that are appropriate in the circumstances, but not for the purpose of expressing an opinion on the effectiveness of the Funds’ internal control over financial reporting. Accordingly, we express no such opinion. An audit also includes examining, on a test basis, evidence supporting the amounts and disclosures in the financial statements and financial highlights, assessing the accounting principles used and significant estimates made by management, and evaluating the overall financial statement presentation. Our procedures included confirmation of securities owned as of October 31, 2016, by correspondence with the custodians and brokers or by other appropriate auditing procedures where replies from brokers were not received. We believe that our audits provide a reasonable basis for our opinion.
In our opinion, the financial statements and financial highlights referred to above present fairly, in all material respects, the financial position of each of the respective funds comprising Old Westbury Funds, Inc. at October 31, 2016, the results of their operations for the year then ended, the changes in their net assets for each of the two years in the period then ended and the financial highlights for each of the five years in the period then ended in conformity with U.S. generally accepted accounting principles.

New York, New York
December 28, 2016
| Old Westbury Funds, Inc. | |
| Directors and Officers of Old Westbury Funds, Inc. (Unaudited) | |
| | |
| | |
Independent and Interested Directors. The following table sets forth certain information with respect to the Directors of the Corporation, each of which, under current Board policy, may serve until the end of the calendar year during which he or she reaches the applicable mandatory retirement age established by the Board.
| Name, Address, and Age | | Position(s)
Held with
the Corporation | | Term
of Office
and Length
of Time
Served as a
Director of
the
Corporation | | Principal Occupation(s)
During Past 5 Years | | Number of
Portfolios in
Fund
Complex
Overseen by
Director | | Other
Director-
ships1
Held by
Director
During
Past 5
Years |
| Interested Director | | | | | | | | | | |
| | | | | | | | | | | |
Jeffrey J. Glowacki2
10250 Constellation
Boulevard, Suite 2600
Los Angeles, CA
90067
Age: 49 | | Director | | Indefinite term; 4 Years | | Managing Director and Western Region Head, Bessemer Trust Company, N.A. (since January 1, 2014); Managing Director and Senior Resident Officer of Bessemer Trust Company, N.A. (2005 - 2013) | | 6 | | 0 |
| | | | | | | | | | | |
| Independent Directors | | | | | | | | | | |
| | | | | | | | | | | |
Alexander Ellis III
630 Fifth Avenue
New York, NY 10111
Age: 67 | | Chairman &
Director | | Indefinite term; 3 Years | | General Partner, Rockport Capital Partners (2000-Present). | | 6 | | 13 |
| | | | | | | | | | | |
Patricia L. Francy
630 Fifth Avenue
New York, NY 10111
Age: 71 | | Director | | Indefinite term; 12 Years | | Director, various corporate, not- for-profit and foundation boards. | | 6 | | 14 |
| | | | | | | | | | | |
J. David Officer
630 Fifth Avenue
New York, NY 10111
Age: 68 | | Director | | Indefinite term; 5 Years | | Independent Director; Consultant, Fidelity (2011); Pershing LLC (2010); various investment companies, not-for-profit boards. | | 6 | | 45 |
| | | | | | | | | | | |
R. Keith Walton
630 Fifth Avenue
New York, NY 10111
Age: 52 | | Director | | Indefinite term; Since July 2016 | | Vice President, Strategy, Arizona State University (Since 2013); Vice President, Global Government & Affairs, Alcoa Inc. (commercial manufacturing company) (2010-2012). | | 6 | | 56 |
| Old Westbury Funds, Inc. | |
| Directors and Officers of Old Westbury Funds, Inc. (Unaudited) - (Continued) | |
| | |
| | |
| 1 | Directorships held during the last five years in (1) any other investment companies registered under the 1940 Act, (2) any company with a class of securities registered pursuant to Section 12 of the Securities and Exchange Act of 1934, as amended, or (3) any company subject to the requirements of Section 15(d) of the Exchange Act. |
| 2 | Directors who are or may be deemed “interested persons” (as defined under the 1940 Act) of the Corporation, BIM (as defined below) or Bessemer (as defined below) are referred to as Interested Directors. Mr. Glowacki is deemed an Interested Director by virtue of his positions as Managing Director and Western Region Head of Bessemer Trust Company, N.A. |
| 3 | Mr. Ellis has served as Director of Clean Diesel Technologies Inc. |
| 4 | Ms. Francy has served as Director of Siebert Financial Corp. |
| 5 | Mr. Officer serves, or has served, as Director of the following entities: DBX ETF Trust (40), Man Long Short Fund; GLG International Small Cap Fund; and Ilex Partners (Asia) LLC. |
| 6 | Mr. Walton serves as Director of the following entities: Blue Crest Capital Management, LLC Funds, Global Infrastructure Partners, Systematica Investments Limited, Zweig Fund Inc. and Zweig Total Return Fund Inc. |
| Old Westbury Funds, Inc. | |
| Directors and Officers of Old Westbury Funds, Inc. (Unaudited) - (Continued) |
| |
| | |
Officers. The table below sets forth certain information with respect to the Officers of the Corporation:
| Name, Address, and Age | | Position(s)
Held with
the Corporation | | Term of
Office
and Length of
Time Served
as
an Officer of
the
Corporation | | Principal Occupation(s)
During Past 5 Years |
| | | | | | | |
David W. Rossmiller
630 Fifth Avenue
New York, NY 10111
Age: 58 | | President &
Chief Executive
Officer | | Indefinite; 4 Years | | Managing Director and Head of Fixed Income, Bessemer Trust Company, N.A. (Since 2010). |
| | | | | | | |
Steven L. Williamson
630 Fifth Avenue
New York, NY 10111
Age: 63 | | Chief Legal
Officer | | Indefinite; 13 Years | | Managing Director and General Counsel, The Bessemer Group, Incorporated and principal bank subsidiaries (Since 2007). |
| | | | | | | |
Matthew A. Rizzi
630 Fifth Avenue
New York, NY 10111
Age: 43 | | Vice President &
Treasurer | | Indefinite; 2 Years | | Principal and Head of Trust Accounting and Fees, Bessemer Trust Company, N.A. (Since 2015); Senior Vice President and Head of Trust Accounting, Bessemer Trust Company, N.A. (2007-2014). |
| | | | | | | |
Nicola R. Knight
630 Fifth Avenue
New York, NY 10111
Age: 53 | | Assistant Secretary | | Indefinite; 7 Years | | Principal and Associate General Counsel of Bessemer Trust Company, N.A. (Since 2007). |
| | | | | | | |
Thomas G. Kennedy
630 Fifth Avenue
New York, NY 10111
Age: 46 | | Chief Compliance Officer | | Indefinite; Since July 2016 | | Chief Compliance Officer of Bessemer Investment Management LLC (Since July 2016); Principal and Director of Investment Management Compliance, Bessemer Trust Company, N.A. (Since July 2016) Head of Alternatives Compliance, Aberdeen Asset Management Inc. (January 2016-April 2016); Managing Director and Chief Compliance Officer, Arden Asset Management LLC (2008-2015). |
| | | | | | | |
Richard Murtagh
630 Fifth Avenue
New York, NY 10111
Age: 55 | | Vice President &
Assitant Treasurer | | Indefinite; 2 Years | | Principal, Managing Director and Corporate Controller, Bessemer Trust Company, N.A. (Since 2010). |
| Old Westbury Funds, Inc. | |
| Directors and Officers of Old Westbury Funds, Inc. (Unaudited) - (Continued) |
| |
| | |
| Name, Address, and Age | | Position(s)
Held with
the Corporation | | Term of
Office
and Length of
Time Served
as
an Officer of
the
Corporation | | Principal Occupation(s)
During Past 5 Years |
| | | | | | | |
David Schwart
801 Brickell Avenue
Suite 2250
Miami, FL 33131
Age: 46 | | Vice President & Anti-Money Laundering Compliance Officer | | Indefinite; 1 Year | | Vice President and Associate Director of Bank Compliance, Bessemer Trust Company, N.A. (Since April 2013); Vice President and Internal Audit Manager, BNP Paribas, N.A. (2009- March 2013). |
| | | | | | | |
Andrew J. McNally
760 Moore Road
King of Prussia, PA
19406
Age: 45 | | Vice President | | Indefinite; 10 Years | | Vice President and Senior Director of Fund Accounting & Administration, BNY Mellon Investment Servicing (US) Inc. (“BNY Mellon”) (formerly, PNC Global Investment Servicing (U.S.) Inc.) (financial services company) (Since 2007). |
| | Assistant Treasurer | | 7 Years | |
| | | | | | |
Jack Jafolla
760 Moore Road
King of Prussia, PA
19406
Age: 46 | | Assistant Treasurer | | Indefinite; 10 Years | | Senior Manager of NAV Operations, BNY Mellon (Since 2008) |
| | | | | | | |
Lisa M. King
301 Bellevue Parkway
Wilmington, DE
19809
Age: 48 | | Secretary | | Indefinite; Since April 2016 | | Vice President and Counsel, BNY Mellon (Since 2016); Counsel, Stradley Ronon Stevens & Young LLP (2007-2016). |
| | | | | | | |
William H. Wallace, III
301 Bellevue Parkway
Wilmington, DE
19809
Age: 46 | | Assistant
Secretary | | Indefinite; Since April 2016 | | Vice President and Manager of BNY Mellon (Since 2010). |
The Statement of Additional Information (“SAI”) includes additional information about the Corporation’s Directors and Officers and is available upon request, without charge. To obtain a copy of the SAI, please call (800) 607-2200.
| Additional Information (Unaudited) |
| | |
| | |
| | |
Information on Proxy Voting:
The Funds’ proxy voting guidelines, used to determine how to vote proxies relating to portfolio securities and information regarding how the Funds voted proxies relating to portfolio securities during the most recent 12-month period ended June 30 is available (i) without charge, upon request, by calling (800) 607-2200; and (ii) on the U.S. Securities and Exchange Commission’s (“SEC”) website at http://www.sec.gov.
Information on Form N-Q:
The Funds provide a complete list of the Funds’ holdings four times in each fiscal year, at the quarter-ends. For the second and fourth quarters, the Schedule of Investments appear in the Funds’ semi-annual and annual reports to shareholders. For the first and third quarters, the Funds file the Schedule of Investments with the SEC on Form N-Q. Shareholders can obtain the Funds’ Form N-Q (i) without charge, upon request, by calling (800) 607-2200; and (ii) on the SEC’s website at http://www.sec.gov. The Fund’s N-Q may be reviewed or copied at the SEC Public Reference Room in Washington D.C. Information on the operation of the Public Reference Room may be obtained by calling (800) SEC-0330.
| Old Westbury Funds, Inc. | |
| Renewal of Investment Advisory Agreement and Sub-Advisory Agreements (Unaudited) |
| |
| | |
At a meeting held on July 27, 2016, the Board of Directors (the “Board” or the “Directors”) of Old Westbury Funds, Inc. (the “Corporation”), including the Directors who are not “interested persons” (as defined under the Investment Company Act of 1940 (the “1940 Act”)) of any party to the agreements defined below (“Independent Directors”), unanimously approved the continuation of the following investment advisory and sub-advisory agreements (collectively, the “Agreements”): (1) an investment advisory agreement between Bessemer Investment Management LLC (“BIM” or the “Adviser”) and the Corporation on behalf of Old Westbury Large Cap Core Fund (“Large Cap Core Fund”), Old Westbury Large Cap Strategies Fund (“Large Cap Strategies Fund”), Old Westbury Small & Mid Cap Fund (“Small & Mid Cap Fund”), Old Westbury Strategic Opportunities Fund (“Strategic Opportunities Fund”), Old Westbury Fixed Income Fund (“Fixed Income Fund”), and Old Westbury Municipal Bond Fund (“Municipal Bond Fund”) (each, a “Fund” and, collectively, the “Funds”), (2) a sub-advisory agreement among BIM, Dimensional Fund Advisors LP (“Dimensional”) and the Corporation on behalf of the Small & Mid Cap Fund, (3) a sub-advisory agreement among BIM, Champlain Investment Partners, LLC (“Champlain”) and the Corporation on behalf of the Small & Mid Cap Fund, (4) a sub-advisory agreement among BIM, Franklin Advisers, Inc. (“Franklin”) and the Corporation on behalf of the Strategic Opportunities Fund, (5) a sub-advisory agreement among BIM, BlackRock Financial Management, Inc. (“BlackRock”) and the Corporation on behalf of the Strategic Opportunities Fund, (6) a sub-advisory agreement among BIM, Mondrian Investment Partners Limited (“Mondrian”) and the Corporation on behalf of the Small & Mid Cap Fund, (7) a sub-advisory agreement among BIM, Sands Capital Management, LLC (“Sands”) and the Corporation on behalf of the Large Cap Strategies Fund, (8) a sub-advisory agreement among BIM, Muzinich & Co, Inc. (“Muzinich”) and the Corporation on behalf of the Strategic Opportunities Fund, (9) a sub-advisory agreement among BIM, Harding Loevner LP (“Harding Loevner”) and the Corporation on behalf of the Large Cap Strategies Fund, and (10) a sub-advisory agreement among BIM, TPH Asset Management, LLC (“TPH”) and the Corporation on behalf of the Strategic Opportunities Fund (TPH and, collectively with Dimensional, Champlain, Frank-lin, BlackRock, Mondrian, Sands, Muzinich, and Harding Loevner, the “Sub-Advisers”). At both the meeting of the Board held on July 27, 2016 and the meeting of the Board held on April 20, 2016, the Board had requested and received substantial information regarding the Adviser, each of the Sub-Advisers, and the Agreements, as well as related matters pertaining to the fee rates charged and services provided by affiliated service providers. The Directors reviewed detailed due diligence questionnaires from BIM and each of the Sub-Advisers, as well as substantial information concerning, among other things, each Fund’s performance, comparative fee and expense information as well as information regarding BIM and each of the Sub-Advisers relating to their respective organizations, compliance and regulatory processes and programs and financial conditions. The Directors also discussed and considered economies of scale and how the Adviser shared those economies with the Funds’ shareholders. The Board received and discussed information concerning BIM’s and each Sub-Adviser’s performance, the use of affiliated brokers to execute transactions, the use of soft dollars, best execution, portfolio manager compensation, and whether there are any other direct or indirect benefits received by the Adviser or Sub-Adviser in managing the Funds. In addition, the Adviser supplied the Directors with additional information concerning its estimated profitability from managing the Funds. Moreover, the Board had received and considered materials and presentations throughout the course of the year relating to the investment management, performance and operation of the Funds.
The Board considered information about BIM and the Sub-Advisers, the performance of the Funds and certain additional factors described above and below that it deemed relevant. The following summary details the materials and factors that the Board considered, among others, and the conclusions they reached, in approving the continuance of the Agreements.
(1) The nature, extent and quality of services provided by the Adviser and Sub-Advisers.
The Board considered the scope and quality of services provided by the Adviser and Sub-Advisers, particularly the qualifications, capabilities and experience of the investment, operational, compliance, legal and other personnel who are responsible for providing services to the Funds. The Board also considered the fact that the Adviser and Sub-Advisers pay the costs of all investment and management facilities necessary for the efficient conduct of their respective services. The Board further considered the role and efforts of the Adviser in providing oversight of the various Sub-Advisers for the Funds, including in overseeing the service of, and in monitoring the performance of, each Sub-Adviser, as well as determining the appropriate allocation of assets to Sub-Advisers. The Board also considered the Adviser’s role in making recommendations to the Board regarding retaining or replacing Sub-Advisers where appropriate and in conducting the necessary searches and due diligence of prospective new sub-advisers. In this regard, the Board noted the information that it had received regarding the Adviser’s on-going due diligence with respect to each Sub-Adviser, including the Adviser’s review of, among other things, each Sub-Adviser’s investment process, compliance program and performance. The Board also considered the role of the Pricing Committee in the valuation of the Funds’ portfolio instruments, including its role in determining fair values for securities pursuant to the Corporation’s Valuation Policies, as well as its role in selecting and monitoring pricing service providers and, foreign fair value service providers.
| Old Westbury Funds, Inc. | |
| Renewal of Investment Advisory Agreement and Sub-Advisory Agreements (Unaudited) - (Continued) |
| |
| | |
In addition, the Board considered that the Adviser manages the overall investment program of the Funds and that the Adviser keeps the Board informed of important developments affecting the Funds, both in connection with the Board’s annual review of the Advisory and Sub-Advisory Agreements and at each Board meeting. The Board also noted that it received in-person reports from each Sub-Adviser throughout the year. The Board evaluated these factors based on its direct experience with the Adviser, and in consultation with Counsel to the Corporation and Counsel to the Independent Directors, as well as Counsel to the Independent Directors alone. The Board also considered the Adviser’s effectiveness in ensuring that the Funds are in compliance with their respective investment policies and restrictions and the requirements of the 1940 Act and related securities regulations. The Board further noted the Adviser’s and its affiliates’ efforts to oversee the Funds’ other service providers, including those providing administrative, accounting and custodial services.
Based on these factors, as well as other factors discussed herein, the Board concluded that the nature, quality and extent of services provided by the Adviser and Sub-Advisers have been and continue to be satisfactory.
(2) The performance of the Funds and the Adviser and Sub-Advisers.
The Board’s analysis of the Funds’ performance included the discussion and review of the performance data of each of the Funds against securities benchmarks as well as against a competitive group of similar funds, based on, in part, information provided by an independent, third-party mutual fund data provider. The Board considered that for some Funds, like the Strategic Opportunities Fund, the investment strategy employed by the Fund was distinct from any securities benchmark and was different than that employed by other funds, making performance comparisons against benchmarks and industry peers difficult or less meaningful. The Board reviewed comparative performance over long-, intermediate- and short-term periods. In reviewing performance, the Board placed greater emphasis on longer term performance than on shorter term performance, taking into account that over short periods of time underperformance may be transitory. The Board also considered the performance of the Funds in the context of whether the Funds were meeting the expectations of the clients invested in the Funds. In this regard, the Board considered that the Fixed Income Fund and the Municipal Bond Fund were designed as conservative investment products and that clients were most interested in capital preservation when investing in those particular Funds. As a result, the Board determined that the Fixed Income Fund and Municipal Bond Fund appeared to be meeting their investment objectives even though both Funds may have underperformed their competitive peer groups during certain periods.
The Board considered the performance of each of the Sub-Advisers both against comparative benchmarks as well as against similarly managed accounts managed by such Sub-Adviser. In this regard, the Board noted that the recent underperformance by certain Sub-Advisers was the result of a very short period of underperformance and that otherwise performance was competitive. When reviewing Sub-Adviser performance against similarly managed accounts, the Board considered, among other things, differences in the nature of such accounts from a regulatory and tax perspective and differences in the investment mandate from that of the Funds. In evaluating the Funds’ performance, the Board also considered the principal role of the Funds as part of the asset allocation strategy for client accounts maintained by Bessemer and its affiliates.
(3) The cost of the advisory and sub-advisory services and the profits to the Adviser and its affiliates from the relationship with the Funds.
In connection with the Board’s consideration of the level of the advisory and sub-advisory fees, the Board considered a number of factors. The Board’s analysis of each Fund’s advisory fees and expenses included a discussion and review of data concerning the current fee and expense ratios of each Fund compared to a peer group of similar funds and noted that each Fund’s advisory fee and expenses were generally in line with those of their representative group. The Board also noted the applicable advisory fee breakpoints as well as the Adviser’s contractual commitment to waive advisory fees for certain of the Funds. Additionally, the Board considered the Adviser’s profitability. With respect to the sub-advisory agreements with the Sub-Advisers, the Board noted that the Sub-Advisers’ fees were paid entirely by the Adviser so that no additional expenses would be borne by shareholders for the engagement of the Sub-Advisers. The Board noted that Sub-Advisory fee levels were arrived at pursuant to an arms-length negotiation between the Adviser and each Sub-Adviser. The Board also considered fee data from the Sub-Advisers with respect to similarly managed accounts and considered the relevance of differences in the services provided to separate accounts as they relate to differences in the fees charged in connection with the Funds.
Based on this analysis as well as other factors described herein, including the fact that the Funds are intended principally to satisfy asset allocation requirements of client accounts maintained by Bessemer and its affiliates, the Board concluded that the advisory fee schedule for each Fund was fair and reasonable in light of the quality of services provided by the Adviser and Sub-Advisers.
| Old Westbury Funds, Inc. | |
| Renewal of Investment Advisory Agreement and Sub-Advisory Agreements (Unaudited) - (Continued) |
| |
| | |
(4) The extent to which economies of scale will be realized as the Funds grow and whether fee levels reflect those economies of scale.
The Board considered the information provided by the Adviser relating to economies of scale. In this regard, the Board noted the current advisory fee breakpoint levels at $500 million and $1 billion with respect to Large Cap Core Fund, Fixed Income Fund and Municipal Bond Fund, and at $1.25 billion and $2.5 billion for the Strategic Opportunities Fund and Large Cap Strategies Fund. The Board also considered the experience of the Adviser in managing the Funds, as well as the Adviser’s profitability analysis. With respect to the Small & Mid Cap Fund, the Board determined that it would continue to monitor whether breakpoints would be appropriate should this Fund continue to grow in size. The Board also noted other areas where each Fund may share in economies of scale, including through potential lower fees charged by third-party service providers based on the combined size of the Funds.
(5) Ancillary benefits and other factors.
In addition to the above factors, the Board also discussed other benefits received by the Adviser, the Sub-Advisers and their affiliates from the management of the Funds (such as soft-dollar credits), including the ability to market their advisory services for similar products in the future. In addition, the Board discussed the compensation payable by the Funds to affiliates of the Adviser for other services including administrative services, shareholder servicing and custody. The Board considered comparative information relating to the fees charged for these services and reviewed reports from the Adviser and its affiliates regarding their capabilities and experience in providing these services. The Board also discussed the use of the Funds as asset allocation investment vehicles for clients of Bessemer and its affiliates, with the resulting expectation that the asset sizes of the Funds would grow as Bessemer’s client base grows. The Board concluded that advisory and sub-advisory fees were reasonable in light of these fall-out benefits.
Conclusion:
The Board, including all of the Independent Directors, concluded that the fees payable under the Investment Advisory Agreement and Sub-Advisory Agreements were fair and reasonable with respect to the services that BIM and each Sub-Adviser provides, in light of the factors described above that the Board deemed relevant. The Board based its decision on an evaluation of all these factors as a whole and did not consider any one factor as all-important or controlling. The Independent Directors were also assisted by the advice of Counsel to the Independent Directors, as well as Counsel to the Corporation, in making this determination.
| Old Westbury Funds, Inc. | |
| Approval of New Sub-Advisory Agreement with Martingale Asset Management, L.P. (Unaudited) |
| |
| | |
At a meeting held on July 27, 2016, the Board of Directors, including the Independent Directors, unanimously approved a new Sub-Advisory Agreement among Bessemer Investment Management LLC (“BIM” or the “Adviser”), Martingale Asset Management, L.P. (“Martingale”) and the Corporation on behalf of the Old Westbury Strategic Opportunities Fund (the “Fund”) (the “Sub-Advisory Agreement”). The Board noted that the fees payable to Martingale under the Sub-Advisory Agreement would be paid by the Adviser from the advisory fees that it receives from the Fund.
In approving the Sub-Advisory Agreement with Martingale, the Board considered the overall fairness of the Sub-Advisory Agreement and whether the agreement was in the best interests of the Fund. The Board noted that it had received and reviewed substantial information regarding Martingale, and the services to be provided by Martingale to the Fund under the Sub-Advisory Agreement. This information, which included a detailed due diligence questionnaire from Martingale, as well as information concerning its organization, compliance program and financial condition, formed, in part, the primary (but not exclusive) basis for the Board’s determinations. The Board also noted that the Independent Directors had met in executive session with their Counsel and Counsel to the Corporation, as well as with BIM to discuss BIM’s recommendation regarding Martingale’s appointment. During the executive session, the Independent Directors reviewed their legal responsibilities in approving the Sub-Advisory Agreement and discussed materials and other information provided to them. The Board concluded that they had received adequate information to make a reasonable determination with respect to the approval of the Sub-Advisory Agreement.
The Board’s conclusions are based on the comprehensive consideration of all information presented to it and are not the result of any single controlling factor.
The following summary details the factors considered by the Board and the conclusions that formed the basis for the Board’s approval of the proposed Sub-Advisory Agreement.
(1) The nature, extent and quality of services to be provided by Martingale.
The Board considered the scope and quality of services to be provided by Martingale, including the fact that Martingale pays the costs of all investment and management facilities necessary for the efficient conduct of its services. The Board also considered, among other things, the qualifications and experience of the individual portfolio managers responsible for managing Martingale’s portion of the Fund, as well as the compliance, operational and trading capabilities of Martingale.
Based on these considerations, as well as those discussed below, the Board concluded that the nature, extent and quality of services to be provided by Martingale were satisfactory.
(2) The performance of Martingale.
The Board considered the performance data provided by Martingale with respect to other accounts and determined that Martingale had demonstrated an ability to appropriately manage assets in the style expected to be used by Martingale in connection with the Fund.
(3) The cost of the advisory services and comparative fee rates.
As previously discussed, the Board noted that Martingale’s fee would be paid entirely by BIM. The Directors reviewed the level of the proposed fee against a number of different benchmarks and peer comparisons. Based on these considerations, as well as other factors described herein, the Board, including all of the Independent Directors, concluded that Martingale’s sub-advisory fee was fair and reasonable in light of the quality of services to be provided by Martingale.
(4) The extent to which economies of scale will be realized as the Fund grows and whether fee levels reflect those economies of scale.
The Board discussed whether any economies of scale would be realized with respect to the management of the Fund and whether the Fund would benefit from any such economies of scale. The Board noted in this regard that BIM would bear Martingale’s sub-advisory fee. The Directors undertook to continue to monitor the appropriateness of the sub-advisory fee, taking into account the potential impact of economies of scale, as the mandate grew.
| Old Westbury Funds, Inc. | |
| Approval of New Sub-Advisory Agreement with Martingale Asset Management, L.P. (Unaudited) - (Continued) |
| |
| | |
(5) Ancillary benefits and other factors.
In addition to the above factors, the Board also discussed whether there were other benefits received by BIM, Martingale, or their affiliates, from Martingale’s relationship with the Fund. The Board concluded that any such fall-out benefits resulting from the proposed engagement of Martingale were such that it did not affect the Board’s conclusion that the proposed sub-advisory fee was reasonable.
Conclusion:
The Board, including all of the Independent Directors, concluded that the fee to be paid to Martingale under the Sub-Advisory Agreement was fair and reasonable with respect to the services that Martingale would provide, in light of the factors described above that the Board deemed relevant. The Board based its decision on an evaluation of all these factors as a whole and did not consider any one factor as all-important or controlling. The Independent Directors were also assisted by the advice of Counsel to the Independent Directors, as well as Counsel to the Corporation, in making this determination.
This Page Intentionally Left Blank
This Page Intentionally Left Blank
This Page Intentionally Left Blank
| Investment Adviser: | Administrator: |
| Bessemer Investment Management LLC | BNY Mellon Investment Servicing (US) Inc. |
| 630 Fifth Avenue | 760 Moore Road |
| New York, NY 10111 | King of Prussia, PA 19406 |
| (212) 708-9100 | |
| | Transfer Agent: |
| Distributor: | BNY Mellon Investment Servicing (US) Inc. |
| Foreside Funds Distributors LLC | 760 Moore Road |
| 400 Berwyn Park | King of Prussia, PA 19406 |
| 899 Cassatt Road | |
| Berwyn, PA 19312 | Independent Registered Public Accounting Firm: |
| | Ernst & Young LLP |
| Custodians: | 5 Times Square |
| Bessemer Trust Company | New York, NY 10036 |
| 100 Woodbridge Center Drive | |
| Woodbridge, NJ 07095 | |
| | |
| Citibank, N.A. | |
| 388 Greenwich Street | |
| New York, NY 10013 | |
Mutual funds are not bank deposits or obligations, are not guaranteed by any bank, and are not insured or guaranteed by the U.S. government, the Federal Deposit Insurance Corporation, the Federal Reserve Board, or any other government agency. Investment in mutual funds involves investment risks, including possible loss of principal.
This report is authorized for distribution to prospective investors only when preceded or accompanied by the Funds’ prospectus which contains facts concerning the Funds’ objectives and policies, management fees, expenses and other information.
The information in this report is based on data obtained from recognized services and sources and is believed to be reliable. Any opinions, projections, or recommendations in this report are subject to change without notice and are not intended as individual investment advice. Furthermore, Bessemer Investment Management LLC and its affiliates, as agents for their clients, and any of its officers or employees may have a beneficial interest or position in any of the securities mentioned, which may be contrary to any opinion or projection expressed in this report.
Cusip 680414307
Cusip 680414604
Cusip 680414109
Cusip 680414406
Cusip 680414505
Cusip 680414802
(A21-AR2016)
(12/16)
| Old Westbury Funds, Inc. | |
| Small & Mid Cap Fund | |
| Portfolio of Investments | October 31, 2016 |
| | |
| Shares | | | | | Value | |
| COMMON STOCKS — 93.8% | | | | |
| AUSTRALIA — 1.7% | | | | |
| | 29,208 | | | Acrux Ltd.(b) | | $ | 7,554 | |
| | 99,433 | | | Adelaide Brighton Ltd. | | | 404,666 | |
| | 69,555 | | | AED Oil Ltd.(b)(c)(d) | | | 0 | |
| | 34,185 | | | Ainsworth Game Technology Ltd. | | | 46,418 | |
| | 105,636 | | | ALS Ltd. | | | 500,625 | |
| | 13,518 | | | Altium Ltd. | | | 80,620 | |
| | 475,084 | | | Alumina Ltd. | | | 571,006 | |
| | 60,601 | | | Ansell Ltd. | | | 999,890 | |
| | 14,818 | | | AP Eagers Ltd. | | | 110,466 | |
| | 60,912 | | | APN News & Media Ltd.(b)(e) | | | 124,180 | |
| | 23,465 | | | APN News & Media Ltd.(b)(d)(e) | | | 47,837 | |
| | 2,836 | | | APN News & Media Ltd.(b)(d)(e) | | | 5,782 | |
| | 4,250 | | | Arb Corp Ltd. | | | 55,154 | |
| | 1,547,765 | | | Arrium Ltd.(b)(d) | | | 8 | |
| | 1,933 | | | Asaleo Care Ltd. | | | 2,147 | |
| | 76,846 | | | ASG Group Ltd.(b) | | | 93,531 | |
| | 9,691 | | | AUB Group Ltd. | | | 72,982 | |
| | 82,510 | | | Ausdrill Ltd.(b) | | | 82,850 | |
| | 173,833 | | | Ausnet Services | | | 198,352 | |
| | 39,283 | | | Austal Ltd. | | | 46,019 | |
| | 188,262 | | | Australian Agricultural Co. Ltd.(b) | | | 249,903 | |
| | 141,784 | | | Australian Pharmaceutical Industries Ltd. | | | 204,924 | |
| | 103,850 | | | Automotive Holdings Group Ltd. | | | 319,944 | |
| | 4,480 | | | Aveo Group | | | 10,974 | |
| | 104,949 | | | AWE Ltd.(b) | | | 43,510 | |
| | 83,558 | | | Bank of Queensland Ltd. | | | 664,864 | |
| | 207,809 | | | Beach Energy Ltd. | | | 114,608 | |
| | 11,095 | | | Bega Cheese Ltd. | | | 41,609 | |
| | 144,060 | | | Bendigo & Adelaide Bank Ltd. | | | 1,219,695 | |
| | 32,618 | | | Billabong International Ltd.(b) | | | 30,023 | |
| | 2,067 | | | Blackmores Ltd. | | | 176,231 | |
| | 188,427 | | | BlueScope Steel Ltd. | | | 1,118,023 | |
| | 215,619 | | | Boral Ltd. | | | 1,033,333 | |
| | 9,870 | | | Bradken Ltd.(b) | | | 24,176 | |
| | 15,029 | | | Breville Group Ltd. | | | 105,865 | |
| | 17,433 | | | Brickworks Ltd. | | | 178,762 | |
| | 17,980 | | | BT Investment Management Ltd. | | | 126,516 | |
| | 37,347 | | | Cabcharge Australia Ltd. | | | 102,275 | |
| | 16,047 | | | carsales.com Ltd. | | | 130,126 | |
| | 96,536 | | | Cash Converters International Ltd. | | | 23,499 | |
| | 3,423 | | | Cedar Woods Properties Ltd. | | | 11,717 | |
| | 187,629 | | | Challenger Ltd. | | | 1,535,766 | |
| | 3,117,364 | | | Charter Hall Retail REIT | | | 9,841,209 | |
| | 456,872 | | | Cleanaway Waste Management Ltd. | | | 403,149 | |
| | 108,165 | | | Coca-Cola Amatil Ltd. | | | 784,961 | |
| | 8,941 | | | Cochlear Ltd. | | | 870,308 | |
| Shares | | | | | Value | |
| AUSTRALIA (continued) | | | | |
| | 19,968 | | | Collins Foods Ltd. | | $ | 73,062 | |
| | 32,117 | | | Computershare Ltd. | | | 257,751 | |
| | 6,689 | | | Corporate Travel Management Ltd. | | | 96,678 | |
| | 3,172,593 | | | Costa Group Holdings Ltd.(d) | | | 6,878,157 | |
| | 8,836 | | | Credit Corp. Group Ltd. | | | 119,106 | |
| | 30,098 | | | CSG Ltd. | | | 29,306 | |
| | 302,614 | | | CSR Ltd. | | | 842,525 | |
| | 17,343 | | | Decmil Group Ltd. | | | 14,578 | |
| | 15,520 | | | Domino’s Pizza Enterprises Ltd. | | | 758,539 | |
| | 2,862 | | | Doray Minerals Ltd.(b) | | | 1,143 | |
| | 238,091 | | | Downer EDI Ltd. | | | 1,055,904 | |
| | 163,204 | | | DUET Group | | | 295,475 | |
| | 51,932 | | | DuluxGroup Ltd. | | | 254,410 | |
| | 307,875 | | | Emeco Holdings Ltd.(b) | | | 16,160 | |
| | 17 | | | EQT Holdings Ltd. | | | 230 | |
| | 32,208 | | | Event Hospitality and Entertainment Ltd. | | | 343,008 | |
| | 591,253 | | | Evolution Mining Ltd. | | | 1,016,470 | |
| | 715,392 | | | Fairfax Media Ltd. | | | 448,963 | |
| | 16,777 | | | Finbar Group Ltd. | | | 11,103 | |
| | 9,044 | | | Flight Centre Travel Group Ltd. | | | 233,018 | |
| | 11,536 | | | G.U.D. Holdings Ltd. | | | 83,367 | |
| | 11,340 | | | G8 Education Ltd. | | | 27,259 | |
| | 13,440 | | | Gbst Holdings Ltd. | | | 38,953 | |
| | 50,395 | | | GrainCorp Ltd. - Class A | | | 322,018 | |
| | 16,663 | | | Greencross Ltd. | | | 88,475 | |
| | 7,628 | | | GWA Group Ltd. | | | 16,595 | |
| | 28,670 | | | Hansen Technologies Ltd. | | | 89,636 | |
| | 164,992 | | | Harvey Norman Holdings Ltd. | | | 633,822 | |
| | 78,568 | | | Healthscope Ltd. | | | 132,084 | |
| | 1,000 | | | HFA Holdings Ltd. | | | 1,741 | |
| | 39,987 | | | Iluka Resources Ltd. | | | 175,512 | |
| | 12,050 | | | IMF Bentham Ltd. | | | 16,820 | |
| | 721,969 | | | Incitec Pivot Ltd. | | | 1,620,143 | |
| | 89,744 | | | Independence Group NL | | | 290,140 | |
| | 40,796 | | | Infomedia Ltd. | | | 23,585 | |
| | 1,108,826 | | | Invocare Ltd.(d) | | | 11,024,321 | |
| | 53,982 | | | IOOF Holdings Ltd. | | | 336,725 | |
| | 22,132 | | | Iress Ltd. | | | 191,086 | |
| | 24,489 | | | JB Hi-Fi Ltd. | | | 528,870 | |
| | 10,888 | | | Karoon Gas Australia Ltd.(b) | | | 19,050 | |
| | 35,487 | | | Kingsgate Consolidated Ltd.(b) | | | 5,399 | |
| | 37,216 | | | MACA Ltd. | | | 49,826 | |
| | 328,362 | | | Macmahon Holdings Ltd.(b) | | | 23,230 | |
| | 24,272 | | | Macquarie Atlas Roads Group | | | 87,149 | |
| | 16,274 | | | Magellan Financial Group Ltd. | | | 263,562 | |
| | 54,631 | | | Mayne Pharma Group Ltd.(b) | | | 68,155 | |
| | 18,709 | | | McMillan Shakespeare Ltd. | | | 154,132 | |
| | 87,069 | | | Medibank Private Ltd. | | | 170,882 | |
| | 35,316 | | | Medusa Mining Ltd.(b) | | | 16,925 | |
| | 10,438 | | | Melbourne IT Ltd. | | | 15,483 | |
| | 86,417 | | | Metals X Ltd.(b) | | | 90,718 | |
| | 100,744 | | | Metcash Ltd.(b) | | | 152,505 | |
| | 52,702 | | | Mincor Resources NL(b) | | | 13,029 | |
| | 53,989 | | | Mineral Resources Ltd. | | | 475,173 | |
| Old Westbury Funds, Inc. | |
| Small & Mid Cap Fund | |
| Portfolio of Investments - (Continued) | October 31, 2016 |
| | |
| Shares | | | | | Value | |
| AUSTRALIA (continued) | | | | |
| | 732,000 | | | MMG Ltd.(b) | | $ | 192,543 | |
| | 36,171 | | | Monadelphous Group Ltd. | | | 256,442 | |
| | 34,487 | | | Mortgage Choice Ltd. | | | 58,765 | |
| | 366,646 | | | Myer Holdings Ltd. | | | 327,716 | |
| | 1,050 | | | MyState Ltd. | | | 3,179 | |
| | 24,976 | | | Navitas Ltd. | | | 99,556 | |
| | 4,428 | | | NetComm Wireless Ltd.(b) | | | 7,646 | |
| | 120,898 | | | New Hope Corp. Ltd. | | | 172,898 | |
| | 127,143 | | | NIB Holdings Ltd. | | | 466,179 | |
| | 150,444 | | | Northern Star Resources Ltd. | | | 476,081 | |
| | 33,366 | | | Nufarm Ltd. | | | 224,880 | |
| | 170,332 | | | OceanaGold Corp. | | | 520,660 | |
| | 92,294 | | | Orica Ltd. | | | 1,143,688 | |
| | 6,370 | | | Orocobre Ltd.(b) | | | 18,559 | |
| | 130,800 | | | Orora Ltd. | | | 288,548 | |
| | 124,310 | | | OZ Minerals Ltd. | | | 633,569 | |
| | 23,610 | | | OzForex Group Ltd. | | | 27,838 | |
| | 3,507 | | | Pacific Current Group Ltd. | | | 9,871 | |
| | 2,184,939 | | | Pact Group Holdings Ltd. | | | 10,919,872 | |
| | 143,129 | | | Panoramic Resources Ltd.(b) | | | 25,042 | |
| | 13,359 | | | Peet Ltd. | | | 9,654 | |
| | 5,607 | | | Perpetual Ltd. | | | 192,959 | |
| | 101,149 | | | Perseus Mining Ltd.(b) | | | 46,166 | |
| | 48,159 | | | Platinum Asset Mangement Ltd. | | | 182,806 | |
| | 85,726 | | | PMP Ltd. | | | 56,082 | |
| | 11,475 | | | Premier Investments Ltd. | | | 123,865 | |
| | 50,905 | | | Primary Health Care Ltd. | | | 148,698 | |
| | 22,727 | | | Programmed Maintenance Services Ltd. | | | 24,809 | |
| | 50,519 | | | Qantas Airways Ltd. | | | 117,595 | |
| | 177,021 | | | Qube Holdings Ltd. | | | 300,291 | |
| | 31,502 | | | RCG Corp Ltd. | | | 34,867 | |
| | 35,352 | | | RCR Tomlinson Ltd. | | | 71,533 | |
| | 30,974 | | | Reckon Ltd. | | | 37,228 | |
| | 8,332 | | | Reece Ltd. | | | 278,878 | |
| | 99,706 | | | Regis Resources Ltd. | | | 246,500 | |
| | 570 | | | Reject Shop Ltd. (The) | | | 3,239 | |
| | 102,446 | | | Resolute Mining Ltd. | | | 117,286 | |
| | 15,501 | | | Retail Food Group Ltd. | | | 79,829 | |
| | 101,020 | | | Ridley Corp. Ltd. | | | 95,673 | |
| | 3,195 | | | Ruralco Holdings Ltd. | | | 7,680 | |
| | 17,821 | | | SAI Global Ltd. | | | 63,444 | |
| | 20,536 | | | Sandfire Resources NL | | | 81,233 | |
| | 53,605 | | | Santos Ltd. | | | 145,575 | |
| | 222,211 | | | Saracen Mineral Holdings Ltd.(b) | | | 188,475 | |
| | 54,966 | | | Seek Ltd. | | | 612,136 | |
| | 11,618 | | | Select Harvests Ltd. | | | 54,087 | |
| | 16,377 | | | Servcorp Ltd. | | | 98,916 | |
| | 19,063 | | | Seven Group Holdings Ltd. | | | 131,816 | |
| | 63,604 | | | Seven West Media Ltd. | | | 32,901 | |
| | 6,302,616 | | | Shopping Centres Australasia Property Group REIT | | | 10,499,722 | |
| | 212,165 | | | Sigma Pharmaceuticals Ltd. | | | 214,654 | |
| | 55,963 | | | Silver Lake Resources Ltd.(b) | | | 26,820 | |
| | 9,054 | | | Sirtex Medical Ltd. | | | 192,226 | |
| Shares | | | | | Value | |
| AUSTRALIA (continued) | | | | |
| | 182,372 | | | Southern Cross Media Group Ltd. | | $ | 199,771 | |
| | 112,599 | | | Spark Infrastructure Group | | | 190,152 | |
| | 5,087,362 | | | Spotless Group Holdings Ltd. | | | 3,869,951 | |
| | 62,936 | | | St Barbara Ltd.(b) | | | 125,912 | |
| | 237,816 | | | Star Entertainment Group Ltd. | | | 902,723 | |
| | 74,283 | | | Steadfast Group Ltd. | | | 120,925 | |
| | 202,284 | | | Sundance Energy Australia Ltd.(b) | | | 26,929 | |
| | 37,756 | | | Sunland Group Ltd. | | | 43,512 | |
| | 22,520 | | | Super Retail Group Ltd. | | | 167,883 | |
| | 191,884 | | | Tabcorp Holdings Ltd. | | | 706,475 | |
| | 63,361 | | | Tassal Group Ltd. | | | 185,565 | |
| | 341,492 | | | Tatts Group Ltd. | | | 1,054,677 | |
| | 42,660 | | | Technology One Ltd. | | | 182,701 | |
| | 36,550 | | | Ten Network Holdings Ltd.(b) | | | 28,777 | |
| | 111,348 | | | TFS Corp. Ltd. | | | 118,583 | |
| | 39,830 | | | Thorn Group Ltd. | | | 52,265 | |
| | 4,364 | | | Tiger Resources Ltd.(b) | | | 66 | |
| | 45,574 | | | Tox Free Solutions Ltd. | | | 81,470 | |
| | 11,686 | | | Tox Free Solutions Ltd.(d) | | | 20,890 | |
| | 155,842 | | | Treasury Wine Estates Ltd. | | | 1,273,215 | |
| | 207,285 | | | Troy Resources Ltd.(b) | | | 55,189 | |
| | 33,081 | | | UGL Ltd.(b) | | | 81,030 | |
| | 28,287 | | | Village Roadshow Ltd. | | | 109,526 | |
| | 492,324 | | | Virgin Australia Holdings Ltd.(b) | | | 88,010 | |
| | 521,584 | | | Virgin Australia Holdings Ltd. - CVR Shares(c)(d) | | | 0 | |
| | 21,545 | | | Virtus Health Ltd. | | | 114,233 | |
| | 100,763 | | | Vocus Communications Ltd. | | | 437,673 | |
| | 8,496 | | | Webjet Ltd. | | | 70,704 | |
| | 50,095 | | | Western Areas NL(b) | | | 94,125 | |
| | 19,953 | | | Whitehaven Coal Ltd.(b) | | | 45,990 | |
| | 24,859 | | | Worleyparsons Ltd.(b) | | | 160,737 | |
| | 65,654 | | | WPP AUNZ Ltd. | | | 40,703 | |
| | | | | | | | 93,849,550 | |
| AUSTRIA — 0.2% | | | | |
| | 1,036 | | | Agrana Beteiligungs AG | | | 124,247 | |
| | 16,739 | | | ams AG | | | 469,413 | |
| | 4,733 | | | Andritz AG | | | 247,574 | |
| | 7,540 | | | Austria Technologie & Systemtechnik AG | | | 83,474 | |
| | 6,441 | | | BUWOG AG | | | 155,660 | |
| | 4,123 | | | CA Immobilien Anlagen AG | | | 74,861 | |
| | 3,421 | | | Conwert Immobilien Invest SE | | | 60,688 | |
| | 827 | | | DO & CO AG | | | 63,985 | |
| | 1,410 | | | EVN AG | | | 16,484 | |
| | 1,397 | | | Lenzing AG | | | 181,957 | |
| | 1,068 | | | Mayr Melnhof Karton AG | | | 118,295 | |
| | 8,170 | | | Oesterreichische Post AG | | | 282,109 | |
| | 101,173 | | | OMV AG | | | 3,162,524 | |
| | 1,990 | | | Palfinger AG | | | 60,293 | |
| | 5,197 | | | POLYTEC Holding AG | | | 45,070 | |
| Old Westbury Funds, Inc. | |
| Small & Mid Cap Fund | |
| Portfolio of Investments - (Continued) | October 31, 2016 |
| | |
| Shares | | | | | Value | |
| AUSTRIA (continued) | | | | |
| | 6,398 | | | Raiffeisen Bank International AG(b) | | $ | 104,860 | |
| | 6,198 | | | RHI AG | | | 156,081 | |
| | 516 | | | Rosenbauer International AG | | | 30,191 | |
| | 5,208 | | | S IMMO AG | | | 55,913 | |
| | 1,691 | | | Schoeller-Bleckmann Oilfield Equipment AG | | | 119,750 | |
| | 19,252 | | | Strabag SE | | | 646,066 | |
| | 2,110 | | | Verbund AG | | | 35,219 | |
| | 38,117 | | | Voestalpine AG | | | 1,348,604 | |
| | 23,351 | | | Wienerberger AG | | | 373,355 | |
| | 1,597 | | | Wolford AG | | | 40,059 | |
| | 4,663 | | | Zumtobel Group AG | | | 81,876 | |
| | | | | | | | 8,138,608 | |
| BELGIUM — 0.2% | | | | |
| | 10,580 | | | Ackermans & van Haaren NV | | | 1,469,783 | |
| | 849 | | | Aedifica SA REIT | | | 70,459 | |
| | 38,172 | | | Ageas | | | 1,394,339 | |
| | 57,651 | | | AGFA - Gevaert NV(b) | | | 239,857 | |
| | 120 | | | Banque Nationale de Belgique | | | 371,546 | |
| | 1,108 | | | Barco NV | | | 87,088 | |
| | 662 | | | Befimmo SA | | | 38,567 | |
| | 10,243 | | | Bekaert SA | | | 455,619 | |
| | 4,815 | | | Bpost SA | | | 128,099 | |
| | 2,364 | | | Cie d’Entreprises CFE | | | 260,418 | |
| | 1,352 | | | Cie Immobiliere de Belgique SA(b) | | | 75,307 | |
| | 1,148 | | | Cofinimmo SA REIT | | | 134,529 | |
| | 11,324 | | | Colruyt SA | | | 608,683 | |
| | 18,761 | | | Deceuninck NV | | | 48,604 | |
| | 12,200 | | | Deceuninck NV- VVPR Strip(b)(c)(d) | | | 0 | |
| | 6,005 | | | D’ieteren SA NV | | | 264,900 | |
| | 9,725 | | | Econocom Group SA | | | 144,709 | |
| | 2,295 | | | Elia System Operator SA NV | | | 118,787 | |
| | 23,104 | | | Euronav NV | | | 181,063 | |
| | 503 | | | EVS Broadcast Equipment SA | | | 17,578 | |
| | 4,996 | | | Exmar NV | | | 35,703 | |
| | 2,258 | | | Fagron NV(b) | | | 22,314 | |
| | 2,849 | | | Galapagos NV(b) | | | 173,952 | |
| | 972 | | | Intervest Offices & Warehouses NV REIT | | | 25,774 | |
| | 460 | | | Jensen-Group NV | | | 17,320 | |
| | 2,543 | | | Kinepolis Group NV | | | 114,399 | |
| | 47 | | | Lotus Bakeries | | | 129,247 | |
| | 3,041 | | | Melexis NV | | | 199,328 | |
| | 11,184 | | | Mobistar SA(b) | | | 251,869 | |
| | 9,629 | | | Nyrstar NV(b) | | | 49,469 | |
| | 8,030 | | | Ontex Group NV | | | 242,808 | |
| | 201 | | | Picanol | | | 16,438 | |
| | 29,109 | | | Proximus SADP | | | 833,375 | |
| | 704 | | | RealDolmen | | | 17,427 | |
| | 8,109 | | | Recticel SA | | | 53,018 | |
| | 118 | | | Resilux | | | 19,670 | |
| | 436 | | | Retail Estates NV REIT | | | 36,423 | |
| Shares | | | | | Value | |
| BELGIUM (continued) | | | | |
| | 3,766 | | | Sioen Industries NV | | $ | 112,180 | |
| | 1,780 | | | Sipef NV | | | 102,116 | |
| | 1,913 | | | Telenet Group Holding NV(b) | | | 102,407 | |
| | 8,048 | | | Tessenderlo Chemie NV(b) | | | 268,399 | |
| | 18,822 | | | Umicore SA | | | 1,144,465 | |
| | 1,138 | | | Van de Velde NV | | | 80,114 | |
| | 6,098 | | | Viohalco SA(b) | | | 8,950 | |
| | 916 | | | Warehouses De Pauw CVA REIT | | | 84,345 | |
| | | | | | | | 10,251,445 | |
| BERMUDA — 1.2% | | | | |
| | 321,498 | | | Argo Group International Holdings Ltd.(d) | | | 17,875,289 | |
| | 13,200 | | | Blue Capital Reinsurance Holdings Ltd. | | | 233,640 | |
| | 325,000 | | | Endurance Specialty Holdings Ltd. | | | 29,883,750 | |
| | 106,500 | | | Helen of Troy Ltd.(b) | | | 8,679,750 | |
| | 102,290 | | | Hiscox Ltd. | | | 1,278,327 | |
| | 24,100 | | | James River Group Holdings Ltd. | | | 907,124 | |
| | 87,500 | | | Maiden Holdings Ltd. | | | 1,194,375 | |
| | 113,807 | | | Validus Holdings Ltd. | | | 5,815,538 | |
| | 197,400 | | | Wilson Sons Ltd. - BDR(d) | | | 2,102,632 | |
| | | | | | | | 67,970,425 | |
| BRAZIL — 0.3% | | | | |
| | 2,300 | | | Aliansce Shopping Centers SA | | | 12,025 | |
| | 567 | | | Aliansce Shopping Centers SA(b) | | | 3,011 | |
| | 2,400 | | | Alpargatas SA - Preference Shares | | | 8,098 | |
| | 11,870 | | | Banco ABC Brasil SA - Preference Shares | | | 57,082 | |
| | 29,687 | | | Banco do Estado do Rio Grande do Sul SA - Class B, Preference Shares | | | 128,160 | |
| | 16,000 | | | Banco Industrial e Comercial SA - Preference Shares(b)(c)(d) | | | 41,554 | |
| | 20,647 | | | Banco Pine SA - Preference Shares | | | 26,714 | |
| | 21,905 | | | BM&FBovespa SA - Bolsa de Valores Mercadorias e Futuros | | | 128,671 | |
| | 23,909 | | | BR Malls Participacoes SA(b) | | | 95,576 | |
| | 25,718 | | | Braskem SA - Class A, Preference Shares | | | 228,336 | |
| | 15,300 | | | Centrais Eletricas Brasileiras SA(b) | | | 114,223 | |
| | 13,800 | | | Centrais Eletricas Brasileiras SA - Preference B Shares(b) | | | 118,026 | |
| | 3,200 | | | Centrais Eletricas Santa Catarina - Preference Shares | | | 13,905 | |
| | 36,400 | | | CETIP SA - Mercados Organizados | | | 511,675 | |
| | 21,526 | | | Cia Brasileira de Distribuicao - Preference Shares | | | 411,772 | |
| Old Westbury Funds, Inc. | |
| Small & Mid Cap Fund | |
| Portfolio of Investments - (Continued) | October 31, 2016 |
| | |
| Shares | | | | | Value | |
| BRAZIL (continued) | | | | |
| | 1,900 | | | Cia de Gas de Sao Paulo - Class A, Preference Shares | | $ | 30,952 | |
| | 11,500 | | | Cia de Saneamento Basico do Estado de Sao Paulo | | | 121,413 | |
| | 4,000 | | | Cia de Saneamento do Parana - Preference Shares | | | 12,068 | |
| | 1,857 | | | Cia de Transmissao de Energia Eletrica Paulista - Preference Shares | | | 40,311 | |
| | 20,400 | | | Cia Energetica de Minas Gerais - Preference Shares | | | 62,312 | |
| | 10,800 | | | Cia Energetica de Sao Paulo - Class B, Preference Shares | | | 49,906 | |
| | 2,075 | | | Cia Energetica do Ceara - Class A, Preference Shares | | | 31,151 | |
| | 30,206 | | | Cia Hering | | | 184,529 | |
| | 5,800 | | | Cia Paranaense de Energia - Class B, Preference Shares | | | 66,595 | |
| | 93,097 | | | Cia Siderurgica Nacional SA(b) | | | 313,240 | |
| | 7,300 | | | Cosan SA Industria e Comercio | | | 97,676 | |
| | 9,840 | | | CPFL Energia SA | | | 74,663 | |
| | 24,388 | | | Cyrela Brazil Realty SA Empreendimentos e Participacoes | | | 82,057 | |
| | 400 | | | Cyrela Commercial Properties SA Empreendimentos e Participacoes | | | 1,278 | |
| | 64,695 | | | Duratex SA | | | 174,709 | |
| | 19,751 | | | EDP - Energias do Brasil SA | | | 94,609 | |
| | 216,620 | | | Embraer SA | | | 1,161,143 | |
| | 10,069 | | | Equatorial Energia SA | | | 179,015 | |
| | 29,000 | | | Estacio Participacoes SA | | | 169,167 | |
| | 44,700 | | | Even Construtora e Incorporadora SA | | | 62,177 | |
| | 24,025 | | | Ez Tec Empreendimentos e Participacoes SA | | | 124,641 | |
| | 38,678 | | | Fibria Celulose SA | | | 310,805 | |
| | 3,000 | | | Fleury SA | | | 39,756 | |
| | 11,700 | | | Gerdau SA | | | 29,323 | |
| | 115,300 | | | Gerdau SA - Preference Shares | | | 398,782 | |
| | 8,500 | | | Grendene SA | | | 52,299 | |
| | 15,700 | | | Hypermarcas SA | | | 131,473 | |
| | 15,100 | | | Iguatemi Empresa de Shopping Centers SA | | | 141,965 | |
| | 7,672 | | | Iochpe-Maxion SA | | | 39,153 | |
| | 4,434 | | | JHSF Participacoes SA(b) | | | 2,417 | |
| | 100 | | | JSL SA | | | 367 | |
| | 34,900 | | | Klabin SA - Units | | | 179,748 | |
| | 214,184 | | | Kroton Educacional SA | | | 1,066,223 | |
| | 246,600 | | | Linx SA | | | 1,463,222 | |
| | 14,075 | | | Localiza Rent a Car SA | | | 175,452 | |
| | 26,460 | | | Lojas Americanas SA | | | 130,559 | |
| | 68,760 | | | Lojas Americanas SA - Preference Shares | | | 448,922 | |
| | 75,100 | | | Lojas Renner SA | | | 635,009 | |
| | 3,300 | | | M Dias Branco SA | | | 140,788 | |
| | 249,500 | | | Mahle-Metal Leve SA | | | 1,730,555 | |
| Shares | | | | | Value | |
| BRAZIL (continued) | | | | |
| | 82,243 | | | Marcopolo SA - Preference Shares(b) | | $ | 85,283 | |
| | 62,584 | | | Marfrig Global Foods SA(b) | | | 111,169 | |
| | 4,950 | | | Marisa Lojas SA(b) | | | 12,065 | |
| | 9,300 | | | Minerva SA(b) | | | 29,805 | |
| | 38,600 | | | MRV Engenharia e Participacoes SA | | | 148,741 | |
| | 4,650 | | | Multiplan Empreendimentos Imobiliarios SA | | | 93,539 | |
| | 5,300 | | | Multiplus SA | | | 72,128 | |
| | 11,500 | | | Natura Cosmeticos SA | | | 111,397 | |
| | 24,900 | | | Odontoprev SA | | | 93,609 | |
| | 119,600 | | | Ouro Fino Saude Animal Participacoes SA(d) | | | 1,399,455 | |
| | 38,355 | | | Porto Seguro SA | | | 365,766 | |
| | 12,900 | | | Qualicorp SA | | | 83,373 | |
| | 21,309 | | | Raia Drogasil SA | | | 474,312 | |
| | 6,200 | | | Rodobens Negocios Imobiliarios SA | | | 10,392 | |
| | 6,250 | | | Santos Brasil Participacoes SA | | | 6,011 | |
| | 9,400 | | | Sao Martinho SA | | | 187,912 | |
| | 10,100 | | | SLC Agricola SA | | | 49,393 | |
| | 121,173 | | | Sul America SA - Units | | | 739,489 | |
| | 61,653 | | | Suzano Papel e Celulose SA - Class A, Preference Shares | | | 217,292 | |
| | 31,700 | | | Tim Participacoes SA | | | 87,393 | |
| | 11,821 | | | Totvs SA | | | 107,396 | |
| | 4,500 | | | Transmissora Alianca de Energia Eletrica SA - Units | | | 29,041 | |
| | 66,116 | | | Usinas Siderurgicas de Minas Gerais SA - Class A, Preference shares(b) | | | 93,623 | |
| | 8,958 | | | Valid Solucoes e Servicos de Seguranca em Meios de Pagamento e Identificacao SA | | | 84,164 | |
| | 2,499 | | | Via Varejo SA | | | 7,093 | |
| | | | | | | | 16,849,099 | |
| CAMBODIA — 0.0% | | | | |
| | 166,000 | | | NagaCorp Ltd. | | | 102,525 | |
| CANADA — 2.3% | | | | |
| | 2,275 | | | Absolute Software Corp. | | | 10,804 | |
| | 1,608 | | | Acadian Timber Corp. | | | 20,908 | |
| | 83,136 | | | Advantage Oil & Gas Ltd.(b) | | | 560,934 | |
| | 27,538 | | | Aecon Group, Inc. | | | 356,005 | |
| | 1,900 | | | AG Growth International, Inc. | | | 66,053 | |
| | 11,700 | | | AGF Management Ltd. - Class B | | | 44,574 | |
| | 3,110 | | | AGT Food & Ingredients, Inc. | | | 88,433 | |
| | 2,500 | | | Air Canada(b) | | | 23,578 | |
| | 1,100 | | | Akita Drilling Ltd. - Class A | | | 6,807 | |
| | 40,768 | | | Alamos Gold, Inc. - Class A | | | 319,749 | |
| | 2,681 | | | Algoma Central Corp. | | | 22,686 | |
| | 44,100 | | | Algonquin Power & Utilities Corp. | | | 389,611 | |
| | 19,458 | | | AltaGas Ltd. | | | 481,481 | |
| | 4,000 | | | Altus Group Ltd. | | | 86,275 | |
| Old Westbury Funds, Inc. | |
| Small & Mid Cap Fund | |
| Portfolio of Investments - (Continued) | October 31, 2016 |
| | |
| Shares | | | | | Value | |
| CANADA (continued) | | | | |
| | 11,915 | | | Amaya, Inc.(b) | | $ | 159,542 | |
| | 22,248 | | | Arc Resources Ltd. | | | 377,684 | |
| | 7,300 | | | Atco Ltd. - Class I | | | 255,905 | |
| | 9,200 | | | ATS Automation Tooling Systems, Inc.(b) | | | 78,879 | |
| | 2,554 | | | AutoCanada, Inc. | | | 41,986 | |
| | 267,386 | | | B2Gold Corp.(b) | | | 773,472 | |
| | 2,400 | | | Badger Daylighting Ltd. | | | 51,854 | |
| | 36,000 | | | Banro Corp.(b) | | | 9,260 | |
| | 44,670 | | | Baytex Energy Corp.(b) | | | 171,846 | |
| | 839 | | | Baytex Energy Corp.(b) | | | 3,230 | |
| | 23,100 | | | Bellatrix Exploration Ltd.(b) | | | 20,839 | |
| | 60,900 | | | Birchcliff Energy Ltd.(b) | | | 387,748 | |
| | 176,217 | | | BlackBerry Ltd.(b) | | | 1,244,147 | |
| | 59,048 | | | BlackPearl Resources, Inc.(b) | | | 65,154 | |
| | 700 | | | Boardwalk Real Estate Investment Trust, REIT | | | 25,687 | |
| | 8,400 | | | Bombardier, Inc. - Class A(b) | | | 12,650 | |
| | 76,155 | | | Bombardier, Inc. - Class B(b) | | | 101,063 | |
| | 27,185 | | | Bonavista Energy Corp. | | | 88,772 | |
| | 11,285 | | | Bonterra Energy Corp. | | | 212,356 | |
| | 8,200 | | | Boralex, Inc. - Class A | | | 117,623 | |
| | 1,433,521 | | | CAE, Inc. | | | 20,135,343 | |
| | 16,500 | | | Calfrac Well Services Ltd. | | | 33,829 | |
| | 3,825 | | | Callidus Capital Corp. | | | 48,422 | |
| | 8,700 | | | Canaccord Genuity Group, Inc. | | | 27,177 | |
| | 35,750 | | | Canacol Energy Ltd.(b) | | | 110,344 | |
| | 6,800 | | | Canadian Apartment Properties REIT | | | 148,644 | |
| | 45,555 | | | Canadian Energy Services & Technology Corp. | | | 179,666 | |
| | 3,400 | | | Canadian Real Estate Investment Trust | | | 117,060 | |
| | 22,300 | | | Canadian Western Bank | | | 423,123 | |
| | 10,832 | | | Canam Group, Inc. - Class A | | | 72,762 | |
| | 26,643 | | | Canfor Corp.(b) | | | 295,570 | |
| | 5,457 | | | Canfor Pulp Products, Inc. | | | 41,254 | |
| | 8,000 | | | CanWel Building Materials Group Ltd. | | | 39,067 | |
| | 32,854 | | | Canyon Services Group, Inc. | | | 130,554 | |
| | 72,367 | | | Capstone Mining Corp.(b) | | | 43,702 | |
| | 43,552 | | | Cascades, Inc. | | | 410,745 | |
| | 1,000 | | | CCL Industries, Inc. - Class B | | | 177,842 | |
| | 31,157 | | | Celestica, Inc.(b) | | | 368,644 | |
| | 67,326 | | | Centerra Gold, Inc. | | | 340,319 | |
| | 2,472 | | | Cervus Equipment Corp. | | | 24,788 | |
| | 4,700 | | | Chartwell Retirement Residences - Units | | | 52,351 | |
| | 9,300 | | | CI Financial Corp. | | | 171,121 | |
| | 7,377 | | | Cineplex, Inc. | | | 280,494 | |
| | 56,400 | | | City Office REIT Inc. | | | 708,384 | |
| | 3,297 | | | Clearwater Seafoods, Inc. - Units | | | 33,553 | |
| | 6,800 | | | Cogeco Communications Inc. | | | 317,161 | |
| | 3,464 | | | Cogeco, Inc. | | | 127,708 | |
| | 9,700 | | | Colliers International Group, Inc. | | | 337,725 | |
| Shares | | | | | Value | |
| CANADA (continued) | | | | |
| | 6,500 | | | Cominar Real Estate Investment Trust | | $ | 72,012 | |
| | 8,925 | | | Computer Modelling Group Ltd. | | | 66,008 | |
| | 1,912 | | | Corby Spirit and Wine Ltd. | | | 34,696 | |
| | 3,800 | | | Corus Entertainment, Inc. - Class B | | | 31,362 | |
| | 50,217 | | | Cott Corp. | | | 658,553 | |
| | 18,491 | | | Crew Energy, Inc.(b) | | | 90,849 | |
| | 9,900 | | | CRH Medical Corp.(b) | | | 47,976 | |
| | 48,220 | | | Delphi Energy Corp.(b) | | | 37,388 | |
| | 10,500 | | | Denison Mines Corp.(b) | | | 4,227 | |
| | 6,900 | | | Descartes Systems Group, Inc. (The)(b) | | | 143,782 | |
| | 35,700 | | | Detour Gold Corp.(b) | | | 680,570 | |
| | 5,311 | | | DH Corp. | | | 68,739 | |
| | 6,761 | | | DHX Media Ltd. | | | 34,327 | |
| | 1,071 | | | DHX Media Ltd. - Variable Voting | | | 5,398 | |
| | 11,696 | | | Dominion Diamond Corp. | | | 99,533 | |
| | 11,430 | | | Dominion Diamond Corp. | | | 97,146 | |
| | 11,361 | | | Dorel Industries, Inc. - Class B | | | 288,408 | |
| | 23,639 | | | Dundee Precious Metals, Inc.(b) | | | 48,290 | |
| | 91,300 | | | ECN Capital Corp.(b) | | | 199,440 | |
| | 664 | | | E-L Financial Corp. Ltd. | | | 340,094 | |
| | 91,300 | | | Element Fleet Management Corp. | | | 889,653 | |
| | 32,269 | | | Empire Co. Ltd. - Class A | | | 464,801 | |
| | 8,100 | | | Endeavour Silver Corp.(b) | | | 35,569 | |
| | 18,173 | | | EnerCare, Inc. | | | 262,576 | |
| | 41,281 | | | Enerflex Ltd. | | | 438,570 | |
| | 2,342 | | | Enghouse Systems Ltd. | | | 87,984 | |
| | 11,317 | | | Ensign Energy Services, Inc. | | | 68,258 | |
| | 7,766 | | | Entertainment One Ltd. | | | 22,072 | |
| | 14,642 | | | Epsilon Energy Ltd.(b) | | | 31,657 | |
| | 3,142 | | | Equitable Group, Inc. | | | 123,778 | |
| | 1,900 | | | Evertz Technologies Ltd. | | | 23,203 | |
| | 3,224 | | | Exchange Income Corp. | | | 90,473 | |
| | 5,600 | | | Exco Technologies Ltd. | | | 48,013 | |
| | 38 | | | EXFO, Inc.(b) | | | 165 | |
| | 10,800 | | | Extendicare, Inc. | | | 74,238 | |
| | 1,000 | | | Fiera Capital Corp. | | | 8,969 | |
| | 76,082 | | | Finning International, Inc. | | | 1,415,796 | |
| | 7,834 | | | First Capital Realty Inc. | | | 124,930 | |
| | 21,951 | | | First Majestic Silver Corp.(b) | | | 176,256 | |
| | 1,563 | | | First National Financial Corp. | | | 28,491 | |
| | 202,903 | | | First Quantum Minerals Ltd. | | | 1,927,223 | |
| | 9,700 | | | FirstService Corp. - Voting Shares | | | 393,048 | |
| | 35,000 | | | Fortuna Silver Mines, Inc.(b) | | | 239,283 | |
| | 23,321 | | | Genworth MI Canada, Inc. | | | 506,479 | |
| | 11,624 | | | Gibson Energy, Inc. | | | 145,852 | |
| | 481 | | | GMP Capital, Inc. | | | 1,732 | |
| | 12,981 | | | Golden Star Resources Ltd.(b) | | | 11,807 | |
| | 35,929 | | | Gran Tierra Energy, Inc.(b) | | | 105,004 | |
| Old Westbury Funds, Inc. | |
| Small & Mid Cap Fund | |
| Portfolio of Investments - (Continued) | October 31, 2016 |
| | |
| Shares | | | | | Value | |
| CANADA (continued) | | | | |
| | 6,598 | | | Granite Oil Corp. | | $ | 24,940 | |
| | 10,752 | | | Great Canadian Gaming Corp.(b) | | | 178,599 | |
| | 8,500 | | | H&R Real Estate Investment Trust | | | 144,550 | |
| | 8,874 | | | Heroux-Devtek, Inc.(b) | | | 95,799 | |
| | 3,040 | | | High Liner Foods, Inc. | | | 55,687 | |
| | 2,065 | | | HNZ Group, Inc. | | | 19,475 | |
| | 10,700 | | | Home Capital Group, Inc. | | | 211,798 | |
| | 38,409 | | | HudBay Minerals, Inc. | | | 161,791 | |
| | 7,000 | | | Hudson’s Bay Co. | | | 86,006 | |
| | 80,964 | | | IAMGOLD Corp.(b) | | | 324,146 | |
| | 9,300 | | | IMAX Corp.(b) | | | 281,325 | |
| | 18,778 | | | Imperial Metals Corp.(b) | | | 72,099 | |
| | 36,900 | | | Industrial Alliance Insurance and Financial Services, Inc. | | | 1,428,902 | |
| | 212,232 | | | Innergex Renewable Energy, Inc. | | | 2,359,188 | |
| | 3,800 | | | Interfor Corp.(b) | | | 42,524 | |
| | 5,300 | | | Intertain Group Ltd. (The)(b) | | | 32,757 | |
| | 15,926 | | | Intertape Polymer Group, Inc. | | | 269,767 | |
| | 18,416 | | | Jean Coutu Group PJC, Inc. (The) Class A | | | 277,345 | |
| | 10,100 | | | Just Energy Group, Inc. | | | 53,011 | |
| | 1,300 | | | K-Bro Linen, Inc. | | | 37,276 | |
| | 20,366 | | | Keyera Corp. | | | 611,299 | |
| | 1,953 | | | Kingsway Financial Services, Inc.(b) | | | 10,920 | |
| | 480,745 | | | Kinross Gold Corp.(b) | | | 1,867,354 | |
| | 36,600 | | | Kirkland Lake Gold, Inc.(b) | | | 253,769 | |
| | 16,100 | | | Klondex Mines Ltd.(b) | | | 88,704 | |
| | 14,535 | | | Laurentian Bank of Canada | | | 537,165 | |
| | 8,626 | | | Leon’s Furniture Ltd. | | | 107,142 | |
| | 17,910 | | | Linamar Corp. | | | 728,391 | |
| | 70,300 | | | Lucara Dianmond Corp.(b) | | | 198,641 | |
| | 98,241 | | | Lundin Mining Corp.(b) | | | 384,526 | |
| | 7,862 | | | MacDonald Dettwiler & Associates Ltd. | | | 449,986 | |
| | 7,130 | | | Magellan Aerospace Corp. | | | 97,544 | |
| | 500 | | | Mainstreet Equity Corp.(b) | | | 12,115 | |
| | 24,900 | | | Major Drilling Group International, Inc. | | | 127,535 | |
| | 152,729 | | | Mandalay Resources Corp. | | | 113,866 | |
| | 10,028 | | | Manitoba Telecom Services, Inc. | | | 280,288 | |
| | 19,300 | | | Maple Leaf Foods, Inc. | | | 439,585 | |
| | 28,898 | | | Martinrea International, Inc. | | | 169,557 | |
| | 6,800 | | | Medical Facilities Corp. | | | 110,925 | |
| | 2,123 | | | Melcor Developments Ltd. | | | 19,627 | |
| | 13,200 | | | Methanex Corp.(e) | | | 479,820 | |
| | 1,803 | | | Methanex Corp.(e) | | | 65,531 | |
| | 10,302 | | | Morneau Shepell, Inc. | | | 153,919 | |
| | 2,186 | | | MTY Food Group, Inc. | | | 78,880 | |
| | 35,100 | | | Mullen Group Ltd. | | | 486,475 | |
| | 29,286 | | | Nevsun Resources Ltd. | | | 84,934 | |
| | 7,829 | | | New Flyer Industries, Inc. | | | 218,883 | |
| | 200,658 | | | New Gold, Inc.(b) | | | 791,382 | |
| Shares | | | | | Value | |
| CANADA (continued) | | | | |
| | 4,802 | | | Norbord, Inc. | | $ | 112,952 | |
| | 10,846 | | | North West Co. Inc., (The) | | | 207,006 | |
| | 16,129 | | | Northland Power, Inc. | | | 288,598 | |
| | 382,668 | | | Northview Apartment Real Estate Investment Trust(d) | | | 5,685,956 | |
| | 65,000 | | | NuVista Energy Ltd.(b) | | | 330,500 | |
| | 1,600 | | | Onex Corp. | | | 103,494 | |
| | 26,536 | | | Pan American Silver Corp. | | | 423,769 | |
| | 12,837 | | | Pan American Silver Corp. | | | 205,777 | |
| | 4,839 | | | Paramount Resources Ltd. - Class A(b) | | | 54,909 | |
| | 54,424 | | | Parex Resources, Inc.(b) | | | 626,081 | |
| | 18,488 | | | Parkland Fuel Corp. | | | 431,842 | |
| | 14,000 | | | Pason Systems, Inc. | | | 159,174 | |
| | 91,322 | | | Pengrowth Energy Corp. | | | 140,935 | |
| | 65,445 | | | Penn West Petroleum Ltd.(b) | | | 104,415 | |
| | 131,919 | | | Peyto Exploration & Development Corp.(d) | | | 3,389,196 | |
| | 5,653 | | | Pizza Pizza Royalty Corp. | | | 64,061 | |
| | 8,200 | | | Precision Drilling Corp. | | | 36,559 | |
| | 6,936 | | | Premium Brands Holdings Corp. | | | 335,656 | |
| | 6,820 | | | Pulse Seismic, Inc.(b) | | | 11,745 | |
| | 6,200 | | | Pure Industrial Real Estate Trust REIT | | | 24,868 | |
| | 26,700 | | | Quebecor, Inc. - Class B | | | 749,264 | |
| | 14,785 | | | Questerre Energy Corp. - Class A(b) | | | 5,511 | |
| | 7,600 | | | Raging River Exploration Inc.(b) | | | 60,911 | |
| | 10,943 | | | RB Energy, Inc.(b)(d) | | | 7 | |
| | 4,231 | | | Reitmans (Canada) Ltd. - Class A | | | 20,724 | |
| | 13,200 | | | Richelieu Hardware Ltd. | | | 253,805 | |
| | 20,367 | | | Richmont Mines, Inc.(b) | | | 192,843 | |
| | 410,000 | | | Ritchie Bros Auctioneers, Inc.(e) | | | 14,181,900 | |
| | 208,388 | | | Ritchie Bros. Auctioneers, Inc.(e) | | | 7,205,722 | |
| | 1,500 | | | Rocky Mountain Dealerships, Inc. | | | 10,110 | |
| | 26,754 | | | Rogers Sugar, Inc. | | | 125,263 | |
| | 13,600 | | | Russel Metals, Inc. | | | 216,477 | |
| | 33,588 | | | Sandstorm Gold Ltd.(b) | | | 161,517 | |
| | 125,000 | | | Sandvine Corp. | | | 280,511 | |
| | 2,551 | | | Sears Canada, Inc.(b) | | | 5,101 | |
| | 27,414 | | | Secure Energy Services, Inc. | | | 168,003 | |
| | 118,801 | | | SEMAFO, Inc.(b) | | | 465,886 | |
| | 11,300 | | | ShawCor Ltd. | | | 282,647 | |
| | 76,500 | | | Sherritt International Corp.(b) | | | 49,049 | |
| | 2,282 | | | Sienna Senior Living, Inc. | | | 27,170 | |
| | 12,100 | | | Sierra Wireless, Inc.(b) | | | 165,447 | |
| | 48,544 | | | Silver Standard Resources, Inc.(b) | | | 532,743 | |
| | 3,400 | | | Smart Real Estate Investment Trust | | | 84,791 | |
| | 5,900 | | | SNC-Lavalin Group, Inc. | | | 239,730 | |
| Old Westbury Funds, Inc. | |
| Small & Mid Cap Fund | |
| Portfolio of Investments - (Continued) | October 31, 2016 |
| | |
| Shares | | | | | Value | |
| CANADA (continued) | | | | |
| | 31,428 | | | Spartan Energy Corp.(b) | | $ | 73,105 | |
| | 9,522 | | | Stantec, Inc. | | | 211,837 | |
| | 4,087 | | | Stantec, Inc. | | | 91,140 | |
| | 7,060 | | | Stella-Jones, Inc. | | | 250,545 | |
| | 500 | | | Strad Energy Services Ltd.(b) | | | 615 | |
| | 15,100 | | | Street Capital Group, Inc.(b) | | | 16,099 | |
| | 2,100 | | | Stuart Olson, Inc. | | | 9,159 | |
| | 22,548 | | | Student Transportation, Inc. | | | 130,618 | |
| | 19,026 | | | SunOpta, Inc.(b) | | | 126,244 | |
| | 16,900 | | | Superior Plus Corp. | | | 150,441 | |
| | 42,709 | | | Surge Energy, Inc. | | | 87,246 | |
| | 68,695 | | | Teck Resources Ltd. - Class B | | | 1,483,193 | |
| | 15,975 | | | Tembec, Inc.(b) | | | 12,863 | |
| | 175,990 | | | Teranga Gold Corp.(b) | | | 143,017 | |
| | 42,529 | | | Teranga Gold Corp. - CDI(b) | | | 35,263 | |
| | 4,501 | | | TMX Group Ltd. | | | 207,684 | |
| | 20,645 | | | Toromont Industries Ltd. | | | 606,436 | |
| | 17,764 | | | Total Energy Services, Inc. | | | 168,197 | |
| | 64,386 | | | Tourmaline Oil Corp.(b) | | | 1,687,294 | |
| | 13,378 | | | Transalta Corp. | | | 59,532 | |
| | 10,100 | | | TransAlta Corp. | | | 44,502 | |
| | 393,871 | | | Transalta Renewables, Inc. | | | 4,348,937 | |
| | 30,590 | | | Transcontinental, Inc. - Class A | | | 409,144 | |
| | 21,164 | | | TransForce, Inc. | | | 480,147 | |
| | 5,600 | | | Trilogy Energy Corp.(b) | | | 30,060 | |
| | 8,684 | | | Trinidad Drilling Ltd. | | | 16,639 | |
| | 101,200 | | | Turquoise Hill Resources Ltd.(b) | | | 313,869 | |
| | 6,497 | | | Uni-Select, Inc. | | | 146,186 | |
| | 3,080 | | | Valener, Inc. | | | 48,360 | |
| | 9,795 | | | Vermilion Energy, Inc. | | | 384,748 | |
| | 1,936 | | | Vermilion Energy, Inc. | | | 75,922 | |
| | 2,002 | | | Wajax Corp. | | | 22,762 | |
| | 76,391 | | | Waste Connections, Inc. | | | 5,732,885 | |
| | 20,400 | | | Wesdome Gold Mines Ltd.(b) | | | 39,696 | |
| | 3,800 | | | West Fraser Timber Co. Ltd. | | | 130,095 | |
| | 116,238 | | | Western Forest Products, Inc. | | | 176,788 | |
| | 6,800 | | | Westjet Airlines Ltd. | | | 111,280 | |
| | 8,613 | | | Westshore Terminals Investment Corp. | | | 166,121 | |
| | 60,324 | | | Whitecap Resources, Inc. | | | 482,124 | |
| | 54,800 | | | Wi-Lan, Inc. | | | 78,443 | |
| | 4,348 | | | Winpak Ltd. | | | 148,596 | |
| | 327,069 | | | WSP Global, Inc. | | | 10,595,056 | |
| | 416 | | | Xtreme Drilling & Coil Services Corp.(b) | | | 868 | |
| | 399,266 | | | Yamana Gold, Inc. | | | 1,425,844 | |
| | 19,314 | | | Yellow Pages Ltd.(b) | | | 312,900 | |
| | 6,007 | | | ZCL Composites, Inc. | | | 52,354 | |
| | | | | | | | 127,342,852 | |
| CAYMAN ISLANDS — 0.0% | | | | |
| | 36,700 | | | Fresh Del Monte Produce, Inc. | | | 2,214,845 | |
| CHILE — 0.1% | | | | |
| | 79,358 | | | AES Gener SA | | | 27,038 | |
| | 208,255 | | | Aguas Andinas SA - Class A | | | 137,310 | |
| Shares | | | | | Value | |
| CHILE (continued) | | | | |
| | 495 | | | Banco de Credito e Inversiones | | $ | 25,442 | |
| | 109,821 | | | Banmedica SA | | | 230,311 | |
| | 2,962 | | | Cia Cervecerias Unidas SA | | | 31,815 | |
| | 54,166 | | | Colbún SA | | | 11,801 | |
| | 45,839 | | | E.Cl SA | | | 81,332 | |
| | 9,007 | | | Embotelladora Andina SA - Class B, Preference Shares | | | 36,119 | |
| | 43,791 | | | Empresa Nacional de Telecomunicaciones SA(b) | | | 469,606 | |
| | 11,402 | | | Forus SA | | | 41,082 | |
| | 282,124 | | | Inversiones Aguas Metropolitanas SA | | | 514,433 | |
| | 28,820,129 | | | Itau CorpBanca | | | 261,985 | |
| | 31,424 | | | LATAM Airlines Group SA - BDR(b) | | | 300,982 | |
| | 43,624 | | | Multiexport Foods SA(b) | | | 13,156 | |
| | 36,535 | | | Parque Arauco SA | | | 90,602 | |
| | 22,204 | | | PAZ Corp. SA | | | 18,084 | |
| | 154,380 | | | Sigdo Koppers SA | | | 212,703 | |
| | 1,023 | | | Sociedad Matriz SAAM SA | | | 87 | |
| | 34,456 | | | Sonda SA | | | 71,210 | |
| | 29,577 | | | Vina Concha y Toro SA | | | 51,618 | |
| | | | | | | | 2,626,716 | |
| CHINA — 1.2% | | | | |
| | 597,250 | | | Agile Property Holdings Ltd. | | | 331,910 | |
| | 58,000 | | | Aluminum Corp. of China Ltd. - H Shares(b) | | | 21,538 | |
| | 182,000 | | | Angang Steel Co. Ltd. - H Shares(b) | | | 93,399 | |
| | 2,000 | | | Anhui Expressway Co. Ltd. - H Shares | | | 1,614 | |
| | 104,000 | | | ANTA Sports Products Ltd. | | | 300,378 | |
| | 174,000 | | | Anton Oilfield Services Group(b) | | | 23,333 | |
| | 415,500 | | | Asia Cement China Holdings Corp. | | | 103,399 | |
| | 140,000 | | | AVIC International Holdings Ltd. | | | 79,066 | |
| | 280,000 | | | AviChina Industry & Technology Co. - H Shares | | | 190,264 | |
| | 14,000 | | | Bank of Chongqing Co. Ltd. - H Shares | | | 11,264 | |
| | 5,951 | | | Baoxin Auto Group Ltd.(b) | | | 1,941 | |
| | 104,000 | | | Baoye Group Co. Ltd. - H Shares | | | 80,459 | |
| | 490,000 | | | BBMG Corp. - H Shares | | | 179,433 | |
| | 614,000 | | | Beijing Capital International Airport Co. Ltd. - H Shares | | | 643,645 | |
| | 434,000 | | | Beijing Capital Land Ltd. - H Shares | | | 166,761 | |
| | 184,000 | | | Beijing North Star Co. Ltd. - H Shares | | | 62,159 | |
| | 943,000 | | | Belle International Holdings Ltd. | | | 571,475 | |
| | 1,552,500 | | | Bloomage BioTechnology Corp. Ltd. | | | 2,602,330 | |
| | 3,621,000 | | | Boer Power Holdings Ltd. | | | 1,452,032 | |
| Old Westbury Funds, Inc. | |
| Small & Mid Cap Fund | |
| Portfolio of Investments - (Continued) | October 31, 2016 |
| | |
| Shares | | | | | Value | |
| CHINA (continued) | | | | |
| | 452,000 | | | BYD Electronic International Co. Ltd. | | $ | 356,679 | |
| | 358,656 | | | Central China Real Estate Ltd. | | | 78,617 | |
| | 23,000 | | | Central China Securities Co. Ltd. | | | 11,892 | |
| | 32,000 | | | Changshouhua Food Co. Ltd. | | | 16,504 | |
| | 118,000 | | | Chaowei Power Holdings Ltd. | | | 105,591 | |
| | 908,000 | | | Chigo Holding Ltd.(b) | | | 12,879 | |
| | 70,000 | | | China Animal Healthcare Ltd.(b)(c)(d) | | | 8,800 | |
| | 715,000 | | | China Aoyuan Property Group Ltd. | | | 168,711 | |
| | 64,000 | | | China BlueChemical Ltd. - H Shares | | | 12,378 | |
| | 562,000 | | | China Communications Services Corp. Ltd. - H Shares | | | 334,060 | |
| | 37,500 | | | China Conch Venture Holdings Ltd. | | | 70,111 | |
| | 121,000 | | | China Datang Corp. Renewable Power Co. Ltd. - H Shares(b) | | | 11,077 | |
| | 65,000 | | | China Dredging Environment Protection Holdings Ltd.(b) | | | 3,562 | |
| | 7,414,900 | | | China Everbright Water Ltd.(d) | | | 3,037,911 | |
| | 61,000 | | | China Evergrande Group | | | 40,349 | |
| | 589,500 | | | China Galaxy Securities Co. Ltd. - H Shares | | | 560,954 | |
| | 29,004 | | | China Gold International Resources Corp. Ltd.(b) | | | 75,251 | |
| | 23,308 | | | China Great Star International Ltd.(b) | | | 26,481 | |
| | 259,000 | | | China Hongqiao Group Ltd. | | | 231,764 | |
| | 140,000 | | | China Huishan Dairy Holdings Co. Ltd. | | | 51,989 | |
| | 151,500 | | | China Huiyuan Juice Group Ltd.(b) | | | 56,064 | |
| | 37,700 | | | China International Marine Containers Group Co. Ltd. - H Shares | | | 44,916 | |
| | 32,000 | | | China ITS Holdings Co. Ltd.(b) | | | 2,393 | |
| | 466,000 | | | China Lesso Group Holdings. Ltd. | | | 341,889 | |
| | 66,000 | | | China Lilang Ltd. | | | 37,274 | |
| | 111,000 | | | China Longyuan Power Group Corp. - H Shares | | | 84,872 | |
| | 156,000 | | | China Machinery Engineering Corp. - H Shares | | | 93,332 | |
| | 135,000 | | | China Medical System Holdings Ltd. | | | 210,971 | |
| | 183,000 | | | China Mengniu Dairy Co. Ltd. | | | 346,861 | |
| | 16,000 | | | China Modern Dairy Holdings Ltd.(b) | | | 3,487 | |
| | 638,084 | | | China National Building Material Co. Ltd. - H Shares | | | 292,074 | |
| | 544,000 | | | China National Materials Co. Ltd. - H Shares | | | 122,751 | |
| | 196,000 | | | China Oilfield Services Ltd. | | | 189,542 | |
| | 648,400 | | | China SCE Property Holdings Ltd. | | | 198,143 | |
| Shares | | | | | Value | |
| CHINA (continued) | | | | |
| | 309,488 | | | China Shanshui Cement Group Ltd.(b)(c)(d) | | $ | 81,323 | |
| | 49,000 | | | China Shineway Pharmaceutical Group Ltd. | | | 50,481 | |
| | 961,093 | | | China Shipping Container Lines Co. Ltd. - H Shares(b) | | | 201,995 | |
| | 600,000 | | | China Shipping Development Co. Ltd., H Shares | | | 331,891 | |
| | 388,000 | | | China Southern Airlines Co. Ltd. - H Shares | | | 218,125 | |
| | 85,000 | | | China Suntien Green Energy Corp. Ltd. - H Shares | | | 11,398 | |
| | 164,000 | | | China Taifeng Beddings Holdings Ltd.(b)(c)(d) | | | 4,282 | |
| | 101,500 | | | China ZhengTong Auto Services Holdings Ltd. | | | 32,588 | |
| | 330,000 | | | China Zhongwang Holdings Ltd. | | | 152,755 | |
| | 144,000 | | | Chinasoft International Ltd.(b) | | | 67,771 | |
| | 270,000 | | | Chongqing Machinery & Electric Co. Ltd. - H Shares | | | 32,029 | |
| | 706,000 | | | Chongqing Rural Commercial Bank Co. Ltd. - H Shares | | | 423,297 | |
| | 58,000 | | | Chu Kong Petroleum & Natural Gas Steel Pipe Holdings Ltd.(b) | | | 8,226 | |
| | 671,600 | | | Coolpad Group Ltd.(b) | | | 116,905 | |
| | 953,443 | | | Country Garden Holdings Co. Ltd. | | | 496,665 | |
| | 4,949,000 | | | CPMC Holdings Ltd.(d) | | | 2,597,163 | |
| | 250,000 | | | CSPC Pharmaceutical Group Ltd. | | | 259,169 | |
| | 10,840,000 | | | CT Environmental Group Ltd. | | | 3,047,005 | |
| | 104,000 | | | Da Ming International Holdings, Ltd.(b) | | | 38,084 | |
| | 713,000 | | | Dalian Port PDA Co. Ltd. - H Shares | | | 127,788 | |
| | 192,000 | | | Daphne International Holdings Ltd.(b) | | | 25,252 | |
| | 54,000 | | | Datang International Power Generation Co. Ltd. - H Shares | | | 14,552 | |
| | 37,200 | | | Dongfang Electric Corp. Ltd. - H Shares | | | 28,827 | |
| | 459,000 | | | Dongyue Group Ltd.(b)(c)(d) | | | 60,811 | |
| | 2,849,000 | | | Dynagreen Environmental Protection Group Co. Ltd.(d) | | | 1,351,847 | |
| | 44,000 | | | ENN Energy Holdings Ltd. | | | 207,078 | |
| | 774,000 | | | Fantasia Holdings Group Co. Ltd. | | | 100,797 | |
| | 616,000 | | | FIH Mobile Ltd. | | | 203,333 | |
| | 5,082,000 | | | Fu Shou Yuan International Group Ltd. | | | 2,981,491 | |
| | 497,600 | | | Fufeng Group Ltd. | | | 210,446 | |
| | 2,020,000 | | | Geely Automobile Holdings Ltd. | | | 2,083,669 | |
| | 86,000 | | | Golden Eagle Retail Group Ltd. | | | 119,538 | |
| Old Westbury Funds, Inc. | |
| Small & Mid Cap Fund | |
| Portfolio of Investments - (Continued) | October 31, 2016 |
| | |
| Shares | | | | | Value | |
| CHINA (continued) | | | | |
| | 1,180,600 | | | GOME Electrical Appliances Holdings Ltd. | | $ | 149,182 | |
| | 144,000 | | | Goodbaby International Holdings Ltd. | | | 69,628 | |
| | 201,000 | | | Greatview Aseptic Packaging Co. Ltd. | | | 102,113 | |
| | 41,000 | | | Greenland Hong Kong Holdings Ltd.(b) | | | 10,520 | |
| | 225,500 | | | Greentown China Holdings Ltd.(b) | | | 184,342 | |
| | 238,000 | | | Guangshen Railway Co. Ltd. - H Shares | | | 131,650 | |
| | 18,000 | | | Guangzhou Baiyunshan Pharmaceutical Holdings Co. Ltd. - H Shares(b) | | | 42,566 | |
| | 288,800 | | | Guangzhou R&F Properties Co. Ltd. - H Shares | | | 408,127 | |
| | 68,000 | | | Haitian International Holdings Ltd. | | | 140,287 | |
| | 152,000 | | | Harbin Electric Co. Ltd. - H Shares | | | 74,280 | |
| | 11,000 | | | HNA Infrastructure Company Ltd. | | | 12,311 | |
| | 82,000 | | | HOSA International Ltd. | | | 27,701 | |
| | 82,000 | | | Huadian Fuxin Energy Corp. Ltd. | | | 19,032 | |
| | 74,000 | | | Huadian Power International Corp. Ltd. - H Shares | | | 31,773 | |
| | 138,000 | | | Huan Yue Interactive Holdings Ltd.(b) | | | 16,726 | |
| | 1,622,000 | | | Huaneng Renewables Corp. Ltd. - H Shares | | | 545,857 | |
| | 113,000 | | | Huishang Bank Corp. Ltd. - H Shares | | | 54,347 | |
| | 102,000 | | | Intime Retail Group Co. Ltd. | | | 80,095 | |
| | 156,000 | | | Jiangnan Group Ltd. | | | 25,747 | |
| | 50,000 | | | Jiangsu Expressway Co. Ltd. - H Shares | | | 68,080 | |
| | 236,000 | | | Jiangxi Copper Co. Ltd. - H Shares | | | 278,737 | |
| | 1,235,000 | | | Kaisa Group Holdings Ltd.(b)(c)(d) | | | 46,578 | |
| | 164,000 | | | Kingdee International Software Group Co. Ltd.(b) | | | 66,610 | |
| | 465,000 | | | KWG Property Holding Ltd. | | | 269,807 | |
| | 106,000 | | | Lenovo Group Ltd. | | | 68,065 | |
| | 91,000 | | | Lianhua Supermarket Holdings Co. Ltd. - H Shares(b) | | | 37,078 | |
| | 128,000 | | | Lifetech Scientific Corp.(b) | | | 30,368 | |
| | 7,800 | | | Livzon Pharmaceutical Group, Inc. | | | 45,509 | |
| | 74,000 | | | Logan Property Holdings Co. Ltd. | | | 29,770 | |
| | 528,500 | | | Longfor Properties Co. Ltd. | | | 701,891 | |
| | 652,000 | | | Lonking Holdings Ltd. | | | 106,767 | |
| | 130,000 | | | Maanshan Iron & Steel Co. Ltd. - H Shares(b) | | | 29,669 | |
| Shares | | | | | Value | |
| CHINA (continued) | | | | |
| | 512,000 | | | Maoye International Holdings Ltd.(b) | | $ | 48,853 | |
| | 4,141,000 | | | Microport Scientific Corp.(b) | | | 3,064,817 | |
| | 3,763,000 | | | Microport Scientific Corp.(b)(d) | | | 2,785,053 | |
| | 132,000 | | | Minth Group Ltd. | | | 469,754 | |
| | 80,000 | | | NVC Lighting Holdings Ltd. | | | 11,037 | |
| | 54,000 | | | O-Net Technologies Group Ltd.(b) | | | 29,452 | |
| | 49,800 | | | Pacific Online Ltd. | | | 12,393 | |
| | 197,000 | | | Powerlong Real Estate Holdings Ltd. | | | 67,059 | |
| | 261,000 | | | Qunxing Paper Holdings Co. Ltd.(b)(c)(d) | | | 12,721 | |
| | 67,000 | | | Real Gold Mining Ltd.(b)(c)(d) | | | 2,272 | |
| | 3,828,145 | | | Renhe Commercial Holdings Co. Ltd.(b) | | | 99,214 | |
| | 214,000 | | | Sany Heavy Equipment International Holdings Co. Ltd.(b) | | | 33,388 | |
| | 10,766,806 | | | Semiconductor Manufacturing International Corp.(b) | | | 1,304,975 | |
| | 70,000 | | | Shandong Chenming Paper Holdings Ltd. - H Shares | | | 60,473 | |
| | 28,000 | | | Shandong Weigao Group Medical Polymer Co. Ltd. - H Shares | | | 18,268 | |
| | 18,500 | | | Shanghai Fosun Pharmaceutical Group Co. Ltd. - H Shares | | | 56,892 | |
| | 229,235 | | | Shanghai Jin Jiang International Hotels Group Co. Ltd. - H Shares | | | 67,096 | |
| | 123,700 | | | Shanghai Pharmaceuticals Holding Co. Ltd. - H Shares | | | 318,997 | |
| | 32,000 | | | Shenzhen Expressway Co. Ltd. - H Shares | | | 32,142 | |
| | 66,000 | | | Shenzhou International Group Holdings Ltd. | | | 437,841 | |
| | 706,381 | | | Shui On Land Ltd. | | | 174,875 | |
| | 64,000 | | | Sichuan Expressway Co. Ltd. - H Shares | | | 25,747 | |
| | 360,000 | | | Sihuan Pharmaceutical Holdings Group Ltd. | | | 86,338 | |
| | 46,500 | | | Sino Grandness Food Industry Group Ltd. | | | 11,364 | |
| | 1,436,062 | | | Sino-Ocean Land Holdings Ltd. | | | 598,085 | |
| | 119,000 | | | Sinopec Engineering Group Co. Ltd. | | | 105,259 | |
| | 224,000 | | | Sinopec Shanghai Petrochemical Co. Ltd. - H Shares | | | 114,375 | |
| | 3,295,200 | | | Sinosoft Technology Group Ltd. | | | 1,440,353 | |
| | 405,000 | | | Sinotrans Ltd. - H Shares | | | 191,128 | |
| | 334,000 | | | Sinotruk Hong Kong Ltd. | | | 184,753 | |
| | 364,000 | | | SOHO China Ltd. | | | 188,206 | |
| | 6,000 | | | Springland International Holdings Ltd. | | | 928 | |
| | 352,000 | | | Sunac China Holdings Ltd. | | | 241,004 | |
| | 1,796,000 | | | Sunny Optical Technology Group Co. Ltd. | | | 8,776,734 | |
| Old Westbury Funds, Inc. | |
| Small & Mid Cap Fund | |
| Portfolio of Investments - (Continued) | October 31, 2016 |
| | |
| Shares | | | | | Value | |
| CHINA (continued) | | | | |
| | 36,000 | | | Tian Shan Development Holdings Ltd. | | $ | 13,229 | |
| | 340,000 | | | Tiangong International Co. Ltd. | | | 42,963 | |
| | 164,000 | | | Tianneng Power International Ltd. | | | 148,023 | |
| | 186,000 | | | Tingyi Cayman Islands Holding Corp. | | | 200,736 | |
| | 1,566,000 | | | Tong Ren Tang Technologies Co. Ltd. - H Shares | | | 2,859,186 | |
| | 22,800 | | | Tonly Electronics Holdings Ltd. | | | 12,053 | |
| | 774,500 | | | Travelsky Technology Ltd. - H Shares | | | 1,655,745 | |
| | 210,000 | | | Trigiant Group Ltd. | | | 33,847 | |
| | 201,000 | | | Trony Solar Holdings Co. Ltd.(b)(c)(d) | | | 3,058 | |
| | 20,000 | | | Tsingtao Brewery Co. Ltd. - H Shares | | | 79,943 | |
| | 63,400 | | | Uni-President China Holdings Ltd. | | | 42,918 | |
| | 124,000 | | | Universal Health International Group Holding Ltd.(b) | | | 5,596 | |
| | 439,200 | | | V1 Group Ltd.(b) | | | 21,803 | |
| | 119,000 | | | Weichai Power Co. Ltd. - H Shares | | | 179,830 | |
| | 496,000 | | | Welling Holding Ltd. | | | 99,129 | |
| | 1,066,000 | | | West China Cement Ltd.(b) | | | 108,585 | |
| | 582,000 | | | Wuzhou International Holdings Ltd.(b) | | | 60,034 | |
| | 626,000 | | | Xiamen International Port Co. Ltd. - H Shares | | | 134,796 | |
| | 74,000 | | | Xingda International Holdings Ltd. | | | 30,724 | |
| | 62,200 | | | Xinjiang Goldwind Science & Technology Co. Ltd. - H Shares | | | 85,975 | |
| | 217,000 | | | Xinjiang Xinxin Mining Industry Co. Ltd. - H Shares(b) | | | 23,783 | |
| | 212,000 | | | Xinyi Solar Holdings Ltd. | | | 78,726 | |
| | 283,000 | | | Xiwang Special Steel Co. Ltd.(b) | | | 27,732 | |
| | 149,000 | | | XTEP International Holdings Ltd. | | | 65,705 | |
| | 52,000 | | | Yanzhou Coal Mining Co. Ltd. - H Shares | | | 38,553 | |
| | 5,270,000 | | | Yestar International Holdings Co. Ltd. | | | 2,799,595 | |
| | 49,500 | | | Youyuan International Holdings Ltd.(b) | | | 11,425 | |
| | 370,000 | | | Yuanda China Holdings Ltd.(b) | | | 9,589 | |
| | 531,760 | | | Yuzhou Properties Co. Ltd. | | | 197,467 | |
| | 159,000 | | | Zall Development Group Ltd.(b)(c) | | | 108,453 | |
| | 97,500 | | | Zhaojin Mining Industry Co. Ltd. - H Shares | | | 98,562 | |
| | 96,000 | | | Zhejiang Expressway Co. Ltd. - H Shares | | | 100,635 | |
| | 40,000 | | | Zhejiang Glass Co. Ltd. - H Shares(b)(c)(d) | | | 0 | |
| Shares | | | | | Value | |
| CHINA (continued) | | | | |
| | 166,000 | | | Zhong An Real Estate Ltd.(b) | | $ | 15,625 | |
| | 23,000 | | | Zhongsheng Group Holdings Ltd. | | | 23,161 | |
| | 24,000 | | | Zhuzhou CRRC Times Electric Co. Ltd. | | | 116,355 | |
| | 43,000 | | | Zoomlion Heavy Industry Science and Technology Co. Ltd. - H Shares | | | 15,691 | |
| | | | | | | | 64,369,399 | |
| CURACAO — 0.1% | | | | |
| | 71,060 | | | Mouwasat Medical Services Co.(b) | | | 2,511,971 | |
| DENMARK — 0.5% | | | | |
| | 13,506 | | | ALK-Abello A/S | | | 1,825,835 | |
| | 26,508 | | | Alm Brand A/S | | | 199,520 | |
| | 8,231 | | | Amagerbanken A/S(b)(c)(d) | | | 0 | |
| | 1,801 | | | Ambu A/S - B Shares | | | 93,295 | |
| | 1,663 | | | Bang & Olufsen A/S(b) | | | 18,407 | |
| | 2,210 | | | Bavarian Nordic A/S(b) | | | 75,017 | |
| | 1,079 | | | Brodrene Hartmann A/S | | | 53,346 | |
| | 235,467 | | | Chr. Hansen Holding A/S | | | 14,102,026 | |
| | 692 | | | D/S Norden A/S(b) | | | 9,850 | |
| | 10,570 | | | Dfds A/S | | | 510,888 | |
| | 23,297 | | | DSV A/S | | | 1,129,126 | |
| | 7,093 | | | FLSmidth & Co. A/S | | | 257,726 | |
| | 3,180 | | | Genmab A/S(b) | | | 524,697 | |
| | 66,435 | | | GN Store Nord A/S | | | 1,347,172 | |
| | 8,562 | | | H. Lundbeck A/S(b) | | | 276,100 | |
| | 1,804 | | | H+H International A/S - Class B(b) | | | 18,104 | |
| | 825 | | | Harboes Bryggeri A/S - Class B | | | 17,107 | |
| | 2,037 | | | IC Group A/S | | | 48,101 | |
| | 49,776 | | | ISS A/S | | | 1,957,013 | |
| | 17,993 | | | Jyske Bank A/S | | | 816,560 | |
| | 3,569 | | | Matas A/S | | | 69,265 | |
| | 6,510 | | | NKT Holding A/S | | | 438,496 | |
| | 1,101 | | | Nordjyske Bank A/S | | | 16,249 | |
| | 10,150 | | | Per Aarsleff A/S | | | 239,676 | |
| | 1,300 | | | Ringkjoebing Landbobank A/S | | | 275,126 | |
| | 1,648 | | | Rockwool International A/S - Class B | | | 275,810 | |
| | 9,265 | | | Royal Unibrew A/S | | | 433,455 | |
| | 7,654 | | | Santa Fe Group A/S(b) | | | 74,554 | |
| | 7,068 | | | Schouw & Co. | | | 449,065 | |
| | 8,811 | | | SimCorp A/S | | | 486,986 | |
| | 1,324 | | | Solar A/S - Class B | | | 72,787 | |
| | 21,891 | | | Spar Nord Bank A/S | | | 219,692 | |
| | 21,662 | | | Sydbank A/S | | | 677,437 | |
| | 219,403 | | | TDC A/S(b) | | | 1,210,703 | |
| | 21,852 | | | TK Development A/S(b) | | | 28,864 | |
| | 16,542 | | | Topdanmark A/S(b) | | | 445,544 | |
| | 18,025 | | | Tryg A/S | | | 352,211 | |
| | 16,000 | | | William Demant Holding A/S(b) | | | 298,002 | |
| | | | | | | | 29,343,812 | |
| Old Westbury Funds, Inc. | |
| Small & Mid Cap Fund | |
| Portfolio of Investments - (Continued) | October 31, 2016 |
| | |
| Shares | | | | | Value | |
| FAEROE ISLANDS — 0.0% |
| | 7,482 | | | Bakkafrost | | $ | 313,865 | |
| FINLAND — 0.4% |
| | 2,873 | | | Ahlstrom Oyj | | | 40,054 | |
| | 872 | | | Aktia Bank Oyj | | | 8,711 | |
| | 10,210 | | | Amer Sports Oyj | | | 277,960 | |
| | 1,322 | | | Atria Oyj | | | 14,512 | |
| | 361 | | | BasWare Oyj(b) | | | 13,276 | |
| | 1,691 | | | Bittium Oyj | | | 10,470 | |
| | 11,384 | | | Cargotec Oyj - Class B | | | 467,132 | |
| | 26,892 | | | Caverion Corp. | | | 193,657 | |
| | 32,219 | | | Citycon Oyj | | | 75,547 | |
| | 2,317 | | | Comptel Oyj | | | 5,469 | |
| | 11,552 | | | Cramo Oyj | | | 303,716 | |
| | 29,832 | | | Elisa Oyj | | | 1,005,371 | |
| | 16,218 | | | Finnair Oyj(b) | | | 71,926 | |
| | 7,981 | | | Fiskars Oyj Abp | | | 142,983 | |
| | 8,344 | | | F-Secure Oyj | | | 29,494 | |
| | 4,792 | | | HKScan Oyj - A Shares | | | 16,676 | |
| | 21,678 | | | Huhtamaki Oyj | | | 875,259 | |
| | 36,532 | | | Kemira Oyj | | | 435,521 | |
| | 9,291 | | | Kesko OYJ - B Shares | | | 461,822 | |
| | 2,280 | | | Kesko Oyj - Class A | | | 106,548 | |
| | 12,022 | | | Konecranes Oyj | | | 409,773 | |
| | 9,896 | | | Lassila & Tikanoja Oyj | | | 205,970 | |
| | 745 | | | Lemminkainen Oyj | | | 14,148 | |
| | 75,818 | | | Metsa Board Oyj | | | 435,707 | |
| | 28,994 | | | Metso Oyj | | | 760,697 | |
| | 51,836 | | | Neste Oyj | | | 2,238,004 | |
| | 15,813 | | | Nokian Renkaat Oyj | | | 530,659 | |
| | 2,393 | | | Olvi Oyj - Class A | | | 72,477 | |
| | 27,474 | | | Oriola-KD Oyj - Class B | | | 128,782 | |
| | 6,792 | | | Orion Oyj - Class A | | | 288,694 | |
| | 21,898 | | | Orion Oyj - Class B | | | 932,459 | |
| | 58,724 | | | Outokumpu Oyj(b) | | | 409,350 | |
| | 25,811 | | | Outotec Oyj(b) | | | 112,430 | |
| | 7,716 | | | PKC Group Oyj | | | 135,270 | |
| | 420 | | | Ponsse Oyj | | | 10,494 | |
| | 38,176 | | | Raisio Oyj - V Shares | | | 159,669 | |
| | 22,193 | �� | | Ramirent Oyj | | | 163,716 | |
| | 32,530 | | | Sanoma Oyj | | | 304,785 | |
| | 2,082 | | | SRV Group Plc | | | 9,965 | |
| | 293,089 | | | Stora Enso Oyj - Class R | | | 2,771,790 | |
| | 163,338 | | | Talvivaara Mining Co. Plc(b)(c)(d) | | | 1,022 | |
| | 7,035 | | | Technopolis Oyj | | | 24,327 | |
| | 11,475 | | | Tieto Oyj | | | 314,793 | |
| | 8,844 | | | Tikkurila Oyj | | | 170,385 | |
| | 150,989 | | | UPM-Kymmene Oyj | | | 3,513,878 | |
| | 15,354 | | | Uponor Oyj | | | 261,251 | |
| | 3,684 | | | Vaisala Oyj - Class A | | | 125,328 | |
| | 14,981 | | | Valmet Oyj | | | 222,507 | |
| | 15,103 | | | Wartsila Oyj Abp | | | 653,228 | |
| | 32,499 | | | YIT Oyj | | | 270,780 | |
| | | | | | | | 20,208,442 | |
| Shares | | | | | Value | |
| FRANCE — 1.4% |
| | 24,178 | | | Accor SA | | $ | 917,939 | |
| | 5,058 | | | Actia Group | | | 45,252 | |
| | 17,052 | | | Air France-KLM(b) | | | 104,040 | |
| | 1,984 | | | Akka Technologies SA | | | 69,368 | |
| | 8,106 | | | Albioma SA | | | 133,921 | |
| | 6,803 | | | Alstom SA(b) | | | 182,743 | |
| | 327 | | | Altarea SCA REIT | | | 62,460 | |
| | 5,734 | | | Alten SA | | | 409,837 | |
| | 25,305 | | | Altran Technologies SA | | | 361,123 | |
| | 4,393 | | | APRIL SA | | | 60,280 | |
| | 35,335 | | | Arkema SA | | | 3,350,609 | |
| | 4,208 | | | Assystem | | | 126,108 | |
| | 38,573 | | | Atos SE | | | 4,006,562 | |
| | 560 | | | Axway Software SA | | | 17,164 | |
| | 4,971 | | | Beneteau SA | | | 57,462 | |
| | 1,991 | | | BioMerieux | | | 290,252 | |
| | 72,366 | | | Boiron SA(d) | | | 6,120,069 | |
| | 8,998 | | | Bonduelle SCA | | | 213,356 | |
| | 4,028 | | | Bourbon SA | | | 52,619 | |
| | 33,357 | | | Bureau Veritas SA | | | 630,193 | |
| | 158 | | | Burelle SA | | | 155,407 | |
| | 12,743 | | | Casino Guichard Perrachon SA | | | 634,107 | |
| | 1,749 | | | Cegedim SA(b) | | | 44,543 | |
| | 548 | | | CGG SA(b) | | | 14,492 | |
| | 9,650 | | | Chargeurs SA | | | 167,904 | |
| | 3,649 | | | Cie des Alpes | | | 67,536 | |
| | 3,058 | | | Coface SA(b) | | | 19,803 | |
| | 56,117 | | | Derichebourg SA | | | 175,814 | |
| | 1,675 | | | Devoteam SA | | | 90,448 | |
| | 5,553 | | | Edenred | | | 128,653 | |
| | 24,093 | | | Eiffage SA | | | 1,783,668 | |
| | 410 | | | Electricite de Strasbourg SA | | | 45,075 | |
| | 6,919 | | | Elior Participations SCA | | | 155,363 | |
| | 1,730 | | | Elis SA | | | 28,753 | |
| | 1,370 | | | Eramet(b) | | | 64,308 | |
| | 779 | | | Esso SA Francaise(b) | | | 31,367 | |
| | 34,332 | | | Etablissements Maurel et Prom(b) | | | 151,129 | |
| | 4,816 | | | Euler Hermes Group | | | 417,921 | |
| | 42,903 | | | Eutelsat Communications SA | | | 899,552 | |
| | 1,226 | | | Exel Industries SA - Class A | | | 89,768 | |
| | 1,633 | | | Faiveley Transport SA | | | 178,098 | |
| | 23,531 | | | Faurecia | | | 865,606 | |
| | 18 | | | Fimalac | | | 1,947 | |
| | 1,637 | | | Fonciere Des Regions REIT | | | 143,097 | |
| | 22,138 | | | Gaztransport Et Technigaz SA | | | 748,505 | |
| | 1,825 | | | Gecina SA REIT | | | 266,052 | |
| | 4,424 | | | GL Events | | | 78,918 | |
| | 1,240 | | | Groupe Crit | | | 81,741 | |
| | 66,814 | | | Groupe Eurotunnel SE | | | 625,710 | |
| | 4,051 | | | Groupe Fnac SA(b)(e) | | | 276,159 | |
| | 1,024 | | | Groupe Fnac SA(b)(e) | | | 70,107 | |
| | 1,569 | | | Groupe Open | | | 42,129 | |
| | 1,572 | | | Guerbet | | | 93,393 | |
| | 2,937 | | | Haulotte Group SA | | | 40,688 | |
| | 26,272 | | | Havas SA | | | 213,735 | |
| Old Westbury Funds, Inc. | |
| Small & Mid Cap Fund | |
| Portfolio of Investments - (Continued) | October 31, 2016 |
| | |
| Shares | | | | | Value | |
| FRANCE (continued) |
| | 1,746 | | | ICADE REIT | | $ | 125,504 | |
| | 301 | | | ID Logistics Group(b) | | | 42,460 | |
| | 10,951 | | | Imerys SA | | | 761,683 | |
| | 62,015 | | | Ingenico Group SA | | | 4,908,372 | |
| | 1,475 | | | Interparfums SA | | | 42,309 | |
| | 5,550 | | | Ipsen SA | | | 383,586 | |
| | 10,952 | | | IPSOS | | | 357,673 | |
| | 6,546 | | | Jacquet Metal Service | | | 109,944 | |
| | 7,047 | | | JCDecaux SA | | | 215,483 | |
| | 317,291 | | | Korian SA | | | 9,719,529 | |
| | 40,363 | | | Lagardere SCA | | | 1,027,962 | |
| | 863 | | | Laurent-Perrier | | | 66,315 | |
| | 1,830 | | | Le Noble Age | | | 64,365 | |
| | 3,616 | | | Lectra | | | 65,338 | |
| | 1,180 | | | Linedata Services | | | 54,405 | |
| | 224,236 | | | LISI(d) | | | 6,637,602 | |
| | 438 | | | Maisons France Confort SA | | | 22,954 | |
| | 3,615 | | | Manitou BF SA | | | 65,280 | |
| | 576 | | | Mersen | | | 11,527 | |
| | 6,820 | | | Metropole Television SA | | | 118,851 | |
| | 5,327 | | | MGI Coutier | | | 149,585 | |
| | 1,975 | | | Mr Bricolage | | | 28,618 | |
| | 1,247 | | | Naturex(b) | | | 113,167 | |
| | 11,769 | | | Neopost SA | | | 356,319 | |
| | 8,744 | | | Nexans SA(b) | | | 497,024 | |
| | 6,068 | | | Nexity SA | | | 304,716 | |
| | 511 | | | NRJ Group(b) | | | 5,088 | |
| | 5,591 | | | Oeneo SA | | | 49,837 | |
| | 4,198 | | | Onxeo SA(b)(e) | | | 10,968 | |
| | 3,092 | | | Onxeo SA(b)(e) | | | 8,123 | |
| | 4,524 | | | Orpea | | | 376,640 | |
| | 1,064 | | | Parrot SA(b) | | | 9,461 | |
| | 2,566 | | | Pierre & Vacances SA(b) | | | 100,420 | |
| | 11,853 | | | Plastic Omnium SA | | | 386,187 | |
| | 506 | | | Plastivaloire | | | 63,384 | |
| | 577 | | | PSB Industries SA | | | 29,137 | |
| | 7,664 | | | Rallye SA | | | 138,734 | |
| | 468 | | | Remy Cointreau SA | | | 37,966 | |
| | 14,166 | | | Rexel SA | | | 196,484 | |
| | 963 | | | Rothschild & Co. | | | 22,834 | |
| | 138,029 | | | Rubis SCA | | | 12,588,451 | |
| | 6,138 | | | Sartorius Stedim Biotech | | | 413,917 | |
| | 2,137 | | | Savencia SA | | | 130,901 | |
| | 50,206 | | | SCOR SE | | | 1,625,309 | |
| | 6,771 | | | SEB SA | | | 996,380 | |
| | 2,944 | | | Societe BIC SA | | | 408,175 | |
| | 320 | | | Societe Internationale de Plantations d’Heveas SA(b) | | | 12,997 | |
| | 9,258 | | | Societe Television Francaise 1 | | | 85,349 | |
| | 517 | | | Somfy SA | | | 215,665 | |
| | 2,996 | | | Sopra Steria Group | | | 304,747 | |
| | 16,115 | | | Ste Industrielle d’Aviation Latecoere SA(b) | | | 61,916 | |
| | 1,615 | | | Stef SA | | | 125,041 | |
| | 25,453 | | | Suez Environnement Co. | | | 403,051 | |
| | 1,087 | | | Sword Group | | | 32,588 | |
| Shares | | | | | Value | |
| FRANCE (continued) |
| | 4,320 | | | Synergie SA | | $ | 139,898 | |
| | 2,499 | | | Tarkett SA | | | 89,006 | |
| | 48,862 | | | Technicolor SA | | | 285,679 | |
| | 23,862 | | | Technip SA | | | 1,582,680 | |
| | 15,168 | | | Teleperformance SA | | | 1,602,968 | |
| | 318 | | | Tessi SA | | | 48,492 | |
| | 260 | | | Thermador Groupe | | | 22,477 | |
| | 1,951 | | | Trigano SA | | | 138,034 | |
| | 46,170 | | | UBISOFT Entertainment(b) | | | 1,571,184 | |
| | 63,349 | | | Vallourec SA(b) | | | 311,269 | |
| | 1,621 | | | Valneva SE(b) | | | 4,413 | |
| | 602 | | | Vetoquinol SA | | | 30,273 | |
| | 7,105 | | | Vicat SA | | | 446,680 | |
| | 2,732 | | | Vilmorin & Cie SA | | | 164,259 | |
| | 596 | | | Virbac SA(b) | | | 94,868 | |
| | 449 | | | Vranken - Pommery Monopole SA | | | 11,302 | |
| | 340 | | | Worldline S.A.(b) | | | 9,346 | |
| | 6,029 | | | Zodiac Aerospace | | | 146,729 | |
| | | | | | | | 77,892,731 | |
| GERMANY — 1.6% |
| | 13,680 | | | Aareal Bank AG | | | 493,543 | |
| | 2,745 | | | Adler Modemaerkte AG | | | 15,609 | |
| | 23,898 | | | ADVA Optical Networking SE(b) | | | 190,093 | |
| | 20,551 | | | Aixtron SE(b) | | | 97,752 | |
| | 4,617 | | | Allgeier SE | | | 91,129 | |
| | 6,126 | | | Alstria Office REIT AG | | | 79,051 | |
| | 752 | | | Amadeus Fire AG | | | 60,419 | |
| | 9,471 | | | Aurubis AG | | | 492,706 | |
| | 12,739 | | | Axel Springer SE | | | 637,894 | |
| | 310 | | | Basler AG | | | 19,499 | |
| | 1,588 | | | Bauer AG | | | 21,825 | |
| | 4,494 | | | BayWa AG | | | 150,787 | |
| | 2,465 | | | Bechtle AG | | | 259,096 | |
| | 284 | | | Bertrandt AG | | | 30,257 | |
| | 495 | | | Bijou Brigitte AG | | | 29,343 | |
| | 2,505 | | | Biotest AG | | | 44,685 | |
| | 256 | | | Biotest AG - Preference Shares | | | 3,558 | |
| | 20,442 | | | Borussia Dortmund GmbH & Co. KGaA | | | 129,032 | |
| | 25,055 | | | Brenntag AG | | | 1,339,320 | |
| | 2,756 | | | CANCOM SE | | | 125,131 | |
| | 6,532 | | | Carl Zeiss Meditec AG | | | 234,871 | |
| | 2,761 | | | CENIT AG | | | 68,786 | |
| | 4,110 | | | CENTROTEC Sustainable AG | | | 67,451 | |
| | 3,390 | | | Cewe Stiftung & Co. KGaA | | | 324,505 | |
| | 7,896 | | | Comdirect Bank AG | | | 80,134 | |
| | 39,273 | | | Commerzbank AG | | | 266,735 | |
| | 4,097 | | | CompuGroup Medical SE | | | 181,384 | |
| | 5,206 | | | Constantin Medien AG(b) | | | 11,773 | |
| | 9,051 | | | CTS Eventim AG & Co KGaA | | | 325,198 | |
| | 27,541 | | | Deutsche Lufthansa AG | | | 352,066 | |
| | 28,878 | | | Deutsche Wohnen AG | | | 942,153 | |
| | 39,243 | | | Deutz AG | | | 193,856 | |
| Old Westbury Funds, Inc. | |
| Small & Mid Cap Fund | |
| Portfolio of Investments - (Continued) | October 31, 2016 |
| | |
| Shares | | | | | Value | |
| GERMANY (continued) |
| | 1,078 | | | Dic Asset AG | | $ | 10,342 | |
| | 9,306 | | | DMG Mori AG | | | 425,944 | |
| | 2,100 | | | Dr Hoenle AG | | | 58,324 | |
| | 940 | | | Draegerwerk AG & Co. KGaA | | | 59,953 | |
| | 1,025 | | | Draegerwerk AG & Co. KGaA - Preference Shares | | | 73,115 | |
| | 6,958 | | | Drillisch AG | | | 317,748 | |
| | 78,796 | | | Duerr AG | | | 5,873,262 | |
| | 1,537 | | | Eckert & Ziegler AG | | | 35,736 | |
| | 6,212 | | | Elmos Semiconductor AG | | | 94,106 | |
| | 143,249 | | | Fielmann AG | | | 9,935,202 | |
| | 1,910 | | | First Sensor AG(b) | | | 29,752 | |
| | 19,763 | | | Fraport AG Frankfurt Airport Services Worldwide | | | 1,173,045 | |
| | 25,028 | | | Freenet AG | | | 717,225 | |
| | 7,844 | | | Fuchs Petrolub SE | | | 310,075 | |
| | 7,977 | | | Fuchs Petrolub SE - Preference Shares | | | 356,620 | |
| | 28,204 | | | GEA Group AG | | | 1,090,604 | |
| | 10,704 | | | Gerresheimer AG | | | 807,368 | |
| | 6,067 | | | Gerry Weber International AG | | | 75,758 | |
| | 2,114 | | | Gesco AG | | | 168,990 | |
| | 2,596 | | | GFK SE | | | 87,574 | |
| | 2,873 | | | GFT Technologies SE | | | 57,432 | |
| | 5,876 | | | Grammer AG | | | 335,615 | �� |
| | 1,925 | | | Grenkeleasing AG | | | 335,150 | |
| | 3,022 | | | H&R AG(b) | | | 55,915 | |
| | 4,739 | | | Hamborner AG REIT | | | 46,852 | |
| | 2,835 | | | Hamburger Hafen und Logistik AG | | | 45,157 | |
| | 71,944 | | | Heidelberger Druckmaschinen AG(b) | | | 191,124 | |
| | 4,966 | | | Hella KGaA Hueck & Co. | | | 189,329 | |
| | 3,483 | | | Hochtief AG | | | 475,450 | |
| | 1,089 | | | Hornbach Baumarkt AG | | | 34,345 | |
| | 9,402 | | | Indus Holding AG | | | 554,346 | |
| | 1,165 | | | Isra Vision AG | | | 135,562 | |
| | 11,957 | | | Jenoptik AG | | | 205,026 | |
| | 9,534 | | | Jungheinrich AG | | | 300,845 | |
| | 16,064 | | | KION Group AG | | | 970,241 | |
| | 19,662 | | | Kloeckner & Co. SE(b) | | | 245,411 | |
| | 1,986 | | | Koenig & Bauer AG(b) | | | 93,277 | |
| | 2,229 | | | Krones AG | | | 227,194 | |
| | 210 | | | KSB AG | | | 86,679 | |
| | 5,395 | | | KUKA AG(b) | | | 613,559 | |
| | 425 | | | KWS Saat SE | | | 139,031 | |
| | 52,769 | | | Lanxess AG | | | 3,378,907 | |
| | 3,023 | | | Leg Immobilien AG | | | 254,995 | |
| | 798 | | | Leifheit AG | | | 51,685 | |
| | 8,461 | | | Leoni AG | | | 321,229 | |
| | 2,628 | | | LPKF Laser & Electronics AG(b) | | | 20,203 | |
| | 830 | | | Manz AG(b) | | | 30,263 | |
| | 69,610 | | | Metro AG | | | 2,085,358 | |
| | 7,391 | | | MLP AG | | | 30,020 | |
| | 152,665 | | | MTU Aero Engines AG | | | 15,934,341 | |
| | 1,808 | | | MVV Energie AG | | | 40,092 | |
| Shares | | | | | Value | |
| GERMANY (continued) |
| | 5,477 | | | Nemetschek SE | | $ | 341,505 | |
| | 2,244 | | | Nexus AG | | | 46,139 | |
| | 120,526 | | | NORMA Group SE | | | 5,546,353 | |
| | 1,895 | | | OHB SE | | | 39,233 | |
| | 38,202 | | | OSRAM Licht AG | | | 2,166,017 | |
| | 15,324 | | | Patrizia Immobilien AG(b) | | | 316,758 | |
| | 1,780 | | | Pfeiffer Vacuum Technology AG | | | 161,538 | |
| | 4,667 | | | PNE Wind AG | | | 10,426 | |
| | 386 | | | Progress-Werk Oberkirch AG | | | 15,892 | |
| | 690 | | | ProSiebenSat.1 Media SE | | | 29,738 | |
| | 484 | | | Puma SE | | | 120,449 | |
| | 870 | | | R Stahl AG | | | 28,761 | |
| | 11,329 | | | Rational AG | | | 5,876,231 | |
| | 19,717 | | | Rheinmetall AG | | | 1,365,980 | |
| | 93,544 | | | RHOEN-KLINIKUM AG | | | 2,603,664 | |
| | 6,892 | | | RIB Software AG | | | 93,323 | |
| | 227,787 | | | RWE AG(b) | | | 3,615,786 | |
| | 19,824 | | | SAF-Holland SA | | | 266,039 | |
| | 9,704 | | | Salzgitter AG | | | 318,513 | |
| | 2,626 | | | Sartorius AG - Preference Shares | | | 206,315 | |
| | 1,579 | | | Schaltbau Holding AG | | | 48,881 | |
| | 2,624 | | | SHW AG | | | 90,736 | |
| | 7,152 | | | Sixt SE | | | 433,383 | |
| | 4,730 | | | Sixt SE - Preference Shares | | | 210,811 | |
| | 977 | | | Softing AG | | | 13,085 | |
| | 16,990 | | | Software AG | | | 617,343 | |
| | 35,155 | | | Stada Arzneimittel AG | | | 1,759,969 | |
| | 655 | | | Sto Se & CO KGAA | | | 78,482 | |
| | 629 | | | STRATEC Biomedical AG | | | 35,898 | |
| | 7,241 | | | Stroeer SE & Co. KGaA | | | 330,076 | |
| | 22,636 | | | Suedzucker AG | | | 579,971 | |
| | 4,961 | | | Suess MicroTec AG(b) | | | 34,745 | |
| | 1,278 | | | Surteco SE | | | 32,267 | |
| | 16,341 | | | Symrise AG | | | 1,121,330 | |
| | 7,410 | | | TAG Immobilien AG | | | 98,914 | |
| | 13,088 | | | Takkt AG | | | 310,049 | |
| | 13,953 | | | Talanx AG | | | 433,088 | |
| | 423 | | | Technotrans AG | | | 10,123 | |
| | 4,463 | | | Tom Tailor Holding AG(b) | | | 22,400 | |
| | 4,964 | | | Tomorrow Focus AG(b) | | | 12,206 | |
| | 5,098 | | | United Internet AG | | | 209,248 | |
| | 3,994 | | | VERBIO Vereinigte BioEnergie AG | | | 29,674 | |
| | 4,362 | | | Villeroy & Boch AG | | | 67,062 | |
| | 1,793 | | | Vossloh AG(b) | | | 108,826 | |
| | 8,065 | | | VTG AG | | | 246,124 | |
| | 9,072 | | | Wacker Chemie AG | | | 808,060 | |
| | 8,248 | | | Wacker Neuson SE | | | 114,084 | |
| | 1,136 | | | Washtec AG | | | 57,676 | |
| | 7,886 | | | Wirecard AG | | | 374,108 | |
| | 363 | | | XING AG | | | 73,899 | |
| | | | | | | | 88,076,195 | |
| Old Westbury Funds, Inc. | |
| Small & Mid Cap Fund | |
| Portfolio of Investments - (Continued) | October 31, 2016 |
| | |
| Shares | | | | | Value | |
| GIBRALTAR — 0.0% |
| | 23,380 | | | 888 Holdings Plc | | $ | 62,242 | |
| GREECE — 0.0% |
| | 1,466 | | | Aegean Airlines SA | | | 9,447 | |
| | 96 | | | Alapis Holding Industrial and Commercial SA of Pharmaceutical Chemical Products(b)(c)(d) | | | 0 | |
| | 2,153 | | | Athens Water Supply & Sewage Co. SA (The) | | | 12,763 | |
| | 32,394 | | | Ellaktor SA(b) | | | 44,095 | |
| | 14,537 | | | GEK Terna Holding Real Estate Construction SA(b) | | | 33,672 | |
| | 5,827 | | | Hellenic Exchanges - Athens Stock Exchange SA | | | 28,785 | |
| | 42,339 | | | Intralot SA-Integrated Lottery Systems & Services(b) | | | 57,168 | |
| | 7,101 | | | JUMBO SA | | | 100,947 | |
| | 1,715 | | | Lamda Development SA(b) | | | 9,300 | |
| | 132,453 | | | Marfin Investment Group Holdings SA(b) | | | 19,048 | |
| | 3,653 | | | Metka SA | | | 30,717 | |
| | 3,640 | | | Motor Oil (Hellas) Corinth Refineries SA | | | 43,594 | |
| | 26,955 | | | Mytilineos Holdings SA(b) | | | 154,164 | |
| | 22,848 | | | Proton Bank SA(b)(c)(d) | | | 0 | |
| | 3,988 | | | Sarantis SA | | | 43,954 | |
| | 12,534 | | | T Bank SA(b)(c)(d) | | | 0 | |
| | 6,226 | | | Terna Energy SA | | | 19,000 | |
| | 647 | | | Thessaloniki Port Authority SA | | | 13,069 | |
| | 31,091 | | | TT Hellenic Postbank SA(b)(c)(d) | | | 0 | |
| | | | | | | | 619,723 | |
| GUERNSEY — 0.0% |
| | 5,739 | | | Raven Russia Ltd.(b) | | | 2,740 | |
| HONG KONG — 1.1% |
| | 375,000 | | | Agritrade Resources Ltd. | | | 60,441 | |
| | 440,000 | | | Alibaba Pictures Group Ltd.(b) | | | 86,802 | |
| | 22,000 | | | Allied Group Ltd. | | | 116,587 | |
| | 1,415,693 | | | Allied Properties HK Ltd. | | | 299,365 | |
| | 138,000 | | | AMVIG Holdings Ltd. | | | 46,620 | |
| | 520,000 | | | Anxin-China Holdings Ltd.(b)(c)(d) | | | 4,841 | |
| | 182,250 | | | APT Satellite Holdings Ltd. | | | 119,846 | |
| | 144,000 | | | Asia Financial Holdings Ltd. | | | 82,625 | |
| | 34,500 | | | Asia Satellite Telecommunications Holdings Ltd.(b) | | | 46,708 | |
| | 290,100 | | | ASM Pacific Technology Ltd. | | | 2,799,799 | |
| | 74,000 | | | Associated International Hotels Ltd. | | | 214,685 | |
| | 275,000 | | | Auto Italia Holdings Ltd.(b) | | | 4,610 | |
| | 52,000 | | | Beijing Enterprises Holdings Ltd. | | | 260,149 | |
| | 432,000 | | | Beijing Enterprises Water Group Ltd. | | | 313,603 | |
| | 504,000 | | | Bel Global Resources Holdings Ltd.(b)(c)(d) | | | 0 | |
| Shares | | | | | Value | |
| HONG KONG (continued) |
| | 426,000 | | | Bosideng International Holdings Ltd. | | $ | 38,450 | |
| | 218,000 | | | Bossini International Holdings Ltd. | | | 13,211 | |
| | 92,000 | | | Bright Smart Securities & Commodities Group Ltd. | | | 39,146 | |
| | 355,000 | | | Brightoil Petroleum Holdings Ltd. | | | 102,533 | |
| | 160,000 | | | Brilliance China Automotive Holdings Ltd. | | | 190,006 | |
| | 56,897 | | | Brilliant Circle Holdings International Ltd. | | | 8,804 | |
| | 1,644,354 | | | Brockman Mining Ltd.(b) | | | 21,838 | |
| | 608,000 | | | Burwill Holdings Ltd.(b) | | | 17,482 | |
| | 496,791 | | | C C Land Holdings Ltd. | | | 132,596 | |
| | 44,000 | | | Cafe de Coral Holdings Ltd. | | | 155,450 | |
| | 92,000 | | | Carrianna Group Holdings Co. Ltd. | | | 8,660 | |
| | 92,000 | | | Cathay Pacific Airways Ltd. | | | 121,234 | |
| | 166,800 | | | Century City International Holdings Ltd. | | | 11,184 | |
| | 1,604,275 | | | Champion Technology Holdings Ltd.(b) | | | 34,338 | |
| | 128,813 | | | Cheuk Nang Holdings Ltd. | | | 96,499 | |
| | 85,873 | | | Chevalier International Holdings Ltd. | | | 135,970 | |
| | 398,000 | | | China Aerospace International Holdings Ltd. | | | 51,318 | |
| | 207,137 | | | China Agri-Industries Holdings Ltd.(b) | | | 81,193 | |
| | 136,000 | | | China All Access Holdings Ltd. | | | 43,489 | |
| | 2,520,000 | | | China Daye Non-Ferrous Metals Mining Ltd.(b) | | | 34,118 | |
| | 950,000 | | | China Ever Grand Financial Leasing Group Co. Ltd.(b) | | | 12,617 | |
| | 56,000 | | | China Everbright International Ltd. | | | 67,152 | |
| | 525,600 | | | China Fiber Optic Network System Group Ltd.(b)(c)(d) | | | 47,440 | |
| | 62,000 | | | China Foods Ltd. | | | 27,500 | |
| | 224,000 | | | China Gas Holdings Ltd. | | | 341,392 | |
| | 130,000 | | | China Glass Holdings Ltd.(b) | | | 15,086 | |
| | 6,603,000 | | | China High Precision Automation Group Ltd.(b)(c)(d) | | | 194,756 | |
| | 287,000 | | | China High Speed Transmission Equipment Group Co. Ltd. | | | 297,896 | |
| | 1,816,000 | | | China Jinmao Holdings Group Ltd. | | | 501,091 | |
| | 10,378,000 | | | China Lumena New Materials Corp.(b)(c)(d) | | | 0 | |
| | 1,858,000 | | | China Lumena New Materials Corp.(b)(c) | | | 0 | |
| | 216,000 | | | China Metal International Holdings, Inc. | | | 75,476 | |
| | 193,200 | | | China Metal Recycling Holdings Ltd.(b)(c)(d) | | | 0 | |
| Old Westbury Funds, Inc. | |
| Small & Mid Cap Fund | |
| Portfolio of Investments - (Continued) | October 31, 2016 |
| | |
| Shares | | | | | Value | |
| HONG KONG (continued) |
| | 492,557 | | | China New Town Development Co. Ltd.(b) | | $ | 25,087 | |
| | 1,110,000 | | | China Oil and Gas Group Ltd.(b) | | | 84,443 | |
| | 24,500 | | | China Overseas Grand Oceans Group Ltd.(b) | | | 9,003 | |
| | 136,000 | | | China Power International Development Ltd. | | | 49,626 | |
| | 22,000 | | | China Power New Energy Development Co. Ltd. | | | 13,361 | |
| | 251,000 | | | China Properties Group Ltd.(b) | | | 62,139 | |
| | 135,102 | | | China Resources Beer Holdings Co. Ltd.(b) | | | 287,431 | |
| | 286,440 | | | China Resources Cement Holdings Ltd. | | | 115,971 | |
| | 70,800 | | | China Resources Gas Group Ltd. | | | 222,290 | |
| | 44,000 | | | China Resources Power Holdings Co. Ltd. | | | 74,775 | |
| | 4,812,920 | | | China Singyes Solar Technologies Holdings Ltd. | | | 2,296,137 | |
| | 1,104,000 | | | China South City Holdings Ltd. | | | 244,841 | |
| | 249,440 | | | China State Construction International Holdings Ltd. | | | 364,726 | |
| | 385,400 | | | China Taiping Insurance Holdings Co. Ltd.(b) | | | 744,408 | |
| | 226,000 | | | China Travel International Investment Hong Kong Ltd. | | | 65,275 | |
| | 50,000 | | | China Water Affairs Group Ltd. | | | 36,361 | |
| | 10,000 | | | Chinese Estates Holdings Ltd. | | | 18,077 | |
| | 103,000 | | | Chow Sang Sang Holdings International Ltd. | | | 181,947 | |
| | 110,000 | | | Chu Kong Shipping Enterprises Group Co. Ltd. | | | 30,352 | |
| | 237,500 | | | Chuang’s Consortium International Ltd. | | | 52,059 | |
| | 90,000 | | | CIMC Enric Holdings Ltd. | | | 37,715 | |
| | 647,000 | | | CITIC Resources Holdings Ltd.(b) | | | 80,921 | |
| | 649,000 | | | CITIC Telecom International Holdings Ltd. | | | 222,594 | |
| | 320,000 | | | Citychamp Watch & Jewellery Group Ltd. | | | 88,298 | |
| | 756,000 | | | CK Life Sciences International Holdings, Inc. | | | 66,285 | |
| | 47,000 | | | Clear Media Ltd. | | | 45,936 | |
| | 142,000 | | | CNT Group Ltd. | | | 13,366 | |
| | 177,000 | | | Coastal Greenland Ltd.(b) | | | 5,340 | |
| | 224,007 | | | Comba Telecom Systems Holdings Ltd. | | | 39,859 | |
| | 520,000 | | | Concord New Energy Group Ltd. | | | 26,149 | |
| | 522,729 | | | COSCO Pacific Ltd. | | | 518,985 | |
| | 1,402,000 | | | CP Pokphand Co. Ltd. | | | 178,966 | |
| | 1,109,335 | | | CSI Properties Ltd. | | | 40,051 | |
| | 84,924 | | | Dah Sing Banking Group Ltd. | | | 153,739 | |
| | 60,678 | | | Dah Sing Financial Holdings Ltd. | | | 412,315 | |
| Shares | | | | | Value | |
| HONG KONG (continued) |
| | 101,000 | | | Dan Form Holdings Co. Ltd. | | $ | 35,422 | |
| | 80,000 | | | Dawnrays Pharmaceutical Holdings Ltd. | | | 47,862 | |
| | 244,000 | | | DBA Telecommunication Asia Holdings Ltd.(b)(c)(d) | | | 2,064 | |
| | 188,000 | | | Digital China Holdings Ltd. | | | 157,565 | |
| | 108,000 | | | Dynasty Fine Wines Group Ltd.(b)(c)(d) | | | 3,760 | |
| | 92,000 | | | Eagle Nice International Holdings Ltd. | | | 27,640 | |
| | 168,234 | | | EganaGoldpfeil Holdings Ltd.(b)(c)(d) | | | 0 | |
| | 275,000 | | | Emperor Entertainment Hotel Ltd. | | | 66,662 | |
| | 386,416 | | | Emperor International Holdings Ltd. | | | 90,680 | |
| | 218,000 | | | Esprit Holdings Ltd.(b) | | | 179,897 | |
| | 220,000 | | | EVA Precision Industrial Holdings Ltd. | | | 24,112 | |
| | 9,500 | | | Fairwood Holdings Ltd. | | | 44,097 | |
| | 585,595 | | | Far East Consortium International Ltd. | | | 240,111 | |
| | 200,000 | | | Far East Horizon Ltd. | | | 182,579 | |
| | 790,000 | | | First Pacific Co. Ltd. | | | 598,952 | |
| | 168,000 | | | First Shanghai Investments Ltd. | | | 29,893 | |
| | 30,000 | | | Fountain SET Holdings Ltd. | | | 3,907 | |
| | 2,375,000 | | | GCL-Poly Energy Holdings Ltd. | | | 321,544 | |
| | 116,000 | | | Genting Hong Kong Ltd.(b) | | | 33,055 | |
| | 60,150 | | | Get Nice Financial Group Ltd. | | | 8,221 | |
| | 2,406,000 | | | Get Nice Holdings Ltd. | | | 83,762 | |
| | 266,000 | | | Giordano International Ltd. | | | 140,279 | |
| | 1,758,000 | | | Global Brands Group Holding Ltd.(b) | | | 199,475 | |
| | 1,325,000 | | | Glorious Property Holdings Ltd.(b) | | | 158,886 | |
| | 37,000 | | | Glorious Sun Enterprises Ltd. | | | 4,962 | |
| | 220,000 | | | Gold Peak Industries Holdings Ltd. | | | 22,126 | |
| | 180,000 | | | Goldbond Group Holdings Ltd. | | | 7,659 | |
| | 118,000 | | | Goldlion Holdings Ltd. | | | 47,014 | |
| | 16,000 | | | Good Friend International Holdings, Inc. | | | 3,260 | |
| | 55,484 | | | Great Eagle Holdings Ltd. | | | 246,459 | |
| | 4,618,102 | | | G-Resources Group Ltd. | | | 80,982 | |
| | 174,000 | | | Guangdong Investment Ltd. | | | 262,945 | |
| | 14,000 | | | Guoco Group Ltd. | | | 157,229 | |
| | 155,600 | | | Guotai Junan International Holdings Ltd. | | | 59,587 | |
| | 83,000 | | | Haier Electronics Group Co. Ltd. | | | 133,989 | |
| | 412,331 | | | Haitong International Securities Group Ltd. | | | 264,766 | |
| | 211,000 | | | Hang Lung Group Ltd. | | | 809,388 | |
| | 133,267 | | | Hanison Construction Holdings Ltd. | | | 23,541 | |
| | 114,000 | | | Harbour Centre Development Ltd. | | | 206,670 | |
| Old Westbury Funds, Inc. | |
| Small & Mid Cap Fund | |
| Portfolio of Investments - (Continued) | October 31, 2016 |
| | |
| Shares | | | | | Value | |
| HONG KONG (continued) |
| | 245,400 | | | Hengdeli Holdings Ltd.(b) | | $ | 26,579 | |
| | 4,808,565 | | | HKBN Ltd.(d) | | | 5,673,146 | |
| | 48,441 | | | HKC Holdings Ltd.(b) | | | 20,799 | |
| | 90,000 | | | Hon Kwok Land Investment Co. Ltd. | | | 35,046 | |
| | 2,400 | | | Hong Kong Aircraft Engineering Co. Ltd. | | | 17,113 | |
| | 253,651 | | | Hongkong & Shanghai Hotels Ltd. (The) | | | 286,829 | |
| | 483,700 | | | Hongkong Chinese Ltd. | | | 88,563 | |
| | 12,650 | | | Hopewell Highway Infrastructure Ltd. | | | 6,769 | |
| | 135,500 | | | Hopewell Holdings Ltd. | | | 475,221 | |
| | 150,000 | | | Hopson Development Holdings Ltd. | | | 135,387 | |
| | 188,000 | | | Hsin Chong Construction Group Ltd.(b) | | | 8,363 | |
| | 220,000 | | | Hua Han Health Industry Holdings Ltd.(c)(d) | | | 15,034 | |
| | 439,000 | | | Huabao International Holdings Ltd.(b) | | | 164,719 | |
| | 71,631 | | | Hung Hing Printing Group Ltd. | | | 8,959 | |
| | 527,000 | | | Hutchison Telecommunications Hong Kong Holdings Ltd. | | | 169,878 | |
| | 44,000 | | | Hysan Development Co. Ltd. | | | 203,106 | |
| | 335,000 | | | I-CABLE Communications Ltd.(b) | | | 35,852 | |
| | 175,500 | | | International Standard Resources Holdings Ltd.(b) | | | 2,897 | |
| | 175,000 | | | IPE Group Ltd. | | | 37,908 | |
| | 28,266 | | | IRC Ltd.(b) | | | 652 | |
| | 398,000 | | | IT Ltd. | | | 146,770 | |
| | 95,905 | | | ITC Properties Group Ltd. | | | 35,861 | |
| | 65,000 | | | Jinhui Holdings Co. Ltd.(b) | | | 7,543 | |
| | 95,125 | | | Johnson Electric Holdings Ltd. | | | 230,099 | |
| | 434,000 | | | Ju Teng International Holdings Ltd. | | | 137,661 | |
| | 84,000 | | | Kader Holdings Co. Ltd. | | | 7,798 | |
| | 1,940,000 | | | Kai Yuan Holdings Ltd.(b) | | | 22,013 | |
| | 8,000 | | | Keck Seng Investments | | | 5,931 | |
| | 153,000 | | | Kerry Logistics Network Ltd. | | | 203,196 | |
| | 206,000 | | | Kerry Properties Ltd. | | | 652,088 | |
| | 150,200 | | | Kingboard Chemical Holdings Ltd. | | | 444,468 | |
| | 430,500 | | | Kingboard Laminates Holdings Ltd. | | | 386,340 | |
| | 74,000 | | | Kingmaker Footwear Holdings Ltd. | | | 18,129 | |
| | 1,428,000 | | | Kingston Financial Group Ltd. | | | 594,728 | |
| | 344,000 | | | Ko Yo Chemical Group Ltd.(b) | | | 10,778 | |
| | 328,000 | | | Kowloon Development Co. Ltd. | | | 328,611 | |
| | 1,070,000 | | | Kunlun Energy Co. Ltd. | | | 809,859 | |
| | 2,159,000 | | | Lai Fung Holdings Ltd. | | | 46,768 | |
| | 2,074,750 | | | Lai Sun Development Co. Ltd. | | | 42,535 | |
| | 603,200 | | | Lai Sun Garment International Ltd. | | | 119,776 | |
| | 9,000 | | | Lam Soon Hong Kong Ltd. | | | 9,980 | |
| Shares | | | | | Value | |
| HONG KONG (continued) |
| | 68,000 | | | Landsea Green Properties Co. Ltd. | | $ | 5,348 | |
| | 127,600 | | | Le Saunda Holdings Ltd. | | | 29,779 | |
| | 24,000 | | | Lee & Man Chemical Co. Ltd. | | | 7,520 | |
| | 549,200 | | | Lee & Man Paper Manufacturing Ltd. | | | 412,844 | |
| | 15,000 | | | Lee’s Pharmaceutical Holdings Ltd. | | | 13,016 | |
| | 178,000 | | | Li & Fung Ltd. | | | 87,674 | |
| | 131,000 | | | Lifestyle China Group Ltd.(b) | | | 36,823 | |
| | 55,500 | | | Lifestyle International Holdings Ltd. | | | 74,424 | |
| | 784,500 | | | Link REIT (The) | | | 5,593,781 | |
| | 64,000 | | | Liu Chong Hing Investment Ltd. | | | 90,444 | |
| | 170,000 | | | Luen Thai Holdings Ltd. | | | 69,924 | |
| | 106,000 | | | Luk Fook Holdings International Ltd. | | | 310,939 | |
| | 1,298,000 | | | Magnificent Hotel Investment Ltd. | | | 30,460 | |
| | 260,000 | | | Man Wah Holdings Ltd. | | | 172,651 | |
| | 3,700 | | | Mandarin Oriental International Ltd. | | | 5,162 | |
| | 410,000 | | | Master Glory Group Ltd. | | | 22,996 | |
| | 65,000 | | | Melco International Development Ltd. | | | 84,984 | |
| | 162,000 | | | Midland Holdings Ltd.(b) | | | 57,652 | |
| | 429,000 | | | Mingfa Group International Co. Ltd.(b)(c)(d) | | | 78,409 | |
| | 344,000 | | | Minmetals Land Ltd. | | | 43,468 | |
| | 39,000 | | | Miramar Hotel & Investment Co. Ltd. | | | 78,849 | |
| | 361,500 | | | Neo-Neon Holdings Ltd.(b) | | | 56,400 | |
| | 440,000 | | | Newocean Energy Holdings Ltd. | | | 113,467 | |
| | 362,000 | | | Next Digital Ltd.(b) | | | 19,837 | |
| | 386,000 | | | Nine Dragons Paper Holdings Ltd. | | | 314,552 | |
| | 281,100 | | | Noble Group Ltd.(b) | | | 33,540 | |
| | 338,545 | | | NWS Holdings Ltd. | | | 599,778 | |
| | 76,500 | | | O Luxe Holdings Ltd.(b) | | | 6,313 | |
| | 9,500 | | | Orient Overseas International Ltd. | | | 35,584 | |
| | 118,000 | | | Overseas Chinese Town Asia Holdings Ltd. | | | 43,210 | |
| | 1,340,246 | | | Pacific Andes International Holdings Ltd.(b)(c)(d) | | | 9,470 | |
| | 105,000 | | | Pacific Textile Holdings Ltd. | | | 132,408 | |
| | 201,240 | | | Paliburg Holdings Ltd. | | | 61,756 | |
| | 42,000 | | | PAX Global Technology Ltd. | | | 26,265 | |
| | 8,371,394 | | | PCCW Ltd. | | | 4,986,860 | |
| | 48,000 | | | Peace Mark Holdings Ltd.(b)(c)(d) | | | 0 | |
| | 154,000 | | | Phoenix Satellite Television Holdings Ltd. | | | 31,175 | |
| | 368,000 | | | Pico Far East Holdings Ltd. | | | 111,982 | |
| | 54,000 | | | Playmates Holdings Ltd. | | | 63,152 | |
| Old Westbury Funds, Inc. | |
| Small & Mid Cap Fund | |
| Portfolio of Investments - (Continued) | October 31, 2016 |
| | |
| Shares | | | | | Value | |
| HONG KONG (continued) |
| | 36,000 | | | Playmates Toys Ltd. | | $ | 5,663 | |
| | 318,000 | | | Poly Property Group Co. Ltd.(b) | | | 100,867 | |
| | 460,000 | | | Polytec Asset Holdings Ltd. | | | 33,215 | |
| | 132,000 | | | Pou Sheng International Holdings Ltd. | | | 41,359 | |
| | 78,000 | | | Public Financial Holdings Ltd. | | | 34,999 | |
| | 442,000 | | | PYI Corp. Ltd.(b) | | | 9,290 | |
| | 314,200 | | | Regal Hotels International Holdings Ltd. | | | 175,421 | |
| | 5,581,033 | | | REXLot Holdings Ltd.(b) | | | 94,990 | |
| | 194,132 | | | SA SA International Holdings Ltd. | | | 88,861 | |
| | 116,000 | | | SAS Dragon Holdings Ltd. | | | 20,491 | |
| | 30,000 | | | SEA Holdings Ltd. | | | 76,513 | |
| | 143,516 | | | Shanghai Industrial Holdings Ltd. | | | 439,492 | |
| | 669,000 | | | Shanghai Industrial Urban Development Group Ltd. | | | 169,934 | |
| | 1,190,000 | | | Shanghai Zendai Property Ltd.(b) | | | 23,476 | |
| | 234,000 | | | Shangri-La Asia Ltd. | | | 257,367 | |
| | 120,000 | | | Shenwan Hongyuan HK Ltd. | | | 66,224 | |
| | 232,184 | | | Shenzhen International Holdings Ltd. | | | 359,253 | |
| | 344,956 | | | Shenzhen Investment Ltd. | | | 150,782 | |
| | 427,129 | | | Shimao Property Holdings Ltd. | | | 571,668 | |
| | 2,408,000 | | | Shougang Concord International Enterprises Co. Ltd.(b) | | | 77,311 | |
| | 23,826 | | | Shun Ho Tech Holdings Ltd. | | | 8,418 | |
| | 299,750 | | | Shun Tak Holdings Ltd.(b) | | | 101,262 | |
| | 652,000 | | | Singamas Container Holdings Ltd.(b) | | | 68,096 | |
| | 360,000 | | | Sino Biopharmaceutical Ltd. | | | 252,052 | |
| | 2,225,000 | | | Sino Oil And Gas Holdings Ltd.(b) | | | 54,796 | |
| | 486,000 | | | Sinofert Holdings Ltd. | | | 63,918 | |
| | 38,000 | | | SIS International Holdings | | | 19,060 | |
| | 61,000 | | | SITC International Holdings Co. Ltd. | | | 36,102 | |
| | 58,000 | | | Sitoy Group Holdings Ltd. | | | 20,940 | |
| | 56,000 | | | SJM Holdings Ltd. | | | 38,775 | |
| | 623,224 | | | Skyworth Digital Holdings Ltd. | | | 403,399 | |
| | 1,287,643 | | | SmarTone Telecommunications Holding Ltd. | | | 1,945,855 | |
| | 291,934 | | | SMI Holdings Group Ltd. | | | 27,855 | |
| | 64,843 | | | SOCAM Development Ltd.(b) | | | 25,166 | |
| | 1,392,000 | | | South China Holdings Co. Ltd.(b) | | | 69,101 | |
| | 144,000 | | | Sparkle Roll Group Ltd.(b) | | | 12,997 | |
| | 1,073,428 | | | SRE Group Ltd.(b) | | | 31,557 | |
| | 3,544,010 | | | SSY Group Ltd. | | | 1,197,247 | |
| | 65,500 | | | Stella International Holdings Ltd. | | | 113,677 | |
| | 204,000 | | | Success Universe Group Ltd.(b) | | | 4,629 | |
| | 251,000 | | | Sun Art Retail Group Ltd. | | | 177,031 | |
| | 271,801 | | | Sun Hung Kai & Co. Ltd. | | | 171,375 | |
| Shares | | | | | Value | |
| HONG KONG (continued) |
| | 99,000 | | | TAI Cheung Holdings Ltd. | | $ | 84,377 | |
| | 456,000 | | | TCC International Holdings Ltd. | | | 115,829 | |
| | 56,000 | | | TCL Multimedia Technology Holdings Ltd.(b) | | | 28,377 | |
| | 42,800 | | | Television Broadcasts Ltd. | | | 155,073 | |
| | 125,000 | | | Texhong Textile Group Ltd. | | | 176,003 | |
| | 132,000 | | | Texwinca Holdings Ltd. | | | 92,589 | |
| | 185,800 | | | Tian An China Investment Co. Ltd. | | | 99,182 | |
| | 1,116,000 | | | Tianjin Port Development Holdings Ltd. | | | 171,237 | |
| | 130,000 | | | Tibet Water Resources Ltd. | | | 48,443 | |
| | 2,380,000 | | | Titan Petrochemicals Group Ltd.(b) | | | 28,233 | |
| | 138,026 | | | Tomson Group Ltd. | | | 45,916 | |
| | 590,000 | | | Tongda Group Holdings Ltd. | | | 155,953 | |
| | 62,000 | | | Top Spring International Holdings Ltd. | | | 18,067 | |
| | 44,000 | | | Towngas China Co. Ltd. | | | 24,793 | |
| | 406,000 | | | TPV Technology Ltd. | | | 77,477 | |
| | 58,000 | | | Tradelink Electronic Commerce Ltd. | | | 12,414 | |
| | 80,800 | | | Transport International Holdings Ltd. | | | 244,310 | |
| | 102,000 | | | Trinity Ltd.(b) | | | 7,497 | |
| | 394,000 | | | Truly International Holdings Ltd. | | | 154,439 | |
| | 233,000 | | | TSC Group Holdings Ltd.(b) | | | 34,549 | |
| | 2,164,000 | | | United Energy Group Ltd.(b) | | | 131,142 | |
| | 288,500 | | | United Laboratories International Holdings Ltd. (The)(b) | | | 159,584 | |
| | 44,000 | | | Up Energy Development Group Ltd.(b)(c)(d) | | | 549 | |
| | 101,100 | | | Valuetronics Holdings Ltd. | | | 35,971 | |
| | 159,000 | | | Varitronix International Ltd. | | | 64,580 | |
| | 152,000 | | | Vitasoy International Holdings Ltd. | | | 317,894 | |
| | 483,600 | | | VST Holdings Ltd. | | | 141,547 | |
| | 27,400 | | | VTech Holdings Ltd. | | | 336,337 | |
| | 90,622 | | | Wasion Group Holdings Ltd. | | | 53,400 | |
| | 68,000 | | | Wing On Co. International Ltd. | | | 211,745 | |
| | 220,000 | | | Wing Tai Properties Ltd. | | | 136,161 | |
| | 450,000 | | | Xinyi Glass Holdings Ltd. | | | 387,013 | |
| | 30,000 | | | YGM Trading Ltd. | | | 29,746 | |
| | 73,500 | | | Yingde Gases Group Co. Ltd. | | | 29,663 | |
| | 84,000 | | | Yip’s Chemical Holdings Ltd. | | | 34,334 | |
| | 1,542,500 | | | Yue Yuen Industrial Holdings Ltd. | | | 5,877,194 | |
| | 480,946 | | | Yuexiu Property Co. Ltd. | | | 70,695 | |
| | 34,191 | | | Yuexiu Transport Infrastructure Ltd. | | | 23,454 | |
| | 306,000 | | | Zhuhai Holdings Investment Group Ltd. | | | 48,136 | |
| | | | | | | | 62,425,471 | |
| Old Westbury Funds, Inc. | |
| Small & Mid Cap Fund | |
| Portfolio of Investments - (Continued) | October 31, 2016 |
| | |
| Shares | | | | | Value | |
| HUNGARY — 0.0% |
| | 34,076 | | | Magyar Telekom Telecommunications Plc | | $ | 56,339 | |
| | 310 | | | Richter Gedeon Nyrt | | | 6,663 | |
| | | | | | | | 63,002 | |
| INDIA — 1.3% |
| | 293 | | | 3M India Ltd.(b) | | | 58,333 | |
| | 4,102 | | | Aarti Industries | | | 46,556 | |
| | 642 | | | ABB India Ltd. | | | 10,565 | |
| | 8,628 | | | ACC Ltd. | | | 196,075 | |
| | 198,763 | | | Adani Power Ltd.(b) | | | 81,396 | |
| | 6,435 | | | Aditya Birla Nuvo Ltd. | | | 133,678 | |
| | 33,300 | | | Aegis Logistics Ltd. | | | 79,228 | |
| | 5,111 | | | AIA Engineering Ltd. | | | 99,294 | |
| | 3,985 | | | Ajanta Pharma Ltd. | | | 122,477 | |
| | 250 | | | Akzo Nobel India Ltd. | | | 6,222 | |
| | 19,534 | | | Alembic Ltd. | | | 12,270 | |
| | 16,192 | | | Alembic Pharmaceuticals Ltd. | | | 162,219 | |
| | 20,161 | | | Allahabad Bank(b) | | | 22,686 | |
| | 1,620 | | | Allcargo Logistics Ltd. | | | 4,582 | |
| | 241,287 | | | Alok Industries Ltd.(b) | | | 12,464 | |
| | 1,082 | | | Alstom India Ltd.(b) | | | 8,358 | |
| | 222,033 | | | Amara Raja Batteries Ltd. | | | 3,412,453 | |
| | 17,157 | | | Ambuja Cements Ltd. | | | 61,706 | |
| | 11,406 | | | Amtek Auto Ltd.(b) | | | 7,446 | |
| | 28,807 | | | Anant Raj Ltd. | | | 23,788 | |
| | 16,348 | | | Andhra Bank | | | 13,818 | |
| | 3,086 | | | Apar Industries Ltd. | | | 27,246 | |
| | 161,686 | | | Apollo Hospitals Enterprise Ltd. | | | 3,246,841 | |
| | 76,659 | | | Apollo Tyres Ltd. | | | 230,999 | |
| | 4,919 | | | Arvind Infrastructure Ltd.(b) | | | 6,997 | |
| | 49,192 | | | Arvind Ltd. | | | 306,444 | |
| | 136,311 | | | Ashok Leyland Ltd.(b) | | | 186,445 | |
| | 1,251 | | | Ashoka Buildcon Ltd. | | | 3,051 | |
| | 1,523 | | | Atul Ltd. | | | 53,245 | |
| | 17,706 | | | Aurobindo Pharma Ltd.(b) | | | 216,876 | |
| | 3,198 | | | Bajaj Corp. Ltd. | | | 19,539 | |
| | 32,380 | | | Bajaj Finance Ltd. | | | 523,809 | |
| | 12,411 | | | Bajaj Finserv Ltd. | | | 634,938 | |
| | 18,091 | | | Bajaj Holdings & Investment Ltd. | | | 599,088 | |
| | 15,043 | | | Balkrishna Industries Ltd. | | | 239,655 | |
| | 45,240 | | | Ballarpur Industries Ltd.(b) | | | 11,380 | |
| | 3,642 | | | Balmer Lawrie & Co. Ltd. | | | 42,813 | |
| | 30,184 | | | Balrampur Chini Mills Ltd. | | | 52,607 | |
| | 84,289 | | | Bank of Baroda(b) | | | 196,441 | |
| | 33,912 | | | Bank of India(b) | | | 58,216 | |
| | 17,071 | | | Bank of Maharashtra(b) | | | 7,962 | |
| | 811 | | | BASF India Ltd. | | | 15,039 | |
| | 5,028 | | | Bata India Ltd. | | | 36,257 | |
| | 1,167 | | | BEML Ltd. - Partly Paid Shares | | | 16,415 | |
| | 886,930 | | | Berger Paints India Ltd. | | | 3,430,908 | |
| | 6,287 | | | Bharat Electronics Ltd.(b) | | | 124,961 | |
| | 5,737 | | | Bharat Forge Ltd.(b) | | | 75,953 | |
| | 57,633 | | | Bharat Heavy Electricals Ltd. | | | 119,949 | |
| | 21,658 | | | Bharti Retail Ltd.(b) | | | 55,177 | |
| Shares | | | | | Value | |
| INDIA (continued) |
| | 10,128 | | | Biocon Ltd. | | $ | 140,509 | |
| | 5,808 | | | Birla Corp. Ltd. | | | 69,040 | |
| | 22,287 | | | Blue Dart Express Ltd. | | | 1,716,830 | |
| | 1,437 | | | Britannia Industries Ltd. | | | 71,342 | |
| | 16,510 | | | Cadila Healthcare Ltd. | | | 103,554 | |
| | 37,970 | | | Cairn India Ltd.(b) | | | 128,772 | |
| | 19,327 | | | Canara Bank(b) | | | 90,881 | |
| | 7,476 | | | Carborundum Universal Ltd. | | | 31,802 | |
| | 5,310 | | | Ceat Ltd. | | | 96,645 | |
| | 532,292 | | | Century Plyboards India Ltd.(b) | | | 1,992,513 | |
| | 9,871 | | | Century Textiles & Industries Ltd. | | | 139,478 | |
| | 3,805 | | | CESC Ltd. | | | 35,710 | |
| | 58,225 | | | Chambal Fertilizers and Chemicals Ltd. | | | 55,883 | |
| | 56,756 | | | Chennai Super Kings Cricket Ltd.(c)(d) | | | 359 | |
| | 4,511 | | | Cipla Ltd. | | | 39,091 | |
| | 36,243 | | | City Union Bank Ltd. | | | 81,183 | |
| | 7,502 | | | Colgate-Palmolive India Ltd. | | | 109,054 | |
| | 2,821 | | | Container Corp. of India Ltd. | | | 57,994 | |
| | 10,814 | | | Coromandel International Ltd. | | | 46,560 | |
| | 41,645 | | | Corp. Bank(b) | | | 26,470 | |
| | 21,138 | | | Cox & Kings Ltd. | | | 72,558 | |
| | 62,592 | | | Crisil Ltd.(d) | | | 2,096,178 | |
| | 23,809 | | | Crompton Greaves Consumer Electricals Ltd.(b) | | | 65,916 | |
| | 28,811 | | | Crompton Greaves Ltd.(b) | | | 33,066 | |
| | 11,310 | | | Cummins India Ltd. | | | 144,901 | |
| | 13,663 | | | Cyient Ltd. | | | 101,573 | |
| | 4,199 | | | Dalmia Bharat Ltd. | | | 129,237 | |
| | 6,484 | | | DB Corp. Ltd. | | | 37,558 | |
| | 18,464 | | | DB Realty Ltd.(b) | | | 13,298 | |
| | 27,921 | | | DCB Bank Ltd.(b) | | | 55,184 | |
| | 7,946 | | | DCM Shriram Ltd. | | | 31,112 | |
| | 17,752 | | | Deepak Fertilizers & Petrochemicals Corp. Ltd. | | | 58,888 | |
| | 12,047 | | | Delta Corp Ltd. | | | 33,163 | |
| | 43,420 | | | Dena Bank(b) | | | 24,737 | |
| | 28,502 | | | Dewan Housing Finance Corp. Ltd. | | | 140,554 | |
| | 15,060 | | | Divi’s Laboratories Ltd. | | | 290,651 | |
| | 34,985 | | | DLF Ltd. | | | 78,706 | |
| | 5,324 | | | eClerx Services Ltd. | | | 121,193 | |
| | 22,258 | | | EID Parry India Ltd.(b) | | | 89,966 | |
| | 178,333 | | | Emami Ltd.(b) | | | 3,214,381 | |
| | 4,970 | | | Engineers India Ltd. | | | 20,185 | |
| | 8,345 | | | Eros International Media Ltd.(b) | | | 24,778 | |
| | 9,996 | | | Escorts Ltd. | | | 56,239 | |
| | 20,879 | | | Essel Propack Ltd. | | | 75,905 | |
| | 72,861 | | | Exide Industries Ltd. | | | 216,500 | |
| | 247 | | | FAG Bearings India Ltd. | | | 16,535 | |
| | 14,742 | | | FDC Ltd. | | | 50,217 | |
| | 294,564 | | | Federal Bank Ltd. | | | 362,987 | |
| | 4,296 | | | Federal-Mogul Goetze India Ltd.(b) | | | 30,876 | |
| Old Westbury Funds, Inc. | |
| Small & Mid Cap Fund | |
| Portfolio of Investments - (Continued) | October 31, 2016 |
| | |
| Shares | | | | | Value | |
| INDIA (continued) |
| | 14,606 | | | Finolex Cables Ltd. | | $ | 98,250 | |
| | 14,293 | | | Finolex Industries Ltd. | | | 99,119 | |
| | 768,571 | | | Fortis Healthcare Ltd.(b) | | | 2,080,049 | |
| | 21,658 | | | Future Retail Ltd. | | | 5,545 | |
| | 2,160 | | | GAIL India Ltd.(b) | | | 13,968 | |
| | 7,516 | | | Gateway Distriparks Ltd. | | | 28,151 | |
| | 4,043 | | | GHCL Ltd. | | | 16,838 | |
| | 49 | | | Gillette India Ltd. | | | 3,161 | |
| | 810 | | | GlaxoSmithKline Consumer Healthcare Ltd. | | | 73,474 | |
| | 18,031 | | | Glenmark Pharmaceuticals Ltd. | | | 252,431 | |
| | 24,402 | | | GMR Infrastructure Ltd.(b) | | | 5,024 | |
| | 3,837 | | | Godfrey Phillips India, Ltd. | | | 82,662 | |
| | 6,533 | | | Godrej Industries Ltd. | | | 42,908 | |
| | 5,642 | | | Godrej Properties Ltd.(b) | | | 30,780 | |
| | 8,033 | | | Great Eastern Shipping Co. Ltd. (The) | | | 45,020 | |
| | 7,420 | | | Greaves Cotton Ltd. | | | 15,387 | |
| | 770 | | | Greenlam Industries Ltd. | | | 8,622 | |
| | 3,850 | | | Greenply Industries Ltd. | | | 16,827 | |
| | 5,192 | | | Grindwell Norton Ltd. | | | 25,678 | |
| | 10,264 | | | Gujarat Alkalies & Chemicals(b) | | | 62,872 | |
| | 5,390 | | | Gujarat Flourochemicals Ltd. | | | 42,564 | |
| | 10,870 | | | Gujarat Pipavav Port Ltd. | | | 27,099 | |
| | 27,992 | | | Gujarat State Fertilizers & Chemicals Ltd. | | | 40,676 | |
| | 26,093 | | | Gujarat State Petronet Ltd. | | | 61,964 | |
| | 27,765 | | | Hathway Cable & Datacom Ltd.(b) | | | 12,804 | |
| | 25,011 | | | Havells India Ltd. | | | 152,793 | |
| | 11,965 | | | HCL Infosystems Ltd.(b) | | | 9,585 | |
| | 849 | | | HEG Ltd.(b) | | | 2,220 | |
| | 3,695 | | | HeidelbergCement India Ltd.(b) | | | 8,050 | |
| | 21,668 | | | Hexaware Technologies Ltd. | | | 66,428 | |
| | 71,498 | | | Himachal Futuristic Communications Ltd.(b) | | | 16,433 | |
| | 1,739 | | | Himatsingka Seide Ltd. | | | 7,335 | |
| | 106,422 | | | Hindalco Industries Ltd. | | | 238,621 | |
| | 5,961 | | | Hindustan Petroleum Corp. Ltd. | | | 41,704 | |
| | 207 | | | Honeywell Automation India Ltd. | | | 27,918 | |
| | 28,793 | | | Housing Development & Infrastructure Ltd.(b) | | | 35,654 | |
| | 314,818 | | | HSIL Ltd. | | | 1,648,179 | |
| | 4,443 | | | Huhtamaki PPL Ltd. | | | 19,279 | |
| | 20,323 | | | ICRA Ltd.(d) | | | 1,303,537 | |
| | 82,829 | | | IDBI Bank Ltd.(b) | | | 91,341 | |
| | 96,642 | | | Idea Cellular Ltd. | | | 111,132 | |
| | 73,673 | | | IDFC Bank Ltd. | | | 87,753 | |
| | 73,673 | | | IDFC Ltd.(b) | | | 76,556 | |
| | 73,581 | | | IFCI Ltd.(b) | | | 28,645 | |
| | 77,633 | | | IIFL Holdings Ltd. | | | 380,978 | |
| | 34,426 | | | India Cements Ltd. (The) | | | 81,546 | |
| | 24,089 | | | Indiabulls Housing Finance Ltd. | | | 305,646 | |
| | 14,343 | | | Indian Bank | | | 49,459 | |
| | 9,700 | | | Intellect Design Arena Ltd.(b) | | | 27,428 | |
| Shares | | | | | Value | |
| INDIA (continued) |
| | 5,383 | | | Ipca Laboratories Ltd.(b) | | $ | 50,037 | |
| | 8,799 | | | IRB Infrastructure Developers Ltd. | | | 31,033 | |
| | 8,006 | | | Jagran Prakashan Pvt Ltd.(b) | | | 23,777 | |
| | 79,442 | | | Jain Irrigation Systems Ltd. - DVR | | | 127,573 | |
| | 223,726 | | | Jaiprakash Associates Ltd.(b) | | | 37,519 | |
| | 57,737 | | | Jammu & Kashmir Bank Ltd. (The) | | | 58,873 | |
| | 4,032 | | | JBF Industries Ltd. | | | 14,571 | |
| | 6,226 | | | Jindal Poly Films Ltd. | | | 39,564 | |
| | 29,253 | | | Jindal Saw Ltd.(b) | | | 28,098 | |
| | 37,945 | | | Jindal Steel & Power Ltd.(b) | | | 42,782 | |
| | 2,351 | | | JITF Infralogistics Ltd.(b)(c)(d) | | | 1,445 | |
| | 7,796 | | | JK Lakshmi Cement Ltd. | | | 57,758 | |
| | 13,845 | | | JK Tyre & Industries Ltd. | | | 29,395 | |
| | 47,286 | | | JM Financial Ltd. | | | 62,093 | |
| | 91,795 | | | JSW Energy Ltd. | | | 90,302 | |
| | 16,885 | | | JSW Steel Ltd. | | | 419,164 | |
| | 2,138 | | | Jubilant Foodworks Ltd. | | | 32,299 | |
| | 23,442 | | | Jubilant Organosys Ltd.(b) | | | 241,207 | |
| | 4,478 | | | Kajaria Ceramics Ltd. | | | 41,825 | |
| | 10,037 | | | Kalpataru Power Transmission Ltd. | | | 38,368 | |
| | 207,730 | | | Kansai Nerolac Paints Ltd. | | | 1,197,022 | |
| | 22,504 | | | Karnataka Bank Ltd. (The) | | | 41,210 | |
| | 3,825 | | | Karur Vysya Bank Ltd. (The) | | | 27,677 | |
| | 942 | | | Kaya Ltd.(b) | | | 12,369 | |
| | 16,755 | | | KEC International Ltd. | | | 31,874 | |
| | 24,476 | | | KPIT Technologies Ltd. | | | 52,462 | |
| | 429 | | | KPR Mill Ltd. | | | 7,588 | |
| | 9,361 | | | KRBL Ltd. | | | 34,291 | |
| | 14,276 | | | L&T Finance Holdings Ltd. | | | 23,043 | |
| | 657 | | | Lakshmi Machine Works Ltd. | | | 42,163 | |
| | 51,502 | | | LIC Housing Finance Ltd. | | | 453,741 | |
| | 16,975 | | | Mahindra & Mahindra Financial Services Ltd. | | | 92,072 | |
| | 237 | | | Mahindra Lifespace Developers Ltd. | | | 1,524 | |
| | 549 | | | Manappuram Finance Ltd. | | | 844 | |
| | 13,414 | | | Marico Ltd. | | | 55,876 | |
| | 1,910,170 | | | Marksans Pharma Ltd. | | | 1,490,119 | |
| | 11,396 | | | Max Financial Services Ltd. | | | 96,092 | |
| | 11,396 | | | Max Ltd. | | | 24,153 | |
| | 2,279 | | | Max Ventures & Industries Ltd.(b) | | | 1,873 | |
| | 21,008 | | | MindTree Ltd. | | | 138,498 | |
| | 339 | | | Monsanto India Ltd. | | | 11,941 | |
| | 21,333 | | | Motherson Sumi Systems Ltd. | | | 105,968 | |
| | 11,049 | | | Mphasis Ltd. | | | 84,894 | |
| | 374 | | | MRF Ltd. | | | 268,567 | |
| | 26,185 | | | Mundra Port and Special Economic Zone Ltd.(b) | | | 119,699 | |
| | 600 | | | Muthoot Finance Ltd. | | | 3,266 | |
| | 90,563 | | | Nagarjuna Fertilizers & Chemicals Ltd. | | | 16,543 | |
| | 64,807 | | | NCC Ltd. | | | 90,098 | |
| Old Westbury Funds, Inc. | |
| Small & Mid Cap Fund | |
| Portfolio of Investments - (Continued) | October 31, 2016 |
| | |
| Shares | | | | | Value | |
| INDIA (continued) |
| | 91,063 | | | NHPC Ltd. | | $ | 36,473 | |
| | 7,886 | | | NIIT Technologies Ltd. | | | 48,323 | |
| | 534 | | | Nilkamal Ltd. | | | 13,289 | |
| | 471,407 | | | NRB Bearings Ltd.(d) | | | 902,772 | |
| | 6,838 | | | Oil India Ltd. | | | 42,726 | |
| | 19,289 | | | OMAXE Ltd. | | | 48,969 | |
| | 1,647 | | | Oracle Financial Sevices Software Ltd. | | | 79,008 | |
| | 9,573 | | | Oriental Bank of Commerce | | | 18,440 | |
| | 14,643 | | | Page Industries Ltd. | | | 3,603,619 | |
| | 33,462 | | | Pantaloons Fashions and Retail Ltd(b) | | | 82,169 | |
| | 8,697 | | | Parsvnath Developers Ltd.(b) | | | 1,784 | |
| | 6,026 | | | PC Jeweller Ltd. | | | 46,115 | |
| | 2,621 | | | Persistent Systems Ltd. | | | 25,717 | |
| | 51,330 | | | Petronet LNG Ltd. | | | 297,436 | |
| | 1,475 | | | Pfizer Ltd. | | | 40,757 | |
| | 270,857 | | | Phoenix Mills Ltd. (The)(d) | | | 1,539,493 | |
| | 230,255 | | | PI Industries Ltd.(d) | | | 2,982,371 | |
| | 182,936 | | | Pidilite Industries Ltd. | | | 1,986,955 | |
| | 533 | | | Polaris Consulting & Services Ltd.(b) | | | 1,287 | |
| | 106,936 | | | Power Finance Corp. Ltd. | | | 199,345 | |
| | 14,904 | | | Prestige Estates Projects Ltd. | | | 43,304 | |
| | 1,310 | | | Procter & Gamble Hygiene & Health Care Ltd. | | | 138,232 | |
| | 81,828 | | | PTC India Financial Services Ltd. | | | 47,845 | |
| | 66,948 | | | PTC India Ltd. | | | 74,329 | |
| | 5,166 | | | Punjab National Bank(b) | | | 11,200 | |
| | 610 | | | PVR Ltd. | | | 11,225 | |
| | 36,362 | | | Rain Industries Ltd. | | | 28,529 | |
| | 8,005 | | | Rallis India Ltd. | | | 26,920 | |
| | 16,737 | | | Ramco Cements Ltd. (The) | | | 159,021 | |
| | 4,423 | | | Ratnamani Metals & Tubes Ltd. | | | 43,123 | |
| | 12,772 | | | Raymond Ltd. | | | 118,595 | |
| | 57,342 | | | Redington India Ltd. | | | 90,452 | |
| | 127,357 | | | Reliance Communications Ltd.(b) | | | 88,958 | |
| | 7,440 | | | Reliance Infrastructure Ltd. | | | 60,379 | |
| | 82,336 | | | Reliance Power Ltd. | | | 58,004 | |
| | 38,166 | | | Rolta India Ltd.(b) | | | 36,174 | |
| | 78,210 | | | Rural Electrification Corp. Ltd.(b) | | | 157,974 | |
| | 816 | | | Sanofi India Ltd. | | | 53,282 | |
| | 84,073 | | | Sesa Sterlite Ltd. | | | 254,976 | |
| | 463,976 | | | SH Kelkar & Co. Ltd.(d) | | | 2,210,584 | |
| | 6,446 | | | Shipping Corporation of India Ltd.(b) | | | 6,587 | |
| | 2,527 | | | Shoppers Stop Ltd. | | | 14,096 | |
| | 310 | | | Shriram City Union Finance Ltd. | | | 12,025 | |
| | 6,596 | | | Shriram Transport Finance Co. Ltd. | | | 107,202 | |
| | 13,529 | | | Shyam Century Ferrous Ltd.(b) | | | 1,489 | |
| | 1,002 | | | Simplex Infrastructures Ltd. | | | 4,897 | |
| | 91,132 | | | Sintex Industries Ltd.(b) | | | 123,421 | |
| Shares | | | | | Value | |
| INDIA (continued) |
| | 15,463 | | | SJVN Ltd. | | $ | 7,698 | |
| | 1,095 | | | SKF India Ltd. | | | 23,046 | |
| | 7,092 | | | Sobha Ltd. | | | 30,142 | |
| | 7,369 | | | Sonata Software Ltd. | | | 17,279 | |
| | 401,240 | | | South Indian Bank Ltd. (The) | | | 143,586 | |
| | 19,219 | | | SREI Infrastructure Finance Ltd. | | | 21,266 | |
| | 5,376 | | | SRF Ltd. | | | 147,025 | |
| | 13,529 | | | Star Ferro and Cement Ltd.(b) | | | 23,245 | |
| | 5,304 | | | State Bank of Bikaner & Jaipur | | | 55,215 | |
| | 2,126 | | | State Bank of Travancore | | | 17,446 | |
| | 2,418 | | | Sterlite Technologies Ltd. | | | 3,812 | |
| | 154,101 | | | Strides Shasun Ltd. | | | 2,404,508 | |
| | 14,358 | | | Sun TV Network Ltd.(b) | | | 118,080 | |
| | 6,937 | | | Sundram Fasteners Ltd. | | | 33,181 | |
| | 331,190 | | | Suprajit Engineering Ltd(d) | | | 1,057,245 | |
| | 6,405 | | | Supreme Industries Ltd. | | | 86,590 | |
| | 86,462 | | | Symphony Ltd. | | | 1,652,172 | |
| | 30,834 | | | Syndicate Bank(b) | | | 33,933 | |
| | 3,270 | | | TAKE Solutions Ltd. | | | 7,976 | |
| | 4,899 | | | Tamil Nadu Newsprint & Papers Ltd. | | | 27,522 | |
| | 13,597 | | | Tata Chemicals Ltd. | | | 110,345 | |
| | 2,779 | | | Tata Communications Ltd. | | | 26,404 | |
| | 1,268 | | | Tata Elxsi Ltd. | | | 24,632 | |
| | 75,981 | | | Tata Power Co. Ltd. | | | 88,852 | |
| | 27,195 | | | Tata Steel Ltd. | | | 164,791 | |
| | 45,306 | | | Tata Tea Ltd.(b) | | | 94,565 | |
| | 4,213 | | | TCI Express Ltd.(c)(d) | | | 18,041 | |
| | 1,858 | | | Tech Mahindra Ltd. | | | 12,232 | |
| | 2,619 | | | Thermax Ltd. | | | 33,699 | |
| | 4,840 | | | Time Technoplast Ltd. | | | 6,986 | |
| | 24,582 | | | Titan Co. Ltd. | | | 140,694 | |
| | 111,098 | | | Torrent Pharmaceuticals Ltd. | | | 2,356,486 | |
| | 8,427 | | | Transport Corp. of India Ltd. | | | 23,343 | |
| | 1,040 | | | Trent Ltd. | | | 3,181 | |
| | 5,808 | | | Triveni Turbine Ltd. | | | 11,049 | |
| | 344 | | | TTK Prestige Ltd. | | | 33,014 | |
| | 23,147 | | | Tube Investments of India Ltd. | | | 225,833 | |
| | 44,084 | | | TV18 Broadcast Ltd.(b) | | | 29,769 | |
| | 8,017 | | | TVS Motor Co. Ltd. | | | 49,108 | |
| | 18,874 | | | UCO Bank(b) | | | 9,905 | |
| | 2,330 | | | Uflex Ltd. | | | 11,127 | |
| | 2,441 | | | Unichem Laboratories Ltd. | | | 10,618 | |
| | 13,827 | | | Union Bank of India | | | 30,351 | |
| | 6,122 | | | United Breweries Ltd. | | | 80,079 | |
| | 114,212 | | | United Phosphorus Ltd.(b) | | | 1,190,576 | |
| | 1,544 | | | VA Tech Wabag Ltd. | | | 11,715 | |
| | 1,130 | | | Vakrangee Ltd. | | | 4,264 | |
| | 6,257 | | | Vardhman Textiles Ltd. | | | 106,423 | |
| | 10,665 | | | Videocon Industries Ltd.(b) | | | 16,639 | |
| | 36,860 | | | Vijaya Bank(b) | | | 24,146 | |
| | 10,224 | | | Voltas Ltd. | | | 59,152 | |
| | 629 | | | VST Industries Ltd. | | | 22,176 | |
| | 368 | | | WABCO India Ltd. | | | 31,696 | |
| | 35,139 | | | Welspun Corp. Ltd. | | | 37,540 | |
| | 2,827 | | | Wockhardt Ltd.(b) | | | 36,877 | |
| Old Westbury Funds, Inc. | |
| Small & Mid Cap Fund | |
| Portfolio of Investments - (Continued) | October 31, 2016 |
| | |
| Shares | | | | | Value |
| INDIA (continued) | | | | |
| | 35,865 | | | Yes Bank Ltd. | | $ | 680,042 | |
| | 3,524 | | | Zensar Technologies Ltd. | | | 48,789 | |
| | | | | | | | 69,594,797 | |
| INDONESIA — 0.5% | | | | |
| | 3,252,200 | | | Adaro Energy Tbk PT | | | 395,060 | |
| | 242,553 | | | Adhi Karya Persero Tbk PT | | | 42,198 | |
| | 660,600 | | | Agung Podomoro Land Tbk PT(b) | | | 14,581 | |
| | 5,368,700 | | | AKR Corporindo Tbk PT | | | 2,921,350 | |
| | 1,513,429 | | | Aneka Tambang Persero Tbk PT(b) | | | 103,810 | |
| | 55,891,500 | | | Arwana Citramulia Tbk PT(d) | | | 2,612,953 | |
| | 28,100 | | | Asahimas Flat Glass Tbk PT | | | 14,483 | |
| | 9,100 | | | Astra Agro Lestari Tbk PT | | | 10,636 | |
| | 31,750,200 | | | Bakrie & Brothers Tbk PT(b) | | | 121,667 | |
| | 5,078,900 | | | Bakrie Sumatera Plantations Tbk PT(b) | | | 19,462 | |
| | 9,876,000 | | | Bakrie Telecom Tbk PT(b)(c)(d) | | | 37,845 | |
| | 1,518,266 | | | Bank Bukopin Tbk PT | | | 80,288 | |
| | 629,616 | | | Bank Danamon Indonesia Tbk PT | | | 186,260 | |
| | 2,753,950 | | | Bank Pan Indonesia Tbk PT(b) | | | 168,850 | |
| | 556,300 | | | Bank Pembangunan Daerah Jawa Barat Dan Banten Tbk PT | | | 67,789 | |
| | 1,685,800 | | | Bank Tabungan Negara Persero Tbk PT | | | 246,772 | |
| | 141,100 | | | Bank Tabungan Pensiunan Nasional Tbk PT(b) | | | 31,036 | |
| | 54,000 | | | Bayan Resources Tbk PT(b) | | | 26,901 | |
| | 583,600 | | | Bumi Serpong Damai Tbk PT | | | 97,058 | |
| | 122,900 | | | Charoen Pokphand Indonesia Tbk PT | | | 34,851 | |
| | 4,469,107 | | | Ciputra Development Tbk PT | | | 541,170 | |
| | 63,930 | | | Ciputra Property Tbk PT | | | 3,724 | |
| | 191,517 | | | Ciputra Surya Tbk PT | | | 44,768 | |
| | 542,500 | | | Citra Marga Nusaphala Persada Tbk PT(b) | | | 62,990 | |
| | 6,654,200 | | | Darma Henwa Tbk PT(b) | | | 28,559 | |
| | 969,800 | | | Elnusa Tbk PT | | | 33,744 | |
| | 16,087,500 | | | Express Transindo Utama Tbk PT(b) | | | 213,300 | |
| | 947,000 | | | Gajah Tunggal Tbk PT(b) | | | 90,723 | |
| | 1,049,000 | | | Garuda Indonesia Persero Tbk PT(b) | | | 30,229 | |
| | 2,161,000 | | | Global Mediacom Tbk PT | | | 140,776 | |
| | 1,043,600 | | | Holcim Indonesia Tbk PT | | | 77,182 | |
| | 101,500 | | | Indo Tambangraya Megah Tbk PT | | | 111,434 | |
| | 113,400 | | | Indosat Tbk PT(b) | | | 57,361 | |
| | 762,700 | | | Intiland Development Tbk PT | | | 33,611 | |
| | 449,100 | | | Japfa Comfeed Indonesia Tbk PT | | | 64,880 | |
| | 34,300 | | | Jasa Marga Persero Tbk PT | | | 11,908 | |
| Shares | | | | | Value |
| INDONESIA (continued) | | | | |
| | 8,140,236 | | | Kawasan Industri Jababeka Tbk PT(b) | | $ | 187,161 | |
| | 100,700 | | | Lippo Cikarang Tbk PT(b) | | | 46,692 | |
| | 8,121,650 | | | Lippo Karawaci Tbk PT | | | 563,312 | |
| | 1,313,300 | | | Malindo Feedmill Tbk PT(b) | | | 182,682 | |
| | 103,000 | | | Matahari Department Store Tbk PT | | | 142,288 | |
| | 658,300 | | | Matahari Putra Prima Tbk PT | | | 91,066 | |
| | 22,764,375 | | | Mayora Indah Tbk PT(d) | | | 2,651,889 | |
| | 810,300 | | | Medco Energi Internasional Tbk PT(b) | | | 81,353 | |
| | 515,000 | | | Media Nusantara Citra Tbk PT | | | 82,886 | |
| | 106,200 | | | Mitra Adiperkasa Tbk PT(b) | | | 44,765 | |
| | 5,385,600 | | | MNC Investama Tbk PT(b) | | | 56,960 | |
| | 530,000 | | | Modernland Realty Tbk PT(b) | | | 14,867 | |
| | 522,600 | | | Multipolar Tbk PT(b) | | | 15,300 | |
| | 26,286,500 | | | Nippon Indosari Corpindo Tbk PT(d) | | | 3,334,163 | |
| | 1,292,700 | | | Pakuwon Jati Tbk PT | | | 71,332 | |
| | 2,432,900 | | | Panin Financial Tbk PT(b) | | | 35,613 | |
| | 139,100 | | | Pembangunan Perumahan Persero Tbk PT | | | 43,922 | |
| | 840,000 | | | Perusahaan Perkebunan London Sumatra Indonesia Tbk PT | | | 98,176 | |
| | 1,487,500 | | | PT Alam Sutera Realty Tbk PT(b) | | | 51,073 | |
| | 398,800 | | | Ramayana Lestari Sentosa Tbk PT | | | 41,873 | |
| | 8,044,100 | | | Sarana Meditama Metropolitan Tbk PT(d) | | | 1,763,192 | |
| | 13,210,100 | | | Sawit Sumbermas Sarana Tbk PT | | | 1,538,884 | |
| | 4,331,700 | | | Selamat Sempurna Tbk PT(d) | | | 1,510,518 | |
| | 170,000 | | | Semen Indonesia Persero Tbk PT | | | 128,334 | |
| | 3,065,800 | | | Sentul City Tbk PT(b) | | | 21,382 | |
| | 3,209,100 | | | Siloam International Hospitals Tbk PT(b)(d) | | | 2,551,687 | |
| | 117,500 | | | Sinar Mas Agro Resources & Technology Tbk PT(b) | | | 40,523 | |
| | 1,203,400 | | | Sri Rejeki Isman Tbk PT | | | 23,426 | |
| | 1,533,300 | | | Summarecon Agung Tbk PT | | | 193,895 | |
| | 215,100 | | | Surya Citra Media Tbk PT | | | 43,685 | |
| | 1,475,000 | | | Surya Semesta Internusa Tbk PT | | | 63,870 | |
| | 117,900 | | | Tambang Batubara Bukit Asam Persero Tbk PT | | | 107,527 | |
| | 458,600 | | | Tiga Pilar Sejahtera Food Tbk(b) | | | 73,106 | |
| | 617,700 | | | Timah Persero Tbk PT | | | 44,027 | |
| | 166,600 | | | Tower Bersama Infrastructure Tbk PT | | | 76,290 | |
| | 4,875,000 | | | Truba Alam Manunggal Engineering PT(b)(c)(d) | | | 3,736 | |
| | 1,152,000 | | | Tunas Baru Lampung Tbk PT | | | 98,884 | |
| | 539,500 | | | Tunas Ridean Tbk PT | | | 57,886 | |
| | 269,400 | | | United Tractors Tbk PT | | | 446,488 | |
| Old Westbury Funds, Inc. | |
| Small & Mid Cap Fund | |
| Portfolio of Investments - (Continued) | October 31, 2016 |
| | |
| Shares | | | | | Value |
| INDONESIA (continued) | | | | |
| | 1,938,200 | | | Visi Media Asia Tbk PT(b) | | $ | 37,730 | |
| | 439,785 | | | Waskita Karya Persero Tbk PT | | | 88,308 | |
| | 219,852 | | | Wijaya Karya Persero Tbk PT | | | 43,303 | |
| | 37,100 | | | XL Axiata Tbk PT(b) | | | 6,255 | |
| | | | | | | | 25,580,518 | |
| | IRELAND — 0.3% | | | | |
| | 299,888 | | | Bank of Ireland(b) | | | 64,195 | |
| | 90,764 | | | C&C Group Plc | | | 348,728 | |
| | 8,890 | | | DCC Plc | | | 725,246 | |
| | 5,572 | | | FBD Holdings Plc(b) | | | 37,312 | |
| | 643,235 | | | Glanbia Plc | | | 10,478,739 | |
| | 55,515 | | | Grafton Group Plc - Units | | | 337,919 | |
| | 85,105 | | | Greencore Group Plc | | | 343,758 | |
| | 23,429 | | | Hibernia REIT plc | | | 32,998 | |
| | 16,165 | | | IFG Group Plc | | | 31,941 | |
| | 23,450 | | | Irish Continental Group Plc - Units | | | 109,354 | |
| | 430 | | | Kenmare Resources Plc(b) | | | 1,515 | |
| | 12,297 | | | Kingspan Group Plc(b) | | | 301,030 | |
| | 6,121 | | | Kingspan Group Plc | | | 148,498 | |
| | 11,096 | | | Paddy Power Betfair Plc | | | 1,148,639 | |
| | 107,448 | | | Smurfit Kappa Group Plc(b) | | | 2,354,314 | |
| | 4,022 | | | Tarsus Group Plc | | | 12,627 | |
| | 85,271 | | | United Drug Plc(b) | | | 682,072 | |
| | | | | | | | 17,158,885 | |
| ISLE OF MAN — 0.0% | | | | |
| | 19,921 | | | Gvc Holdings Plc | | | 169,830 | |
| ISRAEL — 1.5% | | | | |
| | 0 | | | Africa Israel Investments Ltd.(b) | | | 0 | |
| | 5,950 | | | Airport City Ltd.(b) | | | 64,749 | |
| | 931 | | | Alrov Properties and Lodging | | | 19,922 | |
| | 3,712 | | | AudioCodes Ltd.(b) | | | 19,661 | |
| | 28 | | | Bayside Land Corp. | | | 10,970 | |
| | 850,833 | | | Check Point Software Technologies Ltd.(b) | | | 71,946,438 | |
| | 0 | | | Clal Biotechnology Industries Ltd.(b) | | | 0 | |
| | 7,778 | | | Clal Insurance Enterprise Holdings Ltd.(b) | | | 89,391 | |
| | 4,759 | | | Compugen Ltd.(b) | | | 26,994 | |
| | 9,651 | | | Delek Automotive Systems Ltd. | | | 82,515 | |
| | 1,216 | | | Delek Group Ltd. | | | 238,585 | |
| | 3,947 | | | Delta-Galil Industries Ltd. | | | 112,454 | |
| | 9,680 | | | Direct Insurance Financial Investments Ltd. | | | 82,157 | |
| | 56,421 | | | El Al Israel Airlines | | | 54,858 | |
| | 7,683 | | | Elbit Systems Ltd. | | | 761,030 | |
| | 905 | | | Electra Ltd. | | | 124,392 | |
| | 1 | | | Electra Real Estate Ltd.(b) | | | 1 | |
| | 1,009 | | | Equital Ltd.(b) | | | 18,929 | |
| | 0 | | | Evogene Ltd.(b) | | | 3 | |
| | 14,334 | | | First International Bank of Israel Ltd. | | | 184,581 | |
| | 3,036 | | | Formula Systems 1985 Ltd. | | | 117,125 | |
| Shares | | | | | Value |
| ISRAEL (continued) | | | | |
| | 9,837 | | | Frutarom Industries Ltd. | | $ | 520,530 | |
| | 1,135 | | | Hadera Paper Ltd.(b) | | | 40,828 | |
| | 43,055 | | | Harel Insurance Investments & Financial Services Ltd. | | | 166,550 | |
| | 850 | | | Hilan Ltd. | | | 13,121 | |
| | 360 | | | Industrial Buildings Corp. Ltd. | | | 434 | |
| | 274,008 | | | Israel Discount Bank Ltd. - Class A(b) | | | 503,475 | |
| | 4,804 | | | Jerusalem Oil Exploration(b) | | | 211,504 | |
| | 4,100 | | | Magic Software Enterprises Ltd. | | | 30,160 | |
| | 16,429 | | | Matrix IT Ltd. | | | 116,570 | |
| | 1,459 | | | Melisron Ltd. | | | 61,867 | |
| | 15,752 | | | Menora Mivtachim Holdings Ltd.(b) | | | 140,262 | |
| | 34,854 | | | Migdal Insurance & Financial Holding Ltd.(b) | | | 23,086 | |
| | 76,835 | | | Mizrahi Tefahot Bank Ltd. | | | 1,001,421 | |
| | 7,596 | | | Naphtha Israel Petroleum Corp. Ltd.(b) | | | 41,246 | |
| | 736 | | | Neto ME Holdings Ltd. | | | 57,939 | |
| | 12,080 | | | NICE-Systems Ltd. | | | 802,017 | |
| | 7,762 | | | Nova Measuring Instruments Ltd.(b) | | | 92,647 | |
| | 391,918 | | | Oil Refineries Ltd.(b) | | | 138,325 | |
| | 59,383 | | | Orbotech Ltd. | | | 1,627,094 | |
| | 5,275 | | | Partner Communications Co. Ltd.(b) | | | 24,613 | |
| | 2,872 | | | Paz Oil Co. Ltd. | | | 448,734 | |
| | 14,145 | | | Phoenix Holdings Ltd. (The)(b) | | | 40,411 | |
| | 1,121 | | | Plasson Industries Ltd.(b) | | | 34,422 | |
| | 1 | | | Protalix Biotherapeutics, Inc.(b) | | | 0 | |
| | 715 | | | Rami Levy Chain Stores Hashikma Marketing 2006 Ltd. | | | 28,777 | |
| | 18,000 | | | Sapiens International Corp NV | | | 244,980 | |
| | 1,316 | | | Sapiens International Corp NV | | | 18,006 | |
| | 2,783,400 | | | Sarine Technologies Ltd.(d) | | | 3,261,054 | |
| | 68,879 | | | Shikun & Binui Ltd. | | | 119,577 | |
| | 35,913 | | | Shufersal Ltd. | | | 135,644 | |
| | 6,039 | | | Strauss Group Ltd. | | | 95,080 | |
| | 3,075 | | | Summit Real Estate Holdings Ltd.(b) | | | 17,859 | |
| | 3,108 | | | Tower Semiconductor Ltd.(b) | | | 48,110 | |
| | 6,295 | | | Union Bank of Israel(b) | | | 21,168 | |
| | | | | | | | 84,082,266 | |
| ITALY — 0.3% | | | | |
| | 42,476 | | | A2A SpA | | | 57,866 | |
| | 3,408 | | | ACEA SpA | | | 44,146 | |
| | 578 | | | Alerion Cleanpower SpA | | | 1,699 | |
| | 14,575 | | | Amplifon SpA | | | 154,078 | |
| | 22,692 | | | Ansaldo STS SpA | | | 260,810 | |
| | 69,425 | | | Arnoldo Mondadori Editore SpA(b) | | | 68,629 | |
| | 5,010 | | | Ascopiave SpA | | | 14,651 | |
| | 27,975 | | | Astaldi SpA | | | 112,950 | |
| | 14,058 | | | Autogrill SpA | | | 117,208 | |
| Old Westbury Funds, Inc. | |
| Small & Mid Cap Fund | |
| Portfolio of Investments - (Continued) | October 31, 2016 |
| | |
| Shares | | | | | Value |
| ITALY (continued) | | | | |
| | 10,738 | | | Azimut Holding SpA | | $ | 172,336 | |
| | 10,128 | | | Banca Generali SpA | | | 224,918 | |
| | 5,378 | | | Banca IFIS SpA | | | 155,563 | |
| | 30,322 | | | Banca Mediolanum SpA | | | 209,703 | |
| | 39,310 | | | Banca Popolare dell’Emilia Romagna Scarl | | | 184,435 | |
| | 408,772 | | | Banca Popolare di Milano Scarl | | | 187,390 | |
| | 34,975 | | | Banca Popolare di Sondrio SCARL | | | 116,718 | |
| | 6,391 | | | Banco di Desio e della Brianza SpA | | | 11,850 | |
| | 17,479 | | | BasicNet SpA | | | 64,662 | |
| | 4,057 | | | Biesse SpA | | | 69,966 | |
| | 3,590 | | | Brembo SpA | | | 221,875 | |
| | 21,385 | | | Buzzi Unicem SpA | | | 415,986 | |
| | 12,711 | | | Cementir Holding SpA | | | 62,093 | |
| | 14,539 | | | Cerved Information Solutions SpA | | | 117,069 | |
| | 163,542 | | | CIR-Compagnie Industriali Riunite SpA | | | 182,402 | |
| | 29,592 | | | Credito Emiliano SpA | | | 166,647 | |
| | 216,734 | | | Credito Valtellinese SC | | | 95,264 | |
| | 4,557 | | | Danieli & C Officine Meccaniche SpA | | | 85,042 | |
| | 4,885 | | | Datalogic SpA | | | 102,424 | |
| | 36,080 | | | Davide Campari-Milano SpA | | | 363,394 | |
| | 9,415 | | | De’ Longhi SpA | | | 220,350 | |
| | 4,071 | | | DiaSorin SpA | | | 250,262 | |
| | 2,953 | | | Ei Towers SpA(b) | | | 139,392 | |
| | 2,136 | | | El.En. SpA | | | 46,849 | |
| | 19,172 | | | ERG SpA | | | 212,987 | |
| | 5,852 | | | Esprinet SpA | | | 43,362 | |
| | 9,629 | | | Eurotech SpA(b) | | | 12,758 | |
| | 55,057 | | | Falck Renewables SpA | | | 49,046 | |
| | 5,591 | | | Ferrari NV | | | 294,480 | |
| | 39,751 | | | Fincantieri SpA(b) | | | 18,009 | |
| | 5,919 | | | FinecoBank Banca Fineco SpA | | | 34,567 | |
| | 187,037 | | | Finmeccanica SpA(b) | | | 2,279,061 | |
| | 34,243 | | | FNM SpA | | | 15,487 | |
| | 14,723 | | | Geox SpA | | | 31,743 | |
| | 46,449 | | | Gruppo Editoriale L’Espresso SpA(b) | | | 38,599 | |
| | 3,426 | | | Gruppo Mutuionline SpA | | | 30,388 | |
| | 51,774 | | | Hera SpA | | | 132,426 | |
| | 2,710 | | | Immobiliare Grande Distribuzione SIIQ SpA REIT | | | 2,085 | |
| | 57,566 | | | IMMSI SpA | | | 24,165 | |
| | 3,035 | | | Industria Macchine Automatiche SpA | | | 187,741 | |
| | 128,806 | | | Intek Group SpA(b) | | | 30,188 | |
| | 7,391 | | | Interpump Group SpA | | | 118,619 | |
| | 61,258 | | | Iren SpA | | | 110,015 | |
| | 4,398 | | | Italmobiliare SpA | | | 208,615 | |
| | 69,111 | | | Juventus Football Club SpA(b) | | | 22,267 | |
| | 2,796 | | | La Doria SpA | | | 23,511 | |
| | 23,268 | | | Maire Tecnimont SpA | | | 56,194 | |
| | 1,779 | | | Mariella Burani SpA(b)(c)(d) | | | 0 | |
| Shares | | | | | Value |
| ITALY (continued) | | | |
| | 6,331 | | | MARR SpA | | $ | 116,619 | |
| | 256,282 | | | Mediaset SpA | | | 732,596 | |
| | 124,699 | | | Mediobanca SpA | | | 913,734 | |
| | 13,734 | | | Moncler SpA | | | 228,712 | |
| | 123,440 | | | Parmalat SpA | | | 326,030 | |
| | 59,042 | | | Piaggio & C SpA | | | 103,054 | |
| | 35,489 | | | Prysmian SpA | | | 883,183 | |
| | 17,110 | | | Recordati SpA | | | 484,215 | |
| | 831 | | | Reply SpA | | | 104,451 | |
| | 29,208 | | | Retelit SpA(b) | | | 29,049 | |
| | 1,204 | | | Sabaf SpA | | | 11,809 | |
| | 1,494 | | | SAES Getters SpA | | | 19,435 | |
| | 5,932 | | | Safilo Group SpA(b) | | | 62,091 | |
| | 369,818 | | | Saipem SpA(b) | | | 152,239 | |
| | 9,131 | | | Salini Impregilo SpA | | | 25,460 | |
| | 145,104 | | | Saras SpA | | | 251,995 | |
| | 3,891 | | | SAVE SpA/Tessera | | | 76,372 | |
| | 8,533 | | | Societa Cattolica di Assicurazioni SCRL | | | 51,613 | |
| | 34,431 | | | Societa Iniziative Autostradali e Servizi SpA | | | 322,407 | |
| | 10,691 | | | Sogefi SpA(b) | | | 24,528 | |
| | 11,520 | | | SOL SpA | | | 98,830 | |
| | 106,594 | | | Terna Rete Elettrica Nazionale SpA | | | 522,117 | |
| | 20,102 | | | Tiscali SpA(b) | | | 973 | |
| | 879 | | | Tod’s SpA | | | 51,431 | |
| | 6,610 | | | Uni Land SpA(b)(c)(d) | | | 0 | |
| | 52,182 | | | Unione di Banche Italiane SpA | | | 143,895 | |
| | 76,274 | | | Unipol Gruppo Finanziario SpA | | | 233,272 | |
| | 322,477 | | | UnipolSai SpA | | | 615,961 | |
| | 7,876 | | | Vittoria Assicurazioni SpA | | | 84,125 | |
| | 7,438 | | | Yoox Net-A-Porter Group SpA(b) | | | 213,926 | |
| | 3,856 | | | Zignago Vetro SpA | | | 23,345 | |
| | | | | | | | 15,582,407 | |
| JAPAN — 6.1% | | | | |
| | 48,000 | | | 77 Bank Ltd. (The) | | | 217,412 | |
| | 6,900 | | | Accordia Golf Co. Ltd. | | | 69,743 | |
| | 4,600 | | | Achilles Corp. | | | 66,234 | |
| | 2,600 | | | Adastria Co. Ltd. | | | 68,229 | |
| | 23,800 | | | ADEKA Corp. | | | 360,847 | |
| | 2,500 | | | Advan Co. Ltd. | | | 23,124 | |
| | 1,800 | | | Advanex, Inc. | | | 21,112 | |
| | 20,400 | | | Advantest Corp. | | | 292,373 | |
| | 1,200 | | | Aeon Delight Co. Ltd. | | | 35,530 | |
| | 2,200 | | | Aeon Fantasy Co. Ltd. | | | 68,285 | |
| | 4,700 | | | Aeon Mall Co. Ltd. | | | 69,915 | |
| | 11,700 | | | Ahresty Corp. | | | 132,653 | |
| | 3,900 | | | Ai Holdings Corp. | | | 96,059 | |
| | 5,900 | | | Aica Kogyo Co. Ltd. | | | 168,780 | |
| | 2,700 | | | Aichi Bank Ltd. (The) | | | 149,843 | |
| | 3,800 | | | Aichi Corp. | | | 30,800 | |
| | 5,500 | | | Aichi Steel Corp. | | | 265,376 | |
| | 1,600 | | | Aichi Tokei Denki Co. Ltd. | | | 48,822 | |
| Old Westbury Funds, Inc. | |
| Small & Mid Cap Fund | |
| Portfolio of Investments - (Continued) | October 31, 2016 |
| | |
| Shares | | | | | Value |
| JAPAN (continued) | | | | |
| | 11,400 | | | Aida Engineering Ltd. | | $ | 98,270 | |
| | 3,800 | | | Ain Holdings, Inc. | | | 256,909 | |
| | 43,000 | | | Air Water, Inc. | | | 806,532 | |
| | 4,700 | | | Airport Facilities Co. Ltd. | | | 25,636 | |
| | 12,300 | | | Aisan Industry Co. Ltd. | | | 100,164 | |
| | 44,000 | | | Akita Bank Ltd. (The) | | | 147,688 | |
| | 500 | | | Albis Co. Ltd. | | | 10,694 | |
| | 3,400 | | | Alconix Corp. | | | 45,033 | |
| | 5,900 | | | Alinco, Inc. | | | 55,079 | |
| | 3,100 | | | Alpen Co. Ltd. | | | 56,549 | |
| | 2,800 | | | Alpha Corp. | | | 27,447 | |
| | 10,600 | | | Alpine Electronics, Inc. | | | 141,509 | |
| | 6,600 | | | Alps Logistics Co. Ltd. | | | 37,887 | |
| | 400 | | | Altech Corp. | | | 8,639 | |
| | 24,900 | | | Amada Holdings Co. Ltd. | | | 284,449 | |
| | 10,100 | | | Amano Corp. | | | 188,285 | |
| | 500 | | | Amiyaki Tei Co. Ltd. | | | 18,475 | |
| | 3,700 | | | Anest Iwata Corp. | | | 37,293 | |
| | 1,900 | | | Anritsu Corp. | | | 10,092 | |
| | 300 | | | AOI Electronics Co. Ltd. | | | 7,292 | |
| | 3,300 | | | AOI Pro, Inc. | | | 26,181 | |
| | 20,300 | | | AOKI Holdings, Inc. | | | 246,031 | |
| | 50,000 | | | Aomori Bank Ltd. (The) | | | 169,257 | |
| | 8,900 | | | Aoyama Trading Co. Ltd. | | | 314,008 | |
| | 7,000 | | | Arakawa Chemical Industries Ltd. | | | 104,129 | |
| | 2,500 | | | Arata Corp. | | | 57,261 | |
| | 16,000 | | | Araya Industrial Co. Ltd. | | | 22,580 | |
| | 15,800 | | | Arcland Sakamoto Co. Ltd. | | | 188,630 | |
| | 9,738 | | | Arcs Co. Ltd. | | | 245,052 | |
| | 118,800 | | | Ariake Japan Co. Ltd. | | | 6,649,719 | |
| | 2,090 | | | As One Corp. | | | 93,967 | |
| | 3,100 | | | Asahi Co. Ltd. | | | 37,483 | |
| | 13,800 | | | Asahi Diamond Industrial Co. Ltd. | | | 103,036 | |
| | 4,350 | | | Asahi Holdings, Inc. | | | 78,314 | |
| | 9,400 | | | Asahi Intecc Co. Ltd. | | | 407,838 | |
| | 1,800 | | | Asahi Kogyosha Co. Ltd. | | | 52,522 | |
| | 23,000 | | | Asahi Yukizai Corp. | | | 44,960 | |
| | 24,000 | | | Asanuma Corp. | | | 57,214 | |
| | 2,300 | | | Asax Co. Ltd. | | | 33,665 | |
| | 33,000 | | | Ashimori Industry Co. Ltd. | | | 52,551 | |
| | 2,600 | | | Asia Pile Holdings Corp. | | | 10,859 | |
| | 2,400 | | | ASKA Pharmaceutical Co. Ltd. | | | 41,514 | |
| | 1,600 | | | ASKUL Corp. | | | 65,986 | |
| | 6,700 | | | Asunaro Aoki Construction Co. Ltd. | | | 46,191 | |
| | 10,200 | | | Atom Corp. | | | 67,501 | |
| | 19,300 | | | Autobacs Seven Co. Ltd. | | | 274,952 | |
| | 4,000 | | | Avex Group Holdings, Inc. | | | 53,018 | |
| | 57,000 | | | Awa Bank Ltd. (The) | | | 375,579 | |
| | 3,800 | | | Axial Retailing, Inc. | | | 136,788 | |
| | 9,300 | | | Azbil Corp. | | | 276,685 | |
| | 21,000 | | | Bando Chemical Industries Ltd. | | | 202,451 | |
| | 4,400 | | | Bank of Iwate Ltd. (The) | | | 185,658 | |
| | 22,000 | | | Bank of Kochi Ltd. (The) | | | 25,174 | |
| Shares | | | | | Value |
| JAPAN (continued) | | | | |
| | 25,000 | | | Bank of Kyoto Ltd. (The) | | $ | 183,799 | |
| | 3,700 | | | Bank of Nagoya Ltd. (The) | | | 130,543 | |
| | 6,600 | | | Bank of Okinawa Ltd. (The) | | | 232,230 | |
| | 41,000 | | | Bank of Saga Ltd. (The) | | | 107,123 | |
| | 9,500 | | | Bank of the Ryukyus Ltd. | | | 125,193 | |
| | 2,200 | | | Belc Co. Ltd. | | | 89,053 | |
| | 29,400 | | | Belluna Co. Ltd. | | | 196,523 | |
| | 3,500 | | | Benesse Holdings, Inc. | | | 91,880 | |
| | 8,700 | | | Bic Camera, Inc. | | | 75,079 | |
| | 72,800 | | | BML, Inc. | | | 1,934,715 | |
| | 1,400 | | | Bookoff Corp. | | | 10,920 | |
| | 22,400 | | | Bunka Shutter Co. Ltd. | | | 186,044 | |
| | 800 | | | C Uyemura & Co. Ltd. | | | 37,265 | |
| | 47,000 | | | Calsonic Kansei Corp. | | | 589,349 | |
| | 900 | | | Can Do Co. Ltd. | | | 15,679 | |
| | 12,000 | | | Canon Marketing Japan, Inc. | | | 207,686 | |
| | 5,300 | | | Capcom Co. Ltd. | | | 137,213 | |
| | 3,400 | | | Carlit Holdings Co. Ltd. | | | 17,280 | |
| | 3,700 | | | Cawachi Ltd. | | | 95,367 | |
| | 109,000 | | | Central Glass Co. Ltd. | | | 446,934 | |
| | 900 | | | Central Security Patrols Co. Ltd. | | | 17,748 | |
| | 1,300 | | | Central Sports Co. Ltd. | | | 31,115 | |
| | 3,700 | | | Chiba Kogyo Bank Ltd. (The) | | | 16,441 | |
| | 1,300 | | | Chino Corp. | | | 13,004 | |
| | 4,000 | | | Chiyoda Co. Ltd. | | | 95,242 | |
| | 3,700 | | | Chiyoda Integre Co. Ltd.(b) | | | 76,773 | |
| | 3,800 | | | Chori Co. Ltd. | | | 60,296 | |
| | 11,700 | | | Chubu Shiryo Co. Ltd. | | | 95,055 | |
| | 60,000 | | | Chuetsu Pulp & Paper Co. Ltd. | | | 131,591 | |
| | 150,500 | | | Chugai Mining Co. Ltd.(b) | | | 40,183 | |
| | 4,000 | | | Chugai Ro Co. Ltd. | | | 7,743 | |
| | 20,000 | | | Chugoku Bank Ltd. (The) | | | 268,904 | |
| | 23,000 | | | Chugoku Marine Paints Ltd. | | | 167,779 | |
| | 3,200 | | | Chukyo Bank Ltd. (The) | | | 71,067 | |
| | 4,600 | | | Ci:z Holdings Co. Ltd. | | | 132,030 | |
| | 24,000 | | | Citizen Watch Co. Ltd. | | | 135,253 | |
| | 15,000 | | | CKD Corp. | | | 187,375 | |
| | 21,000 | | | Clarion Co. Ltd. | | | 69,086 | |
| | 7,000 | | | Cleanup Corp. | | | 59,741 | |
| | 1,900 | | | CMIC Holdings Co. Ltd. | | | 28,264 | |
| | 12,900 | | | CMK Corp.(b) | | | 68,147 | |
| | 18,023 | | | Coca-Cola East Japan Co. Ltd. | | | 398,029 | |
| | 11,600 | | | Coca-Cola West Co. Ltd. | | | 343,454 | |
| | 2,290 | | | Cocokara Fine, Inc. | | | 88,766 | |
| | 6,400 | | | Colowide Co. Ltd. | | | 124,558 | |
| | 6,100 | | | Computer Engineering & Consulting Ltd. | | | 114,299 | |
| | 16,300 | | | COMSYS Holdings Corp. | | | 287,702 | |
| | 4,500 | | | CONEXIO Corp. | | | 61,276 | |
| | 3,300 | | | COOKPAD, Inc. | | | 31,436 | |
| | 16,500 | | | Cosmo Energy Holdings Co. Ltd. | | | 216,811 | |
| | 1,500 | | | Cosmos Pharmaceutical Corp. | | | 327,119 | |
| | 5,400 | | | Create SD Holdings Co. Ltd. | | | 113,283 | |
| | 30,100 | | | Credit Saison Co. Ltd. | | | 521,232 | |
| | 4,700 | | | CTI Engineering Co. Ltd. | | | 45,490 | |
| Old Westbury Funds, Inc. | |
| Small & Mid Cap Fund | |
| Portfolio of Investments - (Continued) | October 31, 2016 |
| | |
| Shares | | | | | Value |
| JAPAN (continued) | | | | |
| | 12,000 | | | CyberAgent, Inc. | | $ | 349,576 | |
| | 3,900 | | | D.A. Consortium Holdings, Inc.(b) | | | 26,181 | |
| | 43,000 | | | Dai Nippon Toryo Co. Ltd. | | | 92,257 | |
| | 9,100 | | | Daibiru Corp. | | | 79,138 | |
| | 6,000 | | | Dai-Dan Co. Ltd. | | | 50,863 | |
| | 17,000 | | | Daido Kogyo Co. Ltd. | | | 38,095 | |
| | 6,600 | | | Daido Metal Co. Ltd. | | | 71,305 | |
| | 148,000 | | | Daido Steel Co. Ltd. | | | 629,427 | |
| | 11,200 | | | Daifuku Co. Ltd. | | | 203,131 | |
| | 10,000 | | | Daihatsu Diesel Manufacturing Co. Ltd. | | | 59,693 | |
| | 30,000 | | | Daihen Corp. | | | 174,216 | |
| | 17,000 | | | Daiho Corp. | | | 93,697 | |
| | 13,000 | | | Daiichi Jitsugyo Co. Ltd. | | | 72,146 | |
| | 200 | | | Daiichi Kigenso Kagaku-Kogyo Co. Ltd. | | | 6,580 | |
| | 131,700 | | | Daiichikosho Co. Ltd. | | | 5,732,912 | |
| | 4,600 | | | Daiken Corp. | | | 95,667 | |
| | 19,000 | | | Daiki Aluminium Industry Co. Ltd. | | | 78,268 | |
| | 2,300 | | | Daikoku Denki Co. Ltd. | | | 36,933 | |
| | 400 | | | Daikokutenbussan Co. Ltd. | | | 18,823 | |
| | 86,000 | | | Daikyo, Inc. | | | 184,514 | |
| | 2,100 | | | Daikyonishikawa Corp. | | | 27,154 | |
| | 39,000 | | | Dainichiseika Color & Chemicals Manufacturing Co. Ltd. | | | 208,258 | |
| | 37,000 | | | Daio Paper Corp. | | | 445,256 | |
| | 2,100 | | | Daisan Bank Ltd. (The) | | | 35,564 | |
| | 4,910 | | | Daiseki Co. Ltd. | | | 101,037 | |
| | 64,000 | | | Daishi Bank Ltd. (The) | | | 275,846 | |
| | 57,000 | | | Daito Bank Ltd. (The) | | | 91,857 | |
| | 2,260 | | | Daito Pharmaceutical Co. Ltd. | | | 49,846 | |
| | 118,000 | | | Daiwabo Holdings Co. Ltd. | | | 285,801 | |
| | 601,160 | | | DCM Holdings Co. Ltd. | | | 5,273,836 | |
| | 191,000 | | | Denka Co. Ltd. | | | 868,761 | |
| | 5,700 | | | Denyo Co. Ltd. | | | 70,876 | |
| | 8,200 | | | Descente Ltd. | | | 114,004 | |
| | 5,400 | | | Dexerials Corp.(b) | | | 43,460 | |
| | 37,400 | | | DIC Corp. | | | 1,135,873 | |
| | 1,400 | | | Digital Arts, Inc. | | | 37,753 | |
| | 2,500 | | | Disco Corp. | | | 302,756 | |
| | 23,000 | | | DKS Co. Ltd. | | | 75,446 | |
| | 3,500 | | | DMG Mori Co. Ltd. | | | 37,213 | |
| | 4,000 | | | Doshisha Co. Ltd. | | | 82,845 | |
| | 5,674 | | | Doutor Nichires Holdings Co. Ltd. | | | 113,837 | |
| | 71,000 | | | Dowa Holdings Co. Ltd. | | | 528,759 | |
| | 400 | | | DSB Co. Ltd. | | | 1,968 | |
| | 3,200 | | | DTS Corp. | | | 71,037 | |
| | 2,300 | | | Dunlop Sports Co. Ltd. | | | 22,612 | |
| | 2,000 | | | Dynic Corp. | | | 3,223 | |
| | 7,900 | | | Eagle Industry Co. Ltd. | | | 112,846 | |
| | 48,400 | | | Ebara Corp. | | | 1,439,954 | |
| | 500 | | | Ebara Jitsugyo Co. Ltd. | | | 6,055 | |
| Shares | | | | | Value |
| JAPAN (continued) | | | | |
| | 48,400 | | | EDION Corp. | | $ | 429,679 | |
| | 10,400 | | | Ehime Bank Ltd. (The) | | | 137,450 | |
| | 8,000 | | | Eidai Co. Ltd. | | | 34,557 | |
| | 41,000 | | | Eighteenth Bank Ltd. (The) | | | 127,453 | |
| | 1,900 | | | Eiken Chemical Co. Ltd. | | | 51,998 | |
| | 2,800 | | | Elecom Co. Ltd. | | | 57,378 | |
| | 700 | | | Elematec Corp. | | | 11,847 | |
| | 2,600 | | | Endo Lighting Corp. | | | 20,355 | |
| | 3,000 | | | en-japan, Inc. | | | 57,929 | |
| | 1,900 | | | Enplas Corp. | | | 58,792 | |
| | 5,500 | | | EPS Holdings Inc. | | | 72,323 | |
| | 4,200 | | | ESPEC Corp. | | | 50,863 | |
| | 2,300 | | | Excel Co. Ltd. | | | 30,836 | |
| | 15,200 | | | Exedy Corp. | | | 433,520 | |
| | 5,200 | | | Ezaki Glico Co. Ltd. | | | 296,024 | |
| | 3,000 | | | FALCO HOLDINGS Co. Ltd. | | | 39,134 | |
| | 231,000 | | | FCC Co. Ltd. | | | 5,075,083 | |
| | 35,680 | | | Feed One Co. Ltd. | | | 45,251 | |
| | 8,300 | | | Ferrotec Corp. | | | 101,069 | |
| | 17,000 | | | FIDEA Holdings Co. Ltd. | | | 30,638 | |
| | 2,900 | | | Fields Corp. | | | 35,258 | |
| | 9,300 | | | Financial Products Group Co. Ltd. | | | 81,587 | |
| | 8,500 | | | FJ Next Co. Ltd. | | | 50,577 | |
| | 11,400 | | | Foster Electric Co. Ltd. | | | 209,911 | |
| | 2,200 | | | FP Corp. | | | 118,737 | |
| | 5,400 | | | France Bed Holdings Co. Ltd. | | | 46,189 | |
| | 7,100 | | | F-Tech, Inc. | | | 93,295 | |
| | 9,400 | | | Fudo Tetra Corp. | | | 16,582 | |
| | 3,700 | | | Fuji Co. Ltd. | | | 77,796 | |
| | 10,600 | | | Fuji Corp. Ltd. | | | 71,057 | |
| | 151,000 | | | Fuji Electric Co. Ltd. | | | 755,936 | |
| | 13,000 | | | Fuji Kiko Co. Ltd. | | | 47,726 | |
| | 12,000 | | | Fuji Kyuko Co. Ltd. | | | 137,771 | |
| | 13,800 | | | Fuji Oil Co. Ltd.(b) | | | 44,215 | |
| | 9,600 | | | Fuji Oil Holdings, Inc. | | | 185,464 | |
| | 2,200 | | | Fuji Pharma Co. Ltd. | | | 54,544 | |
| | 2,900 | | | Fuji Seal International, Inc. | | | 119,877 | |
| | 3,800 | | | Fuji Soft, Inc. | | | 101,169 | |
| | 2,700 | | | Fujibo Holdings, Inc. | | | 85,606 | |
| | 2,700 | | | Fujicco Co. Ltd. | | | 61,920 | |
| | 10,700 | | | Fujikura Kasei Co. Ltd. | | | 64,586 | |
| | 170,000 | | | Fujikura Ltd. | | | 1,001,812 | |
| | 1,200 | | | Fujikura Rubber Ltd. | | | 6,557 | |
| | 2,200 | | | Fujimi, Inc. | | | 34,321 | |
| | 2,600 | | | Fujimori Kogyo Co. Ltd. | | | 64,733 | |
| | 6,000 | | | Fujita Kanko, Inc. | | | 19,968 | |
| | 19,100 | | | Fujitec Co. Ltd. | | | 218,921 | |
| | 6,200 | | | Fujitsu Frontech Ltd. | | | 74,138 | |
| | 8,000 | | | Fujitsu General Ltd. | | | 183,999 | |
| | 12,000 | | | Fujiya Co. Ltd.(b) | | | 23,343 | |
| | 7,000 | | | FuKoKu Co. Ltd. | | | 55,535 | |
| | 8,000 | | | Fukuda Corp. | | | 94,364 | |
| | 43,000 | | | Fukui Bank Ltd. (The) | | | 113,989 | |
| | 68,000 | | | Fukuoka Financial Group, Inc. | | | 295,032 | |
| | 74,000 | | | Fukushima Bank Ltd. (The) | | | 68,447 | |
| Old Westbury Funds, Inc. | |
| Small & Mid Cap Fund | |
| Portfolio of Investments - (Continued) | October 31, 2016 |
| | |
| Shares | | | | | Value | |
| JAPAN (continued) | | | | |
| | 3,100 | | | Fukushima Industries Corp. | | $ | 105,974 | |
| | 28,000 | | | Fukuyama Transporting Co. Ltd. | | | 159,664 | |
| | 6,300 | | | FULLCAST Holdings Co. Ltd. | | | 58,152 | |
| | 3,600 | | | Funai Soken Holdings, Inc. | | | 55,749 | |
| | 44,000 | | | Furukawa Co. Ltd. | | | 70,487 | |
| | 31,300 | | | Furukawa Electric Co. Ltd. | | | 923,748 | |
| | 7,200 | | | Furuno Electric Co. Ltd. | | | 55,749 | |
| | 4,000 | | | Furusato Industries Ltd. | | | 57,252 | |
| | 3,500 | | | Fuso Chemical Co. Ltd. | | | 74,859 | |
| | 1,100 | | | Fuso Pharmaceutical Industries Ltd. | | | 28,677 | |
| | 27,500 | | | Futaba Industrial Co. Ltd. | | | 164,156 | |
| | 3,200 | | | Future Corp. | | | 21,360 | |
| | 8,900 | | | Fuyo General Lease Co. Ltd. | | | 452,341 | |
| | 20,000 | | | Gakken Holdings Co. Ltd. | | | 66,368 | |
| | 8,000 | | | Gecoss Corp. | | | 73,234 | |
| | 1,300 | | | Genki Sushi Co. Ltd. | | | 25,164 | |
| | 10,000 | | | Geo Holdings Corp. | | | 127,110 | |
| | 2,500 | | | GLOBERIDE, Inc. | | | 42,910 | |
| | 14,500 | | | Glory Ltd. | | | 480,476 | |
| | 6,400 | | | GMO Internet, Inc. | | | 85,744 | |
| | 1,600 | | | GMO Payment Gateway, Inc. | | | 73,691 | |
| | 3,400 | | | Godo Steel Ltd. | | | 59,687 | |
| | 2,280 | | | Goldcrest Co. Ltd. | | | 41,547 | |
| | 110,000 | | | GS Yuasa Corp. | | | 476,209 | |
| | 24,000 | | | GSI Creos Corp. | | | 26,318 | |
| | 8,300 | | | G-Tekt Corp. | | | 157,737 | |
| | 7,200 | | | Gulliver International Co. Ltd. | | | 37,624 | |
| | 1,600 | | | Gun-Ei Chemical Industry Co. Ltd. | | | 46,076 | |
| | 15,400 | | | GungHo Online Entertainment, Inc. | | | 39,062 | |
| | 31,500 | | | Gunma Bank Ltd. (The) | | | 150,787 | |
| | 48,000 | | | Gunze Ltd. | | | 161,571 | |
| | 3,500 | | | Gurunavi, Inc. | | | 96,119 | |
| | 7,200 | | | H.I.S. Co. Ltd. | | | 196,907 | |
| | 23,735 | | | H2O Retailing Corp. | | | 353,071 | |
| | 38,600 | | | Hachijuni Bank Ltd. (The) | | | 210,907 | |
| | 1,600 | | | Hagihara Industries, Inc. | | | 37,578 | |
| | 700 | | | Hagiwara Electric Co. Ltd. | | | 13,150 | |
| | 3,500 | | | Hakudo Co. Ltd. | | | 40,450 | |
| | 4,800 | | | Hakuto Co. Ltd. | | | 44,627 | |
| | 6,600 | | | Hamakyorex Co. Ltd. | | | 123,164 | |
| | 9,800 | | | Haneda Zenith Holdings Co. Ltd. | | | 25,325 | |
| | 247,000 | | | Hanwa Co. Ltd. | | | 1,514,456 | |
| | 7,000 | | | Happinet Corp. | | | 74,092 | |
| | 5,000 | | | Hard Off Corp. Co. Ltd. | | | 54,877 | |
| | 2,400 | | | Harmonic Drive Systems, Inc. | | | 67,764 | |
| | 50,900 | | | Haseko Corp. | | | 496,526 | |
| | 24,260 | | | Hazama Ando Corp. | | | 156,844 | |
| | 41,300 | | | Heiwa Corp. | | | 972,738 | |
| | 4,000 | | | Heiwa Real Estate Co. Ltd. | | | 56,985 | |
| | 18,000 | | | Heiwado Co. Ltd. | | | 375,551 | |
| | 15,800 | | | Hibiya Engineering Ltd. | | | 248,593 | |
| Shares | | | | | Value | |
| JAPAN (continued) | | | | |
| | 3,225 | | | Hiday Hidaka Corp. | | $ | 80,540 | |
| | 1,600 | | | Hikari Tsushin, Inc. | | | 147,077 | |
| | 4,700 | | | HI-LEX Corp. | | | 128,626 | |
| | 3,200 | | | Hiramatsu, Inc. | | | 18,705 | |
| | 104,000 | | | Hiroshima Bank Ltd. (The) | | | 446,267 | |
| | 18,900 | | | Hitachi Capital Corp. | | | 423,164 | |
| | 51,000 | | | Hitachi Construction Machinery Co. Ltd. | | | 1,068,437 | |
| | 8,700 | | | Hitachi Koki Co. Ltd. | | | 73,751 | |
| | 11,000 | | | Hitachi Kokusai Electric, Inc. | | | 220,063 | |
| | 68,200 | | | Hitachi Metals Ltd. | | | 853,232 | |
| | 19,900 | | | Hitachi Transport System Ltd. | | | 411,017 | |
| | 51,500 | | | Hitachi Zosen Corp. | | | 259,784 | |
| | 8,700 | | | Hochiki Corp. | | | 102,704 | |
| | 1,000 | | | Hodogaya Chemical Co. Ltd. | | | 28,035 | |
| | 130,100 | | | Hogy Medical Co. Ltd. | | | 8,584,838 | |
| | 12,800 | | | Hokkaido Electric Power Co., Inc. | | | 97,523 | |
| | 25,000 | | | Hokkan Holdings Ltd. | | | 89,158 | |
| | 10,000 | | | Hokko Chemical Industry Co. Ltd. | | | 33,947 | |
| | 34,000 | | | Hokkoku Bank Ltd. (The) | | | 114,122 | |
| | 7,400 | | | Hokuetsu Bank Ltd. (The) | | | 174,998 | |
| | 7,100 | | | Hokuetsu Industries Co. Ltd. | | | 46,444 | |
| | 43,500 | | | Hokuetsu Kishu Paper Co. Ltd. | | | 272,523 | |
| | 5,100 | | | Hokuhoku Financial Group, Inc. | | | 73,677 | |
| | 17,000 | | | Hokuriku Electric Industry Co. Ltd. | | | 21,398 | |
| | 5,600 | | | Hokuriku Electric Power Co. | | | 63,706 | |
| | 2,000 | | | Hokuriku Electrical Construction Co. Ltd. | | | 16,382 | |
| | 2,500 | | | Hokuto Corp. | | | 48,727 | |
| | 2,000 | | | H-One Co. Ltd. | | | 17,679 | |
| | 3,320 | | | Honeys Co. Ltd. | | | 39,098 | |
| | 9,600 | | | Hoosiers Holdings | | | 49,157 | |
| | 7,700 | | | Horiba Ltd. | | | 368,590 | |
| | 9,000 | | | Hosokawa Micron Corp. | | | 56,127 | |
| | 3,300 | | | Howa Machinery Ltd. | | | 16,269 | |
| | 44,000 | | | Hyakugo Bank Ltd. (The) | | | 162,372 | |
| | 26,000 | | | Hyakujushi Bank Ltd. (The) | | | 88,758 | |
| | 36,700 | | | Ibiden Co. Ltd. | | | 533,685 | |
| | 6,300 | | | IBJ Leasing Co. Ltd. | | | 132,043 | |
| | 400 | | | Ichibanya Co. Ltd. | | | 15,143 | |
| | 9,900 | | | Ichigo, Inc. | | | 43,048 | |
| | 19,000 | | | Ichikoh Industries Ltd. | | | 58,701 | |
| | 7,300 | | | ICHINEN Holdings Co. Ltd. | | | 70,654 | |
| | 4,300 | | | Idec Corp. | | | 38,625 | |
| | 22,800 | | | Idemitsu Kosan Co. Ltd. | | | 526,355 | |
| | 3,100 | | | Ihara Chemical Industry Co. Ltd. | | | 26,545 | |
| | 66,000 | | | IHI Corp.(b) | | | 174,330 | |
| | 17,100 | | | Iino Kaiun Kaisha Ltd. | | | 63,756 | |
| | 4,580 | | | IJT Technology Holdings Co. Ltd. | | | 18,124 | |
| | 4,000 | | | Imasen Electric Industrial | | | 35,511 | |
| Old Westbury Funds, Inc. | |
| Small & Mid Cap Fund | |
| Portfolio of Investments - (Continued) | October 31, 2016 |
| | |
| Shares | | | | | Value | |
| JAPAN (continued) | | | | |
| | 3,500 | | | Inaba Denki Sangyo Co. Ltd. | | $ | 127,324 | |
| | 13,200 | | | Inabata & Co. Ltd. | | | 143,870 | |
| | 5,600 | | | Inageya Co. Ltd. | | | 75,934 | |
| | 3,300 | | | Ines Corp. | | | 36,786 | |
| | 1,980 | | | I-Net Corp. | | | 20,655 | |
| | 3,000 | | | Infocom Corp. | | | 44,198 | |
| | 900 | | | Infomart Corp. | | | 10,702 | |
| | 2,300 | | | Information Services International-Dentsu Ltd. | | | 39,982 | |
| | 2,400 | | | Innotech Corp. | | | 11,214 | |
| | 1,400 | | | Intage Holdings, Inc. | | | 25,205 | |
| | 4,500 | | | Internet Initiative Japan, Inc. | | | 79,641 | |
| | 1,100 | | | Inui Warehouse Co. Ltd. | | | 10,605 | |
| | 1,500 | | | Iriso Electronics Co. Ltd. | | | 82,674 | |
| | 5,000 | | | Ise Chemicals Corp. | | | 21,837 | |
| | 36,000 | | | Iseki & Co. Ltd. | | | 89,253 | |
| | 13,100 | | | Ishihara Sangyo Kaisha Ltd.(b) | | | 99,683 | |
| | 15,966 | | | IT Holdings Corp. | | | 362,192 | |
| | 11,000 | | | Ito En Ltd. | | | 401,735 | |
| | 26,200 | | | Itochu Enex Co. Ltd. | | | 201,865 | |
| | 9,200 | | | Itochu Techno-Solutions Corp. | | | 227,478 | |
| | 1,300 | | | Itochu-Shokuhin Co. Ltd. | | | 52,064 | |
| | 14,000 | | | Itoham Yonekyu Holdings, Inc.(b) | | | 133,766 | |
| | 16,200 | | | Itoki Corp. | | | 100,101 | |
| | 3,100 | | | IwaiCosmo Holdings, Inc. | | | 27,018 | |
| | 23,000 | | | Iwasaki Electric Co. Ltd. | | | 35,530 | |
| | 32,000 | | | Iwatani Corp. | | | 191,628 | |
| | 7,500 | | | Izumi Co. Ltd. | | | 347,573 | |
| | 4,600 | | | Izutsuya Co. Ltd.(b) | | | 17,195 | |
| | 13,900 | | | J Trust Co. Ltd. | | | 113,856 | |
| | 42,500 | | | J. Front Retailing Co. Ltd. | | | 586,417 | |
| | 900 | | | Jalux, Inc. | | | 15,190 | |
| | 1,900 | | | Jamco Corp. | | | 39,279 | |
| | 6,100 | | | Janome Sewing Machine Co. Ltd.(b) | | | 45,138 | |
| | 4,000 | | | Japan Airport Terminal Co. Ltd. | | | 153,905 | |
| | 7,400 | | | Japan Asia Group Ltd. | | | 26,814 | |
| | 19,000 | | | Japan Aviation Electronics Industry Ltd. | | | 272,490 | |
| | 122,900 | | | Japan Display, Inc.(b) | | | 242,589 | |
| | 600 | | | Japan Drilling Co. Ltd. | | | 13,514 | |
| | 3,900 | | | Japan Medical Dynamic Marketing, Inc. | | | 29,007 | |
| | 42,000 | | | Japan Pulp & Paper Co. Ltd. | | | 140,975 | |
| | 5,600 | | | Japan Radio Co. Ltd. | | | 72,089 | |
| | 2,500 | | | Japan Securities Finance Co. Ltd. | | | 11,133 | |
| | 17,800 | | | Japan Steel Works Ltd. (The) | | | 383,090 | |
| | 24,000 | | | Japan Transcity Corp. | | | 89,482 | |
| | 20,000 | | | Japan Wool Textile Co. Ltd. (The) | | | 146,086 | |
| | 6,000 | | | JBCC Holdings, Inc. | | | 38,905 | |
| | 21,000 | | | JGC Corp. | | | 372,261 | |
| | 25,400 | | | Jimoto Holdings, Inc. | | | 42,870 | |
| | 1,500 | | | Jin Co. Ltd. | | | 78,097 | |
| Shares | | | | | Value | |
| JAPAN (continued) | | | | |
| | 3,600 | | | JK Holdings Co. Ltd. | | $ | 18,915 | |
| | 7,000 | | | JMS Co. Ltd. | | | 18,490 | |
| | 2,800 | | | Joban Kosan Co. Ltd. | | | 40,797 | |
| | 2,400 | | | J-Oil Mills, Inc. | | | 85,477 | |
| | 18,000 | | | Joshin Denki Co. Ltd. | | | 154,305 | |
| | 5,400 | | | JSP Corp. | | | 129,297 | |
| | 35,100 | | | JSR Corp. | | | 534,851 | |
| | 3,200 | | | Juki Corp. | | | 23,984 | |
| | 23,000 | | | Juroku Bank Ltd. (The) | | | 69,524 | |
| | 64,900 | | | JVC Kenwood Corp. | | | 175,757 | |
| | 34,400 | | | kabu.com Securities Co. Ltd. | | | 108,576 | |
| | 1,000 | | | Kabuki-Za Co. Ltd. | | | 47,535 | |
| | 2,900 | | | Kadokawa Dwango Corp.(b) | | | 42,890 | |
| | 10,500 | | | Kaga Electronics Co. Ltd. | | | 153,690 | |
| | 8,600 | | | Kakaku.com, Inc. | | | 144,741 | |
| | 3,800 | | | Kaken Pharmaceutical Co. Ltd. | | | 239,878 | |
| | 1,000 | | | Kameda Seika Co. Ltd. | | | 52,446 | |
| | 13,800 | | | Kamei Corp. | | | 131,855 | |
| | 27,000 | | | Kamigumi Co. Ltd. | | | 230,943 | |
| | 3,000 | | | Kanagawa Chuo Kotsu Co. Ltd. | | | 21,427 | |
| | 7,600 | | | Kanamoto Co. Ltd. | | | 182,988 | |
| | 99,000 | | | Kandenko Co. Ltd. | | | 977,067 | |
| | 98,000 | | | Kaneka Corp. | | | 813,007 | |
| | 1,300 | | | Kaneko Seeds Co. Ltd. | | | 18,867 | |
| | 220,000 | | | Kanematsu Corp. | | | 362,926 | |
| | 1,800 | | | Kanematsu Electronics Ltd. | | | 36,371 | |
| | 2,400 | | | Kansai Urban Banking Corp. | | | 26,662 | |
| | 5,000 | | | Kanto Denka Kogyo Co. Ltd. | | | 42,100 | |
| | 4,400 | | | Kappa Create Co. Ltd. | | | 51,061 | |
| | 11,900 | | | Kasai Kogyo Co. Ltd. | | | 134,693 | |
| | 2,600 | | | Kato Sangyo Co. Ltd. | | | 62,800 | |
| | 5,200 | | | Kato Works Co. Ltd. | | | 130,707 | |
| | 2,400 | | | KAWADA Technologies, Inc. | | | 113,169 | |
| | 2,300 | | | Kawai Musical Instruments Manufacturing Co. Ltd. | | | 45,158 | |
| | 674,000 | | | Kawasaki Kisen Kaisha Ltd. | | | 1,671,021 | |
| | 41,000 | | | Keihan Holdings Co. Ltd. | | | 277,191 | |
| | 15,900 | | | Keihanshin Building Co. Ltd. | | | 83,086 | |
| | 13,000 | | | Keihin Co. Ltd. (The) | | | 17,727 | |
| | 30,200 | | | Keihin Corp. | | | 492,150 | |
| | 40,000 | | | Keiyo Bank Ltd. (The) | | | 168,590 | |
| | 7,800 | | | Keiyo Co. Ltd. | | | 39,420 | |
| | 27,100 | | | Kenedix, Inc. | | | 114,220 | |
| | 2,600 | | | Kenko Mayonnaise Co. Ltd. | | | 95,452 | |
| | 1,825 | | | KEY Coffee, Inc. | | | 36,215 | |
| | 2,000 | | | KFC Holdings Japan Ltd. | | | 35,492 | |
| | 21,000 | | | Kinden Corp. | | | 253,514 | |
| | 14,000 | | | Kintetsu Department Store Co. Ltd.(b) | | | 46,591 | |
| | 5,800 | | | Kintetsu World Express, Inc. | | | 79,088 | |
| | 5,900 | | | Kitagawa Iron Works Co. Ltd. | | | 101,043 | |
| | 2,600 | | | Kita-Nippon Bank Ltd. (The) | | | 77,725 | |
| | 21,000 | | | Kitano Construction Corp. | | | 55,869 | |
| | 7,900 | | | Kito Corp. | | | 74,955 | |
| | 34,300 | | | Kitz Corp. | | | 197,551 | |
| | 24,000 | | | Kiyo Bank Ltd. (The) | | | 398,894 | |
| Old Westbury Funds, Inc. | |
| Small & Mid Cap Fund | |
| Portfolio of Investments - (Continued) | October 31, 2016 |
| | |
| Shares | | | | | Value | |
| JAPAN (continued) | | | | |
| | 7,300 | | | Koa Corp. | | $ | 67,313 | |
| | 22,000 | | | Koatsu Gas Kogyo Co. Ltd. | | | 147,268 | |
| | 6,600 | | | Kobayashi Pharmaceutical Co. Ltd. | | | 345,513 | |
| | 1,000 | | | Kobe Bussan Co. Ltd. | | | 31,372 | |
| | 116,400 | | | Kobe Steel Ltd.(b) | | | 963,433 | |
| | 77,400 | | | Koei Tecmo Holdings Co. Ltd. | | | 1,484,970 | |
| | 9,600 | | | Kohnan Shoji Co. Ltd. | | | 190,224 | |
| | 1,300 | | | Kohsoku Corp. | | | 13,029 | |
| | 3,000 | | | Koike Sanso Kogyo Co. Ltd. | | | 7,438 | |
| | 700 | | | Kokusai Co. Ltd. | | | 5,534 | |
| | 13,800 | | | Kokuyo Co. Ltd. | | | 183,175 | |
| | 800 | | | KOMAIHALTEC, Inc. | | | 15,547 | |
| | 3,400 | | | Komatsu Wall Industry Co. Ltd. | | | 56,834 | |
| | 11,200 | | | Komeri Co. Ltd. | | | 274,153 | |
| | 3,000 | | | Konaka Co. Ltd. | | | 14,275 | |
| | 6,300 | | | Kondotec, Inc. | | | 48,180 | |
| | 7,400 | | | Konishi Co.Ltd. | | | 88,134 | |
| | 7,600 | | | Konoike Transport Co. Ltd. | | | 100,807 | |
| | 1,800 | | | Kotobuki Spirits Co. Ltd. | | | 42,533 | |
| | 2,000 | | | Kourakuen Holdings Corp. | | | 29,694 | |
| | 25,000 | | | Krosaki Harima Corp. | | | 76,047 | |
| | 4,200 | | | KRS Corp. | | | 92,394 | |
| | 19,356 | | | K’s Holdings Corp. | | | 335,735 | |
| | 2,000 | | | KU Holdings Co. Ltd. | | | 15,295 | |
| | 47,000 | | | Kumagai Gumi Co. Ltd. | | | 125,041 | |
| | 7,200 | | | Kumiai Chemical Industry Co. Ltd. | | | 40,851 | |
| | 2,100 | | | Kura Corp. | | | 105,931 | |
| | 73,000 | | | Kurabo Industries Ltd. | | | 146,181 | |
| | 3,400 | | | Kureha Corp. | | | 130,333 | |
| | 2,100 | | | Kurimoto Ltd. | | | 39,269 | |
| | 8,100 | | | Kurita Water Industries Ltd. | | | 192,092 | |
| | 900 | | | Kuriyama Holdings Corp. | | | 12,530 | |
| | 10,500 | | | Kuroda Electric Co. Ltd. | | | 204,754 | |
| | 2,000 | | | Kusuri No Aoki Co. Ltd. | | | 102,222 | |
| | 111,000 | | | KYB Corp. | | | 509,116 | |
| | 38,000 | | | Kyodo Printing Co. Ltd. | | | 128,998 | |
| | 6,700 | | | Kyoei Steel Ltd. | | | 128,033 | |
| | 10,800 | | | Kyokuto Kaihatsu Kogyo Co. Ltd. | | | 127,804 | |
| | 1,600 | | | Kyokuyo Co. Ltd. | | | 42,155 | |
| | 6,500 | | | KYORIN Holdings, Inc. | | | 145,657 | |
| | 1,420 | | | Kyoritsu Maintenance Co. Ltd. | | | 85,441 | |
| | 400 | | | Kyoritsu Printing Co. Ltd. | | | 1,175 | |
| | 18,000 | | | Kyosan Electric Manufacturing Co. Ltd. | | | 66,940 | |
| | 3,500 | | | Kyowa Electronic Instruments Co. Ltd. | | | 12,682 | |
| | 22,700 | | | Kyowa Exeo Corp. | | | 342,004 | |
| | 1,400 | | | Kyowa Leather Cloth Co. Ltd. | | | 10,173 | |
| | 7,000 | | | Kyudenko Corp. | | | 225,946 | |
| | 125,940 | | | Kyushu Financial Group, Inc. | | | 839,440 | |
| | 5,600 | | | Laox Co. Ltd.(b) | | | 45,283 | |
| | 3,500 | | | Lasertec Corp. | | | 68,018 | |
| | 600 | | | LEC, Inc. | | | 15,235 | |
| Shares | | | | | Value | |
| JAPAN (continued) | | | | |
| | 62,200 | | | Leopalace21 Corp. | | $ | 405,691 | |
| | 2,400 | | | Life Corp. | | | 78,039 | |
| | 8,000 | | | Lintec Corp. | | | 174,692 | |
| | 3,700 | | | Mabuchi Motor Co. Ltd. | | | 215,572 | |
| | 10,450 | | | Macnica Fuji Electronics Holdings, Inc. | | | 131,335 | |
| | 220,000 | | | Maeda Corp. | | | 2,043,292 | |
| | 2,400 | | | Maeda Kosen Co. Ltd. | | | 26,662 | |
| | 36,000 | | | Maeda Road Construction Co. Ltd. | | | 667,341 | |
| | 45,000 | | | Makino Milling Machine Co. Ltd. | | | 286,641 | |
| | 4,100 | | | Mamezou Holdings Co. Ltd. | | | 42,536 | |
| | 2,300 | | | Mandom Corp. | | | 107,466 | |
| | 900 | | | Mani, Inc. | | | 20,992 | |
| | 7,700 | | | Marubun Corp. | | | 44,055 | |
| | 31,000 | | | Marudai Food Co. Ltd. | | | 147,802 | |
| | 4,000 | | | Marufuji Sheet Piling Co. Ltd. | | | 8,925 | |
| | 11,700 | | | Maruha Nichiro Corp. | | | 324,994 | |
| | 7,800 | | | Marusan Securities Co. Ltd. | | | 64,932 | |
| | 2,900 | | | Maruwa Co. Ltd. | | | 109,645 | |
| | 20,000 | | | Maruyama Manufacturing Co., Inc. | | | 33,756 | |
| | 20,000 | | | Maruzen Showa Unyu Co. Ltd. | | | 81,243 | |
| | 6,400 | | | Marvelous, Inc. | | | 45,588 | |
| | 2,900 | | | Matsuda Sangyo Co. Ltd. | | | 40,789 | |
| | 2,000 | | | Matsui Construction Co. Ltd. | | | 21,970 | |
| | 16,400 | | | Matsui Securities Co. Ltd. | | | 131,519 | |
| | 7,200 | | | Matsumotokiyoshi Holdings Co. Ltd. | | | 371,431 | |
| | 700 | | | Matsuya Foods Co. Ltd. | | | 22,728 | |
| | 6,000 | | | Max Co. Ltd. | | | 72,433 | |
| | 2,400 | | | Maxvalu Nishinihon Co. Ltd. | | | 38,333 | |
| | 3,700 | | | Maxvalu Tokai Co. Ltd. | | | 65,765 | |
| | 31,590 | | | Mebuki Financial Group, Inc. | | | 112,660 | |
| | 2,900 | | | MEC Co. Ltd. | | | 28,759 | |
| | 14,400 | | | Medipal Holdings Corp. | | | 246,477 | |
| | 5,200 | | | Megachips Corp. | | | 104,575 | |
| | 117,200 | | | Megmilk Snow Brand Co. Ltd. | | | 4,084,733 | |
| | 45,000 | | | Meidensha Corp. | | | 151,044 | |
| | 7,800 | | | Meiko Electronics Co. Ltd.(b) | | | 27,669 | |
| | 2,600 | | | Meiko Network Japan Co. Ltd. | | | 24,520 | |
| | 12,000 | | | Meisei Industrial Co. Ltd. | | | 61,676 | |
| | 6,000 | | | Meitec Corp. | | | 204,825 | |
| | 13,200 | | | Meiwa Corp. | | | 41,537 | |
| | 1,400 | | | Menicon Co. Ltd. | | | 39,743 | |
| | 43,000 | | | Michinoku Bank Ltd. (The) | | | 85,697 | |
| | 4,400 | | | Micronics Japan Co. Ltd. | | | 50,977 | |
| | 1,000 | | | Mie Bank Ltd. (The) | | | 20,425 | |
| | 3,100 | | | Mikuni Corp. | | | 10,435 | |
| | 1,237 | | | Milbon Co. Ltd. | | | 55,498 | |
| | 6,700 | | | Mimasu Semiconductor Industry Co. Ltd. | | | 85,419 | |
| | 6,300 | | | Minato Bank Ltd. (The) | | | 115,463 | |
| | 31,000 | | | Minebea Co. Ltd. | | | 317,479 | |
| | 2,900 | | | Ministop Co. Ltd. | | | 50,052 | |
| Old Westbury Funds, Inc. | |
| Small & Mid Cap Fund | |
| Portfolio of Investments - (Continued) | October 31, 2016 |
| | |
| Shares | | | | | Value | |
| JAPAN (continued) | | | | |
| | 129,200 | | | Miraca Holdings, Inc. | | $ | 6,258,568 | |
| | 16,940 | | | Mirait Holdings Corp. | | | 150,549 | |
| | 2,300 | | | Miroku Jyoho Service Co. Ltd. | | | 45,026 | |
| | 8,500 | | | Misawa Homes Co. Ltd. | | | 64,113 | |
| | 450,000 | | | MISUMI Group, Inc. | | | 8,225,899 | |
| | 6,400 | | | Mitani Corp. | | | 191,017 | |
| | 6,000 | | | Mitsuba Corp. | | | 87,880 | |
| | 51,500 | | | Mitsubishi Gas Chemical Co., Inc. | | | 794,574 | |
| | 14,000 | | | Mitsubishi Logistics Corp. | | | 190,102 | |
| | 38,400 | | | Mitsubishi Materials Corp. | | | 1,103,995 | |
| | 11,800 | | | Mitsubishi Nichiyu Forklift Co. Ltd. | | | 71,563 | |
| | 7,300 | | | Mitsubishi Paper Mills Ltd.(b) | | | 47,961 | |
| | 2,100 | | | Mitsubishi Pencil Co. Ltd. | | | 105,330 | |
| | 1,000 | | | Mitsubishi Research Institute, Inc. | | | 31,801 | |
| | 2,800 | | | Mitsubishi Shokuhin Co. Ltd. | | | 92,114 | |
| | 24,000 | | | Mitsubishi Steel Manufacturing Co. Ltd. | | | 43,254 | |
| | 74,600 | | | Mitsubishi UFJ Lease & Finance Co. Ltd. | | | 362,081 | |
| | 13,000 | | | Mitsuboshi Belting Ltd. | | | 112,434 | |
| | 43,000 | | | Mitsui Engineering & Shipbuilding Co. Ltd. | | | 59,865 | |
| | 9,100 | | | Mitsui High-Tec, Inc. | | | 61,263 | |
| | 14,000 | | | Mitsui Home Co. Ltd. | | | 61,810 | |
| | 230,000 | | | Mitsui Mining & Smelting Co. Ltd. | | | 513,207 | |
| | 315,000 | | | Mitsui Osk Lines Ltd. | | | 789,978 | |
| | 2,000 | | | Mitsui Sugar Co. Ltd. | | | 45,142 | |
| | 23,000 | | | Mitsui-Soko Holdings Co. Ltd. | | | 69,524 | |
| | 20,800 | | | Mitsumi Electric Co. Ltd.(b) | | | 126,541 | |
| | 18,000 | | | Miyaji Engineering Group, Inc. | | | 29,694 | |
| | 43,000 | | | Miyazaki Bank Ltd. (The) | | | 121,369 | |
| | 18,000 | | | Miyoshi Oil & Fat Co. Ltd. | | | 23,172 | |
| | 25,000 | | | Mizuno Corp. | | | 134,691 | |
| | 35,100 | | | Mochida Pharmaceutical Co. Ltd. | | | 2,754,582 | |
| | 4,300 | | | Modec, Inc. | | | 72,945 | |
| | 17,000 | | | Monex Group, Inc. | | | 39,067 | |
| | 4,700 | | | Monotaro Co. Ltd. | | | 114,822 | |
| | 5,200 | | | Morinaga & Co. Ltd. | | | 242,224 | |
| | 347,000 | | | Morinaga Milk Industry Co. Ltd. | | | 2,799,294 | |
| | 8,400 | | | Morita Holdings Corp. | | | 126,877 | |
| | 2,400 | | | Mory Industries, Inc. | | | 44,924 | |
| | 6,200 | | | MTI Ltd. | | | 38,606 | |
| | 2,000 | | | Murakami Corp. | | | 34,843 | |
| | 250,100 | | | Musashi Seimitsu Industry Co. Ltd. | | | 6,119,544 | |
| | 2,000 | | | Musashino Bank Ltd. (The) | | | 55,345 | |
| | 18,500 | | | Nabtesco Corp. | | | 553,924 | |
| | 5,100 | | | NAC Co. Ltd. | | | 43,039 | |
| | 46,000 | | | Nachi-Fujikoshi Corp. | | | 175,017 | |
| | 800 | | | Nafco Co. Ltd. | | | 12,930 | |
| | 1,800 | | | Nagaileben Co. Ltd. | | | 39,615 | |
| | 3,500 | | | Nagano Bank Ltd. | | | 66,950 | |
| Shares | | | | | Value | |
| JAPAN (continued) | | | | |
| | 36,300 | | | Nagase & Co. Ltd. | | $ | 465,562 | |
| | 5,000 | | | Nagatanien Holdings Co. Ltd. | | | 63,841 | |
| | 22,000 | | | Nakabayashi Co. Ltd. | | | 49,509 | |
| | 2,500 | | | Nakanishi, Inc. | | | 89,516 | |
| | 40,000 | | | Nankai Electric Railway Co. Ltd. | | | 181,940 | |
| | 5,100 | | | Nanto Bank Ltd. (The) | | | 194,283 | |
| | 1,100 | | | Natori Co. Ltd. | | | 19,227 | |
| | 900 | | | NDS Co. Ltd. | | | 22,614 | |
| | 4,700 | | | NEC Capital Solutions Ltd. | | | 78,430 | |
| | 10,300 | | | NEC Networks & System Integration Corp. | | | 183,469 | |
| | 11,000 | | | NET One Systems Co. Ltd. | | | 80,032 | |
| | 5,600 | | | Next Co. Ltd. | | | 47,205 | |
| | 75,300 | | | NHK Spring Co. Ltd. | | | 710,852 | |
| | 18,000 | | | Nice Holdings, Inc. | | | 23,858 | |
| | 38,000 | | | Nichias Corp. | | | 338,800 | |
| | 6,000 | | | Nichiban Co. Ltd. | | | 54,239 | |
| | 5,900 | | | Nichiha Corp. | | | 145,995 | |
| | 14,000 | | | Nichii Gakkan Co. | | | 116,811 | |
| | 5,150 | | | Nichi-Iko Pharmaceutical Co. Ltd. | | | 92,618 | |
| | 96,000 | | | Nichirei Corp. | | | 2,104,548 | |
| | 18,000 | | | Nichireki Co. Ltd. | | | 141,947 | |
| | 333,300 | | | Nifco, Inc. | | | 19,228,235 | |
| | 900 | | | Nihon Chouzai Co. Ltd. | | | 37,718 | |
| | 5,500 | | | Nihon Dempa Kogyo Co. Ltd. | | | 44,422 | |
| | 1,400 | | | Nihon Eslead Corp. | | | 15,526 | |
| | 10,000 | | | Nihon House Holdings Co. Ltd. | | | 37,570 | |
| | 8,700 | | | Nihon Kohden Corp. | | | 212,626 | |
| | 247,800 | | | Nihon M&A Center, Inc. | | | 8,069,391 | |
| | 14,500 | | | Nihon Nohyaku Co. Ltd. | | | 79,365 | |
| | 12,000 | | | Nihon Parkerizing Co. Ltd. | | | 165,920 | |
| | 2,800 | | | Nihon Plast Co. Ltd. | | | 26,486 | |
| | 1,100 | | | Nihon Tokushu Toryo Co. Ltd. | | | 15,576 | |
| | 600 | | | Nihon Trim Co. Ltd. | | | 27,119 | |
| | 15,300 | | | Nihon Unisys Ltd. | | | 186,891 | |
| | 3,000 | | | Nihon Yamamura Glass Co. Ltd. | | | 5,493 | |
| | 19,300 | | | Nikkiso Co. Ltd. | | | 170,971 | |
| | 1,200 | | | Nikko Co. Ltd. | | | 19,807 | |
| | 17,900 | | | Nikkon Holdings Co. Ltd. | | | 385,412 | |
| | 407,100 | | | Nikon Corp. | | | 6,160,653 | |
| | 2,000 | | | Nippi, Inc. | | | 15,371 | |
| | 31,000 | | | Nippo Corp. | | | 599,485 | |
| | 4,000 | | | Nippon Air Conditioning Services Co. Ltd. | | | 21,512 | |
| | 31,000 | | | Nippon Chemical Industrial Co. Ltd. | | | 79,517 | |
| | 300 | | | Nippon Chemiphar Co. Ltd. | | | 12,473 | |
| | 7,500 | | | Nippon Concrete Industries Co. Ltd. | | | 27,105 | |
| | 19,205 | | | Nippon Denko Co. Ltd. | | | 35,711 | |
| | 8,000 | | | Nippon Densetsu Kogyo Co. Ltd. | | | 146,162 | |
| | 107,000 | | | Nippon Electric Glass Co. Ltd. | | | 582,598 | |
| Old Westbury Funds, Inc. | |
| Small & Mid Cap Fund | |
| Portfolio of Investments - (Continued) | October 31, 2016 |
| | |
| Shares | | | | | Value | |
| JAPAN (continued) | | | | |
| | 376,000 | | | Nippon Express Co. Ltd. | | $ | 1,860,818 | |
| | 2,300 | | | Nippon Fine Chemical Co. Ltd. | | | 17,370 | |
| | 58,500 | | | Nippon Flour Mills Co. Ltd. | | | 866,873 | |
| | 5,400 | | | Nippon Gas Co. Ltd. | | | 164,003 | |
| | 7,500 | | | Nippon Hume Corp. | | | 49,776 | |
| | 24,000 | | | Nippon Kayaku Co. Ltd. | | | 277,143 | |
| | 47,000 | | | Nippon Koei Co. Ltd. | | | 220,950 | |
| | 346,900 | | | Nippon Light Metal Holdings Co. Ltd. | | | 790,589 | |
| | 57,700 | | | Nippon Paper Industries Co. Ltd. | | | 1,082,803 | |
| | 37,600 | | | Nippon Parking Development Co. Ltd. | | | 51,271 | |
| | 4,700 | | | Nippon Piston Ring Co. Ltd. | | | 71,573 | |
| | 4,000 | | | Nippon Rietec Co. Ltd. | | | 34,061 | |
| | 30,000 | | | Nippon Road Co. Ltd. (The) | | | 123,296 | |
| | 4,000 | | | Nippon Seisen Co. Ltd. | | | 19,415 | |
| | 9,000 | | | Nippon Sharyo Ltd.(b) | | | 22,828 | |
| | 5,200 | | | Nippon Sheet Glass Co. Ltd.(b) | | | 42,395 | |
| | 6,000 | | | Nippon Shokubai Co. Ltd. | | | 415,371 | |
| | 13,200 | | | Nippon Signal Co. Ltd. | | | 117,311 | |
| | 32,000 | | | Nippon Soda Co. Ltd. | | | 142,195 | |
| | 9,748 | | | Nippon Steel & Sumikin Bussan Corp. | | | 357,870 | |
| | 51,100 | | | Nippon Suisan Kaisha Ltd. | | | 246,071 | |
| | 8,000 | | | Nippon Thompson Co. Ltd. | | | 31,735 | |
| | 3,600 | | | Nippon Valqua Industries Ltd. | | | 48,849 | |
| | 640,000 | | | Nippon Yusen KK | | | 1,312,101 | |
| | 32,800 | | | Nipro Corp. | | | 405,973 | |
| | 73,000 | | | Nishimatsu Construction Co. Ltd. | | | 341,785 | |
| | 19,200 | | | Nishi-Nippon Financial Holdings, Inc.(b) | | | 191,140 | |
| | 28,000 | | | Nishi-Nippon Railroad Co. Ltd. | | | 132,965 | |
| | 3,400 | | | Nishio Rent All Co. Ltd. | | | 102,937 | |
| | 24,300 | | | Nissan Shatai Co. Ltd. | | | 251,411 | |
| | 9,600 | | | Nissan Tokyo Sales Holdings Co. Ltd. | | | 23,618 | |
| | 11,000 | | | Nissei Build Kogyo Co. Ltd. | | | 51,502 | |
| | 1,500 | | | Nissei Plastic Industrial Co. Ltd. | | | 11,886 | |
| | 4,500 | | | Nissha Printing Co. Ltd. | | | 109,121 | |
| | 6,800 | | | Nisshin Fudosan Co. Ltd. | | | 25,807 | |
| | 29,000 | | | Nisshin Oillio Group Ltd. (The) | | | 132,183 | |
| | 50,824 | | | Nisshin Steel Co. Ltd. | | | 676,070 | |
| | 59,000 | | | Nisshinbo Holdings, Inc. | | | 589,044 | |
| | 23,000 | | | Nissin Corp. | | | 76,542 | |
| | 84,800 | | | Nissin Electric Co. Ltd. | | | 1,132,068 | |
| | 68,900 | | | Nissin Foods Holdings Co. Ltd. | | | 3,994,584 | |
| | 19,400 | | | Nissin Kogyo Co. Ltd. | | | 287,476 | |
| | 3,200 | | | Nitta Corp. | | | 82,998 | |
| | 2,600 | | | Nittetsu Mining Co. Ltd. | | | 108,840 | |
| | 80,000 | | | Nitto Boseki Co. Ltd. | | | 260,894 | |
| | 10,800 | | | Nitto Kogyo Corp. | | | 158,802 | |
| | 2,600 | | | Nitto Kohki Co. Ltd. | | | 60,172 | |
| | 12,000 | | | Nitto Seiko Co. Ltd. | | | 45,885 | |
| | 13,100 | | | Nittoc Construction Co. Ltd. | | | 61,959 | |
| Shares | | | | | Value | |
| JAPAN (continued) | | | | |
| | 3,200 | | | Noda Corp. | | $ | 21,116 | |
| | 1,200 | | | Noevir Holdings Co. Ltd. | | | 36,388 | |
| | 473,000 | | | NOF Corp. | | | 5,155,326 | |
| | 2,700 | | | Nohmi Bosai Ltd. | | | 40,370 | |
| | 3,600 | | | Nojima Corp. | | | 46,721 | |
| | 43,900 | | | NOK Corp. | | | 986,672 | |
| | 5,000 | | | Nomura Co. Ltd. | | | 81,339 | |
| | 58,300 | | | Nomura Real Estate Holdings, Inc. | | | 987,881 | |
| | 2,100 | | | Noritake Co. Ltd. | | | 47,999 | |
| | 6,600 | | | Noritz Corp. | | | 137,073 | |
| | 62,900 | | | North Pacific Bank Ltd. | | | 235,118 | |
| | 4,100 | | | NS Solutions Corp. | | | 78,388 | |
| | 23,000 | | | NS United Kaiun Kaisha Ltd. | | | 32,021 | |
| | 3,100 | | | NSD Co. Ltd. | | | 49,987 | |
| | 27,000 | | | NTN Corp. | | | 102,470 | |
| | 8,400 | | | NTT Urban Development Corp. | | | 77,216 | |
| | 2,600 | | | Obara Group, Inc. | | | 112,310 | |
| | 14,900 | | | Obayashi Road Corp. | | | 93,773 | |
| | 1,800 | | | Odelic Co. Ltd. | | | 70,030 | |
| | 27,000 | | | Oenon Holdings, Inc. | | | 66,425 | |
| | 49,000 | | | Ogaki Kyoritsu Bank Ltd. (The) | | | 175,684 | |
| | 4,500 | | | Ohashi Technica, Inc. | | | 59,989 | |
| | 900 | | | Ohsho Food Service Corp. | | | 34,714 | |
| | 7,245 | | | Oiles Corp. | | | 131,608 | |
| | 46,000 | | | Oita Bank Ltd. (The) | | | 174,578 | |
| | 11,100 | | | Okabe Co. Ltd. | | | 94,943 | |
| | 8,000 | | | Okamoto Industries, Inc. | | | 86,812 | |
| | 176,700 | | | Okamura Corp. | | | 1,737,177 | |
| | 3,200 | | | Okinawa Cellular Telephone Co. | | | 100,086 | |
| | 1,125 | | | Okinawa Electric Power Co., Inc. (The) | | | 26,079 | |
| | 18,000 | | | OKK Corp. | | | 18,537 | |
| | 40,000 | | | OKUMA Corp. | | | 335,654 | |
| | 24,000 | | | Okumura Corp. | | | 138,686 | |
| | 26,000 | | | Okura Industrial Co. Ltd. | | | 103,881 | |
| | 10,000 | | | Okuwa Co. Ltd. | | | 104,892 | |
| | 2,600 | | | ONO Sokki Co. Ltd. | | | 22,512 | |
| | 2,400 | | | Onoken Co. Ltd. | | | 29,682 | |
| | 26,000 | | | Onward Holdings Co. Ltd. | | | 174,292 | |
| | 4,800 | | | Open House Co. Ltd. | | | 101,749 | |
| | 3,400 | | | OPT Holding, Inc. | | | 22,954 | |
| | 1,800 | | | Optex Co. Ltd. | | | 45,983 | |
| | 75,000 | | | Oracle Corp. Japan | | | 4,090,779 | |
| | 9,000 | | | Organo Corp. | | | 38,877 | |
| | 36,200 | | | Orient Corp.(b) | | | 67,657 | |
| | 10,000 | | | Origin Electric Co. Ltd. | | | 26,604 | |
| | 8,100 | | | Osaka Organic Chemical Industry Ltd. | | | 63,490 | |
| | 24,000 | | | Osaka Soda Co. Ltd. | | | 102,756 | |
| | 7,000 | | | Osaka Steel Co. Ltd. | | | 131,296 | |
| | 5,000 | | | Osaki Electric Co. Ltd. | | | 48,107 | |
| | 12,500 | | | OSG Corp. | | | 266,878 | |
| | 12,200 | | | OSJB Holdings Corp. | | | 29,084 | |
| | 5,000 | | | OUG Holdings, Inc. | | | 12,873 | |
| Old Westbury Funds, Inc. | |
| Small & Mid Cap Fund | |
| Portfolio of Investments - (Continued) | October 31, 2016 |
| | |
| Shares | | | | | Value | |
| JAPAN (continued) | | | | |
| | 1,000 | | | Outsourcing Inc. | | $ | 38,047 | |
| | 24,900 | | | Pacific Industrial Co. Ltd. | | | 306,056 | |
| | 31,000 | | | Pacific Metals Co. Ltd.(b) | | | 93,411 | |
| | 2,950 | | | Pack Corp. (The) | | | 80,199 | |
| | 1,400 | | | Pal Co. Ltd. | | | 34,763 | |
| | 5,850 | | | PALTAC Corp. | | | 143,809 | |
| | 8,000 | | | PanaHome Corp. | | | 59,579 | |
| | 5,300 | | | Panasonic Industrial Devices SUNX Co. Ltd. | | | 31,890 | |
| | 49,000 | | | Paramount Bed Holdings Co. Ltd. | | | 1,868,981 | |
| | 4,500 | | | Parco Co. Ltd. | | | 41,752 | |
| | 158,800 | | | Park24 Co. Ltd. | | | 4,913,760 | |
| | 3,000 | | | Pasco Corp. | | | 10,813 | |
| | 1,900 | | | Pasona Group, Inc. | | | 16,161 | |
| | 3,000 | | | PC Depot Corp. | | | 14,733 | |
| | 4,100 | | | Pegasus Sewing Machine Manufacturing Co. Ltd. | | | 24,787 | |
| | 57,100 | | | Penta-Ocean Construction Co. Ltd. | | | 340,847 | |
| | 700 | | | PIA Corp. | | | 16,400 | |
| | 20,100 | | | Pigeon Corp. | | | 567,331 | |
| | 6,200 | | | Pilot Corp. | | | 277,868 | |
| | 2,200 | | | Piolax, Inc. | | | 139,716 | |
| | 129,500 | | | Pioneer Corp.(b) | | | 318,594 | |
| | 3,500 | | | Plenus Co. Ltd. | | | 72,189 | |
| | 2,600 | | | Pocket Card Co. Ltd. | | | 12,396 | |
| | 62,000 | | | Press Kogyo Co. Ltd. | | | 302,107 | |
| | 2,400 | | | Pressance Corp. | | | 27,691 | |
| | 6,000 | | | Prestige International, Inc. | | | 45,256 | |
| | 15,000 | | | Prima Meat Packers Ltd. | | | 54,639 | |
| | 1,200 | | | Proto Corp. | | | 13,617 | |
| | 3,400 | | | PS Mitsubishi Construction Co. Ltd. | | | 11,866 | |
| | 3,700 | | | Qol Co. Ltd. | | | 58,462 | |
| | 9,000 | | | Raito Kogyo Co. Ltd. | | | 108,649 | |
| | 20,000 | | | Rasa Industries Ltd. | | | 25,555 | |
| | 1,900 | | | Relo Holdings, Inc. | | | 314,342 | |
| | 216,840 | | | Rengo Co. Ltd. | | | 1,362,616 | |
| | 369,800 | | | Resorttrust, Inc. | | | 7,408,695 | |
| | 3,000 | | | Rheon Automatic Machinery Co. Ltd. | | | 23,486 | |
| | 10,000 | | | Ricoh Leasing Co. Ltd. | | | 289,406 | |
| | 4,800 | | | Right On Co. Ltd. | | | 47,327 | |
| | 2,900 | | | Riken Corp. | | | 106,603 | |
| | 6,500 | | | Riken Keiki Co. Ltd. | | | 80,390 | |
| | 19,000 | | | Riken Technos Corp. | | | 99,647 | |
| | 900 | | | Riken Vitamin Co. Ltd. | | | 39,091 | |
| | 3,000 | | | Ringer Hut Co. Ltd. | | | 76,437 | |
| | 42,500 | | | Rinnai Corp. | | | 4,093,163 | |
| | 17,500 | | | Riso Kagaku Corp. | | | 303,876 | |
| | 8,500 | | | Riso Kyoiku Co. Ltd. | | | 48,470 | |
| | 1,800 | | | Rock Field Co. Ltd. | | | 25,060 | |
| | 11,400 | | | Rohto Pharmaceutical Co. Ltd. | | | 200,454 | |
| | 900 | | | Rokko Butter Co. Ltd. | | | 24,236 | |
| | 600 | | | Roland DG Corp. | | | 14,189 | |
| Shares | | | | | Value | |
| JAPAN (continued) | | | | |
| | 1,700 | | | Rorze Corp. | | $ | 32,389 | |
| | 43,000 | | | Round One Corp. | | | 303,833 | |
| | 6,300 | | | Royal Holdings Co. Ltd. | | | 109,035 | |
| | 59,000 | | | Ryobi Ltd. | | | 237,980 | |
| | 6,000 | | | Ryoden Trading Co. Ltd. | | | 38,619 | |
| | 8,400 | | | Ryosan Co. Ltd. | | | 259,121 | |
| | 1,800 | | | S Foods, Inc. | | | 48,231 | |
| | 1,700 | | | Sac’s Bar Holdings, Inc. | | | 18,204 | |
| | 22,000 | | | Saibu Gas Co. Ltd. | | | 51,607 | |
| | 4,700 | | | Saizeriya Co. Ltd. | | | 124,099 | |
| | 28,000 | | | Sakai Chemical Industry Co. Ltd. | | | 100,124 | |
| | 14,000 | | | Sakai Heavy Industries Ltd. | | | 28,569 | |
| | 1,800 | | | Sakai Moving Service Co. Ltd. | | | 39,014 | |
| | 1,800 | | | Sakai Ovex Co. Ltd. | | | 32,921 | |
| | 9,300 | | | Sakata INX Corp. | | | 122,203 | |
| | 2,900 | | | Sakata Seed Corp. | | | 83,651 | |
| | 5,100 | | | SAMTY Co. Ltd. | | | 53,057 | |
| | 2,300 | | | San-A Co. Ltd. | | | 125,451 | |
| | 31,000 | | | San-Ai Oil Co. Ltd. | | | 219,043 | |
| | 29,000 | | | Sanden Holdings Corp. | | | 89,873 | |
| | 1,100 | | | Sanei Architecture Planning Co. Ltd. | | | 19,552 | |
| | 21,750 | | | Sangetsu Co. Ltd. | | | 421,021 | |
| | 40,800 | | | San-In Godo Bank Ltd. (The) | | | 294,124 | |
| | 20,000 | | | Sanken Electric Co. Ltd.(b) | | | 70,945 | |
| | 800 | | | Sanko Metal Industrial Co. Ltd. | | | 22,588 | |
| | 3,900 | | | Sankyo Co. Ltd. | | | 137,599 | |
| | 6,200 | | | Sankyo Tateyama, Inc. | | | 97,786 | |
| | 52,000 | | | Sankyu, Inc. | | | 306,932 | |
| | 14,600 | | | Sanoh Industrial Co. Ltd. | | | 100,795 | |
| | 1,100 | | | Sanrio Co. Ltd. | | | 20,653 | |
| | 6,800 | | | Sanshin Electronics Co. Ltd. | | | 60,303 | |
| | 30,800 | | | Sanwa Holdings Corp. | | | 307,794 | |
| | 3,800 | | | Sanyo Chemical Industries Ltd. | | | 172,299 | |
| | 11,000 | | | Sanyo Denki Co. Ltd. | | | 71,641 | |
| | 2,000 | | | Sanyo Electric Railway Co. Ltd. | | | 9,879 | |
| | 2,400 | | | Sanyo Housing Nagoya Co. Ltd. | | | 21,009 | |
| | 8,000 | | | Sanyo Industries Ltd. | | | 13,884 | |
| | 60,000 | | | Sanyo Special Steel Co. Ltd. | | | 307,810 | |
| | 2,100 | | | Sanyo Trading Co. Ltd. | | | 26,613 | |
| | 13,000 | | | Sapporo Holdings Ltd. | | | 368,046 | |
| | 1,500 | | | SATO Holdings Corp. | | | 33,127 | |
| | 2,700 | | | Sato Shoji Corp. | | | 20,803 | |
| | 4,100 | | | Satori Electric Co. Ltd. | | | 29,166 | |
| | 7,800 | | | Sawada Holdings Co. Ltd. | | | 71,477 | |
| | 74,500 | | | Sawai Pharmaceutical Co. Ltd. | | | 4,823,639 | |
| | 35,000 | | | SAXA Holdings, Inc. | | | 74,092 | |
| | 112,480 | | | SBI Holdings, Inc. | | | 1,340,708 | |
| | 8,500 | | | SBS Holdings, Inc. | | | 75,460 | |
| | 2,400 | | | SCREEN Holdings Co. Ltd. | | | 164,547 | |
| | 5,800 | | | Scroll Corp. | | | 20,242 | |
| | 18,800 | | | Sega Sammy Holdings, Inc. | | | 278,047 | |
| | 800 | | | Seibu Electric Industry Co. Ltd. | | | 16,035 | |
| | 18,000 | | | Seika Corp. | | | 53,552 | |
| | 8,700 | | | Seikitokyu Kogyo Co. Ltd. | | | 41,978 | |
| Old Westbury Funds, Inc. | |
| Small & Mid Cap Fund | |
| Portfolio of Investments - (Continued) | October 31, 2016 |
| | |
| Shares | | | | | Value | |
| JAPAN (continued) | | | | |
| | 54,000 | | | Seiko Holdings Corp. | | $ | 177,134 | |
| | 38,300 | | | Seino Holdings Co. Ltd. | | | 425,474 | |
| | 13,400 | | | Seiren Co. Ltd. | | | 157,166 | |
| | 1,000 | | | Sekisui Plastics Co. Ltd. | | | 7,390 | |
| | 29,500 | | | Senko Co. Ltd. | | | 204,224 | |
| | 2,000 | | | Senshu Electric Co. Ltd. | | | 30,934 | |
| | 92,420 | | | Senshu Ikeda Holdings, Inc. | | | 421,253 | |
| | 8,800 | | | Senshukai Co. Ltd. | | | 59,746 | |
| | 13,000 | | | Septeni Holdings Co. Ltd. | | | 58,634 | |
| | 2,000 | | | Seria Co. Ltd. | | | 158,291 | |
| | 57,900 | | | Seven Bank Ltd. | | | 178,332 | |
| | 1,200 | | | Shibaura Electronics Co. Ltd. | | | 22,210 | |
| | 11,000 | | | Shibaura Mechatronics Corp. | | | 26,957 | |
| | 17,000 | | | Shibusawa Warehouse Co. Ltd. (The) | | | 49,442 | |
| | 5,100 | | | Shibuya Corp. | | | 106,260 | |
| | 1,400 | | | Shidax Corp. | | | 5,647 | |
| | 42,000 | | | Shiga Bank Ltd. (The) | | | 218,270 | |
| | 44,000 | | | Shikibo Ltd. | | | 50,768 | |
| | 14,000 | | | Shikoku Bank Ltd. (The) | | | 33,108 | |
| | 14,000 | | | Shikoku Chemicals Corp. | | | 134,300 | |
| | 3,900 | | | Shikoku Electric Power Co., Inc.(b) | | | 36,743 | |
| | 6,900 | | | Shima Seiki Manufacturing Ltd. | | | 194,821 | |
| | 12,749 | | | Shimachu Co. Ltd. | | | 342,826 | |
| | 1,800 | | | Shimizu Bank Ltd. (The) | | | 54,410 | |
| | 3,100 | | | Shin Nippon Air Technologies Co. Ltd. | | | 35,118 | |
| | 32,000 | | | Shinagawa Refractories Co. Ltd. | | | 68,351 | |
| | 7,000 | | | Shindengen Electric Manufacturing Co. Ltd. | | | 30,371 | |
| | 20,700 | | | Shinko Electric Industries Co. Ltd. | | | 133,631 | |
| | 12,700 | | | Shinko Plantech Co. Ltd. | | | 94,339 | |
| | 4,900 | | | Shinko Shoji Co. Ltd. | | | 55,369 | |
| | 18,000 | | | Shinmaywa Industries Ltd. | | | 139,544 | |
| | 8,400 | | | Shinnihon Corp. | | | 81,221 | |
| | 2,200 | | | Shinsho Corp. | | | 40,090 | |
| | 900 | | | Shinwa Co. Ltd. | | | 13,680 | |
| | 8,800 | | | Ship Healthcare Holdings, Inc. | | | 258,034 | |
| | 3,000 | | | Shizuki Electric Co., Inc. | | | 17,822 | |
| | 27,900 | | | Shizuoka Gas Co. Ltd. | | | 219,486 | |
| | 7,000 | | | Shochiku Co. Ltd. | | | 78,564 | |
| | 800 | | | Shoei Co. Ltd. | | | 14,601 | |
| | 3,000 | | | Shoei Foods Corp. | | | 47,430 | |
| | 1,000 | | | Showa Aircraft Industry Co. Ltd. | | | 9,135 | |
| | 24,600 | | | Showa Corp. | | | 160,685 | |
| | 16,600 | | | Showa Denko KK | | | 219,867 | |
| | 32,000 | | | Showa Sangyo Co. Ltd. | | | 171,489 | |
| | 118,900 | | | Showa Shell Sekiyu KK | | | 1,112,243 | |
| | 3,200 | | | Siix Corp. | | | 128,159 | |
| | 3,000 | | | Sinanen Holdings Co. Ltd. | | | 59,588 | |
| | 31,000 | | | Sinfonia Technology Co. Ltd. | | | 57,052 | |
| | 2,600 | | | Sinko Industries Ltd. | | | 32,652 | |
| | 107,200 | | | SKY Perfect JSAT Holdings, Inc. | | | 532,576 | |
| Shares | | | | | Value | |
| JAPAN (continued) | | | | |
| | 2,800 | | | Skylark Co. Ltd. | | $ | 39,435 | |
| | 17,000 | | | SMK Corp. | | | 65,491 | |
| | 2,800 | | | SMS Co. Ltd. | | | 73,184 | |
| | 12,400 | | | Sodick Co. Ltd. | | | 93,293 | |
| | 3,200 | | | Sogo Medical Co. Ltd. | | | 97,645 | |
| | 315,700 | | | Sojitz Corp. | | | 830,869 | |
| | 30,000 | | | Sotetsu Holdings, Inc. | | | 146,753 | |
| | 18,500 | | | Sparx Group Co. Ltd. | | | 35,458 | |
| | 700 | | | SPK Corp. | | | 14,478 | |
| | 5,000 | | | Square Enix Holdings Co. Ltd. | | | 165,920 | |
| | 300 | | | ST Corp. | | | 3,707 | |
| | 3,000 | | | St. Marc Holdings Co. Ltd. | | | 84,304 | |
| | 6,500 | | | Star Micronics Co. Ltd. | | | 92,724 | |
| | 4,900 | | | Starts Corp., Inc. | | | 91,160 | |
| | 2,200 | | | Starzen Co. Ltd. | | | 116,640 | |
| | 3,200 | | | Stella Chemifa Corp. | | | 112,749 | |
| | 1,300 | | | Studio Alice Co. Ltd. | | | 26,268 | |
| | 2,700 | | | Sugi Holdings Co. Ltd. | | | 144,951 | |
| | 2,700 | | | Sugimoto & Co. Ltd. | | | 35,092 | |
| | 44,600 | | | Sumco Corp. | | | 468,668 | |
| | 4,800 | | | Sumida Corp. | | | 49,936 | |
| | 7,000 | | | Suminoe Textile Co. Ltd. | | | 14,818 | |
| | 104,000 | | | Sumitomo Bakelite Co. Ltd. | | | 566,263 | |
| | 8,900 | | | Sumitomo Densetsu Co. Ltd. | | | 98,870 | |
| | 67,800 | | | Sumitomo Forestry Co. Ltd. | | | 946,498 | |
| | 144,000 | | | Sumitomo Heavy Industries Ltd. | | | 760,713 | |
| | 126,500 | | | Sumitomo Mitsui Construction Co. Ltd. | | | 120,626 | |
| | 1,464,000 | | | Sumitomo Osaka Cement Co. Ltd. | | | 6,072,661 | |
| | 7,000 | | | Sumitomo Precision Products Co. Ltd. | | | 21,627 | |
| | 1,980 | | | Sumitomo Real Estate Sales Co. Ltd. | | | 44,936 | |
| | 19,100 | | | Sumitomo Riko Co. Ltd. | | | 183,587 | |
| | 37,900 | | | Sumitomo Rubber Industries Ltd. | | | 635,341 | |
| | 3,800 | | | Sumitomo Seika Chemicals Co. Ltd. | | | 142,405 | |
| | 27,000 | | | Sumitomo Warehouse Co. Ltd. (The) | | | 144,693 | |
| | 5,200 | | | Sun Frontier Fudousan Co. Ltd. | | | 49,684 | |
| | 3,600 | | | Sun-Wa Technos Corp. | | | 28,939 | |
| | 9,590 | | | Suzuken Co. Ltd. | | | 308,632 | |
| | 42,000 | | | SWCC Showa Holdings Co. Ltd.(b) | | | 29,637 | |
| | 1,700 | | | Systena Corp. | | | 29,763 | |
| | 7,000 | | | T&K Toka Co. Ltd. | | | 66,416 | |
| | 3,200 | | | T. Hasegawa Co. Ltd. | | | 56,634 | |
| | 18,000 | | | T. RAD Co. Ltd. | | | 39,477 | |
| | 3,240 | | | Tachibana Eletech Co. Ltd. | | | 35,900 | |
| | 6,700 | | | Tachi-S Co. Ltd. | | | 111,422 | |
| | 40,000 | | | Tadano Ltd. | | | 450,081 | |
| | 360,300 | | | Taiheiyo Cement Corp. | | | 1,034,140 | |
| | 9,600 | | | Taiho Kogyo Co. Ltd. | | | 137,954 | |
| | 6,000 | | | Taikisha Ltd. | | | 151,902 | |
| Old Westbury Funds, Inc. | |
| Small & Mid Cap Fund | |
| Portfolio of Investments - (Continued) | October 31, 2016 |
| | |
| Shares | | | | | Value | |
| JAPAN (continued) | | | | |
| | 700 | | | Taiko Pharmaceutical Co. Ltd. | | $ | 10,847 | |
| | 136,000 | | | Taisei Corp. | | | 1,021,913 | |
| | 3,000 | | | Taiyo Holdings Co. Ltd. | | | 112,854 | |
| | 37,500 | | | Taiyo Yuden Co. Ltd. | | | 401,211 | |
| | 2,400 | | | Takaoka Toko Co. Ltd. | | | 43,894 | |
| | 17,700 | | | Takara Holdings, Inc. | | | 168,105 | |
| | 8,000 | | | Takara Leben Co. Ltd. | | | 54,467 | |
| | 11,000 | | | Takara Standard Co. Ltd. | | | 204,644 | |
| | 5,200 | | | Takasago International Corp. | | | 139,632 | |
| | 6,800 | | | Takasago Thermal Engineering Co. Ltd. | | | 96,096 | |
| | 18,000 | | | Takashima & Co. Ltd. | | | 29,007 | |
| | 112,000 | | | Takashimaya Co. Ltd. | | | 915,267 | |
| | 5,700 | | | Takeuchi Manufacturing Co. Ltd. | | | 110,771 | |
| | 8,000 | | | Takihyo Co. Ltd. | | | 33,413 | |
| | 14,000 | | | Takiron Co. Ltd. | | | 65,948 | |
| | 33,000 | | | Takisawa Machine Tool Co. Ltd. | | | 42,796 | |
| | 9,000 | | | Takuma Co. Ltd. | | | 82,817 | |
| | 6,800 | | | Tama Home Co. Ltd. | | | 35,728 | |
| | 1,900 | | | Tamron Co. Ltd. | | | 33,337 | |
| | 34,000 | | | Tamura Corp. | | | 140,059 | |
| | 1,950 | | | Tanseisha Co. Ltd. | | | 14,708 | |
| | 20,500 | | | Tatsuta Electric Wire and Cable Co. Ltd. | | | 81,515 | |
| | 18,000 | | | Tayca Corp. | | | 95,604 | |
| | 10,700 | | | TBK Co. Ltd. | | | 44,384 | |
| | 600 | | | Techno Medica Co. Ltd. | | | 10,258 | |
| | 51,600 | | | Teijin Ltd. | | | 1,000,313 | |
| | 12,000 | | | Tekken Corp. | | | 39,134 | |
| | 13,200 | | | Temp Holdings Co. Ltd. | | | 224,301 | |
| | 900 | | | T-Gaia Corp. | | | 13,869 | |
| | 7,900 | | | THK Co. Ltd. | | | 167,236 | |
| | 6,000 | | | Toa Corp. | | | 54,811 | |
| | 4,000 | | | Toa Corp. | | | 84,333 | |
| | 58,000 | | | Toa Oil Co. Ltd. | | | 83,513 | |
| | 22,000 | | | Toa Road Corp. | | | 59,159 | |
| | 1,400 | | | Toabo Corp. | | | 6,902 | |
| | 42,250 | | | Toagosei Co. Ltd. | | | 471,772 | |
| | 33,100 | | | Tobishima Corp. | | | 58,391 | |
| | 500 | | | Tobu Store Co. Ltd. | | | 13,455 | |
| | 17,100 | | | TOC Co. Ltd. | | | 155,069 | |
| | 2,200 | | | Tocalo Co. Ltd. | | | 49,467 | |
| | 40,000 | | | Tochigi Bank Ltd. (The) | | | 193,382 | |
| | 37,000 | | | Toda Corp. | | | 201,106 | |
| | 3,000 | | | Toda Kogyo Corp. | | | 8,611 | |
| | 20,000 | | | Toei Co. Ltd. | | | 160,961 | |
| | 21,000 | | | Toenec Corp. | | | 100,725 | |
| | 59,000 | | | Toho Bank Ltd. (The) | | | 224,478 | |
| | 4,000 | | | Toho Co. Ltd. | | | 94,517 | |
| | 676,000 | | | Toho Gas Co. Ltd. | | | 6,272,032 | |
| | 6,300 | | | Toho Holdings Co. Ltd. | | | 132,464 | |
| | 68,000 | | | Toho Zinc Co. Ltd. | | | 237,322 | |
| | 26,000 | | | Tohoku Bank Ltd. (The) | | | 36,197 | |
| | 15,000 | | | Tokai Carbon Co. Ltd. | | | 45,771 | |
| Shares | | | | | Value | |
| JAPAN (continued) | | | | |
| | 2,400 | | | Tokai Corp. | | $ | 81,930 | |
| | 19,000 | | | TOKAI Holdings Corp. | | | 122,113 | |
| | 12,000 | | | Tokai Lease Co. Ltd. | | | 22,657 | |
| | 14,500 | | | Tokai Rika Co. Ltd. | | | 271,970 | |
| | 20,000 | | | Tokai Tokyo Financial Holdings, Inc. | | | 101,840 | |
| | 3,084 | | | Tokushu Tokai Paper Co. Ltd. | | | 105,427 | |
| | 54,000 | | | Tokuyama Corp.(b) | | | 231,715 | |
| | 11,850 | | | Tokyo Century Corp. | | | 418,654 | |
| | 22,200 | | | Tokyo Dome Corp. | | | 211,479 | |
| | 1,100 | | | Tokyo Electron Device Ltd. | | | 15,692 | |
| | 7,000 | | | Tokyo Energy & Systems, Inc. | | | 67,751 | |
| | 40,000 | | | Tokyo Keiki, Inc. | | | 68,275 | |
| | 11,300 | | | Tokyo Ohka Kogyo Co. Ltd. | | | 401,917 | |
| | 4,000 | | | Tokyo Rakutenchi Co. Ltd. | | | 19,186 | |
| | 2,500 | | | Tokyo Sangyo Co. Ltd. | | | 9,512 | |
| | 6,800 | | | Tokyo Seimitsu Co. Ltd. | | | 185,903 | |
| | 27,500 | | | Tokyo Steel Manufacturing Co. Ltd. | | | 190,641 | |
| | 25,300 | | | Tokyo Tatemono Co. Ltd. | | | 322,311 | |
| | 27,000 | | | Tokyo Tekko Co. Ltd. | | | 117,660 | |
| | 18,000 | | | Tokyo Theaters Co., Inc. | | | 20,769 | |
| | 6,275 | | | Tokyo Ty Financial Group, Inc. | | | 201,348 | |
| | 4,800 | | | Tokyu Construction Co. Ltd. | | | 48,655 | |
| | 170,800 | | | Tokyu Fudosan Holdings Corp. | | | 965,809 | |
| | 27,000 | | | Toli Corp. | | | 96,548 | |
| | 2,800 | | | Tomato Bank Ltd. | | | 42,399 | |
| | 1,100 | | | Tomen Devices Corp. | | | 20,464 | |
| | 7,300 | | | Tomoe Corp. | | | 24,085 | |
| | 1,300 | | | Tomoe Engineering Co. Ltd. | | | 19,127 | |
| | 41,000 | | | Tomoku Co. Ltd. | | | 119,243 | |
| | 26,700 | | | TOMONY Holdings, Inc. | | | 138,248 | |
| | 11,800 | | | Tomy Co. Ltd. | | | 127,710 | |
| | 11,000 | | | Tonami Holdings Co. Ltd. | | | 29,684 | |
| | 10,000 | | | TonenGeneral Sekiyu KK | | | 98,789 | |
| | 7,000 | | | Topcon Corp. | | | 104,863 | |
| | 18,600 | | | Toppan Forms Co. Ltd. | | | 185,344 | |
| | 8,100 | | | Topre Corp. | | | 187,535 | |
| | 7,200 | | | Topy Industries Ltd. | | | 167,384 | |
| | 4,000 | | | TORIDOLL Holdings Corp. | | | 92,953 | |
| | 2,500 | | | Torii Pharmaceutical Co. Ltd. | | | 57,714 | |
| | 5,000 | | | Torishima Pump Manufacturing Co. Ltd. | | | 53,972 | |
| | 12,100 | | | Tosei Corp. | | | 90,689 | |
| | 32,000 | | | Toshiba Machine Co. Ltd. | | | 115,953 | |
| | 11,000 | | | Toshiba Plant Systems & Services Corp. | | | 177,792 | |
| | 46,000 | | | Toshiba TEC Corp.(b) | | | 205,283 | |
| | 1,000 | | | Tosho Co. Ltd. | | | 43,387 | |
| | 163,000 | | | Tosoh Corp. | | | 1,067,808 | |
| | 5,900 | | | Totetsu Kogyo Co. Ltd. | | | 167,711 | |
| | 800 | | | Tottori Bank Ltd. (The) | | | 13,205 | |
| | 94,000 | | | Towa Bank Ltd. (The) | | | 99,495 | |
| | 5,500 | | | Towa Corp. | | | 63,460 | |
| | 2,000 | | | Towa Pharmaceutical Co. Ltd. | | | 74,759 | |
| | 15,700 | | | Toyo Construction Co. Ltd. | | | 65,573 | |
| Old Westbury Funds, Inc. | |
| Small & Mid Cap Fund | |
| Portfolio of Investments - (Continued) | October 31, 2016 |
| | |
| Shares | | | | | Value | |
| JAPAN (continued) | | | | |
| | 3,000 | | | Toyo Denki Seizo KK | | $ | 8,439 | |
| | 16,000 | | | Toyo Engineering Corp. | | | 54,925 | |
| | 89,000 | | | Toyo Ink SC Holdings Co. Ltd. | | | 415,000 | |
| | 6,000 | | | TOYO KANETSU K.K. | | | 13,617 | |
| | 16,000 | | | Toyo Securities Co. Ltd. | | | 28,531 | |
| | 117,000 | | | Toyo Suisan Kaisha Ltd. | | | 4,747,163 | |
| | 32,200 | | | Toyo Tire & Rubber Co. Ltd. | | | 497,109 | |
| | 20,000 | | | Toyo Wharf & Warehouse Co. Ltd. | | | 32,612 | |
| | 544,000 | | | Toyobo Co. Ltd. | | | 892,228 | |
| | 36,000 | | | Toyoda Gosei Co. Ltd. | | | 824,220 | |
| | 9,200 | | | Toyota Boshoku Corp. | | | 231,776 | |
| | 5,100 | | | TPR Co. Ltd. | | | 147,597 | |
| | 1,200 | | | Trancom Co. Ltd. | | | 69,915 | |
| | 3,000 | | | Transcosmos, Inc. | | | 76,094 | |
| | 2,600 | | | Trusco Nakayama Corp. | | | 134,624 | |
| | 7,500 | | | TS Tech Co. Ltd. | | | 201,321 | |
| | 47,000 | | | Tsubakimoto Chain Co. | | | 373,329 | |
| | 8,000 | | | Tsubakimoto Kogyo Co. Ltd. | | | 23,648 | |
| | 7,000 | | | Tsudakoma Corp.(b) | | | 10,012 | |
| | 3,100 | | | Tsukada Global Holdings, Inc. | | | 21,343 | |
| | 6,800 | | | Tsukishima Kikai Co. Ltd. | | | 76,254 | |
| | 20,833 | | | Tsukuba Bank Ltd. | | | 62,378 | |
| | 5,000 | | | Tsukui Corp. | | | 32,850 | |
| | 8,800 | | | Tsumura & Co. | | | 250,565 | |
| | 1,200 | | | Tsurumi Manufacturing Co. Ltd. | | | 17,507 | |
| | 7,000 | | | TTK Co. Ltd. | | | 32,507 | |
| | 2,400 | | | Tv Tokyo Holdings Corp. | | | 55,017 | |
| | 86,840 | | | UACJ Corp. | | | 284,029 | |
| | 267,800 | | | Ube Industries Ltd. | | | 554,139 | |
| | 23,000 | | | Uchida Yoko Co. Ltd. | | | 96,062 | |
| | 6,000 | | | Ueki Corp. | | | 12,930 | |
| | 2,500 | | | UKC Holdings Corp. | | | 41,909 | |
| | 7,200 | | | Ulvac, Inc. | | | 227,939 | |
| | 18,500 | | | Unipres Corp. | | | 356,522 | |
| | 2,600 | | | United Arrows Ltd. | | | 71,056 | |
| | 9,300 | | | United Super Markets Holdings, Inc. | | | 84,070 | |
| | 35,000 | | | Unitika Ltd.(b) | | | 23,695 | |
| | 4,700 | | | Universal Entertainment Corp.(b) | | | 140,951 | |
| | 2,800 | | | Unizo Holdings Co. Ltd. | | | 77,963 | |
| | 19,880 | | | Usen Corp. | | | 64,264 | |
| | 8,600 | | | U-Shin Ltd. | | | 60,603 | |
| | 111,400 | | | USS Co. Ltd. | | | 1,888,712 | |
| | 8,800 | | | Utoc Corp. | | | 32,223 | |
| | 400 | | | V Technology Co. Ltd. | | | 47,793 | |
| | 37,500 | | | Valor Holdings Co. Ltd. | | | 1,065,247 | |
| | 1,400 | | | Village Vanguard Co. Ltd. | | | 17,902 | |
| | 11,200 | | | Vital KSK Holdings, Inc. | | | 118,654 | |
| | 16,200 | | | VT Holdings Co. Ltd. | | | 87,279 | |
| | 23,000 | | | Wacoal Holdings Corp. | | | 265,815 | |
| | 33,000 | | | Wakachiku Construction Co. Ltd. | | | 49,404 | |
| | 7,600 | | | Warabeya Nichiyo Co. Ltd. | | | 183,641 | |
| | 2,700 | | | WATAMI Co. Ltd. | | | 29,299 | |
| Shares | | | | | Value | |
| JAPAN (continued) | | | | |
| | 600 | | | Weathernews, Inc. | | $ | 18,766 | |
| | 3,340 | | | Welcia Holdings Co. Ltd. | | | 228,357 | |
| | 5,900 | | | West Holdings Corp. | | | 46,921 | |
| | 1,000 | | | Wowow, Inc. | | | 28,655 | |
| | 6,500 | | | Xebio Holdings Co. Ltd. | | | 101,092 | |
| | 4,000 | | | Yachiyo Industry Co. Ltd. | | | 34,748 | |
| | 4,500 | | | Yahagi Construction Co. Ltd. | | | 41,408 | |
| | 11,200 | | | YAMABIKO Corp. | | | 111,071 | |
| | 462,700 | | | Yamada Denki Co. Ltd. | | | 2,395,786 | |
| | 42,000 | | | Yamagata Bank Ltd. (The) | | | 181,825 | |
| | 51,000 | | | Yamaguchi Financial Group, Inc. | | | 563,154 | |
| | 7,000 | | | Yamaichi Electronics Co. Ltd. | | | 55,602 | |
| | 45,000 | | | Yamanashi Chuo Bank Ltd. (The) | | | 220,559 | |
| | 5,100 | | | Yamatane Corp. | | | 67,355 | |
| | 8,400 | | | Yamato Kogyo Co. Ltd. | | | 236,853 | |
| | 800 | | | Yamaya Corp. | | | 11,649 | |
| | 100 | | | Yamazawa Co. Ltd. | | | 1,647 | |
| | 12,300 | | | Yamazen Corp. | | | 98,287 | |
| | 1,200 | | | Yaoko Co. Ltd. | | | 50,520 | |
| | 700 | | | Yashima Denki Co. Ltd. | | | 3,865 | |
| | 43,800 | | | Yaskawa Electric Corp. | | | 700,416 | |
| | 4,700 | | | Yellow Hat Ltd. | | | 100,525 | |
| | 7,600 | | | Yokogawa Bridge Holdings Corp. | | | 83,704 | |
| | 133,300 | | | Yokogawa Electric Corp. | | | 1,877,411 | |
| | 22,300 | | | Yokohama Reito Co. Ltd. | | | 226,041 | |
| | 42,500 | | | Yokohama Rubber Co. Ltd. (The) | | | 739,201 | |
| | 500 | | | Yondoshi Holdings, Inc. | | | 12,520 | |
| | 8,300 | | | Yorozu Corp. | | | 130,669 | |
| | 2,700 | | | Yoshinoya Holdings Co. Ltd. | | | 40,730 | |
| | 6,800 | | | Yuasa Trading Co. Ltd. | | | 163,337 | |
| | 27,000 | | | Yuken Kogyo Co. Ltd. | | | 47,373 | |
| | 2,700 | | | Yumeshin Holdings Co. Ltd. | | | 19,129 | |
| | 13,000 | | | Yurtec Corp. | | | 95,452 | |
| | 8,000 | | | Yusen Logistics Co. Ltd. | | | 81,625 | |
| | 900 | | | Yushiro Chemical Industry Co. Ltd. | | | 12,444 | |
| | 3,000 | | | Zenkoku Hosho Co. Ltd. | | | 129,303 | |
| | 2,400 | | | Zenrin Co. Ltd. | | | 41,995 | |
| | 14,300 | | | Zensho Holdings Co. Ltd. | | | 267,537 | |
| | 52,000 | | | Zeon Corp. | | | 476,514 | |
| | 1,500 | | | ZERIA Pharmaceutical Co. Ltd. | | | 25,203 | |
| | 4,000 | | | Zojirushi Corp. | | | 55,307 | |
| | | | | | | | 333,968,451 | |
| JERSEY CHANNEL ISLANDS — 0.1% | | | | |
| | 679,538 | | | Atrium European Real Estate Ltd.(d) | | | 2,908,523 | |
| | 400,611 | | | Centamin Plc | | | 773,772 | |
| | 51,777 | | | Phoenix Group Holdings | | | 462,957 | |
| | 3,503 | | | Randgold Resources Ltd. | | | 310,429 | |
| | | | | | | | 4,455,681 | |
| Old Westbury Funds, Inc. | |
| Small & Mid Cap Fund | |
| Portfolio of Investments - (Continued) | October 31, 2016 |
| | |
| Shares | | | | | Value | |
| LUXEMBOURG — 0.2% |
| | 22,999 | | | APERAM SA | | $ | 1,045,111 | |
| | 9,853 | | | B&M European Value Retail SA | | | 28,293 | |
| | 843 | | | BRAAS Monier Building Group SA | | | 24,269 | |
| | 60,129 | | | d’Amico International Shipping SA | | | 20,594 | |
| | 1,249 | | | Eurofins Scientific SE | | | 567,497 | |
| | 600 | | | Globant SA | | | 26,099 | |
| | 22,500 | | | L’Occitane International SA | | | 46,476 | |
| | 100,579 | | | Regus Plc | | | 306,419 | |
| | 160,515 | | | Stabilus SA(b)(d) | | | 8,362,744 | |
| | | | | | | | 10,427,502 | |
| MALAYSIA — 0.4% |
| | 75,100 | | | Aeon Co. (M) Berhad | | | 50,663 | |
| | 314,490 | | | Affin Holdings Berhad | | | 164,929 | |
| | 155,500 | | | AirAsia Berhad | | | 102,678 | |
| | 320,200 | | | Alliance Financial Group Berhad | | | 304,553 | |
| | 123,600 | | | Ammb Holdings Berhad | | | 123,747 | |
| | 20,100 | | | Amway Malaysia Holdings Berhad | | | 39,290 | |
| | 480,800 | | | APM Automotive Holdings Berhad(d) | | | 388,537 | |
| | 32,700 | | | Batu Kawan Berhad | | | 142,804 | |
| | 95,933 | | | Berjaya Assets Berhad | | | 18,295 | |
| | 327,300 | | | Berjaya Corp. Berhad | | | 25,357 | |
| | 19,519 | | | Berjaya Sports Toto Berhad | | | 14,843 | |
| | 57,200 | | | BIMB Holdings Berhad | | | 59,995 | |
| | 486,500 | | | Bintulu Port Holdings Berhad(d) | | | 781,647 | |
| | 627,207 | | | Boustead Holdings Berhad | | | 327,433 | |
| | 46,400 | | | Bursa Malaysia Berhad | | | 95,676 | |
| | 60,400 | | | Cahya Mata Sarawak Berhad | | | 55,289 | |
| | 20,200 | | | Carlsberg Brewery-Malaysia Berhad | | | 70,206 | |
| | 98,060 | | | CB Industrial Product Holding Berhad | | | 46,517 | |
| | 3,350 | | | Dayang Enterprise Holdings Berhad(b) | | | 687 | |
| | 8,130,386 | | | Dialog Group Berhad | | | 3,004,076 | |
| | 234,500 | | | DRB-Hicom Berhad | | | 70,993 | |
| | 264,574 | | | Eastern & Oriental Berhad | | | 99,018 | |
| | 148,050 | | | Evergreen Fibreboard Berhad | | | 37,057 | |
| | 55,400 | | | Felda Global Ventures Holdings Berhad | | | 26,544 | |
| | 29,900 | | | Gamuda Berhad | | | 34,996 | |
| | 26,200 | | | Genting Plantations Berhad | | | 68,701 | |
| | 23,300 | | | Globetronics Technology Berhad | | | 20,273 | |
| | 75,000 | | | Glomac Berhad | | | 13,766 | |
| | 41,100 | | | GuocoLand Malaysia Berhad | | | 11,855 | |
| | 337,480 | | | HAP Seng Consolidated Berhad | | | 626,691 | |
| | 93,500 | | | Hap Seng Plantations Holdings Berhad | | | 53,938 | |
| | 2,712,360 | | | Hartalega Holdings Berhad | | | 3,168,192 | |
| | 31,600 | | | Heineken Malaysia Berhad | | | 129,413 | |
| Shares | | | | | Value | |
| MALAYSIA (continued) |
| | 19,992 | | | Hock Seng LEE Berhad | | $ | 8,292 | |
| | 50,200 | | | Hong Leong Industries Berhad | | | 119,307 | |
| | 45,377 | | | Hua Yang Berhad | | | 13,197 | |
| | 21,720 | | | Hume Industries Berhad | | | 16,517 | |
| | 550,980 | | | IJM Corp. Berhad | | | 433,429 | |
| | 36,700 | | | IJM Plantations Berhad | | | 32,369 | |
| | 73,827 | | | Inari Amertron Berhad | | | 58,955 | |
| | 9,300 | | | Jaya Tiasa Holdings Berhad | | | 3,082 | |
| | 134,000 | | | JCY International Berhad | | | 16,770 | |
| | 59,079 | | | K&N Kenanga Holdings Berhad(b)(c)(d) | | | 6,830 | |
| | 45,100 | | | Kian JOO CAN Factory Berhad | | | 30,210 | |
| | 1,976,800 | | | KKB Engineering Berhad(d) | | | 669,143 | |
| | 310,080 | | | KNM Group Berhad(b) | | | 29,567 | |
| | 21,600 | | | Kossan Rubber Industries | | | 34,756 | |
| | 1,362,088 | | | KPJ Healthcare Berhad(d) | | | 1,363,711 | |
| | 181,574 | | | KSL Holdings Berhad | | | 48,045 | |
| | 35,950 | | | Kumpulan Fima Berhad | | | 15,426 | |
| | 102,500 | | | Kumpulan Perangsang Selangor Berhad | | | 32,497 | |
| | 15,000 | | | Lafarge Malaysia Berhad | | | 28,963 | |
| | 187,300 | | | Land & General Berhad | | | 16,743 | |
| | 157,800 | | | Landmarks Berhad(b) | | | 28,588 | |
| | 34,400 | | | LBS Bina Group Berhad | | | 14,268 | |
| | 79,000 | | | Lingkaran Trans Kota Holdings Berhad | | | 111,108 | |
| | 17,100 | | | LPI Capital Berhad | | | 68,563 | |
| | 214,257 | | | Lynas Corp. Ltd.(b) | | | 9,127 | |
| | 62,600 | | | Magnum Berhad | | | 34,471 | |
| | 542,073 | | | Mah Sing Group Berhad | | | 197,705 | |
| | 73,050 | | | Malayan Flour Mills Berhad | | | 25,250 | |
| | 71,823 | | | Malaysia Airports Holdings Berhad | | | 113,513 | |
| | 223,560 | | | Malaysia Building Society Berhad | | | 48,762 | |
| | 27,400 | | | Malaysian Pacific Industries Berhad | | | 51,665 | |
| | 291,250 | | | Malaysian Resources Corp. Berhad | | | 93,728 | |
| | 12,100 | | | Media Prima Berhad | | | 3,461 | |
| | 18,700 | | | Mega First Corp. Berhad | | | 10,297 | |
| | 81,000 | | | MKH Berhad | | | 53,678 | |
| | 355,200 | | | MMC Corp. Berhad | | | 202,367 | |
| | 45,500 | | | MNRB Holdings Berhad(b) | | | 34,274 | |
| | 22,700 | | | Muhibbah Engineering M Berhad | | | 12,446 | |
| | 579,100 | | | Mulpha International Berhad(b) | | | 28,990 | |
| | 71,200 | | | My EG Services Berhad | | | 41,413 | |
| | 31,800 | | | Naim Holdings Berhad(b) | | | 11,750 | |
| | 71,200 | | | Oriental Holdings Berhad | | | 118,299 | |
| | 30,500 | | | Padini Holdings Berhad | | | 20,576 | |
| | 72,631 | | | Pantech Group Holdings Berhad | | | 9,609 | |
| | 107,600 | | | POS Malaysia Berhad | | | 102,598 | |
| | 111,200 | | | Press Metal Berhad | | | 115,574 | |
| | 48,600 | | | Protasco Berhad | | | 18,421 | |
| | 2,848,900 | | | QL Resources Berhad(d) | | | 3,001,702 | |
| Old Westbury Funds, Inc. | |
| Small & Mid Cap Fund | |
| Portfolio of Investments - (Continued) | October 31, 2016 |
| | |
| Shares | | | | | Value | |
| MALAYSIA (continued) |
| | 615,200 | | | SapuraKencana Petroleum Berhad(b) | | $ | 237,574 | |
| | 19,800 | | | Sarawak Oil Palms Berhad | | | 17,511 | |
| | 15,200 | | | Scientex Berhad | | | 23,624 | |
| | 2,300 | | | Selangor Properties Berhad | | | 2,741 | |
| | 51,400 | | | Shangri-La Hotels (Malaysia) Berhad | | | 64,327 | |
| | 6,100 | | | Shell Refining Co. Federation of Malaya Berhad(b) | | | 4,435 | |
| | 149,660 | | | Sunway Berhad | | | 111,309 | |
| | 14,966 | | | Sunway Construction Group Berhad | | | 5,958 | |
| | 21,100 | | | Supermax Corp. Berhad | | | 10,915 | |
| | 27,000 | | | Syarikat Takaful Malaysia Berhad | | | 27,290 | |
| | 30,436 | | | Ta Ann Holdings Berhad | | | 25,611 | |
| | 269,700 | | | TA Enterprise Berhad | | | 30,860 | |
| | 195,360 | | | TA Global Berhad | | | 10,245 | |
| | 126,800 | | | TAN Chong Motor Holdings Berhad | | | 57,430 | |
| | 211,200 | | | TDM Berhad | | | 34,990 | |
| | 54,040 | | | TH Plantations Berhad(b) | | | 14,557 | |
| | 20,860 | | | Time dotCom Berhad | | | 39,781 | |
| | 17,800 | | | Tiong NAM Logistics Holdings | | | 7,213 | |
| | 105,720 | | | Top Glove Corp. Berhad | | | 124,747 | |
| | 157,116 | | | Tropicana Corp. Berhad | | | 38,202 | |
| | 43,600 | | | TSH Resources Berhad | | | 19,955 | |
| | 41,800 | | | UEM Edgenta Berhad | | | 33,380 | |
| | 120,408 | | | UEM Sunrise Berhad | | | 32,147 | |
| | 12,100 | | | UMW Holdings Berhad | | | 17,191 | |
| | 167,600 | | | Unisem M Berhad | | | 101,878 | |
| | 15,000 | | | United Malacca Berhad | | | 19,917 | |
| | 31,900 | | | United Plantations Berhad | | | 212,160 | |
| | 142,300 | | | VS Industry Berhad | | | 48,168 | |
| | 95,155 | | | Wah Seong Corp. Berhad | | | 19,507 | |
| | 117,038 | | | WCT Holdings Berhad | | | 47,429 | |
| | 4,085,950 | | | Wellcall Holdings Berhad(d) | | | 1,909,049 | |
| | 36,900 | | | WTK Holdings Berhad | | | 9,500 | |
| | 47,600 | | | Yinson Holdings Berhad | | | 35,516 | |
| | 43,014 | | | YNH Property Berhad(b) | | | 16,201 | |
| | 25,600 | | | Zhulian Corp. Berhad | | | 8,360 | |
| | | | | | | | 21,158,349 | |
| MALTA — 0.0% |
| | 34,973 | | | Unibet Group Plc - SDR | | | 308,603 | |
| MARTINIQUE — 0.0% |
| | 100,000 | | | MGM China Holdings Ltd. | | | 165,559 | |
| MEXICO — 0.4% |
| | 10,100 | | | Alpek SAB de CV | | | 15,037 | |
| | 35,265 | | | Alsea SAB de CV | | | 131,574 | |
| | 3,201,600 | | | Asesor de Activos Prisma SAPI de CV REIT(d) | | | 2,151,226 | |
| | 203,861 | | | Axtel SAB de CV - CPO Units(b) | | | 50,369 | |
| | 27,586 | | | Banregio Grupo Financiero SAB de CV | | | 180,817 | |
| Shares | | | | | Value | |
| MEXICO (continued) |
| | 2,584 | | | Bio Pappel SAB de CV(b) | | $ | 3,390 | |
| | 1,166,800 | | | Bolsa Mexicana de Valores SAB de CV | | | 1,867,399 | |
| | 155,625 | | | Consorcio ARA SAB de CV | | | 58,871 | |
| | 1,887,370 | | | Corp Inmobiliaria Vesta SAB de CV | | | 2,852,873 | |
| | 800 | | | Corp. Actinver SAB de CV | | | 567 | |
| | 61,938 | | | Corp. Interamericana de Entretenimiento SAB de CV - Series B(b) | | | 58,985 | |
| | 27,300 | | | Corp. Moctezuma SAB de CV | | | 85,875 | |
| | 2,674,900 | | | Fibra Shop Portafolios Inmobiliarios SAPI de CV REIT(d) | | | 2,264,346 | |
| | 43,027 | | | Fibra Uno Administracion SA de CV REIT | | | 81,884 | |
| | 5,418 | | | Fresnillo Plc | | | 108,759 | |
| | 121,017 | | | Genomma Lab Internacional SAB de CV - Class B(b) | | | 145,213 | |
| | 36,469 | | | Gruma SAB de CV - Series B | | | 506,950 | |
| | 29,269 | | | Grupo Aeromexico SAB de CV(b) | | | 57,559 | |
| | 47,113 | | | Grupo Aeroportuario del Centro Norte SAB de CV | | | 274,936 | |
| | 248,952 | | | Grupo Aeroportuario del Pacifico SAB de CV - Series B | | | 2,405,092 | |
| | 92,763 | | | Grupo Aeroportuario del Sureste SAB de CV - Series B | | | 1,476,768 | |
| | 120,492 | | | Grupo Cementos de Chihuahua SAB de CV | | | 387,275 | |
| | 45,878 | | | Grupo Comercial Chedraui SA de CV | | | 102,043 | |
| | 53,661 | | | Grupo Famsa SAB de CV - Class A(b) | | | 23,252 | |
| | 12,100 | | | Grupo Financiero Interacciones SA de CV | | | 59,216 | |
| | 46,057 | | | Grupo Herdez SAB de CV | | | 111,554 | |
| | 57,500 | | | Grupo Industrial Maseca SAB de CV - Series B | | | 69,939 | |
| | 12,400 | | | Grupo Industrial Saltillo SAB de CV | | | 24,838 | |
| | 17,079 | | | Grupo KUO SAB de CV - Series B | | | 33,885 | |
| | 15,920 | | | Grupo Simec SAB de CV - Series B(b) | | | 55,658 | |
| | 19,508 | | | Grupo Sports World SAB de CV(b) | | | 17,443 | |
| | 264,100 | | | Impulsora del Desarrollo y El Empleo en America Latina SAB de CV(b) | | | 358,402 | |
| | 49,176 | | | Industrias Bachoco SAB de CV - Series B | | | 217,300 | |
| | 158,336 | | | Industrias CH SAB de CV - Series B(b) | | | 748,077 | |
| | 9,200 | | | Infraestructura Energetica Nova SAB de CV | | | 40,643 | |
| Old Westbury Funds, Inc. | |
| Small & Mid Cap Fund | |
| Portfolio of Investments - (Continued) | October 31, 2016 |
| | |
| Shares | | | | | Value | |
| MEXICO (continued) |
| | 110,913 | | | Kimberly-Clark de Mexico SAB de CV - Class A | | $ | 239,008 | |
| | 140,111 | | | La Comer SAB de CV(b) | | | 128,614 | |
| | 2,031,800 | | | Macquarie Mexico Real Estate Management SA de CV REIT | | | 2,556,278 | |
| | 100 | | | Medica Sur SAB de CV - Series B | | | 227 | |
| | 33,400 | | | Megacable Holdings SAB de CV - CPO Shares | | | 122,248 | |
| | 349,076 | | | Mexichem SAB de CV | | | 834,229 | |
| | 83,226 | | | OHL Mexico SAB de CV(b) | | | 97,664 | |
| | 53,106 | | | Organizacion Cultiba SAB de CV | | | 58,638 | |
| | 130,899 | | | Organizacion Soriana SAB de CV - Series B(b) | | | 355,763 | |
| | 26,195 | | | Promotora y Operadora de Infraestructura SAB de CV | | | 292,218 | |
| | 23,143 | | | Qualitas Controladora SAB de CV - Class I | | | 42,671 | |
| | 67 | | | Urbi Desarrollos Urbanos SAB de CV(b)(d) | | | 76 | |
| | 4,415 | | | Vitro SAB de CV - Series A | | | 14,541 | |
| | | | | | | | 21,770,190 | |
| MONACO — 0.0% |
| | 12,500 | | | Endeavour Mining Corp.(b) | | | 244,166 | |
| NETHERLANDS — 0.5% |
| | 21,357 | | | Aalberts Industries NV | | | 674,623 | |
| | 9,662 | | | Accell Group NV | | | 241,828 | |
| | 19,244 | | | Aegon NV | | | 82,980 | |
| | 6,845 | | | AMG Advanced Metallurgical Group NV | | | 136,344 | |
| | 3,385 | | | Amsterdam Commodities NV | | | 76,436 | |
| | 10,875 | | | Arcadis NV | | | 143,257 | |
| | 11,197 | | | ASM International NV | | | 477,650 | |
| | 4,808 | | | BE Semiconductor Industries NV | | | 156,572 | |
| | 3,301 | | | Beter Bed Holding NV | | | 59,791 | |
| | 17,415 | | | BinckBank NV | | | 103,349 | |
| | 104,995 | | | Boskalis Westminster | | | 3,388,032 | |
| | 3,196 | | | Brunel International NV | | | 52,153 | |
| | 4,038 | | | Corbion NV | | | 93,176 | |
| | 14,948 | | | Delta Lloyd NV | | | 90,415 | |
| | 5,097 | | | Euronext N.V | | | 203,975 | |
| | 2,355 | | | Fugro NV(b) | | | 42,087 | |
| | 9,716 | | | Gemalto NV | | | 528,330 | |
| | 4,518 | | | GrandVision NV | | | 103,483 | |
| | 5,707 | | | Heijmans NV - CVA(b) | | | 54,736 | |
| | 1,031 | | | Hunter Douglas NV | | | 55,022 | |
| | 3,654 | | | KAS Bank NV - CVA | | | 33,112 | |
| | 3,442 | | | Kendrion NV | | | 99,336 | |
| | 35,275 | | | Koninklijke BAM Groep NV | | | 164,226 | |
| | 12,374 | | | Koninklijke Vopak NV | | | 624,915 | |
| | 431 | | | Nederland Apparatenfabriek | | | 14,904 | |
| | 10,625 | | | NSI NV REIT | | | 41,639 | |
| | 13,255 | | | Ordina NV(b) | | | 35,315 | |
| | 27,537 | | | PostNL NV(b) | | | 129,742 | |
| Shares | | | | | Value | |
| NETHERLANDS (continued) |
| | 218,302 | | | QIAGEN NV(b) | | $ | 5,345,218 | |
| | 22,201 | | | Randstad Holding NV | | | 1,143,378 | |
| | 522,458 | | | Refresco Gerber NV(d) | | | 7,627,961 | |
| | 99,492 | | | SBM Offshore NV | | | 1,429,116 | |
| | 10,543 | | | Sligro Food Group NV | | | 377,532 | |
| | 86,230 | | | SNS REAAL NV(b)(c)(d) | | | 0 | |
| | 8,477 | | | TKH Group NV | | | 326,443 | |
| | 18,993 | | | TomTom NV(b) | | | 153,579 | |
| | 2,363 | | | Van Lanschot NV - CVA | | | 48,482 | |
| | 12,798 | | | Wessanen | | | 152,924 | |
| | | | | | | | 24,512,061 | |
| NEW ZEALAND — 0.7% |
| | 7,184 | | | a2 Milk Co. Ltd.(b) | | | 9,555 | |
| | 320,760 | | | Air New Zealand Ltd. | | | 442,693 | |
| | 3,211,087 | | | Auckland International Airport Ltd.(d) | | | 15,132,234 | |
| | 44,374 | | | Chorus Ltd. | | | 115,980 | |
| | 105,881 | | | Contact Energy Ltd. | | | 359,648 | |
| | 19,426 | | | Ebos Group Ltd. | | | 236,850 | |
| | 86,198 | | | Fisher & Paykel Healthcare Corp. Ltd. | | | 546,131 | |
| | 23,408 | | | Freightways Ltd. | | | 106,962 | |
| | 34,123 | | | Genesis Energy Ltd. | | | 47,827 | |
| | 53,576 | | | Heartland Bank Ltd. | | | 57,468 | |
| | 36,913 | | | Infratil Ltd. | | | 78,661 | |
| | 7,542 | | | Kathmandu Holdings Ltd. | | | 10,840 | |
| | 70,342 | | | Kiwi Property Group Ltd. REIT | | | 73,692 | |
| | 22,834 | | | Mainfreight Ltd. | | | 303,221 | |
| | 5,691,378 | | | Mercury Ltd.(d) | | | 12,413,174 | |
| | 28,706 | | | Metlifecare Ltd. | | | 118,650 | |
| | 39,566 | | | New Zealand Oil & Gas Ltd. | | | 14,996 | |
| | 13,133 | | | New Zealand Refining Co. Ltd. (The) | | | 21,037 | |
| | 56,805 | | | NZME Ltd. | | | 27,007 | |
| | 45,243 | | | NZX Ltd. | | | 33,647 | |
| | 73,491 | | | PGG Wrightson Ltd. | | | 24,175 | |
| | 80,140 | | | Pike River Coal Ltd.(b)(c)(d) | | | 0 | |
| | 226,520 | | | Port of Tauranga Ltd.(b) | | | 631,738 | |
| | 19,670 | | | Restaurant Brands New Zealand Ltd. | | | 74,268 | |
| | 23,602 | | | Ryman Healthcare Ltd. | | | 149,874 | |
| | 15,128 | | | Sanford Ltd. | | | 69,019 | |
| | 74,844 | | | Skellerup Holdings Ltd. | | | 76,535 | |
| | 182,421 | | | SKY Network Television Ltd. | | | 602,674 | |
| | 1,943,565 | | | SKYCITY Entertainment Group Ltd. | | | 5,420,374 | |
| | 55,636 | | | Summerset Group Holdings Ltd. | | | 189,378 | |
| | 29,035 | | | Tilt Renewables Ltd.(b) | | | 45,678 | |
| | 43,782 | | | Tower Ltd. | | | 28,178 | |
| | 82,337 | | | Trade Me Group Ltd. | | | 286,152 | |
| | 29,035 | | | TrustPower Ltd.(b) | | | 101,946 | |
| | 25,065 | | | Vector Ltd. | | | 56,998 | |
| | 43,509 | | | Warehouse Group Ltd. (The) | | | 93,340 | |
| | | | | | | | 38,000,600 | |
| Old Westbury Funds, Inc. | |
| Small & Mid Cap Fund | |
| Portfolio of Investments - (Continued) | October 31, 2016 |
| | |
| Shares | | | | | Value | |
| NORWAY — 0.1% |
| | 39,115 | | | ABG Sundal Collier Holding ASA | | $ | 23,150 | |
| | 1,087 | | | AF Gruppen ASA | | | 19,208 | |
| | 11,195 | | | Akastor ASA(b) | | | 15,446 | |
| | 9,669 | | | Aker ASA - Class A | | | 356,926 | |
| | 13,163 | | | Aker BP ASA(b) | | | 211,249 | |
| | 21,852 | | | Aker Solutions ASA(b) | | | 100,581 | |
| | 3,472 | | | American Shipping Co. ASA | | | 10,463 | |
| | 18,135 | | | Atea ASA | | | 162,422 | |
| | 41,175 | | | Austevoll Seafood ASA | | | 371,267 | |
| | 8,177 | | | Bonheur ASA | | | 52,700 | |
| | 6,200 | | | Borregaard ASA | | | 60,782 | |
| | 78,478 | | | DNO ASA(b) | | | 67,248 | |
| | 279,724 | | | DOF ASA(b) | | | 29,793 | |
| | 5,301 | | | Ekornes ASA | | | 66,725 | |
| | 22,339 | | | Grieg Seafood ASA | | | 196,695 | |
| | 14,061 | | | Hexagon Composites ASA(b) | | | 49,353 | |
| | 4,846 | | | Hoegh LNG Holdings Ltd. | | | 50,734 | |
| | 194,372 | | | Kongsberg Automotive ASA(b) | | | 160,676 | |
| | 4,472 | | | Kongsberg Gruppen ASA | | | 63,868 | |
| | 28,990 | | | Kvaerner ASA | | | 38,069 | |
| | 5,047 | | | Leroy Seafood Group ASA | | | 266,877 | |
| | 12,409 | | | Nordic Semiconductor ASA(b) | | | 49,562 | |
| | 2,144 | | | Norwegian Air Shuttle ASA(b) | | | 72,294 | |
| | 2,652 | | | Ocean Yield ASA | | | 22,147 | |
| | 23,394 | | | Opera Software ASA(b) | | | 164,929 | |
| | 3,922 | | | Petroleum Geo-Services ASA(b) | | | 10,552 | |
| | 5,031 | | | Protector Forsikring ASA | | | 43,080 | |
| | 12,159 | | | Salmar ASA | | | 394,687 | |
| | 4,634 | | | Schibsted ASA - Class A | | | 111,106 | |
| | 4,604 | | | Schibsted ASA - Class B | | | 103,644 | |
| | 5,087 | | | Sevan Marine ASA(b) | | | 10,467 | |
| | 7,660 | | | Solstad Offshore ASA(b) | | | 12,377 | |
| | 29,923 | | | SpareBank 1 SMN | | | 220,013 | |
| | 2,731 | | | SpareBank 1 SR-Bank ASA | | | 16,295 | |
| | 126,468 | | | Storebrand ASA(b) | | | 650,834 | |
| | 16,346 | | | TGS Nopec Geophysical Co. ASA | | | 331,377 | |
| | 26,311 | | | Tomra Systems ASA | | | 285,804 | |
| | 12,901 | | | Veidekke ASA | | | 192,835 | |
| | 3,880 | | | Wilh Wilhelmsen Holding ASA | | | 82,884 | |
| | | | | | | | 5,149,119 | |
| PERU — 0.1% |
| | 1,162,608 | | | Alicorp SA(d) | | | 2,696,103 | |
| | 2,050,358 | | | Ferreycorp SAA(d) | | | 1,018,016 | |
| | | | | | | | 3,714,119 | |
| PHILIPPINES — 0.2% |
| | 476,500 | | | Alliance Global Group, Inc. | | | 140,325 | |
| | 23,966 | | | Belle Corp. | | | 1,445 | |
| | 37,840 | | | Cebu Air, Inc. | | | 82,053 | |
| | 124,030 | | | China Banking Corp. | | | 97,206 | |
| | 1,776,466 | | | Concepcion Industrial Corp.(d) | | | 2,274,581 | |
| | 90,600 | | | Cosco Capital, Inc. | | | 15,904 | |
| | 13,943,200 | | | D&L Industries, Inc. | | | 3,161,678 | |
| Shares | | | | | Value | |
| PHILIPPINES (continued) |
| | 130,900 | | | Del Monte Pacific Ltd. | | $ | 32,460 | |
| | 98,300 | | | DMCI Holdings, Inc. | | | 25,376 | |
| | 72,800 | | | EEI Corp. | | | 10,825 | |
| | 726,600 | | | Energy Development Corp. | | | 88,532 | |
| | 2,062,375 | | | Filinvest Land, Inc. | | | 75,387 | |
| | 86,000 | | | First Gen Corp. | | | 40,760 | |
| | 123,070 | | | First Philippine Holdings Corp. | | | 176,259 | |
| | 12,964,900 | | | GMA Holdings, Inc. - PDR(d) | | | 1,603,795 | |
| | 12,280 | | | International Container Terminal Services, Inc. | | | 19,730 | |
| | 1,274,700 | | | Lopez Holdings Corp. | | | 209,280 | |
| | 3,657,300 | | | Manila Water Co., Inc. | | | 2,284,750 | |
| | 4,702,696 | | | Megaworld Corp. | | | 390,414 | |
| | 443,500 | | | Metro Pacific Investments Corp. | | | 65,945 | |
| | 623,000 | | | Pepsi-Cola Products Philippines, Inc. | | | 40,013 | |
| | 282,000 | | | Petron Corp. | | | 60,450 | |
| | 2,020 | | | Philippine National Bank | | | 2,420 | |
| | 39,900 | | | Puregold Price Club, Inc. | | | 33,578 | |
| | 75,400 | | | Rizal Commercial Banking Corp. | | | 55,901 | |
| | 420,000 | | | Robinsons Land Corp. | | | 268,450 | |
| | 48,560 | | | San Miguel Corp. | | | 80,729 | |
| | 64,281 | | | Security Bank Corp. | | | 292,582 | |
| | 34,010 | | | Semirara Mining & Power Corp. | | | 88,427 | |
| | 6 | | | Top Frontier Investment Holdings, Inc.(b) | | | 29 | |
| | 161,290 | | | Union Bank of Philippines, Inc. | | | 249,650 | |
| | 1,010,600 | | | Vista Land & Lifescapes, Inc. | | | 109,153 | |
| | | | | | | | 12,078,087 | |
| POLAND — 0.1% |
| | 2,119 | | | Alior Bank SA(b) | | | 25,466 | |
| | 25,202 | | | Asseco Poland SA | | | 336,284 | |
| | 41,005 | | | Bank Millennium SA(b) | | | 60,307 | |
| | 37,571 | | | Boryszew SA(b) | | | 76,804 | |
| | 2,395 | | | Budimex SA | | | 124,077 | |
| | 683 | | | CCC SA | | | 34,661 | |
| | 2,131 | | | CD Projekt Red SA(b) | | | 21,662 | |
| | 10,830 | | | Ciech SA | | | 176,670 | |
| | 1,000 | | | Dom Development SA | | | 15,803 | |
| | 40,455 | | | Enea SA(b) | | | 103,529 | |
| | 13,280 | | | Eurocash SA | | | 134,586 | |
| | 5,542 | | | Farmacol SA(b) | | | 72,043 | |
| | 125,804 | | | Getin Holding SA(b) | | | 36,876 | |
| | 76,926 | | | Getin Noble Bank SA(b) | | | 25,686 | |
| | 10,371 | | | Grupa Azoty SA | | | 165,217 | |
| | 119 | | | Grupa Azoty Zaklady Chemiczne Police SA(b) | | | 634 | |
| | 2,931 | | | Grupa Kety SA | | | 291,811 | |
| | 21,247 | | | Grupa Lotos SA(b) | | | 184,187 | |
| | 4,256 | | | Impexmetal SA(b) | | | 2,962 | |
| | 2,075 | | | Inter Cars SA | | | 142,803 | |
| | 155 | | | LPP SA | | | 232,307 | |
| | 1,171 | | | Lubelski Wegiel Bogdanka SA(b) | | | 20,744 | |
| Old Westbury Funds, Inc. | |
| Small & Mid Cap Fund | |
| Portfolio of Investments - (Continued) | October 31, 2016 |
| | |
| Shares | | | | | Value | |
| POLAND (continued) |
| | 146,043 | | | Netia SA | | $ | 173,096 | |
| | 32,745 | | | Orange Polska SA | | | 46,740 | |
| | 9,643 | | | Orbis SA | | | 174,512 | |
| | 1,623 | | | Pelion SA(b) | | | 22,505 | |
| | 46,907 | | | Synthos SA(b) | | | 56,672 | |
| | 64,659 | | | Tauron Polska Energia SA(b) | | | 43,675 | |
| | 884 | | | Warsaw Stock Exchange | | | 8,812 | |
| | | | | | | | 2,811,131 | |
| PORTUGAL — 0.0% |
| | 16,720 | | | Altri SGPS SA | | | 58,312 | |
| | 31,522 | | | Banco BPI SA(b) | | | 39,102 | |
| | 59,527 | | | Banco Comercial Portugues SA(b) | | | 79,265 | |
| | 1,231,589 | | | Banco Espirito Santo SA(b)(c)(d) | | | 0 | |
| | 2,336 | | | Corticeira Amorim SGPS SA | | | 23,451 | |
| | 26,118 | | | Galp Energia SGPS SA | | | 354,089 | |
| | 31,264 | | | Jeronimo Martins SGPS SA | | | 537,798 | |
| | 22,362 | | | Mota-Engil SGPS SA | | | 43,695 | |
| | 47,493 | | | Navigator Co. SA (The) | | | 139,202 | |
| | 36,299 | | | NOS SGPS SA | | | 241,157 | |
| | 15,219 | | | REN - Redes Energeticas Nacionais SGPS SA | | | 44,473 | |
| | 5,424 | | | Semapa - Sociedade de Investimento e Gestao | | | 69,784 | |
| | 109,476 | | | Sonae SGPS SA | | | 87,129 | |
| | | | | | | | 1,717,457 | |
| PUERTO RICO — 0.0% |
| | 74,300 | | | Evertec Inc. | | | 1,125,645 | |
| ROMANIA — 0.0% |
| | 3,619 | | | New Europe Property Investments Plc | | | 44,624 | |
| SINGAPORE — 1.0% | | | | |
| | 32,200 | | | Accordia Golf Trust | | | 15,160 | |
| | 2,373,000 | | | Ascendas India Trust - Unit(d) | | | 1,825,057 | |
| | 6,935,700 | | | Ascendas Real Estate Investment Trust | | | 11,814,993 | |
| | 155,400 | | | ASL Marine Holdings Ltd. | | | 13,515 | |
| | 7,400 | | | Bonvests Holdings Ltd. | | | 6,489 | |
| | 25,598 | | | Boustead Projects Ltd.(b) | | | 13,339 | |
| | 48,229 | | | Boustead Singapore Ltd. | | | 31,026 | |
| | 16,000 | | | Breadtalk Group Ltd. | | | 11,443 | |
| | 40,000 | | | Bukit Sembawang Estates Ltd. | | | 129,380 | |
| | 9,716 | | | BW LPG Ltd. | | | 31,350 | |
| | 41,612 | | | Cape Plc | | | 105,814 | |
| | 7,364,200 | | | CapitaLand Mall Trust REIT | | | 10,956,977 | |
| | 42,000 | | | China Aviation Oil Singapore Corp. Ltd. | | | 43,019 | |
| | 116,500 | | | Chip Eng Seng Corp. Ltd. | | | 54,011 | |
| | 95,400 | | | ComfortDelGro Corp. Ltd. | | | 174,171 | |
| | 115,600 | | | Cosco Corp. Singapore Ltd.(b) | | | 21,188 | |
| | 18,200 | | | CSE Global Ltd. | | | 5,364 | |
| | 156,000 | | | CW Group Holdings Ltd. | | | 32,183 | |
| | 65,300 | | | CWT Ltd. | | | 92,699 | |
| Shares | | | | | Value | |
| SINGAPORE (continued) |
| | 282,746 | | | Ezion Holdings Ltd.(b) | | $ | 60,969 | |
| | 130,121 | | | Far East Orchard Ltd. | | | 138,422 | |
| | 73,900 | | | First Resources Ltd. | | | 96,674 | |
| | 183,000 | | | FJ Benjamin Holdings Ltd.(b) | | | 5,525 | |
| | 164,000 | | | Fragrance Group Ltd.(b) | | | 18,507 | |
| | 15,000 | | | Frasers Centrepoint Ltd. | | | 16,011 | |
| | 91,900 | | | Gallant Venture Ltd.(b) | | | 8,455 | |
| | 59,100 | | | GL Ltd. | | | 33,984 | |
| | 52,560 | | | Global Premium Hotels Ltd.(b) | | | 11,145 | |
| | 463,600 | | | Golden Agri-Resources Ltd. | | | 128,292 | |
| | 58,000 | | | GP Industries Ltd. | | | 23,763 | |
| | 48,960 | | | GSH Corp. Ltd. | | | 14,780 | |
| | 118,666 | | | Guocoland Ltd. | | | 163,339 | |
| | 11,199 | | | Halcyon Agri Corp. Ltd.(b) | | | 3,824 | |
| | 32,000 | | | Hiap Hoe Ltd. | | | 16,216 | |
| | 66,600 | | | Ho Bee Land Ltd. | | | 101,964 | |
| | 285,340 | | | Hong Fok Corp. Ltd. | | | 133,312 | |
| | 110,600 | | | Hong Leong Asia Ltd. | | | 54,853 | |
| | 9,000 | | | Hour Glass Ltd. (The) | | | 4,367 | |
| | 409,500 | | | Hutchison Port Holdings Trust - Units | | | 182,228 | |
| | 129,600 | | | Indofood Agri Resources Ltd. | | | 44,714 | |
| | 92,950 | | | Jurong Technologies Industrial Corp. Ltd.(b)(c)(d) | | | 0 | |
| | 60,800 | | | K1 Ventures Ltd. | | | 44,357 | |
| | 81,178 | | | Keppel Infrastructure Trust | | | 29,466 | |
| | 10,000 | | | Keppel Telecommunications & Transportation Ltd. | | | 12,363 | |
| | 166,600 | | | Lian Beng Group Ltd. | | | 54,486 | |
| | 42,000 | | | Low Keng Huat Singapore Ltd. | | | 16,302 | |
| | 75,000 | | | Lum Chang Holdings Ltd. | | | 19,946 | |
| | 39,000 | | | M1 Ltd. | | | 57,186 | |
| | 209,700 | | | Midas Holdings Ltd. | | | 32,406 | |
| | 214,300 | | | Olam International Ltd. | | | 331,173 | |
| | 34,400 | | | Oxley Holdings Ltd. | | | 11,498 | |
| | 21,000 | | | Pan-United Corp. Ltd. | | | 8,755 | |
| | 113,400 | | | Penguin International Ltd. | | | 20,377 | |
| | 63,500 | | | Petra Foods Ltd. | | | 102,239 | |
| | 100,770 | | | QAF Ltd. | | | 89,453 | |
| | 176,250 | | | Raffles Education Corp. Ltd.(b) | | | 23,817 | |
| | 95,875 | | | Raffles Medical Group Ltd. | | | 103,714 | |
| | 90,300 | | | Religare Health Trust - Units | | | 55,819 | |
| | 81,700 | | | Rotary Engineering Ltd. | | | 22,315 | |
| | 217,500 | | | Roxy-Pacific Holdings Ltd. | | | 65,660 | |
| | 4,320,000 | | | SATS Ltd. | | | 15,028,787 | |
| | 165,600 | | | Sembcorp Industries Ltd. | | | 301,145 | |
| | 97,000 | | | Sheng Siong Group Ltd. | | | 72,859 | |
| | 4,029,200 | | | SIA Engineering Co. Ltd.(d) | | | 10,686,611 | |
| | 131,100 | | | SIIC Environment Holdings Ltd.(b) | | | 59,837 | |
| | 592,000 | | | Sinarmas Land Ltd. | | | 204,248 | |
| | 106,200 | | | Singapore Post Ltd. | | | 122,135 | |
| | 174,000 | | | Singapore Reinsurance Corp. Ltd. | | | 38,771 | |
| | 440,400 | | | Stamford Land Corp. Ltd. | | | 144,030 | |
| | 47,200 | | | StarHub Ltd. | | | 114,671 | |
| Old Westbury Funds, Inc. | |
| Small & Mid Cap Fund | |
| Portfolio of Investments - (Continued) | October 31, 2016 |
| | |
| Shares | | | | | Value | |
| SINGAPORE (continued) |
| | 36,600 | | | Sunningdale Tech Ltd. | | $ | 27,754 | |
| | 82,000 | | | Super Group Ltd.(c) | | | 57,172 | |
| | 126,700 | | | Tat Hong Holdings Ltd.(b) | | | 40,070 | |
| | 54,000 | | | Technovator International Ltd. | | | 22,350 | |
| | 66,500 | | | Tiong Woon Corp Holding Ltd. | | | 12,428 | |
| | 378,314 | | | Tuan Sing Holdings Ltd. | | | 77,498 | |
| | 42,550 | | | UMS Holdings Ltd. | | | 18,962 | |
| | 220,554 | | | United Engineers Ltd. | | | 410,591 | |
| | 405,492 | | | United Industrial Corp. Ltd. | | | 792,768 | |
| | 158,057 | | | UOB-Kay Hian Holdings Ltd. | | | 150,530 | |
| | 87,611 | | | UOL Group Ltd. | | | 357,056 | |
| | 33,000 | | | Venture Corp. Ltd. | | | 225,337 | |
| | 142,729 | | | Vibrant Group Ltd. | | | 36,933 | |
| | 179,912 | | | Wheelock Properties (Singapore) Ltd. | | | 192,682 | |
| | 30,300 | | | Wing Tai Holdings Ltd. | | | 36,915 | |
| | 871 | | | XP Power Ltd. | | | 18,124 | |
| | 96,800 | | | Yongnam Holdings Ltd.(b) | | | 13,916 | |
| | | | | | | | 57,004,034 | |
| SOUTH AFRICA — 0.4% |
| | 11,472 | | | Adcock Ingram Holdings Ltd. | | | 39,860 | |
| | 111,347 | | | Advtech Ltd. | | | 143,687 | |
| | 54,174 | | | Aeci Ltd. | | | 409,004 | |
| | 109,566 | | | African Bank Investments Ltd.(b)(d) | | | 41 | |
| | 81,492 | | | AngloGold Ashanti Ltd.(b) | | | 1,091,798 | |
| | 25,692 | | | ArcelorMittal South Africa Ltd.(b) | | | 21,912 | |
| | 1,118 | | | Assore Ltd. | | | 15,130 | |
| | 6,924 | | | Astral Foods Ltd. | | | 62,699 | |
| | 25,834 | | | AVI Ltd. | | | 181,554 | |
| | 43,469 | | | Barloworld Ltd. | | | 281,567 | |
| | 10,152 | | | Bidvest Group Ltd. (The) | | | 126,044 | |
| | 28,795 | | | Blue Label Telecoms Ltd. | | | 43,565 | |
| | 787 | | | Capitec Bank Holdings Ltd. | | | 39,981 | |
| | 3,151 | | | Cashbuild Ltd. | | | 92,017 | |
| | 16,438 | | | Caxton and CTP Publishers and Printers Ltd. | | | 16,104 | |
| | 4,704 | | | City Lodge Hotels Ltd. | | | 50,857 | |
| | 201,044 | | | Clicks Group Ltd. | | | 1,871,217 | |
| | 1,776 | | | Consolidated Infrastructure Group Ltd.(b) | | | 3,087 | |
| | 28,204 | | | Coronation Fund Managers Ltd. | | | 151,711 | |
| | 40,384 | | | DataTec Ltd. | | | 134,446 | |
| | 16,226 | | | Discovery Ltd. | | | 138,665 | |
| | 4,599 | | | Distell Group Ltd. | | | 56,397 | |
| | 165,998 | | | EOH Holdings Ltd. | | | 1,968,524 | |
| | 7,305 | | | Exxaro Resources Ltd. | | | 53,743 | |
| | 3,147 | | | Famous Brands Ltd. | | | 36,708 | |
| | 20,489 | | | Foschini Group Ltd. (The) | | | 210,911 | |
| | 926,791 | | | Gold Fields Ltd. | | | 3,767,306 | |
| | 7,837 | | | Grand Parade Investments Ltd. | | | 2,180 | |
| | 63,300 | | | Grindrod Ltd. | | | 52,156 | |
| | 60,564 | | | Growthpoint Properties Ltd. | | | 112,920 | |
| | 71,271 | | | Harmony Gold Mining Co. Ltd. | | | 217,295 | |
| Shares | | | | | Value | |
| SOUTH AFRICA (continued) |
| | 7,349 | | | Hudaco Industries Ltd. | | $ | 59,419 | |
| | 14,135 | | | Hyprop Investments Ltd. | | | 125,481 | |
| | 11,036 | | | Impala Platinum Holdings Ltd.(b) | | | 44,361 | |
| | 67,405 | | | Imperial Holdings Ltd. | | | 851,426 | |
| | 197,189 | | | Investec Plc | | | 1,226,110 | |
| | 164 | | | Invicta Holdings Ltd. | | | 676 | |
| | 8,718 | | | JSE Ltd. | | | 101,684 | |
| | 56,049 | | | KAP Industrial Holdings Ltd. | | | 32,215 | |
| | 13,417 | | | Lewis Group Ltd. | | | 39,812 | |
| | 25,495 | | | Liberty Holdings Ltd. | | | 219,238 | |
| | 67,214 | | | Life Healthcare Group Holdings Ltd. | | | 179,453 | |
| | 31,180 | | | Lonmin Plc(b) | | | 72,513 | |
| | 5,304 | | | Massmart Holdings Ltd. | | | 45,968 | |
| | 20,504 | | | Metair Investments Ltd. | | | 28,892 | |
| | 271,218 | | | MMI Holdings Ltd. | | | 454,787 | |
| | 24,354 | | | Mpact Ltd. | | | 59,550 | |
| | 30,760 | | | Mr Price Group Ltd. | | | 350,676 | |
| | 18,223 | | | Murray & Roberts Holdings Ltd. | | | 12,474 | |
| | 69,834 | | | Nampak Ltd. | | | 97,368 | |
| | 67,640 | | | Netcare Ltd. | | | 173,718 | |
| | 45,409 | | | Northam Platinum Ltd.(b) | | | 165,791 | |
| | 196,458 | | | Oceana Group Ltd.(d) | | | 1,675,548 | |
| | 10,702 | | | Omnia Holdings Ltd. | | | 129,690 | |
| | 42,192 | | | Peregrine Holdings Ltd. | | | 81,357 | |
| | 88,529 | | | Petra Diamonds Ltd. | | | 164,599 | |
| | 17,069 | | | Pick’n Pay Stores Ltd. | | | 83,536 | |
| | 12,372 | | | Pioneer Foods Group Ltd. | | | 149,349 | |
| | 12,665 | | | PPC Ltd. | | | 5,166 | |
| | 10,839 | | | PSG Group Ltd. | | | 169,373 | |
| | 6,594 | | | Raubex Group Ltd. | | | 12,289 | |
| | 83,975 | | | Redefine Properties Ltd. REIT | | | 72,119 | |
| | 18,485 | | | Resilient REIT Ltd. | | | 152,952 | |
| | 12,269 | | | Reunert Ltd. | | | 56,141 | |
| | 746,260 | | | Rhodes Food Group Pty Ltd.(d) | | | 1,439,527 | |
| | 5,166 | | | Santam Ltd. | | | 92,755 | |
| | 155,870 | | | Sappi Ltd.(b) | | | 866,988 | |
| | 300,480 | | | Sibanye Gold Ltd. | | | 818,959 | |
| | 23,216 | | | Spar Group Ltd. (The) | | | 328,859 | |
| | 4,194 | | | Sun International Ltd. | | | 25,894 | |
| | 159,288 | | | Super Group Ltd.(b) | | | 470,171 | |
| | 104,458 | | | Telkom SA SOC Ltd. | | | 481,938 | |
| | 6,788 | | | Tiger Brands Ltd. | | | 193,304 | |
| | 7,382 | | | Tongaat Hulett Ltd. | | | 66,737 | |
| | 24,146 | | | Trencor Ltd. | | | 51,394 | |
| | 58,341 | | | Truworths International Ltd. | | | 309,147 | |
| | 48,096 | | | Tsogo Sun Holdings Ltd. | | | 109,185 | |
| | 3,138 | | | Wilson Bayly Holmes-Ovcon Ltd. | | | 35,374 | |
| | | | | | | | 23,777,049 | |
| SOUTH KOREA — 1.0% | | | |
| | 923 | | | Able C&C Co. Ltd. | | | 16,899 | |
| | 4,160 | | | Aekyung Petrochemical Co. Ltd. | | | 43,263 | |
| Old Westbury Funds, Inc. | |
| Small & Mid Cap Fund | |
| Portfolio of Investments - (Continued) | October 31, 2016 |
| | |
| Shares | | | | | Value | |
| SOUTH KOREA (continued) |
| | 1,398 | | | AfreecaTV Co. Ltd. | | $ | 30,666 | |
| | 821 | | | AJ Rent A Car Co. Ltd.(b) | | | 7,089 | |
| | 1,228 | | | AK Holdings, Inc. | | | 66,109 | |
| | 1,630 | | | Amotech Co. Ltd.(b) | | | 24,644 | |
| | 61 | | | Asia Cement Co. Ltd. | | | 3,924 | |
| | 299 | | | ASIA Holdings Co. Ltd. | | | 26,261 | |
| | 612 | | | Asia Paper Manufacturing Co. Ltd.(b) | | | 10,430 | |
| | 12,631 | | | Asiana Airlines, Inc.(b) | | | 50,999 | |
| | 2,934 | | | Baiksan Co. Ltd. | | | 22,821 | |
| | 1,005 | | | Binggrae Co. Ltd. | | | 54,806 | |
| | 642 | | | Bioland Ltd. | | | 10,352 | |
| | 104,993 | | | BNK Financial Group, Inc. | | | 852,423 | |
| | 666 | | | Boryung Pharmaceutical Co. Ltd. | | | 33,176 | |
| | 1,745 | | | Bukwang Pharmaceutical Co. Ltd. | | | 38,125 | |
| | 2,010 | | | Byucksan Corp. | | | 8,660 | |
| | 3,199 | | | Chabiotech Co. Ltd.(b) | | | 38,581 | |
| | 7,205 | | | Cheil Worldwide, Inc. | | | 106,729 | |
| | 190 | | | Chongkundang Holdings Corp. | | | 11,026 | |
| | 73 | | | Chosun Refractories Co. Ltd. | | | 5,869 | |
| | 1,161 | | | CJ CGV Co. Ltd. | | | 68,792 | |
| | 1,614 | | | CJ CheilJedang Corp. | | | 492,981 | |
| | 4,840 | | | CJ E&M Corp. | | | 295,666 | |
| | 160 | | | CJ Freshway Corp. | | | 5,495 | |
| | 2,306 | | | CJ Hellovision Co. Ltd. | | | 16,485 | |
| | 725 | | | CJ Korea Express Corp.(b) | | | 127,354 | |
| | 331 | | | CJ O Shopping Co. Ltd. | | | 46,891 | |
| | 930 | | | CKD Bio Corp. | | | 18,165 | |
| | 7,404 | | | Com2uSCorp(b) | | | 614,708 | |
| | 270 | | | Cosmax BTI, Inc. | | | 9,509 | |
| | 750 | | | Crown Confectionery Co. Ltd. | | | 20,483 | |
| | 2,318 | | | Crucialtec Co. Ltd.(b) | | | 16,227 | |
| | 252 | | | Cuckoo Electronics Co. Ltd. | | | 29,071 | |
| | 2,180 | | | Dae Dong Industrial Co. Ltd. | | | 12,879 | |
| | 16,020 | | | Dae Won Kang Up Co. Ltd. | | | 72,382 | |
| | 8,001 | | | Daeduck Electronics Co. | | | 52,652 | |
| | 5,167 | | | Daeduck GDS Co. Ltd. | | | 53,736 | |
| | 2,409 | | | Daehan Steel Co. Ltd. | | | 19,600 | |
| | 3,830 | | | Dae-Il Corp.(b) | | | 33,472 | |
| | 9,113 | | | Daelim Industrial Co. Ltd. | | | 650,673 | |
| | 3,143 | | | Daeryuk Can Co. Ltd. | | | 18,239 | |
| | 3,639 | | | Daesang Corp. | | | 85,708 | |
| | 3,927 | | | Daesang Holdings Co. Ltd. | | | 35,864 | |
| | 2,180 | | | Daesung Holdings Co. Ltd. | | | 17,585 | |
| | 3,074 | | | Daewon San Up Co. Ltd. | | | 22,190 | |
| | 18,818 | | | Daewoo Engineering & Construction Co. Ltd.(b) | | | 104,101 | |
| | 33,769 | | | Daewoo Securities Co. Ltd. | | | 228,717 | |
| | 9,121 | | | Daewoo Shipbuilding & Marine Engineering Co. Ltd.(b)(c)(d) | | | 35,711 | |
| | 496 | | | Daewoong Co. Ltd. | | | 19,073 | |
| | 513 | | | Daewoong Pharmaceutical Co. Ltd. | | | 30,621 | |
| | 7,916 | | | Daishin Securities Co. Ltd. | | | 72,986 | |
| Shares | | | | | Value | |
| SOUTH KOREA (continued) |
| | 1,845 | | | Dasan Networks, Inc.(b) | | $ | 10,932 | |
| | 3,650 | | | Dayou Automotive Seat Technology Co. Ltd. | | | 5,263 | |
| | 39,722 | | | DGB Financial Group, Inc. | | | 333,259 | |
| | 1,248 | | | Dio Corp(b) | | | 49,789 | |
| | 2,359 | | | Dong Ah Tire & Rubber Co. Ltd. | | | 49,685 | |
| | 456 | | | Dong-A Socio Holdings Co. Ltd. | | | 57,785 | |
| | 144 | | | Dong-A ST Co. Ltd. | | | 10,810 | |
| | 1,950 | | | Dong-Ah Geological Engineering Co. Ltd. | | | 14,059 | |
| | 3,534 | | | Dongbu HiTek Co. Ltd.(b) | | | 52,659 | |
| | 49,137 | | | Dongbu Insurance Co. Ltd. | | | 3,053,215 | |
| | 905 | | | Dongbu Securities Co. Ltd.(b) | | | 2,626 | |
| | 791 | | | Dong-IL Corp. | | | 41,961 | |
| | 288 | | | Dongil Industries Co. Ltd. | | | 18,248 | |
| | 10,139 | | | Dongjin Semichem Co. Ltd. | | | 74,520 | |
| | 665 | | | DongKook Pharmaceutical Co. Ltd. | | | 30,511 | |
| | 4,404 | | | Dongkuk Industries Co. Ltd. | | | 19,052 | |
| | 10,327 | | | Dongkuk Steel Mill Co. Ltd.(b) | | | 73,826 | |
| | 694 | | | Dongkuk Structures & Construction Co. Ltd. | | | 5,016 | |
| | 3,480 | | | Dongsuh Cos., Inc. | | | 82,571 | |
| | 9,440 | | | DONGSUNG Corp. | | | 53,295 | |
| | 767 | | | Dongwha Enterprise Co. Ltd.(b) | | | 23,394 | |
| | 1,969 | | | Dongwha Pharmaceutical Co. Ltd. | | | 13,388 | |
| | 210 | | | Dongwon F&B Co. Ltd. | | | 36,981 | |
| | 267 | | | Dongwon Industries Co. Ltd. | | | 71,869 | |
| | 376 | | | Dongwon Systems Corp. | | | 18,369 | |
| | 221 | | | Dongyang E&P, Inc. | | | 2,588 | |
| | 2,018 | | | Doosan Corp. | | | 180,769 | |
| | 10,689 | | | Doosan Heavy Industries & Construction Co. Ltd. | | | 244,747 | |
| | 29,204 | | | Doosan Infracore Co. Ltd.(b) | | | 176,870 | |
| | 2,532 | | | DRB Holding Co. Ltd. | | | 28,324 | |
| | 1,797 | | | Duzon Bizon Co. Ltd. | | | 35,100 | |
| | 2,090 | | | DY Corp. | | | 11,452 | |
| | 190 | | | e Tec E&C Ltd. | | | 16,322 | |
| | 153 | | | E1 Corp. | | | 8,130 | |
| | 1,441 | | | Eagon Industrial Ltd. | | | 14,294 | |
| | 17,017 | | | Easy Bio, Inc. | | | 89,974 | |
| | 5,009 | | | e-LITECOM Co. Ltd. | | | 42,550 | |
| | 5,176 | | | E-Mart Co. Ltd. | | | 735,067 | |
| | 2,121 | | | EM-Tech Co. Ltd.(b) | | | 19,092 | |
| | 305 | | | Eo Technics Co. Ltd. | | | 16,793 | |
| | 10,985 | | | Eugene Corp. | | | 44,257 | |
| | 20,861 | | | Eugene Investment & Securities Co. Ltd.(b) | | | 43,937 | |
| | 3,243 | | | Eugene Technology Co. Ltd. | | | 55,125 | |
| | 4,964 | | | Eusu Holdings Co. Ltd. | | | 27,157 | |
| | 3,297 | | | EVERDIGM Corp. | | | 26,307 | |
| | 656 | | | Fila Korea Ltd. | | | 49,992 | |
| | 520 | | | Gaon Cable Co. Ltd. | | | 9,180 | |
| Old Westbury Funds, Inc. | |
| Small & Mid Cap Fund | |
| Portfolio of Investments - (Continued) | October 31, 2016 |
| | |
| Shares | | | | | Value | |
| SOUTH KOREA (continued) |
| | 2,787 | | | Global Display Co. Ltd.(b) | | $ | 8,196 | |
| | 237 | | | Golfzon Co. Ltd. | | | 13,960 | |
| | 3,423 | | | Grand Korea Leisure Co. Ltd. | | | 64,915 | |
| | 289 | | | Green Cross Corp. | | | 35,233 | |
| | 2,348 | | | Green Cross Holdings Corp. | | | 45,554 | |
| | 9,764 | | | GS Engineering & Construction Corp.(b) | | | 228,687 | |
| | 15,652 | | | GS Global Corp.(b) | | | 36,591 | |
| | 33,998 | | | GS Holdings Corp. | | | 1,518,285 | |
| | 4,367 | | | GS Retail Co. Ltd. | | | 186,244 | |
| | 2,130 | | | Halla Corp.(b) | | | 8,563 | |
| | 1,748 | | | Halla Holdings Corp. | | | 103,727 | |
| | 4,637 | | | Han Kuk Carbon Co. Ltd. | | | 24,720 | |
| | 3,827 | | | Hana Micron, Inc. | | | 17,124 | |
| | 717 | | | Hana Tour Service, Inc. | | | 40,416 | |
| | 2,251 | | | Hancom, Inc. | | | 34,722 | |
| | 174 | | | Handok, Inc. | | | 3,452 | |
| | 1,621 | | | Handsome Co. Ltd. | | | 57,516 | |
| | 1,474 | | | Hanil Cement Co. Ltd. | | | 95,841 | |
| | 2,710 | | | Hanjin Heavy Industries & Construction Holdings Co. Ltd.(b) | | | 12,315 | |
| | 2,205 | | | Hanjin Kal Corp. | | | 32,567 | |
| | 1,870 | | | Hanjin Transportation Co. Ltd. | | | 48,129 | |
| | 90 | | | Hankook Shell Oil Co. Ltd. | | | 34,686 | |
| | 680 | | | Hankuk Paper Manufacturing Co. Ltd. | | | 17,264 | |
| | 1,523 | | | Hanmi Semiconductor Co. Ltd. | | | 18,434 | |
| | 956 | | | Hansae Co. Ltd. | | | 21,138 | |
| | 1,879 | | | Hansae Yes24 Holdings Co. Ltd. | | | 17,242 | |
| | 143 | | | Hanshin Construction Co. Ltd.(b) | | | 2,225 | |
| | 1,840 | | | Hansol Chemical Co. Ltd. | | | 133,146 | |
| | 11,098 | | | Hansol Holdings Co. Ltd.(b) | | | 62,364 | |
| | 6,958 | | | Hansol HomeDeco Co. Ltd.(b) | | | 10,641 | |
| | 387 | | | Hansol Logistics Co. Ltd. | | | 910 | |
| | 1,411 | | | Hansol Paper Co. Ltd. | | | 25,032 | |
| | 1,271 | | | Hansol Technics Co. Ltd.(b) | | | 16,828 | |
| | 662 | | | Hanssem Co. Ltd. | | | 102,692 | |
| | 20,200 | | | Hanwha Chemical Corp. | | | 477,527 | |
| | 18,918 | | | Hanwha Corp. | | | 617,511 | |
| | 3,335 | | | Hanwha Corp. Pref Share(b) | | | 55,085 | |
| | 195 | | | Hanwha Galleria Timeworld Co. Ltd. | | | 6,706 | |
| | 11,354 | | | Hanwha General Insurance Co. Ltd. | | | 75,313 | |
| | 17,063 | | | Hanwha Investment & Securities Co. Ltd.(b) | | | 33,403 | |
| | 1,369 | | | Hanwha Techwin Co. Ltd. | | | 76,331 | |
| | 3,343 | | | Hanyang Eng Co. Ltd. | | | 36,373 | |
| | 1,616 | | | Hanyang Securities Co. Ltd. | | | 10,507 | |
| | 4,708 | | | Harim Holdings Co. Ltd.(b) | | | 16,479 | |
| | 16,835 | | | Heung-A Shipping Co. Ltd. | | | 24,717 | |
| | 70,813 | | | Hite Jinro Co. Ltd. | | | 1,361,491 | |
| | 2,043 | | | Hite Jinro Holdings Co. Ltd. | | | 21,336 | |
| Shares | | | | | Value | |
| SOUTH KOREA (continued) |
| | 3,259 | | | HMC Investment Securities Co. Ltd. | | $ | 27,200 | |
| | 1,641 | | | Homecast Co. Ltd.(b) | | | 26,603 | |
| | 3,323 | | | Hotel Shilla Co. Ltd. | | | 166,404 | |
| | 5,644 | | | HS Industries Co. Ltd. | | | 47,894 | |
| | 700 | | | HS R&A Co. Ltd. | | | 19,943 | |
| | 4,768 | | | Huchems Fine Chemical Corp. | | | 98,548 | |
| | 2,950 | | | Humax Co. Ltd. | | | 37,640 | |
| | 617 | | | Huons Co. Ltd.(b) | | | 31,705 | |
| | 575 | | | Huons Global Co. Ltd. | | | 21,633 | |
| | 6,850 | | | Huvis Corp. | | | 42,923 | |
| | 106,753 | | | Huvitz Co. Ltd. | | | 1,142,866 | |
| | 4,721 | | | Hwa Shin Co. Ltd. | | | 28,386 | |
| | 1,748 | | | Hwasung Industrial Co. Ltd. | | | 19,248 | |
| | 1,254 | | | Hy-Lok Corp. | | | 24,987 | |
| | 7,624 | | | Hyosung Corp. | | | 892,826 | |
| | 3,447 | | | Hyundai BNG Steel Co. Ltd.(b) | | | 34,643 | |
| | 1,266 | | | Hyundai C&F, Inc. | | | 17,813 | |
| | 1,840 | | | Hyundai Corp. | | | 33,769 | |
| | 3,354 | | | Hyundai Department Store Co. Ltd. | | | 344,413 | |
| | 11,399 | | | Hyundai Development Co-Engineering & Construction | | | 483,156 | |
| | 1,811 | | | Hyundai Elevator Co. Ltd.(b) | | | 88,631 | |
| | 26,096 | | | Hyundai Engineering & Construction Co. Ltd. | | | 945,317 | |
| | 4,090 | | | Hyundai Engineering Plastics Co. Ltd. | | | 32,277 | |
| | 3,301 | | | Hyundai Greenfood Co. Ltd. | | | 48,321 | |
| | 704 | | | Hyundai Home Shopping Network Corp. | | | 69,831 | |
| | 12,260 | | | Hyundai Hy Communications & Network Co. Ltd. | | | 39,643 | |
| | 755 | | | Hyundai Livart Furniture Co. Ltd. | | | 16,331 | |
| | 27,209 | | | Hyundai Marine & Fire Insurance Co. Ltd. | | | 840,584 | |
| | 4,968 | | | Hyundai Wia Corp. | | | 341,692 | |
| | 13,395 | | | IHQ Inc.(b) | | | 23,179 | |
| | 252 | | | Il Dong Pharmaceutical Co. Ltd. | | | 6,012 | |
| | 625 | | | Il Dong Pharmaceutical Co. Ltd. New(b) | | | 9,613 | |
| | 2,212 | | | Iljin Electric Co. Ltd. | | | 8,989 | |
| | 2,696 | | | Iljin Holdings Co. Ltd. | | | 13,783 | |
| | 403 | | | Ilshin Spinning Co. Ltd. | | | 45,785 | |
| | 3,555 | | | iMarketKorea, Inc. | | | 39,768 | |
| | 1,599 | | | InBody Co. Ltd. | | | 46,185 | |
| | 319 | | | Innocean Worldwide Inc. | | | 19,320 | |
| | 4,561 | | | Innox Corp.(b) | | | 73,143 | |
| | 680 | | | Intelligent Digital Integrated Security Co. Ltd. | | | 6,359 | |
| | 1,997 | | | Interflex Co. Ltd.(b) | | | 28,448 | |
| | 13,496 | | | Interpark Holdings Corp. | | | 58,914 | |
| | 1,551 | | | IS Dongseo Co. Ltd. | | | 67,096 | |
| | 15,507 | | | IsuPetasys Co. Ltd. | | | 56,580 | |
| Old Westbury Funds, Inc. | |
| Small & Mid Cap Fund | |
| Portfolio of Investments - (Continued) | October 31, 2016 |
| | |
| Shares | | | | | Value | |
| SOUTH KOREA (continued) |
| | 17,236 | | | JB Financial Group Co. Ltd. | | $ | 89,475 | |
| | 666 | | | Jeil Pharmaceutical Co. | | | 39,404 | |
| | 2,861 | | | Jusung Engineering Co. Ltd.(b) | | | 23,653 | |
| | 1,210 | | | JW Pharmaceutical Corp. | | | 52,027 | |
| | 2,895 | | | Kaon Media Co. Ltd. | | | 26,312 | |
| | 5,374 | | | KB Capital Co. Ltd. | | | 123,284 | |
| | 4,264 | | | KB Financial Group, Inc. | | | 157,629 | |
| | 11,141 | | | KB Insurance Co. Ltd. | | | 281,872 | |
| | 1,853 | | | KC Green Holdings Co. Ltd. | | | 14,008 | |
| | 2,112 | | | KC Tech Co. Ltd. | | | 25,656 | |
| | 2,519 | | | KEPCO Plant Service & Engineering Co. Ltd. | | | 120,859 | |
| | 1,633 | | | Keyang Electric Machinery Co. Ltd. | | | 7,129 | |
| | 2,361 | | | KG Chemical Corp. | | | 28,887 | |
| | 2,369 | | | KH Vatec Co. Ltd. | | | 26,086 | |
| | 585 | | | KISCO Corp. | | | 19,223 | |
| | 354 | | | KISCO Holdings Co. Ltd. | | | 19,026 | |
| | 2,233 | | | Kishin Corp. | | | 10,362 | |
| | 2,418 | | | KISWIRE Ltd. | | | 82,414 | |
| | 3,098 | | | KIWOOM Securities Co. Ltd. | | | 180,045 | |
| | 9,767 | | | Koentec Co. Ltd. | | | 23,559 | |
| | 1,319 | | | Koh Young Technology, Inc. | | | 51,642 | |
| | 193,971 | | | Kolao Holdings | | | 1,491,759 | |
| | 1,491 | | | Kolon Corp. | | | 66,325 | |
| | 3,413 | | | Kolon Industries, Inc. | | | 221,916 | |
| | 1,632 | | | KONA I Co. Ltd. | | | 17,044 | |
| | 3,069 | | | Korea Circuit Co. Ltd. | | | 21,591 | |
| | 1,343 | | | Korea Electric Terminal Co. Ltd. | | | 83,919 | |
| | 820 | | | Korea Export Packaging Industrial Co. Ltd. | | | 13,222 | |
| | 1,060 | | | Korea Flange Co. Ltd.(b) | | | 13,432 | |
| | 1,290 | | | Korea Gas Corp. | | | 52,254 | |
| | 15,405 | | | Korea Investment Holdings Co. Ltd. | | | 553,328 | |
| | 1,694 | | | Korea Kolmar Co. Ltd. | | | 120,656 | |
| | 602 | | | Korea Kolmar Holdings Co. Ltd. | | | 15,415 | |
| | 2,929 | | | Korea Line Corp.(b) | | | 46,204 | |
| | 668 | | | Korea PetroChemical Ind Co. Ltd. | | | 119,385 | |
| | 1,632 | | | Korea United Pharm, Inc. | | | 23,961 | |
| | 7,494 | | | Korean Air Lines Co. Ltd.(b) | | | 209,577 | |
| | 21,897 | | | Korean Reinsurance Co. | | | 225,811 | |
| | 2,714 | | | Kortek Corp. | | | 33,325 | |
| | 787 | | | KPX Chemical Co. Ltd. | | | 43,468 | |
| | 2,960 | | | KT Hitel Co. Ltd.(b) | | | 19,065 | |
| | 1,874 | | | KT Skylife Co. Ltd. | | | 29,234 | |
| | 1,913 | | | Kukdo Chemical Co. Ltd. | | | 90,614 | |
| | 1,801 | | | Kumho Industrial Co. Ltd.(b) | | | 15,079 | |
| | 3,137 | | | Kumho Petrochemical Co. Ltd. | | | 192,182 | |
| | 7,068 | | | Kumho Tire Co., Inc.(b) | | | 63,314 | |
| | 865 | | | Kumkang Kind Co. Ltd. | | | 34,396 | |
| | 5,317 | | | Kwang Dong Pharmaceutical Co. Ltd. | | | 38,428 | |
| | 4,902 | | | Kyobo Securities Co. Ltd. | | | 39,841 | |
| Shares | | | | | Value | |
| SOUTH KOREA (continued) |
| | 597 | | | Kyung Dong Navien Co. Ltd. | | $ | 30,626 | |
| | 2,000 | | | Kyungbang Ltd. | | | 31,636 | |
| | 5,351 | | | Kyungchang Industrial Co. Ltd. | | | 23,476 | |
| | 1,746 | | | Kyungdong Pharm Co. Ltd. | | | 27,390 | |
| | 2,833 | | | Kyung-In Synthetic Corp. | | | 11,389 | |
| | 2,193 | | | Leadcorp Inc (The) | | | 15,236 | |
| | 975 | | | Leaders Cosmetics Co. Ltd.(b) | | | 16,871 | |
| | 1,856 | | | LEENO Industrial, Inc. | | | 69,747 | |
| | 4,166 | | | LF Corp. | | | 79,006 | |
| | 1,071 | | | LG Hausys Ltd. | | | 88,638 | |
| | 3,281 | | | LG Innotek Co. Ltd. | | | 223,656 | |
| | 6,921 | | | LG International Corp. | | | 168,451 | |
| | 695 | | | LG Life Sciences Ltd.(b) | | | 37,779 | |
| | 71,227 | | | LG Uplus Corp. | | | 734,524 | |
| | 2,359 | | | Lock & Lock Co. Ltd. | | | 27,626 | |
| | 558 | | | Loen Entertainment, Inc.(b) | | | 32,868 | |
| | 319 | | | Lotte Chilsung Beverage Co. Ltd. | | | 429,329 | |
| | 167 | | | Lotte Confectionary Co. Ltd. | | | 28,022 | |
| | 1,316 | | | LOTTE Fine Chemical Co. Ltd. | | | 33,353 | |
| | 97 | | | Lotte Food Co. Ltd. | | | 58,577 | |
| | 2,017 | | | LOTTE Himart Co. Ltd. | | | 77,824 | |
| | 7,921 | | | Lotte Non-Life Insurance Co. Ltd.(b) | | | 18,829 | |
| | 3,061 | | | LS Corp. | | | 146,864 | |
| | 3,687 | | | LS Industrial Systems Co. Ltd. | | | 126,149 | |
| | 16,340 | | | Macquarie Korea Infrastructure Fund | | | 125,808 | |
| | 1,072 | | | Maeil Dairy Industry Co. Ltd. | | | 31,759 | |
| | 1,025 | | | Mando Corp. | | | 240,518 | |
| | 7,032 | | | Medy-Tox, Inc. | | | 2,499,994 | |
| | 450 | | | MegaStudyEdu Co. Ltd. | | | 18,602 | |
| | 5,349 | | | Meritz Financial Group, Inc. | | | 52,590 | |
| | 20,522 | | | Meritz Fire & Marine Insurance Co. Ltd. | | | 286,062 | |
| | 135,059 | | | Meritz Securities Co. Ltd. | | | 401,902 | |
| | 44 | | | Mi Chang Oil Industrial Co. Ltd. | | | 3,384 | |
| | 19,450 | | | Mirae Asset Securities Co. Ltd. | | | 385,005 | |
| | 3,838 | | | MK Electron Co. Ltd. | | | 28,175 | |
| | 9,910 | | | Moorim P&P Co. Ltd. | | | 35,336 | |
| | 1,053 | | | Muhak Co. Ltd. | | | 20,936 | |
| | 2,496 | | | Namhae Chemical Corp. | | | 17,778 | |
| | 16,035 | | | Namsun Aluminum Co. Ltd.(b) | | | 16,536 | |
| | 29 | | | Namyang Dairy Products Co. Ltd. | | | 17,082 | |
| | 1,538 | | | Neowiz Games Corp.(b) | | | 14,516 | |
| | 3,444 | | | NEPES Corp. | | | 21,219 | |
| | 23,030 | | | Nexen Corp. | | | 160,812 | |
| | 6,177 | | | Nexen Tire Corp. | | | 70,988 | |
| | 18,756 | | | NH Investment & Securities Co. Ltd. | | | 165,554 | |
| | 1,316 | | | NHN KCP Corp. | | | 19,667 | |
| | 3,490 | | | NICE Holdings Co. Ltd. | | | 51,393 | |
| | 574 | | | NICE Information & Telecommunication Inc. | | | 18,360 | |
| Old Westbury Funds, Inc. | |
| Small & Mid Cap Fund | |
| Portfolio of Investments - (Continued) | October 31, 2016 |
| | |
| Shares | | | | | Value | |
| SOUTH KOREA (continued) |
| | 5,313 | | | NICE Information Service Co. Ltd. | | $ | 35,567 | |
| | 3,081 | | | NK Co. Ltd.(b) | | | 12,965 | |
| | 449 | | | Nong Shim Holdings Co. Ltd. | | | 39,632 | |
| | 280 | | | NongShim Co. Ltd. | | | 70,474 | |
| | 454 | | | Noroo Holdings Co. Ltd. | | | 6,626 | |
| | 2,740 | | | NPC | | | 15,086 | |
| | 22,824 | | | Nutribiotech Co. Ltd.(b) | | | 1,300,524 | |
| | 3,910 | | | OCI Co. Ltd.(b) | | | 309,246 | |
| | 1,723 | | | Osstem Implant Co. Ltd.(b) | | | 82,066 | |
| | 131 | | | Ottogi Corp. | | | 75,331 | |
| | 26,773 | | | Pan Ocean Co. Ltd.(b) | | | 84,349 | |
| | 2,944 | | | Pan-Pacific Co. Ltd. | | | 7,551 | |
| | 1,991 | | | PaperCorea, Inc.(b) | | | 1,007 | |
| | 5,040 | | | Paradise Co. Ltd. | | | 57,260 | |
| | 4,829 | | | Partron Co. Ltd. | | | 37,771 | |
| | 9,216 | | | Poongsan Corp. | | | 280,286 | |
| | 3,440 | | | POSCO Chemtech Co. Ltd. | | | 35,775 | |
| | 13,431 | | | Posco Daewoo Corp. | | | 292,859 | |
| | 9,753 | | | Posco ICT Co. Ltd.(b) | | | 48,840 | |
| | 601 | | | Posco M-Tech Co. Ltd. | | | 1,418 | |
| | 5,547 | | | Power Logics Co. Ltd.(b) | | | 17,985 | |
| | 180 | | | Pulmuone Co. Ltd. | | | 18,641 | |
| | 134,562 | | | Pyeong Hwa Automotive Co. Ltd.(d) | | | 1,375,902 | |
| | 3,651 | | | S&T Dynamics Co. Ltd. | | | 29,546 | |
| | 3,341 | | | S&T Holdings Co. Ltd. | | | 43,797 | |
| | 1,631 | | | S&T Motiv Co. Ltd. | | | 58,298 | |
| | 61,232 | | | S-1 Corp. | | | 4,949,932 | |
| | 481 | | | Sajo Industries Co. Ltd.(b) | | | 26,273 | |
| | 422 | | | Sam Yung Trading Co. Ltd. | | | 6,491 | |
| | 163 | | | Samchully Co. Ltd. | | | 13,903 | |
| | 1,716 | | | SAMHWA Paints Industrial Co. Ltd. | | | 16,796 | |
| | 5,492 | | | Samick Musical Instruments Co. Ltd. | | | 11,039 | |
| | 4,310 | | | Samick THK Co. Ltd. | | | 39,550 | |
| | 2,001 | | | Samjin Pharmaceutical Co. Ltd. | | | 55,260 | |
| | 250 | | | Samkwang Glass Co. Ltd. | | | 13,109 | |
| | 217 | | | Samlip General Foods Co. Ltd. | | | 32,334 | |
| | 1,914 | | | Sammok S-Form Co. Ltd. | | | 23,083 | |
| | 13,987 | | | Samsung Electro-Mechanics Co. Ltd. | | | 575,738 | |
| | 7,710 | | | Samsung Engineering Co. Ltd.(b) | | | 63,809 | |
| | 19,123 | | | Samsung Heavy Industries Co. Ltd.(b) | | | 162,945 | |
| | 10,766 | | | Samsung Securities Co. Ltd. | | | 325,073 | |
| | 87 | | | Samyang Corp. | | | 7,831 | |
| | 653 | | | Samyang Holdings Corp. | | | 71,335 | |
| | 85 | | | Samyang Tongsang Co. Ltd. | | | 3,655 | |
| | 10,570 | | | Savezone I&C Corp. | | | 50,806 | |
| | 5,185 | | | SBS Media Holdings Co. Ltd. | | | 12,937 | |
| | 7,130 | | | Seah Besteel Corp. | | | 144,563 | |
| | 485 | | | SeAH Holdings Corp. | | | 50,863 | |
| | 1,408 | | | SeAH Steel Corp. | | | 85,766 | |
| Shares | | | | | Value | |
| SOUTH KOREA (continued) |
| | 2,045 | | | Sebang Co. Ltd. | | $ | 26,897 | |
| | 2,530 | | | Sebang Global Battery Co. Ltd. | | | 82,030 | |
| | 69,164 | | | Seegene, Inc.(b) | | | 1,831,478 | |
| | 5,490 | | | Sejong Industrial Co. Ltd. | | | 49,418 | |
| | 1,680 | | | Sekonix Co. Ltd. | | | 18,867 | |
| | 877 | | | Seobu T&D(b) | | | 15,252 | |
| | 17,654 | | | Seohan Co. Ltd. | | | 32,323 | |
| | 23,722 | | | Seohee Construction Co. Ltd.(b) | | | 31,512 | |
| | 5,420 | | | Seoul Semiconductor Co. Ltd. | | | 64,893 | |
| | 502 | | | Seowonintech Co. Ltd. | | | 4,782 | |
| | 3,879 | | | Seoyon Co. Ltd. | | | 37,629 | |
| | 3,253 | | | Sewon Cellontech Co. Ltd.(b) | | | 8,301 | |
| | 1,290 | | | SFA Engineering Corp. | | | 65,275 | |
| | 11,028 | | | SFA Semicon Co. Ltd.(b) | | | 21,299 | |
| | 3,125 | | | Shin Poong Pharmaceutical Co. Ltd.(b) | | | 16,632 | |
| | 2,335 | | | Shinsegae Co. Ltd. | | | 379,559 | |
| | 176 | | | Shinsegae International, Inc. | | | 12,044 | |
| | 5,073 | | | Shinsung Solar Energy Co. Ltd.(b) | | | 11,505 | |
| | 22,990 | | | Shinsung Tongsang Co. Ltd.(b) | | | 24,512 | |
| | 2,106 | | | Shinwha Intertek Corp.(b) | | | 6,064 | |
| | 15,480 | | | Shinwon Corp.(b) | | | 22,187 | |
| | 2,111 | | | Silicon Works Co. Ltd. | | | 49,350 | |
| | 1,760 | | | SIMPAC, Inc. | | | 7,537 | |
| | 1,888 | | | SJM Co. Ltd. | | | 10,147 | |
| | 2,206 | | | SK Chemicals Co. Ltd. | | | 115,288 | |
| | 1,906 | | | SK Gas Ltd. | | | 160,076 | |
| | 537 | | | SK Materials Co. Ltd. | | | 73,211 | |
| | 16,645 | | | SK Networks Co. Ltd. | | | 94,844 | |
| | 39,972 | | | SK Securities Co. Ltd.(b) | | | 36,330 | |
| | 10,160 | | | SKC Co. Ltd. | | | 240,182 | |
| | 2,927 | | | SL Corp. | | | 39,010 | |
| | 1,102 | | | SM Entertainment Co.(b) | | | 26,292 | |
| | 3,825 | | | Songwon Industrial Co. Ltd. | | | 58,666 | |
| | 2,204 | | | Soulbrain Co. Ltd. | | | 120,192 | |
| | 5,736 | | | Ssangyong Cement Industrial Co. Ltd.(b) | | | 80,457 | |
| | 1,402 | | | Suheung Co. Ltd. | | | 48,459 | |
| | 4,811 | | | Sung Kwang Bend Co. Ltd. | | | 39,606 | |
| | 3,790 | | | Sungchang Enterprise Holdings Ltd. | | | 10,102 | |
| | 5,826 | | | Sungshin Cement Co. Ltd.(b) | | | 38,747 | |
| | 11,189 | | | Sungwoo Hitech Co. Ltd. | | | 75,099 | |
| | 214 | | | Sunjin Co. Ltd. | | | 4,919 | |
| | 73 | | | Suprema HQ, Inc.(b) | | | 521 | |
| | 67 | | | Suprema, Inc.(b) | | | 1,394 | |
| | 6,520 | | | Tae Kyung Industrial Co. Ltd. | | | 27,607 | |
| | 182 | | | Taekwang Industrial Co. Ltd. | | | 133,448 | |
| | 10,606 | | | Taeyoung Engineering & Construction Co. Ltd.(b) | | | 45,186 | |
| | 10,109 | | | Tailim Packaging Industrial Co. Ltd. | | | 27,034 | |
| | 1,541 | | | TBH Global Co. Ltd. (The)(b) | | | 11,124 | |
| | 1,795 | | | Texcell-Netcom Co. Ltd.(b) | | | 9,883 | |
| Old Westbury Funds, Inc. | |
| Small & Mid Cap Fund | |
| Portfolio of Investments - (Continued) | October 31, 2016 |
| | |
| Shares | | | | | Value | |
| SOUTH KOREA (continued) |
| | 16,250 | | | TK Chemical Corp.(b) | | $ | 27,409 | |
| | 3,460 | | | TK Corp. | | | 25,581 | |
| | 16,256 | | | Tongyang Life Insurance Co. Ltd. | | | 170,480 | |
| | 13,826 | | | Tongyang, Inc. | | | 38,847 | |
| | 3,450 | | | Tovis Co. Ltd. | | | 25,357 | |
| | 1,049 | | | TS Corp. | | | 22,048 | |
| | 470 | | | Uju Electronics Co. Ltd. | | | 6,141 | |
| | 1,935 | | | Unid Co. Ltd. | | | 78,973 | |
| | 740 | | | Value Added Technologies Co. Ltd. | | | 20,339 | |
| | 719 | | | Vieworks Co. Ltd. | | | 38,644 | |
| | 1,340 | | | Visang Education, Inc. | | | 17,625 | |
| | 1,916 | | | Webzen Inc(b) | | | 28,801 | |
| | 1,638 | | | Whanin Pharmaceutical Co. Ltd. | | | 20,900 | |
| | 3,358 | | | Wonik Holdings Corp.(b) | | | 19,075 | |
| | 3,533 | | | Wonik IPS Co. Ltd.(b) | | | 71,941 | |
| | 5,253 | | | Woongjin Thinkbig Co. Ltd.(b) | | | 43,750 | |
| | 4,055 | | | Y G-1 Co. Ltd. | | | 32,071 | |
| | 1,080 | | | YESCO Co. Ltd. | | | 35,583 | |
| | 1,004 | | | YG Entertainment, Inc. | | | 25,709 | |
| | 9,270 | | | Yoosung Enterprise Co. Ltd. | | | 32,730 | |
| | 1,618 | | | Yoosung T&S Co. Ltd. | | | 8,230 | |
| | 2,084 | | | Youlchon Chemical Co. Ltd. | | | 24,678 | |
| | 191 | | | Young Poong Corp. | | | 166,087 | |
| | 4,549 | | | Youngone Corp. | | | 127,813 | |
| | 1,498 | | | Youngone Holdings Co. Ltd. | | | 75,407 | |
| | 454 | | | Yuhan Corp. | | | 83,321 | |
| | | | | | | | 52,468,259 | |
| SPAIN — 0.3% |
| | 13,281 | | | Acciona SA | | | 1,010,928 | |
| | 12,680 | | | Acerinox SA | | | 156,177 | |
| | 56,469 | | | ACS Actividades de Construccion y Servicios SA | | | 1,731,356 | |
| | 18,012 | | | Almirall SA | | | 259,221 | |
| | 33,799 | | | Applus Services SA | | | 324,726 | |
| | 811,144 | | | Banco de Sabadell SA | | | 1,085,443 | |
| | 659 | | | Banco Popular Espanol SA | | | 723 | |
| | 55,114 | | | Bankia SA | | | 48,522 | |
| | 143,492 | | | Bankinter SA | | | 1,098,538 | |
| | 895 | | | Baron de Ley(b) | | | 101,295 | |
| | 4,515 | | | Bolsas y Mercados Espanoles SHMSF SA | | | 136,647 | |
| | 20,024 | | | Caja de Ahorros del Mediterraneo(b)(c)(d) | | | 0 | |
| | 5,702 | | | Cementos Portland Valderrivas SA(b) | | | 39,059 | |
| | 485 | | | Cia de Distribucion Integral Logista Holdings SA | | | 10,771 | |
| | 14,653 | | | Cie Automotive SA | | | 302,245 | |
| | 452 | | | Construcciones y Auxiliar de Ferrocarriles SA | | | 170,340 | |
| | 44,724 | | | Distribuidora Internacional de Alimentacion SA | | | 239,441 | |
| | 25,642 | | | Ebro Foods SA | | | 553,402 | |
| Shares | | | | | Value | |
| SPAIN (continued) |
| | 88,525 | | | EDP Renovaveis SA | | $ | 668,979 | |
| | 16,194 | | | eDreams ODIGEO SA(b) | | | 49,420 | |
| | 8,592 | | | Elecnor SA | | | 84,887 | |
| | 62,171 | | | Enagas SA | | | 1,784,699 | |
| | 34,719 | | | Ence Energia y Celulosa SA | | | 75,845 | |
| | 64,456 | | | Ercros SA(b) | | | 148,165 | |
| | 26,641 | | | Faes Farma SA | | | 97,826 | |
| | 9,353 | | | Fluidra SA | | | 44,663 | |
| | 31,022 | | | Gamesa Corp. Tecnologica SA | | | 717,700 | |
| | 16,692 | | | Grupo Catalana Occidente SA | | | 526,074 | |
| | 1,413 | | | Iberpapel Gestion SA | | | 30,976 | |
| | 9,566 | | | Indra Sistemas SA(b) | | | 118,505 | |
| | 6,773 | | | Inmobiliaria Colonial SA | | | 47,830 | |
| | 1,502 | | | Laboratorios Farmaceuticos Rovi SA | | | 20,281 | |
| | 1 | | | Liberbank SA(b) | | | 1 | |
| | 348,864 | | | Mapfre SA | | | 1,036,692 | |
| | 20,608 | | | Mediaset Espana Comunicacion SA | | | 230,184 | |
| | 20,767 | | | Melia Hotels International SA | | | 256,809 | |
| | 2,083 | | | Miquel y Costas & Miquel SA | | | 88,675 | |
| | 7,443 | | | NH Hotel Group SA(b) | | | 32,887 | |
| | 22,626 | | | Papeles y Cartones de Europa SA | | | 117,980 | |
| | 9,252 | | | Pescanova SA(b)(c)(d) | | | 0 | |
| | 9,982 | | | Pharma Mar SA(b) | | | 27,011 | |
| | 1,765 | | | Prim SA | | | 16,101 | |
| | 5,650 | | | Promotora de Informaciones SA(b) | | | 39,199 | |
| | 18,972 | | | Prosegur Cia de Seguridad SA | | | 137,872 | |
| | 28,335 | | | Red Electrica Corp. SA | | | 591,148 | |
| | 134,338 | | | Sacyr SA(b) | | | 307,180 | |
| | 861 | | | Tecnicas Reunidas SA | | | 32,292 | |
| | 41,405 | | | Tubacex SA | | | 123,176 | |
| | 13,858 | | | Tubos Reunidos SA(b) | | | 12,931 | |
| | 4,430 | | | Vidrala SA | | | 254,095 | |
| | 6,047 | | | Viscofan SA | | | 285,008 | |
| | 10,741 | | | Zardoya Otis SA | | | 90,673 | |
| | | | | | | | 15,364,598 | |
| SWEDEN — 0.8% |
| | 154,954 | | | AAK AB(d) | | | 10,233,451 | |
| | 22,251 | | | Acando AB | | | 56,908 | |
| | 3,798 | | | Addlife AB(b) | | | 58,659 | |
| | 3,083 | | | AddNode Group AB | | | 19,627 | |
| | 12,158 | | | AddTech AB - Class B | | | 172,971 | |
| | 698,519 | | | AF AB - B Shares(d) | | | 12,799,266 | |
| | 2,072 | | | Atrium Ljungberg AB - Class B | | | 32,231 | |
| | 2,441 | | | Avanza Bank Holding AB | | | 92,293 | |
| | 13,583 | | | Axfood AB | | | 212,344 | |
| | 6,689 | | | B&B Tools AB - Class B | | | 148,856 | |
| | 4,948 | | | Beijer Alma AB | | | 114,221 | |
| | 2,816 | | | Beijer Ref AB | | | 65,940 | |
| | 8,862 | | | Betsson AB | | | 85,557 | |
| | 11,179 | | | Bilia AB | | | 266,722 | |
| | 79,471 | | | BillerudKorsnas AB | | | 1,305,724 | |
| Old Westbury Funds, Inc. | |
| Small & Mid Cap Fund | |
| Portfolio of Investments - (Continued) | October 31, 2016 |
| | |
| Shares | | | | | Value | |
| SWEDEN (continued) |
| | 2,484 | | | BioGaia AB - Class B | | $ | 75,905 | |
| | 8,156 | | | Biotage AB | | | 39,551 | |
| | 24,317 | | | Boliden AB | | | 563,492 | |
| | 1,799 | | | Bonava AB(b) | | | 21,810 | |
| | 40,560 | | | Bonava AB - Class B(b) | | | 501,154 | |
| | 2,022 | | | Bulten AB | | | 20,260 | |
| | 19,231 | | | Bure Equity AB | | | 210,788 | |
| | 17,958 | | | Byggmax Group AB | | | 118,300 | |
| | 12,355 | | | Castellum AB | | | 167,430 | |
| | 1,272 | | | Catena AB | | | 18,554 | |
| | 7,218 | | | Clas Ohlson AB - Class B | | | 101,891 | |
| | 56,029 | | | Cloetta AB - B Shares | | | 198,505 | |
| | 14,299 | | | Com Hem Holding AB | | | 128,866 | |
| | 3,266 | | | Dios Fastigheter AB | | | 21,786 | |
| | 11,559 | | | Doro AB(b) | | | 73,586 | |
| | 12,044 | | | Duni AB | | | 160,348 | |
| | 1,810 | | | Dustin Group AB | | | 12,324 | |
| | 52,670 | | | Elekta AB - Class B | | | 456,890 | |
| | 622,171 | | | Eltel AB | | | 3,857,506 | |
| | 1,207 | | | Enea AB | | | 10,824 | |
| | 7,041 | | | Fabege AB | | | 118,959 | |
| | 2,223 | | | Fagerhult AB | | | 56,608 | |
| | 21,939 | | | Fingerprint Cards AB(b) | | | 212,537 | |
| | 4,295 | | | Getinge AB - Class B | | | 70,377 | |
| | 7,403 | | | Granges AB | | | 71,922 | |
| | 22,187 | | | Gunnebo AB | | | 102,925 | |
| | 3,932 | | | Haldex AB | | | 50,716 | |
| | 1,030 | | | Hemfosa Fastigheter AB | | | 9,693 | |
| | 49,658 | | | Hexpol AB | | | 408,220 | |
| | 5,834 | | | HiQ International AB | | | 36,333 | |
| | 440 | | | HMS Networks AB | | | 12,861 | |
| | 12,960 | | | Holmen AB - Class B | | | 443,663 | |
| | 4,434 | | | Hufvudstaden AB - Class A | | | 68,630 | |
| | 16,852 | | | Husqvarna AB - Class A | | | 126,593 | |
| | 123,031 | | | Husqvarna AB - Class B | | | 925,578 | |
| | 16,467 | | | Indutrade AB | | | 306,108 | |
| | 14,684 | | | Intrum Justitia AB | | | 452,771 | |
| | 2,751 | | | Inwido AB | | | 30,077 | |
| | 20,956 | | | JM AB | | | 603,473 | |
| | 28,301 | | | KappAhl AB | | | 147,581 | |
| | 4,979 | | | KNOW IT AB | | | 44,514 | |
| | 13,464 | | | Kungsleden AB | | | 84,968 | |
| | 8,118 | | | Lagercrantz Group AB - B Shares | | | 74,375 | |
| | 18,526 | | | Lindab International AB | | | 158,756 | |
| | 22,722 | | | Loomis AB - Class B | | | 646,530 | |
| | 5,649 | | | Medivir AB - Class B(b) | | | 41,435 | |
| | 9,858 | | | Mekonomen AB | | | 175,175 | |
| | 3,948 | | | Modern Times Group MTG AB - Class B | | | 106,304 | |
| | 4,122 | | | MQ Holding AB | | | 15,517 | |
| | 3,624 | | | Munksjo Oyj | | | 52,075 | |
| | 5,655 | | | Mycronic AB | | | 59,010 | |
| | 13,909 | | | NCC AB - Class B | | | 353,571 | |
| | 2,159 | | | Nederman Holding AB | | | 45,178 | |
| | 66,395 | | | Net Insight AB - Class B(b) | | | 49,619 | |
| Shares | | | | | Value | |
| SWEDEN (continued) |
| | 29,286 | | | Netent AB | | $ | 230,698 | |
| | 10,064 | | | New Wave Group AB - Class B | | | 55,712 | |
| | 41,644 | | | Nibe Industrier AB - Class B | | | 309,835 | |
| | 31,265 | | | Nobia AB | | | 272,422 | |
| | 8,614 | | | Nolato AB - B Shares | | | 247,009 | |
| | 16,154 | | | Nordnet AB - Class B | | | 66,353 | |
| | 77,713 | | | Opus Group AB | | | 57,217 | |
| | 117,641 | | | Peab AB | | | 998,343 | |
| | 12,951 | | | Pricer AB - B Shares | | | 13,550 | |
| | 649 | | | Proact IT Group AB | | | 10,006 | |
| | 12,271 | | | Qliro Group AB(b) | | | 12,703 | |
| | 2,630 | | | Raysearch Laboratories AB | | | 58,236 | |
| | 32,557 | | | Rezidor Hotel Group AB | | | 133,009 | |
| | 10,568 | | | Saab AB - Class B | | | 374,414 | |
| | 166 | | | Sagax AB - Class B | | | 1,466 | |
| | 48,567 | | | SAS AB(b) | | | 82,270 | |
| | 7,101 | | | Scandi Standard AB | | | 49,727 | |
| | 3,644 | | | Sectra AB - B Shares | | | 56,281 | |
| | 3,842 | | | Semcon AB | | | 19,907 | |
| | 7,282 | | | SkiStar AB | | | 112,066 | |
| | 31,885 | | | SSAB - A Shares(b) | | | 101,436 | |
| | 147,413 | | | SSAB AB - B Shares(b) | | | 391,613 | |
| | 50,676 | | | SSAB AB - Class A(b) | | | 160,632 | |
| | 98,446 | | | SSAB AB - Class B(b) | | | 261,370 | |
| | 13,628 | | | Sweco AB - Class B | | | 273,250 | |
| | 2,770 | | | Systemair AB | | | 35,498 | |
| | 11,101 | | | Tele2 AB - B Shares | | | 91,749 | |
| | 3,356 | | | Transcom Worldwide AB | | | 24,152 | |
| | 20,268 | | | Trelleborg AB - Class B | | | 353,876 | |
| | 2,479 | | | Vitrolife AB | | | 128,312 | |
| | 12,698 | | | Wallenstam AB | | | 97,778 | |
| | 1,693 | | | Wihlborgs Fastigheter AB | | | 32,802 | |
| | | | | | | | 43,700,884 | |
| SWITZERLAND — 1.5% |
| | 7,763 | | | AFG Arbonia-Forster Holding AG(b) | | | 116,498 | |
| | 615,000 | | | Allied World Assurance Co. Holdings AG | | | 26,432,700 | |
| | 4,067 | | | Allreal Holding AG | | | 598,409 | |
| | 368 | | | Alpiq Holding AG(b) | | | 34,214 | |
| | 934 | | | ALSO Holding AG | | | 85,608 | |
| | 276 | | | APG SGA SA | | | 115,261 | |
| | 25,085 | | | Aryzta AG | | | 1,102,214 | |
| | 11,931 | | | Ascom Holding AG | | | 204,366 | |
| | 827 | | | Autoneum Holding AG | | | 218,962 | |
| | 83 | | | Bachem Holding AG - Class B | | | 7,398 | |
| | 30,200 | | | Baloise Holding AG | | | 3,717,205 | |
| | 640 | | | Bank Coop AG | | | 27,099 | |
| | 277 | | | Banque Cantonale de Geneve | | | 81,878 | |
| | 935 | | | Banque Cantonale Vaudoise | | | 587,239 | |
| | 486 | | | Barry Callebaut AG | | | 605,075 | |
| | 942 | | | Basler Kantonalbank | | | 63,781 | |
| | 1,131 | | | Belimo Holding AG(d) | | | 3,457,405 | |
| | 610 | | | Bell AG | | | 261,217 | |
| | 1,144 | | | Berner Kantonalbank AG | | | 207,632 | |
| Old Westbury Funds, Inc. | |
| Small & Mid Cap Fund | |
| Portfolio of Investments - (Continued) | October 31, 2016 |
| | |
| Shares | | | | | Value | |
| SWITZERLAND (continued) |
| | 528 | | | BKW AG | | $ | 24,571 | |
| | 2,740 | | | Bobst Group SA | | | 150,907 | |
| | 1,166 | | | Bossard Holding AG(b) | | | 166,142 | |
| | 2,624 | | | Bucher Industries AG | | | 583,111 | |
| | 18,581 | | | Burckhardt Compression Holding AG | | | 5,389,063 | |
| | 232 | | | Burkhalter Holding AG | | | 29,681 | |
| | 1,012 | | | Calida Holding AG | | | 35,180 | |
| | 36 | | | Carlo Gavazzi Holding AG | | | 8,877 | |
| | 2,014 | | | Cembra Money Bank AG | | | 153,968 | |
| | 178 | | | Cham Paper Holding AG | | | 56,662 | |
| | 200 | | | Cicor Technologies(b) | | | 4,982 | |
| | 40 | | | Cie Financiere Tradition SA | | | 3,169 | |
| | 117,388 | | | Clariant AG | | | 1,944,307 | |
| | 32,329 | | | Coca-Cola HBC AG - CDI | | | 698,821 | |
| | 638 | | | Coltene Holding AG | | | 45,486 | |
| | 140 | | | Conzzeta AG | | | 96,701 | |
| | 29,189 | | | Daetwyler Holding AG | | | 3,993,927 | |
| | 1,006 | | | DKSH Holding AG | | | 69,740 | |
| | 821 | | | dorma+kaba Holding AG | | | 570,398 | |
| | 1,559 | | | Dufry AG(b) | | | 189,686 | |
| | 844 | | | Emmi AG | | | 498,101 | |
| | 2,730 | | | Energiedienst Holding AG | | | 70,626 | |
| | 284 | | | Feintool International Holding AG | | | 33,062 | |
| | 46,077 | | | Ferrexpo Plc(b) | | | 56,680 | |
| | 6,395 | | | Flughafen Zuerich AG | | | 1,176,181 | |
| | 178 | | | Forbo Holding AG | | | 227,008 | |
| | 854 | | | Galenica AG | | | 856,114 | |
| | 47,446 | | | GAM Holding AG | | | 459,812 | |
| | 3,045 | | | Gategroup Holding AG(b) | | | 160,166 | |
| | 2,399 | | | Georg Fischer AG | | | 2,127,353 | |
| | 127 | | | Gurit Holding AG | | | 107,550 | |
| | 4,128 | | | Helvetia Holdings AG | | | 2,148,370 | |
| | 3,758 | | | Highlight Communications AG(b) | | | 21,534 | |
| | 201 | | | HOCHDORF Holding AG | | | 55,859 | |
| | 1,701 | | | Huber & Suhner AG | | | 99,012 | |
| | 5,293 | | | Implenia AG | | | 354,364 | |
| | 249 | | | Inficon Holding AG | | | 89,454 | |
| | 136 | | | Interroll Holding AG | | | 148,431 | |
| | 104 | | | Intershop Holding AG | | | 53,075 | |
| | 7,531 | | | Julius Baer Group Ltd. | | | 305,258 | |
| | 1 | | | Jungfraubahn Holding AG | | | 94 | |
| | 1,015 | | | Kardex AG | | | 86,776 | |
| | 1,169 | | | Komax Holding AG | | | 281,751 | |
| | 19,796 | | | Kudelski SA(b) | | | 341,086 | |
| | 144 | | | LEM Holding SA | | | 160,800 | |
| | 13,174 | | | Logitech International SA | | | 318,849 | |
| | 10,301 | | | Lonza Group AG | | | 1,944,547 | |
| | 989 | | | Luzerner Kantonalbank AG | | | 384,286 | |
| | 275 | | | MCH Group AG | | | 18,481 | |
| | 74 | | | Metall Zug AG - Class B | | | 237,805 | |
| | 1,111 | | | Meyer Burger Technology AG(b) | | | 3,638 | |
| | 1,603 | | | Mobilezone Holding AG | | | 23,813 | |
| Shares | | | | | Value | |
| SWITZERLAND (continued) |
| | 1,904 | | | Mobimo Holding AG | | $ | 458,130 | |
| | 111,727 | | | OC Oerlikon Corp AG(b) | | | 1,051,163 | |
| | 1,320 | | | Orascom Development Holding AG(b) | | | 7,897 | |
| | 3,404 | | | Oriflame Holding AG(b) | | | 125,160 | |
| | 1,832 | | | Orior AG | | | 148,108 | |
| | 1,572 | | | Panalpina Welttransport Holding AG | | | 204,135 | |
| | 879 | | | Partners Group Holding AG | | | 445,030 | |
| | 208 | | | Phoenix Mecano AG | | | 106,359 | |
| | 140 | | | Plazza AG | | | 33,276 | |
| | 1,688 | | | PSP Swiss Property AG | | | 150,966 | |
| | 1,315 | | | Rieter Holding AG | | | 250,097 | |
| | 154 | | | Romande Energie Holding SA | | | 189,553 | |
| | 23 | | | Schaffner Holding AG | | | 5,474 | |
| | 125,129 | | | Schmolz & Bickenbach AG(b) | | | 82,193 | |
| | 225 | | | Schweiter Technologies AG | | | 242,383 | |
| | 763 | | | Siegfried Holding AG | | | 156,910 | |
| | 1,983 | | | Sonova Holding AG | | | 265,923 | |
| | 763 | | | St. Galler Kantonalbank AG | | | 286,255 | |
| | 258,092 | | | STMicroelectronics NV | | | 2,461,217 | |
| | 1,057 | | | Straumann Holding AG | | | 396,822 | |
| | 4,456 | | | Sulzer AG | | | 439,048 | |
| | 858 | | | Sunrise Communications Group AG | | | 58,613 | |
| | 8,673 | | | Swiss Life Holding AG | | | 2,296,323 | |
| | 896 | | | Swissquote Group Holding SA | | | 25,489 | |
| | 953 | | | Tamedia AG | | | 155,535 | |
| | 717 | | | Tecan Group AG | | | 118,105 | |
| | 4,539 | | | Temenos Group AG | | | 292,876 | |
| | 24,389 | | | U-Blox AG | | | 4,608,906 | |
| | 4,427 | | | Valiant Holding AG | | | 419,862 | |
| | 1,601 | | | Valora Holding AG | | | 465,553 | |
| | 457 | | | Vaudoise Assurances Holding SA | | | 222,369 | |
| | 42 | | | Vetropack Holding AG | | | 68,716 | |
| | 7,402 | | | Vontobel Holding AG | | | 362,414 | |
| | 60 | | | VZ Holding AG | | | 17,766 | |
| | 679 | | | Walter Meier AG | | | 24,702 | |
| | 1,680 | | | Wizz Air Holdings Plc(b) | | | 31,071 | |
| | 272 | | | Ypsomed Holding AG | | | 51,951 | |
| | 3,383 | | | Zehnder Group AG(b) | | | 140,681 | |
| | 52 | | | Zug Estates Holding AG - B Shares | | | 86,864 | |
| | 31 | | | Zuger Kantonalbank AG | | | 154,851 | |
| | | | | | | | 82,098,222 | |
| TAIWAN — 0.8% |
| | 53,000 | | | AcBel Polytech, Inc. | | | 39,300 | |
| | 32,000 | | | Accton Technology Corp. | | | 51,107 | |
| | 302,878 | | | Acer, Inc. | | | 139,166 | |
| | 64,765 | | | Achem Technology Corp. | | | 22,165 | |
| | 9,000 | | | Actron Technology Corp. | | | 29,518 | |
| | 9,998 | | | Adlink Technology, Inc. | | | 19,389 | |
| | 59,464 | | | Advancetek Enterprise Co. Ltd. | | | 33,918 | |
| | 246,694 | | | Airtac International Group | | | 1,966,047 | |
| Old Westbury Funds, Inc. | |
| Small & Mid Cap Fund | |
| Portfolio of Investments - (Continued) | October 31, 2016 |
| | |
| Shares | | | | | Value | |
| TAIWAN (continued) |
| | 25,572 | | | Alltek Technology Corp. | | $ | 20,461 | |
| | 2,000 | | | Alpha Networks, Inc. | | | 1,153 | |
| | 29,050 | | | Altek Corp. | | | 20,804 | |
| | 44,000 | | | Ambassador Hotel (The) | | | 34,439 | |
| | 18,000 | | | AMPOC Far-East Co. Ltd. | | | 14,374 | |
| | 24,139 | | | Anpec Electronics Corp. | | | 21,991 | |
| | 42,000 | | | APCB, Inc.(b) | | | 29,746 | |
| | 165,872 | | | Ardentec Corp. | | | 123,783 | |
| | 63,427 | | | Arima Communications Corp.(b) | | | 9,909 | |
| | 83,000 | | | Asia Cement Corp. | | | 72,460 | |
| | 54,000 | | | Asia Optical Co., Inc.(b) | | | 49,795 | |
| | 59,100 | | | Asia Vital Components Co. Ltd. | | | 44,291 | |
| | 11,000 | | | Aten International Co. Ltd. | | | 27,642 | |
| | 118,000 | | | AU Optronics Corp. | | | 44,870 | |
| | 27,800 | | | Audix Corp. | | | 32,110 | |
| | 12,000 | | | Aurora Corp. | | | 19,393 | |
| | 46,278 | | | Bank of Kaohsiung Co. Ltd. | | | 12,978 | |
| | 360,350 | | | BES Engineering Corp. | | | 61,433 | |
| | 1,000 | | | Boardtek Electronics Corp. | | | 992 | |
| | 13,000 | | | C Sun Manufacturing Ltd.(b) | | | 6,571 | |
| | 145,781 | | | Capital Securities Corp. | | | 36,494 | |
| | 69,000 | | | Career Technology Manufacturing Co. Ltd. | | | 44,058 | |
| | 29,000 | | | Casetek Holdings Ltd. | | | 93,274 | |
| | 104,300 | | | Cathay Real Estate Development Co. Ltd. | | | 53,542 | |
| | 19,760 | | | Central Reinsurance Co. Ltd. | | | 8,641 | |
| | 141,000 | | | Chailease Holding Co. Ltd. | | | 243,955 | |
| | 26,000 | | | ChainQui Construction Development Co. Ltd. | | | 15,407 | |
| | 87,000 | | | Champion Building Materials Co. Ltd.(b) | | | 19,160 | |
| | 1,730 | | | Chang Wah Electromaterials, Inc. | | | 8,141 | |
| | 46,185 | | | Charoen Pokphand Enterprise | | | 65,785 | |
| | 7,000 | | | Chaun-Choung Technology Corp. | | | 30,944 | |
| | 13,000 | | | CHC Resources Corp. | | | 22,122 | |
| | 731,920 | | | Cheng Loong Corp. | | | 265,562 | |
| | 110,797 | | | Cheng Uei Precision Industry Co. Ltd. | | | 135,698 | |
| | 100,024 | | | Chicony Electronics Co. Ltd. | | | 256,102 | |
| | 48,120 | | | Chien Kuo Construction Co. Ltd. | | | 12,915 | |
| | 11,164 | | | Chilisin Electronics Corp. | | | 24,445 | |
| | 671,744 | | | China Airlines Ltd. | | | 203,285 | |
| | 18,000 | | | China Chemical & Pharmaceutical Co. Ltd. | | | 10,153 | |
| | 11,000 | | | China Ecotek Corp. | | | 15,686 | |
| | 71,305 | | | China General Plastics Corp. | | | 57,166 | |
| | 555,472 | | | China Life Insurance Co. Ltd. | | | 513,095 | |
| | 63,077 | | | China Metal Products | | | 62,262 | |
| | 12,114 | | | China Steel Chemical Corp. | | | 41,650 | |
| | 37,000 | | | China Steel Structure Co. Ltd. | | | 25,677 | |
| | 202,321 | | | China Synthetic Rubber Corp. | | | 158,997 | |
| | 44,800 | | | China Wire & Cable Co. Ltd. | | | 21,436 | |
| Shares | | | | | Value | |
| TAIWAN (continued) |
| | 42,883 | | | Chin-Poon Industrial Co. Ltd. | | $ | 82,213 | |
| | 99,000 | | | Chipbond Technology Corp. | | | 136,936 | |
| | 12,751 | | | Chipmos Technologies, Inc.(b) | | | 11,374 | |
| | 12,000 | | | Chong Hong Construction Co. Ltd. | | | 19,697 | |
| | 35,876 | | | Chroma ATE, Inc. | | | 91,061 | |
| | 64,000 | | | Chun Yu Works & Co. Ltd. | | | 26,365 | |
| | 112,779 | | | Chun Yuan Steel | | | 38,597 | |
| | 77,779 | | | Chung Hwa Pulp Corp. | | | 22,059 | |
| | 69,125 | | | Chung-Hsin Electric & Machinery Manufacturing Corp. | | | 38,771 | |
| | 228,000 | | | Chunghwa Picture Tubes Ltd.(b) | | | 11,199 | |
| | 4,000 | | | Cleanaway Co. Ltd. | | | 21,294 | |
| | 51,348 | | | Clevo Co. | | | 47,024 | |
| | 175,000 | | | CMC Magnetics Corp.(b) | | | 20,629 | |
| | 30,034 | | | CoAsia Microelectronics Corp. | | | 12,991 | |
| | 940,000 | | | Compal Electronics, Inc. | | | 559,994 | |
| | 366,000 | | | Compeq Manufacturing Co. Ltd. | | | 193,105 | |
| | 51,000 | | | Concord Securities Co. Ltd. | | | 10,020 | |
| | 115,873 | | | Continental Holdings Corp. | | | 37,820 | |
| | 177,200 | | | Coretronic Corp. | | | 183,615 | |
| | 50,000 | | | Coxon Precise Industrial Co. Ltd. | | | 47,770 | |
| | 84,838 | | | CTCI Corp. | | | 124,606 | |
| | 2,900 | | | Cub Elecparts, Inc. | | | 26,650 | |
| | 6,000 | | | Cyberpower Systems, Inc. | | | 17,188 | |
| | 36,000 | | | CyberTAN Technology, Inc. | | | 21,561 | |
| | 76,000 | | | DA CIN Construction Co. Ltd. | | | 45,517 | |
| | 15,833 | | | Da-Li Development Co. Ltd. | | | 9,959 | |
| | 42,000 | | | Darfon Electronics Corp. | | | 24,622 | |
| | 66,201 | | | Delpha Construction Co. Ltd. | | | 27,796 | |
| | 24,000 | | | Depo Auto Parts Industrial Co. Ltd. | | | 74,987 | |
| | 7,000 | | | DFI, Inc. | | | 10,692 | |
| | 65,904 | | | D-Link Corp. | | | 21,197 | |
| | 20,183 | | | Dynamic Electronics Co. Ltd.(b) | | | 5,967 | |
| | 18,000 | | | Dynapack International Technology Corp. | | | 23,557 | |
| | 54,000 | | | E Ink Holdings, Inc. | | | 45,859 | |
| | 63,675 | | | Eastern Media International Corp.(b) | | | 15,153 | |
| | 11,000 | | | Eclat Textile Co. Ltd. | | | 125,137 | |
| | 14,895 | | | Edom Technology Co. Ltd. | | | 8,307 | |
| | 34,320 | | | Elan Microelectronics Corp. | | | 38,880 | |
| | 14,000 | | | E-LIFE MALL Corp. | | | 26,796 | |
| | 17,280 | | | Elite Advanced Laser Corp. | | | 62,971 | |
| | 43,967 | | | Elite Material Co. Ltd. | | | 122,744 | |
| | 14,000 | | | Elite Semiconductor Memory Technology, Inc. | | | 14,928 | |
| | 96,489 | | | Elitegroup Computer Systems Co. Ltd. | | | 41,277 | |
| | 9,000 | | | eMemory Technology, Inc. | | | 95,540 | |
| | 8,819 | | | ENG Electric Co. Ltd. | | | 4,667 | |
| Old Westbury Funds, Inc. | |
| Small & Mid Cap Fund | |
| Portfolio of Investments - (Continued) | October 31, 2016 |
| | |
| Shares | | | | | Value | |
| TAIWAN (continued) |
| | 133,000 | | | EnTie Commercial Bank Co. Ltd. | | $ | 50,785 | |
| | 75,015 | | | Epistar Corp.(b) | | | 51,107 | |
| | 114,270 | | | Eternal Materials Co. Ltd. | | | 120,580 | |
| | 28,000 | | | E-Ton Solar Tech Co. Ltd.(b) | | | 8,695 | |
| | 497,985 | | | Eva Airways Corp. | | | 239,860 | |
| | 40,000 | | | Everest Textile Co. Ltd. | | | 20,978 | |
| | 99,000 | | | Evergreen International Storage & Transport Corp. | | | 40,155 | |
| | 297,138 | | | Evergreen Marine Corp. Taiwan Ltd.(b) | | | 111,106 | |
| | 65,342 | | | Everlight Chemical Industrial Corp. | | | 41,411 | |
| | 75,643 | | | Everlight Electronics Co. Ltd. | | | 114,217 | |
| | 10,373 | | | Excelsior Medical Co. Ltd. | | | 14,824 | |
| | 215,062 | | | Far Eastern Department Stores Ltd. | | | 114,150 | |
| | 701,846 | | | Far Eastern International Bank | | | 199,717 | |
| | 478 | | | Faraday Technology Corp. | | | 476 | |
| | 43,000 | | | Farglory F T Z Investment Holding Co. Ltd.(b) | | | 18,736 | |
| | 33,000 | | | Farglory Land Development Co. Ltd. | | | 37,959 | |
| | 159,255 | | | Federal Corp. | | | 68,128 | |
| | 75,320 | | | Feng Hsin Steel Co. Ltd. | | | 100,005 | |
| | 6,720 | | | Feng TAY Enterprise Co. Ltd. | | | 28,109 | |
| | 66,778 | | | First Hotel | | | 34,915 | |
| | 61,000 | | | First Insurance Co. Ltd. (The)(b) | | | 21,843 | |
| | 59,000 | | | First Steamship Co. Ltd.(b) | | | 13,386 | |
| | 32,594 | | | FLEXium Interconnect, Inc. | | | 92,853 | |
| | 9,955 | | | Flytech Technology Co. Ltd. | | | 32,807 | |
| | 20,000 | | | Focaltech Systems Co. Ltd. | | | 21,675 | |
| | 71,000 | | | Forhouse Corp. | | | 27,448 | |
| | 48,000 | | | Formosa Advanced Technologies Co. Ltd. | | | 33,615 | |
| | 9,764 | | | Formosa International Hotels Corp. | | | 54,764 | |
| | 31,203 | | | Formosa Oilseed Processing Co. Ltd. | | | 51,416 | |
| | 54,900 | | | Formosan Rubber Group, Inc. | | | 25,573 | |
| | 73,628 | | | Formosan Union Chemical | | | 39,430 | |
| | 33,000 | | | Fortune Electric Co. Ltd. | | | 18,143 | |
| | 58,210 | | | Founding Construction & Development Co. Ltd. | | | 29,790 | |
| | 90,321 | | | Froch Enterprise Co. Ltd.(b) | | | 27,448 | |
| | 7,518 | | | FSP Technology, Inc. | | | 5,741 | |
| | 20,000 | | | Fulltech Fiber Glass Corp. | | | 8,271 | |
| | 105,412 | | | Fwusow Industry Co. Ltd. | | | 51,608 | |
| | 27,000 | | | Gemtek Technology Corp. | | | 15,572 | |
| | 7,000 | | | Genius Electronic Optical Co. Ltd.(b) | | | 11,180 | |
| | 7,610 | | | GeoVision, Inc. | | | 11,454 | |
| | 77,000 | | | Getac Technology Corp. | | | 100,040 | |
| | 13,000 | | | Giant Manufacturing Co. Ltd. | | | 92,070 | |
| | 58,781 | | | Gigabyte Technology Co. Ltd. | | | 77,394 | |
| | 2,400 | | | Gigasolar Materials Corp. | | | 30,307 | |
| Shares | | | | | Value | |
| TAIWAN (continued) |
| | 81,000 | | | Gigastorage Corp.(b) | | $ | 58,265 | |
| | 303,000 | | | Ginko International Co. Ltd. | | | 2,827,648 | |
| | 86,474 | | | Gintech Energy Corp.(b) | | | 61,929 | |
| | 26,000 | | | Global Brands Manufacture Ltd.(b) | | | 8,980 | |
| | 12,000 | | | Global Lighting Technologies, Inc. | | | 25,705 | |
| | 6,000 | | | Global Unichip Corp. | | | 15,305 | |
| | 76,650 | | | Globe Union Industrial Corp. | | | 37,769 | |
| | 48,880 | | | Gloria Material Technology Corp. | | | 26,177 | |
| | 164,770 | | | Gold Circuit Electronics Ltd.(b) | | | 55,606 | |
| | 370,852 | | | Goldsun Building Materials Co. Ltd. | | | 85,552 | |
| | 7,350 | | | Gourmet Master Co. Ltd. | | | 65,913 | |
| | 344,000 | | | Grand Pacific Petrochemical | | | 192,398 | |
| | 12,000 | | | Grape King Bio Ltd. | | | 100,768 | |
| | 59,000 | | | Great China Metal Industry | | | 43,375 | |
| | 40,000 | | | Great Taipei Gas Co. Ltd. | | | 30,104 | |
| | 127,946 | | | Great Wall Enterprise Co. Ltd. | | | 116,563 | |
| | 27,000 | | | GTM Holdings Corp.(b) | | | 12,919 | |
| | 35,000 | | | Hannstar Board Corp. | | | 16,858 | |
| | 333,000 | | | HannStar Display Corp.(b) | | | 83,468 | |
| | 30,300 | | | Harvatek Corp.(b) | | | 8,997 | |
| | 110,000 | | | Hey Song Corp. | | | 112,588 | |
| | 66,666 | | | Highwealth Construction Corp. | | | 98,761 | |
| | 7,000 | | | Hiroca Holdings Ltd. | | | 24,400 | |
| | 3,620 | | | Hitron Technology, Inc. | | | 2,375 | |
| | 13,575 | | | Hiwin Technologies Corp. | | | 60,008 | |
| | 95,281 | | | Ho Tung Chemical Corp.(b) | | | 23,399 | |
| | 87,000 | | | Hocheng Corp. | | | 22,110 | |
| | 8,800 | | | Holiday Entertainment Co. Ltd. | | | 13,748 | |
| | 28,294 | | | Holy Stone Enterprise Co. Ltd. | | | 28,556 | |
| | 17,507 | | | Hota Industrial Manufacturing Co. Ltd. | | | 72,952 | |
| | 68,678 | | | Hsin Kuang Steel Co. Ltd. | | | 40,588 | |
| | 56,993 | | | Hsing TA Cement Co. | | | 18,060 | |
| | 36,000 | | | HTC Corp.(b) | | | 105,408 | |
| | 11,000 | | | Hu Lane Associate, Inc. | | | 48,626 | |
| | 26,479 | | | Huaku Development Co. Ltd. | | | 46,652 | |
| | 31,000 | | | Hung Ching Development & Construction Co. Ltd. | | | 17,878 | |
| | 109,514 | | | Hung Poo Real Estate Development Corp. | | | 90,054 | |
| | 39,000 | | | Hung Sheng Construction Ltd. | | | 21,071 | |
| | 42,830 | | | Hwa Fong Rubber Co. Ltd. | | | 13,843 | |
| | 34,341 | | | Ichia Technologies, Inc.(b) | | | 15,235 | |
| | 22,000 | | | I-Chiun Precision Industry Co. Ltd.(b) | | | 5,919 | |
| | 209,155 | | | Inventec Corp. | | | 163,705 | |
| | 2,000 | | | I-Sheng Electric Wire & Cable Co. Ltd. | | | 2,792 | |
| | 13,000 | | | ITEQ Corp. | | | 14,089 | |
| | 14,000 | | | Jess-Link Products Co. Ltd. | | | 11,601 | |
| | 145,731 | | | Jih Sun Financial Holdings Co. Ltd. | | | 30,386 | |
| | 4,680 | | | Johnson Health Tech Co. Ltd. | | | 6,807 | |
| Old Westbury Funds, Inc. | |
| Small & Mid Cap Fund | |
| Portfolio of Investments - (Continued) | October 31, 2016 |
| | |
| Shares | | | | | Value | |
| TAIWAN (continued) |
| | 13,000 | | | Kaulin Manufacturing Co. Ltd. | | $ | 6,632 | |
| | 165,823 | | | KEE TAI Properties Co. Ltd. | | | 53,072 | |
| | 145,682 | | | Kenda Rubber Industrial Co. Ltd. | | | 222,972 | |
| | 24,000 | | | Kenmec Mechanical Engineering Co. Ltd. | | | 8,898 | |
| | 49,000 | | | Kerry TJ Logistics Co. Ltd. | | | 64,283 | |
| | 171,000 | | | Kindom Construction Corp. | | | 84,260 | |
| | 132,000 | | | King Slide Works Co. Ltd. | | | 1,618,759 | |
| | 241,184 | | | King Yuan Electronics Co. Ltd. | | | 212,084 | |
| | 294,185 | | | King’s Town Bank Co. Ltd. | | | 240,979 | |
| | 27,062 | | | King’s Town Construction Co. Ltd.(b) | | | 16,293 | |
| | 16,000 | | | Kinik Co. | | | 26,466 | |
| | 244,343 | | | Kinpo Electronics, Inc. | | | 91,752 | |
| | 56,000 | | | Kinsus Interconnect Technology Corp. | | | 129,364 | |
| | 534,123 | | | KMC Kuei Meng International, Inc.(d) | | | 1,853,330 | |
| | 16,328 | | | KS Terminals, Inc. | | | 18,420 | |
| | 11,000 | | | Kung Long Batteries Industrial Co. Ltd. | | | 51,588 | |
| | 40,000 | | | Kung Sing Engineering Corp.(b) | | | 12,663 | |
| | 104,982 | | | Kuoyang Construction Co. Ltd. | | | 41,251 | |
| | 134,110 | | | Kwong Fong Industries Corp. | | | 108,580 | |
| | 32,000 | | | L&K Engineering Co. Ltd. | | | 25,097 | |
| | 102,714 | | | Lealea Enterprise Co. Ltd. | | | 26,266 | |
| | 43,000 | | | LEE CHI Enterprises Co. Ltd. | | | 13,762 | |
| | 62,275 | | | Leofoo Development Co. Ltd. | | | 16,853 | |
| | 23,000 | | | Lextar Electronics Corp. | | | 9,548 | |
| | 167,788 | | | Li Peng Enterprise Co. Ltd.(b) | | | 37,750 | |
| | 33,138 | | | Lian Hwa Food Corp. | | | 30,977 | |
| | 269,181 | | | Lien Hwa Industrial Corp. | | | 182,539 | |
| | 70,000 | | | Lingsen Precision Industries Ltd. | | | 24,733 | |
| | 53,882 | | | Lite-On Semiconductor Corp. | | | 37,819 | |
| | 64,000 | | | Long Bon International Co. Ltd. | | | 33,057 | |
| | 263,193 | | | Long Chen Paper Co. Ltd. | | | 125,102 | |
| | 6,000 | | | Longwell Co. | | | 5,276 | |
| | 9,451 | | | Lotes Co. Ltd. | | | 24,079 | |
| | 69,000 | | | Lucky Cement Corp. | | | 19,853 | |
| | 13,939 | | | Lumax International Corp. Ltd. | | | 22,129 | |
| | 4,000 | | | Macauto Industrial Co. Ltd. | | | 23,196 | |
| | 183,509 | | | Macronix International(b) | | | 25,412 | |
| | 17,213 | | | Makalot Industrial Co. Ltd. | | | 67,908 | |
| | 44,000 | | | Marketech International Corp. | | | 37,785 | |
| | 150,998 | | | Masterlink Securities Corp. | | | 38,375 | |
| | 2,152 | | | Mayer Steel Pipe Corp.(b) | | | 869 | |
| | 31,440 | | | Meiloon Industrial Co. Ltd. | | | 13,599 | |
| | 102,047 | | | Mercuries & Associates Holding Ltd. | | | 62,733 | |
| | 45,017 | | | Mercuries Life Insurance Co. Ltd.(b) | | | 21,683 | |
| | 16,130 | | | Merida Industry Co. Ltd. | | | 74,369 | |
| | 27,091 | | | Merry Electronics Co. Ltd. | | | 104,733 | |
| Shares | | | | | Value | |
| TAIWAN (continued) |
| | 55,404 | | | Micro-Star International Co. Ltd. | | $ | 159,589 | |
| | 17,369 | | | Mirle Automation Corp. | | | 22,071 | |
| | 60,000 | | | Motech Industries Inc.(b) | | | 58,180 | |
| | 4,000 | | | Nak Sealing Technologies Corp. | | | 10,457 | |
| | 24,000 | | | Namchow Chemical Industrial Co. Ltd. | | | 51,183 | |
| | 28,590 | | | Nan Kang Rubber Tire Co. Ltd. | | | 26,364 | |
| | 49,000 | | | Nan Ren Lake Leisure Amusement Co. Ltd. | | | 11,739 | |
| | 38,000 | | | Nan Ya Printed Circuit Board Corp. | | | 28,719 | |
| | 64,767 | | | Nantex Industry Co. Ltd. | | | 47,101 | |
| | 21,000 | | | National Petroleum Co. Ltd. | | | 24,322 | |
| | 44,428 | | | Neo Solar Power Corp.(b) | | | 22,737 | |
| | 34,043 | | | Nichidenbo Corp. | | | 26,322 | |
| | 40,267 | | | Nien Hsing Textile Co. Ltd. | | | 30,177 | |
| | 43,000 | | | Novatek Microelectronics Corp. | | | 161,467 | |
| | 23,000 | | | Ocean Plastics Co. Ltd.(b) | | | 18,549 | |
| | 171,000 | | | OptoTech Corp. | | | 72,068 | |
| | 71,000 | | | Orient Semiconductor Electronics Ltd.(b) | | | 25,648 | |
| | 35,500 | | | Oriental Union Chemical Corp. | | | 22,217 | |
| | 644,000 | | | Pacific Hospital Supply Co. Ltd. | | | 1,822,362 | |
| | 159,453 | | | Pan Jit International, Inc. | | | 75,286 | |
| | 47,000 | | | Pan-International Industrial Corp. | | | 43,191 | |
| | 7,000 | | | Parade Technologies Ltd. | | | 78,856 | |
| | 4,242 | | | Paragon Technologies Co. Ltd. | | | 3,199 | |
| | 14,545 | | | PChome Online, Inc. | | | 158,090 | |
| | 39,746 | | | Phihong Technology Co. Ltd.(b) | | | 12,469 | |
| | 11,000 | | | Phison Electronics Corp. | | | 78,080 | |
| | 12,000 | | | Pixart Imaging, Inc. | | | 26,010 | |
| | 7,000 | | | Portwell, Inc. | | | 9,339 | |
| | 661,200 | | | Powertech Technology, Inc. | | | 1,887,796 | |
| | 5,151 | | | Poya International Co. Ltd. | | | 75,002 | |
| | 400,939 | | | President Securities Corp. | | | 139,755 | |
| | 312,370 | | | Prince Housing & Development Corp. | | | 98,984 | |
| | 121,000 | | | Prodisc Technology, Inc.(b)(c)(d) | | | 0 | |
| | 26,000 | | | Promate Electronic Co. Ltd. | | | 26,282 | |
| | 16,000 | | | Promise Technology, Inc. | | | 7,352 | |
| | 628,520 | | | Qisda Corp. | | | 264,892 | |
| | 17,000 | | | Qualipoly Chemical Corp. | | | 18,235 | |
| | 93,008 | | | Radiant Opto-Electronics Corp. | | | 157,089 | |
| | 135,677 | | | Radium Life Tech Co. Ltd.(b) | | | 38,436 | |
| | 36,825 | | | Realtek Semiconductor Corp. | | | 124,860 | |
| | 45,771 | | | Rechi Precision Co. Ltd. | | | 52,214 | |
| | 35,616 | | | Rich Development Co. Ltd. | | | 9,819 | |
| | 159,597 | | | Ritek Corp.(b) | | | 27,512 | |
| | 36,000 | | | Ruentex Development Co. Ltd.(b) | | | 41,524 | |
| | 53,781 | | | Ruentex Industries Ltd. | | | 86,745 | |
| | 75,335 | | | Sampo Corp. | | | 46,909 | |
| Old Westbury Funds, Inc. | |
| Small & Mid Cap Fund | |
| Portfolio of Investments - (Continued) | October 31, 2016 |
| | |
| Shares | | | | | Value | |
| TAIWAN (continued) |
| | 19,113 | | | San Fang Chemical Industry Co. Ltd. | | $ | 21,107 | |
| | 17,600 | | | San Shing Fastech Corp. | | | 30,730 | |
| | 96,080 | | | Sanyang Motor Co. Ltd. | | | 61,501 | |
| | 17,000 | | | SDI Corp. | | | 21,386 | |
| | 21,000 | | | Sercomm Corp. | | | 49,377 | |
| | 24,309 | | | Sesoda Corp. | | | 19,681 | |
| | 28,000 | | | Sheng Yu Steel Co. Ltd. | | | 25,686 | |
| | 24,000 | | | Shihlin Electric & Engineering Corp. | | | 30,839 | |
| | 1,138,606 | | | Shin Kong Financial Holding Co. Ltd.(b) | | | 247,150 | |
| | 10,000 | | | Shin Zu Shing Co. Ltd. | | | 30,135 | |
| | 75,658 | | | Shining Building Business Co. Ltd.(b) | | | 23,927 | |
| | 99,000 | | | Shinkong Insurance Co. Ltd. | | | 74,664 | |
| | 198,314 | | | Shinkong Synthetic Fibers Corp. | | | 52,913 | |
| | 33,000 | | | Shinkong Textile Co. Ltd. | | | 40,260 | |
| | 95,000 | | | Sigurd Microelectronics Corp. | | | 71,045 | |
| | 54,000 | | | Simplo Technology Co. Ltd. | | | 166,838 | |
| | 70,364 | | | Sinbon Electronics Co. Ltd. | | | 158,309 | |
| | 57,170 | | | Sincere Navigation Corp. | | | 31,975 | |
| | 6,487 | | | Sinmag Equipment Corp. | | | 30,423 | |
| | 117,000 | | | Sino-American Silicon Products, Inc. | | | 126,056 | |
| | 151,000 | | | Sinon Corp. | | | 73,209 | |
| | 15,146 | | | Sinphar Pharmaceutical Co. Ltd. | | | 12,263 | |
| | 23,487 | | | Sinyi Realty, Inc. | | | 21,509 | |
| | 24,000 | | | Sirtec International Co. Ltd. | | | 30,116 | |
| | 12,000 | | | Sitronix Technology Corp. | | | 44,490 | |
| | 36,000 | | | Siward Crystal Technology Co. Ltd. | | | 22,873 | |
| | 14,013 | | | Solartech Energy Corp.(b) | | | 7,038 | |
| | 15,000 | | | Sonix Technology Co. Ltd. | | | 15,353 | |
| | 132,000 | | | Southeast Cement Co. Ltd. | | | 63,161 | |
| | 5,249 | | | Sporton International, Inc. | | | 25,116 | |
| | 8,560 | | | Standard Chemical & Pharmaceutical Co. Ltd. | | | 8,897 | |
| | 78,233 | | | Standard Foods Corp. | | | 193,615 | |
| | 33,000 | | | Stark Technology, Inc. | | | 27,188 | |
| | 20,000 | | | Sunonwealth Electric Machine Industry Co. Ltd. | | | 14,830 | |
| | 31,171 | | | Sunrex Technology Corp. | | | 18,767 | |
| | 13,000 | | | Sunspring Metal Corp. | | | 16,993 | |
| | 113,245 | | | Supreme Electronics Co. Ltd. | | | 81,460 | |
| | 90,874 | | | Sweeten Real Estate Development Co. Ltd. | | | 42,187 | |
| | 20,000 | | | Syncmold Enterprise Corp. | | | 33,463 | |
| | 63,550 | | | Synnex Technology International Corp. | | | 67,865 | |
| | 5,000 | | | Systex Corp. | | | 8,429 | |
| | 197,631 | | | TA Chen Stainless Pipe Co. Ltd. | | | 103,959 | |
| | 107,340 | | | Ta Ya Electric Wire & Cable(b) | | | 17,857 | |
| | 53,000 | | | Tah Hsin Industrial Corp. | | | 42,155 | |
| | 2,262 | | | TA-I Technology Co. Ltd. | | | 1,369 | |
| Shares | | | | | Value | |
| TAIWAN (continued) |
| | 762,911 | | | Taichung Commercial Bank Co. Ltd. | | $ | 217,336 | |
| | 29,580 | | | Taiflex Scientific Co. Ltd. | | | 28,120 | |
| | 10,000 | | | Tainan Enterprises Co. Ltd. | | | 9,253 | |
| | 878,045 | | | Tainan Spinning Co. Ltd. | | | 336,666 | |
| | 35,716 | | | Taisun Enterprise Co. Ltd.(b) | | | 19,070 | |
| | 56,924 | | | Taita Chemical Co. Ltd.(b) | | | 14,647 | |
| | 12,000 | | | Taiwan Acceptance Corp. | | | 27,607 | |
| | 8,304,643 | | | Taiwan Business Bank | | | 2,100,010 | |
| | 31,088 | | | Taiwan Cogeneration Corp. | | | 22,658 | |
| | 6,000 | | | Taiwan FamilyMart Co. Ltd. | | | 42,399 | |
| | 65,000 | | | Taiwan Fertilizer Co. Ltd. | | | 87,127 | |
| | 54,320 | | | Taiwan Fire & Marine Insurance Co. Ltd. | | | 31,844 | |
| | 18,000 | | | Taiwan FU Hsing Industrial Co. Ltd. | | | 22,730 | |
| | 182,919 | | | Taiwan Glass Industrial Corp.(b) | | | 76,512 | |
| | 42,081 | | | Taiwan Hon Chuan Enterprise Co. Ltd. | | | 68,940 | |
| | 30,000 | | | Taiwan Hopax Chemicals Manufacturing Co. Ltd. | | | 17,967 | |
| | 152,701 | | | Taiwan Land Development Corp. | | | 47,711 | |
| | 12,471 | | | Taiwan Line Tek Electronic | | | 7,904 | |
| | 49,544 | | | Taiwan Navigation Co. Ltd. | | | 18,447 | |
| | 36,032 | | | Taiwan Paiho Ltd. | | | 122,742 | |
| | 102,000 | | | Taiwan PCB Techvest Co. Ltd. | | | 99,713 | |
| | 60,120 | | | Taiwan Pulp & Paper Corp.(b) | | | 19,432 | |
| | 41,408 | | | Taiwan Secom Co. Ltd. | | | 118,749 | |
| | 48,000 | | | Taiwan Semiconductor Co. Ltd. | | | 53,921 | |
| | 50,010 | | | Taiwan Sogo Shin Kong Security Co. Ltd. | | | 63,151 | |
| | 128,500 | | | Taiwan Styrene Monomer | | | 68,001 | |
| | 75,875 | | | Taiwan Surface Mounting Technology Corp. | | | 63,234 | |
| | 123,469 | | | Taiwan TEA Corp. | | | 53,797 | |
| | 71,000 | | | Taiwan Union Technology Corp. | | | 78,633 | |
| | 10,322 | | | Taiyen Biotech Co. Ltd. | | | 9,862 | |
| | 103,000 | | | Tatung Co. Ltd.(b) | | | 27,123 | |
| | 850,000 | | | Teco Electric and Machinery Co. Ltd. | | | 755,526 | |
| | 16,000 | | | Test Research, Inc. | | | 20,280 | |
| | 24,000 | | | Test Rite International Co. Ltd. | | | 14,792 | |
| | 21,000 | | | Thinking Electronic Industrial Co. Ltd. | | | 41,058 | |
| | 25,525 | | | Thye Ming Industrial Co, Ltd. | | | 24,953 | |
| | 41,000 | | | T-Mac Techvest PCB Co. Ltd. | | | 15,656 | |
| | 220,100 | | | Ton Yi Industrial Corp. | | | 94,505 | |
| | 8,000 | | | Tong Hsing Electronic Industries Ltd. | | | 27,632 | |
| | 28,834 | | | Tong Yang Industry Co. Ltd. | | | 67,065 | |
| | 43,946 | | | Tong-Tai Machine & Tool Co. Ltd. | | | 31,333 | |
| | 58,662 | | | Topco Scientific Co. Ltd. | | | 150,570 | |
| | 50,049 | | | Topoint Technology Co. Ltd. | | | 31,561 | |
| Old Westbury Funds, Inc. | |
| Small & Mid Cap Fund | |
| Portfolio of Investments - (Continued) | October 31, 2016 |
| | |
| Shares | | | | | Value | |
| TAIWAN (continued) |
| | 8,000 | | | Toung Loong Textile Manufacturing Co. | | $ | 21,928 | |
| | 24,000 | | | TPK Holding Co. Ltd.(b) | | | 38,406 | |
| | 13,137 | | | Transcend Information, Inc. | | | 36,300 | |
| | 95,000 | | | Tripod Technology Corp. | | | 224,875 | |
| | 13,300 | | | Truelight Corp. | | | 23,011 | |
| | 7,988 | | | Tsann Kuen Enterprise Co. Ltd. | | | 7,429 | |
| | 42,942 | | | TSRC Corp. | | | 44,429 | |
| | 15,000 | | | Ttet Union Corp. | | | 40,212 | |
| | 116,315 | | | Tung Ho Steel Enterprise Corp. | | | 74,269 | |
| | 205,000 | | | Tung Thih Electronic Co. Ltd. | | | 3,001,188 | |
| | 91,815 | | | TXC Corp. | | | 128,161 | |
| | 37,000 | | | TYC Brother Industrial Co. Ltd. | | | 38,105 | |
| | 88,303 | | | Tycoons Group Enterprise(b) | | | 12,452 | |
| | 42,458 | | | Tyntek Corp. | | | 16,145 | |
| | 22,000 | | | U-Ming Marine Transport Corp. | | | 15,267 | |
| | 276,000 | | | Unimicron Technology Corp. | | | 114,135 | |
| | 394,686 | | | Union Bank of Taiwan | | | 109,310 | |
| | 32,762 | | | Union Insurance Co. Ltd. | | | 12,198 | |
| | 258,037 | | | Unitech Printed Circuit Board Corp. | | | 81,195 | |
| | 24,000 | | | Unity Opto Technology Co. Ltd.(b) | | | 11,408 | |
| | 272,127 | | | Universal Cement Corp. | | | 211,700 | |
| | 103,922 | | | UPC Technology Corp. | | | 36,553 | |
| | 123,337 | | | USI Corp. | | | 60,188 | |
| | 77,000 | | | Vanguard International Semiconductor Corp. | | | 157,135 | |
| | 39,800 | | | Ve Wong Corp. | | | 27,746 | |
| | 33,000 | | | Visual Photonics Epitaxy Co. Ltd. | | | 44,234 | |
| | 198,452 | | | Voltronic Power Technology Corp. | | | 2,980,789 | |
| | 57,287 | | | Wafer Works Corp.(b) | | | 15,848 | |
| | 69,000 | | | Wah Lee Industrial Corp. | | | 98,501 | |
| | 680,000 | | | Walsin Lihwa Corp. | | | 238,105 | |
| | 159,971 | | | Walsin Technology Corp. | | | 194,150 | |
| | 110,000 | | | Walton Advanced Engineering, Inc. | | | 39,388 | |
| | 110,300 | | | Wan Hai Lines Ltd. | | | 54,350 | |
| | 32,000 | | | Wei Chuan Foods Corp.(b) | | | 18,151 | |
| | 33,290 | | | Weikeng Industrial Co. Ltd. | | | 18,303 | |
| | 19,460 | | | Win Semiconductors Corp. | | | 54,080 | |
| | 787,977 | | | Winbond Electronics Corp. | | | 247,698 | |
| | 44,673 | | | Wintek Corp.(b)(c)(d) | | | 486 | |
| | 100,156 | | | Wisdom Marine Lines Co. Ltd. | | | 90,770 | |
| | 618,276 | | | Wistron Corp. | | | 466,291 | |
| | 33,835 | | | Wistron NeWeb Corp. | | | 94,244 | |
| | 148,865 | | | WPG Holdings Co. Ltd. | | | 174,539 | |
| | 63,126 | | | WT Microelectronics Co. Ltd. | | | 89,516 | |
| | 17,000 | | | WUS Printed Circuit Co. Ltd. | | | 9,481 | |
| | 10,204 | | | Xxentria Technology Materials Corp. | | | 26,741 | |
| | 140,708 | | | Yageo Corp. | | | 283,579 | |
| | 520,600 | | | Yang Ming Marine Transport Corp.(b) | | | 115,643 | |
| | 43,868 | | | YC Co. Ltd. | | | 16,681 | |
| Shares | | | | | Value | |
| TAIWAN (continued) |
| | 77,084 | | | YC INOX Co. Ltd. | | $ | 55,937 | |
| | 162,624 | | | YFY, Inc. | | | 47,925 | |
| | 31,348 | | | Yi Jinn Industrial Co. Ltd. | | | 9,934 | |
| | 143,321 | | | Yieh Phui Enterprise Co. Ltd.(b) | | | 55,407 | |
| | 24,110 | | | Youngtek Electronics Corp. | | | 34,762 | |
| | 196,000 | | | Yulon Motor Co. Ltd. | | | 171,731 | |
| | 14,000 | | | Yung Chi Paint & Varnish Manufacturing Co. Ltd. | | | 34,470 | |
| | 28,350 | | | YungShin Global Holding Corp. | | | 42,177 | |
| | 64,000 | | | Yungtay Engineering Co. Ltd. | | | 90,349 | |
| | 7,000 | | | Zeng Hsing Industrial Co. Ltd. | | | 33,827 | |
| | 27,000 | | | Zenitron Corp. | | | 14,545 | |
| | 80,000 | | | Zhen Ding Technology Holding Ltd. | | | 182,270 | |
| | 72,826 | | | Zig Sheng Industrial Co. Ltd. | | | 18,646 | |
| | 26,169 | | | Zinwell Corp. | | | 29,853 | |
| | 4,000 | | | Zippy Technology Corp. | | | 4,227 | |
| | | | | | | | 45,836,320 | |
| THAILAND — 0.3% |
| | 84,800 | | | Amata Corp. Public Co. Ltd. - FOR | | | 28,107 | |
| | 171,100 | | | Ananda Development Public Co. Ltd. - FOR | | | 24,151 | |
| | 463,768 | | | AP Thailand Public Co. Ltd. - FOR | | | 94,085 | |
| | 237,900 | | | Asia Plus Group Holdings Securities Plc | | | 23,112 | |
| | 146,200 | | | Bangchak Petroleum Public Co. Ltd. (The) - FOR | | | 126,368 | |
| | 8,125 | | | Bangkok Aviation Fuel Services Public Co. Ltd. - FOR | | | 8,590 | |
| | 6,996,650 | | | Bangkok Chain Hospital Public Co. Ltd. - FOR | | | 2,638,925 | |
| | 251,006 | | | Bangkok Expressway & Metro Public Co. Ltd. - FOR | | | 53,432 | |
| | 26,500 | | | Bangkok Insurance Public Co. Ltd. - FOR | | | 258,204 | |
| | 1,178,400 | | | Bangkok Land Public Co. Ltd. - FOR | | | 53,200 | |
| | 229,200 | | | Banpu Public Co. Ltd. - FOR | | | 119,847 | |
| | 33,100 | | | BEC World Public Co. Ltd. - FOR | | | 19,389 | |
| | 564,708 | | | Cal-Comp Electronics Thailand Public Co. Ltd. - FOR | | | 40,662 | |
| | 93,900 | | | Central Plaza Hotel Public Co. Ltd. - FOR | | | 101,956 | |
| | 48,222 | | | CH Karnchang Public Co. Ltd. - FOR | | | 40,647 | |
| | 29,800 | | | Charoong Thai Wire & Cable Public Co. Ltd. - FOR | | | 8,515 | |
| | 38,400 | | | Delta Electronics Thailand Public Co. Ltd. - FOR | | | 86,132 | |
| | 13,400 | | | Dhipaya Insurance Public Co. Ltd. - FOR | | | 16,081 | |
| Old Westbury Funds, Inc. | |
| Small & Mid Cap Fund | |
| Portfolio of Investments - (Continued) | October 31, 2016 |
| | |
| Shares | | | | | Value | |
| THAILAND (continued) |
| | 376,500 | | | Dynasty Ceramic Public Co. Ltd. | | $ | 47,980 | |
| | 6,743,500 | | | Eastern Water Resources Development and Management Public Co. Ltd. - FOR(d) | | | 2,254,417 | |
| | 10,000 | | | Electricity Generating Public Co. Ltd. - FOR | | | 55,718 | |
| | 26,000 | | | Energy Absolute Public Co. Ltd. | | | 20,987 | |
| | 166,300 | | | Erawan Group Public Co. Ltd. (The) - FOR | | | 21,383 | |
| | 427,600 | | | Esso Thailand Public Co. Ltd. - FOR | | | 123,402 | |
| | 4,200 | | | Fabrinet | | | 159,432 | |
| | 120,200 | | | GFPT Public Co. Ltd. - FOR | | | 52,205 | |
| | 256,400 | | | Grand Canal Land Public Co. Ltd. - FOR | | | 18,169 | |
| | 46,500 | | | Hana Microelectronics Public Co. Ltd. - FOR | | | 42,517 | |
| | 449,640 | | | Home Product Center Public Co. Ltd. - FOR | | | 129,763 | |
| | 63,100 | | | ICC International Public Co. Ltd. - FOR | | | 64,682 | |
| | 1,754,700 | | | IRPC Public Co. Ltd. - FOR | | | 239,659 | |
| | 314,991 | | | Italian-Thai Development Public Co. Ltd. - FOR | | | 44,642 | |
| | 217,000 | | | Jasmine International Public Co. Ltd. | | | 51,774 | |
| | 17,500 | | | KCE Electronics Public Co. Ltd. - FOR | | | 56,003 | |
| | 178,900 | | | KGI Securities Thailand Public Co. Ltd. - FOR | | | 18,300 | |
| | 316,866 | | | Khon Kaen Sugar Industry Public Co. Ltd. | | | 35,310 | |
| | 61,300 | | | Kiatnakin Bank Public Co. Ltd. - FOR | | | 102,466 | |
| | 16,100 | | | Krungthai Card Public Co. Ltd. - FOR | | | 69,005 | |
| | 59,000 | | | Land and Houses Public Co. Ltd. - FOR | | | 15,510 | |
| | 90,560 | | | Land and Houses Public Co. Ltd. - NVDR | | | 23,806 | |
| | 21,900 | | | Lanna Resources Public Co. Ltd. - FOR | | | 8,010 | |
| | 90,330 | | | Loxley Public Co. Ltd. - FOR | | | 8,001 | |
| | 164,500 | | | LPN Development Public Co. Ltd. - FOR | | | 53,584 | |
| | 1,580,700 | | | Major Cineplex Group PCL | | | 1,309,816 | |
| | 1,513,700 | | | Major Cineplex Group Public Co. Ltd. - FOR | | | 1,254,298 | |
| | 30,600 | | | Maybank Kim Eng Securities Thailand Public Co. Ltd. - FOR | | | 19,236 | |
| | 369,000 | | | MBK Public Co. Ltd. - FOR | | | 154,991 | |
| | 3,100 | | | Muang Thai Insurance Public Co. Ltd. - FOR | | | 12,091 | |
| | 105,900 | | | Polyplex Public Co. Ltd. - FOR | | | 35,403 | |
| Shares | | | | | Value | |
| THAILAND (continued) |
| | 181,050 | | | Precious Shipping Public Co. Ltd. - FOR | | $ | 31,298 | |
| | 115,900 | | | Pruksa Real Estate Public Co. Ltd. - FOR | | | 76,499 | |
| | 939,331 | | | Quality Houses Public Co. Ltd. - FOR | | | 67,100 | |
| | 26,700 | | | Ratchaburi Electricity Generating Holding Public Co. Ltd. - FOR | | | 38,146 | |
| | 179,100 | | | Ratchthani Leasing Public Co. Ltd. - FOR | | | 26,611 | |
| | 34,100 | | | Regional Container Lines Public Co. Ltd. - FOR | | | 4,755 | |
| | 38,000 | | | Robinson Department Store Public Co. Ltd. - FOR | | | 62,976 | |
| | 80,900 | | | Rojana Industrial Park Public Co. Ltd. - FOR | | | 10,772 | |
| | 63,000 | | | Saha-Union Public Co. Ltd. - FOR | | | 67,055 | |
| | 54,300 | | | Samart Corp. Public Co. Ltd. - FOR | | | 21,877 | |
| | 35,700 | | | Samart Telcoms Public Co. Ltd. - FOR | | | 11,323 | |
| | 1,663,000 | | | Sansiri Public Co. Ltd. - FOR | | | 78,879 | |
| | 526,176 | | | SC Asset Corp. Public Co. Ltd. - FOR | | | 52,020 | |
| | 10,800 | | | Siam City Cement Public Co. Ltd. - FOR | | | 89,184 | |
| | 267,441 | | | Siam Future Development Public Co. Ltd. - FOR | | | 46,232 | |
| | 51,479 | | | Siam Global House Public Co. Ltd - FOR | | | 22,652 | |
| | 165,200 | | | Siamgas & Petrochemicals Public Co. Ltd. - FOR | | | 54,756 | |
| | 39,200 | | | Sino-Thai Engineering & Construction Public Co. Ltd. - FOR | | | 28,562 | |
| | 92,817 | | | Somboon Advance Technology Public Co. Ltd. - FOR | | | 32,621 | |
| | 56,200 | | | SPCG Public Co. Ltd. | | | 32,759 | |
| | 81,900 | | | Sri Trang Agro-Industry Public Co. Ltd. - FOR | | | 31,592 | |
| | 364,000 | | | Srithai Superware Public Co. Ltd. - FOR | | | 19,241 | |
| | 141,350 | | | STP & I Public Co. Ltd. - FOR | | | 36,956 | |
| | 165,400 | | | Supalai Public Co. Ltd. - FOR | | | 115,316 | |
| | 1,330,700 | | | Tata Steel Thailand Public Co. Ltd. - FOR | | | 28,517 | |
| | 4,380 | | | Thai Agro Energy | | | 378 | |
| | 410,100 | | | Thai Airways International Public Co. Ltd. - FOR | | | 328,103 | |
| | 15,000 | | | Thai Central Chemical Public Co. Ltd. - FOR | | | 12,322 | |
| | 18,200 | | | Thai Stanley Electric Public Co. Ltd. - FOR | | | 89,966 | |
| | 153,600 | | | Thai Union Group Public Co. Ltd. - FOR | | | 95,239 | |
| Old Westbury Funds, Inc. | |
| Small & Mid Cap Fund | |
| Portfolio of Investments - (Continued) | October 31, 2016 |
| | |
| Shares | | | | | Value | |
| THAILAND (continued) |
| | 55,000 | | | Thai Vegetable Oil Public Co. Ltd. - FOR | | $ | 52,647 | |
| | 97,800 | | | Thaicom Public Co. Ltd. - FOR | | | 58,125 | |
| | 159,600 | | | Thanacart Capital Public Co. Ltd. - FOR | | | 180,133 | |
| | 17,300 | | | Thitikorn Public Co. Ltd. - FOR | | | 5,092 | |
| | 104,284 | | | Thoresen Thai Agencies Public Co. Ltd. - FOR | | | 27,116 | |
| | 5,782,482 | | | Ticon Industrial Connection Public Co. Ltd. - FOR(d) | | | 2,445,338 | |
| | 80,900 | | | Tisco Financial Group Public Co. Ltd. - FOR | | | 119,625 | |
| | 620,700 | | | TMB Bank Public Co. Ltd. - FOR | | | 37,245 | |
| | 1,159,600 | | | TPI Polene Public Co. Ltd. - FOR | | | 72,894 | |
| | 27,100 | | | TTCL Public Co. Ltd. | | | 17,190 | |
| | 33,400 | | | TTW Public Co. Ltd. - FOR | | | 10,021 | |
| | 34,800 | | | Unique Engineering & Construction Public Co. Ltd. - FOR | | | 16,904 | |
| | 69,000 | | | Vanachai Group Public Co. Ltd. - FOR | | | 29,574 | |
| | 270,200 | | | Vibhavadi Medical Center Public Co. Ltd. - FOR | | | 22,853 | |
| | 223,000 | | | Vinythai Public Co. Ltd. - FOR | | | 63,400 | |
| | | | | | | | 15,015,827 | |
| TURKEY — 0.0% |
| | 5,489 | | | Adana Cimento Sanayii T.A.S. - Class A | | | 11,051 | |
| | 8,195 | | | Akcansa Cimento AS | | | 34,166 | |
| | 0 | | | Akenerji Elektrik Uretim AS - Placement Shares(b) | | | 0 | |
| | 0 | | | Akmerkez Gayrimenkul Yatirim Ortakligi AS REIT | | | 2 | |
| | 22,383 | | | Aksa Akrilik Kimya Sanayii AS | | | 62,933 | |
| | 47,331 | | | Aksigorta AS(b) | | | 30,899 | |
| | 1 | | | Alarko Holding AS | | | 1 | |
| | 43,803 | | | Albaraka Turk Katilim Bankasi AS | | | 17,554 | |
| | 31,268 | | | Anadolu Anonim Turk Sigorta Sirketi(b) | | | 17,381 | |
| | 1 | | | Anadolu Cam Sanayii AS(b) | | | 1 | |
| | 3,118 | | | Anadolu Efes Biracilik Ve Malt Sanayii AS | | | 19,055 | |
| | 7,704 | | | Anadolu Hayat Emeklilik AS | | | 12,299 | |
| | 1 | | | Arcelik AS | | | 6 | |
| | 6,222 | | | Aselsan Elektronik Sanayi Ve Ticaret AS | | | 18,902 | |
| | 1 | | | Aygaz AS | | | 3 | |
| | 1 | | | Baticim Bati Anadolu Cimento Sanayii AS | | | 2 | |
| | 0 | | | Bolu Cimento Sanayii AS | | | 0 | |
| | 12,360 | | | Borusan Mannesmann Boru Sanayi ve Ticaret AS | | | 33,674 | |
| | 5,586 | | | Boyner Perakende Ve Tekstil Yatirimlari AS(b) | | | 137,111 | |
| Shares | | | | | Value | |
| TURKEY (continued) |
| | 9,168 | | | Brisa Bridgestone Sabanci Sanayi ve Ticaret AS | | $ | 20,652 | |
| | 0 | | | Celebi Hava Servisi AS | | | 3 | |
| | 9,101 | | | Cimsa Cimento Sanayi VE Ticaret AS | | | 45,207 | |
| | 1,251 | | | Coca-Cola Icecek AS | | | 14,150 | |
| | 11,012 | | | Deva Holding AS(b) | | | 15,054 | |
| | 0 | | | Dogan Sirketler Grubu Holding AS(b) | | | 0 | |
| | 20,278 | | | Dogus Otomotiv Servis ve Ticaret AS | | | 65,338 | |
| | 38,442 | | | Emlak Konut Gayrimenkul Yatirim Ortakligi AS REIT | | | 39,259 | |
| | 1 | | | Eregli Demir ve Celik Fabrikalari TAS | | | 1 | |
| | 1,019 | | | Ford Otomotiv Sanayi AS | | | 10,420 | |
| | 1 | | | Gentas Genel Metal Sanayi ve Ticaret AS | | | 0 | |
| | 42,374 | | | Global Yatirim Holding AS | | | 21,774 | |
| | 1,044 | | | Goltas Goller Bolgesi Cimento Sanayi ve Ticaret AS | | | 24,495 | |
| | 28,410 | | | Goodyear Lastikleri TAS | | | 34,247 | |
| | 1 | | | Gozde Girisim Sermayesi Yatirim Ortakligi AS(b) | | | 0 | |
| | 64,549 | | | GSD Holding AS | | | 20,027 | |
| | 20,444 | | | Gubre Fabrikalari TAS | | | 33,696 | |
| | 1 | | | Hurriyet Gazetecilik ve Matbaacilik AS(b) | | | 0 | |
| | 0 | | | IS Finansal Kiralama AS | | | 0 | |
| | 1 | | | IS Yatirim Menkul Degerler AS | | | 0 | |
| | 25,002 | | | Izmir Demir Celik Sanayi AS(b) | | | 24,241 | |
| | 30,850 | | | Kardemir Karabuk Demir Celik Sanayi ve Ticaret AS - Class A | | | 13,858 | |
| | 0 | | | Kardemir Karabuk Demir Celik Sanayi ve Ticaret AS - Class B | | | 0 | |
| | 136,259 | | | Kardemir Karabuk Demir Celik Sanayi ve Ticaret AS - Class D | | | 55,485 | |
| | 30,773 | | | Karsan Otomotiv Sanayii Ve Ticaret AS(b) | | | 11,139 | |
| | 125 | | | Kartonsan Karton Sanayi ve Ticaret AS(b) | | | 11,104 | |
| | 118 | | | Konya Cimento Sanayii AS | | | 10,239 | |
| | 5,811 | | | Koza Altin Isletmeleri AS(b) | | | 33,015 | |
| | 4,718 | | | Mardin Cimento Sanayii ve Ticaret AS | | | 6,907 | |
| | 0 | | | Menderes Tekstil Sanayi ve Ticaret AS(b) | | | 0 | |
| | 13,216 | | | Metro Ticari ve Mali Yatirimlar Holding AS(b) | | | 4,527 | |
| | 5,288 | | | Migros Ticaret AS(b) | | | 30,403 | |
| | 0 | | | NET Holding AS(b) | | | 0 | |
| | 4,289 | | | Netas Telekomunikasyon AS(b) | | | 13,806 | |
| | 1,061 | | | Otokar Otomotiv Ve Savunma Sanayi AS | | | 35,044 | |
| | 59,936 | | | Petkim Petrokimya Holding AS | | | 81,355 | |
| Old Westbury Funds, Inc. | |
| Small & Mid Cap Fund | |
| Portfolio of Investments - (Continued) | October 31, 2016 |
| | |
| Shares | | | | | Value | |
| TURKEY (continued) |
| | 5,159 | | | Pinar SUT Mamulleri Sanayii AS | | $ | 25,710 | |
| | 38,573 | | | Sarkuysan Elektrolitik Bakir Sanayi ve Ticaret AS | | | 38,520 | |
| | 93,519 | | | Sekerbank TAS(b) | | | 35,361 | |
| | 68,959 | | | Selcuk Ecza Deposu Ticaret ve Sanayi AS | | | 69,979 | |
| | 18,424 | | | Soda Sanayii AS | | | 25,603 | |
| | 24,515 | | | TAV Havalimanlari Holding AS | | | 100,778 | |
| | 14,398 | | | Tofas Turk Otomobil Fabrikasi AS | | | 108,419 | |
| | 56,634 | | | Trakya Cam Sanayii AS | | | 46,672 | |
| | 0 | | | Turcas Petrol AS | | | 0 | |
| | 89,407 | | | Turk Hava Yollari AO(b) | | | 157,186 | |
| | 1,453 | | | Turk Traktor ve Ziraat Makineleri AS | | | 37,707 | |
| | 77,586 | | | Turkiye Halk Bankasi AS | | | 235,698 | |
| | 1 | | | Turkiye Sinai Kalkinma Bankasi AS | | | 0 | |
| | 143,795 | | | Turkiye Sise ve Cam Fabrikalari AS | | | 151,033 | |
| | 43,081 | | | Turkiye Vakiflar Bankasi TAO | | | 63,767 | |
| | 14,505 | | | Ulker Biskuvi Sanayi AS | | | 90,003 | |
| | 10,576 | | | Vestel Elektonik Sanayi ve Ticaret AS(b) | | | 22,455 | |
| | 1 | | | Zorlu Enerji Elektrik Uretim AS(b) | | | 0 | |
| | | | | | | | 2,279,377 | |
| UKRAINE — 0.0% |
| | 11,788 | | | Kernel Holding SA | | | 188,872 | |
| UNITED ARAB EMIRATES — 0.0% |
| | 64,871 | | | Lamprell Plc(b) | | | 58,361 | |
| UNITED KINGDOM — 3.6% |
| | 1,160 | | | 4imprint Group Plc | | | 23,413 | |
| | 16,302 | | | A.G. Barr Plc | | | 94,042 | |
| | 7,199 | | | Aa Plc | | | 22,567 | |
| | 466,618 | | | ABcam Plc | | | 4,974,653 | |
| | 277,420 | | | Aberdeen Asset Management Plc | | | 1,087,282 | |
| | 27,684 | | | Acacia Mining Plc | | | 175,696 | |
| | 9,019 | | | Acal Plc | | | 25,501 | |
| | 25,242 | | | Admiral Group Plc | | | 592,283 | |
| | 129,757 | | | Afren Plc(b)(c)(d) | | | 0 | |
| | 6,006 | | | Aggreko Plc | | | 58,921 | |
| | 15,015 | | | Amec Foster Wheeler Plc | | | 82,188 | |
| | 64,494 | | | Antofagasta Plc | | | 428,650 | |
| | 47,156 | | | Ashmore Group Plc | | | 202,652 | |
| | 136,120 | | | Ashtead Group Plc | | | 2,129,296 | |
| | 27,283 | | | Assura Plc | | | 19,636 | |
| | 37,432 | | | Auto Trader Group Plc | | | 171,676 | |
| | 5,635 | | | Avon Rubber Plc | | | 68,421 | |
| | 112,769 | | | Babcock International Group Plc | | | 1,365,115 | |
| | 138,254 | | | Balfour Beatty Plc | | | 458,596 | |
| | 259,149 | | | Barratt Developments Plc | | | 1,439,135 | |
| | 284,785 | | | BBA Aviation Plc | | | 901,423 | |
| Shares | | | | | Value | |
| UNITED KINGDOM (continued) |
| | 212,875 | | | Beazley Plc | | $ | 948,439 | |
| | 52,442 | | | Bellway Plc | | | 1,518,718 | |
| | 47,274 | | | Berendsen Plc | | | 558,962 | |
| | 37,557 | | | Berkeley Group Holdings Plc | | | 1,084,431 | |
| | 4,097 | | | BGEO Group Plc | | | 148,236 | |
| | 10,409 | | | Big Yellow Group Plc REIT | | | 88,165 | |
| | 6,537 | | | Bloomsbury Publishing Plc | | | 12,121 | |
| | 118,275 | | | Bodycote Plc | | | 857,757 | |
| | 17,964 | | | Booker Group Plc | | | 39,447 | |
| | 2,938 | | | Boot (Henry) Plc | | | 7,048 | |
| | 36,479 | | | Bovis Homes Group Plc | | | 338,227 | |
| | 5,675 | | | Braemar Shipping Services Plc | | | 21,881 | |
| | 1,216 | | | Brammer Plc | | | 1,548 | |
| | 42,050 | | | Brewin Dolphin Holdings Plc | | | 133,820 | |
| | 23,921 | | | Britvic Plc | | | 162,501 | |
| | 21,123 | | | BTG Plc(b) | | | 170,124 | |
| | 55,211 | | | Burberry Group Plc | | | 996,783 | |
| | 6,355 | | | Cambian Group Plc | | | 9,509 | |
| | 62,129 | | | Capital & Regional Plc | | | 42,966 | |
| | 25,009 | | | Card Factory Plc | | | 77,660 | |
| | 46,800 | | | Cardtronics Plc | | | 2,340,000 | |
| | 74,673 | | | Carillion Plc | | | 229,506 | |
| | 72,121 | | | Chemring Group Plc(b) | | | 128,001 | |
| | 51,870 | | | Chesnara Plc | | | 202,054 | |
| | 524,988 | | | Cineworld Group Plc | | | 3,473,188 | |
| | 2,013 | | | Clarkson Plc | | | 48,046 | |
| | 55,392 | | | Close Brothers Group Plc | | | 899,707 | |
| | 152,751 | | | CNH Industrial NV | | | 1,187,197 | |
| | 93,352 | | | Cobham Plc | | | 163,282 | |
| | 27,870 | | | Communisis Plc | | | 12,366 | |
| | 27,792 | | | Computacenter Plc | | | 247,137 | |
| | 7,150 | | | Concentric AB | | | 85,099 | |
| | 28,341 | | | Connect Group Plc | | | 47,698 | |
| | 5,916 | | | Consort Medical Plc | | | 82,767 | |
| | 8,781 | | | Costain Group Plc | | | 39,768 | |
| | 11,020 | | | Cranswick Plc | | | 285,687 | |
| | 4,000 | | | Creston Plc | | | 4,994 | |
| | 400,493 | | | Croda International Plc | | | 17,147,386 | |
| | 23,730 | | | Daily Mail & General Trust Plc - Class A | | | 217,842 | |
| | 42,282 | | | Dairy Crest Group Plc | | | 315,696 | |
| | 9,017 | | | De La Rue Plc | | | 63,296 | |
| | 220,187 | | | Debenhams Plc | | | 144,727 | |
| | 8,007 | | | Dechra Pharmaceuticals Plc | | | 131,818 | |
| | 5,370 | | | Derwent London Plc REIT | | | 158,999 | |
| | 51,874 | | | Devro Plc | | | 144,131 | |
| | 20,474 | | | Dialog Semiconductor Plc(b) | | | 803,497 | |
| | 4,728 | | | Dignity Plc | | | 153,532 | |
| | 786,736 | | | Diploma Plc(d) | | | 9,027,832 | |
| | 351,814 | | | Direct Line Insurance Group Plc | | | 1,490,383 | |
| | 112,360 | | | Dixons Carphone Plc | | | 432,804 | |
| | 126,447 | | | Domino’s Pizza Group Plc | | | 526,379 | |
| | 27,008 | | | Drax Group Plc | | | 104,761 | |
| | 188,197 | | | DS Smith Plc | | | 918,652 | |
| | 6,273 | | | Dunelm Group Plc | | | 58,085 | |
| Old Westbury Funds, Inc. | |
| Small & Mid Cap Fund | |
| Portfolio of Investments - (Continued) | October 31, 2016 |
| | |
| Shares | | | | | Value | |
| UNITED KINGDOM (continued) |
| | 32,028 | | | E2V Technologies Plc | | $ | 85,069 | |
| | 180,493 | | | Electrocomponents Plc | | | 823,164 | |
| | 1,169,349 | | | Elementis Plc | | | 3,409,330 | |
| | 178,175 | | | Enterprise Inns Plc(b) | | | 201,185 | |
| | 12,758 | | | Essentra Plc | | | 79,641 | |
| | 26,527 | | | Esure Group Plc | | | 88,284 | |
| | 8,918 | | | Euromoney Institutional Investor Plc | | | 113,741 | |
| | 57,195 | | | Fenner Plc | | | 153,315 | |
| | 386,559 | | | Fiat Chrysler Automobiles NV | | | 2,830,395 | |
| | 7,847 | | | Fidessa Group Plc | | | 236,181 | |
| | 350,779 | | | Firstgroup Plc(b) | | | 470,573 | |
| | 41,320 | | | Flybe Group Plc(b) | | | 18,587 | |
| | 3,059 | | | Fuller Smith & Turner Plc - Class A | | | 39,090 | |
| | 112,080 | | | G4S Plc | | | 301,810 | |
| | 23,516 | | | Galliford Try Plc | | | 352,888 | |
| | 5,545 | | | Games Workshop Group Plc | | | 38,551 | |
| | 19,358 | | | Gem Diamonds Ltd. | | | 27,485 | |
| | 16,644 | | | Genus Plc | | | 382,185 | |
| | 580,156 | | | GKN Plc | | | 2,266,683 | |
| | 5,199 | | | Go-Ahead Group Plc | | | 131,981 | |
| | 3,689 | | | Great Portland Estates Plc REIT | | | 26,821 | |
| | 630,095 | | | Greene King Plc | | | 5,641,616 | |
| | 30,359 | | | Greggs Plc | | | 355,060 | |
| | 52,704 | | | Halfords Group Plc | | | 218,818 | |
| | 652,517 | | | Halma Plc | | | 8,370,209 | |
| | 8,931 | | | Hammerson Plc REIT | | | 60,233 | |
| | 67,725 | | | Hansteen Holdings Plc REIT | | | 89,113 | |
| | 48,772 | | | Hargreaves Lansdown Plc | | | 692,487 | |
| | 73,639 | | | Hays Plc | | | 123,124 | |
| | 6,623 | | | Headlam Group Plc | | | 39,884 | |
| | 26,404 | | | Helical Bar Plc | | | 85,483 | |
| | 228,310 | | | Henderson Group Plc | | | 647,492 | |
| | 29,542 | | | Hikma Pharmaceuticals Plc | | | 634,239 | |
| | 28,944 | | | Hill & Smith Holdings Plc | | | 355,693 | |
| | 632 | | | Hilton Food Group Plc | | | 4,684 | |
| | 18,932 | | | Hochschild Mining Plc | | | 61,756 | |
| | 5,026 | | | Hogg Robinson Group Plc | | | 4,368 | |
| | 106,742 | | | HomeServe Plc | | | 796,328 | |
| | 137,108 | | | Howden Joinery Group Plc | | | 629,160 | |
| | 38,644 | | | Hunting Plc | | | 238,158 | |
| | 123,567 | | | ICAP Plc | | | 732,790 | |
| | 57,706 | | | IG Group Holdings Plc | | | 583,071 | |
| | 26,778 | | | Imagination Technologies Group Plc(b) | | | 74,075 | |
| | 22,425 | | | IMI Plc | | | 272,836 | |
| | 140,251 | | | Inchcape Plc | | | 1,116,700 | |
| | 25,333 | | | Indivior Plc | | | 97,488 | |
| | 141,286 | | | Informa Plc | | | 1,162,986 | |
| | 60,633 | | | Inmarsat Plc | | | 520,619 | |
| | 3,568 | | | Intercontinental Hotels Group Plc | | | 138,660 | |
| | 1,434,301 | | | Interserve Plc | | | 5,942,678 | |
| | 41,164 | | | Intertek Group Plc | | | 1,722,157 | |
| | 21,818 | | | Intu Properties Plc REIT | | | 73,573 | |
| Shares | | | | | Value | |
| UNITED KINGDOM (continued) |
| | 53,330 | | | ITE Group Plc | | $ | 93,835 | |
| | 64,401 | | | Ithaca Energy, Inc.(b) | | | 61,938 | |
| | 127,442 | | | J D Wetherspoon Plc | | | 1,357,110 | |
| | 242,374 | | | J Sainsbury Plc | | | 744,337 | |
| | 12,426 | | | James Fisher & Sons Plc | | | 246,089 | |
| | 27,095 | | | Jardine Lloyd Thompson Group Plc | | | 340,930 | |
| | 20,600 | | | JD Sports Fashion Plc | | | 383,008 | |
| | 17,247 | | | John Menzies Plc | | | 104,866 | |
| | 205,284 | | | John Wood Group Plc | | | 1,932,256 | |
| | 45,041 | | | Johnson Matthey Plc | | | 1,879,947 | |
| | 24,083 | | | JRP Group Plc | | | 35,668 | |
| | 36,192 | | | Jupiter Fund Management Plc | | | 191,240 | |
| | 55,928 | | | KAZ Minerals Plc(b) | | | 195,785 | |
| | 134,990 | | | Kcom Group Plc | | | 194,556 | |
| | 31,360 | | | Keller Group Plc | | | 261,209 | |
| | 14,590 | | | Kier Group Plc | | | 242,693 | |
| | 84,172 | | | Ladbrokes Coral Group Plc | | | 137,644 | |
| | 2,408,079 | | | Laird Plc | | | 4,273,876 | |
| | 28,095 | | | Lancashire Holdings Ltd. | | | 239,687 | |
| | 28,169 | | | Lavendon Group Plc | | | 42,754 | |
| | 20,610 | | | Londonmetric Property Plc REIT | | | 37,613 | |
| | 63,260 | | | Lookers Plc | | | 79,947 | |
| | 5,374 | | | Low & Bonar Plc | | | 4,654 | |
| | 2,969 | | | LSL Property Services Plc | | | 7,068 | |
| | 342,890 | | | Man Strategic Holdings Plc(b) | | | 523,365 | |
| | 138,598 | | | Marks & Spencer Group Plc | | | 577,640 | |
| | 29,565 | | | Marshalls Plc | | | 99,154 | |
| | 252,093 | | | Marston’s Plc | | | 412,549 | |
| | 9,060 | | | McColl’s Retail Group Plc | | | 18,908 | |
| | 18,776 | | | Mears Group Plc | | | 103,476 | |
| | 270,937 | | | Meggitt Plc | | | 1,443,578 | |
| | 826,796 | | | Melrose Industries Plc | | | 1,707,754 | |
| | 64,579 | | | Merlin Entertainments Plc | | | 364,239 | |
| | 22,060 | | | Michael Page International Plc | | | 98,043 | |
| | 19,192 | | | Micro Focus International Plc | | | 502,945 | |
| | 46,577 | | | Millennium & Copthorne Hotels Plc | | | 255,977 | |
| | 34,277 | | | Mitchells & Butlers Plc | | | 116,761 | |
| | 120,239 | | | Mitie Group Plc | | | 309,947 | |
| | 112,692 | | | Moneysupermarket.com Group Plc | | | 361,253 | |
| | 73,299 | | | Morgan Advanced Materials Plc | | | 244,482 | |
| | 14,135 | | | Morgan Sindall Group Plc | | | 124,310 | |
| | 11,299 | | | Mothercare Plc(b) | | | 14,833 | |
| | 28,165 | | | N Brown Group Plc | | | 65,742 | |
| | 204,239 | | | National Express Group Plc | | | 919,462 | |
| | 3,594 | | | NCC Group Plc | | | 8,336 | |
| | 61,768 | | | Northgate Plc | | | 318,105 | |
| | 23,821 | | | Novae Group Plc | | | 235,151 | |
| | 691 | | | Onesavings Bank Plc | | | 2,453 | |
| | 269,296 | | | Oxford Instruments Plc(d) | | | 2,228,229 | |
| | 4,258 | | | PayPoint Plc | | | 56,027 | |
| | 296,703 | | | Pendragon Plc | | | 108,950 | |
| | 20,546 | | | Pennon Group Plc | | | 209,863 | |
| Old Westbury Funds, Inc. | |
| Small & Mid Cap Fund | |
| Portfolio of Investments - (Continued) | October 31, 2016 |
| | |
| Shares | | | | | Value | |
| UNITED KINGDOM (continued) |
| | 68,756 | | | Persimmon Plc | | $ | 1,425,631 | |
| | 14,329 | | | Petrofac Ltd. | | | 141,450 | |
| | 13,538 | | | Pets at Home Group Plc | | | 35,362 | |
| | 36,290 | | | Photo-Me International Plc | | | 67,295 | |
| | 29,505 | | | Playtech Plc | | | 335,140 | |
| | 319,105 | | | Premier Foods Plc(b) | | | 177,717 | |
| | 180,426 | | | Premier Oil Plc(b) | | | 145,756 | |
| | 2,152 | | | Provident Financial Plc | | | 77,705 | |
| | 61,900 | | | PZ Cussons Plc | | | 253,740 | |
| | 179,176 | | | QinetiQ Group Plc | | | 504,857 | |
| | 28,721 | | | Rank Group Plc | | | 68,024 | |
| | 97,202 | | | Redrow Plc | | | 451,394 | |
| | 8,153 | | | Renishaw Plc | | | 257,766 | |
| | 51,233 | | | Renold Plc(b) | | | 25,711 | |
| | 195,018 | | | Rentokil Initial Plc | | | 544,959 | |
| | 18,513 | | | Restaurant Group Plc (The) | | | 85,088 | |
| | 7,870 | | | Ricardo Plc | | | 89,153 | |
| | 13,079 | | | Rightmove Plc | | | 597,927 | |
| | 17,462 | | | Robert Walters Plc | | | 73,739 | |
| | 186,900 | | | Rotork Plc | | | 466,684 | |
| | 173,243 | | | Royal Mail Plc | | | 1,041,167 | |
| | 68,348 | | | RPC Group Plc | | | 793,081 | |
| | 98,326 | | | RPS Group Plc | | | 203,695 | |
| | 127,808 | | | RSA Insurance Group Plc | | | 864,318 | |
| | 13,220 | | | Safestore Holdings Plc REIT | | | 57,978 | |
| | 51,636 | | | Saga plc | | | 125,394 | |
| | 22,285 | | | Savills Plc | | | 189,302 | |
| | 21,495 | | | SDL Plc | | | 114,120 | |
| | 33,651 | | | Seadrill Ltd.(e) | | | 71,677 | |
| | 2,838 | | | Seadrill Ltd.(b)(e) | | | 6,089 | |
| | 56,504 | | | Segro Plc REIT | | | 302,373 | |
| | 159,868 | | | Senior Plc | | | 341,069 | |
| | 73,665 | | | Severfield Plc | | | 51,846 | |
| | 153,006 | | | Severn Trent Plc | | | 4,359,881 | |
| | 19,812 | | | Shaftesbury Plc REIT | | | 222,372 | |
| | 99,820 | | | Shanks Group Plc | | | 109,351 | |
| | 16,920 | | | Shawbrook Group Plc(b) | | | 46,556 | |
| | 172,927 | | | SIG Plc | | | 233,888 | |
| | 133,882 | | | Smiths Group Plc | | | 2,323,708 | |
| | 46,937 | | | Soco International Plc | | | 79,426 | |
| | 197,117 | | | Spectris Plc | | | 4,943,667 | |
| | 183,962 | | | Speedy Hire Plc | | | 86,128 | |
| | 253,076 | | | Spirax-Sarco Engineering Plc | | | 13,666,889 | |
| | 129,217 | | | Spirent Communications Plc | | | 130,088 | |
| | 15,991 | | | Sportech Plc(b) | | | 13,285 | |
| | 63,174 | | | Sports Direct International Plc(b) | | | 213,959 | |
| | 11,710 | | | SSP Group Plc | | | 48,690 | |
| | 12,066 | | | St. Ives Plc | | | 19,753 | |
| | 82,064 | | | St. James’s Place Plc | | | 949,222 | |
| | 54,495 | | | St. Modwen Properties Plc | | | 181,963 | |
| | 134 | | | Stallergenes Greer Plc(b) | | | 4,282 | |
| | 26,739 | | | Sthree Plc | | | 78,222 | |
| | 7,112 | | | Stobart Group Ltd. | | | 14,124 | |
| | 4,450 | | | Stolt-Nielsen Ltd. | | | 54,667 | |
| | 56,188 | | | Subsea 7 SA(b) | | | 630,405 | |
| Shares | | | | | Value | |
| UNITED KINGDOM (continued) |
| | 8,341 | | | SuperGroup Plc | | $ | 137,419 | |
| | 54,149 | | | Synthomer Plc | | | 236,880 | |
| | 90,072 | | | Talktalk Telecom Group Plc | | | 224,466 | |
| | 93,409 | | | Tate & Lyle Plc | | | 891,798 | |
| | 853,109 | | | Taylor Wimpey Plc | | | 1,479,645 | |
| | 5,162 | | | Ted Baker Plc | | | 156,378 | |
| | 9,195 | | | Telecom Plus Plc | | | 133,256 | |
| | 3,226 | | | Topps Tiles Plc | | | 3,613 | |
| | 135,500 | | | Travelport Worldwide Ltd. | | | 1,913,260 | |
| | 63,929 | | | Travis Perkins Plc | | | 1,043,065 | |
| | 16,317 | | | Trifast Plc | | | 34,751 | |
| | 118,829 | | | Trinity Mirror Plc | | | 118,903 | |
| | 47,851 | | | TT electronics Plc | | | 81,119 | |
| | 45,883 | | | Tullett Prebon Plc | | | 199,372 | |
| | 173,732 | | | Tullow Oil Plc(b) | | | 562,881 | |
| | 26,201 | | | U & I Group Plc | | | 50,591 | |
| | 61,174 | | | UBM Plc | | | 537,993 | |
| | 309,168 | | | Ultra Electronics Holdings Plc | | | 7,031,103 | |
| | 16,892 | | | UNITE Group Plc (The) | | | 114,441 | |
| | 81,812 | | | Vectura Group Plc(b) | | | 135,587 | |
| | 162,796 | | | Vesuvius Plc | | | 726,314 | |
| | 447,044 | | | Victrex Plc | | | 9,581,193 | |
| | 13,110 | | | Virgin Money Holdings UK Plc | | | 52,794 | |
| | 11,826 | | | Vitec Group Plc (The) | | | 90,216 | |
| | 495 | | | VP Plc | | | 4,235 | |
| | 14,613 | | | Weir Group Plc (The) | | | 304,069 | |
| | 28,154 | | | WH Smith Plc | | | 507,605 | |
| | 244,679 | | | William Hill Plc | | | 885,886 | |
| | 15,003 | | | Wilmington Plc | | | 47,998 | |
| | 12,913 | | | Wincanton Plc | | | 30,307 | |
| | 353,909 | | | WM Morrison Supermarkets Plc | | | 981,167 | |
| | 11,514 | | | Workspace Group Plc REIT | | | 88,717 | |
| | 9,736 | | | WS Atkins Plc | | | 180,184 | |
| | 12,348 | | | Xaar Plc | | | 63,479 | |
| | | | | | | | 197,966,963 | |
| UNITED STATES — 59.0% |
| | 11,100 | | | 1st Source Corp. | | | 383,616 | |
| | 237,675 | | | Aaron’s, Inc.(b) | | | 5,872,949 | |
| | 44,300 | | | Abaxis, Inc. | | | 2,114,882 | |
| | 7,000 | | | ABM Industries, Inc. | | | 273,560 | |
| | 500 | | | Access National Corp. | | | 11,785 | |
| | 225,000 | | | Aceto Corp. | | | 4,124,250 | |
| | 47,900 | | | ACI Worldwide, Inc.(b) | | | 867,948 | |
| | 4,700 | | | ACNB Corp. | | | 126,430 | |
| | 475,000 | | | Actuant Corp. - Class A | | | 10,592,500 | |
| | 452,587 | | | Advance Auto Parts, Inc. | | | 63,398,387 | |
| | 22,200 | | | Advanced Energy Industries, Inc.(b) | | | 1,058,940 | |
| | 200,000 | | | AdvancePierre Foods Holdings, Inc. | | | 5,592,000 | |
| | 1,500 | | | AEP Industries, Inc. | | | 164,325 | |
| | 61,000 | | | AG Mortgage Investment Trust, Inc. REIT | | | 947,330 | |
| | 271,585 | | | AGNC Investment Corp. REIT | | | 5,447,995 | |
| | 37,500 | | | Agree Realty Corp. REIT | | | 1,813,125 | |
| Old Westbury Funds, Inc. | |
| Small & Mid Cap Fund | |
| Portfolio of Investments - (Continued) | October 31, 2016 |
| | |
| Shares | | | | | Value | |
| UNITED STATES (continued) |
| | 82,491 | | | Alacer Gold Corp.(b) | | $ | 166,667 | |
| | 2,100 | | | Alexander’s, Inc. REIT | | | 806,967 | |
| | 9,400 | | | Allegiant Travel Co. | | | 1,296,260 | |
| | 42,700 | | | ALLETE, Inc. | | | 2,617,083 | |
| | 30,200 | | | Alpha & Omega Semiconductor Ltd. | | | 638,126 | |
| | 42,508 | | | American Eagle Outfitters, Inc. | | | 724,336 | |
| | 3,200 | | | American National Bankshares, Inc. | | | 86,560 | |
| | 25,600 | | | American Software, Inc. - Class A | | | 267,008 | |
| | 47,900 | | | American States Water Co. | | | 1,915,042 | |
| | 26,200 | | | AMERISAFE, Inc. | | | 1,456,720 | |
| | 160,000 | | | Amplify Snack Brands, Inc.(b) | | | 2,318,400 | |
| | 20,400 | | | Analogic Corp. | | | 1,669,740 | |
| | 44,700 | | | AngioDynamics, Inc.(b) | | | 712,518 | |
| | 486,350 | | | Annaly Capital Management, Inc., REIT | | | 5,038,586 | |
| | 768,000 | | | ANSYS, Inc.(b) | | | 70,156,800 | |
| | 179,737 | | | Apollo Commercial Real Estate Finance, Inc., REIT | | | 3,041,150 | |
| | 40,700 | | | Applied Industrial Technologies, Inc. | | | 2,067,560 | |
| | 60,200 | | | Ares Commercial Real Estate Corp. | | | 789,824 | |
| | 31,200 | | | Argonaut Gold, Inc.(b) | | | 63,037 | |
| | 34,400 | | | Armada Hoffler Properties, Inc. REIT | | | 461,992 | |
| | 6,489 | | | Arrow Financial Corp. | | | 205,052 | |
| | 16,300 | | | Artesian Resources Corp. - Class A | | | 459,986 | |
| | 50,400 | | | Aspen Technology, Inc.(b) | | | 2,481,696 | |
| | 2,500 | | | Atlas Financial Holdings, Inc. | | | 42,875 | |
| | 10,300 | | | ATN International Inc. | | | 696,692 | |
| | 2,400 | | | Atrion Corp. | | | 1,053,960 | |
| | 53,800 | | | Avista Corp. | | | 2,227,320 | |
| | 56,700 | | | AVX Corp. | | | 794,934 | |
| | 28,400 | | | AZZ, Inc. | | | 1,512,300 | |
| | 243,500 | | | B&G Foods, Inc. | | | 10,324,400 | |
| | 116,600 | | | Balchem Corp. | | | 8,849,940 | |
| | 13,800 | | | Baldwin & Lyons, Inc. - Class B | | | 339,480 | |
| | 13,200 | | | BancFirst Corp. | | | 946,440 | |
| | 2,900 | | | Bank of Marin Bancorp | | | 147,175 | |
| | 12,900 | | | BankFinancial Corp. | | | 162,153 | |
| | 5,000 | | | Bar Harbor Bankshares | | | 181,750 | |
| | 19,200 | | | Bel Fuse, Inc. - Class B | | | 457,920 | |
| | 65,300 | | | Benchmark Electronics, Inc.(b) | | | 1,642,295 | |
| | 46,300 | | | Berkshire Hills Bancorp, Inc. | | | 1,368,165 | |
| | 6,500 | | | Big 5 Sporting Goods Corp. | | | 100,750 | |
| | 43,800 | | | Big Lots, Inc. | | | 1,900,920 | |
| | 2,200 | | | Biglari Holdings, Inc.(b) | | | 963,996 | |
| | 9,469 | | | Bizlink Holding, Inc. | | | 48,009 | |
| | 61,331 | | | BJ’s Restaurants, Inc.(b) | | | 2,214,049 | |
| | 11,600 | | | Black Hills Corp. | | | 717,460 | |
| | 343,900 | | | Blackbaud, Inc. | | | 21,115,460 | |
| | 117,700 | | | Bloomin’ Brands, Inc. | | | 2,036,210 | |
| | 58,077 | | | Boart Longyear Ltd.(b) | | | 6,185 | |
| Shares | | | | | Value | |
| UNITED STATES (continued) |
| | 42,000 | | | Bob Evans Farms, Inc. | | $ | 1,731,240 | |
| | 13,500 | | | Bojangles’ Inc.(b) | | | 199,800 | |
| | 77,700 | | | Boston Beer Co., Inc. (The) - Class A(b) | | | 12,062,925 | |
| | 371,100 | | | Brady Corp. - Class A | | | 12,283,410 | |
| | 8,600 | | | Bright Horizons Family Solutions, Inc.(b) | | | 575,426 | |
| | 64,800 | | | Brookline Bancorp, Inc. | | | 829,440 | |
| | 42,000 | | | Brooks Automation, Inc. | | | 547,260 | |
| | 259,519 | | | Bryn Mawr Bank Corp.(d) | | | 8,148,897 | |
| | 76,100 | | | Buffalo Wild Wings, Inc.(b) | | | 11,083,965 | |
| | 34,500 | | | Cabot Microelectronics Corp. | | | 1,906,470 | |
| | 14,600 | | | Calavo Growers, Inc. | | | 863,590 | |
| | 19,100 | | | Caleres, Inc. | | | 477,691 | |
| | 10,000 | | | Cambrex Corp.(b) | | | 403,000 | |
| | 170,100 | | | Cantel Medical Corp. | | | 12,116,223 | |
| | 14,800 | | | Capella Education Co. | | | 1,081,880 | |
| | 6,900 | | | Capital City Bank Group, Inc. | | | 103,776 | |
| | 393,600 | | | Cardiovascular Systems, Inc.(b) | | | 9,222,048 | |
| | 10,700 | | | Carolina Financial Corp. | | | 243,960 | |
| | 66,000 | | | Carrols Restaurant Group, Inc.(b) | | | 825,000 | |
| | 58,700 | | | Casella Waste Systems, Inc. - Class A(b) | | | 657,440 | |
| | 33,400 | | | CatchMark Timber Trust, Inc. - Class A REIT | | | 352,036 | |
| | 71,600 | | | CBIZ, Inc.(b) | | | 791,180 | |
| | 11,500 | | | Centerstate Banks, Inc. | | | 214,820 | |
| | 14,700 | | | Central Garden & Pet Co.(b) | | | 357,504 | |
| | 65,900 | | | Central Garden & Pet Co. - Class A(b) | | | 1,538,106 | |
| | 51,000 | | | Central Pacific Financial Corp. | | | 1,307,130 | |
| | 19,700 | | | Central Valley Community Bancorp | | | 282,104 | |
| | 495,000 | | | Cepheid, Inc.(b) | | | 26,185,500 | |
| | 10,500 | | | ChannelAdvisor Corp.(b) | | | 115,500 | |
| | 10,200 | | | Charter Financial Corp (MD) | | | 129,030 | |
| | 34,500 | | | Chase Corp. | | | 2,358,075 | |
| | 10,700 | | | Chatham Lodging Trust REIT | | | 189,390 | |
| | 156,278 | | | Cheesecake Factory, Inc. (The) | | | 8,312,427 | |
| | 16,500 | | | Chemed Corp. | | | 2,333,430 | |
| | 26,200 | | | Chesapeake Utilities Corp. | | | 1,678,110 | |
| | 23,400 | | | Children’s Place, Inc. (The) | | | 1,777,230 | |
| | 14,500 | | | Churchill Downs, Inc. | | | 1,972,000 | |
| | 31,000 | | | Chuy’s Holdings, Inc.(b) | | | 880,400 | |
| | 22,400 | | | City Holding Co. | | | 1,170,848 | |
| | 325,000 | | | CLARCOR, Inc.(d) | | | 20,218,250 | |
| | 7,600 | | | CNB Financial Corp. | | | 148,580 | |
| | 5,900 | | | Coca-Cola Bottling Co. Consolidated | | | 833,670 | |
| | 20,200 | | | Coherent, Inc.(b) | | | 2,103,224 | |
| | 8,600 | | | Collectors Universe, Inc. | | | 161,594 | |
| | 205,000 | | | Community Bank System, Inc. | | | 9,657,550 | |
| | 11,600 | | | Community Trust Bancorp, Inc. | | | 423,980 | |
| | 229,400 | | | CommVault Systems, Inc.(b) | | | 12,272,900 | |
| | 385,000 | | | CONMED Corp.(d) | | | 15,400,000 | |
| Old Westbury Funds, Inc. | |
| Small & Mid Cap Fund | |
| Portfolio of Investments - (Continued) | October 31, 2016 |
| | |
| Shares | | | | | Value | |
| UNITED STATES (continued) |
| | 10,300 | | | Connecticut Water Service, Inc. | | $ | 536,321 | |
| | 3,500 | | | Consolidated Communications Holdings, Inc. | | | 83,755 | |
| | 74,800 | | | Convergys Corp. | | | 2,184,160 | |
| | 533,000 | | | Cooper Cos., Inc. (The) | | | 93,829,320 | |
| | 18,500 | | | Cooper-Standard Holding Inc.(b) | | | 1,688,495 | |
| | 2,730,400 | | | CoreLogic, Inc.(b)(d) | | | 116,205,824 | |
| | 600 | | | Core-Mark Holding Co., Inc. | | | 21,209 | |
| | 8,200 | | | CorVel Corp.(b) | | | 283,310 | |
| | 460,000 | | | CR Bard, Inc. | | | 99,672,800 | |
| | 17,200 | | | CRA International, Inc.(b) | | | 535,608 | |
| | 47,229 | | | Cracker Barrel Old Country Store, Inc. | | | 6,517,602 | |
| | 42,500 | | | CSG Systems International, Inc. | | | 1,616,275 | |
| | 200,000 | | | CST Brands, Inc. | | | 9,604,000 | |
| | 23,700 | | | Culp, Inc. | | | 663,600 | |
| | 27,800 | | | Curtiss-Wright Corp. | | | 2,491,436 | |
| | 650,000 | | | CVB Financial Corp. | | | 10,907,000 | |
| | 27,400 | | | Cynosure, Inc. - Class A(b) | | | 1,168,610 | |
| | 81,313 | | | Darden Restaurants, Inc. | | | 5,268,269 | |
| | 3,600 | | | Datalink Corp.(b) | | | 34,127 | |
| | 9,000 | | | Dave & Buster’s Entertainment, Inc.(b) | | | 372,150 | |
| | 12,900 | | | Dean Foods Co. | | | 235,554 | |
| | 40,800 | | | Del Frisco’s Restaurant Group, Inc.(b) | | | 583,440 | |
| | 7,000 | | | Delta Natural Gas Co., Inc. | | | 164,850 | |
| | 120,900 | | | Denny’s Corp.(b) | | | 1,253,733 | |
| | 3,463 | | | Diebold, Inc. | | | 79,642 | |
| | 27,900 | | | DineEquity, Inc. | | | 2,206,890 | |
| | 12,700 | | | Donegal Group, Inc. - Class A | | | 191,135 | |
| | 27,541 | | | Dril-Quip, Inc.(b) | | | 1,308,198 | |
| | 32,507 | | | DSW, Inc. - Class A | | | 675,170 | |
| | 860,759 | | | Dun & Bradstreet Corp. (The)(d) | | | 107,465,761 | |
| | 26,900 | | | DuPont Fabros Technology, Inc. REIT | | | 1,097,789 | |
| | 62,400 | | | Easterly Government Properties, Inc. REIT | | | 1,183,728 | |
| | 30,100 | | | EastGroup Properties, Inc. REIT | | | 2,044,091 | |
| | 335,000 | | | El Pollo Loco Holdings, Inc.(b) | | | 4,087,000 | |
| | 8,800 | | | EMC Insurance Group, Inc. | | | 214,280 | |
| | 38,700 | | | EMCOR Group, Inc. | | | 2,339,802 | |
| | 18,600 | | | Employers Holdings, Inc. | | | 583,110 | |
| | 4,000 | | | EnerSys, Inc. | | | 260,520 | |
| | 61,000 | | | Ennis, Inc. | | | 893,650 | |
| | 27,800 | | | Enterprise Financial Services Corp. | | | 920,180 | |
| | 245,000 | | | Envestnet, Inc.(b) | | | 8,660,750 | |
| | 7,800 | | | ESSA Bancorp, Inc. | | | 105,144 | |
| | 26,000 | | | Exa Corp.(b) | | | 364,000 | |
| | 17,800 | | | Exactech, Inc.(b) | | | 429,870 | |
| | 18,900 | | | Fair Isaac Corp. | | | 2,280,852 | |
| | 5,500 | | | FairPoint Communications, Inc.(b) | | | 85,800 | |
| | 2,000 | | | Farmers Capital Bank Corp. | | | 62,800 | |
| Shares | | | | | Value | |
| UNITED STATES (continued) |
| | 14,700 | | | Fidelity Southern Corp. | | $ | 267,981 | |
| | 450,000 | | | Financial Engines, Inc.(d) | | | 12,442,500 | |
| | 13,200 | | | Financial Institutions, Inc. | | | 354,420 | |
| | 18,100 | | | First Bancorp | | | 357,837 | |
| | 6,300 | | | First Business Financial Services, Inc. | | | 118,755 | |
| | 6,600 | | | First Citizens BancShares, Inc. | | | 1,920,600 | |
| | 11,300 | | | First Community Bancshares, Inc. | | | 255,945 | |
| | 16,600 | | | First Defiance Financial Corp. | | | 655,368 | |
| | 275,000 | | | First Financial Bankshares, Inc.(d) | | | 9,955,000 | |
| | 13,500 | | | First Financial Corp. | | | 541,350 | |
| | 28,800 | | | First Interstate BancSystem, Inc. | | | 918,720 | |
| | 8,300 | | | First Mid-Illinois Bancshares, Inc. | | | 219,867 | |
| | 5,600 | | | Five9, Inc.(b) | | | 80,192 | |
| | 11,700 | | | Flexsteel Industries, Inc. | | | 490,230 | |
| | 160,365 | | | FLIR Systems, Inc. | | | 5,279,216 | |
| | 23,300 | | | Flushing Financial Corp. | | | 499,086 | |
| | 16,000 | | | Forrester Research, Inc. | | | 596,000 | |
| | 610,000 | | | Forum Energy Technologies, Inc.(b) | | | 10,980,000 | |
| | 33,400 | | | Forward Air Corp. | | | 1,380,088 | |
| | 164,600 | | | Franklin Street Properties Corp. | | | 1,904,422 | |
| | 33,200 | | | FTD Cos Inc.(b) | | | 667,984 | |
| | 170,962 | | | FTI Consulting, Inc.(b) | | | 6,660,680 | |
| | 95,381 | | | Gannett Co., Inc. | | | 741,110 | |
| | 100,000 | | | German American Bancorp, Inc.(d) | | | 3,893,000 | |
| | 55,700 | | | Getty Realty Corp. | | | 1,266,061 | |
| | 49,600 | | | Gladstone Commercial Corp. REIT | | | 885,360 | |
| | 38,400 | | | Global Brass & Copper Holdings, Inc. | | | 1,102,080 | |
| | 225,700 | | | Globus Medical, Inc. - Class A(b) | | | 4,994,741 | |
| | 145,000 | | | Gorman-Rupp Co. (The)(d) | | | 3,482,900 | |
| | 88,600 | | | Government Properties Income Trust, REIT | | | 1,695,804 | |
| | 54,400 | | | Gramercy Property Trust | | | 501,568 | |
| | 27,400 | | | Great Ajax Corp. REIT | | | 379,764 | |
| | 9,500 | | | Great Southern Bancorp, Inc. | | | 392,825 | |
| | 150,000 | | | Guidewire Software, Inc.(b) | | | 8,617,500 | |
| | 33,900 | | | Hackett Group, Inc. (The) | | | 546,468 | |
| | 57,600 | | | Haemonetics Corp.(b) | | | 1,924,416 | |
| | 7,400 | | | Hallmark Financial Services, Inc.(b) | | | 76,664 | |
| | 13,200 | | | Halyard Health, Inc.(b) | | | 427,020 | |
| | 45,663 | | | Hancock Holding Co. | | | 1,531,994 | |
| | 3,110,000 | | | Hanesbrands, Inc. | | | 79,927,000 | |
| | 36,300 | | | Hanmi Financial Corp. | | | 907,500 | |
| | 8,136 | | | Hanover Insurance Group, Inc. (The) | | | 619,882 | |
| | 15,000 | | | Haverty Furniture Cos., Inc. | | | 266,250 | |
| | 44,600 | | | Hawaiian Holdings, Inc.(b) | | | 2,008,115 | |
| | 11,400 | | | Hawkins, Inc. | | | 459,990 | |
| Old Westbury Funds, Inc. | |
| Small & Mid Cap Fund | |
| Portfolio of Investments - (Continued) | October 31, 2016 |
| | |
| Shares | | | | | Value | |
| UNITED STATES (continued) |
| | 148,270 | | | HB Fuller Co. | | $ | 6,237,719 | |
| | 56,700 | | | HealthSouth Corp. | | | 2,276,505 | |
| | 32,300 | | | Heartland Financial USA, Inc. | | | 1,209,635 | |
| | 33,000 | | | Heritage Commerce Corp. | | | 358,050 | |
| | 21,200 | | | Heritage Financial Corp. | | | 390,080 | |
| | 9,400 | | | Heska Corp.(b) | | | 464,360 | |
| | 192,600 | | | Hibbett Sports, Inc.(b) | | | 7,482,510 | |
| | 1,500 | | | Hingham Institution For Savings | | | 215,175 | |
| | 3,600 | | | Home Bancorp, Inc. | | | 103,356 | |
| | 38,200 | | | HomeStreet, Inc.(b) | | | 1,052,410 | |
| | 18,000 | | | Hooker Furniture Corp. | | | 473,400 | |
| | 12,700 | | | Horizon Bancorp | | | 368,300 | |
| | 42,700 | | | HSN, Inc. | | | 1,609,790 | |
| | 35,700 | | | Hub Group, Inc. - Class A(b) | | | 1,301,265 | |
| | 71,898 | | | Huron Consulting Group, Inc.(b) | | | 4,029,883 | |
| | 27,600 | | | ICF International, Inc.(b) | | | 1,280,640 | |
| | 136,300 | | | ICU Medical, Inc.(b) | | | 18,986,590 | |
| | 31,300 | | | IDACORP, Inc. | | | 2,453,607 | |
| | 595,000 | | | IDEX Corp. | | | 51,431,800 | |
| | 160,000 | | | Independent Bank Corp.(d)(e) | | | 8,824,000 | |
| | 27,100 | | | Independent Bank Corp.(e) | | | 455,280 | |
| | 13,700 | | | Infinity Property & Casuality Corp. | | | 1,122,715 | |
| | 4,100 | | | InfraREIT, Inc.(b) | | | 68,142 | |
| | 104,200 | | | Ingredion, Inc. | | | 13,667,914 | |
| | 26,700 | | | Innophos Holdings, Inc. | | | 1,223,928 | |
| | 241,130 | | | Innospec, Inc.(d) | | | 14,528,083 | |
| | 5,600 | | | Inogen, Inc.(b) | | | 300,552 | |
| | 40,200 | | | Insight Enterprises, Inc.(b) | | | 1,157,358 | |
| | 21,900 | | | Insperity, Inc. | | | 1,646,880 | |
| | 20,100 | | | Insteel Industries, Inc. | | | 540,690 | |
| | 214,000 | | | Insulet Corp.(b) | | | 7,943,680 | |
| | 336,200 | | | Integra LifeScience Holdings Corp.(b) | | | 26,731,262 | |
| | 7,100 | | | InterDigital, Inc. | | | 501,615 | |
| | 1,800 | | | Investors Title Co. | | | 172,800 | |
| | 63,307 | | | J & J Snack Foods Corp. | | | 7,732,950 | |
| | 33,600 | | | j2 Global, Inc. | | | 2,390,640 | |
| | 24,000 | | | Jack in the Box, Inc. | | | 2,249,520 | |
| | 524,800 | | | JM Smucker Co. (The) | | | 68,911,488 | |
| | 6,000 | | | John B. Sanfilippo & Son, Inc. | | | 304,080 | |
| | 132,100 | | | John Bean Technologies Corp. | | | 10,548,185 | |
| | 430,000 | | | John Wiley & Sons, Inc. - Class A(d) | | | 22,188,000 | |
| | 400 | | | Kadant, Inc. | | | 20,659 | |
| | 7,200 | | | Kaman Corp. | | | 314,352 | |
| | 2,500,000 | | | KAR Auction Services, Inc.(d) | | | 106,450,000 | |
| | 24,500 | | | Kelly Services, Inc. - Class A | | | 458,885 | |
| | 18,100 | | | Kimball Electronics, Inc.(b) | | | 251,590 | |
| | 19,000 | | | KMG Chemicals, Inc. | | | 515,660 | |
| | 65,480 | | | Knight Transportation, Inc. | | | 1,915,290 | |
| | 73,200 | | | Knoll, Inc. | | | 1,584,048 | |
| | 111,122 | | | Kohl’s Corp. | | | 4,861,588 | |
| Shares | | | | | Value | |
| UNITED STATES (continued) |
| | 830,000 | | | Laboratory Corp of America Holdings(b) | | $ | 104,032,200 | |
| | 16,800 | | | Lancaster Colony Corp. | | | 2,194,920 | |
| | 9,500 | | | Landauer, Inc. | | | 413,250 | |
| | 75,000 | | | Landstar System, Inc. | | | 5,336,250 | |
| | 7,200 | | | LCNB Corp. | | | 123,840 | |
| | 27,400 | | | LeMaitre Vascular, Inc. | | | 573,756 | |
| | 209,400 | | | Lexington Realty Trust REIT | | | 2,123,316 | |
| | 12,200 | | | LHC Group, Inc.(b) | | | 418,094 | |
| | 34,400 | | | Liquidity Services, Inc.(b) | | | 304,440 | |
| | 225,000 | | | LogMein, Inc. | | | 21,375,000 | |
| | 57,600 | | | Luminex Corp.(b) | | | 1,199,808 | |
| | 240,000 | | | Lydall, Inc.(b)(d) | | | 11,220,000 | |
| | 32,900 | | | Mack-Cali Realty Corp. REIT | | | 844,872 | |
| | 71,962 | | | Magellan Health, Inc.(b) | | | 3,702,445 | |
| | 660,000 | | | Manitowoc Foodservice, Inc.(b) | | | 9,972,600 | |
| | 38,200 | | | ManTech International Corp. - Class A | | | 1,483,306 | |
| | 7,300 | | | Marcus Corp. (The) | | | 193,450 | |
| | 255,170 | | | Masimo Corp.(b) | | | 14,034,350 | |
| | 400 | | | Masonite International Corp.(b) | | | 22,759 | |
| | 18,000 | | | Maxlinear, Inc.(b) | | | 336,780 | |
| | 28,400 | | | McGrath RentCorp | | | 854,840 | |
| | 285,000 | | | Medidata Solutions, Inc.(b) | | | 13,677,150 | |
| | 24,800 | | | Medifast, Inc. | | | 1,018,288 | |
| | 501,075 | | | Mentor Graphics Corp. | | | 14,481,068 | |
| | 10,800 | | | Mercantile Bank Corp. | | | 297,216 | |
| | 2,100 | | | Merchants Bancshares, Inc. | | | 90,300 | |
| | 78,800 | | | Meridian Bioscience, Inc. | | | 1,296,260 | |
| | 52,800 | | | Merit Medical Systems, Inc.(b) | | | 1,158,960 | |
| | 16,100 | | | Meta Financial Group, Inc. | | | 1,179,325 | |
| | 751,240 | | | MFA Financial, Inc. | | | 5,491,564 | |
| | 36,800 | | | MGE Energy, Inc. | | | 2,150,960 | |
| | 12,300 | | | MicroStrategy, Inc. - Class A(b) | | | 2,396,163 | |
| | 30,800 | | | Middlesex Water Co. | | | 1,111,880 | |
| | 6,000 | | | Midland States Bancorp Inc. | | | 153,180 | |
| | 6,700 | | | MidWestOne Financial Group, Inc. | | | 194,836 | |
| | 24,900 | | | Moelis & Co. - Class A | | | 632,460 | |
| | 115,500 | | | Monmouth Real Estate Investment Corp. | | | 1,578,885 | |
| | 19,800 | | | Monolithic Power Systems, Inc. | | | 1,560,438 | |
| | 45,300 | | | Monotype Imaging Holdings, Inc. | | | 865,230 | |
| | 68,202 | | | Morningstar, Inc. | | | 4,817,107 | |
| | 677 | | | Movie Gallery, Inc.(b)(c)(d) | | | 0 | |
| | 35,900 | | | MSA Safety, Inc. | | | 2,092,970 | |
| | 9,605 | | | MSC Industrial Direct Co., Inc. - Class A | | | 699,244 | |
| | 88,400 | | | MTGE Investment Corp. REIT | | | 1,507,220 | |
| | 3,900 | | | MutualFirst Financial, Inc. | | | 106,665 | |
| | 9,918 | | | Mylan, Inc. | | | 362,003 | |
| | 30,600 | | | MYR Group, Inc./Delaware(b) | | | 913,104 | |
| | 6,000 | | | NACCO Industries, Inc. - Class A | | | 438,900 | |
| | 1,441,000 | | | Nasdaq, Inc. | | | 92,180,770 | |
| Old Westbury Funds, Inc. | |
| Small & Mid Cap Fund | |
| Portfolio of Investments - (Continued) | October 31, 2016 |
| | |
| Shares | | | | | Value | |
| UNITED STATES (continued) |
| | 4,700 | | | Nathan’s Famous Inc.(b) | | $ | 250,510 | |
| | 74,900 | | | National CineMedia, Inc. | | | 1,038,863 | |
| | 8,700 | | | National Commerce Corp.(b) | | | 246,210 | |
| | 61,600 | | | National General Holdings Corp. | | | 1,265,880 | |
| | 28,400 | | | National Health Investors, Inc. REIT | | | 2,151,584 | |
| | 15,800 | | | National HealthCare Corp. | | | 1,022,260 | |
| | 13,300 | | | National Presto Industries, Inc. | | | 1,160,425 | |
| | 44,700 | | | Natus Medical, Inc.(b) | | | 1,758,945 | |
| | 38,100 | | | Navigant Consulting, Inc.(b) | | | 891,540 | |
| | 121,300 | | | Navigators Group, Inc. (The)(d) | | | 11,305,160 | |
| | 3,300 | | | NBT Bancorp, Inc. | | | 111,243 | |
| | 37,600 | | | Neogen Corp.(b) | | | 1,981,144 | |
| | 2,243,900 | | | Newell Brands, Inc. | | | 107,752,078 | |
| | 20,700 | | | NexPoint Residential Trust, Inc., REIT | | | 385,848 | |
| | 13,004,296 | | | Nexteer Automotive Group Ltd. | | | 17,136,619 | |
| | 713,272 | | | NIC, Inc.(d) | | | 16,369,592 | |
| | 8,200 | | | Northrim Bancorp, Inc. | | | 201,310 | |
| | 120,800 | | | Northwest Bancshares, Inc. | | | 1,901,392 | |
| | 119,651 | | | Northwest Natural Gas Co. | | | 7,035,479 | |
| | 41,100 | | | NorthWestern Corp. | | | 2,365,305 | |
| | 29,600 | | | Novanta Inc.(b) | | | 516,520 | |
| | 8,600 | | | Nutraceutical International Corp.(b) | | | 247,680 | |
| | 317,500 | | | NuVasive, Inc.(b) | | | 18,964,275 | |
| | 5,700 | | | NVE Corp. | | | 320,739 | |
| | 8,100 | | | NxStage Medical, Inc.(b) | | | 184,194 | |
| | 32,300 | | | OceanFirst Financial Corp. | | | 667,964 | |
| | 3,700 | | | Oil-Dri Corp of America | | | 124,912 | |
| | 4,400 | | | Old Line Bancshares Inc. | | | 86,614 | |
| | 390,000 | | | Omnicell, Inc.(b)(d) | | | 12,723,750 | |
| | 119,200 | | | Omnicom Group, Inc. | | | 9,514,544 | |
| | 38,900 | | | ONE Gas, Inc. | | | 2,383,792 | |
| | 31,900 | | | One Liberty Properties, Inc. REIT | | | 751,564 | |
| | 36,100 | | | OneBeacon Insurance Group Ltd. | | | 496,014 | |
| | 0 | | | Ormat Technologies, Inc. | | | 14 | |
| | 28,500 | | | Orthofix International NV | | | 1,044,525 | |
| | 33,100 | | | Otter Tail Corp. | | | 1,189,945 | |
| | 64,600 | | | Owens & Minor, Inc. | | | 2,096,270 | |
| | 30,300 | | | Papa John’s International, Inc. | | | 2,286,135 | |
| | 24,400 | | | PAREXEL International Corp.(b) | | | 1,421,544 | |
| | 1,825,000 | | | Patterson Cos., Inc.(d) | | | 77,945,750 | |
| | 19,600 | | | PC Connection, Inc. | | | 454,916 | |
| | 14,600 | | | Peapack Gladstone Financial Corp. | | | 308,790 | |
| | 400 | | | Penns Woods Bancorp Inc. | | | 16,999 | |
| | 32,600 | | | Penumbra, Inc.(b) | | | 2,149,970 | |
| | 15,400 | | | Peoples Bancorp, Inc. | | | 381,458 | |
| | 19,700 | | | People’s Utah Bancorp | | | 394,985 | |
| | 26,000 | | | Perficient, Inc.(b) | | | 483,860 | |
| | 57,100 | | | Performance Food Group Co.(b) | | | 1,370,400 | |
| Shares | | | | | Value | |
| UNITED STATES (continued) |
| | 3,184 | | | Performance Sports Group Ltd.(b) | | $ | 8,403 | |
| | 24,500 | | | Plantronics, Inc. | | | 1,266,895 | |
| | 40,200 | | | Plexus Corp.(b) | | | 1,841,562 | |
| | 38,900 | | | Popeyes Louisiana Kitchen Inc.(b) | | | 2,076,482 | |
| | 59,000 | | | Portland General Electric Co. | | | 2,574,760 | |
| | 45,500 | | | Potbelly Corp.(b) | | | 593,775 | |
| | 13,000 | | | Powell Industries, Inc. | | | 460,070 | |
| | 30,000 | | | Power Integrations, Inc. | | | 1,933,500 | |
| | 21,500 | | | Preferred Bank | | | 815,280 | |
| | 6,200 | | | Premier Financial Bancorp Inc. | | | 104,284 | |
| | 44,200 | | | Prestige Brands Holdings, Inc.(b) | | | 2,001,376 | |
| | 14,400 | | | Primo Water Corp.(b) | | | 188,496 | |
| | 76,300 | | | Progress Software Corp.(b) | | | 2,053,233 | |
| | 200,000 | | | Prosperity Bancshares, Inc. | | | 11,094,000 | |
| | 9,000 | | | Provident Financial Holdings, Inc. | | | 171,720 | |
| | 76,000 | | | Provident Financial Services, Inc. | | | 1,724,440 | |
| | 20,400 | | | PS Business Parks, Inc. REIT | | | 2,239,716 | |
| | 7,400 | | | QAD Inc. | | | 177,970 | |
| | 10,500 | | | QCR Holdings, Inc. | | | 341,250 | |
| | 15,900 | | | Quaker Chemical Corp. | | | 1,709,250 | |
| | 500,000 | | | Qualys, Inc.(b)(d) | | | 18,625,000 | |
| | 61,422 | | | Quest Diagnostics, Inc. | | | 5,002,208 | |
| | 140,000 | | | RBC Bearings, Inc.(b)(d) | | | 9,989,000 | |
| | 326,864 | | | REC Silicon ASA(b) | | | 40,945 | |
| | 6,900 | | | Reis Inc. | | | 135,585 | |
| | 52,700 | | | Renasant Corp. | | | 1,778,098 | |
| | 4,800 | | | Republic Bancorp, Inc. - Class A | | | 151,872 | |
| | 41,800 | | | Resources Connection, Inc. | | | 620,730 | |
| | 13,700 | | | Rightside Group Ltd.(b) | | | 115,217 | |
| | 15,000 | | | RMR Group Inc. (The) - Class A | | | 515,250 | |
| | 538,593 | | | Rockwell Collins, Inc. | | | 45,414,162 | |
| | 6,300 | | | Rogers Corp.(b) | | | 342,909 | |
| | 52,300 | | | Rudolph Technologies, Inc.(b) | | | 946,630 | |
| | 63,000 | | | Ruth’s Hospitality Group Inc. | | | 998,550 | |
| | 42,300 | | | Ryman Hospitality Properties Inc. | | | 2,132,766 | |
| | 20,200 | | | Safety Insurance Group, Inc. | | | 1,367,540 | |
| | 11,694,600 | | | Samsonite International SA(d) | | | 36,792,779 | |
| | 62,695 | | | Sanderson Farms, Inc. | | | 5,641,296 | |
| | 15,800 | | | Sanmina Corp.(b) | | | 436,870 | |
| | 2,200 | | | Saul Centers, Inc. REIT | | | 133,056 | |
| | 1,700 | | | ScanSource, Inc.(b) | | | 59,500 | |
| | 31,700 | | | Science Applications International Corp. | | | 2,184,447 | |
| | 40 | | | Seaboard Corp.(b) | | | 135,400 | |
| | 38,200 | | | Select Income REIT | | | 945,068 | |
| | 56,100 | | | Selective Insurance Group, Inc. | | | 2,072,895 | |
| | 5,000 | | | Semtech Corp.(b) | | | 121,000 | |
| | 2,600 | | | Seneca Foods Corp. Class A(b) | | | 76,440 | |
| | 90,400 | | | Sensient Technologies Corp. | | | 6,735,704 | |
| Old Westbury Funds, Inc. | |
| Small & Mid Cap Fund | |
| Portfolio of Investments - (Continued) | October 31, 2016 |
| | |
| Shares | | | | | Value | |
| UNITED STATES (continued) |
| | 33,600 | | | Shutterfly, Inc.(b) | | $ | 1,646,400 | |
| | 4,400 | | | SI Financial Group, Inc. | | | 57,419 | |
| | 11,800 | | | Sierra Bancorp | | | 210,748 | |
| | 4,000 | | | Silicon Laboratories, Inc.(b) | | | 239,800 | |
| | 60,500 | | | Silver Bay Realty Trust Corp., REIT | | | 1,013,375 | |
| | 12,100 | | | Simmons First National Corp. - Class A | | | 597,135 | |
| | 33,900 | | | SJW Corp. | | | 1,719,747 | |
| | 594,000 | | | Snap-on, Inc. | | | 91,535,400 | |
| | 600,000 | | | Snyder’s-Lance, Inc. | | | 21,342,000 | |
| | 25,000 | | | South State Corp. | | | 1,833,750 | |
| | 2,800 | | | Southern First Bancshares, Inc.(b) | | | 74,340 | |
| | 3,600 | | | Southern Missouri Bancorp, Inc. | | | 88,524 | |
| | 7,300 | | | Southern National Bancorp of Virginia, Inc. | | | 95,776 | |
| | 35,100 | | | Southwest Gas Corp. | | | 2,543,346 | |
| | 12,500 | | | Spark Energy, Inc. Class A | | | 302,500 | |
| | 58,300 | | | SpartanNash Co. | | | 1,632,400 | |
| | 860,000 | | | Spectrum Brands Holdings, Inc.(d) | | | 116,306,400 | |
| | 36,000 | | | Spire, Inc. | | | 2,260,800 | |
| | 26,200 | | | Spok Holdings, Inc. | | | 472,910 | |
| | 165,000 | | | SPS Commerce, Inc.(b) | | | 10,292,700 | |
| | 165,900 | | | Standex International Corp.(d) | | | 12,674,760 | |
| | 109,537 | | | Starwood Property Trust, Inc., REIT | | | 2,436,103 | |
| | 8,300 | | | State Auto Financial Corp. | | | 190,070 | |
| | 28,800 | | | State National Cos., Inc. | | | 294,624 | |
| | 25,100 | | | Stepan Co. | | | 1,782,853 | |
| | 32,400 | | | Stewart Information Services Corp. | | | 1,456,380 | |
| | 209,250 | | | Stock Yards Bancorp, Inc.(d) | | | 7,135,425 | |
| | 21,600 | | | Stonegate Bank | | | 748,224 | |
| | 30,000 | | | Summit Hotel Properties, Inc. | | | 389,700 | |
| | 3,700 | | | Surgical Care Affiliates, Inc.(b) | | | 158,323 | |
| | 214,457 | | | Sykes Enterprises, Inc.(b) | | | 5,734,580 | |
| | 20,800 | | | SYNNEX Corp. | | | 2,132,832 | |
| | 19,900 | | | Syntel, Inc. | | | 399,990 | |
| | 4,600 | | | Systemax, Inc. | | | 36,109 | |
| | 48,925 | | | Tahoe Resources, Inc. | | | 586,531 | |
| | 22,800 | | | Teledyne Technologies, Inc.(b) | | | 2,455,104 | |
| | 30,200 | | | TeleTech Holdings, Inc. | | | 848,620 | |
| | 7,600 | | | Territorial Bancorp Inc. | | | 216,752 | |
| | 63,900 | | | Tessera Technologies, Inc. | | | 2,370,690 | |
| | 60,400 | | | Tetra Tech, Inc. | | | 2,322,380 | |
| | 145,752 | | | Texas Roadhouse, Inc. | | | 5,905,871 | |
| | 13,000 | | | Tootsie Roll Industries, Inc. | | | 460,850 | |
| | 7,900 | | | Topbuild Corp.(b) | | | 238,027 | |
| | 52,800 | | | TowneBank | | | 1,309,440 | |
| | 8,800 | | | Tredegar Corp. | | | 162,800 | |
| | 265,000 | | | TreeHouse Foods, Inc.(b) | | | 23,182,200 | |
| | 17,400 | | | TriCo Bancshares | | | 457,968 | |
| | 800,000 | | | TriMas Corp.(b)(d) | | | 14,360,000 | |
| Shares | | | | | Value | |
| UNITED STATES (continued) |
| | 12,200 | | | Trinseo S.A. | | $ | 639,890 | |
| | 98,300 | | | TrustCo Bank Corp. | | | 688,100 | |
| | 196,754 | | | Two Harbors Investment Corp., REIT | | | 1,638,961 | |
| | 250,000 | | | UMB Financial Corp. | | | 15,512,500 | |
| | 52,700 | | | UMH Properties, Inc. | | | 638,724 | |
| | 26,100 | | | Union Bankshares Corp. | | | 728,973 | |
| | 1,300 | | | Union Bankshares, Inc. | | | 42,899 | |
| | 17,700 | | | United Community Financial Corp. | | | 130,095 | |
| | 33,100 | | | United Fire Group, Inc. | | | 1,308,112 | |
| | 33,100 | | | United Insurance Holdings Corp. | | | 479,950 | |
| | 11,500 | | | United Natural Foods, Inc.(b) | | | 480,010 | |
| | 25,900 | | | Unitil Corp. | | | 1,050,763 | |
| | 29,300 | | | Universal Corp. | | | 1,588,060 | |
| | 9,500 | | | Universal Health Realty Income Trust REIT | | | 557,650 | |
| | 815,000 | | | Universal Health Services, Inc., Series B | | | 98,378,650 | |
| | 27,600 | | | Universal Insurance Holdings, Inc. | | | 587,880 | |
| | 45,300 | | | Urstadt Biddle Properties, Inc. - Class A REIT | | | 973,950 | |
| | 22,200 | | | US Ecology, Inc. | | | 937,950 | |
| | 17,800 | | | US Physical Therapy, Inc. | | | 1,012,820 | |
| | 7,700 | | | USANA Health Sciences, Inc.(b) | | | 989,450 | |
| | 2,500 | | | Utah Medical Products Inc. | | | 155,375 | |
| | 769 | | | Vail Resorts, Inc. | | | 122,609 | |
| | 1,350,000 | | | Vantiv, Inc. - Class A(b) | | | 78,786,000 | |
| | 25,900 | | | Vascular Solutions, Inc.(b) | | | 1,181,040 | |
| | 26,430 | | | Vector Group Ltd. | | | 553,444 | |
| | 31,300 | | | Viad Corp. | | | 1,298,950 | |
| | 11,500 | | | Village Super Market, Inc. | | | 343,850 | |
| | 32,800 | | | Vitamin Shoppe Inc.(b) | | | 821,640 | |
| | 55,100 | | | Vocera Communications, Inc.(b) | | | 1,013,840 | |
| | 6,300 | | | VSE Corp. | | | 181,692 | |
| | 795,000 | | | Wabtec Corp. | | | 61,461,450 | |
| | 83,400 | | | Washington Federal, Inc. | | | 2,272,650 | |
| | 69,300 | | | Washington Real Estate Investment Trust | | | 2,038,806 | |
| | 215,000 | | | Washington Trust Bancorp, Inc.(d) | | | 9,868,500 | |
| | 4,500 | | | WashingtonFirst Bankshares Inc. | | | 110,025 | |
| | 502,351 | | | Waters Corp.(b) | | | 69,897,118 | |
| | 44,400 | | | Waterstone Financial Inc. | | | 752,580 | |
| | 4,800 | | | WD-40 Co. | | | 511,800 | |
| | 4,700 | | | Weis Markets, Inc. | | | 261,461 | |
| | 6,400 | | | West Bancorp, Inc. | | | 123,520 | |
| | 29,600 | | | West Corp. | | | 583,712 | |
| | 200,000 | | | WEX, Inc.(b) | | | 21,820,000 | |
| | 6,100 | | | Weyco Group, Inc. | | | 154,391 | |
| | 38,300 | | | WGL Holdings, Inc. | | | 2,415,581 | |
| | 1,000 | | | Winmark Corp. | | | 106,950 | |
| | 1,035,000 | | | Wolverine World Wide, Inc. | | | 22,097,250 | |
| Old Westbury Funds, Inc. | |
| Small & Mid Cap Fund | |
| Portfolio of Investments - (Continued) | October 31, 2016 |
| | |
| Shares | | | | | Value | |
| UNITED STATES (continued) |
| | 196,000 | | | Woodward, Inc. | | $ | 11,560,080 | |
| | 7,863 | | | WW Grainger, Inc. | | | 1,636,448 | |
| | 1,633,500 | | | Wyndham Worldwide Corp. | | | 107,549,640 | |
| | 42,400 | | | Xactly Corp.(b) | | | 546,960 | |
| | 44,100 | | | Xenia Hotels & Resorts, Inc. REIT | | | 688,401 | |
| | 45,200 | | | XO Group Inc.(b) | | | 831,680 | |
| | | | | | | | 3,228,357,568 | |
Total Common Stocks
(Cost $4,109,361,311) | | | 5,133,172,039 | |
| INVESTMENT COMPANY — 1.1% | | | |
| | 62,714,100 | | | SEI Daily Income Trust Government II Fund, Class A 0.01%(f) | | | 62,714,100 | |
Total Investment Company
(Cost $62,714,100) | | | 62,714,100 | |
| EXCHANGE TRADED FUNDS — 3.5% |
| | 100,861 | | | iShares MSCI Japan Small Cap Index Fund(d) | | | 6,569,077 | |
| | 175,300 | | | iShares S&P Small Cap 600 Value Index Fund | | | 21,060,542 | |
| | 180,000 | | | SPDR S&P Emerging Markets Small Cap Index Fund(d) | | | 7,740,000 | |
| | 860,000 | | | SPDR S&P Oil & Gas Exploration & Production Index Fund | | | 30,401,000 | |
| | 868,200 | | | SPDR S&P Regional Banking Index Fund | | | 38,018,478 | |
| | 229,300 | | | Vanguard Mid-Cap Value ETF | | | 20,937,383 | |
| | 495,750 | | | Vanguard Small-Cap ETF | | | 58,111,815 | |
| | 185,000 | | | WisdomTree Emerging Markets SmallCap Dividend Fund | | | 7,594,250 | |
Total Exchange Traded Funds
(Cost $163,250,010) | | | 190,432,545 | |
| RIGHTS/WARRANTS — 0.0% |
| Banks — 0.0% |
| | 11,252 | | | Karnataka Bank - Rights | | | 8,811 | |
| Shares | | | | | Value | |
| Consumer Discretionary — 0.0% |
| | 1,710 | | | Centrebet Litigation Rights(c)(d) | | $ | 0 | |
| | 1,710 | | | Centrebet Litigation Units(c)(d) | | | 0 | |
| | 3,819 | | | Restaurant Brands New Zealand Rights, Expire 11/16/16(c)(d) | | | 0 | |
| | | | | | | | 0 | |
| Energy — 0.0% |
| | 90,313 | | | Ezion Holdings Ltd. Warrants, Expire 4/24/20(b) | | | 4,284 | |
| Financials — 0.0% |
| | 30,203 | | | Phoenix Group Holdings Rights, Expire 11/8/16(b) | | | 82,070 | |
| Health Care — 0.0% |
| | 9,812 | | | Intercell Contigent Value Rights(b)(c)(d) | | | 0 | |
| | 201,026 | | | KPJ Healthcare Berhad Warrants, Expire 1/23/19(b) | | | 27,554 | |
| | 9,600 | | | Ligand Pharmaceuticals Contingent Value Rights(c) | | | 0 | |
| | | | | | | | 27,554 | |
| Industrials — 0.0% |
| | 2,151 | | | Asiana Airlines, Inc. - Rights(b)(c) | | | 0 | |
| | 77,700 | | | ASL Marine Rights, Expire 11/11/16 | | | 56 | |
| | 428,722 | | | Dialog Group Berhad Warrants, Expire 2/12/17(b) | | | 34,747 | |
| | 573 | | | Interflex Co. Ltd. Rights, Expire 11/24/16(b)(d) | | | 1,878 | |
| | 151,177 | | | Prosafe - Rights Expire 10/31/16 | | | 549 | |
| | 11,873 | | | Samsung Heavy Industries Co. Ltd. Rights, Expire 11/08/16(b) | | | 26,771 | |
| | 37,432 | | | Shanks Group Plc, Rights(b) | | | 14,432 | |
| | | | | | | | 78,433 | |
| Materials — 0.0% |
| | 22,626 | | | Papeles y Cartones de Europe SA Rights, Expire 11/14/16(b) | | | 4,545 | |
| | 7,158 | | | TPI Polene Rights(c)(d) | | | 0 | |
| | | | | | | | 4,545 | |
| Real Estate — 0.0% |
| | 3,633 | | | Cheuk Nang Holdings Ltd. Warrants, Expire 4/24/17(b) | | | 960 | |
| Telecommunication Services — 0.0% |
| | 11,101 | | | Tele2 AB Rights, Expire 11/16/16(d) | | | 3,331 | |
Total Rights/Warrants
(Cost $103,022) | | | 209,988 | |
| Old Westbury Funds, Inc. | |
| Small & Mid Cap Fund | |
| Portfolio of Investments - (Continued) | October 31, 2016 |
| | |
| Principal | | | | | | |
| Amount | | | | | | |
| U.S. GOVERNMENT AGENCIES — 0.6% |
| Federal Home Loan Bank — 0.6% |
| $ | 8,600,000 | | | 0.25%, 11/28/2016(g) | | $ | 8,598,710 | |
| | 9,800,000 | | | 0.26%, 12/19/2016(g) | | | 9,797,256 | |
| | 11,600,000 | | | 0.27%, 11/23/2016(g) | | | 11,598,585 | |
Total U.S. Government Agencies
(Cost $29,993,190) | | | 29,994,551 | |
| | | | | |
| Shares | | | | | Value | |
| CASH SWEEP — 1.0% |
| | 54,342,747 | | | Citibank - US Dollars on Deposit in Custody Account, 0.02%(f) | | | 54,342,747 | |
Total Cash Sweep
(Cost $54,342,747) | | | 54,342,747 | |
TOTAL INVESTMENTS — 100.0%
(Cost $4,419,764,380)(a) | | | 5,470,865,970 | |
| OTHER ASSETS IN EXCESS OF LIABILITIES — 0.0% | | | 757,555 | |
| NET ASSETS — 100.0% | | $ | 5,471,623,525 | |
| (a) | Cost for federal income tax purposes is $4,431,768,641 and net unrealized appreciation of investments is as follows: | |
| Unrealized appreciation | $ | 1,182,602,979 | |
| Unrealized depreciation | | (143,505,650 | ) |
| Net unrealized appreciation | $ | 1,039,097,329 | |
| (b) | Non-income producing security. |
| (c) | Level 3 fair valued security under procedures established by the Fund’s Board of Directors. The aggregate value of fair valued securities is $888,822, which is 0.02% of net assets and the cost is $8,412,587. |
| (d) | This security is considered either fully or partially illiquid. These securities, or portions thereof, have a value of $489,280,110 or 8.94% of net assets. |
| (e) | Securities incorporated in the same country but traded on different exchanges. |
| (f) | The rate shown is the current yield as of October 31, 2016. |
| (g) | The rate represents the annualized yield at time of purchase. |
BDR — Brazilian Depositary Receipt
CDI — CHESS Depositary Interests
CPO — Certificate of Participation-Common
CVR — Contingent Value Rights
DVR — Differential Voting Rights
FOR — Foreign Ownership Restrictions
NVDR — Non Voting Depositary Receipt
PDR — Phillippine Depositary Receipt
REIT — Real Estate Investment Trust
SDR — Swedish Depositary Receipt
VVPR — Voter Verified Paper Record
Portfolio diversification by Sector (Unaudited)
| | | Percentage |
| Sector | | of Net Assets |
| Industrials | | | 20.5 | % |
| Health Care | | | 16.5 | |
| Consumer Discretionary | | | 15.2 | |
| Information Technology | | | 12.7 | |
| Consumer Staples | | | 8.5 | |
| Materials | | | 5.0 | |
| Diversified Financials | | | 3.4 | |
| Banks | | | 3.3 | |
| Insurance | | | 2.7 | |
| Real Estate | | | 2.6 | |
| Utilities | | | 2.0 | |
| Energy | | | 1.0 | |
| Telecommunication Services | | | 0.4 | |
| Other* | | | 6.2 | |
| Total | | | 100.0 | % |
| * | | Includes cash and equivalents, exchange traded funds, rights/warrants, U.S. government agencies, investment companies, pending trades and Fund share transactions, interest and dividends receivable, prepaids and accrued expenses payable. |
The Board of Directors and Shareholders of Small & Mid Cap Fund, a fund comprised within the Old Westbury Funds, Inc.
We have audited the accompanying statements of assets and liabilities of Old Westbury Small & Mid Cap Fund (the “Fund”) (one of the funds comprising the Old Westbury Funds, Inc.), including the condensed portfolio of investments as of October 31, 2016, and the related statements of operations for the year then ended, the statements of changes in net assets for each of the two years in the period then ended (collectively, the “financial statements”), the financial highlights for each of the five years in the period then ended (the financial statements and financial highlights are included in Item 1 of this Form N-CSR) and the portfolio of investments as of October 31, 2016 (included in Item 6 of this Form N-CSR). These financial statements, financial highlights and portfolio of investments are the responsibility of the Fund’s management. Our responsibility is to express an opinion on these financial statements, financial highlights and portfolio of investments based on our audit.
We conducted our audit in accordance with the standards of the Public Company Accounting Oversight Board (United States). Those standards require that we plan and perform the audit to obtain reasonable assurance about whether the financial statements, financial highlights and portfolio of investments are free of material misstatement. An audit includes examining, on a test basis, evidence supporting the amounts and disclosures in the financial statements and portfolio of investments. An audit also includes assessing the accounting principles used and significant estimates made by management, and evaluating the overall financial statement presentation. Our procedures included confirmation of securities owned as of October 31, 2016, by correspondence with the custodians and brokers or by other appropriate auditing procedures where replies from brokers were not received. We believe that our audit provides a reasonable basis for our opinion.
In our opinion, the financial statements, financial highlights and portfolio of investments referred to above present fairly, in all material respects, the financial position of Old Westbury Small & Mid Cap Fund at October 31, 2016, the results of its operations for the year then ended, the changes in its net assets for each of the two years in the period then ended and the financial highlights for each of the five years in the period then ended, in conformity with U.S. generally accepted accounting principles.

New York, New York
December 28, 2016
Item 2. Code of Ethics.
| (a) | The registrant, as of the end of the period covered by this report, has adopted a code of ethics that applies to the registrant’s principal executive officer, principal financial officer, principal accounting officer or controller, or persons performing similar functions, regardless of whether these individuals are employed by the registrant or a third party. |
The Code of Ethics for Principal Executive and Principal Financial Officers is attached as an Exhibit under Item 12 (a)(1).
| (c) | There have been no amendments, during the period covered by this report, to a provision of the code of ethics that applies to the registrant’s principal executive officer, principal financial officer, principal accounting officer or controller, or persons performing similar functions, regardless of whether these individuals are employed by the registrant or a third party, and that relates to any element of the code of ethics description. |
| (d) | The registrant has not granted any waivers, including an implicit waiver, from a provision of the code of ethics that applies to the registrant’s principal executive officer, principal financial officer, principal accounting officer or controller, or persons performing similar functions, regardless of whether these individuals are employed by the registrant or a third party, that relates to one or more of the items set forth in paragraph (b) of this item’s instructions. |
Item 3. Audit Committee Financial Expert.
The registrant’s board of directors has determined that the registrant has three audit committee financial experts serving on its audit committee and those persons (Patricia L. Francy, J. David Officer and R. Keith Walton) are “independent” for purposes of this Item 3 of Form N-CSR.
Item 4. Principal Accountant Fees and Services.
Audit Fees
| (a) | The aggregate fees billed for each of the last two fiscal years for professional services rendered by the principal accountant for the audit of the registrant's annual financial statements or services that are normally provided by the accountant in connection with statutory and regulatory filings or engagements for those fiscal years are $695,750 in 2016 and $792,000 in 2015. |
Audit-Related Fees
| (b) | The aggregate fees billed in each of the last two fiscal years for assurance and related services by the principal accountant that are reasonably related to the performance of the audit of the registrant's financial statements and are not reported under paragraph (a) of this Item are $14,600 in 2016 and $13,957 in 2015. [Fees for both 2016 and 2015 relate to the review of financial statement data incorporated in the Funds periodic N-1A filings.] |
Tax Fees
| (c) | The aggregate fees billed in each of the last two fiscal years for professional services rendered by the principal accountant for tax compliance, tax advice, and tax planning are $268,233 in 2016 and $250,577 in 2015. [Fees for both 2016 and 2015 relate to the review of federal income and excise tax returns, review of capital gains distribution calculations and certain global tax compliance services.] |
All Other Fees
| (d) | The aggregate fees billed in each of the last two fiscal years for products and services provided by the principal accountant, other than the services reported in paragraphs (a) through (c) of this Item are $53,400 in 2016 and $51,800 in 2015. [Fees for both 2016 and 2015 relate to the review of holdings for the Funds affiliated custodian under Rule 17f-2 and regulatory reporting for OWF Strategic Opportunities Fund Ltd.] |
| (e)(1) | Disclose the audit committee's pre-approval policies and procedures described in paragraph (c)(7) of Rule 2-01 of Regulation S-X. |
Before an auditor is engaged by the Funds to render audit services, the Audit Committee reviews and approves the engagement, including all related fees. The Audit Committee also reviews and approves in advance, unless excepted under Rule 2-01(c)(7) of Regulation S-X, any proposal that the Funds employ their auditor to render “permissible non-audit services” to the Funds, including all related fees. In addition, the Audit Committee reviews and approves in advance, unless excepted under Rule 2-01(c)(7) of Regulation S-X, any proposal that the Adviser, and any entity controlling, controlled by, or under common control with the Adviser that provides ongoing services to the Funds, employ the Funds’ Auditor to render non-audit services, if such engagement would relate directly to the operations and financial reporting of the Funds. As a part of its review, the Audit Committee considers whether the provision of such services does not impact the Auditor’s independence.
| (e)(2) | The percentage of services described in each of paragraphs (b) through (d) of this Item that were approved by the audit committee pursuant to paragraph (c)(7)(i)(C) of Rule 2-01 of Regulation S-X are as follows: |
(b) 100%
(c) 100%
(d) 100%
| (f) | The percentage of hours expended on the principal accountant's engagement to audit the registrant's financial statements for the most recent fiscal year that were attributed to work performed by persons other than the principal accountant's full-time, permanent employees was less than fifty percent. |
| (g) | The aggregate non-audit fees billed by the registrant's accountant for services rendered to the registrant, and rendered to the registrant's investment adviser (not including any sub-adviser whose role is primarily portfolio management and is subcontracted with or overseen by another investment adviser), and any entity controlling, controlled by, or under common control with the adviser that provides ongoing services to the registrant for each of the last two fiscal years of the registrant was $321,633 in 2016 and $302,377 in 2015. |
| (h) | The registrant's audit committee of the board of directors has considered whether the provision of non-audit services that were rendered to the registrant's investment adviser (not including any sub-adviser whose role is primarily portfolio management and is subcontracted with or overseen by another investment adviser), and any entity controlling, controlled by, or under common control with the investment adviser that provides ongoing services to the registrant that were not pre-approved pursuant to paragraph (c)(7)(ii) of Rule 2-01 of Regulation S-X is compatible with maintaining the principal accountant's independence. |
Item 5. Audit Committee of Listed Registrants.
Not applicable.
Item 6. Investments.
| (a) | The Schedule of Investments in securities of unaffiliated issuers as of the close of reporting period for the Old Westbury Small & Mid Cap Fund is listed below. The Schedules of Investments in securities of unaffiliated issuers as of the close of the reporting period for the Old Westbury Large Cap Core Fund, Old Westbury Large Cap Strategies Fund, Old Westbury Strategic Opportunities Fund, Old Westbury Fixed Income Fund and Old Westbury Municipal Bond Fund are included as part of the report to shareholders filed under Item 1 of this form. |
Item 7. Disclosure of Proxy Voting Policies and Procedures for Closed-End Management Investment Companies.
Not applicable.
Item 8. Portfolio Managers of Closed-End Management Investment Companies.
Not applicable.
Item 9. Purchases of Equity Securities by Closed-End Management Investment Company and Affiliated Purchasers.
Not applicable.
Item 10. Submission of Matters to a Vote of Security Holders.
There have been no material changes to the procedures by which the shareholders may recommend nominees to the registrant’s board of directors, where those changes were implemented after the registrant last provided disclosure in response to the requirements of Item 407(c)(2)(iv) of Regulation S-K (17 CFR 229.407) (as required by Item 22(b)(15) of Schedule 14A (17 CFR 240.14a-101)), or this Item.
Item 11. Controls and Procedures.
| (a) | The registrant’s principal executive and principal financial officers, or persons performing similar functions, have concluded that the registrant’s disclosure controls and procedures (as defined in Rule 30a-3(c) under the Investment Company Act of 1940, as amended (the “1940 Act”) (17 CFR 270.30a-3(c))) are effective, as of a date within 90 days of the filing date of the report that includes the disclosure required by this paragraph, based on their evaluation of these controls and procedures required by Rule 30a-3(b) under the 1940 Act (17 CFR 270.30a-3(b)) and Rules 13a-15(b) or 15d-15(b) under the Securities Exchange Act of 1934, as amended (17 CFR 240.13a-15(b) or 240.15d-15(b)). |
| (b) | There were no changes in the registrant’s internal control over financial reporting (as defined in Rule 30a-3(d) under the 1940 Act (17 CFR 270.30a-3(d)) that occurred during the registrant’s second fiscal quarter of the period covered by this report that has materially affected, or is reasonably likely to materially affect, the registrant’s internal control over financial reporting. |
Item 12. Exhibits.
(a)(1) Code of ethics, or any amendment thereto, that is the subject of disclosure required by Item 2 is attached hereto.
| (a)(2) | Certifications pursuant to Rule 30a-2(a) under the 1940 Act (17 CFR 270.30a-2(a)) are attached hereto. |
(a)(3) Not applicable.
(b) Certifications pursuant to Rule 30a-2(b) under the 1940 Act (17 CFR 270.30a-2(b)) are attached hereto.
| (12.other) | Not applicable. |
SIGNATURES
Pursuant to the requirements of the Securities Exchange Act of 1934 and the Investment Company Act of 1940, the registrant has duly caused this report to be signed on its behalf by the undersigned, thereunto duly authorized.
(Registrant) Old Westbury Funds, Inc.
By (Signature and Title)* /s/ David W. Rossmiller
David W. Rossmiller, President
(Principal Executive Officer)
Date 1/4/2017
Pursuant to the requirements of the Securities Exchange Act of 1934 and the Investment Company Act of 1940, this report has been signed below by the following persons on behalf of the registrant and in the capacities and on the dates indicated.
By (Signature and Title)* /s/ David W. Rossmiller
David W. Rossmiller, President
(Principal Executive Officer)
Date 1/4/2017
By (Signature and Title)* /s/ Matthew A. Rizzi
Matthew A. Rizzi, Treasurer
(Principal Financial Officer)
Date 1/4/2017
* Print the name and title of each signing officer under his or her signature.