UNITED STATES SECURITIES AND EXCHANGE COMMISSION
Washington, D.C. 20549
FORM N-CSR
CERTIFIED SHAREHOLDER REPORT OF REGISTERED MANAGEMENT
INVESTMENT COMPANIES
| Investment Company Act file number: | 811-07972 |
| Exact name of registrant as specified in charter: | Delaware Group® Adviser Funds |
| Address of principal executive offices: | 2005 Market Street |
| Philadelphia, PA 19103 | |
| Name and address of agent for service: | David F. Connor, Esq. |
| 2005 Market Street | |
| Philadelphia, PA 19103 | |
| Registrant’s telephone number, including area code: | (800) 523-1918 |
| Date of fiscal year end: | October 31 |
| Date of reporting period: | October 31, 2014 |
Item 1. Reports to Stockholders
Table of Contents

Annual report
Fixed income mutual fund
Delaware Diversified Income Fund
October 31, 2014
Carefully consider the Fund’s investment objectives, risk factors, charges, and expenses before investing. This and other information can be found in the Fund’s prospectus and its summary prospectus, which may be obtained by visiting delawareinvestments.com or calling 800 523-1918. Investors should read the prospectus and the summary prospectus carefully before investing.
You can obtain shareholder reports and prospectuses online instead of in the mail.
Visit delawareinvestments.com/edelivery.
Table of Contents
Experience Delaware Investments
Delaware Investments is committed to the pursuit of consistently superior asset management and unparalleled client service. We believe in our investment processes, which seek to deliver consistent results, and in convenient services that help add value for our clients.
If you are interested in learning more about creating an investment plan, contact your financial advisor.
You can learn more about Delaware Investments or obtain a prospectus for Delaware Diversified Income Fund at delawareinvestments.com.
Manage your investments online
| • | 24-hour access to your account information |
| • | Obtain share prices |
| • | Check your account balance and recent transactions |
| • | Request statements or literature |
| • | Make purchases and redemptions |
Delaware Management Holdings, Inc. and its subsidiaries (collectively known by the marketing name of Delaware Investments) are wholly owned subsidiaries of Macquarie Group Limited, a global provider of banking, financial, advisory, investment and funds management services.
Investments in Delaware Diversified Income Fund are not and will not be deposits with or liabilities of Macquarie Bank Limited ABN 46 008 583 542 and its holding companies, including their subsidiaries or related companies (Macquarie Group), and are subject to investment risk, including possible delays in repayment and loss of income and capital invested. No Macquarie Group company guarantees or will guarantee the performance of the Fund, the repayment of capital from the Fund, or any particular rate of return.
| 1 | ||||
| 3 | ||||
| 6 | ||||
| 8 | ||||
| 10 | ||||
| 58 | ||||
| 60 | ||||
| 62 | ||||
| 64 | ||||
| 72 | ||||
| 92 | ||||
| 93 | ||||
| 96 | ||||
| 104 |
Unless otherwise noted, views expressed herein are current as of Oct. 31, 2014, and subject to change.
Funds are not FDIC insured and are not guaranteed. It is possible to lose the principal amount invested.
Mutual fund advisory services provided by Delaware Management Company, a series of Delaware Management Business Trust, which is a registered investment advisor. Delaware Investments, a member of Macquarie Group, refers to Delaware Management Holdings, Inc. and its subsidiaries, including the Fund’s distributor, Delaware Distributors, L.P. Macquarie Group refers to Macquarie Group Limited and its subsidiaries and affiliates worldwide.
©2014 Delaware Management Holdings, Inc.
All third-party marks cited are the property of their respective owners.
Table of Contents
| Delaware Diversified Income Fund | November 11, 2014 |
Performance preview (for the year ended October 31, 2014)
Delaware Diversified Income Fund (Class A shares) | 1-year return | +5.25 | % | |||||
Barclays U.S. Aggregate Index (benchmark) | 1-year return | +4.14 | % |
Past performance does not guarantee future results.
For complete, annualized performance for Delaware Diversified Income Fund, please see the table on page 3.
The performance of Class A shares excludes the applicable sales charge and reflects the reinvestment of all distributions. Index performance returns do not reflect any management fees, transaction costs, or expenses. Indices are unmanaged and one cannot invest directly in an index.
Until nearly the very end of 2013, global central bank policies in the United States, Europe, and Japan were largely in sync with one another. On Dec. 18, 2013, however, after months of speculation, the U.S. Federal Reserve broke ranks with its counterparts and began tapering its asset-purchasing program known as quantitative easing. The decision highlighted the stark contrast between the U.S., where economic growth and a strengthening labor market warranted the change, and much of the rest of the world, which was still hobbled by anemic growth.
The first quarter of 2014 presented major challenges to the U.S. economy. Some problems came from abroad, including the impact of China’s slowing economic expansion, increased concern about the risk of deflation in the euro zone, and tensions in Ukraine. But most of all, the U.S. economy was greatly hampered by severe winter weather across much of the country. After a brief contraction, reflecting all of these issues, the U.S. economy rebounded. Employment, manufacturing, auto sales, and housing data all indicated that the economy was growing in the second quarter.
As 2014 unfolded, global central bank policies diverged further as the U.S. economy maintained its slow, but steady improvement while most other countries continued to struggle. The Bank of England eventually followed the Fed and
began tapering its monetary stimulus, but other central banks, most notably the European Central Bank and Bank of Japan, were considering or actually introducing more stimuli, including quantitative easing.
Overall, the sustained slow recovery in the U.S. was the foundation for continued positive fundamentals of corporate bonds and securitized fixed income products such as asset-backed securities (ABS) and mortgage-backed securities (MBS).
Fund performance
For the fiscal year ended Oct. 31, 2014, Delaware Diversified Income Fund (Class A shares) returned +5.25% at net asset value and +0.54% at maximum offer price (both returns reflect all distributions reinvested). For the same period, the Barclays U.S. Aggregate Index returned +4.14%. Complete annualized performance for Delaware Diversified Income Fund is shown in the table on page 3.
Throughout the fiscal year, the Fund maintained an overweight in corporate bonds, notably investment grade corporate bonds. We were comfortable with the Fund’s exposure to traditional high yield bonds, bank loans, and U.S. dollar-denominated emerging market corporate issues. The Fund was underweight agency MBS. While we believed these had decent fundamentals
1
Table of Contents
Portfolio management review
Delaware Diversified Income Fund
and technicals, they yielded less than other sectors. The Fund also had less exposure to the agency MBS sector because we believed its relative high quality and consequent low yield was relatively unattractive. Similarly, the Fund also was underweight U.S. Treasurys and agencies, as they had, in our view, very low yields and low potential returns.
The Fund’s positive performance relative to the benchmark index was largely driven by exposure to traditional high yield bonds and investment grade corporate bonds. The Fund was overweight to the benchmark in both sectors, and benefited from their relatively strong performances. The Fund also benefited from security selection in investment grade corporate credit and the Fund’s allocation to bank loans and emerging market bonds. The small allocation to convertible securities also added to performance. This sector was influenced by strong equity market returns.
One of the main detractors from performance was the Fund’s underweight of U.S. Treasury securities. However, the Fund’s Treasurys outperformed the index Treasurys, partly offsetting the effect of the underweight. Poor security selection detracted from performance in the agency MBS sector, but that was partially offset by a large underweight to the benchmark. Additionally, yield curve positioning in the agency MBS area resulted in a small underperformance by the Fund’s investments relative to the index.
The Fund’s small weighting in foreign currencies detracted somewhat as the U.S. dollar surged versus most currencies. But our team had anticipated a strong U.S. dollar and kept that exposure low throughout the period.
Fund management strategies
As the divergence of global central bank policies continues and becomes more pronounced, we expect more volatility from these asset classes. Accordingly, our team is slowly adopting a more
defensive posture and purchasing higher-quality securities.
Over the past 12 months, but particularly in 2014, we reduced exposure to traditional high yield bonds, bank loans, and emerging market debt. In their place, we increased exposure to agency MBS, which are supported by what we view as a fairly strong technical backdrop: There has been unexpectedly low issuance in that sector because of low household creation and higher interest rates or expenses on conforming mortgages. Although the Fed has ended its quantitative-easing program, it will continue to buy agency MBS with the interest generated by the investments on its balance sheet.
At the end of the fiscal year, the Fund’s largest three sectors were investment grade bonds, 37% of the portfolio; high yield bonds, 20%; and MBS and collateralized mortgage obligations, 20%.
Use of derivatives
The Fund’s use of derivatives was modest. We used Treasury futures in an effort to smooth out or neutralize risks associated with yield curve exposures. The portfolio usually carries a concentration in 5- to 10-year corporates. Because of corporate credit curves, we have had an underweight to the 30-year sector. Treasury futures enable the Fund to seek to balance that.
Throughout the year, we made limited use of hedging in some risk sectors by investing in credit default swap (CDS) index vehicles. Additionally, we used currency forwards to hedge currency exposure on some international investments. We also used options to a small degree to hedge interest rates.
At fiscal year end, we held Treasury futures, currency forwards, and CDS indices, the latter two positions being fairly small. We had a small hedge in high yield and investment grade bonds. Overall, the Fund’s use of derivatives did not have a material effect on its performance.
2
Table of Contents
| Delaware Diversified Income Fund | October 31, 2014 |
The performance data quoted represent past performance; past performance does not guarantee future results. Investment return and principal value will fluctuate so your shares, when redeemed, may be worth more or less than their original cost. Please obtain the performance data current for the most recent month end by calling 800 523-1918 or visiting our website at delawareinvestments.com/performance. Current performance may be lower or higher than the performance data quoted.
Fund and benchmark performance1,2 | Average annual total returns through October 31, 2014 | |||||||||||||||
| 1 year | 5 years | 10 years | ||||||||||||||
Class A (Est. Dec. 29, 1997) | ||||||||||||||||
Excluding sales charge | +5.25 | % | +5.45 | % | +6.13 | % | ||||||||||
Including sales charge | +0.54 | % | +4.48 | % | +5.64 | % | ||||||||||
Class C (Est. Oct. 28, 2002) | ||||||||||||||||
Excluding sales charge | +4.59 | % | +4.66 | % | +5.34 | % | ||||||||||
Including sales charge | +3.59 | % | +4.66 | % | +5.34 | % | ||||||||||
Class R (Est. June 2, 2003) | ||||||||||||||||
Excluding sales charge | +5.11 | % | +5.21 | % | +5.86 | % | ||||||||||
Including sales charge | +5.11 | % | +5.21 | % | +5.86 | % | ||||||||||
Institutional Class (Est. Oct. 28, 2002) | ||||||||||||||||
Excluding sales charge | +5.63 | % | +5.71 | % | +6.40 | % | ||||||||||
Including sales charge | +5.63 | % | +5.71 | % | +6.40 | % | ||||||||||
Barclays U.S. Aggregate Index | +4.14 | % | +4.22 | % | +4.64 | % | ||||||||||
1 Returns reflect the reinvestment of all distributions and are presented both with and without the applicable sales charges described below. Returns do not reflect the deduction of taxes the shareholder would pay on Fund distributions or redemptions of Fund shares.
Expense limitations were in effect for certain classes during some or all of the periods shown in the “Fund and benchmark performance” table. Expenses for each class are listed on the “Fund expense ratios” table on page 4. Performance would have been lower had expense limitations not been in effect.
Class A shares are sold with a maximum front-end sales charge of 4.50%, and have an annual distribution and service fee of 0.25% of average daily net assets. Performance for Class A shares,
excluding sales charges, assumes that no front-end sales charge applied.
Class C shares are sold with a contingent deferred sales charge of 1.00% if redeemed during the first 12 months. They are also subject to an annual distribution and service fee of 1.00% of average daily net assets.
Performance for Class C shares, excluding sales charges, assumes either that contingent deferred sales charges did not apply or that the investment was not redeemed.
Class R shares are available only for certain retirement plan products. They are sold without a sales charge and have an annual distribution and service fee of 0.50% of average daily net assets.
3
Table of Contents
Performance summary
Delaware Diversified Income Fund
Institutional Class shares are available without sales or asset-based distribution charges only to certain eligible institutional accounts.
The “Fund and benchmark performance” table and the “Performance of a $10,000 investment” graph do not reflect the deduction of taxes the shareholder would pay on Fund distributions or redemptions of Fund shares.
Fixed income securities and bond funds can lose value, and investors can lose principal, as interest rates rise. They also may be affected by economic conditions that hinder an issuer’s ability to make interest and principal payments on its debt.
The Fund may also be subject to prepayment risk, the risk that the principal of a fixed income security that is held by the Fund may be prepaid prior to maturity, potentially forcing the Fund to reinvest that money at a lower interest rate.
High yielding, noninvestment grade bonds (junk bonds) involve higher risk than investment grade bonds. The high yield secondary market is particularly susceptible to liquidity problems when institutional investors, such as mutual funds and certain other financial institutions, temporarily stop buying bonds for regulatory, financial, or other reasons. In addition, a less liquid secondary market makes it more difficult for the Fund to obtain precise valuations of the high yield securities in its portfolio.
International investments entail risks not ordinarily associated with U.S. investments including fluctuation in currency values, differences in accounting principles, or economic or political instability in other nations.
Investing in emerging markets can be riskier than investing in established foreign markets due to increased volatility and lower trading volume.
If and when the Fund invests in forward foreign currency contracts or uses other investments to hedge against currency risks, the Fund will be subject to special risks, including counterparty risk.
Diversification may not protect against market risk.
The Fund may invest in derivatives, which may involve additional expenses and are subject to risk, including the risk that an underlying security or securities index moves in the opposite direction from what the portfolio manager anticipated. A derivative transaction depends upon the counterparties’ ability to fulfill their contractual obligations.
The Fund may experience portfolio turnover in excess of 100%, which could result in higher transaction costs and tax liability.
2 The Fund’s expense ratios, as described in the most recent prospectus, are disclosed in the following
“Fund expense ratios” table.
Fund expense ratios | Class A | Class C | Class R | Institutional Class | ||||||||||||
Total annual operating expenses | 0.90% | 1.65% | 1.15% | 0.65% | ||||||||||||
(without fee waivers) | ||||||||||||||||
Net expenses | 0.90% | 1.65% | 1.15% | 0.65% | ||||||||||||
(including fee waivers, if any) | ||||||||||||||||
Type of waiver | n/a | n/a | n/a | n/a |
4
Table of Contents
Performance of a $10,000 investment1
Average annual total returns from Oct. 31, 2004, through Oct. 31, 2014
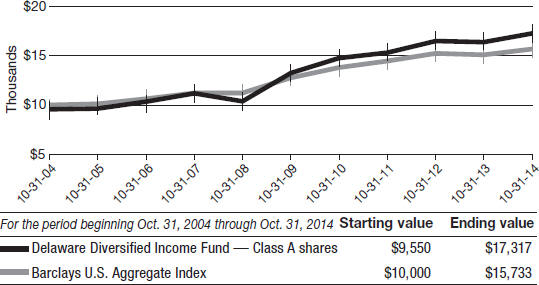
1 The “Performance of a $10,000 investment” graph assumes $10,000 invested in Class A shares of the Fund on Oct. 31, 2004, and includes the effect of a 4.50% front-end sales charge and the reinvestment of all distributions. The graph does not reflect the deduction of taxes the shareholders would pay on Fund distributions or redemptions of Fund shares. Expense limitations were in effect for some or all of the periods shown. Performance would have been lower had expense limitations not been in effect. Expenses are listed in the “Fund expense ratios” table on page 4. Please note additional details on pages 3 through 5.
The graph also assumes $10,000 invested in the Barclays U.S. Aggregate Index as of Oct. 31, 2004. The Barclays U.S. Aggregate Index measure the performance of publicly issued investment grade (Baa3/BBB- or better) corporate, U.S. government, mortgage-and asset-backed securities with at least one year to maturity and at least $250 million par amount outstanding.
Index performance returns do not reflect any management fees, transaction costs, or expenses. Indices are unmanaged and one cannot invest directly in an index. Past performance is not a guarantee of future results.
Performance of other Fund classes will vary due to different charges and expenses.
| Nasdaq | CUSIPs | |||||||
Class A | DPDFX | 246248744 | ||||||
Class C | DPCFX | 246248595 | ||||||
Class R | DPRFX | 246248553 | ||||||
Institutional Class | DPFFX | 246248587 |
5
Table of Contents
For the six-month period from May 1, 2014 to October 31, 2014 (Unaudited)
As a shareholder of the Fund, you incur two types of costs: (1) transaction costs, including sales charges (loads) on purchase payments, reinvested dividends, or other distributions; redemption fees; and exchange fees; and (2) ongoing costs, including management fees; distribution and/or service (12b-1) fees; and other Fund expenses. This example is intended to help you understand your ongoing costs (in dollars) of investing in the Fund and to compare these costs with the ongoing costs of investing in other mutual funds.
The example is based on an investment of $1,000 invested at the beginning of the period and held for the entire six-month period from May 1, 2014 to Oct. 31, 2014.
Actual expenses
The first section of the table shown, “Actual Fund return,” provides information about actual account values and actual expenses. You may use the information in this section of the table, together with the amount you invested, to estimate the expenses that you paid over the period. Simply divide your account value by $1,000 (for example, an $8,600 account value divided by $1,000 = 8.6), then multiply the result by the number in the first section under the heading entitled “Expenses Paid During Period” to estimate the expenses you paid on your account during this period.
Hypothetical example for comparison purposes
The second section of the table shown, “Hypothetical 5% return,” provides information about hypothetical account values and hypothetical expenses based on the Fund’s actual expense ratio and an assumed rate of return of 5% per year before expenses, which is not the Fund’s actual return. The hypothetical account values and expenses may not be used to estimate the actual ending account balance or expenses you paid for the period. You may use this information to compare the ongoing costs of investing in the Fund and other funds. To do so, compare this 5% hypothetical example with the 5% hypothetical examples that appear in the shareholder reports of the other funds.
Please note that the expenses shown in the table are meant to highlight your ongoing costs only and do not reflect any transactional costs, such as sales charges (loads), redemption fees, or exchange fees. Therefore, the second section of the table is useful in comparing ongoing costs only, and will not help you determine the relative total costs of owning different funds. In addition, if these transactional costs were included, your costs would have been higher. The expenses shown in the table assume reinvestment of all dividends and distributions.
6
Table of Contents
Delaware Diversified Income Fund
Expense analysis of an investment of $1,000
| Beginning Account Value 5/1/14 | Ending Account Value 10/31/14 | Annualized Expense Ratio | Expenses Paid During Period 5/1/14 to 10/31/14* | |||||||||||||
Actual Fund return† | ||||||||||||||||
Class A | $1,000.00 | $1,022.10 | 0.88 | % | $4.49 | |||||||||||
Class C | 1,000.00 | 1,018.30 | 1.63 | % | 8.29 | |||||||||||
Class R | 1,000.00 | 1,020.90 | 1.13 | % | 5.76 | |||||||||||
Institutional Class | 1,000.00 | 1,023.50 | 0.63 | % | 3.21 | |||||||||||
Hypothetical 5% return (5% return before expenses) |
| |||||||||||||||
Class A | $1,000.00 | $1,020.77 | 0.88 | % | $4.48 | |||||||||||
Class C | 1,000.00 | 1,016.99 | 1.63 | % | 8.29 | |||||||||||
Class R | 1,000.00 | 1,019.51 | 1.13 | % | 5.75 | |||||||||||
Institutional Class | 1,000.00 | 1,022.03 | 0.63 | % | 3.21 | |||||||||||
| * | “Expenses Paid During Period” are equal to the Fund’s annualized expense ratio, multiplied by the average account value over the period, multiplied by 184/365 (to reflect the one-half year period). |
| † | Because actual returns reflect only the most recent six-month period, the returns shown may differ significantly from fiscal year returns. |
7
Table of Contents
Delaware Diversified Income Fund | As of October 31, 2014 (Unaudited) |
Sector designations may be different than the sector designations presented in other fund materials. The sector designations may represent the investment manager’s internal sector classifications, which may result in the sector designations for one fund being different than another fund’s sector designations.
| Security type / sector | Percentage of net assets | |
Agency Asset-Backed Securities | 0.02% | |
Agency Collateralized Mortgage Obligations | 1.87% | |
Agency Mortgage-Backed Securities | 17.26% | |
Agency Obligation | 0.11% | |
Collateralized Debt Obligation | 0.17% | |
Commercial Mortgage-Backed Securities | 4.76% | |
Convertible Bonds | 1.51% | |
Corporate Bonds | 52.70% | |
Automotive | 0.54% | |
Banking | 6.34% | |
Basic Industry | 5.27% | |
Brokerage | 0.27% | |
Capital Goods | 1.49% | |
Communications | 8.48% | |
Consumer Cyclical | 3.48% | |
Consumer Non-Cyclical | 2.61% | |
Electric | 4.95% | |
Energy | 5.09% | |
Finance Companies | 1.33% | |
Healthcare | 1.35% | |
Insurance | 2.07% | |
Natural Gas | 2.71% | |
Real Estate | 1.84% | |
Services | 0.71% | |
Technology | 2.18% | |
Transportation | 1.34% | |
Utilities | 0.65% | |
Municipal Bonds | 0.44% | |
Non-Agency Asset-Backed Securities | 1.73% | |
Non-Agency Collateralized Mortgage Obligations | 0.88% | |
Regional Bonds | 0.26% | |
Senior Secured Loans | 8.74% | |
Sovereign Bonds | 2.49% | |
Supranational Banks | 0.19% | |
U.S. Treasury Obligation | 2.00% | |
Common Stock | 0.00% | |
Convertible Preferred Stock | 0.55% |
8
Table of Contents
Security type / sector | Percentage of net assets | |||||
Preferred Stock | 0.63 | % | ||||
Short-Term Investments | 11.88 | % | ||||
Securities Lending Collateral | 2.34 | % | ||||
Total Value of Securities | 110.53 | % | ||||
Obligation to Return Securities Lending Collateral | (2.34 | %) | ||||
Liabilities Net of Receivables and Other Assets | (8.19 | %) | ||||
Total Net Assets | 100.00 | % | ||||
9
Table of Contents
Delaware Diversified Income Fund | October 31, 2014 |
| Principal amount° | Value (U.S. $) | |||||||
| ||||||||
Agency Asset-Backed Securities – 0.02% | ||||||||
| ||||||||
Fannie Mae Grantor Trust | ||||||||
Series 2003-T4 2A5 5.407% 9/26/33 | 935,607 | $ | 1,023,149 | |||||
Fannie Mae Whole Loan REMIC Trust | ||||||||
Series 2001-W2 AS5 6.473% 10/25/31 | 4,256 | 4,435 | ||||||
Series 2002-W11 AV1 0.492% 11/25/32 — | 8,541 | 7,823 | ||||||
|
| |||||||
Total Agency Asset-Backed Securities (cost $913,866) | 1,035,407 | |||||||
|
| |||||||
| ||||||||
Agency Collateralized Mortgage Obligations – 1.87% | ||||||||
| ||||||||
Fannie Mae Grantor Trust | ||||||||
Series 1999-T2 A1 7.50% 1/19/39 — | 15,776 | 17,588 | ||||||
Series 2002-T4 A3 7.50% 12/25/41 | 164,201 | 186,707 | ||||||
Series 2002-T19 A1 6.50% 7/25/42 | 118,072 | 134,766 | ||||||
Series 2004-T1 1A2 6.50% 1/25/44 | 53,579 | 61,175 | ||||||
Fannie Mae Interest Strip | ||||||||
Series 265 2 9.00% 3/25/24 | 6,997 | 8,152 | ||||||
Fannie Mae REMICs | ||||||||
Series 1990-92 C 7.00% 8/25/20 | 777 | 856 | ||||||
Series 1996-46 ZA 7.50% 11/25/26 | 149,603 | 170,197 | ||||||
Series 2001-50 BA 7.00% 10/25/41 | 79,964 | 91,439 | ||||||
Series 2002-83 GH 5.00% 12/25/17 | 124,316 | 130,410 | ||||||
Series 2002-90 A2 6.50% 11/25/42 | 223,995 | 253,328 | ||||||
Series 2003-11 BY 5.50% 2/25/33 | 132,806 | 146,373 | ||||||
Series 2003-26 AT 5.00% 11/25/32 | 2,779,072 | 2,874,794 | ||||||
Series 2003-38 MP 5.50% 5/25/23 | 2,241,815 | 2,450,208 | ||||||
Series 2003-78 B 5.00% 8/25/23 | 65,417 | 71,308 | ||||||
Series 2003-106 WE 4.50% 11/25/22 | 1,005,542 | 1,012,863 | ||||||
Series 2005-110 MB 5.50% 9/25/35 | 1,064,667 | 1,152,621 | ||||||
Series 2007-40 PT 5.50% 5/25/37 | 32,279 | 35,945 | ||||||
Series 2009-11 MP 7.00% 3/25/49 | 40,065 | 45,789 | ||||||
Series 2009-94 AC 5.00% 11/25/39 | 5,482,307 | 5,983,170 | ||||||
Series 2010-41 PN 4.50% 4/25/40 | 7,623,413 | 8,248,441 | ||||||
Series 2010-75 NA 4.00% 9/25/28 | 664,983 | 688,781 | ||||||
Series 2010-96 DC 4.00% 9/25/25 | 14,795,000 | 15,795,956 | ||||||
Series 2011-113 CP 5.00% 9/25/39 | 1,609,022 | 1,723,433 | ||||||
Series 2012-19 HB 4.00% 1/25/42 | 184,229 | 192,520 | ||||||
Series 2012-19 NI 3.50% 10/25/31 S | 5,271,373 | 737,779 | ||||||
Series 2012-122 SD 5.948% 11/25/42 —S | 10,931,878 | 2,639,517 | ||||||
Series 2013-20 IH 3.00% 3/25/33 S | 6,736,196 | 1,068,281 | ||||||
Series 2013-31 MI 3.00% 4/25/33 S | 33,628,506 | 5,246,516 | ||||||
Series 2013-44 DI 3.00% 5/25/33 S | 41,517,058 | 6,693,480 | ||||||
Series 2014-36 ZE 3.00% 6/25/44 | 4,118,092 | 3,571,852 | ||||||
Fannie Mae Whole Loan REMIC Trust | ||||||||
Series 2002-W1 2A 6.527% 2/25/42 — | 16,650 | 19,445 | ||||||
10
Table of Contents
| Principal amount° | Value (U.S. $) | |||||||
| ||||||||
Agency Collateralized Mortgage Obligations (continued) |
| |||||||
| ||||||||
Fannie Mae Whole Loan REMIC Trust | ||||||||
Series 2002-W6 2A 6.914% 6/25/42 — | 32,183 | $ | 36,610 | |||||
Series 2003-W1 2A 6.575% 12/25/42 — | 16,815 | 19,797 | ||||||
Series 2003-W10 1A4 4.505% 6/25/43 | 22,895 | 24,461 | ||||||
Series 2003-W15 2A7 5.55% 8/25/43 | 23,852 | 25,384 | ||||||
Series 2004-W11 1A2 6.50% 5/25/44 | 343,033 | 399,972 | ||||||
Freddie Mac REMICs | ||||||||
Series 1730 Z 7.00% 5/15/24 | 177,737 | 202,060 | ||||||
Series 2326 ZQ 6.50% 6/15/31 | 582,963 | 661,914 | ||||||
Series 2557 WE 5.00% 1/15/18 | 1,488,120 | 1,561,917 | ||||||
Series 2621 QH 5.00% 5/15/33 | 58,269 | 63,960 | ||||||
Series 2624 QH 5.00% 6/15/33 | 27,030 | 29,669 | ||||||
Series 2717 MH 4.50% 12/15/18 | 44,166 | 46,408 | ||||||
Series 2809 DC 4.50% 6/15/19 | 847,277 | 888,044 | ||||||
Series 2981 NE 5.00% 5/15/35 | 19,607 | 21,436 | ||||||
Series 3123 HT 5.00% 3/15/26 | 34,022 | 36,527 | ||||||
Series 3150 EQ 5.00% 5/15/26 | 43,835 | 48,015 | ||||||
Series 3232 KF 0.603% 10/15/36 — | 76,511 | 77,119 | ||||||
Series 3290 PE 5.50% 3/15/37 | 367,865 | 407,675 | ||||||
Series 3416 GK 4.00% 7/15/22 | 37,351 | 37,863 | ||||||
Series 3574 D 5.00% 9/15/39 | 247,466 | 271,667 | ||||||
Series 3656 PM 5.00% 4/15/40 | 10,899,895 | 12,046,946 | ||||||
Series 3804 EH 3.50% 7/15/40 | 136,904 | 143,776 | ||||||
Series 4065 DE 3.00% 6/15/32 | 1,626,000 | 1,597,560 | ||||||
Series 4122 LI 3.00% 10/15/27 S | 1,019,766 | 112,662 | ||||||
Series 4185 LI 3.00% 3/15/33 S | 10,328,598 | 1,687,275 | ||||||
Series 4191 CI 3.00% 4/15/33 S | 4,211,658 | 594,360 | ||||||
Series 4217 HI 2.50% 6/15/28 S | 941,648 | 106,245 | ||||||
Series 4251 KI 2.50% 4/15/28 S | 831,089 | 65,393 | ||||||
Freddie Mac Strips | ||||||||
Series 19 F 1.038% 6/1/28 — | 3,952 | 4,023 | ||||||
Freddie Mac Structured Agency Credit Risk Debt Notes | ||||||||
Series 2014-DN2 M2 1.802% 4/25/24 — | 1,505,000 | 1,453,764 | ||||||
Freddie Mac Structured Pass Through Securities | ||||||||
Series T-42 A5 7.50% 2/25/42 ¿ | 96,730 | 112,966 | ||||||
Series T-54 2A 6.50% 2/25/43 ¿ | 25,976 | 30,812 | ||||||
Series T-58 2A 6.50% 9/25/43 ¿ | 566,784 | 647,690 | ||||||
Series T-60 1A4C 4.716% 3/25/44 ¿— | 2,995 | 3,013 | ||||||
GNMA | ||||||||
Series 2010-113 KE 4.50% 9/20/40 | 20,442,264 | 22,328,819 | ||||||
11
Table of Contents
Schedule of investments
Delaware Diversified Income Fund
| Principal amount° | Value (U.S. $) | |||||||
| ||||||||
Agency Collateralized Mortgage Obligations (continued) |
| |||||||
| ||||||||
Vendee Mortgage Trust | ||||||||
Series 2000-1 1A 6.443% 1/15/30 — | 19,973 | $ | 22,733 | |||||
|
| |||||||
Total Agency Collateralized Mortgage Obligations (cost $104,825,531) |
| 107,272,225 | ||||||
|
| |||||||
| ||||||||
Agency Mortgage-Backed Securities – 17.26% |
| |||||||
| ||||||||
Fannie Mae | ||||||||
6.00% 9/1/17 | 4,512 | 4,754 | ||||||
6.50% 8/1/17 | 46,532 | 48,615 | ||||||
7.00% 11/15/16 | 818 | 821 | ||||||
Fannie Mae ARM | ||||||||
1.871% 7/1/33 — | 68,433 | 72,865 | ||||||
1.95% 1/1/36 — | 80,442 | 85,509 | ||||||
1.989% 11/1/24 — | 2,310 | 2,418 | ||||||
2.057% 8/1/34 — | 20,494 | 21,642 | ||||||
2.088% 9/1/38 — | 442,205 | 475,801 | ||||||
2.116% 3/1/38 — | 8,730 | 9,307 | ||||||
2.167% 6/1/37 — | 8,922 | 9,557 | ||||||
2.192% 8/1/36 — | 27,166 | 29,141 | ||||||
2.238% 4/1/36 — | 738 | 797 | ||||||
2.247% 4/1/37 — | 1,098,007 | 1,180,991 | ||||||
2.259% 6/1/36 — | 112,029 | 120,434 | ||||||
2.268% 7/1/36 — | 2,226 | 2,427 | ||||||
2.274% 12/1/33 — | 14,794 | 15,716 | ||||||
2.277% 10/1/33 — | 79,148 | 79,741 | ||||||
2.277% 6/1/34 — | 1,238 | 1,311 | ||||||
2.277% 7/1/36 — | 55,055 | 59,575 | ||||||
2.313% 11/1/35 — | 105,392 | 112,843 | ||||||
2.321% 4/1/36— | 345,473 | 368,439 | ||||||
2.333% 11/1/35 — | 341,522 | 366,167 | ||||||
2.34% 11/1/32 — | 482 | 520 | ||||||
2.341% 4/1/36 — | 244,132 | 261,984 | ||||||
2.397% 6/1/34 — | 84,927 | 86,033 | ||||||
2.42% 5/1/43 — | 6,131,189 | 6,135,235 | ||||||
2.546% 6/1/43 — | 1,449,780 | 1,461,793 | ||||||
3.199% 4/1/44 — | 3,934,081 | 4,080,748 | ||||||
3.279% 3/1/44 — | 4,740,625 | 4,947,590 | ||||||
3.292% 9/1/43 — | 4,918,946 | 5,102,789 | ||||||
5.07% 5/1/36 — | 155,467 | 167,681 | ||||||
5.141% 8/1/35 — | 74,555 | 79,799 | ||||||
5.807% 8/1/37 — | 522,368 | 559,369 | ||||||
Fannie Mae Relocation 15 yr | ||||||||
4.00% 9/1/20 | 146,194 | 154,427 | ||||||
12
Table of Contents
| Principal amount° | Value (U.S. $) | |||||||
| ||||||||
Agency Mortgage-Backed Securities (continued) |
| |||||||
| ||||||||
Fannie Mae Relocation 30 yr | ||||||||
5.00% 9/1/33 | 76,809 | $ | 84,202 | |||||
5.00% 11/1/33 | 56,130 | 61,527 | ||||||
5.00% 1/1/34 | 2,583 | 2,833 | ||||||
5.00% 11/1/34 | 34,451 | 37,763 | ||||||
5.00% 4/1/35 | 85,112 | 93,313 | ||||||
5.00% 10/1/35 | 90,525 | 99,158 | ||||||
5.00% 1/1/36 | 142,836 | 156,546 | ||||||
Fannie Mae S.F. 15 yr | ||||||||
2.50% 7/1/27 | 742,422 | 757,581 | ||||||
2.50% 9/1/27 | 2,961,727 | 3,022,209 | ||||||
2.50% 10/1/27 | 4,828,655 | 4,927,245 | ||||||
2.50% 11/1/27 | 240,857 | 244,718 | ||||||
2.50% 2/1/28 | 11,764,631 | 12,003,544 | ||||||
2.50% 4/1/28 | 81,974 | 83,545 | ||||||
2.50% 5/1/28 | 2,020,650 | 2,059,375 | ||||||
3.00% 4/1/27 | 1,105,024 | 1,149,500 | ||||||
3.00% 6/1/27 | 82,860 | 86,196 | ||||||
3.00% 8/1/27 | 352,542 | 367,377 | ||||||
3.00% 5/1/28 | 1,318,703 | 1,371,049 | ||||||
3.50% 2/1/26 | 994,312 | 1,052,144 | ||||||
3.50% 7/1/26 | 4,877,639 | 5,165,838 | ||||||
3.50% 3/1/27 | 166,390 | 176,135 | ||||||
3.50% 11/1/27 | 524,812 | 556,890 | ||||||
3.50% 11/1/28 | 403,219 | 427,816 | ||||||
4.00% 3/1/24 | 29,719 | 31,714 | ||||||
4.00% 11/1/24 | 19,700 | 21,109 | ||||||
4.00% 2/1/25 | 770,374 | 823,362 | ||||||
4.00% 5/1/25 | 1,914,781 | 2,051,737 | ||||||
4.00% 6/1/25 | 6,976,987 | 7,473,091 | ||||||
4.00% 11/1/25 | 13,130,560 | 14,094,288 | ||||||
4.00% 12/1/26 | 3,267,128 | 3,491,961 | ||||||
4.00% 5/1/27 | 6,979,668 | 7,491,499 | ||||||
4.00% 8/1/27 | 3,497,087 | 3,745,542 | ||||||
4.50% 4/1/18 | 14,026 | 14,778 | ||||||
4.50% 7/1/18 | 24,561 | 25,878 | ||||||
4.50% 9/1/18 | 14,964 | 15,766 | ||||||
4.50% 11/1/18 | 29,125 | 30,686 | ||||||
4.50% 2/1/19 | 32,211 | 33,977 | ||||||
4.50% 3/1/19 | 98,680 | 104,082 | ||||||
4.50% 4/1/20 | 12,505 | 13,203 | ||||||
4.50% 7/1/20 | 179,378 | 189,406 | ||||||
4.50% 4/1/23 | 68,698 | 73,976 | ||||||
13
Table of Contents
Schedule of investments
Delaware Diversified Income Fund
| Principal amount° | Value (U.S. $) | |||||||
| ||||||||
Agency Mortgage-Backed Securities (continued) |
| |||||||
| ||||||||
Fannie Mae S.F. 15 yr | ||||||||
4.50% 9/1/24 | 209,755 | $ | 224,011 | |||||
4.50% 11/1/24 | 76,162 | 82,486 | ||||||
5.00% 11/1/18 | 169,434 | 178,923 | ||||||
5.00% 6/1/19 | 87,636 | 92,534 | ||||||
5.00% 12/1/19 | 257,209 | 271,672 | ||||||
5.00% 9/1/20 | 3,784 | 4,039 | ||||||
5.00% 5/1/21 | 446,876 | 479,065 | ||||||
5.00% 12/1/21 | 45,346 | 48,505 | ||||||
5.50% 2/1/18 | 38,156 | 40,326 | ||||||
5.50% 4/1/19 | 15,274 | 16,258 | ||||||
5.50% 5/1/19 | 50,670 | 53,535 | ||||||
5.50% 10/1/21 | 14,408 | 15,793 | ||||||
5.50% 4/1/23 | 78,189 | 85,083 | ||||||
5.50% 6/1/23 | 56,012 | 61,734 | ||||||
6.00% 12/1/16 | 8,932 | 9,271 | ||||||
6.00% 8/1/17 | 21,499 | 22,490 | ||||||
6.00% 12/1/17 | 5,496 | 5,739 | ||||||
6.00% 3/1/21 | 1,004 | 1,090 | ||||||
6.00% 9/1/21 | 2,446,742 | 2,700,619 | ||||||
6.00% 2/1/22 | 49,941 | 54,286 | ||||||
6.00% 8/1/22 | 33,496 | 36,613 | ||||||
6.00% 2/1/23 | 4,159 | 4,628 | ||||||
Fannie Mae S.F. 20 yr | ||||||||
3.00% 2/1/33 | 415,374 | 425,307 | ||||||
3.00% 8/1/33 | 177,389 | 181,631 | ||||||
3.00% 8/1/34 | 1,374,883 | 1,400,119 | ||||||
3.50% 11/1/31 | 56,500 | 59,365 | ||||||
3.50% 4/1/32 | 23,557 | 24,753 | ||||||
3.50% 5/1/32 | 139,490 | 146,574 | ||||||
3.50% 8/1/32 | 641,110 | 673,846 | ||||||
3.50% 10/1/34 | 2,804,014 | 2,932,049 | ||||||
4.00% 12/1/30 | 163,389 | 175,297 | ||||||
4.00% 1/1/31 | 1,082,774 | 1,161,680 | ||||||
4.00% 2/1/31 | 2,755,626 | 2,956,594 | ||||||
4.50% 9/1/23 | 805,375 | 872,938 | ||||||
4.50% 4/1/24 | 7,952 | 8,619 | ||||||
5.00% 7/1/23 | 24,484 | 27,216 | ||||||
5.00% 11/1/23 | 473,754 | 524,491 | ||||||
5.00% 12/1/23 | 213,581 | 236,454 | ||||||
5.00% 3/1/28 | 40,425 | 44,754 | ||||||
5.50% 7/1/23 | 115,597 | 128,950 | ||||||
5.50% 2/1/24 | 232,901 | 259,805 | ||||||
14
Table of Contents
| Principal amount° | Value (U.S. $) | |||||||
| ||||||||
Agency Mortgage-Backed Securities (continued) |
| |||||||
| ||||||||
Fannie Mae S.F. 20 yr | ||||||||
5.50% 12/1/24 | 336,507 | $ | 375,379 | |||||
5.50% 1/1/25 | 233,473 | 260,444 | ||||||
5.50% 2/1/25 | 41,933 | 46,777 | ||||||
5.50% 7/1/25 | 33,775 | 37,677 | ||||||
5.50% 11/1/25 | 303,074 | 338,091 | ||||||
5.50% 3/1/27 | 113,729 | 127,163 | ||||||
5.50% 3/1/28 | 467,541 | 523,278 | ||||||
5.50% 8/1/28 | 1,821,727 | 2,037,963 | ||||||
5.50% 12/1/29 | 509,233 | 569,128 | ||||||
6.00% 10/1/21 | 15,810 | 17,950 | ||||||
6.00% 9/1/29 | 2,440,667 | 2,758,851 | ||||||
6.50% 10/1/18 | 4,829 | 5,480 | ||||||
6.50% 2/1/19 | 9,020 | 10,237 | ||||||
6.50% 5/1/22 | 5,299 | 6,014 | ||||||
6.50% 10/1/24 | 11,640 | 13,211 | ||||||
6.50% 10/1/27 | 63,000 | 71,501 | ||||||
Fannie Mae S.F. 30 yr | ||||||||
3.00% 7/1/42 | 3,464,136 | 3,473,596 | ||||||
3.00% 10/1/42 | 55,002,735 | 55,139,055 | ||||||
3.00% 12/1/42 | 9,803,603 | 9,826,877 | ||||||
3.00% 1/1/43 | 16,408,052 | 16,443,321 | ||||||
3.00% 2/1/43 | 1,955,812 | 1,960,090 | ||||||
3.00% 4/1/43 | 14,238,869 | 14,268,364 | ||||||
3.00% 5/1/43 | 3,112,916 | 3,119,006 | ||||||
3.50% 4/1/42 | 10,621 | 11,010 | ||||||
3.50% 9/1/42 | 254,272 | 263,256 | ||||||
3.50% 1/1/43 | 780,185 | 808,733 | ||||||
4.00% 5/1/43 | 575,007 | 614,162 | ||||||
4.00% 8/1/43 | 1,453,418 | 1,549,715 | ||||||
4.00% 7/1/44 | 14,924,052 | 15,940,845 | ||||||
4.50% 7/1/36 | 1,646,607 | 1,784,740 | ||||||
4.50% 4/1/39 | 6,565,207 | 7,130,947 | ||||||
4.50% 4/1/40 | 4,576,887 | 4,971,004 | ||||||
4.50% 11/1/40 | 4,615,577 | 5,013,821 | ||||||
4.50% 12/1/40 | 1,648,916 | 1,792,115 | ||||||
4.50% 3/1/41 | 9,505,945 | 10,325,661 | ||||||
4.50% 4/1/41 | 8,306,731 | 9,020,327 | ||||||
4.50% 5/1/41 | 961,896 | 1,050,694 | ||||||
4.50% 8/1/41 | 3,125 | 3,393 | ||||||
4.50% 10/1/41 | 6,677,436 | 7,249,945 | ||||||
4.50% 11/1/41 | 4,991,631 | 5,416,232 | ||||||
4.50% 12/1/43 | 860,486 | 936,311 | ||||||
15
Table of Contents
Schedule of investments
Delaware Diversified Income Fund
| Principal amount° | Value (U.S. $) | |||||||
| ||||||||
Agency Mortgage-Backed Securities (continued) |
| |||||||
| ||||||||
Fannie Mae S.F. 30 yr | ||||||||
4.50% 2/1/44 | 1,118,165 | $ | 1,214,122 | |||||
4.50% 5/1/44 | 3,660,949 | 3,983,551 | ||||||
5.00% 4/1/33 | 123,417 | 137,008 | ||||||
5.00% 7/1/33 | 126,188 | 140,057 | ||||||
5.00% 11/1/33 | 137,008 | 152,102 | ||||||
5.00% 3/1/34 | 63,891 | 70,921 | ||||||
5.00% 4/1/34 | 310,909 | 346,546 | ||||||
5.00% 4/1/35 | 649,236 | 720,346 | ||||||
5.00% 5/1/35 | 26,381 | 29,251 | ||||||
5.00% 6/1/35 | 3,966 | 4,402 | ||||||
5.00% 7/1/35 | 1,522,900 | 1,689,539 | ||||||
5.00% 8/1/35 | 658,040 | 729,848 | ||||||
5.00% 9/1/35 | 5,043 | 5,596 | ||||||
5.00% 10/1/35 | 3,336,507 | 3,701,098 | ||||||
5.00% 11/1/35 | 1,513,117 | 1,678,907 | ||||||
5.00% 7/1/36 | 3,535 | 3,925 | ||||||
5.00% 8/1/36 | 6,784 | 7,527 | ||||||
5.00% 12/1/36 | 11,479 | 12,740 | ||||||
5.00% 4/1/37 | 877,912 | 973,362 | ||||||
5.00% 8/1/37 | 2,438,422 | 2,705,026 | ||||||
5.00% 2/1/38 | 934,594 | 1,036,892 | ||||||
5.00% 5/1/38 | 41,651 | 46,208 | ||||||
5.00% 6/1/39 | 317,575 | 352,312 | ||||||
5.50% 12/1/32 | 181,637 | 204,353 | ||||||
5.50% 2/1/33 | 2,882,539 | 3,231,207 | ||||||
5.50% 9/1/33 | 9,172 | 10,319 | ||||||
5.50% 3/1/34 | 247,037 | 277,838 | ||||||
5.50% 4/1/34 | 1,067,017 | 1,199,762 | ||||||
5.50% 5/1/34 | 461,308 | 518,557 | ||||||
5.50% 8/1/34 | 126,356 | 141,247 | ||||||
5.50% 9/1/34 | 136,909 | 153,889 | ||||||
5.50% 11/1/34 | 1,052,261 | 1,182,763 | ||||||
5.50% 12/1/34 | 688,093 | 773,066 | ||||||
5.50% 1/1/35 | 2,835,652 | 3,185,391 | ||||||
5.50% 2/1/35 | 751,698 | 844,444 | ||||||
5.50% 3/1/35 | 581,386 | 652,291 | ||||||
5.50% 4/1/35 | 2,670 | 3,001 | ||||||
5.50% 5/1/35 | 8,755 | 9,831 | ||||||
5.50% 6/1/35 | 839,427 | 942,944 | ||||||
5.50% 8/1/35 | 208,686 | 234,904 | ||||||
5.50% 9/1/35 | 3,145 | 3,531 | ||||||
5.50% 10/1/35 | 1,930,904 | 2,163,679 | ||||||
16
Table of Contents
| Principal amount° | Value (U.S. $) | |||||||
| ||||||||
Agency Mortgage-Backed Securities (continued) |
| |||||||
| ||||||||
Fannie Mae S.F. 30 yr | ||||||||
5.50% 11/1/35 | 9,365 | $ | 10,501 | |||||
5.50% 12/1/35 | 590,706 | 663,540 | ||||||
5.50% 1/1/36 | 665,716 | 747,723 | ||||||
5.50% 3/1/36 | 41,588 | 46,609 | ||||||
5.50% 4/1/36 | 108,517 | 121,367 | ||||||
5.50% 5/1/36 | 2,275,586 | 2,548,043 | ||||||
5.50% 7/1/36 | 628,258 | 705,681 | ||||||
5.50% 9/1/36 | 216,189 | 243,113 | ||||||
5.50% 11/1/36 | 1,682,359 | 1,877,024 | ||||||
5.50% 12/1/36 | 147,834 | 164,912 | ||||||
5.50% 1/1/37 | 427,898 | 480,277 | ||||||
5.50% 2/1/37 | 43,403 | 48,482 | ||||||
5.50% 4/1/37 | 62,384 | 69,590 | ||||||
5.50% 8/1/37 | 2,966,493 | 3,332,174 | ||||||
5.50% 11/1/37 | 40,967 | 45,699 | ||||||
5.50% 12/1/37 | 5,347 | 5,965 | ||||||
5.50% 1/1/38 | 283,880 | 316,674 | ||||||
5.50% 2/1/38 | 2,545,692 | 2,852,984 | ||||||
5.50% 3/1/38 | 1,931,422 | 2,172,790 | ||||||
5.50% 4/1/38 | 20,572 | 22,948 | ||||||
5.50% 5/1/38 | 272,580 | 304,126 | ||||||
5.50% 6/1/38 | 192,609 | 214,859 | ||||||
5.50% 7/1/38 | 53,632 | 59,827 | ||||||
5.50% 8/1/38 | 60,903 | 67,939 | ||||||
5.50% 11/1/38 | 122,253 | 136,376 | ||||||
5.50% 12/1/38 | 630,736 | 707,702 | ||||||
5.50% 1/1/39 | 512,401 | 575,117 | ||||||
5.50% 9/1/39 | 9,503 | 10,622 | ||||||
5.50% 10/1/39 | 2,854,588 | 3,184,344 | ||||||
5.50% 11/1/39 | 22,717 | 25,341 | ||||||
5.50% 5/1/40 | 13,283 | 14,818 | ||||||
5.50% 6/1/40 | 8,554 | 9,543 | ||||||
5.50% 7/1/40 | 2,650,060 | 2,958,128 | ||||||
5.50% 4/1/41 | 1,611,648 | 1,807,685 | ||||||
5.50% 9/1/41 | 982,473 | 1,096,872 | ||||||
6.00% 7/1/27 | 7,561 | 8,649 | ||||||
6.00% 4/1/32 | 15,513 | 17,735 | ||||||
6.00% 8/1/34 | 352,736 | 401,759 | ||||||
6.00% 11/1/34 | 17,792 | 20,258 | ||||||
6.00% 12/1/34 | 3,924 | 4,472 | ||||||
6.00% 6/1/35 | 3,330 | 3,764 | ||||||
6.00% 7/1/35 | 83,392 | 94,992 | ||||||
17
Table of Contents
Schedule of investments
Delaware Diversified Income Fund
| Principal amount° | Value (U.S. $) | |||||||
| ||||||||
Agency Mortgage-Backed Securities (continued) |
| |||||||
| ||||||||
Fannie Mae S.F. 30 yr | ||||||||
6.00% 9/1/35 | 108,974 | $ | 123,181 | |||||
6.00% 10/1/35 | 53,529 | 60,974 | ||||||
6.00% 11/1/35 | 30,536 | 34,846 | ||||||
6.00% 12/1/35 | 615,624 | 700,786 | ||||||
6.00% 6/1/36 | 348,671 | 395,738 | ||||||
6.00% 7/1/36 | 29,591 | 33,621 | ||||||
6.00% 8/1/36 | 248,100 | 281,713 | ||||||
6.00% 9/1/36 | 165,311 | 187,001 | ||||||
6.00% 12/1/36 | 371,741 | 422,421 | ||||||
6.00% 2/1/37 | 1,093,151 | 1,240,896 | ||||||
6.00% 3/1/37 | 35,551 | 40,349 | ||||||
6.00% 5/1/37 | 2,875,176 | 3,252,631 | ||||||
6.00% 6/1/37 | 185,620 | 211,993 | ||||||
6.00% 7/1/37 | 211,886 | 240,837 | ||||||
6.00% 8/1/37 | 2,851,504 | 3,232,307 | ||||||
6.00% 9/1/37 | 887,534 | 1,004,845 | ||||||
6.00% 10/1/37 | 522,597 | 590,727 | ||||||
6.00% 11/1/37 | 509,680 | 576,183 | ||||||
6.00% 1/1/38 | 1,471,226 | 1,663,748 | ||||||
6.00% 3/1/38 | 1,185 | 1,354 | ||||||
6.00% 5/1/38 | 5,443,685 | 6,157,511 | ||||||
6.00% 6/1/38 | 417,687 | 475,315 | ||||||
6.00% 7/1/38 | 133,617 | 151,051 | ||||||
6.00% 8/1/38 | 329,523 | 372,482 | ||||||
6.00% 9/1/38 | 945,355 | 1,068,729 | ||||||
6.00% 10/1/38 | 4,376,211 | 4,947,713 | ||||||
6.00% 11/1/38 | 854,301 | 969,953 | ||||||
6.00% 12/1/38 | 524,533 | 597,185 | ||||||
6.00% 1/1/39 | 1,839,600 | 2,079,424 | ||||||
6.00% 9/1/39 | 329,408 | 372,352 | ||||||
6.00% 10/1/39 | 1,137,901 | 1,302,051 | ||||||
6.00% 1/1/40 | 14,836 | 16,883 | ||||||
6.00% 3/1/40 | 1,525,743 | 1,724,651 | ||||||
6.00% 7/1/40 | 6,053,495 | 6,842,674 | ||||||
6.00% 9/1/40 | 1,368,756 | 1,551,881 | ||||||
6.00% 11/1/40 | 534,547 | 610,191 | ||||||
6.00% 5/1/41 | 2,184,583 | 2,475,315 | ||||||
6.50% 3/1/32 | 201 | 230 | ||||||
6.50% 8/1/34 | 5,240 | 5,990 | ||||||
6.50% 1/1/36 | 39,403 | 44,719 | ||||||
6.50% 2/1/36 | 1,221,159 | 1,426,913 | ||||||
6.50% 3/1/36 | 60,531 | 70,065 | ||||||
18
Table of Contents
| Principal amount° | Value (U.S. $) | |||||||
| ||||||||
Agency Mortgage-Backed Securities (continued) |
| |||||||
| ||||||||
Fannie Mae S.F. 30 yr | ||||||||
6.50% 8/1/36 | 131,584 | $ | 149,338 | |||||
6.50% 9/1/36 | 59,587 | 67,911 | ||||||
6.50% 11/1/36 | 466,902 | 529,900 | ||||||
6.50% 3/1/37 | 16,812 | 19,081 | ||||||
6.50% 8/1/37 | 94,023 | 108,397 | ||||||
6.50% 9/1/37 | 943,649 | 1,081,544 | ||||||
6.50% 11/1/37 | 1,741 | 1,976 | ||||||
6.50% 12/1/37 | 345,241 | 391,824 | ||||||
6.50% 1/1/38 | 2,833 | 3,215 | ||||||
6.50% 10/1/38 | 43,383 | 49,236 | ||||||
6.50% 11/1/38 | 30,655 | 34,792 | ||||||
6.50% 1/1/39 | 20,493 | 23,259 | ||||||
6.50% 6/1/39 | 7,218 | 8,192 | ||||||
7.00% 8/1/32 | 70,007 | 79,987 | ||||||
7.00% 9/1/32 | 38,844 | 41,422 | ||||||
7.00% 2/1/36 | 13,905 | 16,478 | ||||||
7.00% 4/1/37 | 9,205 | 10,345 | ||||||
7.00% 12/1/37 | 4,512 | 4,824 | ||||||
7.50% 1/1/31 | 1,315 | 1,556 | ||||||
7.50% 3/1/32 | 20,074 | 23,282 | ||||||
7.50% 4/1/32 | 14,864 | 17,368 | ||||||
7.50% 6/1/34 | 22,076 | 25,369 | ||||||
7.50% 10/1/34 | 15,490 | 18,163 | ||||||
Fannie Mae S.F. 30 yr TBA | ||||||||
3.00% 11/1/44 | 55,878,000 | 55,886,728 | ||||||
3.00% 12/1/44 | 76,630,000 | 76,417,451 | ||||||
3.50% 11/1/44 | 23,011,000 | 23,794,801 | ||||||
4.00% 11/1/44 | 84,877,000 | 90,115,507 | ||||||
4.00% 12/1/44 | 49,950,000 | 52,891,386 | ||||||
4.50% 11/1/44 | 89,467,000 | 96,959,861 | ||||||
4.50% 12/1/44 | 81,044,000 | 87,654,151 | ||||||
5.00% 11/1/44 | 3,143,000 | 3,480,136 | ||||||
Freddie Mac ARM | ||||||||
2.167% 8/1/37 — | 7,322 | 7,788 | ||||||
2.249% 7/1/36 — | 277,172 | 297,715 | ||||||
2.263% 5/1/35 — | 248,368 | 264,230 | ||||||
2.265% 10/1/36 — | 55,545 | 59,090 | ||||||
2.311% 2/1/37 — | 598,388 | 639,784 | ||||||
2.316% 4/1/34 — | 17,060 | 18,124 | ||||||
2.342% 12/1/33 — | 240,483 | 256,624 | ||||||
2.345% 12/1/33 — | 37,773 | 40,191 | ||||||
2.35% 4/1/33 — | 5,026 | 5,085 | ||||||
19
Table of Contents
Schedule of investments
Delaware Diversified Income Fund
| Principal amount° | Value (U.S. $) | |||||||
| ||||||||
Agency Mortgage-Backed Securities (continued) | ||||||||
| ||||||||
Freddie Mac ARM | ||||||||
2.432% 3/1/36 • | 74,884 | $ | 80,222 | |||||
2.526% 1/1/44 • | 4,380,774 | 4,496,289 | ||||||
3.848% 10/1/37 • | 3,643 | 3,867 | ||||||
4.883% 8/1/38 • | 66,396 | 70,318 | ||||||
6.362% 10/1/37 • | 84,169 | 89,799 | ||||||
Freddie Mac Relocation 15 yr | ||||||||
3.50% 10/1/18 | 41,346 | 42,280 | ||||||
Freddie Mac Relocation 30 yr | ||||||||
5.00% 9/1/33 | 144,261 | 158,194 | ||||||
6.50% 10/1/30 | 601 | 640 | ||||||
Freddie Mac S.F. 15 yr | ||||||||
2.50% 3/1/28 | 1,787,113 | 1,821,899 | ||||||
3.00% 12/1/26 | 153,451 | 159,359 | ||||||
3.50% 10/1/26 | 1,013,371 | 1,075,978 | ||||||
4.00% 12/1/20 | 57,534 | 61,061 | ||||||
4.00% 5/1/24 | 84,017 | 89,712 | ||||||
4.00% 5/1/25 | 545,846 | 583,500 | ||||||
4.00% 8/1/25 | 7,639 | 8,167 | ||||||
4.00% 11/1/26 | 1,920,102 | 2,047,652 | ||||||
4.50% 5/1/20 | 817,045 | 874,278 | ||||||
4.50% 6/1/20 | 75,287 | 80,558 | ||||||
4.50% 10/1/20 | 20,185 | 21,596 | ||||||
4.50% 9/1/24 | 70,624 | 75,169 | ||||||
4.50% 7/1/25 | 619,619 | 659,304 | ||||||
4.50% 6/1/26 | 1,584,407 | 1,686,528 | ||||||
5.00% 6/1/18 | 258,598 | 272,845 | ||||||
5.00% 10/1/18 | 26,798 | 28,274 | ||||||
5.00% 11/1/18 | 23,362 | 24,649 | ||||||
5.00% 4/1/20 | 371,428 | 395,583 | ||||||
5.00% 7/1/23 | 103,636 | 112,642 | ||||||
5.50% 6/1/21 | 164,964 | 179,697 | ||||||
5.50% 7/1/21 | 120,340 | 131,098 | ||||||
6.00% 4/1/17 | 6,522 | 6,800 | ||||||
6.00% 8/1/17 | 2,561 | 2,686 | ||||||
6.50% 8/1/16 | 794 | 820 | ||||||
Freddie Mac S.F. 20 yr | ||||||||
3.50% 1/1/34 | 4,952,464 | 5,176,298 | ||||||
5.00% 10/1/23 | 77,627 | 85,767 | ||||||
5.00% 3/1/24 | 451,150 | 498,457 | ||||||
5.00% 9/1/25 | 2,513,404 | 2,776,960 | ||||||
5.00% 12/1/29 | 168,917 | 187,351 | ||||||
5.50% 1/1/23 | 12,834 | 14,291 | ||||||
20
Table of Contents
| Principal amount° | Value (U.S. $) | |||||||
| ||||||||
Agency Mortgage-Backed Securities (continued) | ||||||||
| ||||||||
Freddie Mac S.F. 30 yr | ||||||||
3.00% 10/1/42 | 4,407,844 | $ | 4,428,761 | |||||
3.00% 11/1/42 | 5,168,240 | 5,208,763 | ||||||
3.50% 11/1/41 | 185,178 | 192,010 | ||||||
3.50% 4/1/42 | 61,303 | 63,378 | ||||||
4.50% 7/1/39 | 1,062,511 | 1,151,013 | ||||||
4.50% 10/1/39 | 2,426,673 | 2,629,244 | ||||||
4.50% 3/1/42 | 9,881,486 | 10,710,213 | ||||||
4.50% 5/1/44 | 3,568,214 | 3,871,340 | ||||||
5.00% 3/1/34 | 100,388 | 111,283 | ||||||
5.00% 4/1/35 | 35,579 | 39,455 | ||||||
5.00% 6/1/36 | 19,910 | 22,060 | ||||||
5.50% 3/1/34 | 364,281 | 409,297 | ||||||
5.50% 12/1/34 | 366,464 | 413,099 | ||||||
5.50% 1/1/35 | 3,346 | 3,757 | ||||||
5.50% 2/1/35 | 14,027 | 15,721 | ||||||
5.50% 3/1/36 | 239,331 | 268,033 | ||||||
5.50% 6/1/36 | 266,033 | 297,795 | ||||||
5.50% 11/1/36 | 464,818 | 519,569 | ||||||
5.50% 12/1/36 | 124,628 | 138,972 | ||||||
5.50% 1/1/37 | 26,884 | 30,003 | ||||||
5.50% 11/1/37 | 23,027 | 25,705 | ||||||
5.50% 6/1/38 | 266,375 | 297,303 | ||||||
5.50% 3/1/40 | 1,478,857 | 1,650,276 | ||||||
5.50% 8/1/40 | 1,212,990 | 1,353,063 | ||||||
5.50% 1/1/41 | 1,204,408 | 1,343,617 | ||||||
5.50% 6/1/41 | 5,817,050 | 6,488,961 | ||||||
6.00% 12/1/33 | 14,141 | 16,076 | ||||||
6.00% 11/1/34 | 42,391 | 47,837 | ||||||
6.00% 2/1/36 | 4,937,573 | 5,632,230 | ||||||
6.00% 3/1/36 | 1,389,674 | 1,581,590 | ||||||
6.00% 4/1/36 | 27,667 | 31,268 | ||||||
6.00% 10/1/36 | 26,811 | 30,452 | ||||||
6.00% 4/1/37 | 37,423 | 42,274 | ||||||
6.00% 8/1/37 | 26,095 | 29,447 | ||||||
6.00% 10/1/37 | 15,913 | 17,957 | ||||||
6.00% 1/1/38 | 549,519 | 620,118 | ||||||
6.00% 6/1/38 | 1,478,910 | 1,670,327 | ||||||
6.00% 7/1/38 | 17,221 | 19,434 | ||||||
6.00% 8/1/38 | 3,930,882 | 4,451,254 | ||||||
6.00% 10/1/38 | 134,072 | 151,937 | ||||||
6.00% 5/1/40 | 680,000 | 767,364 | ||||||
6.50% 10/1/32 | 1,432 | 1,623 | ||||||
21
Table of Contents
Schedule of investments
Delaware Diversified Income Fund
| Principal amount° | Value (U.S. $) | |||||||
| ||||||||
Agency Mortgage-Backed Securities (continued) | ||||||||
| ||||||||
Freddie Mac S.F. 30 yr | ||||||||
6.50% 8/1/36 | 340 | $ | 391 | |||||
6.50% 6/1/37 | 6,718 | 7,843 | ||||||
6.50% 8/1/38 | 296,463 | 336,034 | ||||||
6.50% 9/1/38 | 976 | 1,106 | ||||||
6.50% 4/1/39 | 731,257 | 834,157 | ||||||
7.00% 11/1/33 | 182,281 | 214,969 | ||||||
GNMA I S.F. 30 yr | ||||||||
5.00% 6/15/40 | 780,725 | 864,470 | ||||||
7.00% 5/15/28 | 106,348 | 123,304 | ||||||
7.00% 12/15/34 | 2,193,026 | 2,589,514 | ||||||
7.50% 10/15/30 | 1,447 | 1,655 | ||||||
7.50% 2/15/32 | 1,878 | 2,279 | ||||||
9.50% 9/15/17 | 1,774 | 1,862 | ||||||
10.00% 7/15/17 | 1,809 | 1,818 | ||||||
|
| |||||||
Total Agency Mortgage-Backed Securities (cost $979,907,185) | 990,445,640 | |||||||
|
| |||||||
| ||||||||
Agency Obligation – 0.11% | ||||||||
| ||||||||
Tennessee Valley Authority | ||||||||
2.875% 9/15/24 | 6,525,000 | 6,547,302 | ||||||
|
| |||||||
Total Agency Obligation (cost $6,456,446) | 6,547,302 | |||||||
|
| |||||||
| ||||||||
Collateralized Debt Obligation – 0.17% | ||||||||
| ||||||||
CIFC Funding | ||||||||
Series 2013-2A A1L 144A 1.381% 4/21/25 #• | 10,000,000 | 9,795,900 | ||||||
|
| |||||||
Total Collateralized Debt Obligation (cost $9,973,651) | 9,795,900 | |||||||
|
| |||||||
| ||||||||
Commercial Mortgage-Backed Securities – 4.76% | ||||||||
| ||||||||
Banc of America Commercial Mortgage Trust | ||||||||
Series 2006-4 A4 5.634% 7/10/46 | 554,042 | 585,236 | ||||||
Series 2007-4 AM 5.821% 2/10/51 • | 3,670,000 | 4,022,548 | ||||||
CD1 Commercial Mortgage Trust | ||||||||
Series 2005-CD1 AM 5.226% 7/15/44 • | 4,366,000 | 4,503,525 | ||||||
Series 2005-CD1 C 5.226% 7/15/44 • | 1,620,000 | 1,657,488 | ||||||
Citigroup Commercial Mortgage Trust | ||||||||
Series 2014-GC23 AS 3.863% 7/10/47 | 2,580,000 | 2,643,489 | ||||||
Series 2014-GC25 A4 3.635% 10/10/47 | 7,230,000 | 7,420,886 | ||||||
Commercial Mortgage Pass Through Certificates | ||||||||
Series 2014-CR19 A5 3.796% 8/10/47 | 13,400,000 | 13,941,588 | ||||||
Series 2014-CR20 A4 3.59% 11/10/47 ¿ | 2,935,000 | 3,009,980 | ||||||
Series 2014-CR20 AM 3.938% 11/10/47 ¿ | 2,570,000 | 2,638,266 | ||||||
Credit Suisse Commercial Mortgage Trust | ||||||||
Series 2006-C1 AAB 5.463% 2/15/39 • | 89,437 | 89,932 | ||||||
22
Table of Contents
| Principal amount° | Value (U.S. $) | |||||||
| ||||||||
Commercial Mortgage-Backed Securities (continued) | ||||||||
| ||||||||
DB-UBS Mortgage Trust | ||||||||
Series 2011-LC1A A3 144A 5.002% 11/10/46 # | 12,704,000 | $ | 14,328,244 | |||||
Series 2011-LC1A C 144A 5.557% 11/10/46 #• | 5,320,000 | 5,987,979 | ||||||
FREMF Mortgage Trust | ||||||||
Series 2011-K10 B 144A 4.615% 11/25/49 #• | 3,150,000 | 3,383,024 | ||||||
Series 2011-K702 B 144A 4.77% 4/25/44 #• | 1,340,000 | 1,434,506 | ||||||
Series 2011-K703 144A 4.884% 7/25/44 #• | 4,255,000 | 4,572,214 | ||||||
Series 2012-K19 B 144A 4.036% 5/25/45 #• | 1,130,963 | 1,167,569 | ||||||
Series 2012-K22 B 144A 3.686% 8/25/45 #• | 4,285,000 | 4,303,151 | ||||||
Series 2012-K708 B 144A 3.759% 2/25/45 #• | 12,625,000 | 13,046,662 | ||||||
Series 2012-K711 B 144A 3.562% 8/25/45 #• | 4,100,000 | 4,186,145 | ||||||
Series 2013-K33 B 144A 3.504% 8/25/46 #• | 3,285,000 | 3,219,491 | ||||||
Series 2013-K712 B 144A 3.368% 5/25/45 #• | 14,951,068 | 15,075,252 | ||||||
Series 2013-K713 B 144A 3.165% 4/25/46 #• | 8,315,000 | 8,277,832 | ||||||
Series 2014-K716 B 144A 3.954% 8/25/47 #• | 2,729,000 | 2,793,489 | ||||||
General Electric Capital Commercial Mortgage | ||||||||
Series 2005-C4 A4 5.312% 11/10/45 • | 108,000 | 110,380 | ||||||
Goldman Sachs Mortgage Securities II | ||||||||
Series 2005-GG4 A4A 4.751% 7/10/39 | 6,860,855 | 6,903,584 | ||||||
Goldman Sachs Mortgage Securities Trust | ||||||||
Series 2006-GG6 A4 5.552% 4/10/38 • | 8,640,000 | 8,965,659 | ||||||
Series 2010-C1 A2 144A 4.592% 8/10/43 # | 9,975,000 | 10,983,891 | ||||||
Series 2010-C1 C 144A 5.635% 8/10/43 #• | 4,765,000 | 5,203,890 | ||||||
Grace Mortgage Trust | ||||||||
Series 2014-GRCE A 144A 3.369% 6/10/28 # | 20,610,000 | 21,235,060 | ||||||
Hilton USA Trust | ||||||||
Series 2013-HLT AFX 144A 2.662% 11/5/30 # | 10,480,000 | 10,539,767 | ||||||
Series 2013-HLT BFX 144A 3.367% 11/5/30 # | 10,760,000 | 10,852,913 | ||||||
JPMBB Commercial Mortgage Securities Trust | ||||||||
Series 2014-C18 A1 1.254% 2/15/47 | 3,363,471 | 3,358,837 | ||||||
Series 2014-C21 AS 3.997% 8/15/47 | 2,165,000 | 2,236,051 | ||||||
Series 2014-C22 B 4.562% 9/15/47 • | 3,040,000 | 3,199,433 | ||||||
JPMorgan Chase Commercial Mortgage Securities Trust | ||||||||
Series 2005-CB11 E 5.468% 8/12/37 • | 1,765,000 | 1,899,652 | ||||||
Series 2005-LDP5 D 5.391% 12/15/44 • | 2,895,000 | 2,987,235 | ||||||
Series 2006-LDP8 AM 5.44% 5/15/45 | 12,218,000 | 13,027,052 | ||||||
Series 2011-C5 C 144A 5.323% 8/15/46 #• | 3,280,000 | 3,631,606 | ||||||
Lehman Brothers-UBS Commercial Mortgage Trust | ||||||||
Series 2004-C1 A4 4.568% 1/15/31 | 578,574 | 593,180 | ||||||
Series 2006-C6 AJ 5.452% 9/15/39 • | 4,965,000 | 5,222,083 | ||||||
Series 2006-C6 AM 5.413% 9/15/39 | 4,265,000 | 4,571,193 | ||||||
Morgan Stanley Bank of America Merrill Lynch Trust | ||||||||
Series 2014-C18 A4 3.923% 10/15/47 | 4,040,000 | 4,249,801 | ||||||
23
Table of Contents
Schedule of investments
Delaware Diversified Income Fund
| Principal amount° | Value (U.S. $) | |||||||
| ||||||||
Commercial Mortgage-Backed Securities (continued) |
| |||||||
| ||||||||
Morgan Stanley Capital I Trust | ||||||||
Series 2005-HQ7 AJ 5.207% 11/14/42 • | 5,235,000 | $ | 5,378,706 | |||||
Series 2005-HQ7 C 5.207% 11/14/42 • | 5,840,000 | 5,881,242 | ||||||
Series 2006-T21 B 144A 5.315% 10/12/52 #• | 2,000,000 | 2,085,220 | ||||||
TimberStar Trust 1 | ||||||||
Series 2006-1A A 144A 5.668% 10/15/36 # | 7,090,000 | 7,613,830 | ||||||
Series 2006-1A C 144A 5.884% 10/15/36 # | 4,500,000 | 4,774,802 | ||||||
VNDO Mortgage Trust | ||||||||
Series 2012-6AVE A 144A 2.996% 11/15/30 # | 1,635,000 | 1,623,769 | ||||||
WF-RBS Commercial Mortgage Trust | ||||||||
Series 2014-C23 A5 3.917% 10/15/57 | 3,530,000 | 3,713,684 | ||||||
|
| |||||||
Total Commercial Mortgage-Backed Securities (cost $273,221,173) | 273,131,016 | |||||||
|
| |||||||
| ||||||||
Convertible Bonds – 1.51% | ||||||||
| ||||||||
Alaska Communications Systems Group 6.25% exercise price $10.28, expiration date 4/27/18 | 3,704,000 | 3,000,240 | ||||||
Ares Capital 5.75% exercise price $19.13, expiration date 2/1/16 | 924,000 | 964,425 | ||||||
BGC Partners 4.50% exercise price $9.84, expiration date 7/13/16 | 2,653,000 | 2,835,394 | ||||||
BioMarin Pharmaceutical 1.50% exercise price $94.15, expiration date 10/13/20 * | 1,856,000 | 2,191,240 | ||||||
Blackstone Mortgage Trust 5.25% exercise price $28.66, expiration date 12/1/18 | 3,219,000 | 3,331,665 | ||||||
Blucora 4.25% exercise price $21.66, expiration date 3/29/19 | 845,000 | 871,934 | ||||||
Campus Crest Communities Operating Partnership 144A 4.75% exercise price $12.56, expiration date 10/11/18 # | 1,736,000 | 1,639,435 | ||||||
Cardtronics 144A 1.00% exercise price $52.35, expiration date 11/27/20 #* | 3,078,000 | 3,018,379 | ||||||
Chesapeake Energy 2.25% exercise price $80.36, expiration date 12/14/38 | 1,000,000 | 952,500 | ||||||
Ciena 144A 3.75% exercise price $20.17, expiration date 10/15/18 # | 1,864,000 | 2,169,230 | ||||||
Energy XXI Bermuda 144A 3.00% exercise price $40.40, expiration date 12/13/18 # | 3,179,000 | 2,274,972 | ||||||
Equinix 4.75% exercise price $84.32, expiration date 6/13/16 | 382,000 | 992,484 | ||||||
General Cable 4.50% exercise price $35.33, expiration date 11/15/29 f | 3,567,000 | 2,369,826 | ||||||
Gilead Sciences 1.625% exercise price $22.71, expiration date 4/29/16 | 985,000 | 4,846,821 | ||||||
Hologic 2.00% exercise price $31.17, expiration date 2/27/42 f | 1,786,000 | 1,948,973 | ||||||
24
Table of Contents
| Principal amount° | Value (U.S. $) | |||||||
| ||||||||
Convertible Bonds (continued) | ||||||||
| ||||||||
Illumina 0.25% exercise price $83.55, expiration date 3/11/16 | 598,000 | $ | 1,379,888 | |||||
Intel 3.25% exercise price $21.71, expiration date 8/1/39 | 980,000 | 1,627,417 | ||||||
j2 Global 3.25% exercise price $69.37, expiration date 6/14/29 * | 2,885,000 | 2,951,716 | ||||||
Jefferies Group 3.875% exercise price $45.19, expiration date 10/31/29 | 1,430,000 | 1,497,031 | ||||||
Lexington Realty Trust 144A 6.00% exercise price $6.68, expiration date 1/11/30 # | 871,000 | 1,409,387 | ||||||
Liberty Interactive 0.75% exercise price $1,000.00, expiration date 3/30/43 | 3,077,000 | 4,242,414 | ||||||
Liberty Interactive 144A 1.00% exercise price $74.31, expiration date 9/28/43 # | 2,202,000 | 2,353,388 | ||||||
Meritor 4.00% exercise price $26.73, expiration date 2/12/27 f | 3,429,000 | 3,566,160 | ||||||
MGM Resorts International 4.25% exercise price $18.58, expiration date 4/10/15 | 1,493,000 | 1,918,505 | ||||||
Mylan 3.75% exercise price $13.32, expiration date 9/15/15 | 800,000 | 3,220,000 | ||||||
Novellus Systems 2.625% exercise price $34.93, expiration date 5/14/41 | 1,741,000 | 3,935,748 | ||||||
NuVasive 2.75% exercise price $42.13, expiration date 6/30/17 | 3,385,000 | 4,085,272 | ||||||
Peabody Energy 4.75% exercise price $57.62, expiration date 12/15/41 * | 5,559,000 | 3,710,633 | ||||||
RTI International Metals 1.625% exercise price $40.72, expiration date 10/10/19 * | 2,046,000 | 1,967,996 | ||||||
SanDisk 1.50% exercise price $51.36, expiration date 8/11/17 | 1,609,000 | 3,062,128 | ||||||
Spirit Realty Capital 3.75% exercise price $13.10, expiration date 5/13/21 | 1,955,000 | 1,942,791 | ||||||
Titan Machinery 3.75% exercise price $43.17, expiration date 4/30/19 * | 1,990,000 | 1,534,788 | ||||||
TPG Specialty Lending 144A 4.50% exercise price $25.83, expiration date 12/15/19 # | 2,258,000 | 2,169,091 | ||||||
Vantage Drilling 144A 5.50% exercise price $2.39, expiration date 7/15/43 # | 1,117,000 | 1,010,187 | ||||||
Vector Group 1.75% exercise price $25.87, expiration date 4/15/20 | 1,996,000 | 2,160,670 | ||||||
Vector Group 2.50% exercise price $16.78, expiration date 1/14/19 • | 938,000 | 1,344,238 | ||||||
VeriSign 4.086% exercise price $34.37, expiration date 8/15/37 | 1,078,000 | 1,938,379 | ||||||
|
| |||||||
Total Convertible Bonds (cost $78,352,799) | 86,435,345 | |||||||
|
| |||||||
25
Table of Contents
Schedule of investments
Delaware Diversified Income Fund
| Principal amount° | Value (U.S. $) | |||||||||||
| ||||||||||||
Corporate Bonds – 52.70% |
| |||||||||||
| ||||||||||||
Automotive – 0.54% | ||||||||||||
American Axle & Manufacturing 6.25% 3/15/21 | 4,810,000 | $ | 5,074,550 | |||||||||
Chassix 144A 9.25% 8/1/18 # | 825,000 | 804,375 | ||||||||||
Ford Motor 7.45% 7/16/31 | 9,269,000 | 12,446,979 | ||||||||||
Gates Global 144A 6.00% 7/15/22 # | 5,570,000 | 5,430,750 | ||||||||||
International Automotive Components Group 144A 9.125% 6/1/18 # | 89,000 | 93,227 | ||||||||||
Meritor 6.75% 6/15/21 | 2,195,000 | 2,326,700 | ||||||||||
TRW Automotive 144A 4.50% 3/1/21 # | 4,570,000 | 4,604,275 | ||||||||||
|
| |||||||||||
| 30,780,856 | ||||||||||||
|
| |||||||||||
Banking – 6.34% | ||||||||||||
ANZ New Zealand International 144A 2.60% 9/23/19 # | 1,300,000 | 1,319,491 | ||||||||||
Australia & New Zealand Banking Group | ||||||||||||
2.625% 12/10/18 | CAD | 1,683,000 | 1,522,400 | |||||||||
3.614% 11/6/18 • | AUD | 1,469,000 | 1,304,560 | |||||||||
Banco de Costa Rica 144A 5.25% 8/12/18 # | 3,500,000 | 3,608,150 | ||||||||||
Banco Santander Mexico 144A 5.95% 1/30/24 #*• | 5,630,000 | 6,010,025 | ||||||||||
Bancolombia 5.95% 6/3/21 | 3,825,000 | 4,260,094 | ||||||||||
Bank of America | ||||||||||||
4.25% 10/22/26 | 10,435,000 | 10,381,688 | ||||||||||
6.25% 9/29/49 • | 6,955,000 | 6,981,081 | ||||||||||
Bank of Georgia 144A 7.75% 7/5/17 # | 1,645,000 | 1,757,304 | ||||||||||
Barclays 4.375% 9/11/24 | 2,665,000 | 2,589,367 | ||||||||||
Barclays Bank 7.625% 11/21/22 | 5,770,000 | 6,296,513 | ||||||||||
BB&T 3.95% 3/22/22 | 250,000 | 264,116 | ||||||||||
BBVA Banco Continental 144A 5.00% 8/26/22 # | 3,075,000 | 3,248,737 | ||||||||||
BBVA Bancomer 144A 6.50% 3/10/21 # | 7,925,000 | 8,836,375 | ||||||||||
Branch Banking & Trust | ||||||||||||
0.554% 9/13/16 • | 5,010,000 | 5,001,633 | ||||||||||
3.80% 10/30/26 | 10,605,000 | 10,782,729 | ||||||||||
City National 5.25% 9/15/20 * | 5,655,000 | 6,315,125 | ||||||||||
Cooperatieve Centrale Raiffeisen-Boerenleenbank | ||||||||||||
2.50% 9/4/20 | NOK | 8,100,000 | 1,223,459 | |||||||||
3.662% 3/22/17 • | AUD | 2,000,000 | 1,778,686 | |||||||||
Credit Suisse | ||||||||||||
3.00% 10/29/21 | 2,230,000 | 2,209,299 | ||||||||||
144A 6.50% 8/8/23 # | 9,325,000 | 10,304,125 | ||||||||||
Credit Suisse Group 144A 7.50% 12/11/49 #• | 1,255,000 | 1,336,951 | ||||||||||
Export-Import Bank of China | ||||||||||||
144A 2.50% 7/31/19 # | 5,370,000 | 5,378,168 | ||||||||||
144A 3.625% 7/31/24 # | 5,555,000 | 5,598,046 | ||||||||||
Export-Import Bank of Korea 144A 3.00% 5/22/18 # | NOK | 1,400,000 | 213,963 | |||||||||
26
Table of Contents
| Principal amount° | Value (U.S. $) | |||||||||||
| ||||||||||||
Corporate Bonds (continued) |
| |||||||||||
| ||||||||||||
Banking (continued) | ||||||||||||
Goldman Sachs Group | ||||||||||||
3.55% 2/12/21 | CAD | 3,000,000 | $ | 2,723,435 | ||||||||
3.925% 8/21/19 • | AUD | 2,390,000 | 2,127,164 | |||||||||
4.325% 8/8/18 • | AUD | 2,570,000 | 2,323,069 | |||||||||
6.15% 4/1/18 | 5,845,000 | 6,607,930 | ||||||||||
HBOS 144A 6.75% 5/21/18 # | 6,740,000 | 7,581,678 | ||||||||||
HSBC Holdings | ||||||||||||
5.625% 12/29/49 *• | 6,830,000 | 6,949,525 | ||||||||||
6.375% 12/29/49 • | 3,195,000 | 3,262,894 | ||||||||||
HSBC New Zealand 4.58% 12/10/18 • | NZD | 3,300,000 | 2,594,703 | |||||||||
ING Bank 144A 5.80% 9/25/23 # | 4,150,000 | 4,626,756 | ||||||||||
JPMorgan Chase | ||||||||||||
0.863% 1/28/19 • | 2,985,000 | 2,991,877 | ||||||||||
3.50% 12/18/26 | GBP | 986,000 | 1,589,871 | |||||||||
3.685% 5/17/18 • | AUD | 2,730,000 | 2,424,923 | |||||||||
3.875% 9/10/24 | 12,325,000 | 12,259,714 | ||||||||||
4.25% 11/2/18 | NZD | 5,735,000 | 4,407,452 | |||||||||
6.75% 1/29/49 • | 4,715,000 | 4,991,299 | ||||||||||
KeyBank 6.95% 2/1/28 | 17,740,000 | 22,938,707 | ||||||||||
Lloyds Banking Group 7.50% 4/30/49 *• | 9,475,000 | 9,877,688 | ||||||||||
Morgan Stanley | ||||||||||||
1.083% 1/24/19 • | 3,119,000 | 3,144,214 | ||||||||||
3.125% 8/5/21 | CAD | 999,000 | 878,968 | |||||||||
4.35% 9/8/26 | 13,930,000 | 13,987,085 | ||||||||||
5.00% 9/30/21 | AUD | 1,489,000 | 1,329,279 | |||||||||
7.60% 8/8/17 | NZD | 1,444,000 | 1,198,587 | |||||||||
Oversea-Chinese Banking 144A 4.00% 10/15/24 #• | 8,540,000 | 8,708,417 | ||||||||||
PNC Bank 3.30% 10/30/24 | 6,410,000 | 6,399,199 | ||||||||||
PNC Preferred Funding Trust II 144A 1.457% 3/29/49 #• | 13,900,000 | 13,361,375 | ||||||||||
Rabobank 4.625% 12/1/23 | 8,865,000 | 9,334,632 | ||||||||||
Santander Holdings USA 3.45% 8/27/18 | 5,675,000 | 5,925,733 | ||||||||||
Siam Commercial Bank 144A 3.50% 4/7/19 # | 4,560,000 | 4,682,983 | ||||||||||
SVB Financial Group 5.375% 9/15/20 | 5,175,000 | 5,846,151 | ||||||||||
Turkiye Garanti Bankasi 144A 4.75% 10/17/19 # | 6,858,000 | 6,992,142 | ||||||||||
USB Capital IX 3.50% 10/29/49 • | 27,182,000 | 22,226,721 | ||||||||||
USB Realty 144A 1.378% 12/22/49 #• | 4,485,000 | 4,148,625 | ||||||||||
Wells Fargo | ||||||||||||
3.50% 9/12/29 | GBP | 1,700,000 | 2,679,206 | |||||||||
4.10% 6/3/26 | 15,450,000 | 15,692,148 | ||||||||||
4.65% 11/4/44 | 8,665,000 | 8,671,343 | ||||||||||
Woori Bank | ||||||||||||
144A 2.875% 10/2/18 # | 7,180,000 | 7,376,014 | ||||||||||
27
Table of Contents
Schedule of investments
Delaware Diversified Income Fund
| Principal amount° | Value (U.S. $) | |||||||
| ||||||||
Corporate Bonds (continued) | ||||||||
| ||||||||
Banking (continued) | ||||||||
Woori Bank | ||||||||
144A 4.75% 4/30/24 # | 6,370,000 | $ | 6,617,341 | |||||
Zions Bancorp 4.50% 6/13/23 | 5,355,000 | 5,639,865 | ||||||
|
| |||||||
| 363,640,798 | ||||||||
|
| |||||||
Basic Industry – 5.27% | ||||||||
AK Steel 7.625% 5/15/20 * | 3,259,000 | 3,299,737 | ||||||
ArcelorMittal | ||||||||
6.125% 6/1/18 | 2,072,000 | 2,222,220 | ||||||
10.35% 6/1/19 | 12,195,000 | 15,106,556 | ||||||
Axalta Coating Systems US Holdings 144A | ||||||||
7.375% 5/1/21 #* | 4,585,000 | 4,986,188 | ||||||
Braskem Finance 6.45% 2/3/24 | 5,900,000 | 6,273,175 | ||||||
Builders FirstSource 144A 7.625% 6/1/21 # | 2,975,000 | 3,101,437 | ||||||
Celanese U.S. Holdings 4.625% 11/15/22 | 5,180,000 | 5,244,750 | ||||||
CF Industries | ||||||||
5.15% 3/15/34 | 2,580,000 | 2,755,146 | ||||||
5.375% 3/15/44 | 9,735,000 | 10,394,206 | ||||||
6.875% 5/1/18 | 18,334,000 | 21,201,584 | ||||||
7.125% 5/1/20 | 2,841,000 | 3,419,868 | ||||||
Dow Chemical | ||||||||
3.50% 10/1/24 * | 9,830,000 | 9,707,970 | ||||||
4.25% 10/1/34 | 3,020,000 | 2,932,640 | ||||||
8.55% 5/15/19 | 33,036,000 | 41,648,948 | ||||||
Fibria Overseas Finance 5.25% 5/12/24 | 4,375,000 | 4,472,125 | ||||||
First Quantum Minerals | ||||||||
144A 6.75% 2/15/20 # | 47,000 | 45,707 | ||||||
144A 7.00% 2/15/21 # | 47,000 | 46,354 | ||||||
FMG Resources August 2006 144A 6.875% 4/1/22 #* | 16,108,000 | 16,691,915 | ||||||
Georgia-Pacific 8.00% 1/15/24 | 16,321,000 | 22,074,414 | ||||||
Gerdau Holdings 144A 7.00% 1/20/20 #* | 2,400,000 | 2,738,880 | ||||||
HD Supply | ||||||||
7.50% 7/15/20 | 2,684,000 | 2,871,880 | ||||||
11.50% 7/15/20 | 1,765,000 | 2,062,844 | ||||||
International Paper | ||||||||
4.80% 6/15/44 | 975,000 | 963,484 | ||||||
6.00% 11/15/41 | 815,000 | 942,549 | ||||||
JMC Steel Group 144A 8.25% 3/15/18 # | 97,000 | 98,819 | ||||||
LSB Industries 7.75% 8/1/19 | 725,000 | 777,345 | ||||||
Lundin Mining 144A 7.50% 11/1/20 # | 2,945,000 | 3,077,525 | ||||||
Mexichem 144A 5.875% 9/17/44 # | 1,700,000 | 1,717,000 | ||||||
MMC Finance 144A 5.55% 10/28/20 # | 2,362,000 | 2,362,000 | ||||||
Monsanto 4.40% 7/15/44 | 23,195,000 | 23,478,559 | ||||||
28
Table of Contents
| Principal amount° | Value (U.S. $) | |||||||
| ||||||||
Corporate Bonds (continued) |
| |||||||
| ||||||||
Basic Industry (continued) | ||||||||
Mosaic 5.625% 11/15/43 | 16,160,000 | $ | 18,304,012 | |||||
New Gold 144A 6.25% 11/15/22 # | 232,000 | 227,940 | ||||||
Nortek 8.50% 4/15/21 | 5,564,000 | 6,009,120 | ||||||
Novelis 8.75% 12/15/20 | 5,145,000 | 5,640,206 | ||||||
OCP | ||||||||
144A 5.625% 4/25/24 # | 6,515,000 | 6,850,197 | ||||||
144A 6.875% 4/25/44 # | 4,925,000 | 5,412,329 | ||||||
Phosagro 144A 4.204% 2/13/18 # | 5,322,000 | 5,149,035 | ||||||
PolyOne 5.25% 3/15/23 | 3,470,000 | 3,496,025 | ||||||
Rock-Tenn 3.50% 3/1/20 | 5,021,000 | 5,137,633 | ||||||
Rockwood Specialties Group 4.625% 10/15/20 | 2,355,000 | 2,467,451 | ||||||
Ryerson | ||||||||
9.00% 10/15/17 | 3,784,000 | 3,992,120 | ||||||
11.25% 10/15/18 | 1,060,000 | 1,160,700 | ||||||
TPC Group 144A 8.75% 12/15/20 # | 2,852,000 | 2,998,165 | ||||||
Vedanta Resources 144A 6.00% 1/31/19 #* | 6,540,000 | 6,703,500 | ||||||
Weyerhaeuser 4.625% 9/15/23 | 6,715,000 | 7,156,874 | ||||||
Yamana Gold 144A 4.95% 7/15/24 # | 4,790,000 | 4,693,922 | ||||||
|
| |||||||
| 302,115,054 | ||||||||
|
| |||||||
Brokerage – 0.27% | ||||||||
Jefferies Group | ||||||||
5.125% 1/20/23 | 6,490,000 | 6,888,908 | ||||||
6.45% 6/8/27 | 3,815,000 | 4,338,532 | ||||||
6.50% 1/20/43 | 2,455,000 | 2,760,363 | ||||||
Lazard Group 4.25% 11/14/20 | 1,255,000 | 1,332,082 | ||||||
|
| |||||||
| 15,319,885 | ||||||||
|
| |||||||
Capital Goods – 1.49% | ||||||||
Accudyne Industries 144A 7.75% 12/15/20 # | 2,670,000 | 2,790,150 | ||||||
Ball 5.00% 3/15/22 | 2,715,000 | 2,857,537 | ||||||
Berry Plastics 5.50% 5/15/22 | 1,700,000 | 1,708,500 | ||||||
BWAY Holding 144A 9.125% 8/15/21 # | 5,635,000 | 5,874,487 | ||||||
Cemex | ||||||||
144A 5.875% 3/25/19 # | 1,790,000 | 1,859,363 | ||||||
144A 7.25% 1/15/21 # | 2,175,000 | 2,351,719 | ||||||
144A 9.50% 6/15/18 # | 2,845,000 | 3,192,090 | ||||||
Consolidated Container 144A 10.125% 7/15/20 # | 3,016,000 | 2,850,120 | ||||||
Crane | ||||||||
2.75% 12/15/18 | 1,660,000 | 1,690,195 | ||||||
4.45% 12/15/23 | 6,850,000 | 7,269,761 | ||||||
Ingersoll-Rand Global Holding 4.25% 6/15/23 | 12,055,000 | 12,689,792 | ||||||
Ingersoll-Rand Luxembourg Finance 3.55% 11/1/24 | 5,090,000 | 5,032,997 | ||||||
Metalloinvest Finance 144A 5.625% 4/17/20 # | 3,000,000 | 2,733,750 | ||||||
29
Table of Contents
Schedule of investments
Delaware Diversified Income Fund
| Principal amount° | Value (U.S. $) | |||||||
| ||||||||
Corporate Bonds (continued) |
| |||||||
| ||||||||
Capital Goods (continued) | ||||||||
Milacron 144A 7.75% 2/15/21 # | 3,335,000 | $ | 3,485,075 | |||||
OAS Finance 144A 8.00% 7/2/21 # | 1,765,000 | 1,654,688 | ||||||
OAS Investments 144A 8.25% 10/19/19 # | 4,825,000 | 4,704,375 | ||||||
Plastipak Holdings 144A 6.50% 10/1/21 # | 3,655,000 | 3,782,925 | ||||||
Reynolds Group Issuer 8.25% 2/15/21 * | 2,330,000 | 2,516,400 | ||||||
Textron 3.875% 3/1/25 | 2,605,000 | 2,614,868 | ||||||
TransDigm | ||||||||
6.00% 7/15/22 | 1,405,000 | 1,427,831 | ||||||
6.50% 7/15/24 | 1,500,000 | 1,552,500 | ||||||
7.50% 7/15/21 | 3,825,000 | 4,150,125 | ||||||
Votorantim Cimentos 144A 7.25% 4/5/41 # | 6,410,000 | 6,695,245 | ||||||
|
| |||||||
| 85,484,493 | ||||||||
|
| |||||||
Communications – 8.48% | ||||||||
Altice 144A 7.75% 5/15/22 # | 1,825,000 | 1,920,813 | ||||||
America Movil 5.00% 3/30/20 | 10,870,000 | 12,036,895 | ||||||
American Tower Trust I | ||||||||
144A 1.551% 3/15/43 # | 4,240,000 | 4,213,517 | ||||||
144A 3.07% 3/15/23 # | 10,205,000 | 10,147,648 | ||||||
AT&T 4.80% 6/15/44 | 25,000 | 25,334 | ||||||
Bell Canada 3.35% 3/22/23 | CAD | 2,132,000 | 1,876,894 | |||||
Bharti Airtel International Netherlands 144A 5.35% 5/20/24 # | 8,185,000 | 8,837,181 | ||||||
Brasil Telecom 144A 5.75% 2/10/22 #* | 4,818,000 | 4,601,190 | ||||||
British Sky Broadcasting Group 144A 3.75% 9/16/24 # | 9,145,000 | 9,193,542 | ||||||
CC Holdings GS V 3.849% 4/15/23 | 4,955,000 | 4,938,668 | ||||||
CCO Holdings 5.25% 9/30/22 | 4,068,000 | 4,108,680 | ||||||
CCOH Safari 5.75% 12/1/24 | 830,000 | 836,744 | ||||||
CenturyLink | ||||||||
5.80% 3/15/22 | 12,355,000 | 13,158,075 | ||||||
6.75% 12/1/23 * | 3,120,000 | 3,474,900 | ||||||
Cequel Communications Holdings I 144A 6.375% 9/15/20 # | 3,245,000 | 3,399,137 | ||||||
Columbus International 144A 7.375% 3/30/21 # | 8,305,000 | 8,834,444 | ||||||
Comcast | ||||||||
3.375% 2/15/25 | 2,400,000 | 2,424,917 | ||||||
4.75% 3/1/44 | 1,760,000 | 1,898,744 | ||||||
Crown Castle Towers 144A 4.883% 8/15/20 # | 25,685,000 | 28,418,346 | ||||||
CSC Holdings 144A 5.25% 6/1/24 # | 4,175,000 | 4,195,875 | ||||||
Deutsche Telekom International Finance 6.50% 4/8/22 | GBP | 1,270,000 | 2,489,962 | |||||
Digicel Group 144A 8.25% 9/30/20 # | 10,574,000 | 11,102,700 | ||||||
DIRECTV Holdings | ||||||||
4.45% 4/1/24 | 16,640,000 | 17,394,408 | ||||||
30
Table of Contents
| Principal amount° | Value (U.S. $) | |||||||
| ||||||||
Corporate Bonds (continued) |
| |||||||
| ||||||||
Communications (continued) | ||||||||
DIRECTV Holdings | ||||||||
5.15% 3/15/42 | 1,450,000 | $ | 1,478,778 | |||||
DISH DBS 5.00% 3/15/23 | 4,695,000 | 4,689,131 | ||||||
Entel Chile 144A 4.875% 10/30/24 # | 6,205,000 | 6,442,583 | ||||||
Equinix | ||||||||
4.875% 4/1/20 | 2,245,000 | 2,306,737 | ||||||
5.375% 4/1/23 | 3,545,000 | 3,673,506 | ||||||
Gray Television 7.50% 10/1/20 | 4,390,000 | 4,614,987 | ||||||
Grupo Televisa 5.00% 5/13/45 | 4,145,000 | 4,145,829 | ||||||
Historic TW 6.875% 6/15/18 | 24,654,000 | 28,835,738 | ||||||
Hughes Satellite Systems 7.625% 6/15/21 | 2,255,000 | 2,519,963 | ||||||
iHeartMedia PIK 14.00% 2/1/21 * | 398,950 | 348,084 | ||||||
Intelsat Luxembourg | ||||||||
7.75% 6/1/21 | 4,665,000 | 4,892,419 | ||||||
8.125% 6/1/23 * | 7,800,000 | 8,326,500 | ||||||
Lamar Media 5.00% 5/1/23 | 4,740,000 | 4,764,293 | ||||||
Level 3 Escrow II 144A 5.375% 8/15/22 # | 3,580,000 | 3,651,600 | ||||||
MDC Partners 144A 6.75% 4/1/20 # | 3,290,000 | 3,425,713 | ||||||
MetroPCS Wireless 6.625% 11/15/20 | 2,848,000 | 3,011,760 | ||||||
Millicom International Cellular 144A 6.625% 10/15/21 #* | 4,645,000 | 4,993,375 | ||||||
Mobile Telesystems 144A 8.625% 6/22/20 # | 4,300,000 | 4,699,470 | ||||||
Myriad International Holdings 144A 6.00% 7/18/20 # | 2,310,000 | 2,517,900 | ||||||
Nielsen Luxembourg 144A 5.50% 10/1/21 # | 2,040,000 | 2,126,700 | ||||||
Numericable Group 144A 6.00% 5/15/22 # | 1,955,000 | 2,001,431 | ||||||
Omnicom Group 3.65% 11/1/24 | 15,680,000 | 15,608,531 | ||||||
Orange 5.50% 2/6/44 | 1,455,000 | 1,617,668 | ||||||
SBA Tower Trust | ||||||||
144A 2.24% 4/16/18 # | 7,270,000 | 7,222,916 | ||||||
144A 2.898% 10/15/19 # | 405,000 | 406,076 | ||||||
SES 144A 3.60% 4/4/23 # | 13,044,000 | 13,330,642 | ||||||
SES Global Americas Holdings 144A 5.30% 3/25/44 # | 9,940,000 | 10,816,678 | ||||||
Sinclair Television Group | ||||||||
5.375% 4/1/21 | 4,900,000 | 4,936,750 | ||||||
6.125% 10/1/22 | 2,143,000 | 2,228,720 | ||||||
SK Telecom 144A 2.125% 5/1/18 # | 1,750,000 | 1,752,151 | ||||||
Sprint | ||||||||
144A 7.125% 6/15/24 # | 5,035,000 | 5,192,344 | ||||||
144A 7.25% 9/15/21 # | 5,945,000 | 6,301,700 | ||||||
144A 7.875% 9/15/23 # | 1,010,000 | 1,095,850 | ||||||
Sprint Capital 6.90% 5/1/19 | 2,095,000 | 2,231,175 | ||||||
Telefonica Emisiones 4.57% 4/27/23 | 14,684,000 | 15,551,516 | ||||||
Telemar Norte Leste 144A 5.50% 10/23/20 # | 2,820,000 | 2,777,700 | ||||||
31
Table of Contents
Schedule of investments
Delaware Diversified Income Fund
| Principal amount° | Value (U.S. $) | |||||||
| ||||||||
Corporate Bonds (continued) |
| |||||||
| ||||||||
Communications (continued) | ||||||||
Time Warner 4.70% 1/15/21 | 250,000 | $ | 274,076 | |||||
Time Warner Cable | ||||||||
4.00% 9/1/21 | 2,940,000 | 3,117,688 | ||||||
8.25% 4/1/19 | 13,981,000 | 17,378,089 | ||||||
T-Mobile USA | ||||||||
6.125% 1/15/22 | 1,340,000 | 1,393,600 | ||||||
6.836% 4/28/23 | 7,245,000 | 7,688,756 | ||||||
Turk Telekomunikasyon 144A 3.75% 6/19/19 # | 7,330,000 | 7,320,581 | ||||||
Unitymedia KabelBW 144A 6.125% 1/15/25 # | 2,960,000 | 3,096,900 | ||||||
Verizon Communications | ||||||||
3.00% 11/1/21 | 10,345,000 | 10,281,771 | ||||||
3.25% 2/17/26 | EUR | 2,606,000 | 3,699,577 | |||||
4.40% 11/1/34 | 8,365,000 | 8,195,483 | ||||||
5.15% 9/15/23 | 10,060,000 | 11,274,192 | ||||||
Viacom | ||||||||
3.25% 3/15/23 | 2,205,000 | 2,134,147 | ||||||
3.875% 4/1/24 | 3,295,000 | 3,302,667 | ||||||
5.25% 4/1/44 | 14,355,000 | 15,137,089 | ||||||
Vimpel Communications 144A 7.748% 2/2/21 # | 9,019,000 | 9,267,023 | ||||||
Virgin Media Finance 144A 6.375% 4/15/23 # | 3,270,000 | 3,474,375 | ||||||
VTR Finance 144A 6.875% 1/15/24 # | 7,295,000 | 7,677,988 | ||||||
Wind Acquisition Finance 144A 7.375% 4/23/21 # | 3,155,000 | 3,091,900 | ||||||
Windstream | ||||||||
7.50% 6/1/22 * | 49,000 | 52,246 | ||||||
7.50% 4/1/23 | 1,375,000 | 1,450,625 | ||||||
7.75% 10/1/21 | 2,300,000 | 2,472,500 | ||||||
WPP Finance 2010 5.625% 11/15/43 | 4,910,000 | 5,478,308 | ||||||
Zayo Group 10.125% 7/1/20 | 4,770,000 | 5,312,588 | ||||||
|
| |||||||
| 486,637,697 | ||||||||
|
| |||||||
Consumer Cyclical – 3.48% | ||||||||
Bed Bath & Beyond | ||||||||
4.915% 8/1/34 | 6,270,000 | 6,245,509 | ||||||
5.165% 8/1/44 | 4,750,000 | 4,756,360 | ||||||
Chinos Intermediate Holdings 144A PIK 7.75% 5/1/19 #*T | 3,445,000 | 3,315,813 | ||||||
Daimler 2.75% 12/10/18 | NOK | 14,510,000 | 2,257,384 | |||||
Delphi | ||||||||
4.15% 3/15/24 | 7,035,000 | 7,231,340 | ||||||
6.125% 5/15/21 | 6,275,000 | 6,839,750 | ||||||
Expedia 4.50% 8/15/24 | 4,140,000 | 4,144,662 | ||||||
Ford Motor Credit | ||||||||
3.664% 9/8/24 | 8,200,000 | 8,168,889 | ||||||
5.875% 8/2/21 | 205,000 | 237,267 | ||||||
32
Table of Contents
| Principal amount° | Value (U.S. $) | |||||||
| ||||||||
Corporate Bonds (continued) |
| |||||||
| ||||||||
Consumer Cyclical (continued) | ||||||||
General Motors 3.50% 10/2/18 | 6,545,000 | $ | 6,774,075 | |||||
General Motors Financial | ||||||||
3.00% 9/25/17 | 1,800,000 | 1,838,250 | ||||||
4.375% 9/25/21 | 4,490,000 | 4,709,337 | ||||||
Host Hotels & Resorts | ||||||||
3.75% 10/15/23 | 8,335,000 | 8,269,220 | ||||||
4.75% 3/1/23 | 9,710,000 | 10,280,268 | ||||||
5.875% 6/15/19 | 3,020,000 | 3,182,579 | ||||||
Hyundai Capital America | ||||||||
144A 2.125% 10/2/17 # | 6,005,000 | 6,073,199 | ||||||
144A 2.55% 2/6/19 # | 275,000 | 277,391 | ||||||
International Game Technology 5.35% 10/15/23 | 8,654,000 | 8,825,964 | ||||||
INVISTA Finance 144A 4.25% 10/15/19 # | 6,085,000 | 6,138,244 | ||||||
Landry’s 144A 9.375% 5/1/20 # | 1,579,000 | 1,695,451 | ||||||
Levi Strauss 6.875% 5/1/22 | 4,240,000 | 4,632,200 | ||||||
Magna International 3.625% 6/15/24 | 8,410,000 | 8,506,782 | ||||||
Netflix 144A 5.75% 3/1/24 # | 4,400,000 | 4,631,000 | ||||||
Pantry 8.375% 8/1/20 | 94,000 | 99,170 | ||||||
Party City Holdings 8.875% 8/1/20 * | 99,000 | 107,910 | ||||||
PF Chang’s China Bistro 144A 10.25% 6/30/20 #* | 1,281,000 | 1,281,000 | ||||||
QVC | ||||||||
4.375% 3/15/23 | 11,250,000 | 11,179,508 | ||||||
144A 5.45% 8/15/34 # | 7,680,000 | 7,448,556 | ||||||
SACI Falabella 144A 4.375% 1/27/25 # | 2,620,000 | 2,640,281 | ||||||
Sally Holdings 5.75% 6/1/22 | 4,201,000 | 4,495,070 | ||||||
Signet UK Finance 4.70% 6/15/24 | 7,955,000 | 8,105,596 | ||||||
Starwood Hotels & Resorts Worldwide | ||||||||
3.75% 3/15/25 | 4,225,000 | 4,248,014 | ||||||
4.50% 10/1/34 | 2,620,000 | 2,554,036 | ||||||
Tenedora Nemak 144A 5.50% 2/28/23 #* | 7,940,000 | 8,294,918 | ||||||
Toyota Finance Australia | ||||||||
2.25% 8/31/16 | NOK | 1,710,000 | 256,685 | |||||
3.04% 12/20/16 | NZD | 2,810,000 | 2,120,006 | |||||
TRW Automotive 144A 4.45% 12/1/23 # | 9,055,000 | 9,077,638 | ||||||
Tupy Overseas 144A 6.625% 7/17/24 # | 5,655,000 | 5,753,963 | ||||||
Volvo Treasury 1.751% 3/1/17 • | SEK | 10,400,000 | 1,428,641 | |||||
Wyndham Worldwide | ||||||||
4.25% 3/1/22 | 4,510,000 | 4,558,054 | ||||||
5.625% 3/1/21 | 6,270,000 | 7,017,616 | ||||||
|
| |||||||
| 199,697,596 | ||||||||
|
| |||||||
Consumer Non-Cyclical – 2.61% | ||||||||
Amgen 4.00% 9/13/29 | GBP | 1,271,000 | 2,036,281 | |||||
33
Table of Contents
Schedule of investments
Delaware Diversified Income Fund
| Principal amount° | Value (U.S. $) | |||||||
| ||||||||
Corporate Bonds (continued) |
| |||||||
| ||||||||
Consumer Non-Cyclical (continued) | ||||||||
Boston Scientific 6.00% 1/15/20 | 12,055,000 | $ | 13,842,190 | |||||
BRF 144A 3.95% 5/22/23 # | 5,495,000 | 5,206,513 | ||||||
CareFusion 6.375% 8/1/19 | 18,330,000 | 21,294,639 | ||||||
Celgene | ||||||||
3.95% 10/15/20 | 10,850,000 | 11,532,693 | ||||||
4.625% 5/15/44 | 3,360,000 | 3,441,168 | ||||||
ENA Norte Trust 144A 4.95% 4/25/23 # | 4,261,704 | 4,400,209 | ||||||
Forest Laboratories 144A 4.375% 2/1/19 # | 5,730,000 | 6,007,745 | ||||||
JBS Investments 144A 7.75% 10/28/20 # | 10,215,000 | 11,242,935 | ||||||
Kimberly-Clark de Mexico 144A 3.80% 4/8/24 # | 635,000 | 662,330 | ||||||
McKesson 3.796% 3/15/24 | 11,960,000 | 12,182,695 | ||||||
Minerva Luxembourg 144A 7.75% 1/31/23 # | 2,260,000 | 2,367,350 | ||||||
Pernod-Ricard 144A 5.75% 4/7/21 # | 5,860,000 | 6,713,825 | ||||||
Prestige Brands 144A 5.375% 12/15/21 # | 4,170,000 | 4,055,325 | ||||||
Smithfield Foods 6.625% 8/15/22 | 1,730,000 | 1,894,350 | ||||||
Spectrum Brands | ||||||||
6.375% 11/15/20 | 4,575,000 | 4,872,375 | ||||||
6.625% 11/15/22 | 68,000 | 73,270 | ||||||
Sysco | ||||||||
3.50% 10/2/24 | 6,225,000 | 6,329,904 | ||||||
4.35% 10/2/34 | 7,090,000 | 7,305,777 | ||||||
Thermo Fisher Scientific 2.40% 2/1/19 | 7,067,000 | 7,114,193 | ||||||
Zimmer Holdings 4.625% 11/30/19 | 15,621,000 | 17,147,843 | ||||||
|
| |||||||
| 149,723,610 | ||||||||
|
| |||||||
Electric – 4.95% | ||||||||
AES Gener | ||||||||
144A 5.25% 8/15/21 # | 3,140,000 | 3,359,495 | ||||||
144A 8.375% 12/18/73 #• | 4,962,000 | 5,576,047 | ||||||
Ameren Illinois 9.75% 11/15/18 | 16,140,000 | 20,896,603 | ||||||
American Electric Power 2.95% 12/15/22 | 2,225,000 | 2,180,044 | ||||||
American Transmission Systems 144A 5.25% 1/15/22 # | 19,970,000 | 22,370,254 | ||||||
CMS Energy 6.25% 2/1/20 | 7,690,000 | 9,070,109 | ||||||
ComEd Financing III 6.35% 3/15/33 | 8,849,000 | 9,136,593 | ||||||
Comision Federal de Electricidad 144A 4.875% 1/15/24 # | 4,575,000 | 4,838,063 | ||||||
Dominion Gas Holdings 3.55% 11/1/23 | 2,225,000 | 2,282,797 | ||||||
DTE Energy 3.50% 6/1/24 | 2,365,000 | 2,402,544 | ||||||
Duquesne Light Holdings 5.50% 8/15/15 | 3,168,000 | 3,278,943 | ||||||
E.CL 144A 4.50% 1/29/25 # | 3,735,000 | 3,769,530 | ||||||
Electricite de France | ||||||||
144A 4.60% 1/27/20 # | 2,485,000 | 2,764,709 | ||||||
144A 5.25% 1/29/49 #*• | 15,720,000 | 16,348,800 | ||||||
Enel 144A 8.75% 9/24/73 #• | 11,295,000 | 13,243,387 | ||||||
34
Table of Contents
| Principal amount° | Value (U.S. $) | |||||||
| ||||||||
Corporate Bonds (continued) |
| |||||||
| ||||||||
Electric (continued) | ||||||||
Entergy Arkansas 3.70% 6/1/24 | 2,220,000 | $ | 2,323,945 | |||||
Entergy Louisiana 4.05% 9/1/23 | 13,970,000 | 14,970,406 | ||||||
Great Plains Energy | ||||||||
4.85% 6/1/21 | 4,610,000 | 5,131,207 | ||||||
5.292% 6/15/22 | 4,490,000 | 5,167,384 | ||||||
Integrys Energy Group 6.11% 12/1/66 *• | 10,010,000 | 10,190,090 | ||||||
IPALCO Enterprises 5.00% 5/1/18 | 5,745,000 | 6,118,425 | ||||||
ITC Holdings 3.65% 6/15/24 * | 7,450,000 | 7,540,354 | ||||||
LG&E & KU Energy | ||||||||
3.75% 11/15/20 | 9,222,000 | 9,661,133 | ||||||
4.375% 10/1/21 | 15,285,000 | 16,621,933 | ||||||
National Rural Utilities Cooperative Finance 4.75% 4/30/43 • | 9,740,000 | 9,669,969 | ||||||
NextEra Energy Capital Holdings | ||||||||
2.40% 9/15/19 | 5,700,000 | 5,719,830 | ||||||
3.625% 6/15/23 | 4,580,000 | 4,671,728 | ||||||
NV Energy 6.25% 11/15/20 | 10,843,000 | 12,816,415 | ||||||
Pennsylvania Electric 5.20% 4/1/20 | 9,308,000 | 10,366,012 | ||||||
Public Service of Oklahoma 5.15% 12/1/19 | 13,585,000 | 15,264,935 | ||||||
Puget Energy 6.00% 9/1/21 | 4,685,000 | 5,447,493 | ||||||
SCANA 4.125% 2/1/22 | 7,385,000 | 7,699,224 | ||||||
Transelec 144A 4.25% 1/14/25 # | 4,525,000 | 4,558,218 | ||||||
Wisconsin Energy 6.25% 5/15/67 • | 8,282,000 | 8,431,813 | ||||||
|
| |||||||
| 283,888,432 | ||||||||
|
| |||||||
Energy – 5.09% | ||||||||
AmeriGas Finance 7.00% 5/20/22 | 2,724,000 | 2,955,540 | ||||||
Anadarko Petroleum 3.45% 7/15/24 | 4,860,000 | 4,800,616 | ||||||
BHP Billiton Finance 3.25% 9/25/24 | GBP | 812,000 | 1,292,507 | |||||
BP Capital Markets | ||||||||
2.521% 1/15/20 | 2,815,000 | 2,830,805 | ||||||
3.535% 11/4/24 | 3,770,000 | 3,779,493 | ||||||
Bristow Group 6.25% 10/15/22 | 3,735,000 | 3,898,406 | ||||||
California Resources | ||||||||
144A 5.50% 9/15/21 # | 1,580,000 | 1,613,575 | ||||||
144A 6.00% 11/15/24 # | 1,590,000 | 1,625,775 | ||||||
Chaparral Energy | ||||||||
7.625% 11/15/22 | 769,000 | 753,620 | ||||||
8.25% 9/1/21 | 78,000 | 78,780 | ||||||
Chesapeake Energy 5.75% 3/15/23 | 4,665,000 | 5,131,500 | ||||||
Cimarex Energy 4.375% 6/1/24 | 4,955,000 | 5,047,906 | ||||||
CNOOC Finance 2012 144A 3.875% 5/2/22 # | 4,955,000 | 5,074,891 | ||||||
CNOOC Nexen Finance 2014 4.25% 4/30/24 | 4,860,000 | 5,030,873 | ||||||
35
Table of Contents
Schedule of investments
Delaware Diversified Income Fund
| Principal amount° | Value (U.S. $) | |||||||
| ||||||||
Corporate Bonds (continued) |
| |||||||
| ||||||||
Energy (continued) | ||||||||
Continental Resources | ||||||||
4.50% 4/15/23 | 16,115,000 | $ | 16,909,115 | |||||
4.90% 6/1/44 | 1,755,000 | 1,739,905 | ||||||
Drill Rigs Holdings 144A 6.50% 10/1/17 # | 5,584,000 | 5,276,880 | ||||||
Energy XXI Gulf Coast | ||||||||
144A 6.875% 3/15/24 # | 3,050,000 | 2,417,125 | ||||||
7.50% 12/15/21 * | 1,595,000 | 1,331,825 | ||||||
Enterprise Products Operating 5.10% 2/15/45 | 450,000 | 478,254 | ||||||
Exterran Partners 6.00% 4/1/21 | 1,270,000 | 1,231,900 | ||||||
Halcon Resources 8.875% 5/15/21 | 3,976,000 | 3,280,200 | ||||||
Hercules Offshore | ||||||||
144A 6.75% 4/1/22 #* | 870,000 | 514,387 | ||||||
144A 8.75% 7/15/21 #* | 1,270,000 | 825,500 | ||||||
Honghua Group 144A 7.45% 9/25/19 # | 2,310,000 | 2,142,525 | ||||||
KazMunayGas National | ||||||||
144A 6.00% 11/7/44 # | 4,000,000 | 3,945,240 | ||||||
144A 9.125% 7/2/18 # | 2,915,000 | 3,457,919 | ||||||
Key Energy Services 6.75% 3/1/21 | 3,945,000 | 3,530,775 | ||||||
Laredo Petroleum 7.375% 5/1/22 * | 3,602,000 | 3,764,090 | ||||||
Lukoil International Finance 144A 3.416% 4/24/18 # | 3,560,000 | 3,404,250 | ||||||
Marathon Petroleum 4.75% 9/15/44 | 19,550,000 | 19,748,706 | ||||||
Midstates Petroleum 9.25% 6/1/21 * | 4,390,000 | 3,753,450 | ||||||
MIE Holdings 144A 7.50% 4/25/19 # | 1,470,000 | 1,444,275 | ||||||
Murphy Oil USA 6.00% 8/15/23 | 4,130,000 | 4,346,825 | ||||||
Newfield Exploration 5.625% 7/1/24 | 8,180,000 | 8,834,400 | ||||||
Oasis Petroleum 6.875% 3/15/22 | 4,755,000 | 4,968,975 | ||||||
Odebrecht Offshore Drilling Finance 144A 6.625% 10/1/22 # | 6,120,147 | 6,334,352 | ||||||
ONGC Videsh | ||||||||
2.50% 5/7/18 * | 1,550,000 | 1,537,275 | ||||||
3.25% 7/15/19 * | 4,900,000 | 4,913,867 | ||||||
Pacific Rubiales Energy | ||||||||
144A 5.375% 1/26/19 #* | 4,710,000 | 4,733,550 | ||||||
144A 5.625% 1/19/25 #* | 5,769,000 | 5,500,453 | ||||||
PDC Energy 7.75% 10/15/22 | 1,273,000 | 1,343,295 | ||||||
Pertamina Persero 144A 4.875% 5/3/22 # | 5,715,000 | 5,843,588 | ||||||
Petrobras Global Finance 4.875% 3/17/20 | 7,415,000 | 7,553,661 | ||||||
Petrobras International Finance 5.375% 1/27/21 | 6,036,000 | 6,210,199 | ||||||
Petroleos de Venezuela 9.00% 11/17/21 * | 5,530,000 | 3,532,288 | ||||||
Petroleos Mexicanos | ||||||||
144A 4.25% 1/15/25 # | 2,030,000 | 2,060,044 | ||||||
6.50% 6/2/41 | 3,250,000 | 3,818,750 | ||||||
36
Table of Contents
| Principal amount° | Value (U.S. $) | |||||||
| ||||||||
Corporate Bonds (continued) |
| |||||||
| ||||||||
Energy (continued) | ||||||||
Pride International 6.875% 8/15/20 | 30,655,000 | $ | 35,876,436 | |||||
PTT Exploration & Production PCL 144A 4.875% 12/29/49 #• | 8,200,000 | 8,353,340 | ||||||
Range Resources 5.75% 6/1/21 | 1,800,000 | 1,908,000 | ||||||
Samson Investment 9.75% 2/15/20 * | 5,538,000 | 4,125,810 | ||||||
SandRidge Energy 8.125% 10/15/22 | 5,482,000 | 4,988,620 | ||||||
Suburban Propane Partners 7.375% 8/1/21 | 1,449,000 | 1,564,920 | ||||||
Sunoco Logistics Partners Operations 3.45% 1/15/23 | 2,550,000 | 2,507,866 | ||||||
Talisman Energy 5.50% 5/15/42 | 18,890,000 | 18,533,942 | ||||||
Woodside Finance 144A 8.75% 3/1/19 # | 10,406,000 | 13,067,074 | ||||||
YPF | ||||||||
7.734% 8/15/18 • | 1,411,765 | 1,420,447 | ||||||
144A 8.75% 4/4/24 #* | 4,732,000 | 4,903,535 | ||||||
|
| |||||||
| 291,892,120 | ||||||||
|
| |||||||
Finance Companies – 1.33% | ||||||||
Aviation Capital Group 144A 6.75% 4/6/21 # | 4,630,000 | 5,301,350 | ||||||
Consolidated Energy Finance 144A 6.75% 10/15/19 # | 4,410,000 | 4,509,225 | ||||||
Corp Financiera de Desarrollo | ||||||||
144A 4.75% 2/8/22 # | 1,545,000 | 1,622,250 | ||||||
144A 5.25% 7/15/29 #*• | 2,200,000 | 2,261,600 | ||||||
Corporacion Financiera de Desarrollo 144A 3.25% 7/15/19 # | 2,175,000 | 2,194,031 | ||||||
General Electric Capital | ||||||||
2.10% 12/11/19 | 3,225,000 | 3,243,099 | ||||||
3.45% 5/15/24 | 6,860,000 | 7,005,130 | ||||||
144A 3.80% 6/18/19 # | 6,510,000 | 6,925,624 | ||||||
4.208% 12/6/21 | SEK | 4,000,000 | 621,661 | |||||
4.25% 1/17/18 | NZD | 1,010,000 | 787,484 | |||||
7.125% 12/29/49 • | 17,945,000 | 20,973,219 | ||||||
Hutchison Whampoa International 14 144A 3.625% 10/31/24 # | 4,915,000 | 4,892,593 | ||||||
Nuveen Investments 144A 9.50% 10/15/20 # | 2,824,000 | 3,452,340 | ||||||
SUAM Finance 144A 4.875% 4/17/24 # | 7,797,000 | 8,011,418 | ||||||
Temasek Financial I 144A 2.375% 1/23/23 # | 4,915,000 | 4,773,709 | ||||||
|
| |||||||
| 76,574,733 | ||||||||
|
| |||||||
Healthcare – 1.35% | ||||||||
Air Medical Group Holdings 9.25% 11/1/18 | 2,651,000 | 2,780,236 | ||||||
Bayer U.S. Finance | ||||||||
144A 2.375% 10/8/19 # | 4,625,000 | 4,638,107 | ||||||
144A 3.375% 10/8/24 # | 8,245,000 | 8,286,456 | ||||||
Community Health Systems | ||||||||
144A 6.875% 2/1/22 # | 2,615,000 | 2,827,469 | ||||||
37
Table of Contents
Schedule of investments
Delaware Diversified Income Fund
| Principal amount° | Value (U.S. $) | |||||||
| ||||||||
Corporate Bonds (continued) |
| |||||||
| ||||||||
Healthcare (continued) | ||||||||
Community Health Systems | ||||||||
7.125% 7/15/20 | 50,000 | $ | 54,187 | |||||
Crimson Merger Sub 144A 6.625% 5/15/22 # | 3,020,000 | 2,827,475 | ||||||
DaVita HealthCare Partners 5.125% 7/15/24 | 5,605,000 | 5,727,609 | ||||||
Fresenius Medical Care US Finance II 144A 5.875% 1/31/22 # | 4,243,000 | 4,646,085 | ||||||
HCA | ||||||||
5.00% 3/15/24 | 4,010,000 | 4,145,378 | ||||||
7.50% 2/15/22 | 4,544,000 | 5,288,080 | ||||||
HCA Holdings 6.25% 2/15/21 | 2,683,000 | 2,894,286 | ||||||
Immucor 11.125% 8/15/19 | 3,332,000 | 3,648,540 | ||||||
Kinetic Concepts 10.50% 11/1/18 | 2,579,000 | 2,849,795 | ||||||
Par Pharmaceutical 7.375% 10/15/20 | 1,776,000 | 1,895,880 | ||||||
Perrigo | ||||||||
4.00% 11/15/23 | 9,210,000 | 9,433,112 | ||||||
5.30% 11/15/43 | 2,095,000 | 2,289,181 | ||||||
Salix Pharmaceuticals 144A 6.00% 1/15/21 # | 4,300,000 | 4,665,500 | ||||||
Tenet Healthcare 6.00% 10/1/20 | 5,524,000 | 5,952,110 | ||||||
Valeant Pharmaceuticals International | ||||||||
144A 5.625% 12/1/21 # | 865,000 | 858,513 | ||||||
144A 6.375% 10/15/20 # | 1,586,000 | 1,633,580 | ||||||
|
| |||||||
| 77,341,579 | ||||||||
|
| |||||||
Insurance – 2.07% | ||||||||
Allstate 5.75% 8/15/53 • | 8,455,000 | 9,009,859 | ||||||
American International Group 8.175% 5/15/58 • | 1,778,000 | 2,422,525 | ||||||
Chubb 6.375% 3/29/67 • | 10,428,000 | 11,418,660 | ||||||
Five Corners Funding Trust 144A 4.419% 11/15/23 # | 2,845,000 | 3,010,849 | ||||||
Highmark | ||||||||
144A 4.75% 5/15/21 # | 5,320,000 | 5,458,006 | ||||||
144A 6.125% 5/15/41 # | 2,000,000 | 2,010,302 | ||||||
Hockey Merger Sub 2 144A 7.875% 10/1/21 # | 2,500,000 | 2,618,750 | ||||||
Liberty Mutual Group 144A 4.25% 6/15/23 # | 7,135,000 | 7,392,609 | ||||||
MetLife | ||||||||
3.60% 4/10/24 | 6,140,000 | 6,270,665 | ||||||
6.40% 12/15/36 | 40,000 | 45,150 | ||||||
MetLife Capital Trust X 144A 9.25% 4/8/38 # | 11,520,000 | 16,531,200 | ||||||
Onex USI Acquisition 144A 7.75% 1/15/21 # | 709,000 | 721,408 | ||||||
Prudential Financial | ||||||||
3.50% 5/15/24 | 3,810,000 | 3,833,058 | ||||||
4.50% 11/15/20 | 3,385,000 | 3,685,730 | ||||||
5.625% 6/15/43 • | 4,620,000 | 4,816,350 | ||||||
5.875% 9/15/42 • | 4,100,000 | 4,366,500 | ||||||
38
Table of Contents
| Principal amount° | Value (U.S. $) | |||||||
| ||||||||
Corporate Bonds (continued) | ||||||||
| ||||||||
Insurance (continued) | ||||||||
Teachers Insurance & Annuity Association of America 144A 4.90% 9/15/44 # | 4,410,000 | $ | 4,693,889 | |||||
TIAA Asset Management Finance | ||||||||
144A 2.95% 11/1/19 # | 7,310,000 | 7,332,383 | ||||||
144A 4.125% 11/1/24 # | 7,310,000 | 7,363,641 | ||||||
Voya Financial 5.65% 5/15/53 • | 8,420,000 | 8,462,100 | ||||||
XL Group 6.50% 10/29/49 • | 7,814,000 | 7,517,068 | ||||||
|
| |||||||
| 118,980,702 | ||||||||
|
| |||||||
Natural Gas – 2.71% | ||||||||
El Paso Pipeline Partners Operating 4.30% 5/1/24 | 8,565,000 | 8,618,531 | ||||||
Enbridge Energy Partners 8.05% 10/1/37 • | 16,755,000 | 18,954,094 | ||||||
Energy Transfer Partners | ||||||||
5.15% 2/1/43 | 5,190,000 | 5,193,078 | ||||||
5.95% 10/1/43 * | 10,990,000 | 12,187,382 | ||||||
9.70% 3/15/19 | 8,018,000 | 10,280,142 | ||||||
EnLink Midstream Partners 4.40% 4/1/24 | 4,910,000 | 5,176,873 | ||||||
Enterprise Products Operating | ||||||||
7.034% 1/15/68 • | 20,274,000 | 22,571,105 | ||||||
8.375% 8/1/66 • | 1,492,000 | 1,630,677 | ||||||
Kinder Morgan Energy Partners 9.00% 2/1/19 | 15,367,000 | 19,076,978 | ||||||
Plains All American Pipeline 8.75% 5/1/19 | 13,239,000 | 16,787,502 | ||||||
TransCanada PipeLines 6.35% 5/15/67 • | 16,140,000 | 16,341,750 | ||||||
Williams 4.55% 6/24/24 | 4,645,000 | 4,559,537 | ||||||
Williams Partners 7.25% 2/1/17 | 12,358,000 | 13,835,214 | ||||||
|
| |||||||
| 155,212,863 | ||||||||
|
| |||||||
Real Estate – 1.84% | ||||||||
Alexandria Real Estate Equities | ||||||||
3.90% 6/15/23 | 1,955,000 | 1,967,512 | ||||||
4.50% 7/30/29 | 3,010,000 | 3,059,665 | ||||||
Carey (W.P.) 4.60% 4/1/24 | 4,620,000 | 4,821,815 | ||||||
CBL & Associates | ||||||||
4.60% 10/15/24 | 9,355,000 | 9,446,202 | ||||||
5.25% 12/1/23 | 1,050,000 | 1,119,043 | ||||||
Corporate Office Properties | ||||||||
3.60% 5/15/23 | 6,520,000 | 6,289,629 | ||||||
5.25% 2/15/24 | 5,285,000 | 5,688,024 | ||||||
DDR | ||||||||
4.75% 4/15/18 | 7,195,000 | 7,784,494 | ||||||
7.50% 4/1/17 | 4,935,000 | 5,599,409 | ||||||
7.875% 9/1/20 | 7,204,000 | 8,954,543 | ||||||
Digital Realty Trust 5.875% 2/1/20 * | 6,950,000 | 7,774,485 | ||||||
Excel Trust 4.625% 5/15/24 | 3,210,000 | 3,307,822 | ||||||
39
Table of Contents
Schedule of investments
Delaware Diversified Income Fund
| Principal amount° | Value (U.S. $) | |||||||
| ||||||||
Corporate Bonds (continued) | ||||||||
| ||||||||
Real Estate (continued) | ||||||||
Healthcare Trust of America Holdings 3.375% 7/15/21 | 2,865,000 | $ | 2,863,507 | |||||
Hospitality Properties Trust 4.50% 3/15/25 | 4,985,000 | 4,962,303 | ||||||
Regency Centers | ||||||||
4.80% 4/15/21 | 8,625,000 | 9,451,706 | ||||||
5.875% 6/15/17 | 2,032,000 | 2,248,920 | ||||||
Trust F/1401 144A 5.25% 12/15/24 # | 7,040,000 | 7,444,800 | ||||||
WEA Finance 144A 3.75% 9/17/24 # | 12,790,000 | 12,976,043 | ||||||
|
| |||||||
| 105,759,922 | ||||||||
|
| |||||||
Services – 0.71% | ||||||||
Activision Blizzard 144A 6.125% 9/15/23 # | 3,385,000 | 3,672,725 | ||||||
Algeco Scotsman Global Finance | ||||||||
144A 8.50% 10/15/18 #* | 4,430,000 | 4,629,350 | ||||||
144A 10.75% 10/15/19 # | 4,406,000 | 4,361,940 | ||||||
Ameristar Casinos 7.50% 4/15/21 | 4,395,000 | 4,713,637 | ||||||
Avis Budget Car Rental 5.50% 4/1/23 | 3,150,000 | 3,181,500 | ||||||
Caesars Growth Properties Holdings 144A | ||||||||
9.375% 5/1/22 #* | 1,725,000 | 1,610,719 | ||||||
CDK Global 144A 4.50% 10/15/24 # | 5,930,000 | 5,915,756 | ||||||
Corrections Corporation of America 4.625% 5/1/23 | 3,851,000 | 3,793,235 | ||||||
Geo Group 5.875% 10/15/24 | 1,645,000 | 1,702,575 | ||||||
Mattamy Group 144A 6.50% 11/15/20 # | 233,000 | 237,078 | ||||||
MGM Resorts International 6.75% 10/1/20 | 1,010,000 | 1,111,000 | ||||||
Service International 5.375% 5/15/24 | 1,565,000 | 1,619,775 | ||||||
United Rentals North America 5.75% 11/15/24 | 3,855,000 | 4,052,569 | ||||||
|
| |||||||
| 40,601,859 | ||||||||
|
| |||||||
Technology – 2.18% | ||||||||
Baidu 2.75% 6/9/19 | 10,063,000 | 10,121,506 | ||||||
BMC Software Finance 144A 8.125% 7/15/21 # | 1,855,000 | 1,785,437 | ||||||
First Data | ||||||||
11.25% 1/15/21 | 7,562,000 | 8,734,110 | ||||||
11.75% 8/15/21 | 1,549,000 | 1,823,947 | ||||||
Jabil Circuit 7.75% 7/15/16 | 1,178,000 | 1,294,327 | ||||||
KLA-Tencor | ||||||||
3.375% 11/1/19 | 940,000 | 945,994 | ||||||
4.65% 11/1/24 | 1,875,000 | 1,884,767 | ||||||
Motorola Solutions 4.00% 9/1/24 * | 7,525,000 | 7,413,374 | ||||||
National Semiconductor 6.60% 6/15/17 | 23,237,000 | 26,434,388 | ||||||
NCR 6.375% 12/15/23 | 1,815,000 | 1,923,900 | ||||||
NetApp 3.25% 12/15/22 | 6,420,000 | 6,340,899 | ||||||
NXP Funding 144A 5.75% 3/15/23 # | 2,055,000 | 2,178,300 | ||||||
Oracle | ||||||||
3.40% 7/8/24 | 12,125,000 | 12,276,563 | ||||||
40
Table of Contents
| Principal amount° | Value (U.S. $) | |||||||||||
| ||||||||||||
Corporate Bonds (continued) | ||||||||||||
| ||||||||||||
Technology (continued) | ||||||||||||
Oracle | ||||||||||||
4.50% 7/8/44 | 4,300,000 | $ | 4,452,568 | |||||||||
Samsung Electronics America 144A 1.75% 4/10/17 # | 10,895,000 | 10,965,567 | ||||||||||
Seagate HDD Cayman 144A 4.75% 1/1/25 # | 9,855,000 | 10,015,144 | ||||||||||
Tencent Holdings 144A 3.375% 5/2/19 # | 4,440,000 | 4,519,196 | ||||||||||
Viasystems 144A 7.875% 5/1/19 # | 96,000 | 102,240 | ||||||||||
Xerox 6.35% 5/15/18 | 10,503,000 | 12,004,005 | ||||||||||
|
| |||||||||||
| 125,216,232 | ||||||||||||
|
| |||||||||||
Transportation – 1.34% | ||||||||||||
American Airlines 2014-1 Class A Pass Through Trust | 2,725,000 | 2,714,781 | ||||||||||
AP Moeller - Maersk 144A 3.75% 9/22/24 # | 4,560,000 | 4,675,537 | ||||||||||
Brambles USA 144A 5.35% 4/1/20 # | 6,810,000 | 7,682,082 | ||||||||||
Burlington Northern Santa Fe | ||||||||||||
3.40% 9/1/24 | 5,440,000 | 5,473,146 | ||||||||||
4.90% 4/1/44 | 6,325,000 | 6,834,093 | ||||||||||
DP World 144A 6.85% 7/2/37 # | 3,020,000 | 3,480,550 | ||||||||||
ERAC USA Finance 144A 5.25% 10/1/20 # | 28,100,000 | 31,686,319 | ||||||||||
Red de Carreteras de Occidente 144A 9.00% 6/10/28 # | MXN | 60,960,000 | 4,364,353 | |||||||||
Trinity Industries 4.55% 10/1/24 | 5,770,000 | 5,630,395 | ||||||||||
United Airlines 2014-1 Class A Pass Through Trust 4.00% 4/11/26 ¿ | 2,290,000 | 2,318,625 | ||||||||||
United Airlines 2014-2 Class A Pass Through Trust 3.75% 9/3/26 ¿ | 2,055,000 | 2,080,688 | ||||||||||
|
| |||||||||||
| 76,940,569 | ||||||||||||
|
| |||||||||||
Utilities – 0.65% | ||||||||||||
AES | ||||||||||||
5.50% 3/15/24 | 1,550,000 | 1,592,625 | ||||||||||
7.375% 7/1/21 | 3,062,000 | 3,508,859 | ||||||||||
Calpine 5.375% 1/15/23 | 5,605,000 | 5,668,056 | ||||||||||
Dynegy Finance I | ||||||||||||
144A 6.75% 11/1/19 # | 625,000 | 647,656 | ||||||||||
144A 7.375% 11/1/22 # | 950,000 | 1,005,813 | ||||||||||
144A 7.625% 11/1/24 # | 355,000 | 376,744 | ||||||||||
Elwood Energy 8.159% 7/5/26 | 2,461,338 | 2,756,698 | ||||||||||
NRG Energy 144A 6.25% 5/1/24 # | 1,485,000 | 1,540,688 | ||||||||||
Perusahaan Listrik Negara PT 144A 5.50% 11/22/21 # | 5,890,000 | 6,287,575 | ||||||||||
Saudi Electricity Global Sukuk 3 144A 5.50% 4/8/44 # | 2,183,000 | 2,368,555 | ||||||||||
State Grid Overseas Investment 2014 | ||||||||||||
144A 2.75% 5/7/19 # | 3,430,000 | 3,461,748 | ||||||||||
41
Table of Contents
Schedule of investments
Delaware Diversified Income Fund
| Principal amount° | Value (U.S. $) | |||||||
| ||||||||
Corporate Bonds (continued) | ||||||||
| ||||||||
Utilities (continued) | ||||||||
State Grid Overseas Investment 2014 | ||||||||
144A 4.125% 5/7/24 #* | 7,770,000 | $ | 8,085,672 | |||||
|
| |||||||
| 37,300,689 | ||||||||
|
| |||||||
Total Corporate Bonds (cost $2,911,855,952) | 3,023,109,689 | |||||||
|
| |||||||
| ||||||||
Municipal Bonds – 0.44% | ||||||||
| ||||||||
Golden State, California Tobacco Securitization Corporation Settlement Revenue (Asset-Backed Senior Notes) Series A-1 | ||||||||
5.125% 6/1/47 | 3,170,000 | 2,369,638 | ||||||
5.75% 6/1/47 | 3,500,000 | 2,861,495 | ||||||
New Jersey Transportation Trust Fund | ||||||||
Series AA 5.00% 6/15/44 | 4,080,000 | 4,382,573 | ||||||
New York City, New York | ||||||||
Series I 5.00% 8/1/22 | 2,680,000 | 3,224,817 | ||||||
New York State Thruway Authority Revenue | ||||||||
Series A 5.00% 5/1/19 | 3,145,000 | 3,642,382 | ||||||
Oregon State Taxable Pension | ||||||||
5.892% 6/1/27 | 305,000 | 376,242 | ||||||
State of Maryland Local Facilities | ||||||||
Series A 5.00% 8/1/21 | 3,960,000 | 4,830,210 | ||||||
Texas Private Activity Bond Surface Transportation Revenue (Senior Lien NTE Mobility) | ||||||||
6.75% 6/30/43 (AMT) | 2,795,000 | 3,394,555 | ||||||
|
| |||||||
Total Municipal Bonds (cost $23,420,775) | 25,081,912 | |||||||
|
| |||||||
| ||||||||
Non-Agency Asset-Backed Securities – 1.73% | ||||||||
| ||||||||
AEP Texas Central Transition Funding II | ||||||||
Series 2006-A A4 5.17% 1/1/18 | 145,000 | 156,906 | ||||||
Ally Master Owner Trust | ||||||||
Series 2013-2 A 0.603% 4/15/18 • | 5,280,000 | 5,287,772 | ||||||
Series 2014-1 A1 0.623% 1/15/19 • | 2,750,000 | 2,758,602 | ||||||
American Express Credit Account Master Trust | ||||||||
Series 2013-2 A 0.573% 5/17/21 • | 3,480,000 | 3,494,609 | ||||||
Ameriquest Mortgage Securities Asset-Backed Pass Through Certificates | ||||||||
Series 2003-8 AF4 5.642% 10/25/33 ¿ | 65,003 | 65,724 | ||||||
Applebee’s | ||||||||
Series 2014-1 A2 144A 4.277% 9/5/44 # | 7,400,000 | 7,373,730 | ||||||
ARL Second | ||||||||
Series 2014-1A A1 144A 2.92% 6/15/44 # | 4,862,199 | 4,833,648 | ||||||
42
Table of Contents
| Principal amount° | Value (U.S. $) | |||||||
| ||||||||
Non-Agency Asset-Backed Securities (continued) | ||||||||
| ||||||||
Avis Budget Rental Car Funding AESOP | ||||||||
Series 2011-3A A 144A 3.41% 11/20/17 # | 4,435,000 | $ | 4,618,644 | |||||
Series 2013-1A A 144A 1.92% 9/20/19 # | 6,115,000 | 6,110,285 | ||||||
Series 2014-1A A 144A 2.46% 7/20/20 # | 4,587,000 | 4,610,875 | ||||||
BA Credit Card Trust | ||||||||
Series 2014-A3 A 0.443% 1/15/20 • | 4,310,000 | 4,310,147 | ||||||
California Republic Auto Receivables Trust | ||||||||
Series 2013-1 A2 144A 1.41% 9/17/18 # | 2,888,568 | 2,910,645 | ||||||
Capital One Multi-Asset Execution Trust | ||||||||
Series 2007-A1 A1 0.203% 11/15/19 • | 1,700,000 | 1,691,259 | ||||||
CenterPoint Energy Transition Bond IV | ||||||||
Series 2012-1 A3 3.028% 10/15/25 | 3,550,000 | 3,605,270 | ||||||
Citibank Credit Card Issuance Trust | ||||||||
Series 2014-A5 A5 2.68% 6/7/23 | 3,310,000 | 3,337,132 | ||||||
Contimortgage Home Equity Loan Trust | ||||||||
Series 1996-4 A8 7.22% 1/15/28 | 4,850 | 4,763 | ||||||
Countrywide Asset-Backed Certificates | ||||||||
Series 2006-13 1AF3 4.94% 1/25/37 • | 18,649 | 23,735 | ||||||
Discover Card Execution Note Trust | ||||||||
Series 2012-A6 A6 1.67% 1/18/22 | 6,655,000 | 6,545,266 | ||||||
Series 2014-A5 A 1.39% 4/15/20 | 2,900,000 | 2,899,113 | ||||||
Ford Credit Auto Owner Trust | ||||||||
Series 2014-2 A 144A 2.31% 4/15/26 # | 4,315,000 | 4,325,451 | ||||||
GE Dealer Floorplan Master Note Trust | ||||||||
Series 2013-1 A 0.557% 4/20/18 • | 7,250,000 | 7,270,423 | ||||||
Golden Credit Card Trust | ||||||||
Series 2012-5A A 144A 0.79% 9/15/17 # | 4,440,000 | 4,446,420 | ||||||
Series 2014-2A A 144A 0.603% 3/15/21 #• | 2,815,000 | 2,811,320 | ||||||
GreatAmerica Leasing Receivables | ||||||||
Series 2013-1 B 144A 1.44% 5/15/18 # | 1,045,000 | 1,051,135 | ||||||
HOA Funding | ||||||||
Series 2014-1A A2 144A 4.846% 8/20/44 # | 8,035,000 | 7,971,805 | ||||||
MASTR Specialized Loan Trust | ||||||||
Series 2005-2 A2 144A 5.006% 7/25/35 #• | 121,645 | 121,583 | ||||||
Mid-State Trust XI | ||||||||
Series 11 A1 4.864% 7/15/38 | 371,533 | 395,262 | ||||||
MMAF Equipment Finance | ||||||||
Series 2014-AA A4 144A 1.59% 2/8/22 # | 5,755,000 | 5,734,368 | ||||||
RASC Trust | ||||||||
Series 2006-EMX1 A2 0.382% 1/25/36 • | 348,523 | 347,814 | ||||||
Trafigura Securitisation Finance | ||||||||
Series 2012-1A A 144A 2.553% 10/15/15 #• | 170,000 | 170,604 | ||||||
|
| |||||||
Total Non-Agency Asset-Backed Securities | 99,284,310 | |||||||
|
| |||||||
43
Table of Contents
Schedule of investments
Delaware Diversified Income Fund
| Principal amount° | Value (U.S. $) | |||||||
| ||||||||
Non-Agency Collateralized Mortgage Obligations – 0.88% |
| |||||||
| ||||||||
American Home Mortgage Investment Trust | ||||||||
Series 2005-2 5A1 5.064% 9/25/35 f | 580,814 | $ | 574,428 | |||||
Banc of America Alternative Loan Trust | ||||||||
Series 2005-1 2A1 5.50% 2/25/20 | 228,381 | 233,221 | ||||||
Series 2005-3 2A1 5.50% 4/25/20 | 203,405 | 210,163 | ||||||
Series 2005-6 7A1 5.50% 7/25/20 | 857,320 | 871,978 | ||||||
Banc of America Mortgage Trust | ||||||||
Series 2003-E 2A2 2.726% 6/25/33 — | 88,670 | 89,281 | ||||||
Chase Mortgage Finance Trust | ||||||||
Series 2005-A1 3A1 2.525% 12/25/35 — | 718,465 | 652,063 | ||||||
ChaseFlex Trust | ||||||||
Series 2006-1 A4 5.091% 6/25/36 — | 6,119,000 | 5,406,069 | ||||||
CHL Mortgage Pass Through Trust | ||||||||
Series 2003-21 A1 2.599% 5/25/33 ¿— | 32,347 | 32,487 | ||||||
Series 2004-HYB2 2A 2.588% 7/20/34 ¿— | 118,048 | 107,679 | ||||||
Series 2004-HYB5 3A1 2.483% 4/20/35 ¿— | 143,762 | 127,665 | ||||||
Citicorp Mortgage Securities Trust | ||||||||
Series 2006-3 1A9 5.75% 6/25/36 | 750,466 | 772,142 | ||||||
Citicorp Residential Mortgage Trust | ||||||||
Series 2006-3 A5 5.948% 11/25/36 f | 5,800,000 | 5,796,711 | ||||||
Credit Suisse First Boston Mortgage Securities | ||||||||
Series 2005-5 6A3 5.00% 7/25/35 | 3,819,406 | 3,826,892 | ||||||
First Horizon Mortgage Pass Through Trust | ||||||||
Series 2004-5 2A1 6.25% 8/25/17 ¿ | 7,143 | 7,272 | ||||||
Series 2004-7 1A3 5.50% 1/25/35 ¿ | 2,708,674 | 2,801,522 | ||||||
Series 2005-4 1A8 5.50% 8/25/35 ¿ | 1,077,322 | 1,086,011 | ||||||
GSMPS Mortgage Loan Trust | ||||||||
Series 1998-3 A 144A 7.75% 9/19/27 #— | 48,874 | 51,232 | ||||||
GSR Mortgage Loan Trust | ||||||||
Series 2004-9 4A1 2.657% 8/25/34 — | 696,207 | 672,058 | ||||||
Series 2006-AR1 3A1 2.878% 1/25/36 — | 692,180 | 631,841 | ||||||
JPMorgan Mortgage Trust | ||||||||
Series 2005-A8 1A1 5.04% 11/25/35 — | 453,972 | 430,380 | ||||||
Series 2006-S1 1A1 6.00% 4/25/36 | 4,029,640 | 4,069,142 | ||||||
Series 2007-A1 7A4 2.541% 7/25/35 — | 105,561 | 94,689 | ||||||
MASTR ARM Trust | ||||||||
Series 2003-6 1A2 2.45% 12/25/33 — | 43,900 | 43,633 | ||||||
Series 2004-10 2A2 3.02% 10/25/34 — | 60,176 | 37,557 | ||||||
Sequoia Mortgage Trust | ||||||||
Series 2013-11 B1 144A 3.713% 9/25/43 #— | 2,668,798 | 2,598,648 | ||||||
Structured Asset Securities Mortgage Pass Through Certificates | ||||||||
Series 2004-20 2A1 5.50% 11/25/34 ¿ | 3,365,857 | 3,435,783 | ||||||
44
Table of Contents
| Principal amount° | Value (U.S. $) | |||||||||||
| ||||||||||||
Non-Agency Collateralized Mortgage Obligations (continued) | ||||||||||||
| ||||||||||||
Structured Asset Securities Trust | ||||||||||||
Series 2005-1 4A1 5.00% 2/25/20 | 3,862,463 | $ | 3,930,516 | |||||||||
Washington Mutual Alternative Mortgage Pass Through Certificates | ||||||||||||
Series 2005-1 5A2 6.00% 3/25/35 ¿ | 332,018 | 167,481 | ||||||||||
Washington Mutual Mortgage Pass Through Certificates | ||||||||||||
Series 2003-S10 A2 5.00% 10/25/18 ¿ | 182,655 | 187,867 | ||||||||||
Series 2006-AR14 2A1 2.00% 11/25/36 ¿— | 4,244,839 | 3,584,707 | ||||||||||
Wells Fargo Mortgage-Backed Securities Trust | ||||||||||||
Series 2006-2 3A1 5.75% 3/25/36 | 2,448,745 | 2,488,309 | ||||||||||
Series 2006-3 A11 5.50% 3/25/36 | 2,392,925 | 2,479,568 | ||||||||||
Series 2006-20 A1 5.50% 12/25/21 | 912,395 | 927,986 | ||||||||||
Series 2006-AR5 2A1 2.615% 4/25/36 — | 1,996,334 | 1,904,644 | ||||||||||
Series 2007-14 1A1 6.00% 10/25/37 | 137,162 | 139,018 | ||||||||||
|
| |||||||||||
Total Non-Agency Collateralized Mortgage Obligations (cost $46,896,315) |
| 50,470,643 | ||||||||||
|
| |||||||||||
| ||||||||||||
Regional Bonds – 0.26%D | ||||||||||||
| ||||||||||||
Australia – 0.05% | ||||||||||||
New South Wales Treasury 4.00% 5/20/26 | AUD | 1,382,000 | 1,233,661 | |||||||||
Queensland Treasury 144A 4.75% 7/21/25 # | AUD | 1,455,000 | 1,379,121 | |||||||||
|
| |||||||||||
| 2,612,782 | ||||||||||||
|
| |||||||||||
Canada – 0.21% | ||||||||||||
Province of Ontario Canada 3.45% 6/2/45 | CAD | 726,000 | 632,541 | |||||||||
Province of Quebec 2.875% 10/16/24 * | 7,605,000 | 7,581,957 | ||||||||||
Province of Quebec Canada 6.00% 10/1/29 | CAD | 3,366,000 | 3,899,740 | |||||||||
|
| |||||||||||
| 12,114,238 | ||||||||||||
|
| |||||||||||
Total Regional Bonds (cost $14,725,818) | 14,727,020 | |||||||||||
|
| |||||||||||
| ||||||||||||
Senior Secured Loans – 8.74%« | ||||||||||||
| ||||||||||||
Air Medical Group Holdings Tranche B1 5.00% 5/29/18 | 2,545,048 | 2,559,364 | ||||||||||
Albertsons Holdings Tranche B4 5.50% 8/25/21 | 860,000 | 861,134 | ||||||||||
Albertsons Holdings Tranche B4 1st Lien 5.50% 8/8/21 | 8,795,000 | 8,806,601 | ||||||||||
Albertsons Tranche B 1st Lien 4.75% 3/21/19 | 2,459,812 | 2,456,737 | ||||||||||
Amaya Gaming 1st Lien 5.00% 7/29/21 | 4,820,000 | 4,789,875 | ||||||||||
Amaya Gaming 2nd Lien 8.00% 7/29/22 | 2,195,000 | 2,218,778 | ||||||||||
Applied Systems 1st Lien 4.25% 1/15/21 | 2,659,900 | 2,636,626 | ||||||||||
Applied Systems 2nd Lien 7.50% 1/15/22 | 7,643,000 | 7,654,946 | ||||||||||
Ashland Water 1st Lien 4.25% 7/2/21 | 2,350,000 | 2,307,363 | ||||||||||
Ashland Water 2nd Lien 7.75% 7/2/22 | 1,875,000 | 1,836,563 | ||||||||||
Atkore International 2nd Lien 7.75% 9/27/21 | 2,465,000 | 2,437,269 | ||||||||||
Avast Software 1st Lien 5.00% 3/18/20 | 4,816,500 | 4,806,467 | ||||||||||
Axalta Coating Systems U.S. Holdings 1st Lien 3.75% 2/1/20 | 4,592,666 | 4,526,646 | ||||||||||
45
Table of Contents
Schedule of investments
Delaware Diversified Income Fund
| Principal amount° | Value (U.S. $) | |||||||
| ||||||||
Senior Secured Loans« (continued) |
| |||||||
| ||||||||
Azure Midstream Tranche B 6.50% 10/21/18 | 1,911,536 | $ | 1,874,452 | |||||
BJ’s Wholesale Club 2nd Lien 8.50% 3/31/20 | 6,410,000 | 6,429,230 | ||||||
BJ’s Wholesale Club Tranche B 1st Lien 4.50% 9/26/19 | 2,314,557 | 2,292,238 | ||||||
Bowie Recourse Tranche B 1st Lien 6.75% 8/9/20 | 4,013,750 | 4,013,750 | ||||||
Bway Holding Tranche B 1st Lien 5.50% 8/8/20 | 5,581,013 | 5,608,918 | ||||||
Caesars Growth Partners Tranche B 1st Lien 6.25% 5/8/21 | 10,284,225 | 9,753,950 | ||||||
Calpine Construction Finance Tranche B 3.00% 5/1/20 | 1,449,131 | 1,411,092 | ||||||
Charter Communications Tranche B 1st Lien 4.25% 8/12/21 | 6,590,000 | 6,651,096 | ||||||
Chrysler Group Tranche B 1st Lien | ||||||||
3.25% 12/29/18 | 10,273,375 | 10,193,119 | ||||||
3.50% 5/24/17 | 1,979,767 | 1,971,518 | ||||||
Citycenter Holdings Tranche B 1st Lien 4.25% 10/28/20 | 1,639,609 | 1,632,231 | ||||||
Clear Channel Communications Tranche B 3.804% 1/29/16 | 25,723,700 | 25,542,245 | ||||||
Clear Channel Communications Tranche D 6.904% 1/30/19 | 2,250,000 | 2,131,313 | ||||||
Clear Channel Communications Tranche E 1st Lien 7.654% 7/30/19 | 1,349,729 | 1,307,887 | ||||||
Community Health Systems Tranche D 4.25% 1/27/21 | 3,635,148 | 3,643,102 | ||||||
Crown Castles Operating Tranche B2 3.00% 1/31/21 | 3,469,071 | 3,441,606 | ||||||
Davita Healthcare Partners Tranche B 3.50% 6/19/21 | 3,930,150 | 3,898,218 | ||||||
Drillships Financing Holding Tranche B1 6.00% 2/17/21 | 14,749,876 | 14,166,032 | ||||||
Dynegy Tranche B2 4.00% 4/23/20 | 5,354,187 | 5,330,763 | ||||||
Emdeon 1st Lien 3.75% 11/2/18 | 3,817,015 | 3,789,181 | ||||||
Exgen Texas Power Tranche B 1st Lien 5.75% 9/16/21 | 8,705,000 | 8,721,322 | ||||||
Exide Technologies DIP 9.00% 3/31/15 | 5,926,983 | 5,897,348 | ||||||
Expro Holdings UK 3 Tranche B 1st Lien 5.75% 8/12/21 | 7,800,000 | 7,650,497 | ||||||
Fieldwood Energy 2nd Lien 8.375% 9/30/20 | 7,253,675 | 7,010,676 | ||||||
First Data Tranche B 1st Lien 4.153% 3/24/21 | 4,597,445 | 4,572,734 | ||||||
Flint Group 1st Lien 4.75% 5/2/21 | 4,800,000 | 4,704,000 | ||||||
Flint Group 2nd Lien 8.25% 5/2/22 | 2,125,000 | 2,045,313 | ||||||
Flying Fortress 1st Lien 3.50% 6/30/17 | 1,225,209 | 1,222,912 | ||||||
Gardner Denver 1st Lien 4.25% 7/23/20 | 2,044,849 | 2,017,301 | ||||||
Gates Global 1st Lien 4.25% 6/12/21 | 2,665,000 | 2,639,064 | ||||||
Gentiva Health Services Tranche B 6.50% 10/10/19 | 7,332,294 | 7,355,208 | ||||||
Gentiva Health Services Tranche C 5.75% 10/10/18 | 1,344,784 | 1,344,993 | ||||||
Goodpack 1st Lien 4.75% 8/5/21 | 5,600,000 | 5,577,835 | ||||||
Goodpack 2nd Lien 8.00% 8/5/22 | 945,000 | 946,181 | ||||||
HD Supply Tranche B 4.00% 6/28/18 | 7,350,188 | 7,302,720 | ||||||
Hilton Worldwide Finance Tranche B2 3.50% 9/23/20 | 10,201,579 | 10,115,508 | ||||||
Hostess Brands 1st Lien 6.75% 3/12/20 | 2,741,225 | 2,799,476 | ||||||
Houghton International 1st Lien 4.00% 12/10/19 | 1,886,400 | 1,873,431 | ||||||
46
Table of Contents
| Principal amount° | Value (U.S. $) | |||||||
| ||||||||
Senior Secured Loans« (continued) |
| |||||||
| ||||||||
Houghton International 2nd Lien 9.50% 11/20/20 | 2,605,000 | $ | 2,631,050 | |||||
Huntsman International Tranche B 3.75% 10/11/20 | 5,865,000 | 5,817,347 | ||||||
IASIS Healthcare Tranche B 1st Lien 4.50% 5/3/18 | 8,054,129 | 8,061,683 | ||||||
Immucor Tranche B2 5.00% 8/19/18 | 9,759,905 | 9,761,935 | ||||||
Ineos U.S. Finance Tranche B 3.75% 5/4/18 | 5,993,144 | 5,916,569 | ||||||
Infor U.S. Tranche B5 1st Lien 3.75% 6/3/20 | 57,630 | 56,838 | ||||||
Intelsat Jackson Holdings Tranche B2 3.75% 6/30/19 | 7,492,366 | 7,445,539 | ||||||
KIK Custom Products 1st Lien 5.50% 5/17/19 | 8,049,404 | 8,021,738 | ||||||
Kinetic Concepts Tranche E1 4.00% 5/8/18 | 1,422,845 | 1,414,842 | ||||||
Landry’s Tranche B 4.00% 4/24/18 | 5,128,500 | 5,120,489 | ||||||
Level 3 Financing Tranche B 4.00% 1/15/20 | 8,015,000 | 7,960,899 | ||||||
Lightower Fiber Networks 4.00% 4/1/20 | 975,938 | 961,445 | ||||||
LTS Buyer 2nd Lien 8.00% 3/15/21 | 3,141,138 | 3,129,358 | ||||||
Mauser Holdings 2nd Lien 8.25% 6/30/22 | 4,150,000 | 4,113,688 | ||||||
MGM Resorts International 3.50% 12/20/19 | 2,727,385 | 2,698,832 | ||||||
Michael Stores Tranche B 1st Lien 3.75% 1/16/20 | 2,306,369 | 2,271,054 | ||||||
Moxie Liberty Tranche B 7.50% 8/21/20 | 8,341,000 | 8,507,820 | ||||||
Moxie Patriot (Panda Power Fund) Tranche B1 6.75% 12/19/20 | 4,500,000 | 4,545,000 | ||||||
National Vision 4.00% 3/6/21 | 315,595 | 307,310 | ||||||
NEP Broadcasting 2nd Lien 9.50% 7/3/20 | 6,737,857 | 6,737,857 | ||||||
NEP/NCP Tranche B 1st Lien 4.25% 1/22/20 | 810,930 | 794,711 | ||||||
New Albertsons 1st Lien 4.75% 6/24/21 | 3,050,000 | 3,019,500 | ||||||
Numericable 4.50% 4/23/20 | 5,239,295 | 5,236,838 | ||||||
Numericable U.S. Tranche B2 1st Lien 4.50% 4/23/20 | 4,532,705 | 4,548,488 | ||||||
Ocean Rig (Drillship) Tranche B 1st Lien 5.50% 7/18/21 | 2,807,963 | 2,702,664 | ||||||
Pacific Drilling Tranche B 4.50% 6/3/18 | 1,604,000 | 1,542,514 | ||||||
Panda Temple Power II Tranche B 1st Lien 7.25% 4/3/19 | 3,741,000 | 3,825,173 | ||||||
Polymer Group Tranche B 5.25% 12/13/19 | 6,510,093 | 6,524,337 | ||||||
Prestige Brands Tranche B 1st Lien 4.50% 4/28/21 | 2,000,000 | 2,007,084 | ||||||
Quickrete 2nd Lien 7.00% 3/19/21 | 3,475,000 | 3,505,406 | ||||||
Republic of Angola 6.57% 12/16/23 | 11,720,000 | 11,749,300 | ||||||
Reynolds Group 1st Lien 4.00% 12/31/18 | 8,542,576 | 8,507,517 | ||||||
Rite Aid 2nd Lien 5.75% 8/3/20 | 4,665,000 | 4,698,042 | ||||||
Samson Investment 2nd Lien 5.00% 9/25/18 | 3,619,000 | 3,365,670 | ||||||
Santander Asset Management Tranche B 4.25% 11/26/20 | 2,327,413 | 2,324,503 | ||||||
Scientific Games International 4.25% 5/22/20 | 9,920,038 | 9,893,690 | ||||||
Scientific Games International Tranche B2 1st Lien 6.00% 9/17/21 | 2,410,000 | 2,363,682 | ||||||
Sensus 2nd Lien 8.50% 4/13/18 | 2,660,000 | 2,606,800 | ||||||
Sinclair Broadcasting Tranche B1 1st Lien 3.50% 7/22/21 | 2,725,000 | 2,680,719 | ||||||
Smart & Final Tranche B 1st Lien 4.75% 11/15/19 | 3,859,281 | 3,856,869 | ||||||
Sprouts Farmers 4.00% 4/12/20 | 3,401,501 | 3,385,911 | ||||||
47
Table of Contents
Schedule of investments
Delaware Diversified Income Fund
| Principal amount° | Value (U.S. $) | |||||||||||
| ||||||||||||
Senior Secured Loans« (continued) |
| |||||||||||
| ||||||||||||
Stena 1st Lien 4.00% 2/21/21 | 1,139,275 | $ | 1,122,186 | |||||||||
Styrolution Group Tranche B 1st Lien 6.50% 10/31/19 | 2,155,000 | 2,111,900 | ||||||||||
Supervalu 1st Lien 4.50% 3/21/19 | 3,183,678 | 3,145,075 | ||||||||||
Surgical Care Affiliates 4.233% 12/30/17 | 4,620,259 | 4,519,075 | ||||||||||
Surgical Care Affiliates Tranche C 4.25% 6/30/18 | 982,563 | 963,501 | ||||||||||
TransDigm Tranche C 3.75% 2/7/20 | 5,819,176 | 5,735,526 | ||||||||||
United Continental Tranche B 3.50% 4/1/19 | 1,058,425 | 1,040,432 | ||||||||||
Univision Communications 1st Lien 4.00% 3/1/20 | 2,137,450 | 2,116,520 | ||||||||||
Univision Communications Tranche C4 4.00% 3/1/20 | 5,368,447 | 5,322,032 | ||||||||||
US Airways Tranche B1 3.50% 5/23/19 | 1,692,550 | 1,655,525 | ||||||||||
USI Insurance Services Tranche B 1st Lien 4.25% 12/3/18 | 8,867,739 | 8,779,062 | ||||||||||
Valeant Pharmaceuticals International Tranche BE 3.75% 8/5/20 | 4,679,827 | 4,650,578 | ||||||||||
Vantage Drilling Tranche B 1st Lien 5.00% 10/25/17 | 4,307,892 | 4,049,418 | ||||||||||
Wide Open West Finance 4.75% 3/27/19 | 12,721,275 | 12,727,903 | ||||||||||
Windstream Tranche B5 1st Lien 3.50% 8/8/19 | 37,219 | 36,901 | ||||||||||
Zayo Group Tranche B 1st Lien 4.00% 7/2/19 | 8,956,036 | 8,888,866 | ||||||||||
Ziggo Tranche B 2nd Lien 3.50% 1/15/22 | 1,358,298 | 1,324,946 | ||||||||||
Ziggo Tranche B1 1st Lien 3.50% 1/15/22 | 2,107,787 | 2,056,033 | ||||||||||
|
| |||||||||||
Total Senior Secured Loans (cost $505,287,756) | 501,643,019 | |||||||||||
|
| |||||||||||
| ||||||||||||
Sovereign Bonds – 2.49%D | ||||||||||||
| ||||||||||||
Brazil – 0.25% | ||||||||||||
Brazil Notas do Tesouro Nacional Series F | ||||||||||||
10.00% 1/1/17 | BRL | 8,729,000 | 3,373,056 | |||||||||
10.00% 1/1/21 | BRL | 29,069,000 | 10,725,577 | |||||||||
|
| |||||||||||
| 14,098,633 | ||||||||||||
|
| |||||||||||
Chile – 0.09% | ||||||||||||
Chile Government International Bond 5.50% 8/5/20 | CLP | 2,737,000,000 | 5,027,648 | |||||||||
|
| |||||||||||
| 5,027,648 | ||||||||||||
|
| |||||||||||
Colombia – 0.23% | ||||||||||||
Colombia Government International Bond | ||||||||||||
4.00% 2/26/24 | 3,800,000 | 3,908,300 | ||||||||||
4.375% 3/21/23 * | COP | 7,082,000,000 | 3,054,812 | |||||||||
5.625% 2/26/44 | 4,300,000 | 4,822,906 | ||||||||||
9.85% 6/28/27 | COP | 2,576,000,000 | 1,608,451 | |||||||||
|
| |||||||||||
| 13,394,469 | ||||||||||||
|
| |||||||||||
Costa Rica – 0.05% | ||||||||||||
Costa Rica Government International Bond | ||||||||||||
5.625% 4/30/43 * | 3,100,000 | 2,743,500 | ||||||||||
|
| |||||||||||
| 2,743,500 | ||||||||||||
|
| |||||||||||
48
Table of Contents
| Principal amount° | Value (U.S. $) | |||||||||||
| ||||||||||||
Sovereign BondsD (continued) | ||||||||||||
| ||||||||||||
Guatemala – 0.11% | ||||||||||||
Guatemala Government Bond 144A 5.75% 6/6/22 # | 5,630,000 | $ | 6,207,075 | |||||||||
|
| |||||||||||
| 6,207,075 | ||||||||||||
|
| |||||||||||
Hungary – 0.06% | ||||||||||||
Hungary Government International Bond 5.375% 3/25/24 | 3,140,000 | 3,367,964 | ||||||||||
|
| |||||||||||
| 3,367,964 | ||||||||||||
|
| |||||||||||
Iceland – 0.10% | ||||||||||||
Republic of Iceland 144A 5.875% 5/11/22 # | 5,275,000 | 5,969,607 | ||||||||||
|
| |||||||||||
| 5,969,607 | ||||||||||||
|
| |||||||||||
Indonesia – 0.32% | ||||||||||||
Indonesia Government International Bond | ||||||||||||
144A 3.375% 4/15/23 # | 10,812,000 | 10,406,550 | ||||||||||
144A 5.875% 1/15/24 # | 3,226,000 | 3,677,640 | ||||||||||
Indonesia Treasury Bond 7.875% 4/15/19 | IDR | 52,047,000,000 | 4,321,818 | |||||||||
|
| |||||||||||
| 18,406,008 | ||||||||||||
|
| |||||||||||
Japan – 0.02% | ||||||||||||
Japanese Government CPI Linked Bond 0.10% 3/10/24 | JPY | 136,239,600 | 1,298,209 | |||||||||
|
| |||||||||||
| 1,298,209 | ||||||||||||
|
| |||||||||||
Kazakhstan – 0.06% | ||||||||||||
Kazakhstan Government International Bond 144A 4.875% 10/14/44 # | 3,490,000 | 3,376,575 | ||||||||||
|
| |||||||||||
| 3,376,575 | ||||||||||||
|
| |||||||||||
Kenya – 0.08% | ||||||||||||
Kenya Government International Bond 144A 5.875% 6/24/19 # | 4,370,000 | 4,539,337 | ||||||||||
|
| |||||||||||
| 4,539,337 | ||||||||||||
|
| |||||||||||
Mexico – 0.12% | ||||||||||||
Mexican Bonos | ||||||||||||
6.50% 6/10/21 | MXN | 4,573,100 | 358,702 | |||||||||
6.50% 6/9/22 | MXN | 59,642,000 | 4,647,430 | |||||||||
8.00% 6/11/20 | MXN | 25,129,000 | 2,123,331 | |||||||||
|
| |||||||||||
| 7,129,463 | ||||||||||||
|
| |||||||||||
Norway – 0.05% | ||||||||||||
Kommunalbanken 5.00% 3/28/19 | NZD | 510,000 | 406,847 | |||||||||
Norway Government Bond | ||||||||||||
2.00% 5/24/23 | NOK | 1,662,000 | 248,033 | |||||||||
3.75% 5/25/21 | NOK | 14,526,000 | 2,429,852 | |||||||||
|
| |||||||||||
| 3,084,732 | ||||||||||||
|
| |||||||||||
Pakistan – 0.16% | ||||||||||||
Pakistan Government International Bond 144A 7.25% 4/15/19 # | 8,649,000 | 8,973,338 | ||||||||||
|
| |||||||||||
| 8,973,338 | ||||||||||||
|
| |||||||||||
49
Table of Contents
Schedule of investments
Delaware Diversified Income Fund
| Principal amount° | Value (U.S. $) | |||||||||
| ||||||||||
Sovereign BondsD (continued) | ||||||||||
| ||||||||||
Peru – 0.09% | ||||||||||
Peruvian Government International Bond 144A 5.70% 8/12/24 # | PEN | 14,913,000 | $ | 5,083,583 | ||||||
|
| |||||||||
| 5,083,583 | ||||||||||
|
| |||||||||
Philippines – 0.09% | ||||||||||
Philippine Government International Bond | ||||||||||
3.90% 11/26/22 | PHP | 120,000,000 | 2,608,696 | |||||||
6.25% 1/14/36 | PHP | 102,000,000 | 2,491,871 | |||||||
|
| |||||||||
| 5,100,567 | ||||||||||
|
| |||||||||
Poland – 0.06% | ||||||||||
Poland Government Bond | ||||||||||
2.242% 7/25/16 ^ | PLN | 2,788,000 | 803,439 | |||||||
4.00% 10/25/23 | PLN | 4,118,000 | 1,373,406 | |||||||
5.25% 10/25/17 | PLN | 3,101,000 | 1,011,406 | |||||||
|
| |||||||||
| 3,188,251 | ||||||||||
|
| |||||||||
Portugal – 0.02% | ||||||||||
Portugal Government International Bond 144A 5.125% 10/15/24 # | 1,045,000 | 1,077,286 | ||||||||
|
| |||||||||
| 1,077,286 | ||||||||||
|
| |||||||||
Republic of Korea – 0.14% | ||||||||||
Korea Treasury Inflation-Linked Bond 1.125% 6/10/23 | KRW | 8,871,306,540 | 8,023,350 | |||||||
|
| |||||||||
| 8,023,350 | ||||||||||
|
| |||||||||
Russia – 0.04% | ||||||||||
Russian-Eurobond 7.85% 3/10/18 | RUB | 110,000,000 | 2,406,222 | |||||||
|
| |||||||||
| 2,406,222 | ||||||||||
|
| |||||||||
Senegal – 0.05% | ||||||||||
Senegal Government International Bond 144A 6.25% 7/30/24 # | 3,000,000 | 2,981,160 | ||||||||
|
| |||||||||
| 2,981,160 | ||||||||||
|
| |||||||||
Slovenia – 0.06% | ||||||||||
Slovenia Government International Bond 144A 5.25% 2/18/24 # | 3,330,000 | 3,602,660 | ||||||||
|
| |||||||||
| 3,602,660 | ||||||||||
|
| |||||||||
South Africa – 0.10% | ||||||||||
South Africa Government Bond 8.00% 1/31/30 | ZAR | 44,854,000 | 3,974,387 | |||||||
South Africa Government International Bond 5.375% 7/24/44 | 1,777,000 | 1,842,527 | ||||||||
|
| |||||||||
| 5,816,914 | ||||||||||
|
| |||||||||
Sweden – 0.06% | ||||||||||
Sweden Government Bond 2.50% 5/12/25 | SEK | 22,685,000 | 3,477,524 | |||||||
|
| |||||||||
| 3,477,524 | ||||||||||
|
| |||||||||
United Kingdom – 0.08% | ||||||||||
United Kingdom Gilt 1.25% 7/22/18 | GBP | 1,623,148 | 2,593,662 | |||||||
50
Table of Contents
| Principal amount° | Value (U.S. $) | |||||||||||
| ||||||||||||
Sovereign BondsD (continued) | ||||||||||||
| ||||||||||||
United Kingdom (continued) | ||||||||||||
United Kingdom Gilt Inflation-Linked 0.125% 3/22/24 | GBP | 983,815 | $ | 1,680,435 | ||||||||
|
| |||||||||||
| 4,274,097 | ||||||||||||
|
| |||||||||||
Total Sovereign Bonds (cost $143,392,522) | 142,648,172 | |||||||||||
|
| |||||||||||
| ||||||||||||
Supranational Banks – 0.19% | ||||||||||||
| ||||||||||||
European Bank for Reconstruction & Development 6.00% 3/3/16 | INR | 260,400,000 | 4,266,565 | |||||||||
Inter-American Development Bank 7.25% 7/17/17 | IDR | 15,220,000,000 | 1,254,753 | |||||||||
International Bank for Reconstruction & Development | ||||||||||||
2.898% 9/24/18 — | AUD | 4,747,000 | 4,180,795 | |||||||||
4.625% 10/6/21 | NZD | 1,397,000 | 1,099,965 | |||||||||
|
| |||||||||||
Total Supranational Banks (cost $11,099,807) | 10,802,078 | |||||||||||
|
| |||||||||||
| ||||||||||||
U.S. Treasury Obligation – 2.00% | ||||||||||||
| ||||||||||||
U.S. Treasury Bond 3.125% 8/15/44 ¥ | 113,520,000 | 114,939,000 | ||||||||||
|
| |||||||||||
Total U.S. Treasury Obligation (cost $112,537,758) | 114,939,000 | |||||||||||
|
| |||||||||||
Number of Shares | ||||||||||||
| ||||||||||||
Common Stock – 0.00% | ||||||||||||
| ||||||||||||
Century Communications =† | 7,875,000 | 0 | ||||||||||
|
| |||||||||||
Total Common Stock (cost $238,403) | 0 | |||||||||||
|
| |||||||||||
| ||||||||||||
Convertible Preferred Stock – 0.55% | ||||||||||||
| ||||||||||||
Alcoa 5.375% exercise price $19.39, expiration date 10/1/17 | 34,550 | 1,800,055 | ||||||||||
ArcelorMittal 6.00% exercise price $20.36, expiration date 12/21/15 | 106,550 | 2,212,575 | ||||||||||
Bank of America 7.25% exercise price $50.00, expiration date 12/31/49 | 1,465 | 1,666,804 | ||||||||||
Chesapeake Energy 144A 5.75% exercise price $26.14, expiration date 12/31/49 # | 1,633 | 1,778,949 | ||||||||||
Dominion Resources 6.125% exercise price $65.21, expiration date 4/1/16 | 23,556 | 1,339,865 | ||||||||||
Dynegy 5.375% exercise price $38.75, expiration date 11/1/17 @ | 18,850 | 1,894,425 | ||||||||||
Exelon 6.50% exercise price $43.75, expiration date 6/1/17 | 38,450 | 2,025,546 | ||||||||||
Halcon Resources 5.75% exercise price $6.16, expiration date 12/31/49 | 1,803 | 1,196,065 | ||||||||||
51
Table of Contents
Schedule of investments
Delaware Diversified Income Fund
| Number of Shares | Value (U.S. $) | |||||||
| ||||||||
Convertible Preferred Stock (continued) | ||||||||
| ||||||||
HealthSouth 6.50% exercise price $29.70, expiration date 12/31/49 | 2,663 | $ | 3,742,181 | |||||
Huntington Bancshares 8.50% exercise price $11.95, expiration date 12/31/49 | 1,635 | 2,141,850 | ||||||
Intelsat 5.75% exercise price $22.05, expiration date 5/1/16 | 66,691 | 3,430,585 | ||||||
Maiden Holdings 7.25% exercise price $15.39, expiration date 9/15/16 | 58,850 | 2,750,061 | ||||||
SandRidge Energy 8.50% exercise price $8.01, expiration date 12/31/49 | 28,053 | 2,594,903 | ||||||
Wells Fargo 7.50% exercise price $156.71, expiration date 12/31/49 | 2,210 | 2,660,840 | ||||||
|
| |||||||
Total Convertible Preferred Stock (cost $31,926,695) | 31,234,704 | |||||||
|
| |||||||
| ||||||||
Preferred Stock – 0.63% | ||||||||
| ||||||||
Alabama Power 5.625% | 289,178 | 7,200,532 | ||||||
Ally Financial 144A 7.00% # | 9,820 | 9,883,830 | ||||||
Integrys Energy Group 6.00% • | 205,350 | 5,363,742 | ||||||
National Retail Properties 5.70% | 202,445 | 4,919,414 | ||||||
Public Storage 5.20% | 212,995 | 4,894,625 | ||||||
Regions Financial 6.375% • | 160,200 | 4,101,120 | ||||||
|
| |||||||
Total Preferred Stock (cost $35,304,598) | 36,363,263 | |||||||
|
| |||||||
| Principal amount° | ||||||||
| ||||||||
Short-Term Investments – 11.88% | ||||||||
| ||||||||
Discount Notes – 4.73%≠ | ||||||||
Federal Home Loan Bank | ||||||||
0.006% 11/13/14 | 34,567,472 | 34,567,334 | ||||||
0.012% 11/19/14 | 148,707,693 | 148,706,800 | ||||||
0.018% 11/14/14 | 88,089,627 | 88,089,275 | ||||||
|
| |||||||
| 271,363,409 | ||||||||
|
| |||||||
Repurchase Agreements – 5.80% | ||||||||
Bank of America Merrill Lynch | ||||||||
0.06%, dated 10/31/14, to be repurchased on 11/3/14, repurchase price $106,055,669 (collateralized by U.S. government obligations 0.00%–2.75% 2/15/19–1/15/26 market value $108,176,242) | 106,055,139 | 106,055,139 | ||||||
Bank of Montreal | ||||||||
0.07%, dated 10/31/14, to be repurchased on 11/3/14, repurchase price $17,675,960 (collateralized by U.S. government obligations 0.00%–11.25% 10/31/14–5/15/44 market value $18,029,383) | 17,675,857 | 17,675,857 | ||||||
52
Table of Contents
| Principal amount° | Value (U.S. $) | |||||||
| ||||||||
Short-Term Investments (continued) | ||||||||
| ||||||||
Repurchase Agreements (continued) | ||||||||
BNP Paribas | ||||||||
0.11%, dated 10/31/14, to be repurchased on 11/3/14, repurchase price $208,802,918 (collateralized by U.S.government obligations | 208,801,004 | $ | 208,801,004 | |||||
|
| |||||||
| 332,532,000 | ||||||||
|
| |||||||
U.S. Treasury Obligations – 1.35%≠ | ||||||||
U.S. Treasury Bills | ||||||||
0.001% 11/13/14 | 26,474,856 | 26,474,830 | ||||||
0.002% 12/26/14 | 51,326,067 | 51,325,297 | ||||||
|
| |||||||
| 77,800,127 | ||||||||
|
| |||||||
Total Short-Term Investments (cost $681,692,723) | 681,695,536 | |||||||
|
| |||||||
Total Value of Securities Before Securities | 6,206,662,181 | |||||||
|
| |||||||
|
| Number of Shares |
| ||||||
| ||||||||
Securities Lending Collateral – 2.34%** | ||||||||
| ||||||||
Investment Company | ||||||||
Delaware Investments® Collateral Fund No. 1 | 134,138,153 | 134,138,153 | ||||||
|
| |||||||
Total Securities Lending Collateral (cost $134,138,153) | 134,138,153 | |||||||
|
| |||||||
Total Value of Securities – 110.53% | $ | 6,340,800,334n | ||||||
|
| |||||||
| # | Security exempt from registration under Rule 144A of the Securities Act of 1933, as amended. At Oct. 31, 2014, the aggregate value of Rule 144A securities was $1,293,171,560, which represents 22.54% of the Fund’s net assets. See Note 11 in “Notes to financial statements.” |
| * | Fully or partially on loan. |
| ** | See Note 10 in “Notes to financial statements” for additional information on securities lending collateral. |
| @ | Illiquid security. At Oct. 31, 2014, the aggregate value of illiquid securities was $1,894,425, which represents 0.03% of the Fund’s net assets. See Note 11 in “Notes to financial statements.” |
| ¿ | Pass Through Agreement. Security represents the contractual right to receive a proportionate amount of underlying payments due to the counterparty pursuant to various agreements related to the rescheduling of obligations and the exchange of certain notes. |
 | 86% of the income received was in the form of cash and 14% of the income received was in the form of additional par. |
53
Table of Contents
Schedule of investments
Delaware Diversified Income Fund
| T | 100% of the income received was in the form of additional cash. |
| = | Security is being fair valued in accordance with the Fund’s fair valuation policy. At Oct. 31, 2014, the aggregate value of fair valued securities was $0, which represents 0.00% of the Fund’s net assets. See Note 1 in “Notes to financial statements.” |
| ≠ | The rate shown is the effective yield at the time of purchase. |
| n | Includes $128,586,133 of securities loaned. |
| ° | Principal amount shown is stated in U.S. dollars unless noted that the security is denominated in another currency. |
| † | Non-income-producing security. |
| • | Variable rate security. The rate shown is the rate as of Oct. 31, 2014. Interest rates reset periodically. |
| ¥ | Fully or partially pledged as collateral for futures contracts. |
| D | Securities have been classified by country of origin. |
| S | Interest only security. An interest only security is the interest only portion of a fixed income security which is separated and sold individually from the principal portion of the security. |
| ^ | Zero coupon security. The rate shown is the yield at the time of purchase. |
| « | Senior secured loans generally pay interest at rates which are periodically redetermined by reference to a base lending rate plus a premium. These base lending rates are generally: (i) the prime rate offered by one or more United States banks, (ii) the lending rate offered by one or more European banks such as the London Inter-Bank Offered Rate (LIBOR), and (iii) the certificate of deposit rate. Senior secured loans may be subject to restrictions on resale. Stated rate in effect at Oct. 31, 2014. |
| f | Step coupon bond. Coupon increases or decreases periodically based on a predetermined schedule. Stated rate in effect at Oct. 31, 2014. |
Unfunded Commitments
The Fund may invest in floating rate loans. In connection with these investments, the Fund may also enter into unfunded corporate loan commitments (commitments). Commitments may obligate the Fund to furnish temporary financing to a borrower until permanent financing can be arranged. In connection with these commitments, the Fund earns a commitment fee, typically set as a percentage of the commitment amount. The following commitment was outstanding at Oct. 31, 2014:
Borrower | Unfunded Amount | Cost | Value | Unrealized Appreciation (Depreciation) | ||||||
Ziggo | $2,233,915 | $2,228,330 | $2,179,063 | $(49,267) |
54
Table of Contents
The following foreign currency exchange contracts, futures contracts, and swap contracts were outstanding at Oct. 31, 2014:1
Foreign Currency Exchange Contracts
Counterparty | Contracts to Receive (Deliver) | In Exchange For | Settlement Date | Unrealized Appreciation (Depreciation) | ||||||||||||||||||||||
BAML | AUD | (8,232,899 | ) | USD | 7,239,435 | 11/21/14 | $ | 5,858 | ||||||||||||||||||
BAML | CAD | (6,275,724 | ) | USD | 5,575,602 | 11/21/14 | 10,668 | |||||||||||||||||||
BAML | EUR | (2,551,322 | ) | USD | 3,238,210 | 11/21/14 | 40,718 | |||||||||||||||||||
BAML | JPY | (715,886,976 | ) | USD | 6,412,000 | 11/21/14 | 35,354 | |||||||||||||||||||
BAML | NZD | (16,312,335 | ) | USD | 12,827,368 | 11/21/14 | 137,723 | |||||||||||||||||||
BNP | AUD | (9,189,661 | ) | USD | 8,073,724 | 11/21/14 | (482 | ) | ||||||||||||||||||
BNP | NOK | (3,348,000 | ) | USD | 505,541 | 11/21/14 | 9,584 | |||||||||||||||||||
BNYM | BRL | 5,297,338 | USD | (2,179,077 | ) | 11/3/14 | (43,481 | ) | ||||||||||||||||||
BNYM | BRL | 11,960,282 | USD | (4,887,732 | ) | 11/4/14 | (67,487 | ) | ||||||||||||||||||
DB | MXN | (50,422,763 | ) | USD | 3,711,732 | 11/21/14 | (27,761 | ) | ||||||||||||||||||
HSBC | GBP | (6,740,268 | ) | USD | 10,860,661 | 11/21/14 | 80,104 | |||||||||||||||||||
JPMC | KRW | (4,604,025,610 | ) | USD | 4,371,256 | 11/21/14 | 89,856 | |||||||||||||||||||
JPMC | SEK | (25,036,314 | ) | USD | 3,411,000 | 11/21/14 | 20,721 | |||||||||||||||||||
TD | JPY | (518,797,760 | ) | USD | 4,812,493 | 11/21/14 | 191,386 | |||||||||||||||||||
UBS | BRL | 29,664 | USD | (12,128 | ) | 11/21/14 | (235 | ) | ||||||||||||||||||
UBS | CLP | (1,815,785,232 | ) | USD | 3,095,968 | 11/21/14 | (53,255 | ) | ||||||||||||||||||
|
| |||||||||||||||||||||||||
| $ | 429,271 | |||||||||||||||||||||||||
|
| |||||||||||||||||||||||||
Futures Contracts
| Contracts to Buy (Sell) | Notional Cost (Proceeds) | Notional Value | Expiration Date | Unrealized Appreciation (Depreciation) | ||||||||||||||||
| (1,606) | U.S. Treasury 5 yr Notes | $ | (191,734,859 | ) | $ | (191,804,078 | ) | 1/2/15 | $ | (69,219 | ) | |||||||||
| 370 | U.S. Treasury 10 yr Notes | 47,122,857 | 46,752,969 | 12/22/14 | (369,888 | ) | ||||||||||||||
| 445 | U.S. Treasury Long Bond | 61,303,072 | 62,786,719 | 12/22/14 | 1,483,647 | |||||||||||||||
|
|
|
| |||||||||||||||||
| $ | (83,308,930 | ) | $ | 1,044,540 | ||||||||||||||||
|
|
|
| |||||||||||||||||
Swap Contracts
CDS Contracts2
Counterparty | Swap Referenced Obligation | Notional Value | Annual Protection Payments | Termination Date | Unrealized Appreciation (Depreciation) | |||||||||||||||
| Protection Purchased: | ||||||||||||||||||||
| BCLY | ICE-CDX.NA.HY.23 | $ | 28,245,000 | 5.00 | % | 12/20/19 | $ | (110,753 | ) | |||||||||||
| BCLY | ICE-CDX.NA.IG.22 | 1,000,000 | 1.00 | % | 6/20/19 | (2,984 | ) | |||||||||||||
| $ | (113,737 | ) | ||||||||||||||||||
55
Table of Contents
Schedule of investments
Delaware Diversified Income Fund
The use of foreign currency exchange contracts, futures contracts, and swap contracts involves elements of market risk and risks in excess of the amounts disclosed in the financial statements. The notional values and foreign currency exchange contracts presented above represent the Fund’s total exposure in such contracts, whereas only the net unrealized appreciation (depreciation) is reflected in the Fund’s net assets.
1See Note 8 in “Notes to financial statements.”
2A CDS contract is a risk-transfer instrument through which one party (purchaser of protection) transfers to another party (seller of protection) the financial risk of a credit event (as defined in the CDS agreement), as it relates to a particular reference security or basket of securities (such as an index). Periodic payments (receipts) on such contracts are accrued daily and recorded as unrealized losses (gains) on swap contracts. Upon payment (receipt), such amounts are recorded as realized losses (gains) on swap contracts. Upfront payments made or received in connection with CDS contracts are amortized over the expected life of the CDS contracts as unrealized losses (gains) on swap contracts. The change in value of CDS contracts is recorded as unrealized appreciation or depreciation daily. A realized gain or loss is recorded upon a credit event (as defined in the CDS agreement) or the maturity or termination of the agreement.
Summary of Abbreviations:
AMT – Subject to Alternative Minimum Tax
ARM – Adjustable Rate Mortgage
AUD – Australian Dollar
BAML – Bank of America Merrill Lynch
BCLY – Barclays Bank
BNP – Banque Paribas
BNYM – Bank of New York Mellon
BRL – Brazilian Real
CAD – Canadian Dollar
CDS – Credit Default Swap
CDX.NA – Credit Default Swap Index North America
CLP – Chilean Peso
COP – Colombian Peso
CPI – Consumer Price Index
DB – Deutsche Bank
DIP – Debtor in Possession
EUR – European Monetary Unit
GBP – British Pound Sterling
GNMA – Government National Mortgage Association
GSMPS – Goldman Sachs Reperforming Mortgage Securities
HSBC – Hong Kong Shanghai Bank
HY – High Yield
ICE – IntercontinentalExchange, Inc.
IDR – Indonesian Rupiah
IG – Investment Grade
INR – Indian Rupee
JPMC – JPMorgan Chase Bank
56
Table of Contents
Summary of Abbreviations (continued):
JPY – Japanese Yen
KRW – South Korean Won
MASTR – Mortgage Asset Securitization Transactions, Inc.
MXN – Mexican Peso
NOK – Norwegian Krone
NZD – New Zealand Dollar
PEN – Peruvian Nuevo Sol
PHP – Philippine Peso
PIK – Pay-in-kind
PLN – Polish Zloty
RASC – Residential Asset Securities Corporation
REMIC – Real Estate Mortgage Investment Conduit
RUB – Russian Ruble
SEK – Swedish Krona
S.F. – Single Family
TBA – To be announced
TD – Toronto Dominion Securities
UBS – Union Bank of Switzerland
USD – United States Dollar
yr – Year
ZAR – South African Rand
See accompanying notes, which are an integral part of the financial statements.
57
Table of Contents
Statement of assets and liabilities
| Delaware Diversified Income Fund | October 31, 2014 |
Assets: | ||||
Investments, at value1,2 | $ | 5,524,966,645 | ||
Short-term investments, at value3 | 681,695,536 | |||
Short-term investments held as collateral for loaned securities, at value4 | 134,138,153 | |||
Cash | 16,599,179 | |||
Foreign currencies, at value5 | 3,236,792 | |||
Cash collateral due from brokers | 2,917,694 | |||
Receivable for securities sold | 279,963,792 | |||
Dividends and interest receivable | 49,046,074 | |||
Receivable for fund shares sold | 13,875,283 | |||
Securities lending income receivable | 62,001 | |||
Unrealized gain on foreign currency exchange contracts | 621,972 | |||
|
| |||
Total assets | 6,707,123,121 | |||
|
| |||
Liabilities: | ||||
Payable for securities purchased | 813,080,489 | |||
Obligation to return securities lending collateral | 134,138,153 | |||
Payable for fund shares redeemed | 8,841,724 | |||
Distribution payable | 5,014,721 | |||
Variation margin due to broker on futures contracts | 757,473 | |||
Swap interest payable | 157,501 | |||
Investment management fees payable | 2,175,662 | |||
Other accrued expenses | 2,087,626 | |||
Distribution fees payable | 1,483,485 | |||
Other affiliates payable | 217,498 | |||
Trustees’ fees and expenses payable | 13,318 | |||
Upfront payments paid on credit default swap contracts | 1,893,503 | |||
Unrealized loss on foreign currency exchange contracts | 192,701 | |||
Unrealized loss on credit default swap contracts | 113,737 | |||
Other liabilities | 2,994 | |||
|
| |||
Total liabilities | 970,170,585 | |||
|
| |||
Total Net Assets | $ | 5,736,952,536 | ||
|
| |||
Net Assets Consist of: | ||||
Paid-in capital | $ | 5,626,494,731 | ||
Distributions in excess of net investment income | (7,422,323 | ) | ||
Accumulated net realized loss | (19,162,663 | ) | ||
Net unrealized appreciation of investments, foreign currencies, and derivatives | 137,042,791 | |||
|
| |||
Total Net Assets | $ | 5,736,952,536 | ||
|
| |||
58
Table of Contents
Net Asset Value | ||||
Class A: | ||||
Net assets | $ | 2,048,202,323 | ||
Shares of beneficial interest outstanding, unlimited authorization, no par | 225,308,501 | |||
Net asset value per share | $ | 9.09 | ||
Sales charge | 4.50 | % | ||
Offering price per share, equal to net asset value per share / (1 – sales charge) | $ | 9.52 | ||
Class C: | ||||
Net assets | $ | 1,177,575,033 | ||
Shares of beneficial interest outstanding, unlimited authorization, no par | 129,548,915 | |||
Net asset value per share | $ | 9.09 | ||
Class R: | ||||
Net assets | $ | 116,839,912 | ||
Shares of beneficial interest outstanding, unlimited authorization, no par | 12,859,246 | |||
Net asset value per share | $ | 9.09 | ||
Institutional Class: | ||||
Net assets | $ | 2,394,335,268 | ||
Shares of beneficial interest outstanding, unlimited authorization, no par | 263,186,064 | |||
Net asset value per share | $ | 9.10 | ||
| ||||
| 1Investments,at cost | $ | 5,389,352,423 | ||
| 2Including securities on loan | 128,586,133 | |||
| 3Short-term investments, at cost | 681,692,723 | |||
| 4Short-term investments held as collateral for loaned securities, at cost | 134,138,153 | |||
| 5Foreign currencies, at cost | 1,149,478 | |||
See accompanying notes, which are an integral part of the financial statements.
59
Table of Contents
| Delaware Diversified Income Fund | Year ended October 31, 2014 |
Investment Income: | ||||
Interest | $ | 242,890,520 | ||
Dividends | 3,682,157 | |||
Securities lending income | 922,606 | |||
Foreign tax withheld | (125,462 | ) | ||
|
| |||
| 247,369,821 | ||||
|
| |||
Expenses: | ||||
Management fees | 26,142,184 | |||
Distribution expenses – Class A | 6,654,919 | |||
Distribution expenses – Class B* | 58,321 | |||
Distribution expenses – Class C | 12,637,857 | |||
Distribution expenses – Class R | 599,215 | |||
Dividend disbursing and transfer agent fees and expenses | 7,787,808 | |||
Accounting and administration expenses | 2,002,601 | |||
Reports and statements to shareholders | 493,308 | |||
Legal fees | 376,498 | |||
Custodian fees | 316,850 | |||
Trustees’ fees and expenses | 285,448 | |||
Registration fees | 230,760 | |||
Audit and tax | 51,847 | |||
Other | 275,078 | |||
|
| |||
| 57,912,694 | ||||
Less waived distribution expenses – Class B | (19,301 | ) | ||
Less expense paid indirectly | (3,146 | ) | ||
|
| |||
Total operating expenses | 57,890,247 | |||
|
| |||
Net Investment Income | $ | 189,479,574 | ||
|
| |||
60
Table of Contents
Net Realized and Unrealized Gain (Loss): | ||||
Net realized gain (loss) on: | ||||
Investments | $ | 98,519,020 | ||
Foreign currencies | (16,286,652 | ) | ||
Foreign currency exchange contracts | (470,162 | ) | ||
Futures contracts | 7,737,661 | |||
Swap contracts | (1,241,974 | ) | ||
|
| |||
Net realized gain | 88,257,893 | |||
|
| |||
Net change in unrealized appreciation (depreciation) of: | ||||
Investments** | 12,463,742 | |||
Foreign currencies | 254,572 | |||
Foreign currency exchange contracts | 1,255,898 | |||
Futures contracts | 1,420,453 | |||
Swap contracts | (166,019 | ) | ||
|
| |||
Net change in unrealized appreciation (depreciation) | 15,228,646 | |||
|
| |||
Net Realized and Unrealized Gain | 103,486,539 | |||
|
| |||
Net Increase in Net Assets Resulting from Operations | $ | 292,966,113 | ||
|
| |||
*Effective Sept. 25, 2014, all remaining shares of Class B were converted to Class A shares.
**Includes $2,994 capital gain taxes accrued.
See accompanying notes, which are an integral part of the financial statements.
61
Table of Contents
Statements of changes in net assets
Delaware Diversified Income Fund
| Year ended | ||||||||
| 10/31/14 | 10/31/13 | |||||||
Increase (Decrease) in Net Assets from Operations: | ||||||||
Net investment income | $ | 189,479,574 | $ | 247,984,321 | ||||
Net realized gain (loss) | 88,257,893 | (30,715,964 | ) | |||||
Net change in unrealized appreciation (depreciation) | 15,228,646 | (317,703,648 | ) | |||||
|
|
|
| |||||
Net increase (decrease) in net assets resulting from operations | 292,966,113 | (100,435,291 | ) | |||||
|
|
|
| |||||
Dividends and Distributions to Shareholders from: | ||||||||
Net investment income: | ||||||||
Class A | (101,311,286 | ) | (113,401,573 | ) | ||||
Class B | (199,020 | ) | (325,601 | ) | ||||
Class C | (38,624,229 | ) | (41,424,219 | ) | ||||
Class R | (4,252,164 | ) | (3,628,912 | ) | ||||
Institutional Class | (71,970,965 | ) | (63,836,683 | ) | ||||
Net realized gain: | ||||||||
Class A | — | (44,853,987 | ) | |||||
Class B | — | (179,929 | ) | |||||
Class C | — | (20,830,889 | ) | |||||
Class R | — | (1,508,898 | ) | |||||
Institutional Class | — | (22,333,841 | ) | |||||
Return of capital: | ||||||||
Class A | — | (37,093,319 | ) | |||||
Class B | — | (107,045 | ) | |||||
Class C | — | (13,596,818 | ) | |||||
Class R | — | (1,187,785 | ) | |||||
Institutional Class | — | (20,849,919 | ) | |||||
|
|
|
| |||||
| (216,357,664 | ) | (385,159,418 | ) | |||||
|
|
|
| |||||
Capital Share Transactions: | ||||||||
Proceeds from shares sold: | ||||||||
Class A | 409,534,255 | 889,060,120 | ||||||
Class B | 10,560 | 48,967 | ||||||
Class C | 91,850,364 | 174,308,080 | ||||||
Class R | 41,084,040 | 51,152,003 | ||||||
Institutional Class | 1,335,463,575 | 977,466,627 | ||||||
62
Table of Contents
| Year ended | ||||||||
| 10/31/14 | 10/31/13 | |||||||
Capital Share Transactions (continued): | ||||||||
Net asset value of shares based upon reinvestment of dividends and distributions: | ||||||||
Class A | $ | 99,203,203 | $ | 188,583,462 | ||||
Class B | 184,545 | 564,306 | ||||||
Class C | 35,230,749 | 53,114,891 | ||||||
Class R | 4,250,429 | 6,130,292 | ||||||
Institutional Class | 66,560,180 | 94,270,920 | ||||||
|
|
|
| |||||
| 2,083,371,900 | 2,434,699,668 | |||||||
|
|
|
| |||||
Cost of shares redeemed: | ||||||||
Class A | (1,745,741,871 | ) | (2,484,540,885 | ) | ||||
Class B | (9,700,498 | ) | (12,268,441 | ) | ||||
Class C | (437,984,676 | ) | (875,859,568 | ) | ||||
Class R | (54,724,332 | ) | (85,464,560 | ) | ||||
Institutional Class | (762,910,784 | ) | (1,445,552,892 | ) | ||||
|
|
|
| |||||
| (3,011,062,161 | ) | (4,903,686,346 | ) | |||||
|
|
|
| |||||
Decrease in net assets derived from capital share transactions | (927,690,261 | ) | (2,468,986,678 | ) | ||||
|
|
|
| |||||
Net Decrease in Net Assets | (851,081,812 | ) | (2,954,581,387 | ) | ||||
Net Assets: | ||||||||
Beginning of year | 6,588,034,348 | 9,542,615,735 | ||||||
|
|
|
| |||||
End of year | $ | 5,736,952,536 | $ | 6,588,034,348 | ||||
|
|
|
| |||||
Distributions in excess of net investment income | $ | (7,422,323 | ) | $ | (13,486,194 | ) | ||
|
|
|
| |||||
See accompanying notes, which are an integral part of the financial statements.
63
Table of Contents
Delaware Diversified Income Fund Class A |
Selected data for each share of the Fund outstanding throughout each period were as follows:
Net asset value, beginning of period |
Income (loss) from investment operations: |
Net investment income1 |
Net realized and unrealized gain (loss) |
Total from investment operations |
Less dividends and distributions from: |
Net investment income |
Net realized gain |
Return of capital |
Total dividends and distributions |
Net asset value, end of period |
Total return2 |
Ratios and supplemental data: |
Net assets, end of period (000 omitted) |
Ratio of expenses to average net assets |
Ratio of expenses to average net assets prior to fees waived |
Ratio of net investment income to average net assets |
Ratio of net investment income to average net assets prior to fees waived |
Portfolio turnover |
| 1 | The average shares outstanding method has been applied for per share information. |
| 2 | Total investment return is based on the change in net asset value of a share during the period and assumes reinvestment of dividends and distributions at net asset value and does not reflect the impact of a sales charge. Total investment return during some of the periods shown reflects a waiver by the distributor. Performance would have been lower had the waiver not been in effect. |
See accompanying notes, which are an integral part of the financial statements.
64
Table of Contents
| Year ended | ||||||||||||||||||
| 10/31/14 | 10/31/13 | 10/31/12 | 10/31/11 | 10/31/10 | ||||||||||||||
| $ | 8.960 | $ | 9.450 | $ | 9.330 | $ | 9.770 | $ | 9.270 | |||||||||
| 0.302 | 0.278 | 0.304 | 0.359 | 0.444 | ||||||||||||||
| 0.171 | (0.350 | ) | 0.396 | (0.033 | ) | 0.598 | ||||||||||||
|
|
|
|
|
|
|
|
|
| |||||||||
| 0.473 | (0.072 | ) | 0.700 | 0.326 | 1.042 | |||||||||||||
|
|
|
|
|
|
|
|
|
| |||||||||
| (0.343 | ) | (0.248 | ) | (0.346 | ) | (0.399 | ) | (0.474 | ) | |||||||||
| — | (0.089 | ) | (0.234 | ) | (0.367 | ) | (0.068 | ) | ||||||||||
| — | (0.081 | ) | — | — | — | |||||||||||||
|
|
|
|
|
|
|
|
|
| |||||||||
| (0.343 | ) | (0.418 | ) | (0.580 | ) | (0.766 | ) | (0.542 | ) | |||||||||
|
|
|
|
|
|
|
|
|
| |||||||||
| $ | 9.090 | $ | 8.960 | $ | 9.450 | $ | 9.330 | $ | 9.770 | |||||||||
|
|
|
|
|
|
|
|
|
| |||||||||
| 5.25% | (0.66% | ) | 7.82% | 3.64% | 11.60% | |||||||||||||
| $ | 2,048,203 | $ | 3,244,801 | $ | 4,890,056 | $ | 4,370,224 | $ | 4,423,278 | |||||||||
| 0.90% | 0.90% | 0.90% | 0.92% | 0.93% | ||||||||||||||
| 0.90% | 0.95% | 0.95% | 0.97% | 0.98% | ||||||||||||||
| 3.34% | 3.03% | 3.26% | 3.84% | 4.68% | ||||||||||||||
| 3.34% | 2.98% | 3.21% | 3.79% | 4.63% | ||||||||||||||
| 189% | 238% | 238% | 237% | 232% | ||||||||||||||
65
Table of Contents
Financial highlights | ||
Delaware Diversified Income Fund Class C |
Selected data for each share of the Fund outstanding throughout each period were as follows:
Net asset value, beginning of period |
Income (loss) from investment operations: |
Net investment income1 |
Net realized and unrealized gain (loss) |
Total from investment operations |
Less dividends and distributions from: |
Net investment income |
Net realized gain |
Return of capital |
Total dividends and distributions |
Net asset value, end of period |
Total return2 |
Ratios and supplemental data: |
Net assets, end of period (000 omitted) |
Ratio of expenses to average net assets |
Ratio of net investment income to average net assets |
Portfolio turnover |
| 1 | The average shares outstanding method has been applied for per share information. |
| 2 | Total investment return is based on the change in net asset value of a share during the period and assumes reinvestment of dividends and distributions at net asset value and does not reflect the impact of a sales charge. |
See accompanying notes, which are an integral part of the financial statements.
66
Table of Contents
| Year ended | ||||||||||||||||||
| 10/31/14 | 10/31/13 | 10/31/12 | 10/31/11 | 10/31/10 | ||||||||||||||
| $ | 8.960 | $ | 9.450 | $ | 9.330 | $ | 9.760 | $ | 9.270 | |||||||||
| 0.234 | 0.209 | 0.234 | 0.289 | 0.373 | ||||||||||||||
| 0.172 | (0.349 | ) | 0.397 | (0.023 | ) | 0.588 | ||||||||||||
|
|
|
|
|
|
|
|
|
| |||||||||
| 0.406 | (0.140 | ) | 0.631 | 0.266 | 0.961 | |||||||||||||
|
|
|
|
|
|
|
|
|
| |||||||||
| (0.276 | ) | (0.197 | ) | (0.277 | ) | (0.329 | ) | (0.403 | ) | |||||||||
| — | (0.089 | ) | (0.234 | ) | (0.367 | ) | (0.068 | ) | ||||||||||
| — | (0.064 | ) | — | — | — | |||||||||||||
|
|
|
|
|
|
|
|
|
| |||||||||
| (0.276 | ) | (0.350 | ) | (0.511 | ) | (0.696 | ) | (0.471 | ) | |||||||||
|
|
|
|
|
|
|
|
|
| |||||||||
| $ | 9.090 | $ | 8.960 | $ | 9.450 | $ | 9.330 | $ | 9.760 | |||||||||
|
|
|
|
|
|
|
|
|
| |||||||||
| 4.59% | (1.51% | ) | 7.01% | 2.98% | 10.65% | |||||||||||||
| $ | 1,177,575 | $ | 1,471,553 | $ | 2,230,985 | $ | 2,012,603 | $ | 2,097,340 | |||||||||
| 1.65% | 1.65% | 1.65% | 1.67% | 1.68% | ||||||||||||||
| 2.59% | 2.28% | 2.51% | 3.09% | 3.93% | ||||||||||||||
| 189% | 238% | 238% | 237% | 232% | ||||||||||||||
67
Table of Contents
Financial highlights | ||
Delaware Diversified Income Fund Class R |
Selected data for each share of the Fund outstanding throughout each period were as follows:
Net asset value, beginning of period |
Income (loss) from investment operations: |
Net investment income1 |
Net realized and unrealized gain (loss) |
Total from investment operations |
Less dividends and distributions from: |
Net investment income |
Net realized gain |
Return of capital |
Total dividends and distributions |
Net asset value, end of period |
Total return2 |
Ratios and supplemental data: |
Net assets, end of period (000 omitted) |
Ratio of expenses to average net assets |
Ratio of expenses to average net assets prior to fees waived |
Ratio of net investment income to average net assets |
Ratio of net investment income to average net assets prior to fees waived |
Portfolio turnover |
| 1 | The average shares outstanding method has been applied for per share information. |
| 2 | Total investment return is based on the change in net asset value of a share during the period and assumes reinvestment of dividends and distributions at net asset value. Total investment return during some of the periods shown reflects a waiver by the distributor. Performance would have been lower had the waiver not been in effect. |
See accompanying notes, which are an integral part of the financial statements.
68
Table of Contents
| Year ended | ||||||||||||||||||
| 10/31/14 | 10/31/13 | 10/31/12 | 10/31/11 | 10/31/10 | ||||||||||||||
| $ | 8.960 | $ | 9.450 | $ | 9.330 | $ | 9.760 | $ | 9.270 | |||||||||
| 0.279 | 0.255 | 0.280 | 0.336 | 0.420 | ||||||||||||||
| 0.171 | (0.350 | ) | 0.397 | (0.023 | ) | 0.589 | ||||||||||||
|
|
|
|
|
|
|
|
|
| |||||||||
| 0.450 | (0.095 | ) | 0.677 | 0.313 | 1.009 | |||||||||||||
|
|
|
|
|
|
|
|
|
| |||||||||
| (0.320 | ) | (0.231 | ) | (0.323 | ) | (0.376 | ) | (0.451 | ) | |||||||||
| — | (0.089 | ) | (0.234 | ) | (0.367 | ) | (0.068 | ) | ||||||||||
| — | (0.075 | ) | — | — | — | |||||||||||||
|
|
|
|
|
|
|
|
|
| |||||||||
| (0.320 | ) | (0.395 | ) | (0.557 | ) | (0.743 | ) | (0.519 | ) | |||||||||
|
|
|
|
|
|
|
|
|
| |||||||||
| $ | 9.090 | $ | 8.960 | $ | 9.450 | $ | 9.330 | $ | 9.760 | |||||||||
|
|
|
|
|
|
|
|
|
| |||||||||
| 5.11% | (1.02% | ) | 7.55% | 3.49% | 11.33% | |||||||||||||
| $ | 116,840 | $ | 124,586 | $ | 160,695 | $ | 146,620 | $ | 172,642 | |||||||||
| 1.15% | 1.15% | 1.15% | 1.17% | 1.18% | ||||||||||||||
| 1.15% | 1.24% | 1.25% | 1.27% | 1.28% | ||||||||||||||
| 3.09% | 2.78% | 3.01% | 3.59% | 4.43% | ||||||||||||||
| 3.09% | 2.69% | 2.91% | 3.49% | 4.33% | ||||||||||||||
| 189% | 238% | 238% | 237% | 232% | ||||||||||||||
69
Table of Contents
Financial highlights | ||
Delaware Diversified Income Fund Institutional Class |
Selected data for each share of the Fund outstanding throughout each period were as follows:
Net asset value, beginning of period |
Income (loss) from investment operations: |
Net investment income1 |
Net realized and unrealized gain (loss) |
Total from investment operations |
Less dividends and distributions from: |
Net investment income |
Net realized gain |
Return of capital |
Total dividends and distributions |
Net asset value, end of period |
Total return2 |
Ratios and supplemental data: |
Net assets, end of period (000 omitted) |
Ratio of expenses to average net assets |
Ratio of net investment income to average net assets |
Portfolio turnover |
| 1 | The average shares outstanding method has been applied for per share information. |
| 2 | Total investment return is based on the change in net asset value of a share during the period and assumes reinvestment of dividends and distributions at net asset value. |
See accompanying notes, which are an integral part of the financial statements.
70
Table of Contents
| Year ended | ||||||||||||||||||
| 10/31/14 | 10/31/13 | 10/31/12 | 10/31/11 | 10/31/10 | ||||||||||||||
| $ | 8.970 | $ | 9.460 | $ | 9.340 | $ | 9.770 | $ | 9.280 | |||||||||
| 0.325 | 0.301 | 0.327 | 0.383 | 0.470 | ||||||||||||||
| 0.171 | (0.350 | ) | 0.397 | (0.023 | ) | 0.586 | ||||||||||||
|
|
|
|
|
|
|
|
|
| |||||||||
| 0.496 | (0.049 | ) | 0.724 | 0.360 | 1.056 | |||||||||||||
|
|
|
|
|
|
|
|
|
| |||||||||
| (0.366 | ) | (0.265 | ) | (0.370 | ) | (0.423 | ) | (0.498 | ) | |||||||||
| — | (0.089 | ) | (0.234 | ) | (0.367 | ) | (0.068 | ) | ||||||||||
| — | (0.087 | ) | — | — | — | |||||||||||||
|
|
|
|
|
|
|
|
|
| |||||||||
| (0.366 | ) | (0.441 | ) | (0.604 | ) | (0.790 | ) | (0.566 | ) | |||||||||
|
|
|
|
|
|
|
|
|
| |||||||||
| $ | 9.100 | $ | 8.970 | $ | 9.460 | $ | 9.340 | $ | 9.770 | |||||||||
|
|
|
|
|
|
|
|
|
| |||||||||
| 5.63% | (0.52% | ) | 8.08% | 4.01% | 11.76% | |||||||||||||
| $ | 2,394,335 | $ | 1,737,652 | $ | 2,238,906 | $ | 1,620,249 | $ | 1,242,001 | |||||||||
| 0.65% | 0.65% | 0.65% | 0.67% | 0.68% | ||||||||||||||
| 3.59% | 3.28% | 3.51% | 4.09% | 4.93% | ||||||||||||||
| 189% | 238% | 238% | 237% | 232% | ||||||||||||||
71
Table of Contents
Delaware Diversified Income Fund | October 31, 2014 |
Delaware Group® Adviser Funds (Trust) is organized as a Delaware statutory trust and offers three series: Delaware Diversified Income Fund, Delaware Global Real Estate Opportunities Fund, and Delaware U.S. Growth Fund. These financial statements and related notes pertain to Delaware Diversified Income Fund (Fund). The Trust is an open-end investment company. The Fund is considered diversified under the Investment Company Act of 1940, as amended, and offers Class A, Class C, Class R, and Institutional Class shares. Class A shares are sold with a maximum front-end sales charge of 4.50%. Class A share purchases of $1,000,000 or more will incur a contingent deferred sales charge (CDSC) of 1.00% if redeemed during the first year and 0.50% during the second year, provided that Delaware Distributors, L.P. (DDLP) paid a financial advisor a commission on the purchase of those shares. Effective Sept. 25, 2014, all remaining shares of Class B were converted to Class A shares. Prior to Sept. 25, 2014, Class B shares could be purchased only through dividend reinvestment and certain permitted exchanges. Prior to June 1, 2007, Class B shares were sold with a CDSC that declined from 4.00% to zero depending upon the period of time the shares were held. Class B shares automatically converted to Class A shares on a quarterly basis approximately eight years after purchase. Class C shares are sold with a CDSC of 1.00%, if redeemed during the first 12 months. Class R and Institutional Class shares are not subject to a sales charge and are offered for sale exclusively to certain eligible investors.
The investment objective of the Fund is to seek maximum long-term total return, consistent with reasonable risk.
1. Significant Accounting Policies
The following accounting policies are in accordance with U.S. generally accepted accounting principles (U.S. GAAP) and are consistently followed by the Fund.
Security Valuation – Equity securities, except those traded on the Nasdaq Stock Market, Inc. (Nasdaq), are valued at the last quoted sales price as of the time of the regular close of the New York Stock Exchange on the valuation date. Securities traded on the Nasdaq are valued in accordance with the Nasdaq Official Closing Price, which may not be the last sales price. If, on a particular day, an equity security does not trade, then the mean between the bid and ask prices will be used, which approximates fair value. Debt securities and credit default swap (CDS) contracts are valued based upon valuations provided by an independent pricing service or broker/counterparty and reviewed by management. To the extent current market prices are not available, the pricing service may take into account developments related to the specific security, as well as transactions in comparable securities. U.S. government and agency securities are valued at the mean between the bid and ask prices, which approximates fair value. Valuations for fixed income securities utilize matrix systems, which reflect such factors as security prices, yields, maturities, and ratings, and are supplemented by dealer and exchange quotations. For asset-backed securities, collateralized mortgage obligations, commercial mortgage securities, and U.S. government agency mortgage securities, pricing vendors utilize matrix pricing which considers prepayment speed, attributes of the collateral, yield or price of bonds of comparable quality, coupon, maturity, and type as well as broker/dealer-supplied prices. Swap prices are derived using daily swap curves and models that incorporate a number of market data factors, such as discounted cash flows, trades, and values of the underlying reference instruments. Open-end investment company securities are valued at net asset value per share, as reported by the underlying investment company. Foreign
72
Table of Contents
currency exchange contracts and foreign cross currency exchange contracts are valued at the mean between the bid and ask prices, which approximates fair value. Interpolated values are derived when the settlement date of the contract is an interim date for which quotations are not available. Futures contracts and options on futures contracts are valued at the daily quoted settlement prices. Exchange-traded options are valued at the last reported sale price or, if no sales are reported, at the mean between the last reported bid and ask prices, which approximates fair value. Generally, other securities and assets for which market quotations are not readily available are valued at fair value as determined in good faith under the direction of the Fund’s Board of Trustees (Board). In determining whether market quotations are readily available or fair valuation will be used, various factors will be taken into consideration, such as market closures or suspension of trading in a security. The Fund may use fair value pricing more frequently for securities traded primarily in non-U.S. markets because, among other things, most foreign markets close well before the Fund values its securities, generally as of 4:00 p.m. Eastern time. The earlier close of these foreign markets gives rise to the possibility that significant events, including broad market moves, government actions or pronouncements, aftermarket trading, or news events may have occurred in the interim. To account for this, the Fund may frequently value foreign securities using fair value prices based on third-party vendor modeling tools (international fair value pricing).
Federal and Foreign Income Taxes – No provision for federal income taxes has been made as the Fund intends to continue to qualify for federal income tax purposes as a regulated investment company under Subchapter M of the Internal Revenue Code of 1986, as amended, and make the requisite distributions to shareholders. The Fund evaluates tax positions taken or expected to be taken in the course of preparing the Fund’s tax returns to determine whether the tax positions are “more likely-than-not” of being sustained by the applicable tax authority. Tax positions not deemed to meet the “more-likely-than-not” threshold are recorded as a tax benefit or expense in the current year. Management has analyzed the Fund’s tax positions taken for all open federal income tax years (Oct. 31, 2011–Oct. 31, 2014), and has concluded that no provision for federal income tax is required in the Fund’s financial statements. In regard to foreign taxes only, the Fund has open tax years in certain foreign countries it invests in that may date back to the inception of the Fund.
Class Accounting – Investment income and common expenses are allocated to the various classes of the Fund on the basis of “settled shares” of each class in relation to the net assets of the Fund. Realized and unrealized gain (loss) on investments are allocated to the various classes of the Fund on the basis of daily net assets of each class. Distribution expenses relating to a specific class are charged directly to that class.
Repurchase Agreements – The Fund may purchase certain U.S. government securities subject to the counterparty’s agreement to repurchase them at an agreed upon date and price. The counterparty will be required on a daily basis to maintain the value of the collateral subject to the agreement at not less than the repurchase price (including accrued interest). The agreements are conditioned upon the collateral being deposited under the Federal Reserve book-entry system with the Fund’s custodian or a third-party sub-custodian. In the event of default or bankruptcy by the other party to the agreement, retention of the collateral may be subject to legal proceedings. All open repurchase agreements as of the date of this report were entered into on Oct. 31, 2014.
73
Table of Contents
Notes to financial statements
Delaware Diversified Income Fund
1. Significant Accounting Policies (continued)
To Be Announced Trades (TBA) – The Fund may contract to purchase or sell securities for a fixed price at a transaction date beyond the customary settlement period (examples: when issued, delayed delivery, forward commitment, or TBA transactions) consistent with the Fund’s ability to manage its investment portfolio and meet redemption requests. These transactions involve a commitment by the Fund to purchase or deliver securities for a predetermined price or yield with payment and delivery taking place more than three days in the future, or after a period longer than the customary settlement period for that type of security. No interest will be earned by the Fund on such purchases until the securities are delivered or the transaction is completed; however, the market value may change prior to delivery.
Foreign Currency Transactions – Transactions denominated in foreign currencies are recorded at the prevailing exchange rates on the valuation date in accordance with the Fund’s prospectus. The value of all assets and liabilities denominated in foreign currencies is translated daily into U.S. dollars at the exchange rate of such currencies against the U.S. dollar. Transaction gains or losses resulting from changes in exchange rates during the reporting period or upon settlement of the foreign currency transaction are reported in operations for the current period. The Fund generally bifurcates that portion of realized gains and losses on investments in debt securities which is due to changes in foreign exchange rates from that which is due to changes in market prices of debt securities. That portion of gains (losses) is included on the “Statement of operations” under “Net realized gain (loss) on foreign currencies.” The Fund reports certain foreign currency related transactions as components of realized gains (losses) for financial reporting purposes, whereas such components are treated as ordinary income (loss) for federal income tax purposes.
Use of Estimates – The preparation of financial statements in conformity with U.S. GAAP requires management to make estimates and assumptions that affect the fair value of investments, the reported amounts of assets and liabilities and disclosure of contingent assets and liabilities at the date of the financial statements, and the reported amounts of revenues and expenses during the reporting period. Actual results could differ from those estimates and the differences could be material.
Other – Expenses directly attributable to the Fund are charged directly to the Fund. Other expenses common to various funds within the Delaware Investments® Family of Funds are generally allocated among such funds on the basis of average net assets. Management fees and some other expenses are paid monthly. Security transactions are recorded on the date the securities are purchased or sold (trade date) for financial reporting purposes. Costs used in calculating realized gains and losses on the sale of investment securities are those of the specific securities sold. Dividend income is recorded on the ex-dividend date and interest income is recorded on the accrual basis. Discounts and premiums on debt securities are amortized to interest income over the lives of the respective securities using the effective interest method. Realized gains (losses) on paydowns of asset- and mortgage-backed securities are classified as interest income. Withholding taxes and reclaims on foreign interest have been recorded in accordance with the Fund’s understanding of the applicable country’s tax rules and rates. The Fund may pay foreign capital gain taxes on certain foreign securities held, which are reported as components of realized losses for financial reporting purposes, whereas such components are treated as ordinary loss for federal income tax purposes. The Fund declares dividends daily from net investment income and pays the dividends monthly and declares and pays dividends from net realized gain on investments, if
74
Table of Contents
any, annually. The Fund may distribute more frequently, if necessary for tax purposes. Dividends and distributions, if any, are recorded on the ex-dividend date.
The Fund may receive earnings credits from its custodian when positive cash balances are maintained, which may be used to offset custody fees. There were no earnings credits for the year ended Oct. 31, 2014.
The Fund receives earnings credits from its transfer agent when positive cash balances are maintained, which may be used to offset transfer agent fees. If the amount earned is greater than one dollar, the expense paid under this arrangement is included on the “Statement of operations” under “Dividend disbursing and transfer agent fees and expenses” with the corresponding expense offset shown under “Less expense paid indirectly.” For the year ended Oct. 31, 2014, the Fund earned $3,146 under this agreement.
2. Investment Management, Administration Agreements and Other Transactions with Affiliates
In accordance with the terms of its investment management agreement, the Fund pays Delaware Management Company (DMC), a series of Delaware Management Business Trust and the investment manager, an annual fee which is calculated daily at the rate of 0.55% on the first $500 million of the average daily net assets of the Fund; 0.50% on the next $500 million; 0.45% on the next $1.5 billion; and 0.425% on average daily net assets in excess $2.5 billion.
Delaware Service Company, Inc. (DSC), an affiliate of DMC, provides fund accounting and financial administration oversight services to the Fund. For these services, the Fund pays DSC fees based on the aggregate daily net assets of the Delaware Investments® Family of Funds at the following annual rate: 0.0050% on the first $30 billion; 0.0045% on the next $10 billion; 0.0040% on the next $10 billion; and 0.0025% on aggregate average daily net assets in excess of $50 billion. The fees payable to DSC under the service agreement described above are allocated among all Funds in the Delaware Investments Family of Funds on a relative net asset value basis. For the year ended Oct. 31, 2014, the Fund was charged $279,807 for these services. This amount is included on the “Statement of operations” under “Accounting and administration expenses.”
DSC is also the transfer agent and dividend disbursing agent of the Fund. For these services, the Fund pays DSC fees based on the aggregate daily net assets of the retail funds within the Delaware Investments Family of Funds at the following annual rate: 0.025% on the first $20 billion; 0.020% on the next $5 billion; 0.015% on the next $5 billion; and 0.013% on average daily net assets in excess of $30 billion. This amount is included on the “Statement of operations” under “Dividend disbursing and transfer agent fees and expenses.” For the year ended Oct. 31, 2014, the amount charged by DSC was $1,264,686. Pursuant to a sub-transfer agency agreement between DSC and BNY Mellon Investment Servicing (US) Inc. (BNYMIS), BNYMIS provides certain sub-transfer agency services to the Fund. Sub-transfer agency fees are passed on to and paid directly by the Fund.
Pursuant to a distribution agreement and distribution plan, the Fund pays DDLP, the distributor and an affiliate of DMC, an annual distribution and service fee of 0.25% of the average daily net assets of the Class A shares, 1.00% of the average daily net assets of the Class B and Class C shares, and 0.50% of the average daily net assets of the Class R shares. Institutional Class shares pay no distribution and
75
Table of Contents
Notes to financial statements
Delaware Diversified Income Fund
2. Investment Management, Administration Agreements and Other Transactions with Affiliates (continued)
service fee. DDLP had contracted to waive distribution and service fee in order to limit distribution and service fee of Class B shares to 0.25% of the average daily net assets.
As provided in the investment management agreement, the Fund bears a portion of the cost of certain resources shared with DMC, including the cost of internal personnel of DMC and/or its affiliated that provide legal, tax, and regulatory reporting services to the Fund. For the year ended Oct. 31, 2014, the Fund was charged $165,971 for internal legal, tax, and regulatory reporting services provided by DMC and/or its affiliates’ employees. This amount is included on the “Statement of operations” under “Legal fees.”
For the year ended Oct. 31, 2014, DDLP earned $71,923 for commissions on sales of the Fund’s Class A shares. For the year ended Oct. 31, 2014, DDLP received gross CDSC commissions of $3,983 and $7,348 on redemptions of the Fund’s Class A and Class C shares, respectively, and these commissions were entirely used to offset upfront commissions previously paid by DDLP to broker/dealers on sales of those shares.
Trustees’ fees include expenses accrued by the Fund for each Trustee’s retainer and meeting fees. Certain officers of DMC, DSC, and DDLP are officers and/or Trustees of the Trust. These officers and Trustees are paid no compensation by the Fund.
3. Investments
For the year ended Oct. 31, 2014, the Fund made purchases and sales of investment securities other than short-term investments as follows:
Purchases other than U.S. government securities | $ | 8,916,802,629 | ||
Purchases of U.S. government securities | 1,933,036,071 | |||
Sales other than U.S. government securities | 10,034,798,810 | |||
Sales of U.S. government securities | 1,871,858,964 |
At Oct. 31, 2014, the cost of investments and unrealized appreciation (depreciation) for federal income tax purposes were as follows:
Cost of investments | $ | 6,242,331,531 | ||
|
| |||
Aggregate unrealized appreciation | $ | 185,207,225 | ||
Aggregate unrealized depreciation | (86,738,422 | ) | ||
|
| |||
Net unrealized appreciation | $ | 98,468,803 | ||
|
|
U.S. GAAP defines fair value as the price that the Fund would receive to sell an asset or pay to transfer a liability in an orderly transaction between market participants at the measurement date under current market conditions. A three-level hierarchy for fair value measurements has been established based upon the transparency of inputs to the valuation of an asset or liability. Inputs may be observable or unobservable and refer broadly to the assumptions that market participants would use in pricing the asset or liability. Observable inputs reflect the assumptions market participants would use in pricing the asset or liability based on market data obtained from sources independent of the reporting entity. Unobservable inputs reflect the reporting entity’s own assumptions about the assumptions that market
76
Table of Contents
participants would use in pricing the asset or liability developed based on the best information available under the circumstances. The Fund’s investment in its entirety is assigned a level based upon the observability of the inputs which are significant to the overall valuation. The three-level hierarchy of inputs is summarized below.
| Level 1 – | Inputs are quoted prices in active markets for identical investments. (Examples: equity securities, open-end investment companies, futures contracts, exchange-traded options contracts) | |
| Level 2 – | Other observable inputs, including, but not limited to: quoted prices for similar assets or liabilities in markets that are active, quoted prices for identical or similar assets or liabilities in markets that are not active, inputs other than quoted prices that are observable for the assets or liabilities (such as interest rates, yield curves, volatilities, prepayment speeds, loss severities, credit risks, and default rates) or other market-corroborated inputs. (Examples: debt securities, government securities, swap contracts, foreign currency exchange contracts, foreign securities utilizing international fair value pricing, broker-quoted securities, fair valued securities) | |
| Level 3 – | Significant unobservable inputs, including the Fund’s own assumptions used to determine the fair value of investments. (Examples: broker-quoted securities, fair valued securities) | |
Level 3 investments are valued using significant unobservable inputs. The Fund may also use an income-based valuation approach in which the anticipated future cash flows of the investment are discounted to calculate fair value. Discounts may also be applied due to the nature or duration of any restrictions on the disposition of the investments. Valuations may also be based upon current market prices of securities that are comparable in coupon, rating, maturity, and industry. The derived value of a Level 3 investment may not represent the value which is received upon disposition and this could impact the results of operations.
77
Table of Contents
Notes to financial statements
Delaware Diversified Income Fund
3. Investments (continued)
The following table summarizes the valuation of the Fund’s investments by fair value hierarchy levels as of Oct. 31, 2014:
| Level 1 | Level 2 | Level 3 | Total | |||||||||||||
Agency, Asset- & Mortgage- Backed Securities1 | $ | — | $ | 1,532,334,197 | $ | 5,648,246 | $ | 1,537,982,443 | ||||||||
Corporate Debt | — | 3,109,545,034 | — | 3,109,545,034 | ||||||||||||
Municipal Bonds | — | 25,081,912 | — | 25,081,912 | ||||||||||||
Foreign Debt | — | 168,177,270 | — | 168,177,270 | ||||||||||||
Senior Secured Loans1 | — | 485,348,719 | 16,294,300 | 501,643,019 | ||||||||||||
U.S. Treasury Obligations | — | 114,939,000 | — | 114,939,000 | ||||||||||||
Convertible Preferred Stock1 | 18,043,227 | 13,191,477 | — | 31,234,704 | ||||||||||||
Preferred Stock1 | 26,479,433 | 9,883,830 | — | 36,363,263 | ||||||||||||
Short-Term Investments | — | 681,695,536 | — | 681,695,536 | ||||||||||||
Securities Lending Collateral | — | 134,138,153 | — | 134,138,153 | ||||||||||||
|
|
|
|
|
|
|
| |||||||||
Total | $ | 44,522,660 | $ | 6,274,335,128 | $ | 21,942,546 | $ | 6,340,800,334 | ||||||||
|
|
|
|
|
|
|
| |||||||||
Foreign Currency Exchange Contracts | $ | — | $ | 429,271 | $ | — | $ | 429,271 | ||||||||
Futures Contracts | 1,044,540 | — | — | 1,044,540 | ||||||||||||
Swap Contracts | — | (113,737 | ) | — | (113,737 | ) | ||||||||||
The securities that have been deemed worthless on the “Schedule of investments” are considered to be Level 3 investments in this table.
1Security type is valued across multiple levels. Level 1 investments represent exchange-traded investments, Level 2 investments represent investments with observable input or matrix-price investments, and Level 3 investments represent investments without observable inputs. The amounts attributed to Level 1 investments, Level 2 investments, and Level 3 investments represent the following percentages of the total value of these security types:
| Level 1 | Level 2 | Level 3 | Total | |||||||||||||||||||
Agency, Asset- & Mortgage- Backed Securities | — | 99.63 | % | 0.37 | % | 100.00 | % | |||||||||||||||
Senior Secured Loans | — | 96.75 | % | 3.25 | % | 100.00 | % | |||||||||||||||
Convertible Preferred Stock | 57.77 | % | 42.23 | % | — | 100.00 | % | |||||||||||||||
Preferred Stock | 72.82 | % | 27.18 | % | — | 100.00 | % | |||||||||||||||
During the year ended Oct. 31, 2014, there were no transfers between Level 1 investments, Level 2 investments, or Level 3 investments that had a significant impact to the Fund. The Fund’s policy is to recognize transfers between levels at the beginning of the reporting period.
A reconciliation of Level 3 investments is presented when the Fund has a significant amount of Level 3 investments at the beginning, interim, or end of the period in relation to net assets. Management has determined not to provide additional disclosure on Level 3 inputs under ASU No. 2011-04 since the Level 3 investments are not considered significant to the Fund’s net assets at the end of the year.
78
Table of Contents
4. Dividend and Distribution Information
Income and long-term capital gain distributions are determined in accordance with federal income tax regulations, which may differ from U.S. GAAP. Additionally, distributions from net gains on foreign currency transactions and net short-term gains on sales of investment securities are treated as ordinary income for federal income tax purposes. The tax character of dividends and distributions paid during the years ended Oct. 31, 2014 and 2013 was as follows:
| Year ended | ||||||||
| 10/31/14 | 10/31/13 | |||||||
Ordinary income | $ | 199,259,224 | $ | 275,299,727 | ||||
Long-term capital gains | 17,098,440 | 37,024,805 | ||||||
Return of capital | — | 72,834,886 | ||||||
|
|
|
| |||||
Total | $ | 216,357,664 | $ | 385,159,418 | ||||
|
|
|
| |||||
5. Components of Net Assets on a Tax Basis
As of Oct. 31, 2014, the components of net assets on a tax basis were as follows:
Shares of beneficial interest | $ | 5,626,494,731 | ||
Undistributed long-term capital gains | 19,690,758 | |||
Distributions payable | (5,014,722 | ) | ||
Other temporary differences | (2,739,747 | ) | ||
Unrealized appreciation | 98,521,516 | |||
|
| |||
Net assets | $ | 5,736,952,536 | ||
|
|
The differences between book basis and tax basis components of net assets are primarily attributable to tax deferral of losses on wash sales, mark-to-market of foreign currency exchange contracts, mark-to-market of futures contracts, tax deferral of losses on straddles, tax treatment of CDS contracts, tax treatment of contingent payment on debt instruments, and tax treatment of market discount and premium on debt instruments.
For financial reporting purposes, capital accounts are adjusted to reflect the tax character of permanent book/tax differences. Reclassifications are primarily due to tax treatment of gain (loss) on foreign currency transactions, dividends and distributions, tax treatment of contingent payments on debt instruments, market discount and premium on certain debt instruments, CDS contracts, and tax treatment of paydown gains (losses) of asset-and mortgage-backed securities. Results of operations and net assets were not affected by these reclassifications. For the year ended Oct. 31, 2014, the Fund recorded the following reclassifications:
Distributions in excess of net investment income | $ | 32,941,961 | ||
Accumulated net realized gain | (32,941,961 | ) |
The Regulated Investment Company Modernization Act of 2010 (the Act) was enacted on Dec. 22, 2010. The Act makes changes to several tax rules, including providing for the unlimited carryover of future capital losses. The Act also provides that each capital loss carryforward retains its character as short-term or long-term capital loss.
For federal income tax purposes, $35,118,418 of capital loss carryforwards from prior years was utilized in the year ended Oct. 31, 2014.
79
Table of Contents
Notes to financial statements
Delaware Diversified Income Fund
6. Capital Shares
Transactions in capital shares were as follows:
| Year ended | ||||||||
| 10/31/14 | 10/31/13 | |||||||
Shares sold: | ||||||||
Class A | 45,331,754 | 96,364,829 | ||||||
Class B | 1,174 | 5,288 | ||||||
Class C | 10,145,095 | 18,780,252 | ||||||
Class R | 4,543,927 | 5,561,330 | ||||||
Institutional Class | 146,809,977 | 105,812,619 | ||||||
Shares issued upon reinvestment of dividends and distributions: | ||||||||
Class A | 10,982,199 | 20,512,652 | ||||||
Class B | 20,489 | 61,303 | ||||||
Class C | 3,899,038 | 5,787,536 | ||||||
Class R | 470,459 | 667,773 | ||||||
Institutional Class | 7,350,511 | 10,266,953 | ||||||
|
|
|
| |||||
| 229,554,623 | 263,820,535 | |||||||
|
|
|
| |||||
Shares redeemed: | ||||||||
Class A | (192,953,742 | ) | (272,143,771 | ) | ||||
Class B | (1,076,611 | ) | (1,339,486 | ) | ||||
Class C | (48,662,025 | ) | (96,397,088 | ) | ||||
Class R | (6,059,471 | ) | (9,329,920 | ) | ||||
Institutional Class | (84,668,441 | ) | (159,031,102 | ) | ||||
|
|
|
| |||||
| (333,420,290 | ) | (538,241,367 | ) | |||||
|
|
|
| |||||
Net decrease | (103,865,667 | ) | (274,420,832 | ) | ||||
|
|
|
| |||||
For the years ended Oct. 31, 2014 and 2013, 152,636 Class B shares were converted to 152,495 Class A shares valued at $1,378,560, and 162,021 Class B shares were converted to 161,950 Class A shares valued at $1,492,498, respectively. The respective amounts are included in Class B redemptions and Class A subscriptions in the table above and the “Statements of changes in net assets.”
Certain shareholders of one class shares may exchange their shares for another class shares. For the year ended Oct. 31, 2014, 219,614 Class A shares were exchanged to 219,730 Institutional Class shares valued at $1,993,533; 91,553 Class C shares were exchanged to 91,598 Class A shares valued at $836,146; 25,720 Class C shares were exchanged to 25,717 Institutional Class shares valued at $233,854; and 1,138 Institutional Class shares were exchanged to 1,140 Class A shares valued at $10,355. These exchange transactions are included as subscriptions and redemptions in the table on the previous page and the “Statements of changes in net assets.”
80
Table of Contents
7. Line of Credit
The Fund, along with certain other funds in the Delaware Investments® Family of Funds (Participants), was a participant in a $125,000,000 revolving line of credit to be used for temporary or emergency purposes as an additional source of liquidity to fund redemptions of investor shares. Under the agreement, the Participants were charged an annual commitment fee of 0.08%, which was allocated across the Participants on the basis of each Participant’s allocation of the entire facility. The Participants were permitted to borrow up to a maximum of one third of their net assets under the agreement. Each Participant was individually, and not jointly, liable for its particular advances, if any, under the line of credit. The line of credit under the agreement expired on Nov. 12, 2013.
On Nov. 12, 2013, the Fund, along with the other Participants, entered into an amendment to the agreement for a $225,000,000 revolving line of credit. The line of credit is to be used as described above and operates in substantially the same manner as the original agreement. The line of credit available under the agreement expired on Nov. 10, 2014.
The Fund had no amounts outstanding as of Oct. 31, 2014 or at any time during the year then ended.
8. Derivatives
U.S. GAAP requires disclosures that enable investors to understand: (1) how and why an entity uses derivatives; (2) how they are accounted for; and (3) how they affect an entity’s results of operations and financial position.
Foreign Currency Exchange Contracts — The Fund may enter into foreign currency exchange contracts and foreign cross currency exchange contracts as a way of managing foreign exchange rate risk. The Fund may enter into these contracts to fix the U.S. dollar value of a security that it has agreed to buy or sell for the period between the date the trade was entered into and the date the security is delivered and paid for. The Fund may also use these contracts to hedge the U.S. dollar value of securities it already owns that are denominated in foreign currencies. In addition, the Fund may enter into these contracts to facilitate or expedite the settlement of portfolio transactions. The change in value is recorded as an unrealized gain or loss. When the contract is closed, a realized gain or loss is recorded equal to the difference between the value of the contract at the time it was opened and the value at the time it was closed.
The use of foreign currency exchange contracts and foreign cross currency exchange contracts does not eliminate fluctuations in the underlying prices of the securities, but does establish a rate of exchange that can be achieved in the future. Although foreign currency exchange contracts and foreign cross currency exchange contracts limit the risk of loss due to an unfavorable change in the value of the hedged currency, they also limit any potential gain that might result should the value of the currency change favorably. In addition, the Fund could be exposed to risks if the counterparties to the contracts are unable to meet the terms of their contracts. The Fund’s maximum risk of loss from counterparty credit risk is the value of its currency exchanged with the counterparty. The risk is generally mitigated by having a netting arrangement between the Fund and the counterparty and by the posting of collateral by the counterparty to the Fund to cover the Fund’s exposure to the counterparty. At Oct. 31, 2014, the Fund received $304,000 in securities collateral for certain open foreign currency exchange contracts.
81
Table of Contents
Notes to financial statements
Delaware Diversified Income Fund
8. Derivatives (continued)
During the year ended Oct. 31, 2014, the Fund used foreign currency exchange contracts to hedge the U.S. dollar value of securities it already owns that are denominated in foreign currencies.
Futures Contracts — A futures contract is an agreement in which the writer (or seller) of the contract agrees to deliver to the buyer an amount of cash or securities equal to a specific dollar amount times the difference between the value of a specific security or index at the close of the last trading day of the contract and the price at which the agreement is made. The Fund may use futures in the normal course of pursuing its investment objective. The Fund may invest in futures contracts to hedge its existing portfolio securities against fluctuations in fair value caused by changes in interest rates, or market conditions. Upon entering into a futures contract, the Fund deposits cash or pledges U.S. government securities to a broker, equal to the minimum “initial margin” requirements of the exchange on which the contract is traded. Subsequent payments are received from the broker or paid to the broker each day, based on the daily fluctuation in the market value of the contract. These receipts or payments are known as “variation margin” and are recorded daily by the Fund as unrealized gains or losses until the contracts are closed. When the contracts are closed, the Fund records a realized gain or loss equal to the difference between the value of the contract at the time it was opened and the value at the time it was closed. Risks of entering into futures contracts include potential imperfect correlation between the futures contracts and the underlying securities and the possibility of an illiquid secondary market for these instruments. When investing in futures, there is reduced counterparty credit risk to the Fund because futures are exchange-traded and the exchange’s clearinghouse, as counterparty to all exchange-traded futures, guarantees against default.
During the year ended Oct. 31, 2014, the Fund used futures contracts to hedge the Fund’s existing portfolio securities against fluctuations in value caused by changes in interest rates or market conditions.
Options Contracts — During the year ended Oct. 31, 2014, the Fund entered into options contracts in the normal course of pursuing its investment objective. The Fund may buy or write options contracts for any number of reasons, including without limitation: to manage the Fund’s exposure to changes in securities prices caused by interest rates or market conditions and foreign currencies; as an efficient means of adjusting the Fund’s overall exposure to certain markets; to protect the value of portfolio securities; and as a cash management tool. The Fund may buy or write call or put options on securities, futures, swaps, swaptions, financial indices, and foreign currencies. When the Fund buys an option, a premium is paid and an asset is recorded and adjusted on a daily basis to reflect the current market value of the option purchased. When the Fund writes an option, a premium is received and a liability is recorded and adjusted on a daily basis to reflect the current market value of the option written. Premiums received from writing options that expire unexercised are treated by the Fund on the expiration date as realized gains. The difference between the premium received and the amount paid on effecting a closing purchase transaction, including brokerage commissions, is treated as realized gain or loss. If a call option is exercised, the premium is added to the proceeds from the sale of the underlying security in determining whether the Fund has a realized gain or loss. If a put option is exercised, the premium reduces the cost basis of the securities purchased by the Fund. The Fund, as writer of an option, bears the market risk of an unfavorable change in the price of the security underlying the
82
Table of Contents
written option. When writing options, the Fund is subject to minimal counterparty risk because the counterparty is only obligated to pay premiums and does not bear the market risk of an unfavorable market change.
During the year ended Oct. 31, 2014, the Fund used purchased option contracts to manage the Fund’s exposure to changes in security prices caused by interest rates or market conditions. There were no transactions in options written during the year ended Oct. 31, 2014.
Swap Contracts — The Fund may enter into CDS contracts in the normal course of pursuing its investment objective. The Fund may enter into CDS contracts in order to hedge against a credit event, to enhance total return or to gain exposure to certain securities or markets. The Fund will not be permitted to enter into any swap transactions unless, at the time of entering into such transactions, the unsecured long-term debt of the actual counterparty, combined with any credit enhancements, is rated at least BBB- by Standard & Poor’s Financial Services LLC. (S&P) or Baa3 by Moody’s Investors Service Inc. (Moody’s) or is determined to be of equivalent credit quality by DMC.
Credit Default Swaps. A CDS contract is a risk-transfer instrument through which one party (purchaser of protection) transfers to another party (seller of protection) the financial risk of a credit event (as defined in the CDS agreement), as it relates to a particular reference security or basket of securities (such as an index). In exchange for the protection offered by the seller of protection, the purchaser of protection agrees to pay the seller of protection a periodic amount at a stated rate that is applied to the notional amount of the CDS contract. In addition, an upfront payment may be made or received by the Fund in connection with an unwinding or assignment of a CDS contract. Upon the occurrence of a credit event, the seller of protection would pay the par (or other agreed-upon) value of the reference security (or basket of securities) to the counterparty. Credit events generally include, among others, bankruptcy, failure to pay, and obligation default.
During the year ended Oct. 31, 2014, the Fund entered into CDS contracts as a purchaser of protection. Periodic payments (receipts) on such contracts are accrued daily and recorded as unrealized losses (gains) on swap contracts. Upon payment (receipt), such amounts are recorded as realized losses (gains) on swap contracts. Upfront payments made or received in connection with CDS contracts are amortized over the expected life of the CDS contracts as unrealized losses (gains) on swap contracts. The change in value of CDS contracts is recorded daily as unrealized appreciation or depreciation. A realized gain or loss is recorded upon a credit event (as defined in the CDS agreement) or the maturity or termination of the agreement. Initial margin and variation margin is posted to central counterparties for CDS basket trades as determined by the applicable central counterparty.
CDS contracts may involve greater risks than if the Fund had invested in the reference obligation directly. CDS contracts are subject to general market risk, liquidity risk, counterparty risk and credit risk. The Fund’s maximum risk of loss from counterparty credit risk, either as the seller of protection or the buyer of protection, is the fair value of the contract. This risk is mitigated by (1) for bilateral swap contracts, having a netting arrangement between the Fund and the counterparty and by the posting of collateral by the counterparty to the Fund to cover the Fund’s exposure to the counterparty or (2) for cleared swaps, trading these instruments through a central counterparty.
During the year ended Oct. 31, 2014, the Fund used CDS contracts to hedge against a credit event.
83
Table of Contents
Notes to financial statements
Delaware Diversified Income Fund
8. Derivatives (continued)
Swaps Generally. The value of open swaps may differ from that which would be realized in the event the Fund terminated its position in the contract on a given day. Risks of entering into these contracts include the potential inability of the counterparty to meet the terms of the contracts. This type of risk is generally limited to the amount of favorable movement in the value of the underlying security, instrument, or basket of instruments, if any, at the day of default. Risks also arise from potential losses from adverse market movements and such losses could exceed the unrealized amounts that would be shown on the “Schedule of investments.”
At Oct. 31, 2014, for centrally cleared swap contracts, the Fund posted $2,917,694 in cash collateral, which is presented as “Cash collateral due from brokers” on the “Statement of assets and liabilities.”
Fair values of derivative instruments as of Oct. 31, 2014 were as follows:
| Asset Derivatives | Liability Derivatives | |||||||||||
| Statement of Assets and Liabilities | Statement of Assets and Liabilities | |||||||||||
| Location | Fair Value | Location | Fair Value | |||||||||
| Unrealized gain | Unrealized loss | |||||||||||
| of foreign | of foreign | |||||||||||
Forward currency exchange contracts (Foreign currency exchange contracts) | currency exchange contracts | $ | 621,972 | currency exchange contracts | $ | (192,701 | ) | |||||
| Variation | Variation | |||||||||||
| margin | margin | |||||||||||
| payable on | payable on | |||||||||||
Interest rate contracts (Futures contracts) | futures contracts | 1,483,647 | * | futures contracts | (439,107 | )* | ||||||
| Unrealized loss | Unrealized loss | |||||||||||
| on credit | on credit | |||||||||||
Credit contracts (Swap contracts) | default swap contracts | — | default swap contracts | (113,737 | ) | |||||||
|
|
|
| |||||||||
Total | $ | 2,105,619 | $ | (745,545 | ) | |||||||
|
|
|
| |||||||||
*Includes cumulative appreciation/(depreciation) of futures contracts from the date the contracts are opened through Oct. 31, 2014. Only current day variation margin is reported on the “Statement of assets and liabilities.”
84
Table of Contents
The effect of derivative instruments on the “Statement of operations” for the year ended Oct. 31, 2014 was as follows:
| Net Realized Gain (Loss) on: | ||||||||||||||||
| Foreign Currency Exchange Contracts | Futures Contracts | Swap Contracts | Total | |||||||||||||
Forward currency exchange contracts | $ | (470,162 | ) | $ | — | $ | — | $ | (470,162 | ) | ||||||
Interest rate contracts | — | 7,737,661 | — | 7,737,661 | ||||||||||||
Credit contracts | — | — | (1,241,974 | ) | (1,241,974 | ) | ||||||||||
|
|
|
|
|
|
|
| |||||||||
Total | $ | (470,162 | ) | $ | 7,737,661 | $ | (1,241,974 | ) | $ | 6,025,525 | ||||||
|
|
|
|
|
|
|
| |||||||||
| Net Change in Unrealized Appreciation (Depreciation) of: | ||||||||||||||||
| Foreign Currency Exchange Contracts | Futures Contracts | Swap Contracts | Total | |||||||||||||
Forward currency exchange contracts | $ | 1,255,898 | $ | — | $ | — | $ | 1,255,898 | ||||||||
Interest rate contracts | — | 1,420,453 | — | 1,420,453 | ||||||||||||
Credit contracts | — | — | (166,019 | ) | (166,019 | ) | ||||||||||
|
|
|
|
|
|
|
| |||||||||
Total | $ | 1,255,898 | $ | 1,420,453 | $ | (166,019 | ) | $ | 2,510,332 | |||||||
|
|
|
|
|
|
|
| |||||||||
Derivatives Generally. The table below summarizes the average balance of derivative holdings by the Fund during the year ended Oct. 31, 2014.
Long Derivative Volume | Short Derivative Volume | |||||||||||||||
Foreign currency exchange contracts (average cost) | USD | 47,359,242 | USD | 108,838,457 | ||||||||||||
Futures contracts (average notional value) | 246,009,188 | 356,395,927 | ||||||||||||||
Options contracts (average notional value) | 29,960 | — | ||||||||||||||
CDS contracts (average notional value)* | EUR | 612,569 | — | |||||||||||||
| USD | 19,017,562 | — | ||||||||||||||
*Long represents buying protection and short represents selling protection.
9. Offsetting
In December 2011, the Financial Accounting Standards Board (FASB) issued guidance that expands disclosure requirements on the offsetting of certain assets and liabilities. The disclosures are required for investments and derivative financial instruments subject to master netting or similar agreements which are eligible for offset on the “Statements of assets and liabilities” and require an entity to disclose both gross and net information about such investments and transactions in the financial statements. In January 2013, the FASB issued guidance that clarifies which investments and transactions are subject to the offsetting disclosure requirements. The scope of the disclosure requirements for offsetting is limited to derivative instruments, repurchase agreements and reverse repurchase agreements, and securities borrowing. The guidance is effective for financial statements with fiscal years beginning on or after
85
Table of Contents
Notes to financial statements
Delaware Diversified Income Fund
9. Offsetting (continued)
Jan. 1, 2013, and interim periods within those fiscal years. The Fund adopted the disclosure provisions on offsetting during the current reporting period.
In order to better define its contractual rights and to secure rights that will help the Fund mitigate its counterparty risk, the Fund entered into an International Swaps and Derivatives Association, Inc. Master Agreement (ISDA Master Agreement) or a similar agreement with each of its derivative contract counterparties. An ISDA Master Agreement is a bilateral agreement between the Fund and a counterparty that governs over-the-counter (OTC) derivatives and foreign exchange contracts and typically contains, among other things, collateral posting items and netting provisions in the event of a default and/or termination event. Under an ISDA Master Agreement, the Fund may, under certain circumstances, offset with the counterparty certain derivative financial instrument’s payables and/or receivables with collateral held and/or posted and create one single net payment. The provisions of the ISDA Master Agreement typically permit a single net payment in the event of default (close-out) netting including the bankruptcy or insolvency of the counterparty. However, bankruptcy or insolvency laws of a particular jurisdiction may impose restrictions on or prohibitions against the right of offset in bankruptcy, insolvency or other events.
For financial reporting purposes, the Fund does not offset derivative assets and derivative liabilities that are subject to netting arrangements on the “Statement of assets and liabilities.”
At Oct. 31, 2014, the Fund had the following assets and liabilities subject to offsetting provisions:
Offsetting of Financial Assets and Liabilities and Derivative Assets and Liabilities
Counterparty | Gross Value of Derivative Asset | Gross Value of Derivative Liability | Net Position | |||||||||
Bank of America Merrill Lynch | $ | 230,321 | $ | — | $ | 230,321 | ||||||
Barclays Bank | — | (113,737 | ) | (113,737 | ) | |||||||
BNP Paribas | 9,584 | (482 | ) | 9,102 | ||||||||
BNY Mellon | — | (110,968 | ) | (110,968 | ) | |||||||
Deutsche Bank | — | (27,761 | ) | (27,761 | ) | |||||||
Hong Kong Shanghai Bank | 80,104 | — | 80,104 | |||||||||
JPMorgan Chase Bank | 110,577 | — | 110,577 | |||||||||
Toronto Dominion Bank | 191,386 | — | 191,386 | |||||||||
Union Bank of Switzerland | — | (53,490 | ) | (53,490 | ) | |||||||
|
|
|
|
|
| |||||||
Total | $ | 621,972 | $ | (306,438 | ) | $ | 315,534 | |||||
|
|
|
|
|
| |||||||
86
Table of Contents
Counterparty | Net Position | Fair Value of Non-Cash Collateral Received | Cash Collateral Received | Fair Value of Non- Cash Collateral Pledged | Cash Collateral Pledged | Net Amount(a) | ||||||||||||||||||
Bank of America Merrill Lynch | $ | 230,321 | $ | — | $ | — | $ | — | $ | — | $ | 230,321 | ||||||||||||
Barclays Bank | (113,737 | ) | — | — | — | — | (113,737 | ) | ||||||||||||||||
BNP Paribas | 9,102 | (9,102 | ) | — | — | — | — | |||||||||||||||||
BNY Mellon | (110,968 | ) | — | — | — | — | (110,968 | ) | ||||||||||||||||
Deutsche Bank | (27,761 | ) | — | — | — | — | (27,761 | ) | ||||||||||||||||
Hong Kong Shanghai Bank | 80,104 | (80,104 | ) | — | — | — | — | |||||||||||||||||
JPMorgan Chase Bank | 110,577 | — | — | — | — | 110,577 | ||||||||||||||||||
Toronto Dominion Bank | 191,386 | — | — | — | — | 191,386 | ||||||||||||||||||
Union Bank of Switzerland | (53,490 | ) | — | — | — | — | (53,490 | ) | ||||||||||||||||
|
|
|
|
|
|
|
|
|
|
|
| |||||||||||||
Total | $ | 315,534 | $ | (89,206 | ) | $ | — | $ | — | $ | — | $ | 226,328 | |||||||||||
|
|
|
|
|
|
|
|
|
|
|
| |||||||||||||
Master Repurchase Agreements
Counterparty | Repurchase Agreements | Fair Value of Non-Cash Collateral Received | Cash Collateral Received | Net Amount(a) | ||||||||||||
Bank of America Merrill Lynch | $ | 106,055,139 | $ | (106,055,139 | ) | $ | — | $ | — | |||||||
Bank of Montreal | 17,675,857 | (17,675,857 | ) | — | — | |||||||||||
BNP Paribas | 208,801,004 | (208,801,004 | ) | — | — | |||||||||||
|
|
|
|
|
|
|
| |||||||||
Total | $ | 332,532,000 | $ | (332,532,000 | ) | $ | — | $ | — | |||||||
|
|
|
|
|
|
|
| |||||||||
(a)Net amount represents the receivable/(payable) that would be due from/(to) the counterparty in the event of default.
10. Securities Lending
The Fund, along with other funds in the Delaware Investments® Family of Funds, may lend its securities pursuant to a security lending agreement (Lending Agreement) with The Bank of New York Mellon (BNY Mellon). At the time a security is loaned, the borrower must post collateral equal to the required percentage of the market value of the loaned security, including any accrued interest. The required percentage is: (1) 102% with respect to U.S. securities and foreign securities that are denominated and payable in U.S. dollars; and (2) 105% with respect to foreign securities. With respect to each loan, if on any business day the aggregate market value of securities collateral plus cash collateral held is less than the aggregate market value of the securities which are the subject of such loan, the borrower will be notified to provide additional collateral by the end of the following business day which, together with the collateral already held, will be not less than the applicable initial collateral requirements for such security loan. If the aggregate market value of securities collateral and cash collateral held with respect to a security loan exceeds the applicable initial collateral requirement, upon the request of the borrower, BNY Mellon must return enough collateral to the borrower by the end of the following business day to reduce
87
Table of Contents
Notes to financial statements
Delaware Diversified Income Fund
10. Securities Lending (continued)
the value of the remaining collateral to the applicable initial collateral requirement for such security loan. As a result of the foregoing, the value of the collateral held with respect to a loaned security on any particular day may be more or less than the value of the security on loan.
Cash collateral received is generally invested in the Delaware Investments Collateral Fund No. 1 (Collective Trust) established by BNY Mellon for the purpose of investment on behalf of funds managed by DMC that participate in BNY Mellon’s securities lending program. The Collective Trust may invest in U.S. government securities and high-quality corporate debt, asset-backed and other money market securities, and in repurchase agreements collateralized by such securities, provided that the Collective Trust will generally have a dollar-weighted average portfolio maturity of 60 days or less. The Fund can also accept U.S. government securities and letters of credit (non-cash collateral) in connection with securities loans. In the event of default or bankruptcy by the lending agent, realization and/or retention of the collateral may be subject to legal proceedings. In the event the borrower fails to return loaned securities and the collateral received is insufficient to cover the value of the loaned securities and provided such collateral shortfall is not the result of investment losses, the lending agent has agreed to pay the amount of the shortfall to the Fund or, at the discretion of the lending agent, replace the loaned securities. The Fund continues to record dividends or interest, as applicable, on the securities loaned and is subject to changes in value of the securities loaned that may occur during the term of the loan. The Fund has the right under the Lending Agreement to recover the securities from the borrower on demand. With respect to security loans collateralized by non-cash collateral, the Fund receives loan premiums paid by the borrower. With respect to security loans collateralized by cash collateral, the earnings from the collateral investments are shared among the Fund, the security lending agent and the borrower. The Fund records security lending income net of allocations to the security lending agent and the borrower.
The Collective Trust used for the investment of cash collateral received from borrowers of securities seeks to maintain a net asset value per unit of $1.00, but there can be no assurance that it will always be able to do so. The Fund may incur investment losses as a result of investing securities lending collateral in the Collective Trust. This could occur if an investment in a Collective Trust defaulted or if it were necessary to liquidate assets in the Collective Trust to meet returns on outstanding security loans at a time when the Collective Trust’s net asset value per unit was less than $1.00. Under those circumstances, the Fund may not receive an amount from the Collective Trust that is equal in amount to the collateral the Fund would be required to return to the borrower of the securities and the Fund would be required to make up for this shortfall.
At Oct. 31, 2014, the value of securities on loan was $128,586,133, and the value of invested collateral was $134,138,153, for which cash collateral was received and invested in accordance with the Lending Agreement. These investments are presented on the “Schedule of investments” under the caption “Securities Lending Collateral.”
11. Credit and Market Risk
The Fund invests in fixed income securities whose value is derived from an underlying pool of mortgages or consumer loans. The value of these securities is sensitive to changes in economic conditions,
88
Table of Contents
including delinquencies and/or defaults, and may be adversely affected by shifts in the market’s perception of the issuers and changes in interest rates. Investors receive principal and interest payments as the underlying mortgages or consumer loans are paid back. Some of these securities are collateralized mortgage obligations (CMOs). CMOs are debt securities issued by U.S. government agencies or by financial institutions and other mortgage lenders, which are collateralized by a pool of mortgages held under an indenture. Prepayment of mortgages may shorten the stated maturity of the obligations and can result in a loss of premium, if any has been paid. Certain of these securities may be stripped (securities which provide only the principal or interest feature of the underlying security). The yield to maturity on an interest-only CMO is extremely sensitive not only to changes in prevailing interest rates, but also to the rate of principal payments (including prepayments) on the related underlying mortgage assets. A rapid rate of principal payments may have a material adverse effect on the Fund’s yield to maturity. If the underlying mortgage assets experience greater than anticipated prepayments of principal, the Fund may fail to fully recoup its initial investment in these securities even if the securities are rated in the highest rating categories.
The Fund invests a portion of its assets in high yield fixed income securities, which are securities rated lower than BBB- by S&P and Baa3 by Moody’s, or similarly rated by another nationally recognized statistical rating organization. Investments in these higher yielding securities are generally accompanied by a greater degree of credit risk than higher rated securities. Additionally, lower rated securities may be more susceptible to adverse economic and competitive industry conditions than investment-grade securities.
Some countries in which the Fund may invest require governmental approval for the repatriation of investment income, capital or the proceeds of sales of securities by foreign investors. In addition, if there is deterioration in a country’s balance of payments or for other reasons, a country may impose temporary restrictions on foreign capital remittances abroad.
The securities exchanges of certain foreign markets are substantially smaller, less liquid, and more volatile than the major securities markets in the United States. Consequently, acquisition and disposition of securities by the Fund may be inhibited. In addition, a significant portion of the aggregate market value of securities listed on the major securities exchanges in emerging markets is held by a smaller number of investors. This may limit the number of shares available for acquisition or disposition by the Fund.
The Fund invests in certain obligations that may have liquidity protection designed to ensure that the receipt of payments due on the underlying security is timely. Such protection may be provided through guarantees, insurance policies or letters of credit obtained by the issuer or sponsor through third parties, through various means of structuring the transaction or through a combination of such approaches. The Fund will not pay any additional fees for such credit support, although the existence of credit support may increase the price of a security.
The Fund invests in bank loans and other securities that may subject them to direct indebtedness risk, the risk that the Fund will not receive payment of principal, interest, and other amounts due in connection with these investments and will depend primarily on the financial condition of the borrower. Loans that are fully secured offer the Fund more protection than unsecured loans in the event of nonpayment of scheduled interest or principal, although there is no assurance that the liquidation of collateral from a secured loan would satisfy the corporate borrower’s obligation, or that the collateral can
89
Table of Contents
Notes to financial statements
Delaware Diversified Income Fund
11. Credit and Market Risk (continued)
be liquidated. Some loans or claims may be in default at the time of purchase. Certain of the loans and the other direct indebtedness acquired by the Fund may involve revolving credit facilities or other standby financing commitments that obligate the Fund to pay additional cash on a certain date or on demand. These commitments may require the Fund to increase its investment in a company at a time when the Fund might not otherwise decide to do so (including at a time when the company’s financial condition makes it unlikely that such amounts will be repaid). To the extent that the Fund is committed to advance additional funds, it will at all times hold and maintain cash or other high grade debt obligations in an amount sufficient to meet such commitments.
As the Fund may be required to rely upon another lending institution to collect and pass on to the Fund amounts payable with respect to the loan and to enforce the Fund’s rights under the loan and other direct indebtedness, an insolvency, bankruptcy or reorganization of the lending institution may delay or prevent the Fund from receiving such amounts. The highly leveraged nature of many loans may make them especially vulnerable to adverse changes in economic or market conditions. Investments in such loans and other direct indebtedness may involve additional risk to the Fund.
The Fund may invest up to 15% of its net assets in illiquid securities, which may include securities with contractual restrictions on resale, securities exempt from registration under Rule 144A of the Securities Act of 1933, as amended, and other securities which may not be readily marketable. The relative illiquidity of these securities may impair the Fund from disposing of them in a timely manner and at a fair price when it is necessary or desirable to do so. While maintaining oversight, the Fund’s Board has delegated to DMC, the day-to-day functions of determining whether individual securities are liquid for purposes of the Fund’s limitation on investments in illiquid securities. Securities eligible for resale pursuant to Rule 144A, which are determined to be liquid, are not subject to the Fund’s 15% limit on investments in illiquid securities. Rule 144A and illiquid securities have been identified on the “Schedule of investments.”
12. Contractual Obligations
The Fund enters into contracts in the normal course of business that contain a variety of indemnifications. The Fund’s maximum exposure under these arrangements is unknown. However, the Fund has not had prior claims or losses pursuant to these contracts. Management has reviewed the Fund’s existing contracts and expects the risk of loss to be remote.
13. Recent Accounting Pronouncements
In June 2014, the Financial Accounting Standards Board issued guidance to improve the financial reporting of reverse repurchase agreements and other similar transactions. The guidance includes expanded disclosure requirements for entities that enter into reverse repurchase agreements and similar transactions accounted for as secured borrowings. The guidance is effective for financial statements with fiscal years beginning on or after Dec. 15, 2014 and interim periods within those fiscal years. Management is evaluating the impact, if any, of this guidance on the Funds’ financial statement disclosures.
90
Table of Contents
14. Subsequent Events
Effective Nov. 1, 2014, Delaware Investments® Fund Services Company (DIFSC), an affiliate of DMC, provides fund accounting and financial administration oversight services to the Fund. Also effective Nov. 1, 2014, DIFSC is the transfer agent and dividend disbursing agent of the Fund.
On Nov. 10, 2014, the Fund, along with the other Participants, entered into an agreement for a $275,000,000 revolving line of credit to be used as described in Note 7 and to be operated in substantially the same manner as the agreement described in Note 7. The line of credit under the agreement expires on Nov. 9, 2015.
Management has determined that no other material events or transactions occurred subsequent to Oct. 31, 2014 that would require recognition or disclosure in the Fund’s financial statements.
91
Table of Contents
registered public accounting firm
To the Board of Trustees of Delaware Group® Adviser Funds
and the Shareholders of Delaware Diversified Income Fund:
In our opinion, the accompanying statement of assets and liabilities, including the schedule of investments, and the related statements of operations and of changes in net assets and the financial highlights present fairly, in all material respects, the financial position of Delaware Diversified Income Fund (one of the series constituting Delaware Group Adviser Funds, hereafter referred to as the “Fund”) at October 31, 2014, the results of its operations for the year then ended, the changes in its net assets for each of the two years in the period then ended and the financial highlights for each of the five years in the period then ended, in conformity with accounting principles generally accepted in the United States of America. These financial statements and financial highlights (hereafter referred to as “financial statements”) are the responsibility of the Fund’s management. Our responsibility is to express an opinion on these financial statements based on our audits. We conducted our audits of these financial statements in accordance with the standards of the Public Company Accounting Oversight Board (United States). Those standards require that we plan and perform the audit to obtain reasonable assurance about whether the financial statements are free of material misstatement. An audit includes examining, on a test basis, evidence supporting the amounts and disclosures in the financial statements, assessing the accounting principles used and significant estimates made by management, and evaluating the overall financial statement presentation. We believe that our audits, which included confirmation of securities at October 31, 2014 by correspondence with the custodian and brokers, and the application of alternative auditing procedures where confirmations of security purchases had not been received, provide a reasonable basis for our opinion.
PricewaterhouseCoopers LLP
Philadelphia, Pennsylvania
December 17, 2014
92
Table of Contents
Other Fund information (Unaudited)
Delaware Diversified Income Fund
Tax Information
The information set forth below is for the Fund’s fiscal year as required by federal income tax laws. Shareholders, however, must report distributions on a calendar year basis for income tax purposes, which may include distributions for portions of two fiscal years of a Fund. Accordingly, the information needed by shareholders for income tax purposes will be sent to them in January of each year. Please consult your tax advisor for proper treatment of this information.
All disclosures are based on financial information available as of the date of this annual report and, accordingly are subject to change. For any and all items requiring reporting, it is the intention of the Fund to report the maximum amount permitted under the Internal Revenue Code and the regulations thereunder.
For the fiscal year ended Oct. 31, 2014, the Fund reports distributions paid during the year as follows:
(A) Long-Term Capital Gains Distributions (Tax Basis) | 7.90 | % | ||
(B) Ordinary Income Distributions (Tax Basis)* | 92.10 | % | ||
Total Distributions. | 100.00 | % |
(A) and (B) are based on a percentage of the Fund’s total distributions.
For the fiscal year ended Oct. 31, 2014, certain interest income paid by the Fund, determined to be Qualified Interest Income may be subject to relief from U.S. withholding for foreign shareholders, as provided by the American Jobs Creation Act of 2004, and as extended by Tax Relief Unemployment Insurance Reauthorization and Job Creations Act of 2010, and the American Taxpayer Relief Act of 2012. For the fiscal year ended Oct. 31, 2014, the Fund has reported maximum distributions of Qualified Interest Income of $206,953,613.
Board consideration of Delaware Diversified Income Fund investment advisory agreement
At a meeting held on Aug. 19–21, 2014 (the “Annual Meeting”), the Board of Trustees (the “Board”), including a majority of disinterested or independent Trustees, approved the renewal of the Investment Management Agreement for Delaware Diversified Income Fund (the “Fund”). In making its decision, the Board considered information furnished at regular quarterly Board meetings, including reports detailing Fund performance, investment strategies and expenses, as well as information prepared specifically in connection with the renewal of the investment advisory and sub-advisory contracts. Information furnished specifically in connection with the renewal of the Investment Management Agreement with Delaware Management Company (“DMC”) included materials provided by DMC and its affiliates (“Delaware Investments”) concerning, among other things, the nature, extent and quality of services provided to the Fund, the costs of such services to the Fund, economies of scale and the financial condition and profitability of Delaware Investments. In addition, in connection with the Annual Meeting, reports were provided to the Trustees in May 2014 and included reports provided by Lipper, Inc., an independent statistical compilation organization (“Lipper”). The Lipper reports compared the Fund’s investment performance and expenses with those of other comparable mutual funds. The Independent Trustees reviewed and discussed the Lipper reports with independent legal counsel to the Independent Trustees. The Board requested and received information regarding DMC’s policy with respect to advisory fee levels and its breakpoint philosophy; the structure of portfolio manager compensation; the investment manager’s profitability; comparative client fee information; and any constraints or limitations on the availability of securities for certain investment styles, which had in the past year inhibited, or which were likely in the future to inhibit, DMC’s ability to invest fully in accordance with Fund policies.
93
Table of Contents
Other Fund information (Unaudited)
Delaware Diversified Income Fund
Board consideration of Delaware Diversified Income Fund investment advisory agreement (continued)
In considering information relating to the approval of the Fund’s advisory agreement, the Independent Trustees received assistance and advice from and met separately with independent legal counsel to the Independent Trustees. Although the Board gave attention to all information furnished, the following discussion identifies, under separate headings, the primary factors taken into account by the Board during its contract renewal considerations.
Nature, Extent and Quality of Service. The Board considered the services provided by Delaware Investments to the Fund and its shareholders. In reviewing the nature, extent and quality of services, the Board considered reports furnished to it throughout the year, which covered matters such as the relative performance of the Fund, compliance of portfolio managers with the investment policies, strategies and restrictions for the Fund, compliance by DMC and Delaware Distributors, L.P. (together, “Management”) personnel with the Code of Ethics adopted throughout the Delaware Investments® Family of Funds complex and adherence to fair value pricing procedures as established by the Board. The Board was pleased with the current staffing of the Fund’s investment manager and the emphasis placed on research in the investment process. The Board recognized DMC’s recent receipt of several industry distinctions. The Board gave favorable consideration to DMC’s efforts to control expenditures while maintaining service levels committed to Fund matters. The Board noted that, in the third and fourth quarters of 2013, Management reduced the maximum 12b-1 fee for certain funds; and in November 2013 Management negotiated a substantial reduction in fees for fund accounting services provided to the Funds. The Board noted the benefits provided to Fund shareholders through each shareholder’s ability to exchange an investment in one Delaware Investments fund for the same class of shares in another Delaware Investments fund without a sales charge, to reinvest Fund dividends into additional shares of the Fund or into additional shares of other Delaware Investments funds and the privilege to combine holdings in other Delaware Investments funds to obtain a reduced sales charge. The Board was satisfied with the nature, extent and quality of the overall services provided by Delaware Investments.
Investment Performance. The Board placed significant emphasis on the investment performance of the Fund in view of the importance of investment performance to shareholders. Although the Board gave appropriate consideration to performance reports and discussions with portfolio managers at Investment Committee meetings throughout the year, the Board gave particular weight to the Lipper reports furnished for the Annual Meeting. The Lipper reports prepared for the Fund showed the investment performance of its Class A shares in comparison to a group of similar funds as selected by Lipper (the “Performance Universe”). A fund with the best performance ranked first, and a fund with the poorest performance ranked last. The highest/best performing 25% of funds in the Performance Universe make up the first quartile; the next 25%, the second quartile; the next 25%, the third quartile; and the poorest/worst performing 25% of funds in the Performance Universe make up the fourth quartile. Comparative annualized performance for the Fund was shown for the past one-, three-, five- and ten-year periods, to the extent applicable, ended March 31, 2014. The Board’s objective is that the Fund’s performance for the periods considered be at or above the median of its Performance Universe. The following paragraph summarizes the performance results for the Fund and the Board’s view of such performance.
The Performance Universe for the Fund consisted of the Fund and all retail and institutional multi-sector income funds as selected by Lipper. The Lipper report comparison showed that the Fund’s total return for the one- and five-year periods was in the fourth quartile of its Performance Universe. The report further showed that the Fund’s total return for the three-and ten-year periods was in the third quartile and second quartile, respectively. The Fund’s performance results were not in line with the Board’s objective. In evaluating the Fund’s performance, the Board considered the investment policy changes implemented in late 2012. The Board also considered the numerous investment and performance reports
94
Table of Contents
delivered by Management personnel to the Board’s Investment Committee. The Board was satisfied that Management was taking action to improve the Fund’s performance and to meet the Board’s performance objective.
Comparative Expenses. The Board considered expense comparison data for the Delaware Investments® Family of Funds. Management provided the Board with information on pricing levels and fee structures for the Fund as of its most recently completed fiscal year. The Board also focused on the comparative analysis of effective management fees and total expense ratios of the Fund versus effective management fees and expense ratios of a group of similar funds as selected by Lipper (the “Expense Group”). In reviewing comparative costs, the Fund’s contractual management fee and the actual management fee incurred by the Fund were compared with the contractual management fees (assuming all funds in the Expense Group were similar in size to the Fund) and actual management fees (as reported by each fund) within the Expense Group, taking into account any applicable breakpoints and fee waivers. The Fund’s total expenses were also compared with those of its Expense Group. The Lipper total expenses, for comparative consistency, were shown by Lipper for Class A shares and comparative total expenses including 12b-1 and non 12b-1 service fees. The Board considered fees paid to Delaware Investments for non-management services. The Board’s objective is to limit the Fund’s total expense ratio to be competitive with that of the Expense Group. The following paragraph summarizes the expense results for the Fund and the Board’s view of such expenses.
The expense comparisons for the Fund showed that its actual management fee and total expenses were in the quartile with the lowest expenses of its Expense Group. The Board was satisfied with the management fee and total expenses of the Fund in comparison to those of its Expense Group as shown in the Lipper report.
Management Profitability. The Board considered the level of profits realized by Delaware Investments in connection with the operation of the Fund. In this respect, the Board reviewed the Investment Management Profitability Analysis that addressed the overall profitability of Delaware Investments’ business in providing management and other services to each of the individual funds and the Delaware Investments Family of Funds as a whole. Specific attention was given to the methodology followed in allocating costs for the purpose of determining profitability. Management stated that the level of profits of Delaware Investments, to a certain extent, reflects recent operational cost savings and efficiencies initiated by Delaware Investments. The Board considered Delaware Investments’ efforts to improve services provided to fund shareholders and to meet additional regulatory and compliance requirements resulting from recent industry-wide Securities and Exchange Commission initiatives. The Board also considered the extent to which Delaware Investments might derive ancillary benefits from fund operations, including the potential for procuring additional business as a result of the prestige and visibility associated with its role as service provider to the Delaware Investments Family of Funds and the benefits from allocation of fund brokerage to improve trading efficiencies. The Board found that the management fees were reasonable in light of the services rendered and the level of profitability of Delaware Investments.
Economies of Scale. The Trustees considered whether economies of scale are realized by Delaware Investments as the Fund’s assets increase and the extent to which any economies of scale are reflected in the level of management fees charged. The Trustees reviewed the standardized advisory fee pricing and structure, approved by the Board and shareholders, which includes breakpoints. Breakpoints in the advisory fee occur when the advisory fee rate is reduced on assets in excess of specified levels. Breakpoints result in a lower advisory fee than would otherwise be the case on all assets when the asset levels specified are exceeded. The Board noted that the fee under the Fund’s management contract fell within the standard structure. The Board also noted that the Fund’s assets exceeded the final breakpoint level. The Board believed that, given the extent to which economies of scale might be realized by the advisor and its affiliates, the schedule of fees under the Investment Management Agreement provides a sharing of benefits with the Fund and its shareholders.
95
Table of Contents
Board of trustees/directors and officers addendum
Delaware Investments® Family of Funds
A mutual fund is governed by a Board of Trustees/Directors (“Trustees”), which has oversight responsibility for the management of a fund’s business affairs. Trustees establish procedures and oversee and review the performance of the investment manager, the distributor, and others who perform services for the fund. The independent fund trustees, in particular, are advocates
Name, Address, and Birth Date | Position(s) Held with Fund(s) | Length of Time Served | ||||
Interested Trustees
| ||||||
Patrick P. Coyne1 2005 Market Street Philadelphia, PA 19103 April 1963 | Chairman, President, Chief Executive Officer, and Trustee | Chairman and Trustee since August 16, 2006 | ||||
President and Chief Executive Officer since August 1, 2006 | ||||||
Independent Trustees
| ||||||
Thomas L. Bennett 2005 Market Street Philadelphia, PA 19103 October 1947
| Trustee | Since March 2005 | ||||
Joseph W. Chow 2005 Market Street Philadelphia, PA 19103 January 1953
| Trustee | Since January 2013 | ||||
John A. Fry 2005 Market Street Philadelphia, PA 19103 May 1960
| Trustee | Since January 2001 | ||||
Anthony D. Knerr 2005 Market Street Philadelphia, PA 19103 December 1938
| Trustee | Since April 1990 | ||||
1 Patrick P.Coyne is considered to be an “Interested Trustee“ because he is an executive officer of the Fund’s(s’) investment advisor.
96
Table of Contents
for shareholder interests. Each trustee has served in that capacity since he or she was elected to or appointed to the Board of Trustees, and will continue to serve until his or her retirement or the election of a new trustee in his or her place. The following is a list of the Trustees and Officers with certain background and related information.
Principal Occupation(s) During Past 5 Years | Number of Portfolios in Fund Complex Overseen by Trustee or Officer | Other Directorships Held by Trustee or Officer | ||||
Patrick P. Coyne has served in various executive capacities at different times at Delaware Investments.2 | 65 | Director and Audit Committee Member Kaydon Corp. | ||||
Board of Governors Member Investment Company Institute (ICI) | ||||||
Private Investor (March 2004–Present) | 65 | Director Bryn Mawr Bank Corp. (BMTC) (2007–2011)
| ||||
Executive Vice President (Emerging Economies Strategies, Risk and Corporate Administration) State Street Corporation (July 2004–March 2011)
| 65 | Director and Audit Committee Member — Hercules Technology Growth Capital, Inc. | ||||
President Drexel University (August 2010–Present)
| 65 | Director — Hershey Trust Company | ||||
President Franklin & Marshall College (July 2002–July 2010)
| Director, Audit Committee, and Governance Committee Member Community Health Systems
| |||||
Managing Director AKA Strategy (Strategic Consulting) (1990–Present)
| 65 | None |
| 2 | Delaware Investments is the marketing name for Delaware Management Holdings, Inc. and its subsidiaries, including the Fund’s(s’) investment advisor, principal underwriter, and its transfer agent. |
97
Table of Contents
Board of trustees/directors and officers addendum
Delaware Investments® Family of Funds
Name, Address, and Birth Date | Position(s) Held with Fund(s) | Length of Time Served | ||||
Independent Trustees (continued)
| ||||||
Lucinda S. Landreth 2005 Market Street Philadelphia, PA 19103 June 1947
| Trustee | Since March 2005 | ||||
Frances A. Sevilla-Sacasa 2005 Market Street Philadelphia, PA 19103 January 1956
| Trustee | Since September 2011 | ||||
Thomas K. Whitford 2005 Market Street Philadelphia, PA 19103 March 1956
| Trustee | Since January 2013 | ||||
98
Table of Contents
Principal Occupation(s) During Past 5 Years | Number of Portfolios in Fund Complex Overseen by Trustee or Officer | Other Directorships Held by Trustee or Officer | ||
Private Investor (2004–Present)
| 65 | None | ||
Chief Executive Officer — Banco Itaú Europa International (April 2012–Present)
Executive Advisor to Dean (August 2011–March 2012) and Interim Dean (January 2011–July 2011) — University of Miami School of Business Administration
President — U.S. Trust, Bank of America Private Wealth Management (Private Banking) (July 2007–December 2008)
| 65 | Trust Manager and Audit Committee Member — Camden Property Trust | ||
Vice Chairman (2010–April 2013) Chief Administrative Officer (2008–2010) and Executive Vice President and Chief Administrative Officer (2007–2009) — PNC Financial Services Group
| 65 | Director — HSBC Finance Corporation and HSBC North America Holdings Inc. |
99
Table of Contents
Board of trustees/directors and officers addendum
Delaware Investments® Family of Funds
Name, Address, and Birth Date | Position(s) Held with Fund(s) | Length of Time Served | ||||
Independent Trustees (continued)
| ||||||
Janet L. Yeomans 2005 Market Street Philadelphia, PA 19103 July 1948
| Trustee | Since April 1999 | ||||
J. Richard Zecher 2005 Market Street Philadelphia, PA 19103 July 1940
| Trustee | Since March 2005 | ||||
100
Table of Contents
Principal Occupation(s) During Past 5 Years | Number of Portfolios in Fund Complex Overseen by Trustee or Officer | Other Directorships Held by Trustee or Officer | ||
Vice President and Treasurer | 65 | Director, Audit and | ||
(January 2006–July 2012) | Compliance Committee Chair, | |||
Vice President — Mergers & | Investment Committee | |||
Acquisitions | Member, and Governance | |||
(January 2003–January 2006), | Committee Member | |||
and | Okabena Company | |||
Vice President and Treasurer | ||||
(July 1995–January 2003) | Chair — 3M | |||
3M Corporation | Investment Management | |||
| Company | ||||
(2005–2012)
| ||||
Founder | 65 | Director and Compensation | ||
Investor Analytics | Committee Member | |||
(Risk Management) | Investor Analytics | |||
(May 1999–Present) | ||||
| Director — P/E Investments | ||||
Founder | ||||
P/E Investments | ||||
(Hedge Fund) | ||||
(September 1996–Present)
|
101
Table of Contents
Board of trustees/directors and officers addendum
Delaware Investments® Family of Funds
Name, Address, and Birth Date | Position(s) Held with Fund(s) | Length of Time Served | ||
Officers | ||||
David F. Connor | Senior Vice President, | Senior Vice President, | ||
2005 Market Street | Deputy General | Deputy General Counsel | ||
Philadelphia, PA 19103 | Counsel, and Secretary | since May 2013; | ||
December 1963 | Vice President, Deputy | |||
| General Counsel | ||||
| September 2000 – | ||||
| May 2013; Secretary since | ||||
October 2005
| ||||
Daniel V. Geatens | Vice President | Treasurer since October 2007 | ||
2005 Market Street | and Treasurer | |||
Philadelphia, PA 19103 | ||||
October 1972
| ||||
David P. O’Connor | Executive Vice President, | Executive Vice President | ||
2005 Market Street | General Counsel | since February 2012; | ||
Philadelphia, PA 19103 | and Chief Legal Officer | Senior Vice President | ||
February 1966 | October 2005 – | |||
| February 2012; | ||||
| General Counsel and | ||||
| Chief Legal Officer | ||||
since October 2005
| ||||
Richard Salus | Senior Vice President | Chief Financial Officer | ||
2005 Market Street | and Chief Financial Officer | since November 2006 | ||
Philadelphia, PA 19103 | ||||
October 1963
|
The Statement of Additional Information for the Fund(s) includes additional information about the Trustees and Officers and is available, without charge, upon request by calling 800 523-1918.
102
Table of Contents
Principal Occupation(s) During Past 5 Years | Number of Portfolios in Fund Complex Overseen by Trustee or Officer | Other Directorships Held by Trustee or Officer | ||
David F. Connor has served as Deputy General Counsel of Delaware Investments since 2000.
| 65 | None3 | ||
Daniel V. Geatens has served in various capacities at different times at Delaware Investments. | 65 | None3 | ||
David P. O’Connor has served in various executive and legal capacities at different times at Delaware Investments.
| 65 | None3 | ||
Richard Salus has served in various executive capacities at different times at Delaware Investments. | 65 | None3 |
| 3 | David F. Connor, Daniel V. Geatens, David P. O’Connor, and Richard Salus serve in similar capacities for the six portfolios of the Optimum Fund Trust, which have the same investment advisor, principal underwriter, and transfer agent as the registrant. |
103
Table of Contents
Board of trustees
| ||||||
| Patrick P. Coyne | Joseph W. Chow | Lucinda S. Landreth | Thomas K. Whitford | |||
| Chairman, President, and | Former Executive Vice | Former Chief Investment | Former Vice Chairman | |||
| Chief Executive Officer | President | Officer | PNC Financial Services Group | |||
| Delaware Investments ® | State Street Corporation | Assurant, Inc. | Pittsburgh, PA | |||
| Family of Funds | Brookline, MA | Philadelphia, PA | ||||
| Philadelphia, PA | Janet L. Yeomans | |||||
| John A. Fry | Frances A. | Former Vice President and | ||||
| Thomas L. Bennett | President | Sevilla-Sacasa | Treasurer | |||
| Private Investor | Drexel University | Chief Executive Officer | 3M Corporation | |||
| Rosemont, PA | Philadelphia, PA | Banco Itaú | St. Paul, MN | |||
| International Miami, FL |
J. Richard Zecher | |||||
| Founder | ||||||
| Investor Analytics | ||||||
| Scottsdale, AZ | ||||||
| Affiliated officers | ||||||
| David F. Connor | Daniel V. Geatens | David P. O’Connor | Richard Salus | |||
| Senior Vice President, | Vice President and | Executive Vice President, | Senior Vice President and | |||
| Deputy General Counsel, | Treasurer | General Counsel, | Chief Financial Officer | |||
| and Secretary | Delaware Investments | and Chief Legal Officer | Delaware Investments | |||
| Delaware Investments | Family of Funds | Delaware Investments | Family of Funds | |||
| Family of Funds | Philadelphia, PA | Family of Funds | Philadelphia, PA | |||
| Philadelphia, PA | Philadelphia, PA | |||||
This annual report is for the information of Delaware Diversified Income Fund shareholders, but it may be used with prospective investors when preceded or accompanied by the Delaware Investments Fund fact sheet for the most recently completed calendar quarter. These documents are available at delawareinvestments.com.
Delaware Investments is the marketing name of Delaware Management Holdings, Inc. and its subsidiaries.
The Fund files its complete schedule of portfolio holdings with the Securities and Exchange Commission (SEC) for the first and third quarters of each fiscal year on Form N-Q. The Fund’s Forms N-Q, as well as a description of the policies and procedures that the Fund uses to determine how to vote proxies (if any) relating to portfolio securities are available without charge (i) upon request, by calling 800 523-1918; and (ii) on the SEC’s website at sec.gov. In addition, a description of the policies and procedures that the Fund uses to determine how to vote proxies (if any) relating to portfolio securities and the Fund’s Schedule of Investments are available without charge on the Fund’s website at delawareinvestments.com. The Fund’s Forms N-Q may be reviewed and copied at the SEC’s Public Reference Room in Washington, D.C.; information on the operation of the Public Reference Room may be obtained by calling 800 SEC-0330.
Information (if any) regarding how the Fund voted proxies relating to portfolio securities during the most recently disclosed 12-month period ended June 30 is available without charge (i) through the Fund’s website at delawareinvestments.com; and (ii) on the SEC’s website at sec.gov.
104
Table of Contents

Annual report
U.S. growth equity mutual fund
Delaware U.S. Growth Fund
October 31, 2014
Carefully consider the Fund’s investment objectives, risk factors, charges, and expenses before investing. This and other information can be found in the Fund’s prospectus and its summary prospectus, which may be obtained by visiting delawareinvestments.com or calling 800 523-1918. Investors should read the prospectus and the summary prospectus carefully before investing.
You can obtain shareholder reports and prospectuses online instead of in the mail.
Visit delawareinvestments.com/edelivery.
Table of Contents
Experience Delaware Investments
Delaware Investments is committed to the pursuit of consistently superior asset management and unparalleled client service. We believe in our investment processes, which seek to deliver consistent results, and in convenient services that help add value for our clients.
If you are interested in learning more about creating an investment plan, contact your financial advisor.
You can learn more about Delaware Investments or obtain a prospectus for Delaware U.S. Growth Fund at delawareinvestments.com.
Manage your investments online
| — | 24-hour access to your account information |
| — | Obtain share prices |
| — | Check your account balance and recent transactions |
| — | Request statements or literature |
| — | Make purchases and redemptions |
Delaware Management Holdings, Inc. and its subsidiaries (collectively known by the marketing name of Delaware Investments) are wholly owned subsidiaries of Macquarie Group Limited, a global provider of banking, financial, advisory, investment and funds management services.
Investments in Delaware U.S. Growth Fund are not and will not be deposits with or liabilities of Macquarie Bank Limited ABN 46 008 583 542 and its holding companies, including their subsidiaries or related companies (Macquarie Group), and are subject to investment risk, including possible delays in repayment and loss of income and capital invested. No Macquarie Group company guarantees or will guarantee the performance of the Fund, the repayment of capital from the Fund, or any particular rate of return.
| 1 | ||||
| 4 | ||||
| 8 | ||||
Security type / sector allocation and top 10 equity holdings | 10 | |||
| 12 | ||||
| 14 | ||||
| 16 | ||||
| 17 | ||||
| 18 | ||||
| 26 | ||||
| 36 | ||||
| 37 | ||||
| 44 | ||||
| 52 |
Unless otherwise noted, views expressed herein are current as of Oct. 31, 2014, and subject to change.
Funds are not FDIC insured and are not guaranteed. It is possible to lose the principal amount invested.
Mutual fund advisory services provided by Delaware Management Company, a series of Delaware Management Business Trust, which is a registered investment advisor. Delaware Investments, a member of Macquarie Group, refers to Delaware Management Holdings, Inc. and its subsidiaries, including the Fund’s distributor, Delaware Distributors, L.P. Macquarie Group refers to Macquarie Group Limited and its subsidiaries and affiliates worldwide.
© 2014 Delaware Management Holdings, Inc.
All third-party marks cited are the property of their respective owners.
Table of Contents
| Portfolio management review | ||
Delaware U.S. Growth Fund | November 11, 2014 |
Performance preview (for the year ended October 31, 2014)
Delaware U.S. Growth Fund (Class A shares)
|
| 1-year return
|
|
| +16.80%
|
| ||
Russell 1000® Growth Index (benchmark)
|
| 1-year return
|
|
| +17.11%
|
| ||
Past performance does not guarantee future results.
For complete, annualized performance for Delaware U.S. Growth Fund, please see the table on page 4.
The performance of Class A shares excludes the applicable sales charge and reflects the reinvestment of all distributions. Index performance returns do not reflect any management fees, transaction costs, or expenses. Indices are unmanaged and one cannot invest directly in an index.
Jackson Square Partners, LLC (JSP) is the sub-advisor to the Fund. As sub-advisor, JSP is responsible for day-to-day management of the Fund’s assets. Although JSP serves as sub-advisor, the investment manager, Delaware Management Company, a series of Delaware Management Business Trust, has ultimate responsibility for all investment advisory services with JSP.
Despite several economic hurdles, U.S. stocks posted strong gains for the fiscal year ended Oct. 31, 2014. The S&P 500® Index gained a solid 17.27% during the period, recovering handily from several severe market dips, most notably in early February and mid-October 2014. Large-cap equities performed particularly well during the period, as indicated by the 16.78% gain in the Russell 1000® Index. (Source: FactSet.)
Early in the fiscal year, the U.S. Federal Reserve, under the leadership of newly appointed Chairwoman Janet Yellen, announced it would begin reducing its $85-billion-per-month quantitative-easing (QE3) strategy, with the goal of ending it by late 2014. The Fed reduced its purchase of U.S. Treasurys by $10 billion on several occasions and eventually completed its purchase program in late October. The Fed indicated, however, that it would revisit the bond buyback strategy if the economy were to worsen.
Short-term interest rates were held at near zero at the end of the fiscal year. The Fed indicated rates would remain at that level for a “considerable time” though it later qualified its intentions: rate
hikes could come sooner if the job market improves faster than expected or if inflation rises. Likewise, the first rate hike could be delayed if inflation or the job market slows. It’s generally expected that increases may begin sometime in mid-2015.
Economic growth gained momentum during the last six months of the Fund’s fiscal year after a series of severe storms limited consumer spending and housing activity for much of the winter. Consumer confidence rose during this period as job openings expanded somewhat and unemployment claims dropped. Consumer spending, capital purchases, and spending by local governments all added to gross domestic product, which grew 4.6% in the second quarter of 2014 and then another (unrevised) 3.5% in the third quarter (source: U.S. Commerce Department).
Outside the United States, market conditions remained volatile for much of the fiscal year as evidenced by the MSCI EAFE Index decline of 0.60%. The tension between Russia and Ukraine, conflicts in the Middle East, and concerns about the Islamic State of Iraq and Syria (ISIS) increased anxiety for investors throughout the world. Furthermore, economic growth has been stagnant within the European Union for the past several years. Despite concerns about the future viability of the euro zone’s single-currency bloc, the European Central Bank (ECB) has vowed to do
1
Table of Contents
Portfolio management review
Delaware U.S. Growth Fund
“whatever it takes” to ensure its success. As the Fed wrapped up its asset buyback program, the ECB embarked upon one of its own. Meanwhile, weakness in Europe has affected global commodity prices. The cost of crude oil dropped precipitously in October 2014 and reached a four-year low just after the end of the fiscal year.
Fund performance
For the fiscal year ended Oct. 31, 2014, Delaware U.S. Growth Fund (Class A shares) returned +16.80% at net asset value and +10.08% at maximum offer price (both figures reflect all distributions reinvested). During the same period, the Fund’s benchmark, the Russell 1000 Growth Index, returned +17.11%. For complete, annualized performance of Delaware U.S. Growth Fund, please see the table on page 4.
Allergan was a strong contributor to performance during the period. The stock experienced a strong rise in price following an acquisition offer from Canada-based Valeant Pharmaceuticals International. While Allergan rejected the acquisition offer, Valeant continued to aggressively pursue an acquisition of Allergan. We continue to hold the company’s stock in the Fund’s portfolio — our internal discussions are focused on what we believe to be fair value for Allergan under several different scenarios. While much attention has been focused on the potential acquisition, we continue to believe the company operates at a high level driven both by its core ophthalmology franchise and the growing use of Botox in both cosmetic and other medical indications.
Celgene contributed to performance during the period as the company experienced several positive events throughout the year. The company made significant progress toward regulatory approval for expanded use of one of its drugs within the United Kingdom. It also achieved positive clinical advancements for a new drug to
treat Crohn’s disease. Overall, Celgene continues to be a leader in the treatment of blood cancers with a growing pipeline of breast, lung, and pancreatic cancer treatments. We believe the company appears poised to continue to benefit from large growth prospects driven by additional indications for its drugs, by increased use of existing drugs, and by international growth opportunities.
Adobe Systems likewise contributed to performance during the period. The company continued to show significant progress in transitioning from a “seat license” software model to a “subscription” model that is likely leading to a more consistent, stable revenue stream with more recurring revenues. While the transition has led to more attractive financial metrics, it has also resulted in the company trading at a higher valuation that is more in line with comparable subscription and cloud-based software companies.
Apple was a detractor from performance during the period due to the Fund’s lack of significant exposure to this strong-performing company. We sold the company due to growing concerns related to its future growth trajectory, margin compression, and product innovation, among others. We still believe Apple is not merely a hardware company, but rather a platform solution where customers tend to be sticky and buy into the “halo” effect of the Apple ecosystem. Therefore, we believe that the sustainability of Apple’s franchise should be stronger for a longer period of time, and that the company deserves a higher valuation than the typical technology hardware company. However, as the risk-reward profile of this company had changed, we no longer felt the stock was as attractive relative to the Fund’s other holdings in the portfolio and therefore decided to exit the position.
Syngenta detracted from performance during the period. Investors have shown increasing concern about future product development, margin
2
Table of Contents
compression, lack of progress in cost savings, industry lawsuits, and certain regulatory issues – most notably in China. We continue to believe that companies like Syngenta are likely to benefit from the growing secular demand for their services, which can help increase crop yield and overall food quality. However, given Syngenta’s higher risk-reward trade-off as well as current headwinds that we believe are unlikely to subside in the near-to-intermediate term, we decided to exit the Fund’s position during the period and allocate to what we view as more attractive opportunities.
eBay likewise detracted from performance during the period. The stock experienced some volatility as investors’ enthusiasm for eBay’s PayPal business, which will be spun out in early 2015, was offset by concern over slowing growth in the eBay Marketplace and potential weakness in the overall retail environment. We continue to hold the stock in the Fund as we believe some of the additional value of the PayPal business embedded within eBay may be unlocked as the company splits into two separate businesses. We also believe there is upside potential to eBay’s core e-commerce business.
Regardless of the economic outcome, we remain consistent in our long-term investment philosophy: We want to own what we view as strong secular-growth companies with solid business models and competitive positions that we believe can grow market share and have the potential to deliver shareholder value in a variety of market environments.
3
Table of Contents
| Performance summary | ||||
| Delaware U.S. Growth Fund | October 31, 2014 |
The performance data quoted represent past performance; past performance does not guarantee future results. Investment return and principal value will fluctuate so your shares, when redeemed, may be worth more or less than their original cost. Please obtain the performance data current for the most recent month end by calling 800 523-1918 or visiting our website at delawareinvestments.com/performance. Current performance may be lower or higher than the performance data quoted.
| Fund and benchmark performance1,2 | Average annual total returns through October 31, 2014 | |||||||||||
| 1 year | 5 years | 10 years | ||||||||||
Class A (Est. Dec. 3, 1993) | ||||||||||||
Excluding sales charge | +16.80 | % | +18.25 | % | +9.22 | % | ||||||
Including sales charge | +10.08 | % | +16.85 | % | +8.58 | % | ||||||
Class C (Est. May 23, 1994) | ||||||||||||
Excluding sales charge | +15.89 | % | +17.36 | % | +8.42 | % | ||||||
Including sales charge | +14.89 | % | +17.36 | % | +8.42 | % | ||||||
Class R (Est. June 2, 2003) | ||||||||||||
Excluding sales charge | +16.47 | % | +17.94 | % | +8.95 | % | ||||||
Including sales charge | +16.47 | % | +17.94 | % | +8.95 | % | ||||||
Institutional Class (Est. Feb. 3, 1994) | ||||||||||||
Excluding sales charge | +17.04 | % | +18.53 | % | +9.50 | % | ||||||
Including sales charge | +17.04 | % | +18.53 | % | +9.50 | % | ||||||
Russell 1000 Growth Index | +17.11 | % | +17.43 | % | +9.05 | % | ||||||
1 Returns reflect the reinvestment of all distributions and are presented both with and without the applicable sales charges described below. Returns do not reflect the deduction of taxes the shareholder would pay on Fund distributions or redemptions of Fund shares.
Expense limitations were in effect for certain classes during some or all of the periods shown in the “Fund and benchmark performance” table. Expenses for each class are listed on the “Fund expense ratios” table on page 5. Performance would have been lower had expense limitations not been in effect.
Class A shares are sold with a maximum front-end sales charge of 5.75%, and have an annual distribution and service fee of 0.25% of average daily net assets. Performance for Class A shares, excluding sales charges, assumes that no front-end sales charge applied.
Class C shares are sold with a contingent deferred sales charge of 1.00% if redeemed during the first 12 months. They are also subject to an annual distribution and service fee of 1.00% of average daily net assets.
Performance for C shares, excluding sales charges, assumes either that contingent deferred sales charges did not apply or that the investment was not redeemed.
Class R shares are available only for certain retirement plan products. They are sold without a sales charge and have an annual distribution and service fee of 0.50% of average daily net assets.
Institutional Class shares are available without sales or asset-based distribution charges only to certain eligible institutional accounts.
4
Table of Contents
The “Fund and benchmark performance” table and the “Performance of a $10,000 investment” graph do not reflect the deduction of taxes the shareholder would pay on Fund distributions or redemptions of Fund shares.
2 The Fund’s expense ratios, as described in the most recent prospectus, are disclosed in the following “Fund expense ratios” table. Delaware Management Company has agreed to reimburse certain expenses and/or waive certain fees in order to prevent total fund operating expenses (excluding any 12b-1 fees, taxes, interest, short sale and dividend interest expenses, brokerage fees, certain insurance costs, acquired fund fees and expenses, and nonroutine expenses or costs, including, but not limited to, those relating to reorganizations, litigation, conducting shareholder meetings, and liquidations (collectively nonroutine expenses)) from exceeding 0.85% of the Fund’s average daily net assets during the period from Nov. 1, 2013, through Oct. 31, 2014.* Please see the most recent prospectus and any applicable supplement(s) for additional information on these fee waivers and/or reimbursements.
| Fund expense ratios | Class A | Class C | Class R | Institutional Class | ||||
Total annual operating expenses | 1.09% | 1.84% | 1.34% | 0.84% | ||||
(without fee waivers) | ||||||||
Net expenses | 1.09% | 1.84% | 1.34% | 0.84% | ||||
(including fee waivers, if any) | ||||||||
Type of waiver | Contractual | Contractual | Contractual | Contractual |
*The contractual waiver period is from Feb. 28, 2013, through Feb. 27, 2015.
5
Table of Contents
Performance summary
Delaware U.S. Growth Fund
Performance of a $10,000 Investment1
Average annual total returns from Oct. 31, 2004, through Oct. 31, 2014
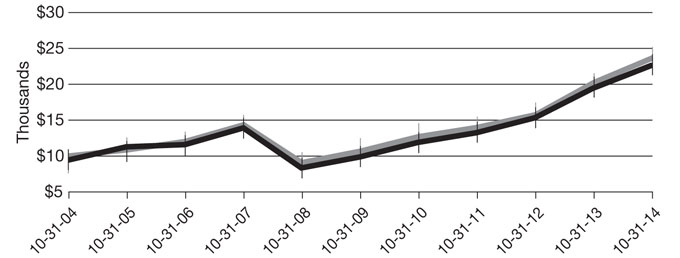
| For the period beginning Oct. 31, 2004 through Oct. 31, 2014 | Starting value | Ending value | ||||||
| $10,000 | $23,791 | ||||||
| $9,425 | $22,768 | ||||||
 Russell 1000 Growth Index
 Delaware U.S. Growth Fund — Class A shares
1 The “Performance of a $10,000 investment” graph assumes $10,000 invested in Class A shares of the Fund on Oct. 31, 2004, and includes the effect of a 5.75% front-end sales charge and the reinvestment of all distributions. The graph does not reflect the deduction of taxes the shareholders would pay on Fund distributions or redemptions of Fund shares. Expense limitations were in effect for some or all of the periods shown. Performance would have been lower had expense limitations not been in effect. Expenses are listed in the “Fund expense ratios” table on page 5. Please note additional details on pages 4 through 7.
The graph also assumes $10,000 invested in the Russell 1000 Growth Index as of Oct. 31, 2004. The Russell 1000 Growth Index measures the performance of the large-cap growth segment of the U.S. equity universe. It includes those Russell 1000 companies with higher price-to-book ratios and higher forecasted growth values.
The S&P 500 Index, mentioned on page 1, measures the performance of 500 mostly large-cap stocks weighted by market value, and is often used to represent performance of the U.S. stock market.
The Russell 1000 Index, mentioned on page 1, measures the performance of the large-cap segment of the U.S. equity universe.
The MSCI EAFE Index, mentioned on page 1, measures equity market performance across developed market countries in Europe, Australasia, and the Far East. Index “net” return approximates the minimum possible dividend reinvestment, after deduction of withholding tax at the highest possible rate.
Index performance returns do not reflect any management fees, transaction costs, or expenses. Indices are unmanaged and one cannot invest directly in an index. Past performance is not a guarantee of future results.
Performance of other Fund classes will vary due to different charges and expenses.
6
Table of Contents
| Nasdaq symbols | CUSIPs | |||||
Class A | DUGAX | 245917505 | ||||
Class C | DEUCX | 245917703 | ||||
Class R | DEURX | 245917711 | ||||
Institutional Class | DEUIX | 245917802 |
7
Table of Contents
For the six-month period from May 1, 2014 to October 31, 2014 (Unaudited)
As a shareholder of the Fund, you incur two types of costs: (1) transaction costs, including sales charges (loads) on purchase payments, reinvested dividends, or other distributions; redemption fees; and exchange fees; and (2) ongoing costs, including management fees; distribution and/or service (12b-1) fees; and other Fund expenses. This example is intended to help you understand your ongoing costs (in dollars) of investing in the Fund and to compare these costs with the ongoing costs of investing in other mutual funds.
The example is based on an investment of $1,000 invested at the beginning of the period and held for the entire six-month period from May 1, 2014 to Oct. 31, 2014.
Actual expenses
The first section of the table shown, “Actual Fund return,” provides information about actual account values and actual expenses. You may use the information in this section of the table, together with the amount you invested, to estimate the expenses that you paid over the period. Simply divide your account value by $1,000 (for example, an $8,600 account value divided by $1,000 = 8.6), then multiply the result by the number in the first section under the heading entitled “Expenses Paid During Period” to estimate the expenses you paid on your account during this period.
Hypothetical example for comparison purposes
The second section of the table shown, “Hypothetical 5% return,” provides information about hypothetical account values and hypothetical expenses based on the Fund’s actual expense ratio and an assumed rate of return of 5% per year before expenses, which is not the Fund’s actual return. The hypothetical account values and expenses may not be used to estimate the actual ending account balance or expenses you paid for the period. You may use this information to compare the ongoing costs of investing in the Fund and other funds. To do so, compare this 5% hypothetical example with the 5% hypothetical examples that appear in the shareholder reports of the other funds.
Please note that the expenses shown in the table are meant to highlight your ongoing costs only and do not reflect any transactional costs, such as sales charges (loads), redemption fees, or exchange fees. Therefore, the second section of the table is useful in comparing ongoing costs only, and will not help you determine the relative total costs of owning different funds. In addition, if these transactional costs were included, your costs would have been higher. The expenses shown in the table assume reinvestment of all dividends and distributions.
8
Table of Contents
Delaware U.S. Growth Fund
Expense analysis of an investment of $1,000
| Beginning Account Value 5/1/14 | Ending Account Value 10/31/14 | Annualized Expense Ratio | Expenses Paid During Period 5/1/14 to 10/31/14* | |||||||||||||||||
Actual Fund return† | ||||||||||||||||||||
Class A | $1,000.00 | $1,096.60 | 1.06 | % | $5.60 | |||||||||||||||
Class C | 1,000.00 | 1,092.30 | 1.81 | % | 9.55 | |||||||||||||||
Class R | 1,000.00 | 1,095.20 | 1.31 | % | 6.92 | |||||||||||||||
Institutional Class | 1,000.00 | 1,097.90 | 0.81 | % | 4.28 | |||||||||||||||
Hypothetical 5% return (5% return before expenses) |
| |||||||||||||||||||
Class A | $1,000.00 | $1,019.86 | 1.06 | % | $5.40 | |||||||||||||||
Class C | 1,000.00 | 1,016.08 | 1.81 | % | 9.20 | |||||||||||||||
Class R | 1,000.00 | 1,018.60 | 1.31 | % | 6.67 | |||||||||||||||
Institutional Class | 1,000.00 | 1,021.12 | 0.81 | % | 4.13 | |||||||||||||||
* “Expenses Paid During Period” are equal to the Fund’s annualized expense ratio, multiplied by the average account value over the period, multiplied by 184/365 (to reflect the one-half year period).
† Because actual returns reflect only the most recent six-month period, the returns shown may differ significantly from fiscal year returns.
9
Table of Contents
Security type / sector allocations and top 10 equity holdings | ||
| Delaware U.S. Growth Fund | As of October 31, 2014 (Unaudited) | |
Sector designations may be different than the sector designations presented in other Fund materials. The sector designations may represent the investment manager’s internal sector classifications, which may result in the sector designations for one fund being different than another fund’s sector designations.
| Security type / sector | Percentage of net assets | ||||
Common Stock² | 98.73 | % | |||
Consumer Discretionary | 24.06 | % | |||
Consumer Staples | 4.27 | % | |||
Energy | 9.59 | % | |||
Financial Services | 17.10 | % | |||
Healthcare | 16.59 | % | |||
Technology | 27.12 | % | |||
Short-Term Investments | 0.69 | % | |||
Total Value of Securities | 99.42 | % | |||
Receivables and Other Assets Net of Liabilities | 0.58 | % | |||
Total Net Assets | 100.00 | % | |||
| ² | Narrow industries are utilized for compliance purposes for diversification whereas broad sectors are used for financial reporting. |
To monitor compliance with the Fund’s concentration guidelines as described in the Fund’s Prospectus and Statement of Additional Information, the Technology sector (as disclosed herein for financial reporting purposes) is subdivided into a variety of “industries” (in accordance with the requirements of the 1940 Act) such as internet, semiconductors, and software. As of Oct. 31, 2014 such amounts, as percentage of total net assets, were 11.15% 4.81%, and 11.16% respectively. The percentage in any such single industry will comply with the Fund’s concentration policy even if the percentage in the “Technology sector” for financial reporting purposes may exceed 25%.
10
Table of Contents
Holdings are for informational purposes only and are subject to change at any time. They are not a recommendation to buy, sell, or hold any security.
| Top 10 equity holdings | Percentage of net assets | |
Celgene | 6.47% | |
Microsoft | 5.72% | |
Allergan | 5.50% | |
Visa Class A | 5.18% | |
QUALCOMM | 4.81% | |
MasterCard Class A | 4.75% | |
eBay | 4.50% | |
Crown Castle International | 4.35% | |
EOG Resources | 4.29% | |
Walgreen
| 4.27%
|
11
Table of Contents
| Schedule of investments | ||
| Delaware U.S. Growth Fund | October 31, 2014 | |
| Number of shares | Value (U.S. $) | |||||||
| ||||||||
Common Stock – 98.73%² | ||||||||
| ||||||||
Consumer Discretionary – 24.06% | ||||||||
Discovery Communications Class A † | 825,480 | $ | 29,180,718 | |||||
Discovery Communications Class C † | 2,508,833 | 87,784,067 | ||||||
eBay † | 2,956,469 | 155,214,623 | ||||||
L Brands | 1,854,310 | 133,732,837 | ||||||
Liberty Interactive Class A † | 4,690,310 | 122,604,703 | ||||||
Liberty Ventures Class A † | 656,108 | 23,029,391 | ||||||
NIKE Class B | 939,359 | 87,332,206 | ||||||
Priceline Group † | 118,184 | 142,554,723 | ||||||
Sally Beauty Holdings † | 1,680,120 | 49,244,317 | ||||||
|
| |||||||
| 830,677,585 | ||||||||
|
| |||||||
Consumer Staples – 4.27% | ||||||||
Walgreen | 2,293,871 | 147,312,396 | ||||||
|
| |||||||
| 147,312,396 | ||||||||
|
| |||||||
Energy – 9.59% | ||||||||
EOG Resources | 1,559,628 | 148,242,641 | ||||||
Kinder Morgan | 1,808,734 | 69,998,006 | ||||||
Williams | 2,035,026 | 112,964,293 | ||||||
|
| |||||||
| 331,204,940 | ||||||||
|
| |||||||
Financial Services – 17.10% | ||||||||
Crown Castle International | 1,923,540 | 150,266,945 | ||||||
IntercontinentalExchange | 465,602 | 96,980,241 | ||||||
MasterCard Class A | 1,958,501 | 164,024,459 | ||||||
Visa Class A | 740,756 | 178,840,721 | ||||||
|
| |||||||
| 590,112,366 | ||||||||
|
| |||||||
Healthcare – 16.59% | ||||||||
Allergan | 999,593 | 189,982,646 | ||||||
Celgene † | 2,085,480 | 223,334,053 | ||||||
Novo Nordisk ADR | 2,059,435 | 93,045,273 | ||||||
Perrigo | 410,253 | 66,235,347 | ||||||
|
| |||||||
| 572,597,319 | ||||||||
|
| |||||||
Technology – 27.12% | ||||||||
Adobe Systems † | 1,198,219 | 84,019,116 | ||||||
Baidu ADR † | 422,733 | 100,935,958 | ||||||
Equinix | 507,938 | 106,108,248 | ||||||
Google Class A † | 127,254 | 72,263,729 | ||||||
Google Class C † | 128,602 | 71,898,806 | ||||||
Intuit | 1,178,679 | 103,735,539 | ||||||
Microsoft | 4,206,782 | 197,508,415 | ||||||
12
Table of Contents
| Number of shares | Value (U.S. $) | |||||||
| ||||||||
Common Stock² (continued) | ||||||||
| ||||||||
Technology (continued) | ||||||||
QUALCOMM | 2,114,783 | $ | 166,031,613 | |||||
Yelp † | 560,031 | 33,601,860 | ||||||
|
| |||||||
| 936,103,284 | ||||||||
|
| |||||||
Total Common Stock (cost $2,563,568,948) | 3,408,007,890 | |||||||
|
| |||||||
| Principal amount° | ||||||||
| ||||||||
Short-Term Investments – 0.69% | ||||||||
| ||||||||
Discount Note – 0.60%≠ | ||||||||
Federal Home Loan Bank 0.041% 11/19/14 | 20,638,376 | 20,638,252 | ||||||
|
| |||||||
| 20,638,252 | ||||||||
|
| |||||||
U.S. Treasury Obligation – 0.09%≠ | ||||||||
U.S. Treasury Bill 0.005% 12/26/14 | 3,221,965 | 3,221,916 | ||||||
|
| |||||||
| 3,221,916 | ||||||||
|
| |||||||
Total Short-Term Investments (cost $23,859,880) | 23,860,168 | |||||||
|
| |||||||
Total Value of Securities – 99.42% | $ | 3,431,868,058 | ||||||
|
| |||||||
| ² | Narrow industries are utilized for compliance purposes for diversification whereas broad sectors are used for financial reporting. |
| ≠ | The rate shown is the effective yield at the time of purchase. |
| ° | Principal amount shown is stated in U.S. dollars unless noted that the security is denominated in another currency. |
| † | Non-income-producing security. |
ADR – American Depositary Receipt
See accompanying notes, which are an integral part of the financial statements.
13
Table of Contents
Statement of assets and liabilities
Delaware U.S. Growth Fund | October 31, 2014 |
Assets: | ||||
Investments, at value1 | $ | 3,408,007,890 | ||
Short-term investments, at value2 | 23,860,168 | |||
Receivable for fund shares sold | 27,750,197 | |||
Dividends and interest receivable | 5,107,639 | |||
|
| |||
Total assets | 3,464,725,894 | |||
|
| |||
Liabilities: | ||||
Cash overdraft | 568,949 | |||
Payable for securities purchased | 6,149,815 | |||
Payable for fund shares redeemed | 2,933,499 | |||
Investment management fees payable | 1,535,331 | |||
Other accrued expenses | 1,278,081 | |||
Distribution fees payable | 153,579 | |||
Other affiliates payable | 115,333 | |||
Trustees’ fees and expenses payable | 7,571 | |||
|
| |||
Total liabilities | 12,742,158 | |||
|
| |||
Total Net Assets | $ | 3,451,983,736 | ||
|
| |||
Net Assets Consist of: | ||||
Paid-in capital | $ | 2,509,261,262 | ||
Undistributed net investment income | 12,286,316 | |||
Accumulated net realized gain on investments | 85,996,928 | |||
Net unrealized appreciation of investments | 844,439,230 | |||
|
| |||
Total Net Assets | $ | 3,451,983,736 | ||
|
| |||
14
Table of Contents
Net Asset Value | ||||
Class A: | ||||
Net assets | $ | 351,387,985 | ||
Shares of beneficial interest outstanding, unlimited authorization, no par | 13,694,620 | |||
Net asset value per share | $ | 25.66 | ||
Sales charge | 5.75 | % | ||
Offering price per share, equal to net asset value per share / (1 – sales charge) | $ | 27.23 | ||
Class C: | ||||
Net assets | $ | 90,103,591 | ||
Shares of beneficial interest outstanding, unlimited authorization, no par | 3,823,814 | |||
Net asset value per share | $ | 23.56 | ||
Class R: | ||||
Net assets | $ | 27,052,657 | ||
Shares of beneficial interest outstanding, unlimited authorization, no par | 1,083,844 | |||
Net asset value per share | $ | 24.96 | ||
Institutional Class: | ||||
Net assets | $ | 2,983,439,503 | ||
Shares of beneficial interest outstanding, unlimited authorization, no par | 109,438,881 | |||
Net asset value per share | $ | 27.26 | ||
| ||||
1Investments, at cost | $ | 2,563,568,948 | ||
2Short-term investments, at cost | 23,859,880 | |||
See accompanying notes, which are an integral part of the financial statements.
15
Table of Contents
Delaware U.S. Growth Fund | Year ended October 31, 2014 |
Investment Income: | ||||
Dividends | $ | 40,264,357 | ||
Interest | 28,739 | |||
Foreign tax withheld | (471,146 | ) | ||
|
| |||
| 39,821,950 | ||||
|
| |||
Expenses: | ||||
Management fees | 17,094,562 | |||
Distribution expenses – Class A | 900,735 | |||
Distribution expenses – Class B | 8,837 | |||
Distribution expenses – Class C | 803,967 | |||
Distribution expenses – Class R | 113,744 | |||
Dividend disbursing and transfer agent fees and expenses | 5,133,554 | |||
Accounting and administration expenses | 1,031,858 | |||
Registration fees | 244,215 | |||
Reports and statements to shareholders | 236,002 | |||
Legal fees | 203,607 | |||
Trustees’ fees and expenses | 140,536 | |||
Custodian fees | 125,472 | |||
Audit and tax | 31,875 | |||
Other | 82,895 | |||
|
| |||
| 26,151,859 | ||||
Less waived distribution expenses – Class B | (6,637 | ) | ||
Less expense paid indirectly | (404 | ) | ||
|
| |||
Total operating expenses | 26,144,818 | |||
|
| |||
Net Investment Income | 13,677,132 | |||
|
| |||
Net Realized and Unrealized Gain: | ||||
Net realized gain on: | ||||
Investments | 121,411,979 | |||
Redemptions in kind* | 20,783,777 | |||
|
| |||
Net realized gain | 142,195,756 | |||
Net change in unrealized appreciation (depreciation) of investments | 318,136,773 | |||
|
| |||
Net Realized and Unrealized Gain | 460,332,529 | |||
|
| |||
Net Increase in Net Assets Resulting from Operations | $ | 474,009,661 | ||
|
| |||
*See Note 11 in “Notes to financial statements.”
See accompanying notes, which are an integral part of the financial statements.
16
Table of Contents
Statements of changes in net assets
Delaware U.S. Growth Fund
| Year Ended | ||||||||
| 10/31/14 | 10/31/13 | |||||||
Increase in Net Assets from Operations: | ||||||||
Net investment income | $ | 13,677,132 | $ | 1,837,278 | ||||
Net realized gain | 142,195,756 | 114,719,095 | ||||||
Net change in unrealized appreciation (depreciation) | 318,136,773 | 288,392,710 | ||||||
|
|
|
| |||||
Net increase in net assets resulting from operations | 474,009,661 | 404,949,083 | ||||||
|
|
|
| |||||
Dividends and Distributions to Shareholders from: | ||||||||
Net investment income: | ||||||||
Institutional Class | (1,820,767 | ) | (1,407,327 | ) | ||||
|
|
|
| |||||
| (1,820,767 | ) | (1,407,327 | ) | |||||
|
|
|
| |||||
Capital Share Transactions: | ||||||||
Proceeds from shares sold: | ||||||||
Class A | 254,971,002 | 157,616,843 | ||||||
Class B | 13,417 | 67,162 | ||||||
Class C | 25,719,809 | 32,926,610 | ||||||
Class R | 9,814,713 | 17,216,523 | ||||||
Institutional Class | 965,778,442 | 1,255,751,527 | ||||||
Net asset value of shares issued upon reinvestment of dividends and distributions: | ||||||||
Institutional Class | 1,720,838 | 1,281,746 | ||||||
|
|
|
| |||||
| 1,258,018,221 | 1,464,860,411 | |||||||
|
|
|
| |||||
Cost of shares redeemed: | ||||||||
Class A | (247,749,954 | ) | (64,441,424 | ) | ||||
Class B | (1,613,327 | ) | (1,294,061 | ) | ||||
Class C | (15,208,519 | ) | (7,646,363 | ) | ||||
Class R | (10,164,108 | ) | (8,779,050 | ) | ||||
Institutional Class | (590,872,593 | ) | (312,149,814 | ) | ||||
|
|
|
| |||||
| (865,608,501 | ) | (394,310,712 | ) | |||||
|
|
|
| |||||
Increase in net assets derived from capital share transactions | 392,409,720 | 1,070,549,699 | ||||||
|
|
|
| |||||
Net Increase in Net Assets | 864,598,614 | 1,474,091,455 | ||||||
Net Assets: | ||||||||
Beginning of year | 2,587,385,122 | 1,113,293,667 | ||||||
|
|
|
| |||||
End of year | $ | 3,451,983,736 | $ | 2,587,385,122 | ||||
|
|
|
| |||||
Undistributed net investment income | $ | 12,286,316 | $ | 429,951 | ||||
|
|
|
| |||||
See accompanying notes, which are an integral part of the financial statements.
17
Table of Contents
Delaware U.S. Growth Fund Class A
Selected data for each share of the Fund outstanding throughout each period were as follows:
| ||
Net asset value, beginning of period | ||
Income (loss) from investment operations: | ||
Net investment income (loss)1 | ||
Net realized and unrealized gain | ||
Total from investment operations | ||
Net asset value, end of period | ||
Total return2 | ||
Ratios and supplemental data: | ||
Net assets, end of period (000 omitted) | ||
Ratio of expenses to average net assets | ||
Ratio of expenses to average net assets prior to fees waived | ||
Ratio of net investment income (loss) to average net assets | ||
Ratio of net investment income (loss) to average net assets prior to fees waived | ||
Portfolio turnover
| ||
| ||
| 1 | The average shares outstanding method has been applied for per share information. |
| 2 | Total investment return is based on the change in net asset value of a share during the period and assumes reinvestment of dividends and distributions at net asset value and does not reflect the impact of a sales charge. Total investment return during some of the periods shown reflects waivers by the manager and/or distributor. Performance would have been lower had the waivers not been in effect. |
See accompanying notes, which are an integral part of the financial statements.
18
Table of Contents
| Year ended | ||||||||||||||||||||||||||||
| 10/31/14 | 10/31/13 | 10/31/12 | 10/31/11 | 10/31/10 | ||||||||||||||||||||||||
| ||||||||||||||||||||||||||||
| $ | 21.970 | $ | 17.310 | $ | 14.960 | $ | 13.450 | $ | 11.100 | |||||||||||||||||||
| 0.062 | (0.012 | ) | (0.031 | ) | 0.006 | (0.038 | ) | |||||||||||||||||||||
| 3.628 | 4.672 | 2.381 | 1.504 | 2.388 | ||||||||||||||||||||||||
|
|
|
|
|
|
|
|
|
| |||||||||||||||||||
| 3.690 | 4.660 | 2.350 | 1.510 | 2.350 | ||||||||||||||||||||||||
|
|
|
|
|
|
|
|
|
| |||||||||||||||||||
| $ | 25.660 | $ | 21.970 | $ | 17.310 | $ | 14.960 | $ | 13.450 | |||||||||||||||||||
|
|
|
|
|
|
|
|
|
| |||||||||||||||||||
| 16.80% | 26.92% | 15.71% | 11.23% | 21.17% | ||||||||||||||||||||||||
| $ | 351,388 | $ | 290,303 | $ | 146,112 | $ | 60,615 | $ | 89,259 | |||||||||||||||||||
| 1.06% | 1.09% | 1.10% | 1.10% | 1.07% | ||||||||||||||||||||||||
| 1.06% | 1.13% | 1.16% | 1.21% | 1.26% | ||||||||||||||||||||||||
| 0.26% | (0.06% | ) | (0.19% | ) | 0.04% | (0.31% | ) | |||||||||||||||||||||
| 0.26% | (0.10% | ) | (0.25% | ) | (0.07% | ) | (0.50% | ) | ||||||||||||||||||||
| 25% | 23% | 20% | 25% | 22% | ||||||||||||||||||||||||
| ||||||||||||||||||||||||||||
19
Table of Contents
Financial highlights
Delaware U.S. Growth Fund Class C
Selected data for each share of the Fund outstanding throughout each period were as follows:
| ||
Net asset value, beginning of period | ||
Income (loss) from investment operations: | ||
Net investment loss1 | ||
Net realized and unrealized gain | ||
Total from investment operations | ||
Net asset value, end of period | ||
Total return2 | ||
Ratios and supplemental data: | ||
Net assets, end of period (000 omitted) | ||
Ratio of expenses to average net assets | ||
Ratio of expenses to average net assets prior to fees waived | ||
Ratio of net investment loss to average net assets | ||
Ratio of net investment loss to average net assets prior to fees waived | ||
Portfolio turnover
| ||
| ||
| 1 | The average shares outstanding method has been applied for per share information. |
| 2 | Total investment return is based on the change in net asset value of a share during the period and assumes reinvestment of dividends and distributions at net asset value and does not reflect the impact of a sales charge. Total investment return during some of the periods shown reflects a waiver by the manager. Performance would have been lower had the waiver not been in effect. |
See accompanying notes, which are an integral part of the financial statements.
20
Table of Contents
| Year ended | ||||||||||||||||||||||||||||
|
| |||||||||||||||||||||||||||
| 10/31/14 | 10/31/13 | 10/31/12 | 10/31/11 | 10/31/10 | ||||||||||||||||||||||||
| ||||||||||||||||||||||||||||
| $ | 20.330 | $ | 16.130 | $ | 14.050 | $ | 12.720 | $ | 10.580 | |||||||||||||||||||
| (0.107 | ) | (0.147 | ) | (0.146 | ) | (0.098 | ) | (0.123 | ) | |||||||||||||||||||
| 3.337 | 4.347 | 2.226 | 1.428 | 2.263 | ||||||||||||||||||||||||
|
|
|
|
|
|
|
|
|
| |||||||||||||||||||
| 3.230 | 4.200 | 2.080 | 1.330 | 2.140 | ||||||||||||||||||||||||
|
|
|
|
|
|
|
|
|
| |||||||||||||||||||
| $ | 23.560 | $ | 20.330 | $ | 16.130 | $ | 14.050 | $ | 12.720 | |||||||||||||||||||
|
|
|
|
|
|
|
|
|
| |||||||||||||||||||
| 15.89% | 26.04% | 14.80% | 10.46% | 20.23% | ||||||||||||||||||||||||
| $ | 90,104 | $ | 67,898 | $ | 31,103 | $ | 13,456 | $ | 12,535 | |||||||||||||||||||
| 1.81% | 1.84% | 1.85% | 1.85% | 1.82% | ||||||||||||||||||||||||
| 1.81% | 1.84% | 1.86% | 1.91% | 1.96% | ||||||||||||||||||||||||
| (0.49% | ) | (0.81% | ) | (0.94% | ) | (0.71% | ) | (1.06% | ) | |||||||||||||||||||
| (0.49% | ) | (0.81% | ) | (0.95% | ) | (0.77% | ) | (1.20% | ) | |||||||||||||||||||
| 25% | 23% | 20% | 25% | 22% | ||||||||||||||||||||||||
| ||||||||||||||||||||||||||||
21
Table of Contents
Financial highlights
Delaware U.S. Growth Fund Class R
Selected data for each share of the Fund outstanding throughout each period were as follows:
|
Net asset value, beginning of period |
Income (loss) from investment operations: |
Net investment income (loss)1 |
Net realized and unrealized gain |
Total from investment operations |
Net asset value, end of period |
Total return2 |
Ratios and supplemental data: |
Net assets, end of period (000 omitted) |
Ratio of expenses to average net assets |
Ratio of expenses to average net assets prior to fees waived |
Ratio of net investment income (loss) to average net assets |
Ratio of net investment income (loss) to average net assets prior to fees waived |
Portfolio turnover
|
|
| 1 | The average shares outstanding method has been applied for per share information. |
| 2 | Total investment return is based on the change in net asset value of a share during the period and assumes reinvestment of dividends and distributions at net asset value. Total investment return during some of the periods shown reflects waivers by the manager and/or distributor. Performance would have been lower had the waivers not been in effect. |
See accompanying notes, which are an integral part of the financial statements.
22
Table of Contents
| Year ended | ||||||||||||||||||||||||||||
| 10/31/14 | 10/31/13 | 10/31/12 | 10/31/11 | 10/31/10 | ||||||||||||||||||||||||
| ||||||||||||||||||||||||||||
| $ | 21.430 | $ | 16.920 | $ | 14.660 | $ | 13.210 | $ | 10.930 | |||||||||||||||||||
| 0.004 | (0.059 | ) | (0.073 | ) | (0.030 | ) | (0.067 | ) | ||||||||||||||||||||
| 3.526 | 4.569 | 2.333 | 1.480 | 2.347 | ||||||||||||||||||||||||
|
|
|
|
|
|
|
|
|
| |||||||||||||||||||
| 3.530 | 4.510 | 2.260 | 1.450 | 2.280 | ||||||||||||||||||||||||
|
|
|
|
|
|
|
|
|
| |||||||||||||||||||
| $ | 24.960 | $ | 21.430 | $ | 16.920 | $ | 14.660 | $ | 13.210 | |||||||||||||||||||
|
|
|
|
|
|
|
|
|
| |||||||||||||||||||
| 16.47% | 26.66% | 15.42% | 10.98% | 20.86% | ||||||||||||||||||||||||
| $ | 27,053 | $ | 23,815 | $ | 11,202 | $ | 1,697 | $ | 2,375 | |||||||||||||||||||
| 1.31% | 1.34% | 1.35% | 1.35% | 1.32% | ||||||||||||||||||||||||
| 1.31% | 1.43% | 1.46% | 1.51% | 1.56% | ||||||||||||||||||||||||
| 0.01% | (0.31% | ) | (0.44% | ) | (0.21% | ) | (0.56% | ) | ||||||||||||||||||||
| 0.01% | (0.40% | ) | (0.55% | ) | (0.37% | ) | (0.80% | ) | ||||||||||||||||||||
| 25% | 23% | 20% | 25% | 22% | ||||||||||||||||||||||||
| ||||||||||||||||||||||||||||
23
Table of Contents
Financial highlights
Delaware U.S. Growth Fund Institutional Class
Selected data for each share of the Fund outstanding throughout each period were as follows:
|
Net asset value, beginning of period |
Income (loss) from investment operations: |
Net investment income (loss)1 |
Net realized and unrealized gain |
Total from investment operations |
Less dividends and distributions from: |
Net investment income |
Total dividends and distributions |
Net asset value, end of period |
Total return2 |
Ratios and supplemental data: |
Net assets, end of period (000 omitted) |
Ratio of expenses to average net assets |
Ratio of expenses to average net assets prior to fees waived |
Ratio of net investment income (loss) to average net assets |
Ratio of net investment income (loss) to average net assets prior to fees waived |
Portfolio turnover
|
|
| 1 | The average shares outstanding method has been applied for per share information. |
| 2 | Total investment return is based on the change in net asset value of a share during the period and assumes reinvestment of dividends and distributions at net asset value. Total investment return during some of the periods shown reflects a waiver by the manager. Performance would have been lower had the waiver not been in effect. |
See accompanying notes, which are an integral part of the financial statements.
24
Table of Contents
| Year ended | ||||||||||||||||||||||||||||
| 10/31/14 | 10/31/13 | 10/31/12 | 10/31/11 | 10/31/10 | ||||||||||||||||||||||||
| ||||||||||||||||||||||||||||
| $ | 23.310 | $ | 18.340 | $ | 15.830 | $ | 14.220 | $ | 11.710 | |||||||||||||||||||
| 0.130 | 0.039 | 0.011 | 0.045 | (0.008 | ) | |||||||||||||||||||||||
| 3.839 | 4.959 | 2.520 | 1.587 | 2.527 | ||||||||||||||||||||||||
|
|
|
|
|
|
|
|
|
| |||||||||||||||||||
| 3.969 | 4.998 | 2.531 | 1.632 | 2.519 | ||||||||||||||||||||||||
|
|
|
|
|
|
|
|
|
| |||||||||||||||||||
| (0.019 | ) | (0.028 | ) | (0.021 | ) | (0.022 | ) | (0.009 | ) | |||||||||||||||||||
|
|
|
|
|
|
|
|
|
| |||||||||||||||||||
| (0.019 | ) | (0.028 | ) | (0.021 | ) | (0.022 | ) | (0.009 | ) | |||||||||||||||||||
|
|
|
|
|
|
|
|
|
| |||||||||||||||||||
| $ | 27.260 | $ | 23.310 | $ | 18.340 | $ | 15.830 | $ | 14.220 | |||||||||||||||||||
|
|
|
|
|
|
|
|
|
| |||||||||||||||||||
| 17.04% | 27.29% | 16.01% | 11.48% | 21.42% | ||||||||||||||||||||||||
| $ | 2,983,439 | $ | 2,203,909 | $ | 922,606 | $ | 563,004 | $ | 477,361 | |||||||||||||||||||
| 0.81% | 0.84% | 0.85% | 0.85% | 0.82% | ||||||||||||||||||||||||
| 0.81% | 0.84% | 0.86% | 0.91% | 0.96% | ||||||||||||||||||||||||
| 0.51% | 0.19% | 0.06% | 0.29% | (0.06% | ) | |||||||||||||||||||||||
| 0.51% | 0.19% | 0.05% | 0.23% | (0.20% | ) | |||||||||||||||||||||||
| 25% | 23% | 20% | 25% | 22% | ||||||||||||||||||||||||
| ||||||||||||||||||||||||||||
25
Table of Contents
Delaware U.S. Growth Fund | October 31, 2014 |
Delaware Group® Adviser Funds (Trust) is organized as a Delaware statutory trust and offers three series: Delaware Diversified Income Fund, Delaware Global Real Estate Opportunities Fund and Delaware U.S. Growth Fund. These financial statements and the related notes pertain to Delaware U.S. Growth Fund (Fund). The Trust is an open-end investment company. The Fund is considered diversified under the Investment Company Act of 1940, as amended, and offers Class A, Class C, Class R, and Institutional Class shares. Class A shares are sold with a front-end sales charge of 5.75%. Class A share purchases of $1,000,000 or more will incur a contingent deferred sales charge (CDSC) of 1.00% if redeemed during the first year and 0.50% during the second year, provided that Delaware Distributors, L.P. (DDLP) paid a financial advisor a commission on the purchase of those shares. Effective Sept. 25, 2014, all remaining shares of Class B were converted to Class A shares. Prior to Sept. 25, 2014, Class B shares could be purchased only through dividend reinvestment and certain permitted exchanges. Prior to June 1, 2007, Class B shares were sold with a CDSC that declined from 4.00% to zero depending upon the period of time the shares were held. Class B shares automatically converted to Class A shares on a quarterly basis approximately eight years after purchase. Class C shares are sold with a CDSC of 1.00%, if redeemed during the first 12 months. Class R and Institutional Class shares are not subject to a sales charge and are offered for sale exclusively to certain eligible investors.
The investment objective of the Fund is to seek long-term capital appreciation by investing in equity securities of companies believed to have the potential for sustainable free cash flow growth.
1. Significant Accounting Policies
The following accounting policies are in accordance with U.S. generally accepted accounting principles (U.S. GAAP) and are consistently followed by the Fund.
Security Valuation – Equity securities, except those traded on the Nasdaq Stock Market, Inc. (Nasdaq), are valued at the last quoted sales price as of the time of the regular close of the New York Stock Exchange on the valuation date. Securities traded on the Nasdaq are valued in accordance with the Nasdaq Official Closing Price, which may not be the last sales price. If, on a particular day, an equity security does not trade, then the mean between the bid and ask prices will be used, which approximates fair value. U.S. government and agency securities are valued at the mean between the bid and ask prices, which approximates fair value. Generally, other securities and assets for which market quotations are not readily available are valued at fair value as determined in good faith under the direction of the Fund’s Board of Trustees (Board). In determining whether market quotations are readily available or fair valuation will be used, various factors will be taken into consideration, such as market closures or suspension of trading in a security.
Federal Income Taxes – No provision for federal income taxes has been made as the Fund intends to continue to qualify for federal income tax purposes as a regulated investment company under Subchapter M of the Internal Revenue Code of 1986, as amended, and make the requisite distributions to shareholders. The Fund evaluates tax positions taken or expected to be taken in the course of preparing the Fund’s tax returns to determine whether the tax positions are “more-likely-than-not” of being sustained by the applicable tax authority. Tax positions not deemed to meet the “more-likely-than-not” threshold are recorded as a tax benefit or expense in the current year. Management has analyzed
26
Table of Contents
the Fund’s tax positions taken for all open federal income tax years (Oct. 31, 2011–Oct. 31, 2014), and has concluded that no provision for federal income tax is required in the Fund’s financial statements.
Class Accounting – Investment income, common expenses, and realized and unrealized gain (loss) on investments are allocated to the various classes of the Fund on the basis of daily net assets of each class. Distribution expenses relating to a specific class are charged directly to that class.
Repurchase Agreements – The Fund may purchase certain U.S. government securities subject to the counterparty’s agreement to repurchase them at an agreed upon date and price. The counterparty will be required on a daily basis to maintain the value of the collateral subject to the agreement at not less than the repurchase price (including accrued interest). The agreements are conditioned upon the collateral being deposited under the Federal Reserve book-entry system with the Fund’s custodian or a third party sub-custodian. In the event of default or bankruptcy by the other party to the agreement, retention of the collateral may be subject to legal proceedings. At Oct. 31, 2014 the Fund held no investments in repurchase agreements.
Use of Estimates – The preparation of financial statements in conformity with U.S. GAAP requires management to make estimates and assumptions that affect the fair value of investments, the reported amounts of assets and liabilities and disclosure of contingent assets and liabilities at the date of the financial statements, and the reported amounts of revenues and expenses during the reporting period. Actual results could differ from those estimates and the differences could be material.
Other – Expenses directly attributable to the Fund are charged directly to the Fund. Other expenses common to various funds within the Delaware Investments® Family of Funds are generally allocated among such funds on the basis of average net assets. Management fees and some other expenses are paid monthly. Security transactions are recorded on the date the securities are purchased or sold (trade date) for financial reporting purposes. Costs used in calculating realized gains and losses on the sale of investment securities are those of the specific securities sold. Dividend income is recorded on the ex-dividend date and interest income is recorded on the accrual basis. Foreign dividends are also recorded on the ex-dividend date or as soon after the ex-dividend date that the Fund is aware of such dividends, net of all tax withholdings, a portion of which may be reclaimable. Withholding taxes and reclaims on foreign dividends have been recorded in accordance with the Fund’s understanding of the applicable country’s tax rules and rates. The Fund declares and pays dividends from net investment income and distributions from net realized gain on investments, if any, annually. The Fund may distribute more frequently, if necessary for tax purposes. Dividends and distributions, if any, are recorded on the ex-dividend date.
Subject to seeking best execution, the Fund may direct certain security trades to brokers who have agreed to rebate a portion of the related brokerage commission to the Fund in cash. Such commission rebates are included on the “Statement of operations” under “Net realized gain on investments” and totaled $17,035 for the year ended Oct. 31, 2014. In general, best execution refers to many factors, including the price paid or received for a security, the commission charged, the promptness and reliability of execution, the confidentiality and placement accorded the order, and other factors affecting the overall benefit obtained by the Fund on the transaction.
27
Table of Contents
Notes to financial statements
Delaware U.S. Growth Fund
1. Significant Accounting Policies (continued)
The Fund may receive earnings credits from its custodian when positive cash balances are maintained, which may be used to offset custody fees. There were no earnings credits for the year ended Oct. 31, 2014.
The Fund receives earnings credits from its transfer agent when positive cash balances are maintained, which may be used to offset transfer agent fees. If the amount earned is greater than one dollar, the expense paid under this arrangement is included on the “Statement of operations” under “Dividend disbursing and transfer agent fees and expenses” with the corresponding expense offset shown under “Less expense paid indirectly.” For the year ended Oct. 31, 2014, the Fund earned $404 under this agreement.
2. Investment Management, Administration Agreements and Other Transactions with Affiliates
In accordance with the terms of its investment management agreement, the Fund pays Delaware Management Company (DMC), a series of Delaware Management Business Trust and the investment manager, an annual fee which is calculated daily at the rate of 0.65% on the first $500 million of average daily net assets of the Fund, 0.60% on the next $500 million, 0.55% on the next $1.5 billion and 0.50% on the average daily net assets in excess of $2.5 billion.
DMC has contractually agreed to waive that portion, if any, of its management fee and reimburse the Fund to the extent necessary to ensure that total annual fund operating expenses (excluding any 12b-1 fees, taxes, interest, short sale and dividend interest expenses, brokerage fees, certain insurance costs, acquired fund fees and expenses, and nonroutine expenses or costs, including, but not limited to, those relating to reorganizations, litigation, conducting shareholder meetings, and liquidations) do not exceed 0.85% of average daily net assets of the Fund from Nov. 1, 2013 through Oct 31, 2014.* For purposes of this waiver and reimbursement, nonroutine expenses may also include such additional costs and expenses as may be agreed upon from time to time by the Fund’s Board and DMC. This expense waiver and reimbursement may only be terminated by agreement of DMC and the Fund.
Effective June 3, 2014, Jackson Square Partners, LLC (JSP) furnishes investment sub-advisory services to the Fund. Prior to June 3, 2014, the Fund was not sub-advised. For these services, DMC, not the Fund, pays JSP fees based on the aggregate average daily net assets of the Fund at the following annual rate: 0.325% of the first $500 million; 0.300% of the next $500 million; 0.275% of the next $1.5 billion; and 0.250% of aggregate average daily net assets in excess of $2.5 billion.
Delaware Service Company, Inc. (DSC), an affiliate of DMC, provides fund accounting and financial administration oversight services to the Fund. For these services, the Fund pays DSC fees based on the aggregate daily net assets of the Delaware Investments® Family of Funds at the following annual rate: 0.0050% of the first $30 billion; 0.0045% of the next $10 billion; 0.0040% of the next $10 billion; and 0.0025% of aggregate average daily net assets in excess of $50 billion. The fees payable to DSC under the service agreement described above are allocated among all Funds in the Delaware Investments Family of Funds on a relative net asset value basis. For the year ended Oct. 31, 2014, the Fund was charged $144,879 for these services. This amount is included on the “Statement of operations” under “Accounting and Administration expenses.”
28
Table of Contents
DSC is also the transfer agent and dividend disbursing agent of the Fund. For these services, the Fund pays DSC fees based on the aggregate daily net assets of the retail funds within the Delaware Investments Family of Funds at the following annual rate: 0.025% of the first $20 billion; 0.020% of the next $5 billion; 0.015% of the next $5 billion; and 0.013% on average daily net assets in excess of $30 billion. This amount is included on the “Statement of operations” under “Dividend disbursing and transfer agent fees and expenses.” For the year ended Oct. 31, 2014, the amount charged by DSC was $654,274. Pursuant to a sub-transfer agency agreement between DSC and BNY Mellon Investment Servicing (US) Inc. (BNYMIS), BNYMIS provides certain sub-transfer agency services to the Fund. Sub-transfer agency fees are passed on to and paid directly by the Fund.
Pursuant to a distribution agreement and distribution plan, the Fund pays DDLP, the distributor and an affiliate of DMC, an annual distribution and service fee of 0.25% of the average daily net assets of the Class A shares, 1.00% of the average daily net assets of the Class C shares, and 0.50% of the daily net assets of the Class R shares. Institutional Class shares pay no distribution and service expenses. The Fund’s Class B shares paid DDLP 1.00% of the average daily net assets for the period Nov. 1, 2013 through Sept. 25, 2014. DDLP had contracted to limit the Fund’s Class B 12b-1 fees from Nov. 1, 2013 through Sept. 25, 2014** to 0.25% of average daily net assets.
As provided in the investment management agreement, the Fund bears a portion of the cost of resources shared with DMC, including the cost of internal personnel of DMC and/or its affiliates that provide legal, tax, and regulatory reporting services to the Fund. For the year ended Oct. 31, 2014, the Fund was charged $83,596 for internal legal, tax, and regulatory reporting services provided by DMC and/or its affiliates’ employees. This amount is included on the “Statement of operations” under “Legal fees.”
For the year ended Oct. 31, 2014, DDLP earned $89,298 for commissions on sales of the Fund’s Class A shares. For the year ended Oct. 31, 2014, DDLP received gross CDSC commissions of $14 and $586 on redemption of the Fund’s Class A and Class C shares, respectively, and these commissions were entirely used to offset upfront commissions previously paid by DDLP to broker/dealers on sales of those shares.
Trustees’ fees include expenses accrued by the Fund for each Trustee’s retainer and meeting fees. Certain officers of DMC, DSC, and DDLP are officers and/or Trustees of the Trust. These officers and Trustees are paid no compensation by the Fund.
*The contractual waiver period is Feb. 28, 2013 through Feb. 27, 2015.
**The contractual waiver period is Oct. 1, 2013 through Sept. 25, 2014.
3. Investments
For the year ended Oct. 31, 2014, the Fund made purchases and sales of investment securities other than short-term investments as follows:
Purchases | $ | 1,161,730,347 | ||
Sales | 750,103,963 |
29
Table of Contents
Notes to financial statements
Delaware U.S. Growth Fund
3. Investments (continued)
At Oct. 31, 2014, the cost of investments and unrealized appreciation (depreciation) for federal income tax purposes was as follows:
Cost of investments | $ | 2,590,784,599 | ||
|
| |||
Aggregate unrealized appreciation | $ | 883,629,126 | ||
Aggregate unrealized depreciation | (42,545,667 | ) | ||
|
| |||
Net unrealized appreciation | $ | 841,083,459 | ||
|
|
U.S. GAAP defines fair value as the price that the Fund would receive to sell an asset or pay to transfer a liability in an orderly transaction between market participants at the measurement date under current market conditions. A three-level hierarchy for fair value measurements has been established based upon the transparency of inputs to the valuation of an asset or liability. Inputs may be observable or unobservable and refer broadly to the assumptions that market participants would use in pricing the asset or liability. Observable inputs reflect the assumptions market participants would use in pricing the asset or liability based on market data obtained from sources independent of the reporting entity. Unobservable inputs reflect the reporting entity’s own assumptions about the assumptions that market participants would use in pricing the asset or liability developed based on the best information available under the circumstances. The Fund’s investment in its entirety is assigned a level based upon the observability of the inputs which are significant to the overall valuation. The three-level hierarchy of inputs is summarized below.
| Level 1 | – | Inputs are quoted prices in active markets for identical investments. (Examples: equity securities, open-end investment companies, futures contracts, exchange-traded options contracts) | ||
| Level 2 | – | Other observable inputs, including, but not limited to: quoted prices for similar assets or liabilities in markets that are active, quoted prices for identical or similar assets or liabilities in markets that are not active, inputs other than quoted prices that are observable for the assets or liabilities (such as interest rates, yield curves, volatilities, prepayment speeds, loss severities, credit risks, and default rates) or other market-corroborated inputs. (Examples: debt securities, government securities, swap contracts, foreign currency exchange contracts, foreign securities utilizing international fair value pricing, broker-quoted securities, fair value securities) | ||
| Level 3 | – | Significant unobservable inputs, including the Fund’s own assumptions used to determine the fair value of investments. (Examples: broker-quoted securities, fair valued securities) | ||
Level 3 investments are valued using significant unobservable inputs. The Fund may also use an income-based valuation approach in which the anticipated future cash flows of the investment are discounted to calculate fair value. Discounts may also be applied due to the nature or duration of any restrictions on the disposition of the investments. Valuations may also be based upon current market prices of securities that are comparable in coupon, rating, maturity, and industry. The derived value of a Level 3 investment may not represent the value which is received upon disposition and this could impact the results of operations.
30
Table of Contents
The following table summarizes the valuation of the Fund’s investments by fair value hierarchy levels as of Oct. 31, 2014:
| Level 1 | Level 2 | Total | ||||||||||
Common Stock | $ | 3,408,007,890 | $ | — | $ | 3,408,007,890 | ||||||
Short-Term Investments | — | 23,860,168 | 23,860,168 | |||||||||
|
|
|
|
|
| |||||||
Total | $ | 3,408,007,890 | $ | 23,860,168 | $ | 3,431,868,058 | ||||||
|
|
|
|
|
| |||||||
During the year ended Oct. 31, 2014, there were no transfers between Level 1 investments, Level 2 investments, or Level 3 investments that had a significant impact to the Fund. The Fund’s policy is to recognize transfers between levels at the beginning of the reporting period.
A reconciliation of Level 3 investments is presented when the Fund has a significant amount of Level 3 investments at the beginning, interim, or end of the period in relation to net assets. At Oct. 31, 2014, there were no Level 3 investments.
4. Dividend and Distribution Information
Income and long-term capital gain distributions are determined in accordance with federal income tax regulations, which may differ from U.S. GAAP. Additionally, distributions from net short-term gains on sales of investment securities are treated as ordinary income for federal income tax purposes. The tax character of dividends and distributions paid during the years ended Oct. 31, 2014 and 2013 was as follows:
| Year Ended | ||||||||
| 10/31/14 | 10/31/13 | |||||||
Ordinary income | $ | 1,820,767 | $ | 1,407,327 | ||||
5. Components of Net Assets on a Tax Basis
As of Oct. 31, 2014, the components of net assets on a tax basis were as follows:
Shares of beneficial interest | $ | 2,509,261,262 | ||
Undistributed ordinary income | 12,286,316 | |||
Undistributed long-term capital gains | 89,352,699 | |||
Unrealized appreciation | 841,083,459 | |||
|
| |||
Net assets | $ | 3,451,983,736 | ||
|
|
The differences between book basis and tax basis components of net assets are primarily attributable to tax deferral of losses on wash sales.
For financial reporting purposes, capital accounts are adjusted to reflect the tax character of permanent book/tax differences. Reclassifications are primarily due to gains (losses) from redemptions in-kind. Results of operations and net assets were not affected by these reclassifications. For the year ended Oct. 31, 2014, the Fund recorded the following reclassifications:
Accumulated net realized gain | (20,783,777 | ) | ||
Paid-in capital | 20,783,777 |
31
Table of Contents
Notes to financial statements
Delaware U.S. Growth Fund
5. Components of Net Assets on a Tax Basis (continued)
For federal income tax purposes, capital loss carryforwards may be carried forward and applied against future capital gains. $27,065,298 was utilized in 2014.
On Dec. 22, 2010, the Regulated Investment Company Modernization Act of 2010 (the Act) was enacted, which changed various technical rules governing the tax treatment of regulated investment companies. The changes are generally effective for taxable years beginning after the date of enactment. Under the Act, the Fund is permitted to carry forward capital losses incurred in taxable years beginning after the date of enactment for an unlimited period. However, any losses incurred during those future taxable years will be required to be utilized prior to the losses incurred in pre-enactment taxable years, which carry an expiration date. As a result of this ordering rule, pre-enactment capital loss carryforwards may be more likely to expire unused. Additionally, post-enactment capital loss carryforwards will retain their character as either short-term or long-term capital losses rather than being considered all short-term as permitted under previous regulation. At Oct. 31, 2014, there were no capital loss carryforwards under the Act.
6. Capital Shares
Transactions in capital shares were as follows:
| Year ended | ||||||||
| 10/31/14 | 10/31/13 | |||||||
Shares sold: | ||||||||
Class A | 10,776,994 | 8,064,934 | ||||||
Class B | 689 | 4,129 | ||||||
Class C | 1,175,839 | 1,834,459 | ||||||
Class R | 419,718 | 932,956 | ||||||
Institutional Class | 37,996,352 | 59,025,140 | ||||||
Shares issued upon reinvestment of dividends and distributions: | ||||||||
Institutional Class | 69,875 | 69,723 | ||||||
|
|
|
| |||||
| 50,439,467 | 69,931,341 | |||||||
|
|
|
| |||||
Shares redeemed: | ||||||||
Class A | (10,293,569 | ) | (3,297,022 | ) | ||||
Class B | (78,453 | ) | (78,949 | ) | ||||
Class C | (691,476 | ) | (423,054 | ) | ||||
Class R | (447,125 | ) | (483,774 | ) | ||||
Institutional Class | (23,188,911 | ) | (14,849,574 | ) | ||||
|
|
|
| |||||
| (34,699,534 | ) | (19,132,373 | ) | |||||
|
|
|
| |||||
Net increase | 15,739,933 | 50,798,968 | ||||||
|
|
|
| |||||
For the years ended Oct. 31, 2014 and 2013, 47,284 Class B shares were converted to 40,382 Class A shares valued at $974,760 and 36,910 Class B shares were converted to 31,642 Class A shares valued
32
Table of Contents
at $603,231, respectively. The respective amounts are included in Class B redemptions and Class A subscriptions in the table above and the “Statements of changes in net assets.”
Certain shareholders of Class A and Class C shares may exchange their shares for Institutional Class shares. For the year ended Oct. 31, 2014, 3,922 Class A shares were exchanged for 3,696 Institutional Class shares valued at $93,467, and 13,933 Class C shares were exchanged for 12,091 Institutional Class shares valued at $307,699. These exchange transactions are included as subscriptions and redemptions in the table above and the “Statements of changes in net assets.”
7. Line of Credit
The Fund, along with certain other funds in the Delaware Investments® Family of Funds (Participants), was a participant in a $125,000,000 revolving line of credit to be used for temporary or emergency purposes as an additional source of liquidity to fund redemptions of investor shares. Under the agreement, the Participants were charged an annual commitment fee of 0.08%, which was allocated across the Participants on the basis of each Participant’s allocation of the entire facility. The Participants were permitted to borrow up to a maximum of one third of their net assets under the agreement. Each Participant was individually, and not jointly, liable for its particular advances, if any, under the line of credit. The line of credit available under the agreement expired on Nov. 12, 2013.
On Nov. 12, 2013, the Fund, along with the other Participants, entered into an amendment to the agreement for a $225,000,000 revolving line of credit. The line of credit is to be used as described above and operates in substantially the same manner as the agreement described above. The line of credit available under the agreement expired on Nov. 10, 2014.
The Fund had no amounts outstanding as of Oct. 31, 2014 or at any time during the year then ended.
8. Securities Lending
The Fund, along with other funds in the Delaware Investments Family of Funds, may lend its securities pursuant to a security lending agreement (Lending Agreement) with The Bank of New York Mellon (BNY Mellon). At the time a security is loaned, the borrower must post collateral equal to the required percentage of the market value of the loaned security, including any accrued interest. The required percentage is: (1) 102% with respect to U.S. securities and foreign securities that are denominated and payable in U.S. dollars; and (2) 105% with respect to foreign securities. With respect to each loan, if on any business day the aggregate market value of securities collateral plus cash collateral held is less than the aggregate market value of the securities which are the subject of such loan, the borrower will be notified to provide additional collateral by the end of the following business day which, together with the collateral already held, will be not less than the applicable initial collateral requirements for such security loan. If the aggregate market value of securities collateral and cash collateral held with respect to a security loan exceeds the applicable initial collateral requirement, upon request of the borrower, BNY Mellon must return enough collateral to the borrower by the end of the following business day to reduce the value of the remaining collateral to the applicable initial collateral requirement for such security loan. As a result of the foregoing, the value of the collateral held with respect to a loaned security on any particular day may be more or less than the value of the security on loan.
33
Table of Contents
Notes to financial statements
Delaware U.S. Growth Fund
8. Securities Lending (continued)
Cash collateral received is generally invested in the Delaware Investments Collateral Fund No. 1 (Collective Trust) established by BNY Mellon for the purpose of investment on behalf of funds managed by DMC that participate in BNY Mellon’s securities lending program. The Collective Trust may invest in U.S. government securities and high quality corporate debt, asset-backed and other money market securities, and in repurchase agreements collateralized by such securities, provided that the Collective Trust will generally have a dollar-weighted average portfolio maturity of 60 days or less. The Fund can also accept U.S. government securities and letters of credit (non-cash collateral) in connection with securities loans. In the event of default or bankruptcy by the lending agent, realization and/or retention of the collateral may be subject to legal proceedings. In the event the borrower fails to return loaned securities and the collateral received is insufficient to cover the value of the loaned securities and provided such collateral shortfall is not the result of investment losses, the lending agent has agreed to pay the amount of the shortfall to the Fund or, at the discretion of the lending agent, replace the loaned securities. The Fund continues to record dividends or interest, as applicable, on the securities loaned and is subject to changes in value of the securities loaned that may occur during the term of the loan. The Fund has the right under the Lending Agreement to recover the securities from the borrower on demand. With respect to security loans collateralized by non-cash collateral, the Fund receives loan premiums paid by the borrower. With respect to security loans collateralized by cash collateral, the earnings from the collateral investments are shared among the Fund, the security lending agent and the borrower. The Fund records security lending income net of allocations to the security lending agent and the borrower.
The Collective Trust used for the investment of cash collateral received from borrowers of securities seeks to maintain a net asset value per unit of $1.00, but there can be no assurance that it will always be able to do so. The Fund may incur investment losses as a result of investing securities lending collateral in the Collective Trust. This could occur if an investment in the Collective Trust defaulted or if it were necessary to liquidate assets in the Collective Trust to meet returns on outstanding security loans at a time when the Collective Trust’s net asset value per unit was less than $1.00. Under those circumstances, the Fund may not receive an amount from the Collective Trust that is equal in amount to the collateral the Fund would be required to return to the borrower of the securities and the Fund would be required to make up for this shortfall.
During the year ended Oct. 31, 2014, the Fund had no securities out on loan.
9. Credit and Market Risk
The Fund may invest up to 15% of its net assets in illiquid securities, which may include securities with contractual restrictions on resale, securities exempt from registration under Rule 144A of the Securities Act of 1933, as amended, and other securities which may not be readily marketable. The relative illiquidity of these securities may impair the Fund from disposing of them in a timely manner and at a fair price when it is necessary or desirable to do so. While maintaining oversight, the Fund’s Board has delegated to DMC the day-to-day functions of determining whether individual securities are illiquid for purposes of the Fund’s limitation on investments in illiquid securities. Securities eligible for resale pursuant to Rule 144A, which are determined to be liquid, are not subject to the Fund’s 15% limit on
34
Table of Contents
investments in illiquid securities. As of Oct. 31, 2014, there were no Rule 144A securities held by the Fund and no securities have been determined to be illiquid under the Fund’s Liquidity Procedures.
10. Contractual Obligations
The Fund enters into contracts in the normal course of business that contain a variety of indemnifications. The Fund’s maximum exposure under these arrangements is unknown. However, the Fund has not had prior claims or losses pursuant to these contracts. Management has reviewed the Fund’s existing contracts and expects the risk of loss to be remote.
11. In-Kind Redemptions
During the year ended Oct. 31, 2014, Delaware U.S. Growth Fund satisfied withdrawal requests with transfers of securities and cash of $45,813,033, resulting in net realized gains of $20,783,777.
12. Recent Accounting Pronouncements
In June 2014, the Financial Accounting Standards Board issued guidance to improve the financial reporting of reverse repurchase agreements and other similar transactions. The guidance includes expanded disclosure requirements for entities that enter into reverse repurchase agreements and similar transactions accounted for as secured borrowings. The guidance is effective for financial statements with fiscal years beginning on or after Dec. 15, 2014 and interim periods within those fiscal years. Management is evaluating the impact, if any, of this guidance on the Fund’s financial statement disclosures.
13. Subsequent Events
Effective Nov. 1, 2014, Delaware Investments® Fund Services Company (DIFSC), an affiliate of DMC, provides fund accounting and financial administration oversight services to the Fund. Also effective Nov. 1, 2014, DIFSC is the transfer agent and dividend disbursing agent of the Fund.
On Nov. 10, 2014, the Fund, along with the other Participants, entered into an agreement for a $275,000,000 revolving line of credit to be used as described in Note 7 and to be operated in substantially the same manner as the agreement described in Note 7. The line of credit under the agreement expires on Nov. 9, 2015.
Management has determined that no other material events or transactions occurred subsequent to Oct. 31, 2014 that would require recognition or disclosure in the Fund’s financial statements.
35
Table of Contents
registered public accounting firm
To the Board of Trustees of Delaware Group® Adviser Funds
and the Shareholders of Delaware U.S. Growth Fund:
In our opinion, the accompanying statement of assets and liabilities, including the schedule of investments, and the related statements of operations and of changes in net assets and the financial highlights present fairly, in all material respects, the financial position of Delaware U.S. Growth Fund (one of the series constituting Delaware Group Adviser Funds, hereafter referred to as the “Fund”) at October 31, 2014, the results of its operations for the year then ended, the changes in its net assets for each of the two years in the period then ended and the financial highlights for each of the five years in the period then ended, in conformity with accounting principles generally accepted in the United States of America. These financial statements and financial highlights (hereafter referred to as “financial statements”) are the responsibility of the Fund’s management. Our responsibility is to express an opinion on these financial statements based on our audits. We conducted our audits of these financial statements in accordance with the standards of the Public Company Accounting Oversight Board (United States). Those standards require that we plan and perform the audit to obtain reasonable assurance about whether the financial statements are free of material misstatement. An audit includes examining, on a test basis, evidence supporting the amounts and disclosures in the financial statements, assessing the accounting principles used and significant estimates made by management, and evaluating the overall financial statement presentation. We believe that our audits, which included confirmation of securities at October 31, 2014 by correspondence with the custodian and brokers, and the application of alternative auditing procedures where confirmations of security purchases had not been received, provide a reasonable basis for our opinion.
PricewaterhouseCoopers LLP
Philadelphia, Pennsylvania
December 17, 2014
36
Table of Contents
Other Fund information (Unaudited)
Delaware U.S. Growth Fund
Tax Information
The information set forth below is for the Fund’s fiscal year as required by federal income tax laws. Shareholders, however, must report distributions on a calendar year basis for income tax purposes, which may include distributions for portions of two fiscal years of the Fund. Accordingly, the information needed by shareholders for income tax purposes will be sent to them in January of each year. Please consult your tax advisor for proper treatment of this information.
All disclosures are based on financial information available as of the date of this annual report and, accordingly are subject to change. For any and all items requiring reporting, it is the intention of the Fund to report the maximum amount permitted under the Internal Revenue Code and the regulations thereunder.
For the fiscal year ended Oct. 31, 2014, the Fund reports distributions paid during the year as follows:
(A) Ordinary Income Distributions* (Tax Basis) | 100.00 | % | ||
(B) Qualified Dividends1 | 100.00 | % |
(A) is based on a percentage of the Fund’s total distributions.
(B) is based on a percentage of the Fund’s ordinary income distributions.
* For the fiscal year ended Oct. 31, 2014, certain dividends paid by the Fund may be subject to a maximum tax rate of 15%, as provided for by the Jobs and Growth Tax Relief Reconciliation Act of 2003, and as extended by the Tax Relief Unemployment Insurance Reauthorization and Job Creations Act of 2010, and made permanent by the American Taxpayer Relief Act of 2012. The Fund intends to report 100.00% to be taxed at a maximum rate of 15%. Complete information will be computed and reported in conjunction with your 2014 Form 1099-DIV.
1 Qualified dividends represent dividends which qualify for the corporate dividends received deduction.
For the fiscal year ended Oct. 31, 2014, certain interest income paid by each Fund, determined to be Qualified Interest Income may be subject to relief from U.S. withholding for foreign shareholders, as provided by the American Jobs Creation Act of 2004 and as extended by Tax Relief Unemployment Insurance Reauthorization and Job Creations Act of 2010, and by the American Taxpayer Relief Act of 2012. For the fiscal year ended Oct. 31, 2014, the Fund has reported maximum distributions of Qualified Interest Income of $10,091.
Proxy Results
At Joint Special Meetings of Shareholders of Delaware U.S. Growth Fund (Fund) held on May 16, 2014, the shareholders of the Fund voted to approve a new sub-advisory agreement for the Fund between Delaware Management Company (DMC), the advisor to the Fund, and Jackson Square Partners, LLC (JSP). JSP, a Delaware limited liability company, is a joint venture between Delaware Investments Advisers Partner, Inc., an affiliate of DMC, and California Street Partners, LLC, a Delaware limited liability company owned by certain JSP personnel.
The following proposal was submitted for a vote of the shareholders:
To approve a new sub-advisory agreement for the Fund.
A quorum of the shares outstanding was present, and the votes passed with a majority of those shares.
37
Table of Contents
Other Fund information (Unaudited)
Delaware U.S. Growth Fund
Proxy Results (continued)
The results were as follows:
Shares voted for | 81,843,840 | |||
Percentage of outstanding shares | 69.12 | % | ||
Percentage of shares voted | 97.58 | % | ||
Shares voted against | 236,220 | |||
Percentage of outstanding shares | 0.20 | % | ||
Percentage of shares voted | 0.28 | % | ||
Shares abstained | 1,791,264 | |||
Percentage of outstanding shares | 1.51 | % | ||
Percentage of shares voted | 2.14 | % |
Board consideration of Delaware U.S. Growth Fund sub-advisory agreement with Jackson Square Partners, LLC
At a meeting held on Feb. 18–20, 2014 (“Meeting”), the Board of Trustees (“Board”), including a majority of disinterested or Independent Trustees, approved a Sub-Advisory Agreement for Delaware U.S. Growth Fund (“Fund”). In making its decision, the Board considered information prepared specifically in connection with the approval of the Sub-advisory Agreement. Information furnished specifically in connection with the approval of the Sub-advisory Agreement with Jackson Square Partners, LLC (“JSP”) included materials provided by JSP concerning, among other things, the nature, extent and quality of service provided to the Fund, the costs of such services to the Fund, economies of scale and the financial condition and profitability of JSP. In addition, the Board considered reports prepared by Lipper, Inc., an independent statistical compilation organization (“Lipper”), which compared the Fund’s investment performance and expenses with those of other comparable mutual funds.
In considering information relating to the approval of the Sub-advisory Agreement, the Independent Trustees received assistance and advice from and met separately with independent legal counsel to the Independent Trustees. Although the Board gave attention to all information furnished, the following discussion identifies, under separate headings, the primary factors taken into account by the Board during its contract approval considerations.
Nature, Extent and Quality of Service. The Board considered the continuity of investment management to be provided to the Fund and its shareholders. Management provided certain information to the Board regarding the transition of the current portfolio management team (“Focus Growth Team”) to JSP (“Transaction”). Following the close of the Transaction, the Focus Growth Team would continue to provide portfolio management services to the Fund as owners or employees of JSP. In reviewing the nature, extent, and quality of services, the Board considered that the same personnel will be providing portfolio management services to the Fund following the completion of the Transaction, and therefore, considered the many reports furnished to them throughout 2012 and 2013 at regular Board meetings covering matters such as the relative performance of the Fund, and the compliance of portfolio managers with the investment policies, strategies, and restrictions for the Fund. The Board was pleased
38
Table of Contents
with the emphasis placed on research and risk management in the investment process. The Board concluded that it was satisfied with the nature, extent, and quality of the overall services to be provided by JSP.
In addition, the Board considered that in connection with the Transaction, Delaware Investments Advisers Partner, Inc. (“DIAP”) and JSP would enter into a transaction services agreement. Under the terms of this agreement, DIAP and certain of its affiliates would provide compliance and other administrative support to JSP for an 18-month period following the close of the Transaction.
Investment Performance. The Board considered the overall investment performance of the Focus Growth Team and the Fund. The Board placed significant emphasis on the investment performance of the Fund in view of its importance to shareholders. The Board reviewed reports prepared by Lipper for the Fund that showed the Fund’s investment performance as of March 31, 2013 in comparison to a group of funds selected by Lipper as being similar to the Fund (the “Performance Universe”). A fund with the best performance ranked first, and a fund with the poorest performance ranked last. The highest/ best performing 25% of funds in the Performance Universe make up the first quartile; the next 25%, the second quartile; the next 25%, the third quartile; and the poorest/worst performing 25% of funds in the Performance Universe make up the fourth quartile. Annualized investment performance for the Fund was shown for the past one-, three-, five-, and ten-year periods, as applicable, compared to that of the Performance Universe. The Board’s objective was that the Fund’s performance for the periods considered be at or above the median of its Performance Universe. In addition, the Board reviewed more recent Lipper data that had been provided at the quarterly Board meetings held since March 31, 2013. With respect to the Fund’s performance as of Dec. 31, 2013, they noted:
The Performance Universe for the Fund consisted of the Fund and all retail and institutional large-cap growth funds as selected by Lipper. The Lipper report comparison showed that the Fund’s total return for the one-year period was in the second quartile of its Performance Universe. The report further showed that the Fund’s total return for the three- and five-year periods was in the first quartile of its Performance Universe, and the Fund’s total return for the ten-year period was in the second quartile of its Performance Universe.
The Board noted that they were satisfied with the overall performance of the Fund. Moreover, the Board concluded that the Transaction was unlikely to have any effect on JSP’s management of the Fund or its investment performance because the current portfolio management personnel will continue to provide portfolio management services to the Funds.
Comparative Expenses. The Board also evaluated expense comparison data for the Fund. JSP provided the Board with information on pricing levels and fee structures for the Fund and comparative funds. The Board noted that JSP’s fees will be paid by the Fund’s advisor, Delaware Management Company, Inc. (“DMC”), not by the Fund. They also focused on the comparative analysis of the effective management fees (including sub-advisory fees) and total expense ratios of the Fund versus the effective management fees (including sub-advisory fees) and expense ratios of a group of funds selected by Lipper as being similar to the Fund (“Expense Group”). In reviewing comparative costs, the Fund’s contractual management fee (including sub-advisory fees) and the actual management fee incurred by the Fund were compared with the contractual management fees (assuming all funds in the Expense Group were similar in size to the applicable Fund) and actual management fees (as reported by each
39
Table of Contents
Other Fund information (Unaudited)
Delaware U.S. Growth Fund
Board consideration of Delaware U.S. Growth Fund sub-advisory agreement with Jackson Square Partners, LLC (continued)
fund) of other funds within the Expense Group. The Fund’s total expenses were also compared with those of its Expense Group. The Board’s objective was for the Fund’s total expense ratio to be competitive with that of the Expense Group. They concluded that, because the sub-advisory fee rate paid by DMC on behalf of the Fund would not change, the Fund’s expenses were satisfactory.
Management Profitability. Because JSP did not have historical operations, it provided a pro forma profitability analysis to the Board, and the Board considered the level of profits expected to be realized by JSP as part of their annual contract evaluation. The Board discussed the transition services to be provided to JSP by Delaware Investments and the cost of providing those services. The Board also considered the extent to which JSP might derive ancillary benefits from the Fund’s operations, including the potential for procuring additional business as a result of the prestige and visibility associated with its role as sub-advisor to the Fund and the benefits from allocation of the Fund’s brokerage to improve trading efficiencies. The Board concluded that the sub-advisory fee was reasonable in light of the services to be rendered.
Economies of Scale. The Board considered whether economies of scale would be realized by JSP and the extent to which any economies of scale would be reflected in the level of sub-advisory fees. The Board considered the fact that several of the funds to be managed by JSP had already reached breakpoints in their management fees.
Fall-out Benefits. The Board considered that JSP may derive reputational, strategic and other benefits from its association with the Fund, and evaluated the extent to which JSP might derive ancillary benefits from Fund operations, including the potential for procuring additional business as a result of its role as a service provider to the Fund and the benefits from allocation of Fund brokerage to improve trading efficiencies. However, the Board concluded that (i) such benefits did not impose a cost or burden on the Fund or its shareholders, and (ii) such benefits would probably have an indirectly beneficial effect on the Fund and its shareholders because of the added importance that JSP might attach to the Fund as a result of the fall-out benefits that the Fund conveyed.
Board consideration of Delaware U.S. Growth Fund investment management agreement
At a meeting held on Aug. 19-21, 2014 (the “Annual Meeting”), the Board of Trustees (the “Board”), including a majority of disinterested or independent Trustees, approved the renewal of the Investment Management Agreement for Delaware U.S. Growth Fund (the “Fund”). In making its decision, the Board considered information furnished at regular quarterly Board meetings, including reports detailing Fund performance, investment strategies and expenses, as well as information prepared specifically in connection with the renewal of the investment advisory and sub-advisory contracts. Information furnished specifically in connection with the renewal of the Investment Management Agreement with Delaware Management Company (“DMC”) included materials provided by DMC and its affiliates (“Delaware Investments”) concerning, among other things, the nature, extent and quality of services provided to the Fund, the costs of such services to the Fund, economies of scale and the financial condition and profitability of Delaware Investments. In addition, in connection with the Annual Meeting, reports were provided to the Trustees in May 2014 and included reports provided by Lipper, Inc., an
40
Table of Contents
independent statistical compilation organization (“Lipper”). The Lipper reports compared the Fund’s investment performance and expenses with those of other comparable mutual funds. The Independent Trustees reviewed and discussed the Lipper reports with independent legal counsel to the Independent Trustees. The Board requested and received information regarding DMC’s policy with respect to advisory fee levels and its breakpoint philosophy; the structure of portfolio manager compensation; the investment manager’s profitability; comparative client fee information; and any constraints or limitations on the availability of securities for certain investment styles, which had in the past year inhibited, or which were likely in the future to inhibit, DMC’s ability to invest fully in accordance with Fund policies. It was noted that the Board approved a subadvisory agreement between DMC and Jackson Square Partners, LLC in February 2014.
In considering information relating to the approval of the Fund’s advisory agreement, the Independent Trustees received assistance and advice from and met separately with independent legal counsel to the Independent Trustees. Although the Board gave attention to all information furnished, the following discussion identifies, under separate headings, the primary factors taken into account by the Board during its contract renewal considerations.
Nature, Extent, and Quality of Service. The Board considered the services provided by Delaware Investments to the Fund and its shareholders. In reviewing the nature, extent and quality of services, the Board considered reports furnished to it throughout the year, which covered matters such as the relative performance of the Fund, compliance of portfolio managers with the investment policies, strategies and restrictions for the Fund, compliance by DMC and Delaware Distributors, L.P. (together, “Management”) personnel with the Code of Ethics adopted throughout the Delaware Investments® Family of Funds complex and adherence to fair value pricing procedures as established by the Board. The Board was pleased with the current staffing of the Fund’s investment manager and the emphasis placed on research in the investment process. The Board recognized DMC’s recent receipt of several industry distinctions. The Board gave favorable consideration to DMC’s efforts to control expenditures while maintaining service levels committed to Fund matters. The Board noted that, in the third and fourth quarters of 2013, Management reduced the maximum 12b-1 fee for certain funds; and in November 2013 Management negotiated a substantial reduction in fees for fund accounting services provided to the Funds. The Board noted the benefits provided to Fund shareholders through each shareholder’s ability to exchange an investment in one Delaware Investments fund for the same class of shares in another Delaware Investments fund without a sales charge, to reinvest Fund dividends into additional shares of the Fund or into additional shares of other Delaware Investments funds and the privilege to combine holdings in other Delaware Investments funds to obtain a reduced sales charge. The Board was satisfied with the nature, extent and quality of the overall services provided by Delaware Investments.
Investment Performance. The Board placed significant emphasis on the investment performance of the Fund in view of the importance of investment performance to shareholders. Although the Board gave appropriate consideration to performance reports and discussions with portfolio managers at Investment Committee meetings throughout the year, the Board gave particular weight to the Lipper reports furnished for the Annual Meeting. The Lipper reports prepared for the Fund showed the investment performance of its Class A shares in comparison to a group of similar funds as selected by Lipper (the “Performance Universe”). A fund with the best performance ranked first, and a fund with the poorest
41
Table of Contents
Other Fund information (Unaudited)
Delaware U.S. Growth Fund
Board consideration of Delaware U.S. Growth Fund investment management agreement (continued)
performance ranked last. The highest/best performing 25% of funds in the Performance Universe make up the first quartile; the next 25%, the second quartile; the next 25%, the third quartile; and the poorest/ worst performing 25% of funds in the Performance Universe make up the fourth quartile. Comparative annualized performance for the Fund was shown for the past one-, three-, five- and ten-year periods, to the extent applicable, ended March 31, 2014. The Board’s objective is that the Fund’s performance for the periods considered be at or above the median of its Performance Universe. The following paragraph summarizes the performance results for the Fund and the Board’s view of such performance.
The Performance Universe for the Fund consisted of the Fund and all retail and institutional large cap growth funds as selected by Lipper. The Lipper report comparison showed that the Fund’s total return for the one-year period was in the third quartile of its Performance Universe. The report further showed that the Fund’s total return for the three- and five-year periods was in the first quartile of its Performance Universe and the Fund’s total return for the ten-year period was in the second quartile of its Performance Universe. The Board was satisfied with performance.
Comparative Expenses. The Board considered expense comparison data for the Delaware Investments® Family of Funds. Management provided the Board with information on pricing levels and fee structures for the Fund as of its most recently completed fiscal year. The Board also focused on the comparative analysis of effective management fees and total expense ratios of the Fund versus effective management fees and expense ratios of a group of similar funds as selected by Lipper (the “Expense Group”). In reviewing comparative costs, the Fund’s contractual management fee and the actual management fee incurred by the Fund were compared with the contractual management fees (assuming all funds in the Expense Group were similar in size to the Fund) and actual management fees (as reported by each fund) within the Expense Group, taking into account any applicable breakpoints and fee waivers. The Fund’s total expenses were also compared with those of its Expense Group. The Lipper total expenses, for comparative consistency, were shown by Lipper for Class A shares and comparative total expenses including 12b-1 and non 12b-1 service fees. The Board considered fees paid to Delaware Investments for non-management services. The Board’s objective is to limit the Fund’s total expense ratio to be competitive with that of the Expense Group. The following paragraph summarizes the expense results for the Fund and the Board’s view of such expenses.
The expense comparisons for the Fund showed that its actual management fee and total expenses were in the quartile with the second lowest expenses of its Expense Group. The Board was satisfied with the management fee and total expenses of the Fund in comparison to those of its Expense Group as shown in the Lipper report.
Management Profitability. The Board considered the level of profits realized by Delaware Investments in connection with the operation of the Fund. In this respect, the Board reviewed the Investment Management Profitability Analysis that addressed the overall profitability of Delaware Investments’ business in providing management and other services to each of the individual funds and the Delaware Investments Family® of Funds as a whole. Specific attention was given to the methodology followed in allocating costs for the purpose of determining profitability. Management stated that the level of profits
42
Table of Contents
of Delaware Investments, to a certain extent, reflects recent operational cost savings and efficiencies initiated by Delaware Investments. The Board considered Delaware Investments’ efforts to improve services provided to fund shareholders and to meet additional regulatory and compliance requirements resulting from recent industry-wide Securities and Exchange Commission initiatives. The Board also considered the extent to which Delaware Investments might derive ancillary benefits from fund operations, including the potential for procuring additional business as a result of the prestige and visibility associated with its role as service provider to the Delaware Investments Family of Funds and the benefits from allocation of fund brokerage to improve trading efficiencies. The Board found that the management fees were reasonable in light of the services rendered and the level of profitability of Delaware Investments.
Economies of Scale. The Trustees considered whether economies of scale are realized by Delaware Investments as the Fund’s assets increase and the extent to which any economies of scale are reflected in the level of management fees charged. The Trustees reviewed the standardized advisory fee pricing and structure, approved by the Board and shareholders, which includes breakpoints. Breakpoints in the advisory fee occur when the advisory fee rate is reduced on assets in excess of specified levels. Breakpoints result in a lower advisory fee than would otherwise be the case on all assets when the asset levels specified are exceeded. The Board noted that the fee under the Fund’s management contract fell within the standard structure. Although the Fund has not reached a size at which it can take advantage of breakpoints, the Board recognized that the fee was structured so that when the Fund grows, economies of scale may be shared.
43
Table of Contents
Board of trustees / directors and officers addendum
Delaware Investments® Family of Funds
A mutual fund is governed by a Board of Trustees / Directors (“Trustees”), which has oversight responsibility for the management of a fund’s business affairs. Trustees establish procedures and oversee and review the performance of the investment manager, the distributor, and others who perform services for the fund. The independent fund trustees, in particular, are advocates
| Name, Address, and Birth Date | Position(s) Held with Fund(s) | Length of Time Served | ||
Interested Trustees
| ||||
Patrick P. Coyne1 | Chairman, President, | Chairman and Trustee | ||
2005 Market Street | Chief Executive Officer, | since August 16, 2006 | ||
Philadelphia, PA 19103 | and Trustee | |||
April 1963 | President and | |||
| Chief Executive Officer | ||||
| since August 1, 2006 | ||||
Independent Trustees
| ||||
Thomas L. Bennett | Trustee | Since March 2005 | ||
2005 Market Street | ||||
Philadelphia, PA 19103 | ||||
October 1947 | ||||
Joseph W. Chow | Trustee | Since January 2013 | ||
2005 Market Street | ||||
Philadelphia, PA 19103 | ||||
January 1953 | ||||
John A. Fry | Trustee | Since January 2001 | ||
2005 Market Street | ||||
Philadelphia, PA 19103 | ||||
May 1960 | ||||
1 Patrick P. Coyne is considered to be an “Interested Trustee” because he is an executive officer of the Fund’s(s’) investment advisor.
44
Table of Contents
for shareholder interests. Each trustee has served in that capacity since he or she was elected to or appointed to the Board of Trustees, and will continue to serve until his or her retirement or the election of a new trustee in his or her place. The following is a list of the Trustees and Officers with certain background and related information.
| Principal Occupation(s) During Past 5 Years | Number of Portfolios in Fund Complex Overseen by Trustee or Officer | Other Directorships Held by Trustee or Officer | ||
Patrick P. Coyne has served in | 65 | Board of Governors Member | ||
various executive capacities | Investment Company | |||
at different times at | Institute (ICI) | |||
Delaware Investments.2 | ||||
| Director and Audit | ||||
| Committee Member | ||||
| Kaydon Corp. | ||||
| (2007–2013) | ||||
Private Investor | 65 | Director | ||
(March 2004–Present) | Bryn Mawr Bank Corp. (BMTC) | |||
| (2007–2011) | ||||
Executive Vice President | 65 | Director and Audit Committee | ||
(Emerging Economies | Member — Hercules | |||
Strategies, Risk and | Technology Growth | |||
Corporate Administration) | Capital, Inc. | |||
State Street Corporation | (2004-2014) | |||
(July 2004–March 2011) | ||||
President | 65 | Director — Hershey Trust | ||
Drexel University | Company | |||
(August 2010–Present) | ||||
| Director, Audit Committee, | ||||
President | and Governance Committee | |||
Franklin & Marshall College | Member Community | |||
(July 2002–July 2010) | Health Systems | |||
| 2 | Delaware Investments is the marketing name for Delaware Management Holdings, Inc. and its subsidiaries, including the Fund’s(s’) investment advisor, principal underwriter, and its transfer agent. |
45
Table of Contents
Board of trustees / directors and officers addendum
Delaware Investments® Family of Funds
| Name, Address, and Birth Date | Position(s) Held with Fund(s) | Length of Time Served | ||
Independent Trustees (continued)
| ||||
Lucinda S. Landreth | Trustee | Since March 2005 | ||
2005 Market Street | ||||
Philadelphia, PA 19103 | ||||
June 1947 | ||||
Frances A. Sevilla-Sacasa | Trustee | Since September 2011 | ||
2005 Market Street | ||||
Philadelphia, PA 19103 | ||||
January 1956 | ||||
Thomas K. Whitford | Trustee | Since January 2013 | ||
2005 Market Street | ||||
Philadelphia, PA 19103 | ||||
March 1956 | ||||
46
Table of Contents
| Principal Occupation(s) During Past 5 Years | Number of Portfolios in Fund Complex Overseen by Trustee or Officer | Other Directorships Held by Trustee or Officer | ||
Private Investor | 65 | None | ||
(2004–Present) | ||||
Chief Executive Officer — | 65 | Trust Manager and | ||
Banco Itaú | Audit Committee | |||
International | Member — Camden | |||
(April 2012–Present) | Property Trust | |||
Executive Advisor to Dean | ||||
(August 2011–March 2012) | ||||
(January 2011–July 2011) — | ||||
University of Miami School of | ||||
Business Administration | ||||
President — U.S. Trust, | ||||
Bank of America Private | ||||
Wealth Management | ||||
(Private Banking) | ||||
(July 2007–December 2008) | ||||
Vice Chairman | 65 | Director — HSBC Finance | ||
(2010–April 2013) | Corporation and HSBC | |||
Chief Administrative | North America Holdings Inc. | |||
Officer (2008–2010) | ||||
President and Chief | ||||
Administrative Officer | ||||
(2007–2009) — | ||||
PNC Financial | ||||
Services Group | ||||
47
Table of Contents
Board of trustees / directors and officers addendum
Delaware Investments® Family of Funds
| Name, Address, and Birth Date | Position(s) Held with Fund(s) | Length of Time Served | ||
Independent Trustees (continued)
| ||||
Janet L. Yeomans | Trustee | Since April 1999 | ||
2005 Market Street | ||||
Philadelphia, PA 19103 | ||||
July 1948 | ||||
J. Richard Zecher | Trustee | Since March 2005 | ||
2005 Market Street | ||||
Philadelphia, PA 19103 | ||||
July 1940 | ||||
48
Table of Contents
| Principal Occupation(s) During Past 5 Years | Number of Portfolios in Fund Complex Overseen by Trustee or Officer | Other Directorships Held by Trustee or Officer | ||
Vice President and Treasurer | 65 | Director, Audit and | ||
(January 2006–July 2012) | Compliance Committee Chair, | |||
Vice President — | Investment Committee | |||
Mergers & Acquisitions | Member and Governance | |||
(January 2003–January 2006), | Committee Member | |||
and Vice President | Okabena Company | |||
and Treasurer | ||||
(July 1995–January 2003) | Chair — 3M | |||
3M Corporation | Investment Management | |||
| Company | ||||
| (2005–2012) | ||||
Founder | 65 | Director and Compensation | ||
Investor Analytics | Committee Chairman | |||
(Risk Management) | Investor Analytics | |||
(May 1999–Present) | ||||
| Director — P/E Investments | ||||
Founder | ||||
P/E Investments | ||||
(Hedge Fund) | ||||
(September 1996–Present) | ||||
49
Table of Contents
Board of trustees / directors and officers addendum
Delaware Investments® Family of Funds
| Name, Address, and Birth Date | Position(s) Held with Fund(s) | Length of Time Served | ||
Officers
| ||||
David F. Connor | Senior Vice President, | Senior Vice President, | ||
2005 Market Street | Deputy General | Deputy General Counsel | ||
Philadelphia, PA 19103 | Counsel, and Secretary | since May 2013; | ||
December 1963 | Vice President, Deputy | |||
| General Counsel | ||||
| September 2000 – | ||||
| May 2013; Secretary since | ||||
| October 2005 | ||||
Daniel V. Geatens | Vice President | Treasurer since October 2007 | ||
2005 Market Street | and Treasurer | |||
Philadelphia, PA 19103 | ||||
October 1972 | ||||
David P. O’Connor | Executive Vice President, | Executive Vice President | ||
2005 Market Street | General Counsel | since February 2012; | ||
Philadelphia, PA 19103 | and Chief Legal Officer | Senior Vice President | ||
February 1966 | October 2005 – | |||
| February 2012; | ||||
| General Counsel and | ||||
| Chief Legal Officer | ||||
| since October 2005 | ||||
Richard Salus | Senior Vice President | Chief Financial Officer | ||
2005 Market Street | and Chief Financial Officer | since November 2006 | ||
Philadelphia, PA 19103 | ||||
October 1963 |
The Statement of Additional Information for the Fund(s) includes additional information about the Trustees and Officers and is available, without charge, upon request by calling 800 523-1918.
50
Table of Contents
| Principal Occupation(s) During Past 5 Years | Number of Portfolios in Fund Complex Overseen by Trustee or Officer | Other Directorships Held by Trustee or Officer | ||
David F. Connor has served as | 65 | None3 | ||
Deputy General Counsel of | ||||
Delaware Investments | ||||
Daniel V. Geatens has served | 65 | None3 | ||
in various capacities at | ||||
Delaware Investments. | ||||
David P. O’Connor has served | 65 | None3 | ||
in various executive | ||||
Richard Salus has served in | 65 | None3 | ||
various executive capacities | ||||
Delaware Investments. | ||||
| 3 | David F. Connor, Daniel V. Geatens, David P. O’Connor, and Richard Salus serve in similar capacities for the six portfolios of the Optimum Fund Trust, which have the same investment advisor, principal underwriter, and transfer agent as the registrant. |
51
Table of Contents
Board of trustees | ||||||
Patrick P. Coyne | Joseph W. Chow | Lucinda S. Landreth | Thomas K. Whitford | |||
Chairman, President, and | Former Executive Vice | Former Chief Investment | Former Vice Chairman | |||
Chief Executive Officer | President | Officer | PNC Financial Services Group | |||
Delaware Investments ® | State Street Corporation | Assurant, Inc. | Pittsburgh, PA | |||
Family of Funds | Brookline, MA | Philadelphia, PA | ||||
Philadelphia, PA | Janet L. Yeomans | |||||
John A. Fry | Frances A. | Former Vice President | ||||
Thomas L. Bennett | President | Sevilla-Sacasa | and Treasurer | |||
Private Investor | Drexel University | Chief Executive Officer | 3M Corporation | |||
Rosemont, PA | Philadelphia, PA | Banco Itaú | St. Paul, MN | |||
| International | ||||||
| Miami, FL | J. Richard Zecher | |||||
| Founder | ||||||
| Investor Analytics | ||||||
| Scottsdale, AZ | ||||||
Affiliated officers | ||||||
David F. Connor | Daniel V. Geatens | David P. O’Connor | Richard Salus | |||
Senior Vice President, | Vice President and | Executive Vice President, | Senior Vice President and | |||
Deputy General Counsel, | Treasurer | General Counsel, | Chief Financial Officer | |||
and Secretary | Delaware Investments | and Chief Legal Officer | Delaware Investments | |||
Delaware Investments | Family of Funds | Delaware Investments | Family of Funds | |||
Family of Funds | Philadelphia, PA | Family of Funds | Philadelphia, PA | |||
Philadelphia, PA | Philadelphia, PA | |||||
This annual report is for the information of Delaware U.S. Growth Fund shareholders, but it may be used with prospective investors when preceded or accompanied by the Delaware Investments Fund fact sheet for the most recently completed calendar quarter. These documents are available at delawareinvestments.com.
Delaware Investments is the marketing name of Delaware Management Holdings, Inc. and its subsidiaries.
The Fund files its complete schedule of portfolio holdings with the Securities and Exchange Commission (SEC) for the first and third quarters of each fiscal year on Form N-Q. The Fund’s Forms N-Q, as well as a description of the policies and procedures that the Fund uses to determine how to vote proxies (if any) relating to portfolio securities are available without charge (i) upon request, by calling 800 523-1918; and (ii) on the SEC’s website at sec.gov. In addition, a description of the policies and procedures that the Fund uses to determine how to vote proxies (if any) relating to portfolio securities and the Fund’s Schedule of Investments are available without charge on the Fund’s website at delawareinvestments.com. The Fund’s Forms N-Q may be reviewed and copied at the SEC’s Public Reference Room in Washington, D.C.; information on the operation of the Public Reference Room may be obtained by calling 800 SEC-0330.
Information (if any) regarding how the Fund voted proxies relating to portfolio securities during the most recently disclosed 12-month period ended June 30 is available without charge (i) through the Fund’s website at delawareinvestments.com; and (ii) on the SEC’s website at sec.gov.
52
Table of Contents

Annual report
Alternative / specialty mutual fund
Delaware Global Real Estate Opportunities Fund
October 31, 2014
Carefully consider the Fund’s investment objectives, risk factors, charges, and expenses before investing. This and other information can be found in the Fund’s prospectus and its summary prospectus, which may be obtained by visiting delawareinvestments.com or calling 800 523-1918. Investors should read the prospectus and the summary prospectus carefully before investing.
You can obtain shareholder reports and prospectuses online instead of in the mail.
Visit delawareinvestments.com/edelivery.
Table of Contents
Experience Delaware Investments
Delaware Investments is committed to the pursuit of consistently superior asset management and unparalleled client service. We believe in our investment processes, which seek to deliver consistent results, and in convenient services that help add value for our clients.
If you are interested in learning more about creating an investment plan, contact your financial advisor.
You can learn more about Delaware Investments or obtain a prospectus for Delaware Global Real Estate Opportunities Fund at delawareinvestments.com.
Manage your investments online
| • | 24-hour access to your account information |
| • | Obtain share prices |
| • | Check your account balance and recent transactions |
| • | Request statements or literature |
| • | Make purchases and redemptions |
Delaware Management Holdings, Inc. and its subsidiaries (collectively known by the marketing name of Delaware Investments) are wholly owned subsidiaries of Macquarie Group Limited, a global provider of banking, financial, advisory, investment and funds management services.
Investments in Delaware Global Real Estate Opportunities Fund are not and will not be deposits with or liabilities of Macquarie Bank Limited ABN 46 008 583 542 and its holding companies, including their subsidiaries or related companies (Macquarie Group), and are subject to investment risk, including possible delays in repayment and loss of income and capital invested. No Macquarie Group company guarantees or will guarantee the performance of the Fund, the repayment of capital from the Fund, or any particular rate of return.
| 1 | ||||
| 4 | ||||
| 8 | ||||
| 10 | ||||
| 12 | ||||
| 17 | ||||
| 19 | ||||
| 20 | ||||
| 22 | ||||
| 30 | ||||
| 43 | ||||
| 44 | ||||
| 48 | ||||
| 56 |
Unless otherwise noted, views expressed herein are current as of Oct. 31, 2014, and subject to change.
Funds are not FDIC insured and are not guaranteed. It is possible to lose the principal amount invested.
Mutual fund advisory services provided by Delaware Management Company, a series of Delaware Management Business Trust, which is a registered investment advisor. Delaware Investments, a member of Macquarie Group, refers to Delaware Management Holdings, Inc. and its subsidiaries, including the Fund’s distributor, Delaware Distributors, L.P. Macquarie Group refers to Macquarie Group Limited and its subsidiaries and affiliates worldwide.
©2014 Delaware Management Holdings, Inc.
All third-party marks cited are the property of their respective owners.
Table of Contents
Delaware Global Real Estate Opportunities Fund | November 11, 2014 |
| Performance preview (for the year ended October 31, 2014) | ||||
Delaware Global Real Estate Opportunities Fund (Class A shares) | 1-year return | +11.80% | ||
FTSE EPRA/NAREIT Developed Index (benchmark) | 1-year return | +10.66% |
Past performance does not guarantee future results.
For complete, annualized performance for Delaware Global Real Estate Opportunities Fund, please see the table on page 4.
The performance of Class A shares excludes the applicable sales charge and reflects the reinvestment of all distributions. Index performance returns do not reflect any management fees, transaction costs, or expenses. Indices are unmanaged and one cannot invest directly in an index.
During the Fund’s fiscal year ended Oct. 31, 2014, global real estate securities generated positive results overall, with the FTSE EPRA/NAREIT Developed Index advancing more than 10%. Market conditions varied widely around the globe, however.
Property stocks in the United Kingdom and United States, for example, did very well, rising 16% and 19%, respectively. In the U.S., global investors were eager to take advantage of an especially favorable backdrop characterized by falling interest rates, a declining cost of capital, and a beneficial supply-demand balance for real estate. Short-duration property sectors, such as lodging and apartments, fared particularly well.
Other markets saw less favorable results. In China, for example, where we avoided making direct investments during the Fund’s fiscal year, slowing housing prices combined with tightening credit conditions to provide what we saw as a weak investment environment. Japan also struggled, held back by slow growth, high debt, and deflationary conditions.
Fund performance
For the fiscal year ended Oct. 31, 2014, Delaware Global Real Estate Opportunities Fund (Class A shares) returned +11.80% at net asset value and +5.30% at maximum offer price (both returns reflect reinvestment of all distributions).
For the same period, the Fund’s benchmark, the FTSE EPRA/NAREIT Developed Index, returned +10.66%. Complete annualized performance for Delaware Global Real Estate Opportunities Fund is shown in the table on page 4.
Helpful positioning in Japan and the U.S.
The Fund’s relative outperformance during the fiscal year was largely driven by timely underweighting in the weak Japanese market and an equally timely overweighting in the strong-performing U.S. market. We believed the U.S. offered an attractive credit environment and opportunities for internal cash-flow growth.
Not surprisingly, a handful of U.S. stocks were among the Fund’s strongest individual contributors. For example, the Fund benefited from positions in hotel property owners Strategic Hotels & Resorts and Pebblebrook Hotel Trust. Strategic Hotels owns luxury properties that have profited from improved management operations and what we view as high-quality, desirable property locations. Pebblebrook, which primarily owns boutique-oriented hotels in urban locations, benefited from strong demand and limited supply in most of its markets.
Also helpful was the Fund’s underweighting in American Realty Capital Properties, a triple-net real estate investment trust (REIT), meaning that tenants agree to pay their own real estate taxes, insurance costs, and maintenance expenses. We
1
Table of Contents
Portfolio management review
Delaware Global Real Estate Opportunities Fund
had gradually reduced the Fund’s position in the stock and owned just a small stake by late October, when an accounting scandal caused the company’s shares to lose about 28% of their market value in the final three trading days of the Fund’s fiscal year. Although the Fund was hurt by its position in American Realty Capital Properties, we believe we were fortunate to have relatively little exposure to the stock when news of the scandal broke.
Our avoidance of Japanese issues also benefited the Fund’s relative performance, given that market’s decline of more than 7% for the 12-month period. Specifically, the Fund benefited from limiting its exposure to Mitsubishi Estate and Sumitomo Realty & Development, two benchmark components that significantly lagged the index. We were cautious about Mitsubishi’s relatively high valuation, as well as the company’s focus on office properties, given our limited expectation for an increase in Japanese office rents. We were concerned about Sumitomo’s high level of debt. The Fund also benefited from a slightly overweight position in Mitsui Fudosan Co., a third Japanese developer whose prospects we liked better because the company’s real estate portfolio provided what we viewed as a more favorable balance between office and retail properties.
Despite outperformance, some stocks detracted
Unfortunately, not all of our picks met our expectations during the Fund’s fiscal year. For example, a position in Sabra Health Care REIT hampered results. This owner of nursing homes and assisted living facilities struggled along with the entire U.S. healthcare REIT sector. Our timing was also poor with this benchmark component, as Sabra’s shares fell after we established a position in April 2014. Then, after we ultimately sold the Fund’s stake in September, Sabra regained some of its lost ground, further hurting the Fund’s relative performance. In addition, the Fund was
hurt by an investment in the convertible securities of U.S. real estate developer Forest City Enterprises, which significantly lagged the benchmark’s return.
Swedish real estate company Castellum was another relative detractor. We had identified Castellum as the highest-quality real estate company in Sweden, a market that we otherwise underweighted in the Fund. Overall, Sweden lagged the index for the 12-month period due to its relatively high indebtedness, in our view. Lar España Real Estate is another holding that weighed on relative performance. This Spanish real estate company has relied on its large cash position to build its property portfolio. We ultimately concluded that the company faced the risk that capitalization rates could compress and its properties become less favorably priced. This led us to sell the Fund’s position during the fiscal year.
Positioning at period end
When we decide how much to invest in certain markets, our process begins with analyzing the overall credit environment to gain confidence that (1) it appears favorable for real estate investing, and (2) in our view it provides more potential upside than downside. During the past 12 months, the U.S., U.K., and Australia all met our criteria, which led us to maintain overweight allocations to these three markets at fiscal year end.
In contrast, we saw limited upside in Europe because of high valuations there. We also believed Japan had a great deal of risk. Accordingly, we invested lightly in both regions, as well as in Hong Kong and Singapore, as both offered what we saw as an unfavorable backdrop for property stocks.
We have continued to see what we consider some of the best relative potential in the U.S. market, but we are concerned about the amount of capital coming in from global investors. We see too much money chasing too few properties, which has pushed valuations above where we would typically
2
Table of Contents
expect them to be purely on a cash-flow basis. Even as we continue to believe the U.S. offers a favorable backdrop, we have begun to emphasize more-conservative names within this market segment, and we will not hesitate to make further shifts to the portfolio if we see market conditions turning toward the potential for increased risk.
3
Table of Contents
Delaware Global Real Estate Opportunities Fund | October 31, 2014 |
The performance data quoted represent past performance; past performance does not guarantee future results. Investment return and principal value will fluctuate so your shares, when redeemed, may be worth more or less than their original cost. Please obtain the performance data current for the most recent month end by calling 800 523-1918 or visiting our website at delawareinvestments.com/performance. Current performance may be lower or higher than the performance data quoted.
Fund and benchmark performance1,2 | Average annual total returns through October 31, 2014 | ||||||||||||||
| 1 year | 5 years | Lifetime | |||||||||||||
Class A (Est. Jan. 10, 2007) | |||||||||||||||
Excluding sales charge | +11.80 | % | +13.30 | % | +1.84 | % | |||||||||
Including sales charge | +5.30 | % | +11.95 | % | +1.07 | % | |||||||||
Class C (Est. Sept. 28, 2012) | |||||||||||||||
Excluding sales charge | +11.06 | % | n/a | +12.00 | % | ||||||||||
Including sales charge | +10.06 | % | n/a | +12.00 | % | ||||||||||
Class R (Est. Sept. 28, 2012) | |||||||||||||||
Excluding sales charge | +11.48 | % | n/a | +12.51 | % | ||||||||||
Including sales charge | +11.48 | % | n/a | +12.51 | % | ||||||||||
Institutional Class (Est. Jan. 10, 2007) | |||||||||||||||
Excluding sales charge | +11.93 | % | +13.53 | % | +2.07 | % | |||||||||
Including sales charge | +11.93 | % | +13.53 | % | +2.07 | % | |||||||||
FTSE EPRA/NAREIT Developed Index | +10.66 | % | +12.95 | % | +2.18 | % | |||||||||
1Returns reflect the reinvestment of all distributions and are presented both with and without the applicable sales charges described below. Returns do not reflect the deduction of taxes the shareholder would pay on Fund distributions or redemptions of Fund shares.
Expense limitations were in effect for certain classes during some or all of the periods shown in the “Fund and benchmark performance” table. Expenses for each class are listed on the “Fund expense ratios” table on page 5. Performance would have been lower had expense limitations not been in effect.
Class A shares are sold with a maximum front-end sales charge of 5.75%, and have an annual distribution and service fee of 0.25% of average daily net assets. Performance for Class A shares,
excluding sales charges, assumes that no front-end sales charge applied.
Class C shares are sold with a contingent deferred sales charge of 1.00% if redeemed during the first 12 months. They are also subject to an annual distribution and service fee of 1.00% of average daily net assets.
Performance for Class C shares, excluding sales charges, assumes either that contingent deferred sales charges did not apply or that the investment was not redeemed.
Class R shares are available only for certain retirement plan products. They are sold without a sales charge and have an annual distribution and service fee of 0.50% of average daily net assets.
4
Table of Contents
Institutional Class shares are available without sales or asset-based distribution charges only to certain eligible institutional accounts.
The “Fund and benchmark performance” table and the “Performance of a $10,000 investment” graph do not reflect the deduction of taxes the shareholder would pay on Fund distributions or redemptions of Fund shares.
Narrowly focused investments may exhibit higher volatility than investments in multiple industry sectors.
REIT investments are subject to many of the risks associated with direct real estate ownership, including changes in economic conditions, credit risk, and interest rate fluctuations. A REIT fund’s tax status as a regulated investment company could be jeopardized if it holds real estate directly, as a result of defaults, or receives rental income from real estate holdings.
“Nondiversified” Funds may allocate more of their net assets to investments in single securities than “diversified” Funds. Resulting adverse effects may subject these Funds to greater risks and volatility.
International investments entail risks not ordinarily associated with U.S. investments including fluctuation in currency values, differences in accounting principles, or economic or political instability in other nations.
Investing in emerging markets can be riskier than investing in established foreign markets due to increased volatility and lower trading volume.
The Fund may experience portfolio turnover in excess of 100%, which could result in higher transaction costs and tax liability.
2 The Fund’s expense ratios, as described in the most recent prospectus, are disclosed in the following “Fund expense ratios” table. Delaware Management Company has agreed to reimburse certain expenses and/or waive certain fees in order to prevent total annual fund operating expenses (excluding any 12b-1 fees, taxes, interest, short sale and dividend interest expenses, brokerage fees, certain insurance costs, acquired fund fees and expenses, and nonroutine expenses or costs, including, but not limited to, those relating to reorganizations, litigation, conducting shareholder meetings, and liquidations (collectively, nonroutine expenses)) from exceeding 1.15% of the Fund’s average daily net assets during the period from Nov. 1, 2013, through Oct. 31, 2014.* Please see the most recent prospectus and any applicable
supplement(s) for additional information on these fee waivers and/or reimbursements.
| Fund expense ratios | Class A | Class C | Class R | Institutional Class | ||||
Total annual operating expenses (without fee waivers) | 1.66% | 2.41% | 1.91% | 1.41% | ||||
Net expenses (including fee waivers, if any) | 1.40% | 2.15% | 1.65% | 1.15% | ||||
Type of waiver | Contractual | Contractual | Contractual | Contractual |
*The contractual waiver period is from Feb. 28, 2013, through Feb. 27, 2015.
5
Table of Contents
Performance summary
Delaware Global Real Estate Opportunities Fund
Performance of a $10,000 investment1
Average annual total returns from Jan. 10, 2007 (Fund’s inception), through Oct. 31, 2014
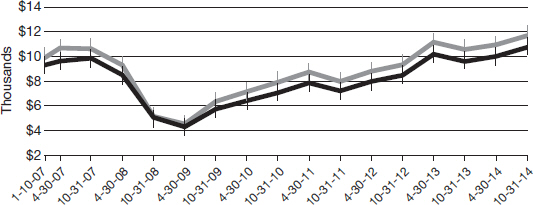
| For the period beginning Jan. 10, 2007 through Oct. 31, 2014 | Starting value | Ending value | ||||||||
| FTSE EPRA/NAREIT Developed Index | $10,000 | $11,832 | |||||||
| Delaware Global Real Estate Opportunities | ||||||||||
| Fund — Class A shares | $9,425 | $10,865 | ||||||||

1The Fund is the successor to The Global Real Estate Securities Portfolio, formerly a series of the Delaware Pooled® Trust, pursuant to the reorganization (Reorganization) of The Global Real Estate Securities Portfolio, which occurred on Sept. 28, 2012. Prior to the Reorganization, the Fund had no investment operations. Accordingly, the performance information shown in the graph is historical information for The Global Real Estate Securities Portfolio, which has been adjusted to reflect the Fund’s applicable sales charges and 12b-1 fees, but not certain other expenses. Because the Fund’s fees and expenses are higher than those of The Global Real Estate Securities Portfolio, the Fund’s performance would have been lower than that of The Global Real Estate Securities Portfolio.
The “Performance of a $10,000 investment” graph assumes $10,000 invested in Class A shares of the Fund on Jan. 10, 2007, and includes the effect
of a 5.75% front-end sales charge and the reinvestment of all distributions. The graph does not reflect the deduction of taxes the shareholders would pay on Fund distributions or redemptions of Fund shares. Expense limitations were in effect for some or all of the periods shown. Performance would have been lower had expense limitations not been in effect. Expenses are listed in the “Fund expense ratios” table on page 5. Please note additional details on pages 4 through 7.
The graph also assumes $10,000 invested in the FTSE EPRA/NAREIT Developed Index as of Jan. 10, 2007. The FTSE EPRA/NAREIT Developed Index tracks the performance of listed real estate companies and real estate investment trusts (REITs) worldwide, based in U.S. dollars.
Index performance returns do not reflect any management fees, transaction costs, or expenses. Indices are unmanaged and one cannot invest
6
Table of Contents
directly in an index. Past performance is not a
guarantee of future results.
Performance of other Fund classes will vary due to
different charges and expenses.
| Nasdaq symbols | CUSIPs | |||||||||
Class A | DGRPX | 245917653 | ||||||||
Class C | DLPCX | 245917646 | ||||||||
Class R | DLPRX | 245917638 | ||||||||
Institutional Class
| DGROX
| 245917620
| ||||||||
7
Table of Contents
For the six-month period from May 1, 2014 to October 31, 2014 (Unaudited)
As a shareholder of the Fund, you incur two types of costs: (1) transaction costs, including sales charges (loads) on purchase payments, reinvested dividends, or other distributions; redemption fees; and exchange fees; and (2) ongoing costs, including management fees; distribution and/or service (12b-1) fees; and other Fund expenses. This example is intended to help you understand your ongoing costs (in dollars) of investing in the Fund and to compare these costs with the ongoing costs of investing in other mutual funds.
The example is based on an investment of $1,000 invested at the beginning of the period and held for the entire six-month period from May 1, 2014 to Oct. 31, 2014.
Actual expenses
The first section of the table shown, “Actual Fund return,” provides information about actual account values and actual expenses. You may use the information in this section of the table, together with the amount you invested, to estimate the expenses that you paid over the period. Simply divide your account value by $1,000 (for example, an $8,600 account value divided by $1,000 = 8.6), then multiply the result by the number in the first section under the heading entitled “Expenses Paid During Period” to estimate the expenses you paid on your account during this period.
Hypothetical example for comparison purposes
The second section of the table shown, “Hypothetical 5% return,” provides information about hypothetical account values and hypothetical expenses based on the Fund’s actual expense ratio and an assumed rate of return of 5% per year before expenses, which is not the Fund’s actual return. The hypothetical account values and expenses may not be used to estimate the actual ending account balance or expenses you paid for the period. You may use this information to compare the ongoing costs of investing in the Fund and other funds. To do so, compare this 5% hypothetical example with the 5% hypothetical examples that appear in the shareholder reports of the other funds.
Please note that the expenses shown in the table are meant to highlight your ongoing costs only and do not reflect any transactional costs, such as sales charges (loads), redemption fees, or exchange fees. Therefore, the second section of the table is useful in comparing ongoing costs only, and will not help you determine the relative total costs of owning different funds. In addition, if these transactional costs were included, your costs would have been higher. The Fund’s expenses shown in the table reflect fee waivers in effect. The expenses shown in the table assume reinvestment of all dividends and distributions.
8
Table of Contents
Delaware Global Real Estate Opportunities Fund
Expense analysis of an investment of $1,000
| Beginning Account Value 5/1/14 | Ending 10/31/14 | Annualized Expense Ratio | Expenses Paid During Period 5/1/14 to 10/31/14* | |||||||||||||||||
Actual Fund return† | ||||||||||||||||||||
Class A | $ | 1,000.00 | $ | 1,072.00 | 1.40 | % | $ | 7.31 | ||||||||||||
Class C | 1,000.00 | 1,068.50 | 2.15 | % | 11.21 | |||||||||||||||
Class R | 1,000.00 | 1,069.00 | 1.65 | % | 8.60 | |||||||||||||||
Institutional Class | 1,000.00 | 1,071.90 | 1.15 | % | 6.01 | |||||||||||||||
Hypothetical 5% return (5% return before expenses) | ||||||||||||||||||||
Class A | $ | 1,000.00 | $ | 1,018.15 | 1.40 | % | $ | 7.12 | ||||||||||||
Class C | 1,000.00 | 1,014.37 | 2.15 | % | 10.92 | |||||||||||||||
Class R | 1,000.00 | 1,016.89 | 1.65 | % | 8.39 | |||||||||||||||
Institutional Class | 1,000.00 | 1,019.41 | 1.15 | % | 5.85 | |||||||||||||||
| * | “Expenses Paid During Period” are equal to the Fund’s annualized expense ratio, multiplied by the average account value over the period, multiplied by 184/365 (to reflect the one-half year period). |
| † | Because actual returns reflect only the most recent six-month period, the returns shown may differ significantly from fiscal year returns. |
9
Table of Contents
Security type / country and sector allocations
Delaware Global Real Estate Opportunities Fund | As of October 31, 2014 (Unaudited) |
Sector designations may be different than the sector designations presented in other fund materials. The sector designations may represent the investment manager’s internal sector classifications, which may result in the sector designations for one fund being different than another fund’s sector designations.
Security type / country | Percentage of net assets | |||
Convertible Bond | 1.07% | |||
Common Stock by Country | 94.81% | |||
Australia | 7.61% | |||
Canada | 3.33% | |||
China/Hong Kong | 6.59% | |||
Finland | 0.64% | |||
France | 2.32% | |||
Germany | 2.12% | |||
Italy | 0.60% | |||
Japan | 8.27% | |||
Mexico | 1.18% | |||
Singapore | 1.67% | |||
Sweden | 0.45% | |||
United Kingdom | 5.33% | |||
United States | 54.70% | |||
Warrant | 0.03% | |||
Short-Term Investments | 3.58% | |||
Total Value of Securities | 99.49% | |||
Receivables and Other Assets Net of Liabilities | 0.51% | |||
Total Net Assets | 100.00% |
10
Table of Contents
Convertible bond, common stock, and warrant by sector
| Percentage of net assets
| ||||
Diversified REITs | 12.41% | ||||
Healthcare REITs | 5.17% | ||||
Hotel REITs | 7.89% | ||||
Industrial REITs | 5.50% | ||||
Mall REITs | 7.82% | ||||
Multifamily REITs | 13.38% | ||||
Office REITs | 11.36% | ||||
Office/Industrial REITs | 6.37% | ||||
Real Estate Operating Companies/Developer | 10.25% | ||||
Retail REITs | 4.79% | ||||
Self-Storage REIT | 1.62% | ||||
Shopping Center REITs | 6.52% | ||||
Single Tenant REIT | 1.11% | ||||
Specialty REITs | 1.72% | ||||
Total | 95.91% | ||||
11
Table of Contents
Delaware Global Real Estate Opportunities Fund | October 31, 2014 |
| Principal amount° | Value (U.S. $) | |||||||
Convertible Bond – 1.07% | ||||||||
Forest City Enterprises 3.625% exercise price $24.21,expiration date 8/14/20 | 542,000 | $ | 575,875 | |||||
|
| |||||||
Total Convertible Bond (cost $590,489) | 575,875 | |||||||
|
| |||||||
| Number of shares | ||||||||
Common Stock – 94.81%D | ||||||||
Australia – 7.61% | ||||||||
Dexus Property Group † | 692,482 | 740,045 | ||||||
GPT Group-In Specie @=† | 1,377,200 | 0 | ||||||
Investa Office Fund | 166,342 | 524,767 | ||||||
Mirvac Group | 328,343 | 520,861 | ||||||
Scentre Group † | 415,233 | 1,324,418 | ||||||
Westfield | 140,160 | 984,792 | ||||||
|
| |||||||
| 4,094,883 | ||||||||
|
| |||||||
Canada – 3.33% | ||||||||
Allied Properties Real Estate Investment Trust | 19,700 | 621,682 | ||||||
Boardwalk Real Estate Investment Trust | 9,183 | 581,703 | ||||||
H&R Real Estate Investment Trust | 29,700 | 591,022 | ||||||
|
| |||||||
| 1,794,407 | ||||||||
|
| |||||||
China/Hong Kong – 6.59% | ||||||||
Hongkong Land Holdings | 96,000 | 669,496 | ||||||
Hysan Development | 129,072 | 588,925 | ||||||
Link REIT | 77,000 | 452,797 | ||||||
Sun Hung Kai Properties | 123,053 | 1,836,051 | ||||||
|
| |||||||
| 3,547,269 | ||||||||
|
| |||||||
Finland – 0.64% | ||||||||
Citycon | 106,739 | 345,811 | ||||||
|
| |||||||
| 345,811 | ||||||||
|
| |||||||
France – 2.32% | ||||||||
Klepierre | 13,466 | 582,811 | ||||||
Unibail-Rodamco | 2,585 | 662,787 | ||||||
|
| |||||||
| 1,245,598 | ||||||||
|
| |||||||
Germany – 2.12% | ||||||||
Alstria Office REIT | 33,145 | 411,480 | ||||||
Deutsche Annington Immobilien | 25,158 | 728,217 | ||||||
|
| |||||||
| 1,139,697 | ||||||||
|
| |||||||
Italy – 0.60% | ||||||||
Beni Stabili | 471,351 | 324,994 | ||||||
|
| |||||||
| 324,994 | ||||||||
|
| |||||||
Japan – 8.27% | ||||||||
GLP J-REIT | 540 | 612,971 | ||||||
12
Table of Contents
| Number of shares | Value (U.S. $) | |||||||
| ||||||||
Common StockD (continued) | ||||||||
| ||||||||
Japan (continued) | ||||||||
Kenedix Office Investment | 62 | $ | 331,657 | |||||
Mitsubishi Estate | 31,642 | 806,359 | ||||||
Mitsui Fudosan | 60,446 | 1,945,025 | ||||||
Mori Hills REIT Investment | 300 | 419,092 | ||||||
Sumitomo Realty & Development | 9,000 | 337,521 | ||||||
|
| |||||||
| 4,452,625 | ||||||||
|
| |||||||
Mexico – 1.18% | ||||||||
Concentradora Fibra Hotelera Mexicana | 145,031 | 243,944 | ||||||
Prologis Property Mexico † | 189,100 | 391,653 | ||||||
|
| |||||||
| 635,597 | ||||||||
|
| |||||||
Singapore – 1.67% | ||||||||
CapitaCommercial Trust | 276,000 | 358,862 | ||||||
Mapletree Commercial Trust | 165,694 | 184,361 | ||||||
Suntec Real Estate Investment Trust | 256,000 | 355,653 | ||||||
|
| |||||||
| 898,876 | ||||||||
|
| |||||||
Sweden – 0.45% | ||||||||
Castellum | 15,664 | 240,180 | ||||||
|
| |||||||
| 240,180 | ||||||||
|
| |||||||
United Kingdom – 5.33% | ||||||||
British Land | 112,134 | 1,309,356 | ||||||
Great Portland Estates | 57,861 | 636,821 | ||||||
Segro | 151,287 | 921,684 | ||||||
|
| |||||||
| 2,867,861 | ||||||||
|
| |||||||
United States – 54.70% | ||||||||
American Campus Communities | 17,081 | 670,771 | ||||||
American Residential Properties † | 16,404 | 311,676 | ||||||
Apartment Investment & Management | 15,977 | 571,817 | ||||||
AvalonBay Communities | 5,930 | 924,131 | ||||||
Boston Properties | 8,206 | 1,040,112 | ||||||
Brandywine Realty Trust | 17,426 | 268,883 | ||||||
Camden Property Trust | 7,043 | 539,987 | ||||||
CyrusOne | 12,300 | 335,913 | ||||||
DCT Industrial Trust | 70,595 | 604,999 | ||||||
DDR | 31,065 | 563,519 | ||||||
DiamondRock Hospitality | 39,276 | 563,611 | ||||||
Douglas Emmett | 12,673 | 356,492 | ||||||
Duke Realty | 39,799 | 754,589 | ||||||
Equity Commonwealth | 14,572 | 389,218 | ||||||
Equity Residential | 16,968 | 1,180,294 | ||||||
Essex Property Trust | 2,159 | 435,600 | ||||||
First Industrial Realty Trust | 10,238 | 199,948 | ||||||
13
Table of Contents
Schedule of investments
Delaware Global Real Estate Opportunities Fund
| Number of shares | Value (U.S. $) | |||||||
| ||||||||
Common StockD (continued) | ||||||||
| ||||||||
United States (continued) | ||||||||
General Growth Properties | 31,239 | $ | 809,402 | |||||
Gramercy Property Trust | 77,647 | 485,294 | ||||||
Health Care REIT | 22,878 | 1,626,855 | ||||||
Healthcare Realty Trust | 10,098 | 267,294 | ||||||
Healthcare Trust of America Class A | 27,932 | 358,647 | ||||||
Highwoods Properties | 16,701 | 715,972 | ||||||
Host Hotels & Resorts | 55,241 | 1,287,668 | ||||||
Kilroy Realty | 7,945 | 538,194 | ||||||
Kimco Realty | 14,512 | 362,074 | ||||||
Kite Realty Group Trust | 15,379 | 398,162 | ||||||
Pebblebrook Hotel Trust | 14,162 | 603,301 | ||||||
Post Properties | 8,431 | 471,630 | ||||||
Prologis | 20,160 | 839,664 | ||||||
PS Business Parks | 5,496 | 462,873 | ||||||
Public Storage | 4,734 | 872,666 | ||||||
Ramco-Gershenson Properties Trust | 20,060 | 350,649 | ||||||
Regency Centers | 8,450 | 512,915 | ||||||
RLJ Lodging Trust | 20,316 | 654,582 | ||||||
Simon Property Group | 15,802 | 2,831,876 | ||||||
SL Green Realty | 3,630 | 419,991 | ||||||
Spirit Realty Capital | 50,383 | 599,558 | ||||||
Starwood Hotels & Resorts Worldwide | 3,767 | 288,778 | ||||||
Strategic Hotels & Resorts † | 46,893 | 602,575 | ||||||
Taubman Centers | 7,420 | 564,291 | ||||||
UDR | 36,268 | 1,096,382 | ||||||
Ventas | 7,751 | 531,021 | ||||||
Vornado Realty Trust | 6,739 | 737,786 | ||||||
Washington Real Estate Investment Trust | 15,226 | 430,287 | ||||||
|
| |||||||
| 29,431,947 | ||||||||
|
| |||||||
Total Common Stock (cost $45,703,371) | 51,019,745 | |||||||
| ||||||||
Warrant – 0.03%D | ||||||||
| ||||||||
Hong Kong – 0.03% | ||||||||
Sun Hung Kai Properties CW16 strike price HKD98.60,expiration date 4/22/16 † | 6,671 | 14,486 | ||||||
|
| |||||||
Total Warrant (cost $4,946) | 14,486 | |||||||
|
| |||||||
14
Table of Contents
| Principal amount° | Value (U.S. $) | |||||||
Short-Term Investments – 3.58% | ||||||||
Discount Notes – 1.80%≠ | ||||||||
Federal Home Loan Bank | ||||||||
0.025% 11/13/14 | 103,031 | $ | 103,031 | |||||
0.041% 11/19/14 | 479,295 | 479,292 | ||||||
0.077% 11/14/14 | 388,012 | 388,011 | ||||||
|
| |||||||
| 970,334 | ||||||||
|
| |||||||
Repurchase Agreements – 0.77% | ||||||||
Bank of America Merrill Lynch | ||||||||
0.06%, dated 10/31/14, to be repurchased on 11/3/14, repurchase price $131,082 (collateralized by U.S. government obligations 0.00%–2.75% 2/15/19–1/15/26 market value $133,703) | 131,081 | 131,081 | ||||||
Bank of Montreal | ||||||||
0.07%, dated 10/31/14, to be repurchased on 11/3/14, repurchase price $21,847 (collateralized by U.S. government obligations 0.00%–11.25% 10/31/14–5/15/44 market value $22,284) | 21,847 | 21,847 | ||||||
BNP Paribas | ||||||||
0.11%, dated 10/31/14, to be repurchased on 11/3/14, repurchase price $258,074 (collateralized by U.S. government obligations 0.00%–4.375% 8/31/15–11/15/42 market value $263,234) | 258,072 | 258,072 | ||||||
|
| |||||||
| 411,000 | ||||||||
|
| |||||||
U.S. Treasury Obligations – 1.01%≠ | ||||||||
U.S. Treasury Bills | ||||||||
0.005% 12/26/14 | 425,260 | 425,253 | ||||||
0.093% 11/13/14 | 119,490 | 119,490 | ||||||
|
| |||||||
| 544,743 | ||||||||
|
| |||||||
Total Short-Term Investments (cost $1,926,060) | 1,926,077 | |||||||
|
| |||||||
Total Value of Securities – 99.49% | $ | 53,536,183 | ||||||
|
| |||||||
| @ | Illiquid security. At Oct. 31, 2014, the aggregate value of illiquid securities was $0, which represents 0.00% of the Fund’s net assets. See Note 11 in “Notes to financial statements.” |
| = | Security is being fair valued in accordance with the Fund’s fair valuation policy. At Oct. 31, 2014, the aggregate value of fair valued securities was $0, which represents 0.00% of the Fund’s net assets. See Note 1 in “Notes to financial statements.” |
| ≠ | The rate shown is the effective yield at the time of purchase. |
| ° | Principal amount shown is stated in U.S. dollars unless noted that the security is denominated in another currency. |
| † | Non-income-producing security. |
15
Table of Contents
Schedule of investments
Delaware Global Real Estate Opportunities Fund
| D | Securities have been classified by country of origin. Aggregate classification by business sectors has been presented on page 11 in “Security type / country and sector allocations.” |
The following foreign currency exchange contracts were outstanding at Oct. 31, 2014:1
Foreign Currency Exchange Contracts
Counterparty | Contracts to Receive (Deliver) | In Exchange For | Settlement Date | Unrealized Appreciation (Depreciation) | ||||||||||||||||||
BNYM | JPY | 19,396,319 | USD | (177,851 | ) | 11/5/14 | $ | (5,103 | ) | |||||||||||||
BNYM | JPY | (7,847,269 | ) | USD | 69,806 | 11/6/14 | (85 | ) | ||||||||||||||
BNYM | SGD | (22,714 | ) | USD | 17,630 | 11/5/14 | (49 | ) | ||||||||||||||
|
| |||||||||||||||||||||
| $ | (5,237 | ) | ||||||||||||||||||||
|
| |||||||||||||||||||||
The use of foreign currency exchange contracts involves elements of market risk and risks in excess of the amounts disclosed in the financial statements. The foreign currency exchange contracts presented above represent the Fund’s total exposure in such contracts, whereas only the net unrealized appreciation (depreciation) is reflected in the Fund’s net assets.
1See Note 9 in “Notes to financial statements.”
Summary of abbreviations:
BNYM – BNY Mellon
HKD – Hong Kong Dollar
JPY – Japanese Yen
REIT – Real Estate Investment Trust
SGD – Singapore Dollar
USD – United States Dollar
See accompanying notes, which are an integral part of the financial statements.
16
Table of Contents
Statement of assets and liabilities
Delaware Global Real Estate Opportunities Fund | October 31, 2014 |
Assets: | ||||
Investments, at value1 | $ | 51,610,106 | ||
Short-term investments, at value2 | 1,926,077 | |||
Foreign currencies, at value3 | 81,759 | |||
Cash | 20,374 | |||
Receivable for securities sold | 573,475 | |||
Receivable for fund shares sold | 94,151 | |||
Dividends and interest receivable | 71,173 | |||
Receivable from investment manager | 10,932 | |||
|
| |||
Total assets | 54,388,047 | |||
|
| |||
Liabilities: | ||||
Payable for securities purchased | 427,680 | |||
Payable for fund shares redeemed | 69,450 | |||
Other accrued expenses | 70,715 | |||
Distribution fees payable to affiliates | 3,056 | |||
Other affiliates payable | 2,277 | |||
Trustees’ fees and expenses payable | 119 | |||
Unrealized loss on foreign currency exchange contracts | 5,237 | |||
|
| |||
Total liabilities | 578,534 | |||
|
| |||
Total Net Assets | $ | 53,809,513 | ||
|
| |||
Net Assets Consist of: | ||||
Paid-in capital | $ | 143,783,784 | ||
Undistributed net investment income | 157,227 | |||
Accumulated net realized loss on investments | (95,438,997 | ) | ||
Net unrealized appreciation of investments, foreign currencies, and derivatives | 5,307,499 | |||
|
| |||
Total Net Assets | $ | 53,809,513 | ||
|
| |||
17
Table of Contents
Statement of assets and liabilities
Delaware Global Real Estate Opportunities Fund
Net Asset Value | ||||
Class A: | ||||
Net assets | $ | 6,570,555 | ||
Shares of beneficial interest outstanding, unlimited authorization, no par | 912,546 | |||
Net asset value per share | $ | 7.20 | ||
Sales charge | 5.75 | % | ||
Offering price per share, equal to net asset value per share / (1 – sales charge) | $ | 7.64 | ||
Class C: | ||||
Net assets | $ | 2,118,819 | ||
Shares of beneficial interest outstanding, unlimited authorization, no par | 294,865 | |||
Net asset value per share | $ | 7.19 | ||
Class R: | ||||
Net assets | $ | 120,705 | ||
Shares of beneficial interest outstanding, unlimited authorization, no par | 16,783 | |||
Net asset value per share | $ | 7.19 | ||
Institutional Class: | ||||
Net assets | $ | 44,999,434 | ||
Shares of beneficial interest outstanding, unlimited authorization, no par | 6,254,706 | |||
Net asset value per share | $ | 7.19 | ||
1 Investments, at cost | $ | 46,298,806 | ||
| 2 Short-term investments, at cost | 1,926,060 | |||
| 3 Foreign currencies, at cost | 81,867 | |||
See accompanying notes, which are an integral part of the financial statements.
18
Table of Contents
| Statement of operations | ||
Delaware Global Real Estate Opportunities Fund | Year ended October 31, 2014 |
Investment Income: | ||||
Dividends | $ | 1,625,212 | ||
Interest | 52,436 | |||
Foreign tax withheld | (63,942 | ) | ||
|
| |||
| 1,613,706 | ||||
|
| |||
Expenses: | ||||
Management fees | 512,017 | |||
Distribution expenses – Class A | 15,202 | |||
Distribution expenses – Class C | 14,346 | |||
Distribution expenses – Class R | 322 | |||
Registration fees | 116,011 | |||
Audit and tax | 44,993 | |||
Dividend disbursing and transfer agent fees and expenses | 33,037 | |||
Reports and statements to shareholders | 27,200 | |||
Custodian fees | 19,125 | |||
Accounting and administration expenses | 17,735 | |||
Legal fees | 4,401 | |||
Trustees’ fees and expenses | 2,485 | |||
Other | 14,892 | |||
|
| |||
| 821,766 | ||||
Less expenses waived | (196,827 | ) | ||
Less expense paid indirectly | (14 | ) | ||
|
| |||
Total operating expenses | 624,925 | |||
|
| |||
Net Investment Income | 988,781 | |||
|
| |||
Net Realized and Unrealized Gain (Loss): | ||||
Net realized gain (loss) on: | ||||
Investments | 2,714,693 | |||
Foreign currencies | 11,796 | |||
Foreign currency exchange contracts | (82,233 | ) | ||
|
| |||
Net realized gain | 2,644,256 | |||
|
| |||
Net change in unrealized appreciation (depreciation) of: | ||||
Investments | 2,174,309 | |||
Foreign currencies | 902 | |||
Foreign currency exchange contracts | (4,793 | ) | ||
|
| |||
Net change in unrealized appreciation (depreciation) | 2,170,418 | |||
|
| |||
Net Realized and Unrealized Gain | 4,814,674 | |||
|
| |||
Net Increase in Net Assets Resulting from Operations | $ | 5,803,455 | ||
|
| |||
See accompanying notes, which are an integral part of the financial statements.
19
Table of Contents
Statements of changes in net assets
Delaware Global Real Estate Opportunities Fund
| Year ended | ||||||||
| 10/31/14 | 10/31/13 | |||||||
Increase (Decrease) in Net Assets from Operations: | ||||||||
Net investment income | $ | 988,781 | $ | 947,006 | ||||
Net realized gain | 2,644,256 | 10,725,716 | ||||||
Net change in unrealized appreciation (depreciation) | 2,170,418 | (2,088,740 | ) | |||||
|
|
|
| |||||
Net increase in net assets resulting from operations | 5,803,455 | 9,583,982 | ||||||
|
|
|
| |||||
Dividends and Distributions to Shareholders from: | ||||||||
Net investment income: | ||||||||
Class A | (159,306 | ) | (43,533 | ) | ||||
Class C | (22,045 | ) | (1,019 | ) | ||||
Class R | (963 | ) | (200 | ) | ||||
Institutional Class | (1,562,972 | ) | (2,409,597 | ) | ||||
|
|
|
| |||||
| (1,745,286 | ) | (2,454,349 | ) | |||||
|
|
|
| |||||
Capital Share Transactions: | ||||||||
Proceeds from shares sold: | ||||||||
Class A | 6,540,240 | 4,848,064 | ||||||
Class C | 1,589,505 | 533,552 | ||||||
Class R | 89,526 | 16,130 | ||||||
Institutional Class | 13,834,067 | 5,978,853 | ||||||
Net asset value of shares issued upon reinvestment of dividends and distributions: | ||||||||
Class A | 151,317 | 36,689 | ||||||
Class C | 21,387 | 1,018 | ||||||
Class R | 963 | 199 | ||||||
Institutional Class | 287,571 | 1,994,281 | ||||||
|
|
|
| |||||
| 22,514,576 | 13,408,786 | |||||||
|
|
|
| |||||
20
Table of Contents
| Year ended | ||||||||
| 10/31/14 | 10/31/13 | |||||||
Capital Share Transactions (continued): | ||||||||
Cost of shares redeemed: | ||||||||
Class A | $ | (5,097,137 | ) | $ | (1,049,483 | ) | ||
Class C | (219,233 | ) | (3,384 | ) | ||||
Class R | (703 | ) | — | |||||
Institutional Class | (21,673,279 | ) | (42,013,438 | ) | ||||
|
|
|
| |||||
| (26,990,352 | ) | (43,066,305 | ) | |||||
|
|
|
| |||||
Decrease in net assets derived from capital share transactions | (4,475,776 | ) | (29,657,519 | ) | ||||
|
|
|
| |||||
Net Decrease in Net Assets | (417,607 | ) | (22,527,886 | ) | ||||
Net Assets: | ||||||||
Beginning of year | 54,227,120 | 76,755,006 | ||||||
|
|
|
| |||||
End of year | $ | 53,809,513 | $ | 54,227,120 | ||||
|
|
|
| |||||
Undistributed net investment income | $ | 157,227 | $ | 563,988 | ||||
|
|
|
| |||||
See accompanying notes, which are an integral part of the financial statements.
21
Table of Contents
Delaware Global Real Estate Opportunities Fund Class A1
Selected data for each share of the Fund outstanding throughout each period were as follows:
Net asset value, beginning of period |
Income (loss) from investment operations: |
Net investment income2 |
Net realized and unrealized gain (loss) |
Total from investment operations |
Less dividends and distributions from: |
Net investment income |
Total dividends and distributions |
Net asset value, end of period |
Total return3 |
Ratios and supplemental data: |
Net assets, end of period (000 omitted) |
Ratio of expenses to average net assets |
Ratio of expenses to average net assets prior to fees waived |
Ratio of net investment income to average net assets |
Ratio of net investment income to average net assets prior to fees waived |
Portfolio turnover |
| 1 | The Fund is the successor to The Global Real Estate Securities Portfolio, formerly a series of the Delaware Pooled® Trust, pursuant to the reorganization (Reorganization) of The Global Real Estate Securities Portfolio which occurred after the close of business on Sept. 28, 2012. Prior to the Reorganization, the Fund had no investment operations. The information shown for 2012 and earlier is historical information for The Global Real Estate Securities Portfolio. Because the Fund’s fees and expenses are higher than those of The Global Real Estate Securities Portfolio, the Fund’s performance would have been lower than that of The Global Real Estate Securities Portfolio. |
| 2 | The average shares outstanding method has been applied for per share information. |
| 3 | Total investment return is based on the change in net asset value of a share during the period and assumes reinvestment of dividends and distributions at net asset value and does not reflect the impact of a sales charge. Total investment return during some of the periods shown reflects a waiver by the manager. Performance would have been lower had the waiver not been in effect. |
See accompanying notes, which are an integral part of the financial statements.
22
Table of Contents
| Year ended | ||||||||||||||||||||
| 10/31/14 | 10/31/13 | 10/31/12 | 10/31/11 | 10/31/10 | ||||||||||||||||
| ||||||||||||||||||||
| $ | 6.650 | $ | 6.060 | $ | 5.370 | $ | 5.780 | $ | 5.040 | |||||||||||
| 0.116 | 0.079 | 0.103 | 0.148 | 0.129 | ||||||||||||||||
| 0.642 | 0.696 | 0.799 | (0.069 | ) | 0.973 | |||||||||||||||
|
|
|
|
|
|
|
|
|
| |||||||||||
| 0.758 | 0.775 | 0.902 | 0.079 | 1.102 | ||||||||||||||||
|
|
|
|
|
|
|
|
|
| |||||||||||
| (0.208 | ) | (0.185 | ) | (0.212 | ) | (0.489 | ) | (0.362 | ) | |||||||||||
|
|
|
|
|
|
|
|
|
| |||||||||||
| (0.208 | ) | (0.185 | ) | (0.212 | ) | (0.489 | ) | (0.362 | ) | |||||||||||
|
|
|
|
|
|
|
|
|
| |||||||||||
| $ | 7.200 | $ | 6.650 | $ | 6.060 | $ | 5.370 | $ | 5.780 | |||||||||||
|
|
|
|
|
|
|
|
|
| |||||||||||
| 11.80% | 13.11% | 17.79% | 1.68% | 23.26% | ||||||||||||||||
| $ | 6,571 | $ | 4,340 | $ | 297 | $ | 8 | $ | 8 | |||||||||||
| 1.40% | 1.40% | 1.38% | 1.39% | 1.50% | ||||||||||||||||
| 1.78% | 1.66% | 1.52% | 1.49% | 1.50% | ||||||||||||||||
| 1.72% | 1.21% | 1.65% | 2.69% | 2.52% | ||||||||||||||||
| 1.34% | 0.95% | 1.51% | 2.59% | 2.52% | ||||||||||||||||
| 107% | 112% | 128% | 155% | 185% | ||||||||||||||||
| ||||||||||||||||||||
23
Table of Contents
Financial highlights
Delaware Global Real Estate Opportunities Fund Class C
Selected data for each share of the Fund outstanding throughout each period were as follows:
Net asset value, beginning of period |
Income (loss) from investment operations: |
Net investment income (loss)2 |
Net realized and unrealized gain |
Total from investment operations |
Less dividends and distributions from: |
Net investment income |
Total dividends and distributions |
Net asset value, end of period |
Total return3 |
Ratios and supplemental data: |
Net assets, end of period (000 omitted) |
Ratio of expenses to average net assets |
Ratio of expenses to average net assets prior to fees waived |
Ratio of net investment income (loss) to average net assets |
Ratio of net investment income (loss) to average net assets prior to fees waived |
Portfolio turnover |
| 1 | Date of commencement of operations; ratios have been annualized and total return has not been annualized. |
| 2 | The average shares outstanding method has been applied for per share information. |
| 3 | Total investment return is based on the change in net asset value of a share during the period and assumes reinvestment of dividends and distributions at net asset value and does not reflect the impact of a sales charge. Total investment return during all of the periods shown reflects a waiver by the manager. Performance would have been lower had the waiver not been in effect. |
| 4 | Portfolio turnover is representative of the Fund for the entire annual period. |
See accompanying notes, which are an integral part of the financial statements.
24
Table of Contents
| Year ended |
|
| 10/1/121 to 10/31/12 |
| |||||||||||
| 10/31/14 | 10/31/13 | |||||||||||||||
|
| |||||||||||||||
| $ 6.640 | $ | 6.060 | $ | 5.960 | ||||||||||||
| 0.066 | 0.030 | (0.005 | ) | |||||||||||||
| 0.637 | 0.705 | 0.105 | ||||||||||||||
|
|
|
|
|
| |||||||||||
| 0.703 | 0.735 | 0.100 | ||||||||||||||
|
|
|
|
|
| |||||||||||
| (0.153) | (0.155 | ) | — | |||||||||||||
|
|
|
|
|
| |||||||||||
| (0.153) | (0.155 | ) | — | |||||||||||||
|
|
|
|
|
| |||||||||||
| $ 7.190 | $ | 6.640 | $ | 6.060 | ||||||||||||
|
|
|
|
|
| |||||||||||
| 11.06% | 12.23% | 1.68% | ||||||||||||||
| $ 2,119 | $ | 572 | $ | 25 | ||||||||||||
| 2.15% | 2.15% | 2.15% | ||||||||||||||
| 2.53% | 2.41% | 2.52% | ||||||||||||||
| 0.97% | 0.46% | (0.93% | ) | |||||||||||||
| 0.59% | 0.20% | (1.30% | ) | |||||||||||||
| 107% | 112% | 128%4 | ||||||||||||||
|
| |||||||||||||||
25
Table of Contents
Financial highlights
Delaware Global Real Estate Opportunities Fund Class R
Selected data for each share of the Fund outstanding throughout each period were as follows:
Net asset value, beginning of period |
Income (loss) from investment operations: |
Net investment income (loss)2 |
Net realized and unrealized gain |
Total from investment operations |
Less dividends and distributions from: |
Net investment income |
Total dividends and distributions |
Net asset value, end of period |
Total return3 |
Ratios and supplemental data: |
Net assets, end of period (000 omitted) |
Ratio of expenses to average net assets |
Ratio of expenses to average net assets prior to fees waived |
Ratio of net investment income (loss) to average net assets |
Ratio of net investment income (loss) to average net assets prior to fees waived |
Portfolio turnover |
| 1 | Date of commencement of operations; ratios have been annualized and total return has not been annualized. |
| 2 | The average shares outstanding method has been applied for per share information. |
| 3 | Total investment return is based on the change in net asset value of a share during the period and assumes reinvestment of dividends and distributions at net asset value. Total investment return during some of the periods shown reflects waivers by the manager and/or distributor. Performance would have been lower had the waivers not been in effect. |
| 4 | Portfolio turnover is representative of the Fund for the entire annual period. |
See accompanying notes, which are an integral part of the financial statements.
26
Table of Contents
| Year ended | 10/1/121 to | |||||||||||||||
|
| |||||||||||||||
| 10/31/14 | 10/31/13 | 10/31/12 | ||||||||||||||
| $ | 6.640 | $ | 6.060 | $ | 5.960 | |||||||||||
| 0.101 | 0.062 | (0.002 | ) | |||||||||||||
| 0.637 | 0.699 | 0.102 | ||||||||||||||
|
|
|
|
|
| |||||||||||
| 0.738 | 0.761 | 0.100 | ||||||||||||||
|
|
|
|
|
| |||||||||||
| (0.188 | ) | (0.181 | ) | — | ||||||||||||
|
|
|
|
|
| |||||||||||
| (0.188 | ) | (0.181 | ) | — | ||||||||||||
|
|
|
|
|
| |||||||||||
| $ | 7.190 | $ | 6.640 | $ | 6.060 | |||||||||||
|
|
|
|
|
| |||||||||||
| 11.48% | 12.87% | 1.68% | ||||||||||||||
| $ | 121 | $ | 24 | $ | 7 | |||||||||||
| 1.65% | 1.65% | 1.65% | ||||||||||||||
| 2.03% | 2.00% | 2.12% | ||||||||||||||
| 1.47% | 0.96% | (0.43% | ) | |||||||||||||
| 1.09% | 0.61% | (0.90% | ) | |||||||||||||
|
| 107%
|
|
| 112%
|
|
| 128%
| 4
| ||||||||
27
Table of Contents
Financial highlights
Delaware Global Real Estate Opportunities Fund Institutional Class1
Selected data for each share of the Fund outstanding throughout each period were as follows:
Net asset value, beginning of period |
Income (loss) from investment operations: |
Net investment income2 |
Net realized and unrealized gain (loss) |
Total from investment operations |
Less dividends and distributions from: |
Net investment income |
Total dividends and distributions |
Net asset value, end of period |
Total return3 |
Ratios and supplemental data: |
Net assets, end of period (000 omitted) |
Ratio of expenses to average net assets |
Ratio of expenses to average net assets prior to fees waived |
Ratio of net investment income to average net assets |
Ratio of net investment income to average net assets prior to fees waived |
Portfolio turnover |
| 1 | The Fund is the successor to The Global Real Estate Securities Portfolio, formerly a series of the Delaware Pooled® Trust, pursuant to the reorganization (Reorganization) of The Global Real Estate Securities Portfolio which occurred after the close of business on Sept. 28, 2012. Prior to the Reorganization, the Fund had no investment operations. The information shown for 2012 and earlier is historical information for The Global Real Estate Securities Portfolio. Because the Fund’s fees and expenses are higher than those of The Global Real Estate Securities Portfolio, the Fund’s performance would have been lower than that of The Global Real Estate Securities Portfolio. |
| 2 | The average shares outstanding method has been applied for per share information. |
| 3 | Total investment return is based on the change in net asset value of a share during the period and assumes reinvestment of dividends and distributions at net asset value. Total investment return during some of the periods shown reflects a waiver by the manager. Performance would have been lower had the waiver not been in effect. |
See accompanying notes, which are an integral part of the financial statements.
28
Table of Contents
| Year ended | ||||||||||||||||||||||
| 10/31/14 | 10/31/13 | 10/31/12 | 10/31/11 | 10/31/10 | ||||||||||||||||||
| ||||||||||||||||||||||
| $ | 6.650 | $ | 6.060 | $ | 5.390 | $ | 5.790 | $ | 5.050 | |||||||||||||
| 0.132 | 0.094 | 0.105 | 0.163 | 0.142 | ||||||||||||||||||
| 0.633 | 0.707 | 0.791 | (0.061 | ) | 0.971 | |||||||||||||||||
|
|
|
|
|
|
|
|
|
| |||||||||||||
| 0.765 | 0.801 | 0.896 | 0.102 | 1.113 | ||||||||||||||||||
|
|
|
|
|
|
|
|
|
| |||||||||||||
| (0.225 | ) | (0.211 | ) | (0.226 | ) | (0.502 | ) | (0.373 | ) | |||||||||||||
|
|
|
|
|
|
|
|
|
| |||||||||||||
| (0.225 | ) | (0.211 | ) | (0.226 | ) | (0.502 | ) | (0.373 | ) | |||||||||||||
|
|
|
|
|
|
|
|
|
| |||||||||||||
| $ | 7.190 | $ | 6.650 | $ | 6.060 | $ | 5.390 | $ | 5.790 | |||||||||||||
|
|
|
|
|
|
|
|
|
| |||||||||||||
| 11.93% | 13.58% | 17.68% | 2.10% | 23.49% | ||||||||||||||||||
| $ | 44,999 | $ | 49,291 | $ | 76,426 | $ | 49,359 | $ | 60,307 | |||||||||||||
| 1.15% | 1.15% | 1.13% | 1.14% | 1.25% | ||||||||||||||||||
| 1.53% | 1.41% | 1.27% | 1.24% | 1.25% | ||||||||||||||||||
| 1.97% | 1.46% | 1.90% | 2.94% | 2.77% | ||||||||||||||||||
| 1.59% | 1.20% | 1.76% | 2.84% | 2.77% | ||||||||||||||||||
| 107% | 112% | 128% | 155% | 185% | ||||||||||||||||||
| ||||||||||||||||||||||
29
Table of Contents
Delaware Global Real Estate Opportunities Fund | October 31, 2014 |
Delaware Group® Adviser Funds (Trust) is organized as a Delaware statutory trust and offers three series: Delaware Diversified Income Fund, Delaware Global Real Estate Opportunities Fund, and Delaware U.S. Growth Fund. These financial statements and related notes pertain to Delaware Global Real Estate Opportunities Fund (Fund). The Trust is an open-end investment company. The Fund is considered non-diversified under the Investment Company Act of 1940, as amended, and offers Class A, Class C, Class R, and Institutional Class shares. Class A shares are sold with a maximum front-end sales charge of 5.75%. Class A share purchases of $1,000,000 or more will incur a contingent deferred sales charge (CDSC) of 1.00% if redeemed during the first year and 0.50% during the second year, provided that Delaware Distributors, L.P. (DDLP) paid a financial advisor a commission on the purchase of those shares. Class C shares are sold with a CDSC of 1.00%, if redeemed during the first 12 months. Class R and Institutional Class shares are not subject to a sales charge and are offered for sale exclusively to certain eligible investors.
The investment objective of the Fund is to seek maximum long-term total return through a combination of current income and capital appreciation.
1. Significant Accounting Policies
The following accounting policies are in accordance with U.S. generally accepted accounting principles (U.S. GAAP) and are consistently followed by the Fund.
Security Valuation – Equity securities, except those traded on the Nasdaq Stock Market, Inc. (Nasdaq), are valued at the last quoted sales price as of the time of the regular close of the New York Stock Exchange on the valuation date. Securities traded on the Nasdaq are valued in accordance with the Nasdaq Official Closing Price, which may not be the last sales price. If, on a particular day, an equity security does not trade, then the mean between the bid and ask prices will be used, which approximates fair value. Securities listed on a foreign exchange are normally valued at the last quoted sales price on the valuation date. U.S. government and agency securities are valued at the mean between the bid and ask prices, which approximates fair value. Foreign currency exchange contracts and foreign cross currency exchange contracts are valued at the mean between the bid and ask prices, which approximates fair value. Interpolated values are derived when the settlement date of the contract is an interim date for which quotations are not available. Generally, other securities and assets for which market quotations are not readily available are valued at fair value as determined in good faith under the direction of the Fund’s Board of Trustees (Board). In determining whether market quotations are readily available or fair valuation will be used, various factors will be taken into consideration, such as market closures or suspension of trading in a security. The Fund may use fair value pricing more frequently for securities traded primarily in non-U.S. markets because, among other things, most foreign markets close well before the Fund values its securities, generally as of 4:00 p.m. Eastern time. The earlier close of these foreign markets gives rise to the possibility that significant events, including broad market moves, government actions or pronouncements, aftermarket trading, or news events may have occurred in the interim. To account for this, the Fund may frequently value foreign securities using fair value prices based on third-party vendor modeling tools (international fair value pricing).
Federal and Foreign Income Taxes – No provision for federal income taxes has been made as the Fund intends to continue to qualify for federal income tax purposes as a regulated investment company under Subchapter M of the Internal Revenue Code of 1986, as amended, and make the requisite
30
Table of Contents
distributions to shareholders. The Fund evaluates tax positions taken or expected to be taken in the course of preparing the Fund’s tax returns to determine whether the tax positions are “more-likely -than-not” of being sustained by the applicable tax authority. Tax positions not deemed to meet the “more-likely-than-not” threshold are recorded as a tax benefit or expense in the current year. Management has analyzed the Fund’s tax positions taken for all open federal income tax years (Oct. 31, 2011–Oct. 31, 2014), and has concluded that no provision for federal income tax is required in the Fund’s financial statements. In regard to foreign taxes only, the Fund has open tax years in certain foreign countries it invests in that may date back to the inception of the Fund.
Class Accounting – Investment income, common expenses, and realized and unrealized gain (loss) on investments are allocated to the various classes of the Fund on the basis of daily net assets of each class. Distribution expenses relating to a specific class are charged directly to that class.
Repurchase Agreements – The Fund may purchase certain U.S. government securities subject to the counterparty’s agreement to repurchase them at an agreed upon date and price. The counterparty will be required on a daily basis to maintain the value of the collateral subject to the agreement at not less than the repurchase price (including accrued interest). The agreements are conditioned upon the collateral being deposited under the Federal Reserve book-entry system with the Fund’s custodian or a third-party sub-custodian. In the event of default or bankruptcy by the other party to the agreement, retention of the collateral may be subject to legal proceedings. All open repurchase agreements as of the date of this report were entered into on Oct. 31, 2014.
Foreign Currency Transactions – Transactions denominated in foreign currencies are recorded at the prevailing exchange rates on the valuation date in accordance with the Fund’s prospectus. The value of all assets and liabilities denominated in foreign currencies is translated daily into U.S. dollars at the exchange rate of such currencies against the U.S. dollar. Transaction gains or losses resulting from changes in exchange rates during the reporting period or upon settlement of the foreign currency transaction are reported in operations for the current period. The Fund generally does not bifurcate that portion of realized gains and losses on investments which is due to changes in foreign exchange rates from that which is due to changes in market prices. The changes are included with the net realized and unrealized gain or loss on investments. The Fund reports certain foreign currency related transactions as components of realized gains (losses) for financial reporting purposes, whereas such components are treated as ordinary income (loss) for federal income tax purposes.
Use of Estimates – The preparation of financial statements in conformity with U.S. GAAP requires management to make estimates and assumptions that affect the fair value of investments, the reported amounts of assets and liabilities and disclosure of contingent assets and liabilities at the date of the financial statements, and the reported amounts of revenues and expenses during the reporting period. Actual results could differ from those estimates and the differences could be material.
Other – Expenses directly attributable to the Fund are charged directly to the Fund. Other expenses common to various funds within the Delaware Investments® Family of Funds are generally allocated among such funds on the basis of average net assets. Management fees and some other expenses are paid monthly. Security transactions are recorded on the date the securities are purchased or sold (trade date) for financial reporting purposes. Costs used in calculating realized gains and losses on the sale of
31
Table of Contents
Notes to financial statements
Delaware Global Real Estate Opportunities Fund
1. Significant Accounting Policies (continued)
investment securities are those of the specific securities sold. Dividend income is recorded on the ex-dividend date and interest income is recorded on the accrual basis. Distributions received from investments in real estate investment trusts (REITs) are recorded as dividend income on the ex-dividend date, subject to reclassification upon notice of the character of such distributions by the issuer. The financial statements reflect an estimate of the reclassification of the distribution character. Foreign dividends are also recorded on the ex-dividend date or as soon after the ex-dividend date that the Fund is aware of such dividends, net of all tax withholdings, a portion of which may be reclaimable. Withholding taxes and reclaims on foreign dividends have been recorded in accordance with the Fund’s understanding of the applicable country’s tax rules and rates. The Fund declares and pays dividends from net investment income quarterly and distributions from net realized gain on investments, if any, annually. The Fund may distribute more frequently, if necessary for tax purposes. Dividends and distributions, if any, are recorded on the ex-dividend date.
The Fund may receive earnings credits from its custodian when positive cash balances are maintained, which may be used to offset custody fees. There were no earnings credits for the year ended Oct. 31, 2014.
The Fund receives earnings credits from its transfer agent when positive cash balances are maintained, which may be used to offset transfer agent fees. If the amount earned is greater than one dollar, the expense paid under this arrangement is included on the “Statement of operations” under “Dividend disbursing and transfer agent fees and expenses” with the corresponding expense offset shown under “Less expense paid indirectly.” For the year ended Oct. 31, 2014, the Fund earned $14 under the agreement.
2. Investment Management, Administration Agreements and Other Transactions with Affiliates
In accordance with the terms of its investment management agreement, the Fund pays Delaware Management Company (DMC), a series of Delaware Management Business Trust and the investment manager, an annual fee which is calculated daily at the rate of 0.99% on the first $100 million of the average daily net assets of the Fund, 0.90% on the next $150 million, and 0.80% on average daily net assets in excess of $250 million.
DMC has contractually agreed to waive that portion if any, of its management fee and reimburse the Fund to the extent necessary to ensure that total annual fund operating expenses (excluding any 12b-1 fees, taxes, interest, short sale and dividend interest expenses, brokerage fees, certain insurance costs, acquired fund fees and expenses, and nonroutine expenses or costs, including, but not limited to, those relating to reorganizations, litigation, conducting shareholder meetings, and liquidations (collectively nonroutine expenses)) do not exceed 1.15% of the Fund’s average daily net assets from Nov. 1, 2013 through Oct. 31, 2014.* For purposes of this waiver and reimbursement, nonroutine expenses may also include such additional costs and expenses as may be agreed upon from time to time by the Fund’s Board and DMC. This expense waiver and reimbursement may only be terminated by agreement of DMC and the Fund.
*The contractual waiver period is Feb. 28, 2013 to Feb. 27, 2015.
32
Table of Contents
Delaware Service Company, Inc. (DSC), an affiliate of DMC, provides fund accounting and financial administration oversight services to the Fund. For these services, the Fund pays DSC fees based on the aggregate daily net assets of the Delaware Investments® Family of Funds at the following annual rate: 0.0050% of the first $30 billion; 0.0045% of the next $10 billion; 0.0040% of the next $10 billion; and 0.0025% of aggregate average daily net assets in excess of $50 billion. The fees payable to DSC under the service agreement described above are allocated among all Funds in the Delaware Investments Family of Funds on a relative net asset value basis. For the year ended Oct. 31, 2014, the Fund was charged $2,483 for these services. This amount is included on the “Statement of operations” under “Accounting and administration expenses.”
DSC is also the transfer agent and dividend disbursing agent of the Fund. For these services, the Fund pays DSC fees based on the aggregate daily net assets of the retail funds within the Delaware Investments Family of Funds at the following annual rate: 0.025% of the first $20 billion; 0.020% of the next $5 billion; 0.015% of the next $5 billion; and 0.013% of average daily net assets in excess of $30 billion. This amount is included on the “Statement of operations” under “Dividend disbursing and transfer agent fees and expenses.” For the year ended Oct. 31, 2014, the amount charged by DSC was $11,219. Pursuant to a sub-transfer agency agreement between DSC and BNY Mellon Investment Servicing (US) Inc. (BNYMIS), BNYMIS provides certain sub-transfer agency services to the Fund. Sub-transfer agency fees are passed on to and paid directly by the Fund.
Pursuant to a distribution agreement and distribution plan, the Fund pays DDLP, the distributor and an affiliate of DMC, an annual distribution and service fee of 0.25% of the average daily net assets of the Class A shares, 1.00% of the average daily net assets of the Class C shares, and 0.50% of the average daily net assets of the Class R shares. Institutional Class shares pay no distribution and service expenses.
As provided in the investment management agreement, the Fund bears a portion of the cost of resources shared with DMC, including the cost of internal personnel of DMC and/or its affiliates that provide legal, tax, and regulatory reporting services to the Fund. For the year ended Oct. 31, 2014, the Fund was charged $1,452 for internal legal, tax, and regulatory services provided by DMC and/or its affiliates’ employees. This amount is included on the “Statement of operations” under “Legal fees.”
For the year ended Oct. 31, 2014, DDLP earned $4,021 for commissions on sales of the Fund’s Class A shares. For the year ended Oct. 31, 2014, DDLP received gross CDSC commissions of $262 on redemptions of the Fund’s Class C shares and these commissions were entirely used to offset up front commissions previously paid by DDLP to broker/dealers on sales of those shares.
Trustees’ fees include expenses accrued by the Fund for each Trustee’s retainer and meeting fees. Certain officers of DMC, DSC, and DDLP are officers and/or Trustees of the Trust. These officers and Trustees are paid no compensation by the Fund.
33
Table of Contents
Notes to financial statements
Delaware Global Real Estate Opportunities Fund
3. Investments
For the year ended Oct. 31, 2014, the Fund made purchases and sales of investment securities other than short-term investments as follows:
| Purchases | $53,243,152 | |||
| Sales | 58,364,504 |
At Oct. 31, 2014, the cost of investments and unrealized appreciation (depreciation) for federal income tax purposes were as follows:
Cost of investments | $ | 48,886,575 | ||
|
| |||
Aggregate unrealized appreciation | $ | 6,380,094 | ||
Aggregate unrealized depreciation | (1,730,486 | ) | ||
|
| |||
Net unrealized appreciation | $ | 4,649,608 | ||
|
|
U.S. GAAP defines fair value as the price that the Fund would receive to sell an asset or pay to transfer a liability in an orderly transaction between market participants at the measurement date under current market conditions. A three-level hierarchy for fair value measurements has been established based upon the transparency of inputs to the valuation of an asset or liability. Inputs may be observable or unobservable and refer broadly to the assumptions that market participants would use in pricing the asset or liability. Observable inputs reflect the assumptions market participants would use in pricing the asset or liability based on market data obtained from sources independent of the reporting entity. Unobservable inputs reflect the reporting entity’s own assumptions about the assumptions that market participants would use in pricing the asset or liability developed based on the best information available under the circumstances. The Fund’s investment in its entirety is assigned a level based upon the observability of the inputs which are significant to the overall valuation. The three-level hierarchy of inputs is summarized below.
| Level 1 | – | Inputs are quoted prices in active markets for identical investments. (Examples: equity securities, open-end investment companies, futures contracts, exchange-traded options contracts) | ||
| Level 2 | – | Other observable inputs, including, but not limited to: quoted prices for similar assets or liabilities in markets that are active, quoted prices for identical or similar assets or liabilities in markets that are not active, inputs other than quoted prices that are observable for the assets or liabilities (such as interest rates, yield curves, volatilities, prepayment speeds, loss severities, credit risks, and default rates) or other market-corroborated inputs. (Examples: debt securities, government securities, swap contracts, foreign currency exchange contracts, foreign securities utilizing international fair value pricing, broker-quoted securities, fair valued securities) | ||
| Level 3 | – | Significant unobservable inputs, including the Fund’s own assumptions used to determine the fair value of investments. (Examples: broker-quoted securities, fair valued securities) | ||
Level 3 investments are valued using significant unobservable inputs. The Fund may also use an income-based valuation approach in which the anticipated future cash flows of the investment are discounted to calculate fair value. Discounts may also be applied due to the nature or duration of any restrictions on the disposition of the investments. Valuations may also be based upon current market
34
Table of Contents
prices of securities that are comparable in coupon, rating, maturity, and industry. The derived value of a Level 3 investment may not represent the value which is received upon disposition and this could impact the results of operations.
The following table summarizes the valuation of the Fund’s investments by fair value hierarchy levels as of Oct. 31, 2014:
| Level 1 | Level 2 | Level 3 | Total | |||||||||||
Convertible Bond | $ | — | $ | 575,875 | $— | $ | 575,875 | |||||||
Common Stock | ||||||||||||||
Australia | — | 4,094,883 | — | 4,094,883 | ||||||||||
Canada | 1,794,407 | — | — | 1,794,407 | ||||||||||
China/Hong Kong | — | 3,547,269 | — | 3,547,269 | ||||||||||
Finland | — | 345,811 | — | 345,811 | ||||||||||
France | — | 1,245,598 | — | 1,245,598 | ||||||||||
Germany | — | 1,139,697 | — | 1,139,697 | ||||||||||
Italy | — | 324,994 | — | 324,994 | ||||||||||
Japan | — | 4,452,625 | — | 4,452,625 | ||||||||||
Mexico | 635,597 | — | — | 635,597 | ||||||||||
Singapore | — | 898,876 | — | 898,876 | ||||||||||
Sweden | — | 240,180 | — | 240,180 | ||||||||||
United Kingdom | — | 2,867,861 | — | 2,867,861 | ||||||||||
United States | 29,431,947 | — | — | 29,431,947 | ||||||||||
Warrant | — | 14,486 | — | 14,486 | ||||||||||
Short-Term Investments | — | 1,926,077 | — | 1,926,077 | ||||||||||
|
|
|
|
|
|
| ||||||||
Total | $ | 31,861,951 | $ | 21,674,232 | $— | $ | 53,536,183 | |||||||
|
|
|
|
|
|
| ||||||||
Foreign Currency Exchange Contracts | $ | — | $ | (5,237 | ) | $— | $ | (5,237 | ) | |||||
A security that has been deemed worthless on the “Schedule of investments” is considered to be a Level 3 investment in this table.
As a result of utilizing international fair value pricing at Oct. 31, 2014, a portion of the Fund’s common stock investments were categorized as Level 2.
During the year ended Oct. 31, 2014, there were no transfers between Level 1 investments, Level 2 investments, or Level 3 investments that had a significant impact to the Fund. This does not include transfers between Level 1 investments and Level 2 investments due to the Fund utilizing international fair value pricing during the year. In accordance with the fair valuation procedures described in Note 1, international fair value pricing of securities in the Fund occurs when market volatility exceeds an established rolling threshold. If the threshold is exceeded on a given date, then prices of international securities (those that traded on exchanges that close at a different time than the time that the Fund’s net asset value is determined) will be established using a separate pricing feed from a third party vendor designed to establish a price for each security as of the time that the Fund’s net asset value is determined. Further, international fair value pricing uses other observable market-based inputs in place
35
Table of Contents
Notes to financial statements
Delaware Global Real Estate Opportunities Fund
3. Investments (continued)
of the closing exchange price due to the events occurring after the close of the exchange or market on which the investment is principally traded, causing a change in the classification between levels. The Fund’s policy is to recognize transfers between levels at the beginning of the reporting period.
A reconciliation of Level 3 investments is presented when the Fund has a significant amount of Level 3 investments at the beginning, interim, or end of the period in relation to net assets. Management has determined not to provide additional disclosure on Level 3 inputs under ASU No. 2011-04 since the Level 3 investments are not considered significant to the Fund’s net assets at the end of the year.
4. Dividend and Distribution Information
Income and long-term capital gain distributions are determined in accordance with federal income tax regulations, which may differ from U.S. GAAP. Additionally, distributions from net gains on foreign currency transactions and net short-term gains on sales of investment securities are treated as ordinary income for federal income tax purposes. The tax character of dividends and distributions paid during the years ended Oct. 31, 2014 and 2013 were as follows:
| Year ended | ||||||||
| 10/31/14 | 10/31/13 | |||||||
Ordinary income | $ | 1,745,286 | $ | 2,454,349 | ||||
5. Components of Net Assets on a Tax Basis
As of Oct. 31, 2014, the components of net assets on a tax basis were as follows:
Shares of beneficial interest | $ | 143,783,784 | ||
Undistributed ordinary income* | 467,194 | |||
Capital loss carryforwards** | (95,092,442 | ) | ||
Unrealized appreciation | 4,650,977 | |||
|
| |||
Net assets | $ | 53,809,513 | ||
|
|
*The undistributed earnings for the Fund are estimated pending final notification of the tax character of distributions received from investments in REITs.
**The amount of this loss which can be utilized in subsequent years may be subject to an annual limitation in accordance with the Internal Revenue Code due to the Fund merger with Delaware Global Real Estate Securities Fund on Sept. 28, 2012.
The differences between book basis and tax basis components of net assets are primarily attributable to tax deferral of losses on wash sales, mark-to-market of foreign currency exchange contracts, and tax treatment of passive foreign investment companies.
For financial reporting purposes, capital accounts are adjusted to reflect the tax character of permanent book/tax differences. Reclassifications are primarily due to tax treatment of gain (loss) on foreign currency transactions, and passive foreign investment companies. Results of operations and net assets were not affected by these reclassifications. For the year ended Oct. 31, 2014, the Fund recorded the following reclassifications:
36
Table of Contents
Undistributed net investment income | $ | 349,744 | ||
Accumulated net realized loss | (349,744 | ) |
For federal income tax purposes, capital loss carryforwards may be carried forward and applied against future capital gains. $2,220,286 was utilized in 2014. Capital loss carryforwards remaining at Oct. 31, 2014 will expire as follows: $40,907,101 expires in 2016, $50,784,384 expires in 2017, and $3,400,957 expires in 2018.
On Dec. 22, 2010, the Regulated Investment Company Modernization Act of 2010 (Act) was enacted, which changed various technical rules governing the tax treatment of regulated investment companies. The changes were generally effective for taxable years beginning after the date of enactment. Under the Act, the Fund is permitted to carry forward capital losses incurred in taxable years beginning after the date of enactment for an unlimited period. Additionally, post-enactment capital loss carryforwards will retain their character as either short-term or long-term capital losses rather than being considered all short-term as permitted under previous regulation. At Oct. 31, 2014, there were no capital loss carryforwards under the Act.
6. Capital Shares
Transactions in capital shares were as follows:
| Year ended | ||||||||
| 10/31/14 | 10/31/13 | |||||||
Shares sold: | ||||||||
Class A | 979,245 | 760,881 | ||||||
Class C | 237,941 | 82,306 | ||||||
Class R | 13,205 | 2,408 | ||||||
Institutional Class | 2,027,984 | 917,597 | ||||||
Shares issued upon reinvestment of dividends and distributions: | ||||||||
Class A | 23,284 | 6,032 | ||||||
Class C | 3,328 | 168 | ||||||
Class R | 147 | 33 | ||||||
Institutional Class | 44,280 | 331,969 | ||||||
|
|
|
| |||||
| 3,329,414 | 2,101,394 | |||||||
|
|
|
| |||||
Shares redeemed: | ||||||||
Class A | (742,232 | ) | (163,649 | ) | ||||
Class C | (32,589 | ) | (513 | ) | ||||
Class R | (99 | ) | — | |||||
Institutional Class | (3,229,334 | ) | (6,441,084 | ) | ||||
|
|
|
| |||||
| (4,004,254 | ) | (6,605,246 | ) | |||||
|
|
|
| |||||
Net decrease | (674,840 | ) | (4,503,852 | ) | ||||
|
|
|
| |||||
37
Table of Contents
Notes to financial statements
Delaware Global Real Estate Opportunities Fund
7. Line of Credit
The Fund, along with certain other funds in the Delaware Investments® Family of Funds (Participants), was a participant in a $125,000,000 revolving line of credit to be used for temporary or emergency purposes as an additional source of liquidity to fund redemptions of investor shares. Under the agreement, the Participants were charged an annual commitment fee of 0.08%, which was allocated across the Participants on the basis of each Participant’s allocation of the entire facility. The Participants were permitted to borrow up to a maximum of one third of their net assets under the agreement. Each Participant was individually, and not jointly, liable for its particular advances, if any, under the line of credit. The line of credit under the agreement expired on Nov. 12, 2013.
On Nov. 12, 2013, the Fund, along with the other Participants, entered into an amendment to the agreement for a $225,000,000 revolving line of credit. The line of credit was to be used as described above and operated in substantially the same manner as the agreement described above. The line of credit available under the agreement expired on Nov. 10, 2014.
The Fund had no amounts outstanding as of Oct. 31, 2014 or at any time during the year then ended.
8. Offsetting
In December 2011, the Financial Accounting Standards Board (FASB) issued guidance that expands current disclosure requirements on the offsetting of certain assets and liabilities. The disclosures are required for investments and derivative financial instruments subject to master netting or similar agreements which are eligible for offset on the “Statement of assets and liabilities” and requires an entity to disclose both gross and net information about such investments and transactions in the financial statements. In January 2013, the FASB issued guidance that clarifies which investments and transactions are subject to the offsetting disclosure requirements. The scope of the disclosure requirements for offsetting is limited to derivative instruments, repurchase agreements and reverse repurchase agreements, and securities borrowing. The guidance is effective for financial statements with fiscal years beginning on or after Jan. 1, 2013, and interim periods within those fiscal years. The Fund adopted the disclosure provisions on offsetting during the current reporting period.
In order to better define its contractual rights and to secure rights that will help the Fund mitigate its counterparty risk, the Fund entered into an International Swaps and Derivatives Association, Inc. Master Agreement (ISDA Master Agreement) or a similar agreement with each of its derivative contract counterparties. An ISDA Master Agreement is a bilateral agreement between the Fund and a counterparty that governs over-the-counter (OTC) derivatives and foreign exchange contracts and typically contains, among other things, collateral posting items and netting provisions in the event of a default and/or termination event. Under an ISDA Master Agreement, the Fund may, under certain circumstances, offset with the counterparty certain derivative financial instruments’ payables and/or receivables with collateral held and/or posted and create one single net payment. The provisions of the ISDA Master Agreement typically permit a single net payment in the event of default (close-out) netting including the bankruptcy or insolvency of the counterparty. However, bankruptcy or insolvency laws of a particular jurisdiction may impose restrictions on or prohibitions against the right of offset in bankruptcy, insolvency, or other events.
38
Table of Contents
For financial reporting purposes, the Fund does not offset derivative assets and derivative liabilities that are subject to netting arrangements on the “Statement of assets and liabilities.”
At Oct. 31, 2014, the Fund had the following assets and liabilities subject to offsetting provisions:
Offsetting of Financial Assets and Liabilities and Derivative Assets and Liabilities
Counterparty | Gross Value of Derivative Asset | Gross Value of Derivative Liability | Net Position | |||
BNY Mellon | $— | $(5,237) | $(5,237) |
Counterparty | Net Position | Fair Value of Non-Cash Collateral Received | Cash Collateral Received | Fair Value of Non-Cash Collateral Pledged | Cash Collateral Pledged | Net Amount(a) | ||||||
| BNY Mellon | $(5,237) | $— | $— | $— | $— | $(5,237) |
Master Repurchase Agreements
Counterparty | Repurchase Agreements | Fair Value of Non-Cash Collateral Received | Cash Collateral Received | Net Amount(a) | ||||||||||||
Bank of America Merrill Lynch | $ | 131,081 | $ | (131,081 | ) | $ | — | $ | — | |||||||
Bank of Montreal | 21,847 | (21,847 | ) | — | — | |||||||||||
BNP Paribas | 258,072 | (258,072 | ) | — | — | |||||||||||
|
|
|
|
|
|
|
| |||||||||
Total | $ | 411,000 | $ | (411,000) | $ | — | $ | — | ||||||||
|
|
|
|
|
|
|
| |||||||||
(a)Net amount represents the net receivable/(payable) that would be due from/(to) the counterparty in an event of default.
9. Derivatives
U.S. GAAP requires disclosures that enable investors to understand: (1) how and why an entity uses derivatives; (2) how they are accounted for; and (3) how they affect an entity’s results of operations and financial position.
Foreign Currency Exchange Contracts – The Fund may enter into foreign currency exchange contracts and foreign cross currency exchange contracts as a way of managing foreign exchange rate risk. The Fund may use these contracts to hedge the U.S. dollar value of securities it already owns that are denominated in foreign currencies. The Fund may also enter into these contracts to fix the U.S. dollar value of a security that it has agreed to buy or sell for the period between the date the trade was entered into and the date the security is delivered and paid for. In addition, the Fund may enter into these contracts to facilitate or expedite the settlement of portfolio transactions. The change in value is recorded as an unrealized gain or loss. When the contract is closed, a realized gain or loss is recorded equal to the difference between the value of the contract at the time it was opened and the value at the time it was closed.
The use of foreign currency exchange contracts and foreign cross currency exchange contracts does not eliminate fluctuations in the underlying prices of the securities, but does establish a rate of exchange that
39
Table of Contents
Notes to financial statements
Delaware Global Real Estate Opportunities Fund
9. Derivatives (continued)
can be achieved in the future. Although foreign currency exchange contracts and foreign cross currency exchange contracts limit the risk of loss due to an unfavorable change in the value of the hedged currency, they also limit any potential gain that might result should the value of the currency change favorably. In addition, the Fund could be exposed to risks if the counterparties to the contracts are unable to meet the terms of their contracts. The Fund’s maximum risk of loss from counterparty credit risk is the value of its currency exchanged with the counterparty. The risk is generally mitigated by having a netting arrangement between the Fund and the counterparty and by the posting of collateral by the counterparty to the Fund to cover the Fund’s exposure to the counterparty.
During the year ended Oct. 31, 2014, the Fund held foreign currency exchange contracts, which are reflected on the “Statement of operations” under “Net realized gain (loss) on foreign currency exchange contracts.”
During the year ended Oct. 31, 2014, the Fund used foreign currency exchange contracts to facilitate or expedite the settlement of portfolio transactions.
Derivatives Generally. The table below summarizes the average balance of derivative holdings by the Fund during the year ended Oct. 31, 2014:
| Long Derivative Volume | Short Derivative Volume | |||||||||||||||
Foreign currency exchange contracts (average cost) | USD | 141,309 | USD | 165,591 | ||||||||||||
10. Securities Lending
The Fund, along with other funds in the Delaware Investments® Family of Funds, may lend its securities pursuant to a security lending agreement (Lending Agreement) with The Bank of New York Mellon (BNY Mellon). At the time a security is loaned, the borrower must post collateral equal to the required percentage of the market value of the loaned security, including any accrued interest. The required percentage is: (1) 102% with respect to U.S. securities and foreign securities that are denominated and payable in U.S. dollars; and (2) 105% with respect to foreign securities. With respect to each loan, if on any business day the aggregate market value of securities collateral plus cash collateral held is less than the aggregate market value of the securities which are the subject of such loan, the borrower will be notified to provide additional collateral by the end of the following business day which, together with the collateral already held, will be not less than the applicable initial collateral requirements for such security loan. If the aggregate market value of securities collateral and cash collateral held with respect to a security loan exceeds the applicable initial collateral requirement, upon the request of the borrower, BNY Mellon must return enough collateral to the borrower by the end of the following business day to reduce the value of the remaining collateral to the applicable initial collateral requirement for such security loan. As a result of the foregoing, the value of the collateral held with respect to a loaned security on any particular day, may be more or less than the value of the security on loan.
Cash collateral received is generally invested in the Delaware Investments Collateral Fund No. 1 (Collective Trust) established by BNY Mellon for the purpose of investment on behalf of funds managed by DMC that participate in BNY Mellon’s securities lending program. The Collective Trust may invest in U.S. government securities and high-quality corporate debt, asset-backed and other money market
40
Table of Contents
securities, and in repurchase agreements collateralized by such securities, provided that the Collective Trust will generally have a dollar-weighted average portfolio maturity of 60 days or less. The Fund can also accept U.S. government securities and letters of credit (non-cash collateral) in connection with securities loans. In the event of default or bankruptcy by the lending agent, realization and/or retention of the collateral may be subject to legal proceedings. In the event the borrower fails to return loaned securities and the collateral received is insufficient to cover the value of the loaned securities and provided such collateral shortfall is not the result of investment losses, the lending agent has agreed to pay the amount of the shortfall to the Fund or, at the discretion of the lending agent, replace the loaned securities. The Fund continues to record dividends or interest, as applicable, on the securities loaned and is subject to changes in value of the securities loaned that may occur during the term of the loan. The Fund has the right under the Lending Agreement to recover the securities from the borrower on demand. With respect to security loans collateralized by non-cash collateral, the Fund receives loan premiums paid by the borrower. With respect to security loans collateralized by cash collateral, the earnings from the collateral investments are shared among the Fund, the security lending agent, and the borrower. The Fund records security lending income net of allocations to the security lending agent and the borrower.
The Collective Trust used for the investment of cash collateral received from borrowers of securities seeks to maintain a net asset value per unit of $1.00, but there can be no assurance that it will always be able to do so. The Fund may incur investment losses as a result of investing securities lending collateral in the Collective Trust. This could occur if an investment in the Collective Trust defaulted or if it were necessary to liquidate assets in the Collective Trust to meet returns on outstanding security loans at a time when the Collective Trust’s net asset value per unit was less than $1.00. Under those circumstances, the Fund may not receive an amount from the Collective Trust that is equal in amount to the collateral the Fund would be required to return to the borrower of the securities and the Fund would be required to make up for this shortfall.
At Oct. 31, 2014, the Fund had no securities out on loan.
11. Credit and Market Risk
Some countries in which the Fund may invest require governmental approval for the repatriation of investment income, capital, or the proceeds of sales of securities by foreign investors. In addition, if there is deterioration in a country’s balance of payments or for other reasons, a country may impose temporary restrictions on foreign capital remittances abroad.
The securities exchanges of certain foreign markets are substantially smaller, less liquid, and more volatile than the major securities markets in the United States. Consequently, acquisition and disposition of securities by the Fund may be inhibited. In addition, a significant portion of the aggregate market value of equity securities listed on the major securities exchanges in emerging markets is held by a smaller number of investors. This may limit the number of shares available for acquisition or disposition by the Fund.
The Fund concentrates its investments in the real estate industry and is subject to the risks associated with that industry. If the Fund holds real estate directly as a result of defaults or receives rental income
41
Table of Contents
Notes to financial statements
Delaware Global Real Estate Opportunities Fund
11. Credit and Market Risk (continued)
directly from real estate holdings, its tax status as a regulated investment company may be jeopardized. The Fund is also affected by interest rate changes, particularly if the REITs it holds use floating rate debt to finance their ongoing operations. Its investments may also tend to fluctuate more in value than a portfolio that invests in a broader range of industries.
The Fund may invest up to 15% of its net assets in illiquid securities, which may include securities with contractual restrictions on resale, securities exempt from registration under Rule 144A of the Securities Act of 1933, as amended, and other securities which may not be readily marketable. The relative illiquidity of these securities may impair the Fund from disposing of them in a timely manner and at a fair price when it is necessary or desirable to do so. While maintaining oversight, the Fund’s Board has delegated to DMC, the day-to-day functions of determining whether individual securities are liquid for purposes of the Fund’s limitation on investments in illiquid securities. Securities eligible for resale pursuant to Rule 144A, which are determined to be liquid, are not subject to the Fund’s 15% limit on investments in illiquid securities. As of Oct. 31, 2014, there were no Rule 144A securities held by the Fund. Illiquid securities have been identified on the “Schedule of investments.”
12. Contractual Obligations
The Fund enters into contracts in the normal course of business that contain a variety of indemnifications. The Fund’s maximum exposure under these arrangements is unknown. However, the Fund has not had prior claims or losses pursuant to these contracts. Management has reviewed the Fund’s existing contracts and expects the risk of loss to be remote.
13. Recent Accounting Pronouncements
In June 2014, the FASB issued guidance to improve the financial reporting of reverse repurchase agreements and other similar transactions. The guidance includes expanded disclosure requirements for entities that enter into reverse repurchase agreements and similar transactions accounted for as secured borrowings. The guidance is effective for financial statements with fiscal years beginning on or after Dec. 15, 2014 and interim periods within those fiscal years. Management is evaluating the impact, if any, of this guidance on the Funds’ financial statement disclosures.
14. Subsequent Events
Effective Nov. 1, 2014, Delaware Investments Fund Services Company (DIFSC), an affiliate of DMC, provides fund accounting and financial administration oversight services to the Fund. Also effective Nov. 1, 2014, DIFSC is the transfer agent and dividend disbursing agent of the Fund.
On Nov. 10, 2014, the Fund, along with the other Participants, entered into an agreement for a $275,000,000 revolving line of credit to be used as described in Note 7 and to be operated in substantially the same manner as the agreement described in Note 7. The line of credit under the agreement expires on Nov. 9, 2015.
Management has determined that no other material events or transactions occurred subsequent to Oct. 31, 2014 that would require recognition or disclosure in the Fund’s financial statements.
42
Table of Contents
registered public accounting firm
To the Board of Trustees of Delaware Group® Adviser Funds
and the Shareholders of Delaware Global Real Estate Opportunities Fund:
In our opinion, the accompanying statement of assets and liabilities, including the schedule of investments, and the related statements of operations and of changes in net assets and the financial highlights present fairly, in all material respects, the financial position of Delaware Global Real Estate Opportunities Fund (one of the series constituting Delaware Group Adviser Funds, hereafter referred to as the “Fund”) at October 31, 2014, the results of its operations for the year then ended, the changes in its net assets for each of the two years in the period then ended and the financial highlights for each of the five years in the period then ended, in conformity with accounting principles generally accepted in the United States of America. These financial statements and financial highlights (hereafter referred to as “financial statements”) are the responsibility of the Fund’s management. Our responsibility is to express an opinion on these financial statements based on our audits. We conducted our audits of these financial statements in accordance with the standards of the Public Company Accounting Oversight Board (United States). Those standards require that we plan and perform the audit to obtain reasonable assurance about whether the financial statements are free of material misstatement. An audit includes examining, on a test basis, evidence supporting the amounts and disclosures in the financial statements, assessing the accounting principles used and significant estimates made by management, and evaluating the overall financial statement presentation. We believe that our audits, which included confirmation of securities at October 31, 2014 by correspondence with the custodian and brokers, and the application of alternative auditing procedures where confirmations of security purchases had not been received, provide a reasonable basis for our opinion.
PricewaterhouseCoopers LLP
Philadelphia, Pennsylvania
December 17, 2014
43
Table of Contents
Other Fund information (Unaudited)
Delaware Global Real Estate Opportunities Fund
Tax Information
The information set forth below is for the Fund’s fiscal year as required by federal income tax laws. Shareholders, however, must report distributions on a calendar year basis for income tax purposes, which may include distributions for portions of two fiscal years of the Fund. Accordingly, the information needed by shareholders for income tax purposes will be sent to them in January of each year. Please consult your tax advisor for proper treatment of this information.
All disclosures are based on financial information available as of the date of this annual report and, accordingly are subject to change. For any and all items requiring reporting, it is the intention of the Fund to report the maximum amount permitted under the Internal Revenue Code and the regulations thereunder.
For the fiscal year ended Oct. 31, 2014, the Fund reports distributions paid during the year as follows:
(A) Ordinary Income Distributions* (Tax Basis) | 100.00% | |||
(B) Qualifying Dividends1 | 2.12% |
(A) is based on a percentage of the Fund’s total distributions.
(B) is based on a percentage of the Fund’s ordinary income distributions.
1 Qualifying dividends represent dividends which qualify for the corporate dividends received deduction.
*For the fiscal year ended Oct. 31, 2014, certain dividends paid by the Fund may be subject to a maximum tax rate of 15%, as provided for by the Jobs and Growth Tax Relief Reconciliation Act of 2003, as extended by the Tax Relief Unemployment Insurance Reauthorization and Jobs Creation Act of 2010, and made permanent by the American Taxpayer Relief Act of 2012. The Fund intends to report up to a maximum of 25.66% to be taxed at a maximum rate of 15%. Complete information will be computed and reported in conjunction with your 2014 Form 1099-DIV.
Board consideration of Delaware Global Real Estate Opportunities Fund investment management agreement
At a meeting held on Aug. 19-21, 2014 (the “Annual Meeting”), the Board of Trustees (the “Board”), including a majority of disinterested or independent Trustees, approved the renewal of the Investment Management Agreement for Delaware Global Real Estate Opportunities Fund (the “Fund”). In making its decision, the Board considered information furnished at regular quarterly Board meetings, including reports detailing Fund performance, investment strategies and expenses, as well as information prepared specifically in connection with the renewal of the investment advisory and sub-advisory contracts. Information furnished specifically in connection with the renewal of the Investment Management Agreement with Delaware Management Company (“DMC”) included materials provided by DMC and its affiliates (“Delaware Investments”) concerning, among other things, the nature, extent and quality of services provided to the Fund, the costs of such services to the Fund, economies of scale and the financial condition and profitability of Delaware Investments. In addition, in connection with the Annual Meeting, reports were provided to the Trustees in May 2014 and included reports provided by Lipper, Inc., an independent statistical compilation organization (“Lipper”). The Lipper reports compared the Fund’s investment performance and expenses with those of other comparable mutual funds. The Independent Trustees reviewed and discussed the Lipper reports with independent legal counsel to the Independent Trustees. The Board requested and received information regarding DMC’s policy with respect to advisory fee levels and its breakpoint philosophy; the structure of portfolio manager
44
Table of Contents
compensation; the investment manager’s profitability; comparative client fee information; and any constraints or limitations on the availability of securities for certain investment styles, which had in the past year inhibited, or which were likely in the future to inhibit, DMC’s ability to invest fully in accordance with Fund policies.
In considering information relating to the approval of the Fund’s advisory agreement, the Independent Trustees received assistance and advice from and met separately with independent legal counsel to the Independent Trustees. Although the Board gave attention to all information furnished, the following discussion identifies, under separate headings, the primary factors taken into account by the Board during its contract renewal considerations.
Nature, Extent and Quality of Service. The Board considered the services provided by Delaware Investments to the Fund and its shareholders. In reviewing the nature, extent and quality of services, the Board considered reports furnished to it throughout the year, which covered matters such as the relative performance of the Fund, compliance of portfolio managers with the investment policies, strategies and restrictions for the Fund, compliance by DMC and Delaware Distributors, L.P. (together, “Management”) personnel with the Code of Ethics adopted throughout the Delaware Investments® Family of Funds complex and adherence to fair value pricing procedures as established by the Board. The Board was pleased with the current staffing of the Fund’s investment manager and the emphasis placed on research in the investment process. The Board recognized DMC’s recent receipt of several industry distinctions. The Board gave favorable consideration to DMC’s efforts to control expenditures while maintaining service levels committed to Fund matters. The Board noted that, in the third and fourth quarters of 2013, Management reduced the maximum 12b-1 fee for certain funds; and in November 2013 Management negotiated a substantial reduction in fees for fund accounting services provided to the Funds. The Board noted the benefits provided to Fund shareholders through each shareholder’s ability to exchange an investment in one Delaware Investments fund for the same class of shares in another Delaware Investments fund without a sales charge, to reinvest Fund dividends into additional shares of the Fund or into additional shares of other Delaware Investments funds and the privilege to combine holdings in other Delaware Investments funds to obtain a reduced sales charge. The Board was satisfied with the nature, extent and quality of the overall services provided by Delaware Investments.
Investment Performance. The Board placed significant emphasis on the investment performance of the Fund in view of the importance of investment performance to shareholders. Although the Board gave appropriate consideration to performance reports and discussions with portfolio managers at Investment Committee meetings throughout the year, the Board gave particular weight to the Lipper reports furnished for the Annual Meeting. The Lipper reports prepared for the Fund showed the investment performance of its Class A shares in comparison to a group of similar funds as selected by Lipper (the “Performance Universe”). A fund with the best performance ranked first, and a fund with the poorest performance ranked last. The highest/best performing 25% of funds in the Performance Universe make up the first quartile; the next 25%, the second quartile; the next 25%, the third quartile; and the poorest/ worst performing 25% of funds in the Performance Universe make up the fourth quartile. Comparative annualized performance for the Fund was shown for the past one-, three-, five- and ten-year periods, to the extent applicable, ended March 31, 2014. The Board’s objective is that the Fund’s performance for the periods considered be at or above the median of its Performance Universe. The following paragraph summarizes the performance results for the Fund and the Board’s view of such performance.
45
Table of Contents
Other Fund information (Unaudited)
Delaware Global Real Estate Opportunities Fund
Board consideration of Delaware Global Real Estate Opportunities Fund investment management agreement (continued)
The Performance Universe for the Fund consisted of the Fund and all retail and institutional global real estate funds as selected by Lipper. The Lipper report comparison showed that the Fund’s total return for the one- and three-year periods was in the first quartile of its Performance Universe. The report further showed that the Fund’s total return for the five-year period was in the second quartile of its Performance Universe. The Board was satisfied with performance.
Comparative Expenses. The Board considered expense comparison data for the Delaware Investments Family of Funds. Management provided the Board with information on pricing levels and fee structures for the Fund as of its most recently completed fiscal year. The Board also focused on the comparative analysis of effective management fees and total expense ratios of the Fund versus effective management fees and expense ratios of a group of similar funds as selected by Lipper (the “Expense Group”). In reviewing comparative costs, the Fund’s contractual management fee and the actual management fee incurred by the Fund were compared with the contractual management fees (assuming all funds in the Expense Group were similar in size to the Fund) and actual management fees (as reported by each fund) within the Expense Group, taking into account any applicable breakpoints and fee waivers. The Fund’s total expenses were also compared with those of its Expense Group. The Lipper total expenses, for comparative consistency, were shown by Lipper for Class A shares and comparative total expenses including 12b-1 and non 12b-1 service fees. The Board considered fees paid to Delaware Investments for non-management services. The Board’s objective is to limit the Fund’s total expense ratio to be competitive with that of the Expense Group. The following paragraph summarizes the expense results for the Fund and the Board’s view of such expenses.
The expense comparisons for the Fund showed that its actual management fee was in the quartile with the second lowest expenses of its Expense Group and its total expenses were in the quartile with the second highest expenses of its Expense Group. The Board noted that the Fund’s total expenses were not in line with the Board’s objective. In evaluating total expenses, the Board considered fee waivers in place through February 2015 and various initiatives implemented by Management, such as the outsourcing of certain transfer agency services and a negotiation of lower fees for fund accounting services, which had created an opportunity for a further reduction in expenses. The Board was satisfied with Management’s efforts to improve the Fund’s total expense ratio and to bring it in line with the Board’s objective.
Management Profitability. The Board considered the level of profits realized by Delaware Investments in connection with the operation of the Fund. In this respect, the Board reviewed the Investment Management Profitability Analysis that addressed the overall profitability of Delaware Investments’ business in providing management and other services to each of the individual funds and the Delaware Investments® Family of Funds as a whole. Specific attention was given to the methodology followed in allocating costs for the purpose of determining profitability. Management stated that the level of profits of Delaware Investments, to a certain extent, reflects recent operational cost savings and efficiencies initiated by Delaware Investments. The Board considered Delaware Investments’ efforts to improve services provided to fund shareholders and to meet additional regulatory and compliance requirements resulting from recent industry-wide Securities and Exchange Commission initiatives. The Board also considered the extent to which Delaware Investments might derive ancillary benefits from
46
Table of Contents
fund operations, including the potential for procuring additional business as a result of the prestige and visibility associated with its role as service provider to the Delaware Investments® Family of Funds and the benefits from allocation of fund brokerage to improve trading efficiencies. The Board found that the management fees were reasonable in light of the services rendered and the level of profitability of Delaware Investments.
Economies of Scale. The Trustees considered whether economies of scale are realized by Delaware Investments as the Fund’s assets increase and the extent to which any economies of scale are reflected in the level of management fees charged. The Trustees reviewed the standardized advisory fee pricing and structure, approved by the Board and shareholders, which includes breakpoints. Breakpoints in the advisory fee occur when the advisory fee rate is reduced on assets in excess of specified levels. Breakpoints result in a lower advisory fee than would otherwise be the case on all assets when the asset levels specified are exceeded. The Board noted that the fee under the Fund’s management contract did not fall within the standard structure. Management explained that the Fund was very similar to another existing product offered by Delaware Investments and Management wanted consistency across the fee structure. In addition the Fund generally invests a significant portion of its assets in international (including emerging markets) securities, an asset category that requires more research and firm resources than is typically true for funds investing in domestic securities. Although the Fund has not reached a size at which it can take advantage of breakpoints, the Board recognized that the fee was structured so that when the Fund grows, economies of scale may be shared.
47
Table of Contents
Board of trustees / directors and officers addendum
Delaware Investments® Family of Funds
A mutual fund is governed by a Board of Trustees / Directors (“Trustees”), which has oversight responsibility for the management of a fund’s business affairs. Trustees establish procedures and oversee and review the performance of the investment manager, the distributor, and others who perform services for the fund. The independent fund trustees, in particular, are advocates
Name, Address, and Birth Date | Position(s) Held with Fund(s) | Length of Time Served | ||
| Interested Trustees | ||||
Patrick P. Coyne1 2005 Market Street Philadelphia, PA 19103 April 1963 | Chairman, President, Chief Executive Officer, and Trustee | Chairman and Trustee since August 16, 2006 | ||
President and Chief Executive Officer since August 1, 2006 | ||||
| Independent Trustees | ||||
Thomas L. Bennett 2005 Market Street Philadelphia, PA 19103 October 1947 | Trustee | Since March 2005 | ||
Joseph W. Chow 2005 Market Street Philadelphia, PA 19103 January 1953 | Trustee | Since January 2013 | ||
John A. Fry 2005 Market Street Philadelphia, PA 19103 May 1960 | Trustee | Since January 2001 | ||
| 1 | Patrick P. Coyne is considered to be an “Interested Trustee“ because he is an executive officer of the Fund’s(s’) investment advisor. |
48
Table of Contents
for shareholder interests. Each trustee has served in that capacity since he or she was elected to or appointed to the Board of Trustees, and will continue to serve until his or her retirement or the election of a new trustee in his or her place. The following is a list of the Trustees and Officers with certain background and related information.
Principal Occupation(s) During Past 5 Years | Number of Portfolios in Fund Complex Overseen by Trustee or Officer | Other Directorships Held by Trustee or Officer | ||
Patrick P. Coyne has served in various executive capacities at different times at Delaware Investments.2 | 65 | Board of Governors Member Investment Company Institute (ICI) | ||
Director and Audit Committee Member Kaydon Corp. (2007–2013) | ||||
Private Investor (March 2004–Present) | 65 | Director Bryn Mawr Bank Corp. (BMTC) (2007–2011) | ||
Executive Vice President (Emerging Economies Strategies, Risk and Corporate Administration) State Street Corporation (July 2004–March 2011)
| 65 | Director and Audit Committee Member — Hercules Technology Growth Capital, Inc. (2004-2014) | ||
President Drexel University (August 2010–Present) | 65 | Director — Hershey Trust Company | ||
President Franklin & Marshall College (July 2002–July 2010) | Director, Audit Committee, and Governance Committee Member Community Health Systems | |||
| 2 | Delaware Investments is the marketing name for Delaware Management Holdings, Inc. and its subsidiaries, including the Fund’s(s’) investment advisor, principal underwriter, and its transfer agent. |
49
Table of Contents
Board of trustees / directors and officers addendum
Delaware Investments® Family of Funds
Name, Address, and Birth Date | Position(s) Held with Fund(s) | Length of Time Served | ||
| Independent Trustees (continued) | ||||
Lucinda S. Landreth 2005 Market Street Philadelphia, PA 19103 June 1947
| Trustee | Since March 2005 | ||
Frances A. Sevilla-Sacasa 2005 Market Street Philadelphia, PA 19103 January 1956
| Trustee | Since September 2011 | ||
Thomas K. Whitford 2005 Market Street Philadelphia, PA 19103 March 1956
| Trustee | Since January 2013 | ||
50
Table of Contents
Principal Occupation(s) During Past 5 Years | Number of Portfolios in Fund Complex Overseen by Trustee or Officer | Other Directorships Held by Trustee or Officer | ||
Private Investor (2004–Present)
| 65 | None | ||
Chief Executive Officer — Banco Itaú International (April 2012–Present) | 65 | Trust Manager and Audit Committee Member — Camden Property Trust | ||
Executive Advisor to Dean (August 2011–March 2012) and Interim Dean (January 2011–July 2011) — University of Miami School of Business Administration | ||||
President — U.S. Trust, Bank of America Private Wealth Management (Private Banking) (July 2007–December 2008)
| ||||
Vice Chairman (2010–April 2013) Chief Administrative Officer (2008–2010) and Executive Vice President and Chief Administrative Officer (2007–2009) — PNC Financial Services Group
| 65 | Director — HSBC Finance Corporation and HSBC North America Holdings Inc. | ||
51
Table of Contents
Board of trustees / directors and officers addendum
Delaware Investments® Family of Funds
Name, Address, and Birth Date | Position(s) Held with Fund(s) | Length of Time Served | ||
Independent Trustees (continued) | ||||
Janet L. Yeomans 2005 Market Street Philadelphia, PA 19103 July 1948
| Trustee | Since April 1999 | ||
J. Richard Zecher 2005 Market Street Philadelphia, PA 19103 July 1940
| Trustee | Since March 2005 |
52
Table of Contents
Principal Occupation(s) During Past 5 Years | Number of Portfolios in Fund Complex Overseen by Trustee or Officer | Other Directorships Held by Trustee or Officer | ||
Vice President and Treasurer (January 2006–July 2012) Vice President — Mergers & Acquisitions (January 2003–January 2006), and Vice President and Treasurer (July 1995–January 2003) 3M Corporation | 65 | Director, Audit and Compliance Committee Chair, Investment Committee Member and Governance Committee Member Okabena Company
Chair — 3M Investment Management Company (2005–2012) | ||
Founder Investor Analytics (Risk Management) (May 1999–Present) | 65 | Director and Compensation Committee Chairman Investor Analytics | ||
Founder P/E Investments (Hedge Fund) (September 1996–Present) | Director — P/E Investments | |||
53
Table of Contents
Board of trustees / directors and officers addendum
Delaware Investments® Family of Funds
Name, Address, and Birth Date | Position(s) Held with Fund(s) | Length of Time Served | ||
| Officers | ||||
David F. Connor 2005 Market Street Philadelphia, PA 19103 December 1963 | Senior Vice President, Deputy General Counsel, and Secretary | Senior Vice President, Deputy General Counsel since May 2013; Vice President, Deputy General Counsel September 2000 – May 2013; Secretary since October 2005 | ||
Daniel V. Geatens 2005 Market Street Philadelphia, PA 19103 October 1972 | Vice President and Treasurer | Treasurer since October 2007 | ||
David P. O’Connor 2005 Market Street Philadelphia, PA 19103 February 1966 | Executive Vice President, General Counsel and Chief Legal Officer | Executive Vice President since February 2012; Senior Vice President October 2005 – February 2012; General Counsel and Chief Legal Officer since October 2005 | ||
Richard Salus 2005 Market Street Philadelphia, PA 19103 October 1963 | Senior Vice President and Chief Financial Officer | Chief Financial Officer since November 2006 | ||
The Statement of Additional Information for the Fund(s) includes additional information about the Trustees and Officers and is available, without charge, upon request by calling 800 523-1918.
54
Table of Contents
Principal Occupation(s) During Past 5 Years | Number of Portfolios in Fund Complex Overseen by Trustee or Officer | Other Directorships Held by Trustee or Officer | ||
David F. Connor has served as Deputy General Counsel of Delaware Investments since 2000.
| 65 | None3 | ||
Daniel V. Geatens has served in various capacities at different times at Delaware Investments.
| 65 | None3 | ||
David P. O’Connor has served in various executive and legal capacities at different times at Delaware Investments.
| 65 | None3 | ||
Richard Salus has served in various executive capacities at different times at Delaware Investments.
| 65 | None3 |
| 3 | David F. Connor, Daniel V. Geatens, David P. O’Connor, and Richard Salus serve in similar capacities for the six portfolios of the Optimum Fund Trust, which have the same investment advisor, principal underwriter, and transfer agent as the registrant. |
55
Table of Contents
Board of trustees
| ||||||
| Patrick P. Coyne | Joseph W. Chow | Lucinda S. Landreth | Thomas K. Whitford | |||
| Chairman, President, and | Former Executive Vice | Former Chief Investment | Former Vice Chairman | |||
| Chief Executive Officer | President | Officer | PNC Financial Services Group | |||
| Delaware Investments® | State Street Corporation | Assurant, Inc. | Pittsburgh, PA | |||
Family of Funds | Brookline, MA | Philadelphia, PA | ||||
| Philadelphia, PA | Janet L. Yeomans | |||||
John A. Fry | Frances A. | Former Vice President | ||||
| Thomas L. Bennett | President | Sevilla-Sacasa | and Treasurer | |||
| Private Investor | Drexel University | Chief Executive Officer | 3M Corporation | |||
| Rosemont, PA | Philadelphia, PA | Banco Itaú | St. Paul, MN | |||
International | ||||||
| Miami, FL | J. Richard Zecher | |||||
Founder | ||||||
| Investor Analytics | ||||||
| Scottsdale, AZ | ||||||
| Affiliated officers | ||||||
| David F. Connor | Daniel V. Geatens | David P. O’Connor | Richard Salus | |||
| Senior Vice President, | Vice President and | Executive Vice President, | Senior Vice President and | |||
| Deputy General Counsel, | Treasurer | General Counsel, | Chief Financial Officer | |||
| and Secretary | Delaware Investments | and Chief Legal Officer | Delaware Investments | |||
| Delaware Investments | Family of Funds | Delaware Investments | Family of Funds | |||
| Family of Funds | Philadelphia, PA | Family of Funds | Philadelphia, PA | |||
| Philadelphia, PA | Philadelphia, PA | |||||
This annual report is for the information of Delaware Global Real Estate Opportunities Fund shareholders, but it may be used with prospective investors when preceded or accompanied by the Delaware Investments Fund fact sheet for the most recently completed calendar quarter. These documents are available at delawareinvestments.com.
Delaware Investments is the marketing name of Delaware Management Holdings, Inc. and its subsidiaries.
The Fund files its complete schedule of portfolio holdings with the Securities and Exchange Commission (SEC) for the first and third quarters of each fiscal year on Form N-Q. The Fund’s Forms N-Q, as well as a description of the policies and procedures that the Fund uses to determine how to vote proxies (if any) relating to portfolio securities are available without charge (i) upon request, by calling 800 523-1918; and (ii) on the SEC’s website at sec.gov. In addition, a description of the policies and procedures that the Fund uses to determine how to vote proxies (if any) relating to portfolio securities and the Fund’s Schedule of Investments are available without charge on the Fund’s website at delawareinvestments.com. The Fund’s Forms N-Q may be reviewed and copied at the SEC’s Public Reference Room in Washington, D.C.; information on the operation of the Public Reference Room may be obtained by calling 800 SEC-0330. Information (if any) regarding how the Fund voted proxies relating to portfolio securities during the most recently disclosed 12-month period ended June 30 is available without charge (i) through the Fund’s website at delawareinvestments.com; and (ii) on the SEC’s website at sec.gov.
56
Item 2. Code of Ethics
The registrant has adopted a code of ethics that applies to the registrant’s principal executive officer, principal financial officer, principal accounting officer or controller, or persons performing similar functions, regardless of whether these individuals are employed by the registrant or a third party. A copy of the registrant’s Code of Business Ethics has been posted on the Delaware Investments Internet Web site at www.delawareinvestments.com. Any amendments to the Code of Business Ethics, and information on any waiver from its provisions granted by the registrant, will also be posted on this Web site within five business days of such amendment or waiver and will remain on the Web site for at least 12 months.
Item 3. Audit Committee Financial Expert
The registrant’s Board of Trustees/Directors has determined that certain members of the registrant’s Audit Committee are audit committee financial experts, as defined below. For purposes of this item, an “audit committee financial expert” is a person who has the following attributes:
a. An understanding of generally accepted accounting principles and financial statements;
b. The ability to assess the general application of such principles in connection with the accounting for estimates, accruals, and reserves;
c. Experience preparing, auditing, analyzing, or evaluating financial statements that present a breadth and level of complexity of accounting issues that are generally comparable to the breadth and complexity of issues that can reasonably be expected to be raised by the registrant’s financial statements, or experience actively supervising one or more persons engaged in such activities;
d. An understanding of internal controls and procedures for financial reporting; and
e. An understanding of audit committee functions.
An “audit committee financial expert” shall have acquired such attributes through:
a. Education and experience as a principal financial officer, principal accounting officer, controller, public accountant, or auditor or experience in one or more positions that involve the performance of similar functions;
b. Experience actively supervising a principal financial officer, principal accounting officer, controller, public accountant, auditor, or person performing similar functions;
c. Experience overseeing or assessing the performance of companies or public accountants with respect to the preparation, auditing, or evaluation of financial statements; or
d. Other relevant experience.
The registrant’s Board of Trustees/Directors has also determined that each member of the registrant’s Audit Committee is independent. In order to be “independent” for purposes of this item, the Audit Committee member may not: (i) other than in his or her capacity as a member of the Board of Trustees/Directors or any committee thereof, accept directly or indirectly any consulting, advisory or other compensatory fee from the issuer; or (ii) be an “interested person” of the registrant as defined in Section 2(a)(19) of the Investment Company Act of 1940.
The names of the audit committee financial experts on the registrant’s Audit Committee are set forth below:
Joseph W. Chow
Lucinda S. Landreth1
Frances A. Sevilla-Sacasa
Janet L. Yeomans
Item 4. Principal Accountant Fees and Services
(a) Audit fees.
The aggregate fees billed for services provided to the registrant by its independent auditors for the audit of the registrant’s annual financial statements and for services normally provided by the independent auditors in connection with statutory and regulatory filings or engagements were $97,615 for the fiscal year ended October 31, 2014.
The aggregate fees billed for services provided to the registrant by its independent auditors for the audit of the registrant’s annual financial statements and for services normally provided by the independent auditors in connection with statutory and regulatory filings or engagements were $117,640 for the fiscal year ended October 31, 2013.
(b) Audit-related fees.
The aggregate fees billed by the registrant’s independent auditors for services relating to the performance of the audit of the registrant’s financial statements and not reported under paragraph (a) of this Item were $0 for the fiscal year ended October 31, 2014.
The aggregate fees billed by the registrant’s independent auditors for services relating to the performance of the audit of the financial statements of the registrant’s investment adviser and other service providers under common control with the adviser and that relate directly to the operations or financial reporting of the registrant were $618,000 for the registrant’s fiscal year ended October 31, 2014. The percentage of these fees relating to services approved by the registrant’s Audit Committee pursuant to the de minimis exception from the pre-approval requirement in Rule 2-01(c)(7)(i)(C) of Regulation S-X was 0%. These audit-related services were as follows: year end audit procedures; group reporting and subsidiary statutory audits.
The aggregate fees billed by the registrant’s independent auditors for services relating to the performance of the audit of the registrant’s financial statements and not reported under paragraph (a) of this Item were $0 for the fiscal year ended October 31, 2013.
____________________
1 The instructions to Form N-CSR require disclosure on the relevant experience of persons who qualify as audit committee financial experts based on “other relevant experience.” The Board of Trustees/Directors has determined that Ms. Landreth qualifies as an audit committee financial expert by virtue of her experience as a financial analyst, her Chartered Financial Analyst (CFA) designation and her service as an audit committee chairperson for a non-profit organization.
The aggregate fees billed by the registrant’s independent auditors for services relating to the performance of the audit of the financial statements of the registrant’s investment adviser and other service providers under common control with the adviser and that relate directly to the operations or financial reporting of the registrant were $618,000 for the registrant’s fiscal year ended October 31, 2013. The percentage of these fees relating to services approved by the registrant’s Audit Committee pursuant to the de minimis exception from the pre-approval requirement in Rule 2-01(c)(7)(i)(C) of Regulation S-X was 0%. These audit-related services were as follows: year end audit procedures; group reporting and subsidiary statutory audits.
(c) Tax fees.
The aggregate fees billed by the registrant’s independent auditors for tax-related services provided to the registrant were $16,068 for the fiscal year ended October 31, 2014. The percentage of these fees relating to services approved by the registrant’s Audit Committee pursuant to the de minimis exception from the pre-approval requirement in Rule 2-01(c)(7)(i)(C) of Regulation S-X was 0%. These tax-related services were as follows: review of income tax returns and review of annual excise distribution calculations.
The aggregate fees billed by the registrant’s independent auditors for tax-related services provided to the registrant’s investment adviser and other service providers under common control with the adviser and that relate directly to the operations or financial reporting of the registrant were $0 for the registrant’s fiscal year ended October 31, 2014.
The aggregate fees billed by the registrant’s independent auditors for tax-related services provided to the registrant were $21,650 for the fiscal year ended October 31, 2013. The percentage of these fees relating to services approved by the registrant’s Audit Committee pursuant to the de minimis exception from the pre-approval requirement in Rule 2-01(c)(7)(i)(C) of Regulation S-X was 0%. These tax-related services were as follows: review of income tax returns and review of annual excise distribution calculations.
The aggregate fees billed by the registrant’s independent auditors for tax-related services provided to the registrant’s investment adviser and other service providers under common control with the adviser and that relate directly to the operations or financial reporting of the registrant were $0 for the registrant’s fiscal year ended October 31, 2013.
(d) All other fees.
The aggregate fees billed for all services provided by the independent auditors to the registrant other than those set forth in paragraphs (a), (b) and (c) of this Item were $0 for the fiscal year ended October 31, 2014.
The aggregate fees billed for all services other than those set forth in paragraphs (b) and (c) of this Item provided by the registrant’s independent auditors to the registrant’s adviser and other service providers under common control with the adviser and that relate directly to the operations or financial reporting of the registrant were $0 for the registrant’s fiscal year ended October 31, 2014. The percentage of these fees relating to services approved by the registrant’s Audit Committee pursuant to the de minimis exception from the pre-approval requirement in Rule 2-01(c)(7)(i)(C) of Regulation S-X was 0%.
The aggregate fees billed for all services provided by the independent auditors to the registrant other than those set forth in paragraphs (a), (b) and (c) of this Item were $0 for the fiscal year ended October 31, 2013.
The aggregate fees billed for all services other than those set forth in paragraphs (b) and (c) of this Item provided by the registrant’s independent auditors to the registrant’s adviser and other service providers under common control with the adviser and that relate directly to the operations or financial reporting of the registrant were $0 for the registrant’s fiscal year ended October 31, 2013. The percentage of these fees relating to services approved by the registrant’s Audit Committee pursuant to the de minimis exception from the pre-approval requirement in Rule 2-01(c)(7)(i)(C) of Regulation S-X was 0%.
(e) The registrant’s Audit Committee has established pre-approval policies and procedures as permitted by Rule 2-01(c)(7)(i)(B) of Regulation S-X (the “Pre-Approval Policy”) with respect to services provided by the registrant’s independent auditors. Pursuant to the Pre-Approval Policy, the Audit Committee has pre-approved the services set forth in the table below with respect to the registrant up to the specified fee limits. Certain fee limits are based on aggregate fees to the registrant and other registrants within the Delaware Investments Family of Funds.
| Service | Range of Fees |
| Audit Services | |
| Statutory audits or financial audits for new Funds | up to $40,000 per Fund |
Services associated with SEC registration statements (e.g., Form N-1A, Form N-14, etc.), periodic reports and other documents filed with the SEC or other documents issued in connection with securities offerings (e.g., comfort letters for closed-end Fund offerings, consents), and assistance in responding to SEC comment letters | up to $10,000 per Fund |
Consultations by Fund management as to the accounting or disclosure treatment of transactions or events and/or the actual or potential impact of final or proposed rules, standards or interpretations by the SEC, FASB, or other regulatory or standard-setting bodies (Note: Under SEC rules, some consultations may be considered “audit-related services” rather than “audit services”) | up to $25,000 in the aggregate |
Audit-Related Services | |
Consultations by Fund management as to the accounting or disclosure treatment of transactions or events and/or the actual or potential impact of final or proposed rules, standards or interpretations by the SEC, FASB, or other regulatory or standard-setting bodies (Note: Under SEC rules, some consultations may be considered “audit services” rather than “audit-related services”) | up to $25,000 in the aggregate |
Tax Services | |
U.S. federal, state and local and international tax planning and advice (e.g., consulting on statutory, regulatory or administrative developments, evaluation of Funds’ tax compliance function, etc.) | up to $25,000 in the aggregate |
U.S. federal, state and local tax compliance (e.g., excise distribution reviews, etc.) | up to $5,000 per Fund |
Review of federal, state, local and international income, franchise and other tax returns | up to $5,000 per Fund |
Under the Pre-Approval Policy, the Audit Committee has also pre-approved the services set forth in the table below with respect to the registrant’s investment adviser and other entities controlling, controlled by or under common control with the investment adviser that provide ongoing services to the registrant (the “Control Affiliates”) up to the specified fee limit. This fee limit is based on aggregate fees to the investment adviser and its Control Affiliates.
| Service | Range of Fees |
| Non-Audit Services | |
Services associated with periodic reports and other documents filed with the SEC and assistance in responding to SEC comment letters | up to $10,000 in the aggregate |
The Pre-Approval Policy requires the registrant’s independent auditors to report to the Audit Committee at each of its regular meetings regarding all services initiated since the last such report was rendered, including those services authorized by the Pre-Approval Policy.
(f) Not applicable.
(g) The aggregate non-audit fees billed by the registrant’s independent auditors for services rendered to the registrant and to its investment adviser and other service providers under common control with the adviser were $5,653,375 and $7,732,970 for the registrant’s fiscal years ended October 31, 2014 and October 31, 2013, respectively.
(h) In connection with its selection of the independent auditors, the registrant’s Audit Committee has considered the independent auditors’ provision of non-audit services to the registrant’s investment adviser and other service providers under common control with the adviser that were not required to be pre-approved pursuant to Rule 2-01(c)(7)(ii) of Regulation S-X. The Audit Committee has determined that the independent auditors’ provision of these services is compatible with maintaining the auditors’ independence.
Item 5. Audit Committee of Listed Registrants
Not applicable.
Item 6. Investments
(a) Included as part of report to shareholders filed under Item 1 of this Form N-CSR.
(b) Divestment of securities in accordance with Section 13(c) of the Investment Company Act of 1940.
Not applicable.
Item 7. Disclosure of Proxy Voting Policies and Procedures for Closed-End Management Investment Companies
Not applicable.
Item 8. Portfolio Managers of Closed-End Management Investment Companies
Not applicable.
Item 9. Purchases of Equity Securities by Closed-End Management Investment Company and Affiliated Purchasers
Not applicable.
Item 10. Submission of Matters to a Vote of Security Holders
Not applicable.
Item 11. Controls and Procedures
The registrant’s principal executive officer and principal financial officer have evaluated the registrant’s disclosure controls and procedures within 90 days of the filing of this report and have concluded that they are effective in providing reasonable assurance that the information required to be disclosed by the registrant in its reports or statements filed under the Securities Exchange Act of 1934 is recorded, processed, summarized and reported within the time periods specified in the rules and forms of the Securities and Exchange Commission.
There were no significant changes in the registrant’s internal control over financial reporting that occurred during the second fiscal quarter of the period covered by the report to stockholders included herein (i.e., the registrant’s fourth fiscal quarter) that have materially affected, or are reasonably likely to materially affect, the registrant’s internal control over financial reporting.
Item 12. Exhibits
(a) (1) Code of Ethics
Not applicable.
(2) Certifications of Principal Executive Officer and Principal Financial Officer pursuant to Rule 30a-2 under the Investment Company Act of 1940 are attached hereto as Exhibit 99.CERT.
(3) Written solicitations to purchase securities pursuant to Rule 23c-1 under the Securities Exchange Act of 1934.
Not applicable.
(b) Certifications pursuant to Section 906 of the Sarbanes-Oxley Act of 2002 are furnished herewith as Exhibit 99.906CERT.
SIGNATURES
Pursuant to the requirements of the Securities Exchange Act of 1934 and the Investment Company Act of 1940, the registrant has duly caused this report to be signed on its behalf, by the undersigned, thereunto duly authorized.
Name of Registrant: DELAWARE GROUP® ADVISER FUNDS
| /s/ PATRICK P. COYNE | |
| By: | Patrick P. Coyne |
| Title: | Chief Executive Officer |
| Date: | January 6, 2015 |
Pursuant to the requirements of the Securities Exchange Act of 1934 and the Investment Company Act of 1940, this report has been signed below by the following persons on behalf of the registrant and in the capacities and on the dates indicated.
| /s/ PATRICK P. COYNE | |
| By: | Patrick P. Coyne |
| Title: | Chief Executive Officer |
| Date: | January 6, 2015 |
| /s/ RICHARD SALUS | |
| By: | Richard Salus |
| Title: | Chief Financial Officer |
| Date: | January 6, 2015 |