UNITED STATES SECURITIES AND EXCHANGE COMMISSION
Washington, D.C. 20549
FORM N-CSR
CERTIFIED SHAREHOLDER REPORT OF REGISTERED MANAGEMENT
INVESTMENT COMPANIES
| Investment Company Act file number: | 811-07972 | |
| Exact name of registrant as specified in charter: | Delaware Group® Adviser Funds | |
| Address of principal executive offices: | 2005 Market Street | |
| Philadelphia, PA 19103 | ||
| Name and address of agent for service: | David F. Connor, Esq. | |
| 2005 Market Street | ||
| Philadelphia, PA 19103 | ||
| Registrant’s telephone number, including area code: | (800) 523-1918 | |
| Date of fiscal year end: | October 31 | |
| Date of reporting period: | October 31, 2017 |
Item 1. Reports to Stockholders
Table of Contents
Delaware FundsSM by MACQUARIE |  | |||
| Annual report | ||||
Fixed income mutual fund
Delaware Diversified Income Fund
October 31, 2017
Carefully consider the Fund’s investment objectives, risk factors, charges, and expenses before investing. This and other information can be found in the Fund’s prospectus and its summary prospectus, which may be obtained by visiting delawarefunds.com/literature or calling 800 523-1918. Investors should read the prospectus and the summary prospectus carefully before investing.
You can obtain shareholder reports and prospectuses online instead of in the mail. Visit delawarefunds.com/edelivery.
Table of Contents
Experience Delaware FundsSM by Macquarie
Macquarie Investment Management (MIM) is a global asset manager with offices throughout the United States, Europe, Asia, and Australia. We are active managers who prioritize autonomy and accountability at the investment team level in pursuit of opportunities that matter for our clients. Delaware Funds is one of the longest-standing mutual fund families, with more than 75 years in existence.
If you are interested in learning more about creating an investment plan, contact your financial advisor.
You can learn more about Delaware Funds or obtain a prospectus for Delaware Diversified Income Fund at delawarefunds.com/literature.
Manage your account online
| ● | Check your account balance and transactions |
| ● | View statements and tax forms |
| ● | Make purchases and redemptions |
Visit delawarefunds.com/account-access.
MIM is the marketing name for the registered investment advisers including Macquarie Investment Management Business Trust (MIMBT) (formerly, Delaware Management Business Trust), Macquarie Funds Management Hong Kong Limited, Macquarie Investment Management Austria Kapitalanlage AG, Macquarie Investment Management Global Limited, Macquarie Bank International Limited, Macquarie Investment Management Europe Limited, Macquarie Investment Management Limited, and Macquarie Capital Investment Management, Inc.
The Fund is distributed by Delaware Distributors, L.P., an affiliate of MIMBT and Macquarie Group Limited. MIM, a member of Macquarie Group, refers to the companies comprising the asset management division of Macquarie Group Limited and its subsidiaries and affiliates worldwide.
Other than Macquarie Bank Limited (MBL), none of the entities noted are authorized deposit-taking institutions for the purposes of the Banking Act 1959 (Commonwealth of Australia). The obligations of these entities do not represent deposits or other liabilities of MBL. MBL does not guarantee or otherwise provide assurance in respect of the obligations of these entities, unless noted otherwise. The Fund is governed by US laws and regulations.
| 1 | ||||
| 4 | ||||
| 8 | ||||
| 10 | ||||
| 12 | ||||
| 72 | ||||
| 74 | ||||
| 76 | ||||
| 78 | ||||
| 87 | ||||
| 110 | ||||
| 111 | ||||
| 116 | ||||
| 122 |
Unless otherwise noted, views expressed herein are current as of Oct. 31, 2017, and subject to change for events occurring after such date.
The Fund is not FDIC insured and is not guaranteed. It is possible to lose the principal amount invested.
Advisory services provided by Delaware Management Company, a series of MIMBT, a US registered investment advisor.
All third-party marks cited are the property of their respective owners.
© 2017 Macquarie Management Holdings, Inc. (formerly, Delaware Management Holdings, Inc.)
Table of Contents
| Portfolio management review | ||
Delaware Diversified Income Fund | November 7, 2017 | |
Performance preview (for the year ended October 31, 2017) | ||||||||
Delaware Diversified Income Fund (Institutional Class shares) | 1-year return | +3.03 | % | |||||
Delaware Diversified Income Fund (Class A shares) | 1-year return | +2.89 | % | |||||
Bloomberg Barclays US Aggregate Index (benchmark) | 1-year return | +0.90 | % |
Past performance does not guarantee future results.
For complete, annualized performance for Delaware Diversified Income Fund, please see the table on page 4. Institutional Class shares are not subject to a sales charge and are offered for sale exclusively to certain eligible investors. In addition, Institutional Class shares pay no distribution and service fee.
The performance of Class A shares excludes the applicable sales charge. Both Institutional Class shares and Class A shares reflect the reinvestment of all distributions and reflects the reinvestment of all distributions. Please see page 7 for a description of the index. Index performance returns do not reflect any management fees, transaction costs, or expenses. Indices are unmanaged and one cannot invest directly in an index.
As the Fund’s fiscal year began, the global economy picked up momentum following a brief period of economic and financial weakness. Earlier in 2016, slow-growing economies led the Bank of Japan (BOJ) and the European Central Bank (ECB) to initiate new stimulus policies, igniting rallies in numerous fixed income sectors. The BOJ pegged its 10-year government bond at a 0% yield and maintained shorter-term rates in negative yield territory, while the ECB extended its monthly asset purchases to $60 billion and began to include corporate bond purchases.
These major central bank moves and the delay in the US Federal Reserve’s move toward rate normalization in 2016 enhanced liquidity, boosting the performance of many fixed income asset classes.
Additionally, early in the Fund’s fiscal year, the surprise election of Donald Trump as US president had a twofold effect on investors as they anticipated a more favorable operating environment for businesses and better returns from stocks. Additionally, Trump’s early tough talk on trade had a negative effect on emerging market fixed income securities and currencies, creating a buying opportunity.
Fixed income markets benefited from:
| ● | Continued central bank stimulus abroad |
| ● | Steadily improving economic conditions in the United States |
| ● | The Trump administration’s pro-business policies. |
1
Table of Contents
Portfolio management review
Delaware Diversified Income Fund
Fixed income market yield premiums compressed throughout the fiscal year, despite a series of legislative disappointments, as investors found favor with the administration’s effort to reduce the regulatory burden on businesses. Meanwhile, the economic and financial market environments continued to improve. The euro zone entered a slow but steady period of growth while the US economy strengthened as unemployment continued to decline. China’s rate of growth stabilized, and other emerging market countries, which had suffered from a downturn in commodity prices, rallied back strongly. Early in 2017, for example, Brazil rebounded from a two-year recession.
The tightening of yield spreads boosted prices in most non-Treasury fixed income sectors. High yield spreads compressed significantly during the fiscal year, and investment grade corporate bonds, emerging market bonds, agency mortgage-backed securities (MBS), and commercial mortgage-backed securities (CMBS) benefited to varying degrees. High yield bonds also gained from a clearing-out process prompted by a modest spike in credit defaults before the fiscal period. This removed some market participants with weaker balance sheets and reinforced better behavior among companies that had taken on leverage or were considering doing so. As the fiscal year unfolded, companies reduced their leverage, improved their interest rate coverage ratios, and had better balance-sheet liquidity, resulting in lower default rates.
Fund performance
For the fiscal year ended Oct. 31, 2017, Delaware Diversified Income Fund outperformed its benchmark, the Bloomberg Barclays US Aggregate Index. The Fund’s Institutional Class shares returned +3.03%. The Fund’s Class A shares returned +2.89% at net asset value and -1.79% at maximum offer price (these figures reflect all distributions reinvested). During the
same period, the benchmark returned +0.90%. For complete, annualized performance of Delaware Diversified Income Fund, please see the table on page 4.
Holdings in high yield bonds, emerging markets, bank and finance bonds, and hybrid-type vehicles, including convertible bonds and preferred stocks, aided the Fund’s performance relative to its benchmark. A barbell strategy among agency MBS – focused on the short and long ends of the yield curve – also contributed.
Among high yield bonds, the Fund’s relatively defensive position helped during the fiscal year as intermediate quality and some lower-beta (less volatile) energy holdings performed well, including pipeline investments and independent energy producers.
In emerging market bonds, US dollar-denominated government bonds performed well early in the fiscal year, with yields decreasing as a result of improving economic fundamentals and a healthier market environment. Later in the period, the combination of some disappointments regarding the Trump administration’s legislative agenda and firming economic growth in non-US markets sparked a rally in both emerging market and developed market currencies relative to the US dollar. The Fund’s local-currency emerging market investments did well in Latin America, Asia, and Eastern Europe. We invested in Argentina for the first time in years, encouraged by its new president’s attractive economic policies. Uruguayan and Turkish government issues also contributed among emerging market bonds.
Domestically, with the Fund’s bank and finance investments, we went lower in the capital structure to find additional yield and greater potential return. This included extensive exposure to subordinate debt, including alternative tier 1 capital investments, which performed particularly well. The banking sector recovered strongly from the global financial crisis, thanks in part to regulators’ forcing banks to add capital and bolster their
2
Table of Contents
balance sheets. The result during the Fund’s fiscal year was a sound return on investments lower in capital structure. Individual contributors included hybrid securities issued by Royal Bank of Scotland Group, Credit Suisse Group, and UBS Group.
Among agency collateralized mortgage obligations (CMOs), we combined short-term interest-only investments on the short end of the barbell with long average life sequential-pay investments on the long end. With the yield curve flattening and short-term rates rising as a result of the Fed’s rate hikes, this barbell approach outperformed a typical plain-vanilla agency MBS investment.
On the negative side, the Fund’s US Treasury investments detracted from absolute returns. However, the Fund’s underweight exposure in Treasurys aided relative performance. Cross-country hedging was a more significant relative detractor from Fund returns. We had anticipated that European rates would rise as a result of the region’s economic upswing. Accordingly, we used an interest rate swap in which the Fund paid 30-year bond rates and received the London interbank offered rate (LIBOR). However, while the swap spreads widened, the yield curve flattened, hurting that trade.
Individual detractors from Fund performance included Fannie Mae fixed-rate agency MBS, 30-year interest rate swaps, and a short position
on 10-year German bund futures. Also, late in the fiscal year, South African bonds detracted from performance as a result of some political volatility in that country.
Overall, as of fiscal year end, we believed a number of sectors were fully priced and could be subject to corrections in the event of disappointing performance. The yield curve has flattened in response to the Fed’s slow and steady interest rate increases. With a rise in inflation, the curve could steepen again and compress fixed income prices across multiple sectors. Accordingly, as central bank stimulus is gradually withdrawn, we anticipate a shift toward capital preservation.
The Fund used interest rate swaps – specifically interest rate futures – to adjust yield curve and duration levels. We used currency forwards to hedge currency exposure, primarily to help reduce it, but also to raise it at times. The use of both of these derivatives, though intended to hedge risks, detracted from overall returns.
We also bought options on spot currency to help hedge long positions, used credit default swaps to lower credit exposure at times, and bought E-mini S&P 500 futures (these are one-fifth the size of the standard S&P 500 futures contracts) to hedge volatility and credit exposure. None of these derivative products or strategies had a material effect on the Fund’s returns.
3
Table of Contents
| Delaware Diversified Income Fund | October 31, 2017 |
The performance quoted represents past performance and does not guarantee future results. Investment return and principal value of an investment will fluctuate so that shares, when redeemed, may be worth more or less than their original cost. Current performance may be lower or higher than the performance quoted. Performance data current to the most recent month end may be obtained by calling 800 523-1918 or visiting delawarefunds.com/performance.
| Fund and benchmark performance1,2 | Average annual total returns through October 31, 2017 | |||||||||||||||
| 1 year | 5 years | 10 years | Lifetime | |||||||||||||
Class A (Est. Dec. 29, 1997) | ||||||||||||||||
Excluding sales charge | +2.89% | +2.24% | +5.15% | +6.64% | ||||||||||||
Including sales charge | –1.79% | +1.29% | +4.67% | +6.39% | ||||||||||||
Class C (Est. Oct. 28, 2002) | ||||||||||||||||
Excluding sales charge | +2.13% | +1.48% | +4.36% | +5.41% | ||||||||||||
Including sales charge | +1.13% | +1.48% | +4.36% | +5.41% | ||||||||||||
Class R (Est. June 2, 2003) | ||||||||||||||||
Excluding sales charge | +2.52% | +1.96% | +4.87% | +5.20% | ||||||||||||
Including sales charge | +2.52% | +1.96% | +4.87% | +5.20% | ||||||||||||
Institutional Class (Est. Oct. 28, 2002) | ||||||||||||||||
Excluding sales charge | +3.03% | +2.47% | +5.39% | +6.45% | ||||||||||||
Including sales charge | +3.03% | +2.47% | +5.39% | +6.45% | ||||||||||||
Class R6 (Est. May 2, 2016) | ||||||||||||||||
Excluding sales charge | +3.02%* | n/a | n/a | +3.70% | ||||||||||||
Including sales charge | +3.02%* | n/a | n/a | +3.70% | ||||||||||||
Bloomberg Barclays US Aggregate Index | +0.90% | +2.04% | +4.19% | +4.26%** | ||||||||||||
* Total return for the report period presented in the table differs from the return in “Financial highlights.” The total return presented in the above table is calculated based on the net asset value (NAV) at which shareholder transactions were processed. The total return presented in “Financial highlights” is calculated in the same manner, but also takes into account certain adjustments that are necessary under US generally accepted accounting principles required in the annual report.
** The benchmark lifetime return is for Institutional Class share comparison only and is calculated using the last business day in the month of the Fund’s Institutional Class inception date.
1 Returns reflect the reinvestment of all distributions and are presented both with and without the applicable sales charges described below. Returns do not reflect the deduction of taxes the shareholder would pay on Fund distributions or redemptions of Fund shares.
Expense limitations were in effect for certain classes during some or all of the periods shown in the “Fund and benchmark performance” table. Expenses for each class are listed on the “Fund expense ratios” table on page 6. Performance
would have been lower had expense limitations not been in effect.
Institutional Class shares are not subject to a sales charge and are offered for sale exclusively to certain eligible investors. In addition, Institutional Class shares pay no distribution and service fee.
Class A shares are sold with a maximum front-end sales charge of 4.50%, and have an annual distribution and service fee of 0.25% of average daily net assets. Performance for Class A shares, excluding sales charges, assumes that no front-end sales charge applied.
4
Table of Contents
Class C shares are sold with a contingent deferred sales charge of 1.00% if redeemed during the first 12 months. They are also subject to an annual distribution and service fee of 1.00% of average daily net assets. Performance for Class C shares, excluding sales charges, assumes either that contingent deferred sales charges did not apply or that the investment was not redeemed.
Class R shares are available only for certain retirement plan products. They are sold without a sales charge and have an annual distribution and service fee of 0.50% of average daily net assets.
Class R6 shares are available only to certain investors. In addition, Class R6 shares do not pay any service fees, sub-accounting fees, and/or sub-transfer agency fees to any brokers, dealers, or other financial intermediaries. Class R6 shares pay no distribution and service fee.
Fixed income securities and bond funds can lose value, and investors can lose principal, as interest rates rise. They also may be affected by economic conditions that hinder an issuer’s ability to make interest and principal payments on its debt.
The Fund may also be subject to prepayment risk, the risk that the principal of a bond that is held by a portfolio will be prepaid prior to maturity, at the time when interest rates are lower than what the bond was paying. A portfolio may then have to reinvest that money at a lower interest rate.
High yielding, non-investment-grade bonds (junk bonds) involve higher risk than investment grade bonds. The high yield secondary market is particularly susceptible to liquidity problems when institutional investors, such as mutual funds and certain other financial institutions, temporarily stop buying bonds for regulatory, financial, or other reasons. In addition, a less liquid secondary market makes it more difficult for the Fund to obtain precise valuations of the high yield securities in its portfolio.
The Fund may invest in derivatives, which may involve additional expenses and are subject to risk, including the risk that an underlying security or securities index moves in the opposite direction from what the portfolio manager anticipated. A derivatives transaction depends upon the counterparties’ ability to fulfill their contractual obligations.
If and when the Fund invests in forward foreign currency contracts or uses other investments to hedge against currency risks, the Fund will be subject to special risks, including counterparty risk.
The Fund may experience portfolio turnover in excess of 100%, which could result in higher transaction costs and tax liability.
Investments in mortgage-backed securities (MBS) may involve risks. MBS represent an ownership interest in a pool of mortgage loans. The individual mortgage loans are packaged or “pooled” together for sale to investors. These mortgage loans may have either fixed or adjustable interest rates.
Investments in collateralized loan obligations (CLOs) may involve risks. CLOs are securities backed by a pool of debt, often low-rated corporate loans. Investors receive scheduled debt payments from the underlying loans but assume most of the risk in the event that borrowers default.
International investments entail risks not ordinarily associated with US investments including fluctuation in currency values, differences in accounting principles, or economic or political instability in other nations.
Investing in emerging markets can be riskier than investing in established foreign markets due to increased volatility and lower trading volume.
5
Table of Contents
Performance summary
Delaware Diversified Income Fund
2 The Fund’s expense ratios, as described in the most recent prospectus, are disclosed in the following “Fund expense ratios” table. Please see the “Financial highlights” section in this report for the most recent expense ratios.
| Fund expense ratios | Class A | Class C | Class R | Institutional Class | Class R6 | |||||
Total annual operating expenses | 0.89% | 1.64% | 1.14% | 0.64% | 0.55% | |||||
(without fee waivers) | ||||||||||
Net expenses | 0.89% | 1.64% | 1.14% | 0.64% | 0.55% | |||||
(including fee waivers, if any) | ||||||||||
Type of waiver | n/a | n/a | n/a | n/a | n/a |
Performance of a $10,000 investment1
Average annual total returns from Oct. 31, 2007 through Oct. 31, 2017
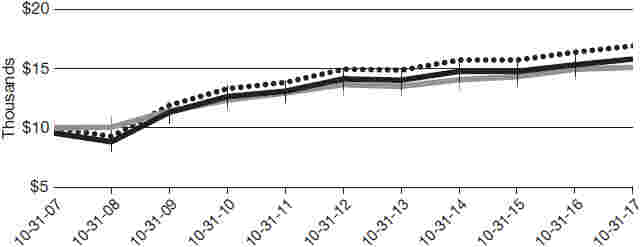
For the period beginning Oct. 31, 2007 through Oct. 31, 2017 | Starting value | Ending value | ||||||||
| Delaware Diversified Income | |||||||||
Fund — Institutional Class shares | $10,000 | $16,912 | ||||||||
| Delaware Diversified Income | |||||||||
Fund — Class A shares | $9,550 | $15,776 | ||||||||
| Bloomberg Barclays US Aggregate Index | $10,000 | $15,070 | |||||||


1 The “Performance of a $10,000 investment” graph assumes $10,000 invested in Institutional Class and Class A shares of the Fund on Oct. 31, 2007, and includes the effect of a 4.50% front-end sales charge (for Class A shares) and the reinvestment of all distributions. The graph does not reflect the deduction of taxes the shareholders
would pay on Fund distributions or redemptions of Fund shares. Expense limitations were in effect for some or all of the periods shown. Performance would have been lower had expense limitations not been in effect. Expenses are listed in the “Fund expense ratios” table above. Please note additional details on pages 4 through 7.
6
Table of Contents
The graph also assumes $10,000 invested in the Bloomberg Barclays US Aggregate Index as of Oct. 31, 2007. The Bloomberg Barclays US Aggregate Index measures the performance of publicly issued investment grade (Baa3/BBB- or better) corporate, US government, mortgage- and asset-backed securities with at least one year to maturity and at least $250 million par amount outstanding.
Index performance returns do not reflect any management fees, transaction costs, or expenses. Indices are unmanaged and one cannot invest directly in an index. Past performance is not a guarantee of future results.
Performance of other Fund classes will vary due to different charges and expenses.
| Nasdaq | CUSIPs | |||||||||
Class A | DPDFX | 246248744 | ||||||||
Class C | DPCFX | 246248595 | ||||||||
Class R | DPRFX | 246248553 | ||||||||
Institutional Class | DPFFX | 246248587 | ||||||||
Class R6 | DPZRX | 245917612 | ||||||||
7
Table of Contents
For the six-month period from May 1, 2017 to October 31, 2017 (Unaudited)
As a shareholder of the Fund, you incur two types of costs: (1) transaction costs, including sales charges (loads) on purchase payments, reinvested dividends, or other distributions; redemption fees; and exchange fees; and (2) ongoing costs, including management fees; distribution and/or service (12b-1) fees; and other Fund expenses. This example is intended to help you understand your ongoing costs (in dollars) of investing in the Fund and to compare these costs with the ongoing costs of investing in other mutual funds.
The example is based on an investment of $1,000 invested at the beginning of the period and held for the entire six-month period from May 1, 2017 to Oct. 31, 2017.
Actual expenses
The first section of the table shown, “Actual Fund return,” provides information about actual account values and actual expenses. You may use the information in this section of the table, together with the amount you invested, to estimate the expenses that you paid over the period. Simply divide your account value by $1,000 (for example, an $8,600 account value divided by $1,000 = 8.6), then multiply the result by the number in the first section under the heading entitled “Expenses Paid During Period” to estimate the expenses you paid on your account during this period.
Hypothetical example for comparison purposes
The second section of the table shown, “Hypothetical 5% return,” provides information about hypothetical account values and hypothetical expenses based on the Fund’s actual expense ratio and an assumed rate of return of 5% per year before expenses, which is not the Fund’s actual return. The hypothetical account values and expenses may not be used to estimate the actual ending account balance or expenses you paid for the period. You may use this information to compare the ongoing costs of investing in the Fund and other funds. To do so, compare this 5% hypothetical example with the 5% hypothetical examples that appear in the shareholder reports of the other funds.
Please note that the expenses shown in the table are meant to highlight your ongoing costs only and do not reflect any transactional costs, such as sales charges (loads), redemption fees, or exchange fees. Therefore, the second section of the table is useful in comparing ongoing costs only, and will not help you determine the relative total costs of owning different funds. In addition, if these transactional costs were included, your costs would have been higher. The expenses shown in the table assume reinvestment of all dividends and distributions.
8
Table of Contents
Delaware Diversified Income Fund
Expense analysis of an investment of $1,000
Beginning Account Value 5/1/17 | Ending Account Value 10/31/17 | Annualized Expense Ratio | Expenses Paid During Period 5/1/17 to 10/31/17* | |||||||||||||
| ||||||||||||||||
Actual Fund return† | ||||||||||||||||
Class A | $1,000.00 | $1,022.20 | 0.88% | $4.49 | ||||||||||||
Class C | 1,000.00 | 1,018.30 | 1.63% | 8.29 | ||||||||||||
Class R | 1,000.00 | 1,019.70 | 1.13% | 5.75 | ||||||||||||
Institutional Class | 1,000.00 | 1,022.30 | 0.63% | 3.21 | ||||||||||||
Class R6 | 1,000.00 | 1,022.70 | 0.54% | 2.75 | ||||||||||||
| ||||||||||||||||
Hypothetical 5% return (5% return before expenses) |
| |||||||||||||||
Class A | $1,000.00 | $1,020.77 | 0.88% | $4.48 | ||||||||||||
Class C | 1,000.00 | 1,016.99 | 1.63% | 8.29 | ||||||||||||
Class R | 1,000.00 | 1,019.51 | 1.13% | 5.75 | ||||||||||||
Institutional Class | 1,000.00 | 1,022.03 | 0.63% | 3.21 | ||||||||||||
Class R6 | 1,000.00 | 1,022.48 | 0.54% | 2.75 | ||||||||||||
| ||||||||||||||||
| * | “Expenses Paid During Period” are equal to the Fund’s annualized expense ratio, multiplied by the average account value over the period, multiplied by 184/365 (to reflect the one-half year period). |
| † | Because actual returns reflect only the most recent six-month period, the returns shown may differ significantly from fiscal year returns. |
9
Table of Contents
| Security type / sector allocation | ||
| Delaware DiversiSfied Income Fund | As of October 31, 2017 (Unaudited) |
Sector designations may be different than the sector designations presented in other Fund materials. The sector designations may represent the investment manager’s internal sector classifications.
Security type / sector | Percentage of net assets | |||||||||
Agency Asset-Backed Securities | 0.02% | |||||||||
Agency Collateralized Mortgage Obligations | 8.61% | |||||||||
Agency Commercial Mortgage-Backed Securities | 1.27% | |||||||||
Agency Mortgage-Backed Securities | 4.43% | |||||||||
Collateralized Debt Obligations | 2.12% | |||||||||
Convertible Bonds | 2.69% | |||||||||
Corporate Bonds | 50.74% | |||||||||
Automotive | 0.14% | |||||||||
Banking | 11.05% | |||||||||
Basic Industry | 5.18% | |||||||||
Brokerage | 0.91% | |||||||||
Capital Goods | 2.00% | |||||||||
Communications | 5.15% | |||||||||
Consumer Cyclical | 1.99% | |||||||||
Consumer Non-Cyclical | 4.36% | |||||||||
Electric | 5.19% | |||||||||
Energy | 5.67% | |||||||||
Finance Companies | 1.22% | |||||||||
Healthcare | 0.74% | |||||||||
Insurance | 1.43% | |||||||||
Media | 1.25% | |||||||||
Real Estate | 1.32% | |||||||||
Services | 0.81% | |||||||||
Technology | 0.83% | |||||||||
Transportation | 1.16% | |||||||||
Utilities | 0.34% | |||||||||
Loan Agreements | 5.76% | |||||||||
Municipal Bonds | 0.67% | |||||||||
Non-Agency Asset-Backed Securities | 1.66% | |||||||||
Non-Agency Collateralized Mortgage Obligations | 2.12% | |||||||||
Non-Agency Commercial Mortgage-Backed Securities | 6.24% | |||||||||
Regional Bonds | 0.65% | |||||||||
Sovereign Bonds | 6.69% | |||||||||
Supranational Banks | 0.63% | |||||||||
US Treasury Obligations | 2.06% | |||||||||
Common Stock | 0.00% | |||||||||
Convertible Preferred Stock | 0.66% | |||||||||
Preferred Stock | 0.72% | |||||||||
10
Table of Contents
Security type / sector | Percentage of net assets | |||||||||||
Options Purchased | 0.01 | % | ||||||||||
Short-Term Investments | 2.22 | % | ||||||||||
Securities Lending Collateral | 2.14 | % | ||||||||||
Total Value of Securities | 102.11 | % | ||||||||||
Obligation to Return Securities Lending Collateral | (2.13 | %) | ||||||||||
Receivables and Other Assets Net of Liabilities | 0.02 | % | ||||||||||
Total Net Assets | 100.00 | % | ||||||||||
11
Table of Contents
| Schedule of investments | ||
| Delaware Diversified Income Fund | October 31, 2017 |
| Principal amount° | Value (US $) | |||||||
| ||||||||
Agency Asset-Backed Securities – 0.02% | ||||||||
| ||||||||
Fannie Mae Grantor Trust | ||||||||
Series 2003-T4 2A5 4.757% 9/26/33 f | 705,119 | $ | 775,874 | |||||
Fannie Mae REMIC Trust | ||||||||
Series 2001-W2 AS5 6.473% 10/25/31 f | 180 | 180 | ||||||
Series 2002-W11 AV1 1.578% (LIBOR01M + 0.34%) 11/25/32 ● | 3,317 | 3,245 | ||||||
|
| |||||||
Total Agency Asset-Backed Securities (cost $682,501) | 779,299 | |||||||
|
| |||||||
| ||||||||
Agency Collateralized Mortgage Obligations – 8.61% | ||||||||
| ||||||||
Fannie Mae Connecticut Avenue Securities | ||||||||
Series 2016-C03 1M1 3.238% (LIBOR01M + 2.00%) 10/25/28 ● | 4,479,746 | 4,556,382 | ||||||
Series 2016-C04 1M1 2.688% (LIBOR01M + 1.45%) 1/25/29 ● | 2,862,162 | 2,892,460 | ||||||
Series 2016-C05 2M1 2.588% (LIBOR01M + 1.35%) 1/25/29 ● | 1,481,863 | 1,491,648 | ||||||
Series 2017-C01 1M1 2.538% (LIBOR01M + 1.30%) 7/25/29 ● | 2,534,743 | 2,559,157 | ||||||
Series 2017-C04 2M2 4.088% (LIBOR01M + 2.85%) 11/25/29 ● | 1,860,000 | 1,900,698 | ||||||
Series 2017-C05 1M2 3.438% (LIBOR01M + 2.20%) 1/25/30 ● | 3,075,000 | 3,051,542 | ||||||
Fannie Mae Grantor Trust | ||||||||
Series 1999-T2 A1 7.50% 1/19/39 ● | 9,600 | 10,653 | ||||||
Series 2002-T1 A2 7.00% 11/25/31 | 784,232 | 922,622 | ||||||
Series 2002-T4 A3 7.50% 12/25/41 | 101,547 | 114,249 | ||||||
Series 2002-T19 A1 6.50% 7/25/42 | 82,567 | 95,703 | ||||||
Series 2004-T1 1A2 6.50% 1/25/44 | 35,054 | 40,010 | ||||||
Fannie Mae Interest Strip | ||||||||
Series 265 2 9.00% 3/25/24 | 3,509 | 4,049 | ||||||
Series 413 167 4.50% 7/25/42 S● | 180,700 | 46,047 | ||||||
Series 419 C3 3.00% 11/25/43 S | 1,987,122 | 385,522 | ||||||
Fannie Mae REMIC Trust | ||||||||
Series 2002-W1 2A 7.50% 2/25/42 ● | 495,059 | 556,939 | ||||||
Series 2002-W6 2A 7.50% 6/25/42 ● | 21,500 | 24,087 | ||||||
Series 2003-W1 2A 7.50% 12/25/42 ● | 12,100 | 13,721 | ||||||
Series 2003-W10 1A4 4.505% 6/25/43 | 15,842 | 16,557 | ||||||
Series 2003-W15 2A7 5.55% 8/25/43 | 14,942 | 15,665 | ||||||
Series 2004-W11 1A2 6.50% 5/25/44 | 236,406 | 270,806 | ||||||
Fannie Mae REMICs | ||||||||
Series 1990-92 C 7.00% 8/25/20 | 281 | 295 | ||||||
Series 1996-46 ZA 7.50% 11/25/26 | 83,649 | 94,615 | ||||||
Series 2001-50 BA 7.00% 10/25/41 | 46,002 | 52,399 | ||||||
Series 2002-77 Z 5.50% 12/25/32 | 394,676 | 434,816 | ||||||
12
Table of Contents
| Principal amount° | Value (US $) | |||||||
| ||||||||
Agency Collateralized Mortgage Obligations (continued) | ||||||||
| ||||||||
Fannie Mae REMICs | ||||||||
Series 2002-83 GH 5.00% 12/25/17 | 704 | $ | 703 | |||||
Series 2002-84 DZ 5.50% 12/25/32 | 424,115 | 470,688 | ||||||
Series 2002-90 A1 6.50% 6/25/42 | 783 | 902 | ||||||
Series 2002-90 A2 6.50% 11/25/42 | 154,099 | 175,598 | ||||||
Series 2003-11 BY 5.50% 2/25/33 | 66,028 | 73,940 | ||||||
Series 2003-38 MP 5.50% 5/25/23 | 967,291 | 1,027,277 | ||||||
Series 2003-78 B 5.00% 8/25/23 | 76,395 | 81,156 | ||||||
Series 2005-70 PA 5.50% 8/25/35 | 310,915 | 348,714 | ||||||
Series 2007-40 PT 5.50% 5/25/37 | 14,875 | 16,413 | ||||||
Series 2008-15 SB 5.362% (6.60% minus LIBOR01M, Cap 6.60%, Floor 0.00%) 8/25/36 S● | 667,866 | 124,548 | ||||||
Series 2009-11 MP 7.00% 3/25/49 | 15,675 | 18,696 | ||||||
Series 2009-69 HL 5.00% 9/25/39 | 741,711 | 801,388 | ||||||
Series 2009-94 AC 5.00% 11/25/39 | 2,486,087 | 2,703,980 | ||||||
Series 2010-35 AB 5.00% 11/25/49 | 108,818 | 118,685 | ||||||
Series 2010-41 PN 4.50% 4/25/40 | 33,000 | 35,240 | ||||||
Series 2010-43 HJ 5.50% 5/25/40 | 788,531 | 869,507 | ||||||
Series 2010-96 DC 4.00% 9/25/25 | 6,305,543 | 6,701,788 | ||||||
Series 2010-129 SM 4.762% (6.00% minus LIBOR01M, Cap 6.00%, Floor 0.00%) 11/25/40 S● | 5,175,002 | 780,204 | ||||||
Series 2011-105 FP 1.638% (LIBOR01M + 0.40%) 6/25/41 ● | 19,519 | 19,606 | ||||||
Series 2012-19 HB 4.00% 1/25/42 | 524,358 | 542,726 | ||||||
Series 2012-19 NI 3.50% 10/25/31 S | 2,806,245 | 347,100 | ||||||
Series 2012-98 MI 3.00% 8/25/31 S | 6,941,251 | 795,651 | ||||||
Series 2012-99 AI 3.50% 5/25/39 S | 2,377,933 | 298,433 | ||||||
Series 2012-115 MI 3.50% 3/25/42 S | 1,236,780 | 153,406 | ||||||
Series 2012-120 WI 3.00% 11/25/27 S | 5,613,641 | 552,513 | ||||||
Series 2012-122 SD 4.862% (6.10% minus LIBOR01M, Cap 6.10%, Floor 0.00%) 11/25/42 S● | 11,159,811 | 2,161,836 | ||||||
Series 2012-137 AI 3.00% 12/25/27 S | 2,482,786 | 235,818 | ||||||
Series 2012-139 NS 5.462% (6.70% minus LIBOR01M, Cap 6.70%, Floor 0.00%) 12/25/42 S● | 2,498,240 | 584,754 | ||||||
Series 2012-150 KC 2.50% 1/25/43 | 617,350 | 612,680 | ||||||
Series 2013-2 CS 4.912% (6.15% minus LIBOR01M, Cap 6.15%, Floor 0.00%) 2/25/43 S● | 6,351,899 | 1,211,892 | ||||||
Series 2013-2 LZ 3.00% 2/25/43 | 844,974 | 783,616 | ||||||
Series 2013-7 EI 3.00% 10/25/40 S | 3,755,246 | 495,066 | ||||||
Series 2013-20 IH 3.00% 3/25/33 S | 2,253,325 | 326,595 | ||||||
Series 2013-23 IL 3.00% 3/25/33 S | 2,036,590 | 288,791 | ||||||
Series 2013-26 ID 3.00% 4/25/33 S | 9,308,486 | 1,349,165 | ||||||
Series 2013-31 MI 3.00% 4/25/33 S | 3,246,605 | 472,589 | ||||||
Series 2013-38 AI 3.00% 4/25/33 S | 9,067,461 | 1,197,027 | ||||||
13
Table of Contents
| Schedule of investments | ||
| Delaware Diversified Income Fund |
| Principal amount° | Value (US $) | |||||||
| ||||||||
Agency Collateralized Mortgage Obligations (continued) | ||||||||
| ||||||||
Fannie Mae REMICs | ||||||||
Series 2013-41 HI 3.00% 2/25/33 S | 6,812,313 | $ | 775,419 | |||||
Series 2013-43 IX 4.00% 5/25/43 S | 21,716,119 | 5,190,997 | ||||||
Series 2013-44 DI 3.00% 5/25/33 S | 27,158,660 | 3,953,326 | ||||||
Series 2013-44 Z 3.00% 5/25/43 | 143,302 | 133,844 | ||||||
Series 2013-45 PI 3.00% 5/25/33 S | 703,562 | 101,535 | ||||||
Series 2013-55 AI 3.00% 6/25/33 S | 8,790,511 | 1,290,539 | ||||||
Series 2013-59 PY 2.50% 6/25/43 | 514,000 | 473,482 | ||||||
Series 2013-62 PY 2.50% 6/25/43 | 105,000 | 95,480 | ||||||
Series 2013-69 IJ 3.00% 7/25/33 S | 1,598,559 | 226,657 | ||||||
Series 2013-72 ZL 3.50% 7/25/43 | 177,942 | 176,523 | ||||||
Series 2013-92 SA 4.712% (5.95% minus LIBOR01M, Cap 5.95%, Floor 0.00%) 9/25/43 S● | 9,904,830 | 2,126,538 | ||||||
Series 2013-101 HS 5.262% (6.50% minus LIBOR01M, Cap 6.50%, Floor 0.00%) 10/25/43 S● | 2,986,615 | 709,314 | ||||||
Series 2013-103 SK 4.682% (5.92% minus LIBOR01M, Cap 5.92%, Floor 0.00%) 10/25/43 S● | 8,512,902 | 1,877,192 | ||||||
Series 2014-5 JL 4.00% 2/25/44 | 78,000 | 85,110 | ||||||
Series 2014-21 ID 3.50% 6/25/33 S | 89,527 | 11,890 | ||||||
Series 2014-36 ZE 3.00% 6/25/44 | 4,505,405 | 4,168,677 | ||||||
Series 2014-68 BS 4.912% (6.15% minus LIBOR01M, Cap 6.15%, Floor 0.00%) 11/25/44 S● | 7,345,617 | 1,451,844 | ||||||
Series 2014-72 ZJ 3.00% 11/25/44 | 433,349 | 424,105 | ||||||
Series 2014-77 AI 3.00% 10/25/40 S | 368,647 | 43,866 | ||||||
Series 2014-85 IB 3.00% 12/25/44 S | 1,323,568 | 251,565 | ||||||
Series 2014-90 SA 4.912% (6.15% minus LIBOR01M, Cap 6.15%, Floor 0.00%) 1/25/45 S● | 32,844,173 | 6,400,833 | ||||||
Series 2015-27 SA 5.212% (6.45% minus LIBOR01M, Cap 6.45%, Floor 0.00%) 5/25/45 S● | 2,739,875 | 579,369 | ||||||
Series 2015-31 ZD 3.00% 5/25/45 | 694,092 | 604,467 | ||||||
Series 2015-34 OK 0.884% 3/25/44 W | 920,667 | 790,148 | ||||||
Series 2015-40 GZ 3.50% 5/25/45 | 2,035,215 | 1,995,106 | ||||||
Series 2015-43 PZ 3.50% 6/25/45 | 2,133,230 | 2,196,045 | ||||||
Series 2015-44 Z 3.00% 9/25/43 | 9,449,101 | 9,193,556 | ||||||
Series 2015-56 MI 3.50% 10/25/41 S | 2,372,188 | 373,546 | ||||||
Series 2015-66 KI 3.00% 9/25/45 S | 2,293,747 | 360,339 | ||||||
Series 2015-89 AZ 3.50% 12/25/45 | 1,529,071 | 1,488,338 | ||||||
Series 2015-90 AZ 3.00% 6/25/41 | 589,932 | 546,741 | ||||||
Series 2015-95 SH 4.762% (6.00% minus LIBOR01M, Cap 6.00%, Floor 0.00%) 1/25/46 S● | 6,462,621 | 1,437,059 | ||||||
Series 2016-6 AI 3.50% 4/25/34 S | 5,246,985 | 667,356 | ||||||
Series 2016-23 AI 3.50% 2/25/41 S | 2,218,058 | 332,163 | ||||||
Series 2016-33 DI 3.50% 6/25/36 S | 10,578,650 | 1,583,548 | ||||||
14
Table of Contents
| Principal amount° | Value (US $) | |||||||
| ||||||||
Agency Collateralized Mortgage Obligations (continued) | ||||||||
| ||||||||
Fannie Mae REMICs | ||||||||
Series 2016-36 SB 4.762% (6.00% minus LIBOR01M, Cap 6.00%, Floor 0.00%) 3/25/43 S● | 3,389,595 | $ | 558,102 | |||||
Series 2016-40 IO 3.50% 7/25/36 S | 1,388,734 | 217,449 | ||||||
Series 2016-40 ZC 3.00% 7/25/46 | 1,612,135 | 1,493,486 | ||||||
Series 2016-55 SK 4.762% (6.00% minus LIBOR01M, Cap 6.00%, Floor 0.00%) 8/25/46 S● | 5,354,153 | 1,198,068 | ||||||
Series 2016-62 SA 4.762% (6.00% minus LIBOR01M, Cap 6.00%, Floor 0.00%) 9/25/46 S● | 10,506,132 | 2,457,700 | ||||||
Series 2016-64 CI 3.50% 7/25/43 S | 5,156,271 | 760,409 | ||||||
Series 2016-74 GS 4.762% (6.00% minus LIBOR01M, Cap 6.00%, Floor 0.00%) 10/25/46 S● | 6,981,414 | 1,713,740 | ||||||
Series 2016-79 JS 4.812% (6.05% minus LIBOR01M, Cap 6.05%, Floor 0.00%) 11/25/46 S● | 5,306,885 | 1,141,672 | ||||||
Series 2016-79 AZ 3.00% 11/25/46 | 1,030,416 | 952,691 | ||||||
Series 2016-85 SA 4.762% (6.00% minus LIBOR01M, Cap 6.00%, Floor 0.00%) 11/25/46 S● | 10,626,494 | 2,514,707 | ||||||
Series 2016-90 CI 3.00% 2/25/45 S | 751,363 | 110,300 | ||||||
Series 2016-95 LZ 2.50% 12/25/46 | 864,916 | 739,726 | ||||||
Series 2016-99 DI 3.50% 1/25/46 S | 3,012,073 | 507,966 | ||||||
Series 2016-105 SA 4.762% (6.00% minus LIBOR01M, Cap 6.00%, Floor 0.00%) 1/25/47 S● | 6,909,287 | 1,522,971 | ||||||
Series 2017-4 BI 3.50% 5/25/41 S | 3,115,742 | 469,153 | ||||||
Series 2017-6 NI 3.50% 3/25/46 S | 624,010 | 115,827 | ||||||
Series 2017-8 BZ 3.00% 2/25/47 | 5,093,177 | 4,718,008 | ||||||
Series 2017-8 SG 4.762% (6.00% minus LIBOR01M, Cap 6.00%, Floor 0.00%) 2/25/47 S● | 8,750,286 | 1,940,016 | ||||||
Series 2017-11 EI 3.00% 3/25/42 S | 8,659,383 | 1,276,944 | ||||||
Series 2017-16 SM 4.812% (6.05% minus LIBOR01M, Cap 6.05%, Floor 0.00%) 3/25/47 S● | 10,622,827 | 2,281,409 | ||||||
Series 2017-16 WI 3.00% 1/25/45 S | 1,885,812 | 262,104 | ||||||
Series 2017-16 YT 3.00% 7/25/46 | 1,319,000 | 1,301,736 | ||||||
Series 2017-21 ZD 3.50% 4/25/47 | 1,808,496 | 1,791,742 | ||||||
Series 2017-25 BL 3.00% 4/25/47 | 725,000 | 696,466 | ||||||
Series 2017-25 GS 5.462% (6.70% minus LIBOR01M, Cap 6.70%, Floor 0.00%) 4/25/47 S● | 10,438,109 | 1,771,013 | ||||||
Series 2017-26 VZ 3.00% 4/25/47 | 4,006,416 | 3,672,372 | ||||||
Series 2017-39 CY 3.50% 5/25/47 | 4,178,523 | 4,168,789 | ||||||
Series 2017-40 GZ 3.50% 5/25/47 | 1,567,147 | 1,601,009 | ||||||
Series 2017-45 JZ 3.00% 6/25/47 | 534,633 | 487,033 | ||||||
Series 2017-45 ZK 3.50% 6/25/47 | 1,141,502 | 1,120,917 | ||||||
Series 2017-46 VG 3.50% 4/25/38 | 928,000 | 953,247 | ||||||
Series 2017-61 SB 4.912% (6.15% minus LIBOR01M, Cap 6.15%, Floor 0.00%) 8/25/47 S● | 13,742,074 | 3,159,663 | ||||||
15
Table of Contents
| Schedule of investments | ||
| Delaware Diversified Income Fund |
| Principal amount° | Value (US $) | |||||||
| ||||||||
Agency Collateralized Mortgage Obligations (continued) | ||||||||
| ||||||||
Fannie Mae REMICs | ||||||||
Series 2017-61 TB 3.00% 8/25/44 | 1,231,000 | $ | 1,201,862 | |||||
Series 2017-69 SG 4.912% (6.15% minus LIBOR01M, Cap 6.15%, Floor 0.00%) 9/25/47 S● | 6,770,654 | 1,475,868 | ||||||
Series 2017-77 HZ 3.50% 10/25/47 | 2,117,157 | 2,115,574 | ||||||
Series 2017-94 CZ 3.50% 11/25/47 = | 1,316,000 | 1,294,512 | ||||||
Freddie Mac REMICs | ||||||||
Series 1730 Z 7.00% 5/15/24 | 92,294 | 101,526 | ||||||
Series 2326 ZQ 6.50% 6/15/31 | 282,933 | 318,041 | ||||||
Series 2621 QH 5.00% 5/15/33 | 34,323 | 37,550 | ||||||
Series 2624 QH 5.00% 6/15/33 | 28,835 | 31,592 | ||||||
Series 2708 ZD 5.50% 11/15/33 | 243,503 | 273,432 | ||||||
Series 2717 MH 4.50% 12/15/18 | 5,148 | 5,195 | ||||||
Series 2809 DC 4.50% 6/15/19 | 77,883 | 78,460 | ||||||
Series 2981 NE 5.00% 5/15/35 | 8,501 | 9,319 | ||||||
Series 3123 HT 5.00% 3/15/26 | 14,585 | 15,535 | ||||||
Series 3139 ZT 5.50% 4/15/36 | 114,031 | 129,671 | ||||||
Series 3150 EQ 5.00% 5/15/26 | 20,201 | 21,462 | ||||||
Series 3232 KF 1.689% (LIBOR01M + 0.45%) 10/15/36 ● | 30,927 | 31,073 | ||||||
Series 3239 EF 1.589% (LIBOR01M + 0.35%) 11/15/36 ● | 6,940 | 6,936 | ||||||
Series 3290 PE 5.50% 3/15/37 | 147,742 | 167,944 | ||||||
Series 3351 ZC 5.50% 7/15/37 | 1,150,422 | 1,281,854 | ||||||
Series 3451 WD 5.00% 2/15/37 | 16,138 | 17,597 | ||||||
Series 3574 D 5.00% 9/15/39 | 102,382 | 112,561 | ||||||
Series 3578 EO 0.49% 5/15/37 W | 589,885 | 550,758 | ||||||
Series 3662 ZB 5.50% 8/15/36 | 178,054 | 198,235 | ||||||
Series 3852 TP 5.50% (27.50% minus LIBOR01M, Cap 27.50%, Floor 0.00%) 5/15/41 ● | 43,331 | 49,129 | ||||||
Series 4050 EI 4.00% 2/15/39 S | 5,696,193 | 642,401 | ||||||
Series 4065 DE 3.00% 6/15/32 | 1,626,000 | 1,645,955 | ||||||
Series 4076 QB 1.75% 11/15/41 | 492,442 | 479,632 | ||||||
Series 4097 VY 1.50% 8/15/42 | 341,521 | 287,200 | ||||||
Series 4101 WI 3.50% 8/15/32 S | 3,016,940 | 468,380 | ||||||
Series 4109 AI 3.00% 7/15/31 S | 12,976,599 | 1,515,978 | ||||||
Series 4120 IK 3.00% 10/15/32 S | 11,211,506 | 1,553,471 | ||||||
Series 4122 LI 3.00% 10/15/27 S | 553,221 | 55,844 | ||||||
Series 4135 AI 3.50% 11/15/42 S | 5,041,428 | 1,046,569 | ||||||
Series 4136 EZ 3.00% 11/15/42 | 2,815,043 | 2,803,133 | ||||||
Series 4142 HA 2.50% 12/15/32 | 850,321 | 852,815 | ||||||
Series 4146 IA 3.50% 12/15/32 S | 5,773,584 | 919,749 | ||||||
Series 4150 PQ 2.50% 1/15/43 | 199,672 | 187,399 | ||||||
16
Table of Contents
| Principal amount° | Value (US $) | |||||||
| ||||||||
Agency Collateralized Mortgage Obligations (continued) | ||||||||
| ||||||||
Freddie Mac REMICs | ||||||||
Series 4150 UI 3.50% 8/15/32 S | 8,768,390 | $ | 958,121 | |||||
Series 4153 IB 2.50% 1/15/28 S | 2,967,469 | 267,916 | ||||||
Series 4156 AI 3.00% 10/15/31 S | 2,871,537 | 331,867 | ||||||
Series 4158 ZT 3.00% 1/15/43 | 239,155 | 227,965 | ||||||
Series 4159 KS 4.911% (6.15% minus LIBOR01M, Cap 6.15%, Floor 0.00%) 1/15/43 S● | 5,231,525 | 1,147,673 | ||||||
Series 4161 IM 3.50% 2/15/43 S | 1,578,702 | 352,174 | ||||||
Series 4171 MN 3.00% 2/15/43 | 739,000 | 717,512 | ||||||
Series 4171 Z 3.00% 2/15/43 | 1,116,606 | 1,046,516 | ||||||
Series 4180 ZB 3.00% 3/15/43 | 730,151 | 716,646 | ||||||
Series 4181 DI 2.50% 3/15/33 S | 3,535,414 | 448,374 | ||||||
Series 4184 GS 4.881% (6.12% minus LIBOR01M, Cap 6.12%, Floor 0.00%) 3/15/43 S● | 5,796,600 | 1,249,517 | ||||||
Series 4185 LI 3.00% 3/15/33 S | 6,738,101 | 978,636 | ||||||
Series 4191 CI 3.00% 4/15/33 S | 2,831,756 | 412,196 | ||||||
Series 4217 HI 2.50% 6/15/28 S | 567,682 | 53,742 | ||||||
Series 4226 GZ 3.00% 7/15/43 | 530,421 | 500,664 | ||||||
Series 4251 KI 2.50% 4/15/28 S | 418,650 | 27,077 | ||||||
Series 4278 HI 4.00% 12/15/28 S | 368,743 | 38,898 | ||||||
Series 4342 CI 3.00% 11/15/33 S | 2,059,784 | 258,622 | ||||||
Series 4356 GZ 2.00% 1/15/43 | 148,085 | 126,603 | ||||||
Series 4389 ZC 3.00% 9/15/44 | 880,442 | 854,341 | ||||||
Series 4391 GZ 2.50% 12/15/40 | 109,345 | 104,922 | ||||||
Series 4403 CZ 3.00% 10/15/44 | 126,048 | 119,929 | ||||||
Series 4435 DY 3.00% 2/15/35 | 6,624,571 | 6,634,395 | ||||||
Series 4448 TS 1.882% 5/15/40 S● | 17,959,075 | 1,094,546 | ||||||
Series 4453 DI 3.50% 11/15/33 S | 2,623,508 | 345,809 | ||||||
Series 4464 DA 2.50% 1/15/43 | 2,301,079 | 2,182,844 | ||||||
Series 4479 TI 4.00% 7/15/34 S | 1,158,022 | 196,045 | ||||||
Series 4494 SA 4.941% (6.18% minus LIBOR01M, Cap 6.18%, Floor 0.00%) 7/15/45 S● | 1,432,487 | 296,378 | ||||||
Series 4504 IO 3.50% 5/15/42 S | 2,495,806 | 280,066 | ||||||
Series 4520 AI 3.50% 10/15/35 S | 1,555,402 | 266,751 | ||||||
Series 4527 CI 3.50% 2/15/44 S | 6,713,302 | 1,150,517 | ||||||
Series 4567 LI 4.00% 8/15/45 S | 248,204 | 46,386 | ||||||
Series 4574 AI 3.00% 4/15/31 S | 6,488,460 | 799,398 | ||||||
Series 4581 LI 3.00% 5/15/36 S | 2,536,833 | 359,732 | ||||||
Series 4592 WT 5.50% 6/15/46 | 390,316 | 433,488 | ||||||
Series 4594 SG 4.761% (6.00% minus LIBOR01M, Cap 6.00%, Floor 0.00%) 6/15/46 S● | 15,861,512 | 3,590,827 | ||||||
Series 4596 ZH 3.00% 11/15/45 | 2,669,546 | 2,601,780 | ||||||
Series 4601 IN 3.50% 7/15/46 S | 24,889,943 | 4,943,658 | ||||||
17
Table of Contents
| Schedule of investments | ||
| Delaware Diversified Income Fund |
| Principal amount° | Value (US $) | |||||||
| ||||||||
Agency Collateralized Mortgage Obligations (continued) | ||||||||
| ||||||||
Freddie Mac REMICs | ||||||||
Series 4609 QZ 3.00% 8/15/46 | 2,034,504 | $ | 1,865,641 | |||||
Series 4610 IB 3.00% 6/15/41 S | 15,264,857 | 1,762,772 | ||||||
Series 4614 HB 2.50% 9/15/46 | 2,842,000 | 2,572,514 | ||||||
Series 4618 SA 4.761% (6.00% minus LIBOR01M, Cap 6.00%, Floor 0.00%) 9/15/46 S● | 3,210,770 | 767,893 | ||||||
Series 4623 LZ 2.50% 10/15/46 | 2,497,383 | 2,180,340 | ||||||
Series 4623 MS 4.761% (6.00% minus LIBOR01M, Cap 6.00%, Floor 0.00%) 10/15/46 S● | 2,310,888 | 559,963 | ||||||
Series 4623 MW 2.50% 10/15/46 | 2,880,000 | 2,633,447 | ||||||
Series 4625 PZ 3.00% 6/15/46 | 1,283,898 | 1,214,051 | ||||||
Series 4631 GS 4.761% (6.00% minus LIBOR01M, Cap 6.00%, Floor 0.00%) 11/15/46 S● | 11,130,818 | 2,381,827 | ||||||
Series 4631 LJ 3.00% 3/15/41 | 776,000 | 775,749 | ||||||
Series 4636 NZ 3.00% 12/15/46 | 3,168,125 | 3,010,415 | ||||||
Series 4644 GI 3.50% 5/15/40 S | 3,903,540 | 618,714 | ||||||
Series 4648 MZ 3.00% 6/15/46 | 551,249 | 519,967 | ||||||
Series 4648 ND 3.00% 9/15/46 | 428,000 | 410,660 | ||||||
Series 4648 SA 4.761% (6.00% minus LIBOR01M, Cap 6.00%, Floor 0.00%) 1/15/47 S● | 7,582,819 | 1,639,842 | ||||||
Series 4650 JE 3.00% 7/15/46 | 519,000 | 499,529 | ||||||
Series 4655 WI 3.50% 8/15/43 S | 3,058,562 | 523,924 | ||||||
Series 4657 JZ 3.50% 2/15/47 | 615,167 | 630,339 | ||||||
Series 4657 NW 3.00% 4/15/45 | 678,000 | 670,271 | ||||||
Series 4657 PS 4.761% (6.00% minus LIBOR01M, Cap 6.00%, Floor 0.00%) 2/15/47 S● | 7,950,976 | 1,682,143 | ||||||
Series 4660 GI 3.00% 8/15/43 S | 2,273,102 | 366,091 | ||||||
Series 4663 AI 3.00% 3/15/42 S | 5,416,468 | 743,308 | ||||||
Series 4663 HZ 3.50% 3/15/47 | 717,479 | 705,401 | ||||||
Series 4664 ZC 3.00% 9/15/45 | 532,221 | 508,977 | ||||||
Series 4665 NI 3.50% 7/15/41 S | 16,227,094 | 2,160,063 | ||||||
Series 4673 WI 3.50% 9/15/43 S | 3,693,624 | 511,365 | ||||||
Series 4675 KS 4.761% (6.00% minus LIBOR01M, Cap 6.00%, Floor 0.00%) 4/15/47 S● | 6,045,915 | 1,413,107 | ||||||
Series 4676 KZ 2.50% 7/15/45 | 1,584,916 | 1,398,654 | ||||||
Series 4681 WI 1.563% 8/15/33 S● | 19,859,586 | 1,351,945 | ||||||
Series 4690 WI 3.50% 12/15/43 S | 4,823,533 | 741,929 | ||||||
Series 4693 EI 3.50% 8/15/42 S | 2,570,923 | 352,377 | ||||||
Series 4700 WI 3.50% 1/15/44 S | 4,293,658 | 643,758 | ||||||
Series 4703 CI 3.50% 7/15/42 S | 7,705,783 | 1,021,029 | ||||||
Freddie Mac Strips | ||||||||
Series 19 F 1.763% 6/1/28 ● | 1,133 | 1,134 | ||||||
Series 267 S5 4.761% (6.00% minus LIBOR01M, Cap 6.00%, Floor 0.00%) 8/15/42 S● | 7,168,375 | 1,352,438 | ||||||
18
Table of Contents
| Principal amount° | Value (US $) | |||||||
| ||||||||
Agency Collateralized Mortgage Obligations (continued) | ||||||||
| ||||||||
Freddie Mac Strips | ||||||||
Series 284 S6 4.861% (6.10% minus LIBOR01M, Cap 6.10%, Floor 0.00%) 10/15/42 S● | 6,021,234 | $ | 1,262,979 | |||||
Series 299 S1 4.761% (6.00% minus LIBOR01M, Cap 6.00%, Floor 0.00%) 1/15/43 S● | 5,472,930 | 1,026,822 | ||||||
Series 303 151 4.314% 12/15/42 S● | 844,143 | 213,248 | ||||||
Series 319 S2 4.761% (6.00% minus LIBOR01M, Cap 6.00%, Floor 0.00%) 11/15/43 S● | 2,120,101 | 455,772 | ||||||
Series 326 S2 4.711% (5.95% minus LIBOR01M, Cap 5.95%, Floor 0.00%) 3/15/44 S● | 5,459,521 | 1,073,847 | ||||||
Series 337 S1 4.811% (6.05% minus LIBOR01M, Cap 6.05%, Floor 0.00%) 9/15/44 S● | 4,579,945 | 974,224 | ||||||
Series 350 S5 1.697% 9/15/40 S● | 9,408,225 | 501,410 | ||||||
Freddie Mac Structured Agency Credit Risk Debt Notes | ||||||||
Series 2015-DNA3 M2 4.088% (LIBOR01M + 2.85%) 4/25/28 ● | 2,705,631 | 2,803,573 | ||||||
Series 2015-HQA1 M2 3.888% (LIBOR01M + 2.65%) 3/25/28 ● | 1,661,037 | 1,698,650 | ||||||
Series 2015-HQA2 M2 4.038% (LIBOR01M + 2.80%) 5/25/28 ● | 1,997,377 | 2,064,085 | ||||||
Series 2016-DNA1 M2 4.138% (LIBOR01M + 2.90%) 7/25/28 ● | 1,585,000 | 1,634,810 | ||||||
Series 2016-DNA3 M2 3.238% (LIBOR01M + 2.00%) 12/25/28 ● | 1,485,000 | 1,515,692 | ||||||
Series 2016-DNA4 M2 2.538% (LIBOR01M + 1.30%) 3/25/29 ● | 1,225,000 | 1,241,481 | ||||||
Series 2016-HQA2 M2 3.488% (LIBOR01M + 2.25%) 11/25/28 ● | 1,720,000 | 1,769,317 | ||||||
Series 2017-DNA1 M2 4.488% (LIBOR01M + 3.25%) 7/25/29 ● | 4,500,000 | 4,733,503 | ||||||
Series 2017-DNA3 M2 3.738% (LIBOR01M + 2.50%) 3/25/30 ● | 1,420,000 | 1,432,717 | ||||||
Series 2017-HQA3 M2 3.588% (LIBOR01M + 2.35%) 4/25/30 ● | 3,480,000 | 3,478,084 | ||||||
Freddie Mac Structured Pass Through Certificates | ||||||||
Series T-42 A5 7.50% 2/25/42 ◆ | 66,565 | 77,119 | ||||||
Series T-54 2A 6.50% 2/25/43 ◆ | 19,272 | 22,555 | ||||||
Series T-58 2A 6.50% 9/25/43 ◆ | 413,552 | 475,959 | ||||||
GNMA | ||||||||
Series 2012-136 MX 2.00% 11/20/42 | 1,130,000 | 992,285 | ||||||
Series 2012-145 PY 2.00% 12/20/42 | 1,923,000 | 1,733,541 | ||||||
Series 2013-113 AZ 3.00% 8/20/43 | 8,161,928 | 7,927,285 | ||||||
Series 2013-113 LY 3.00% 5/20/43 | 817,000 | 811,529 | ||||||
Series 2013-182 CZ 2.50% 12/20/43 | 1,575,867 | 1,435,523 | ||||||
19
Table of Contents
| Schedule of investments | ||
| Delaware Diversified Income Fund |
| Principal amount° | Value (US $) | |||||||
| ||||||||
Agency Collateralized Mortgage Obligations (continued) | ||||||||
| ||||||||
GNMA | ||||||||
Series 2015-64 GZ 2.00% 5/20/45 | 3,040,338 | $ | 2,541,668 | |||||
Series 2015-133 AL 3.00% 5/20/45 | 9,636,978 | 9,673,610 | ||||||
Series 2015-139 EY 2.50% 9/16/45 | 1,548,000 | 1,450,719 | ||||||
Series 2015-142 AI 4.00% 2/20/44 S | 1,775,834 | 232,202 | ||||||
Series 2015-157 HZ 3.00% 10/20/45 | 502,880 | 468,746 | ||||||
Series 2016-5 GL 3.00% 7/20/45 | 251,000 | 249,155 | ||||||
Series 2016-46 DZ 3.00% 4/20/46 | 405,836 | 375,165 | ||||||
Series 2016-49 PZ 3.00% 11/16/45 | 329,480 | 307,187 | ||||||
Series 2016-74 PL 3.00% 5/20/46 | 1,227,000 | 1,214,836 | ||||||
Series 2016-80 JZ 3.00% 6/20/46 | 362,184 | 341,165 | ||||||
Series 2016-89 QS 4.811% (6.05% minus LIBOR01M, Cap 6.05%, Floor 0.00%) 7/20/46 S● | 4,908,373 | 1,174,296 | ||||||
Series 2016-108 YL 3.00% 8/20/46 | 3,095,000 | 2,937,828 | ||||||
Series 2016-111 PB 2.50% 8/20/46 | 2,739,000 | 2,498,602 | ||||||
Series 2016-115 SA 4.861% (6.10% minus LIBOR01M, Cap 6.10%, Floor 0.00%) 8/20/46 S● | 13,846,123 | 3,138,098 | ||||||
Series 2016-118 DI 3.50% 3/20/43 S | 11,225,569 | 1,754,509 | ||||||
Series 2016-118 ES 4.861% (6.10% minus LIBOR01M, Cap 6.10%, Floor 0.00%) 9/20/46 S● | 5,758,990 | 1,381,388 | ||||||
Series 2016-120 MW 2.00% 9/20/46 | 1,614,000 | 1,378,281 | ||||||
Series 2016-120 NS 4.861% (6.10% minus LIBOR01M, Cap 6.10%, Floor 0.00%) 9/20/46 S● | 11,552,774 | 2,753,908 | ||||||
Series 2016-121 JS 4.861% (6.10% minus LIBOR01M, Cap 6.10%, Floor 0.00%) 9/20/46 S● | 8,382,313 | 2,027,764 | ||||||
Series 2016-126 NS 4.861% (6.10% minus LIBOR01M, Cap 6.10%, Floor 0.00%) 9/20/46 S● | 5,706,595 | 1,349,691 | ||||||
Series 2016-134 MW 3.00% 10/20/46 | 461,000 | 469,047 | ||||||
Series 2016-134 MZ 3.00% 10/20/46 | 3,245,810 | 3,179,811 | ||||||
Series 2016-146 KS 4.861% (6.10% minus LIBOR01M, Cap 6.10%, Floor 0.00%) 10/20/46 S● | 3,430,821 | 801,518 | ||||||
Series 2016-147 ST 4.811% (6.05% minus LIBOR01M, Cap 6.05%, Floor 0.00%) 10/20/46 S● | 5,461,025 | 1,250,711 | ||||||
Series 2016-149 GI 4.00% 11/20/46 S | 5,094,750 | 1,128,955 | ||||||
Series 2016-156 PB 2.00% 11/20/46 | 1,707,124 | 1,405,052 | ||||||
Series 2016-160 GI 3.50% 11/20/46 S | 6,846,249 | 1,582,580 | ||||||
Series 2016-160 VZ 2.50% 11/20/46 | 826,711 | 707,896 | ||||||
Series 2016-163 MI 3.50% 11/20/46 S | 5,336,543 | 632,588 | ||||||
Series 2016-163 XI 3.00% 10/20/46 S | 7,892,199 | 1,104,341 | ||||||
Series 2016-171 IP 3.00% 3/20/46 S | 7,017,506 | 1,127,924 | ||||||
Series 2017-4 BW 3.00% 1/20/47 | 495,000 | 471,040 | ||||||
Series 2017-10 IB 4.00% 1/20/47 S | 6,540,690 | 1,612,813 | ||||||
Series 2017-10 KZ 3.00% 1/20/47 | 562,499 | 520,615 | ||||||
Series 2017-18 GM 2.50% 2/20/47 | 421,000 | 392,216 | ||||||
20
Table of Contents
| Principal amount° | Value (US $) | |||||||
| ||||||||
Agency Collateralized Mortgage Obligations (continued) | ||||||||
| ||||||||
GNMA | ||||||||
Series 2017-18 QS 4.861% (6.10% minus LIBOR01M, Cap 6.10%, Floor 0.00%) 2/16/47 S● | 6,486,732 | $ | 1,437,717 | |||||
Series 2017-25 CZ 3.50% 2/20/47 | 2,154,267 | 2,155,031 | ||||||
Series 2017-25 WZ 3.00% 2/20/47 | 1,632,281 | 1,570,919 | ||||||
Series 2017-26 SA 4.861% (6.10% minus LIBOR01M, Cap 6.10%, Floor 0.00%) 2/20/47 S● | 6,652,400 | 1,416,987 | ||||||
Series 2017-34 AZ 3.00% 1/20/47 | 84,463 | 77,753 | ||||||
Series 2017-34 DY 3.50% 3/20/47 | 1,098,995 | 1,095,822 | ||||||
Series 2017-56 QS 4.911% (6.15% minus LIBOR01M, Cap 6.15%, Floor 0.00%) 4/20/47 S● | 8,434,626 | 1,756,420 | ||||||
Series 2017-68 SB 4.911% (6.15% minus LIBOR01M, Cap 6.15%, Floor 0.00%) 5/20/47 S● | 6,572,919 | 1,252,629 | ||||||
Series 2017-80 AS 4.961% (6.20% minus LIBOR01M, Cap 6.20%, Floor 0.00%) 5/20/47 S● | 9,426,046 | 2,071,885 | ||||||
Series 2017-91 SM 4.961% (6.20% minus LIBOR01M, Cap 6.20%, Floor 0.00%) 6/20/47 S● | 5,517,711 | 1,254,275 | ||||||
Series 2017-101 AI 4.00% 7/20/47 S | 3,918,975 | 797,609 | ||||||
Series 2017-101 KS 4.961% (6.20% minus LIBOR01M, Cap 6.20%, Floor 0.00%) 7/20/47 S● | 6,442,736 | 1,403,617 | ||||||
Series 2017-101 SK 4.961% (6.20% minus LIBOR01M, Cap 6.20%, Floor 0.00%) 7/20/47 S● | 16,314,681 | 3,551,982 | ||||||
Series 2017-101 TI 4.00% 3/20/44 S | 6,144,699 | 989,386 | ||||||
Series 2017-107 T 3.00% 1/20/47 | 2,694,000 | 2,635,730 | ||||||
Series 2017-107 QZ 3.00% 8/20/45 | 992,654 | 940,655 | ||||||
Series 2017-113 LB 3.00% 7/20/47 | 2,620,000 | 2,548,093 | ||||||
Series 2017-114 IK 4.00% 10/20/44 S | 8,971,047 | 1,894,805 | ||||||
Series 2017-116 ZL 3.00% 6/20/47 | 1,959,624 | 1,836,756 | ||||||
Series 2017-117 SD 4.961% (6.20% minus LIBOR01M, Cap 6.20%, Floor 0.00%) 8/20/47 S● | 5,408,698 | 1,202,331 | ||||||
Series 2017-120 QS 4.961% (6.20% minus LIBOR01M, Cap 6.20%, Floor 0.00%) 8/20/47 S● | 6,886,497 | 1,466,840 | ||||||
Series 2017-130 YJ 2.50% 8/20/47 | 1,210,000 | 1,092,629 | ||||||
Series 2017-134 VD 3.00% 4/20/38 | 135,000 | 133,216 | ||||||
Series 2017-137 CZ 3.00% 9/20/47 | 5,768,385 | 5,312,597 | ||||||
Vendee Mortgage Trust | ||||||||
Series 2000-1 1A 6.414% 1/15/30 ● | 13,933 | 15,430 | ||||||
|
| |||||||
Total Agency Collateralized Mortgage Obligations (cost $387,576,946) | 379,363,654 | |||||||
|
| |||||||
| ||||||||
Agency Commercial Mortgage-Backed Securities – 1.27% | ||||||||
| ||||||||
Freddie Mac Multifamily Structured Pass Through Certificates | ||||||||
Series KS03 A4 3.161% 5/25/25 ◆● | 4,250,000 | 4,367,642 | ||||||
21
Table of Contents
| Schedule of investments | ||
| Delaware Diversified Income Fund |
| Principal amount° | Value (US $) | |||||||
| ||||||||
Agency Commercial Mortgage-Backed Securities (continued) | ||||||||
| ||||||||
FREMF Mortgage Trust | ||||||||
Series 2010-K8 B 144A 5.278% 9/25/43 #● | 3,720,000 | $ | 3,968,931 | |||||
Series 2011-K12 B 144A 4.344% 1/25/46 #● | 3,186,000 | 3,342,123 | ||||||
Series 2011-K14 B 144A 5.167% 2/25/47 #● | 3,335,000 | 3,598,605 | ||||||
Series 2011-K15 B 144A 4.948% 8/25/44 #● | 485,000 | 521,084 | ||||||
Series 2011-K704 B 144A 4.536% 10/25/30 #● | 3,045,000 | 3,089,832 | ||||||
Series 2012-K22 B 144A 3.686% 8/25/45 #● | 4,285,000 | 4,411,945 | ||||||
Series 2012-K23 B 144A 3.655% 10/25/45 #● | 7,400,000 | 7,612,526 | ||||||
Series 2012-K708 B 144A 3.751% 2/25/45 #● | 4,225,000 | 4,289,691 | ||||||
Series 2013-K32 B 144A 3.537% 10/25/46 #● | 8,145,000 | 8,361,610 | ||||||
Series 2013-K33 B 144A 3.501% 8/25/46 #● | 4,285,000 | 4,347,823 | ||||||
Series 2013-K712 B 144A 3.365% 5/25/45 #● | 2,220,000 | 2,251,859 | ||||||
Series 2013-K713 B 144A 3.165% 4/25/46 #● | 1,355,000 | 1,370,176 | ||||||
Series 2013-K713 C 144A 3.165% 4/25/46 #● | 4,400,000 | 4,406,682 | ||||||
|
| |||||||
Total Agency Commercial Mortgage-Backed Securities (cost $55,888,856) | 55,940,529 | |||||||
|
| |||||||
| ||||||||
Agency Mortgage-Backed Securities – 4.43% | ||||||||
| ||||||||
Fannie Mae ARM | ||||||||
2.529% (LIBOR12M + 1.608%) 12/1/46 ● | 7,283,090 | 7,290,881 | ||||||
Fannie Mae S.F. 30 yr 4.50% 4/1/39 | 610,201 | 659,177 | ||||||
4.50% 11/1/39 | 1,996,309 | 2,171,418 | ||||||
4.50% 8/1/40 | 872,337 | 942,593 | ||||||
4.50% 10/1/43 | 2,902,000 | 3,145,346 | ||||||
4.50% 12/1/43 | 391,648 | 424,953 | ||||||
4.50% 10/1/44 | 1,201,243 | 1,303,403 | ||||||
4.50% 5/1/46 | 4,074,667 | 4,397,718 | ||||||
5.00% 10/1/35 | 20,939 | 22,970 | ||||||
5.00% 7/1/40 | 82,201 | 89,370 | ||||||
5.50% 1/1/34 | 2,369 | 2,661 | ||||||
5.50% 11/1/34 | 951,608 | 1,062,683 | ||||||
5.50% 4/1/35 | 1,790 | 1,999 | ||||||
5.50% 8/1/37 | 5,041,078 | 5,635,150 | ||||||
5.50% 2/1/38 | 2,009,417 | 2,223,579 | ||||||
5.50% 3/1/38 | 444,974 | 497,486 | ||||||
5.50% 3/1/39 | 2,249,416 | 2,532,773 | ||||||
5.50% 12/1/39 | 1,057,566 | 1,175,913 | ||||||
5.50% 7/1/40 | 1,639,401 | 1,831,080 | ||||||
5.50% 6/1/41 | 4,158,988 | 4,651,544 | ||||||
5.50% 9/1/41 | 2,374,430 | 2,676,552 | ||||||
5.50% 5/1/44 | 59,840,740 | 66,850,251 | ||||||
6.00% 9/1/36 | 685,782 | 787,037 | ||||||
6.00% 12/1/36 | 143,667 | 162,345 | ||||||
22
Table of Contents
| Principal amount° | Value (US $) | |||||||
| ||||||||
Agency Mortgage-Backed Securities (continued) | ||||||||
| ||||||||
Fannie Mae S.F. 30 yr | ||||||||
6.00% 5/1/37 | 12,030 | $ | 13,556 | |||||
6.00% 6/1/37 | 82,328 | 93,360 | ||||||
6.00% 7/1/37 | 64,511 | 72,990 | ||||||
6.00% 3/1/38 | 196,784 | 223,368 | ||||||
6.00% 6/1/38 | 231,075 | 263,644 | ||||||
6.00% 10/1/38 | 657,357 | 745,915 | ||||||
6.00% 11/1/38 | 375,691 | 426,036 | ||||||
6.00% 12/1/38 | 197,882 | 223,820 | ||||||
6.00% 2/1/39 | 32,983 | 37,534 | ||||||
6.00% 9/1/39 | 39,529 | 45,492 | ||||||
6.00% 10/1/39 | 6,340,993 | 7,221,225 | ||||||
6.00% 11/1/40 | 240,751 | 273,910 | ||||||
6.00% 7/1/41 | 17,604,486 | 19,959,268 | ||||||
6.50% 2/1/36 | 444,862 | 503,237 | ||||||
6.50% 8/1/36 | 10,971 | 12,160 | ||||||
6.50% 9/1/36 | 2,436 | 2,805 | ||||||
6.50% 11/1/36 | 197,932 | 226,179 | ||||||
6.50% 3/1/37 | 366,377 | 413,323 | ||||||
6.50% 12/1/37 | 142,913 | 162,612 | ||||||
6.50% 3/1/40 | 507,503 | 578,675 | ||||||
6.50% 5/1/40 | 1,048,757 | 1,176,793 | ||||||
7.00% 12/1/37 | 4,270 | 4,528 | ||||||
7.50% 1/1/31 | 575 | 646 | ||||||
7.50% 3/1/32 | 8,701 | 9,870 | ||||||
7.50% 4/1/32 | 11,104 | 12,554 | ||||||
7.50% 6/1/34 | 19,888 | 22,490 | ||||||
Fannie Mae S.F. 30 yr TBA | ||||||||
3.00% 12/1/47 | 2,344,000 | 2,341,345 | ||||||
Freddie Mac ARM | ||||||||
2.558% (LIBOR12M + 1.63%) 10/1/46 ● | 1,945,421 | 1,950,248 | ||||||
3.111% (LIBOR12M + 1.62%) 3/1/46 ● | 3,375,411 | 3,453,931 | ||||||
Freddie Mac S.F. 30 yr | ||||||||
4.50% 4/1/39 | 356,544 | 383,844 | ||||||
4.50% 8/1/44 | 1,450,219 | 1,559,692 | ||||||
5.00% 12/1/41 | 1,980,326 | 2,168,358 | ||||||
5.00% 4/1/44 | 2,305,792 | 2,532,640 | ||||||
5.50% 3/1/34 | 186,470 | 207,791 | ||||||
5.50% 12/1/34 | 174,052 | 194,330 | ||||||
5.50% 12/1/35 | 199,253 | 222,994 | ||||||
5.50% 9/1/37 | 229,951 | 255,461 | ||||||
5.50% 4/1/38 | 745,725 | 828,272 | ||||||
5.50% 1/1/39 | 632,315 | 702,569 | ||||||
23
Table of Contents
| Schedule of investments | ||
| Delaware Diversified Income Fund |
| Principal amount° | Value (US $) | |||||||
| ||||||||
Agency Mortgage-Backed Securities (continued) | ||||||||
| ||||||||
Freddie Mac S.F. 30 yr | ||||||||
5.50% 6/1/39 | 165,334 | $ | 183,558 | |||||
5.50% 6/1/41 | 5,692,123 | 6,325,931 | ||||||
6.00% 2/1/36 | 2,288,882 | 2,582,144 | ||||||
6.00% 3/1/36 | 1,118,039 | 1,270,995 | ||||||
6.00% 10/1/36 | 1,072 | 1,216 | ||||||
6.00% 9/1/37 | 379,830 | 427,334 | ||||||
6.00% 8/1/38 | 2,064,020 | 2,348,650 | ||||||
6.00% 5/1/40 | 1,242,347 | 1,407,840 | ||||||
6.00% 7/1/40 | 3,256,293 | 3,687,384 | ||||||
6.50% 12/1/31 | 248,951 | 279,613 | ||||||
6.50% 8/1/38 | 86,389 | 95,802 | ||||||
6.50% 4/1/39 | 278,047 | 311,131 | ||||||
7.00% 11/1/33 | 104,641 | 119,716 | ||||||
GNMA I S.F. 30 yr | ||||||||
5.50% 2/15/41 | 1,261,802 | 1,401,748 | ||||||
7.00% 12/15/34 | 1,303,053 | 1,515,827 | ||||||
GNMA II S.F. 30 yr | ||||||||
5.50% 5/20/37 | 1,221,865 | 1,352,951 | ||||||
5.50% 4/20/40 | 807,211 | 877,369 | ||||||
6.00% 2/20/39 | 1,051,241 | 1,167,319 | ||||||
6.00% 10/20/39 | 3,661,114 | 4,067,156 | ||||||
6.00% 2/20/40 | 3,915,829 | 4,364,182 | ||||||
6.00% 4/20/46 | 1,288,891 | 1,437,086 | ||||||
|
| |||||||
Total Agency Mortgage-Backed Securities (cost $196,078,514) | 195,291,299 | |||||||
|
| |||||||
| ||||||||
Collateralized Debt Obligations – 2.12% | ||||||||
| ||||||||
AMMC CLO 21 | ||||||||
Series 2017-21A A 144A 2.637% (LIBOR03M + 1.25%) 11/2/30 #● | 2,750,000 | 2,762,595 | ||||||
Benefit Street Partners CLO II | ||||||||
Series 2013-IIA A1R 144A 2.609% (LIBOR03M + 1.25%) 7/15/29 #● | 4,000,000 | 4,026,456 | ||||||
Benefit Street Partners CLO IV | ||||||||
Series 2014-IVA A1R 144A 2.853% (LIBOR03M + 1.49%) 1/20/29 #● | 14,000,000 | 14,228,956 | ||||||
Black Diamond CLO | ||||||||
Series 2017-1A A1A 144A 2.655% (LIBOR03M + 1.29%) 4/24/29 #● | 4,000,000 | 4,017,276 | ||||||
BlueMountain CLO | ||||||||
Series 2015-2A A1 144A 2.784% (LIBOR03M + 1.43%) 7/18/27 #● | 2,450,000 | 2,456,568 | ||||||
24
Table of Contents
| Principal amount° | Value (US $) | |||||||
| ||||||||
Collateralized Debt Obligations (continued) | ||||||||
| ||||||||
Catamaran CLO | ||||||||
Series 2014-1A A1BR 144A 2.753% (LIBOR03M + 1.39%) 4/22/30 #● | 5,000,000 | $ | 5,000,000 | |||||
Cedar Funding IV CLO | ||||||||
Series 2014-4A AR 144A 2.593% (LIBOR03M + 1.23%) 7/23/30 #● | 4,000,000 | 4,036,500 | ||||||
Cedar Funding VI CLO | ||||||||
Series 2016-6A A1 144A 2.777% (LIBOR03M + 1.47%) 10/20/28 #● | 5,210,000 | 5,280,127 | ||||||
Cedar Funding VIII CLO | ||||||||
Series 2017-8A A1 144A 2.618% (LIBOR03M + 1.25%) 10/17/30 #● | 5,330,000 | 5,359,875 | ||||||
GoldenTree Loan Management US CLO 1 | ||||||||
Series 2017-1A A 144A 2.583% (LIBOR03M + 1.22%) 4/20/29 #● | 5,005,000 | 5,062,998 | ||||||
Hull Street CLO | ||||||||
Series 2014-1A AR 144A 2.574% (LIBOR03M + 1.22%) 10/18/26 #● | 3,000,000 | 3,017,334 | ||||||
KVK CLO | ||||||||
Series 2015-1A AR 144A 2.561% (LIBOR03M + 1.25%) 5/20/27 #● | 2,000,000 | 2,011,160 | ||||||
MP CLO IV | ||||||||
Series 2013-2A ARR 144A 2.647% (LIBOR03M + 1.28%) 7/25/29 #● | 7,000,000 | 7,011,963 | ||||||
OCP CLO | ||||||||
Series 2017-13A A1A 144A 2.561% (LIBOR03M + 1.26%) 7/15/30 #● | 5,750,000 | 5,784,506 | ||||||
TIAA CLO II | ||||||||
Series 2017-1A A 144A 2.643% (LIBOR03M + 1.28%) 4/20/29 #● | 4,185,000 | 4,207,988 | ||||||
Venture CDO | ||||||||
Series 2016-25A A1 144A 2.853% (LIBOR03M + 1.49%) 4/20/29 #● | 2,085,000 | 2,094,251 | ||||||
Venture XXIV CLO | ||||||||
Series 2016-24A A1D 144A 2.783% (LIBOR03M + 1.42%) 10/20/28 #● | 5,335,000 | 5,409,210 | ||||||
Venture XXVIII CLO | ||||||||
Series 2017-28A A2 144A 2.716% (LIBOR03M + 1.11%) 7/20/30 #● | 7,550,000 | 7,537,482 | ||||||
Zais CLO 6 | ||||||||
Series 2017-1A A1 144A 2.729% (LIBOR03M + 1.37%) 7/15/29 #● | 4,000,000 | 4,026,572 | ||||||
|
| |||||||
Total Collateralized Debt Obligations (cost $92,494,640) | 93,331,817 | |||||||
|
| |||||||
25
Table of Contents
| Schedule of investments | ||
| Delaware Diversified Income Fund |
| Principal amount° | Value (US $) | |||||||
| ||||||||
Convertible Bonds – 2.69% | ||||||||
| ||||||||
Aerojet Rocketdyne Holdings 144A 2.25% exercise price $26.00, maturity date 12/15/23 # | 491,000 | $ | 680,342 | |||||
Alaska Communications Systems Group 6.25% exercise price $10.28, maturity date 5/1/18 | 1,222,000 | 1,249,495 | ||||||
Ares Capital 144A 3.75% exercise price $19.39, maturity date 2/1/22 # | 497,000 | 507,872 | ||||||
BioMarin Pharmaceutical 1.50% exercise price $94.15, maturity date 10/15/20 | 2,824,000 | 3,217,595 | ||||||
Blackhawk Network Holdings 1.50% exercise price $49.83, maturity date 1/15/22 * | 3,988,000 | 4,005,447 | ||||||
Blackstone Mortgage Trust 4.375% exercise price $35.67, maturity date 5/5/22 | 1,326,000 | 1,348,376 | ||||||
Blackstone Mortgage Trust 5.25% exercise price $27.67, maturity date 12/1/18 | 4,203,000 | 4,883,361 | ||||||
Brookdale Senior Living 2.75% exercise price $29.33, maturity date 6/15/18 | 3,427,000 | 3,422,716 | ||||||
Cardtronics 1.00% exercise price $52.35, maturity date 12/1/20 | 1,179,000 | 1,093,523 | ||||||
Cemex 3.72% exercise price $11.01, maturity date 3/15/20 | 2,898,000 | 3,091,804 | ||||||
Chart Industries 2.00% exercise price $69.03, maturity date 8/1/18 * | 2,642,000 | 2,650,256 | ||||||
Ciena 3.75% exercise price $20.17, maturity date 10/15/18 | 1,095,000 | 1,297,575 | ||||||
Clearwire Communications 144A 8.25% exercise price $7.08, maturity date 12/1/40 # | 2,469,000 | 2,493,690 | ||||||
DISH Network 144A 2.375% exercise price $82.22, maturity date 3/15/24 # | 1,943,000 | 1,871,352 | ||||||
DISH Network 3.375% exercise price $65.18, maturity date 8/15/26 | 3,139,000 | 3,392,082 | ||||||
GAIN Capital Holdings 144A 5.00% exercise price $8.20, maturity date 8/15/22 # | 3,035,000 | 3,397,303 | ||||||
General Cable 4.50% exercise price $30.70, maturity date 11/15/29 f | 1,962,000 | 1,892,104 | ||||||
Helix Energy Solutions Group 4.25% exercise price $13.89, maturity date 5/1/22 | 2,354,000 | 2,287,794 | ||||||
Hologic 2.00% exercise price $31.18, maturity date 3/1/42 *f | 2,840,000 | 3,535,800 | ||||||
Huron Consulting Group 1.25% exercise price $79.89, maturity date 10/1/19 | 786,000 | 740,805 | ||||||
IAC FinanceCo 144A 0.875% exercise price $152.18, maturity date 10/1/22 #* | 2,460,000 | 2,661,413 | ||||||
Infinera 1.75% exercise price $12.58, maturity date 6/1/18 | 1,793,000 | 1,818,774 | ||||||
Insulet 1.25% exercise price $58.37, maturity date 9/15/21 | 2,862,000 | 3,409,357 | ||||||
26
Table of Contents
| Principal amount° | Value (US $) | |||||||
| ||||||||
Convertible Bonds (continued) | ||||||||
| ||||||||
Kaman 144A 3.25% exercise price $65.26, maturity date 5/1/24 # | 2,711,000 | $ | 2,943,129 | |||||
Knowles 3.25% exercise price $18.43, maturity date 11/1/21 * | 1,455,000 | 1,716,900 | ||||||
Liberty Interactive 144A 1.75% exercise price $341.10, maturity date 9/30/46 # | 3,457,000 | 3,921,534 | ||||||
Liberty Media 2.25% exercise price $104.55, maturity date 9/30/46 | 512,000 | 538,560 | ||||||
Medicines 2.75% exercise price $48.97, maturity date 7/15/23 | 3,162,000 | 2,978,209 | ||||||
Microchip Technology 144A 1.625% exercise price $99.68, | 2,050,000 | 2,591,969 | ||||||
Neurocrine Biosciences 144A 2.25% exercise price $75.92, | 3,086,000 | 3,543,114 | ||||||
New Mountain Finance 5.00% exercise price $15.80, maturity date 6/15/19 | 1,630,000 | 1,683,994 | ||||||
Novellus Systems 2.625% exercise price $33.54, maturity date 5/15/41 | 477,000 | 2,958,891 | ||||||
NXP Semiconductors 1.00% exercise price $102.84, maturity date 12/1/19 | 1,850,000 | 2,288,219 | ||||||
ON Semiconductor 1.00% exercise price $18.50, maturity date 12/1/20 | 1,489,000 | 1,927,324 | ||||||
Pacira Pharmaceuticals 144A 2.375% exercise price $66.89, | 4,166,000 | 3,876,984 | ||||||
PDC Energy 1.125% exercise price $85.39, maturity date 9/15/21 | 3,831,000 | 3,759,169 | ||||||
Priceline Group 0.35% exercise price $1,315.10, maturity date 6/15/20 | 2,210,000 | 3,292,900 | ||||||
PROS Holdings 2.00% exercise price $33.79, maturity date 12/1/19 | 3,202,000 | 3,210,005 | ||||||
RPM International 2.25% exercise price $52.36, maturity date 12/15/20 | 1,090,000 | 1,272,575 | ||||||
SolarCity 1.625% exercise price $759.35, maturity date 11/1/19 * | 2,086,000 | 1,972,574 | ||||||
Spectrum Pharmaceuticals 2.75% exercise price $10.53, maturity date 12/15/18 * | 469,000 | 890,514 | ||||||
Spirit Realty Capital 3.75% exercise price $12.96, maturity date 5/15/21 * | 2,661,000 | 2,719,223 | ||||||
Synaptics 144A 0.50% exercise price $73.02, maturity date 6/15/22 # | 1,194,000 | 1,076,093 | ||||||
Synchronoss Technologies 0.75% exercise price $53.17, maturity date 8/15/19 * | 1,481,000 | 1,391,214 | ||||||
Team 144A 5.00% exercise price $21.70, maturity date 8/1/23 # | 370,000 | 342,019 | ||||||
27
Table of Contents
| Schedule of investments | ||
| Delaware Diversified Income Fund |
| Principal amount° | Value (US $) | |||||||||||
| ||||||||||||
Convertible Bonds (continued) | ||||||||||||
| ||||||||||||
Vector Group 1.75% exercise price $22.35, maturity date 4/15/20 ● | 2,229,000 | $ | 2,515,984 | |||||||||
Vector Group 2.50% exercise price $14.50, maturity date 1/15/19 ● | 2,571,000 | 3,771,336 | ||||||||||
VEREIT 3.75% exercise price $14.99, maturity date 12/15/20 * | 2,750,000 | 2,860,014 | ||||||||||
Verint Systems 1.50% exercise price $64.46, maturity date 6/1/21 | 3,751,000 | 3,692,391 | ||||||||||
|
| |||||||||||
Total Convertible Bonds (cost $113,477,889) | 118,683,674 | |||||||||||
|
| |||||||||||
| ||||||||||||
Corporate Bonds – 50.74% | ||||||||||||
| ||||||||||||
Automotive – 0.14% | ||||||||||||
Allison Transmission 144A 4.75% 10/1/27 # | 1,550,000 | 1,569,375 | ||||||||||
Goodyear Tire & Rubber | ||||||||||||
4.875% 3/15/27 | 1,900,000 | 1,938,000 | ||||||||||
5.00% 5/31/26 | 2,535,000 | 2,607,881 | ||||||||||
|
| |||||||||||
| 6,115,256 | ||||||||||||
|
| |||||||||||
Banking – 11.05% | ||||||||||||
Akbank Turk 144A 7.20% 3/16/27 #µ | 4,060,000 | 4,203,838 | ||||||||||
Ally Financial 5.75% 11/20/25 * | 2,200,000 | 2,439,250 | ||||||||||
ANZ New Zealand International 144A 2.60% 9/23/19 # | 1,300,000 | 1,313,476 | ||||||||||
Banco do Brasil 144A 4.625% 1/15/25 # | 5,105,000 | 5,102,447 | ||||||||||
Banco Nacional de Costa Rica 144A 5.875% 4/25/21 # | 3,925,000 | 4,099,663 | ||||||||||
Banco Santander 3.80% 2/23/28 | 4,200,000 | 4,202,462 | ||||||||||
Bancolombia 4.875% 10/18/27 µ | 4,400,000 | 4,403,300 | ||||||||||
Banistmo 144A 3.65% 9/19/22 # | 3,770,000 | 3,777,163 | ||||||||||
Bank Nederlandse Gemeenten 3.50% 7/19/27 | AUD | 1,736,000 | 1,347,290 | |||||||||
Bank of America | ||||||||||||
3.30% 8/5/21 | AUD | 1,420,000 | 1,099,727 | |||||||||
3.593% 7/21/28 µ | 13,890,000 | 14,052,977 | ||||||||||
4.183% 11/25/27 | 13,685,000 | 14,295,989 | ||||||||||
4.443% 1/20/48 µ | 3,535,000 | 3,840,203 | ||||||||||
Bank of New York Mellon | ||||||||||||
2.50% 4/15/21 | 3,295,000 | 3,327,211 | ||||||||||
3.30% 8/23/29 | 6,595,000 | 6,580,977 | ||||||||||
4.625% µy | 7,155,000 | 7,378,594 | ||||||||||
Barclays | ||||||||||||
4.836% 5/9/28 | 2,310,000 | 2,412,303 | ||||||||||
8.25% µy | 7,590,000 | 8,080,200 | ||||||||||
BB&T 2.85% 10/26/24 | 6,845,000 | 6,834,307 | ||||||||||
BBVA Bancomer | ||||||||||||
144A 6.50% 3/10/21 # | 3,865,000 | 4,241,837 | ||||||||||
144A 7.25% 4/22/20 # | 935,000 | 1,020,599 | ||||||||||
28
Table of Contents
| Principal amount° | Value (US $) | |||||||||||
| ||||||||||||
Corporate Bonds (continued) | ||||||||||||
| ||||||||||||
Banking (continued) | ||||||||||||
BGEO Group 144A 6.00% 7/26/23 #* | 3,380,000 | $ | 3,486,423 | |||||||||
Citigroup | ||||||||||||
2.414% (LIBOR03M + 1.10%) 5/17/24 ● | 835,000 | 843,586 | ||||||||||
3.52% 10/27/28 µ | 500,000 | 500,145 | ||||||||||
3.75% 10/27/23 | AUD | 2,222,000 | 1,734,785 | |||||||||
Citizens Bank | ||||||||||||
2.55% 5/13/21 | 1,975,000 | 1,984,484 | ||||||||||
2.65% 5/26/22 | 305,000 | 305,080 | ||||||||||
Citizens Financial Group | ||||||||||||
2.375% 7/28/21 | 485,000 | 481,510 | ||||||||||
4.30% 12/3/25 | 4,810,000 | 5,038,009 | ||||||||||
Compass Bank | ||||||||||||
2.875% 6/29/22 | 5,190,000 | 5,158,078 | ||||||||||
3.875% 4/10/25 | 5,505,000 | 5,519,900 | ||||||||||
Cooperatieve Rabobank | ||||||||||||
2.50% 9/4/20 | NOK | 8,100,000 | 1,031,451 | |||||||||
3.625% 6/8/22 | NZD | 1,403,000 | 975,237 | |||||||||
3.75% 7/21/26 | 5,565,000 | 5,675,302 | ||||||||||
Credit Suisse Group | ||||||||||||
144A 4.282% 1/9/28 # | 15,081,000 | 15,738,823 | ||||||||||
144A 6.25% #µy | 10,305,000 | 11,296,856 | ||||||||||
Credit Suisse Group Funding Guernsey 4.55% 4/17/26 | 5,740,000 | 6,180,539 | ||||||||||
Fifth Third Bancorp 2.60% 6/15/22 | 2,835,000 | 2,826,949 | ||||||||||
Fifth Third Bank | ||||||||||||
2.25% 6/14/21 | 6,370,000 | 6,363,194 | ||||||||||
3.85% 3/15/26 | 2,435,000 | 2,517,021 | ||||||||||
Goldman Sachs Group | ||||||||||||
2.99% (BBSW3M + 1.30%) 8/21/19 ● | AUD | 2,390,000 | 1,848,437 | |||||||||
3.55% 2/12/21 | CAD | 1,500,000 | 1,205,546 | |||||||||
3.691% 6/5/28 µ | 15,280,000 | 15,436,204 | ||||||||||
5.15% 5/22/45 | 4,570,000 | 5,214,097 | ||||||||||
5.20% 12/17/19 | NZD | 1,444,000 | 1,032,684 | |||||||||
Huntington National Bank 2.50% 8/7/22 | 2,745,000 | 2,728,246 | ||||||||||
ICICI Bank 144A 4.00% 3/18/26 # | 5,100,000 | 5,240,250 | ||||||||||
JPMorgan Chase & Co. | ||||||||||||
3.50% 12/18/26 | GBP | 986,000 | 1,453,945 | |||||||||
3.54% 5/1/28 µ | 3,475,000 | 3,519,322 | ||||||||||
3.882% 7/24/38 µ | 4,825,000 | 4,879,312 | ||||||||||
4.032% 7/24/48 µ | 4,215,000 | 4,309,166 | ||||||||||
4.25% 11/2/18 | NZD | 5,735,000 | 3,987,825 | |||||||||
4.25% 10/1/27 | 820,000 | 869,675 | ||||||||||
6.75% *µy | 4,475,000 | 5,135,063 | ||||||||||
29
Table of Contents
| Schedule of investments | ||||
| Delaware Diversified Income Fund |
| Principal amount° | Value (US $) | |||||||||||
| ||||||||||||
Corporate Bonds (continued) | ||||||||||||
| ||||||||||||
Banking (continued) | ||||||||||||
KeyBank | ||||||||||||
2.30% 9/14/22 | 3,960,000 | $ | 3,924,501 | |||||||||
2.40% 6/9/22 | 1,845,000 | 1,836,936 | ||||||||||
6.95% 2/1/28 | 17,740,000 | 22,440,735 | ||||||||||
Landwirtschaftliche Rentenbank 5.375% 4/23/24 | NZD | 4,880,000 | 3,733,465 | |||||||||
Lloyds Banking Group | ||||||||||||
2.907% 11/7/23 µ | 2,395,000 | 2,395,000 | ||||||||||
3.574% 11/7/28 µ | 4,960,000 | 4,960,000 | ||||||||||
7.50% *µy | 2,555,000 | 2,922,281 | ||||||||||
Manufacturers & Traders Trust 2.50% 5/18/22 | 2,850,000 | 2,854,848 | ||||||||||
Morgan Stanley | ||||||||||||
3.125% 8/5/21 | CAD | 999,000 | 793,733 | |||||||||
3.591% 7/22/28 µ | 8,490,000 | 8,565,557 | ||||||||||
3.95% 4/23/27 | 2,745,000 | 2,803,818 | ||||||||||
4.375% 1/22/47 | 9,455,000 | 10,088,685 | ||||||||||
5.00% 9/30/21 | AUD | 1,489,000 | 1,226,811 | |||||||||
5.00% 11/24/25 | 9,400,000 | 10,310,153 | ||||||||||
Nationwide Building Society 144A 4.125% 10/18/32 #µ | 7,950,000 | 7,965,032 | ||||||||||
Nederlandse Waterschapsbank 144A 1.341% (LIBOR03M + 0.02%) 3/15/19 #● | 1,145,000 | 1,144,754 | ||||||||||
Northern Trust 3.375% 5/8/32 µ | 1,695,000 | 1,689,730 | ||||||||||
PNC Bank 3.10% 10/25/27 | 13,499,000 | 13,474,821 | ||||||||||
PNC Financial Services Group 5.00% µy | 5,800,000 | 6,162,500 | ||||||||||
Popular 7.00% 7/1/19 | 3,170,000 | 3,249,250 | ||||||||||
Regions Financial 2.75% 8/14/22 | 2,140,000 | 2,145,683 | ||||||||||
Royal Bank of Scotland Group | ||||||||||||
3.875% 9/12/23 | 3,720,000 | 3,819,546 | ||||||||||
8.625% µy | 8,640,000 | 9,805,536 | ||||||||||
Santander UK 144A 5.00% 11/7/23 # | 8,330,000 | 9,019,416 | ||||||||||
Santander UK Group Holdings 3.823% 11/3/28 µ | 3,365,000 | 3,394,199 | ||||||||||
State Street | ||||||||||||
2.653% 5/15/23 µ | 2,375,000 | 2,388,167 | ||||||||||
3.30% 12/16/24 | 4,420,000 | 4,591,176 | ||||||||||
SunTrust Banks | ||||||||||||
2.45% 8/1/22 | 3,070,000 | 3,059,540 | ||||||||||
2.70% 1/27/22 | 5,605,000 | 5,643,240 | ||||||||||
3.30% 5/15/26 | 2,845,000 | 2,821,294 | ||||||||||
5.05% µy | 485,000 | 498,580 | ||||||||||
Toronto-Dominion Bank 2.50% 12/14/20 | 3,650,000 | 3,688,355 | ||||||||||
Turkiye Garanti Bankasi | ||||||||||||
144A 5.25% 9/13/22 # | 610,000 | 619,054 | ||||||||||
144A 6.25% 4/20/21 # | 3,965,000 | 4,185,851 | ||||||||||
30
Table of Contents
| Principal amount° | Value (US $) | |||||||||||
| ||||||||||||
Corporate Bonds (continued) | ||||||||||||
| ||||||||||||
Banking (continued) | ||||||||||||
Turkiye Is Bankasi 144A 7.00% 6/29/28 #µ | 3,690,000 | $ | 3,625,919 | |||||||||
UBS Group 6.875% µy | 2,760,000 | 3,104,114 | ||||||||||
UBS Group Funding Switzerland | ||||||||||||
144A 2.859% 8/15/23 #µ | 2,570,000 | 2,568,561 | ||||||||||
144A 3.491% 5/23/23 # | 4,485,000 | 4,600,800 | ||||||||||
144A 4.125% 9/24/25 # | 5,345,000 | 5,642,680 | ||||||||||
144A 4.125% 4/15/26 # | 4,570,000 | 4,825,686 | ||||||||||
144A 4.253% 3/23/28 # | 3,565,000 | 3,763,224 | ||||||||||
US Bancorp | ||||||||||||
3.10% 4/27/26 | 7,010,000 | 6,990,160 | ||||||||||
3.15% 4/27/27 | 2,610,000 | 2,623,289 | ||||||||||
USB Capital IX 3.50% (LIBOR03M + 1.02%) y• | 27,182,000 | 24,443,142 | ||||||||||
Wells Fargo & Co. | ||||||||||||
3.00% 7/27/21 | AUD | 2,492,000 | 1,909,274 | |||||||||
3.50% 9/12/29 | GBP | 1,700,000 | 2,508,398 | |||||||||
4.75% 12/7/46 | 3,220,000 | 3,519,369 | ||||||||||
Wells Fargo Capital X 5.95% 12/15/36 | 470,000 | 531,100 | ||||||||||
Westpac Banking | ||||||||||||
4.322% 11/23/31 µ | 990,000 | 1,027,837 | ||||||||||
5.00% µy | 1,345,000 | 1,352,912 | ||||||||||
Woori Bank 144A 4.75% 4/30/24 # | 3,670,000 | 3,855,827 | ||||||||||
Zions Bancorporation 4.50% 6/13/23 | 3,460,000 | 3,667,043 | ||||||||||
|
| |||||||||||
| 487,352,539 | ||||||||||||
|
| |||||||||||
Basic Industry – 5.18% | ||||||||||||
AK Steel 6.375% 10/15/25 | 1,065,000 | 1,051,687 | ||||||||||
Allegheny Technologies 7.875% 8/15/23 | 965,000 | 1,059,087 | ||||||||||
Anglo American Capital 144A 4.875% 5/14/25 # | 9,270,000 | 9,913,103 | ||||||||||
ArcelorMittal 6.125% 6/1/25 * | 1,611,000 | 1,866,295 | ||||||||||
Barrick North America Finance 5.75% 5/1/43 | 2,825,000 | 3,521,683 | ||||||||||
Beacon Escrow 144A 4.875% 11/1/25 # | 3,060,000 | 3,117,375 | ||||||||||
BHP Billiton Finance USA 144A 6.25% 10/19/75 #*µ | 12,410,000 | 13,626,180 | ||||||||||
BMC East 144A 5.50% 10/1/24 # | 1,200,000 | 1,260,000 | ||||||||||
Boise Cascade 144A 5.625% 9/1/24 # | 3,705,000 | 3,871,725 | ||||||||||
Braskem Netherlands Finance 144A 4.50% 1/10/28 # | 4,440,000 | 4,420,686 | ||||||||||
Builders FirstSource | ||||||||||||
144A 5.625% 9/1/24 # | 3,430,000 | 3,635,800 | ||||||||||
144A 10.75% 8/15/23 # | 340,000 | 387,600 | ||||||||||
Cemex 144A 7.75% 4/16/26 #* | 1,540,000 | 1,748,054 | ||||||||||
CF Industries 6.875% 5/1/18 | 9,229,000 | 9,471,261 | ||||||||||
Chemours | ||||||||||||
5.375% 5/15/27 | 865,000 | 925,550 | ||||||||||
7.00% 5/15/25 | 445,000 | 498,400 | ||||||||||
31
Table of Contents
Schedule of investments
Delaware Diversified Income Fund
| Principal amount° | Value (US $) | |||||||
| ||||||||
Corporate Bonds (continued) | ||||||||
| ||||||||
Basic Industry (continued) | ||||||||
Cia Brasileira de Aluminio 144A 6.75% 4/5/21 # | 3,545,000 | $ | 3,877,344 | |||||
CK Hutchison International 17 144A 2.875% 4/5/22 # | 5,190,000 | 5,216,844 | ||||||
Cydsa 144A 6.25% 10/4/27 # | 2,555,000 | 2,545,419 | ||||||
Dow Chemical 8.55% 5/15/19 | 33,171,000 | 36,434,257 | ||||||
First Quantum Minerals 144A 7.25% 4/1/23 # | 3,845,000 | 4,085,313 | ||||||
FMG Resources August 2006 | ||||||||
144A 4.75% 5/15/22 # | 1,085,000 | 1,112,125 | ||||||
144A 5.125% 5/15/24 #* | 3,535,000 | 3,649,887 | ||||||
Freeport-McMoRan | ||||||||
4.55% 11/14/24 * | 3,040,000 | 3,047,600 | ||||||
6.875% 2/15/23 | 3,420,000 | 3,758,135 | ||||||
Georgia-Pacific 8.00% 1/15/24 | 15,521,000 | 19,970,475 | ||||||
HD Supply 144A 5.75% 4/15/24 # | 2,550,000 | 2,757,187 | ||||||
Hudbay Minerals | ||||||||
144A 7.25% 1/15/23 # | 30,000 | 32,475 | ||||||
144A 7.625% 1/15/25 # | 1,590,000 | 1,760,925 | ||||||
International Paper | ||||||||
4.35% 8/15/48 | 1,520,000 | 1,568,673 | ||||||
4.40% 8/15/47 | 1,825,000 | 1,893,175 | ||||||
Joseph T Ryerson & Son 144A 11.00% 5/15/22 # | 800,000 | 902,000 | ||||||
Koppers 144A 6.00% 2/15/25 # | 380,000 | 408,500 | ||||||
Kraton Polymers 144A 10.50% 4/15/23 # | 350,000 | 399,000 | ||||||
Lennar | ||||||||
4.50% 4/30/24 | 1,290,000 | 1,331,925 | ||||||
4.75% 5/30/25 | 180,000 | 189,225 | ||||||
4.875% 12/15/23 | 782,000 | 829,897 | ||||||
M/I Homes 6.75% 1/15/21 | 370,000 | 386,650 | ||||||
Mexichem 144A 5.50% 1/15/48 # | 4,225,000 | 4,111,770 | ||||||
Mosaic 5.625% 11/15/43 * | 4,635,000 | 4,877,879 | ||||||
NCI Building Systems 144A 8.25% 1/15/23 # | 1,405,000 | 1,509,497 | ||||||
Nexa Resources 144A 5.375% 5/4/27 # | 3,660,000 | 3,883,260 | ||||||
NOVA Chemicals | ||||||||
144A 5.00% 5/1/25 # | 2,470,000 | 2,507,050 | ||||||
144A 5.25% 6/1/27 # | 860,000 | 877,200 | ||||||
Novelis 144A 6.25% 8/15/24 # | 1,225,000 | 1,295,437 | ||||||
Novolipetsk Steel via Steel Funding 144A 4.50% 6/15/23 # | 2,905,000 | 3,012,049 | ||||||
OCP | ||||||||
144A 4.50% 10/22/25 # | 3,665,000 | 3,670,622 | ||||||
144A 6.875% 4/25/44 # | 2,310,000 | 2,612,610 | ||||||
Olin 5.125% 9/15/27 | 1,725,000 | 1,817,719 | ||||||
32
Table of Contents
| Principal amount° | Value (US $) | |||||||
| ||||||||
Corporate Bonds (continued) | ||||||||
| ||||||||
Basic Industry (continued) | ||||||||
Phosagro OAO Via Phosagro Bond Funding DAC 144A 3.95% 11/3/21 # | 4,650,000 | $ | 4,709,055 | |||||
PolyOne 5.25% 3/15/23 | 2,470,000 | 2,667,600 | ||||||
PQ 144A 6.75% 11/15/22 # | 360,000 | 390,600 | ||||||
PulteGroup 5.00% 1/15/27 | 2,080,000 | 2,199,600 | ||||||
SPCM 144A 4.875% 9/15/25 # | 2,645,000 | 2,724,350 | ||||||
Standard Industries 144A 5.00% 2/15/27 # | 4,830,000 | 5,045,901 | ||||||
Steel Dynamics 5.00% 12/15/26 | 2,405,000 | 2,549,300 | ||||||
Summit Materials | ||||||||
144A 5.125% 6/1/25 # | 1,085,000 | 1,101,275 | ||||||
6.125% 7/15/23 | 360,000 | 375,300 | ||||||
8.50% 4/15/22 | 130,000 | 145,925 | ||||||
Suzano Austria 144A 7.00% 3/16/47 #* | 3,550,000 | 3,974,225 | ||||||
US Concrete 6.375% 6/1/24 | 2,955,000 | 3,191,400 | ||||||
Vale Overseas 4.375% 1/11/22 | 1,045,000 | 1,092,339 | ||||||
Vedanta Resources | ||||||||
144A 6.125% 8/9/24 # | 1,590,000 | 1,626,174 | ||||||
144A 6.375% 7/30/22 #* | 2,210,000 | 2,317,627 | ||||||
WestRock | ||||||||
144A 3.00% 9/15/24 # | 2,165,000 | 2,160,297 | ||||||
144A 3.375% 9/15/27 # | 2,030,000 | 2,023,964 | ||||||
WR Grace & Co.-Conn 144A 5.625% 10/1/24 # | 2,556,000 | 2,805,210 | ||||||
Zekelman Industries 144A 9.875% 6/15/23 # | 440,000 | 498,300 | ||||||
|
| |||||||
| 228,305,052 | ||||||||
|
| |||||||
Brokerage – 0.91% | ||||||||
Charles Schwab 5.00% µy | 1,740,000 | 1,761,750 | ||||||
E*TRADE Financial | ||||||||
3.80% 8/24/27 | 4,310,000 | 4,346,357 | ||||||
5.875% *µy | 4,760,000 | 5,093,200 | ||||||
Intercontinental Exchange 3.10% 9/15/27 | 2,840,000 | 2,827,482 | ||||||
Jefferies Group | ||||||||
6.45% 6/8/27 | 3,815,000 | 4,469,947 | ||||||
6.50% 1/20/43 | 2,455,000 | 2,823,286 | ||||||
Lazard Group 3.75% 2/13/25 | 15,330,000 | 15,670,600 | ||||||
SUAM Finance 144A 4.875% 4/17/24 #* | 3,110,000 | 3,347,915 | ||||||
|
| |||||||
| 40,340,537 | ||||||||
|
| |||||||
Capital Goods – 2.00% | ||||||||
3M 2.875% 10/15/27 | 4,030,000 | 4,034,438 | ||||||
Allegion US Holding | ||||||||
3.20% 10/1/24 | 2,345,000 | 2,355,693 | ||||||
3.55% 10/1/27 | 6,966,000 | 6,969,413 | ||||||
33
Table of Contents
Schedule of investments
Delaware Diversified Income Fund
| Principal amount° | Value (US $) | |||||||||||
| ||||||||||||
Corporate Bonds (continued) | ||||||||||||
| ||||||||||||
Capital Goods (continued) | ||||||||||||
Ardagh Packaging Finance | ||||||||||||
144A 6.00% 2/15/25 # | 2,645,000 | $ | 2,813,619 | |||||||||
144A 7.25% 5/15/24 # | 585,000 | 644,963 | ||||||||||
Ball 5.25% 7/1/25 | 3,535,000 | 3,897,337 | ||||||||||
Boral Finance 144A 3.75% 5/1/28 # | 1,685,000 | 1,700,861 | ||||||||||
BWAY Holding 144A 5.50% 4/15/24 # | 2,165,000 | 2,259,719 | ||||||||||
CCL Industries 144A 3.25% 10/1/26 # | 3,480,000 | 3,335,704 | ||||||||||
Eaton 3.103% 9/15/27 | 6,780,000 | 6,690,167 | ||||||||||
LafargeHolcim Finance US 144A 3.50% 9/22/26 #* | 10,530,000 | 10,502,793 | ||||||||||
Lennox International 3.00% 11/15/23 | 3,730,000 | 3,737,602 | ||||||||||
Northrop Grumman | ||||||||||||
3.25% 1/15/28 | 3,010,000 | 3,035,337 | ||||||||||
4.03% 10/15/47 | 3,445,000 | 3,551,085 | ||||||||||
Owens-Brockway Glass Container 144A 5.875% 8/15/23 # | 3,165,000 | 3,479,522 | ||||||||||
Rockwell Collins | ||||||||||||
3.20% 3/15/24 | 2,705,000 | 2,761,577 | ||||||||||
3.50% 3/15/27 | 1,915,000 | 1,969,283 | ||||||||||
San Miguel Industrias Pet 144A 4.50% 9/18/22 # | 2,555,000 | 2,590,515 | ||||||||||
Siemens Financieringsmaatschappij | ||||||||||||
144A 3.125% 3/16/24 # | 6,780,000 | 6,938,050 | ||||||||||
144A 4.20% 3/16/47 # | 515,000 | 555,217 | ||||||||||
StandardAero Aviation Holdings 144A 10.00% 7/15/23 # | 170,000 | 188,700 | ||||||||||
TransDigm 6.375% 6/15/26 | 1,670,000 | 1,707,575 | ||||||||||
United Technologies | ||||||||||||
2.80% 5/4/24 | 3,785,000 | 3,783,728 | ||||||||||
3.75% 11/1/46 | 4,415,000 | 4,312,922 | ||||||||||
Waste Management 3.15% 11/15/27 | 4,380,000 | 4,389,188 | ||||||||||
|
| |||||||||||
| 88,205,008 | ||||||||||||
|
| |||||||||||
Communications – 5.15% | ||||||||||||
American Tower | ||||||||||||
4.00% 6/1/25 | 3,285,000 | 3,417,287 | ||||||||||
4.40% 2/15/26 | 1,740,000 | 1,847,040 | ||||||||||
American Tower Trust #1 144A 3.07% 3/15/23 # | 10,235,000 | 10,392,998 | ||||||||||
AT&T | ||||||||||||
3.90% 8/14/27 | 3,640,000 | 3,630,679 | ||||||||||
4.25% 3/1/27 | 4,455,000 | 4,576,692 | ||||||||||
4.90% 8/14/37 | 10,655,000 | 10,683,282 | ||||||||||
5.15% 2/14/50 | 2,445,000 | 2,420,279 | ||||||||||
5.25% 3/1/37 | 1,000,000 | 1,049,275 | ||||||||||
Bell Canada 3.35% 3/22/23 | CAD | 2,132,000 | 1,703,666 | |||||||||
Cablevision 144A 6.50% 6/15/21 # | 2,125,000 | 2,278,149 | ||||||||||
34
Table of Contents
| Principal amount° | Value (US $) | |||||||||||
| ||||||||||||
Corporate Bonds (continued) | ||||||||||||
| ||||||||||||
Communications (continued) | ||||||||||||
CC Holdings GS V 3.849% 4/15/23 | 4,980,000 | $ | 5,178,412 | |||||||||
CenturyLink 6.75% 12/1/23 * | 2,080,000 | 2,171,520 | ||||||||||
Cincinnati Bell 144A 7.00% 7/15/24 # | 923,000 | 923,000 | ||||||||||
Comcast 3.15% 2/15/28 | 8,030,000 | 7,967,580 | ||||||||||
Comcel Trust 144A 6.875% 2/6/24 # | 2,525,000 | 2,676,500 | ||||||||||
Crown Castle International | ||||||||||||
3.65% 9/1/27 | 1,465,000 | 1,464,828 | ||||||||||
5.25% 1/15/23 | 4,275,000 | 4,728,083 | ||||||||||
Crown Castle Towers 144A 4.883% 8/15/20 # | 25,785,000 | 27,240,687 | ||||||||||
CyrusOne 144A 5.00% 3/15/24 # | 730,000 | 767,413 | ||||||||||
Deutsche Telekom International Finance | ||||||||||||
144A 1.95% 9/19/21 # | 3,015,000 | 2,946,527 | ||||||||||
144A 2.485% 9/19/23 # | 14,695,000 | 14,318,014 | ||||||||||
6.50% 4/8/22 | GBP | 1,270,000 | 2,048,164 | |||||||||
Digicel 144A 6.75% 3/1/23 # | 2,780,000 | 2,759,150 | ||||||||||
Digicel Group | ||||||||||||
144A 7.125% 4/1/22 # | 3,260,000 | 3,084,775 | ||||||||||
144A 8.25% 9/30/20 # | 2,200,000 | 2,183,500 | ||||||||||
Discovery Communications | ||||||||||||
3.95% 3/20/28 | 8,265,000 | 8,214,033 | ||||||||||
5.20% 9/20/47 | 6,050,000 | 6,186,000 | ||||||||||
Equinix 5.375% 5/15/27 | 1,680,000 | 1,803,900 | ||||||||||
GTP Acquisition Partners I 144A 2.35% 6/15/20 # | 2,605,000 | 2,597,609 | ||||||||||
Level 3 Financing | ||||||||||||
5.25% 3/15/26 | 215,000 | 222,729 | ||||||||||
5.375% 5/1/25 | 4,475,000 | 4,687,563 | ||||||||||
MTS International Funding 144A 5.00% 5/30/23 # | 3,175,000 | 3,306,083 | ||||||||||
Myriad International Holdings | ||||||||||||
144A 4.85% 7/6/27 # | 1,405,000 | 1,445,708 | ||||||||||
144A 5.50% 7/21/25 # | 2,605,000 | 2,832,588 | ||||||||||
Radiate Holdco 144A 6.625% 2/15/25 # | 380,000 | 374,300 | ||||||||||
SBA Communications 4.875% 9/1/24 | 2,665,000 | 2,744,950 | ||||||||||
SBA Tower Trust | ||||||||||||
144A 2.24% 4/10/18 # | 7,270,000 | 7,271,776 | ||||||||||
144A 2.898% 10/8/19 # | 405,000 | 408,084 | ||||||||||
Sirius XM Radio | ||||||||||||
144A 5.00% 8/1/27 # | 2,955,000 | 2,995,631 | ||||||||||
144A 5.375% 4/15/25 # | 5,327,000 | 5,626,644 | ||||||||||
Sprint | ||||||||||||
7.125% 6/15/24 | 520,000 | 563,389 | ||||||||||
7.875% 9/15/23 | 3,023,000 | 3,385,760 | ||||||||||
Sprint Communications 7.00% 8/15/20 | 270,000 | 292,275 | ||||||||||
35
Table of Contents
Schedule of investments
Delaware Diversified Income Fund
| Principal amount° | Value (US $) | |||||||||||
| ||||||||||||
Corporate Bonds (continued) | ||||||||||||
| ||||||||||||
Communications (continued) | ||||||||||||
Telecom Italia 144A 5.303% 5/30/24 # | 1,485,000 | $ | 1,605,656 | |||||||||
Time Warner Cable 7.30% 7/1/38 | 10,770,000 | 13,526,993 | ||||||||||
Time Warner Entertainment 8.375% 3/15/23 | 5,470,000 | 6,796,768 | ||||||||||
T-Mobile USA | ||||||||||||
6.375% 3/1/25 | 250,000 | 270,625 | ||||||||||
6.50% 1/15/26 | 3,725,000 | 4,130,541 | ||||||||||
VEON Holdings | ||||||||||||
144A 4.95% 6/16/24 # | 2,425,000 | 2,487,468 | ||||||||||
144A 5.95% 2/13/23 # | 3,340,000 | 3,625,603 | ||||||||||
Verizon Communications | ||||||||||||
3.25% 2/17/26 | EUR | 2,606,000 | 3,547,155 | |||||||||
4.50% 8/17/27 | AUD | 2,230,000 | 1,720,060 | |||||||||
4.50% 8/10/33 | 3,135,000 | 3,238,281 | ||||||||||
5.25% 3/16/37 | 1,435,000 | 1,567,016 | ||||||||||
Wind Acquisition Finance 144A 7.375% 4/23/21 # | 2,290,000 | 2,384,577 | ||||||||||
Zayo Group | ||||||||||||
144A 5.75% 1/15/27 # | 3,875,000 | 4,092,969 | ||||||||||
6.375% 5/15/25 | 520,000 | 561,657 | ||||||||||
|
| |||||||||||
| 226,971,891 | ||||||||||||
|
| |||||||||||
Consumer Cyclical – 1.99% | ||||||||||||
AMC Entertainment Holdings 6.125% 5/15/27 * | 1,930,000 | 1,920,350 | ||||||||||
American Tire Distributors 144A 10.25% 3/1/22 # | 310,000 | 324,725 | ||||||||||
Boyd Gaming 6.375% 4/1/26 | 4,285,000 | 4,713,500 | ||||||||||
Daimler 2.75% 12/10/18 | NOK | 14,510,000 | 1,813,441 | |||||||||
Dollar General 3.875% 4/15/27 | 6,685,000 | 6,985,005 | ||||||||||
Ford Motor Credit 3.096% 5/4/23 | 6,810,000 | 6,807,485 | ||||||||||
General Motors 6.75% 4/1/46 | 1,230,000 | 1,509,523 | ||||||||||
General Motors Financial 5.25% 3/1/26 | 4,005,000 | 4,382,193 | ||||||||||
GLP Capital 5.375% 4/15/26 | 3,025,000 | 3,282,125 | ||||||||||
Hanesbrands 144A 4.875% 5/15/26 # | 3,119,000 | 3,228,165 | ||||||||||
Hilton Worldwide Finance 4.875% 4/1/27 | 1,765,000 | 1,862,075 | ||||||||||
Hyundai Capital America | ||||||||||||
144A 2.55% 2/6/19 # | 275,000 | 275,559 | ||||||||||
144A 3.00% 3/18/21 #* | 1,835,000 | 1,838,283 | ||||||||||
JC Penney 8.125% 10/1/19 | 538,000 | 538,000 | ||||||||||
JD.com 3.125% 4/29/21 | 6,185,000 | 6,214,522 | ||||||||||
KFC Holding | ||||||||||||
144A 5.00% 6/1/24 # | 1,825,000 | 1,929,937 | ||||||||||
144A 5.25% 6/1/26 # | 1,700,000 | 1,810,755 | ||||||||||
Lear 3.80% 9/15/27 | 3,255,000 | 3,272,246 | ||||||||||
Lithia Motors 144A 5.25% 8/1/25 # | 1,660,000 | 1,745,075 | ||||||||||
Lowe’s 3.70% 4/15/46 | 8,315,000 | 8,131,859 | ||||||||||
36
Table of Contents
| Principal amount° | Value (US $) | |||||||||||
| ||||||||||||
Corporate Bonds (continued) | ||||||||||||
| ||||||||||||
Consumer Cyclical (continued) | ||||||||||||
Marriott International 4.50% 10/1/34 | 1,035,000 | $ | 1,095,156 | |||||||||
MGM Resorts International 4.625% 9/1/26 | 3,040,000 | 3,055,200 | ||||||||||
Mohegan Gaming & Entertainment 144A 7.875% 10/15/24 #* | 550,000 | 587,813 | ||||||||||
New Red Finance 144A 5.00% 10/15/25 # | 1,495,000 | 1,524,900 | ||||||||||
Penn National Gaming 144A 5.625% 1/15/27 #* | 4,515,000 | 4,684,313 | ||||||||||
Penske Automotive Group 5.50% 5/15/26 | 2,430,000 | 2,505,937 | ||||||||||
Scientific Games International | ||||||||||||
144A 5.00% 10/15/25 # | 955,000 | 971,713 | ||||||||||
10.00% 12/1/22 | 2,745,000 | 3,043,519 | ||||||||||
Tapestry 4.125% 7/15/27 | 3,295,000 | 3,323,947 | ||||||||||
Toyota Motor Credit 2.80% 7/13/22 | 2,820,000 | 2,876,230 | ||||||||||
Wyndham Worldwide 4.15% 4/1/24 | 1,380,000 | 1,400,530 | ||||||||||
|
| |||||||||||
| 87,654,081 | ||||||||||||
|
| |||||||||||
Consumer Non-Cyclical – 4.36% | ||||||||||||
Abbott Laboratories 4.90% 11/30/46 | 6,515,000 | 7,327,978 | ||||||||||
Air Medical Group 144A 6.375% 5/15/23 # | 550,000 | 533,500 | ||||||||||
Albertsons | ||||||||||||
5.75% 3/15/25 | 1,985,000 | 1,756,725 | ||||||||||
6.625% 6/15/24 * | 350,000 | 330,750 | ||||||||||
Amgen 4.00% 9/13/29 | GBP | 1,271,000 | 1,917,485 | |||||||||
Anheuser-Busch InBev Finance 3.65% 2/1/26 | 23,645,000 | 24,437,079 | ||||||||||
BAT Capital | ||||||||||||
144A 3.557% 8/15/27 # | 8,805,000 | 8,843,937 | ||||||||||
144A 4.39% 8/15/37 # | 6,440,000 | 6,676,246 | ||||||||||
Becle 144A 3.75% 5/13/25 # | 8,625,000 | 8,671,442 | ||||||||||
Becton Dickinson & Co. | ||||||||||||
3.363% 6/6/24 | 5,755,000 | 5,810,620 | ||||||||||
3.70% 6/6/27 | 2,025,000 | 2,040,884 | ||||||||||
Biogen 5.20% 9/15/45 | 8,138,000 | 9,382,420 | ||||||||||
Cencosud 144A 6.625% 2/12/45 # | 3,215,000 | 3,516,232 | ||||||||||
Cott Holdings 144A 5.50% 4/1/25 # | 1,825,000 | 1,886,594 | ||||||||||
ESAL 144A 6.25% 2/5/23 # | 3,120,000 | 3,018,600 | ||||||||||
HCA 5.875% 2/15/26 | 1,850,000 | 1,949,437 | ||||||||||
inVentiv Group Holdings 144A 7.50% 10/1/24 # | 154,000 | 170,555 | ||||||||||
JBS USA 144A 5.75% 6/15/25 # | 380,000 | 370,500 | ||||||||||
Kernel Holding 144A 8.75% 1/31/22 # | 4,410,000 | 4,873,711 | ||||||||||
Kroger 2.65% 10/15/26 * | 2,890,000 | 2,680,797 | ||||||||||
Lamb Weston Holdings | ||||||||||||
144A 4.625% 11/1/24 # | 1,095,000 | 1,149,750 | ||||||||||
144A 4.875% 11/1/26 # | 1,700,000 | 1,791,375 | ||||||||||
Marfrig Holdings Europe 144A 8.00% 6/8/23 # | 4,535,000 | 4,756,081 | ||||||||||
37
Table of Contents
Schedule of investments
Delaware Diversified Income Fund
| Principal amount° | Value (US $) | |||||||
| ||||||||
Corporate Bonds (continued) | ||||||||
| ||||||||
Consumer Non-Cyclical (continued) | ||||||||
McCormick & Co. 2.70% 8/15/22 | 2,050,000 | $ | 2,060,074 | |||||
MHP 144A 7.75% 5/10/24 # | 3,030,000 | 3,277,703 | ||||||
Molson Coors Brewing | ||||||||
3.00% 7/15/26 | 7,245,000 | 7,068,660 | ||||||
4.20% 7/15/46 | 4,370,000 | 4,327,521 | ||||||
Mylan 3.95% 6/15/26 | 2,530,000 | 2,531,428 | ||||||
New York & Presbyterian Hospital 4.063% 8/1/56 | 3,740,000 | 3,780,766 | ||||||
Pernod Ricard 144A 4.45% 1/15/22 # | 7,270,000 | 7,815,739 | ||||||
Pfizer 3.00% 12/15/26 | 5,815,000 | 5,874,022 | ||||||
Post Holdings | ||||||||
144A 5.00% 8/15/26 # | 4,120,000 | 4,150,900 | ||||||
144A 5.75% 3/1/27 # | 190,000 | 198,313 | ||||||
Scotts Miracle-Gro 5.25% 12/15/26 | 1,965,000 | 2,102,747 | ||||||
Shire Acquisitions Investments Ireland | ||||||||
2.40% 9/23/21 | 6,075,000 | 6,038,879 | ||||||
2.875% 9/23/23 | 5,655,000 | 5,604,354 | ||||||
Team Health Holdings 144A 6.375% 2/1/25 #* | 280,000 | 259,000 | ||||||
Tempur Sealy International 5.50% 6/15/26 | 2,230,000 | 2,302,475 | ||||||
Thermo Fisher Scientific 3.00% 4/15/23 | 10,750,000 | 10,891,868 | ||||||
Zimmer Biomet Holdings 4.625% 11/30/19 | 15,621,000 | 16,368,771 | ||||||
Zoetis 3.00% 9/12/27 | 3,685,000 | 3,614,983 | ||||||
|
| |||||||
| 192,160,901 | ||||||||
|
| |||||||
Electric – 5.19% | �� | |||||||
AEP Texas 144A 3.80% 10/1/47 # | 2,570,000 | 2,603,134 | ||||||
AES Gener 144A 8.375% 12/18/73 #*µ | 3,260,000 | 3,461,142 | ||||||
Ameren Illinois 9.75% 11/15/18 | 16,210,000 | 17,476,469 | ||||||
American Transmission Systems 144A 5.25% 1/15/22 # | 14,260,000 | 15,593,350 | ||||||
Appalachian Power 3.30% 6/1/27 | 3,140,000 | 3,172,200 | ||||||
Cerro del Aguila 144A 4.125% 8/16/27 # | 4,945,000 | 4,945,000 | ||||||
Cleveland Electric Illuminating 5.50% 8/15/24 | 290,000 | 332,740 | ||||||
CMS Energy 6.25% 2/1/20 | 7,695,000 | 8,359,578 | ||||||
ComEd Financing III 6.35% 3/15/33 | 8,344,000 | 9,157,540 | ||||||
Consumers Energy 3.25% 8/15/46 | 2,485,000 | 2,282,546 | ||||||
Dominion Energy 3.625% 12/1/24 | 4,495,000 | 4,658,238 | ||||||
DTE Energy | ||||||||
2.85% 10/1/26 | 3,355,000 | 3,241,247 | ||||||
3.30% 6/15/22 | 5,955,000 | 6,108,481 | ||||||
Duke Energy | ||||||||
2.65% 9/1/26 | 975,000 | 937,435 | ||||||
3.15% 8/15/27 | 4,130,000 | 4,108,321 | ||||||
Emera 6.75% 6/15/76 *µ | 6,710,000 | 7,708,113 | ||||||
Emera US Finance 4.75% 6/15/46 | 5,495,000 | 5,966,987 | ||||||
38
Table of Contents
| Principal amount° | Value (US $) | |||||||||||
| ||||||||||||
Corporate Bonds (continued) | ||||||||||||
| ||||||||||||
Electric (continued) | ||||||||||||
Enel 144A 8.75% 9/24/73 #µ | 7,060,000 | $ | 8,736,750 | |||||||||
Enel Americas 4.00% 10/25/26 | 2,475,000 | 2,530,687 | ||||||||||
Enel Finance International | ||||||||||||
144A 3.50% 4/6/28 # | 3,510,000 | 3,456,294 | ||||||||||
144A 3.625% 5/25/27 # | 7,850,000 | 7,859,876 | ||||||||||
Entergy 2.95% 9/1/26 | 965,000 | 938,166 | ||||||||||
Entergy Louisiana | ||||||||||||
4.05% 9/1/23 | 14,030,000 | 15,011,415 | ||||||||||
4.95% 1/15/45 | 685,000 | 716,226 | ||||||||||
Exelon 3.497% 6/1/22 | 2,810,000 | 2,894,554 | ||||||||||
Fortis 3.055% 10/4/26 | 10,395,000 | 10,111,669 | ||||||||||
Great Plains Energy 4.85% 6/1/21 | 2,805,000 | 2,982,312 | ||||||||||
Kansas City Power & Light 3.65% 8/15/25 | 7,975,000 | 8,207,761 | ||||||||||
National Rural Utilities Cooperative Finance | ||||||||||||
2.70% 2/15/23 | 5,640,000 | 5,664,097 | ||||||||||
4.75% 4/30/43 µ | 5,585,000 | 5,900,826 | ||||||||||
5.25% 4/20/46 µ | 6,060,000 | 6,553,185 | ||||||||||
Newfoundland & Labrador Hydro 3.60% 12/1/45 | CAD | 1,500,000 | 1,194,954 | |||||||||
NextEra Energy Capital Holdings 3.625% 6/15/23 | 4,318,000 | 4,491,648 | ||||||||||
NV Energy 6.25% 11/15/20 | 10,391,000 | 11,559,198 | ||||||||||
Pennsylvania Electric 5.20% 4/1/20 | 398,000 | 423,803 | ||||||||||
Perusahaan Listrik Negara | ||||||||||||
144A 4.125% 5/15/27 # | 2,435,000 | 2,445,313 | ||||||||||
144A 5.25% 5/15/47 # | 1,995,000 | 2,102,540 | ||||||||||
Public Service Co. of Oklahoma 5.15% 12/1/19 | 3,340,000 | 3,538,154 | ||||||||||
Southern | ||||||||||||
2.75% 6/15/20 | 3,565,000 | 3,619,236 | ||||||||||
3.25% 7/1/26 | 11,040,000 | 10,998,422 | ||||||||||
Trans-Allegheny Interstate Line 144A 3.85% 6/1/25 # | 2,505,000 | 2,622,725 | ||||||||||
Union Electric 2.95% 6/15/27 | 645,000 | 643,181 | ||||||||||
Wisconsin Electric Power 4.30% 12/15/45 | 3,090,000 | 3,293,559 | ||||||||||
|
| |||||||||||
| 228,609,072 | ||||||||||||
|
| |||||||||||
Energy – 5.67% | ||||||||||||
Abu Dhabi Crude Oil Pipeline | ||||||||||||
144A 3.65% 11/2/29 # | 4,760,000 | 4,783,800 | ||||||||||
144A 4.60% 11/2/47 # | 5,100,000 | 5,219,376 | ||||||||||
Alta Mesa Holdings 144A 7.875% 12/15/24 # | 370,000 | 403,300 | ||||||||||
AmeriGas Partners 5.875% 8/20/26 | 4,230,000 | 4,420,350 | ||||||||||
Anadarko Petroleum 6.60% 3/15/46 | 5,915,000 | 7,499,998 | ||||||||||
Andeavor Logistics 5.25% 1/15/25 | 1,935,000 | 2,087,381 | ||||||||||
Antero Resources | ||||||||||||
5.00% 3/1/25 | 535,000 | 545,700 | ||||||||||
39
Table of Contents
Schedule of investments
Delaware Diversified Income Fund
| Principal amount° | Value (US $) | |||||||
| ||||||||
Corporate Bonds (continued) | ||||||||
| ||||||||
Energy (continued) | ||||||||
Antero Resources | ||||||||
5.625% 6/1/23 | 440,000 | $ | 463,100 | |||||
Boston Gas 144A 3.15% 8/1/27 # | 1,600,000 | 1,600,731 | ||||||
Cheniere Corpus Christi Holdings | ||||||||
5.875% 3/31/25 | 1,465,000 | 1,591,356 | ||||||
7.00% 6/30/24 | 170,000 | 194,863 | ||||||
Crestwood Midstream Partners 5.75% 4/1/25 | 1,950,000 | 2,008,500 | ||||||
Diamondback Energy 4.75% 11/1/24 | 3,750,000 | 3,834,375 | ||||||
Ecopetrol | ||||||||
5.875% 9/18/23 | 915,000 | 1,033,950 | ||||||
7.375% 9/18/43 | 2,245,000 | 2,612,731 | ||||||
Enbridge 3.70% 7/15/27 | 4,085,000 | 4,146,281 | ||||||
Energy Transfer 6.125% 12/15/45 | 10,690,000 | 11,724,905 | ||||||
Energy Transfer Equity | ||||||||
5.50% 6/1/27 | 230,000 | 244,950 | ||||||
7.50% 10/15/20 | 2,395,000 | 2,706,350 | ||||||
EnLink Midstream Partners 6.00% µy | 2,040,000 | 2,059,894 | ||||||
Enterprise Products Operating 7.034% 1/15/68 µ | 1,094,000 | 1,099,470 | ||||||
Gazprom OAO Via Gaz Capital 144A 4.95% 3/23/27 # | 5,155,000 | 5,291,520 | ||||||
Genesis Energy 6.75% 8/1/22 | 3,315,000 | 3,439,313 | ||||||
Gulfport Energy | ||||||||
6.00% 10/15/24 | 2,565,000 | 2,577,825 | ||||||
6.625% 5/1/23 | 1,140,000 | 1,174,200 | ||||||
Hilcorp Energy I | ||||||||
144A 5.00% 12/1/24 # | 3,390,000 | 3,390,000 | ||||||
144A 5.75% 10/1/25 # | 170,000 | 174,887 | ||||||
Holly Energy Partners 144A 6.00% 8/1/24 # | 200,000 | 210,500 | ||||||
KazMunayGas National | ||||||||
144A 3.875% 4/19/22 # | 1,785,000 | 1,809,117 | ||||||
144A 4.75% 4/19/27 # | 2,335,000 | 2,391,316 | ||||||
Laredo Petroleum 6.25% 3/15/23 | 1,380,000 | 1,438,650 | ||||||
Magellan Midstream Partners 4.20% 10/3/47 | 3,395,000 | 3,362,988 | ||||||
Marathon Oil 4.40% 7/15/27 | 4,385,000 | 4,510,041 | ||||||
MPLX 4.875% 12/1/24 | 8,490,000 | 9,246,355 | ||||||
Murphy Oil 6.875% 8/15/24 | 5,025,000 | 5,414,437 | ||||||
Murphy Oil USA 6.00% 8/15/23 | 4,629,000 | 4,877,809 | ||||||
Nabors Industries 5.50% 1/15/23 * | 1,307,000 | 1,257,987 | ||||||
Newfield Exploration | ||||||||
5.375% 1/1/26 * | 260,000 | 277,550 | ||||||
5.75% 1/30/22 | 2,505,000 | 2,705,400 | ||||||
Noble Energy | ||||||||
3.85% 1/15/28 | 3,310,000 | 3,329,212 | ||||||
40
Table of Contents
| Principal amount° | Value (US $) | |||||||
| ||||||||
Corporate Bonds (continued) | ||||||||
| ||||||||
Energy (continued) | ||||||||
Noble Energy | ||||||||
4.95% 8/15/47 | 740,000 | $ | 774,965 | |||||
5.05% 11/15/44 | 10,415,000 | 10,981,562 | ||||||
NuStar Logistics 5.625% 4/28/27 | 1,385,000 | 1,464,637 | ||||||
Oasis Petroleum | ||||||||
6.50% 11/1/21 * | 1,220,000 | 1,247,450 | ||||||
6.875% 3/15/22 | 200,000 | 206,500 | ||||||
ONEOK | ||||||||
4.95% 7/13/47 | 2,735,000 | 2,806,330 | ||||||
7.50% 9/1/23 | 6,425,000 | 7,708,073 | ||||||
Pertamina Persero | ||||||||
144A 4.30% 5/20/23 # | 3,460,000 | 3,663,265 | ||||||
144A 4.875% 5/3/22 # | 355,000 | 382,221 | ||||||
144A 5.625% 5/20/43 # | 1,980,000 | 2,173,167 | ||||||
Perusahaan Gas Negara Persero 144A 5.125% 5/16/24 #* | 2,975,000 | 3,234,393 | ||||||
Petrobras Global Finance | ||||||||
144A 5.299% 1/27/25 # | 2,746,000 | 2,758,357 | ||||||
6.75% 1/27/41 | 2,350,000 | 2,373,500 | ||||||
7.25% 3/17/44 | 2,135,000 | 2,244,419 | ||||||
7.375% 1/17/27 | 2,465,000 | 2,741,080 | ||||||
Petroleos Mexicanos | ||||||||
144A 6.50% 3/13/27 # | 775,000 | 846,804 | ||||||
144A 6.75% 9/21/47 # | 2,435,000 | 2,515,842 | ||||||
6.75% 9/21/47 | 695,000 | 718,074 | ||||||
Plains All American Pipeline 8.75% 5/1/19 | 13,279,000 | 14,457,295 | ||||||
Precision Drilling | ||||||||
6.625% 11/15/20 | 917,792 | 929,264 | ||||||
7.75% 12/15/23 | 1,125,000 | 1,158,750 | ||||||
QEP Resources 5.25% 5/1/23 * | 2,750,000 | 2,729,375 | ||||||
Raizen Fuels Finance 144A 5.30% 1/20/27 # | 4,390,000 | 4,653,400 | ||||||
Sabine Pass Liquefaction | ||||||||
5.75% 5/15/24 | 6,095,000 | 6,836,023 | ||||||
5.875% 6/30/26 | 9,320,000 | 10,560,698 | ||||||
Shell International Finance 4.375% 5/11/45 | 822,000 | 892,448 | ||||||
Southern Gas Corridor 144A 6.875% 3/24/26 # | 2,225,000 | 2,519,635 | ||||||
Southwestern Energy | ||||||||
4.10% 3/15/22 * | 1,085,000 | 1,071,437 | ||||||
6.70% 1/23/25 | 465,000 | 476,625 | ||||||
Summit Midstream Holdings 5.75% 4/15/25 | 2,040,000 | 2,091,000 | ||||||
Sunoco Logistics Partners Operations 5.40% 10/1/47 | 1,765,000 | 1,794,863 | ||||||
Targa Resources Partners 5.375% 2/1/27 | 3,350,000 | 3,484,000 | ||||||
41
Table of Contents
Schedule of investments
Delaware Diversified Income Fund
| Principal amount° | Value (US $) | |||||||||||
| ||||||||||||
Corporate Bonds (continued) | ||||||||||||
| ||||||||||||
Energy (continued) | ||||||||||||
Tengizchevroil Finance Co. International 144A 4.00% 8/15/26 #* | 3,820,000 | $ | 3,766,157 | |||||||||
Transcanada Trust | ||||||||||||
5.30% 3/15/77 µ | 2,685,000 | 2,797,971 | ||||||||||
5.875% 8/15/76 µ | 2,885,000 | 3,159,075 | ||||||||||
Transocean 144A 9.00% 7/15/23 #* | 330,000 | 359,700 | ||||||||||
Transocean Proteus 144A 6.25% 12/1/24 # | 1,529,500 | 1,611,711 | ||||||||||
WildHorse Resource Development 144A 6.875% 2/1/25 # | 380,000 | 378,100 | ||||||||||
Woodside Finance | ||||||||||||
144A 3.65% 3/5/25 # | 335,000 | 338,610 | ||||||||||
144A 8.75% 3/1/19 # | 10,841,000 | 11,771,839 | ||||||||||
YPF 144A 25.458% (BADLARPP + 4.00%) 7/7/20 #● | 6,250,000 | 6,085,937 | ||||||||||
|
| |||||||||||
| 249,925,020 | ||||||||||||
|
| |||||||||||
Finance Companies – 1.22% | ||||||||||||
AerCap Global Aviation Trust 144A 6.50% 6/15/45 #µ | 7,385,000 | 8,086,575 | ||||||||||
AerCap Ireland Capital 3.65% 7/21/27 | 8,998,000 | 9,008,982 | ||||||||||
Air Lease | ||||||||||||
3.00% 9/15/23 | 5,225,000 | 5,268,696 | ||||||||||
3.625% 4/1/27 | 3,575,000 | 3,601,138 | ||||||||||
Aviation Capital Group | ||||||||||||
144A 2.875% 1/20/22 # | 4,430,000 | 4,450,102 | ||||||||||
144A 4.875% 10/1/25 # | 4,855,000 | 5,328,232 | ||||||||||
BOC Aviation 144A 2.375% 9/15/21 # | 4,235,000 | 4,158,016 | ||||||||||
Equate Petrochemical 144A 3.00% 3/3/22 # | 3,055,000 | 3,029,033 | ||||||||||
General Electric 4.25% 1/17/18 | NZD | 1,010,000 | 693,858 | |||||||||
International Lease Finance 8.625% 1/15/22 | 3,082,000 | 3,770,542 | ||||||||||
SURA Asset Management 144A 4.375% 4/11/27 # | 1,645,000 | 1,671,649 | ||||||||||
Temasek Financial I 144A 2.375% 1/23/23 # | 4,915,000 | 4,903,757 | ||||||||||
|
| |||||||||||
| 53,970,580 | ||||||||||||
|
| |||||||||||
Healthcare – 0.74% | ||||||||||||
Change Healthcare Holdings 144A 5.75% 3/1/25 # | 2,035,000 | 2,088,419 | ||||||||||
DaVita 5.00% 5/1/25 | 2,503,000 | 2,471,713 | ||||||||||
HCA | ||||||||||||
5.375% 2/1/25 | 4,580,000 | 4,721,705 | ||||||||||
7.58% 9/15/25 | 160,000 | 183,600 | ||||||||||
HealthSouth | ||||||||||||
5.125% 3/15/23 | 920,000 | 943,000 | ||||||||||
5.75% 11/1/24 | 3,367,000 | 3,453,279 | ||||||||||
5.75% 9/15/25 | 1,280,000 | 1,326,400 | ||||||||||
Hill-Rom Holdings | ||||||||||||
144A 5.00% 2/15/25 # | 1,185,000 | 1,217,587 | ||||||||||
144A 5.75% 9/1/23 # | 1,555,000 | 1,644,413 | ||||||||||
42
Table of Contents
| Principal amount° | Value (US $) | |||||||
| ||||||||
Corporate Bonds (continued) | ||||||||
| ||||||||
Healthcare (continued) | ||||||||
MPH Acquisition Holdings 144A 7.125% 6/1/24 # | 2,640,000 | $ | 2,847,900 | |||||
Quintiles IMS 144A 5.00% 10/15/26 # | 2,645,000 | 2,816,925 | ||||||
Tenet Healthcare 144A 5.125% 5/1/25 # | 7,805,000 | 7,629,387 | ||||||
Universal Health Services 144A 5.00% 6/1/26 # | 1,135,000 | 1,210,194 | ||||||
|
| |||||||
| 32,554,522 | ||||||||
|
| |||||||
Insurance – 1.43% | ||||||||
Allstate 3.28% 12/15/26 | 1,575,000 | 1,609,881 | ||||||
Berkshire Hathaway 2.75% 3/15/23 | 3,155,000 | 3,200,816 | ||||||
Cigna 3.05% 10/15/27 | 5,980,000 | 5,843,097 | ||||||
HUB International 144A 7.875% 10/1/21 # | 570,000 | 593,986 | ||||||
MetLife | ||||||||
6.40% 12/15/36 | 40,000 | 46,250 | ||||||
144A 9.25% 4/8/38 # | 8,985,000 | 13,376,419 | ||||||
Metropolitan Life Global Funding I 144A 3.45% 12/18/26 # | 1,390,000 | 1,428,733 | ||||||
Nuveen Finance | ||||||||
144A 2.95% 11/1/19 # | 4,670,000 | 4,744,032 | ||||||
144A 4.125% 11/1/24 # | 9,485,000 | 10,045,872 | ||||||
Progressive 4.125% 4/15/47 | 3,900,000 | 4,126,478 | ||||||
Prudential Financial | ||||||||
4.50% 11/15/20 | 3,385,000 | 3,613,736 | ||||||
5.375% 5/15/45 µ | 4,135,000 | 4,458,771 | ||||||
UnitedHealth Group 3.75% 10/15/47 | 3,065,000 | 3,010,609 | ||||||
USIS Merger Sub 144A 6.875% 5/1/25 # | 920,000 | 956,800 | ||||||
XLIT | ||||||||
3.817% (LIBOR03M + 2.458%) y● | 2,639,000 | 2,384,996 | ||||||
5.50% 3/31/45 | 3,555,000 | 3,762,632 | ||||||
|
| |||||||
| 63,203,108 | ||||||||
|
| |||||||
Media – 1.25% | ||||||||
Altice Luxembourg 144A 7.75% 5/15/22 # | 300,000 | 318,000 | ||||||
AMC Networks 4.75% 8/1/25 | 2,115,000 | 2,117,644 | ||||||
CCO Holdings | ||||||||
144A 5.125% 5/1/27 # | 3,265,000 | 3,301,731 | ||||||
144A 5.50% 5/1/26 # | 2,435,000 | 2,501,963 | ||||||
144A 5.75% 2/15/26 # | 390,000 | 408,661 | ||||||
144A 5.875% 5/1/27 # | 300,000 | 314,910 | ||||||
Cequel Communications Holdings I 144A 7.75% 7/15/25 # | 330,000 | 362,175 | ||||||
CSC Holdings | ||||||||
144A 5.50% 4/15/27 # | 3,366,000 | 3,475,395 | ||||||
144A 10.875% 10/15/25 # | 460,000 | 564,650 | ||||||
DISH DBS 7.75% 7/1/26 | 944,000 | 1,036,040 | ||||||
Gray Television 144A 5.875% 7/15/26 # | 3,065,000 | 3,149,287 | ||||||
43
Table of Contents
Schedule of investments
Delaware Diversified Income Fund
| Principal amount° | Value (US $) | |||||||
| ||||||||
Corporate Bonds (continued) | ||||||||
| ||||||||
Media (continued) | ||||||||
Lamar Media 5.75% 2/1/26 | 2,319,000 | $ | 2,510,317 | |||||
Midcontinent Communications 144A 6.875% 8/15/23 # | 1,770,000 | 1,907,175 | ||||||
Nexstar Broadcasting 144A 5.625% 8/1/24 # | 3,190,000 | 3,281,713 | ||||||
Nielsen Luxembourg 144A 5.00% 2/1/25 #* | 4,850,000 | 5,031,875 | ||||||
SFR Group 144A 6.25% 5/15/24 # | 4,110,000 | 4,320,637 | ||||||
Sinclair Television Group 144A 5.125% 2/15/27 #* | 2,985,000 | 2,854,406 | ||||||
Tribune Media 5.875% 7/15/22 | 1,595,000 | 1,662,787 | ||||||
Unitymedia 144A 6.125% 1/15/25 # | 2,060,000 | 2,205,024 | ||||||
UPCB Finance IV 144A 5.375% 1/15/25 # | 2,849,000 | 2,927,347 | ||||||
Virgin Media Secured Finance 144A 5.25% 1/15/26 # | 4,530,000 | 4,717,769 | ||||||
VTR Finance 144A 6.875% 1/15/24 # | 5,815,000 | 6,179,891 | ||||||
|
| |||||||
| 55,149,397 | ||||||||
|
| |||||||
Real Estate – 1.32% | ||||||||
Corporate Office Properties | ||||||||
3.60% 5/15/23 | 6,545,000 | 6,609,549 | ||||||
5.25% 2/15/24 | 5,315,000 | 5,771,172 | ||||||
Education Realty Operating Partnership 4.60% 12/1/24 | 5,440,000 | 5,674,270 | ||||||
ESH Hospitality 144A 5.25% 5/1/25 # | 4,135,000 | 4,284,894 | ||||||
Goodman US Finance Three 144A 3.70% 3/15/28 # | 1,640,000 | 1,636,653 | ||||||
Hospitality Properties Trust 4.50% 3/15/25 | 5,010,000 | 5,221,869 | ||||||
Host Hotels & Resorts | ||||||||
3.75% 10/15/23 | 4,180,000 | 4,301,947 | ||||||
3.875% 4/1/24 | 705,000 | 724,381 | ||||||
4.50% 2/1/26 | 1,525,000 | 1,609,940 | ||||||
Hudson Pacific Properties 3.95% 11/1/27 | 2,425,000 | 2,431,886 | ||||||
LifeStorage 3.50% 7/1/26 | 3,750,000 | 3,626,386 | ||||||
MGM Growth Properties Operating Partnership 4.50% 9/1/26 | 1,315,000 | 1,326,506 | ||||||
Physicians Realty 4.30% 3/15/27 | 2,035,000 | 2,083,760 | ||||||
Regency Centers 3.60% 2/1/27 | 4,115,000 | 4,126,005 | ||||||
Trust F/1401 144A 5.25% 1/30/26 # | 3,485,000 | 3,733,481 | ||||||
WP Carey 4.60% 4/1/24 | 4,645,000 | 4,862,500 | ||||||
|
| |||||||
| 58,025,199 | ||||||||
|
| |||||||
Services – 0.81% | ||||||||
Advanced Disposal Services 144A 5.625% 11/15/24 # | 380,000 | 396,150 | ||||||
Aramark Services 4.75% 6/1/26 | 4,445,000 | 4,660,494 | ||||||
Ashtead Capital 144A 4.375% 8/15/27 # | 2,165,000 | 2,200,181 | ||||||
Atento Luxco 1 144A 6.125% 8/10/22 #* | 3,430,000 | 3,603,558 | ||||||
Avis Budget Car Rental 144A 6.375% 4/1/24 #* | 1,115,000 | 1,162,387 | ||||||
Cardtronics 144A 5.50% 5/1/25 # | 230,000 | 229,425 | ||||||
Covanta Holding 5.875% 7/1/25 | 1,105,000 | 1,096,713 | ||||||
44
Table of Contents
| Principal amount° | Value (US $) | |||||||
| ||||||||
Corporate Bonds (continued) | ||||||||
| ||||||||
Services (continued) | ||||||||
GEO Group | ||||||||
5.125% 4/1/23 | 860,000 | $ | 879,350 | |||||
5.875% 1/15/22 | 500,000 | 519,375 | ||||||
5.875% 10/15/24 | 190,000 | 199,557 | ||||||
6.00% 4/15/26 | 250,000 | 262,500 | ||||||
Herc Rentals 144A 7.75% 6/1/24 #* | 1,412,000 | 1,556,730 | ||||||
Iron Mountain US Holdings 144A 5.375% 6/1/26 # | 2,975,000 | 3,123,750 | ||||||
KAR Auction Services 144A 5.125% 6/1/25 # | 955,000 | 990,813 | ||||||
Prime Security Services Borrower 144A 9.25% 5/15/23 # | 3,320,000 | 3,687,524 | ||||||
ServiceMaster 144A 5.125% 11/15/24 # | 3,245,000 | 3,350,463 | ||||||
United Rentals North America 5.50% 5/15/27 | 7,165,000 | 7,684,463 | ||||||
|
| |||||||
| 35,603,433 | ||||||||
|
| |||||||
Technology – 0.83% | ||||||||
Broadcom 144A 3.50% 1/15/28 # | 4,865,000 | 4,848,943 | ||||||
CDK Global | ||||||||
144A 4.875% 6/1/27 # | 1,450,000 | 1,515,250 | ||||||
5.00% 10/15/24 | 4,350,000 | 4,666,245 | ||||||
CDW Finance 5.00% 9/1/25 | 1,880,000 | 1,976,350 | ||||||
CommScope Technologies 144A 5.00% 3/15/27 # | 1,665,000 | 1,625,456 | ||||||
Dell International | ||||||||
144A 6.02% 6/15/26 # | 3,095,000 | 3,460,692 | ||||||
144A 8.10% 7/15/36 # | 140,000 | 177,922 | ||||||
Entegris 144A 6.00% 4/1/22 # | 310,000 | 324,337 | ||||||
First Data | ||||||||
144A 5.75% 1/15/24 # | 2,575,000 | 2,703,750 | ||||||
144A 7.00% 12/1/23 # | 1,287,000 | 1,380,333 | ||||||
Genesys Telecommunications Laboratories 144A 10.00% 11/30/24 # | 90,000 | 101,813 | ||||||
Infor US 6.50% 5/15/22 | 320,000 | 335,936 | ||||||
Microsoft 4.25% 2/6/47 | 4,660,000 | 5,156,303 | ||||||
NXP 144A 4.625% 6/1/23 # | 3,230,000 | 3,488,400 | ||||||
Solera 144A 10.50% 3/1/24 # | 230,000 | 263,350 | ||||||
Symantec 144A 5.00% 4/15/25 # | 2,485,000 | 2,603,037 | ||||||
Tyco Electronics Group 3.125% 8/15/27 | 1,960,000 | 1,950,579 | ||||||
|
| |||||||
| 36,578,696 | ||||||||
|
| |||||||
Transportation – 1.16% | ||||||||
Air Canada 2015-1 Class A Pass Through Trust 144A 3.60% 3/15/27 #◆ | 3,000,462 | 3,077,574 | ||||||
American Airlines 2014-1 Class A Pass Through Trust 3.70% 10/1/26 ◆ | 2,276,120 | 2,340,990 | ||||||
American Airlines 2015-1 Class A Pass Through Trust 3.375% 5/1/27 ◆ | 2,119,704 | 2,147,557 | ||||||
45
Table of Contents
Schedule of investments
Delaware Diversified Income Fund
| Principal amount° | Value (US $) | |||||||
| ||||||||
Corporate Bonds (continued) | ||||||||
| ||||||||
Transportation (continued) | ||||||||
American Airlines 2015-2 Class AA Pass Through Trust 3.60% 9/22/27 ◆ | 1,254,121 | $ | 1,301,088 | |||||
American Airlines 2016-1 Class AA Pass Through Trust 3.575% 1/15/28 ◆ | 2,731,073 | 2,818,603 | ||||||
Penske Truck Leasing | ||||||||
144A 2.70% 3/14/23 # | 3,110,000 | 3,077,068 | ||||||
144A 3.30% 4/1/21 # | 4,320,000 | 4,434,678 | ||||||
144A 3.40% 11/15/26 # | 465,000 | 461,696 | ||||||
144A 4.20% 4/1/27 # | 11,425,000 | 11,989,456 | ||||||
Topaz Marine 144A 9.125% 7/26/22 # | 2,560,000 | 2,598,561 | ||||||
Transnet SOC 144A 4.00% 7/26/22 # | 3,370,000 | 3,289,356 | ||||||
United Airlines 2014-1 Class A Pass Through Trust 4.00% 4/11/26 ◆ | 1,970,091 | 2,074,407 | ||||||
United Airlines 2014-2 Class A Pass Through Trust 3.75% 9/3/26 ◆ | 1,841,419 | 1,908,170 | ||||||
United Airlines 2016-1 Class AA Pass Through Trust 3.10% 7/7/28 ◆ | 3,470,000 | 3,493,318 | ||||||
United Continental Holdings 4.25% 10/1/22 | 1,850,000 | 1,861,563 | ||||||
XPO Logistics 144A 6.125% 9/1/23 # | 4,075,000 | 4,304,219 | ||||||
|
| |||||||
| 51,178,304 | ||||||||
|
| |||||||
Utilities – 0.34% | ||||||||
Aegea Finance 144A 5.75% 10/10/24 # | 2,670,000 | 2,753,037 | ||||||
AES | ||||||||
5.50% 4/15/25 | 3,741,000 | 3,974,813 | ||||||
6.00% 5/15/26 | 20,000 | 21,650 | ||||||
AES Andres 144A 7.95% 5/11/26 # | 4,100,000 | 4,458,750 | ||||||
Calpine 144A 5.25% 6/1/26 # | 2,555,000 | 2,570,969 | ||||||
Dynegy | ||||||||
7.375% 11/1/22 * | 915,000 | 982,481 | ||||||
144A 8.00% 1/15/25 #* | 350,000 | 384,563 | ||||||
|
| |||||||
| 15,146,263 | ||||||||
|
| |||||||
Total Corporate Bonds (cost $2,166,810,773) | 2,237,048,859 | |||||||
|
| |||||||
| ||||||||
Loan Agreements – 5.76% | ||||||||
| ||||||||
Air Medical Group Holdings Tranche B 1st Lien 4.25% | 5,262,197 | 5,256,714 | ||||||
Air Medical Group Holdings Tranche B1 1st Lien 5.00% | 845,534 | 848,704 | ||||||
Albertson’s Tranche B 1st Lien 3.50% (LIBOR03M + 2.75%) 8/25/21 ● | 2,332,300 | 2,266,704 | ||||||
Alpha 3 Tranche B1 1st Lien 4.00% (LIBOR03M + 3.00%) 1/31/24 ● | 1,007,475 | 1,015,031 | ||||||
46
Table of Contents
| Principal amount° | Value (US $) | |||||||
| ||||||||
Loan Agreements (continued) | ||||||||
| ||||||||
American Airlines Tranche B 1st Lien 3.25% (LIBOR03M + 2.50%) 12/14/23 ● | 1,950,000 | $ | 1,955,959 | |||||
American Tire Distributors 1st Lien 5.25% (LIBOR03M + 4.25%) 9/1/21 ● | 795,918 | 800,313 | ||||||
Applied Systems 2nd Lien 8.00% (LIBOR03M + 7.00%) 9/19/25 ● | 2,890,000 | 2,983,324 | ||||||
AssuredPartners Tranche B 1st Lien 3.50% (LIBOR03M + 3.50%) 10/22/24 ● | 1,075,000 | 1,083,623 | ||||||
ATI Holdings Acquisition Tranche B 1st Lien 4.50% (LIBOR03M + 3.50%) 5/10/23 ● | 3,608,036 | 3,656,521 | ||||||
Beacon Roofing Supply Tranche B 1st Lien 2.25% (LIBOR03M + 2.25%) 1/2/25 ● | 1,020,000 | 1,027,225 | ||||||
Blue Ribbon 1st Lien 5.00% (LIBOR03M + 4.00%) 11/13/21 ● | 3,899,706 | 3,877,771 | ||||||
Builders FirstSource 1st Lien 4.00% (LIBOR03M + 3.00%) 2/29/24 ● | 5,449,709 | 5,476,957 | ||||||
BWAY Tranche B 1st Lien 3.25% (LIBOR03M + 3.25%) 4/3/24 ● | 3,436,388 | 3,450,807 | ||||||
CH Hold 2nd Lien 8.25% (LIBOR03M + 7.25%) 2/1/25 ● | 1,977,418 | 2,028,708 | ||||||
Change Healthcare Holdings Tranche B 1st Lien 3.75% (LIBOR03M + 2.75%) 3/1/24 ● | 6,014,775 | 6,054,039 | ||||||
Chesapeake Energy 1st Lien 8.50% (LIBOR03M + 7.50%) 8/23/21 ● | 2,510,000 | 2,702,643 | ||||||
CityCenter Holdings Tranche B 1st Lien 3.25% (LIBOR03M + 2.50%) 4/18/24 ● | 2,623,425 | 2,637,568 | ||||||
Constellis Holdings 1st Lien 6.00% (LIBOR03M + 5.00%) 4/21/24 ● | 2,103,728 | 2,101,098 | ||||||
Constellis Holdings 2nd Lien 10.00% (LIBOR03M + 9.00%) 4/21/25 ● | 1,208,000 | 1,199,191 | ||||||
CSC Holdings Tranche B 1st Lien 2.25% (LIBOR03M + 2.25%) 7/17/25 ● | 1,855,675 | 1,853,342 | ||||||
Cyxera DC Holdings 2nd Lien 8.25% (LIBOR03M + 7.25%) 5/1/25 ● | 1,230,000 | 1,249,475 | ||||||
DaVita Tranche B 1st Lien 3.50% (LIBOR03M + 2.75%) 6/24/21 ● | 625,646 | 631,733 | ||||||
Dynegy Tranche C 1st Lien 4.25% (LIBOR03M + 3.25%) 2/7/24 ● | 2,994,987 | 3,015,994 | ||||||
Energy Future Intermediate Holding 1st Lien 4.00% (LIBOR03M + 3.00%) 6/28/18 ● | 3,730,000 | 3,755,644 | ||||||
Energy Transfer Equity Tranche B 1st Lien 2.00% (LIBOR03M + 2.00%) 2/2/24 ● | 1,325,000 | 1,324,275 | ||||||
ESH Hospitality Tranche B 1st Lien 2.50% (LIBOR03M + 2.50%) 8/30/23 ● | 1,227,623 | 1,237,001 | ||||||
ExamWorks Group Tranche B1 1st Lien 4.25% (LIBOR03M + 3.25%) 7/27/23 ● | 5,014,445 | 5,055,187 | ||||||
47
Table of Contents
Schedule of investments
Delaware Diversified Income Fund
| Principal amount° | Value (US $) | |||||||
| ||||||||
Loan Agreements (continued) | ||||||||
| ||||||||
First Data 1st Lien | ||||||||
2.25% (LIBOR03M + 2.25%) 7/10/22 ● | 1,196,460 | $ | 1,201,399 | |||||
2.50% (LIBOR03M + 2.50%) 4/26/24 ● | 1,870,438 | 1,881,938 | ||||||
First Eagle Holdings Tranche B 1st Lien 3.75% (LIBOR03M + 3.00%) 12/1/22 ● | 1,408,663 | 1,422,089 | ||||||
Flex Acquisition 1st Lien 4.00% (LIBOR03M + 3.00%) 12/29/23 ● | 2,144,225 | 2,160,530 | ||||||
Flying Fortress Holdings Tranche B 1st Lien 2.00% (LIBOR03M + 2.00%) 11/2/22 ● | 1,650,209 | 1,661,554 | ||||||
Frontier Communications Tranche B 1st Lien 4.50% (LIBOR03M + 3.75%) 6/15/24 ● | 2,513,700 | 2,397,833 | ||||||
Gardner Denver Tranche B 1st Lien 2.75% (LIBOR03M + 2.75%) 7/30/24 ● | 3,397,880 | 3,414,170 | ||||||
Gates Global Tranche B 1st Lien 4.25% (LIBOR03M + 3.25%) 3/31/24 ● | 2,924,498 | 2,945,101 | ||||||
Genoa a QoL Healthcare 1st Lien 4.25% (LIBOR03M + 3.25%) 10/28/23 ● | 3,965,025 | 4,000,338 | ||||||
Greeneden US Holdings II Tranche B 1st Lien 3.75% (LIBOR03M + 3.75%) 12/1/23 ● | 3,736,810 | 3,760,497 | ||||||
Greenhill Tranche B 1st Lien 4.75% (LIBOR03M + 3.75%) 10/12/22 ● | 1,080,000 | 1,086,075 | ||||||
Hoya Midco Tranche B 1st Lien 5.00% (LIBOR03M + 4.00%) 6/30/24 ● | 2,384,025 | 2,392,965 | ||||||
HUB International Tranche B 1st Lien 4.25% (LIBOR03M + 3.25%) 10/2/20 ● | 2,183,033 | 2,202,960 | ||||||
HVSC Merger Sub 1st Lien 5.00% (LIBOR03M + 4.00%) 10/20/24 ● | 2,410,000 | 2,436,361 | ||||||
HVSC Merger Sub 2nd Lien 9.25% (LIBOR03M + 8.25%) 10/20/25 ● | 2,945,000 | 2,945,000 | ||||||
Hyperion Insurance Group Tranche B 1st Lien 5.00% (LIBOR03M + 4.00%) 4/29/22 ● | 4,985,461 | 5,046,223 | ||||||
INEOS US Finance Tranche B 1st Lien | ||||||||
2.00% (LIBOR03M + 2.00%) 3/31/24 ● | 3,340,000 | 3,349,743 | ||||||
2.75% (LIBOR03M + 2.75%) 3/31/24 ● | 185,789 | 186,602 | ||||||
JBS USA Tranche B 1st Lien 3.25% (LIBOR03M + 2.50%) 10/30/22 ● | 3,498,011 | 3,447,727 | ||||||
JC Penney Tranche B 1st Lien 5.25% (LIBOR03M + 4.25%) 6/23/23 ● | 2,309,258 | 2,130,771 | ||||||
Kingpin Intermediate Holdings Tranche B 1st Lien 5.25% (LIBOR03M + 4.25%) 6/29/24 ● | 1,251,863 | 1,265,148 | ||||||
Kloeckner Pentaplast of America Tranche B 1st Lien 5.25% | 1,715,000 | 1,726,434 | ||||||
Kraton Polymers Tranche B 1st Lien 4.00% (LIBOR03M + 3.00%) 1/6/22 ● | 2,122,457 | 2,156,550 | ||||||
Kronos 2nd Lien 9.25% (LIBOR03M + 8.25%) 11/1/24 ● | 2,730,000 | 2,822,137 | ||||||
48
Table of Contents
| Principal amount° | Value (US $) | |||||||
| ||||||||
Loan Agreements (continued) | ||||||||
| ||||||||
Kronos Tranche B 1st Lien 4.50% (LIBOR03M + 3.50%) 11/1/23 ● | 1,970,112 | $ | 1,985,745 | |||||
Mohegan Gaming & Entertainment Tranche B 1st Lien 5.00% (LIBOR03M + 4.00%) 10/13/23 ● | 5,546,784 | 5,612,652 | ||||||
MPH Acquisition Holdings Tranche B 1st Lien 4.00% (LIBOR03M + 3.00%) | 3,827,824 | 3,861,796 | ||||||
ON Semiconductor Tranche B 1st Lien 2.25% (LIBOR03M + 2.25%) 3/31/23 ● | 1,366,789 | 1,374,406 | ||||||
Panda Hummel Tranche B1 1st Lien 7.00% (LIBOR03M + 6.00%) 10/27/22 ● | 1,280,000 | 1,187,200 | ||||||
Panda Stonewall Tranche B 1st Lien 6.50% (LIBOR03M + 5.50%) 11/13/21 =● | 2,263,000 | 2,132,877 | ||||||
Penn National Gaming Tranche B 1st Lien 3.25% (LIBOR03M + 2.50%) 1/19/24 ● | 1,925,325 | 1,937,530 | ||||||
PetSmart Tranche B 1st Lien 4.00% (LIBOR03M + 3.00%) 3/10/22 ● | 1,119,296 | 964,518 | ||||||
PharMerica Tranche B 1st Lien 4.50% (LIBOR03M + 3.50%) 9/26/24 ● | 3,240,000 | 3,262,275 | ||||||
PharMerica Tranche B 2nd Lien 8.75% (LIBOR03M + 7.75%) 9/26/25 ● | 1,210,000 | 1,217,563 | ||||||
PQ Tranche B 1st Lien 3.25% (LIBOR03M + 3.25%) 11/4/22 ● | 5,413,358 | 5,481,507 | ||||||
Radiate Holdco 1st Lien 3.75% (LIBOR03M + 3.00%) 2/1/24 ● | 4,159,100 | 4,123,032 | ||||||
Republic of Angola 7.683% (LIBOR06M + 6.25%) 12/16/23 =● | 7,195,036 | 6,682,389 | ||||||
Ring Container Technologies Group 1st Lien 2.75% (LIBOR03M + 2.75%) | 2,155,000 | 2,159,715 | ||||||
Rite Aid 2nd Lien 5.75% (LIBOR03M + 4.75%) 8/21/20 ● | 570,000 | 577,125 | ||||||
Russell Investments US Institutional Holdco Tranche B 1st Lien 5.25% (LIBOR03M + 4.25%) 6/1/23 ● | 7,004,725 | 7,099,583 | ||||||
Sable International Finance Tranche B3 1st Lien 3.50% | 950,000 | 953,637 | ||||||
SAM Finance Tranche B 1st Lien 4.25% (LIBOR03M + 3.25%) 12/17/20 ● | 3,201,982 | 3,222,280 | ||||||
Scientific Games International Tranche B4 1st Lien 3.25% (LIBOR03M + 3.25%) 8/14/24 ● | 6,170,000 | 6,249,056 | ||||||
SFR Group Tranche B 1st Lien 2.75% (LIBOR03M + 2.75%) 7/18/25 ● | 4,303,375 | 4,305,393 | ||||||
SFR Group Tranche B12 1st Lien 3.00% (LIBOR03M + 3.00%) 1/31/26 ● | 2,340,654 | 2,346,262 | ||||||
Sinclair Television Group Tranche B2 1st Lien 2.25% (LIBOR03M + 2.25%) | 2,171,728 | 2,179,872 | ||||||
Sprint Communications Tranche B 1st Lien 3.25% (LIBOR03M + 2.50%) 2/2/24 ● | 2,928,305 | 2,940,331 | ||||||
49
Table of Contents
Schedule of investments
Delaware Diversified Income Fund
| Principal amount° | Value (US $) | |||||||
| ||||||||
Loan Agreements (continued) | ||||||||
| ||||||||
StandardAero Aviation Holdings 1st Lien 4.75% (LIBOR03M + 3.75%) 7/7/22 ● | 2,447,619 | $ | 2,471,878 | |||||
Staples 1st Lien 5.00% (LIBOR03M + 4.00%) 9/12/24 ● | 2,013,000 | 1,903,885 | ||||||
Stars Group Holdings 2nd Lien 8.00% (LIBOR03M + 7.00%) 8/1/22 ● | 389,048 | 392,938 | ||||||
Stars Group Holdings Tranche B 1st Lien 4.50% (LIBOR03M + 3.50%) 8/1/21 ● | 5,541,739 | 5,584,688 | ||||||
Summit Materials Tranche B1 1st Lien 3.50% (LIBOR03M + 2.75%) 7/17/22 ● | 2,793,963 | 2,819,575 | ||||||
Summit Midstream Partners Holdings Tranche B 1st Lien 7.00% (LIBOR03M + 6.00%) 5/21/22 ● | 2,438,888 | 2,487,665 | ||||||
Surgery Center Holdings 1st Lien 4.25% (LIBOR03M + 3.25%) 9/3/24 ● | 530,000 | 527,217 | ||||||
Team Health Holdings Tranche B 1st Lien 3.75% (LIBOR03M + 2.75%) 2/6/24 ● | 590,591 | 585,670 | ||||||
Telenet Financing USD Tranche A1 1st Lien 2.75% (LIBOR03M + 2.75%) | 1,955,000 | 1,965,047 | ||||||
TKC Holdings 1st Lien 5.25% (LIBOR03M + 4.25%) 2/1/23 ● | 2,422,825 | 2,448,190 | ||||||
TransDigm Tranche F 1st Lien 3.75% (LIBOR03M + 3.00%) 6/9/23 ● | 3,020,492 | 3,037,072 | ||||||
Tribune Media Tranche B 1st Lien 3.75% (LIBOR03M + 3.00%) 12/27/20 ● | 159,116 | 159,845 | ||||||
Tribune Media Tranche C 1st Lien 3.75% (LIBOR03M + 3.00%) 1/27/24 ● | 1,983,178 | 1,990,109 | ||||||
Uniti Group 1st Lien 4.00% (LIBOR03M + 3.00%) 10/24/22 ● | 928,447 | 892,756 | ||||||
Unitymedia Finance Tranche D 1st Lien 2.25% (LIBOR03M + 2.25%) 1/15/26 ● | 1,025,000 | 1,023,612 | ||||||
Univision Communications Tranche C 1st Lien 3.75% | ||||||||
(LIBOR03M + 2.75%) 3/15/24 ● | 476,627 | 474,948 | ||||||
UPC Financing Partnership Tranche AR 1st Lien 2.50% | 1,000,000 | 1,004,500 | ||||||
USI Tranche B 1st Lien 3.00% (LIBOR03M + 3.00%) 5/16/24 ● | 5,565,000 | 5,572,832 | ||||||
USIC Holdings Tranche SR 1st Lien 4.50% (LIBOR03M + 3.50%) 12/9/23 ● | 3,721,875 | 3,755,606 | ||||||
USS Ultimate Holdings 2nd Lien 8.75% (LIBOR03M + 7.75%) 8/25/25 ● | 555,000 | 560,319 | ||||||
Valeant Pharmaceuticals International 1st Lien 5.50% (LIBOR03M + 4.75%) 4/1/22 ● | 1,075,000 | 1,097,037 | ||||||
VC GB Holdings 2nd Lien 9.00% (LIBOR03M + 8.00%) 2/28/25 =● | 1,390,000 | 1,383,050 | ||||||
Virgin Media Bristol Tranche I 1st Lien 2.75% (LIBOR03M + 2.75%) 1/31/25 ● | 1,658,000 | 1,666,161 | ||||||
50
Table of Contents
| Principal amount° | Value (US $) | |||||||
| ||||||||
Loan Agreements (continued) | ||||||||
| ||||||||
Western Digital 1st Lien 3.50% (LIBOR03M + 2.75%) 4/29/23 ● | 1,155,523 | $ | 1,163,829 | |||||
WideOpenWest Finance Tranche B 1st Lien 4.25% | 4,599,035 | 4,610,123 | ||||||
Windstream Services Tranche B6 1st Lien 4.75% (LIBOR03M + 4.00%) | 2,640,411 | 2,481,163 | ||||||
Zayo Group Tranche B2 1st Lien 3.25% (LIBOR03M + 2.25%) 1/19/24 ● | 718,537 | 721,383 | ||||||
Zekelman Industries 1st Lien 3.75% (LIBOR03M + 2.75%) 6/14/21 ● | 2,523,158 | 2,539,829 | ||||||
|
| |||||||
Total Loan Agreements (cost $250,824,164) | 253,763,367 | |||||||
|
| |||||||
| ||||||||
Municipal Bonds – 0.67% | ||||||||
| ||||||||
Bay Area, California Toll Authority (Build America Bonds) 6.907% 10/1/50 | 4,980,000 | 7,604,012 | ||||||
Buckeye, Ohio Tobacco Settlement Financing Authority (Asset-Backed Senior Turbo) Series A-2 5.875% 6/1/47 | 1,535,000 | 1,442,900 | ||||||
Commonwealth of Massachusetts Series C 5.00% 10/1/25 | 565,000 | 693,588 | ||||||
New Jersey Turnpike Authority | ||||||||
(Build America Bonds) | ||||||||
Series A 7.102% 1/1/41 | 2,680,000 | 3,962,675 | ||||||
Series F 7.414% 1/1/40 | 1,290,000 | 1,967,495 | ||||||
Oregon State Taxable Pension (Build America Bonds) 5.892% 6/1/27 | 305,000 | 371,740 | ||||||
South Carolina Public Service Authority Series D 4.77% 12/1/45 | 1,575,000 | 1,637,527 | ||||||
State of California Various Purposes (Build America Bonds) 7.55% 4/1/39 | 4,005,000 | 6,189,727 | ||||||
Texas Water Development Board Series A 5.00% 10/15/45 | 1,345,000 | 1,556,716 | ||||||
(Water Implementation Revenue) 5.00% 10/15/46 | 3,505,000 | 4,078,663 | ||||||
|
| |||||||
Total Municipal Bonds (cost $29,792,756) | 29,505,043 | |||||||
|
| |||||||
| ||||||||
Non-Agency Asset-Backed Securities – 1.66% | ||||||||
| ||||||||
AEP Texas Central Transition Funding II Series 2006-A A4 5.17% 1/1/18 | 343,406 | 345,399 | ||||||
American Express Credit Account Master Trust Series 2017-5 A 1.619% (LIBOR01M + 0.38%) 2/18/25 ● | 1,875,000 | 1,885,346 | ||||||
Avis Budget Rental Car Funding AESOP | ||||||||
Series 2013-1A A 144A 1.92% 9/20/19 # | 6,115,000 | 6,104,632 | ||||||
Series 2014-1A A 144A 2.46% 7/20/20 # | 6,297,000 | 6,321,548 | ||||||
51
Table of Contents
Schedule of investments
Delaware Diversified Income Fund
| Principal amount° | Value (US $) | |||||||
| ||||||||
Non-Agency Asset-Backed Securities (continued) | ||||||||
| ||||||||
Barclays Dryrock Issuance Trust Series 2017-1 A 1.569% (LIBOR01M + 0.33%) 3/15/23 ● | 980,000 | $ | 982,923 | |||||
Capital One Multi-Asset Execution Trust Series 2017-A5 A5 1.818% (LIBOR01M + 0.58%) 7/15/27 ● | 3,835,000 | 3,847,563 | ||||||
Citibank Credit Card Issuance Trust Series 2017-A5 A5 1.859% (LIBOR01M + 0.62%) 4/22/26 ● | 1,465,000 | 1,481,379 | ||||||
Series 2017-A6 A6 2.009% (LIBOR01M + 0.77%) 5/14/29 ● | 1,535,000 | 1,549,564 | ||||||
Series 2017-A7 A7 1.605% (LIBOR01M + 0.37%) 8/8/24 ● | 2,530,000 | 2,541,099 | ||||||
Citicorp Mortgage Securities Trust Series 2006-3 1A9 5.75% 6/25/36 | 384,754 | 378,996 | ||||||
CNH Equipment Trust Series 2016-B A2B 1.639% (LIBOR01M + 0.40%) | 374,483 | 374,757 | ||||||
Contimortgage Home Equity Loan Trust Series 1996-4 A8 7.22% 1/15/28 | 3,074 | 2,909 | ||||||
Discover Card Execution Note Trust | ||||||||
Series 2017-A5 A5 1.839% (LIBOR01M + 0.60%) 12/15/26 ● | 6,080,000 | 6,141,576 | ||||||
Series 2017-A7 A7 1.592% (LIBOR01M + 0.36%) 4/15/25 ● | 2,730,000 | 2,736,503 | ||||||
Ford Credit Floorplan Master Owner Trust A Series 2017-1 A2 1.659% (LIBOR01M + 0.42%) 5/15/22 ● | 1,350,000 | 1,356,818 | ||||||
Golden Credit Card Trust Series 2014-2A A 144A 1.689% (LIBOR01M + 0.45%) 3/15/21 #● | 2,815,000 | 2,825,814 | ||||||
HOA Funding Series 2014-1A A2 144A 4.846% 8/20/44 # | 7,632,800 | 7,385,039 | ||||||
Hyundai Auto Lease Securitization Trust Series 2016-C A3 144A 1.49% 2/18/20 # | 4,425,000 | 4,416,257 | ||||||
Mercedes-Benz Auto Lease Trust Series 2016-A A2B 1.799% (LIBOR01M + 0.56%) 7/16/18 ● | 152,333 | 152,357 | ||||||
Mercedes-Benz Master Owner Trust Series 2016-AA A 144A 1.819% (LIBOR01M + 0.58%) 5/15/20 #● | 4,000,000 | 4,010,082 | ||||||
Morgan Stanley ABS Capital I Trust Series 2005-HE5 M1 1.868% (LIBOR01M + 0.63%) 9/25/35 ● | 206,348 | 206,398 | ||||||
52
Table of Contents
| Principal amount° | Value (US $) | |||||||
| ||||||||
Non-Agency Asset-Backed Securities (continued) | ||||||||
| ||||||||
Navistar Financial Dealer Note Master Owner Trust II | ||||||||
Series 2016-1 A 144A 2.588% (LIBOR01M + 1.35%) 9/27/21 #● | 2,480,000 | $ | 2,497,543 | |||||
Nissan Auto Lease Trust | ||||||||
Series 2016-B A3 1.50% 7/15/19 | 4,500,000 | 4,491,784 | ||||||
Popular ABS Mortgage Pass Through Trust | ||||||||
Series 2006-C A4 1.488% (LIBOR01M + 0.25%) 7/25/36 ◆● | 4,049,005 | 4,011,827 | ||||||
Synchrony Credit Card Master Note Trust | ||||||||
Series 2015-2 A 1.60% 4/15/21 | 4,055,000 | 4,056,416 | ||||||
Verizon Owner Trust | ||||||||
Series 2016-2A A 144A 1.68% 5/20/21 # | 3,190,000 | 3,177,791 | ||||||
|
| |||||||
Total Non-Agency Asset-Backed Securities | 73,282,320 | |||||||
|
| |||||||
| ||||||||
Non-Agency Collateralized Mortgage Obligations – 2.12% | ||||||||
| ||||||||
Agate Bay Mortgage Trust | ||||||||
Series 2015-1 B1 144A 3.824% 1/25/45 #● | 2,422,763 | 2,470,044 | ||||||
Series 2015-1 B2 144A 3.824% 1/25/45 #● | 1,369,919 | 1,378,264 | ||||||
Banc of America Mortgage Trust | ||||||||
Series 2004-K 2A1 3.439% 12/25/34 ● | 728,903 | 721,885 | ||||||
Bank of America Alternative Loan Trust | ||||||||
Series 2005-1 2A1 5.50% 2/25/20 | 83,724 | 80,889 | ||||||
Series 2005-6 7A1 5.50% 7/25/20 | 234,427 | 224,076 | ||||||
CHL Mortgage Pass Through Trust | ||||||||
Series 2004-HYB2 2A 3.508% 7/20/34 ◆● | 63,551 | 58,773 | ||||||
Citicorp Residential Mortgage Trust | ||||||||
Series 2006-3 A5 5.482% 11/25/36 f | 5,800,000 | 6,064,595 | ||||||
Credit Suisse First Boston Mortgage Securities | ||||||||
Series 2005-5 6A3 5.00% 7/25/35 | 1,730,461 | 1,724,036 | ||||||
First Horizon Mortgage Pass Through Trust | ||||||||
Series 2004-7 1A3 5.50% 1/25/35 ◆ | 692,162 | 706,564 | ||||||
GSR Mortgage Loan Trust | ||||||||
Series 2004-9 4A1 3.441% 8/25/34 ● | 375,401 | 368,057 | ||||||
JPMorgan Mortgage Trust | ||||||||
Series 2005-A8 1A1 3.443% 11/25/35 ● | 225,114 | 216,283 | ||||||
Series 2006-S1 1A1 6.00% 4/25/36 | 2,469,146 | 2,552,617 | ||||||
Series 2007-A1 7A4 3.627% 7/25/35 ● | 46,755 | 42,110 | ||||||
Series 2014-2 B1 144A 3.426% 6/25/29 #● | 1,848,388 | 1,874,359 | ||||||
Series 2014-2 B2 144A 3.426% 6/25/29 #● | 688,674 | 695,513 | ||||||
Series 2014-IVR6 2A4 144A 2.50% 7/25/44 #● | 2,470,000 | 2,470,543 | ||||||
Series 2015-1 B1 144A 2.609% 12/25/44 #● | 3,331,270 | 3,312,544 | ||||||
Series 2015-1 B2 144A 2.609% 12/25/44 #● | 2,793,179 | 2,764,784 | ||||||
Series 2015-4 B1 144A 3.627% 6/25/45 #● | 2,557,016 | 2,508,500 | ||||||
53
Table of Contents
Schedule of investments
Delaware Diversified Income Fund
| Principal amount° | Value (US $) | |||||||
| ||||||||
Non-Agency Collateralized Mortgage Obligations (continued) | ||||||||
| ||||||||
JPMorgan Mortgage Trust | ||||||||
Series 2015-4 B2 144A 3.627% 6/25/45 #● | 1,835,661 | $ | 1,780,545 | |||||
Series 2015-5 B2 144A 2.871% 5/25/45 #● | 2,620,706 | 2,571,901 | ||||||
Series 2015-6 B1 144A 3.62% 10/25/45 #● | 1,784,362 | 1,761,277 | ||||||
Series 2015-6 B2 144A 3.62% 10/25/45 #● | 1,727,565 | 1,687,650 | ||||||
Series 2016-4 B1 144A 3.901% 10/25/46 #● | 1,138,023 | 1,158,824 | ||||||
Series 2016-4 B2 144A 3.901% 10/25/46 #● | 1,948,900 | 1,999,094 | ||||||
Series 2017-1 B2 144A 3.561% 1/25/47 #● | 3,371,948 | 3,375,242 | ||||||
Series 2017-2 A3 144A 3.50% 5/25/47 #● | 1,610,919 | 1,634,453 | ||||||
MASTR ARM Trust | ||||||||
Series 2004-10 2A2 3.52% 10/25/34 ● | 41,311 | 38,851 | ||||||
New Residential Mortgage Loan Trust | ||||||||
Series 2016-4A A1 144A 3.75% 11/25/56 #● | 1,036,009 | 1,064,537 | ||||||
Series 2017-1A A1 144A 4.00% 2/25/57 #● | 2,191,341 | 2,269,446 | ||||||
Series 2017-2A A3 144A 4.00% 3/25/57 #● | 2,122,125 | 2,198,229 | ||||||
Series 2017-6A A1 144A 4.00% 8/27/57 #● | 1,278,304 | 1,326,815 | ||||||
Sequoia Mortgage Trust | ||||||||
Series 2013-4 B2 3.49% 4/25/43 ● | 1,484,470 | 1,476,652 | ||||||
Series 2013-12 B3 144A 4.206% 12/25/43 #● | 4,041,590 | 4,112,415 | ||||||
Series 2014-2 A4 144A 3.50% 7/25/44 #● | 1,782,362 | 1,810,628 | ||||||
Series 2015-1 B2 144A 3.874% 1/25/45 #● | 1,993,331 | 2,003,305 | ||||||
Series 2017-4 A1 144A 3.50% 7/25/47 #● | 1,722,131 | 1,752,624 | ||||||
Structured Asset Securities Mortgage Pass Through Certificates | ||||||||
Series 2004-20 2A1 5.50% 11/25/34◆ | 1,759,722 | 1,797,826 | ||||||
Structured Asset Securities Trust | ||||||||
Series 2005-1 4A1 5.00% 2/25/20 | 388,730 | 391,479 | ||||||
Thornburg Mortgage Securities Trust | ||||||||
Series 2007-4 1A1 3.106% 9/25/37 ● | 1,439,577 | 1,449,177 | ||||||
Towd Point Mortgage Trust | ||||||||
Series 2015-4 A2 144A 3.75% 4/25/55 #● | 2,835,000 | 2,942,524 | ||||||
Series 2015-5 A1B 144A 2.75% 5/25/55 #● | 2,713,945 | 2,723,938 | ||||||
Series 2015-6 A1B 144A 2.75% 4/25/55 #● | 2,942,007 | 2,952,156 | ||||||
Series 2016-1 A1B 144A 2.75% 2/25/55 #● | 1,902,864 | 1,909,867 | ||||||
Series 2016-2 A1 144A 3.00% 8/25/55 #● | 1,740,757 | 1,756,534 | ||||||
Series 2016-3 A1 144A 2.25% 4/25/56 #● | 2,358,565 | 2,343,385 | ||||||
Series 2017-1 A1 144A 2.75% 10/25/56 #● | 1,734,262 | 1,740,057 | ||||||
Series 2017-2 A1 144A 2.75% 4/25/57 #● | 943,696 | 948,445 | ||||||
Series 2017-4 M1 144A 3.25% 6/25/57 #● | 2,705,000 | 2,623,627 | ||||||
Washington Mutual Mortgage Pass Through Certificates Trust | ||||||||
Series 2005-1 5A2 6.00% 3/25/35 ◆ | 167,520 | 46,423 | ||||||
Wells Fargo Mortgage-Backed Securities Trust | ||||||||
Series 2005-3 A4 5.50% 5/25/35 | 2,198,886 | 2,268,393 | ||||||
54
Table of Contents
| Principal amount° | Value (US $) | |||||||
| ||||||||
Non-Agency Collateralized Mortgage Obligations (continued) | ||||||||
| ||||||||
Wells Fargo Mortgage-Backed Securities Trust | ||||||||
Series 2006-2 3A1 5.75% 3/25/36 | 982,892 | $ | 983,607 | |||||
Series 2006-3 A11 5.50% 3/25/36 | 1,182,115 | 1,204,767 | ||||||
Series 2006-20 A1 5.50% 12/25/21 | 303,545 | 306,489 | ||||||
Series 2006-AR5 2A1 3.326% 4/25/36 ● | 1,069,731 | 1,009,981 | ||||||
|
| |||||||
Total Non-Agency Collateralized Mortgage Obligations | 93,655,599 | |||||||
|
| |||||||
| ||||||||
Non-Agency Commercial Mortgage-Backed Securities – 6.24% | ||||||||
| ||||||||
Banc of America Commercial Mortgage Trust | ||||||||
Series 2017-BNK3 AS 3.748% 2/15/50 | 2,800,000 | 2,885,736 | ||||||
Series 2017-BNK3 C 4.352% 2/15/50 ● | 1,490,000 | 1,524,055 | ||||||
BANK | ||||||||
Series 2017-BNK4 XA 1.458% 5/15/50 ● | 19,126,378 | 1,881,269 | ||||||
Series 2017-BNK5 A5 3.39% 6/15/60 | 6,515,000 | 6,700,202 | ||||||
Series 2017-BNK5 B 3.896% 6/15/60 ● | 2,775,000 | 2,822,652 | ||||||
Series 2017-BNK7 A5 3.435% 9/15/60 | 3,180,000 | 3,284,497 | ||||||
Series 2017-BNK8 A4 3.488% 11/15/50 | 2,260,000 | 2,336,108 | ||||||
CD Mortgage Trust | ||||||||
Series 2016-CD2 A3 3.248% 11/10/49 | 4,440,000 | 4,527,463 | ||||||
Series 2016-CD2 A4 3.526% 11/10/49 ● | 3,000,000 | 3,117,218 | ||||||
CFCRE Commercial Mortgage Trust | ||||||||
Series 2011-C2 C 144A 5.754% 12/15/47 #● | 1,745,000 | 1,910,604 | ||||||
Series 2016-C7 A3 3.839% 12/10/54 | 4,835,000 | 5,092,699 | ||||||
Series 2017-C8 A4 3.572% 6/15/50 | 2,000,000 | 2,061,969 | ||||||
Citigroup Commercial Mortgage Trust | ||||||||
Series 2014-GC25 A4 3.635% 10/10/47 | 3,540,000 | 3,706,341 | ||||||
Series 2015-GC27 A5 3.137% 2/10/48 | 6,497,146 | 6,579,395 | ||||||
Series 2016-P3 A4 3.329% 4/15/49 | 6,315,000 | 6,470,513 | ||||||
Series 2017-C4 A4 3.471% 10/12/50 | 4,465,000 | 4,607,721 | ||||||
COMM Mortgage Trust | ||||||||
Series 2013-CR6 AM 144A 3.147% 3/10/46 # | 4,205,000 | 4,254,393 | ||||||
Series 2013-WWP A2 144A 3.424% 3/10/31 # | 1,550,000 | 1,614,177 | ||||||
Series 2014-CR19 A5 3.796% 8/10/47 | 2,885,000 | 3,040,745 | ||||||
Series 2014-CR20 AM 3.938% 11/10/47 | 10,325,000 | 10,837,035 | ||||||
Series 2015-3BP A 144A 3.178% 2/10/35 # | 10,890,000 | 11,025,270 | ||||||
Series 2015-CR23 A4 3.497% 5/10/48 | 5,500,000 | 5,708,869 | ||||||
Commercial Mortgage Pass Through Certificates | ||||||||
Series 2016-CR28 A4 3.762% 2/10/49 ◆ | 3,290,000 | 3,474,468 | ||||||
DB-JPM Mortgage Trust | ||||||||
Series 2016-C1 A4 3.276% 5/10/49 | 8,785,000 | 8,971,491 | ||||||
Series 2016-C3 A5 2.89% 9/10/49 | 4,465,000 | 4,429,474 | ||||||
DB-UBS Mortgage Trust | ||||||||
Series 2011-LC1A C 144A 5.685% 11/10/46 #● | 5,960,000 | 6,458,232 | ||||||
55
Table of Contents
Schedule of investments
Delaware Diversified Income Fund
| Principal amount° | Value (US $) | |||||||
| ||||||||
Non-Agency Commercial Mortgage-Backed Securities (continued) | ||||||||
| ||||||||
GRACE Mortgage Trust | ||||||||
Series 2014-GRCE A 144A 3.369% 6/10/28 # | 17,610,000 | $ | 18,166,008 | |||||
Series 2014-GRCE B 144A 3.52% 6/10/28 # | 3,000,000 | 3,067,728 | ||||||
GS Mortgage Securities Trust | ||||||||
Series 2010-C1 C 144A 5.635% 8/10/43 #● | 4,765,000 | 5,007,784 | ||||||
Series 2015-GC32 A4 3.764% 7/10/48 | 3,086,000 | 3,260,344 | ||||||
Series 2017-GS5 A4 3.674% 3/10/50 | 6,835,000 | 7,178,122 | ||||||
Series 2017-GS5 XA 0.825% 3/10/50 ● | 57,757,090 | 3,720,856 | ||||||
Series 2017-GS6 A3 3.433% 5/10/50 | 3,380,000 | 3,470,446 | ||||||
JPM-BB Commercial Mortgage Securities Trust | ||||||||
Series 2015-C31 A3 3.801% 8/15/48 | 2,980,000 | 3,127,971 | ||||||
Series 2015-C33 A4 3.77% 12/15/48 | 7,480,000 | 7,866,149 | ||||||
JPM-DB Commercial Mortgage Securities Trust | ||||||||
Series 2016-C2 A4 3.144% 6/15/49 | 9,250,000 | 9,351,616 | ||||||
Series 2017-C7 A5 3.409% 10/15/50 | 6,140,000 | 6,286,952 | ||||||
JPMorgan Chase Commercial Mortgage Securities Trust | ||||||||
Series 2005-CB11 E 5.525% 8/12/37 ● | 1,765,000 | 1,816,262 | ||||||
Series 2013-LC11 B 3.499% 4/15/46 | 8,410,000 | 8,429,312 | ||||||
Series 2015-JP1 A5 3.914% 1/15/49 | 3,745,000 | 3,982,564 | ||||||
Series 2016-JP2 A4 2.822% 8/15/49 | 3,780,000 | 3,724,042 | ||||||
Series 2016-JP3 B 3.397% 8/15/49 ● | 1,535,000 | 1,507,630 | ||||||
Series 2016-WIKI A 144A 2.798% 10/5/31 # | 3,250,000 | 3,279,664 | ||||||
Series 2016-WIKI B 144A 3.201% 10/5/31 # | 3,250,000 | 3,290,988 | ||||||
LB-UBS Commercial Mortgage Trust | ||||||||
Series 2006-C6 AJ 5.452% 9/15/39 ● | 4,747,919 | 3,792,068 | ||||||
Morgan Stanley BAML Trust | ||||||||
Series 2014-C17 A5 3.741% 8/15/47 | 3,241,000 | 3,421,549 | ||||||
Series 2015-C23 A4 3.719% 7/15/50 | 12,915,000 | 13,576,810 | ||||||
Series 2015-C26 A5 3.531% 10/15/48 | 3,910,000 | 4,062,094 | ||||||
Series 2016-C29 A4 3.325% 5/15/49 | 2,480,000 | 2,534,863 | ||||||
Morgan Stanley Capital I Trust | ||||||||
Series 2006-HQ10 B 5.448% 11/12/41 ● | 5,379,000 | 5,108,644 | ||||||
Series 2006-T21 B 144A 5.238% 10/12/52 #● | 2,000,000 | 1,999,771 | ||||||
Series 2016-BNK2 B 3.485% 11/15/49 | 1,500,000 | 1,484,427 | ||||||
Wells Fargo Commercial Mortgage Trust | ||||||||
Series 2014-LC18 A5 3.405% 12/15/47 | 2,415,029 | 2,493,531 | ||||||
Series 2015-C30 XA 0.963% 9/15/58 S● | 29,833,138 | 1,707,166 | ||||||
Series 2015-NXS3 A4 3.617% 9/15/57 | 2,255,000 | 2,356,160 | ||||||
Series 2016-BNK1 A3 2.652% 8/15/49 | 5,770,000 | 5,621,718 | ||||||
Series 2016-BNK1 B 2.967% 8/15/49 | 380,000 | 362,813 | ||||||
Series 2017-C38 A5 3.453% 7/15/50 | 4,140,000 | 4,275,626 | ||||||
56
Table of Contents
| Principal amount° | Value (US $) | |||||||||||
| ||||||||||||
Non-Agency Commercial Mortgage-Backed Securities (continued) |
| |||||||||||
| ||||||||||||
WF-RBS Commercial Mortgage Trust | ||||||||||||
Series 2012-C10 A3 2.875% 12/15/45 | 6,330,115 | $ | 6,417,394 | |||||||||
|
| |||||||||||
Total Non-Agency Commercial Mortgage-Backed Securities |
| 275,071,668 | ||||||||||
|
| |||||||||||
| ||||||||||||
Regional Bonds – 0.65%D | ||||||||||||
| ||||||||||||
Argentina – 0.20% | ||||||||||||
Provincia De Buenos Aires 144A 7.875% 6/15/27 # | 3,035,000 | 3,371,885 | ||||||||||
Provincia de Cordoba | ||||||||||||
144A 7.125% 6/10/21 # | 1,809,000 | 1,956,234 | ||||||||||
144A 7.125% 8/1/27 # | 3,165,000 | 3,383,227 | ||||||||||
|
| |||||||||||
| 8,711,346 | ||||||||||||
|
| |||||||||||
Australia – 0.14% | ||||||||||||
New South Wales Treasury 4.00% 5/20/26 | AUD | 2,363,900 | 1,970,410 | |||||||||
Queensland Treasury | ||||||||||||
144A 2.75% 8/20/27 # | AUD | 2,839,000 | 2,099,287 | |||||||||
144A 3.25% 7/21/28 # | AUD | 2,933,000 | 2,249,245 | |||||||||
|
| |||||||||||
| 6,318,942 | ||||||||||||
|
| |||||||||||
Canada – 0.31% | ||||||||||||
Province of Ontario Canada | ||||||||||||
2.60% 6/2/27 | CAD | 1,092,000 | 845,727 | |||||||||
3.45% 6/2/45 | CAD | 2,594,000 | 2,150,058 | |||||||||
Province of Quebec Canada | ||||||||||||
2.75% 4/12/27 | CAD | 8,840,000 | 8,828,871 | |||||||||
6.00% 10/1/29 | CAD | 1,985,000 | 2,037,683 | |||||||||
|
| |||||||||||
| 13,862,339 | ||||||||||||
|
| |||||||||||
Total Regional Bonds (cost $28,725,383) | 28,892,627 | |||||||||||
|
| |||||||||||
| ||||||||||||
Sovereign Bonds – 6.69%D | ||||||||||||
| ||||||||||||
Argentina – 0.74% | ||||||||||||
Argentine Bonos del Tesoro | ||||||||||||
15.50% 10/17/26 | ARS | 61,053,000 | 3,656,438 | |||||||||
16.00% 10/17/23 | ARS | 144,927,000 | 8,412,866 | |||||||||
22.75% 3/5/18 | ARS | 207,486,000 | 12,073,729 | |||||||||
Argentine Republic Government International Bond | ||||||||||||
5.625% 1/26/22 | 4,375,000 | 4,604,687 | ||||||||||
144A 7.125% 6/28/17 #* | 3,705,000 | 3,810,593 | ||||||||||
|
| |||||||||||
| 32,558,313 | ||||||||||||
|
| |||||||||||
Bahrain – 0.06% | ||||||||||||
Bahrain Government International Bond 144A | ||||||||||||
7.50% 9/20/47 # | 2,765,000 | 2,699,807 | ||||||||||
|
| |||||||||||
| 2,699,807 | ||||||||||||
|
| |||||||||||
57
Table of Contents
Schedule of investments
Delaware Diversified Income Fund
| Principal amount° | Value (US $) | |||||||||||
| ||||||||||||
Sovereign BondsD (continued) |
| |||||||||||
| ||||||||||||
Bermuda – 0.07% | ||||||||||||
Bermuda Government International Bond 144A | ||||||||||||
3.717% 1/25/27 # | 3,200,000 | $ | 3,232,000 | |||||||||
|
| |||||||||||
| 3,232,000 | ||||||||||||
|
| |||||||||||
Brazil – 0.47% | ||||||||||||
Brazil Notas do Tesouro Nacional Series F 10.00% 1/1/25 | BRL | 66,410,000 | 20,555,511 | |||||||||
|
| |||||||||||
| 20,555,511 | ||||||||||||
|
| |||||||||||
Canada – 0.02% | ||||||||||||
Canadian Government Bond 2.75% 12/1/48 | CAD | 1,202,000 | 1,022,413 | |||||||||
|
| |||||||||||
| 1,022,413 | ||||||||||||
|
| |||||||||||
Chile – 0.13% | ||||||||||||
Bonos de la Tesoreria de la Republica en pesos | ||||||||||||
4.50% 3/1/21 | CLP | 3,605,000,000 | 5,855,966 | |||||||||
|
| |||||||||||
| 5,855,966 | ||||||||||||
|
| |||||||||||
Colombia – 0.27% | ||||||||||||
Colombia Government International Bond 5.00% 6/15/45 | 3,680,000 | 3,795,000 | ||||||||||
Colombian TES 7.00% 6/30/32 | COP | 24,033,000,000 | 7,943,313 | |||||||||
|
| |||||||||||
| 11,738,313 | ||||||||||||
|
| |||||||||||
Costa Rica – 0.05% | ||||||||||||
Costa Rica Government International Bond 144A | ||||||||||||
4.25% 1/26/23 #* | 2,070,000 | 2,051,887 | ||||||||||
|
| |||||||||||
| 2,051,887 | ||||||||||||
|
| |||||||||||
Croatia – 0.11% | ||||||||||||
Croatia Government International Bond 144A | ||||||||||||
5.50% 4/4/23 #* | 4,215,000 | 4,662,195 | ||||||||||
|
| |||||||||||
| 4,662,195 | ||||||||||||
|
| |||||||||||
Dominican Republic – 0.06% | ||||||||||||
Dominican Republic International Bond 144A | ||||||||||||
6.85% 1/27/45 # | 2,300,000 | 2,570,250 | ||||||||||
|
| |||||||||||
| 2,570,250 | ||||||||||||
|
| |||||||||||
Ecuador – 0.18% | ||||||||||||
Ecuador Government International Bond 144A | ||||||||||||
8.875% 10/23/27 # | 7,900,000 | 8,057,368 | ||||||||||
|
| |||||||||||
| 8,057,368 | ||||||||||||
|
| |||||||||||
Egypt – 0.11% | ||||||||||||
Egypt Government International Bond | ||||||||||||
144A 6.125% 1/31/22 # | 1,500,000 | 1,567,361 | ||||||||||
144A 8.50% 1/31/47 # | 2,870,000 | 3,252,100 | ||||||||||
|
| |||||||||||
| 4,819,461 | ||||||||||||
|
| |||||||||||
58
Table of Contents
| Principal amount° | Value (US $) | |||||||||
| ||||||||||
Sovereign BondsD (continued) | ||||||||||
| ||||||||||
Indonesia – 0.26% | ||||||||||
Indonesia Government International Bond 144A | ||||||||||
5.125% 1/15/45 # | 1,200,000 | $ | 1,333,105 | |||||||
Indonesia Treasury Bond 7.50% 8/15/32 | IDR | 134,667,000,000 | 10,137,881 | |||||||
|
| |||||||||
| 11,470,986 | ||||||||||
|
| |||||||||
Ivory Coast – 0.19% | ||||||||||
Ivory Coast Government International Bond 144A | ||||||||||
6.125% 6/15/33 # | 8,400,000 | 8,314,656 | ||||||||
|
| |||||||||
| 8,314,656 | ||||||||||
|
| |||||||||
Japan – 0.03% | ||||||||||
Japan Government 30 Year Bond 0.80% 6/20/47 | JPY | 127,700,000 | 1,107,072 | |||||||
|
| |||||||||
| 1,107,072 | ||||||||||
|
| |||||||||
Jordan – 0.09% | ||||||||||
Jordan Government International Bond 144A | ||||||||||
5.75% 1/31/27 # | 3,980,000 | 3,988,302 | ||||||||
|
| |||||||||
| 3,988,302 | ||||||||||
|
| |||||||||
Malaysia – 0.33% | ||||||||||
Malaysia Government Bond 3.844% 4/15/33 | MYR | 66,352,000 | 14,594,603 | |||||||
|
| |||||||||
| 14,594,603 | ||||||||||
|
| |||||||||
Mexico – 0.87% | ||||||||||
Mexican Bonos | ||||||||||
5.75% 3/5/26 | MXN | 183,586,800 | 8,705,453 | |||||||
6.50% 6/9/22 | MXN | 426,030,000 | 21,759,102 | |||||||
10.00% 12/5/24 | MXN | 67,412,000 | 4,081,535 | |||||||
Mexico Government International Bond | ||||||||||
4.15% 3/28/27 * | 1,615,000 | 1,680,811 | ||||||||
4.35% 1/15/47 | 2,200,000 | 2,074,600 | ||||||||
|
| |||||||||
| 38,301,501 | ||||||||||
|
| |||||||||
Mongolia – 0.09% | ||||||||||
Mongolia Government International Bond 144A | ||||||||||
5.625% 5/1/23 # | 4,045,000 | 4,061,402 | ||||||||
|
| |||||||||
| 4,061,402 | ||||||||||
|
| |||||||||
Nigeria – 0.11% | ||||||||||
Nigeria Government International Bond 144A | ||||||||||
7.875% 2/16/32 # | 4,600,000 | 5,064,094 | ||||||||
|
| |||||||||
| 5,064,094 | ||||||||||
|
| |||||||||
Poland – 0.06% | ||||||||||
Republic of Poland Government Bond 3.25% 7/25/25 | PLN | 9,401,000 | 2,583,373 | |||||||
|
| |||||||||
| 2,583,373 | ||||||||||
|
| |||||||||
Republic of Korea – 0.22% | ||||||||||
Export-Import Bank of Korea | ||||||||||
144A 3.00% 5/22/18 # | NOK | 1,400,000 | 173,137 | |||||||
4.00% 6/7/27 | AUD | 1,660,000 | 1,270,874 | |||||||
59
Table of Contents
Schedule of investments
Delaware Diversified Income Fund
| Principal amount° | Value (US $) | |||||||||
| ||||||||||
Sovereign BondsD (continued) | ||||||||||
| ||||||||||
Republic of Korea (continued) | ||||||||||
Inflation Linked Korea Treasury Bond 1.125% 6/10/23 | KRW | 9,205,868,664 | $ | 8,337,870 | ||||||
|
| |||||||||
| 9,781,881 | ||||||||||
|
| |||||||||
Russia – 0.05% | ||||||||||
Russian Foreign Bond – Eurobond 144A 4.75% 5/27/26 # | 2,200,000 | 2,326,016 | ||||||||
|
| |||||||||
| 2,326,016 | ||||||||||
|
| |||||||||
Saudi Arabia – 0.10% | ||||||||||
Saudi Government International Bond 144A | ||||||||||
2.875% 3/4/23 # | 4,518,000 | 4,504,220 | ||||||||
|
| |||||||||
| 4,504,220 | ||||||||||
|
| |||||||||
South Africa – 0.38% | ||||||||||
Republic of South Africa Government Bond | ||||||||||
8.00% 1/31/30 | ZAR | 35,151,000 | 2,201,888 | |||||||
8.75% 1/31/44 | ZAR | 177,739,000 | 10,938,326 | |||||||
Republic of South Africa Government International Bond | ||||||||||
5.875% 5/30/22 * | 3,460,000 | 3,781,866 | ||||||||
|
| |||||||||
| 16,922,080 | ||||||||||
|
| |||||||||
Sri Lanka – 0.13% | ||||||||||
Sri Lanka Government International Bond | ||||||||||
144A 6.20% 5/11/27 # | 2,790,000 | 2,970,368 | ||||||||
144A 6.825% 7/18/26 # | 2,510,000 | 2,789,483 | ||||||||
|
| |||||||||
| 5,759,851 | ||||||||||
|
| |||||||||
Turkey – 0.86% | ||||||||||
Export Credit Bank of Turkey 144A 5.375% 10/24/23 # | 4,565,000 | 4,612,421 | ||||||||
Turkey Government Bond 11.10% 5/15/19 | TRY | 108,835,000 | 28,210,372 | |||||||
Turkey Government International Bond | ||||||||||
3.25% 3/23/23 | 3,200,000 | 3,022,976 | ||||||||
5.75% 5/11/47 | 2,100,000 | 2,006,025 | ||||||||
|
| |||||||||
| 37,851,794 | ||||||||||
|
| |||||||||
Ukraine – 0.29% | ||||||||||
Ukraine Government International Bond | ||||||||||
144A 7.375% 9/25/32 # | 8,050,000 | 7,952,160 | ||||||||
144A 7.75% 9/1/26 # | 4,500,000 | 4,648,635 | ||||||||
|
| |||||||||
| 12,600,795 | ||||||||||
|
| |||||||||
United Kingdom – 0.05% | ||||||||||
United Kingdom Gilt 3.50% 1/22/45 | GBP | 1,169,100 | 2,064,023 | |||||||
|
| |||||||||
| 2,064,023 | ||||||||||
|
| |||||||||
60
Table of Contents
| Principal amount° | Value (US $) | |||||||||
| ||||||||||
Sovereign BondsD (continued) | ||||||||||
| ||||||||||
Uruguay – 0.31% | ||||||||||
Uruguay Government International Bond | ||||||||||
144A 8.50% 3/15/28 # | UYU | 99,896,000 | $ | 3,479,072 | ||||||
144A 9.875% 6/20/22 # | UYU | 281,233,000 | 10,291,239 | |||||||
|
| |||||||||
| 13,770,311 | ||||||||||
|
| |||||||||
Total Sovereign Bonds (cost $301,661,405) | 294,890,444 | |||||||||
|
| |||||||||
| ||||||||||
Supranational Banks – 0.63% | ||||||||||
| ||||||||||
Asian Development Bank 3.50% 5/30/24 | NZD | 1,775,000 | 1,230,081 | |||||||
Banque Ouest Africaine de Developpement 144A | ||||||||||
5.00% 7/27/27 # | 4,640,000 | 4,838,615 | ||||||||
Inter-American Development Bank 6.25% 6/15/21 | IDR | 171,050,000,000 | 12,599,029 | |||||||
International Bank for Reconstruction & Development | ||||||||||
1.307% (LIBOR01M + 0.07%) 4/17/19 ● | 1,269,000 | 1,268,739 | ||||||||
2.50% 11/25/24 | 2,469,000 | 2,487,829 | ||||||||
3.375% 1/25/22 | NZD | 1,980,000 | 1,385,122 | |||||||
4.625% 10/6/21 | NZD | 2,649,000 | 1,938,549 | |||||||
International Finance | ||||||||||
3.625% 5/20/20 | NZD | 1,035,000 | 728,276 | |||||||
3.75% 8/9/27 | NZD | 1,795,000 | 1,224,229 | |||||||
|
| |||||||||
Total Supranational Banks (cost $27,887,657) | 27,700,469 | |||||||||
|
| |||||||||
| ||||||||||
US Treasury Obligations – 2.06% | ||||||||||
| ||||||||||
US Treasury Bonds | ||||||||||
2.75% 8/15/47 | 87,120,000 | 84,877,340 | ||||||||
US Treasury Notes | ||||||||||
1.875% 9/30/22 | 3,315,000 | 3,293,245 | ||||||||
2.00% 10/31/22 | 1,670,000 | 1,668,858 | ||||||||
2.25% 8/15/27 | 785,000 | 776,399 | ||||||||
|
| |||||||||
Total US Treasury Obligations (cost $91,917,207) | 90,615,842 | |||||||||
|
| |||||||||
Number of shares | ||||||||||
| ||||||||||
Common Stock – 0.00% | ||||||||||
| ||||||||||
Century Communications =† | 7,875,000 | 0 | ||||||||
|
| |||||||||
Total Common Stock (cost $238,403) | 0 | |||||||||
|
| |||||||||
| ||||||||||
Convertible Preferred Stock – 0.66% | ||||||||||
| ||||||||||
A Schulman 6.00% exercise price $52.33 y | 1,531 | 1,470,158 | ||||||||
American Tower 5.50% exercise price $115.11, maturity date 2/15/18 | 4,563 | 575,714 | ||||||||
AMG Capital Trust II 5.15% exercise price $200.00, maturity date 10/15/37 | 52,740 | 3,203,955 | ||||||||
61
Table of Contents
Schedule of investments
Delaware Diversified Income Fund
Number of shares | Value (US $) | |||||||
| ||||||||
Convertible Preferred Stock (continued) | ||||||||
| ||||||||
Bank of America 7.25% exercise price $50.00 y | 1,477 | $ | 1,915,610 | |||||
Becton Dickinson 6.125% exercise price $211.80, maturity date 5/1/20 | 59,663 | 3,387,068 | ||||||
Crown Castle International 6.875% exercise price $115.20, maturity date 8/1/20 | 179 | 196,327 | ||||||
DTE Energy 6.50% exercise price $116.31, maturity date 10/1/19 | 45,354 | 2,491,295 | ||||||
El Paso Energy Capital Trust I 4.75% exercise price $50.00, maturity date 3/31/28 | 48,135 | 2,339,602 | ||||||
Electronics For Imaging 0.75% exercise price $52.72, maturity date 9/1/19 | 2,239,000 | 2,188,623 | ||||||
Huntington Bancshares 8.50% exercise price $11.95 y | 795 | 1,116,975 | ||||||
Kinder Morgan 9.75% exercise price $32.38, maturity date 10/26/18 * | 80,850 | 3,039,960 | ||||||
NextEra Energy | ||||||||
6.123% exercise price $159.55, maturity date 9/1/19 | 27,900 | 1,601,460 | ||||||
6.371% exercise price $114.03, maturity date 9/1/18 | 15,286 | 1,067,421 | ||||||
T-Mobile US 5.50% exercise price $31.02, maturity date 12/15/17 | 10,855 | 1,050,764 | ||||||
Wells Fargo & Co. 7.50% exercise price $156.71 y | 1,605 | 2,102,550 | ||||||
Welltower 6.50% exercise price $57.42 y | 24,012 | 1,472,656 | ||||||
|
| |||||||
Total Convertible Preferred Stock (cost $27,939,551) | 29,220,138 | |||||||
|
| |||||||
| ||||||||
Preferred Stock – 0.72% | ||||||||
| ||||||||
Bank of America 6.50% µy | 5,975,000 | 6,841,375 | ||||||
General Electric 5.00% µy | 13,537,000 | 14,107,991 | ||||||
Integrys Holdings 6.00% 8/1/73 µ | 205,350 | 5,813,972 | ||||||
Morgan Stanley 5.55% µy | 1,050,000 | 1,103,813 | ||||||
USB Realty 144A 2.506% (LIBOR03M + 1.147%) #y● | 4,485,000 | 4,002,863 | ||||||
|
| |||||||
Total Preferred Stock (cost $29,843,536) | 31,870,014 | |||||||
|
| |||||||
| Number of contracts | ||||||||
| ||||||||
Options Purchased – 0.01% | ||||||||
| ||||||||
Currency Call Options – 0.00% | ||||||||
USD vs KRW strike price KRW 1,130, expiration date 1/31/18, notional amount $3,889,173 (CITI) | 10,713,000 | 137,555 | ||||||
|
| |||||||
| 137,555 | ||||||||
|
| |||||||
Currency Put Options – 0.01% | ||||||||
USD vs CNH strike price CNH 6.70, expiration date 1/19/18, notional amount $3,817,268 (BNP) | 10,744,000 | 76,920 | ||||||
62
Table of Contents
| Number of contracts | Value (US $) | |||||||
| ||||||||
Options Purchased (continued) | ||||||||
| ||||||||
Currency Put Options (continued) |
| |||||||
USD vs KRW strike price KRW 1,140, expiration date 1/22/18, notional amount $3,122,605 (BAML) | 10,618,000 | $ | 99,405 | |||||
USD vs MXN strike price MXN 19.50, expiration date 1/17/18, notional amount $4,548,769 (BNP) | 10,620,000 | 212,991 | ||||||
USD vs SGD strike price SGD 1.37, expiration date 1/19/18, notional amount $5,653,637 (BNP) | 13,586,000 | 95,089 | ||||||
|
| |||||||
| 484,405 | ||||||||
|
| |||||||
Total Options Purchased (cost $677,198) | 621,960 | |||||||
|
| |||||||
| Principal amount° | ||||||||
Short-Term Investments – 2.22% | ||||||||
Discount Notes – 1.35%≠ | ||||||||
Federal Home Loan Bank | ||||||||
0.85% 11/1/17 | 5,004,484 | 5,004,484 | ||||||
0.90% 11/6/17 | 11,340,014 | 11,338,438 | ||||||
0.96% 11/3/17 | 4,730,193 | 4,729,928 | ||||||
0.97% 11/15/17 | 6,223,938 | 6,221,516 | ||||||
1.005% 11/9/17 | 20,647,802 | 20,643,218 | ||||||
1.005% 11/13/17 | 11,268,900 | 11,265,148 | ||||||
|
| |||||||
| 59,202,732 | ||||||||
|
| |||||||
Repurchase Agreements – 0.87% | ||||||||
Bank of America Merrill Lynch 0.97%, dated 10/31/17, to be repurchased on 11/1/17, repurchase price $10,060,182 (collateralized by US government obligations 0.00%–9.00% 11/24/17–5/15/47; market value $10,261,118) | 10,059,911 | 10,059,911 | ||||||
BNP Paribas 1.00%, dated 10/31/17, to be repurchased on 11/1/17, repurchase price $28,417,120 (collateralized by US government obligations 0.00%–5.00% 2/15/18–2/15/46; market value $28,984,657) | 28,416,330 | 28,416,330 | ||||||
|
| |||||||
| 38,476,241 | ||||||||
|
| |||||||
Total Short-Term Investments (cost $97,679,168) | 97,678,973 | |||||||
|
| |||||||
Total Value of Securities Before Securities Lending Collateral – 99.97% | 4,407,207,595 | |||||||
|
| |||||||
| ||||||||
Security Lending Collateral – 2.14%** | ||||||||
| ||||||||
Certificates of Deposit – 0.38%≠ | ||||||||
Australia & New Zealand Banking Group 1.18% 11/1/17 | 1,399,000 | 1,399,000 | ||||||
Commonwealth Bank Australia 1.10% 11/1/17 | 1,740,000 | 1,740,000 | ||||||
63
Table of Contents
Schedule of investments
Delaware Diversified Income Fund
| Principal amount° | Value (US $) | |||||||
| ||||||||
Security Lending Collateral** (continued) | ||||||||
| ||||||||
Certificates of Deposit≠ (continued) | ||||||||
National Australia Bank (Cayman) 1.05% 11/1/17 | 2,646,000 | $ | 2,646,000 | |||||
National Bank of Canada (Montreal) 1.06% 11/1/17 | 3,361,000 | 3,361,000 | ||||||
Northern Trust (Cayman) 1.03% 11/1/17 | 4,238,000 | 4,238,000 | ||||||
Royal Bank of Canada (Toronto) 1.08% 11/1/17 | 3,425,000 | 3,425,000 | ||||||
|
| |||||||
| 16,809,000 | ||||||||
|
| |||||||
Discounted Commercial Papers – 0.34%≠ | ||||||||
American Honda Finance | ||||||||
1.15% 11/22/17 | 465,000 | 464,675 | ||||||
1.20% 12/12/17 | 367,000 | 366,502 | ||||||
Apple | ||||||||
1.17% 12/8/17 ³ | 746,000 | 745,112 | ||||||
1.17% 12/13/17 ³ | 578,000 | 577,218 | ||||||
1.20% 12/6/17 ³ | 972,000 | 970,906 | ||||||
Coca-Cola 1.18% 12/12/17 ³ | 1,021,000 | 1,019,651 | ||||||
Exxon Mobile 1.11% 12/6/17 | 890,000 | 888,992 | ||||||
Johnson & Johnson 1.08% 11/9/17 ³ | 876,000 | 875,759 | ||||||
Microsoft | ||||||||
1.16% 12/7/17 ³ | 928,000 | 926,925 | ||||||
1.17% 11/28/17 ³ | 986,000 | 985,142 | ||||||
Novartis Finance | ||||||||
1.15% 11/29/17 ³ | 667,000 | 666,399 | ||||||
1.16% 11/13/17 ³ | 421,000 | 420,832 | ||||||
1.16% 11/17/17 ³ | 575,000 | 574,698 | ||||||
Pfizer 1.16% 12/12/17 ³ | 1,075,000 | 1,073,580 | ||||||
Procter & Gamble 1.17% 12/6/17 ³ | 1,063,000 | 1,061,803 | ||||||
Roche Holdings 1.08% 11/6/17 | 430,000 | 429,921 | ||||||
Sanofi 1.13% 11/13/17 ³ | 923,000 | 922,631 | ||||||
Unilever Capital | ||||||||
1.09% 11/20/17 ³ | 974,000 | 973,382 | ||||||
1.10% 11/20/17 | 775,000 | 774,508 | ||||||
|
| |||||||
| 14,718,636 | ||||||||
|
| |||||||
Repurchase Agreements – 0.94% | ||||||||
Credit Agricole | ||||||||
1.05%, dated 10/31/17, to be repurchased on 11/1/17, repurchase price $13,856,822 (collateralized by US government obligations 1.375% 1/31/20; market value $14,133,600) | 13,856,418 | 13,856,418 | ||||||
JPMorgan Securities | ||||||||
1.05%, dated 10/31/17, to be repurchased on 11/1/17, repurchase price $21,920,893 (collateralized by US government obligations 0.125% 4/15/19–4/15/21; market value $22,360,003) | 21,920,254 | 21,920,254 | ||||||
64
Table of Contents
| Principal amount° | Value (US $) | |||||||
| ||||||||
Security Lending Collateral** (continued) | ||||||||
| ||||||||
Repurchase Agreements (continued) | ||||||||
Merrill Lynch, Pierce, Fenner & Smith | ||||||||
1.03%, dated 10/31/17, to be repurchased on 11/1/17, repurchase price $5,742,863 (collateralized by US government obligations 1.375% 12/15/19; market value $5,857,572) | 5,742,699 | $ | 5,742,699 | |||||
|
| |||||||
| 41,519,371 | ||||||||
|
| |||||||
Short-Term Floating Rate Notes – 0.48% | ||||||||
American Honda Finance 1.39% (LIBOR03M + 0.07%) 9/20/18 ● | 900,000 | 899,852 | ||||||
Australia & New Zealand Banking Group | ||||||||
1.35% (LIBOR01M + 0.11%) 4/5/18 ³● | 578,000 | 578,033 | ||||||
1.39% (LIBOR01M + 0.16%) 9/7/18 ³● | 1,021,000 | 1,020,816 | ||||||
1.41% (LIBOR01M + 0.17%) 9/5/18 ³● | 1,238,000 | 1,237,897 | ||||||
Bank of Montreal (Chicago) | ||||||||
1.42% (LIBOR03M + 0.40%) 6/18/18 ● | 1,125,000 | 1,124,927 | ||||||
1.47% (LIBOR03M + 0.33%) 11/9/17 ● | 700,000 | 700,083 | ||||||
Bank of Nova Scotia 1.69% (LIBOR01M + 0.45%) 2/14/18 ³● | 900,000 | 900,972 | ||||||
Bank of Nova Scotia (Houston) | ||||||||
1.39% (LIBOR03M + 0.08%) 5/4/18 ● | 800,000 | 800,199 | ||||||
1.44% (LIBOR01M + 0.02%) 7/6/18 ● | 431,000 | 430,994 | ||||||
Commonwealth Bank of Australia | ||||||||
1.41% (LIBOR01M + 0.17%) 6/1/18 ³● | 800,000 | 800,203 | ||||||
1.43% (LIBOR01M + 0.17%) 9/13/18 ³● | 1,037,000 | 1,037,063 | ||||||
1.61% (LIBOR01M + 0.30%) 11/3/17 ³● | 657,000 | 657,025 | ||||||
National Australia Bank (New York) | ||||||||
1.34% (LIBOR01M + 0.10%) 2/8/18 ³● | 818,000 | 818,097 | ||||||
1.47% (LIBOR01M + 0.14%) 4/5/18 ³● | 772,000 | 772,475 | ||||||
National Bank of Canada (New York) 1.37% (LIBOR01M + 0.12%) 4/13/18 ● | 876,000 | 875,966 | ||||||
Royal Bank of Canada (New York) 1.56% (LIBOR01M + 0.32%) 3/16/18 ● | 812,000 | 812,672 | ||||||
Toronto-Dominion Bank (New York) | ||||||||
1.39% (LIBOR03M + 0.08%) 5/3/18 ● | 730,000 | 730,219 | ||||||
1.41% (LIBOR01M + 0.17%) 5/23/18 ● | 561,000 | 561,021 | ||||||
1.44% (LIBOR01M + 0.20%) 8/10/18 ● | 741,000 | 740,977 | ||||||
US Bank (Cincinnati) 1.32% 3/20/18 | 800,000 | 799,986 | ||||||
Wells Fargo Bank | ||||||||
1.33% (LIBOR01M + 0.09%) 11/7/17 ● | 1,000,000 | 1,000,033 | ||||||
1.43% (LIBOR01M + 0.19%) 6/1/18 ● | 600,000 | 600,085 | ||||||
1.45% (LIBOR01M + 0.22%) 10/5/18 ● | 369,000 | 368,987 | ||||||
1.59% (LIBOR03M + 0.28%) 2/6/18 ● | 435,000 | 435,425 | ||||||
65
Table of Contents
Schedule of investments
Delaware Diversified Income Fund
| Principal amount° | Value (US $) | |||||||
| ||||||||
Security Lending Collateral** (continued) | ||||||||
| ||||||||
Short-Term Floating Rate Notes (continued) | ||||||||
Westpac Banking (New York) | ||||||||
1.39% (LIBOR01M + 0.15%) 7/18/18 ● | 329,000 | $ | 328,917 | |||||
1.39% (LIBOR01M + 0.16%) 8/10/18 ● | 530,000 | 529,822 | ||||||
1.41% (LIBOR01M + 0.17%) 5/24/18 ³● | 739,000 | 739,095 | ||||||
1.49% (LIBOR03M + 0.13%) 4/12/18 ● | 800,000 | 800,483 | ||||||
|
| |||||||
| 21,102,324 | ||||||||
|
| |||||||
Total Securities Lending Collateral (cost $94,148,379) | 94,149,331 | |||||||
|
| |||||||
Total Value of Securities – 102.11% | $ | 4,501,356,926∎ | ||||||
|
| |||||||
| # | Security exempt from registration under Rule 144A of the Securities Act of 1933, as amended. At Oct. 31, 2017, the aggregate value of Rule 144A securities was $1,278,275,779, which represents 29.00% of the Fund’s net assets. See Note 11 in “Notes to financial statements.” |
| * | Fully or partially on loan. |
| ** | See Note 10 in “Notes to financial statements” for additional information on securities lending collateral. |
| ¨ | Pass Through Agreement. Security represents the contractual right to receive a proportionate amount of underlying payments due to the counterparty pursuant to various agreements related to the rescheduling of obligations and the exchange of certain notes. |
| = | The value of this security was determined using significant unobservable inputs and is reported as a Level 3 security in the disclosure table located in Note 3 in “Notes to financial statements.” |
| ≠ | The rate shown is the effective yield at the time of purchase. |
| ³ | Commercial paper exempt from registration under Section 4(2) and/or Rule 144A of the Securities Act of 1933, as amended, and may be resold in transactions exempt from registration only to dealers in that program or other “accredited investors.” At Oct. 31, 2017, the aggregate value of these securities was $20,355,714, which represented 0.46% of the Fund’s net assets. See Note 11 in “Notes to financial statements.” |
| ∎ | Includes $89,038,038 of securities loaned. |
| ° | Principal amount shown is stated in US dollars unless noted that the security is denominated in another currency. |
| D | Securities have been classified by country of origin. |
| µ | Fixed to variable rate investment. The rate shown reflects the fixed rate in effect at Oct. 31, 2017. Rate will reset at a future date. |
| S | Interest only security. An interest only security is the interest only portion of a fixed income security, which is separated and sold individually from the principal portion of the security. |
| y | No contractual maturity date. |
66
Table of Contents
| W | Principal only security. A principal only security is the principal only portion of a fixed income security which is separated and sold individually from the interest portion of the security. |
| † | Non-income producing security. |
| · | Variable rate investment. Interest rates reset periodically. Rate shown reflects the rate in effect at Oct. 31, 2017. For securities based on a published reference rate and spread, the reference rate and spread are indicated in their description above. Certain variable rate securities are not based on a published reference rate and spread but are determined by the issuer or agent and are based on current market conditions. These securities do not indicate a reference rate and spread in their description above. |
| f | Step coupon bond. Coupon increases or decreases periodically based on a predetermined schedule. Stated rate in effect at Oct. 31, 2017. |
The following foreign currency exchange contracts, futures contracts, and swap contracts were outstanding at Oct. 31, 2017:1
Foreign Currency Exchange Contracts
Counterparty | Contracts to Receive (Deliver) | In Exchange For | Settlement Date | Unrealized Appreciation | Unrealized Depreciation | |||||||||||||||||
BAML | AUD | (12,354,370 | ) | USD | 9,588,226 | 11/17/17 | $ | 134,502 | $ | — | ||||||||||||
BAML | CAD | (1,053,842 | ) | USD | 840,249 | 11/17/17 | 23,265 | — | ||||||||||||||
BAML | EUR | (3,308,127 | ) | USD | 3,730,502 | 11/17/17 | — | (126,529 | ) | |||||||||||||
BAML | JPY | (2,014,722,179 | ) | USD | 17,650,985 | 11/17/17 | — | (80,779 | ) | |||||||||||||
BAML | KRW | (13,858,952,340 | ) | USD | 12,086,997 | 11/17/17 | — | (309,130 | ) | |||||||||||||
BAML | NZD | (9,378,956 | ) | USD | 6,648,274 | 11/17/17 | 232,362 | — | ||||||||||||||
BNP | AUD | (1,395,745 | ) | USD | 1,082,917 | 11/17/17 | 14,874 | — | ||||||||||||||
BNP | COP | 31,510,497,932 | USD | (10,533,557 | ) | 11/17/17 | — | (192,531 | ) | |||||||||||||
BNP | NOK | (23,773,164 | ) | USD | 2,970,717 | 11/17/17 | 59,008 | — | ||||||||||||||
CITI | AUD | 7,856,295 | USD | (6,006,137 | ) | 11/17/17 | 5,602 | — | ||||||||||||||
CITI | GBP | (7,856,295 | ) | USD | 10,412,929 | 11/17/17 | — | (26,524 | ) | |||||||||||||
CITI | NZD | 7,856,295 | USD | (5,370,720 | ) | 11/17/17 | 3,576 | — | ||||||||||||||
HSBC | EUR | 763,699 | USD | (897,591 | ) | 11/17/17 | — | (7,174 | ) | |||||||||||||
HSBC | GBP | (3,442,875 | ) | USD | 4,512,984 | 11/17/17 | — | (61,913 | ) | |||||||||||||
JPMC | KRW | (8,155,696,010 | ) | USD | 7,116,911 | 11/17/17 | — | (177,944 | ) | |||||||||||||
JPMC | PLN | (9,818,851 | ) | USD | 2,670,916 | 11/17/17 | — | (26,500 | ) | |||||||||||||
TD | AUD | 13,228,387 | USD | (10,266,802 | ) | 11/17/17 | — | (144,268 | ) | |||||||||||||
TD | COP | 14,492,104,819 | USD | (4,900,119 | ) | 11/17/17 | — | (144,141 | ) | |||||||||||||
TD | JPY | 2,356,035,512 | USD | (20,917,666 | ) | 11/17/17 | — | (181,970 | ) | |||||||||||||
|
|
|
| |||||||||||||||||||
Total Foreign Currency Exchange Contracts | $ | 473,189 | $ | (1,479,403 | ) | |||||||||||||||||
|
|
|
| |||||||||||||||||||
67
Table of Contents
Schedule of investments
Delaware Diversified Income Fund
Futures Contracts
Contracts to Buy (Sell) | Notional Amount | Notional Cost (Proceeds) | Expiration Date | Value/ Unrealized Appreciation | Value/ Unrealized Depreciation | |||||||||||||||||
(9) | Euro-OAT | $ | (1,650,756 | ) | $ | (1,631,960 | ) | 12/8/17 | $ | — | $ | (18,796) | ||||||||||
(304) | Long Gilt | (50,199,183 | ) | (50,149,589 | ) | 12/28/17 | — | (49,594) | ||||||||||||||
(1,784) | US Treasury 5 yr Notes | (209,062,500 | ) | (209,645,839 | ) | 1/2/18 | 583,339 | — | ||||||||||||||
42 | US Treasury 10 yr Notes | 5,247,375 | 5,258,556 | 12/20/17 | — | (11,181) | ||||||||||||||||
(2,924) | US Treasury 10 yr Notes | (365,317,250 | ) | (365,601,633 | ) | 12/20/17 | 284,383 | — | ||||||||||||||
(16) | US Treasury Long Bond | (2,439,500 | ) | (2,475,955 | ) | 12/20/17 | 36,455 | — | ||||||||||||||
1,364 | US Treasury Long Bond | 207,967,375 | 212,058,831 | 12/20/17 | — | (4,091,456) | ||||||||||||||||
|
|
|
|
|
| |||||||||||||||||
Total Futures Contracts | $ | (412,187,589 | ) | $ | 904,177 | $ | (4,171,027) | |||||||||||||||
|
|
|
|
|
| |||||||||||||||||
Swap Contracts
CDS Contracts2
Counterparty/ Reference Obligation/ Termination Date/ Payment Frequency | Notional Amount3 | Annual | Value | Upfront Paid | Unrealized Depreciation4 | |||||||||||||||
Over-The-Counter/ Protection Purchased: | ||||||||||||||||||||
HSBC-CDX.EM.275 6/20/22- Quarterly | 11,075,000 | 1.00 | % | $ | 295,831 | $ | 547,978 | $ | (252,147 | ) | ||||||||||
Over-The-Counter/ Protection Sold/ Moody’s Ratings: | ||||||||||||||||||||
MSC-CMBX.NA.BBB-.66 5/11/63- Monthly | (19,415,000 | ) | 3.00 | % | (3,248,241 | ) | (2,209,482 | ) | (1,038,759 | ) | ||||||||||
|
|
|
|
|
| |||||||||||||||
Total CDS Contracts | $ | (2,952,410 | ) | $ | (1,661,504 | ) | $ | (1,290,906 | ) | |||||||||||
|
|
|
|
|
| |||||||||||||||
68
Table of Contents
IRS Contracts7 | ||||||||||||||||
Reference Obligation/ Termination Date/ Payment Frequency (Fixed Rate/Floating Rate) | Notional | Fixed/Floating Paid (Received) | Value | Unrealized | ||||||||||||
Centrally Cleared: | ||||||||||||||||
30 yr IRS 12/21/46-(Semiannually/Quarterly) | 9,220,000 | 2.767%/(1.326% | ) | $ | (275,574 | ) | $ | (275,574 | ) | |||||||
30 yr IRS 1/27/47-(Semiannually/Quarterly) | 2,290,000 | 2.661%/(1.374% | ) | (35,679 | ) | (35,679 | ) | |||||||||
30 yr IRS 1/30/47-(Semiannually/Quarterly) | 3,655,000 | 2.687%/(1.311% | ) | (77,055 | ) | (77,055 | ) | |||||||||
|
|
|
| |||||||||||||
Total IRS Contracts | $ | (388,308 | ) | $ | (388,308 | ) | ||||||||||
|
|
|
| |||||||||||||
The use of foreign currency exchange contracts, futures contracts, and swap contracts involves elements of market risk and risks in excess of the amounts disclosed in these financial statements. The notional amounts and foreign currency exchange contracts presented above represent the Fund’s total exposure in such contracts, whereas only the net unrealized appreciation (depreciation) is reflected in the Fund’s net assets.
1See Note 8 in “Notes to financial statements.”
2A CDS contract is a risk-transfer instrument through which one party (purchaser of protection) transfers to another party (seller of protection) the financial risk of a credit event (as defined in the CDS agreement), as it relates to a particular reference security or basket of securities (such as an index). Periodic payments (receipts) on such contracts are accrued daily and recorded as unrealized losses (gains) on swap contracts. Upon payment (receipt), such amounts are recorded as realized losses (gains) on swap contracts. Upfront payments made or received in connection with CDS contracts are amortized over the expected life of the CDS contracts as unrealized losses (gains) on swap contracts. The change in value of CDS contracts is recorded daily as unrealized appreciation or depreciation. A realized gain or loss is recorded upon a credit event (as defined in the CDS agreement) or the maturity or termination of the agreement.
3Notional amount shown is stated in US Dollars unless noted that the swap is denominated in another currency.
4Unrealized appreciation (depreciation) does not include periodic interest payments (receipt) on swap contracts accrued daily in the amount of $(130,091).
5Markit’s CDX Emerging markets Index, or the CDX.EM Index is composed of 15 sovereign issuers from the following countries: Argentina, Brazil, Chile, China, Columbia, Indonesia, Malaysia, Mexico, Panama, Peru, Philippines, Russia, South Africa, Turkey, and Venezuela, which have a S&P credit quality rating of CCC and above.
6Markit’s CMBX Index or the CMBX.NA Index is a synthetic tradable index referencing a basket of 25 commercial mortgage-backed securities in North America. Credit-quality ratings are measured on a scale that ranges from AAA (highest) to BB (lowest). US Agency and US Agency mortgage-backed securities appear under US Government.
7An interest rate swap agreement is an exchange of interest rates between counterparties. Periodic payments (receipt) on such contracts are accrued daily and recorded as unrealized appreciation (depreciation) on swap contracts. Upon periodic payment (receipt) or termination of the contract, such amounts are recorded as realized gains (losses) on swap contracts.
69
Table of Contents
Schedule of investments
Delaware Diversified Income Fund
Summary of abbreviations:
ABS – Asset-Backed Security
ARM – Adjustable Rate Mortgage
ARS – Argentine Peso
AUD – Australian Dollar
BADLARPP – Argentina Term Deposit Rate
BAML – Bank of America Merrill Lynch
BB – Barclays Bank
BBSW3M – Bank Bill Swap 3 Months
BNP – BNP Paribas
BRL – Brazilian Real
CAD – Canadian Dollar
CDO – Collateralized Debt Obligation
CDS – Credit Default Swap
CDX.EM – Credit Default Swap Index Emerging Markets
CITI – Citigroup Global Markets
CLO – Collateralized Loan Obligation
CLP – Chilean Peso
CMBX.NA – Commercial Mortgaged-Backed Securities Index North America
CNH – Chinese Offshore Renminbi
COP – Colombian Peso
DB – Deutsche Bank
EUR – European Monetary Unit
FREMF – Freddie Mac Multifamily
GBP – British Pound Sterling
GNMA – Government National Mortgage Association
GS – Goldman Sachs
HSBC – Hong Kong Shanghai Bank
ICE – Intercontinental Exchange
IDR – Indonesian Rupiah
IRS – Interest Rate Swap
JPM – JPMorgan
JPMC – JPMorgan Chase Bank
JPY – Japanese Yen
KRW – South Korean Won
LB – Lehman Brothers
LIBOR – London Interbank Offered Rate
LIBOR01M – ICE LIBOR USD 1 Month
LIBOR03M – ICE LIBOR USD 3 Month
LIBOR06M – ICE LIBOR USD 6 Month
LIBOR12M – ICE LIBOR USD 12 Month
MSC – Morgan Stanley Capital
70
Table of Contents
Summary of abbreviations (continued):
MXN – Mexican Peso
MYR – Malaysian Ringgit
NCUA – National Credit Union Administration
NGN – Nigerian Naira
MYR – Malaysian Ringgit
NOK – Norwegian Krone
NZD – New Zealand Dollar
OAT – Obligations Assimilables du Tresor
RBS – Royal Bank of Scotland
REMIC – Real Estate Mortgage Investment Conduit
S&P – Standard & Poor’s Financial Services LLC
SGD – Singapore Dollar
S.F. – Single Family
TBA – To be announced
TD – Toronto Dominion Bank
TRY – Turkish Lira
USD – US Dollar
UYU – Uruguayan Peso
WF – Wells Fargo
yr – Year
ZAR – South African Rand
See accompanying notes, which are an integral part of the financial statements.
71
Table of Contents
| Statement of assets and liabilities | ||
| Delaware Diversified Income Fund | October 31, 2017 | |
Assets: | ||||
Investments, at value1,2 | $ | 4,308,906,662 | ||
Short-term investments, at value3 | 97,678,973 | |||
Short-term investments held as collateral for loaned securities, at value4 | 94,149,331 | |||
Foreign currencies, at value5 | 4,144,530 | |||
Options purchased, at value6 | 621,960 | |||
Cash collateral due from brokers | 8,161,609 | |||
Receivable for securities sold | 56,222,199 | |||
Dividends and interest receivable | 40,460,198 | |||
Receivable for fund shares sold | 7,659,410 | |||
Upfront payments paid on credit default swap contracts | 547,978 | |||
Variation margin due from broker on futures contracts | 497,329 | |||
Unrealized appreciation on foreign currency exchange contracts | 473,189 | |||
Securities lending income receivable | 50,783 | |||
Swap payments receivable | 28,442 | |||
Other assets7 | 4,787,750 | |||
|
| |||
Total assets | $ | 4,624,390,343 | ||
|
| |||
Liabilities: | ||||
Cash due to custodian | 4,695,243 | |||
Obligation to return securities lending collateral | 94,085,371 | |||
Payable for securities purchased | 82,322,665 | |||
Contingent liabilities7 | 15,959,167 | |||
Payable for fund shares redeemed | 5,269,688 | |||
Distribution payable | 3,584,597 | |||
Upfront payments received on credit default swap contracts | 2,209,482 | |||
Investment management fees payable to affiliates | 1,710,834 | |||
Unrealized depreciation on foreign currency exchange contracts | 1,479,403 | |||
Unrealized depreciation on credit default swap contracts | 1,290,906 | |||
Other accrued expenses | 1,089,443 | |||
Distribution fees payable to affiliates | 752,273 | |||
Cash collateral due to brokers | 370,000 | |||
Unrealized depreciation on centrally cleared interest rate swap contracts | 369,902 | |||
Administration fees payable | 319,937 | |||
Swap payments payable | 131,418 | |||
Custodian fees payable | 96,493 | |||
Other liabilities | 93,770 | |||
Dividend disbursing and transfer agent fees and expenses payable to affiliates | 73,885 | |||
Audit and tax fees payable | 46,850 | |||
Variation margin due to brokers on centrally cleared interest rate swap contracts | 18,406 | |||
Accounting and administration expenses payable to affiliates | 14,594 | |||
Trustees’ fees and expenses payable | 10,981 | |||
Legal fees payable to affiliates | 6,508 | |||
Reports and statements to shareholders expenses payable to affiliates | 3,131 | |||
|
| |||
Total Liabilities | 216,004,947 | |||
|
| |||
Total Net Assets | $ | 4,408,385,396 | ||
|
|
72
Table of Contents
Net Assets Consist of: | ||||
Paid-in capital | $ | 4,499,188,223 | ||
Distributions in excess of net investment income | (3,156,843 | ) | ||
Accumulated net realized loss | (145,040,286 | ) | ||
Net unrealized appreciation of investments | 63,932,896 | |||
Net unrealized depreciation of foreign currencies | (400,987 | ) | ||
Net unrealized depreciation of foreign currency exchange contracts | (1,006,214 | ) | ||
Net unrealized depreciation of futures contracts | (3,266,850 | ) | ||
Net unrealized depreciation of options purchased | (55,238 | ) | ||
Net unrealized depreciation of swap contracts | (1,809,305 | ) | ||
|
| |||
Total Net Assets | $ | 4,408,385,396 | ||
|
| |||
Net Asset Value | ||||
Class A: | ||||
Net assets | $ | 893,311,213 | ||
Shares of beneficial interest outstanding, unlimited authorization, no par | 102,243,161 | |||
Net asset value per share | $ | 8.74 | ||
Sales charge | 4.50 | % | ||
Offering price per share, equal to net asset value per share / (1 – sales charge) | $ | 9.15 | ||
Class C: | ||||
Net assets | $ | 620,954,366 | ||
Shares of beneficial interest outstanding, unlimited authorization, no par | 71,079,458 | |||
Net asset value per share | $ | 8.74 | ||
Class R: | ||||
Net assets | $ | 61,630,133 | ||
Shares of beneficial interest outstanding, unlimited authorization, no par | 7,057,496 | |||
Net asset value per share | $ | 8.73 | ||
Institutional Class: | ||||
Net assets | $ | 2,819,554,650 | ||
Shares of beneficial interest outstanding, unlimited authorization, no par | 322,469,018 | |||
Net asset value per share | $ | 8.74 | ||
Class R6: | ||||
Net assets | $ | 12,935,034 | ||
Shares of beneficial interest outstanding, unlimited authorization, no par | 1,479,562 | |||
Net asset value per share | $ | 8.74 | ||
| ||||
1Investments, at cost | $ | 4,244,974,523 | ||
2Including securities on loan | 89,038,038 | |||
3Short-term investments, at cost | 97,679,168 | |||
4Short-term investments held as collateral for loaned securities, at cost | 94,148,379 | |||
5Foreign currencies, at cost | 4,314,225 | |||
6Options purchased, at cost | 677,198 | |||
7See Note 14 in “Notes to financial statements.” | ||||
See accompanying notes, which are an integral part of the financial statements.
73
Table of Contents
| Statement of operations | ||
| Delaware Diversified Income Fund | Year ended October 31, 2017 |
Investment Income: | ||||
Interest | $ | 184,849,319 | ||
Dividends | 1,465,515 | |||
Securities lending income | 644,119 | |||
Foreign tax withheld | (143,628 | ) | ||
|
| |||
| 186,815,325 | ||||
|
| |||
Expenses: | ||||
Management fees | 20,616,989 | |||
Distribution expenses – Class A | 2,510,816 | |||
Distribution expenses – Class C | 7,321,549 | |||
Distribution expenses – Class R | 330,172 | |||
Dividend disbursing and transfer agent fees and expenses | 5,331,591 | |||
Accounting and administration expenses | 1,223,441 | |||
Reports and statements to shareholders expenses | 389,842 | |||
Legal fees | 355,013 | |||
Custodian fees | 308,499 | |||
Trustees’ fees and expenses | 218,923 | |||
Registration fees | 174,426 | |||
Audit and tax fees | 57,440 | |||
Other | 225,776 | |||
|
| |||
| 39,064,477 | ||||
Less expenses paid indirectly | (36,066 | ) | ||
|
| |||
Total operating expenses | 39,028,411 | |||
|
| |||
Net Investment Income | 147,786,914 | |||
|
| |||
74
Table of Contents
Net Realized and Unrealized Gain (Loss): | ||||
Net realized gain (loss) on: | ||||
Investments1 | $ | 160,357 | ||
Foreign currencies | (160,624 | ) | ||
Foreign currency exchange contracts | (1,385,855 | ) | ||
Futures contracts | (7,868,499 | ) | ||
Options written | 1,364,234 | |||
Options purchased | (402,801 | ) | ||
Swap contracts | (3,180,160 | ) | ||
|
| |||
Net realized loss | (11,473,348 | ) | ||
|
| |||
Net change in unrealized appreciation (depreciation) of: | ||||
Investments | (6,473,908 | ) | ||
Foreign currencies | (541,322 | ) | ||
Foreign currency exchange contracts | (706,199 | ) | ||
Futures contracts | (4,648,993 | ) | ||
Options purchased | (125,606 | ) | ||
Swap contracts | (1,862,081 | ) | ||
|
| |||
Net change in unrealized appreciation (depreciation) | (14,358,109 | ) | ||
|
| |||
Net Realized and Unrealized Loss | (25,831,457 | ) | ||
|
| |||
Net Increase in Net Assets Resulting from Operations | $ | 121,955,457 | ||
|
| |||
1Includes $130,822 capital gains tax paid.
See accompanying notes, which are an integral part of the financial statements.
75
Table of Contents
| Statements of changes in net assets | ||
| Delaware Diversified Income Fund | ||
| Year ended | ||||||||
| 10/31/17 | 10/31/16 | |||||||
Increase (Decrease) in Net Assets from Operations: | ||||||||
Net investment income | $ | 147,786,914 | $ | 128,965,086 | ||||
Net realized loss | (11,473,348 | ) | (24,918,308 | ) | ||||
Net change in unrealized appreciation (depreciation) | (14,358,109 | ) | 94,822,652 | |||||
|
|
|
| |||||
Net increase in net assets resulting from operations | 121,955,457 | 198,869,430 | ||||||
|
|
|
| |||||
Dividends and Distributions to Shareholders from: | ||||||||
Net investment income: | ||||||||
Class A | (35,719,780 | ) | (43,287,704 | ) | ||||
Class C | (20,671,479 | ) | (20,524,146 | ) | ||||
Class R | (2,184,123 | ) | (2,421,985 | ) | ||||
Institutional Class | (103,732,622 | ) | (83,360,173 | ) | ||||
Class R6 | (129,659 | ) | (31 | ) | ||||
Return of capital: | ||||||||
Class A | (811,257 | ) | (1,998,204 | ) | ||||
Class C | (563,918 | ) | (1,395,844 | ) | ||||
Class R | (55,969 | ) | (122,996 | ) | ||||
Institutional Class | (2,560,569 | ) | (4,237,551 | ) | ||||
Class R6 | (11,747 | ) | (3 | ) | ||||
|
|
|
| |||||
| (166,441,123 | ) | (157,348,637 | ) | |||||
|
|
|
| |||||
Capital Share Transactions: | ||||||||
Proceeds from shares sold: | ||||||||
Class A | 143,375,898 | 194,846,145 | ||||||
Class C | 24,968,862 | 63,689,723 | ||||||
Class R | 14,221,329 | 24,662,141 | ||||||
Institutional Class | 921,870,328 | 819,341,305 | ||||||
Class R6 | 13,462,002 | 2,000 | ||||||
76
Table of Contents
| Year ended | ||||||||
| 10/31/17 | 10/31/16 | |||||||
Capital Share Transactions (continued): | ||||||||
Net asset value of shares issued upon reinvestment of dividends and distributions: | ||||||||
Class A | $ | 35,097,067 | $ | 43,377,366 | ||||
Class C | 19,703,738 | 20,169,368 | ||||||
Class R | 2,238,458 | 2,546,410 | ||||||
Institutional Class | 98,334,237 | 82,440,055 | ||||||
Class R6 | 130,937 | 32 | ||||||
|
|
|
| |||||
| 1,273,402,856 | 1,251,074,545 | |||||||
|
|
|
| |||||
Cost of shares redeemed: | ||||||||
Class A | (530,755,749 | ) | (649,512,099 | ) | ||||
Class C | (294,678,417 | ) | (218,658,275 | ) | ||||
Class R | (31,475,251 | ) | (52,150,195 | ) | ||||
Institutional Class | (852,537,719 | ) | (870,590,826 | ) | ||||
Class R6 | (654,239 | ) | — | |||||
|
|
|
| |||||
| (1,710,101,375 | ) | (1,790,911,395 | ) | |||||
|
|
|
| |||||
Decrease in net assets derived from capital share transactions | (436,698,519 | ) | (539,836,850 | ) | ||||
|
|
|
| |||||
Net Decrease in Net Assets | (481,184,185 | ) | (498,316,057 | ) | ||||
Net Assets: | ||||||||
Beginning of year | 4,889,569,581 | 5,387,885,638 | ||||||
|
|
|
| |||||
End of year | $ | 4,408,385,396 | $ | 4,889,569,581 | ||||
|
|
|
| |||||
Distributions in excess of net investment income | $ | (3,156,843 | ) | $ | (6,429,608 | ) | ||
|
|
|
| |||||
See accompanying notes, which are an integral part of the financial statements.
77
Table of Contents
Delaware Diversified Income Fund Class A
Selected data for each share of the Fund outstanding throughout each period were as follows:
Net asset value, beginning of period |
Income (loss) from investment operations: |
Net investment income1 |
Net realized and unrealized gain (loss) |
Total from investment operations |
Less dividends and distributions from: |
Net investment income |
Net realized gain |
Return of capital |
Total dividends and distributions |
Net asset value, end of period |
Total return3 |
Ratios and supplemental data: |
Net assets, end of period (000 omitted) |
Ratio of expenses to average net assets |
Ratio of expenses to average net assets prior to fees waived4 |
Ratio of net investment income to average net assets |
Ratio of net investment income to average net assets prior to fees waived4 |
Portfolio turnover |
| 1 | The average shares outstanding method has been applied for per share information. |
| 2 | For the year ended Oct. 31, 2017, return of capital distributions of $811,257 were made by the Fund’s Class A shares, which calculated to a de minimis amount of $0.00 per share. |
| 3 | Total investment return is based on the change in net asset value of a share during the period and assumes reinvestment of dividends and distributions at net asset value and does not reflect the impact of a sales charge. Total investment return during some of the periods shown reflects a waiver by the distributor. Performance would have been lower had the waiver not been in effect. |
| 4 | Expenses paid indirectly were not material and had no impact on the ratios disclosed. Expenses paid indirectly for the year ended Oct. 31, 2017 are reflected on the “Statement of operations.” |
See accompanying notes, which are an integral part of the financial statements.
78
Table of Contents
| Year ended | ||||||||||||||||||||||||||||
| 10/31/17 | 10/31/16 | 10/31/15 | 10/31/14 | 10/31/13 | ||||||||||||||||||||||||
| $ | 8.81 | $ | 8.74 | $ | 9.09 | $ | 8.96 | $ | 9.45 | |||||||||||||||||||
| 0.28 | 0.22 | 0.26 | 0.30 | 0.28 | ||||||||||||||||||||||||
| (0.03 | ) | 0.12 | (0.27 | ) | 0.17 | (0.35 | ) | |||||||||||||||||||||
|
|
|
|
|
|
|
|
|
| |||||||||||||||||||
| 0.25 | 0.34 | (0.01 | ) | 0.47 | (0.07 | ) | ||||||||||||||||||||||
|
|
|
|
|
|
|
|
|
| |||||||||||||||||||
| (0.32 | ) | (0.26 | ) | (0.29 | ) | (0.34 | ) | (0.25 | ) | |||||||||||||||||||
| — | — | (0.03 | ) | — | (0.09 | ) | ||||||||||||||||||||||
| — | 2 | (0.01 | ) | (0.02 | ) | — | (0.08 | ) | ||||||||||||||||||||
|
|
|
|
|
|
|
|
|
| |||||||||||||||||||
| (0.32 | ) | (0.27 | ) | (0.34 | ) | (0.34 | ) | (0.42 | ) | |||||||||||||||||||
|
|
|
|
|
|
|
|
|
| |||||||||||||||||||
| $ | 8.74 | $ | 8.81 | $ | 8.74 | $ | 9.09 | $ | 8.96 | |||||||||||||||||||
|
|
|
|
|
|
|
|
|
| |||||||||||||||||||
| 2.89% | 3.96% | (0.11% | ) | 5.25% | (0.66% | ) | ||||||||||||||||||||||
| $ | 893,311 | $ | 1,259,472 | $ | 1,658,922 | $ | 2,048,203 | $ | 3,244,801 | |||||||||||||||||||
| 0.89% | 0.89% | 0.91% | 0.90% | 0.90% | ||||||||||||||||||||||||
| 0.89% | 0.89% | 0.91% | 0.90% | 0.95% | ||||||||||||||||||||||||
| 3.24% | 2.54% | 2.95% | 3.34% | 3.03% | ||||||||||||||||||||||||
| 3.24% | 2.54% | 2.95% | 3.34% | 2.98% | ||||||||||||||||||||||||
| 125% | 240% | 218% | 189% | 238% | ||||||||||||||||||||||||
79
Table of Contents
Financial highlights
Delaware Diversified Income Fund Class C
Selected data for each share of the Fund outstanding throughout each period were as follows:
Net asset value, beginning of period |
Income (loss) from investment operations: |
Net investment income1 |
Net realized and unrealized gain (loss) |
Total from investment operations |
Less dividends and distributions from: |
Net investment income |
Net realized gain |
Return of capital |
Total dividends and distributions |
Net asset value, end of period |
Total return3 |
Ratios and supplemental data: |
Net assets, end of period (000 omitted) |
Ratio of expenses to average net assets |
Ratio of net investment income to average net assets4 |
Portfolio turnover |
| 1 | The average shares outstanding method has been applied for per share information. |
| 2 | For the year ended Oct. 31, 2017, return of capital distributions of $563,918 were made by the Fund’s Class C shares, which calculated to a de minimis amount of $0.00 per share. |
| 3 | Total investment return is based on the change in net asset value of a share during the period and assumes reinvestment of dividends and distributions at net asset value and does not reflect the impact of a sales charge. |
| 4 | Expenses paid indirectly were not material and had no impact on the ratios disclosed. Expenses paid indirectly for the year ended Oct. 31, 2017 are reflected on the “Statement of operations.” |
See accompanying notes, which are an integral part of the financial statements.
80
Table of Contents
| Year ended | ||||||||||||||||||||||||||||
| 10/31/17 | 10/31/16 | 10/31/15 | 10/31/14 | 10/31/13 | ||||||||||||||||||||||||
| $ | 8.81 | $ | 8.74 | $ | 9.09 | $ | 8.96 | $ | 9.45 | |||||||||||||||||||
| 0.22 | 0.16 | 0.20 | 0.23 | 0.21 | ||||||||||||||||||||||||
| (0.04 | ) | 0.11 | (0.28 | ) | 0.18 | (0.35 | ) | |||||||||||||||||||||
|
|
|
|
|
|
|
|
|
| |||||||||||||||||||
| 0.18 | 0.27 | (0.08 | ) | 0.41 | (0.14 | ) | ||||||||||||||||||||||
|
|
|
|
|
|
|
|
|
| |||||||||||||||||||
| (0.25 | ) | (0.19 | ) | (0.22 | ) | (0.28 | ) | (0.20 | ) | |||||||||||||||||||
| — | — | (0.03 | ) | — | (0.09 | ) | ||||||||||||||||||||||
| — | 2 | (0.01 | ) | (0.02 | ) | — | (0.06 | ) | ||||||||||||||||||||
|
|
|
|
|
|
|
|
|
| |||||||||||||||||||
| (0.25 | ) | (0.20 | ) | (0.27 | ) | (0.28 | ) | (0.35 | ) | |||||||||||||||||||
|
|
|
|
|
|
|
|
|
| |||||||||||||||||||
| $ | 8.74 | $ | 8.81 | $ | 8.74 | $ | 9.09 | $ | 8.96 | |||||||||||||||||||
|
|
|
|
|
|
|
|
|
| |||||||||||||||||||
| 2.13% | 3.19% | (0.85% | ) | 4.59% | (1.51% | ) | ||||||||||||||||||||||
| $ | 620,954 | $ | 879,706 | $ | 1,007,163 | $ | 1,177,575 | $ | 1,471,553 | |||||||||||||||||||
| 1.64% | 1.64% | 1.66% | 1.65% | 1.65% | ||||||||||||||||||||||||
| 2.49% | 1.79% | 2.20% | 2.59% | 2.28% | ||||||||||||||||||||||||
| 125% | 240% | 218% | 189% | 238% | ||||||||||||||||||||||||
81
Table of Contents
Financial highlights
Delaware Diversified Income Fund Class R
Selected data for each share of the Fund outstanding throughout each period were as follows:
Net asset value, beginning of period |
Income (loss) from investment operations: |
Net investment income1 |
Net realized and unrealized gain (loss) |
Total from investment operations |
Less dividends and distributions from: |
Net investment income |
Net realized gain |
Return of capital |
Total dividends and distributions |
Net asset value, end of period |
Total return3 |
Ratios and supplemental data: |
Net assets, end of period (000 omitted) |
Ratio of expenses to average net assets |
Ratio of expenses to average net assets prior to fees waived4 |
Ratio of net investment income to average net assets |
Ratio of net investment income to average net assets prior to fees waived4 |
Portfolio turnover |
| 1 | The average shares outstanding method has been applied for per share information. |
| 2 | For the year ended Oct. 31, 2017, return of capital distributions of $55,969 were made by the Fund’s Class R shares, which calculated to a de minimis amount of $0.00 per share. |
| 3 | Total investment return is based on the change in net asset value of a share during the period and assumes reinvestment of dividends and distributions at net asset value. Total investment return during some of the periods shown reflects a waiver by the distributor. Performance would have been lower had the waiver not been in effect. |
| 4 | Expenses paid indirectly were not material and had no impact on the ratios disclosed. Expenses paid indirectly for the year ended Oct. 31, 2017 are reflected on the “Statement of operations.” |
See accompanying notes, which are an integral part of the financial statements.
82
Table of Contents
| Year ended | ||||||||||||||||||||||||||||
| 10/31/17 | 10/31/16 | 10/31/15 | 10/31/14 | 10/31/13 | ||||||||||||||||||||||||
| $ | 8.81 | $ | 8.73 | $ | 9.09 | $ | 8.96 | $ | 9.45 | |||||||||||||||||||
| 0.26 | 0.20 | 0.24 | 0.28 | 0.26 | ||||||||||||||||||||||||
| (0.04 | ) | 0.13 | (0.28 | ) | 0.17 | (0.35 | ) | |||||||||||||||||||||
|
|
|
|
|
|
|
|
|
| |||||||||||||||||||
| 0.22 | 0.33 | (0.04 | ) | 0.45 | (0.09 | ) | ||||||||||||||||||||||
|
|
|
|
|
|
|
|
|
| |||||||||||||||||||
| (0.30 | ) | (0.24 | ) | (0.27 | ) | (0.32 | ) | (0.23 | ) | |||||||||||||||||||
| — | — | (0.03 | ) | — | (0.09 | ) | ||||||||||||||||||||||
| — | 2 | (0.01 | ) | (0.02 | ) | — | (0.08 | ) | ||||||||||||||||||||
|
|
|
|
|
|
|
|
|
| |||||||||||||||||||
| (0.30 | ) | (0.25 | ) | (0.32 | ) | (0.32 | ) | (0.40 | ) | |||||||||||||||||||
|
|
|
|
|
|
|
|
|
| |||||||||||||||||||
| $ | 8.73 | $ | 8.81 | $ | 8.73 | $ | 9.09 | $ | 8.96 | |||||||||||||||||||
|
|
|
|
|
|
|
|
|
| |||||||||||||||||||
| 2.52% | 3.82% | (0.47% | ) | 5.11% | (1.02% | ) | ||||||||||||||||||||||
| $ | 61,630 | $ | 77,484 | $ | 101,732 | $ | 116,840 | $ | 124,586 | |||||||||||||||||||
| 1.14% | 1.14% | 1.16% | 1.15% | 1.15% | ||||||||||||||||||||||||
| 1.14% | 1.14% | 1.16% | 1.15% | 1.24% | ||||||||||||||||||||||||
| 2.99% | 2.29% | 2.70% | 3.09% | 2.78% | ||||||||||||||||||||||||
| 2.99% | 2.29% | 2.70% | 3.09% | 2.69% | ||||||||||||||||||||||||
| 125% | 240% | 218% | 189% | 238% | ||||||||||||||||||||||||
83
Table of Contents
Financial highlights
Delaware Diversified Income Fund Institutional Class
Selected data for each share of the Fund outstanding throughout each period were as follows:
Net asset value, beginning of period |
Income (loss) from investment operations: |
Net investment income1 |
Net realized and unrealized gain (loss) |
Total from investment operations |
Less dividends and distributions from: |
Net investment income |
Net realized gain |
Return of capital |
Total dividends and distributions |
Net asset value, end of period |
Total return3 |
Ratios and supplemental data: |
Net assets, end of period (000 omitted) |
Ratio of expenses to average net assets |
Ratio of net investment income to average net assets4 |
Portfolio turnover |
| 1 | The average shares outstanding method has been applied for per share information. |
| 2 | For the year ended Oct. 31, 2017, return of capital distributions of $2,560,569 were made by the Fund’s Institutional Class, which calculated to a de minimis amount of $0.00 per share. |
| 3 | Total investment return is based on the change in net asset value of a share during the period and assumes reinvestment of dividends and distributions at net asset value. |
| 4 | Expenses paid indirectly were not material and had no impact on the ratios disclosed. Expenses paid indirectly for the year ended Oct. 31, 2017 are reflected on the “Statement of operations.” |
See accompanying notes, which are an integral part of the financial statements.
84
Table of Contents
| Year ended | ||||||||||||||||||||||||||||
| 10/31/17 | 10/31/16 | 10/31/15 | 10/31/14 | 10/31/13 | ||||||||||||||||||||||||
| $ | 8.82 | $ | 8.74 | $ | 9.10 | $ | 8.97 | $ | 9.46 | |||||||||||||||||||
| 0.30 | 0.24 | 0.29 | 0.33 | 0.30 | ||||||||||||||||||||||||
| (0.04 | ) | 0.13 | (0.29 | ) | 0.17 | (0.35 | ) | |||||||||||||||||||||
|
|
|
|
|
|
|
|
|
| |||||||||||||||||||
| 0.26 | 0.37 | — | 0.50 | (0.05 | ) | |||||||||||||||||||||||
|
|
|
|
|
|
|
|
|
| |||||||||||||||||||
| (0.34 | ) | (0.28 | ) | (0.31 | ) | (0.37 | ) | (0.26 | ) | |||||||||||||||||||
| — | — | (0.03 | ) | — | (0.09 | ) | ||||||||||||||||||||||
| — | 2 | (0.01 | ) | (0.02 | ) | — | (0.09 | ) | ||||||||||||||||||||
|
|
|
|
|
|
|
|
|
| |||||||||||||||||||
| (0.34 | ) | (0.29 | ) | (0.36 | ) | (0.37 | ) | (0.44 | ) | |||||||||||||||||||
|
|
|
|
|
|
|
|
|
| |||||||||||||||||||
| $ | 8.74 | $ | 8.82 | $ | 8.74 | $ | 9.10 | $ | 8.97 | |||||||||||||||||||
|
|
|
|
|
|
|
|
|
| |||||||||||||||||||
| 3.03% | 4.34% | 0.03% | 5.63% | (0.52% | ) | |||||||||||||||||||||||
| $ | 2,819,555 | $ | 2,672,906 | $ | 2,620,069 | $ | 2,394,335 | $ | 1,737,652 | |||||||||||||||||||
| 0.64% | 0.64% | 0.66% | 0.65% | 0.65% | ||||||||||||||||||||||||
| 3.49% | 2.79% | 3.20% | 3.59% | 3.28% | ||||||||||||||||||||||||
| 125% | 240% | 218% | 189% | 238% | ||||||||||||||||||||||||
85
Table of Contents
Financial highlights
Delaware Diversified Income Fund Class R6
Selected data for each share of the Fund outstanding throughout the period were as follows:
| Year ended 10/31/17 | 5/2/161 to 10/31/16 | |||||||
Net asset value, beginning of period | $ | 8.81 | $ | 8.75 | ||||
Income (loss) from investment operations: | ||||||||
Net investment income2 | 0.31 | 0.12 | ||||||
Net realized and unrealized gain (loss) | (0.04 | ) | 0.08 | |||||
|
|
|
| |||||
Total from investment operations | 0.27 | 0.20 | ||||||
|
|
|
| |||||
Less dividends and distributions from: | ||||||||
Net investment income | (0.34 | ) | (0.13 | ) | ||||
Return of capital | — | 3 | (0.01 | ) | ||||
|
|
|
| |||||
Total dividends and distributions | (0.34 | ) | (0.14 | ) | ||||
|
|
|
| |||||
Net asset value, end of period | $ | 8.74 | $ | 8.81 | ||||
|
|
|
| |||||
Total return4 | 3.14% | 2.50% | ||||||
Ratios and supplemental data: | ||||||||
Net assets, end of period (000 omitted) | $ | 12,935 | $ | 2 | ||||
Ratio of expenses to average net assets | 0.55% | 0.55% | ||||||
Ratio of net investment income to average net assets5 | 3.57% | 2.75% | ||||||
Portfolio turnover | 125% | 240% | 6 | |||||
| 1 | Date of commencement of operations; ratios have been annualized and total return has not been annualized. |
| 2 | The average shares outstanding method has been applied for per share information. |
| 3 | For the year ended Oct. 31, 2017, return of capital distributions of $11,747 were made by the Fund’s Class R6 shares, which calculated to a de minimis amount of $0.00 per share. |
| 4 | Total investment return is based on the change in net asset value of a share during the period and assumes reinvestment of dividends and distributions at net asset value. |
| 5 | Expenses paid indirectly were not material and had no impact on the ratios disclosed. Expenses paid indirectly for the year ended Oct. 31, 2017 are reflected on the “Statement of operations.” |
| 6 | Portfolio turnover is representative of the Fund for the entire year ended Oct. 31, 2016. |
See accompanying notes, which are an integral part of the financial statements.
86
Table of Contents
| Delaware Diversified Income Fund | October 31, 2017 |
Delaware Group® Adviser Funds (Trust) is organized as a Delaware statutory trust and offers three series: Delaware Diversified Income Fund, Delaware Global Real Estate Opportunities Fund, and Delaware U.S. Growth Fund. These financial statements and related notes pertain to Delaware Diversified Income Fund (Fund). The Trust is an open-end investment company. The Fund is considered diversified under the Investment Company Act of 1940, as amended (1940 Act), and offers Class A, Class C, Class R, Institutional Class, and Class R6 shares. Class A shares are sold with a maximum front-end sales charge of 4.50%. Class A share purchases of $1,000,000 or more will incur a contingent deferred sales charge (CDSC) instead of a front-end sales charge of 1.00% if redeemed during the first year, and 0.50% during the second year, provided that Delaware Distributors, L.P. (DDLP) paid a financial advisor a commission on the purchase of those shares. Class C shares are sold with a CDSC of 1.00%, if redeemed during the first 12 months. Class R, Institutional Class, and Class R6 shares are not subject to a sales charge and are offered for sale exclusively to certain eligible investors. In addition, Class R6 shares do not pay any service fees, sub-accounting fees, and/or sub-transfer agency fees to any brokers, dealers, or other financial intermediaries.
The investment objective of the Fund is to seek maximum long-term total return, consistent with reasonable risk.
1. Significant Accounting Policies
The following accounting policies are in accordance with US generally accepted accounting principles (US GAAP) and are consistently followed by the Fund.
Security Valuation – Equity securities, except those traded on the Nasdaq Stock Market LLC (Nasdaq), are valued at the last quoted sales price as of the time of the regular close of the New York Stock Exchange on the valuation date. Equity securities traded on the Nasdaq are valued in accordance with the Nasdaq Official Closing Price, which may not be the last sales price. If, on a particular day, an equity security does not trade, the mean between the bid and ask prices will be used, which approximates fair value. Equity securities listed on a foreign exchange are normally valued at the last quoted sales price on the valuation date. Open-end investment company securities are valued at net asset value (NAV) per share, as reported by the underlying investment company. US government and agency securities are valued at the mean between the bid and ask prices, which approximates fair value. Other debt securities, credit default swap (CDS) contracts, interest rate swap options contracts (swaptions) and interest rate swap contracts are valued based upon valuations provided by an independent pricing service or broker/counterparty and reviewed by management. To the extent current market prices are not available, the pricing service may take into account developments related to the specific security, as well as transactions in comparable securities. Valuations for fixed income securities utilize matrix systems, which reflect such factors as security prices, yields, maturities, and ratings, and are supplemented by dealer and exchange quotations. For asset-backed securities, collateralized mortgage obligations, commercial mortgage securities, and US government agency mortgage securities, pricing vendors utilize matrix pricing which considers prepayment speed, attributes of the collateral, yield or price of bonds of comparable quality, coupon, maturity, and type as well as broker/dealer-supplied prices. Swap prices are derived using daily swap curves and models that incorporate a number of market data factors, such as discounted cash flows, trades, and values of the underlying reference instruments. Foreign currency exchange contracts and foreign cross currency exchange contracts are
87
Table of Contents
Notes to financial statements
Delaware Diversified Income Fund
1. Significant Accounting Policies (continued)
valued at the mean between the bid and ask prices, which approximates fair value. Interpolated values are derived when the settlement date of the contract is an interim date for which quotations are not available. Futures contracts and options on futures contracts are valued at the daily quoted settlement prices. Exchange-traded options are valued at the last reported sale price or, if no sales are reported, at the mean between the last reported bid and ask prices, which approximates fair value. Generally, other securities and assets for which market quotations are not readily available are valued at fair value as determined in good faith under the direction of the Trust’s Board of Trustees (Board). In determining whether market quotations are readily available or fair valuation will be used, various factors will be taken into consideration, such as market closures or suspension of trading in a security. The foregoing valuation policies apply to restricted and unrestricted securities.
Federal and Foreign Income Taxes – No provision for federal income taxes has been made as the Fund intends to continue to qualify for federal income tax purposes as a regulated investment company under Subchapter M of the Internal Revenue Code of 1986, as amended, and make the requisite distributions to shareholders. The Fund evaluates tax positions taken or expected to be taken in the course of preparing the Fund’s tax returns to determine whether the tax positions are “more likely-than-not” of being sustained by the applicable tax authority. Tax positions not deemed to meet the “more-likely-than-not” threshold are recorded as a tax benefit or expense in the current year. Management has analyzed the Fund’s tax positions taken or to be taken on the Fund’s federal income tax returns through the year ended Oct. 31, 2017 and for all open tax years (years ended Oct. 31, 2014–Oct. 31, 2016), and has concluded that no provision for federal income tax is required in the Fund’s financial statements. If applicable, the Fund recognizes interest accrued on unrecognized tax benefits in interest expense and penalties in other expenses on the “Statement of operations.” During the year ended Oct. 31, 2017, the Fund did not incur any interest or tax penalties. In regard to foreign taxes only, the Fund has open tax years in certain foreign countries in which it invests that may date back to the inception of the Fund.
Class Accounting — Investment income and common expenses are allocated to the various classes of the Fund on the basis of “settled shares” of each class in relation to the net assets of the Fund. Realized and unrealized gain (loss) on investments are allocated to the various classes of the Fund on the basis of daily net assets of each class. Distribution expenses relating to a specific class are charged directly to that class. Class R6 shares will not be allocated any expenses related to service fees, sub-accounting fees, and/or sub-transfer agency fees paid to brokers, dealers, or other financial intermediaries.
Repurchase Agreements — The Fund may purchase certain US government securities subject to the counterparty’s agreement to repurchase them at an agreed upon date and price. The counterparty will be required on a daily basis to maintain the value of the collateral subject to the agreement at not less than the repurchase price (including accrued interest). The agreements are conditioned upon the collateral being deposited under the Federal Reserve book-entry system with the Fund’s custodian or a third-party sub-custodian. In the event of default or bankruptcy by the other party to the agreement, retention of the collateral may be subject to legal proceedings. All open repurchase agreements as of the date of this report were entered into on Oct. 31, 2017, and matured on the next business day.
88
Table of Contents
To Be Announced Trades (TBA) – The Fund may contract to purchase or sell securities for a fixed price at a transaction date beyond the customary settlement period (examples: when issued, delayed delivery, forward commitment, or TBA transactions) consistent with the Fund’s ability to manage its investment portfolio and meet redemption requests. These transactions involve a commitment by the Fund to purchase or sell securities for a predetermined price or yield with payment and delivery taking place more than three days in the future, or after a period longer than the customary settlement period for that type of security. No interest will be earned by the Fund on such purchases until the securities are delivered or the transaction is completed; however, the market value may change prior to delivery.
Foreign Currency Transactions – Transactions denominated in foreign currencies are recorded at the prevailing exchange rates on the valuation date in accordance with the Fund’s prospectus. The value of all assets and liabilities denominated in foreign currencies is translated daily into US dollars at the exchange rate of such currencies against the US dollar. Transaction gains or losses resulting from changes in exchange rates during the reporting period or upon settlement of the foreign currency transaction are reported in operations for the current period. The Fund generally bifurcates that portion of realized gains and losses on investments in debt securities which is due to changes in foreign exchange rates from that which is due to changes in market prices of debt securities. That portion of gains (losses), which is due to changes in foreign exchange rates, is included on the “Statement of operations” under “Net realized gain (loss) on foreign currencies.” The Fund reports certain foreign currency related transactions as components of realized gains (losses) for financial reporting purposes, whereas such components are treated as ordinary income (loss) for federal income tax purposes.
Use of Estimates – The Fund is an investment company, whose financial statements are prepared in conformity with US GAAP. Therefore, the Fund follows the accounting and reporting guidelines for investment companies. The preparation of financial statements in conformity with US GAAP requires management to make estimates and assumptions that affect the fair value of investments, the reported amounts of assets and liabilities and disclosure of contingent assets and liabilities at the date of the financial statements, and the reported amounts of revenues and expenses during the reporting period. Actual results could differ from those estimates and the differences could be material.
Other – Expenses directly attributable to the Fund are charged directly to the Fund. Other expenses common to various funds within the Delaware FundsSM by Macquarie (Delaware Funds) are generally allocated among such funds on the basis of average net assets. Management fees and certain other expenses are paid monthly. Security transactions are recorded on the date the securities are purchased or sold (trade date) for financial reporting purposes. Costs used in calculating realized gains and losses on the sale of investment securities are those of the specific securities sold. Dividend income is recorded on the ex-dividend date and interest income is recorded on the accrual basis. Discounts and premiums on debt securities are accreted or amortized to interest income, respectively, over the lives of the respective securities using the effective interest method. Realized gains (losses) on paydowns of asset and mortgage-backed securities are classified as interest income. Withholding taxes and reclaims on foreign interest have been recorded in accordance with the Fund’s understanding of the applicable country’s tax rules and rates. The Fund may pay foreign capital gains taxes on certain foreign securities held, which are reported as components of realized losses for financial reporting purposes, whereas such components are treated as ordinary loss for federal income tax purposes. The Fund will accrue such taxes as applicable based upon current interpretations of the tax rules and regulations that exist in
89
Table of Contents
Notes to financial statements
Delaware Diversified Income Fund
1. Significant Accounting Policies (continued)
the markets in which it invests. The Fund declares dividends daily from net investment income and pays the dividends monthly and declares and pays dividends from net realized gain on investments, if any, annually. The Fund may distribute more frequently, if necessary for tax purposes. Dividends and distributions, if any, are recorded on the ex-dividend date.
The Fund receives earnings credits from its custodian when positive cash balances are maintained, which may be used to offset custody fees. The expenses paid under this arrangement is included on the “Statement of operations” under “Custodian fees” with the corresponding expense offset shown under “Less expenses paid indirectly.” For the year ended Oct. 31, 2017, the Fund earned $33,353 under this agreement.
The Fund receives earnings credits from its transfer agent when positive cash balances are maintained, which may be used to offset transfer agent fees. If the amount earned is greater than $1, the expense paid under this arrangement is included on the “Statement of operations” under “Dividend disbursing and transfer agent fees and expenses” with the corresponding expense offset shown under “Less expenses paid indirectly.” For the year ended Oct. 31, 2017, the Fund earned $2,713 under this agreement.
2. Investment Management, Administration Agreements, and Other Transactions with Affiliates
In accordance with the terms of its investment management agreement, the Fund pays Delaware Management Company (DMC), a series of Macquarie Investment Management Business Trust (formerly, Delaware Management Business Trust) and the investment manager, an annual fee which is calculated daily and paid monthly at the rate of 0.55% on the first $500 million of the average daily net assets of the Fund; 0.50% on the next $500 million; 0.45% on the next 1.5 billion; and 0.425% on average daily net assets in excess $2.5 billion.
Delaware Investments Fund Services Company (DIFSC), an affiliate of DMC, provides fund accounting and financial administration oversight services to the Fund. For these services, DIFSC’s fees were calculated daily and paid monthly based on the aggregate daily net assets of the Delaware Funds from Nov. 1, 2016 through Aug. 31, 2017 at the following annual rate: 0.0050% of the first $30 billion; 0.0045% of the next $10 billion; 0.0040% of the next $10 billion; and 0.0025% of aggregate average daily net assets in excess of $50 billion. The fees payable to DIFSC under the service agreement described above were allocated among all funds in the Delaware Funds on a relative NAV basis. Effective Sept. 1, 2017, the Fund entered into an amendment to DIFSC agreement. Under the amendment to the DIFSC agreement, DIFSC’s fees are calculated daily and paid monthly based on the aggregate daily net assets of the Delaware Funds at the following annual rate: 0.00475% of the first $35 billion; 0.0040% of the next $10 billion; and 0.0025% of aggregate average daily net assets in excess of $45 billion (Total Fee). Each Fund in the Delaware Funds pays a minimum of $4,000, which, in aggregate, is subtracted from the Total Fee. Each Fund in the Delaware Funds then pays its relative portion of the remainder of the Total Fee on a relative NAV basis. For the year ended Oct. 31, 2017, the Fund was charged $204,724 for these services. This amount is included on the “Statement of operations” under “Accounting and administration expenses.”
90
Table of Contents
DIFSC is also the transfer agent and dividend disbursing agent of the Fund. For these services, DIFSC’s fees are calculated daily and paid monthly based on the aggregate daily net assets of the retail funds within the Delaware Funds at the following annual rate: 0.025% of the first $20 billion; 0.020% of the next $5 billion; 0.015% of the next $5 billion; and 0.013% of average daily net assets in excess of $30 billion. The fees payable to DIFSC under the service agreement described above are allocated among all retail funds in the Delaware Funds on a relative NAV basis. For the year ended Oct. 31, 2017, the Fund was charged $901,254 for these services. This amount is included on the “Statement of operations” under “Dividend disbursing and transfer agent fees and expenses.” Pursuant to a sub-transfer agency agreement between DIFSC and BNY Mellon Investment Servicing (US) Inc. (BNYMIS), BNYMIS provides certain sub-transfer agency services to the Fund. Sub-transfer agency fees are paid by the Fund and are also included on the “Statement of operations” under “Dividend disbursing and transfer agent fees and expenses.”
Pursuant to a distribution agreement and distribution plan, the Fund pays DDLP, the distributor and an affiliate of DMC, an annual distribution and service (12b-1) fees of 0.25% of the average daily net assets of the Class A shares, 1.00% of the average daily net assets of the Class C shares, and 0.50% of the average daily net assets of Class R shares. The fees are calculated daily and paid monthly. Institutional Class and Class R6 shares pay no 12b-1 fees.
As provided in the investment management agreement, the Fund bears a portion of the cost of certain resources shared with DMC, including the cost of internal personnel of DMC and/or its affiliates that provide legal, tax, and regulatory reporting services to the Fund. For the year ended Oct. 31, 2017, the Fund was charged $93,766 for internal legal, tax, and regulatory reporting services provided by DMC and/or its affiliates’ employees. This amount is included on the “Statement of operations” under “Legal fees.”
For the year ended Oct. 31, 2017, DDLP earned $25,579 for commissions on sales of the Fund’s Class A shares. For the year ended Oct. 31, 2017, DDLP received gross CDSC commissions of $4,437 and $37,892 on redemptions of the Fund’s Class A and Class C shares, respectively, and these commissions were entirely used to offset upfront commissions previously paid by DDLP to broker/dealers on sales of those shares.
Trustees’ fees include expenses accrued by the Fund for each Trustee’s retainer and meeting fees. Certain officers of DMC, DIFSC, and DDLP are officers and/or Trustees of the Trust. These officers and Trustees are paid no compensation by the Fund.
Cross trades for the year ended Oct. 31, 2017 were executed by the Fund pursuant to procedures adopted by the Board designed to ensure compliance with Rule 17a-7 under the 1940 Act. Cross trading is the buying or selling of portfolio securities between funds of investment companies, or between a fund of an investment company and another entity, that are or could be considered affiliates by virtue of having a common investment advisor (or affiliated investment advisors), common directors/trustees and/or common officers. At its regularly scheduled meetings, the Board reviews such transactions for compliance with the procedures adopted by the Board. Pursuant to these procedures, for the year ended Oct. 31, 2017, the Fund engaged in securities purchased of $158,834,334 and sales of $8,205,189, which resulted in net realized losses of $(462).
91
Table of Contents
Notes to financial statements
Delaware Diversified Income Fund
3. Investments
For the year ended Oct. 31, 2017, the Fund made purchases and sales of investment securities other than short-term investments as follows:
Purchases other than US government securities | $ | 4,435,550,189 | ||
Purchases of US government securities | 1,169,292,299 | |||
Sales other than US government securities | 4,970,647,173 | |||
Sales of US government securities | 1,131,219,950 |
The tax cost of investments includes adjustments to net unrealized appreciation (depreciation) which may not necessarily be final tax cost basis adjustments, but approximate the tax basis unrealized gains and losses that may be realized and distributed to shareholders. At Oct. 31, 2017, the cost and unrealized appreciation (depreciation) of investments and derivatives for federal income tax purposes were as follows:
Cost of investments and derivatives | $ | 4,462,038,450 | ||
|
| |||
Aggregate unrealized appreciation of investments and derivatives | $ | 138,184,069 | ||
Aggregate unrealized depreciation of investments and derivatives | (104,817,871 | ) | ||
|
| |||
Net unrealized appreciation of investments and derivatives | $ | 33,366,198 | ||
|
|
US GAAP defines fair value as the price that the Fund would receive to sell an asset or pay to transfer a liability in an orderly transaction between market participants at the measurement date under current market conditions. A three-level hierarchy for fair value measurements has been established based upon the transparency of inputs to the valuation of an asset or liability. Inputs may be observable or unobservable and refer broadly to the assumptions that market participants would use in pricing the asset or liability. Observable inputs reflect the assumptions market participants would use in pricing the asset or liability based on market data obtained from sources independent of the reporting entity. Unobservable inputs reflect the reporting entity’s own assumptions about the assumptions that market participants would use in pricing the asset or liability based on the best information available under the circumstances. The Fund’s investment in its entirety is assigned a level based upon the observability of the inputs which are significant to the overall valuation. The three-level hierarchy of inputs is summarized below and on the next page.
| Level 1 – | Inputs are quoted prices in active markets for identical investments. (Examples: equity securities, open-end investment companies, futures contracts, exchange-traded options contracts) | |
| Level 2 – | Other observable inputs, including, but not limited to: quoted prices for similar assets or liabilities in markets that are active, quoted prices for identical or similar assets or liabilities in markets that are not active, inputs other than quoted prices that are observable for the assets or liabilities (such as interest rates, yield curves, volatilities, prepayment speeds, loss severities, credit risks, and default rates) or other market-corroborated inputs. (Examples: debt securities, government securities, swap contracts, foreign currency exchange contracts, foreign securities utilizing international fair value pricing, broker-quoted securities, fair valued securities) | |
| Level 3 – | Significant unobservable inputs, including the Fund’s own assumptions used to determine the fair value of investments. (Examples: broker-quoted securities, fair valued securities) | |
92
Table of Contents
Level 3 investments are valued using significant unobservable inputs. The Fund may also use an income-based valuation approach in which the anticipated future cash flows of the investment are discounted to calculate fair value. Discounts may also be applied due to the nature or duration of any restrictions on the disposition of the investments. Valuations may also be based upon current market prices of securities that are comparable in coupon, rating, maturity, and industry. The derived value of a Level 3 investment may not represent the value which is received upon disposition and this could impact the results of operations.
The following table summarizes the valuation of the Fund’s investments by fair value hierarchy levels as of Oct. 31, 2017:
Securities | Level 1 | Level 2 | Level 3 | Total | ||||||||||||
Assets: | ||||||||||||||||
Agency, Asset- & Mortgage-Backed Securities | $ | — | $ | 1,166,716,185 | $ | — | $ | 1,166,716,185 | ||||||||
Corporate Debt | — | 2,355,732,533 | — | 2,355,732,533 | ||||||||||||
Municipal Bonds | — | 29,505,043 | — | 29,505,043 | ||||||||||||
Foreign Debt | — | 351,483,540 | — | 351,483,540 | ||||||||||||
Loan Agreements1 | — | 243,565,051 | 10,198,316 | 253,763,367 | ||||||||||||
US Treasury Obligations | — | 90,615,842 | — | 90,615,842 | ||||||||||||
Common Stock | — | — | — | — | ||||||||||||
Convertible Preferred Stock1 | 7,633,834 | 21,586,304 | — | 29,220,138 | ||||||||||||
Preferred Stock | — | 31,870,014 | — | 31,870,014 | ||||||||||||
Options Purchased | — | 621,960 | — | 621,960 | ||||||||||||
Short-Term Investments | — | 97,678,973 | — | 97,678,973 | ||||||||||||
Securities Lending Collateral | ||||||||||||||||
Certificates of Deposit | — | 16,809,000 | — | 16,809,000 | ||||||||||||
Discounted Commercial Papers | — | 14,718,636 | — | 14,718,636 | ||||||||||||
Repurchase Agreements | — | 41,519,371 | — | 41,519,371 | ||||||||||||
Short-Term Floating Rate Notes | — | 21,102,324 | — | 21,102,324 | ||||||||||||
|
|
|
|
|
|
|
| |||||||||
Total Value of Securities | $ | 7,633,834 | $ | 4,483,524,776 | $ | 10,198,316 | $ | 4,501,356,926 | ||||||||
|
|
|
|
|
|
|
| |||||||||
Derivatives:* | ||||||||||||||||
Assets: | ||||||||||||||||
Foreign Currency Exchange Contracts | — | 473,189 | — | 473,189 | ||||||||||||
Futures Contracts | 904,177 | — | — | 904,177 | ||||||||||||
Liabilities: | ||||||||||||||||
Foreign Currency Exchange Contracts | — | (1,479,403 | ) | — | (1,479,403 | ) | ||||||||||
Futures Contracts | (4,171,027 | ) | — | — | (4,171,027 | ) | ||||||||||
Swap Contracts | — | (1,679,214 | ) | — | (1,679,214 | ) | ||||||||||
The security that has been valued at zero on the “Schedule of investments” is considered to be Level 3 investment in this table.
93
Table of Contents
Notes to financial statements
Delaware Diversified Income Fund
3. Investments (continued)
*Foreign Currency Exchange Contracts, Futures contracts and Swap Contracts are valued at the unrealized appreciation (depreciation) on the instrument at the year end.
1Security type is valued across multiple levels. Level 1 investments represent exchange-traded investments, Level 2 investments represent investments with observable input or matrix-priced investments, and Level 3 investments represent investments without observable inputs. The amounts attributed to Level 1 investments, Level 2 investments, and Level 3 investments represent the following percentages of the total value of these security types:
| Level 1 | Level 2 | Level 3 | Total | |||||||||||
Loan Agreements | — | 95.98 | % | 4.02 | % | 100.00% | ||||||||
Convertible Preferred Stock | 26.13 | % | 73.87 | % | — | 100.00% | ||||||||
During the year ended Oct. 31, 2017, there were no transfers between Level 1 investments, Level 2 investments, or Level 3 investments that had a significant impact to the Fund. The Fund’s policy is to recognize transfers between levels based on fair value at the beginning of the reporting year.
A reconciliation of Level 3 investments is presented when the Fund has a significant amount of Level 3 investments at the beginning, interim, or end of the period in relation to the Fund’s net assets. Management has determined not to provide a reconciliation of Level 3 investments as the Level 3 investments were not considered significant to the Fund’s net assets at the beginning, interim, or end of the year. Management has determined not to provide additional disclosure on Level 3 inputs since the Level 3 investments are not considered significant to the Fund’s net assets at the end of the year.
4. Dividend and Distribution Information
Income and long-term capital gain distributions are determined in accordance with federal income tax regulations, which may differ from US GAAP. Additionally, distributions from net gains on foreign currency transactions and net short-term gains on sales of investment securities are treated as ordinary income for federal income tax purposes. The tax character of dividends and distributions paid during the years ended Oct. 31, 2017 and 2016 was as follows:
| Year ended | ||||||||||||
10/31/17 | 10/31/16 | |||||||||||
Ordinary | $ | 162,437,663 | $ | 149,594,039 | ||||||||
Return of capital | 4,003,460 | 7,754,598 | ||||||||||
|
|
|
| |||||||||
Total | $ | 166,441,123 | $ | 157,348,637 | ||||||||
|
|
|
| |||||||||
94
Table of Contents
5. Components of Net Assets on a Tax Basis
As of Oct. 31, 2017, the components of net assets on a tax basis were as follows:
Shares of beneficial interest | $ | 4,499,188,223 | ||
Distributions payable | (3,584,597 | ) | ||
Capital loss carryforwards | (109,413,011 | ) | ||
Troubled debt litigation | (11,171,417 | ) | ||
Unrealized appreciation of investments, foreign currencies, and derivatives | 33,366,198 | |||
|
| |||
Net assets | $ | 4,408,385,396 | ||
|
|
The differences between book basis and tax basis components of net assets are primarily attributable to tax deferral of losses on wash sales, mark-to-market of foreign currency exchange contracts, mark-to-market of futures contracts, tax deferral of straddles losses, tax treatment of CDS contracts, contingent payment on debt instruments, market discount and premium on debt instruments, and deemed dividend income.
For financial reporting purposes, capital accounts are adjusted to reflect the tax character of permanent book/tax differences. Reclassifications are primarily due to tax treatment of gain (loss) on foreign currency transactions, foreign capital gains tax, contingent payments on debt instruments, market discount and premium on certain debt instruments, CDS contracts, deemed dividend income and paydown gains (losses) of asset-and mortgage-backed securities. Results of operations and net assets were not affected by these reclassifications. For the year ended Oct. 31, 2017, the Fund recorded the following reclassifications:
Distributions in excess of net investment income | $ | 17,923,514 | ||
Accumulated net realized loss | (17,923,514 | ) |
Under the Regulated Investment Company Modernization Act of 2010 (2010 Act), net capital losses recognized for the tax years beginning after Dec. 22, 2010 may be carried forward indefinitely, and their character is retained as short-term or long-term losses. At Oct. 31, 2017, capital loss carryforwards available to offset future realized capital gains were as follows:
| Loss carryforward character | ||||||||||||
Short-term | Long-term | Total | ||||||||||
| $ | 35,030,895 | $ | 74,382,116 | $ | 109,413,011 | |||||||
95
Table of Contents
Notes to financial statements
Delaware Diversified Income Fund
6. Capital Shares
Transactions in capital shares were as follows:
| Year ended | ||||||||
10/31/17 | 10/31/16 | |||||||
Shares sold: | ||||||||
Class A | 16,474,509 | 22,293,079 | ||||||
Class C | 2,869,327 | 7,294,893 | ||||||
Class R | 1,632,764 | 2,826,750 | ||||||
Institutional Class | 106,070,006 | 93,667,529 | ||||||
Class R6 | 1,539,327 | 228 | ||||||
Shares issued upon reinvestment of dividends and distributions: | ||||||||
Class A | 4,038,452 | 4,962,623 | ||||||
Class C | 2,266,960 | 2,305,639 | ||||||
Class R | 257,591 | 291,359 | ||||||
Institutional Class | 11,291,356 | 9,413,723 | ||||||
Class R6 | 14,933 | 4 | ||||||
|
|
|
| |||||
| 146,455,225 | 143,055,827 | |||||||
|
|
|
| |||||
Shares redeemed: | ||||||||
Class A | (61,225,045 | ) | (74,179,878 | ) | ||||
Class C | (33,918,115 | ) | (25,030,654 | ) | ||||
Class R | (3,632,184 | ) | (5,969,202 | ) | ||||
Institutional Class | (98,054,617 | ) | (99,588,779 | ) | ||||
Class R6 | (74,930 | ) | — | |||||
|
|
|
| |||||
| (196,904,891 | ) | (204,768,513 | ) | |||||
|
|
|
| |||||
Net decrease | (50,449,666 | ) | (61,712,686 | ) | ||||
|
|
|
| |||||
Certain shareholders may exchange shares of one class for shares of another class in the same Fund. For the years ended Oct. 31, 2017 and 2016, the Fund had the following exchange transactions. These exchange transactions are included as subscriptions and redemptions in the table above and the “Statements of changes in net assets.”
Exchange Redemptions | Exchange Subscriptions | |||||||||||||||||||||
| Year ended | Class A | Class C | Class A | Institutional Shares | Value | |||||||||||||||||
| 10/31/17 | 6,462,318 | 710,034 | 44,559 | 7,133,891 | $ | 62,150,647 | ||||||||||||||||
| 10/31/16 | 1,695,346 | 116,413 | 4,162 | 1,808,129 | 16,026,057 | |||||||||||||||||
96
Table of Contents
7. Line of Credit
The Fund, along with certain other funds in the Delaware Funds (Participants), was a participant in a $155,000,000 revolving line of credit intended to be used for temporary or emergency purposes as an additional source of liquidity to fund redemptions of investor shares. Under the agreement, the Participants were charged an annual commitment fee of 0.10%, which was generally allocated across the Participants based on a weighted average of the respective net assets of each participant. The Participants were permitted to borrow up to a maximum of one-third of their net assets under the agreement. Each Participant was individually, and not jointly, liable for its particular advances, if any, under the line of credit. The line of credit available under the agreement expired on Nov. 7, 2016.
On Nov. 7, 2016, the Fund, along with the other Participants, entered into an amendment to the agreement for a $155,000,000 revolving line of credit. The line of credit was to be used as described above and operated in substantially the same manner as the original agreement, with the exception of the annual commitment fee. Under the amendment to the agreement, the Participants were charged an annual commitment fee of 0.15%, which was generally allocated across the Participants based on a weighted average of the respective net assets of each participant. The line of credit available under the agreement expired on Nov. 6, 2017.
The Fund had no amounts outstanding as of Oct. 31, 2017, or at any time during the year then ended.
8. Derivatives
US GAAP requires disclosures that enable investors to understand: (1) how and why an entity uses derivatives; (2) how they are accounted for; and (3) how they affect an entity’s results of operations and financial position.
Foreign Currency Exchange Contracts – The Fund may enter into foreign currency exchange contracts and foreign cross currency exchange contracts as a way of managing foreign exchange rate risk. The Fund may enter into these contracts to fix the US dollar value of a security that it has agreed to buy or sell for the period between the date the trade was entered into and the date the security is delivered and paid for. The Fund may also enter these contracts to hedge the US dollar value of securities it already owns that are denominated in foreign currencies. In addition, the Fund may enter into these contracts to facilitate or expedite the settlement of portfolio transactions. The change in value is recorded as an unrealized gain or loss. When the contract is closed, a realized gain or loss is recorded equal to the difference between the value of the contract at the time it was opened and the value at the time it was closed.
The use of foreign currency exchange contracts and foreign cross currency exchange contracts does not eliminate fluctuations in the underlying prices of the securities, but does establish a rate of exchange that can be achieved in the future. Although foreign currency exchange contracts and foreign cross currency exchange contracts limit the risk of loss due to an unfavorable change in the value of the hedged currency, they also limit any potential gain that might result should the value of the currency change favorably. In addition, the Fund could be exposed to risks if the counterparties to the contracts are unable to meet the terms of their contracts. The Fund’s maximum risk of loss from counterparty credit risk is the value of its currency exchanged with the counterparty. The risk is generally mitigated by having
97
Table of Contents
Notes to financial statements
Delaware Diversified Income Fund
8. Derivatives (continued)
a netting arrangement between the Fund and the counterparty and by the posting of collateral by the counterparty to the Fund to cover the Fund’s exposure to the counterparty.
During the year ended Oct. 31, 2017, the Fund entered into foreign currency exchange contracts to hedge the US dollar value of securities it already owns that are denominated in foreign currencies.
Futures Contracts — A futures contract is an agreement in which the writer (or seller) of the contract agrees to deliver to the buyer an amount of cash or securities equal to a specific dollar amount times the difference between the value of a specific security or index at the close of the last trading day of the contract and the price at which the agreement is made. The Fund may use futures contracts in the normal course of pursuing its investment objective. The Fund may invest in futures contracts to hedge its existing portfolio securities against fluctuations in value caused by changes in interest rates or market conditions. Upon entering into a futures contract, the Fund deposits cash or pledges US government securities to a broker, equal to the minimum “initial margin” requirements of the exchange on which the contract is traded. Subsequent payments are received from the broker or paid to the broker each day, based on the daily fluctuation in the market value of the contract. These receipts or payments are known as “variation margin” and are recorded daily by the Fund as unrealized gains or losses until the contracts are closed. When the contracts are closed, the Fund records a realized gain or loss equal to the difference between the value of the contract at the time it was opened and the value at the time it was closed. Risks of entering into futures contracts include potential imperfect correlation between the futures contracts and the underlying securities and the possibility of an illiquid secondary market for these instruments. When investing in futures, there is reduced counterparty credit risk to the Fund because futures are exchange-traded and the exchange’s clearinghouse, as counterparty to all exchange-traded futures, guarantees against default. At Oct. 31, 2017, the Fund posted $2,506,000 in cash as margin for open futures contracts, which is presented on the “Statement of assets and liabilities” as “Cash collateral due from brokers.”
During the year ended Oct. 31, 2017, the Fund entered into futures contracts to hedge the Fund’s existing portfolio securities against fluctuations in value caused by changes in interest rates or market conditions.
Options Contracts — The Fund may enter into options contracts in the normal course of pursuing its investment objective. The Fund may buy or write options contracts for any number of reasons, including without limitation: to manage the Fund’s exposure to changes in securities prices caused by interest rates or market conditions and foreign currencies; as an efficient means of adjusting the Fund’s overall exposure to certain markets; to protect the value of portfolio securities; and as a cash management tool. The Fund may buy or write call or put options on securities, futures, swaps, swaptions, financial indices, and foreign currencies. When the Fund buys an option, a premium is paid and an asset is recorded and adjusted on a daily basis to reflect the current market value of the option purchased. When the Fund writes an option, a premium is received and a liability is recorded and adjusted on a daily basis to reflect the current market value of the option written. Premiums received from writing options that expire unexercised are treated by the Fund on the expiration date as realized gains. The difference between the premium received and the amount paid on effecting a closing purchase transaction, including brokerage commissions, is treated as realized gain or loss. If a call option is exercised, the premium is added to the
98
Table of Contents
proceeds from the sale of the underlying security in determining whether the Fund has a realized gain or loss. If a put option is exercised, the premium reduces the cost basis of the securities purchased by the Fund. The Fund, as writer of an option, bears the market risk of an unfavorable change in the price of the security underlying the written option. When writing options, the Fund is subject to minimal counterparty risk because the counterparty is only obligated to pay premiums and does not bear the market risk of an unfavorable market change.
During the year ended Oct. 31, 2017, the Fund entered into option contracts to manage the Fund’s exposure to changes in security prices caused by interest rates or market conditions and to manage the Fund’s exposure to changes in foreign currencies.
Swap Contracts — The Fund may enter into interest rate swap contracts and CDS contracts in the normal course of pursuing its investment objective. The Fund may invest in interest rate swaps to manage the Fund’s sensitivity to interest rates or to hedge against changes in interest rates. The Fund may enter into CDS contracts in order to hedge against a credit event, to enhance total return or to gain exposure to certain securities or markets. The Fund will not be permitted to enter into any swap transactions unless, at the time of entering into such transactions, the unsecured long-term debt of the actual counterparty, combined with any credit enhancements, is rated at least BBB- by Standard & Poor’s Financial Services LLC. (S&P) or Baa3 by Moody’s Investors Service Inc. (Moody’s) or is determined to be of equivalent credit quality by DMC.
Interest Rate Swaps. An interest rate swap contract is an exchange of interest rates between counterparties. In one instance, an interest rate swap involves payments received by the Fund from another party based on a variable or floating interest rate, in return for making payments based on a fixed interest rate. An interest rate swap can also work in reverse with the Fund receiving payments based on a fixed interest rate and making payments based on a variable or floating interest rate. Interest rate swaps may be used to adjust the Fund’s sensitivity to interest rates or to hedge against changes in interest rates. Periodic payments on such contracts are accrued daily and recorded as unrealized appreciation (depreciation) on swap contracts. Upon periodic payment (receipt) or termination of the contract, such amounts are recorded as realized gains or losses on swap contracts. The Fund’s maximum risk of loss from counterparty credit risk is the discounted net value of the cash flows to be received from/paid to the counterparty over the interest rate swap contract’s remaining life, to the extent that the amount is positive. This risk is mitigated by (1) for bilateral swap contracts, having a netting arrangement between the Fund and the counterparty and by the posting of collateral by the counterparty to the Fund to cover the Fund’s exposure to the counterparty and (2) for cleared swaps, trading these instruments through a central counterparty.
During the year ended Oct. 31, 2017, the Fund entered into interest rate swap contracts to manage the Fund’s sensitivity to interest rate or to hedge against changes in interest rates.
Credit Default Swaps. A CDS contract is a risk-transfer instrument through which one party (purchaser of protection) transfers to another party (seller of protection) the financial risk of a credit event (as defined in the CDS agreement), as it relates to a particular reference security or basket of securities (such as an index). In exchange for the protection offered by the seller of protection, the purchaser of protection agrees to pay the seller of protection a periodic amount at a stated rate that is applied to the notional amount of the CDS contract. In addition, an upfront payment may be made or received by the
99
Table of Contents
Notes to financial statements
Delaware Diversified Income Fund
8. Derivatives (continued)
Fund in connection with an unwinding or assignment of a CDS contract. Upon the occurrence of a credit event, the seller of protection would pay the par (or other agreed-upon) value of the reference security (or basket of securities) to the counterparty. Credit events generally include, among others, bankruptcy, failure to pay, and obligation default.
During the year ended Oct. 31, 2017, the Fund entered into CDS contracts as a purchaser and seller of protection, as a hedge against credit events. Periodic payments (receipts) on such contracts are accrued daily and recorded as unrealized losses (gains) on swap contracts. Upon payment (receipt), such amounts are recorded as realized losses (gains) on swap contracts. Upfront payments made or received in connection with CDS contracts are amortized over the expected life of the CDS contracts as unrealized losses (gains) on swap contracts. The change in value of CDS contracts is recorded daily as unrealized appreciation or depreciation. A realized gain or loss is recorded upon a credit event (as defined in the CDS agreement) or the maturity or termination of the agreement. Initial margin and variation margin are posted to centrally counterparties for centrally cleared CDS basket trades, as determined by the applicable central counterparty.
As disclosed in the footnotes to the “Schedule of investments,” at Oct. 31, 2017, the notional value of the protection sold was $19,415,000, which reflects the maximum potential amount the Fund would have been required to make as a seller of credit protection if a credit event had occurred. In addition to serving as the source of the current value of the securities, the quoted market prices and resulting market values for credit default swap agreements on securities and credit indices serve as an indicator of the current status of the payment/performance risk and represent the likelihood of an expected liability (or profit) for the credit derivative if the swap agreement has been closed/sold as of the period end. Increasing market values, in absolute terms when compared to the notional amount of the swap, represent a deterioration of the reference entity’s credit soundness and a greater likelihood of risk of default or other credit event occurring as defined under the terms of the agreement. At Oct. 31, 2017, there were no recourse provisions with third parties to recover any amounts paid under the credit derivative agreement (including any purchased credit protection) nor was any collateral held by the Fund and other third parties which the Fund can obtain occurrence of a credit event. At Oct. 31, 2017, the net unrealized depreciation of the protection sold was $(1,038,759).
CDS contracts may involve greater risks than if the Fund had invested in the reference obligation directly. CDS contracts are subject to general market risk, liquidity risk, counterparty risk, and credit risk. The Fund’s maximum risk of loss from counterparty credit risk, either as the seller of protection or the buyer of protection, is the fair value of the contract. This risk is mitigated by (1) for bilateral swap contracts, having a netting arrangement between the Fund and the counterparty and by the posting of collateral by the counterparty to the Fund to cover the Fund’s exposure to the counterparty, and (2) for cleared swaps, trading these instruments through a central counterparty.
During the year ended Oct. 31, 2017, the Fund entered into CDS contracts to hedge against credit events and to gain exposure to certain securities or markets.
Swaps Generally. The value of open swaps may differ from that which would be realized in the event the Fund terminated its position in the contract on a given day. Risks of entering into these contracts include the potential inability of the counterparty to meet the terms of the contracts. This type of risk is generally
100
Table of Contents
limited to the amount of favorable movement in the value of the underlying security, instrument, or basket of instruments, if any, at the day of default. Risks also arise from potential losses from adverse market movements and such losses could exceed the unrealized amounts shown on the “Schedule of investments.”
At Oct. 31, 2017, the Fund posted $1,955,609 in cash as collateral for certain open centrally cleared interest rate swap contracts, which is presented as “Cash collateral due from brokers” on the “Statement of assets and liabilities.” At Oct. 31, 2017, for bilateral derivatives contracts, the Fund posted $3,700,000 in cash as collateral for certain open derivatives, which is presented as “Cash collateral due from brokers” on the “Statement of asset and liabilities.” At Oct. 31, 2017, the Fund received $370,000 in cash and $444,000 in securities as collateral for certain bilateral derivatives. Cash collateral is presented as “Cash collateral due to brokers” on the “Statement of asset and liabilities.”
Fair values of derivative instruments as of Oct. 31, 2017 were as follows:
| Asset Derivatives Fair Value | ||||||||||||||||||||||||
Statements of Assets and Liabilities Location | Currency Contracts | Interest Rate Contracts | Total | |||||||||||||||||||||
Unrealized appreciation on foreign currency exchange contracts | $ | 473,189 | $ | — | $ | 473,189 | ||||||||||||||||||
Variation margin due from broker on futures contracts* | — | 904,177 | 904,177 | |||||||||||||||||||||
Options purchased, at value | 621,960 | — | 621,960 | |||||||||||||||||||||
|
|
|
|
|
| |||||||||||||||||||
Total | $ | 1,095,149 | $ | 904,177 | $ | 1,999,326 | ||||||||||||||||||
|
|
|
|
|
| |||||||||||||||||||
101
Table of Contents
Notes to financial statements
Delaware Diversified Income Fund
8. Derivatives (continued)
| Liability Derivatives Fair Value | ||||||||||||||||
Statements of Assets and Liabilities Location | Currency Contracts | Interest Rate Contracts | Credit Contracts | Total | ||||||||||||
Unrealized depreciation on foreign currency exchange contracts | $ | (1,479,403 | ) | $ | — | $ | — | $ | (1,479,403 | ) | ||||||
Variation margin due from broker on futures contracts* | — | (4,171,027 | ) | — | (4,171,027 | ) | ||||||||||
Unrealized depreciation on credit default swap contracts | — | — | (1,290,906 | ) | (1,290,906 | ) | ||||||||||
Variation margin due to brokers on centrally cleared interest rate swap contracts | — | (18,406 | ) | — | (18,406 | ) | ||||||||||
Unrealized depreciation on centrally cleared interest rate swap contracts | — | (369,902 | ) | — | (369,902 | ) | ||||||||||
|
|
|
|
|
|
|
| |||||||||
Total | $ | (1,479,403 | ) | $ | (4,559,335 | ) | $ | (1,290,906 | ) | $ | (7,329,644 | ) | ||||
|
|
|
|
|
|
|
| |||||||||
*Includes cumulative appreciation (depreciation) of futures contracts from the date the contracts were opened through Oct. 31, 2017. Only current day variation margin is reported on the “Statement of assets and liabilities.”
The effect of derivative instruments on the “Statement of operations” for the year ended Oct. 31, 2017 was as follows:
| Net Realized Gain (Loss) on: | ||||||||||||||||||||||||
Foreign Currency Exchange Contracts | Futures Contracts | Options Purchased | Options Written | Swap Contracts | Total | |||||||||||||||||||
Currency contracts | $ | (1,385,855 | ) | $ | — | $ | (412,632 | ) | — | $ | — | $ | (1,798,487 | ) | ||||||||||
Interest rate contracts | — | (1,167,968 | ) | 9,693 | 1,364,234 | 486,370 | 692,329 | |||||||||||||||||
Equity contracts | — | (6,700,531 | ) | 138 | — | — | (6,700,393 | ) | ||||||||||||||||
Credit contracts | — | — | — | — | (3,666,530 | ) | (3,666,530 | ) | ||||||||||||||||
|
|
|
|
|
|
|
|
|
|
|
| |||||||||||||
Total | $ | (1,385,855 | ) | $ | (7,868,499 | ) | $ | (402,801 | ) | $ | 1,364,234 | $ | (3,180,160 | ) | $ | (11,473,081 | ) | |||||||
|
|
|
|
|
|
|
|
|
|
|
| |||||||||||||
102
Table of Contents
| Net Change in Unrealized Appreciation (Depreciation) of: | ||||||||||||||||||||
Foreign Currency Exchange Contracts | Futures Contracts | Options Purchased | Swap Contracts | Total | ||||||||||||||||
Currency contracts | $ | (706,199 | ) | $ | (475,229 | ) | $ | (55,238 | ) | $ | — | $ | (1,236,666 | ) | ||||||
Interest rate contracts | — | (4,173,764 | ) | (70,368 | ) | (510,856 | ) | (4,754,988 | ) | |||||||||||
Credit contracts | — | — | — | (1,351,225 | ) | (1,351,225 | ) | |||||||||||||
|
|
|
|
|
|
|
|
|
| |||||||||||
Total | $ | (706,199 | ) | $ | (4,648,993 | ) | $ | (125,606 | ) | $ | (1,862,081 | ) | $ | (7,342,879 | ) | |||||
|
|
|
|
|
|
|
|
|
| |||||||||||
Derivatives Generally. The table below summarizes the average balance of derivative holdings by the Fund during the year ended Oct. 31, 2017.
Long Derivative Volume | Short Derivative Volume | |||||||
Foreign currency exchange contracts (average cost) | USD 108,108,417 | USD 122,661,498 | ||||||
Futures contracts (average notional value) | 265,679,933 | 253,540,235 | ||||||
Options contracts (average notional value) | 179,546 | 293,481 | ||||||
CDS contracts (average notional value)* | 31,530,658 | 8,771,230 | ||||||
Interest rate swap contracts (average notional value)** | — | 23,604,127 | ||||||
*Long represents buying protection and short represents selling protection.
**Long represents receiving fixed interest payments and short represents paying fixed interest payments.
9. Offsetting
The Fund entered into an International Swaps and Derivatives Association, Inc. Master Agreement (ISDA Master Agreement) or a similar agreement with certain of its derivative contract counterparties in order to better define its contractual rights and to secure rights that will help the Fund mitigate its counterparty risk. An ISDA Master Agreement is a bilateral agreement between the Fund and a counterparty that governs certain over-the-counter (OTC) derivatives and foreign exchange contracts and typically contains, among other things, collateral posting items and netting provisions in the event of a default and/or termination event. Under an ISDA Master Agreement, the Fund may, under certain circumstances, offset with the counterparty certain derivative financial instruments’ payables and/or receivables with collateral held and/or posted and create one single net payment. The provisions of the ISDA Master Agreement typically permit a single net payment in the event of default (close-out), including the bankruptcy or insolvency of the counterparty. However, bankruptcy or insolvency laws of a particular jurisdiction may impose restrictions on or prohibitions against the right of offset in bankruptcy, insolvency, or other events.
For financial reporting purposes, the Fund does not offset derivative assets and derivative liabilities that are subject to netting arrangements on the “Statement of assets and liabilities.”
103
Table of Contents
Notes to financial statements
Delaware Diversified Income Fund
9. Offsetting (continued)
At Oct. 31, 2017, the Fund had the following assets and liabilities subject to offsetting provisions:
Offsetting of Financial Assets and Liabilities and Derivative Assets and Liabilities
| Counterparty | Gross Value of Derivative Asset | Gross Value of Derivative Liability | Net Position | ||||||||||||
Bank of America Merrill Lynch | $ | 390,129 | $ | (576,610 | ) | $ | (186,481 | ) | |||||||
BNP Paribas | 102,197 | (215,912 | ) | (113,715 | ) | ||||||||||
Citigroup Global Markets | 9,178 | (26,524 | ) | (17,346 | ) | ||||||||||
Hong Kong Shanghai Bank | — | (321,234 | ) | (321,234 | ) | ||||||||||
JPMorgan Chase Bank | — | (204,444 | ) | (204,444 | ) | ||||||||||
Morgan Stanley Capital | — | (1,038,759 | ) | (1,038,759 | ) | ||||||||||
Toronto Dominion Bank | — | (470,379 | ) | (470,379 | ) | ||||||||||
|
|
|
|
|
| ||||||||||
Total | $ | 501,504 | $ | (2,853,862 | ) | $ | (2,352,358 | ) | |||||||
|
|
|
|
|
| ||||||||||
| Counterparty | Net Position | Fair Value of Non-Cash Collateral Received | Cash Collateral Received(a) | Fair Value of Non-Cash Collateral Pledged | Cash Collateral Pledged | Net Exposure(b) | ||||||||||||||||||||||||
Bank of America Merrill Lynch | $ | (186,481 | ) | $ | — | $ | — | $ | — | $ | 186,481 | $ | — | |||||||||||||||||
BNP Paribas | (113,715 | ) | — | — | — | — | (113,715 | ) | ||||||||||||||||||||||
Citigroup Global Markets | (17,346 | ) | — | — | — | — | (17,346 | ) | ||||||||||||||||||||||
Hong Kong Shanghai Bank | (321,234 | ) | — | — | — | — | (321,234 | ) | ||||||||||||||||||||||
JPMorgan Chase Bank | (204,444 | ) | — | — | — | 140,000 | (64,444 | ) | ||||||||||||||||||||||
Morgan Stanley Capital | (1,038,759 | ) | — | — | — | 1,038,759 | — | |||||||||||||||||||||||
Toronto Dominion Bank | (470,379 | ) | — | — | — | 90,000 | (380,379 | ) | ||||||||||||||||||||||
|
|
|
|
|
|
|
|
|
|
|
| |||||||||||||||||||
Total | $ | (2,352,358 | ) | $ | — | $ | — | $ | — | $ | 1,455,240 | $ | (897,118 | ) | ||||||||||||||||
|
|
|
|
|
|
|
|
|
|
|
| |||||||||||||||||||
Master Repurchase Agreements
| Counterparty | Repurchase Agreements | Fair Value of Non-Cash Collateral Received(a) | Cash Collateral Received | Net Collateral Received | Net Exposure(b) | ||||||||||||||||||||
Bank of America Merrill Lynch | $ | 10,059,911 | $ | (10,059,911 | ) | $ | — | $ | (10,059,911 | ) | $ | — | |||||||||||||
BNP Paribas | 28,416,330 | (28,416,330 | ) | — | (28,416,330 | ) | — | ||||||||||||||||||
|
|
|
|
|
|
|
|
|
| ||||||||||||||||
Total | $ | 38,476,241 | $ | (38,476,241 | ) | $ | — | $ | (38,476,241 | ) | $ | — | |||||||||||||
|
|
|
|
|
|
|
|
|
| ||||||||||||||||
104
Table of Contents
Security Lending
Securities lending transactions are entered into by the Fund under Master Securities Lending Agreements (each, an MSLA) which provide the right, in the event of default (including bankruptcy or insolvency), for the non-defaulting party to liquidate the collateral and calculate a net exposure to the defaulting party or request additional collateral. In the event that a borrower defaults, the Fund, as lender, would offset the market value of the collateral received against the market value of the securities loaned. When the value of the collateral is greater than that of the market value of the securities loaned, the lender is left with a net amount payable to the defaulting party. However, bankruptcy or insolvency laws of a particular jurisdiction may impose restrictions on or prohibitions against such a right of offset in the event of an MSLA counterparty’s bankruptcy or insolvency. Under the MSLA, the borrower can resell or re-pledge the loaned securities, and the Fund can reinvest cash collateral, or, upon an event of default, resell or re-pledge the collateral.
As of Oct. 31, 2017, the following table is a summary of the Fund’s securities lending agreements by counterparty which are subject to offset under an MSLA:
| Counterparty | Securities at Value | Cash Collateral Received - Invested in Securities(a) | Fair Value of Non-Cash Collateral Received | Net Collateral | Net Exposure(b) | |||||||||||
The Bank of New York Mellon | $89,038,038 | $(89,038,038) | $— | $ | (89,038,038 | ) | $— | |||||||||
(a) The value of the related collateral exceeded the value of the net position, purchase agreements and securities loaned at value as of Oct. 31, 2017.
(b) Net exposure represents the receivable (payable) that would be due from (to) the counterparty in the event of default.
10. Securities Lending
The Fund, along with other funds in the Delaware Funds, may lend its securities pursuant to a security lending agreement (Lending Agreement) with The Bank of New York Mellon (BNY Mellon). At the time a security is loaned, the borrower must post collateral equal to the required percentage of the market value of the loaned security, including any accrued interest. The required percentage is: (1) 102% with respect to US securities and foreign securities that are denominated and payable in US dollars; and (2) 105% with respect to foreign securities. With respect to each loan, if on any business day the aggregate market value of securities collateral plus cash collateral held is less than the aggregate market value of the securities that are the subject of such loan, the borrower will be notified to provide additional collateral by the end of the following business day which, together with the collateral already held, will be not less than the applicable initial collateral requirements for such security loan. If the aggregate market value of securities collateral and cash collateral held with respect to a security loan exceeds the applicable initial collateral requirement, upon request of the borrower, BNY Mellon must return enough collateral to the borrower by the end of the following business day to reduce the value of the remaining collateral to the applicable initial collateral requirement for such security loan. As a result of the foregoing, the value of the collateral held with respect to a loaned security on any particular day may be more or less than the value of the security on loan.
105
Table of Contents
Notes to financial statements
Delaware Diversified Income Fund
10. Securities Lending (continued)
Cash collateral received by each Fund of the Trust is generally invested in a series of individual separate accounts, each corresponding to a Fund. The investment guidelines permit each separate account to hold certain securities that would be considered eligible securities for a money market fund. Cash collateral received is generally invested in government securities; certain obligations issued by government sponsored enterprises; repurchase agreements collateralized by US Treasury securities; obligations issued by the central government of any Organization for Economic Cooperation and Development (OECD) country or its agencies, instrumentalities, or establishments; obligations of supranational organizations, commercial paper, notes, bonds and other debt obligations; certificates of deposit, time deposits, and other bank obligations; and asset-backed securities as disclosed on the “Schedule of investments.” Securities purchased with cash collateral are valued at the market value. A Fund can also accept US government securities and letters of credit (non-cash collateral) in connection with securities loans.
In the event of default or bankruptcy by the lending agent, realization and/or retention of the collateral may be subject to legal proceedings. In the event the borrower fails to return loaned securities and the collateral received is insufficient to cover the value of the loaned securities and provided such collateral shortfall is not the result of investment losses, the lending agent has agreed to pay the amount of the shortfall to the Fund or, at the discretion of the lending agent, replace the loaned securities. The Fund continues to record dividends or interest, as applicable, on the securities loaned and are subject to changes in value of the securities loaned that may occur during the term of the loan. The Fund has the right under the Lending Agreement to recover the securities from the borrower on demand. With respect to security loans collateralized by non-cash collateral, the Fund receives loan premiums paid by the borrower. With respect to security loans collateralized by cash collateral, the earnings from the collateral investments are shared among the Fund, the security lending agent, and the borrower. The Fund records security lending income net of allocations to the security lending agent, and the borrower.
The Fund may incur investment losses as a result of investing securities lending collateral. This could occur if an investment in the collateral investment account defaulted or became impaired. Under those circumstances, the value of the Fund’s cash collateral account may be less than the amount the Fund would be required to return to the borrowers of the securities and the Fund would be required to make up for this shortfall.
The following table reflects a breakdown of security lending collateral accounted for as secured borrowings, the gross obligation by the type of collateral pledged, and the remaining contractual maturity of those transactions as of Oct. 31, 2017:
| Securities Lending Collateral | Overnight and Continuous | Under 30 days | Between 30 & 90 days | Over 90 days | Total | |||||||||||||||
Certificates of Deposit, Discounted Commercial Papers, Repurchased Agreements and Short-Term Floating Rate Notes | $ | 94,149,131 | $— | $— | $— | $ | 94,149,131 | |||||||||||||
106
Table of Contents
At Oct. 31, 2017, the value of securities on loan was $89,038,038 for which the Fund received cash collateral of $94,149,131. At Oct. 31, 2017, the value of invested collateral was $94,149,131. Investments purchased with cash collateral are presented on the “Schedule of investments” under the caption “Securities Lending Collateral.”
11. Credit and Market Risk
The Fund invests in fixed income securities whose value is derived from an underlying pool of mortgages or consumer loans. The value of these securities is sensitive to changes in economic conditions, including delinquencies and/or defaults, and may be adversely affected by shifts in the market’s perception of the issuers and changes in interest rates. Investors receive principal and interest payments as the underlying mortgages or consumer loans are paid back. Some of these securities are collateralized mortgage obligations (CMOs). CMOs are debt securities issued by US government agencies or by financial institutions and other mortgage lenders, which are collateralized by a pool of mortgages held under an indenture. Prepayment of mortgages may shorten the stated maturity of the obligations and can result in a loss of premium, if any has been paid. Certain of these securities may be stripped (securities which provide only the principal or interest feature of the underlying security). The yield to maturity on an interest-only CMO is extremely sensitive not only to changes in prevailing interest rates, but also to the rate of principal payments (including prepayments) on the related underlying mortgage assets. A rapid rate of principal payments may have a material adverse effect on the Fund’s yield to maturity. If the underlying mortgage assets experience greater than anticipated prepayments of principal, the Fund may fail to fully recoup its initial investment in these securities even if the securities are rated in the highest rating categories.
The Fund invests in certain obligations that may have liquidity protection designed to ensure that the receipt of payments due on the underlying security is timely. Such protection may be provided through guarantees, insurance policies, or letters of credit obtained by the issuer or sponsor through third parties, through various means of structuring the transaction or through a combination of such approaches. The Fund will not pay any additional fees for such credit support, although the existence of credit support may increase the price of a security.
The Fund invests a portion of its assets in high yield fixed income securities, which are securities rated lower than BBB- by S&P and Baa3 by Moody’s, or similarly rated by another nationally recognized statistical rating organization. Investments in these higher yielding securities are generally accompanied by a greater degree of credit risk than higher rated securities. Additionally, lower rated securities may be more susceptible to adverse economic and competitive industry conditions than investment grade securities.
Some countries in which the Fund may invest require governmental approval for the repatriation of investment income, capital, or the proceeds of sales of securities by foreign investors. In addition, if there is deterioration in a country’s balance of payments or for other reasons, a country may impose temporary restrictions on foreign capital remittances abroad.
The securities exchanges of certain foreign markets are substantially smaller, less liquid, and more volatile than the major securities markets in the United States. Consequently, acquisition and disposition of securities by the Fund may be inhibited. In addition, a significant portion of the aggregate market value
107
Table of Contents
Notes to financial statements
Delaware Diversified Income Fund
11. Credit and Market Risk (continued)
of securities listed on the major securities exchanges in emerging markets is held by a smaller number of investors. This may limit the number of shares available for acquisition or disposition by the Fund.
The Fund invests in bank loans and other securities that may subject it to direct indebtedness risk, the risk that the Fund will not receive payment of principal, interest, and other amounts due in connection with these investments and will depend primarily on the financial condition of the borrower. Loans that are fully secured offer the Fund more protection than unsecured loans in the event of nonpayment of scheduled interest or principal, although there is no assurance that the liquidation of collateral from a secured loan would satisfy the corporate borrower’s obligation, or that the collateral can be liquidated. Some loans or claims may be in default at the time of purchase. Certain of the loans and the other direct indebtedness acquired by the Fund may involve revolving credit facilities or other standby financing commitments that obligate the Fund to pay additional cash on a certain date or on demand. These commitments may require the Fund to increase its investment in a company at a time when the Fund might not otherwise decide to do so (including at a time when the company’s financial condition makes it unlikely that such amounts will be repaid). To the extent that the Fund is committed to advance additional funds, it will at all times hold and maintain cash or other high grade debt obligations in an amount sufficient to meet such commitments. When a loan agreement is purchased, the Fund may pay an assignment fee. On an ongoing basis, the Fund may receive a commitment fee based on the undrawn portion of the underlying line of credit portion of a loan agreement. Prepayment penalty fees are received upon the prepayment of a loan agreement by a borrower. Prepayment penalty, facility, commitment, consent, and amendment fees are recorded to income as earned or paid.
As the Fund may be required to rely upon another lending institution to collect and pass on to the Fund amounts payable with respect to the loan and to enforce the Fund’s rights under the loan and other direct indebtedness, an insolvency, bankruptcy, or reorganization of the lending institution may delay or prevent the Fund from receiving such amounts. The highly leveraged nature of many loans may make them especially vulnerable to adverse changes in economic or market conditions. Investments in such loans and other direct indebtedness may involve additional risk to the Fund.
The Fund may invest up to 15% of its net assets in illiquid securities, which may include securities with contractual restrictions on resale, securities exempt from registration under Rule 144A promulgated under the Securities Act of 1933, as amended (1933 Act), and other securities which may not be readily marketable. The Fund may also invest in securities exempt from registration under Section 4(2) of the Act, which exempts from registration transactions by an issuer not involving any public offering. The relative illiquidity of these securities may impair the Fund from disposing of them in a timely manner and at a fair price when it is necessary or desirable to do so. While maintaining oversight, the Board has delegated to DMC, the day-to-day functions of determining whether individual securities are liquid for purposes of the Fund’s limitation on investments in illiquid securities. Securities eligible for resale pursuant to Rule 144A, which are determined to be liquid, are not subject to the Fund’s 15% limit on investments in illiquid securities. Rule 144A and 4(2) securities have been identified on the “Schedule of investments.”
108
Table of Contents
12. Contractual Obligations
The Fund enters into contracts in the normal course of business that contain a variety of indemnifications. The Fund’s maximum exposure under these arrangements is unknown. However, the Fund has not had prior claims or losses pursuant to these contracts. Management has reviewed the Fund’s existing contracts and expects the risk of loss to be remote.
13. Recent Accounting Pronouncements
In October 2016, the Securities and Exchange Commission released its Final Rule on Investment Company Reporting Modernization (Rule). The Rule contains amendments to Regulation S-X which impact financial statement presentation, particularly the presentation of derivative investments. The financial statements presented are in compliance with the most recent Regulation S-X amendments.
14. General Motors Term Loan Litigation
The Fund received notice of a litigation proceeding related to a General Motors Corporation (G.M.) term loan participation previously held by the Fund in 2009. We believe the matter subject to the litigation notice will likely lead to a recovery from the Fund of certain amounts received by the Fund because a US Court of Appeals has ruled that the Fund and similarly situated investors were unsecured creditors rather than secured lenders of G.M. as a result of an erroneous Uniform Commercial Code filing made by a third party. The Fund received the full principal on the loans in 2009 after the G.M. bankruptcy. However, based upon the court ruling the estate is seeking to recover such amounts arguing that, as unsecured creditors, the Fund should not have received payment in full. Based upon currently available information related to the litigation and the Fund’s potential exposure, the Fund recorded a contingent liability of $15,959,167 and an asset of $4,787,750 based on the expected recoveries to unsecured creditors as of Oct. 31, 2017 that resulted in a decrease in the Fund’s NAV to reflect this likely recovery.
15. Subsequent Events
On Nov. 6, 2017, the Fund, along with the other Participants, entered into an amendment to the agreement for a $155,000,000 revolving line of credit is to be used as described in Note 7 and to be operated in substantially the same manner as the agreement described in Note 7. Under the amendment to the agreement, the Participants are charged an annual commitment fee of 0.15%, which is generally allocated across the Participants based on a weighted average of the respective net assets of each participant. The line of credit available under the agreement expires on Nov. 5, 2018.
Management has determined that no other material events or transactions occurred subsequent to Oct. 31, 2017, that would require recognition or disclosure in the Fund’s financial statements.
109
Table of Contents
registered public accounting firm
To the Board of Trustees of Delaware Group® Adviser Funds
and the Shareholders of Delaware Diversified Income Fund
In our opinion, the accompanying statement of assets and liabilities, including the schedule of investments, and the related statements of operations and of changes in net assets and the financial highlights present fairly, in all material respects, the financial position of Delaware Diversified Income Fund (one of the series constituting Delaware Group Adviser Funds, hereafter referred to as the “Fund”) as of October 31, 2017, the results of its operations for the year then ended, the changes in its net assets for each of the two years in the period then ended and the financial highlights for each of the periods indicated, in conformity with accounting principles generally accepted in the United States of America. These financial statements and financial highlights (hereafter referred to as “financial statements”) are the responsibility of the Fund’s management. Our responsibility is to express an opinion on these financial statements based on our audits. We conducted our audits of these financial statements in accordance with the standards of the Public Company Accounting Oversight Board (United States). Those standards require that we plan and perform the audit to obtain reasonable assurance about whether the financial statements are free of material misstatement. An audit includes examining, on a test basis, evidence supporting the amounts and disclosures in the financial statements, assessing the accounting principles used and significant estimates made by management, and evaluating the overall financial statement presentation. We believe that our audits, which included confirmation of securities as of October 31, 2017 by correspondence with the custodian and brokers, provide a reasonable basis for our opinion.
PricewaterhouseCoopers LLP
Philadelphia, Pennsylvania
December 19, 2017
110
Table of Contents
Other Fund information (Unaudited)
Delaware Diversified Income Fund
Tax Information
The information set forth below is for the Fund’s fiscal year as required by federal income tax laws. Shareholders, however, must report distributions on a calendar year basis for income tax purposes, which may include distributions for portions of two fiscal years of the Fund. Accordingly, the information needed by shareholders for income tax purposes will be sent to them in January of each year. Please consult your tax advisor for proper treatment of this information.
All disclosures are based on financial information available as of the date of this annual report and, accordingly are subject to change. For any and all items requiring reporting, it is the intention of the Fund to report the maximum amount permitted under the Internal Revenue Code and the regulations thereunder.
For the fiscal year ended Oct. 31, 2017, the Fund reports distributions paid during the year as follows:
(A) Ordinary Income Distributions (Tax Basis)* | 97.59 | % | ||
(B) Return of Capital (Tax Basis) | 2.41 | % | ||
Total Distributions | 100.00 | % | ||
(C) Qualifying Dividends1 | 0.68 | % |
(A) and (B) are based on a percentage of the Fund’s total distributions.
(C) is based on a percentage of the Fund’s ordinary income distributions.
1 Qualifying dividends represent dividends which qualify for the corporate dividends received deduction.
*For the fiscal year ended Oct. 31, 2017, certain dividends paid by the Fund may be subject to a maximum tax rate of 20%. The percentage of dividends paid by the Fund from ordinary income reported as qualified income is 0.76%. Complete information will be computed and reported in conjunction with your 2017 Form 1099-DIV.
For the fiscal year ended Oct. 31, 2017, certain interest income paid by the Fund, has been determined to be Qualified Interest Income and Short-Term Capital Gains may be subject to relief from US withholding for foreign shareholders, as provided by the American Jobs Creation Act of 2004; the Tax Relief Unemployment Insurance Reauthorization, and Job Creations Act of 2010; and as extended by the American Taxpayer Relief Act of 2012. For the fiscal year ended Oct. 31, 2017, the Fund has reported maximum distributions of Qualified Interest Income of $114,554,621.
Board consideration of Delaware Diversified Income Fund investment advisory agreement
At a meeting held on Aug. 16-17, 2017 (the “Annual Meeting”), the Board of Trustees (the “Board”), including a majority of disinterested or independent Trustees, approved the renewal of the Investment Advisory Agreement for Delaware Diversified Income Fund (the “Fund”). In making its decision, the Board considered information furnished at regular quarterly Board meetings, including reports detailing Fund performance, investment strategies, and expenses, as well as information prepared specifically in connection with the renewal of the Investment Advisory Agreement. Information furnished specifically in connection with the renewal of the Investment Advisory Agreement with Delaware Management Company (“DMC”), a series of Macquarie Investment Management Business Trust (formerly, Delaware Management Business Trust), included materials provided by DMC and its affiliates concerning, among other things, the nature, extent, and quality of services provided to the Fund; the costs of such services
111
Table of Contents
Other Fund information (Unaudited)
Delaware Diversified Income Fund
Board consideration of Delaware Diversified Income Fund investment advisory agreement (continued)
to the Fund; economies of scale; and the investment manager’s financial condition and profitability. In addition, in connection with the Annual Meeting, reports were provided to the Trustees in May 2017 and included reports provided by Broadridge Financial Solutions (formerly Lipper) (“Broadridge” or “Lipper”). The Broadridge reports compared the Fund’s investment performance and expenses with those of other comparable mutual funds. The Independent Trustees reviewed and discussed the Broadridge reports with independent legal counsel to the Independent Trustees. In addition to the information noted above, the Board also requested and received information regarding DMC’s policy with respect to advisory fee levels and its breakpoint philosophy; the structure of portfolio manager compensation; comparative client fee information; and any constraints or limitations on the availability of securities for certain investment styles, which had in the past year inhibited, or which were likely in the future to inhibit, the investment manager’s ability to invest fully in accordance with Fund policies.
In considering information relating to the approval of the Fund’s advisory agreement, the Independent Trustees received assistance and advice from and met separately with independent legal counsel to the Independent Trustees and also from an experienced and knowledgeable fund consultant, JDL Consultants, LLC (“JDL”). Although the Board gave attention to all information furnished, the following discussion identifies, under separate headings, the primary factors taken into account by the Board during its contract renewal considerations.
Nature, extent, and quality of service. The Board considered the services provided by DMC to the Fund and its shareholders. In reviewing the nature, extent, and quality of services, the Board considered reports furnished to it throughout the year, which covered matters such as the relative performance of the Fund; compliance of portfolio managers with the investment policies, strategies, and restrictions for the Fund; compliance by DMC and Delaware Distributors, L.P. (together, “Management”) personnel with the Code of Ethics adopted throughout the Delaware FundsSM by Macquarie (“Delaware Funds”); and adherence to fair value pricing procedures as established by the Board. The Board was pleased with the current staffing of the Fund’s investment advisor and the emphasis placed on research in the investment process. The Board recognized DMC’s receipt of certain industry distinctions during the past several years. The Board gave favorable consideration to DMC’s efforts to control expenditures while maintaining service levels committed to Fund matters. The Board also noted the benefits provided to Fund shareholders through each shareholder’s ability to exchange an investment in one Delaware Fund for the same class of shares in another Delaware Fund without a sales charge, to reinvest Fund dividends into additional shares of the Fund or into additional shares of other Delaware Funds and the privilege to combine holdings in other Delaware Funds to obtain a reduced sales charge. The Board was satisfied with the nature, extent, and quality of the overall services provided by DMC.
Investment performance. The Board placed significant emphasis on the investment performance of the Fund in view of the importance of investment performance to shareholders. Although the Board considered performance reports and discussions with portfolio managers at Investments Committee meetings throughout the year, the Board gave particular weight to the Broadridge reports furnished for the Annual Meeting. The Broadridge reports prepared for the Fund showed the investment performance of its Class A shares in comparison to a group of similar funds as selected by Broadridge (the “Performance Universe”). A fund with the best performance ranked first, and a fund with the poorest
112
Table of Contents
performance ranked last. The highest/best performing 25% of funds in the Performance Universe make up the first quartile; the next 25%, the second quartile; the next 25%, the third quartile; and the poorest/ worst performing 25% of funds in the Performance Universe make up the fourth quartile. Comparative annualized performance for the Fund was shown for the past 1-, 3-, 5-, and 10-year periods, to the extent applicable, ended Jan. 31, 2017. The Board’s objective is that the Fund’s performance for the 1-, 3-, and 5-year periods considered be at or above the median of its Performance Universe.
The Performance Universe for the Fund consisted of the Fund and all retail and institutional multi-sector income funds as selected by Broadridge. The Broadridge report comparison showed that the Fund’s total return for the 1- and 5-year periods was in the fourth quartile of its Performance Universe. The report further showed that the Fund’s total return for the 3-year period was in the third quartile of its Performance Universe. The Board observed that the Fund’s performance results were not in line with the Board’s objective. In evaluating the Fund’s performance, the Board considered the numerous investment and performance reports delivered by Management personnel to the Board’s Investments Committee. The Board was satisfied that Management was taking action to improve Fund performance and to meet the Board’s performance objective.
Comparative expenses. The Board considered expense data for the Delaware Funds. Management provided the Board with information on pricing levels and fee structures for the Fund as of its most recently completed fiscal year. The Board also focused on the comparative analysis of effective management fees and total expense ratios of the Fund versus effective management fees and total expense ratios of a group of similar funds as selected by Broadridge (the “Expense Group”). In reviewing comparative costs, the Fund’s contractual management fee and the actual management fee incurred by the Fund were compared with the contractual management fees (assuming all funds in the Expense Group were similar in size to the Fund) and actual management fees (as reported by each fund) within the Expense Group, taking into account any applicable breakpoints and fee waivers. The Fund’s total expenses were also compared with those of its Expense Group. The Broadridge total expenses, for comparative consistency, were shown by Broadridge for Class A shares and comparative total expenses including 12b-1 and non-12b-1 service fees. The Board’s objective is to limit the Fund’s total expense ratio to be competitive with that of the Expense Group.
The expense comparisons for the Fund showed that its actual management fee was in the quartile with the lowest expenses of its Expense Group and its total expenses were in the quartile with the second lowest expenses of its Expense Group. The Board was satisfied with the management fee and total expenses of the Fund in comparison to those of its Expense Group as shown in the Broadridge report.
Management profitability. The Board considered the level of profits realized by DMC in connection with the operation of the Fund. In this respect, the Board reviewed the Investment Management Profitability Analysis that addressed the overall profitability of DMC’s business in providing management and other services to each of the individual funds and the Delaware Funds as a whole. Specific attention was given to the methodology used by DMC in allocating costs for the purpose of determining profitability. Management stated that the level of profits of DMC, to a certain extent, reflects recent operational cost savings and efficiencies initiated by DMC. The Board considered DMC’s efforts to improve services provided to fund shareholders and to meet additional regulatory and compliance requirements resulting from recent industry-wide Securities and Exchange Commission initiatives. The Board also considered the extent to which DMC might derive ancillary benefits from fund operations, including the potential for
113
Table of Contents
Other Fund information (Unaudited)
Delaware Diversified Income Fund
Board consideration of Delaware Diversified Income Fund investment advisory agreement (continued)
procuring additional business as a result of the prestige and visibility associated with its role as service provider to the Delaware Funds and the benefits from allocation of fund brokerage to improve trading efficiencies. Finally, the Board also reviewed a report prepared by JDL regarding DMC profitability in the context of sub-advised funds and met with JDL personnel to discuss DMC’s profitability in such context. The Board found that the management fees were reasonable in light of the services rendered and the level of profitability of DMC.
Economies of scale. The Trustees considered whether economies of scale are realized by DMC as the Fund’s assets increase and the extent to which any economies of scale are reflected in the level of management fees charged. The Trustees reviewed the standardized advisory fee pricing and structure, approved by the Board and shareholders, which includes breakpoints, and which applies to most funds in the Delaware Funds complex. Breakpoints in the advisory fee occur when the advisory fee rate is reduced on assets in excess of specified levels. Breakpoints result in a lower advisory fee than would otherwise be the case in the absence of breakpoints, when the asset levels specified in the breakpoints are exceeded. The Board noted that the fee under the Fund’s management contract fell within the standardized fee pricing structure. The Board also noted that, as of Feb. 28, 2017, the Fund’s assets exceeded the final breakpoint level. The Board believed that, given the extent to which economies of scale might be realized by the advisor and its affiliates, the schedule of fees under the Investment Advisory Agreement provides a sharing of benefits with the Fund and its shareholders.
114
Table of Contents
This page intentionally left blank.
Table of Contents
Board of trustees / directors and officers addendum
Delaware FundsSM by Macquarie
A mutual fund is governed by a Board of Trustees/Directors (“Trustees”), which has oversight responsibility for the management of a fund’s business affairs. Trustees establish procedures and oversee and review the performance of the investment manager, the distributor, and others who perform services for the fund. The independent fund trustees, in particular, are advocates
| Name, Address, | Position(s) | Length of | ||
| and Birth Date | Held with Fund(s) | Time Served | ||
Interested Trustee
| ||||
| Shawn K. Lytle1, 2 | President, | Trustee since | ||
| 2005 Market Street | Chief Executive Officer, | September 2015 | ||
| Philadelphia, PA 19103 | and Trustee | |||
| February 1970 | President and | |||
| Chief Executive Officer | ||||
since August 2015
| ||||
Independent Trustees
| ||||
| Thomas L. Bennett | Chairman and Trustee | Trustee since | ||
| 2005 Market Street | March 2005 | |||
| Philadelphia, PA 19103 | ||||
| October 1947 | Chairman since | |||
March 2015
| ||||
| Ann D. Borowiec | Trustee | Since March 2015 | ||
| 2005 Market Street | ||||
| Philadelphia, PA 19103 | ||||
| November 1958 | ||||
| Joseph W. Chow | Trustee | Since January 2013 | ||
| 2005 Market Street | ||||
| Philadelphia, PA 19103 | ||||
| January 1953 | ||||
| 1 | Shawn K. Lytle is considered to be an “Interested Trustee” because he is an executive officer of the Fund’s(s’) investment advisor. |
| 2 | Shawn K. Lytle, David F. Connor, Daniel V. Geatens, and Richard Salus serve in similar capacities for the six portfolios of the Optimum Fund Trust, which have the same investment advisor, principal underwriter, and transfer agent as the registrant. Mr. Geatens also serves as the CFO and Treasurer for Macquarie Global Infrastructure Total Return Fund Inc., which shares an affiliated investment manager. |
116
Table of Contents
for shareholder interests. Each trustee has served in that capacity since he or she was elected to or appointed to the Board of Trustees, and will continue to serve until his or her retirement or the election of a new trustee in his or her place. The following is a list of the Trustees and Officers with certain background and related information.
Principal Occupation(s) During the Past Five Years | Number of Portfolios in Fund Complex Overseen by Trustee or Officer | Other Directorships Held by Trustee or Officer | ||
| Shawn K. Lytle has served as | 60 | Trustee — UBS | ||
| President of | Relationship Funds, | |||
| Macquarie Investment | SMA Relationship | |||
| Management3 | Trust, and UBS Funds | |||
| since June 2015 and was the | (May 2010–April 2015) | |||
| Regional Head of Americas for | ||||
| UBS Global Asset | ||||
Management from 2010 through 2015. | ||||
| Private Investor | 60 | None | ||
| (March 2004–Present) | ||||
| Chief Executive Officer, | 60 | Director — | ||
| Private Wealth Management | Banco Santander International | |||
| (2011–2013) and | ||||
| Market Manager, | Director — | |||
| New Jersey Private | Santander Bank, N.A. | |||
| Bank (2005–2011) — | ||||
J.P. Morgan Chase & Co.
| ||||
| Executive Vice President | 60 | Director and Audit Committee | ||
| (Emerging Economies | Member — Hercules | |||
| Strategies, Risks, and | Technology Growth | |||
| Corporate Administration) | Capital, Inc. | |||
| State Street Corporation | (2004–2014) | |||
(July 2004–March 2011)
| ||||
| 3 | Macquarie Investment Management (formerly known as Delaware Investments) is the marketing name for Macquarie Management Holdings, Inc. (formerly known as Delaware Management Holdings, Inc.) and its subsidiaries, including the Fund’s(s’) investment advisor, principal underwriter, and its transfer agent. |
117
Table of Contents
Board of trustees / directors and officers addendum
Delaware FundsSM by Macquarie
| Name, Address, | Position(s) | Length of | ||
| and Birth Date | Held with Fund(s) | Time Served | ||
Independent Trustees (continued)
| ||||
| John A. Fry | Trustee | Since January 2001 | ||
| 2005 Market Street | ||||
| Philadelphia, PA 19103 | ||||
| May 1960 |
| Lucinda S. Landreth | Trustee | Since March 2005 | ||
| 2005 Market Street | ||||
| Philadelphia, PA 19103 | ||||
| June 1947 | ||||
| Frances A. Sevilla-Sacasa | Trustee | Since September 2011 | ||
| 2005 Market Street | ||||
| Philadelphia, PA 19103 | ||||
| January 1956 | ||||
118
Table of Contents
Principal Occupation(s) During the Past Five Years | Number of Portfolios in Fund Complex Overseen by Trustee or Officer | Other Directorships Held by Trustee or Officer | ||
| President — | 60 | Director, Audit Committee, | ||
| Drexel University | and Governance Committee | |||
| (August 2010–Present) | Member — Community | |||
| Health Systems | ||||
| President — | ||||
| Franklin & Marshall College | Director — Drexel | |||
| (July 2002–July 2010) | Morgan & Co. | |||
| Director, Audit Committee | ||||
| Member — vTv | ||||
| Therapeutics LLC | ||||
| Director — FS Credit Real | ||||
| Estate Income Trust, Inc. | ||||
| Private Investor | 60 | None | ||
| (2004–Present) |
| Chief Executive Officer — | 60 | Trust Manager and | ||
| Banco Itaú | Audit Committee | |||
| International | Chair — Camden | |||
| (April 2012–December 2016) | Property Trust | |||
| Executive Advisor to Dean | ||||
(August 2011–March 2012) and Interim Dean | ||||
| (January 2011–July 2011) — | ||||
| University of Miami School of | ||||
| Business Administration | ||||
| President — U.S. Trust, | ||||
| Bank of America Private | ||||
| Wealth Management | ||||
| (Private Banking) | ||||
(July 2007–December 2008)
|
119
Table of Contents
Board of trustees / directors and officers addendum
Delaware FundsSM by Macquarie
Name, Address, and Birth Date | Position(s) Held with Fund(s) | Length of Time Served | ||
Independent Trustees (continued)
| ||||
| Thomas K. Whitford | Trustee | Since January 2013 | ||
| 2005 Market Street | ||||
| Philadelphia, PA 19103 | ||||
| March 1956 |
| Janet L. Yeomans | Trustee | Since April 1999 | ||
| 2005 Market Street | ||||
| Philadelphia, PA 19103 | ||||
| July 1948 |
Officers
| ||||
| David F. Connor | Senior Vice President, | Senior Vice President | ||
| 2005 Market Street | General Counsel, | since May 2013; | ||
| Philadelphia, PA 19103 | and Secretary | General Counsel | ||
| December 1963 | since May 2015; | |||
| Secretary since | ||||
| October 2005 |
| Daniel V. Geatens | Vice President | Treasurer since October 2007 | ||
| 2005 Market Street | and Treasurer | |||
| Philadelphia, PA 19103 | ||||
| October 1972 |
| Richard Salus | Senior Vice President | Chief Financial Officer | ||
| 2005 Market Street | and Chief Financial Officer | since November 2006 | ||
| Philadelphia, PA 19103 | ||||
| October 1963 |
The Statement of Additional Information for the Fund(s) includes additional information about the Trustees and Officers and is available, without charge, upon request by calling 800 523-1918.
120
Table of Contents
| Number of Portfolios in | ||||
| Principal Occupation(s) | Fund Complex Overseen | Other Directorships | ||
| During the Past Five Years | by Trustee or Officer | Held by Trustee or Officer | ||
| Vice Chairman | 60 | Director — HSBC Finance | ||
| (2010–April 2013) — | Corporation and HSBC | |||
| PNC Financial | North America Holdings Inc. | |||
| Services Group |
| Director — | ||||
| HSBC USA Inc. |
| Vice President and Treasurer | 60 | Director (2009–2017); | ||
| (January 2006–July 2012), | Personnel and Compensation | |||
| Vice President — | Committee Chair; Member of | |||
| Mergers & Acquisitions | Nominating, Investments, and | |||
| (January 2003–January 2006), | Audit Committees for various | |||
| and Vice President | periods throughout | |||
| and Treasurer | directorship — | |||
| (July 1995–January 2003) — | Okabena Company | |||
| 3M Company |
| David F. Connor has served | 60 | None2 | ||
in various capacities at different times at | ||||
| Macquarie Investment | ||||
| Management. |
| Daniel V. Geatens has served | 60 | None2 | ||
in various capacities at different times at | ||||
| Macquarie Investment | ||||
| Management. |
| Richard Salus has served | 60 | None2 | ||
in various executive capacities at different times at | ||||
| Macquarie Investment | ||||
| Management. |
121
Table of Contents
Board of trustees
| Shawn K. Lytle | Ann D. Borowiec | John A. Fry | Frances A. | |||
| President and | Former Chief Executive | President | Sevilla-Sacasa | |||
| Chief Executive Officer | Officer | Drexel University | Former Chief Executive | |||
| Delaware FundsSM | Private Wealth Management | Philadelphia, PA | Officer | |||
| by Macquarie | J.P. Morgan Chase & Co. | Banco Itaú International | ||||
| Philadelphia, PA | New York, NY | Lucinda S. Landreth | Miami, FL | |||
| Former Chief Investment | ||||||
| Thomas L. Bennett | Joseph W. Chow | Officer | Thomas K. Whitford | |||
| Chairman of the Board | Former Executive Vice | Assurant, Inc. | Former Vice Chairman | |||
| Delaware Funds | President | New York, NY | PNC Financial Services Group | |||
| by Macquarie | State Street Corporation | Pittsburgh, PA | ||||
| Private Investor | Boston, MA | |||||
| Rosemont, PA | Janet L. Yeomans | |||||
| Former Vice President and | ||||||
| Treasurer | ||||||
| 3M Company | ||||||
| St. Paul, MN | ||||||
Affiliated officers | ||||||
| David F. Connor | Daniel V. Geatens | Richard Salus | ||||
| Senior Vice President, | Vice President and | Senior Vice President and | ||||
| General Counsel, | Treasurer | Chief Financial Officer | ||||
| and Secretary | Delaware Funds | Delaware Funds | ||||
| Delaware Funds | by Macquarie | by Macquarie | ||||
| by Macquarie | Philadelphia, PA | Philadelphia, PA | ||||
| Philadelphia, PA | ||||||
This annual report is for the information of Delaware Diversified Income Fund shareholders, but it may be used with prospective investors when preceded or accompanied by the Delaware Fund fact sheet for the most recently completed calendar quarter. These documents are available at delawarefunds.com/literature.
The Fund files its complete schedule of portfolio holdings with the Securities and Exchange Commission (SEC) for the first and third quarters of each fiscal year on Form N-Q. The Fund’s Forms N-Q, as well as a description of the policies and procedures that the Fund uses to determine how to vote proxies (if any) relating to portfolio securities are available without charge (i) upon request, by calling 800 523-1918; and (ii) on the SEC’s website at sec.gov. In addition, a description of the policies and procedures that the Fund uses to determine how to vote proxies (if any) relating to portfolio securities and the Schedule of Investments included in the Fund’s most recent Form N-Q are available without charge on the Fund’s website at delawarefunds.com/literature. The Fund’s Forms N-Q may be reviewed and copied at the SEC’s Public Reference Room in Washington, D.C.; information on the operation of the Public Reference Room may be obtained by calling 800 SEC-0330.
Information (if any) regarding how the Fund voted proxies relating to portfolio securities during the most recently disclosed 12-month period ended June 30 is available without charge (i) through the Fund’s website at delawarefunds.com/proxy; and (ii) on the SEC’s website at sec.gov.
122
Table of Contents
US equity mutual fund
Delaware U.S. Growth Fund
October 31, 2017
Carefully consider the Fund’s investment objectives, risk factors, charges, and expenses before investing. This and other information can be found in the Fund’s prospectus and its summary prospectus, which may be obtained by visiting delawarefunds.com/literature or calling 800 523-1918. Investors should read the prospectus and the summary prospectus carefully before investing.
You can obtain shareholder reports and prospectuses online instead of in the mail.
Visit delawarefunds.com/edelivery.

Table of Contents
Experience Delaware FundsSM by Macquarie
Macquarie Investment Management (MIM) is a global asset manager with offices throughout the United States, Europe, Asia, and Australia. We are active managers who prioritize autonomy and accountability at the investment team level in pursuit of opportunities that matter for our clients. Delaware Funds is one of the longest-standing mutual fund families, with more than 75 years in existence.
If you are interested in learning more about creating an investment plan, contact your financial advisor.
You can learn more about Delaware Funds or obtain a prospectus for Delaware U.S. Growth Fund at delawarefunds.com/literature.
Manage your account online
| • | Check your account balance and transactions |
| • | View statements and tax forms |
| • | Make purchases and redemptions |
Visit delawarefunds.com/account-access.
MIM is the marketing name for the registered investment advisers including Macquarie Investment Management Business Trust (MIMBT) (formerly, Delaware Management Business Trust), Macquarie Funds Management Hong Kong Limited, Macquarie Investment Management Austria Kapitalanlage AG, Macquarie Investment Management Global Limited, Macquarie Bank International Limited, Macquarie Investment Management Europe Limited, Macquarie Investment Management Limited, and Macquarie Capital Investment Management, Inc.
The Fund is distributed by Delaware Distributors, L.P., an affiliate of MIMBT and Macquarie Group Limited. MIM, a member of Macquarie Group, refers to the companies comprising the asset management division of Macquarie Group Limited and its subsidiaries and affiliates worldwide.
Other than Macquarie Bank Limited (MBL), none of the entities noted are authorized deposit-taking institutions for the purposes of the Banking Act 1959 (Commonwealth of Australia). The obligations of these entities do not represent deposits or other liabilities of MBL. MBL does not guarantee or otherwise provide assurance in respect of the obligations of these entities, unless noted otherwise. The Fund is governed by US laws and regulations.
| 1 | ||||
| 4 | ||||
| 8 | ||||
Security type / sector allocation and top 10 equity holdings | 10 | |||
| 12 | ||||
| 14 | ||||
| 16 | ||||
| 18 | ||||
| 20 | ||||
| 29 | ||||
| 41 | ||||
| 42 | ||||
| 46 | ||||
| 52 |
Unless otherwise noted, views expressed herein are current as of Oct. 31, 2017, and subject to change for events occurring after such date.
The Fund is not FDIC insured and is not guaranteed. It is possible to lose the principal amount invested.
Advisory services provided by Delaware Management Company, a series of MIMBT, a US registered investment advisor.
All third-party marks cited are the property of their respective owners.
© 2017 Macquarie Management Holdings, Inc. (formerly, Delaware Management Holdings, Inc.)
Table of Contents
| Portfolio management review | ||||
| Delaware U.S. Growth Fund | November 7, 2017 |
Performance preview (for the year ended October 31, 2017) | ||||||
Delaware U.S. Growth Fund (Institutional Class shares) | 1-year return | +24.00% | ||||
Delaware U.S. Growth Fund (Class A shares) | 1-year return | +23.66% | ||||
Russell 1000® Growth Index (benchmark) | 1-year return | +29.71% | ||||
Past performance does not guarantee future results.
For complete, annualized performance for Delaware U.S. Growth Fund, please see the table on page 4. Institutional Class shares are not subject to a sales charge and are offered for sale exclusively to certain eligible investors. In addition, Institutional Class shares pay no distribution and service fee.
The performance of Class A shares excludes the applicable sales charge. Both Institutional Class shares and Class A shares reflect the reinvestment of all distributions.
Please see page 6 for a description of the index. Index performance returns do not reflect any management fees, transaction costs, or expenses. Indices are unmanaged and one cannot invest directly in an index.
Jackson Square Partners, LLC (JSP), a US registered investment advisor, is the sub-advisor to the Fund. As sub-advisor, JSP is responsible for day-to-day management of the Fund’s assets. Although JSP serves as sub-advisor, the investment manager, Delaware Management Company (DMC), a series of Macquarie Investment Management Business Trust, has ultimate responsibility for all investment advisory services.
Solid growth, both in the United States and around the world, marked the fiscal year ended Oct. 31, 2017. The US economy was poised for an upswing early in the period, as consumers closely watched a presidential campaign that resulted in a surprising upset. Wages were up, consumer confidence had risen sharply, and residential home construction was at near pre-global-financial-crisis highs. US equity markets experienced an additional boost on the heels of the election, in anticipation of potential tax reform and infrastructure spending in the upcoming Trump administration.
As President Trump took office, domestic equity markets remained robust, despite a flurry of political headlines. Investors barely reacted as the administration’s efforts to enact its policy agenda foundered – particularly repeated attempts to repeal and replace the Affordable Care Act and efforts to have Mexico foot the bill for Trump’s
campaign promise of a border wall. Still, healthy performance buoyed stocks, primarily within the commodity markets and the financials sector. Decreased output by the Organization of the Petroleum Exporting Countries (OPEC) pushed oil prices higher, while the expectation of higher inflation combined with an increasingly less accommodative monetary policy led to enhanced opportunities within financial markets.
The US Federal Reserve raised rates three times during the fiscal year: in December 2016 and in March and June 2017. None of these moves blindsided investors, as the domestic market had already built the anticipated increases into stock and bond prices. Overseas, both the European Central Bank and the Bank of England began to prepare investors for slowdowns in monetary stimulus.
Fiscal tightening in the US, combined with global growth throughout the year, led to a decrease in the US dollar’s value, which helped bolster emerging market economies. The MSCI Emerging Markets Index rose 26.45% during the fiscal year.
Within developed markets, international equities mirrored those in the US, rising despite political uncertainties. The future of trade between the United Kingdom and the European Union (EU)
1
Table of Contents
| Portfolio management review | ||||
| Delaware U.S. Growth Fund |
remained uncertain, even one and a half years after the UK voted to exit the bloc. Elsewhere in Europe, however, a series of elections in Austria, the Netherlands, and France reflected a growing rejection of anti-EU politicians. Even in Spain, where Catalans recently voted to leave the nation, sentiment heavily favored support for the euro zone. By the end of the period, the MSCI EAFE Index had risen 23.44%.
In late summer 2017, three Category 4 hurricanes struck large parts of Texas, Florida, and Puerto Rico within a month of one another. The preliminary estimate for the total cost of resulting damage was at least $300 billion (source: Moody’s Analytics). Despite widespread wreckage, the US economy remained unflappable. Corporations continued to invest, and consumers remained confident. In mid-September, the Fed announced its expectation that the storms would leave few long-lasting economic effects. New York Fed President William Dudley further added that rebuilding could even boost economic activity.
US real gross domestic product (GDP) – a measure of national economic output – remained strong and unemployment continued to fall, eventually ending the period at the lowest level seen since 2001 (source: US Bureau of Economic Analysis). Consumer sentiment did cool in November on the expectation of future inflation and higher interest rates, according to the University of Michigan Consumer Sentiment Index. The S&P 500® Index rose 23.63% during the fiscal period. The nation’s largest and most established companies performed even better, as indicated by the 32.07% gain of the Dow Jones Industrial Average.
Within the Fund
For the fiscal year ended Oct. 31, 2017, Delaware U.S. Growth Fund Institutional Class shares returned +24.00%. The Fund’s Class A shares returned +23.66% at net asset value (NAV) and +16.56% at maximum offer price. These figures
reflect all distributions reinvested. During the same period, the Fund’s benchmark, the Russell 1000 Growth Index, returned +29.71%. For complete, annualized performance of Delaware U.S. Growth Fund, please see the table on page 4.
Strong relative performance in the information technology and consumer staples sectors was unable to overcome weak relative performance in the consumer discretionary, healthcare, and industrials sectors. On a stock-specific level, the following were the most significant contributors and detractors during the fiscal year:
PayPal Holdings, a key supply-chain participant in the electronic payments industry, contributed to performance during the period. The company continued to experience increasing business momentum, seeing significant growth in both total payment volume and active users. Notwithstanding the impressive stock performance year to date, we are excited about PayPal’s growth prospects. PayPal’s core payment product continued to show significant growth by expanding its reach to physical merchants, via Venmo and PayPal, and by increasing infrastructure offerings to other payment companies, via Braintree.
Celgene, a biopharmaceutical company focused on treatments for cancer and other severe immune-inflammatory conditions, added to performance. Celgene continues to be a leader in the treatment of blood cancer with a growing pipeline of breast, lung, and pancreatic cancer treatments. We believe that the company is well positioned to continue to achieve growth driven by additional indications for its drugs, by increased use of existing drugs, and from international opportunities.
Take-Two Interactive Software, a publisher and distributor of video games, was also a contributor to performance during the period. Take-Two’s business is transitioning toward a greater mix-shift of digital games, which we think will drive higher margins over time. The company is also uniquely
2
Table of Contents
advantaged given that it controls its own content and is therefore not subject to high licensing fees. We believe Wall Street and the market are underestimating or incorrectly modeling (1) the unit potential of Red Dead Redemption 2 and Grand Theft Auto VI, (2) the potential for making money and retaining online players, and (3) the company’s operating leverage as it scales revenues and the digital mix grows as a percentage of overall revenue.
TripAdvisor, a travel website providing travel advice and planning features, was a detractor from performance during the period. Despite recent earnings disappointments, we believe the company had some positive underlying trends including revenue-per-shopper growth (online and mobile), monthly unique-visitor growth, and total click-based and transaction-based revenue growth. While the company’s monetization plans for its booking business have been slower than investors might have expected or hoped, we still believe the company has an undervalued asset of 400 million interested travelers that are worth more than recognized at the current depressed valuation.
Qualcomm, a leading intellectual property and fabless-semiconductor company, detracted from performance. In recent years, Qualcomm’s patent portfolio and its ability to collect royalties on those patents has been repeatedly attacked by various
entities worldwide. The stock had recovered in 2016 partly because investors believed most of these challenges were behind the company. However, given Apple’s most recent withholding of royalty payments, there will be an adjustment to Qualcomm’s total earnings. Considering the pattern of routine legal battles and increased risk in China, we decided to allocate capital elsewhere.
Nielsen Holdings, an information, data, and measurement company, also detracted from performance during the period. Negative market sentiment directed at consumer packaged goods (CPG) companies, a core customer base for Nielsen, has likely pressured the stock. With CPG companies cutting costs and marketing budgets, we think Nielsen is likely to be affected. Despite weakness in the CPG segment, we own Nielsen for its core ratings and measurement franchise in both traditional media and the Internet, both of which we believe are still performing well.
Regardless of the economic outcome, we remain consistent in our long-term investment philosophy: We want to own what we view as strong secular-growth companies with solid business models and competitive positions that we believe can grow market share and have the potential to deliver shareholder value in a variety of market environments.
3
Table of Contents
| Performance summary | ||||
| Delaware U.S. Growth Fund | October 31, 2017 |
The performance quoted represents past performance and does not guarantee future results. Investment return and principal value of an investment will fluctuate so that shares, when redeemed, may be worth more or less than their original cost. Current performance may be lower or higher than the performance data quoted. Performance data current to the most recent month end may be obtained by calling 800 523-1918 or visiting delawarefunds.com/performance.
Fund and benchmark performance1,2
|
| Average annual total returns through October 31, 2017
|
| |||||||||||||
| 1 year | 5 years | 10 years | Lifetime | |||||||||||||
Class A (Est. Dec. 3, 1993) | ||||||||||||||||
Excluding sales charge | +23.66% | +13.75% | +7.66% | +7.87% | ||||||||||||
Including sales charge | +16.56% | +12.41% | +7.02% | +7.60% | ||||||||||||
Class C (Est. May 23, 1994) | ||||||||||||||||
Excluding sales charge | +22.80% | +12.91% | +6.86% | +7.46% | ||||||||||||
Including sales charge | +21.80% | +12.91% | +6.86% | +7.46% | ||||||||||||
Class R (Est. June 2, 2003) | ||||||||||||||||
Excluding sales charge | +23.39% | +13.47% | +7.39% | +8.28% | ||||||||||||
Including sales charge | +23.39% | +13.47% | +7.39% | +8.28% | ||||||||||||
Institutional Class (Est. Feb. 3, 1994) | ||||||||||||||||
Excluding sales charge | +24.00% | +14.04% | +7.93% | +7.99% | ||||||||||||
Including sales charge | +24.00% | +14.04% | +7.93% | +7.99% | ||||||||||||
Class R6 (Est. May 2, 2016) | ||||||||||||||||
Excluding sales charge | +24.19% | n/a | n/a | +18.55% | ||||||||||||
Including sales charge | +24.19% | n/a | n/a | +18.55% | ||||||||||||
Russell 1000 Growth Index | +29.71% | +16.83% | +9.13% | +9.29%* | ||||||||||||
*The benchmark lifetime return is for Institutional Class share comparison only and is calculated using the last business day in the month of the Fund’s Institutional Class inception date.
1 Returns reflect the reinvestment of all distributions and are presented both with and without the applicable sales charges described below. Returns do not reflect the deduction of taxes the shareholder would pay on Fund distributions or redemptions of Fund shares.
Expense limitations were in effect for certain classes during some or all of the periods shown in the “Fund and benchmark performance” table. Expenses for each class are listed on the “Fund expense ratios” table on page 5. Performance would have been lower had expense limitations not been in effect.
Institutional Class shares are not subject to a sales charge and are offered for sale exclusively to
certain eligible investors. In addition, Institutional Class shares pay no distribution and service fee.
Class A shares are sold with a maximum front-end sales charge of 5.75%, and have an annual distribution and service fee of 0.25% of average daily net assets. Performance for Class A shares, excluding sales charges, assumes that no front-end sales charge applied.
Class C shares are sold with a contingent deferred sales charge of 1.00% if redeemed during the first 12 months. They are also subject to an annual distribution and service fee of 1.00% of average daily net assets. Performance for C shares, excluding sales charges, assumes either that
4
Table of Contents
contingent deferred sales charges did not apply or that the investment was not redeemed.
Class R shares are available only for certain retirement plan products. They are sold without a sales charge and have an annual distribution and service fee of 0.50% of average daily net assets.
Class R6 shares are available only to certain investors. In addition, Class R6 shares do not pay any service fees, sub-accounting fees, and/or sub-transfer agency fees to any brokers, dealers, or other financial intermediaries. Class R6 shares pay no distribution and service fee.
2 The Fund’s expense ratios, as described in the most recent prospectus, are disclosed in the following “Fund expense ratios” table. Please see the “Financial highlights” for the most recent expense ratios.
| Fund expense ratios | Class A | Class C | Class R | Institutional Class | Class R6 | |||||
Total annual operating expenses | 1.05% | 1.80% | 1.30% | 0.80% | 0.66% | |||||
(without fee waivers) | ||||||||||
Net expenses | 1.05% | 1.80% | 1.30% | 0.80% | 0.66% | |||||
(including fee waivers, if any) | ||||||||||
Type of waiver | n/a | n/a | n/a | n/a | n/a |
5
Table of Contents
| Performance summary | ||||
| Delaware U.S. Growth Fund |
Performance of a $10,000 Investment1
Average annual total returns from Oct. 31, 2007 through Oct. 31, 2017
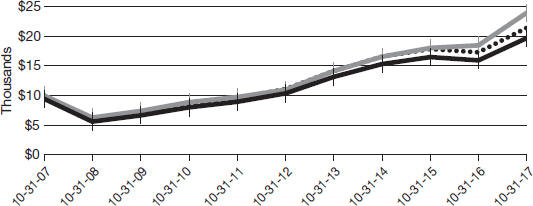
| For the period beginning Oct. 31, 2007 through Oct. 31, 2017 | Starting value | Ending value | ||||||||
 | Russell 1000 Growth Index | $10,000 | $23,965 | |||||||
 | Delaware U.S. Growth Fund — Institutional Class shares | $10,000 | $21,449 | |||||||
 | Delaware U.S. Growth Fund — Class A shares | $9,425 | $19,716 | |||||||
1 The “Performance of a $10,000 investment” graph assumes $10,000 invested in Institutional Class and Class A shares of the Fund on Oct. 31, 2007, and includes the effect of a 5.75% front-end sales charge (for Class A shares) and the reinvestment of all distributions. The graph does not reflect the deduction of taxes the shareholders would pay on Fund distributions or redemptions of Fund shares. Expense limitations were in effect for some or all of the periods shown. Performance would have been lower had expense limitations not been in effect. Expenses are listed in the “Fund expense ratios” table on page 5. Please note additional details on pages 4 through 7.
The graph also assumes $10,000 invested in the Russell 1000 Growth Index as of Oct. 31, 2007. The Russell 1000 Growth Index measures the performance of the large-cap growth segment of the US equity universe. It includes those Russell
1000 companies with higher price-to-book ratios and higher forecasted growth values.
Russell Investment Group is the source and owner of the trademarks, service marks, and copyrights related to the Russell Indexes. Russell® is a trademark of Russell Investment Group.
The MSCI Emerging Markets Index, mentioned on page 1, is a free float-adjusted market capitalization index designed to measure equity market performance across emerging market countries worldwide. Index “net” return approximates the minimum possible dividend reinvestment, after deduction of withholding tax at the highest possible rate.
The MSCI EAFE (Europe, Australasia, Far East) Index, mentioned on page 2, is a free float-adjusted market capitalization weighted index designed to measure equity market performance of developed markets, excluding the United States
6
Table of Contents
and Canada. Index “net” return approximates the minimum possible dividend reinvestment, after deduction of withholding tax at the highest possible rate.
The S&P 500 Index, mentioned on page 2, measures the performance of 500 mostly large-cap stocks weighted by market value, and is often used to represent performance of the US stock market.
The Dow Jones Industrial Average, mentioned on page 2, is an often-quoted market indicator that comprises 30 widely held US blue-chip stocks.
The University of Michigan Consumer Sentiment Index, mentioned on page 2, is a national survey
of consumer confidence conducted by the University of Michigan in 48 contiguous states and the District of Columbia. The index uses telephone surveys to gather information on the expectations regarding the overall economy of adult consumers from the age of 18 and up.
Index performance returns do not reflect any management fees, transaction costs, or expenses. Indices are unmanaged and one cannot invest directly in an index. Past performance is not a guarantee of future results.
Performance of other Fund classes will vary due to different charges and expenses.
| Nasdaq symbols | CUSIPs | |||||
Class A | DUGAX | 245917505 | ||||
Class C | DEUCX | 245917703 | ||||
Class R | DEURX | 245917711 | ||||
Institutional Class | DEUIX | 245917802 | ||||
Class R6 | DUZRX | 245917596 |
7
Table of Contents
| Disclosure of Fund expenses | ||||
| For the six-month period from May 1, 2017 to October 31, 2017 (Unaudited) |
As a shareholder of the Fund, you incur two types of costs: (1) transaction costs, including sales charges (loads) on purchase payments, reinvested dividends, or other distributions; redemption fees; and exchange fees; and (2) ongoing costs, including management fees; distribution and/or service (12b-1) fees; and other Fund expenses. This example is intended to help you understand your ongoing costs (in dollars) of investing in the Fund and to compare these costs with the ongoing costs of investing in other mutual funds.
The example is based on an investment of $1,000 invested at the beginning of the period and held for the entire six-month period from May 1, 2017 to Oct. 31, 2017.
Actual expenses
The first section of the table shown, “Actual Fund return,” provides information about actual account values and actual expenses. You may use the information in this section of the table, together with the amount you invested, to estimate the expenses that you paid over the period. Simply divide your account value by $1,000 (for example, an $8,600 account value divided by $1,000 = 8.6), then multiply the result by the number in the first section under the heading entitled “Expenses Paid During Period” to estimate the expenses you paid on your account during this period.
Hypothetical example for comparison purposes
The second section of the table shown, “Hypothetical 5% return,” provides information about hypothetical account values and hypothetical expenses based on the Fund’s actual expense ratio and an assumed rate of return of 5% per year before expenses, which is not the Fund’s actual return. The hypothetical account values and expenses may not be used to estimate the actual ending account balance or expenses you paid for the period. You may use this information to compare the ongoing costs of investing in the Fund and other funds. To do so, compare this 5% hypothetical example with the 5% hypothetical examples that appear in the shareholder reports of the other funds.
Please note that the expenses shown in the table are meant to highlight your ongoing costs only and do not reflect any transactional costs, such as sales charges (loads), redemption fees, or exchange fees. Therefore, the second section of the table is useful in comparing ongoing costs only, and will not help you determine the relative total costs of owning different funds. In addition, if these transactional costs were included, your costs would have been higher. The expenses shown in the table assume reinvestment of all dividends and distributions.
8
Table of Contents
| Delaware U.S. Growth Fund | ||||
| Expense analysis of an investment of $1,000 |
| Beginning Account Value 5/1/17 | Ending Account Value 10/31/17 | Annualized Expense Ratio | Expenses Paid During Period 5/1/17 to 10/31/17* | ||||||||||||||||
Actual Fund return† | ||||||||||||||||||||
Class A | $1,000.00 | $1,138.60 | 1.06 | % | $5.71 | |||||||||||||||
Class C | 1,000.00 | 1,134.70 | 1.81 | % | 9.74 | |||||||||||||||
Class R | 1,000.00 | 1,137.40 | 1.31 | % | 7.06 | |||||||||||||||
Institutional Class | 1,000.00 | 1,140.70 | 0.81 | % | 4.37 | |||||||||||||||
Class R6 | 1,000.00 | 1,141.40 | 0.67 | % | 3.62 | |||||||||||||||
Hypothetical 5% return (5% return before expenses) |
| |||||||||||||||||||
Class A | $1,000.00 | $1,019.86 | 1.06 | % | $5.40 | |||||||||||||||
Class C | 1,000.00 | 1,016.08 | 1.81 | % | 9.20 | |||||||||||||||
Class R | 1,000.00 | 1,018.60 | 1.31 | % | 6.67 | |||||||||||||||
Institutional Class | 1,000.00 | 1,021.12 | 0.81 | % | 4.13 | |||||||||||||||
Class R6 | 1,000.00 | 1,021.83 | 0.67 | % | 3.41 | |||||||||||||||
| * | “Expenses Paid During Period” are equal to the Fund’s annualized expense ratio, multiplied by the average account value over the period, multiplied by 184/365 (to reflect the one-half year period). |
| † | Because actual returns reflect only the most recent six-month period, the returns shown may differ significantly from fiscal year returns. |
9
Table of Contents
| Security type / sector allocation and top 10 equity holdings | ||
| Delaware U.S. Growth Fund | As of October 31, 2017 (Unaudited) | |
Sector designations may be different than the sector designations presented in other Fund materials. The sector designations may represent the investment manager’s internal sector classifications.
| Security type / sector | Percentage of net assets | ||||
Common Stock | 99.29 | % | |||
Consumer Discretionary | 9.82 | % | |||
Financials | 8.62 | % | |||
Healthcare | 17.04 | % | |||
Industrials | 5.24 | % | |||
Real Estate | 6.50 | % | |||
Technology | 52.07 | % | |||
Short-Term Investments | 0.90 | % | |||
Total Value of Securities | 100.19 | % | |||
Liabilities Net of Receivables and Other Assets | (0.19 | %) | |||
Total Net Assets | 100.00 | % | |||
| ² | Narrow industries are utilized for compliance purposes for diversification whereas broad sectors are used for financial reporting. |
To monitor compliance with the Fund’s concentration guidelines as described in the Fund’s prospectus and statement of additional information, the Technology sector (as disclosed herein for financial reporting purposes) is subdivided into a variety of “industries” (in accordance with the requirements of the Investment Company Act of 1940). The Technology sector consisted of commercial services, diversified financial services, Internet, semiconductors, and software. As of Oct. 31, 2017 such amounts, as a percentage of total net assets were 7.76%, 11.20%, 17.25%, 4.02%, and 11.84%, respectively. The percentage in any such single industry will comply with the Fund’s concentration policy even if the percentage in the Technology sector for financial reporting purposes may exceed 25%.
10
Table of Contents
Holdings are for informational purposes only and are subject to change at any time. They are not a recommendation to buy, sell, or hold any security.
| Top 10 equity holdings | Percentage of net assets | ||||
PayPal Holdings | 7.76 | % | |||
Microsoft | 6.37 | % | |||
Visa Class A | 6.05 | % | |||
Mastercard Class A | 5.15 | % | |||
Crown Castle International | 4.30 | % | |||
Biogen | 3.84 | % | |||
eBay | 3.76 | % | |||
Quintiles IMS Holdings | 3.70 | % | |||
Facebook Class A | 3.65 | % | |||
Celgene |
| 3.63
| %
| ||
11
Table of Contents
| Schedule of investments | ||||
| Delaware U.S. Growth Fund | October 31, 2017 |
| Number of shares | Value (US $) | ||||||
Common Stock – 99.29%² | ||||||||
Consumer Discretionary – 9.82% | ||||||||
Dollar General | 780,063 | $ | 63,060,293 | |||||
Liberty Global Class A † | 666,707 | 20,567,911 | ||||||
Liberty Global Class C † | 2,471,510 | 73,873,434 | ||||||
Liberty Interactive Corp. QVC Group Class A † | 3,454,581 | 78,488,080 | ||||||
TripAdvisor † | 1,599,357 | 59,975,888 | ||||||
|
| |||||||
| 295,965,606 | ||||||||
|
| |||||||
Financials – 8.62% | ||||||||
Charles Schwab | 2,099,043 | 94,121,087 | ||||||
CME Group | 435,197 | 59,695,972 | ||||||
Intercontinental Exchange | 1,599,867 | 105,751,209 | ||||||
|
| |||||||
| 259,568,268 | ||||||||
|
| |||||||
Healthcare – 17.04% | ||||||||
Allergan | 300,397 | 53,239,360 | ||||||
Biogen † | 371,300 | 115,719,358 | ||||||
Celgene † | 1,084,330 | 109,484,800 | ||||||
DENTSPLY SIRONA | 1,427,040 | 87,149,333 | ||||||
Illumina † | 176,987 | 36,315,963 | ||||||
Quintiles IMS Holdings † | 1,030,190 | 111,363,539 | ||||||
|
| |||||||
| 513,272,353 | ||||||||
|
| |||||||
Industrials – 5.24% | ||||||||
FedEx | 466,959 | 105,444,012 | ||||||
Nielsen Holdings | 1,418,416 | 52,580,681 | ||||||
|
| |||||||
| 158,024,693 | ||||||||
|
| |||||||
Real Estate – 6.50% | ||||||||
Crown Castle International | 1,210,799 | 129,652,357 | ||||||
Equinix | 142,556 | 66,074,706 | ||||||
|
| |||||||
| 195,727,063 | ||||||||
|
| |||||||
Technology – 52.07% | ||||||||
Alphabet Class A † | 113,696 | 117,452,516 | ||||||
Alphabet Class C † | 85,257 | 86,675,676 | ||||||
ASML Holding | 395,993 | 71,575,735 | ||||||
eBay † | 3,007,893 | 113,217,093 | ||||||
Electronic Arts † | 717,089 | 85,763,844 | ||||||
Facebook Class A † | 610,315 | 109,893,319 | ||||||
Mastercard Class A | 1,043,585 | 155,254,140 | ||||||
Microsoft | 2,306,006 | 191,813,579 | ||||||
NVIDIA | 239,053 | 49,438,551 | ||||||
PayPal Holdings † | 3,222,867 | 233,851,230 | ||||||
Symantec | 2,842,443 | 92,379,397 | ||||||
12
Table of Contents
| Number of shares | Value (US $) | ||||||
Common Stock² (continued) | ||||||||
Technology (continued) | ||||||||
Take-Two Interactive Software † | 714,370 | $ | 79,045,041 | |||||
Visa Class A | 1,657,121 | 182,250,168 | ||||||
|
| |||||||
| 1,568,610,289 | ||||||||
|
| |||||||
Total Common Stock (cost $2,320,957,656) | 2,991,168,272 | |||||||
|
| |||||||
| Principal amount° | |||||||
Short-Term Investments – 0.90% | ||||||||
Discount Notes – 0.67%≠ | ||||||||
Federal Home Loan Bank | 885,818 | 885,818 | ||||||
0.90% 11/6/17 | 2,435,800 | 2,435,461 | ||||||
0.96% 11/3/17 | 1,016,031 | 1,015,974 | ||||||
0.97% 11/15/17 | 1,336,883 | 1,336,362 | ||||||
1.005% 11/9/17 | 13,005,144 | 13,002,257 | ||||||
1.005% 11/13/17 | 1,654,598 | 1,654,047 | ||||||
|
| |||||||
| 20,329,919 | ||||||||
|
| |||||||
Repurchase Agreements – 0.23% | ||||||||
Bank of America Merrill Lynch 0.97%, dated 10/31/17, to be repurchased on 11/1/17, repurchase price $1,790,527 (collateralized by US government obligations 0.00%–9.00% 11/24/17–5/15/47; market value $1,826,290) | 1,790,479 | 1,790,479 | ||||||
BNP Paribas | 5,057,584 | 5,057,584 | ||||||
|
| |||||||
| 6,848,063 | ||||||||
|
| |||||||
Total Short-Term Investments (cost $27,178,014) | 27,177,982 | |||||||
|
| |||||||
Total Value of Securities – 100.19% | $ | 3,018,346,254 | ||||||
|
| |||||||
| ² | Narrow industries are utilized for compliance purposes for diversification whereas broad sectors are used for financial reporting. |
| ≠ | The rate shown is the effective yield at the time of purchase. |
| ° | Principal amount shown is stated in US dollars unless noted that the security is denominated in another currency. |
| † | Non-income producing security. |
See accompanying notes, which are an integral part of the financial statements.
13
Table of Contents
| Statement of assets and liabilities | ||||
| Delaware U.S. Growth Fund | October 31, 2017 |
Assets: | ||||
Investments, at value1 | $ | 2,991,168,272 | ||
Short-term investments, at value2 | 27,177,982 | |||
Receivable for fund shares sold | 3,093,929 | |||
Foreign tax reclaims receivable | 319,313 | |||
Dividends and interest receivable | 232,204 | |||
|
| |||
Total assets | 3,021,991,700 | |||
|
| |||
Liabilities: | ||||
Cash due to custodian | 1,235,161 | |||
Payable for fund shares redeemed | 4,973,809 | |||
Investment management fees payable to affiliates | 1,448,197 | |||
Other accrued expenses | 1,239,073 | |||
Administration fees payable | 199,522 | |||
Custody fees payable | 152,905 | |||
Distribution fees payable to affiliates | 94,634 | |||
Dividend disbursing and transfer agent fees and expenses payable to affiliates | 50,364 | |||
Audit and tax fees payable | 30,006 | |||
Accounting and administration expenses payable to affiliates | 10,056 | |||
Trustees’ fees and expenses payable | 7,433 | |||
Legal fees payable to affiliates | 4,398 | |||
Reports and statements to shareholders expenses payable to affiliates | 2,142 | |||
|
| |||
Total liabilities | 9,447,700 | |||
|
| |||
Total Net Assets | $ | 3,012,544,000 | ||
|
| |||
Net Assets Consist of: | ||||
Paid-in capital | $ | 2,033,129,849 | ||
Accumulated net realized gain on investments | 309,203,567 | |||
Net unrealized appreciation of investments | 670,210,584 | |||
|
| |||
Total Net Assets | $ | 3,012,544,000 | ||
|
| |||
14
Table of Contents
Net Asset Value | ||||
Class A: | ||||
Net assets | $ | 148,866,898 | ||
Shares of beneficial interest outstanding, unlimited authorization, no par | 5,644,393 | |||
Net asset value per share | $ | 26.37 | ||
Sales charge | 5.75 | % | ||
Offering price per share, equal to net asset value per share / (1 – sales charge) | $ | 27.98 | ||
Class C: | ||||
Net assets | $ | 64,233,019 | ||
Shares of beneficial interest outstanding, unlimited authorization, no par | 2,762,846 | |||
Net asset value per share | $ | 23.25 | ||
Class R: | ||||
Net assets | $ | 17,200,216 | ||
Shares of beneficial interest outstanding, unlimited authorization, no par | 676,964 | |||
Net asset value per share | $ | 25.41 | ||
Institutional Class: | ||||
Net assets | $ | 2,780,191,140 | ||
Shares of beneficial interest outstanding, unlimited authorization, no par | 97,692,128 | |||
Net asset value per share | $ | 28.46 | ||
Class R6: | ||||
Net assets | $ | 2,052,727 | ||
Shares of beneficial interest outstanding, unlimited authorization, no par | 72,034 | |||
Net asset value per share | $ | 28.50 | ||
| ||||
1Investments, at cost | $ | 2,320,957,656 | ||
2Short-term investments, at cost | 27,178,014 | |||
See accompanying notes, which are an integral part of the financial statements.
15
Table of Contents
| Statement of operations | ||||
| Delaware U.S. Growth Fund | Year ended October 31, 2017 |
Investment Income: | ||||
Dividends | $ | 20,697,500 | ||
Interest | 49,471 | |||
Foreign tax withheld | (59,697 | ) | ||
|
| |||
| 20,687,274 | ||||
|
| |||
Expenses: | ||||
Management fees | 15,709,238 | |||
Distribution expenses – Class A | 395,036 | |||
Distribution expenses – Class C | 695,375 | |||
Distribution expenses – Class R | 95,655 | |||
Dividend disbursing and transfer agent fees and expenses | 4,662,816 | |||
Accounting and administration expenses | 739,012 | |||
Custodian fees | 280,937 | |||
Registration fees | 252,066 | |||
Reports and statements to shareholders expenses | 193,091 | |||
Legal fees | 173,817 | |||
Trustees’ fees and expenses | 130,406 | |||
Audit and tax fees | 35,820 | |||
Other | 90,676 | |||
|
| |||
| 23,453,945 | ||||
Less expense paid indirectly | (1,919 | ) | ||
|
| |||
Total operating expenses | 23,452,026 | |||
|
| |||
Net Investment Loss | (2,764,752 | ) | ||
|
| |||
Net Realized and Unrealized Gain (Loss): | ||||
Net realized gain (loss) on: | ||||
Investments | 318,764,241 | |||
Foreign currencies | (46,946 | ) | ||
|
| |||
Net realized gain | 318,717,295 | |||
Net change in unrealized appreciation (depreciation) of investments | 281,309,238 | |||
|
| |||
Net Realized and Unrealized Gain | 600,026,533 | |||
|
| |||
Net Increase in Net Assets Resulting from Operations | $ | 597,261,781 | ||
|
| |||
See accompanying notes, which are an integral part of the financial statements.
16
Table of Contents
This page intentionally left blank.
Table of Contents
| Statements of changes in net assets | ||||
| Delaware U.S. Growth Fund |
| Year ended | ||||||||
| 10/31/17 | 10/31/16 | |||||||
Increase (Decrease) in Net Assets from Operations: | ||||||||
Net investment income (loss) | $ | (2,764,752 | ) | $ | 4,619,143 | |||
Net realized gain | 318,717,295 | 185,917,740 | ||||||
Net change in unrealized appreciation (depreciation) | 281,309,238 | (323,055,528 | ) | |||||
|
|
|
| |||||
Net increase (decrease) in net assets resulting from operations | 597,261,781 | (132,518,645 | ) | |||||
|
|
|
| |||||
Dividends and Distributions to Shareholders from: | ||||||||
Net investment income: | ||||||||
Class A | — | (921,459 | ) | |||||
Class R | — | (13,766 | ) | |||||
Institutional Class | (4,320,824 | ) | (16,120,751 | ) | ||||
Class R6 | (353 | ) | — | |||||
Net realized gain: | ||||||||
Class A | (12,628,512 | ) | (35,792,419 | ) | ||||
Class C | (6,105,441 | ) | (12,944,785 | ) | ||||
Class R | (1,577,029 | ) | (3,126,010 | ) | ||||
Institutional Class | (165,799,057 | ) | (335,129,980 | ) | ||||
Class R6 | (8,818 | ) | — | |||||
|
|
|
| |||||
| (190,440,034 | ) | (404,049,170 | ) | |||||
|
|
|
| |||||
Capital Share Transactions: | ||||||||
Proceeds from shares sold: | ||||||||
Class A | 20,520,887 | 59,153,539 | ||||||
Class C | 4,237,808 | 11,249,109 | ||||||
Class R | 3,429,606 | 6,270,010 | ||||||
Institutional Class | 1,119,023,497 | 628,137,564 | ||||||
Class R6 | 17,005,462 | 2,000 | ||||||
Net asset value of shares issued upon reinvestment of dividends and distributions: | ||||||||
Class A | 12,332,480 | 35,873,416 | ||||||
Class C | 5,938,501 | 12,574,496 | ||||||
Class R | 1,576,018 | 3,135,456 | ||||||
Institutional Class | 167,203,248 | 344,353,506 | ||||||
Class R6 | 9,171 | — | ||||||
|
|
|
| |||||
| 1,351,276,678 | 1,100,749,096 | |||||||
|
|
|
| |||||
18
Table of Contents
| Year ended | ||||||||
| 10/31/17 | 10/31/16 | |||||||
Capital Share Transactions (continued): | ||||||||
Cost of shares redeemed: | ||||||||
Class A | $ | (103,806,821 | ) | $ | (257,972,394 | ) | ||
Class C | (34,239,932 | ) | (32,522,415 | ) | ||||
Class R | (11,503,839 | ) | (11,732,609 | ) | ||||
Institutional Class | (1,417,578,844 | ) | (1,224,789,738 | ) | ||||
Class R6 | (17,103,573 | ) | — | |||||
|
|
|
| |||||
| (1,584,233,009 | ) | (1,527,017,156 | ) | |||||
|
|
|
| |||||
Decrease in net assets derived from capital share transactions | (232,956,331 | ) | (426,268,060 | ) | ||||
|
|
|
| |||||
Net Increase (Decrease) in Net Assets | 173,865,416 | (962,835,875 | ) | |||||
Net Assets: | ||||||||
Beginning of year | 2,838,678,584 | 3,801,514,459 | ||||||
|
|
|
| |||||
End of year | $ | 3,012,544,000 | $ | 2,838,678,584 | ||||
|
|
|
| |||||
Undistributed net investment income | $ | — | $ | 2,864,139 | ||||
|
|
|
| |||||
See accompanying notes, which are an integral part of the financial statements.
19
Table of Contents
| Financial highlights | ||||
| Delaware U.S. Growth Fund Class A |
Selected data for each share of the Fund outstanding throughout each period were as follows:
Net asset value, beginning of period |
Income (loss) from investment operations: |
Net investment income (loss)1 |
Net realized and unrealized gain (loss) |
Total from investment operations. |
Less dividends and distributions from: |
Net investment income |
Net realized gain |
Total dividends and distributions |
Net asset value, end of period |
Total return2 |
Ratios and supplemental data: |
Net assets, end of period (000 omitted) |
Ratio of expenses to average net assets |
Ratio of expenses to average net assets prior to fees waived3 |
Ratio of net investment income (loss) to average net assets |
Ratio of net investment income (loss) to average net assets prior to fees waived3 |
Portfolio turnover |
| 1 | The average shares outstanding method has been applied for per share information. |
| 2 | Total investment return is based on the change in net asset value of a share during the period and assumes reinvestment of dividends and distributions at net asset value and does not reflect the impact of a sales charge. Total investment return during some of the periods shown reflects waivers by the manager and/or distributor. Performance would have been lower had the waivers not been in effect. |
| 3 | Expenses paid indirectly were not material and had no impact on the ratios disclosed. Expenses paid indirectly for the year ended Oct. 31, 2017 are reflected on the “Statement of operations.” |
See accompanying notes, which are an integral part of the financial statements.
20
Table of Contents
Year ended | ||||||||||||||||||||
| 10/31/17 | 10/31/16 | 10/31/15 | 10/31/14 | 10/31/13 | ||||||||||||||||
| $ | 22.99 | $ | 26.84 | $ | 25.66 | $ | 21.97 | $ | 17.31 | |||||||||||
| (0.07 | ) | (0.01 | ) | 0.07 | 0.06 | (0.01 | ) | |||||||||||||
| 5.10 | (0.81 | ) | 1.87 | 3.63 | 4.67 | |||||||||||||||
|
|
|
|
|
|
|
|
|
| |||||||||||
| 5.03 | (0.82 | ) | 1.94 | 3.69 | 4.66 | |||||||||||||||
|
|
|
|
|
|
|
|
|
| |||||||||||
| — | (0.08 | ) | (0.06 | ) | — | — | ||||||||||||||
| (1.65 | ) | (2.95 | ) | (0.70 | ) | — | — | |||||||||||||
|
|
|
|
|
|
|
|
|
| |||||||||||
| (1.65 | ) | (3.03 | ) | (0.76 | ) | — | — | |||||||||||||
|
|
|
|
|
|
|
|
|
| |||||||||||
| $ | 26.37 | $ | 22.99 | $ | 26.84 | $ | 25.66 | $ | 21.97 | |||||||||||
|
|
|
|
|
|
|
|
|
| |||||||||||
| 23.66% | (3.48% | ) | 7.63% | 16.80% | 26.92% | |||||||||||||||
| $ | 148,867 | $ | 200,191 | $ | 412,893 | $ | 351,388 | $ | 290,303 | |||||||||||
| 1.06% | 1.05% | 1.05% | 1.06% | 1.09% | ||||||||||||||||
| 1.06% | 1.05% | 1.05% | 1.06% | 1.13% | ||||||||||||||||
| (0.31% | ) | (0.06% | ) | 0.26% | 0.26% | (0.06% | ) | |||||||||||||
| (0.31% | ) | (0.06% | ) | 0.26% | 0.26% | (0.10% | ) | |||||||||||||
| 43% | 22% | 40% | 25% | 23% | ||||||||||||||||
21
Table of Contents
| Financial highlights | ||||
| Delaware U.S. Growth Fund Class C |
Selected data for each share of the Fund outstanding throughout each period were as follows:
Net asset value, beginning of period |
Income (loss) from investment operations: |
Net investment loss1 |
Net realized and unrealized gain (loss) |
Total from investment operations |
Less dividends and distributions from: |
Net realized gain |
Total dividends and distributions |
Net asset value, end of period |
Total return2 |
Ratios and supplemental data: |
Net assets, end of period (000 omitted) |
Ratio of expenses to average net assets |
Ratio of expenses to average net assets prior to fees waived3 |
Ratio of net investment loss to average net assets |
Ratio of net investment loss to average net assets prior to fees waived3 |
Portfolio turnover |
| 1 | The average shares outstanding method has been applied for per share information. |
| 2 | Total investment return is based on the change in net asset value of a share during the period and assumes reinvestment of dividends and distributions at net asset value and does not reflect the impact of a sales charge. Total investment return during some of the periods shown reflects a waiver by the manager. Performance would have been lower had the waiver not been in effect. |
| 3 | Expenses paid indirectly were not material and had no impact on the ratios disclosed. Expenses paid indirectly for the year ended Oct. 31, 2017 are reflected on the “Statement of operations.” |
See accompanying notes, which are an integral part of the financial statements.
22
Table of Contents
| Year ended | ||||||||||||||||||||
| 10/31/17 | 10/31/16 | 10/31/15 | 10/31/14 | 10/31/13 | ||||||||||||||||
| $ | 20.60 | $ | 24.46 | $ | 23.56 | $ | 20.33 | $ | 16.13 | |||||||||||
| (0.22 | ) | (0.17 | ) | (0.12 | ) | (0.11 | ) | (0.15 | ) | |||||||||||
| 4.52 | (0.74 | ) | 1.72 | 3.34 | 4.35 | |||||||||||||||
|
|
|
|
|
|
|
|
|
| |||||||||||
| 4.30 | (0.91 | ) | 1.60 | 3.23 | 4.20 | |||||||||||||||
|
|
|
|
|
|
|
|
|
| |||||||||||
| (1.65 | ) | (2.95 | ) | (0.70 | ) | — | — | |||||||||||||
|
|
|
|
|
|
|
|
|
| |||||||||||
| (1.65 | ) | (2.95 | ) | (0.70 | ) | — | — | |||||||||||||
|
|
|
|
|
|
|
|
|
| |||||||||||
| $ | 23.25 | $ | 20.60 | $ | 24.46 | $ | 23.56 | $ | 20.33 | |||||||||||
|
|
|
|
|
|
|
|
|
| |||||||||||
| 22.80% | (4.24% | ) | 6.86% | 15.89% | 26.04% | |||||||||||||||
| $ | 64,233 | $ | 80,537 | $ | 106,775 | $ | 90,104 | $ | 67,898 | |||||||||||
| 1.81% | 1.80% | 1.80% | 1.81% | 1.84% | ||||||||||||||||
| 1.81% | 1.80% | 1.80% | 1.81% | 1.84% | ||||||||||||||||
| (1.06% | ) | (0.81% | ) | (0.49% | ) | (0.49% | ) | (0.81% | ) | |||||||||||
| (1.06% | ) | (0.81% | ) | (0.49% | ) | (0.49% | ) | (0.81% | ) | |||||||||||
| 43% | 22% | 40% | 25% | 23% | ||||||||||||||||
23
Table of Contents
| Financial highlights | ||||
| Delaware U.S. Growth Fund Class R |
Selected data for each share of the Fund outstanding throughout each period were as follows:
Net asset value, beginning of period |
Income (loss) from investment operations: |
Net investment income (loss)1 |
Net realized and unrealized gain (loss) |
Total from investment operations. |
Less dividends and distributions from: |
Net investment income |
Net realized gain |
Total dividends and distributions |
Net asset value, end of period |
Total return3 |
Ratios and supplemental data: |
Net assets, end of period (000 omitted) |
Ratio of expenses to average net assets |
Ratio of expenses to average net assets prior to fees waived4 |
Ratio of net investment income (loss) to average net assets |
Ratio of net investment income (loss) to average net assets prior to fees waived4 |
Portfolio turnover |
| 1 | The average shares outstanding method has been applied for per share information. |
| 2 | The amount is less than $0.005 per share. |
| 3 | Total investment return is based on the change in net asset value of a share during the period and assumes reinvestment of dividends and distributions at net asset value. Total investment return during some of the periods shown reflects waivers by the manager and/or distributor. Performance would have been lower had the waivers not been in effect. |
| 4 | Expenses paid indirectly were not material and had no impact on the ratios disclosed. Expenses paid indirectly for the year ended Oct. 31, 2017 are reflected on the “Statement of operations.” |
See accompanying notes, which are an integral part of the financial statements.
24
Table of Contents
| Year ended | ||||||||||||||||||||
| 10/31/17 | 10/31/16 | 10/31/15 | 10/31/14 | 10/31/13 | ||||||||||||||||
| $ | 22.26 | $ | 26.08 | $ | 24.96 | $ | 21.43 | $ | 16.92 | |||||||||||
| (0.13 | ) | (0.07 | ) | — | 2 | — | 2 | (0.06 | ) | |||||||||||
| 4.93 | (0.79 | ) | 1.82 | 3.53 | 4.57 | |||||||||||||||
|
|
|
|
|
|
|
|
|
| |||||||||||
| 4.80 | (0.86 | ) | 1.82 | 3.53 | 4.51 | |||||||||||||||
|
|
|
|
|
|
|
|
|
| |||||||||||
| — | (0.01 | ) | — | — | — | |||||||||||||||
| (1.65 | ) | (2.95 | ) | (0.70 | ) | — | — | |||||||||||||
|
|
|
|
|
|
|
|
|
| |||||||||||
| (1.65 | ) | (2.96 | ) | (0.70 | ) | — | — | |||||||||||||
|
|
|
|
|
|
|
|
|
| |||||||||||
| $ | 25.41 | $ | 22.26 | $ | 26.08 | $ | 24.96 | $ | 21.43 | |||||||||||
|
|
|
|
|
|
|
|
|
| |||||||||||
| 23.39% | (3.72% | ) | 7.36% | 16.47% | 26.66% | |||||||||||||||
| $ | 17,200 | $ | 21,358 | $ | 27,920 | $ | 27,053 | $ | 23,815 | |||||||||||
| 1.31% | 1.30% | 1.30% | 1.31% | 1.34% | ||||||||||||||||
| 1.31% | 1.30% | 1.30% | 1.31% | 1.43% | ||||||||||||||||
| (0.56% | ) | (0.31% | ) | 0.01% | 0.01% | (0.31% | ) | |||||||||||||
| (0.56% | ) | (0.31% | ) | 0.01% | 0.01% | (0.40% | ) | |||||||||||||
| 43% | 22% | 40% | 25% | 23% | ||||||||||||||||
25
Table of Contents
| Financial highlights | ||||
| Delaware U.S. Growth Fund Institutional Class |
Selected data for each share of the Fund outstanding throughout each period were as follows:
Net asset value, beginning of period |
Income (loss) from investment operations: |
Net investment income (loss)1 |
Net realized and unrealized gain (loss) |
Total from investment operations. |
Less dividends and distributions from: |
Net investment income |
Net realized gain |
Total dividends and distributions |
Net asset value, end of period |
Total return2 |
Ratios and supplemental data: |
Net assets, end of period (000 omitted) |
Ratio of expenses to average net assets |
Ratio of expenses to average net assets prior to fees waived3 |
Ratio of net investment income (loss) to average net assets |
Ratio of net investment income (loss) to average net assets prior to fees waived3 |
Portfolio turnover |
| 1 | The average shares outstanding method has been applied for per share information. |
| 2 | Total investment return is based on the change in net asset value of a share during the period and assumes reinvestment of dividends and distributions at net asset value. Total investment return during some of the periods shown reflects a waiver by the manager. Performance would have been lower had the waiver not been in effect. |
| 3 | Expenses paid indirectly were not material and had no impact on the ratios disclosed. Expenses paid indirectly for the year ended Oct. 31, 2017 are reflected on the “Statement of operations.” |
See accompanying notes, which are an integral part of the financial statements.
26
Table of Contents
| Year ended | ||||||||||||||||||||
| 10/31/17 | 10/31/16 | 10/31/15 | 10/31/14 | 10/31/13 | ||||||||||||||||
| $ | 24.66 | $ | 28.57 | $ | 27.26 | $ | 23.31 | $ | 18.34 | |||||||||||
| (0.02 | ) | 0.05 | 0.14 | 0.13 | 0.04 | |||||||||||||||
| 5.51 | (0.87 | ) | 1.99 | 3.84 | 4.96 | |||||||||||||||
|
|
|
|
|
|
|
|
|
| |||||||||||
| 5.49 | (0.82 | ) | 2.13 | 3.97 | 5.00 | |||||||||||||||
|
|
|
|
|
|
|
|
|
| |||||||||||
| (0.04 | ) | (0.14 | ) | (0.12 | ) | (0.02 | ) | (0.03 | ) | |||||||||||
| (1.65 | ) | (2.95 | ) | (0.70 | ) | — | — | |||||||||||||
|
|
|
|
|
|
|
|
|
| |||||||||||
| (1.69 | ) | (3.09 | ) | (0.82 | ) | (0.02 | ) | (0.03 | ) | |||||||||||
|
|
|
|
|
|
|
|
|
| |||||||||||
| $ | 28.46 | $ | 24.66 | $ | 28.57 | $ | 27.26 | $ | 23.31 | |||||||||||
|
|
|
|
|
|
|
|
|
| |||||||||||
| 24.00% | (3.24% | ) | 7.90% | 17.04% | 27.29% | |||||||||||||||
| $ | 2,780,191 | $ | 2,536,591 | $ | 3,253,926 | $ | 2,983,439 | $ | 2,203,909 | |||||||||||
| 0.81% | 0.80% | 0.80% | 0.81% | 0.84% | ||||||||||||||||
| 0.81% | 0.80% | 0.80% | 0.81% | 0.84% | ||||||||||||||||
| (0.06% | ) | 0.19% | 0.51% | 0.51% | 0.19% | |||||||||||||||
| (0.06% | ) | 0.19% | 0.51% | 0.51% | 0.19% | |||||||||||||||
| 43% | 22% | 40% | 25% | 23% | ||||||||||||||||
27
Table of Contents
| Financial highlights | ||||
| Delaware U.S. Growth Fund Class R6 |
Selected data for each share of the Fund outstanding throughout each period were as follows:
| Year ended 10/31/17 | 5/2/161 to 10/31/16 | |||||||
Net asset value, beginning of period | $ | 24.68 | $ | 23.75 | ||||
Income from investment operations: | ||||||||
Net investment income2 | 0.02 | 0.04 | ||||||
Net realized and unrealized gain | 5.52 | 0.89 | ||||||
|
|
|
| |||||
Total from investment operations | 5.54 | 0.93 | ||||||
|
|
|
| |||||
Less dividends and distributions from: | ||||||||
Net investment income | (0.07 | ) | — | |||||
Net realized gain | (1.65 | ) | — | |||||
|
|
|
| |||||
Total dividends and distributions | (1.72 | ) | — | |||||
|
|
|
| |||||
Net asset value, end of period | $ | 28.50 | $ | 24.68 | ||||
|
|
|
| |||||
Total return3 | 24.19% | 3.92% | ||||||
Ratios and supplemental data: | ||||||||
Net assets, end of period (000 omitted) | $ | 2,053 | $ | 2 | ||||
Ratio of expenses to average net assets4 | 0.67% | 0.66% | ||||||
Ratio of net investment income to average net assets4 | 0.08% | 0.34% | ||||||
Portfolio turnover. | 43% | 22% | 5 | |||||
| 1 | Date of commencement of operations; ratios have been annualized and total return has not been annualized. |
| 2 | The average shares outstanding method has been applied for per share information. |
| 3 | Total investment return is based on the change in a net asset value of a share during the period and assumes reinvestment of dividends and distributions at net asset value. |
| 4 | Expenses paid indirectly were not material and had no impact on the ratios disclosed. Expenses paid indirectly for the year ended Oct. 31, 2017 are reflected on the “Statement of operations.” |
| 5 | Portfolio turnover is representative of the Fund for the entire year ended Oct. 31, 2016. |
See accompanying notes, which are an integral part of the financial statements.
28
Table of Contents
| Notes to financial statements | ||||
| Delaware U.S. Growth Fund | October 31, 2017 |
Delaware Group® Adviser Funds (Trust) is organized as a Delaware statutory trust and offers three series: Delaware Diversified Income Fund, Delaware Global Real Estate Opportunities Fund, and Delaware U.S. Growth Fund. These financial statements and the related notes pertain to Delaware U.S. Growth Fund (Fund). The Trust is an open-end investment company. The Fund is considered diversified under the Investment Company Act of 1940 as amended, and offers Class A, Class C, Class R, Institutional Class, and Class R6 shares. Class A shares are sold with a maximum front-end sales charge of 5.75%. Class A share purchases of $1,000,000 or more will incur a contingent deferred sales charge (CDSC) instead of a front-end sales charge of 1.00% if redeemed during the first year, and 0.50% during the second year, provided that Delaware Distributors, L.P. (DDLP) paid a financial advisor a commission on the purchase of those shares. Class C shares are sold with a CDSC of 1.00%, if redeemed during the first 12 months. Class R, Institutional Class, and Class R6 shares are not subject to a sales charge and are offered for sale exclusively to certain eligible investors. In addition, Class R6 shares do not pay any service fees, sub-accounting fees, and/or sub-transfer agency fees to any brokers, dealers, or other financial intermediaries.
The investment objective of the Fund is to seek long-term capital appreciation by investing in equity securities of companies believed to have the potential for sustainable free cash flow growth.
1. Significant Accounting Policies
The following accounting policies are in accordance with US generally accepted accounting principles (US GAAP) and are consistently followed by the Fund.
Security Valuation – Equity securities, except those traded on the Nasdaq Stock Market LLC (Nasdaq), are valued at the last quoted sales price as of the time of the regular close of the New York Stock Exchange on the valuation date. Equity securities traded on the Nasdaq are valued in accordance with the Nasdaq Official Closing Price, which may not be the last sales price. If, on a particular day, an equity security does not trade, the mean between the bid and ask prices will be used, which approximates fair value. US government and agency securities are valued at the mean between the bid and ask prices, which approximates fair value. Generally, other securities and assets for which market quotations are not readily available are valued at fair value as determined in good faith under the direction of the Trust’s Board of Trustees (Board). In determining whether market quotations are readily available or fair valuation will be used, various factors will be taken into consideration, such as market closures or suspension of trading in a security. The foregoing valuation policies apply to restricted and unrestricted securities.
Federal Income Taxes – No provision for federal income taxes has been made as the Fund intends to continue to qualify for federal income tax purposes as a regulated investment company under Subchapter M of the Internal Revenue Code of 1986, as amended, and make the requisite distributions to shareholders. The Fund evaluates tax positions taken or expected to be taken in the course of preparing the Fund’s tax returns to determine whether the tax positions are “more-likely-than-not” of being sustained by the applicable tax authority. Tax positions not deemed to meet the “more-likely-than-not” threshold are recorded as a tax benefit or expense in the current year. Management has analyzed the Fund’s tax positions taken or to be taken on the Fund’s federal income tax returns through the year ended Oct. 31, 2017 and for all open tax years (years ended Oct. 31, 2014–Oct. 31, 2016), and has concluded that no provision for federal income tax is required in the Fund’s financial statements. If
29
Table of Contents
| Notes to financial statements | ||||
| Delaware U.S. Growth Fund |
1. Significant Accounting Policies (continued)
applicable, the Fund recognizes interest accrued on unrecognized tax benefits in interest expense and penalties in other expenses on the “Statement of operations.” During the year ended Oct. 31, 2017, the Fund did not incur any interest or tax penalties.
Class Accounting – Investment income, common expenses, and realized and unrealized gain (loss) on investments are allocated to the various classes of the Fund on the basis of daily net assets of each class. Distribution expenses relating to a specific class are charged directly to that class. Class R6 shares will not be allocated any expenses related to service fees, sub-accounting fees, and/or sub-transfer agency fees paid to brokers, dealers, or other financial intermediaries.
Repurchase Agreements – The Fund may purchase certain US government securities subject to the counterparty’s agreement to repurchase them at an agreed upon date and price. The counterparty will be required on a daily basis to maintain the value of the collateral subject to the agreement at not less than the repurchase price (including accrued interest). The agreements are conditioned upon the collateral being deposited under the Federal Reserve book-entry system with the Fund’s custodian or a third-party sub-custodian. In the event of default or bankruptcy by the other party to the agreement, retention of the collateral may be subject to legal proceedings. All open repurchase agreements as of the date of this report were entered into on Oct. 31, 2017, and matured on the next business day.
Foreign Currency Transactions – Transactions denominated in foreign currencies are recorded at the prevailing exchange rates on the valuation date in accordance with the Fund’s prospectus. The value of all assets and liabilities denominated in foreign currencies is translated daily into US dollars at the exchange rate of such currencies against the US dollar. Transaction gains or losses resulting from changes in exchange rates during the reporting period or upon settlement of the foreign currency transaction are reported in operations for the current period. The Fund generally does not bifurcate that portion of realized gains and losses on investments which is due to changes in foreign exchange rates from that which is due to changes in market prices. These gains and losses are included on the “Statement of operations” under “Net realized gain (loss) on investments.” The Fund reports certain foreign currency related transactions as components of realized gains (losses) for financial reporting purposes, whereas such components are treated as ordinary income (loss) for federal income tax purposes.
Use of Estimates – The Fund is an investment company, whose financial statements are prepared in conformity with US GAAP. Therefore, the Fund follows the accounting and reporting guidelines for investment companies. The preparation of financial statements in conformity with US GAAP requires management to make estimates and assumptions that affect the fair value of investments, the reported amounts of assets and liabilities and disclosure of contingent assets and liabilities at the date of the financial statements, and the reported amounts of revenues and expenses during the reporting period. Actual results could differ from those estimates and the differences could be material.
Other – Expenses directly attributable to the Fund are charged directly to the Fund. Other expenses common to various funds within the Delaware FundsSM by Macquarie (Delaware Funds) are generally allocated among such funds on the basis of average net assets. Management fees and certain other expenses are paid monthly. Security transactions are recorded on the date the securities are purchased or sold (trade date) for financial reporting purposes. Costs used in calculating realized gains and losses
30
Table of Contents
on the sale of investment securities are those of the specific securities sold. Dividend income is recorded on the ex-dividend date and interest income is recorded on the accrual basis. Discounts and premiums on debt securities are accreted or amortized to interest income, respectively, over the lives of the respective securities using the effective interest method. Foreign dividends are also recorded on the ex-dividend date or as soon after the ex-dividend date that the Fund is aware of such dividends, net of all tax withholdings, a portion of which may be reclaimable. Withholding taxes and reclaims on foreign dividends have been recorded in accordance with the Fund’s understanding of the applicable country’s tax rules and rates. The Fund declares and pays dividends from net investment income and distributions from net realized gain on investments, if any, annually. The Fund may distribute more frequently, if necessary for tax purposes. Dividends and distributions, if any, are recorded on the ex-dividend date.
Subject to seeking best execution, the Fund may direct certain security trades to brokers who have agreed to rebate a portion of the related brokerage commission to the Fund in cash. In general, best execution refers to many factors, including the price paid or received for a security, the commission charged, the promptness and reliability of execution, the confidentiality and placement accorded the order, and other factors affecting the overall benefit obtained by the Fund on the transaction. There were no commission rebates for the year ended Oct. 31, 2017.
The Fund may receive earnings credits from its custodian when positive cash balances are maintained, which may be used to offset custody fees. There were no such earnings credits for the year ended Oct. 31, 2017.
The Fund receives earnings credits from its transfer agent when positive cash balances are maintained, which may be used to offset transfer agent fees. If the amount earned is greater than $1, the expense paid under this arrangement is included on the “Statement of operations” under “Dividend disbursing and transfer agent fees and expenses” with the corresponding expense offset shown under “Less expense paid indirectly.” For the year ended Oct. 31, 2017, the Fund earned $1,919 under this agreement.
2. Investment Management, Administration Agreements, and Other Transactions with Affiliates
In accordance with the terms of its investment management agreement, the Fund pays Delaware Management Company (DMC), a series of Macquarie Investment Management Business Trust (formerly, Delaware Management Business Trust) and the investment manager, an annual fee which is calculated daily and paid monthly at the rate of 0.65% on the first $500 million of average daily net assets of the Fund, 0.60% on the next $500 million, 0.55% on the next $1.5 billion, and 0.50% on average daily net assets in excess of $2.5 billion.
Jackson Square Partners, LLC (JSP), a related party of DMC, furnishes investment sub-advisory services to the Fund. Effective Jan. 1, 2017, For these services, DMC, not the Fund, pays JSP fees based on the aggregate average daily net assets of the Fund at the following annual rate: 0.39% of the first $500 million; 0.36% of the next $500 million; 0.33% of the next $1.5 billion; and 0.30% of aggregate average daily net assets in excess of $2.5 billion. Prior to Jan. 1, 2017, DMC paid JSP fees based on the aggregate average daily net assets of the Fund at the following annual rate: 0.325% of the first $500 million; 0.300% of the next $500 million; 0.275% of the next $1.5 billion; and 0.250% of aggregate average daily net assets in excess of $2.5 billion.
31
Table of Contents
| Notes to financial statements | ||||
| Delaware U.S. Growth Fund |
2. Investment Management, Administration Agreements, and Other Transactions with Affiliates (continued)
Delaware Investments Fund Services Company (DIFSC), an affiliate of DMC, provides fund accounting and financial administration oversight services to the Fund. For these services, DIFSC’s fees were calculated daily and paid monthly based on the aggregate daily net assets of the Delaware Funds from Nov. 1, 2016 through Aug. 31, 2017 at the following annual rate: 0.0050% of the first $30 billion; 0.0045% of the next $10 billion; 0.0040% of the next $10 billion; and 0.0025% of aggregate average daily net assets in excess of $50 billion. The fees payable to DIFSC under the service agreement described above were allocated among all funds in the Delaware Funds on a relative net asset value (NAV) basis. Effective Sept. 1, 2017, the Fund entered into an amendment to DIFSC agreement. Under the amendment to the DIFSC agreement, DIFSC’s fees are calculated daily and paid monthly based on the aggregate daily net assets of the Delaware Funds at the following annual rate: 0.00475% of the first $35 billion; 0.0040% of the next $10 billion; and 0.0025% of aggregate average daily net assets in excess of $45 billion (Total Fee). Each Fund in the Delaware Funds pays a minimum of $4,000, which, in aggregate, is subtracted from the Total Fee. Each Fund in the Delaware Funds then pays its relative portion of the remainder of the Total Fee on a relative NAV basis. For the year ended Oct. 31, 2017, the Fund was charged $123,754 for these services. This amount is included on the “Statement of operations” under “Accounting and administration expenses.”
DIFSC is also the transfer agent and dividend disbursing agent of the Fund. For these services, DIFSC’s fees are calculated daily and paid monthly based on the aggregate daily net assets of the retail funds within the Delaware Funds at the following annual rate: 0.025% of the first $20 billion; 0.020% of the next $5 billion; 0.015% of the next $5 billion; and 0.013% of average daily net assets in excess of $30 billion. The fees payable to DIFSC under the service agreement described above are allocated among all retail funds in the Delaware Funds on a relative NAV basis. This amount is included on the “Statement of operations” under “Dividend disbursing and transfer agent fees and expenses.” For the year ended Oct. 31, 2017, the Fund was charged $545,651 for these services. Pursuant to a sub-transfer agency agreement between DIFSC and BNY Mellon Investment Servicing (US) Inc. (BNYMIS), BNYMIS provides certain sub-transfer agency services to the Fund. Sub-transfer agency fees are paid by the Fund and are also included on the “Statement of operations” under “Dividend disbursing and transfer agent fees and expenses.”
Pursuant to a distribution agreement and distribution plan, the Fund pays DDLP, the distributor and an affiliate of DMC, an annual distribution and service (12b-1) fee of 0.25% of the average daily net assets of the Class A shares, 1.00% of the average daily net assets of the Class C shares, and 0.50% of the average daily net assets of the Class R shares. The fees are calculated daily and paid monthly. Institutional Class and Class R6 shares pay no 12b-1 fees.
As provided in the investment management agreement, the Fund bears a portion of the cost of certain resources shared with DMC, including the cost of internal personnel of DMC and/or its affiliates that provide legal, tax, and regulatory reporting services to the Fund. For the year ended Oct. 31, 2017, the Fund was charged $56,363 for internal legal, tax, and regulatory reporting services provided by DMC and/or its affiliates’ employees. This amount is included on the “Statement of operations” under “Legal fees.”
32
Table of Contents
For the year ended Oct. 31, 2017, DDLP earned $20,673 for commissions on sales of the Fund’s Class A shares. For the year ended Oct. 31, 2017, DDLP received gross CDSC commissions of $22,866 and $4,349 on redemption of the Fund’s Class A and Class C shares, respectively, and these commissions were entirely used to offset up-front commissions previously paid by DDLP to broker/dealers on sales of those shares.
Trustees’ fees include expenses accrued by the Fund for each Trustee’s retainer and meeting fees. Certain officers of DMC, DIFSC, and DDLP are officers and/or Trustees of the Trust. These officers and Trustees are paid no compensation by the Fund.
3. Investments
For the year ended Oct. 31, 2017, the Fund made purchases and sales of investment securities other than short-term investments as follows:
Purchases | $ | 1,186,194,716 | ||
Sales | 1,629,702,331 |
At Oct. 31, 2017, the cost and unrealized appreciation (depreciation) of investments for federal income tax purposes for the Fund were as follows:
Cost of investments | $ | 2,374,609,636 | ||
|
| |||
Aggregate unrealized appreciation of investments | $ | 754,184,725 | ||
Aggregate unrealized depreciation of investments | (110,448,107 | ) | ||
|
| |||
Net unrealized appreciation of investments | $ | 643,736,618 | ||
|
|
US GAAP defines fair value as the price that the Fund would receive to sell an asset or pay to transfer a liability in an orderly transaction between market participants at the measurement date under current market conditions. A three-level hierarchy for fair value measurements has been established based upon the transparency of inputs to the valuation of an asset or liability. Inputs may be observable or unobservable and refer broadly to the assumptions that market participants would use in pricing the asset or liability. Observable inputs reflect the assumptions market participants would use in pricing the asset or liability based on market data obtained from sources independent of the reporting entity. Unobservable inputs reflect the reporting entity’s own assumptions about the assumptions that market participants would use in pricing the asset or liability based on the best information available under the circumstances. The Fund’s investment in its entirety is assigned a level based upon the observability of the inputs which are significant to the overall valuation. The three-level hierarchy of inputs is summarized below and on the following page.
Level 1 – | Inputs are quoted prices in active markets for identical investments. (Examples: equity securities, open-end investment companies, futures contracts, exchange-traded options contracts) | |
Level 2 – | Other observable inputs, including, but not limited to: quoted prices for similar assets or liabilities in markets that are active, quoted prices for identical or similar assets or liabilities in markets that are not active, inputs other than quoted prices that are observable for the assets or liabilities (such as interest rates, yield curves, volatilities, prepayment speeds, loss severities, credit risks, and default rates) or other market-corroborated inputs. (Examples: debt securities, government securities, swap contracts, foreign currency exchange contracts, foreign securities utilizing international fair value pricing, broker-quoted securities, fair valued securities) | |
33
Table of Contents
| Notes to financial statements | ||||
| Delaware U.S. Growth Fund |
3. Investments (continued)
Level 3 – | Significant unobservable inputs, including the Fund’s own assumptions used to determine the fair value of investments. (Examples: broker-quoted securities, fair valued securities) |
Level 3 investments are valued using significant unobservable inputs. The Fund may also use an income-based valuation approach in which the anticipated future cash flows of the investment are discounted to calculate fair value. Discounts may also be applied due to the nature or duration of any restrictions on the disposition of the investments. Valuations may also be based upon current market prices of securities that are comparable in coupon, rating, maturity, and industry. The derived value of a Level 3 investment may not represent the value which is received upon disposition and this could impact the results of operations.
The following table summarizes the valuation of the Fund’s investments by fair value hierarchy levels as of Oct. 31, 2017:
Securities | Level 1 | Level 2 | Total | |||||||||
Assets: | ||||||||||||
Common Stock | $ | 2,991,168,272 | $ | — | $ | 2,991,168,272 | ||||||
Short-Term Investments | — | 27,177,982 | 27,177,982 | |||||||||
|
|
|
|
|
| |||||||
Total Value of Securities | $ | 2,991,168,272 | $ | 27,177,982 | $ | 3,018,346,254 | ||||||
|
|
|
|
|
| |||||||
During the year ended Oct. 31, 2017, there were no transfers between Level 1 investments, Level 2 investments, or Level 3 investments that had a significant impact to the Fund. The Fund’s policy is to recognize transfers between levels based on the fair value at the beginning of the reporting period.
A reconciliation of Level 3 investments is presented when the Fund has a significant amount of Level 3 investments at the beginning, interim, or end of the period in relation to net assets. During the year ended Oct. 31, 2017, there were no Level 3 investments.
4. Dividend and Distribution Information
Income and long-term capital gain distributions are determined in accordance with federal income tax regulations, which may differ from US GAAP. Additionally, distributions from net short-term gains on sales of investment securities are treated as ordinary income for federal income tax purposes. The tax character of dividends and distributions paid during the years ended Oct. 31, 2017 and 2016 was as follows:
| Year ended | ||||||||
| 10/31/17 | 10/31/16 | |||||||
Ordinary income | $ | 4,321,177 | $ | 17,055,976 | ||||
Long-term capital gain | 186,118,857 | 386,993,194 | ||||||
|
|
|
| |||||
Total | $ | 190,440,034 | $ | 404,049,170 | ||||
|
|
|
| |||||
34
Table of Contents
5. Components of Net Assets on a Tax Basis
As of Oct. 31, 2017, the components of net assets on a tax basis were as follows:
Shares of beneficial interest | $ | 2,033,129,849 | ||
Undistributed ordinary income | 14,560,837 | |||
Undistributed long-term capital gains | 321,116,696 | |||
Unrealized appreciation of investments | 643,736,618 | |||
|
| |||
Net assets | $ | 3,012,544,000 | ||
|
|
The differences between book basis and tax basis components of net assets are primarily attributable to tax deferral of losses on wash sales.
For financial reporting purposes, capital accounts are adjusted to reflect the tax character of permanent book/tax differences. Reclassifications are primarily due to gain (loss) on foreign currency transactions, redesignation of dividends and distributions, and net operating losses. Results of operations and net assets were not affected by these reclassifications. For the year ended Oct. 31, 2017, the Fund recorded the following reclassifications:
Undistributed net investment income | $ | 4,221,790 | ||
Accumulated net realized gain | (4,221,790 | ) |
35
Table of Contents
| Notes to financial statements | ||||
| Delaware U.S. Growth Fund |
6. Capital Shares
Transactions in capital shares were as follows:
| Year ended | ||||||||
| 10/31/17 | 10/31/16 | |||||||
Shares sold: | ||||||||
Class A | 881,320 | 2,489,018 | ||||||
Class C | 207,085 | 528,912 | ||||||
Class R | 154,240 | 279,375 | ||||||
Institutional Class | 42,865,417 | 25,481,591 | ||||||
Class R6 | 690,451 | 84 | ||||||
Shares issued upon reinvestment of dividends and distributions: | ||||||||
Class A | 583,924 | 1,502,868 | ||||||
Class C | 316,889 | 583,774 | ||||||
Class R | 77,294 | 135,324 | ||||||
Institutional Class | 7,352,825 | 13,472,359 | ||||||
Class R6 | 403 | — | ||||||
|
|
|
| |||||
| 53,129,848 | 44,473,305 | |||||||
|
|
|
| |||||
Shares redeemed: | ||||||||
Class A | (4,529,928 | ) | (10,666,478 | ) | ||||
Class C | (1,670,030 | ) | (1,569,397 | ) | ||||
Class R | (514,122 | ) | (525,652 | ) | ||||
Institutional Class | (55,398,802 | ) | (49,964,852 | ) | ||||
Class R6 | (618,904 | ) | — | |||||
|
|
|
| |||||
| (62,731,786 | ) | (62,726,379 | ) | |||||
|
|
|
| |||||
Net decrease | (9,601,938 | ) | (18,253,074 | ) | ||||
|
|
|
| |||||
Certain shareholders may exchange shares of one class for shares of another class in the same Fund. For the years ended Oct. 31, 2017 and 2016, the Fund had the following exchange transactions. These exchange transactions are included as subscriptions and redemptions in the table above and on the “Statements of changes in net assets.”
| Exchange Redemptions | Exchange Subscriptions | |||||||||||||||||||||||
| Class A Shares | Class C Shares | Institutional Shares | Class A Shares | Institutional Shares | Value | |||||||||||||||||||
Year ended 10/31/17 | 549,079 | 4,423 | 212 | 4,029 | 509,937 | $ | 12,244,531 | |||||||||||||||||
Year ended 10/31/16 | 131,002 | 18,974 | — | — | 138,188 | 3,336,778 | ||||||||||||||||||
36
Table of Contents
7. Line of Credit
The Fund, along with certain other funds in the Delaware Funds (Participants), was a participant in a $155,000,000 revolving line of credit to be used for temporary or emergency purposes as an additional source of liquidity to fund redemptions of investor shares. Under the agreement, the Participants were charged an annual commitment fee of 0.10%, which was generally allocated across the Participants based on a weighted average of the respective net assets of each Participant. The Participants were permitted to borrow up to a maximum of one-third of their net assets under the agreement. Each Participant was individually, and not jointly, liable for its particular advances, if any, under the line of credit. The line of credit available under the agreement expired on Nov. 7, 2016.
On Nov. 7, 2016, the Fund, along with the other Participants, entered into an amendment to the agreement for a $155,000,000 revolving line of credit. The line of credit was to be used as described above and operated in substantially the same manner as the original agreement, with the exception of the annual commitment fee. Under the amendment to the agreement, the Participants were charged an annual commitment fee of 0.15%, which was generally allocated across the Participants based on a weighted average of the respective net assets of each Participant. The line of credit available under the agreement expired on Nov. 6, 2017.
The Fund had no amounts outstanding as of Oct. 31, 2017, or at any time during the year then ended.
8. Offsetting
The Fund entered into an International Swaps and Derivatives Association, Inc. Master Agreement (ISDA Master Agreement) or similar agreement with certain of its derivative contract counterparties in order to better define its contractual rights and to secure rights that will help the Fund mitigate its counterparty risk. An ISDA Master Agreement is a bilateral agreement between the Fund and a counterparty that governs certain over-the-counter (OTC) derivatives and foreign exchange contracts and typically contains, among other things, collateral posting items and netting provisions in the event of a default and/or termination event. Under an ISDA Master Agreement, the Fund may, under certain circumstances, offset with the counterparty certain derivative financial instruments’ payables and/or receivables with collateral held and/or posted and create one single net payment. The provisions of the ISDA Master Agreement typically permit a single net payment in the event of default (close-out), including the bankruptcy or insolvency of the counterparty. However, bankruptcy or insolvency laws of a particular jurisdiction may impose restrictions on or prohibitions against the right of offset in bankruptcy, insolvency, or other events.
For financial reporting purposes, the Fund does not offset derivative assets and derivative liabilities that are subject to netting arrangements on the “Statement of assets and liabilities.”
37
Table of Contents
| Notes to financial statements | ||||
| Delaware U.S. Growth Fund |
8. Offsetting (continued)
At Oct. 31, 2017, the Fund had the following assets and liabilities subject to offsetting provisions:
Master Repurchase Agreements
Counterparty | Repurchase Agreements | Fair Value of Non-Cash Collateral Received(a) | Cash Collateral Received | Net Collateral Received | Net Exposure(b) | |||||||||||||||
Bank of America Merrill Lynch | $ | 1,790,479 | $ | (1,790,479 | ) | $ | — | $ | (1,790,479 | ) | $ | — | ||||||||
BNP Paribas | 5,057,584 | (5,057,584 | ) | — | (5,057,584 | ) | — | |||||||||||||
|
|
|
|
|
|
|
|
|
| |||||||||||
Total | $ | 6,848,063 | $ | (6,848,063 | ) | $ | — | $ | (6,848,063 | ) | $ | — | ||||||||
|
|
|
|
|
|
|
|
|
| |||||||||||
(a)The value of the related collateral received exceeded the value of the repurchase agreements as of Oct. 31, 2017
(b)Net exposure represents the net receivable (payable) that would be due from (to) the counterparty in the event of default.
9. Securities Lending
The Fund, along with other funds in the Delaware Funds, may lend its securities pursuant to a security lending agreement (Lending Agreement) with The Bank of New York Mellon (BNY Mellon). At the time a security is loaned, the borrower must post collateral equal to the required percentage of the market value of the loaned security, including any accrued interest. The required percentage is: (1) 102% with respect to US securities and foreign securities that are denominated and payable in US dollars; and (2) 105% with respect to foreign securities. With respect to each loan, if on any business day the aggregate market value of securities collateral plus cash collateral held is less than the aggregate market value of the securities which are the subject of such loan, the borrower will be notified to provide additional collateral by the end of the following business day which, together with the collateral already held, will be not less than the applicable initial collateral requirements for such security loan. If the aggregate market value of securities collateral and cash collateral held with respect to a security loan exceeds the applicable initial collateral requirement, upon request of the borrower, BNY Mellon must return enough collateral to the borrower by the end of the following business day to reduce the value of the remaining collateral to the applicable initial collateral requirement for such security loan. As a result of the foregoing, the value of the collateral held with respect to a loaned security on any particular day may be more or less than the value of the security on loan.
Cash collateral received by each fund of the Trust is generally invested in a series of individual separate accounts, each corresponding to a fund. The investment guidelines permit each separate account to hold certain securities that would be considered eligible securities for a money market fund. Cash collateral received is generally invested in government securities; certain obligations issued by government sponsored enterprises; repurchase agreements collateralized by US Treasury securities; obligations issued by the central government of any Organization for Economic Cooperation and Development (OECD) country or its agencies, instrumentalities, or establishments; obligations of supranational organizations; commercial paper, notes, bonds, and other debt obligations; certificates of deposit, time deposits, and other bank obligations; and asset-backed securities. A Fund can also accept US government securities and letters of credit (non-cash collateral) in connection with securities loans.
38
Table of Contents
In the event of default or bankruptcy by the lending agent, realization and/or retention of the collateral may be subject to legal proceedings. In the event the borrower fails to return loaned securities and the collateral received is insufficient to cover the value of the loaned securities and provided such collateral shortfall is not the result of investment losses, the lending agent has agreed to pay the amount of the shortfall to the Fund or, at the discretion of the lending agent, replace the loaned securities. The Fund continues to record dividends or interest, as applicable, on the securities loaned and is subject to changes in value of the securities loaned that may occur during the term of the loan. The Fund has the right under the Lending Agreement to recover the securities from the borrower on demand. With respect to security loans collateralized by non-cash collateral, the Fund receives loan premiums paid by the borrower. With respect to security loans collateralized by cash collateral, the earnings from the collateral investments are shared among the Fund, the security lending agent, and the borrower. The Fund records security lending income net of allocations to the security lending agent and the borrower.
The Fund may incur investment losses as a result of investing securities lending collateral. This could occur if an investment in the collateral investment account defaulted or became impaired. Under those circumstances, the value of the Fund’s cash collateral account may be less than the amount the Fund would be required to return to the borrowers of the securities and the Fund would be required to make up for this shortfall.
During the year ended Oct. 31, 2017, the Fund had no securities out on loan.
10. Credit and Market Risk
The Fund invested in growth stocks (such as those in the technology sector), which reflect projections of future earnings and revenue. These prices may rise or fall dramatically depending on whether those projections are met. These companies’ stock prices may be more volatile, particularly over the short term.
The Fund invests a significant portion of its assets in small companies and may be subject to certain risks associated with ownership of securities of such companies. Investments in small sized companies may be more volatile than investments in larger companies for a number of reasons, which include limited financial resources or a dependence on narrow product lines.
The Fund may invest up to 15% of its net assets in illiquid securities, which may include securities with contractual restrictions on resale, securities exempt from registration under Rule 144A promulgated under the Securities Act of 1933, as amended, and other securities which may not be readily marketable. The relative illiquidity of these securities may impair the Fund from disposing of them in a timely manner and at a fair price when it is necessary or desirable to do so. While maintaining oversight, the Fund’s Board has delegated to DMC, the day-to-day functions of determining whether individual securities are liquid for purposes of the Fund’s limitation on investments in illiquid securities. Securities eligible for resale pursuant to Rule 144A, which are determined to be liquid, are not subject to the Fund’s 15% limit on investments in illiquid securities. As of Oct. 31, 2017, there were no Rule 144A securities held by the Fund.
39
Table of Contents
| Notes to financial statements | ||||
| Delaware U.S. Growth Fund |
11. Contractual Obligations
The Fund enters into contracts in the normal course of business that contain a variety of indemnifications. The Fund’s maximum exposure under these arrangements is unknown. However, the Fund has not had prior claims or losses pursuant to these contracts. Management has reviewed the Fund’s existing contracts and expects the risk of loss to be remote.
12. Recent Accounting Pronouncements
In October 2016, the Securities and Exchange Commission released its Final Rule on Investment Company Reporting Modernization (Rule). The Rule contains amendments to Regulation S-X which impact financial statement presentation, particularly the presentation of derivative investments. The financial statements presented are in compliance with the most recent Regulation S-X amendments.
13. Subsequent Events
On Nov. 6, 2017, the Fund, along with the other Participants, entered into an amendment to the agreement for a $155,000,000 revolving line of credit to be used as described in Note 7 and operates in substantially the same manner as the agreement described in Note 7. Under the amendment to the agreement, the Participants are charged an annual commitment fee of 0.15%, which is generally allocated across the Participants based on a weighted average of the respective net assets of each Participant. The line of credit available under the agreement expires on Nov. 5, 2018.
Management has determined that no other material events or transactions occurred subsequent to Oct. 31, 2017 that would require recognition or disclosure in the Fund’s financial statements.
40
Table of Contents
registered public accounting firm |
To the Board of Trustees of Delaware Group® Adviser Funds
and the Shareholders of Delaware U.S. Growth Fund
In our opinion, the accompanying statement of assets and liabilities, including the schedule of investments, and the related statements of operations and of changes in net assets and the financial highlights present fairly, in all material respects, the financial position of Delaware U.S. Growth Fund (one of the series constituting Delaware Group Adviser Funds, hereafter referred to as the “Fund”) as of October 31, 2017, the results of its operations for the year then ended, the changes in its net assets for each of the two years in the period then ended and the financial highlights for each of the periods indicated, in conformity with accounting principles generally accepted in the United States of America. These financial statements and financial highlights (hereafter referred to as “financial statements”) are the responsibility of the Fund’s management. Our responsibility is to express an opinion on these financial statements based on our audits. We conducted our audits of these financial statements in accordance with the standards of the Public Company Accounting Oversight Board (United States). Those standards require that we plan and perform the audit to obtain reasonable assurance about whether the financial statements are free of material misstatement. An audit includes examining, on a test basis, evidence supporting the amounts and disclosures in the financial statements, assessing the accounting principles used and significant estimates made by management, and evaluating the overall financial statement presentation. We believe that our audits, which included confirmation of securities as of October 31, 2017 by correspondence with the custodian and brokers, provide a reasonable basis for our opinion.
PricewaterhouseCoopers LLP
Philadelphia, Pennsylvania
December 19, 2017
41
Table of Contents
| Other Fund information (Unaudited) | ||||
| Delaware U.S. Growth Fund |
Tax Information
The information set forth below is for the Fund’s fiscal year as required by federal income tax laws. Shareholders, however, must report distributions on a calendar year basis for income tax purposes, which may include distributions for portions of two fiscal years of the Fund. Accordingly, the information needed by shareholders for income tax purposes will be sent to them in January of each year. Please consult your tax advisor for proper treatment of this information.
All disclosures are based on financial information available as of the date of this annual report and, accordingly are subject to change. For any and all items requiring reporting, it is the intention of the Fund to report the maximum amount permitted under the Internal Revenue Code and the regulations thereunder.
For the fiscal year ended Oct. 31, 2017, the Fund reports distributions paid during the year as follows:
(A) Long-Term Capital Gains Distributions (Tax Basis) | 97.73 | % | ||
(B) Ordinary Income Distributions* (Tax Basis) | 2.27 | % | ||
Total Distributions. | 100.00 | % | ||
(C) Qualified Dividends1 | 95.06 | % |
(A) and (B) are based on a percentage of the Fund’s total distributions.
(C) is based on a percentage of the Fund’s ordinary income distributions.
* For the fiscal year ended Oct. 31, 2017, certain dividends paid by the Fund may be subject to a maximum tax rate of 20%. The percentage of dividends paid by the Fund from ordinary income reported as qualified income is 100.00%. Complete information will be compiled and reported in conjunction with your 2017 Form 1099-DIV.
1 Qualified dividends represent dividends which qualify for the corporate dividends received deduction.
Board consideration of Delaware U.S. Growth Fund investment advisory and sub-advisory agreements
At a meeting held on Aug. 16-17, 2017 (the “Annual Meeting”), the Board of Trustees (the “Board”), including a majority of disinterested or independent Trustees, approved the renewal of the Investment Advisory Agreement for Delaware U.S. Growth Fund (the “Fund”). In making its decision, the Board considered information furnished at regular quarterly Board meetings, including reports detailing Fund performance, investment strategies, and expenses, as well as information prepared specifically in connection with the renewal of the investment advisory and sub-advisory contracts. Information furnished specifically in connection with the renewal of the Investment Advisory Agreement with Delaware Management Company (“DMC”), a series of Macquarie Investment Management Business Trust (formerly, Delaware Management Business Trust), and Sub-Advisory Agreement with Jackson Square Partners, LLC (“JSP”) included materials provided by DMC and its affiliates and JSP, as applicable, concerning, among other things, the nature, extent, and quality of services provided to the Fund; the costs of such services to the Fund; economies of scale; and the investment manager’s financial condition and profitability. In addition, in connection with the Annual Meeting, reports were provided to the Trustees in May 2017 and included reports provided by Broadridge Financial Solutions (formerly Lipper) (“Broadridge” or “Lipper”). The Broadridge reports compared the Fund’s investment performance and expenses with those of other comparable mutual funds. The Independent Trustees reviewed and discussed the Broadridge reports with independent legal counsel to the Independent Trustees. In addition to the information noted above, the Board also requested and received information
42
Table of Contents
regarding DMC’s or JSP’s, as applicable, policy with respect to advisory fee levels and its breakpoint philosophy; the structure of portfolio manager compensation; comparative client fee information; and any constraints or limitations on the availability of securities for certain investment styles, which had in the past year inhibited, or which were likely in the future to inhibit, the investment manager’s ability to invest fully in accordance with Fund policies.
In considering information relating to the approval of the Fund’s advisory and sub-advisory agreements, the Independent Trustees received assistance and advice from and met separately with independent legal counsel to the Independent Trustees and also from an experienced and knowledgeable fund consultant, JDL Consultants, LLC (“JDL”). Although the Board gave attention to all information furnished, the following discussion identifies, under separate headings, the primary factors taken into account by the Board during its contract renewal considerations.
Nature, extent, and quality of service. The Board considered the services provided by DMC to the Fund and its shareholders. In reviewing the nature, extent, and quality of services, the Board considered reports furnished to it throughout the year, which covered matters such as the relative performance of the Fund; compliance of portfolio managers with the investment policies, strategies, and restrictions for the Fund; compliance by DMC and Delaware Distributors, L.P. (together, “Management”) personnel with the Code of Ethics adopted throughout the Delaware FundsSM by Macquarie (“Delaware Funds”); and adherence to fair value pricing procedures as established by the Board. The Board was pleased with the current staffing of the Fund’s investment advisor and the emphasis placed on research in the investment process. The Board recognized DMC’s receipt of certain industry distinctions during the past several years. The Board gave favorable consideration to DMC’s efforts to control expenditures while maintaining service levels committed to Fund matters. The Board also noted the benefits provided to Fund shareholders through each shareholder’s ability to exchange an investment in one Delaware Fund for the same class of shares in another Delaware Fund without a sales charge, to reinvest Fund dividends into additional shares of the Fund or into additional shares of other Delaware Funds and the privilege to combine holdings in other Delaware Funds to obtain a reduced sales charge. The Board was satisfied with the nature, extent, and quality of the overall services provided by DMC.
Nature, extent, and quality of service. The Board considered the services provided by JSP to the Fund and its shareholders. In reviewing the nature, extent, and quality of services, the Board considered reports furnished to it throughout the year at regular Board Meetings covering matters such as relative performance of the Fund; compliance of portfolio managers with the investment policies, strategies, and restrictions for the Fund; the compliance of JSP personnel with its Code of Ethics; and adherence to fair value pricing procedures as established by the Board. The Board was pleased with the current staffing of JSP and the emphasis placed on research in the investment process. The Board was satisfied with the nature, extent, and quality of the overall services provided by JSP.
Investment performance. The Board placed significant emphasis on the investment performance of the Fund in view of the importance of investment performance to shareholders. Although the Board considered performance reports and discussions with portfolio managers at Investments Committee meetings throughout the year, the Board gave particular weight to the Broadridge reports furnished for the Annual Meeting. The Broadridge reports prepared for the Fund showed the investment performance of its Class A shares in comparison to a group of similar funds as selected by Broadridge (the
43
Table of Contents
| Other Fund information (Unaudited) | ||||
| Delaware U.S. Growth Fund |
Board consideration of Delaware U.S. Growth Fund investment advisory and sub-advisory agreements (continued)
“Performance Universe”). A fund with the best performance ranked first, and a fund with the poorest performance ranked last. The highest/best performing 25% of funds in the Performance Universe make up the first quartile; the next 25%, the second quartile; the next 25%, the third quartile; and the poorest/worst performing 25% of funds in the Performance Universe make up the fourth quartile. Comparative annualized performance for the Fund was shown for the past 1-, 3-, 5-, and 10-year periods, to the extent applicable, ended Jan. 31, 2017. The Board’s objective is that the Fund’s performance for the 1-, 3-, and 5-year periods considered be at or above the median of its Performance Universe.
The Performance Universe for the Fund consisted of the Fund and all retail and institutional large-cap growth funds as selected by Broadridge. The Broadridge report comparison showed that the Fund’s total return for the 1-, 3-, and 5-year periods was in the fourth quartile of its Performance Universe. The Board noted that the Fund’s performance was not in line with the Board’s objective. In evaluating the Fund’s performance, the Board considered the numerous investment and performance reports delivered by Management personnel to the Board’s Investments Committee. The Board was satisfied that Management was taking action to improve Fund performance and meet the Board’s performance objective.
Comparative expenses. The Board considered expense data for the Delaware Funds. Management provided the Board with information on pricing levels and fee structures for the Fund as of its most recently completed fiscal year. The Board also focused on the comparative analysis of effective management fees and total expense ratios of the Fund versus effective management fees and total expense ratios of a group of similar funds as selected by Broadridge (the “Expense Group”). In reviewing comparative costs, the Fund’s contractual management fee and the actual management fee incurred by the Fund were compared with the contractual management fees (assuming all funds in the Expense Group were similar in size to the Fund) and actual management fees (as reported by each fund) within the Expense Group, taking into account any applicable breakpoints and fee waivers. The Fund’s total expenses were also compared with those of its Expense Group. The Broadridge total expenses, for comparative consistency, were shown by Broadridge for Class A shares and comparative total expenses including 12b-1 and non-12b-1 service fees. The Board’s objective is to limit the Fund’s total expense ratio to be competitive with that of the Expense Group.
The expense comparisons for the Fund showed that its actual management fee and total expenses were in the quartile with the lowest expenses of its Expense Group. The Board was satisfied with the management fee and total expenses of the Fund in comparison to those of its Expense Group as shown in the Broadridge report.
Management profitability. The Board considered the level of profits realized by DMC in connection with the operation of the Fund. In this respect, the Board reviewed the Investment Management Profitability Analysis that addressed the overall profitability of DMC’s business in providing management and other services to each of the individual funds and the Delaware Funds as a whole. Specific attention was given to the methodology used by DMC in allocating costs for the purpose of determining profitability. Management stated that the level of profits of DMC, to a certain extent, reflects recent operational cost
44
Table of Contents
savings and efficiencies initiated by DMC. The Board considered DMC’s efforts to improve services provided to fund shareholders and to meet additional regulatory and compliance requirements resulting from recent industry-wide Securities and Exchange Commission initiatives. The Board also considered the extent to which DMC might derive ancillary benefits from fund operations, including the potential for procuring additional business as a result of the prestige and visibility associated with its role as service provider to the Delaware Funds and the benefits from allocation of fund brokerage to improve trading efficiencies. Finally, the Board also reviewed a report prepared by JDL regarding DMC profitability in the context of sub-advised funds and met with JDL personnel to discuss DMC’s profitability in such context. The Board found that the management fees were reasonable in light of the services rendered and the level of profitability of DMC.
Management profitability. Trustees were also given available information on profits being realized by JSP in relation to the services being provided to the Fund and in relation to JSP’s overall investment advisory business, but believed such information to be of limited relevance because the sub-advisory fees are paid by DMC out of its management fee, and changes in the level of sub-advisory fees have no effect on Fund expenses. The Board was also provided information on potential fall-out benefits derived or to be derived by JSP in connection with its relationship to the Fund, such as reputational enhancement, soft dollar arrangements or commissions paid to affiliated broker/dealers, as applicable.
Economies of scale. The Trustees considered whether economies of scale are realized by DMC as the Fund’s assets increase and the extent to which any economies of scale are reflected in the level of management fees charged. The Trustees reviewed the standardized advisory fee pricing and structure, approved by the Board and shareholders, which includes breakpoints, and which applies to most funds in the Delaware Funds complex. Breakpoints in the advisory fee occur when the advisory fee rate is reduced on assets in excess of specified levels. Breakpoints result in a lower advisory fee than would otherwise be the case in the absence of breakpoints, when the asset levels specified in the breakpoints are exceeded. The Board noted that the fee under the Fund’s management contract fell within the standardized fee pricing structure. The Board also noted that, as of Feb. 28, 2017, the Fund’s assets exceeded the final breakpoint level. The Board believed that, given the extent to which economies of scale might be realized by the advisor and its affiliates, the schedule of fees under the Investment Management Agreement provides a sharing of benefits with the Fund and its shareholders.
45
Table of Contents
| Board of trustees / directors and officers addendum | ||||
| Delaware FundsSM by Macquarie |
A mutual fund is governed by a Board of Trustees/Directors (“Trustees”), which has oversight responsibility for the management of a fund’s business affairs. Trustees establish procedures and oversee and review the performance of the investment manager, the distributor, and others who perform services for the fund. The independent fund trustees, in particular, are advocates
Name, Address, and Birth Date | Position(s) Held with Fund(s) | Length of Time Served | ||
Interested Trustee
| ||||
Shawn K. Lytle1, 2 2005 Market Street Philadelphia, PA 19103 February 1970 | President, Chief Executive Officer, and Trustee | Trustee since September 2015 | ||
President and Chief Executive Officer since August 2015 | ||||
| ||||
| Independent Trustees | ||||
Thomas L. Bennett 2005 Market Street Philadelphia, PA 19103 October 1947 | Chairman and Trustee | Trustee since March 2005 | ||
Chairman since March 2015 | ||||
Ann D. Borowiec 2005 Market Street Philadelphia, PA 19103 November 1958
| Trustee | Since March 2015 | ||
Joseph W. Chow 2005 Market Street Philadelphia, PA 19103 January 1953
| Trustee | Since January 2013 | ||
| 1 | Shawn K. Lytle is considered to be an “Interested Trustee” because he is an executive officer of the Fund’s(s’) investment advisor. |
| 2 | Shawn K. Lytle, David F. Connor, Daniel V. Geatens, and Richard Salus serve in similar capacities for the six portfolios of the Optimum Fund Trust, which have the same investment advisor, principal underwriter, and transfer agent as the registrant. Mr. Geatens also serves as the CFO and Treasurer for Macquarie Global Infrastructure Total Return Fund Inc., which shares an affiliated investment manager. |
46
Table of Contents
for shareholder interests. Each trustee has served in that capacity since he or she was elected to or appointed to the Board of Trustees, and will continue to serve until his or her retirement or the election of a new trustee in his or her place. The following is a list of the Trustees and Officers with certain background and related information.
Principal Occupation(s) During the Past Five Years | Number of Portfolios in Fund Complex Overseen by Trustee or Officer | Other Directorships Held by Trustee or Officer | ||
Shawn K. Lytle has served as President of Macquarie Investment Management3 since June 2015 and was the Regional Head of Americas for UBS Global Asset Management from 2010 through 2015. | 60 | Trustee — UBS Relationship Funds, SMA Relationship Trust, and UBS Funds (May 2010–April 2015) | ||
Private Investor (March 2004–Present)
| 60 | None | ||
Chief Executive Officer, Private Wealth Management (2011–2013) and Market Manager, New Jersey Private Bank (2005–2011) — J.P. Morgan Chase & Co.
| 60 | Director — Banco Santander International
Director — Santander Bank, N.A. | ||
Executive Vice President (Emerging Economies Strategies, Risks, and Corporate Administration) State Street Corporation (July 2004–March 2011)
| 60 | Director and Audit Committee Member — Hercules Technology Growth Capital, Inc. (2004–2014) | ||
| 3 | Macquarie Investment Management (formerly known as Delaware Investments) is the marketing name for Macquarie Management Holdings, Inc. (formerly known as Delaware Management Holdings, Inc.) and its subsidiaries, including the Fund’s(s’) investment advisor, principal underwriter, and its transfer agent. |
47
Table of Contents
| Board of trustees / directors and officers addendum | ||||
| Delaware FundsSM by Macquarie |
| Name, Address, | Position(s) | Length of | ||
| and Birth Date | Held with Fund(s) | Time Served | ||
Independent Trustees (continued)
| ||||
| John A. Fry | Trustee | Since January 2001 | ||
| 2005 Market Street | ||||
Philadelphia, PA 19103 May 1960
| ||||
| Lucinda S. Landreth | Trustee | Since March 2005 | ||
| 2005 Market Street | ||||
| Philadelphia, PA 19103 | ||||
| June 1947 | ||||
| Frances A. Sevilla-Sacasa | Trustee | Since September 2011 | ||
| 2005 Market Street | ||||
| Philadelphia, PA 19103 | ||||
January 1956
| ||||
48
Table of Contents
| Number of Portfolios in | ||||
| Principal Occupation(s) | Fund Complex Overseen | Other Directorships | ||
| During the Past Five Years | by Trustee or Officer | Held by Trustee or Officer | ||
| President — | 60 | Director, Audit Committee, | ||
| Drexel University | and Governance Committee | |||
| (August 2010–Present) | Member — Community | |||
| Health Systems | ||||
| President — | ||||
| Franklin & Marshall College | Director — Drexel | |||
| (July 2002–July 2010) | Morgan & Co. | |||
| Director, Audit Committee | ||||
| Member — vTv | ||||
| Therapeutics LLC | ||||
| Director — FS Credit Real | ||||
Estate Income Trust, Inc.
| ||||
| Private Investor | 60 | None | ||
(2004–Present)
| ||||
| Chief Executive Officer — | 60 | Trust Manager and | ||
| Banco Itaú | Audit Committee | |||
| International | Chair — Camden | |||
| (April 2012–December 2016) | Property Trust | |||
| Executive Advisor to Dean | ||||
| (August 2011–March 2012) | ||||
| and Interim Dean | ||||
| (January 2011–July 2011) — | ||||
| University of Miami School of | ||||
| Business Administration | ||||
| President — U.S. Trust, | ||||
| Bank of America Private | ||||
| Wealth Management | ||||
| (Private Banking) | ||||
(July 2007–December 2008)
| ||||
49
Table of Contents
| Board of trustees / directors and officers addendum | ||||
| Delaware FundsSM by Macquarie |
Name, Address, and Birth Date | Position(s) Held with Fund(s) | Length of Time Served | ||
Independent Trustees (continued)
| ||||
Thomas K. Whitford 2005 Market Street Philadelphia, PA 19103 March 1956
| Trustee | Since January 2013 | ||
Janet L. Yeomans 2005 Market Street Philadelphia, PA 19103 July 1948
| Trustee | Since April 1999 | ||
Officers
| ||||
David F. Connor 2005 Market Street Philadelphia, PA 19103 December 1963 | Senior Vice President, General Counsel, and Secretary | Senior Vice President since May 2013; General Counsel since May 2015; Secretary since October 2005
| ||
Daniel V. Geatens 2005 Market Street Philadelphia, PA 19103 October 1972
| Vice President and Treasurer | Treasurer since October 2007 | ||
Richard Salus 2005 Market Street Philadelphia, PA 19103 October 1963
| Senior Vice President and Chief Financial Officer | Chief Financial Officer since November 2006 | ||
The Statement of Additional Information for the Fund(s) includes additional information about the Trustees and Officers and is available, without charge, upon request by calling 800 523-1918.
50
Table of Contents
Principal Occupation(s) During the Past Five Years | Number of Portfolios in Fund Complex Overseen by Trustee or Officer | Other Directorships Held by Trustee or Officer | ||
Vice Chairman (2010–April 2013) — PNC Financial Services Group | 60 | Director — HSBC Finance Corporation and HSBC North America Holdings Inc. | ||
| Director — | ||||
HSBC USA Inc.
| ||||
| Vice President and Treasurer | 60 | Director (2009–2017); | ||
| (January 2006–July 2012), | Personnel and Compensation | |||
| Vice President — | Committee Chair; Member of | |||
| Mergers & Acquisitions | Nominating, Investments, and | |||
| (January 2003–January 2006), | Audit Committees for various | |||
| and Vice President | periods throughout | |||
| and Treasurer | directorship — | |||
| (July 1995–January 2003) — | Okabena Company | |||
3M Company
| ||||
| David F. Connor has served | 60 | None2 | ||
in various capacities at different times at | ||||
| Macquarie Investment | ||||
Management.
| ||||
| Daniel V. Geatens has served | 60 | None2 | ||
in various capacities at different times at | ||||
| Macquarie Investment | ||||
Management.
| ||||
| Richard Salus has served | 60 | None2 | ||
in various executive capacities at different times at | ||||
| Macquarie Investment | ||||
Management.
| ||||
51
Table of Contents
| About the organization | ||||
Board of trustees | ||||||
Shawn K. Lytle President and Chief Executive Officer Delaware FundsSM by Macquarie Philadelphia, PA
Thomas L. Bennett Chairman of the Board Delaware Funds by Macquarie Private Investor Rosemont, PA | Ann D. Borowiec Former Chief Executive Officer Private Wealth Management J.P. Morgan Chase & Co. New York, NY
Joseph W. Chow Former Executive Vice President State Street Corporation Boston, MA | John A. Fry President Drexel University Philadelphia, PA
Lucinda S. Landreth Former Chief Investment Officer Assurant, Inc. New York, NY | Frances A. Sevilla-Sacasa Former Chief Executive Officer Banco Itaú International Miami, FL
Thomas K. Whitford Former Vice Chairman PNC Financial Services Group Pittsburgh, PA
Janet L. Yeomans Former Vice President and Treasurer 3M Company St. Paul, MN | |||
Affiliated officers | ||||||
| David F. Connor | Daniel V. Geatens | Richard Salus | ||||
| Senior Vice President, | Vice President and | Senior Vice President and | ||||
| General Counsel, | Treasurer | Chief Financial Officer | ||||
| and Secretary | Delaware Funds | Delaware Funds | ||||
| Delaware Funds | by Macquarie | by Macquarie | ||||
| by Macquarie | Philadelphia, PA | Philadelphia, PA | ||||
| Philadelphia, PA | ||||||
This annual report is for the information of Delaware U.S. Growth Fund shareholders, but it may be used with prospective investors when preceded or accompanied by the Delaware Fund fact sheet for the most recently completed calendar quarter. These documents are available at delawarefunds.com/literature.
The Fund files its complete schedule of portfolio holdings with the Securities and Exchange Commission (SEC) for the first and third quarters of each fiscal year on Form N-Q. The Fund’s Forms N-Q, as well as a description of the policies and procedures that the Fund uses to determine how to vote proxies (if any) relating to portfolio securities are available without charge (i) upon request, by calling 800 523-1918; and (ii) on the SEC’s website at sec.gov. In addition, a description of the policies and procedures that the Fund uses to determine how to vote proxies (if any) relating to portfolio securities and the Schedule of Investments included in the Fund’s most recent Form N-Q are available without charge on the Fund’s website at delawarefunds.com/literature. The Fund’s Forms N-Q may be reviewed and copied at the SEC’s Public Reference Room in Washington, D.C.; information on the operation of the Public Reference Room may be obtained by calling 800 SEC-0330.
Information (if any) regarding how the Fund voted proxies relating to portfolio securities during the most recently disclosed 12-month period ended June 30 is available without charge (i) through the Fund’s website at delawarefunds.com/proxy; and (ii) on the SEC’s website at sec.gov.
52
Table of Contents
Alternative / specialty mutual fund
Delaware Global Real Estate Opportunities Fund
October 31, 2017
Carefully consider the Fund’s investment objectives, risk factors, charges, and expenses before investing. This and other information can be found in the Fund’s prospectus and its summary prospectus, which may be obtained by visiting delawarefunds.com/literature or calling 800 523-1918. Investors should read the prospectus and the summary prospectus carefully before investing.
You can obtain shareholder reports and prospectuses online instead of in the mail.
Visit delawarefunds.com/edelivery.

Table of Contents
Experience Delaware FundsSM by Macquarie
Macquarie Investment Management (MIM) is a global asset manager with offices throughout the United States, Europe, Asia, and Australia. We are active managers who prioritize autonomy and accountability at the investment team level in pursuit of opportunities that matter for our clients. Delaware Funds is one of the longest-standing mutual fund families, with more than 75 years in existence.
If you are interested in learning more about creating an investment plan, contact your financial advisor.
You can learn more about Delaware Funds or obtain a prospectus for Delaware Global Real Estate Opportunities Fund at delawarefunds.com/literature.
Manage your account online
| • | Check your account balance and transactions |
| • | View statements and tax forms |
| • | Make purchases and redemptions |
Visit delawarefunds.com/account-access.
MIM is the marketing name for the registered investment advisers including Macquarie Investment Management Business Trust (MIMBT) (formerly, Delaware Management Business Trust), Macquarie Funds Management Hong Kong Limited, Macquarie Investment Management Austria Kapitalanlage AG, Macquarie Investment Management Global Limited, Macquarie Bank International Limited, Macquarie Investment Management Europe Limited, Macquarie Investment Management Limited, and Macquarie Capital Investment Management, Inc.
The Fund is distributed by Delaware Distributors, L.P., an affiliate of MIMBT and Macquarie Group Limited. MIM, a member of Macquarie Group, refers to the companies comprising the asset management division of Macquarie Group Limited and its subsidiaries and affiliates worldwide.
Other than Macquarie Bank Limited (MBL), none of the entities noted are authorized deposit-taking institutions for the purposes of the Banking Act 1959 (Commonwealth of Australia). The obligations of these entities do not represent deposits or other liabilities of MBL. MBL does not guarantee or otherwise provide assurance in respect of the obligations of these entities, unless noted otherwise. The Fund is governed by US laws and regulations.
| Table of contents | ||||
| 1 | ||||
| 4 | ||||
| 8 | ||||
| 10 | ||||
| 11 | ||||
| 15 | ||||
| 17 | ||||
| 18 | ||||
| 20 | ||||
| 28 | ||||
| 43 | ||||
| 44 | ||||
| 48 | ||||
| 54 |
Unless otherwise noted, views expressed herein are current as of Oct. 31, 2017, and subject to change for events occurring after such date.
The Fund is not FDIC insured and is not guaranteed. It is possible to lose the principal amount invested.
Advisory services provided by Delaware Management Company, a series of MIMBT, a US registered investment advisor.
All third-party marks cited are the property of their respective owners.
© 2017 Macquarie Management Holdings, Inc. (formerly, Delaware Management Holdings, Inc.)
Table of Contents
| Portfolio management review | ||||
| Delaware Global Real Estate Opportunities Fund | November 7, 2017 |
| Performance preview (for the year ended October 31, 2017) | ||||||||
Delaware Global Real Estate Opportunities Fund (Institutional Class shares) | 1-year return | +5.11% | ||||||
Delaware Global Real Estate Opportunities Fund (Class A shares) | 1-year return | +4.69% | ||||||
FTSE EPRA/NAREIT Developed Index (benchmark) | 1-year return | +7.13% | ||||||
Past performance does not guarantee future results.
* For complete, annualized performance for Delaware Global Real Estate Opportunities Fund, please see the table on page 4.
Institutional Class shares are not subject to a sales charge and are offered for sale exclusively to certain eligible investors. In addition, Institutional Class shares pay no distribution and service fee.
The performance of Class A shares excludes the applicable sales charge. Both Institutional Class shares and Class A shares reflect the reinvestment of all distributions.
Please see page 6 for a description of the index. Index performance returns do not reflect any management fees, transaction costs, or expenses. Indices are unmanaged and one cannot invest directly in an index.
Global real estate securities, as measured by the FTSE EPRA/NAREIT Developed Index, returned +7.13% for the Fund’s fiscal year ended Oct. 31, 2017. In truth, most real estate securities markets significantly outperformed that result, with the primary exceptions being Japan (-5.60%) and the United States (+3.61%).
Most other markets performed notably well, as the cyclical upturn in the global economy coupled with several years of prior relative underperformance helped drive strong gains. European markets were especially robust, partly due to aggressive economic stimulus efforts in the region, while a rebound in Singapore’s housing market helped drive that country’s real estate securities market.
In the US market – which on average made up more than 50% of the FTSE EPRA/NAREIT Developed Index and therefore had a disproportionate impact on its results – equity investors found themselves in an increasingly optimistic mood. A strengthening global economy, coupled with the market’s expectation for growth-oriented US government policies after Republicans’ electoral victories in November 2016, led to an especially favorable environment for cyclical growth stocks.
In this environment, value- and yield-oriented investments were left behind after leading the way for several years. Real estate investment trusts (REITs) were at a relative performance
1
Table of Contents
| Portfolio management review | ||||
| Delaware Global Real Estate Opportunities Fund |
disadvantage throughout most of the 12-month period. A series of interest rate increases from the US Federal Reserve, which sought to limit potential inflation amid steadily improving economic and employment data, provided a further headwind for REITs.
Among US REITs, investors encountered a significant performance dichotomy. Retail REITs, for example, significantly underperformed, reflecting growth in ecommerce and a corresponding decline in sales at physical stores. Meanwhile, industrial REITs were strong gainers, benefiting from increased demand for warehouse space that was necessary to accommodate a growing economy and an increased emphasis on ecommerce. Both of these trends were global in nature, but especially prominent in the US.
Fund performance
For the fiscal year ended Oct. 31, 2017, Delaware Global Real Estate Opportunities Fund underperformed its benchmark, the FTSE EPRA/ NAREIT Developed Index. The Fund’s Institutional Class shares returned +5.11%. The Fund’s Class A shares returned +4.69% at net asset value and -1.38% at maximum offer price (these figures reflect all distributions reinvested). During the same period, the benchmark returned +7.13%. For complete, annualized performance of Delaware Global Real Estate Opportunities Fund, please see the table on page 4.
Individual detractors
The Fund’s largest individual detractor relative to its benchmark, by far, was Brookdale Senior Living, which operates senior care facilities. The company’s shares declined more than 15% for the Fund’s fiscal year, as the senior housing industry has been in a cyclical downturn due to an excess of supply. Brookdale Senior Living also struggled due to management missteps. Despite these recent concerns, we remained optimistic about the stock and added to the Fund’s position on weakness as the period progressed. In our view,
Brookdale Senior Living is well positioned to take advantage of the favorable demographics of an aging population. As long-term, value-oriented investors, we are willing to look past a company’s short-term difficulties when we believe the stock’s longer-term potential remains solid. This was the thesis behind our original investment in Brookdale Senior Living, and our view remained intact throughout the fiscal year.
In the retail area, positions in GGP, an owner and operator of regional malls, and Brixmor Property Group, a shopping center REIT, hampered the Fund’s performance. The stocks declined more than 15% and 25%, respectively, for the fiscal year, in a difficult environment for retail property owners. A position in freestanding retail operator Store Capital also hurt the Fund’s performance during the fiscal year. We ultimately sold the Fund’s stake in Store Capital, as we found what we believed were more attractive opportunities elsewhere.
Individual contributors
The Fund benefited from industrial REIT holdings Goodman Group and DCT Industrial Trust, based in Australia and the US, respectively, due to favorable growth trends for owners of warehouse properties.
In Singapore, the Fund’s investment in residential property developer City Developments benefited from a recovery in the country’s housing market, while a position in UK-based Grainger, an owner of rental apartments, was helped by an improving business backdrop coupled with its strong competitive position.
Equinix, an operator of data centers that benefited from the continued dramatic growth of cloud computing and rising infrastructure-related demand, was another notable relative contributor during the fiscal year.
2
Table of Contents
Maintaining a consistent approach
We continued to pursue our consistent management strategy: Regardless of underlying economic or market conditions, we emphasize areas of the real estate securities market that, in our opinion, have the potential to benefit from a strong fundamental backdrop for commercial real estate, and that offer what we see as attractively valued securities. We also emphasize companies that can continue to grow their cash flow and prudently raise capital.
At period end, central bankers and politicians across the globe continued to struggle with slow global growth. Despite potential near-term positives, such as tax relief, the longer-term structural problems of excessive debt and an aging population across much of the world appeared to create a significant headwind for real estate securities markets.
Although we view valuations across most of the broader equity and fixed income markets as elevated, we have seen few signs of stress thus far. Credit spreads (referring to the amount of extra yield investors are demanding in exchange for assuming credit risk) remain tight, and debt capital is widely available at reasonable terms.
In our opinion, the biggest near-term risk as of fiscal year end appears to be in Europe, which has seen negative real yields for some time. If the European Central Bank finally were to begin to normalize its monetary policy, we could see significant upward pressure on yields – a factor that could hurt the performance of European real estate stocks.
In this environment, we continue to maintain the Fund’s overweight in the US, given what we see as solid fundamentals in this market, low supply, reasonable rental growth, and favorable cost and availability of capital. We found some retail REITs particularly attractive at fiscal year end. Although we acknowledge that the business environment has become more challenging for retailers and the REITs that lease them space, we also believe that various high-quality retail REITs have been overly penalized.
Elsewhere, the United Kingdom appears to offer attractive value, as the public real estate securities market has traded at a significant discount to the private-market value of companies’ underlying real estate. However, due to the uncertainty of ongoing Brexit negotiations, we believe it is necessary to be selective about investing in this market. We also remain cautious about developers in many Asian regions and emerging markets. For example, we see increased risks in China, which has managed its economic slowdown so far but has seen increased capital flight and continual government intervention.
We also continue to underweight Japan, given what we see as longer-term structural issues. Within this market, we have favored property developers and avoided REITs, which we see as less attractively valued than developers and less able to capture the benefits of a cyclical upturn in Japan.
3
Table of Contents
| Performance summary | ||||
| Delaware Global Real Estate Opportunities Fund | October 31, 2017 |
The performance quoted represents past performance and does not guarantee future results. Investment return and principal value of an investment will fluctuate so that shares, when redeemed, may be worth more or less than their original cost. Current performance may be lower or higher than the performance quoted. Performance data current to the most recent month end may be obtained by calling 800 523-1918 or visiting delawarefunds.com/performance.
Fund and benchmark performance1,2
|
| Average annual total returns through October 31, 2017
|
| |||||||||||||
| 1 year | 5 years | 10 years | Lifetime | |||||||||||||
Class A (Est. Jan. 10, 2007) | ||||||||||||||||
Excluding sales charge | +4.69% | +6.69% | +1.76% | +2.16% | ||||||||||||
Including sales charge | -1.38% | +5.43% | +1.15% | +1.60% | ||||||||||||
Class C (Est. Sept. 28, 2012) | ||||||||||||||||
Excluding sales charge | +4.05% | +5.89% | n/a | +6.13% | ||||||||||||
Including sales charge | +3.05% | +5.89% | n/a | +6.13% | ||||||||||||
Class R (Est. Sept. 28, 2012) | ||||||||||||||||
Excluding sales charge | +4.56%* | +6.45% | n/a | +6.68% | ||||||||||||
Including sales charge | +4.56%* | +6.45% | n/a | +6.68% | ||||||||||||
Institutional Class (Est. Jan. 10, 2007) | ||||||||||||||||
Excluding sales charge | +5.11% | +6.99% | +2.00% | +2.41% | ||||||||||||
Including sales charge | +5.11% | +6.99% | +2.00% | +2.41% | ||||||||||||
FTSE EPRA/NAREIT Developed Index | +7.13% | +7.32% | +2.28% | +2.25%** | ||||||||||||
* Total return for the report period presented in the table differs from the return in “Financial highlights.” The total return presented in the above table is calculated based on the net asset value (NAV) at which shareholder transactions were processed. The total return presented in “Financial highlights” is calculated in the same manner, but also takes into account certain adjustments that are necessary under US generally accepted accounting principles (US GAAP) required in the annual report.
** The benchmark lifetime return is for Institutional Class share comparison only and is calculated using the last business day in the month of the Fund’s Institutional Class inception date.
1Returns reflect the reinvestment of all distributions and are presented both with and without the applicable sales charges described below. Returns do not reflect the deduction of taxes the shareholder would pay on Fund distributions or redemptions of Fund shares.
Expense limitations were in effect for certain classes during some or all of the periods shown in the “Fund and benchmark performance” table. Expenses for each class are listed on the “Fund expense ratios” table on page 5. Performance would have been lower had expense limitations not been in effect.
Institutional Class shares are not subject to a sales charge and are offered for sale exclusively to certain eligible investors. In addition, Institutional Class shares pay no distribution and service fee.
Class A shares are sold with a maximum front-end sales charge of 5.75%, and have an annual distribution and service fee of 0.25% of average daily net assets. Performance for Class A shares, excluding sales charges, assumes that no front-end sales charge applied.
Class C shares are sold with a contingent deferred sales charge of 1.00% if redeemed during the first 12 months. They are also subject to an annual distribution and service fee of 1.00% of average
4
Table of Contents
daily net assets. Performance for Class C shares, excluding sales charges, assumes either that contingent deferred sales charges did not apply or that the investment was not redeemed.
Class R shares are available only for certain retirement plan products. They are sold without a sales charge and have an annual distribution and service fee of 0.50% of average daily net assets.
Narrowly focused investments may exhibit higher volatility than investments in multiple industry sectors.
REIT investments are subject to many of the risks associated with direct real estate ownership, including changes in economic conditions, credit risk, and interest rate fluctuations.
A REIT fund’s tax status as a regulated investment company could be jeopardized if it holds real
estate directly, as a result of defaults, or receives rental income from real estate holdings.
“Nondiversified” Funds may allocate more of their net assets to investments in single securities than “diversified” Funds. Resulting adverse effects may subject these Funds to greater risks and volatility.
Investments in small and/or medium-sized companies typically exhibit greater risk and higher volatility than larger, more established companies.
International investments entail risks not ordinarily associated with US investments including fluctuation in currency values, differences in accounting principles, or economic or political instability in other nations.
Investing in emerging markets can be riskier than investing in established foreign markets due to increased volatility and lower trading volume.
2 The Fund’s expense ratios, as described in the most recent prospectus, are disclosed in the following “Fund expense ratios” table. Delaware Management Company has agreed to reimburse certain expenses and/or waive certain fees in order to prevent total annual fund operating expenses (excluding any 12b-1 fees, acquired fund fees and expenses, taxes, interest, short sale and dividend interest expenses, brokerage fees, certain insurance costs, and nonroutine expenses or costs, including, but not limited to, those relating to reorganizations, litigation, conducting shareholder meetings, and liquidations (collectively, nonroutine expenses)) from exceeding 1.15% of the Fund’s average daily net assets during the period from Nov. 1, 2016, through Oct. 31, 2017.* Please see the most recent prospectus and any applicable supplement(s) for additional information on these fee waivers and/or reimbursements. Please see the “Financial highlights” section in this report for the most recent expense ratios.
| Fund expense ratios | Class A | Class C | Class R | Institutional Class | ||||
Total annual operating expenses (without fee waivers) | 1.72% | 2.47% | 1.97% | 1.47% | ||||
Net expenses (including fee waivers, if any) | 1.40% | 2.15% | 1.65% | 1.15% | ||||
Type of waiver | Contractual | Contractual | Contractual | Contractual |
* The aggregate contractual waiver period covering this report is from Feb. 26, 2016, through Feb. 28, 2018.
5
Table of Contents
| Performance summary | ||||
| Delaware Global Real Estate Opportunities Fund |
Performance of a $10,000 investment1
Average annual total returns from Oct. 31, 2007 through Oct. 31, 2017
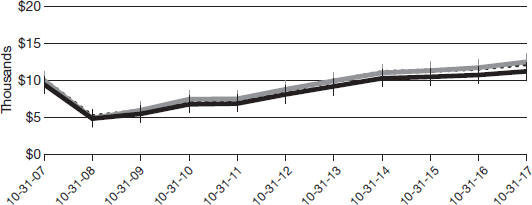
| For the period beginning Oct. 31, 2007 through Oct. 31, 2017 | Starting value | Ending value | ||||||||
 | FTSE EPRA/NAREIT Developed Index | $10,000 | $12,525 | |||||||
 | Delaware Global Real Estate Opportunities Fund — Institutional Class shares | $10,000 | $12,193 | |||||||
 | Delaware Global Real Estate Opportunities Fund — Class A shares | $9,425 | $11,217 | |||||||
1The “Performance of a $10,000 investment” graph assumes $10,000 invested in Institutional Class and Class A shares of the Fund on Oct. 31, 2007, and includes the effect of a 5.75% front-end sales charge (for Class A shares) and the reinvestment of all distributions. The graph does not reflect the deduction of taxes the shareholders would pay on Fund distributions or redemptions of Fund shares. Expense limitations were in effect for some or all of the periods shown. Performance would have been lower had expense limitations not been in effect. Expenses are listed in the “Fund expense ratios” table on page 5. Please note additional details on pages 4 through 7.
The graph also assumes $10,000 invested in the FTSE EPRA/NAREIT Developed Index as of Oct. 31, 2007. The FTSE EPRA/NAREIT Developed Index tracks the performance of listed real estate companies and real estate investment trusts (REITs) worldwide, based in US dollars.
Index performance returns do not reflect any management fees, transaction costs, or expenses. Indices are unmanaged and one cannot invest directly in an index. Past performance is not a guarantee of future results.
Performance of other Fund classes will vary due to different charges and expenses.
6
Table of Contents
Nasdaq symbols |
CUSIPs | |||||
Class A | DGRPX | 245917653 | ||||
Class C | DLPCX | 245917646 | ||||
Class R | DLPRX | 245917638 | ||||
Institutional Class
| DGROX
| 245917620
|
7
Table of Contents
| Disclosure of Fund expenses | ||||
| For the six-month period from May 1, 2017 to October 31, 2017 (Unaudited) |
As a shareholder of the Fund, you incur two types of costs: (1) transaction costs, including sales charges (loads) on purchase payments, reinvested dividends, or other distributions; redemption fees; and exchange fees; and (2) ongoing costs, including management fees; distribution and/or service (12b-1) fees; and other Fund expenses. This example is intended to help you understand your ongoing costs (in dollars) of investing in the Fund and to compare these costs with the ongoing costs of investing in other mutual funds.
The example is based on an investment of $1,000 invested at the beginning of the period and held for the entire six-month period from May 1, 2017 to Oct. 31, 2017.
Actual expenses
The first section of the table shown, “Actual Fund return,” provides information about actual account values and actual expenses. You may use the information in this section of the table, together with the amount you invested, to estimate the expenses that you paid over the period. Simply divide your account value by $1,000 (for example, an $8,600 account value divided by $1,000 = 8.6), then multiply the result by the number in the first section under the heading entitled “Expenses Paid During Period” to estimate the expenses you paid on your account during this period.
Hypothetical example for comparison purposes
The second section of the table shown, “Hypothetical 5% return,” provides information about hypothetical account values and hypothetical expenses based on the Fund’s actual expense ratio and an assumed rate of return of 5% per year before expenses, which is not the Fund’s actual return. The hypothetical account values and expenses may not be used to estimate the actual ending account balance or expenses you paid for the period. You may use this information to compare the ongoing costs of investing in the Fund and other funds. To do so, compare this 5% hypothetical example with the 5% hypothetical examples that appear in the shareholder reports of the other funds.
Please note that the expenses shown in the table are meant to highlight your ongoing costs only and do not reflect any transactional costs, such as sales charges (loads), redemption fees, or exchange fees. Therefore, the second section of the table is useful in comparing ongoing costs only, and will not help you determine the relative total costs of owning different funds. In addition, if these transactional costs were included, your costs would have been higher. The Fund’s expenses shown in the table reflect fee waivers in effect. The expenses shown in the table assume reinvestment of all dividends and distributions.
8
Table of Contents
| Delaware Global Real Estate Opportunities Fund | ||||
| Expense analysis of an investment of $1,000 |
| Beginning 5/1/17 | Ending Account Value | Annualized Expense Ratio | Expenses Paid During Period 5/1/17 to 10/31/17* | ||||||||||||||||
Actual Fund return† | ||||||||||||||||||||
Class A | $1,000.00 | $1,021.20 | 1.40 | % | $7.13 | |||||||||||||||
Class C | 1,000.00 | 1,017.50 | 2.15 | % | 10.93 | |||||||||||||||
Class R | 1,000.00 | 1,018.60 | 1.65 | % | 8.40 | |||||||||||||||
Institutional Class | 1,000.00 | 1,022.50 | 1.15 | % | 5.86 | |||||||||||||||
Hypothetical 5% return (5% return before expenses) |
| |||||||||||||||||||
Class A | $1,000.00 | $1,018.15 | 1.40 | % | $7.12 | |||||||||||||||
Class C | 1,000.00 | 1,014.37 | 2.15 | % | 10.92 | |||||||||||||||
Class R | 1,000.00 | 1,016.89 | 1.65 | % | 8.39 | |||||||||||||||
Institutional Class | 1,000.00 | 1,019.41 | 1.15 | % | 5.85 | |||||||||||||||
| * | “Expenses Paid During Period” are equal to the Fund’s annualized expense ratio, multiplied by the average account value over the period, multiplied by 184/365 (to reflect the one-half year period). |
| † | Because actual returns reflect only the most recent six-month period, the returns shown may differ significantly from fiscal year returns. |
9
Table of Contents
| Security type / country and sector allocations | ||
| Delaware Global Real Estate Opportunities Fund | As of October 31, 2017 (Unaudited) | |
Sector designations may be different than the sector designations presented in other Fund materials. The sector designations may represent the investment manager’s internal sector classifications.
| Security type / country | Percentage of net assets | ||||
Common Stock by Country | 91.83 | % | |||
Australia | 4.09 | % | |||
Canada | 2.83 | % | |||
China/Hong Kong | 6.61 | % | |||
France | 2.53 | % | |||
Germany | 3.81 | % | |||
Ireland | 1.51 | % | |||
Japan | 6.92 | % | |||
Singapore | 4.58 | % | |||
Spain | 1.70 | % | |||
United Kingdom | 6.55 | % | |||
United States | 50.70 | % | |||
Short-Term Investments | 8.60 | % | |||
Total Value of Securities | 100.43 | % | |||
Liabilities Net of Receivables and Other Assets | (0.43 | %) | |||
Total Net Assets | 100.00 | % | |||
Common stock by sector |
Percentage of net assets | ||||
Diversified REITs | 14.57 | % | |||
Healthcare | 3.46 | % | |||
Healthcare REITs | 2.68 | % | |||
Hotel REITs | 4.61 | % | |||
Industrial REITs | 5.11 | % | |||
Information Technology REITs | 4.44 | % | |||
Mall REITs | 4.02 | % | |||
Manufactured Housing REIT | 0.65 | % | |||
Multifamily REITs | 17.14 | % | |||
Office REITs | 9.59 | % | |||
Office/Diversified REITs | 1.99 | % | |||
Real Estate Operating Companies/Developer | 5.45 | % | |||
Retail REITs | 6.29 | % | |||
Self-Storage REITs | 2.74 | % | |||
Shopping Center REITs | 7.50 | % | |||
Single Tenant REITs | 0.68 | % | |||
Specialty REIT | 0.91 | % | |||
Total | 91.83 | % | |||
10
Table of Contents
| Schedule of investments | ||||
| Delaware Global Real Estate Opportunities Fund | October 31, 2017 |
| Number of shares | Value (US $) | |||||||
Common Stock – 98.83%D | ||||||||
Australia – 4.09% | ||||||||
Dexus | 120,589 | $ | 901,701 | |||||
Goodman Group | 138,103 | 883,628 | ||||||
GPT Group-In Specie =† | 1,377,200 | 13,070 | ||||||
Westfield | 106,405 | 632,766 | ||||||
|
| |||||||
| 2,431,165 | ||||||||
|
| |||||||
Canada – 2.83% | ||||||||
Canadian Real Estate Investment Trust | 19,500 | 704,364 | ||||||
Pure Industrial Real Estate Trust | 58,600 | 302,516 | ||||||
RioCan Real Estate Investment Trust | 35,700 | 677,141 | ||||||
|
| |||||||
| 1,684,021 | ||||||||
|
| |||||||
China/Hong Kong – 6.61% | ||||||||
CK Asset Holdings | 149,000 | 1,225,210 | ||||||
Hongkong Land Holdings | 64,509 | 467,690 | ||||||
Link REIT | 132,500 | 1,113,310 | ||||||
Sun Hung Kai Properties | 68,724 | 1,124,052 | ||||||
|
| |||||||
| 3,930,262 | ||||||||
|
| |||||||
France – 2.53% | ||||||||
Gecina | 5,629 | 913,382 | ||||||
Unibail-Rodamco | 2,369 | 592,885 | ||||||
|
| |||||||
| 1,506,267 | ||||||||
|
| |||||||
Germany – 3.81% | ||||||||
alstria office REIT | 38,796 | 551,518 | ||||||
Deutsche Wohnen | 40,008 | 1,712,357 | ||||||
|
| |||||||
| 2,263,875 | ||||||||
|
| |||||||
Ireland – 1.51% | ||||||||
Green REIT | 512,230 | 900,973 | ||||||
|
| |||||||
| 900,973 | ||||||||
|
| |||||||
Japan – 6.92% | ||||||||
Japan Rental Housing Investments | 752 | 519,829 | ||||||
Mitsubishi Estate | 46,900 | 843,709 | ||||||
Mitsui Fudosan | 39,300 | 907,628 | ||||||
Sumitomo Realty & Development | 45,000 | 1,490,040 | ||||||
United Urban Investment | 250 | 359,043 | ||||||
|
| |||||||
| 4,120,249 | ||||||||
|
| |||||||
Singapore – 4.58% | ||||||||
CapitaLand | 349,700 | 941,530 | ||||||
City Developments | 111,000 | 1,053,730 | ||||||
Mapletree Commercial Trust | 641,501 | 731,813 | ||||||
|
| |||||||
| 2,727,073 | ||||||||
|
| |||||||
11
Table of Contents
| Schedule of investments | ||||
| Delaware Global Real Estate Opportunities Fund |
| Number of shares | Value (US $) | |||||||
Common StockD (continued) | ||||||||
Spain – 1.70% | ||||||||
Inmobiliaria Colonial Socimi | 76,809 | $ | 730,888 | |||||
Merlin Properties Socimi | 21,445 | 283,026 | ||||||
|
| |||||||
| 1,013,914 | ||||||||
|
| |||||||
United Kingdom – 6.55% | ||||||||
Assura | 754,455 | 605,226 | ||||||
Capital & Counties Properties | 121,089 | 427,632 | ||||||
Grainger | 463,036 | 1,712,108 | ||||||
Shaftesbury | 55,448 | 729,068 | ||||||
UNITE Group | 45,218 | 422,196 | ||||||
|
| |||||||
| 3,896,230 | ||||||||
|
| |||||||
United States – 50.70% | ||||||||
AvalonBay Communities | 6,959 | 1,261,875 | ||||||
Boston Properties | 10,905 | 1,321,468 | ||||||
Brandywine Realty Trust | 48,281 | 844,435 | ||||||
Brixmor Property Group | 53,205 | 929,491 | ||||||
Brookdale Senior Living † | 205,264 | 2,058,799 | ||||||
Camden Property Trust | 6,693 | 610,669 | ||||||
Columbia Property Trust | 31,286 | 690,795 | ||||||
CoreSite Realty | 3,828 | 423,951 | ||||||
Crown Castle International | 12,872 | 1,378,334 | ||||||
CubeSmart | 17,178 | 467,585 | ||||||
DCT Industrial Trust | 15,413 | 894,262 | ||||||
Empire State Realty Trust | 18,288 | 366,674 | ||||||
Equinix | 1,810 | 838,935 | ||||||
Equity Commonwealth † | 8,020 | 241,001 | ||||||
Equity LifeStyle Properties | 4,380 | 387,542 | ||||||
Equity Residential | 16,235 | 1,091,966 | ||||||
Essex Property Trust | 3,011 | 790,177 | ||||||
Extra Space Storage | 8,208 | 669,691 | ||||||
Forest City Realty Trust | 14,754 | 363,391 | ||||||
GGP | 26,994 | 525,303 | ||||||
HCP | 21,458 | 554,475 | ||||||
Host Hotels & Resorts | 23,206 | 453,909 | ||||||
Invitation Homes | 23,926 | 540,010 | ||||||
Kimco Realty | 41,426 | 752,296 | ||||||
Liberty Property Trust | 11,077 | 474,982 | ||||||
MGM Growth Properties | 36,715 | 1,083,460 | ||||||
Park Hotels & Resorts | 17,212 | 495,533 | ||||||
Prologis | 14,902 | 962,371 | ||||||
Public Storage | 2,380 | 493,255 | ||||||
Realty Income | 3,104 | 166,592 | ||||||
Regency Centers | 18,930 | 1,165,141 | ||||||
12
Table of Contents
| Number of shares | Value (US $) | |||||||
Common StockD (continued) | ||||||||
United States (continued) | ||||||||
Retail Properties of America | 22,513 | $ | 275,109 | |||||
Simon Property Group | 12,029 | 1,868,465 | ||||||
SL Green Realty | 3,349 | 320,432 | ||||||
Sunstone Hotel Investors | 43,607 | 711,666 | ||||||
UDR | 30,114 | 1,168,122 | ||||||
Urban Edge Properties | 31,115 | 729,958 | ||||||
VEREIT | 30,108 | 237,552 | ||||||
Vornado Realty Trust | 6,924 | 518,331 | ||||||
Weingarten Realty Investors | 20,100 | 612,045 | ||||||
Welltower | 6,474 | 433,499 | ||||||
|
| |||||||
| 30,173,547 | ||||||||
|
| |||||||
Total Common Stock (cost $54,306,845) | 54,647,576 | |||||||
|
| |||||||
| Principal amount° | ||||||||
Short-Term Investments – 8.60% | ||||||||
Discount Notes – 5.06%≠ | ||||||||
Federal Home Loan Bank | ||||||||
0.85% 11/1/17 | 272,614 | 272,614 | ||||||
0.90% 11/6/17 | 749,626 | 749,522 | ||||||
0.96% 11/3/17 | 312,687 | 312,670 | ||||||
0.97% 11/15/17 | 411,430 | 411,270 | ||||||
1.004% 11/13/17 | 53,699 | 53,682 | ||||||
1.005% 11/9/17 | 1,213,095 | 1,212,825 | ||||||
|
| |||||||
| 3,012,583 | ||||||||
|
| |||||||
Repurchase Agreements – 3.54% | ||||||||
Bank of America Merrill Lynch | 551,026 | 551,026 | ||||||
BNP Paribas | 1,556,490 | 1,556,490 | ||||||
|
| |||||||
| 2,107,516 | ||||||||
|
| |||||||
Total Short-Term Investments (cost $5,120,114) | 5,120,099 | |||||||
|
| |||||||
Total Value of Securities – 100.43% | $ | 59,767,675 | ||||||
|
| |||||||
13
Table of Contents
| Schedule of investments | ||||
| Delaware Global Real Estate Opportunities Fund |
| = | The value of this security was determined using significant unobservable inputs and is reported as a Level 3 security in the disclosure table located in Note 3 in “Notes to financial statements.” |
| ≠ | The rate shown is the effective yield at the time of purchase. |
| ° | Principal amount shown is stated in US dollars unless noted that the security is denominated in another currency. |
| D | Securities have been classified by country of origin. Aggregate classification by business sector has been presented on page 10 in “Security type / country and sector allocations.” |
| † | Non-income producing security. |
The following foreign currency exchange contracts were outstanding at Oct. 31, 2017:1
Foreign Currency Exchange Contracts
| Contracts to | Settlement | Unrealized | Unrealized | |||||||||||||||||||||
Counterparty | Receive (Deliver) | In Exchange For | Date | Appreciation | Depreciation | |||||||||||||||||||
BNYM | AUD | (28,374 | ) | USD | 21,771 | 11/1/17 | $ | 56 | $ | — | ||||||||||||||
BNYM | EUR | 169,611 | USD | (197,756 | ) | 11/2/17 | — | (163 | ) | |||||||||||||||
BNYM | HKD | (1,058,934 | ) | USD | 135,694 | 11/1/17 | — | (41 | ) | |||||||||||||||
BNYM | JPY | (18,693,651 | ) | USD | 164,380 | 11/1/17 | — | (31 | ) | |||||||||||||||
|
|
|
| |||||||||||||||||||||
Total Foreign Currency Exchange Contracts |
| $ | 56 | $ | (235 | ) | ||||||||||||||||||
|
|
|
| |||||||||||||||||||||
The use of foreign currency exchange contracts involves elements of market risk and risks in excess of the amounts disclosed in the financial statements. The foreign currency exchange contracts presented above represent the Fund’s total exposure in such contracts, whereas only the net unrealized appreciation (depreciation) is reflected in the Fund’s net assets.
1See Note 8 in “Notes to financial statements.”
Summary of abbreviations: |
AUD – Australian Dollar |
BNYM – BNY Mellon |
EUR – European Monetary Unit |
HKD – Hong Kong Dollar |
JPY – Japanese Yen |
REIT – Real Estate Investment Trust |
USD – US Dollar |
See accompanying notes, which are an integral part of the financial statements.
14
Table of Contents
| Statement of assets and liabilities | ||||
| Delaware Global Real Estate Opportunities Fund | October 31, 2017 |
Assets: | ||||
Investments, at value1 | $ | 54,647,576 | ||
Short-term investments, at value2 | 5,120,099 | |||
Foreign currencies, at value3 | 329,141 | |||
Receivable for securities sold | 664,135 | |||
Receivable for fund shares sold | 127,571 | |||
Dividends and interest receivable | 52,555 | |||
Foreign tax reclaims receivable | 48,919 | |||
Unrealized appreciation of foreign currency exchange contracts | 56 | |||
|
| |||
Total assets | 60,990,052 | |||
|
| |||
Liabilities: | ||||
Cash due to custodian | 239,974 | |||
Payable for securities purchased | 1,004,633 | |||
Payable for fund shares redeemed | 107,167 | |||
Audit and tax fees payable | 33,100 | |||
Other accrued expenses | 32,374 | |||
Investment management fees payable to affiliates | 29,124 | |||
Custody fees payable | 13,279 | |||
BNY Mellon administration fees payable | 12,963 | |||
Distribution fees payable to affiliates | 3,649 | |||
Dividend disbursing and transfer agent fees and expenses payable to affiliates | 1,005 | |||
Accounting and administration expenses payable to affiliates | 534 | |||
Unrealized depreciation of foreign currency exchange contracts | 235 | |||
Trustees’ fees and expenses payable | 146 | |||
Legal fees payable to affiliates | 85 | |||
Reports and statements to shareholders expenses payable to affiliates | 42 | |||
|
| |||
Total liabilities | 1,478,310 | |||
|
| |||
Total Net Assets | $ | 59,511,742 | ||
|
| |||
Net Assets Consist of: | ||||
Paid-in capital | $ | 64,608,774 | ||
Undistributed net investment income | 185,040 | |||
Accumulated net realized loss on investments | (5,622,445 | ) | ||
Net unrealized appreciation of investments | 340,716 | |||
Net unrealized depreciation of foreign currencies | (164 | ) | ||
Net unrealized depreciation of foreign currency exchange contracts | (179 | ) | ||
|
| |||
Total Net Assets | $ | 59,511,742 | ||
|
| |||
15
Table of Contents
| Statement of assets and liabilities | ||||
| Delaware Global Real Estate Opportunities Fund |
Net Asset Value | ||||
Class A: | ||||
Net assets | $ | 6,654,174 | ||
Shares of beneficial interest outstanding, unlimited authorization, no par | 894,140 | |||
Net asset value per share | $ | 7.44 | ||
Sales charge | 5.75 | % | ||
Offering price per share, equal to net asset value per share / (1 – sales charge) | $ | 7.89 | ||
Class C: | ||||
Net assets | $ | 2,468,950 | ||
Shares of beneficial interest outstanding, unlimited authorization, no par | 332,274 | |||
Net asset value per share | $ | 7.43 | ||
Class R: | ||||
Net assets | $ | 137,485 | ||
Shares of beneficial interest outstanding, unlimited authorization, no par | 18,492 | |||
Net asset value per share | $ | 7.43 | ||
Institutional Class: | ||||
Net assets | $ | 50,251,133 | ||
Shares of beneficial interest outstanding, unlimited authorization, no par | 6,758,576 | |||
Net asset value per share | $ | 7.44 | ||
| ||||
1 Investments, at cost | $ | 54,306,845 | ||
2 Short-term investments, at cost | 5,120,114 | |||
3 Foreign currencies, at cost | 329,629 | |||
See accompanying notes, which are an integral part of the financial statements.
16
Table of Contents
| Statement of operations | ||||
| Delaware Global Real Estate Opportunities Fund | Year ended October 31, 2017 |
Investment Income: | ||||
Dividends | $ | 1,784,202 | ||
Interest | 23,865 | |||
Foreign tax withheld | (68,973 | ) | ||
|
| |||
| 1,739,094 | ||||
|
| |||
Expenses: | ||||
Management fees | 643,084 | |||
Distribution expenses – Class A | 40,898 | |||
Distribution expenses – Class C | 26,528 | |||
Distribution expenses – Class R | 860 | |||
Registration fees | 87,031 | |||
Dividend disbursing and transfer agent fees and expenses | 60,571 | |||
Audit and tax fees | 42,970 | |||
Reports and statements to shareholders expenses | 32,268 | |||
Custodian fees | 30,620 | |||
Accounting and administration expenses | 26,530 | |||
Legal fees | 3,991 | |||
Trustee’s fees and expenses | 3,135 | |||
Other | 15,643 | |||
|
| |||
| 1,014,129 | ||||
Less expense waived | (198,165 | ) | ||
Less expenses paid indirectly | (130 | ) | ||
|
| |||
Total operating expenses | 815,834 | |||
|
| |||
Net Investment Income | 923,260 | |||
|
| |||
Net Realized and Unrealized Gain (Loss): | ||||
Net realized gain (loss) on: | ||||
Investments | (182,066 | ) | ||
Foreign currencies | (31,086 | ) | ||
Foreign currency exchange contracts | 93,416 | |||
|
| |||
Net realized loss | (119,736 | ) | ||
|
| |||
Net change in unrealized appreciation (depreciation) of: | ||||
Investments | 2,439,557 | |||
Foreign currencies | 2,802 | |||
Foreign currency exchange contracts | 415 | |||
|
| |||
Net change in unrealized appreciation (depreciation) | 2,442,774 | |||
|
| |||
Net Realized and Unrealized Gain | 2,323,038 | |||
|
| |||
Net Increase in Net Assets Resulting from Operations | $ | 3,246,298 | ||
|
| |||
See accompanying notes, which are an integral part of the financial statements.
17
Table of Contents
| Statements of changes in net assets | ||||
| Delaware Global Real Estate Opportunities Fund |
| Year ended | ||||||||
| 10/31/17 | 10/31/16 | |||||||
Increase (Decrease) in Net Assets from Operations: | ||||||||
Net investment income | $ | 923,260 | $ | 576,642 | ||||
Net realized gain (loss) | (119,736 | ) | 3,194,257 | |||||
Net change in unrealized appreciation (depreciation) | 2,442,774 | (3,333,796 | ) | |||||
|
|
|
| |||||
Net increase in net assets resulting from operations | 3,246,298 | 437,103 | ||||||
|
|
|
| |||||
Dividends and Distributions to Shareholders from: | ||||||||
Net investment income: | ||||||||
Class A | (565,264 | ) | (159,517 | ) | ||||
Class C | (51,576 | ) | (7,510 | ) | ||||
Class R | (4,563 | ) | (1,812 | ) | ||||
Institutional Class | (1,200,930 | ) | (339,745 | ) | ||||
|
|
|
| |||||
| (1,822,333 | ) | (508,584 | ) | |||||
|
|
|
| |||||
Capital Share Transactions: | ||||||||
Proceeds from shares sold: | ||||||||
Class A | 2,914,901 | 22,489,581 | ||||||
Class C | 398,458 | 924,672 | ||||||
Class R | 32,278 | 78,508 | ||||||
Institutional Class | 46,334,816 | 26,248,747 | ||||||
Net asset value of shares issued upon reinvestment of dividends and distributions: | ||||||||
Class A | 542,235 | 153,648 | ||||||
Class C | 49,206 | 6,934 | ||||||
Class R | 4,563 | 1,812 | ||||||
Institutional Class | 916,836 | 287,089 | ||||||
|
|
|
| |||||
| 51,193,293 | 50,190,991 | |||||||
|
|
|
| |||||
18
Table of Contents
| Year ended | ||||||||
| 10/31/17 | 10/31/16 | |||||||
Capital Share Transactions (continued): | ||||||||
Cost of shares redeemed: | ||||||||
Class A | $ | (25,368,284 | ) | $ | (3,178,074 | ) | ||
Class C | (867,806 | ) | (964,469 | ) | ||||
Class R | (103,222 | ) | (167,977 | ) | ||||
Institutional Class | (33,470,957 | ) | (16,903,258 | ) | ||||
|
|
|
| |||||
| (59,810,269 | ) | (21,213,778 | ) | |||||
|
|
|
| |||||
Increase (decrease) in net assets derived from capital share transactions | (8,616,976 | ) | 28,977,213 | |||||
|
|
|
| |||||
Net Increase (Decrease) in Net Assets | (7,193,011 | ) | 28,905,732 | |||||
Net Assets: | ||||||||
Beginning of year | 66,704,753 | 37,799,021 | ||||||
|
|
|
| |||||
End of year | $ | 59,511,742 | $ | 66,704,753 | ||||
|
|
|
| |||||
Undistributed net investment income | $ | 185,040 | $ | 744,889 | ||||
|
|
|
| |||||
See accompanying notes, which are an integral part of the financial statements.
19
Table of Contents
| Financial highlights | ||||
| Delaware Global Real Estate Opportunities Fund Class A |
Selected data for each share of the Fund outstanding throughout each period were as follows:
Net asset value, beginning of period |
Income from investment operations: |
Net investment income1 |
Net realized and unrealized gain |
Total from investment operations |
Less dividends and distributions from: |
Net investment income |
Total dividends and distributions |
Net asset value, end of period |
Total return2 |
Ratios and supplemental data: |
Net assets, end of period (000 omitted) |
Ratio of expenses to average net assets |
Ratio of expenses to average net assets prior to fees waived3 |
Ratio of net investment income to average net assets |
Ratio of net investment income to average net assets prior to fees waived3 |
Portfolio turnover |
| 1 | The average shares outstanding method has been applied for per share information. |
| 2 | Total investment return is based on the change in net asset value of a share during the period and assumes reinvestment of dividends and distributions at net asset value and does not reflect the impact of a sales charge. Total investment return during all of the periods shown reflects a waiver by the manager. Performance would have been lower had the waiver not been in effect. |
| 3 | Expenses paid indirectly were not material and had no impact on the ratios disclosed. Expenses paid indirectly for the year ended Oct. 31, 2017 are reflected on the “Statement of operations.” |
See accompanying notes, which are an integral part of the financial statements.
20
Table of Contents
| Year ended | ||||||||||||||||||||
| 10/31/17 | 10/31/16 | 10/31/15 | 10/31/14 | 10/31/13 | ||||||||||||||||
| $ | 7.31 | $ | 7.22 | $ | 7.20 | $ | 6.65 | $ | 6.06 | |||||||||||
| 0.09 | 0.07 | 0.08 | 0.12 | 0.08 | ||||||||||||||||
| 0.24 | 0.09 | 0.07 | 0.64 | 0.70 | ||||||||||||||||
|
|
|
|
|
|
|
|
|
| |||||||||||
| 0.33 | 0.16 | 0.15 | 0.76 | 0.78 | ||||||||||||||||
|
|
|
|
|
|
|
|
|
| |||||||||||
| (0.20 | ) | (0.07 | ) | (0.13 | ) | (0.21 | ) | (0.19 | ) | |||||||||||
|
|
|
|
|
|
|
|
|
| |||||||||||
| (0.20 | ) | (0.07 | ) | (0.13 | ) | (0.21 | ) | (0.19 | ) | |||||||||||
|
|
|
|
|
|
|
|
|
| |||||||||||
| $ | 7.44 | $ | 7.31 | $ | 7.22 | $ | 7.20 | $ | 6.65 | |||||||||||
|
|
|
|
|
|
|
|
|
| |||||||||||
| 4.69% | 2.20% | 2.16% | 11.80% | 13.11% | ||||||||||||||||
| $ | 6,654 | $ | 28,247 | $ | 8,481 | $ | 6,571 | $ | 4,340 | |||||||||||
| 1.40% | 1.40% | 1.41% | 1.40% | 1.40% | ||||||||||||||||
| 1.71% | 1.72% | 1.73% | 1.78% | 1.66% | |||||||||||||||
| 1.28% | 0.98% | 1.07% | 1.72% | 1.21% | ||||||||||||||||
| 0.97% | 0.66% | 0.75% | 1.34% | 0.95% | |||||||||||||||
| 217% | 193% | 116% | 107% | 112% | ||||||||||||||||
21
Table of Contents
| Financial highlights | ||||
| Delaware Global Real Estate Opportunities Fund Class C |
Selected data for each share of the Fund outstanding throughout each period were as follows:
Net asset value, beginning of period |
Income from investment operations: |
Net investment income1 |
Net realized and unrealized gain |
Total from investment operations |
Less dividends and distributions from: |
Net investment income |
Total dividends and distributions |
Net asset value, end of period |
Total return2 |
Ratios and supplemental data: |
Net assets, end of period (000 omitted) |
Ratio of expenses to average net assets |
Ratio of expenses to average net assets prior to fees waived3 |
Ratio of net investment income to average net assets |
Ratio of net investment income (loss) to average net assets prior to fees waived3 |
Portfolio turnover |
| 1 | The average shares outstanding method has been applied for per share information. |
| 2 | Total investment return is based on the change in net asset value of a share during the period and assumes reinvestment of dividends and distributions at net asset value and does not reflect the impact of a sales charge. Total investment return during all of the periods shown reflects a waiver by the manager. Performance would have been lower had the waiver not been in effect. |
| 3 | Expenses paid indirectly were not material and had no impact on the ratios disclosed. Expenses paid indirectly for the year ended Oct. 31, 2017 are reflected on the “Statement of operations.” |
See accompanying notes, which are an integral part of the financial statements.
22
Table of Contents
| Year ended | ||||||||||||||||||||
| 10/31/17 | 10/31/16 | 10/31/15 | 10/31/14 | 10/31/13 | ||||||||||||||||
| $ | 7.28 | $ | 7.21 | $ | 7.19 | $ | 6.64 | $ | 6.06 | |||||||||||
| 0.04 | 0.02 | 0.02 | 0.07 | 0.03 | ||||||||||||||||
| 0.25 | 0.07 | 0.08 | 0.63 | 0.71 | ||||||||||||||||
|
|
|
|
|
|
|
|
|
| |||||||||||
| 0.29 | 0.09 | 0.10 | 0.70 | 0.74 | ||||||||||||||||
|
|
|
|
|
|
|
|
|
| |||||||||||
| (0.14 | ) | (0.02 | ) | (0.08 | ) | (0.15 | ) | (0.16 | ) | |||||||||||
|
|
|
|
|
|
|
|
|
| |||||||||||
| (0.14 | ) | (0.02 | ) | (0.08 | ) | (0.15 | ) | (0.16 | ) | |||||||||||
|
|
|
|
|
|
|
|
|
| |||||||||||
| $ | 7.43 | $ | 7.28 | $ | 7.21 | $ | 7.19 | $ | 6.64 | |||||||||||
|
|
|
|
|
|
|
|
|
| |||||||||||
| 4.05% | 1.24% | 1.41% | 11.06% | 12.23% | ||||||||||||||||
| $ | 2,469 | $ | 2,838 | $ | 2,850 | $ | 2,119 | $ | 572 | |||||||||||
| 2.15% | 2.15% | 2.16% | 2.15% | 2.15% | ||||||||||||||||
| 2.46% | 2.47% | 2.48% | 2.53% | 2.41% | ||||||||||||||||
| 0.53% | 0.23% | 0.32% | 0.97% | 0.46% | ||||||||||||||||
| 0.22% | (0.09% | ) | 0.00% | 0.59% | 0.20% | |||||||||||||||
| 217% | 193% | 116% | 107% | 112% | ||||||||||||||||
23
Table of Contents
| Financial highlights | ||||
| Delaware Global Real Estate Opportunities Fund Class R |
Selected data for each share of the Fund outstanding throughout each period were as follows:
Net asset value, beginning of period |
Income from investment operations: |
Net investment income1 |
Net realized and unrealized gain |
Total from investment operations |
Less dividends and distributions from: |
Net investment income |
Total dividends and distributions |
Net asset value, end of period |
Total return2 |
Ratios and supplemental data: |
Net assets, end of period (000 omitted) |
Ratio of expenses to average net assets |
Ratio of expenses to average net assets prior to fees waived3 |
Ratio of net investment income to average net assets |
Ratio of net investment income to average net assets prior to fees waived3 |
Portfolio turnover |
| 1 | The average shares outstanding method has been applied for per share information. |
| 2 | Total investment return is based on the change in net asset value of a share during the period and assumes reinvestment of dividends and distributions at net asset value. Total investment return during all of the periods shown reflects waivers by the manager and/or distributor. Performance would have been lower had the waivers not been in effect. |
| 3 | Expenses paid indirectly were not material and had no impact on the ratios disclosed. Expenses paid indirectly for the year ended Oct. 31, 2017 are reflected on the “Statement of operations.” |
See accompanying notes, which are an integral part of the financial statements.
24
Table of Contents
| Year ended | ||||||||||||||||||||
| 10/31/17 | 10/31/16 | 10/31/15 | 10/31/14 | 10/31/13 | ||||||||||||||||
| $ | 7.30 | $ | 7.22 | $ | 7.19 | $ | 6.64 | $ | 6.06 | |||||||||||
| 0.08 | 0.05 | 0.06 | 0.10 | 0.06 | ||||||||||||||||
| 0.23 | 0.08 | 0.09 | 0.64 | 0.70 | ||||||||||||||||
|
|
|
|
|
|
|
|
|
| |||||||||||
| 0.31 | 0.13 | 0.15 | 0.74 | 0.76 | ||||||||||||||||
|
|
|
|
|
|
|
|
|
| |||||||||||
| (0.18 | ) | (0.05 | ) | (0.12 | ) | (0.19 | ) | (0.18 | ) | |||||||||||
|
|
|
|
|
|
|
|
|
| |||||||||||
| (0.18 | ) | (0.05 | ) | (0.12 | ) | (0.19 | ) | (0.18 | ) | |||||||||||
|
|
|
|
|
|
|
|
|
| |||||||||||
| $ | 7.43 | $ | 7.30 | $ | 7.22 | $ | 7.19 | $ | 6.64 | |||||||||||
|
|
|
|
|
|
|
|
|
| |||||||||||
| 4.42% | 1.84% | 2.03% | 11.48% | 12.87% | ||||||||||||||||
| $ | 138 | $ | 201 | $ | 286 | $ | 121 | $ | 24 | |||||||||||
| 1.65% | 1.65% | 1.66% | 1.65% | 1.65% | ||||||||||||||||
| 1.96% | 1.97% | 1.98% | 2.03% | 2.00% | ||||||||||||||||
| 1.03% | 0.73% | 0.82% | 1.47% | 0.96% | ||||||||||||||||
| 0.72% | 0.41% | 0.50% | 1.09% | 0.61% | ||||||||||||||||
| 217% | 193% | 116% | 107% | 112% | ||||||||||||||||
25
Table of Contents
| Financial highlights | ||||
| Delaware Global Real Estate Opportunities Fund Institutional Class |
Selected data for each share of the Fund outstanding throughout each period were as follows:
Net asset value, beginning of period |
Income from investment operations: |
Net investment income1 |
Net realized and unrealized gain |
Total from investment operations |
Less dividends and distributions from: |
Net investment income |
Total dividends and distributions |
Net asset value, end of period |
Total return2 |
Ratios and supplemental data: |
Net assets, end of period (000 omitted) |
Ratio of expenses to average net assets |
Ratio of expenses to average net assets prior to fees waived3 |
Ratio of net investment income to average net assets |
Ratio of net investment income to average net assets prior to fees waived3 |
Portfolio turnover
|
| 1 | The average shares outstanding method has been applied for per share information. |
| 2 | Total investment return is based on the change in net asset value of a share during the period and assumes reinvestment of dividends and distributions at net asset value. Total investment return during all of the periods shown reflects a waiver by the manager. Performance would have been lower had the waiver not been in effect. |
| 3 | Expenses paid indirectly were not material and had no impact on the ratios disclosed. Expenses paid indirectly for the year ended Oct. 31, 2017 are reflected on the “Statement of operations.” |
See accompanying notes, which are an integral part of the financial statements.
26
Table of Contents
| Year ended | ||||||||||||||||||||
| 10/31/17 | 10/31/16 | 10/31/15 | 10/31/14 | 10/31/13 | ||||||||||||||||
| $ | 7.30 | $ | 7.22 | $ | 7.19 | $ | 6.65 | $ | 6.06 | |||||||||||
| 0.11 | 0.09 | 0.10 | 0.13 | 0.09 | ||||||||||||||||
| 0.25 | 0.08 | 0.08 | 0.63 | 0.71 | ||||||||||||||||
|
|
|
|
|
|
|
|
|
| |||||||||||
| 0.36 | 0.17 | 0.18 | 0.76 | 0.80 | ||||||||||||||||
|
|
|
|
|
|
|
|
|
| |||||||||||
| (0.22 | ) | (0.09 | ) | (0.15 | ) | (0.22 | ) | (0.21 | ) | |||||||||||
|
|
|
|
|
|
|
|
|
| |||||||||||
| (0.22 | ) | (0.09 | ) | (0.15 | ) | (0.22 | ) | (0.21 | ) | |||||||||||
|
|
|
|
|
|
|
|
|
| |||||||||||
| $ | 7.44 | $ | 7.30 | $ | 7.22 | $ | 7.19 | $ | 6.65 | |||||||||||
|
|
|
|
|
|
|
|
|
| |||||||||||
| 5.11% | 2.32% | 2.55% | 11.93% | 13.58% | ||||||||||||||||
| $ | 50,251 | $ | 35,419 | $ | 26,182 | $ | 44,999 | $ | 49,291 | |||||||||||
| 1.15% | 1.15% | 1.16% | 1.15% | 1.15% | ||||||||||||||||
| 1.46% | 1.47% | 1.48% | 1.53% | 1.41% | ||||||||||||||||
| 1.53% | 1.23% | 1.32% | 1.97% | 1.46% | ||||||||||||||||
| 1.22% | 0.91% | 1.00% | 1.59% | 1.20% | ||||||||||||||||
| 217% | 193% | 116% | 107% | 112% | ||||||||||||||||
27
Table of Contents
| Notes to financial statements | ||||
| Delaware Global Real Estate Opportunities Fund | October 31, 2017 |
Delaware Group® Adviser Funds (Trust) is organized as a Delaware statutory trust and offers three series: Delaware Diversified Income Fund, Delaware Global Real Estate Opportunities Fund, and Delaware U.S. Growth Fund. These financial statements and related notes pertain to Delaware Global Real Estate Opportunities Fund (Fund). The Trust is an open-end investment company. The Fund is considered non-diversified under the Investment Company Act of 1940 as amended (1940 Act), and offers Class A, Class C, Class R, and Institutional Class shares. Class A shares are sold with a maximum front-end sales charge of 5.75%. Class A share purchases of $1,000,000 or more will incur a contingent deferred sales charge (CDSC) instead of a front-end sales charge of 1.00%, if redeemed during the first year and 0.50% during the second year, provided that Delaware Distributors, L.P. (DDLP) paid a financial advisor a commission on the purchase of those shares. Class C shares are sold with a CDSC of 1.00%, if redeemed during the first 12 months. Class R and Institutional Class shares are not subject to a sales charge and are offered for sale exclusively to certain eligible investors.
The investment objective of the Fund is to seek maximum long-term total return through a combination of current income and capital appreciation.
1. Significant Accounting Policies
The following accounting policies are in accordance with US generally accepted accounting principles (US GAAP) and are consistently followed by the Fund.
Security Valuation – Equity securities, except those traded on the Nasdaq Stock Market LLC (Nasdaq), are valued at the last quoted sales price as of the time of the regular close of the New York Stock Exchange on the valuation date. Equity securities traded on the Nasdaq are valued in accordance with the Nasdaq Official Closing Price, which may not be the last sales price. If, on a particular day, an equity security does not trade, the mean between the bid and ask prices will be used, which approximates fair value. Equity securities listed on a foreign exchange are normally valued at the last quoted sales price on the valuation date. US government and agency securities are valued at the mean between the bid and ask prices, which approximates fair value. Other debt securities are valued based upon valuations provided by an independent pricing service or broker and reviewed by management. To the extent current market prices are not available, the pricing service may take into account developments related to the specific security, as well as transactions in comparable securities. Valuations for fixed income securities utilize matrix systems, which reflect such factors as security prices, yields, maturities, and ratings, and are supplemented by dealer and exchange quotations. Foreign currency exchange contracts are valued at the mean between the bid and ask prices, which approximates fair value. Interpolated values are derived when the settlement date of the contract is an interim date for which quotations are not available. Generally, other securities and assets for which market quotations are not readily available are valued at fair value as determined in good faith under the direction of the Trust’s Board of Trustees (Board). In determining whether market quotations are readily available or fair valuation will be used, various factors will be taken into consideration, such as market closures or suspension of trading in a security. The Fund may use fair value pricing more frequently for securities traded primarily in non-US markets because, among other things, most foreign markets close well before the Fund values its securities, generally as of 4:00pm Eastern time. The earlier close of these foreign markets gives rise to the possibility that significant events, including broad market moves, government actions or pronouncements, aftermarket trading, or news events may have occurred in the
28
Table of Contents
interim. Whenever such a significant event occurs, the Fund may value foreign securities using fair value prices based on third-party vendor modeling tools (international fair value pricing). The foregoing valuation policies apply to restricted and unrestricted securities.
Federal and Foreign Income Taxes – No provision for federal income taxes has been made as the Fund intends to continue to qualify for federal income tax purposes as a regulated investment company under Subchapter M of the Internal Revenue Code of 1986, as amended, and make the requisite distributions to shareholders. The Fund evaluates tax positions taken or expected to be taken in the course of preparing the Fund’s tax returns to determine whether the tax positions are “more-likely-than-not” of being sustained by the applicable tax authority. Tax positions not deemed to meet the “more-likely-than-not” threshold are recorded as a tax benefit or expense in the current year. Management has analyzed the Fund’s tax positions taken or to be taken on the Fund’s federal income tax returns through the year ended Oct. 31, 2017 and for all open federal income tax years (Oct. 31, 2014–Oct. 31, 2016), and has concluded that no provision for federal income tax is required in the Fund’s financial statements. If applicable, the Fund recognizes interest accrued on unrecognized tax benefits in interest expense and penalties in other expenses on the “Statement of operations.” During the year ended Oct. 31, 2017, the Fund did not incur any interest or tax penalties. In regard to foreign taxes only, the Fund has open tax years in certain foreign countries in which it invests that may date back to the inception of the Fund.
Class Accounting – Investment income, common expenses, and realized and unrealized gain (loss) on investments are allocated to the various classes of the Fund on the basis of daily net assets of each class. Distribution expenses relating to a specific class are charged directly to that class.
Repurchase Agreements – The Fund may purchase certain US government securities subject to the counterparty’s agreement to repurchase them at an agreed upon date and price. The counterparty will be required on a daily basis to maintain the value of the collateral subject to the agreement at not less than the repurchase price (including accrued interest). The agreements are conditioned upon the collateral being deposited under the Federal Reserve book-entry system with the Fund’s custodian or a third-party sub-custodian. In the event of default or bankruptcy by the other party to the agreement, retention of the collateral may be subject to legal proceedings. All open repurchase agreements as of the date of this report were entered into on Oct. 31, 2017, and matured on the next business day.
Foreign Currency Transactions – Transactions denominated in foreign currencies are recorded at the prevailing exchange rates on the valuation date in accordance with the Fund’s prospectus. The value of all assets and liabilities denominated in foreign currencies is translated daily into US dollars at the exchange rate of such currencies against the US dollar. Transaction gains or losses resulting from changes in exchange rates during the reporting period or upon settlement of the foreign currency transaction are reported in operations for the current period. The Fund generally does not bifurcate that portion of realized gains and losses on investments which is due to changes in foreign exchange rates from that which is due to changes in market prices. These gains and losses are included on the “Statement of operations” under “Net realized and unrealized gain (loss) on investments.” The Fund reports certain foreign currency related transactions as components of realized gains (losses) for financial reporting purposes, whereas such components are treated as ordinary income (loss) for federal income tax purposes.
29
Table of Contents
| Notes to financial statements | ||||
| Delaware Global Real Estate Opportunities Fund |
1. Significant Accounting Policies (continued)
Use of Estimates – The Fund is an investment company, whose financial statements are prepared in conformity with US GAAP. Therefore, the Fund follows the accounting and reporting guidelines for investment companies. The preparation of financial statements in conformity with US GAAP requires management to make estimates and assumptions that affect the fair value of investments, the reported amounts of assets and liabilities and disclosure of contingent assets and liabilities at the date of the financial statements, and the reported amounts of revenues and expenses during the reporting period. Actual results could differ from those estimates and the differences could be material.
Other – Expenses directly attributable to the Fund are charged directly to the Fund. Other expenses common to various funds within the Delaware FundsSM by Macquarie (Delaware Funds) are generally allocated among such funds on the basis of average net assets. Management fees and certain other expenses are paid monthly. Security transactions are recorded on the date the securities are purchased or sold (trade date) for financial reporting purposes. Costs used in calculating realized gains and losses on the sale of investment securities are those of the specific securities sold. Dividend income is recorded on the ex-dividend date and interest income is recorded on the accrual basis. Discounts and premiums on debt securities are accreted or amortized to interest income, respectively over the lives of the respective securities using the effective interest method. Distributions received from investments in real estate investment trusts (REITs) are recorded as dividend income on the ex-dividend date, subject to reclassification upon notice of the character of such distributions by the issuer. The financial statements reflect an estimate of the reclassification of the distribution character. Foreign dividends are also recorded on the ex-dividend date or as soon after the ex-dividend date that the Fund is aware of such dividends, net of all tax withholdings, a portion of which may be reclaimable. Withholding taxes and reclaims on foreign dividends have been recorded in accordance with the Fund’s understanding of the applicable country’s tax rules and rates. The Fund declares and pays dividends from net investment income quarterly and distributions from net realized gain on investments, if any, annually. The Fund may distribute more frequently, if necessary for tax purposes. Dividends and distributions, if any, are recorded on the ex-dividend date.
The Fund receives earnings credits from its custodian when positive cash balances are maintained, which may be used to offset custody fees. The expense paid under this arrangement is included on the “Statement of operations” under “Custodian fees” with the corresponding expense offset shown under “Less expense paid indirectly.” For the year ended Oct. 31, 2017, the Fund earned $15 under this agreement.
The Fund receives earnings credits from its transfer agent when positive cash balances are maintained, which may be used to offset transfer agent fees. If the amount earned is greater than $1, the expense paid under this arrangement is included on the “Statement of operations” under “Dividend disbursing and transfer agent fees and expenses” with the corresponding expense offset shown under “Less expense paid indirectly.” For the year ended Oct. 31, 2017, the Fund earned $115 under this agreement.
30
Table of Contents
2. Investment Management, Administration Agreements, and Other Transactions with Affiliates
In accordance with the terms of its investment management agreement, the Fund pays Delaware Management Company (DMC), a series of Macquarie Investment Management Business Trust (formerly, Delaware Management Business Trust) and the investment manager, an annual fee which is calculated daily and paid monthly at the rate of 0.99% on the first $100 million of the average daily net assets of the Fund, 0.90% on the next $150 million, and 0.80% on average daily net assets in excess of $250 million.
DMC has contractually agreed to waive that portion, if any, of its investment advisory fees and/or pay/reimburse the Fund to the extent necessary to ensure that total annual operating expenses (excluding any distribution and service (12b-1) fees, acquired funds fees and expenses, taxes, interest, short sale and dividend interest expenses, brokerage fees, certain insurance costs, and nonroutine expenses or costs, including, but not limited to, those relating to reorganizations, litigation, conducting shareholder meetings, and liquidations (collectively nonroutine expenses)) do not exceed 1.15% of the Fund’s average daily net assets from Nov. 1, 2016 through Oct. 31, 2017.* For purposes of this waiver and reimbursement, nonroutine expenses may also include such additional costs and expenses as may be agreed upon from time to time by the Fund’s Board and DMC. This expense waiver and reimbursement may only be terminated by agreement of DMC and the Fund.
Delaware Investments Fund Services Company (DIFSC), an affiliate of DMC, provides fund accounting and financial administration oversight services to the Fund. For these services, DIFSC’s fees were calculated daily and paid monthly based on the aggregate daily net assets of the Delaware Funds from Nov. 1, 2016 through Aug. 31, 2017 at the following annual rate: 0.0050% of the first $30 billion; 0.0045% of the next $10 billion; 0.0040% of the next $10 billion; and 0.0025% of aggregate average daily net assets in excess of $50 billion. The fees payable to DIFSC under the service agreement described above are allocated among all retail funds in the Delaware Funds on the relative net asset value (NAV) basis. Effective Sept. 1, 2017, the Fund entered into an amendment to DIFSC agreement. Under the amendment to the DIFSC agreement, DIFSC’s fees are calculated daily and paid monthly based on the aggregate daily net assets of the Delaware Funds at the following annual rate: 0.00475% of the first $35 billion; 0.0040% of the next $10 billion; and 0.0025% of aggregate average daily net assets in excess of $45 billion (Total Fee). Each Fund in the Delaware Funds pays a minimum of $4,000, which, in aggregate, is subtracted from the Total Fee. Each Fund in the Delaware Funds then pays its relative portion of the remainder of the Total Fee on a relative NAV basis. For the year ended Oct. 31, 2017, the Fund was charged $3,601 for these services. This amount is included on the “Statement of operation” under “Accounting and administration expenses.”
DIFSC is also the transfer agent and dividend disbursing agent of the Fund. For these services, DIFSC’s fees are calculated daily and paid monthly based on the aggregate daily net assets of the retail funds within the Delaware Funds at the following annual rate: 0.025% of the first $20 billion; 0.020% of the next $5 billion; 0.015% of the next $5 billion; and 0.013% of average daily net assets in excess of $30 billion. The fees payable to DIFSC under the service agreement described above are allocated among all retail funds in the Delaware Funds on a relative NAV basis. For the year ended Oct. 31, 2017, the Fund was charged $12,928 for these services. This amount is included on the “Statement of operations” under “Dividend disbursing and transfer agent fees and expenses.” Pursuant to a sub-transfer agency agreement between DIFSC and BNY Mellon Investment Servicing (US) Inc. (BNYMIS), BNYMIS provides
31
Table of Contents
| Notes to financial statements | ||||
| Delaware Global Real Estate Opportunities Fund |
2. Investment Management, Administration Agreements, and Other Transactions with Affiliates (continued)
certain sub-transfer agency services to the Fund. Sub-transfer agency fees are paid by the Fund and are also included on the “Statement of operations” under “Dividend disbursing and transfer agent fees and expenses.”
Pursuant to a distribution agreement and distribution plan, the Fund pays DDLP, the distributor and an affiliate of DMC, an annual 12b-1 fee of 0.25% of the average daily net assets of the Class A shares, 1.00% of the average daily net assets of the Class C shares, and 0.50% of the average daily net assets of the Class R shares. The fees are calculated daily and paid monthly. Institutional Class shares pay no 12b-1 fee.
As provided in the investment management agreement, the Fund bears a portion of the cost of certain resources shared with DMC, including the cost of internal personnel of DMC and/or its affiliates that provide legal, tax, and regulatory reporting services to the Fund. For the year ended Oct. 31, 2017, the Fund was charged $1,324 for internal legal, tax, and regulatory reporting services provided by DMC and/or its affiliates’ employees. This amount is included on the “Statement of operations” under “Legal fees.”
For the year ended Oct. 31, 2017, DDLP earned $2,146 for commissions on sales of the Fund’s Class A shares. For the year ended Oct. 31, 2017, DDLP received gross CDSC commissions of $49 and $521 on redemptions of the Fund’s Class A and Class C shares, respectively, and these commissions were entirely used to offset upfront commissions previously paid by DDLP to broker/dealers on sales of those shares.
Trustees’ fees include expenses accrued by the Fund for each Trustee’s retainer and meeting fees. Certain officers of DMC, DIFSC, and DDLP are officers and/or Trustees of the Trust. These officers and Trustees are paid no compensation by the Fund.
Cross trades for the year ended Oct. 31, 2017 were executed by the Fund pursuant to procedures adopted by the Board designed to ensure compliance with Rule 17a-7 under the 1940 Act. Cross trading is the buying or selling of portfolio securities between funds of investment companies, or between a fund of an investment company and another entity, that are or could be considered affiliates by virtue of having a common investment advisor (or affiliated investment advisors), common directors/trustees and/or common officers. At its regularly scheduled meetings, the Board reviews such transactions for compliance with the procedures adopted by the Board. Pursuant to these procedures, for the year ended Oct. 31, 2017, the Fund engaged in securities sales of $471,302, which resulted in net realized gain of $15. There were no securities purchased under Rule 17a-7 for the year ended Oct. 31, 2017.
* The aggregate contractual waiver period covering this report is from Feb. 26, 2016, through Feb. 28, 2018.
32
Table of Contents
3. Investments
For the year ended Oct. 31, 2017, the Fund made purchases and sales of investment securities other than short-term investments as follows:
Purchases | $ | 134,132,332 | ||
Sales | 144,650,469 |
Tax cost of investments includes adjustments to net unrealized appreciation (depreciation), which may not necessarily be the final tax cost basis adjustments, but approximate the tax basis unrealized gains and losses that may be realized and distributed to shareholders. At Oct. 31, 2017, the cost and unrealized appreciation (depreciation) of investments and derivatives for federal income tax purposes for the Fund were as follows:
Cost of investments and derivatives | $ | 61,537,162 | ||
|
| |||
Aggregate unrealized appreciation of investments and derivatives | $ | 1,887,302 | ||
Aggregate unrealized depreciation of investments and derivatives | (3,656,968 | ) | ||
|
| |||
Net unrealized depreciation of investments and derivatives | $ | (1,769,666 | ) | |
|
|
US GAAP defines fair value as the price that the Fund would receive to sell an asset or pay to transfer a liability in an orderly transaction between market participants at the measurement date under current market conditions. A three-level hierarchy for fair value measurements has been established based upon the transparency of inputs to the valuation of an asset or liability. Inputs may be observable or unobservable and refer broadly to the assumptions that market participants would use in pricing the asset or liability. Observable inputs reflect the assumptions market participants would use in pricing the asset or liability based on market data obtained from sources independent of the reporting entity. Unobservable inputs reflect the reporting entity’s own assumptions about the assumptions that market participants would use in pricing the asset or liability based on the best information available under the circumstances. The Fund’s investment in its entirety is assigned a level based upon the observability of the inputs which are significant to the overall valuation. The three-level hierarchy of inputs is summarized below and on the next page.
Level 1 – | Inputs are quoted prices in active markets for identical investments. (Examples: equity securities, open-end investment companies, futures contracts, exchange-traded options contracts) | |
Level 2 – | Other observable inputs, including, but not limited to: quoted prices for similar assets or liabilities in markets that are active, quoted prices for identical or similar assets or liabilities in markets that are not active, inputs other than quoted prices that are observable for the assets or liabilities (such as interest rates, yield curves, volatilities, prepayment speeds, loss severities, credit risks, and default rates) or other market-corroborated inputs. (Examples: debt securities, government securities, swap contracts, foreign currency exchange contracts, foreign securities utilizing international fair value pricing, broker-quoted securities, fair valued securities) | |
Level 3 – | Significant unobservable inputs, including the Fund’s own assumptions used to determine the fair value of investments. (Examples: broker-quoted securities, fair valued securities) | |
33
Table of Contents
| Notes to financial statements | ||||
| Delaware Global Real Estate Opportunities Fund |
3. Investments (continued)
Level 3 investments are valued using significant unobservable inputs. The Fund may also use an income-based valuation approach in which the anticipated future cash flows of the investment are discounted to calculate fair value. Discounts may also be applied due to the nature or duration of any restrictions on the disposition of the investments. Valuations may also be based upon current market prices of securities that are comparable in coupon, rating, maturity, and industry. The derived value of a Level 3 investment may not represent the value which is received upon disposition and this could impact the results of operations.
The following table summarizes the valuation of the Fund’s investments by fair value hierarchy levels as of Oct. 31, 2017:
Securities | Level 1 | Level 2 | Level 3 | Total | ||||||||||||
Assets: | ||||||||||||||||
Common Stock | ||||||||||||||||
Australia | $ | 2,418,095 | $ | — | $ | 13,070 | $ | 2,431,165 | ||||||||
Canada | 1,684,021 | — | — | 1,684,021 | ||||||||||||
China/Hong Kong | 3,930,262 | — | — | 3,930,262 | ||||||||||||
France | 1,506,267 | — | — | 1,506,267 | ||||||||||||
Germany | — | 2,263,875 | — | 2,263,875 | ||||||||||||
Ireland | 900,973 | — | — | 900,973 | ||||||||||||
Japan | 4,120,249 | — | — | 4,120,249 | ||||||||||||
Singapore | 2,727,073 | — | — | 2,727,073 | ||||||||||||
Spain | 1,013,914 | — | — | 1,013,914 | ||||||||||||
United Kingdom | 3,896,230 | — | — | 3,896,230 | ||||||||||||
United States | 30,173,547 | — | — | 30,173,547 | ||||||||||||
Short-Term Investments | — | 5,120,099 | — | 5,120,099 | ||||||||||||
|
|
|
|
|
|
|
| |||||||||
Total Value of Securities | $ | 52,370,631 | $ | 7,383,974 | $ | 13,070 | $ | 59,767,675 | ||||||||
|
|
|
|
|
|
|
| |||||||||
| Derivatives*: | ||||||||||||||||
Assets: | ||||||||||||||||
Foreign Currency Exchange Contracts | $ | — | $ | 56 | $ | — | $ | 56 | ||||||||
Liabilities: | ||||||||||||||||
Foreign Currency Exchange Contracts | $ | — | $ | (235 | ) | $ | — | $ | (235 | ) | ||||||
*Foreign currency exchange contracts are valued at the unrealized appreciation (depreciation) on the instrument at the year end.
As a result of utilizing international fair value pricing at Oct. 31, 2017, a portion of the Fund’s common stock was categorized as Level 2.
34
Table of Contents
During the year ended Oct. 31, 2017, there were no transfers between Level 1 investments, Level 2 investments, or Level 3 investments that had a significant impact to the Fund. This does not include transfers between Level 1 investments and Level 2 investments due to the Fund utilizing international fair value pricing during the year. In accordance with the fair valuation procedures described in Note 1, international fair value pricing of securities in the Fund occurs when market volatility exceeds an established rolling threshold. If the threshold is exceeded on a given date, then prices of international securities (those that traded on exchanges that close at a different time than the time that the Fund’s NAV is determined) are established using a separate pricing feed from a third-party vendor designed to establish a price for each such security as of the time that the Fund’s NAV is determined. Further, international fair value pricing uses other observable market-based inputs in place of the closing exchange price due to the events occurring after the close of the exchange or market on which the investment is principally traded, causing a change in classification between levels. The Fund’s policy is to recognize transfers between levels based on fair value at the beginning of the reporting period.
A reconciliation of Level 3 investments is presented when the Fund has a significant amount of Level 3 investments at the beginning, interim, or end of the period in relation to net assets. Management has determined not to provide a reconciliation of Level 3 investments as they were not considered significant to the Fund’s net assets at the beginning, interim, or end of the period. Management has determined not to provide additional disclosure on Level 3 inputs since the Level 3 investments are not considered significant to the Fund’s net assets at the end of the year.
4. Dividend and Distribution Information
Income and long-term capital gain distributions are determined in accordance with federal income tax regulations, which may differ from US GAAP. Additionally, distributions from net gains on foreign currency transactions and net short-term gains on sales of investment securities are treated as ordinary income for federal income tax purposes. The tax character of dividends and distributions paid during the years ended Oct. 31, 2017 and 2016 was as follows:
| Year ended | ||||
| 10/31/17 | 10/31/16 | |||
Ordinary income | $1,822,333 | $508,584 | ||
35
Table of Contents
Notes to financial statements
Delaware Global Real Estate Opportunities Fund
5. Components of Net Assets on a Tax Basis
As of Oct. 31, 2017, the components of net assets on a tax basis were as follows:
Shares of beneficial interest | $ | 64,608,774 | ||
Undistributed ordinary income* | 251,261 | |||
Capital loss carryforwards | (3,578,627 | ) | ||
Unrealized depreciation of investments, foreign currencies, and derivatives | (1,769,666 | ) | ||
|
| |||
Net assets | $ | 59,511,742 | ||
|
|
* The undistributed earnings for the Fund are estimated pending final notification of the tax character of distributions received from investments in REITs.
The differences between book basis and tax basis components of net assets are primarily attributable to tax deferral of losses on wash sales, and tax treatment of passive foreign investment companies.
For financial reporting purposes, capital accounts are adjusted to reflect the tax character of permanent book/tax differences. Reclassifications are primarily due to tax treatment of gain (loss) on foreign currency transactions, expiring capital loss carryforwards, REITs, and passive foreign investment companies. Results of operations and net assets were not affected by these reclassifications. For the year ended Oct. 31, 2017, the Fund recorded the following reclassifications:
Undistributed net investment income | $ | 339,224 | ||
Accumulated net realized loss | 50,363,008 | |||
Paid in capital | (50,702,232 | ) |
For federal income tax purposes, capital loss carryforwards may be carried forward and applied against future capital gains. $50,784,384 capital loss carryforwards expired at Oct. 31, 2017.
Under the Regulated Investment Company Modernization Act of 2010 (Act), net capital losses recognized for tax years beginning after Dec. 22, 2010 may be carried forward indefinitely, and their character is retained as short-term and/or long-term losses. Previously, net capital losses were carried forward for eight years and treated as short-term losses. As a transition rule, the Act requires that post-enactment net capital losses be used before pre-enactment net capital losses. At Oct. 31, 2017, capital loss carryforwards available to offset future realized capital gains, through the indicated expiration dates for the Fund were as follows:
Pre-enactment capital loss carryover Expiration date | No expiration Post-enactment capital loss character | |||||
| 2018 | Short-term | Long-term | Total | |||
| $3,400,957 | $— | $177,670 | $3,578,627 | |||
36
Table of Contents
6. Capital Shares
Transactions in capital shares were as follows:
| Year ended | ||||||||
| 10/31/17 | 10/31/16 | |||||||
Shares sold: | ||||||||
Class A | 402,298 | 3,110,288 | ||||||
Class C | 54,479 | 125,876 | ||||||
Class R | 4,387 | 10,898 | ||||||
Institutional Class | 6,313,652 | 3,570,524 | ||||||
Shares issued upon reinvestment of dividends and distributions: | ||||||||
Class A | 76,948 | 20,914 | ||||||
Class C | 6,915 | 968 | ||||||
Class R | 642 | 253 | ||||||
Institutional Class | 126,749 | 39,472 | ||||||
|
|
|
| |||||
| 6,986,070 | 6,879,193 | |||||||
|
|
|
| |||||
Shares redeemed: | ||||||||
Class A | (3,451,670 | ) | (438,843 | ) | ||||
Class C | (118,676 | ) | (132,784 | ) | ||||
Class R | (14,054 | ) | (23,230 | ) | ||||
Institutional Class | (4,534,337 | ) | (2,385,423 | ) | ||||
|
|
|
| |||||
| (8,118,737 | ) | (2,980,280 | ) | |||||
|
|
|
| |||||
Net increase (decrease) | (1,132,667 | ) | 3,898,913 | |||||
|
|
|
| |||||
Certain shareholders may exchange shares of one class for shares of another class in the same Fund. These exchange transactions are included as subscriptions and redemptions in the table above and the “Statements of changes in net assets.” For the years ended Oct. 31, 2017 and 2016, the Fund had the following exchange transactions:
| Exchange Redemptions | Exchange Subscriptions | |||||||||||||||||||
Year ended | Class A Shares | Class C Shares | Institutional Class Shares | Value | ||||||||||||||||
10/31/17 | 522,232 | 449 | 522,728 | $ | 3,802,129 | |||||||||||||||
10/31/16 | 26,429 | — | 26,452 | 200,664 | ||||||||||||||||
7. Line of Credit
The Fund, along with certain other funds in the Delaware Funds (Participants), was a participant in a $155,000,000 revolving line of credit to be used for temporary or emergency purposes as an additional source of liquidity to fund redemptions of investor shares. Under the agreement, the Participants were charged an annual commitment fee of 0.10%, which was generally allocated across the Participants based on a weighted average of the respective net assets of each Participant. The Participants were permitted to borrow up to a maximum of one-third of their net assets under the agreement. Each Participant was individually, and not jointly, liable for its particular advances, if any, under the line of credit. The line of credit available under the agreement expired on Nov. 7, 2016.
37
Table of Contents
| Notes to financial statements | ||||
| Delaware Global Real Estate Opportunities Fund |
7. Line of Credit (continued)
On Nov. 7, 2016, the Fund, along with the other Participants, entered into an amendment to the agreement for a $155,000,000 revolving line of credit. The line of credit was to be used as described above and operated in substantially the same manner as the original agreement, with the exception of the annual commitment fee. Under the amendment to the agreement, the Participants were charged an annual commitment fee of 0.15%, which was generally allocated across the Participants based on a weighted average of the respective net assets of each Participant. The line of credit available under the agreement expired on Nov. 6, 2017.
The Fund had no amount outstanding as of Oct. 31, 2017, or at any time during the year then ended.
8. Derivatives
US GAAP requires disclosures that enable investors to understand: (1) how and why an entity uses derivatives; (2) how they are accounted for; and (3) how they affect an entity’s results of operations and financial position.
Foreign Currency Exchange Contracts — The Fund may enter into foreign currency exchange contracts as a way of managing foreign exchange rate risk. The Fund may use these contracts to hedge the US dollar value of securities it already owns that are denominated in foreign currencies. The Fund may also enter into these contracts to fix the US dollar value of a security that it has agreed to buy or sell for the period between the date the trade was entered into and the date the security is delivered and paid for. In addition, the Fund may enter into these contracts to facilitate or expedite the settlement of portfolio transactions. The change in value is recorded as an unrealized gain or loss. When the contract is closed, a realized gain or loss is recorded equal to the difference between the value of the contract at the time it was opened and the value at the time it was closed.
The use of foreign currency exchange contracts does not eliminate fluctuations in the underlying prices of the securities, but does establish a rate of exchange that can be achieved in the future. Although foreign currency exchange contracts limit the risk of loss due to an unfavorable change in the value of the hedged currency, they also limit any potential gain that might result should the value of the currency change favorably. In addition, the Fund could be exposed to risks if the counterparties to the contracts are unable to meet the terms of their contracts. The Fund’s maximum risk of loss from counterparty credit risk is the value of its currency exchanged with the counterparty. The risk is generally mitigated by having a netting arrangement between the Fund and the counterparty and by the posting of collateral by the counterparty to the Fund to cover the Fund’s exposure to the counterparty.
During the year ended Oct. 31, 2017, the Fund used foreign currency exchange contracts to facilitate or expedite the settlement of portfolio transactions.
38
Table of Contents
Fair values of derivative instruments as of Oct. 31, 2017 was as follows:
Statement of Assets and Liabilities Location | Asset Derivatives Fair Value Foreign Currency Exchange Contracts | |
Unrealized appreciation of foreign currency exchange contracts | $56 | |
Statement of Assets and Liabilities Location | Liability Derivatives Fair Value Foreign Currency Exchange Contracts | |
Unrealized depreciation of foreign currency exchange contracts | $(235) |
The effect of derivative instruments on the “Statement of operations” for the year ended Oct. 31, 2017 was as follows:
| Net Realized Gain on: Foreign Currency Exchange Contracts | ||
Currency contracts | $93,416 | |
| Net Change in Unrealized Appreciation (Depreciation) of: Foreign Currency Exchange Contracts | ||
Currency contracts | $415 | |
Derivatives generally. The table below summarizes the average balance of derivative holdings by the Fund during the year ended Oct. 31, 2017:
Long Derivative Volume | Short Derivative Volume | |||||||
|
| |||||||
Foreign currency exchange contracts (average cost) | USD 204,386 | USD 219,298 | ||||||
9. Offsetting
The Fund entered into an International Swaps and Derivatives Association, Inc. Master Agreement (ISDA Master Agreement) or a similar agreement with certain of its derivative contract counterparties in order to better define its contractual rights and to secure rights that will help the Fund mitigate its counterparty risk. An ISDA Master Agreement is a bilateral agreement between the Fund and a counterparty that governs certain over-the-counter (OTC) derivatives and foreign exchange contracts and typically contains, among other things, collateral posting items and netting provisions in the event of a default and/or termination event. Under an ISDA Master Agreement, the Fund may, under certain circumstances, offset with the counterparty certain derivative financial instruments’ payables and/or receivables with collateral held and/or posted and create one single net payment. The provisions of the ISDA Master Agreement typically permit a single net payment in the event of default (close-out), including the bankruptcy or insolvency of the counterparty. However, bankruptcy or insolvency laws of a particular jurisdiction may impose restrictions on or prohibitions against the right of offset in bankruptcy, insolvency, or other events.
For financial reporting purposes, the Fund does not offset derivative assets and derivative liabilities that are subject to netting arrangements on the “Statement of assets and liabilities.”
39
Table of Contents
| Notes to financial statements | ||||
| Delaware Global Real Estate Opportunities Fund |
9. Offsetting (continued)
At Oct. 31, 2017, the Fund had the following assets and liabilities subject to offsetting provisions:
Offsetting of Financial Assets and Liabilities and Derivative Assets and Liabilities
Counterparty | Gross Value of Derivative Asset | Gross Value of | Net Position | |||
BNY Mellon | $56 | $(235) | $(179) |
Counterparty | Net Position | Fair Value of Non-Cash Collateral Received | Cash Collateral Received | Fair Value of Non-Cash Collateral Pledged | Cash Collateral Pledged | Net Exposure(a) | ||||||||||||||||||||||||
BNY Mellon | $ | (179 | ) | $— | $— | $— | $— | $ | (179 | ) | ||||||||||||||||||||
Master Repurchase Agreements
Counterparty | Repurchase | Fair Value of | Cash Collateral | Net Collateral | Net Exposure(a) | ||||||||||||||||||||
Bank of America Merrill Lynch | $ | 551,026 | $ | (551,026 | ) | $ | — | $ | (551,026 | ) | $ | — | |||||||||||||
BNP Paribas | 1,556,490 | (1,556,490 | ) | — | (1,556,490 | ) | — | ||||||||||||||||||
|
|
|
|
|
|
|
|
|
| ||||||||||||||||
Total | $ | 2,107,516 | $ | (2,107,516 | ) | $ | — | $ | (2,107,516 | ) | $ | — | |||||||||||||
|
|
|
|
|
|
|
|
|
| ||||||||||||||||
(a)Net exposure represents the net receivable (payable) that would be due from (to) the counterparty in the event of default.
(b)The value of the related collateral received exceeded the value of the repurchase agreements as of Oct. 31, 2017.
10. Securities Lending
The Fund, along with other funds in the Delaware Funds, may lend its securities pursuant to a security lending agreement (Lending Agreement) with The Bank of New York Mellon (BNY Mellon). At the time a security is loaned, the borrower must post collateral equal to the required percentage of the market value of the loaned security, including any accrued interest. The required percentage is: (1) 102% with respect to US securities and foreign securities that are denominated and payable in US dollars; and (2) 105% with respect to foreign securities. With respect to each loan, if on any business day the aggregate market value of securities collateral plus cash collateral held is less than the aggregate market value of the securities which are the subject of such loan, the borrower will be notified to provide additional collateral by the end of the following business day which, together with the collateral already held, will be not less than the applicable initial collateral requirements for such security loan. If the aggregate market value of securities collateral and cash collateral held with respect to a security loan exceeds the applicable initial collateral requirement, upon the request of the borrower, BNY Mellon must return enough collateral to the borrower by the end of the following business day to reduce the value of the remaining collateral to the applicable initial collateral requirement for such security loan. As a result of the foregoing, the value of the collateral held with respect to a loaned security on any particular day may be more or less than the value of the security on loan.
40
Table of Contents
Cash collateral received by each fund of the Trust is generally invested in a series of individual separate accounts, each corresponding to a fund. The investment guidelines permit each separate account to hold certain securities that would be considered eligible securities for a money market fund. Cash collateral received is generally invested in government securities; certain obligations issued by government sponsored enterprises; repurchase agreements collateralized by US Treasury securities; obligations issued by the central government of any Organization for Economic Cooperation and Development (OECD) country or its agencies, instrumentalities or establishments; obligations of supranational organizations, commercial paper, notes, bonds and other debt obligations; certificates of deposit, time deposits, and other bank obligations; and asset-backed securities. A Fund can also accept US government securities and letters of credit (non-cash collateral) in connection with securities loans.
In the event of default or bankruptcy by the lending agent, realization and/or retention of the collateral may be subject to legal proceedings. In the event the borrower fails to return loaned securities and the collateral received is insufficient to cover the value of the loaned securities and provided such collateral shortfall is not the result of investment losses, the lending agent has agreed to pay the amount of the shortfall to the Fund or, at the discretion of the lending agent, replace the loaned securities. The Fund continues to record dividends or interest, as applicable, on the securities loaned and is subject to changes in value of the securities loaned that may occur during the term of the loan. The Fund has the right under the Lending Agreement to recover the securities from the borrower on demand. With respect to security loans collateralized by non-cash collateral, the Fund receives loan premiums paid by the borrower. With respect to security loans collateralized by cash collateral, the earnings from the collateral investments are shared among the Fund, the security lending agent, and the borrower. The Fund records security lending income net of allocations to the security lending agent and the borrower.
The Fund may incur investment losses as a result of investing securities lending collateral. This could occur if an investment in the collateral investment account defaulted or became impaired. Under those circumstances, the value of the Fund’s cash collateral account may be less than the amount the Fund would be required to return to the borrowers of the securities and the Fund would be required to make up for this shortfall.
During the year ended Oct. 31, 2017, the Fund had no securities out on loan.
11. Credit and Market Risk
Some countries in which the Fund may invest require governmental approval for the repatriation of investment income, capital, or the proceeds of sales of securities by foreign investors. In addition, if there is deterioration in a country’s balance of payments or for other reasons, a country may impose temporary restrictions on foreign capital remittances abroad.
The securities exchanges of certain foreign markets are substantially smaller, less liquid, and more volatile than the major securities markets in the United States. Consequently, acquisition and disposition of securities by the Fund may be inhibited. In addition, a significant portion of the aggregate market value of equity securities listed on the major securities exchanges in emerging markets is held by a smaller number of investors. This may limit the number of shares available for acquisition or disposition by the Fund.
41
Table of Contents
| Notes to financial statements | ||||
| Delaware Global Real Estate Opportunities Fund |
11. Credit and Market Risk (continued)
The Fund is a nondiversified fund that concentrates its investments in the real estate industry and is subject to the risks associated with that industry. If the Fund holds real estate directly as a result of defaults or receives rental income directly from real estate holdings, its tax status as a regulated investment company may be jeopardized. The Fund is also affected by interest rate changes, particularly if the REITs it holds use floating rate debt to finance their ongoing operations. Its investments may also tend to fluctuate more widely than that of a fund that invests in a broad range of industries.
The Fund may invest up to 15% of its net assets in illiquid securities, which may include securities with contractual restrictions on resale, securities exempt from registration under Rule 144A, promulgated under the Securities Act of 1933, as amended, and other securities which may not be readily marketable. The relative illiquidity of these securities may impair the Fund from disposing of them in a timely manner and at a fair price when it is necessary or desirable to do so. While maintaining oversight, the Fund’s Board has delegated to DMC, the day-to-day functions of determining whether individual securities are liquid for purposes of the Fund’s limitation on investments in illiquid securities. Securities eligible for resale pursuant to Rule 144A, which are determined to be liquid, are not subject to the Fund’s 15% limit on investments in illiquid securities. As of Oct. 31, 2017, there were no Rule 144A securities held by the Fund.
12. Contractual Obligations
The Fund enters into contracts in the normal course of business that contain a variety of indemnifications. The Fund’s maximum exposure under these arrangements is unknown. However, the Fund has not had prior claims or losses pursuant to these contracts. Management has reviewed the Fund’s existing contracts and expects the risk of loss to be remote.
13. Recent Accounting Pronouncements
In October 2016, the Securities and Exchange Commission released its Final Rule on Investment Company Reporting Modernization (Rule). The Rule contains amendments to Regulation S-X which impact financial statement presentation, particularly the presentation of derivative investments. The financial statements presented are in compliance with the most recent Regulation S-X amendments.
14. Subsequent Events
On Nov. 6, 2017, the Fund, along with the other Participants, entered into an amendment to the agreement for a $155,000,000 revolving line of credit to be used as described in Note 7 and to be operated in substantially the same manner as the agreement described in Note 7. Under the amendment to the agreement, the Participants are charged an annual commitment fee of 0.15%, which is generally allocated across the Participants based on a weighted average of the respective net assets of each Participant. The line of credit available under the agreement expires on Nov. 5, 2018.
Management has determined that no other material events or transactions occurred subsequent to Oct. 31, 2017, that would require recognition or disclosure in the Fund’s financial statements.
42
Table of Contents
| Report of independent | ||||
| registered public accounting firm |
To the Board of Trustees of Delaware Group® Adviser Funds
and the Shareholders of Delaware Global Real Estate Opportunities Fund
In our opinion, the accompanying statement of assets and liabilities, including the schedule of investments, and the related statements of operations and of changes in net assets and the financial highlights present fairly, in all material respects, the financial position of Delaware Global Real Estate Opportunities Fund (one of the series constituting Delaware Group Adviser Funds, hereafter referred to as the “Fund”) as of October 31, 2017, the results of its operations for the year then ended, the changes in its net assets for each of the two years in the period then ended and the financial highlights for each of the five years in the period then ended, in conformity with accounting principles generally accepted in the United States of America. These financial statements and financial highlights (hereafter referred to as “financial statements”) are the responsibility of the Fund’s management. Our responsibility is to express an opinion on these financial statements based on our audits. We conducted our audits of these financial statements in accordance with the standards of the Public Company Accounting Oversight Board (United States). Those standards require that we plan and perform the audit to obtain reasonable assurance about whether the financial statements are free of material misstatement. An audit includes examining, on a test basis, evidence supporting the amounts and disclosures in the financial statements, assessing the accounting principles used and significant estimates made by management, and evaluating the overall financial statement presentation. We believe that our audits, which included confirmation of securities as of October 31, 2017 by correspondence with the custodian and brokers, provide a reasonable basis for our opinion.
PricewaterhouseCoopers LLP
Philadelphia, Pennsylvania
December 19, 2017
43
Table of Contents
| Other Fund information (Unaudited) | ||||
| Delaware Global Real Estate Opportunities Fund |
Tax Information
The information set forth below is for the Fund’s fiscal year as required by federal income tax laws. Shareholders, however, must report distributions on a calendar year basis for income tax purposes, which may include distributions for portions of two fiscal years of the Fund. Accordingly, the information needed by shareholders for income tax purposes will be sent to them in January of each year. Please consult your tax advisor for proper treatment of the information.
All disclosures are based on financial information available as of the date of this annual report and, accordingly are subject to change. For any and all items requiring reporting, it is the intention of the Fund to report the maximum amount permitted under the Internal Revenue Code and the regulations thereunder.
For the fiscal year ended Oct. 31, 2017, the Fund reports distributions paid during the year as follows:
| (A) Ordinary Income Distributions (Tax Basis)* | 100.00% | |||
| (B) Qualifying Dividends1 | 3.52% |
(A) is based on a percentage of the Fund’s total distributions.
(B) is based on a percentage of the Fund’s ordinary income distributions.
1 Qualifying dividends represent dividends which qualify for the corporate dividends received deduction.
* For the fiscal year ended Oct. 31, 2017, certain dividends paid by the Fund may be subject to a maximum tax rate of 20%. The percentage of dividends paid by the Fund from ordinary income reported as qualified income was 40.81%. Complete information will be computed and reported in conjunction with your 2017 Form 1099-DIV.
Board consideration of Delaware Global Real Estate Opportunities Fund investment advisory agreement
At a meeting held on Aug. 16-17, 2017 (the “Annual Meeting”), the Board of Trustees (the “Board”), including a majority of disinterested or independent Trustees, approved the renewal of the Investment Advisory Agreement for Delaware Global Real Estate Opportunities Fund (the “Fund”). In making its decision, the Board considered information furnished at regular quarterly Board meetings, including reports detailing Fund performance, investment strategies, and expenses, as well as information prepared specifically in connection with the renewal of the Investment Advisory Agreement. Information furnished specifically in connection with the renewal of the Investment Advisory Agreement with Delaware Management Company (“DMC”), a series of Macquarie Investment Management Business Trust (formerly, Delaware Management Business Trust), included materials provided by DMC and its affiliates concerning, among other things, the nature, extent, and quality of services provided to the Fund; the costs of such services to the Fund; economies of scale; and the investment manager’s financial condition and profitability. In addition, in connection with the Annual Meeting, reports were provided to the Trustees in May 2017 and included reports provided by Broadridge Financial Solutions (formerly Lipper) (“Broadridge” or “Lipper”). The Broadridge reports compared the Fund’s investment performance and expenses with those of other comparable mutual funds. The Independent Trustees reviewed and discussed the Broadridge reports with independent legal counsel to the Independent Trustees. In addition to the information noted above, the Board also requested and received information regarding DMC’s policy with respect to advisory fee levels and its breakpoint philosophy; the structure of portfolio manager compensation; comparative client fee information; and any constraints or limitations on the availability of securities for certain investment styles, which had in the past year inhibited, or which were likely in the future to inhibit, the investment manager’s ability to invest fully in accordance with Fund policies.
44
Table of Contents
In considering information relating to the approval of the Fund’s advisory agreement, the Independent Trustees received assistance and advice from and met separately with independent legal counsel to the Independent Trustees and also from an experienced and knowledgeable fund consultant, JDL Consultants, LLC (“JDL”). Although the Board gave attention to all information furnished, the following discussion identifies, under separate headings, the primary factors taken into account by the Board during its contract renewal considerations.
Nature, extent, and quality of service. The Board considered the services provided by DMC to the Fund and its shareholders. In reviewing the nature, extent, and quality of services, the Board considered reports furnished to it throughout the year, which covered matters such as the relative performance of the Fund; compliance of portfolio managers with the investment policies, strategies, and restrictions for the Fund; compliance by DMC and Delaware Distributors, L.P. (together, “Management”) personnel with the Code of Ethics adopted throughout the Delaware FundsSM by Macquarie (“Delaware Funds”); and adherence to fair value pricing procedures as established by the Board. The Board was pleased with the current staffing of the Fund’s investment advisor and the emphasis placed on research in the investment process. The Board recognized DMC’s receipt of certain industry distinctions during the past several years. The Board gave favorable consideration to DMC’s efforts to control expenditures while maintaining service levels committed to Fund matters. The Board also noted the benefits provided to Fund shareholders through each shareholder’s ability to exchange an investment in one Delaware Fund for the same class of shares in another Delaware Fund without a sales charge, to reinvest Fund dividends into additional shares of the Fund or into additional shares of other Delaware Funds and the privilege to combine holdings in other Delaware Funds to obtain a reduced sales charge. The Board was satisfied with the nature, extent, and quality of the overall services provided by DMC.
Investment performance. The Board placed significant emphasis on the investment performance of the Fund in view of the importance of investment performance to shareholders. Although the Board considered performance reports and discussions with portfolio managers at Investments Committee meetings throughout the year, the Board gave particular weight to the Broadridge reports furnished for the Annual Meeting. The Broadridge reports prepared for the Fund showed the investment performance of its Class A shares in comparison to a group of similar funds as selected by Broadridge (the “Performance Universe”). A fund with the best performance ranked first, and a fund with the poorest performance ranked last. The highest/best performing 25% of funds in the Performance Universe make up the first quartile; the next 25%, the second quartile; the next 25%, the third quartile; and the poorest/ worst performing 25% of funds in the Performance Universe make up the fourth quartile. Comparative annualized performance for the Fund was shown for the past 1-, 3-, 5-, and 10-year periods, to the extent applicable, ended Jan. 31, 2017. The Board’s objective is that the Fund’s performance for the 1-, 3-, and 5-year periods considered be at or above the median of its Performance Universe.
The Performance Universe for the Fund consisted of the Fund and all retail and institutional global real estate funds as selected by Broadridge. The Broadridge report comparison showed that the Fund’s total return for the 1- and 3-year periods was in the second quartile of its Performance Universe. The report further showed that the Fund’s total return for the 5-year period was in the first quartile of its Performance Universe. The Board was satisfied with performance.
45
Table of Contents
| Other Fund information (Unaudited) | ||||
| Delaware Global Real Estate Opportunities Fund | ||||
| Board consideration of Delaware Global Real Estate Opportunities Fund investment advisory agreement (continued) | ||||
Comparative expenses. The Board considered expense data for the Delaware Funds. Management provided the Board with information on pricing levels and fee structures for the Fund as of its most recently completed fiscal year. The Board also focused on the comparative analysis of effective management fees and total expense ratios of the Fund versus effective management fees and total expense ratios of a group of similar funds as selected by Broadridge (the “Expense Group”). In reviewing comparative costs, the Fund’s contractual management fee and the actual management fee incurred by the Fund were compared with the contractual management fees (assuming all funds in the Expense Group were similar in size to the Fund) and actual management fees (as reported by each fund) within the Expense Group, taking into account any applicable breakpoints and fee waivers. The Fund’s total expenses were also compared with those of its Expense Group. The Broadridge total expenses, for comparative consistency, were shown by Broadridge for Class A shares and comparative total expenses including 12b-1 and non-12b-1 service fees. The Board’s objective is to limit the Fund’s total expense ratio to be competitive with that of the Expense Group.
The expense comparisons for the Fund showed that its actual management fee was in the quartile with the lowest expenses of its Expense Group and its total expense were in the quartile with the second lowest expenses of its Expense Group. The Board was satisfied with the management fee and total expenses of the Fund in comparison to those of its Expense Group as shown in the Broadridge report.
Management profitability. The Board considered the level of profits realized by DMC in connection with the operation of the Fund. In this respect, the Board reviewed the Investment Management Profitability Analysis that addressed the overall profitability of DMC’s business in providing management and other services to each of the individual funds and the Delaware Funds as a whole. Specific attention was given to the methodology used by DMC in allocating costs for the purpose of determining profitability. Management stated that the level of profits of DMC, to a certain extent, reflects recent operational cost savings and efficiencies initiated by DMC. The Board considered DMC’s efforts to improve services provided to fund shareholders and to meet additional regulatory and compliance requirements resulting from recent industry-wide Securities and Exchange Commission initiatives. The Board also considered the extent to which DMC might derive ancillary benefits from fund operations, including the potential for procuring additional business as a result of the prestige and visibility associated with its role as service provider to the Delaware Funds and the benefits from allocation of fund brokerage to improve trading efficiencies. Finally, the Board also reviewed a report prepared by JDL regarding DMC profitability in the context of sub-advised funds and met with JDL personnel to discuss DMC’s profitability in such context. The Board found that the management fees were reasonable in light of the services rendered and the level of profitability of DMC.
Economies of scale. The Trustees considered whether economies of scale are realized by DMC as the Fund’s assets increase and the extent to which any economies of scale are reflected in the level of management fees charged. The Trustees reviewed the standardized advisory fee pricing and structure, approved by the Board and shareholders, which includes breakpoints, and which applies to most funds
46
Table of Contents
in the Delaware Funds complex. Breakpoints in the advisory fee occur when the advisory fee rate is reduced on assets in excess of specified levels. Breakpoints result in a lower advisory fee than would otherwise be the case in the absence of breakpoints, when the asset levels specified in the breakpoints are exceeded. The Board noted that the fee under the Fund’s management contract did not fall within the standardized fee pricing structure because the Fund was very similar to another existing product offered by DMC, and Management wanted consistency of the fee structure as between the two similar funds. In addition the Fund generally invests a significant portion of its assets in international (including emerging markets) securities, an asset category that requires more research and firm resources than is typically true for funds investing in domestic securities. Although, as of Feb. 28, 2017, the Fund has not reached a size at which it can take advantage of any breakpoints in the applicable fee schedule, the Board recognized that the fee was structured so that if the Fund grows, economies of scale may be shared.
47
Table of Contents
| Board of trustees / directors and officers addendum | ||||
| Delaware FundsSM by Macquarie |
A mutual fund is governed by a Board of Trustees/Directors (“Trustees”), which has oversight responsibility for the management of a fund’s business affairs. Trustees establish procedures and oversee and review the performance of the investment manager, the distributor, and others who perform services for the fund. The independent fund trustees, in particular, are advocates
Name, Address, and Birth Date | Position(s) Held with Fund(s) | Length of Time Served | ||
Interested Trustee
| ||||
Shawn K. Lytle1, 2 2005 Market Street Philadelphia, PA 19103 February 1970 | President, Chief Executive Officer, and Trustee | Trustee since September 2015 | ||
President and Chief Executive Officer since August 2015 | ||||
| ||||
Independent Trustees
| ||||
Thomas L. Bennett 2005 Market Street Philadelphia, PA 19103 October 1947 | Chairman and Trustee | Trustee since March 2005
| ||
Chairman since March 2015 | ||||
Ann D. Borowiec 2005 Market Street Philadelphia, PA 19103 November 1958
| Trustee | Since March 2015 | ||
Joseph W. Chow 2005 Market Street Philadelphia, PA 19103 January 1953
| Trustee | Since January 2013 | ||
| 1 | Shawn K. Lytle is considered to be an “Interested Trustee” because he is an executive officer of the Fund’s(s’) investment advisor. |
| 2 | Shawn K. Lytle, David F. Connor, Daniel V. Geatens, and Richard Salus serve in similar capacities for the six portfolios of the Optimum Fund Trust, which have the same investment advisor, principal underwriter, and transfer agent as the registrant. Mr. Geatens also serves as the CFO and Treasurer for Macquarie Global Infrastructure Total Return Fund Inc., which shares an affiliated investment manager. |
48
Table of Contents
for shareholder interests. Each trustee has served in that capacity since he or she was elected to or appointed to the Board of Trustees, and will continue to serve until his or her retirement or the election of a new trustee in his or her place. The following is a list of the Trustees and Officers with certain background and related information.
Principal Occupation(s) During the Past Five Years | Number of Portfolios in Fund Complex Overseen by Trustee or Officer | Other Directorships Held by Trustee or Officer | ||
Shawn K. Lytle has served as President of Macquarie Investment Management3 since June 2015 and was the Regional Head of Americas for UBS Global Asset Management from 2010 through 2015. | 60 | Trustee — UBS Relationship Funds, SMA Relationship Trust, and UBS Funds (May 2010–April 2015) | ||
Private Investor (March 2004–Present)
| 60 | None | ||
Chief Executive Officer, Private Wealth Management (2011–2013) and Market Manager, New Jersey Private Bank (2005–2011) — J.P. Morgan Chase & Co. | 60 | Director — Banco Santander International
Director — Santander Bank, N.A. | ||
Executive Vice President (Emerging Economies Strategies, Risks, and Corporate Administration) State Street Corporation (July 2004–March 2011) | 60 | Director and Audit Committee Member — Hercules Technology Growth Capital, Inc. (2004–2014) | ||
| 3 | Macquarie Investment Management (formerly known as Delaware Investments) is the marketing name for Macquarie Management Holdings, Inc. (formerly known as Delaware Management Holdings, Inc.) and its subsidiaries, including the Fund’s(s’) investment advisor, principal underwriter, and its transfer agent. |
49
Table of Contents
| Board of trustees / directors and officers addendum | ||||
| Delaware FundsSM by Macquarie |
| Name, Address, | Position(s) | Length of | ||
| and Birth Date | Held with Fund(s) | Time Served | ||
Independent Trustees (continued)
| ||||
John A. Fry 2005 Market Street | Trustee | Since January 2001 | ||
Philadelphia, PA 19103 May 1960 |
| Lucinda S. Landreth | Trustee | Since March 2005 | ||
| 2005 Market Street | ||||
| Philadelphia, PA 19103 | ||||
| June 1947 | ||||
| Frances A. Sevilla-Sacasa | Trustee | Since September 2011 | ||
| 2005 Market Street | ||||
| Philadelphia, PA 19103 | ||||
January 1956
| ||||
50
Table of Contents
| Number of Portfolios in | ||||
| Principal Occupation(s) | Fund Complex Overseen | Other Directorships | ||
| During the Past Five Years | by Trustee or Officer | Held by Trustee or Officer | ||
| President — | 60 | Director, Audit Committee, | ||
| Drexel University | and Governance Committee | |||
| (August 2010–Present) | Member — Community | |||
| Health Systems | ||||
| President — | ||||
| Franklin & Marshall College | Director — Drexel | |||
| (July 2002–July 2010) | Morgan & Co. | |||
| Director, Audit Committee | ||||
| Member — vTv | ||||
| Therapeutics LLC | ||||
| Director — FS Credit Real | ||||
Estate Income Trust, Inc.
| ||||
| Private Investor | 60 | None | ||
(2004–Present)
| ||||
| Chief Executive Officer — | 60 | Trust Manager and | ||
| Banco Itaú | Audit Committee | |||
| International | Chair — Camden | |||
| (April 2012–December 2016) | Property Trust | |||
| Executive Advisor to Dean | ||||
(August 2011–March 2012) and Interim Dean | ||||
| (January 2011–July 2011) — | ||||
| University of Miami School of | ||||
| Business Administration | ||||
| President — U.S. Trust, | ||||
| Bank of America Private | ||||
| Wealth Management | ||||
| (Private Banking) | ||||
(July 2007–December 2008)
| ||||
51
Table of Contents
| Board of trustees / directors and officers addendum | ||||
| Delaware FundsSM by Macquarie |
Name, Address, and Birth Date | Position(s) Held with Fund(s) | Length of Time Served | ||
Independent Trustees (continued)
| ||||
Thomas K. Whitford 2005 Market Street Philadelphia, PA 19103 March 1956
| Trustee | Since January 2013 | ||
Janet L. Yeomans 2005 Market Street Philadelphia, PA 19103 July 1948
| Trustee | Since April 1999 | ||
Officers
| ||||
David F. Connor 2005 Market Street Philadelphia, PA 19103 December 1963 | Senior Vice President, General Counsel, and Secretary | Senior Vice President since May 2013; General Counsel since May 2015; Secretary since October 2005
| ||
Daniel V. Geatens 2005 Market Street Philadelphia, PA 19103 October 1972
| Vice President and Treasurer | Treasurer since October 2007 | ||
Richard Salus 2005 Market Street Philadelphia, PA 19103 October 1963
| Senior Vice President and Chief Financial Officer | Chief Financial Officer since November 2006 | ||
The Statement of Additional Information for the Fund(s) includes additional information about the Trustees and Officers and is available, without charge, upon request by calling 800 523-1918.
52
Table of Contents
Principal Occupation(s) During the Past Five Years | Number of Portfolios in Fund Complex Overseen by Trustee or Officer | Other Directorships Held by Trustee or Officer | ||
Vice Chairman (2010–April 2013) — PNC Financial Services Group | 60 | Director — HSBC Finance Corporation and HSBC North America Holdings Inc.
Director — HSBC USA Inc.
| ||
Vice President and Treasurer (January 2006–July 2012), Vice President — Mergers & Acquisitions (January 2003–January 2006), and Vice President and Treasurer (July 1995–January 2003) — 3M Company
| 60 | Director (2009–2017); Personnel and Compensation Committee Chair; Member of Nominating, Investments, and Audit Committees for various periods throughout directorship — Okabena Company | ||
David F. Connor has served in various capacities at different times at Macquarie Investment Management.
| 60 | None2 | ||
Daniel V. Geatens has served in various capacities at different times at Macquarie Investment Management.
| 60 | None2 | ||
Richard Salus has served in various executive capacities at different times at Macquarie Investment Management.
| 60 | None2 | ||
53
Table of Contents
| About the organization | ||||
| Board of trustees | ||||||
Shawn K. Lytle President and Chief Executive Officer Delaware FundsSM by Macquarie Philadelphia, PA
Thomas L. Bennett Chairman of the Board Delaware Funds by Macquarie Private Investor Rosemont, PA | Ann D. Borowiec Former Chief Executive Officer Private Wealth Management J.P. Morgan Chase & Co. New York, NY
Joseph W. Chow Former Executive Vice President State Street Corporation Boston, MA | John A. Fry President Drexel University Philadelphia, PA
Lucinda S. Landreth Former Chief Investment Officer Assurant, Inc. New York, NY | Frances A. Sevilla-Sacasa Former Chief Executive Officer Banco Itaú International Miami, FL
Thomas K. Whitford Former Vice Chairman PNC Financial Services Group Pittsburgh, PA
Janet L. Yeomans Former Vice President and Treasurer 3M Company St. Paul, MN | |||
| Affiliated officers | ||||||
David F. Connor | Daniel V. Geatens | Richard Salus | ||||
| Senior Vice President, | Vice President and | Senior Vice President and | ||||
| General Counsel, | Treasurer | Chief Financial Officer | ||||
| and Secretary | Delaware Funds | Delaware Funds | ||||
| Delaware Funds | by Macquarie | by Macquarie | ||||
| by Macquarie | Philadelphia, PA | Philadelphia, PA | ||||
| Philadelphia, PA | ||||||
This annual report is for the information of Delaware Global Real Estate Opportunities Fund shareholders, but it may be used with prospective investors when preceded or accompanied by the Delaware Fund fact sheet for the most recently completed calendar quarter. These documents are available at delawarefunds.com/literature.
The Fund files its complete schedule of portfolio holdings with the Securities and Exchange Commission (SEC) for the first and third quarters of each fiscal year on Form N-Q. The Fund’s Forms N-Q, as well as a description of the policies and procedures that the Fund uses to determine how to vote proxies (if any) relating to portfolio securities are available without charge (i) upon request, by calling 800 523-1918; and (ii) on the SEC’s website at sec.gov. In addition, a description of the policies and procedures that the Fund uses to determine how to vote proxies (if any) relating to portfolio securities and the Schedule of Investments included in the Fund’s most recent Form N-Q are available without charge on the Fund’s website at delawarefunds.com/literature. The Fund’s Forms N-Q may be reviewed and copied at the SEC’s Public Reference Room in Washington, D.C.; information on the operation of the Public Reference Room may be obtained by calling 800 SEC-0330.
Information (if any) regarding how the Fund voted proxies relating to portfolio securities during the most recently disclosed 12-month period ended June 30 is available without charge (i) through the Fund’s website at delawarefunds.com/proxy; and (ii) on the SEC’s website at sec.gov.
54
Item 2. Code of Ethics
The registrant has adopted a code of ethics that applies to the registrant’s principal executive officer, principal financial officer, principal accounting officer or controller, or persons performing similar functions, regardless of whether these individuals are employed by the registrant or a third party. A copy of the registrant’s Code of Business Ethics has been posted on the Delaware FundsSM by Macquarie Internet Web site at www.delawarefunds.com. Any amendments to the Code of Business Ethics, and information on any waiver from its provisions granted by the registrant, will also be posted on this Web site within five business days of such amendment or waiver and will remain on the Web site for at least 12 months.
Item 3. Audit Committee Financial Expert
The registrant’s Board of Trustees/Directors has determined that certain members of the registrant’s Audit Committee are audit committee financial experts, as defined below. For purposes of this item, an “audit committee financial expert” is a person who has the following attributes:
a. An understanding of generally accepted accounting principles and financial statements;
b. The ability to assess the general application of such principles in connection with the accounting for estimates, accruals, and reserves;
c. Experience preparing, auditing, analyzing, or evaluating financial statements that present a breadth and level of complexity of accounting issues that are generally comparable to the breadth and complexity of issues that can reasonably be expected to be raised by the registrant’s financial statements, or experience actively supervising one or more persons engaged in such activities;
d. An understanding of internal controls and procedures for financial reporting; and
e. An understanding of audit committee functions.
An “audit committee financial expert” shall have acquired such attributes through:
a. Education and experience as a principal financial officer, principal accounting officer, controller, public accountant, or auditor or experience in one or more positions that involve the performance of similar functions;
b. Experience actively supervising a principal financial officer, principal accounting officer, controller, public accountant, auditor, or person performing similar functions;
c. Experience overseeing or assessing the performance of companies or public accountants with respect to the preparation, auditing, or evaluation of financial statements; or
d. Other relevant experience.
The registrant’s Board of Trustees/Directors has also determined that each member of the registrant’s Audit Committee is independent. In order to be “independent” for purposes of this item, the Audit Committee member may not: (i) other than in his or her capacity as a member of the Board of Trustees/Directors or any committee thereof, accept directly or indirectly any consulting, advisory or other compensatory fee from the issuer; or (ii) be an “interested person” of the registrant as defined in Section 2(a)(19) of the Investment Company Act of 1940.
The names of the audit committee financial experts on the registrant’s Audit Committee are set forth below:
Item 4. Principal Accountant Fees and Services
(a) Audit fees.
The aggregate fees billed for services provided to the registrant by its independent auditors for the audit of the registrant’s annual financial statements and for services normally provided by the independent auditors in connection with statutory and regulatory filings or engagements were $110,130 for the fiscal year ended October 31, 2017.
The aggregate fees billed for services provided to the registrant by its independent auditors for the audit of the registrant’s annual financial statements and for services normally provided by the independent auditors in connection with statutory and regulatory filings or engagements were $110,130 for the fiscal year ended October 31, 2016.
(b) Audit-related fees.
The aggregate fees billed by the registrant’s independent auditors for services relating to the performance of the audit of the registrant’s financial statements and not reported under paragraph (a) of this Item were $0 for the fiscal year ended October 31, 2017.
The aggregate fees billed by the registrant’s independent auditors for services relating to the performance of the audit of the financial statements of the registrant’s investment adviser and other service providers under common control with the adviser and that relate directly to the operations or financial reporting of the registrant were $640,000 for the registrant’s fiscal year ended October 31, 2017. The percentage of these fees relating to services approved by the registrant’s Audit Committee pursuant to the de minimis exception from the pre-approval requirement in Rule 2-01(c)(7)(i)(C) of Regulation S-X was 0%. These audit-related services were as follows: year end audit procedures; group reporting and subsidiary statutory audits.
The aggregate fees billed by the registrant’s independent auditors for services relating to the performance of the audit of the registrant’s financial statements and not reported under paragraph (a) of this Item were $0 for the fiscal year ended October 31, 2016.
The aggregate fees billed by the registrant’s independent auditors for services relating to the performance of the audit of the financial statements of the registrant’s investment adviser and other service providers under common control with the adviser and that relate directly to the operations or financial reporting of the registrant were $667,000 for the registrant’s fiscal year ended October 31, 2016. The percentage of these fees relating to services approved by the registrant’s Audit Committee pursuant to the de minimis exception from the pre-approval requirement in Rule 2-01(c)(7)(i)(C) of Regulation S-X was 0%. These audit-related services were as follows: year end audit procedures; group reporting and subsidiary statutory audits.
(c) Tax fees.
The aggregate fees billed by the registrant’s independent auditors for tax-related services provided to the registrant were $18,435 for the fiscal year ended October 31, 2017. The percentage of these fees relating to services approved by the registrant’s Audit Committee pursuant to the de minimis exception from the pre-approval requirement in Rule 2-01(c)(7)(i)(C) of Regulation S-X was 0%. These tax-related services were as follows: review of income tax returns and review of annual excise distribution calculations.
The aggregate fees billed by the registrant’s independent auditors for tax-related services provided to the registrant’s investment adviser and other service providers under common control with the adviser and that relate directly to the operations or financial reporting of the registrant were $0 for the registrant’s fiscal year ended October 31, 2017.
The aggregate fees billed by the registrant’s independent auditors for tax-related services provided to the registrant were $17,876 for the fiscal year ended October 31, 2016. The percentage of these fees relating to services approved by the registrant’s Audit Committee pursuant to the de minimis exception from the pre-approval requirement in Rule 2-01(c)(7)(i)(C) of Regulation S-X was 0%. These tax-related services were as follows: review of income tax returns and review of annual excise distribution calculations.
The aggregate fees billed by the registrant’s independent auditors for tax-related services provided to the registrant’s investment adviser and other service providers under common control with the adviser and that relate directly to the operations or financial reporting of the registrant were $0 for the registrant’s fiscal year ended October 31, 2016.
(d) All other fees.
The aggregate fees billed for all services provided by the independent auditors to the registrant other than those set forth in paragraphs (a), (b) and (c) of this Item were $0 for the fiscal year ended October 31, 2017.
The aggregate fees billed for all services other than those set forth in paragraphs (b) and (c) of this Item provided by the registrant’s independent auditors to the registrant’s adviser and other service providers under common control with the adviser and that relate directly to the operations or financial reporting of the registrant were $0 for the registrant’s fiscal year ended October 31, 2017. The percentage of these fees relating to services approved by the registrant’s Audit Committee pursuant to the de minimis exception from the pre-approval requirement in Rule 2-01(c)(7)(i)(C) of Regulation S-X was 0%.
The aggregate fees billed for all services provided by the independent auditors to the registrant other than those set forth in paragraphs (a), (b) and (c) of this Item were $0 for the fiscal year ended October 31, 2016.
The aggregate fees billed for all services other than those set forth in paragraphs (b) and (c) of this Item provided by the registrant’s independent auditors to the registrant’s adviser and other service providers under common control with the adviser and that relate directly to the operations or financial reporting of the registrant were $0 for the registrant’s fiscal year ended October 31, 2016. The percentage of these fees relating to services approved by the registrant’s Audit Committee pursuant to the de minimis exception from the pre-approval requirement in Rule 2-01(c)(7)(i)(C) of Regulation S-X was 0%.
(e) The registrant’s Audit Committee has established pre-approval policies and procedures as permitted by Rule 2-01(c)(7)(i)(B) of Regulation S-X (the “Pre-Approval Policy”) with respect to services provided by the registrant’s independent auditors. Pursuant to the Pre-Approval Policy, the Audit Committee has pre-approved the services set forth in the table below with respect to the registrant up to the specified fee limits. Certain fee limits are based on aggregate fees to the registrant and other registrants within the Delaware FundsSM by Macquarie.
| Service | Range of Fees |
| Audit Services | |
| Statutory audits or financial audits for new Funds | up to $40,000 per Fund |
| Services associated with SEC registration statements (e.g., Form N-1A, Form N-14, etc.), periodic reports and other documents filed with the SEC or other documents issued in connection with securities offerings (e.g., comfort letters for closed-end Fund offerings, consents), and assistance in responding to SEC comment letters | up to $10,000 per Fund |
| Consultations by Fund management as to the accounting or disclosure treatment of transactions or events and/or the actual or potential impact of final or proposed rules, standards or interpretations by the SEC, FASB, or other regulatory or standard-setting bodies (Note: Under SEC rules, some consultations may be considered “audit-related services” rather than “audit services”) | up to $25,000 in the aggregate |
| Audit-Related Services | |
| Consultations by Fund management as to the accounting or disclosure treatment of transactions or events and /or the actual or potential impact of final or proposed rules, standards or interpretations by the SEC, FASB, or other regulatory or standard-setting bodies (Note: Under SEC rules, some consultations may be considered “audit services” rather than “audit-related services”) | up to $25,000 in the aggregate |
| Tax Services | |
| U.S. federal, state and local and international tax planning and advice (e.g., consulting on statutory, regulatory or administrative developments, evaluation of Funds’ tax compliance function, etc.) | up to $25,000 in the aggregate |
| U.S. federal, state and local tax compliance (e.g., excise distribution reviews, etc.) | up to $5,000 per Fund |
| Review of federal, state, local and international income, franchise and other tax returns | up to $5,000 per Fund |
Under the Pre-Approval Policy, the Audit Committee has also pre-approved the services set forth in the table below with respect to the registrant’s investment adviser and other entities controlling, controlled by or under common control with the investment adviser that provide ongoing services to the registrant (the “Control Affiliates”) up to the specified fee limit. This fee limit is based on aggregate fees to the investment adviser and its Control Affiliates.
| Service | Range of Fees |
| Non-Audit Services | |
Services associated with periodic reports and other documents filed with the SEC and assistance in responding to SEC comment letters | up to $10,000 in the aggregate |
The Pre-Approval Policy requires the registrant’s independent auditors to report to the Audit Committee at each of its regular meetings regarding all services initiated since the last such report was rendered, including those services authorized by the Pre-Approval Policy.
(f) Not applicable.
(g) The aggregate non-audit fees billed by the registrant’s independent auditors for services rendered to the registrant and to its investment adviser and other service providers under common control with the adviser were $11,180,000 and $8,665,000 for the registrant’s fiscal years ended October 31, 2017 and October 31, 2016, respectively.
(h) In connection with its selection of the independent auditors, the registrant’s Audit Committee has considered the independent auditors’ provision of non-audit services to the registrant’s investment adviser and other service providers under common control with the adviser that were not required to be pre-approved pursuant to Rule 2-01(c)(7)(ii) of Regulation S-X. The Audit Committee has determined that the independent auditors’ provision of these services is compatible with maintaining the auditors’ independence.
Item 5. Audit Committee of Listed Registrants
Not applicable.
Item 6. Investments
(a) Included as part of report to shareholders filed under Item 1 of this Form N-CSR.
(b) Divestment of securities in accordance with Section 13(c) of the Investment Company Act of 1940.
Not applicable.
Item 7. Disclosure of Proxy Voting Policies and Procedures for Closed-End Management Investment Companies
Not applicable.
Item 8. Portfolio Managers of Closed-End Management Investment Companies
Not applicable.
Item 9. Purchases of Equity Securities by Closed-End Management Investment Company and Affiliated Purchasers
Not applicable.
Item 10. Submission of Matters to a Vote of Security Holders
Not applicable.
Item 11. Controls and Procedures
The registrant’s principal executive officer and principal financial officer have evaluated the registrant’s disclosure controls and procedures within 90 days of the filing of this report and have concluded that they are effective in providing reasonable assurance that the information required to be disclosed by the registrant in its reports or statements filed under the Securities Exchange Act of 1934 is recorded, processed, summarized and reported within the time periods specified in the rules and forms of the Securities and Exchange Commission.
There were no significant changes in the registrant’s internal control over financial reporting that occurred during the second fiscal quarter of the period covered by the report to stockholders included herein (i.e., the registrant’s fourth fiscal quarter) that have materially affected, or are reasonably likely to materially affect, the registrant’s internal control over financial reporting.
Item 12. Exhibits
(a) (1) Code of Ethics
Not applicable.
(2) Certifications of Principal Executive Officer and Principal Financial Officer pursuant to Rule 30a-2 under the Investment Company Act of 1940 are attached hereto as Exhibit 99.CERT.
(3) Written solicitations to purchase securities pursuant to Rule 23c-1 under the Securities Exchange Act of 1934.
Not applicable.
(b) Certifications pursuant to Section 906 of the Sarbanes-Oxley Act of 2002 are furnished herewith as Exhibit 99.906CERT.
SIGNATURES
Pursuant to the requirements of the Securities Exchange Act of 1934 and the Investment Company Act of 1940, the registrant has duly caused this report to be signed on its behalf, by the undersigned, thereunto duly authorized.
DELAWARE GROUP® ADVISER FUNDS
| SHAWN K. LYTLE | |
| By: | Shawn K. Lytle |
| Title: | President and Chief Executive Officer |
| Date: | January 3, 2018 |
Pursuant to the requirements of the Securities Exchange Act of 1934 and the Investment Company Act of 1940, this report has been signed below by the following persons on behalf of the registrant and in the capacities and on the dates indicated.
| SHAWN K. LYTLE | |
| By: | Shawn K. Lytle |
| Title: | President and Chief Executive Officer |
| Date: | January 3, 2018 |
| RICHARD SALUS | |
| By: | Richard Salus |
| Title: | Chief Financial Officer |
| Date: | January 3, 2018 |