UNITED STATES SECURITIES AND EXCHANGE COMMISSION
Washington, D.C. 20549
FORM N-CSR
CERTIFIED SHAREHOLDER REPORT OF REGISTERED MANAGEMENT
INVESTMENT COMPANIES
| Investment Company Act file number: | 811-07972 |
| Exact name of registrant as specified in charter: | Delaware Group® Adviser Funds |
| Address of principal executive offices: | 2005 Market Street |
| Philadelphia, PA 19103 | |
| Name and address of agent for service: | David F. Connor, Esq. |
| 2005 Market Street | |
| Philadelphia, PA 19103 | |
| Registrant’s telephone number, including area code: | (800) 523-1918 |
| Date of fiscal year end: | October 31 |
| Date of reporting period: | October 31, 2015 |
Item 1. Reports to Stockholders
Table of Contents
![]()
Annual report
Fixed income mutual fund
Delaware Diversified Income Fund
October 31, 2015
Carefully consider the Fund’s investment objectives, risk factors, charges, and expenses before investing. This and other information can be found in the Fund’s prospectus and its summary prospectus, which may be obtained by visiting delawareinvestments.com or calling 800 523-1918. Investors should read the prospectus and the summary prospectus carefully before investing.
You can obtain shareholder reports and prospectuses online instead of in the mail. Visit delawareinvestments.com/edelivery.
Table of Contents
Experience Delaware Investments
Delaware Investments is committed to the pursuit of consistently superior asset management and unparalleled client service. We believe in our investment processes, which seek to deliver consistent results, and in convenient services that help add value for our clients.
If you are interested in learning more about creating an investment plan, contact your financial advisor.
You can learn more about Delaware Investments or obtain a prospectus for Delaware Diversified Income Fund at delawareinvestments.com.
Manage your investments online
| ● | 24-hour access to your account information |
| ● | Obtain share prices |
| ● | Check your account balance and recent transactions |
| ● | Request statements or literature |
| ● | Make purchases and redemptions |
Delaware Management Holdings, Inc. and its subsidiaries (collectively known by the marketing name of Delaware Investments) are wholly owned subsidiaries of Macquarie Group Limited, a global provider of banking, financial, advisory, investment and funds management services.
Neither Delaware Investments nor its affiliates noted in this document are authorized deposit-taking institutions for the purposes of the Banking Act 1959 (Commonwealth of Australia). The obligations of these entities do not represent deposits or other liabilities of Macquarie Bank Limited (MBL). MBL does not guarantee or otherwise provide assurance in respect of the obligations of these entities, unless noted otherwise.
| 1 | ||||
| 3 | ||||
| 6 | ||||
| 8 | ||||
| 10 | ||||
| 58 | ||||
| 60 | ||||
| 62 | ||||
| 64 | ||||
| 72 | ||||
| 94 | ||||
| 95 | ||||
| 100 | ||||
| 108 |
Unless otherwise noted, views expressed herein are current as of Oct. 31, 2015, and subject to change for events occurring after such date.
Funds are not FDIC insured and are not guaranteed. It is possible to lose the principal amount invested. Mutual fund advisory services provided by Delaware Management Company, a series of Delaware Management Business Trust, which is a registered investment advisor. Delaware Investments, a member of Macquarie Group, refers to Delaware Management Holdings, Inc. and its subsidiaries, including the Fund’s distributor, Delaware Distributors, L.P. Macquarie Group refers to Macquarie Group Limited and its subsidiaries and affiliates worldwide.
©2015 Delaware Management Holdings, Inc. All third-party marks cited are the property of their respective owners.
Table of Contents
| Delaware Diversified Income Fund | November 10, 2015 |
| Performance preview (for the year ended October 31, 2015) | ||||||||
Delaware Diversified Income Fund (Class A shares) | 1-year return | –0.11% | ||||||
Barclays U.S. Aggregate Index (benchmark) | 1-year return | +1.96% | ||||||
Past performance does not guarantee future results.
For complete, annualized performance for Delaware Diversified Income Fund, please see the table on page 3.
The performance of Class A shares excludes the applicable sales charge and reflects the reinvestment of all distributions. Please see page 5 for a description of the index.
Index performance returns do not reflect any management fees, transaction costs, or expenses. Indices are unmanaged and one cannot invest directly in an index.
A key development during the fiscal year ended Oct. 31, 2015 was the divergence in central bank policies. As the European Central Bank launched its quantitative easing program, the U.S. Federal Reserve signaled a potential rate hike in 2015. This had a profound effect on the market, particularly in currencies, driving the U.S. dollar higher versus many other currencies. This contributed to deterioration in emerging-market economies, and hurt revenue growth for U.S.-based multinational companies.
The strong U.S. dollar cut significantly into the global sales and net earnings of many U.S. corporations. Not only did it make U.S. exports more expensive for consumers in other countries, but currency conversions into U.S. dollars became highly unfavorable for many large U.S. companies. This, in turn, affected investment grade corporate credit, leading us to reduce the Fund’s credit overweight during the fiscal year.
Slowdowns in global growth and global trade were among the macroeconomic factors affecting the markets. Of particular concern were continued reports of slowing Chinese growth and the collapse in commodity prices. China’s decelerating economic growth rate is expected to keep commodity prices under pressure, while weighing on many emerging-market nations and Asian countries that have grown dependent on Chinese demand.
Fund performance
For the fiscal year ended Oct. 31, 2015, Delaware Diversified Income Fund (Class A shares) returned -0.11% at net asset value and -4.62% at maximum offer price (both returns reflect all distributions reinvested). For the same period, the Fund’s benchmark, the Barclays U.S. Aggregate Index, returned +1.96%. Complete annualized performance for Delaware Diversified Income Fund is shown in the table on page 3.
Relative to its benchmark, the Fund’s performance was hurt by a significant underweight to U.S. Treasurys, which generally performed better than corporate credit during the fiscal year. The use of futures to manage interest rate risk and yield curve risk somewhat offset this underperformance.
A favorable contributor to performance was the Fund’s security selection within investment grade credit, although the asset class did underperform the broader Barclays U.S. Aggregate Index. The Fund’s holdings within financials were a significant contributor to performance. Barclays, Branch Banking & Trust, Bank of America, and General Electric Capital were the strongest performers for the Fund. We upgraded the portfolio during the fiscal year, investing more in utilities. The Fund’s holdings in utilities outperformed the benchmark in absolute terms and outpaced their index component on strong security selection, which
1
Table of Contents
Portfolio management review
Delaware Diversified Income Fund
included bonds issued by NextEra, Puget Energy, and Entergy.
In terms of below-investment-grade detractors, high yield corporate credit and emerging-market bond exposure both had a significant negative effect on Fund’s performance. Although we reduced the Fund’s allocation to both areas during the course of the fiscal year, exposure to these sectors was detrimental in an environment where the Fund’s benchmark had positive returns. Poor security selection compounded this. For example, Intelsat, a satellite services company, and commodity-focused issuers including Chesapeake Energy and Halcon Resources all detracted from performance.
Although the Fund’s security selection was positive in mortgage-backed securities (MBS), we had a significant underweight to this strong-performing sector. General positioning included current coupons and seasoned higher coupons.
Commercial mortgage-backed securities (CMBS) contributed to performance during the fiscal year. The Fund’s holdings outperformed the overall benchmark and the benchmark’s CMBS component. Positions in seasoned, multifamily-and conduit-loan securitizations were beneficial.
Another position not included in the benchmark that was helpful was the Fund’s small exposure to municipal bonds, including Golden State Tobacco Securitization and City of New York general obligation bonds.
Exposure to below-investment grade assets not included in the benchmark, including emerging-market bonds, detracted from performance. The
asset allocation decision to have greater exposure to lower-quality securities was a significant detractor. However, that was partially offset by security selection, especially in corporate credit, which was generally strong.
The key risk within the Fund’s portfolio continues to be credit risk, although we have increased its exposure to U.S. Treasurys and MBS. We continue to see significant idiosyncratic (security-specific) risk in the market. Because of what we see as a challenging situation for corporate balance sheets, we reduced the Fund’s exposure to high yield and investment grade corporate credit. We believe China’s slowing economy may continue to weigh on commodity markets and hold back overall global growth.
The Fund’s use of derivatives contributed modestly to the Fund’s performance. We used derivatives for several hedging purposes. In addition to U.S. Treasury futures, currency forwards, and credit derivatives, we used E-mini S&P 500 futures (these are one-fifth the size of the Standard S&P 500 futures contracts) to hedge some of the portfolio’s exposure to convertible bonds. However, because convertibles only made up about 2% of the portfolio, this had a minimal effect on performance during the fiscal year.
In our view, we don’t see much risk of the United States slipping into recession in the short term. However, we anticipate higher levels of volatility as the Fed looks to raise interest rates, diverging from the policy moves of other central banks. Accordingly, we will likely maintain a more conservative position in the Fund overall.
2
Table of Contents
| Performance summary | ||
| Delaware Diversified Income Fund | October 31, 2015 |
The performance data quoted represent past performance; past performance does not guarantee future results. Investment return and principal value will fluctuate so your shares, when redeemed, may be worth more or less than their original cost. Please obtain the performance data current for the most recent month end by calling 800 523-1918 or visiting our website at delawareinvestments.com/performance. Current performance may be lower or higher than the performance data quoted.
| Fund and benchmark performance1,2 | Average annual total returns through October 31, 2015 | |||||||||||
| 1 year | 5 years | 10 years | ||||||||||
Class A (Est. Dec. 29, 1997) | ||||||||||||
Excluding sales charge | –0.11 | % | +3.14 | % | +6.01 | % | ||||||
Including sales charge | –4.62 | % | +2.19 | % | +5.53 | % | ||||||
Class C (Est. Oct. 28, 2002) | ||||||||||||
Excluding sales charge | –0.85 | % | +2.39 | % | +5.22 | % | ||||||
Including sales charge | –1.81 | % | +2.39 | % | +5.22 | % | ||||||
Class R (Est. June 2, 2003) | ||||||||||||
Excluding sales charge | –0.47 | % | +2.88 | % | +5.73 | % | ||||||
Including sales charge | –0.47 | % | +2.88 | % | +5.73 | % | ||||||
Institutional Class (Est. Oct. 28, 2002) | ||||||||||||
Excluding sales charge | +0.03 | % | +3.39 | % | +6.26 | % | ||||||
Including sales charge | +0.03 | % | +3.39 | % | +6.26 | % | ||||||
Barclays U.S. Aggregate Index | +1.96 | % | +3.03 | % | +4.72 | % | ||||||
1 Returns reflect the reinvestment of all distributions and are presented both with and without the applicable sales charges described below. Returns do not reflect the deduction of taxes the shareholder would pay on Fund distributions or redemptions of Fund shares.
Expense limitations were in effect for certain classes during some or all of the periods shown in the “Fund and benchmark performance” table. Expenses for each class are listed on the “Fund expense ratios” table on page 4. Performance would have been lower had expense limitations not been in effect.
Class A shares are sold with a maximum front-end sales charge of 4.50%, and have an annual distribution and service fee of 0.25% of average daily net assets. Performance for Class A shares,
excluding sales charges, assumes that no front-end sales charge applied.
Class C shares are sold with a contingent deferred sales charge of 1.00% if redeemed during the first 12 months. They are also subject to an annual distribution and service fee of 1.00% of average daily net assets. Performance for Class C shares, excluding sales charges, assumes either that contingent deferred sales charges did not apply or that the investment was not redeemed.
Class R shares are available only for certain retirement plan products. They are sold without a sales charge and have an annual distribution and service fee of 0.50% of average daily net assets.
Institutional Class shares are available without sales or asset-based distribution charges only to certain eligible institutional accounts.
3
Table of Contents
Performance summary
Delaware Diversified Income Fund
Fixed income securities and bond funds can lose value, and investors can lose principal, as interest rates rise. They also may be affected by economic conditions that hinder an issuer’s ability to make interest and principal payments on its debt.
The Fund may also be subject to prepayment risk, the risk that the principal of a fixed income security that is held by the Fund may be prepaid prior to maturity, potentially forcing the Fund to reinvest that money at a lower interest rate.
High yielding, noninvestment grade bonds (junk bonds) involve higher risk than investment grade bonds. The high yield secondary market is particularly susceptible to liquidity problems when institutional investors, such as mutual funds and certain other financial institutions, temporarily stop buying bonds for regulatory, financial, or other reasons. In addition, a less liquid secondary market makes it more difficult for the Fund to obtain precise valuations of the high yield securities in its portfolio.
The Fund may invest in derivatives, which may involve additional expenses and are subject to
risk, including the risk that an underlying security or securities index moves in the opposite direction from what the portfolio manager anticipated. A derivative transaction depends upon the counterparties’ ability to fulfill their contractual obligations.
If and when the Fund invests in forward foreign currency contracts or uses other investments to hedge against currency risks, the Fund will be subject to special risks, including counterparty risk.
The Fund may experience portfolio turnover in excess of 100%, which could result in higher transaction costs and tax liability.
International investments entail risks not ordinarily associated with U.S. investments including fluctuation in currency values, differences in accounting principles, or economic or political instability in other nations.
Investing in emerging markets can be riskier than investing in established foreign markets due to increased volatility and lower trading volume.
2 The Fund’s expense ratios, as described in the most recent prospectus, are disclosed in the following “Fund expense ratios” table.
Fund expense ratios
| Class A
| Class C
| Class R
| Institutional Class
| ||||
Total annual operating expenses (without fee waivers) | 0.90% | 1.65% | 1.15% | 0.65% | ||||
Net expenses (including fee waivers, if any) | 0.90% | 1.65% | 1.15% | 0.65% | ||||
Type of waiver | n/a | n/a | n/a | n/a |
4
Table of Contents
Performance of a $10,000 investment1
Average annual total returns from Oct. 31, 2005 through Oct. 31, 2015
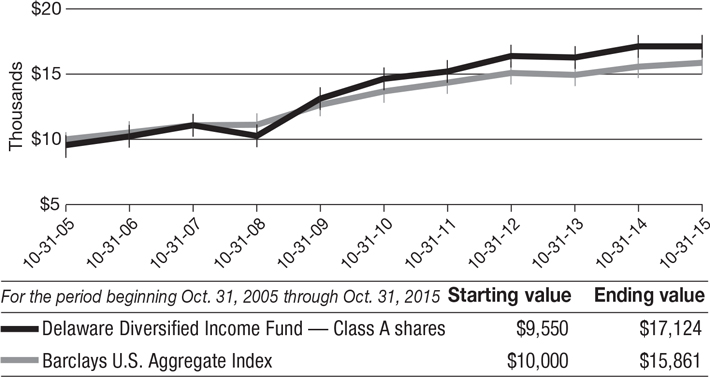
1 The “Performance of a $10,000 investment” graph assumes $10,000 invested in Class A shares of the Fund on Oct. 31, 2005, and includes the effect of a 4.50% front-end sales charge and the reinvestment of all distributions. The graph does not reflect the deduction of taxes the shareholders would pay on Fund distributions or redemptions of Fund shares. Expense limitations were in effect for some or all of the periods shown. Performance would have been lower had expense limitations not been in effect. Expenses are listed in the “Fund expense ratios” table on page 4. Please note additional details on pages 3 through 5.
The graph also assumes $10,000 invested in the Barclays U.S. Aggregate Index as of Oct. 31, 2005. The Barclays U.S. Aggregate Index measure the performance of publicly issued investment grade (Baa3/BBB- or better) corporate, U.S. government, mortgage-and asset-backed securities with at least one year to maturity and at least $250 million par amount outstanding.
Index performance returns do not reflect any management fees, transaction costs, or expenses. Indices are unmanaged and one cannot invest directly in an index. Past performance is not a guarantee of future results.
Performance of other Fund classes will vary due to different charges and expenses.
| Nasdaq | CUSIPs | |||
Class A | DPDFX | 246248744 | ||
Class C | DPCFX | 246248595 | ||
Class R | DPRFX | 246248553 | ||
Institutional Class
| DPFFX
| 246248587
| ||
5
Table of Contents
For the six-month period from May 1, 2015 to October 31, 2015 (Unaudited)
As a shareholder of the Fund, you incur two types of costs: (1) transaction costs, including sales charges (loads) on purchase payments, reinvested dividends, or other distributions; redemption fees; and exchange fees; and (2) ongoing costs, including management fees; distribution and/or service (12b-1) fees; and other Fund expenses. This example is intended to help you understand your ongoing costs (in dollars) of investing in the Fund and to compare these costs with the ongoing costs of investing in other mutual funds.
The example is based on an investment of $1,000 invested at the beginning of the period and held for the entire six-month period from May 1, 2015 to Oct. 31, 2015.
Actual expenses
The first section of the table shown, “Actual Fund return,” provides information about actual account values and actual expenses. You may use the information in this section of the table, together with the amount you invested, to estimate the expenses that you paid over the period. Simply divide your account value by $1,000 (for example, an $8,600 account value divided by $1,000 = 8.6), then multiply the result by the number in the first section under the heading entitled “Expenses Paid During Period” to estimate the expenses you paid on your account during this period.
Hypothetical example for comparison purposes
The second section of the table shown, “Hypothetical 5% return,” provides information about hypothetical account values and hypothetical expenses based on the Fund’s actual expense ratio and an assumed rate of return of 5% per year before expenses, which is not the Fund’s actual return. The hypothetical account values and expenses may not be used to estimate the actual ending account balance or expenses you paid for the period. You may use this information to compare the ongoing costs of investing in the Fund and other funds. To do so, compare this 5% hypothetical example with the 5% hypothetical examples that appear in the shareholder reports of the other funds.
Please note that the expenses shown in the table are meant to highlight your ongoing costs only and do not reflect any transactional costs, such as sales charges (loads), redemption fees, or exchange fees. Therefore, the second section of the table is useful in comparing ongoing costs only, and will not help you determine the relative total costs of owning different funds. In addition, if these transactional costs were included, your costs would have been higher. The expenses shown in the table assume reinvestment of all dividends and distributions.
6
Table of Contents
Delaware Diversified Income Fund
Expense analysis of an investment of $1,000
Beginning
Account Value
5/1/15 | Ending
Account Value
10/31/15 | Annualized
Expense Ratio | Expenses
Paid During Period
5/1/15 to 10/31/15* | |||||||||||
Actual Fund return† |
| |||||||||||||
Class A | $1,000.00 | $983.60 | 0.90% | $4.50 | ||||||||||
Class C | 1,000.00 | 979.90 | 1.65% | 8.23 | ||||||||||
Class R | 1,000.00 | 981.30 | 1.15% | 5.74 | ||||||||||
Institutional Class | 1,000.00 | 983.80 | 0.65% | 3.25 | ||||||||||
Hypothetical 5% return (5% return before expenses) |
| |||||||||||||
Class A | $1,000.00 | $1,020.67 | 0.90% | $4.58 | ||||||||||
Class C | 1,000.00 | 1,016.89 | 1.65% | 8.39 | ||||||||||
Class R | 1,000.00 | 1,019.41 | 1.15% | 5.85 | ||||||||||
Institutional Class | 1,000.00 | 1,021.93 | 0.65% | 3.31 | ||||||||||
| * | “Expenses Paid During Period” are equal to the Fund’s annualized expense ratio, multiplied by the average account value over the period, multiplied by 184/365 (to reflect the one-half year period). |
| † | Because actual returns reflect only the most recent six-month period, the returns shown may differ significantly from fiscal year returns. |
7
Table of Contents
| Security type / sector allocation | ||
| Delaware Diversified Income Fund | As of October 31, 2015 (Unaudited) |
Sector designations may be different than the sector designations presented in other fund materials. The sector designations may represent the investment manager’s internal sector classifications, which may result in the sector designations for one fund being different than another fund’s sector designations.
| Security type / sector | Percentage of net assets | |
Agency Asset-Backed Securities | 0.02% | |
Agency Collateralized Mortgage Obligations | 2.80% | |
Agency Mortgage-Backed Securities | 17.95% | |
Collateralized Debt Obligations | 1.13% | |
Commercial Mortgage-Backed Securities | 5.89% | |
Convertible Bonds | 1.49% | |
Corporate Bonds | 38.61% | |
Automotive | 0.35% | |
Banking | 5.31% | |
Basic Industry | 3.25% | |
Brokerage | 0.41% | |
Capital Goods | 0.79% | |
Communications | 6.14% | |
Consumer Cyclical | 2.07% | |
Consumer Non-Cyclical | 2.14% | |
Electric | 5.55% | |
Energy | 4.47% | |
Finance Companies | 0.80% | |
Healthcare | 1.17% | |
Insurance | 1.66% | |
Real Estate | 1.17% | |
Services | 0.78% | |
Technology | 1.55% | |
Transportation | 0.74% | |
Utilities | 0.26% | |
Municipal Bonds | 1.27% | |
Non-Agency Asset-Backed Securities | 3.45% | |
Non-Agency Collateralized Mortgage Obligations | 1.43% | |
Regional Bonds | 0.30% | |
Senior Secured Loans | 9.91% | |
Sovereign Bonds | 2.56% | |
Supranational Banks | 0.38% | |
U.S. Treasury Obligations | 10.47% | |
Common Stock | 0.00% | |
Convertible Preferred Stock | 0.37% | |
Preferred Stock | 0.70% | |
Short-Term Investments | 11.41% |
8
Table of Contents
| Security type / sector | Percentage of net assets | |
Securities Lending Collateral | 4.73% | |
Total Value of Securities | 114.87% | |
Obligation to Return Securities Lending Collateral | (4.73%) | |
Liabilities Net of Receivables and Other Assets | (10.14%) | |
Total Net Assets | 100.00% |
9
Table of Contents
Delaware Diversified Income Fund | October 31, 2015 |
| Principal amount° | Value (U.S. $) | |||||||
| ||||||||
Agency Asset-Backed Securities – 0.02% | ||||||||
| ||||||||
Fannie Mae Grantor Trust | ||||||||
Series 2003-T4 2A5 5.112% 9/26/33 f | 880,268 | $ | 960,375 | |||||
Fannie Mae REMIC Trust | ||||||||
Series 2001-W2 AS5 6.473% 10/25/31 f | 3,196 | 3,301 | ||||||
Series 2002-W11 AV1 0.537% 11/25/32 ● | 5,846 | 5,707 | ||||||
|
| |||||||
Total Agency Asset-Backed Securities (cost $856,799) | 969,383 | |||||||
|
| |||||||
| ||||||||
Agency Collateralized Mortgage Obligations – 2.80% | ||||||||
Fannie Mae Grantor Trust | ||||||||
Series 1999-T2 A1 7.50% 1/19/39 ● | 13,475 | 14,816 | ||||||
Series 2002-T4 A3 7.50% 12/25/41 | 141,179 | 159,595 | ||||||
Series 2002-T19 A1 6.50% 7/25/42 | 105,989 | 123,032 | ||||||
Series 2004-T1 1A2 6.50% 1/25/44 | 46,456 | 52,419 | ||||||
Fannie Mae Interest Strip | ||||||||
Series 265 2 9.00% 3/25/24 | 5,801 | 6,718 | ||||||
Fannie Mae REMIC Trust | ||||||||
Series 2002-W1 2A 6.366% 2/25/42 ● | 14,256 | 16,596 | ||||||
Series 2002-W6 2A 6.785% 6/25/42 ● | 28,120 | 32,545 | ||||||
Series 2003-W1 2A 6.424% 12/25/42 ● | 15,280 | 17,778 | ||||||
Series 2003-W10 1A4 4.505% 6/25/43 | 20,318 | 21,717 | ||||||
Series 2003-W15 2A7 5.55% 8/25/43 | 21,292 | 22,616 | ||||||
Series 2004-W11 1A2 6.50% 5/25/44 | 297,785 | 350,743 | ||||||
Fannie Mae REMICs | ||||||||
Series 1990-92 C 7.00% 8/25/20 | 616 | 667 | ||||||
Series 1996-46 ZA 7.50% 11/25/26 | 123,779 | 140,126 | ||||||
Series 2001-50 BA 7.00% 10/25/41 | 67,221 | 77,830 | ||||||
Series 2002-77 Z 5.50% 12/25/32 | 1,412,081 | 1,582,404 | ||||||
Series 2002-83 GH 5.00% 12/25/17 | 64,602 | 66,679 | ||||||
Series 2002-90 A2 6.50% 11/25/42 | 204,759 | 231,481 | ||||||
Series 2003-11 BY 5.50% 2/25/33 | 101,820 | 114,172 | ||||||
Series 2003-26 AT 5.00% 11/25/32 | 1,332,779 | 1,357,524 | ||||||
Series 2003-38 MP 5.50% 5/25/23 | 1,686,863 | 1,833,722 | ||||||
Series 2003-78 B 5.00% 8/25/23 | 49,558 | 53,259 | ||||||
Series 2005-70 PA 5.50% 8/25/35 | 494,826 | 557,719 | ||||||
Series 2005-110 MB 5.50% 9/25/35 | 737,968 | 791,187 | ||||||
Series 2007-40 PT 5.50% 5/25/37 | 23,424 | 26,077 | ||||||
Series 2008-15 SB 6.403% 8/25/36 ●S | 996,060 | 197,992 | ||||||
Series 2009-11 MP 7.00% 3/25/49 | 26,475 | 30,316 | ||||||
Series 2009-94 AC 5.00% 11/25/39 | 4,143,443 | 4,539,073 | ||||||
Series 2010-41 PN 4.50% 4/25/40 | 7,623,413 | 8,275,727 | ||||||
Series 2010-129 SM 5.803% 11/25/40 ●S | 8,185,914 | 1,321,484 | ||||||
Series 2010-43 HJ 5.50% 5/25/40 | 809,802 | 911,668 | ||||||
Series 2010-75 NA 4.00% 9/25/28 | 312,967 | 318,811 | ||||||
10
Table of Contents
| Principal amount° | Value (U.S. $) | |||||||
| ||||||||
Agency Collateralized Mortgage Obligations (continued) | ||||||||
| ||||||||
Fannie Mae REMICs | ||||||||
Series 2010-96 DC 4.00% 9/25/25 | 11,956,479 | $ | 12,667,094 | |||||
Series 2011-15 SA 6.863% 3/25/41 ●S | 7,825,574 | 1,792,849 | ||||||
Series 2011-105 FP 0.597% 6/25/41 ● | 29,811 | 29,866 | ||||||
Series 2011-113 CP 5.00% 9/25/39 | 1,176,502 | 1,295,356 | ||||||
Series 2012-19 HB 4.00% 1/25/42 | 862,630 | 903,417 | ||||||
Series 2012-19 NI 3.50% 10/25/31 S | 4,364,916 | 471,691 | ||||||
Series 2012-122 SD 5.903% 11/25/42 ●S | 10,011,105 | 2,405,634 | ||||||
Series 2013-2 LZ 3.00% 2/25/43 | 527,425 | 493,613 | ||||||
Series 2013-20 IH 3.00% 3/25/33 S | 5,889,587 | 828,611 | ||||||
Series 2013-31 MI 3.00% 4/25/33 S | 29,915,601 | 4,300,901 | ||||||
Series 2013-43 IX 4.00% 5/25/43 S | 28,329,849 | 6,889,975 | ||||||
Series 2013-44 DI 3.00% 5/25/33 S | 36,978,190 | 5,301,400 | ||||||
Series 2014-36 ZE 3.00% 6/25/44 | 4,243,348 | 3,795,424 | ||||||
Series 2014-68 BS 5.953% 11/25/44 ●S | 10,567,191 | 2,237,687 | ||||||
Series 2014-72 ZJ 3.00% 11/25/44 | 408,144 | 344,137 | ||||||
Series 2014-90 SA 5.953% 1/25/45 ●S | 29,878,629 | 6,689,954 | ||||||
Series 2015-27 SA 6.253% 5/25/45 ●S | 3,925,110 | 953,868 | ||||||
Series 2015-44 Z 3.00% 9/25/43 | 7,916,728 | 7,508,361 | ||||||
Freddie Mac REMICs | ||||||||
Series 1730 Z 7.00% 5/15/24 | 142,295 | 160,668 | ||||||
Series 2326 ZQ 6.50% 6/15/31 | 451,819 | 512,053 | ||||||
Series 2557 WE 5.00% 1/15/18 | 790,812 | 817,195 | ||||||
Series 2621 QH 5.00% 5/15/33 | 45,541 | 50,087 | ||||||
Series 2624 QH 5.00% 6/15/33 | 21,521 | 23,776 | ||||||
Series 2717 MH 4.50% 12/15/18 | 27,155 | 28,091 | ||||||
Series 2809 DC 4.50% 6/15/19 | 503,858 | 520,872 | ||||||
Series 2981 NE 5.00% 5/15/35 | 14,628 | 16,089 | ||||||
Series 3123 HT 5.00% 3/15/26 | 25,695 | 27,847 | ||||||
Series 3139 ZT 5.50% 4/15/36 | 186,032 | 207,697 | ||||||
Series 3150 EQ 5.00% 5/15/26 | 33,330 | 35,999 | ||||||
Series 3232 KF 0.646% 10/15/36 ● | 59,999 | 60,370 | ||||||
Series 3239 EF 0.546% 11/15/36 ● | 11,594 | 11,651 | ||||||
Series 3290 PE 5.50% 3/15/37 | 269,074 | 300,665 | ||||||
Series 3416 GK 4.00% 7/15/22 | 2,467 | 2,467 | ||||||
Series 3574 D 5.00% 9/15/39 | 180,662 | 199,162 | ||||||
Series 3656 PM 5.00% 4/15/40 | 8,159,618 | 8,975,105 | ||||||
Series 3662 ZB 5.50% 8/15/36 | 308,362 | 347,693 | ||||||
Series 3804 EH 3.50% 7/15/40 | 89,297 | 93,311 | ||||||
Series 4065 DE 3.00% 6/15/32 | 1,626,000 | 1,644,436 | ||||||
Series 4097 VY 1.50% 8/15/42 | 341,521 | 274,711 | ||||||
Series 4120 IK 3.00% 10/15/32 S | 15,811,410 | 2,164,689 | ||||||
Series 4122 LI 3.00% 10/15/27 S | 857,475 | 94,522 | ||||||
11
Table of Contents
Schedule of investments
Delaware Diversified Income Fund
| Principal amount° | Value (U.S. $) | |||||||
| ||||||||
Agency Collateralized Mortgage Obligations (continued) | ||||||||
| ||||||||
Freddie Mac REMICs | ||||||||
Series 4136 EZ 3.00% 11/15/42 | 3,207,475 | $ | 2,992,755 | |||||
Series 4146 IA 3.50% 12/15/32 S | 8,350,265 | 1,335,313 | ||||||
Series 4150 PQ 2.50% 1/15/43 | 535,693 | 522,398 | ||||||
Series 4158 ZT 3.00% 1/15/43 | 225,245 | 213,083 | ||||||
Series 4159 KS 5.954% 1/15/43 ●S | 7,150,470 | 1,745,754 | ||||||
Series 4180 ZB 3.00% 3/15/43 | 1,104,726 | 1,068,207 | ||||||
Series 4185 LI 3.00% 3/15/33 S | 9,007,544 | 1,269,952 | ||||||
Series 4191 CI 3.00% 4/15/33 S | 3,769,496 | 505,916 | ||||||
Series 4217 HI 2.50% 6/15/28 S | 815,250 | 76,779 | ||||||
Series 4251 KI 2.50% 4/15/28 S | 678,962 | 46,250 | ||||||
Series 4389 ZC 3.00% 9/15/44 | 829,231 | 720,745 | ||||||
Series 4391 GZ 2.50% 12/15/40 | 104,017 | 94,756 | ||||||
Series 4403 CZ 3.00% 10/15/44 | 118,716 | 94,570 | ||||||
Series 4435 DY 3.00% 2/15/35 | 6,624,571 | 6,530,234 | ||||||
Freddie Mac Strips | ||||||||
Series 19 F 1.112% 6/1/28 ● | 2,670 | 2,624 | ||||||
Freddie Mac Structured Pass Through Securities | ||||||||
Series T-42 A5 7.50% 2/25/42 ¿ | 87,848 | 104,342 | ||||||
Series T-54 2A 6.50% 2/25/43 ¿ | 23,717 | 28,043 | ||||||
Series T-58 2A 6.50% 9/25/43 ¿ | 512,057 | 587,925 | ||||||
Series T-60 1A4C 4.62% 3/25/44 ¿● | 14 | 14 | ||||||
GNMA | ||||||||
Series 2010-113 KE 4.50% 9/20/40 | 20,442,264 | 22,625,964 | ||||||
Series 2012-145 PY 2.00% 12/20/42 | 1,923,000 | 1,663,109 | ||||||
Series 2015-133 AL 3.00% 5/20/45 | 8,757,978 | 8,414,608 | ||||||
Series 2015-139 EY 2.50% 9/16/45 | 1,548,000 | 1,366,488 | ||||||
Vendee Mortgage Trust | ||||||||
Series 2000-1 1A 6.432% 1/15/30 ● | 17,443 | 19,869 | ||||||
|
| |||||||
Total Agency Collateralized Mortgage Obligations | 150,755,185 | |||||||
|
| |||||||
| ||||||||
Agency Mortgage-Backed Securities – 17.95% | ||||||||
| ||||||||
Fannie Mae | ||||||||
6.50% 8/1/17 | 23,203 | 23,763 | ||||||
7.00% 11/15/16 | 279 | 278 | ||||||
Fannie Mae ARM | ||||||||
1.877% 7/1/33 ● | 65,189 | 68,179 | ||||||
1.889% 1/1/36 ● | 72,041 | 76,035 | ||||||
2.081% 11/1/24 ● | 1,873 | 1,971 | ||||||
2.094% 3/1/38 ● | 8,413 | 8,873 | ||||||
2.269% 4/1/36 ● | 710 | 754 | ||||||
2.283% 8/1/34 ● | 18,678 | 19,743 | ||||||
2.311% 12/1/33 ● | 12,149 | 12,880 | ||||||
12
Table of Contents
| Principal amount° | Value (U.S. $) | |||||||
| ||||||||
Agency Mortgage-Backed Securities (continued) | ||||||||
| ||||||||
Fannie Mae ARM | ||||||||
2.327% 11/1/32 ● | 458 | $ | 488 | |||||
2.341% 9/1/38 ● | 393,690 | 423,523 | ||||||
2.347% 4/1/37 ● | 1,090,363 | 1,160,362 | ||||||
2.352% 4/1/36 ● | 304,758 | 324,925 | ||||||
2.393% 11/1/35 ● | 92,179 | 98,028 | ||||||
2.402% 10/1/33 ● | 52,208 | 54,501 | ||||||
2.408% 6/1/37 ● | 8,076 | 8,595 | ||||||
2.41% 4/1/36 ● | 209,962 | 223,877 | ||||||
2.415% 5/1/43 ● | 5,650,667 | 5,747,580 | ||||||
2.444% 8/1/36 ● | 25,988 | 27,680 | ||||||
2.457% 11/1/35 ● | 304,105 | 323,642 | ||||||
2.461% 6/1/36 ● | 89,231 | 95,158 | ||||||
2.519% 7/1/36 ● | 2,142 | 2,285 | ||||||
2.522% 6/1/34 ● | 43,323 | 45,946 | ||||||
2.527% 6/1/34 ● | 1,005 | 1,070 | ||||||
2.527% 7/1/36 ● | 55,050 | 58,766 | ||||||
2.553% 6/1/43 ● | 1,269,314 | 1,296,872 | ||||||
2.576% 8/1/35 ● | 70,923 | 75,096 | ||||||
2.913% 7/1/45 ● | 1,529,778 | 1,565,963 | ||||||
3.184% 4/1/44 ● | 2,934,538 | 3,040,181 | ||||||
3.26% 3/1/44 ● | 4,404,318 | 4,577,206 | ||||||
3.282% 9/1/43 ● | 3,727,092 | 3,870,128 | ||||||
3.345% 5/1/36 ● | 124,609 | 133,931 | ||||||
6.099% 8/1/37 ● | 175,544 | 182,087 | ||||||
Fannie Mae Relocation 15 yr | ||||||||
4.00% 9/1/20 | 107,491 | 111,294 | ||||||
Fannie Mae Relocation 30 yr | ||||||||
5.00% 11/1/33 | 27,486 | 30,002 | ||||||
5.00% 1/1/34 | 2,499 | 2,727 | ||||||
5.00% 11/1/34 | 29,837 | 32,554 | ||||||
5.00% 4/1/35 | 37,714 | 41,123 | ||||||
5.00% 10/1/35 | 54,781 | 59,782 | ||||||
5.00% 1/1/36 | 84,162 | 91,789 | ||||||
Fannie Mae S.F. 15 yr | ||||||||
2.50% 10/1/27 | 1,176,599 | 1,207,276 | ||||||
2.50% 12/1/27 | 1,541,114 | 1,581,366 | ||||||
2.50% 4/1/28 | 1,424,806 | 1,461,989 | ||||||
2.50% 9/1/28 | 2,640,419 | 2,712,473 | ||||||
3.00% 9/1/30 | 4,651,792 | 4,845,782 | ||||||
3.50% 2/1/26 | 793,866 | 839,602 | ||||||
3.50% 6/1/26 | 3,301,255 | 3,491,026 | ||||||
3.50% 7/1/26 | 3,862,556 | 4,090,987 | ||||||
13
Table of Contents
Schedule of investments
Delaware Diversified Income Fund
| Principal amount° | Value (U.S. $) | |||||||
| ||||||||
Agency Mortgage-Backed Securities (continued) | ||||||||
| ||||||||
Fannie Mae S.F. 15 yr | ||||||||
3.50% 11/1/27 | 732,156 | $ | 777,368 | |||||
3.50% 11/1/28 | 352,063 | 373,738 | ||||||
4.00% 3/1/24 | 22,015 | 23,342 | ||||||
4.00% 4/1/24 | 2,936 | 3,112 | ||||||
4.00% 11/1/24 | 54,934 | 58,403 | ||||||
4.00% 2/1/25 | 577,215 | 612,031 | ||||||
4.00% 5/1/25 | 1,497,400 | 1,591,406 | ||||||
4.00% 11/1/25 | 10,367,423 | 11,017,018 | ||||||
4.00% 1/1/27 | 17,667,774 | 18,777,093 | ||||||
4.00% 5/1/27 | 5,568,643 | 5,918,483 | ||||||
4.50% 4/1/18 | 7,855 | 8,134 | ||||||
4.50% 7/1/18 | 14,269 | 14,776 | ||||||
4.50% 9/1/18 | 8,955 | 9,274 | ||||||
4.50% 11/1/18 | 17,693 | 18,376 | ||||||
4.50% 2/1/19 | 18,451 | 19,136 | ||||||
4.50% 3/1/19 | 56,217 | 58,303 | ||||||
4.50% 4/1/20 | 7,677 | 7,997 | ||||||
4.50% 7/1/20 | 120,594 | 126,774 | ||||||
4.50% 4/1/23 | 48,793 | 51,829 | ||||||
4.50% 9/1/24 | 166,313 | 173,351 | ||||||
4.50% 11/1/24 | 58,233 | 62,301 | ||||||
5.00% 6/1/19 | 68,048 | 70,674 | ||||||
5.00% 12/1/21 | 28,801 | 29,960 | ||||||
5.50% 2/1/18 | 21,604 | 22,417 | ||||||
5.50% 4/1/19 | 8,888 | 9,213 | ||||||
5.50% 5/1/19 | 25,977 | 26,832 | ||||||
5.50% 10/1/21 | 10,361 | 11,228 | ||||||
5.50% 4/1/23 | 58,936 | 64,156 | ||||||
5.50% 6/1/23 | 42,415 | 46,529 | ||||||
6.00% 8/1/17 | 10,953 | 11,238 | ||||||
6.00% 12/1/17 | 1,069 | 1,071 | ||||||
6.00% 3/1/21 | 685 | 735 | ||||||
6.00% 9/1/21 | 1,896,462 | 2,084,308 | ||||||
6.00% 2/1/22 | 44,188 | 47,085 | ||||||
6.00% 8/1/22 | 23,573 | 25,863 | ||||||
6.00% 2/1/23 | 3,055 | 3,367 | ||||||
Fannie Mae S.F. 15 yr TBA | ||||||||
2.50% 1/1/31 | 10,652,000 | 10,798,052 | ||||||
3.00% 1/1/31 | 10,263,000 | 10,633,951 | ||||||
Fannie Mae S.F. 20 yr | ||||||||
3.00% 10/1/32 | 19,631 | 20,312 | ||||||
3.00% 2/1/33 | 367,940 | 380,722 | ||||||
14
Table of Contents
| Principal amount° | Value (U.S. $) | |||||||
| ||||||||
Agency Mortgage-Backed Securities (continued) | ||||||||
| ||||||||
Fannie Mae S.F. 20 yr | ||||||||
3.00% 8/1/33 | 159,062 | $ | 164,782 | |||||
3.00% 4/1/34 | 115,981 | 120,148 | ||||||
3.00% 8/1/34 | 1,097,525 | 1,136,854 | ||||||
3.50% 8/1/32 | 547,411 | 577,160 | ||||||
3.50% 10/1/34 | 2,351,043 | 2,468,402 | ||||||
3.50% 9/1/35 | 45,665 | 47,919 | ||||||
4.00% 1/1/31 | 933,115 | 1,003,558 | ||||||
4.00% 2/1/31 | 2,226,543 | 2,394,586 | ||||||
6.50% 10/1/18 | 2,493 | 2,849 | ||||||
6.50% 2/1/19 | 5,541 | 6,333 | ||||||
6.50% 10/1/24 | 9,035 | 10,327 | ||||||
6.50% 10/1/27 | 46,698 | 53,374 | ||||||
Fannie Mae S.F. 30 yr | ||||||||
3.00% 7/1/42 | 3,012,600 | 3,056,400 | ||||||
3.00% 10/1/42 | 50,620,033 | 51,325,968 | ||||||
3.00% 12/1/42 | 8,653,364 | 8,774,707 | ||||||
3.00% 1/1/43 | 14,415,955 | 14,610,634 | ||||||
3.00% 2/1/43 | 1,790,260 | 1,814,677 | ||||||
3.00% 5/1/43 | 2,781,118 | 2,818,078 | ||||||
3.50% 4/1/42 | 9,158 | 9,553 | ||||||
3.50% 1/1/43 | 709,019 | 739,607 | ||||||
4.00% 5/1/43 | 496,246 | 533,694 | ||||||
4.00% 8/1/43 | 1,287,657 | 1,378,514 | ||||||
4.00% 7/1/44 | 13,542,652 | 14,569,729 | ||||||
4.50% 7/1/36 | 1,578,628 | 1,716,203 | ||||||
4.50% 11/1/40 | 3,505,486 | 3,808,581 | ||||||
4.50% 12/1/40 | 1,365,599 | 1,483,832 | ||||||
4.50% 3/1/41 | 4,214,422 | 4,576,841 | ||||||
4.50% 4/1/41 | 6,388,592 | 6,942,888 | ||||||
4.50% 5/1/41 | 796,997 | 871,770 | ||||||
4.50% 7/1/41 | 1,744,384 | 1,895,520 | ||||||
4.50% 8/1/41 | 1,865,436 | 2,030,285 | ||||||
4.50% 1/1/42 | 69,286,347 | 75,418,062 | ||||||
4.50% 9/1/42 | 8,027,435 | 8,745,877 | ||||||
4.50% 2/1/44 | 893,775 | 968,707 | ||||||
4.50% 6/1/44 | 4,023,523 | 4,369,355 | ||||||
4.50% 10/1/44 | 5,917,279 | 6,448,105 | ||||||
4.50% 2/1/45 | 5,888,550 | 6,413,988 | ||||||
5.00% 4/1/33 | 85,253 | 94,400 | ||||||
5.00% 7/1/33 | 96,339 | 106,658 | ||||||
5.00% 11/1/33 | 107,107 | 118,576 | ||||||
5.00% 3/1/34 | 49,760 | 55,096 | ||||||
15
Table of Contents
Schedule of investments
Delaware Diversified Income Fund
| Principal amount° | Value (U.S. $) | |||||||
| ||||||||
Agency Mortgage-Backed Securities (continued) | ||||||||
| ||||||||
Fannie Mae S.F. 30 yr | ||||||||
5.00% 4/1/34 | 216,163 | $ | 239,971 | |||||
5.00% 2/1/35 | 4,282 | 4,740 | ||||||
5.00% 4/1/35 | 513,104 | 566,613 | ||||||
5.00% 5/1/35 | 19,141 | 21,108 | ||||||
5.00% 6/1/35 | 2,982 | 3,288 | ||||||
5.00% 7/1/35 | 62,560 | 68,878 | ||||||
5.00% 8/1/35 | 487,765 | 537,612 | ||||||
5.00% 9/1/35 | 3,886 | 4,301 | ||||||
5.00% 10/1/35 | 2,592,792 | 2,857,890 | ||||||
5.00% 11/1/35 | 1,615,154 | 1,779,934 | ||||||
5.00% 7/1/36 | 2,829 | 3,122 | ||||||
5.00% 8/1/36 | 5,412 | 5,967 | ||||||
5.00% 12/1/36 | 9,259 | 10,206 | ||||||
5.00% 2/1/37 | 52,685 | 58,272 | ||||||
5.00% 4/1/37 | 727,141 | 801,571 | ||||||
5.00% 8/1/37 | 1,754,380 | 1,933,018 | ||||||
5.00% 2/1/38 | 793,607 | 874,228 | ||||||
5.00% 5/1/38 | 31,836 | 35,109 | ||||||
5.00% 6/1/39 | 240,303 | 264,825 | ||||||
5.50% 12/1/32 | 138,994 | 156,513 | ||||||
5.50% 2/1/33 | 2,021,640 | 2,274,340 | ||||||
5.50% 9/1/33 | 6,029 | 6,793 | ||||||
5.50% 3/1/34 | 188,594 | 212,663 | ||||||
5.50% 4/1/34 | 821,213 | 924,264 | ||||||
5.50% 5/1/34 | 353,784 | 398,398 | ||||||
5.50% 8/1/34 | 115,697 | 129,525 | ||||||
5.50% 9/1/34 | 105,757 | 119,383 | ||||||
5.50% 11/1/34 | 1,093,085 | 1,233,501 | ||||||
5.50% 12/1/34 | 525,622 | 592,866 | ||||||
5.50% 1/1/35 | 2,169,633 | 2,447,019 | ||||||
5.50% 2/1/35 | 708,378 | 797,367 | ||||||
5.50% 3/1/35 | 383,141 | 429,727 | ||||||
5.50% 4/1/35 | 2,166 | 2,449 | ||||||
5.50% 5/1/35 | 6,978 | 7,888 | ||||||
5.50% 6/1/35 | 529,179 | 590,807 | ||||||
5.50% 8/1/35 | 160,066 | 180,243 | ||||||
5.50% 9/1/35 | 2,368 | 2,662 | ||||||
5.50% 10/1/35 | 2,234,351 | 2,515,412 | ||||||
5.50% 11/1/35 | 7,047 | 7,931 | ||||||
5.50% 12/1/35 | 452,915 | 511,276 | ||||||
5.50% 1/1/36 | 3,025,665 | 3,414,148 | ||||||
5.50% 3/1/36 | 33,577 | 37,674 | ||||||
16
Table of Contents
| Principal amount° | Value (U.S. $) | |||||||
| ||||||||
Agency Mortgage-Backed Securities (continued) | ||||||||
| ||||||||
Fannie Mae S.F. 30 yr | ||||||||
5.50% 4/1/36 | 1,982,289 | $ | 2,228,691 | |||||
5.50% 5/1/36 | 1,569,839 | 1,754,576 | ||||||
5.50% 7/1/36 | 480,775 | 542,119 | ||||||
5.50% 9/1/36 | 166,911 | 188,223 | ||||||
5.50% 11/1/36 | 1,617,121 | 1,808,867 | ||||||
5.50% 12/1/36 | 93,725 | 104,640 | ||||||
5.50% 1/1/37 | 2,810,473 | 3,152,536 | ||||||
5.50% 2/1/37 | 40,623 | 45,482 | ||||||
5.50% 3/1/37 | 1,131,842 | 1,267,547 | ||||||
5.50% 4/1/37 | 5,033,585 | 5,644,989 | ||||||
5.50% 8/1/37 | 2,404,939 | 2,713,451 | ||||||
5.50% 9/1/37 | 2,872,738 | 3,219,339 | ||||||
5.50% 11/1/37 | 28,120 | 31,395 | ||||||
5.50% 12/1/37 | 4,378 | 4,888 | ||||||
5.50% 1/1/38 | 178,134 | 199,201 | ||||||
5.50% 2/1/38 | 2,842,555 | 3,196,834 | ||||||
5.50% 3/1/38 | 1,290,308 | 1,451,481 | ||||||
5.50% 4/1/38 | 2,993,455 | 3,354,273 | ||||||
5.50% 5/1/38 | 200,298 | 224,243 | ||||||
5.50% 6/1/38 | 5,379,787 | 6,024,591 | ||||||
5.50% 7/1/38 | 35,713 | 39,872 | ||||||
5.50% 8/1/38 | 42,678 | 47,648 | ||||||
5.50% 9/1/38 | 369,594 | 416,197 | ||||||
5.50% 11/1/38 | 26,338 | 29,406 | ||||||
5.50% 12/1/38 | 528,012 | 594,652 | ||||||
5.50% 1/1/39 | 2,999,196 | 3,358,126 | ||||||
5.50% 2/1/39 | 9,627,825 | 10,848,540 | ||||||
5.50% 9/1/39 | 6,800 | 7,592 | ||||||
5.50% 10/1/39 | 2,045,314 | 2,290,197 | ||||||
5.50% 11/1/39 | 16,405 | 18,331 | ||||||
5.50% 12/1/39 | 864,699 | 972,491 | ||||||
5.50% 5/1/40 | 9,466 | 10,599 | ||||||
5.50% 6/1/40 | 6,237 | 6,984 | ||||||
5.50% 7/1/40 | 4,876,696 | 5,489,872 | ||||||
5.50% 4/1/41 | 1,250,423 | 1,406,980 | ||||||
5.50% 9/1/41 | 23,679,799 | 26,517,549 | ||||||
6.00% 7/1/27 | 6,286 | 7,189 | ||||||
6.00% 4/1/32 | 12,569 | 14,393 | ||||||
6.00% 8/1/34 | 278,843 | 318,383 | ||||||
6.00% 11/1/34 | 13,666 | 15,578 | ||||||
6.00% 12/1/34 | 2,989 | 3,403 | ||||||
6.00% 6/1/35 | 3,248 | 3,678 | ||||||
17
Table of Contents
Schedule of investments
Delaware Diversified Income Fund
| Principal amount° | Value (U.S. $) | |||||||
| ||||||||
Agency Mortgage-Backed Securities (continued) | ||||||||
| ||||||||
Fannie Mae S.F. 30 yr | ||||||||
6.00% 7/1/35 | 66,857 | $ | 76,079 | |||||
6.00% 9/1/35 | 81,839 | 93,178 | ||||||
6.00% 10/1/35 | 41,007 | 46,725 | ||||||
6.00% 11/1/35 | 24,402 | 27,931 | ||||||
6.00% 12/1/35 | 461,886 | 526,921 | ||||||
6.00% 6/1/36 | 260,126 | 295,125 | ||||||
6.00% 7/1/36 | 20,757 | 23,598 | ||||||
6.00% 8/1/36 | 174,560 | 197,959 | ||||||
6.00% 9/1/36 | 127,618 | 144,955 | ||||||
6.00% 12/1/36 | 249,718 | 284,472 | ||||||
6.00% 2/1/37 | 833,196 | 945,492 | ||||||
6.00% 3/1/37 | 25,794 | 29,227 | ||||||
6.00% 5/1/37 | 2,113,862 | 2,395,528 | ||||||
6.00% 6/1/37 | 140,357 | 160,121 | ||||||
6.00% 7/1/37 | 137,511 | 155,705 | ||||||
6.00% 8/1/37 | 1,979,782 | 2,249,133 | ||||||
6.00% 9/1/37 | 627,546 | 711,234 | ||||||
6.00% 10/1/37 | 417,376 | 473,531 | ||||||
6.00% 11/1/37 | 325,583 | 368,702 | ||||||
6.00% 1/1/38 | 1,082,818 | 1,226,388 | ||||||
6.00% 3/1/38 | 892 | 1,019 | ||||||
6.00% 5/1/38 | 3,915,383 | 4,439,944 | ||||||
6.00% 6/1/38 | 340,003 | 387,940 | ||||||
6.00% 7/1/38 | 92,640 | 104,897 | ||||||
6.00% 8/1/38 | 254,297 | 288,612 | ||||||
6.00% 9/1/38 | 719,977 | 817,131 | ||||||
6.00% 10/1/38 | 3,193,661 | 3,623,532 | ||||||
6.00% 11/1/38 | 611,598 | 695,789 | ||||||
6.00% 12/1/38 | 375,500 | 426,370 | ||||||
6.00% 1/1/39 | 1,350,737 | 1,532,044 | ||||||
6.00% 9/1/39 | 290,254 | 330,080 | ||||||
6.00% 10/1/39 | 1,546,734 | 1,767,362 | ||||||
6.00% 1/1/40 | 10,683 | 12,160 | ||||||
6.00% 3/1/40 | 1,125,886 | 1,278,616 | ||||||
6.00% 7/1/40 | 4,253,473 | 4,816,908 | ||||||
6.00% 9/1/40 | 1,027,868 | 1,166,258 | ||||||
6.00% 11/1/40 | 404,879 | 463,153 | ||||||
6.00% 5/1/41 | 10,913,544 | 12,388,209 | ||||||
6.50% 3/1/32 | 195 | 222 | ||||||
6.50% 8/1/34 | 5,099 | 5,828 | ||||||
6.50% 1/1/36 | 32,183 | 38,748 | ||||||
6.50% 2/1/36 | 907,752 | 1,038,739 | ||||||
18
Table of Contents
| Principal amount° | Value (U.S. $) | |||||||
| ||||||||
Agency Mortgage-Backed Securities (continued) | ||||||||
| ||||||||
Fannie Mae S.F. 30 yr | ||||||||
6.50% 3/1/36 | 45,760 | $ | 52,302 | |||||
6.50% 8/1/36 | 48,312 | 55,220 | ||||||
6.50% 9/1/36 | 43,489 | 49,746 | ||||||
6.50% 11/1/36 | 349,761 | 402,576 | ||||||
6.50% 3/1/37 | 5,321 | 6,081 | ||||||
6.50% 8/1/37 | 72,757 | 84,045 | ||||||
6.50% 11/1/37 | 1,267 | 1,448 | ||||||
6.50% 12/1/37 | 257,432 | 294,933 | ||||||
6.50% 10/1/38 | 32,210 | 36,866 | ||||||
6.50% 1/1/39 | 15,356 | 17,656 | ||||||
6.50% 3/1/40 | 871,324 | 996,690 | ||||||
7.00% 8/1/32 | 67,969 | 77,606 | ||||||
7.00% 9/1/32 | 37,643 | 39,840 | ||||||
7.00% 2/1/36 | 10,123 | 11,969 | ||||||
7.00% 12/1/37 | 4,437 | 4,808 | ||||||
7.50% 1/1/31 | 1,092 | 1,319 | ||||||
7.50% 3/1/32 | 13,471 | 14,986 | ||||||
7.50% 4/1/32 | 14,395 | 16,972 | ||||||
7.50% 6/1/34 | 21,443 | 25,057 | ||||||
7.50% 10/1/34 | 13,727 | 16,543 | ||||||
Fannie Mae S.F. 30 yr TBA | ||||||||
3.00% 12/1/45 | 159,878,000 | 161,206,986 | ||||||
3.00% 1/1/46 | 202,023,000 | 203,213,037 | ||||||
4.50% 1/1/46 | 1,705,000 | 1,843,278 | ||||||
Freddie Mac ARM | ||||||||
2.275% 10/1/37 ● | 47,394 | 50,006 | ||||||
2.304% 12/1/33 ● | 31,704 | 33,621 | ||||||
2.342% 12/1/33 ● | 205,686 | 219,324 | ||||||
2.344% 2/1/37 ● | 516,454 | 548,860 | ||||||
2.348% 8/1/37 ● | 6,516 | 6,906 | ||||||
2.374% 10/1/36 ● | 50,382 | 53,510 | ||||||
2.409% 5/1/35 ● | 191,388 | 202,432 | ||||||
2.439% 10/1/37 ● | 2,743 | 2,917 | ||||||
2.457% 3/1/36 ● | 64,152 | 68,495 | ||||||
2.475% 4/1/33 ● | 3,627 | 3,755 | ||||||
2.477% 7/1/36 ● | 219,393 | 233,545 | ||||||
2.513% 4/1/34 ● | 13,529 | 14,362 | ||||||
2.519% 1/1/44 ● | 3,738,836 | 3,839,704 | ||||||
2.958% 10/1/45 ● | 3,217,000 | 3,290,605 | ||||||
3.457% 5/1/42 ● | 624,683 | 656,188 | ||||||
4.852% 8/1/38 ● | 55,362 | 58,881 | ||||||
19
Table of Contents
Schedule of investments
Delaware Diversified Income Fund
| Principal amount° | Value (U.S. $) | |||||||
| ||||||||
Agency Mortgage-Backed Securities (continued) | ||||||||
| ||||||||
Freddie Mac Relocation 30 yr | ||||||||
5.00% 9/1/33 | 122,799 | $ | 133,510 | |||||
6.50% 10/1/30 | 489 | 513 | ||||||
Freddie Mac S.F. 15 yr | ||||||||
3.50% 10/1/26 | 866,269 | 919,894 | ||||||
4.00% 12/1/20 | 39,114 | 40,796 | ||||||
4.00% 6/1/24 | 37,100 | 39,556 | ||||||
4.00% 12/1/24 | 3,612 | 3,848 | ||||||
4.00% 5/1/25 | 399,995 | 426,441 | ||||||
4.00% 8/1/25 | 9,409 | 10,031 | ||||||
4.00% 11/1/26 | 1,412,575 | 1,489,567 | ||||||
4.50% 5/1/20 | 559,995 | 584,146 | ||||||
4.50% 6/1/20 | 52,201 | 54,452 | ||||||
4.50% 10/1/20 | 13,621 | 14,140 | ||||||
4.50% 9/1/24 | 53,107 | 57,444 | ||||||
4.50% 9/1/26 | 1,610,306 | 1,741,285 | ||||||
5.00% 4/1/20 | 253,862 | 267,391 | ||||||
5.50% 6/1/21 | 118,940 | 128,652 | ||||||
5.50% 7/1/21 | 86,489 | 93,501 | ||||||
6.00% 4/1/17 | 2,982 | 3,042 | ||||||
6.00% 8/1/17 | 1,282 | 1,320 | ||||||
6.50% 8/1/16 | 259 | 262 | ||||||
Freddie Mac S.F. 20 yr | ||||||||
3.50% 1/1/34 | 4,057,606 | 4,252,555 | ||||||
Freddie Mac S.F. 30 yr | ||||||||
3.00% 10/1/42 | 3,819,883 | 3,863,740 | ||||||
3.00% 11/1/42 | 4,609,299 | 4,672,396 | ||||||
3.50% 11/1/41 | 146,475 | 152,209 | ||||||
3.50% 4/1/42 | 55,119 | 57,499 | ||||||
4.50% 7/1/39 | 804,589 | 874,221 | ||||||
4.50% 10/1/39 | 1,877,426 | 2,035,199 | ||||||
4.50% 4/1/41 | 8,522,047 | 9,251,247 | ||||||
4.50% 3/1/42 | 8,169,482 | 8,900,171 | ||||||
4.50% 5/1/44 | 2,494,280 | 2,699,904 | ||||||
5.00% 3/1/34 | 78,399 | 86,703 | ||||||
5.00% 4/1/35 | 26,864 | 29,699 | ||||||
5.00% 6/1/36 | 14,315 | 15,756 | ||||||
5.50% 3/1/34 | 295,117 | 329,036 | ||||||
5.50% 12/1/34 | 281,357 | 314,064 | ||||||
5.50% 3/1/36 | 180,708 | 201,173 | ||||||
5.50% 6/1/36 | 192,609 | 213,923 | ||||||
5.50% 11/1/36 | 309,706 | 343,953 | ||||||
5.50% 12/1/36 | 86,226 | 96,029 | ||||||
20
Table of Contents
| Principal amount° | Value (U.S. $) | |||||||
| ||||||||
Agency Mortgage-Backed Securities (continued) | ||||||||
| ||||||||
Freddie Mac S.F. 30 yr | ||||||||
5.50% 1/1/37 | 20,734 | $ | 23,108 | |||||
5.50% 9/1/37 | 405,621 | 452,398 | ||||||
5.50% 11/1/37 | 16,721 | 18,652 | ||||||
5.50% 4/1/38 | 1,319,575 | 1,471,684 | ||||||
5.50% 6/1/38 | 177,219 | 197,137 | ||||||
5.50% 7/1/38 | 1,464,548 | 1,631,770 | ||||||
5.50% 6/1/39 | 1,382,884 | 1,539,289 | ||||||
5.50% 3/1/40 | 1,102,665 | 1,229,693 | ||||||
5.50% 8/1/40 | 881,751 | 983,102 | ||||||
5.50% 1/1/41 | 871,613 | 972,493 | ||||||
5.50% 6/1/41 | 10,459,409 | 11,663,706 | ||||||
6.00% 12/1/33 | 9,369 | 10,676 | ||||||
6.00% 11/1/34 | 41,262 | 46,565 | ||||||
6.00% 2/1/36 | 3,829,392 | 4,357,605 | ||||||
6.00% 3/1/36 | 966,961 | 1,093,057 | ||||||
6.00% 4/1/36 | 17,677 | 20,134 | ||||||
6.00% 10/1/36 | 19,248 | 21,925 | ||||||
6.00% 4/1/37 | 28,602 | 32,480 | ||||||
6.00% 8/1/37 | 19,130 | 21,720 | ||||||
6.00% 10/1/37 | 12,298 | 13,946 | ||||||
6.00% 6/1/38 | 11,200 | 12,684 | ||||||
6.00% 7/1/38 | 10,083 | 11,376 | ||||||
6.00% 8/1/38 | 3,651,470 | 4,181,216 | ||||||
6.00% 10/1/38 | 104,495 | 120,009 | ||||||
6.00% 5/1/40 | 2,077,200 | 2,368,768 | ||||||
6.00% 7/1/40 | 3,462,511 | 3,906,614 | ||||||
6.50% 10/1/32 | 1,081 | 1,239 | ||||||
6.50% 6/1/37 | 6,981 | 7,986 | ||||||
6.50% 8/1/38 | 288,888 | 330,156 | ||||||
6.50% 4/1/39 | 499,839 | 571,242 | ||||||
7.00% 11/1/33 | 153,669 | 183,151 | ||||||
GNMA I S.F. 30 yr | ||||||||
5.00% 6/15/40 | 541,091 | 598,958 | ||||||
7.00% 12/15/34 | 1,857,131 | 2,222,365 | ||||||
7.50% 2/15/32 | 1,592 | 1,955 | ||||||
|
| |||||||
Total Agency Mortgage-Backed Securities (cost $961,273,555) | 966,987,988 | |||||||
|
| |||||||
| ||||||||
Collateralized Debt Obligations – 1.13% | ||||||||
| ||||||||
Avery Point III CLO | ||||||||
Series 2013-3A A 144A 1.715% 1/18/25 #● | 5,500,000 | 5,404,300 | ||||||
Benefit Street Partners CLO IV | ||||||||
Series 2014-IVA A1A 144A 1.807% 7/20/26 #● | 14,000,000 | 13,872,600 | ||||||
21
Table of Contents
Schedule of investments
Delaware Diversified Income Fund
| Principal amount° | Value (U.S. $) | |||||||
| ||||||||
Collateralized Debt Obligations (continued) | ||||||||
| ||||||||
Cent CLO 21 | ||||||||
Series 2014-21A A1B 144A 1.713% 7/27/26 #● | 5,500,000 | $ | 5,421,350 | |||||
CIFC Funding | ||||||||
Series 2013-2A A1L 144A 1.465% 4/21/25 #● | 10,000,000 | 9,804,000 | ||||||
Magnetite IX | ||||||||
Series 2014-9A A1 144A 1.74% 7/25/26 #● | 13,880,000 | 13,717,604 | ||||||
Neuberger Berman CLO XVII | ||||||||
Series 2014-17A A 144A 1.779% 8/4/25 #● | 5,120,000 | 5,071,360 | ||||||
Neuberger Berman CLO XIX | ||||||||
Series 2015-19A A1 144A 1.718% 7/15/27 #● | 8,000,000 | 7,881,600 | ||||||
|
| |||||||
Total Collateralized Debt Obligations (cost $61,939,409) | 61,172,814 | |||||||
|
| |||||||
| ||||||||
Commercial Mortgage-Backed Securities – 5.89% | ||||||||
| ||||||||
Banc of America Commercial Mortgage Trust | ||||||||
Series 2006-1 AM 5.421% 9/10/45 ● | 1,374,000 | 1,375,902 | ||||||
Series 2006-4 A4 5.634% 7/10/46 | 510,378 | 516,792 | ||||||
Series 2007-4 AM 5.809% 2/10/51 ● | 3,670,000 | 3,896,972 | ||||||
Bear Stearns Commercial Mortgage Securities Trust | ||||||||
Series 2007-PW18 A4 5.70% 6/11/50 | 3,140,000 | 3,302,173 | ||||||
CD Commercial Mortgage Trust | ||||||||
Series 2005-CD1 AJ 5.255% 7/15/44 ● | 357,237 | 357,079 | ||||||
Series 2005-CD1 C 5.255% 7/15/44 ● | 1,620,000 | 1,619,025 | ||||||
CFCRE Commercial Mortgage Trust | ||||||||
Series 2011-C1 A2 144A 3.759% 4/15/44 # | 1,344,012 | 1,352,073 | ||||||
Citigroup Commercial Mortgage Trust | ||||||||
Series 2007-C6 AM 5.711% 12/10/49 ● | 2,950,000 | 3,067,193 | ||||||
Series 2014-GC25 A4 3.635% 10/10/47 | 5,655,000 | 5,853,242 | ||||||
Series 2015-GC27 A5 3.137% 2/10/48 | 2,125,000 | 2,109,855 | ||||||
COMM Mortgage Trust | ||||||||
Series 2014-CR19 A5 3.796% 8/10/47 | 4,110,000 | 4,315,568 | ||||||
Series 2014-CR20 A4 3.59% 11/10/47 | 2,305,000 | 2,383,136 | ||||||
Series 2014-CR20 AM 3.938% 11/10/47 | 10,325,000 | 10,812,637 | ||||||
Series 2014-CR21 A3 3.528% 12/10/47 | 1,628,000 | 1,674,719 | ||||||
Series 2015-3BP A 144A 3.178% 2/10/35 # | 9,890,000 | 9,870,836 | ||||||
Series 2015-CR23 A4 3.497% 5/10/48 | 6,000,000 | 6,160,414 | ||||||
Commercial Mortgage Trust | ||||||||
Series 2007-GG9 AM 5.475% 3/10/39 | 3,375,000 | 3,491,792 | ||||||
DB-UBS Mortgage Trust | ||||||||
Series 2011-LC1A A3 144A 5.002% 11/10/46 # | 4,494,000 | 5,041,618 | ||||||
Series 2011-LC1A C 144A 5.607% 11/10/46 #● | 5,320,000 | 5,936,066 | ||||||
Freddie Mac Multifamily Structured Pass Through Certificates | ||||||||
Series K038 A2 3.389% 3/25/24 ¿ | 6,760,000 | 7,144,741 | ||||||
22
Table of Contents
| Principal amount° | Value (U.S. $) | |||||||
| ||||||||
Commercial Mortgage-Backed Securities (continued) | ||||||||
| ||||||||
FREMF Mortgage Trust | ||||||||
Series 2011-K10 B 144A 4.63% 11/25/49 #● | 3,345,000 | $ | 3,558,880 | |||||
Series 2011-K15 B 144A 4.948% 8/25/44 #● | 485,000 | 534,439 | ||||||
Series 2012-K18 B 144A 4.265% 1/25/45 #● | 2,450,000 | 2,608,740 | ||||||
Series 2012-K19 B 144A 4.036% 5/25/45 #● | 1,130,963 | 1,197,967 | ||||||
Series 2012-K22 B 144A 3.687% 8/25/45 #● | 4,285,000 | 4,357,636 | ||||||
Series 2012-K22 C 144A 3.687% 8/25/45 #● | 3,450,000 | 3,472,680 | ||||||
Series 2012-K707 B 144A 3.883% 1/25/47 #● | 1,715,000 | 1,766,149 | ||||||
Series 2012-K708 B 144A 3.754% 2/25/45 #● | 7,330,000 | 7,609,156 | ||||||
Series 2012-K708 C 144A 3.754% 2/25/45 #● | 1,380,000 | 1,406,548 | ||||||
Series 2012-K711 B 144A 3.562% 8/25/45 #● | 4,740,000 | 4,880,705 | ||||||
Series 2013-K25 C 144A 3.618% 11/25/45 #● | 3,480,000 | 3,358,930 | ||||||
Series 2013-K26 C 144A 3.599% 12/25/45 #● | 2,150,000 | 2,090,782 | ||||||
Series 2013-K30 C 144A 3.556% 6/25/45 #● | 3,895,000 | 3,820,499 | ||||||
Series 2013-K31 C 144A 3.627% 7/25/46 #● | 7,355,000 | 7,289,870 | ||||||
Series 2013-K33 B 144A 3.503% 8/25/46 #● | 3,285,000 | 3,211,646 | ||||||
Series 2013-K33 C 144A 3.503% 8/25/46 #● | 1,050,000 | 1,006,306 | ||||||
Series 2013-K712 B 144A 3.371% 5/25/45 #● | 10,101,068 | 10,341,406 | ||||||
Series 2013-K713 B 144A 3.165% 4/25/46 #● | 6,160,000 | 6,253,758 | ||||||
Series 2013-K713 C 144A 3.165% 4/25/46 #● | 5,465,000 | 5,426,206 | ||||||
Series 2014-K716 C 144A 3.954% 8/25/47 #● | 2,755,000 | 2,811,341 | ||||||
Series 2015-K47 B 144A 3.60% 6/25/48 #● | 2,840,000 | 2,555,397 | ||||||
GE Capital Commercial Mortgage | ||||||||
Series 2005-C4 A4 5.385% 11/10/45 ● | 5,090 | 5,084 | ||||||
GRACE Mortgage Trust | ||||||||
Series 2014-GRCE A 144A 3.369% 6/10/28 # | 21,810,000 | 22,657,835 | ||||||
GS Mortgage Securities Trust | ||||||||
Series 2006-GG6 A4 5.553% 4/10/38 ● | 198,258 | 198,062 | ||||||
Series 2010-C1 A2 144A 4.592% 8/10/43 # | 9,975,000 | 10,866,943 | ||||||
Series 2010-C1 C 144A 5.635% 8/10/43 #● | 4,765,000 | 5,248,310 | ||||||
Series 2015-GC32 A4 3.764% 7/10/48 | 2,336,000 | 2,438,953 | ||||||
Hilton USA Trust | ||||||||
Series 2013-HLT AFX 144A 2.662% 11/5/30 # | 1,930,000 | 1,932,076 | ||||||
Series 2013-HLT BFX 144A 3.367% 11/5/30 # | 9,470,000 | 9,483,017 | ||||||
Houston Galleria Mall Trust | ||||||||
Series 2015-HGLR A1A2 144A 3.087% 3/5/37 # | 8,510,000 | 8,277,428 | ||||||
JPMBB Commercial Mortgage Securities Trust | ||||||||
Series 2014-C18 A1 1.254% 2/15/47 | 2,577,376 | 2,572,334 | ||||||
Series 2014-C22 B 4.561% 9/15/47 ● | 1,625,000 | 1,677,679 | ||||||
JPMorgan Chase Commercial Mortgage Securities Trust | ||||||||
Series 2005-CB11 E 5.507% 8/12/37 ● | 1,765,000 | 1,918,327 | ||||||
Series 2005-LDP4 AJ 5.04% 10/15/42 ● | 1,930,237 | 1,929,736 | ||||||
Series 2005-LDP5 D 5.546% 12/15/44 ● | 2,895,000 | 2,888,359 | ||||||
23
Table of Contents
Schedule of investments
Delaware Diversified Income Fund
| Principal amount° | Value (U.S. $) | |||||||
| ||||||||
Commercial Mortgage-Backed Securities (continued) | ||||||||
| ||||||||
JPMorgan Chase Commercial Mortgage Securities Trust | ||||||||
Series 2006-LDP8 AM 5.44% 5/15/45 | 12,218,000 | $ | 12,517,194 | |||||
Series 2011-C5 C 144A 5.323% 8/15/46 #● | 3,780,000 | 4,074,378 | ||||||
LB-UBS Commercial Mortgage Trust | ||||||||
Series 2004-C1 A4 4.568% 1/15/31 | 328,057 | 330,101 | ||||||
Series 2006-C6 AJ 5.452% 9/15/39 ● | 6,325,000 | 6,511,637 | ||||||
Series 2006-C6 AM 5.413% 9/15/39 | 5,285,000 | 5,448,874 | ||||||
Morgan Stanley Bank of America Merrill Lynch Trust | ||||||||
Series 2014-C19 AS 3.832% 12/15/47 | 1,513,000 | 1,551,807 | ||||||
Series 2015-C22 A3 3.046% 4/15/48 | 2,920,000 | 2,857,574 | ||||||
Series 2015-C23 A4 3.719% 7/15/50 | 9,640,000 | 10,018,645 | ||||||
Series 2015-C26 A5 3.531% 11/15/48 | 5,655,000 | 5,824,502 | ||||||
Morgan Stanley Capital I Trust | ||||||||
Series 2005-HQ7 AJ 5.239% 11/14/42 ● | 1,531,078 | 1,531,140 | ||||||
Series 2005-HQ7 C 5.239% 11/14/42 ● | 5,840,000 | 5,833,049 | ||||||
Series 2006-HQ10 B 5.448% 11/12/41 ● | 2,584,000 | 2,466,551 | ||||||
Series 2006-TOP21 B 144A 5.308% 10/12/52 #● | 2,000,000 | 1,996,821 | ||||||
Series 2006-TOP23 A4 5.843% 8/12/41 ● | 3,045,147 | 3,096,181 | ||||||
TimberStar Trust I | ||||||||
Series 2006-1A A 144A 5.668% 10/15/36 # | 7,090,000 | 7,328,587 | ||||||
Series 2006-1A C 144A 5.884% 10/15/36 # | 4,500,000 | 4,624,088 | ||||||
Wells Fargo Commercial Mortgage Trust | ||||||||
Series 2012-LC5 A3 2.918% 10/15/45 | 4,105,000 | 4,151,840 | ||||||
Series 2015-NXS3 A4 3.617% 9/15/57 | 3,730,000 | 3,838,602 | ||||||
WF-RBS Commercial Mortgage Trust | ||||||||
Series 2014-C23 A5 3.917% 10/15/57 | 1,430,000 | 1,512,617 | ||||||
|
| |||||||
Total Commercial Mortgage-Backed Securities (cost $320,343,927) | 317,449,205 | |||||||
|
| |||||||
| ||||||||
Convertible Bonds – 1.49% | ||||||||
| ||||||||
Abengoa 144A 5.125% exercise price $37.29, expiration date 2/23/17 #* | 2,800,000 | 1,450,750 | ||||||
Alaska Communications Systems Group 6.25% exercise price $10.28, expiration date 4/27/18 @ | 4,024,000 | 4,051,665 | ||||||
Ares Capital 5.75% exercise price $18.36, expiration date 2/1/16 | 924,000 | 932,085 | ||||||
BGC Partners 4.50% exercise price $9.84, expiration date 7/13/16 | 2,794,000 | 2,942,431 | ||||||
BioMarin Pharmaceutical 1.50% exercise price $94.15, expiration date 10/13/20 | 1,763,000 | 2,567,369 | ||||||
Blackstone Mortgage Trust 5.25% exercise price $28.66, expiration date 12/1/18 * | 3,590,000 | 3,767,256 | ||||||
Blucora 4.25% exercise price $21.66, expiration date 3/29/19 | 845,000 | 766,837 | ||||||
24
Table of Contents
| Principal amount° | Value (U.S. $) | |||||||
| ||||||||
Convertible Bonds (continued) | ||||||||
| ||||||||
Campus Crest Communities Operating Partnership 144A 5.00% exercise price $12.56, expiration date 10/11/18 # | 3,054,000 | $ | 3,044,456 | |||||
Cardtronics 1.00% exercise price $52.35, expiration date 11/27/20 * | 2,770,000 | 2,638,425 | ||||||
Cemex 3.72% exercise price $11.90, expiration date 3/15/20 | 2,027,000 | 1,816,699 | ||||||
Chart Industries 2.00% exercise price $69.03, expiration date 7/30/18 *@ | 3,081,000 | 2,703,577 | ||||||
Chesapeake Energy 2.25% exercise price $80.28, expiration date 12/14/38 | 1,000,000 | 720,000 | ||||||
Ciena 144A 3.75% exercise price $20.17, expiration date 10/15/18 # | 1,864,000 | 2,569,990 | ||||||
GAIN Capital Holdings 4.125% exercise price $12.00, expiration date 11/30/18 @ | 1,667,000 | 1,600,320 | ||||||
General Cable 4.50% exercise price $33.77, expiration date 11/15/29 @f | 3,050,000 | 2,094,969 | ||||||
Gilead Sciences 1.625% exercise price $22.53, expiration date 4/29/16 | 757,000 | 3,616,098 | ||||||
HealthSouth 2.00% exercise price $38.08, expiration date 11/30/43 | 1,915,000 | 2,095,728 | ||||||
Helix Energy Solutions Group 3.25% exercise price $25.02, expiration date 3/12/32 | 2,154,000 | 1,795,897 | ||||||
Hologic 2.00% exercise price $31.17, expiration date 2/27/42 f | 689,000 | 927,997 | ||||||
inContact 144A 2.50% exercise price $14.23, expiration date 4/1/22 # | 2,569,000 | 2,353,846 | ||||||
Infinera 1.75% exercise price $12.58, expiration date 5/30/18 | 651,000 | 1,075,777 | ||||||
Jefferies Group 3.875% exercise price $44.69, expiration date 10/31/29 | 2,086,000 | 2,140,758 | ||||||
Liberty Interactive 144A 1.00% exercise price $64.26, expiration date 9/28/43 # | 2,422,000 | 2,241,864 | ||||||
Meritor 4.00% exercise price $26.73, expiration date 2/12/27 f | 2,851,000 | 2,817,144 | ||||||
Microchip Technology 144A 1.625% exercise price $67.13, expiration date 2/13/25 # | 1,248,000 | 1,300,260 | ||||||
New Mountain Finance 5.00% exercise price $15.93, expiration date 6/14/19 | 479,000 | 480,497 | ||||||
Novellus Systems 2.625% exercise price $34.51, expiration date 5/14/41 | 1,581,000 | 3,607,644 | ||||||
NuVasive 2.75% exercise price $42.13, expiration date 6/30/17 | 2,618,000 | 3,300,316 | ||||||
NXP Semiconductors 144A 1.00% exercise price $102.84, expiration date 11/27/19 # | 1,530,000 | 1,646,663 | ||||||
25
Table of Contents
Schedule of investments
Delaware Diversified Income Fund
| Principal amount° | Value (U.S. $) | |||||||
| ||||||||
Convertible Bonds (continued) | ||||||||
| ||||||||
PROS Holdings 144A 2.00% exercise price $33.79, expiration date 11/27/19 # | 2,587,000 | $ | 2,595,084 | |||||
Spectrum Pharmaceuticals 2.75% exercise price $10.53, expiration date 12/13/18 *@ | 2,004,000 | 1,683,360 | ||||||
Spirit Realty Capital 3.75% exercise price $13.10, expiration date 5/13/21 @ | 3,171,000 | 3,046,158 | ||||||
SunEdison 144A 3.375% exercise price $38.65, expiration date 5/30/25 # | 1,777,000 | 832,969 | ||||||
Titan Machinery 3.75% exercise price $43.17, expiration date 4/30/19 *@ | 525,000 | 398,672 | ||||||
TPG Specialty Lending 4.50% exercise price $25.83, expiration date 12/15/19 @ | 2,258,000 | 2,243,888 | ||||||
Vector Group 1.75% exercise price $24.64, expiration date 4/15/20 ● | 2,229,000 | 2,575,888 | ||||||
Vector Group 2.50% exercise price $15.98, expiration date 1/14/19 *● | 978,000 | 1,534,177 | ||||||
VEREIT 3.75% exercise price $15.15, expiration date 12/14/20 *@ | 2,502,000 | 2,342,510 | ||||||
|
| |||||||
Total Convertible Bonds (cost $78,575,169) | 80,320,024 | |||||||
|
| |||||||
| ||||||||
Corporate Bonds – 38.61% | ||||||||
| ||||||||
Automotive – 0.35% | ||||||||
American Axle & Manufacturing 6.25% 3/15/21 | 2,815,000 | 2,959,269 | ||||||
Ford Motor 7.45% 7/16/31 | 9,269,000 | 11,926,941 | ||||||
Lear 5.25% 1/15/25 | 2,725,000 | 2,793,125 | ||||||
Meritor 6.75% 6/15/21 | 1,195,000 | 1,186,038 | ||||||
|
| |||||||
| 18,865,373 | ||||||||
|
| |||||||
Banking – 5.31% | ||||||||
Akbank 144A 4.00% 1/24/20 #* | 2,870,000 | 2,822,570 | ||||||
ANZ New Zealand International 144A 2.60% 9/23/19 # | 1,300,000 | 1,313,260 | ||||||
Banco Bilbao Vizcaya Argentaria Colombia 144A 4.875% 4/21/25 # | 5,300,000 | 5,194,000 | ||||||
Banco Nacional de Comercio Exterior SNC 144A 4.375% 10/14/25 # | 5,540,000 | 5,581,550 | ||||||
Bank of America | ||||||||
3.875% 8/1/25 | 830,000 | 846,156 | ||||||
3.95% 4/21/25 | 21,375,000 | 21,073,570 | ||||||
BBVA Bancomer | ||||||||
144A 6.50% 3/10/21 # | 5,255,000 | 5,851,180 | ||||||
144A 7.25% 4/22/20 # | 935,000 | 1,042,600 | ||||||
Branch Banking & Trust 3.625% 9/16/25 | 7,335,000 | 7,410,044 | ||||||
Citigroup 4.45% 9/29/27 | 3,800,000 | 3,805,297 | ||||||
City National 5.25% 9/15/20 | 5,680,000 | 6,402,178 | ||||||
Compass Bank 3.875% 4/10/25 | 5,505,000 | 5,136,347 | ||||||
26
Table of Contents
Principal amount° | Value (U.S. $) | |||||||||||
| ||||||||||||
Corporate Bonds (continued) | ||||||||||||
| ||||||||||||
Banking (continued) | ||||||||||||
Cooperatieve Centrale Raiffeisen-Boerenleenbank | ||||||||||||
2.50% 9/4/20 | NOK | 8,100,000 | $ | 996,823 | ||||||||
4.25% 1/13/22 | AUD | 1,469,000 | 1,089,504 | |||||||||
Credit Suisse Group Funding Guernsey 144A | ||||||||||||
3.75% 3/26/25 # | 4,525,000 | 4,432,663 | ||||||||||
Export-Import Bank of Korea | ||||||||||||
144A 2.711% 12/5/19 # | CAD | 790,000 | 621,470 | |||||||||
144A 3.00% 5/22/18 # | NOK | 1,400,000 | 169,965 | |||||||||
Fifth Third Bancorp 2.875% 7/27/20 | 2,295,000 | 2,313,140 | ||||||||||
Finnvera 144A 2.375% 6/4/25 # | 8,215,000 | 8,083,683 | ||||||||||
Goldman Sachs Group | ||||||||||||
3.435% 8/21/19 ● | AUD | 2,390,000 | 1,707,364 | |||||||||
3.55% 2/12/21 | CAD | 1,500,000 | 1,204,221 | |||||||||
5.20% 12/17/19 | NZD | 5,549,000 | 3,919,425 | |||||||||
HSBC USA 2.75% 8/7/20 | 5,010,000 | 5,048,707 | ||||||||||
Industrial & Commercial Bank of China 144A | ||||||||||||
4.875% 9/21/25 #* | 5,900,000 | 5,980,399 | ||||||||||
ING Groep | ||||||||||||
6.00% 12/29/49 *● | 1,845,000 | 1,815,019 | ||||||||||
6.50% 12/29/49 ● | 5,460,000 | 5,279,138 | ||||||||||
JPMorgan Chase | ||||||||||||
0.953% 1/28/19 ● | 2,985,000 | 2,956,529 | ||||||||||
1.50% 1/27/25 | EUR | 6,198,000 | 6,724,605 | |||||||||
3.50% 12/18/26 | GBP | 986,000 | 1,549,252 | |||||||||
4.25% 11/2/18 | NZD | 5,735,000 | 3,949,028 | |||||||||
KeyBank 6.95% 2/1/28 | 17,740,000 | 22,455,789 | ||||||||||
Lloyds Banking Group 7.50% 4/30/49 *● | 4,125,000 | 4,393,125 | ||||||||||
Morgan Stanley | ||||||||||||
1.17% 1/24/19 ● | 3,119,000 | 3,108,068 | ||||||||||
3.125% 8/5/21 | CAD | 999,000 | 782,317 | |||||||||
3.95% 4/23/27 | 1,095,000 | 1,067,542 | ||||||||||
5.00% 9/30/21 | AUD | 1,489,000 | 1,125,867 | |||||||||
MUFG Americas Holdings 3.00% 2/10/25 | 9,295,000 | 8,889,022 | ||||||||||
Nordea Bank 144A 6.125% 12/29/49 #● | 4,481,000 | 4,441,791 | ||||||||||
PNC Bank | ||||||||||||
1.85% 7/20/18 | 4,630,000 | 4,642,607 | ||||||||||
2.30% 6/1/20 | 8,920,000 | 8,894,846 | ||||||||||
2.60% 7/21/20 | 4,635,000 | 4,688,715 | ||||||||||
3.30% 10/30/24 | 5,290,000 | 5,302,654 | ||||||||||
Santander UK 144A 5.00% 11/7/23 # | 6,830,000 | 7,134,755 | ||||||||||
Santander UK Group Holdings | ||||||||||||
2.875% 10/16/20 | 2,465,000 | 2,468,624 | ||||||||||
27
Table of Contents
Schedule of investments
Delaware Diversified Income Fund
| Principal amount° | Value (U.S. $) | |||||||||||
| ||||||||||||
Corporate Bonds (continued) | ||||||||||||
| ||||||||||||
Banking (continued) | ||||||||||||
Santander UK Group Holdings | ||||||||||||
144A 4.75% 9/15/25 # | 3,050,000 | $ | 3,051,257 | |||||||||
State Street | ||||||||||||
2.55% 8/18/20 | 5,230,000 | 5,287,389 | ||||||||||
3.55% 8/18/25 | 6,620,000 | 6,805,115 | ||||||||||
Trade & Development Bank of Mongolia 144A | ||||||||||||
9.375% 5/19/20 # | 3,300,000 | 3,308,960 | ||||||||||
Turkiye Garanti Bankasi 144A 4.75% 10/17/19 # | 6,858,000 | 6,932,546 | ||||||||||
UBS Group Funding Jersey 144A 4.125% 9/24/25 # | 6,205,000 | 6,244,979 | ||||||||||
USB Capital IX 3.50% 10/29/49 @● | 27,182,000 | 21,637,171 | ||||||||||
Wells Fargo | ||||||||||||
3.50% 9/12/29 | GBP | 1,700,000 | 2,636,427 | |||||||||
4.30% 7/22/27 | 7,420,000 | 7,667,568 | ||||||||||
4.75% 8/27/24 * | AUD | 2,090,000 | 1,586,366 | |||||||||
Woori Bank | ||||||||||||
144A 2.875% 10/2/18 # | 7,180,000 | 7,353,375 | ||||||||||
144A 4.75% 4/30/24 #* | 4,300,000 | 4,443,814 | ||||||||||
Zions Bancorporation 4.50% 6/13/23 | 5,380,000 | 5,560,741 | ||||||||||
|
| |||||||||||
| 286,231,117 | ||||||||||||
|
| |||||||||||
Basic Industry – 3.25% | ||||||||||||
ArcelorMittal 10.60% 6/1/19 | 12,195,000 | 13,536,450 | ||||||||||
Ball 5.25% 7/1/25 | 2,070,000 | 2,111,400 | ||||||||||
BHP Billiton Finance 3.25% 9/25/24 | GBP | 812,000 | 1,241,643 | |||||||||
CF Industries | ||||||||||||
6.875% 5/1/18 | 18,389,000 | 20,362,434 | ||||||||||
7.125% 5/1/20 | 2,841,000 | 3,313,720 | ||||||||||
Chemours 144A 7.00% 5/15/25 #* | 5,623,000 | 4,203,193 | ||||||||||
Corp Nacional del Cobre de Chile 144A 4.50% 9/16/25 #* | 6,005,000 | 5,972,693 | ||||||||||
Dow Chemical 8.55% 5/15/19 | 33,171,000 | 39,924,582 | ||||||||||
Georgia-Pacific 8.00% 1/15/24 | 16,386,000 | 21,033,315 | ||||||||||
Gerdau Holdings 144A 7.00% 1/20/20 #* | 2,400,000 | 2,399,640 | ||||||||||
Grace (W.R.) 144A 5.125% 10/1/21 # | 740,000 | 771,450 | ||||||||||
GTL Trade Finance 144A 5.893% 4/29/24 # | 2,730,000 | 2,301,936 | ||||||||||
HD Supply 7.50% 7/15/20 | 2,684,000 | 2,871,880 | ||||||||||
INVISTA Finance 144A 4.25% 10/15/19 # | 6,085,000 | 5,978,513 | ||||||||||
Joseph T Ryerson & Son | ||||||||||||
9.00% 10/15/17 | 596,000 | 521,500 | ||||||||||
11.25% 10/15/18 *@ | 1,060,000 | 927,500 | ||||||||||
Lundin Mining 144A 7.50% 11/1/20 # | 2,945,000 | 2,981,813 | ||||||||||
Methanex 4.25% 12/1/24 * | 7,185,000 | 6,832,597 | ||||||||||
Mexichem | ||||||||||||
144A 5.875% 9/17/44 # | 1,700,000 | 1,527,875 | ||||||||||
28
Table of Contents
| Principal amount° | Value (U.S. $) | |||||||
| ||||||||
Corporate Bonds (continued) | ||||||||
| ||||||||
Basic Industry (continued) | ||||||||
Mexichem | ||||||||
144A 6.75% 9/19/42 # | 1,915,000 | $ | 1,931,756 | |||||
MMC Norilsk Nickel | ||||||||
144A 5.55% 10/28/20 # | 2,706,000 | 2,731,090 | ||||||
144A 6.625% 10/14/22 # | 2,900,000 | 2,976,125 | ||||||
New Gold 144A 6.25% 11/15/22 # | 371,000 | 319,988 | ||||||
NOVA Chemicals 144A 5.00% 5/1/25 # | 6,493,000 | 6,509,233 | ||||||
OCP | ||||||||
144A 4.50% 10/22/25 # | 5,635,000 | 5,418,633 | ||||||
144A 6.875% 4/25/44 # | 3,925,000 | 4,091,813 | ||||||
Phosagro 144A 4.204% 2/13/18 # | 3,922,000 | 3,924,451 | ||||||
PolyOne 5.25% 3/15/23 | 2,470,000 | 2,488,525 | ||||||
PPG Industries 2.30% 11/15/19 | 4,430,000 | 4,423,940 | ||||||
Tronox Finance 144A 7.50% 3/15/22 # | 2,081,000 | 1,477,510 | ||||||
|
| |||||||
| 175,107,198 | ||||||||
|
| |||||||
Brokerage – 0.41% | ||||||||
Jefferies Group | ||||||||
5.125% 1/20/23 | 1,420,000 | 1,423,262 | ||||||
6.45% 6/8/27 | 3,815,000 | 3,994,732 | ||||||
6.50% 1/20/43 | 2,455,000 | 2,410,375 | ||||||
Lazard Group 3.75% 2/13/25 | 15,330,000 | 14,372,120 | ||||||
|
| |||||||
| 22,200,489 | ||||||||
|
| |||||||
Capital Goods – 0.79% | ||||||||
BWAY Holding 144A 9.125% 8/15/21 # | 3,890,000 | 3,802,475 | ||||||
Cemex | ||||||||
144A 6.50% 12/10/19 # | 3,405,000 | 3,464,587 | ||||||
144A 7.25% 1/15/21 # | 2,375,000 | 2,440,313 | ||||||
Cemex Finance 144A 9.375% 10/12/22 # | 3,240,000 | 3,539,700 | ||||||
Embraer Netherlands Finance 5.05% 6/15/25 | 3,915,000 | 3,758,400 | ||||||
Fortune Brands Home & Security 3.00% 6/15/20 | 3,100,000 | 3,116,743 | ||||||
Masco 4.45% 4/1/25 | 3,460,000 | 3,477,300 | ||||||
Milacron 144A 7.75% 2/15/21 # | 1,730,000 | 1,781,900 | ||||||
Owens-Brockway Glass Container 144A | ||||||||
5.875% 8/15/23 #* | 1,395,000 | 1,483,059 | ||||||
Rolls-Royce 144A 3.625% 10/14/25 # | 9,585,000 | 9,727,232 | ||||||
TransDigm 6.00% 7/15/22 | 1,880,000 | 1,908,200 | ||||||
Union Andina de Cementos 144A 5.875% 10/30/21 # | 3,980,000 | 3,994,925 | ||||||
|
| |||||||
| 42,494,834 | ||||||||
|
| |||||||
Communications – 6.14% | ||||||||
21st Century Fox America | ||||||||
144A 3.70% 10/15/25 # | 4,455,000 | 4,464,676 | ||||||
144A 4.95% 10/15/45 # | 4,125,000 | 4,237,212 | ||||||
29
Table of Contents
Schedule of investments
Delaware Diversified Income Fund
| Principal amount° | Value (U.S. $) | |||||||||||
| ||||||||||||
Corporate Bonds (continued) | ||||||||||||
| ||||||||||||
Communications (continued) | ||||||||||||
Altice US Finance I 144A 5.375% 7/15/23 # | 3,025,000 | $ | 3,068,863 | |||||||||
America Movil 5.00% 3/30/20 | 2,365,000 | 2,608,167 | ||||||||||
American Tower Trust I 144A 3.07% 3/15/23 # | 10,235,000 | 10,018,500 | ||||||||||
AT&T | ||||||||||||
4.50% 5/15/35 | 3,420,000 | 3,209,041 | ||||||||||
4.75% 5/15/46 | 8,785,000 | 8,097,135 | ||||||||||
Bell Canada 3.35% 3/22/23 | CAD | 2,132,000 | 1,642,636 | |||||||||
Bharti Airtel 144A 4.375% 6/10/25 # | 3,710,000 | 3,739,955 | ||||||||||
Bharti Airtel International Netherlands 144A | ||||||||||||
5.35% 5/20/24 # | 1,080,000 | 1,164,249 | ||||||||||
CBS 4.00% 1/15/26 | 3,020,000 | 3,018,381 | ||||||||||
CC Holdings GS V 3.849% 4/15/23 | 4,980,000 | 4,932,884 | ||||||||||
CCO Holdings | ||||||||||||
144A 5.125% 5/1/23 # | 2,785,000 | 2,798,925 | ||||||||||
5.25% 9/30/22 | 1,423,000 | 1,444,923 | ||||||||||
CCO Safari II 144A 4.908% 7/23/25 # | 10,896,000 | 11,092,281 | ||||||||||
CenturyLink | ||||||||||||
5.80% 3/15/22 | 8,005,000 | 7,814,881 | ||||||||||
6.75% 12/1/23 | 3,240,000 | 3,227,526 | ||||||||||
Cequel Communications Holdings I 144A | ||||||||||||
6.375% 9/15/20 # | 3,245,000 | 3,261,225 | ||||||||||
Colombia Telecomunicaciones 144A 5.375% 9/27/22 # | 4,885,000 | 4,372,075 | ||||||||||
Columbus International 144A 7.375% 3/30/21 # | 6,245,000 | 6,518,219 | ||||||||||
Crown Castle Towers 144A 4.883% 8/15/20 # | 25,785,000 | 27,924,278 | ||||||||||
CSC Holdings 5.25% 6/1/24 | 8,968,000 | 7,909,686 | ||||||||||
Deutsche Telekom International Finance 6.50% 4/8/22 | GBP | 1,270,000 | 2,375,493 | |||||||||
Digicel Group 144A 8.25% 9/30/20 # | 9,974,000 | 8,876,860 | ||||||||||
DISH DBS 5.00% 3/15/23 | 3,215,000 | 2,981,913 | ||||||||||
Equinix 5.375% 4/1/23 | 6,550,000 | 6,844,750 | ||||||||||
Frontier Communications 144A 8.875% 9/15/20 # | 6,725,000 | 6,998,169 | ||||||||||
Gray Television 7.50% 10/1/20 | 4,780,000 | 5,006,811 | ||||||||||
Grupo Televisa 5.00% 5/13/45 | 2,370,000 | 2,149,291 | ||||||||||
GTP Acquisition Partners I 144A 2.35% 6/15/20 # | 2,605,000 | 2,578,195 | ||||||||||
Hughes Satellite Systems 7.625% 6/15/21 | 2,419,000 | 2,645,781 | ||||||||||
Intelsat Jackson Holdings 6.625% 12/15/22 * | 965,000 | 767,175 | ||||||||||
Intelsat Luxembourg | ||||||||||||
6.75% 6/1/18 * | 200,000 | 178,500 | ||||||||||
7.75% 6/1/21 | 2,465,000 | 1,466,675 | ||||||||||
8.125% 6/1/23 @ | 9,126,000 | 5,452,785 | ||||||||||
Level 3 Financing 144A 5.375% 5/1/25 # | 4,135,000 | 4,160,844 | ||||||||||
Millicom International Cellular | ||||||||||||
144A 6.00% 3/15/25 #* | 4,635,000 | 3,835,463 | ||||||||||
30
Table of Contents
| Principal amount° | Value (U.S. $) | |||||||||||
| ||||||||||||
Corporate Bonds (continued) | ||||||||||||
| ||||||||||||
Communications (continued) | ||||||||||||
Millicom International Cellular | ||||||||||||
144A 6.625% 10/15/21 #* | 4,645,000 | $ | 4,087,600 | |||||||||
MTN Mauritius Investments 144A 4.755% 11/11/24 # | 3,645,000 | 3,363,242 | ||||||||||
MTS International Funding | ||||||||||||
144A 5.00% 5/30/23 # | 3,175,000 | 2,956,719 | ||||||||||
144A 8.625% 6/22/20 # | 2,300,000 | 2,559,339 | ||||||||||
Myriad International Holdings 144A 5.50% 7/21/25 # | 6,745,000 | 6,626,868 | ||||||||||
Neptune Finco 144A 6.625% 10/15/25 # | 1,100,000 | 1,160,500 | ||||||||||
Numericable-SFR 144A 6.00% 5/15/22 # | 4,535,000 | 4,557,675 | ||||||||||
SBA Tower Trust | ||||||||||||
144A 2.24% 4/16/18 # | 7,270,000 | 7,208,051 | ||||||||||
144A 2.898% 10/15/19 # | 405,000 | 402,655 | ||||||||||
Scripps Networks Interactive 3.95% 6/15/25 | 3,560,000 | 3,413,766 | ||||||||||
SES 144A 3.60% 4/4/23 # | 9,881,000 | 9,871,050 | ||||||||||
SES GLOBAL Americas Holdings 144A 5.30% 3/25/44 # | 12,445,000 | 12,212,863 | ||||||||||
Sirius XM Radio 144A 5.375% 4/15/25 # | 5,327,000 | 5,466,834 | ||||||||||
Sky 144A 3.75% 9/16/24 # | 6,695,000 | 6,684,911 | ||||||||||
Sprint 7.125% 6/15/24 | 11,075,000 | 9,752,922 | ||||||||||
Sprint Communications 7.00% 8/15/20 | 1,630,000 | 1,515,900 | ||||||||||
Time Warner 4.85% 7/15/45 | 3,065,000 | 3,057,362 | ||||||||||
Time Warner Cable 5.50% 9/1/41 | 3,205,000 | 2,951,263 | ||||||||||
T-Mobile USA | ||||||||||||
6.125% 1/15/22 | 2,765,000 | 2,820,300 | ||||||||||
6.836% 4/28/23 * | 2,355,000 | 2,437,425 | ||||||||||
Tribune Media 144A 5.875% 7/15/22 # | 3,500,000 | 3,605,000 | ||||||||||
UPCB Finance IV 144A 5.375% 1/15/25 # | 2,849,000 | 2,866,806 | ||||||||||
Verizon Communications | ||||||||||||
3.25% 2/17/26 | EUR | 2,606,000 | 3,219,548 | |||||||||
4.40% 11/1/34 | 4,370,000 | 4,120,412 | ||||||||||
4.862% 8/21/46 | 10,009,000 | 9,619,009 | ||||||||||
Vimpel Communications 144A 7.748% 2/2/21 # | 6,577,000 | 7,025,696 | ||||||||||
Virgin Media Finance 144A 6.375% 4/15/23 # | 1,740,000 | 1,798,725 | ||||||||||
Virgin Media Secured Finance 144A 5.25% 1/15/26 # | 5,040,000 | 5,052,600 | ||||||||||
VTR Finance 144A 6.875% 1/15/24 # | 8,920,000 | 8,652,400 | ||||||||||
Wind Acquisition Finance 144A 7.375% 4/23/21 # | 3,435,000 | 3,469,350 | ||||||||||
WPP Finance 2010 5.625% 11/15/43 | 1,285,000 | 1,335,578 | ||||||||||
Zayo Group 144A 6.00% 4/1/23 # | 4,030,000 | 4,118,660 | ||||||||||
|
| |||||||||||
| 330,875,452 | ||||||||||||
|
| |||||||||||
Consumer Cyclical – 2.07% | ||||||||||||
AutoNation | ||||||||||||
3.35% 1/15/21 | 1,050,000 | 1,061,388 | ||||||||||
4.50% 10/1/25 | 2,835,000 | 2,909,067 | ||||||||||
31
Table of Contents
Schedule of investments
Delaware Diversified Income Fund
| Principal amount° | Value (U.S. $) | |||||||||||
| ||||||||||||
Corporate Bonds (continued) | ||||||||||||
| ||||||||||||
Consumer Cyclical (continued) | ||||||||||||
CDK Global 4.50% 10/15/24 | 5,955,000 | $ | 5,877,126 | |||||||||
Cencosud 144A 5.15% 2/12/25 #* | 4,785,000 | 4,698,444 | ||||||||||
CVS Health 144A 5.00% 12/1/24 # | 1,393,000 | 1,550,066 | ||||||||||
Daimler 2.75% 12/10/18 | NOK | 14,510,000 | 1,770,062 | |||||||||
Ford Motor Credit | ||||||||||||
2.24% 6/15/18 | 8,500,000 | 8,477,399 | ||||||||||
5.875% 8/2/21 | 205,000 | 233,964 | ||||||||||
General Motors Financial | ||||||||||||
3.20% 7/13/20 | 265,000 | 263,186 | ||||||||||
3.45% 4/10/22 | 6,905,000 | 6,752,517 | ||||||||||
4.00% 1/15/25 | 6,570,000 | 6,453,974 | ||||||||||
4.30% 7/13/25 | 610,000 | 621,986 | ||||||||||
4.375% 9/25/21 | 4,515,000 | 4,690,317 | ||||||||||
Harman International Industries 4.15% 5/15/25 | 6,650,000 | 6,508,289 | ||||||||||
Hyundai Capital America | ||||||||||||
144A 2.125% 10/2/17 # | 6,005,000 | 6,019,748 | ||||||||||
144A 2.55% 2/6/19 # | 275,000 | 273,828 | ||||||||||
Lowe’s 3.375% 9/15/25 | 4,435,000 | 4,509,397 | ||||||||||
Nemak 144A 5.50% 2/28/23 # | 7,940,000 | 8,158,350 | ||||||||||
QVC | ||||||||||||
4.375% 3/15/23 | 11,305,000 | 10,919,093 | ||||||||||
5.45% 8/15/34 | 7,200,000 | 6,434,381 | ||||||||||
Sally Holdings 5.75% 6/1/22 | 99,000 | 104,940 | ||||||||||
Signet UK Finance 4.70% 6/15/24 | 8,010,000 | 8,048,192 | ||||||||||
Starwood Hotels & Resorts Worldwide | ||||||||||||
3.75% 3/15/25 @ | 4,250,000 | 4,162,233 | ||||||||||
4.50% 10/1/34 @ | 1,035,000 | 946,677 | ||||||||||
Toyota Credit Canada 2.05% 5/20/20 | CAD | 1,500,000 | 1,148,996 | |||||||||
Toyota Finance Australia | ||||||||||||
2.25% 8/31/16 | NOK | 1,710,000 | 202,013 | |||||||||
3.04% 12/20/16 | NZD | 2,810,000 | 1,892,544 | |||||||||
Toyota Motor Credit 2.80% 7/13/22 | 2,820,000 | 2,826,401 | ||||||||||
Tupy Overseas 144A 6.625% 7/17/24 # | 3,047,000 | 2,738,491 | ||||||||||
Wynn Las Vegas 144A 5.50% 3/1/25 #* | 1,390,000 | 1,309,797 | ||||||||||
|
| |||||||||||
| 111,562,866 | ||||||||||||
|
| |||||||||||
Consumer Non-Cyclical – 2.14% | ||||||||||||
Amgen 4.00% 9/13/29 | GBP | 1,271,000 | 2,008,330 | |||||||||
Becton Dickinson 6.375% 8/1/19 | 18,375,000 | 20,882,563 | ||||||||||
Boston Scientific 6.00% 1/15/20 | 12,055,000 | 13,514,861 | ||||||||||
EMD Finance 144A 2.95% 3/19/22 # | 3,520,000 | 3,467,024 | ||||||||||
ENA Norte Trust 144A 4.95% 4/25/23 # | 4,079,805 | 4,194,039 | ||||||||||
JB 144A 3.75% 5/13/25 # | 7,935,000 | 7,755,272 | ||||||||||
32
Table of Contents
| Principal amount° | Value (U.S. $) | |||||||
| ||||||||
Corporate Bonds (continued) | ||||||||
| ||||||||
Consumer Non-Cyclical (continued) | ||||||||
JBS Investments 144A 7.75% 10/28/20 # | 7,680,000 | $ | 8,221,440 | |||||
JBS USA 144A 5.75% 6/15/25 # | 3,058,000 | 2,973,905 | ||||||
Mallinckrodt International Finance 144A 5.50% 4/15/25 # | 5,371,000 | 4,912,800 | ||||||
PepsiCo 4.45% 4/14/46 | 3,965,000 | 4,069,295 | ||||||
Perrigo 4.00% 11/15/23 | 7,125,000 | 7,006,547 | ||||||
Perrigo Finance 3.50% 12/15/21 | 2,085,000 | 2,042,835 | ||||||
Prestige Brands 144A 5.375% 12/15/21 #* | 1,504,000 | 1,511,520 | ||||||
Reynolds American | ||||||||
2.30% 6/12/18 | 5,435,000 | 5,517,128 | ||||||
4.00% 6/12/22 | 645,000 | 677,093 | ||||||
5.85% 8/15/45 | 1,610,000 | 1,792,600 | ||||||
St. Jude Medical 2.80% 9/15/20 | 3,155,000 | 3,177,091 | ||||||
Sysco 2.60% 10/1/20 | 4,470,000 | 4,518,830 | ||||||
Zimmer Biomet Holdings 4.625% 11/30/19 | 15,621,000 | 16,873,882 | ||||||
|
| |||||||
| 115,117,055 | ||||||||
|
| |||||||
Electric – 5.55% | ||||||||
AES 5.50% 4/15/25 | 7,391,000 | 6,910,585 | ||||||
AES Gener | ||||||||
144A 5.00% 7/14/25 # | 1,220,000 | 1,232,177 | ||||||
144A 5.25% 8/15/21 # | 2,310,000 | 2,456,038 | ||||||
144A 8.375% 12/18/73 #● | 3,207,000 | 3,335,280 | ||||||
Ameren Illinois 9.75% 11/15/18 | 16,210,000 | 19,847,929 | ||||||
American Transmission Systems 144A 5.25% 1/15/22 # | 14,260,000 | 15,713,379 | ||||||
Appalachian Power 4.45% 6/1/45 | 3,170,000 | 3,094,586 | ||||||
Cleveland Electric Illuminating 5.50% 8/15/24 | 290,000 | 331,037 | ||||||
CMS Energy 6.25% 2/1/20 | 7,715,000 | 8,838,690 | ||||||
ComEd Financing III 6.35% 3/15/33 @ | 8,849,000 | 9,260,797 | ||||||
Dominion Resources 1.90% 6/15/18 | 8,775,000 | 8,784,284 | ||||||
DTE Energy 144A 3.30% 6/15/22 # | 5,955,000 | 6,049,565 | ||||||
Electricite de France | ||||||||
144A 3.625% 10/13/25 # | 4,160,000 | 4,152,591 | ||||||
144A 4.60% 1/27/20 # | 2,485,000 | 2,704,843 | ||||||
144A 4.95% 10/13/45 # | 560,000 | 556,933 | ||||||
144A 5.25% 1/29/49 #● | 8,600,000 | 8,589,250 | ||||||
Enel 144A 8.75% 9/24/73 #● | 8,765,000 | 10,123,575 | ||||||
Entergy 4.00% 7/15/22 | 550,000 | 566,058 | ||||||
Entergy Arkansas 3.70% 6/1/24 | 1,420,000 | 1,450,942 | ||||||
Entergy Louisiana 4.05% 9/1/23 | 14,030,000 | 14,714,846 | ||||||
Eskom Holdings 144A 7.125% 2/11/25 #* | 1,720,000 | 1,603,762 | ||||||
Exelon 3.95% 6/15/25 | 1,605,000 | 1,623,371 | ||||||
Great Plains Energy 4.85% 6/1/21 | 2,805,000 | 3,053,573 | ||||||
Integrys Holding 6.11% 12/1/66 @● | 10,010,000 | 8,422,904 | ||||||
33
Table of Contents
Schedule of investments
Delaware Diversified Income Fund
| Principal amount° | Value (U.S. $) | |||||||
| ||||||||
Corporate Bonds (continued) | ||||||||
| ||||||||
Electric (continued) | ||||||||
Interstate Power & Light 3.40% 8/15/25 | 3,605,000 | $ | 3,647,121 | |||||
IPALCO Enterprises 5.00% 5/1/18 | 4,135,000 | 4,383,100 | ||||||
Kansas City Power & Light 3.65% 8/15/25 | 7,975,000 | 8,110,671 | ||||||
Lamar Funding 144A 3.958% 5/7/25 # | 975,000 | 916,719 | ||||||
LG&E & KU Energy 4.375% 10/1/21 | 15,345,000 | 16,625,663 | ||||||
MidAmerican Energy 4.25% 5/1/46 | 12,840,000 | 13,034,102 | ||||||
National Rural Utilities Cooperative Finance | ||||||||
4.75% 4/30/43 ● | 9,740,000 | 9,710,780 | ||||||
NextEra Energy Capital Holdings 3.625% 6/15/23 | 8,990,000 | 9,026,194 | ||||||
NV Energy 6.25% 11/15/20 | 10,391,000 | 12,027,395 | ||||||
Pennsylvania Electric 5.20% 4/1/20 | 9,048,000 | 9,815,234 | ||||||
Perusahaan Listrik Negara 144A 5.50% 11/22/21 # | 5,890,000 | 6,091,320 | ||||||
Public Service of Oklahoma 5.15% 12/1/19 | 13,585,000 | 15,016,411 | ||||||
Puget Energy 6.00% 9/1/21 | 4,685,000 | 5,384,180 | ||||||
SCANA 4.125% 2/1/22 | 7,385,000 | 7,356,413 | ||||||
Southern 2.75% 6/15/20 | 22,190,000 | 22,092,519 | ||||||
State Grid Overseas Investment 2014 144A | ||||||||
2.75% 5/7/19 # | 3,430,000 | 3,495,691 | ||||||
Trans-Allegheny Interstate Line 144A 3.85% 6/1/25 # | 2,905,000 | 2,918,845 | ||||||
WEC Energy Group 3.55% 6/15/25 | 4,830,000 | 4,924,953 | ||||||
Xcel Energy 3.30% 6/1/25 | 1,145,000 | 1,135,183 | ||||||
|
| |||||||
| 299,129,489 | ||||||||
|
| |||||||
Energy – 4.47% | ||||||||
BHP Billiton Finance USA | ||||||||
144A 6.25% 10/19/75 #● | 3,730,000 | 3,818,587 | ||||||
144A 6.75% 10/19/75 #● | 950,000 | 970,187 | ||||||
Bristow Group 6.25% 10/15/22 * | 2,200,000 | 1,925,000 | ||||||
CNOOC Finance 2015 Australia 2.625% 5/5/20 | 2,800,000 | 2,763,326 | ||||||
Continental Resources 4.50% 4/15/23 | 8,255,000 | 7,304,602 | ||||||
Dominion Gas Holdings | ||||||||
3.60% 12/15/24 | 5,105,000 | 5,046,042 | ||||||
4.60% 12/15/44 | 8,075,000 | 7,647,275 | ||||||
Ecopetrol 5.375% 6/26/26 | 7,035,000 | 6,573,321 | ||||||
Enbridge Energy Partners 8.05% 10/1/37 ● | 16,755,000 | 15,288,937 | ||||||
Energy Transfer Equity | ||||||||
5.50% 6/1/27 | 455,000 | 407,297 | ||||||
5.875% 1/15/24 | 1,381,000 | 1,344,783 | ||||||
Energy Transfer Partners 9.70% 3/15/19 | 8,043,000 | 9,528,904 | ||||||
EnLink Midstream Partners 4.15% 6/1/25 | 5,025,000 | 4,592,915 | ||||||
Ensco 4.70% 3/15/21 | 6,750,000 | 6,081,149 | ||||||
Enterprise Products Operating | ||||||||
7.034% 1/15/68 *● | 20,274,000 | 21,465,097 | ||||||
34
Table of Contents
| Principal amount° | Value (U.S. $) | |||||||
| ||||||||
Corporate Bonds (continued) | ||||||||
| ||||||||
Energy (continued) | ||||||||
Enterprise Products Operating | ||||||||
8.375% 8/1/66 ● | 1,492,000 | $ | 1,469,620 | |||||
Gulfstream Natural Gas System 144A 4.60% 9/15/25 # | 3,780,000 | 3,768,505 | ||||||
KazMunayGas National JSC 144A 5.75% 4/30/43 #* | 2,245,000 | 1,738,474 | ||||||
Kinder Morgan Energy Partners 9.00% 2/1/19 | 15,407,000 | 17,803,898 | ||||||
Laredo Petroleum 7.375% 5/1/22 | 3,524,000 | 3,497,570 | ||||||
Lukoil International Finance 144A 3.416% 4/24/18 # | 3,560,000 | 3,485,899 | ||||||
MarkWest Energy Partners 4.875% 12/1/24 | 4,823,000 | 4,575,821 | ||||||
Murphy Oil USA 6.00% 8/15/23 | 4,319,000 | 4,578,140 | ||||||
Newfield Exploration | ||||||||
5.375% 1/1/26 | 4,215,000 | 4,025,325 | ||||||
5.625% 7/1/24 | 6,120,000 | 6,089,400 | ||||||
Noble Energy 5.05% 11/15/44 | 4,480,000 | 4,113,854 | ||||||
Oasis Petroleum 6.875% 3/15/22 * | 3,353,000 | 2,875,198 | ||||||
PDC Energy 7.75% 10/15/22 | 1,386,000 | 1,399,860 | ||||||
Petrobras Global Finance | ||||||||
4.375% 5/20/23 | 1,895,000 | 1,385,719 | ||||||
4.875% 3/17/20 * | 660,000 | 541,200 | ||||||
Petroleos Mexicanos | ||||||||
144A 4.25% 1/15/25 # | 2,030,000 | 1,936,620 | ||||||
6.50% 6/2/41 | 3,250,000 | 3,135,600 | ||||||
Petronas Global Sukuk 144A 2.707% 3/18/20 # | 2,445,000 | 2,434,398 | ||||||
Plains All American Pipeline 8.75% 5/1/19 | 13,279,000 | 15,750,541 | ||||||
Pride International 6.875% 8/15/20 * | 8,995,000 | 8,868,072 | ||||||
Regency Energy Partners 5.875% 3/1/22 | 7,470,000 | 7,681,177 | ||||||
Talisman Energy | ||||||||
3.75% 2/1/21 | 2,000,000 | 1,828,236 | ||||||
5.50% 5/15/42 | 8,415,000 | 6,161,017 | ||||||
Targa Resources Partners 144A 6.75% 3/15/24 #* | 420,000 | 413,700 | ||||||
TransCanada PipeLines 3.75% 10/16/23 | 1,000,000 | 1,002,144 | ||||||
Williams Partners | ||||||||
4.00% 9/15/25 | 1,010,000 | 861,221 | ||||||
7.25% 2/1/17 | 12,393,000 | 13,114,074 | ||||||
Woodside Finance | ||||||||
144A 3.65% 3/5/25 # | 335,000 | 305,709 | ||||||
144A 8.75% 3/1/19 # | 10,841,000 | 12,684,382 | ||||||
YPF | ||||||||
7.821% 8/15/18 @● | 1,058,824 | 1,071,026 | ||||||
144A 8.75% 4/4/24 #* | 5,635,000 | 5,738,966 | ||||||
144A 8.875% 12/19/18 # | 1,620,000 | 1,680,750 | ||||||
|
| |||||||
| 240,773,538 | ||||||||
|
| |||||||
35
Table of Contents
Schedule of investments
Delaware Diversified Income Fund
| Principal amount° | Value (U.S. $) | |||||||||||
| ||||||||||||
Corporate Bonds (continued) | ||||||||||||
| ||||||||||||
Finance Companies – 0.80% | ||||||||||||
AerCap Ireland Capital 4.625% 7/1/22 | 3,595,000 | $ | 3,680,381 | |||||||||
Affiliated Managers Group 3.50% 8/1/25 | 5,290,000 | 5,088,313 | ||||||||||
Aviation Capital Group | ||||||||||||
144A 2.875% 9/17/18 # | 225,000 | 225,108 | ||||||||||
144A 4.875% 10/1/25 # | 2,435,000 | 2,444,618 | ||||||||||
144A 6.75% 4/6/21 # | 4,655,000 | 5,277,606 | ||||||||||
Corp Financiera de Desarrollo | ||||||||||||
144A 4.75% 7/15/25 # | 2,205,000 | 2,246,344 | ||||||||||
144A 5.25% 7/15/29 #● | 1,100,000 | 1,104,125 | ||||||||||
General Electric Capital | ||||||||||||
144A 3.80% 6/18/19 # | 6,510,000 | 6,946,847 | ||||||||||
4.25% 1/17/18 | NZD | 1,010,000 | 694,108 | |||||||||
7.125% 12/29/49 ● | 9,245,000 | 10,874,431 | ||||||||||
Peachtree Corners Funding Trust 144A 3.976% 2/15/25 # | 4,575,000 | 4,613,288 | ||||||||||
|
| |||||||||||
| 43,195,169 | ||||||||||||
|
| |||||||||||
Healthcare – 1.17% | ||||||||||||
Community Health Systems 6.875% 2/1/22 | 11,423,000 | 11,565,787 | ||||||||||
DaVita HealthCare Partners 5.00% 5/1/25 | 9,388,000 | 9,342,919 | ||||||||||
HCA 5.375% 2/1/25 | 11,524,000 | 11,869,720 | ||||||||||
HealthSouth | ||||||||||||
5.125% 3/15/23 | 1,480,000 | 1,461,500 | ||||||||||
5.75% 11/1/24 | 1,117,000 | 1,122,585 | ||||||||||
144A 5.75% 9/15/25 # | 980,000 | 980,613 | ||||||||||
IASIS Healthcare 8.375% 5/15/19 | 6,115,000 | 6,267,875 | ||||||||||
Immucor 11.125% 8/15/19 | 7,597,000 | 7,824,910 | ||||||||||
Kinetic Concepts 10.50% 11/1/18 | 2,579,000 | 2,729,614 | ||||||||||
Stryker 3.375% 11/1/25 | 2,745,000 | 2,747,223 | ||||||||||
Tenet Healthcare 4.50% 4/1/21 | 2,130,000 | 2,140,650 | ||||||||||
Valeant Pharmaceuticals International 144A | ||||||||||||
5.875% 5/15/23 # | 5,644,000 | 4,779,763 | ||||||||||
|
| |||||||||||
| 62,833,159 | ||||||||||||
|
| |||||||||||
Insurance – 1.66% | ||||||||||||
ACE INA Holdings | ||||||||||||
2.875% 11/3/22 | 2,455,000 | 2,460,507 | ||||||||||
3.35% 5/3/26 | 3,925,000 | 3,943,377 | ||||||||||
4.35% 11/3/45 | 3,465,000 | 3,516,407 | ||||||||||
Five Corners Funding Trust 144A 4.419% 11/15/23 # | 2,660,000 | 2,812,703 | ||||||||||
Highmark | ||||||||||||
144A 4.75% 5/15/21 # | 5,340,000 | 5,499,735 | ||||||||||
144A 6.125% 5/15/41 # | 2,000,000 | 2,014,318 | ||||||||||
HUB International 144A 7.875% 10/1/21 # | 2,867,000 | 2,867,000 | ||||||||||
MetLife 6.40% 12/15/36 | 40,000 | 43,964 | ||||||||||
36
Table of Contents
| Principal amount° | Value (U.S. $) | |||||||
| ||||||||
Corporate Bonds (continued) | ||||||||
| ||||||||
Insurance (continued) | ||||||||
MetLife Capital Trust X 144A 9.25% 4/8/38 # | 11,520,000 | $ | 16,043,904 | |||||
Prudential Financial | ||||||||
4.50% 11/15/20 | 3,385,000 | 3,671,936 | ||||||
5.375% 5/15/45 ● | 4,135,000 | 4,160,844 | ||||||
5.625% 6/15/43 ● | 4,620,000 | 4,846,380 | ||||||
5.875% 9/15/42 ● | 4,100,000 | 4,366,500 | ||||||
TIAA Asset Management Finance | ||||||||
144A 2.95% 11/1/19 # | 4,670,000 | 4,732,905 | ||||||
144A 4.125% 11/1/24 # | 9,485,000 | 9,675,032 | ||||||
USI 144A 7.75% 1/15/21 # | 879,000 | 882,296 | ||||||
Voya Financial 5.65% 5/15/53 ● | 5,340,000 | 5,433,450 | ||||||
XLIT | ||||||||
4.45% 3/31/25 | 5,286,000 | 5,295,113 | ||||||
5.50% 3/31/45 | 5,145,000 | 4,952,757 | ||||||
6.50% 10/29/49 ● | 2,969,000 | 2,375,794 | ||||||
|
| |||||||
| 89,594,922 | ||||||||
|
| |||||||
Real Estate – 1.17% | ||||||||
Carey (W.P.) 4.60% 4/1/24 | 4,645,000 | 4,698,757 | ||||||
CBL & Associates | ||||||||
4.60% 10/15/24 | 4,925,000 | 4,680,474 | ||||||
5.25% 12/1/23 | 1,050,000 | 1,077,111 | ||||||
Corporate Office Properties | ||||||||
3.60% 5/15/23 | 6,545,000 | 6,066,646 | ||||||
5.25% 2/15/24 | 5,315,000 | 5,428,151 | ||||||
DDR | ||||||||
7.50% 4/1/17 | 4,950,000 | 5,335,798 | ||||||
7.875% 9/1/20 | 7,224,000 | 8,765,659 | ||||||
Education Realty Operating Partnership 4.60% 12/1/24 | 5,440,000 | 5,431,340 | ||||||
Hospitality Properties Trust 4.50% 3/15/25 | 5,010,000 | 4,880,071 | ||||||
Host Hotels & Resorts | ||||||||
3.75% 10/15/23 | 4,180,000 | 4,046,829 | ||||||
4.50% 2/1/26 | 1,525,000 | 1,535,434 | ||||||
Kimco Realty 3.40% 11/1/22 | 980,000 | 982,068 | ||||||
Omega Healthcare Investors 144A 5.25% 1/15/26 # | 3,355,000 | 3,469,224 | ||||||
Regency Centers 5.875% 6/15/17 | 2,032,000 | 2,158,994 | ||||||
UDR 4.00% 10/1/25 | 1,670,000 | 1,700,918 | ||||||
Ventas Realty 4.125% 1/15/26 | 2,940,000 | 2,947,626 | ||||||
|
| |||||||
| 63,205,100 | ||||||||
|
| |||||||
Services – 0.78% | ||||||||
AECOM 144A 5.875% 10/15/24 # | 10,297,000 | 10,670,266 | ||||||
Algeco Scotsman Global Finance 144A 8.50% 10/15/18 #* | 4,975,000 | 4,365,563 | ||||||
DigitalGlobe 144A 5.25% 2/1/21 # | 10,329,000 | 9,343,407 | ||||||
37
Table of Contents
Schedule of investments
Delaware Diversified Income Fund
| Principal amount° | Value (U.S. $) | |||||||
| ||||||||
Corporate Bonds (continued) | ||||||||
| ||||||||
Services (continued) | ||||||||
GEO Group | ||||||||
5.125% 4/1/23 | 1,690,000 | $ | 1,664,650 | |||||
5.875% 10/15/24 | 1,645,000 | 1,669,675 | ||||||
Mattamy Group 144A 6.50% 11/15/20 #* | 491,000 | 485,783 | ||||||
MGM Resorts International 6.00% 3/15/23 * | 6,063,000 | 6,169,103 | ||||||
United Rentals North America | ||||||||
5.50% 7/15/25 | 7,278,000 | 7,287,098 | ||||||
5.75% 11/15/24 | 170,000 | 173,400 | ||||||
|
| |||||||
| 41,828,945 | ||||||||
|
| |||||||
Technology – 1.55% | ||||||||
Apple 3.45% 2/9/45 | 7,360,000 | 6,365,568 | ||||||
Baidu 2.75% 6/9/19 | 2,550,000 | 2,549,156 | ||||||
Cisco Systems 1.65% 6/15/18 | 6,455,000 | 6,509,629 | ||||||
First Data | ||||||||
144A 7.00% 12/1/23 # | 4,182,000 | 4,265,640 | ||||||
11.25% 1/15/21 | 4,807,000 | 5,324,714 | ||||||
11.75% 8/15/21 | 1,853,000 | 2,117,053 | ||||||
Flextronics International 144A 4.75% 6/15/25 # | 6,245,000 | 6,104,487 | ||||||
Jabil Circuit 7.75% 7/15/16 | 1,178,000 | 1,228,065 | ||||||
Micron Technology | ||||||||
144A 5.25% 8/1/23 # | 3,905,000 | 3,824,908 | ||||||
144A 5.625% 1/15/26 # | 997,000 | 939,673 | ||||||
Microsoft | ||||||||
4.20% 11/3/35 | 2,105,000 | 2,120,417 | ||||||
4.45% 11/3/45 | 1,580,000 | 1,605,959 | ||||||
Motorola Solutions 4.00% 9/1/24 * | 4,336,000 | 3,833,275 | ||||||
Oracle | ||||||||
3.25% 5/15/30 | 5,440,000 | 5,108,465 | ||||||
4.30% 7/8/34 | 2,960,000 | 2,954,539 | ||||||
QUALCOMM | ||||||||
3.00% 5/20/22 | 4,560,000 | 4,506,881 | ||||||
3.45% 5/20/25 | 4,250,000 | 4,086,456 | ||||||
Samsung Electronics America 144A 1.75% 4/10/17 # | 10,895,000 | 10,892,516 | ||||||
Seagate HDD Cayman | ||||||||
4.75% 1/1/25 | 3,665,000 | 3,297,584 | ||||||
144A 4.875% 6/1/27 # | 1,770,000 | 1,541,803 | ||||||
Tencent Holdings 144A 3.375% 5/2/19 # | 4,170,000 | 4,262,662 | ||||||
|
| |||||||
| 83,439,450 | ||||||||
|
| |||||||
Transportation – 0.74% | ||||||||
Air Canada 2015-1 Class A Pass Through Trust 144A | ||||||||
3.60% 3/15/27 #¿ | 3,290,000 | 3,178,963 | ||||||
38
Table of Contents
| Principal amount° | Value (U.S. $) | |||||||
| ||||||||
Corporate Bonds (continued) | ||||||||
| ||||||||
Transportation (continued) | ||||||||
American Airlines 2014-1 Class A Pass Through Trust 3.70% 10/1/26 ¿ | 2,580,599 | $ | 2,609,630 | |||||
American Airlines 2015-1 Class A Pass Through Trust 3.375% 5/1/27 ¿ | 2,345,000 | 2,290,479 | ||||||
American Airlines 2015-2 Class AA Pass Through Trust 3.60% 9/22/27 ¿ | 1,350,000 | 1,369,237 | ||||||
Brambles USA 144A 5.35% 4/1/20 # | 6,810,000 | 7,470,086 | ||||||
Burlington Northern Santa Fe 3.65% 9/1/25 | 2,885,000 | 2,947,351 | ||||||
CSX 3.35% 11/1/25 | 4,730,000 | 4,736,310 | ||||||
DP World 144A 6.85% 7/2/37 # | 310,000 | 328,987 | ||||||
FedEx 4.75% 11/15/45 | 2,860,000 | 2,832,618 | ||||||
HPHT Finance 15 144A 2.875% 3/17/20 # | 2,020,000 | 2,024,238 | ||||||
Trinity Industries 4.55% 10/1/24 @ | 5,800,000 | 5,523,311 | ||||||
United Airlines 2014-1 Class A Pass Through Trust 4.00% 4/11/26 *¿ | 2,221,940 | 2,269,156 | ||||||
United Airlines 2014-2 Class A Pass Through Trust 3.75% 9/3/26 ¿ | 2,080,000 | 2,098,200 | ||||||
|
| |||||||
| 39,678,566 | ||||||||
|
| |||||||
Utilities – 0.26% | ||||||||
American Water Capital | ||||||||
3.40% 3/1/25 | 1,250,000 | 1,280,424 | ||||||
4.30% 9/1/45 * | 1,450,000 | 1,494,819 | ||||||
Calpine | ||||||||
5.375% 1/15/23 | 2,390,000 | 2,297,387 | ||||||
5.50% 2/1/24 | 913,000 | 871,915 | ||||||
Dynegy | ||||||||
5.875% 6/1/23 * | 3,125,000 | 2,937,500 | ||||||
7.375% 11/1/22 | 1,051,000 | 1,058,883 | ||||||
7.625% 11/1/24 * | 4,153,000 | 4,184,147 | ||||||
|
| |||||||
| 14,125,075 | ||||||||
|
| |||||||
Total Corporate Bonds (cost $2,080,056,031) | 2,080,257,797 | |||||||
|
| |||||||
| ||||||||
Municipal Bonds – 1.27% | ||||||||
| ||||||||
Atlanta, Georgia Water & Wastewater Revenue | ||||||||
5.00% 11/1/40 | 3,240,000 | 3,677,659 | ||||||
California State Various Purpose | ||||||||
5.00% 3/1/45 | 5,630,000 | 6,369,219 | ||||||
City of Chicago, Illinois | ||||||||
(Taxable Build America Bond) Series B 7.75% 1/1/42 | 7,480,000 | 7,711,581 | ||||||
Golden State, California Tobacco Securitization Settlement Revenue | ||||||||
(Asset-Backed) Series A 5.00% 6/1/40 | 9,695,000 | 10,803,526 | ||||||
39
Table of Contents
Schedule of investments
Delaware Diversified Income Fund
| Principal amount° | Value (U.S. $) | |||||||
| ||||||||
Municipal Bonds (continued) | ||||||||
| ||||||||
Golden State, California Tobacco Securitization Settlement Revenue | ||||||||
(Asset-Backed Senior Notes) | ||||||||
Series A-1 5.125% 6/1/47 | 3,170,000 | $ | 2,692,376 | |||||
Series A-1 5.75% 6/1/47 | 3,500,000 | 3,228,330 | ||||||
Maryland State Local Facilities 2nd Loan | ||||||||
Series A 5.00% 8/1/21 | 3,960,000 | 4,755,802 | ||||||
New Jersey Transportation Trust Fund | ||||||||
(Transportation Program) Series AA 5.00% 6/15/44 | 4,080,000 | 4,144,382 | ||||||
New York City, New York | ||||||||
Series I 5.00% 8/1/22 | 2,680,000 | 3,218,224 | ||||||
New York City, New York Water & Sewer System | ||||||||
Series EE 5.00% 6/15/45 | 4,800,000 | 5,394,576 | ||||||
New York State Thruway Authority Revenue | ||||||||
Series A 5.00% 5/1/19 | 3,145,000 | 3,557,844 | ||||||
Oregon State Taxable Pension | ||||||||
5.892% 6/1/27 | 305,000 | 370,743 | ||||||
Texas Private Activity Bond Surface Transportation Revenue (Senior Lien Note Mobility) | ||||||||
6.75% 6/30/43 (AMT) | 2,795,000 | 3,399,642 | ||||||
Texas State Transportation Commission | ||||||||
(Senior Lien Mobility Fund) Series A 5.00% 10/1/44 | 8,175,000 | 9,315,576 | ||||||
|
| |||||||
Total Municipal Bonds (cost $66,691,621) | 68,639,480 | |||||||
|
| |||||||
| ||||||||
Non-Agency Asset-Backed Securities – 3.45% | ||||||||
| ||||||||
AEP Texas Central Transition Funding II | ||||||||
Series 2006-A A4 5.17% 1/1/18 | 126,169 | 132,019 | ||||||
Ally Master Owner Trust | ||||||||
Series 2012-5 A 1.54% 9/15/19 | 7,602,000 | 7,599,270 | ||||||
Series 2014-4 A2 1.43% 6/17/19 | 8,000,000 | 7,990,466 | ||||||
American Express Credit Account Secured Note Trust | ||||||||
Series 2012-4 A 0.436% 5/15/20 ● | 15,100,000 | 15,045,999 | ||||||
Ameriquest Mortgage Securities Asset-Backed Pass Through Certificates | ||||||||
Series 2003-8 AF4 5.30% 10/25/33 f | 55,716 | 55,963 | ||||||
Avis Budget Rental Car Funding AESOP | ||||||||
Series 2011-3A A 144A 3.41% 11/20/17 # | 4,435,000 | 4,524,636 | ||||||
Series 2013-1A A 144A 1.92% 9/20/19 # | 6,115,000 | 6,080,359 | ||||||
Series 2014-1A A 144A 2.46% 7/20/20 # | 4,587,000 | 4,639,980 | ||||||
Bank of America Credit Card Trust | ||||||||
Series 2014-A3 A 0.486% 1/15/20 ● | 4,310,000 | 4,300,643 | ||||||
Series 2015-A1 A 0.526% 6/15/20 ● | 15,975,000 | 15,969,006 | ||||||
40
Table of Contents
| Principal amount° | Value (U.S. $) | |||||||
| ||||||||
Non-Agency Asset-Backed Securities (continued) | ||||||||
| ||||||||
California Republic Auto Receivables Trust | ||||||||
Series 2013-1 A2 144A 1.41% 9/17/18 # | 1,350,847 | $ | 1,354,258 | |||||
Capital One Multi-Asset Execution Trust | ||||||||
Series 2007-A1 A1 0.246% 11/15/19 ● | 1,700,000 | 1,694,220 | ||||||
Series 2007-A5 A5 0.236% 7/15/20 ● | 6,855,000 | 6,800,155 | ||||||
Series 2015-A7 A7 1.45% 8/16/21 | 3,800,000 | 3,784,613 | ||||||
Chase Issuance Trust | ||||||||
Series 2014-A5 A5 0.566% 4/15/21 ● | 5,000,000 | 4,977,010 | ||||||
Series 2015-A4 A4 1.84% 4/15/22 | 3,760,000 | 3,741,071 | ||||||
Citibank Credit Card Issuance Trust | ||||||||
Series 2014-A9 A9 0.445% 11/23/18 ● | 12,390,000 | 12,383,000 | ||||||
Contimortgage Home Equity Loan Trust | ||||||||
Series 1996-4 A8 7.22% 1/15/28 @ | 4,220 | 4,074 | ||||||
Discover Card Execution Note Trust | ||||||||
Series 2013-A1 A1 0.496% 8/17/20 ● | 2,390,000 | 2,384,580 | ||||||
Series 2014-A1 A1 0.626% 7/15/21 ● | 3,690,000 | 3,684,126 | ||||||
Series 2015-A3 A 1.45% 3/15/21 | 4,855,000 | 4,842,416 | ||||||
FirstKey Lending Trust | ||||||||
Series 2015-SFR1 A 144A 2.553% 3/9/47 # | 2,707,248 | 2,661,150 | ||||||
Ford Credit Auto Lease Trust | ||||||||
Series 2015-A A3 1.13% 6/15/18 | 3,995,000 | 3,986,877 | ||||||
Ford Credit Auto Owner Trust | ||||||||
Series 2014-2 A 144A 2.31% 4/15/26 # | 3,140,000 | 3,164,581 | ||||||
GE Dealer Floorplan Master Note Trust | ||||||||
Series 2013-1 A 0.594% 4/20/18 ● | 7,250,000 | 7,246,463 | ||||||
Golden Credit Card Trust | ||||||||
Series 2014-2A A 144A 0.646% 3/15/21 #● | 2,815,000 | 2,800,824 | ||||||
Series 2015-2A A 144A 2.02% 4/15/22 # | 3,480,000 | 3,464,589 | ||||||
GreatAmerica Leasing Receivables Funding | ||||||||
Series 2013-1 B 144A 1.44% 5/15/18 # | 1,045,000 | 1,043,378 | ||||||
HOA Funding | ||||||||
Series 2014-1A A2 144A 4.846% 8/20/44 # | 7,467,600 | 7,193,510 | ||||||
Honda Auto Receivables Owner Trust | ||||||||
Series 2015-3 A3 1.27% 4/18/19 | 4,480,000 | 4,483,124 | ||||||
Mid-State Trust XI | ||||||||
Series 11 A1 4.864% 7/15/38 | 344,898 | 365,579 | ||||||
MMAF Equipment Finance | ||||||||
Series 2014-AA A4 144A 1.59% 2/8/22 # | 5,755,000 | 5,754,631 | ||||||
Penarth Master Issuer | ||||||||
Series 2015-1A A1 144A 0.597% 3/18/19 #● | 2,100,000 | 2,094,630 | ||||||
Porsche Innovative Lease Owner Trust | ||||||||
Series 2015-1 A3 144A 1.19% 7/23/18 # | 4,170,000 | 4,159,078 | ||||||
Progress Residential Trust | ||||||||
Series 2015-SFR2 A 144A 2.74% 6/12/32 # | 2,880,000 | 2,834,864 | ||||||
41
Table of Contents
Schedule of investments
Delaware Diversified Income Fund
| Principal amount° | Value (U.S. $) | |||||||
| ||||||||
Non-Agency Asset-Backed Securities (continued) | ||||||||
| ||||||||
Synchrony Credit Card Master Note Trust | ||||||||
Series 2012-6 A 1.36% 8/17/20 | 3,800,000 | $ | 3,793,657 | |||||
Series 2015-2 A 1.60% 4/15/21 | 6,915,000 | 6,912,744 | ||||||
Volkswagen Credit Auto Master Trust | ||||||||
Series 2014-1A A2 144A 1.40% 7/22/19 # | 11,885,000 | 11,796,274 | ||||||
|
| |||||||
Total Non-Agency Asset-Backed Securities | 185,743,817 | |||||||
|
| |||||||
| ||||||||
Non-Agency Collateralized Mortgage Obligations – 1.43% | ||||||||
| ||||||||
American Home Mortgage Investment Trust | ||||||||
Series 2005-2 5A1 5.064% 9/25/35 f | 402,515 | 409,079 | ||||||
Banc of America Alternative Loan Trust | ||||||||
Series 2005-1 2A1 5.50% 2/25/20 | 174,410 | 177,410 | ||||||
Series 2005-3 2A1 5.50% 4/25/20 | 137,653 | 137,973 | ||||||
Series 2005-6 7A1 5.50% 7/25/20 | 563,456 | 549,627 | ||||||
Banc of America Mortgage Trust | ||||||||
Series 2003-E 2A2 2.793% 6/25/33 ● | 70,661 | 71,020 | ||||||
Series 2004-K 2A1 2.684% 12/25/34 ● | 1,241,243 | 1,222,720 | ||||||
ChaseFlex Trust | ||||||||
Series 2006-1 A4 4.78% 6/25/36 ● | 6,119,000 | 5,245,753 | ||||||
CHL Mortgage Pass Through Trust | ||||||||
Series 2003-21 A1 2.783% 5/25/33 t● | 25,664 | 25,850 | ||||||
Series 2004-HYB2 2A 2.616% 7/20/34 t● | 75,873 | 69,688 | ||||||
Series 2004-HYB5 3A1 2.589% 4/20/35 t● | 119,876 | 107,439 | ||||||
Citicorp Mortgage Securities Trust | ||||||||
Series 2006-3 1A9 5.75% 6/25/36 | 613,432 | 633,967 | ||||||
Citicorp Residential Mortgage Trust | ||||||||
Series 2006-3 A5 5.948% 11/25/36 f | 5,800,000 | 5,768,062 | ||||||
Credit Suisse First Boston Mortgage Securities | ||||||||
Series 2005-5 6A3 5.00% 7/25/35 | 2,897,097 | 2,902,361 | ||||||
First Horizon Mortgage Pass Through Trust | ||||||||
Series 2004-5 2A1 6.25% 8/25/17 @t | 3,966 | 3,992 | ||||||
Series 2004-7 1A3 5.50% 1/25/35 t | 1,746,183 | 1,805,535 | ||||||
Series 2005-4 1A8 5.50% 8/25/35 t | 858,891 | 865,738 | ||||||
Freddie Mac Structured Agency Credit Risk Debt Notes | ||||||||
Series 2014-DN4 M2 2.597% 10/25/24 ● | 2,455,000 | 2,478,946 | ||||||
Series 2015-DNA1 M2 2.047% 10/25/27 ● | 895,000 | 885,649 | ||||||
Series 2015-HQ2 M2 2.147% 5/25/25 ● | 1,830,000 | 1,801,314 | ||||||
GSMPS Mortgage Loan Trust | ||||||||
Series 1998-3 A 144A 7.75% 9/19/27 #● | 40,314 | 41,746 | ||||||
GSR Mortgage Loan Trust | ||||||||
Series 2004-9 4A1 2.836% 8/25/34 ● | 482,931 | 470,196 | ||||||
JPMorgan Mortgage Trust | ||||||||
Series 2005-A8 1A1 2.73% 11/25/35 ● | 369,899 | 349,892 | ||||||
42
Table of Contents
| Principal amount° | Value (U.S. $) | |||||||
| ||||||||
Non-Agency Collateralized Mortgage Obligations (continued) | ||||||||
| ||||||||
JPMorgan Mortgage Trust | ||||||||
Series 2006-S1 1A1 6.00% 4/25/36 | 3,419,732 | $ | 3,526,998 | |||||
Series 2007-A1 7A4 2.658% 7/25/35 ● | 78,838 | 69,614 | ||||||
Series 2014-2 B1 144A 3.427% 6/25/29 #● | 2,239,036 | 2,261,916 | ||||||
Series 2014-2 B2 144A 3.427% 6/25/29 #● | 834,222 | 829,710 | ||||||
Series 2014-IVR6 2A4 144A 2.50% 7/25/44 #● | 2,470,000 | 2,489,984 | ||||||
Series 2015-4 B1 144A 3.637% 6/25/45 #● | 2,679,569 | 2,605,908 | ||||||
Series 2015-4 B2 144A 3.637% 6/25/45 #● | 1,923,640 | 1,830,663 | ||||||
JPMorgan Trust | ||||||||
Series 2015-1 B1 144A 2.664% 12/25/44 #● | 1,695,494 | 1,677,171 | ||||||
Series 2015-6 B1 144A 3.657% 10/25/45 #● | 1,885,000 | 1,883,969 | ||||||
Series 2015-6 B2 144A 3.657% 10/25/45 #● | 1,825,000 | 1,787,502 | ||||||
MASTR ARM Trust | ||||||||
Series 2003-6 1A2 2.45% 12/25/33 ● | 42,007 | 41,733 | ||||||
Series 2004-10 2A2 3.085% 10/25/34 ● | 57,781 | 36,434 | ||||||
Sequoia Mortgage Trust | ||||||||
Series 2013-11 B1 144A 3.689% 9/25/43 #● | 2,608,625 | 2,596,159 | ||||||
Series 2014-2 A4 144A 3.50% 7/25/44 #● | 3,639,325 | 3,689,082 | ||||||
Series 2015-1 B2 144A 3.898% 1/25/45 #● | 2,094,841 | 2,113,067 | ||||||
Structured Asset Securities Mortgage Pass Through Certificates | ||||||||
Series 2004-20 2A1 5.50% 11/25/34 t | 2,719,310 | 2,775,557 | ||||||
Structured Asset Securities Trust | ||||||||
Series 2005-1 4A1 5.00% 2/25/20 | 2,364,646 | 2,399,962 | ||||||
Towd Point Mortgage Trust | ||||||||
Series 2015-5 A1B 144A 2.75% 5/25/55 #● | 4,395,000 | 4,395,000 | ||||||
WaMu Mortgage Pass Through Certificates | ||||||||
Series 2003-S10 A2 5.00% 10/25/18 t | 114,461 | 115,847 | ||||||
Washington Mutual Mortgage Pass Through Trust | ||||||||
Series 2005-1 5A2 6.00% 3/25/35 t | 268,716 | 125,087 | ||||||
Wells Fargo Mortgage-Backed Securities Trust | ||||||||
Series 2005-3 A4 5.50% 5/25/35 | 4,530,079 | 4,696,844 | ||||||
Series 2006-2 3A1 5.75% 3/25/36 | 1,989,709 | 2,029,741 | ||||||
Series 2006-3 A11 5.50% 3/25/36 | 1,916,173 | 1,969,311 | ||||||
Series 2006-20 A1 5.50% 12/25/21 | 584,521 | 593,306 | ||||||
Series 2006-AR5 2A1 2.713% 4/25/36 ● | 1,674,041 | 1,572,374 | ||||||
Series 2007-14 1A1 6.00% 10/25/37 | 104,214 | 105,898 | ||||||
WinWater Mortgage Loan Trust | ||||||||
Series 2015-3 B1 144A 3.907% 3/20/45 #● | 2,807,934 | 2,824,886 | ||||||
|
| |||||||
Total Non-Agency Collateralized Mortgage Obligations (cost $73,232,449) | 77,067,680 | |||||||
|
| |||||||
43
Table of Contents
Schedule of investments
Delaware Diversified Income Fund
| Principal amount° | Value (U.S. $) | |||||||
| ||||||||
Regional Bonds – 0.30%D | ||||||||
| ||||||||
Argentina – 0.11% | ||||||||
Provincia de Buenos Aires 144A 9.95% 6/9/21 #* | 5,890,000 | $ | 6,081,425 | |||||
|
| |||||||
| 6,081,425 | ||||||||
|
| |||||||
Australia – 0.11% | ||||||||
New South Wales Treasury 4.00% 5/20/26 | AUD | 5,181,200 | 4,028,489 | |||||
Queensland Treasury 144A 3.25% 7/21/26 # | AUD | 2,839,000 | 2,017,309 | |||||
|
| |||||||
| 6,045,798 | ||||||||
|
| |||||||
Canada – 0.08% | ||||||||
Province of Ontario Canada 3.45% 6/2/45 | CAD | 2,594,000 | 2,026,145 | |||||
Province of Quebec Canada 6.00% 10/1/29 | CAD | 1,985,000 | 2,037,156 | |||||
|
| |||||||
| 4,063,301 | ||||||||
|
| |||||||
Total Regional Bonds (cost $16,950,147) | 16,190,524 | |||||||
|
| |||||||
| ||||||||
Senior Secured Loans – 9.91%« | ||||||||
| ||||||||
21st Century Oncology Tranche B 1st Lien 6.50% 4/30/22 @ | 5,067,300 | 4,864,608 | ||||||
Accudyne Industries Borrower 1st Lien 4.00% 12/13/19 @ | 6,680,000 | 6,156,736 | ||||||
Air Medical Group Holdings Tranche B 1st Lien 4.50% 4/28/22 @ | 11,291,700 | 11,128,377 | ||||||
Albertson’s Tranche B4 1st Lien 5.50% 8/25/21 @ | 11,439,296 | 11,454,316 | ||||||
Altice Financing Tranche B 1st Lien 5.25% 2/4/22 @ | 6,862,800 | 6,862,800 | ||||||
Amaya Holdings 1st Lien 5.00% 8/1/21 @ | 5,874,051 | 5,754,121 | ||||||
American Tire Distributors 1st Lien 5.25% 9/26/21 @ | 3,248,675 | 3,258,827 | ||||||
Applied Systems 1st Lien 4.25% 1/23/21 @ | 2,593,562 | 2,580,825 | ||||||
Applied Systems 2nd Lien 7.50% 1/23/22 @ | 5,885,662 | 5,787,566 | ||||||
Arnhold & S Bleichroeder Holdings Tranche B 1st Lien 4.75% 1/30/22 @ | 7,730,000 | 7,575,400 | ||||||
Atkore International 2nd Lien 7.75% 10/9/21 @ | 4,194,000 | 3,701,205 | ||||||
Avaya 1st Lien 4.823% 10/26/17 @ | 13,843,555 | 11,420,933 | ||||||
Axalta Coating Systems U.S. Holdings 1st Lien 3.75% 2/1/20 @ | 4,332,494 | 4,327,078 | ||||||
Beacon Roofing Supply tranche B 1st Lien 4.00% 10/1/22 @ | 514,000 | 514,241 | ||||||
Berry Plastics Group 1st Lien 4.00% 10/1/22 @ | 1,540,000 | 1,544,706 | ||||||
BJ’s Wholesale Club 1st Lien 4.50% 9/26/19 @ | 5,655,462 | 5,605,587 | ||||||
BJ’s Wholesale Club 2nd Lien 8.50% 3/31/20 @ | 5,820,000 | 5,686,140 | ||||||
Builders FirstSourse Tranche B 1st Lien 6.00% 7/31/22 @ | 7,035,000 | 7,009,716 | ||||||
Burlington Coat Factory Warehouse Tranche B3 1st Lien 4.25% 8/13/21 @ | 2,876,251 | 2,883,689 | ||||||
BWAY Holding Tranche B 1st Lien 5.50% 8/14/20 @ | 5,525,063 | 5,542,328 | ||||||
Caesars Growth Properties Holdings Tranche B 1st Lien 6.25% 5/8/21 @ | 11,235,449 | 9,978,483 | ||||||
CCO Safari III Tranche H 1st Lien 3.25% 8/24/21 @ | 791,000 | 791,440 | ||||||
44
Table of Contents
| Principal amount° | Value (U.S. $) | |||||||
| ||||||||
Senior Secured Loans« (continued) | ||||||||
| ||||||||
CCO Safari III Tranche I 1st Lien 3.50% 1/21/23 @ | 2,373,000 | $ | 2,373,743 | |||||
CDS U.S. Intermediate Holdings 1st Lien 5.00% 7/8/22 @ | 2,065,000 | 2,075,583 | ||||||
CDS U.S. Intermediate Holdings 2nd Lien 9.25% 6/24/23 @ | 900,000 | 889,500 | ||||||
CityCenter Holdings Tranche B 1st Lien 4.25% 10/16/20 @ | 3,274,609 | 3,279,727 | ||||||
Communications Sales & Leasing Tranche B 1st Lien 5.00% 10/24/22 @ | 8,768,025 | 8,293,087 | ||||||
Community Health Systems Tranche G 1st Lien 3.75% 12/31/19 @ | 3,444,821 | 3,434,593 | ||||||
Community Health Systems Tranche H 1st Lien 4.00% 1/27/21 @ | 7,400,716 | 7,390,954 | ||||||
DAE Aviation Holdings 1st Lien 5.25% 7/7/22 @ | 2,640,000 | 2,636,700 | ||||||
DaVita Healthcare Partners Tranche B 1st Lien 3.50% 6/24/21 @ | 3,890,750 | 3,899,072 | ||||||
Drillships Financing Holding 1st Lien 6.00% 3/31/21 @ | 9,660,775 | 5,627,402 | ||||||
Drillships Ocean Ventures Tranche B 1st Lien 5.50% 7/25/21 @ | 4,535,139 | 2,951,618 | ||||||
Emdeon 1st Lien 3.75% 11/2/18 @ | 3,778,264 | 3,760,948 | ||||||
Endo Luxembourg Finance I Sarl Tranche B 1st Lien 3.75% 9/25/22 @ | 2,640,000 | 2,602,710 | ||||||
Energy Transfer Equity 1st Lien | ||||||||
3.25% 12/2/19 @ | 3,010,000 | 2,882,075 | ||||||
4.00% 12/2/19 @ | 1,951,765 | 1,898,497 | ||||||
First Data Tranche B 1st Lien 4.197% 3/24/21 @ | 4,597,445 | 4,608,102 | ||||||
First Data Tranche C1 1st Lien 3.697% 3/24/18 @ | 6,890,822 | 6,851,344 | ||||||
Flying Fortress 1st Lien 3.50% 6/30/17 @ | 1,225,209 | 1,227,315 | ||||||
FMG Resources August 2006 Pty 1st Lien 3.75% 6/30/19 @ | 10,905,053 | 9,266,569 | ||||||
Gardner Denver 1st Lien 4.25% 7/30/20 @ | 11,271,394 | 10,596,677 | ||||||
Gates Global 1st Lien 4.25% 7/3/21 @ | 2,638,350 | 2,488,843 | ||||||
Green Energy Partners Tranche B 1st Lien 6.50% 11/13/21 @ | 1,711,000 | 1,668,225 | ||||||
Hilton Worldwide Finance 1st Lien 3.50% 10/25/20 @ | 8,288,783 | 8,315,257 | ||||||
Houghton International 1st Lien 4.25% 12/20/19 @ | 1,867,200 | 1,867,979 | ||||||
Houghton International 2nd Lien 9.75% 12/21/20 @ | 2,605,000 | 2,585,463 | ||||||
Hudson’s Bay tranche B 1st Lien 4.75% 9/30/22 @ | 7,880,000 | 7,904,625 | ||||||
Huntsman International Tranche B 1st Lien 3.75% 10/1/21 @ | 5,821,013 | 5,753,099 | ||||||
Hyperion Insurance Group Tranche B 1st Lien 5.50% 4/30/22 @ | 4,333,225 | 4,351,282 | ||||||
IASIS Healthcare Tranche B 1st Lien 4.50% 5/3/18 @ | 7,972,153 | 7,997,895 | ||||||
IBC Capital 1st Lien 4.75% 9/15/21 @ | 2,650,727 | 2,438,669 | ||||||
iHeartCommunications Tranche D 1st Lien 6.938% 1/30/19 @ | 18,035,000 | 15,155,839 | ||||||
45
Table of Contents
Schedule of investments
Delaware Diversified Income Fund
| Principal amount° | Value (U.S. $) | |||||||
| ||||||||
Senior Secured Loans« (continued) | ||||||||
| ||||||||
iHeartCommunications Tranche E 1st Lien 7.688% 7/30/19 @ | 1,349,729 | $ | 1,147,270 | |||||
Immucor 1st Lien 5.00% 8/19/18 @ | 10,558,260 | 10,360,292 | ||||||
Ineos U.S. Finance Tranche B 1st Lien | ||||||||
3.75% 12/15/20 @ | 5,904,468 | 5,761,774 | ||||||
4.25% 3/31/22 @ | 1,303,447 | 1,288,783 | ||||||
Informatica Tranche B 1st Lien 4.50% 6/3/22 @ | 1,855,000 | 1,837,416 | ||||||
Intelsat Jackson Holdings 1st Lien 3.75% 6/30/19 @ | 10,202,366 | 9,907,457 | ||||||
J.C. Penney 1st Lien 6.00% 5/22/18 @ | 3,610,765 | 3,603,995 | ||||||
KIK Custom Products 1st Lien 6.00% 8/26/22 @ | 9,435,000 | 9,243,356 | ||||||
Kinetic Concepts Tranche E1 1st Lien 4.50% 5/4/18 @ | 1,408,509 | 1,410,270 | ||||||
Landry’s Tranche B 1st Lien 4.00% 4/24/18 @ | 4,685,853 | 4,696,809 | ||||||
Level 3 Financing 1st Lien 4.00% 1/15/20 @ | 8,015,000 | 8,045,056 | ||||||
Linxens France 1st Lien 5.00% 7/11/22 @ | 1,810,000 | 1,799,442 | ||||||
LTS Buyer 1st Lien 4.00% 4/13/20 @ | 966,055 | 954,427 | ||||||
LTS Buyer 2nd Lien 8.00% 4/1/21 @ | 3,141,138 | 3,083,551 | ||||||
Marina District Finance Tranche B 1st Lien 6.50% 8/15/18 @ | 4,847,087 | 4,864,236 | ||||||
Mauser Holding Sarl 2nd Lien 8.75% 7/31/22 @ | 557,000 | 527,758 | ||||||
MGM Resorts International 1st Lien 3.50% 12/20/19 @ | 2,699,625 | 2,698,262 | ||||||
Moxie Patriot 1st Lien 6.75% 12/19/20 @ | 2,669,000 | 2,548,895 | ||||||
MPH Acquisition Holdings Tranche B 1st Lien 3.75% 3/31/21 @ | 7,246,582 | 7,164,304 | ||||||
Neiman Marcus Group 1st Lien 4.25% 10/25/20 @ | 1,969,962 | 1,925,191 | ||||||
Neptune Finco tranche B 1st Lien 5.00% 10/9/22 @ | 2,830,000 | 2,843,089 | ||||||
New Albertsons 1st Lien 4.75% 6/27/21 @ | 1,573,152 | 1,567,450 | ||||||
Numericable U.S. 1st Lien 4.50% 5/21/20 @ | 6,934,753 | 6,865,406 | ||||||
Numericable U.S. Tranche B2 1st Lien 4.50% 5/21/20 @ | 5,999,507 | 5,932,480 | ||||||
Pabst Blue Ribbon 1st Lien 5.75% 11/13/21 @ | 3,914,430 | 3,920,956 | ||||||
Pabst Blue Ribbon 2nd Lien 9.25% 11/13/22 @ | 1,610,000 | 1,583,838 | ||||||
Panda Hummel Term Loan B1 1st Lien 7.00% 10/26/22 @ | 2,825,000 | 2,754,375 | ||||||
Panda Liberty Tranche B 1st Lien 7.50% 8/21/20 @ | 6,087,000 | 5,843,520 | ||||||
Prime Security Services Borrower 2nd Lien 9.75% 7/1/22 @ | 4,605,000 | 4,541,681 | ||||||
Quickrete Holdings 2nd Lien 7.00% 3/30/21 @ | 3,072,632 | 3,082,234 | ||||||
Republic of Angola (Unsecured) 6.25% 12/16/23 @ | 11,720,000 | 10,548,000 | ||||||
Reynolds Group Holdings Tranche B 1st Lien 4.50% 12/1/18 @ | 5,897,858 | 5,914,077 | ||||||
Rite Aid 2nd Lien | ||||||||
4.875% 6/21/21 @ | 2,465,000 | 2,473,859 | ||||||
5.75% 8/21/20 @ | 6,310,000 | 6,373,100 | ||||||
RPI Finance Trust Tranche B4 1st Lien 3.50% 11/9/20 @ | 1,558,225 | 1,555,465 | ||||||
SAM Finance Lux Tranche B 1st Lien 4.25% 12/17/20 @ | 2,233,973 | 2,246,191 | ||||||
Scientific Games International 1st Lien 6.00% 10/18/20 @ | 9,820,087 | 9,620,622 | ||||||
46
Table of Contents
| Principal amount° | Value (U.S. $) | |||||||
| ||||||||
Senior Secured Loans« (continued) | ||||||||
| ||||||||
Sensus USA 2nd Lien 8.50% 5/9/18 @ | 2,660,000 | $ | 2,640,050 | |||||
SIG Combibloc PurchaseCo Sarl 1st Lien 4.25% 3/13/22 @ | 5,387,925 | 5,394,288 | ||||||
Sinclair Television Group Tranche B1 1st Lien 3.50% 7/31/21 @ | 2,718,188 | 2,701,199 | ||||||
Solenis International 1st Lien 4.25% 7/31/21 @ | 2,326,500 | 2,293,420 | ||||||
Solenis International 2nd Lien 7.75% 7/31/22 @ | 1,240,000 | 1,169,733 | ||||||
Spectrum Brands 1st Lien 3.75% 6/23/22 @ | 2,238,080 | 2,250,146 | ||||||
SS&C European Holdings Sarl Tranche B2 1st Lien 4.00% 7/8/22 @ | 319,157 | 320,523 | ||||||
SS&C Technologies Tranche B1 1st Lien 4.00% 7/8/22 @ | 2,062,700 | 2,071,526 | ||||||
Stardust Finance Holdings Tranche B 1st Lien 6.50% 3/13/22 @ | 7,530,075 | 7,445,362 | ||||||
Summit Materials Tranche B 1st Lien 4.25% 7/17/22 @ | 2,633,400 | 2,632,578 | ||||||
SUPERVALU 1st Lien 4.50% 3/21/19 @ | 3,155,361 | 3,155,181 | ||||||
Surgical Care Affiliates Tranche B 1st Lien 4.25% 3/17/22 @ | 3,785,975 | 3,785,975 | ||||||
TransDigm Tranche E 1st Lien 3.50% 5/14/22 @ | 5,762,006 | 5,663,574 | ||||||
Tribune Media Tranche B 1st Lien 3.75% 12/27/20 @ | 2,633,400 | 2,631,723 | ||||||
Univar USA Tranche B 1st Lien 4.25% 7/1/22 @ | 844,780 | 832,711 | ||||||
Univision Communications 1st Lien 4.00% 3/1/20 @ | 2,114,937 | 2,103,536 | ||||||
Univision Communications Tranche C4 1st Lien 4.00% 3/1/20 @ | 7,146,462 | 7,102,790 | ||||||
USI 1st Lien 4.25% 12/27/19 @ | 8,778,166 | 8,701,357 | ||||||
Valeant Pharmaceuticals International 3.75% 12/11/19 @ | 1,525,000 | 1,430,450 | ||||||
Valeant Pharmaceuticals International 1st Lien 3.75% 8/5/20 @ | 6,844,827 | 6,379,379 | ||||||
Valeant Pharmaceuticals International Tranche B-F1 1st Lien 4.00% 4/1/22 @ | 8,868,300 | 8,263,358 | ||||||
Varsity Brands Tranche B 1st Lien 5.00% 12/15/21 @ | 3,627,587 | 3,625,320 | ||||||
Visant 1st Lien 7.00% 9/23/21 @ | 4,804,688 | 4,775,120 | ||||||
Weight Watchers International 1st Lien 3.20% 4/2/16 @ | 1,871,566 | 1,843,492 | ||||||
WideOpenWest Finance Tranche B 1st Lien 4.50% 4/1/19 @ | 10,626,113 | 10,492,181 | ||||||
Ziggo Tranche B 1st Lien 3.50% 1/15/22 @ | 1,332,900 | 1,313,218 | ||||||
Ziggo Tranche B1 1st Lien 3.50% 1/15/22 @ | 782,100 | 770,551 | ||||||
|
| |||||||
Total Senior Secured Loans (cost $550,498,091) | 533,826,142 | |||||||
|
| |||||||
| ||||||||
Sovereign Bonds – 2.56%D | ||||||||
| ||||||||
Australia – 0.09% | ||||||||
Australia Government Bond | ||||||||
3.25% 4/21/25 | AUD | 3,397,000 | 2,550,981 | |||||
3.75% 4/21/37 | AUD | 2,743,000 | 2,105,731 | |||||
|
| |||||||
| 4,656,712 | ||||||||
|
| |||||||
47
Table of Contents
Schedule of investments
Delaware Diversified Income Fund
| Principal amount° | Value (U.S. $) | |||||||
| ||||||||
Sovereign BondsD (continued) | ||||||||
| ||||||||
Brazil – 0.08% | ||||||||
Brazilian Government International Bond 5.00% 1/27/45 | 5,800,000 | $ | 4,379,000 | |||||
|
| |||||||
| 4,379,000 | ||||||||
|
| |||||||
Canada – 0.02% | ||||||||
Canadian Government Bond 2.75% 12/1/48 | CAD | 1,202,000 | 1,005,500 | |||||
|
| |||||||
| 1,005,500 | ||||||||
|
| |||||||
Colombia – 0.13% | ||||||||
Colombia Government International Bond 5.00% 6/15/45 | 7,769,000 | 6,933,833 | ||||||
|
| |||||||
| 6,933,833 | ||||||||
|
| |||||||
Costa Rica – 0.08% | ||||||||
Costa Rica Government International Bond 5.625% 4/30/43 | 5,790,000 | 4,472,775 | ||||||
|
| |||||||
| 4,472,775 | ||||||||
|
| |||||||
Dominican Republic – 0.12% | ||||||||
Dominican Republic International Bond 144A 5.50% 1/27/25 # | 6,550,000 | 6,500,875 | ||||||
|
| |||||||
| 6,500,875 | ||||||||
|
| |||||||
Germany – 0.03% | ||||||||
Bundesrepublik Deutschland 0.50% 2/15/25 * | EUR | 1,646,000 | 1,815,716 | |||||
|
| |||||||
| 1,815,716 | ||||||||
|
| |||||||
Hungary – 0.06% | ||||||||
Hungary Government International Bond 5.375% 3/25/24 | 2,946,000 | 3,262,695 | ||||||
|
| |||||||
| 3,262,695 | ||||||||
|
| |||||||
Indonesia – 0.10% | ||||||||
Indonesia Government International Bond 144A 5.125% 1/15/45 # | 5,700,000 | 5,366,521 | ||||||
|
| |||||||
| 5,366,521 | ||||||||
|
| |||||||
Italy – 0.12% | ||||||||
Italy Buoni Poliennali Del Tesoro 1.35% 4/15/22 | EUR | 5,857,000 | 6,589,145 | |||||
|
| |||||||
| 6,589,145 | ||||||||
|
| |||||||
Jamaica – 0.10% | ||||||||
Jamaica Government International Bond 6.75% 4/28/28 | 5,200,000 | 5,304,000 | ||||||
|
| |||||||
| 5,304,000 | ||||||||
|
| |||||||
Japan – 0.02% | ||||||||
Japan Government 40 yr Bond 1.40% 3/20/55 | JPY | 148,300,000 | 1,201,636 | |||||
|
| |||||||
| 1,201,636 | ||||||||
|
| |||||||
Kazakhstan – 0.07% | ||||||||
Kazakhstan Government International Bond 144A 5.125% 7/21/25 #* | 3,885,000 | 3,877,327 | ||||||
|
| |||||||
| 3,877,327 | ||||||||
|
| |||||||
48
Table of Contents
| Principal amount° | Value (U.S. $) | |||||||||||
| ||||||||||||
Sovereign BondsD (continued) | ||||||||||||
| ||||||||||||
Mexico – 0.29% | ||||||||||||
Mexican Bonos | ||||||||||||
7.50% 6/3/27 | MXN | 96,015,000 | $ | 6,415,650 | ||||||||
10.00% 12/5/24 | MXN | 84,791,000 | 6,579,928 | |||||||||
Mexico Government International Bond | ||||||||||||
3.60% 1/30/25 | 1,637,000 | 1,632,908 | ||||||||||
4.60% 1/23/46 | 1,200,000 | 1,117,500 | ||||||||||
|
| |||||||||||
| 15,745,986 | ||||||||||||
|
| |||||||||||
Namibia – 0.09% | ||||||||||||
Namibia International Bonds 144A 5.25% 10/29/25 # | 4,700,000 | 4,670,625 | ||||||||||
|
| |||||||||||
| 4,670,625 | ||||||||||||
|
| |||||||||||
Norway – 0.02% | ||||||||||||
Kommunalbanken 5.00% 3/28/19 | NZD | 510,000 | 364,845 | |||||||||
Norway Government Bond | ||||||||||||
144A 1.75% 3/13/25 # | NOK | 3,622,000 | 432,957 | |||||||||
144A 2.00% 5/24/23 # | NOK | 1,662,000 | 204,219 | |||||||||
|
| |||||||||||
| 1,002,021 | ||||||||||||
|
| |||||||||||
Pakistan – 0.08% | ||||||||||||
Pakistan Government International Bond 144A | 4,629,000 | 4,422,186 | ||||||||||
|
| |||||||||||
| 4,422,186 | ||||||||||||
|
| |||||||||||
Peru – 0.08% | ||||||||||||
Peruvian Government International Bond 4.125% 8/25/27 | 4,068,000 | 4,108,680 | ||||||||||
|
| |||||||||||
| 4,108,680 | ||||||||||||
|
| |||||||||||
Poland – 0.12% | ||||||||||||
Poland Government Bond 3.25% 7/25/25 | PLN | 23,097,000 | 6,278,248 | |||||||||
|
| |||||||||||
| 6,278,248 | ||||||||||||
|
| |||||||||||
Portugal – 0.02% | ||||||||||||
Portugal Government International Bond 144A | 1,045,000 | 1,107,551 | ||||||||||
|
| |||||||||||
| 1,107,551 | ||||||||||||
|
| |||||||||||
Republic of Korea – 0.14% | ||||||||||||
Inflation Linked Korea Treasury Bond 1.125% 6/10/23 | KRW | 8,933,698,798 | 7,584,071 | |||||||||
|
| |||||||||||
| 7,584,071 | ||||||||||||
|
| |||||||||||
Serbia – 0.08% | ||||||||||||
Republic of Serbia 144A 4.875% 2/25/20 # | 4,350,000 | 4,500,723 | ||||||||||
|
| |||||||||||
| 4,500,723 | ||||||||||||
|
| |||||||||||
Singapore – 0.09% | ||||||||||||
Temasek Financial I 144A 2.375% 1/23/23 #* | 4,915,000 | 4,851,700 | ||||||||||
|
| |||||||||||
| 4,851,700 | ||||||||||||
|
| |||||||||||
South Africa – 0.16% | ||||||||||||
South Africa Government Bond 8.00% 1/31/30 | ZAR | 84,590,000 | 5,759,791 | |||||||||
49
Table of Contents
Schedule of investments
Delaware Diversified Income Fund
| Principal amount° | Value (U.S. $) | |||||||||||
| ||||||||||||
Sovereign BondsD (continued) | ||||||||||||
| ||||||||||||
South Africa (continued) | ||||||||||||
South Africa Government International Bond | 2,933,000 | $ | 2,887,788 | |||||||||
|
| |||||||||||
| 8,647,579 | ||||||||||||
|
| |||||||||||
Sri Lanka – 0.15% | ||||||||||||
Sri Lanka Government International Bond | ||||||||||||
144A 6.125% 6/3/25 # | 6,900,000 | 6,547,976 | ||||||||||
144A 6.85% 11/3/25 # | 1,405,000 | 1,391,041 | ||||||||||
|
| |||||||||||
| 7,939,017 | ||||||||||||
|
| |||||||||||
United Kingdom – 0.13% | ||||||||||||
United Kingdom Gilt | ||||||||||||
3.25% 1/22/44 | GBP | 1,752,900 | 3,041,678 | |||||||||
3.50% 1/22/45 | GBP | 1,169,100 | 2,127,452 | |||||||||
United Kingdom Gilt Inflation Linked 0.125% 3/22/24 | GBP | 994,538 | 1,648,322 | |||||||||
|
| |||||||||||
| 6,817,452 | ||||||||||||
|
| |||||||||||
Uruguay – 0.09% | ||||||||||||
Uruguay Government International Bond 4.375% 10/27/27 | 4,804,000 | 4,791,990 | ||||||||||
|
| |||||||||||
| 4,791,990 | ||||||||||||
|
| |||||||||||
Total Sovereign Bonds (cost $142,415,431) | 137,833,564 | |||||||||||
|
| |||||||||||
| ||||||||||||
Supranational Banks – 0.38% | ||||||||||||
| ||||||||||||
European Bank for Reconstruction & Development | IDR | 34,970,000,000 | 2,313,321 | |||||||||
Inter-American Development Bank 6.00% 9/5/17 | INR | 377,950,000 | 5,730,088 | |||||||||
International Bank for Reconstruction & Development | ||||||||||||
0.267% 4/17/19 ● | 2,469,000 | 2,467,519 | ||||||||||
2.50% 11/25/24 | 2,469,000 | 2,520,810 | ||||||||||
3.75% 2/10/20 * | NZD | 3,300,000 | 2,280,127 | |||||||||
4.625% 10/6/21 * | NZD | 6,497,000 | 4,669,604 | |||||||||
International Finance 3.625% 5/20/20 | NZD | 1,035,000 | 711,085 | |||||||||
|
| |||||||||||
Total Supranational Banks (cost $22,335,423) | 20,692,554 | |||||||||||
|
| |||||||||||
| ||||||||||||
U.S. Treasury Obligations – 10.47% | ||||||||||||
| ||||||||||||
U.S. Treasury Bond | ||||||||||||
2.875% 8/15/45 | 28,774,000 | 28,437,373 | ||||||||||
U.S. Treasury Notes | ||||||||||||
1.375% 9/30/20 * | 163,875,000 | 162,775,071 | ||||||||||
1.375% 10/31/20 | 133,985,000 | 133,018,030 | ||||||||||
2.00% 8/15/25 ¥ | 243,040,000 | 239,840,621 | ||||||||||
|
| |||||||||||
Total U.S. Treasury Obligations (cost $568,273,471) | 564,071,095 | |||||||||||
|
| |||||||||||
50
Table of Contents
| Number of Shares | Value (U.S. $) | |||||||
| ||||||||
Common Stock – 0.00% | ||||||||
| ||||||||
Century Communications =† | 7,875,000 | $ | 0 | |||||
|
| |||||||
Total Common Stock (cost $238,403) | 0 | |||||||
|
| |||||||
| ||||||||
Convertible Preferred Stock – 0.37% | ||||||||
| ||||||||
Alcoa 5.375% exercise price $19.39, expiration date 10/1/17 * | 34,550 | 1,092,817 | ||||||
Anadarko Petroleum 7.50% exercise price $69.84, expiration date 6/7/18 * | 27,875 | 1,121,411 | ||||||
Bank of America 7.25% exercise price $50.00, expiration date 12/31/49 | 1,477 | 1,615,838 | ||||||
Chesapeake Energy 5.75% exercise price $26.10, expiration date 12/31/49 | 1,633 | 734,850 | ||||||
Crown Castle International 4.50% exercise price $87.58, expiration date 11/1/16 | 5,995 | 637,089 | ||||||
Dominion Resources 6.125% exercise price $64.91, expiration date 4/1/16 | 23,556 | 1,314,660 | ||||||
Dynegy 5.375% exercise price $38.75, expiration date 11/1/17 *@ | 16,660 | 1,212,515 | ||||||
Exelon 6.50% exercise price $43.75, expiration date 6/1/17 | 38,450 | 1,605,672 | ||||||
Halcon Resources 5.75% exercise price $6.16, expiration date 12/31/49 @ | 2,077 | 344,782 | ||||||
Huntington Bancshares 8.50% exercise price $11.95, expiration date 12/31/49 @ | 1,768 | 2,369,120 | ||||||
Intelsat 5.75% exercise price $22.05, expiration date 5/1/16 @ | 59,086 | 1,125,588 | ||||||
Maiden Holdings 7.25% exercise price $15.22, expiration date 9/15/16 * | 43,033 | 2,381,877 | ||||||
T-Mobile U.S. 5.50% exercise price $31.02, expiration date 12/15/17 | 22,922 | 1,524,084 | ||||||
Wells Fargo 7.50% exercise price $156.71, expiration date 12/31/49 | 2,210 | 2,618,850 | ||||||
|
| |||||||
Total Convertible Preferred Stock (cost $25,349,280) | 19,699,153 | |||||||
|
| |||||||
| ||||||||
Preferred Stock – 0.70% | ||||||||
| ||||||||
Ally Financial 144A 7.00% # | 4,915 | 5,033,728 | ||||||
Bank of America 6.10% ● | 3,595,000 | 3,639,937 | ||||||
Integrys Energy Group 6.00% @● | 205,350 | 5,242,852 | ||||||
National Retail Properties 5.70% | 67,445 | 1,696,916 | ||||||
PNC Preferred Funding Trust II 144A 1.56% #● | 13,900,000 | 12,874,875 | ||||||
Public Storage 5.20% * | 212,995 | 5,263,106 | ||||||
USB Realty 144A 1.468% #● | 4,485,000 | 4,075,744 | ||||||
|
| |||||||
Total Preferred Stock (cost $34,731,710) | 37,827,158 | |||||||
|
| |||||||
51
Table of Contents
Schedule of investments
Delaware Diversified Income Fund
| Principal amount° | Value (U.S. $) | |||||||
| ||||||||
Short-Term Investments – 11.41% | ||||||||
| ||||||||
Discount Notes – 6.46%≠ | ||||||||
Federal Home Loan Bank | ||||||||
0.07% 11/3/15 | 8,813,294 | $ | 8,813,294 | |||||
0.083% 1/4/16 | 83,513,692 | 83,502,000 | ||||||
0.12% 1/25/16 | 29,883,001 | 29,877,413 | ||||||
0.135% 3/7/16 | 40,723,658 | 40,698,694 | ||||||
0.138% 2/26/16 | 31,203,698 | 31,192,651 | ||||||
0.139% 2/18/16 | 32,772,107 | 32,761,292 | ||||||
0.148% 1/19/16 | 12,310,961 | 12,308,831 | ||||||
0.151% 2/3/16 | 38,916,596 | 38,905,544 | ||||||
0.153% 12/2/15 | 17,672,673 | 17,672,231 | ||||||
0.153% 1/21/16 | 25,076,706 | 25,072,242 | ||||||
0.19% 3/22/16 | 22,116,045 | 22,100,895 | ||||||
0.295% 3/2/16 | 4,892,210 | 4,889,334 | ||||||
|
| |||||||
| 347,794,421 | ||||||||
|
| |||||||
Repurchase Agreements – 4.95% | ||||||||
Bank of America Merrill Lynch | ||||||||
market value $45,733,206) | 44,836,473 | 44,836,473 | ||||||
Bank of Montreal | ||||||||
market value $22,866,601) | 22,418,236 | 22,418,236 | ||||||
BNP Paribas | ||||||||
market value $203,492,041) | 199,501,978 | 199,501,978 | ||||||
|
| |||||||
| 266,756,687 | ||||||||
|
| |||||||
Total Short-Term Investments (cost $614,531,434) | 614,551,108 | |||||||
|
| |||||||
Total Value of Securities Before Securities | 5,934,054,671 | |||||||
|
| |||||||
52
Table of Contents
| Number of Shares | Value (U.S. $) | |||||||
| ||||||||
Securities Lending Collateral – 4.73%** | ||||||||
| ||||||||
Investment Company | ||||||||
Delaware Investments® Collateral Fund No. 1 | 255,054,924 | $ | 255,054,924 | |||||
|
| |||||||
Total Securities Lending Collateral (cost $255,054,924) | 255,054,924 | |||||||
|
| |||||||
Total Value of Securities – 114.87% | $ | 6,189,109,595n | ||||||
|
| |||||||
| # | Security exempt from registration under Rule 144A of the Securities Act of 1933, as amended. At Oct. 31, 2015, the aggregate value of Rule 144A securities was $1,121,637,633, which represents 20.82% of the Fund’s net assets. See Note 11 in “Notes to financial statements.” |
| * | Fully or partially on loan. |
| ** | See Note 10 in “Notes to financial statements” for additional information on securities lending collateral. |
| @ | Illiquid security. At Oct. 31, 2015, the aggregate value of illiquid securities was $533,826,142, which represents 9.91% of the Fund’s net assets. See Note 11 in “Notes to financial statements.” |
| ¿ | Pass Through Agreement. Security represents the contractual right to receive a proportionate amount of underlying payments due to the counterparty pursuant to various agreements related to the rescheduling of obligations and the exchange of certain notes. |
| = | Security is being fair valued in accordance with the Fund’s fair valuation policy. At Oct. 31, 2015, the aggregate value of fair valued securities was $0, which represents 0.00% of the Fund’s net assets. |
See Note 1 in “Notes to financial statements.”
| ≠ | The rate shown is the effective yield at the time of purchase. |
| n | Includes $248,165,391 of securities loaned. |
| ° | Principal amount shown is stated in U.S. dollars unless noted that the security is denominated in another currency. |
| † | Non-income-producing security. |
| ● | Variable rate security. The rate shown is the rate as of Oct. 31, 2015. Interest rates reset periodically. |
| ¥ | Fully or partially pledged as collateral for futures contracts. |
| D | Securities have been classified by country of origin. |
| S | Interest only security. An interest only security is the interest only portion of a fixed income security which is separated and sold individually from the principal portion of the security. |
| « | Senior secured loans generally pay interest at rates which are periodically redetermined by reference to a base lending rate plus a premium. These base lending rates are generally: (i) the prime rate offered by one or more U.S. banks, (ii) the lending rate offered by one or more European banks such as the London Interbank Offered Rate (LIBOR), and (iii) the certificate of deposit rate. Senior secured loans may be subject to restrictions on resale. Stated rate in effect at Oct. 31, 2015. |
53
Table of Contents
Schedule of investments
Delaware Diversified Income Fund
| f | Step coupon bond. Coupon increases or decreases periodically based on a predetermined schedule. Stated rate in effect at Oct. 31, 2015. |
The following foreign currency exchange contracts, futures contracts, and swap contracts were outstanding at Oct. 31, 2015:1
Foreign Currency Exchange Contracts
Counterparty | Contracts to Receive (Deliver) | In Exchange For | Settlement Date | Unrealized Appreciation (Depreciation) | ||||||||||||||
BAML | AUD | 218,049 | USD | (121,220 | ) | 11/23/15 | $ | 34,024 | ||||||||||
BAML | CAD | (11,028,908 | ) | USD | 8,490,731 | 11/23/15 | 58,174 | |||||||||||
BAML | EUR | (3,249,893 | ) | USD | 3,689,660 | 11/23/15 | 115,503 | |||||||||||
BAML | JPY | (881,503,168 | ) | USD | 7,325,530 | 11/24/15 | 19,464 | |||||||||||
BAML | NZD | (19,172,716 | ) | USD | 12,791,279 | 11/23/15 | (164,444 | ) | ||||||||||
BNP | AUD | (8,296,448 | ) | USD | 6,054,639 | 11/23/15 | 147,821 | |||||||||||
BNP | MXN | (42,414,851 | ) | USD | 2,573,044 | 11/23/15 | 11,282 | |||||||||||
BNP | NOK | (29,818,164 | ) | USD | 3,680,692 | 11/23/15 | 173,383 | |||||||||||
HSBC | GBP | (4,627,733 | ) | USD | 7,090,182 | 11/23/15 | (42,000 | ) | ||||||||||
JPMC | KRW | (8,525,381,610 | ) | USD | 7,487,600 | 11/23/15 | 26,800 | |||||||||||
JPMC | PLN | (8,143,900 | ) | USD | 2,150,272 | 11/23/15 | 45,315 | |||||||||||
JPMC | SEK | 5,329,174 | USD | (640,870 | ) | 11/23/15 | (16,892 | ) | ||||||||||
TD | CAD | 10,472,970 | USD | (8,038,138 | ) | 11/23/15 | (30,643 | ) | ||||||||||
TD | EUR | (12,231,900 | ) | USD | 13,535,236 | 11/23/15 | 82,878 | |||||||||||
TD | IDR | (22,628,128,280 | ) | USD | 1,666,283 | 11/23/15 | 27,454 | |||||||||||
TD | JPY | 412,077,475 | USD | (3,428,394 | ) | 11/24/15 | (13,016 | ) | ||||||||||
UBS | INR | 193,830,339 | USD | (2,977,882 | ) | 11/23/15 | (26,404 | ) | ||||||||||
UBS | MXN | 83,684,788 | USD | (5,064,259 | ) | 11/23/15 | (9,884 | ) | ||||||||||
|
| |||||||||||||||||
| $ | 438,815 | |||||||||||||||||
|
| |||||||||||||||||
Futures Contracts
| Contracts to Buy (Sell) | Notional Cost (Proceeds) | Notional Value | Expiration Date | Unrealized Appreciation (Depreciation) | ||||||||||||||||
| 1,179 | Euro-Bund | $ | 199,043,093 | $ | 203,783,706 | 12/8/15 | $ | 4,740,613 | ||||||||||||
| (839) | S&P 500 Index E-mini | (81,512,777 | ) | (86,991,715 | ) | 12/21/15 | (5,478,938 | ) | ||||||||||||
| (1,288) | U.S. Treasury 5 yr Notes | (154,360,125 | ) | (154,268,188 | ) | 1/2/16 | 91,937 | |||||||||||||
| 2,000 | U.S. Treasury 10 yr Notes | 255,679,027 | 255,375,000 | 12/22/15 | (304,027 | ) | ||||||||||||||
| 800 | U.S. Treasury Long Bonds | 125,362,590 | 125,150,000 | 12/22/15 | (212,590 | ) | ||||||||||||||
|
|
|
| |||||||||||||||||
| $ | 344,211,808 | $ | (1,163,005 | ) | ||||||||||||||||
|
|
|
| |||||||||||||||||
54
Table of Contents
Swap Contracts
CDS Contracts2
Counterparty | Swap Referenced Obligation | Notional Value3 | Annual | Termination Date | Unrealized | |||||||||||||
Protection Purchased: | ||||||||||||||||||
ICE | JPMC - CDX.NA.HY.24 | 27,041,850 | 5.00% | 6/20/20 | $ | (50,999) | ||||||||||||
ICE | JPMC - iTraxx Euro Crossover Series 24.1 | EUR | 17,805,000 | 5.00% | 12/20/20 | (103,889) | ||||||||||||
JPMC | CDX.EM.24 | 27,422,360 | 1.00% | 12/20/20 | (107,127) | |||||||||||||
JPMC | People’s Republic of China | 11,112,000 | 1.00% | 9/20/20 | (19,659) | |||||||||||||
|
| |||||||||||||||||
| $ | (281,674) | |||||||||||||||||
|
| |||||||||||||||||
The use of foreign currency exchange contracts, futures contracts, and swap contracts involves elements of market risk and risks in excess of the amounts disclosed in the financial statements. The notional values and foreign currency exchange contracts presented above represent the Fund’s total exposure in such contracts, whereas only the net unrealized appreciation (depreciation) is reflected in the Fund’s net assets.
1See Note 8 in “Notes to financial statements.”
2A CDS contract is a risk-transfer instrument through which one party (purchaser of protection) transfers to another party (seller of protection) the financial risk of a credit event (as defined in the CDS agreement), as it relates to a particular reference security or basket of securities (such as an index). Periodic payments (receipts) on such contracts are accrued daily and recorded as unrealized losses (gains) on swap contracts. Upon payment (receipt), such amounts are recorded as realized losses (gains) on swap contracts. Upfront payments made or received in connection with CDS contracts are amortized over the expected life of the CDS contracts as unrealized losses (gains) on swap contracts. The change in value of CDS contracts is recorded daily as unrealized appreciation or depreciation. A realized gain or loss is recorded upon a credit event (as defined in the CDS agreement) or the maturity or termination of the agreement.
3Notional value shown is stated in U.S. Dollars unless noted that the swap is denominated in another currency.
4Unrealized appreciation (depreciation) does not include periodic interest payments on swap contracts accrued daily in the amount of $(289,396).
Summary of abbreviations:
AMT – Subject to Alternative Minimum Tax
ARM – Adjustable Rate Mortgage
AUD – Australian Dollar
BAML – Bank of America Merrill Lynch
BNP – Banque Paribas
CAD – Canadian Dollar
CDS – Credit Default Swap
CDX.EM – Credit Default Swap Index Emerging Markets
CDX.NA.HY – Credit Default Swap Index North America High Yield
CLO – Collateralized Loan Obligation
DB – Deutsche Bank
EUR – European Monetary Unit
55
Table of Contents
Schedule of investments
Delaware Diversified Income Fund
Summary of abbreviations (continued):
GBP – British Pound Sterling
GE – General Electric
GNMA – Government National Mortgage Association
GS – Goldman Sachs
GSMPS – Goldman Sachs Reperforming Mortgage Securities
HSBC – Hong Kong Shanghai Bank
ICE – Intercontinental Exchange, Inc.
IDR – Indonesian Rupiah
INR – Indian Rupee
JPMBB – JPMorgan Barclays Bank
JPMC – JPMorgan Chase Bank
JPY – Japanese Yen
KRW – South Korean Won
LB – Lehman Brothers
MASTR – Mortgage Asset Securitization Transactions, Inc.
MXN – Mexican Peso
NOK – Norwegian Krone
NZD – New Zealand Dollar
PLN – Polish Zloty
RBS – Royal Bank of Scotland
REMIC – Real Estate Mortgage Investment Conduit
SEK – Swedish Krona
S.F. – Single Family
TBA – To be announced
TD – Toronto Dominion Bank
UBS – Union Bank of Switzerland
USD – U.S. Dollar
WaMu – Washington Mutual
WF – Wells Fargo
yr – Year
ZAR – South African Rand
See accompanying notes, which are an integral part of the financial statements.
56
Table of Contents
This page intentionally left blank.
Table of Contents
| Statement of assets and liabilities | ||
| Delaware Diversified Income Fund | October 31, 2015 |
Assets: | ||||
Investments, at value1,2 | $ | 5,319,503,563 | ||
Short-term investments, at value3 | 614,551,108 | |||
Short-term investments held as collateral for loaned securities, at value4 | 255,054,924 | |||
Foreign currencies, at value5 | 6,966,857 | |||
Cash collateral due from brokers | 5,224,979 | |||
Receivable for securities sold | 545,810,641 | |||
Dividends and interest receivable | 39,899,043 | |||
Receivable for fund shares sold | 7,458,785 | |||
Upfront payments paid on credit default swap contracts | 2,925,050 | |||
Variation margin due from broker on futures contracts | 1,181,759 | |||
Unrealized appreciation on foreign currency exchange contracts | 742,098 | |||
Securities lending income receivable | 60,917 | |||
Other assets6 | 4,787,750 | |||
|
| |||
Total assets | 6,804,167,474 | |||
|
| |||
Liabilities: | ||||
Payable for securities purchased | 1,095,069,521 | |||
Obligation to return securities lending collateral | 255,054,924 | |||
Cash overdraft | 25,759,398 | |||
Payable for fund shares redeemed | 8,931,021 | |||
Distribution payable | 4,575,845 | |||
Upfront payments received on credit default swap contracts | 3,214,942 | |||
Investment management fees payable | 2,074,179 | |||
Other accrued expenses | 1,892,940 | |||
Distribution fees payable to affiliates | 1,262,978 | |||
Cash collateral due to brokers | 1,161,000 | |||
Other affiliates payable | 363,871 | |||
Swap payments payable | 308,821 | |||
Unrealized depreciation on foreign currency exchange contracts | 303,283 | |||
Unrealized depreciation on credit default swap contracts | 281,674 | |||
Variation margin due to brokers on centrally cleared credit default swap contracts | 54,408 | |||
Trustees’ fees and expenses payable | 13,864 | |||
Bond proceeds payable6 | 15,959,167 | |||
|
| |||
Total liabilities | 1,416,281,836 | |||
|
| |||
Total Net Assets | $ | 5,387,885,638 | ||
|
|
58
Table of Contents
Net Assets Consist of: | ||||
Paid-in capital | $ | 5,487,481,650 | ||
Distributions in excess of net investment income | (6,326,831 | ) | ||
Accumulated net realized loss on investments | (70,198,940 | ) | ||
Net unrealized depreciation of investments | (21,615,049 | ) | ||
Net unrealized depreciation of foreign currencies | (159,932 | ) | ||
Net unrealized appreciation of foreign currency exchange contracts | 438,815 | |||
Net unrealized depreciation of futures contracts | (1,163,005 | ) | ||
Net unrealized depreciation of swap contracts | (571,070 | ) | ||
|
| |||
Total Net Assets | $ | 5,387,885,638 | ||
|
| |||
Net Asset Value | ||||
Class A: | ||||
Net assets | $ | 1,658,921,809 | ||
Shares of beneficial interest outstanding, unlimited authorization, no par | 189,879,421 | |||
Net asset value per share | $ | 8.74 | ||
Sales charge | 4.50% | |||
Offering price per share, equal to net asset value per share / (1 – sales charge) | $ | 9.15 | ||
Class C: | ||||
Net assets | $ | 1,007,162,830 | ||
Shares of beneficial interest outstanding, unlimited authorization, no par | 115,291,408 | |||
Net asset value per share | $ | 8.74 | ||
Class R: | ||||
Net assets | $ | 101,732,181 | ||
Shares of beneficial interest outstanding, unlimited authorization, no par | 11,650,418 | |||
Net asset value per share | $ | 8.73 | ||
Institutional Class: | ||||
Net assets | $ | 2,620,068,818 | ||
Shares of beneficial interest outstanding, unlimited authorization, no par | 299,669,800 | |||
Net asset value per share | $ | 8.74 | ||
| ||||
1 Investments, at cost | $ | 5,341,138,286 | ||
2 Including securities on loan | 248,165,391 | |||
3 Short-term investments, at cost | 614,531,434 | |||
4 Short-term investments held as collateral for loaned securities, at cost | 255,054,924 | |||
5 Foreign currencies, at cost | 7,101,573 | |||
6 See Note 14 in “Notes to financial statements.” | ||||
See accompanying notes, which are an integral part of the financial statements.
59
Table of Contents
| Delaware Diversified Income Fund | Year ended October 31, 2015 |
Investment Income: | ||||
Interest | $ | 215,078,907 | ||
Dividends | 3,192,602 | |||
Securities lending income | 595,154 | |||
Foreign tax withheld | (7,556 | ) | ||
|
| |||
| 218,859,107 | ||||
|
| |||
Expenses: | ||||
Management fees | 25,465,067 | |||
Distribution expenses – Class A | 4,724,998 | |||
Distribution expenses – Class C | 11,031,509 | |||
Distribution expenses – Class R | 565,925 | |||
Dividend disbursing and transfer agent fees and expenses | 7,332,404 | |||
Accounting and administration expenses | 1,809,032 | |||
Reports and statements to shareholders | 1,421,970 | |||
Legal fees | 467,147 | |||
Custodian fees | 330,761 | |||
Trustees’ fees and expenses | 266,046 | |||
Registration fees | 131,181 | |||
Audit and tax | 56,187 | |||
Other | 242,717 | |||
|
| |||
| 53,844,944 | ||||
Less expense paid indirectly | (1,535 | ) | ||
|
| |||
Total operating expenses | 53,843,409 | |||
|
| |||
Net Investment Income | 165,015,698 | |||
|
| |||
60
Table of Contents
Net Realized and Unrealized Gain (Loss): | ||||
Net realized gain (loss) on: | ||||
Investments1,2 | $ | (21,335,876 | ) | |
Foreign currencies | (22,926,606 | ) | ||
Foreign currency exchange contracts | 7,967,012 | |||
Futures contracts | 23,033,883 | |||
Swap contracts | 73,440 | |||
|
| |||
Net realized loss | (13,188,147 | ) | ||
|
| |||
Net change in unrealized appreciation (depreciation) of: | ||||
Investments | (157,179,823 | ) | ||
Foreign currencies | (318,161 | ) | ||
Foreign currency exchange contracts | 9,544 | |||
Futures contracts | (2,207,545 | ) | ||
Swap contracts | (417,047 | ) | ||
|
| |||
Net change in unrealized appreciation (depreciation) | (160,113,032 | ) | ||
|
| |||
Net Realized and Unrealized Loss | (173,301,179 | ) | ||
|
| |||
Net Decrease in Net Assets Resulting from Operations | $ | (8,285,481 | ) | |
|
| |||
1Includes $39,998 capital gains taxes paid.
2Includes $11,171,417 loss contingencies on General Motors term loan litigation. See Note 14 in “Notes
to financial statements.”
See accompanying notes, which are an integral part of the financial statements.
61
Table of Contents
Statements of changes in net assets
Delaware Diversified Income Fund
| Year ended | ||||||||
| 10/31/15 | 10/31/14 | |||||||
Increase (Decrease) in Net Assets from Operations: | ||||||||
Net investment income | $ | 165,015,698 | $ | 189,479,574 | ||||
Net realized gain (loss) | (13,188,147 | ) | 88,257,893 | |||||
Net change in unrealized appreciation (depreciation) | (160,113,032 | ) | 15,228,646 | |||||
|
|
|
| |||||
Net increase (decrease) in net assets resulting from operations | (8,285,481 | ) | 292,966,113 | |||||
|
|
|
| |||||
Dividends and Distributions to Shareholders from: | ||||||||
Net investment income: | ||||||||
Class A | (61,612,345 | ) | (101,311,286 | ) | ||||
Class B | — | (199,020 | ) | |||||
Class C | (27,592,570 | ) | (38,624,229 | ) | ||||
Class R | (3,399,488 | ) | (4,252,164 | ) | ||||
Institutional Class | (88,904,722 | ) | (71,970,965 | ) | ||||
Net realized gain: | ||||||||
Class A | (7,212,371 | ) | — | |||||
Class C | (4,089,727 | ) | — | |||||
Class R | (409,856 | ) | — | |||||
Institutional Class | (8,547,257 | ) | — | |||||
Return of capital: | ||||||||
Class A | (3,982,476 | ) | — | |||||
Class C | (2,418,089 | ) | — | |||||
Class R | (244,352 | ) | — | |||||
Institutional Class | (6,285,187 | ) | — | |||||
|
|
|
| |||||
| (214,698,440 | ) | (216,357,664 | ) | |||||
|
|
|
| |||||
Capital Share Transactions: | ||||||||
Proceeds from shares sold: | ||||||||
Class A | 378,195,209 | 409,534,255 | ||||||
Class B | — | 10,560 | ||||||
Class C | 75,847,898 | 91,850,364 | ||||||
Class R | 31,430,722 | 41,084,040 | ||||||
Institutional Class | 889,312,529 | 1,335,463,575 | ||||||
62
Table of Contents
| Year ended | ||||||||
| 10/31/15 | 10/31/14 | |||||||
Capital Share Transactions (continued): | ||||||||
Net asset value of shares issued upon reinvestment of dividends and distributions: | ||||||||
Class A | $ | 69,858,108 | $ | 99,203,203 | ||||
Class B | — | 184,545 | ||||||
Class C | 31,402,737 | 35,230,749 | ||||||
Class R | 4,050,199 | 4,250,429 | ||||||
Institutional Class | 98,839,952 | 66,560,180 | ||||||
|
|
|
| |||||
| 1,578,937,354 | 2,083,371,900 | |||||||
|
|
|
| |||||
Cost of shares redeemed: | ||||||||
Class A | (765,044,640 | ) | (1,745,741,871 | ) | ||||
Class B | — | (9,700,498 | ) | |||||
Class C | (234,458,838 | ) | (437,984,676 | ) | ||||
Class R | (46,143,068 | ) | (54,724,332 | ) | ||||
Institutional Class | (659,373,785 | ) | (762,910,784 | ) | ||||
|
|
|
| |||||
| (1,705,020,331 | ) | (3,011,062,161 | ) | |||||
|
|
|
| |||||
Decrease in net assets derived from capital share transactions | (126,082,977 | ) | (927,690,261 | ) | ||||
|
|
|
| |||||
Net Decrease in Net Assets | (349,066,898 | ) | (851,081,812 | ) | ||||
Net Assets: | ||||||||
Beginning of year | 5,736,952,536 | 6,588,034,348 | ||||||
|
|
|
| |||||
End of year | $ | 5,387,885,638 | $ | 5,736,952,536 | ||||
|
|
|
| |||||
Distributions in excess of net investment income | $ | (6,326,831 | ) | $ | (7,422,323 | ) | ||
|
|
|
| |||||
See accompanying notes, which are an integral part of the financial statements.
63
Table of Contents
Delaware Diversified Income Fund Class A
Selected data for each share of the Fund outstanding throughout each period were as follows:
Net asset value, beginning of period |
Income (loss) from investment operations: |
Net investment income1 |
Net realized and unrealized gain (loss) |
Total from investment operations. |
Less dividends and distributions from: |
Net investment income |
Net realized gain |
Return of capital |
Total dividends and distributions |
Net asset value, end of period |
Total return2 |
Ratios and supplemental data: |
Net assets, end of period (000 omitted) |
Ratio of expenses to average net assets |
Ratio of expenses to average net assets |
Ratio of net investment income to average net assets |
Ratio of net investment income to average net assets |
Portfolio turnover |
| 1 | The average shares outstanding method has been applied for per share information. |
| 2 | Total investment return is based on the change in net asset value of a share during the period and assumes reinvestment of dividends and distributions at net asset value and does not reflect the impact of a sales charge. Total investment return during some of the periods shown reflects a waiver by the distributor. Performance would have been lower had the waiver not been in effect. |
See accompanying notes, which are an integral part of the financial statements.
64
Table of Contents
| Year ended | ||||||||||||||||||||
| 10/31/15 | 10/31/14 | 10/31/13 | 10/31/12 | 10/31/11 | ||||||||||||||||
| $ | 9.090 | $ | 8.960 | $ | 9.450 | $ | 9.330 | $ | 9.770 | |||||||||||
| 0.264 | 0.302 | 0.278 | 0.304 | 0.359 | ||||||||||||||||
| (0.272 | ) | 0.171 | (0.350 | ) | 0.396 | (0.033 | ) | |||||||||||||
|
|
|
|
|
|
|
|
|
| |||||||||||
| (0.008 | ) | 0.473 | (0.072 | ) | 0.700 | 0.326 | ||||||||||||||
|
|
|
|
|
|
|
|
|
| |||||||||||
| (0.289 | ) | (0.343 | ) | (0.248 | ) | (0.346 | ) | (0.399 | ) | |||||||||||
| (0.032 | ) | — | (0.089 | ) | (0.234 | ) | (0.367 | ) | ||||||||||||
| (0.021 | ) | — | (0.081 | ) | — | — | ||||||||||||||
|
|
|
|
|
|
|
|
|
| |||||||||||
| (0.342 | ) | (0.343 | ) | (0.418 | ) | (0.580 | ) | (0.766 | ) | |||||||||||
|
|
|
|
|
|
|
|
|
| |||||||||||
| $ | 8.740 | $ | 9.090 | $ | 8.960 | $ | 9.450 | $ | 9.330 | |||||||||||
|
|
|
|
|
|
|
|
|
| |||||||||||
| (0.11% | ) | 5.25% | (0.66% | ) | 7.82% | 3.64% | ||||||||||||||
| $ | 1,658,922 | $ | 2,048,203 | $ | 3,244,801 | $ | 4,890,056 | $ | 4,370,224 | |||||||||||
| 0.91% | 0.90% | 0.90% | 0.90% | 0.92% | ||||||||||||||||
| 0.91% | 0.90% | 0.95% | 0.95% | 0.97% | ||||||||||||||||
| 2.95% | 3.34% | 3.03% | 3.26% | 3.84% | ||||||||||||||||
| 2.95% | 3.34% | 2.98% | 3.21% | 3.79% | ||||||||||||||||
| 218% | 189% | 238% | 238% | 237% | ||||||||||||||||
65
Table of Contents
Financial highlights
Delaware Diversified Income Fund Class C
Selected data for each share of the Fund outstanding throughout each period were as follows:
Net asset value, beginning of period |
Income (loss) from investment operations: |
Net investment income1 |
Net realized and unrealized gain (loss) |
Total from investment operations. |
Less dividends and distributions from: |
Net investment income |
Net realized gain |
Return of capital |
Total dividends and distributions |
Net asset value, end of period |
Total return2 |
Ratios and supplemental data: |
Net assets, end of period (000 omitted) |
Ratio of expenses to average net assets |
Ratio of net investment income to average net assets |
Portfolio turnover |
| 1 | The average shares outstanding method has been applied for per share information. |
| 2 | Total investment return is based on the change in net asset value of a share during the period and assumes reinvestment of dividends and distributions at net asset value and does not reflect the impact of a sales charge. |
See accompanying notes, which are an integral part of the financial statements.
66
Table of Contents
Year ended
| ||||||||||||||||||||
10/31/15
| 10/31/14
| 10/31/13
| 10/31/12
| 10/31/11
| ||||||||||||||||
| $ | 9.090 | $ | 8.960 | $ | 9.450 | $ | 9.330 | $ | 9.760 | |||||||||||
| 0.197 | 0.234 | 0.209 | 0.234 | 0.289 | ||||||||||||||||
| (0.272 | ) | 0.172 | (0.349 | ) | 0.397 | (0.023 | ) | |||||||||||||
|
|
|
|
|
|
|
|
|
| |||||||||||
| (0.075 | ) | 0.406 | (0.140 | ) | 0.631 | 0.266 | ||||||||||||||
|
|
|
|
|
|
|
|
|
| |||||||||||
| (0.222 | ) | (0.276 | ) | (0.197 | ) | (0.277 | ) | (0.329 | ) | |||||||||||
| (0.032 | ) | — | (0.089 | ) | (0.234 | ) | (0.367 | ) | ||||||||||||
| (0.021 | ) | — | (0.064 | ) | — | — | ||||||||||||||
|
|
|
|
|
|
|
|
|
| |||||||||||
| (0.275 | ) | (0.276 | ) | (0.350 | ) | (0.511 | ) | (0.696 | ) | |||||||||||
|
|
|
|
|
|
|
|
|
| |||||||||||
| $ | 8.740 | $ | 9.090 | $ | 8.960 | $ | 9.450 | $ | 9.330 | |||||||||||
|
|
|
|
|
|
|
|
|
| |||||||||||
| (0.85%) | 4.59% | (1.51% | ) | 7.01% | 2.98% | |||||||||||||||
| $ | 1,007,163 | $ | 1,177,575 | $ | 1,471,553 | $ | 2,230,985 | $ | 2,012,603 | |||||||||||
| 1.66% | 1.65% | 1.65% | 1.65% | 1.67% | ||||||||||||||||
| 2.20% | 2.59% | 2.28% | 2.51% | 3.09% | ||||||||||||||||
|
| 218%
|
|
| 189%
|
|
| 238%
|
|
| 238%
|
|
| 237%
|
| ||||||
67
Table of Contents
Financial highlights
Delaware Diversified Income Fund Class R
Selected data for each share of the Fund outstanding throughout each period were as follows:
|
Net asset value, beginning of period |
Income (loss) from investment operations: |
Net investment income1 |
Net realized and unrealized gain (loss) |
Total from investment operations. |
Less dividends and distributions from: |
Net investment income |
Net realized gain |
Return of capital |
Total dividends and distributions |
Net asset value, end of period |
Total return2 |
Ratios and supplemental data: |
Net assets, end of period (000 omitted) |
Ratio of expenses to average net assets |
Ratio of expenses to average net assets |
Ratio of net investment income to average net assets |
Ratio of net investment income to average net assets |
Portfolio turnover |
| 1 | The average shares outstanding method has been applied for per share information. |
| 2 | Total investment return is based on the change in net asset value of a share during the period and assumes reinvestment of dividends and distributions at net asset value. Total investment return during some of the periods shown reflects a waiver by the distributor. Performance would have been lower had the waiver not been in effect. |
See accompanying notes, which are an integral part of the financial statements.
68
Table of Contents
| Year ended | ||||||||||||||||||||
| 10/31/15 | 10/31/14 | 10/31/13 | 10/31/12 | 10/31/11 | ||||||||||||||||
| $ | 9.090 | $ | 8.960 | $ | 9.450 | $ | 9.330 | $ | 9.760 | |||||||||||
| 0.241 | 0.279 | 0.255 | 0.280 | 0.336 | ||||||||||||||||
| (0.282 | ) | 0.171 | (0.350 | ) | 0.397 | (0.023 | ) | |||||||||||||
|
|
|
|
|
|
|
|
|
| |||||||||||
| (0.041 | ) | 0.450 | (0.095 | ) | 0.677 | 0.313 | ||||||||||||||
|
|
|
|
|
|
|
|
|
| |||||||||||
| (0.266 | ) | (0.320 | ) | (0.231 | ) | (0.323 | ) | (0.376 | ) | |||||||||||
| (0.032 | ) | — | (0.089 | ) | (0.234 | ) | (0.367 | ) | ||||||||||||
| (0.021 | ) | — | (0.075 | ) | — | — | ||||||||||||||
|
|
|
|
|
|
|
|
|
| |||||||||||
| (0.319 | ) | (0.320 | ) | (0.395 | ) | (0.557 | ) | (0.743 | ) | |||||||||||
|
|
|
|
|
|
|
|
|
| |||||||||||
| $ | 8.730 | $ | 9.090 | $ | 8.960 | $ | 9.450 | $ | 9.330 | |||||||||||
|
|
|
|
|
|
|
|
|
| |||||||||||
| (0.47% | ) | 5.11% | (1.02% | ) | 7.55% | 3.49% | ||||||||||||||
| $ | 101,732 | $ | 116,840 | $ | 124,586 | $ | 160,695 | $ | 146,620 | |||||||||||
| 1.16% | 1.15% | 1.15% | 1.15% | 1.17% | ||||||||||||||||
| 1.16% | 1.15% | 1.24% | 1.25% | 1.27% | ||||||||||||||||
| 2.70% | 3.09% | 2.78% | 3.01% | 3.59% | ||||||||||||||||
| 2.70% | 3.09% | 2.69% | 2.91% | 3.49% | ||||||||||||||||
| 218% | 189% | 238% | 238% | 237% | ||||||||||||||||
69
Table of Contents
Financial highlights
Delaware Diversified Income Fund Institutional Class
Selected data for each share of the Fund outstanding throughout each period were as follows:
Net asset value, beginning of period |
Income (loss) from investment operations: |
Net investment income1 |
Net realized and unrealized gain (loss) |
Total from investment operations. |
Less dividends and distributions from: |
Net investment income |
Net realized gain |
Return of capital |
Total dividends and distributions |
Net asset value, end of period |
Total return2 |
Ratios and supplemental data: |
Net assets, end of period (000 omitted) |
Ratio of expenses to average net assets |
Ratio of net investment income to average net assets |
Portfolio turnover |
| 1 | The average shares outstanding method has been applied for per share information. |
| 2 | Total investment return is based on the change in net asset value of a share during the period and assumes reinvestment of dividends and distributions at net asset value. |
See accompanying notes, which are an integral part of the financial statements.
70
Table of Contents
| Year ended | ||||||||||||||||||||
| 10/31/15 | 10/31/14 | 10/31/13 | 10/31/12 | 10/31/11 | ||||||||||||||||
| $ | 9.100 | $ | 8.970 | $ | 9.460 | $ | 9.340 | $ | 9.770 | |||||||||||
| 0.286 | 0.325 | 0.301 | 0.327 | 0.383 | ||||||||||||||||
| (0.282 | ) | 0.171 | (0.350 | ) | 0.397 | (0.023 | ) | |||||||||||||
|
|
|
|
|
|
|
|
|
| |||||||||||
| 0.004 | 0.496 | (0.049 | ) | 0.724 | 0.360 | |||||||||||||||
|
|
|
|
|
|
|
|
|
| |||||||||||
| (0.311 | ) | (0.366 | ) | (0.265 | ) | (0.370 | ) | (0.423 | ) | |||||||||||
| (0.032 | ) | — | (0.089 | ) | (0.234 | ) | (0.367 | ) | ||||||||||||
| (0.021 | ) | — | (0.087 | ) | — | — | ||||||||||||||
|
|
|
|
|
|
|
|
|
| |||||||||||
| (0.364 | ) | (0.366 | ) | (0.441 | ) | (0.604 | ) | (0.790 | ) | |||||||||||
|
|
|
|
|
|
|
|
|
| |||||||||||
| $ | 8.740 | $ | 9.100 | $ | 8.970 | $ | 9.460 | $ | 9.340 | |||||||||||
|
|
|
|
|
|
|
|
|
| |||||||||||
| 0.03% | 5.63% | (0.52% | ) | 8.08% | 4.01% | |||||||||||||||
| $ | 2,620,069 | $ | 2,394,335 | $ | 1,737,652 | $ | 2,238,906 | $ | 1,620,249 | |||||||||||
| 0.66% | 0.65% | 0.65% | 0.65% | 0.67% | ||||||||||||||||
| 3.20% | 3.59% | 3.28% | 3.51% | 4.09% | ||||||||||||||||
| 218% | 189% | 238% | 238% | 237% | ||||||||||||||||
71
Table of Contents
| Notes to financial statements | ||||
| Delaware Diversified Income Fund | October 31, 2015 |
Delaware Group® Adviser Funds (Trust) is organized as a Delaware statutory trust and offers three series: Delaware Diversified Income Fund, Delaware Global Real Estate Opportunities Fund, and Delaware U.S. Growth Fund. These financial statements and related notes pertain to Delaware Diversified Income Fund (Fund). The Trust is an open-end investment company. The Fund is considered diversified under the Investment Company Act of 1940, as amended, and offers Class A, Class C, Class R, and Institutional Class shares. Class A shares are sold with a maximum front-end sales charge of 4.50%. Class A share purchases of $1,000,000 or more will incur a contingent deferred sales charge (CDSC) of 1.00% if redeemed during the first year, and 0.50% during the second year, provided that Delaware Distributors, L.P. (DDLP) paid a financial advisor a commission on the purchase of those shares. Effective Sept. 25, 2014, all remaining shares of Class B were converted to Class A shares. Class C shares are sold with a CDSC of 1.00%, if redeemed during the first 12 months. Class R and Institutional Class shares are not subject to a sales charge and are offered for sale exclusively to certain eligible investors.
The investment objective of the Fund is to seek maximum long-term total return, consistent with reasonable risk.
1. Significant Accounting Policies
The following accounting policies are in accordance with U.S. generally accepted accounting principles (U.S. GAAP) and are consistently followed by the Fund.
Security Valuation – Equity securities, except those traded on The Nasdaq Stock Market LLC (Nasdaq), are valued at the last quoted sales price as of the time of the regular close of the New York Stock Exchange on the valuation date. Equity securities traded on the Nasdaq are valued in accordance with the Nasdaq Official Closing Price, which may not be the last sales price. If, on a particular day, an equity security does not trade, the mean between the bid and ask prices will be used, which approximates fair value. Securities listed on a foreign exchange are normally valued at the last quoted sales price on the valuation date. Other debt securities and credit default swap (CDS) contracts are valued based upon valuations provided by an independent pricing service or broker/counterparty and reviewed by management. To the extent current market prices are not available, the pricing service may take into account developments related to the specific security, as well as transactions in comparable securities. U.S. government and agency securities are valued at the mean between the bid and ask prices, which approximates fair value. Valuations for fixed income securities utilize matrix systems, which reflect such factors as security prices, yields, maturities, and ratings, and are supplemented by dealer and exchange quotations. For asset-backed securities, collateralized mortgage obligations, commercial mortgage securities, and U.S. government agency mortgage securities, pricing vendors utilize matrix pricing which considers prepayment speed, attributes of the collateral, yield or price of bonds of comparable quality, coupon, maturity, and type as well as broker/dealer-supplied prices. Swap prices are derived using daily swap curves and models that incorporate a number of market data factors, such as discounted cash flows, trades, and values of the underlying reference instruments. Open-end investment company securities are valued at net asset value (NAV) per share, as reported by the underlying investment company. Foreign currency exchange contracts and foreign cross currency exchange contracts are valued at the mean between the bid and ask prices, which approximates fair value. Interpolated values are derived when the settlement date of the contract is an interim date for
72
Table of Contents
which quotations are not available. Futures contracts and options on futures contracts are valued at the daily quoted settlement prices. Exchange-traded options are valued at the last reported sale price or, if no sales are reported, at the mean between the last reported bid and ask prices, which approximates fair value. Generally, other securities and assets for which market quotations are not readily available are valued at fair value as determined in good faith under the direction of the Fund’s Board of Trustees (Board). In determining whether market quotations are readily available or fair valuation will be used, various factors will be taken into consideration, such as market closures or suspension of trading in a security.
Federal and Foreign Income Taxes – No provision for federal income taxes has been made as the Fund intends to continue to qualify for federal income tax purposes as a regulated investment company under Subchapter M of the Internal Revenue Code of 1986, as amended, and make the requisite distributions to shareholders. The Fund evaluates tax positions taken or expected to be taken in the course of preparing the Fund’s tax returns to determine whether the tax positions are “more likely-than-not” of being sustained by the applicable tax authority. Tax positions not deemed to meet the “more-likely-than-not” threshold are recorded as a tax benefit or expense in the current year. Management has analyzed the Fund’s tax positions taken for all open federal income tax years (Oct. 31, 2012–Oct. 31, 2015), and has concluded that no provision for federal income tax is required in the Fund’s financial statements. In regard to foreign taxes only, the Fund has open tax years in certain foreign countries in which it invests that may date back to the inception of the Fund.
Class Accounting – Investment income and common expenses are allocated to the various classes of the Fund on the basis of “settled shares” of each class in relation to the net assets of the Fund. Realized and unrealized gain (loss) on investments are allocated to the various classes of the Fund on the basis of daily net assets of each class. Distribution expenses relating to a specific class are charged directly to that class.
Repurchase Agreements – The Fund may purchase certain U.S. government securities subject to the counterparty’s agreement to repurchase them at an agreed upon date and price. The counterparty will be required on a daily basis to maintain the value of the collateral subject to the agreement at not less than the repurchase price (including accrued interest). The agreements are conditioned upon the collateral being deposited under the Federal Reserve book-entry system with the Fund’s custodian or a third-party sub-custodian. In the event of default or bankruptcy by the other party to the agreement, retention of the collateral may be subject to legal proceedings. All open repurchase agreements as of the date of this report were entered into on Oct. 30, 2015 and will mature on the next business day.
To Be Announced Trades (TBA) – The Fund may contract to purchase or sell securities for a fixed price at a transaction date beyond the customary settlement period (examples: when issued, delayed delivery, forward commitment, or TBA transactions) consistent with the Fund’s ability to manage its investment portfolio and meet redemption requests. These transactions involve a commitment by the Fund to purchase or sell securities for a predetermined price or yield with payment and delivery taking place more than three days in the future, or after a period longer than the customary settlement period for that type of security. No interest will be earned by the Fund on such purchases until the securities are delivered or the transaction is completed; however, the market value may change prior to delivery. The
73
Table of Contents
Notes to financial statements
Delaware Diversified Income Fund
1. Significant Accounting Policies (continued)
Fund received $951,000 cash collateral for TBA trades as of Oct. 31, 2015, which is shown as “Collateral due to brokers” on the “Statement of assets and liabilities.”
Foreign Currency Transactions – Transactions denominated in foreign currencies are recorded at the prevailing exchange rates on the valuation date in accordance with the Fund’s prospectus. The value of all assets and liabilities denominated in foreign currencies is translated daily into U.S. dollars at the exchange rate of such currencies against the U.S. dollar. Transaction gains or losses resulting from changes in exchange rates during the reporting period or upon settlement of the foreign currency transaction are reported in operations for the current period. The Fund generally bifurcates that portion of realized gains and losses on investments in debt securities which is due to changes in foreign exchange rates from that which is due to changes in market prices of debt securities. That portion of gains (losses), which is due to changes in foreign exchange rates, is included on the “Statement of operations” under “Net realized gain (loss) on foreign currencies.” The Fund reports certain foreign currency related transactions as components of realized gains (losses) for financial reporting purposes, whereas such components are treated as ordinary income (loss) for federal income tax purposes.
Use of Estimates – The Fund is an investment company, whose financial statements are prepared in conformity with U.S. GAAP. Therefore, the Fund follows the accounting and reporting guidelines for investment companies. The preparation of financial statements in conformity with U.S. GAAP requires management to make estimates and assumptions that affect the fair value of investments, the reported amounts of assets and liabilities and disclosure of contingent assets and liabilities at the date of the financial statements, and the reported amounts of revenues and expenses during the reporting period. Actual results could differ from those estimates and the differences could be material.
Other – Expenses directly attributable to the Fund are charged directly to the Fund. Other expenses common to various funds within the Delaware Investments® Family of Funds are generally allocated among such funds on the basis of average net assets. Management fees and some other expenses are paid monthly. Security transactions are recorded on the date the securities are purchased or sold (trade date) for financial reporting purposes. Costs used in calculating realized gains and losses on the sale of investment securities are those of the specific securities sold. Dividend income is recorded on the ex-dividend date and interest income is recorded on the accrual basis. Discounts and premiums on debt securities are accreted or amortized to interest income, respectively, over the lives of the respective securities using the effective interest method. Realized gains (losses) on paydowns of asset- and mortgage-backed securities are classified as interest income. Withholding taxes and reclaims on foreign interest have been recorded in accordance with the Fund’s understanding of the applicable country’s tax rules and rates. The Fund may pay foreign capital gains taxes on certain foreign securities held, which are reported as components of realized losses for financial reporting purposes, whereas such components are treated as ordinary loss for federal income tax purposes. The Fund declares dividends daily from net investment income and pays the dividends monthly and declares and pays dividends from net realized gain on investments, if any, annually. The Fund may distribute more frequently, if necessary for tax purposes. Dividends and distributions, if any, are recorded on the ex-dividend date.
74
Table of Contents
The Fund may receive earnings credits from its custodian when positive cash balances are maintained, which may be used to offset custody fees. There were no such earnings credits for the year ended Oct. 31, 2015.
The Fund receives earnings credits from its transfer agent when positive cash balances are maintained, which may be used to offset transfer agent fees. If the amount earned is greater than one dollar, the expense paid under this arrangement is included on the “Statement of operations” under “Dividend disbursing and transfer agent fees and expenses” with the corresponding expense offset shown under “Less expense paid indirectly.” For the year ended Oct. 31, 2015, the Fund earned $1,535 under this agreement.
2. Investment Management, Administration Agreements, and Other Transactions with Affiliates
In accordance with the terms of its investment management agreement, the Fund pays Delaware Management Company (DMC), a series of Delaware Management Business Trust and the investment manager, an annual fee which is calculated daily at the rate of 0.55% on the first $500 million of the average daily net assets of the Fund; 0.50% on the next $500 million; 0.45% on the next $1.5 billion; and 0.425% on average daily net assets in excess $2.5 billion.
Delaware Investments Fund Services Company (DIFSC), an affiliate of DMC, provides fund accounting and financial administration oversight services to the Fund. For these services, DIFSC’s fees are calculated based on the aggregate daily net assets of the Delaware Investments® Family of Funds at the following annual rate: 0.0050% of the first $30 billion; 0.0045% of the next $10 billion; 0.0040% of the next $10 billion; and 0.0025% of aggregate average daily net assets in excess of $50 billion. The fees payable to DIFSC under the service agreement described above are allocated among all Funds in the Delaware Investments Family of Funds on a relative net asset value basis. For the year ended Oct. 31, 2015, the Fund was charged $268,057 for these services. This amount is included on the “Statement of operations” under “Accounting and administration expenses.”
DIFSC is also the transfer agent and dividend disbursing agent of the Fund. For these services, DIFSC fees are calculated based on the aggregate daily net assets of the retail funds within the Delaware Investments Family of Funds at the following annual rate: 0.025% of the first $20 billion; 0.020% of the next $5 billion; 0.015% of the next $5 billion; and 0.013% of average daily net assets in excess of $30 billion. The fees payable to DIFSC under the service agreement described above are allocated among all retail funds in the Delaware Investments Family of Funds on a relative net asset value basis. For the year ended Oct. 31, 2015, the Fund was charged $1,174,106 for these services. This amount is included on the “Statement of operations” under “Dividend disbursing and transfer agent fees and expenses.” Pursuant to a sub-transfer agency agreement between DIFSC and BNY Mellon Investment Servicing (US) Inc. (BNYMIS), BNYMIS provides certain sub-transfer agency services to the Fund. Sub-transfer agency fees are passed on to and paid directly by the Fund.
Pursuant to a distribution agreement and distribution plan, the Fund pays DDLP, the distributor and an affiliate of DMC, an annual distribution and service fee of 0.25% of the average daily net assets of the Class A shares, 1.00% of the average daily net assets of the Class C shares, and 0.50% of the average daily net assets of the Class R shares. Institutional Class shares pay no distribution and service fee.
75
Table of Contents
Notes to financial statements
Delaware Diversified Income Fund
2. Investment Management, Administration Agreements, and Other Transactions with Affiliates (continued)
As provided in the investment management agreement, the Fund bears a portion of the cost of certain resources shared with DMC, including the cost of internal personnel of DMC and/or its affiliates that provide legal, tax, and regulatory reporting services to the Fund. For the year ended Oct. 31, 2015, the Fund was charged $144,433 for internal legal, tax, and regulatory reporting services provided by DMC and/or its affiliates’ employees. This amount is included on the “Statement of operations” under “Legal fees.”
For the year ended Oct. 31, 2015, DDLP earned $64,071 for commissions on sales of the Fund’s Class A shares. For the year ended Oct. 31, 2015, DDLP received gross CDSC commissions of $12,361 and $49,760 on redemptions of the Fund’s Class A and Class C shares, respectively, and these commissions were entirely used to offset upfront commissions previously paid by DDLP to broker/dealers on sales of those shares.
Trustees’ fees include expenses accrued by the Fund for each Trustee’s retainer and meeting fees. Certain officers of DMC, DIFSC, and DDLP are officers and/or Trustees of the Trust. These officers and Trustees are paid no compensation by the Fund.
3. Investments
For the year ended Oct. 31, 2015, the Fund made purchases and sales of investment securities other than short-term investments as follows:
Purchases other than U.S. government securities | $ | 9,446,337,509 | ||
Purchases of U.S. government securities | 2,633,215,491 | |||
Sales other than U.S. government securities | 9,878,748,916 | |||
Sales of U.S. government securities | 2,193,960,751 |
At Oct. 31, 2015, the cost and unrealized appreciation (depreciation) of investments for federal income tax purposes were as follows:
Cost of investments | $ | 6,246,669,519 | ||
|
| |||
Aggregate unrealized appreciation | $ | 108,171,983 | ||
Aggregate unrealized depreciation | (165,731,907 | ) | ||
|
| |||
Net unrealized depreciation | $ | (57,559,924 | ) | |
|
|
U.S. GAAP defines fair value as the price that the Fund would receive to sell an asset or pay to transfer a liability in an orderly transaction between market participants at the measurement date under current market conditions. A three-level hierarchy for fair value measurements has been established based upon the transparency of inputs to the valuation of an asset or liability. Inputs may be observable or unobservable and refer broadly to the assumptions that market participants would use in pricing the asset or liability. Observable inputs reflect the assumptions market participants would use in pricing the asset or liability based on market data obtained from sources independent of the reporting entity. Unobservable inputs reflect the reporting entity’s own assumptions about the assumptions that market participants would use in pricing the asset or liability based on the best information available under the circumstances. The Fund’s investment in its entirety is assigned a level based upon the observability of
76
Table of Contents
the inputs which are significant to the overall valuation. The three-level hierarchy of inputs is summarized below.
| Level 1 – | Inputs are quoted prices in active markets for identical investments. (Examples: equity securities, open-end investment companies, futures contracts, exchange-traded options contracts) | |
| Level 2 – | Other observable inputs, including, but not limited to: quoted prices for similar assets or liabilities in markets that are active, quoted prices for identical or similar assets or liabilities in markets that are not active, inputs other than quoted prices that are observable for the assets or liabilities (such as interest rates, yield curves, volatilities, prepayment speeds, loss severities, credit risks, and default rates) or other market-corroborated inputs. (Examples: debt securities, government securities, swap contracts, foreign currency exchange contracts, foreign securities utilizing international fair value pricing, broker-quoted securities, fair valued securities) | |
| Level 3 – | Significant unobservable inputs, including the Fund’s own assumptions used to determine the fair value of investments. (Examples: broker-quoted securities, fair valued securities) | |
Level 3 investments are valued using significant unobservable inputs. The Fund may also use an income-based valuation approach in which the anticipated future cash flows of the investment are discounted to calculate fair value. Discounts may also be applied due to the nature or duration of any restrictions on the disposition of the investments. Valuations may also be based upon current market prices of securities that are comparable in coupon, rating, maturity, and industry. The derived value of a Level 3 investment may not represent the value which is received upon disposition and this could impact the results of operations.
77
Table of Contents
Notes to financial statements
Delaware Diversified Income Fund
3. Investments (continued)
The following table summarizes the valuation of the Fund’s investments by fair value hierarchy levels as of Oct. 31, 2015:
Securities | Level 1 | Level 2 | Level 3 | Total | ||||||||||||
Agency, Asset- & Mortgage-Backed Securities | $ | — | $ | 1,755,751,072 | $ | 4,395,000 | $ | 1,760,146,072 | ||||||||
Corporate Debt | — | 2,160,577,821 | — | 2,160,577,821 | ||||||||||||
Municipal Bonds | — | 68,639,480 | — | 68,639,480 | ||||||||||||
Foreign Debt | — | 174,716,642 | — | 174,716,642 | ||||||||||||
Senior Secured Loans1 | — | 515,832,780 | 17,993,362 | 533,826,142 | ||||||||||||
U.S. Treasury Obligations | — | 564,071,095 | — | 564,071,095 | ||||||||||||
Common Stock | — | — | — | — | ||||||||||||
Convertible Preferred Stock1 | 17,003,683 | 2,695,470 | — | 19,699,153 | ||||||||||||
Preferred Stock1 | 12,202,874 | 25,624,284 | — | 37,827,158 | ||||||||||||
Short-Term Investments | — | 614,551,108 | — | 614,551,108 | ||||||||||||
Securities Lending Collateral | — | 255,054,924 | — | 255,054,924 | ||||||||||||
|
|
|
|
|
|
|
| |||||||||
Total Value of Securities | $ | 29,206,557 | $ | 6,137,514,676 | $ | 22,388,362 | $ | 6,189,109,595 | ||||||||
|
|
|
|
|
|
|
| |||||||||
Foreign Currency Exchange Contracts | $ | — | $ | 438,815 | $ | — | $ | 438,815 | ||||||||
Futures Contracts | (1,163,005 | ) | — | — | (1,163,005 | ) | ||||||||||
Swap Contracts | — | (281,674 | ) | — | (281,674 | ) | ||||||||||
The securities that have been deemed worthless on the “Schedule of investments” are considered to be Level 3 investments in this table.
1Security type is valued across multiple levels. Level 1 investments represent exchange-traded investments, Level 2 investments represent investments with observable input or matrix-priced investments, and Level 3 investments represent investments without observable inputs. The amounts attributed to Level 1 investments, Level 2 investments, and Level 3 investments represent the following percentages of the total value of these security types:
Level 1 | Level 2 | Level 3 | Total | |||||||||||||
Agency, Asset- & Mortgage-Backed Securities | — | 99.75 | % | 0.25 | % | 100.00 | % | |||||||||
Senior Secured Loans | — | 96.63 | % | 3.37 | % | 100.00 | % | |||||||||
Convertible Preferred Stock | 86.32 | % | 13.68 | % | — | 100.00 | % | |||||||||
Preferred Stock | 32.26 | % | 67.74 | % | — | 100.00 | % | |||||||||
During the year ended Oct. 31, 2015, there were no transfers between Level 1 investments and Level 2 investments that had a significant impact to the Fund. During the year ended Oct. 31, 2015, transfers out of Level 3 investments into Level 2 investments were made in the amount of $5,648,246 for the Fund. The transfer was due to the Fund’s pricing vendor being able to supply a matrix price for an investment that had been utilizing a broker quoted price. During the year ended Oct. 31, 2015, transfers out of
78
Table of Contents
Level 2 investments into Level 3 investments were made in the amount of $4,545,000 for the Fund. The transfer was due to the Fund’s pricing vendor ceasing to provide pricing for an investment. The Fund’s policy is to recognize transfers between levels at the beginning of the reporting period.
A reconciliation of Level 3 investments is presented when the Fund has a significant amount of Level 3 investments at the beginning, interim, or end of the period in relation to net assets. Management has determined not to provide additional disclosure on Level 3 inputs since the Level 3 investments are not considered significant to the Fund’s net assets at the end of the period.
4. Dividend and Distribution Information
Income and long-term capital gain distributions are determined in accordance with federal income tax regulations, which may differ from U.S. GAAP. Additionally, distributions from net gains on foreign currency transactions and net short-term gains on sales of investment securities are treated as ordinary income for federal income tax purposes. The tax character of dividends and distributions paid during the years ended Oct. 31, 2015 and 2014 was as follows:
| Year ended | ||||||||
10/31/15 | 10/31/14 | |||||||
Ordinary income | $ | 182,077,578 | $ | 199,259,224 | ||||
Long-term capital gains | 19,690,758 | 17,098,440 | ||||||
Return of capital | 12,930,104 | — | ||||||
|
|
|
| |||||
Total | $ | 214,698,440 | $ | 216,357,664 | ||||
|
|
|
| |||||
5. Components of Net Assets on a Tax Basis
As of Oct. 31, 2015, the components of net assets on a tax basis were as follows:
Shares of beneficial interest | $ | 5,487,481,650 | ||
Distributions payable | (4,575,845 | ) | ||
Other temporary differences | (10,131 | ) | ||
Capital loss carryforwards | (26,146,217 | ) | ||
Unrealized depreciation of investments, foreign currencies, and derivatives | (68,863,819 | ) | ||
|
| |||
Net assets | $ | 5,387,885,638 | ||
|
|
The differences between book basis and tax basis components of net assets are primarily attributable to tax deferral of losses on wash sales, mark-to-market of foreign currency exchange contracts, mark-to-market of futures contracts, tax deferral of losses on straddles, tax treatment of CDS contracts, contingent payment on debt instruments, market discount and premium on debt instruments and troubled debt.
For financial reporting purposes, capital accounts are adjusted to reflect the tax character of permanent book/tax differences. Reclassifications are primarily due to tax treatment of gain (loss) on foreign currency transactions, redesignation of dividends and distributions, foreign capital gains tax, contingent payments on debt instruments, market discount and premium on certain debt instruments, CDS contracts, and paydown gains (losses) of asset-and mortgage-backed securities. Results of operations
79
Table of Contents
Notes to financial statements
Delaware Diversified Income Fund
5. Components of Net Assets on a Tax Basis (continued)
and net assets were not affected by these reclassifications. For the year ended Oct. 31, 2015, the Fund recorded the following reclassifications:
Distributions in excess of net investment income | $ | 17,588,919 | ||
Accumulated net realized loss | (17,588,919 | ) |
On Dec. 22, 2010, the Regulated Investment Company Modernization Act of 2010 (Act) was enacted, which changed various technical rules governing the tax treatment of regulated investment companies. The changes were generally effective for taxable years beginning after the date of enactment. Under the Act, the Fund is permitted to carry forward capital losses incurred in taxable years beginning after the date of enactment for an unlimited period. Additionally, post-enactment capital loss carryforwards will retain their character as either short-term or long-term capital losses rather than being considered all short-term as permitted under previous regulation.
Losses incurred that will be carried under the Act are as follows:
| Loss carryforward character | ||||||
| Short-term | Long-term | |||||
| $5,177,814 | $ | 20,968,403 | ||||
80
Table of Contents
6. Capital Shares
Transactions in capital shares were as follows:
| Year ended | ||||||||
10/31/15 | 10/31/14 | |||||||
Shares sold: | ||||||||
Class A | 42,153,447 | 45,331,754 | ||||||
Class B | — | 1,174 | ||||||
Class C | 8,453,164 | 10,145,095 | ||||||
Class R | 3,513,077 | 4,543,927 | ||||||
Institutional Class | 99,228,015 | 146,809,977 | ||||||
Shares issued upon reinvestment of dividends and distributions: | ||||||||
Class A | 7,808,687 | 10,982,199 | ||||||
Class B | — | 20,489 | ||||||
Class C | 3,511,247 | 3,899,038 | ||||||
Class R | 452,999 | 470,459 | ||||||
Institutional Class | 11,049,343 | 7,350,511 | ||||||
|
|
|
| |||||
| 176,169,979 | 229,554,623 | |||||||
|
|
|
| |||||
Shares redeemed: | ||||||||
Class A | (85,391,214 | ) | (192,953,742 | ) | ||||
Class B | — | (1,076,611 | ) | |||||
Class C | (26,221,918 | ) | (48,662,025 | ) | ||||
Class R | (5,174,904 | ) | (6,059,471 | ) | ||||
Institutional Class | (73,793,622 | ) | (84,668,441 | ) | ||||
|
|
|
| |||||
| (190,581,658 | ) | (333,420,290 | ) | |||||
|
|
|
| |||||
Net decrease | (14,411,679 | ) | (103,865,667 | ) | ||||
|
|
|
| |||||
For the year ended Oct. 31, 2014, 152,636 Class B shares were converted to 152,495 Class A shares valued at $1,378,560. The amounts are included in Class B redemptions and Class A subscriptions in the table above and the “Statements of changes in net assets.”
81
Table of Contents
Notes to financial statements
Delaware Diversified Income Fund
6. Capital Shares (continued)
Certain shareholders of one class shares may exchange their shares for another class shares. For the years ended Oct. 31, 2015 and Oct. 31, 2014, the Fund had the following exchange transactions. These exchange transactions are included as subscriptions and redemptions in the table on the previous page and the “Statements of changes in net assets.”
Exchange Redemptions | Exchange | |||||||||||||||||||||||
Year ended | Class A Shares | Class C Shares | Institutional Class Shares | Class A Shares | Institutional Class Shares | Value | ||||||||||||||||||
10/31/15 | 277,471 | 35,516 | — | 14,144 | 299,218 | $ | 2,826,278 | |||||||||||||||||
10/31/14 | 219,614 | 117,273 | 1,138 | 92,738 | 245,447 | 3,073,888 | ||||||||||||||||||
7. Line of Credit
The Fund, along with certain other funds in the Delaware Investment® Family of Funds (Participants), was a participant in a $225,000,000 revolving line of credit intended to be used for temporary or emergency purposes as an additional source of liquidity to fund redemptions of investor shares. Under the agreement, the Participants were charged an annual commitment fee of 0.08%, which was allocated across the Participants on the basis of each Participant’s allocation of the entire facility. The Participants were permitted to borrow up to a maximum of one third of their net assets under the agreement. Each Participant was individually, and not jointly, liable for its particular advances, if any, under the line of credit. The line of credit under the agreement expired on Nov. 10, 2014.
On Nov. 10, 2014, the Fund, along with the other Participants, entered into an amendment to the agreement for a $275,000,000 revolving line of credit. The line of credit was to be used as described above and operated in substantially the same manner as the agreement described above. The line of credit available under the agreement expired on Nov. 9, 2015.
The Fund had no amounts outstanding as of Oct. 31, 2015, or at any time during the year then ended.
8. Derivatives
U.S. GAAP requires disclosures that enable investors to understand: (1) how and why an entity uses derivatives; (2) how they are accounted for; and (3) how they affect an entity’s results of operations and financial position.
Foreign Currency Exchange Contracts — The Fund may enter into foreign currency exchange contracts and foreign cross currency exchange contracts as a way of managing foreign exchange rate risk. The Fund may enter into these contracts to fix the U.S. dollar value of a security that it has agreed to buy or sell for the period between the date the trade was entered into and the date the security is delivered and paid for. The Fund may also use these contracts to hedge the U.S. dollar value of securities it already owns that are denominated in foreign currencies. In addition, the Fund may enter into these contracts to facilitate or expedite the settlement of portfolio transactions. The change in value is recorded as an unrealized gain or loss. When the contract is closed, a realized gain or loss is recorded equal to the difference between the value of the contract at the time it was opened and the value at the time it was closed.
82
Table of Contents
The use of foreign currency exchange contracts and foreign cross currency exchange contracts does not eliminate fluctuations in the underlying prices of the securities, but does establish a rate of exchange that can be achieved in the future. Although foreign currency exchange contracts and foreign cross currency exchange contracts limit the risk of loss due to an unfavorable change in the value of the hedged currency, they also limit any potential gain that might result should the value of the currency change favorably. In addition, the Fund could be exposed to risks if the counterparties to the contracts are unable to meet the terms of their contracts. The Fund’s maximum risk of loss from counterparty credit risk is the value of its currency exchanged with the counterparty. The risk is generally mitigated by having a netting arrangement between the Fund and the counterparty and by the posting of collateral by the counterparty to the Fund to cover the Fund’s exposure to the counterparty.
During the year ended Oct. 31, 2015, the Fund entered into foreign currency exchange contracts to hedge the U.S. dollar value of securities it already owns that are denominated in foreign currencies.
Futures Contracts – A futures contract is an agreement in which the writer (or seller) of the contract agrees to deliver to the buyer an amount of cash or securities equal to a specific dollar amount times the difference between the value of a specific security or index at the close of the last trading day of the contract and the price at which the agreement is made. The Fund may use futures contracts in the normal course of pursuing its respective investment objective. The Fund may invest in futures contracts to hedge its existing portfolio securities against fluctuations in value caused by changes in interest rates or market conditions. Upon entering into a futures contract, the Fund deposits cash or pledges U.S. government securities to a broker, equal to the minimum “initial margin” requirements of the exchange on which the contract is traded. Subsequent payments are received from the broker or paid to the broker each day, based on the daily fluctuation in the market value of the contract. These receipts or payments are known as “variation margin” and are recorded daily by the Fund as unrealized gains or losses until the contracts are closed. When the contracts are closed, the Fund records a realized gain or loss equal to the difference between the value of the contract at the time it was opened and the value at the time it was closed. Risks of entering into futures contracts include potential imperfect correlation between the futures contracts and the underlying securities and the possibility of an illiquid secondary market for these instruments. When investing in futures, there is reduced counterparty credit risk to the Fund because futures are exchange-traded and the exchange’s clearinghouse, as counterparty to all exchange-traded futures, guarantees against default. At Oct. 31, 2015, the Fund posted securities, comprised of U.S. treasury obligations with a value of $12,187,425 as margin for open futures contracts, which is presented on the “Schedule of investments.”
During the year ended Oct. 31, 2015, the Fund used futures contracts to hedge the Fund’s existing portfolio securities against fluctuations in value caused by changes in interest rates or market conditions.
Options Contracts – During the year ended Oct. 31, 2015, the Fund entered into options contracts in the normal course of pursuing its investment objective. The Fund may buy or write options contracts for any number of reasons, including without limitation: to manage the Fund’s exposure to changes in securities prices caused by interest rates or market conditions and foreign currencies; as an efficient means of adjusting the Fund’s overall exposure to certain markets; to protect the value of portfolio securities; and as a cash management tool. The Fund may buy or write call or put options on securities,
83
Table of Contents
Notes to financial statements
Delaware Diversified Income Fund
8. Derivatives (continued)
futures, swaps, swaptions, financial indices, and foreign currencies. When the Fund buys an option, a premium is paid and an asset is recorded and adjusted on a daily basis to reflect the current market value of the option purchased. When the Fund writes an option, a premium is received and a liability is recorded and adjusted on a daily basis to reflect the current market value of the option written. Premiums received from writing options that expire unexercised are treated by the Fund on the expiration date as realized gains. The difference between the premium received and the amount paid on effecting a closing purchase transaction, including brokerage commissions, is treated as realized gain or loss. If a call option is exercised, the premium is added to the proceeds from the sale of the underlying security in determining whether the Fund has a realized gain or loss. If a put option is exercised, the premium reduces the cost basis of the securities purchased by the Fund. The Fund, as writer of an option, bears the market risk of an unfavorable change in the price of the security underlying the written option. When writing options, the Fund is subject to minimal counterparty risk because the counterparty is only obligated to pay premiums and does not bear the market risk of an unfavorable market change. There were no transactions in options written during the year ended Oct. 31, 2015.
During the year ended Oct. 31, 2015, the Fund used purchased option contracts to manage the Fund’s exposure to changes in security prices caused by interest rates or market conditions.
Swap Contracts – The Fund may enter into CDS contracts in the normal course of pursuing its investment objective. The Fund may enter into CDS contracts in order to hedge against a credit event, to enhance total return or to gain exposure to certain securities or markets. The Fund will not be permitted to enter into any swap transactions unless, at the time of entering into such transactions, the unsecured long-term debt of the actual counterparty, combined with any credit enhancements, is rated at least BBB- by Standard & Poor’s Financial Services LLC. (S&P) or Baa3 by Moody’s Investors Service Inc. (Moody’s) or is determined to be of equivalent credit quality by DMC.
Credit Default Swaps. A CDS contract is a risk-transfer instrument through which one party (purchaser of protection) transfers to another party (seller of protection) the financial risk of a credit event (as defined in the CDS agreement), as it relates to a particular reference security or basket of securities (such as an index). In exchange for the protection offered by the seller of protection, the purchaser of protection agrees to pay the seller of protection a periodic amount at a stated rate that is applied to the notional amount of the CDS contract. In addition, an upfront payment may be made or received by the Fund in connection with an unwinding or assignment of a CDS contract. Upon the occurrence of a credit event, the seller of protection would pay the par (or other agreed-upon) value of the reference security (or basket of securities) to the counterparty. Credit events generally include, among others, bankruptcy, failure to pay, and obligation default.
During the year ended Oct. 31, 2015, the Fund entered into CDS contracts as a purchaser of protection. Periodic payments (receipts) on such contracts are accrued daily and recorded as unrealized losses (gains) on swap contracts. Upon payment (receipt), such amounts are recorded as realized losses (gains) on swap contracts. Upfront payments made or received in connection with CDS contracts are amortized over the expected life of the CDS contracts as unrealized losses (gains) on swap contracts. The change in value of CDS contracts is recorded daily as unrealized appreciation or depreciation. A realized gain or loss is recorded upon a credit event (as defined in the CDS agreement) or the maturity or termination of
84
Table of Contents
the agreement. Initial margin and variation margin is posted to central counterparties for central cleared CDS basket trades, as determined by the applicable central counterparty. During the year ended Oct. 31, 2015, the Fund did not enter into any CDS contracts as a seller of protection.
CDS contracts may involve greater risks than if the Fund had invested in the reference obligation directly. CDS contracts are subject to general market risk, liquidity risk, counterparty risk, and credit risk. The Fund’s maximum risk of loss from counterparty credit risk, either as the seller of protection or the buyer of protection, is the fair value of the contract. This risk is mitigated by (1) for bilateral swap contracts, having a netting arrangement between the Fund and the counterparty and by the posting of collateral by the counterparty to the Fund to cover the Fund’s exposure to the counterparty, and (2) for cleared swaps, trading these instruments through a central counterparty.
During the year ended Oct. 31, 2015, the Fund used CDS contracts to hedge against credit events.
Swaps Generally. The value of open swaps may differ from that which would be realized in the event the Fund terminated its position in the contract on a given day. Risks of entering into these contracts include the potential inability of the counterparty to meet the terms of the contracts. This type of risk is generally limited to the amount of favorable movement in the value of the underlying security, instrument, or basket of instruments, if any, at the day of default. Risks also arise from potential losses from adverse market movements and such losses could exceed the unrealized amounts shown on the “Schedule of investments.”
At Oct. 31, 2015, The Fund posted $5,224,979 in cash collateral for centrally cleared swap contracts, which is presented as “Cash collateral due from brokers” on the “Statement of assets and liabilities.” At Oct. 31, 2015, the Fund received $210,000 in cash collateral and $3,382,205 in securities collateral for certain open derivatives. Cash collateral received is presented as “Cash collateral due to brokers” on the “Statement of assets and liabilities.”
85
Table of Contents
Notes to financial statements
Delaware Diversified Income Fund
8. Derivatives (continued)
Fair values of derivative instruments as of Oct. 31, 2015 were as follows:
Asset Derivatives Fair Value | ||||||||||||||||||||
Statements of Assets and Liabilities Location | Forward | Equity | Interest | Credit | Total | |||||||||||||||
Unrealized appreciation on foreign currency exchange contracts | $ | 742,098 | $— | $ | — | $ — | $ | 742,098 | ||||||||||||
| Variation margin due from broker on futures contracts* | — | — | 4,832,550 | — | 4,832,550 | |||||||||||||||
|
|
|
|
|
|
|
|
|
| |||||||||||
| Total | $ | 742,098 | $— | $ | 4,832,550 | $— | $ | 5,574,648 | ||||||||||||
|
|
|
|
|
|
|
|
|
| |||||||||||
Liability Derivatives Fair Value | ||||||||||||||||||||
Statements of Assets and Liabilities Location | Forward | Equity | Interest Rate | Credit Contracts | Total | |||||||||||||||
Unrealized depreciation on foreign currency exchange contracts | $ | 303,283 | $ | — | $ | — | $ | — | $ | 303,283 | ||||||||||
| Variation margin due from broker on futures contracts* | — | 5,478,938 | 516,617 | — | 5,995,555 | |||||||||||||||
| Unrealized depreciation on credit default swap contracts | — | — | — | 281,674 | 281,674 | |||||||||||||||
|
|
|
|
|
|
|
|
|
| |||||||||||
| Total | $ | 303,283 | $ | 5,478,938 | $ | 516,617 | $ | 281,674 | $ | 6,580,512 | ||||||||||
|
|
|
|
|
|
|
|
|
| |||||||||||
*Includes cumulative appreciation (depreciation) of futures contracts from the date the contracts are opened through Oct. 31, 2015. Only current day variation margin is reported on the “Statement of assets and liabilities.”
86
Table of Contents
The effect of derivative instruments on the “Statement of operations” for the year ended Oct. 31, 2015 was as follows:
| Net Realized Gain (Loss) on: | ||||||||||||||||||||
Foreign | Futures | Swap | Total | |||||||||||||||||
Forward currency exchange contracts | $ | 7,967,012 | $ | — | $ — | $ | 7,967,012 | |||||||||||||
Interest rate contracts | — | 20,873,418 | — | 20,873,418 | ||||||||||||||||
Equity contracts | — | 2,160,465 | — | 2,160,465 | ||||||||||||||||
Credit contracts | — | — | 73,440 | 73,440 | ||||||||||||||||
|
|
|
|
|
|
|
| |||||||||||||
Total | $ | 7,967,012 | $ | 23,033,883 | $73,440 | $ | 31,074,335 | |||||||||||||
|
|
|
|
|
|
|
| |||||||||||||
Net Change in Unrealized Appreciation (Depreciation) of: | ||||||||||||||||||||
Foreign | Futures | Swap Contracts | Total | |||||||||||||||||
Forward currency exchange contracts | $9,544 | $ — | $ | — | $ | 9,544 | ||||||||||||||
Interest rate contracts | — | 3,271,393 | — | 3,271,393 | ||||||||||||||||
Equity contracts | — | (5,478,938) | — | (5,478,938 | ) | |||||||||||||||
Credit contracts | — | — | (417,047 | ) | (417,047 | ) | ||||||||||||||
|
|
|
|
|
|
|
| |||||||||||||
Total | $9,544 | $(2,207,545) | $ | (417,047 | ) | $ | (2,615,048 | ) | ||||||||||||
|
|
|
|
|
|
|
| |||||||||||||
Derivatives Generally. The table below summarizes the average balance of derivative holdings by the Fund during the year ended Oct. 31, 2015.
Long Derivative Volume | Short Derivative Volume | |||||||||||||||
Foreign currency exchange contracts | ||||||||||||||||
(average cost) | USD | 68,724,260 | USD | 146,247,645 | ||||||||||||
Futures contracts (average notional value) | 507,419,319 | 119,149,670 | ||||||||||||||
CDS contracts (average notional value)* | EUR | 9,173,068 | — | |||||||||||||
CDS contracts (average notional value)* | USD | 38,068,282 | — | |||||||||||||
*Long represents buying protection and short represents selling protection.
9. Offsetting
In December 2011, the Financial Accounting Standards Board (FASB) issued guidance that expanded disclosure requirements on the offsetting of certain assets and liabilities. The disclosures are required for investments and derivative financial instruments subject to master netting or similar agreements which are eligible for offset on the “Statement of assets and liabilities” and require an entity to disclose both gross and net information about such investments and transactions in the financial statements. In January 2013, the FASB issued guidance that clarified which investments and transactions are subject to the offsetting disclosure requirements. The scope of the disclosure requirements for offsetting is limited to derivative instruments, repurchase agreements and reverse repurchase agreements, and securities
87
Table of Contents
Notes to financial statements
Delaware Diversified Income Fund
9. Offsetting (continued)
borrowing. The guidance is effective for financial statements with fiscal years beginning on or after Jan. 1, 2013, and interim periods within those fiscal years.
In order to better define its contractual rights and to secure rights that will help the Fund mitigate its counterparty risk, the Fund entered into an International Swaps and Derivatives Association, Inc. Master Agreement (ISDA Master Agreement) or a similar agreement with certain of its derivative contract counterparties. An ISDA Master Agreement is a bilateral agreement between the Fund and a counterparty that governs certain over-the-counter (OTC) derivatives and foreign exchange contracts and typically contains, among other things, collateral posting items and netting provisions in the event of a default and/or termination event. Under an ISDA Master Agreement, the Fund may, under certain circumstances, offset with the counterparty certain derivative financial instruments’ payables and/or receivables with collateral held and/or posted and create one single net payment. The provisions of the ISDA Master Agreement typically permit a single net payment in the event of default (close-out), including the bankruptcy or insolvency of the counterparty. However, bankruptcy or insolvency laws of a particular jurisdiction may impose restrictions on or prohibitions against the right of offset in bankruptcy, insolvency, or other events.
For financial reporting purposes, the Fund does not offset derivative assets and derivative liabilities that are subject to netting arrangements on the “Statement of assets and liabilities.”
At Oct. 31, 2015, the Fund had the following assets and liabilities subject to offsetting provisions:
Offsetting of Financial Assets and Liabilities and Derivative Assets and Liabilities
Counterparty | Gross Value of | Gross Value of | Net Position | ||||||||||||
Bank of America Merrill Lynch | $ | 227,165 | $ | (164,444) | $ | 62,721 | |||||||||
BNP Paribas | 332,486 | — | 332,486 | ||||||||||||
Hong Kong Shanghai Bank | — | (42,000) | (42,000) | ||||||||||||
JPMorgan Chase Bank | 72,115 | (143,678) | (71,563) | ||||||||||||
Toronto Dominion Bank | �� | 110,332 | (43,659) | 66,673 | |||||||||||
Union Bank of Switzerland | — | (36,288) | (36,288) | ||||||||||||
|
|
|
|
|
| ||||||||||
Total | $ | 742,098 | $ | (430,069) | $ | 312,029 | |||||||||
|
|
|
|
|
| ||||||||||
88
Table of Contents
Offsetting of Financial Assets and Liabilities and Derivative Assets and Liabilities (continued)
Counterparty | Net Position | Fair Value of | Cash Collateral | Fair Value of | Cash | Net Exposure(a) | ||||||||||||||||||||||||
Bank of America Merrill Lynch | $ | 62,721 | $ | (62,721) | $ | — | $ | — | $ | — | $ | — | ||||||||||||||||||
BNP Paribas | 332,486 | (255,468) | — | — | — | 77,018 | ||||||||||||||||||||||||
Hong Kong Shanghai Bank | (42,000) | — | — | — | — | (42,000) | ||||||||||||||||||||||||
JPMorgan Chase Bank | (71,563) | — | — | — | — | (71,563) | ||||||||||||||||||||||||
Toronto Dominion Bank | 66,673 | — | (66,673) | — | — | — | ||||||||||||||||||||||||
Union Bank of Switzerland | (36,288) | — | — | — | — | (36,288) | ||||||||||||||||||||||||
|
|
|
|
|
|
|
|
|
|
|
| |||||||||||||||||||
Total | $ | 312,029 | $ | (318,189) | $ | (66,673) | $ | — | $ | — | $ | (72,833) | ||||||||||||||||||
|
|
|
|
|
|
|
|
|
|
|
| |||||||||||||||||||
Master Repurchase Agreements
Counterparty | Repurchase | Fair Value of | Cash Collateral | Net Collateral | Net Exposure(a) | ||||||||||||||||||||
Bank of America Merrill Lynch | $ 44,836,473 | $ (44,836,473) | $— | $ (44,836,473) | $— | ||||||||||||||||||||
Bank of Montreal | 22,418,236 | (22,418,236) | — | (22,418,236) | — | ||||||||||||||||||||
BNP Paribas | 199,501,978 | (199,501,978) | — | (199,501,978) | — | ||||||||||||||||||||
|
|
|
|
|
|
|
|
|
| ||||||||||||||||
Total | $266,756,687 | $(266,756,687) | $— | $(266,756,687) | $— | ||||||||||||||||||||
|
|
|
|
|
|
|
|
|
| ||||||||||||||||
(a)Net exposure represents the receivable/(payable) that would be due from/(to) the counterparty in the event of default.
10. Securities Lending
The Fund, along with other funds in the Delaware Investments® Family of Funds, may lend its securities pursuant to a security lending agreement (Lending Agreement) with The Bank of New York Mellon (BNY Mellon). At the time a security is loaned, the borrower must post collateral equal to the required percentage of the market value of the loaned security, including any accrued interest. The required percentage is: (1) 102% with respect to U.S. securities and foreign securities that are denominated and payable in U.S. dollars; and (2) 105% with respect to foreign securities. With respect to each loan, if on any business day the aggregate market value of securities collateral plus cash collateral held is less than the aggregate market value of the securities which are the subject of such loan, the borrower will be notified to provide additional collateral by the end of the following business day which, together with the collateral already held, will be not less than the applicable initial collateral requirements for such security loan. If the aggregate market value of securities collateral and cash collateral held with respect to a security loan exceeds the applicable initial collateral requirement, upon request of the borrower, BNY Mellon must return enough collateral to the borrower by the end of the following business day to reduce the value of the remaining collateral to the applicable initial collateral requirement for such security loan.
89
Table of Contents
Notes to financial statements
Delaware Diversified Income Fund
10. Securities Lending (continued)
As a result of the foregoing, the value of the collateral held with respect to a loaned security on any particular day may be more or less than the value of the security on loan.
Cash collateral received is generally invested in the Delaware Investments® Collateral Fund No. 1 (Collective Trust) established by BNY Mellon for the purpose of investment on behalf of funds managed by DMC that participate in BNY Mellon’s securities lending program. The Collective Trust may invest in U.S. government securities and high-quality corporate debt, asset-backed and other money market securities, and in repurchase agreements collateralized by such securities, provided that the Collective Trust will generally have a dollar-weighted average portfolio maturity of 60 days or less. The Fund can also accept U.S. government securities and letters of credit (non-cash collateral) in connection with securities loans. In the event of default or bankruptcy by the lending agent, realization and/or retention of the collateral may be subject to legal proceedings. In the event the borrower fails to return loaned securities and the collateral received is insufficient to cover the value of the loaned securities and provided such collateral shortfall is not the result of investment losses, the lending agent has agreed to pay the amount of the shortfall to the Fund or, at the discretion of the lending agent, replace the loaned securities. The Fund continues to record dividends or interest, as applicable, on the securities loaned and is subject to changes in value of the securities loaned that may occur during the term of the loan. The Fund has the right under the Lending Agreement to recover the securities from the borrower on demand. With respect to security loans collateralized by non-cash collateral, the Fund receives loan premiums paid by the borrower. With respect to security loans collateralized by cash collateral, the earnings from the collateral investments are shared among the Fund, the security lending agent, and the borrower. The Fund records security lending income net of allocations to the security lending agent, and the borrower.
The Collective Trust used for the investment of cash collateral received from borrowers of securities seeks to maintain a NAV per unit of $1.00, but there can be no assurance that it will always be able to do so. The Fund may incur investment losses as a result of investing securities lending collateral in the Collective Trust. This could occur if an investment in a Collective Trust defaulted or if it were necessary to liquidate assets in the Collective Trust to meet returns on outstanding security loans at a time when the Collective Trust’s NAV per unit was less than $1.00. Under those circumstances, the Fund may not receive an amount from the Collective Trust that is equal in amount to the collateral the Fund would be required to return to the borrower of the securities and the Fund would be required to make up for this shortfall.
At the year ended Oct. 31, 2015, the value of securities on loan was $248,165,391, and the value of invested collateral was $255,054,924, for which cash collateral was received and invested in accordance with the Lending Agreement. These investments are presented on the “Schedule of investments” under the caption “Securities Lending Collateral.”
11. Credit and Market Risk
The Fund invests in fixed income securities whose value is derived from an underlying pool of mortgages or consumer loans. The value of these securities is sensitive to changes in economic conditions, including delinquencies and/or defaults, and may be adversely affected by shifts in the market’s perception of the issuers and changes in interest rates. Investors receive principal and interest payments
90
Table of Contents
as the underlying mortgages or consumer loans are paid back. Some of these securities are collateralized mortgage obligations (CMOs). CMOs are debt securities issued by U.S. government agencies or by financial institutions and other mortgage lenders, which are collateralized by a pool of mortgages held under an indenture. Prepayment of mortgages may shorten the stated maturity of the obligations and can result in a loss of premium, if any has been paid. Certain of these securities may be stripped (securities which provide only the principal or interest feature of the underlying security). The yield to maturity on an interest-only CMO is extremely sensitive not only to changes in prevailing interest rates, but also to the rate of principal payments (including prepayments) on the related underlying mortgage assets. A rapid rate of principal payments may have a material adverse effect on the Fund’s yield to maturity. If the underlying mortgage assets experience greater than anticipated prepayments of principal, the Fund may fail to fully recoup its initial investment in these securities even if the securities are rated in the highest rating categories.
The Fund invests a portion of its assets in high yield fixed income securities, which are securities rated lower than BBB- by S&P and Baa3 by Moody’s, or similarly rated by another nationally recognized statistical rating organization. Investments in these higher yielding securities are generally accompanied by a greater degree of credit risk than higher rated securities. Additionally, lower rated securities may be more susceptible to adverse economic and competitive industry conditions than investment grade securities.
Some countries in which the Fund may invest require governmental approval for the repatriation of investment income, capital, or the proceeds of sales of securities by foreign investors. In addition, if there is deterioration in a country’s balance of payments or for other reasons, a country may impose temporary restrictions on foreign capital remittances abroad.
The securities exchanges of certain foreign markets are substantially smaller, less liquid, and more volatile than the major securities markets in the United States. Consequently, acquisition and disposition of securities by the Fund may be inhibited. In addition, a significant portion of the aggregate market value of securities listed on the major securities exchanges in emerging markets is held by a smaller number of investors. This may limit the number of shares available for acquisition or disposition by the Fund.
The Fund invests in certain obligations that may have liquidity protection designed to ensure that the receipt of payments due on the underlying security is timely. Such protection may be provided through guarantees, insurance policies, or letters of credit obtained by the issuer or sponsor through third parties, through various means of structuring the transaction or through a combination of such approaches. The Fund will not pay any additional fees for such credit support, although the existence of credit support may increase the price of a security.
The Fund invests in bank loans and other securities that may subject it to direct indebtedness risk, the risk that the Fund will not receive payment of principal, interest, and other amounts due in connection with these investments and will depend primarily on the financial condition of the borrower. Loans that are fully secured offer the Fund more protection than unsecured loans in the event of nonpayment of scheduled interest or principal, although there is no assurance that the liquidation of collateral from a secured loan would satisfy the corporate borrower’s obligation, or that the collateral can be liquidated. Some loans or claims may be in default at the time of purchase. Certain of the loans and the other direct indebtedness acquired by the Fund may involve revolving credit facilities or other standby financing
91
Table of Contents
Notes to financial statements
Delaware Diversified Income Fund
11. Credit and Market Risk (continued)
commitments that obligate the Fund to pay additional cash on a certain date or on demand. These commitments may require the Fund to increase its investment in a company at a time when the Fund might not otherwise decide to do so (including at a time when the company’s financial condition makes it unlikely that such amounts will be repaid). To the extent that the Fund is committed to advance additional funds, it will at all times hold and maintain cash or other high grade debt obligations in an amount sufficient to meet such commitments.
As the Fund may be required to rely upon another lending institution to collect and pass on to the Fund amounts payable with respect to the loan and to enforce the Fund’s rights under the loan and other direct indebtedness, an insolvency, bankruptcy, or reorganization of the lending institution may delay or prevent the Fund from receiving such amounts. The highly leveraged nature of many loans may make them especially vulnerable to adverse changes in economic or market conditions. Investments in such loans and other direct indebtedness may involve additional risk to the Fund.
The Fund may invest up to 15% of its net assets in illiquid securities, which may include securities with contractual restrictions on resale, securities exempt from registration under Rule 144A promulgated under the Securities Act of 1933, as amended, and other securities which may not be readily marketable. The relative illiquidity of these securities may impair the Fund from disposing of them in a timely manner and at a fair price when it is necessary or desirable to do so. While maintaining oversight, the Fund’s Board has delegated to DMC, the day-to-day functions of determining whether individual securities are liquid for purposes of the Fund’s limitation on investments in illiquid securities. Securities eligible for resale pursuant to Rule 144A, which are determined to be liquid, are not subject to the Fund’s 15% limit on investments in illiquid securities. Rule 144A and illiquid securities have been identified on the “Schedule of investments.”
12. Contractual Obligations
The Fund enters into contracts in the normal course of business that contain a variety of indemnifications. The Fund’s maximum exposure under these arrangements is unknown. However, the Fund has not had prior claims or losses pursuant to these contracts. Management has reviewed the Fund’s existing contracts and expects the risk of loss to be remote.
13. Recent Accounting Pronouncements
In June 2014, the FASB issued guidance to improve the financial reporting of reverse repurchase agreements and other similar transactions. The guidance includes expanded disclosure requirements for entities that enter into reverse repurchase agreements and similar transactions accounted for as secured borrowings. The guidance is effective for financial statements with fiscal years beginning on or after Dec. 15, 2014 and interim periods within those fiscal years. Management has determined that this pronouncement has no impact to the Fund’s financial statements.
In May 2015, the FASB issued Accounting Standards Update (“ASU”) No. 2015-07 regarding “Disclosures for Investments in Certain Entities That Calculate Net Asset Value per Share.” The amendments in this update are effective for the Fund for fiscal years beginning after Dec. 15, 2015, and interim periods within those fiscal years. ASU No. 2015-07 will eliminate the requirement to categorize
92
Table of Contents
investments in the fair value hierarchy if their fair value is measured at NAV per share (or its equivalent) using the practical expedient in the FASB’s fair value measurement guidance. Management is evaluating the impact, if any, of this guidance on the Fund’s financial statement disclosures.
14. General Motors Term Loan Litigation
The Fund received notice of a litigation proceeding related to a General Motors Corporation (G.M.) term loan participation previously held by the Fund in 2009. We believe the matter subject to the litigation notice will likely lead to a recovery from the Fund of certain amounts received by the Fund because a U.S. Court of Appeals has ruled that the Fund and similarly situated investors were unsecured creditors rather than secured lenders of G.M. as a result of an erroneous UCC filing made by a third party. The Fund received the full principal on the loans in 2009 after the G.M. bankruptcy. However, based upon the court ruling the estate is seeking to recover such amounts arguing that, as unsecured creditors, the Fund should not have received payment in full. Based upon currently available information related to the litigation and the Fund’s potential exposure, the Fund recorded an asset of $4,787,750 and a liability of $15,959,167 that resulted in a decrease in the Fund’s NAV to reflect this likely recovery.
15. Subsequent Events
On Nov. 9, 2015, the Fund, along with the other Participants, entered into an amendment to the agreement for a $155,000,000 revolving line of credit to be used as described in Note 7 and to be operated in substantially the same manner as the agreement described in Note 7, with the exception of the annual commitment fee. Under the amendment to the agreement, the Participants are charged an annual commitment fee of 0.10%, which is allocated across the Participants on the basis of each Participant’s allocation of the entire facility. The line of credit available under the agreement expires on Nov. 7, 2016.
Management has determined that no other material events or transactions occurred subsequent to Oct. 31, 2015 that would require recognition or disclosure in the Fund’s financial statements.
93
Table of Contents
registered public accounting firm
To the Board of Trustees of Delaware Group® Adviser Funds
and the Shareholders of Delaware Diversified Income Fund:
In our opinion, the accompanying statement of assets and liabilities, including the schedule of investments, and the related statements of operations and of changes in net assets and the financial highlights present fairly, in all material respects, the financial position of Delaware Diversified Income Fund (one of the series constituting Delaware Group Adviser Funds, hereafter referred to as the “Fund”) at October 31, 2015, the results of its operations for the year then ended, the changes in its net assets for each of the two years in the period then ended and the financial highlights for each of the five years in the period then ended, in conformity with accounting principles generally accepted in the United States of America. These financial statements and financial highlights (hereafter referred to as “financial statements”) are the responsibility of the Fund’s management. Our responsibility is to express an opinion on these financial statements based on our audits. We conducted our audits of these financial statements in accordance with the standards of the Public Company Accounting Oversight Board (United States). Those standards require that we plan and perform the audit to obtain reasonable assurance about whether the financial statements are free of material misstatement. An audit includes examining, on a test basis, evidence supporting the amounts and disclosures in the financial statements, assessing the accounting principles used and significant estimates made by management, and evaluating the overall financial statement presentation. We believe that our audits, which included confirmation of securities at October 31, 2015 by correspondence with the custodian and brokers, and the application of alternative auditing procedures where confirmations of securities purchased had not been received, provide a reasonable basis for our opinion.
PricewaterhouseCoopers LLP
Philadelphia, Pennsylvania
December 18, 2015
94
Table of Contents
Other Fund information (Unaudited)
Delaware Diversified Income Fund
Tax Information
The information set forth below is for the Fund’s fiscal year as required by federal income tax laws. Shareholders, however, must report distributions on a calendar year basis for income tax purposes, which may include distributions for portions of two fiscal years of a Fund. Accordingly, the information needed by shareholders for income tax purposes will be sent to them in January of each year. Please consult your tax advisor for proper treatment of this information.
All disclosures are based on financial information available as of the date of this annual report and, accordingly are subject to change. For any and all items requiring reporting, it is the intention of the Fund to report the maximum amount permitted under the Internal Revenue Code and the regulations thereunder.
For the fiscal year ended Oct. 31, 2015, the Fund reports distributions paid during the year as follows:
(A) Long-Term Capital Gains Distributions (Tax Basis) | 9.17 | % | ||
(B) Ordinary Income Distributions (Tax Basis)* | 84.81 | % | ||
(C) Return of Capital (Tax Basis) | 6.02 | % | ||
Total Distributions. | 100.00 | % | ||
(D) Qualifying Dividends1 | 1.06 | % |
(A), (B) and (C) are based on a percentage of the Fund’s total distributions.
(D) is based on a percentage of the Fund’s ordinary income distributions.
1 Qualifying dividends represent dividends which qualify for the corporate dividends received deduction.
*For the fiscal year ended Oct. 31, 2015, certain dividends paid by the Fund may be subject to a maximum tax rate of 20%. The percentage of dividends paid by the Fund from ordinary income reported as qualified income is 1.35%. Complete information will be computed and reported tn conjunction with your 2015 Form 1099-DN.
For the fiscal year ended Oct. 31, 2015, certain interest income paid by the Fund, have been determined to be Qualified Interest Income and may be subject to relief from U.S. withholding for foreign shareholders, as provided by the American Jobs Creation Act of 2004; the Tax Relief, Unemployment Insurance Reauthorization, and Job Creations Act of 2010; and as extended by the American Taxpayer Relief Act of 2012. For the fiscal year ended Oct. 31, 2015, the Fund has reported maximum distributions of Qualified Interest Income of $195,446,559.
95
Table of Contents
Other Fund information (Unaudited)
Delaware Diversified Income Fund
Board consideration of Delaware Diversified Income Fund investment advisory agreement
At a meeting held on Aug. 18–20, 2015 (the “Annual Meeting”), the Board of Trustees (collectively referred to here as the “Board”), including a majority of disinterested or independent Trustees, approved the renewal of the Investment Advisory Agreement for Delaware Diversified Income Fund (the “Fund”). In making its decision, the Board considered information furnished at regular quarterly Board meetings, including reports detailing Fund performance, investment strategies and expenses, as well as information prepared specifically in connection with the renewal of the investment advisory and sub-advisory contracts. Information furnished specifically in connection with the renewal of the Investment Management Agreement with Delaware Management Company (“DMC”) included materials provided by DMC and its affiliates (“Delaware Investments”) concerning, among other things, the nature, extent, and quality of services provided to the Fund; the costs of such services to the Fund; economies of scale; and the investment manager’s financial condition and profitability. In addition, in connection with the Annual Meeting, reports were provided to the Trustees in May 2015 and included reports provided by Lipper, Inc., an independent statistical compilation organization (“Lipper”). The Lipper reports compared the Fund’s investment performance and expenses with those of other comparable mutual funds. The Independent Trustees reviewed and discussed the Lipper reports with independent legal counsel to the Independent Trustees. In addition to the information noted above, the Board also requested and received information regarding DMC’s policy with respect to advisory fee levels and its breakpoint philosophy; the structure of portfolio manager compensation; comparative client fee information; and any constraints or limitations on the availability of securities for certain investment styles, which had in the past year inhibited, or which were likely in the future to inhibit, the investment manager’s ability to invest fully in accordance with Fund policies.
In considering information relating to the approval of the Fund’s advisory agreement, the Independent Trustees received assistance and advice from and met separately with independent legal counsel to the Independent Trustees. They also engaged a consultant to assist them in analyzing portions of the data received. The Independent Trustees reviewed and discussed with such consultant two reports prepared by the consultant with respect to such data. Although the Board gave attention to all information furnished, the following discussion identifies, under separate headings, the primary factors taken into account by the Board during its contract renewal considerations.
Nature, extent, and quality of service. The Board considered the services provided by DMC to the Fund and its shareholders. In reviewing the nature, extent, and quality of services, the Board considered reports furnished to it throughout the year, which covered matters such as the relative performance of the Fund; compliance of portfolio managers with the investment policies, strategies, and restrictions for the Fund; compliance by DMC and Delaware Distributors, L.P. (together, “Management”) personnel with the Code of Ethics adopted throughout the Delaware Investments® Family of Funds complex; and adherence to fair value pricing procedures as established by the Board. The Board was pleased with the current staffing of the Fund’s investment adviser and the emphasis placed on research in the investment process. The Board recognized DMC’s receipt of several industry distinctions during the past several years. The Board gave favorable consideration to DMC’s efforts to control expenditures while maintaining service levels committed to Fund matters. The Board noted that, in the third and fourth quarters of 2013, Management reduced the maximum 12b-1 fee for certain Funds; and in November 2013 Management negotiated a substantial reduction in fees for fund accounting services provided to the Funds. The Board noted the benefits provided to Fund shareholders through each shareholder’s
96
Table of Contents
ability to exchange an investment in one Delaware Investments® fund for the same class of shares in another Delaware Investments fund without a sales charge, to reinvest Fund dividends into additional shares of the Fund or into additional shares of other Delaware Investments funds and the privilege to combine holdings in other Delaware Investments funds to obtain a reduced sales charge. The Board was satisfied with the nature, extent, and quality of the overall services provided by DMC.
Investment performance. The Board placed significant emphasis on the investment performance of the Fund in view of the importance of investment performance to shareholders. Although the Board gave appropriate consideration to performance reports and discussions with portfolio managers at Investment Committee meetings throughout the year, the Board gave particular weight to the Lipper reports furnished for the Annual Meeting. The Lipper reports prepared for the Fund showed the investment performance of its Class A shares in comparison to a group of similar funds as selected by Lipper (the “Performance Universe”). A fund with the best performance ranked first, and a fund with the poorest performance ranked last. The highest/best performing 25% of funds in the Performance Universe make up the first quartile; the next 25%, the second quartile; the next 25%, the third quartile; and the poorest/worst performing 25% of funds in the Performance Universe make up the fourth quartile. Comparative annualized performance for the Fund was shown for the past 1-, 3-, 5-, and 10-year periods, to the extent applicable, ended March 31, 2015. The Board’s objective is that the Fund’s performance for the periods considered be at or above the median of its Performance Universe.
The Performance Universe for the Fund consisted of the Fund and all retail and institutional multi-sector income funds as selected by Lipper. The Lipper report comparison showed that the Fund’s total return for the 1-year period was in the first quartile of its Performance Universe. The report further showed that the Fund’s total return for the 3-, 5-, and 10-year periods was in the third quartile, fourth quartile, and second quartile, respectively. The Fund’s performance results were mixed but tended toward median, which was acceptable.
Comparative expenses. The Board considered expense comparison data for the Delaware Investments Family of Funds. Management provided the Board with information on pricing levels and fee structures for the Fund as of its most recently completed fiscal year. The Board also focused on the comparative analysis of effective management fees and total expense ratios of the Fund versus effective management fees and expense ratios of a group of similar funds as selected by Lipper (the “Expense Group”). In reviewing comparative costs, the Fund’s contractual management fee and the actual management fee incurred by the Fund were compared with the contractual management fees (assuming all funds in the Expense Group were similar in size to the Fund) and actual management fees (as reported by each fund) within the Expense Group, taking into account any applicable breakpoints and fee waivers. The Fund’s total expenses were also compared with those of its Expense Group. The Lipper total expenses, for comparative consistency, were shown by Lipper for Class A shares and comparative total expenses including 12b-1 and non 12b-1 service fees. The Board considered fees paid to DMC for non-management services. The Board’s objective is to limit the Fund’s total expense ratio to be competitive with that of the Expense Group.
The expense comparisons for the Fund showed that its actual management fee and total expenses were in the quartile with the lowest expenses of its Expense Group. The Board was satisfied with the management fee and total expenses of the Fund in comparison to those of its Expense Group as shown in the Lipper report.
97
Table of Contents
Other Fund information (Unaudited)
Delaware Diversified Income Fund
Board consideration of Delaware Diversified Income Fund investment advisory agreement (continued)
Management profitability. The Board considered the level of profits realized by DMC in connection with the operation of the Fund. In this respect, the Board reviewed the Investment Management Profitability Analysis that addressed the overall profitability of DMC’s business in providing management and other services to each of the individual funds and the Delaware Investments® Family of Funds as a whole. Specific attention was given to the methodology followed in allocating costs for the purpose of determining profitability. Management stated that the level of profits of DMC, to a certain extent, reflects recent operational cost savings and efficiencies initiated by DMC. The Board considered DMC’s efforts to improve services provided to fund shareholders and to meet additional regulatory and compliance requirements resulting from recent industry-wide Securities and Exchange Commission initiatives. The Board also considered the extent to which DMC might derive ancillary benefits from fund operations, including the potential for procuring additional business as a result of the prestige and visibility associated with its role as service provider to the Delaware Investments Family of Funds and the benefits from allocation of fund brokerage to improve trading efficiencies. The Board found that the management fees were reasonable in light of the services rendered and the level of profitability of DMC.
Economies of scale. The Trustees considered whether economies of scale are realized by DMC as the Fund’s assets increase and the extent to which any economies of scale are reflected in the level of management fees charged. The Trustees reviewed the standardized advisory fee pricing and structure, approved by the Board and shareholders, which includes breakpoints, and which applies to most funds in the Delaware Investments Family of Funds complex. Breakpoints in the advisory fee occur when the advisory fee rate is reduced on assets in excess of specified levels. Breakpoints result in a lower advisory fee than would otherwise be the case in the absence of breakpoints, when the asset levels specified in the breakpoints are exceeded. The Board noted that the fee under the Fund’s management contract fell within the standardized fee pricing structure. The Board also noted that the Fund’s assets exceeded the final breakpoint level. The Board believed that, given the extent to which economies of scale might be realized by the advisor and its affiliates, the schedule of fees under the Investment Management Agreement provides a sharing of benefits with the Fund and its shareholders.
98
Table of Contents
This page intentionally left blank.
Table of Contents
Board of trustees / directors and officers addendum
Delaware Investments® Family of Funds
A mutual fund is governed by a Board of Trustees/Directors (“Trustees”), which has oversight responsibility for the management of a fund’s business affairs. Trustees establish procedures and oversee and review the performance of the investment manager, the distributor, and others who perform services for the fund. The independent fund trustees, in particular, are advocates
Name, Address, and Birth Date | Position(s) Held with Fund(s) | Length of Time Served | ||
Interested Trustee | ||||
Shawn K. Lytle1 | President, | Trustee since | ||
2005 Market Street | Chief Executive Officer, | September 1, 2015 | ||
Philadelphia, PA 19103 | and Trustee | |||
February 1970 | President and | |||
| Chief Executive Officer | ||||
since August 20, 2015
| ||||
Independent Trustees | ||||
Thomas L. Bennett | Chairman and Trustee | Trustee since | ||
2005 Market Street | March 2005 | |||
Philadelphia, PA 19103 | ||||
October 1947 | Chairman since | |||
March 1, 2015
| ||||
Ann D. Borowiec | Trustee | Since March 31, 2015 | ||
2005 Market Street | ||||
Philadelphia, PA 19103 | ||||
November 1958
| ||||
Joseph W. Chow | Trustee | Since January 2013 | ||
2005 Market Street | ||||
Philadelphia, PA 19103 | ||||
January 1953
|
| 1 | Shawn K. Lytle is considered to be an “Interested Trustee” because he is an executive officer of the Fund’s(s’) investment advisor. |
100
Table of Contents
for shareholder interests. Each trustee has served in that capacity since he or she was elected to or appointed to the Board of Trustees, and will continue to serve until his or her retirement or the election of a new trustee in his or her place. The following is a list of the Trustees and Officers with certain background and related information.
Principal Occupation(s) During the Past Five Years | Number of Portfolios in Fund Complex Overseen by Trustee or Officer | Other Directorships Held by Trustee or Officer | ||
Shawn K. Lytle has served as | 64 | Trustee — UBS | ||
President of | Relationship Funds, | |||
Delaware Investments2 | SMA Relationship | |||
since June 2015 and was the | Trust, and UBS Funds | |||
Regional Head of Americas for | (May 2010–April 2015) | |||
UBS Global Asset | ||||
Management from | ||||
2010 through 2015. | ||||
Private Investor | 64 | Director — | ||
(March 2004–Present) | Bryn Mawr Bank Corp. (BMTC) | |||
(2007–2011)
| ||||
Chief Executive Officer | 64 | None | ||
Private Wealth Management | ||||
(2011–2013) and | ||||
Market Manager, | ||||
New Jersey Private | ||||
Bank (2005–2011) — | ||||
J.P. Morgan Chase & Co.
| ||||
Executive Vice President | 64 | Director and Audit Committee | ||
(Emerging Economies | Member — Hercules | |||
Strategies, Risks, and | Technology Growth | |||
Corporate Administration) | Capital, Inc. | |||
State Street Corporation | (2004–2014) | |||
(July 2004–March 2011)
|
| 2 | Delaware Investments is the marketing name for Delaware Management Holdings, Inc. and its subsidiaries, including the Fund’s(s’) investment advisor, principal underwriter, and its transfer agent. |
101
Table of Contents
Board of trustees / directors and officers addendum
Delaware Investments® Family of Funds
Name, Address, and Birth Date | Position(s) Held with Fund(s) | Length of Time Served | ||
Independent Trustees (continued) | ||||
John A. Fry | Trustee | Since January 2001 | ||
2005 Market Street | ||||
Philadelphia, PA 19103 | ||||
May 1960
| ||||
Lucinda S. Landreth | Trustee | Since March 2005 | ||
2005 Market Street | ||||
Philadelphia, PA 19103 | ||||
June 1947
| ||||
Frances A. Sevilla-Sacasa | Trustee | Since September 2011 | ||
2005 Market Street | ||||
Philadelphia, PA 19103 | ||||
January 1956
|
102
Table of Contents
Principal Occupation(s) During the Past Five Years | Number of Portfolios in Fund Complex Overseen by Trustee or Officer | Other Directorships Held by Trustee or Officer | ||
President — | 64 | Director — Hershey Trust | ||
Drexel University | Company | |||
(August 2010–Present) | ||||
| Director, Audit Committee, | ||||
President — | and Governance Committee | |||
Franklin & Marshall College | Member — Community | |||
(July 2002–July 2010) | Health Systems | |||
| Director — Drexel | ||||
Morgan & Co.
| ||||
Private Investor | 64 | None | ||
(2004–Present)
| ||||
Chief Executive Officer — | 64 | Trust Manager and | ||
Banco Itaú | Audit Committee | |||
International | Member — Camden | |||
(April 2012–Present) | Property Trust | |||
Executive Advisor to Dean | ||||
(August 2011–March 2012) and Interim Dean | ||||
(January 2011–July 2011) — | ||||
University of Miami School of | ||||
Business Administration | ||||
President — U.S. Trust, | ||||
Bank of America Private | ||||
Wealth Management | ||||
(Private Banking) | ||||
(July 2007–December 2008)
| ||||
103
Table of Contents
Board of trustees / directors and officers addendum
Delaware Investments® Family of Funds
Name, Address, and Birth Date | Position(s) Held with Fund(s) | Length of Time Served | ||
Independent Trustees (continued) | ||||
Thomas K. Whitford | Trustee | Since January 2013 | ||
2005 Market Street | ||||
Philadelphia, PA 19103 | ||||
March 1956
| ||||
Janet L. Yeomans | Trustee | Since April 1999 | ||
2005 Market Street | ||||
Philadelphia, PA 19103 | ||||
July 1948
|
104
Table of Contents
Principal Occupation(s) During the Past Five Years | Number of Portfolios in Fund Complex Overseen by Trustee or Officer | Other Directorships Held by Trustee or Officer | ||
Vice Chairman | 64 | Director — HSBC Finance | ||
(2010–April 2013), | Corporation and HSBC | |||
Chief Administrative | North America Holdings Inc. | |||
Officer (2008–2010), | ||||
and Executive Vice | Director — | |||
President and Chief | HSBC Bank | |||
Administrative Officer | ||||
(2007–2009) — | ||||
PNC Financial | ||||
Services Group
| ||||
Vice President and Treasurer | 64 | Director, Audit and | ||
(January 2006–July 2012) | Compliance Committee Chair, | |||
Vice President — | Investment Committee | |||
Mergers & Acquisitions | Member, and Governance | |||
(January 2003–January 2006), | Committee Member — | |||
and Vice President | Okabena Company | |||
and Treasurer | ||||
(July 1995–January 2003) | Chair — 3M | |||
3M Corporation | Investment Management | |||
| Company | ||||
(2005–2012)
|
105
Table of Contents
Board of trustees / directors and officers addendum
Delaware Investments® Family of Funds
Name, Address, and Birth Date | Position(s) Held with Fund(s) | Length of Time Served | ||
Officers | ||||
David F. Connor | Senior Vice President, | Senior Vice President | ||
2005 Market Street | General Counsel, | since May 2013; | ||
Philadelphia, PA 19103 | and Secretary | General Counsel | ||
December 1963 | since May 2015; | |||
| Secretary since | ||||
October 2005
| ||||
Daniel V. Geatens | Vice President | Treasurer since October 2007 | ||
2005 Market Street | and Treasurer | |||
Philadelphia, PA 19103 | ||||
October 1972
| ||||
Richard Salus | Senior Vice President | Chief Financial Officer | ||
2005 Market Street | and Chief Financial Officer | since November 2006 | ||
Philadelphia, PA 19103 | ||||
October 1963
|
The Statement of Additional Information for the Fund(s) includes additional information about the Trustees and Officers and is available, without charge, upon request by calling 800 523-1918.
106
Table of Contents
Principal Occupation(s) During the Past Five Years | Number of Portfolios in Fund Complex Overseen by Trustee or Officer | Other Directorships Held by Trustee or Officer | ||
David F. Connor has served as | 64 | None3 | ||
Senior Vice President of the Fund(s) and the investment advisor since 2013, General Counsel of the Fund(s) and the investment advisor since 2015, and Secretary of the Fund(s) and the investment advisor since 2005.
| ||||
Daniel V. Geatens has served | 64 | None3 | ||
as Vice President and | ||||
Treasurer of the Fund(s) since 2007 and Vice President and Director of Financial | ||||
Administration of the investment advisor since 2010.
| ||||
Richard Salus has served as | 64 | None3 | ||
Senior Vice President and Chief Financial Officer of the Fund(s) and the investment advisor since 2006.
|
| 3 | David F. Connor, Daniel V. Geatens, and Richard Salus serve in similar capacities for the six portfolios of the Optimum Fund Trust, which have the same investment advisor, principal underwriter, and transfer agent as the registrant. |
107
Table of Contents
| Board of trustees | ||||||
| Shawn K. Lytle | Ann D. Borowiec | John A. Fry | Frances A. | |||
| President and | Former Chief Executive | President | Sevilla-Sacasa | |||
| Chief Executive Officer | Officer | Drexel University | Chief Executive Officer | |||
| Delaware Investments ® | Private Wealth Management | Philadelphia, PA | Banco Itaú | |||
| Family of Funds | J.P. Morgan Chase & Co. | International | ||||
| Philadelphia, PA | New York, NY | Lucinda S. Landreth | Miami, FL | |||
| Former Chief Investment | ||||||
| Thomas L. Bennett | Joseph W. Chow | Officer | Thomas K. Whitford | |||
| Chairman of the Board | Former Executive Vice | Assurant, Inc. | Former Vice Chairman | |||
| Delaware Investments | President | New York, NY | PNC Financial Services Group | |||
| Family of Funds | State Street Corporation | Pittsburgh, PA | ||||
| Private Investor | Brookline, MA | |||||
| Rosemont, PA | Janet L. Yeomans | |||||
| Former Vice President and | ||||||
| Treasurer | ||||||
| 3M Corporation | ||||||
| St. Paul, MN | ||||||
| Affiliated officers | ||||||
| David F. Connor | Daniel V. Geatens | Richard Salus | ||||
| Senior Vice President, | Vice President and | Senior Vice President and | ||||
| General Counsel, | Treasurer | Chief Financial Officer | ||||
| and Secretary | Delaware Investments | Delaware Investments | ||||
| Delaware Investments | Family of Funds | Family of Funds | ||||
| Family of Funds | Philadelphia, PA | Philadelphia, PA | ||||
| Philadelphia, PA | ||||||
This annual report is for the information of Delaware Diversified Income Fund shareholders, but it may be used with prospective investors when preceded or accompanied by the Delaware Investments Fund fact sheet for the most recently completed calendar quarter. These documents are available at delawareinvestments.com.
Delaware Investments is the marketing name of Delaware Management Holdings, Inc. and its subsidiaries.
The Fund files its complete schedule of portfolio holdings with the Securities and Exchange Commission (SEC) for the first and third quarters of each fiscal year on Form N-Q. The Fund’s Forms N-Q, as well as a description of the policies and procedures that the Fund uses to determine how to vote proxies (if any) relating to portfolio securities are available without charge (i) upon request, by calling 800 523-1918; and (ii) on the SEC’s website at sec.gov. In addition, a description of the policies and procedures that the Fund uses to determine how to vote proxies (if any) relating to portfolio securities and the Schedules of Investments included in the Fund’s most recent Form N-Q are available without charge on the Fund’s website at delawareinvestments.com. The Fund’s Forms N-Q may be reviewed and copied at the SEC’s Public Reference Room in Washington, D.C.; information on the operation of the Public Reference Room may be obtained by calling 800 SEC-0330.
Information (if any) regarding how the Fund voted proxies relating to portfolio securities during the most recently disclosed 12-month period ended June 30 is available without charge (i) through the Fund’s website at delawareinvestments.com; and (ii) on the SEC’s website at sec.gov.
108
Table of Contents

Annual report
U.S. equity mutual fund
Delaware U.S. Growth Fund
October 31, 2015
Carefully consider the Fund’s investment objectives, risk factors, charges, and expenses before investing. This and other information can be found in the Fund’s prospectus and its summary prospectus, which may be obtained by visiting delawareinvestments.com or calling 800 523-1918. Investors should read the prospectus and the summary prospectus carefully before investing.
You can obtain shareholder reports and prospectuses online instead of in the mail.
Visit delawareinvestments.com/edelivery.
Table of Contents
Experience Delaware Investments
Delaware Investments is committed to the pursuit of consistently superior asset management and unparalleled client service. We believe in our investment processes, which seek to deliver consistent results, and in convenient services that help add value for our clients.
If you are interested in learning more about creating an investment plan, contact your financial advisor.
You can learn more about Delaware Investments or obtain a prospectus for Delaware U.S. Growth Fund at delawareinvestments.com.
Manage your investments online
| ● | 24-hour access to your account information |
| ● | Obtain share prices |
| ● | Check your account balance and recent transactions |
| ● | Request statements or literature |
| ● | Make purchases and redemptions |
Delaware Management Holdings, Inc. and its subsidiaries (collectively known by the marketing name of Delaware Investments) are wholly owned subsidiaries of Macquarie Group Limited, a global provider of banking, financial, advisory, investment and funds management services.
Neither Delaware Investments nor its affiliates noted in this document are authorized deposit-taking institutions for the purpose of the Banking Act 1959 (Commonwealth of Australia). The obligations of these entities do not represent deposits or other liabilities of Macquarie Bank Limited (MBL). MBL does not guarantee or otherwise provide assurance in respect of the obligations of these entities, unless noted otherwise.
| 1 | ||||
| 4 | ||||
| 8 | ||||
Security type / sector allocation and top 10 equity holdings | 10 | |||
| 12 | ||||
| 14 | ||||
| 16 | ||||
| 18 | ||||
| 20 | ||||
| 28 | ||||
| 38 | ||||
| 39 | ||||
| 44 | ||||
| 52 |
Unless otherwise noted, views expressed herein are current as of Oct. 31, 2015, and subject to change for events occurring after such date.
Funds are not FDIC insured and are not guaranteed. It is possible to lose the principal amount invested.
Mutual fund advisory services provided by Delaware Management Company, a series of Delaware Management Business Trust, which is a registered investment advisor. Delaware Investments, a member of Macquarie Group, refers to Delaware Management Holdings, Inc. and its subsidiaries, including the Fund’s distributor, Delaware Distributors, L.P. Macquarie Group refers to Macquarie Group Limited and its subsidiaries and affiliates worldwide.
© 2015 Delaware Management Holdings, Inc.
All third-party marks cited are the property of their respective owners.
Table of Contents
| Portfolio management review | ||
| Delaware U.S. Growth Fund | November 10, 2015 | |
| Performance preview (for the year ended October 31, 2015) | ||||||||
Delaware U.S. Growth Fund (Class A shares) | 1-year return | +7.63% | ||||||
Russell 1000® Growth Index (benchmark) | 1-year return | +9.18% | ||||||
Past performance does not guarantee future results.
For complete, annualized performance for Delaware U.S. Growth Fund, please see the table on page 4.
The performance of Class A shares excludes the applicable sales charge and reflects the reinvestment of all distributions. Please see page 6 for a description of the index. Index performance returns do not reflect any management fees, transaction costs, or expenses. Indices are unmanaged and one cannot invest directly in an index.
Jackson Square Partners, LLC (JSP), a U.S. registered investment advisor, is the sub-advisor to the Fund. As sub-advisor, JSP is responsible for day-to-day management of the Fund’s assets. Although JSP serves as sub-advisor, the investment manager, Delaware Management Company (DMC), a series of Delaware Management Business Trust, has ultimate responsibility for all investment advisory services.
The U.S. economy hit several rough patches during the fiscal year ended Oct. 31, 2015, most notably in late summer and early fall as a China-led global slowdown rocked the financial world. An eleventh-hour rebound in October helped domestic stocks climb back to pre-correction levels, enabling the broad-based stock market, as measured by the S&P 500® Index, to gain a moderate 5.20% during the 12-month period.
Oil prices were a recurring theme as the price per barrel fell precipitously throughout the period, eventually bottoming out at a six-year low. Despite a drop in demand brought on primarily by the slowdown in China, and by growing international demand for cleaner energy sources, major oil producers like the Organization of the Petroleum-Exporting Countries (OPEC) maintained production levels in an effort to remain competitive with U.S. shale oil producers. The resulting supply-demand imbalance led many U.S. producers to cut back or close rigs late in the period. Meanwhile, the International Energy Agency (IEA) expected geopolitical turmoil to
crimp production in Iraq, but forecasted a long, slow recovery for oil prices.
The once reliable Chinese growth engine sputtered amid a combination of excess manufacturing capacity and a slowing growth rate. In mid-August, the Chinese government surprised investors by devaluing its currency by roughly 2% relative to the U.S. dollar, a move that triggered the yuan’s largest one-day drop in more than two decades. As the cost of Chinese goods fell in foreign markets, concern grew about the stability of other Asian nations. In light of these events, it’s no surprise that emerging markets were among the weakest performers during the fiscal period.
The European Union (EU) continued to struggle with the management of member nation Greece’s ongoing debt crisis. Despite a series of bailouts by European central banks to the tune of $264 billion, Greece’s economy has shrunk by a quarter over the past five years and unemployment levels have topped 25%. The future of the nation’s membership within the EU remains up in the air, even as the bloc continues to restructure its debt. The EU also shared concerns about the Chinese economy, volatility amid faltering energy stocks, and apprehension about a potential rate increase by the U.S. Federal Reserve. At the same time, European Central Bank President Mario Draghi advised that the easing of EU monetary policy would continue. All of these factors led to dramatic market swings that left international
1
Table of Contents
Portfolio management review
Delaware U.S. Growth Fund
equity market performance, as measured by the MSCI EAFE Index, essentially flat for the fiscal year.
Within the United States, investors spent most of the year trying to predict when the Fed would reverse its seven-year-old, zero interest-rate policy. Though the Fed hinted throughout the year that a rate hike was just around the corner, uncertain economic data repeatedly pushed it off that path. Despite overall strong job gains, positive household spending numbers, and rising home sales, other factors including the Greek debt crisis and China’s devaluation and consequent market volatility induced the Fed to hold off on several occasions. Toward the end of the period, the Fed said it would be “monitoring global economic and financial developments” until its next meeting in December. An October delay in the rate hike led to a widespread market rally, with U.S. equities – in particular large-cap growth equities – posting outsized gains for the month.
At fiscal year end, despite recent market gains, uncertainty remained about China’s economic future, the long-term trajectory of oil prices, and the timeline for Fed rate hikes.
Fund performance
For the fiscal year ended Oct. 31, 2015, Delaware U.S. Growth Fund returned +7.63% at net asset value and +1.43% at maximum offer price (both figures represent Class A shares with distributions reinvested). For the same period, the Fund’s benchmark, the Russell 1000 Growth Index, returned +9.18%. Complete annualized performance for Delaware U.S. Growth Fund is shown in the table on page 4.
Strong relative performance in the financial services and producer durables sectors was unable to overcome weak relative performance in the consumer discretionary and technology sectors.
Equinix was a contributor to performance during the period. The company reported relatively strong financial results and received a favorable real estate investment trust (REIT) status ruling from the Internal Revenue Service. Additionally, the company is pursuing several strategic acquisitions that should further strengthen its global presence. The company continues to benefit from significant opportunities associated with cloud computing and its disruption of the information technology supply chain. Increased globalization and the robust need for a secure and accessible network to meet the needs of a dispersed user base are creating significant demand. We believe the company’s innovative product offerings make it well positioned in a technology-spending environment that is focused on addressing the needs of enterprises struggling to maintain the highest level of network performance and quality of service for global users.
Electronic Arts, a global interactive entertainment software company, was also a contributor to performance during the period. The company reported relatively strong financial results driven in part by several individual game titles, cost controls, and growth in digital-game sales. Additionally, the company had a particularly strong showing at this year’s Electronic Entertainment Expo (E3) after its upcoming game Star Wars Battlefront received an overall positive initial response. We believe the company should continue to benefit from upcoming and established game franchises and its growth within the digital-downloads and mobile-phone gaming channels, which we think will be increasingly important for the company’s growth going forward.
Valeant Pharmaceuticals International was a detractor from performance during the period. The company was hit hard by allegations of wrongdoing at its specialty pharmacy partner, Philidor. Investors’ lack of familiarity with this relationship left the stock vulnerable when
2
Table of Contents
questions were raised, and a short-seller’s analogy to Enron put incremental pressure on the stock and raised investor scrutiny. Our best assessment at this point is that Philidor is a relatively small part of Valeant’s total business. Further, third-quarter cash generation was positive and would indicate the company is what we thought it was: a cash-generating business with solid medium-term growth prospects. At the end of the reporting period, it was trading at a very high free-cash-flow yield on our 2016 projections, despite our having applied a very substantial haircut to those projections. We also note that the shareholder base and board include large owners with an interest in reaching the right economic outcome. Considering both risk and reward, as well as the remaining unknowns, we have maintained exposure to the stock in the midrange of our portfolio weights.
Qualcomm was also a detractor from performance during the period. The stock experienced weakness over concerns related to fears of increased competition and more pricing pressure than expected. We believe these issues are transitory and do not threaten our long-term thesis on the company. A positive development was a settlement of the antimonopoly suit with the Chinese government that had added to downward pressure on the stock. We believe that Qualcomm continues to benefit from its unique intellectual property and patent position in the semiconductor industry as well as its technology applications targeted at the explosive growth and proliferation of wireless devices. Further, we believe that new management at the company appears more willing than its predecessors to consider meaningful capital allocation actions that could potentially create significant value for shareholders.
Regardless of the economic outcome, we remain consistent in our long-term investment philosophy: We want to own what we view as strong secular-growth companies with solid business models and competitive positions that we believe can grow market share and have the potential to deliver shareholder value in a variety of market environments.
3
Table of Contents
| Performance summary | ||
| Delaware U.S. Growth Fund | October 31, 2015 | |
The performance data quoted represent past performance; past performance does not guarantee future results. Investment return and principal value will fluctuate so your shares, when redeemed, may be worth more or less than their original cost. Please obtain the performance data current for the most recent month end by calling 800 523-1918 or visiting our website at delawareinvestments.com/performance. Current performance may be lower or higher than the performance data quoted.
| Fund and benchmark performance1,2 | Average annual total returns through October 31, 2015
| ||||||||||||||
| 1 year | 5 years | 10 years | |||||||||||||
Class A (Est. Dec. 3, 1993) | |||||||||||||||
Excluding sales charge | +7.63% | +15.48% | +8.08% | ||||||||||||
Including sales charge | +1.43% | +14.12% | +7.44% | ||||||||||||
Class C (Est. May 23, 1994) | |||||||||||||||
Excluding sales charge | +6.86% | +14.63% | +7.29% | ||||||||||||
Including sales charge | +5.86% | +14.63% | +7.29% | ||||||||||||
Class R (Est. June 2, 2003) | |||||||||||||||
Excluding sales charge | +7.36% | +15.20% | +7.82% | ||||||||||||
Including sales charge | +7.36% | +15.20% | +7.82% | ||||||||||||
Institutional Class (Est. Feb. 3, 1994) | |||||||||||||||
Excluding sales charge | +7.90% | +15.76% | +8.36% | ||||||||||||
Including sales charge | +7.90% | +15.76% | +8.36% | ||||||||||||
Russell 1000 Growth Index | +9.18% | +15.30% | +9.09% | ||||||||||||
1 Returns reflect the reinvestment of all distributions and are presented both with and without the applicable sales charges described below. Returns do not reflect the deduction of taxes the shareholder would pay on Fund distributions or redemptions of Fund shares.
Expense limitations were in effect for certain classes during some or all of the periods shown in the “Fund and benchmark performance” table. Expenses for each class are listed on the “Fund expense ratios” table on page 5. Performance would have been lower had expense limitations not been in effect.
Class A shares are sold with a maximum front-end sales charge of 5.75%, and have an annual distribution and service fee of 0.25% of average daily net assets. Performance for Class A shares, excluding sales charges, assumes that no front-end sales charge applied.
Class C shares are sold with a contingent deferred sales charge of 1.00% if redeemed during the first 12 months. They are also subject to an annual distribution and service fee of 1.00% of average daily net assets. Performance for C shares, excluding sales charges, assumes either that contingent deferred sales charges did not apply or that the investment was not redeemed.
Class R shares are available only for certain retirement plan products. They are sold without a sales charge and have an annual distribution and service fee of 0.50% of average daily net assets.
Institutional Class shares are available without sales or asset-based distribution charges only to certain eligible institutional accounts.
4
Table of Contents
2 The Fund’s expense ratios, as described in the most recent prospectus, are disclosed in the following “Fund expense ratios” table.
| Fund expense ratios | Class A | Class C | Class R | Institutional Class | ||||
Total annual operating expenses | 1.06% | 1.81% | 1.31% | 0.81% | ||||
(without fee waivers) | ||||||||
Net expenses | 1.06% | 1.81% | 1.31% | 0.81% | ||||
(including fee waivers, if any) | ||||||||
Type of waiver | n/a | n/a | n/a | n/a |
5
Table of Contents
Performance summary
Delaware U.S. Growth Fund
Performance of a $10,000 Investment1
Average annual total returns from Oct. 31, 2005 through Oct. 31, 2015

1 The “Performance of a $10,000 investment” graph assumes $10,000 invested in Class A shares of the Fund on Oct. 31, 2005, and includes the effect of a 5.75% front-end sales charge and the reinvestment of all distributions. The graph does not reflect the deduction of taxes the shareholders would pay on Fund distributions or redemptions of Fund shares. Expense limitations were in effect for some or all of the periods shown. Performance would have been lower had expense limitations not been in effect. Expenses are listed in the “Fund expense ratios” table on page 5. Please note additional details on pages 4 through 7.
The graph also assumes $10,000 invested in the Russell 1000 Growth Index as of Oct. 31, 2005. The Russell 1000 Growth Index measures the performance of the large-cap growth segment of the U.S. equity universe. It includes those Russell 1000 companies with higher price-to-book ratios and higher forecasted growth values.
The S&P 500 Index, mentioned on page 1, measures the performance of 500 mostly large-cap stocks weighted by market value, and is often used to represent performance of the U.S. stock market.
The MSCI EAFE (Europe, Australasia, Far East) Index, mentioned on page 2, is a free float-adjusted market capitalization weighted index designed to measure equity market performance of developed markets, excluding the United States and Canada. Index “net” return approximates the minimum possible dividend reinvestment, after deduction of withholding tax at the highest possible rate.
Russell Investment Group is the source and owner of the trademarks, service marks, and copyrights related to the Russell Indexes. Russell® is a trademark of Russell Investment Group.
Index performance returns do not reflect any management fees, transaction costs, or expenses. Indices are unmanaged and one cannot invest
6
Table of Contents
directly in an index. Past performance is not a guarantee of future results.
Performance of other Fund classes will vary due to different charges and expenses.
| Nasdaq symbols | CUSIPs | |||||
Class A | DUGAX | 245917505 | ||||
Class C | DEUCX | 245917703 | ||||
Class R | DEURX | 245917711 | ||||
Institutional Class
| DEUIX
| 245917802
|
7
Table of Contents
For the six-month period from May 1, 2015 to October 31, 2015 (Unaudited)
As a shareholder of the Fund, you incur two types of costs: (1) transaction costs, including sales charges (loads) on purchase payments, reinvested dividends, or other distributions; redemption fees; and exchange fees; and (2) ongoing costs, including management fees; distribution and/or service (12b-1) fees; and other Fund expenses. This example is intended to help you understand your ongoing costs (in dollars) of investing in the Fund and to compare these costs with the ongoing costs of investing in other mutual funds.
The example is based on an investment of $1,000 invested at the beginning of the period and held for the entire six-month period from May 1, 2015 to Oct. 31, 2015.
Actual expenses
The first section of the table shown, “Actual Fund return,” provides information about actual account values and actual expenses. You may use the information in this section of the table, together with the amount you invested, to estimate the expenses that you paid over the period. Simply divide your account value by $1,000 (for example, an $8,600 account value divided by $1,000 = 8.6), then multiply the result by the number in the first section under the heading entitled “Expenses Paid During Period” to estimate the expenses you paid on your account during this period.
Hypothetical example for comparison purposes
The second section of the table shown, “Hypothetical 5% return,” provides information about hypothetical account values and hypothetical expenses based on the Fund’s actual expense ratio and an assumed rate of return of 5% per year before expenses, which is not the Fund’s actual return. The hypothetical account values and expenses may not be used to estimate the actual ending account balance or expenses you paid for the period. You may use this information to compare the ongoing costs of investing in the Fund and other funds. To do so, compare this 5% hypothetical example with the 5% hypothetical examples that appear in the shareholder reports of the other funds.
Please note that the expenses shown in the table are meant to highlight your ongoing costs only and do not reflect any transactional costs, such as sales charges (loads), redemption fees, or exchange fees. Therefore, the second section of the table is useful in comparing ongoing costs only, and will not help you determine the relative total costs of owning different funds. In addition, if these transactional costs were included, your costs would have been higher. The expenses shown in the table assume reinvestment of all dividends and distributions.
8
Table of Contents
Delaware U.S. Growth Fund
Expense analysis of an investment of $1,000
Beginning
Account Value
5/1/15 | Ending
Account Value
10/31/15 | Annualized
Expense Ratio | Expenses
Paid During Period
5/1/15 to 10/31/15* | |||||||||||||||||
Actual Fund return† | ||||||||||||||||||||
Class A | $1,000.00 | $1,010.20 | 1.04% | $5.27 | ||||||||||||||||
Class C | 1,000.00 | 1,006.60 | 1.79% | 9.05 | ||||||||||||||||
Class R | 1,000.00 | 1,008.90 | 1.29% | 6.53 | ||||||||||||||||
Institutional Class | 1,000.00 | 1,011.30 | 0.79% | 4.00 | ||||||||||||||||
Hypothetical 5% return (5% return before expenses) |
| |||||||||||||||||||
Class A | $1,000.00 | $1,019.96 | 1.04% | $5.30 | ||||||||||||||||
Class C | 1,000.00 | 1,016.18 | 1.79% | 9.10 | ||||||||||||||||
Class R | 1,000.00 | 1,018.70 | 1.29% | 6.56 | ||||||||||||||||
Institutional Class | 1,000.00 | 1,021.22 | 0.79% | 4.02 | ||||||||||||||||
| * | “Expenses Paid During Period” are equal to the Fund’s annualized expense ratio, multiplied by the average account value over the period, multiplied by 184/365 (to reflect the one-half year period). |
| † | Because actual returns reflect only the most recent six-month period, the returns shown may differ significantly from fiscal year returns. |
9
Table of Contents
Security type / sector allocation and top 10 equity holdings | ||
| Delaware U.S. Growth Fund | As of October 31, 2015 (Unaudited) | |
Sector designations may be different than the sector designations presented in other Fund materials. The sector designations may represent the investment manager’s internal sector classifications, which may result in the sector designations for one fund being different than another fund’s sector designations.
| Security type / sector | Percentage of net assets | ||||
Common Stock² | 98.48% | ||||
Consumer Discretionary | 17.83% | ||||
Consumer Staples | 4.43% | ||||
Financial Services | 25.72% | ||||
Healthcare | 22.30% | ||||
Technology | 28.20% | ||||
Short-Term Investments | 0.93% | ||||
Total Value of Securities | 99.41% | ||||
Receivables and Other Assets Net of Liabilities | 0.59% | ||||
Total Net Assets | 100.00% | ||||
| ² | Narrow industries are utilized for compliance purposes for |
diversification whereas broad sectors are used for
financial reporting.
To monitor compliance with the Fund’s concentration guidelines as described in the Fund’s prospectus and statement of additional information, the Financial Services and Technology sectors (as disclosed herein for financial reporting purposes) is subdivided into a variety of “industries” (in accordance with the requirements of the Investment Company Act of 1940). The Financial Services sector consisted of commercial services, diversified financial services, and real estate investment trusts. As of Oct. 31, 2015 such amounts, as a percentage of total net assets, were 8.08%, 9.05%, and 8.59%, respectively. The Technology sector consisted of internet, semiconductors, and software. As of Oct. 31, 2015 such amounts, as a percentage of total net assets, were 12.41%, 5.77%, and 10.02%, respectively. The percentage in any such single industry will comply with the Fund’s concentration policy even if the percentages in the “Financial Services and Technology sectors” for financial reporting purposes may exceed 25%.
10
Table of Contents
Holdings are for informational purposes only and are subject to change at any time. They are not a recommendation to buy, sell, or hold any security.
| Top 10 equity holdings | Percentage of net assets | ||||
Celgene | 5.83% | ||||
Visa Class A | 5.79% | ||||
QUALCOMM | 5.77% | ||||
Allergan | 4.95% | ||||
MasterCard Class A | 4.47% | ||||
Walgreens Boots Alliance | 4.43% | ||||
Equinix | 4.33% | ||||
Crown Castle International | 4.26% | ||||
Liberty Interactive QVC Group Class A | 4.19% | ||||
Microsoft
|
| 4.15%
|
| ||
11
Table of Contents
| Schedule of investments | ||
| Delaware U.S. Growth Fund | October 31, 2015 | |
| Number of shares | Value (U.S. $) | |||||||
| ||||||||
Common Stock – 98.48%² | ||||||||
| ||||||||
Consumer Discretionary – 17.83% | ||||||||
Discovery Communications Class A † | 983,642 | $ | 28,958,420 | |||||
Discovery Communications Class C † | 1,763,808 | 48,539,996 | ||||||
eBay † | 4,560,955 | 127,250,645 | ||||||
L Brands | 1,284,010 | 123,239,280 | ||||||
Liberty Interactive QVC Group Class A † | 5,822,460 | 159,360,730 | ||||||
NIKE Class B | 796,840 | 104,409,945 | ||||||
TripAdvisor † | 1,024,655 | 85,845,596 | ||||||
|
| |||||||
| 677,604,612 | ||||||||
|
| |||||||
Consumer Staples – 4.43% | ||||||||
Walgreens Boots Alliance | 1,990,645 | 168,567,819 | ||||||
|
| |||||||
| 168,567,819 | ||||||||
|
| |||||||
Financial Services – 25.72% | ||||||||
Crown Castle International | 1,893,940 | 161,856,112 | ||||||
Equinix | 554,776 | 164,590,944 | ||||||
Intercontinental Exchange | 490,230 | 123,734,052 | ||||||
MasterCard Class A | 1,716,381 | 169,904,555 | ||||||
PayPal Holdings † | 3,816,905 | 137,446,749 | ||||||
Visa Class A | 2,839,549 | 220,292,211 | ||||||
|
| |||||||
| 977,824,623 | ||||||||
|
| |||||||
Healthcare – 22.30% | ||||||||
Allergan † | 610,249 | 188,243,509 | ||||||
Biogen † | 448,401 | 130,264,974 | ||||||
Celgene † | 1,805,655 | 221,571,925 | ||||||
DENTSPLY International | 700,191 | 42,606,622 | ||||||
Novo Nordisk ADR | 2,217,910 | 117,948,454 | ||||||
Sirona Dental Systems † | 383,312 | 41,830,839 | ||||||
Valeant Pharmaceuticals International † | 1,122,424 | 105,249,698 | ||||||
|
| |||||||
| 847,716,021 | ||||||||
|
| |||||||
Technology – 28.20% | ||||||||
Alphabet Class A † | 185,489 | 136,777,734 | ||||||
Alphabet Class C † | 149,321 | 106,138,860 | ||||||
Baidu ADR † | 605,689 | 113,548,517 | ||||||
Electronic Arts † | 2,072,050 | 149,332,644 | ||||||
Facebook Class A † | 974,994 | 99,420,138 | ||||||
Intuit | 756,969 | 73,751,490 | ||||||
Microsoft | 2,996,832 | 157,753,236 | ||||||
QUALCOMM | 3,690,468 | 219,287,609 | ||||||
Yelp † | 717,631 | 15,967,290 | ||||||
|
| |||||||
| 1,071,977,518 | ||||||||
|
| |||||||
Total Common Stock (cost $3,031,740,531) | 3,743,690,593 | |||||||
|
| |||||||
12
Table of Contents
| Principal amount° | Value (U.S. $) | |||||||
| ||||||||
Short-Term Investments – 0.93% | ||||||||
| ||||||||
Discount Notes – 0.93%≠ | ||||||||
Federal Home Loan Bank | ||||||||
0.14% 2/18/16 | 2,356,775 | $ | 2,355,997 | |||||
0.155% 2/3/16 | 8,580,949 | 8,578,512 | ||||||
0.17% 1/21/16 | 12,853,093 | 12,850,806 | ||||||
0.18% 2/26/16 | 10,514,853 | 10,511,130 | ||||||
0.295% 3/2/16 | 1,206,948 | 1,206,238 | ||||||
|
| |||||||
Total Short-Term Investments (cost $35,495,871) | 35,502,683 | |||||||
|
| |||||||
Total Value of Securities – 99.41% | $ | 3,779,193,276 | ||||||
|
| |||||||
| ² | Narrow industries are utilized for compliance purposes for |
| diversification whereas broad sectors are used for |
| financial reporting. |
| ≠ | The rate shown is the effective yield at the time of purchase. |
| ° | Principal amount shown is stated in U.S. dollars unless noted that the security is denominated in another currency. |
| † | Non-income-producing security. |
ADR – American Depositary Receipt
See accompanying notes, which are an integral part of the financial statements.
13
Table of Contents
| Statement of assets and liabilities | ||
| Delaware U.S. Growth Fund | October 31, 2015 | |
Assets: | ||||
Investments, at value1 | $ | 3,743,690,593 | ||
Short-term investments, at value2 | 35,502,683 | |||
Receivable for securities sold | 33,072,344 | |||
Dividends and interest receivable | 7,734,484 | |||
Receivable for fund shares sold | 5,944,924 | |||
|
| |||
Total assets | 3,825,945,028 | |||
|
| |||
Liabilities: | ||||
Cash overdraft | 7,495,961 | |||
Payable for fund shares redeemed | 10,273,186 | |||
Payable for securities purchased | 2,940,972 | |||
Investment management fees payable | 1,744,110 | |||
Other accrued expenses | 1,617,675 | |||
Distribution fees payable | 183,864 | |||
Other affiliates payable | 165,856 | |||
Trustees’ fees and expenses payable | 8,945 | |||
|
| |||
Total liabilities | 24,430,569 | |||
|
| |||
Total Net Assets | $ | 3,801,514,459 | ||
|
| |||
Net Assets Consist of: | ||||
Paid-in capital | $ | 2,692,354,240 | ||
Undistributed net investment income | 15,300,972 | |||
Accumulated net realized gain on investments | 381,902,373 | |||
Net unrealized appreciation of investments | 711,956,874 | |||
|
| |||
Total Net Assets | $ | 3,801,514,459 | ||
|
| |||
14
Table of Contents
Net Asset Value | ||||
Class A: | ||||
Net assets | $ | 412,893,521 | ||
Shares of beneficial interest outstanding, unlimited authorization, no par | 15,383,669 | |||
Net asset value per share | $ | 26.84 | ||
Sales charge | 5.75 | % | ||
Offering price per share, equal to net asset value per share / (1 – sales charge) | $ | 28.48 | ||
Class C: | ||||
Net assets | $ | 106,775,355 | ||
Shares of beneficial interest outstanding, unlimited authorization, no par | 4,365,613 | |||
Net asset value per share | $ | 24.46 | ||
Class R: | ||||
Net assets | $ | 27,919,828 | ||
Shares of beneficial interest outstanding, unlimited authorization, no par | 1,070,505 | |||
Net asset value per share | $ | 26.08 | ||
Institutional Class: | ||||
Net assets | $ | 3,253,925,755 | ||
Shares of beneficial interest outstanding, unlimited authorization, no par | 113,883,590 | |||
Net asset value per share | $ | 28.57 | ||
| ||||
1Investments, at cost | $ | 3,031,740,531 | ||
2Short-term investments, at cost | 35,495,871 | |||
See accompanying notes, which are an integral part of the financial statements.
15
Table of Contents
| Statement of operations | ||
| Delaware U.S. Growth Fund | Year ended October 31, 2015 | |
Investment Income: | ||||
Dividends | $ | 48,624,335 | ||
Interest | 54,714 | |||
Foreign tax withheld | (227,522 | ) | ||
|
| |||
| 48,451,527 | ||||
|
| |||
Expenses: | ||||
Management fees | 20,548,293 | |||
Distribution expenses – Class A | 1,000,168 | |||
Distribution expenses – Class C | 1,004,859 | |||
Distribution expenses – Class R | 129,287 | |||
Dividend disbursing and transfer agent fees and expenses | 6,387,992 | |||
Accounting and administration expenses | 1,183,544 | |||
Reports and statements to shareholders | 580,934 | |||
Legal fees | 247,647 | |||
Custodian fees | 173,088 | |||
Trustees’ fees and expenses | 171,076 | |||
Registration fees | 135,588 | |||
Audit and tax fees | 34,819 | |||
Other | 91,847 | |||
|
| |||
| 31,689,142 | ||||
Less expense paid indirectly | (553 | ) | ||
|
| |||
Total operating expenses | 31,688,589 | |||
|
| |||
Net Investment Income | 16,762,938 | |||
|
| |||
Net Realized and Unrealized Gain (Loss): | ||||
Net realized gain (loss) on: | ||||
Investments | 385,282,394 | |||
Foreign currencies | (9,895 | ) | ||
|
| |||
Net realized gain | 385,272,499 | |||
Net change in unrealized appreciation (depreciation) of investments | (132,482,356 | ) | ||
|
| |||
Net Realized and Unrealized Gain | 252,790,143 | |||
|
| |||
Net Increase in Net Assets Resulting from Operations | $ | 269,553,081 | ||
|
| |||
See accompanying notes, which are an integral part of the financial statements.
16
Table of Contents
This page intentionally left blank.
Table of Contents
Statements of changes in net assets
Delaware U.S. Growth Fund
| Year ended | ||||||||
| 10/31/15 | 10/31/14 | |||||||
Increase (Decrease) in Net Assets from Operations: | ||||||||
Net investment income | $ | 16,762,938 | $ | 13,677,132 | ||||
Net realized gain | 385,272,499 | 142,195,756 | ||||||
Net change in unrealized appreciation (depreciation) | (132,482,356 | ) | 318,136,773 | |||||
|
|
|
| |||||
Net increase in net assets resulting from operations | 269,553,081 | 474,009,661 | ||||||
|
|
|
| |||||
Dividends and Distributions to Shareholders from: | ||||||||
Net investment income: | ||||||||
Class A | (812,023 | ) | — | |||||
Institutional Class | (12,926,364 | ) | (1,820,767 | ) | ||||
Net realized gain: | ||||||||
Class A | (9,901,170 | ) | — | |||||
Class C | (2,699,044 | ) | — | |||||
Class R | (642,640 | ) | — | |||||
Institutional Class | (76,134,095 | ) | — | |||||
|
|
|
| |||||
| (103,115,336 | ) | (1,820,767 | ) | |||||
|
|
|
| |||||
Capital Share Transactions: | ||||||||
Proceeds from shares sold: | ||||||||
Class A | 170,052,277 | 254,971,002 | ||||||
Class B | — | 13,417 | ||||||
Class C | 28,835,704 | 25,719,809 | ||||||
Class R | 13,207,911 | 9,814,713 | ||||||
Institutional Class | 795,722,253 | 965,778,442 | ||||||
Net asset value of shares issued upon reinvestment of dividends and distributions: | ||||||||
Class A | 10,441,837 | — | ||||||
Class C | 2,632,615 | — | ||||||
Class R | 641,565 | — | ||||||
Institutional Class | 87,416,483 | 1,720,838 | ||||||
|
|
|
| |||||
| 1,108,950,645 | 1,258,018,221 | |||||||
|
|
|
| |||||
18
Table of Contents
| Year ended | ||||||||
| 10/31/15 | 10/31/14 | |||||||
Capital Share Transactions (continued): | ||||||||
Cost of shares redeemed: | ||||||||
Class A | $ | (135,661,875 | ) | $ | (247,749,954 | ) | ||
Class B | — | (1,613,327 | ) | |||||
Class C | (18,418,934 | ) | (15,208,519 | ) | ||||
Class R | (14,220,426 | ) | (10,164,108 | ) | ||||
Institutional Class | (757,556,432 | ) | (590,872,593 | ) | ||||
|
|
|
| |||||
| (925,857,667 | ) | (865,608,501 | ) | |||||
|
|
|
| |||||
Increase in net assets derived from capital share transactions | 183,092,978 | 392,409,720 | ||||||
|
|
|
| |||||
Net Increase in Net Assets | 349,530,723 | 864,598,614 | ||||||
Net Assets: | ||||||||
Beginning of year | 3,451,983,736 | 2,587,385,122 | ||||||
|
|
|
| |||||
End of year | $ | 3,801,514,459 | $ | 3,451,983,736 | ||||
|
|
|
| |||||
Undistributed net investment income | $ | 15,300,972 | $ | 12,286,316 | ||||
|
|
|
| |||||
See accompanying notes, which are an integral part of the financial statements.
19
Table of Contents
Delaware U.S. Growth Fund Class A
Selected data for each share of the Fund outstanding throughout each period were as follows:
Net asset value, beginning of period |
Income (loss) from investment operations: |
Net investment income (loss)1 |
Net realized and unrealized gain |
Total from investment operations |
Less dividends and distributions from: |
Net investment income |
Net realized gain |
Total dividends and distributions |
Net asset value, end of period |
Total return2 |
Ratios and supplemental data: |
Net assets, end of period (000 omitted) |
Ratio of expenses to average net assets |
Ratio of expenses to average net assets prior to fees waived |
Ratio of net investment income (loss) to average net assets |
Ratio of net investment income (loss) to average net assets prior to fees waived |
Portfolio turnover |
| 1 | The average shares outstanding method has been applied for per share information. |
| 2 | Total investment return is based on the change in net asset value of a share during the period and assumes reinvestment of dividends and distributions at net asset value and does not reflect the impact of a sales charge. Total investment return during some of the periods shown reflects waivers by the manager and/or distributor. Performance would have been lower had the waivers not been in effect. |
See accompanying notes, which are an integral part of the financial statements.
20
Table of Contents
| Year ended | ||||||||||||||||||||||
|
| |||||||||||||||||||||
| 10/31/15 | 10/31/14 | 10/31/13 | 10/31/12 | 10/31/11 | ||||||||||||||||||
|
| |||||||||||||||||||||
| $ | 25.660 | $ | 21.970 | $ | 17.310 | $ | 14.960 | $ | 13.450 | |||||||||||||
| 0.069 | 0.062 | (0.012 | ) | (0.031 | ) | 0.006 | ||||||||||||||||
| 1.863 | 3.628 | 4.672 | 2.381 | 1.504 | ||||||||||||||||||
|
|
|
|
|
|
|
|
|
| |||||||||||||
| 1.932 | 3.690 | 4.660 | 2.350 | 1.510 | ||||||||||||||||||
|
|
|
|
|
|
|
|
|
| |||||||||||||
| (0.057 | ) | — | — | — | — | |||||||||||||||||
| (0.695 | ) | — | — | — | — | |||||||||||||||||
|
|
|
|
|
|
|
|
|
| |||||||||||||
| (0.752 | ) | — | — | — | — | |||||||||||||||||
|
|
|
|
|
|
|
|
|
| |||||||||||||
| $ | 26.840 | $ | 25.660 | $ | 21.970 | $ | 17.310 | $ | 14.960 | |||||||||||||
|
|
|
|
|
|
|
|
|
| |||||||||||||
| 7.63% | 16.80% | 26.92% | 15.71% | 11.23% | ||||||||||||||||||
| $ | 412,893 | $ | 351,388 | $ | 290,303 | $ | 146,112 | $ | 60,615 | |||||||||||||
| 1.05% | 1.06% | 1.09% | 1.10% | 1.10% | ||||||||||||||||||
| 1.05% | 1.06% | 1.13% | 1.16% | 1.21% | ||||||||||||||||||
| 0.26% | 0.26% | (0.06% | ) | (0.19% | ) | 0.04% | ||||||||||||||||
| 0.26% | 0.26% | (0.10% | ) | (0.25% | ) | (0.07% | ) | |||||||||||||||
| 40% | 25% | 23% | 20% | 25% | ||||||||||||||||||
|
| |||||||||||||||||||||
21
Table of Contents
Financial highlights
Delaware U.S. Growth Fund Class C
Selected data for each share of the Fund outstanding throughout each period were as follows:
Net asset value, beginning of period |
Income (loss) from investment operations: |
Net investment loss1 |
Net realized and unrealized gain |
Total from investment operations |
Less dividends and distributions from: |
Net realized gain |
Total dividends and distributions |
Net asset value, end of period |
Total return2 |
Ratios and supplemental data: |
Net assets, end of period (000 omitted) |
Ratio of expenses to average net assets |
Ratio of expenses to average net assets prior to fees waived |
Ratio of net investment loss to average net assets |
Ratio of net investment loss to average net assets prior to fees waived |
Portfolio turnover |
| 1 | The average shares outstanding method has been applied for per share information. |
| 2 | Total investment return is based on the change in net asset value of a share during the period and assumes reinvestment of dividends and distributions at net asset value and does not reflect the impact of a sales charge. Total investment return during some of the periods shown reflects a waiver by the manager. Performance would have been lower had the waiver not been in effect. |
See accompanying notes, which are an integral part of the financial statements.
22
Table of Contents
| Year ended | ||||||||||||||||||||
|
| |||||||||||||||||||
| 10/31/15 | 10/31/14 | 10/31/13 | 10/31/12 | 10/31/11 | ||||||||||||||||
| ||||||||||||||||||||
| $ | 23.560 | $ | 20.330 | $ | 16.130 | $ | 14.050 | $ | 12.720 | |||||||||||
| (0.118 | ) | (0.107 | ) | (0.147 | ) | (0.146 | ) | (0.098 | ) | |||||||||||
| 1.713 | 3.337 | 4.347 | 2.226 | 1.428 | ||||||||||||||||
|
|
|
|
|
|
|
|
|
| |||||||||||
| 1.595 | 3.230 | 4.200 | 2.080 | 1.330 | ||||||||||||||||
|
|
|
|
|
|
|
|
|
| |||||||||||
| (0.695 | ) | — | — | — | — | |||||||||||||||
|
|
|
|
|
|
|
|
|
| |||||||||||
| (0.695 | ) | — | — | — | — | |||||||||||||||
|
|
|
|
|
|
|
|
|
| |||||||||||
| $ | 24.460 | $ | 23.560 | $ | 20.330 | $ | 16.130 | $ | 14.050 | |||||||||||
|
|
|
|
|
|
|
|
|
| |||||||||||
| 6.86% | 15.89% | 26.04% | 14.80% | 10.46% | ||||||||||||||||
| $ | 106,775 | $ | 90,104 | $ | 67,898 | $ | 31,103 | $ | 13,456 | |||||||||||
| 1.80% | 1.81% | 1.84% | 1.85% | 1.85% | ||||||||||||||||
| 1.80% | 1.81% | 1.84% | 1.86% | 1.91% | ||||||||||||||||
| (0.49% | ) | (0.49% | ) | (0.81% | ) | (0.94% | ) | (0.71% | ) | |||||||||||
| (0.49% | ) | (0.49% | ) | (0.81% | ) | (0.95% | ) | (0.77% | ) | |||||||||||
| 40% | 25% | 23% | 20% | 25% | ||||||||||||||||
| ||||||||||||||||||||
23
Table of Contents
Financial highlights
Delaware U.S. Growth Fund Class R
Selected data for each share of the Fund outstanding throughout each period were as follows:
Net asset value, beginning of period |
Income (loss) from investment operations: |
Net investment income (loss)1 |
Net realized and unrealized gain |
Total from investment operations |
Less dividends and distributions from: |
Net realized gain |
Total dividends and distributions |
Net asset value, end of period |
Total return2 |
Ratios and supplemental data: |
Net assets, end of period (000 omitted) |
Ratio of expenses to average net assets |
Ratio of expenses to average net assets prior to fees waived |
Ratio of net investment income (loss) to average net assets |
Ratio of net investment income (loss) to average net assets prior to fees waived |
Portfolio turnover |
| 1 | The average shares outstanding method has been applied for per share information. |
| 2 | Total investment return is based on the change in net asset value of a share during the period and assumes reinvestment of dividends and distributions at net asset value. Total investment return during some of the periods shown reflects waivers by the manager and/or distributor. Performance would have been lower had the waivers not been in effect. |
See accompanying notes, which are an integral part of the financial statements.
24
Table of Contents
| Year ended | ||||||||||||||||||||
|
| |||||||||||||||||||
| 10/31/15 | 10/31/14 | 10/31/13 | 10/31/12 | 10/31/11 | ||||||||||||||||
| ||||||||||||||||||||
| $ | 24.960 | $ | 21.430 | $ | 16.920 | $ | 14.660 | $ | 13.210 | |||||||||||
| 0.002 | 0.004 | (0.059 | ) | (0.073 | ) | (0.030 | ) | |||||||||||||
| 1.813 | 3.526 | 4.569 | 2.333 | 1.480 | ||||||||||||||||
|
|
|
|
|
|
|
|
|
| |||||||||||
| 1.815 | 3.530 | 4.510 | 2.260 | 1.450 | ||||||||||||||||
|
|
|
|
|
|
|
|
|
| |||||||||||
| (0.695 | ) | — | — | — | — | |||||||||||||||
|
|
|
|
|
|
|
|
|
| |||||||||||
| (0.695 | ) | — | — | — | — | |||||||||||||||
|
|
|
|
|
|
|
|
|
| |||||||||||
| $ | 26.080 | $ | 24.960 | $ | 21.430 | $ | 16.920 | $ | 14.660 | |||||||||||
|
|
|
|
|
|
|
|
|
| |||||||||||
| 7.36% | 16.47% | 26.66% | 15.42% | 10.98% | ||||||||||||||||
| $ | 27,920 | $ | 27,053 | $ | 23,815 | $ | 11,202 | $ | 1,697 | |||||||||||
| 1.30% | 1.31% | 1.34% | 1.35% | 1.35% | ||||||||||||||||
| 1.30% | 1.31% | 1.43% | 1.46% | 1.51% | ||||||||||||||||
| 0.01% | 0.01% | (0.31% | ) | (0.44% | ) | (0.21% | ) | |||||||||||||
| 0.01% | 0.01% | (0.40% | ) | (0.55% | ) | (0.37% | ) | |||||||||||||
| 40% | 25% | 23% | 20% | 25% | ||||||||||||||||
| ||||||||||||||||||||
25
Table of Contents
Financial highlights
Delaware U.S. Growth Fund Institutional Class
Selected data for each share of the Fund outstanding throughout each period were as follows:
|
Net asset value, beginning of period |
Income from investment operations: |
Net investment income1 |
Net realized and unrealized gain |
Total from investment operations |
Less dividends and distributions from: |
Net investment income |
Net realized gain |
Total dividends and distributions |
Net asset value, end of period |
Total return2 |
Ratios and supplemental data: |
Net assets, end of period (000 omitted) |
Ratio of expenses to average net assets |
Ratio of expenses to average net assets prior to fees waived |
Ratio of net investment income to average net assets |
Ratio of net investment income to average net assets prior to fees waived |
Portfolio turnover |
| 1 | The average shares outstanding method has been applied for per share information. |
| 2 | Total investment return is based on the change in net asset value of a share during the period and assumes reinvestment of dividends and distributions at net asset value. Total investment return during some of the periods shown reflects a waiver by the manager. Performance would have been lower had the waiver not been in effect. |
See accompanying notes, which are an integral part of the financial statements.
26
Table of Contents
| Year ended | ||||||||||||||||||||
|
| |||||||||||||||||||
| 10/31/15 | 10/31/14 | 10/31/13 | 10/31/12 | 10/31/11 | ||||||||||||||||
| ||||||||||||||||||||
| $ 27.260 | $ 23.310 | $ 18.340 | $ 15.830 | $ 14.220 | ||||||||||||||||
| 0.143 | 0.130 | 0.039 | 0.011 | 0.045 | ||||||||||||||||
| 1.980 | 3.839 | 4.959 | 2.520 | 1.587 | ||||||||||||||||
| 2.123 | 3.969 | 4.998 | 2.531 | 1.632 | ||||||||||||||||
| (0.118 | ) | (0.019 | ) | (0.028 | ) | (0.021 | ) | (0.022 | ) | |||||||||||
| (0.695 | ) | — | — | — | — | |||||||||||||||
| (0.813 | ) | (0.019 | ) | (0.028 | ) | (0.021 | ) | (0.022 | ) | |||||||||||
| $ 28.570 | $ 27.260 | $ 23.310 | $ 18.340 | $ 15.830 | ||||||||||||||||
| 7.90% | 17.04% | 27.29% | 16.01% | 11.48% | ||||||||||||||||
| $3,253,926 | $2,983,439 | $2,203,909 | $922,606 | $563,004 | ||||||||||||||||
| 0.80% | 0.81% | 0.84% | 0.85% | 0.85% | ||||||||||||||||
| 0.80% | 0.81% | 0.84% | 0.86% | 0.91% | ||||||||||||||||
| 0.51% | 0.51% | 0.19% | 0.06% | 0.29% | ||||||||||||||||
| 0.51% | 0.51% | 0.19% | 0.05% | 0.23% | ||||||||||||||||
| 40% | 25% | 23% | 20% | 25% | ||||||||||||||||
27
Table of Contents
| Delaware U.S. Growth Fund | October 31, 2015 |
Delaware Group® Adviser Funds (Trust) is organized as a Delaware statutory trust and offers three series: Delaware Diversified Income Fund, Delaware Global Real Estate Opportunities Fund, and Delaware U.S. Growth Fund. These financial statements and the related notes pertain to Delaware U.S. Growth Fund (Fund). The Trust is an open-end investment company. The Fund is considered diversified under the Investment Company Act of 1940, as amended, and offers Class A, Class C, Class R, and Institutional Class shares. Class A shares are sold with a maximum front-end sales charge of 5.75%. Class A share purchases of $1,000,000 or more will incur a contingent deferred sales charge (CDSC) of 1.00% if redeemed during the first year and 0.50% during the second year, provided that Delaware Distributors, L.P. (DDLP) paid a financial advisor a commission on the purchase of those shares. Effective September 25, 2014, all remaining shares of Class B were converted to Class A shares. Class C shares are sold with a CDSC of 1.00%, if redeemed during the first 12 months. Class R and Institutional Class shares are not subject to a sales charge and are offered for sale exclusively to certain eligible investors.
The investment objective of the Fund is to seek long-term capital appreciation by investing in equity securities of companies believed to have the potential for sustainable free cash flow growth.
1. Significant Accounting Policies
The following accounting policies are in accordance with U.S. generally accepted accounting principles (U.S. GAAP) and are consistently followed by the Fund.
Security Valuation – Equity securities, except those traded on The Nasdaq Stock Market LLC (Nasdaq), are valued at the last quoted sales price as of the time of the regular close of the New York Stock Exchange on the valuation date. Equity securities traded on the Nasdaq are valued in accordance with the Nasdaq Official Closing Price, which may not be the last sales price. If, on a particular day, an equity security does not trade, the mean between the bid and ask prices will be used, which approximates fair value. U.S. government and agency securities are valued at the mean between the bid and ask prices, which approximates fair value. Generally, other securities and assets for which market quotations are not readily available are valued at fair value as determined in good faith under the direction of the Fund’s Board of Trustees (Board). In determining whether market quotations are readily available or fair valuation will be used, various factors will be taken into consideration, such as market closures or suspension of trading in a security.
Federal Income Taxes – No provision for federal income taxes has been made as the Fund intends to continue to qualify for federal income tax purposes as a regulated investment company under Subchapter M of the Internal Revenue Code of 1986, as amended, and make the requisite distributions to shareholders. The Fund evaluates tax positions taken or expected to be taken in the course of preparing the Fund’s tax returns to determine whether the tax positions are “more-likely-than-not” of being sustained by the applicable tax authority. Tax positions not deemed to meet the “more-likely-than-not” threshold are recorded as a tax benefit or expense in the current year. Management has analyzed the Fund’s tax positions taken for all open federal income tax years (Oct. 31, 2012–Oct. 31, 2015), and has concluded that no provision for federal income tax is required in the Fund’s financial statements.
28
Table of Contents
Class Accounting – Investment income, common expenses, and realized and unrealized gain (loss) on investments are allocated to the various classes of the Fund on the basis of daily net assets of each class. Distribution expenses relating to a specific class are charged directly to that class.
Repurchase Agreements – The Fund may purchase certain U.S. government securities subject to the counterparty’s agreement to repurchase them at an agreed upon date and price. The counterparty will be required on a daily basis to maintain the value of the collateral subject to the agreement at not less than the repurchase price (including accrued interest). The agreements are conditioned upon the collateral being deposited under the Federal Reserve book-entry system with the Fund’s custodian or a third-party sub-custodian. In the event of default or bankruptcy by the other party to the agreement, retention of the collateral may be subject to legal proceedings. At Oct. 30, 2015, the Fund held no investments in repurchase agreements.
Use of Estimates – The Fund is an investment company, whose financial statements are prepared in conformity with U.S. GAAP. Therefore, the Fund follows the accounting and reporting guidelines for investment companies. The preparation of financial statements in conformity with U.S. GAAP requires management to make estimates and assumptions that affect the fair value of investments, the reported amounts of assets and liabilities and disclosure of contingent assets and liabilities at the date of the financial statements, and the reported amounts of revenues and expenses during the reporting period. Actual results could differ from those estimates and the differences could be material.
Other – Expenses directly attributable to the Fund are charged directly to the Fund. Other expenses common to various funds within the Delaware Investments® Family of Funds are generally allocated among such funds on the basis of average net assets. Management fees and some other expenses are paid monthly. Security transactions are recorded on the date the securities are purchased or sold (trade date) for financial reporting purposes. Costs used in calculating realized gains and losses on the sale of investment securities are those of the specific securities sold. Dividend income is recorded on the ex-dividend date and interest income is recorded on the accrual basis. Discounts and premiums on debt securities are accreted or amortized to interest income, respectively, over the lives of the respective securities using the effective interest method. Foreign dividends are also recorded on the ex-dividend date or as soon after the ex-dividend date that the Fund is aware of such dividends, net of all tax withholdings, a portion of which may be reclaimable. Withholding taxes and reclaims on foreign dividends have been recorded in accordance with the Fund’s understanding of the applicable country’s tax rules and rates. The Fund declares and pays dividends from net investment income and distributions from net realized gain on investments, if any, annually. The Fund may distribute more frequently, if necessary for tax purposes. Dividends and distributions, if any, are recorded on the ex-dividend date.
Subject to seeking best execution, the Fund may direct certain security trades to brokers who have agreed to rebate a portion of the related brokerage commission to the Fund in cash. Such commission rebates are included on the “Statement of operations” under “Net realized gain on investments” and totaled $6,065 for the year ended Oct. 31, 2015. In general, best execution refers to many factors, including the price paid or received for a security, the commission charged, the promptness and reliability of execution, the confidentiality and placement accorded the order, and other factors affecting the overall benefit obtained by the Fund on the transaction.
29
Table of Contents
Notes to financial statements
Delaware U.S. Growth Fund
1. Significant Accounting Policies (continued)
The Fund may receive earnings credits from its custodian when positive cash balances are maintained, which may be used to offset custody fees. There were no such earnings credits for the year ended Oct. 31, 2015.
The Fund receives earnings credits from its transfer agent when positive cash balances are maintained, which may be used to offset transfer agent fees. If the amount earned is greater than one dollar, the expense paid under this arrangement is included on the “Statement of operations” under “Dividend disbursing and transfer agent fees and expenses” with the corresponding expense offset shown under “Less expense paid indirectly.” For the year ended Oct. 31, 2015, the Fund earned $553 under this agreement.
2. Investment Management, Administration Agreements, and Other Transactions with Affiliates
In accordance with the terms of its investment management agreement, the Fund pays Delaware Management Company (DMC), a series of Delaware Management Business Trust and the investment manager, an annual fee which is calculated daily at the rate of 0.65% on the first $500 million of average daily net assets of the Fund, 0.60% on the next $500 million, 0.55% on the next $1.5 billion, and 0.50% on average daily net assets in excess of $2.5 billion.
Jackson Square Partners, LLC (JSP), a related party of DMC, furnishes investment sub-advisory services to the Fund. For these services, DMC, not the Fund, pays JSP fees based on the aggregate average daily net assets of the Fund at the following annual rate: 0.325% of the first $500 million; 0.300% of the next $500 million; 0.275% of the next $1.5 billion; and 0.250% of aggregate average daily net assets in excess of $2.5 billion.
Delaware Investments Fund Services Company (DIFSC), an affiliate of DMC, provides fund accounting and financial administration oversight services to the Fund. For these services, DIFSC’s fees are calculated based on the aggregate daily net assets of the Delaware Investments® Family of Funds at the following annual rate: 0.0050% of the first $30 billion; 0.0045% of the next $10 billion; 0.0040% of the next $10 billion; and 0.0025% of aggregate average daily net assets in excess of $50 billion. The fees payable to DIFSC under the service agreement described above are allocated among all retail funds in the Delaware Investments Family of Funds on a relative net asset value basis. For the year ended Oct. 31, 2015, the Fund was charged $175,417 for these services. This amount is included on the “Statement of operations” under “Accounting and administration expenses.”
DIFSC is also the transfer agent and dividend disbursing agent of the Fund. For these services, DIFSC’s fees are calculated based on the aggregate daily net assets of the retail funds within the Delaware Investments Family of Funds at the following annual rate: 0.025% of the first $20 billion; 0.020% of the next $5 billion; 0.015% of the next $5 billion; and 0.013% of average daily net assets in excess of $30 billion. The fees payable to DIFSC under the service agreement described above are allocated among all retail funds in the Delaware Investments Family of Funds on a relative net asset value basis. This amount is included on the “Statement of operations” under “Dividend disbursing and transfer agent fees and expenses.” For the year ended Oct. 31, 2015, the Fund was charged $768,138 for these services. Pursuant to a sub-transfer agency agreement between DIFSC and BNY Mellon Investment
30
Table of Contents
Servicing (US) Inc. (BNYMIS), BNYMIS provides certain sub-transfer agency services to the Fund. Sub-transfer agency fees are passed on to and paid by the Fund.
Pursuant to a distribution agreement and distribution plan, the Fund pays DDLP, the distributor and an affiliate of DMC, an annual distribution and service fee of 0.25% of the average daily net assets of the Class A shares, 1.00% of the average daily net assets of the Class C shares, and 0.50% of the average daily net assets of the Class R shares. Institutional Class shares pay no distribution and service fees.
As provided in the investment management agreement, the Fund bears a portion of the cost of certain resources shared with DMC, including the cost of internal personnel of DMC and/or its affiliates that provide legal, tax, and regulatory reporting services to the Fund. For the year ended Oct. 31, 2015, the Fund was charged $92,317 for internal legal, tax, and regulatory reporting services provided by DMC and/or its affiliates’ employees. This amount is included on the “Statement of operations” under “Legal fees.”
For the year ended Oct. 31, 2015, DDLP earned $82,585 for commissions on sales of the Fund’s Class A shares. For the year ended Oct. 31, 2015, DDLP received gross CDSC commissions of $7,170 and $11,914 on redemption of the Fund’s Class A and Class C shares, respectively, and these commissions were entirely used to offset upfront commissions previously paid by DDLP to broker/dealers on sales of those shares.
Trustees’ fees include expenses accrued by the Fund for each Trustee’s retainer and meeting fees. Certain officers of DMC, DIFSC, and DDLP are officers and/or Trustees of the Trust. These officers and Trustees are paid no compensation by the Fund.
3. Investments
For the year ended Oct. 31, 2015, the Fund made purchases and sales of investment securities other than short-term investments as follows:
Purchases | $ | 1,526,314,022 | ||
Sales | 1,447,157,478 |
At Oct. 31, 2015, the cost and unrealized appreciation (depreciation) of investments for federal income tax purposes were as follows:
Cost of investments | $ | 3,072,228,630 | ||
|
| |||
Aggregate unrealized appreciation of investments | $ | 898,139,903 | ||
Aggregate unrealized depreciation of investments | (191,175,257 | ) | ||
|
| |||
Net unrealized appreciation of investments | $ | 706,964,646 | ||
|
|
U.S. GAAP defines fair value as the price that the Fund would receive to sell an asset or pay to transfer a liability in an orderly transaction between market participants at the measurement date under current market conditions. A three-level hierarchy for fair value measurements has been established based upon the transparency of inputs to the valuation of an asset or liability. Inputs may be observable or unobservable and refer broadly to the assumptions that market participants would use in pricing the asset or liability. Observable inputs reflect the assumptions market participants would use in pricing the asset or liability based on market data obtained from sources independent of the reporting entity. Unobservable inputs reflect the reporting entity’s own assumptions about the assumptions that market
31
Table of Contents
Notes to financial statements
Delaware U.S. Growth Fund
3. Investments (continued)
participants would use in pricing the asset or liability based on the best information available under the circumstances. The Fund’s investment in its entirety is assigned a level based upon the observability of the inputs which are significant to the overall valuation. The three-level hierarchy of inputs is summarized below.
| Level 1 – | Inputs are quoted prices in active markets for identical investments. (Examples: equity securities, open-end investment companies, futures contracts, exchange-traded options contracts) | |
| Level 2 – | Other observable inputs, including, but not limited to: quoted prices for similar assets or liabilities in markets that are active, quoted prices for identical or similar assets or liabilities in markets that are not active, inputs other than quoted prices that are observable for the assets or liabilities (such as interest rates, yield curves, volatilities, prepayment speeds, loss severities, credit risks, and default rates) or other market-corroborated inputs. (Examples: debt securities, government securities, swap contracts, foreign currency exchange contracts, foreign securities utilizing international fair value pricing, broker-quoted securities, fair valued securities) | |
| Level 3 – | Significant unobservable inputs, including the Fund’s own assumptions used to determine the fair value of investments. (Examples: broker-quoted securities, fair valued securities) | |
Level 3 investments are valued using significant unobservable inputs. The Fund may also use an income-based valuation approach in which the anticipated future cash flows of the investment are discounted to calculate fair value. Discounts may also be applied due to the nature or duration of any restrictions on the disposition of the investments. Valuations may also be based upon current market prices of securities that are comparable in coupon, rating, maturity, and industry. The derived value of a Level 3 investment may not represent the value which is received upon disposition and this could impact the results of operations.
The following table summarizes the valuation of the Fund’s investments by fair value hierarchy levels as of Oct. 31, 2015:
Securities | Level 1 | Level 2 | Total | |||||||||
Common Stock | $ | 3,743,690,593 | $ | — | $ | 3,743,690,593 | ||||||
Short-Term Investments
| — | 35,502,683 | 35,502,683 | |||||||||
|
|
|
|
|
| |||||||
Total Value of Securities | $ | 3,743,690,593 | $ | 35,502,683 | $ | 3,779,193,276 | ||||||
|
|
|
|
|
| |||||||
During the year ended Oct. 31, 2015, there were no transfers between Level 1 investments, Level 2 investments, or Level 3 investments that had a significant impact to the Fund. The Fund’s policy is to recognize transfers between levels at the beginning of the reporting period.
A reconciliation of Level 3 investments is presented when the Fund has a significant amount of Level 3 investments at the beginning, interim, or end of the period in relation to net assets. At Oct. 31, 2015, there were no Level 3 investments.
32
Table of Contents
4. Dividend and Distribution Information
Income and long-term capital gain distributions are determined in accordance with federal income tax regulations, which may differ from U.S. GAAP. Additionally, distributions from net short-term gains on sales of investment securities are treated as ordinary income for federal income tax purposes. The tax character of dividends and distributions paid during the years ended Oct. 31, 2015 and 2014 was as follows:
Year ended
| ||||||||
| 10/31/15 | 10/31/14 | |||||||
Ordinary income | $ | 13,738,387 | $ | 1,820,767 | ||||
Long term capital gain | 89,376,949 | — | ||||||
|
|
|
| |||||
Total | $ | 103,115,336 | $ | 1,820,767 | ||||
|
|
|
| |||||
5. Components of Net Assets on a Tax Basis
As of Oct. 31, 2015, the components of net assets on a tax basis were as follows:
Shares of beneficial interest | $ | 2,692,354,240 | ||
Undistributed ordinary income | 15,300,972 | |||
Undistributed long-term capital gains | 386,894,601 | |||
Unrealized appreciation of investments | 706,964,646 | |||
|
| |||
Net assets | $ | 3,801,514,459 | ||
|
|
The differences between book basis and tax basis components of net assets are primarily attributable to tax deferral of losses on wash sales.
For financial reporting purposes, capital accounts are adjusted to reflect the tax character of permanent book/tax differences. Reclassifications are primarily due to gain (loss) on foreign currency transactions. Results of operations and net assets were not affected by these reclassifications. For the year ended Oct. 31, 2015, the Fund recorded the following reclassifications:
Undistributed net investment income | $ | (9,895 | ) | |
Accumulated net realized gain | 9,895 |
On Dec. 22, 2010, the Regulated Investment Company Modernization Act of 2010 (Act) was enacted, which changed various technical rules governing the tax treatment of regulated investment companies. The changes were generally effective for taxable years beginning after the date of enactment. Under the Act, the Fund is permitted to carry forward capital losses incurred in taxable years beginning after the date of enactment for an unlimited period. However, any losses incurred during those future taxable years will be required to be utilized prior to the losses incurred in pre-enactment taxable years, which carry an expiration date. As a result of this ordering rule, pre-enactment capital loss carryforwards may be more likely to expire unused. Additionally, post-enactment capital loss carryforwards will retain their character as either short-term or long-term capital losses rather than being considered all short-term as permitted under previous regulation. At Oct. 31, 2015, no capital loss carryforwards was incurred under the Act.
33
Table of Contents
Notes to financial statements
Delaware U.S. Growth Fund
6. Capital Shares
Transactions in capital shares were as follows:
Year ended
| ||||||||
| 10/31/15 | 10/31/14 | |||||||
Shares sold: | ||||||||
Class A | 6,447,690 | 10,776,994 | ||||||
Class B | — | 689 | ||||||
Class C | 1,193,515 | 1,175,839 | ||||||
Class R | 513,757 | 419,718 | ||||||
Institutional Class | 28,367,431 | 37,996,352 | ||||||
Shares issued upon reinvestment of dividends and distributions: | ||||||||
Class A | 402,693 | — | ||||||
Class C | 110,710 | — | ||||||
Class R | 25,409 | — | ||||||
Institutional Class | 3,173,109 | 69,875 | ||||||
|
|
|
| |||||
| 40,234,314 | 50,439,467 | |||||||
|
|
|
| |||||
Shares redeemed: | ||||||||
Class A | (5,161,334 | ) | (10,293,569 | ) | ||||
Class B | — | (78,453 | ) | |||||
Class C | (762,426 | ) | (691,476 | ) | ||||
Class R | (552,505 | ) | (447,125 | ) | ||||
Institutional Class | (27,095,831 | ) | (23,188,911 | ) | ||||
|
|
|
| |||||
| (33,572,096 | ) | (34,699,534 | ) | |||||
|
|
|
| |||||
Net increase | 6,662,218 | 15,739,933 | ||||||
|
|
|
| |||||
For the year ended Oct. 31, 2014, 47,284 Class B shares were converted to 40,382 Class A shares valued at $974,760. The respective amounts are included in Class B redemptions and Class A subscriptions in the table above and the “Statements of changes in net assets.”
Certain shareholders may exchange shares of one class for another class in the same Fund. For the years ended Oct. 31, 2015 and 2014, the Fund had the following exchange transactions:
| Year ended | ||||||
| 10/31/15 | ||||||
| Exchange Redemptions | Exchange Subscriptions | |||||
Institutional | ||||||
Class C Shares | Class Shares | Value | ||||
9,123 | 7,864 | $217,744 |
34
Table of Contents
| Year ended | ||||||||
| 10/31/14 | ||||||||
| Exchange Redemptions | Exchange Subscriptions | |||||||
Institutional | ||||||||
Class A Shares | Class C Shares | Class Shares | Value | |||||
3,922 | 13,933 | 15,787 | $401,166 | |||||
These exchange transactions are included as subscriptions and redemptions in the table on the previous page and the “Statements of changes in net assets.”
7. Line of Credit
The Fund, along with certain other funds in the Delaware Investments® Family of Funds (Participants), was a participant in a $225,000,000 revolving line of credit intended to be used for temporary or emergency purposes as an additional source of liquidity to fund redemptions of investor shares. Under the agreement, the Participants were charged an annual commitment fee of 0.08%, which was allocated across the Participants on the basis of each Participant’s allocation of the entire facility. The Participants were permitted to borrow up to a maximum of one third of their net assets under the agreement. Each Participant was individually, and not jointly, liable for its particular advances, if any, under the line of credit. The line of credit available under the agreement expired on Nov. 10, 2014.
On Nov. 10, 2014, the Fund, along with the other Participants, entered into an amendment to the agreement for a $275,000,000 revolving line of credit. The line of credit was to be used as described above and operated in substantially the same manner as the agreement described above. The line of credit available under the agreement expired on Nov. 9, 2015.
The Fund had no amounts outstanding as of Oct. 31, 2015 or at any time during the year then ended.
8. Securities Lending
The Fund, along with other funds in the Delaware Investments Family of Funds, may lend its securities pursuant to a security lending agreement (Lending Agreement) with The Bank of New York Mellon (BNY Mellon). At the time a security is loaned, the borrower must post collateral equal to the required percentage of the market value of the loaned security, including any accrued interest. The required percentage is: (1) 102% with respect to U.S. securities and foreign securities that are denominated and payable in U.S. dollars; and (2) 105% with respect to foreign securities. With respect to each loan, if on any business day the aggregate market value of securities collateral plus cash collateral held is less than the aggregate market value of the securities which are the subject of such loan, the borrower will be notified to provide additional collateral by the end of the following business day which, together with the collateral already held, will be not less than the applicable initial collateral requirements for such security loan. If the aggregate market value of securities collateral and cash collateral held with respect to a security loan exceeds the applicable initial collateral requirement, upon request of the borrower, BNY Mellon must return enough collateral to the borrower by the end of the following business day to reduce the value of the remaining collateral to the applicable initial collateral requirement for such security loan. As a result of the foregoing, the value of the collateral held with respect to a loaned security on any particular day may be more or less than the value of the security on loan.
35
Table of Contents
Notes to financial statements
Delaware U.S. Growth Fund
8. Securities Lending (continued)
Cash collateral received is generally invested in the Delaware Investments Collateral Fund No. 1 (Collective Trust) established by BNY Mellon for the purpose of investment on behalf of funds managed by DMC that participate in BNY Mellon’s securities lending program. The Collective Trust may invest in U.S. government securities and high-quality corporate debt, asset-backed and other money market securities, and in repurchase agreements collateralized by such securities, provided that the Collective Trust will generally have a dollar-weighted average portfolio maturity of 60 days or less. The Fund can also accept U.S. government securities and letters of credit (non-cash collateral) in connection with securities loans. In the event of default or bankruptcy by the lending agent, realization and/or retention of the collateral may be subject to legal proceedings. In the event the borrower fails to return loaned securities and the collateral received is insufficient to cover the value of the loaned securities and provided such collateral shortfall is not the result of investment losses, the lending agent has agreed to pay the amount of the shortfall to the Fund or, at the discretion of the lending agent, replace the loaned securities. The Fund continues to record dividends or interest, as applicable, on the securities loaned and is subject to changes in value of the securities loaned that may occur during the term of the loan. The Fund has the right under the Lending Agreement to recover the securities from the borrower on demand. With respect to security loans collateralized by non-cash collateral, the Fund receives loan premiums paid by the borrower. With respect to security loans collateralized by cash collateral, the earnings from the collateral investments are shared among the Fund, the security lending agent, and the borrower. The Fund records security lending income net of allocations to the security lending agent, and the borrower.
The Collective Trust used for the investment of cash collateral received from borrowers of securities seeks to maintain a net asset value per unit of $1.00, but there can be no assurance that it will always be able to do so. The Fund may incur investment losses as a result of investing securities lending collateral in the Collective Trust. This could occur if an investment in the Collective Trust defaulted or if it were necessary to liquidate assets in the Collective Trust to meet returns on outstanding security loans at a time when the Collective Trust’s net asset value per unit was less than $1.00. Under those circumstances, the Fund may not receive an amount from the Collective Trust that is equal in amount to the collateral the Fund would be required to return to the borrower of the securities and the Fund would be required to make up for this shortfall.
During the year ended Oct. 31, 2015, the Fund had no securities out on loan.
9. Credit and Market Risk
The Fund may invest up to 15% of its net assets in illiquid securities, which may include securities with contractual restrictions on resale, securities exempt from registration under Rule 144A promulgated under the Securities Act of 1933, as amended, and other securities which may not be readily marketable. The relative illiquidity of these securities may impair the Fund from disposing of them in a timely manner and at a fair price when it is necessary or desirable to do so. While maintaining oversight, the Fund’s Board has delegated to DMC, the day-to-day functions of determining whether individual securities are liquid for purposes of the Fund’s limitation on investments in illiquid securities. Securities eligible for resale pursuant to Rule 144A, which are determined to be liquid, are not subject to the Fund’s 15% limit on investments in illiquid securities. As of Oct. 31, 2015, there were no Rule 144A securities held by the Fund and no securities have been determined to be illiquid under the Fund’s Liquidity Procedures.
36
Table of Contents
10. Contractual Obligations
The Fund enters into contracts in the normal course of business that contain a variety of indemnifications. The Fund’s maximum exposure under these arrangements is unknown. However, the Fund has not had prior claims or losses pursuant to these contracts. Management has reviewed the Fund’s existing contracts and expects the risk of loss to be remote.
11. Recent Accounting Pronouncements
In June 2014, the Financial Accounting Standards Board (FASB) issued guidance to improve the financial reporting of reverse repurchase agreements and other similar transactions. The guidance includes expanded disclosure requirements for entities that enter into reverse repurchase agreements and similar transactions accounted for as secured borrowings. The guidance is effective for financial statements with fiscal years beginning on or after Dec. 15, 2014 and interim periods within those fiscal years. Management has determined that this pronouncement has no impact to the Fund’s financial statements.
In May 2015, the FASB issued Accounting Standards Update (“ASU”) No. 2015-07 regarding “Disclosures for Investments in Certain Entities That Calculate Net Asset Value per Share.” The amendments in this update are effective for the Funds for fiscal years beginning after Dec. 15, 2015, and interim periods within those fiscal years. ASU No. 2015-07 will eliminate the requirement to categorize investments in the fair value hierarchy if their fair value is measured at net asset value (“NAV”) per share (or its equivalent) using the practical expedient in the FASB’s fair value measurement guidance. Management is evaluating the impact, if any, of this guidance on the Fund’s financial statement disclosure.
12. Subsequent Events
On Nov. 9, 2015, the Fund, along with the other Participants, entered into an amendment to the agreement for a $155,000,000 revolving line of credit to be used as described in Note 7 and to be operated in substantially the same manner as the agreement described in Note 7, with the exception of the annual commitment fee. Under the amendment to the agreement, the Participants are charged an annual commitment fee of 0.10%, which is allocated across the Participants on the basis of each Participant’s allocation of the entire facility. The line of credit available under the agreement expires on Nov. 7, 2016.
Management has determined that no other material events or transactions occurred subsequent to Oct. 31, 2015 that would require recognition or disclosure in the Fund’s financial statements.
37
Table of Contents
registered public accounting firm
To the Board of Trustees of Delaware Group® Adviser Funds
and the Shareholders of Delaware U.S. Growth Fund:
In our opinion, the accompanying statement of assets and liabilities, including the schedule of investments, and the related statements of operations and of changes in net assets and the financial highlights present fairly, in all material respects, the financial position of Delaware U.S. Growth Fund (one of the series constituting Delaware Group Adviser Funds, hereafter referred to as the “Fund”) at October 31, 2015, the results of its operations for the year then ended, the changes in its net assets for each of the two years in the period then ended and the financial highlights for each of the five years in the period then ended, in conformity with accounting principles generally accepted in the United States of America. These financial statements and financial highlights (hereafter referred to as “financial statements”) are the responsibility of the Fund’s management. Our responsibility is to express an opinion on these financial statements based on our audits. We conducted our audits of these financial statements in accordance with the standards of the Public Company Accounting Oversight Board (United States). Those standards require that we plan and perform the audit to obtain reasonable assurance about whether the financial statements are free of material misstatement. An audit includes examining, on a test basis, evidence supporting the amounts and disclosures in the financial statements, assessing the accounting principles used and significant estimates made by management, and evaluating the overall financial statement presentation. We believe that our audits, which included confirmation of securities at October 31, 2015 by correspondence with the custodian and brokers, and the application of alternative auditing procedures where confirmations of security purchases had not been received, provide a reasonable basis for our opinion.
PricewaterhouseCoopers LLP
Philadelphia, Pennsylvania
December 18, 2015
38
Table of Contents
Other Fund information (Unaudited)
Delaware U.S. Growth Fund
Tax Information
The information set forth below is for the Fund’s fiscal year as required by federal income tax laws. Shareholders, however, must report distributions on a calendar year basis for income tax purposes, which may include distributions for portions of two fiscal years of the Fund. Accordingly, the information needed by shareholders for income tax purposes will be sent to them in January of each year. Please consult your tax advisor for proper treatment of this information.
All disclosures are based on financial information available as of the date of this annual report and, accordingly are subject to change. For any and all items requiring reporting, it is the intention of the Fund to report the maximum amount permitted under the Internal Revenue Code and the regulations thereunder.
For the fiscal year ended Oct. 31, 2015, the Fund reports distributions paid during the year as follows:
(A) Long-Term Capital Gains Distributions (Tax Basis) | 86.68 | % | ||
(B) Ordinary Income Distributions* (Tax Basis) | 13.32 | % | ||
Total Distributions | 100.00 | % | ||
(C) Qualified Dividends1 | 100.00 | % |
(A) and (B) are based on a percentage of the Fund’s total distributions.
(C) is based on a percentage of the Fund’s ordinary income distributions.
* For the fiscal year ended Oct. 31, 2015, certain dividends paid by the Fund may be subject to a maximum tax rate of 20%. The percentage of dividends paid by the Fund from ordinary income reported as qualified income is 100.00%. Complete information will be compiled and reported in conjunction with your 2015 Form 1099-DIV.
1 Qualified dividends represent dividends which qualify for the corporate dividends received deduction.
Board consideration of Delaware U.S. Growth Fund investment management agreement
At a meeting held on Aug. 18–20, 2015 (the “Annual Meeting”), the Board of Trustees (collectively referred to here as the “Board”), including a majority of disinterested or independent Trustees, approved the renewal of the Investment Advisory Agreement and Sub-Advisory Agreement for Delaware U.S. Growth Fund (the “Fund”). In making its decision, the Board considered information furnished at regular quarterly Board meetings, including reports detailing Fund performance, investment strategies and expenses, as well as information prepared specifically in connection with the renewal of the investment advisory and sub-advisory contracts. Information furnished specifically in connection with the renewal of the Investment Management Agreement with Delaware Management Company (“DMC”) and Sub-Advisory Agreement with Jackson Square Partners, LLC (“JSP”) included materials provided by DMC and its affiliates (“Delaware Investments”) and JSP, as applicable, concerning, among other things, the nature, extent, and quality of services provided to the Fund; the costs of such services to the Fund; economies of scale; and the investment manager’s financial condition and profitability. In addition, in connection with the Annual Meeting, reports were provided to the Trustees in May 2015 and included reports provided by Lipper, Inc., an independent statistical compilation organization (“Lipper”). The Lipper reports compared the Fund’s investment performance and expenses with those of other comparable mutual funds. The Independent Trustees reviewed and discussed the Lipper reports with independent legal counsel to the Independent Trustees. In addition to the information noted above, the Board also requested and received information regarding DMC’s or JSP’s, as applicable, policy with respect to advisory fee levels and its breakpoint philosophy; the structure of portfolio manager
39
Table of Contents
Other Fund information (Unaudited)
Delaware U.S. Growth Fund
Board consideration of Delaware U.S. Growth Fund investment management agreement (continued)
compensation; comparative client fee information; and any constraints or limitations on the availability of securities for certain investment styles, which had in the past year inhibited, or which were likely in the future to inhibit, the investment manager’s ability to invest fully in accordance with Fund policies.
In considering information relating to the approval of the Fund’s advisory and sub-advisory agreement, the Independent Trustees received assistance and advice from and met separately with independent legal counsel to the Independent Trustees. They also engaged a consultant to assist them in analyzing portions of the data received. The Independent Trustees reviewed and discussed with such consultant two reports prepared by the consultant with respect to such data. Although the Board gave attention to all information furnished, the following discussion identifies, under separate headings, the primary factors taken into account by the Board during its contract renewal considerations.
Nature, extent, and quality of service. The Board considered the services provided by DMC to the Fund and its shareholders. In reviewing the nature, extent, and quality of services, the Board considered reports furnished to it throughout the year, which covered matters such as the relative performance of the Fund; compliance of portfolio managers with the investment policies, strategies, and restrictions for the Fund; compliance by DMC and Delaware Distributors, L.P. (together, “Management”) personnel with the Code of Ethics adopted throughout the Delaware Investments® Family of Funds complex; and adherence to fair value pricing procedures as established by the Board. The Board was pleased with the current staffing of the Fund’s investment adviser and the emphasis placed on research in the investment process. The Board recognized DMC’s receipt of several industry distinctions during the past several years. The Board gave favorable consideration to DMC’s efforts to control expenditures while maintaining service levels committed to Fund matters. The Board noted that, in the third and fourth quarters of 2013, Management reduced the maximum 12b-1 fee for certain Funds; and in November 2013 Management negotiated a substantial reduction in fees for fund accounting services provided to the Funds. The Board noted the benefits provided to Fund shareholders through each shareholder’s ability to exchange an investment in one Delaware Investments fund for the same class of shares in another Delaware Investments fund without a sales charge, to reinvest Fund dividends into additional shares of the Fund or into additional shares of other Delaware Investments funds and the privilege to combine holdings in other Delaware Investments funds to obtain a reduced sales charge. The Board was satisfied with the nature, extent, and quality of the overall services provided by DMC.
The Board considered the services provided by JSP to the Fund and its shareholders. In reviewing the nature, extent, and quality of services, the Board took account of reports furnished to it throughout the year at regular Board Meetings covering matters such as relative performance of the Fund; compliance of portfolio managers with the investment policies, strategies, and restrictions for the Fund; the compliance of JSP personnel with its Code of Ethics; and adherence to fair value pricing procedures as established by the Board. The Board was pleased with the current staffing of JSP and the emphasis placed on research in the investment process. The Board was satisfied with the nature, extent, and quality of the overall services provided by JSP.
Investment performance. The Board placed significant emphasis on the investment performance of the Fund in view of the importance of investment performance to shareholders. Although the Board gave appropriate consideration to performance reports and discussions with portfolio managers at Investment
40
Table of Contents
Committee meetings throughout the year, the Board gave particular weight to the Lipper reports furnished for the Annual Meeting. The Lipper reports prepared for the Fund showed the investment performance of its Class A shares in comparison to a group of similar funds as selected by Lipper (the “Performance Universe”). A fund with the best performance ranked first, and a fund with the poorest performance ranked last. The highest/best performing 25% of funds in the Performance Universe make up the first quartile; the next 25%, the second quartile; the next 25%, the third quartile; and the poorest/ worst performing 25% of funds in the Performance Universe make up the fourth quartile. Comparative annualized performance for the Fund was shown for the past 1-, 3-, 5-, and 10-year periods, to the extent applicable, ended March 31, 2015. The Board’s objective is that the Fund’s performance for the periods considered be at or above the median of its Performance Universe.
The Performance Universe for the Fund consisted of the Fund and all retail and institutional large-cap growth funds as selected by Lipper. The Lipper report comparison showed that the Fund’s total return for the 1-, 3-, and 10-year periods was in the second quartile of its Performance Universe. The report further showed that the Fund’s total return for the 5-year period was in the first quartile of its Performance Universe. The Board was satisfied with performance.
Comparative expenses. The Board considered expense comparison data for the Delaware Investments® Family of Funds. Management provided the Board with information on pricing levels and fee structures for the Fund as of its most recently completed fiscal year. The Board also focused on the comparative analysis of effective management fees and total expense ratios of the Fund versus effective management fees and expense ratios of a group of similar funds as selected by Lipper (the “Expense Group”). In reviewing comparative costs, the Fund’s contractual management fee and the actual management fee incurred by the Fund were compared with the contractual management fees (assuming all funds in the Expense Group were similar in size to the Fund) and actual management fees (as reported by each fund) within the Expense Group, taking into account any applicable breakpoints and fee waivers. The Fund’s total expenses were also compared with those of its Expense Group. The Lipper total expenses, for comparative consistency, were shown by Lipper for Class A shares and comparative total expenses including 12b-1 and non-12b-1 service fees. The Board considered fees paid to DMC for non-management services. The Board’s objective is to limit the Fund’s total expense ratio to be competitive with that of the Expense Group.
The expense comparisons for the Fund showed that its actual management fee was in the quartile with the lowest expenses of its Expense Group and its total expenses were in the quartile with the second lowest expenses of its Expense Group. The Board was satisfied with the management fee and total expenses of the Fund in comparison to those of its Expense Group as shown in the Lipper report.
Management profitability. The Board considered the level of profits realized by DMC in connection with the operation of the Fund. In this respect, the Board reviewed the Investment Management Profitability Analysis that addressed the overall profitability of DMC’s business in providing management and other services to each of the individual funds and the Delaware Investments Family of Funds as a whole. Specific attention was given to the methodology followed in allocating costs for the purpose of determining profitability. Management stated that the level of profits of DMC, to a certain extent, reflects recent operational cost savings and efficiencies initiated by DMC. The Board considered DMC’s efforts to improve services provided to fund shareholders and to meet additional regulatory and compliance requirements resulting from recent industry-wide Securities and Exchange Commission initiatives. The
41
Table of Contents
Other Fund information (Unaudited)
Delaware U.S. Growth Fund
Board consideration of Delaware U.S. Growth Fund investment management agreement (continued)
Board also considered the extent to which DMC might derive ancillary benefits from fund operations, including the potential for procuring additional business as a result of the prestige and visibility associated with its role as service provider to the Delaware Investments® Family of Funds and the benefits from allocation of fund brokerage to improve trading efficiencies. The Board found that the management fees were reasonable in light of the services rendered and the level of profitability of DMC.
Trustees were also given available information on profits being realized by in relation to the services being provided to the Fund or in relation to JSP’s overall investment advisory business, but believed such information to be of limited relevance because the sub-advisory fees are paid by DMC out of its management fee, and changes in the level of sub-advisory fees have no impact on Fund expenses. The Board was also provided information on potential fall-out benefits derived or to be derived by JSP in connection with its relationship to the Fund, such as reputational enhancement, soft dollar arrangements, or commissions paid to affiliated broker/dealers, as applicable.
Economies of scale. The Trustees considered whether economies of scale are realized by DMC as the Fund’s assets increase and the extent to which any economies of scale are reflected in the level of management fees charged. The Trustees reviewed the standardized advisory fee pricing and structure, approved by the Board and shareholders, which includes breakpoints, and which applies to most funds in the Delaware Investments Family of Funds complex. Breakpoints in the advisory fee occur when the advisory fee rate is reduced on assets in excess of specified levels. Breakpoints result in a lower advisory fee than would otherwise be the case in the absence of breakpoints, when the asset levels specified in the breakpoints are exceeded. The Board noted that the fee under the Fund’s management contract fell within the standardized fee pricing structure. The Board also noted that the Fund’s assets exceeded the final breakpoint level. The Board believed that, given the extent to which economies of scale might be realized by the adviser and its affiliates, the schedule of fees under the Investment Management Agreement provides a sharing of benefits with the Fund and its shareholders.
42
Table of Contents
This page intentionally left blank.
Table of Contents
Board of trustees / directors and officers addendum
Delaware Investments® Family of Funds
A mutual fund is governed by a Board of Trustees/Directors (“Trustees”), which has oversight responsibility for the management of a fund’s business affairs. Trustees establish procedures and oversee and review the performance of the investment manager, the distributor, and others who perform services for the fund. The independent fund trustees, in particular, are advocates
Name, Address, and Birth Date |
Position(s) Held with Fund(s) | Length of Time Served | ||
Interested Trustee
| ||||
Shawn K. Lytle1 |
President, |
Trustee since | ||
2005 Market Street | Chief Executive Officer, | September 1, 2015 | ||
Philadelphia, PA 19103 | and Trustee | |||
February 1970 | President and | |||
| Chief Executive Officer | ||||
| since August 20, 2015 | ||||
Independent Trustees
| ||||
Thomas L. Bennett |
Chairman and Trustee |
Trustee since | ||
2005 Market Street | March 2005 | |||
Philadelphia, PA 19103 | ||||
October 1947 | Chairman since | |||
| March 1, 2015 | ||||
Ann D. Borowiec |
Trustee |
Since March 31, 2015 | ||
2005 Market Street | ||||
Philadelphia, PA 19103 | ||||
November 1958 | ||||
Joseph W. Chow |
Trustee |
Since January 2013 | ||
2005 Market Street | ||||
Philadelphia, PA 19103 | ||||
January 1953 | ||||
1 Shawn K. Lytle is considered to be an “Interested Trustee” because he is an executive officer of the Fund’s(s’) investment advisor.
44
Table of Contents
for shareholder interests. Each trustee has served in that capacity since he or she was elected to or appointed to the Board of Trustees, and will continue to serve until his or her retirement or the election of a new trustee in his or her place. The following is a list of the Trustees and Officers with certain background and related information.
Principal Occupation(s) During the Past Five Years | Number of Portfolios in Fund Complex Overseen by Trustee or Officer | Other Directorships Held by Trustee or Officer | ||
| ||||
Shawn K. Lytle has served as |
64 |
Trustee — UBS | ||
President of | Relationship Funds, | |||
Delaware Investments2 | SMA Relationship | |||
since June 2015 and was the | Trust, and UBS Funds | |||
Regional Head of Americas for | (May 2010–April 2015) | |||
UBS Global Asset | ||||
Management from | ||||
2010 through 2015. | ||||
| ||||
Private Investor |
64 |
Director — | ||
(March 2004–Present) | Bryn Mawr Bank Corp. (BMTC) | |||
| (2007–2011) | ||||
Chief Executive Officer |
64 |
None | ||
Private Wealth Management | ||||
(2011–2013) and | ||||
Market Manager, | ||||
New Jersey Private | ||||
Bank (2005–2011) — | ||||
J.P. Morgan Chase & Co. | ||||
Executive Vice President |
64 |
Director and Audit Committee | ||
(Emerging Economies | Member — Hercules | |||
Strategies, Risks, and | Technology Growth | |||
Corporate Administration) | Capital, Inc. | |||
State Street Corporation | (2004–2014) | |||
(July 2004–March 2011) | ||||
| 2 | Delaware Investments is the marketing name for Delaware Management Holdings, Inc. and its subsidiaries, including the Fund’s(s’) investment advisor, principal underwriter, and its transfer agent. |
45
Table of Contents
Board of trustees / directors and officers addendum
Delaware Investments® Family of Funds
Name, Address, and Birth Date |
Position(s) Held with Fund(s) | Length of Time Served | ||
Independent Trustees (continued)
| ||||
John A. Fry |
Trustee |
Since January 2001 | ||
2005 Market Street | ||||
Philadelphia, PA 19103 | ||||
May 1960 | ||||
Lucinda S. Landreth |
Trustee |
Since March 2005 | ||
2005 Market Street | ||||
Philadelphia, PA 19103 | ||||
June 1947 | ||||
Frances A. Sevilla-Sacasa |
Trustee |
Since September 2011 | ||
2005 Market Street | ||||
Philadelphia, PA 19103 | ||||
January 1956 | ||||
46
Table of Contents
Principal Occupation(s) During the Past Five Years | Number of Portfolios in Fund Complex Overseen by Trustee or Officer | Other Directorships Held by Trustee or Officer | ||
| ||||
President — |
64 |
Director — Hershey Trust | ||
Drexel University | Company | |||
(August 2010–Present) | ||||
| Director, Audit Committee, | ||||
President — | and Governance Committee | |||
Franklin & Marshall College | Member — Community | |||
(July 2002–July 2010) | Health Systems | |||
| Director — Drexel | ||||
| Morgan & Co. | ||||
Private Investor |
64 |
None | ||
(2004–Present) | ||||
Chief Executive Officer — |
64 |
Trust Manager and | ||
Banco Itaú | Audit Committee | |||
International | Member — Camden | |||
(April 2012–Present) | Property Trust | |||
Executive Advisor to Dean | ||||
(August 2011–March 2012) | ||||
(January 2011–July 2011) — | ||||
University of Miami School of | ||||
Business Administration | ||||
President — U.S. Trust, | ||||
Bank of America Private | ||||
Wealth Management | ||||
(Private Banking) | ||||
(July 2007–December 2008) | ||||
47
Table of Contents
Board of trustees / directors and officers addendum
Delaware Investments® Family of Funds
Name, Address, and Birth Date |
Position(s) Held with Fund(s) | Length of Time Served | ||
Independent Trustees (continued)
| ||||
Thomas K. Whitford |
Trustee |
Since January 2013 | ||
2005 Market Street | ||||
Philadelphia, PA 19103 | ||||
March 1956 | ||||
Janet L. Yeomans |
Trustee |
Since April 1999 | ||
2005 Market Street | ||||
Philadelphia, PA 19103 | ||||
July 1948 | ||||
48
Table of Contents
Principal Occupation(s) During the Past Five Years | Number of Portfolios in Fund Complex Overseen by Trustee or Officer | Other Directorships Held by Trustee or Officer | ||
| ||||
Vice Chairman |
64 |
Director — HSBC Finance | ||
(2010–April 2013), | Corporation and HSBC | |||
Chief Administrative | North America Holdings Inc. | |||
Officer (2008–2010), | ||||
and Executive Vice | Director — | |||
President and Chief | HSBC Bank | |||
Administrative Officer | ||||
(2007–2009) — | ||||
PNC Financial | ||||
Services Group | ||||
Vice President and Treasurer |
64 |
Director, Audit and | ||
(January 2006–July 2012) | Compliance Committee Chair, | |||
Vice President — | Investment Committee | |||
Mergers & Acquisitions | Member, and Governance | |||
(January 2003–January 2006), | Committee Member — | |||
and Vice President | Okabena Company | |||
and Treasurer | ||||
(July 1995–January 2003) | Chair — 3M | |||
3M Corporation | Investment Management | |||
| Company | ||||
| (2005–2012) | ||||
49
Table of Contents
Board of trustees / directors and officers addendum
Delaware Investments® Family of Funds
Name, Address, and Birth Date | Position(s) Held with Fund(s) | Length of Time Served | ||
Officers
| ||||
David F. Connor |
Senior Vice President, |
Senior Vice President | ||
2005 Market Street | General Counsel, | since May 2013; | ||
Philadelphia, PA 19103 | and Secretary | General Counsel | ||
December 1963 | since May 2015; | |||
| Secretary since | ||||
| October 2005 | ||||
Daniel V. Geatens |
Vice President |
Treasurer since October 2007 | ||
2005 Market Street | and Treasurer | |||
Philadelphia, PA 19103 | ||||
October 1972 | ||||
Richard Salus |
Senior Vice President |
Chief Financial Officer | ||
2005 Market Street | and Chief Financial Officer | since November 2006 | ||
Philadelphia, PA 19103 | ||||
October 1963 | ||||
The Statement of Additional Information for the Fund(s) includes additional information about the Trustees and Officers and is available, without charge, upon request by calling 800 523-1918.
50
Table of Contents
Principal Occupation(s) During the Past Five Years | Number of Portfolios in Fund Complex Overseen by Trustee or Officer | Other Directorships Held by Trustee or Officer | ||
| ||||
David F. Connor has served as | 64 | None3 | ||
Senior Vice President of the Fund(s) and the investment advisor since 2013, General Counsel of the Fund(s) and the investment advisor since 2015, and Secretary of the Fund(s) and the investment advisor since 2005. | ||||
Daniel V. Geatens has served |
64 |
None3 | ||
as Vice President and | ||||
Treasurer of the Fund(s) since 2007 and Vice President and Director of Financial | ||||
Administration of the investment advisor since 2010. | ||||
Richard Salus has served as |
64 |
None3 | ||
Senior Vice President and Chief Financial Officer of the Fund(s) and the investment advisor since 2006. | ||||
| 3 | David F. Connor, Daniel V. Geatens, and Richard Salus serve in similar capacities for the six portfolios of the Optimum Fund Trust, which have the same investment advisor, principal underwriter, and transfer agent as the registrant. |
51
Table of Contents
| Board of trustees | ||||||
Shawn K. Lytle President and Chief Executive Officer Delaware Investments® Family of Funds Philadelphia, PA
Thomas L. Bennett Chairman of the Board Delaware Investments Family of Funds Private Investor Rosemont, PA | Ann D. Borowiec Former Chief Executive Officer Private Wealth Management J.P. Morgan Chase & Co. New York, NY
Joseph W. Chow Former Executive Vice President State Street Corporation Brookline, MA | John A. Fry President Drexel University Philadelphia, PA
Lucinda S. Landreth Former Chief Investment Officer Assurant, Inc. New York, NY | Frances A. Sevilla-Sacasa Chief Executive Officer Banco Itaú International Miami, FL
Thomas K. Whitford Former Vice Chairman PNC Financial Services Group Pittsburgh, PA
Janet L. Yeomans Former Vice President and Treasurer 3M Corporation St. Paul, MN | |||
| Affiliated officers | ||||||
David F. Connor Senior Vice President, General Counsel, and Secretary Delaware Investments Family of Funds Philadelphia, PA | Daniel V. Geatens Vice President and Treasurer Delaware Investments Family of Funds Philadelphia, PA | Richard Salus Senior Vice President and Chief Financial Officer Delaware Investments Family of Funds Philadelphia, PA | ||||
This annual report is for the information of Delaware U.S. Growth Fund shareholders, but it may be used with prospective investors when preceded or accompanied by the Delaware Investments Fund fact sheet for the most recently completed calendar quarter. These documents are available at delawareinvestments.com.
Delaware Investments is the marketing name of Delaware Management Holdings, Inc. and its subsidiaries.
The Fund files its complete schedule of portfolio holdings with the Securities and Exchange Commission (SEC) for the first and third quarters of each fiscal year on Form N-Q. The Fund’s Forms N-Q, as well as a description of the policies and procedures that the Fund uses to determine how to vote proxies (if any) relating to portfolio securities are available without charge (i) upon request, by calling 800 523-1918; and (ii) on the SEC’s website at sec.gov. In addition, a description of the policies and procedures that the Fund uses to determine how to vote proxies (if any) relating to portfolio securities and the Schedule of Investments included in the Fund’s most recent Form N-Q are available without charge on the Fund’s website at delawareinvestments.com. The Fund’s Forms N-Q may be reviewed and copied at the SEC’s Public Reference Room in Washington, D.C.; information on the operation of the Public Reference Room may be obtained by calling 800 SEC-0330.
Information (if any) regarding how the Fund voted proxies relating to portfolio securities during the most recently disclosed 12-month period ended June 30 is available without charge (i) through the Fund’s website at delawareinvestments.com; and (ii) on the SEC’s website at sec.gov.
52
Table of Contents

Annual report
Alternative / specialty mutual fund
Delaware Global Real Estate Opportunities Fund
October 31, 2015
Carefully consider the Fund’s investment objectives, risk factors, charges, and expenses before investing. This and other information can be found in the Fund’s prospectus and its summary prospectus, which may be obtained by visiting delawareinvestments.com or calling 800 523-1918. Investors should read the prospectus and the summary prospectus carefully before investing.
You can obtain shareholder reports and prospectuses online instead of in the mail. Visit delawareinvestments.com/edelivery. |
Table of Contents
Experience Delaware Investments
Delaware Investments is committed to the pursuit of consistently superior asset management and unparalleled client service. We believe in our investment processes, which seek to deliver consistent results, and in convenient services that help add value for our clients.
If you are interested in learning more about creating an investment plan, contact your financial advisor.
You can learn more about Delaware Investments or obtain a prospectus for Delaware Global Real Estate Opportunities Fund at delawareinvestments.com.
Manage your investments online
| ● | 24-hour access to your account information |
| ● | Obtain share prices |
| ● | Check your account balance and recent transactions |
| ● | Request statements or literature |
| ● | Make purchases and redemptions |
Delaware Management Holdings, Inc. and its subsidiaries (collectively known by the marketing name of Delaware Investments) are wholly owned subsidiaries of Macquarie Group Limited, a global provider of banking, financial, advisory, investment and funds management services.
Neither Delaware Investments nor its affiliates noted in this document are authorized deposit-taking institutions for the purpose of the Banking Act 1959 (Commonwealth of Australia). The obligations of these entities do not represent deposits or other liabilities of Macquarie Bank Limited (MBL). MBL does not guarantee or otherwise provide assurance in respect of the obligations of these entities, unless noted otherwise.
| ||||
| 1 | ||||
| 4 | ||||
| 7 | ||||
| 9 | ||||
| 10 | ||||
| 15 | ||||
| 17 | ||||
| 18 | ||||
| 20 | ||||
| 28 | ||||
| 41 | ||||
| 42 | ||||
| 46 | ||||
| 54 |
Unless otherwise noted, views expressed herein are current as of Oct. 31, 2015, and subject to change for events occurring after such date.
Funds are not FDIC insured and are not guaranteed. It is possible to lose the principal amount invested.
Mutual fund advisory services provided by Delaware Management Company, a series of Delaware Management Business Trust, which is a registered investment advisor. Delaware Investments, a member of Macquarie Group, refers to Delaware Management Holdings, Inc. and its subsidiaries, including the Fund’s distributor, Delaware Distributors, L.P. Macquarie Group refers to Macquarie Group Limited and its subsidiaries and affiliates worldwide.
©2015 Delaware Management Holdings, Inc.
All third-party marks cited are the property of their respective owners.
Table of Contents
| Portfolio management review | ||
| Delaware Global Real Estate Opportunities Fund | November 10, 2015 | |
| Performance preview (for the year ended October 31, 2015) | ||||||||
Delaware Global Real Estate Opportunities Fund (Class A shares) | 1-year return | +2.16 | % | |||||
FTSE EPRA/NAREIT Developed Index (benchmark) | 1-year return | +2.68 | % | |||||
Past performance does not guarantee future results.
For complete, annualized performance for Delaware Global Real Estate Opportunities Fund, please see the table on page 4.
The performance of Class A shares excludes the applicable sales charge and reflects the reinvestment of all distributions. Please see page 6 for a description of the index. Index performance returns do not reflect any management fees, transaction costs, or expenses. Indices are unmanaged and one cannot invest directly in an index.
Global real estate securities, as represented by the FTSE EPRA/NAREIT Developed Index, turned in modest gains during the Fund’s fiscal year ended Oct. 31, 2015. Real estate markets in and around Europe performed particularly well, with Italy, Germany, Spain, and the United Kingdom each gaining 20% or more.
European markets benefited from quantitative easing, the aggressive economic stimulus programs designed to increase the availability of credit by reducing its cost. With better access to capital, the fundamental backdrop for European real estate companies improved, which in turn led to higher equity valuations in the asset class.
Meanwhile, countries whose economies tend to be more closely tied to the health of commodity markets struggled during this period, including Australia (-3.6%) and Canada (-15.0%), which were significantly exposed to iron ore and energy markets, respectively, as of the end of the fiscal year.
Also, as economic growth continued to slow in China, nearby emerging markets with close ties to their larger neighbor encountered difficulties of their own. Hong Kong property stocks, for example, declined more than 6%, while Singapore real estate securities fell 10%.
U.S. real estate investment trusts (REITs) gained more than 5% for the 12-month period, with market rallies early and late in the Fund’s fiscal
year bookending a significant retrenchment in security prices in roughly the first eight months of 2015. U.S. real estate fundamentals remained positive overall and continued to improve. Since few properties were built in most sectors, the supply of real estate was very limited and occupancy rates grew. The rising cost of credit was a challenge for the asset class.
Fund performance
For the fiscal year ended Oct. 31, 2015, Delaware Global Real Estate Opportunities Fund (Class A shares) returned +2.16% at net asset value and -3.73% at maximum offer price (both returns reflect reinvestment of all distributions). For the same period, the Fund’s benchmark, the FTSE EPRA/NAREIT Developed Index, returned +2.68%. Complete annualized performance for Delaware Global Real Estate Opportunities Fund is shown in the table on page 4.
Helpful U.S. security selection
Among U.S.-based REITs, the Fund’s stock selection was positive, as was its overweight allocation to this market.
The Fund benefited from its limited exposure to healthcare REITs, which are relatively sensitive to rising interest rates, given their lower growth prospects and long lease durations. In particular, not purchasing weak-performing benchmark component HCP early during the fiscal year aided
1
Table of Contents
Portfolio management review
Delaware Global Real Estate Opportunities Fund
the Fund’s relative performance. We purchased a small position in HCP, which operates various healthcare facilities, toward the end of the period, as we believed most of the bad news had been priced into the shares.
Investments in the strong-performing self-storage sector, led by the Fund’s overweighting in Extra Space Storage, added to relative performance. Along with its large competitors, Extra Space Storage benefited from the industry’s lack of supply and its capacity to reach renters through new advertising technologies. As the stock’s valuation rose, we trimmed the Fund’s stake in it, reinvesting the proceeds elsewhere in the sector.
Another contributor to relative performance was apartment operator UDR. Apartment REITs continued to perform well, benefiting from a positive fundamental backdrop, while UDR benefited from its exposure to well-positioned coastal markets.
One area of difficulty in the U.S. market was the hotel sector. Various factors, including increased supply in New York City, a strong dollar slowing travel from overseas, and renovation and union-related issues in San Francisco hindered performance. Within this category, Fund holdings Host Hotels & Resorts and Pebblebrook Hotel Trust were notable laggards.
Favorable positioning in Hong Kong and the U.K.
Other notable performance contributors included favorable positioning in Hong Kong and the U.K. In Hong Kong, the Fund benefited from its underweight allocation to several poor-performing benchmark components with more residential exposure.
In the U.K., the Fund benefited from stock selection and its increased exposure to this market. Notable contributions came from positions in Great Portland Estates and Derwent London, two property owners focused on the desirable West End market. Both companies have
benefited from rising property values and higher rental rates. Other U.K. stocks that contributed on a relative basis included Segro, an owner of industrial properties in the U.K. and continental Europe, and Shaftesbury, an owner of high-end retail real estate.
In contrast, Land Securities Group was a relative detractor; in retrospect, we owned the stock at inopportune times. After we sold the Fund’s stake in this owner of office and shopping center properties in London, the stock rallied, causing the Fund to miss out on its gains.
Challenges in Australia and Japan
One area of difficulty for the Fund was Australia, where a position in Scentre Group hampered results the most. The company, which owns high-quality retail properties, performed poorly along with Australia’s struggling market.
The Fund’s largest individual detractor during the fiscal year was Japanese developer Mitsui Fudosan. A proposed change in Japanese inheritance law weighed on the company’s shares, as the change could affect future demand for condominiums built and sold by Mitsui Fudosan. Challenges associated with one of the company’s large contractors also weighed on the stock.
Of final note, the Fund’s relative performance was hurt by its average cash stake of slightly more than 3%, which hampered results in a modestly rising market.
Relative opportunities in the United States
At period end, the Fund remained overweighted in U.S. REITs. In this market, we took advantage of the sharp market selloff between January and September to add to positions we considered to be attractive at improved valuations. At fiscal year end, we kept a close watch on the cost of credit, which we think has the potential to increase further for lower-quality REITs.
In our view, Europe offers some attractive individual opportunities as fundamentals there
2
Table of Contents
appear to be improving. We also see the potential for improved cash flow expectations for certain companies. However, we have chosen not to overweight Europe, because of its relatively high valuations. We also noted various investment opportunities in the U.K., where we found rental rates and cash flow growth particularly attractive. Although U.K. valuations are high, we believe this market’s growth potential could offset some of the valuation premium. Elsewhere, we have maintained the Fund’s underexposure to Asia, due to the uncertainty surrounding China’s economy and its economic policies.
Additionally, the Fund’s use of foreign currency exchange contracts had a negligible effect on
performance, as the short-term effects of currency movements generally canceled one another out over the fiscal year.
Overall, we continue to seek what we believe are good investments at attractive valuations. We think that heightened volatility may create occasional shorter-term investment opportunities as well. Given the short-term variability of financial markets, we remind investors in global property stocks that real estate, in our view, is best seen as a long-term investment.
3
Table of Contents
| Performance summary | ||
| Delaware Global Real Estate Opportunities Fund | October 31, 2015 | |
The performance data quoted represent past performance; past performance does not guarantee future results. Investment return and principal value will fluctuate so your shares, when redeemed, may be worth more or less than their original cost. Please obtain the performance data current for the most recent month end by calling 800 523-1918 or visiting our website at delawareinvestments.com/performance. Current performance may be lower or higher than the performance data quoted.
Fund and benchmark performance1,2
| Average annual total returns through October 31, 2015
| |||||||||||
1 year
| 5 years
| Lifetime
| ||||||||||
Class A (Est. Jan. 10, 2007) | ||||||||||||
Excluding sales charge | +2.16% | +9.12% | +1.88% | |||||||||
Including sales charge | -3.73% | +7.84% | +1.19% | |||||||||
Class C (Est. Sept. 28, 2012) | ||||||||||||
Excluding sales charge | +1.41% | n/a | +8.46% | |||||||||
Including sales charge | +0.41% | n/a | +8.46% | |||||||||
Class R (Est. Sept. 28, 2012) | ||||||||||||
Excluding sales charge | +2.03% | n/a | +9.00% | |||||||||
Including sales charge | +2.03% | n/a | +9.00% | |||||||||
Institutional Class (Est. Jan. 10, 2007) | ||||||||||||
Excluding sales charge | +2.55% | +9.39% | +2.12% | |||||||||
Including sales charge | +2.55% | +9.39% | +2.12% | |||||||||
FTSE EPRA/NAREIT Developed Index* | +2.68% | +8.64% | +1.58% | |||||||||
* The benchmark lifetime return is for Class A share comparison only and is calculated using the last business day in the month of the Fund’s Class A inception date.
1Returns reflect the reinvestment of all distributions and are presented both with and without the applicable sales charges described below. Returns do not reflect the deduction of taxes the shareholder would pay on Fund distributions or redemptions of Fund shares.
Expense limitations were in effect for certain classes during some or all of the periods shown in the “Fund and benchmark performance” table. Expenses for each class are listed on the “Fund expense ratios” table on page 5. Performance would have been lower had expense limitations not been in effect.
Class A shares are sold with a maximum front-end sales charge of 5.75%, and have an annual distribution and service fee of 0.25% of average daily net assets. Performance for Class A shares,
excluding sales charges, assumes that no front-end sales charge applied.
Class C shares are sold with a contingent deferred sales charge of 1.00% if redeemed during the first 12 months. They are also subject to an annual distribution and service fee of 1.00% of average daily net assets. Performance for Class C shares, excluding sales charges, assumes either that contingent deferred sales charges did not apply or that the investment was not redeemed.
Class R shares are available only for certain retirement plan products. They are sold without a sales charge and have an annual distribution and service fee of 0.50% of average daily net assets.
4
Table of Contents
Institutional Class shares are available without sales or asset-based distribution charges only to certain eligible institutional accounts.
Narrowly focused investments may exhibit higher volatility than investments in multiple industry sectors.
REIT investments are subject to many of the risks associated with direct real estate ownership, including changes in economic conditions, credit risk, and interest rate fluctuations.
A REIT fund’s tax status as a regulated investment company could be jeopardized if it holds real estate directly, as a result of defaults, or receives rental income from real estate holdings.
“Nondiversified” Funds may allocate more of their net assets to investments in single securities than “diversified” Funds. Resulting adverse effects may subject these Funds to greater risks and volatility.
International investments entail risks not ordinarily associated with U.S. investments including fluctuation in currency values, differences in accounting principles, or economic or political instability in other nations.
Investing in emerging markets can be riskier than investing in established foreign markets due to increased volatility and lower trading volume.
2 The Fund’s expense ratios, as described in the most recent prospectus, are disclosed in the following “Fund expense ratios” table. Delaware Management Company has agreed to reimburse certain expenses and/or waive certain fees in order to prevent total annual fund operating expenses (excluding any 12b-1 fees, taxes, interest, short sale and dividend interest expenses, brokerage fees, certain insurance costs, acquired fund fees and expenses, and nonroutine expenses or costs, including, but not limited to, those relating to reorganizations, litigation, conducting shareholder meetings, and liquidations (collectively, nonroutine expenses)) from exceeding 1.15% of the Fund’s average daily net assets during the period from Nov. 1, 2014, through Oct. 31, 2015.* Please see the most recent prospectus and any applicable supplement(s) for additional information on these fee waivers and/or reimbursements.
| Fund expense ratios | Class A | Class C | Class R | Institutional Class | ||||||||||
Total annual operating expenses | 1.78% | 2.53% | 2.03% | 1.53% | ||||||||||
(without fee waivers) | ||||||||||||||
Net expenses | 1.40% | 2.15% | 1.65% | 1.15% | ||||||||||
(including fee waivers, if any) | ||||||||||||||
Type of waiver | Contractual
| Contractual
| Contractual
| Contractual
|
* The contractual waiver period is from Feb. 27, 2014, through Feb. 29, 2016.
5
Table of Contents
Performance summary
Delaware Global Real Estate Opportunities Fund
Performance of a $10,000 investment1
Average annual total returns from Jan. 10, 2007 (Fund’s inception) through Oct. 31, 2015
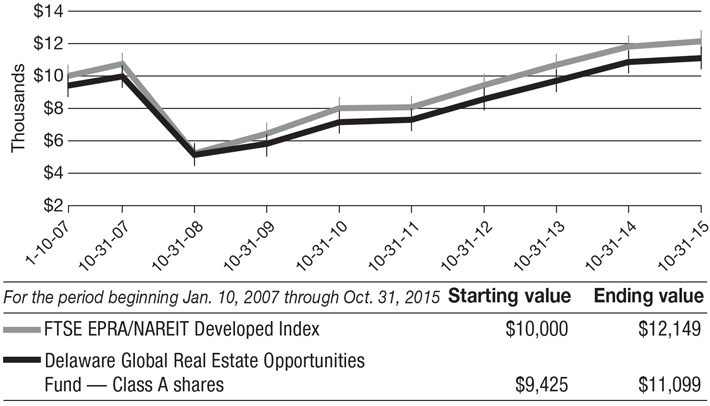
1The “Performance of a $10,000 investment” graph assumes $10,000 invested in Class A shares of the Fund on Jan. 10, 2007, and includes the effect of a 5.75% front-end sales charge and the reinvestment of all distributions. The graph does not reflect the deduction of taxes the shareholders would pay on Fund distributions or redemptions of Fund shares. Expense limitations were in effect for some or all of the periods shown. Performance would have been lower had expense limitations not been in effect. Expenses are listed in the “Fund expense ratios” table on page 5. Please note additional details on pages 4 through 6.
The graph also assumes $10,000 invested in the FTSE EPRA/NAREIT Developed Index as of Jan. 10, 2007. The FTSE EPRA/NAREIT Developed Index tracks the performance of listed real estate companies and REITs worldwide, based in U.S. dollars.
Index performance returns do not reflect any management fees, transaction costs, or expenses. Indices are unmanaged and one cannot invest directly in an index. Past performance is not a guarantee of future results.
Performance of other Fund classes will vary due to different charges and expenses.
| Nasdaq symbols | CUSIPs | |||||||
Class A | DGRPX | 245917653 | ||||||
Class C | DLPCX | 245917646 | ||||||
Class R | DLPRX | 245917638 | ||||||
Institutional Class
| DGROX
| 245917620
|
6
Table of Contents
For the six-month period from May 1, 2015 to October 31, 2015 (Unaudited)
As a shareholder of the Fund, you incur two types of costs: (1) transaction costs, including sales charges (loads) on purchase payments, reinvested dividends, or other distributions; redemption fees; and exchange fees; and (2) ongoing costs, including management fees; distribution and/or service (12b-1) fees; and other Fund expenses. This example is intended to help you understand your ongoing costs (in dollars) of investing in the Fund and to compare these costs with the ongoing costs of investing in other mutual funds.
The example is based on an investment of $1,000 invested at the beginning of the period and held for the entire six-month period from May 1, 2015 to Oct. 31, 2015.
Actual expenses
The first section of the table shown, “Actual Fund return,” provides information about actual account values and actual expenses. You may use the information in this section of the table, together with the amount you invested, to estimate the expenses that you paid over the period. Simply divide your account value by $1,000 (for example, an $8,600 account value divided by $1,000 = 8.6), then multiply the result by the number in the first section under the heading entitled “Expenses Paid During Period” to estimate the expenses you paid on your account during this period.
Hypothetical example for comparison purposes
The second section of the table shown, “Hypothetical 5% return,” provides information about hypothetical account values and hypothetical expenses based on the Fund’s actual expense ratio and an assumed rate of return of 5% per year before expenses, which is not the Fund’s actual return. The hypothetical account values and expenses may not be used to estimate the actual ending account balance or expenses you paid for the period. You may use this information to compare the ongoing costs of investing in the Fund and other funds. To do so, compare this 5% hypothetical example with the 5% hypothetical examples that appear in the shareholder reports of the other funds.
Please note that the expenses shown in the table are meant to highlight your ongoing costs only and do not reflect any transactional costs, such as sales charges (loads), redemption fees, or exchange fees. Therefore, the second section of the table is useful in comparing ongoing costs only, and will not help you determine the relative total costs of owning different funds. In addition, if these transactional costs were included, your costs would have been higher. The Fund’s expenses shown in the table reflect fee waivers in effect. The expenses shown in the table assume reinvestment of all dividends and distributions.
7
Table of Contents
Disclosure of Fund expenses
For the six-month period from May 1, 2015 to October 31, 2015 (Unaudited)
Delaware Global Real Estate Opportunities Fund
Expense analysis of an investment of $1,000
Beginning
Account Value
5/1/15 | Ending
Account Value
10/31/15 | Annualized
Expense Ratio | Expenses
Paid During Period
5/1/15 to 10/31/15* | |||||||||||||||||
Actual Fund return† | ||||||||||||||||||||
Class A | $1,000.00 | $999.00 | 1.40% | $7.05 | ||||||||||||||||
Class C | 1,000.00 | 995.90 | 2.15% | 10.82 | ||||||||||||||||
Class R | 1,000.00 | 999.10 | 1.65% | 8.31 | ||||||||||||||||
Institutional Class | 1,000.00 | 1,000.20 | 1.15% | 5.80 | ||||||||||||||||
Hypothetical 5% return (5% return before expenses) | ||||||||||||||||||||
Class A | $1,000.00 | $1,018.15 | 1.40% | $7.12 | ||||||||||||||||
Class C | 1,000.00 | 1,014.37 | 2.15% | 10.92 | ||||||||||||||||
Class R | 1,000.00 | 1,016.89 | 1.65% | 8.39 | ||||||||||||||||
Institutional Class
| 1,000.00 | 1,019.41 | 1.15% | 5.85 | ||||||||||||||||
| * | “Expenses Paid During Period” are equal to the Fund’s annualized expense ratio, multiplied by the average account value over the period, multiplied by 184/365 (to reflect the one-half year period). |
| † | Because actual returns reflect only the most recent six-month period, the returns shown may differ significantly from fiscal year returns. |
8
Table of Contents
| Security type / country and sector allocations | ||
| Delaware Global Real Estate Opportunities Fund | As of October 31, 2015 (Unaudited) | |
Sector designations may be different than the sector designations presented in other fund materials. The sector designations may represent the investment manager’s internal sector classifications, which may result in the sector designations for one fund being different than another fund’s sector designations.
| Security type / country | Percentage of net assets | ||||
Common Stock by Country | 96.26 | % | |||
Australia | 5.57 | % | |||
Canada | 0.50 | % | |||
China/Hong Kong | 5.70 | % | |||
France | 5.55 | % | |||
Germany | 2.97 | % | |||
Italy | 0.42 | % | |||
Japan | 6.32 | % | |||
Singapore | 1.08 | % | |||
Spain | 1.06 | % | |||
United Kingdom | 8.39 | % | |||
United States | 58.70 | % | |||
Short-Term Investments | 3.54 | % | |||
Total Value of Securities | 99.80 | % | |||
Receivables and Other Assets Net of Liabilities | 0.20 | % | |||
Total Net Assets | 100.00 | % | |||
| Common stock by sector | Percentage of net assets | ||||
Diversified REITs | 8.49 | % | |||
Healthcare REITs | 2.21 | % | |||
Hotel REITs | 3.76 | % | |||
Industrial REITs | 5.26 | % | |||
Mall REITs | 10.23 | % | |||
Mixed REITs | 3.72 | % | |||
Multifamily REITs | 13.77 | % | |||
Office REITs | 19.73 | % | |||
Office/Diversified REITs | 1.48 | % | |||
Real Estate Operating Companies/Developer | 5.43 | % | |||
Retail REITs | 8.11 | % | |||
Self-Storage REITs | 4.25 | % | |||
Shopping Center REITs | 8.09 | % | |||
Single Tenant REIT | 1.14 | % | |||
Specialty REIT | 0.59 | % | |||
Total | 96.26 | % | |||
9
Table of Contents
| Schedule of investments | ||
| Delaware Global Real Estate Opportunities Fund | October 31, 2015 | |
| Number of shares | Value (U.S. $) | |||||||
| ||||||||
Common Stock – 96.26%D | ||||||||
| ||||||||
Australia – 5.57% | ||||||||
GPT Group-In Specie @=† | 1,377,200 | $ | 0 | |||||
Investa Office Fund | 95,644 | 275,446 | ||||||
Scentre Group | 189,917 | 560,483 | ||||||
Stockland | 167,376 | 483,222 | ||||||
Westfield | 107,581 | 786,063 | ||||||
|
| |||||||
| 2,105,214 | ||||||||
|
| |||||||
Canada – 0.50% | ||||||||
Allied Properties Real Estate Investment Trust | 6,950 | 190,691 | ||||||
|
| |||||||
| 190,691 | ||||||||
|
| |||||||
China/Hong Kong – 5.70% | ||||||||
Hongkong Land Holdings | 76,400 | 573,764 | ||||||
Hysan Development | 91,072 | 404,796 | ||||||
Kerry Properties | 52,500 | 155,793 | ||||||
Link REIT | 32,000 | 191,778 | ||||||
Sun Hung Kai Properties | 61,724 | 827,430 | ||||||
|
| |||||||
| 2,153,561 | ||||||||
|
| |||||||
France – 5.55% | ||||||||
Gecina | 4,759 | 609,038 | ||||||
Klepierre | 22,508 | 1,068,427 | ||||||
Unibail-Rodamco | 1,508 | 421,290 | ||||||
|
| |||||||
| 2,098,755 | ||||||||
|
| |||||||
Germany – 2.97% | ||||||||
alstria office REIT † | 40,306 | 562,572 | ||||||
Vonovia | 16,788 | 560,003 | ||||||
|
| |||||||
| 1,122,575 | ||||||||
|
| |||||||
Italy – 0.42% | ||||||||
Beni Stabili | 191,566 | 157,752 | ||||||
|
| |||||||
| 157,752 | ||||||||
|
| |||||||
Japan – 6.32% | ||||||||
Kenedix Office Investment | 45 | 206,952 | ||||||
Mitsubishi Estate | 31,642 | 683,549 | ||||||
Mitsui Fudosan | 47,446 | 1,301,345 | ||||||
Orix JREIT | 96 | 129,665 | ||||||
Sumitomo Realty & Development | 2,000 | 66,357 | ||||||
|
| |||||||
| 2,387,868 | ||||||||
|
| |||||||
Singapore – 1.08% | ||||||||
CapitaLand | 97,100 | 214,838 | ||||||
Mapletree Commercial Trust | 196,794 | 192,426 | ||||||
|
| |||||||
| 407,264 | ||||||||
|
| |||||||
10
Table of Contents
| Number of shares | Value (U.S. $) | |||||||
| ||||||||
Common StockD (continued) | ||||||||
| ||||||||
Spain – 1.06% | ||||||||
Merlin Properties Socimi | 31,377 | $ | 402,240 | |||||
|
| |||||||
| 402,240 | ||||||||
|
| |||||||
United Kingdom – 8.39% | ||||||||
British Land | 28,097 | 377,002 | ||||||
Derwent London | 8,272 | 494,718 | ||||||
Grainger | 76,887 | 295,099 | ||||||
Great Portland Estates | 53,305 | 730,852 | ||||||
Segro | 97,639 | 676,952 | ||||||
Shaftesbury | 41,286 | 598,518 | ||||||
|
| |||||||
| 3,173,141 | ||||||||
|
| |||||||
United States – 58.70% | ||||||||
Alexandria Real Estate Equities | 4,805 | 431,201 | ||||||
American Residential Properties | 13,369 | 221,524 | ||||||
Apartment Investment & Management | 13,759 | 539,215 | ||||||
AvalonBay Communities | 5,282 | 923,452 | ||||||
Boston Properties | 4,129 | 519,635 | ||||||
Brandywine Realty Trust | 21,222 | 286,497 | ||||||
Brixmor Property Group | 14,258 | 365,290 | ||||||
CubeSmart | 17,411 | 484,374 | ||||||
DCT Industrial Trust | 13,609 | 505,166 | ||||||
DDR | 37,858 | 636,014 | ||||||
Digital Realty Trust | 2,791 | 206,422 | ||||||
Douglas Emmett | 10,695 | 326,732 | ||||||
Duke Realty | 36,722 | 760,145 | ||||||
Empire State Realty Trust | 17,080 | 304,366 | ||||||
Equity Commonwealth | 19,518 | 560,362 | ||||||
Equity Residential | 14,234 | 1,100,573 | ||||||
Essex Property Trust | 1,490 | 328,456 | ||||||
Extra Space Storage | 2,383 | 188,829 | ||||||
Federal Realty Investment Trust | 2,051 | 294,298 | ||||||
First Industrial Realty Trust | 14,274 | 309,460 | ||||||
General Growth Properties | 42,897 | 1,241,868 | ||||||
Host Hotels & Resorts | 45,913 | 795,672 | ||||||
Hudson Pacific Properties | 10,475 | 299,271 | ||||||
Kimco Realty | 22,434 | 600,558 | ||||||
Macerich | 2,200 | 186,428 | ||||||
National Retail Properties | 11,320 | 430,160 | ||||||
Paramount Group | 23,758 | 422,180 | ||||||
Parkway Properties | 16,536 | 276,647 | ||||||
Pebblebrook Hotel Trust | 8,237 | 281,541 | ||||||
Post Properties | 2,992 | 178,742 | ||||||
Prologis | 11,612 | 496,181 | ||||||
11
Table of Contents
Schedule of investments
Delaware Global Real Estate Opportunities Fund
| Number of shares | Value (U.S. $) | |||||||
| ||||||||
Common StockD (continued) | ||||||||
| ||||||||
United States (continued) | ||||||||
PS Business Parks | 5,132 | $ | 440,274 | |||||
Public Storage | 4,069 | 933,673 | ||||||
Regency Centers | 3,245 | 220,530 | ||||||
Retail Properties of America | 12,747 | 190,823 | ||||||
Simon Property Group | 9,582 | 1,930,390 | ||||||
SL Green Realty | 8,401 | 996,527 | ||||||
Strategic Hotels & Resorts † | 24,361 | 343,490 | ||||||
Taubman Centers | 6,600 | 508,068 | ||||||
UDR | 19,447 | 670,144 | ||||||
Urban Edge Properties | 8,049 | 191,083 | ||||||
Ventas | 8,795 | 472,467 | ||||||
Vornado Realty Trust | 4,220 | 424,321 | ||||||
Welltower | 5,622 | 364,699 | ||||||
|
| |||||||
| 22,187,748 | ||||||||
|
| |||||||
Total Common Stock (cost $35,149,573) | 36,386,809 | |||||||
|
| |||||||
| Principal amount° | ||||||||
| ||||||||
Short-Term Investments – 3.54% | ||||||||
| ||||||||
Discount Notes – 1.55%≠ | ||||||||
Federal Home Loan Bank | ||||||||
0.12% 1/4/16 | 37,813 | 37,807 | ||||||
0.12% 1/25/16 | 84,240 | 84,224 | ||||||
0.14% 2/18/16 | 73,263 | 73,238 | ||||||
0.155% 2/3/16 | 24,968 | 24,960 | ||||||
0.17% 1/21/16 | 188,152 | 188,118 | ||||||
0.18% 2/26/16 | 55,892 | 55,872 | ||||||
0.18% 3/7/16 | 19,800 | 19,788 | ||||||
0.19% 3/22/16 | 100,328 | 100,260 | ||||||
|
| |||||||
| 584,267 | ||||||||
|
| |||||||
Repurchase Agreements – 1.99% | ||||||||
Bank of America Merrill Lynch | 126,360 | 126,360 | ||||||
Bank of Montreal | 63,180 | 63,180 | ||||||
12
Table of Contents
| Principal amount° | Value (U.S. $) | |||||||
| ||||||||
Short-Term Investments (continued) | ||||||||
| ||||||||
Repurchase Agreements (continued) | ||||||||
BNP Paribas | 562,245 | $ | 562,245 | |||||
|
| |||||||
| 751,785 | ||||||||
|
| |||||||
Total Short-Term Investments (cost $1,335,973) | 1,336,052 | |||||||
|
| |||||||
Total Value of Securities – 99.80% | $37,722,861 | |||||||
|
| |||||||
| @ | Illiquid security. At Oct. 31, 2015, the aggregate value of illiquid securities was $0, which represents 0.00% of the Fund’s net assets. See Note 11 in “Notes to financial statements.” |
| = | Security is being fair valued in accordance with the Fund’s fair valuation policy. At Oct. 31, 2015, the aggregate value of fair valued securities was $0, which represents 0.00% of the Fund’s net assets. |
See Note 1 in “Notes to financial statements.”
| ≠ | The rate shown is the effective yield at the time of purchase. |
| ° | Principal amount shown is stated in U.S. dollars unless noted that the security is denominated in another currency. |
| † | Non-income-producing security. |
| D | Securities have been classified by country of origin. Aggregate classification by business sectors has been presented on page 9 in “Security type / country and sector allocations.” |
13
Table of Contents
Schedule of investments
Delaware Global Real Estate Opportunities Fund
The following foreign currency exchange contracts were outstanding at Oct. 31, 2015:1
Foreign Currency Exchange Contracts
Counterparty | Contracts to Receive (Deliver) | In Exchange For | Settlement Date | Unrealized Appreciation (Depreciation) | ||||||||||
BNYM | AUD | 92,541 | USD | (66,079 | ) | 11/2/15 | $ | (122 | ) | |||||
BNYM | EUR | 119,028 | USD | (131,662 | ) | 11/3/15 | (791 | ) | ||||||
BNYM | GBP | (38,210 | ) | USD | 58,904 | 11/3/15 | 8 | |||||||
BNYM | SGD | (59,506 | ) | USD | 42,463 | 11/4/15 | (1 | ) | ||||||
|
| |||||||||||||
| $ | (906 | ) | ||||||||||||
The use of foreign currency exchange contracts involves elements of market risk and risks in excess of the amounts disclosed in the financial statements. The foreign currency exchange contracts presented above represent the Fund’s total exposure in such contracts, whereas only the net unrealized appreciation (depreciation) is reflected in the Fund’s net assets.
1 See Note 8 in “Notes to financial statements.”
Summary of abbreviations:
AUD – Australian Dollar
BNYM – BNY Mellon
EUR – European Monetary Unit
GBP – British Pound Sterling
REIT – Real Estate Investment Trust
SGD – Singapore Dollar
USD – U.S. Dollar
See accompanying notes, which are an integral part of the financial statements.
14
Table of Contents
| Statement of assets and liabilities | ||
Delaware Global Real Estate Opportunities Fund | October 31, 2015 |
Assets: | ||||
Investments, at value1 | $ | 36,386,809 | ||
Short-term investments, at value2 | 1,336,052 | |||
Cash | 13,652 | |||
Foreign currencies, at value3 | 2,857 | |||
Receivable for securities sold | 627,062 | |||
Receivable for fund shares sold | 105,728 | |||
Dividends and interest receivable | 56,370 | |||
Unrealized appreciation of foreign currency exchange contracts | 8 | |||
|
| |||
Total assets | 38,528,538 | |||
|
| |||
Liabilities: | ||||
Payable for securities purchased | 670,640 | |||
Payable for fund shares redeemed | 10,482 | |||
Other accrued expenses | 37,152 | |||
Distribution fees payable to affiliates | 4,254 | |||
Other affiliates payable | 3,712 | |||
Investment management fees payable | 2,271 | |||
Trustees’ fees and expenses payable | 92 | |||
Unrealized depreciation of foreign currency exchange contracts | 914 | |||
|
| |||
Total liabilities | 729,517 | |||
|
| |||
Total Net Assets | $ | 37,799,021 | ||
|
| |||
Net Assets Consist of: | ||||
Paid-in capital | $ | 128,418,399 | ||
Distributions in excess of net investment income | (33,297 | ) | ||
Accumulated net realized loss on investments | (91,817,476 | ) | ||
Net unrealized appreciation of investments | 1,237,315 | |||
Net unrealized depreciation of foreign currencies | (5,014 | ) | ||
Net unrealized depreciation of foreign currency exchange contracts | (906 | ) | ||
|
| |||
Total Net Assets | $ | 37,799,021 | ||
|
| |||
15
Table of Contents
Statement of assets and liabilities
Delaware Global Real Estate Opportunities Fund
Net Asset Value | ||||
Class A: | ||||
Net assets | $ | 8,481,252 | ||
Shares of beneficial interest outstanding, unlimited authorization, no par | 1,174,205 | |||
Net asset value per share | $ | 7.22 | ||
Sales charge | 5.75 | % | ||
Offering price per share, equal to net asset value per share / (1 – sales charge) | $ | 7.66 | ||
Class C: | ||||
Net assets | $ | 2,850,128 | ||
Shares of beneficial interest outstanding, unlimited authorization, no par | 395,496 | |||
Net asset value per share | $ | 7.21 | ||
Class R: | ||||
Net assets | $ | 285,732 | ||
Shares of beneficial interest outstanding, unlimited authorization, no par | 39,596 | |||
Net asset value per share | $ | 7.22 | ||
Institutional Class: | ||||
Net assets | $ | 26,181,909 | ||
Shares of beneficial interest outstanding, unlimited authorization, no par | 3,627,939 | |||
Net asset value per share | $ | 7.22 | ||
1Investments, at cost | $ | 35,149,573 | ||
2Short-term investments, at cost | 1,335,973 | |||
3Foreign currencies, at cost | 2,902 | |||
See accompanying notes, which are an integral part of the financial statements.
16
Table of Contents
| Statement of operations | ||
Delaware Global Real Estate Opportunities Fund | Year ended October 31, 2015 |
Investment Income: | ||||
Dividends | $ | 1,314,243 | ||
Interest | 7,902 | |||
Foreign tax withheld | (49,955 | ) | ||
|
| |||
| 1,272,190 | ||||
|
| |||
Expenses: | ||||
Management fees | 507,824 | |||
Registration fees | 68,056 | |||
Distribution expenses – Class A | 20,572 | |||
Distribution expenses – Class C | 25,299 | |||
Distribution expenses – Class R | 1,145 | |||
Dividend disbursing and transfer agent fees and expenses | 44,993 | |||
Audit and tax fees | 42,424 | |||
Reports and statements to shareholders | 31,463 | |||
Custodian fees | 25,109 | |||
Accounting and administration expenses | 16,354 | |||
Legal fees | 3,441 | |||
Trustee’s fees and expenses | 2,446 | |||
Other | 14,423 | |||
|
| |||
| 803,549 | ||||
Less expenses waived | (162,079 | ) | ||
Less expense paid indirectly | (26 | ) | ||
|
| |||
Total operating expenses | 641,444 | |||
|
| |||
Net Investment Income | 630,746 | |||
|
| |||
Net Realized and Unrealized Gain (Loss): | ||||
Net realized gain (loss) on: | ||||
Investments | 3,921,603 | |||
Foreign currencies | (24,198 | ) | ||
Foreign currency exchange contracts | (22,669 | ) | ||
|
| |||
Net realized gain | 3,874,736 | |||
|
| |||
Net change in unrealized appreciation (depreciation) of: | ||||
Investments | (4,074,002 | ) | ||
Foreign currencies | (6,433 | ) | ||
Foreign currency exchange contracts | 4,331 | |||
|
| |||
Net change in unrealized appreciation (depreciation) | (4,076,104 | ) | ||
|
| |||
Net Realized and Unrealized Loss | (201,368 | ) | ||
|
| |||
Net Increase in Net Assets Resulting from Operations | $ | 429,378 | ||
|
| |||
See accompanying notes, which are an integral part of the financial statements.
17
Table of Contents
Statements of changes in net assets
Delaware Global Real Estate Opportunities Fund
| Year ended | ||||||||
| 10/31/15 | 10/31/14 | |||||||
Increase (Decrease) in Net Assets from Operations: | ||||||||
Net investment income | $ | 630,746 | $ | 988,781 | ||||
Net realized gain | 3,874,736 | 2,644,256 | ||||||
Net change in unrealized appreciation (depreciation) | (4,076,104 | ) | 2,170,418 | |||||
|
|
|
| |||||
Net increase in net assets resulting from operations | 429,378 | 5,803,455 | ||||||
|
|
|
| |||||
Dividends and Distributions to Shareholders from: | ||||||||
Net investment income: | ||||||||
Class A | (137,457 | ) | (159,306 | ) | ||||
Class C | (24,824 | ) | (22,045 | ) | ||||
Class R | (2,606 | ) | (963 | ) | ||||
Institutional Class | (909,598 | ) | (1,562,972 | ) | ||||
|
|
|
| |||||
| (1,074,485 | ) | (1,745,286 | ) | |||||
|
|
|
| |||||
Capital Share Transactions: | ||||||||
Proceeds from shares sold: | ||||||||
Class A | 5,329,594 | 6,540,240 | ||||||
Class C | 1,269,441 | 1,589,505 | ||||||
Class R | 217,676 | 89,526 | ||||||
Institutional Class | 12,635,818 | 13,834,067 | ||||||
Net asset value of shares issued upon reinvestment of dividends and distributions: | ||||||||
Class A | 130,874 | 151,317 | ||||||
Class C | 22,528 | 21,387 | ||||||
Class R | 2,606 | 963 | ||||||
Institutional Class | 340,357 | 287,571 | ||||||
|
|
|
| |||||
| 19,948,894 | 22,514,576 | |||||||
|
|
|
| |||||
18
Table of Contents
| Year ended | ||||||||
| 10/31/15 | 10/31/14 | |||||||
Capital Share Transactions (continued): | ||||||||
Cost of shares redeemed: | ||||||||
Class A | $ | (3,445,426 | ) | $ | (5,097,137 | ) | ||
Class C | (567,760 | ) | (219,233 | ) | ||||
Class R | (50,962 | ) | (703 | ) | ||||
Institutional Class | (31,250,131 | ) | (21,673,279 | ) | ||||
|
|
|
| |||||
| (35,314,279 | ) | (26,990,352 | ) | |||||
|
|
|
| |||||
Decrease in net assets derived from capital share transactions | (15,365,385 | ) | (4,475,776 | ) | ||||
|
|
|
| |||||
Net Decrease in Net Assets | (16,010,492 | ) | (417,607 | ) | ||||
Net Assets: | ||||||||
Beginning of year | 53,809,513 | 54,227,120 | ||||||
|
|
|
| |||||
End of year | $ | 37,799,021 | $ | 53,809,513 | ||||
|
|
|
| |||||
Undistributed (distributions in excess of) net investment income | $ | (33,297 | ) | $ | 157,227 | |||
|
|
|
| |||||
See accompanying notes, which are an integral part of the financial statements.
19
Table of Contents
Delaware Global Real Estate Opportunities Fund Class A1
Selected data for each share of the Fund outstanding throughout each period were as follows:
Net asset value, beginning of period |
Income (loss) from investment operations: |
Net investment income2 |
Net realized and unrealized gain (loss) |
Total from investment operations |
Less dividends and distributions from: |
Net investment income |
Total dividends and distributions |
Net asset value, end of period |
Total return3 |
Ratios and supplemental data: |
Net assets, end of period (000 omitted) |
Ratio of expenses to average net assets |
Ratio of expenses to average net assets prior to fees waived |
Ratio of net investment income to average net assets |
Ratio of net investment income to average net assets prior to fees waived |
Portfolio turnover |
| 1 | The Fund is the successor to The Global Real Estate Securities Portfolio, formerly a series of the Delaware Pooled® Trust, pursuant to the reorganization (Reorganization) of The Global Real Estate Securities Portfolio which occurred after the close of business on Sept. 28, 2012. Prior to the Reorganization, the Fund had no investment operations. The information shown for 2012 and earlier is historical information for The Global Real Estate Securities Portfolio. Because the Fund’s fees and expenses are higher than those of The Global Real Estate Securities Portfolio, the Fund’s performance would have been lower than that of The Global Real Estate Securities Portfolio. |
| 2 | The average shares outstanding method has been applied for per share information. |
| 3 | Total investment return is based on the change in net asset value of a share during the period and assumes reinvestment of dividends and distributions at net asset value and does not reflect the impact of a sales charge. Total investment return during all of the periods shown reflects a waiver by the manager. Performance would have been lower had the waiver not been in effect. |
See accompanying notes, which are an integral part of the financial statements.
20
Table of Contents
| Year ended | ||||||||||||||||||||||||||||
|
| |||||||||||||||||||||||||||
| 10/31/15 | 10/31/14 | 10/31/13 | 10/31/12 | 10/31/11 | ||||||||||||||||||||||||
| ||||||||||||||||||||||||||||
| $ | 7.200 | $ | 6.650 | $ | 6.060 | $ | 5.370 | $ | 5.780 | |||||||||||||||||||
| ||||||||||||||||||||||||||||
| 0.077 | 0.116 | 0.079 | 0.103 | 0.148 | ||||||||||||||||||||||||
| 0.077 | 0.642 | 0.696 | 0.799 | (0.069 | ) | |||||||||||||||||||||||
|
|
|
|
|
|
|
|
|
| |||||||||||||||||||
| 0.154 | 0.758 | 0.775 | 0.902 | 0.079 | ||||||||||||||||||||||||
|
|
|
|
|
|
|
|
|
| |||||||||||||||||||
| ||||||||||||||||||||||||||||
| (0.134 | ) | (0.208 | ) | (0.185 | ) | (0.212 | ) | (0.489 | ) | |||||||||||||||||||
|
|
|
|
|
|
|
|
|
| |||||||||||||||||||
| (0.134 | ) | (0.208 | ) | (0.185 | ) | (0.212 | ) | (0.489 | ) | |||||||||||||||||||
|
|
|
|
|
|
|
|
|
| |||||||||||||||||||
| $ | 7.220 | $ | 7.200 | $ | 6.650 | $ | 6.060 | $ | 5.370 | |||||||||||||||||||
|
|
|
|
|
|
|
|
|
| |||||||||||||||||||
| 2.16% | 11.80% | 13.11% | 17.79% | 1.68% | ||||||||||||||||||||||||
| ||||||||||||||||||||||||||||
| $ | 8,481 | $ | 6,571 | $ | 4,340 | $ | 297 | $ | 8 | |||||||||||||||||||
| 1.41% | 1.40% | 1.40% | 1.38% | 1.39% | ||||||||||||||||||||||||
| 1.73% | 1.78% | 1.66% | 1.52% | 1.49% | ||||||||||||||||||||||||
| 1.07% | 1.72% | 1.21% | 1.65% | 2.69% | ||||||||||||||||||||||||
| 0.75% | 1.34% | 0.95% | 1.51% | 2.59% | ||||||||||||||||||||||||
| 116% | 107% | 112% | 128% | 155% | ||||||||||||||||||||||||
| ||||||||||||||||||||||||||||
21
Table of Contents
Financial highlights
Delaware Global Real Estate Opportunities Fund Class C
Selected data for each share of the Fund outstanding throughout each period were as follows:
Net asset value, beginning of period |
Income (loss) from investment operations: |
Net investment income (loss)2 |
Net realized and unrealized gain |
Total from investment operations |
Less dividends and distributions from: |
Net investment income |
Total dividends and distributions |
Net asset value, end of period |
Total return3 |
Ratios and supplemental data: |
Net assets, end of period (000 omitted) |
Ratio of expenses to average net assets |
Ratio of expenses to average net assets prior to fees waived |
Ratio of net investment income (loss) to average net assets |
Ratio of net investment income (loss) to average net assets prior to fees waived |
Portfolio turnover |
| 1 | Date of commencement of operations; ratios have been annualized and total return has not been annualized. |
| 2 | The average shares outstanding method has been applied for per share information. |
| 3 | Total investment return is based on the change in net asset value of a share during the period and assumes reinvestment of dividends and distributions at net asset value and does not reflect the impact of a sales charge. Total investment return during all of the periods shown reflects a waiver by the manager. Performance would have been lower had the waiver not been in effect. |
| 4 | Portfolio turnover is representative of the Fund for the entire annual period. |
See accompanying notes, which are an integral part of the financial statements.
22
Table of Contents
| Year ended | 10/1/121 to | |||||||||||||||||||||
|
| |||||||||||||||||||||
| 10/31/15 | 10/31/14 | 10/31/13 | 10/31/12 | |||||||||||||||||||
| ||||||||||||||||||||||
| $ | 7.190 | $ | 6.640 | $ | 6.060 | $ | 5.960 | |||||||||||||||
| ||||||||||||||||||||||
| 0.023 | 0.066 | 0.030 | (0.005) | |||||||||||||||||||
| 0.078 | 0.637 | 0.705 | 0.105 | |||||||||||||||||||
|
|
|
|
|
|
|
| |||||||||||||||
| 0.101 | 0.703 | 0.735 | 0.100 | |||||||||||||||||||
|
|
|
|
|
|
|
| |||||||||||||||
| ||||||||||||||||||||||
| (0.081 | ) | (0.153 | ) | (0.155 | ) | — | ||||||||||||||||
|
|
|
|
|
|
|
| |||||||||||||||
| (0.081 | ) | (0.153 | ) | (0.155 | ) | — | ||||||||||||||||
|
|
|
|
|
|
|
| |||||||||||||||
| $ | 7.210 | $ | 7.190 | $ | 6.640 | $ | 6.060 | |||||||||||||||
|
|
|
|
|
|
|
| |||||||||||||||
| 1.41% | 11.06% | 12.23% | 1.68% | |||||||||||||||||||
| ||||||||||||||||||||||
| $ | 2,850 | $ | 2,119 | $ | 572 | $ | 25 | |||||||||||||||
| 2.16% | 2.15% | 2.15% | 2.15% | |||||||||||||||||||
| 2.48% | 2.53% | 2.41% | 2.52% | |||||||||||||||||||
| 0.32% | 0.97% | 0.46% | (0.93%) | |||||||||||||||||||
| 0.00% | 0.59% | 0.20% | (1.30%) | |||||||||||||||||||
| 116% | 107% | 112% | 128%4 | |||||||||||||||||||
| ||||||||||||||||||||||
23
Table of Contents
Financial highlights
Delaware Global Real Estate Opportunities Fund Class R
Selected data for each share of the Fund outstanding throughout each period were as follows:
Net asset value, beginning of period |
Income (loss) from investment operations: |
Net investment income (loss)2 |
Net realized and unrealized gain |
Total from investment operations |
Less dividends and distributions from: |
Net investment income |
Total dividends and distributions |
Net asset value, end of period |
Total return3 |
Ratios and supplemental data: |
Net assets, end of period (000 omitted) |
Ratio of expenses to average net assets |
Ratio of expenses to average net assets prior to fees waived |
Ratio of net investment income (loss) to average net assets |
Ratio of net investment income (loss) to average net assets prior to fees waived |
Portfolio turnover |
| 1 | Date of commencement of operations; ratios have been annualized and total return has not been annualized. |
| 2 | The average shares outstanding method has been applied for per share information. |
| 3 | Total investment return is based on the change in net asset value of a share during the period and assumes reinvestment of dividends and distributions at net asset value. Total investment return during all of the periods shown reflects waivers by the manager and/or distributor. Performance would have been lower had the waivers not been in effect. |
| 4 | Portfolio turnover is representative of the Fund for the entire annual period. |
See accompanying notes, which are an integral part of the financial statements.
24
Table of Contents
| Year ended | 10/1/121 to | |||||||||||||||||||||
|
| |||||||||||||||||||||
| 10/31/15 | 10/31/14 | 10/31/13 | 10/31/12 | |||||||||||||||||||
| ||||||||||||||||||||||
| $ | 7.190 | $ | 6.640 | $ | 6.060 | $ | 5.960 | |||||||||||||||
| 0.059 | 0.101 | 0.062 | (0.002) | |||||||||||||||||||
| 0.086 | 0.637 | 0.699 | 0.102 | |||||||||||||||||||
|
|
|
|
|
|
|
| |||||||||||||||
| 0.145 | 0.738 | 0.761 | 0.100 | |||||||||||||||||||
|
|
|
|
|
|
|
| |||||||||||||||
| (0.115 | ) | (0.188 | ) | (0.181 | ) | — | ||||||||||||||||
|
|
|
|
|
|
|
| |||||||||||||||
| (0.115 | ) | (0.188 | ) | (0.181 | ) | — | ||||||||||||||||
|
|
|
|
|
|
|
| |||||||||||||||
| $ | 7.220 | $ | 7.190 | $ | 6.640 | $ | 6.060 | |||||||||||||||
|
|
|
|
|
|
|
| |||||||||||||||
| 2.03% | 11.48% | 12.87% | 1.68% | |||||||||||||||||||
| $ | 286 | $ | 121 | $ | 24 | $ | 7 | |||||||||||||||
| 1.66% | 1.65% | 1.65% | 1.65% | |||||||||||||||||||
| 1.98% | 2.03% | 2.00% | 2.12% | |||||||||||||||||||
| 0.82% | 1.47% | 0.96% | (0.43%) | |||||||||||||||||||
| 0.50% | 1.09% | 0.61% | (0.90%) | |||||||||||||||||||
| 116% | 107% | 112% | 128%4 | |||||||||||||||||||
| ||||||||||||||||||||||
25
Table of Contents
Financial highlights
Delaware Global Real Estate Opportunities Fund Institutional Class1
Selected data for each share of the Fund outstanding throughout each period were as follows:
Net asset value, beginning of period |
Income (loss) from investment operations: |
Net investment income2 |
Net realized and unrealized gain (loss) |
Total from investment operations |
Less dividends and distributions from: |
Net investment income |
Total dividends and distributions |
Net asset value, end of period |
Total return3 |
Ratios and supplemental data: |
Net assets, end of period (000 omitted) |
Ratio of expenses to average net assets |
Ratio of expenses to average net assets prior to fees waived |
Ratio of net investment income to average net assets |
Ratio of net investment income to average net assets prior to fees waived |
Portfolio turnover |
| 1 | The Fund is the successor to The Global Real Estate Securities Portfolio, formerly a series of the Delaware Pooled® Trust, pursuant to the reorganization (Reorganization) of The Global Real Estate Securities Portfolio which occurred after the close of business on Sept. 28, 2012. Prior to the Reorganization, the Fund had no investment operations. The information shown for 2012 and earlier is historical information for The Global Real Estate Securities Portfolio. Because the Fund’s fees and expenses are higher than those of The Global Real Estate Securities Portfolio, the Fund’s performance would have been lower than that of The Global Real Estate Securities Portfolio. |
| 2 | The average shares outstanding method has been applied for per share information. |
| 3 | Total investment return is based on the change in net asset value of a share during the period and assumes reinvestment of dividends and distributions at net asset value. Total investment return during all of the periods shown reflects a waiver by the manager. Performance would have been lower had the waiver not been in effect. |
See accompanying notes, which are an integral part of the financial statements.
26
Table of Contents
| Year ended | ||||||||||||||||||||||||||||
|
| |||||||||||||||||||||||||||
| 10/31/15 | 10/31/14 | 10/31/13 | 10/31/12 | 10/31/11 | ||||||||||||||||||||||||
| ||||||||||||||||||||||||||||
| $ | 7.190 | $ | 6.650 | $ | 6.060 | $ | 5.390 | $ | 5.790 | |||||||||||||||||||
| ||||||||||||||||||||||||||||
| 0.095 | 0.132 | 0.094 | 0.105 | 0.163 | ||||||||||||||||||||||||
| 0.086 | 0.633 | 0.707 | 0.791 | (0.061 | ) | |||||||||||||||||||||||
|
|
|
|
|
|
|
|
|
| |||||||||||||||||||
| 0.181 | 0.765 | 0.801 | 0.896 | 0.102 | ||||||||||||||||||||||||
|
|
|
|
|
|
|
|
|
| |||||||||||||||||||
| ||||||||||||||||||||||||||||
| (0.151 | ) | (0.225 | ) | (0.211 | ) | (0.226 | ) | (0.502 | ) | |||||||||||||||||||
|
|
|
|
|
|
|
|
|
| |||||||||||||||||||
| (0.151 | ) | (0.225 | ) | (0.211 | ) | (0.226 | ) | (0.502 | ) | |||||||||||||||||||
|
|
|
|
|
|
|
|
|
| |||||||||||||||||||
| $ | 7.220 | $ | 7.190 | $ | 6.650 | $ | 6.060 | $ | 5.390 | |||||||||||||||||||
|
|
|
|
|
|
|
|
|
| |||||||||||||||||||
| 2.55% | 11.93% | 13.58% | 17.68% | 2.10% | ||||||||||||||||||||||||
| ||||||||||||||||||||||||||||
| $ | 26,182 | $ | 44,999 | $ | 49,291 | $ | 76,426 | $ | 49,359 | |||||||||||||||||||
| 1.16% | 1.15% | 1.15% | 1.13% | 1.14% | ||||||||||||||||||||||||
| 1.48% | 1.53% | 1.41% | 1.27% | 1.24% | ||||||||||||||||||||||||
| 1.32% | 1.97% | 1.46% | 1.90% | 2.94% | ||||||||||||||||||||||||
| 1.00% | 1.59% | 1.20% | 1.76% | 2.84% | ||||||||||||||||||||||||
| 116% | 107% | 112% | 128% | 155% | ||||||||||||||||||||||||
| ||||||||||||||||||||||||||||
27
Table of Contents
| Notes to financial statements | ||
| Delaware Global Real Estate Opportunities Fund | October 31, 2015 |
Delaware Group® Adviser Funds (Trust) is organized as a Delaware statutory trust and offers three series: Delaware Diversified Income Fund, Delaware Global Real Estate Opportunities Fund, and Delaware U.S. Growth Fund. These financial statements and related notes pertain to Delaware Global Real Estate Opportunities Fund (Fund). The Trust is an open-end investment company. The Fund is considered non-diversified under the Investment Company Act of 1940, as amended, and offers Class A, Class C, Class R, and Institutional Class shares. Class A shares are sold with a maximum front-end sales charge of 5.75%. Class A share purchases of $1,000,000 or more will incur a contingent deferred sales charge (CDSC) of 1.00%, if redeemed during the first year and 0.50% during the second year, provided that Delaware Distributors, L.P. (DDLP) paid a financial advisor a commission on the purchase of those shares. Class C shares are sold with a CDSC of 1.00%, if redeemed during the first 12 months. Class R and Institutional Class shares are not subject to a sales charge and are offered for sale exclusively to certain eligible investors.
The investment objective of the Fund is to seek maximum long-term total return through a combination of current income and capital appreciation.
1. Significant Accounting Policies
The following accounting policies are in accordance with U.S. generally accepted accounting principles (U.S. GAAP) and are consistently followed by the Fund.
Security Valuation – Equity securities, except those traded on The Nasdaq Stock Market LLC (Nasdaq), are valued at the last quoted sales price as of the time of the regular close of the New York Stock Exchange on the valuation date. Equity securities traded on the Nasdaq are valued in accordance with the Nasdaq Official Closing Price, which may not be the last sales price. If, on a particular day, an equity security does not trade, the mean between the bid and ask prices will be used, which approximates fair value. Securities listed on a foreign exchange are normally valued at the last quoted sales price on the valuation date. U.S. government and agency securities are valued at the mean between the bid and ask prices, which approximates fair value. Foreign currency exchange contracts and foreign cross currency exchange contracts are valued at the mean between the bid and ask prices, which approximates fair value. Interpolated values are derived when the settlement date of the contract is an interim date for which quotations are not available. Generally, other securities and assets for which market quotations are not readily available are valued at fair value as determined in good faith under the direction of the Fund’s Board of Trustees (Board). In determining whether market quotations are readily available or fair valuation will be used, various factors will be taken into consideration, such as market closures or suspension of trading in a security. The Fund may use fair value pricing more frequently for securities traded primarily in non-U.S. markets because, among other things, most foreign markets close well before the Fund values its securities, generally as of 4:00 p.m. Eastern time. The earlier close of these foreign markets gives rise to the possibility that significant events, including broad market moves, government actions or pronouncements, aftermarket trading, or news events may have occurred in the interim. Whenever such a significant event occurs, the Fund may value foreign securities using fair value prices based on third-party vendor modeling tools (international fair value pricing).
Federal and Foreign Income Taxes – No provision for federal income taxes has been made as the Fund intends to continue to qualify for federal income tax purposes as a regulated investment company under Subchapter M of the Internal Revenue Code of 1986, as amended, and make the requisite
28
Table of Contents
distributions to shareholders. The Fund evaluates tax positions taken or expected to be taken in the course of preparing the Fund’s tax returns to determine whether the tax positions are “more-likely-than-not” of being sustained by the applicable tax authority. Tax positions not deemed to meet the “more-likely-than-not” threshold are recorded as a tax benefit or expense in the current year. Management has analyzed the Fund’s tax positions taken for all open federal income tax years (Oct. 31, 2012–Oct. 31, 2015), and has concluded that no provision for federal income tax is required in the Fund’s financial statements. In regard to foreign taxes only, the Fund has open tax years in certain foreign countries in which it invests that may date back to the inception of the Fund.
Class Accounting – Investment income, common expenses, and realized and unrealized gain (loss) on investments are allocated to the various classes of the Fund on the basis of daily net assets of each class. Distribution expenses relating to a specific class are charged directly to that class.
Repurchase Agreements – The Fund may purchase certain U.S. government securities subject to the counterparty’s agreement to repurchase them at an agreed upon date and price. The counterparty will be required on a daily basis to maintain the value of the collateral subject to the agreement at not less than the repurchase price (including accrued interest). The agreements are conditioned upon the collateral being deposited under the Federal Reserve book-entry system with the Fund’s custodian or a third-party sub-custodian. In the event of default or bankruptcy by the other party to the agreement, retention of the collateral may be subject to legal proceedings. All open repurchase agreements as of the date of this report were entered into on Oct. 30, 2015, and will mature on the next business day.
Foreign Currency Transactions – Transactions denominated in foreign currencies are recorded at the prevailing exchange rates on the valuation date in accordance with the Fund’s prospectus. The value of all assets and liabilities denominated in foreign currencies is translated daily into U.S. dollars at the exchange rate of such currencies against the U.S. dollar. Transaction gains or losses resulting from changes in exchange rates during the reporting period or upon settlement of the foreign currency transaction are reported in operations for the current period. The Fund generally does not bifurcate that portion of realized gains and losses on investments which is due to changes in foreign exchange rates from that which is due to changes in market prices. The changes are included on the “Statement of operations” under “Net realized and unrealized gain (loss) on investments.” The Fund reports certain foreign currency related transactions as components of realized gains (losses) for financial reporting purposes, whereas such components are treated as ordinary income (loss) for federal income tax purposes.
Use of Estimates – The Fund is an investment company, whose financial statements are prepared in conformity with U.S. GAAP. Therefore, the Fund follows the accounting and reporting guidelines for investment companies. The preparation of financial statements in conformity with U.S. GAAP requires management to make estimates and assumptions that affect the fair value of investments, the reported amounts of assets and liabilities and disclosure of contingent assets and liabilities at the date of the financial statements, and the reported amounts of revenues and expenses during the reporting period. Actual results could differ from those estimates and the differences could be material.
29
Table of Contents
Notes to financial statements
Delaware Global Real Estate Opportunities Fund
1. Significant Accounting Policies (continued)
Other – Expenses directly attributable to the Fund are charged directly to the Fund. Other expenses common to various funds within the Delaware Investments® Family of Funds are generally allocated among such funds on the basis of average net assets. Management fees and some other expenses are paid monthly. Security transactions are recorded on the date the securities are purchased or sold (trade date) for financial reporting purposes. Costs used in calculating realized gains and losses on the sale of investment securities are those of the specific securities sold. Dividend income is recorded on the ex-dividend date and interest income is recorded on the accrual basis. Discounts and premiums on debt securities are accreted or amortized to interest income, respectively over the lives of the respective securities using the effective interest method. Distributions received from investments in real estate investment trusts (REITs) are recorded as dividend income on the ex-dividend date, subject to reclassification upon notice of the character of such distributions by the issuer. The financial statements reflect an estimate of the reclassification of the distribution character. Foreign dividends are also recorded on the ex-dividend date or as soon after the ex-dividend date that the Fund is aware of such dividends, net of all tax withholdings, a portion of which may be reclaimable. Withholding taxes and reclaims on foreign dividends have been recorded in accordance with the Fund’s understanding of the applicable country’s tax rules and rates. The Fund declares and pays dividends from net investment income quarterly and distributions from net realized gain on investments, if any, annually. The Fund may distribute more frequently, if necessary for tax purposes. Dividends and distributions, if any, are recorded on the ex-dividend date.
The Fund may receive earnings credits from its custodian when positive cash balances are maintained, which may be used to offset custody fees. There were no such earnings credits for the year ended Oct. 31, 2015.
The Fund receives earnings credits from its transfer agent when positive cash balances are maintained, which may be used to offset transfer agent fees. If the amount earned is greater than one dollar, the expense paid under this arrangement is included on the “Statement of operations” under “Dividend disbursing and transfer agent fees and expenses” with the corresponding expense offset shown under “Less expense paid indirectly.” For the year ended Oct. 31, 2015, the Fund earned $26 under the agreement.
2. Investment Management, Administration Agreements, and Other Transactions with Affiliates
In accordance with the terms of its investment management agreement, the Fund pays Delaware Management Company (DMC), a series of Delaware Management Business Trust and the investment manager, an annual fee which is calculated daily at the rate of 0.99% on the first $100 million of the average daily net assets of the Fund, 0.90% on the next $150 million, and 0.80% on average daily net assets in excess of $250 million.
DMC has contractually agreed to waive that portion if any, of its management fee and/or pay/reimburse the Fund to the extent necessary to ensure that total annual fund operating expenses (excluding any 12b-1 fees, taxes, acquired funds fees and expenses, interest, short sale and dividend interest expenses, brokerage fees, certain insurance costs, and nonroutine expenses or costs, including, but not limited to,
30
Table of Contents
those relating to reorganizations, litigation, conducting shareholder meetings, and liquidations (collectively nonroutine expenses)) do not exceed 1.15% of the Fund’s average daily net assets from Nov. 1, 2014 through Oct. 31, 2015.* For purposes of this waiver and reimbursement, nonroutine expenses may also include such additional costs and expenses as may be agreed upon from time to time by the Fund’s Board and DMC. This expense waiver and reimbursement may only be terminated by agreement of DMC and the Fund.
Delaware Investments Fund Services Company (DIFSC), an affiliate of DMC, provides fund accounting and financial administration oversight services to the Fund. For these services, DIFSC’s fees are calculated based on the aggregate daily net assets of the Delaware Investments® Family of Funds at the following annual rate: 0.0050% of the first $30 billion; 0.0045% of the next $10 billion; 0.0040% of the next $10 billion; and 0.0025% of aggregate average daily net assets in excess of $50 billion. The fees payable to DIFSC under the service agreement described above are allocated among all retail funds in the Delaware Investments Family of Funds on a relative net asset value (NAV) basis. For the year ended Oct. 31, 2015, the Fund was charged $2,425 for these services. This amount is included on the “Statement of operations” under “Accounting and administration expenses.”
DIFSC is also the transfer agent and dividend disbursing agent of the Fund. For these services, DIFSC’s fees are calculated based on the aggregate daily net assets of the retail funds within the Delaware Investments Family of Funds at the following annual rate: 0.025% of the first $20 billion; 0.020% of the next $5 billion; 0.015% of the next $5 billion; and 0.013% of average daily net assets in excess of $30 billion. The fees payable to DIFSC under the service agreement described above are allocated among all retail funds in the Delaware Investments Family of Funds on a relative NAV basis. This amount is included on the “Statement of operations” under “Dividend disbursing and transfer agent fees and expenses.” For the year ended Oct. 31, 2015, the Fund was charged $10,620 for these services. Pursuant to a sub-transfer agency agreement between DIFSC and BNY Mellon Investment Servicing (US) Inc. (BNYMIS), BNYMIS provides certain sub-transfer agency services to the Fund. Sub-transfer agency fees are passed on to and paid by the Fund.
Pursuant to a distribution agreement and distribution plan, the Fund pays DDLP, the distributor and an affiliate of DMC, an annual distribution and service fee of 0.25% of the average daily net assets of the Class A shares, 1.00% of the average daily net assets of the Class C shares, and 0.50% of the average daily net assets of the Class R shares. Institutional Class shares pay no distribution and service fee.
As provided in the investment management agreement, the Fund bears a portion of the cost of certain resources shared with DMC, including the cost of internal personnel of DMC and/or its affiliates that provide legal, tax, and regulatory reporting services to the Fund. For the year ended Oct. 31, 2015, the Fund was charged $1,325 for internal legal, tax, and regulatory reporting services provided by DMC and/or its affiliates’ employees. This amount is included on the “Statement of operations” under “Legal fees.”
* The contractual waiver period is from Feb. 27, 2014, through Feb. 29, 2016.
31
Table of Contents
Notes to financial statements
Delaware Global Real Estate Opportunities Fund
2. Investment Management, Administration Agreements, and Other Transactions with Affiliates (continued)
For the year ended Oct. 31, 2015, DDLP earned $4,856 for commissions on sales of the Fund’s Class A shares. For the year ended Oct. 31, 2015, DDLP received gross CDSC commissions of $844 on redemptions of the Fund’s Class C shares, and these commissions were entirely used to offset upfront commissions previously paid by DDLP to broker/dealers on sales of those shares.
Trustees’ fees include expenses accrued by the Fund for each Trustee’s retainer and meeting fees. Certain officers of DMC, DIFSC, and DDLP are officers and/or Trustees of the Trust. These officers and Trustees are paid no compensation by the Fund.
3. Investments
For the year ended Oct. 31, 2015, the Fund made purchases and sales of investment securities other than short-term investments as follows:
Purchases | $ | 56,774,866 | ||
Sales | 71,537,325 |
At Oct. 31, 2015, the cost and unrealized appreciation (depreciation) of investments for federal income tax purposes were as follows:
Cost of investments | $ | 37,373,072 | ||
|
| |||
Aggregate unrealized appreciation of investments | $ | 2,105,031 | ||
Aggregate unrealized depreciation of investments | (1,755,242 | ) | ||
|
| |||
Net unrealized appreciation of investments | $ | 349,789 | ||
|
|
U.S. GAAP defines fair value as the price that the Fund would receive to sell an asset or pay to transfer a liability in an orderly transaction between market participants at the measurement date under current market conditions. A three-level hierarchy for fair value measurements has been established based upon the transparency of inputs to the valuation of an asset or liability. Inputs may be observable or unobservable and refer broadly to the assumptions that market participants would use in pricing the asset or liability. Observable inputs reflect the assumptions market participants would use in pricing the asset or liability based on market data obtained from sources independent of the reporting entity. Unobservable inputs reflect the reporting entity’s own assumptions about the assumptions that market participants would use in pricing the asset or liability based on the best information available under the circumstances. The Fund’s investment in its entirety is assigned a level based upon the observability of the inputs which are significant to the overall valuation. The three-level hierarchy of inputs is summarized below.
| Level 1 – | Inputs are quoted prices in active markets for identical investments. (Examples: equity securities, open-end investment companies, futures contracts, exchange-traded options contracts) | |
| Level 2 – | Other observable inputs, including, but not limited to: quoted prices for similar assets or liabilities in markets that are active, quoted prices for identical or similar assets or liabilities in markets that are not active, inputs other than quoted prices that are observable for the assets or liabilities (such as interest rates, yield curves, volatilities, prepayment speeds, loss severities, | |
32
Table of Contents
| credit risks, and default rates) or other market-corroborated inputs. (Examples: debt securities, government securities, swap contracts, foreign currency exchange contracts, foreign securities utilizing international fair value pricing, broker-quoted securities, fair valued securities) | ||
| Level 3 – | Significant unobservable inputs, including the Fund’s own assumptions used to determine the fair value of investments. (Examples: broker-quoted securities, fair valued securities) | |
Level 3 investments are valued using significant unobservable inputs. The Fund may also use an income-based valuation approach in which the anticipated future cash flows of the investment are discounted to calculate fair value. Discounts may also be applied due to the nature or duration of any restrictions on the disposition of the investments. Valuations may also be based upon current market prices of securities that are comparable in coupon, rating, maturity, and industry. The derived value of a Level 3 investment may not represent the value which is received upon disposition and this could impact the results of operations.
The following table summarizes the valuation of the Fund’s investments by fair value hierarchy levels as of Oct. 31, 2015:
Securities | Level 1 | Level 2 | Level 3 | Total | ||||||||||||||||
Common Stock | $ | 36,386,809 | $ | — | $ | — | $ | 36,386,809 | ||||||||||||
Short-Term Investments | — | 1,336,052 | — | 1,336,052 | ||||||||||||||||
|
|
|
|
|
|
|
| |||||||||||||
Total Value of Securities | $ | 36,386,809 | $ | 1,336,052 | $ | — | $ | 37,722,861 | ||||||||||||
|
|
|
|
|
|
|
| |||||||||||||
Foreign Currency Exchange Contracts | $ | — | $ | (906 | ) | $ | — | $ | (906 | ) | ||||||||||
A security that has been deemed worthless on the “Schedule of investments” is considered to be a Level 3 investment in this table.
During the year ended Oct. 31, 2015, there were no transfers between Level 1 investments, Level 2 investments, or Level 3 investments that had a significant impact to the Fund. This does not include transfers between Level 1 investments and Level 2 investments due to the Fund utilizing international fair value pricing during the year. In accordance with the fair valuation procedures described in Note 1, international fair value pricing of securities in the Fund occurs when market volatility exceeds an established rolling threshold. If the threshold is exceeded on a given date, then prices of international securities (those that traded on exchanges that close at a different time than the time that the Fund’s NAV is determined) are established using a separate pricing feed from a third-party vendor designed to establish a price for each such security as of the time that the Fund’s NAV is determined. Further, international fair value pricing uses other observable market-based inputs in place of the closing exchange price due to the events occurring after the close of the exchange or market on which the investment is principally traded, causing a change in the classification between levels. The Fund’s policy is to recognize transfers between levels at the beginning of the reporting period.
A reconciliation of Level 3 investments is presented when the Fund has a significant amount of Level 3 investments at the beginning, interim, or end of the period in relation to net assets. Management has determined not to provide additional disclosure on Level 3 inputs since the Level 3 investments are not considered significant to the Fund’s net assets at the end of the year.
33
Table of Contents
Notes to financial statements
Delaware Global Real Estate Opportunities Fund
4. Dividend and Distribution Information
Income and long-term capital gain distributions are determined in accordance with federal income tax regulations, which may differ from U.S. GAAP. Additionally, distributions from net gains on foreign currency transactions and net short-term gains on sales of investment securities are treated as ordinary income for federal income tax purposes. The tax character of dividends and distributions paid during the years ended Oct. 31, 2015 and 2014 was as follows:
| Year ended | ||||||||
| 10/31/15 | 10/31/14 | |||||||
Ordinary income | $ | 1,074,485 | $ | 1,745,286 | ||||
5. Components of Net Assets on a Tax Basis
As of Oct. 31, 2015, the components of net assets on a tax basis were as follows:
Shares of beneficial interest | $ | 128,418,399 | ||
Undistributed ordinary income* | 84,398 | |||
Capital loss carryforwards** | (91,047,758 | ) | ||
Unrealized appreciation of investments, foreign currencies, and derivatives | 343,982 | |||
|
| |||
Net assets | $ | 37,799,021 | ||
|
|
* The undistributed earnings for the Fund are estimated pending final notification of the tax character of distributions received from investments in REITs.
** The amount of this loss which can be utilized in subsequent years may be subject to an annual limitation in accordance with the Internal Revenue Code due to the Fund merger with Delaware Global Real Estate Securities Fund on Sept. 28, 2012.
The differences between book basis and tax basis components of net assets are primarily attributable to tax deferral of losses on wash sales, mark-to-market of foreign currency exchange contracts, and tax treatment of passive foreign investment companies.
For financial reporting purposes, capital accounts are adjusted to reflect the tax character of permanent book/tax differences. Reclassifications are primarily due to tax treatment of gain (loss) on foreign currency transactions, and passive foreign investment companies. Results of operations and net assets were not affected by these reclassifications. For the year ended Oct. 31, 2015, the Fund recorded the following reclassifications:
Distributions in excess of net investment income | $ | 253,215 | ||
Accumulated net realized loss | (253,215 | ) |
For federal income tax purposes, capital loss carryforwards may be carried forward and applied against future capital gains. $4,054,940 was utilized in 2015. Capital loss carryforwards remaining at Oct. 31, 2015 will expire as follows: $36,862,417 expires in 2016, $50,784,384 expires in 2017, and $3,400,957 expires in 2018.
34
Table of Contents
On Dec. 22, 2010, the Regulated Investment Company Modernization Act of 2010 (Act) was enacted, which changed various technical rules governing the tax treatment of regulated investment companies. The changes were generally effective for taxable years beginning after the date of enactment. Under the Act, the Fund is permitted to carry forward capital losses incurred in taxable years beginning after the date of enactment for an unlimited period. Additionally, post-enactment capital loss carryforwards will retain their character as either short-term or long-term capital losses rather than being considered all short-term as permitted under previous regulation. At Oct. 31, 2015, there were no capital loss carryforwards incurred under the Act.
6. Capital Shares
Transactions in capital shares were as follows:
| Year ended | ||||||||||
| 10/31/15 | 10/31/14 | |||||||||
Shares sold: | ||||||||||
Class A | 726,942 | 979,245 | ||||||||
Class C | 176,261 | 237,941 | ||||||||
Class R | 29,537 | 13,205 | ||||||||
Institutional Class | 1,749,605 | 2,027,984 | ||||||||
Shares issued upon reinvestment of dividends and distributions: | ||||||||||
Class A | 18,184 | 23,284 | ||||||||
Class C | 3,126 | 3,328 | ||||||||
Class R | 363 | 147 | ||||||||
Institutional Class | 47,539 | 44,280 | ||||||||
| 2,751,557 | 3,329,414 | |||||||||
Shares redeemed: | ||||||||||
Class A | (483,467 | ) | (742,232 | ) | ||||||
Class C | (78,756 | ) | (32,589 | ) | ||||||
Class R | (7,087 | ) | (99 | ) | ||||||
Institutional Class | (4,423,911 | ) | (3,229,334 | ) | ||||||
| (4,993,221 | ) | (4,004,254 | ) | |||||||
Net decrease | (2,241,664 | ) | (674,840 | ) | ||||||
7. Line of Credit
The Fund, along with certain other funds in the Delaware Investments® Family of Funds (Participants), was a participant in a $225,000,000 revolving line of credit intended to be used for temporary or emergency purposes as an additional source of liquidity to fund redemptions of investor shares. Under the agreement, the Participants were charged an annual commitment fee of 0.08%, which was allocated across the Participants on the basis of each Participant’s allocation of the entire facility. The Participants were permitted to borrow up to a maximum of one third of their net assets under the agreement. Each Participant was individually, and not jointly, liable for its particular advances, if any, under the line of credit. The line of credit under the agreement expired on Nov. 10, 2014.
35
Table of Contents
Notes to financial statements
Delaware Global Real Estate Opportunities Fund
7. Line of Credit (continued)
On Nov. 10, 2014, the Fund, along with the other Participants, entered into an amendment to the agreement for a $275,000,000 revolving line of credit. The line of credit was to be used as described above and operated in substantially the same manner as the agreement described above. The line of credit available under the agreement expired on Nov. 9, 2015.
The Fund had no amounts outstanding as of Oct. 31, 2015, or at any time during the year then ended.
8. Derivatives
U.S. GAAP requires disclosures that enable investors to understand: (1) how and why an entity uses derivatives; (2) how they are accounted for; and (3) how they affect an entity’s results of operations and financial position.
Foreign Currency Exchange Contracts – The Fund may enter into foreign currency exchange contracts and foreign cross currency exchange contracts as a way of managing foreign exchange rate risk. The Fund may use these contracts to hedge the U.S. dollar value of securities it already owns that are denominated in foreign currencies. The Fund may also enter into these contracts to fix the U.S. dollar value of a security that it has agreed to buy or sell for the period between the date the trade was entered into and the date the security is delivered and paid for. In addition, the Fund may enter into these contracts to facilitate or expedite the settlement of portfolio transactions. The change in value is recorded as an unrealized gain or loss. When the contract is closed, a realized gain or loss is recorded equal to the difference between the value of the contract at the time it was opened and the value at the time it was closed.
The use of foreign currency exchange contracts and foreign cross currency exchange contracts does not eliminate fluctuations in the underlying prices of the securities, but does establish a rate of exchange that can be achieved in the future. Although foreign currency exchange contracts and foreign cross currency exchange contracts limit the risk of loss due to an unfavorable change in the value of the hedged currency, they also limit any potential gain that might result should the value of the currency change favorably. In addition, the Fund could be exposed to risks if the counterparties to the contracts are unable to meet the terms of their contracts. The Fund’s maximum risk of loss from counterparty credit risk is the value of its currency exchanged with the counterparty. The risk is generally mitigated by having a netting arrangement between the Fund and the counterparty and by the posting of collateral by the counterparty to the Fund to cover the Fund’s exposure to the counterparty.
During the year ended Oct. 31, 2015, the Fund held foreign currency exchange contracts, which are reflected on the “Statement of operations” under “Net realized gain (loss) on foreign currency exchange contracts.”
During the year ended Oct. 31, 2015, the Fund used foreign currency exchange contracts to hedge the U.S. dollar value of securities it already owns that are denominated in foreign currencies.
36
Table of Contents
Derivatives generally. The table below summarizes the average balance of derivative holdings by the Fund during the year ended Oct. 31, 2015:
| Long Derivative | Short Derivative | |||||||
| Volume | Volume | |||||||
Foreign currency exchange contracts (average cost) | USD 111,696 | USD 164,662 | ||||||
9. Offsetting
In December 2011, the Financial Accounting Standards Board (FASB) issued guidance that expanded disclosure requirements on the offsetting of certain assets and liabilities. The disclosures are required for investments and derivative financial instruments subject to master netting or similar agreements which are eligible for offset on the “Statement of assets and liabilities” and requires an entity to disclose both gross and net information about such investments and transactions in the financial statements. In January 2013, the FASB issued guidance that clarified which investments and transactions are subject to the offsetting disclosure requirements. The scope of the disclosure requirements for offsetting is limited to derivative instruments, repurchase agreements and reverse repurchase agreements, and securities borrowing. The guidance was effective for financial statements with fiscal years beginning on or after Jan. 1, 2013, and interim periods within those fiscal years.
In order to better define its contractual rights and to secure rights that will help the Fund mitigate its counterparty risk, the Fund entered into an International Swaps and Derivatives Association, Inc. Master Agreement (ISDA Master Agreement) or a similar agreement with certain of its derivative contract counterparties. An ISDA Master Agreement is a bilateral agreement between the Fund and a counterparty that governs certain over-the-counter (OTC) derivatives and foreign exchange contracts and typically contains, among other things, collateral posting items and netting provisions in the event of a default and/or termination event. Under an ISDA Master Agreement, the Fund may, under certain circumstances, offset with the counterparty certain derivative financial instruments’ payables and/or receivables with collateral held and/or posted and create one single net payment. The provisions of the ISDA Master Agreement typically permit a single net payment in the event of default (close-out), including the bankruptcy or insolvency of the counterparty. However, bankruptcy or insolvency laws of a particular jurisdiction may impose restrictions on or prohibitions against the right of offset in bankruptcy, insolvency, or other events.
For financial reporting purposes, the Fund does not offset derivative assets and derivative liabilities that are subject to netting arrangements on the “Statement of assets and liabilities.”
At Oct. 31, 2015, the Fund had the following assets and liabilities subject to offsetting provisions:
Offsetting of Financial Assets and Liabilities and Derivative Assets and Liabilities
Counterparty | Gross Value of | Gross Value of | Net Position | ||||||||||||
BNY Mellon | $ | 8 | $ | (914 | ) | $(906) | |||||||||
Counterparty | Net Position | Fair Value of | Cash Collateral Received | Fair Value of Non-Cash Collateral Pledged | Cash Collateral Pledged | Net Exposure(a) | ||||||||||||||||||||||||
BNY Mellon | $(906) | $— | $— | $— | $— | $(906) | ||||||||||||||||||||||||
37
Table of Contents
Notes to financial statements
Delaware Global Real Estate Opportunities Fund
9. Offsetting (continued)
Master Repurchase Agreements
Counterparty | Repurchase | Fair Value of | Cash Collateral Received | Net Collateral Received | Net Exposure(a) | ||||||||||||||||||||
Bank of America Merrill Lynch | $ | 126,360 | $ | (126,360 | ) | $ | — | $ | (126,360 | ) | $ | — | |||||||||||||
Bank of Montreal | 63,180 | (63,180 | ) | — | (63,180 | ) | — | ||||||||||||||||||
BNP Paribas | 562,245 | (562,245 | ) | — | (562,245 | ) | — | ||||||||||||||||||
|
|
|
|
|
|
|
|
|
| ||||||||||||||||
Total | $ | 751,785 | $ | (751,785 | ) | $ | — | $ | (751,785 | ) | $ | — | |||||||||||||
|
|
|
|
|
|
|
|
|
| ||||||||||||||||
(a)Net exposure represents the net receivable (payable) that would be due from (to) the counterparty in the event of default.
10. Securities Lending
The Fund, along with other funds in the Delaware Investments® Family of Funds, may lend its securities pursuant to a security lending agreement (Lending Agreement) with The Bank of New York Mellon (BNY Mellon). At the time a security is loaned, the borrower must post collateral equal to the required percentage of the market value of the loaned security, including any accrued interest. The required percentage is: (1) 102% with respect to U.S. securities and foreign securities that are denominated and payable in U.S. dollars; and (2) 105% with respect to foreign securities. With respect to each loan, if on any business day, the aggregate market value of securities collateral plus cash collateral held is less than the aggregate market value of the securities which are the subject of such loan, the borrower will be notified to provide additional collateral by the end of the following business day which, together with the collateral already held, will be not less than the applicable initial collateral requirements for such security loan. If the aggregate market value of securities collateral and cash collateral held with respect to a security loan exceeds the applicable initial collateral requirement, upon the request of the borrower, BNY Mellon must return enough collateral to the borrower by the end of the following business day to reduce the value of the remaining collateral to the applicable initial collateral requirement for such security loan. As a result of the foregoing, the value of the collateral held with respect to a loaned security on any particular day, may be more or less than the value of the security on loan.
Cash collateral received is generally invested in the Delaware Investments Collateral Fund No. 1 (Collective Trust) established by BNY Mellon for the purpose of investment on behalf of funds managed by DMC that participate in BNY Mellon’s securities lending program. The Collective Trust may invest in U.S. government securities and high-quality corporate debt, asset-backed and other money market securities, and in repurchase agreements collateralized by such securities, provided that the Collective Trust will generally have a dollar-weighted average portfolio maturity of 60 days or less. The Fund can also accept U.S. government securities and letters of credit (non-cash collateral) in connection with securities loans. In the event of default or bankruptcy by the lending agent, realization and/or retention of the collateral may be subject to legal proceedings. In the event the borrower fails to return loaned securities and the collateral received is insufficient to cover the value of the loaned securities and provided such collateral shortfall is not the result of investment losses, the lending agent has agreed to pay the amount of the shortfall to the Fund or, at the discretion of the lending agent, replace the loaned
38
Table of Contents
securities. The Fund continues to record dividends or interest, as applicable, on the securities loaned and is subject to changes in value of the securities loaned that may occur during the term of the loan. The Fund has the right under the Lending Agreement to recover the securities from the borrower on demand. With respect to security loans collateralized by non-cash collateral, the Fund receives loan premiums paid by the borrower. With respect to security loans collateralized by cash collateral, the earnings from the collateral investments are shared among the Fund, the security lending agent, and the borrower. The Fund records security lending income net of allocations to the security lending agent, and the borrower.
The Collective Trust used for the investment of cash collateral received from borrowers of securities seeks to maintain a NAV per unit of $1.00, but there can be no assurance that it will always be able to do so. The Fund may incur investment losses as a result of investing securities lending collateral in the Collective Trust. This could occur if an investment in the Collective Trust defaulted or if it were necessary to liquidate assets in the Collective Trust to meet returns on outstanding security loans at a time when the Collective Trust’s NAV per unit was less than $1.00. Under those circumstances, the Fund may not receive an amount from the Collective Trust that is equal in amount to the collateral the Fund would be required to return to the borrower of the securities and the Fund would be required to make up for this shortfall.
During the year ended Oct. 31, 2015, the Fund had no securities out on loan.
11. Credit and Market Risk
Some countries in which the Fund may invest require governmental approval for the repatriation of investment income, capital, or the proceeds of sales of securities by foreign investors. In addition, if there is deterioration in a country’s balance of payments or for other reasons, a country may impose temporary restrictions on foreign capital remittances abroad.
The securities exchanges of certain foreign markets are substantially smaller, less liquid, and more volatile than the major securities markets in the United States. Consequently, acquisition and disposition of securities by the Fund may be inhibited. In addition, a significant portion of the aggregate market value of equity securities listed on the major securities exchanges in emerging markets is held by a smaller number of investors. This may limit the number of shares available for acquisition or disposition by the Fund.
The Fund concentrates its investments in the real estate industry and is subject to the risks associated with that industry. If the Fund holds real estate directly as a result of defaults or receives rental income directly from real estate holdings, its tax status as a regulated investment company may be jeopardized. The Fund is also affected by interest rate changes, particularly if the REITs it holds use floating rate debt to finance their ongoing operations. Its investments may also tend to fluctuate more widely than that of a fund that invests in a broad range of industries.
The Fund may invest up to 15% of its net assets in illiquid securities, which may include securities with contractual restrictions on resale, securities exempt from registration under Rule 144A, promulgated under the Securities Act of 1933, as amended, and other securities which may not be readily marketable. The relative illiquidity of these securities may impair the Fund from disposing of them in a timely manner and at a fair price when it is necessary or desirable to do so. While maintaining oversight, the Fund’s
39
Table of Contents
Notes to financial statements
Delaware Global Real Estate Opportunities Fund
11. Credit and Market Risk (continued)
Board has delegated to DMC, the day-to-day functions of determining whether individual securities are liquid for purposes of the Fund’s limitation on investments in illiquid securities. Securities eligible for resale pursuant to Rule 144A, which are determined to be liquid, are not subject to the Fund’s 15% limit on investments in illiquid securities. As of Oct. 31, 2015, there were no Rule 144A securities held by the Fund. Illiquid securities have been identified on the “Schedule of investments.”
12. Contractual Obligations
The Fund enters into contracts in the normal course of business that contain a variety of indemnifications. The Fund’s maximum exposure under these arrangements is unknown. However, the Fund has not had prior claims or losses pursuant to these contracts. Management has reviewed the Fund’s existing contracts and expects the risk of loss to be remote.
13. Recent Accounting Pronouncements
In June 2014, the FASB issued guidance to improve the financial reporting of reverse repurchase agreements and other similar transactions. The guidance includes expanded disclosure requirements for entities that enter into reverse repurchase agreements and similar transactions accounted for as secured borrowings. The guidance is effective for financial statements with fiscal years beginning on or after Dec. 15, 2014 and interim periods within those fiscal years. Management has determined that this pronouncement has no impact to the Fund’s financial statements.
In May 2015, the FASB issued Accounting Standards Update (“ASU”) No. 2015-07 regarding “Disclosures for Investments in Certain Entities That Calculate Net Asset Value per Share.” The amendments in this update are effective for the Fund for fiscal years beginning after Dec. 15, 2015, and interim periods within those fiscal years. ASU No. 2015-07 will eliminate the requirement to categorize investments in the fair value hierarchy if the fair value is measured at NAV per share (or its equivalent) using the practical expedient in the FASB’s fair value measurement guidance. Management is evaluating the impact, if any, of this guidance on the Fund’s financial statement disclosures.
14. Subsequent Events
On Nov. 9, 2015, the Fund, along with the other Participants, entered into an amendment to the agreement for a $155,000,000 revolving line of credit to be used as described in Note 7 and to be operated in substantially the same manner as the agreement described in Note 7, with the exception of the annual commitment fee. Under the amendment to the agreement, the Participants are charged an annual commitment fee of 0.10%, which is allocated across the Participants on the basis of each Participant’s allocation of the entire facility. The line of credit available under the agreement expires on Nov. 7, 2016.
Management has determined that no other material events or transactions occurred subsequent to Oct. 31, 2015 that would require recognition or disclosure in the Fund’s financial statements.
40
Table of Contents
registered public accounting firm
To the Board of Trustees of Delaware Group® Adviser Funds
and the Shareholders of Delaware Global Real Estate Opportunities Fund:
In our opinion, the accompanying statement of assets and liabilities, including the schedule of investments, and the related statements of operations and of changes in net assets and the financial highlights present fairly, in all material respects, the financial position of Delaware Global Real Estate Opportunities Fund (one of the series constituting Delaware Group Adviser Funds, hereafter referred to as the “Fund”) at October 31, 2015, the results of its operations for the year then ended, the changes in its net assets for each of the two years in the period then ended and the financial highlights for each of the periods indicated, in conformity with accounting principles generally accepted in the United States of America. These financial statements and financial highlights (hereafter referred to as “financial statements”) are the responsibility of the Fund’s management. Our responsibility is to express an opinion on these financial statements based on our audits. We conducted our audits of these financial statements in accordance with the standards of the Public Company Accounting Oversight Board (United States). Those standards require that we plan and perform the audit to obtain reasonable assurance about whether the financial statements are free of material misstatement. An audit includes examining, on a test basis, evidence supporting the amounts and disclosures in the financial statements, assessing the accounting principles used and significant estimates made by management, and evaluating the overall financial statement presentation. We believe that our audits, which included confirmation of securities at October 31, 2015 by correspondence with the custodian and brokers, and the application of alternative auditing procedures where confirmations of securities purchased had not been received, provide a reasonable basis for our opinion.
PricewaterhouseCoopers LLP
Philadelphia, Pennsylvania
December 18, 2015
41
Table of Contents
Other Fund information (Unaudited)
Delaware Global Real Estate Opportunities Fund
Tax Information
The information set forth below is for the Fund’s fiscal year as required by federal income tax laws. Shareholders, however, must report distributions on a calendar year basis for income tax purposes, which may include distributions for portions of two fiscal years of the Fund. Accordingly, the information needed by shareholders for income tax purposes will be sent to them in January of each year. Please consult your tax advisor for proper treatment of this information.
All disclosures are based on financial information available as of the date of this annual report and, accordingly are subject to change. For any and all items requiring reporting, it is the intention of the Fund to report the maximum amount permitted under the Internal Revenue Code and the regulations thereunder.
For the fiscal year ended Oct. 31, 2015, the Fund reports distributions paid during the year as follows:
(A) Ordinary Income Distributions (Tax Basis)* | 100.00 | % | ||
(B) Qualifying Dividends1 | 2.34 | % |
(A) is based on a percentage of the Fund’s total distributions.
(B) is based on a percentage of the Fund’s ordinary income distributions.
1 Qualifying dividends represent dividends which qualify for the corporate dividends received deduction.
* For the fiscal year ended Oct. 31, 2015, certain dividends paid by the Fund may be subject to a maximum tax rate of 20%. The percentage of dividends paid by the Fund from ordinary income reported as qualified income was 62.08%. Complete information will be computed and reported in conjunction with your 2015 Form 1099-DIV.
For the fiscal year ended Oct. 31, 2015, certain interest income paid by the Fund, has been determined to be Qualified Interest Income, and may be subject to relief from U.S. withholding for foreign shareholders, as provided by the American Jobs Creation Act of 2004; the Tax Relief, Unemployment Insurance Reauthorization, and Job Creation Act of 2010; and as extended by the American Taxpayer Relief Act of 2012. For the fiscal year ended Oct. 31, 2015, the Fund has reported maximum distributions of Qualified Interest Income of $3,637. Complete information will be computed and reported in conjunction with your 2015 Form 1099-DIV.
42
Table of Contents
Board consideration of Delaware Global Real Estate Opportunities Fund investment advisory agreement
At a meeting held on Aug. 18–20, 2015 (the “Annual Meeting”), the Board of Trustees (collectively referred to here as the “Board”), including a majority of disinterested or independent Trustees, approved the renewal of the Investment Advisory Agreement for Delaware Global Real Estate Opportunities Fund (the “Fund”). In making its decision, the Board considered information furnished at regular quarterly Board meetings, including reports detailing Fund performance, investment strategies and expenses, as well as information prepared specifically in connection with the renewal of the investment advisory and sub-advisory contracts. Information furnished specifically in connection with the renewal of the Investment Management Agreement with Delaware Management Company (“DMC”) included materials provided by DMC and its affiliates (“Delaware Investments”) concerning, among other things, the nature, extent, and quality of services provided to the Fund; the costs of such services to the Fund; economies of scale; and the investment manager’s financial condition and profitability. In addition, in connection with the Annual Meeting, reports were provided to the Trustees in May 2015 and included reports provided by Lipper, Inc., an independent statistical compilation organization (“Lipper”). The Lipper reports compared the Fund’s investment performance and expenses with those of other comparable mutual funds. The Independent Trustees reviewed and discussed the Lipper reports with independent legal counsel to the Independent Trustees. In addition to the information noted above, the Board also requested and received information regarding DMC’s policy with respect to advisory fee levels and its breakpoint philosophy; the structure of portfolio manager compensation; comparative client fee information; and any constraints or limitations on the availability of securities for certain investment styles, which had in the past year inhibited, or which were likely in the future to inhibit, the investment manager’s ability to invest fully in accordance with Fund policies.
In considering information relating to the approval of the Fund’s advisory agreement, the Independent Trustees received assistance and advice from and met separately with independent legal counsel to the Independent Trustees. They also engaged a consultant to assist them in analyzing portions of the data received. The Independent Trustees reviewed and discussed with such consultant two reports prepared by the consultant with respect to such data. Although the Board gave attention to all information furnished, the following discussion identifies, under separate headings, the primary factors taken into account by the Board during its contract renewal considerations.
Nature, extent, and quality of service. The Board considered the services provided by DMC to the Fund and its shareholders. In reviewing the nature, extent, and quality of services, the Board considered reports furnished to it throughout the year, which covered matters such as the relative performance of the Fund; compliance of portfolio managers with the investment policies, strategies, and restrictions for the Fund; compliance by DMC and Delaware Distributors, L.P. (together, “Management”) personnel with the Code of Ethics adopted throughout the Delaware Investments® Family of Funds complex; and adherence to fair value pricing procedures as established by the Board. The Board was pleased with the current staffing of the Fund’s investment adviser and the emphasis placed on research in the investment process. The Board recognized DMC’s receipt of several industry distinctions during the past several years. The Board gave favorable consideration to DMC’s efforts to control expenditures while maintaining service levels committed to Fund matters. The Board noted that, in the third and fourth quarters of 2013, Management reduced the maximum 12b-1 fee for certain Funds; and in November 2013 Management negotiated a substantial reduction in fees for fund accounting services provided to
43
Table of Contents
Other Fund information (Unaudited)
Delaware Global Real Estate Opportunities Fund
Board consideration of Delaware Global Real Estate Opportunities Fund investment advisory agreement (continued)
the Funds. The Board noted the benefits provided to Fund shareholders through each shareholder’s ability to exchange an investment in one Delaware Investments fund for the same class of shares in another Delaware Investments fund without a sales charge, to reinvest Fund dividends into additional shares of the Fund or into additional shares of other Delaware Investments funds and the privilege to combine holdings in other Delaware Investments funds to obtain a reduced sales charge. The Board was satisfied with the nature, extent, and quality of the overall services provided by DMC.
Investment performance. The Board placed significant emphasis on the investment performance of the Fund in view of the importance of investment performance to shareholders. Although the Board gave appropriate consideration to performance reports and discussions with portfolio managers at Investment Committee meetings throughout the year, the Board gave particular weight to the Lipper reports furnished for the Annual Meeting. The Lipper reports prepared for the Fund showed the investment performance of its Class A shares in comparison to a group of similar funds as selected by Lipper (the “Performance Universe”). A fund with the best performance ranked first, and a fund with the poorest performance ranked last. The highest/best performing 25% of funds in the Performance Universe make up the first quartile; the next 25%, the second quartile; the next 25%, the third quartile; and the poorest/ worst performing 25% of funds in the Performance Universe make up the fourth quartile. Comparative annualized performance for the Fund was shown for the past 1-, 3-, 5-, and 10-year periods, to the extent applicable, ended March 31, 2015. The Board’s objective is that the Fund’s performance for the periods considered be at or above the median of its Performance Universe.
The Performance Universe for the Fund consisted of the Fund and all retail and institutional global real estate funds as selected by Lipper. The Lipper report comparison showed that the Fund’s total return for the 1-year period was in the third quartile of its Performance Universe. The report further showed that the Fund’s total return for the 3- and 5-year periods was in the first quartile of its Performance Universe. The Board was satisfied with performance.
Comparative expenses. The Board considered expense comparison data for the Delaware Investments® Family of Funds. Management provided the Board with information on pricing levels and fee structures for the Fund as of its most recently completed fiscal year. The Board also focused on the comparative analysis of effective management fees and total expense ratios of the Fund versus effective management fees and expense ratios of a group of similar funds as selected by Lipper (the “Expense Group”). In reviewing comparative costs, the Fund’s contractual management fee and the actual management fee incurred by the Fund were compared with the contractual management fees (assuming all funds in the Expense Group were similar in size to the Fund) and actual management fees (as reported by each fund) within the Expense Group, taking into account any applicable breakpoints and fee waivers. The Fund’s total expenses were also compared with those of its Expense Group. The Lipper total expenses, for comparative consistency, were shown by Lipper for Class A shares and comparative total expenses including 12b-1 and non-12b-1 service fees. The Board considered fees paid to DMC for non-management services. The Board’s objective is to limit the Fund’s total expense ratio to be competitive with that of the Expense Group.
44
Table of Contents
The expense comparisons for the Fund showed that its actual management fee and total expenses were in the quartile with the second lowest expenses of its Expense Group. The Board was satisfied with the management fee and total expenses of the Fund in comparison to those of its Expense Group as shown in the Lipper report.
Management profitability. The Board considered the level of profits realized by DMC in connection with the operation of the Fund. In this respect, the Board reviewed the Investment Management Profitability Analysis that addressed the overall profitability of DMC’s business in providing management and other services to each of the individual funds and the Delaware Investments® Family of Funds as a whole. Specific attention was given to the methodology followed in allocating costs for the purpose of determining profitability. Management stated that the level of profits of DMC, to a certain extent, reflects recent operational cost savings and efficiencies initiated by DMC. The Board considered DMC’s efforts to improve services provided to fund shareholders and to meet additional regulatory and compliance requirements resulting from recent industry-wide Securities and Exchange Commission initiatives. The Board also considered the extent to which DMC might derive ancillary benefits from fund operations, including the potential for procuring additional business as a result of the prestige and visibility associated with its role as service provider to the Delaware Investments Family of Funds and the benefits from allocation of fund brokerage to improve trading efficiencies. The Board found that the management fees were reasonable in light of the services rendered and the level of profitability of DMC.
Economies of scale. The Trustees considered whether economies of scale are realized by DMC as the Fund’s assets increase and the extent to which any economies of scale are reflected in the level of management fees charged. The Trustees reviewed the standardized advisory fee pricing and structure, approved by the Board and shareholders, which includes breakpoints, and which applies to most funds in the Delaware Investments Family of Funds complex. Breakpoints in the advisory fee occur when the advisory fee rate is reduced on assets in excess of specified levels. Breakpoints result in a lower advisory fee than would otherwise be the case in the absence of breakpoints, when the asset levels specified in the breakpoints are exceeded. The Board noted that the fee under the Fund’s management contract did not fall within the standardized fee pricing structure because the Fund was very similar to another existing product offered by DMC, and Management wanted consistency of the fee structure as between the two similar funds. In addition the Fund generally invests a significant portion of its assets in international (including emerging markets) securities, an asset category that requires more research and firm resources than is typically true for funds investing in domestic securities. Although the Fund has not reached a size at which it can take advantage of any breakpoints in the applicable fee schedule, the Board recognized that the fee was structured so that if the Fund grows, economies of scale may be shared.
45
Table of Contents
Board of trustees / directors and officers addendum
Delaware Investments® Family of Funds
A mutual fund is governed by a Board of Trustees/Directors (“Trustees”), which has oversight responsibility for the management of a fund’s business affairs. Trustees establish procedures and oversee and review the performance of the investment manager, the distributor, and others who perform services for the fund. The independent fund trustees, in particular, are advocates
Name, Address, and Birth Date |
Position(s) Held with Fund(s) | Length of Time Served | ||
Interested Trustee
| ||||
Shawn K. Lytle1 |
President, |
Trustee since | ||
2005 Market Street | Chief Executive Officer, | September 1, 2015 | ||
Philadelphia, PA 19103 | and Trustee | |||
February 1970 | President and | |||
| Chief Executive Officer | ||||
| since August 20, 2015 | ||||
Independent Trustees
| ||||
Thomas L. Bennett |
Chairman and Trustee |
Trustee since | ||
2005 Market Street | March 2005 | |||
Philadelphia, PA 19103 | ||||
October 1947 | Chairman since | |||
| March 1, 2015 | ||||
Ann D. Borowiec |
Trustee |
Since March 31, 2015 | ||
2005 Market Street | ||||
Philadelphia, PA 19103 | ||||
November 1958 | ||||
Joseph W. Chow |
Trustee |
Since January 2013 | ||
2005 Market Street | ||||
Philadelphia, PA 19103 | ||||
January 1953 | ||||
| 1 | Shawn K. Lytle is considered to be an “Interested Trustee” because he is an executive officer of the Fund’s(s’) investment advisor. |
46
Table of Contents
for shareholder interests. Each trustee has served in that capacity since he or she was elected to or appointed to the Board of Trustees, and will continue to serve until his or her retirement or the election of a new trustee in his or her place. The following is a list of the Trustees and Officers with certain background and related information.
Principal Occupation(s) During the Past Five Years | Number of Portfolios in Fund Complex Overseen by Trustee or Officer | Other Directorships Held by Trustee or Officer | ||
| ||||
Shawn K. Lytle has served as |
64 |
Trustee — UBS | ||
President of | Relationship Funds, | |||
Delaware Investments2 | SMA Relationship | |||
since June 2015 and was the | Trust, and UBS Funds | |||
Regional Head of Americas for | (May 2010–April 2015) | |||
UBS Global Asset | ||||
Management from | ||||
2010 through 2015. | ||||
| ||||
Private Investor |
64 |
Director — | ||
(March 2004–Present) | Bryn Mawr Bank Corp. (BMTC) | |||
| (2007–2011) | ||||
Chief Executive Officer |
64 |
None | ||
Private Wealth Management | ||||
(2011–2013) and | ||||
Market Manager, | ||||
New Jersey Private | ||||
Bank (2005–2011) — | ||||
J.P. Morgan Chase & Co. | ||||
Executive Vice President |
64 |
Director and Audit Committee | ||
(Emerging Economies | Member — Hercules | |||
Strategies, Risks, and | Technology Growth | |||
Corporate Administration) | Capital, Inc. | |||
State Street Corporation | (2004–2014) | |||
(July 2004–March 2011) | ||||
| 2 | Delaware Investments is the marketing name for Delaware Management Holdings, Inc. and its subsidiaries, including the Fund’s(s’) investment advisor, principal underwriter, and its transfer agent. |
47
Table of Contents
Board of trustees / directors and officers addendum
Delaware Investments® Family of Funds
Name, Address, and Birth Date |
Position(s) Held with Fund(s) | Length of Time Served | ||
Independent Trustees (continued)
| ||||
John A. Fry |
Trustee |
Since January 2001 | ||
2005 Market Street | ||||
Philadelphia, PA 19103 | ||||
May 1960 | ||||
Lucinda S. Landreth |
Trustee |
Since March 2005 | ||
2005 Market Street | ||||
Philadelphia, PA 19103 | ||||
June 1947 | ||||
Frances A. Sevilla-Sacasa |
Trustee |
Since September 2011 | ||
2005 Market Street | ||||
Philadelphia, PA 19103 | ||||
January 1956 | ||||
48
Table of Contents
Principal Occupation(s) During the Past Five Years | Number of Portfolios in Fund Complex Overseen by Trustee or Officer | Other Directorships Held by Trustee or Officer | ||
| ||||
President — |
64 |
Director — Hershey Trust | ||
Drexel University | Company | |||
(August 2010–Present) | ||||
| Director, Audit Committee, | ||||
President — | and Governance Committee | |||
Franklin & Marshall College | Member — Community | |||
(July 2002–July 2010) | Health Systems | |||
| Director — Drexel | ||||
| Morgan & Co. | ||||
Private Investor |
64 |
None | ||
(2004–Present) | ||||
Chief Executive Officer — |
64 |
Trust Manager and | ||
Banco Itaú | Audit Committee | |||
International | Member — Camden | |||
(April 2012–Present) | Property Trust | |||
Executive Advisor to Dean | ||||
(August 2011–March 2012) | ||||
and Interim Dean | ||||
(January 2011–July 2011) — | ||||
University of Miami School of | ||||
Business Administration | ||||
President — U.S. Trust, | ||||
Bank of America Private | ||||
Wealth Management | ||||
(Private Banking) | ||||
(July 2007–December 2008) | ||||
49
Table of Contents
Board of trustees / directors and officers addendum
Delaware Investments® Family of Funds
Name, Address, and Birth Date |
Position(s) Held with Fund(s) | Length of Time Served | ||
Independent Trustees (continued)
| ||||
Thomas K. Whitford |
Trustee |
Since January 2013 | ||
2005 Market Street | ||||
Philadelphia, PA 19103 | ||||
March 1956 | ||||
Janet L. Yeomans |
Trustee |
Since April 1999 | ||
2005 Market Street | ||||
Philadelphia, PA 19103 | ||||
July 1948 | ||||
50
Table of Contents
Principal Occupation(s) During the Past Five Years | Number of Portfolios in Fund Complex Overseen by Trustee or Officer | Other Directorships Held by Trustee or Officer | ||
| ||||
Vice Chairman |
64 |
Director — HSBC Finance | ||
(2010–April 2013), | Corporation and HSBC | |||
Chief Administrative | North America Holdings Inc. | |||
Officer (2008–2010), | ||||
and Executive Vice | Director — | |||
President and Chief | HSBC Bank | |||
Administrative Officer | ||||
(2007–2009) — | ||||
PNC Financial | ||||
Services Group | ||||
Vice President and Treasurer |
64 |
Director, Audit and | ||
(January 2006–July 2012) | Compliance Committee Chair, | |||
Vice President — | Investment Committee | |||
Mergers & Acquisitions | Member, and Governance | |||
(January 2003–January 2006), | Committee Member — | |||
and Vice President | Okabena Company | |||
and Treasurer | ||||
(July 1995–January 2003) | Chair — 3M | |||
3M Corporation | Investment Management | |||
| Company | ||||
| (2005–2012) | ||||
51
Table of Contents
Board of trustees / directors and officers addendum
Delaware Investments® Family of Funds
Name, Address, and Birth Date |
Position(s) Held with Fund(s) | Length of Time Served | ||
Officers
| ||||
David F. Connor |
Senior Vice President, |
Senior Vice President | ||
2005 Market Street | General Counsel, | since May 2013; | ||
Philadelphia, PA 19103 | and Secretary | General Counsel | ||
December 1963 | since May 2015; | |||
| Secretary since | ||||
| October 2005 | ||||
Daniel V. Geatens |
Vice President |
Treasurer since October 2007 | ||
2005 Market Street | and Treasurer | |||
Philadelphia, PA 19103 | ||||
October 1972 | ||||
Richard Salus |
Senior Vice President |
Chief Financial Officer | ||
2005 Market Street | and Chief Financial Officer | since November 2006 | ||
Philadelphia, PA 19103 | ||||
October 1963 | ||||
The Statement of Additional Information for the Fund(s) includes additional information about the Trustees and Officers and is available, without charge, upon request by calling 800 523-1918.
52
Table of Contents
Principal Occupation(s) During the Past Five Years | Number of Portfolios in Fund Complex Overseen by Trustee or Officer | Other Directorships Held by Trustee or Officer | ||
| ||||
David F. Connor has served as |
64 |
None3 | ||
Senior Vice President of | ||||
the Fund(s) and | ||||
the investment advisor | ||||
since 2013, General Counsel | ||||
of the Fund(s) and | ||||
the investment advisor | ||||
since 2015, and Secretary | ||||
of the Fund(s) and the | ||||
investment advisor since 2005. | ||||
Daniel V. Geatens has served | 64 | None3 | ||
as Vice President and | ||||
Treasurer of the Fund(s) | ||||
since 2007 and Vice President | ||||
and Director of Financial | ||||
Administration of the | ||||
investment advisor since 2010.
| ||||
Richard Salus has served as | 64 | None3 | ||
Senior Vice President | ||||
and Chief Financial Officer | ||||
of the Fund(s) and the | ||||
investment advisor since 2006. | ||||
| 3 | David F. Connor, Daniel V. Geatens, and Richard Salus serve in similar capacities for the six portfolios of the Optimum Fund Trust, which have the same investment advisor, principal underwriter, and transfer agent as the registrant. |
53
Table of Contents
| Board of trustees | ||||||
Shawn K. Lytle President and Chief Executive Officer Delaware Investments® Family of Funds Philadelphia, PA
Thomas L. Bennett Chairman of the Board Delaware Investments Family of Funds Private Investor Rosemont, PA | Ann D. Borowiec Former Chief Executive Officer Private Wealth Management J.P. Morgan Chase & Co. New York, NY
Joseph W. Chow Former Executive Vice President State Street Corporation Brookline, MA | John A. Fry President Drexel University Philadelphia, PA
Lucinda S. Landreth Former Chief Investment Officer Assurant, Inc. New York, NY | Frances A. Sevilla-Sacasa Chief Executive Officer Banco Itaú International Miami, FL
Thomas K. Whitford Former Vice Chairman PNC Financial Services Group Pittsburgh, PA
Janet L. Yeomans Former Vice President and Treasurer 3M Corporation St. Paul, MN | |||
| Affiliated officers | ||||||
| David F. Connor | Daniel V. Geatens | Richard Salus | ||||
| Senior Vice President, | Vice President and | Senior Vice President and | ||||
| General Counsel, | Treasurer | Chief Financial Officer | ||||
| and Secretary | Delaware Investments | Delaware Investments | ||||
| Delaware Investments | Family of Funds | Family of Funds | ||||
| Family of Funds | Philadelphia, PA | Philadelphia, PA | ||||
| Philadelphia, PA | ||||||
This annual report is for the information of Delaware Global Real Estate Opportunities Fund shareholders, but it may be used with prospective investors when preceded or accompanied by the Delaware Investments Fund fact sheet for the most recently completed calendar quarter. These documents are available at delawareinvestments.com.
Delaware Investments is the marketing name of Delaware Management Holdings, Inc. and its subsidiaries.
The Fund files its complete schedule of portfolio holdings with the Securities and Exchange Commission (SEC) for the first and third quarters of each fiscal year on Form N-Q. The Fund’s Forms N-Q, as well as a description of the policies and procedures that the Fund uses to determine how to vote proxies (if any) relating to portfolio securities are available without charge (i) upon request, by calling 800 523-1918; and (ii) on the SEC’s website at sec.gov. In addition, a description of the policies and procedures that the Fund uses to determine how to vote proxies (if any) relating to portfolio securities and the Schedule of Investments included in the Fund’s most recent Form N-Q are available without charge on the Fund’s website at delawareinvestments.com. The Fund’s Forms N-Q may be reviewed and copied at the SEC’s Public Reference Room in Washington, D.C.; information on the operation of the Public Reference Room may be obtained by calling 800 SEC-0330.
Information (if any) regarding how the Fund voted proxies relating to portfolio securities during the most recently disclosed 12-month period ended June 30 is available without charge (i) through the Fund’s website at delawareinvestments.com; and (ii) on the SEC’s website at sec.gov.
54
Item 2. Code of Ethics
The registrant has adopted a code of ethics that applies to the registrant’s principal executive officer, principal financial officer, principal accounting officer or controller, or persons performing similar functions, regardless of whether these individuals are employed by the registrant or a third party. A copy of the registrant’s Code of Business Ethics has been posted on the Delaware Investments Internet Web site at www.delawareinvestments.com. Any amendments to the Code of Business Ethics, and information on any waiver from its provisions granted by the registrant, will also be posted on this Web site within five business days of such amendment or waiver and will remain on the Web site for at least 12 months.
Item 3. Audit Committee Financial Expert
The registrant’s Board of Trustees/Directors has determined that certain members of the registrant’s Audit Committee are audit committee financial experts, as defined below. For purposes of this item, an “audit committee financial expert” is a person who has the following attributes:
a. An understanding of generally accepted accounting principles and financial statements;
b. The ability to assess the general application of such principles in connection with the accounting for estimates, accruals, and reserves;
c. Experience preparing, auditing, analyzing, or evaluating financial statements that present a breadth and level of complexity of accounting issues that are generally comparable to the breadth and complexity of issues that can reasonably be expected to be raised by the registrant’s financial statements, or experience actively supervising one or more persons engaged in such activities;
d. An understanding of internal controls and procedures for financial reporting; and
e. An understanding of audit committee functions.
An “audit committee financial expert” shall have acquired such attributes through:
a. Education and experience as a principal financial officer, principal accounting officer, controller, public accountant, or auditor or experience in one or more positions that involve the performance of similar functions;
b. Experience actively supervising a principal financial officer, principal accounting officer, controller, public accountant, auditor, or person performing similar functions;
c. Experience overseeing or assessing the performance of companies or public accountants with respect to the preparation, auditing, or evaluation of financial statements; or
d. Other relevant experience.
The registrant’s Board of Trustees/Directors has also determined that each member of the registrant’s Audit Committee is independent. In order to be “independent” for purposes of this item, the Audit Committee member may not: (i) other than in his or her capacity as a member of the Board of Trustees/Directors or any committee thereof, accept directly or indirectly any consulting, advisory or other compensatory fee from the issuer; or (ii) be an “interested person” of the registrant as defined in Section 2(a)(19) of the Investment Company Act of 1940.
The names of the audit committee financial experts on the registrant’s Audit Committee are set forth below:
Ann D. Borowiec
Joseph W. Chow
Lucinda S. Landreth1
Frances A. Sevilla-Sacasa
Item 4. Principal Accountant Fees and Services
(a) Audit fees.
The aggregate fees billed for services provided to the registrant by its independent auditors for the audit of the registrant’s annual financial statements and for services normally provided by the independent auditors in connection with statutory and regulatory filings or engagements were $105,935 for the fiscal year ended October 31, 2015.
The aggregate fees billed for services provided to the registrant by its independent auditors for the audit of the registrant’s annual financial statements and for services normally provided by the independent auditors in connection with statutory and regulatory filings or engagements were $97,615 for the fiscal year ended October 31, 2014.
(b) Audit-related fees.
The aggregate fees billed by the registrant’s independent auditors for services relating to the performance of the audit of the registrant’s financial statements and not reported under paragraph (a) of this Item were $0 for the fiscal year ended October 31, 2015.
The aggregate fees billed by the registrant’s independent auditors for services relating to the performance of the audit of the financial statements of the registrant’s investment adviser and other service providers under common control with the adviser and that relate directly to the operations or financial reporting of the registrant were $612,000 for the registrant’s fiscal year ended October 31, 2015. The percentage of these fees relating to services approved by the registrant’s Audit Committee pursuant to the de minimis exception from the pre-approval requirement in Rule 2-01(c)(7)(i)(C) of Regulation S-X was 0%. These audit-related services were as follows: year end audit procedures; group reporting and subsidiary statutory audits.
The aggregate fees billed by the registrant’s independent auditors for services relating to the performance of the audit of the registrant’s financial statements and not reported under paragraph (a) of this Item were $0 for the fiscal year ended October 31, 2014.
____________________
1 The instructions to Form N-CSR require disclosure on the relevant experience of persons who qualify as audit committee financial experts based on “other relevant experience.” The Board of Trustees/Directors has determined that Ms. Landreth qualifies as an audit committee financial expert by virtue of her experience as a financial analyst, her Chartered Financial Analyst (CFA) designation and her service as an audit committee chairperson for a non-profit organization.
The aggregate fees billed by the registrant’s independent auditors for services relating to the performance of the audit of the financial statements of the registrant’s investment adviser and other service providers under common control with the adviser and that relate directly to the operations or financial reporting of the registrant were $618,000 for the registrant’s fiscal year ended October 31, 2014. The percentage of these fees relating to services approved by the registrant’s Audit Committee pursuant to the de minimis exception from the pre-approval requirement in Rule 2-01(c)(7)(i)(C) of Regulation S-X was 0%. These audit-related services were as follows: year end audit procedures; group reporting and subsidiary statutory audits.
(c) Tax fees.
The aggregate fees billed by the registrant’s independent auditors for tax-related services provided to the registrant were $17,876 for the fiscal year ended October 31, 2015. The percentage of these fees relating to services approved by the registrant’s Audit Committee pursuant to the de minimis exception from the pre-approval requirement in Rule 2-01(c)(7)(i)(C) of Regulation S-X was 0%. These tax-related services were as follows: review of income tax returns and review of annual excise distribution calculations.
The aggregate fees billed by the registrant’s independent auditors for tax-related services provided to the registrant’s investment adviser and other service providers under common control with the adviser and that relate directly to the operations or financial reporting of the registrant were $0 for the registrant’s fiscal year ended October 31, 2015.
The aggregate fees billed by the registrant’s independent auditors for tax-related services provided to the registrant were $16,068 for the fiscal year ended October 31, 2014. The percentage of these fees relating to services approved by the registrant’s Audit Committee pursuant to the de minimis exception from the pre-approval requirement in Rule 2-01(c)(7)(i)(C) of Regulation S-X was 0%. These tax-related services were as follows: review of income tax returns and review of annual excise distribution calculations.
The aggregate fees billed by the registrant’s independent auditors for tax-related services provided to the registrant’s investment adviser and other service providers under common control with the adviser and that relate directly to the operations or financial reporting of the registrant were $0 for the registrant’s fiscal year ended October 31, 2014.
(d) All other fees.
The aggregate fees billed for all services provided by the independent auditors to the registrant other than those set forth in paragraphs (a), (b) and (c) of this Item were $0 for the fiscal year ended October 31, 2015.
The aggregate fees billed for all services other than those set forth in paragraphs (b) and (c) of this Item provided by the registrant’s independent auditors to the registrant’s adviser and other service providers under common control with the adviser and that relate directly to the operations or financial reporting of the registrant were $0 for the registrant’s fiscal year ended October 31, 2015. The percentage of these fees relating to services approved by the registrant’s Audit Committee pursuant to the de minimis exception from the pre-approval requirement in Rule 2-01(c)(7)(i)(C) of Regulation S-X was 0%.
The aggregate fees billed for all services provided by the independent auditors to the registrant other than those set forth in paragraphs (a), (b) and (c) of this Item were $0 for the fiscal year ended October 31, 2014.
The aggregate fees billed for all services other than those set forth in paragraphs (b) and (c) of this Item provided by the registrant’s independent auditors to the registrant’s adviser and other service providers under common control with the adviser and that relate directly to the operations or financial reporting of the registrant were $0 for the registrant’s fiscal year ended October 31, 2014. The percentage of these fees relating to services approved by the registrant’s Audit Committee pursuant to the de minimis exception from the pre-approval requirement in Rule 2-01(c)(7)(i)(C) of Regulation S-X was 0%.
(e) The registrant’s Audit Committee has established pre-approval policies and procedures as permitted by Rule 2-01(c)(7)(i)(B) of Regulation S-X (the “Pre-Approval Policy”) with respect to services provided by the registrant’s independent auditors. Pursuant to the Pre-Approval Policy, the Audit Committee has pre-approved the services set forth in the table below with respect to the registrant up to the specified fee limits. Certain fee limits are based on aggregate fees to the registrant and other registrants within the Delaware Investments Family of Funds.
| Service | Range of Fees |
| Audit Services | |
| Statutory audits or financial audits for new Funds | up to $40,000 per Fund |
Services associated with SEC registration statements (e.g., Form N-1A, Form N-14, etc.), periodic reports and other documents filed with the SEC or other documents issued in connection with securities offerings (e.g., comfort letters for closed-end Fund offerings, consents), and assistance in responding to SEC comment letters | up to $10,000 per Fund |
Consultations by Fund management as to the accounting or disclosure treatment of transactions or events and/or the actual or potential impact of final or proposed rules, standards or interpretations by the SEC, FASB, or other regulatory or standard-setting bodies (Note: Under SEC rules, some consultations may be considered “audit-related services” rather than “audit services”) | up to $25,000 in the aggregate |
Audit-Related Services | |
Consultations by Fund management as to the accounting or disclosure treatment of transactions or events and/or the actual or potential impact of final or proposed rules, standards or interpretations by the SEC, FASB, or other regulatory or standard-setting bodies (Note: Under SEC rules, some consultations may be considered “audit services” rather than “audit-related services”) | up to $25,000 in the aggregate |
Tax Services | |
U.S. federal, state and local and international tax planning and advice (e.g., consulting on statutory, regulatory or administrative developments, evaluation of Funds’ tax compliance function, etc.) | up to $25,000 in the aggregate |
U.S. federal, state and local tax compliance (e.g., excise distribution reviews, etc.) | up to $5,000 per Fund |
Review of federal, state, local and international income, franchise and other tax returns | up to $5,000 per Fund |
Under the Pre-Approval Policy, the Audit Committee has also pre-approved the services set forth in the table below with respect to the registrant’s investment adviser and other entities controlling, controlled by or under common control with the investment adviser that provide ongoing services to the registrant (the “Control Affiliates”) up to the specified fee limit. This fee limit is based on aggregate fees to the investment adviser and its Control Affiliates.
| Service | Range of Fees |
| Non-Audit Services | |
Services associated with periodic reports and other documents filed with the SEC and assistance in responding to SEC comment letters | up to $10,000 in the aggregate |
The Pre-Approval Policy requires the registrant’s independent auditors to report to the Audit Committee at each of its regular meetings regarding all services initiated since the last such report was rendered, including those services authorized by the Pre-Approval Policy.
(f) Not applicable.
(g) The aggregate non-audit fees billed by the registrant’s independent auditors for services rendered to the registrant and to its investment adviser and other service providers under common control with the adviser were $11,111,212 and $5,653,375 for the registrant’s fiscal years ended October 31, 2015 and October 31, 2014, respectively.
(h) In connection with its selection of the independent auditors, the registrant’s Audit Committee has considered the independent auditors’ provision of non-audit services to the registrant’s investment adviser and other service providers under common control with the adviser that were not required to be pre-approved pursuant to Rule 2-01(c)(7)(ii) of Regulation S-X. The Audit Committee has determined that the independent auditors’ provision of these services is compatible with maintaining the auditors’ independence.
Item 5. Audit Committee of Listed Registrants
Not applicable.
Item 6. Investments
(a) Included as part of report to shareholders filed under Item 1 of this Form N-CSR.
(b) Divestment of securities in accordance with Section 13(c) of the Investment Company Act of 1940.
Not applicable.
Item 7. Disclosure of Proxy Voting Policies and Procedures for Closed-End Management Investment Companies
Not applicable.
Item 8. Portfolio Managers of Closed-End Management Investment Companies
Not applicable.
Item 9. Purchases of Equity Securities by Closed-End Management Investment Company and Affiliated Purchasers
Not applicable.
Item 10. Submission of Matters to a Vote of Security Holders
Not applicable.
Item 11. Controls and Procedures
The registrant’s principal executive officer and principal financial officer have evaluated the registrant’s disclosure controls and procedures within 90 days of the filing of this report and have concluded that they are effective in providing reasonable assurance that the information required to be disclosed by the registrant in its reports or statements filed under the Securities Exchange Act of 1934 is recorded, processed, summarized and reported within the time periods specified in the rules and forms of the Securities and Exchange Commission.
There were no significant changes in the registrant’s internal control over financial reporting that occurred during the second fiscal quarter of the period covered by the report to stockholders included herein (i.e., the registrant’s fourth fiscal quarter) that have materially affected, or are reasonably likely to materially affect, the registrant’s internal control over financial reporting.
Item 12. Exhibits
(a) (1) Code of Ethics
Not applicable.
(2) Certifications of Principal Executive Officer and Principal Financial Officer pursuant to Rule 30a-2 under the Investment Company Act of 1940 are attached hereto as Exhibit 99.CERT.
(3) Written solicitations to purchase securities pursuant to Rule 23c-1 under the Securities Exchange Act of 1934.
Not applicable.
(b) Certifications pursuant to Section 906 of the Sarbanes-Oxley Act of 2002 are furnished herewith as Exhibit 99.906CERT.
SIGNATURES
Pursuant to the requirements of the Securities Exchange Act of 1934 and the Investment Company Act of 1940, the registrant has duly caused this report to be signed on its behalf, by the undersigned, thereunto duly authorized.
DELAWARE GROUP® ADVISER FUNDS
| /s/ SHAWN LYTLE | |
| By: | Shawn Lytle |
| Title: | Chief Executive Officer |
| Date: | January 6, 2016 |
Pursuant to the requirements of the Securities Exchange Act of 1934 and the Investment Company Act of 1940, this report has been signed below by the following persons on behalf of the registrant and in the capacities and on the dates indicated.
| /s/ SHAWN LYTLE | |
| By: | Shawn Lytle |
| Title: | Chief Executive Officer |
| Date: | January 6, 2016 |
| /s/ RICHARD SALUS | |
| By: | Richard Salus |
| Title: | Chief Financial Officer |
| Date: | January 6, 2016 |