ITEM 1. | REPORT(S) TO STOCKHOLDERS. |

| 1 | |
| 11 | |
| 19 | |
| 20 | |
| 37 | |
| 41 | |
| 43 | |
| 47 | |
| 62 | |
| 85 |
| • | The Trump election in the fall of 2016 resulted in the Russell 3000 Value Index rising 6% relative to the Russell 3000 Growth Index, as investors priced in lower corporate tax rates which benefit more domestically oriented companies like banks and retailers. Approximately half of the rally was concentrated in the two weeks after the election. |
| • | When worries about the longevity of the European Union subsided in the spring of 2012, the Russell 3000 Value Index rallied over 8% relative to the growth benchmark through mid-2013. More than half of that move occurred in late 2012 and early 2013. |
| • | After the Global Financial Crisis, the Russell 3000 Value Index rose over 4% relative to the Russell 3000 Growth Index in the summer of 2009, but most of the rally took place over only one month. |

| • | The S&P 500 Index: An index of large company stocks considered to be representative of the U.S. stock market. |
| • | The Russell 2000 Value Index measures the performance of small-cap value segment of the U.S. equity universe. It includes those Russell 2000 companies with lower price-to-book ratios and lower forecasted growth values. |
| • | The MSCI ACWI ex USA Index (gross) captures large and mid cap representation across 22 of 23 Developed Markets (DM) countries (excluding the US) and 26 Emerging Markets (EM) countries. The index covers approximately 85% of the global equity opportunity set outside the US. |
| • | The MSCI ACWI Index (gross) is a free float-adjusted market capitalization weighted index that is designed to measure the equity market performance of developed and emerging markets. The MSCI ACWI captures large and mid cap representation across 23 Developed Markets (DM) and 26 Emerging Markets (EM) countries. |
| • | The Morgan Stanley Capital International (MSCI) Emerging Markets Index (gross) is a free float-adjusted market capitalization index that is designed to measure equity market performance in the global emerging markets. |
| • | The Russell 1000 Growth Index measures the performance of the large-cap growth segment of the U.S. equity universe. It includes those Russell 1000 companies with higher growth earning potential as defined by Russell's leading style methodology. The Russell 1000 Growth Index is constructed to provide a comprehensive and unbiased barometer for the large-cap growth segment. |
| • | The Russell Midcap Growth Index measures the performance of the mid- cap growth segment of the U.S. equity universe. It includes those Russell Midcap Index companies with higher growth earning potential as defined by Russell's leading style methodology. The Russell Midcap Growth Index is constructed to provide a comprehensive and unbiased barometer of the mid-cap growth market. |
| • | The Russell 2000 Growth Index measures the performance of the small- cap growth segment of the U.S. equity universe. It includes those Russell 2000 companies with higher growth earning potential as defined by Russell's leading style methodology. The Russell 2000 Growth Index is constructed to provide a comprehensive and unbiased barometer for the small-cap growth segment. |
| • | The Russell 3000 Growth Index is constructed to provide a comprehensive, unbiased and stable barometer of the broad growth market. The index is completely reconstituted annually to ensure new and growing equities are included and that the represented companies continue to reflect growth characteristics. |
| • | The Russell 3000 Value Index measures the performance of the broad value segment of the US equity value universe. It includes those Russell 3000 companies with lower price-to-book ratios and lower forecasted growth values. The Russell 3000 Value Index is constructed to provide a comprehensive, unbiased and stable barometer of the broad value market. |
FUND PERFORMANCE AS OF 3/31/21 (Unaudited) | ||||||||||||||||
| AVERAGE ANNUAL TOTAL RETURNS | ||||||||||||||||
1 YEAR | 5 YEARS | 10 YEARS | SINCE INCEPTION | |||||||||||||
Alger Capital Appreciation Institutional Class I (Inception 11/8/93) | 61.07 | % | 20.70 | % | 15.96 | % | 13.23 | % | ||||||||
Alger Capital Appreciation Institutional Class R (Inception 1/27/03)* | 60.37 | % | 20.15 | % | 15.41 | % | 12.68 | % | ||||||||
Alger Capital Appreciation Institutional Class Y (Inception 2/28/17) | 61.70 | % | n/a | n/a | 22.60 | % | ||||||||||
Alger Capital Appreciation Institutional Class Z-2 (Inception 10/14/16) | 61.55 | % | n/a | n/a | 22.83 | % | ||||||||||
Alger Focus Equity Class A (Inception 12/31/12) | 57.77 | % | 21.67 | % | n/a | 19.23 | % | |||||||||
Alger Focus Equity Class C (Inception 12/31/12) | 64.31 | % | 22.06 | % | n/a | 19.11 | % | |||||||||
Alger Focus Equity Class I (Inception 11/8/93) | 66.62 | % | 23.03 | % | 16.60 | % | 10.75 | % | ||||||||
Alger Focus Equity Class Y (Inception 2/28/17) | 67.05 | % | n/a | n/a | 25.28 | % | ||||||||||
Alger Focus Equity Class Z (Inception 12/31/12) | 67.04 | % | 23.37 | % | n/a | 20.42 | % | |||||||||
Alger Mid Cap Growth Institutional Class I (Inception 11/8/93) | 98.81 | % | 22.62 | % | 14.28 | % | 13.27 | % | ||||||||
Alger Mid Cap Growth Institutional Class R (Inception 1/27/03)* | 97.84 | % | 22.00 | % | 13.69 | % | 12.70 | % | ||||||||
Alger Mid Cap Growth Institutional Class Z-2 (Inception 10/14/16) | 99.38 | % | n/a | n/a | 25.23 | % | ||||||||||
Alger Small Cap Growth Institutional Class I (Inception 11/8/93) | 86.82 | % | 26.85 | % | 14.43 | % | 11.37 | % | ||||||||
Alger Small Cap Growth Institutional Class R (Inception 1/27/03)* | 85.94 | % | 26.24 | % | 13.87 | % | 10.83 | % | ||||||||
Alger Small Cap Growth Institutional Class Z-2 (Inception 8/1/16) | 87.43 | % | n/a | n/a | 26.54 | % | ||||||||||
| * | Since inception performance is calculated from 11/8/93. Performance figures prior to 1/27/03, inception of Class R shares, are those of the Fund's Class I shares. The performance figures prior to 1/27/03 have been reduced to reflect the higher operating expenses of Class R shares. |
ALGER CAPITAL APPRECIATION INSTITUTIONAL FUND
Fund Highlights Through April 30, 2021 (Unaudited) (Continued)
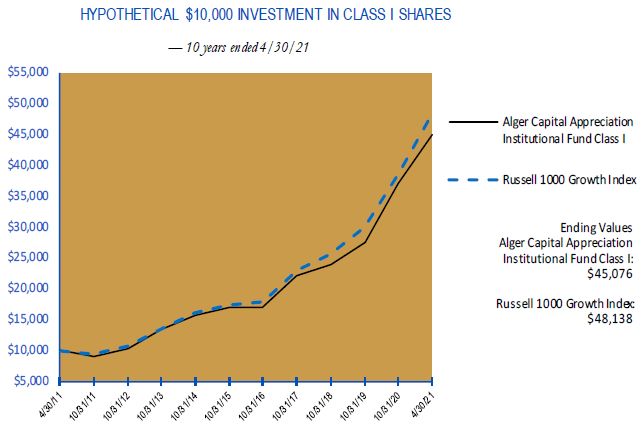
| PERFORMANCE COMPARISON AS OF 4/30/21 | ||||||||||||||||
| AVERAGE ANNUAL TOTAL RETURNS | ||||||||||||||||
1 YEAR | 5 YEARS | 10 YEARS | Since 11/8/1993 | |||||||||||||
| Class I (Inception 11/8/93) | 49.57 | % | 22.48 | % | 16.25 | % | 13.45 | % | ||||||||
| Class R (Inception 1/27/03)* | 48.89 | % | 21.92 | % | 15.70 | % | 12.89 | % | ||||||||
Russell 1000 Growth Index | 51.41 | % | 22.88 | % | 17.02 | % | 10.99 | % | ||||||||
1 YEAR | 5 YEARS | 10 YEARS | Since 2/28/2017 | |||||||||||||
| Class Y (Inception 2/28/17) | 50.14 | % | n/a | n/a | 23.95 | % | ||||||||||
Russell 1000 Growth Index | 51.41 | % | n/a | n/a | 23.69 | % | ||||||||||
1 YEAR | 5 YEARS | 10 YEARS | Since 10/14/2016 | |||||||||||||
| Class Z-2 (Inception 10/14/16) | 50.03 | % | n/a | n/a | 24.07 | % | ||||||||||
Russell 1000 Growth Index | 51.41 | % | n/a | n/a | 24.33 | % | ||||||||||
| * | Performance figures prior to 1/27/03, inception of Class R shares, are those of the Fund's Class I shares. The performance figures prior to 1/27/03 have been reduced to reflect the higher operating expenses of Class R shares. |
ALGER FOCUS EQUITY FUND
Fund Highlights Through April 30, 2021 (Unaudited)
ALGER FOCUS EQUITY FUND
Fund Highlights Through April 30, 2021 (Unaudited) (Continued)
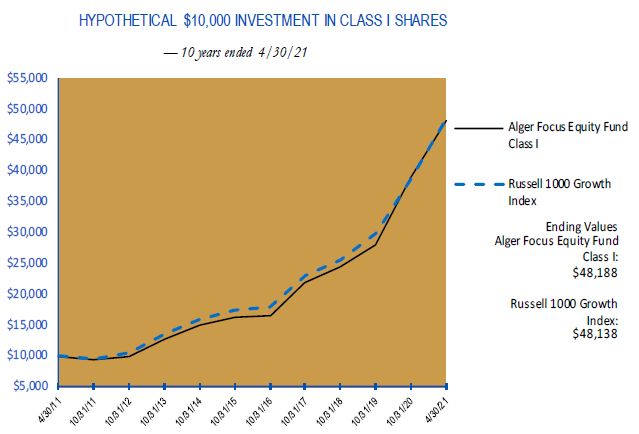
| PERFORMANCE COMPARISON AS OF 4/30/21 | ||||||||||||||||
| AVERAGE ANNUAL TOTAL RETURNS | ||||||||||||||||
1 YEAR | 5 YEARS | 10 YEARS | Since 11/8/1993 | |||||||||||||
| Class I (Inception 11/8/93) | 54.60 | % | 25.17 | % | 17.03 | % | 10.99 | % | ||||||||
Russell 1000 Growth Index | 51.41 | % | 22.88 | % | 17.02 | % | 10.99 | % | ||||||||
1 YEAR | 5 YEARS | 10 YEARS | Since 12/31/2012 | |||||||||||||
| Class A (Inception 12/31/12) | 46.42 | % | 23.79 | % | n/a | 20.00 | % | |||||||||
| Class C (Inception 12/31/12) | 52.39 | % | 24.17 | % | n/a | 19.87 | % | |||||||||
| Class Z (Inception 12/31/12) | 55.03 | % | 25.51 | % | n/a | 21.19 | % | |||||||||
Russell 1000 Growth Index | 51.41 | % | 22.88 | % | n/a | 19.66 | % | |||||||||
1 YEAR | 5 YEARS | 10 YEARS | Since 2/28/2017 | |||||||||||||
| Class Y (Inception 2/28/17) | 55.05 | % | n/a | n/a | 26.78 | % | ||||||||||
Russell 1000 Growth Index | 51.41 | % | n/a | n/a | 23.69 | % | ||||||||||
ALGER MID CAP GROWTH INSTITUTIONAL FUND
Fund Highlights Through April 30, 2021 (Unaudited)
ALGER MID CAP GROWTH INSTITUTIONAL FUND
Fund Highlights Through April 30, 2021 (Unaudited) (Continued)
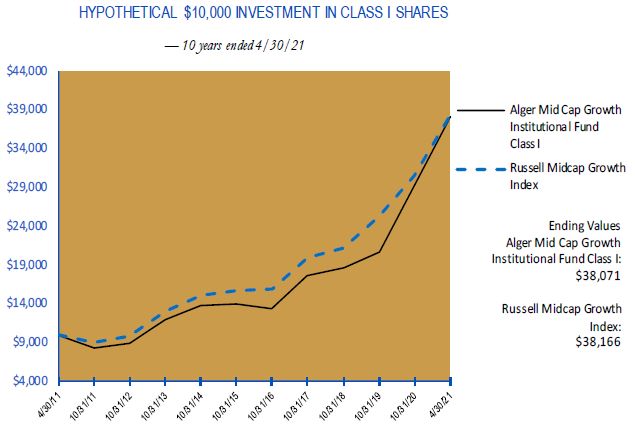
| PERFORMANCE COMPARISON AS OF 4/30/21 | ||||||||||||||||
| AVERAGE ANNUAL TOTAL RETURNS | ||||||||||||||||
1 YEAR | 5 YEARS | 10 YEARS | Since 11/8/1993 | |||||||||||||
| Class I (Inception 11/8/93) | 79.18 | % | 23.81 | % | 14.30 | % | 13.40 | % | ||||||||
| Class R (Inception 1/27/03)* | 78.37 | % | 23.18 | % | 13.72 | % | 12.83 | % | ||||||||
Russell Midcap Growth Index | 53.97 | % | 19.70 | % | 14.33 | % | 10.98 | % | ||||||||
1 YEAR | 5 YEARS | 10 YEARS | Since 10/14/2016 | |||||||||||||
| Class Z-2 (Inception 10/14/16) | 79.74 | % | n/a | n/a | 25.88 | % | ||||||||||
Russell Midcap Growth Index | 53.97 | % | n/a | n/a | 21.10 | % | ||||||||||
| * | Performance figures prior to 1/27/03, inception of Class R shares, are those of the Fund's Class I shares. The performance figures prior to 1/27/03 have been reduced to reflect the higher operating expenses of Class R shares. |
ALGER SMALL CAP GROWTH INSTITUTIONAL FUND
Fund Highlights Through April 30, 2021 (Unaudited)
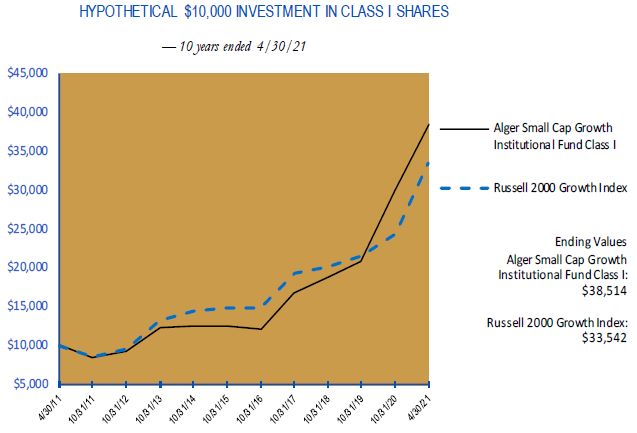
ALGER SMALL CAP GROWTH INSTITUTIONAL FUND
Fund Highlights Through April 30, 2021 (Unaudited) (Continued)
| PERFORMANCE COMPARISON AS OF 4/30/21 | ||||||||||||||||
| AVERAGE ANNUAL TOTAL RETURNS | ||||||||||||||||
1 YEAR | 5 YEARS | 10 YEARS | Since 11/8/1993 | |||||||||||||
| Class I (Inception 11/8/93) | 65.47 | % | 27.73 | % | 14.44 | % | 11.52 | % | ||||||||
| Class R (Inception 1/27/03)* | 64.74 | % | 27.11 | % | 13.88 | % | 10.98 | % | ||||||||
Russell 2000 Growth Index | 69.15 | % | 18.89 | % | 12.86 | % | 8.76 | % | ||||||||
1 YEAR | 5 YEARS | 10 YEARS | Since 8/1/2016 | |||||||||||||
| Class Z-2 (Inception 8/1/16) | 66.05 | % | n/a | n/a | 27.24 | % | ||||||||||
Russell 2000 Growth Index | 69.15 | % | n/a | n/a | 17.80 | % | ||||||||||
| * | Performance figures prior to 1/27/03, inception of Class R shares, are those of the Fund's Class I shares. The performance figures prior to 1/27/03 have been reduced to reflect the higher operating expenses of Class R shares. |
SECTORS | Alger Capital Appreciation Institutional Fund | Alger Focus Equity Fund | Alger Mid Cap Growth Institutional Fund | Alger Small Cap Growth Institutional Fund | ||||||||||||
Communication Services | 13.7 | % | 15.3 | % | 8.2 | % | 6.6 | % | ||||||||
Consumer Discretionary | 21.4 | 17.4 | 19.0 | 15.0 | ||||||||||||
Consumer Staples | 1.2 | 1.8 | 1.3 | 2.8 | ||||||||||||
Energy | 0.0 | 0.0 | 0.0 | 1.1 | ||||||||||||
Financials | 3.6 | 3.8 | 2.4 | 1.8 | ||||||||||||
Healthcare | 7.9 | 8.0 | 22.4 | 36.8 | ||||||||||||
Industrials | 5.4 | 6.6 | 11.2 | 4.7 | ||||||||||||
Information Technology | 45.6 | 45.7 | 32.0 | 26.1 | ||||||||||||
Materials | 1.0 | 0.0 | 0.0 | 2.1 | ||||||||||||
Real Estate | 0.2 | 0.0 | 3.3 | 1.2 | ||||||||||||
| Short-Term Investments and Net Other Assets | 0.0 | 1.4 | 0.2 | 1.8 | ||||||||||||
| 100.0 | % | 100.0 | % | 100.0 | % | 100.0 | % | |||||||||
THE ALGER INSTITUTIONAL FUNDS
ALGER CAPITAL APPRECIATION INSTITUTIONAL FUND
Schedule of Investments April 30, 2021 (Unaudited)
| COMMON STOCKS—99.7% | SHARES | VALUE | ||||||
| AEROSPACE & DEFENSE—1.4% | ||||||||
| Raytheon Technologies Corp. | 153,764 | $ | 12,799,315 | |||||
| TransDigm Group, Inc.* | 72,450 | 44,465,463 | ||||||
| 57,264,778 | ||||||||
| AIR FREIGHT & LOGISTICS—0.6% | ||||||||
| XPO Logistics, Inc.* | 168,054 | 23,379,672 | ||||||
| APPAREL ACCESSORIES & LUXURY GOODS—1.4% | ||||||||
| Capri Holdings Ltd.* | 190,797 | 10,509,099 | ||||||
| LVMH Moet Hennessy Louis Vuitton SE | 61,688 | 46,476,551 | ||||||
| 56,985,650 | ||||||||
| APPAREL RETAIL—0.7% | ||||||||
| The TJX Cos., Inc. | 397,508 | 28,223,068 | ||||||
| APPLICATION SOFTWARE—8.5% | ||||||||
| Adobe, Inc.* | 275,228 | 139,909,402 | ||||||
| Autodesk, Inc.* | 33,544 | 9,791,829 | ||||||
| Cadence Design Systems, Inc.* | 144,660 | 19,061,848 | ||||||
| Five9, Inc.* | 79,119 | 14,871,998 | ||||||
| Intuit, Inc. | 122,943 | 50,672,187 | ||||||
| RingCentral, Inc., Cl. A* | 108,085 | 34,473,711 | ||||||
| salesforce.com, Inc.* | 303,025 | 69,792,718 | ||||||
| 338,573,693 | ||||||||
| AUTOMOBILE MANUFACTURERS—1.8% | ||||||||
| General Motors Co.* | 181,220 | 10,369,408 | ||||||
| Tesla, Inc.* | 88,159 | 62,543,521 | ||||||
| 72,912,929 | ||||||||
| AUTOMOTIVE RETAIL—1.1% | ||||||||
| Carvana Co., Cl. A* | 74,127 | 21,145,468 | ||||||
| Lithia Motors, Inc., Cl. A | 57,600 | 22,140,288 | ||||||
| 43,285,756 | ||||||||
| BIOTECHNOLOGY—0.3% | ||||||||
| Vertex Pharmaceuticals, Inc.* | 58,422 | 12,747,680 | ||||||
| BROADCASTING—0.6% | ||||||||
| Discovery, Inc., Cl. A* | 586,560 | 22,089,850 | ||||||
| CASINOS & GAMING—2.2% | ||||||||
| DraftKings, Inc., Cl. A* | 486,582 | 27,569,736 | ||||||
| Flutter Entertainment PLC* | 39,270 | 8,006,255 | ||||||
| Las Vegas Sands Corp.* | 165,140 | 10,116,476 | ||||||
| MGM Resorts International | 1,031,592 | 42,006,426 | ||||||
| 87,698,893 | ||||||||
| DATA PROCESSING & OUTSOURCED SERVICES—10.2% | ||||||||
| Fidelity National Information Services, Inc. | 23,246 | 3,554,313 | ||||||
| Fiserv, Inc.* | 479,809 | 57,634,657 | ||||||
| PayPal Holdings, Inc.* | 469,827 | 123,230,924 | ||||||
| Square, Inc., Cl. A* | 125,139 | 30,636,530 | ||||||
| Visa, Inc., Cl. A | 830,141 | 193,887,732 | ||||||
| 408,944,156 | ||||||||
| DIVERSIFIED BANKS—0.3% | ||||||||
| Bank of America Corp. | 201,216 | 8,155,285 | ||||||
THE ALGER INSTITUTIONAL FUNDS
ALGER CAPITAL APPRECIATION INSTITUTIONAL FUND
Schedule of Investments April 30, 2021 (Unaudited) (Continued)
| COMMON STOCKS—99.7% (CONT.) | SHARES | VALUE | ||||||
| DIVERSIFIED BANKS—0.3% (CONT.) | ||||||||
JPMorgan Chase & Co. | 32,041 | $ | 4,928,226 | |||||
| 13,083,511 | ||||||||
| DIVERSIFIED SUPPORT SERVICES—0.5% | ||||||||
Cintas Corp. | 61,662 | 21,282,023 | ||||||
| ELECTRICAL COMPONENTS & EQUIPMENT—0.9% | ||||||||
AMETEK, Inc. | 140,871 | 19,007,724 | ||||||
Eaton Corp. PLC | 116,201 | 16,608,609 | ||||||
| 35,616,333 | ||||||||
| FINANCIAL EXCHANGES & DATA—1.8% | ||||||||
CME Group, Inc., Cl. A | 133,576 | 26,981,016 | ||||||
Coinbase Global, Inc., Cl. A* | 30,938 | 9,208,386 | ||||||
S&P Global, Inc. | 95,215 | 37,170,984 | ||||||
| 73,360,386 | ||||||||
| FOOD DISTRIBUTORS—1.0% | ||||||||
Sysco Corp. | 488,870 | 41,421,955 | ||||||
| FOOTWEAR—0.7% | ||||||||
NIKE, Inc., Cl. B | 198,559 | 26,332,895 | ||||||
| GENERAL MERCHANDISE STORES—0.2% | ||||||||
Target Corp. | 40,568 | 8,408,124 | ||||||
| HEALTHCARE EQUIPMENT—4.9% | ||||||||
Danaher Corp. | 365,368 | 92,781,550 | ||||||
Dexcom, Inc.* | 22,697 | 8,763,311 | ||||||
Intuitive Surgical, Inc.* | 54,845 | 47,440,925 | ||||||
Medtronic PLC | 356,640 | 46,691,309 | ||||||
| 195,677,095 | ||||||||
| HEALTHCARE SERVICES—0.5% | ||||||||
Guardant Health, Inc.* | 129,005 | 20,509,215 | ||||||
| HEALTHCARE SUPPLIES—0.7% | ||||||||
Align Technology, Inc.* | 45,719 | 27,227,036 | ||||||
| HEALTHCARE TECHNOLOGY—0.0% | ||||||||
Veeva Systems, Inc., Cl. A* | 4,451 | 1,257,185 | ||||||
| HOME IMPROVEMENT RETAIL—0.7% | ||||||||
Lowe's Cos., Inc. | 151,610 | 29,753,463 | ||||||
| HOTELS RESORTS & CRUISE LINES—1.4% | ||||||||
Booking Holdings, Inc.* | 11,036 | 27,215,659 | ||||||
Expedia Group, Inc.* | 152,900 | 26,945,567 | ||||||
| 54,161,226 | ||||||||
| INDUSTRIAL CONGLOMERATES—0.1% | ||||||||
General Electric Co. | 145,514 | 1,909,144 | ||||||
| INDUSTRIAL GASES—0.4% | ||||||||
Air Products & Chemicals, Inc. | 59,860 | 17,268,413 | ||||||
| INTERACTIVE MEDIA & SERVICES—10.6% | ||||||||
Alphabet, Inc., Cl. C* | 87,990 | 212,066,459 | ||||||
Facebook, Inc., Cl. A* | 420,534 | 136,707,193 | ||||||
Pinterest, Inc., Cl. A* | 729,737 | 48,432,644 | ||||||
Snap, Inc., Cl. A* | 419,612 | 25,940,414 | ||||||
| 423,146,710 | ||||||||
THE ALGER INSTITUTIONAL FUNDS
ALGER CAPITAL APPRECIATION INSTITUTIONAL FUND
Schedule of Investments April 30, 2021 (Unaudited) (Continued)
| COMMON STOCKS—99.7% (CONT.) | SHARES | VALUE | ||||||
| INTERNET & DIRECT MARKETING RETAIL—9.1% | ||||||||
| Altaba, Inc.*,@,(a) | 342,659 | $ | 4,081,069 | |||||
Amazon.com, Inc.* | 97,777 | 339,033,925 | ||||||
MercadoLibre, Inc.* | 13,017 | 20,449,447 | ||||||
| 363,564,441 | ||||||||
| INTERNET SERVICES & INFRASTRUCTURE—2.3% | ||||||||
Shopify, Inc., Cl. A* | 27,747 | 32,811,105 | ||||||
Snowflake, Inc., Cl. A* | 88,140 | 20,412,343 | ||||||
Twilio, Inc., Cl. A* | 107,987 | 39,717,618 | ||||||
| 92,941,066 | ||||||||
| INVESTMENT BANKING & BROKERAGE—0.7% | ||||||||
Morgan Stanley | 324,934 | 26,823,302 | ||||||
| MANAGED HEALTHCARE—0.6% | ||||||||
UnitedHealth Group, Inc. | 61,313 | 24,451,624 | ||||||
| MOVIES & ENTERTAINMENT—1.4% | ||||||||
Live Nation Entertainment, Inc.* | 227,735 | 18,646,942 | ||||||
Netflix, Inc.* | 31,662 | 16,257,487 | ||||||
Roku, Inc., Cl. A* | 38,304 | 13,137,123 | ||||||
The Walt Disney Co.* | 53,496 | 9,951,326 | ||||||
| 57,992,878 | ||||||||
| PERSONAL PRODUCTS—0.2% | ||||||||
The Estee Lauder Cos, Inc., Cl. A | 25,591 | 8,030,456 | ||||||
| PHARMACEUTICALS—0.9% | ||||||||
Horizon Therapeutics PLC* | 144,339 | 13,657,356 | ||||||
Zoetis, Inc., Cl. A | 117,965 | 20,411,484 | ||||||
| 34,068,840 | ||||||||
| RAILROADS—0.9% | ||||||||
Union Pacific Corp. | 161,001 | 35,756,712 | ||||||
| REGIONAL BANKS—0.8% | ||||||||
Signature Bank | 130,789 | 32,894,741 | ||||||
| RESEARCH & CONSULTING SERVICES—0.4% | ||||||||
CoStar Group, Inc.* | 20,411 | 17,439,771 | ||||||
| RESTAURANTS—2.1% | ||||||||
Chipotle Mexican Grill, Inc., Cl. A* | 28,505 | 42,530,315 | ||||||
Starbucks Corp. | 363,726 | 41,642,990 | ||||||
| 84,173,305 | ||||||||
| SEMICONDUCTOR EQUIPMENT—2.3% | ||||||||
Applied Materials, Inc. | 145,527 | 19,312,888 | ||||||
Enphase Energy, Inc.* | 107,607 | 14,984,275 | ||||||
Lam Research Corp. | 94,010 | 58,328,504 | ||||||
| 92,625,667 | ||||||||
| SEMICONDUCTORS—7.1% | ||||||||
Advanced Micro Devices, Inc.* | 229,501 | 18,731,872 | ||||||
Microchip Technology, Inc. | 103,869 | 15,610,472 | ||||||
Micron Technology, Inc.* | 466,005 | 40,109,050 | ||||||
NVIDIA Corp. | 110,107 | 66,106,041 | ||||||
NXP Semiconductors NV | 229,174 | 44,118,287 | ||||||
QUALCOMM, Inc. | 335,727 | 46,598,907 | ||||||
THE ALGER INSTITUTIONAL FUNDS
ALGER CAPITAL APPRECIATION INSTITUTIONAL FUND
Schedule of Investments April 30, 2021 (Unaudited) (Continued)
| COMMON STOCKS—99.7% (CONT.) | SHARES | VALUE | ||||||
| SEMICONDUCTORS—7.1% (CONT.) | ||||||||
Taiwan Semiconductor Manufacturing Co., Ltd.# | 454,962 | $ | 53,112,264 | |||||
| 284,386,893 | ||||||||
| SPECIALTY CHEMICALS—0.6% | ||||||||
The Sherwin-Williams Co. | 88,328 | 24,190,389 | ||||||
| SYSTEMS SOFTWARE—10.1% | ||||||||
Crowdstrike Holdings, Inc., Cl. A* | 99,816 | 20,812,634 | ||||||
Microsoft Corp. | 1,451,056 | 365,927,302 | ||||||
ServiceNow, Inc.* | 36,867 | 18,668,343 | ||||||
| 405,408,279 | ||||||||
| TECHNOLOGY HARDWARE STORAGE & PERIPHERALS—5.0% | ||||||||
Apple, Inc. | 1,537,993 | 202,184,560 | ||||||
| TRUCKING—0.6% | ||||||||
Uber Technologies, Inc.* | 429,780 | 23,539,051 | ||||||
| WIRELESS TELECOMMUNICATION SERVICES—1.1% | ||||||||
T-Mobile US, Inc.* | 327,996 | 43,338,111 | ||||||
| TOTAL COMMON STOCKS | ||||||||
(Cost $2,120,133,217) | 3,996,330,925 | |||||||
| REAL ESTATE INVESTMENT TRUST—0.2% | SHARES | VALUE | ||||||
| RETAIL—0.2% | ||||||||
Simon Property Group, Inc. | 73,457 | 8,942,655 | ||||||
(Cost $6,588,721) | 8,942,655 | |||||||
| SPECIAL PURPOSE VEHICLE—0.1% | SHARES | VALUE | ||||||
| DATA PROCESSING & OUTSOURCED SERVICES—0.1% | ||||||||
| Crosslink Ventures Capital LLC, Cl. A*,@,(a),(b) | 123 | 3,075,000 | ||||||
(Cost $3,075,000) | 3,075,000 | |||||||
| Total Investments | ||||||||
| (Cost $2,129,796,938) | 100.0 | % | $ | 4,008,348,580 | ||||
Affiliated Securities (Cost $3,075,000) | 3,075,000 | |||||||
Unaffiliated Securities (Cost $2,126,721,938) | 4,005,273,580 | |||||||
Liabilities in Excess of Other Assets | 0.0 | % | (1,437,265 | ) | ||||
| NET ASSETS | 100.0 | % | $ | 4,006,911,315 | ||||
| # | American Depositary Receipts. |
| (a) | Security is valued in good faith at fair value determined using significant unobservable inputs pursuant to procedures established by the Board. |
| (b) | Deemed an affiliate of the Fund in accordance with Section 2(a)(3) of the Investment Company Act of 1940. See Note 11 - Affiliated Securities. |
| * | Non-income producing security. |
ALGER CAPITAL APPRECIATION INSTITUTIONAL FUND
Schedule of Investments April 30, 2021 (Unaudited) (Continued)
Security | Acquisition Date(s) | Acquisition Cost | % of net assets (Acquisition Date) | Market Value | % of net assets as of 4/30/2021 | ||||||||||||
| Altaba, Inc. | 10/24/18 | $ | 986,137 | 0.03 | % | $ | 668,091 | 0.02 | % | ||||||||
| Altaba, Inc. | 10/25/18 | 1,506,214 | 0.04 | % | 1,015,601 | 0.02 | % | ||||||||||
| Altaba, Inc. | 10/29/18 | 1,458,917 | 0.04 | % | 1,024,332 | 0.03 | % | ||||||||||
| Altaba, Inc. | 10/30/18 | 1,034,749 | 0.03 | % | 740,195 | 0.02 | % | ||||||||||
| Altaba, Inc. | 10/31/18 | 767,835 | 0.02 | % | 522,861 | 0.01 | % | ||||||||||
| Altaba, Inc. | 11/6/18 | 165,940 | 0.00 | % | 109,989 | 0.00 | % | ||||||||||
| Crosslink Ventures Capital LLC, Cl. A | 10/2/20 | 3,075,000 | 0.08 | % | 3,075,000 | 0.08 | % | ||||||||||
| Total | $ | 7,156,069 | 0.18 | % | |||||||||||||
THE ALGER INSTITUTIONAL FUNDS
ALGER FOCUS EQUITY FUND
Schedule of Investments April 30, 2021 (Unaudited)
| COMMON STOCKS—98.6% | SHARES | VALUE | ||||||
| AEROSPACE & DEFENSE—2.9% | ||||||||
Textron, Inc. | 136,821 | $ | 8,789,381 | |||||
TransDigm Group, Inc.* | 52,961 | 32,504,284 | ||||||
| 41,293,665 | ||||||||
| APPAREL ACCESSORIES & LUXURY GOODS—0.6% | ||||||||
Moncler SpA* | 138,871 | 8,512,180 | ||||||
| APPLICATION SOFTWARE—10.1% | ||||||||
Adobe, Inc.* | 118,422 | 60,198,640 | ||||||
Five9, Inc.* | 118,515 | 22,277,265 | ||||||
Intuit, Inc. | 55,064 | 22,695,178 | ||||||
RingCentral, Inc., Cl. A* | 38,854 | 12,392,483 | ||||||
salesforce.com, Inc.* | 102,903 | 23,700,619 | ||||||
| 141,264,185 | ||||||||
| AUTOMOTIVE RETAIL—1.2% | ||||||||
Carvana Co., Cl. A* | 59,634 | 17,011,195 | ||||||
| CASINOS & GAMING—2.5% | ||||||||
DraftKings, Inc., Cl. A* | 173,632 | 9,837,989 | ||||||
MGM Resorts International | 604,996 | 24,635,437 | ||||||
| 34,473,426 | ||||||||
| DATA PROCESSING & OUTSOURCED SERVICES—11.2% | ||||||||
Fiserv, Inc.* | 184,099 | 22,113,972 | ||||||
PayPal Holdings, Inc.* | 243,739 | 63,930,302 | ||||||
Visa, Inc., Cl. A | 302,964 | 70,760,272 | ||||||
| 156,804,546 | ||||||||
| DIVERSIFIED SUPPORT SERVICES—0.9% | ||||||||
Cintas Corp. | 34,741 | 11,990,509 | ||||||
| ELECTRICAL COMPONENTS & EQUIPMENT—1.2% | ||||||||
Eaton Corp. PLC | 115,454 | 16,501,840 | ||||||
| FINANCIAL EXCHANGES & DATA—2.4% | ||||||||
CME Group, Inc., Cl. A | 65,839 | 13,298,819 | ||||||
Coinbase Global, Inc., Cl. A* | 10,712 | 3,188,320 | ||||||
S&P Global, Inc. | 44,541 | 17,388,361 | ||||||
| 33,875,500 | ||||||||
| FOOD DISTRIBUTORS—1.8% | ||||||||
US Foods Holding Corp.* | 616,734 | 25,569,792 | ||||||
| HEALTHCARE EQUIPMENT—5.1% | ||||||||
Danaher Corp. | 132,934 | 33,757,260 | ||||||
Dexcom, Inc.* | 16,589 | 6,405,013 | ||||||
Medtronic PLC | 242,331 | 31,725,974 | ||||||
| 71,888,247 | ||||||||
| HEALTHCARE SERVICES—0.4% | ||||||||
Guardant Health, Inc.* | 30,648 | 4,872,419 | ||||||
| HEALTHCARE SUPPLIES—0.8% | ||||||||
Align Technology, Inc.* | 18,591 | 11,071,498 | ||||||
| HOTELS RESORTS & CRUISE LINES—0.8% | ||||||||
Booking Holdings, Inc.* | 4,294 | 10,589,348 | ||||||
| INTERACTIVE MEDIA & SERVICES—13.8% | ||||||||
Alphabet, Inc., Cl. C* | 33,461 | 80,645,025 | ||||||
Facebook, Inc., Cl. A* | 136,522 | 44,380,572 | ||||||
| COMMON STOCKS—98.6% (CONT.) | SHARES | VALUE | ||||||
| INTERACTIVE MEDIA & SERVICES—13.8% (CONT.) | ||||||||
Genius Sports Ltd.* | 1,557,169 | $ | 32,856,266 | |||||
Pinterest, Inc., Cl. A* | 371,903 | 24,683,202 | ||||||
Snap, Inc., Cl. A* | 173,470 | 10,723,915 | ||||||
| 193,288,980 | ||||||||
| INTERNET & DIRECT MARKETING RETAIL—9.7% | ||||||||
Amazon.com, Inc.* | 33,048 | 114,591,296 | ||||||
Magnite, Inc.* | 344,625 | 13,802,231 | ||||||
MercadoLibre, Inc.* | 5,084 | 7,986,863 | ||||||
| 136,380,390 | ||||||||
| INTERNET SERVICES & INFRASTRUCTURE—0.2% | ||||||||
Twilio, Inc., Cl. A* | 9,143 | 3,362,795 | ||||||
| INVESTMENT BANKING & BROKERAGE—0.6% | ||||||||
Morgan Stanley | 109,146 | 9,010,002 | ||||||
| MANAGED HEALTHCARE—1.7% | ||||||||
UnitedHealth Group, Inc. | 61,286 | 24,440,857 | ||||||
| MOVIES & ENTERTAINMENT—0.6% | ||||||||
Live Nation Entertainment, Inc.* | 106,727 | 8,738,807 | ||||||
| RAILROADS—1.0% | ||||||||
Union Pacific Corp. | 63,118 | 14,017,877 | ||||||
| REGIONAL BANKS—0.8% | ||||||||
Signature Bank | 45,657 | 11,483,192 | ||||||
| RESTAURANTS—2.6% | ||||||||
Starbucks Corp. | 314,172 | 35,969,552 | ||||||
| SEMICONDUCTOR EQUIPMENT—4.1% | ||||||||
Applied Materials, Inc. | 436,565 | 57,936,541 | ||||||
| SEMICONDUCTORS—5.7% | ||||||||
NVIDIA Corp. | 48,874 | 29,342,972 | ||||||
NXP Semiconductors NV | 68,884 | 13,260,859 | ||||||
QUALCOMM, Inc. | 126,815 | 17,601,922 | ||||||
Taiwan Semiconductor Manufacturing Co., Ltd.# | 171,080 | 19,971,879 | ||||||
| 80,177,632 | ||||||||
| SYSTEMS SOFTWARE—9.5% | ||||||||
Microsoft Corp. | 527,180 | 132,944,252 | ||||||
| TECHNOLOGY HARDWARE STORAGE & PERIPHERALS—4.9% | ||||||||
Apple, Inc. | 525,599 | 69,095,245 | ||||||
| TRUCKING—0.6% | ||||||||
Uber Technologies, Inc.* | 157,496 | 8,626,056 | ||||||
| WIRELESS TELECOMMUNICATION SERVICES—0.9% | ||||||||
T-Mobile US, Inc.* | 100,056 | 13,220,399 | ||||||
| TOTAL COMMON STOCKS | ||||||||
| (Cost $952,379,470) | 1,384,410,927 | |||||||
| PREFERRED STOCKS—0.0% | SHARES | VALUE | ||||||
| BIOTECHNOLOGY—0.0% | ||||||||
| Prosetta Biosciences, Inc., Series D*,@,(a),(b) | 76,825 | 11,524 | ||||||
| (Cost $345,713) | 11,524 | |||||||
| SHARES | VALUE | |||||||
| Total Investments | ||||||||
| (Cost $952,725,183) | 98.6 | % | $ | 1,384,422,451 | ||||
| Affiliated Securities (Cost $345,713) | 11,524 | |||||||
| Unaffiliated Securities (Cost $952,379,470) | 1,384,410,927 | |||||||
Other Assets in Excess of Liabilities | 1.4 | % | 19,984,986 | |||||
| NET ASSETS | 100.0 | % | $ | 1,404,407,437 | ||||
| # | American Depositary Receipts. |
| (a) | Deemed an affiliate of the Fund in accordance with Section 2(a)(3) of the Investment Company Act of 1940. See Note 11 - Affiliated Securities. |
| (b) | Security is valued in good faith at fair value determined using significant unobservable inputs pursuant to procedures established by the Board. |
| * | Non-income producing security. |
Security | Acquisition Date(s) | Acquisition Cost | % of net assets (Acquisition Date) | Market Value | % of net assets as of 4/30/2021 | ||||||||||||
| Prosetta Biosciences, Inc., Series D | 2/6/15 | $ | 345,713 | 0.80 | % | $ | 11,524 | 0.00 | % | ||||||||
| Total | $ | 11,524 | 0.00 | % | |||||||||||||
| COMMON STOCKS—93.8% | SHARES | VALUE | ||||||
| ADVERTISING—0.8% | ||||||||
Cardlytics, Inc.* | 8,269 | $ | 1,137,236 | |||||
| AEROSPACE & DEFENSE—1.9% | ||||||||
HEICO Corp. | 18,388 | 2,589,030 | ||||||
| AIR FREIGHT & LOGISTICS—0.7% | ||||||||
XPO Logistics, Inc.* | 7,148 | 994,430 | ||||||
| APPAREL ACCESSORIES & LUXURY GOODS—3.3% | ||||||||
Capri Holdings Ltd.* | 37,696 | 2,076,296 | ||||||
Lululemon Athletica, Inc.* | 3,610 | 1,210,325 | ||||||
Moncler SpA* | 20,497 | 1,256,375 | ||||||
| 4,542,996 | ||||||||
| APPAREL RETAIL—0.9% | ||||||||
Burlington Stores, Inc.* | 3,906 | 1,274,645 | ||||||
| APPLICATION SOFTWARE—16.5% | ||||||||
ANSYS, Inc.* | 4,229 | 1,546,376 | ||||||
Avalara, Inc.* | 9,126 | 1,293,245 | ||||||
Bill.com Holdings, Inc.* | 4,392 | 679,135 | ||||||
Cadence Design Systems, Inc.* | 9,858 | 1,298,989 | ||||||
Ceridian HCM Holding, Inc.* | 7,426 | 701,608 | ||||||
Coupa Software, Inc.* | 3,189 | 857,969 | ||||||
Datadog, Inc., Cl. A* | 16,561 | 1,420,437 | ||||||
Digital Turbine, Inc.* | 7,481 | 564,292 | ||||||
DocuSign, Inc., Cl. A* | 12,511 | 2,789,202 | ||||||
Dynatrace, Inc.* | 24,156 | 1,257,078 | ||||||
Fair Isaac Corp.* | 3,198 | 1,667,469 | ||||||
Five9, Inc.* | 11,474 | 2,156,768 | ||||||
Paycom Software, Inc.* | 4,501 | 1,730,229 | ||||||
PTC, Inc.* | 14,940 | 1,956,244 | ||||||
Sprout Social, Inc., Cl. A* | 10,802 | 716,065 | ||||||
The Trade Desk, Inc., Cl. A* | 653 | 476,239 | ||||||
Voyager Digital Ltd.* | 39,674 | 892,665 | ||||||
Zendesk, Inc.* | 3,957 | 578,316 | ||||||
| 22,582,326 | ||||||||
| ASSET MANAGEMENT & CUSTODY BANKS—0.5% | ||||||||
Silver Spike Acquisition Corp., Cl. A* | 41,494 | 726,145 | ||||||
| AUTOMOTIVE RETAIL—0.8% | ||||||||
Carvana Co., Cl. A* | 3,789 | 1,080,850 | ||||||
| BIOTECHNOLOGY—4.5% | ||||||||
DermTech, Inc.* | 10,700 | 449,935 | ||||||
Exact Sciences Corp.* | 4,298 | 566,562 | ||||||
Forte Biosciences, Inc.* | 44,725 | 1,618,598 | ||||||
Invitae Corp.* | 16,244 | 566,916 | ||||||
Moderna, Inc.* | 4,587 | 820,247 | ||||||
Natera, Inc.* | 19,741 | 2,171,905 | ||||||
| 6,194,163 | ||||||||
| BROADCASTING—2.1% | ||||||||
Discovery, Inc., Cl. A* | 74,404 | 2,802,055 | ||||||
| CASINOS & GAMING—3.9% | ||||||||
DraftKings, Inc., Cl. A* | 23,663 | 1,340,745 | ||||||
| COMMON STOCKS—93.8% (CONT.) | SHARES | VALUE | ||||||
| CASINOS & GAMING—3.9% (CONT.) | ||||||||
Flutter Entertainment PLC* | 4,339 | $ | 884,623 | |||||
MGM Resorts International | 51,093 | 2,080,507 | ||||||
Penn National Gaming, Inc.* | 12,175 | 1,085,036 | ||||||
| 5,390,911 | ||||||||
| DATA PROCESSING & OUTSOURCED SERVICES—1.6% | ||||||||
Square, Inc., Cl. A* | 9,090 | 2,225,414 | ||||||
| DIVERSIFIED SUPPORT SERVICES—2.1% | ||||||||
Cintas Corp. | 3,715 | 1,282,195 | ||||||
Copart, Inc.* | 12,487 | 1,554,756 | ||||||
| 2,836,951 | ||||||||
| EDUCATION SERVICES—0.5% | ||||||||
Chegg, Inc.* | 8,011 | 723,634 | ||||||
| ELECTRICAL COMPONENTS & EQUIPMENT—2.1% | ||||||||
AMETEK, Inc. | 12,830 | 1,731,152 | ||||||
Generac Holdings, Inc.* | 3,522 | 1,140,952 | ||||||
| 2,872,104 | ||||||||
| ELECTRONIC EQUIPMENT & INSTRUMENTS—1.0% | ||||||||
Trimble, Inc.* | 17,081 | 1,400,642 | ||||||
| FINANCIAL EXCHANGES & DATA—0.3% | ||||||||
MarketAxess Holdings, Inc. | 935 | 456,710 | ||||||
| FOOD DISTRIBUTORS—1.3% | ||||||||
US Foods Holding Corp.* | 43,416 | 1,800,027 | ||||||
| HEALTHCARE DISTRIBUTORS—0.7% | ||||||||
McKesson Corp. | 4,711 | 883,595 | ||||||
| HEALTHCARE EQUIPMENT—3.1% | ||||||||
ABIOMED, Inc.* | 1,561 | 500,659 | ||||||
CryoPort, Inc.* | 15,749 | 890,921 | ||||||
Dexcom, Inc.* | 1,729 | 667,567 | ||||||
Inari Medical, Inc.* | 6,137 | 701,398 | ||||||
Insulet Corp.* | 5,203 | 1,536,030 | ||||||
| 4,296,575 | ||||||||
| HEALTHCARE FACILITIES—0.8% | ||||||||
The Joint Corp.* | 19,958 | 1,107,270 | ||||||
| HEALTHCARE SERVICES—1.3% | ||||||||
Guardant Health, Inc.* | 11,545 | 1,835,424 | ||||||
| HEALTHCARE SUPPLIES—1.4% | ||||||||
Align Technology, Inc.* | 3,234 | 1,925,944 | ||||||
| HEALTHCARE TECHNOLOGY—2.7% | ||||||||
Inspire Medical Systems, Inc.* | 3,054 | 723,248 | ||||||
Teladoc Health, Inc.* | 3,814 | 657,343 | ||||||
Veeva Systems, Inc., Cl. A* | 8,361 | 2,361,565 | ||||||
| 3,742,156 | ||||||||
| HOMEFURNISHING RETAIL—0.8% | ||||||||
Williams-Sonoma, Inc. | 6,483 | 1,106,972 | ||||||
| HOTELS RESORTS & CRUISE LINES—1.0% | ||||||||
Expedia Group, Inc.* | 7,906 | 1,393,274 | ||||||
| HUMAN RESOURCE & EMPLOYMENT SERVICES—1.2% | ||||||||
Upwork, Inc.* | 35,030 | 1,613,482 | ||||||
| COMMON STOCKS—93.8% (CONT.) | SHARES | VALUE | ||||||
| INDUSTRIAL MACHINERY—0.3% | ||||||||
The Middleby Corp.* | 2,416 | $ | 438,069 | |||||
| INTERACTIVE MEDIA & SERVICES—3.7% | ||||||||
Genius Sports Ltd.* | 118,047 | 2,490,792 | ||||||
Pinterest, Inc., Cl. A* | 31,534 | 2,092,911 | ||||||
TripAdvisor, Inc.* | 11,654 | 549,253 | ||||||
| 5,132,956 | ||||||||
| INTERNET & DIRECT MARKETING RETAIL—3.1% | ||||||||
Etsy, Inc.* | 3,318 | 659,585 | ||||||
Fiverr International Ltd.* | 1,445 | 300,661 | ||||||
Magnite, Inc.* | 34,696 | 1,389,575 | ||||||
Quotient Technology, Inc.* | 67,300 | 1,099,682 | ||||||
The RealReal, Inc.* | 32,859 | 813,918 | ||||||
| 4,263,421 | ||||||||
| INTERNET SERVICES & INFRASTRUCTURE—2.9% | ||||||||
BigCommerce Holdings, Inc.* | 32,722 | 1,961,357 | ||||||
Okta, Inc., Cl. A* | 3,538 | 954,198 | ||||||
Twilio, Inc., Cl. A* | 2,950 | 1,085,010 | ||||||
| 4,000,565 | ||||||||
| LEISURE FACILITIES—0.9% | ||||||||
Vail Resorts, Inc.* | 3,854 | 1,253,167 | ||||||
| LEISURE PRODUCTS—0.5% | ||||||||
Peloton Interactive, Inc., Cl. A* | 6,922 | 680,779 | ||||||
| LIFE SCIENCES TOOLS & SERVICES—3.8% | ||||||||
10X Genomics, Inc., Cl. A* | 7,782 | 1,539,280 | ||||||
Bio-Techne Corp. | 5,480 | 2,342,645 | ||||||
Repligen Corp.* | 6,428 | 1,360,872 | ||||||
| 5,242,797 | ||||||||
| MOVIES & ENTERTAINMENT—1.6% | ||||||||
Roku, Inc., Cl. A* | 6,430 | 2,205,297 | ||||||
| PHARMACEUTICALS—2.0% | ||||||||
Catalent, Inc.* | 8,966 | 1,008,406 | ||||||
Green Thumb Industries, Inc.* | 55,457 | 1,762,244 | ||||||
| 2,770,650 | ||||||||
| REGIONAL BANKS—1.6% | ||||||||
Signature Bank | 3,789 | 952,971 | ||||||
Silvergate Capital Corp., Cl. A* | 5,545 | 594,535 | ||||||
SVB Financial Group* | 1,013 | 579,264 | ||||||
| 2,126,770 | ||||||||
| RESEARCH & CONSULTING SERVICES—1.3% | ||||||||
CoStar Group, Inc.* | 2,052 | 1,753,290 | ||||||
| RESTAURANTS—3.3% | ||||||||
Chipotle Mexican Grill, Inc., Cl. A* | 915 | 1,365,207 | ||||||
Shake Shack, Inc., Cl. A* | 18,291 | 1,989,146 | ||||||
The Cheesecake Factory, Inc.* | 18,745 | 1,173,250 | ||||||
| 4,527,603 | ||||||||
| SEMICONDUCTOR EQUIPMENT—6.0% | ||||||||
Enphase Energy, Inc.* | 8,492 | 1,182,511 | ||||||
KLA Corp. | 6,247 | 1,969,991 | ||||||
| COMMON STOCKS—93.8% (CONT.) | SHARES | VALUE | ||||||
| SEMICONDUCTOR EQUIPMENT—6.0% (CONT.) | ||||||||
Lam Research Corp. | 3,282 | $ | 2,036,317 | |||||
MKS Instruments, Inc. | 5,524 | 989,404 | ||||||
SolarEdge Technologies, Inc.* | 7,866 | 2,073,006 | ||||||
| 8,251,229 | ||||||||
| SEMICONDUCTORS—2.1% | ||||||||
Advanced Micro Devices, Inc.* | 11,735 | 957,811 | ||||||
Microchip Technology, Inc. | 7,959 | 1,196,158 | ||||||
Universal Display Corp. | 3,117 | 697,242 | ||||||
| 2,851,211 | ||||||||
| SYSTEMS SOFTWARE—1.3% | ||||||||
Crowdstrike Holdings, Inc., Cl. A* | 8,271 | 1,724,586 | ||||||
| TRUCKING—1.6% | ||||||||
Lyft, Inc., Cl. A* | 10,173 | 566,229 | ||||||
Old Dominion Freight Line, Inc. | 4,038 | 1,041,037 | ||||||
Uber Technologies, Inc.* | 9,686 | 530,502 | ||||||
| 2,137,768 | ||||||||
| TOTAL COMMON STOCKS | ||||||||
| (Cost $99,494,338) | 128,895,119 | |||||||
| PREFERRED STOCKS—0.0% | SHARES | VALUE | ||||||
| BIOTECHNOLOGY—0.0% | ||||||||
| Prosetta Biosciences, Inc., Series D*,@,(a),(b) | 166,009 | 24,901 | ||||||
| (Cost $747,040) | 24,901 | |||||||
| WARRANTS—1.8% | SHARES | VALUE | ||||||
| BIOTECHNOLOGY—1.8% | ||||||||
| Forte Biosciences, Inc., 6/30/21*,@ | 95,530 | 2,448,052 | ||||||
| (Cost $0) | 2,448,052 | |||||||
| RIGHTS—0.3% | SHARES | VALUE | ||||||
| BIOTECHNOLOGY—0.3% | ||||||||
| Tolero CDR*,@,(b),(c) | 422,928 | 352,468 | ||||||
| (Cost $226,186) | 352,468 | |||||||
| REAL ESTATE INVESTMENT TRUST—3.3% | SHARES | VALUE | ||||||
| RETAIL—2.1% | ||||||||
Simon Property Group, Inc. | 10,383 | 1,264,026 | ||||||
Tanger Factory Outlet Centers, Inc. | 93,342 | 1,628,818 | ||||||
| 2,892,844 | ||||||||
| SPECIALIZED—1.2% | ||||||||
Crown Castle International Corp. | 9,176 | 1,734,815 | ||||||
| TOTAL REAL ESTATE INVESTMENT TRUST | ||||||||
| (Cost $3,439,517) | 4,627,659 | |||||||
| SPECIAL PURPOSE VEHICLE—0.6% | SHARES | VALUE | ||||||
| DATA PROCESSING & OUTSOURCED SERVICES—0.6% | ||||||||
| Crosslink Ventures Capital LLC, Cl. A*,@,(a),(b) | 22 | 550,000 | ||||||
| Crosslink Ventures Capital LLC, Cl. B*,@,(a),(b) | 9 | 225,000 | ||||||
| 775,000 | ||||||||
| TOTAL SPECIAL PURPOSE VEHICLE | ||||||||
| (Cost $775,000) | 775,000 | |||||||
| SHARES | VALUE | |||||||
| Total Investments | ||||||||
| (Cost $104,682,081) | 99.8 | % | $ | 137,123,199 | ||||
| Affiliated Securities (Cost $1,522,040) | 799,901 | |||||||
| Unaffiliated Securities (Cost $103,160,041) | 136,323,298 | |||||||
Other Assets in Excess of Liabilities | 0.2 | % | 230,619 | |||||
| NET ASSETS | 100.0 | % | $ | 137,353,818 | ||||
Security | Acquisition Date(s) | Acquisition Cost | % of net assets (Acquisition Date) | Market Value | % of net assets as of 4/30/2021 | ||||||||||||
| Crosslink Ventures Capital LLC, Cl. A | 10/2/20 | $ | 550,000 | 0.50 | % | $ | 550,000 | 0.40 | % | ||||||||
| Crosslink Ventures Capital LLC, Cl. B | 12/16/20 | 225,000 | 0.19 | % | 225,000 | 0.16 | % | ||||||||||
| Forte Biosciences, Inc., Warrants | 2/19/20 | 0 | 0.00 | % | 2,448,052 | 1.78 | % | ||||||||||
| Prosetta Biosciences, Inc., Series D | 2/6/15 | 747,040 | 0.50 | % | 24,901 | 0.02 | % | ||||||||||
| Tolero CDR | 2/6/17 | 226,186 | 0.23 | % | 352,468 | 0.26 | % | ||||||||||
| Total | $ | 3,600,421 | 2.62 | % | |||||||||||||
| COMMON STOCKS—96.6% | SHARES | VALUE | ||||||
| ADVERTISING—0.8% | ||||||||
Cardlytics, Inc.* | 23,076 | $ | 3,173,642 | |||||
| AEROSPACE & DEFENSE—1.8% | ||||||||
HEICO Corp. | 22,108 | 3,112,806 | ||||||
Hexcel Corp.* | 14,484 | 817,043 | ||||||
Mercury Systems, Inc.* | 39,079 | 2,940,304 | ||||||
| 6,870,153 | ||||||||
| AGRICULTURAL & FARM MACHINERY—0.9% | ||||||||
Hydrofarm Holdings Group, Inc.* | 53,309 | 3,502,401 | ||||||
| ALTERNATIVE CARRIERS—1.7% | ||||||||
Bandwidth, Inc., Cl. A* | 47,138 | 6,231,644 | ||||||
| APPAREL ACCESSORIES & LUXURY GOODS—0.8% | ||||||||
Capri Holdings Ltd.* | 55,913 | 3,079,688 | ||||||
| APPLICATION SOFTWARE—20.3% | ||||||||
ACI Worldwide, Inc.* | 202,474 | 7,649,468 | ||||||
Avalara, Inc.* | 44,164 | 6,258,481 | ||||||
Benefitfocus, Inc.* | 67,429 | 911,640 | ||||||
Bill.com Holdings, Inc.* | 31,925 | 4,936,563 | ||||||
Blackbaud, Inc.* | 40,144 | 2,855,041 | ||||||
Blackline, Inc.* | 39,681 | 4,605,377 | ||||||
Digital Turbine, Inc.* | 20,820 | 1,570,453 | ||||||
Everbridge, Inc.* | 41,328 | 5,484,639 | ||||||
Guidewire Software, Inc.* | 22,593 | 2,383,787 | ||||||
HubSpot, Inc.* | 14,052 | 7,397,675 | ||||||
Manhattan Associates, Inc.* | 36,068 | 4,949,972 | ||||||
Medallia, Inc.* | 45,923 | 1,354,269 | ||||||
Paycom Software, Inc.* | 13,714 | 5,271,799 | ||||||
Q2 Holdings, Inc.* | 64,415 | 6,700,448 | ||||||
SEMrush Holdings, Inc., Cl. A* | 55,354 | 910,573 | ||||||
Smartsheet, Inc., Cl. A* | 47,654 | 2,825,882 | ||||||
Sprout Social, Inc., Cl. A* | 35,212 | 2,334,204 | ||||||
SPS Commerce, Inc.* | 42,902 | 4,394,881 | ||||||
Vertex, Inc., Cl. A* | 109,304 | 2,233,081 | ||||||
Viant Technology, Inc., Cl. A* | 29,805 | 978,796 | ||||||
| 76,007,029 | ||||||||
| ASSET MANAGEMENT & CUSTODY BANKS—1.3% | ||||||||
Affiliated Managers Group, Inc. | 29,079 | 4,686,662 | ||||||
| BIOTECHNOLOGY—3.8% | ||||||||
CareDx, Inc.* | 142,958 | 11,303,689 | ||||||
Forte Biosciences, Inc.* | 35,696 | 1,291,838 | ||||||
Karuna Therapeutics, Inc.* | 7,889 | 875,758 | ||||||
Turning Point Therapeutics, Inc.* | 9,812 | 747,969 | ||||||
| 14,219,254 | ||||||||
| CASINOS & GAMING—2.8% | ||||||||
DraftKings, Inc., Cl. A* | 80,481 | 4,560,053 | ||||||
Penn National Gaming, Inc.* | 65,513 | 5,838,519 | ||||||
| 10,398,572 | ||||||||
| DIVERSIFIED SUPPORT SERVICES—0.4% | ||||||||
IAA, Inc.* | 24,663 | 1,549,083 | ||||||
| COMMON STOCKS—96.6% (CONT.) | SHARES | VALUE | ||||||
| ELECTRICAL COMPONENTS & EQUIPMENT—0.9% | ||||||||
Sunrun, Inc.* | 65,956 | $ | 3,231,844 | |||||
| ELECTRONIC EQUIPMENT & INSTRUMENTS—1.3% | ||||||||
Cognex Corp. | 55,477 | 4,777,679 | ||||||
| FOOD DISTRIBUTORS—1.9% | ||||||||
The Chefs' Warehouse, Inc.* | 61,410 | 1,979,244 | ||||||
US Foods Holding Corp.* | 126,278 | 5,235,486 | ||||||
| 7,214,730 | ||||||||
| HEALTHCARE DISTRIBUTORS—0.4% | ||||||||
PetIQ, Inc., Cl. A* | 34,205 | 1,457,133 | ||||||
| HEALTHCARE EQUIPMENT—9.4% | ||||||||
Cantel Medical Corp.* | 74,202 | 6,523,098 | ||||||
CryoPort, Inc.* | 68,144 | 3,854,906 | ||||||
Inmode Ltd.* | 49,446 | 4,268,673 | ||||||
Inogen, Inc.* | 65,764 | 4,300,308 | ||||||
Insulet Corp.* | 25,575 | 7,550,252 | ||||||
Mesa Laboratories, Inc. | 12,633 | 3,141,195 | ||||||
Tandem Diabetes Care, Inc.* | 61,196 | 5,623,912 | ||||||
| 35,262,344 | ||||||||
| HEALTHCARE FACILITIES—1.2% | ||||||||
The Joint Corp.* | 81,470 | 4,519,956 | ||||||
| HEALTHCARE SERVICES—2.2% | ||||||||
1Life Healthcare, Inc.* | 43,118 | 1,876,064 | ||||||
Biodesix, Inc.* | 39,526 | 646,645 | ||||||
Guardant Health, Inc.* | 32,574 | 5,178,615 | ||||||
Progenity, Inc.* | 140,074 | 442,634 | ||||||
| 8,143,958 | ||||||||
| HEALTHCARE SUPPLIES—4.1% | ||||||||
Neogen Corp.* | 113,698 | 10,916,145 | ||||||
Quidel Corp.* | 42,856 | 4,490,880 | ||||||
| 15,407,025 | ||||||||
| HEALTHCARE TECHNOLOGY—4.0% | ||||||||
Privia Health Group, Inc.* | 26,621 | 966,875 | ||||||
Veeva Systems, Inc., Cl. A* | 27,682 | 7,818,781 | ||||||
Vocera Communications, Inc.* | 171,671 | 6,209,340 | ||||||
| 14,994,996 | ||||||||
| HOMEFURNISHING RETAIL—0.5% | ||||||||
Bed Bath & Beyond, Inc.* | 74,371 | 1,883,074 | ||||||
| HUMAN RESOURCE & EMPLOYMENT SERVICES—0.7% | ||||||||
Upwork, Inc.* | 60,877 | 2,803,995 | ||||||
| HYPERMARKETS & SUPER CENTERS—0.9% | ||||||||
BJ's Wholesale Club Holdings, Inc.* | 73,502 | 3,283,334 | ||||||
| INTERACTIVE HOME ENTERTAINMENT—0.3% | ||||||||
Take-Two Interactive Software, Inc.* | 6,964 | 1,221,346 | ||||||
| INTERACTIVE MEDIA & SERVICES—3.2% | ||||||||
Bumble, Inc., Cl. A* | 10,659 | 642,098 | ||||||
Eventbrite, Inc., Cl. A* | 75,413 | 1,777,484 | ||||||
Genius Sports Ltd.* | 304,896 | 6,433,306 | ||||||
THE ALGER INSTITUTIONAL FUNDS
ALGER SMALL CAP GROWTH INSTITUTIONAL FUND
Schedule of Investments April 30, 2021 (Unaudited) (Continued)
| COMMON STOCKS—96.6% (CONT.) | SHARES | VALUE | ||||||
| INTERACTIVE MEDIA & SERVICES—3.2% (CONT.) | ||||||||
TripAdvisor, Inc.* | 70,404 | $ | 3,318,141 | |||||
| 12,171,029 | ||||||||
| INTERNET & DIRECT MARKETING RETAIL—6.4% | ||||||||
Farfetch Ltd., Cl. A* | 75,456 | 3,696,590 | ||||||
Fiverr International Ltd.* | 20,262 | 4,215,914 | ||||||
Magnite, Inc.* | 255,225 | 10,221,761 | ||||||
Quotient Technology, Inc.* | 211,357 | 3,453,573 | ||||||
The RealReal, Inc.* | 98,283 | 2,434,470 | ||||||
| 24,022,308 | ||||||||
| INTERNET SERVICES & INFRASTRUCTURE—1.2% | ||||||||
BigCommerce Holdings, Inc.* | 76,858 | 4,606,869 | ||||||
| LEISURE FACILITIES—0.7% | ||||||||
Planet Fitness, Inc., Cl. A* | 30,731 | 2,581,097 | ||||||
| LIFE SCIENCES TOOLS & SERVICES—10.2% | ||||||||
10X Genomics, Inc., Cl. A* | 19,661 | 3,888,946 | ||||||
Akoya Biosciences, Inc.* | 76,947 | 1,726,691 | ||||||
Bio-Techne Corp. | 20,776 | 8,881,532 | ||||||
Maravai LifeSciences Holdings, Inc., Cl. A* | 24,410 | 949,793 | ||||||
NanoString Technologies, Inc.* | 118,917 | 9,474,117 | ||||||
NeoGenomics, Inc.* | 83,007 | 4,066,513 | ||||||
Personalis, Inc.* | 41,237 | 1,016,080 | ||||||
PRA Health Sciences, Inc.* | 25,052 | 4,180,928 | ||||||
Repligen Corp.* | 18,568 | 3,931,031 | ||||||
| 38,115,631 | ||||||||
| MANAGED HEALTHCARE—1.2% | ||||||||
HealthEquity, Inc.* | 58,937 | 4,477,444 | ||||||
| MOVIES & ENTERTAINMENT—0.6% | ||||||||
Live Nation Entertainment, Inc.* | 26,506 | 2,170,311 | ||||||
| OIL & GAS EXPLORATION & PRODUCTION—1.1% | ||||||||
Magnolia Oil & Gas Corp., Cl. A* | 377,791 | 4,253,927 | ||||||
| PHARMACEUTICALS—0.2% | ||||||||
Aerie Pharmaceuticals, Inc.* | 32,450 | 555,868 | ||||||
| REAL ESTATE SERVICES—0.1% | ||||||||
Compass, Inc., Cl. A* | 14,729 | 280,146 | ||||||
| REGIONAL BANKS—0.5% | ||||||||
Webster Financial Corp. | 36,852 | 1,949,839 | ||||||
| RESTAURANTS—3.1% | ||||||||
Shake Shack, Inc., Cl. A* | 67,989 | 7,393,804 | ||||||
Wingstop, Inc. | 27,385 | 4,338,058 | ||||||
| 11,731,862 | ||||||||
| SEMICONDUCTOR EQUIPMENT—0.5% | ||||||||
SolarEdge Technologies, Inc.* | 7,100 | 1,871,134 | ||||||
| SEMICONDUCTORS—0.9% | ||||||||
Universal Display Corp. | 15,358 | 3,435,431 | ||||||
| SPECIALTY CHEMICALS—2.1% | ||||||||
Balchem Corp. | 60,415 | 7,684,184 | ||||||
| SPECIALTY STORES—0.7% | ||||||||
Five Below, Inc.* | 13,404 | 2,697,823 | ||||||
| COMMON STOCKS—96.6% (CONT.) | SHARES | VALUE | ||||||
| SYSTEMS SOFTWARE—1.5% | ||||||||
Proofpoint, Inc.* | 32,296 | $ | 5,558,465 | |||||
| TOTAL COMMON STOCKS | ||||||||
| (Cost $214,540,706) | 362,082,910 | |||||||
| PREFERRED STOCKS—0.0% | SHARES | VALUE | ||||||
| BIOTECHNOLOGY—0.0% | ||||||||
| Prosetta Biosciences, Inc., Series D*,@,(a),(b) | 133,263 | 19,989 | ||||||
| (Cost $599,684) | 19,989 | |||||||
| RIGHTS—0.1% | SHARES | VALUE | ||||||
| BIOTECHNOLOGY—0.1% | ||||||||
| Tolero CDR*,@,(b),(c) | 528,559 | 440,501 | ||||||
| (Cost $285,725) | 440,501 | |||||||
| REAL ESTATE INVESTMENT TRUST—1.1% | SHARES | VALUE | ||||||
| RETAIL—1.1% | ||||||||
Tanger Factory Outlet Centers, Inc. | 226,053 | 3,944,625 | ||||||
| (Cost $3,747,681) | 3,944,625 | |||||||
| SPECIAL PURPOSE VEHICLE—0.4% | SHARES | VALUE | ||||||
| DATA PROCESSING & OUTSOURCED SERVICES—0.4% | ||||||||
| Crosslink Ventures Capital LLC, Cl. A*,@,(a),(b) | 51 | 1,275,000 | ||||||
| Crosslink Ventures Capital LLC, Cl. B*,@,(a),(b) | 13 | 325,000 | ||||||
| 1,600,000 | ||||||||
| TOTAL SPECIAL PURPOSE VEHICLE | ||||||||
| (Cost $1,600,000) | 1,600,000 | |||||||
| Total Investments | ||||||||
| (Cost $220,773,796) | 98.2 | % | $ | 368,088,025 | ||||
| Affiliated Securities (Cost $2,199,684) | 1,619,989 | |||||||
| Unaffiliated Securities (Cost $218,574,112) | 366,468,036 | |||||||
Other Assets in Excess of Liabilities | 1.8 | % | 6,799,374 | |||||
| NET ASSETS | 100.0 | % | $ | 374,887,399 | ||||
Security | Acquisition Date(s) | Acquisition Cost | % of net assets (Acquisition Date) | Market Value | % of net assets as of 4/30/2021 | ||||||||||||
| Crosslink Ventures Capital LLC, Cl. A | 10/2/20 | $ | 1,275,000 | 0.49 | % | $ | 1,275,000 | 0.34 | % | ||||||||
| Crosslink Ventures Capital LLC, Cl. B | 12/16/20 | 325,000 | 0.11 | % | 325,000 | 0.09 | % | ||||||||||
| Prosetta Biosciences, Inc., Series D | 2/6/15 | 599,684 | 0.10 | % | 19,989 | 0.00 | % | ||||||||||
| Tolero CDR | 2/6/17 | 285,725 | 0.16 | % | 440,501 | 0.12 | % | ||||||||||
| Total | $ | 2,060,490 | 0.55 | % | |||||||||||||
Alger Capital Appreciation Institutional Fund | Alger Focus Equity Fund | |||||||
| ASSETS: | ||||||||
| Investments in unaffiliated securities, at value (Identified cost below)* see accompanying schedules of investments | $ | 4,005,273,580 | $ | 1,384,410,927 | ||||
| Investments in affiliated securities, at value (Identified cost below)** see accompanying schedules of investments | 3,075,000 | 11,524 | ||||||
| Cash and cash equivalents | — | 31,086,534 | ||||||
| Receivable for investment securities sold | 32,987,043 | 8,127,943 | ||||||
| Receivable for shares of beneficial interest sold | 1,982,853 | 1,956,555 | ||||||
| Dividends and interest receivable | 889,396 | 63,769 | ||||||
| Receivable from Investment Manager | 16,388 | — | ||||||
| Security litigation receivable | 10,476 | 2,946 | ||||||
| Prepaid expenses | 193,258 | 77,052 | ||||||
| Total Assets | 4,044,427,994 | 1,425,737,250 | ||||||
| LIABILITIES: | ||||||||
| Payable for investment securities purchased | 23,069,887 | 19,883,797 | ||||||
| Payable for shares of beneficial interest redeemed | 6,740,512 | 542,137 | ||||||
| Bank overdraft | 72,964 | — | ||||||
| Payable for interfund loans | 3,146,000 | — | ||||||
| Due to investment advisor | — | 15,982 | ||||||
| Accrued investment advisory fees | 2,356,621 | 590,904 | ||||||
| Accrued distribution fees | 227,527 | 74,940 | ||||||
| Accrued shareholder servicing fees | 575,107 | 13,959 | ||||||
| Accrued shareholder administrative fees | 32,857 | 12,251 | ||||||
| Accrued administrative fees | 90,358 | 31,250 | ||||||
| Accrued custodian fees | 20,673 | 9,740 | ||||||
| Accrued transfer agent fees | 1,017,595 | 73,802 | ||||||
| Accrued printing fees | 26,774 | 12,961 | ||||||
| Accrued professional fees | 30,676 | 26,889 | ||||||
| Accrued trustee fees | 8,010 | 2,588 | ||||||
| Accrued fund accounting fees | 95,597 | 36,074 | ||||||
| Accrued other expenses | 5,521 | 2,539 | ||||||
| Total Liabilities | 37,516,679 | 21,329,813 | ||||||
| NET ASSETS | $ | 4,006,911,315 | $ | 1,404,407,437 | ||||
| NET ASSETS CONSIST OF: | ||||||||
| Paid in capital (par value of $.001 per share) | 1,730,514,059 | 869,985,602 | ||||||
| Distributable earnings | 2,276,397,256 | 534,421,835 | ||||||
| NET ASSETS | $ | 4,006,911,315 | $ | 1,404,407,437 | ||||
* Identified cost | $ | 2,126,721,938(a | ) | $ | 952,379,470(b | ) | ||
** Identified cost | $ | 3,075,000(a | ) | $ | 345,713(b | ) | ||
Alger Capital Appreciation Institutional Fund | Alger Focus Equity Fund | |||||||
| NET ASSETS BY CLASS: | ||||||||
| Class A | $ | — | $ | 100,844,844 | ||||
| Class C | $ | — | $ | 67,011,164 | ||||
| Class I | $ | 2,244,464,331 | $ | 69,085,725 | ||||
| Class R | $ | 550,748,877 | $ | — | ||||
| Class Y | $ | 617,911,190 | $ | 179,333,834 | ||||
| Class Z | $ | — | $ | 988,131,870 | ||||
| Class Z-2 | $ | 593,786,917 | $ | — | ||||
SHARES OF BENEFICIAL INTEREST OUTSTANDING — NOTE 6: | ||||||||
| Class A | — | 1,710,319 | ||||||
| Class C | — | 1,221,253 | ||||||
| Class I | 49,956,260 | 1,164,205 | ||||||
| Class R | 14,697,150 | — | ||||||
| Class Y | 13,454,757 | 2,953,718 | ||||||
| Class Z | — | 16,310,283 | ||||||
| Class Z-2 | 12,960,522 | — | ||||||
| NET ASSET VALUE PER SHARE: | ||||||||
| Class A — Net Asset Value Per Share Class A | $ | — | $ | 58.96 | ||||
| Class A — Offering Price Per Share (includes a 5.25% sales charge) | $ | — | $ | 62.23 | ||||
| Class C — Net Asset Value Per Share Class C | $ | — | $ | 54.87 | ||||
| Class I — Net Asset Value Per Share Class I | $ | 44.93 | $ | 59.34 | ||||
| Class R — Net Asset Value Per Share Class R | $ | 37.47 | $ | — | ||||
| Class Y — Net Asset Value Per Share Class Y | $ | 45.93 | $ | 60.71 | ||||
| Class Z — Net Asset Value Per Share Class Z | $ | — | $ | 60.58 | ||||
| Class Z-2 — Net Asset Value Per Share Class Z-2 | $ | 45.82 | $ | — | ||||
| (a) | At April 30, 2021, the net unrealized appreciation on investments, based on cost for federal income tax purposes of $2,162,593,539, amounted to $1,845,755,041 which consisted of aggregate gross unrealized appreciation of $1,887,364,078 and aggregate gross unrealized depreciation of $41,609,037. |
| (b) | At April 30, 2021, the net unrealized appreciation on investments, based on cost for federal income tax purposes of $965,519,521, amounted to $418,902,930 which consisted of aggregate gross unrealized appreciation of $433,396,478 and aggregate gross unrealized depreciation of $14,493,548. |
Alger Mid Cap Growth Institutional Fund | Alger Small Cap Growth Institutional Fund | |||||||
| ASSETS: | ||||||||
| Investments in unaffiliated securities, at value (Identified cost below)* see accompanying schedules of investments | $ | 136,323,298 | $ | 366,468,036 | ||||
| Investments in affiliated securities, at value (Identified cost below)** see accompanying schedules of investments | 799,901 | 1,619,989 | ||||||
| Cash and cash equivalents | 325,833 | 6,245,094 | ||||||
| Receivable for investment securities sold | 1,418,012 | — | ||||||
| Receivable for shares of beneficial interest sold | 86,423 | 2,356,262 | ||||||
| Dividends and interest receivable | 23,562 | 40,125 | ||||||
| Security litigation receivable | 1,855 | 109 | ||||||
| Prepaid expenses | 50,215 | 38,967 | ||||||
| Total Assets | 139,029,099 | 376,768,582 | ||||||
| LIABILITIES: | ||||||||
| Payable for investment securities purchased | 1,262,078 | 868,948 | ||||||
| Payable for shares of beneficial interest redeemed | 197,363 | 571,491 | ||||||
| Due to investment advisor | 545 | 1,055 | ||||||
| Accrued investment advisory fees | 86,256 | 244,823 | ||||||
| Accrued distribution fees | 2,925 | 4,468 | ||||||
| Accrued shareholder servicing fees | 23,835 | 39,569 | ||||||
| Accrued shareholder administrative fees | 1,135 | 3,023 | ||||||
| Accrued administrative fees | 3,121 | 8,312 | ||||||
| Accrued custodian fees | 2,973 | 3,258 | ||||||
| Accrued transfer agent fees | 33,526 | 64,198 | ||||||
| Accrued printing fees | 4,777 | 12,610 | ||||||
| Accrued professional fees | 42,055 | 39,800 | ||||||
| Accrued trustee fees | 290 | 743 | ||||||
| Accrued fund accounting fees | 11,259 | 15,683 | ||||||
| Accrued other expenses | 3,143 | 3,202 | ||||||
| Total Liabilities | 1,675,281 | 1,881,183 | ||||||
| NET ASSETS | $ | 137,353,818 | $ | 374,887,399 | ||||
| NET ASSETS CONSIST OF: | ||||||||
| Paid in capital (par value of $.001 per share) | 77,809,025 | 185,055,741 | ||||||
| Distributable earnings | 59,544,793 | 189,831,658 | ||||||
| NET ASSETS | $ | 137,353,818 | $ | 374,887,399 | ||||
* Identified cost | $ | 103,160,041(a | ) | $ | 218,574,112(b | ) | ||
** Identified cost | $ | 1,522,040(a | ) | $ | 2,199,684(b | ) | ||
Alger Mid CapGrowth Institutional Fund | Alger Small Cap Growth Institutional Fund | |||||||
| NET ASSETS BY CLASS: | ||||||||
| Class I | $ | 107,996,761 | $ | 183,986,395 | ||||
| Class R | $ | 7,177,380 | $ | 10,815,996 | ||||
| Class Z-2 | $ | 22,179,677 | $ | 180,085,008 | ||||
SHARES OF BENEFICIAL INTEREST OUTSTANDING — NOTE 6: | ||||||||
| Class I | 2,310,584 | 5,844,019 | ||||||
| Class R | 175,361 | 452,649 | ||||||
| Class Z-2 | 467,093 | 5,634,967 | ||||||
| NET ASSET VALUE PER SHARE: | ||||||||
| Class I — Net Asset Value Per Share Class I | $ | 46.74 | $ | 31.48 | ||||
| Class R — Net Asset Value Per Share Class R | $ | 40.93 | $ | 23.89 | ||||
| Class Z-2 — Net Asset Value Per Share Class Z-2 | $ | 47.48 | $ | 31.96 | ||||
See Notes to Financial Statements.
| (a) | At April 30, 2021, the net unrealized appreciation on investments, based on cost for federal income tax purposes of $106,428,804, amounted to $30,694,395 which consisted of aggregate gross unrealized appreciation of $35,764,384 and aggregate gross unrealized depreciation of $5,069,989. |
| (b) | At April 30, 2021, the net unrealized appreciation on investments, based on cost for federal income tax purposes of $223,464,853, amounted to $144,623,172 which consisted of aggregate gross unrealized appreciation of $152,047,999 and aggregate gross unrealized depreciation of $7,424,827. |
Alger Capital Appreciation Institutional Fund | Alger Focus Equity Fund | |||||||
| INCOME: | ||||||||
| Dividends (net of foreign withholding taxes*) | $ | 11,221,365 | $ | 3,465,272 | ||||
| Interest | 141 | 346 | ||||||
| Total Income | 11,221,506 | 3,465,618 | ||||||
| EXPENSES: | ||||||||
| Investment advisory fees — Note 3(a) | 14,140,638 | 3,292,966 | ||||||
| Distribution fees — Note 3(c) | ||||||||
| Class A | — | 120,583 | ||||||
| Class C | — | 315,354 | ||||||
| Class R | 1,371,058 | — | ||||||
| Shareholder servicing fees — Note 3(k) | 3,495,273 | 87,919 | ||||||
| Shareholder administrative fees — Note 3(f) | 196,958 | 68,511 | ||||||
| Administration fees — Note 3(b) | 541,633 | 174,147 | ||||||
| Custodian fees | 71,466 | 35,342 | ||||||
| Interest expenses | 26,243 | 1,789 | ||||||
| Transfer agent fees — Note 3(f) | 1,009,373 | 100,598 | ||||||
| Printing fees | 45,526 | 30,147 | ||||||
| Professional fees | 71,865 | 33,720 | ||||||
| Registration fees | 38,542 | 32,546 | ||||||
| Trustee fees — Note 3(g) | 48,121 | 15,455 | ||||||
| Fund accounting fees | 270,886 | 101,861 | ||||||
| Other expenses | 104,058 | 27,215 | ||||||
| Total Expenses | 21,431,640 | 4,438,153 | ||||||
| Less, expense reimbursements/waivers — Note 3(a) | (147,112 | ) | (18,692 | ) | ||||
| Net Expenses | 21,284,528 | 4,419,461 | ||||||
| NET INVESTMENT LOSS | (10,063,022 | ) | (953,843 | ) | ||||
REALIZED AND UNREALIZED GAIN (LOSS) ON INVESTMENTS AND FOREIGN CURRENCY: | ||||||||
| Net realized gain on unaffiliated investments | 455,760,636 | 116,791,684 | ||||||
| Net realized (loss) on foreign currency transactions | (14,985 | ) | (3,840 | ) | ||||
| Net change in unrealized appreciation on unaffiliated investments | 312,708,782 | 144,935,985 | ||||||
| Net change in unrealized appreciation on foreign currency | 3,494 | — | ||||||
| Net realized and unrealized gain on investments and foreign currency | 768,457,927 | 261,723,829 | ||||||
| NET INCREASE IN NET ASSETS RESULTING FROM OPERATIONS | $ | 758,394,905 | $ | 260,769,986 | ||||
| * Foreign withholding taxes | $ | 210,930 | $ | 41,073 | ||||
Alger Mid Cap Growth Institutional Fund | Alger Small Cap Growth Institutional Fund | |||||||
| INCOME: | ||||||||
| Dividends | $ | 255,441 | $ | 538,346 | ||||
| Interest | 150 | 1,124 | ||||||
| Total Income | 255,591 | 539,470 | ||||||
| EXPENSES: | ||||||||
| Investment advisory fees — Note 3(a) | 506,982 | 1,397,755 | ||||||
| Distribution fees — Note 3(c) | ||||||||
| Class R | 17,495 | 27,802 | ||||||
| Shareholder servicing fees — Note 3(k) | 140,333 | 251,077 | ||||||
| Shareholder administrative fees — Note 3(f) | 6,671 | 17,256 | ||||||
| Administration fees — Note 3(b) | 18,345 | 47,455 | ||||||
| Custodian fees | 15,151 | 14,374 | ||||||
| Interest expenses | 442 | — | ||||||
| Transfer agent fees — Note 3(f) | 31,560 | 68,792 | ||||||
| Printing fees | 2,185 | 11,685 | ||||||
| Professional fees | 24,616 | �� | 24,435 | |||||
| Registration fees | 16,989 | 27,571 | ||||||
| Trustee fees — Note 3(g) | 1,709 | 4,352 | ||||||
| Fund accounting fees | 29,115 | 40,392 | ||||||
| Other expenses | 7,191 | 10,534 | ||||||
| Total Expenses | 818,784 | 1,943,480 | ||||||
| NET INVESTMENT LOSS | (563,193 | ) | (1,404,010 | ) | ||||
REALIZED AND UNREALIZED GAIN (LOSS) ON INVESTMENTS AND FOREIGN CURRENCY: | ||||||||
| Net realized gain on unaffiliated investments | 29,417,851 | 47,917,083 | ||||||
| Net realized (loss) on foreign currency transactions | (1,897 | ) | — | |||||
| Net change in unrealized appreciation on unaffiliated investments | 3,477,309 | 30,082,279 | ||||||
| Net change in unrealized appreciation on foreign currency | 28 | — | ||||||
| Net realized and unrealized gain on investments and foreign currency | 32,893,291 | 77,999,362 | ||||||
| NET INCREASE IN NET ASSETS RESULTING FROM OPERATIONS | $ | 32,330,098 | $ | 76,595,352 | ||||
See Notes to Financial Statements.
| Alger Capital Appreciation Institutional Fund | ||||||||
For the Six Months Ended April 30, 2021 | For the Year Ended October 31, 2020 | |||||||
Net investment loss | $ | (10,063,022 | ) | $ | (12,016,635 | ) | ||
Net realized gain on investments and foreign currency | 455,745,651 | 590,378,334 | ||||||
| Net change in unrealized appreciation on investments and foreign currency | 312,712,276 | 461,624,956 | ||||||
Net increase in net assets resulting from operations | 758,394,905 | 1,039,986,655 | ||||||
Dividends and distributions to shareholders: | ||||||||
| Class I | (334,101,515 | ) | (200,011,978 | ) | ||||
| Class R | (93,628,884 | ) | (58,241,889 | ) | ||||
| Class Y | (77,891,544 | ) | (34,356,897 | ) | ||||
| Class Z-2 | (83,783,950 | ) | (45,806,329 | ) | ||||
Total dividends and distributions to shareholders | (589,405,893 | ) | (338,417,093 | ) | ||||
Increase (decrease) from shares of beneficial interest transactions: | ||||||||
| Class I | 40,452,848 | (341,194,835 | ) | |||||
| Class R | 18,713,493 | (98,309,581 | ) | |||||
| Class Y | 103,658,650 | 54,422,986 | ||||||
| Class Z-2 | 25,876,335 | (22,794,851 | ) | |||||
| Net increase (decrease) from shares of beneficial interest transactions — Note 6 | 188,701,326 | (407,876,281 | ) | |||||
Total increase | 357,690,338 | 293,693,281 | ||||||
Net Assets: | ||||||||
| Beginning of period | 3,649,220,977 | 3,355,527,696 | ||||||
| END OF PERIOD | $ | 4,006,911,315 | $ | 3,649,220,977 | ||||
See Notes to Financial Statements.
| Alger Focus Equity Fund | ||||||||
For the Six Months Ended April 30, 2021 | For the Year Ended October 31, 2020 | |||||||
Net investment income (loss) | $ | (953,843 | ) | $ | 228,836 | |||
Net realized gain on investments and foreign currency | 116,787,844 | 68,638,861 | ||||||
| Net change in unrealized appreciation on investments and foreign currency | 144,935,985 | 205,055,742 | ||||||
Net increase in net assets resulting from operations | 260,769,986 | 273,923,439 | ||||||
Dividends and distributions to shareholders: | ||||||||
| Class A | (5,562,411 | ) | (1,113,560 | ) | ||||
| Class C | (4,078,168 | ) | (803,917 | ) | ||||
| Class I | (4,326,615 | ) | (1,526,332 | ) | ||||
| Class Y | (8,557,155 | ) | (1,574,517 | ) | ||||
| Class Z | (50,310,167 | ) | (8,371,220 | ) | ||||
Total dividends and distributions to shareholders | (72,834,516 | ) | (13,389,546 | ) | ||||
Increase (decrease) from shares of beneficial interest transactions: | ||||||||
| Class A | (2,674,390 | ) | 13,845,608 | |||||
| Class C | 1,133,323 | 5,921,949 | ||||||
| Class I | (4,190,355 | ) | (33,712,496 | ) | ||||
| Class Y | 34,572,300 | 26,745,124 | ||||||
| Class Z | 110,066,888 | 224,117,879 | ||||||
| Net increase from shares of beneficial interest transactions — Note 6 | 138,907,766 | 236,918,064 | ||||||
Total increase | 326,843,236 | 497,451,957 | ||||||
Net Assets: | ||||||||
| Beginning of period | 1,077,564,201 | 580,112,244 | ||||||
| END OF PERIOD | $ | 1,404,407,437 | $ | 1,077,564,201 | ||||
See Notes to Financial Statements.
| Alger Mid Cap Growth Institutional Fund | ||||||||
For the Six Months Ended April 30, 2021 | For the Year Ended October 31, 2020 | |||||||
Net investment loss | $ | (563,193 | ) | $ | (744,079 | ) | ||
Net realized gain on investments and foreign currency | 29,415,954 | 14,869,310 | ||||||
| Net change in unrealized appreciation on investments and foreign currency | 3,477,337 | 18,493,167 | ||||||
Net increase in net assets resulting from operations | 32,330,098 | 32,618,398 | ||||||
Dividends and distributions to shareholders: | ||||||||
| Class I | (11,492,230 | ) | (5,942,045 | ) | ||||
| Class R | (841,887 | ) | (709,966 | ) | ||||
| Class Z-2 | (2,277,430 | ) | (986,240 | ) | ||||
Total dividends and distributions to shareholders | (14,611,547 | ) | (7,638,251 | ) | ||||
Increase (decrease) from shares of beneficial interest transactions: | ||||||||
| Class I | 7,605,839 | (7,589,143 | ) | |||||
| Class R | 215,746 | (3,375,494 | ) | |||||
| Class Z-2 | 2,040,545 | 2,122,368 | ||||||
| Net increase (decrease) from shares of beneficial interest transactions — Note 6 | 9,862,130 | (8,842,269 | ) | |||||
Total increase | 27,580,681 | 16,137,878 | ||||||
Net Assets: | ||||||||
| Beginning of period | 109,773,137 | 93,635,259 | ||||||
| END OF PERIOD | $ | 137,353,818 | $ | 109,773,137 | ||||
See Notes to Financial Statements.
| Alger Small Cap Growth Institutional Fund | ||||||||
For the Six Months Ended April 30, 2021 | For the Year Ended October 31, 2020 | |||||||
Net investment loss | $ | (1,404,010 | ) | $ | (1,964,548 | ) | ||
Net realized gain on investments and foreign currency | 47,917,083 | 18,540,662 | ||||||
| Net change in unrealized appreciation on investments and foreign currency | 30,082,279 | 52,905,806 | ||||||
Net increase in net assets resulting from operations | 76,595,352 | 69,481,920 | ||||||
Dividends and distributions to shareholders: | ||||||||
| Class I | (9,442,561 | ) | (16,684,165 | ) | ||||
| Class R | (741,154 | ) | (1,835,545 | ) | ||||
| Class Z-2 | (6,376,031 | ) | (8,353,315 | ) | ||||
Total dividends and distributions to shareholders | (16,559,746 | ) | (26,873,025 | ) | ||||
Increase (decrease) from shares of beneficial interest transactions: | ||||||||
| Class I | (2,823,146 | ) | 28,151,365 | |||||
| Class R | (1,133,365 | ) | (219,458 | ) | ||||
| Class Z-2 | 57,731,560 | 38,130,343 | ||||||
| Net increase from shares of beneficial interest transactions — Note 6 | 53,775,049 | 66,062,250 | ||||||
Total increase | 113,810,655 | 108,671,145 | ||||||
Net Assets: | ||||||||
| Beginning of period | 261,076,744 | 152,405,599 | ||||||
| END OF PERIOD | $ | 374,887,399 | $ | 261,076,744 | ||||
Alger Capital Appreciation Institutional Fund | Class I | |||||||||||||||||||||||
Six months ended 4/30/2021(i) | Year ended 10/31/2020 | Year ended 10/31/2019 | Year ended 10/31/2018 | Year ended 10/31/2017 | Year ended 10/31/2016 | |||||||||||||||||||
| Net asset value, beginning of period | $ | 43.16 | $ | 35.43 | $ | 34.51 | $ | 33.96 | $ | 26.44 | $ | 28.48 | ||||||||||||
| INCOME FROM INVESTMENT OPERATIONS: | ||||||||||||||||||||||||
| Net investment income (loss)(ii) | (0.12 | ) | (0.14 | ) | (0.07 | ) | (0.05 | ) | – | 0.02 | ||||||||||||||
| Net realized and unrealized gain (loss) on investments | 8.83 | 11.44 | 4.54 | 2.79 | 7.71 | (0.02 | ) | |||||||||||||||||
| Total from investment operations | 8.71 | 11.30 | 4.47 | 2.74 | 7.71 | – | ||||||||||||||||||
| Distributions from net realized gains | (6.94 | ) | (3.57 | ) | (3.55 | ) | (2.19 | ) | (0.19 | ) | (2.04 | ) | ||||||||||||
| Net asset value, end of period | $ | 44.93 | $ | 43.16 | $ | 35.43 | $ | 34.51 | $ | 33.96 | $ | 26.44 | ||||||||||||
| Total return | 21.57 | % | 34.58 | % | 15.20 | % | 8.46 | % | 29.38 | % | (0.08 | )% | ||||||||||||
| RATIOS/SUPPLEMENTAL DATA: | ||||||||||||||||||||||||
| Net assets, end of period (000's omitted) | $ | 2,244,464 | $ | 2,105,435 | $ | 2,028,574 | $ | 2,259,000 | $ | 2,451,822 | $ | 2,965,503 | ||||||||||||
| Ratio of gross expenses to average net assets | 1.12 | % | 1.13 | % | 1.16 | % | 1.15 | % | 1.14 | % | 1.12 | % | ||||||||||||
| Ratio of expense reimbursements to average net assets | – | – | – | –(iii) | – | – | ||||||||||||||||||
| Ratio of net expenses to average net assets | 1.12 | % | 1.13 | % | 1.16 | % | 1.15 | % | 1.14 | % | 1.12 | % | ||||||||||||
| Ratio of net investment income (loss) to average net assets | (0.55 | )% | (0.36 | )% | (0.21 | )% | (0.16 | )% | 0.01 | % | 0.07 | % | ||||||||||||
| Portfolio turnover rate | 41.00 | % | 83.95 | % | 80.36 | % | 64.77 | % | 66.72 | % | 94.56 | % | ||||||||||||
| (i) | Ratios have been annualized; total return and portfolio turnover rate have not been annualized. |
| (ii) | Amount was computed based on average shares outstanding during the period. |
| (iii) | Amount was less than 0.005% per share. |
Alger Capital Appreciation Institutional Fund | Class R | |||||||||||||||||||||||
Six months ended 4/30/2021(i) | Year ended 10/31/2020 | Year ended 10/31/2019 | Year ended 10/31/2018 | Year ended 10/31/2017 | Year ended 10/31/2016 | |||||||||||||||||||
| Net asset value, beginning of period | $ | 37.10 | $ | 31.05 | $ | 30.83 | $ | 30.70 | $ | 24.03 | $ | 26.19 | ||||||||||||
| INCOME FROM INVESTMENT OPERATIONS: | ||||||||||||||||||||||||
| Net investment loss(ii) | (0.18 | ) | (0.26 | ) | (0.20 | ) | (0.19 | ) | (0.13 | ) | (0.10 | ) | ||||||||||||
| Net realized and unrealized gain (loss) on investments | 7.49 | 9.88 | 3.97 | 2.51 | 6.99 | (0.02 | ) | |||||||||||||||||
| Total from investment operations | 7.31 | 9.62 | 3.77 | 2.32 | 6.86 | (0.12 | ) | |||||||||||||||||
| Distributions from net realized gains | (6.94 | ) | (3.57 | ) | (3.55 | ) | (2.19 | ) | (0.19 | ) | (2.04 | ) | ||||||||||||
| Net asset value, end of period | $ | 37.47 | $ | 37.10 | $ | 31.05 | $ | 30.83 | $ | 30.70 | $ | 24.03 | ||||||||||||
| Total return | 21.28 | % | 33.99 | % | 14.69 | % | 7.96 | % | 28.78 | % | (0.57 | )% | ||||||||||||
| RATIOS/SUPPLEMENTAL DATA: | ||||||||||||||||||||||||
| Net assets, end of period (000's omitted) | $ | 550,749 | $ | 520,172 | $ | 525,018 | $ | 595,010 | $ | 654,966 | $ | 578,297 | ||||||||||||
| Ratio of gross expenses to average net assets | 1.56 | % | 1.58 | % | 1.61 | % | 1.59 | % | 1.62 | % | 1.61 | % | ||||||||||||
| Ratio of expense reimbursements to average net assets | – | – | – | –(iii) | – | – | ||||||||||||||||||
| Ratio of net expenses to average net assets | 1.56 | % | 1.58 | % | 1.61 | % | 1.59 | % | 1.62 | % | 1.61 | % | ||||||||||||
| Ratio of net investment loss to average net assets | (0.99 | )% | (0.80 | )% | (0.67 | )% | (0.60 | )% | (0.48 | )% | (0.41 | )% | ||||||||||||
| Portfolio turnover rate | 41.00 | % | 83.95 | % | 80.36 | % | 64.77 | % | 66.72 | % | 94.56 | % | ||||||||||||
| (i) | Ratios have been annualized; total return and portfolio turnover rate have not been annualized. |
| (ii) | Amount was computed based on average shares outstanding during the period. |
| (iii) | Amount was less than 0.005% per share. |
Alger Capital Appreciation Institutional Fund | Class Y | |||||||||||||||||||
Six months ended 4/30/2021(i) | Year ended 10/31/2020 | Year ended 10/31/2019 | Year ended 10/31/2018 | From 2/28/2017 (commencement of operations) to 10/31/2017(ii) | ||||||||||||||||
| Net asset value, beginning of period | $ | 43.91 | $ | 35.86 | $ | 34.75 | $ | 34.05 | $ | 28.85 | ||||||||||
| INCOME FROM INVESTMENT OPERATIONS: | ||||||||||||||||||||
| Net investment income (loss)(iii) | (0.04 | ) | –(iv) | 0.05 | 0.08 | 0.02 | ||||||||||||||
| Net realized and unrealized gain on investments | 9.00 | 11.62 | 4.61 | 2.81 | 5.18 | |||||||||||||||
| Total from investment operations | 8.96 | 11.62 | 4.66 | 2.89 | 5.20 | |||||||||||||||
| Distributions from net realized gains | (6.94 | ) | (3.57 | ) | (3.55 | ) | (2.19 | ) | – | |||||||||||
| Net asset value, end of period | $ | 45.93 | $ | 43.91 | $ | 35.86 | $ | 34.75 | $ | 34.05 | ||||||||||
| Total return | 21.79 | % | 35.10 | % | 15.69 | % | 8.90 | % | 18.02 | % | ||||||||||
| RATIOS/SUPPLEMENTAL DATA: | ||||||||||||||||||||
| Net assets, end of period (000's omitted) | $ | 617,911 | $ | 484,362 | $ | 337,299 | $ | 166,778 | $ | 97,889 | ||||||||||
| Ratio of gross expenses to average net assets | 0.80 | % | 0.82 | % | 0.84 | % | 0.83 | % | 0.85 | % | ||||||||||
| Ratio of expense reimbursements to average net assets | (0.05 | )% | (0.07 | )% | (0.09 | )% | (0.10 | )% | (0.10 | )% | ||||||||||
| Ratio of net expenses to average net assets | 0.75 | % | 0.75 | % | 0.75 | % | 0.73 | % | 0.75 | % | ||||||||||
| Ratio of net investment income (loss) to average net assets | (0.18 | )% | (0.01 | )% | 0.14 | % | 0.22 | % | 0.10 | % | ||||||||||
| Portfolio turnover rate | 41.00 | % | 83.95 | % | 80.36 | % | 64.77 | % | 66.72 | % | ||||||||||
| (i) | Ratios have been annualized; total return and portfolio turnover rate have not been annualized. |
| (ii) | Ratios have been annualized; total return has not been annualized; portfolio turnover is for the twelve months then ended. |
| (iii) | Amount was computed based on average shares outstanding during the period. |
| (iv) | Amount was less than $0.005 per share. |
Alger Capital Appreciation Institutional Fund | Class Z-2 | |||||||||||||||||||||||
Six months ended 4/30/2021(i) | Year ended 10/31/2020 | Year ended 10/31/2019 | Year ended 10/31/2018 | Year ended 10/31/2017 | From 10/14/2016 (commencement of operations) to 10/31/2016(ii) | |||||||||||||||||||
| Net asset value, beginning of period | $ | 43.83 | $ | 35.82 | $ | 34.74 | $ | 34.08 | $ | 26.44 | $ | 26.67 | ||||||||||||
| INCOME FROM INVESTMENT OPERATIONS: | ||||||||||||||||||||||||
| Net investment income (loss)(iii) | (0.05 | ) | (0.02 | ) | 0.03 | 0.06 | 0.07 | 0.01 | ||||||||||||||||
| Net realized and unrealized gain (loss) on investments | 8.98 | 11.60 | 4.60 | 2.79 | 7.76 | (0.24 | ) | |||||||||||||||||
| Total from investment operations | 8.93 | 11.58 | 4.63 | 2.85 | 7.83 | (0.23 | ) | |||||||||||||||||
| Distributions from net realized gains | (6.94 | ) | (3.57 | ) | (3.55 | ) | (2.19 | ) | (0.19 | ) | – | |||||||||||||
| Net asset value, end of period | $ | 45.82 | $ | 43.83 | $ | 35.82 | $ | 34.74 | $ | 34.08 | $ | 26.44 | ||||||||||||
| Total return | 21.76 | % | 35.02 | % | 15.56 | % | 8.80 | % | 29.83 | % | (0.86 | )% | ||||||||||||
| RATIOS/SUPPLEMENTAL DATA: | ||||||||||||||||||||||||
| Net assets, end of period (000's omitted) | $ | 593,787 | $ | 539,253 | $ | 464,636 | $ | 463,046 | $ | 436,145 | $ | 2,212 | ||||||||||||
| Ratio of gross expenses to average net assets | 0.79 | % | 0.82 | % | 0.83 | % | 0.82 | % | 0.84 | % | 3.11 | % | ||||||||||||
| Ratio of expense reimbursements to average net assets | – | – | – | –(iv) | – | (2.16 | )% | |||||||||||||||||
| Ratio of net expenses to average net assets | 0.79 | % | 0.82 | % | 0.83 | % | 0.82 | % | 0.84 | % | 0.95 | % | ||||||||||||
| Ratio of net investment income (loss) to average net assets | (0.22 | )% | (0.05 | )% | 0.10 | % | 0.16 | % | 0.22 | % | 1.29 | % | ||||||||||||
| Portfolio turnover rate | 41.00 | % | 83.95 | % | 80.36 | % | 64.77 | % | 66.72 | % | 94.56 | % | ||||||||||||
| (i) | Ratios have been annualized; total return and portfolio turnover rate have not been annualized. |
| (ii) | Ratios have been annualized; total return has not been annualized; portfolio turnover is for the twelve months then ended. |
| (iii) | Amount was computed based on average shares outstanding during the period. |
| (iv) | Amount was less than 0.005% per share. |
| Alger Focus Equity Fund | Class A | |||||||||||||||||||||||
Six months ended 4/30/2021(i) | Year ended 10/31/2020 | Year ended 10/31/2019 | Year ended 10/31/2018 | Year ended 10/31/2017 | Year ended 10/31/2016 | |||||||||||||||||||
Net asset value, beginning of period | $ | 50.77 | $ | 37.33 | $ | 34.00 | $ | 31.74 | $ | 23.95 | $ | 24.13 | ||||||||||||
INCOME FROM INVESTMENT OPERATIONS: | ||||||||||||||||||||||||
| Net investment income (loss)(ii) | (0.10 | ) | (0.07 | ) | –(iii) | (0.06 | ) | 0.01 | (0.03 | ) | ||||||||||||||
Net realized and unrealized gain on investments | 11.68 | 14.29 | 4.95 | 3.55 | 7.78 | 0.12 | ||||||||||||||||||
Total from investment operations | 11.58 | 14.22 | 4.95 | 3.49 | 7.79 | 0.09 | ||||||||||||||||||
Dividends from net investment income | – | (0.02 | ) | – | – | – | – | |||||||||||||||||
Distributions from net realized gains | (3.39 | ) | (0.76 | ) | (1.62 | ) | (1.23 | ) | – | (0.27 | ) | |||||||||||||
Net asset value, end of period | $ | 58.96 | $ | 50.77 | $ | 37.33 | $ | 34.00 | $ | 31.74 | $ | 23.95 | ||||||||||||
| Total return(iv) | 23.49 | % | 38.75 | % | 15.56 | % | 11.33 | % | 32.53 | % | 0.36 | % | ||||||||||||
RATIOS/SUPPLEMENTAL DATA: | ||||||||||||||||||||||||
Net assets, end of period (000's omitted) | $ | 100,845 | $ | 89,028 | $ | 53,533 | $ | 43,621 | $ | 23,693 | $ | 25,524 | ||||||||||||
Ratio of gross expenses to average net assets | 0.92 | % | 0.95 | % | 1.00 | % | 1.03 | % | 1.11 | % | 1.26 | % | ||||||||||||
Ratio of expense reimbursements to average net assets | – | – | – | – | – | (0.07 | )% | |||||||||||||||||
Ratio of net expenses to average net assets | 0.92 | % | 0.95 | % | 1.00 | % | 1.03 | % | 1.11 | % | 1.19 | % | ||||||||||||
Ratio of net investment income (loss) to average net assets | (0.37 | )% | (0.16 | )% | (0.01 | )% | (0.17 | )% | 0.03 | % | (0.13 | )% | ||||||||||||
Portfolio turnover rate | 61.60 | % | 99.52 | % | 134.50 | % | 135.54 | % | 98.57 | % | 127.40 | % | ||||||||||||
| (i) | Ratios have been annualized; total return and portfolio turnover rate have not been annualized. |
| (ii) | Amount was computed based on average shares outstanding during the period. |
| (iii) | Amount was less than $0.005 per share. |
| (iv) | Does not reflect the effect of sales charges, if applicable. |
| Alger Focus Equity Fund | Class C | |||||||||||||||||||||||
Six months ended 4/30/2021(i) | Year ended 10/31/2020 | Year ended 10/31/2019 | Year ended 10/31/2018 | Year ended 10/31/2017 | Year ended 10/31/2016 | |||||||||||||||||||
| Net asset value, beginning of period | $ | 47.63 | $ | 35.30 | $ | 32.47 | $ | 30.59 | $ | 23.27 | $ | 23.62 | ||||||||||||
| INCOME FROM INVESTMENT OPERATIONS: | ||||||||||||||||||||||||
| Net investment loss(ii) | (0.29 | ) | (0.38 | ) | (0.26 | ) | (0.31 | ) | (0.21 | ) | (0.20 | ) | ||||||||||||
| Net realized and unrealized gain on investments | 10.92 | 13.47 | 4.71 | 3.42 | 7.53 | 0.12 | ||||||||||||||||||
| Total from investment operations | 10.63 | 13.09 | 4.45 | 3.11 | 7.32 | (0.08 | ) | |||||||||||||||||
| Distributions from net realized gains | (3.39 | ) | (0.76 | ) | (1.62 | ) | (1.23 | ) | – | (0.27 | ) | |||||||||||||
| Net asset value, end of period | $ | 54.87 | $ | 47.63 | $ | 35.30 | $ | 32.47 | $ | 30.59 | $ | 23.27 | ||||||||||||
| Total return(iii) | 23.02 | % | 37.73 | % | 14.68 | % | 10.51 | % | 31.46 | % | (0.36 | )% | ||||||||||||
| RATIOS/SUPPLEMENTAL DATA: | ||||||||||||||||||||||||
| Net assets, end of period (000's omitted) | $ | 67,011 | $ | 57,067 | $ | 37,169 | $ | 26,366 | $ | 18,660 | $ | 12,021 | ||||||||||||
| Ratio of gross expenses to average net assets | 1.68 | % | 1.71 | % | 1.75 | % | 1.80 | % | 1.90 | % | 2.03 | % | ||||||||||||
| Ratio of expense reimbursements to average net assets | – | – | – | – | – | (0.10 | )% | |||||||||||||||||
| Ratio of net expenses to average net assets | 1.68 | % | 1.71 | % | 1.75 | % | 1.80 | % | 1.90 | % | 1.93 | % | ||||||||||||
| Ratio of net investment loss to average net assets | (1.12 | )% | (0.91 | )% | (0.77 | )% | (0.93 | )% | (0.79 | )% | (0.87 | )% | ||||||||||||
| Portfolio turnover rate | 61.60 | % | 99.52 | % | 134.50 | % | 135.54 | % | 98.57 | % | 127.40 | % | ||||||||||||
| (i) | Ratios have been annualized; total return and portfolio turnover rate have not been annualized. |
| (ii) | Amount was computed based on average shares outstanding during the period. |
| (iii) | Does not reflect the effect of sales charges, if applicable. |
| Alger Focus Equity Fund | Class I | |||||||||||||||||||||||
Six months ended 4/30/2021(i) | Year ended 10/31/2020 | Year ended 10/31/2019 | Year ended 10/31/2018 | Year ended 10/31/2017 | Year ended 10/31/2016 | |||||||||||||||||||
| Net asset value, beginning of period | $ | 51.07 | $ | 37.56 | $ | 34.17 | $ | 31.88 | $ | 24.06 | $ | 24.23 | ||||||||||||
| INCOME FROM INVESTMENT OPERATIONS: | ||||||||||||||||||||||||
| Net investment income (loss)(ii) | (0.09 | ) | (0.03 | ) | 0.01 | (0.05 | ) | 0.01 | (0.02 | ) | ||||||||||||||
| Net realized and unrealized gain on investments | 11.75 | 14.37 | 5.00 | 3.57 | 7.81 | 0.12 | ||||||||||||||||||
| Total from investment operations | 11.66 | 14.34 | 5.01 | 3.52 | 7.82 | 0.10 | ||||||||||||||||||
| Dividends from net investment income | –(iii) | (0.07 | ) | – | – | – | – | |||||||||||||||||
| Distributions from net realized gains | (3.39 | ) | (0.76 | ) | (1.62 | ) | (1.23 | ) | – | (0.27 | ) | |||||||||||||
| Net asset value, end of period | $ | 59.34 | $ | 51.07 | $ | 37.56 | $ | 34.17 | $ | 31.88 | $ | 24.06 | ||||||||||||
| Total return(iv) | 23.51 | % | 38.81 | % | 15.66 | % | 11.40 | % | 32.50 | % | 0.40 | % | ||||||||||||
| RATIOS/SUPPLEMENTAL DATA: | ||||||||||||||||||||||||
| Net assets, end of period (000's omitted) | $ | 69,086 | $ | 63,658 | $ | 68,705 | $ | 37,070 | $ | 23,952 | $ | 22,527 | ||||||||||||
| Ratio of gross expenses to average net assets | 0.91 | % | 0.93 | % | 0.96 | % | 1.02 | % | 1.12 | % | 1.30 | % | ||||||||||||
| Ratio of expense reimbursements to average net assets | (0.01 | )% | (0.04 | )% | (0.04 | )% | (0.02 | )% | – | (0.15 | )% | |||||||||||||
| Ratio of net expenses to average net assets | 0.90 | % | 0.89 | % | 0.92 | % | 1.00 | % | 1.12 | % | 1.15 | % | ||||||||||||
| Ratio of net investment income (loss) to average net assets | (0.33 | )% | (0.06 | )% | 0.04 | % | (0.13 | )% | 0.02 | % | (0.09 | )% | ||||||||||||
| Portfolio turnover rate | 61.60 | % | 99.52 | % | 134.50 | % | 135.54 | % | 98.57 | % | 127.40 | % | ||||||||||||
| (i) | Ratios have been annualized; total return and portfolio turnover rate have not been annualized. |
| (ii) | Amount was computed based on average shares outstanding during the period. |
| (iii) | Amount was less than $0.005 per share. |
| (iv) | Does not reflect the effect of sales charges, if applicable. |
| Alger Focus Equity Fund | Class Y | |||||||||||||||||||
Six months ended 4/30/2021(i) | Year ended 10/31/2020 | Year ended 10/31/2019 | Year ended 10/31/2018 | From 2/28/2017 (commencement of operations) to 10/31/2017(ii) | ||||||||||||||||
| Net asset value, beginning of period | $ | 52.12 | $ | 38.29 | $ | 34.79 | $ | 32.33 | $ | 26.86 | ||||||||||
| INCOME FROM INVESTMENT OPERATIONS: | ||||||||||||||||||||
| Net investment income (loss)(iii) | (0.01 | ) | 0.07 | 0.12 | 0.04 | (0.01 | ) | |||||||||||||
| Net realized and unrealized gain on investments | 12.01 | 14.65 | 5.08 | 3.65 | 5.48 | |||||||||||||||
| Total from investment operations | 12.00 | 14.72 | 5.20 | 3.69 | 5.47 | |||||||||||||||
| Dividends from net investment income | (0.02 | ) | (0.13 | ) | (0.08 | ) | – | – | ||||||||||||
| Distributions from net realized gains | (3.39 | ) | (0.76 | ) | (1.62 | ) | (1.23 | ) | – | |||||||||||
| Net asset value, end of period | $ | 60.71 | $ | 52.12 | $ | 38.29 | $ | 34.79 | $ | 32.33 | ||||||||||
| Total return(iv) | 23.70 | % | 39.17 | % | 15.97 | % | 11.78 | % | 20.36 | % | ||||||||||
| RATIOS/SUPPLEMENTAL DATA: | ||||||||||||||||||||
| Net assets, end of period (000's omitted) | $ | 179,334 | $ | 121,688 | $ | 69,175 | $ | 57,880 | $ | 4,319 | ||||||||||
| Ratio of gross expenses to average net assets | 0.61 | % | 0.63 | % | 0.66 | % | 0.70 | % | 1.51 | % | ||||||||||
| Ratio of expense reimbursements to average net assets | (0.02 | )% | – | (0.01 | )% | (0.05 | )% | (0.86 | )% | |||||||||||
| Ratio of net expenses to average net assets | 0.59 | % | 0.63 | % | 0.65 | % | 0.65 | % | 0.65 | % | ||||||||||
| Ratio of net investment income (loss) to average net assets | (0.05 | )% | 0.16 | % | 0.34 | % | 0.11 | % | (0.05 | )% | ||||||||||
| Portfolio turnover rate | 61.60 | % | 99.52 | % | 134.50 | % | 135.54 | % | 98.57 | % | ||||||||||
| (i) | Ratios have been annualized; total return and portfolio turnover rate have not been annualized. |
| (ii) | Ratios have been annualized; total return has not been annualized; portfolio turnover is for the twelve months then ended. |
| (iii) | Amount was computed based on average shares outstanding during the period. |
| (iv) | Does not reflect the effect of sales charges, if applicable. |
| Alger Focus Equity Fund | Class Z | |||||||||||||||||||||||
Six months ended 4/30/2021(i) | Year ended 10/31/2020 | Year ended 10/31/2019 | Year ended 10/31/2018 | Year ended 10/31/2017 | Year ended 10/31/2016 | |||||||||||||||||||
| Net asset value, beginning of period | $ | 52.02 | $ | 38.21 | $ | 34.73 | $ | 32.28 | $ | 24.30 | $ | 24.41 | ||||||||||||
| INCOME FROM INVESTMENT OPERATIONS: | ||||||||||||||||||||||||
| Net investment income (loss)(ii) | (0.02 | ) | 0.06 | 0.11 | 0.05 | 0.07 | 0.03 | |||||||||||||||||
| Net realized and unrealized gain on investments | 11.99 | 14.64 | 5.07 | 3.63 | 7.91 | 0.13 | ||||||||||||||||||
| Total from investment operations | 11.97 | 14.70 | 5.18 | 3.68 | 7.98 | 0.16 | ||||||||||||||||||
| Dividends from net investment income | (0.02 | ) | (0.13 | ) | (0.08 | ) | – | – | – | |||||||||||||||
| Distributions from net realized gains | (3.39 | ) | (0.76 | ) | (1.62 | ) | (1.23 | ) | – | (0.27 | ) | |||||||||||||
| Net asset value, end of period | $ | 60.58 | $ | 52.02 | $ | 38.21 | $ | 34.73 | $ | 32.28 | $ | 24.30 | ||||||||||||
| Total return(iii) | 23.68 | % | 39.20 | % | 15.93 | % | 11.74 | % | 32.84 | % | 0.64 | % | ||||||||||||
| RATIOS/SUPPLEMENTAL DATA: | ||||||||||||||||||||||||
| Net assets, end of period (000's omitted) | $ | 988,132 | $ | 746,122 | $ | 351,530 | $ | 172,900 | $ | 61,721 | $ | 15,693 | ||||||||||||
| Ratio of gross expenses to average net assets | 0.61 | % | 0.63 | % | 0.66 | % | 0.71 | % | 0.84 | % | 1.05 | % | ||||||||||||
| Ratio of expense reimbursements to average net assets | – | – | – | (0.02 | )% | – | (0.12 | )% | ||||||||||||||||
| Ratio of net expenses to average net assets | 0.61 | % | 0.63 | % | 0.66 | % | 0.69 | % | 0.84 | % | 0.93 | % | ||||||||||||
| Ratio of net investment income (loss) to average net assets | (0.06 | )% | 0.13 | % | 0.29 | % | 0.15 | % | 0.25 | % | 0.12 | % | ||||||||||||
| Portfolio turnover rate | 61.60 | % | 99.52 | % | 134.50 | % | 135.54 | % | 98.57 | % | 127.40 | % | ||||||||||||
| (i) | Ratios have been annualized; total return and portfolio turnover rate have not been annualized. |
| (ii) | Amount was computed based on average shares outstanding during the period. |
| (iii) | Does not reflect the effect of sales charges, if applicable. |
Alger Mid Cap Growth Institutional Fund | Class I | |||||||||||||||||||||||
Six months ended 4/30/2021(i) | Year ended 10/31/2020 | Year ended 10/31/2019 | Year ended 10/31/2018 | Year ended 10/31/2017 | Year ended 10/31/2016 | |||||||||||||||||||
| Net asset value, beginning of period | $ | 40.47 | $ | 31.04 | $ | 30.20 | $ | 28.65 | $ | 21.59 | $ | 22.54 | ||||||||||||
| INCOME FROM INVESTMENT OPERATIONS: | ||||||||||||||||||||||||
| Net investment loss(ii) | (0.20 | ) | (0.27 | ) | (0.21 | ) | (0.25 | ) | (0.13 | ) | (0.05 | ) | ||||||||||||
| Net realized and unrealized gain (loss) on investments | 11.80 | 12.27 | 3.03 | 1.80 | 7.19 | (0.90 | ) | |||||||||||||||||
| Total from investment operations | 11.60 | 12.00 | 2.82 | 1.55 | 7.06 | (0.95 | ) | |||||||||||||||||
| Distributions from net realized gains | (5.33 | ) | (2.57 | ) | (1.98 | ) | – | – | – | |||||||||||||||
| Net asset value, end of period | $ | 46.74 | $ | 40.47 | $ | 31.04 | $ | 30.20 | $ | 28.65 | $ | 21.59 | ||||||||||||
| Total return | 29.83 | % | 41.71 | % | 10.76 | % | 5.44 | % | 32.70 | % | (4.21 | )% | ||||||||||||
| RATIOS/SUPPLEMENTAL DATA: | ||||||||||||||||||||||||
| Net assets, end of period (000's omitted) | $ | 107,997 | $ | 86,228 | $ | 73,274 | $ | 79,954 | $ | 85,890 | $ | 81,782 | ||||||||||||
| Ratio of gross expenses to average net assets | 1.25 | % | 1.35 | % | 1.35 | % | 1.34 | % | 1.28 | % | 1.25 | % | ||||||||||||
| Ratio of net expenses to average net assets | 1.25 | % | 1.35 | % | 1.35 | % | 1.34 | % | 1.28 | % | 1.25 | % | ||||||||||||
| Ratio of net investment loss to average net assets | (0.87 | )% | (0.80 | )% | (0.70 | )% | (0.80 | )% | (0.50 | )% | (0.24 | )% | ||||||||||||
| Portfolio turnover rate | 93.89 | % | 180.30 | % | 182.64 | % | 127.57 | % | 157.49 | % | 95.75 | % | ||||||||||||
| (i) | Ratios have been annualized; total return and portfolio turnover rate have not been annualized. |
| (ii) | Amount was computed based on average shares outstanding during the period. |
Alger Mid Cap Growth Institutional Fund | Class R | |||||||||||||||||||||||
Six months ended 4/30/2021(i) | Year ended 10/31/2020 | Year ended 10/31/2019 | Year ended 10/31/2018 | Year ended 10/31/2017 | Year ended 10/31/2016 | |||||||||||||||||||
| Net asset value, beginning of period | $ | 36.07 | $ | 28.06 | $ | 27.64 | $ | 26.35 | $ | 19.96 | $ | 20.96 | ||||||||||||
| INCOME FROM INVESTMENT OPERATIONS: | ||||||||||||||||||||||||
| Net investment loss(ii) | (0.27 | ) | (0.36 | ) | (0.32 | ) | (0.36 | ) | (0.24 | ) | (0.16 | ) | ||||||||||||
| Net realized and unrealized gain (loss) on investments | 10.46 | 10.94 | 2.72 | 1.65 | 6.63 | (0.84 | ) | |||||||||||||||||
| Total from investment operations | 10.19 | 10.58 | 2.40 | 1.29 | 6.39 | (1.00 | ) | |||||||||||||||||
| Distributions from net realized gains | (5.33 | ) | (2.57 | ) | (1.98 | ) | – | – | – | |||||||||||||||
| Net asset value, end of period | $ | 40.93 | $ | 36.07 | $ | 28.06 | $ | 27.64 | $ | 26.35 | $ | 19.96 | ||||||||||||
| Total return | 29.53 | % | 41.03 | % | 10.24 | % | 4.90 | % | 32.01 | % | (4.82 | )% | ||||||||||||
| RATIOS/SUPPLEMENTAL DATA: | ||||||||||||||||||||||||
| Net assets, end of period (000's omitted) | $ | 7,177 | $ | 6,093 | $ | 7,952 | $ | 10,672 | $ | 12,943 | $ | 13,093 | ||||||||||||
| Ratio of gross expenses to average net assets | 1.73 | % | 1.83 | % | 1.85 | % | 1.82 | % | 1.81 | % | 1.82 | % | ||||||||||||
| Ratio of net expenses to average net assets | 1.73 | % | 1.83 | % | 1.85 | % | 1.82 | % | 1.81 | % | 1.82 | % | ||||||||||||
| Ratio of net investment loss to average net assets | (1.34 | )% | (1.22 | )% | (1.18 | )% | (1.28 | )% | (1.04 | )% | (0.81 | )% | ||||||||||||
| Portfolio turnover rate | 93.89 | % | 180.30 | % | 182.64 | % | 127.57 | % | 157.49 | % | 95.75 | % | ||||||||||||
| (i) | Ratios have been annualized; total return and portfolio turnover rate have not been annualized. |
| (ii) | Amount was computed based on average shares outstanding during the period. |
Alger Mid Cap Growth Institutional Fund | Class Z-2 | |||||||||||||||||||||||
Six months ended 4/30/2021(i) | Year ended 10/31/2020 | Year ended 10/31/2019 | Year ended 10/31/2018 | Year ended 10/31/2017 | From 10/14/2016 (commencement of operations) to 10/31/2016(ii) | |||||||||||||||||||
| Net asset value, beginning of period | $ | 40.99 | $ | 31.31 | $ | 30.36 | $ | 28.72 | $ | 21.59 | $ | 21.95 | ||||||||||||
| INCOME FROM INVESTMENT OPERATIONS: | ||||||||||||||||||||||||
| Net investment income (loss)(iii) | (0.13 | ) | (0.16 | ) | (0.12 | ) | (0.17 | ) | (0.08 | ) | 0.04 | |||||||||||||
| Net realized and unrealized gain (loss) on investments | 11.95 | 12.41 | 3.05 | 1.81 | 7.21 | (0.40 | ) | |||||||||||||||||
| Total from investment operations | 11.82 | 12.25 | 2.93 | 1.64 | 7.13 | (0.36 | ) | |||||||||||||||||
| Distributions from net realized gains | (5.33 | ) | (2.57 | ) | (1.98 | ) | – | – | – | |||||||||||||||
| Net asset value, end of period | $ | 47.48 | $ | 40.99 | $ | 31.31 | $ | 30.36 | $ | 28.72 | $ | 21.59 | ||||||||||||
| Total return | 30.03 | % | 42.18 | % | 11.08 | % | 5.74 | % | 33.02 | % | (1.64 | )% | ||||||||||||
| RATIOS/SUPPLEMENTAL DATA: | ||||||||||||||||||||||||
| Net assets, end of period (000's omitted) | $ | 22,180 | $ | 17,452 | $ | 12,409 | $ | 11,316 | $ | 8,810 | $ | 113 | ||||||||||||
| Ratio of gross expenses to average net assets | 0.95 | % | 1.05 | % | 1.09 | % | 1.08 | % | 1.14 | % | 32.21 | % | ||||||||||||
| Ratio of expense reimbursements to average net assets | – | (0.01 | )% | (0.04 | )% | (0.03 | )% | (0.09 | )% | (31.16 | )% | |||||||||||||
| Ratio of net expenses to average net assets | 0.95 | % | 1.04 | % | 1.05 | % | 1.05 | % | 1.05 | % | 1.05 | % | ||||||||||||
| Ratio of net investment income (loss) to average net assets | (0.57 | )% | (0.48 | )% | (0.40 | )% | (0.53 | )% | (0.31 | )% | 4.35 | % | ||||||||||||
| Portfolio turnover rate | 93.89 | % | 180.30 | % | 182.64 | % | 127.57 | % | 157.49 | % | 95.75 | % | ||||||||||||
| (i) | Ratios have been annualized; total return and portfolio turnover rate have not been annualized. |
| (ii) | Ratios have been annualized; total return has not been annualized; portfolio turnover is for the twelve months then ended. |
| (iii) | Amount was computed based on average shares outstanding during the period. |
Alger Small Cap Growth Institutional Fund | Class I | |||||||||||||||||||||||
Six months ended 4/30/2021(i) | Year ended 10/31/2020 | Year ended 10/31/2019 | Year ended 10/31/2018 | Year ended 10/31/2017 | Year ended 10/31/2016 | |||||||||||||||||||
| Net asset value, beginning of period | $ | 25.77 | $ | 21.49 | $ | 22.53 | $ | 20.52 | $ | 14.83 | $ | 23.10 | ||||||||||||
| INCOME FROM INVESTMENT OPERATIONS: | ||||||||||||||||||||||||
| Net investment loss(ii) | (0.14 | ) | (0.24 | ) | (0.25 | ) | (0.22 | ) | (0.14 | ) | (0.10 | ) | ||||||||||||
| Net realized and unrealized gain (loss) on investments | 7.40 | 8.32 | 1.95 | 2.81 | 5.83 | (0.54 | ) | |||||||||||||||||
| Total from investment operations | 7.26 | 8.08 | 1.70 | 2.59 | 5.69 | (0.64 | ) | |||||||||||||||||
| Dividends from net investment income | – | (0.03 | ) | – | – | – | – | |||||||||||||||||
| Distributions from net realized gains | (1.55 | ) | (3.77 | ) | (2.74 | ) | (0.58 | ) | – | (7.63 | ) | |||||||||||||
| Net asset value, end of period | $ | 31.48 | $ | 25.77 | $ | 21.49 | $ | 22.53 | $ | 20.52 | $ | 14.83 | ||||||||||||
| Total return | 28.74 | % | 44.12 | % | 10.20 | % | 12.96 | % | 38.37 | % | (3.76 | )% | ||||||||||||
| RATIOS/SUPPLEMENTAL DATA: | ||||||||||||||||||||||||
| Net assets, end of period (000's omitted) | $ | 183,986 | $ | 152,183 | $ | 95,853 | $ | 132,526 | $ | 130,527 | $ | 129,188 | ||||||||||||
| Ratio of gross expenses to average net assets | 1.24 | % | 1.30 | % | 1.35 | % | 1.32 | % | 1.32 | % | 1.28 | % | ||||||||||||
| Ratio of net expenses to average net assets | 1.24 | % | 1.30 | % | 1.35 | % | 1.32 | % | 1.32 | % | 1.28 | % | ||||||||||||
| Ratio of net investment loss to average net assets | (0.92 | )% | (1.10 | )% | (1.16 | )% | (1.00 | )% | (0.77 | )% | (0.67 | )% | ||||||||||||
| Portfolio turnover rate | 25.59 | % | 23.78 | % | 14.93 | % | 28.20 | % | 29.70 | % | 55.08 | % | ||||||||||||
| (i) | Ratios have been annualized; total return and portfolio turnover rate have not been annualized. |
| (ii) | Amount was computed based on average shares outstanding during the period. |
Alger Small Cap Growth Institutional Fund | Class R | |||||||||||||||||||||||
Six months ended 4/30/2021(i) | Year ended 10/31/2020 | Year ended 10/31/2019 | Year ended 10/31/2018 | Year ended 10/31/2017 | Year ended 10/31/2016 | |||||||||||||||||||
| Net asset value, beginning of period | $ | 19.92 | $ | 17.48 | $ | 18.97 | $ | 17.44 | $ | 12.67 | $ | 20.92 | ||||||||||||
| INCOME FROM INVESTMENT OPERATIONS: | ||||||||||||||||||||||||
| Net investment loss(ii) | (0.16 | ) | (0.27 | ) | (0.28 | ) | (0.27 | ) | (0.19 | ) | (0.16 | ) | ||||||||||||
| Net realized and unrealized gain (loss) on investments | 5.68 | 6.48 | 1.53 | 2.38 | 4.96 | (0.46 | ) | |||||||||||||||||
| Total from investment operations | 5.52 | 6.21 | 1.25 | 2.11 | 4.77 | (0.62 | ) | |||||||||||||||||
| Distributions from net realized gains | (1.55 | ) | (3.77 | ) | (2.74 | ) | (0.58 | ) | – | (7.63 | ) | |||||||||||||
| Net asset value, end of period | $ | 23.89 | $ | 19.92 | $ | 17.48 | $ | 18.97 | $ | 17.44 | $ | 12.67 | ||||||||||||
| Total return | 28.43 | % | 43.38 | % | 9.67 | % | 12.48 | % | 37.65 | % | (4.22 | )% | ||||||||||||
| RATIOS/SUPPLEMENTAL DATA: | ||||||||||||||||||||||||
| Net assets, end of period (000's omitted) | $ | 10,816 | $ | 9,940 | $ | 8,690 | $ | 9,238 | $ | 11,253 | $ | 12,675 | ||||||||||||
| Ratio of gross expenses to average net assets | 1.72 | % | 1.80 | % | 1.81 | % | 1.77 | % | 1.82 | % | 1.80 | % | ||||||||||||
| Ratio of net expenses to average net assets | 1.72 | % | 1.80 | % | 1.81 | % | 1.77 | % | 1.82 | % | 1.80 | % | ||||||||||||
| Ratio of net investment loss to average net assets | (1.38 | )% | (1.58 | )% | (1.63 | )% | (1.44 | )% | (1.27 | )% | (1.20 | )% | ||||||||||||
| Portfolio turnover rate | 25.59 | % | 23.78 | % | 14.93 | % | 28.20 | % | 29.70 | % | 55.08 | % | ||||||||||||
| (i) | Ratios have been annualized; total return and portfolio turnover rate have not been annualized. |
| (ii) | Amount was computed based on average shares outstanding during the period. |
Alger Small Cap Growth Institutional Fund | Class Z-2 | |||||||||||||||||||||||
Six months ended 4/30/2021(i) | Year ended 10/31/2020 | Year ended 10/31/2019 | Year ended 10/31/2018 | Year ended 10/31/2017 | From 8/1/2016 (commencement of operations) to 10/31/2016(ii) | |||||||||||||||||||
| Net asset value, beginning of period | $ | 26.10 | $ | 21.76 | $ | 22.70 | $ | 20.60 | $ | 14.84 | $ | 15.35 | ||||||||||||
| INCOME FROM INVESTMENT OPERATIONS: | ||||||||||||||||||||||||
| Net investment loss(iii) | (0.10 | ) | (0.18 | ) | (0.17 | ) | (0.15 | ) | (0.09 | ) | (0.03 | ) | ||||||||||||
| Net realized and unrealized gain (loss) on investments | 7.51 | 8.42 | 1.97 | 2.83 | 5.85 | (0.48 | ) | |||||||||||||||||
| Total from investment operations | 7.41 | 8.24 | 1.80 | 2.68 | 5.76 | (0.51 | ) | |||||||||||||||||
| Dividends from net investment income | – | (0.13 | ) | – | – | – | – | |||||||||||||||||
| Distributions from net realized gains | (1.55 | ) | (3.77 | ) | (2.74 | ) | (0.58 | ) | – | – | ||||||||||||||
| Net asset value, end of period | $ | 31.96 | $ | 26.10 | $ | 21.76 | $ | 22.70 | $ | 20.60 | $ | 14.84 | ||||||||||||
| Total return | 28.96 | % | 44.55 | % | 10.61 | % | 13.35 | % | 38.81 | % | (3.32 | )% | ||||||||||||
| RATIOS/SUPPLEMENTAL DATA: | ||||||||||||||||||||||||
| Net assets, end of period (000's omitted) | $ | 180,085 | $ | 98,954 | $ | 47,863 | $ | 49,552 | $ | 67,268 | $ | 41,787 | ||||||||||||
| Ratio of gross expenses to average net assets | 0.93 | % | 0.99 | % | 1.02 | % | 1.00 | % | 1.03 | % | 1.07 | % | ||||||||||||
| Ratio of expense reimbursements to average net assets | – | (0.01 | )% | (0.03 | )% | (0.01 | )% | (0.04 | )% | (0.08 | )% | |||||||||||||
| Ratio of net expenses to average net assets | 0.93 | % | 0.98 | % | 0.99 | % | 0.99 | % | 0.99 | % | 0.99 | % | ||||||||||||
| Ratio of net investment loss to average net assets | (0.63 | )% | (0.79 | )% | (0.81 | )% | (0.66 | )% | (0.51 | )% | (0.76 | )% | ||||||||||||
| Portfolio turnover rate | 25.59 | % | 23.78 | % | 14.93 | % | 28.20 | % | 29.70 | % | 55.08 | % | ||||||||||||
| (i) | Ratios have been annualized; total return and portfolio turnover rate have not been annualized. |
| (ii) | Ratios have been annualized; total return has not been annualized; portfolio turnover is for the twelve months then ended. |
| (iii) | Amount was computed based on average shares outstanding during the period. |
| • | Level 1 – quoted prices in active markets for identical investments |
| • | Level 2 – significant other observable inputs (including quoted prices for similar investments, interest rates, prepayment speeds, credit risk, etc.) |
| • | Level 3 – significant unobservable inputs (including the Funds’ own assumptions in determining the fair value of investments) |
| Tier 1 | Tier 2 | Tier 3 | Tier 4 | Tier 5 | Actual Rate | |||||||||||||||||||
| Alger Capital Appreciation Institutional Fund(a) | 0.81 | % | 0.65 | % | 0.60 | % | 0.55 | % | 0.45 | % | 0.72 | % | ||||||||||||
| Alger Focus Equity Fund(b) | 0.52 | % | — | — | — | — | 0.52 | % | ||||||||||||||||
| Alger Mid Cap Growth Institutional Fund(c) | 0.76 | % | 0.70 | % | — | — | — | 0.76 | % | |||||||||||||||
| Alger Small Cap Growth Institutional Fund(c) | 0.81 | % | 0.75 | % | — | — | — | 0.81 | % | |||||||||||||||
| CLASS | FEES WAIVED / REIMBURSED FOR THE SIX MONTHS ENDED | |||||||||||||||||||||||||||
| A | C | I | Y | Z | Z-2 | APRIL 30, 2021 | ||||||||||||||||||||||
| Alger Capital Appreciation Institutional Fund | – | – | – | 0.75% | – | 0.85%(a) | $ | 147,112 | ||||||||||||||||||||
| Alger Focus Equity Fund | – | – | –(b) | 0.58%(b) | 0.63%(b) | – | 18,692 | |||||||||||||||||||||
| Alger Mid Cap Growth Institutional Fund | – | – | – | – | – | 0.99%(c) | – | |||||||||||||||||||||
| Alger Small Cap Growth Institutional Fund | – | – | – | – | – | 0.99 | – | |||||||||||||||||||||
CONTINGENT DEFERRED SALES CHARGES | ||||
Alger Focus Equity Fund | $ | 3,254 | ||
| SHARE CLASS | ||||
| A | Y | Z | Z-2 | |
| Alger Capital Appreciation Institutional Fund | – | 415 | – | 4,518 |
| Alger Focus Equity Fund | 14,581 | 408 | 38,745 | – |
| Alger Mid Cap Growth Institutional Fund | – | – | – | 4,909 |
| Alger Small Cap Growth Institutional Fund | – | – | – | 7,733 |
| PURCHASES | SALES | |||||||
Alger Capital Appreciation Institutional Fund | $ | 1,597,448,696 | $ | 1,993,536,976 | ||||
Alger Focus Equity Fund | 812,879,912 | 765,065,225 | ||||||
Alger Mid Cap Growth Institutional Fund | 121,452,263 | 125,918,366 | ||||||
Alger Small Cap Growth Institutional Fund | 136,447,313 | 81,625,243 | ||||||
AVERAGE DAILY BORROWING | WEIGHTED AVERAGE INTEREST RATE | |||||||
Alger Capital Appreciation Institutional Fund | $ | 4,760,709 | 1.11 | % | ||||
Alger Focus Equity Fund | 275,898 | 1.30 | ||||||
Alger Mid Cap Growth Institutional Fund | 71,212 | 1.25 | ||||||
| HIGHEST BORROWING | ||||
Alger Capital Appreciation Institutional Fund | $ | 95,005,000 | ||
Alger Focus Equity Fund | 8,203,337 | |||
Alger Mid Cap Growth Institutional Fund | 3,569,586 | |||
FOR THE SIX MONTHS ENDED APRIL 30, 2021 | FOR THE YEAR ENDED OCTOBER 31, 2020 | |||||||||||||||
| SHARES | AMOUNT | SHARES | AMOUNT | |||||||||||||
| Alger Capital Appreciation Institutional Fund | ||||||||||||||||
| Class I: | ||||||||||||||||
| Shares sold | 4,896,575 | $ | 213,336,029 | 9,512,752 | $ | 354,784,336 | ||||||||||
| Dividends reinvested | 7,958,968 | 329,262,481 | 5,785,382 | 196,992,265 | ||||||||||||
| Shares redeemed | (11,676,350 | ) | (502,145,662 | ) | (23,770,207 | ) | (892,971,436 | ) | ||||||||
| Net increase (decrease) | 1,179,193 | $ | 40,452,848 | (8,472,073 | ) | $ | (341,194,835 | ) | ||||||||
| Class R: | ||||||||||||||||
| Shares sold | 765,616 | $ | 28,195,044 | 1,740,073 | $ | 56,013,443 | ||||||||||
| Dividends reinvested | 2,698,456 | 93,258,631 | 1,943,976 | 57,114,016 | ||||||||||||
| Shares redeemed | (2,787,313 | ) | (102,740,182 | ) | (6,570,339 | ) | (211,437,040 | ) | ||||||||
| Net increase (decrease) | 676,759 | $ | 18,713,493 | (2,886,290 | ) | $ | (98,309,581 | ) | ||||||||
| Class Y: | ||||||||||||||||
| Shares sold | 2,464,703 | $ | 108,961,066 | 4,082,027 | $ | 154,355,254 | ||||||||||
| Dividends reinvested | 1,699,103 | 71,753,136 | 925,653 | 31,953,564 | ||||||||||||
| Shares redeemed | (1,739,803 | ) | (77,055,552 | ) | (3,383,026 | ) | (131,885,832 | ) | ||||||||
| Net increase | 2,424,003 | $ | 103,658,650 | 1,624,654 | $ | 54,422,986 | ||||||||||
| Class Z-2: | ||||||||||||||||
| Shares sold | 1,092,685 | $ | 49,067,203 | 3,153,670 | $ | 122,079,625 | ||||||||||
| Dividends reinvested | 1,986,370 | 83,705,657 | 1,327,202 | 45,761,941 | ||||||||||||
| Shares redeemed | (2,421,910 | ) | (106,896,525 | ) | (5,147,635 | ) | (190,636,417 | ) | ||||||||
| Net increase (decrease) | 657,145 | $ | 25,876,335 | (666,763 | ) | $ | (22,794,851 | ) | ||||||||
FOR THE SIX MONTHS ENDED APRIL 30, 2021 | FOR THE YEAR ENDED OCTOBER 31, 2020 | |||||||||||||||
| SHARES | AMOUNT | SHARES | AMOUNT | |||||||||||||
| Alger Focus Equity Fund | ||||||||||||||||
| Class A: | ||||||||||||||||
| Shares sold | 291,790 | $ | 16,067,028 | 756,504 | $ | 33,006,385 | ||||||||||
| Shares converted from Class C | 20,622 | 1,175,712 | 197 | 10,336 | ||||||||||||
| Dividends reinvested | 101,841 | 5,447,453 | 28,146 | 1,090,390 | ||||||||||||
| Shares redeemed | (457,449 | ) | (25,364,583 | ) | (465,365 | ) | (20,261,503 | ) | ||||||||
| Net increase (decrease) | (43,196 | ) | $ | (2,674,390 | ) | 319,482 | $ | 13,845,608 | ||||||||
| Class C: | ||||||||||||||||
| Shares sold | 94,199 | $ | 4,895,079 | 333,777 | $ | 13,412,154 | ||||||||||
| Shares converted to Class A | (22,133 | ) | (1,175,712 | ) | (210 | ) | (10,336 | ) | ||||||||
| Dividends reinvested | 79,104 | 3,948,864 | 20,918 | 765,179 | ||||||||||||
| Shares redeemed | (128,131 | ) | (6,534,908 | ) | (209,117 | ) | (8,245,048 | ) | ||||||||
| Net increase | 23,039 | $ | 1,133,323 | 145,368 | $ | 5,921,949 | ||||||||||
| Class I: | ||||||||||||||||
| Shares sold | 273,066 | $ | 15,318,527 | 1,023,198 | $ | 42,760,856 | ||||||||||
| Dividends reinvested | 75,865 | 4,083,795 | 37,422 | 1,457,601 | ||||||||||||
| Shares redeemed | (431,117 | ) | (23,592,677 | ) | (1,643,204 | ) | (77,930,953 | ) | ||||||||
| Net decrease | (82,186 | ) | $ | (4,190,355 | ) | (582,584 | ) | $ | (33,712,496 | ) | ||||||
| Class Y: | ||||||||||||||||
| Shares sold | 603,771 | $ | 34,072,975 | 916,312 | $ | 44,292,550 | ||||||||||
| Dividends reinvested | 145,885 | 8,025,161 | 35,839 | 1,421,385 | ||||||||||||
| Shares redeemed | (130,511 | ) | (7,525,836 | ) | (424,315 | ) | (18,968,811 | ) | ||||||||
| Net increase | 619,145 | $ | 34,572,300 | 527,836 | $ | 26,745,124 | ||||||||||
| Class Z: | ||||||||||||||||
| Shares sold | 3,298,138 | $ | 187,556,328 | 8,107,523 | $ | 359,259,793 | ||||||||||
| Dividends reinvested | 914,460 | 50,203,839 | 210,801 | 8,343,502 | ||||||||||||
| Shares redeemed | (2,244,774 | ) | (127,693,279 | ) | (3,175,558 | ) | (143,485,416 | ) | ||||||||
| Net increase | 1,967,824 | $ | 110,066,888 | 5,142,766 | $ | 224,117,879 | ||||||||||
FOR THE SIX MONTHS ENDED APRIL 30, 2021 | FOR THE YEAR ENDED OCTOBER 31, 2020 | |||||||||||||||
| SHARES | AMOUNT | SHARES | AMOUNT | |||||||||||||
| Alger Mid Cap Growth Institutional Fund | ||||||||||||||||
| Class I: | ||||||||||||||||
| Shares sold | 290,461 | $ | 13,318,332 | 318,705 | $ | 10,667,833 | ||||||||||
| Dividends reinvested | 265,104 | 11,365,021 | 194,914 | 5,771,390 | ||||||||||||
| Shares redeemed | (375,689 | ) | (17,077,514 | ) | (743,767 | ) | (24,028,366 | ) | ||||||||
| Net increase (decrease) | 179,876 | $ | 7,605,839 | (230,148 | ) | $ | (7,589,143 | ) | ||||||||
| Class R: | ||||||||||||||||
| Shares sold | 34,848 | $ | 1,416,696 | 43,711 | $ | 1,263,197 | ||||||||||
| Dividends reinvested | 21,723 | 816,986 | 23,447 | 621,356 | ||||||||||||
| Shares redeemed | (50,110 | ) | (2,017,936 | ) | (181,655 | ) | (5,260,047 | ) | ||||||||
| Net increase (decrease) | 6,461 | $ | 215,746 | (114,497 | ) | $ | (3,375,494 | ) | ||||||||
| Class Z-2: | ||||||||||||||||
| Shares sold | 84,091 | $ | 4,041,861 | 140,999 | $ | 5,818,711 | ||||||||||
| Dividends reinvested | 45,688 | 1,987,879 | 32,511 | 972,401 | ||||||||||||
| Shares redeemed | (88,487 | ) | (3,989,195 | ) | (144,060 | ) | (4,668,744 | ) | ||||||||
| Net increase | 41,292 | $ | 2,040,545 | 29,450 | $ | 2,122,368 | ||||||||||
| Alger Small Cap Growth Institutional Fund | ||||||||||||||||
| Class I: | ||||||||||||||||
| Shares sold | 1,718,260 | $ | 52,481,227 | 4,210,802 | $ | 93,971,359 | ||||||||||
| Dividends reinvested | 314,064 | 9,029,341 | 870,649 | 16,394,317 | ||||||||||||
| Shares redeemed | (2,094,676 | ) | (64,333,714 | ) | (3,635,194 | ) | (82,214,311 | ) | ||||||||
| Net increase (decrease) | (62,352 | ) | $ | (2,823,146 | ) | 1,446,257 | $ | 28,151,365 | ||||||||
| Class R: | ||||||||||||||||
| Shares sold | 91,307 | $ | 2,108,309 | 95,511 | $ | 1,616,821 | ||||||||||
| Dividends reinvested | 33,490 | 732,104 | 122,794 | 1,795,254 | ||||||||||||
| Shares redeemed | (171,182 | ) | (3,973,778 | ) | (216,466 | ) | (3,631,533 | ) | ||||||||
| Net increase (decrease) | (46,385 | ) | $ | (1,133,365 | ) | 1,839 | $ | (219,458 | ) | |||||||
| Class Z-2: | ||||||||||||||||
| Shares sold | 2,546,581 | $ | 79,816,146 | 2,100,922 | $ | 50,447,038 | ||||||||||
| Dividends reinvested | 213,916 | 6,235,667 | 437,592 | 8,322,998 | ||||||||||||
| Shares redeemed | (917,313 | ) | (28,320,253 | ) | (946,708 | ) | (20,639,693 | ) | ||||||||
| Net increase | 1,843,184 | $ | 57,731,560 | 1,591,806 | $ | 38,130,343 | ||||||||||
Alger Capital Appreciation Institutional Fund | TOTAL | LEVEL 1 | LEVEL 2 | LEVEL 3 | ||||||||||||
| COMMON STOCKS | ||||||||||||||||
| Communication Services | $ | 546,567,549 | $ | 546,567,549 | $ | — | $ | — | ||||||||
| Consumer Discretionary | 855,499,750 | 796,935,875 | 54,482,806 | 4,081,069 | ||||||||||||
| Consumer Staples | 49,452,411 | 49,452,411 | — | — | ||||||||||||
| Financials | 146,161,940 | 146,161,940 | — | — | ||||||||||||
| Healthcare | 315,938,675 | 315,938,675 | — | — | ||||||||||||
| Industrials | 216,187,484 | 216,187,484 | — | — | ||||||||||||
| Information Technology | 1,825,064,314 | 1,825,064,314 | — | — | ||||||||||||
| Materials | 41,458,802 | 41,458,802 | — | — | ||||||||||||
| TOTAL COMMON STOCKS | $ | 3,996,330,925 | $ | 3,937,767,050 | $ | 54,482,806 | $ | 4,081,069 | ||||||||
| REAL ESTATE INVESTMENT TRUST | ||||||||||||||||
| Real Estate | 8,942,655 | — | — | |||||||||||||
| SPECIAL PURPOSE VEHICLE | 8,942,655 | |||||||||||||||
| Information Technology | 3,075,000 | — | — | 3,075,000 | ||||||||||||
| TOTAL INVESTMENTS IN SECURITIES | $ | 4,008,348,580 | $ | 3,946,709,705 | $ | 54,482,806 | $ | 7,156,069 | ||||||||
| Alger Focus Equity Fund | TOTAL | LEVEL 1 | LEVEL 2 | LEVEL 3 | ||||||||||||
| COMMON STOCKS | ||||||||||||||||
| Communication Services | $ | 215,248,186 | $ | 215,248,186 | $ | — | $ | — | ||||||||
| Consumer Discretionary | 242,936,091 | 234,423,911 | 8,512,180 | — | ||||||||||||
| Consumer Staples | 25,569,792 | 25,569,792 | — | — | ||||||||||||
| Financials | 54,368,694 | 54,368,694 | — | — | ||||||||||||
| Healthcare | 112,273,021 | 112,273,021 | — | — | ||||||||||||
| Industrials | 92,429,947 | 92,429,947 | — | — | ||||||||||||
| Information Technology | 641,585,196 | 641,585,196 | — | — | ||||||||||||
| TOTAL COMMON STOCKS | $ | 1,384,410,927 | $ | 1,375,898,747 | $ | 8,512,180 | $ | — | ||||||||
| PREFERRED STOCKS | ||||||||||||||||
| Healthcare | 11,524 | — | — | 11,524 | ||||||||||||
| TOTAL INVESTMENTS IN SECURITIES | $ | 1,384,422,451 | $ | 1,375,898,747 | $ | 8,512,180 | $ | 11,524 | ||||||||
Alger Mid Cap Growth Institutional Fund | TOTAL | LEVEL 1 | LEVEL 2 | LEVEL 3 | ||||||||||||
| COMMON STOCKS | ||||||||||||||||
| Communication Services | $ | 11,277,544 | $ | 11,277,544 | $ | — | $ | — | ||||||||
| Consumer Discretionary | 26,238,252 | 24,097,254 | 2,140,998 | — | ||||||||||||
| Consumer Staples | 1,800,027 | 1,800,027 | — | — | ||||||||||||
| Financials | 3,309,625 | 3,309,625 | — | — | ||||||||||||
| Healthcare | 27,998,574 | 27,998,574 | — | — | ||||||||||||
| Industrials | 15,235,124 | 15,235,124 | — | — | ||||||||||||
| Information Technology | 43,035,973 | 43,035,973 | — | — | ||||||||||||
| TOTAL COMMON STOCKS | $ | 128,895,119 | $ | 126,754,121 | $ | 2,140,998 | $ | — | ||||||||
| PREFERRED STOCKS | ||||||||||||||||
| Healthcare | 24,901 | — | — | 24,901 | ||||||||||||
| WARRANTS | ||||||||||||||||
| Healthcare | 2,448,052 | — | 2,448,052 | — | ||||||||||||
| RIGHTS | ||||||||||||||||
| Healthcare | 352,468 | — | — | 352,468 | ||||||||||||
| REAL ESTATE INVESTMENT TRUST | ||||||||||||||||
| Real Estate | 4,627,659 | 4,627,659 | — | — | ||||||||||||
| SPECIAL PURPOSE VEHICLE | ||||||||||||||||
| Information Technology | 775,000 | — | — | 775,000 | ||||||||||||
| TOTAL INVESTMENTS IN SECURITIES | $ | 137,123,199 | $ | 131,381,780 | $ | 4,589,050 | $ | 1,152,369 | ||||||||
Alger Small Cap Growth Institutional Fund | TOTAL | LEVEL 1 | LEVEL 2 | LEVEL 3 | ||||||||||||
| COMMON STOCKS | ||||||||||||||||
| Communication Services | $ | 24,967,972 | $ | 24,967,972 | $ | — | $ | — | ||||||||
| Consumer Discretionary | 56,394,424 | 56,394,424 | — | — | ||||||||||||
| Consumer Staples | 10,498,064 | 10,498,064 | — | — | ||||||||||||
| Energy | 4,253,927 | 4,253,927 | — | — | ||||||||||||
| Financials | 6,636,501 | 6,636,501 | — | — | ||||||||||||
| Healthcare | 137,153,609 | 137,153,609 | — | — | ||||||||||||
| Industrials | 17,957,476 | 17,957,476 | — | — | ||||||||||||
| Information Technology | 96,256,607 | 96,256,607 | — | — | ||||||||||||
| Materials | 7,684,184 | 7,684,184 | — | — | ||||||||||||
| Real Estate | 280,146 | 280,146 | — | — | ||||||||||||
| TOTAL COMMON STOCKS | $ | 362,082,910 | $ | 362,082,910 | $ | — | $ | — | ||||||||
| PREFERRED STOCKS | ||||||||||||||||
| Healthcare | 19,989 | — | — | 19,989 | ||||||||||||
| RIGHTS | ||||||||||||||||
| Healthcare | 440,501 | — | — | 440,501 | ||||||||||||
| REAL ESTATE INVESTMENT TRUST | ||||||||||||||||
| Real Estate | 3,944,625 | 3,944,625 | — | — | ||||||||||||
| SPECIAL PURPOSE VEHICLE | ||||||||||||||||
| Information Technology | 1,600,000 | — | — | 1,600,000 | ||||||||||||
| TOTAL INVESTMENTS IN SECURITIES | $ | 368,088,025 | $ | 366,027,535 | $ | — | $ | 2,060,490 | ||||||||
FAIR VALUE MEASUREMENTS USING SIGNIFICANT UNOBSERVABLE INPUTS (LEVEL 3) | ||||
| Alger Capital Appreciation Institutional Fund | Common Stocks | |||
Opening balance at November 1, 2020 | $ | 7,562,484 | ||
| Transfers into Level 3 | — | |||
| Transfers out of Level 3 | — | |||
| Total gains or losses | ||||
| Included in net realized gain (loss) on investments | — | |||
| Included in net change in unrealized appreciation (depreciation) on investments | (3,481,415 | ) | ||
| Purchases and sales | ||||
| Purchases | — | |||
| Sales | — | |||
Closing balance at April 30, 2021 | 4,081,069 | |||
| Net change in unrealized appreciation (depreciation) attributable to investments still held at April 30, 2021* | $ | (3,481,415 | ) | |
| Alger Capital Appreciation Institutional Fund | Special Purpose Vehicle | |||
Opening balance at November 1, 2020 | $ | 3,075,000 | ||
| Transfers into Level 3 | — | |||
| Transfers out of Level 3 | — | |||
| Total gains or losses | ||||
| Included in net realized gain (loss) on investments | — | |||
| Included in net change in unrealized appreciation (depreciation) on investments | — | |||
| Purchases and sales | ||||
| Purchases | — | |||
| Sales | — | |||
Closing balance at April 30, 2021 | 3,075,000 | |||
| Net change in unrealized appreciation (depreciation) attributable to investments still held at April 30, 2021* | $ | — | ||
FAIR VALUE MEASUREMENTS USING SIGNIFICANT UNOBSERVABLE INPUTS (LEVEL 3) | ||||
| Alger Focus Equity Fund | Preferred Stocks | |||
Opening balance at November 1, 2020 | $ | 11,524 | ||
| Transfers into Level 3 | — | |||
| Transfers out of Level 3 | — | |||
| Total gains or losses | ||||
| Included in net realized gain (loss) on investments | — | |||
| Included in net change in unrealized appreciation (depreciation) on investments | — | |||
| Purchases and sales | ||||
| Purchases | — | |||
| Sales | — | |||
Closing balance at April 30, 2021 | 11,524 | |||
| Net change in unrealized appreciation (depreciation) attributable to investments still held at April 30, 2021* | $ | — | ||
| FAIR VALUE MEASUREMENTS USING SIGNIFICANT UNOBSERVABLE INPUTS (LEVEL 3) | ||||
| Alger Mid Cap Growth Institutional Fund | Preferred Stocks | |||
Opening balance at November 1, 2020 | $ | 24,901 | ||
| Transfers into Level 3 | — | |||
| Transfers out of Level 3 | — | |||
| Total gains or losses | ||||
| Included in net realized gain (loss) on investments | — | |||
| Included in net change in unrealized appreciation (depreciation) on investments | — | |||
| Purchases and sales | ||||
| Purchases | — | |||
| Sales | — | |||
Closing balance at April 30, 2021 | 24,901 | |||
| Net change in unrealized appreciation (depreciation) attributable to investments still held at April 30, 2021* | $ | — | ||
FAIR VALUE MEASUREMENTS USING SIGNIFICANT UNOBSERVABLE INPUTS (LEVEL 3) | ||||
| Alger Mid Cap Growth Institutional Fund | Rights | |||
Opening balance at November 1, 2020 | $ | 291,820 | ||
| Transfers into Level 3 | — | |||
| Transfers out of Level 3 | — | |||
| Total gains or losses | ||||
| Included in net realized gain (loss) on investments | — | |||
| Included in net change in unrealized appreciation (depreciation) on investments | 60,648 | |||
| Purchases and sales | ||||
| Purchases | — | |||
| Sales | — | |||
Closing balance at April 30, 2021 | 352,468 | |||
| Net change in unrealized appreciation (depreciation) attributable to investments still held at April 30, 2021* | $ | 60,648 | ||
| Alger Mid Cap Growth Institutional Fund | Special Purpose Vehicle | |||
Opening balance at November 1, 2020 | $ | 550,000 | ||
| Transfers into Level 3 | — | |||
| Transfers out of Level 3 | — | |||
| Total gains or losses | ||||
| Included in net realized gain (loss) on investments | — | |||
| Included in net change in unrealized appreciation (depreciation) on investments | — | |||
| Purchases and sales | ||||
| Purchases | 225,000 | |||
| Sales | — | |||
Closing balance at April 30, 2021 | 775,000 | |||
| Net change in unrealized appreciation (depreciation) attributable to investments still held at April 30, 2021* | $ | — | ||
FAIR VALUE MEASUREMENTS USING SIGNIFICANT UNOBSERVABLE INPUTS (LEVEL 3) | ||||
| Alger Small Cap Growth Institutional Fund | Preferred Stocks | |||
Opening balance at November 1, 2020 | $ | 19,989 | ||
| Transfers into Level 3 | — | |||
| Transfers out of Level 3 | — | |||
| Total gains or losses | ||||
| Included in net realized gain (loss) on investments | — | |||
| Included in net change in unrealized appreciation (depreciation) on investments | — | |||
| Purchases and sales | ||||
| Purchases | — | |||
| Sales | — | |||
Closing balance at April 30, 2021 | 19,989 | |||
| Net change in unrealized appreciation (depreciation) attributable to investments still held at April 30, 2021* | $ | — | ||
| Alger Small Cap Growth Institutional Fund | Rights | |||
Opening balance at November 1, 2020 | $ | 364,706 | ||
| Transfers into Level 3 | — | |||
| Transfers out of Level 3 | — | |||
| Total gains or losses | ||||
| Included in net realized gain (loss) on investments | — | |||
| Included in net change in unrealized appreciation (depreciation) on investments | 75,795 | |||
| Purchases and sales | ||||
| Purchases | — | |||
| Sales | — | |||
Closing balance at April 30, 2021 | 440,501 | |||
| Net change in unrealized appreciation (depreciation) attributable to investments still held at April 30, 2021* | $ | 75,795 | ||
| Alger Small Cap Growth Institutional Fund | Special Purpose Vehicle | |||
Opening balance at November 1, 2020 | $ | 1,275,000 | ||
| Transfers into Level 3 | — | |||
| Transfers out of Level 3 | — | |||
| Total gains or losses | ||||
| Included in net realized gain (loss) on investments | — | |||
| Included in net change in unrealized appreciation (depreciation) on investments | — | |||
| Purchases and sales | ||||
| Purchases | 325,000 | |||
| Sales | — | |||
Closing balance at April 30, 2021 | 1,600,000 | |||
| Net change in unrealized appreciation (depreciation) attributable to investments still held at April 30, 2021* | $ | — | ||
Fair Value April 30, 2021 | Valuation Methodology | Unobservable Input | Input/Range | Weighted Average Inputs | ||||||||||
| Alger Capital Appreciation Institutional Fund | ||||||||||||||
| Common Stocks | $ | 4,081,069 | Income Approach | Discount Rate | 1.00%-3.40 | % | N/A | |||||||
| Special Purpose Vehicle | 3,075,000 | Cost Approach | Priced at Cost | N/A | N/A | |||||||||
| Alger Focus Equity Fund | ||||||||||||||
| Preferred Stocks | $ | 11,524 | Income Approach | Discount Rate | 72.50%-77.50 | % | N/A | |||||||
| Alger Mid Cap Growth Institutional Fund | ||||||||||||||
| Preferred Stocks | $ | 24,901 | Income Approach | Discount Rate | 72.50%-77.50 | % | N/A | |||||||
| Rights | 352,468 | Income Approach | Discount Rate Probability of Success | 3.40%-5.12% 0.00%-100 | % | N/A | ||||||||
Special Purpose Vehicle | 775,000 | Cost Approach | Priced at Cost | N/A | N/A | |||||||||
| Alger Small Cap Growth Institutional Fund | ||||||||||||||
| Preferred Stocks | $ | 19,989 | Income Approach | Discount Rate | 72.50%-77.50 | % | N/A | |||||||
| Rights | 440,501 | Income Approach | Discount Rate Probability of Success | 3.40%-5.12% 0.00%-100 | % | N/A | ||||||||
| Special Purpose Vehicle | 1,600,000 | Cost Approach | Priced at Cost | N/A | N/A | |||||||||
| TOTAL | LEVEL 1 | LEVEL 2 | LEVEL 3 | |||||||||||||
| Cash, Foreign Cash and Cash Equivalents: | ||||||||||||||||
Alger Capital Appreciation Institutional Fund | $ | (72,964 | ) | $ | — | $ | (72,964 | ) | $ | — | ||||||
Alger Focus Equity Fund | 31,086,534 | — | 31,086,534 | — | ||||||||||||
Alger Mid Cap Growth Institutional Fund | 325,833 | — | 325,833 | — | ||||||||||||
Alger Small Cap Growth Institutional Fund | 6,245,094 | — | 6,245,094 | — | ||||||||||||
| Security | Value at October 31, 2020 | Purchases/ Conversion | Sales/ Conversion | Dividend/ Interest Income | Realized Gain (Loss) | Net Change in Unrealized App(Dep) | Value at April 30, 2021 | |||||||||||||||||||||
| Alger Capital Appreciation Institutional Fund | ||||||||||||||||||||||||||||
| Special Purpose Vehicle | ||||||||||||||||||||||||||||
| Crosslink Ventures Capital LLC, Cl. A | $ | 3,075,000 | $ | – | $ | – | $ | – | $ | – | $ | – | $ | 3,075,000 | ||||||||||||||
| Total | $ | 3,075,000 | $ | – | $ | – | $ | – | $ | – | $ | – | $ | 3,075,000 | ||||||||||||||
Security | Value at October 31, 2020 | Purchases/ Conversion | Sales/ Conversion | Dividend/ Interest Income | Realized Gain (Loss) | Net Change in Unrealized App(Dep) | Value at April 30, 2021 | |||||||||||||||||||||
| Alger Focus Equity Fund | ||||||||||||||||||||||||||||
| Preferred Stocks | ||||||||||||||||||||||||||||
| Prosetta Biosciences, Inc., Series D | $ | 11,524 | $ | – | $ | – | $ | – | $ | – | $ | – | $ | 11,524 | ||||||||||||||
| Total | $ | 11,524 | $ | – | $ | – | $ | – | $ | – | $ | – | $ | 11,524 | ||||||||||||||
Security | Value at October 31, 2020 | Purchases/ Conversion | Sales/ Conversion | Dividend/ Interest Income | Realized Gain (Loss) | Net Change in Unrealized App(Dep) | Value at April 30, 2021 | |||||||||||||||||||||
| Alger Mid Cap Growth Institutional Fund | ||||||||||||||||||||||||||||
| Preferred Stocks | ||||||||||||||||||||||||||||
| Prosetta Biosciences, Inc., Series D | $ | 24,901 | $ | – | $ | – | $ | – | $ | – | $ | – | $ | 24,901 | ||||||||||||||
| Special Purpose Vehicle | ||||||||||||||||||||||||||||
| Crosslink Ventures Capital LLC, Cl. A | 550,000 | – | – | – | – | – | 550,000 | |||||||||||||||||||||
| Crosslink Ventures Capital LLC, Cl. B | – | 225,000 | – | – | – | – | 225,000 | |||||||||||||||||||||
| Total | $ | 574,901 | $ | 225,000 | $ | – | $ | – | $ | – | $ | – | $ | 799,901 | ||||||||||||||
Security | Value at October 31, 2020 | Purchases/ Conversion | Sales/ Conversion | Dividend/ Interest Income | Realized Gain (Loss) | Net Change in Unrealized App(Dep) | Value at April 30, 2021 | |||||||||||||||||||||
| Alger Small Cap Growth Institutional Fund | ||||||||||||||||||||||||||||
| Preferred Stocks | ||||||||||||||||||||||||||||
| Prosetta Biosciences, Inc., Series D | $ | 19,989 | $ | – | $ | – | $ | – | $ | – | $ | – | $ | 19,989 | ||||||||||||||
| Special Purpose Vehicle | ||||||||||||||||||||||||||||
| Crosslink Ventures Capital LLC, Cl. A | 1,275,000 | – | – | – | – | – | 1,275,000 | |||||||||||||||||||||
| Crosslink Ventures Capital LLC, Cl. B | – | 325,000 | – | – | – | – | 325,000 | |||||||||||||||||||||
| Total | $ | 1,294,989 | $ | 325,000 | $ | – | $ | – | $ | – | $ | – | $ | 1,619,989 | ||||||||||||||
Beginning Account Value November 1, 2020 | Ending Account Value April 30, 2021 | Expenses Paid During the Six Months Ended April 30, 2021(a) | Annualized Expense Ratio For the Six Months Ended April 30, 2021(b) | ||
| Alger Capital Appreciation Institutional Fund | |||||
| Class I | Actual | $ 1,000.00 | $ 1,215.70 | $ 6.15 | 1.12% |
| Hypothetical(c) | 1,000.00 | 1,019.24 | 5.61 | 1.12 | |
| Class R | Actual | 1,000.00 | 1,212.80 | 8.56 | 1.56 |
| Hypothetical(c) | 1,000.00 | 1,017.06 | 7.80 | 1.56 | |
| Class Y | Actual | 1,000.00 | 1,217.90 | 4.12 | 0.75 |
| Hypothetical(c) | 1,000.00 | 1,021.08 | 3.76 | 0.75 | |
| Class Z-2 | Actual | 1,000.00 | 1,217.60 | 4.34 | 0.79 |
| Hypothetical(c) | 1,000.00 | 1,020.88 | 3.96 | 0.79 | |
| Alger Focus Equity Fund | |||||
| Class A | Actual | $ 1,000.00 | $ 1,170.10 | $ 4.95 | 0.92% |
| Hypothetical(c) | 1,000.00 | 1,020.23 | 4.61 | 0.92 | |
| Class C | Actual | 1,000.00 | 1,220.20 | 9.25 | 1.68 |
| Hypothetical(c) | 1,000.00 | 1,016.46 | 8.40 | 1.68 | |
| Class I | Actual | 1,000.00 | 1,235.10 | 4.99 | 0.90 |
| Hypothetical(c) | 1,000.00 | 1,020.33 | 4.51 | 0.90 | |
| Class Y | Actual | 1,000.00 | 1,237.00 | 3.27 | 0.59 |
| Hypothetical(c) | 1,000.00 | 1,021.87 | 2.96 | 0.59 | |
| Class Z | Actual | 1,000.00 | 1,236.80 | 3.38 | 0.61 |
| Hypothetical(c) | 1,000.00 | 1,021.77 | 3.06 | 0.61 | |
| Alger Mid Cap Growth Institutional Fund | |||||
| Class I | Actual | $ 1,000.00 | $ 1,298.30 | $ 7.12 | 1.25% |
| Hypothetical(c) | 1,000.00 | 1,018.60 | 6.26 | 1.25 | |
| Class R | Actual | 1,000.00 | 1,295.30 | 9.85 | 1.73 |
| Hypothetical(c) | 1,000.00 | 1,016.22 | 8.65 | 1.73 | |
| Class Z-2 | Actual | 1,000.00 | 1,300.30 | 5.42 | 0.95 |
| Hypothetical(c) | 1,000.00 | 1,020.08 | 4.76 | 0.95 | |
| Alger Small Cap Growth Institutional Fund | |||||
| Class I | Actual | $ 1,000.00 | $ 1,287.40 | $ 7.03 | 1.24% |
| Hypothetical(c) | 1,000.00 | 1,018.65 | 6.21 | 1.24 | |
| Class R | Actual | 1,000.00 | 1,284.30 | 9.74 | 1.72 |
| Hypothetical(c) | 1,000.00 | 1,016.27 | 8.60 | 1.72 | |
| Class Z-2 | Actual | 1,000.00 | 1,289.60 | 5.28 | 0.93 |
| Hypothetical(c) | 1,000.00 | 1,020.18 | 4.66 | 0.93 | |
| (a) | Expenses are equal to the annualized expense ratio of the respective share class, multiplied by the average account value over the period, multiplied by 181/365 (to reflect the one-half year period). |
| (b) | Annualized. |
| (c) | 5% annual return before expenses. |
| U.S. Consumer Privacy Notice | Rev. 6/22/21 |
| FACTS | WHAT DOES ALGER DO WITH YOUR PERSONAL INFORMATION? |
| Why? | Financial companies choose how they share your personal information. Federal law gives consumers the right to limit some but not all sharing. Federal law also requires us to tell you how we collect, share, and protect your personal information. Please read this notice carefully to understand what we do. |
| What? | The types of personal information we collect and share depend on the product or service you have with us. This information can include: • Social Security number and • Account balances and • Transaction history and • Purchase history and • Assets When you are no longer our customer, we continue to share your information as described in this notice. |
| How? | All financial companies need to share personal information to run their everyday business. In the section below, we list the reasons financial companies can share personal information; the reasons Alger chooses to share; and whether you can limit this sharing. |
| Reasons we can share your personal information | Does Alger share? | Can you limit this sharing? |
For our everyday business purposes — such as to process your transactions, maintain your account(s), respond to court orders and legal investigations, or report to credit bureaus | Yes | No |
For our marketing purposes — to offer our products and services to you | Yes | No |
For joint marketing with other financial companies | No | We don’t share |
For our affiliates’ everyday business purposes — information about your transactions and experiences | Yes | No |
For our affiliates’ everyday business purposes — information about your creditworthiness | No | We don’t share |
| For nonaffiliates to market to you | No | We don’t share |
| Questions? Call 1-800-223-3810 |
| Who we are | |
| Who is providing this notice? | Alger includes Fred Alger Management, LLC and Fred Alger & Company, LLC as well as the following funds: The Alger Funds, The Alger Funds II, The Alger Institutional Funds, The Alger Portfolios, Alger Global Focus Fund, and the Alger ETF Trust. |
| What we do | |
| How does Alger protect my personal information? | To protect your personal information from unauthorized access and use, we use security measures that comply with federal law. These measures include computer safeguards and secured files and buildings. |
| How does Alger collect my personal information? | We collect your personal information, for example, when you: • Open an account or • Make deposits or withdrawals from your account or • Give us your contact information or • Provide account information or • Pay us by check. |
| Why can’t I limit all sharing? | Federal law gives you the right to limit some but not all sharing related to: • sharing for affiliates’ everyday business purposes ─ information about your credit worthiness • affiliates from using your information to market to you • sharing for nonaffiliates to market to you State laws and individual companies may give you additional rights to limit sharing. |
| Definitions | |
| Affiliates | Companies related by common ownership or control. They can be financial and nonfinancial companies. • Our affiliates include Fred Alger Management, LLC, Weatherbie Capital, LLC and Fred Alger & Company, LLC as well as the following funds: The Alger Funds, The Alger Funds II, The Alger Institutional Funds, The Alger Portfolios, Alger Global Focus Fund, and the Alger ETF Trust. |
| Nonaffiliates | Companies not related by common ownership or control. They can be financial and nonfinancial companies. |
| Joint marketing | A formal agreement between nonaffiliated financial companies that together market financial products or services to you. |
Milwaukee, WI 53212
ITEM 2. | CODE OF ETHICS. |
ITEM 3. | AUDIT COMMITTEE FINANCIAL EXPERT. |
ITEM 4. | PRINCIPAL ACCOUNTANT FEES AND SERVICES. |
ITEM 5. | AUDIT COMMITTEE OF LISTED REGISTRANTS. |
ITEM 6. | INVESTMENTS. |
ITEM 7. | DISCLOSURE OF PROXY VOTING POLICIES AND PROCEDURES FOR CLOSED-END MANAGEMENT INVESTMENT COMPANIES. |
ITEM 8. | PORTFOLIO MANAGERS OF CLOSED-END MANAGEMENT INVESTMENT COMPANIES. |
ITEM 9. | PURCHASES OF EQUITY SECURITIES BY CLOSED-END MANAGEMENT INVESTMENT COMPANY AND AFFILIATED PURCHASERS. |
ITEM 10. | SUBMISSION OF MATTERS TO A VOTE OF SECURITY HOLDERS. |
ITEM 11. | CONTROLS AND PROCEDURES. |
ITEM 12. | Disclosure of Securities Lending Activities for Closed-End Management Investment Companies. |
ITEM 13. | EXHIBITS. |
By: | /s/ Hal Liebes |
Hal Liebes | |
President |
By: | /s/ Hal Liebes |
Hal Liebes | |
President |
By: | /s/ Michael D. Martins |
Michael D. Martins | |
Treasurer |
Date: June 21, 2021